UNITED STATES
SECURITIES AND EXCHANGE COMMISSION
WASHINGTON, D.C. 20549
FORM N-CSR
CERTIFIED SHAREHOLDER REPORT OF REGISTERED
MANAGEMENT INVESTMENT COMPANIES
Investment Company Act file number: 811-22671
AB MULTI-MANAGER ALTERNATIVE FUND, INC.
(Exact name of registrant as specified in charter)
1345 Avenue of the Americas, New York, New York 10105
(Address of principal executive offices) (Zip code)
Joseph J. Mantineo
AllianceBernstein L.P.
1345 Avenue of the Americas
New York, New York 10105
(Name and address of agent for service)
Registrant’s telephone number, including area code: (800) 221-5672
Date of fiscal year end: March 31, 2019
Date of reporting period: September 30, 2018
ITEM 1. REPORTS TO STOCKHOLDERS.
SEP 09.30.18
SEMI-ANNUAL REPORT
AB MULTI-MANAGER ALTERNATIVE FUND

| | |
| |
| Investment Products Offered | | • Are Not FDIC Insured • May Lose Value • Are Not Bank Guaranteed |
Investors should consider the investment objectives, risks, charges and expenses of the Fund carefully before investing. For copies of our prospectus or summary prospectus, which contain this and other information, visit us online at www.abfunds.com or contact your AB representative. Please read the prospectus and/or summary prospectus carefully before investing.
This shareholder report must be preceded or accompanied by the Fund’s prospectus for individuals who are not current shareholders of the Fund.
You may obtain a description of the Fund’s proxy voting policies and procedures, and information regarding how the Fund voted proxies relating to portfolio securities during the most recent 12-month period ended June 30, without charge. Simply visit AB’s website at www.abfunds.com, or go to the Securities and Exchange Commission’s (the “Commission”) website at www.sec.gov, or call AB at (800) 227 4618.
The Fund files its complete schedule of portfolio holdings with the Commission for the first and third quarters of each fiscal year. The Fund’s portfolio holdings reports are available on the Commission’s website at www.sec.gov. The Fund’s portfolio holdings reports may also be reviewed and copied at the Commission’s Public Reference Room in Washington, DC; information on the operation of the Public Reference Room may be obtained by calling (800) SEC 0330. AB publishes full portfolio holdings for the Fund monthly at www.abfunds.com.
Sanford C. Bernstein & Company LLC (SCB) and AllianceBernstein Investments, Inc. (ABI) are the distributors of the AB family of mutual funds. SCB and ABI are members of FINRA and are affiliates of AllianceBernstein L.P., the Adviser of the funds.
The [A/B] logo is a registered service mark of AllianceBernstein and AllianceBernstein® is a registered service mark used by permission of the owner, AllianceBernstein L.P.
SEMI-ANNUAL REPORT
November 15, 2018
This report provides certain performance data for AB Multi-Manager Alternative Fund (the “Fund”) for the semi-annual reporting period ended September 30, 2018.
The Fund’s investment objective is to seek long-term capital appreciation.
RETURNS AS OF SEPTEMBER 30, 2018 (unaudited)
| | | | | | | | |
| | | 6 Months | | | 12 Months | |
| AB MULTI-MANAGER ALTERNATIVE FUND | | | 0.80% | | | | 1.53% | |
| Benchmark: HFRI FOF Composite Index | | | 0.89% | | | | 3.25% | |
| MSCI World Index (net) | | | 6.80% | | | | 11.24% | |
| S&P 500 Index | | | 11.41% | | | | 17.91% | |
| Bloomberg Barclays US Aggregate Index | | | -0.14% | | | | -1.22% | |
INVESTMENT RESULTS
The table above provides performance data for the Fund and its benchmark, the HFRI Fund of Funds (“HFRI FOF”) Composite Index, for the six- and 12-month periods ended September 30, 2018. The table also includes the performance of the Morgan Stanley Capital International (“MSCI”) World Index (net), the Standard and Poor’s (“S&P”) 500 Index and the Bloomberg Barclays US Aggregate Index.
The Fund underperformed the HFRI FOF Composite Index, the MSCI World Index (net) and the S&P 500 Index, but outperformed the Bloomberg Barclays US Aggregate Index, during both periods.
The six-month period was an environment of low monthly volatility, with only modest changes from month to month. Low volatility was a consistent pattern within global bond markets; however, non-US equity markets, particularly Asia, generated negative returns and elevated volatility levels. Therefore, investments in hedge funds with exposure to Asian equity markets detracted. In some cases, the exposures were directional, i.e. long equities, and in other cases the positions were more relative value, such as long equities in China versus short equities in the US.
On a broader scale, the Fund benefited from positive absolute performance across the Long/Short Equity, Credit/Distressed and Event Driven Underlying Portfolios, while Multi-Strategy was the only notable detractor; Global Macro was flat. While the Long/Short Equity Underlying Portfolios with exposure to Asia and emerging-equity markets were a headwind to performance, Underlying Portfolios with exposures to US and, more broadly,
| | |
| abfunds.com | | AB MULTI-MANAGER ALTERNATIVE FUND | 1 |
global markets, fared much better. The credit-focused Underlying Portfolios managed a positive contribution despite headwinds for the global credit markets from rising interest rates. In fact, the performance of all of the core Credit/Distressed Underlying Portfolios was positive, led by investments in distressed and short-duration high-yielding credit instruments. Event Driven had a successful period with five of the six core Underlying Portfolios positively contributing, the sole outlier producing only a marginal loss due to the performance of hedging positions, rather than the assets held on the long side. The top Event Driven contributors were led by a diverse group of equity and fixed-income positions undergoing meaningful corporate events that unlocked value during the period. The losses within Multi-Strategy were tied primarily to volatility in Asian markets, with relative value positioning long Chinese equities underperforming against shorts across the rest of Asia.
The majority of the underperformance during the 12-month period occurred during the first half of the period. Global Macro was the sole absolute negative contributor; Underlying Portfolios with exposures to select emerging markets, such as Argentina and South Africa, were the largest detractors. The Long/Short Equity allocation was the top contributor, including a positive contribution during the time of high volatility between January and March 2018, but with a more notable shortcoming during the equity rally towards the end of 2017. Several Underlying Portfolios showed strong stock selection in January during the rising market, but also showed meaningful capital preservation during the downside volatility in February and March, from a combination of short stock selection and significant exposure to put options held throughout the period, which helped returns as markets fell. During the October through December period however, poor stock selection across sector-specific funds in energy, health care and technology detracted. Similar to the six-month period, most of the Credit/Distressed Underlying Portfolios contributed, with gains diversified across distressed, high yield and structured credits. The sole negative contributor was positioned significantly net short through hedges across multiple asset classes, negating the gains from the long credit positions. The Event Driven allocation was small and therefore only modestly contributed to returns. Multi-Strategy also contributed, albeit more modestly, from gains across equities, fixed income, mergers and macro-trading strategies.
For both periods, the Fund utilized total return swaps for hedging and investment purposes which had no material impact on absolute performance.
As a result of changes to the Fund’s investment policies that were effective July 31, 2018, including changes to allow for greater direct investment in securities and other financial instruments (in addition to investment in hedge funds), the portfolio composition is expected to evolve over time. However, the changes in investment policies had only a limited impact on the Fund’s performance for the period ended September 30, 2018.
| | |
| 2 | AB MULTI-MANAGER ALTERNATIVE FUND | | abfunds.com |
MARKET REVIEW AND INVESTMENT STRATEGY
US stocks outperformed their non-US counterparts during the six-month period ended September 30, 2018. US indices advanced to record highs, amid continued economic strength and strong corporate earnings. Conversely, emerging-market equities fell on the back of a stronger US dollar, rising US interest rates, and fears that financial turmoil in countries such as Turkey and Argentina would spread to other markets. From a style perspective, growth stocks outperformed value stocks. Performance was mixed in terms of market capitalization. Trade wars dominated market-related headlines, while political instability in Europe also weighed on investor sentiment.
Fixed-income markets had mixed performance. Global high yield outperformed the flat returns of developed-market treasuries, while emerging-market local-currency government bonds and investment-grade securities ended the period lower. Emerging-market debt sectors generally sold off. The US Federal Reserve hiked interest rates twice and increased forward guidance, while the European Central Bank started to scale back its asset purchases. Elsewhere, markets responded positively when the Chinese central bank took steps to stop further depreciation of the yuan.
INVESTMENT POLICIES
There can be no assurance that the Fund will achieve its investment objective, be able to structure its investments as anticipated, or that its returns will be positive over any period of time. The Fund is not intended as a complete investment program for investors.
The Fund seeks to achieve its investment objective primarily by allocating its assets among investments in a diversified portfolio of private investment vehicles commonly referred to as hedge funds (“Underlying Portfolios”). The Fund will invest primarily in Underlying Portfolios pursuing the following strategies: Long/Short Equity, Event Driven, Credit/Distressed, Emerging Markets, Global Macro and Multi-Strategy. For more information on these strategies, please see “Consolidated Portfolio of Investments” on pages 8-18. As a secondary strategy, the Fund will generally also make direct investments in securities and other financial instruments. For more information regarding the Fund’s risks, please see “Disclosures and Risks” on pages 4-6 and “Note E—Risks Involved in Investing in the Fund” of the Notes to Consolidated Financial Statements on pages 35-37.
| | |
| abfunds.com | | AB MULTI-MANAGER ALTERNATIVE FUND | 3 |
DISCLOSURES AND RISKS
Benchmark Disclosure
All indices are unmanaged and do not reflect fees and expenses associated with the active management of a mutual fund portfolio. The HFRI FOF Composite Index is an equal-weighted performance index that includes over 650 constituent funds of hedge funds that report their monthly net-of-fee returns to Hedge Fund Research, have at least $50 million under management and have been actively trading for at least 12 months. The MSCI World Index (net, free float-adjusted, market capitalization weighted) represents the equity market performance of developed markets. The S&P 500® Index includes 500 US stocks and is a common representation of the performance of the overall US stock market. The Bloomberg Barclays US Aggregate Index represents the performance of securities within the US investment-grade fixed-rate bond market, with index components for government and corporate securities, mortgage pass-through securities, asset-backed securities and commercial mortgage-backed securities. MSCI makes no express or implied warranties or representations, and shall have no liability whatsoever with respect to any MSCI data contained herein. The MSCI data may not be further redistributed or used as a basis for other indices, any securities or financial products. This report is not approved, reviewed or produced by MSCI. Net returns include the reinvestment of dividends after deduction of non-US withholding tax. An investor cannot invest directly in an index, and its results are not indicative of the performance for any specific investment, including the Fund.
A Word about Risk
An investment in the Fund’s shares may be speculative in that it involves a high degree of risk and should not constitute a complete investment program. Before making an investment decision, you should carefully consider the following risk factors, together with the other information contained in the prospectus. At any point in time, an investment in the Fund’s shares may be worth less than the original amount invested, even after taking into account the distributions paid, if any, and the ability of shareholders to reinvest distributions. If any of the risks discussed below occurs, the Fund’s results of operations could be materially and adversely affected. If this were to happen, the price of Fund shares could decline significantly and you could lose all or a part of your investment.
Investment in this Fund is highly speculative and involves substantial risk, including loss of principal, and therefore may not be suitable for all investors.
General Risk Factors: Underlying Portfolios and the Fund’s direct investments may exhibit high volatility, and investors may lose all or substantially all of their investment. Investments by Underlying Portfolios and
| | |
| 4 | AB MULTI-MANAGER ALTERNATIVE FUND | | abfunds.com |
DISCLOSURES AND RISKS (continued)
the Fund in illiquid assets and foreign markets and the use of short sales, options, leverage, futures, swaps and other derivative instruments may create special risks and substantially increase the impact and likelihood of adverse price movements. Interests in Underlying Portfolios are subject to limitations on transferability and are illiquid, and no secondary market for interests typically exists or is likely to develop. Underlying Portfolios are typically not registered with securities regulators and are therefore generally subject to little or no regulatory oversight. Performance compensation payable to an Underlying Portfolio investment advisor may create an incentive to make riskier or more speculative investments. Underlying Portfolios typically charge higher fees than many other types of investments, which can offset trading profits, if any. There can be no assurance that any Underlying Portfolio will achieve its investment objectives.
Tax Risks: The Fund intends to be treated as a regulated investment company (“RIC”) under the Internal Revenue Code. However, in order to qualify as a RIC and also to avoid having to pay an “excise tax,” the Fund will be subject to certain limitations on its investments and operations, including a requirement that a specified proportion of its income come from qualifying sources, an asset diversification requirement and minimum distribution requirements. Satisfaction of the various requirements requires significant support and information from the Underlying Portfolios, and such support and information may not be available, sufficient, verifiable, or provided on a timely basis.
Limited Liquidity: The Fund’s shares are not listed on any securities exchange or traded in any other market, and are subject to substantial restrictions on transfer. Although the Fund has offered to repurchase shares on a quarterly basis, such periodic repurchase offers are at the sole discretion of the Fund’s Board of Trustees, and there is no assurance that these repurchase offers will continue. It will normally be four to six months between the time an investor tenders shares for repurchase (i.e., requests that the Fund repurchase shares as part of a repurchase offer) and the investor’s receipt of any cash proceeds associated with the repurchase.
Fund of Funds Considerations: The Fund will have no control rights over and limited transparency into the investment programs of the Underlying Portfolios in which it invests. In valuing the Fund’s holdings, the Investment Manager will generally rely on financial information provided by Underlying Portfolios, which may be unaudited, estimated and/or may not involve third parties. The Fund’s investment opportunities may be limited as a result of withdrawal terms or anticipated liquidity needs (e.g., withdrawal restrictions imposed by underlying hedge funds may delay, preclude or involve expense in connection with portfolio adjustments by the Investment Manager).
| | |
| abfunds.com | | AB MULTI-MANAGER ALTERNATIVE FUND | 5 |
DISCLOSURES AND RISKS (continued)
These risks are fully discussed in the Fund’s prospectus. As with all investments, you may lose money by investing in the Fund.
An Important Note About Historical Performance
The performance shown in this report represents past performance and does not guarantee future results. Current performance may be lower or higher than the performance information shown. All fees and expenses related to the operation of the Fund have been deducted. Performance assumes reinvestment of distributions and does not account for taxes.
| | |
| 6 | AB MULTI-MANAGER ALTERNATIVE FUND | | abfunds.com |
PORTFOLIO SUMMARY
September 30, 2018 (unaudited)
Net Assets ($mil): $1,092.2
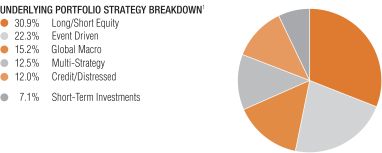
| 1 | All data are as of September 30, 2018. The Fund’s portfolio strategy breakdown is based on the Adviser’s internal classification and is expressed as a percentage of total investment exposure, including exposure from derivatives (see “Consolidated Portfolio of Investments” section of the report for additional details). |
| | |
| abfunds.com | | AB MULTI-MANAGER ALTERNATIVE FUND | 7 |
CONSOLIDATED PORTFOLIO OF INVESTMENTS
September 30, 2018 (unaudited)
| | | | | | | | | | | | | | |
Underlying
Portfolios | | Shares | | | Fair Value ($) | | | % Net
Assets | | | Liquidity* |
| | | | | | |
Long/Short Equity |
Aravt Global Fund Ltd. | | | 6,380 | | | $ | 7,349,684 | | | | 0.7 | % | | Semi-Annual |
Coatue Offshore Fund, Ltd. | | | 185,720 | | | | 42,913,860 | | | | 3.9 | | | Quarterly |
Darsana Overseas Fund Ltd. | | | 20,362 | | | | 27,750,681 | | | | 2.5 | | | Quarterly |
Janchor Partners Pan-Asian Fund | | | 216,000 | | | | 26,929,095 | | | | 2.5 | | | Triennially |
Luminus Energy Partners, Ltd. | | | 20,077 | | | | 45,849,984 | | | | 4.2 | | | Quarterly |
Nokota Capital Offshore Fund, Ltd. | | | 10,303 | | | | 18,669,612 | | | | 1.7 | | | Quarterly |
PFM Healthcare Offshore Fund, Ltd. | | | 53,049 | | | | 55,751,570 | | | | 5.1 | | | Quarterly |
Sheffield International Partners, Ltd. | | | 7,500 | | | | 9,031,336 | | | | 0.8 | | | Anniversary |
The Children’s Investment Fund | | | 190,000 | | | | 24,747,500 | | | | 2.3 | | | Triennially |
Think Investments Offshore Ltd. | | | 24,771 | | | | 34,390,743 | | | | 3.2 | | | Semi-Annual |
Two Creeks Capital Offshore Fund, Ltd. | | | 18,290 | | | | 22,201,624 | | | | 2.0 | | | Quarterly |
Tybourne Equity (Offshore) Fund | | | 26,550 | | | | 43,703,753 | | | | 4.0 | | | Quarterly |
| | | | | | | | | | | | | | |
Total | | | | | | | 359,289,442 | | | | 32.9 | | | |
| | | | | | | | | | | | | | |
|
Event Driven |
Empyrean Capital Overseas Fund, Ltd. | | | 38,781 | | | | 48,972,764 | | | | 4.5 | | | Quarterly |
Fir Tree International Value Fund, Ltd. | | | 46 | | | | 2,194,168 | | | | 0.2 | | | Biennially |
Governors Lane Offshore Fund Ltd. | | | 27,548 | | | | 31,130,539 | | | | 2.9 | | | Quarterly |
Indaba Capital Partners (Cayman), LP | | | 22,572 | | | | 26,447,161 | | | | 2.4 | | | Quarterly |
Lion Point International, Ltd. | | | 36,002 | | | | 37,046,639 | | | | 3.4 | | | Semi-Annual |
| | |
| 8 | AB MULTI-MANAGER ALTERNATIVE FUND | | abfunds.com |
CONSOLIDATED PORTFOLIO OF INVESTMENTS (continued)
| | | | | | | | | | | | | | |
Underlying
Portfolios | | Shares | | | Fair Value ($) | | | % Net
Assets | | | Liquidity* |
| | | | | | |
Luxor Capital Partners Offshore Liquidating SPV, Ltd. | | | 2,410 | | | $ | 2,711,300 | | | | 0.2 | % | | At Fund’s Discretion |
Senator Global Opportunity Offshore Fund II Ltd. | | | 32,208 | | | | 37,213,007 | | | | 3.4 | | | Quarterly |
Starboard Leaders Fund LP. | | | 6,466 | | | | 7,582,225 | | | | 0.7 | | | At Fund’s Discretion |
| | | | | | | | | | | | | | |
Total | | | | | | | 193,297,803 | | | | 17.7 | | | |
| | | | | | | | | | | | | | |
|
Global Macro |
Alphadyne International Fund, Ltd. | | | 65,000 | | | | 66,848,692 | | | | 6.1 | | | Quarterly |
Brevan Howard AS Macro Fund Limited | | | 280,000 | | | | 28,008,400 | | | | 2.6 | | | Monthly |
Graticule Asia Macro Fund Ltd. | | | 33,000 | | | | 30,726,544 | | | | 2.8 | | | Quarterly |
Light Sky Macro Offshore Fund Ltd. | | | 20,000 | | | | 18,200,580 | | | | 1.7 | | | Quarterly |
Rokos Global Macro Fund Limited | | | 401,922 | | | | 24,019,745 | | | | 2.2 | | | Monthly |
Spinnaker GEM Holdings Ltd. | | | 67,220 | | | | 8,962,049 | | | | 0.8 | | | Annual |
| | | | | | | | | | | | | | |
Total | | | | | | | 176,766,010 | | | | 16.2 | | | |
| | | | | | | | | | | | | | |
|
Credit/Distressed |
Caius Capital International Fund | | | 35,000 | | | | 35,303,519 | | | | 3.2 | | | Quarterly |
King Street Capital, Ltd. | | | 194,074 | | | | 33,359,120 | | | | 3.0 | | | Quarterly |
Panning Overseas Fund, Ltd. | | | 1,768 | | | | 1,828,901 | | | | 0.2 | | | Quarterly |
Silver Point Capital Offshore Fund, Ltd. | | | 3,520 | | | | 55,320,694 | | | | 5.1 | | | Annual |
Warlander Offshore Fund, Ltd. | | | 15,001 | | | | 13,349,370 | | | | 1.2 | | | Quarterly |
Wingspan Overseas Fund, Ltd. | | | 953 | | | | 638,227 | | | | 0.1 | | | Fund in Liquidation |
| | | | | | | | | | | | | | |
Total | | | | | | | 139,799,831 | | | | 12.8 | | | |
| | | | | | | | | | | | | | |
| | |
| abfunds.com | | AB MULTI-MANAGER ALTERNATIVE FUND | 9 |
CONSOLIDATED PORTFOLIO OF INVESTMENTS (continued)
| | | | | | | | | | | | | | |
Underlying
Portfolios | | Shares | | | Fair Value ($) | | | % Net
Assets | | | Liquidity* |
| | | | | | |
|
Multi-Strategy |
Elliott International Limited | | | 23,648 | | | $ | 32,747,977 | | | | 3.0 | % | | Quarterly |
Myriad Opportunities Offshore Fund Limited | | | 48,797 | | | | 57,755,779 | | | | 5.3 | | | Quarterly |
| | | | | | | | | | | | | | |
Total | | | | | | | 90,503,756 | | | | 8.3 | | | |
| | | | | | | | | | | | | | |
Total Underlying Portfolios
(cost $827,860,139) | | | | | | | 959,656,842 | | | | 87.9 | | | |
| | | | | | | | | | | | | | |
|
Short-Term Investments |
Investment Companies | | | |
AB Fixed Income Shares, Inc.—Government Money Market Portfolio—Class AB, 1.98%(a)(b)(c)
(cost $82,250,000) | | | 82,250,000 | | | | 82,250,000 | | | | 7.5 | | | |
| | | | | | | | | | | | | | |
| | | | |
Total Investments
(cost $910,110,139) | | | | | | | 1,041,906,842 | | | | 95.4 | | | |
Other assets less liabilities | | | | | | | 50,263,456 | | | | 4.6 | | | |
| | | | | | | | | | | | | | |
| | | | |
Net Assets | | | | | | $ | 1,092,170,298 | | | | 100.0 | % | | |
| | | | | | | | | | | | | | |
TOTAL RETURN SWAPS (see Note C)
| | | | | | | | | | | | | | | | | | | | | | | | |
Counterparty &
Referenced
Obligation | | # of Shares
or Units | | | Rate Paid/
Received | | Payment
Frequency | | Notional
Amount
(000) | | | Maturity
Date | | | Unrealized
Appreciation/
(Depreciation) | |
Receive Total Return on Reference Obligation | |
Barclays Bank PLC | |
BCCFHI2P | | | 49,038 | | | 0.02% | | Quarterly | | | USD | | | | 9,820 | | | | 10/15/19 | | | $ | 76,997 | |
BXCS1673 | | | 5,682 | | | 0.30% | | Quarterly | | | USD | | | | 3,345 | | | | 10/15/19 | | | | 31,754 | |
Citibank, NA
FX G10 Value PPP (C) Index(1) | | | 74,026 | | | 0.30% | | Quarterly | | | USD | | | | 12,743 | | | | 10/15/19 | | | | 40,593 | |
Goldman Sachs International | |
Cross Asset Trend Basket Series 2 10% Volatility Target ER Strategy | | | 101,055 | | | 0.00% | | Quarterly | | | USD | | | | 11,611 | | | | 10/15/19 | | | | (16,522 | ) |
GSGLEURA | | | 257,206 | | | 3 Month
EURIBOR
Minus 0.60% | | Quarterly | | | EUR | | | | 27,800 | | | | 8/15/19 | | | | 74,511 | |
GSISM49E(2) | | | 217,990 | | | 0.00% | | Quarterly | | | USD | | | | 22,187 | | | | 10/15/19 | | | | 16,569 | |
| | |
| 10 | AB MULTI-MANAGER ALTERNATIVE FUND | | abfunds.com |
CONSOLIDATED PORTFOLIO OF INVESTMENTS (continued)
| | | | | | | | | | | | | | | | | | | | | | | | |
Counterparty &
Referenced
Obligation | | # of Shares
or Units | | | Rate Paid/
Received | | Payment
Frequency | | Notional
Amount
(000) | | | Maturity
Date | | | Unrealized
Appreciation/
(Depreciation) | |
RP Equity Carry Series 01 Excess Return Strategy | | | 77,830 | | | 0.00% | | Quarterly | | | USD | | | | 9,632 | | | | 10/15/19 | | | $ | (5,775 | ) |
JPMorgan Chase Bank, NA | |
JMABRCGA | | | 13,384 | | | 0.50% | | Quarterly | | | USD | | | | 3,824 | | | | 10/15/19 | | | | 24,277 | |
JMABRCX1 | | | 147,816 | | | 0.18% | | Quarterly | | | USD | | | | 28,143 | | | | 10/15/19 | | | | 8,687 | |
JMABRG34 | | | 3,988 | | | 0.60% | | Quarterly | | | USD | | | | 7,029 | | | | 10/15/19 | | | | (65,813 | ) |
JPABSAA1 | | | 101,626 | | | 0.00% | | Quarterly | | | USD | | | | 10,303 | | | | 10/31/19 | | | | (213 | ) |
JPMZRMR1 | | | 54,342 | | | 0.00% | | Quarterly | | | USD | | | | 8,492 | | | | 10/15/19 | | | | 16,846 | |
JPQCRMFA(3) | | | 194,127 | | | 0.00% | | Quarterly | | | USD | | | | 19,138 | | | | 10/15/19 | | | | 22,344 | |
Morgan Stanley Capital Services, LLC | |
Aetna, Inc. | | | 9,510 | | | LIBOR Plus
0.30% | | Maturity | | | USD | | | | 1,954 | | | | 12/11/19 | | | | (26,631 | ) |
Andeavor | | | 12,490 | | | LIBOR Plus
0.30% | | Maturity | | | USD | | | | 1,949 | | | | 12/11/19 | | | | (33,365 | ) |
Avista Corp. | | | 37,940 | | | LIBOR Plus
0.30% | | Maturity | | | USD | | | | 1,954 | | | | 12/11/19 | | | | (37,423 | ) |
Bemis Co., Inc. | | | 40,030 | | | LIBOR Plus
0.30% | | Maturity | | | USD | | | | 1,955 | | | | 12/11/19 | | | | (10,116 | ) |
CA, Inc. | | | 44,480 | | | LIBOR Plus
0.30% | | Maturity | | | USD | | | | 1,959 | | | | 12/11/19 | | | | 3,976 | |
Connecticut Water SVC Inc. | | | 6,023 | | | LIBOR Plus
0.30% | | Maturity | | | USD | | | | 414 | | | | 12/11/19 | | | | 3,933 | |
Enbridge Income Fund Holdings, Inc. | | | 75,810 | | | CDOR Plus
0.40% | | Maturity | | | CAD | | | | 2,382 | | | | 12/11/19 | | | | (2,910 | ) |
EnerCare, Inc. | | | 83,810 | | | CDOR Plus
0.40% | | Maturity | | | CAD | | | | 2,425 | | | | 12/11/19 | | | | (36 | ) |
Energen Corp. | | | 22,557 | | | LIBOR Plus
0.30% | | Maturity | | | USD | | | | 1,823 | | | | 12/11/19 | | | | 119,429 | |
Express Scripts Holding Co. | | | 20,390 | | | LIBOR Plus
0.30% | | Maturity | | | USD | | | | 1,951 | | | | 12/11/19 | | | | (15,316 | ) |
FCB Financial Holdings | | | 40,570 | | | LIBOR Plus
0.30% | | Maturity | | | USD | | | | 1,959 | | | | 12/11/19 | | | | (37,348 | ) |
Gemalto | | | 27,550 | | | EURIBOR
Plus 0.50% | | Maturity | | | EUR | | | | 1,381 | | | | 12/11/19 | | | | 2,334 | |
Integrated Device Technology, Inc. | | | 41,520 | | | LIBOR Plus
0.30% | | Maturity | | | USD | | | | 1,956 | | | | 12/11/19 | | | | (4,904 | ) |
Kapstone Paper and Packaging | | | 57,160 | | | LIBOR Plus
0.30% | | Maturity | | | USD | | | | 1,952 | | | | 12/11/19 | | | | (9,614 | ) |
LINDE AG | | | 7,949 | | | EURIBOR
Plus 0.50% | | Maturity | | | EUR | | | | 1,541 | | | | 12/11/19 | | | | 83,943 | |
Luxottica Group Spa | | | 29,970 | | | EURIBOR
Plus 0.50% | | Maturity | | | EUR | | | | 1,675 | | | | 12/11/19 | | | | 91,209 | |
| | |
| abfunds.com | | AB MULTI-MANAGER ALTERNATIVE FUND | 11 |
CONSOLIDATED PORTFOLIO OF INVESTMENTS (continued)
| | | | | | | | | | | | | | | | | | | | | | | | |
Counterparty &
Referenced
Obligation | | # of Shares
or Units | | | Rate Paid/
Received | | Payment
Frequency | | Notional
Amount
(000) | | | Maturity
Date | | | Unrealized
Appreciation/
(Depreciation) | |
MSABFLSU | | | 75,934 | | | 0.65% | | Quarterly | | | USD | | | | 7,093 | | | | 10/15/19 | | | $ | 1,978 | |
MSABSLSU | | | 32,426 | | | 1.20% | | Quarterly | | | USD | | | | 3,038 | | | | 10/15/19 | | | | 13,820 | |
MSCBGABG(4) | | | 99,616 | | | 0.30% | | Quarterly | | | USD | | | | 16,457 | | | | 10/15/19 | | | | 30,830 | |
MSCBRMF4 | | | 31,511 | | | 0.60% | | Quarterly | | | USD | | | | 6,306 | | | | 10/15/19 | | | | (30,353 | ) |
MSCBVB3U | | | 17,242 | | | 0.50% | | Quarterly | | | USD | | | | 11,836 | | | | 10/15/19 | | | | 36,880 | |
NEX Group PLC | | | 142,010 | | | LIBOR Plus
0.50% | | Maturity | | | GBP | | | | 1,478 | | | | 12/11/19 | | | | (86,664 | ) |
NxStage Medical Inc. | | | 56,830 | | | LIBOR Plus
0.30% | | Maturity | | | USD | | | | 1,618 | | | | 12/11/19 | | | | (34,160 | ) |
Ocean Rig UDW Inc. | | | 56,213 | | | LIBOR Plus
0.30% | | Maturity | | | USD | | | | 1,799 | | | | 12/11/19 | | | | 145,982 | |
Oclaro, Inc. | | | 180,160 | | | LIBOR Plus
0.30% | | Maturity | | | USD | | | | 1,635 | | | | 12/11/19 | | | | (25,499 | ) |
Orbotech Ltd. | | | 32,240 | | | LIBOR Plus
0.30% | | Maturity | | | USD | | | | 1,964 | | | | 12/11/19 | | | | (49,108 | ) |
Pinnacle Entertainment Inc. | | | 9,563 | | | LIBOR Plus
0.30% | | Maturity | | | USD | | | | 319 | | | | 12/11/19 | | | | 2,816 | |
Rockwell Collins Inc. | | | 13,930 | | | LIBOR Plus
0.30% | | Maturity | | | USD | | | | 1,960 | | | | 12/11/19 | | | | (4,246 | ) |
Scana Corp. | | | 36,410 | | | LIBOR Plus
0.30% | | Maturity | | | USD | | | | 1,297 | | | | 12/11/19 | | | | 117,724 | |
Shire PLC | | | 33,135 | | | LIBOR Plus
0.50% | | Maturity | | | GBP | | | | 1,488 | | | | 12/11/19 | | | | 56,734 | |
Sprint Corp. | | | 218,100 | | | LIBOR Plus
0.30% | | Maturity | | | USD | | | | 1,400 | | | | 12/11/19 | | | | 25,674 | |
Pay Total Return on Reference Obligation | |
Goldman Sachs International | |
STOXX Europe 600 | | | 72,495 | | | 3 Month
EURIBOR
Plus 0.14% | | Quarterly | | | EUR | | | | 14,014 | | | | 8/15/19 | | | | 201,934 | |
Morgan Stanley Capital Services, LLC | |
Amcor Ltd. | | | 204,153 | | | 1 Month
BBSW | | Maturity | | | AUD | | | | 2,772 | | | | 12/11/19 | | | | (14,817 | ) |
Cigna Corp. | | | 4,962 | | | LIBOR Plus
0.30% | | Maturity | | | USD | | | | 997 | | | | 12/11/19 | | | | (36,075 | ) |
CME Group, Inc. | | | 6,305 | | | LIBOR Plus
0.30% | | Maturity | | | USD | | | | 1,084 | | | | 12/11/19 | | | | 11,732 | |
CVS Health Corp. | | | 7,967 | | | LIBOR Plus
0.30% | | Maturity | | | USD | | | | 625 | | | | 12/11/19 | | | | (1,922 | ) |
Diamondback Energy, Inc. | | | 14,531 | | | LIBOR Minus
0.06% | | Maturity | | | USD | | | | 1,844 | | | | 12/11/19 | | | | (119,421 | ) |
Dominion Energy, Inc. | | | 24,358 | | | LIBOR Minus
0.06% | | Maturity | | | USD | | | | 1,737 | | | | 12/11/19 | | | | 26,186 | |
Enbridge Income Fund Holdings, Inc. | | | 55,720 | | | CDOR Plus
1.63% | | Maturity | | | CAD | | | | 2,334 | | | | 12/11/19 | | | | 9,230 | |
| | |
| 12 | AB MULTI-MANAGER ALTERNATIVE FUND | | abfunds.com |
CONSOLIDATED PORTFOLIO OF INVESTMENTS (continued)
| | | | | | | | | | | | | | | | | | | | | | | | |
Counterparty &
Referenced
Obligation | | # of Shares
or Units | | | Rate Paid/
Received | | Payment
Frequency | | Notional
Amount
(000) | | | Maturity
Date | | | Unrealized
Appreciation/
(Depreciation) | |
Essilor International Cie Generale d’Optique SA | | | 13,816 | | | EURIBOR
Plus 0.50% | | Maturity | | | EUR | | | | 1,682 | | | | 12/11/19 | | | $ | (91,581 | ) |
KLA-Tencor Corp. | | | 8,060 | | | LIBOR Minus
0.06% | | Maturity | | | USD | | | | 830 | | | | 12/11/19 | | | | 10,512 | |
Lumentum Holdings Inc. | | | 11,458 | | | LIBOR Minus
0.06% | | Maturity | | | USD | | | | 686 | | | | 12/11/19 | | | | (707 | ) |
Marathon Petroleum Corp. | | | 19,852 | | | LIBOR Plus
0.30% | | Maturity | | | USD | | | | 1,670 | | | | 12/11/19 | | | | 84,018 | |
Penn National Gaming Inc. | | | 3,975 | | | LIBOR Minus
0.06% | | Maturity | | | USD | | | | 128 | | | | 12/11/19 | | | | (2,614 | ) |
Praxair Inc. | | | 12,241 | | | LIBOR Plus
0.30% | | Maturity | | | USD | | | | 1,935 | | | | 12/11/19 | | | | (30,676 | ) |
Synovus Financial Corp. | | | 42,801 | | | LIBOR Minus
0.06% | | Maturity | | | USD | | | | 1,996 | | | | 12/11/19 | | | | 37,483 | |
T-Mobile US, Inc. | | | 22,377 | | | LIBOR Minus
0.06% | | Maturity | | | USD | | | | 1,521 | | | | 12/11/19 | | | | (48,221 | ) |
Takeda Pharmaceutical Co., Ltd. | | | 27,800 | | | LIBOR Plus
0.40% | | Maturity | | | JPY | | | | 132,526 | | | | 12/11/19 | | | | (44,951 | ) |
Transocean Ltd. | | | 90,660 | | | LIBOR Minus
0.06% | | Maturity | | | USD | | | | 1,120 | | | | 12/11/19 | | | | (144,008 | ) |
United Technologies Corp. | | | 5,227 | | | LIBOR Plus
0.30% | | Maturity | | | USD | | | | 726 | | | | 12/11/19 | | | | (4,741 | ) |
| | | | | | | | | | | | | | | | | | | | | | | | |
| | | | | | | | | | | | | | | | | | | | | | $ | 395,185 | |
| | | | | | | | | | | | | | | | | | | | | | | | |
| (a) | Affiliated investments. |
| (b) | The rate shown represents the 7-day yield as of period end. |
| (c) | To obtain a copy of the fund’s shareholder report, please go to the Securities and Exchange Commission’s website at www.sec.gov, or call AB at (800) 227-4618. |
| * | The investment strategies and liquidity of the Underlying Portfolios in which the Fund invests are as follows: |
Long/Short Equity Underlying Portfolios seek to buy securities with the expectation that they will increase in value (called “going long”) and sell securities short in the expectation that they will decrease in value (“going short”). Underlying Portfolios within this strategy are generally subject to 30 – 120 day redemption notice periods. The majority of the Underlying Portfolios are no longer subject to initial lockups. Certain Underlying Portfolios have lock up periods of up to three years.
Event Driven Underlying Portfolios seek to take advantage of information inefficiencies resulting from a particular corporate event, such as a takeover, liquidation, bankruptcy, tender offer, buyback, spin-off, exchange offer, merger or other type of corporate reorganization. Underlying Portfolios within this strategy are generally subject to 60 – 90 day redemption notice periods. Certain Underlying Portfolios may have lock up periods of up to two years.
Credit/Distressed Underlying Portfolios invest in a variety of fixed income and other securities, including bonds (corporate and government), bank debt, asset-backed financial instruments, mortgage-backed securities and mezzanine and distressed securities, as well as securities of distressed companies and high
| | |
| abfunds.com | | AB MULTI-MANAGER ALTERNATIVE FUND | 13 |
CONSOLIDATED PORTFOLIO OF INVESTMENTS (continued)
yield securities. Underlying Portfolios within this strategy are generally subject to 60 – 90 day redemption notice periods. Certain Underlying Portfolios may have lock up periods of up to three years.
Multi-Strategy Underlying Portfolios invest across multiple strategies, including long/short equity, event driven, global macro, credit/distressed and emerging markets, in which the investment process is predicated on movements in underlying economic variables and the impact these variables have on equity, fixed income, currency, commodity and other financial instrument markets. Underlying Portfolios within this strategy are generally subject to 30 – 60 day redemption notice periods. Certain Underlying Portfolios may have lock up periods of up to two years.
Global Macro Underlying Portfolios aim to identify and exploit imbalances in global economics and asset classes, typically utilizing macroeconomic and technical market factors rather than “bottom-up” individual security analysis. The Underlying Portfolios within this strategy are subject to 30 – 90 day redemption notice periods. Certain Underlying Portfolios have a lock up period of one year.
The Fund may also make direct investments in securities (other than securities of Underlying Portfolios), options, futures, options on futures, swap contracts, or other derivative or financial instruments.
Currency Abbreviations:
AUD – Australian Dollar
CAD – Canadian Dollar
EUR – Euro
GBP – Great British Pound
JPY – Japanese Yen
USD – United States Dollar
Glossary:
BBSW – Bank Bill Swap Reference Rate (Australia)
CDOR – Canadian Dealer Offered Rate
EURIBOR – Euro Interbank Offered Rate
LIBOR – London Interbank Offered Rates
| (1) | The following table represents the basket holdings underlying the total return swap with CIFXPPD2 as of September 30, 2018. |
| | | | | | | | |
| Security Description | | Notional Amount
as of 9/30/18 | | | Percent of
Basket’s Value | |
USD/CHF | | $ | 7,645,836 | | | | 59.8 | % |
USD/CAD | | | (5,097,224 | ) | | | (39.9 | )% |
USD/EUR | | | (5,097,224 | ) | | | (39.9 | )% |
USD/NOK | | | 5,097,224 | | | | 39.9 | % |
USD/JPY | | | (2,548,612 | ) | | | (19.9 | )% |
| (2) | The following table represents the 50 largest (long/short) equity basket holdings underlying the total return swap with GSISM49E as of September 30, 2018. |
| | | | | | | | | | | | |
| Security Description | | Shares | | | Notional Amount
as of 9/30/18 | | | Percent of
Basket’s Value | |
Apple, Inc. | | | (3,645 | ) | | $ | (822,786 | ) | | | (3.7 | )% |
Microsoft Corp. | | | (6,685 | ) | | | (764,535 | ) | | | (3.4 | )% |
Amazon.com, Inc. | | | (282 | ) | | | (565,628 | ) | | | (2.5 | )% |
JPMorgan Chase & Co. | | | (3,118 | ) | | | (351,861 | ) | | | (1.6 | )% |
Alphabet, Inc. | | | (274 | ) | | | (330,162 | ) | | | (1.5 | )% |
Exxon Mobil Corp. | | | (3,406 | ) | | | (289,555 | ) | | | (1.3 | )% |
Johnson & Johnson | | | (1,920 | ) | | | (265,335 | ) | | | (1.2 | )% |
Bank of America Corp. | | | (8,822 | ) | | | (259,888 | ) | | | (1.2 | )% |
Berkshire Hathaway, Inc. | | | (1,171 | ) | | | (250,755 | ) | | | (1.1 | )% |
Visa, Inc. | | | (1,636 | ) | | | (245,523 | ) | | | (1.1 | )% |
Nestle SA | | | (2,865 | ) | | | (238,746 | ) | | | (1.1 | )% |
Facebook, Inc. | | | (1,438 | ) | | | (236,447 | ) | | | (1.1 | )% |
| | |
| 14 | AB MULTI-MANAGER ALTERNATIVE FUND | | abfunds.com |
CONSOLIDATED PORTFOLIO OF INVESTMENTS (continued)
| | | | | | | | | | | | |
| Security Description | | Shares | | | Notional Amount
as of 9/30/18 | | | Percent of
Basket’s Value | |
Alphabet, Inc. | | | (198 | ) | | $ | (235,779 | ) | | | (1.1 | )% |
UnitedHealth Group, Inc. | | | (880 | ) | | | (234,143 | ) | | | (1.1 | )% |
AT&T, Inc. | | | (6,651 | ) | | | (223,324 | ) | | | (1.0 | )% |
Wells Fargo & Co. | | | (4,240 | ) | | | (222,835 | ) | | | (1.0 | )% |
Home Depot, Inc./The | | | (1,056 | ) | | | (218,846 | ) | | | (1.0 | )% |
Chevron Corp. | | | (1,750 | ) | | | (214,006 | ) | | | (1.0 | )% |
Cisco Systems, Inc. | | | (4,307 | ) | | | (209,540 | ) | | | (0.9 | )% |
WellCare Health Plans, Inc. | | | 617 | | | | 197,766 | | | | 0.9 | % |
Mastercard, Inc. | | | (849 | ) | | | (189,028 | ) | | | (0.9 | )% |
Boeing Co./The | | | (507 | ) | | | (188,506 | ) | | | (0.8 | )% |
F5 Networks, Inc. | | | 933 | | | | 185,978 | | | | 0.8 | % |
Universal Health Services, Inc. | | | 1,438 | | | | 183,793 | | | | 0.8 | % |
Jazz Pharmaceuticals PLC | | | 1,080 | | | | 181,639 | | | | 0.8 | % |
ResMed, Inc. | | | 1,558 | | | | 179,646 | | | | 0.8 | % |
AGNC Investment Corp. | | | 9,609 | | | | 179,010 | | | | 0.8 | % |
Textron, Inc. | | | 2,465 | | | | 176,183 | | | | 0.8 | % |
ANSYS, Inc. | | | 936 | | | | 174,793 | | | | 0.8 | % |
Total System Services, Inc. | | | 1,766 | | | | 174,381 | | | | 0.8 | % |
Twenty-First Century Fox, Inc. | | | 3,805 | | | | 174,326 | | | | 0.8 | % |
Annaly Capital Management, Inc. | | | 16,962 | | | | 173,522 | | | | 0.8 | % |
Novartis AG | | | (1,996 | ) | | | (171,562 | ) | | | (0.8 | )% |
L3 Technologies, Inc. | | | 807 | | | | 171,504 | | | | 0.8 | % |
Coca-Cola Co./The | | | (3,702 | ) | | | (171,008 | ) | | | (0.8 | )% |
Expeditors International of Wa | | | 2,321 | | | | 170,634 | | | | 0.8 | % |
Rockwell Collins, Inc. | | | 1,208 | | | | 169,674 | | | | 0.8 | % |
Synopsys, Inc. | | | 1,719 | | | | 169,530 | | | | 0.8 | % |
Hormel Foods Corp | | | 4,287 | | | | 168,892 | | | | 0.8 | % |
Broadridge Financial Solutions | | | 1,277 | | | | 168,445 | | | | 0.8 | % |
Citigroup, Inc. | | | (2,335 | ) | | | (167,537 | ) | | | (0.8 | )% |
Clorox Co./The | | | 1,113 | | | | 167,367 | | | | 0.8 | % |
Intel Corp. | | | (3,531 | ) | | | (166,957 | ) | | | (0.8 | )% |
Repsol SA | | | 8,380 | | | | 166,919 | | | | 0.8 | % |
Archer-Daniels-Midland Co. | | | 3,301 | | | | 165,918 | | | | 0.7 | % |
Church & Dwight Co., Inc. | | | 2,774 | | | | 164,686 | | | | 0.7 | % |
Centene Corp. | | | 1,131 | | | | 163,760 | | | | 0.7 | % |
CenterPoint Energy, Inc. | | | 5,880 | | | | 162,569 | | | | 0.7 | % |
Citizens Financial Group, Inc. | | | 4,201 | | | | 162,032 | | | | 0.7 | % |
Public Service Enterprise Group | | | 3,063 | | | | 161,684 | | | | 0.7 | % |
Other | | | 664,691 | | | | 9,573,732 | | | | 43.1 | % |
| (3) | The following table represents the 50 largest (long/short) equity basket holdings underlying the total return swap with JPQCRMFA as of September 30, 2018. |
| | | | | | | | | | | | |
| Security Description | | Shares | | | Notional Amount
as of 9/30/18 | | | Percent of
Basket’s Value | |
ABIOMED, Inc. | | | 258 | | | $ | 116,125 | | | | 0.6 | % |
Alexion Pharmaceuticals, Inc. | | | (821 | ) | | | (114,155 | ) | | | (0.6 | )% |
thyssenkrupp AG | | | (4,359 | ) | | | (109,959 | ) | | | (0.6 | )% |
Shopify, Inc. | | | (656 | ) | | | (107,873 | ) | | | (0.6 | )% |
SES SA | | | (4,906 | ) | | | (107,605 | ) | | | (0.6 | )% |
Concho Resources, Inc. | | | (704 | ) | | | (107,529 | ) | | | (0.6 | )% |
Komatsu Ltd. | | | (3,525 | ) | | | (107,163 | ) | | | (0.6 | )% |
Bausch Health Cos, Inc. | | | 4,137 | | | | 106,295 | | | | 0.6 | % |
John Wood Group PLC | | | (105 | ) | | | (105,830 | ) | | | (0.6 | )% |
| | |
| abfunds.com | | AB MULTI-MANAGER ALTERNATIVE FUND | 15 |
CONSOLIDATED PORTFOLIO OF INVESTMENTS (continued)
| | | | | | | | | | | | |
| Security Description | | Shares | | | Notional Amount
as of 9/30/18 | | | Percent of
Basket’s Value | |
Yakult Honsha Co. Ltd. | | | (1,292 | ) | | $ | (105,774 | ) | | | (0.6 | )% |
Konica Minolta, Inc. | | | 9,952 | | | | 105,751 | | | | 0.6 | % |
Under Armour, Inc. | | | (4,980 | ) | | | (105,674 | ) | | | (0.6 | )% |
Activision Blizzard, Inc. | | | (1,268 | ) | | | (105,485 | ) | | | (0.6 | )% |
Daifuku Co. Ltd. | | | (2,070 | ) | | | (105,436 | ) | | | (0.6 | )% |
AIA Group Ltd. | | | (11,805 | ) | | | (105,400 | ) | | | (0.6 | )% |
Marubeni Corp. | | | 11,513 | | | | 105,322 | | | | 0.5 | % |
Vistra Energy Corp. | | | 4,233 | | | | 105,314 | | | | 0.5 | % |
Vertex Pharmaceuticals, Inc. | | | (543 | ) | | | (104,737 | ) | | | (0.5 | )% |
Parsley Energy, Inc. | | | (3,570 | ) | | | (104,413 | ) | | | (0.5 | )% |
Ono Pharmaceutical Co. Ltd. | | | (3,687 | ) | | | (104,270 | ) | | | (0.5 | )% |
Under Armour, Inc. | | | (5,351 | ) | | | (104,127 | ) | | | (0.5 | )% |
Juniper Networks, Inc. | | | 3,472 | | | | 104,045 | | | | 0.5 | % |
Porsche Automobil Holding SE | | | 1,542 | | | | 103,790 | | | | 0.5 | % |
Symantec Corp. | | | (4,871 | ) | | | (103,658 | ) | | | (0.5 | )% |
Baker Hughes a GE Co. | | | (3,063 | ) | | | (103,615 | ) | | | (0.5 | )% |
Alkermes PLC | | | (2,436 | ) | | | (103,388 | ) | | | (0.5 | )% |
ConocoPhillips | | | 1,335 | | | | 103,327 | | | | 0.5 | % |
Netflix, Inc. | | | (276 | ) | | | (103,322 | ) | | | (0.5 | )% |
Keyence Corp. | | | (178 | ) | | | (103,017 | ) | | | (0.5 | )% |
TechnipFMC PLC | | | (3,295 | ) | | | (102,980 | ) | | | (0.5 | )% |
Sprint Corp. | | | (15,737 | ) | | | (102,922 | ) | | | (0.5 | )% |
Cooper Cos, Inc./The | | | 371 | | | | 102,882 | | | | 0.5 | % |
Occidental Petroleum Corp. | | | 1,249 | | | | 102,654 | | | | 0.5 | % |
Oracle Corp. | | | (1,991 | ) | | | (102,649 | ) | | | (0.5 | )% |
Reckitt Benckiser Group PLC | | | (11 | ) | | | (102,558 | ) | | | (0.5 | )% |
Nintendo Co. Ltd. | | | (281 | ) | | | (102,519 | ) | | | (0.5 | )% |
Liberty Global PLC | | | (3,540 | ) | | | (102,426 | ) | | | (0.5 | )% |
Fortinet, Inc. | | | 1,110 | | | | 102,391 | | | | 0.5 | % |
Lululemon Athletica, Inc. | | | 629 | | | | 102,281 | | | | 0.5 | % |
Encana Corp. | | | (7,799 | ) | | | (102,274 | ) | | | (0.5 | )% |
Computershare Ltd. | | | 7,094 | | | | 102,242 | | | | 0.5 | % |
Electronic Arts, Inc. | | | (848 | ) | | | (102,202 | ) | | | (0.5 | )% |
Methanex Corp. | | | 1,294 | | | | 102,162 | | | | 0.5 | % |
Broadcom, Inc. | | | (413 | ) | | | (101,906 | ) | | | (0.5 | )% |
Autodesk, Inc. | | | (652 | ) | | | (101,853 | ) | | | (0.5 | )% |
Brookfield Property REIT, Inc. | | | 4,861 | | | | 101,748 | | | | 0.5 | % |
Take(Two Interactive Software | | | (737 | ) | | | (101,668 | ) | | | (0.5 | )% |
Veeva Systems, Inc. | | | 933 | | | | 101,582 | | | | 0.5 | % |
SCOR SE | | | 2,185 | | | | 101,418 | | | | 0.5 | % |
American Airlines Group, Inc. | | | (2,453 | ) | | | (101,383 | ) | | | (0.5 | )% |
Other | | | 104,536 | | | | 3,745,092 | | | | 19.5 | % |
| (4) | The following table represents the 50 largest (long/short) equity basket holdings underlying the total return swap with MSCBGABG as of September 30, 2018. |
| | | | | | | | | | | | |
| Security Description | | Shares | | | Notional Amount
as of 9/30/18 | | | Percent of
Basket’s Value | |
Tesla Inc | | | (967 | ) | | $ | (256,148 | ) | | | (1.6 | )% |
Liberty Global PLC | | | (8,934 | ) | | | (251,581 | ) | | | (1.5 | )% |
Sempra Energy | | | (1,944 | ) | | | (221,126 | ) | | | (1.3 | )% |
ABIOMED Inc | | | 467 | | | | 210,046 | | | | 1.3 | % |
PG&E Corp | | | (4,520 | ) | | | (207,952 | ) | | | (1.3 | )% |
Liberty Global PLC | | | (7,147 | ) | | | (206,765 | ) | | | (1.3 | )% |
| | |
| 16 | AB MULTI-MANAGER ALTERNATIVE FUND | | abfunds.com |
CONSOLIDATED PORTFOLIO OF INVESTMENTS (continued)
| | | | | | | | | | | | |
| Security Description | | Shares | | | Notional Amount
as of 9/30/18 | | | Percent of
Basket’s Value | |
Barrick Gold Corp | | | (17,092 | ) | | $ | (189,188 | ) | | | (1.1 | )% |
United Therapeutics Corp | | | 1,462 | | | | 187,012 | | | | 1.1 | % |
Nektar Therapeutics | | | 3,038 | | | | 185,198 | | | | 1.1 | % |
Cenovus Energy Inc | | | (18,222 | ) | | | (183,071 | ) | | | (1.1 | )% |
RioCan Real Estate Investment | | | 9,562 | | | | 182,791 | | | | 1.1 | % |
H&R Real Estate Investment Tru | | | 11,810 | | | | 181,769 | | | | 1.1 | % |
Crown Castle International Cor | | | (1,573 | ) | | | (175,157 | ) | | | (1.1 | )% |
DENTSPLY SIRONA Inc | | | (4,536 | ) | | | (171,183 | ) | | | (1.0 | )% |
Interpublic Group of Cos Inc/T | | | 7,473 | | | | 170,903 | | | | 1.0 | % |
Brookfield Property REIT Inc | | | 8,065 | | | | 168,792 | | | | 1.0 | % |
SmartCentres Real Estate Inves | | | 7,034 | | | | 166,236 | | | | 1.0 | % |
Arconic Inc | | | (7,437 | ) | | | (163,681 | ) | | | (1.0 | )% |
General Electric Co | | | (14,149 | ) | | | (159,740 | ) | | | (1.0 | )% |
Liberty Media Corp-Liberty For | | | (4,260 | ) | | | (158,421 | ) | | | (1.0 | )% |
Oracle Corp | | | (3,004 | ) | | | (154,892 | ) | | | (0.9 | )% |
Metro Inc | | | 4,856 | | | | 151,133 | | | | 0.9 | % |
Equinix Inc | | | (342 | ) | | | (148,165 | ) | | | (0.9 | )% |
Mattel Inc | | | (9,329 | ) | | | (146,467 | ) | | | (0.9 | )% |
Charles Schwab Corp/The | | | (2,962 | ) | | | (145,576 | ) | | | (0.9 | )% |
Facebook Inc | | | (884 | ) | | | (145,329 | ) | | | (0.9 | )% |
Seagate Technology PLC | | | 3,003 | | | | 142,213 | | | | 0.9 | % |
Walmart Inc | | | (1,509 | ) | | | (141,735 | ) | | | (0.9 | )% |
Alnylam Pharmaceuticals Inc | | | (1,619 | ) | | | (141,735 | ) | | | (0.9 | )% |
Concho Resources Inc | | | (889 | ) | | | (135,799 | ) | | | (0.8 | )% |
Hologic Inc | | | 3,206 | | | | 131,396 | | | | 0.8 | % |
Costco Wholesale Corp | | | 556 | | | | 130,687 | | | | 0.8 | % |
Live Nation Entertainment Inc | | | (2,364 | ) | | | (128,742 | ) | | | (0.8 | )% |
Philip Morris International In | | | (1,576 | ) | | | (128,511 | ) | | | (0.8 | )% |
JPMorgan Chase & Co | | | (1,135 | ) | | | (128,082 | ) | | | (0.8 | )% |
Robert Half International Inc | | | 1,801 | | | | 126,780 | | | | 0.8 | % |
Under Armour Inc | | | (6,489 | ) | | | (126,268 | ) | | | (0.8 | )% |
AGNC Investment Corp | | | 6,733 | | | | 125,428 | | | | 0.8 | % |
HollyFrontier Corp | | | 1,792 | | | | 125,263 | | | | 0.8 | % |
AES Corp/VA | | | 8,899 | | | | 124,587 | | | | 0.8 | % |
American Express Co | | | (1,168 | ) | | | (124,356 | ) | | | (0.8 | )% |
Arrow Electronics Inc | | | 1,686 | | | | 124,257 | | | | 0.8 | % |
MercadoLibre Inc | | | (363 | ) | | | (123,614 | ) | | | (0.7 | )% |
Valero Energy Corp | | | 1,082 | | | | 123,053 | | | | 0.7 | % |
Inter Pipeline Ltd | | | 7,046 | | | | 122,262 | | | | 0.7 | % |
Leggett & Platt Inc | | | 2,772 | | | | 121,388 | | | | 0.7 | % |
F5 Networks Inc | | | 607 | | | | 120,992 | | | | 0.7 | % |
Honeywell International Inc | | | (754 | ) | | | (120,118 | ) | | | (0.7 | )% |
ON Semiconductor Corp | | | 6,492 | | | | 119,640 | | | | 0.7 | % |
Cardinal Health Inc | | | (2,212 | ) | | | (119,442 | ) | | | (0.7 | )% |
Other | | | (418,494 | ) | | | 1,059,316 | | | | 6.4 | % |
See notes to financial statements.
| | |
| abfunds.com | | AB MULTI-MANAGER ALTERNATIVE FUND | 17 |
CONSOLIDATED STATEMENT OF ASSETS & LIABILITIES
September 30, 2018 (unaudited)
| | | | |
| Assets | |
Investments in unaffiliated Underlying Portfolios, at value
(cost $827,860,139) | | $ | 959,656,842 | |
Investments in affiliated Underlying Portfolios, at value
(cost $82,250,000) | | | 82,250,000 | |
Cash | | | 76,862,863 | |
Cash collateral due from broker | | | 32,342 | |
Foreign currencies, at value (cost $802,949) | | | 797,036 | |
Investment in Underlying Portfolios paid in advance
(see Note A2) | | | 15,000,000 | |
Receivable for investments sold | | | 10,143,103 | |
Unrealized appreciation on total return swaps | | | 1,430,935 | |
Affiliated dividends receivable | | | 142,025 | |
Deferred offering expense | | | 33,917 | |
| | | | |
Total assets | | | 1,146,349,063 | |
| | | | |
| Liabilities | |
Payable for shares of beneficial interest redeemed | | | 45,017,860 | |
Subscriptions received in advance | | | 6,078,850 | |
Unrealized depreciation on total return swaps | | | 1,035,750 | |
Management fee payable | | | 940,020 | |
Cash collateral due to broker | | | 451,408 | |
Administrative fee payable | | | 127,033 | |
Transfer Agent fee payable | | | 18,968 | |
Payable for terminated total return swaps | | | 5,594 | |
Accrued expenses | | | 503,282 | |
| | | | |
Total liabilities | | | 54,178,765 | |
| | | | |
Net Assets | | $ | 1,092,170,298 | |
| | | | |
| Composition of Net Assets | |
Shares of beneficial interest, at par | | $ | 96,722 | |
Additional paid-in capital | | | 1,057,793,490 | |
Distributable earnings | | | 34,280,086 | |
| | | | |
Net Assets | | $ | 1,092,170,298 | |
| | | | |
Shares of beneficial interest outstanding—unlimited shares authorized, with par value of $.001 (based on 96,722,054 shares outstanding) | | $ | 11.29 | |
| | | | |
See notes to consolidated financial statements.
| | |
| 18 | AB MULTI-MANAGER ALTERNATIVE FUND | | abfunds.com |
CONSOLIDATED STATEMENT OF OPERATIONS
Six Months Ended September 30, 2018 (unaudited)
| | | | | | | | |
| Investment Income | | | | | | | | |
Dividends—Affiliated issuers | | | | | | $ | 548,872 | |
| | | | | | | | |
| Expenses | | | | | | | | |
Management fee (see Note B) | | $ | 8,620,987 | | | | | |
Custodian | | | 243,466 | | | | | |
Administrative | | | 167,867 | | | | | |
Credit facility fees | | | 151,300 | | | | | |
Transfer agency | | | 115,946 | | | | | |
Trustees’ fees | | | 69,218 | | | | | |
Legal | | | 65,643 | | | | | |
Audit and tax | | | 55,916 | | | | | |
Registration fees | | | 47,953 | | | | | |
Printing | | | 36,773 | | | | | |
Amortization of offering expenses | | | 3,083 | | | | | |
Miscellaneous | | | 126,659 | | | | | |
| | | | | | | | |
Total expenses before interest expense | | | 9,704,811 | | | | | |
Interest expense | | | 10,315 | | | | | |
| | | | | | | | |
Total expenses | | | 9,715,126 | | | | | |
Less: expenses waived and reimbursed by the Investment Manager (see Note B) | | | (1,952,261 | ) | | | | |
| | | | | | | | |
Net expenses | | | | | | | 7,762,865 | |
| | | | | | | | |
Net investment loss | | | | | | | (7,213,993 | ) |
| | | | | | | | |
| Realized and Unrealized Gain (Loss) on Investment and Foreign Currency Transactions | | | | | | | | |
Net realized gain (loss) on: | | | | | | | | |
Investment transactions | | | | | | | 56,597,128 | |
Swaps | | | | | | | 44,553 | |
Foreign currency transactions | | | | | | | (12,453 | ) |
Net change in unrealized appreciation/depreciation of: | | | | | | | | |
Investments | | | | | | | (39,920,195 | ) |
Swaps | | | | | | | 395,185 | |
Foreign currency denominated assets and liabilities | | | | | | | (5,913 | ) |
| | | | | | | | |
Net gain on investment and foreign currency transactions | | | | | | | 17,098,305 | |
| | | | | | | | |
Net Increase in Net Assets from Operations | | | | | | $ | 9,884,312 | |
| | | | | | | | |
See notes to consolidated financial statements.
| | |
| abfunds.com | | AB MULTI-MANAGER ALTERNATIVE FUND | 19 |
CONSOLIDATED STATEMENT OF CHANGES IN NET ASSETS
| | | | | | | | |
| | | Six Months Ended
September 30,
2018
(unaudited) | | | Year Ended
March 31,
2018 | |
| Increase (Decrease) in Net Assets from Operations | | | | | | | | |
Net investment loss | | $ | (7,213,993 | ) | | $ | (20,469,210 | ) |
Net realized gain on investment and foreign currency transactions | | | 56,629,228 | | | | 47,070,125 | |
Net change in unrealized appreciation/depreciation of investments and foreign currency denominated assets and liabilities | | | (39,530,923 | ) | | | 26,237,629 | |
| | | | | | | | |
Net increase in net assets from operations | | | 9,884,312 | | | | 52,838,544 | |
Distributions to shareholders | | | – 0 | – | | | (12,605,284 | ) |
Return of capital | | | – 0 | – | | | (2,494,217 | ) |
| Transactions in Shares of Beneficial Interest | | | | | | | | |
Net decrease (see Note D) | | | (72,773,842 | ) | | | (131,497,085 | ) |
| | | | | | | | |
Total decrease | | | (62,889,530 | ) | | | (93,758,042 | ) |
| Net Assets | | | | | | | | |
Beginning of period | | | 1,155,059,828 | | | | 1,248,817,870 | |
| | | | | | | | |
End of period | | $ | 1,092,170,298 | | | $ | 1,155,059,828 | |
| | | | | | | | |
See notes to consolidated financial statements.
| | |
| 20 | AB MULTI-MANAGER ALTERNATIVE FUND | | abfunds.com |
CONSOLIDATED STATEMENT OF CASH FLOWS
for the six months ended September 30, 2018 (unaudited)
| | | | | | | | |
| Cash flows from operating activities | | | | | | | | |
Net increase in net assets from operations | | | | | | $ | 9,884,312 | |
| Reconciliation of net increase in net assets from operations to net increase in cash from operating activities | | | | | | | | |
Purchases of Underlying Portfolio shares | | $ | (153,900,000 | ) | | | | |
Purchases of short-term investments | | | (215,000,000 | ) | | | | |
Sales of Underlying Portfolio shares | | | 367,420,930 | | | | | |
Proceeds from disposition of short-term investments | | | 150,050,000 | | | | | |
Net realized gain on investment transactions and foreign currency transactions | | | (56,629,228 | ) | | | | |
Net change in unrealized appreciation/depreciation on investments in Underlying Portfolio shares | | | 39,530,923 | | | | | |
Increase in receivable for investments sold | | | (6,996,600 | ) | | | | |
Increase in affiliated dividends receivable | | | (122,269 | ) | | | | |
Increase in investments in Underlying Portfolios paid in advance | | | (13,200,000 | ) | | | | |
Increase in cash collateral due from broker | | | (32,342 | ) | | | | |
Increase in payable for investments purchased | | | 45,023,454 | | | | | |
Increase in cash collateral due to broker | | | 451,408 | | | | | |
Decrease in management fee payable | | | (552,417 | ) | | | | |
Increase in administrative fee payable | | | 578 | | | | | |
Increase in Transfer Agent fee payable | | | 30 | | | | | |
Increase in accrued expenses | | | 105,668 | | | | | |
Increase in offering expenses payable | | | 3,083 | | | | | |
Proceeds on swaps, net | | | 44,553 | | | | | |
| | | | | | | | |
Total adjustments | | | | | | | 156,197,771 | |
| | | | | | | | |
Net cash provided by (used in) from operating activities | | | | | | | 166,082,083 | |
| Cash flows from financing activities | | | | | | | | |
Subscriptions, including change in subscriptions received in advance | | | 19,699,966 | | | | | |
Redemptions, net of payable for shares of beneficial interest redeemed | | | (114,133,812 | ) | | | | |
| | | | | | | | |
Net cash provided by (used in) from financing activities | | | | | | | (94,433,846 | ) |
Effect of exchange rate on cash | | | | | | | (18,366 | ) |
| | | | | | | | |
Net increase in cash | | | | | | | 71,629,871 | |
Cash at beginning of period | | | | | | | 6,030,028 | |
| | | | | | | | |
Cash at end of period | | | | | | $ | 77,659,899 | |
| | | | | | | | |
| Supplemental disclosure of cash flow information | | | | | | | | |
Interest expense paid during the period | | $ | 10,315 | | | | | |
See notes to consolidated financial statements.
| | |
| abfunds.com | | AB MULTI-MANAGER ALTERNATIVE FUND | 21 |
NOTES TO CONSOLIDATED FINANCIAL STATEMENTS
September 30, 2018 (unaudited)
NOTE A
Significant Accounting Policies
AB Multi-Manager Alternative Fund (the “Fund”) is a statutory trust formed under the laws of the State of Delaware and registered under the Investment Company Act of 1940 as a diversified, closed-end management investment company. The Fund commenced operations on October 1, 2012. The Fund’s investment objective is to seek long-term capital appreciation. There can be no assurance that the Fund will achieve its investment objective, be able to structure its investments as anticipated, or that its returns will be positive over any period of time. The Fund is not intended as a complete investment program for investors. The Fund seeks to achieve its investment objective primarily by allocating its assets among investments in private investment vehicles (“Underlying Portfolios”), commonly referred to as hedge funds, that are managed by unaffiliated asset managers that employ a broad range of investment strategies. As a secondary strategy, the Fund will generally also make direct investments in securities and other financial instruments. As part of the Fund’s investment strategy, the Fund seeks exposure to commodities and commodities-related instruments and derivatives primarily through investments in AB Multi-Manager Alternative Fund (Cayman), Ltd., a wholly-owned subsidiary of the Fund organized under the laws of the Cayman Islands (the “Subsidiary”). The Fund is the sole shareholder of the Subsidiary and it is intended that the Fund will remain the sole shareholder and will continue to control the Subsidiary. Under the Articles of Association of the Subsidiary, shares issued by the Subsidiary confer upon a shareholder the right to receive notice of, to attend and to vote at general meetings of the Subsidiary and shall confer upon the shareholder rights in a winding-up or repayment of capital and the right to participate in the profits or assets of the Subsidiary. As of September 30, 2018, net assets of the Fund were $1,092,170,298, of which $10,089,368, or approximately 1%, represented the Fund’s ownership of all issued shares and voting rights of the Subsidiary. This report presents the consolidated financial statements of AB Multi-Manager Alternative Fund and the Subsidiary. All intercompany transactions and balances have been eliminated in consolidation.
The consolidated financial statements have been prepared in conformity with U.S. generally accepted accounting principles (“U.S. GAAP”) which require management to make certain estimates and assumptions that affect the reported amounts of assets and liabilities in the consolidated financial statements and amounts of income and expenses during the reporting period. Actual results could differ from those estimates. The Fund is an investment company under U.S. GAAP and follows the accounting and reporting guidance applicable to investment companies. The following is a summary of significant accounting policies followed by the Fund.
| | |
| 22 | AB MULTI-MANAGER ALTERNATIVE FUND | | abfunds.com |
NOTES TO CONSOLIDATED FINANCIAL STATEMENTS (continued)
1. Valuation of Investments
The Fund’s Board of Trustees (the “Board”) has approved pricing and valuation policies and procedures pursuant to which the Fund’s investments in Underlying Portfolios are valued at fair value (the “Valuation Procedures”). Among other matters, the Valuation Procedures set forth the Fund’s valuation policies and the mechanisms and processes to be employed on a monthly basis to implement such policies. In accordance with the Valuation Procedures, fair value of an Underlying Portfolio as of each valuation time ordinarily is the value determined as of such month-end for each Underlying Portfolio in accordance with the Underlying Portfolio’s valuation policies and reported at the time of the Fund’s valuation. Open end mutual funds are valued at the closing net asset value per share.
On a monthly basis, the Fund generally uses the net asset value (“NAV”), provided by the Underlying Portfolios, to determine the fair value of all Underlying Portfolios which (a) do not have readily determinable fair values and (b) either have the attributes of an investment company or prepare their financial statements consistent with measurement principles of an investment company. As a general matter, the fair value of the Fund’s interest in an Underlying Portfolio represents the amount that the Fund could reasonably expect to receive from an Underlying Portfolio if its interest were redeemed at the time of valuation. In the unlikely event that an Underlying Portfolio does not report a month-end value to the Fund on a timely basis, the Fund would determine the fair value of such Underlying Portfolio based on the most recent value reported by the Underlying Portfolio, and any other relevant information available at the time the Fund values its portfolio. In making a fair value determination, the Fund will consider all appropriate information reasonably available to it at the time and that AllianceBernstein L.P. (the “Investment Manager”) believes to be reliable. The Fund may consider factors such as, among others: (i) the price at which recent subscriptions for or redemptions of the Underlying Portfolio’s interests were effected; (ii) information provided to the Fund by the manager of an Underlying Portfolio, or the failure to provide such information as the Underlying Portfolio manager agreed to provide in the Underlying Portfolio’s offering materials or other agreements with the Fund; (iii) relevant news and other sources; and (iv) market events. In addition, when an Underlying Portfolio imposes extraordinary restrictions on redemptions, or when there have been no recent subscriptions for Underlying Portfolio interests, the Fund may determine that it is appropriate to apply a discount to the NAV reported by the Underlying Portfolio. The use of different factors and estimation methodologies could have a significant effect on the estimated fair value and could be material to the consolidated financial statements.
| | |
| abfunds.com | | AB MULTI-MANAGER ALTERNATIVE FUND | 23 |
NOTES TO CONSOLIDATED FINANCIAL STATEMENTS (continued)
Swaps and other derivatives are valued daily, primarily using independent pricing services, independent pricing models using market inputs, as well as third party broker-dealers or counterparties. Open end mutual funds are valued at the closing net asset value per share, while exchange traded funds are valued at the closing market price per share.
The Investment Manager has established a Valuation Committee (the “Committee”) made up of representatives of portfolio management, fund accounting, compliance and risk management which operates under the Valuation Procedures and is responsible for overseeing the pricing and valuation of all securities held in the Fund. The Committee’s responsibilities include: 1) fair value determinations (and oversight of any third parties to whom any responsibility for fair value determinations is delegated), and 2) regular monitoring of the Valuation Procedures and modification or enhancement of the Valuation Procedures (or recommendation of the modification of the Valuation Procedures) as the Committee believes appropriate. Prior to investing in any Underlying Portfolio, and periodically thereafter, the Investment Manager will conduct a due diligence review of the valuation methodology utilized by the Underlying Portfolio. In addition, there are several processes outside of the pricing process that are used to monitor valuation issues including: 1) performance and performance attribution reports are monitored for anomalous impacts based upon benchmark performance, and 2) portfolio managers review all portfolios for performance and analytics.
U.S. GAAP establishes a framework for measuring fair value, and a three-level hierarchy for fair value measurements based upon the transparency of inputs to the valuation of an asset or liability. Inputs may be observable or unobservable and refer broadly to the assumptions that market participants would use in pricing the asset or liability. Observable inputs reflect the assumptions market participants would use in pricing the asset or liability based on market data obtained from sources independent of the Fund. Unobservable inputs reflect the Fund’s own assumptions about the assumptions that market participants would use in pricing the asset or liability based on the best information available in the circumstances. Each investment is assigned a level based upon the observability of the inputs which are significant to the overall valuation. The three-tier hierarchy of inputs is summarized below.
| | • | | Level 1—quoted prices in active markets for identical investments |
| | • | | Level 2—other significant observable inputs |
| | • | | Level 3—significant unobservable inputs |
The fair value of debt instruments, such as bonds, and over-the-counter derivatives is generally based on market price quotations, recently executed market transactions (where observable) or industry recognized
| | |
| 24 | AB MULTI-MANAGER ALTERNATIVE FUND | | abfunds.com |
NOTES TO CONSOLIDATED FINANCIAL STATEMENTS (continued)
modeling techniques and are generally classified as Level 2. Pricing vendor inputs to Level 2 valuations may include quoted prices for similar investments in active markets, interest rate curves, coupon rates, currency rates, yield curves, option adjusted spreads, default rates, credit spreads and other unique security features in order to estimate the relevant cash flows which is then discounted to calculate fair values. If these inputs are unobservable and significant to the fair value, these investments will be classified as Level 3. In addition, non-agency rated investments are classified as Level 3.
In May 2015, the Financial Accounting Standards Board (FASB) issued Accounting Standards Update (ASU) 2015-07, Disclosures for Investments in Certain Entities That Calculate Net Asset Value per Share (or its equivalent), as an amendment to Accounting Standards Codification (ASC) 820, Fair Value Measurement. The amendments in this ASU apply to reporting entities that elect to measure the fair value of an investment using the net asset value per share (or its equivalent) practical expedient, as the Fund does for its investments in Underlying Portfolios. The amendments in this ASU remove the requirement to categorize within the fair value hierarchy, as described above, all investments for which fair value is measured using the net asset value per share practical expedient.
Valuations reflected in this report are as of the report date. As a result, changes in valuation due to market events and/or issuer related events after the report date and prior to issuance of the report are not reflected herein.
The following table summarizes the valuation of the Fund’s investments by the above fair value hierarchy levels as of September 30, 2018:
| | | | | | | | | | | | | | | | |
Investments in Securities: | | Level 1 | | | Level 2 | | | Level 3 | | | Total | |
Assets: | |
Short-Term Investments: | | | | | | | | | | | | | | | | |
Investment Companies | | $ | 82,250,000 | | | $ | – 0 | – | | $ | – 0 | – | | $ | 82,250,000 | |
Investments valued at NAV** | | | | | | | | | | | | | | | 959,656,842 | |
| | | | | | | | | | | | | | | | |
Total Investments in Securities | | | 82,250,000 | | | | – 0 | – | | | – 0 | – | | | 1,041,906,842 | |
Other Financial Instruments(a): | | | | | | | | | | | | | | | | |
Assets: | |
Total Return Swaps | | | – 0 | – | | | 1,430,935 | | | | – 0 | – | | | 1,430,935 | |
Liabilities: | |
Total Return Swaps | | | – 0 | – | | | (1,035,750 | ) | | | – 0 | – | | | (1,035,750 | ) |
| | | | | | | | | | | | | | | | |
Total(b) | | $ | 82,250,000 | | | $ | 395,185 | | | $ | – 0 | – | | $ | 1,042,302,027 | |
| | | | | | | | | | | | | | | | |
| (a) | Other financial instruments are derivative instruments, such as futures, forwards and swaps, which are valued at the unrealized appreciation/(depreciation) on the instrument. Other financial instruments may also include swaps with upfront premiums, options written and swaptions written which are valued at market value. |
| (b) | There were no transfers between any levels during the reporting period. |
| | |
| abfunds.com | | AB MULTI-MANAGER ALTERNATIVE FUND | 25 |
NOTES TO CONSOLIDATED FINANCIAL STATEMENTS (continued)
| ** | In May 2015, the Financial Accounting Standards Board issued an Accounting Standards Update, ASU 2015-07 (the “ASU”) which removes the requirement to categorize within the fair value hierarchy all investments for which fair value is measured using the net asset value per share practical expedient. The ASU is effective for annual periods beginning after December 15, 2015 and interim periods within those annual periods, with application of the amendments noted above retrospectively to all periods presented. The retrospective approach requires that an investment for which fair value is measured using the net asset value per share practical expedient be removed from the fair value hierarchy in all periods presented herein. Accordingly, the total investments of the Underlying Portfolios with a fair value of $959,656,842 have not been categorized in the fair value hierarchy. |
The Fund recognizes all transfers between levels of the fair value hierarchy assuming the financial instruments were transferred at the beginning of the reporting period.
2. Cash Committed
As of September 30, 2018, the Fund has committed to purchase the following Underlying Portfolios for effective date October 1, 2018:
| | |
Underlying Portfolios | | Amount Committed |
Indaba Capital Partners (Cayman), L.P* | | $ 15,000,000 |
| * | Investments paid in advance amounted to $15,000,000. |
3. Currency Translation
Assets and liabilities denominated in foreign currencies and commitments under forward currency exchange contracts are translated into U.S. dollars at the mean of the quoted bid and ask prices of such currencies against the U.S. dollar. Purchases and sales of portfolio securities are translated into U.S. dollars at the rates of exchange prevailing when such securities were acquired or sold. Income and expenses are translated into U.S. dollars at rates of exchange prevailing when accrued.
Net realized gain or loss on foreign currency transactions represents foreign exchange gains and losses from sales and maturities of foreign fixed income investments, holding of foreign currencies, currency gains or losses realized between the trade and settlement dates on foreign investment transactions, and the difference between the amounts of dividends, interest and foreign withholding taxes recorded on the Fund’s books and the U.S. dollar equivalent amounts actually received or paid. Net unrealized currency gains and losses from valuing foreign currency denominated assets and liabilities at period end exchange rates are reflected as a component of net unrealized appreciation or depreciation of foreign currency denominated assets and liabilities.
4. Taxes
It is the Fund’s policy to meet the requirements of the Internal Revenue Code applicable to regulated investment companies and to distribute all of its investment company taxable income and net realized gains, if any, to
| | |
| 26 | AB MULTI-MANAGER ALTERNATIVE FUND | | abfunds.com |
NOTES TO CONSOLIDATED FINANCIAL STATEMENTS (continued)
shareholders. Therefore, no provisions for federal income or excise taxes are required. The Fund intends to continue to comply with the requirements of Subchapter M of the Internal Revenue Code of 1986 as they apply to regulated investment companies. By so complying, the Fund will not be subject to federal and state income taxes to the extent that all of its income is distributed.
In accordance with U.S. GAAP requirements regarding accounting for uncertainties in income taxes, management has analyzed the Fund’s tax positions taken or expected to be taken on federal and state income tax returns for all open tax years (the current and the prior three tax years) and has concluded that no provision for income tax is required in the Fund’s consolidated financial statements.
5. Investment Income and Investment Transactions
Income and capital gain distributions, if any, are recorded on the ex-dividend date. Investment transactions are accounted for on the trade date or effective date. Investment gains and losses are determined on the identified cost basis.
6. Expenses
Expenses included in the accompanying consolidated statements of operations do not include any expenses of the Underlying Portfolios.
7. Dividends and Distributions
Dividends and distributions to shareholders, if any, are recorded on the ex-dividend date. Income dividends and capital gains distributions are determined in accordance with federal tax regulations and may differ from those determined in accordance with U.S. GAAP. To the extent these differences are permanent, such amounts are reclassified within the capital accounts based on their federal tax basis treatment; temporary differences do not require such reclassification.
8. Offering Expenses
Offering expenses of $37,000 were deferred and amortized on a straight line basis over a one year period starting from September 21, 2018 (Subsidiary’s commencement of operations).
NOTE B
Management Fee and Other Transactions with Affiliates
Under the terms of the investment advisory agreement in effect during the reporting period (the “Advisory Agreement”), the Fund paid the Investment Manager a management fee at an annual rate of 1.50% of an aggregate of the Fund’s net assets determined as of the last day of a calendar month and adjusted for subscriptions and repurchases accepted as of the first
| | |
| abfunds.com | | AB MULTI-MANAGER ALTERNATIVE FUND | 27 |
NOTES TO CONSOLIDATED FINANCIAL STATEMENTS (continued)
day of the subsequent month (the “Management Fee”). The Management Fee is payable in arrears as of the last day of the subsequent month.
In addition, effective June 1, 2018, the Investment Manager agreed to waive a portion of its management fee so that the Fund paid management fees at an annual rate of 1.00% of the Fund’s net assets determined as of the last day of a calendar month and adjusted for subscriptions and repurchases accepted as of the first day of the subsequent month. This waiver could not be terminated by the Investment Manager prior to July 31, 2019 without the approval of the Board. For the six months ended September 30, 2018, such reimbursements/waivers amounted to $1,908,158.
Under a separate administrative agreement, the Fund may use the Investment Manager and its personnel to provide certain administrative services to the Fund and, in such event, the services and payments will be subject to approval by the Fund’s Board. For the six months ended September 30, 2018, the reimbursement for such fees amounted to $167,867.
The Fund may engage one or more distributors to solicit investments in the Fund. Sanford C. Bernstein & Company LLC (“Bernstein”) and AllianceBernstein Investments, Inc. (“ABI”), each an affiliate of the Investment Manager, have been selected as distributors of the Fund under Distribution Services Agreements. The Distribution Services Agreements do not call for any payments to be made to Bernstein or ABI by the Fund.
The Fund compensates AllianceBernstein Investor Services, Inc. (“ABIS”), a wholly-owned subsidiary of the Investment Manager, under a Transfer Agency Agreement for providing personnel and facilities to perform transfer agency services for the Fund. Such compensation paid to ABIS amounted to $115,946 for the six months ended September 30, 2018.
The Fund may invest in AB Government Money Market Portfolio (the “Government Money Market Portfolio”) which has a contractual annual advisory fee rate of .20% of the portfolio’s average daily net assets and bears its own expenses. Effective August 1, 2018 the Adviser has contractually agreed to waive .10% of the advisory fee of the Government Money Market Portfolio until August 31, 2019. In connection with the investment by the Fund in the Government Money Market Portfolio, the Investment Manager has contractually agreed to waive its advisory fee from the Fund in an amount equal to the Fund’s pro rata share of the effective advisory fee of Government Money Market Portfolio, as borne indirectly by the Fund as an acquired fund fee and expense. For the six months ended September 30, 2018, such waiver amounted to $44,103.
| | |
| 28 | AB MULTI-MANAGER ALTERNATIVE FUND | | abfunds.com |
NOTES TO CONSOLIDATED FINANCIAL STATEMENTS (continued)
A summary of the Fund’s transactions in AB mutual funds for the six months ended September 30, 2018 is as follows:
| | | | | | | | | | | | | | | | | | | | |
Fund | | Market Value
3/31/18
(000) | | | Purchases
at Cost
(000) | | | Sales
Proceeds
(000) | | | Market Value
9/30/18
(000) | | | Dividend
Income
(000) | |
Government Money Market Portfolio | | $ | 17,300 | | | $ | 215,000 | | | $ | 150,050 | | | $ | 82,250 | | | $ | 549 | |
NOTE C
Investment Transactions
1. Purchases and Sales
Purchases and sales of investments in the Underlying Portfolios, aggregated $153,900,000 and $368,008,282, respectively, for the six months ended September 30, 2018.
The cost of investments for federal income tax purposes was substantially the same as the cost for financial reporting purposes. Accordingly, gross unrealized appreciation and unrealized depreciation are as follows:
| | | | |
Gross unrealized appreciation | | $ | 139,732,035 | |
Gross unrealized depreciation | | | (7,540,147 | ) |
| | | | |
Net unrealized appreciation | | $ | 132,191,888 | |
| | | | |
2. Derivative Financial Instruments
The Fund may use derivatives in an effort enhance returns, to replace more traditional direct investments, to obtain exposure to otherwise inaccessible markets (collectively, “investment purposes”), or to hedge or adjust the risk profile of its portfolio.
The principal type of derivative utilized by the Fund, as well as the methods in which they may be used are:
The Fund may enter into swaps to hedge their exposure to interest rates, credit risk, or currencies. Certain Portfolios may also enter into swaps for non-hedging purposes as a means of gaining market exposures, including by making direct investments in foreign currencies, as described below under “Currency Transactions.” A swap is an agreement that obligates two parties to exchange a series of cash flows at specified intervals based upon or calculated by reference to changes in specified prices or rates for a specified amount of an underlying asset. The payment flows are usually netted against each other, with the difference being paid by one party to the other. In addition, collateral may be pledged or received by the Fund
| | |
| abfunds.com | | AB MULTI-MANAGER ALTERNATIVE FUND | 29 |
NOTES TO CONSOLIDATED FINANCIAL STATEMENTS (continued)
in accordance with the terms of the respective swaps to provide value and recourse to the Fund or its counterparties in the event of default, bankruptcy or insolvency by one of the parties to the swap.
Risks may arise as a result of the failure of the counterparty to the swap to comply with the terms of the swap. The loss incurred by the failure of a counterparty is generally limited to the net interim payment to be received by the Fund, and/or the termination value at the end of the contract. Therefore, the Fund considers the creditworthiness of each counterparty to a swap in evaluating potential counterparty risk. This risk is mitigated by having a netting arrangement between the Fund and the counterparty and by the posting of collateral by the counterparty to the Fund to cover the Fund’s exposure to the counterparty. Additionally, risks may arise from unanticipated movements in interest rates or in the value of the underlying securities. The Fund accrues for the interim payments on swaps on a daily basis, with the net amount recorded within unrealized appreciation/depreciation of swaps on the consolidated statement of assets and liabilities, where applicable. Once the interim payments are settled in cash, the net amount is recorded as realized gain/(loss) on swaps on the consolidated statement of operations, in addition to any realized gain/(loss) recorded upon the termination of swaps. Upfront premiums paid or received for OTC swaps are recognized as cost or proceeds on the consolidated statement of assets and liabilities and are amortized on a straight line basis over the life of the contract. Amortized upfront premiums are included in net realized gain/(loss) from swaps on the consolidated statement of operations. Fluctuations in the value of swaps are recorded as a component of net change in unrealized appreciation/depreciation of swaps on the consolidated statement of operations.
Total Return Swaps:
The Fund may enter into total return swaps in order to take a “long” or “short” position with respect to an underlying referenced asset. The Fund is subject to market price volatility of the underlying referenced asset. A total return swap involves commitments to pay interest in exchange for a market linked return based on a notional amount. To the extent that the total return of the security, group of securities or index underlying the transaction exceeds or falls short of the offsetting interest obligation, the Fund will receive a payment from or make a payment to the counterparty.
During the six months ended September 30, 2018, the Fund held total return swaps for hedging and non-hedging purposes.
| | |
| 30 | AB MULTI-MANAGER ALTERNATIVE FUND | | abfunds.com |
NOTES TO CONSOLIDATED FINANCIAL STATEMENTS (continued)
The Fund and the Subsidiary typically enters into International Swaps and Derivatives Association, Inc. Master Agreements (“ISDA Master Agreement”) with its OTC derivative contract counterparties in order to, among other things, reduce its credit risk to OTC counterparties. ISDA Master Agreements include provisions for general obligations, representations, collateral and events of default or termination. Under an ISDA Master Agreement, the Fund typically may offset with the OTC counterparty certain derivative financial instruments’ payables and/or receivables with collateral held and/or posted and create one single net payment (close-out netting) in the event of default or termination. In the event of a default by an OTC counterparty, the return of collateral with market value in excess of the Fund and the Subsidiary net liability, held by the defaulting party, may be delayed or denied.
The Fund and Subsidiary’s ISDA Master Agreements may contain provisions for early termination of OTC derivative transactions in the event the net assets of the Fund or the Subsidiary decline below specific levels (“net asset contingent features”). If these levels are triggered, the Fund and the Subsidiary OTC counterparty has the right to terminate such transaction and require the Fund or the Subsidiary to pay or receive a settlement amount in connection with the terminated transaction. For additional details, please refer to netting arrangements by the OTC counterparty tables below.
During the six months ended September 30, 2018, the Fund had entered into the following derivatives:
| | | | | | | | | | | | |
| | | Asset Derivatives | | | Liability Derivatives | |
Derivative Type | | Statement of Assets and Liabilities Location | | Fair Value | | | Statement of Assets and Liabilities Location | | Fair Value | |
Equity contracts | | Unrealized appreciation on total return swaps | | $ | 1,430,935 | | | Unrealized depreciation on total return swaps | | $ | 1,035,750 | |
| | | | | | | | | | | | |
Total | | | | $ | 1,430,935 | | | | | $ | 1,035,750 | |
| | | | | | | | | | | | |
| | | | | | | | | | |
Derivative Type | | Location of Gain or (Loss) on Derivatives Within Statement of Operations | | Realized Gain
or (Loss) on
Derivatives | | | Change in
Unrealized
Appreciation or
(Depreciation) | |
Equity contracts | | Net realized gain (loss) on swaps; Net change in unrealized appreciation/depreciation of swaps | | $ | 44,553 | | | $ | 395,185 | |
| | | | | | | | | | |
Total | | | | $ | 44,553 | | | $ | 395,185 | |
| | | | | | | | | | |
| | |
| abfunds.com | | AB MULTI-MANAGER ALTERNATIVE FUND | 31 |
NOTES TO CONSOLIDATED FINANCIAL STATEMENTS (continued)
The following table represents the average monthly volume of the Fund’s derivative transactions during the six months ended September 30, 2018:
| | | | |
Total Return Swaps: | | | | |
Average notional amount | | $ | 164,924,989 | (a) |
| (a) | Positions were open for two months during the period. |
For financial reporting purposes, the Fund does not offset derivative assets and derivative liabilities that are subject to netting arrangements in the consolidated statement of assets and liabilities.
All OTC derivatives held at period end were subject to netting arrangements. The following tables present the Fund’s derivative assets and liabilities by OTC counterparty net of amounts available for offset under ISDA Master Agreements (“MA”) and net of the related collateral received/pledged by the Fund as of September 30, 2018. Exchange-traded derivatives and centrally cleared swaps are not subject to netting arrangements and as such are excluded from the tables.
AB Multi-Manager Alternative Fund
| | | | | | | | | | | | | | | | | | | | |
Counterparty | | Derivatives
Assets
Subject to
a MA | | | Derivatives
Available
for Offset | | | Cash
Collateral
Received* | | | Security
Collateral
Received* | | | Net
Amount of
Derivatives
Assets | |
Citibank, NA | | $ | 40,593 | | | $ | – 0 | – | | $ | – 0 | – | | $ | – 0 | – | | $ | 40,593 | |
Goldman Sachs International | | | 293,014 | | | | (5,775 | ) | | | (287,239 | ) | | | – 0 | – | | | – 0 | – |
JPMorgan Chase Bank, NA | | | 39,190 | | | | (213 | ) | | | – 0 | – | | | – 0 | – | | | 38,977 | |
Morgan Stanley Capital Services, LLC | | | 879,543 | | | | (879,543 | ) | | | – 0 | – | | | – 0 | – | | | – 0 | – |
| | | | | | | | | | | | | | | | | | | | |
Total | | $ | 1,252,340 | | | $ | (885,531 | ) | | $ | (287,239 | ) | | $ | – 0 | – | | $ | 79,570 | ^ |
| | | | | | | | | | | | | | | | | | | | |
| | | | | | | | | | | | | | | | | | | | |
Counterparty | | Derivatives
Liabilities
Subject
to a MA | | | Derivatives
Available
for Offset | | | Cash
Collateral
Pledged* | | | Security
Collateral
Pledged* | | | Net
Amount of
Derivatives
Liabilities | |
Goldman Sachs International | | $ | 5,775 | | | $ | (5,775 | ) | | $ | – 0 | – | | $ | –0 | – | | $ | –0 | – |
JPMorgan Chase Bank, NA | | | 213 | | | | (213 | ) | | | – 0 | – | | | – 0 | – | | | – 0 | – |
Morgan Stanley Capital Services, LLC | | | 947,427 | | | | (879,543 | ) | | | (67,884 | ) | | | – 0 | – | | | – 0 | – |
| | | | | | | | | | | | | | | | | | | | |
Total | | $ | 953,415 | | | $ | (885,531 | ) | | $ | (67,884 | ) | | $ | – 0 | – | | $ | – 0 | –^ |
| | | | | | | | | | | | | | | | | | | | |
| * | The actual collateral received/pledged may be more than the amount reported due to over-collateralization. |
| ^ | Net amount represents the net receivable/payable that would be due from/to the counterparty in the event of default or termination. The net amount from OTC financial derivative instruments can only be netted across transactions governed under the same master agreement with the same counterparty. |
| | |
| 32 | AB MULTI-MANAGER ALTERNATIVE FUND | | abfunds.com |
NOTES TO CONSOLIDATED FINANCIAL STATEMENTS (continued)
AB Multi-Manager Alternative Fund (Cayman), Ltd.
| | | | | | | | | | | | | | | | | | | | |
Counterparty | | Derivatives
Assets
Subject
to a MA | | | Derivatives
Available
for Offset | | | Cash
Collateral
Received* | | | Security
Collateral
Received* | | | Net
Amount of
Derivatives
Assets | |
Barclays Bank PLC | | $ | 108,751 | | | $ | – 0 | – | | $ | – 0 | – | | $ | – 0 | – | | $ | 108,751 | |
JPMorgan Chase Bank, NA | | | 32,964 | | | | (32,964 | ) | | | – 0 | – | | | – 0 | – | | | – 0 | – |
Morgan Stanley Capital Services, LLC | | | 36,880 | | | | – 0 | – | | | – 0 | – | | | – 0 | – | | | 36,880 | |
| | | | | | | | | | | | | | | | | | | | |
Total | | $ | 178,595 | | | $ | (32,964 | ) | | $ | – 0 | – | | $ | – 0 | – | | $ | 145,631 | ^ |
| | | | | | | | | | | | | | | | | | | | |
| | | | | |
Counterparty | | Derivatives
Liabilities
Subject
to a MA | | | Derivatives
Available
for Offset | | | Cash
Collateral
Pledged* | | | Security
Collateral
Pledged* | | | Net
Amount of
Derivatives
Liabilities | |
Goldman Sachs International | | $ | 16,522 | | | $ | 0 | | | $ | –0 | – | | $ | –0 | – | | $ | 16,522 | |
JPMorgan Chase Bank, NA | | | 65,813 | | | | (32,964 | ) | | | – 0 | – | | | – 0 | – | | | 32,849 | |
| | | | | | | | | | | | | | | | | | | | |
Total | | $ | 82,335 | | | $ | (32,964 | ) | | $ | – 0 | – | | $ | – 0 | – | | $ | 49,371 | ^ |
| | | | | | | | | | | | | | | | | | | | |
| * | The actual collateral received/pledged may be more than the amount reported due to over-collateralization. |
| ^ | Net amount represents the net receivable/payable that would be due from/to the counterparty in the event of default or termination. The net amount from OTC financial derivative instruments can only be netted across transactions governed under the same master agreement with the same counterparty. |
3. Currency Transactions
The Fund may invest in non-U.S. Dollar-denominated securities on a currency hedged or unhedged basis through its investments in an Underlying Portfolio. The Fund or an Underlying Portfolio may seek investment opportunities by taking long or short positions in currencies through the use of currency-related derivatives, including forward currency exchange contracts, futures and options on futures, swaps, and other options. The Fund or an Underlying Portfolio may enter into transactions for investment opportunities when it anticipates that a foreign currency will appreciate or depreciate in value but securities denominated in that currency are not held by the Fund or the Underlying Portfolio and do not present attractive investment opportunities. Such transactions may also be used when the Investment Manager or the manager of an Underlying Portfolio believes that it may be more efficient than a direct investment in a foreign currency-denominated security. A Fund or an Underlying Portfolio may also conduct currency exchange contracts on a spot basis (i.e., for cash at the spot rate prevailing in the currency exchange market for buying or selling currencies).
NOTE D
Shares of Beneficial Interest
Generally, initial and additional subscriptions for shares may be accepted as of the first day of each month. The Fund reserves the right to reject any subscription for shares. The Fund intends to repurchase shares from shareholders in accordance with written tenders by shareholders at those
| | |
| abfunds.com | | AB MULTI-MANAGER ALTERNATIVE FUND | 33 |
NOTES TO CONSOLIDATED FINANCIAL STATEMENTS (continued)
times, in those amounts, and on such terms and conditions as the Board of Trustees may determine in its sole discretion. When a repurchase offer occurs, a shareholder will generally be required to provide notice of their tender of shares for repurchase to the Fund more than three months in advance of the date that the shares will be valued for repurchase (the “Valuation Date”). Valuation Dates are generally expected to be the last business days of March, June, September or December, and payment for tendered shares will generally be made by the Fund approximately 45 days following the Valuation Date.
Transactions in shares of beneficial interest were as follows for the six months ended September 30, 2018 and year ended March 31, 2018:
| | | | | | | | | | | | | | | | | | | | | | | | |
| | | | | | | | | | | | | | | | | | | | | | | | |
| | | Shares | | | | | | Amount | | | | |
| | | Six Months Ended
September 30,
2018
(unaudited) | | | Year Ended
March 31, 2018 | | | | | | Six Months Ended
September 30,
2018
(unaudited) | | | Year Ended
March 31, 2018 | | | | |
| | | | | | | | | | | | | | | | | | | | | | | | |
Shares sold | | | 1,347,209 | | | | 2,637,812 | | | | | | | $ | 15,209,516 | | | $ | 29,519,509 | | | | | |
| | | | | | | | | | | | | | | | | | | | | | | | |
Shares issued in reinvestment of dividends and distributions | | | – 0 | – | | | 1,178,207 | | | | | | | | – 0 | – | | | 13,184,134 | | | | | |
| | | | | | | | | | | | | | | | | | | | | | | | |
Shares redeemed | | | (7,786,304 | ) | | | (15,585,132 | ) | | | | | | | (87,983,358 | ) | | | (174,200,728 | ) | | | | |
| | | | | | | | | | | | | | | | | | | | | | | | |
Net decrease | | | (6,439,095 | ) | | | (11,769,113 | ) | | | | | | $ | (72,773,842 | ) | | $ | (131,497,085 | ) | | | | |
| | | | | | | | | | | | | | | | | | | | | | | | |
NOTE E
Risks Involved in Investing in the Fund
Limitations on the Fund’s ability to withdraw its assets from Underlying Portfolios may limit the Fund’s ability to repurchase its shares. For example, many Underlying Portfolios impose lock-up periods prior to allowing withdrawals, which can be two years or longer. After expiration of the lock-up period, withdrawals typically are permitted only on a limited basis, such as monthly, quarterly, semi-annually or annually. Many Underlying Portfolios may also indefinitely suspend redemptions or establish restrictions on the ability to fully receive proceeds from redemptions through the application of a redemption restriction or “gate”. In instances where the primary source of funds to repurchase shares will be withdrawals from Underlying Portfolios, the application of these lock-ups and withdrawal limitations may significantly limit the Fund’s ability to repurchase its shares. Although the Investment Manager will seek to select Underlying Portfolios that offer the opportunity to have their shares or units redeemed within a reasonable timeframe, there can be no assurance that the liquidity of the investments of such Underlying Portfolios will always be sufficient to meet redemption requests as, and when, made.
| | |
| 34 | AB MULTI-MANAGER ALTERNATIVE FUND | | abfunds.com |
NOTES TO CONSOLIDATED FINANCIAL STATEMENTS (continued)
The Fund invests primarily in Underlying Portfolios that are not registered under the 1940 Act and invest in and actively trade securities and other financial instruments using different strategies and investment techniques that may involve significant risks. Such risks include those related to the volatility of the equity, credit, and currency markets, the use of leverage associated with certain investment strategies, derivative contracts and in connection with short positions, the potential illiquidity of certain instruments and counterparty and broker arrangements.
Some of the Underlying Portfolios in which the Fund invests may invest all or a portion of their assets in securities that are illiquid or are subject to an anticipated event. These Underlying Portfolios may create “side pockets” in which to hold these securities. Side pockets are series or classes of shares which are not redeemable by the investors but which are automatically redeemed or converted back into the Underlying Portfolio’s regular series or classes of shares upon the realization of those securities or the happening of some other liquidity event with respect to those securities.
These “side pockets” can often be held for long periods before they are realized, and may therefore be much less liquid than the general liquidity offered on the Underlying Portfolio’s regular series or classes of shares. Should the Fund seek to liquidate its investment in an Underlying Portfolio that maintains investments in a side pocket arrangement or that holds a substantial portion of its assets in illiquid securities, the Fund might not be able to fully liquidate its investments without delay, which could be considerable. In such cases, during the period until the Fund is permitted to fully liquidate the investment in the Underlying Portfolio, the value of the investment could fluctuate.
The Underlying Portfolios may utilize leverage in pursuit of achieving a potentially greater investment return. The use of leverage exposes an Underlying Portfolio to additional risk including (i) greater losses from investments than would otherwise have been the case had the Underlying Portfolio not used leverage to make the investments; (ii) margin calls or interim margin requirements may force premature liquidations of investment positions; and (iii) losses on investments where the investment fails to earn a return that equals or exceeds the Underlying Portfolio’s cost of leverage related to such investment. In the event of a sudden, precipitous drop in the value of an Underlying Portfolio’s assets, the Underlying Portfolio might not be able to liquidate assets quickly enough to repay its borrowings, further magnifying the losses incurred by the Underlying Portfolio.
The Underlying Portfolios may invest in securities of foreign companies that involve special risks and considerations not typically associated with investments in the United States, due to concentrated investments in a
| | |
| abfunds.com | | AB MULTI-MANAGER ALTERNATIVE FUND | 35 |
NOTES TO CONSOLIDATED FINANCIAL STATEMENTS (continued)
limited number of countries or regions, which may vary throughout the year depending on the Underlying Portfolio. Such concentrations may subject the Underlying Portfolios to additional risks resulting from political or economic conditions in such countries or regions, and the possible imposition of adverse governmental laws or currency exchange restrictions could cause the securities and their markets to be less liquid and their prices to be more volatile than those of comparable U.S. securities.
The Underlying Portfolios may invest a higher percentage of their assets in specific sectors of the market in order to achieve a potentially greater investment return. As a result, the Underlying Portfolios may be more susceptible to economic, political and regulatory developments in a particular sector of the market, positive or negative, and may experience increased volatility of the Underlying Portfolio’s net asset value.
The Fund invests in a limited number of Underlying Portfolios. Such concentration may result in additional risk. Various risks are also associated with an investment in the Fund, including risks relating to compensation arrangements and risks relating to limited liquidity of the Interests.
The Fund is subject to credit risk arising from its transactions with its custodian, State Street Bank and Trust, related to holding the Fund’s cash. This credit risk arises to the extent that the custodian may be unable to fulfill its obligation to return the Fund’s cash held in its custody.
In the ordinary course of business, the Fund enters into contracts that contain a variety of indemnifications. The Fund’s maximum exposure under these arrangements is unknown. However, the Fund has not had prior claims or losses pursuant to these indemnification provisions and expects the risk of loss thereunder to be remote. Therefore, the Fund has not accrued any liability in connection with these indemnification provisions.
NOTE F
Tax Information
The tax character of fiscal year-end distributions for 2018 is based on estimated tax information provided by certain Underlying Portfolios. The character may materially change as the Fund receives final 2017 tax reporting from Underlying Portfolios. The tax character of distributions paid during the fiscal years ended March 31, 2018 and March 31, 2017 were as follows:
| | | | | | | | |
| | | 2018 | | | 2017 | |
Distributions paid from: | | | | | | | | |
Ordinary income | | $ | 12,605,284 | | | $ | 2,840,922 | |
Return of capital | | | 2,494,217 | | | | – 0 | – |
Long-term capital gains | | | – 0 | – | | | 7,989,905 | |
| | | | | | | | |
Total taxable distributions paid | | $ | 15,099,501 | | | $ | 10,830,827 | |
| | | | | | | | |
| | |
| 36 | AB MULTI-MANAGER ALTERNATIVE FUND | | abfunds.com |
NOTES TO CONSOLIDATED FINANCIAL STATEMENTS (continued)
As of March 31, 2018, the components of accumulated earnings/(deficit) on a tax basis were as follows:
| | | | |
Undistributed net investment income | | $ | – 0 | – |
Accumulated capital and other losses | | | (10,293,384 | )(a) |
Unrealized appreciation/(depreciation) | | | 34,689,162 | (b) |
| | | | |
Total accumulated earnings/(deficit) | | $ | 24,395,778 | |
| | | | |
| (a) | At March 31, 2018, the Fund had a qualified late-year ordinary loss deferral of $5,363,236 and a post-October short-term capital loss deferral of $3,031,761. These losses are deemed to arise on April 1, 2018. |
| (b) | The differences between book-basis and tax-basis unrealized appreciation/(depreciation) are attributable primarily to the tax treatment of passive foreign investment companies (PFICs) and partnerships. |
For tax purposes, net capital losses may be carried over to offset future capital gains, if any. Funds are permitted to carry forward capital losses for an indefinite period, and such losses will retain their character as either short-term or long-term capital losses. During the current fiscal year, the Fund utilized $8,399,038 of prior year capital losses. As of March 31, 2018, the Fund has $1,898,387 in short-term carry forward capital losses.
NOTE G
Credit Facility
The Fund is a party to a $75 million revolving credit facility (the “Facility”) intended to provide short term financing, if necessary, subject to certain restrictions in connection with, among other matters, abnormal redemption activity. Credit Facility fees are paid by the Fund and are included in the consolidated statement of operations. The Fund had no borrowings outstanding from the Facility at September 30, 2018. For the six months ended September 30, 2018, the Fund had borrowings under the Agreement as follows:
| | | | |
Average Daily Loan Balance* | | Maximum Daily
Loan Outstanding | | Weighted Average
Interest Rate |
| $ 18,000,000 | | $ 18,000,000 | | 3.44% |
| * | For 6 days borrowings were outstanding. |
NOTE H
Recent Accounting Pronouncement
In August 2018, the Financial Accounting Standards Board issued an Accounting Standards Update, ASU 2018-13, Fair Value Measurement (Topic 820), Disclosure Framework—Changes to the Disclosure Requirements for Fair Value Measurement which removes, modifies and adds disclosures to Topic 820. The amendments in this ASU 2018-13 apply to all entities that are required, under existing U.S. GAAP, to make disclosures about recurring or nonrecurring fair value measurements. The amendments in this ASU 2018-13 are effective for all entities for fiscal years, and
| | |
| abfunds.com | | AB MULTI-MANAGER ALTERNATIVE FUND | 37 |
NOTES TO CONSOLIDATED FINANCIAL STATEMENTS (continued)
interim periods within those fiscal years, beginning after December 15, 2019. At this time, management is evaluating the implications of these changes on the consolidated financial statements.
In October 2018, the U.S. Securities and Exchange Commission adopted amendments to certain disclosure requirements included in Regulation S-X that had become “redundant, duplicative, overlapping, outdated or superseded, in light of the other Commission disclosure requirements, GAAP or changes in the information environment.” The compliance date for the amendments to Regulation S-X was November 5, 2018 (for reporting period end dates of September 30, 2018 or after). Management has evaluated the impact of the amendments and determined the effect of the adoption of the rules will simplify certain disclosure requirements on the consolidated financial statements.
NOTE I
Subsequent Events
Effective October 26, 2018, the Credit Facility was decreased to $50 million.
Effective November 1, 2018, the Advisory Agreement was amended so that the Fund pays a management fee at an annual rate of 1.00% of the Fund’s net assets determined as of the last day of a calendar month and adjusted for subscriptions and repurchases accepted as of the first day of the subsequent month. By making the 1.00% management fee part of the Advisory Agreement, the amendment effectively supersedes the management fee waiver addressed in Note B above.
Management has evaluated subsequent events for possible recognition or disclosure in the financial statements through the date the consolidated financial statements are issued. Management has determined that there are no other material events that would require disclosure in the Fund’s consolidated financial statements through this date.
| | |
| 38 | AB MULTI-MANAGER ALTERNATIVE FUND | | abfunds.com |
CONSOLIDATED FINANCIAL HIGHLIGHTS
Selected Data For A Share Of Beneficial Interest Outstanding Throughout Each Period
| | | | | | | | | | | | | | | | | | | | | | | | |
| | | Six Months
Ended
September 30,
2018‡
(Unaudited) | | | Year Ended March 31 , | |
| | | 2018 | | | 2017 | | | 2016 | | | 2015 | | | 2014 | |
| | | | |
| | | | | | | | | | | | | | | | | | | | | | | | |
Net asset value, beginning of period | | | $11.20 | | | | $10.87 | | | | $10.05 | | | | $11.64 | | | | $11.41 | | | | $10.75 | |
| | | | |
Income From Investment Operations | | | | | | | | | | | | | | | | | | | | | | | | |
Net investment loss(a) | | | (.07 | )(b) | | | (.19 | )(b) | | | (.18 | ) | | | (.19 | ) | | | (.20 | )(b) | | | (.20 | )(b) |
Net realized and unrealized gain (loss) on investment transactions | | | .16 | | | | .66 | | | | 1.09 | | | | (1.12 | ) | | | .56 | | | | 1.06 | |
| | | | |
Net increase (decrease) in net asset value from operations | | | .09 | | | | .47 | | | | .91 | | | | (1.31 | ) | | | .36 | | | | .86 | |
| | | | |
Less: Dividends and Distributions | | | | | | | | | | | | | | | | | | | | | | | | |
Dividends from net investment income | | | 0 | | | | (.12 | ) | | | (.02 | ) | | | (.01 | ) | | | (.02 | ) | | | (.17 | ) |
Distributions from net realized gain on investment transactions | | | 0 | | | | 0 | | | | (.07 | ) | | | (.27 | ) | | | (.11 | ) | | | (.03 | ) |
Return of capital | | | 0 | | | | (.02 | ) | | | 0 | | | | 0 | | | | 0 | | | | 0 | |
| | | | |
Total dividends and distributions | | | 0 | | | | (.14 | ) | | | (.09 | ) | | | (.28 | ) | | | (.13 | ) | | | (.20 | ) |
| | | | |
Net asset value, end of period | | | $ 11.29 | | | | $ 11.20 | | | | $ 10.87 | | | | $ 10.05 | | | | $ 11.64 | | | | $ 11.41 | |
| | | | |
Total Return | | | | | | | | | | | | | | | | | | | | | | | | |
Total investment return based on net asset value(c) | | | .85 | % | | | 4.33 | % | | | 9.06 | % | | | (11.38 | )% | | | 3.16 | % | | | 8.04 | % |
Ratios/Supplemental Data | | | | | | | | | | | | | | | | | | | | | | | | |
Net assets, end of period (000’s omitted) | | | $1,092,170 | | | | $1,155,060 | | | | $1,248,818 | | | | $1,310,647 | | | | $1,376,552 | | | | $980,537 | |
Ratio to average net assets of: | | | | | | | | | | | | | | | | | | | | | | | | |
Expenses, net of
waivers/reimbursements(d)(e) | | | 1.34 | %^ | | | 1.68 | % | | | 1.67 | % | | | 1.66 | % | | | 1.75 | %(b) | | | 1.75 | %(b) |
Expenses, before
waivers/reimbursements(d)(e) | | | 1.68 | %^ | | | 1.68 | % | | | 1.67 | % | | | 1.66 | % | | | 1.75 | % | | | 1.79 | % |
Net investment loss(e) | | | (1.24 | )%(b)^ | | | (1.66 | )%(b) | | | (1.67 | )% | | | (1.66 | )% | | | (1.75 | )%(b) | | | (1.75 | )%(b) |
Portfolio turnover rate | | | 14 | % | | | 19 | % | | | 3 | % | | | 7 | % | | | 8 | % | | | 0 | %(f) |
Asset coverage ratio | | | N/A | | | | N/A | | | | N/A | | | | N/A | | | | 33,674 | % | | | N/A | |
Bank borrowing outstanding (in millions) | | | N/A | | | | N/A | | | | N/A | | | | N/A | | | | $4 | | | | N/A | |
| | |
| abfunds.com | | AB MULTI-MANAGER ALTERNATIVE FUND | 39 |
CONSOLIDATED FINANCIAL HIGHLIGHTS (continued)
Selected Data For A Share Of Beneficial Interest Outstanding Throughout Each Period
| (a) | Based on average shares outstanding. |
| (b) | Net of fees and expenses waived/reimbursed by the Investment Manager. |
| (c) | Total investment return is calculated assuming a purchase of beneficial shares on the opening of the first day and a sale on the closing of the last day of each period reported. Dividends and distributions, if any, are assumed for purposes of this calculation, to be reinvested at prices obtained under the Fund’s dividend reinvestment plan. Total investment return calculated for a period of less than one year is not annualized. |
| (d) | The expense ratios presented below exclude interest expense: |
| | | | | | | | | | | | | | | | | | | | | | | | |
| | | Six Months
Ended
September 30,
2018
(unaudited) | | | Year Ended March 31, | |
| | | 2018 | | | 2017 | | | 2016 | | | 2015 | | | 2014 | |
Expenses | | | 1.34 | %^ | | | 1.68 | % | | | 1.66 | % | | | 1.66 | % | | | 1.75 | % | | | N/A | |
| (e) | The expense and net investment loss ratios do not include income earned or expenses incurred by the Fund through its Underlying Portfolios. |
| (f) | Amount is less than .50%. |
| ‡ | Consolidated (see Note A). |
See notes to consolidated financial statements.
| | |
| 40 | AB MULTI-MANAGER ALTERNATIVE FUND | | abfunds.com |
BOARD OF TRUSTEES
Carter F. “Terry” Wolfe(1) Chairman
Christopher J. Bricker President and Chief Executive Officer
Lawrence D. Haber(1)
Jeanette Loeb(1)
OFFICERS
Stuart Davies(2) Vice President
Vikas Kapoor(2) Vice President
Emilie D. Wrapp Secretary
Michael B. Reyes Senior Analyst
Joseph J. Mantineo Treasurer and Chief Financial Officer
Stephen M. Woetzel Controller
Vincent S. Noto Chief Compliance Officer
| | |
Custodian State Street Bank and Trust Company State Street Corporation CCB/5 1 Iron Street Boston, MA 02210 Distributors Sanford C. Bernstein & Co., LLC 1345 Avenue of the Americas New York, NY 10105 AllianceBernstein Investments, Inc. 1345 Avenue of the Americas New York, NY 10105 Transfer Agent AllianceBernstein Investor Services, Inc. P.O. Box 786003 San Antonio, TX 78278-6003 Toll-Free (800) 221-5672 | | Legal Counsel Willkie Farr & Gallagher LLP 787 Seventh Avenue New York, NY 10019 Independent Registered Public Accounting Firm PricewaterhouseCoopers LLP 300 Madison Avenue New York, NY 10017 |
| 1 | Member of the Audit Committee and the Governance and Nominating Committee. |
| 2 | The day-to-day management of, and investment decisions for, the Fund’s portfolio are made by the Investment Manager’s Alternative Investment Management Group. Messrs. Davies and Kapoor are the investment professionals with the most significant responsibility for the day-to-day management of the Fund’s portfolio. |
| | |
| abfunds.com | | AB MULTI-MANAGER ALTERNATIVE FUND | 41 |
Information Regarding Review and Approval of the Fund’s Advisory Agreement
At a meeting held on July 24, 2018, the Trustees of Fund met in person to consider a New Management Agreement for the Fund required as a result of AXA S.A. planning to sell its remaining shares in AXA Equitable Holdings, Inc., the entity that holds a majority of the partnership interests in the Manager and is the parent of the Manager’s sole general partner (the “Plan”). In connection with their deliberations, the Trustees held discussions with management and reviewed certain written materials, memoranda, presentations and analyses relating to the Fund, including materials from the Manager and counsel to the Independent Trustees which: (i) included information concerning the Manager’s organization, including with respect to the Plan, the services rendered to the Fund by the Manager, the fees paid by the Fund to the Manager and the estimated profitability of the Manager with respect to its relationship with the Fund; and (ii) outlined the legal duties of the Board under the 1940 Act. The Board Materials also contained information from Strategic Insight”), an information service provider unaffiliated with the Manager, including a draft report (“Strategic Insight Report”) comparing the Fund’s fee rate for advisory services to those of other alternative strategy closed-end funds selected by Strategic Insight.
The Trustees discussed with counsel the legal standards regarding the approval of the New Management Agreement and the 15a-4 Agreement and reviewed the information included in the Board Materials.
The Trustees considered information received throughout the year regarding the Fund, the Manager and the services provided under the current investment management agreement. In connection with their approval of the New Management Agreement, the Board considered its conclusions in connection with their most recent approvals of the current investment management agreement that was in effect at the time of the Board’s approval of the New Management Agreement. The Board also took note of the Manager’s agreement to waive 50 basis points (of its 150 basis point fee under the current investment management agreement) for a one-year period. The Board considered representations by representatives of the Manager that the Fund was not expected to experience any change in the nature and quality of services delivered by the Manager as a result of the Plan. The Trustees considered the fact that the New Management Agreement would have corresponding terms and conditions identical to those of the current investment management agreement with the exception of the effective date under the New Management Agreement.
The Trustees discussed the Board Materials with management and representatives of the Manager responded to questions from the Trustees. The Trustees also held discussions in executive session with their independent counsel, outside the presence of management. After discussing a range of
| | |
| 42 | AB MULTI-MANAGER ALTERNATIVE FUND | | abfunds.com |
issues, the Trustees considered, among other relevant matters, the following factors:
(a) The nature, extent and quality of services provided by the Manager. The Trustees discussed with representatives of the Manager the services that the Manager provides to the Fund under the current investment management agreement and the expectation that there would be no change in such services under the New Management Agreement. The Trustees discussed the resources available to the Manager, including its research and compliance capabilities. The Board also considered representations by representatives of the Manager that the Manager would continue to have adequate resources following a transaction that constitutes a change of control event as discussed at the Meeting.
The Trustees noted the size and experience of the Manager’s staff, and the experience of its key personnel in providing investment management services. The Manager’s investment diligence and risk management capabilities were also considered. The Trustees took into account that the Trustees regularly receive reports from the Manager regarding the Fund’s performance and the Adviser’s compliance history and compliance program. The Trustees also noted the discussions they had with officers of the Adviser regarding the management of the Fund’s investments and the investment strategies to which the Fund has exposure. During these discussions with Fund officers and representatives of the Manager, the Trustees asked detailed questions of, and received substantive answers from, these representatives regarding the implementation of the Fund’s investment strategy, its efficacy and potential risks.
In addition to the investment advisory services provided to the Fund, the Trustees considered that the Manager and its affiliates also provide certain administrative services necessary for the operations of the Fund on an “at cost” basis pursuant to a separate Administrative Reimbursement Agreement. The Trustees noted that the Manager has an administrative, legal and compliance staff to ensure a high level of quality in the compliance and other services provided to the Fund, including its oversight of the Fund’s day-to-day operations. Based on the presentations made during their meetings and their knowledge of management and Fund operations gained during their tenure as trustees of the Fund, the Trustees concluded that the services provided to the Fund by the Manager under the current investment management agreement were of a high quality and benefited the fund and would be expected to be the same under the New Management Agreement.
(b) Investment performance of the Fund and the Manager. The Trustees reviewed performance information for the Fund, noting that they receive performance reports at regular board meetings and monitor the Fund’s performance throughout the year. The Trustees discussed the Fund’s
| | |
| abfunds.com | | AB MULTI-MANAGER ALTERNATIVE FUND | 43 |
performance with representatives of the Manager, including as compared to relevant benchmarks. The Trustees also reviewed the performance information provided in the Strategic Insight Report. The Trustees concluded that the Fund’s performance was generally in line with expectations in light of the strategies used by the Fund and current market conditions. The Trustees took note that a majority of the performance considered was achieved by the prior portfolio management team. The Trustees also considered the experience, resources and strengths of the Manager and its affiliates in managing funds of funds, including the experience of the portfolio management team in managing multi-strategy funds. Based on these factors, the Trustees determined that the Manager continues to be an appropriate investment manager for the Fund and for purposes of approving the New Management Agreement.
(c) Cost of the services provided and profits realized by the Manager from the relationship with the Fund. The Trustees considered the profitability of the Manager. The Trustees discussed in detail with representatives of the Manager and independent consultants the Manager’s profitability and the methodology used in the profitability analysis. The Trustees noted that an affiliate of the Manager provided distribution services to the Fund at no cost. The amounts recently reimbursed to the Manager by the Fund were also noted. The Trustees also considered the services and costs associated with the Fund’s Administrative Reimbursement Agreement with the Manager. The Trustees considered the Manager’s agreement to waive a portion of its management (constituting more than 30% of the contractual fee rate under the current investment management agreement) for a period of at least a year. The Trustees noted that the Manager’s profitability does not appear to be unreasonable in respect of the Fund.
(d) Economies of scale and whether fee levels reflect these economies of scale. The Trustees discussed whether any economies of scale have been realized for the Fund. The Trustees considered the initial level of advisory fees set for the Fund, the Manager’s agreement to waive a portion of its management fee, recent rates of tenders of fund shares and the potential for economies of scale. The Trustees concluded that any economies of scale achieved by the Manager were not unreasonable under the current advisory arrangements.
(e) Comparison of services rendered and fees paid to those under other investment advisory contracts, such as contracts of the same and other investment advisers or other clients. The Trustees were aware of the services rendered and the fees paid under the current investment management agreement in comparison to other contracts of the Manager with respect to private investment vehicles managed in a similar manner to the Fund and were provided with updated information regarding contractual fee rates of other investment advisers with respect to other closed-end registered investment companies with similar investment programs as the Fund. The
| | |
| 44 | AB MULTI-MANAGER ALTERNATIVE FUND | | abfunds.com |
Trustees noted the Manager’s representation that providing advisory services to a registered investment company entailed different, and potentially greater, business and regulatory risks than those associated with providing services to the Manager’s other funds and accounts. The Trustees also discussed the fee structure of the Manager’s institutional accounts. The Trustees discussed the management of the comparable institutional accounts, including the allocation of opportunities available to those funds.
The Trustees reviewed with representatives of the Manager the information included in the Strategic Insight Report. The Trustees also noted that the Fund’s total expense ratio was competitive with the expense group median in the Strategic Insight Report. The Trustees reviewed the list of funds provided by Strategic Insight. They discussed whether certain funds should be viewed as comparable to the Fund. The Trustees noted the difficulty in obtaining comparable peer funds, particularly finding funds of comparable size and strategy. The Trustees discussed the Strategic Insight Report with the Manager, including the comparison of advisory fees and expense ratios.
Conclusion. No single factor was determinative to the decision of the Trustees. Based on the foregoing and such other matters as were deemed relevant, all of the Trustees concluded that the advisory fee rate under the New Management Agreement was reasonable in relation to the services provided by the Manager. The Trustees determined that the selection of the Manager to manage the Fund, and the overall arrangements between the Fund and the Manager, as provided in the New Management Agreement, were fair and reasonable in light of the services performed under the current investment management agreement and to be performed under the New Management Agreement, expenses incurred and to be incurred and such other matters as the Trustees considered relevant in the exercise of their business judgment. Based on these factors, the Trustees decided to approve the New Management Agreement.
15a-4 Agreement
In approving the 15a-4 Agreement, the Board, with the assistance of independent counsel, considered similar factors to those considered in approving the New Management Agreement. The Trustees noted that the 15a-4 Agreement is identical to the New Management Agreement, as well as the current investment management agreement, in all material respects except for their proposed effective and termination dates and provisions intended to comply with the requirements of Rule 15a-4 under the 1940 Act, such as provisions requiring escrow of advisory fees. The Trustees considered that under the 15a-4 Agreement, the Manager would continue to manage the Fund pursuant to the 15a-4 Agreement until a new advisory agreement was approved by shareholders or until the end of the 150-day period, whichever would occur earlier. The Trustees also noted that all fees earned by the Manager under the 15a-4 Agreement would be held in escrow pending shareholder approval of the New Management Agreement.
| | |
| abfunds.com | | AB MULTI-MANAGER ALTERNATIVE FUND | 45 |
This page is not part of the Shareholder Report or the Financial Statements.
AB FAMILY OF FUNDS
US EQUITY
US CORE
Core Opportunities Fund
FlexFee™ US Thematic Portfolio
Select US Equity Portfolio
US GROWTH
Concentrated Growth Fund
Discovery Growth Fund
FlexFee™ Large Cap Growth Portfolio
Growth Fund
Large Cap Growth Fund
Small Cap Growth Portfolio
US VALUE
Discovery Value Fund
Equity Income Fund
Relative Value Fund
Small Cap Value Portfolio
Value Fund
INTERNATIONAL/ GLOBAL EQUITY
INTERNATIONAL/ GLOBAL CORE
FlexFee™ International Strategic Core Portfolio
Global Core Equity Portfolio
International Portfolio
International Strategic Core Portfolio
Sustainable Global Thematic Fund
Tax-Managed International Portfolio
Tax-Managed Wealth Appreciation Strategy
Wealth Appreciation Strategy
INTERNATIONAL/ GLOBAL GROWTH
Concentrated International Growth Portfolio
FlexFee™ Emerging Markets Growth Portfolio
INTERNATIONAL/ GLOBAL EQUITY (continued)
Sustainable International Thematic Fund1
INTERNATIONAL/ GLOBAL VALUE
All China Equity Portfolio
International Value Fund
FIXED INCOME
MUNICIPAL
High Income Municipal Portfolio
Intermediate California Municipal Portfolio
Intermediate Diversified Municipal Portfolio
Intermediate New York Municipal Portfolio
Municipal Bond Inflation Strategy
Tax-Aware Fixed Income Portfolio
National Portfolio
Arizona Portfolio
California Portfolio
Massachusetts Portfolio
Minnesota Portfolio
New Jersey Portfolio
New York Portfolio
Ohio Portfolio
Pennsylvania Portfolio
Virginia Portfolio
TAXABLE
Bond Inflation Strategy
FlexFee™ High Yield Portfolio1
FlexFee™ International Bond Portfolio
Global Bond Fund
High Income Fund
Income Fund
Intermediate Bond Portfolio
Limited Duration High Income Portfolio
Short Duration Portfolio
ALTERNATIVES
All Market Real Return Portfolio
Global Real Estate Investment Fund
Select US Long/Short Portfolio
Unconstrained Bond Fund
MULTI-ASSET
All Market Income Portfolio
All Market Total Return Portfolio
Conservative Wealth Strategy
Emerging Markets Multi-Asset Portfolio
Global Risk Allocation Fund
Tax-Managed All Market Income Portfolio
TARGET-DATE
Multi-Manager Select Retirement Allocation Fund
Multi-Manager Select 2010 Fund
Multi-Manager Select 2015 Fund
Multi-Manager Select 2020 Fund
Multi-Manager Select 2025 Fund
Multi-Manager Select 2030 Fund
Multi-Manager Select 2035 Fund
Multi-Manager Select 2040 Fund
Multi-Manager Select 2045 Fund
Multi-Manager Select 2050 Fund
Multi-Manager Select 2055 Fund
CLOSED-END FUNDS
Alliance California Municipal Income Fund
AllianceBernstein Global High Income Fund
AllianceBernstein National Municipal Income Fund
We also offer Government Money Market Portfolio, which serves as the money market fund exchange vehicle for the AB mutual funds. You could lose money by investing in the Fund. Although the Fund seeks to preserve the value of your investment at $1.00 per share, it cannot guarantee it will do so. The Fund may impose a fee upon sale of your shares or may temporarily suspend your ability to sell shares if the Fund’s liquidity falls below required minimums because of market conditions or other factors. An investment in the Fund is not insured or guaranteed by the Federal Deposit Insurance Corporation or any other government agency. The Fund’s sponsor has no legal obligation to provide financial support to the Fund, and you should not expect that the sponsor will provide financial support to the Fund at any time.
Investors should consider the investment objectives, risks, charges and expenses of the Fund carefully before investing. For copies of our prospectus or summary prospectus, which contain this and other information, visit us online at www.abfunds.com or contact your AB representative. Please read the prospectus and/or summary prospectus carefully before investing.
| 1 | Prior to January 8, 2018, Sustainable International Thematic Fund was named International Growth Fund; prior to February 23, 2018, FlexFee High Yield Portfolio was named High Yield Portfolio. |
| | |
| 46 | AB MULTI-MANAGER ALTERNATIVE FUND | | abfunds.com |
NOTES
| | |
| abfunds.com | | AB MULTI-MANAGER ALTERNATIVE FUND | 47 |
NOTES
| | |
| 48 | AB MULTI-MANAGER ALTERNATIVE FUND | | abfunds.com |
NOTES
| | |
| abfunds.com | | AB MULTI-MANAGER ALTERNATIVE FUND | 49 |
NOTES
| | |
| 50 | AB MULTI-MANAGER ALTERNATIVE FUND | | abfunds.com |
NOTES
| | |
| abfunds.com | | AB MULTI-MANAGER ALTERNATIVE FUND | 51 |
NOTES
| | |
| 52 | AB MULTI-MANAGER ALTERNATIVE FUND | | abfunds.com |
Privacy Notice
AllianceBernstein and its affiliates (collectively referred to as “AllianceBernstein”, “we”, “our”, and similar pronouns) understand the importance of maintaining the confidentiality and security of our clients’ nonpublic personal information. Nonpublic personal information is personally identifiable financial information about our clients who are natural persons. To provide financial products and services to our clients, we collect nonpublic personal information from a variety of sources, including: (1) information we receive from clients, such as through applications or other forms, which can include a client’s name, address, phone number, social security number, assets, income and other household information, (2) information about client transactions with us, our affiliates and non-affiliated third parties, which can include account balances and transactions history, and (3) information from visitors to our websites provided through online forms, site visitorship data and online information-collecting devices known as “cookies.”
We may disclose all of the nonpublic personal information that we collect about our current and former clients, as described above, to non-affiliated third parties to manage our business and as otherwise required or permitted by law, including those that perform transaction processing or servicing functions, marketing services providers that provide marketing services on our behalf pursuant to a joint marketing agreement, and professional services firms that provide knowledge-based services such as accountants, consultants, lawyers and auditors to help manage client accounts. We require all the third-party providers to adhere to our privacy policy or a functional equivalent.
We may also disclose the nonpublic personal information that we collect about current and former clients, as described above, to our affiliated investment, brokerage, service and insurance companies for the purpose of marketing their products or services to clients under circumstances that are permitted by law, such as if our affiliate has its own relationship with you. We have policies and procedures to ensure that certain conditions are met before an AllianceBernstein affiliated company may use information obtained from another affiliate to solicit clients for marketing purposes.
We will also use nonpublic personal information about our clients for our own internal analysis, analytics, research and development, and to improve and add to our client offerings.
We have policies and procedures designed to safeguard the confidentiality and security of nonpublic personal information about our clients that include restricting access to nonpublic personal information to personnel that have been screened and undergone security and privacy training; to personnel who need it to perform their work functions such as our operations, customer service, account management, finance, quality, vendor management and compliance teams as required to provide services, communicate with you and fulfill our legal obligations.
We employ reasonably designed physical, electronic and procedural safeguards to secure and protect client nonpublic personal information.
If you are in the European Economic Area (“EEA”) or Switzerland, we will comply with applicable legal requirements providing adequate protection for the transfer of personal information to recipients in countries outside of the EEA and Switzerland.
For more information, our Privacy Policy statement can be viewed here: https://www.alliancebernstein.com/abcom/Privacy_Terms/PrivacyPolicy.htm.

AB MULTI-MANAGER ALTERNATIVE FUND
1345 Avenue of the Americas
New York, NY 10105
800 221 5672
MMAF-0152-0918 
ITEM 2. CODE OF ETHICS.
(a) The registrant has adopted a code of ethics that applies to its principal executive officer, principal financial officer and principal accounting officer. A copy of the registrant’s code of ethics is filed herewith as Exhibit 12(a)(1).
(b) During the period covered by this report, no material amendments were made to the provisions of the code of ethics adopted in 2(a) above.
(c) During the period covered by this report, no implicit or explicit waivers to the provisions of the code of ethics adopted in 2(a) above were granted.
ITEM 3. AUDIT COMMITTEE FINANCIAL EXPERT.
The registrant’s Board of Directors has determined that independent director Lawrence D. Haber qualifies as an audit committee financial expert.
ITEM 4. PRINCIPAL ACCOUNTANT FEES AND SERVICES.
Not applicable when filing a semi-annual report to shareholders.
ITEM 5. AUDIT COMMITTEE OF LISTED REGISTRANTS.
Not applicable when filing a semi-annual report to shareholders.
ITEM 6. SCHEDULE OF INVESTMENTS.
Please see Schedule of Investments contained in the Report to Shareholders included under Item 1 of this Form N-CSR.
ITEM 7. DISCLOSURE OF PROXY VOTING POLICIES AND PROCEDURES FOR CLOSED-END MANAGEMENT INVESTMENT COMPANIES.
Not applicable when filing a semi-annual report to shareholders.
ITEM 8. PORTFOLIO MANAGERS OF CLOSED-END MANAGEMENT INVESTMENT COMPANIES.
Not applicable when filing a semi-annual report to shareholders.
ITEM 9. PURCHASES OF EQUITY SECURITIES BY CLOSED-END MANAGEMENT INVESTMENT COMPANY AND AFFILIATED PURCHASERS.
Not applicable when filing a semi-annual report to shareholders.
ITEM 10. SUBMISSION OF MATTERS TO A VOTE OF SECURITY HOLDERS.
There have been no material changes to the procedures by which shareholders may recommend nominees to the Fund’s Board of Directors since the Fund last provided disclosure in response to this item.
ITEM 11. CONTROLS AND PROCEDURES.
(a) The registrant’s principal executive officer and principal financial officer have concluded that the registrant’s disclosure controls and procedures (as defined in Rule 30a-2(c) under the Investment Company Act of 1940, as amended) are effective at the reasonable assurance level based on their evaluation of these controls and procedures as of a date within 90 days of the filing date of this document.
(b) There were no changes in the registrant’s internal controls over financial reporting that occurred during the second fiscal quarter of the period that has materially affected, or is reasonably likely to materially affect, the registrant’s internal control over financial reporting.
ITEM 12. EXHIBITS.
The following exhibits are attached to this Form N-CSR:
| | |
EXHIBIT NO. | | DESCRIPTION OF EXHIBIT |
| |
| 12 (b) (1) | | Certification of Principal Executive Officer Pursuant to Section 302 of the Sarbanes-Oxley Act of 2002 |
| |
| 12 (b) (2) | | Certification of Principal Financial Officer Pursuant to Section 302 of the Sarbanes-Oxley Act of 2002 |
| |
| 12 (c) | | Certification of Principal Executive Officer and Principal Financial Officer Pursuant to Section 906 of the Sarbanes-Oxley Act of 2002 |
SIGNATURES
Pursuant to the requirements of the Securities Exchange Act of 1934 and the Investment Company Act of 1940, the registrant has duly caused this report to be signed on its behalf by the undersigned, thereunto duly authorized.
| | |
| (Registrant): AB Multi-Manager Alternative Fund, Inc. |
| |
| By: | | /s/ Christopher J. Bricker |
| | Christopher J. Bricker |
| | President |
|
| Date: November 26, 2018 |
Pursuant to the requirements of the Securities Exchange Act of 1934 and the Investment Company Act of 1940, this report has been signed below by the following persons on behalf of the registrant and in the capacities and on the dates indicated.
| | |
| By: | | /s/ Christopher J. Bricker |
| | Christopher J. Bricker |
| | President |
|
| Date: November 26, 2018 |
| | |
| By: | | /s/ Joseph J. Mantineo |
| | Joseph J. Mantineo |
| | Treasurer and Chief Financial Officer |
|
| Date: November 26, 2018 |