UNITED STATES
SECURITIES AND EXCHANGE COMMISSION
WASHINGTON, D.C. 20549
FORM N-CSR
CERTIFIED SHAREHOLDER REPORT OF REGISTERED
MANAGEMENT INVESTMENT COMPANIES
Investment Company Act file number: 811-22671
AB MULTI-MANAGER ALTERNATIVE FUND, INC.
(Exact name of registrant as specified in charter)
1345 Avenue of the Americas, New York, New York 10105
(Address of principal executive offices) (Zip code)
Joseph J. Mantineo
AllianceBernstein L.P.
1345 Avenue of the Americas
New York, New York 10105
(Name and address of agent for service)
Registrant’s telephone number, including area code: (800) 221-5672
Date of fiscal year end: March 31, 2016
Date of reporting period: September 30, 2015
| ITEM 1. | REPORTS TO STOCKHOLDERS. |
SEP 09.30.15

SEMI-ANNUAL REPORT
AB MULTI-MANAGER ALTERNATIVE FUND
Investment Products Offered
• Are Not FDIC Insured • May Lose Value • Are Not Bank Guaranteed |
Investors should consider the investment objectives, risks, charges and expenses of the Fund carefully before investing. For copies of our prospectus or summary prospectus, which contain this and other information, visit us online at www.abglobal.com or contact your AB representative. Please read the prospectus and/or summary prospectus carefully before investing.
This shareholder report must be preceded or accompanied by the Fund’s prospectus for individuals who are not current shareholders of the Fund.
You may obtain a description of the Fund’s proxy voting policies and procedures, and information regarding how the Fund voted proxies relating to portfolio securities during the most recent 12-month period ended June 30, without charge. Simply visit AB’s website at www.abglobal.com, or go to the Securities and Exchange Commission’s (the “Commission”) website at www.sec.gov, or call AB at (800) 227-4618.
The Fund files its complete schedule of portfolio holdings with the Commission for the first and third quarters of each fiscal year on Form N-Q. The Fund’s Forms N-Q are available on the Commission’s website at www.sec.gov. The Fund’s Forms N-Q may also be reviewed and copied at the Commission’s Public Reference Room in Washington, DC; information on the operation of the Public Reference Room may be obtained by calling (800) SEC-0330.
Sanford C. Bernstein & Company LLC (“SCB”) and AllianceBernstein Investments, Inc. (ABI) are the distributors of the Fund. SCB and ABI are members of FINRA and are affiliates of AllianceBernstein L.P., the Adviser of the funds.
The [A/B] logo is a registered service mark of AllianceBernstein and AllianceBernstein® is a registered service mark used by permission of the owner, AllianceBernstein L.P.
November 16, 2015
Semi-Annual Report
This report provides certain performance data for AB Multi-Manager Alternative Fund (the “Fund”) for the semi-annual reporting period ended September 30, 2015. Effective January 30, 2015, the Fund’s name changed from AllianceBernstein Multi-Manager Alternative Fund to AB Multi-Manager Alternative Fund.
Investment Objectives and Policies
The Fund’s investment objective is to seek long-term capital appreciation. There can be no assurance that the Fund will achieve its investment objective, be able to structure its investments as anticipated, or that its returns will be positive over any period of time. The Fund is not intended as a complete investment program for investors.
The Fund seeks to achieve its investment objective primarily by allocating its assets among investments in a diversified portfolio of private investment vehicles commonly referred to as hedge funds (“Underlying Portfolios”). The Fund will invest primarily in Underlying Portfolios pursuing the following strategies: Long/Short Equity, Event Driven, Credit/Distressed, Emerging Markets and Global Macro. For more information on these strategies, please see “Portfolio of Investments” on pages 7-9. For more information regarding the Fund’s risks, please see “Disclosures and Risks” on pages 3-4 and “Note E—Risks Involved in Investing in the Fund” of the Notes to Financial Statements on pages 21-23.
Investment Results
The table on page 5 provides performance data for the Fund and its benchmark, the Hedge Fund Research Indices Fund of Funds (“HFRI FOF”) Composite Index, for the six- and 12-month periods ended September 30, 2015.
For the six-month period, the Fund generated negative absolute returns and underperformed the benchmark. Much of the underperformance was due to weak performance from the Fund’s Credit/Distressed Underlying Portfolios. After years of strong performance, many of these Underlying Portfolios were weak during the reporting period. Event Driven Underlying Portfolios were also weak; it has been a particularly difficult period as merger arbitrage spreads widened across the board and several widely-owned, catalyst-driven names declined. The Fund’s Equity Long/Short Underlying Portfolios were collectively negative but strongly outperformed global equity markets. Emerging Markets Underlying Portfolios represent a small part of the Fund, but performed well despite extremely weak market returns. They outperformed the MSCI Emerging Markets Index as well as their peers in the HFRI Emerging Markets Index.
For the 12-month period, the Fund generated negative absolute returns and underperformed the benchmark. Much of the underperformance was due to disappointing performance from the Fund’s Credit/Distressed Underlying Portfolios. The Fund’s limited exposure to Underlying
| AB MULTI-MANAGER ALTERNATIVE FUND • | 1 |
Portfolios that use Global Macro strategies, including commodity trading strategies and other systematic quantitative strategies that led the market in late 2014 and early 2015, also detracted. The Fund’s Equity Long/Short Underlying Portfolios, which represent the Fund’s largest allocation, were collectively positive. They outperformed global equity markets and their peers, as measured by the HFRI Equity Hedge Index.
As of September 30, 2015, the Fund was allocated as follows: 46% to Long/Short Equity among 24 Underlying Portfolios; 35% to Event Driven among 16 Underlying Portfolios; 15% to Credit/Distressed among eight Underlying Portfolios; and 4% between two Emerging Markets Underlying Portfolios.
The Fund did not directly enter into derivative transactions for the six- and 12-month periods ended September 30, 2015.
Market Review and Investment Strategy
Macroeconomic and geopolitical concerns, particularly about the implications of potentially slower growth in China, have weighed on investor sentiment since the end of 2014. More recently, negative, company-specific headlines have caused segments of the market to trade down sharply. With persistently low oil prices fueling concern about
growth and deflation in many regions, monetary policy has generally remained accommodative. In addition, the US dollar has been strong. These macroeconomic conditions have been favorable for Global Macro funds, which include systematic quantitative strategies. The Fund has little exposure to Underlying Portfolios that use these strategies, and this has been detrimental to recent performance. However, this positioning has helped the Fund’s performance since inception. The continued selloff in lower rated and less liquid credit has proven difficult for credit funds, including some of the Underlying Portfolios. Despite record levels of corporate activity, the recent period has also been challenging for Event Driven funds, including the Underlying Portfolios.
Against a backdrop of volatile and weak global equity returns, the Alternative Investment Management Team (the “Team”) was satisfied with the performance of the Fund’s Long/Short Equity Underlying Portfolios relative to their Long/Short peers over the 12-month period. Consistent with the Team’s expectations for hedge funds, the Fund has provided downside protection versus global equities during a turbulent period. In line with the Team’s goal to capitalize on return opportunities across the spectrum and limit risk, the Fund remains diversified by Underlying Portfolio and by strategy.
| 2 | • AB MULTI-MANAGER ALTERNATIVE FUND |
DISCLOSURES AND RISKS
Benchmark Disclosure
The unmanaged HFRI FOF Composite Index does not reflect fees and expenses associated with the active management of a mutual fund portfolio. The HFRI FOF Composite Index is an equal-weighted performance index that includes over 650 constituent funds of hedge funds that report their monthly net-of-fee returns to Hedge Fund Research, have at least $50 million under management and have been actively trading for at least 12 months. An investor cannot invest directly in an index, and its results are not indicative of the performance for any specific investment, including the Fund.
A Word about Risk
An investment in the Fund’s shares may be speculative in that it involves a high degree of risk and should not constitute a complete investment program. Before making an investment decision, you should carefully consider the following risk factors, together with the other information contained in this prospectus. At any point in time, an investment in the Fund’s shares may be worth less than the original amount invested, even after taking into account the distributions paid, if any, and the ability of shareholders to reinvest distributions. If any of the risks discussed below occurs, the Fund’s results of operations could be materially and adversely affected. If this were to happen, the price of Fund shares could decline significantly and you could lose all or a part of your investment.
Investment in this Fund is highly speculative and involves substantial risk, including loss of principal, and therefore may not be suitable for all investors.
General Risk Factors. Underlying Portfolio may exhibit high volatility, and investors may lose all or substantially all of their investment. Investments by Underlying Portfolio in illiquid assets and foreign markets and the use of short sales, options, leverage, futures, swaps, and other derivative instruments may create special risks and substantially increase the impact and likelihood of adverse price movements. Interests in Underlying Portfolio are subject to limitations on transferability and are illiquid, and no secondary market for interests typically exists or is likely to develop. Underlying Portfolio are typically not registered with securities regulators and are therefore generally subject to little or no regulatory oversight. Performance compensation payable to an Underlying Portfolio investment advisor may create an incentive to make riskier or more speculative investments. Underlying Portfolio typically charge higher fees than many other types of investments, which can offset trading profits, if any. There can be no assurance that any Underlying Portfolio will achieve its investment objectives.
Tax Risks. The Fund intends to be treated as a regulated investment company (a “RIC”) under the Internal Revenue Code. However, in order to qualify as a RIC and also to avoid having to pay an “excise tax,” the Fund will be subject to certain limitations on its investments and operations, including a requirement that a specified proportion of its income come from qualifying sources, an asset diversification requirement, and minimum distribution requirements. Satisfaction of the various requirements requires significant support and information from the Underlying Portfolio funds, and such support and information may not be available, sufficient, verifiable, or provided on a timely basis.
Limited Operating History. The Fund has limited operating history upon which prospective investors can evaluate the performance of the Fund. There can be no assurance that the Fund will achieve its investment objective. The past investment performance of other accounts managed by AllianceBernstein L.P., the Fund’s investment manager (the “Investment Manager”) and its affiliates should not be construed as an indication of the future results of an investment in the Fund.
(Disclosures, Risks and Note about Historical Performance continued on next page)
| AB MULTI-MANAGER ALTERNATIVE FUND • | 3 |
Disclosures and Risks
DISCLOSURES AND RISKS
(continued from previous page)
Fund of Funds Considerations. The Fund will have no control rights over and limited transparency into the investment programs of the underlying portfolios in which it invests. In valuing the Fund’s holdings, the Investment Manager will generally rely on financial information provided by underlying portfolios, which may be unaudited, estimated, and/or may not involve third parties. The Fund’s investment opportunities may be limited as a result of withdrawal terms or anticipated liquidity needs (e.g., withdrawal restrictions imposed by underlying hedge funds may delay, preclude, or involve expense in connection with portfolio adjustments by the Investment Manager).
These risks are more fully discussed in the Fund’s prospectus. As with all investments, you may lose money by investing in the Fund.
An Important Note About Historical Performance
The performance on the following page represents past performance and does not guarantee future results. Current performance may be lower or higher than the performance information shown. All fees and expenses related to the operation of the Fund have been deducted. Performance assumes reinvestment of distributions and does not account for taxes.
| 4 | • AB MULTI-MANAGER ALTERNATIVE FUND |
Disclosures and Risks
HISTORICAL PERFORMANCE
| THE FUND VS. ITS BENCHMARK PERIODS ENDED SEPTEMBER 30, 2015 (unaudited) | Returns | |||||||||
| 6 Months | 12 Months | |||||||||
| AB Multi-Manager Alternative Fund | -6.53% | -4.33% | ||||||||
| ||||||||||
| HFRI FOF Composite | -3.09% | 0.27% | ||||||||
See Disclosures, Risks and Note about Historical Performance on pages 3-4.
| AB MULTI-MANAGER ALTERNATIVE FUND • | 5 |
Historical Performance
PORTFOLIO SUMMARY
September 30, 2015 (unaudited)
Net Assets ($mil): $1,366
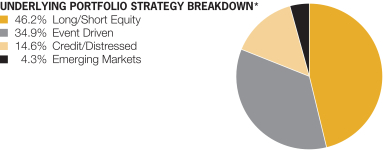
| * | All data are as of September 30, 2015. The Fund’s strategy breakdown is expressed as a percentage of total investments and may vary over time. |
| 6 | • AB MULTI-MANAGER ALTERNATIVE FUND |
Portfolio Summary
PORTFOLIO OF INVESTMENTS
September 30, 2015
Underlying Portfolios | Fair Value ($) | % Net Assets | Liquidity* | |||||||
| ||||||||||
Long/Short Equity | ||||||||||
Aravt Global Fund Ltd. | $ | 27,440,469 | 2.0 | % | Semi-Annual | |||||
Cadian Offshore Fund Ltd. | 21,162,003 | 1.5 | Semi-Annual | |||||||
Coatue Offshore Fund, Ltd. | 31,014,490 | 2.3 | Quarterly | |||||||
Corvex Investment Offshore SPC | 7,496,287 | 0.5 | At Fund’s Discretion | |||||||
Corvex Offshore Ltd. | 38,628,806 | 2.8 | Quarterly | |||||||
Criterion Horizons Offshore, Ltd. | 30,941,596 | 2.3 | Monthly | |||||||
Darsana Overseas Fund Ltd. | 24,082,078 | 1.8 | Quarterly | |||||||
Egerton Long-Short Fund (USD) Limited | 34,416,442 | 2.5 | Monthly | |||||||
Falcon Edge Global, Ltd. | 27,036,431 | 2.0 | Quarterly | |||||||
Jana Nirvana Offshore Fund, Ltd. | 34,369,296 | 2.5 | Quarterly | |||||||
Luminus Energy Partners Ltd. | 35,971,943 | 2.6 | Quarterly | |||||||
Marble Arch Offshore Partners, Ltd. | 29,361,631 | 2.1 | Quarterly | |||||||
Nokota Capital Offshore Fund, Ltd. | 32,649,807 | 2.4 | Quarterly | |||||||
OrbiMed Partners, Ltd. | 39,491,378 | 2.9 | Quarterly | |||||||
Pershing Square International, Ltd. | 16,636,951 | 1.2 | Quarterly | |||||||
Sheffield International Partners, Ltd. | 24,582,812 | 1.8 | Quarterly | |||||||
Starboard Leaders | 10,996,443 | 0.8 | At Fund’s Discretion | |||||||
Starboard Value and Opportunity Fund Ltd. | 28,103,046 | 2.1 | Quarterly | |||||||
Think Investments Offshore Ltd. | 29,088,134 | 2.1 | Semi-Annual | |||||||
Two Creeks Capital Offshore Fund, Ltd. | 31,911,184 | 2.3 | Quarterly | |||||||
Tybourne Equity (Offshore) Fund | 34,859,996 | 2.6 | Quarterly | |||||||
ValueAct Capital International I LP | 29,663,817 | 2.2 | Anniversary | |||||||
Wellington Management Investors (Bermuda), Ltd. | 2,942,366 | 0.2 | Semi-Annual | |||||||
White Elm Capital Offshore, Ltd. | 12,891,579 | 0.9 | 6 Months Rolling | |||||||
|
|
|
| |||||||
Total | 635,738,985 | 46.5 | ||||||||
|
|
|
| |||||||
Event Driven | ||||||||||
Canyon Balanced Fund (Cayman), Ltd. | 39,039,301 | 2.9 | Quarterly | |||||||
CQS Directional Opportunities Feeder Fund Limited | 30,618,733 | 2.2 | Monthly | |||||||
Empyrean Capital Overseas Fund, Ltd. | 23,078,143 | 1.7 | Quarterly | |||||||
| AB MULTI-MANAGER ALTERNATIVE FUND • | 7 |
Portfolio of Investments
Underlying Portfolios | Fair Value ($) | % Net Assets | Liquidity* | |||||||
| ||||||||||
Fir Tree International Value Fund, Ltd. | $ | 24,904,115 | 1.8 | % | Anniversary | |||||
Governors Lane Offshore Fund Ltd. | 29,040,385 | 2.1 | Quarterly | |||||||
Indaba Capital Partners (Cayman), LP | 26,342,907 | 1.9 | Quarterly | |||||||
King Street Capital, Ltd. | 27,183,111 | 2.0 | Quarterly | |||||||
Lion Point International, Ltd. | 28,146,165 | 2.1 | Semi-Annual | |||||||
Luxor Capital Partners Offshore, Ltd. | 21,245,875 | 1.6 | Anniversary | |||||||
Manikay Offshore Fund, Ltd. | 31,206,421 | 2.3 | Quarterly | |||||||
Myriad Opportunities Offshore Fund Limited | 29,964,104 | 2.2 | Quarterly | |||||||
Pentwater Event Fund Ltd. | 31,523,802 | 2.3 | Monthly | |||||||
Roystone Capital Offshore Fund Ltd. | 30,005,408 | 2.2 | Quarterly | |||||||
Senator Global Opportunity Offshore Fund II Ltd. | 33,707,555 | 2.5 | Quarterly | |||||||
TBC Offshore Ltd. | 32,938,107 | 2.4 | Quarterly | |||||||
Third Point Offshore Fund, Ltd. | 41,649,080 | 3.0 | Quarterly | |||||||
|
|
|
| |||||||
Total | 480,593,212 | 35.2 | ||||||||
|
|
|
| |||||||
Credit/Distressed | ||||||||||
Claren Road Credit Fund, Ltd. | 4,982,743 | 0.4 | Quarterly | |||||||
JMB Capital Partners Offshore, Ltd. | 27,930,522 | 2.0 | Anniversary | |||||||
Mudrick Distressed Opportunity Fund Offshore, Ltd. | 21,933,917 | 1.6 | Anniversary | |||||||
Oaktree Value Opportunities (Cayman) Fund, Ltd. | 26,783,760 | 2.0 | Semi-Annual | |||||||
Panning Overseas Fund, Ltd. | 29,884,705 | 2.2 | Quarterly | |||||||
Silver Point Capital Offshore Fund, Ltd. | 32,941,715 | 2.4 | Anniversary | |||||||
Stone Lion Fund Ltd. | 23,439,828 | 1.7 | Quarterly | |||||||
Wingspan Overseas Fund, Ltd. | 33,390,149 | 2.4 | Quarterly | |||||||
|
|
|
| |||||||
Total | 201,287,339 | 14.7 | ||||||||
|
|
|
| |||||||
Emerging Markets | ||||||||||
Discovery Global Opportunity Fund, Ltd. | 31,585,003 | 2.3 | Semi-Annual | |||||||
Spinnaker GEM Holdings Ltd. | 27,531,744 | 2.0 | Anniversary | |||||||
|
|
|
| |||||||
Total | 59,116,747 | 4.3 | ||||||||
|
|
|
| |||||||
Total Investments | 1,376,736,283 | 100.8 | ||||||||
Liabilities in excess of other assets | (10,539,755 | ) | (0.8 | ) | ||||||
|
|
|
| |||||||
Net Assets | $ | 1,366,196,528 | 100.0 | % | ||||||
|
|
|
| |||||||
| * | The investment strategies and liquidity of the Underlying Portfolios in which the Fund invests are as follows: |
| 8 | • AB MULTI-MANAGER ALTERNATIVE FUND |
Portfolio of Investments
Long/Short Equity Underlying Portfolios seek to buy securities with the expectation that they will increase in value (called “going long”) and sell securities short in the expectation that they will decrease in value (“going short”). Underlying Portfolios within this strategy are generally subject to 30 – 180 day redemption notice periods. The Underlying Portfolios have monthly to biennial liquidity. The majority of the managers have initial lockups of less than a year and a half. Certain Underlying Portfolios may have lock up periods of up to five years.
Credit/Distressed Underlying Portfolios invest in a variety of fixed income and other securities, including bonds (corporate and government), bank debt, asset-backed financial instruments, mortgage-backed securities and mezzanine and distressed securities, as well as securities of distressed companies and high yield securities. Underlying Portfolios within this strategy are generally subject to 45 – 90 day redemption notice periods. The Underlying Portfolios have monthly to one and a half years’ liquidity. Certain Underlying Portfolios may have lock up periods of up to three years.
Event Driven Underlying Portfolios seek to take advantage of information inefficiencies resulting from a particular corporate event, such as a takeover, liquidation, bankruptcy, tender offer, buyback, spin-off, exchange offer, merger or other type of corporate reorganization. Underlying Portfolios within this strategy are generally subject to 60 – 90 day redemption notice periods. The Underlying Portfolios have monthly to biennial liquidity. Private investment vehicles within the strategy may have lock up periods of up to two years.
Emerging Markets Underlying Portfolios invest in a range of emerging markets asset classes including debt, equity and currencies, and may use a broad array of hedging techniques involving both emerging markets and non-emerging markets securities with the intention of reducing volatility and enhancing returns. Underlying Portfolios within this strategy are generally subject to 60 – 120 day redemption notice periods. The Underlying Portfolios have semi-annual to annual liquidity. Private investment vehicles within the strategy may have lock up periods of up to three years.
The Fund may also make direct investments in securities (other than securities of Underlying Portfolios), options, futures, options on futures, swap contracts, or other derivative or financial instruments.
See notes to financial statements.
| AB MULTI-MANAGER ALTERNATIVE FUND • | 9 |
Portfolio of Investments
STATEMENT OF ASSETS & LIABILITIES
September 30, 2015 (unaudited)
| Assets | ||||
Investments in Underlying Portfolios, at value | $ | 1,376,736,283 | ||
Cash | 34,670,079 | |||
|
| |||
Total assets | 1,411,406,362 | |||
|
| |||
| Liabilities | ||||
Subscriptions received in advance | 20,308,684 | |||
Payable for shares of beneficial interest redeemed | 16,750,993 | |||
Credit facility payable | 5,780,000 | |||
Management fee payable | 1,797,983 | |||
Administrative fee payable | 76,186 | |||
Transfer Agent fee payable | 23,973 | |||
Accrued expenses | 472,015 | |||
|
| |||
Total liabilities | 45,209,834 | |||
|
| |||
Net Assets | $ | 1,366,196,528 | ||
|
| |||
| Composition of Net Assets | ||||
Shares of beneficial interest, at par | $ | 125,603 | ||
Additional paid-in capital | 1,380,046,118 | |||
Distributions in excess of net investment income | (59,830,409 | ) | ||
Accumulated net realized loss on investment transactions | (14,855,445 | ) | ||
Net unrealized appreciation on investments | 60,710,661 | |||
|
| |||
Net Assets | $ | 1,366,196,528 | ||
|
| |||
Shares of beneficial interest outstanding — unlimited shares authorized, with par value of $.001 (based on 125,603,162 shares outstanding) | $ | 10.88 | ||
|
|
See notes to financial statements.
| 10 | • AB MULTI-MANAGER ALTERNATIVE FUND |
Statement of Assets & Liabilities
STATEMENT OF OPERATIONS
Six Months Ended September 30, 2015 (unaudited)
| Expenses | ||||||||
Management fee (see Note B) | $ | 10,722,931 | ||||||
Custodian | 279,784 | |||||||
Transfer agency | 142,972 | |||||||
Legal | 128,465 | |||||||
Administrative | 110,979 | |||||||
Trustee’s fees | 67,600 | |||||||
Audit and tax | 46,650 | |||||||
Registration fees | 40,788 | |||||||
Printing | 29,784 | |||||||
Miscellaneous | 297,889 | |||||||
|
| |||||||
Total expenses before interest expense | 11,867,842 | |||||||
Interest expense | 18,571 | |||||||
|
| |||||||
Total expenses | $ | 11,886,413 | ||||||
|
| |||||||
Net investment loss | (11,886,413 | ) | ||||||
|
| |||||||
| Realized and Unrealized Gain (Loss) on Investment Transactions | ||||||||
Sale of Underlying Portfolio shares | 6,200,182 | |||||||
Net change in unrealized appreciation/(depreciation) of investments transactions | (90,890,802 | ) | ||||||
|
| |||||||
Net loss on investment transactions | (84,690,620 | ) | ||||||
|
| |||||||
Net Decrease in Net Assets from Operations | $ | (96,577,033 | ) | |||||
|
|
See notes to financial statements.
| AB MULTI-MANAGER ALTERNATIVE FUND • | 11 |
Statement of Operations
STATEMENT OF CHANGES IN NET ASSETS
| Six Months Ended September 30, 2015 (unaudited) | Year Ended March 31, 2015 | |||||||
| Increase (Decrease) in Net Assets from Operations | ||||||||
Net investment loss | $ | (11,886,413 | ) | $ | (21,538,421 | ) | ||
Net realized gain (loss) on investment transactions | 6,200,182 | (4,684,619 | ) | |||||
Net change in unrealized appreciation/(depreciation) of investments transactions | (90,890,802 | ) | 67,884,151 | |||||
|
|
|
| |||||
Net increase (decrease) in net assets from operations | (96,577,033 | ) | 41,661,111 | |||||
| Dividends and Distributions to Shareholders from | ||||||||
Net investment income | – 0 | – | (1,911,161 | ) | ||||
Net realized gain on investment transactions | – 0 | – | (12,456,272 | ) | ||||
| Transactions in Shares of Beneficial Interest | ||||||||
Net increase (See Note D) | 86,221,897 | 368,720,756 | ||||||
|
|
|
| |||||
Total increase (decrease) | (10,355,136 | ) | 396,014,434 | |||||
| Net Assets | ||||||||
Beginning of period | 1,376,551,664 | 980,537,230 | ||||||
|
|
|
| |||||
End of period (including distributions in excess of net investment income of ($59,830,409) and ($47,943,996), respectively) | $ | 1,366,196,528 | $ | 1,376,551,664 | ||||
|
|
|
| |||||
See notes to financial statements.
| 12 | • AB MULTI-MANAGER ALTERNATIVE FUND |
Statement of Changes in Net Assets
STATEMENT OF CASH FLOWS
For the Six Months Ended September 30, 2015 (unaudited)
| Cash flows from operating activities | ||||||||
Net decrease in net assets from operations | $ | (96,577,033 | ) | |||||
|
| |||||||
| Adjustments to reconcile net decrease in net assets resulting from operations to net cash used in operating activities: | ||||||||
Decrease in receivable for investments sold | $ | 1,708,684 | ||||||
Purchases of investments | (119,640,304 | ) | ||||||
Sales of investments | 47,982,453 | |||||||
Net realized gain on investment transactions | (6,200,182 | ) | ||||||
Net change in unrealized appreciation/depreciation on investment transactions | 90,890,802 | |||||||
Decrease in investments in Underlying Portfolios paid in advance | 30,000,000 | |||||||
Increase in management fee payable | 29,854 | |||||||
Increase in accrued expenses | 63,710 | |||||||
|
| |||||||
Net cash used in operating activities | (51,742,016 | ) | ||||||
|
| |||||||
| Cash flows from financing activities | ||||||||
Subscriptions, including change in subscriptions received in advance | 124,599,576 | |||||||
Redemptions, net of payable for shares of beneficial interest redeemed | (41,504,063 | ) | ||||||
Borrowing on credit facility | 23,105,000 | |||||||
Paydowns on credit facility | (21,425,000 | ) | ||||||
|
| |||||||
Net cash provided by financing activities | 84,775,513 | |||||||
|
| |||||||
Net increase in cash | 33,033,497 | |||||||
Cash at beginning of period | 1,636,582 | |||||||
|
| |||||||
Cash at end of period | $ | 34,670,079 | ||||||
|
| |||||||
Supplemental disclosure of cash flow information: |
| |||||||
Interest expense paid during the period | 18,571 | |||||||
See notes to financial statements.
| AB MULTI-MANAGER ALTERNATIVE FUND • | 13 |
Statement of Cash Flows
NOTES TO FINANCIAL STATEMENTS
NOTE A
Significant Accounting Policies
AB Multi-Manager Alternative Fund (the “Fund”) is a statutory trust formed under the laws of the State of Delaware and registered under the Investment Company Act of 1940 as a non-diversified, closed-end management investment company. Prior to January 30, 2015, the Fund was known as AllianceBernstein Multi-Manager Alternative Fund. The Fund commenced operations on October 1, 2012. The Fund’s investment objective is to seek long-term capital appreciation. There can be no assurance that the Fund will achieve its investment objective, be able to structure its investments as anticipated, or that its returns will be positive over any period of time. The Fund is not intended as a complete investment program for investors. The Fund seeks to achieve its investment objective primarily by allocating its assets among investments in private investment vehicles (“Underlying Portfolios”), commonly referred to as hedge funds, that are managed by unaffiliated asset managers that employ a broad range of investment strategies. The financial statements have been prepared in conformity with U.S. generally accepted accounting principles (“U.S. GAAP”) which require management to make certain estimates and assumptions that affect the reported amounts of assets and liabilities in the financial statements and amounts of income and expenses during the reporting period. The Fund is an investment company under U.S. GAAP and follows the accounting and reporting guidance applicable to investment companies. Actual results could differ from those estimates, and such differences could be material. The following is a summary of significant accounting policies followed by the Fund.
1. Valuation of Investments
The Fund’s Board of Trustees (the “Board”) has approved pricing and valuation policies and procedures pursuant to which the Fund’s investments in Underlying Portfolios are valued at fair value (the “Valuation Procedures”). Among other matters, the Valuation Procedures set forth the Fund’s valuation policies and the mechanisms and processes to be employed on a monthly basis to implement such policies. In accordance with the Valuation Procedures, fair value of an Underlying Portfolio as of each valuation time ordinarily is the value determined as of such month-end for each Underlying Portfolio in accordance with the Underlying Portfolio’s valuation policies and reported at the time of the Fund’s valuation.
On a monthly basis, the Fund generally uses the net asset value (“NAV”), provided by the Underlying Portfolios, to determine the fair value of all Underlying Portfolios which (a) do not have readily determinable fair values and (b) either have the attributes of an investment company or prepare their financial statements consistent with measurement principles of an investment company. As a general matter, the fair value of the Fund’s interest in an Underlying Portfolio represents the amount that the Fund could reasonably expect to receive from an Underlying Portfolio if its interest were redeemed at the time of valuation. In
| 14 | • AB MULTI-MANAGER ALTERNATIVE FUND |
Notes to Financial Statements
the unlikely event that an Underlying Portfolio does not report a month-end value to the Fund on a timely basis, the Fund would determine the fair value of such Underlying Portfolio based on the most recent value reported by the Underlying Portfolio, and any other relevant information available at the time the Fund values its portfolio. In making a fair value determination, the Fund will consider all appropriate information reasonably available to it at the time and that AllianceBernstein L.P. (the “Investment Manager”) believes to be reliable. The Fund may consider factors such as, among others: (i) the price at which recent subscriptions for or redemptions of the Underlying Portfolio’s interests were effected; (ii) information provided to the Fund by the manager of an Underlying Portfolio, or the failure to provide such information as the Underlying Portfolio manager agreed to provide in the Underlying Portfolio’s offering materials or other agreements with the Fund; (iii) relevant news and other sources; and (iv) market events. In addition, when an Underlying Portfolio imposes extraordinary restrictions on redemptions, or when there have been no recent subscriptions for Underlying Portfolio interests, the Fund may determine that it is appropriate to apply a discount to the NAV reported by the Underlying Portfolio. The use of different factors and estimation methodologies could have a significant effect on the estimated fair value and could be material to the financial statements.
In general, the market values of securities which are readily available and deemed reliable are determined as follows: securities listed on a national securities exchange (other than securities listed on the NASDAQ Stock Market, Inc. (“NASDAQ”)) or on a foreign securities exchange are valued at the last sale price at the close of the exchange or foreign securities exchange. If there has been no sale on such day, the securities are valued at the last traded price from the previous day. Securities listed on more than one exchange are valued by reference to the principal exchange on which the securities are traded; securities listed only on NASDAQ are valued in accordance with the NASDAQ Official Closing Price; listed or over the counter (“OTC”) market put or call options are valued at the mid level between the current bid and ask prices. If either a current bid or current ask price is unavailable, the Investment Manager will have discretion to determine the best valuation (e.g. last trade price in the case of listed options); open futures are valued using the closing settlement price or, in the absence of such a price, the most recent quoted bid price. If there are no quotations available for the day of valuation, the last available closing settlement price is used. Swaps and other derivatives are valued daily, primarily using independent pricing services, independent pricing models using market inputs, as well as third party broker-dealers or counterparties. Investment companies are valued at their net asset value each day.
Securities for which market quotations are not readily available (including restricted securities) or are deemed unreliable are valued at fair value. Factors considered in making this determination may include, but are not limited to,
| AB MULTI-MANAGER ALTERNATIVE FUND • | 15 |
Notes to Financial Statements
information obtained by contacting the issuer, analysts, analysis of the issuer’s financial statements or other available documents. In addition, the Fund may use fair value pricing for securities primarily traded in non-U.S. markets because most foreign markets close well before the Fund values its securities at 4:00 p.m., Eastern Time. The earlier close of these foreign markets gives rise to the possibility that significant events, including broad market moves, may have occurred between the close of the foreign markets and the time at which the Fund values its securities which may materially affect the value of securities trading in such markets. To account for this, the Fund may frequently value many of its foreign equity securities using fair value prices based on third party vendor modeling tools to the extent available.
The Investment Manager has established a Valuation Committee (the “Committee”) made up of representatives of portfolio management, fund accounting, compliance and risk management which operates under the Valuation Procedures and is responsible for overseeing the pricing and valuation of all securities held in the Fund. The Committee’s responsibilities include: 1) fair value determinations (and oversight of any third parties to whom any responsibility for fair value determinations is delegated), and 2) regular monitoring of the Valuation Procedures and modification or enhancement of the Valuation Procedures (or recommendation of the modification of the Valuation Procedures) as the Committee believes appropriate. Prior to investing in any Underlying Portfolio, and periodically thereafter, the Investment Manager will conduct a due diligence review of the valuation methodology utilized by the Underlying Portfolio. In addition, there are several processes outside of the pricing process that are used to monitor valuation issues including: 1) performance and performance attribution reports are monitored for anomalous impacts based upon benchmark performance, and 2) portfolio managers review all portfolios for performance and analytics.
U.S. GAAP establishes a framework for measuring fair value, and a three-level hierarchy for fair value measurements based upon the transparency of inputs to the valuation of an asset or liability. Inputs may be observable or unobservable and refer broadly to the assumptions that market participants would use in pricing the asset or liability. Observable inputs reflect the assumptions market participants would use in pricing the asset or liability based on market data obtained from sources independent of the Fund. Unobservable inputs reflect the Fund’s own assumptions about the assumptions that market participants would use in pricing the asset or liability based on the best information available in the circumstances. Each investment is assigned a level based upon the observability of the inputs which are significant to the overall valuation. The three-tier hierarchy of inputs is summarized below.
| • | Level 1—quoted prices in active markets for identical investments |
| • | Level 2—other significant observable inputs |
| • | Level 3—significant unobservable inputs |
| 16 | • AB MULTI-MANAGER ALTERNATIVE FUND |
Notes to Financial Statements
In May 2015, the Financial Accounting Standards Board (FASB) issued Accounting Standards Update (ASU) 2015-07, Disclosures for Investments in Certain Entities That Calculate Net Asset Value per Share (or its equivalent), as an amendment to Accounting Standards Codification (ASC) 820, Fair Value Measurement. The amendments in this ASU apply to reporting entities that elect to measure the fair value of an investment using the net asset value per share (or its equivalent) practical expedient, as the Fund does for its investments in Underlying Portfolios. The amendments in this ASU remove the requirement to categorize within the fair value hierarchy, as described above, all investments for which fair value is measured using the net asset value per share practical expedient. The amendments also remove the requirement to make certain disclosures for all investments that are eligible to be measured at fair value using the net asset value per share practical expedient. Rather, those disclosures are limited to investments for which the Fund has elected to measure the fair value using that practical expedient.
The amendments in this update are effective for fiscal years beginning after December 15, 2015, and interim periods within those fiscal years, with application of the amendments noted above retrospectively to all periods presented. The retrospective approach requires that an investment for which fair value is measured using the net asset value per share practical expedient be removed from the fair value hierarchy in all periods presented in an entity’s financial statements. Earlier application of this ASU is permitted. The Investment Manager has reviewed the requirements of the ASU and determined that early adoption of this ASU would be applied to the relevant disclosures of the Fund.
Valuations reflected in this report are as of the report date. As a result, changes in valuation due to market events and/or issuer related events after the report date and prior to issuance of the report are not reflected herein.
Total Investments Measured at NAV | $ | 1,376,736,283 | ||
|
|
At September 30, 2015, the Fund only held investments valued at NAV as practical expedient, as such, no leveling in accordance with the hierarchy described above requires disclosure.
2. Cash Committed
As of September 30, 2015, the Fund has committed to purchase the following Underlying Portfolio:
Underlying Portfolios | Amount Committed | |
Elliott International Limited | $30,000,000 |
3. Taxes
It is the Fund’s policy to meet the requirements of the Internal Revenue Code applicable to regulated investment companies and to distribute all of its investment company taxable income and net realized gains, if any, to shareholders.
| AB MULTI-MANAGER ALTERNATIVE FUND • | 17 |
Notes to Financial Statements
Therefore, no provisions for federal income or excise taxes are required. The Fund intends to continue to comply with the requirements of Subchapter M of the Internal Revenue Code of 1986 as they apply to regulated investment companies. By so complying, the Fund will not be subject to federal and state income taxes to the extent that all of its income is distributed.
In accordance with U.S. GAAP requirements regarding accounting for uncertainties in income taxes, management has analyzed the Fund’s tax positions taken or expected to be taken on federal and state income tax returns for all open tax years (all years since inception of the Fund) and has concluded that no provision for income tax is required in the Fund’s financial statements.
4. Investment Income and Investment Transactions
Income and capital gain distributions, if any, are recorded on the ex-dividend date. Investment transactions are accounted for on the trade date or effective date. Investment gains and losses are determined on the identified cost basis.
5. Expenses
Expenses included in the accompanying statements of operations do not include any expenses of the Underlying Portfolios.
6. Dividends and Distributions
Dividends and distributions to shareholders, if any, are recorded on the ex-dividend date. Income dividends and capital gains distributions are determined in accordance with federal tax regulations and may differ from those determined in accordance with U.S. GAAP. To the extent these differences are permanent, such amounts are reclassified within the capital accounts based on their federal tax basis treatment; temporary differences do not require such reclassification.
NOTE B
Management Fee and Other Transactions with Affiliates
Under the terms of the investment advisory agreement (the “Advisory Agreement”), the Fund pays the Investment Manager a management fee at an annual rate of 1.50% of an aggregate of the Fund’s net assets determined as of the last day of a calendar month and adjusted for subscriptions and repurchases accepted as of the first day of the subsequent month (the “Management Fee”). The Management Fee is payable in arrears as of the last day of the subsequent month.
The Investment Manager agreed to waive its fees and bear certain expenses through July 31, 2015 to the extent necessary to limit total operating expenses, excluding the Management Fee, extraordinary expenses, interest expenses, taxes, brokerage commissions and other transaction costs, and Underlying Portfolio fees and expenses, on an annual basis to 0.25% of average monthly net assets (1.75% including Management Fee). For the six months ended September 30, 2015, there was no such waiver or reimbursement. Under an expense limitation agreement between the Investment Manager and the Fund, certain fees previously waived and expenses previously borne by the Investment Manager
| 18 | • AB MULTI-MANAGER ALTERNATIVE FUND |
Notes to Financial Statements
were subject to repayment by the Fund until September 30, 2015. No repayment would be made that would have caused the Fund’s total annualized operating expenses to exceed the net fee percentage set forth above or that exceeded the amount of offering expenses as recorded by the Fund on or before September 30, 2013. For the six months ended September 30, 2015, the Fund did not make any such repayments.
Under a separate administrative agreement, the Fund may use the Investment Manager and its personnel to provide certain administrative services to the Fund and, in such event, the services and payments will be subject to approval by the Fund’s Board. For the six months ended September 30, 2015, the reimbursement for such fees amounted to $110,979.
The Fund may engage one or more distributors to solicit investments in the Fund. Sanford C. Bernstein & Company LLC (“Bernstein”) and AllianceBernstein Investments, Inc. (“ABI”), each an affiliate of the Investment Manager, have been selected as distributors of the Fund under Distribution Services Agreement. The Distribution Services Agreements do not call for any payments to be made to Bernstein or ABI by the Fund.
The Fund compensates AllianceBernstein Investor Services, Inc. (“ABIS”), a wholly-owned subsidiary of the Investment Manager, under a Transfer Agency Agreement for providing personnel and facilities to perform transfer agency services for the Fund. Such compensation paid to ABIS amounted to $142,972 for the six months ended September 30, 2015.
NOTE C
Investment Transactions
1. Purchases and Sales
Purchases and sales of investments in the Underlying Portfolios, aggregated $119,640,304 and $47,982,453, respectively, for the six months ended September 30, 2015.
The cost of investments for federal income tax purposes was substantially the same as the cost for financial reporting purposes. Accordingly, gross unrealized appreciation and unrealized depreciation are as follows:
Gross unrealized appreciation | $ | 98,691,980 | ||
Gross unrealized depreciation | (37,981,319 | ) | ||
|
| |||
Net unrealized appreciation | $ | 60,710,661 | ||
|
|
2. Derivative Financial Instruments
The Fund may use derivatives in an effort to earn income and enhance returns, to replace more traditional direct investments, to obtain exposure to otherwise inaccessible markets (collectively, “investment purposes”), or to hedge or adjust the risk profile of its portfolio.
| AB MULTI-MANAGER ALTERNATIVE FUND • | 19 |
Notes to Financial Statements
The Fund did not engage in derivatives transactions for the six months ended September 30, 2015.
3. Currency Transactions
The Fund may invest in non-U.S. Dollar securities on a currency hedged or unhedged basis through its investments in an Underlying Portfolio. The Fund or an Underlying Portfolio may seek investment opportunities by taking long or short positions in currencies through the use of currency-related derivatives, including forward currency exchange contracts, futures and options on futures, swaps, and other options. The Fund or an Underlying Portfolio may enter into transactions for investment opportunities when it anticipates that a foreign currency will appreciate or depreciate in value but securities denominated in that currency are not held by the Fund or the Underlying Portfolio and do not present attractive investment opportunities. Such transactions may also be used when the Investment Manager or the manager of an Underlying Portfolio believes that it may be more efficient than a direct investment in a foreign currency-denominated security. A Fund or an Underlying Portfolio may also conduct currency exchange contracts on a spot basis (i.e., for cash at the spot rate prevailing in the currency exchange market for buying or selling currencies).
NOTE D
Shares of Beneficial Interest
During the six months ended September 30, 2015 the Fund did not issue any shares in connection with the Fund’s dividend reinvestment plan. During the year ended March 31, 2014 the Fund issued 1,096,680 shares, in connection with the Fund’s dividend reinvestment plan.
Subscriptions and Repurchases
Generally, initial and additional subscriptions for shares may be accepted as of the first day of each month. The Fund reserves the right to reject any subscription for shares. The Fund intends to repurchase shares from shareholders in accordance with written tenders by shareholders at those times, in those amounts, and on such terms and conditions as the Board of Trustees may determine in its sole discretion. When a repurchase offer occurs, a shareholder will generally be required to provide notice of their tender of shares for repurchase to the Fund more than three months in advance of the date that the shares will be valued for repurchase (the “Valuation Date”). Valuation Dates are generally expected to be the last business days of March, June, September or December, and payment for tendered shares will generally be made by the Fund approximately 45 days following the Valuation Date.
| 20 | • AB MULTI-MANAGER ALTERNATIVE FUND |
Notes to Financial Statements
Transactions in shares of beneficial interest were as follows for the six months ended September 30, 2015 and year ended March 31, 2015:
| Shares | Amount | |||||||||||||||||||
| Six Months Ended September 30, 2015 (unaudited) | Year Ended March 31, 2015 | Six Months Ended September 30, 2015 (unaudited) | Year Ended March 31, 2015 | |||||||||||||||||
|
| |||||||||||||||||||
| Class A | ||||||||||||||||||||
Shares sold | 10,627,255 | 35,625,154 | $ | 122,902,643 | $ | 407,375,912 | ||||||||||||||
| ||||||||||||||||||||
Shares issued in reinvestment of dividends | – 0 | – | 1,096,680 | – 0 | – | 12,502,147 | ||||||||||||||
| ||||||||||||||||||||
Shares redeemed | (3,266,628 | ) | (4,423,327 | ) | (36,680,746 | ) | (51,157,303 | ) | ||||||||||||
| ||||||||||||||||||||
Net increase | 7,360,627 | 32,298,507 | $ | 86,221,897 | $ | 368,720,756 | ||||||||||||||
| ||||||||||||||||||||
NOTE E
Risks Involved in Investing in the Fund
Limitations on the Fund’s ability to withdraw its assets from Underlying Portfolios may limit the Fund’s ability to repurchase its shares. For example, many Underlying Portfolios impose lock-up periods prior to allowing withdrawals, which can be two years or longer. After expiration of the lock-up period, withdrawals typically are permitted only on a limited basis, such as monthly, quarterly, semi-annually or annually. Many Underlying Portfolios may also indefinitely suspend redemptions or establish restrictions on the ability to fully receive proceeds from redemptions through the application of a redemption restriction or “gate”. In instances where the primary source of funds to repurchase shares will be withdrawals from Underlying Portfolios, the application of these lock-ups and withdrawal limitations may significantly limit the Fund’s ability to repurchase its shares. Although the Investment Manager will seek to select Underlying Portfolios that offer the opportunity to have their shares or units redeemed within a reasonable timeframe, there can be no assurance that the liquidity of the investments of such Underlying Portfolios will always be sufficient to meet redemption requests as, and when, made.
The Fund invests primarily in Underlying Portfolios that are not registered under the 1940 Act and invest in and actively trade securities and other financial instruments using different strategies and investment techniques that may involve significant risks. Such risks include those related to the volatility of the equity, credit, and currency markets, the use of leverage associated with certain investment strategies, derivative contracts and in connection with short positions, the potential illiquidity of certain instruments and counterparty and broker arrangements.
Some of the Underlying Portfolios in which the Fund invests may invest all or a portion of their assets in securities that are illiquid or are subject to an anticipated
| AB MULTI-MANAGER ALTERNATIVE FUND • | 21 |
Notes to Financial Statements
event. These Underlying Portfolios may create “side pockets” in which to hold these securities. Side pockets are series or classes of shares which are not redeemable by the investors but which are automatically redeemed or converted back into the Underlying Portfolio’s regular series or classes of shares upon the realization of those securities or the happening of some other liquidity event with respect to those securities.
These “side pockets” can often be held for long periods before they are realized, and may therefore be much less liquid than the general liquidity offered on the Underlying Portfolio’s regular series or classes of shares. Should the Fund seek to liquidate its investment in an Underlying Portfolio that maintains investments in a side pocket arrangement or that holds a substantial portion of its assets in illiquid securities, the Fund might not be able to fully liquidate its investments without delay, which could be considerable. In such cases, during the period until the Fund is permitted to fully liquidate the investment in the Underlying Portfolio, the value of the investment could fluctuate.
The Underlying Portfolios may utilize leverage in pursuit of achieving a potentially greater investment return. The use of leverage exposes an Underlying Portfolio to additional risk including (i) greater losses from investments than would otherwise have been the case had the Underlying Portfolio not used leverage to make the investments; (ii) margin calls or interim margin requirements may force premature liquidations of investment positions; and (iii) losses on investments where the investment fails to earn a return that equals or exceeds the Underlying Portfolio’s cost of leverage related to such investment. In the event of a sudden, precipitous drop in the value of an Underlying Portfolio’s assets, the Underlying Portfolio might not be able to liquidate assets quickly enough to repay its borrowings, further magnifying the losses incurred by the Underlying Portfolio.
The Underlying Portfolios may invest in securities of foreign companies that involve special risks and considerations not typically associated with investments in the United States, due to concentrated investments in a limited number of countries or regions, which may vary throughout the year depending on the Underlying Portfolio. Such concentrations may subject the Underlying Portfolios to additional risks resulting from political or economic conditions in such countries or regions, and the possible imposition of adverse governmental laws or currency exchange restrictions could cause the securities and their markets to be less liquid and their prices to be more volatile than those of comparable U.S. securities.
The Underlying Portfolios may invest a higher percentage of their assets in specific sectors of the market in order to achieve a potentially greater investment return. As a result, the Underlying Portfolios may be more susceptible to economic, political and regulatory developments in a particular sector of the market, positive or negative, and may experience increased volatility of the Underlying Portfolio’s net asset value.
| 22 | • AB MULTI-MANAGER ALTERNATIVE FUND |
Notes to Financial Statements
The Fund invests in a limited number of Underlying Portfolios. Such concentration may result in additional risk. Various risks are also associated with an investment in the Fund, including risks relating to compensation arrangements and risks relating to limited liquidity of the Interests.
The Fund is subject to credit risk arising from its transactions with its custodian, State Street Bank and Trust, related to holding the Fund’s cash. This credit risk arises to the extent that the custodian may be unable to fulfill its obligation to return the Fund’s cash held in its custody.
In the ordinary course of business, the Fund enters into contracts that contain a variety of indemnifications. The Fund’s maximum exposure under these arrangements is unknown. However, the Fund has not had prior claims or losses pursuant to these indemnification provisions and expects the risk of loss thereunder to be remote. Therefore, the Fund has not accrued any liability in connection with these indemnification provisions.
NOTE F
Tax Information
The tax character of distributions to be paid for the year ending March 31, 2016 will be determined at the end of the current fiscal year. The tax character of distributions paid during the fiscal years ended March 31, 2015 and March 31, 2014 were as follows:
| 2015 | 2014 | |||||||
Distributions paid from: | ||||||||
Ordinary income | $ | 3,167,920 | $ | 12,368,064 | ||||
Net long-term capital gains | 11,199,513 | 2,314,956 | ||||||
|
|
|
| |||||
Total taxable distributions paid | $ | 14,367,433 | $ | 14,683,020 | ||||
|
|
|
| |||||
As of March 31, 2015, the components of accumulated earnings/(deficit) on a tax basis were as follows:
Undistributed capital gain | $ | 15,169,796 | ||
Accumulated capital and other losses | (2,082,468 | )(a) | ||
Unrealized appreciation/(depreciation) | 69,514,514 | (b) | ||
|
| |||
Total accumulated earnings/(deficit) | $ | 82,601,842 | ||
|
|
| (a) | At March 31, 2015, the Fund had a qualified late-year ordinary loss deferral of $2,082,468 which is deemed to arise on April 1, 2015. |
| (b) | The differences between book-basis and tax-basis unrealized appreciation/(depreciation) are attributable primarily to the tax treatment of passive foreign investment companies (PFICs) and partnerships. |
For tax purposes, net capital losses may be carried over to offset future capital gains, if any. Funds are permitted to carry forward capital losses incurred in taxable years beginning after December 22, 2010 for an indefinite period and such
| AB MULTI-MANAGER ALTERNATIVE FUND • | 23 |
Notes to Financial Statements
losses will retain their character as either short-term or long-term capital losses rather than being considered short-term as under previous regulation. As of March 31, 2015, the Fund did not have any capital loss carryforwards.
NOTE G
Credit Facility
The Fund is a party to a $75 million revolving credit facility (the “Facility”) intended to provide short term financing, if necessary, subject to certain restrictions in connection with, among other matters, abnormal redemption activity. Commitment fees related to the Facility are paid by the Fund and are included in miscellaneous expenses in the statement of operations. For the six months ended September 30, 2015, the Fund had borrowings under the Agreement as follows:
Average Daily Loan Balance* | Maximum Daily Loan Outstanding | Weighted Average Interest Rate | ||
| $ 5,524,730 | $ 10,100,000 | 1.63% |
| * | For 74 days borrowings were outstanding. |
NOTE H
Subsequent Events
Management has evaluated subsequent events for possible recognition or disclosure in the financial statements through the date the financial statements are issued. Management has determined that there are no material events that would require disclosure in the Fund’s financial statements through this date.
| 24 | • AB MULTI-MANAGER ALTERNATIVE FUND |
Notes to Financial Statements
FINANCIAL HIGHLIGHTS
Selected Data For A Share Of Beneficial Interest Outstanding Throughout Each Period
| Six Months Ended September 30, 2015 (unaudited) | Year Ended March 31, | October 1, 2012(a) to March 31, | ||||||||||||||
| 2015 | 2014 | |||||||||||||||
|
| |||||||||||||||
Net asset value, beginning of period | $ 11.64 | $ 11.41 | $ 10.75 | $ 10.00 | ||||||||||||
|
| |||||||||||||||
Income From Investment Operations | ||||||||||||||||
Net investment loss(b) | (.10 | ) | (.20 | )(c) | (.20 | )(c) | (.09 | )(c) | ||||||||
Net realized and unrealized gain (loss) on investment transactions | (.66 | ) | .56 | 1.06 | .87 | |||||||||||
|
| |||||||||||||||
Net increase (decrease) in net asset value from operations | (.76 | ) | .36 | .86 | .78 | |||||||||||
|
| |||||||||||||||
Less: Dividends and Distributions | ||||||||||||||||
Dividends from net investment income | – 0 | – | (.02 | ) | (.17 | ) | (.03 | ) | ||||||||
Distributions from net realized gain on investment transactions | – 0 | – | (.11 | ) | (.03 | ) | – 0 | – | ||||||||
|
| |||||||||||||||
Total dividends and distributions | – 0 | – | (.13 | ) | (.20 | ) | (.03 | ) | ||||||||
|
| |||||||||||||||
Net asset value, end of period | $ 10.88 | $ 11.64 | $ 11.41 | $ 10.75 | ||||||||||||
|
| |||||||||||||||
Total Return | ||||||||||||||||
Total investment return based on net asset value(d) | (6.53 | )% | 3.18 | % | 8.04 | % | 7.81 | % | ||||||||
Ratios/Supplemental Data | ||||||||||||||||
Net assets, end of period (000’s omitted) | $1,366,197 | $1,376,552 | $980,537 | $310,519 | ||||||||||||
Ratio to average net assets of: | ||||||||||||||||
Expenses, net of waivers/reimbursements(e)(f) | 1.66 | %(g) | 1.75 | %(c) | 1.75 | %(c) | 1.75 | %(c)(h) | ||||||||
Expenses, before waivers/reimbursements(e)(f) | 1.66 | %(g) | 1.75 | % | 1.79 | % | 2.38 | %(h) | ||||||||
Net investment loss(f) | (1.66 | )%(g) | (1.75 | )%(c) | (1.75 | )%(c) | (1.75 | )%(c)(h) | ||||||||
Portfolio turnover rate | 3 | % | 8 | % | 0 | %(i) | 0 | % | ||||||||
Asset coverage ratio | 23,737 | % | 33,674 | % | N/A | % | N/A | % | ||||||||
Bank borrowing outstanding (in millions) | $6 | $4 | N/A | N/A | ||||||||||||
See footnote summary on page 26.
| AB MULTI-MANAGER ALTERNATIVE FUND • | 25 |
Financial Highlights
| (a) | Commencement of operations. |
| (b) | Based on average shares outstanding. |
| (c) | Net of fees and expenses waived/reimbursed by the Investment Manager. |
| (d) | Total investment return is calculated assuming a purchase of beneficial shares on the opening of the first day and a sale on the closing of the last day of each period reported. Dividends and distributions, if any, are assumed for purposes of this calculation, to be reinvested at prices obtained under the Fund’s dividend reinvestment plan. Total investment return calculated for a period of less than one year is not annualized. |
| (e) | The expense and net investment loss ratios do not include income earned or expenses incurred by the Fund through its Underlying Portfolios. |
| (f) | The expense ratios presented below exclude interest expense: |
| Six Months Ended September 30, 2015 (unaudited) |
| October 1, 2012(a) to March 31, 2013 | ||||||||||||||
| 2015 | 2014 | |||||||||||||||
Expenses | 1.66 | %(g) | 1.75 | % | N/A | % | N/A | % | ||||||||
| (g) | Annualized. |
| (h) | Annualized, except for certain non-recurring fees. |
| (i) | Amount is less than .50%. |
See notes to financial statements.
| 26 | • AB MULTI-MANAGER ALTERNATIVE FUND |
Financial Highlights
BOARD OF TRUSTEES
Carter “Terry” F. Wolfe(1) Chairman
Christopher J. Bricker President and Chief Executive Officer
Lawrence D. Haber(1)
Jeanette Loeb(1)
OFFICERS
Philip L. Kirstein Senior Vice President and Independent Compliance Officer
Marc H. Gamsin(2) Vice President
Greg Outcalt(2) Vice President
Eric Wortman Vice President
Emilie D. Wrapp Secretary
Joseph J. Mantineo Treasurer and Chief Financial Officer
Stephen M. Woetzel Controller
Vincent S. Noto Chief Compliance Officer
| Custodian | Legal Counsel | |
State Street Bank and Trust Company State Street Corporation CCB/5 1 Iron Street Boston, MA 02210 | Willkie Farr & Gallagher LLP 787 Seventh Avenue New York, NY 10019 | |
Distributors | Independent Registered Public Accounting Firm | |
Sanford C. Bernstein & Co., LLC 1345 Avenue of the Americas New York, NY 10105 | PricewaterhouseCoopers LLP 300 Madison Avenue New York, NY 10017 | |
AllianceBernstein Investments, Inc. 1345 Avenue of the Americas New York, NY 10105 | ||
Transfer Agent | ||
AllianceBernstein Investor Services, Inc. P.O. Box 786003 San Antonio, TX 78278-6003 Toll-Free (800) 221-5672 | ||
| (1) | Member of the Audit Committee and the Governance and Nominating Committee. |
| (2) | The day-to-day management of, and investment decisions for, the Fund’s portfolio are made by the Investment Manager’s Alternative Investment Management Group. Messrs. Gamsin and Outcalt are the investment professionals with the most significant responsibility for the day-to-day management of the Fund’s portfolio. |
| AB MULTI-MANAGER ALTERNATIVE FUND • | 27 |
Board of Trustees
THIS PAGE IS NOT PART OF THE SHAREHOLDER REPORT OR THE FINANCIAL STATEMENTS
AB FAMILY OF FUNDS
US EQUITY
US Core
Core Opportunities Fund
Select US Equity Portfolio
US Growth
Concentrated Growth Fund
Discovery Growth Fund
Growth Fund
Large Cap Growth Fund
Small Cap Growth Portfolio
US Value
Discovery Value Fund
Equity Income Fund
Growth & Income Fund
Small Cap Value Portfolio
Value Fund
INTERNATIONAL/ GLOBAL EQUITY
International/Global Core
Global Core Equity Portfolio
Global Equity & Covered Call Strategy Fund
Global Thematic Growth Fund
International Portfolio
Tax-Managed International Portfolio
International/Global Growth
International Growth Fund
International/Global Value
International Value Fund
FIXED INCOME
Municipal
High Income Municipal Portfolio
Intermediate California Municipal Portfolio
Intermediate Diversified Municipal Portfolio
Intermediate New York Municipal Portfolio
Municipal Bond Inflation Strategy
Tax-Aware Fixed Income Portfolio
FIXED INCOME (continued)
National Portfolio
Arizona Portfolio
California Portfolio
Massachusetts Portfolio
Michigan Portfolio
Minnesota Portfolio
New Jersey Portfolio
New York Portfolio
Ohio Portfolio
Pennsylvania Portfolio
Virginia Portfolio
Taxable
Bond Inflation Strategy
Global Bond Fund
High Income Fund
High Yield Portfolio
Intermediate Bond Portfolio
Limited Duration High Income Portfolio
Short Duration Portfolio
ALTERNATIVES
All Market Real Return Portfolio*
Credit Long/Short Portfolio
Global Real Estate Investment Fund
Long/Short Multi-Manager Fund
Multi-Manager Alternative Strategies Fund
Select US Long/Short Portfolio
Unconstrained Bond Fund
MULTI-ASSET
All Market Growth Portfolio*
All Market Income Portfolio
Emerging Markets Multi-Asset Portfolio
Global Risk Allocation Fund
Target-Date
Multi-Manager Select Retirement Allocation Fund
Multi-Manager Select 2010 Fund
MULTI-ASSET (continued)
Multi-Manager Select 2015 Fund
Multi-Manager Select 2020 Fund
Multi-Manager Select 2025 Fund
Multi-Manager Select 2030 Fund
Multi-Manager Select 2035 Fund
Multi-Manager Select 2040 Fund
Multi-Manager Select 2045 Fund
Multi-Manager Select 2050 Fund
Multi-Manager Select 2055 Fund
Wealth Strategies
Balanced Wealth Strategy
Conservative Wealth Strategy
Wealth Appreciation Strategy
Tax-Managed Balanced Wealth Strategy
Tax-Managed Conservative Wealth Strategy
Tax-Managed Wealth Appreciation Strategy
CLOSED-END FUNDS
AB Multi-Manager Alternative Fund
Alliance California Municipal Income Fund
AllianceBernstein Global High Income Fund
AllianceBernstein Income Fund
AllianceBernstein National Municipal Income Fund
We also offer Exchange Reserves, which serves as the money market fund exchange vehicle for the AB mutual funds. An investment in Exchange Reserves is not a deposit in a bank and is not insured or guaranteed by the Federal Deposit Insurance Corporation or any other government agency. Although the Fund seeks to preserve the value of your investment at $1.00 per share, it is possible to lose money by investing in the Fund.
Investors should consider the investment objectives, risks, charges and expenses of the Fund carefully before investing. For copies of our prospectus or summary prospectus, which contain this and other information, visit us online at www.abglobal.com or contact your AB representative. Please read the prospectus and/or summary prospectus carefully before investing.
* Prior to December 15, 2014, All Market Growth Portfolio was named Dynamic All Market Fund; All Market Real Return Portfolio was named Real Asset Strategy.
| 28 | • AB MULTI-MANAGER ALTERNATIVE FUND |
AB Family of Funds
AB MULTI-MANAGER ALTERNATIVE FUND
1345 Avenue of the Americas,
New York, NY 10105
800.221.5672
MMAF–0152-0915 
| ITEM 2. | CODE OF ETHICS. |
(a) The registrant has adopted a code of ethics that applies to its principal executive officer, principal financial officer and principal accounting officer. A copy of the registrant’s code of ethics is filed herewith as Exhibit 12(a)(1).
(b) During the period covered by this report, no material amendments were made to the provisions of the code of ethics adopted in 2(a) above.
(c) During the period covered by this report, no implicit or explicit waivers to the provisions of the code of ethics adopted in 2(a) above were granted.
| ITEM 3. | AUDIT COMMITTEE FINANCIAL EXPERT. |
The registrant’s Board of Directors has determined that independent director Lawrence D. Haber qualifies as an audit committee financial expert.
| ITEM 4. | PRINCIPAL ACCOUNTANT FEES AND SERVICES. |
Not applicable when filing a semi-annual report to shareholders.
| ITEM 5. | AUDIT COMMITTEE OF LISTED REGISTRANTS. |
Not applicable when filing a semi-annual report to shareholders.
| ITEM 6. | SCHEDULE OF INVESTMENTS. |
Please see Schedule of Investments contained in the Report to Shareholders included under Item 1 of this Form N-CSR.
ITEM 7. DISCLOSURE OF PROXY VOTING POLICIES AND PROCEDURES FOR CLOSED-END MANAGEMENT INVESTMENT COMPANIES.
Not applicable when filing a semi-annual report to shareholders.
ITEM 8. PORTFOLIO MANAGERS OF CLOSED-END MANAGEMENT INVESTMENT COMPANIES.
Not applicable when filing a semi-annual report to shareholders.
ITEM 9. PURCHASES OF EQUITY SECURITIES BY CLOSED-END MANAGEMENT INVESTMENT COMPANY AND AFFILIATED PURCHASERS.
Not applicable when filing a semi-annual report to shareholders.
| ITEM 10. | SUBMISSION OF MATTERS TO A VOTE OF SECURITY HOLDERS. |
There have been no material changes to the procedures by which shareholders may recommend nominees to the Fund’s Board of Directors since the Fund last provided disclosure in response to this item.
| ITEM 11. | CONTROLS AND PROCEDURES. |
(a) The registrant’s principal executive officer and principal financial officer have concluded that the registrant’s disclosure controls and procedures (as defined in Rule 30a-2(c) under the Investment Company Act of 1940, as amended) are effective at the reasonable assurance level based on their evaluation of these controls and procedures as of a date within 90 days of the filing date of this document.
(b) There were no changes in the registrant’s internal controls over financial reporting that occurred during the second fiscal quarter of the period that has materially affected, or is reasonably likely to materially affect, the registrant’s internal control over financial reporting.
| ITEM 12. | EXHIBITS. |
The following exhibits are attached to this Form N-CSR:
EXHIBIT | DESCRIPTION OF EXHIBIT | |
| 12 (b) (1) | Certification of Principal Executive Officer Pursuant to Section 302 of the Sarbanes-Oxley Act of 2002 | |
| 12 (b) (2) | Certification of Principal Financial Officer Pursuant to Section 302 of the Sarbanes-Oxley Act of 2002 | |
| 12 (c) | Certification of Principal Executive Officer and Principal Financial Officer Pursuant to Section 906 of the Sarbanes-Oxley Act of 2002 | |
SIGNATURES
Pursuant to the requirements of the Securities Exchange Act of 1934 and the Investment Company Act of 1940, the registrant has duly caused this report to be signed on its behalf by the undersigned, thereunto duly authorized.
(Registrant): AB Multi-Manager Alternative Fund, Inc.
| By: | /s/ Christopher J. Bricker | |
| Christopher J. Bricker | ||
| President | ||
| Date: | November 20, 2015 | |
Pursuant to the requirements of the Securities Exchange Act of 1934 and the Investment Company Act of 1940, this report has been signed below by the following persons on behalf of the registrant and in the capacities and on the dates indicated.
| By: | /s/ Christopher J. Bricker | |
| Christopher J. Bricker | ||
| President | ||
| Date: | November 20, 2015 | |
| By: | /s/ Joseph J. Mantineo | |
| Joseph J. Mantineo | ||
| Treasurer and Chief Financial Officer | ||
| Date: | November 20, 2015 | |