|
Exhibit 99.1 
|
CU Bancorp
Investor Presentation
as of June 30, 2015
… a better banking experience
Forward-Looking Statements
This press release contains certain forward-looking information about CU Bancorp (the “Company”) that is intended to be covered by the safe harbor for “forward-looking statements” provided by the Private Securities Litigation Reform Act of 1995. All statements other than statements of historical fact are forward-looking statements. Such statements involve inherent risks and uncertainties, many of which are difficult to predict and are generally beyond the control of the Company. Forward-looking statements speak only as of the date they are made and we assume no duty to update such statements. We caution readers that a number of important factors could cause actual results to differ materially from those expressed in, implied or projected by, such forward-looking statements. Risks and uncertainties include, but are not limited to: lower than expected revenues; credit quality deterioration or a reduction in real estate values which could cause an increase in the allowance for credit losses and a reduction in net earnings; increased competitive pressure among depository institutions; the Company’s ability to complete future acquisitions, successfully integrate acquired entities, or achieve expected beneficial synergies and/or operating efficiencies within expected time-frames or at all; the cost of additional capital is more than expected; a change in the interest rate environment reduces net interest margins; asset/liability repricing risks and liquidity risks; legal matters could be filed against the Company and could take longer or cost more than expected to resolve or may be resolved adversely to the Company; general economic conditions, either nationally or in the market areas in which the Company does or anticipates doing business, are less favorable than expected; environmental conditions, including natural disasters and drought, may disrupt our business, impede our operations, negatively impact the values of collateral securing the Company’s loans and leases or impair the ability of our borrowers to support their debt obligations; the economic and regulatory effects of the continuing war on terrorism and other events of war; legislative or regulatory requirements or changes adversely affecting the Company’s business; changes in the securities markets; regulatory approvals for any capital activities cannot be obtained on the terms expected or on the anticipated schedule; and, other risks that are described in CU Bancorp’s public filings with the U.S. Securities and Exchange Commission (the “SEC”). If any of these risks or uncertainties materializes or if any of the assumptions underlying such forward-looking statements proves to be incorrect, CU Bancorp’s results could differ materially from those expressed in, implied or projected by such forward-looking statements. CU Bancorp assumes no obligation to update such forward-looking statements. For a more complete discussion of risks and uncertainties, investors and security holders are urged to read CU Bancorp’s Annual Report on Form 10-K, Quarterly Reports on Form 10-Q and other reports filed by CU Bancorp with the SEC. The documents filed by CU Bancorp with the SEC may be obtained at CU Bancorp’s website at www.cubancorp.com or at the SEC’s website at www.sec.gov. These documents may also be obtained free of charge from CU Bancorp by directing a request to: CU Bancorp c/o California United Bank, 15821 Ventura Boulevard, Suite 100, Encino, CA 91436. Attention: Investor Relations. Telephone 818-257-7700.
Investment Highlights
Premier community-based, business banking franchise serving large and diverse Southern California market
Scarcity value of $2.5 billion “pure play” business bank in one of the country’s top markets
Strong organic loan growth and attractive low-cost core deposit base
Exceptional credit quality
Opportunistic acquirer with successful history of transactions
Improving efficiency ratio and return on average tangible equity driven by recent merger
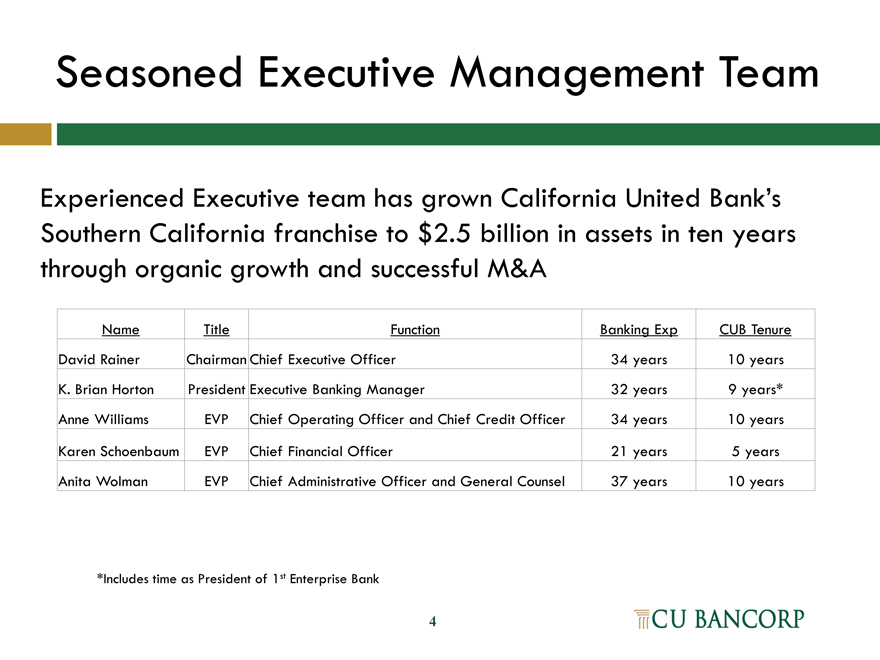
Seasoned Executive Management Team
Experienced Executive team has grown California United Bank’s
Southern California franchise to $2.5 billion in assets in ten years through organic growth and successful M&A
Name Title Function Banking Exp CUB Tenure
David Rainer Chairman Chief Executive Officer 34 years 10 years
K. Brian Horton President Executive Banking Manager 32 years 9 years*
Anne Williams EVP Chief Operating Officer and Chief Credit Officer 34 years 10 years
Karen Schoenbaum EVP Chief Financial Officer 21 years 5 years
Anita Wolman EVP Chief Administrative Officer and General Counsel 37 years 10 years
*Includes time as President of 1st Enterprise Bank
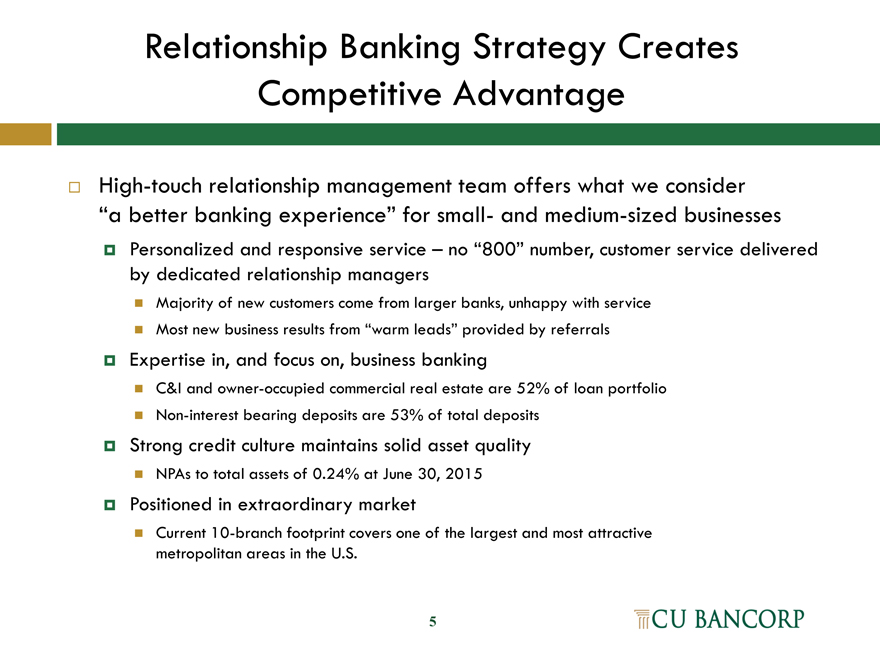
Relationship Banking Strategy Creates Competitive Advantage
High-touch relationship management team offers what we consider
“a better banking experience” for small- and medium-sized businesses
Personalized and responsive service – no “800” number, customer service delivered by dedicated relationship managers
Majority of new customers come from larger banks, unhappy with service
Most new business results from “warm leads” provided by referrals
Expertise in, and focus on, business banking
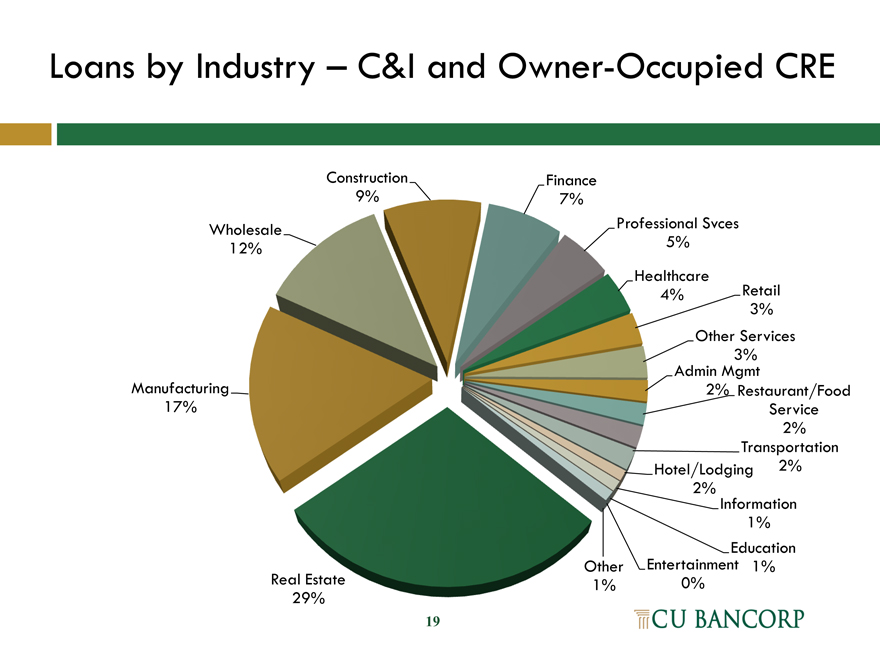
C&I and owner-occupied commercial real estate are 52% of loan portfolio
Non-interest bearing deposits are 53% of total deposits
Strong credit culture maintains solid asset quality
NPAs to total assets of 0.24% at June 30, 2015
Positioned in extraordinary market
Current 10-branch footprint covers one of the largest and most attractive metropolitan areas in the U.S.
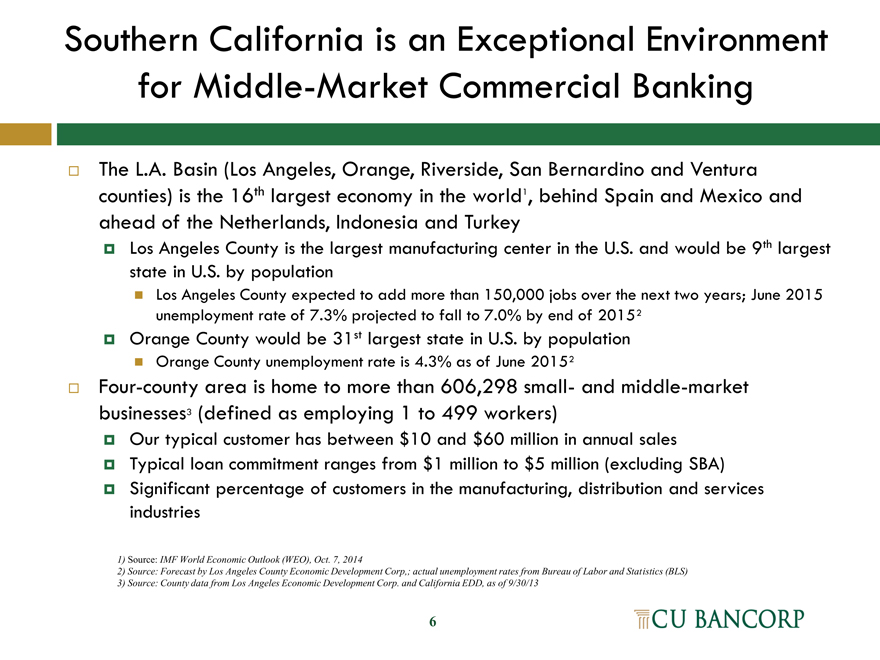
Southern California is an Exceptional Environment for Middle-Market Commercial Banking
The L.A. Basin (Los Angeles, Orange, Riverside, San Bernardino and Ventura counties) is the 16th largest economy in the world1, behind Spain and Mexico and ahead of the Netherlands, Indonesia and Turkey
Los Angeles County is the largest manufacturing center in the U.S. and would be 9th largest state in U.S. by population
Los Angeles County expected to add more than 150,000 jobs over the next two years; June 2015 unemployment rate of 7.3% projected to fall to 7.0% by end of 20152
Orange County would be 31st largest state in U.S. by population
Orange County unemployment rate is 4.3% as of June 20152
Four-county area is home to more than 606,298 small- and middle-market businesses3 (defined as employing 1 to 499 workers)
Our typical customer has between $10 and $60 million in annual sales
Typical loan commitment ranges from $1 million to $5 million (excluding SBA)
Significant percentage of customers in the manufacturing, distribution and services industries
Source: IMF World Economic Outlook (WEO), Oct. 7, 2014
Source: Forecast by Los Angeles County Economic Development Corp,; actual unemployment rates from Bureau of Labor and Statistics (BLS)
Source: County data from Los Angeles Economic Development Corp. and California EDD, as of 9/30/13
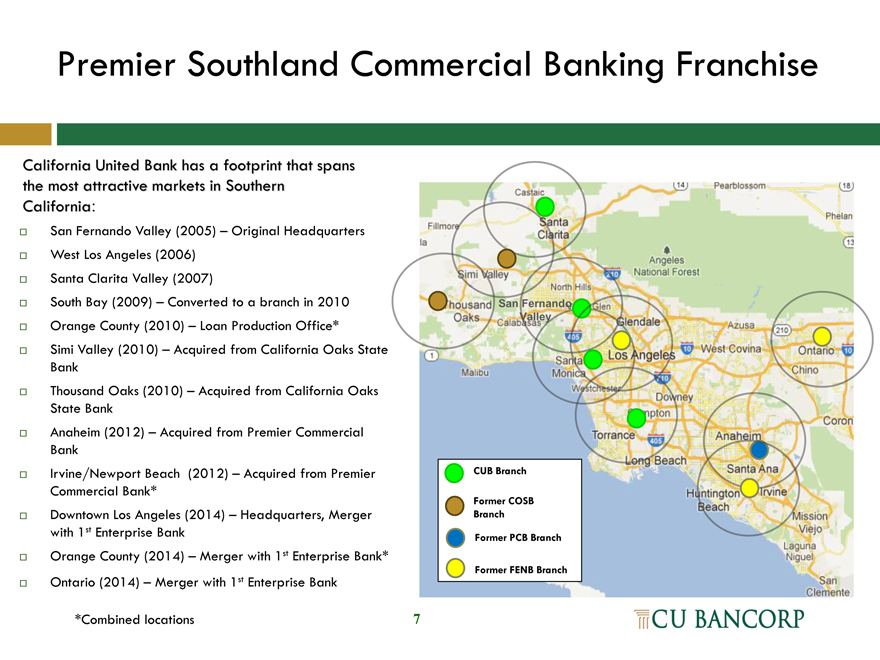
Premier Southland Commercial Banking Franchise
California United Bank has a footprint that spans
the most attractive markets in Southern
California:
? San Fernando Valley (2005) – Original Headquarters
? West Los Angeles (2006)
? Santa Clarita Valley (2007)
? South Bay (2009) – Converted to a branch in 2010 San Fernando
Valley
? Orange County (2010) – Loan Production Office*
? Simi Valley (2010) – Acquired from California Oaks State
Bank
? Thousand Oaks (2010) – Acquired from California Oaks
State Bank
? Anaheim (2012) – Acquired from Premier Commercial
Bank
? Irvine/Newport Beach (2012) – Acquired from Premier CUB Branch
Commercial Bank*
Former COSB
? Downtown Los Angeles (2014) – Headquarters, Merger Branch
with 1st Enterprise Bank Former PCB Branch
? Orange County (2014) – Merger with 1st Enterprise Bank*
Former FENB Branch
? Ontario (2014) – Merger with 1st Enterprise Bank
*Combined locations 7
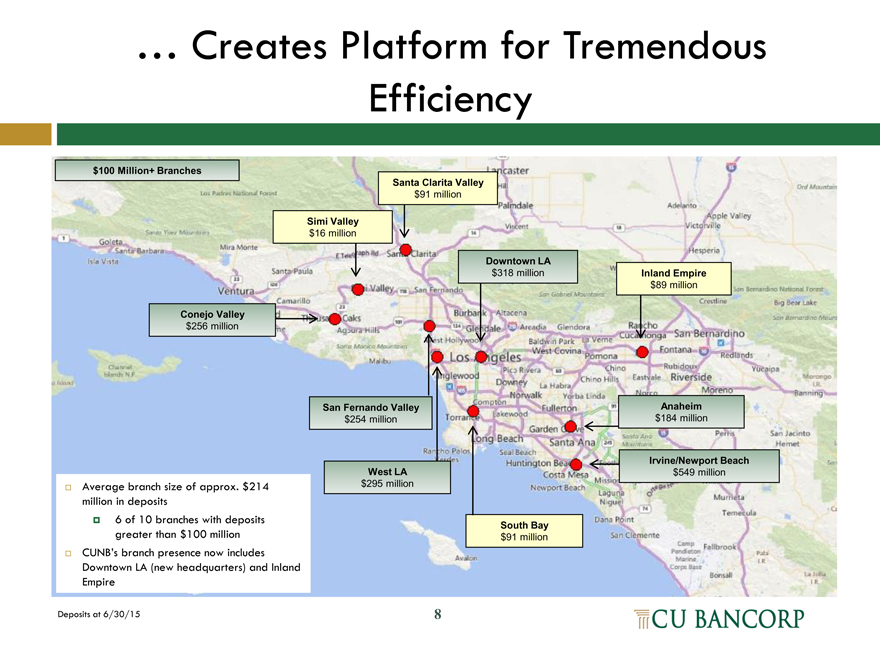
… Creates Platform for Tremendous
Efficiency
$100 Million+ Branches
Conejo Valley
$256 million
Average branch size of approx. $214 million in deposits
6 | | of 10 branches with deposits greater than $100 million |
CUNB’s branch presence now includes
Downtown LA (new headquarters) and Inland Empire
Deposits at 6/30/15
Santa Clarita Valley
$91 million
Simi Valley
$16 million
Downtown LA
$318 million Inland Empire
$89 million
San Fernando Valley Anaheim
$254 million $184 million
Irvine/Newport Beach
West LA $549 million
$295 million
South Bay
$91 million
Strategy for High Quality Growth
Strong and Ongoing Organic Growth
Establish a highly desirable footprint in region with tremendous opportunities for growth
Leverage relationship-based banking approach and superior service
Recruit experienced and connected “in market” talent
Build on products and expertise acquired in strategic acquisitions, such as the SBA lending platform obtained with Premier Commercial Bank
Strong capital management
Result: Asset CAGR of 41% from inception in 2005 through 2014
Growth by Opportunistic Merger/Acquisition
Strong management team experienced with strategic, successful acquisitions
Focus on in-market and in-state acquisitions and mergers
Immediately accretive to earnings
Tangible book value payback under four years
Result: Successfully completed three transactions since 2010
9
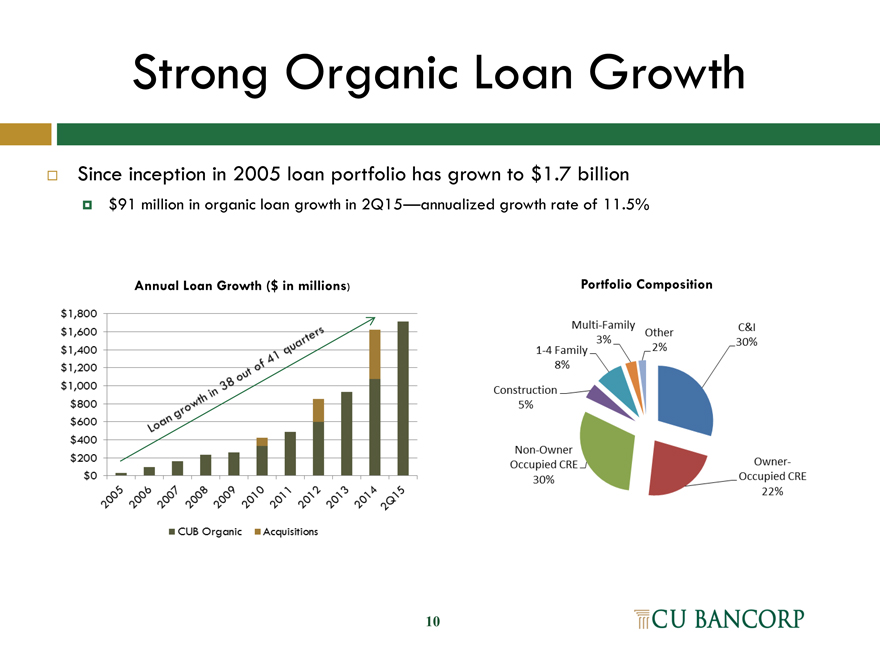
Strong Organic Loan Growth
Since inception in 2005 loan portfolio has grown to $1.7 billion
? $91 million in organic loan growth in 2Q15—annualized growth rate of 11.5%
Annual Loan Growth ($ in millions)
Portfolio Composition
10
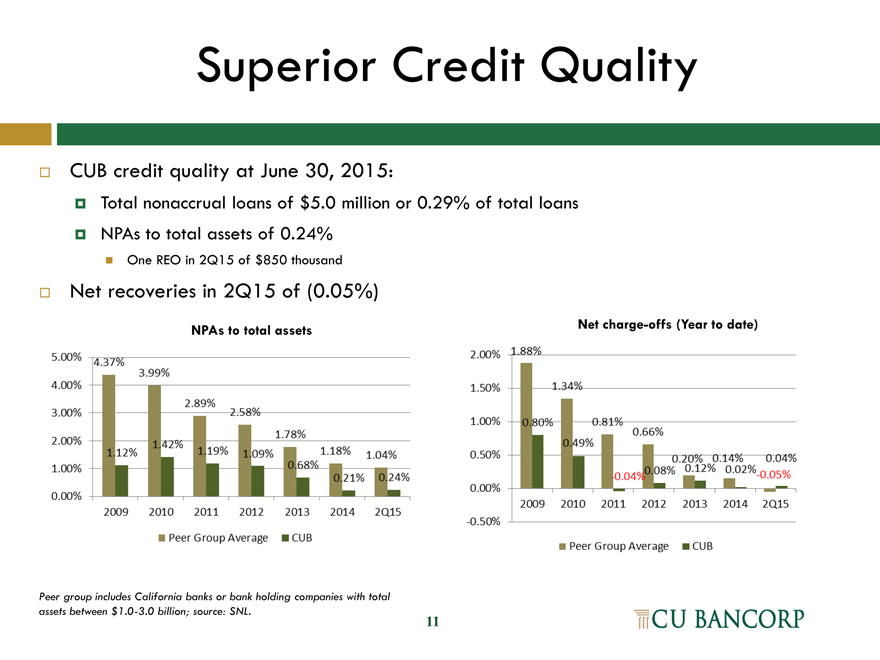
Superior Credit Quality
CUB credit quality at June 30, 2015:
Total nonaccrual loans of $5.0 million or 0.29% of total loans
NPAs to total assets of 0.24%
? One REO in 2Q15 of $850 thousand
Net recoveries in 2Q15 of (0.05%)
NPAs to total assets
Net charge-offs (Year to date)
Peer group includes California banks or bank holding companies with total assets between $1.0-3.0 billion; source: SNL.
11
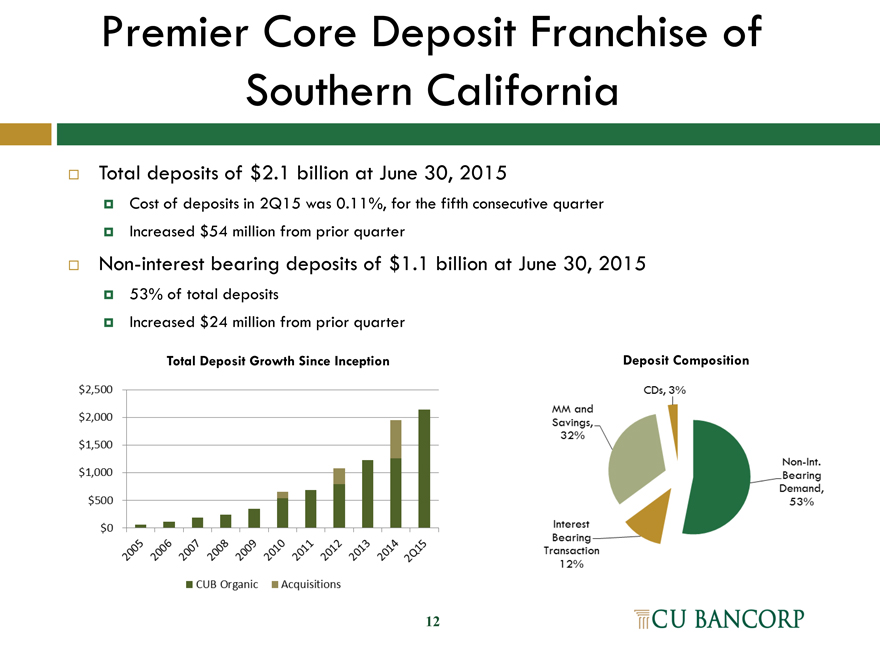
Premier Core Deposit Franchise of
Southern California
Total deposits of $2.1 billion at June 30, 2015
Cost of deposits in 2Q15 was 0.11%, for the fifth consecutive quarter
Increased $54 million from prior quarter
Non-interest bearing deposits of $1.1 billion at June 30, 2015
53% of total deposits
Increased $24 million from prior quarter
Total Deposit Growth Since Inception
Deposit Composition
12
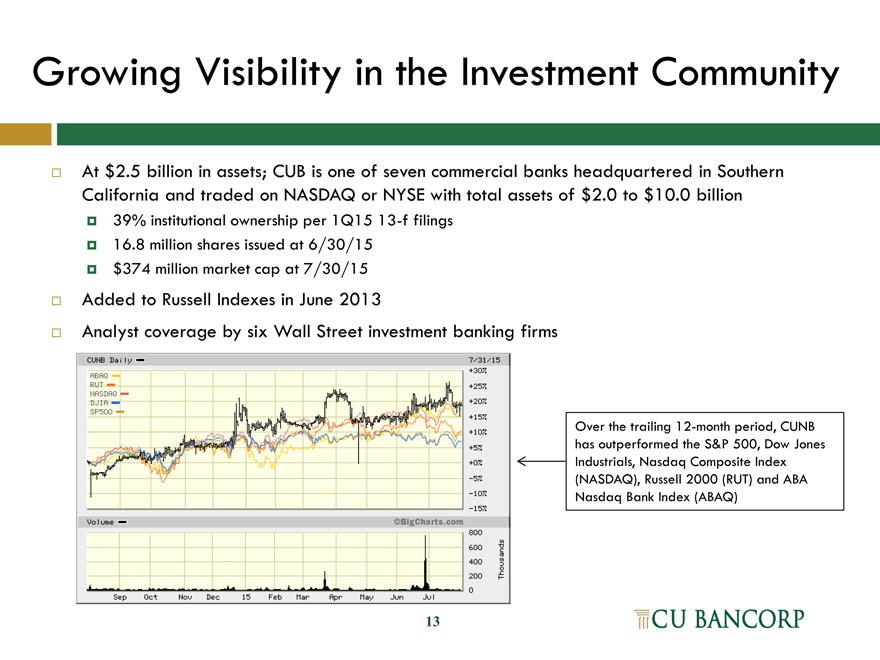
Growing Visibility in the Investment Community
At $2.5 billion in assets; CUB is one of seven commercial banks headquartered in Southern California and traded on NASDAQ or NYSE with total assets of $2.0 to $10.0 billion
39% institutional ownership per 1Q15 13-f filings
16.8 million shares issued at 6/30/15
$374 million market cap at 7/30/15
Added to Russell Indexes in June 2013
Analyst coverage by six Wall Street investment banking firms
Over the trailing 12-month period, CUNB
has outperformed the S&P 500, Dow Jones
Industrials, Nasdaq Composite Index
(NASDAQ), Russell 2000 (RUT) and ABA
Nasdaq Bank Index (ABAQ)
13
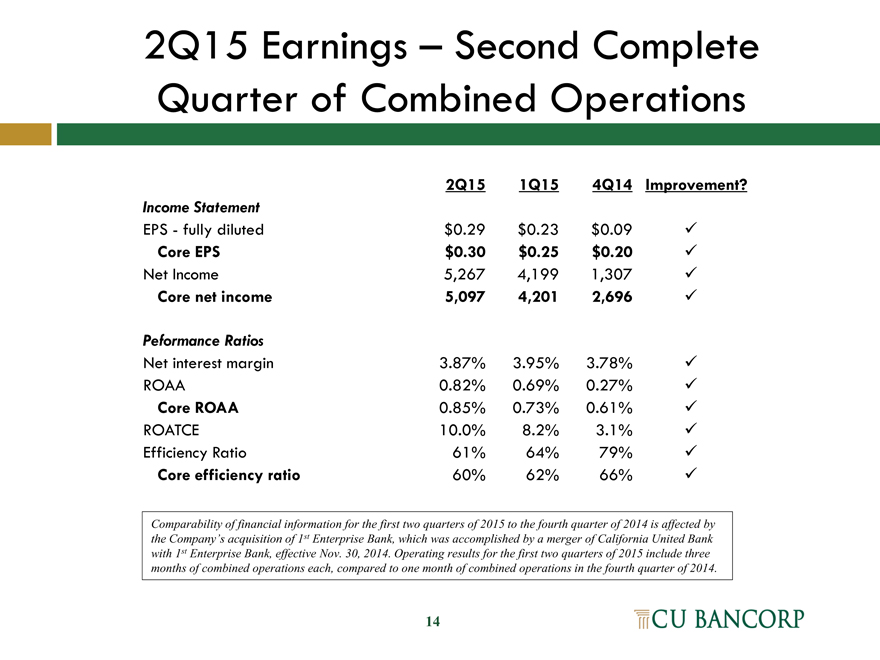
2Q15 Earnings – Second Complete Quarter of Combined Operations
2Q15 1Q15 4Q14 Improvement?
Income Statement
EPS—fully diluted $ 0.29 $ 0.23 $ 0.09 ?
Core EPS $0.30 $0.25 $0.20 ?
Net Income 5,267 4,199 1,307 ?
Core net income 5,097 4,201 2,696 ?
Peformance Ratios
Net interest margin 3.87% 3.95% 3.78% ?
ROAA 0.82% 0.69% 0.27% ?
Core ROAA 0.85% 0.73% 0.61% ?
ROATCE 10.0% 8.2% 3.1% ?
Efficiency Ratio 61% 64% 79% ?
Core efficiency ratio 60% 62% 66% ?
Comparability of financial information for the first two quarters of 2015 to the fourth quarter of 2014 is affected by the Company’s acquisition of 1st Enterprise Bank, which was accomplished by a merger of California United Bank with 1st Enterprise Bank, effective Nov. 30, 2014. Operating results for the first two quarters of 2015 include three months of combined operations each, compared to one month of combined operations in the fourth quarter of 2014.
14
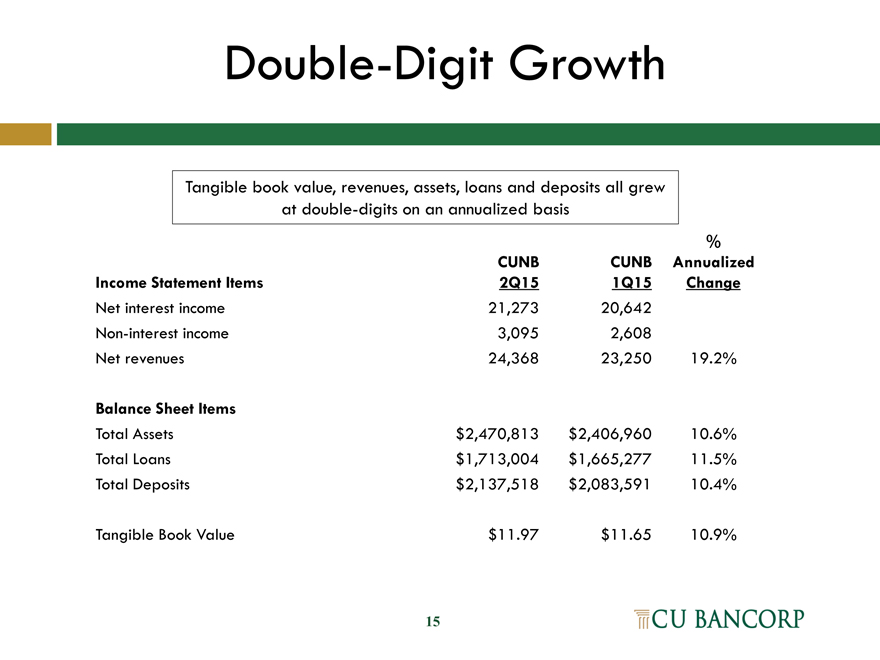
Double-Digit Growth
Tangible book value, revenues, assets, loans and deposits all grew
at double-digits on an annualized basis
%
CUNB CUNB Annualized
Income Statement Items 2Q15 1Q15 Change
Net interest income 21,273 20,642
Non-interest income 3,095 2,608
Net revenues 24,368 23,250 19.2%
Balance Sheet Items
Total Assets $2,470,813 $2,406,960 10.6%
Total Loans $1,713,004 $1,665,277 11.5%
Total Deposits $2,137,518 $2,083,591 10.4%
Tangible Book Value $11.97 $11.65 10.9%
15
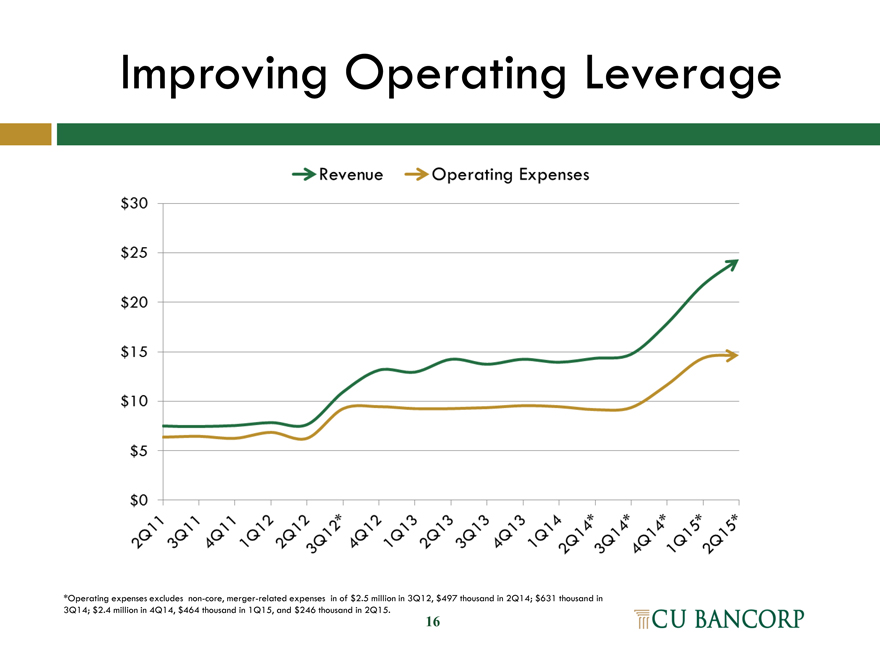
Improving Operating Leverage
*Operating expenses excludes non-core, merger-related expenses in of $2.5 million in 3Q12, $497 thousand in 2Q14; $631 thousand in 3Q14; $2.4 million in 4Q14, $464 thousand in 1Q15, and $246 thousand in 2Q15.
16
Appendix
17
Reconciliation of Non-GAAP Measures
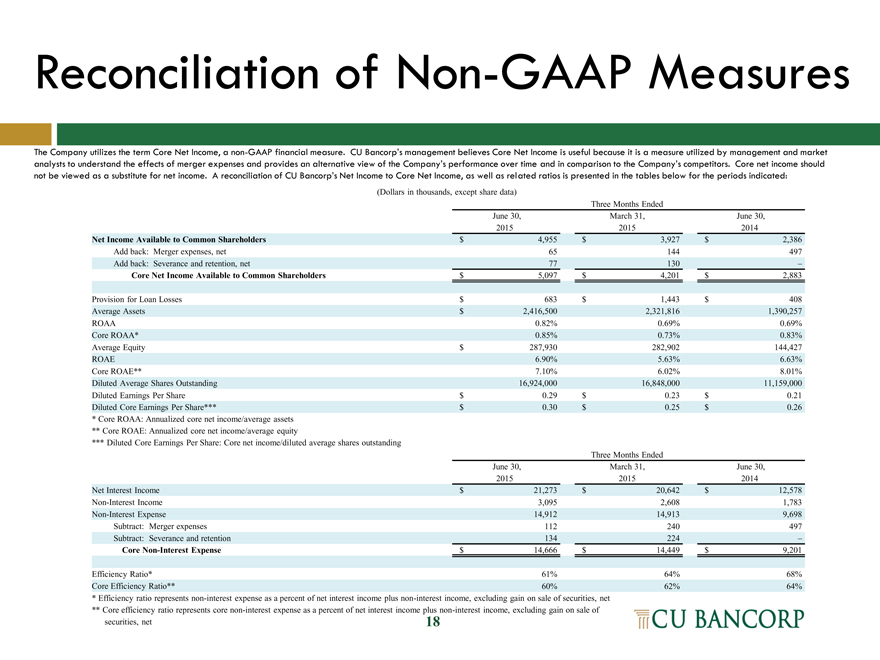
The Company utilizes the term Core Net Income, a non-GAAP financial measure. CU Bancorp’s management believes Core Net Income is useful because it is a measure utilized by management and market analysts to understand the effects of merger expenses and provides an alternative view of the Company’s performance over time and in comparison to the Company’s competitors. Core net income should not be viewed as a substitute for net income. A reconciliation of CU Bancorp’s Net Income to Core Net Income, as well as related ratios is presented in the tables below for the periods indicated:
(Dollars in thousands, except share data)
Three Months Ended
June 30, March 31, June 30,
2015 2015 2014
Net Income Available to Common Shareholders $ 4,955 $ 3,927 $ 2,386
Add back: Merger expenses, net 65 144 497
Add back: Severance and retention, net 77 130 –
Core Net Income Available to Common Shareholders $ 5,097 $ 4,201 $ 2,883
Provision for Loan Losses $ 683 $ 1,443 $ 408
Average Assets $ 2,416,500 2,321,816 1,390,257
ROAA 0.82% 0.69% 0.69%
Core ROAA* 0.85% 0.73% 0.83%
Average Equity $ 287,930 282,902 144,427
ROAE 6.90% 5.63% 6.63%
Core ROAE** 7.10% 6.02% 8.01%
Diluted Average Shares Outstanding 16,924,000 16,848,000 11,159,000
Diluted Earnings Per Share $ 0.29 $ 0.23 $ 0.21
Diluted Core Earnings Per Share*** $ 0.30 $ 0.25 $ 0.26
* | | Core ROAA: Annualized core net income/average assets |
** Core ROAE: Annualized core net income/average equity
*** Diluted Core Earnings Per Share: Core net income/diluted average shares outstanding
Three Months Ended
June 30, March 31, June 30,
2015 2015 2014
Net Interest Income $ 21,273 $ 20,642 $ 12,578
Non-Interest Income 3,095 2,608 1,783
Non-Interest Expense 14,912 14,913 9,698
Subtract: Merger expenses 112 240 497
Subtract: Severance and retention 134 224 –
Core Non-Interest Expense $ 14,666 $ 14,449 $ 9,201
Efficiency Ratio* 61% 64% 68%
Core Efficiency Ratio** 60% 62% 64%
Efficiency ratio represents non-interest expense as a percent of net interest income plus non-interest income, excluding gain on sale of securities, net
Core efficiency ratio represents core non-interest expense as a percent of net interest income plus non-interest income, excluding gain on sale of
securities, net
18
Loans by Industry – C&I and Owner-Occupied CRE
19
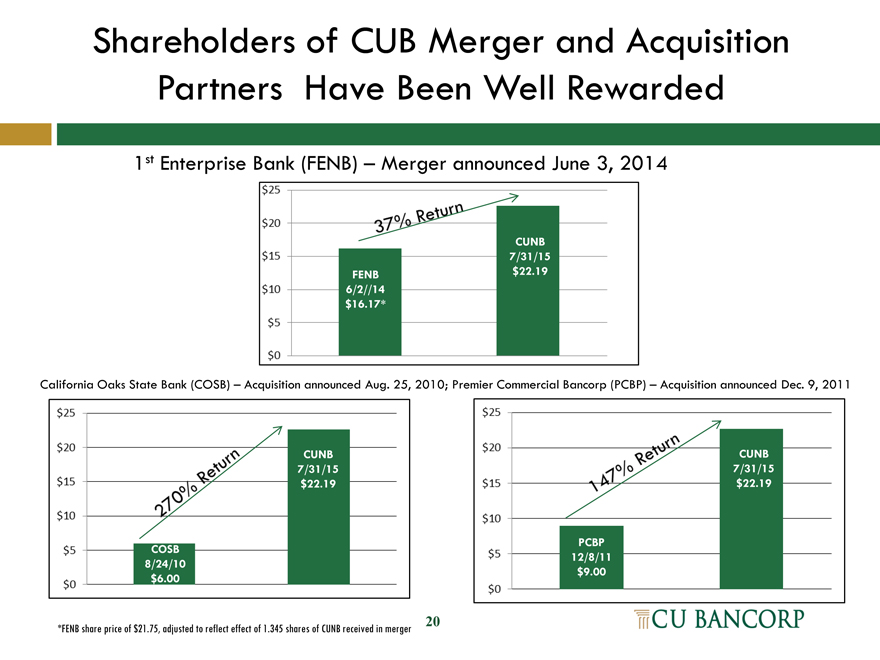
Shareholders of CUB Merger and Acquisition Partners Have Been Well Rewarded
1st Enterprise Bank (FENB) – Merger announced June 3, 2014
[Graphic Appears Here]
California Oaks State Bank (COSB) – Acquisition announced Aug. 25, 2010; Premier Commercial Bancorp (PCBP) – Acquisition announced Dec. 9, 2011
CUNB CUNB
7/31/15 7/31/15
COSB PCBP
8/24/10 12/8/11
*FENB share price of $21.75, adjusted to reflect effect of 1.345 shares of CUNB received in merger 20