Washington, D.C. 20549
Frank L. Newbauer, Esq.
Form N-CSR is to be used by management investment companies to file reports with the Commission not later than 10 days after the transmission to stockholders of any report that is required to be transmitted to stockholders under Rule 30e-1 under the Investment Company Act of 1940 (17 CFR 270.30e-1). The Commission may use the information provided on Form N-CSR in its regulatory, disclosure review, inspection, and policymaking roles.
A registrant is required to disclose the information specified by Form N-CSR, and the Commission will make this information public. A registrant is not required to respond to the collection of information contained in Form N-CSR unless the Form displays a currently valid Office of Management and Budget ("OMB") control number. Please direct comments concerning the accuracy of the information collection burden estimate and any suggestions for reducing the burden to Secretary, Securities and Exchange Commission, 450 Fifth Street, NW, Washington, DC 20549-0609. The OMB has reviewed this collection of information under the clearance requirements of 44 U.S.C. § 3507.
APEXcm SMALL/MID CAP GROWTH FUND
(APSGX)
Semi-Annual Report
November 30, 2013
(Unaudited)
APEXcm SMALL/MID CAP GROWTH FUND LETTER TO SHAREHOLDERS | |
Dear Fellow APEXcm Fund Shareholder,
We thank you for your support as the Fund has nearly tripled in net assets during the six months ended November 30, 2013. We were well positioned for a shift to a more growth-oriented environment with your Fund increasing 14.03% (net of expenses) during the six month period. Small/mid cap growth stocks continued to do well as the Russell 2500 Growth Index, the Fund’s benchmark index, rose 16.86%.
APEX PHILOSOPHY
We believe that the best way to provide value added returns is to identify companies, through our research driven process, that exhibit certain favorable fundamental advantages and benefit from secular growth trends allowing us to structure the portfolio in high conviction areas of longer term sustainable growth. Embedded in our portfolio construction is the recognition of companies at different stages of their growth cycle which we designate as “stable” and “emerging” growth stocks. We believe having the spectrum of growth companies that are really innovative and growing rapidly, combined with established growth businesses, can provide relative stability while allowing the opportunity to drive outperformance versus our benchmark and peers over time. Also, we believe the SMID style provides the opportunity to invest in higher growth companies and capture a longer period of growth as these companies mature.
INVESTMENT ENVIRONMENT
During this semi-annual period, investors became more optimistic about the global recovery led by the U.S. In spite of a continued challenging job market, the U.S. economy continues to recover at a moderate pace, led by pent up demand for housing, autos and airplanes. Europe continues to inch forward and Japan has shown strength under the adoption of Abenomics. During this short time period, we have gone from concerns about the Federal Reserve tapering its’ monetary stimulus program, a U.S. government shutdown, Syria violence and slowing growth in the emerging markets to more optimism about a self sustaining global recovery.
KEY PERFORMANCE DRIVERS VERSUS THE BENCHMARK
| | • | Solid stock selection in the Energy, Financials, Health Care, Industrials and Materials sectors added approximately 200 basis points in value. |
| | • | Overall stock selection was negative as Consumer Discretionary and Information Technology sector holdings underperformed by approximately 300 basis points. |
| | • | Overall attribution from sector effect was slightly negative (approximately 30 basis points) due mostly to the underweights in Health Care and Consumer Staples. |
| | • | Additionally, the timing of significant cash inflows into the Fund as the market continued its relentless advance negatively impacted performance. |
KEY POSITIONING AND HOLDINGS DISCUSSION VERSUS THE BENCHMARK
Information Technology: We remain overweight in Information Technology due to attractive valuations with sustainable growth and cash flow characteristics. Several businesses in the payment and processing area performed very well with Alliance Data Systems (+19.21%), FleetCor (+22.25%), Heartland Payment Systems(+22.98%), and Total System Services (+15.50%) all performed admirably. In spite of the success of the holdings in the secular growth payments and processing companies, as mentioned, stock selection overall in Information Technology trailed the benchmark index due mostly to MercadoLibre (-20.77%), Rovi (-46.28%), SolarWinds (-38.26%-sold in November), Akamai (-20.63%-sold in November) and Ixia (-34.96%).
Consumer Discretionary: We remain overweight in Consumer Discretionary as there are several elements of the economy with significant pent up demand. Housing and the corresponding multiplier of durables as well as automotives (we added Dana Holding and Visteon during this semi-annual period) should continue to benefit from resurgence in demand. As mentioned, a few of our holdings had a negative impact on our performance during this time period, most notably International Game Technology (-18.33%), Panera Bread (-24.82%-sold in September), and Dana Holding (-9.31%).
Health Care: Although underweight in Health Care, we continue to add positions to take advantage of key growth areas of biotechnology, specialty pharmas and diagnostic equipment providers. During the semi-annual period, we added Salix Pharmaceuticals with its strong franchise in treating intestinal disorders, along with Jazz Pharmaceuticals providing strong growth with Xyrem, a drug for narcolepsy. During the period, Jazz Pharmaceuticals was up (+48.55%), Incyte (+86.73%) with these gains offset by PAREXEL International being down (-33.25%).
Financials: We remain overweight in Financials, although we did sell Hertz during this six month period. In our view, the steep yield curve, better credit standards and declining delinquencies support this attractively valued sector. Stock selection was excellent with First Republic (+28.83%) and Evercore Partners (+30.02%) leading the way.
Industrials: Although still slightly underweight in Industrials, we continue to selectively add to the Fund’s allocation to Industrials as many companies, especially in aerospace, show good long term secular growth prospects. During the semi-annual period we added B/E Aerospace, a key supplier to new and existing airplanes. Towers Watson, a beneficiary of the roll out of the Affordable Care Act, was up (+22.77%) during this time period.
OUTLOOK
The U.S. economy seems to be gaining momentum boosted by stronger corporate profits and hiring continuing at a steady pace. The U.S. consumer, even in the face of budget turmoil in Washington that temporarily darkened their mood, is showing signs of increasing confidence. We expect the Federal Reserve (the “Fed”) to gradually taper its monthly bond-buying program, allowing interest rates to edge higher. We believe this is the first acknowledgement of a more sustainable recovery, which should benefit quality businesses which grow on the basis of corporate fundamentals instead of the incredible influence of the Fed. An economy that is reaccelerating, accompanied by low inflation, should encourage more capital spending and business investment as well as accelerated hiring as an uptick in demand occurs. We do believe there will be added volatility as the tug of war between the timing of the unwinding of the historic stimulus measures and the healthier cycle of higher consumer and business spending unfolds. We believe this should provide a sense of more normality to the markets and return expectations. Valuations are still reasonable in our opinion and no one can be certain of relative growth trajectories, but we continue to find opportunities and are encouraged by secular growth areas such as the U.S. manufacturing renaissance, U.S. energy independence, personalized medicine, pent up demand in housing and autos and many other substantial long-term sustainable trends.
Thank you for your confidence in the APEXcm Small/Mid Cap Growth Fund.
Sincerely,
Nitin N. Kumbhani
President and Chief Investment Officer
Past performance is not predictive of future performance. Investment results and principal value will fluctuate so that shares, when redeemed, may be worth more or less than their original cost. Current performance may be higher or lower than the performance data quoted. Performance data current to the most recent month end are available by calling 1-888-575-4800.
An investor should consider the investment objectives, risks, charges and expenses of the Fund carefully before investing. The Fund’s prospectus contains this and other important information. To obtain a copy of the Fund’s prospectus please visit our website at www.apexcmfund.com or call 1-888-575-4800 and a copy will be sent to you free of charge. Please read the prospectus carefully before you invest. The APEXcm Small/Mid Cap Growth Fund is distributed by Ultimus Fund Distributors, LLC.
The Letter to Shareholders seeks to describe some of the Adviser’s current opinions and views of the financial markets. Although the Adviser believes it has a reasonable basis for any opinions or views expressed, actual results may differ, sometimes significantly so, from those expected or expressed. The securities held by the Fund that are discussed in the Letter to Shareholders were held during the period covered by this Report. They do not comprise the entire investment portfolio of the Fund, may be sold at any time and may no longer be held by the Fund. The opinions of the Fund’s Adviser with respect to those securities may change at any time.
APEXcm SMALL/MID CAP GROWTH FUND
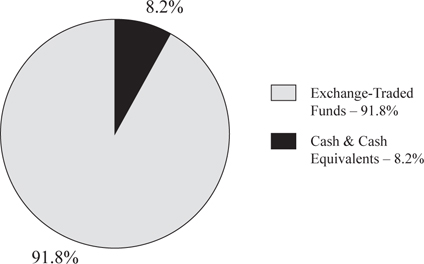
PORTFOLIO INFORMATION
November 30, 2013 (Unaudited)
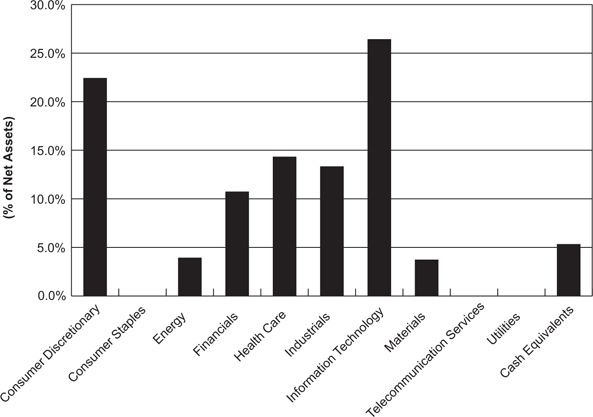
Sector Diversification
| | |
| Illumina, Inc. | | 3.2% |
| Alliance Data Systems Corp. | | 2.4% |
| Signet Jewelers Ltd. | | 2.4% |
| United Rentals, Inc. | | 2.2% |
| Expedia, Inc. | | 2.2% |
| FleetCor Technologies, Inc. | | 2.2% |
| Polaris Industries, Inc. | | 2.1% |
| IAC/InterActiveCorp | | 2.0% |
| MercadoLibre, Inc. | | 2.0% |
| Autoliv, Inc. | | 2.0% |
APEXcm SMALL/MID CAP GROWTH FUND SCHEDULE OF INVESTMENTS November 30, 2013 (Unaudited) | |
| | | | | | |
| Consumer Discretionary — 22.4% | | | | | | |
| Auto Components — 5.6% | | | | | | |
| Autoliv, Inc. | | | 10,531 | | | $ | 977,909 | |
| Dana Holding Corp. | | | 25,761 | | | | 522,433 | |
| Gentex Corp. | | | 16,388 | | | | 488,526 | |
| Visteon Corp. * | | | 9,746 | | | | 766,425 | |
| | | | | | | | 2,755,293 | |
| Hotels, Restaurants & Leisure — 2.7% | | | | | | | | |
| International Game Technology | | | 35,015 | | | | 612,412 | |
| Wyndham Worldwide Corp. | | | 10,320 | | | | 740,047 | |
| | | | | | | | 1,352,459 | |
| Internet & Catalog Retail — 2.2% | | | | | | | | |
| Expedia, Inc. | | | 17,168 | | | | 1,093,430 | |
| | | | | | | | | |
| Leisure Equipment & Products — 2.1% | | | | | | | | |
| Polaris Industries, Inc. | | | 7,624 | | | | 1,017,575 | |
| | | | | | | | | |
| Multi-line Retail — 0.9% | | | | | | | | |
| Dillard's, Inc. | | | 4,673 | | | | 427,579 | |
| | | | | | | | | |
| Specialty Retail — 8.9% | | | | | | | | |
| AutoNation, Inc. * | | | 12,812 | | | | 628,300 | |
| GNC Holdings, Inc. - Class A | | | 10,578 | | | | 636,584 | |
| PetSmart, Inc. | | | 12,561 | | | | 930,896 | |
| Sally Beauty Holdings, Inc. * | | | 9,242 | | | | 260,070 | |
| Signet Jewelers Ltd. | | | 15,492 | | | | 1,190,405 | |
| Williams-Sonoma, Inc. | | | 13,251 | | | | 783,399 | |
| | | | | | | | 4,429,654 | |
| Energy — 3.9% | | | | | | | | |
| Energy Equipment & Services — 1.2% | | | | | | | | |
| Helmerich & Payne, Inc. | | | 8,106 | | | | 624,162 | |
| | | | | | | | | |
| Oil, Gas & Consumable Fuels — 2.7% | | | | | | | | |
| Carrizo Oil & Gas, Inc. * | | | 14,871 | | | | 601,383 | |
| Whiting Petroleum Corp. * | | | 11,937 | | | | 720,995 | |
| | | | | | | | 1,322,378 | |
| Financials — 10.7% | | | | | | | | |
| Capital Markets — 3.6% | | | | | | | | |
| Affiliated Managers Group, Inc. * | | | 3,948 | | | | 790,587 | |
| Evercore Partners, Inc. - Class A | | | 9,712 | | | | 532,703 | |
APEXcm SMALL/MID CAP GROWTH FUND SCHEDULE OF INVESTMENTS (Continued) | |
COMMON STOCKS — 94.7% (Continued) | | | | | | |
| Financials — 10.7% (Continued) | | | | | | |
| Capital Markets — 3.6% (Continued) | | | | | | |
| Janus Capital Group, Inc. | | | 39,605 | | | $ | 430,902 | |
| | | | | | | | 1,754,192 | |
| Commercial Banks — 2.9% | | | | | | | | |
| Cullen/Frost Bankers, Inc. | | | 8,495 | | | | 610,111 | |
| First Republic Bank/CA | | | 16,432 | | | | 839,675 | |
| | | | | | | | 1,449,786 | |
| Diversified Financial Services — 1.0% | | | | | | | | |
| Interactive Brokers Group, Inc. | | | 10,245 | | | | 248,441 | |
| MarketAxess Holdings, Inc. | | | 3,545 | | | | 249,462 | |
| | | | | | | | 497,903 | |
| Insurance — 1.5% | | | | | | | | |
| XL Group plc | | | 23,443 | | | | 749,942 | |
| | | | | | | | | |
| Real Estate Management & Development — 1.7% | | | | | | | | |
| CBRE Group, Inc. * | | | 34,256 | | | | 830,365 | |
| | | | | | | | | |
| Health Care — 14.3% | | | | | | | | |
| Biotechnology — 2.8% | | | | | | | | |
| Genomic Health, Inc. * | | | 9,038 | | | | 317,957 | |
| Incyte Corp. * | | | 10,800 | | | | 503,280 | |
| United Therapeutics Corp. * | | | 6,173 | | | | 569,830 | |
| | | | | | | | 1,391,067 | |
| Health Care Providers & Services — 2.5% | | | | | | | | |
| Hanger, Inc. * | | | 6,464 | | | | 251,062 | |
| Universal Health Services, Inc. - Class B | | | 11,860 | | | | 977,620 | |
| | | | | | | | 1,228,682 | |
| Life Sciences Tools & Services — 5.8% | | | | | | | | |
| Illumina, Inc. * | | | 16,332 | | | | 1,600,536 | |
| PAREXEL International Corp. * | | | 18,471 | | | | 761,375 | |
| WuXi PharmaTech (Cayman), Inc.* | | | 15,604 | | | | 516,961 | |
| | | | | | | | 2,878,872 | |
| Pharmaceuticals — 3.2% | | | | | | | | |
| Akorn, Inc. * | | | 13,307 | | | | 342,655 | |
| Jazz Phamarceuticals plc * | | | 5,870 | | | | 686,320 | |
| Salix Pharmaceuticals Ltd. * | | | 6,301 | | | | 534,388 | |
| | | | | | | | 1,563,363 | |
| Industrials — 13.3% | | | | | | | | |
| Aerospace & Defense — 1.5% | | | | | | | | |
| B/E Aerospace, Inc. * | | | 8,352 | | | | 726,624 | |
APEXcm SMALL/MID CAP GROWTH FUND SCHEDULE OF INVESTMENTS (Continued) | |
COMMON STOCKS — 94.7% (Continued) | | | | | | |
| Industrials — 13.3% (Continued) | | | | | | |
| Electrical Equipment — 1.0% | | | | | | |
| EnerSys, Inc. | | | 7,225 | | | $ | 515,504 | |
| | | | | | | | | |
| Machinery — 4.5% | | | | | | | | |
| Nordson Corp. | | | 8,975 | | | | 647,277 | |
| Valmont Industries, Inc. | | | 4,322 | | | | 625,437 | |
| Wabtec Corp. | | | 13,856 | | | | 956,064 | |
| | | | | | | | 2,228,778 | |
| Professional Services — 3.1% | | | | | | | | |
| Robert Half International, Inc. | | | 16,674 | | | | 644,117 | |
| Towers Watson & Co. | | | 7,859 | | | | 884,923 | |
| | | | | | | | 1,529,040 | |
| Road & Rail — 1.0% | | | | | | | | |
| Old Dominion Freight Line, Inc. * | | | 9,371 | | | | 482,888 | |
| | | | | | | | | |
| Trading Companies & Distributors — 2.2% | | | | | | | | |
| United Rentals, Inc. * | | | 16,119 | | | | 1,107,859 | |
| | | | | | | | | |
| Information Technology — 26.4% | | | | | | | | |
| Communications Equipment — 0.7% | | | | | | | | |
| Ixia * | | | 25,640 | | | | 333,064 | |
| | | | | | | | | |
| Electronic Equipment, Instruments & Components — 2.3% | | | | | | | | |
| Dolby Laboratories, Inc. - Class A | | | 13,343 | | | | 479,414 | |
| FEI Co. | | | 7,166 | | | | 652,464 | |
| | | | | | | | 1,131,878 | |
| Internet Software & Services — 6.4% | | | | | | | | |
| AOL, Inc. * | | | 16,340 | | | | 728,437 | |
| IAC/InterActiveCorp | | | 17,616 | | | | 1,007,811 | |
| MercadoLibre, Inc. | | | 9,099 | | | | 1,007,350 | |
| Rackspace Hosting, Inc. * | | | 10,467 | | | | 399,944 | |
| | | | | | | | 3,143,542 | |
| IT Services — 11.1% | | | | | | | | |
| Alliance Data Systems Corp. * | | | 4,978 | | | | 1,205,970 | |
| FleetCor Technologies, Inc. * | | | 8,748 | | | | 1,065,331 | |
| Gartner, Inc. * | | | 13,375 | | | | 864,694 | |
| Heartland Payment Systems, Inc. | | | 14,486 | | | | 650,566 | |
| InterXion Holding N.V.* | | | 12,251 | | | | 275,770 | |
| NeuStar, Inc.* - Class A | | | 9,990 | | | | 487,013 | |
| Total System Services, Inc. | | | 30,995 | | | | 962,395 | |
| | | | | | | | 5,511,739 | |
APEXcm SMALL/MID CAP GROWTH FUND SCHEDULE OF INVESTMENTS (Continued) | |
COMMON STOCKS — 94.7% (Continued) | | | | | | |
| Information Technology — 26.4% (Continued) | | | | | | |
| Semiconductors & Semiconductor Equipment — 2.4% | | | | | | |
| Entegris, Inc. * | | | 40,659 | | | $ | 446,436 | |
| NXP Semiconductors N.V. * | | | 17,691 | | | | 751,868 | |
| | | | | | | | 1,198,304 | |
| Software — 3.5% | | | | | | | | |
| Informatica Corp. * | | | 11,825 | | | | 458,928 | |
| Manhattan Associates, Inc. * | | | 2,216 | | | | 266,496 | |
| Rovi Corp. * | | | 17,939 | | | | 330,078 | |
| TIBCO Software, Inc. * | | | 28,164 | | | | 680,724 | |
| | | | | | | | 1,736,226 | |
| Materials — 3.7% | | | | | | | | |
| Chemicals — 1.1% | | | | | | | | |
| Albemarle Corp. | | | 7,551 | | | | 518,829 | |
| | | | | | | | | |
| Containers & Packaging — 1.3% | | | | | | | | |
| Silgan Holdings, Inc. | | | 13,701 | | | | 640,522 | |
| | | | | | | | | |
| Paper & Forest Products — 1.3% | | | | | | | | |
| KapStone Paper and Packaging Corp. | | | 12,520 | | | | 667,066 | |
| | | | | | | | | |
Total Common Stocks (Cost $41,045,205) | | | | | | $ | 46,838,565 | |
| | |
MONEY MARKET FUNDS — 5.8% | | | | | | |
Fidelity Institutional Money Market Portfolio - Class I, 0.05% (a) (Cost $2,889,471) | | | 2,889,471 | | | $ | 2,889,471 | |
| | | | | | | | | |
Total Investments at Value — 100.5% (Cost $43,934,676) | | | | | | $ | 49,728,036 | |
| | | | | | | | | |
| Liabilities in Excess of Other Assets — (0.5%) | | | | | | | (269,104 | ) |
| | | | | | | | | |
| Net Assets — 100.0% | | | | | | $ | 49,458,932 | |
| * | Non-income producing security. |
| (a) | The rate shown is the 7-day effective yield as of November 30, 2013. |
| See accompanying notes to financial statements. |
APEXcm SMALL/MID CAP GROWTH FUND STATEMENT OF ASSETS AND LIABILITIES November 30, 2013 (Unaudited) | |
ASSETS | | | |
| Investments in securities: | | | |
| At acquisition cost | | $ | 43,934,676 | |
| At value (Note 2) | | $ | 49,728,036 | |
| Dividends receivable | | | 38,168 | |
| Receivable for capital shares sold | | | 1,782 | |
| Receivable for investment securities sold | | | 1,007,287 | |
| Other assets | | | 22,248 | |
| Total assets | | | 50,797,521 | |
| | | | | |
| LIABILITIES | | | | |
| Payable for investment securities purchased | | | 1,297,313 | |
| Payable to Adviser (Note 4) | | | 20,881 | |
| Payable to administrator (Note 4) | | | 9,020 | |
| Other accrued expenses | | | 11,375 | |
| Total liabilities | | | 1,338,589 | |
| | | | | |
| NET ASSETS | | $ | 49,458,932 | |
| | | | | |
| NET ASSETS CONSIST OF: | | | | |
| Paid-in capital | | $ | 43,418,068 | |
| Accumulated net investment loss | | | (71,320 | ) |
| Accumulated net realized gains from security transactions | | | 318,824 | |
| Net unrealized appreciation on investments | | | 5,793,360 | |
| NET ASSETS | | $ | 49,458,932 | |
| | | | | |
Shares of beneficial interest outstanding
(unlimited number of shares authorized, no par value) | | | 3,419,125 | |
| | | | | |
Net asset value, offering price and redemption price per share
(Note 2) | | $ | 14.47 | |
| See accompanying notes to financial statements. |
APEXcm SMALL/MID CAP GROWTH FUND STATEMENT OF OPERATIONS For the Six Months Ended November 30, 2013 (Unaudited) | |
INVESTMENT INCOME | | | |
| Dividend income | | $ | 101,159 | |
| | | | | |
| EXPENSES | | | | |
| Investment advisory fees (Note 4) | | | 155,088 | |
| Custody and bank service fees | | | 18,866 | |
| Administration fees (Note 4) | | | 17,411 | |
| Professional fees | | | 16,286 | |
| Fund accounting fees (Note 4) | | | 14,806 | |
| Registration and filing fees | | | 13,998 | |
| Transfer agent fees (Note 4) | | | 9,000 | |
| Compliance fees (Note 4) | | | 6,000 | |
| Trustees' fees and expenses (Note 4) | | | 4,451 | |
| Postage and supplies | | | 2,684 | |
| Insurance expense | | | 2,030 | |
| Other expenses | | | 5,853 | |
| Total expenses | | | 266,473 | |
| Less fee reductions by the Adviser (Note 4) | | | (103,631 | ) |
| Net expenses | | | 162,842 | |
| | | | | |
| NET INVESTMENT LOSS | | | (61,683 | ) |
| | | | | |
| REALIZED AND UNREALIZED GAINS ON INVESTMENTS | | | | |
| Net realized gains from security transactions | | | 352,268 | |
Net change in unrealized appreciation/
depreciation on investments | | | 4,730,390 | |
| NET REALIZED AND UNREALIZED GAINS ON INVESTMENTS | | | 5,082,658 | |
| | | | | |
| NET INCREASE IN NET ASSETS RESULTING FROM OPERATIONS | | $ | 5,020,975 | |
| See accompanying notes to financial statements. |
APEXcm SMALL/MID CAP GROWTH FUND STATEMENTS OF CHANGES IN NET ASSETS | |
| | Six Months Ended November 30, 2013 (Unaudited) | | | Period Ended May 31, 2013(a) | |
| FROM OPERATIONS | | | | | | |
| Net investment income (loss) | | $ | (61,683 | ) | | $ | 9,832 | |
Net realized gains (losses)
from security transactions | | | 352,268 | | | | (33,444 | ) |
Net change in unrealized appreciation/
depreciation on investments | | | 4,730,390 | | | | 1,062,970 | |
| Net increase in net assets resulting from operations | | | 5,020,975 | | | | 1,039,358 | |
| | | | | | | | | |
| DISTRIBUTIONS TO SHAREHOLDERS | | | | | | | | |
| From net investment income | | | — | | | | (19,469 | ) |
| | | | | | | | | |
| CAPITAL SHARE TRANSACTIONS | | | | | | | | |
| Proceeds from shares sold | | | 32,293,006 | | | | 12,444,893 | |
Net asset value of shares issued in reinvestment of
distributions to shareholders | | | — | | | | 19,469 | |
| Payments for shares redeemed | | | (1,008,028 | ) | | | (431,272 | ) |
Net increase in net assets from
capital share transactions | | | 31,284,978 | | | | 12,033,090 | |
| | | | | | | | | |
| TOTAL INCREASE IN NET ASSETS | | | 36,305,953 | | | | 13,052,979 | |
| | | | | | | | | |
| NET ASSETS | | | | | | | | |
| Beginning of period | | | 13,152,979 | | | | 100,000 | |
| End of period | | $ | 49,458,932 | | | $ | 13,152,979 | |
| | | | | | | | | |
| ACCUMULATED NET INVESTMENT LOSS | | $ | (71,320 | ) | | $ | (9,637 | ) |
| | | | | | | | | |
| CAPITAL SHARE ACTIVITY | | | | | | | | |
| Shares sold | | | 2,456,381 | | | | 1,060,310 | |
| Shares reinvested | | | — | | | | 1,764 | |
| Shares redeemed | | | (73,963 | ) | | | (35,367 | ) |
| Net increase in shares outstanding | | | 2,382,418 | | | | 1,026,707 | |
| Shares outstanding at beginning of period | | | 1,036,707 | | | | 10,000 | |
| Shares outstanding at end of period | | | 3,419,125 | | | | 1,036,707 | |
| (a) | Represents the period from the commencement of operations (June 29, 2012) through May 31, 2013. |
| See accompanying notes to financial statements. |
APEXcm SMALL/MID CAP GROWTH FUND FINANCIAL HIGHLIGHTS | |
Per Share Data for a Share Outstanding Throughout each Period | |
| | Six Months Ended November 30, 2013 (Unaudited) | | | Period Ended May 31, 2013(a) | |
| Net asset value at beginning of period | | $ | 12.69 | | | $ | 10.00 | |
| | | | | | | | | |
| Income (loss) from investment operations: | | | | | | | | |
| Net investment income (loss) | | | (0.01 | ) | | | 0.04 | (b) |
| Net realized and unrealized gains on investments | | | 1.79 | | | | 2.72 | |
| Total from investment operations | | | 1.78 | | | | 2.76 | |
| | | | | | | | | |
| Less distributions: | | | | | | | | |
| From net investment income | | | — | | | | (0.07 | ) |
| | | | | | | | | |
| Net asset value at end of period | | $ | 14.47 | | | $ | 12.69 | |
| | | | | | | | | |
Total return (c) | | | 14.03% | (d) | | | 27.65% | (d) |
| | | | | | | | | |
| Net assets at end of period (000's) | | $ | 49,459 | | | $ | 13,153 | |
| | | | | | | | | |
| Ratios/supplementary data: | | | | | | | | |
| Ratio of total expenses to average net assets | | | 1.71% | (e) | | | 4.87% | (e) |
| | | | | | | | | |
Ratio of net expenses to average net assets (f) | | | 1.05% | \(e) | | | 1.05% | (e) |
| | | | | | | | | |
Ratio of net investment income (loss)
to average net assets (f) | | | (0.40% | )(e) | | | 0.26% | (e) |
| | | | | | | | | |
| Portfolio turnover rate | | | 23% | (d) | | | 18% | (d) |
| (a) | Represents the period from the commencement of operations (June 29, 2012) through May 31, 2013. |
| (b) | Calculated using weighted average shares outstanding during the period. |
| (c) | Total return is a measure of the change in value of an investment in the Fund over the period covered. The returns shown do not reflect the deduction of taxes a shareholder would pay on Fund distributions, if any, or the redemption of Fund shares. The total returns would be lower if the Adviser had not reduced advisory fees and/or reimbursed expenses. |
| (d) | Not annualized. |
| (e) | Annualized. |
| (f) | Ratio was determined after advisory fee reductions and/or expense reimbursements (Note 4). |
| See accompanying notes to financial statements. |
APEXcm SMALL/MID CAP GROWTH FUND
NOTES TO FINANCIAL STATEMENTS
November 30, 2013 (Unaudited)
1. Organization
APEXcm Small/Mid Cap Growth Fund (the “Fund”) is a diversified series of Ultimus Managers Trust (the “Trust”), an open-end investment company established as an Ohio business trust under a Declaration of Trust dated February 28, 2012. Other series of the Trust are not incorporated in this report. The Fund commenced operations on June 29, 2012.
The investment objective of the Fund is long-term capital growth.
2. Significant Accounting Policies
The following is a summary of the Fund’s significant accounting policies. The policies are in conformity with accounting principles generally accepted in the United States of America (“GAAP”).
Securities valuation – The Fund’s portfolio securities are valued at market value as of the close of regular trading on the New York Stock Exchange (the “NYSE”) (normally 4:00 p.m. Eastern time) on each business day the NYSE is open. Securities listed on the NYSE or other exchanges are valued on the basis of their last sales prices on the exchanges on which they are primarily traded. If there are no sales on that day, the securities are valued at the closing bid price on the NYSE or other primary exchange for that day. NASDAQ listed securities are valued at the NASDAQ Official Closing Price. If there are no sales on that day, the securities are valued at the last bid price as reported by NASDAQ. Securities traded in the over-the-counter market are valued at the last sale price, if available, otherwise at the most recently quoted bid price. In the event that market quotations are not readily available or are considered unreliable due to market or other events, securities and other assets are valued at fair value as determined in good faith in accordance with procedures adopted by the Board of Trustees of the Trust and will be classified as Level 2 or 3 within the fair value hierarchy (see below), depending on the inputs used. Factors determining portfolio investments subject to fair value determination include, but are not limited to, the following: the spread between bid and asked prices is substantial; infrequency of sales; thinness of market; the size of reported trades; a temporary lapse in the provision of prices by any reliable pricing source; and actions of the securities or futures markets, such as the suspension or limitation of trading. Securities with remaining maturities of 60 days or less are valued at amortized cost value, absent unusual circumstances.
GAAP establishes a single authoritative definition of fair value, sets out a framework for measuring fair value and requires additional disclosures about fair value measurements.
APEXcm SMALL/MID CAP GROWTH FUND NOTES TO FINANCIAL STATEMENTS (Continued) |
Various inputs are used in determining the value of the Fund’s investments. These inputs are summarized in the three broad levels listed below:
| • | Level 1 – quoted prices in active markets for identical securities |
| • | Level 2 – other significant observable inputs |
| • | Level 3 – significant unobservable inputs |
The inputs or methodology used for valuing securities are not necessarily an indication of the risks associated with investing in those securities. The inputs used to measure fair value may fall into different levels of the fair value hierarchy. In such cases, for disclosure purposes, the level in the fair value hierarchy within which the fair value measurement falls in its entirety is determined based on the lowest level input that is significant to the fair value measurement.
The following is a summary of the inputs used to value the Fund’s investments as of November 30, 2013:
| | | | | | | | | | | | |
| Common Stocks | | $ | 46,838,565 | | | $ | — | | | $ | — | | | $ | 46,838,565 | |
| Money Market Funds | | | 2,889,471 | | | | — | | | | — | | | | 2,889,471 | |
| Total | | $ | 49,728,036 | | | $ | — | | | $ | — | | | $ | 49,728,036 | |
Refer to the Fund’s Schedule of Investments for a listing of the common stocks by industry type. As of November 30, 2013, the Fund did not have any transfers in and out of any Level. In addition, the Fund did not have derivative instruments or any assets or liabilities that were measured at fair value on a recurring basis using significant unobservable inputs (Level 3) as of November 30, 2013. It is the Fund’s policy to recognize transfers into and out of any Level at the end of the reporting period.
Share valuation – The net asset value per share of the Fund is calculated daily by dividing the total value of the Fund’s assets, less liabilities, by the number of shares outstanding. The offering price and redemption price per share of the Fund is equal to the net asset value per share.
Investment income – Dividend income is recorded on the ex-dividend date. Interest income is accrued as earned.
Security transactions – Security transactions are accounted for on the trade date. Gains and losses on securities sold are determined on a specific identification basis.
APEXcm SMALL/MID CAP GROWTH FUND NOTES TO FINANCIAL STATEMENTS (Continued) |
Common expenses – Common expenses of the Trust are allocated among the Fund and the other series of the Trust based on the relative net assets of each series or the nature of the services performed and the relative applicability to each series.
Distributions to shareholders – Distributions to shareholders arising from net investment income and net realized capital gains, if any, are distributed at least once each year. The amount of distributions from net investment income and net realized gains are determined in accordance with federal income tax regulations, which may differ from GAAP. Dividends and distributions to shareholders are recorded on the ex-dividend date. The tax character of distributions paid during the periods ended November 30, 2013 and May 31, 2013 was as follows:
| | | | | | | | | |
| November 30, 2013 | | $ | — | | | $ | — | | | $ | — | |
| May 31, 2013 | | $ | 19,469 | | | $ | — | | | $ | 19,469 | |
On December 31, 2013, the Fund paid short-term and long-term capital gains to shareholders of $0.0572 and $0.0036 per share, respectively. The distributions were paid on December 31, 2013 to shareholders of record on December 30, 2013.
Estimates – The preparation of financial statements in conformity with GAAP requires management to make estimates and assumptions that affect the reported amounts of assets and liabilities and disclosure of contingent assets and liabilities as of the date of the financial statements and the reported amounts of income and expenses during the reporting period. Actual results could differ from those estimates.
Federal income tax – It is the Fund’s intention to qualify as a regulated investment company under the Internal Revenue Code of 1986 (the “Code”). Qualification generally will relieve the Fund of liability for federal income taxes to the extent 100% of its net investment income and net realized gains are distributed in accordance with the Code. Accordingly, no provision for income tax has been made.
In order to avoid imposition of the excise tax applicable to regulated investment companies, it is also the Fund’s intention to declare as dividends in each calendar year at least 98% of its net investment income (earned during the calendar year) and 98.2% of its net realized capital gains (earned during the twelve months ended October 31) plus undistributed amounts from prior years.
APEXcm SMALL/MID CAP GROWTH FUND NOTES TO FINANCIAL STATEMENTS (Continued) |
The following information is computed on a tax basis for each item as of November 30, 2013:
| Tax cost of portfolio investments | | $ | 43,937,018 | |
| Gross unrealized appreciation | | $ | 6,371,456 | |
| Gross unrealized depreciation | | | (580,438 | ) |
| Net unrealized appreciation | | | 5,791,018 | |
| Accumulated ordinary loss | | | (71,320 | ) |
| Capital loss carryforward | | | (33,360 | ) |
| Other gains | | | 354,526 | |
| Total accumulated earnings | | $ | 6,040,864 | |
The difference between the federal income tax cost of portfolio investments and the financial statement cost is due to certain timing differences in the recognition of capital gains or losses under income tax regulations and GAAP. These “book/tax” differences are temporary in nature and are primarily due to the tax deferral of losses on wash sales.
As of May 31, 2013, the Fund had a short-term capital loss carryforward in the amount of $33,360. This capital loss carryforward, which does not expire, may be utilized in the current and future years to offset net realized capital gains, if any, prior to distributing such gains to shareholders.
The Fund recognizes the tax benefits or expenses of uncertain tax positions only when the position is “more likely than not” to be sustained assuming examination by tax authorities. Management has reviewed the Fund’s tax positions for all open tax periods (period ended May 31, 2013) and has concluded that no provision for unrecognized tax benefits or expenses is required in these financial statements.
3. Investment Transactions
During the six months ended November 30, 2013, cost of purchases and proceeds from sales of investment securities, other than short-term investments, were $35,864,560 and $6,761,046, respectively.
4. Transactions with Related Parties
INVESTMENT ADVISORY AGREEMENT
The Fund’s investments are managed by the Adviser pursuant to the terms of an Investment Advisory Agreement. Under the Investment Advisory Agreement, the Fund pays the Adviser an advisory fee, computed and accrued daily and paid monthly, at the annual rate of 1.00% of its average daily net assets.
APEXcm SMALL/MID CAP GROWTH FUND NOTES TO FINANCIAL STATEMENTS (Continued) |
The Adviser has contractually agreed, until August 31, 2015, to reduce its advisory fees and to reimburse the Fund’s operating expenses (excluding brokerage costs, taxes, interest, costs to organize the Fund, acquired fund fees and expenses and extraordinary expenses) to the extent necessary so that the Fund’s annual ordinary operating expenses do not exceed an amount equal to 1.05% of its average daily net assets. Accordingly, the Adviser reduced its advisory fees in the amount of $103,631 during the six months ended November 30, 2013.
Advisory fee reductions and expense reimbursements by the Adviser are subject to repayment by the Fund for a period of three years after such fees and expenses were incurred, provided that the repayments do not cause the Fund’s ordinary operating expenses, at the time the repayment occurs, to exceed the expense limitation of 1.05% per annum. As of November 30, 2013, the Adviser may in the future recover advisory fee reductions and expense reimbursements totaling $248,507. The Adviser may recover a portion of this amount no later than the dates as stated below:
| May 31, 2016 | | $ | 144,876 | |
| November 30, 2016 | | | 103,631 | |
| | | $ | 248,507 | |
Certain officers of the Fund are also officers of the Adviser.
OTHER SERVICE PROVIDERS
Ultimus Fund Solutions, LLC (“Ultimus”) provides fund administration, fund accounting, compliance and transfer agency services to the Fund. Pursuant to seperate servicing agreements with Ultimus, the Fund pays Ultimus a customary fee for its services. Certain officers of the Trust are also officers of Ultimus.
DISTRIBUTION AGREEMENT
Under the terms of a Distribution Agreement with the Trust, Ultimus Fund Distributors, LLC (the “Distributor”) serves as principal underwriter to the Fund. The Distributor is a wholly-owned subsidiary of Ultimus.
TRUSTEE COMPENSATION
Each Trustee who is not an interested person of the Trust receives from the Fund a fee of $500 for each Board meeting attended plus reimbursement of travel and other expenses incurred in attending the meetings. Trustees affiliated with the Adviser or Ultimus are not compensated by the Trust for their services.
APEXcm SMALL/MID CAP GROWTH FUND NOTES TO FINANCIAL STATEMENTS (Continued) |
5. Contingencies and Commitments
The Fund indemnifies the Trust’s officers and Trustees for certain liabilities that might arise from their performance of their duties to the Fund. Additionally, in the normal course of business the Fund enters into contracts that contain a variety of representations and warranties and which provide general indemnifications. The Fund’s maximum exposure under these arrangements is unknown, as this would involve future claims that may be made against the Fund that have not yet occurred. However, based on experience, the Fund expects the risk of loss to be remote.
6. Sector Risk
If the Fund has significant investments in the securities of issuers in industries within a particular sector, any development affecting that sector will have a greater impact on the value of the net assets of the Fund than would be the case if the Fund did not have significant investments in that sector. In addition, this may increase the risk of loss of an investment in the Fund and increase the volatility of the Fund’s net asset value per share. From time to time, a particular set of circumstances may affect this sector or other companies within the sector. For instance, economic or market factors, regulation or deregulation, and technological or other developments may negatively impact all companies in a particular sector and, therefore, the value of the Fund’s portfolio could be adversely affected. As of November 30, 2013, the Fund had 26.4% of the value of its net assets invested in stocks within the Information Technology sector.
7. Subsequent Events
The Fund is required to recognize in the financial statements the effects of all subsequent events that provide additional evidence about conditions that existed as of the date of the Statement of Assets and Liabilities. For non-recognized subsequent events that must be disclosed to keep the financial statements from being misleading, the Fund is required to disclose the nature of the event as well as an estimate of its financial effect, or a statement that such an estimate cannot be made. Management has evaluated subsequent events through the issuance of these financial statements and has noted no such events.
APEXcm SMALL/MID CAP GROWTH FUND ABOUT YOUR FUND’S EXPENSES (Unaudited) |
We believe it is important for you to understand the impact of costs on your investment. As a shareholder of the Fund, you incur ongoing costs, including management fees and other operating expenses. The following examples are intended to help you understand your ongoing costs (in dollars) of investing in the Fund and to compare these costs with the ongoing costs of investing in other mutual funds.
A mutual fund’s ongoing costs are expressed as a percentage of its average net assets. This figure is known as the expense ratio. The expenses in the table below are based on an investment of $1,000 made at the beginning of the most recent period (June 1, 2013) and held until the end of the period (November 30, 2013).
The table below illustrates the Fund’s ongoing costs in two ways:
Actual fund return – This section helps you to estimate the actual expenses that you paid over the period. The “Ending Account Value” shown is derived from the Fund’s actual return, and the third column shows the dollar amount of operating expenses that would have been paid by an investor who started with $1,000 in the Fund. You may use the information here, together with the amount you invested, to estimate the expenses that you paid over the period.
To do so, simply divide your account value by $1,000 (for example, an $8,600 account value divided by $1,000 = 8.6), then multiply the result by the number given for the Fund under the heading “Expenses Paid During Period.”
Hypothetical 5% return – This section is intended to help you compare the Fund’s ongoing costs with those of other mutual funds. It assumes that the Fund had an annual return of 5% before expenses during the period shown, but that the expense ratio is unchanged. In this case, because the return used is not the Fund’s actual return, the results do not apply to your investment. The example is useful in making comparisons because the SEC requires all mutual funds to calculate expenses based on a 5% return. You can assess the Fund’s ongoing costs by comparing this hypothetical example with the hypothetical examples that appear in shareholder reports of other funds.
Note that expenses shown in the table are meant to highlight and help you compare ongoing costs only. The Fund does not charge transaction fees, such as purchase or redemption fees, nor does it carry a “sales load.”
The calculations assume no shares were bought or sold during the period. Your actual costs may have been higher or lower, depending on the amount of your investment and the timing of any purchases or redemptions.
APEXcm SMALL/MID CAP GROWTH FUND ABOUT YOUR FUND’S EXPENSES (Unaudited) (Continued) |
More information about the Fund’s expenses can be found in this report. For additional information on operating expenses and other shareholder costs, please refer to the Fund’s prospectus.
| Beginning Account Value June 1, 2013 | Ending Account Value November 30, 2013 | Expenses Paid During Period* |
| Based on Actual Fund Return | $1,000.00 | $1,140.30 | $5.63 |
| Based on Hypothetical 5% Return (before expenses) | $1,000.00 | $1,019.80 | $5.32 |
| * | Expenses are equal to the Fund’s annualized expense ratio of 1.05% for the period, multiplied by the average account value over the period, multiplied by 183/365 (to reflect the one-half year period). |
OTHER INFORMATION (Unaudited) |
A description of the policies and procedures that the Fund uses to vote proxies relating to portfolio securities is available without charge upon request by calling toll-free 1-888-575-4800, or on the SEC’s website at http://www.sec.gov. Information regarding how the Fund voted proxies relating to portfolio securities during the most recent 12-month period ended June 30 is available without charge upon request by calling toll-free 1-888-575-4800, or on the SEC’s website at http://www.sec.gov.
The Trust files a complete listing of portfolio holdings for the Fund with the SEC as of the end of the first and third quarters of each fiscal year on Form N-Q. These filings are available upon request by calling 1-888-575-4800. Furthermore, you may obtain a copy of the filings on the SEC’s website at http://www.sec.gov. The Trust’s Forms N-Q may also be reviewed and copied at the SEC’s Public Reference Room in Washington, DC, and information on the operation of the Public Reference Room may be obtained by calling 1-800-SEC-0330.
This page intentionally left blank.
BARROW ALL-CAP CORE FUND
INVESTOR CLASS (BALAX)
INSTITUTIONAL CLASS (BALIX)
BARROW ALL-CAP LONG/SHORT FUND
INVESTOR CLASS (BFLSX)
INSTITUTIONAL CLASS (BFSLX)
Semi-Annual Report
November 30, 2013
(Unaudited)
BARROW ALL-CAP CORE FUND LETTER TO SHAREHOLDERS | |
Dear Shareholder,
Barrow Street Advisors LLC re-organized the Barrow Street Fund LP, a private investment partnership started on 12/31/2008 (the “Predecessor Partnership”), into the Barrow All-Cap Core Fund (the “Fund”) on the close of business August 30, 2013. For the quarter ended November 30, 2013, the Fund’s Institutional Class posted a total return of +12.49%, which compared favorably against a +11.16% total return for the S&P 500 Index and -1.42% for Bloomberg’s 10-Year U.S. Treasury index. Calendar year-to-date the Fund’s Institutional Class generated a total return of +35.38% compared to +29.12% for the S&P 500. Since 12/31/08, the Fund has generated a total return of +162.10% compared to +122.56% for the S&P 500.
The Fund continued to implement its Systematic Quality Value (“SQV”) strategy, which seeks to employ a disciplined and dispassionate approach to investing in diverse sub-portfolios of high quality companies at prices that are well below our estimate of their intrinsic value. During the quarter, we invested in three new sub-portfolios comprising multiple industry sectors and market capitalizations and composed of numerous businesses with strong balance sheets that are growing, generating ample free cash flow, and re-investing that cash at high internal rates of return.
Drawing on our firm's 17 years of private and public equity investment experience and research, we made these investments with confidence that the market price of a well-constructed portfolio of high-quality stocks purchased at bargain levels will trend toward our estimate of its intrinsic value over time. Our portfolio is highly diversified by market cap segment, sector, industry, and position size.
Our investments are sourced by taking account of the opportunity set of all companies in our broad investment universe each time we commit capital to a new position. We think this approach allows us to uncover investment opportunities that arise from temporary market inefficiencies and to gather up the most compelling investments across a wide array of industries and market caps without the behavioral biases inherent in concentrated-stock and sector-specialized investing.
With regard to hold period, we typically give the market at least one year to re-appraise each of the Fund’s sub-portfolios. The idea here is that it takes time from the date of our investment in any given company for the market to realize that it is trading cheap to its intrinsic value and has high quality business metrics. We are more interested in the performance of each of our diversified sub-portfolios taken as a whole than that of any one position.
The three best-performing positions for the quarter were Endo Health Solutions, Inc., Nu Skin Enterprises, Inc. and Sturm Ruger & Company Inc., which generated total returns of +63.52%, +53.12% and +48.05%, respectively, and contributed to the Fund’s return by 94 bps, 86 bps and 55 bps, respectively. The three worst-performing positions were Questcor Pharmaceuticals, Inc., Terra Nitrogen Company, L.P., and Select Comfort Corp., which generated total returns of (12.61%), (26.17%) and (14.53%), respectively, and reduced the Fund’s return by 18 bps, 18 bps and 10 bps, respectively.
None of our holdings was announced as a take-over target during the quarter. On average, the Fund has experienced three take-outs per quarter, for a total of 54 since 12/31/08, or roughly 4x the market average.1 The control premia we have captured by virtue of holding stocks which end up being merger targets has made repeated and meaningful contributions to the Fund’s total returns, and we expect to continue to benefit from this effect going forward. We remove companies from the Fund’s portfolio soon after they are announced as take-over targets and re-invest that capital.
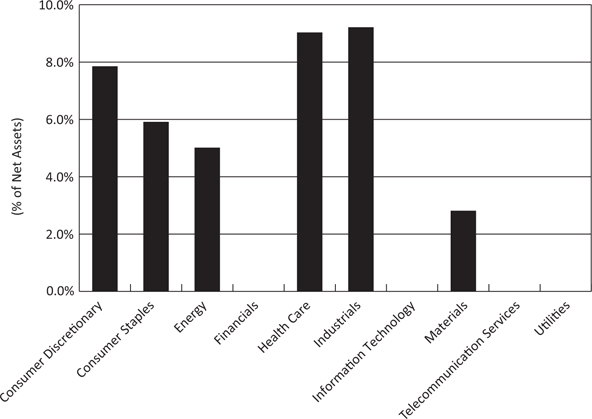
For the quarter, the portfolio generated a price return of +12.16%, including +14.09% for large caps, +10.19% for mid caps and +11.18% for small caps. This compares to +10.58% for the S&P 500 Index, +10.16% for the S&P 400 Midcap Index, and +13.06% for the Russell 2000 Index. Our sectors with the best absolute performance were health care and industrials, which generated price returns of +16.02% and +15.96%, respectively. Our sectors that did least well were materials and consumer discretionary, which returned +1.32% and +8.75%, respectively.
Going forward, we believe the Fund is well positioned for near-term and long-term success given the quality and value attributes of its stock portfolio. We expect the Fund will continue to outperform its benchmarks over time.
The Fund’s portfolio had a position-weighted EBIT (Earnings Before Interest and Taxes) yield of 9.30% on 11/30/13, which compares favorably with the 6.91% EBIT yield for the S&P 500 and the 2.74% yield-to-maturity of the benchmark 10-year U.S. Treasury note. The Fund’s dividend yield was 2.5%, which was 25% higher than that of the S&P 500. These healthy vital signs are consistent with the use of our private equity framework, which among other things focuses on cash flow over GAAP earnings, in selecting securities for investment.
In addition to the attractive valuation level of our portfolio, we expect to benefit from the absolute and relative level of quality fundamentals in our holdings. As of 11/30/13, our portfolio had the following position-weighted quality characteristics relative to the S&P 500 (SPX): return on equity (29.0% vs. 14.5% SPX); return on assets (13.7% vs. 3.1% SPX), operating margin (19.5% vs. 13.5% SPX) and debt-to-enterprise value (15.1% vs. 33.5% SPX).
Sincerely,
| Nicholas Chermayeff | Robert F. Greenhill, Jr. | David R. Bechtel |
| Co-Portfolio Manager, | Co-Portfolio Manager, | Principal, |
| Investment Committee | Investment Committee | Investment Committee |
| 1 | Barrow calculates the frequency of merger and acquisition (“M&A”) activity in its portfolio on a quarterly basis by dividing the cumulative number of portfolio holdings that have been announced as merger or acquisition targets by the cumulative number of unique holdings it has held in its portfolio. Barrow calculates the frequency of M&A activity in the market on a quarterly basis by dividing the cumulative number of publicly-traded U.S. common stocks that have been announced as acquisition targets per Bloomberg by the total universe of publicly-traded U.S. common stocks as identified by Bloomberg (approximately 10,000). The ratio of portfolio M&A frequency to market-wide M&A frequency is calculated by dividing the portfolio’s average of quarterly M&A frequency since inception 12/31/08 by the market-wide average of quarterly M&A frequency since inception 12/31/08. |
Past performance is not predictive of future performance. Investment results and principal value will fluctuate so that shares, when redeemed, may be worth more or less than their original cost. Current performance may be higher or lower than the performance data quoted. Performance data current to the most recent month end are available by calling 1-877-767-6633.
An investor should consider the investment objectives, risks, charges and expenses of the Fund carefully before investing. The Fund’s prospectus contains this and other important information. To obtain a copy of the Fund’s prospectus please visit our website at www.barrowfunds.com or call 1-877-767-6633 and a copy will be sent to you free of charge. Please read the prospectus carefully before you invest. The Fund is distributed by Ultimus Fund Distributors, LLC.
The Letter to Shareholders seeks to describe some of the Adviser’s current opinions and views of the financial markets. Although the Adviser believes it has a reasonable basis for any opinions or views expressed, actual results may differ, sometimes significantly so, from those expected or expressed. The securities held by the Fund that are discussed in the Letter to Shareholders were held during the period covered by this Report. They do not comprise the entire investment portfolio of the Fund, may be sold at any time and may no longer be held by the Fund. The opinions of the Fund’s Adviser with respect to those securities may change at any time. The 30-day SEC yield for the Fund as of November 30, 2013 was 0.86%.
The investment related and performance information discussed above for periods prior to Barrow All-Cap Core Fund’s inception date (close of business August 30, 2013) are based on the activities of the Fund’s predecessor, the Barrow Street Fund LP, an unregistered limited partnership managed by the portfolio managers of Barrow All-Cap Core Fund (the “Predecessor Private Fund”). The Predecessor Private Fund was reorganized into the Institutional Class shares on close of business August 30, 2013, the date that Barrow All- Cap Core Fund commenced operations. Barrow All-Cap Core Fund has been managed in the same style and by the same portfolio managers since the Predecessor Private Fund’s inception on December 31, 2008. The performance information shows the Predecessor Private Fund’s returns calculated using the actual fees and expenses that were charged by the Predecessor Private Fund. This prior performance is net of management fees and other expenses but does not include the effect of the Predecessor Private Fund’s performance fee which was in place until October 7, 2012. From the Predecessor Private Fund’s inception on December 31, 2008 through the date of this prospectus, the Predecessor Private Fund was not subject to certain investment restrictions, diversification requirements and other restrictions of the Investment Company Act of 1940, as amended (the “1940 Act”) or Subchapter M of the Internal Revenue Code of 1986, as amended, which, if they had been applicable, might have adversely affected Barrow All-Cap Core Fund’s performance.
BARROW ALL-CAP LONG/SHORT FUND LETTER TO SHAREHOLDERS | |
Dear Shareholder,
On the close of business August 30, 2013, Barrow Street Advisors LLC launched the Barrow All-Cap Long/Short Fund (the “Fund”). For the quarter ended November 30, 2013, the Fund’s Institutional Class posted a total return of 4.40%, which compares to 11.16% for the S&P 500 Index and -1.42% for Bloomberg’s 10-Year U.S. Treasury index. The Fund maintains a gross exposure of approximately 220% of its net capital with long exposure of 130%, short exposure of 90%, and net exposure of 40%.
The Fund continued to implement its Systematic Quality Value (“SQV”) strategy, which seeks to employ a disciplined and dispassionate approach to investing in diverse sub-portfolios of companies at prices that are well below (longs) or well above (shorts) our appraisal of their intrinsic value. During the quarter, we invested in three new sub-portfolios comprising multiple industry sectors and market capitalizations. We purchased long many high quality businesses with strong balance sheets that are growing, generating ample free cash flow, and re-investing that cash at high internal rates of return. In tandem, we sold short four times as many companies that we consider to be overpriced with poor quality characteristics. Our short positions are tailored to our long positions by market capitalization and sector.
Drawing on our firm's 17 years of private and public equity investment experience and research, we made these investments with confidence that the market price of a well-constructed portfolio of high (or low) quality stocks purchased at bargain (or lofty) levels will trend toward our estimate of its intrinsic value over time. Our long and short portfolios are highly diversified by market cap segment, sector, industry, and position size.
Our investments are sourced by taking account of the opportunity set of all companies in our broad investment universe each time we commit capital to a new position. We think this approach allows us to uncover investment opportunities that arise from temporary market inefficiencies and to gather up the most compelling investments across a wide array of industries and market caps without the behavioral biases inherent in concentrated-stock and sector-specialized investing.
With regard to hold period, we typically give the market at least one year to re-appraise each of the Fund’s positions. The idea here is that it takes time from the date of our investment in any given company for the market to realize that it is trading at a large discount or premium to its intrinsic value, especially when re-considered in light of the high or low quality of their business characteristics. We are more interested in the average performance of each of our diversified sub-portfolios taken as a whole than that of any one position.
The three best-performing positions for the quarter were Endo Health Solutions, Inc. (long), Nu Skin Enterprises, Inc. (long) and Sturm Ruger & Company Inc. (long), which generated total returns of +63.52%, +53.12% and +48.05%, respectively, and increased
the Fund’s return by 121 bps, 112 bps and 71 bps, respectively. The three worst-performing positions were Mako Surgical Corp. (short), Questcor Pharmaceuticals, Inc. (long) and Terra Nitrogen Company, L.P. (long), which generated total returns of +100.13%, -12.61% and -26.17%, respectively, and reduced the Fund’s return by 37 bps, 24 bps and 23 bps, respectively.
None of our long holdings was announced as a take-over target during the quarter. On average, our firm’s investments have experienced three long take-outs per quarter, for a total of 54 since 12/31/08, or roughly four times the market average.1 The control premia we have captured by virtue of holding stocks which end up being merger targets has made repeated and meaningful contributions to our firm’s investments over the years, and we expect to continue to benefit from this effect going forward. We remove companies from the Fund’s portfolio soon after they are announced as take-over targets and re-invest that capital.
During the quarter, the long portfolio generated a price return of +12.16%, including +14.03% for large caps, +10.21% for mid caps and +11.24% for small caps. This compares to +10.58% for the S&P 500 Index, +10.16% for the S&P 400 Midcap Index, and +13.06% for the Russell 2000 Index. Our sectors with the best performance were industrials and health care, which generated price returns of +15.89% and +15.87%, respectively. The two sectors that did least well were consumer discretionary and materials, which returned +8.77% and +1.38%, respectively. Given its gross weight of approximately 130% of the Fund’s net assets, the long portfolio contributed 1570 basis points to the Fund’s return over the quarter.
The short portfolio generated a price return of -12.06%, including -10.25% for large caps, -11.88% for mid caps and -14.52% for small caps. Our sectors with the best performance were health care and energy, which generated price returns of +2.69% and -6.86%, respectively. Our sectors that did least well were industrials and health care, which returned -14.24% and -14.15%, respectively. Given its gross weight of approximately 90% of the Fund’s net assets, the short portfolio reduced by 1085 basis points the Fund’s return over the quarter.
Going forward, we believe the Fund is well positioned for near-term and long-term success given the fundamental quality and value attributes of its positions and its hedged portfolio, designed to reduce price volatility. We expect the Fund’s long and short portfolios to outperform its benchmarks over time.
The Fund’s long portfolio had a position-weighted EBIT (Earnings Before Interest and Taxes) yield of 9.30% on 11/30/13, which compares favorably with the 6.91% EBIT yield for the S&P 500 and the 2.74% yield-to-maturity of the benchmark 10-year U.S. Treasury note. The short portfolio’s position-weighted EBIT yield of 2.15% is substantially lower than the average stock in the market, indicating to us that these securities are significantly overpriced relative to market levels. The Fund’s returns would benefit if the prices of these stocks were to drop. Furthermore, our long portfolio had an attractive dividend yield of 2.5%, which was nearly twice that of the short portfolio (1.3%) and 25% higher than that of the S&P 500 (2.0%). These healthy vital signs are consistent with the use of our private equity framework, which among other things focuses on cash flow over GAAP earnings, in selecting securities for investment.
In addition to the attractive valuation levels of our portfolio, we expect to benefit from the absolute and relative level of quality fundamentals in our holdings. As of 11/30/13, our long and short portfolios had the following position-weighted quality characteristics relative to the S&P 500 (SPX): return on equity (29.0%/8.1% L/S vs. 14.5% SPX); return on assets (13.7%/2.5% L/S vs. 3.1% SPX), operating margin (19.5%/1.8% L/S vs. 13.5% SPX) and debt-to-enterprise value (15.1%/19.0% L/S vs. 33.5% SPX).
Sincerely,
| Nicholas Chermayeff | Robert F. Greenhill, Jr. | David R. Bechtel |
| Co-Portfolio Manager, | Co-Portfolio Manager, | Principal, |
| Investment Committee | Investment Committee | Investment Committee |
| 1 | Barrow calculates the frequency of merger and acquisition (“M&A”) activity in its portfolio on a quarterly basis by dividing the cumulative number of portfolio holdings that have been announced as merger or acquisition targets by the cumulative number of unique holdings it has held in its portfolio. Barrow calculates the frequency of M&A activity in the market on a quarterly basis by dividing the cumulative number of publicly-traded U.S. common stocks that have been announced as acquisition targets per Bloomberg by the total universe of publicly-traded U.S. common stocks as identified by Bloomberg (approximately 10,000). The ratio of portfolio M&A frequency to market-wide M&A frequency is calculated by dividing the portfolio’s average of quarterly M&A frequency since inception 12/31/08 by the market-wide average of quarterly M&A frequency since inception 12/31/08. |
Past performance is not predictive of future performance. Investment results and principal value will fluctuate so that shares, when redeemed, may be worth more or less than their original cost. Current performance may be higher or lower than the performance data quoted. Performance data current to the most recent month end are available by calling 1-877-767-6633.
An investor should consider the investment objectives, risks, charges and expenses of the Fund carefully before investing. The Fund’s prospectus contains this and other important information. To obtain a copy of the Fund’s prospectus please visit our website at www.barrowfunds.com or call 1-877-767-6633 and a copy will be sent to you free of charge. Please read the prospectus carefully before you invest. The Fund is distributed by Ultimus Fund Distributors, LLC.
The Letter to Shareholders seeks to describe some of the Adviser’s current opinions and views of the financial markets. Although the Adviser believes it has a reasonable basis for any opinions or views expressed, actual results may differ, sometimes significantly so, from those expected or expressed. The securities held by the Fund that are discussed in the Letter to Shareholders were held during the period covered by this Report. They do not comprise the entire investment portfolio of the Fund, may be sold at any time and may no longer be held by the Fund. The opinions of the Fund’s Adviser with respect to those securities may change at any time. The 30-day SEC yield for the Fund as of November 30, 2013 was -0.94%.
BARROW ALL-CAP CORE FUND
PORTFOLIO INFORMATION
November 30, 2013 (Unaudited)
Sector Diversification
Top 10 Equity Holdings
| | |
| Nu Skin Enterprises, Inc. - Class A | | 1.63% |
| Endo Health Solutions, Inc. | | 1.47% |
| Questcor Pharmaceuticals, Inc. | | 1.47% |
| AmSurg Corporation | | 1.37% |
| Northrop Grumman Corporation | | 1.33% |
| Express, Inc. | | 1.29% |
| Raytheon Company | | 1.29% |
| Cardinal Health, Inc. | | 1.28% |
| Deluxe Corporation | | 1.27% |
| USANA Health Sciences, Inc. | | 1.24% |
BARROW ALL-CAP LONG/SHORT FUND
PORTFOLIO INFORMATION
November 30, 2013 (Unaudited)
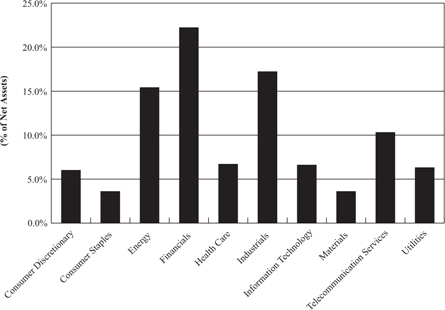
Net Sector Exposure Diversification*
| * | The net percentages are computed by taking the net dollar exposure, including short positions, and dividing by the net assets of the Fund. Consequently, the percentages will not total to 100%. |
| Top 10 Long Common Stocks | | Top 10 Short Common Stocks |
| | | | |
| Nu Skin Enterprises, Inc. - Class A | 2.10% | | West Pharmaceutical Services, Inc. | 0.58% |
| Endo Health Solutions, Inc. | 1.90% | | athenahealth, Inc. | 0.57% |
| Questcor Pharmaceuticals, Inc. | 1.90% | | Team Health Holdings, Inc. | 0.51% |
| AmSurg Corporation | 1.78% | | Align Technology, Inc. | 0.43% |
| Northrop Grumman Corporation | 1.73% | | Actavis plc | 0.42% |
| Express, Inc. | 1.66% | | Andersons, Inc. (The) | 0.42% |
| Raytheon Company | 1.66% | | Haemonetics Corporation | 0.41% |
| Cardinal Health, Inc. | 1.65% | | Constellation Brands, Inc. - Class A | 0.39% |
| Deluxe Corporation | 1.65% | | LifePoint Hospitals, Inc. | 0.39% |
| Dun & Bradstreet Corporation (The) | 1.60% | | Allscripts Healthcare Solutions, Inc. | 0.39% |
BARROW ALL-CAP CORE FUND SCHEDULE OF INVESTMENTS November 30, 2013 (Unaudited) | |
| | | | | | |
| Consumer Discretionary — 22.0% | | | | | | |
| Auto Components — 0.1% | | | | | | |
TRW Automotive Holdings Corporation (a) | | | 248 | | | $ | 19,245 | |
| | | | | | | | | |
| Automobiles — 0.1% | | | | | | | | |
Ford Motor Company (b) | | | 1,057 | | | | 18,054 | |
| | | | | | | | | |
| Diversified Consumer Services — 1.7% | | | | | | | | |
H&R Block, Inc. (b) | | | 5,539 | | | | 154,483 | |
Outerwall, Inc. (a) (b) | | | 1,648 | | | | 112,723 | |
Weight Watchers International, Inc. (b) | | | 2,082 | | | | 67,477 | |
| | | | | | | | 334,683 | |
| Hotels, Restaurants & Leisure — 0.7% | | | | | | | | |
International Game Technology (b) | | | 5,296 | | | | 92,627 | |
Interval Leisure Group, Inc. (b) | | | 1,218 | | | | 32,618 | |
| | | | | | | | 125,245 | |
| Household Durables — 0.6% | | | | | | | | |
iRobot Corporation (a) (b) | | | 769 | | | | 25,539 | |
Tempur Sealy International, Inc. (a) (b) | | | 919 | | | | 46,887 | |
Tupperware Brands Corporation (b) | | | 374 | | | | 34,161 | |
| | | | | | | | 106,587 | |
| Leisure Equipment & Products — 2.7% | | | | | | | | |
LeapFrog Enterprises, Inc. (a) (b) | | | 11,898 | | | | 102,442 | |
Smith & Wesson Holding Corporation (a) (b) | | | 16,825 | | | | 198,872 | |
Sturm, Ruger & Company, Inc. (b) | | | 2,851 | | | | 219,327 | |
| | | | | | | | 520,641 | |
| Media — 5.7% | | | | | | | | |
Crown Media Holdings, Inc. - Class A (a) (b) | | | 6,107 | | | | 20,458 | |
DIRECTV (a) (b) | | | 1,887 | | | | 124,750 | |
Gannett Company, Inc. (b) | | | 1,280 | | | | 34,637 | |
Interpublic Group of Companies, Inc. (b) | | | 9,930 | | | | 172,782 | |
John Wiley & Sons, Inc. - Class A (b) | | | 2,201 | | | | 112,163 | |
Meredith Corporation | | | 268 | | | | 14,295 | |
National CineMedia, Inc. (b) | | | 9,013 | | | | 168,092 | |
Omnicom Group, Inc. (b) | | | 3,051 | | | | 217,994 | |
Valassis Communications, Inc. (b) | | | 6,698 | | | | 196,653 | |
Viacom, Inc. - Class B (b) | | | 515 | | | | 41,288 | |
| | | | | | | | 1,103,112 | |
BARROW ALL-CAP CORE FUND SCHEDULE OF INVESTMENTS (Continued) | |
COMMON STOCKS — 100.0% (Continued) | | | | | | |
| Consumer Discretionary — 22.0% (Continued) | | | | | | |
| Specialty Retail — 7.5% | | | | | | |
American Eagle Outfitters, Inc. (b) | | | 8,188 | | | $ | 133,219 | |
Bed Bath & Beyond, Inc. (a) (b) | | | 1,400 | | | | 109,242 | |
Buckle, Inc. (The) (b) | | | 3,962 | | | | 210,224 | |
Cato Corporation (The) - Class A (b) | | | 1,092 | | | | 37,172 | |
Chico's FAS, Inc. (b) | | | 1,555 | | | | 29,063 | |
Express, Inc. (a) (b) | | | 10,065 | | | | 247,700 | |
Foot Locker, Inc. (b) | | | 4,095 | | | | 159,254 | |
Francesca's Holdings Corporation (a) (b) | | | 2,694 | | | | 52,856 | |
GameStop Corporation - Class A (b) | | | 4,174 | | | | 201,395 | |
Gap, Inc. (The) (b) | | | 2,404 | | | | 98,492 | |
Guess?, Inc. (b) | | | 530 | | | | 18,158 | |
Select Comfort Corporation (a) | | | 6,430 | | | | 135,737 | |
Staples, Inc. (b) | | | 1,226 | | | | 19,040 | |
| | | | | | | | 1,451,552 | |
| Textiles, Apparel & Luxury Goods — 2.9% | | | | | | | | |
Coach, Inc. (b) | | | 3,134 | | | | 181,458 | |
Iconix Brand Group, Inc. (a) (b) | | | 3,140 | | | | 124,595 | |
Steven Madden Ltd. (a) (b) | | | 5,985 | | | | 233,176 | |
Vera Bradley, Inc. (a) | | | 474 | | | | 11,907 | |
| | | | | | | | 551,136 | |
| Consumer Staples — 14.3% | | | | | | | | |
| Beverages — 1.5% | | | | | | | | |
Boston Beer Company, Inc. (The) - Class A (a) | | | 28 | | | | 6,854 | |
Dr Pepper Snapple Group, Inc. (b) | | | 3,972 | | | | 191,689 | |
National Beverage Corporation (b) | | | 3,925 | | | | 82,896 | |
| | | | | | | | 281,439 | |
| Food & Staples Retailing — 0.3% | | | | | | | | |
CVS Caremark Corporation | | | 299 | | | | 20,021 | |
Village Super Market, Inc. - Class A (b) | | | 1,235 | | | | 47,832 | |
| | | | | | | | 67,853 | |
| Food Products — 3.1% | | | | | | | | |
B&G Foods, Inc. (b) | | | 914 | | | | 31,652 | |
Darling International, Inc. (a) (b) | | | 9,906 | | | | 205,351 | |
Dean Foods Company (a) (b) | | | 1,613 | | | | 29,002 | |
Hillshire Brands Company (The) (b) | | | 1,490 | | | | 49,796 | |
Ingredion, Inc. | | | 253 | | | | 17,498 | |
Kraft Foods Group, Inc. | | | 354 | | | | 18,804 | |
Lancaster Colony Corporation (b) | | | 1,834 | | | | 158,934 | |
Mondelēz International, Inc. - Class A (b) | | | 952 | | | | 31,921 | |
BARROW ALL-CAP CORE FUND SCHEDULE OF INVESTMENTS (Continued) | |
COMMON STOCKS — 100.0% (Continued) | | | | | | |
| Consumer Staples — 14.3% (Continued) | | | | | | |
| Food Products — 3.1% (Continued) | | | | | | |
Pilgrim's Pride Corporation (a) (b) | | | 2,226 | | | $ | 36,462 | |
Seaboard Corporation | | | 7 | | | | 19,775 | |
| | | | | | | | 599,195 | |
| Household Products — 0.7% | | | | | | | | |
Energizer Holdings, Inc. (b) | | | 975 | | | | 107,591 | |
Spectrum Brands Holdings, Inc. (b) | | | 288 | | | | 20,327 | |
| | | | | | | | 127,918 | |
| Personal Products — 3.8% | | | | | | | | |
Inter Parfums, Inc. (b) | | | 3,731 | | | | 135,808 | |
Nu Skin Enterprises, Inc. - Class A (b) | | | 2,446 | | | | 312,697 | |
Revlon, Inc. - Class A (a) (b) | | | 2,012 | | | | 53,117 | |
USANA Health Sciences, Inc. (a) (b) | | | 3,257 | | | | 238,119 | |
| | | | | | | | 739,741 | |
| Tobacco — 4.9% | | | | | | | | |
Altria Group, Inc. (b) | | | 5,212 | | | | 192,740 | |
Lorillard, Inc. (b) | | | 4,267 | | | | 219,025 | |
Philip Morris International, Inc. (b) | | | 1,891 | | | | 161,756 | |
Reynolds American, Inc. (b) | | | 3,886 | | | | 196,048 | |
Vector Group Ltd. (b) | | | 10,073 | | | | 164,996 | |
| | | | | | | | 934,565 | |
| Energy — 11.2% | | | | | | | | |
| Energy Equipment & Services — 1.7% | | | | | | | | |
C&J Energy Services, Inc. (a) (b) | | | 7,530 | | | | 178,461 | |
Forum Energy Technologies, Inc. (a) (b) | | | 545 | | | | 14,720 | |
Geospace Technologies Corporation (a) | | | 201 | | | | 17,541 | |
Halliburton Company (b) | | | 801 | | | | 42,197 | |
National Oilwell Varco, Inc. (b) | | | 834 | | | | 67,971 | |
| | | | | | | | 320,890 | |
| Oil, Gas & Consumable Fuels — 9.5% | | | | | | | | |
Alon USA Energy, Inc. (b) | | | 6,824 | | | | 94,171 | |
Alon USA Partners, L.P. (b) | | | 3,891 | | | | 60,544 | |
Chevron Corporation (b) | | | 767 | | | | 93,911 | |
CVR Energy, Inc. (b) | | | 2,601 | | | | 102,688 | |
CVR Refining, L.P. (b) | | | 2,781 | | | | 66,744 | |
Delek US Holdings, Inc. (b) | | | 3,410 | | | | 103,187 | |
HollyFrontier Corporation (b) | | | 3,981 | | | | 191,008 | |
Marathon Oil Corporation (b) | | | 4,476 | | | | 161,315 | |
Marathon Petroleum Corporation (b) | | | 2,529 | | | | 209,249 | |
Northern Tier Energy, L.P. (b) | | | 7,478 | | | | 189,941 | |
Phillips 66 (b) | | | 1,600 | | | | 111,376 | |
BARROW ALL-CAP CORE FUND SCHEDULE OF INVESTMENTS (Continued) | |
COMMON STOCKS — 100.0% (Continued) | | | | | | |
| Energy — 11.2% (Continued) | | | | | | |
| Oil, Gas & Consumable Fuels — 9.5% (Continued) | | | | | | |
Renewable Energy Group, Inc. (a) (b) | | | 2,426 | | | $ | 27,584 | |
Rentech, Inc. (b) | | | 34,518 | | | | 62,478 | |
Stone Energy Corporation (a) | | | 229 | | | | 7,575 | |
Tesoro Corporation (b) | | | 1,566 | | | | 91,815 | |
VAALCO Energy, Inc. (a) (b) | | | 4,905 | | | | 29,675 | |
Western Refining, Inc. (b) | | | 5,823 | | | | 227,505 | |
| | | | | | | | 1,830,766 | |
| Health Care — 21.5% | | | | | | | | |
| Biotechnology — 4.6% | | | | | | | | |
Cubist Pharmaceuticals, Inc. (a) (b) | | | 1,567 | | | | 107,355 | |
Myriad Genetics, Inc. (a) (b) | | | 6,741 | | | | 200,545 | |
PDL BioPharma, Inc. (b) | | | 23,632 | | | | 230,885 | |
Spectrum Pharmaceuticals, Inc. | | | 13,094 | | | | 126,095 | |
United Therapeutics Corporation (a) (b) | | | 2,329 | | | | 214,990 | |
| | | | | | | | 879,870 | |
| Health Care Equipment & Supplies — 2.7% | | | | | | | | |
ArthroCare Corporation (a) (b) | | | 2,602 | | | | 98,147 | |
C.R. Bard, Inc. (b) | | | 704 | | | | 97,772 | |
CareFusion Corporation (a) | | | 460 | | | | 18,331 | |
Globus Medical, Inc. - Class A (a) (b) | | | 7,062 | | | | 136,014 | |
Medtronic, Inc. (b) | | | 1,840 | | | | 105,469 | |
St. Jude Medical, Inc. (b) | | | 1,113 | | | | 65,021 | |
| | | | | | | | 520,754 | |
| Health Care Providers & Services — 9.4% | | | | | | | | |
AmerisourceBergen Corporation (b) | | | 3,147 | | | | 221,958 | |
AMN Healthcare Services, Inc. (a) (b) | | | 1,850 | | | | 25,678 | |
AmSurg Corporation (a) (b) | | | 5,464 | | | | 264,020 | |
Bio-Reference Laboratories, Inc. (a) (b) | | | 3,091 | | | | 90,257 | |
Cardinal Health, Inc. (b) | | | 3,813 | | | | 246,320 | |
Chemed Corporation (b) | | | 2,389 | | | | 186,175 | |
HealthSouth Corporation (b) | | | 3,130 | | | | 112,023 | |
Laboratory Corporation of America Holdings (a) (b) | | | 1,935 | | | | 197,080 | |
MEDNAX, Inc. (a) (b) | | | 1,503 | | | | 166,532 | |
Patterson Companies, Inc. (b) | | | 1,223 | | | | 50,742 | |
PharMerica Corporation (a) | | | 914 | | | | 20,638 | |
Quest Diagnostics, Inc. (b) | | | 3,107 | | | | 189,341 | |
Select Medical Holdings Corporation (b) | | | 1,350 | | | | 11,691 | |
VCA Antech, Inc. (a) (b) | | | 1,232 | | | | 36,898 | |
| | | | | | | | 1,819,353 | |
BARROW ALL-CAP CORE FUND SCHEDULE OF INVESTMENTS (Continued) | |
COMMON STOCKS — 100.0% (Continued) | | | | | | |
| Health Care — 21.5% (Continued) | | | | | | |
| Health Care Technology — 0.3% | | | | | | |
Computer Programs & Systems, Inc. | | | 113 | | | $ | 6,952 | |
Quality Systems, Inc. (b) | | | 1,869 | | | | 43,660 | |
| | | | | | | | 50,612 | |
| Pharmaceuticals — 4.5% | | | | | | | | |
Abbott Laboratories (b) | | | 2,430 | | | | 92,802 | |
Auxilium Pharmaceuticals, Inc. (a) (b) | | | 4,666 | | | | 95,233 | |
Eli Lilly & Company | | | 366 | | | | 18,380 | |
Endo Health Solutions, Inc. (a) (b) | | | 4,212 | | | | 283,004 | |
Impax Laboratories, Inc. (a) (b) | | | 944 | | | | 22,694 | |
Pfizer, Inc. (b) | | | 573 | | | | 18,181 | |
Prestige Brands Holdings, Inc. (a) (b) | | | 1,582 | | | | 55,750 | |
Questcor Pharmaceuticals, Inc. (b) | | | 4,863 | | | | 282,103 | |
| | | | | | | | 868,147 | |
| Industrials — 22.2% | | | | | | | | |
| Aerospace & Defense — 6.2% | | | | | | | | |
AeroVironment, Inc. (a) (b) | | | 757 | | | | 22,839 | |
Alliant Techsystems, Inc. (b) | | | 1,213 | | | | 147,052 | |
Cubic Corporation (b) | | | 572 | | | | 32,055 | |
Engility Holdings, Inc. (a) (b) | | | 1,616 | | | | 51,469 | |
Exelis, Inc. (b) | | | 13,325 | | | | 235,453 | |
Lockheed Martin Corporation | | | 293 | | | | 41,509 | |
National Presto Industries, Inc. (b) | | | 1,770 | | | | 135,600 | |
Northrop Grumman Corporation (b) | | | 2,276 | | | | 256,460 | |
Raytheon Company (b) | | | 2,791 | | | | 247,506 | |
Triumph Group, Inc. | | | 366 | | | | 27,062 | |
| | | | | | | | 1,197,005 | |
| Commercial Services & Supplies — 2.5% | | | | | | | | |
Deluxe Corporation (b) | | | 4,919 | | | | 244,425 | |
Herman Miller, Inc. (b) | | | 672 | | | | 21,444 | |
Performant Financial Corporation (a) (b) | | | 10,672 | | | | 111,949 | |
Pitney Bowes, Inc. (b) | | | 4,020 | | | | 93,143 | |
| | | | | | | | 470,961 | |
| Construction & Engineering — 1.1% | | | | | | | | |
Fluor Corporation (b) | | | 696 | | | | 54,156 | |
KBR, Inc. (b) | | | 4,574 | | | | 154,738 | |
| | | | | | | | 208,894 | |
| Electrical Equipment — 1.1% | | | | | | | | |
Brady Corporation - Class A | | | 631 | | | | 19,769 | |
Emerson Electric Company (b) | | | 2,091 | | | | 140,076 | |
BARROW ALL-CAP CORE FUND SCHEDULE OF INVESTMENTS (Continued) | |
COMMON STOCKS — 100.0% (Continued) | | | | | | |
| Industrials — 22.2% (Continued) | | | | | | |
| Electrical Equipment — 1.1% (Continued) | | | | | | |
EnerSys, Inc. (b) | | | 648 | | | $ | 46,235 | |
| | | | | | | | 206,080 | |
| Machinery — 5.3% | | | | | | | | |
Actuant Corporation - Class A (b) | | | 2,338 | | | | 91,369 | |
American Railcar Industries, Inc. | | | 480 | | | | 20,832 | |
Crane Company (b) | | | 1,942 | | | | 121,006 | |
Deere & Company (b) | | | 1,672 | | | | 140,849 | |
ITT Corporation (b) | | | 1,715 | | | | 70,006 | |
Joy Global, Inc. (b) | | | 3,058 | | | | 172,960 | |
Lindsay Corporation (b) | | | 1,661 | | | | 126,884 | |
NACCO Industries, Inc. - Class A (b) | | | 670 | | | | 43,383 | |
Oshkosh Corporation (b) | | | 1,261 | | | | 61,474 | |
PACCAR, Inc. (b) | | | 886 | | | | 50,777 | |
Timken Company (b) | | | 596 | | | | 30,849 | |
Valmont Industries, Inc. (b) | | | 649 | | | | 93,917 | |
| | | | | | | | 1,024,306 | |
| Professional Services — 5.8% | | | | | | | | |
Acacia Research Corporation (b) | | | 1,092 | | | | 16,249 | |
Dun & Bradstreet Corporation (The) (b) | | | 2,036 | | | | 237,906 | |
Exponent, Inc. (b) | | | 1,355 | | | | 104,836 | |
FTI Consulting, Inc. (a) (b) | | | 1,282 | | | | 57,575 | |
Huron Consulting Group, Inc. (a) (b) | | | 1,307 | | | | 77,688 | |
Insperity, Inc. | | | 504 | | | | 17,766 | |
Korn/Ferry International (a) (b) | | | 3,480 | | | | 80,597 | |
Navigant Consulting, Inc. (a) (b) | | | 5,591 | | | | 109,584 | |
Resources Connection, Inc. (b) | | | 10,115 | | | | 143,835 | |
Robert Half International, Inc. (b) | | | 1,374 | | | | 53,078 | |
RPX Corporation (a) (b) | | | 13,452 | | | | 222,227 | |
| | | | | | | | 1,121,341 | |
| Road & Rail — 0.2% | | | | | | | | |
Landstar System, Inc. (b) | | | 586 | | | | 32,892 | |
| | | | | | | | | |
| Materials — 8.8% | | | | | | | | |
| Chemicals — 6.1% | | | | | | | | |
CF Industries Holdings, Inc. (b) | | | 921 | | | | 200,207 | |
FutureFuel Corporation (b) | | | 6,289 | | | | 105,152 | |
Innospec, Inc. (b) | | | 2,266 | | | | 110,377 | |
Koppers Holdings, Inc. (b) | | | 846 | | | | 40,083 | |
Kronos Worldwide, Inc. (b) | | | 4,792 | | | | 79,835 | |
LSB Industries, Inc. (a) (b) | | | 1,120 | | | | 35,930 | |
BARROW ALL-CAP CORE FUND SCHEDULE OF INVESTMENTS (Continued) | |
COMMON STOCKS — 100.0% (Continued) | | | | | | |
| Materials — 8.8% (Continued) | | | | | | |
| Chemicals — 6.1% (Continued) | | | | | | |
LyondellBasell Industries N.V. - Class A | | | 215 | | | $ | 16,594 | |
NewMarket Corporation (b) | | | 662 | | | | 214,455 | |
Olin Corporation (b) | | | 5,791 | | | | 143,790 | |
PetroLogistics, L.P. (b) | | | 1,210 | | | | 14,605 | |
Rentech Nitrogen Partners, L.P. (b) | | | 1,530 | | | | 31,396 | |
Terra Nitrogen Company, L.P. (b) | | | 865 | | | | 135,174 | |
W.R. Grace & Company (a) | | | 216 | | | | 20,742 | |
Westlake Chemical Corporation | | | 318 | | | | 35,800 | |
| | | | | | | | 1,184,140 | |
| Containers & Packaging — 0.1% | | | | | | | | |
Sonoco Products Company | | | 391 | | | | 15,663 | |
| | | | | | | | | |
| Metals & Mining — 1.8% | | | | | | | | |
Gold Resource Corporation (b) | | | 8,124 | | | | 41,920 | |
Kaiser Aluminum Corporation (b) | | | 1,732 | | | | 116,598 | |
Reliance Steel & Aluminum Company (b) | | | 462 | | | | 33,971 | |
Southern Copper Corporation (b) | | | 5,880 | | | | 147,588 | |
| | | | | | | | 340,077 | |
| Paper & Forest Products — 0.8% | | | | | | | | |
Louisiana-Pacific Corporation (a) (b) | | | 3,086 | | | | 50,610 | |
Schweitzer-Mauduit International, Inc. (b) | | | 1,996 | | | | 103,014 | |
| | | | | | | | 153,624 | |
| | | | | | | | | |
Total Common Stocks (Cost $15,496,630) | | | | | | $ | 19,226,341 | |
BARROW ALL-CAP CORE FUND SCHEDULE OF INVESTMENTS (Continued) | |
MONEY MARKET FUNDS — 0.1% | | | | | | |
Fidelity Institutional Money Market Government Portfolio - Class I, 0.01% (c) (Cost $14,911) | | | 14,911 | | | $ | 14,911 | |
| | | | | | | | | |
Total Investments at Value — 100.1% (Cost $15,511,541) | | | | | | $ | 19,241,252 | |
| | | | | | | | | |
| Liabilities in Excess of Other Assets — (0.1%) | | | | | | | (12,786 | ) |
| | | | | | | | | |
Net Assets — 100.0% | | | | | | $ | 19,228,466 | |
| (a) | Non-income producing security. |
| (b) | All or a portion of the shares have been pledged as collateral for the bank line of credit (Note 5). |
| (c) | The rate shown is the 7-day effective yield as of November 30, 2013. |
See accompanying notes to financial statements.
BARROW ALL-CAP LONG/SHORT FUND SCHEDULE OF INVESTMENTS November 30, 2013 (Unaudited) | |
| | | | | | |
| Consumer Discretionary — 28.2% | | | | | | |
| Auto Components — 0.1% | | | | | | |
TRW Automotive Holdings Corporation (a) (b) | | | 57 | | | $ | 4,423 | |
| | | | | | | | | |
| Automobiles — 0.1% | | | | | | | | |
Ford Motor Company (b) | | | 239 | | | | 4,082 | |
| | | | | | | | | |
| Diversified Consumer Services — 2.3% | | | | | | | | |
H&R Block, Inc. (b) | | | 1,226 | | | | 34,193 | |
Outerwall, Inc. (a) (b) | | | 373 | | | | 25,513 | |
Weight Watchers International, Inc. (b) | | | 465 | | | | 15,071 | |
| | | | | | | | 74,777 | |
| Hotels, Restaurants & Leisure — 0.8% | | | | | | | | |
International Game Technology (b) | | | 1,165 | | | | 20,376 | |
Interval Leisure Group, Inc. (b) | | | 273 | | | | 7,311 | |
| | | | | | | | 27,687 | |
| Household Durables — 0.6% | | | | | | | | |
iRobot Corporation (a) (b) | | | 117 | | | | 3,886 | |
Tempur Sealy International, Inc. (a) (b) | | | 141 | | | | 7,194 | |
Tupperware Brands Corporation (b) | | | 83 | | | | 7,581 | |
| | | | | | | | 18,661 | |
| Leisure Equipment & Products — 3.5% | | | | | | | | |
LeapFrog Enterprises, Inc. (a) (b) | | | 2,630 | | | | 22,644 | |
Smith & Wesson Holding Corporation (a) (b) | | | 3,757 | | | | 44,408 | |
Sturm, Ruger & Company, Inc. (b) | | | 636 | | | | 48,927 | |
| | | | | | | | 115,979 | |
| Media — 7.4% | | | | | | | | |
Crown Media Holdings, Inc. - Class A (a) (b) | | | 1,336 | | | | 4,476 | |
DIRECTV (a) (b) | | | 421 | | | | 27,832 | |
Gannett Company, Inc. (b) | | | 287 | | | | 7,766 | |
Interpublic Group of Companies, Inc. (b) | | | 2,222 | | | | 38,663 | |
John Wiley & Sons, Inc. - Class A (b) | | | 488 | | | | 24,869 | |
Meredith Corporation (b) | | | 60 | | | | 3,200 | |
National CineMedia, Inc. (b) | | | 2,004 | | | | 37,375 | |
Omnicom Group, Inc. (b) | | | 681 | | | | 48,657 | |
Valassis Communications, Inc. (b) | | | 1,492 | | | | 43,805 | |
Viacom, Inc. - Class B (b) | | | 117 | | | | 9,380 | |
| | | | | | | | 246,023 | |
BARROW ALL-CAP LONG/SHORT FUND SCHEDULE OF INVESTMENTS (Continued) | |
COMMON STOCKS — 127.9% (Continued) | | | | | | |
| Consumer Discretionary — 28.2% (Continued) | | | | | | |
| Specialty Retail — 9.7% | | | | | | |
American Eagle Outfitters, Inc. (b) | | | 1,821 | | | $ | 29,628 | |
Bed Bath & Beyond, Inc. (a) (b) | | | 311 | | | | 24,267 | |
Buckle, Inc. (The) (b) | | | 881 | | | | 46,746 | |
Cato Corporation (The) - Class A (b) | | | 241 | | | | 8,204 | |
Chico's FAS, Inc. (b) | | | 344 | | | | 6,429 | |
Express, Inc. (a) (b) | | | 2,245 | | | | 55,250 | |
Foot Locker, Inc. (b) | | | 912 | | | | 35,468 | |
Francesca's Holdings Corporation (a) (b) | | | 592 | | | | 11,615 | |
GameStop Corporation - Class A (b) | | | 938 | | | | 45,259 | |
Gap, Inc. (The) (b) | | | 532 | | | | 21,796 | |
Guess?, Inc. (b) | | | 117 | | | | 4,008 | |
Select Comfort Corporation (a) (b) | | | 1,422 | | | | 30,018 | |
Staples, Inc. (b) | | | 278 | | | | 4,317 | |
| | | | | | | | 323,005 | |
| Textiles, Apparel & Luxury Goods — 3.7% | | | | | | | | |
Coach, Inc. (b) | | | 697 | | | | 40,356 | |
Iconix Brand Group, Inc. (a) (b) | | | 695 | | | | 27,577 | |
Steven Madden Ltd. (a) (b) | | | 1,332 | | | | 51,895 | |
Vera Bradley, Inc. (a) (b) | | | 106 | | | | 2,663 | |
| | | | | | | | 122,491 | |
| Consumer Staples — 18.1% | | | | | | | | |
| Beverages — 1.8% | | | | | | | | |
Brown-Forman Corporation - Class B (b) | | | 2 | | | | 150 | |
Dr Pepper Snapple Group, Inc. (b) | | | 883 | | | | 42,613 | |
National Beverage Corporation (b) | | | 873 | | | | 18,438 | |
| | | | | | | | 61,201 | |
| Food & Staples Retailing — 0.5% | | | | | | | | |
CVS Caremark Corporation (b) | | | 69 | | | | 4,620 | |
Village Super Market, Inc. - Class A (b) | | | 275 | | | | 10,651 | |
| | | | | | | | 15,271 | |
| Food Products — 3.7% | | | | | | | | |
B&G Foods, Inc. (b) | | | 205 | | | | 7,099 | |
Darling International, Inc. (a) (b) | | | 2,204 | | | | 45,689 | |
Dean Foods Company (a) (b) | | | 358 | | | | 6,437 | |
Hillshire Brands Company (The) (b) | | | 336 | | | | 11,229 | |
Ingredion, Inc. (b) | | | 58 | | | | 4,011 | |
Kraft Foods Group, Inc. | | | 75 | | | | 3,984 | |
Lancaster Colony Corporation (b) | | | 407 | | | | 35,271 | |
Mondelēz International, Inc. - Class A (b) | | | 145 | | | | 4,862 | |
BARROW ALL-CAP LONG/SHORT FUND SCHEDULE OF INVESTMENTS (Continued) | |
COMMON STOCKS — 127.9% (Continued) | | | | | | |
| Consumer Staples — 18.1% (Continued) | | | | | | |
| Food Products — 3.7% (Continued) | | | | | | |
Pilgrim's Pride Corporation (a) | | | 73 | | | $ | 1,196 | |
Seaboard Corporation | | | 1 | | | | 2,825 | |
| | | | | | | | 122,603 | |
| Household Products — 0.9% | | | | | | | | |
Energizer Holdings, Inc. (b) | | | 219 | | | | 24,167 | |
Spectrum Brands Holdings, Inc. | | | 61 | | | | 4,305 | |
| | | | | | | | 28,472 | |
| Personal Products — 5.0% | | | | | | | | |
Inter Parfums, Inc. (b) | | | 830 | | | | 30,212 | |
Nu Skin Enterprises, Inc. - Class A (b) | | | 546 | | | | 69,801 | |
Revlon, Inc. - Class A (a) (b) | | | 441 | | | | 11,642 | |
USANA Health Sciences, Inc. (a) (b) | | | 723 | | | | 52,859 | |
| | | | | | | | 164,514 | |
| Tobacco — 6.2% | | | | | | | | |
Altria Group, Inc. (b) | | | 1,161 | | | | 42,934 | |
Lorillard, Inc. (b) | | | 949 | | | | 48,712 | |
Philip Morris International, Inc. (b) | | | 417 | | | | 35,670 | |
Reynolds American, Inc. (b) | | | 862 | | | | 43,488 | |
Vector Group Ltd. (b) | | | 2,249 | | | | 36,839 | |
| | | | | | | | 207,643 | |
| Energy — 14.5% | | | | | | | | |
| Energy Equipment & Services — 2.2% | | | | | | | | |
C&J Energy Services, Inc. (a) (b) | | | 1,684 | | | | 39,911 | |
Forum Energy Technologies, Inc. (a) (b) | | | 118 | | | | 3,187 | |
Geospace Technologies Corporation (a) (b) | | | 46 | | | | 4,014 | |
Halliburton Company (b) | | | 179 | | | | 9,430 | |
National Oilwell Varco, Inc. (b) | | | 189 | | | | 15,404 | |
| | | | | | | | 71,946 | |
| Oil, Gas & Consumable Fuels — 12.3% | | | | | | | | |
Alon USA Energy, Inc. (b) | | | 1,509 | | | | 20,824 | |
Alon USA Partners, L.P. (b) | | | 855 | | | | 13,304 | |
Chevron Corporation (b) | | | 165 | | | | 20,203 | |
CVR Energy, Inc. (b) | | | 585 | | | | 23,096 | |
CVR Refining, L.P. (b) | | | 610 | | | | 14,640 | |
Delek US Holdings, Inc. (b) | | | 770 | | | | 23,300 | |
HollyFrontier Corporation (b) | | | 886 | | | | 42,510 | |
Marathon Oil Corporation (b) | | | 997 | | | | 35,932 | |
Marathon Petroleum Corporation (b) | | | 565 | | | | 46,748 | |
Northern Tier Energy, L.P. (b) | | | 1,668 | | | | 42,367 | |
Phillips 66 (b) | | | 360 | | | | 25,060 | |
BARROW ALL-CAP LONG/SHORT FUND SCHEDULE OF INVESTMENTS (Continued) | |
COMMON STOCKS — 127.9% (Continued) | | | | | | |
| Energy — 14.5% (Continued) | | | | | | |
| Oil, Gas & Consumable Fuels — 12.3% (Continued) | | | | | | |
Renewable Energy Group, Inc. (a) (b) | | | 521 | | | $ | 5,924 | |
Rentech, Inc. (b) | | | 7,559 | | | | 13,682 | |
Stone Energy Corporation (a) (b) | | | 50 | | | | 1,654 | |
Tesoro Corporation (b) | | | 353 | | | | 20,696 | |
VAALCO Energy, Inc. (a) (b) | | | 1,101 | | | | 6,661 | |
Western Refining, Inc. (b) | | | 1,304 | | | | 50,947 | |
| | | | | | | | 407,548 | |
Financials — 0.0% (c) | | | | | | | | |
Insurance — 0.0% (c) | | | | | | | | |
Gerova Financial Group Ltd. (a) (b) | | | 2 | | | | — | |
| | | | | | | | | |
| Health Care — 27.6% | | | | | | | | |
| Biotechnology — 5.9% | | | | | | | | |
Cubist Pharmaceuticals, Inc. (a) (b) | | | 346 | | | | 23,704 | |
Myriad Genetics, Inc. (a) (b) | | | 1,501 | | | | 44,655 | |
PDL BioPharma, Inc. (b) | | | 5,263 | | | | 51,419 | |
Spectrum Pharmaceuticals, Inc. (b) | | | 2,927 | | | | 28,187 | |
United Therapeutics Corporation (a) (b) | | | 521 | | | | 48,094 | |
| | | | | | | | 196,059 | |
| Health Care Equipment & Supplies — 3.5% | | | | | | | | |
ArthroCare Corporation (a) (b) | | | 573 | | | | 21,614 | |
C.R. Bard, Inc. (b) | | | 158 | | | | 21,943 | |
CareFusion Corporation (a) (b) | | | 100 | | | | 3,985 | |
Globus Medical, Inc. - Class A (a) (b) | | | 1,570 | | | | 30,238 | |
Medtronic, Inc. (b) | | | 409 | | | | 23,444 | |
St. Jude Medical, Inc. (b) | | | 253 | | | | 14,780 | |
| | | | | | | | 116,004 | |
| Health Care Providers & Services — 12.2% | | | | | | | | |
AmerisourceBergen Corporation (b) | | | 703 | | | | 49,583 | |
AMN Healthcare Services, Inc. (a) (b) | | | 395 | | | | 5,483 | |
AmSurg Corporation (a) (b) | | | 1,220 | | | | 58,950 | |
Bio-Reference Laboratories, Inc. (a) (b) | | | 692 | | | | 20,206 | |
Cardinal Health, Inc. (b) | | | 849 | | | | 54,845 | |
Chemed Corporation (b) | | | 541 | | | | 42,160 | |
HealthSouth Corporation (b) | | | 696 | | | | 24,910 | |
Laboratory Corporation of America Holdings (a) (b) | | | 429 | | | | 43,694 | |
MEDNAX, Inc. (a) (b) | | | 338 | | | | 37,450 | |
Patterson Companies, Inc. (b) | | | 269 | | | | 11,161 | |
PharMerica Corporation (a) | | | 193 | | | | 4,358 | |
Quest Diagnostics, Inc. (b) | | | 693 | | | | 42,231 | |
BARROW ALL-CAP LONG/SHORT FUND SCHEDULE OF INVESTMENTS (Continued) | |
COMMON STOCKS — 127.9% (Continued) | | | | | | |
| Health Care — 27.2% (Continued) | | | | | | |
| Health Care Providers & Services — 12.2% (Continued) | | | | | | |
Select Medical Holdings Corporation (b) | | | 303 | | | $ | 2,624 | |
VCA Antech, Inc. (a) (b) | | | 267 | | | | 7,997 | |
| | | | | | | | 405,652 | |
| Health Care Technology — 0.4% | | | | | | | | |
Computer Programs & Systems, Inc. (b) | | | 25 | | | | 1,538 | |
Quality Systems, Inc. (b) | | | 424 | | | | 9,905 | |
| | | | | | | | 11,443 | |
| Pharmaceuticals — 5.6% | | | | | | | | |
Abbott Laboratories (b) | | | 415 | | | | 15,849 | |
Auxilium Pharmaceuticals, Inc. (a) (b) | | | 1,010 | | | | 20,614 | |
Eli Lilly & Company | | | 77 | | | | 3,867 | |
Endo Health Solutions, Inc. (a) (b) | | | 938 | | | | 63,024 | |
Impax Laboratories, Inc. (a) (b) | | | 189 | | | | 4,544 | |
Pfizer, Inc. (b) | | | 128 | | | | 4,061 | |
Prestige Brands Holdings, Inc. (a) (b) | | | 348 | | | | 12,263 | |
Questcor Pharmaceuticals, Inc. (b) | | | 1,085 | | | | 62,941 | |
| | | | | | | | 187,163 | |
| Industrials — 28.4% | | | | | | | | |
| Aerospace & Defense — 8.0% | | | | | | | | |
AeroVironment, Inc. (a) (b) | | | 94 | | | | 2,836 | |
Alliant Techsystems, Inc. (b) | | | 273 | | | | 33,096 | |
Cubic Corporation (b) | | | 129 | | | | 7,229 | |
Engility Holdings, Inc. (a) (b) | | | 355 | | | | 11,307 | |
Exelis, Inc. (b) | | | 2,976 | | | | 52,586 | |
Lockheed Martin Corporation (b) | | | 68 | | | | 9,633 | |
National Presto Industries, Inc. (b) | | | 395 | | | | 30,261 | |
Northrop Grumman Corporation (b) | | | 509 | | | | 57,354 | |
Raytheon Company (b) | | | 623 | | | | 55,248 | |
Triumph Group, Inc. (b) | | | 77 | | | | 5,693 | |
| | | | | | | | 265,243 | |
| Commercial Services & Supplies — 3.1% | | | | | | | | |
Deluxe Corporation (b) | | | 1,101 | | | | 54,709 | |
Herman Miller, Inc. (b) | | | 151 | | | | 4,818 | |
Performant Financial Corporation (a) (b) | | | 2,371 | | | | 24,872 | |
Pitney Bowes, Inc. (b) | | | 883 | | | | 20,459 | |
| | | | | | | | 104,858 | |
| Construction & Engineering — 1.4% | | | | | | | | |
Fluor Corporation (b) | | | 155 | | | | 12,060 | |
KBR, Inc. (b) | | | 1,020 | | | | 34,507 | |
| | | | | | | | 46,567 | |
BARROW ALL-CAP LONG/SHORT FUND SCHEDULE OF INVESTMENTS (Continued) | |
COMMON STOCKS — 127.9% (Continued) | | | | | | |
| Industrials — 28.4% (Continued) | | | | | | |
| Electrical Equipment — 1.4% | | | | | | |
Brady Corporation - Class A | | | 133 | | | $ | 4,167 | |
Emerson Electric Company (b) | | | 467 | | | | 31,284 | |
EnerSys, Inc. (b) | | | 144 | | | | 10,275 | |
| | | | | | | | 45,726 | |
| Machinery — 6.8% | | | | | | | | |
Actuant Corporation - Class A (b) | | | 523 | | | | 20,439 | |
American Railcar Industries, Inc. (b) | | | 109 | | | | 4,730 | |
Crane Company (b) | | | 435 | | | | 27,105 | |
Deere & Company (b) | | | 365 | | | | 30,748 | |
ITT Corporation (b) | | | 373 | | | | 15,226 | |
Joy Global, Inc. (b) | | | 681 | | | | 38,517 | |
Lindsay Corporation (b) | | | 370 | | | | 28,264 | |
NACCO Industries, Inc. - Class A (b) | | | 137 | | | | 8,871 | |
Oshkosh Corporation (b) | | | 274 | | | | 13,357 | |
PACCAR, Inc. (b) | | | 199 | | | | 11,405 | |
Timken Company (b) | | | 117 | | | | 6,056 | |
Valmont Industries, Inc. (b) | | | 141 | | | | 20,404 | |
| | | | | | | | 225,122 | |
| Professional Services — 7.5% | | | | | | | | |
Acacia Research Corporation (b) | | | 134 | | | | 1,994 | |
Dun & Bradstreet Corporation (The) (b) | | | 455 | | | | 53,167 | |
Exponent, Inc. (b) | | | 304 | | | | 23,521 | |
FTI Consulting, Inc. (a) (b) | | | 288 | | | | 12,934 | |
Huron Consulting Group, Inc. (a) (b) | | | 291 | | | | 17,297 | |
Insperity, Inc. (b) | | | 113 | | | | 3,983 | |
Korn/Ferry International (a) (b) | | | 776 | | | | 17,972 | |
Navigant Consulting, Inc. (a) (b) | | | 1,237 | | | | 24,245 | |
Resources Connection, Inc. (b) | | | 2,269 | | | | 32,265 | |
Robert Half International, Inc. (b) | | | 310 | | | | 11,975 | |
RPX Corporation (a) (b) | | | 2,998 | | | | 49,527 | |
| | | | | | | | 248,880 | |
| Road & Rail — 0.2% | | | | | | | | |
Landstar System, Inc. (b) | | | 134 | | | | 7,522 | |
| | | | | | | | | |
| Materials — 11.1% | | | | | | | | |
| Chemicals — 7.8% | | | | | | | | |
CF Industries Holdings, Inc. (b) | | | 198 | | | | 43,041 | |
FutureFuel Corporation (b) | | | 1,393 | | | | 23,291 | |
Innospec, Inc. (b) | | | 513 | | | | 24,988 | |
Koppers Holdings, Inc. (b) | | | 188 | | | | 8,907 | |
BARROW ALL-CAP LONG/SHORT FUND SCHEDULE OF INVESTMENTS (Continued) | |
COMMON STOCKS — 127.9% (Continued) | | | | | | |
| Materials — 11.1% (Continued) | | | | | | |
| Chemicals — 7.8% (Continued) | | | | | | |
Kronos Worldwide, Inc. (b) | | | 1,072 | | | $ | 17,860 | |
LSB Industries, Inc. (a) (b) | | | 209 | | | | 6,705 | |
LyondellBasell Industries N.V. - Class A (b) | | | 47 | | | | 3,628 | |
NewMarket Corporation (b) | | | 144 | | | | 46,649 | |
Olin Corporation (b) | | | 1,285 | | | | 31,907 | |
PetroLogistics, L.P. (b) | | | 276 | | | | 3,331 | |
Rentech Nitrogen Partners, L.P. (b) | | | 327 | | | | 6,710 | |
Terra Nitrogen Company, L.P. (b) | | | 185 | | | | 28,910 | |
W.R. Grace & Company (a) (b) | | | 48 | | | | 4,609 | |
Westlake Chemical Corporation (b) | | | 69 | | | | 7,768 | |
| | | | | | | | 258,304 | |
| Containers & Packaging — 0.1% | | | | | | | | |
Sonoco Products Company (b) | | | 89 | | | | 3,565 | |
| | | | | | | | | |
| Metals & Mining — 2.2% | | | | | | | | |
Gold Resource Corporation (b) | | | 1,825 | | | | 9,417 | |
Kaiser Aluminum Corporation (b) | | | 384 | | | | 25,851 | |
Reliance Steel & Aluminum Company (b) | | | 84 | | | | 6,176 | |
Southern Copper Corporation (b) | | | 1,306 | | | | 32,781 | |
| | | | | | | | 74,225 | |
| Paper & Forest Products — 1.0% | | | | | | | | |
Louisiana-Pacific Corporation (a) (b) | | | 571 | | | | 9,365 | |
Schweitzer-Mauduit International, Inc. (b) | | | 443 | | | | 22,863 | |
| | | | | | | | 32,228 | |
| | | | | | | | | |
Total Common Stocks (Cost $3,847,820) | | | | | | $ | 4,244,887 | |
BARROW ALL-CAP LONG/SHORT FUND SCHEDULE OF INVESTMENTS (Continued) | |
MONEY MARKET FUNDS — 1.5% | | | | | | |
Fidelity Institutional Money Market Government Portfolio - Class I, 0.01% (d) (Cost $50,767) | | | 50,767 | | | $ | 50,767 | |
| | | | | | | | | |
Total Investments at Value — 129.4% (Cost $3,898,587) | | | | | | $ | 4,295,654 | |
| | | | | | | | | |
| Liabilities in Excess of Other Assets — (29.4%) | | | | | | | (976,728 | )(e) |
| | | | | | | | | |
Net Assets — 100.0% | | | | | | $ | 3,318,926 | |
| (a) | Non-income producing security. |
| (b) | All or a portion of the shares have been pledged as collateral for open short positions and any outstanding borrowings for investment purposes. |
| (c) | Percentage rounds to less than 0.1%. |
| (d) | The rate shown is the 7-day effective yield as of November 30, 2013. |
| (e) | Includes cash held as margin deposits for open short positions. |
See accompanying notes to financial statements.
BARROW ALL-CAP LONG/SHORT FUND SCHEDULE OF SECURITIES SOLD SHORT November 30, 2013 (Unaudited) | |
| | | | | | |
| Consumer Discretionary — 20.4% | | | | | | |
| Auto Components — 0.9% | | | | | | |
Allison Transmission Holdings, Inc. | | | 140 | | | $ | 3,811 | |
BorgWarner, Inc. | | | 41 | | | | 4,394 | |
Dorman Products, Inc. | | | 8 | | | | 398 | |
Drew Industries, Inc. | | | 26 | | | | 1,409 | |
Federal-Mogul Corporation | | | 21 | | | | 431 | |
Gentherm, Inc. | | | 178 | | | | 4,301 | |
Goodyear Tire & Rubber Company (The) | | | 29 | | | | 646 | |
Johnson Controls, Inc. | | | 123 | | | | 6,213 | |
Modine Manufacturing Company | | | 186 | | | | 2,470 | |
Superior Industries International, Inc. | | | 79 | | | | 1,559 | |
Visteon Corporation | | | 66 | | | | 5,190 | |
| | | | | | | | 30,822 | |
| Automobiles — 0.6% | | | | | | | | |
General Motors Company | | | 93 | | | | 3,602 | |
Harley-Davidson, Inc. | | | 81 | | | | 5,429 | |
Tesla Motors, Inc. | | | 59 | | | | 7,510 | |
Winnebago Industries, Inc. | | | 114 | | | | 3,529 | |
| | | | | | | | 20,070 | |
| Distributors — 0.5% | | | | | | | | |
Core-Mark Holding Company, Inc. | | | 69 | | | | 5,094 | |
LKQ Corporation | | | 176 | | | | 5,834 | |
Pool Corporation | | | 87 | | | | 4,875 | |
| | | | | | | | 15,803 | |
| Diversified Consumer Services — 0.8% | | | | | | | | |
Ascent Capital Group, Inc. - Class A | | | 3 | | | | 258 | |
Graham Holdings Company - Class B | | | 5 | | | | 3,368 | |
Hillenbrand, Inc. | | | 138 | | | | 3,878 | |
LifeLock, Inc. | | | 335 | | | | 5,769 | |
| Matthews International Corporation - Class A | | | 81 | | | | 3,417 | |
Regis Corporation | | | 246 | | | | 3,933 | |
Service Corporation International | | | 117 | | | | 2,114 | |
Sotheby's | | | 98 | | | | 5,023 | |
| | | | | | | | 27,760 | |
| Hotels, Restaurants & Leisure — 5.8% | | | | | | | | |
Biglari Holdings, Inc. | | | 11 | | | | 5,336 | |
BJ's Restaurants, Inc. | | | 127 | | | | 3,764 | |
Bloomin' Brands, Inc. | | | 219 | | | | 5,738 | |
Bob Evans Farms, Inc. | | | 89 | | | | 4,947 | |
BARROW ALL-CAP LONG/SHORT FUND SCHEDULE OF SECURITIES SOLD SHORT (Continued) | |
COMMON STOCKS — 88.2% (Continued) | | | | | | |
| Consumer Discretionary — 20.4% (Continued) | | | | | | |
| Hotels, Restaurants & Leisure — 5.8% (Continued) | | | | | | |
Brinker International, Inc. | | | 79 | | | $ | 3,715 | |
Buffalo Wild Wings, Inc. | | | 46 | | | | 6,911 | |
Burger King Worldwide, Inc. | | | 236 | | | | 5,001 | |
Carnival Corporation | | | 123 | | | | 4,442 | |
CEC Entertainment, Inc. | | | 104 | | | | 4,987 | |
Cedar Fair, L.P. | | | 104 | | | | 5,179 | |
Cheesecake Factory, Inc. (The) | | | 102 | | | | 4,972 | |
Chipotle Mexican Grill, Inc. - Class A | | | 13 | | | | 6,810 | |
Churchill Downs, Inc. | | | 48 | | | | 4,313 | |
Chuy's Holdings, Inc. | | | 103 | | | | 3,589 | |
Cracker Barrel Old Country Store, Inc. | | | 35 | | | | 3,797 | |
Darden Restaurants, Inc. | | | 88 | | | | 4,693 | |
Del Frisco's Restaurant Group, Inc. | | | 78 | | | | 1,651 | |
Dunkin' Brands Group, Inc. | | | 85 | | | | 4,163 | |
Fiesta Restaurant Group, Inc. | | | 101 | | | | 4,946 | |
Hyatt Hotels Corporation - Class A | | | 105 | | | | 5,079 | |
Ignite Restaurant Group, Inc. | | | 41 | | | | 506 | |
| International Speedway Corporation - Class A | | | 125 | | | | 4,291 | |
Jack in the Box, Inc. | | | 107 | | | | 5,066 | |
Krispy Kreme Doughnuts, Inc. | | | 231 | | | | 5,863 | |
Las Vegas Sands Corporation | | | 82 | | | | 5,878 | |
Life Time Fitness, Inc. | | | 87 | | | | 4,220 | |
Marriott International, Inc. - Class A | | | 106 | | | | 4,984 | |
| Marriott Vacations Worldwide Corporation | | | 41 | | | | 2,142 | |
McDonald's Corporation | | | 27 | | | | 2,629 | |
MGM Resorts International | | | 16 | | | | 307 | |
Norwegian Cruise Line Holdings Ltd. | | | 40 | | | | 1,364 | |
Panera Bread Company - Class A | | | 18 | | | | 3,184 | |
Penn National Gaming, Inc. | | | 72 | | | | 1,040 | |
Red Robin Gourmet Burgers, Inc. | | | 79 | | | | 6,297 | |
Royal Caribbean Cruises Ltd. | | | 35 | | | | 1,542 | |
Ruby Tuesday, Inc. | | | 399 | | | | 2,813 | |
Scientific Games Corporation - Class A | | | 21 | | | | 377 | |
Six Flags Entertainment Corporation | | | 131 | | | | 4,875 | |
Sonic Corporation | | | 150 | | | | 2,968 | |
Speedway Motorsports, Inc. | | | 37 | | | | 745 | |
Starbucks Corporation | | | 74 | | | | 6,028 | |
| Starwood Hotels & Resorts Worldwide, Inc. | | | 70 | | | | 5,214 | |
Texas Roadhouse, Inc. | | | 59 | | | | 1,651 | |
Vail Resorts, Inc. | | | 82 | | | | 6,215 | |
BARROW ALL-CAP LONG/SHORT FUND SCHEDULE OF SECURITIES SOLD SHORT (Continued) | |
COMMON STOCKS — 88.2% (Continued) | | | | | | |
| Consumer Discretionary — 20.4% (Continued) | | | | | | |
| Hotels, Restaurants & Leisure — 5.8% (Continued) | | | | | | |
Wendy's Company (The) | | | 812 | | | $ | 6,991 | |
Wyndham Worldwide Corporation | | | 39 | | | | 2,797 | |
Wynn Resorts Ltd. | | | 32 | | | | 5,308 | |
Yum! Brands, Inc. | | | 38 | | | | 2,952 | |
| | | | | | | | 192,280 | |
| Household Durables — 2.2% | | | | | | | | |
Cavco Industries, Inc. | | | 19 | | | | 1,282 | |
D.R. Horton, Inc. | | | 210 | | | | 4,175 | |
Ethan Allen Interiors, Inc. | | | 136 | | | | 4,202 | |
Harman International Industries, Inc. | | | 53 | | | | 4,295 | |
Jarden Corporation | | | 88 | | | | 4,949 | |
La-Z-Boy, Inc. | | | 160 | | | | 4,682 | |
Leggett & Platt, Inc. | | | 141 | | | | 4,260 | |
Lennar Corporation - Class A | | | 75 | | | | 2,682 | |
M/I Homes, Inc. | | | 169 | | | | 3,713 | |
MDC Holdings, Inc. | | | 130 | | | | 3,929 | |
Meritage Homes Corporation | | | 98 | | | | 4,271 | |
Mohawk Industries, Inc. | | | 41 | | | | 5,741 | |
Newell Rubbermaid, Inc. | | | 71 | | | | 2,155 | |
PulteGroup, Inc. | | | 166 | | | | 3,114 | |
Ryland Group, Inc. (The) | | | 109 | | | | 4,308 | |
Standard Pacific Corporation | | | 642 | | | | 5,251 | |
Stanley Black & Decker, Inc. | | | 34 | | | | 2,767 | |
Toll Brothers, Inc. | | | 134 | | | | 4,569 | |
Universal Electronics, Inc. | | | 36 | | | | 1,368 | |
| | | | | | | | 71,713 | |
| Internet & Catalog Retail — 1.2% | | | | | | | | |
Amazon.com, Inc. | | | 14 | | | | 5,511 | |
Groupon, Inc. | | | 284 | | | | 2,570 | |
HomeAway, Inc. | | | 144 | | | | 5,256 | |
| Liberty Interactive Corporation - Series A | | | 87 | | | | 2,443 | |
Netflix, Inc. | | | 23 | | | | 8,413 | |
NutriSystem, Inc. | | | 21 | | | | 413 | |
Orbitz Worldwide, Inc. | | | 312 | | | | 2,159 | |
Shutterfly, Inc. | | | 94 | | | | 4,440 | |
TripAdvisor, Inc. | | | 80 | | | | 7,066 | |
| | | | | | | | 38,271 | |
| Leisure Equipment & Products — 0.3% | | | | | | | | |
Brunswick Corporation | | | 45 | | | | 2,057 | |
Callaway Golf Company | | | 633 | | | | 5,127 | |
BARROW ALL-CAP LONG/SHORT FUND SCHEDULE OF SECURITIES SOLD SHORT (Continued) | |
COMMON STOCKS — 88.2% (Continued) | | | | | | |
| Consumer Discretionary — 20.4% (Continued) | | | | | | |
| Leisure Equipment & Products — 0.3% (Continued) | | | | | | |
Hasbro, Inc. | | | 6 | | | $ | 323 | |
Mattel, Inc. | | | 22 | | | | 1,018 | |
Polaris Industries, Inc. | | | 2 | | | | 267 | |
| | | | | | | | 8,792 | |
| Media — 2.0% | | | | | | | | |
Charter Communications, Inc. - Class A | | | 9 | | | | 1,216 | |
| Discovery Communications, Inc. - Class A | | | 7 | | | | 611 | |
DISH Network Corporation - Class A | | | 26 | | | | 1,408 | |
| DreamWorks Animation SKG, Inc. - Class A | | | 168 | | | | 5,352 | |
E.W. Scripps Company (The) - Class A | | | 134 | | | | 2,716 | |
Lamar Advertising Company - Class A | | | 115 | | | | 5,741 | |
Lions Gate Entertainment Corporation | | | 100 | | | | 3,164 | |
Live Nation Entertainment, Inc. | | | 361 | | | | 6,632 | |
Loral Space & Communications, Inc. | | | 59 | | | | 4,657 | |
| Madison Square Garden Company (The) - Class A | | | 75 | | | | 4,227 | |
Morningstar, Inc. | | | 5 | | | | 417 | |
| New York Times Company (The) - Class A | | | 125 | | | | 1,745 | |
News Corporation - Class A | | | 139 | | | | 2,496 | |
Nexstar Broadcasting Group, Inc. | | | 50 | | | | 2,484 | |
ReachLocal, Inc. | | | 19 | | | | 240 | |
Regal Entertainment Group - Class A | | | 206 | | | | 4,013 | |
Rentrak Corporation | | | 10 | | | | 399 | |
Scholastic Corporation | | | 50 | | | | 1,527 | |
Sirius XM Holdings, Inc. | | | 1,322 | | | | 4,984 | |
Time Warner Cable, Inc. | | | 9 | | | | 1,244 | |
Walt Disney Company (The) | | | 49 | | | | 3,456 | |
World Wrestling Entertainment, Inc. | | | 359 | | | | 5,496 | |
| | | | | | | | 64,225 | |
| Multiline Retail — 0.4% | | | | | | | | |
Dillard's, Inc. | | | 7 | | | | 640 | |
Family Dollar Stores, Inc. | | | 19 | | | | 1,326 | |
Fred's, Inc. - Class A | | | 266 | | | | 4,618 | |
Kohl's Corporation | | | 12 | | | | 663 | |
Nordstrom, Inc. | | | 8 | | | | 498 | |
Target Corporation | | | 60 | | | | 3,836 | |
Tuesday Morning Corporation | | | 192 | | | | 2,659 | |
| | | | | | | | 14,240 | |
| Specialty Retail — 3.7% | | | | | | | | |
Abercrombie & Fitch Company - Class A | | | 19 | | | | 651 | |
Aéropostale, Inc. | | | 306 | | | | 3,158 | |
BARROW ALL-CAP LONG/SHORT FUND SCHEDULE OF SECURITIES SOLD SHORT (Continued) | |
COMMON STOCKS — 88.2% (Continued) | | | | | | |
| Consumer Discretionary — 20.4% (Continued) | | | | | | |
| Specialty Retail — 3.7% (Continued) | | | | | | |
Asbury Automotive Group, Inc. | | | 38 | | | $ | 1,973 | |
Ascena Retail Group, Inc. | | | 15 | | | | 319 | |
AutoNation, Inc. | | | 91 | | | | 4,463 | |
Barnes & Noble, Inc. | | | 278 | | | | 4,665 | |
bebe stores, Inc. | | | 413 | | | | 2,433 | |
Big 5 Sporting Goods Corporation | | | 18 | | | | 335 | |
Brown Shoe Company, Inc. | | | 61 | | | | 1,570 | |
Cabela's, Inc. - Class A | | | 75 | | | | 4,594 | |
CarMax, Inc. | | | 103 | | | | 5,186 | |
Children's Place Retail Stores, Inc. (The) | | | 29 | | | | 1,595 | |
Conn's, Inc. | | | 90 | | | | 5,430 | |
Dick's Sporting Goods, Inc. | | | 36 | | | | 2,035 | |
Five Below, Inc. | | | 98 | | | | 5,210 | |
Group 1 Automotive, Inc. | | | 20 | | | | 1,369 | |
Haverty Furniture Companies, Inc. | | | 125 | | | | 3,562 | |
hhgregg, Inc. | | | 43 | | | | 641 | |
Home Depot, Inc. (The) | | | 60 | | | | 4,840 | |
Lithia Motors, Inc. | | | 76 | | | | 5,022 | |
Lowe's Companies, Inc. | | | 111 | | | | 5,270 | |
Lumber Liquidators Holdings, Inc. | | | 55 | | | | 5,538 | |
Monro Muffler Brake, Inc. | | | 95 | | | | 5,041 | |
Office Depot, Inc. | | | 1,061 | | | | 5,772 | |
O'Reilly Automotive, Inc. | | | 30 | | | | 3,749 | |
Penske Automotive Group, Inc. | | | 60 | | | | 2,665 | |
Pep Boys - Manny, Moe & Jack (The) | | | 376 | | | | 5,151 | |
PetSmart, Inc. | | | 20 | | | | 1,482 | |
Restoration Hardware Holdings, Inc. | | | 40 | | | | 3,020 | |
Stage Stores, Inc. | | | 170 | | | | 3,572 | |
Stein Mart, Inc. | | | 82 | | | | 1,209 | |
Tiffany & Company | | | 64 | | | | 5,705 | |
Tile Shop Holdings, Inc. (The) | | | 19 | | | | 318 | |
Tractor Supply Company | | | 82 | | | | 6,003 | |
Ulta Salon, Cosmetics & Fragrance, Inc. | | | 44 | | | | 5,585 | |
Urban Outfitters, Inc. | | | 70 | | | | 2,731 | |
Vitamin Shoppe, Inc. | | | 4 | | | | 217 | |
Williams-Sonoma, Inc. | | | 10 | | | | 591 | |
Zale Corporation | | | 26 | | | | 383 | |
| | | | | | | | 123,053 | |
BARROW ALL-CAP LONG/SHORT FUND SCHEDULE OF SECURITIES SOLD SHORT (Continued) | |
COMMON STOCKS — 88.2% (Continued) | | | | | | |
| Consumer Discretionary — 20.4% (Continued) | | | | | | |
| Textiles, Apparel & Luxury Goods — 2.0% | | | | | | |
Carter's, Inc. | | | 9 | | | $ | 636 | |
Columbia Sportswear Company | | | 67 | | | | 4,649 | |
Deckers Outdoor Corporation | | | 6 | | | | 496 | |
Fifth & Pacific Companies, Inc. | | | 237 | | | | 7,740 | |
Fossil Group, Inc. | | | 3 | | | | 382 | |
G-III Apparel Group Ltd. | | | 15 | | | | 904 | |
Hanesbrands, Inc. | | | 78 | | | | 5,468 | |
Jones Group, Inc. (The) | | | 202 | | | | 2,836 | |
Movado Group, Inc. | | | 99 | | | | 4,506 | |
NIKE, Inc. - Class B | | | 69 | | | | 5,461 | |
Oxford Industries, Inc. | | | 11 | | | | 827 | |
PVH Corporation | | | 36 | | | | 4,821 | |
Quiksilver, Inc. | | | 657 | | | | 5,847 | |
Skechers U.S.A., Inc. - Class A | | | 169 | | | | 5,682 | |
Tumi Holdings, Inc. | | | 58 | | | | 1,392 | |
Under Armour, Inc. - Class A | | | 75 | | | | 6,052 | |
Unifi, Inc. | | | 32 | | | | 888 | |
VF Corporation | | | 13 | | | | 3,050 | |
Wolverine World Wide, Inc. | | | 167 | | | | 5,496 | |
| | | | | | | | 67,133 | |
| Consumer Staples — 12.2% | | | | | | | | |
| Beverages — 2.0% | | | | | | | | |
Beam, Inc. | | | 139 | | | | 9,387 | |
| Boston Beer Company, Inc. (The) - Class A | | | 24 | | | | 5,875 | |
Brown-Forman Corporation - Class B | | | 103 | | | | 7,727 | |
| Coca-Cola Bottling Company Consolidated | | | 142 | | | | 9,642 | |
Coca-Cola Company (The) | | | 35 | | | | 1,407 | |
Coca-Cola Enterprises, Inc. | | | 215 | | | | 9,017 | |
Constellation Brands, Inc. - Class A | | | 185 | | | | 13,026 | |
| Molson Coors Brewing Company - Class B | | | 180 | | | | 9,480 | |
PepsiCo, Inc. | | | 19 | | | | 1,605 | |
| | | | | | | | 67,166 | |
| Food & Staples Retailing — 3.8% | | | | | | | | |
Andersons, Inc. (The) | | | 162 | | | | 13,781 | |
Casey's General Stores, Inc. | | | 150 | | | | 11,163 | |
Chefs' Warehouse, Inc. (The) | | | 166 | | | | 4,260 | |
Costco Wholesale Corporation | | | 78 | | | | 9,784 | |
Fairway Group Holdings Corporation | | | 60 | | | | 1,139 | |
Fresh Market, Inc. (The) | | | 178 | | | | 7,246 | |
Kroger Company (The) | | | 125 | | | | 5,219 | |
BARROW ALL-CAP LONG/SHORT FUND SCHEDULE OF SECURITIES SOLD SHORT (Continued) | |
COMMON STOCKS — 88.2% (Continued) | | | | | | |
| Consumer Staples — 12.2% (Continued) | | | | | | |
| Food & Staples Retailing — 3.8% (Continued) | | | | | | |
Natural Grocers by Vitamin Cottage, Inc. | | | 290 | | | $ | 10,666 | |
PriceSmart, Inc. | | | 79 | | | | 9,859 | |
Safeway, Inc. | | | 134 | | | | 4,686 | |
Susser Holdings Corporation | | | 98 | | | | 6,274 | |
Sysco Corporation | | | 239 | | | | 8,038 | |
United Natural Foods, Inc. | | | 162 | | | | 11,154 | |
Walgreen Company | | | 189 | | | | 11,189 | |
Wal-Mart Stores, Inc. | | | 28 | | | | 2,268 | |
Weis Markets, Inc. | | | 13 | | | | 663 | |
Whole Foods Market, Inc. | | | 169 | | | | 9,565 | |
| | | | | | | | 126,954 | |
| Food Products — 5.2% | | | | | | | | |
Annie's, Inc. | | | 216 | | | | 9,925 | |
Archer-Daniels-Midland Company | | | 205 | | | | 8,251 | |
Boulder Brands, Inc. | | | 648 | | | | 9,921 | |
Bunge Ltd. | | | 119 | | | | 9,534 | |
Cal-Maine Foods, Inc. | | | 122 | | | | 6,704 | |
Campbell Soup Company | | | 140 | | | | 5,422 | |
Chiquita Brands International, Inc. | | | 84 | | | | 888 | |
ConAgra Foods, Inc. | | | 266 | | | | 8,775 | |
Flowers Foods, Inc. | | | 245 | | | | 5,324 | |
Fresh Del Monte Produce, Inc. | | | 332 | | | | 9,299 | |
Green Mountain Coffee Roasters, Inc. | | | 70 | | | | 4,717 | |
Hain Celestial Group, Inc. (The) | | | 41 | | | | 3,390 | |
Hershey Company (The) | | | 100 | | | | 9,689 | |
Hormel Foods Corporation | | | 126 | | | | 5,673 | |
Kellogg Company | | | 137 | | | | 8,308 | |
McCormick & Company, Inc. | | | 125 | | | | 8,625 | |
Mead Johnson Nutrition Company | | | 17 | | | | 1,437 | |
Post Holdings, Inc. | | | 225 | | | | 11,396 | |
Sanderson Farms, Inc. | | | 99 | | | | 6,766 | |
Snyder's-Lance, Inc. | | | 388 | | | | 11,178 | |
Tootsie Roll Industries, Inc. | | | 335 | | | | 10,737 | |
TreeHouse Foods, Inc. | | | 141 | | | | 9,891 | |
Tyson Foods, Inc. - Class A | | | 23 | | | | 729 | |
| WhiteWave Foods Company (The) - Class A | | | 240 | | | | 5,105 | |
| | | | | | | | 171,684 | |
BARROW ALL-CAP LONG/SHORT FUND SCHEDULE OF SECURITIES SOLD SHORT (Continued) | |
COMMON STOCKS — 88.2% (Continued) | | | | | | |
| Consumer Staples — 12.2% (Continued) | | | | | | |
| Household Products — 0.4% | | | | | | |
Central Garden & Pet Company | | | 127 | | | $ | 987 | |
Colgate-Palmolive Company | | | 11 | | | | 724 | |
Kimberly-Clark Corporation | | | 87 | | | | 9,497 | |
Procter & Gamble Company (The) | | | 17 | | | | 1,431 | |
| | | | | | | | 12,639 | |
| Personal Products — 0.8% | | | | | | | | |
Avon Products, Inc. | | | 442 | | | | 7,881 | |
Elizabeth Arden, Inc. | | | 225 | | | | 8,894 | |
| Estée Lauder Companies, Inc. (The) - Class A | | | 126 | | | | 9,445 | |
Medifast, Inc. | | | 19 | | | | 515 | |
| | | | | | | | 26,735 | |
Tobacco — 0.0% (a) | | | | | | | | |
Universal Corporation | | | 22 | | | | 1,147 | |
| | | | | | | | | |
| Energy — 9.5% | | | | | | | | |
| Energy Equipment & Services — 1.1% | | | | | | | | |
Baker Hughes, Inc. | | | 6 | | | | 342 | |
Bristow Group, Inc. | | | 6 | | | | 481 | |
Era Group, Inc. | | | 32 | | | | 1,044 | |
Exterran Holdings, Inc. | | | 67 | | | | 2,179 | |
Exterran Partners, L.P. | | | 95 | | | | 2,644 | |
FMC Technologies, Inc. | | | 33 | | | | 1,587 | |
Gulfmark Offshore, Inc. - Class A | | | 54 | | | | 2,665 | |
Helix Energy Solutions Group, Inc. | | | 165 | | | | 3,665 | |
Hercules Offshore, Inc. | | | 240 | | | | 1,534 | |
Hornbeck Offshore Services, Inc. | | | 14 | | | | 709 | |
ION Geophysical Corporation | | | 89 | | | | 343 | |
Key Energy Services, Inc. | | | 124 | | | | 972 | |
McDermott International, Inc. | | | 77 | | | | 627 | |
Parker Drilling Company | | | 188 | | | | 1,491 | |
Rowan Companies plc - Class A | | | 80 | | | | 2,770 | |
SEACOR Holdings, Inc. | | | 40 | | | | 3,722 | |
TETRA Technologies, Inc. | | | 443 | | | | 5,467 | |
Tidewater, Inc. | | | 55 | | | | 3,137 | |
Willbros Group, Inc. | | | 80 | | | | 702 | |
| | | | | | | | 36,081 | |
| Oil, Gas & Consumable Fuels — 8.4% | | | | | | | | |
Access Midstream Partners, L.P. | | | 115 | | | | 6,460 | |
Anadarko Petroleum Corporation | | | 37 | | | | 3,286 | |
Approach Resources, Inc. | | | 123 | | | | 2,606 | |
BARROW ALL-CAP LONG/SHORT FUND SCHEDULE OF SECURITIES SOLD SHORT (Continued) | |
COMMON STOCKS — 88.2% (Continued) | | | | | | |
| Energy — 9.5% (Continued) | | | | | | |
| Oil, Gas & Consumable Fuels — 8.4% (Continued) | | | | | | |
Atlas Energy, L.P. | | | 100 | | | $ | 4,438 | |
Atlas Pipeline Partners, L.P. | | | 130 | | | | 4,545 | |
Atlas Resource Partners, L.P. | | | 196 | | | | 4,053 | |
Bill Barrett Corporation | | | 12 | | | | 323 | |
Bonanza Creek Energy, Inc. | | | 48 | | | | 2,202 | |
Buckeye Partners, L.P. | | | 60 | | | | 4,085 | |
Cabot Oil & Gas Corporation | | | 130 | | | | 4,478 | |
Carrizo Oil & Gas, Inc. | | | 7 | | | | 283 | |
Cheniere Energy, Inc. | | | 159 | | | | 6,295 | |
Chesapeake Energy Corporation | | | 165 | | | | 4,434 | |
Cobalt International Energy, Inc. | | | 196 | | | | 4,357 | |
Concho Resources, Inc. | | | 45 | | | | 4,677 | |
CONSOL Energy, Inc. | | | 157 | | | | 5,586 | |
Contango Oil & Gas Company | | | 107 | | | | 5,041 | |
Continental Resources, Inc. | | | 12 | | | | 1,290 | |
Crestwood Equity Partners, L.P. | | | 326 | | | | 5,014 | |
Crosstex Energy, Inc. | | | 194 | | | | 6,305 | |
Crosstex Energy, L.P. | | | 234 | | | | 6,234 | |
DCP Midstream Partners, L.P. | | | 63 | | | | 3,035 | |
Devon Energy Corporation | | | 34 | | | | 2,061 | |
Diamondback Energy, Inc. | | | 22 | | | | 1,094 | |
Eagle Rock Energy Partners, L.P. | | | 263 | | | | 1,594 | |
Emerald Oil, Inc. | | | 87 | | | | 632 | |
Enbridge Energy Partners, L.P. | | | 122 | | | | 3,671 | |
Energen Corporation | | | 4 | | | | 289 | |
Energy Transfer Equity, L.P. | | | 75 | | | | 5,608 | |
Energy Transfer Partners, L.P. | | | 86 | | | | 4,658 | |
Enterprise Products Partners, L.P. | | | 71 | | | | 4,471 | |
EOG Resources, Inc. | | | 8 | | | | 1,320 | |
EQT Corporation | | | 58 | | | | 4,936 | |
EQT Midstream Partners, L.P. | | | 19 | | | | 1,045 | |
EV Energy Partners, L.P. | | | 26 | | | | 850 | |
EXCO Resources, Inc. | | | 235 | | | | 1,243 | |
Genesis Energy, L.P. | | | 58 | | | | 3,009 | |
Goodrich Petroleum Corporation | | | 140 | | | | 2,694 | |
Gulfport Energy Corporation | | | 56 | | | | 3,272 | |
Holly Energy Partners, L.P. | | | 15 | | | | 472 | |
Kinder Morgan Energy Partners, L.P. | | | 51 | | | | 4,180 | |
Kinder Morgan, Inc. | | | 112 | | | | 3,980 | |
Kodiak Oil & Gas Corporation | | | 269 | | | | 3,050 | |
BARROW ALL-CAP LONG/SHORT FUND SCHEDULE OF SECURITIES SOLD SHORT (Continued) | |
COMMON STOCKS — 88.2% (Continued) | | | | | | |
| Energy — 9.5% (Continued) | | | | | | |
| Oil, Gas & Consumable Fuels — 8.4% (Continued) | | | | | | |
Laredo Petroleum, Inc. | | | 36 | | | $ | 972 | |
Legacy Reserves, L.P. | | | 97 | | | | 2,618 | |
Linn Energy, LLC | | | 92 | | | | 2,799 | |
Magellan Midstream Partners, L.P. | | | 80 | | | | 4,971 | |
Magnum Hunter Resources Corporation | | | 1,037 | | | | 7,508 | |
MarkWest Energy Partners, L.P. | | | 84 | | | | 5,802 | |
Martin Midstream Partners, L.P. | | | 6 | | | | 269 | |
Matador Resources Company | | | 248 | | | | 5,404 | |
Memorial Production Partners, L.P. | | | 141 | | | | 2,813 | |
Newfield Exploration Company | | | 11 | | | | 309 | |
NGL Energy Partners, L.P. | | | 33 | | | | 1,072 | |
Noble Energy, Inc. | | | 70 | | | | 4,917 | |
NuStar Energy, L.P. | | | 68 | | | | 3,628 | |
Oasis Petroleum, Inc. | | | 9 | | | | 415 | |
Oiltanking Partners, L.P. | | | 16 | | | | 958 | |
ONEOK Partners, L.P. | | | 19 | | | | 1,018 | |
Par Petroleum Corporation | | | 142 | | | | 291 | |
PDC Energy, Inc. | | | 94 | | | | 5,538 | |
Pioneer Natural Resources Company | | | 27 | | | | 4,799 | |
Plains All American Pipeline, L.P. | | | 38 | | | | 1,960 | |
QEP Resources, Inc. | | | 170 | | | | 5,443 | |
QR Energy, L.P. | | | 134 | | | | 2,196 | |
Range Resources Corporation | | | 56 | | | | 4,348 | |
Regency Energy Partners, L.P. | | | 162 | | | | 3,950 | |
Resolute Energy Corporation | | | 153 | | | | 1,378 | |
Rex Energy Corporation | | | 183 | | | | 3,510 | |
Rose Rock Midstream, L.P. | | | 23 | | | | 825 | |
Sanchez Energy Corporation | | | 101 | | | | 2,593 | |
SandRidge Energy, Inc. | | | 466 | | | | 2,605 | |
SemGroup Corporation - Class A | | | 85 | | | | 5,217 | |
SM Energy Company | | | 42 | | | | 3,702 | |
Southwestern Energy Company | | | 36 | | | | 1,392 | |
Spectra Energy Corporation | | | 131 | | | | 4,395 | |
Summit Midstream Partners, L.P. | | | 11 | | | | 369 | |
Sunoco Logistics Partners, L.P. | | | 5 | | | | 354 | |
Synergy Resources Corporation | | | 169 | | | | 1,595 | |
Targa Resources Corporation | | | 35 | | | | 2,838 | |
Targa Resources Partners, L.P. | | | 68 | | | | 3,471 | |
Tesoro Logistics, L.P. | | | 19 | | | | 974 | |
TransMontaigne Partners, L.P. | | | 13 | | | | 548 | |
BARROW ALL-CAP LONG/SHORT FUND SCHEDULE OF SECURITIES SOLD SHORT (Continued) | |
COMMON STOCKS — 88.2% (Continued) | | | | | | |
| Energy — 9.5% (Continued) | | | | | | |
| Oil, Gas & Consumable Fuels — 8.4% (Continued) | | | | | | |
Triangle Petroleum Corporation | | | 335 | | | $ | 3,558 | |
Ultra Petroleum Corporation | | | 161 | | | | 3,296 | |
W&T Offshore, Inc. | | | 16 | | | | 275 | |
Western Gas Partners, L.P. | | | 81 | | | | 5,158 | |
Williams Companies, Inc. (The) | | | 120 | | | | 4,226 | |
Williams Partners, L.P. | | | 82 | | | | 4,214 | |
WPX Energy, Inc. | | | 255 | | | | 4,740 | |
| | | | | | | | 278,387 | |
| Health Care — 18.6% | | | | | | | | |
| Biotechnology — 2.2% | | | | | | | | |
ACADIA Pharmaceuticals, Inc. | | | 69 | | | | 1,607 | |
Achillion Pharmaceuticals, Inc. | | | 291 | | | | 1,007 | |
Aegerion Pharmaceuticals, Inc. | | | 49 | | | | 3,476 | |
Alnylam Pharmaceuticals, Inc. | | | 32 | | | | 1,958 | |
Anacor Pharmaceuticals, Inc. | | | 15 | | | | 210 | |
Ariad Pharmaceuticals, Inc. | | | 178 | | | | 863 | |
Array BioPharma, Inc. | | | 87 | | | | 498 | |
Celldex Therapeutics, Inc. | | | 77 | | | | 2,137 | |
Cepheid, Inc. | | | 85 | | | | 3,861 | |
Chemocentryx, Inc. | | | 62 | | | | 321 | |
Clovis Oncology, Inc. | | | 41 | | | | 2,471 | |
Dynavax Technologies Corporation | | | 124 | | | | 219 | |
Exact Sciences Corporation | | | 135 | | | | 1,658 | |
Geron Corporation | | | 40 | | | | 215 | |
Halozyme Therapeutics, Inc. | | | 70 | | | | 1,033 | |
Hyperion Therapeutics, Inc. | | | 11 | | | | 281 | |
Idenix Pharmaceuticals, Inc. | | | 439 | | | | 2,357 | |
ImmunoGen, Inc. | | | 53 | | | | 770 | |
Immunomedics, Inc. | | | 80 | | | | 346 | |
Incyte Corporation | | | 84 | | | | 3,914 | |
Infinity Pharmaceuticals, Inc. | | | 98 | | | | 1,432 | |
Insmed, Inc. | | | 87 | | | | 1,409 | |
Intercept Pharmaceuticals, Inc. | | | 2 | | | | 105 | |
InterMune, Inc. | | | 213 | | | | 2,946 | |
Ironwood Pharmaceuticals, Inc. | | | 117 | | | | 1,336 | |
Isis Pharmaceuticals, Inc. | | | 85 | | | | 3,295 | |
Keryx Biopharmaceuticals, Inc. | | | 169 | | | | 2,347 | |
KYTHERA Biopharmaceuticals, Inc. | | | 47 | | | | 1,832 | |
Lexicon Pharmaceuticals, Inc. | | | 830 | | | | 1,992 | |
Medivation, Inc. | | | 74 | | | | 4,663 | |
BARROW ALL-CAP LONG/SHORT FUND SCHEDULE OF SECURITIES SOLD SHORT (Continued) | |
COMMON STOCKS — 88.2% (Continued) | | | | | | |
| Health Care — 18.6% (Continued) | | | | | | |
| Biotechnology — 2.2% (Continued) | | | | | | |
Merrimack Pharmaceuticals, Inc. | | | 196 | | | $ | 772 | |
Momenta Pharmaceuticals, Inc. | | | 172 | | | | 3,060 | |
Neurocrine Biosciences, Inc. | | | 24 | | | | 236 | |
Novavax, Inc. | | | 111 | | | | 413 | |
NPS Pharmaceuticals, Inc. | | | 35 | | | | 924 | |
OPKO Health, Inc. | | | 32 | | | | 337 | |
Orexigen Therapeutics, Inc. | | | 364 | | | | 2,486 | |
Puma Biotechnology, Inc. | | | 54 | | | | 2,689 | |
Raptor Pharmaceutical Corporation | | | 27 | | | | 375 | |
Rigel Pharmaceuticals, Inc. | | | 69 | | | | 184 | |
Seattle Genetics, Inc. | | | 86 | | | | 3,534 | |
Stemline Therapeutics, Inc. | | | 4 | | | | 83 | |
Synageva BioPharma Corporation | | | 6 | | | | 362 | |
Synergy Pharmaceuticals, Inc. | | | 17 | | | | 78 | |
TESARO, Inc. | | | 44 | | | | 1,716 | |
Theravance, Inc. | | | 135 | | | | 5,098 | |
| | | | | | | | 72,906 | |
| Health Care Equipment & Supplies — 7.4% | | | | | | | | |
Abaxis, Inc. | | | 50 | | | | 1,799 | |
Abiomed, Inc. | | | 35 | | | | 1,001 | |
Accuray, Inc. | | | 439 | | | | 3,503 | |
Align Technology, Inc. | | | 264 | | | | 14,425 | |
Analogic Corporation | | | 47 | | | | 4,541 | |
AngioDynamics, Inc. | | | 57 | | | | 881 | |
Antares Pharma, Inc. | | | 1,282 | | | | 5,051 | |
Baxter International, Inc. | | | 114 | | | | 7,803 | |
Becton, Dickinson and Company | | | 26 | | | | 2,823 | |
Boston Scientific Corporation | | | 1,030 | | | | 11,927 | |
Cardiovascular Systems, Inc. | | | 182 | | | | 6,042 | |
CONMED Corporation | | | 56 | | | | 2,280 | |
Cooper Companies, Inc. (The) | | | 94 | | | | 12,384 | |
Cynosure, Inc. - Class A | | | 113 | | | | 2,926 | |
DENTSPLY International, Inc. | | | 183 | | | | 8,704 | |
DexCom, Inc. | | | 295 | | | | 9,762 | |
Edwards Lifesciences Corporation | | | 82 | | | | 5,373 | |
Endologix, Inc. | | | 331 | | | | 5,915 | |
GenMark Diagnostics, Inc. | | | 76 | | | | 904 | |
Greatbatch, Inc. | | | 136 | | | | 5,526 | |
Haemonetics Corporation | | | 322 | | | | 13,608 | |
HeartWare International, Inc. | | | 66 | | | | 6,362 | |
BARROW ALL-CAP LONG/SHORT FUND SCHEDULE OF SECURITIES SOLD SHORT (Continued) | |
COMMON STOCKS — 88.2% (Continued) | | | | | | |
| Health Care — 18.6% (Continued) | | | | | | |
| Health Care Equipment & Supplies — 7.4% (Continued) | | | | | | |
Hill-Rom Holdings, Inc. | | | 29 | | | $ | 1,201 | |
Hologic, Inc. | | | 454 | | | | 10,165 | |
IDEXX Laboratories, Inc. | | | 59 | | | | 6,145 | |
Insulet Corporation | | | 216 | | | | 7,996 | |
| Integra LifeSciences Holdings Corporation | | | 106 | | | | 4,924 | |
Intuitive Surgical, Inc. | | | 5 | | | | 1,885 | |
Invacare Corporation | | | 208 | | | | 4,659 | |
Merit Medical Systems, Inc. | | | 263 | | | | 4,305 | |
Neogen Corporation | | | 14 | | | | 712 | |
NuVasive, Inc. | | | 195 | | | | 6,484 | |
NxStage Medical, Inc. | | | 357 | | | | 3,645 | |
Quidel Corporation | | | 80 | | | | 2,013 | |
ResMed, Inc. | | | 28 | | | | 1,367 | |
Sirona Dental Systems, Inc. | | | 64 | | | | 4,402 | |
Spectranetics Corporation (The) | | | 268 | | | | 6,234 | |
STAAR Surgical Company | | | 140 | | | | 1,767 | |
Stryker Corporation | | | 43 | | | | 3,200 | |
Symmetry Medical, Inc. | | | 24 | | | | 235 | |
Teleflex, Inc. | | | 101 | | | | 9,929 | |
Volcano Corporation | | | 226 | | | | 5,146 | |
West Pharmaceutical Services, Inc. | | | 384 | | | | 19,169 | |
Wright Medical Group, Inc. | | | 191 | | | | 5,694 | |
ZELTIQ Aesthetics, Inc. | | | 26 | | | | 456 | |
| | | | | | | | 245,273 | |
| Health Care Providers & Services — 3.4% | | | | | | | | |
Acadia Healthcare Company, Inc. | | | 197 | | | | 9,102 | |
Accretive Health, Inc. | | | 282 | | | | 2,391 | |
Air Methods Corporation | | | 69 | | | | 3,861 | |
Amedisys, Inc. | | | 78 | | | | 1,270 | |
BioScrip, Inc. | | | 315 | | | | 2,145 | |
Brookdale Senior Living, Inc. | | | 364 | | | | 10,614 | |
Capital Senior Living Corporation | | | 213 | | | | 4,756 | |
DaVita HealthCare Partners, Inc. | | | 32 | | | | 1,906 | |
ExamWorks Group, Inc. | | | 221 | | | | 6,522 | |
Express Scripts Holding Company | | | 132 | | | | 8,890 | |
Healthways, Inc. | | | 152 | | | | 2,130 | |
Henry Schein, Inc. | | | 83 | | | | 9,462 | |
HMS Holdings Corporation | | | 409 | | | | 9,370 | |
LifePoint Hospitals, Inc. | | | 254 | | | | 13,013 | |
MWI Veterinary Supply, Inc. | | | 12 | | | | 2,186 | |
BARROW ALL-CAP LONG/SHORT FUND SCHEDULE OF SECURITIES SOLD SHORT (Continued) | |
COMMON STOCKS — 88.2% (Continued) | | | | | | |
| Health Care — 18.6% (Continued) | | | | | | |
| Health Care Providers & Services — 3.4% (Continued) | | | | | | |
Team Health Holdings, Inc. | | | 359 | | | $ | 16,776 | |
Universal Health Services, Inc. - Class B | | | 98 | | | | 8,078 | |
| | | | | | | | 112,472 | |
| Health Care Technology — 1.6% | | | | | | | | |
Allscripts Healthcare Solutions, Inc. | | | 856 | | | | 12,789 | |
athenahealth, Inc. | | | 143 | | | | 18,757 | |
Cerner Corporation | | | 181 | | | | 10,402 | |
Medidata Solutions, Inc. | | | 84 | | | | 9,988 | |
Omnicell, Inc. | | | 30 | | | | 728 | |
Vocera Communications, Inc. | | | 77 | | | | 1,368 | |
| | | | | | | | 54,032 | |
| Life Sciences Tools & Services — 0.1% | | | | | | | | |
Covance, Inc. | | | 24 | | | | 2,025 | |
PAREXEL International Corporation | | | 6 | | | | 247 | |
PerkinElmer, Inc. | | | 20 | | | | 761 | |
| | | | | | | | 3,033 | |
| Pharmaceuticals — 3.9% | | | | | | | | |
Actavis plc | | | 86 | | | | 14,024 | |
Allergan, Inc. | | | 27 | | | | 2,620 | |
AVANIR Pharmaceuticals, Inc. - Class A | | | 866 | | | | 3,845 | |
Bristol-Myers Squibb Company | | | 168 | | | | 8,632 | |
Cadence Pharmaceuticals, Inc. | | | 789 | | | | 7,117 | |
Endocyte, Inc. | | | 247 | | | | 2,850 | |
Forest Laboratories, Inc. | | | 195 | | | | 10,005 | |
Hospira, Inc. | | | 276 | | | | 10,850 | |
Lannett Company, Inc. | | | 37 | | | | 1,093 | |
Medicines Company (The) | | | 171 | | | | 6,260 | |
Merck & Company, Inc. | | | 159 | | | | 7,923 | |
Mylan, Inc. | | | 245 | | | | 10,812 | |
Nektar Therapeutics | | | 554 | | | | 6,958 | |
Pacira Pharmaceuticals, Inc. | | | 175 | | | | 9,658 | |
Perrigo Company | | | 71 | | �� | | 11,068 | |
Repros Therapeutics, Inc. | | | 57 | | | | 978 | |
Sagent Pharmaceuticals, Inc. | | | 194 | | | | 4,406 | |
Salix Pharmaceuticals Ltd. | | | 9 | | | | 763 | |
TherapeuticsMD, Inc. | | | 229 | | | | 1,120 | |
Zoetis, Inc. | | | 252 | | | | 7,850 | |
| | | | | | | | 128,832 | |
BARROW ALL-CAP LONG/SHORT FUND SCHEDULE OF SECURITIES SOLD SHORT (Continued) | |
COMMON STOCKS — 88.2% (Continued) | | | | | | |
| Industrials — 19.2% | | | | | | |
| Aerospace & Defense — 3.3% | | | | | | |
AAR Corporation | | | 40 | | | $ | 1,249 | |
Astronics Corporation | | | 32 | | | | 1,673 | |
Astronics Corporation - Class B | | | 3 | | | | 156 | |
B/E Aerospace, Inc. | | | 80 | | | | 6,960 | |
Boeing Company (The) | | | 52 | | | | 6,981 | |
Curtiss-Wright Corporation | | | 96 | | | | 5,066 | |
DigitalGlobe, Inc. | | | 200 | | | | 7,920 | |
Esterline Technologies Corporation | | | 48 | | | | 4,225 | |
GenCorp, Inc. | | | 239 | | | | 4,383 | |
General Dynamics Corporation | | | 51 | | | | 4,675 | |
HEICO Corporation | | | 51 | | | | 2,911 | |
Hexcel Corporation | | | 165 | | | | 7,248 | |
Honeywell International, Inc. | | | 64 | | | | 5,665 | |
Huntington Ingalls Industries, Inc. | | | 101 | | | | 8,305 | |
KEYW Holding Corporation (The) | | | 171 | | | | 2,119 | |
MOOG, Inc. - Class A | | | 92 | | | | 6,318 | |
Precision Castparts Corporation | | | 26 | | | | 6,720 | |
Rockwell Collins, Inc. | | | 6 | | | | 436 | |
| Spirit AeroSystems Holdings, Inc. - Class A | | | 318 | | | | 10,379 | |
Taser International, Inc. | | | 75 | | | | 1,289 | |
Teledyne Technologies, Inc. | | | 59 | | | | 5,471 | |
Textron, Inc. | | | 172 | | | | 5,716 | |
United Technologies Corporation | | | 44 | | | | 4,878 | |
| | | | | | | | 110,743 | |
| Air Freight & Logistics — 0.5% | | | | | | | | |
Air Transport Services Group, Inc. | | | 38 | | | | 296 | |
Atlas Air Worldwide Holdings, Inc. | | | 15 | | | | 576 | |
Echo Global Logistics, Inc. | | | 13 | | | | 267 | |
FedEx Corporation | | | 46 | | | | 6,380 | |
United Parcel Service, Inc. - Class B | | | 59 | | | | 6,040 | |
UTi Worldwide, Inc. | | | 214 | | | | 3,383 | |
XPO Logistics, Inc. | | | 14 | | | | 322 | |
| | | | | | | | 17,264 | |
| Building Products — 2.6% | | | | | | | | |
A.O. Smith Corporation | | | 114 | | | | 6,173 | |
AAON, Inc. | | | 156 | | | | 4,800 | |
American Woodmark Corporation | | | 69 | | | | 2,490 | |
Apogee Enterprises, Inc. | | | 122 | | | | 4,370 | |
Armstrong World Industries, Inc. | | | 112 | | | | 5,958 | |
Builders FirstSource, Inc. | | | 556 | | | | 3,920 | |
BARROW ALL-CAP LONG/SHORT FUND SCHEDULE OF SECURITIES SOLD SHORT (Continued) | |
COMMON STOCKS — 88.2% (Continued) | | | | | | |
| Industrials — 19.2% (Continued) | | | | | | |
| Building Products — 2.6% (Continued) | | | | | | |
Fortune Brands Home & Security, Inc. | | | 134 | | | $ | 5,842 | |
Gibraltar Industries, Inc. | | | 124 | | | | 2,195 | |
Griffon Corporation | | | 164 | | | | 2,109 | |
Lennox International, Inc. | | | 78 | | | | 6,427 | |
Masco Corporation | | | 259 | | | | 5,807 | |
Masonite International Corporation | | | 6 | | | | 300 | |
NCI Building Systems, Inc. | | | 139 | | | | 2,353 | |
Nortek, Inc. | | | 8 | | | | 584 | |
Owens Corning, Inc. | | | 171 | | | | 6,696 | |
PGT, Inc. | | | 87 | | | | 870 | |
Ply Gem Holdings, Inc. | | | 107 | | | | 1,877 | |
Quanex Building Products Corporation | | | 180 | | | | 3,211 | |
Simpson Manufacturing Company, Inc. | | | 105 | | | | 3,812 | |
Trex Company, Inc. | | | 70 | | | | 5,067 | |
Universal Forest Products, Inc. | | | 81 | | | | 4,210 | |
USG Corporation | | | 258 | | | | 7,067 | |
| | | | | | | | 86,138 | |
| Commercial Services & Supplies — 2.4% | | | | | | | | |
ABM Industries, Inc. | | | 130 | | | | 3,615 | |
Brink's Company (The) | | | 88 | | | | 2,951 | |
Clean Harbors, Inc. | | | 117 | | | | 6,174 | |
Copart, Inc. | | | 37 | | | | 1,274 | |
Covanta Holding Corporation | | | 333 | | | | 5,961 | |
EnerNOC, Inc. | | | 58 | | | | 995 | |
G&K Services, Inc. | | | 49 | | | | 2,951 | |
Healthcare Services Group, Inc. | | | 79 | | | | 2,290 | |
HNI Corporation | | | 24 | | | | 951 | |
InnerWorkings, Inc. | | | 188 | | | | 1,293 | |
Interface, Inc. | | | 172 | | | | 3,449 | |
Iron Mountain, Inc. | | | 164 | | | | 4,612 | |
KAR Auction Services, Inc. | | | 247 | | | | 6,815 | |
Kimball International, Inc. - Class B | | | 37 | | | | 551 | |
McGrath RentCorp | | | 97 | | | | 3,772 | |
Mine Safety Appliances Company | | | 30 | | | | 1,495 | |
Republic Services, Inc. | | | 155 | | | | 5,411 | |
Rollins, Inc. | | | 18 | | | | 506 | |
Standard Parking Corporation | | | 81 | | | | 1,980 | |
Steelcase, Inc. - Class A | | | 59 | | | | 963 | |
Stericycle, Inc. | | | 47 | | | | 5,521 | |
Team, Inc. | | | 58 | | | | 2,373 | |
BARROW ALL-CAP LONG/SHORT FUND SCHEDULE OF SECURITIES SOLD SHORT (Continued) | |
COMMON STOCKS — 88.2% (Continued) | | | | | | |
| Industrials — 19.2% (Continued) | | | | | | |
| Commercial Services & Supplies — 2.4% (Continued) | | | | | | |
Tetra Tech, Inc. | | | 57 | | | $ | 1,630 | |
Viad Corp | | | 65 | | | | 1,755 | |
Waste Connections, Inc. | | | 134 | | | | 5,888 | |
Waste Management, Inc. | | | 129 | | | | 5,893 | |
| | | | | | | | 81,069 | |
| Construction & Engineering — 0.7% | | | | | | | | |
AECOM Technology Corporation | | | 92 | | | | 2,673 | |
Aegion Corporation | | | 136 | | | | 2,961 | |
Comfort Systems USA, Inc. | | | 174 | | | | 3,567 | |
Dycom Industries, Inc. | | | 136 | | | | 3,849 | |
Granite Construction, Inc. | | | 110 | | | | 3,437 | |
Great Lakes Dredge & Dock Corporation | | | 237 | | | | 2,112 | |
Layne Christensen Company | | | 8 | | | | 133 | |
MasTec, Inc. | | | 47 | | | | 1,488 | |
Quanta Services, Inc. | | | 74 | | | | 2,191 | |
Tutor Perini Corporation | | | 14 | | | | 343 | |
| | | | | | | | 22,754 | |
| Electrical Equipment — 1.1% | | | | | | | | |
Babcock & Wilcox Company (The) | | | 145 | | | | 4,708 | |
Encore Wire Corporation | | | 85 | | | | 4,269 | |
Franklin Electric Company, Inc. | | | 65 | | | | 2,893 | |
Generac Holdings, Inc. | | | 10 | | | | 533 | |
General Cable Corporation | | | 95 | | | | 2,768 | |
GrafTech International Ltd. | | | 277 | | | | 3,191 | |
II-VI, Inc. | | | 181 | | | | 2,959 | |
Polypore International, Inc. | | | 132 | | | | 5,013 | |
Power Solutions International, Inc. | | | 18 | | | | 1,347 | |
Regal-Beloit Corporation | | | 50 | | | | 3,679 | |
Roper Industries, Inc. | | | 34 | | | | 4,410 | |
SolarCity Corporation | | | 8 | | | | 418 | |
| | | | | | | | 36,188 | |
| Industrial Conglomerates — 0.1% | | | | | | | | |
General Electric Company | | | 154 | | | | 4,106 | |
| | | | | | | | | |
| Machinery — 3.9% | | | | | | | | |
Alamo Group, Inc. | | | 7 | | | | 411 | |
| Albany International Corporation - Class A | | | 79 | | | | 2,904 | |
Astec Industries, Inc. | | | 90 | | | | 3,294 | |
Barnes Group, Inc. | | | 98 | | | | 3,577 | |
Blount International, Inc. | | | 116 | | | | 1,681 | |
BARROW ALL-CAP LONG/SHORT FUND SCHEDULE OF SECURITIES SOLD SHORT (Continued) | |
COMMON STOCKS — 88.2% (Continued) | | | | | | |
| Industrials — 19.2% (Continued) | | | | | | |
| Machinery — 3.9% (Continued) | | | | | | |
Briggs & Stratton Corporation | | | 143 | | | $ | 2,891 | |
Caterpillar, Inc. | | | 19 | | | | 1,607 | |
Chart Industries, Inc. | | | 65 | | | | 6,324 | |
CIRCOR International, Inc. | | | 63 | | | | 4,998 | |
Colfax Corporation | | | 107 | | | | 6,215 | |
Cummins, Inc. | | | 25 | | | | 3,309 | |
Donaldson Company, Inc. | | | 135 | | | | 5,634 | |
EnPro Industries, Inc. | | | 35 | | | | 1,981 | |
ESCO Technologies, Inc. | | | 87 | | | | 2,963 | |
Federal Signal Corporation | | | 142 | | | | 2,219 | |
Flowserve Corporation | | | 92 | | | | 6,567 | |
Gorman-Rupp Company (The) | | | 75 | | | | 3,155 | |
Graco, Inc. | | | 9 | | | | 695 | |
Harsco Corporation | | | 237 | | | | 6,198 | |
John Bean Technologies Corporation | | | 48 | | | | 1,419 | |
Kennametal, Inc. | | | 50 | | | | 2,374 | |
L.B. Foster Company - Class A | | | 18 | | | | 844 | |
Lincoln Electric Holdings, Inc. | | | 10 | | | | 715 | |
Manitowoc Company, Inc. (The) | | | 53 | | | | 1,091 | |
Middleby Corporation | | | 15 | | | | 3,313 | |
Mueller Industries, Inc. | | | 37 | | | | 2,260 | |
Mueller Water Products, Inc. - Class A | | | 453 | | | | 3,900 | |
Pall Corporation | | | 73 | | | | 6,110 | |
Proto Labs, Inc. | | | 64 | | | | 4,755 | |
RBC Bearings, Inc. | | | 17 | | | | 1,163 | |
SPX Corporation | | | 71 | | | | 6,719 | |
Tennant Company | | | 25 | | | | 1,632 | |
Terex Corporation | | | 196 | | | | 7,119 | |
Titan International, Inc. | | | 17 | | | | 293 | |
Toro Company (The) | | | 11 | | | | 679 | |
Trimas Corporation | | | 35 | | | | 1,280 | |
Trinity Industries, Inc. | | | 99 | | | | 5,139 | |
Wabash National Corporation | | | 68 | | | | 826 | |
WABCO Holdings, Inc. | | | 14 | | | | 1,240 | |
Watts Water Technologies, Inc. - Class A | | | 41 | | | | 2,465 | |
Woodward, Inc. | | | 138 | | | | 5,920 | |
Xylem, Inc. | | | 11 | | | | 380 | |
| | | | | | | | 128,259 | |
BARROW ALL-CAP LONG/SHORT FUND SCHEDULE OF SECURITIES SOLD SHORT (Continued) | |
COMMON STOCKS — 88.2% (Continued) | | | | | | |
| Industrials — 19.2% (Continued) | | | | | | |
| Marine — 0.3% | | | | | | |
Kirby Corporation | | | 70 | | | $ | 6,612 | |
Matson, Inc. | | | 109 | | | | 2,728 | |
| | | | | | | | 9,340 | |
| Professional Services — 1.4% | | | | | | | | |
Advisory Board Company (The) | | | 101 | | | | 6,537 | |
Barrett Business Services, Inc. | | | 15 | | | | 1,268 | |
| Corporate Executive Board Company (The) | | | 71 | | | | 5,228 | |
Equifax, Inc. | | | 35 | | | | 2,356 | |
IHS, Inc. - Class A | | | 45 | | | | 5,149 | |
Kelly Services, Inc. - Class A | | | 115 | | | | 2,673 | |
Kforce, Inc. | | | 93 | | | | 1,877 | |
ManpowerGroup, Inc. | | | 92 | | | | 7,354 | |
Mistras Group, Inc. | | | 138 | | | | 2,767 | |
Nielsen Holdings N.V. | | | 36 | | | | 1,554 | |
On Assignment, Inc. | | | 48 | | | | 1,633 | |
Pendrell Corporation | | | 1,010 | | | | 2,161 | |
Towers Watson & Company - Class A | | | 4 | | | | 450 | |
TrueBlue, Inc. | | | 92 | | | | 2,350 | |
Verisk Analytics, Inc. - Class A | | | 39 | | | | 2,539 | |
WageWorks, Inc. | | | 35 | | | | 2,005 | |
| | | | | | | | 47,901 | |
| Road & Rail — 1.8% | | | | | | | | |
Arkansas Best Corporation | | | 81 | | | | 2,636 | |
Celadon Group, Inc. | | | 50 | | | | 1,041 | |
Con-Way, Inc. | | | 117 | | | | 4,843 | |
CSX Corporation | | | 211 | | | | 5,754 | |
Genesee & Wyoming, Inc. - Class A | | | 70 | | | | 6,734 | |
J.B. Hunt Transport Services, Inc. | | | 71 | | | | 5,338 | |
Kansas City Southern | | | 47 | | | | 5,688 | |
Knight Transportation, Inc. | | | 62 | | | | 1,108 | |
Marten Transport Ltd. | | | 132 | | | | 2,565 | |
Norfolk Southern Corporation | | | 68 | | | | 5,963 | |
Old Dominion Freight Line, Inc. | | | 132 | | | | 6,802 | |
Saia, Inc. | | | 65 | | | | 2,257 | |
Swift Transportation Company | | | 60 | | | | 1,389 | |
Union Pacific Corporation | | | 34 | | | | 5,509 | |
Universal Truckload Services, Inc. | | | 35 | | | | 1,008 | |
Werner Enterprises, Inc. | | | 23 | | | | 554 | |
| | | | | | | | 59,189 | |
BARROW ALL-CAP LONG/SHORT FUND SCHEDULE OF SECURITIES SOLD SHORT (Continued) | |
COMMON STOCKS — 88.2% (Continued) | | | | | | |
| Industrials — 19.2% (Continued) | | | | | | |
| Trading Companies & Distributors — 0.9% | | | | | | |
Beacon Roofing Supply, Inc. | | | 38 | | | $ | 1,413 | |
Fastenal Company | | | 102 | | | | 4,746 | |
Grainger (W.W.), Inc. | | | 17 | | | | 4,385 | |
H&E Equipment Services, Inc. | | | 144 | | | | 4,108 | |
Kaman Corporation | | | 77 | | | | 3,069 | |
MRC Global, Inc. | | | 47 | | | | 1,438 | |
Rush Enterprises, Inc. - Class A | | | 33 | | | | 964 | |
Watsco, Inc. | | | 66 | | | | 6,333 | |
WESCO International, Inc. | | | 18 | | | | 1,548 | |
| | | | | | | | 28,004 | |
| Transportation Infrastructure — 0.2% | | | | | | | | |
Macquarie Infrastructure Company, LLC | | | 128 | | | | 6,980 | |
Wesco Aircraft Holdings, Inc. | | | 46 | | | | 960 | |
| | | | | | | | 7,940 | |
| Materials — 8.3% | | | | | | | | |
| Chemicals — 3.0% | | | | | | | | |
A. Schulman, Inc. | | | 96 | | | | 3,283 | |
Advanced Emissions Solutions, Inc. | | | 7 | | | | 406 | |
Air Products & Chemicals, Inc. | | | 37 | | | | 4,027 | |
Airgas, Inc. | | | 37 | | | | 4,019 | |
Albemarle Corporation | | | 17 | | | | 1,168 | |
American Vanguard Corporation | | | 35 | | | | 1,006 | |
Ashland, Inc. | | | 41 | | | | 3,734 | |
Axiall Corporation | | | 40 | | | | 1,812 | |
Balchem Corporation | | | 23 | | | | 1,361 | |
Cabot Corporation | | | 133 | | | | 6,490 | |
Calgon Carbon Corporation | | | 260 | | | | 5,385 | |
Celanese Corporation - Series A | | | 76 | | | | 4,266 | |
Chemtura Corporation | | | 110 | | | | 2,904 | |
Cytec Industries, Inc. | | | 38 | | | | 3,400 | |
Dow Chemical Company (The) | | | 112 | | | | 4,375 | |
E.I. du Pont de Nemours and Company | | | 72 | | | | 4,419 | |
Eastman Chemical Company | | | 33 | | | | 2,542 | |
Ecolab, Inc. | | | 42 | | | | 4,501 | |
Ferro Corporation | | | 94 | | | | 1,309 | |
Flotek Industries, Inc. | | | 34 | | | | 712 | |
FMC Corporation | | | 6 | | | | 437 | |
Huntsman Corporation | | | 36 | | | | 826 | |
Kraton Performance Polymers, Inc. | | | 242 | | | | 5,636 | |
BARROW ALL-CAP LONG/SHORT FUND SCHEDULE OF SECURITIES SOLD SHORT (Continued) | |
COMMON STOCKS — 88.2% (Continued) | | | | | | |
| Materials — 8.3% (Continued) | | | | | | |
| Chemicals — 3.0% (Continued) | | | | | | |
OM Group, Inc. | | | 188 | | | $ | 6,193 | |
PolyOne Corporation | | | 223 | | | | 7,239 | |
Praxair, Inc. | | | 32 | | | | 4,040 | |
Rockwood Holdings, Inc. | | | 55 | | | | 3,765 | |
| Scotts Miracle-Gro Company (The) - Class A | | | 25 | | | | 1,465 | |
Sensient Technologies Corporation | | | 41 | | | | 2,015 | |
Sherwin-Williams Company (The) | | | 2 | | | | 366 | |
Taminco Corporation | | | 18 | | | | 387 | |
Tredegar Corporation | | | 45 | | | | 1,178 | |
Tronox Ltd. - Class A | | | 224 | | | | 4,760 | |
Valhi, Inc. | | | 84 | | | | 1,284 | |
| | | | | | | | 100,710 | |
| Construction Materials — 0.8% | | | | | | | | |
Eagle Materials, Inc. | | | 83 | | | | 6,474 | |
Headwaters, Inc. | | | 475 | | | | 4,589 | |
Martin Marietta Materials, Inc. | | | 56 | | | | 5,407 | |
Texas Industries, Inc. | | | 87 | | | | 5,056 | |
Vulcan Materials Company | | | 75 | | | | 4,228 | |
| | | | | | | | 25,754 | |
| Containers & Packaging — 0.4% | | | | | | | | |
Bemis Company, Inc. | | | 67 | | | | 2,615 | |
Graphic Packaging Holding Company | | | 373 | | | | 3,350 | |
Myers Industries, Inc. | | | 153 | | | | 3,097 | |
Packaging Corporation of America | | | 24 | | | | 1,470 | |
Rock-Tenn Company - Class A | | | 33 | | | | 3,116 | |
Sealed Air Corporation | | | 12 | | | | 385 | |
Silgan Holdings, Inc. | | | 6 | | | | 280 | |
| | | | | | | | 14,313 | |
| Metals & Mining — 3.0% | | | | | | | | |
Alcoa, Inc. | | | 452 | | | | 4,344 | |
Allegheny Technologies, Inc. | | | 196 | | | | 6,511 | |
Allied Nevada Gold Corporation | | | 163 | | | | 541 | |
AMCOL International Corporation | | | 95 | | | | 2,960 | |
Carpenter Technology Corporation | | | 59 | | | �� | 3,557 | |
Century Aluminum Company | | | 617 | | | | 5,553 | |
Cliffs Natural Resources, Inc. | | | 85 | | | | 2,126 | |
Coeur Mining, Inc. | | | 312 | | | | 3,438 | |
Commercial Metals Company | | | 189 | | | | 3,670 | |
Compass Minerals International, Inc. | | | 69 | | | | 4,937 | |
BARROW ALL-CAP LONG/SHORT FUND SCHEDULE OF SECURITIES SOLD SHORT (Continued) | |
COMMON STOCKS — 88.2% (Continued) | | | | | | |
| Materials — 8.3% (Continued) | | | | | | |
| Metals & Mining — 3.0% (Continued) | | | | | | |
Freeport-McMoRan Copper & Gold, Inc. | | | 47 | | | $ | 1,630 | |
Globe Specialty Metals, Inc. | | | 346 | | | | 6,159 | |
Hecla Mining Company | | | 1,461 | | | | 4,310 | |
Horsehead Holding Corporation | | | 352 | | | | 5,269 | |
Materion Corporation | | | 155 | | | | 4,458 | |
Newmont Mining Corporation | | | 57 | | | | 1,415 | |
Nucor Corporation | | | 84 | | | | 4,289 | |
Royal Gold, Inc. | | | 106 | | | | 4,780 | |
RTI International Metals, Inc. | | | 161 | | | | 5,614 | |
Schnitzer Steel Industries, Inc. - Class A | | | 195 | | | | 5,974 | |
Steel Dynamics, Inc. | | | 334 | | | | 6,086 | |
Stillwater Mining Company | | | 379 | | | | 4,256 | |
SunCoke Energy, Inc. | | | 61 | | | | 1,383 | |
Worthington Industries, Inc. | | | 177 | | | | 7,422 | |
| | | | | | | | 100,682 | |
| Paper & Forest Products — 1.1% | | | | | | | | |
Clearwater Paper Corporation | | | 73 | | | | 3,865 | |
Deltic Timber Corporation | | | 74 | | | | 4,663 | |
International Paper Company | | | 87 | | | | 4,059 | |
| KapStone Paper and Packaging Corporation | | | 168 | | | | 8,951 | |
MeadWestvaco Corporation | | | 110 | | | | 3,862 | |
P.H. Glatfelter Company | | | 191 | | | | 5,346 | |
Wausau Paper Corporation | | | 299 | | | | 3,630 | |
| | | | | | | | 34,376 | |
| | | | | | | | | |
Total Common Stocks (Proceeds $2,657,920) | | | | | | $ | 2,926,233 | |
| | |
| | | | | | |
Magnum Hunter Resources Corporation (b) (Proceeds $0) | | | 97 | | | $ | — | |
Total Securities Sold Short — 88.2% (Proceeds $2,657,920) | | | | | | $ | 2,926,233 | |
| (a) | Percentage rounds to less than 0.1%. |
| (b) | Security value has been determined in good faith by the Board of Trustees. The total value of such security is $0 at November 30, 2013, represents 0.0% of net assets (Note 2). |
See accompanying notes to financial statements.
BARROW FUNDS STATEMENTS OF ASSETS AND LIABILITIES November 30, 2013 (Unaudited) | |
| | | | | Barrow All-Cap Long/ Short Fund | |
| ASSETS | | | | | | |
| Investments in securities: | | | | | | |
At acquisition cost | | $ | 15,511,541 | | | $ | 3,898,587 | |
At value (Note 2) | | $ | 19,241,252 | | | $ | 4,295,654 | |
| Deposits with brokers for securities sold short (Note 2) | | | — | | | | 1,927,176 | |
Dividends and interest receivable | | | 29,421 | | | | 6,633 | |
Receivable from Adviser (Note 4) | | | — | | | | 15,443 | |
Other assets | | | 19,553 | | | | 19,888 | |
TOTAL ASSETS | | | 19,290,226 | | | | 6,264,794 | |
| | | | | | | | | |
| LIABILITIES | | | | | | | | |
| Securities sold short, at value (Note 2) (proceeds $2,657,920) | | | — | | | | 2,926,233 | |
Line of credit payable (Note 5) | | | 43,572 | | | | — | |
Dividends payable on securities sold short (Note 2) | | | — | | | | 2,170 | |
Payable to Adviser (Note 4) | | | 2,623 | | | | — | |
Payable to administrator (Note 4) | | | 7,650 | | | | 7,530 | |
| Accrued brokerage expense on securities sold short (Note 2) | | | — | | | | 214 | |
Other accrued expenses and liabilities | | | 7,915 | | | | 9,721 | |
TOTAL LIABILITIES | | | 61,760 | | | | 2,945,868 | |
| | | | | | | | | |
NET ASSETS | | $ | 19,228,466 | | | $ | 3,318,926 | |
| | | | | | | | | |
| Net assets consist of: | | | | | | | | |
Paid-in capital | | $ | 14,835,358 | | | $ | 3,186,898 | |
Accumulated net investment income (loss) | | | 33,157 | | | | (5,000 | ) |
| Accumulated net realized gains from security transactions | | | 630,240 | | | | 8,274 | |
| Net unrealized appreciation (depreciation) on: | | | | | | | | |
Investments | | | 3,729,711 | | | | 397,067 | |
Short positions | | | — | | | | (268,313 | ) |
Net assets | | $ | 19,228,466 | | | $ | 3,318,926 | |
| | | | | | | | | |
| NET ASSET VALUE PER SHARE: | | | | | | | | |
| INVESTOR CLASS | | | | | | | | |
Net assets applicable to Investor Class | | $ | 128,169 | | | $ | 114,619 | |
| Investor Class shares of beneficial interest outstanding | | | 4,893 | | | | 10,989 | |
Net asset value, offering price and redemption
price per share (Note 2) | | $ | 26.19 | | | $ | 10.43 | |
| | | | | | | | | |
| INSTITUTIONAL CLASS | | | | | | | | |
Net assets applicable to Institutional Class | | $ | 19,100,297 | | | $ | 3,204,307 | |
| Institutional Class shares of beneficial interest outstanding | | | 728,723 | | | | 307,051 | |
Net asset value, offering price and redemption
price per share (Note 2) | | $ | 26.21 | | | $ | 10.44 | |
See accompanying notes to financial statements.
BARROW FUNDS STATEMENTS OF OPERATIONS For the Period Ended November 30, 2013(a) (Unaudited) | |
| | | | | Barrow All-Cap Long/ Short Fund | |
| INVESTMENT INCOME | | | | | | |
Dividends | | $ | 85,338 | | | $ | 17,956 | |
Interest | | | — | | | | 1,730 | |
TOTAL INVESTMENT INCOME | | | 85,338 | | | | 19,686 | |
| | | | | | | | | |
| EXPENSES | | | | | | | | |
Investment advisory fees (Note 4) | | | 44,792 | | | | 10,736 | |
Accounting services fees (Note 4) | | | 7,944 | | | | 7,574 | |
Registration and filing fees, Common | | | 4,231 | | | | 2,331 | |
Registration fees, Institutional Class | | | 2,476 | | | | 2,476 | |
Registration fees, Investor Class | | | 688 | | | | 688 | |
Custodian fees | | | 4,825 | | | | 8,043 | |
Administration fees (Note 4) | | | 6,000 | | | | 6,000 | |
Transfer agent fees - Institutional Class (Note 4) | | | 3,000 | | | | 3,000 | |
Transfer agent fees - Investor Class (Note 4) | | | 3,000 | | | | 3,000 | |
Professional fees | | | 4,125 | | | | 4,125 | |
Dividend expense on securities sold short (Note 2) | | | — | | | | 7,074 | |
Compliance service fees (Note 4) | | | 3,000 | | | | 3,000 | |
Brokerage expense on securities sold short (Note 2) | | | — | | | | 5,092 | |
Pricing fees | | | 889 | | | | 4,040 | |
Trustees’ fees and expenses (Note 4) | | | 2,299 | | | | 2,299 | |
Postage and supplies | | | 2,049 | | | | 2,049 | |
Printing of shareholder reports | | | 1,935 | | | | 1,787 | |
Insurance expense | | | 370 | | | | 370 | |
Distribution fees, Investor Class (Note 4) | | | 71 | | | | 67 | |
Borrowing costs (Note 5) | | | 79 | | | | — | |
Other expenses | | | 1,525 | | | | 1,524 | |
TOTAL EXPENSES | | | 93,298 | | | | 75,275 | |
| Fee reductions and expense reimbursements by the Adviser (Note 4): | | | | | | | | |
Common | | | (31,953 | ) | | | (41,425 | ) |
Institutional Class | | | (5,476 | ) | | | (5,476 | ) |
Investor Class | | | (3,688 | ) | | | (3,688 | ) |
NET EXPENSES | | | 52,181 | | | | 24,686 | |
| | | | | | | | | |
NET INVESTMENT INCOME (LOSS) | | | 33,157 | | | | (5,000 | ) |
| (a) | Represents the period from the commencement of operations (close of business August 30, 2013) through November 30, 2013 (Note 1). |
See accompanying notes to financial statements.
BARROW FUNDS STATEMENTS OF OPERATIONS For the Period Ended November 30, 2013(a) (Unaudited) (Continued) | |
| | | | | Barrow All-Cap Long/ Short Fund | |
| REALIZED AND UNREALIZED GAINS (LOSSES) ON INVESTMENTS AND SECURITIES SOLD SHORT | | | | | | |
| Net realized gains (losses) from: | | | | | | |
Investments | | $ | 630,240 | | | $ | 32,976 | |
Securities sold short | | | — | | | | (24,702 | ) |
| Net change in unrealized appreciation (depreciation) on: | | | | | | | | |
Investments | | | 1,452,175 | | | | 397,067 | |
Securities sold short | | | — | | | | (268,313 | ) |
| NET REALIZED AND UNREALIZED GAINS ON INVESTMENTS | | | 2,082,415 | | | | 137,028 | |
| | | | | | | | | |
| NET INCREASE IN NET ASSETS RESULTING FROM OPERATIONS | | $ | 2,115,572 | | | $ | 132,028 | |
| (a) | Represents the period from the commencement of operations (close of business August 30, 2013) through November 30, 2013 (Note 1). |
See accompanying notes to financial statements.
BARROW FUNDS STATEMENTS OF CHANGES IN NET ASSETS | |
| | | | | | Barrow All-Cap Long/ Short Fund | |
| | Period Ended November 30, 2013(a) (Unaudited) | | | Period Ended November 30, 2013(a) (Unaudited) | |
| FROM OPERATIONS | | | | | | |
Net investment income (loss) | | $ | 33,157 | | | $ | (5,000 | ) |
| Net realized gains (losses) from: | | | | | | | | |
Investments | | | 630,240 | | | | 32,976 | |
Securities sold short | | | — | | | | (24,702 | ) |
| Net change in unrealized appreciation (depreciation) on: | | | | | | | | |
Investments | | | 1,452,175 | | | | 397,067 | |
Securities sold short | | | — | | | | (268,313 | ) |
Net increase in net assets resulting from operations | | | 2,115,572 | | | | 132,028 | |
| | | | | | | | | |
| CAPITAL SHARE TRANSACTIONS | | | | | | | | |
| Investor Class | | | | | | | | |
Proceeds from shares sold | | | 115,000 | | | | 110,000 | |
| | | | | | | | | |
| Institutional Class | | | | | | | | |
Proceeds from shares sold | | | 275,197 | | | | 3,085,441 | |
Proceeds from tax-free reorganization (Note 1) | | | 16,722,697 | | | | — | |
Payments for shares redeemed | | | — | | | | (8,543 | ) |
Net increase in Institutional Class net assets
from capital share transactions | | | 16,997,894 | | | | 3,076,898 | |
| | | | | | | | | |
TOTAL INCREASE IN NET ASSETS | | | 19,228,466 | | | | 3,318,926 | |
| | | | | | | | | |
| NET ASSETS | | | | | | | | |
Beginning of period | | | — | | | | — | |
End of period | | $ | 19,228,466 | | | $ | 3,318,926 | |
| (a) | Represents the period from the commencement of operations (close of business August 30, 2013) through November 30, 2013 (Note 1). |
See accompanying notes to financial statements.
BARROW FUNDS STATEMENTS OF CHANGES IN NET ASSETS (Continued) | |
| | | | | | Barrow All-Cap Long/ Short Fund | |
| | Period Ended November 30, 2013(a) (Unaudited) | | | Period Ended November 30, 2013(a) (Unaudited) | |
| CAPITAL SHARE ACTIVITY | | | | | | |
| Investor Class | | | | | | |
Shares sold | | | 4,893 | | | | 10,989 | |
Shares outstanding, beginning of period | | | — | | | | — | |
Shares outstanding, end of period | | | 4,893 | | | | 10,989 | |
| | | | | | | | | |
| Institutional Class | | | | | | | | |
Shares sold | | | 11,011 | | | | 307,905 | |
Shares issued from tax-free reorganization (Note 1) | | | 717,712 | | | | — | |
Shares redeemed | | | — | | | | (854 | ) |
Net increase in shares outstanding | | | 728,723 | | | | 307,051 | |
Shares outstanding, beginning of period | | | — | | | | — | |
Shares outstanding, end of period | | | 728,723 | | | | 307,051 | |
| (a) | Represents the period from the commencement of operations (close of business August 30, 2013) through November 30, 2013 (Note 1). |
See accompanying notes to financial statements.
BARROW ALL-CAP CORE FUND INVESTOR CLASS FINANCIAL HIGHLIGHTS | |
Per share data for a share outstanding throughout the period: | |
| | Period Ended November 30, 2013(a) (Unaudited) | |
| Net asset value at beginning of period | | $ | 23.30 | |
| | | | | |
| Income from investment operations: | | | | |
| Net investment income | | | 0.03 | |
| Net realized and unrealized gains on investments | | | 2.86 | |
| Total from investment operations | | | 2.89 | |
| | | | | |
| Net asset value at end of period | | $ | 26.19 | |
| | | | | |
Total return (b) | | | 12.40% | (c) |
| | | | | |
| Ratios and supplemental data: | | | | |
| Net assets at end of period (000’s) | | $ | 128 | |
| | | | | |
| Ratio of total expenses to average net assets | | | 15.13% | (d) |
| | | | | |
Ratio of net expenses to average net assets (e)(f) | | | 1.40% | (d) |
| | | | | |
Ratio of net investment income to average net assets (e) | | | 0.48% | (d) |
| | | | | |
| Portfolio turnover rate | | | 15% | (c) |
| (a) | Represents the period from the commencement of operations (close of business August 30, 2013) through November 30, 2013 (Note 1). |
| (b) | Total return is a measure of the change in value of an investment in the Fund over the period covered, which assumes any dividends or capital gains distributions are reinvested in shares of the Fund. The return shown does not reflect the deduction of taxes a shareholder would pay on Fund distributions or the redemption of Fund shares. Total return would be lower if the Adviser had not reduced advisory fees and reimbursed expenses. |
| (e) | Ratio was determined after fee reductions and expense reimbursements by the Adviser (Note 4). |
| (f) | Excluding borrowing costs on the bank line of credit, the ratio of net expenses to average net assets for the period ended November 30, 2013 is 1.40%(d) (Note 4). |
See accompanying notes to financial statements.
BARROW ALL-CAP CORE FUND INSTITUTIONAL CLASS FINANCIAL HIGHLIGHTS | |
Per share data for a share outstanding throughout the period: | |
| | Period Ended November 30, 2013(a) (Unaudited) | |
| Net asset value at beginning of period | | $ | 23.30 | |
| | | | | |
| Income from investment operations: | | | | |
| Net investment income | | | 0.05 | |
| Net realized and unrealized gains on investments | | | 2.86 | |
| Total from investment operations | | | 2.91 | |
| | | | | |
| Net asset value at end of period | | $ | 26.21 | |
| | | | | |
Total return (b) | | | 12.49% | (c) |
| | | | | |
| Ratios and supplemental data: | | | | |
| Net assets at end of period (000’s) | | $ | 19,100 | |
| | | | | |
| Ratio of total expenses to average net assets | | | 1.98% | (d) |
| | | | | |
Ratio of net expenses to average net assets (e)(f) | | | 1.15% | (d) |
| | | | | |
Ratio of net investment income to average net assets (e) | | | 0.73% | (d) |
| | | | | |
| Portfolio turnover rate | | | 15% | (c) |
| (a) | Represents the period from the commencement of operations (close of business August 30, 2013) through November 30, 2013 (Note 1). |
| (b) | Total return is a measure of the change in value of an investment in the Fund over the period covered, which assumes any dividends or capital gains distributions are reinvested in shares of the Fund. The return shown does not reflect the deduction of taxes a shareholder would pay on Fund distributions or the redemption of Fund shares. Total return would be lower if the Adviser had not reduced advisory fees and reimbursed expenses. |
| (e) | Ratio was determined after fee reductions and expense reimbursements by the Adviser (Note 4). |
| (f) | Excluding borrowing costs on the bank line of credit, the ratio of net expenses to average net assets for the period ended November 30, 2013 is 1.15%(d) (Note 4). |
See accompanying notes to financial statements.
BARROW ALL-CAP LONG/SHORT FUND INVESTOR CLASS FINANCIAL HIGHLIGHTS | |
Per share data for a share outstanding throughout the period: | |
| | Period Ended November 30, 2013(a) (Unaudited) | |
| Net asset value at beginning of period | | $ | 10.00 | |
| | | | | |
| Income (loss) from investment operations: | | | | |
| Net investment loss | | | (0.02 | ) |
| Net realized and unrealized gains on investments | | | 0.45 | |
| Total from investment operations | | | 0.43 | |
| | | | | |
| Net asset value at end of period | | $ | 10.43 | |
| | | | | |
Total return (b) | | | 4.30% | (c) |
| | | | | |
| Ratios and supplemental data: | | | | |
| Net assets at end of period (000’s) | | $ | 115 | |
| | | | | |
| Ratio of total expenses to average net assets | | | 23.26% | (d) |
| | | | | |
Ratio of net expenses to average net assets (e)(f) | | | 3.68% | (d) |
| | | | | |
Ratio of net investment loss to average net assets (e) | | | (0.94% | )(d) |
| | | | | |
| Portfolio turnover rate | | | 17% | (c) |
| (a) | Represents the period from the commencement of operations (close of business August 30, 2013) through November 30, 2013 (Note 1). |
| (b) | Total return is a measure of the change in value of an investment in the Fund over the period covered, which assumes any dividends or capital gains distributions are reinvested in shares of the Fund. The return shown does not reflect the deduction of taxes a shareholder would pay on Fund distributions or the redemption of Fund shares. Total return would be lower if the Adviser had not reduced advisory fees and reimbursed expenses. |
| (e) | Ratio was determined after fee reductions and expense reimbursements by the Adviser (Note 4). |
| (f) | Excluding dividend expense, the ratio of net expenses to average net assets for the period ended November 30, 2013 is 2.70%(d). Excluding dividend expense and brokerage expense on securities sold short, the ratio of net expenses to average net assets for the period ended November 30, 2013 is 1.99%(d) (Note 4). |
See accompanying notes to financial statements.
BARROW ALL-CAP LONG/SHORT FUND INSTITUTIONAL CLASS FINANCIAL HIGHLIGHTS | |
Per share data for a share outstanding throughout the period: | |
| | Period Ended November 30, 2013(a) (Unaudited) | |
| Net asset value at beginning of period | | $ | 10.00 | |
| | | | | |
| Income (loss) from investment operations: | | | | |
| Net investment loss | | | (0.02 | ) |
| Net realized and unrealized gains on investments | | | 0.46 | |
| Total from investment operations | | | 0.44 | |
| | | | | |
| Net asset value at end of period | | $ | 10.44 | |
| | | | | |
Total return (b) | | | 4.40% | (c) |
| | | | | |
| Ratios and supplemental data: | | | | |
| Net assets at end of period (000’s) | | $ | 3,204 | |
| | | | | |
| Ratio of total expenses to average net assets | | | 10.00% | (d) |
| | | | | |
Ratio of net expenses to average net assets (e)(f) | | | 3.43% | (d) |
| | | | | |
Ratio of net investment loss to average net assets (e) | | | (0.69% | )(d) |
| | | | | |
| Portfolio turnover rate | | | 17% | (c) |
| (a) | Represents the period from the commencement of operations (close of business August 30, 2013) through November 30, 2013 (Note 1). |
| (b) | Total return is a measure of the change in value of an investment in the Fund over the period covered, which assumes any dividends or capital gains distributions are reinvested in shares of the Fund. The return shown does not reflect the deduction of taxes a shareholder would pay on Fund distributions or the redemption of Fund shares. Total return would be lower if the Adviser had not reduced advisory fees and reimbursed expenses. |
| (e) | Ratio was determined after fee reductions and expense reimbursements by the Adviser (Note 4). |
| (f) | Excluding dividend expense, the ratio of net expenses to average net assets for the period ended November 30, 2013 is 2.45%(d). Excluding dividend expense and brokerage expense on securities sold short, the ratio of net expenses to average net assets for the period ended November 30, 2013 is 1.74%(d) (Note 4). |
See accompanying notes to financial statements.
BARROW FUNDS
NOTES TO FINANCIAL STATEMENTS
November 30, 2013 (Unaudited)
1. Organization
Barrow All-Cap Core Fund and Barrow All-Cap Long/Short Fund (individually, a “Fund” and, collectively the “Funds”) are each a diversified series of Ultimus Managers Trust (the “Trust”), an open-end investment company established as an Ohio business trust under a Declaration of Trust dated February 28, 2012. Other series of the Trust are not incorporated in this report. The Funds commenced operations on the close of business August 30, 2013.
The investment objective of Barrow All-Cap Core Fund is to generate long-term capital appreciation and the investment objective of Barrow All-Cap Long/Short Fund is to generate above-average returns through capital appreciation, while also attempting to reduce volatility and preserve capital during market downturns.
Barrow All-Cap Core Fund acquired the assets and liabilities of Barrow Street Fund LP, a Delaware limited partnership (the “Predecessor Private Fund”), in a tax-free reorganization completed on the close of business August 30, 2013, the date the Barrow All-Cap Core Fund commenced operations. The Predecessor Private Fund had an investment objective and investment policies that were, in all material respects, the same as those of Barrow All-Cap Core Fund. However, the Predecessor Private Fund was not registered as an investment company under the Investment Company Act of 1940, as amended (the “1940 Act”), and was not subject to certain investment limitations, diversification requirements, liquidity requirements and other restrictions imposed by the 1940 Act and the Internal Revenue Code of 1986, as amended (the “Code”). If such requirements and restrictions had been applicable, they might have adversely affected the Predecessor Private Fund’s performance. In addition, the Predecessor Private Fund charged an annual management fee of 1.50% of assets and a 20% performance fee after it reached certain performance benchmarks. Barrow All-Cap Core Fund does not charge a performance fee.
Upon completion of the reorganization, the net assets of Barrow All-Cap Core Fund were $16,722,697. The number of shares of Barrow All-Cap Core Fund issued in connection with the reorganization was 717,712, and the amount of net unrealized gains on the portfolio securities transferred to Barrow All-Cap Core Fund was $2,277,536.
Each Fund offers two classes of shares: Investor Class shares (sold without any sales loads, but subject to a distribution fee of up to 0.25% of the average daily net assets attributable to Investor Class shares) and Institutional Class shares (sold without any sales loads or distribution fees) (each a “Class”). Each share class represents an ownership interest in the same investment portfolio.
BARROW FUNDS NOTES TO FINANCIAL STATEMENTS (Continued) |
2. Significant Accounting Policies
The following is a summary of the Funds’ significant accounting policies. The policies are in conformity with accounting principles generally accepted in the United States of America (“GAAP”).
Securities valuation – Each Fund’s portfolio securities are valued at market value as of the close of regular trading on the New York Stock Exchange (the “NYSE”) (normally 4:00 p.m. Eastern time) on each business day the NYSE is open. Securities listed on the NYSE or other exchanges are valued on the basis of their last sales prices on the exchanges on which they are primarily traded. If there are no sales on that day, the securities are valued at the closing bid price on the NYSE or other primary exchange for that day. NASDAQ listed securities are valued at the NASDAQ Official Closing Price. If there are no sales on that day, the securities are valued at the last bid price as reported by NASDAQ. Securities traded in the over-the-counter market are valued at the last sale price, if available, otherwise at the most recently quoted bid price. In the event that market quotations are not readily available or are considered unreliable due to market or other events, securities and other assets are valued at fair value as determined in good faith in accordance with procedures adopted by the Board of Trustees of the Trust and will be classified as Level 2 or 3 within the fair value hierarchy (see below), depending on the inputs used. Factors determining portfolio investments subject to fair value determination include, but are not limited to, the following: the spread between bid and asked prices is substantial; infrequency of sales; thinness of market; the size of reported trades; a temporary lapse in the provision of prices by any reliable pricing source; and actions of the securities or futures markets, such as the suspension or limitation of trading. Securities with remaining maturities of 60 days or less are valued at amortized cost value, absent unusual circumstances.
GAAP establishes a single authoritative definition of fair value, sets out a framework for measuring fair value and requires additional disclosures about fair value measurements.
Various inputs are used in determining the value of each Fund’s investments. These inputs are summarized in the three broad levels listed below:
| • | Level 1 – quoted prices in active markets for identical securities |
| • | Level 2 – other significant observable inputs |
| • | Level 3 – significant unobservable inputs |
The inputs or methodology used for valuing securities are not necessarily an indication of the risks associated with investing in those securities. The inputs used to measure fair value may fall into different levels of the fair value hierarchy. In such cases, for disclosure purposes, the level in the fair value hierarchy within which the fair value measurement falls in its entirety is determined based on the lowest level input that is significant to the fair value measurement.
BARROW FUNDS NOTES TO FINANCIAL STATEMENTS (Continued) |
The following is a summary of the inputs used to value the Funds’ investments as of November 30, 2013:
| | | | | | | | | | | | |
| Investment in Securities: | | | | | | | | | | | | |
| Common Stocks | | $ | 19,226,341 | | | $ | — | | | $ | — | | | $ | 19,226,341 | |
| Money Market Funds | | | 14,911 | | | | — | | | | — | | | | 14,911 | |
| Total | | $ | 19,241,252 | | | $ | — | | | $ | — | | | $ | 19,241,252 | |
| | | | | | | | | | | | | | | | | |
Barrow All-Cap Long/Short Fund | | | | | | | | | | | | |
| Investment in Securities: | | | | | | | | | | | | | | | | |
| Common Stocks | | $ | 4,244,887 | | | $ | — | | | $ | — | | | $ | 4,244,887 | |
| Money Market Funds | | | 50,767 | | | | — | | | | — | | | | 50,767 | |
| Total | | $ | 4,295,654 | | | $ | — | | | $ | — | | | $ | 4,295,654 | |
| Other Financial Instruments: | | | | | | | | | | | | | | | | |
| Common Stocks – Sold Short | | $ | (2,926,233 | ) | | $ | — | | | $ | — | | | $ | (2,926,233 | ) |
| Warrants – Sold Short | | | — | | | | 0 | | | | — | | | | — | |
| | | $ | (2,926,233 | ) | | $ | 0 | | | $ | — | | | $ | (2,926,233 | ) |
Refer to each Fund’s Schedule of Investments and Schedule of Securities Sold Short, as applicable, for a listing of securities by industry type. As of November 30, 2013, the Funds did not have any transfers in and out of any Level. There were no Level 2 or Level 3 securities and or derivative instruments held by the Funds as of November 30, 2013. It is the Funds’ policy to recognize transfers into and out of any Level at the end of the reporting period.
Share valuation – The net asset value per share of each class of each Fund is calculated daily by dividing the total value of the assets attributable to that class, less liabilities attributable to that class, by the number of shares of that class outstanding. The offering price and redemption price per share of each class of each Fund is equal to the net asset value per share of each class of each Fund.
Investment income – Dividend income is recorded on the ex-dividend date. Interest income is accrued as earned.
Security transactions – Security transactions are accounted for on the trade date. Gains and losses on securities sold are determined on a specific identification basis.
Allocation between classes – Investment income earned, realized capital gains and losses, and unrealized appreciation and depreciation are allocated daily to each class of shares based upon its proportionate share of total net assets of each Fund. Class specific expenses are charged directly to the class incurring the expense. Common expenses which are not attributable to a specific class are allocated daily to each class of shares based upon its proportionate share of total net assets of each Fund.
BARROW FUNDS NOTES TO FINANCIAL STATEMENTS (Continued) |
Common expenses – Common expenses of the Trust are allocated among the Funds and the other series of the Trust based on the relative net assets of each series or the nature of the services performed and the relative applicability to each series.
Distributions to shareholders – Distributions to shareholders arising from net investment income and net realized capital gains, if any, are distributed at least once each year. The amount of distributions from net investment income and net realized gains are determined in accordance with federal income tax regulations, which may differ from GAAP. Dividends and distributions to shareholders are recorded on the ex-dividend date. There were no distributions paid to shareholders by either fund during the period ended November 30, 2013. On December 31, 2013, Barrow All-Cap Core Fund paid income dividends to Investor Class and Institutional Class shareholders of $0.0655 per share and $0.0456 per share, respectively, and capital gain distributions totaling $0.4885 per share for each Class of the Fund. The dividends were paid on December 31, 2013 to shareholders of record on December 30, 2013. No distributions were paid to shareholders of the Barrow All-Cap Long/Short Fund on December 31, 2013.
Short Positions – Barrow All-Cap Long/Short Fund may sell securities short. For financial statement purposes, an amount equal to the settlement amount is included in the Statements of Assets and Liabilities as an asset and an equivalent liability is then subsequently marked-to-market daily to reflect the current value of the short position. Subsequent fluctuations in the market prices of securities sold, but not yet purchased, may require purchasing the securities at prices which may differ from the market value reflected on the Statements of Assets and Liabilities. The Fund is liable for any dividends payable on securities while those securities are in a short position and will also bear other costs, such as charges for the prime brokerage accounts, in connection with the short positions. These costs are reported as brokerage expenses on securities sold short in the Statements of Operations. As collateral for its short positions, the Fund is required under the 1940 Act to maintain assets consisting of cash, cash equivalents or liquid securities equal to the market value of the securities sold short. The deposits with brokers for securities sold short are reported on the Statements of Assets and Liabilities. The amount of collateral is required to be adjusted daily to reflect changes in the value of the securities sold short. To the extent Barrow All-Cap Long/Short Fund invests the proceeds received from selling securities short, the Fund is engaging in a form of leverage. The use of leverage by the Fund may make any change in the Fund’s net asset value greater than it would be without the use of leverage. Short sales are speculative transactions and involve special risks, including greater reliance on the ability of Barrow Street Advisors, LLC (the "Adviser") to accurately anticipate the future value of a security.
Estimates – The preparation of financial statements in conformity with GAAP requires management to make estimates and assumptions that affect the reported amounts of assets and liabilities and disclosure of contingent assets and liabilities as of the date of the financial statements and the reported amounts of income and expenses during the reporting period. Actual results could differ from those estimates.
BARROW FUNDS NOTES TO FINANCIAL STATEMENTS (Continued) |
Federal income tax – It is each Fund’s intention to qualify as a regulated investment company under the Code. Qualification generally will relieve each Fund of liability for federal income taxes to the extent 100% of their net investment income and net realized gains are distributed in accordance with the Code. Accordingly, no provision for income tax has been made.
In order to avoid imposition of the excise tax applicable to regulated investment companies, it is also each Fund’s intention to declare as dividends in each calendar year at least 98% of its net investment income (earned during the calendar year) and 98.2% of its net realized capital gains (earned during the twelve months ended October 31) plus undistributed amounts from prior years.
The following information is computed on a tax basis for each item as of November 30, 2013:
| | | | | Barrow All-Cap Long/Short Fund | |
Cost of portfolio investments | | $ | 15,520,056 | | | $ | 3,904,303 | |
Gross unrealized appreciation | | $ | 4,100,417 | | | $ | 449,102 | |
Gross unrealized depreciation | | | (379,221 | ) | | | (57,751 | ) |
Net unrealized appreciation | | | 3,721,196 | | | | 391,351 | |
Net unrealized depreciation on securities sold short | | | — | | | | (276,156 | ) |
Accumulated ordinary income | | | 178,920 | | | | 16,833 | |
Other gains | | | 492,992 | | | | — | |
Accumulated earnings | | $ | 4,393,108 | | | $ | 132,028 | |
As of November 30, 2013, the tax cost of securities sold short is $2,650,077 for Barrow All-Cap Long/Short Fund.
The difference between the federal income tax cost of portfolio investments and securities sold short and the financial statement cost is due to certain timing differences in the recognition of capital gains or losses under income tax regulations and GAAP. These “book/tax” differences are temporary in nature and are primarily due to the tax deferral of losses on wash sales.
The Funds recognize tax benefits or expenses of uncertain tax positions only when the position is “more likely than not” to be sustained assuming examination by tax authorities. Management has reviewed tax positions for the current tax year and has concluded that no provision for unrecognized tax benefits or expenses is required in these financial statements.
BARROW FUNDS NOTES TO FINANCIAL STATEMENTS (Continued) |
3. Investment Transactions
During the period ended November 30, 2013, cost of purchases and proceeds from sales of investment securities, other than short-term investments and short positions, amounted to $3,124,993 and $2,674,981, respectively, for Barrow All-Cap Core Fund and $1,080,316 and $620,457, respectively, for Barrow All-Cap Long/Short Fund.
4. Transactions with Related Parties
INVESTMENT ADVISORY AGREEMENT
Each Fund’s investments are managed by Barrow Street Advisors LLC (the “Adviser”) pursuant to the terms of an Investment Advisory Agreement. Barrow All-Cap Core Fund pays the Adviser an investment advisory fee, computed and accrued daily and paid monthly, at the annual rate of 0.99% of its average daily net assets. Barrow All-Cap Long/Short Fund pays the Adviser an investment advisory fee, computed and accrued daily and paid monthly, at the annual rate of 1.50% of its average daily net assets.
The Adviser has contractually agreed, until October 1, 2016, to reduce its investment advisory fees and to reimburse each Fund’s expenses to the extent necessary to limit annual ordinary operating expenses (excluding brokerage costs, taxes, interest, borrowing costs such as interest and dividend expense on securities sold short, acquired fund fees and expenses, extraordinary expenses such as litigation and merger or reorganization costs and other expenses not incurred in the ordinary course of such Fund’s business, and amounts, if any, payable under a Rule 12b-1 Plan) to 1.40% and 1.15% of average daily net assets of Investor Class and Institutional Class shares, respectively, for Barrow All-Cap Core Fund and to 1.99% and 1.74% of average daily net assets of Investor Class and Institutional Class shares, respectively, for Barrow All-Cap Long/Short Fund. During the period ended November 30, 2013, the Adviser reduced its investment advisory fees and reimbursed fund expenses as follows:
| | Investment Advisory Fees Reduced | | | | | | | |
| Barrow All-Cap Core Fund: | | | | | | | | | |
| Common | | $ | 31,953 | | | $ | — | | | $ | 31,953 | |
| Investor Class | | | — | | | | 5,476 | | | | 5,476 | |
| Institutional Class | | | — | | | | 3,688 | | | | 3,688 | |
| | | $ | 31,953 | | | $ | 9,164 | | | $ | 41,117 | |
| Barrow All-Cap Long/Short Fund: | | | | | | | | | | | | |
| Common | | $ | 10,736 | | | $ | 30,689 | | | $ | 41,425 | |
| Investor Class | | | — | | | | 5,476 | | | | 5,476 | |
| Institutional Class | | | — | | | | 3,688 | | | | 3,688 | |
| | | $ | 10,736 | | | $ | 39,853 | | | $ | 50,589 | |
BARROW FUNDS NOTES TO FINANCIAL STATEMENTS (Continued) |
Advisory fee reductions and expense reimbursements by the Adviser are subject to repayment by each Fund for a period of three years after such fees and expenses were incurred, provided that the repayments do not cause each Fund’s ordinary operating expenses, at the time the repayment occurs, to exceed the expense limitations stated above. As of November 30, 2013, the Adviser may in the future recover advisory fee reductions and expense reimbursements totaling $41,117 and $50,589 from Barrow All-Cap Core Fund and Barrow All-Cap Long/Short Fund, respectively. The Adviser may recover these amounts no later than November 30, 2016.
Certain officers of the Funds are also officers of the Adviser.
OTHER SERVICE PROVIDERS
Ultimus Fund Solutions, LLC (“Ultimus”) provides fund administration, fund accounting, compliance and transfer agency services to the Funds. Pursuant to separate servicing agreements with Ultimus, each Fund pays Ultimus customary fees for its services. Certain officers of the Trust are also officers of Ultimus.
DISTRIBUTION AGREEMENT
Under the terms of a Distribution Agreement with the Trust, Ultimus Fund Distributors, LLC (the “Distributor”) serves as principal underwriter to each Fund. The Distributor is a wholly-owned subsidiary of Ultimus.
DISTRIBUTION PLAN
Each Fund has adopted a distribution plan pursuant to Rule 12b-1 under the 1940 Act (the “Plan”), pursuant to which each Fund may pay intermediaries and other persons for rendering distribution services and for bearing any related expenses with respect to the Investor Class of each Fund, which fees will not exceed the annual rate of 0.25% of the Fund’s average daily net assets attributable to Investor Class shares. During the period ended November 30, 2013, the Investor Class of Barrow All-Cap Core Fund and Barrow All-Cap Long/Short Fund incurred $71 and $67, respectively, of distribution fees under the Plan.
TRUSTEE COMPENSATION
Each Trustee who is not an interested person of the Trust receives from each Fund a fee of $500 for each Board meeting attended plus reimbursement of travel and other expenses incurred in attending the meetings. Trustees affiliated with the Adviser or Ultimus are not compensated by the Trust for their services.
PRINCIPAL HOLDERS OF FUND SHARES
As of November 30, 2013, Robert F. Greenhill, Jr., a principal of the Adviser, owned 74% of the outstanding shares of both the Investor Class and Institutional Class shares of Barrow All-Cap Core Fund and 81% and 72% of the outstanding shares of the Investor Class and Institutional Class shares, respectively, of Barrow All-Cap Long/Short Fund.
BARROW FUNDS NOTES TO FINANCIAL STATEMENTS (Continued) |
5. Borrowing Costs
During the period ended November 30, 2013, Barrow All-Cap Core Fund incurred $79 of borrowing costs. Barrow All-Cap Long/Short Fund incurred no borrowing costs for the period ended November 30, 2013. As of November 30, 2013, Barrow All-Cap Core Fund had outstanding borrowings of $43,572. The average outstanding borrowings and average interest rate on borrowings during the period ended November 30, 2013 were $29,960 and 1.05%, respectively. The average outstanding borrowings for Barrow All-Cap Core Fund include 25 days of $0 borrowings.
6. Contingencies and Commitments
The Funds indemnify the Trust’s officers and Trustees for certain liabilities that might arise from their performance of their duties to the Funds. Additionally, in the normal course of business the Funds enter into contracts that contain a variety of representations and warranties and which provide general indemnifications. The Funds’ maximum exposure under these arrangements is unknown, as this would involve future claims that may be made against the Funds that have not yet occurred. However, based on experience, the Funds expect the risk of loss to be remote.
7. Subsequent Events
The Funds are required to recognize in the financial statements the effects of all subsequent events that provide additional evidence about conditions that existed as of the date of the Statements of Assets and Liabilities. For non-recognized subsequent events that must be disclosed to keep the financial statements from being misleading, the Funds are required to disclose the nature of the event as well as an estimate of its financial effect, or a statement that such an estimate cannot be made. Management has evaluated subsequent events through the issuance of these financial statements and has noted no such events.
BARROW FUNDS ABOUT YOUR FUNDS’ EXPENSES (Unaudited) |
We believe it is important for you to understand the impact of costs on your investment. As a shareholder of the Funds, you incur ongoing costs, including management fees, class specific fees (such as distribution (12b-1) fees) and other operating expenses. The following examples are intended to help you understand your ongoing costs (in dollars) of investing in the Funds and to compare these costs with the ongoing costs of investing in other mutual funds.
A mutual fund’s ongoing costs are expressed as a percentage of its average net assets. This figure is known as the expense ratio. The expenses in the table below are based on an investment of $1,000 made at the beginning of the most recent period (August 30, 2013) and held until the end of the period (November 30, 2013).
The table below illustrates each Fund’s ongoing costs in two ways:
Actual fund return – This section helps you to estimate the actual expenses that you paid over the period. The “Ending Account Value” shown is derived from each Fund’s actual return, and the third column shows the dollar amount of operating expenses that would have been paid by an investor who started with $1,000 in the Funds. You may use the information here, together with the amount you invested, to estimate the expenses that you paid over the period.
To do so, simply divide your account value by $1,000 (for example, an $8,600 account value divided by $1,000 = 8.6), then multiply the result by the number given for the Funds under the heading “Expenses Paid During Period.”
Hypothetical 5% return – This section is intended to help you compare the Funds’ ongoing costs with those of other mutual funds. It assumes that each Fund had an annual return of 5% before expenses during the period shown, but that the expense ratio is unchanged. In this case, because the return used is not the Funds’ actual return, the results do not apply to your investment. The example is useful in making comparisons because the Securities and Exchange Commission (the “SEC”) requires all mutual funds to calculate expenses based on a 5% return. You can assess each Fund’s ongoing costs by comparing this hypothetical example with the hypothetical examples that appear in shareholder reports of other funds.
Note that expenses shown in the table are meant to highlight and help you compare ongoing costs only. The Funds do not charge transaction fees, such as purchase or redemption fees, nor do they carry a “sales load.”
The calculations assume no shares were bought or sold during the period. Your actual costs may have been higher or lower, depending on the amount of your investment and the timing of any purchases or redemptions.
BARROW FUNDS ABOUT YOUR FUNDS’ EXPENSES (Unaudited) (Continued) |
More information about the Funds’ expenses can be found in this report. For additional information on operating expenses and other shareholder costs, please refer to the Funds’ prospectus.
Barrow All-Cap Core Fund - Investor Class |
| Beginning Account Value August 30, 2013 | Ending Account Value November 30, 2013 | Expenses Paid During Period* |
Based on Actual Fund Return | $1,000.00 | $1,124.00 | $3.75 |
| * | Expenses are equal to the Fund’s annualized expense ratio of 1.40% for the period, multiplied by the average account value over the period, multiplied by 92/365 (to reflect the period since inception). |
| Beginning Account Value June 1, 2013 | Ending Account Value November 30, 2013 | Expenses Paid During Period* |
Based on Hypothetical 5% Return (before expenses) | $1,000.00 | $1,018.05 | $7.08 |
| * | Expenses are equal to the Fund’s annualized expense ratio of 1.40% for the period, multiplied by the average account value over the period, multiplied by 183/365 (to reflect the one-half year period). |
Barrow All-Cap Core Fund - Institutional Class |
| Beginning Account Value August 30, 2013 | Ending Account Value November 30, 2013 | Expenses Paid During Period* |
Based on Actual Fund Return | $1,000.00 | $1,124.90 | $3.08 |
| * | Expenses are equal to the Fund’s annualized expense ratio of 1.15% for the period, multiplied by the average account value over the period, multiplied by 92/365 (to reflect the period since inception). |
| Beginning Account Value June 1, 2013 | Ending Account Value November 30, 2013 | Expenses Paid During Period* |
Based on Hypothetical 5% Return (before expenses) | $1,000.00 | $1,019.30 | $5.82 |
| * | Expenses are equal to the Fund’s annualized expense ratio of 1.15% for the period, multiplied by the average account value over the period, multiplied by 183/365 (to reflect the one-half year period). |
BARROW FUNDS ABOUT YOUR FUNDS’ EXPENSES (Unaudited) (Continued) |
Barrow All-Cap Long/Short Fund - Investor Class |
| Beginning Account Value August 30, 2013 | Ending Account Value November 30, 2013 | Expenses Paid During Period* |
Based on Actual Fund Return | $1,000.00 | $1,043.00 | $9.48 |
| * | Expenses are equal to the Fund’s annualized expense ratio of 3.68% for the period, multiplied by the average account value over the period, multiplied by 92/365 (to reflect the period since inception). |
| Beginning Account Value June 1, 2013 | Ending Account Value November 30, 2013 | Expenses Paid During Period* |
Based on Hypothetical 5% Return (before expenses) | $1,000.00 | $1,006.60 | $18.53 |
| * | Expenses are equal to the Fund’s annualized expense ratio of 3.68% for the period, multiplied by the average account value over the period, multiplied by 183/365 (to reflect the one-half year period). |
Barrow All-Cap Long/Short Fund - Institutional Class |
| Beginning Account Value August 30, 2013 | Ending Account Value November 30, 2013 | Expenses Paid During Period* |
Based on Actual Fund Return | $1,000.00 | $1,044.00 | $8.85 |
| * | Expenses are equal to the Fund’s annualized expense ratio of 3.43% for the period, multiplied by the average account value over the period, multiplied by 92/365 (to reflect the period since inception). |
| Beginning Account Value June 1, 2013 | Ending Account Value November 30, 2013 | Expenses Paid During Period* |
Based on Hypothetical 5% Return (before expenses) | $1,000.00 | $1,007.85 | $17.28 |
| * | Expenses are equal to the Fund’s annualized expense ratio of 3.43% for the period, multiplied by the average account value over the period, multiplied by 183/365 (to reflect the one-half year period). |
BARROW FUNDS
OTHER INFORMATION (Unaudited)
A description of the policies and procedures that the Funds use to vote proxies relating to portfolio securities is available without charge upon request by calling toll-free 1-877-767-6633, or on the SEC’s website at http://www.sec.gov. Information regarding how the Funds voted proxies relating to portfolio securities during the most recent period ended June 30 will be available without charge upon request no later than August 31, 2014 by calling toll-free 1-877-767-6633, or on the SEC’s website at http://www.sec.gov.
The Trust files a complete listing of portfolio holdings for each of the Funds with the SEC as of the end of the first and third quarters of each fiscal year on Form N-Q. These filings are available upon request by calling 1-877-767-6633. Furthermore, you may obtain a copy of the filings on the SEC’s website at http://www.sec.gov. The Trust’s Forms N-Q may also be reviewed and copied at the SEC’s Public Reference Room in Washington, DC, and information on the operation of the Public Reference Room may be obtained by calling 1-800-SEC-0330.
BARROW FUNDS
ADVISORY AGREEMENT DISCLOSURE (Unaudited)
The Board of Trustees (the “Board”), including the Independent Trustees voting separately, has reviewed and approved each Fund's Investment Advisory Agreement with the Adviser for an initial two-year term. Approval took place at an in-person meeting held on April 23, 2013, at which all of the Trustees were present.
In the course of their deliberations, the Board was advised by legal counsel. The Board received and reviewed a substantial amount of information provided by the Adviser in response to requests of the Board and counsel.
In considering the Investment Advisory Agreements and reaching their conclusions with respect thereto, the Board reviewed and analyzed various factors that they determined were relevant, including the factors described below.
Barrow All-Cap Core Fund
The nature, extent, and quality of the services to be provided by the Adviser. In this regard, the Board considered the responsibilities the Adviser would have under the Investment Advisory Agreement. The Board also considered the services to be provided by the Adviser to the Fund including, without limitation, the Adviser’s procedures for formulating investment recommendations and assuring compliance with the Fund’s investment objectives and limitations, proposed efforts during the Fund’s start-up phase, and efforts to promote the Fund, grow the Fund’s assets, and assist in the distribution of the Fund’s shares. The Board noted that the Fund’s Principal Executive Officer is an employee of the Adviser and will be serving the Trust without additional compensation. After reviewing the foregoing information and further information provided by the Adviser (e.g., descriptions of the Adviser’s business, the Adviser’s compliance programs, and the Adviser’s Form ADV), the Board concluded that the quality, extent, and nature of the services to be provided by the Adviser were satisfactory and adequate for the Fund.
The investment management capabilities and experience of the Adviser. In this regard, the Board considered the investment management experience of the Adviser and its principals. In particular, the Board received information from the Adviser regarding the experience of the Fund’s portfolio managers in managing domestic long only equity portfolios along with the performance of such portfolios, including those with strategies similar to the strategy to be employed by the Fund. The Board discussed with the Adviser the investment objectives and strategies for the Fund and the Adviser’s plans for implementing such strategies for the Fund. The Board considered that while the Adviser was newly established, its principals and the Fund’s portfolio managers have had experience in managing strategies similar to the one to be employed by the Fund. After consideration of these factors, as well as other factors, the Board determined that the Adviser has the requisite experience to serve as manager for the Fund.
BARROW FUNDS
ADVISORY AGREEMENT DISCLOSURE (Unaudited) (Continued)
The costs of the services to be provided and profits to be realized by the Adviser and its affiliates from the relationship with the Fund. In this regard, the Board considered the Adviser’s staffing, personnel, and methods of operating; the education and experience of the Adviser’s personnel; the Adviser’s compliance programs, policies, and procedures; the financial condition of the Adviser and its parent company Barrow Street Holdings LLC, and the level of commitment to the Fund and the Adviser by the principals of the Adviser; the projected asset levels of the Fund; and the overall expenses of the Fund, including the management fee. The Board reviewed the Fund’s proposed expense limitation agreement with the Adviser, and noted the benefit that would result to the Fund from the Adviser’s commitment to reduce its management fees and/or reimburse other operating expenses for a period of three years. The Board reviewed the draft consolidated financial statements of Barrow Street Capital LLC and discussed the financial stability of the firm and its ability to satisfy its financial commitments to the Fund. The Board also considered potential benefits for the Adviser in managing the Fund, including promotion of the Adviser’s name, the ability for the Adviser to place small private client accounts into the Fund, and the potential for the Adviser to receive research, statistical, or other services from the Fund’s trades that may benefit the Adviser’s other clients. The Board then compared the expected fees and expenses of the Fund (including the management fee) to other funds comparable to the Fund in terms of the type of fund, the style of investment management, the projected size of the Fund and the nature of the investment strategy and markets invested in, among other factors. The Board noted that the Fund’s management fee of 0.99% per annum was higher than the average management fee of 0.76% for comparable funds in the Morningstar category of domestic equity funds, but was less than the maximum management fee for comparable funds reported for the category. It was further noted by the Board that the overall proposed expense ratio of 1.15% per annum (after applying the expense limitation agreement) for the Fund’s Institutional Class of shares, would be lower than the 1.20% average expense ratio for comparable funds in the Morningstar category of domestic equity funds. The Board further noted that the Investor Class of shares expense ratio of 1.40% would be higher than the 1.20% average expense ratio for comparable funds in the Morningstar category of domestic equity funds, but would be less than the maximum expense ratio for comparable funds reported for the category. The Board also compared the proposed fees to be paid by the Fund to the fees paid by other clients of the Adviser, and considered the similarities and differences of services received by such other clients as compared to the services to be provided to the Fund. Following these comparisons and upon further consideration and discussion of the foregoing, the Board concluded that the fees to be paid to the Adviser by the Fund were fair and reasonable and within the range that would have been negotiated at arm’s length.
BARROW FUNDS
ADVISORY AGREEMENT DISCLOSURE (Unaudited) (Continued)
The extent to which economies of scale would be realized as the Fund grows and whether advisory fee levels reflect these economies of scale for the benefit of the Fund’s investors. In this regard, the Board considered the Fund’s fee arrangements with the Adviser, including both the management fee and the expense limitation agreement. The Board considered that the shareholders of the Fund would likely benefit from the expense limitation agreement until the Fund’s assets grew to a level where the Adviser begins receiving its full fees and the Adviser has been reimbursed for all eligible reimbursements pursuant to the expense limitation agreement or the Fund’s expenses otherwise fell below the expense cap. Thereafter, the Board noted that the Fund would benefit from economies of scale under its agreements with service providers other than the Adviser. Following further discussion of the Fund’s projected asset levels, expectations for growth and levels of fees, the Board determined that the Fund’s fee arrangements with the Adviser would provide benefits through the expense limitation agreement and that, at the Fund’s projected asset levels for the next year, the Fund’s arrangements with the Adviser were fair and reasonable.
Brokerage and portfolio transactions. In this regard, the Board considered the Adviser’s policies and procedures as it relates to seeking best execution for its clients, including the Fund. The Board also considered the anticipated portfolio turnover rate for the Fund; the process by which evaluations are made of the overall reasonableness of commissions paid; the method and basis for selecting and evaluating the broker-dealers used; any anticipated allocation of portfolio business to persons affiliated with the Adviser; and the extent to which the Fund’s trades may be allocated to soft dollar arrangements. After further review and discussion, the Board determined that the Adviser’s practices regarding brokerage and portfolio transactions were satisfactory.
Possible conflicts of interest. In evaluating the possibility for conflicts of interest, the Board considered such matters as the Adviser’s process for allocating trades among its different clients on a pari passu basis. The Board also considered the method for bunching of portfolio securities transactions among the Adviser clients; and the substance and administration of the Adviser’s code of ethics. Following further consideration and discussion, the Board indicated that the Adviser’s standards and practices relating to the identification and mitigation of potential conflicts of interests were satisfactory.
Barrow All-Cap Long/Short Fund
The nature, extent, and quality of the services to be provided by the Adviser. In this regard, the Board considered the responsibilities the Adviser would have under the Investment Advisory Agreement. The Board also considered the services to be provided by the Adviser to the Fund including, without limitation, the Adviser’s procedures for formulating investment recommendations and assuring compliance with the Fund’s investment objectives and limitations, proposed efforts during the Fund’s start-up phase, and efforts to promote the Fund, grow the Fund’s assets, and assist in the
BARROW FUNDS
ADVISORY AGREEMENT DISCLOSURE (Unaudited) (Continued)
distribution of the Fund’s shares. The Board noted that the Fund’s Principal Executive Officer is an employee of the Adviser and will be serving the Trust without additional compensation. After reviewing the foregoing information and further information provided by the Adviser (e.g., descriptions of the Adviser’s business, the Adviser’s compliance programs, and the Adviser’s Form ADV), the Board concluded that the quality, extent, and nature of the services to be provided by the Adviser were satisfactory and adequate for the Fund.
The investment management capabilities and experience of the Adviser. In this regard, the Board considered the investment management experience of the Adviser and its principals. In particular, the Board received information from the Adviser regarding the experience of the Fund’s portfolio managers in managing domestic long and short equity portfolios along with the performance of such portfolios, including those with strategies similar to the strategy to be employed by the Fund. The Board discussed with the Adviser the investment objectives and strategies for the Fund and the Adviser’s plans for implementing such strategies for the Fund. The Board considered that while the Adviser was newly established, its principals and the Fund’s portfolio managers have had experience in managing strategies similar to the one to be employed by the Fund. After consideration of these factors, as well as other factors, the Board determined that the Adviser has the requisite experience to serve as manager for the Fund.
The costs of the services to be provided and profits to be realized by the Adviser and its affiliates from the relationship with the Fund. In this regard, the Board considered the Adviser’s staffing, personnel, and methods of operating; the education and experience of the Adviser’s personnel; the Adviser’s compliance programs, policies, and procedures; the financial condition of the Adviser and its parent company Barrow Street Holdings LLC, and the level of commitment to the Fund and the Adviser by the principals of the Adviser; the projected asset levels of the Fund; and the overall expenses of the Fund, including the management fee. The Board reviewed the Fund’s proposed expense limitation agreement with the Adviser, and noted the benefit that would result to the Fund from the Adviser’s commitment to reduce its management fees and/or reimburse other operating expenses for a period of three years. The Board reviewed the draft consolidate financial statements of Barrow Street Capital LLC and discussed the financial stability of the firm and its ability to satisfy its financial commitments to the Fund. The Board also considered potential benefits for the Adviser in managing the Fund, including promotion of the Adviser’s name, the ability for the Adviser to place small private accounts into the Fund, and the potential for the Adviser to receive research, statistical, or other services from the Fund’s trades that may benefit the Adviser’s other clients. The Board then compared the expected fees and expenses of the Fund (including the management fee) to other funds comparable to the Fund in terms of the type of fund, the style of investment management, the projected size of the Fund and the nature of the investment strategy and markets invested in, among other factors. The Board noted that the Fund’s management
BARROW FUNDS
ADVISORY AGREEMENT DISCLOSURE (Unaudited) (Continued)
fee of 1.50% per annum was higher than the average management fee of 1.29% for comparable funds in the Morningstar category of long-short funds, but was less than the maximum management fee for comparable funds reported for the category. It was further noted by the Board that the overall proposed expense ratio of 1.74% per annum (after applying the expense limitation agreement) for the Fund’s Institutional Class of shares would be lower than the 1.95% average expense ratio for comparable funds in the Morningstar category of long-short funds. It was further noted by the Board that the Investor Class of shares expense ratio of 1.99% per annum would be slightly higher than the 1.95% average expense ratio for comparable funds in the Morningstar long-short category, but would be less than the maximum expense ratio for comparable funds reported for the category. The Board also compared the proposed fees to be paid by the Fund to the fees paid by other clients of the Adviser, and considered the similarities and differences of services received by such other clients as compared to the services to be provided to the Fund. Following these comparisons and upon further consideration and discussion of the foregoing, the Board concluded that the fees to be paid to the Adviser by the Fund were fair and reasonable and within the range that would have been negotiated at arm’s length.
The extent to which economies of scale would be realized as the Fund grows and whether advisory fee levels reflect these economies of scale for the benefit of the Fund’s investors. In this regard, the Board considered the Fund’s fee arrangements with the Adviser, including both the management fee and the expense limitation agreement. The Board considered that the shareholders of the Fund would likely benefit from the expense limitation agreement until the Fund’s assets grew to a level where the Adviser begins receiving its full fees and the Adviser has been reimbursed for all eligible reimbursements pursuant to the expense limitation agreement or the Fund’s expenses otherwise fell below the expense cap. Thereafter, the Board noted that the Fund would benefit from economies of scale under its agreements with service providers other than the Adviser. Following further discussion of the Fund’s projected asset levels, expectations for growth and levels of fees, the Board determined that the Fund’s fee arrangements with the Adviser would provide benefits through the expense limitation agreement and that, at the Fund’s projected asset levels for the next year, the Fund’s arrangements with the Adviser were fair and reasonable.
Brokerage and portfolio transactions. In this regard, the Board considered the Adviser’s policies and procedures as it relates to seeking best execution for its clients, including the Fund. The Board also considered the anticipated portfolio turnover rate for the Fund; the process by which evaluations are made of the overall reasonableness of commissions paid; the method and basis for selecting and evaluating the broker-dealers used; any anticipated allocation of portfolio business to persons affiliated with the Adviser; and the extent to which the Fund’s trades may be allocated to soft dollar arrangements. After further review and discussion, the Board determined that the Adviser’s practices regarding brokerage and portfolio transactions were satisfactory.
BARROW FUNDS
ADVISORY AGREEMENT DISCLOSURE (Unaudited) (Continued)
Possible conflicts of interest. In evaluating the possibility for conflicts of interest, the Board considered such matters as the Adviser’s process for allocating trades among its different clients on a pari passu basis. The Board also considered the Adviser’s method for bunching of portfolio securities transactions among the Adviser’s clients; and the substance and administration of the Adviser’s code of ethics. Following further consideration and discussion, the Board indicated that the Adviser’s standards and practices relating to the identification and mitigation of potential conflicts of interests were satisfactory.
Conclusion
After full consideration of the above factors as well as other factors, the Board unanimously concluded that approval of the Investment Advisory Agreement was in the best interests of each of the Funds and their respective shareholders.
This page intentionally left blank.

CINCINNATI ASSET MANAGEMENT FUNDS:
BROAD MARKET STRATEGIC INCOME FUND
Semi-Annual Report
November 30, 2013
(Unaudited)
CINCINNATI ASSET MANAGEMENT FUNDS: BROAD MARKET STRATEGIC INCOME FUND LETTER TO SHAREHOLDERS | |
Dear Fellow Shareholders,
Our Semi-Annual report for the Cincinnati Asset Management Funds: Broad Market Strategic Income Fund (the “Fund”) presents data and performance for the six months ended November 30, 2013. All of us at Cincinnati Asset Management want to thank you for your investment with us and we appreciate your confidence in our investment management.
The Fund is currently invested primarily in investment grade corporate bonds and high yield corporate bonds that we consider undervalued. We believe that our proprietary analysis enhances our ability to identify such opportunities and enables us to sell securities when more attractive opportunities present themselves. These investment decisions are made with the important discipline of maintaining portfolio diversification and with the dual objectives of achieving a high level of income while preserving capital.
Our disciplined investing strategy resulted in our holding 69 positions in the bonds of 63 different corporations at November 30. At that time, cash balances amounted to approximately 2% of the Fund’s assets and the Fund continues to be close to fully invested, as is its objective. The Fund outperformed its benchmark (Barclays US Corporate BBB Index) for the six month period ended November 30, 2013 with a return of (1.12%), as compared to (1.39%) for the benchmark. We attribute this outperformance primarily to security selection.
During the past several months, interest rates have been volatile while increasing; the yield on the 10-year Treasury Bond was 2.11% at May 31 and rose to 3.00% in early September before settling back to 2.50% in late October and then ending up at 2.75% on November 30. (As of the date of this letter, that rate is slightly over 3.00%.) Bond prices decline as rates increase, and the price of your Fund shares will reflect those changes in interest rates. Bonds that the Fund owns were yielding, on average, around 2.0% more than Treasury yields at November 30. Your managers believe that the Fund’s positions will continue to provide excellent value relative to other investment grade rated fixed income alternatives.
During the third quarter of 2013, annualized GDP growth was 4.1%. However, many economists believe that the US economy will continue to face headwinds that will result in GDP growing at a rate closer to 2%-3% for all of 2014. The Federal Reserve (the “Fed”) continues to reinforce its policy of maintaining short-term interest rates close to 0%. On the other hand, the Fed announced in December that it would begin to taper, in January, its open market purchases of Treasury, Agency and Mortgage securities from the $85 billion per month level to $75 billion per month. The Fed did not indicate when, nor by how much, it will decrease that amount in future periods. Interestingly, when the Fed first indicated its intent to “taper” back in May, interest rates increased from the 2.11% level mentioned above to close to the 3.0% level; when the Fed announced its actual plan to taper, Treasury rates increased by only 0.25%, while rates on corporate debt increased by a lesser amount. Although rates will be impacted by “headline” news and the so-called “risk-off/risk-on” trades that cause short-term volatility, we intend to focus on the relative value of corporate and high yield bonds and will maintain our focus on the intermediate term maturity of the
portfolio. It is the underlying credit quality of the companies we purchase that influences our investment decisions, not short-term interest rate fluctuations. The current Fed tapering suggests that they believe the economy is strengthening, and credit quality improves when that is the case.
We believe that the companies in our Fund’s portfolio are positioned to withstand economic adversity and to participate in any economic expansion. For example, the Fund’s positions in the energy sector acknowledge our belief that fossil fuels will continue to play an important role in a growing economy; the yields at which we purchased and continue to hold these securities have rewarded the Fund for the challenges that this sector may face. Similarly, the Fund’s positions in the financials sector represent investments in those companies that we believe have the financial strength and diversity of business to meet the regulatory constraints with which they are dealing and to benefit from the possibility of a more rapid economic recovery.
While we continue to face economic uncertainty in the face of unemployment, Federal Government deficits, tax reform, and a host of other issues, we are reminded that there are still opportunities that can reward investors, and we endeavor to identify these opportunities every day.
Thank you again for your confidence in our Fund. Our fellow investors are very important to us and if you have any questions regarding market conditions or the Fund, please don’t hesitate to call us (513.554.8500).
Sincerely,
Cincinnati Asset Management Funds: Broad Market Strategic Income Fund
Managed by Cincinnati Asset Management, Inc.
Past performance is not predictive of future performance. Investment results and principal value will fluctuate so that shares, when redeemed, may be worth more or less than their original cost. Current performance may be higher or lower than the performance data quoted. Performance data current to the most recent month end are available by calling 1-866-738-1128.
An investor should consider the investment objectives, risks, charges and expenses of the Fund carefully before investing. The Fund’s prospectus contains this and other important information. To obtain a copy of the Fund’s prospectus please call 1-866-738-1128 and a copy will be sent to you free of charge. Please read the prospectus carefully before you invest. Cincinnati Asset Management Funds: Broad Market Strategic Income Fund is distributed by Ultimus Fund Distributors, LLC.
The Letter to Shareholders seeks to describe some of the adviser’s current opinions and views of the financial markets. Although the adviser believes it has a reasonable basis for any opinions or views expressed, actual results may differ, sometimes significantly so, from those expected or expressed. The securities held by the Fund that are discussed in the Letter to Shareholders were held during the period covered by this Report. They do not comprise the entire investment portfolio of the Fund, may be sold at any time and may no longer be held by the Fund. The opinions of the Fund’s adviser with respect to those securities may change at any time.
CINCINNATI ASSET MANAGEMENT FUNDS:
BROAD MARKET STRATEGIC INCOME FUND
PORTFOLIO INFORMATION
November 30, 2013 (Unaudited)
Sector Diversification
| | |
| Qwest Corp., 6.750%, due12/01/21 | | 3.2% |
| JPMorgan Chase & Co., 4.500%, due 01/24/22 | | 3.1% |
| International Lease Finance Corp., 5.875%, due 08/15/22 | | 3.1% |
| PerkinElmer, Inc., 5.000%, due 11/15/21 | | 3.0% |
| Ford Motor Credit Co., LLC, 4.250%, due 09/20/22 | | 3.0% |
| Hewlett-Packard Co., 4.375%, due 09/15/21 | | 3.0% |
| US Airways Class A Pass-Through Certificates, Series 2012-2, 4.625%, due 06/03/25 | | 3.0% |
| Apache Corp., 3.250%, due 04/15/22 | | 2.9% |
| General Electric Capital Corp., 3.150%, due 09/07/22 | | 2.9% |
| Bank of America Corp., 3.300%, due 01/11/23 | | 2.8% |
|
| | |
| AA | | 7.4% |
| A | | 38.6% |
| BBB | | 17.5% |
| BB | | 21.0% |
| B | | 15.5% |
CINCINNATI ASSET MANAGEMENT FUNDS: BROAD MARKET STRATEGIC INCOME FUND SCHEDULE OF INVESTMENTS November 30, 2013 (Unaudited) | |
| | | | | | | | | |
| Consumer Discretionary — 6.0% | | | | | | | | | | |
CCO Holdings, LLC | | | 5.250 | % | 09/30/22 | | $ | 43,000 | | | $ | 40,742 | |
Lamar Media Corp. | | | 5.875 | % | 02/01/22 | | | 43,000 | | | | 44,559 | |
MGM Resorts International | | | 6.625 | % | 12/15/21 | | | 45,000 | | | | 47,419 | |
Penske Auto Group, Inc. | | | 5.750 | % | 10/01/22 | | | 30,000 | | | | 30,450 | |
Regal Entertainment Group | | | 5.750 | % | 02/01/25 | | | 4,000 | | | | 3,820 | |
Walt Disney Co. (The) | | | 2.350 | % | 12/01/22 | | | 150,000 | | | | 137,492 | |
| | | | | | | | | | | | | 304,482 | |
| Consumer Staples — 3.6% | | | | | | | | | | | | | |
Anheuser-Busch InBev SA/NV | | | 2.625 | % | 01/17/23 | | | 100,000 | | | | 92,950 | |
B&G Foods, Inc. | | | 4.625 | % | 06/01/21 | | | 4,000 | | | | 3,830 | |
Wal-Mart Stores, Inc. | | | 2.550 | % | 04/11/23 | | | 90,000 | | | | 83,461 | |
| | | | | | | | | | | | | 180,241 | |
| Energy — 15.4% | | | | | | | | | | | | | |
Apache Corp. | | | 3.250 | % | 04/15/22 | | | 150,000 | | | | 149,279 | |
Arch Coal, Inc. | | | 7.250 | % | 10/01/20 | | | 46,000 | | | | 35,075 | |
Chesapeake Energy Corp. | | | 6.125 | % | 02/15/21 | | | 42,000 | | | | 45,360 | |
Chevron Corp. | | | 2.355 | % | 12/05/22 | | | 150,000 | | | | 138,086 | |
ConocoPhillips Co. | | | 2.400 | % | 12/15/22 | | | 150,000 | | | | 138,686 | |
Denbury Resources, Inc. | | | 4.625 | % | 07/15/23 | | | 45,000 | | | | 40,838 | |
Forest Oil Corp. | | | 7.500 | % | 09/15/20 | | | 47,000 | | | | 46,648 | |
Offshore Group Investment Ltd. | | | 7.500 | % | 11/01/19 | | | 20,000 | | | | 21,800 | |
Offshore Group Investment Ltd. | | | 7.125 | % | 04/01/23 | | | 27,000 | | | | 27,945 | |
Peabody Energy Corp. | | | 7.875 | % | 11/01/26 | | | 44,000 | | | | 45,100 | |
Range Resources Corp. | | | 5.000 | % | 08/15/22 | | | 46,000 | | | | 45,425 | |
Teekay Corp. | | | 8.500 | % | 01/15/20 | | | 45,000 | | | | 48,825 | |
| | | | | | | | | | | | | 783,067 | |
| Financials — 22.2% | | | | | | | | | | | | | |
Bank of America Corp. | | | 3.300 | % | 01/11/23 | | | 150,000 | | | | 142,206 | |
Ford Motor Credit Co., LLC | | | 4.250 | % | 09/20/22 | | | 150,000 | | | | 152,239 | |
General Electric Capital Corp. | | | 3.150 | % | 09/07/22 | | | 150,000 | | | | 145,999 | |
International Lease Finance Corp. | | | 8.625 | % | 01/15/22 | | | 35,000 | | | | 42,437 | |
International Lease Finance Corp. | | | 5.875 | % | 08/15/22 | | | 150,000 | | | | 155,250 | |
JPMorgan Chase & Co. | | | 4.500 | % | 01/24/22 | | | 150,000 | | | | 159,490 | |
PNC Financial Services Group, Inc. | | | 2.854 | % | 11/09/22 | | | 150,000 | | | | 141,016 | |
U.S. Bancorp | | | 2.950 | % | 07/15/22 | | | 150,000 | | | | 141,276 | |
Zayo Group, LLC | | | 8.125 | % | 01/01/20 | | | 40,000 | | | | 44,300 | |
| | | | | | | | | | | | | 1,124,213 | |
| Health Care — 6.7% | | | | | | | | | | | | | |
Community Health Systems, Inc. | | | 7.125 | % | 07/15/20 | | | 45,000 | | | | 46,631 | |
Davita Healthcare Partners, Inc. | | | 5.750 | % | 08/15/22 | | | 50,000 | | | | 51,250 | |
CINCINNATI ASSET MANAGEMENT FUNDS: BROAD MARKET STRATEGIC INCOME FUND SCHEDULE OF INVESTMENTS (Continued) | |
CORPORATE BONDS — 97.9% (Continued) | | | | | | | | | |
| Health Care — 6.7% (Continued) | | | | | | | | | | |
HCA Holdings, Inc. | | | 6.250 | % | 02/15/21 | | $ | 40,000 | | | $ | 42,000 | |
HCA Holdings, Inc. | | | 5.875 | % | 05/01/23 | | | 3,000 | | | | 2,985 | |
HealthSouth Corp. | | | 5.750 | % | 11/01/24 | | | 43,000 | | | | 42,893 | |
PerkinElmer, Inc. | | | 5.000 | % | 11/15/21 | | | 150,000 | | | | 153,603 | |
| | | | | | | | | | | | | 339,362 | |
| Industrials — 17.2% | | | | | | | | | | | | | |
B/E Aerospace, Inc. | | | 5.250 | % | 04/01/22 | | | 46,000 | | | | 47,380 | |
General Dynamics Corp. | | | 2.250 | % | 11/15/22 | | | 150,000 | | | | 135,854 | |
Hertz Corp. | | | 6.250 | % | 10/15/22 | | | 43,000 | | | | 44,935 | |
Iron Mountain, Inc. | | | 5.750 | % | 08/15/24 | | | 43,000 | | | | 40,420 | |
R.R. Donnelley & Sons Co. | | | 7.625 | % | 06/15/20 | | | 4,000 | | | | 4,370 | |
R.R. Donnelley & Sons Co. | | | 7.875 | % | 03/15/21 | | | 41,000 | | | | 45,407 | |
Raytheon Co. | | | 2.500 | % | 12/15/22 | | | 150,000 | | | | 137,419 | |
Stanley Black & Decker, Inc. | | | 2.900 | % | 11/01/22 | | | 150,000 | | | | 140,679 | |
| United Airlines Class B Pass-Through Certificates, Series 2013-1 | | | 5.375 | % | 02/15/23 | | | 43,000 | | | | 43,323 | |
United Rentals North America, Inc. | | | 6.125 | % | 06/15/23 | | | 40,000 | | | | 41,600 | |
| US Airways Class A Pass-Through Certificates, Series 2012-2 | | | 4.625 | % | 06/03/25 | | | 150,000 | | | | 150,750 | |
| US Airways Class B Pass-Through Certificates, Series 2012-1 | | | 8.000 | % | 04/01/21 | | | 38,333 | | | | 42,549 | |
| | | | | | | | | | | | | 874,686 | |
| Information Technology — 6.6% | | | | | | | | | | | | | |
Equinix, Inc. | | | 5.375 | % | 04/01/23 | | | 45,000 | | | | 44,438 | |
Hewlett-Packard Co. | | | 4.375 | % | 09/15/21 | | | 150,000 | | | | 151,263 | |
Intel Corp. | | | 2.700 | % | 12/15/22 | | | 150,000 | | | | 139,494 | |
| | | | | | | | | | | | | 335,195 | |
| Materials — 3.6% | | | | | | | | | | | | | |
Ball Corp. | | | 4.000 | % | 11/15/23 | | | 6,000 | | | | 5,415 | |
Praxair, Inc. | | | 2.200 | % | 08/15/22 | | | 150,000 | | | | 136,161 | |
Vulcan Materials Co. | | | 7.500 | % | 06/15/21 | | | 36,000 | | | | 40,770 | |
| | | | | | | | | | | | | 182,346 | |
| Telecommunication Services — 10.3% | | | | | | | | | | | | | |
AT&T, Inc. | | | 2.625 | % | 12/01/22 | | | 140,000 | | | | 125,130 | |
Embarq Corp. | | | 7.995 | % | 06/01/36 | | | 40,000 | | | | 40,790 | |
Frontier Communications Corp. | | | 9.000 | % | 08/15/31 | | | 50,000 | | | | 50,625 | |
Intelsat Jackson Holdings S.A. | | | 7.500 | % | 04/01/21 | | | 40,000 | | | | 44,150 | |
Mediacom, LLC/Mediacom Capital Corp. | | | 7.250 | % | 02/15/22 | | | 43,000 | | | | 46,010 | |
Qwest Corp. | | | 6.750 | % | 12/01/21 | | | 150,000 | | | | 163,349 | |
Verizon Communications, Inc. | | | 5.150 | % | 09/15/23 | | | 50,000 | | | | 53,461 | |
| | | | | | | | | | | | | 523,515 | |
CINCINNATI ASSET MANAGEMENT FUNDS: BROAD MARKET STRATEGIC INCOME FUND SCHEDULE OF INVESTMENTS (Continued) | |
CORPORATE BONDS — 97.9% (Continued) | | | | | | | | | |
| Utilities — 6.3% | | | | | | | | | | |
AES Corp. (The) | | | 7.375 | % | 07/01/21 | | | 45,000 | | | $ | 51,075 | |
Amerigas Finance, LLC | | | 7.000 | % | 05/20/22 | | | 43,000 | | | | 46,762 | |
DPL, Inc. | | | 7.250 | % | 10/15/21 | | | 50,000 | | | | 51,250 | |
Ferrellgas, L.P. | | | 6.500 | % | 05/01/21 | | | 44,000 | | | | 44,990 | |
GenOn Americas Generation, LLC | | | 8.500 | % | 10/01/21 | | | 28,000 | | | | 30,660 | |
NRG Energy, Inc. | | | 7.875 | % | 05/15/21 | | | 37,000 | | | | 41,440 | |
NRG Energy, Inc. | | | 6.625 | % | 03/15/23 | | | 8,000 | | | | 8,240 | |
Suburban Propane Partners, L.P., CV | | | 7.375 | % | 03/15/20 | | | 41,000 | | | | 44,178 | |
| | | | | | | | | | | | | 318,595 | |
| | | | | | |
Total Investments at Value — 97.9% (Cost $5,172,963) | | | $ | 4,965,702 | |
| | | | | | |
| Other Assets in Excess of Liabilities — 2.1% | | | | 104,072 | |
| | | | | | |
| Net Assets — 100.0% | | | $ | 5,069,774 | |
CV - Convertible Security |
| See accompanying notes to financial statements. |
CINCINNATI ASSET MANAGEMENT FUNDS: BROAD MARKET STRATEGIC INCOME FUND STATEMENT OF ASSETS AND LIABILITIES November 30, 2013 (Unaudited) | |
ASSETS | | | |
| Investments in securities: | | | |
At acquisition cost | | $ | 5,172,963 | |
At value (Note 2) | | $ | 4,965,702 | |
Cash | | | 11,563 | |
Interest receivable | | | 66,069 | |
Receivable from Adviser (Note 4) | | | 13,718 | |
Other assets | | | 25,625 | |
Total assets | | | 5,082,677 | |
| | | | | |
| LIABILITIES | | | | |
Payable to administrator (Note 4) | | | 6,540 | |
Accrued distribution fees (Note 4) | | | 733 | |
Other accrued expenses | | | 5,630 | |
Total liabilities | | | 12,903 | |
| | | | | |
NET ASSETS | | $ | 5,069,774 | |
| | | | | |
| NET ASSETS CONSIST OF: | | | | |
Paid-in capital | | $ | 5,248,310 | |
Accumulated undistributed net investment income | | | 29,768 | |
| Accumulated net realized losses from security transactions | | | (1,043 | ) |
Net unrealized depreciation on investments | | | (207,261 | ) |
NET ASSETS | | $ | 5,069,774 | |
| | | | | |
Shares of beneficial interest outstanding
(unlimited number of shares authorized, no par value) | | | 525,075 | |
| | | | | |
| Net asset value, offering price and redemption price per share (Note 2) | | $ | 9.66 | |
| See accompanying notes to financial statements. |
CINCINNATI ASSET MANAGEMENT FUNDS: BROAD MARKET STRATEGIC INCOME FUND STATEMENT OF OPERATIONS Six Months Ended November 30, 2013 (Unaudited) | |
INVESTMENT INCOME | | | |
Interest | | $ | 104,726 | |
| | | | | |
| EXPENSES | | | | |
Investment advisory fees (Note 4) | | | 19,093 | |
Registration and filing fees | | | 14,236 | |
Professional fees | | | 13,786 | |
Fund accounting fees (Note 4) | | | 12,498 | |
Administration fees (Note 4) | | | 12,250 | |
Pricing fees | | | 7,950 | |
Compliance fees (Note 4) | | | 6,000 | |
Transfer agent fees (Note 4) | | | 6,000 | |
Distribution fees (Note 4) | | | 4,632 | |
Trustees' fees and expenses (Note 4) | | | 4,451 | |
Custody and bank service fees | | | 4,118 | |
Postage and supplies | | | 2,235 | |
Insurance expense | | | 2,048 | |
Other expenses | | | 2,731 | |
Total expenses | | | 112,028 | |
| Less fee reductions and expense reimbursements by the Adviser (Note 4) | | | (95,481 | ) |
Net expenses | | | 16,547 | |
| | | | | |
NET INVESTMENT INCOME | | | 88,179 | |
| | | | | |
| REALIZED AND UNREALIZED LOSSES ON INVESTMENTS | | | | |
Net realized losses from security transactions | | | (328 | ) |
| Net change in unrealized appreciation/depreciation on investments | | | (149,318 | ) |
| NET REALIZED AND UNREALIZED LOSSES ON INVESTMENTS | | | (149,646 | ) |
| | | | | |
NET DECREASE IN NET ASSETS
RESULTING FROM OPERATIONS | | $ | (61,467 | ) |
| See accompanying notes to financial statements. |
CINCINNATI ASSET MANAGEMENT FUNDS: BROAD MARKET STRATEGIC INCOME FUND STATEMENTS OF CHANGES IN NET ASSETS | |
| | Six Months Ended November 30, 2013 (Unaudited) | | | Period Ended May 31, 2013(a) | |
| FROM OPERATIONS | | | | | | |
Net investment income | | $ | 88,179 | | | $ | 84,972 | |
Net realized losses from security transactions | | | (328 | ) | | | (715 | ) |
Net change in unrealized appreciation/
depreciation on investments | | | (149,318 | ) | | | (57,943 | ) |
Net increase (decrease) in net assets resulting
from operations | | | (61,467 | ) | | | 26,314 | |
| | | | | | | | | |
| DISTRIBUTIONS TO SHAREHOLDERS | | | | | | | | |
From net investment income | | | (87,002 | ) | | | (56,381 | ) |
| | | | | | | | | |
| FROM CAPITAL SHARE TRANSACTIONS | | | | | | | | |
Proceeds from shares sold | | | 106,980 | | | | 5,243,516 | |
Net asset value of shares issued in
reinvestment of distributions to shareholders | | | 87,002 | | | | 56,381 | |
Payments for shares redeemed | | | (195,569 | ) | | | (50,000 | ) |
Net increase (decrease) in net assets
from capital share transactions | | | (1,587 | ) | | | 5,249,897 | |
| | | | | | | | | |
| TOTAL INCREASE (DECREASE) IN NET ASSETS | | | (150,056 | ) | | | 5,219,830 | |
| | | | | | | | | |
| NET ASSETS | | | | | | | | |
Beginning of period | | | 5,219,830 | | | | — | |
End of period | | $ | 5,069,774 | | | $ | 5,219,830 | |
| | | | | | | | | |
| ACCUMULATED UNDISTRIBUTED NET INVESTMENT INCOME | | $ | 29,768 | | | $ | 28,591 | |
| | | | | | | | | |
| CAPITAL SHARE ACTIVITY | | | | | | | | |
Shares sold | | | 11,363 | | | | 524,271 | |
Shares reinvested | | | 9,168 | | | | 5,633 | |
Shares redeemed | | | (20,385 | ) | | | (4,975 | ) |
Net increase in shares outstanding | | | 146 | | | | 524,929 | |
Shares outstanding at beginning of period | | | 524,929 | | | | — | |
Shares outstanding at end of period | | | 525,075 | | | | 524,929 | |
| (a) | Represents the period from the commencement of operations (October 26, 2012) through May 31, 2013. |
| See accompanying notes to financial statements. |
CINCINNATI ASSET MANAGEMENT FUNDS: BROAD MARKET STRATEGIC INCOME FUND FINANCIAL HIGHLIGHTS | |
Per Share Data for a Share Outstanding Throughout each Period | |
| | Six Months Ended November 30, 2013 (Unaudited) | | | Period Ended May 30, 2013(a) | |
Net asset value at beginning of period | | $ | 9.94 | | | $ | 10.00 | |
| | | | | | | | | |
| Income (loss) from investment operations: | | | | | | | | |
Net investment income | | | 0.17 | | | | 0.16 | |
| Net realized and unrealized losses on investments | | | (0.29 | ) | | | (0.11 | ) |
Total from investment operations | | | (0.12 | ) | | | 0.05 | |
| | | | | | | | | |
| Less distributions: | | | | | | | | |
From net investment income | | | (0.16 | ) | | | (0.11 | ) |
| | | | | | | | | |
Net asset value at end of period | | $ | 9.66 | | | $ | 9.94 | |
| | | | | | | | | |
Total return (b) | | | (1.12% | )(c) | | | 0.48% | (c) |
| | | | | | | | | |
Net assets at end of period | | $ | 5,069,774 | | | $ | 5,219,830 | |
| | | | | | | | | |
| Ratios/supplementary data: | | | | | | | | |
Ratio of total expenses to average net assets | | | 4.40% | (e) | | | 3.69% | (e) |
| | | | | | | | | |
Ratio of net expenses to average net assets (d) | | | 0.65% | (e) | | | 0.65% | (e) |
| | | | | | | | | |
Ratio of net investment income to average net assets (d) | | | 3.46% | (e) | | | 2.81% | (e) |
| | | | | | | | | |
Portfolio turnover rate | | | 6% | (c) | | | 13% | (c) |
| (a) | Represents the period from the commencement of operations (October 26, 2012) through May 31, 2013. |
| (b) | Total return is a measure of the change in value of an investment in the Fund over the period covered. The returns shown do not reflect the deduction of taxes a shareholder would pay on Fund distributions, if any, or the redemption of Fund shares. The total returns would be lower if the Adviser had not reduced advisory fees and reimbursed expenses. |
| (c) | Not annualized. |
| (d) | Ratio was determined after advisory fee reductions and expense reimbursements (Note 4). |
| (e) | Annualized. |
| See accompanying notes to financial statements. |
CINCINNATI ASSET MANAGEMENT FUNDS:
BROAD MARKET STRATEGIC INCOME FUND
NOTES TO FINANCIAL STATEMENTS
November 30, 2013 (Unaudited)
1. Organization
Cincinnati Asset Management Funds: Broad Market Strategic Income Fund (the “Fund”) is a diversified series of Ultimus Managers Trust (the “Trust”), an open-end investment company established as an Ohio business trust under a Declaration of Trust dated February 28, 2012. Other series of the Trust are not incorporated in this report. The Fund commenced operations on October 26, 2012.
The investment objective of the Fund is to achieve a high level of income consistent with a secondary goal of preservation of capital.
2. Significant Accounting Policies
The following is a summary of the Fund’s significant accounting policies. The policies are in conformity with accounting principles generally accepted in the United States of America (“GAAP”).
Securities valuation – The Fund’s fixed income securities are generally valued using prices provided by an independent pricing service approved by the Fund’s Board of Trustees (the “Board”). The independent pricing service uses information with respect to transactions in bonds, quotations from bond dealers, market transactions in comparable securities and various relationships between securities in determining these prices. The methods used by the independent pricing service and the quality of valuations so established are reviewed by Cincinnati Asset Management, Inc. (the “Adviser”), under the general supervision of the Board.
Securities for which market quotations are not readily available are valued at fair value as determined in good faith under procedures adopted by the Board. Short-term debt securities having remaining maturities of sixty days or less are stated at amortized cost, which approximates market value.
GAAP establishes a single authoritative definition of fair value, sets out a framework for measuring fair value and requires additional disclosures about fair value measurements.
Various inputs are used in determining the value of the Fund’s investments. These inputs are summarized in the three broad levels listed below:
| • | Level 1 – quoted prices in active markets for identical securities |
| • | Level 2 – other significant observable inputs |
| • | Level 3 – significant unobservable inputs |
CINCINNATI ASSET MANAGEMENT FUNDS: BROAD MARKET STRATEGIC INCOME FUND NOTES TO FINANCIAL STATEMENTS (Continued) |
Corporate bonds are classified as Level 2 since values are based on prices provided by an independent pricing service that utilizes various “other significant observable inputs” including bid and ask quotations, prices of similar securities and interest rates, among other factors. The inputs or methodology used for valuing securities are not necessarily an indication of the risks associated with investing in those securities. The inputs used to measure fair value may fall into different levels of the fair value hierarchy. In such cases, for disclosure purposes, the level in the fair value hierarchy within which the fair value measurement falls in its entirety is determined based on the lowest level input that is significant to the fair value measurement.
The following is a summary of the inputs used to value the Fund’s investments as of November 30, 2013:
| | | | | | | | | | | | |
| Corporate Bonds | | $ | — | | | $ | 4,965,702 | | | $ | — | | | $ | 4,965,702 | |
Refer to the Fund’s Schedule of Investments for a listing of the securities by sector type. As of November 30, 2013, the Fund did not have any transfers in and out of any Level. In addition, the Fund did not have derivative instruments or any assets or liabilities that were measured at fair value on a recurring basis using significant unobservable inputs (Level 3) as of November 30, 2013. It is the Fund’s policy to recognize transfers into and out of any Level at the end of the reporting period.
Share valuation – The net asset value per share of the Fund is calculated daily by dividing the total value of the Fund’s assets, less liabilities, by the number of shares outstanding. The offering price and redemption price per share of the Fund is equal to the net asset value per share.
Investment income – Interest income is accrued as earned. Discounts and premiums on fixed income securities purchased are accreted or amortized using the effective interest method. Dividend income is recorded on the ex-dividend date.
Security transactions – Security transactions are accounted for on the trade date. Gains and losses on securities sold are determined on a specific identification basis.
Common expenses – Common expenses of the Trust are allocated among the Fund and other series of the Trust based on the relative net assets of each series or the nature of the services performed and the relative applicability to each series.
CINCINNATI ASSET MANAGEMENT FUNDS: BROAD MARKET STRATEGIC INCOME FUND NOTES TO FINANCIAL STATEMENTS (Continued) |
Distributions to shareholders – Dividends from net investment income are declared and paid quarterly to shareholders. Net realized capital gains, if any, are distributed at least once each year. The amount of distributions from net investment income and net realized gains are determined in accordance with federal income tax regulations, which may differ from GAAP. Dividends and distributions to shareholders are recorded on the ex-dividend date. The tax character of distributions paid during the periods ended November 30, 2013 and May 31, 2013 was ordinary income.
Estimates – The preparation of financial statements in conformity with GAAP requires management to make estimates and assumptions that affect the reported amounts of assets and liabilities and disclosure of contingent assets and liabilities as of the date of the financial statements and the reported amounts of income and expenses during the reporting period. Actual results could differ from those estimates.
Federal income tax – It is the Fund’s intention to qualify as a regulated investment company under the Internal Revenue Code of 1986 (the “Code”). Qualification generally will relieve the Fund of liability for federal income taxes to the extent 100% of its net investment income and net realized gains are distributed in accordance with the Code. Accordingly, no provision for income tax has been made.
In order to avoid imposition of the excise tax applicable to regulated investment companies, it is also the Fund’s intention to declare as dividends in each calendar year at least 98% of its net investment income (earned during the calendar year) and 98.2% of its net realized capital gains (earned during the twelve months ended October 31) plus undistributed amounts from prior years.
The following information is computed on a tax basis for each item as of November 30, 2013:
Tax cost of portfolio investments | | $ | 5,172,963 | |
Gross unrealized appreciation | | $ | 30,332 | |
Gross unrealized depreciation | | | (237,593 | ) |
Net unrealized depreciation on investments | | | (207,261 | ) |
Accumulated ordinary income | | | 29,768 | |
Capital loss carryforward | | | (715 | ) |
Other losses | | | (328 | ) |
Accumulated deficit | | $ | (178,536 | ) |
As of May 31, 2013, the Fund had a short-term capital loss carryforward of $715. This capital loss carryforward, which does not expire, may be utilized in the current and future years to offset net realized capital gains, if any, prior to distributing such gains to shareholders.
CINCINNATI ASSET MANAGEMENT FUNDS: BROAD MARKET STRATEGIC INCOME FUND NOTES TO FINANCIAL STATEMENTS (Continued) |
The Fund recognizes the tax benefits or expenses of uncertain tax positions only when the position is “more likely than not” to be sustained assuming examination by tax authorities. Management has reviewed the Fund’s tax positions for all open tax periods (period ended May 31, 2013) and has concluded that no provision for unrecognized tax benefits or expenses is required in these financial statements.
3. Investment Transactions
During the six months ended November 30, 2013, cost of purchases and proceeds from sales of investment securities, other than short-term investments, were $477,310 and $321,205, respectively.
4. Transactions with Related Parties
INVESTMENT ADVISORY AGREEMENT
The Fund’s investments are managed by the Adviser pursuant to the terms of an Investment Advisory Agreement. Under the Investment Advisory Agreement, the Fund pays the Adviser an advisory fee, computed and accrued daily and paid monthly, at the annual rate of 0.75% of its average daily net assets.
The Adviser has contractually agreed, until October 1, 2015, to reduce its advisory fees and to reimburse the Fund’s operating expenses to the extent necessary so that the Fund’s annual ordinary operating expenses (excluding brokerage costs, taxes, interest, costs to organize the Fund, acquired fund fees and expenses and extraordinary expenses) do not exceed an amount equal to 0.65% of its average daily net assets. During the six months ended November 30, 2013, the Adviser did not collect any of its advisory fees and, in addition, reimbursed other operating expenses totaling $76,388.
Advisory fee reductions and expense reimbursements by the Adviser are subject to repayment by the Fund for a period of three years after such fees and expenses were incurred, provided that the repayments do not cause the Fund’s ordinary operating expenses, at the time repayment occurs, to exceed the expense limitation in effect at the time the advisory fee reductions and expense reimbursements were made. As of November 30, 2013, the Adviser may in the future recover advisory fee reductions and expense reimbursements totaling $187,479. The Adviser may recover a portion of this amount no later than the dates as stated below:
May 31, 2016 | | $ | 91,998 | |
November 30, 2016 | | | 95,481 | |
| | | $ | 187,479 | |
Certain officers of the Fund are also officers of the Adviser.
CINCINNATI ASSET MANAGEMENT FUNDS: BROAD MARKET STRATEGIC INCOME FUND NOTES TO FINANCIAL STATEMENTS (Continued) |
DISTRIBUTION PLAN
The Fund has adopted a distribution plan pursuant to Rule 12b-1 under the Investment Company Act of 1940 (the “Rule 12b-1 Plan”), pursuant to which the Fund may incur certain costs for distribution and/or shareholder servicing expenses not to exceed 0.25% per annum of the Fund’s average daily net assets. During the six months ended November 30, 2013, the Fund incurred $4,632 in distribution and service fees under the Rule 12b-1 Plan.
OTHER SERVICE PROVIDERS
Ultimus Fund Solutions, LLC (“Ultimus”) provides fund administration, fund accounting, compliance and transfer agency services to the Fund. Pursuant to separate servicing agreements with Ultimus, the Fund pays Ultimus a customary fee for its services. Certain officers of the Trust are also officers of Ultimus.
DISTRIBUTION AGREEMENT
Under the terms of a Distribution Agreement with the Trust, Ultimus Fund Distributors, LLC (the “Distributor”) serves as principal underwriter to the Fund. The Distributor is a wholly-owned subsidiary of Ultimus.
TRUSTEE COMPENSATION
Each Trustee who is not an interested person of the Trust receives from the Fund a fee of $500 for each Board meeting attended plus reimbursement of travel and other expenses incurred in attending the meetings. Trustees affiliated with the Adviser or Ultimus are not compensated by the Trust for their services.
PRINCIPAL HOLDER OF FUND SHARES
As of November 30, 2013, Mary S. Sloneker owned 60% of the outstanding shares of the Fund.
5. Contingencies and Commitments
The Fund indemnifies the Trust’s officers and Trustees for certain liabilities that might arise from their performance of their duties to the Fund. Additionally, in the normal course of business the Fund enters into contracts that contain a variety of representations and warranties and which provide general indemnifications. The Fund’s maximum exposure under these arrangements is unknown, as this would involve future claims that may be made against the Fund that have not yet occurred. However, based on experience, the Fund expects the risk of loss to be remote.
6. Subsequent Events
The Fund is required to recognize in the financial statements the effects of all subsequent events that provide additional evidence about conditions that existed as of the date of the Statement of Assets and Liabilities. For non-recognized subsequent events that must be disclosed to keep the financial statements from being misleading, the Fund is required to disclose the nature of the event as well as an estimate of its financial effect, or a statement that such an estimate cannot be made. Management has evaluated subsequent events through the issuance of these financial statements and has noted no such events.
CINCINNATI ASSET MANAGEMENT FUNDS: BROAD MARKET STRATEGIC INCOME FUND ABOUT YOUR FUND’S EXPENSES (Unaudited) |
We believe it is important for you to understand the impact of costs on your investment. As a shareholder of the Fund, you incur ongoing costs, including management fees, distribution (12b-1) fees and other operating expenses. The following examples are intended to help you understand your ongoing costs (in dollars) of investing in the Fund and to compare these costs with the ongoing costs of investing in other mutual funds.
A mutual fund’s ongoing costs are expressed as a percentage of its average net assets. This figure is known as the expense ratio. The expenses in the table below are based on an investment of $1,000 made at the beginning of the most recent period (June 1, 2013) and held until the end of the period (November 30, 2013).
The table below illustrates the Fund’s ongoing costs in two ways:
Actual fund return – This section helps you to estimate the actual expenses that you paid over the period. The “Ending Account Value” shown is derived from the Fund’s actual return, and the third column shows the dollar amount of operating expenses that would have been paid by an investor who started with $1,000 in the Fund. You may use the information here, together with the amount you invested, to estimate the expenses that you paid over the period.
To do so, simply divide your account value by $1,000 (for example, an $8,600 account value divided by $1,000 = 8.6), then multiply the result by the number given for the Fund under the heading “Expenses Paid During Period.”
Hypothetical 5% return – This section is intended to help you compare the Fund’s ongoing costs with those of other mutual funds. It assumes that the Fund had an annual return of 5% before expenses during the period shown, but that the expense ratio is unchanged. In this case, because the return used is not the Fund’s actual return, the results do not apply to your investment. The example is useful in making comparisons because the SEC requires all mutual funds to calculate expenses based on a 5% return. You can assess the Fund’s ongoing costs by comparing this hypothetical example with the hypothetical examples that appear in shareholder reports of other funds.
Note that expenses shown in the table are meant to highlight and help you compare ongoing costs only. The Fund does not charge transaction fees, such as purchase or redemption fees, nor does it carry a “sales load.” The calculations assume no shares were bought or sold during the period. Your actual costs may have been higher or lower, depending on the amount of your investment and the timing of any purchases or redemptions.
CINCINNATI ASSET MANAGEMENT FUNDS: BROAD MARKET STRATEGIC INCOME FUND ABOUT YOUR FUND’S EXPENSES (Continued) |
More information about the Fund’s expenses can be found in this report. For additional information on operating expenses and other shareholder costs, please refer to the Fund’s prospectus.
| Beginning Account Value June 1, 2013 | Ending Account Value November 30, 2013 | Expenses Paid During Period* |
Based on Actual Fund Return | $1,000.00 | $988.80 | $3.24 |
Based on Hypothetical 5% Return (before expenses) | $1,000.00 | $1,021.81 | $3.29 |
| * | Expenses are equal to the Fund’s annualized expense ratio of 0.65% for the period, multiplied by the average account value over the period, multiplied by 183/365 (to reflect the one-half year period). |
OTHER INFORMATION (Unaudited) |
A description of the policies and procedures that the Fund uses to vote proxies relating to portfolio securities is available without charge upon request by calling toll-free 1-866-738-1128, or on the SEC’s website at http://www.sec.gov. Information regarding how the Fund voted proxies relating to portfolio securities during the most recent 12-month period ended June 30 is available without charge upon request by calling toll-free 1-866-738-1128, or on the SEC’s website at http://www.sec.gov.
The Trust files a complete listing of portfolio holdings for the Fund with the SEC as of the end of the first and third quarters of each fiscal year on Form N-Q. These filings are available upon request by calling 1-866-738-1128. Furthermore, you may obtain a copy of the filings on the SEC’s website at http://www.sec.gov. The Trust’s Forms N-Q may also be reviewed and copied at the SEC’s Public Reference Room in Washington, DC, and information on the operation of the Public Reference Room may be obtained by calling 1-800-SEC-0330.
WAVELENGTH INTEREST RATE NEUTRAL FUND LETTER TO SHAREHOLDERS | |
Dear Fellow Shareholders:
It is with great pleasure that I welcome you as investors in the Wavelength Interest Rate Neutral Fund (the “Fund”) with this, the Fund’s first shareholder letter. Thank you for your trust and support, I sincerely appreciate it, and I look forward to building on the partnership your investment creates as we approach new market risks and opportunities together.
PERFORMANCE SUMMARY
From the Fund’s launch on September 30, 2013 through November 30, 2013, a range of financial market conditions were experienced, and these conditions were driven by a diverse set of underlying risk factors. In seeking a balanced exposure to the factors driving changes in interest rates over the period, the Fund delivered a return of +0.10% versus a return of +0.01% for its benchmark, the S&P/BGCantor 0-3 Month US Treasury Bill Index (which seeks to represent the return from not taking risk in financial markets). The Fund generated positive performance despite increased market volatility and negative returns for a number of instruments traded over the period; this was in line with its target of seeking a balanced and hedged portfolio exposure.
WAVELENGTH PHILOSOPHY
We believe that macroeconomic conditions drive asset prices and central banks use interest rates to manage macroeconomic conditions. Based on this fundamental logic, we seek to build a portfolio that is hedged to changes in interest rates by balancing investment exposure between instruments we expect to outperform in rising and falling macroeconomic conditions.
INVESTMENT ENVIRONMENT
In October and November, financial markets were affected by investors’ changing expectations around a number of potential economic outcomes. While both positive and negative surprises were processed by markets over the period, speculation regarding how these datapoints would influence existing Federal Reserve programs often had a second-order impact on how assets were priced.
The effects of October’s economic releases that came in below consensus estimates were often compounded by speculation that the Federal Reserve would extend its asset purchases to promote further economic recovery. As a result, there was support for both the government bonds purchased as part of these programs and riskier corporate securities that tend to benefit from improving economic conditions.
When economic releases came in above consensus estimates in November, however, the traditionally positive effects this has on corporate securities were often overwhelmed. Fear that the Federal Reserve would reduce asset purchases due to stronger realized growth led to weaker future growth expectations for the market. This interaction and the uncertainty surrounding it drove many market participants out of investments and into cash holdings, resulting in a broad-based sell-off that had a negative impact on both corporate and government securities.
PERFORMANCE DISCUSSION
In the context of the market conditions described above, the return from the Fund’s investments over the period ultimately outperformed the alternative of not taking risk in financial markets (as represented by the S&P/BGCantor 0-3 Month US Treasury Bill Index). While seesaw price action and heightened correlations across markets made some fundamentally-based hedges less effective, the Fund ultimately benefited from the diversification across risk factors and balance targeted in its investment process.
Performance in October was relatively balanced, and all but one of the markets traded contributed positively to the portfolio. US Treasuries were profitable during the month, as holdings across both the intermediate and longer-term portions of the yield curve rallied. Positions related to corporate issuers, such as credit spreads and convertible bonds, contributed meaningfully to performance on the month, and USD-denominated emerging market debt spreads also provided strong gains. Commodity exposure was the sole negative contributor for the Fund in October, suffering mainly from energy and agricultural contracts. These losses, however, were ultimately outweighed by gains elsewhere in the portfolio as it closed the month of October up +1.0%.
November proved to be more challenging for the Fund due in large part to investors selling assets in favor of cash and the heightened correlations this produced. Losses were driven by the inflation-hedging components of the portfolio, including Treasury inflation-protected securities, commodities, and USD-denominated emerging market debt. Nominal US government bonds also made a negative contribution to overall portfolio performance, though this was not uniform across the yield curve as intermediate-term bonds held ground relative to the losses experienced in longer-term issues. Exposure to corporate securities, where profits were generated from high yield spread and convertible bond trades, helped limit downside exposure for the overall portfolio which ended the month of November down -0.90%.
OUTLOOK
While the market uncertainty experienced in October and November was challenging for a number of investment strategies and asset classes, resulting dislocations can offer opportunities for investors as markets return to more fundamental drivers. Increased clarity from the Federal Reserve regarding its asset purchases is likely to alleviate much of the related uncertainty, and additional macroeconomic datapoints should help investors as they assess the trajectory and strength of the economy moving forward. Due to this process and the range of potential market outcomes it creates, we believe that seeking portfolio balance through hedges based on the macroeconomic drivers of interest rates will continue to be a prudent investment approach.
Sincerely,
Andrew Dassori
Founding Partner & Chief Investment Officer
Wavelength Capital Management
Past performance is not predictive of future performance. Investment results and principal value will fluctuate so that shares, when redeemed, may be worth more or less than their original cost. Current performance may be higher or lower than the performance data quoted. Performance data current to the most recent month end are available by calling 1-866-896-9292.
An investor should consider the investment objectives, risks, charges and expenses of the Fund carefully before investing. The Fund’s prospectus contains this and other important information. To obtain a copy of the Fund’s prospectus please call 1-866-896-9292 and a copy will be sent to you free of charge. Please read the prospectus carefully before you invest. The Fund is distributed by Ultimus Fund Distributors, LLC.
The Letter to Shareholders seeks to describe some of the adviser’s current opinions and views of the financial markets. Although the adviser believes it has a reasonable basis for any opinions or views expressed, actual results may differ, sometimes significantly so, from those expected or expressed. The securities held by the Fund that are discussed in the Letter to Shareholders were held during the period covered by this Report. They do not comprise the entire investment portfolio of the Fund, may be sold at any time and may no longer be held by the Fund. The opinions of the Fund’s adviser with respect to those securities may change at any time.
WAVELENGTH INTEREST RATE NEUTRAL FUND
PORTFOLIO INFORMATION
November 30, 2013 (Unaudited)
Portfolio Allocation (% of Net Assets)
Top 10 Exchange-Traded Funds
| | |
iShares® Barclays 3-7 Year Treasury Bond Fund | | 19.1% |
iShares® Barclays TIPS Bond Fund | | 16.1% |
| PowerShares Senior Loan Portfolio | | 12.5% |
SPDR® Barclays Convertible Securities ETF | | 7.9% |
iShares® J.P. Morgan USD Emerging Markets Bond Fund | | 6.9% |
iShares® Barclays 7-10 Year Treasury Bond Fund | | 5.9% |
| PowerShares Emerging Markets Sovereign Debt Portfolio | | 5.8% |
iShares® iBoxx $ High Yield Corporate Bond Fund | | 4.7% |
iShares® S&P GSCI™ Commodity-Indexed Trust | | 4.7% |
| Vanguard REIT ETF | | 3.3% |
WAVELENGTH INTEREST RATE NEUTRAL FUND SCHEDULE OF INVESTMENTS November 30, 2013 (Unaudited) | |
EXCHANGE-TRADED FUNDS — 91.8% | | | | | | |
| Commodities — 4.8% | | | | | | |
iShares® S&P GSCI™ Commodity-Indexed Trust (a) | | | 5,850 | | | $ | 185,796 | |
iShares® Silver Trust (a) (b) | | | 200 | | | | 3,848 | |
Sprott Physical Platinum and Palladium Trust (a) | | | 200 | | | | 1,752 | |
| | | | | | | | 191,396 | |
| Emerging Markets — 12.8% | | | | | | | | |
iShares® J.P. Morgan USD Emerging Markets Bond Fund | | | 2,525 | | | | 274,392 | |
| PowerShares Emerging Markets Sovereign Debt Portfolio | | | 8,600 | | | | 231,684 | |
| | | | | | | | 506,076 | |
| Real Estate Investment Trusts (REIT) — 3.7% | | | | | | | | |
SPDR® Dow Jones REIT ETF | | | 200 | | | | 14,338 | |
Vanguard REIT ETF | | | 2,000 | | | | 131,000 | |
| | | | | | | | 145,338 | |
| U.S. Fixed Income — 70.5% | | | | | | | | |
Highland/iBoxx Senior Loan ETF | | | 800 | | | | 15,984 | |
iShares® Barclays TIPS Bond Fund | | | 5,700 | | | | 636,177 | |
iShares® Barclays 0-5 Year TIPS Bond Fund | | | 171 | | | | 17,335 | |
iShares® Barclays 3-7 Year Treasury Bond Fund | | | 6,200 | | | | 754,850 | |
iShares® Barclays 7-10 Year Treasury Bond Fund | | | 2,300 | | | | 233,887 | |
iShares® Barclays 20+ Year Treasury Bond Fund | | | 600 | | | | 62,670 | |
iShares® iBoxx $ High Yield Corporate Bond Fund | | | 2,000 | | | | 186,840 | |
| PIMCO 0-5 Year High Yield Corporate Bond Index ETF | | | 200 | | | | 21,292 | |
PowerShares Senior Loan Portfolio | | | 20,000 | | | | 496,400 | |
SPDR® Barclays Convertible Securities ETF | | | 6,700 | | | | 312,957 | |
SPDR® Barclays Short Term High Yield Bond ETF | | | 1,200 | | | | 37,188 | |
| Vanguard Short-Term Corporate Bond ETF | | | 200 | | | | 16,038 | |
| | | | | | | | 2,791,618 | |
Total Exchange-Traded Funds — 91.8% (Cost $3,636,943) | | | | | | $ | 3,634,428 | |
WAVELENGTH INTEREST RATE NEUTRAL FUND SCHEDULE OF INVESTMENTS (Continued) | |
MONEY MARKET FUNDS — 6.1% | | | | | | |
Fidelity Institutional Money Market Government Portfolio - Class I, 0.01%(c) (Cost $241,019) | | | 241,019 | | | $ | 241,019 | |
| | | | | | | | | |
Total Investments at Value — 97.9% (Cost $3,877,962) | | | | | | $ | 3,875,447 | |
| | | | | | | | | |
| Other Assets in Excess of Liabilities — 2.1% | | | | | | | 85,181 | |
| | | | | | | | | |
Net Assets — 100.0% | | | | | | $ | 3,960,628 | |
| (a) | Non-income producing security. |
| (b) | For federal income tax purposes, structured as a grantor trust. |
| (c) | The rate shown is the 7-day effective yield as of November 30, 2013. |
| See accompanying notes to financial statements. |
WAVELENGTH INTEREST RATE NEUTRAL FUND STATEMENT OF ASSETS AND LIABILITIES November 30, 2013 (Unaudited) | |
ASSETS | | | |
| Investments in securities: | | | |
At acquisition cost | | $ | 3,877,962 | |
At value (Note 2) | | $ | 3,875,447 | |
Cash | | | 871 | |
Deposit at Broker | | | 150,000 | |
Dividends receivable | | | 114 | |
Receivable for investment securities sold | | | 27,935 | |
Receivable from Adviser (Note 4) | | | 9,273 | |
Other assets | | | 6,752 | |
Total assets | | | 4,070,392 | |
| | | | | |
| LIABILITIES | | | | |
Payable for investment securities purchased | | | 100,384 | |
Payable to administrator (Note 4) | | | 6,030 | |
Other accrued expenses | | | 3,350 | |
Total liabilities | | | 109,764 | |
| | | | | |
NET ASSETS | | $ | 3,960,628 | |
| | | | | |
| NET ASSETS CONSIST OF: | | | | |
Paid-in capital | | $ | 3,957,946 | |
Accumulated net investment income | | | 4,234 | |
| Accumulated net realized gains from security transactions | | | 963 | |
Net unrealized depreciation on investments | | | (2,515 | ) |
NET ASSETS | | $ | 3,960,628 | |
| | | | | |
Shares of beneficial interest outstanding
(unlimited number of shares authorized, no par value) | | | 395,746 | |
| | | | | |
| Net asset value, offering price and redemption price per share (Note 2) | | $ | 10.01 | |
| See accompanying notes to financial statements. |
WAVELENGTH INTEREST RATE NEUTRAL FUND STATEMENT OF OPERATIONS For the Period Ended November 30, 2013(a) (Unaudited) | |
INVESTMENT INCOME | | | |
Dividends | | $ | 9,841 | |
| | | | | |
| EXPENSES | | | | |
Investment advisory fees (Note 4) | | | 5,380 | |
Fund accounting fees (Note 4) | | | 4,055 | |
Administration fees (Note 4) | | | 4,000 | |
Registration and filing fees | | | 3,574 | |
Legal fees | | | 2,500 | |
Trustees' fees and expenses (Note 4) | | | 2,147 | |
Compliance fees (Note 4) | | | 2,000 | |
Transfer agent fees (Note 4) | | | 2,000 | |
Postage and supplies | | | 1,551 | |
Custody and bank service fees | | | 1,420 | |
Insurance expense | | | 667 | |
Other expenses | | | 771 | |
Total expenses | | | 30,065 | |
| Less fee reductions and expense reimbursements by the Adviser (Note 4) | | | (24,458 | ) |
Net expenses | | | 5,607 | |
| | | | | |
NET INVESTMENT INCOME | | | 4,234 | |
| | | | | |
| REALIZED AND UNREALIZED GAINS (LOSSES) ON INVESTMENTS | | | | |
Net realized gains from security transactions | | | 963 | |
| Net change in unrealized appreciation/depreciation on investments | | | (2,515 | ) |
| NET REALIZED AND UNREALIZED LOSSES ON INVESTMENTS | | | (1,552 | ) |
| | | | | |
NET INCREASE IN NET ASSETS
RESULTING FROM OPERATIONS | | $ | 2,682 | |
| (a) | Represents the period from the commencement of operations (September 30, 2013) through November 30, 2013. |
| See accompanying notes to financial statements. |
WAVELENGTH INTEREST RATE NEUTRAL FUND STATEMENT OF CHANGES IN NET ASSETS | |
| | Period Ended November 30, 2013(a) (Unaudited) | |
| FROM OPERATIONS | | | |
Net investment income | | $ | 4,234 | |
Net realized gains from security transactions | | | 963 | |
| Net change in unrealized appreciation/depreciation on investments | | | (2,515 | ) |
Net increase in net assets resulting from operations | | | 2,682 | |
| | | | | |
| CAPITAL SHARE TRANSACTIONS | | | | |
Proceeds from shares sold | | | 3,957,946 | |
| | | | | |
TOTAL INCREASE IN NET ASSETS | | | 3,960,628 | |
| | | | | |
| NET ASSETS | | | | |
Beginning of period | | | — | |
End of period | | $ | 3,960,628 | |
| | | | | |
| ACCUMULATED NET INVESTMENT INCOME | | $ | 4,234 | |
| | | | | |
| CAPITAL SHARE ACTIVITY | | | | |
Shares sold | | | 395,746 | |
Increase in shares outstanding | | | 395,746 | |
Shares outstanding at beginning of period | | | — | |
Shares outstanding at end of period | | | 395,746 | |
| (a) | Represents the period from the commencement of operations (September 30, 2013) through November 30, 2013. |
| See accompanying notes to financial statements. |
WAVELENGTH INTEREST RATE NEUTRAL FUND FINANCIAL HIGHLIGHTS | |
Per Share Data for a Share Outstanding Throughout the Period | |
| | Period Ended November 30, 2013(a) (Unaudited) | |
| Net asset value at beginning of period | | $ | 10.00 | |
| | | | | |
| Income (loss) from investment operations: | | | | |
| Net investment income | | | 0.01 | |
| Net realized and unrealized losses on investments | | | (0.00 | )(b) |
| Total from investment operations | | | 0.01 | |
| | | | | |
| Net asset value at end of period | | $ | 10.01 | |
| | | | | |
Total return (c) | | | 0.10% | (d) |
| | | | | |
| Net assets at end of period (000's) | | $ | 3,961 | |
| | | | | |
| Ratios/supplementary data: | | | | |
| Ratio of total expenses to average net assets | | | 5.31% | (f) |
| | | | | |
Ratio of net expenses to average net assets (e) | | | 0.99% | (f) |
| | | | | |
Ratio of net investment income to average net assets (e) | | | 0.75% | (f) |
| | | | | |
| Portfolio turnover rate | | | 24% | (d) |
| (a) | Represents the period from the commencement of operations (September 30, 2013) through November 30, 2013. |
| (b) | Amount rounds to less than $0.01 per share. |
| (c) | Total return is a measure of the change in value of an investment in the Fund over the period covered. The return shown does not reflect the deduction of taxes a shareholder would pay on Fund distributions, if any, or the redemption of Fund shares. The total return would be lower if the Adviser had not reduced advisory fees and reimbursed expenses. |
| (d) | Not annualized. |
| (e) | Ratio was determined after advisory fee reductions and expense reimbursements (Note 4). |
| (f) | Annualized. |
| See accompanying notes to financial statements. |
WAVELENGTH INTEREST RATE NEUTRAL FUND
NOTES TO FINANCIAL STATEMENTS
November 30, 2013 (Unaudited)
1. Organization
Wavelength Interest Rate Neutral Fund (the “Fund”) is a non-diversified series of Ultimus Managers Trust (the “Trust”), an open-end investment company established as an Ohio business trust under a Declaration of Trust dated February 28, 2012. Other series of the Trust are not incorporated in this report. The Fund commenced operations on September 30, 2013.
The investment objective of the Fund is total return.
2. Significant Accounting Policies
The following is a summary of the Fund’s significant accounting policies. The policies are in conformity with accounting principles generally accepted in the United States of America (“GAAP”).
Securities valuation – The Fund’s portfolio securities are valued at market value as of the close of regular trading on the New York Stock Exchange (the “NYSE”) (normally 4:00 p.m. Eastern time) on each business day the NYSE is open. Securities listed on the NYSE or other exchanges are valued on the basis of their last sales prices on the exchanges on which they are primarily traded. If there are no sales on that day, the securities are valued at the closing bid price on the NYSE or other primary exchange for that day. NASDAQ listed securities are valued at the NASDAQ Official Closing Price. If there are no sales on that day, the securities are valued at the last bid price as reported by NASDAQ. Securities traded in the over-the-counter market are valued at the last sale price, if available, otherwise at the most recently quoted bid price. In the event that market quotations are not readily available or are considered unreliable due to market or other events, securities and other assets are valued at fair value as determined in good faith in accordance with procedures adopted by the Board of Trustees of the Trust and will be classified as Level 2 or 3 within the fair value hierarchy (see below), depending on the inputs used. Factors determining portfolio investments subject to fair value determination include, but are not limited to, the following: the spread between bid and asked prices is substantial; infrequency of sales; thinness of market; the size of reported trades; a temporary lapse in the provision of prices by any reliable pricing source; and actions of the securities or futures markets, such as the suspension or limitation of trading. Securities with remaining maturities of 60 days or less are valued at amortized cost value, absent unusual circumstances.
GAAP establishes a single authoritative definition of fair value, sets out a framework for measuring fair value and requires additional disclosures about fair value measurements.
Various inputs are used in determining the value of the Fund’s investments. These inputs are summarized in the three broad levels listed below:
| • | Level 1 – quoted prices in active markets for identical securities |
| • | Level 2 – other significant observable inputs |
| • | Level 3 – significant unobservable inputs |
WAVELENGTH INTEREST RATE NEUTRAL FUND NOTES TO FINANCIAL STATEMENTS (Continued) |
The inputs or methodology used for valuing securities are not necessarily an indication of the risks associated with investing in those securities. The inputs used to measure fair value may fall into different levels of the fair value hierarchy. In such cases, for disclosure purposes, the level in the fair value hierarchy within which the fair value measurement falls in its entirety is determined based on the lowest level input that is significant to the fair value measurement.
The following is a summary of the inputs used to value the Fund’s investments as of November 30, 2013:
| | | | | | | | | | | | |
| Exchange-Traded Funds | | $ | 3,634,428 | | | $ | — | | | $ | — | | | $ | 3,634,428 | |
| Money Market Funds | | | 241,019 | | | | — | | | | — | | | | 241,019 | |
| Total | | $ | 3,875,447 | | | $ | — | | | $ | — | | | $ | 3,875,447 | |
As of November 30, 2013, the Fund did not have any transfers in and out of any Level. In addition, the Fund did not have derivative instruments or any assets or liabilities that were measured at fair value on a recurring basis using significant unobservable inputs (Level 3) as of November 30, 2013. It is the Fund’s policy to recognize transfers into and out of any Level at the end of the reporting period.
Share valuation – The net asset value per share of the Fund is calculated daily by dividing the total value of the Fund’s assets, less liabilities, by the number of shares outstanding. The offering price and redemption price per share of the Fund is equal to the net asset value per share.
Investment income – Dividend income is recorded on the ex-dividend date. Interest income is accrued as earned.
Security transactions – Security transactions are accounted for on the trade date. Gains and losses on securities sold are determined on a specific identification basis.
Common expenses – Common expenses of the Trust are allocated among the Fund and the other series of the Trust based on the relative net assets of each series or the nature of the services performed and the relative applicability to each series.
Distributions to shareholders – Distributions to shareholders arising from net investment income and net realized capital gains, if any, are distributed at least once each year. The amount of distributions from net investment income and net realized gains are determined in accordance with federal income tax regulations, which may differ from GAAP. Dividends and distributions to shareholders are recorded on the ex-dividend date. There were no distributions paid to shareholders during the period ended November 30, 2013. On December 31, 2013, the Fund paid income and short-term capital gains to shareholders of $0.0430 and $0.0099 per share, respectively. The distributions were paid on December 31, 2013 to shareholders of record on December 30, 2013.
WAVELENGTH INTEREST RATE NEUTRAL FUND NOTES TO FINANCIAL STATEMENTS (Continued) |
Estimates – The preparation of financial statements in conformity with GAAP requires management to make estimates and assumptions that affect the reported amounts of assets and liabilities and disclosure of contingent assets and liabilities as of the date of the financial statements and the reported amounts of income and expenses during the reporting period. Actual results could differ from those estimates.
Federal income tax – It is the Fund’s intention to qualify as a regulated investment company under the Internal Revenue Code of 1986 (the “Code”). Qualification generally will relieve the Fund of liability for federal income taxes to the extent 100% of its net investment income and net realized gains are distributed in accordance with the Code. Accordingly, no provision for income tax has been made.
In order to avoid imposition of the excise tax applicable to regulated investment companies, it is also the Fund’s intention to declare as dividends in each calendar year at least 98% of its net investment income (earned during the calendar year) and 98.2% of its net realized capital gains (earned during the twelve months ended October 31) plus undistributed amounts from prior years.
The following information is computed on a tax basis for each item as of November 30, 2013:
Tax cost of portfolio investments | | $ | 3,879,319 | |
Gross unrealized appreciation | | $ | 19,999 | |
Gross unrealized depreciation | | | (23,871 | ) |
Net unrealized depreciation | | | (3,872 | ) |
Accumulated ordinary income | | | 6,554 | |
Total accumulated earnings | | $ | 2,682 | |
The difference between the federal income tax cost of portfolio investments and the financial statement cost is due to certain timing differences in the recognition of capital gains or losses under income tax regulations and GAAP. These “book/tax” differences are temporary in nature and are primarily due to the tax deferral of losses on wash sales.
The Fund recognizes the tax benefits or expenses of uncertain tax positions only when the position is “more likely than not” to be sustained assuming examination by tax authorities. Management has reviewed the Fund’s tax positions for the current tax year and has concluded that no provision for unrecognized tax benefits or expenses is required in these financial statements.
WAVELENGTH INTEREST RATE NEUTRAL FUND NOTES TO FINANCIAL STATEMENTS (Continued) |
3. Investment Transactions
During the period ended November 30, 2013, cost of purchases and proceeds from sales of investment securities, other than short-term investments, were $4,449,176 and $813,196, respectively.
4. Transactions with Related Parties
INVESTMENT ADVISORY AGREEMENT
The Fund’s investments are managed by the Adviser pursuant to the terms of an Investment Advisory Agreement. Under the Investment Advisory Agreement, the Fund pays the Adviser an advisory fee, computed and accrued daily and paid monthly, at the annual rate of 0.95% of its average daily net assets.
The Adviser has contractually agreed, until October 1, 2016, to reduce its advisory fees and to reimburse the Fund’s operating expenses (excluding brokerage costs, taxes, interest, acquired fund fees and expenses and extraordinary expenses) to the extent necessary so that the Fund’s annual ordinary operating expenses do not exceed an amount equal to 0.99% of its average daily net assets. During the period ended November 30, 2013, the Adviser did not collect any of its advisory fees and, in addition, reimbursed the Fund for other operating expenses totaling $19,078.
Advisory fee reductions and expense reimbursements by the Adviser are subject to repayment by the Fund for a period of three years after such fees and expenses were incurred, provided that the repayments do not cause the Fund’s ordinary operating expenses, at the time the repayment occurs, to exceed the expense limitation of 0.99% per annum. As of November 30, 2013, the Adviser may in the future recover advisory fee reductions and expense reimbursements totaling $24,458. The Adviser may recover this amount no later than November 30, 2016.
Certain officers of the Fund are also officers of the Adviser.
OTHER SERVICE PROVIDERS
Ultimus Fund Solutions, LLC (“Ultimus”) provides fund administration, fund accounting, compliance and transfer agency services to the Fund. Pursuant to separate servicing agreements with Ultimus, the Fund pays Ultimus a customary fee for its services. Certain officers of the Trust are also officers of Ultimus.
DISTRIBUTION AGREEMENT
Under the terms of a Distribution Agreement with the Trust, Ultimus Fund Distributors, LLC (the “Distributor”) serves as the principal underwriter to the Fund. The Distributor is a wholly-owned subsidiary of Ultimus.
TRUSTEE COMPENSATION
Each Trustee who is not an interested person of the Trust receives from the Fund a fee of $500 for each Board meeting attended plus reimbursement of travel and other expenses incurred in attending the meetings. Trustees affiliated with the Adviser or Ultimus are not compensated by the Trust for their services.
WAVELENGTH INTEREST RATE NEUTRAL FUND NOTES TO FINANCIAL STATEMENTS (Continued) |
PRINCIPAL HOLDER OF FUND SHARES
As of November 30, 2013, Mark Landis owned 83% of the outstanding shares of the Fund.
5. Certain Investments and Risks
The securities in which the Fund invests, as well as the risks associated with these securities, are described in the Fund’s prospectus. Among these risks are those associated with investments in exchange-traded funds (“ETF”). Investments in ETFs are subject to the risk that the market price of an ETF’s shares may differ from its net asset value. This difference in price may be due to the fact that the supply and demand in the market for ETF shares at any point in time is not always identical to the supply and demand in the market for the underlying basket of securities. Accordingly, there may be times when an ETF trades at a premium (creating the risk that the Fund pays more than NAV for an ETF when making a purchase) or discount (creating the risks that the Fund’s NAV is reduced for undervalued ETFs it holds, and that the Fund receives less than NAV when selling an ETF). Investments in ETFs are also subject to the risk that the ETF may not be able to replicate exactly the performance of the indices it tracks because the total return generated by the securities will be reduced by transaction costs incurred in adjusting the actual balance of the securities. In addition, an ETF in which the Fund invests may incur expenses not incurred by their applicable indices. Certain securities comprising the indices tracked by the ETF may, from time to time, temporarily be unavailable, which may further impede the ETF’s ability to track their applicable indices or match their performance. To the extent that the Fund invests in ETFs, there will be some duplication of expenses because the Fund would bear its pro-rata portion of such ETF’s advisory fees and operational expenses.
6. Contingencies and Commitments
The Fund indemnifies the Trust’s officers and Trustees for certain liabilities that might arise from their performance of their duties to the Fund. Additionally, in the normal course of business the Fund enters into contracts that contain a variety of representations and warranties and which provide general indemnifications. The Fund’s maximum exposure under these arrangements is unknown, as this would involve future claims that may be made against the Fund that have not yet occurred. However, based on experience, the Fund expects the risk of loss to be remote.
7. Subsequent Events
The Fund is required to recognize in the financial statements the effects of all subsequent events that provide additional evidence about conditions that existed as of the date of the Statement of Assets and Liabilities. For non-recognized subsequent events that must be disclosed to keep the financial statements from being misleading, the Fund is required to disclose the nature of the event as well as an estimate of its financial effect, or a statement that such an estimate cannot be made. Management has evaluated subsequent events through the issuance of these financial statements and has noted no such events.
WAVELENGTH INTEREST RATE NEUTRAL FUND ABOUT YOUR FUND’S EXPENSES (Unaudited) |
We believe it is important for you to understand the impact of costs on your investment. As a shareholder of the Fund, you incur ongoing costs, including management fees and other operating expenses. The following examples are intended to help you understand your ongoing costs (in dollars) of investing in the Fund and to compare these costs with the ongoing costs of investing in other mutual funds.
A mutual fund’s ongoing costs are expressed as a percentage of its average net assets. This figure is known as the expense ratio. The expenses in the table below are based on an investment of $1,000 made at the beginning of the most recent period (September 30, 2013) and held until the end of the period (November 30, 2013).
The table below illustrates the Fund’s ongoing costs in two ways:
Actual fund return – This section helps you to estimate the actual expenses that you paid over the period. The “Ending Account Value” shown is derived from the Fund’s actual return, and the third column shows the dollar amount of operating expenses that would have been paid by an investor who started with $1,000 in the Fund. You may use the information here, together with the amount you invested, to estimate the expenses that you paid over the period.
To do so, simply divide your account value by $1,000 (for example, an $8,600 account value divided by $1,000 = 8.6), then multiply the result by the number given for the Fund under the heading “Expenses Paid During Period.”
Hypothetical 5% return – This section is intended to help you compare the Fund’s ongoing costs with those of other mutual funds. It assumes that the Fund had an annual return of 5% before expenses during the period shown, but that the expense ratio is unchanged. In this case, because the return used is not the Fund’s actual return, the results do not apply to your investment. The example is useful in making comparisons because the SEC requires all mutual funds to calculate expenses based on a 5% return. You can assess the Fund’s ongoing costs by comparing this hypothetical example with the hypothetical examples that appear in shareholder reports of other funds.
Note that expenses shown in the table are meant to highlight and help you compare ongoing costs only. The Fund does not charge transaction fees, such as purchase or redemption fees, nor does it carry a “sales load.”
The calculations assume no shares were bought or sold during the period. Your actual costs may have been higher or lower, depending on the amount of your investment and the timing of any purchases or redemptions.
WAVELENGTH INTEREST RATE NEUTRAL FUND ABOUT YOUR FUND’S EXPENSES (Unaudited) (Continued) |
More information about the Fund’s expenses can be found in this report. For additional information on operating expenses and other shareholder costs, please refer to the Fund’s prospectus.
| Beginning Account Value September 30, 2013 | Ending Account Value November 30, 2013 | Expenses Paid During Period* |
Based on Actual Fund Return | $1,000.00 | $1,001.00 | $1.68 |
| * | Expenses are equal to the Fund’s annualized expense ratio of 0.99% for the period, multiplied by the average account value over the period, multiplied by 62/365 (to reflect the period since inception). |
| Beginning Account Value June 1, 2013 | Ending Account Value November 30, 2013 | Expenses Paid During Period* |
Based on Hypothetical 5% Return (before expenses) | $1,000.00 | $1,020.10 | $5.01 |
| * | Expenses are equal to the Fund’s annualized expense ratio of 0.99% for the period, multiplied by the average account value over the period, multiplied by 183/365 (to reflect the one-half year period). |
OTHER INFORMATION (Unaudited) |
A description of the policies and procedures that the Fund uses to vote proxies relating to portfolio securities is available without charge upon request by calling toll-free 1-866-896-9292, or on the SEC’s website at http://www.sec.gov. Information regarding how the Fund voted proxies relating to portfolio securities during the most recent period ended June 30 is available without charge upon request by calling toll-free 1-866-896-9292, or on the SEC’s website at http://www.sec.gov.
The Trust files a complete listing of portfolio holdings for the Fund with the SEC as of the end of the first and third quarters of each fiscal year on Form N-Q. These filings are available upon request by calling 1-866-896-9292. Furthermore, you may obtain a copy of the filings on the SEC’s website at http://www.sec.gov. The Trust’s Forms N-Q may also be reviewed and copied at the SEC’s Public Reference Room in Washington, DC, and information on the operation of the Public Reference Room may be obtained by calling 1-800-SEC-0330.
WAVELENGTH INTEREST RATE NEUTRAL FUND
ADVISORY AGREEMENT DISCLOSURE (Unaudited)
The Board of Trustees (the “Board”), including the Independent Trustees voting separately, has reviewed and approved the Fund’s Investment Advisory Agreement with the Adviser for an initial two-year term. Approval took place at an in-person meeting held on July 23, 2013, at which all of the Trustees were present.
In the course of their deliberations, the Board was advised by legal counsel. The Board received and reviewed a substantial amount of information provided by the Adviser in response to requests of the Board and counsel.
In considering the Investment Advisory Agreement and reaching their conclusions with respect thereto, the Board reviewed and analyzed various factors that they determined were relevant, including the factors described below.
The nature, extent, and quality of the services to be provided by the Adviser. In this regard, the Board considered the responsibilities the Adviser would have under the Investment Advisory Agreement. The Board also considered the services to be provided by the Adviser to the Fund including, without limitation, the Adviser’s procedures for formulating investment recommendations and assuring compliance with the Fund’s investment objective and limitations, and proposed marketing and distribution efforts to assist in the distribution of the Fund’s shares. The Board noted that the Fund’s Principal Executive Officer is an employee of the Adviser and will be serving the Trust without additional compensation. After reviewing the foregoing information and further information provided by the Adviser (e.g., descriptions of the Adviser’s business, the Adviser’s compliance programs, and the Adviser’s Form ADV), the Board concluded that the quality, extent, and nature of the services to be provided by the Adviser were satisfactory and adequate for the Fund.
The investment management capabilities and experience of the Adviser. In this regard, the Board considered the investment management experience of the Adviser. In particular, the Board noted that while the interest rate neutral strategy is new and has no performance history to report, the Board did receive information from the Adviser regarding the portfolio manager’s past investment management experience for other portfolios. The Board discussed with the Adviser the investment objective and strategies for the Fund and the Adviser’s plans for implementing such strategies. After consideration of these factors, as well as other factors, the Board determined that the Adviser has the requisite experience to serve as manager for the Fund.
The costs of the services to be provided and profits to be realized by the Adviser and its affiliates from the relationship with the Fund. In this regard, the Board considered the Adviser’s staffing, personnel, and methods of operating; the education and experience of the Adviser’s personnel; the Adviser’s compliance program, policies, and procedures; the financial condition of the Adviser and the level of commitment to the Fund and the Adviser by the principals of the Adviser; the projected asset levels of the Fund; and the overall expenses of the Fund, including the advisory fee. The Board reviewed the Fund’s proposed expense limitation agreement with the Adviser, and noted the benefit that would result to the Fund from the Adviser’s commitment to reduce its advisory fee and/or reimburse other operating expenses until October 1, 2016. The Board discussed the financial condition of the Adviser and its ability to satisfy its financial commitments to the Fund. The Board also
WAVELENGTH INTEREST RATE NEUTRAL FUND
ADVISORY AGREEMENT DISCLOSURE (Unaudited)
(Continued)
considered potential benefits for the Adviser in managing the Fund, including promotion of the Adviser’s name and the potential for the Adviser to receive research, statistical, or other services from the Fund’s trades that may benefit the Adviser’s other clients. The Board then compared the Fund’s projected advisory fee and overall expense ratio to other funds comparable to the Fund in terms of the type of fund, the style of investment management, the projected size of the Fund and the nature of the investment strategy and markets invested in. The Board noted that the Fund’s advisory fee of 0.95% per annum was higher than the average advisory fee of 0.79% for comparable funds in the Morningstar category of nontraditional bond funds, but was less than the maximum management fee for comparable funds reported for the category. It was further noted by the Board that the proposed overall expense ratio of 0.99% per annum (after applying the expense limitation agreement) for the Fund would be lower than the 1.38% average expense ratio for comparable funds in the Morningstar category of nontraditional bond funds. Upon further consideration and discussion of the foregoing, the Board concluded that the advisory fee to be paid to the Adviser by the Fund is fair and reasonable and within the range that would have been negotiated at arm’s length.
The extent to which economies of scale would be realized as the Fund grows and whether advisory fee levels reflect these economies of scale for the benefit of the Fund’s investors. In this regard, the Board considered the Fund’s fee arrangements with the Adviser, including both the advisory fee and the expense limitation agreement. The Board determined that since the advisory fee would stay the same as asset levels increased, the shareholders of the Fund would benefit from the expense limitation agreement until the Fund’s assets grow to a level where the Adviser begins receiving its full advisory fee and the Adviser has been reimbursed for all eligible reimbursements pursuant to the expense limitation agreement or the Fund’s expenses otherwise fall below the expense cap. Thereafter, the Board noted that the Fund would benefit from economies of scale under its agreements with service providers other than the Adviser. Following further discussion of the Fund’s projected asset levels, expectations for growth, and level of fees, the Board determined that the Fund’s fee arrangements with the Adviser would provide benefits and that, at the Fund’s projected asset levels for the next year, the Fund’s arrangements with the Adviser were fair and reasonable.
Brokerage and portfolio transactions. In this regard, the Board considered the Adviser’s policies and procedures as it relates to seeking best execution for its clients, including the Fund. The Board also considered the anticipated portfolio turnover rate for the Fund; the process by which evaluations are made of the overall reasonableness of commissions paid; the method and basis for selecting and evaluating the broker-dealers used; any anticipated allocation of portfolio business to persons affiliated with the Adviser; and the extent to which the Fund’s trades may be allocated to soft dollar arrangements. After further review and discussion, the Board determined that the Adviser’s practices regarding brokerage and portfolio transactions were satisfactory.
WAVELENGTH INTEREST RATE NEUTRAL FUND
ADVISORY AGREEMENT DISCLOSURE (Unaudited)
(Continued)
Possible conflicts of interest. In evaluating the possibility for conflicts of interest, the Board considered such matters as the Adviser’s process for allocating trades among its different clients on a pari passu basis. The Board also considered the substance and administration of the Adviser’s code of ethics. Following further consideration and discussion, the Board indicated that the Adviser’s standards and practices relating to the identification and mitigation of potential conflicts of interests were satisfactory.
Conclusion
After full consideration of the above factors as well as other factors, the Board unanimously concluded that approval of the Investment Advisory Agreement was in the best interests of the Fund and its shareholders.
This page intentionally left blank.
The registrant’s Committee of Independent Trustees shall review shareholder recommendations to fill vacancies on the registrant’s board of trustees if such recommendations are submitted in writing, addressed to the Committee at the registrant’s offices and meet any minimum qualifications adopted by the Committee. The Committee may adopt, by resolution, a policy regarding its procedures for considering candidates for the board of trustees, including any recommended by shareholders.
(a) Based on their evaluation of the registrant’s disclosure controls and procedures (as defined in Rule 30a-3(c) under the Investment Company Act of 1940) as of a date within 90 days of the filing date of this report, the registrant’s principal executive officers and principal financial officer have concluded that such disclosure controls and procedures are reasonably designed and are operating effectively to ensure that material information relating to the registrant, including its consolidated subsidiaries, is made known to them by others within those entities, particularly during the period in which this report is being prepared, and that the information required in filings on Form N-CSR is recorded, processed, summarized, and reported on a timely basis.
(b) There were no changes in the registrant’s internal control over financial reporting (as defined in Rule 30a-3(d) under the Investment Company Act of 1940) that occurred during the second fiscal quarter of the period covered by this report that have materially affected, or are reasonably likely to materially affect, the registrant’s internal control over financial reporting.
File the exhibits listed below as part of this Form. Letter or number the exhibits in the sequence indicated.
(a)(1) Any code of ethics, or amendment thereto, that is the subject of the disclosure required by Item 2, to the extent that the registrant intends to satisfy the Item 2 requirements through filing of an exhibit: Not required
(a)(2) A separate certification for each principal executive officer and principal financial officer of the registrant as required by Rule 30a-2(a) under the Act (17 CFR 270.30a-2(a)): Attached hereto
(a)(3) Any written solicitation to purchase securities under Rule 23c-1 under the Act (17 CFR 270.23c-1) sent or given during the period covered by the report by or on behalf of the registrant to 10 or more persons: Not applicable
(b) Certifications required by Rule 30a-2(b) under the Act (17 CFR 270.30a-2(b)): Attached hereto