| OMB APPROVAL |
OMB Number: 3235-0570
Expires: January 31, 2017
Estimated average burden hours per response: 20.6
|
UNITED STATES
SECURITIES AND EXCHANGE COMMISSION
Washington, D.C. 20549
FORM N-CSR
CERTIFIED SHAREHOLDER REPORT OF REGISTERED
MANAGEMENT INVESTMENT COMPANIES
| Investment Company Act file number | 811-22680 | |
Ultimus Managers Trust
(Exact name of registrant as specified in charter)
| 225 Pictoria Drive, Suite 450 Cincinnati, Ohio | 45246 |
| (Address of principal executive offices) | (Zip code) |
Frank L. Newbauer, Esq.
Ultimus Fund Solutions, LLC 225 Pictoria Drive, Suite 450 Cincinnati, Ohio 45246
(Name and address of agent for service)
| Registrant's telephone number, including area code: | (513) 587-3400 | |
| Date of fiscal year end: | May 31 | |
| | | |
| Date of reporting period: | November 30, 2014 | |
Form N-CSR is to be used by management investment companies to file reports with the Commission not later than 10 days after the transmission to stockholders of any report that is required to be transmitted to stockholders under Rule 30e-1 under the Investment Company Act of 1940 (17 CFR 270.30e-1). The Commission may use the information provided on Form N-CSR in its regulatory, disclosure review, inspection, and policymaking roles.
A registrant is required to disclose the information specified by Form N-CSR, and the Commission will make this information public. A registrant is not required to respond to the collection of information contained in Form N-CSR unless the Form displays a currently valid Office of Management and Budget ("OMB") control number. Please direct comments concerning the accuracy of the information collection burden estimate and any suggestions for reducing the burden to Secretary, Securities and Exchange Commission, 450 Fifth Street, NW, Washington, DC 20549-0609. The OMB has reviewed this collection of information under the clearance requirements of 44 U.S.C. § 3507.
Item 1. Reports to Stockholders.

APEXcm SMALL/MID-CAP GROWTH FUND
(APSGX)
Semi-Annual Report
November 30, 2014
(Unaudited)
APEXcm SMALL/MID-CAP GROWTH FUND
LETTER TO SHAREHOLDERS | November 30, 2014 |
Dear Fellow APEXcm Fund Shareholder,
PERFORMANCE SUMMARY
We are pleased to report that the APEXcm Small/Mid-Cap Growth Fund (the “Fund”) continues to grow and achieve its performance objectives relative to its benchmark. In spite of a challenging roller coaster environment during the six months ended November 30, 2014, the Fund’s performance was +7.50% (net of expenses), outperforming the Fund’s benchmark, the Russell 2500TM Growth Index, which rose + 7.03%.
APEX PHILOSOPHY
We believe that the best way to provide value-added returns is to identify companies that exhibit certain favorable fundamental advantages and benefit from secular growth trends, allowing us to structure the portfolio in high-conviction areas of longer-term sustainable growth. Embedded in our portfolio construction is the recognition of companies at different stages of their growth cycle, which we designate as “stable” and “emerging” growth stocks. We believe that having the spectrum of growth companies that are truly innovative and growing rapidly, combined with established growth companies, can provide relative stability while allowing the opportunity to drive outperformance versus our benchmark and peers over time. In addition, we believe the SMID style provides the opportunity to invest in higher growth companies and capture a longer period of growth as these companies mature.
INVESTMENT ENVIRONMENT
During the last six months, we have seen a market, which began almost too sanguine, become much more volatile. The volatility was initially driven by the Federal Reserve taking its foot off the gas by eliminating its bond buying program at the end of October, and then accelerated by both deflation and growth scares emerging from Brazil, Europe, Japan, and China, and heightened geopolitical concerns. As we entered the third quarter, we saw a market that had moved almost straight up for two years without any significant correction (defined as a market decline of 10%). Many smaller-cap companies were already down in excess of 20% as we entered October, with their larger-cap (S&P 500) brethren touching a correction on October 15th off of its September 18th high. This much-overdue correction set the stage for a strong rally that focused on improving valuations and a continued dissection as to whether the U.S. economy was strong enough to stand on its own two feet. At the same time, many other central banks, including the European Central Bank, the Bank of Japan, and the Peoples Bank of China, began easing credit conditions in response to slower global growth. As we moved into November, a supply shock of excess oil provided good news to the world economy in the form of falling energy prices, but left many energy stocks down in excess of 30% to 40%. Concerns over the global outlook, with associated fears of deflation and slower spending, continue to compete for investors’ attention, while declining fuel costs put more money into household coffers, which may boost spending and bolster the world’s largest economies.
DISCUSSION OF KEY POSITIONING AND
HOLDINGS VERSUS THE BENCHMARK
| • | Overall positioning added approximately 25 basis points to performance, as the overweight positioning in the cyclical sectors of Consumer Discretionary (+0.08%), and Information Technology (+0.22%) had a positive impact. Additionally, the underweights in Consumer Staples (+0.21%), Materials (+0.18%) and Industrials (0.15%) added to performance. Although we moved to an overweight in the best performing sector of Healthcare during the six months, we were underweight for most of the time period, which detracted (-0.21%) slightly from performance. The slight overweight in Energy was the most significant detractor (-0.32%). |
| • | Stock selection was positive during the six months, adding approximately 80 basis points. Solid stock selection in Consumer Discretionary, Healthcare, Industrials, and Information Technology was offset by the negative impact of Energy (-0.22%) and Materials (-0.39%). |
| • | Key secular growth areas of payments and processing, personalized medicine and genomics, and big data were offset by a significant decline in companies associated with energy independence. |
| • | The high growth areas of personalized medicine and genomics produced two outstanding performers during the six-month period. Isis Pharmaceuticals, with its strong pipeline centered on its anti-sense drug platform, was up 77%, as well as Medivation, with its pre-chemo prostate cancer drug Xtandi, up 59%. Also during the six months, we added key strategic companies in the ongoing battle with diabetes, such as continuous glucose monitoring device company DexCom, coupled with insulin pump/monitor providers Insulet and Tandem. |
| • | E-commerce continues to grow in adoption, thus one of our top holdings continues to be travel site Expedia, which was up 24% during this time period. We also believe that opportunities exist within the emerging markets to capture their growth in consumerism with e-commerce names such as Bitauto (Chinese on-line provider of new and used car listings), up 129%. Additionally, web-based platforms were added to the portfolio during this time period (which have not performed as of yet), such as Zulily, down 26%, and Yelp, down 12%. U.S. consumer spending continues to ratchet up, and a couple of our names, Signet Jewelers (+24%) and PetSmart (which is transitioning to a private company) (+38%), performed well. |
| • | The biggest challenge was our investment in companies that are leading the drive towards U.S energy independence. The plunge in oil prices from $110 per barrel in June 2014 to $60 may increase money in the pockets of U.S. consumers, but provides uncertainty for companies providing the infrastructure and exploration to extract more oil, while still maintaining profitability and servicing high debt levels. Companies like Carrizo and Whiting, who are in the trenches of the unconventional shale areas, were down -31% and -42%, respectively. Another long-term successful investment |
in horizontal flex, drill provider Heimerich & Payne (“HP”) was down -36%. Although we do believe that the U.S. will continue to accelerate its drive towards energy independence, given this traffic jam of too much supply, we decided to lighten up our exposure and sell HP subsequent to November 30th.
OUTLOOK
We expect the higher level of volatility to continue as the market wrestles with balancing multiple factors: the tailwinds of continued U.S. economic growth, a pick-up in consumer spending, consistent gains in hiring, strong corporate balance sheets, earnings acceleration, the temporary stimulus from declining energy and commodity prices, the uncertainties of declining global growth, likely U.S. interest rate increases, and a corresponding stronger U.S. dollar.
A potential silver lining exists as the stronger U.S. dollar and falling commodity prices put downward pressure on inflation. Forward inflation expectations may remain subdued, allowing the Federal Reserve to be more patient in raising interest rates, which may continue to benefit equity investors. Although it is hard to detangle all of the risks and drags from overseas with a U.S. economy that appears to be stronger and more able to cope with any external shocks, we believe that growth continues to accelerate in the U.S., and see it continuing its upward trajectory on the holy grail of earnings.
At Apex, one of the foundations of our success is focusing on the long-term sustainability of secular growth trends. During challenging times, we remain committed to the opportunities provided in such areas as consumer mobility, big data and cloud computing, the U.S. manufacturing renaissance, personalized medicine and genomics, and energy independence. As we navigate through the early stages of the self-sustaining U.S. economy, coupled with global growth concerns, our focus will continue to be on selective opportunities that could benefit in this environment. In our stable growth names, we will continue to focus on balance sheet flexibility (as depicted by accelerating cash flow) along with organic revenue and earnings growth. These companies should also be more levered to U.S. growth, with identified catalysts and capital deployment strategies. While maintaining a long-term focus, emerging growth companies in key strategic areas will be highly scrutinized in order to determine their viability in this more volatile environment.
Thank you for your continued confidence in the APEXcm Small/Mid-Cap Growth Fund.
Sincerely,
Nitin N. Kumbhani
President and Chief Investment Officer
Past performance is not predictive of future performance. Investment results and principal value will fluctuate so that shares, when redeemed, may be worth more or less than their original cost. Current performance may be higher or lower than the performance data quoted. Performance data current to the most recent month end are available by calling 1-888-575-4800.
An investor should consider the investment objectives, risks, charges and expenses of the Fund carefully before investing. The Fund’s prospectus contains this and other important information. To obtain a copy of the Fund’s prospectus please visit our website at www.apexcmfund.com or call 1-888-575-4800 and a copy will be sent to you free of charge. Please read the prospectus carefully before you invest. The APEXcm Small/Mid-Cap Growth Fund is distributed by Ultimus Fund Distributors, LLC.
The Letter to Shareholders seeks to describe some of the Adviser’s current opinions and views of the financial markets. Although the Adviser believes it has a reasonable basis for any opinions or views expressed, actual results may differ, sometimes significantly so, from those expected or expressed. The securities held by the Fund that are discussed in the Letter to Shareholders were held during the period covered by this Report. They do not comprise the entire investment portfolio of the Fund, may be sold at any time and may no longer be held by the Fund. The opinions of the Adviser with respect to those securities may change at any time.
APEXcm SMALL/MID-CAP GROWTH FUND
PORTFOLIO INFORMATION
November 30, 2014 (Unaudited)
Sector Diversification (% of Net Assets)
Top 10 Equity Holdings
| Security Description | | % of
Net Assets |
| Signet Jewelers Ltd. | | 2.8% |
| Expedia, Inc. | | 2.7% |
| United Rentals, Inc. | | 2.6% |
| Robert Half International, Inc. | | 2.5% |
| PetSmart, Inc. | | 2.2% |
| Universal Health Services, Inc. - Class B | | 2.2% |
| Wabtec Corp. | | 2.2% |
| Old Dominion Freight Line, Inc. | | 2.2% |
| Polaris Industries, Inc. | | 2.1% |
| IAC/InterActiveCorp | | 2.1% |
APEXcm SMALL/MID-CAP GROWTH FUND
SCHEDULE OF INVESTMENTS
November 30, 2014 (Unaudited) | |
| COMMON STOCKS — 98.5% | | Shares | | | Value | |
| Consumer Discretionary — 22.0% | | | | | | |
| Auto Components — 4.6% | | | | | | |
Autoliv, Inc. | | | 26,330 | | | $ | 2,605,617 | |
Gentex Corp. | | | 40,841 | | | | 1,452,306 | |
Visteon Corp. * | | | 24,134 | | | | 2,365,132 | |
| | | | | | | | 6,423,055 | |
| Hotels, Restaurants & Leisure — 1.5% | | | | | | | | |
Wyndham Worldwide Corp. | | | 24,808 | | | | 2,067,995 | |
| | | | | | | | | |
| Internet & Catalog Retail — 3.3% | | | | | | | | |
Expedia, Inc. | | | 42,858 | | | | 3,733,360 | |
zulily, inc. - Class A * | | | 26,879 | | | | 772,234 | |
| | | | | | | | 4,505,594 | |
| Leisure Products — 2.1% | | | | | | | | |
Polaris Industries, Inc. | | | 18,642 | | | | 2,921,388 | |
| | | | | | | | | |
| Multi-line Retail — 1.0% | | | | | | | | |
Dillard's, Inc. - Class A | | | 11,660 | | | | 1,374,481 | |
| | | | | | | | | |
| Specialty Retail — 8.3% | | | | | | | | |
Foot Locker, Inc. | | | 35,152 | | | | 2,013,858 | |
PetSmart, Inc. | | | 39,574 | | | | 3,116,848 | |
Signet Jewelers Ltd. | | | 29,959 | | | | 3,923,431 | |
Williams-Sonoma, Inc. | | | 32,329 | | | | 2,410,450 | |
| | | | | | | | 11,464,587 | |
| Textiles, Apparel & Luxury Goods — 1.2% | | | | | | | | |
Deckers Outdoor Corp. * | | | 17,766 | | | | 1,718,327 | |
| | | | | | | | | |
| Energy — 3.7% | | | | | | | | |
| Energy Equipment & Services — 1.7% | | | | | | | | |
Core Laboratories N.V. | | | 8,155 | | | | 1,050,609 | |
Helmerich & Payne, Inc. | | | 20,124 | | | | 1,399,624 | |
| | | | | | | | 2,450,233 | |
| Oil, Gas & Consumable Fuels — 2.0% | | | | | | | | |
Carrizo Oil & Gas, Inc. * | | | 37,492 | | | | 1,479,434 | |
Whiting Petroleum Corp. * | | | 30,321 | | | | 1,266,508 | |
| | | | | | | | 2,745,942 | |
| Financials — 8.4% | | | | | | | | |
| Banks — 2.6% | | | | | | | | |
Cullen/Frost Bankers, Inc. | | | 20,512 | | | | 1,531,426 | |
APEXcm SMALL/MID-CAP GROWTH FUND
SCHEDULE OF INVESTMENTS (Continued) | |
| COMMON STOCKS — 98.5% (Continued) | | Shares | | | Value | |
| Financials — 8.4% (Continued) | | | | | | |
| Banks — 2.6% (Continued) | | | | | | |
First Republic Bank/CA | | | 40,472 | | | $ | 2,085,522 | |
| | | | | | | | 3,616,948 | |
| Capital Markets — 1.4% | | | | | | | | |
Affiliated Managers Group, Inc. * | | | 9,537 | | | | 1,941,638 | |
| | | | | | | | | |
| Diversified Financial Services — 0.9% | | | | | | | | |
Interactive Brokers Group, Inc. - Class A | | | 24,806 | | | | 677,700 | |
MarketAxess Holdings, Inc. | | | 8,844 | | | | 579,901 | |
| | | | | | | | 1,257,601 | |
| Insurance — 1.5% | | | | | | | | |
XL Group plc | | | 58,730 | | | | 2,086,090 | |
| | | | | | | | | |
| Real Estate Management & Development — 2.0% | | | | | | | | |
CBRE Group, Inc. - Class A * | | | 83,422 | | | | 2,814,658 | |
| | | | | | | | | |
| Health Care — 19.5% | | | | | | | | |
| Biotechnology — 4.9% | | | | | | | | |
Isis Pharmaceuticals, Inc. * | | | 38,923 | | | | 2,015,822 | |
Keryx Biopharmaceuticals, Inc. * | | | 65,812 | | | | 1,046,411 | |
Medivation, Inc. * | | | 19,957 | | | | 2,312,817 | |
Momenta Pharmaceuticals, Inc. * | | | 34,194 | | | | 401,096 | |
United Therapeutics Corp. * | | | 7,458 | | | | 988,707 | |
| | | | | | | | 6,764,853 | |
| Health Care Equipment & Supplies — 2.6% | | | | | | | | |
Align Technology, Inc. * | | | 25,264 | | | | 1,437,522 | |
DexCom, Inc. * | | | 23,645 | | | | 1,216,772 | |
Insulet Corp. * | | | 13,252 | | | | 617,411 | |
Tandem Diabetes Care, Inc. * | | | 24,473 | | | | 345,803 | |
| | | | | | | | 3,617,508 | |
| Health Care Providers & Services — 4.4% | | | | | | | | |
Centene Corp. * | | | 17,309 | | | | 1,709,610 | |
Tenet Healthcare Corp. * | | | 28,311 | | | | 1,360,343 | |
Universal Health Services, Inc. - Class B | | | 29,657 | | | | 3,102,715 | |
| | | | | | | | 6,172,668 | |
| Life Sciences Tools & Services — 3.1% | | | | | | | | |
ICON plc * | | | 26,995 | | | | 1,499,302 | |
PAREXEL International Corp. * | | | 22,607 | | | | 1,322,736 | |
| WuXi PharmaTech (Cayman), Inc. - ADR * | | | 41,319 | | | | 1,417,655 | |
| | | | | | | | 4,239,693 | |
APEXcm SMALL/MID-CAP GROWTH FUND
SCHEDULE OF INVESTMENTS (Continued) | |
| COMMON STOCKS — 98.5% (Continued) | | Shares | | | Value | |
| Health Care — 19.5% (Continued) | | | | | | |
| Pharmaceuticals — 4.5% | | | | | | |
Akorn, Inc. * | | | 57,941 | | | $ | 2,321,696 | |
Jazz Pharmaceuticals plc * | | | 11,671 | | | | 2,066,817 | |
Salix Pharmaceuticals Ltd. * | | | 17,921 | | | | 1,840,307 | |
| | | | | | | | 6,228,820 | |
| Industrials — 15.0% | | | | | | | | |
| Aerospace & Defense — 1.1% | | | | | | | | |
B/E Aerospace, Inc. * | | | 20,647 | | | | 1,607,782 | |
| | | | | | | | | |
| Machinery — 5.0% | | | | | | | | |
Nordson Corp. | | | 22,593 | | | | 1,765,643 | |
Proto Labs, Inc. * | | | 9,682 | | | | 628,362 | |
Valmont Industries, Inc. | | | 10,897 | | | | 1,473,492 | |
Wabtec Corp. | | | 34,938 | | | | 3,091,664 | |
| | | | | | | | 6,959,161 | |
| Professional Services — 4.1% | | | | | | | | |
Robert Half International, Inc. | | | 60,751 | | | | 3,450,049 | |
Towers Watson & Co. - Class A | | | 19,197 | | | | 2,168,493 | |
| | | | | | | | 5,618,542 | |
| Road & Rail — 2.2% | | | | | | | | |
Old Dominion Freight Line, Inc. * | | | 37,173 | | | | 3,012,500 | |
| | | | | | | | | |
| Trading Companies & Distributors — 2.6% | | | | | | | | |
United Rentals, Inc. * | | | 31,331 | | | | 3,550,116 | |
| | | | | | | | | |
| Information Technology — 26.2% | | | | | | | | |
| Communications Equipment — 2.7% | | | | | | | | |
Ciena Corp. * | | | 68,205 | | | | 1,127,429 | |
F5 Networks, Inc. * | | | 20,254 | | | | 2,616,614 | |
| | | | | | | | 3,744,043 | |
Electronic Equipment, Instruments &
Components — 2.1% | | | | | | | | |
Dolby Laboratories, Inc. - Class A | | | 32,546 | | | | 1,444,392 | |
FEI Co. | | | 17,449 | | | | 1,494,332 | |
| | | | | | | | 2,938,724 | |
| Internet Software & Services — 5.4% | | | | | | | | |
Bitauto Holdings Ltd. - ADR * | | | 23,982 | | | | 2,210,181 | |
IAC/InterActiveCorp | | | 44,229 | | | | 2,887,269 | |
Yelp, Inc. * | | | 20,309 | | | | 1,159,441 | |
YY, Inc. - ADR * | | | 16,492 | | | | 1,260,813 | |
| | | | | | | | 7,517,704 | |
APEXcm SMALL/MID-CAP GROWTH FUND
SCHEDULE OF INVESTMENTS (Continued) | |
| COMMON STOCKS — 98.5% (Continued) | | Shares | | | Value | |
| Information Technology — 26.2% (Continued) | | | | | | |
| IT Services — 7.7% | | | | | | |
Gartner, Inc. * | | | 32,119 | | | $ | 2,745,532 | |
Global Payments, Inc. | | | 27,410 | | | | 2,367,128 | |
Heartland Payment Systems, Inc. | | | 35,736 | | | | 1,948,327 | |
NeuStar, Inc. - Class A * | | | 38,141 | | | | 1,039,342 | |
Total System Services, Inc. | | | 77,243 | | | | 2,548,247 | |
| | | | | | | | 10,648,576 | |
| Semiconductors & Semiconductor Equipment — 1.9% | | | | | | | | |
Entegris, Inc. * | | | 101,796 | | | | 1,371,192 | |
Power Integrations, Inc. | | | 25,240 | | | | 1,266,038 | |
| | | | | | | | 2,637,230 | |
| Software — 6.4% | | | | | | | | |
Advent Software, Inc. | | | 40,950 | | | | 1,291,154 | |
Informatica Corp. * | | | 29,306 | | | | 1,066,152 | |
Manhattan Associates, Inc. * | | | 21,350 | | | | 844,606 | |
NetScout Systems, Inc. * | | | 30,244 | | | | 1,153,809 | |
Rovi Corp. * | | | 46,486 | | | | 1,035,708 | |
Splunk, Inc.* | | | 22,380 | | | | 1,501,698 | |
Tableau Software, Inc. - Class A * | | | 22,999 | | | | 1,929,156 | |
| | | | | | | | 8,822,283 | |
| Materials — 3.7% | | | | | | | | |
| Chemicals — 0.8% | | | | | | | | |
Albemarle Corp. | | | 19,325 | | | | 1,140,948 | |
| | | | | | | | | |
| Containers & Packaging — 1.2% | | | | | | | | |
Silgan Holdings, Inc. | | | 33,100 | | | | 1,670,226 | |
| | | | | | | | | |
| Metals & Mining — 0.3% | | | | | | | | |
Constellium N.V. - Class A * | | | 26,691 | | | | 420,383 | |
| | | | | | | | | |
| Paper & Forest Products — 1.4% | | | | | | | | |
KapStone Paper and Packaging Corp. * | | | 62,171 | | | | 1,857,048 | |
| | | | | | | | | |
Total Common Stocks (Cost $119,269,616) | | | | | | $ | 136,557,345 | |
APEXcm SMALL/MID-CAP GROWTH FUND
SCHEDULE OF INVESTMENTS (Continued) | |
| MONEY MARKET FUNDS — 2.9% | | Shares | | | Value | |
Fidelity Institutional Money Market Portfolio - Class I, 0.05% (a) (Cost $4,090,258) | | | 4,090,258 | | | $ | 4,090,258 | |
| | | | | | | | | |
Total Investments at Value — 101.4% (Cost $123,359,874) | | | | | | $ | 140,647,603 | |
| | | | | | | | | |
| Liabilities in Excess of Other Assets — (1.4%) | | | | | | | (1,960,040 | ) |
| | | | | | | | | |
Net Assets — 100.0% | | | | | | $ | 138,687,563 | |
ADR - American Depositary Receipt. |
| * | Non-income producing security. |
(a) | The rate shown is the 7-day effective yield as of November 30, 2014. |
| See accompanying notes to financial statements. |
APEXcm SMALL/MID-CAP GROWTH FUND
STATEMENT OF ASSETS AND LIABILITIES
November 30, 2014 (Unaudited) | |
| ASSETS | | | |
| Investments in securities: | | | |
At acquisition cost | | $ | 123,359,874 | |
At value (Note 2) | | $ | 140,647,603 | |
Dividends receivable | | | 103,790 | |
Receivable for capital shares sold | | | 35,768 | |
Other assets | | | 21,892 | |
Total assets | | | 140,809,053 | |
| | | | | |
| LIABILITIES | | | | |
Payable for investment securities purchased | | | 1,991,516 | |
Payable for capital shares redeemed | | | 14,146 | |
Payable to Adviser (Note 4) | | | 83,311 | |
Payable to administrator (Note 4) | | | 17,248 | |
Other accrued expenses | | | 15,269 | |
Total liabilities | | | 2,121,490 | |
| | | | | |
NET ASSETS | | $ | 138,687,563 | |
| | | | | |
| NET ASSETS CONSIST OF: | | | | |
Paid-in capital | | $ | 121,409,547 | |
Accumulated net investment loss | | | (336,529 | ) |
| Accumulated net realized gains from security transactions | | | 326,816 | |
Net unrealized appreciation on investments | | | 17,287,729 | |
NET ASSETS | | $ | 138,687,563 | |
| | | | | |
| Shares of beneficial interest outstanding (unlimited number of shares authorized, no par value) | | | 8,485,954 | |
| | | | | |
Net asset value, offering price and redemption price per share (Note 2) | | $ | 16.34 | |
| See accompanying notes to financial statements. |
APEXcm SMALL/MID-CAP GROWTH FUND
STATEMENT OF OPERATIONS
For the Six Months Ended November 30, 2014 (Unaudited) | |
| INVESTMENT INCOME | | | |
Dividend income (net of foreign expense of $984) | | $ | 350,307 | |
| | | | | |
| EXPENSES | | | | |
Investment advisory fees (Note 4) | | | 553,764 | |
Administration fees (Note 4) | | | 55,452 | |
Custody and bank service fees | | | 23,264 | |
Registration and filing fees | | | 21,415 | |
Fund accounting fees (Note 4) | | | 20,301 | |
Professional fees | | | 17,727 | |
Transfer agent fees (Note 4) | | | 9,008 | |
Compliance fees (Note 4) | | | 6,597 | |
Postage and supplies | | | 4,590 | |
Trustees' fees and expenses (Note 4) | | | 3,369 | |
Insurance expense | | | 1,717 | |
Other expenses | | | 9,625 | |
Total expenses | | | 726,829 | |
Less fee reductions by the Adviser (Note 4) | | | (145,381 | ) |
Net expenses | | | 581,448 | |
| | | | | |
NET INVESTMENT LOSS | | | (231,141 | ) |
| | | | | |
| REALIZED AND UNREALIZED GAINS ON INVESTMENTS | | | | |
Net realized gains from security transactions | | | 784,141 | |
Net change in unrealized appreciation/depreciation on investments | | | 7,520,167 | |
| NET REALIZED AND UNREALIZED GAINS ON INVESTMENTS | | | 8,304,308 | |
| | | | | |
| NET INCREASE IN NET ASSETS RESULTING FROM OPERATIONS | | $ | 8,073,167 | |
| See accompanying notes to financial statements. |
APEXcm SMALL/MID-CAP GROWTH FUND
STATEMENTS OF CHANGES IN NET ASSETS | |
| | | Six Months Ended November 30, 2014 (Unaudited) | | | Year Ended May 31, 2014 | |
| FROM OPERATIONS | | | | | | |
Net investment loss | | $ | (231,141 | ) | | $ | (192,714 | ) |
| Net realized gains (losses) from security transactions | | | 784,141 | | | | (197,613 | ) |
Net change in unrealized appreciation/ depreciation on investments | | | 7,520,167 | | | | 8,704,592 | |
Net increase in net assets resulting from operations | | | 8,073,167 | | | | 8,314,265 | |
| | | | | | | | | |
| DISTRIBUTIONS TO SHAREHOLDERS | | | | | | | | |
From net realized gains on investments | | | — | | | | (226,268 | ) |
| | | | | | | | | |
| CAPITAL SHARE TRANSACTIONS | | | | | | | | |
Proceeds from shares sold | | | 50,446,250 | | | | 74,662,709 | |
| Net asset value of shares issued in reinvestment of distributions to shareholders | | | — | | | | 162,061 | |
Payments for shares redeemed | | | (8,308,554 | ) | | | (7,589,046 | ) |
Net increase in net assets from capital share transactions | | | 42,137,696 | | | | 67,235,724 | |
| | | | | | | | | |
TOTAL INCREASE IN NET ASSETS | | | 50,210,863 | | | | 75,323,721 | |
| | | | | | | | | |
| NET ASSETS | | | | | | | | |
Beginning of period | | | 88,476,700 | | | | 13,152,979 | |
End of period | | $ | 138,687,563 | | | $ | 88,476,700 | |
| | | | | | | | | |
ACCUMULATED NET INVESTMENT LOSS | | $ | (336,529 | ) | | $ | (105,388 | ) |
| | | | | | | | | |
| CAPITAL SHARE ACTIVITY | | | | | | | | |
Shares sold | | | 3,181,661 | | | | 5,289,946 | |
Shares reinvested | | | ��� | | | | 10,768 | |
Shares redeemed | | | (517,929 | ) | | | (515,199 | ) |
Net increase in shares outstanding | | | 2,663,732 | | | | 4,785,515 | |
Shares outstanding at beginning of period | | | 5,822,222 | | | | 1,036,707 | |
Shares outstanding at end of period | | | 8,485,954 | | | | 5,822,222 | |
| See accompanying notes to financial statements. |
APEXcm SMALL/MID-CAP GROWTH FUND
FINANCIAL HIGHLIGHTS | |
| Per Share Data for a Share Outstanding Throughout each Period | |
| | | Six Months Ended November 30, 2014 (Unaudited) | | | Year
Ended
May 31,
2014 | | | Period
Ended
May 31,
2013(a) | |
Net asset value at beginning of period | | $ | 15.20 | | | $ | 12.69 | | | $ | 10.00 | |
| | | | | | | | | | | | | |
| Income (loss) from investment operations: | | | | | | | | | | | | |
Net investment income (loss) | | | (0.02 | ) | | | (0.03 | ) | | | 0.04 | (b) |
Net realized and unrealized gains on investments | | | 1.16 | | | | 2.60 | | | | 2.72 | |
Total from investment operations | | | 1.14 | | | | 2.57 | | | | 2.76 | |
| | | | | | | | | | | | | |
| Less distributions: | | | | | | | | | | | | |
From net investment income | | | — | | | | — | | | | (0.07 | ) |
From net realized gains on investments | | | — | | | | (0.06 | ) | | | — | |
Total distributions | | | — | | | | (0.06 | ) | | | (0.07 | ) |
| | | | | | | | | | | | | |
Net asset value at end of period | | $ | 16.34 | | | $ | 15.20 | | | $ | 12.69 | |
| | | | | | | | | | | | | |
Total return (c) | | | 7.50 | %(d) | | | 20.26 | % | | | 27.65 | %(d) |
| | | | | | | | | | | | | |
Net assets at end of period (000's) | | $ | 138,688 | | | $ | 88,477 | | | $ | 13,153 | |
| | | | | | | | | | | | | |
| Ratios/supplementary data: | | | | | | | | | | | | |
Ratio of total expenses to average net assets | | | 1.31 | %(e) | | | 1.49 | % | | | 4.87 | %(e) |
| | | | | | | | | | | | | |
Ratio of net expenses to average net assets (f) | | | 1.05 | %(e) | | | 1.05 | % | | | 1.05 | %(e) |
| | | | | | | | | | | | | |
Ratio of net investment income (loss) to average net assets (f) | | | (0.42% | )(e) | | | (0.38 | %) | | | 0.26 | %(e) |
| | | | | | | | | | | | | |
Portfolio turnover rate | | | 28 | %(d) | | | 47 | % | | | 18 | %(d) |
(a) | Represents the period from the commencement of operations (June 29, 2012) through May 31, 2013. |
(b) | Calculated using weighted average shares outstanding during the period. |
(c) | Total return is a measure of the change in value of an investment in the Fund over the periods covered. The returns shown do not reflect the deduction of taxes a shareholder would pay on Fund distributions, if any, or the redemption of Fund shares. The total returns would be lower if the Adviser had not reduced advisory fees and/or reimbursed expenses. |
(d) | Not annualized. |
(e) | Annualized. |
(f) | Ratio was determined after advisory fee reductions and/or expense reimbursements (Note 4). |
| See accompanying notes to financial statements. |
APEXcm SMALL/MID-CAP GROWTH FUND
NOTES TO FINANCIAL STATEMENTS
November 30, 2014 (Unaudited)
1. Organization
APEXcm Small/Mid-Cap Growth Fund (the “Fund”) is a diversified series of Ultimus Managers Trust (the “Trust”), an open-end investment company established as an Ohio business trust under a Declaration of Trust dated February 28, 2012. Other series of the Trust are not incorporated in this report. The Fund commenced operations on June 29, 2012.
The investment objective of the Fund is long-term capital growth.
2. Significant Accounting Policies
The following is a summary of the Fund’s significant accounting policies. The policies are in conformity with accounting principles generally accepted in the United States of America (“GAAP”). As an investment company, as defined in Financial Accounting Standards Board (“FASB”) Accounting Standards Update 2013-08, the Fund follows accounting and reporting guidance under FASB Accounting Standards Codification Topic 946, “Financial Services – Investment Companies.”
Securities valuation – The Fund values its portfolio securities at market value as of the close of regular trading on the New York Stock Exchange (the “NYSE”) (normally 4:00 p.m. Eastern time) on each business day the NYSE is open for business. The pricing and valuation of portfolio securities is determined in good faith in accordance with procedures established by and under the direction of the Board of Trustees (the “Board”) of the Trust. The Fund values its listed securities on the basis of the security’s last sale price on the security’s primary exchange, if available, otherwise at the exchange’s most recently quoted bid price. NASDAQ-listed securities are valued at the NASDAQ Official Closing Price. In the event that market quotations are not readily available or are considered unreliable due to market or other events, the Fund values its securities and other assets at fair value pursuant to the procedures adopted by the Board. Under these procedures, the securities will be classified as Level 2 or 3 within the fair value hierarchy (see below), depending on the inputs used. Unreliable market quotes may be due to the following factors: a substantial bid-ask spread; infrequent sales resulting in stale prices; insufficient trading volume; small trade sizes; a temporary lapse in any reliable pricing source; and actions of the securities or futures markets, such as the suspension or limitation of trading. As a result, the prices of securities used to calculate the Fund’s net asset value may differ from quoted or published prices for the same securities.
GAAP establishes a single authoritative definition of fair value, sets out a framework for measuring fair value, and requires additional disclosures about fair value measurements.
APEXcm SMALL/MID-CAP GROWTH FUND
NOTES TO FINANCIAL STATEMENTS (Continued) |
Various inputs are used in determining the value of the Fund’s investments. These inputs are summarized in the three broad levels listed below:
| • | Level 1 – quoted prices in active markets for identical securities |
| • | Level 2 – other significant observable inputs |
| • | Level 3 – significant unobservable inputs |
The inputs or methods used for valuing securities are not necessarily an indication of the risks associated with investing in those securities. The inputs used to measure fair value may fall into different levels of the fair value hierarchy. In such cases, for disclosure purposes, the level in the fair value hierarchy within which the fair value measurement falls in its entirety is determined based on the lowest level input that is significant to the fair value measurement.
The following is a summary of the inputs used to value the Fund’s investments as of November 30, 2014:
| | | Level 1 | | | Level 2 | | | Level 3 | | | Total | |
| Common Stocks | | $ | 136,557,345 | | | $ | — | | | $ | — | | | $ | 136,557,345 | |
| Money Market Funds | | | 4,090,258 | | | | — | | | | — | | | | 4,090,258 | |
Total | | $ | 140,647,603 | | | $ | — | | | $ | — | | | $ | 140,647,603 | |
Refer to the Fund’s Schedule of Investments for a listing of the common stocks by industry type. As of November 30, 2014, the Fund did not have any transfers in and out of any Level. In addition, the Fund did not have derivative instruments or any assets or liabilities that were measured at fair value on a recurring basis using significant unobservable inputs (Level 3) as of November 30, 2014. It is the Fund’s policy to recognize transfers into and out of any Level at the end of the reporting period.
Share valuation – The net asset value per share of the Fund is calculated daily by dividing the total value of the Fund’s assets, less liabilities, by the number of shares outstanding. The offering price and redemption price per share of the Fund is equal to the net asset value per share.
Investment income – Dividend income is recorded on the ex-dividend date. Interest income is accrued as earned.
Security transactions – Security transactions are accounted for on the trade date. Gains and losses on securities sold are determined on a specific identification basis.
APEXcm SMALL/MID-CAP GROWTH FUND
NOTES TO FINANCIAL STATEMENTS (Continued) |
Common expenses – Common expenses of the Trust are allocated among the Fund and the other series of the Trust based on the relative net assets of each series or the nature of the services performed and the relative applicability to each series.
Distributions to shareholders – The Fund will distribute to shareholders any net investment income dividends and net realized capital gains distributions at least once each year. The amount of such dividends and distributions are determined in accordance with federal income tax regulations, which may differ from GAAP. Dividends and distributions are recorded on the ex-dividend date. There were no distributions paid during the six months ended November 30, 2014. The tax character of the Fund’s distributions paid during the year ended May 31, 2014 was as follows:
| Year Ended | | Ordinary Income | | | Long-Term Capital Gains | | | Total Distributions | |
| May 31, 2014 | | $ | 212,871 | | | $ | 13,397 | | | $ | 226,268 | |
Estimates – The preparation of financial statements in conformity with GAAP requires management to make estimates and assumptions that affect the reported amounts of assets and liabilities and disclosure of contingent assets and liabilities as of the date of the financial statements and the reported amounts of income and expenses during the reporting period. Actual results could differ from those estimates.
Federal income tax – The Fund has qualified and intends to continue to qualify as a regulated investment company under the Internal Revenue Code of 1986 (the “Code”). Qualification generally will relieve the Fund of liability for federal income taxes to the extent 100% of its net investment income and net realized capital gains are distributed in accordance with the Code. Accordingly, no provision for income tax has been made.
In order to avoid imposition of the excise tax applicable to regulated investment companies, it is also the Fund’s intention to declare as dividends in each calendar year at least 98% of its net investment income (earned during the calendar year) and 98.2% of its net realized capital gains (earned during the twelve months ended October 31) plus undistributed amounts from prior years.
APEXcm SMALL/MID-CAP GROWTH FUND
NOTES TO FINANCIAL STATEMENTS (Continued) |
The following information is computed on a tax basis for each item as of November 30, 2014:
| Tax cost of portfolio investments | | $ | 123,387,413 | |
| Gross unrealized appreciation | | $ | 20,942,870 | |
| Gross unrealized depreciation | | | (3,682,680 | ) |
| Net unrealized appreciation | | | 17,260,190 | |
| Accumulated net investment loss | | | (336,529 | ) |
| Other gains | | | 354,355 | |
| Accumulated earnings | | $ | 17,278,016 | |
The difference between the federal income tax cost of portfolio investments and the financial statement cost is due to certain timing differences in the recognition of capital gains or losses under income tax regulations and GAAP. These “book/tax” differences are temporary in nature and are primarily due to the tax deferral of losses on wash sales.
The Fund recognizes the tax benefits or expenses of uncertain tax positions only when the position is “more likely than not” to be sustained assuming examination by tax authorities. Management has reviewed the Fund’s tax positions for the current and all open tax periods (periods ended May 31, 2013 and May 31, 2014) and has concluded that no provision for unrecognized tax benefits or expenses is required in these financial statements.
3. Investment Transactions
During the six months ended November 30, 2014, cost of purchases and proceeds from sales of investment securities, other than short-term investments, were $75,386,237 and $30,735,150, respectively.
4. Transactions with Related Parties
INVESTMENT ADVISORY AGREEMENT
The Fund’s investments are managed by Apex Capital Management, Inc. (the “Adviser”) pursuant to the terms of an Investment Advisory Agreement. Under the Investment Advisory Agreement, the Fund pays the Adviser an advisory fee, computed and accrued daily and paid monthly, at the annual rate of 1.00% of its average daily net assets.
APEXcm SMALL/MID-CAP GROWTH FUND
NOTES TO FINANCIAL STATEMENTS (Continued) |
Pursuant to an expense limitation agreement (the “Expense Limitation Agreement”), the Adviser has contractually agreed, until October 1, 2017, to reduce investment advisory fees and reimburse other expenses to the extent necessary to limit total annual fund operating expenses (exclusive of brokerage costs, taxes, interest, acquired fund fees and expenses, extraordinary expenses, and other expenses not incurred in the ordinary course of the Fund’s business) to an amount not exceeding 1.05% of the Fund’s average daily net assets. Accordingly, during the six months ended November 30, 2014, the Adviser reduced its advisory fees in the amount of $145,381.
Under the terms of the Expense Limitation Agreement, investment advisory fee reductions and expense reimbursements by the Adviser are subject to repayment by the Fund for a period of three years after such fees and expenses were incurred, provided the repayments do not cause total annual fund operating expenses to exceed the foregoing expense limitations. As of November 30, 2014, the Adviser may seek repayment of investment advisory fee reductions and expense reimbursements no later than the dates as stated below:
| May 31, 2016 | | May 31, 2017 | | November 30, 2017 |
| $144,876 | | $223,293 | | $145,381 |
Certain officers of the Fund are also officers of the Adviser.
OTHER SERVICE PROVIDERS
Ultimus Fund Solutions, LLC (“Ultimus”) provides fund administration, fund accounting, compliance and transfer agency services to the Fund. The Fund pays Ultimus fees in accordance with the agreements for such services. In addition, the Fund pays out-of-pocket expenses including but not limited to postage, supplies and costs of pricing the Fund’s portfolio securities.
DISTRIBUTION AGREEMENT
Under the terms of a Distribution Agreement with the Trust, Ultimus Fund Distributors, LLC (the “Distributor”) serves as principal underwriter to the Fund. The Distributor is a wholly-owned subsidiary of Ultimus. The Distributor is compensated by the Adviser (not the Fund) for acting as principal underwriter.
Certain officers of the Trust are also officers of Ultimus and/or the Distributor.
TRUSTEE COMPENSATION
Each Independent Trustee receives from each Fund of the Trust a fee of $500 for each Board meeting attended plus reimbursement of travel and other meeting-related expenses. Trustees affiliated with the Adviser or Ultimus are not compensated by the Fund for their services.
APEXcm SMALL/MID-CAP GROWTH FUND
NOTES TO FINANCIAL STATEMENTS (Continued) |
5. Sector Risk
If a Fund has significant investments in the securities of issuers within a particular sector, any development affecting that sector will have a greater impact on the value of the net assets of the Fund than would be the case if the Fund did not have significant investments in that sector. In addition, this may increase the risk of loss in the Fund and increase the volatility of the Fund’s net asset value per share. Occasionally, market conditions, regulatory changes or other developments may negatively impact this sector, and therefore the value of the Fund’s portfolio will be adversely affected. As of November 30, 2014, the Fund had 26.2% of the value of its net assets invested in stocks within the Information Technology sector.
6. Contingencies and Commitments
The Fund indemnifies the Trust’s officers and Trustees for certain liabilities that might arise from their performance of their duties to the Fund. Additionally, in the normal course of business the Fund enters into contracts that contain a variety of representations and warranties and which provide general indemnifications. The Fund’s maximum exposure under these arrangements is unknown, as this would involve future claims that may be made against the Fund that have not yet occurred. However, based on experience, the Fund expects the risk of loss to be remote.
7. Subsequent Events
The Fund is required to recognize in the financial statements the effects of all subsequent events that provide additional evidence about conditions that existed as of the date of the Statement of Assets and Liabilities. For non-recognized subsequent events that must be disclosed to keep the financial statements from being misleading, the Fund is required to disclose the nature of the event as well as an estimate of its financial effect, or a statement that such an estimate cannot be made. Management has evaluated subsequent events through the issuance of these financial statements and has noted no such events.
APEXcm SMALL/MID-CAP GROWTH FUND
ABOUT YOUR FUND’S EXPENSES (Unaudited) |
We believe it is important for you to understand the impact of costs on your investment. As a shareholder of the Fund, you incur ongoing costs, including management fees and other operating expenses. The following examples are intended to help you understand your ongoing costs (in dollars) of investing in the Fund and to compare these costs with the ongoing costs of investing in other mutual funds.
A mutual fund’s ongoing costs are expressed as a percentage of its average net assets. This figure is known as the expense ratio. The expenses in the table below are based on an investment of $1,000 made at the beginning of the most recent period (June 1, 2014) and held until the end of the period (November 30, 2014).
The table below illustrates the Fund’s ongoing costs in two ways:
Actual fund return – This section helps you to estimate the actual expenses that you paid over the period. The “Ending Account Value” shown is derived from the Fund’s actual return, and the third column shows the dollar amount of operating expenses that would have been paid by an investor who started with $1,000 in the Fund. You may use the information here, together with the amount you invested, to estimate the expenses that you paid over the period.
To do so, simply divide your account value by $1,000 (for example, an $8,600 account value divided by $1,000 = 8.6), then multiply the result by the number given for the Fund under the heading “Expenses Paid During Period.”
Hypothetical 5% return – This section is intended to help you compare the Fund’s ongoing costs with those of other mutual funds. It assumes that the Fund had an annual return of 5% before expenses during the period shown, but that the expense ratio is unchanged. In this case, because the return used is not the Fund’s actual return, the results do not apply to your investment. The example is useful in making comparisons because the SEC requires all mutual funds to calculate expenses based on a 5% return. You can assess the Fund’s ongoing costs by comparing this hypothetical example with the hypothetical examples that appear in shareholder reports of other funds.
Note that expenses shown in the table are meant to highlight and help you compare ongoing costs only. The Fund does not charge transaction fees, such as purchase or redemption fees, nor does it carry a “sales load.”
The calculations assume no shares were bought or sold during the period. Your actual costs may have been higher or lower, depending on the amount of your investment and the timing of any purchases or redemptions.
APEXcm SMALL/MID-CAP GROWTH FUND
ABOUT YOUR FUND’S EXPENSES (Unaudited) (Continued) |
More information about the Fund’s expenses can be found in this report. For additional information on operating expenses and other shareholder costs, please refer to the Fund’s prospectus.
| | Beginning
Account Value
June 1, 2014 | Ending
Account Value
November 30,
2014 | Expenses
Paid During
Period* |
| Based on Actual Fund Return | $1,000.00 | $1,075.00 | $5.46 |
| Based on Hypothetical 5% Return (before expenses) | $1,000.00 | $1,019.80 | $5.32 |
| * | Expenses are equal to the Fund’s annualized expense ratio of 1.05% for the period, multiplied by the average account value over the period, multiplied by 183/365 (to reflect the one-half year period). |
OTHER INFORMATION (Unaudited)
A description of the policies and procedures that the Fund uses to vote proxies relating to portfolio securities is available without charge upon request by calling toll-free 1-888-575-4800, or on the SEC’s website at http://www.sec.gov. Information regarding how the Fund voted proxies relating to portfolio securities during the most recent 12-month period ended June 30 is available without charge upon request by calling toll-free 1-888-575-4800, or on the SEC’s website at http://www.sec.gov.
The Trust files a complete listing of portfolio holdings for the Fund with the SEC as of the end of the first and third quarters of each fiscal year on Form N-Q. These filings are available upon request by calling 1-888-575-4800. Furthermore, you may obtain a copy of the filings on the SEC’s website at http://www.sec.gov. The Trust’s Forms N-Q may also be reviewed and copied at the SEC’s Public Reference Room in Washington, DC, and information on the operation of the Public Reference Room may be obtained by calling 1-800-SEC-0330.
This page intentionally left blank.
This page intentionally left blank.
This page intentionally left blank.
BARROW ALL-CAP CORE FUND
INSTITUTIONAL CLASS (BALIX)
INVESTOR CLASS (BALAX)
BARROW ALL-CAP LONG/SHORT FUND
INSTITUTIONAL CLASS (BFSLX)
INVESTOR CLASS (BFLSX)
Semi-Annual Report
November 30, 2014
(Unaudited)
BARROW ALL-CAP CORE FUND
LETTER TO SHAREHOLDERS | January 15, 2015 |
Dear Shareholder,
For the six-month period ended November 30, 2014, the Barrow All-Cap Core Fund’s (the “Fund”) Institutional Class posted a total return net of fees and expenses of +3.64%, which lagged the total return of +8.58% for the S&P 500 Index (“S&P 500”). Calendar year-to-date, the Fund’s Institutional Class generated a total return of +5.60% compared to +13.98% for the S&P 500. Since 12/31/08, the Fund has generated a total return of +179.45% compared to +160.08% for the S&P 500*.
The Fund’s performance for the six months ended November 30, 2014 was negatively impacted by two main factors:
| 1. | Large-cap companies significantly outperformed mid-caps and small-caps, which compose roughly 80% of the Fund’s portfolio. The large-cap S&P 500 generated a total return of +8.58% compared to +5.47% and +4.09% for the S&P 400 Midcap and Russell 2000 Indices, which measure the performance of mid-cap and small-cap equities, respectively. |
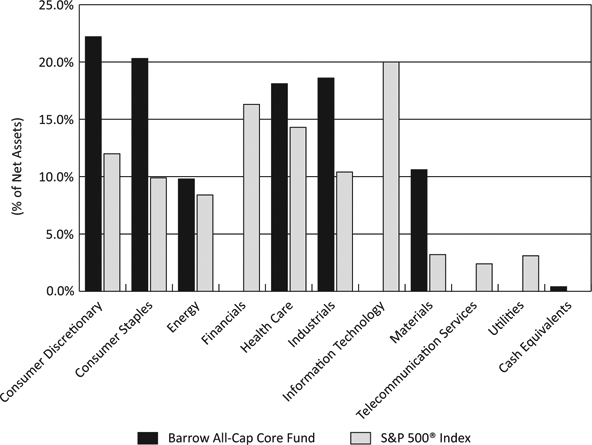
| 2. | The performance of the six sectors in which the Fund currently invests (Consumer Discretionary, Consumer Staples, Energy, Health Care, Industrials, and Materials) lagged that of the four non-included sectors (Financials, Information Technology, Telecommunications, and Utilities). For the six months ended November 30, 2014, the Fund’s six sectors in the S&P 500 Index generated a weighted average total return of +6.28% compared to +12.01% for the four non-included sectors. This differential was primarily caused by the Energy sector, which generated a total return of -14.48%. The S&P 400 Midcap and Russell 2000 Indices revealed a similar story with Energy sector total returns of -24.70% and -40.12%, respectively. |
The Fund continued to implement its strategy of investing in companies that we believe are at the intersection of quality and value. We seek to employ a disciplined and dispassionate approach to investing in high quality companies at prices that are well below our estimate of their intrinsic value. During the period, we invested in new companies comprising multiple industry sectors and market capitalizations with what we consider to be strong balance sheets that are growing, generating ample free cash flow, and re-investing that cash at high internal rates of return.
Drawing on our investment team’s 18 years of private and public equity investment experience and research, we made these investments based on our belief that the market price of a well-constructed portfolio of high-quality stocks purchased at, in our opinion, bargain levels will trend toward our estimate of its intrinsic value over time. The Fund’s portfolio is highly diversified by market cap segment, industry, and position size.
The Fund’s investments are sourced by taking account of the opportunity set of all companies in our broad investment universe each time we commit capital to a new position. We think this approach allows us to uncover investment opportunities that arise from temporary market inefficiencies and to gather up the most compelling investments across a wide array of industries and market capitalizations without the behavioral biases inherent in concentrated-stock and sector-specialized investing.
With regard to hold period, we typically give the market at least one year to re-appraise each of the Fund’s holdings. The idea here is that it takes time from the date of our investment in any given company for the market to realize (or not) that a security’s market value is low compared to our estimate of intrinsic value and has high quality business metrics. We are more interested in the aggregate performance of the Fund’s diversified portfolio as opposed to any one position.
The three best-performing positions for the six months ended November 30, 2014 were USANA Health Sciences, Inc., United Therapeutics Corp., and Pilgrim’s Pride Corp., which generated total returns of +48.06%, +32.07% and +26.90%, respectively. The three worst-performing positions were Smith and Wesson Holding Corp., Future Fuel Corp., and Geospace Technologies Corp., which generated total returns of -35.36%, -29.43% and -42.45%, respectively.
Four of the Fund’s holdings were announced as take-over targets during the six-month period. On average, the Fund has experienced more than two take-overs per quarter, for a total of 64 since 12/31/08*, or roughly 4 times the market average.1 The control premium we have captured by virtue of holding stocks that end up being merger targets has made meaningful contributions to the Fund’s total returns, and we expect to continue to benefit from this effect going forward. We remove companies from the Fund’s portfolio soon after they are announced as take-over targets and re-invest that capital.
For the six-month period, the portfolio generated a total return before fees and expenses of +4.29%, including +3.62% for large-caps, +6.94% for mid-caps and +2.45% for small-caps. This compares to +8.58% for the S&P 500 Index, +5.47% for the S&P 400 Midcap Index, and +4.09% for the Russell 2000 Index. Our sectors with the best absolute performance were Health Care and Consumer Staples, which generated total returns of +14.99% and +10.31%, respectively. Our sectors that did least well were Energy and Materials, which returned -14.34% and -4.36%, respectively.
Going forward, we believe the Fund is well positioned for near-term and long-term success given the quality and value attributes of its portfolio. Our goal remains unchanged, we expect the Fund to outperform its benchmarks over time.
The Fund’s portfolio had a position-weighted EBIT (Earnings Before Interest and Taxes) yield of 9.42% on November 30, 2014, which compares favorably with the 6.68% EBIT yield for the S&P 500. As of November 30, 2014, the Fund’s trailing twelve-month dividend yield was 1.92%, and the Fund’s 30 day SEC yield was 1.26%. We consider these healthy vital signs as being consistent with the use of our private equity framework, which, among other things, focuses on cash flow over GAAP earnings, in selecting securities for investment.
In addition to what we consider to be an attractive valuation level for our portfolio, we expect to benefit from the absolute and relative level of quality fundamentals in our holdings. As of November 30, 2014, our portfolio had the following position-weighted quality characteristics relative to the S&P 500 (SPX): return on equity (25.9% vs. 15.2% SPX); return on assets (11.1% vs. 3.3% SPX), operating margin (18.3% vs. 14.0% SPX) and debt-to-enterprise value (17.6% vs. 34.0% SPX).
Sincerely,
| Nicholas Chermayeff | Robert F. Greenhill, Jr. | David R. Bechtel |
| Principal | Principal | Principal |
1 | Barrow calculates the frequency of merger and acquisition ("M&A") activity in the Fund's portfolio on a quarterly basis by dividing the cumulative number of portfolio holdings that have been announced as merger or acquisition targets by the cumulative number of unique holdings the Fund has held in the Fund's portfolio. Barrow calculates the frequency of M&A activity in the market on a quarterly basis by dividing the cumulative number of publicly-traded U.S. common stocks that have been announced as acquisition targets per Bloomberg by the total universe of publicly-traded U.S. common stocks as identified by Bloomberg (approximately 10,000). |
Past performance is not predictive of future performance. Investment results and principal value will fluctuate so that shares, when redeemed, may be worth more or less than their original cost. Current performance may be higher or lower than the performance data quoted. Performance data current to the most recent month end are available by calling 1-877-767-6633.
An investor should consider the investment objectives, risks, charges and expenses of the Fund carefully before investing. The Fund’s prospectus contains this and other important information. To obtain a copy of the Fund’s prospectus please visit our website at www.barrowfunds.com or call 1-877-767-6633 and a copy will be sent to you free of charge. Please read the prospectus carefully before you invest. The Fund is distributed by Ultimus Fund Distributors, LLC.
The Letter to Shareholders seeks to describe some of the Adviser’s current opinions and views of the financial markets. Although the Adviser believes it has a reasonable basis for any opinions or views expressed, actual results may differ, sometimes significantly so, from those expected or expressed. The securities held by the Fund that are discussed in the Letter to Shareholders were held during the period covered by this Report. They do not comprise the entire investment portfolio of the Fund, may be sold at any time and may no longer be held by the Fund. The opinions of the Fund’s Adviser with respect to those securities may change at any time.
| * | The investment related and performance information discussed above for periods prior to Barrow All-Cap Core Fund’s inception date (August 30, 2013) are based on the activities of the Fund’s predecessor, the Barrow Street Fund LP, an unregistered limited partnership managed by the portfolio managers of Barrow All-Cap Core Fund (the “Predecessor Private Fund”). The Predecessor Private Fund was reorganized into the Institutional Class shares on August 30, 2013, the date that Barrow All- Cap Core Fund commenced operations. Barrow All-Cap Core Fund has been managed in the same style and by the same portfolio managers since the Predecessor Private Fund’s inception on December 31, 2008. The performance information shows the Predecessor Private Fund’s returns calculated using the actual fees and expenses that were charged by the Predecessor Private Fund. This prior performance is net of management fees and other expenses but does not include the effect of the Predecessor Private Fund’s performance fee which was in place until October 7, 2012. From the Predecessor Private Fund’s inception on December 31, 2008 through the date of this prospectus, the Predecessor Private Fund was not subject to certain investment restrictions, diversification requirements and other restrictions of the Investment Company Act of 1940, as amended (the “1940 Act”) or Subchapter M of the Internal Revenue Code of 1986, as amended, which, if they had been applicable, might have adversely affected Barrow All-Cap Core Fund’s performance. |
BARROW ALL-CAP CORE FUND
PERFORMANCE INFORMATION
November 30, 2014 (Unaudited)
Comparison of the Change in Value of a $250,000 Investment in
Barrow All-Cap Core Fund - Institutional Class(a)
versus the S&P 500® Index
Average Annual Total Returns(a)(b) For the periods ended November 30, 2014(a) | |
| | 1 Year | 5 Years | Since
Inception(c) | |
| Barrow All-Cap Core Fund - Institutional Class | 6.62% | 17.93% | 18.97% | |
| Barrow All-Cap Core Fund - Investor Class | 6.35% | n/a | 15.32% | |
S&P 500® Index | 16.86% | 15.96% | 17.54% | |
BARROW ALL-CAP CORE FUND
PERFORMANCE INFORMATION
November 30, 2014 (Unaudited) (Continued)
Comparison of Total Rates of Return with the S&P 500® Index | |
| | Barrow All-Cap Core Fund - Institutional Class(a) | S&P 500® Index | Difference | |
Annual Total Rates of Return
for the Calendar Years: | | | | |
| 2009 | 30.10% | 26.46% | 3.64% | |
| 2010 | 18.75% | 15.06% | 3.69% | |
| 2011 | 5.50% | 2.12% | 3.38% | |
| 2012 | 18.77% | 16.00% | 2.77% | |
| 2013 | 36.69% | 32.38% | 4.31% | |
| 2014 (through 11/30/14) | 5.60% | 13.98% | (8.38%) | |
| | | | | |
Total Return Since Inception
(not annualized, as of 11/30/14) | 179.45% | 160.08% | 19.37% | |
(a) | The Barrow All-Cap Core Fund - Institutional Class (the "Fund") performance includes the performance of the Barrow Street Fund LP (the "Predecessor Private Fund"), the Fund's predecessor, for the periods before the Fund's registration statement became effective. The Predecessor Private Fund was reorganized into the Institutional Class shares of the Fund at the close of business on August 30, 2013, the date the Fund commenced operations. The Fund has been managed in the same style and by the same portfolio managers since the Predecessor Private Fund’s inception on December 31, 2008. The Fund’s investment goals, policies, guidelines and restrictions are, in all material respects, equivalent to those of the Predecessor Private Fund. The performance of the Predecessor Private Fund is net of management fees of 1.50% of assets but does not include the effect of a 20% performance fee which was in place until October 7, 2012. The prior performance of the Predecessor Private Fund was not subject to certain investment restrictions, diversification requirements and other restrictions of the Investment Company Act of 1940, as amended, or Subchapter M of the Internal Revenue Code of 1986, as amended. If such restrictions had been applicable, they might have adversely affected the Predecessor Private Fund’s performance. |
(b) | The Fund’s total return does not reflect the deduction of taxes a shareholder would pay on Fund distributions, if any, or the redemption of Fund shares. |
(c) | Represents the period from December 31,2008(a) and August 30,2013 for the Institutional and Investor Classes, respectively, through November 30, 2014. |
BARROW ALL-CAP LONG/SHORT FUND
LETTER TO SHAREHOLDERS | January 15, 2015 |
Dear Shareholder,
For the six-month period ended November 30, 2014, the Barrow All-Cap Long/Short Fund’s (the “Fund”) Institutional Class posted a total return net of fees and expenses of +0.00%, which compares to +8.58% for the S&P 500 Index (“S&P 500”).
The Fund’s performance for the past six months was negatively impacted by two main factors:
| 1. | Large cap companies significantly outperformed mid caps and small caps, which compose roughly 80% of the Fund’s long and short portfolios. The S&P 500 generated a total return of +8.58% compared to +5.47% and +4.09% for the S&P 400 Midcap and Russell 2000 Indices, which measure the performance of mid-cap and small-cap equities, respectively. |
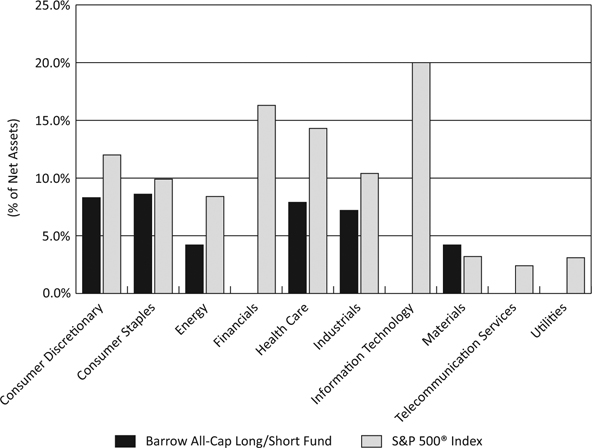
| 2. | The performance of the six sectors (Consumer Discretionary, Consumer Staples, Energy, Health Care, Industrials, and Materials) in which the Fund currently invests lagged that of the four non-included sectors (Financials, Information Technology, Telecommunications, and Utilities). For the six months ended November 30, 2014, the Fund’s six sectors in the S&P 500 Index generated a weighted average total return of +6.28% compared to +12.01% for the four non-included sectors. This differential was primarily caused by the Energy sector, which generated a total return of -14.48%. The S&P 400 Midcap and Russell 2000 Indices revealed a similar story with Energy sector total returns of -24.70% and -40.12%, respectively. |
The Fund continued to implement its strategy of investing in companies that we believe are at the intersection of quality and value. We seek to employ a disciplined and dispassionate approach to investing in companies at prices that are well below (longs) or well above (shorts) our appraisal of their intrinsic value. During the period, we invested in new companies comprising multiple industry sectors and market capitalizations. We purchased long many businesses that we believe are high-quality with strong balance sheets that are growing, generating ample free cash flow, and re-investing that cash at high internal rates of return. In tandem, we sold short four times as many companies that we consider to be overpriced with poor quality characteristics. Our short positions are tailored to our long positions by market capitalization and sector.
Drawing on our investment team’s 18 years of private and public equity investment experience and research, we made these investments based on the belief that the market price of a well-constructed portfolio of high (or low) quality stocks purchased at, in our opinion, bargain (or lofty) levels will trend toward our estimate of its intrinsic value over time. The Fund’s long and short portfolios are highly diversified by market cap segment, industry, and position size.
The Fund’s investments are sourced by taking account of the opportunity set of all companies in our broad investment universe each time we commit capital to a new position. We think this approach allows us to uncover investment opportunities that arise from temporary market inefficiencies and to gather up the most compelling investments across a wide array of industries and market capitalizations without the behavioral biases inherent in concentrated-stock and sector-specialized investing.
With regard to hold period, we typically give the market at least one year to re-appraise each of the Fund’s positions. The idea here is that it takes time from the date of our investment in any given company for the market to realize (or not) that a security’s market value is low (or high) compared to our estimate of intrinsic value, especially when re-considered in light of the high or low quality of their business characteristics. We are more interested in the aggregate performance of the Fund’s diversified portfolio as opposed to any one position.
The three best-performing positions for the six-months ended November 30, 2014 were USANA Health Sciences, Inc. (long), United Therapeutics Corp. (long), and Pilgrim’s Pride Corp. (long), which generated total returns of +45.93%, +31.94% and +23.27%, respectively. The three worst-performing positions were Puma Biotechnology, Inc. (short), Smith and Wesson Holding Corp. (long) and Future Fuel Corp. (long), which generated total returns of +256.15%, -35.34% and -29.74%, respectively.
Four of the Fund’s long holdings were announced as take-over targets during the six-month period. The control premium we have captured by virtue of holding stocks that end up being merger targets has made meaningful contributions to the Fund’s total returns, and we expect to continue to benefit from this effect going forward. We remove companies from the Fund’s portfolio soon after they are announced as take-over targets and re-invest that capital.
During the period, the long portfolio generated a total return before fees and expenses of +3.72%, including +3.07% for large-caps, +6.40% for mid–caps, and +1.88% for small-caps. This compares to +8.58% for the S&P 500 Index, +5.47% for the S&P 400 Midcap Index, and +4.09% for the Russell 2000 Index. Our sectors with the best performance were Health Care and Consumer Staples, which generated price returns of +14.46% and +9.12%, respectively. The two sectors that did least well were Energy and Materials, which returned -15.04% and -5.02%, respectively.
The short portfolio generated a total return before fees and expenses of +4.04%, including +7.73% for large-caps, +4.95% for mid–caps, and +1.73% for small-caps which had a negative impact on the Fund as increasing prices of shorted securities reduce the portfolio’s value. The sectors with the best performance were Energy and Material, which generated total returns of -21.14% and -2.60%, respectively. The sectors that did least well were Health Care and Consumer Staples, which returned +18.63% and +8.12%, respectively.
Going forward, we believe the Fund is well positioned for near-term and long-term success given the fundamental quality and value attributes of its positions and its hedged portfolio, designed to reduce price volatility. Our goal remains the same; we expect the Fund’s long and short portfolios to outperform its benchmarks over time.
The Fund’s long portfolio had a position-weighted EBIT (Earnings Before Interest and Taxes) yield of 9.42% on November 30, 2014, which compares favorably with the 6.68% EBIT yield for the S&P 500. The short portfolio’s position-weighted EBIT yield of 3.60% is substantially lower than the S&P 500, indicating to us that these securities are significantly overpriced relative to market values. The Fund’s returns would benefit if the prices of these stocks were to drop. Furthermore, our long portfolio had an attractive dividend yield of 1.9%, which was nearly twice that of the short portfolio at 1.1%. The Fund’s 30-day SEC yield was -0.38%. We consider these healthy vital signs as being consistent with our strategy, which, among other things, focuses on cash flow over GAAP earnings, in selecting securities for investment.
Finally, we expect to benefit from the absolute and relative level of quality fundamentals in our holdings. As of November 30, 2014, our long and short portfolios had the following position-weighted quality characteristics relative to the S&P 500 (SPX): return on equity (25.9%/10.5% L/S vs. 15.2% SPX); return on assets (11.1%/4.1% L/S vs. 3.3% SPX), operating margin (18.3%/7.9% L/S vs. 14.0% SPX) and debt-to-enterprise value (17.6%/20.5% L/S vs. 34.0% SPX).
Sincerely,
| Nicholas Chermayeff | Robert F. Greenhill, Jr. | David R. Bechtel |
| Principal | Principal | Principal |
Past performance is not predictive of future performance. Investment results and principal value will fluctuate so that shares, when redeemed, may be worth more or less than their original cost. Current performance may be higher or lower than the performance data quoted. Performance data current to the most recent month end are available by calling 1-877-767-6633.
An investor should consider the investment objectives, risks, charges and expenses of the Fund carefully before investing. The Fund’s prospectus contains this and other important information. To obtain a copy of the Fund’s prospectus please visit our website at www.barrowfunds.com or call 1-877-767-6633 and a copy will be sent to you free of charge. Please read the prospectus carefully before you invest. The Fund is distributed by Ultimus Fund Distributors, LLC.
The Letter to Shareholders seeks to describe some of the Adviser’s current opinions and views of the financial markets. Although the Adviser believes it has a reasonable basis for any opinions or views expressed, actual results may differ, sometimes significantly so, from those expected or expressed. The securities held by the Fund that are discussed in the Letter to Shareholders were held during the period covered by this Report. They do not comprise the entire investment portfolio of the Fund, may be sold at any time and may no longer be held by the Fund. The opinions of the Fund’s Adviser with respect to those securities may change at any time.
BARROW ALL-CAP LONG/SHORT FUND
PERFORMANCE INFORMATION
November 30, 2014 (Unaudited)
Comparison of the Change in Value of a $250,000 Investment in
Barrow All-Cap Long/Short Fund - Institutional Class
versus the S&P 500® Index
Average Annual Total Returns(a)
For Periods Ended November 30, 2014 | |
| | 1 Year | Since
Inception(b) | |
| Barrow All-Cap Long/Short Fund - Institutional Class | (0.29%) | 3.26% | |
| Barrow All-Cap Long/Short Fund - Investor Class | (0.48%) | 3.02% | |
S&P 500® Index | 16.86% | 23.24% | |
(a) | The Fund's total return does not reflect the deduction of taxes a shareholder would pay on Fund distributions, if any, or the redemption of Fund shares. |
(b) | The Fund commenced operations on August 30, 2013. |
BARROW ALL-CAP CORE FUND
PORTFOLIO INFORMATION
November 30, 2014 (Unaudited)
Sector Diversification
Top 10 Equity Holdings
| Security Description | | % of
Net Assets |
| USANA Health Sciences, Inc. | | 1.70% |
| Vector Group Ltd. | | 1.66% |
| Lancaster Colony Corporation | | 1.54% |
| Altria Group, Inc. | | 1.43% |
| Dun & Bradstreet Corporation (The) | | 1.39% |
| Bed Bath & Beyond, Inc. | | 1.38% |
| Reynolds American, Inc. | | 1.37% |
| Northrop Grumman Corporation | | 1.35% |
| Outerwall, Inc. | | 1.32% |
| CF Industries Holdings, Inc. | | 1.31% |
BARROW ALL-CAP LONG/SHORT FUND
PORTFOLIO INFORMATION
November 30, 2014 (Unaudited)
Net Sector Exposure Diversification*
| * | The net percentages are computed by taking the net dollar exposure, including short positions, and dividing by the net assets of the Fund. Consequently, the percentages will not total to 100%. |
| Top 10 Long Equity Holdings | | Top 10 Short Equity Holdings |
| Security Description | % of
Net Assets | | Security Description | % of
Net Assets |
| USANA Health Sciences, Inc. | 2.20% | | Boston Beer Company, Inc. - Class A | 0.64% |
| Vector Group Ltd. | 2.15% | | United Natural Foods, Inc. | 0.61% |
| Lancaster Colony Corporation | 2.00% | | TreeHouse Foods, Inc. | 0.60% |
| Altria Group, Inc. | 1.86% | | Coca-Cola Bottling Company Consolidated | 0.56% |
| Dun & Bradstreet Corporation (The) | 1.80% | | Fresh Del Monte Produce, Inc. | 0.55% |
| Bed Bath & Beyond, Inc. | 1.79% | | Hain Celestial Group, Inc. (The) | 0.53% |
| Reynolds American, Inc. | 1.78% | | Snyder's-Lance, Inc. | 0.51% |
| Northrop Grumman Corporation | 1.76% | | WhiteWave Foods Company (The) | 0.49% |
| Outerwall, Inc. | 1.71% | | Anderson's, Inc. (The) | 0.48% |
| CF Industries Holdings, Inc. | 1.71% | | DexCom, Inc. | 0.47% |
BARROW ALL-CAP CORE FUND
SCHEDULE OF INVESTMENTS
November 30, 2014 (Unaudited) | |
| COMMON STOCKS — 99.7% | | Shares | | | Value | |
| Consumer Discretionary — 22.2% | | | | | | |
| Auto Components — 0.7% | | | | | | |
Dorman Products, Inc. (a) | | | 1,286 | | | $ | 60,866 | |
Gentex Corporation | | | 314 | | | | 11,166 | |
Motorcar Parts of America, Inc. (a) | | | 2,132 | | | | 71,955 | |
| | | | | | | | 143,987 | |
| Automobiles — 0.9% | | | | | | | | |
Thor Industries, Inc. | | | 1,336 | | | | 78,504 | |
Winnebago Industries, Inc. | | | 4,807 | | | | 121,040 | |
| | | | | | | | 199,544 | |
| Diversified Consumer Services — 0.9% | | | | | | | | |
H&R Block, Inc. (b) | | | 5,933 | | | | 199,586 | |
| | | | | | | | | |
| Hotels, Restaurants & Leisure — 1.3% | | | | | | | | |
DineEquity, Inc. | | | 661 | | | | 65,657 | |
Interval Leisure Group, Inc. (b) | | | 10,432 | | | | 226,792 | |
| | | | | | | | 292,449 | |
| Household Durables — 0.7% | | | | | | | | |
NVR, Inc. (a) | | | 105 | | | | 132,160 | |
Tupperware Brands Corporation (b) | | | 466 | | | | 31,339 | |
| | | | | | | | 163,499 | |
| Leisure Products — 0.1% | | | | | | | | |
Arctic Cat, Inc. | | | 535 | | | | 17,682 | |
| | | | | | | | | |
| Media — 4.5% | | | | | | | | |
CBS Corporation - Class B | | | 1,144 | | | | 62,783 | |
| Entravision Communications Corporation - Class A | | | 15,329 | | | | 99,026 | |
Interpublic Group of Companies, Inc. (b) | | | 7,708 | | | | 156,395 | |
Omnicom Group, Inc. | | | 2,748 | | | | 212,338 | |
| Scripps Networks Interactive, Inc. - Class A | | | 1,225 | | | | 95,758 | |
Starz - Series A (a) | | | 7,744 | | | | 255,475 | |
Time Warner, Inc. | | | 802 | | | | 68,266 | |
Time, Inc. | | | 1,963 | | | | 46,994 | |
| | | | | | | | 997,035 | |
| Specialty Retail — 10.5% | | | | | | | | |
American Eagle Outfitters, Inc. (b) | | | 1,466 | | | | 20,671 | |
AutoZone, Inc. (a) | | | 76 | | | | 43,906 | |
Bed Bath & Beyond, Inc. (a) (b) | | | 4,149 | | | | 304,412 | |
Best Buy Company, Inc. | | | 713 | | | | 28,099 | |
Buckle, Inc. (The) (b) | | | 5,412 | | | | 277,040 | |
BARROW ALL-CAP CORE FUND
SCHEDULE OF INVESTMENTS (Continued) | |
| COMMON STOCKS — 99.7% (Continued) | | Shares | | | Value | |
| Consumer Discretionary — 22.2% (Continued) | | | | | | |
| Specialty Retail — 10.5% (Continued) | | | | | | |
Cato Corporation (The) - Class A (b) | | | 4,317 | | | $ | 173,198 | |
DSW, Inc. - Class A | | | 331 | | | | 11,744 | |
Express, Inc. (a) (b) | | | 13,703 | | | | 204,860 | |
Finish Line, Inc. (The) - Class A | | | 2,221 | | | | 63,387 | |
Foot Locker, Inc. (b) | | | 1,725 | | | | 98,825 | |
GameStop Corporation - Class A (b) | | | 6,225 | | | | 235,367 | |
GNC Holdings, Inc. - Class A | | | 4,058 | | | | 179,445 | |
Hibbett Sports, Inc. (a) | | | 3,198 | | | | 160,444 | |
Outerwall, Inc. (a) (b) | | | 4,136 | | | | 290,678 | |
PetSmart, Inc. | | | 157 | | | | 12,365 | |
Ross Stores, Inc. | | | 656 | | | | 60,011 | |
Sally Beauty Holdings, Inc. (a) | | | 339 | | | | 10,730 | |
Select Comfort Corporation (a) (b) | | | 5,486 | | | | 144,501 | |
| | | | | | | | 2,319,683 | |
| Textiles, Apparel & Luxury Goods — 2.6% | | | | | | | | |
Fossil Group, Inc. (a) | | | 623 | | | | 69,601 | |
Iconix Brand Group, Inc. (a) (b) | | | 4,331 | | | | 175,016 | |
Steven Madden Ltd. (a) (b) | | | 7,577 | | | | 258,376 | |
Vera Bradley, Inc. (a) | | | 2,658 | | | | 61,107 | |
| | | | | | | | 564,100 | |
| Consumer Staples — 20.3% | | | | | | | | |
| Beverages — 1.9% | | | | | | | | |
Dr Pepper Snapple Group, Inc. (b) | | | 2,399 | | | | 177,526 | |
National Beverage Corporation (a) (b) | | | 9,417 | | | | 236,743 | |
| | | | | | | | 414,269 | |
| Food & Staples Retailing — 0.2% | | | | | | | | |
CVS Health Corporation | | | 187 | | | | 17,084 | |
Weis Markets, Inc. | | | 496 | | | | 22,876 | |
| | | | | | | | 39,960 | |
| Food Products — 8.3% | | | | | | | | |
B&G Foods, Inc. (b) | | | 5,931 | | | | 169,745 | |
Calavo Growers, Inc. | | | 956 | | | | 41,051 | |
Cal-Maine Foods, Inc. | | | 2,735 | | | | 114,542 | |
Darling Ingredients, Inc. (a) (b) | | | 1,018 | | | | 18,935 | |
General Mills, Inc. | | | 282 | | | | 14,875 | |
Ingredion, Inc. | | | 565 | | | | 47,025 | |
J & J Snack Foods Corporation | | | 1,054 | | | | 110,723 | |
J.M. Smucker Company (The) | | | 143 | | | | 14,667 | |
Kellogg Company | | | 2,774 | | | | 183,777 | |
Kraft Foods Group, Inc. | | | 3,811 | | | | 229,308 | |
BARROW ALL-CAP CORE FUND
SCHEDULE OF INVESTMENTS (Continued) | |
| COMMON STOCKS — 99.7% (Continued) | | Shares | | | Value | |
| Consumer Staples — 20.3% (Continued) | | | | | | |
| Food Products — 8.3% (Continued) | | | | | | |
Lancaster Colony Corporation (b) | | | 3,625 | | | $ | 340,387 | |
Pilgrim's Pride Corporation (a) (b) | | | 8,062 | | | | 260,403 | |
Pinnacle Foods, Inc. | | | 3,498 | | | | 119,037 | |
Seaboard Corporation (a) | | | 46 | | | | 158,700 | |
| | | | | | | | 1,823,175 | |
| Household Products — 2.1% | | | | | | | | |
Clorox Company (The) | | | 386 | | | | 39,225 | |
Energizer Holdings, Inc. (b) | | | 323 | | | | 41,997 | |
Spectrum Brands Holdings, Inc. | | | 2,199 | | | | 202,242 | |
WD-40 Company | | | 2,463 | | | | 187,434 | |
| | | | | | | | 470,898 | |
| Personal Products — 2.2% | | | | | | | | |
Revlon, Inc. - Class A (a) (b) | | | 3,203 | | | | 105,571 | |
USANA Health Sciences, Inc. (a) (b) | | | 3,512 | | | | 374,520 | |
| | | | | | | | 480,091 | |
| Tobacco — 5.6% | | | | | | | | |
Altria Group, Inc. (b) | | | 6,280 | | | | 315,633 | |
Philip Morris International, Inc. (b) | | | 2,329 | | | | 202,460 | |
Reynolds American, Inc. (b) | | | 4,593 | | | | 302,724 | |
Universal Corporation | | | 1,505 | | | | 60,185 | |
Vector Group Ltd. (b) | | | 16,792 | | | | 365,226 | |
| | | | | | | | 1,246,228 | |
| Energy — 9.8% | | | | | | | | |
| Energy Equipment & Services — 1.8% | | | | | | | | |
C&J Energy Services, Inc. (a) (b) | | | 1,854 | | | | 28,088 | |
CARBO Ceramics, Inc. | | | 302 | | | | 11,488 | |
Halliburton Company | | | 399 | | | | 16,838 | |
Helmerich & Payne, Inc. | | | 220 | | | | 15,301 | |
Matrix Service Company (a) | | | 1,541 | | | | 32,546 | |
National Oilwell Varco, Inc. (b) | | | 3,086 | | | | 206,885 | |
Oil States International, Inc. (a) | | | 1,515 | | | | 75,523 | |
RPC, Inc. | | | 446 | | | | 5,927 | |
| | | | | | | | 392,596 | |
| Oil, Gas & Consumable Fuels — 8.0% | | | | | | | | |
Alliance Holdings GP, L.P. | | | 105 | | | | 7,038 | |
Alliance Resource Partners, L.P. | | | 3,266 | | | | 150,432 | |
Alon USA Partners, L.P. (b) | | | 8,505 | | | | 145,010 | |
BP Prudhoe Bay Royalty Trust | | | 1,818 | | | | 139,441 | |
CVR Energy, Inc. (b) | | | 1,929 | | | | 89,776 | |
CVR Refining, L.P. (b) | | | 4,407 | | | | 98,232 | |
BARROW ALL-CAP CORE FUND
SCHEDULE OF INVESTMENTS (Continued) | |
| COMMON STOCKS — 99.7% (Continued) | | Shares | | | Value | |
| Energy — 9.8% (Continued) | | | | | | |
| Oil, Gas & Consumable Fuels — 8.0% (Continued) | | | | | | |
Delek US Holdings, Inc. (b) | | | 1,298 | | | $ | 38,810 | |
Green Plains, Inc. | | | 2,464 | | | | 73,945 | |
HollyFrontier Corporation (b) | | | 3,385 | | | | 138,176 | |
Marathon Oil Corporation (b) | | | 4,411 | | | | 127,566 | |
Marathon Petroleum Corporation (b) | | | 1,596 | | | | 143,784 | |
Northern Tier Energy, L.P. (b) | | | 6,862 | | | | 163,864 | |
Occidental Petroleum Corporation | | | 835 | | | | 66,608 | |
Permian Basin Royalty Trust | | | 7,183 | | | | 78,654 | |
REX American Resources Corporation (a) | | | 1,286 | | | | 81,365 | |
VAALCO Energy, Inc. (a) | | | 7,144 | | | | 40,935 | |
Valero Energy Corporation | | | 1,620 | | | | 78,748 | |
Western Refining, Inc. (b) | | | 2,527 | | | | 103,885 | |
| | | | | | | | 1,766,269 | |
| Health Care — 18.1% | | | | | | | | |
| Health Care Equipment & Supplies — 3.1% | | | | | | | | |
Align Technology, Inc. (a) | | | 122 | | | | 6,942 | |
Anika Therapeutics, Inc. (a) | | | 3,039 | | | | 124,265 | |
Edwards Lifesciences Corporation (a) | | | 367 | | | | 47,592 | |
Globus Medical, Inc. - Class A (a) (b) | | | 9,388 | | | | 216,299 | |
Medtronic, Inc. (b) | | | 3,562 | | | | 263,125 | |
Sirona Dental Systems, Inc. (a) | | | 84 | | | | 7,257 | |
Thoratec Corporation (a) | | | 883 | | | | 27,541 | |
| | | | | | | | 693,021 | |
| Health Care Providers & Services — 12.0% | | | | | | | | |
AMN Healthcare Services, Inc. (a) (b) | | | 9,525 | | | | 163,068 | |
AmSurg Corporation (a) (b) | | | 5,096 | | | | 262,801 | |
Bio-Reference Laboratories, Inc. (a) (b) | | | 4,465 | | | | 126,359 | |
Cardinal Health, Inc. (b) | | | 2,608 | | | | 214,351 | |
Chemed Corporation (b) | | | 2,047 | | | | 225,395 | |
CorVel Corporation (a) | | | 586 | | | | 20,311 | |
Ensign Group, Inc. (The) | | | 1,235 | | | | 48,684 | |
HealthSouth Corporation (b) | | | 6,841 | | | | 281,370 | |
IPC The Hospitalist Company, Inc. (a) | | | 634 | | | | 27,947 | |
Laboratory Corporation of America Holdings (a) (b) | | | 2,005 | | | | 209,803 | |
MEDNAX, Inc. (a) (b) | | | 3,813 | | | | 249,599 | |
Owens & Minor, Inc. | | | 179 | | | | 6,124 | |
Patterson Companies, Inc. (b) | | | 4,046 | | | | 194,936 | |
PharMerica Corporation (a) | | | 973 | | | | 21,221 | |
Premier, Inc. - Class A (a) | | | 2,037 | | | | 69,299 | |
BARROW ALL-CAP CORE FUND
SCHEDULE OF INVESTMENTS (Continued) | |
| COMMON STOCKS — 99.7% (Continued) | | Shares | | | Value | |
| Health Care — 18.1% (Continued) | | | | | | |
| Health Care Providers & Services — 12.0% (Continued) | | | | | | |
Quest Diagnostics, Inc. (b) | | | 4,134 | | | $ | 269,992 | |
Select Medical Holdings Corporation | | | 4,693 | | | | 67,720 | |
VCA, Inc. (a) (b) | | | 3,721 | | | | 176,115 | |
| | | | | | | | 2,635,095 | |
| Health Care Technology — 0.2% | | | | | | | | |
Computer Programs & Systems, Inc. | | | 688 | | | | 40,413 | |
| | | | | | | | | |
| Pharmaceuticals — 2.8% | | | | | | | | |
AbbVie, Inc. | | | 350 | | | | 24,220 | |
DepoMed, Inc. (a) | | | 9,302 | | | | 144,088 | |
Eli Lilly & Company | | | 822 | | | | 55,995 | |
Johnson & Johnson | | | 204 | | | | 22,083 | |
Lannett Company, Inc. (a) | | | 469 | | | | 23,042 | |
Pfizer, Inc. (b) | | | 5,405 | | | | 168,366 | |
Prestige Brands Holdings, Inc. (a) (b) | | | 5,619 | | | | 187,955 | |
| | | | | | | | 625,749 | |
| Industrials — 18.7% | | | | | | | | |
| Aerospace & Defense — 4.7% | | | | | | | | |
Cubic Corporation (b) | | | 2,328 | | | | 119,776 | |
Engility Holdings, Inc. (a) (b) | | | 2,789 | | | | 117,277 | |
Exelis, Inc. (b) | | | 13,767 | | | | 246,980 | |
Northrop Grumman Corporation (b) | | | 2,113 | | | | 297,785 | |
Raytheon Company (b) | | | 2,270 | | | | 242,209 | |
Vectrus, Inc. (a) (b) | | | 642 | | | | 18,143 | |
| | | | | | | | 1,042,170 | |
| Air Freight & Logistics — 0.2% | | | | | | | | |
| Expeditors International of Washington, Inc. | | | 937 | | | | 43,870 | |
| | | | | | | | | |
| Commercial Services & Supplies — 2.8% | | | | | | | | |
ADT Corporation (The) | | | 1,824 | | | | 63,730 | |
Deluxe Corporation (b) | | | 4,908 | | | | 286,873 | |
Pitney Bowes, Inc. (b) | | | 10,366 | | | | 255,211 | |
UniFirst Corporation | | | 13 | | | | 1,451 | |
| | | | | | | | 607,265 | |
| Construction & Engineering — 0.5% | | | | | | | | |
Argan, Inc. | | | 3,365 | | | | 106,906 | |
| | | | | | | | | |
| Electrical Equipment — 2.0% | | | | | | | | |
Babcock & Wilcox Company (The) | | | 6,030 | | | | 178,669 | |
Emerson Electric Company (b) | | | 2,494 | | | | 158,993 | |
BARROW ALL-CAP CORE FUND
SCHEDULE OF INVESTMENTS (Continued) | |
| COMMON STOCKS — 99.7% (Continued) | | Shares | | | Value | |
| Industrials — 18.7% (Continued) | | | | | | |
| Electrical Equipment — 2.0% (Continued) | | | | | | |
Generac Holdings, Inc. (a) | | | 1,960 | | | $ | 85,025 | |
Rockwell Automation, Inc. | | | 201 | | | | 23,197 | |
| | | | | | | | 445,884 | |
| Machinery — 3.2% | | | | | | | | |
Actuant Corporation - Class A | | | 702 | | | | 20,611 | |
American Railcar Industries, Inc. | | | 488 | | | | 28,782 | |
Deere & Company (b) | | | 469 | | | | 40,625 | |
Dover Corporation | | | 1,012 | | | | 77,914 | |
Greenbrier Companies, Inc. (The) | | | 925 | | | | 51,319 | |
Joy Global, Inc. (b) | | | 1,063 | | | | 52,129 | |
Lindsay Corporation (b) | | | 1,974 | | | | 173,574 | |
Oshkosh Corporation (b) | | | 1,661 | | | | 75,409 | |
PACCAR, Inc. (b) | | | 348 | | | | 23,323 | |
Valmont Industries, Inc. (b) | | | 1,213 | | | | 164,022 | |
| | | | | | | | 707,708 | |
| Professional Services — 5.0% | | | | | | | | |
Dun & Bradstreet Corporation (The) (b) | | | 2,412 | | | | 306,203 | |
FTI Consulting, Inc. (a) (b) | | | 1,572 | | | | 60,947 | |
GP Strategies Corporation (a) | | | 1,116 | | | | 33,837 | |
Huron Consulting Group, Inc. (a) (b) | | | 2,121 | | | | 146,688 | |
Insperity, Inc. | | | 5,670 | | | | 185,126 | |
Korn/Ferry International (a) | | | 1,424 | | | | 38,662 | |
Navigant Consulting, Inc. (a) (b) | | | 6,501 | | | | 91,014 | |
Resources Connection, Inc. (b) | | | 1,353 | | | | 20,525 | |
RPX Corporation (a) (b) | | | 16,142 | | | | 211,783 | |
| | | | | | | | 1,094,785 | |
| Trading Companies & Distributors — 0.3% | | | | | | | | |
United Rentals, Inc. (a) | | | 575 | | | | 65,153 | |
| | | | | | | | | |
| Materials — 10.6% | | | | | | | | |
| Chemicals — 7.3% | | | | | | | | |
Albemarle Corporation | | | 2,098 | | | | 123,866 | |
Celanese Corporation - Series A | | | 767 | | | | 46,074 | |
CF Industries Holdings, Inc. (b) | | | 1,075 | | | | 288,261 | |
CVR Partners, L.P. | | | 1,767 | | | | 18,978 | |
Ferro Corporation (a) | | | 12,596 | | | | 162,111 | |
Innophos Holdings, Inc. | | | 350 | | | | 18,928 | |
Innospec, Inc. | | | 1,036 | | | | 44,403 | |
Koppers Holdings, Inc. (b) | | | 463 | | | | 13,510 | |
BARROW ALL-CAP CORE FUND
SCHEDULE OF INVESTMENTS (Continued) | |
| COMMON STOCKS — 99.7% (Continued) | | Shares | | | Value | |
| Materials — 10.6% (Continued) | | | | | | |
| Chemicals — 7.3% (Continued) | | | | | | |
LSB Industries, Inc. (a) | | | 1,123 | | | $ | 37,138 | |
LyondellBasell Industries N.V. - Class A | | | 1,571 | | | | 123,889 | |
Minerals Technologies, Inc. | | | 271 | | | | 20,116 | |
NewMarket Corporation (b) | | | 446 | | | | 175,599 | |
OCI Partners, L.P. | | | 6,336 | | | | 107,712 | |
Olin Corporation (b) | | | 7,918 | | | | 199,217 | |
| Scotts Miracle-Gro Company (The) - Class A | | | 2,012 | | | | 122,792 | |
W.R. Grace & Company (a) | | | 248 | | | | 23,825 | |
Westlake Chemical Corporation | | | 1,455 | | | | 92,538 | |
| | | | | | | | 1,618,957 | |
| Containers & Packaging — 1.8% | | | | | | | | |
Avery Dennison Corporation | | | 3,748 | | | | 185,563 | |
Crown Holdings, Inc. (a) | | | 1,260 | | | | 62,370 | |
Greif, Inc. - Class A | | | 315 | | | | 13,813 | |
Owens-Illinois, Inc. (a) | | | 1,673 | | | | 42,896 | |
Sonoco Products Company | | | 1,915 | | | | 80,468 | |
| | | | | | | | 385,110 | |
| Metals & Mining — 0.7% | | | | | | | | |
Compass Minerals International, Inc. | | | 739 | | | | 64,330 | |
Kaiser Aluminum Corporation (b) | | | 311 | | | | 22,634 | |
Southern Copper Corporation (b) | | | 2,368 | | | | 70,922 | |
| | | | | | | | 157,886 | |
| Paper & Forest Products — 0.8% | | | | | | | | |
Boise Cascade Company (a) | | | 554 | | | | 19,772 | |
Louisiana-Pacific Corporation (a) (b) | | | 3,477 | | | | 52,990 | |
Schweitzer-Mauduit International, Inc. (b) | | | 2,278 | | | | 97,430 | |
| | | | | | | | 170,192 | |
| | | | | | | | | |
Total Common Stocks (Cost $18,599,195) | | | | | | $ | 21,971,215 | |
BARROW ALL-CAP CORE FUND
SCHEDULE OF INVESTMENTS (Continued) | |
| MONEY MARKET FUNDS — 0.2% | | Shares | | | Value | |
Fidelity Institutional Money Market Government Portfolio - Class I, 0.01% (c) (Cost $39,891) | | | 39,891 | | | $ | 39,891 | |
| | | | | | | | | |
Total Investments at Value — 99.9% (Cost $18,639,086) | | | | | | $ | 22,011,106 | |
| | | | | | | | | |
| Other Assets in Excess of Liabilities — 0.1% | | | | | | | 28,138 | |
| | | | | | | | | |
Net Assets — 100.0% | | | | | | $ | 22,039,244 | |
(a) | Non-income producing security. |
(b) | All or a portion of the shares have been pledged as collateral for the bank line of credit (Note 5). |
(c) | The rate shown is the 7-day effective yield as of November 30, 2014. |
| See accompanying notes to financial statements. |
BARROW ALL-CAP LONG/SHORT FUND
SCHEDULE OF INVESTMENTS
November 30, 2014 (Unaudited) | |
| COMMON STOCKS — 127.7% | | Shares | | | Value | |
| Consumer Discretionary — 28.8% | | | | | | |
| Auto Components — 0.8% | | | | | | |
Dorman Products, Inc. (a) | | | 712 | | | $ | 33,699 | |
Gentex Corporation (b) | | | 174 | | | | 6,187 | |
Motorcar Parts of America, Inc. (a) | | | 1,182 | | | | 39,893 | |
| | | | | | | | 79,779 | |
| Automobiles — 1.2% | | | | | | | | |
Thor Industries, Inc. (b) | | | 750 | | | | 44,070 | |
Winnebago Industries, Inc. | | | 2,641 | | | | 66,500 | |
| | | | | | | | 110,570 | |
| Diversified Consumer Services — 1.2% | | | | | | | | |
H&R Block, Inc. (b) | | | 3,240 | | | | 108,993 | |
| | | | | | | | | |
| Hotels, Restaurants & Leisure — 1.7% | | | | | | | | |
DineEquity, Inc. | | | 366 | | | | 36,355 | |
Interval Leisure Group, Inc. (b) | | | 5,780 | | | | 125,657 | |
| | | | | | | | 162,012 | |
| Household Durables — 1.0% | | | | | | | | |
NVR, Inc. (a) (b) | | | 57 | | | | 71,744 | |
Tupperware Brands Corporation (b) | | | 262 | | | | 17,620 | |
| | | | | | | | 89,364 | |
| Leisure Products — 0.1% | | | | | | | | |
Arctic Cat, Inc. (b) | | | 294 | | | | 9,717 | |
| | | | | | | | | |
| Media — 5.9% | | | | | | | | |
CBS Corporation - Class B | | | 621 | | | | 34,081 | |
Entravision Communications Corporation - Class A (b) | | | 8,516 | | | | 55,013 | |
Interpublic Group of Companies, Inc. (b) | | | 4,270 | | | | 86,638 | |
Omnicom Group, Inc. (b) | | | 1,522 | | | | 117,605 | |
Scripps Networks Interactive, Inc. - Class A (b) | | | 683 | | | | 53,390 | |
Starz - Series A (a) (b) | | | 4,299 | | | | 141,824 | |
Time Warner, Inc. (b) | | | 444 | | | | 37,793 | |
Time, Inc. | | | 1,105 | | | | 26,454 | |
| | | | | | | | 552,798 | |
| Specialty Retail — 13.6% | | | | | | | | |
American Eagle Outfitters, Inc. (b) | | | 519 | | | | 7,318 | |
AutoZone, Inc. (a) (b) | | | 43 | | | | 24,841 | |
Bed Bath & Beyond, Inc. (a) (b) | | | 2,299 | | | | 168,678 | |
Best Buy Company, Inc. (b) | | | 393 | | | | 15,488 | |
Buckle, Inc. (The) (b) | | | 2,998 | | | | 153,468 | |
BARROW ALL-CAP LONG/SHORT FUND
SCHEDULE OF INVESTMENTS (Continued) | |
| COMMON STOCKS — 127.7% (Continued) | | Shares | | | Value | |
| Consumer Discretionary — 28.8% (Continued) | | | | | | |
| Specialty Retail — 13.6% (Continued) | | | | | | |
Cato Corporation (The) - Class A (b) | | | 2,399 | | | $ | 96,248 | |
DSW, Inc. - Class A (b) | | | 183 | | | | 6,493 | |
Express, Inc. (a) (b) | | | 7,616 | | | | 113,859 | |
Finish Line, Inc. (The) - Class A | | | 1,229 | | | | 35,076 | |
Foot Locker, Inc. (b) | | | 957 | | | | 54,826 | |
GameStop Corporation - Class A (b) | | | 3,454 | | | | 130,596 | |
GNC Holdings, Inc. - Class A (b) | | | 2,246 | | | | 99,318 | |
Hibbett Sports, Inc. (a) (b) | | | 1,780 | | | | 89,303 | |
Outerwall, Inc. (a) (b) | | | 2,288 | | | | 160,801 | |
PetSmart, Inc. (b) | | | 91 | | | | 7,167 | |
Ross Stores, Inc. (b) | | | 364 | | | | 33,299 | |
Sally Beauty Holdings, Inc. (a) (b) | | | 187 | | | | 5,918 | |
Select Comfort Corporation (a) (b) | | | 3,045 | | | | 80,205 | |
| | | | | | | | 1,282,902 | |
| Textiles, Apparel & Luxury Goods — 3.3% | | | | | | | | |
Fossil Group, Inc. (a) (b) | | | 346 | | | | 38,655 | |
Iconix Brand Group, Inc. (a) (b) | | | 2,403 | | | | 97,105 | |
Steven Madden Ltd. (a) (b) | | | 4,203 | | | | 143,323 | |
Vera Bradley, Inc. (a) (b) | | | 1,471 | | | | 33,818 | |
| | | | | | | | 312,901 | |
| Consumer Staples — 25.3% | | | | | | | | |
| Beverages — 2.4% | | | | | | | | |
Brown-Forman Corporation - Class B (b) | | | 2 | | | | 194 | |
Dr Pepper Snapple Group, Inc. (b) | | | 1,343 | | | | 99,382 | |
National Beverage Corporation (a) (b) | | | 5,222 | | | | 131,281 | |
| | | | | | | | 230,857 | |
| Food & Staples Retailing — 0.2% | | | | | | | | |
CVS Health Corporation (b) | | | 105 | | | | 9,593 | |
Weis Markets, Inc. | | | 279 | | | | 12,867 | |
| | | | | | | | 22,460 | |
| Food Products — 9.6% | | | | | | | | |
B&G Foods, Inc. (b) | | | 3,286 | | | | 94,045 | |
Cal-Maine Foods, Inc. (b) | | | 700 | | | | 29,316 | |
General Mills, Inc. (b) | | | 156 | | | | 8,229 | |
Ingredion, Inc. (b) | | | 151 | | | | 12,568 | |
J & J Snack Foods Corporation (b) | | | 581 | | | | 61,034 | |
J.M. Smucker Company (The) (b) | | | 81 | | | | 8,308 | |
Kellogg Company (b) | | | 1,467 | | | | 97,189 | |
Kraft Foods Group, Inc. (b) | | | 2,111 | | | | 127,019 | |
Lancaster Colony Corporation (b) | | | 2,010 | | | | 188,739 | |
BARROW ALL-CAP LONG/SHORT FUND
SCHEDULE OF INVESTMENTS (Continued) | |
| COMMON STOCKS — 127.7% (Continued) | | Shares | | | Value | |
| Consumer Staples — 25.3% (Continued) | | | | | | |
| Food Products — 9.6% (Continued) | | | | | | |
Pilgrim's Pride Corporation (a) (b) | | | 4,479 | | | $ | 144,672 | |
Pinnacle Foods, Inc. | | | 1,950 | | | | 66,358 | |
Seaboard Corporation (a) (b) | | | 18 | | | | 62,100 | |
| | | | | | | | 899,577 | |
| Household Products — 2.8% | | | | | | | | |
Clorox Company (The) (b) | | | 216 | | | | 21,950 | |
Energizer Holdings, Inc. (b) | | | 183 | | | | 23,794 | |
Spectrum Brands Holdings, Inc. (b) | | | 1,221 | | | | 112,295 | |
WD-40 Company (b) | | | 1,366 | | | | 103,953 | |
| | | | | | | | 261,992 | |
| Personal Products — 3.1% | | | | | | | | |
Inter Parfums, Inc. (b) | | | 861 | | | | 22,084 | |
Revlon, Inc. - Class A (a) (b) | | | 1,783 | | | | 58,768 | |
USANA Health Sciences, Inc. (a) (b) | | | 1,939 | | | | 206,775 | |
| | | | | | | | 287,627 | |
| Tobacco — 7.2% | | | | | | | | |
Altria Group, Inc. (b) | | | 3,483 | | | | 175,055 | |
Philip Morris International, Inc. (b) | | | 1,290 | | | | 112,140 | |
Reynolds American, Inc. (b) | | | 2,542 | | | | 167,543 | |
Universal Corporation | | | 622 | | | | 24,874 | |
Vector Group Ltd. (b) | | | 9,325 | | | | 202,819 | |
| | | | | | | | 682,431 | |
| Energy — 12.8% | | | | | | | | |
| Energy Equipment & Services — 2.3% | | | | | | | | |
C&J Energy Services, Inc. (a) (b) | | | 941 | | | | 14,256 | |
CARBO Ceramics, Inc. | | | 166 | | | | 6,315 | |
Halliburton Company | | | 224 | | | | 9,453 | |
Helmerich & Payne, Inc. | | | 124 | | | | 8,624 | |
Matrix Service Company (a) | | | 860 | | | | 18,163 | |
National Oilwell Varco, Inc. (b) | | | 1,714 | | | | 114,907 | |
Oil States International, Inc. (a) (b) | | | 845 | | | | 42,123 | |
RPC, Inc. | | | 247 | | | | 3,283 | |
| | | | | | | | 217,124 | |
| Oil, Gas & Consumable Fuels — 10.5% | | | | | | | | |
Alliance Holdings GP, L.P. | | | 58 | | | | 3,888 | |
Alliance Resource Partners, L.P. (b) | | | 1,810 | | | | 83,369 | |
Alon USA Energy, Inc. (b) | | | 492 | | | | 6,868 | |
Alon USA Partners, L.P. (b) | | | 4,716 | | | | 80,408 | |
BP Prudhoe Bay Royalty Trust (b) | | | 1,010 | | | | 77,467 | |
CVR Energy, Inc. (b) | | | 1,058 | | | | 49,239 | |
BARROW ALL-CAP LONG/SHORT FUND
SCHEDULE OF INVESTMENTS (Continued) | |
| COMMON STOCKS — 127.7% (Continued) | | Shares | | | Value | |
| Energy — 12.8% (Continued) | | | | | | |
| Oil, Gas & Consumable Fuels — 10.5% (Continued) | | | | | | |
CVR Refining, L.P. (b) | | | 2,451 | | | $ | 54,633 | |
Delek US Holdings, Inc. (b) | | | 716 | | | | 21,408 | |
Green Plains, Inc. (b) | | | 1,370 | | | | 41,114 | |
HollyFrontier Corporation (b) | | | 1,866 | | | | 76,170 | |
Marathon Oil Corporation (b) | | | 2,441 | | | | 70,594 | |
Marathon Petroleum Corporation (b) | | | 883 | | | | 79,549 | |
Northern Tier Energy, L.P. (b) | | | 3,820 | | | | 91,222 | |
Occidental Petroleum Corporation (b) | | | 462 | | | | 36,854 | |
Permian Basin Royalty Trust (b) | | | 3,986 | | | | 43,647 | |
Phillips 66 (b) | | | 57 | | | | 4,162 | |
REX American Resources Corporation (a) (b) | | | 715 | | | | 45,238 | |
VAALCO Energy, Inc. (a) (b) | | | 3,946 | | | | 22,610 | |
Valero Energy Corporation (b) | | | 898 | | | | 43,652 | |
Western Refining, Inc. (b) | | | 1,404 | | | | 57,718 | |
| | | | | | | | 989,810 | |
Financials — 0.0% (c) | | | | | | | | |
Insurance — 0.0% (c) | | | | | | | | |
Gerova Financial Group Ltd. (a) (b) (d) | | | 2 | | | | 0 | |
| | | | | | | | | |
| Health Care — 23.5% | | | | | | | | |
| Health Care Equipment & Supplies — 4.1% | | | | | | | | |
Align Technology, Inc. (a) (b) | | | 132 | | | | 7,511 | |
Anika Therapeutics, Inc. (a) (b) | | | 1,690 | | | | 69,104 | |
Edwards Lifesciences Corporation (a) (b) | | | 184 | | | | 23,861 | |
Globus Medical, Inc. - Class A (a) (b) | | | 5,222 | | | | 120,315 | |
Medtronic, Inc. (b) | | | 1,973 | | | | 145,746 | |
Sirona Dental Systems, Inc. (a) (b) | | | 42 | | | | 3,628 | |
Thoratec Corporation (a) (b) | | | 491 | | | | 15,314 | |
| | | | | | | | 385,479 | |
| Health Care Providers & Services — 15.5% | | | | | | | | |
AmerisourceBergen Corporation (b) | | | 4 | | | | 364 | |
AMN Healthcare Services, Inc. (a) (b) | | | 5,251 | | | | 89,897 | |
AmSurg Corporation (a) (b) | | | 2,824 | | | | 145,634 | |
Bio-Reference Laboratories, Inc. (a) (b) | | | 2,475 | | | | 70,043 | |
Cardinal Health, Inc. (b) | | | 1,438 | | | | 118,189 | |
Chemed Corporation (b) | | | 1,139 | | | | 125,415 | |
CorVel Corporation (a) | | | 330 | | | | 11,438 | |
Ensign Group, Inc. (The) (b) | | | 691 | | | | 27,239 | |
HealthSouth Corporation (b) | | | 3,796 | | | | 156,129 | |
IPC The Hospitalist Company, Inc. (a) | | | 356 | | | | 15,693 | |
BARROW ALL-CAP LONG/SHORT FUND
SCHEDULE OF INVESTMENTS (Continued) | |
| COMMON STOCKS — 127.7% (Continued) | | Shares | | | Value | |
| Health Care — 23.5% (Continued) | | | | | | |
| Health Care Providers & Services — 15.5% (Continued) | | | | | | |
Laboratory Corporation of America Holdings (a) (b) | | | 1,104 | | | $ | 115,523 | |
MEDNAX, Inc. (a) (b) | | | 2,111 | | | | 138,186 | |
Owens & Minor, Inc. (b) | | | 95 | | | | 3,250 | |
Patterson Companies, Inc. (b) | | | 2,241 | | | | 107,971 | |
PharMerica Corporation (a) (b) | | | 430 | | | | 9,378 | |
Premier, Inc. - Class A (a) (b) | | | 1,141 | | | | 38,817 | |
Quest Diagnostics, Inc. (b) | | | 2,297 | | | | 150,017 | |
Select Medical Holdings Corporation (b) | | | 2,579 | | | | 37,215 | |
VCA, Inc. (a) (b) | | | 2,058 | | | | 97,405 | |
| | | | | | | | 1,457,803 | |
| Health Care Technology — 0.2% | | | | | | | | |
Computer Programs & Systems, Inc. (b) | | | 383 | | | | 22,497 | |
| | | | | | | | | |
| Pharmaceuticals — 3.7% | | | | | | | | |
AbbVie, Inc. (b) | | | 188 | | | | 13,010 | |
DepoMed, Inc. (a) (b) | | | 5,168 | | | | 80,052 | |
Eli Lilly & Company (b) | | | 403 | | | | 27,453 | |
Johnson & Johnson | | | 115 | | | | 12,449 | |
Lannett Company, Inc. (a) | | | 263 | | | | 12,921 | |
Pfizer, Inc. (b) | | | 2,994 | | | | 93,263 | |
Prestige Brands Holdings, Inc. (a) (b) | | | 3,105 | | | | 103,862 | |
| | | | | | | | 343,010 | |
| Industrials — 24.0% | | | | | | | | |
| Aerospace & Defense — 6.1% | | | | | | | | |
Cubic Corporation (b) | | | 1,181 | | | | 60,763 | |
Engility Holdings, Inc. (a) (b) | | | 1,544 | | | | 64,925 | |
Exelis, Inc. (b) | | | 7,628 | | | | 136,846 | |
Northrop Grumman Corporation (b) | | | 1,175 | | | | 165,593 | |
Raytheon Company (b) | | | 1,257 | | | | 134,122 | |
Vectrus, Inc. (a) (b) | | | 355 | | | | 10,032 | |
| | | | | | | | 572,281 | |
| Air Freight & Logistics — 0.3% | | | | | | | | |
| Expeditors International of Washington, Inc. | | | 525 | | | | 24,581 | |
| | | | | | | | | |
| Commercial Services & Supplies — 3.5% | | | | | | | | |
ADT Corporation (The) (b) | | | 869 | | | | 30,363 | |
Deluxe Corporation (b) | | | 2,721 | | | | 159,043 | |
Pitney Bowes, Inc. (b) | | | 5,744 | | | | 141,417 | |
UniFirst Corporation (b) | | | 9 | | | | 1,004 | |
| | | | | | | | 331,827 | |
BARROW ALL-CAP LONG/SHORT FUND
SCHEDULE OF INVESTMENTS (Continued) | |
| COMMON STOCKS — 127.7% (Continued) | | Shares | | | Value | |
| Industrials — 24.0% (Continued) | | | | | | |
| Construction & Engineering — 0.6% | | | | | | |
Argan, Inc. (b) | | | 1,864 | | | $ | 59,219 | |
| | | | | | | | | |
| Electrical Equipment — 2.6% | | | | | | | | |
Babcock & Wilcox Company (The) (b) | | | 3,339 | | | | 98,935 | |
Emerson Electric Company (b) | | | 1,387 | | | | 88,421 | |
Generac Holdings, Inc. (a) (b) | | | 1,094 | | | | 47,458 | |
Rockwell Automation, Inc. | | | 113 | | | | 13,041 | |
| | | | | | | | 247,855 | |
| Machinery — 4.1% | | | | | | | | |
Actuant Corporation - Class A | | | 394 | | | | 11,568 | |
American Railcar Industries, Inc. (b) | | | 274 | | | | 16,160 | |
Deere & Company (b) | | | 264 | | | | 22,868 | |
Dover Corporation (b) | | | 569 | | | | 43,807 | |
Greenbrier Companies, Inc. (The) (b) | | | 518 | | | | 28,739 | |
Joy Global, Inc. (b) | | | 537 | | | | 26,334 | |
Lindsay Corporation (b) | | | 1,092 | | | | 96,020 | |
Oshkosh Corporation (b) | | | 928 | | | | 42,131 | |
PACCAR, Inc. (b) | | | 179 | | | | 11,997 | |
Valmont Industries, Inc. (b) | | | 669 | | | | 90,462 | |
| | | | | | | | 390,086 | |
| Professional Services — 6.4% | | | | | | | | |
Dun & Bradstreet Corporation (The) (b) | | | 1,333 | | | | 169,224 | |
FTI Consulting, Inc. (a) (b) | | | 848 | | | | 32,877 | |
GP Strategies Corporation (a) (b) | | | 623 | | | | 18,889 | |
Huron Consulting Group, Inc. (a) (b) | | | 1,176 | | | | 81,332 | |
Insperity, Inc. (b) | | | 3,138 | | | | 102,456 | |
Korn/Ferry International (a) (b) | | | 797 | | | | 21,639 | |
Navigant Consulting, Inc. (a) (b) | | | 3,414 | | | | 47,796 | |
Resources Connection, Inc. (b) | | | 762 | | | | 11,560 | |
RPX Corporation (a) (b) | | | 8,953 | | | | 117,463 | |
| | | | | | | | 603,236 | |
| Trading Companies & Distributors — 0.4% | | | | | | | | |
United Rentals, Inc. (a) (b) | | | 317 | | | | 35,919 | |
| | | | | | | | | |
| Materials — 13.3% | | | | | | | | |
| Chemicals — 9.2% | | | | | | | | |
Albemarle Corporation (b) | | | 1,126 | | | | 66,479 | |
Celanese Corporation - Series A (b) | | | 289 | | | | 17,360 | |
CF Industries Holdings, Inc. (b) | | | 599 | | | | 160,622 | |
CVR Partners, L.P. | | | 978 | | | | 10,504 | |
BARROW ALL-CAP LONG/SHORT FUND
SCHEDULE OF INVESTMENTS (Continued) | |
| COMMON STOCKS — 127.7% (Continued) | | Shares | | | Value | |
| Materials — 13.3% (Continued) | | | | | | |
| Chemicals — 9.2% (Continued) | | | | | | |
Ferro Corporation (a) (b) | | | 6,623 | | | $ | 85,238 | |
Innophos Holdings, Inc. | | | 193 | | | | 10,437 | |
Innospec, Inc. | | | 578 | | | | 24,773 | |
Koppers Holdings, Inc. (b) | | | 196 | | | | 5,719 | |
LSB Industries, Inc. (a) | | | 382 | | | | 12,633 | |
LyondellBasell Industries N.V. - Class A (b) | | | 872 | | | | 68,766 | |
Minerals Technologies, Inc. (b) | | | 61 | | | | 4,528 | |
NewMarket Corporation (b) | | | 250 | | | | 98,430 | |
OCI Partners, L.P. (b) | | | 3,522 | | | | 59,874 | |
Olin Corporation (b) | | | 4,391 | | | | 110,477 | |
Scotts Miracle-Gro Company (The) - Class A (b) | | | 1,113 | | | | 67,926 | |
W.R. Grace & Company (a) | | | 138 | | | | 13,258 | |
Westlake Chemical Corporation (b) | | | 806 | | | | 51,262 | |
| | | | | | | | 868,286 | |
| Containers & Packaging — 2.3% | | | | | | | | |
Avery Dennison Corporation (b) | | | 2,072 | | | | 102,585 | |
Crown Holdings, Inc. (a) (b) | | | 695 | | | | 34,402 | |
Greif, Inc. - Class A (b) | | | 176 | | | | 7,718 | |
Owens-Illinois, Inc. (a) | | | 929 | | | | 23,820 | |
Sonoco Products Company (b) | | | 1,066 | | | | 44,793 | |
| | | | | | | | 213,318 | |
| Metals & Mining — 0.9% | | | | | | | | |
Compass Minerals International, Inc. (b) | | | 412 | | | | 35,865 | |
Kaiser Aluminum Corporation (b) | | | 172 | | | | 12,518 | |
Reliance Steel & Aluminum Company (b) | | | 7 | | | | 448 | |
Southern Copper Corporation (b) | | | 1,314 | | | | 39,354 | |
| | | | | | | | 88,185 | |
| Paper & Forest Products — 0.9% | | | | | | | | |
Boise Cascade Company (a) | | | 307 | | | | 10,957 | |
Louisiana-Pacific Corporation (a) (b) | | | 1,010 | | | | 15,392 | |
Schweitzer-Mauduit International, Inc. (b) | | | 1,258 | | | | 53,805 | |
| | | | | | | | 80,154 | |
| | | | | | | | | |
Total Common Stocks (Cost $11,059,666) | | | | | | $ | 12,024,650 | |
BARROW ALL-CAP LONG/SHORT FUND
SCHEDULE OF INVESTMENTS (Continued) | |
| MONEY MARKET FUNDS — 6.8% | | Shares | | | Value | |
Fidelity Institutional Money Market Government Portfolio - Class I, 0.01% (e) (Cost $638,944) | | | 638,944 | | | $ | 638,944 | |
| | | | | | | | | |
Total Investments at Value — 134.5% (Cost $11,698,610) | | | | | | $ | 12,663,594 | |
| | | | | | | | | |
| Liabilities in Excess of Other Assets — (34.5%) | | | | | | | (3,248,979 | )(f) |
| | | | | | | | | |
Net Assets — 100.0% | | | | | | $ | 9,414,615 | |
(a) | Non-income producing security. |
(b) | All or a portion of the shares have been pledged as collateral for open short positions and any outstanding borrowings for investment purposes (Note 2). |
(c) | Percentage rounds to less than 0.1%. |
(d) | Security value has been determined in good faith pursuant to procedures adopted by the Board of Trustees. The total value of such securities is $0 at November 30, 2014, representing 0.0% of net assets (Note 2). |
(e) | The rate shown is the 7-day effective yield as of November 30, 2014. |
(f) | Includes cash held as margin deposits for open short positions. |
| See accompanying notes to financial statements. |
BARROW ALL-CAP LONG/SHORT FUND
SCHEDULE OF SECURITIES SOLD SHORT
November 30, 2014 (Unaudited) | |
| COMMON STOCKS — 87.3% | | Shares | | | Value | |
| Consumer Discretionary — 20.5% | | | | | | |
| Auto Components — 0.8% | | | | | | |
Allison Transmission Holdings, Inc. | | | 247 | | | $ | 8,124 | |
BorgWarner, Inc. | | | 162 | | | | 9,163 | |
Federal Mogul Holdings Corporation | | | 385 | | | | 5,975 | |
Gentherm, Inc. | | | 340 | | | | 12,814 | |
Goodyear Tire & Rubber Company (The) | | | 304 | | | | 8,333 | |
Modine Manufacturing Company | | | 940 | | | | 11,440 | |
Superior Industries International, Inc. | | | 422 | | | | 7,647 | |
Visteon Corporation | | | 91 | | | | 8,918 | |
| | | | | | | | 72,414 | |
| Automobiles — 0.3% | | | | | | | | |
General Motors Company | | | 264 | | | | 8,825 | |
Harley-Davidson, Inc. | | | 98 | | | | 6,829 | |
Tesla Motors, Inc. | | | 62 | | | | 15,160 | |
| | | | | | | | 30,814 | |
| Distributors — 0.4% | | | | | | | | |
Core-Mark Holding Company, Inc. | | | 334 | | | | 20,077 | |
LKQ Corporation | | | 407 | | | | 11,823 | |
Pool Corporation | | | 38 | | | | 2,258 | |
| | | | | | | | 34,158 | |
| Diversified Consumer Services — 0.7% | | | | | | | | |
Hillenbrand, Inc. | | | 257 | | | | 8,265 | |
LifeLock, Inc. | | | 870 | | | | 14,364 | |
| Matthews International Corporation - Class A | | | 288 | | | | 13,268 | |
Regis Corporation | | | 1,097 | | | | 18,144 | |
Service Corporation International | | | 443 | | | | 10,012 | |
Sotheby's | | | 121 | | | | 4,890 | |
| | | | | | | | 68,943 | |
| Hotels, Restaurants & Leisure — 6.2% | | | | | | | | |
Aramark | | | 253 | | | | 7,691 | |
Biglari Holdings, Inc. | | | 35 | | | | 13,001 | |
BJ's Restaurants, Inc. | | | 479 | | | | 23,548 | |
Bloomin' Brands, Inc. | | | 682 | | | | 15,529 | |
Bob Evans Farms, Inc. | | | 330 | | | | 17,939 | |
Brinker International, Inc. | | | 98 | | | | 5,520 | |
Buffalo Wild Wings, Inc. | | | 103 | | | | 17,532 | |
Carnival Corporation | | | 313 | | | | 13,822 | |
Cedar Fair, L.P. | | | 234 | | | | 11,169 | |
Cheesecake Factory, Inc. (The) | | | 251 | | | | 12,156 | |
BARROW ALL-CAP LONG/SHORT FUND
SCHEDULE OF SECURITIES SOLD SHORT (Continued) | |
| COMMON STOCKS — 87.3% (Continued) | | Shares | | | Value | |
| Consumer Discretionary — 20.5% (Continued) | | | | | | |
| Hotels, Restaurants & Leisure — 6.2% (Continued) | | | | | | |
Chipotle Mexican Grill, Inc. | | | 19 | | | $ | 12,609 | |
Churchill Downs, Inc. | | | 174 | | | | 16,754 | |
Chuy's Holdings, Inc. | | | 415 | | | | 8,885 | |
ClubCorp Holdings, Inc. | | | 379 | | | | 7,470 | |
Cracker Barrel Old Country Store, Inc. | | | 75 | | | | 9,601 | |
Darden Restaurants, Inc. | | | 246 | | | | 14,020 | |
Dave & Buster's Entertainment, Inc. | | | 120 | | | | 2,750 | |
Del Frisco's Restaurant Group, Inc. | | | 397 | | | | 8,821 | |
Diamond Resorts International, Inc. | | | 488 | | | | 11,800 | |
Dunkin' Brands Group, Inc. | | | 78 | | | | 3,771 | |
Extended Stay America, Inc. | | | 245 | | | | 4,557 | |
Fiesta Restaurant Group, Inc. | | | 309 | | | | 17,322 | |
Hilton Worldwide Holdings, Inc. | | | 41 | | | | 1,075 | |
Hyatt Hotels Corporation - Class A | | | 208 | | | | 12,257 | |
| International Speedway Corporation - Class A | | | 497 | | | | 15,546 | |
Jack in the Box, Inc. | | | 242 | | | | 18,029 | |
Krispy Kreme Doughnuts, Inc. | | | 646 | | | | 13,153 | |
La Quinta Holdings, Inc. | | | 74 | | | | 1,629 | |
Las Vegas Sands Corporation | | | 163 | | | | 10,381 | |
Life Time Fitness, Inc. | | | 295 | | | | 16,337 | |
Marcus Corporation (The) | | | 423 | | | | 6,963 | |
Marriott International, Inc. - Class A | | | 150 | | | | 11,818 | |
| Marriott Vacations Worldwide Corporation | | | 178 | | | | 13,085 | |
MGM Resorts International | | | 501 | | | | 11,428 | |
Norwegian Cruise Line Holdings Ltd. | | | 351 | | | | 15,405 | |
Papa John's International, Inc. | | | 121 | | | | 6,386 | |
Red Robin Gourmet Burgers, Inc. | | | 236 | | | | 15,895 | |
Royal Caribbean Cruises Ltd. | | | 223 | | | | 16,444 | |
Ruby Tuesday, Inc. | | | 802 | | | | 6,689 | |
Scientific Games Corporation - Class A | | | 73 | | | | 1,105 | |
SeaWorld Entertainment, Inc. | | | 409 | | | | 6,826 | |
Six Flags Entertainment Corporation | | | 364 | | | | 14,797 | |
Sonic Corporation | | | 675 | | | | 18,353 | |
Speedway Motorsports, Inc. | | | 573 | | | | 11,294 | |
Starbucks Corporation | | | 146 | | | | 11,857 | |
| Starwood Hotels & Resorts Worldwide, Inc. | | | 142 | | | | 11,218 | |
Texas Roadhouse, Inc. | | | 398 | | | | 13,158 | |
Vail Resorts, Inc. | | | 204 | | | | 17,879 | |
Wendy's Company (The) | | | 1,711 | | | | 14,920 | |
Wynn Resorts Ltd. | | | 55 | | | | 9,824 | |
BARROW ALL-CAP LONG/SHORT FUND
SCHEDULE OF SECURITIES SOLD SHORT (Continued) | |
| COMMON STOCKS — 87.3% (Continued) | | Shares | | | Value | |
| Consumer Discretionary — 20.5% (Continued) | | | | | | |
| Hotels, Restaurants & Leisure — 6.2% (Continued) | | | | | | |
Yum! Brands, Inc. | | | 49 | | | $ | 3,785 | |
| | | | | | | | 583,803 | |
| Household Durables — 2.7% | | | | | | | | |
Cavco Industries, Inc. | | | 185 | | | | 13,714 | |
D.R. Horton, Inc. | | | 429 | | | | 10,935 | |
Ethan Allen Interiors, Inc. | | | 177 | | | | 5,241 | |
Harman International Industries, Inc. | | | 112 | | | | 12,155 | |
Installed Building Products, Inc. | | | 242 | | | | 4,114 | |
Jarden Corporation | | | 291 | | | | 12,848 | |
La-Z-Boy, Inc. | | | 38 | | | | 988 | |
Leggett & Platt, Inc. | | | 256 | | | | 10,775 | |
Lennar Corporation - Class A | | | 297 | | | | 14,030 | |
Libbey, Inc. | | | 278 | | | | 8,354 | |
M/I Homes, Inc. | | | 633 | | | | 14,508 | |
MDC Holdings, Inc. | | | 543 | | | | 14,286 | |
Meritage Homes Corporation | | | 103 | | | | 4,040 | |
Mohawk Industries, Inc. | | | 88 | | | | 13,516 | |
Newell Rubbermaid, Inc. | | | 118 | | | | 4,285 | |
PulteGroup, Inc. | | | 544 | | | | 11,767 | |
Ryland Group, Inc. (The) | | | 258 | | | | 10,096 | |
Standard Pacific Corporation | | | 1,560 | | | | 11,778 | |
Stanley Black & Decker, Inc. | | | 23 | | | | 2,172 | |
| Taylor Morrison Home Corporation - Class A | | | 485 | | | | 9,380 | |
Tempur Sealy International, Inc. | | | 187 | | | | 10,668 | |
Toll Brothers, Inc. | | | 346 | | | | 12,106 | |
TRI Pointe Homes, Inc. | | | 374 | | | | 5,707 | |
Universal Electronics, Inc. | | | 319 | | | | 19,303 | |
WCI Communities, Inc. | | | 588 | | | | 10,937 | |
William Lyon Homes - Class A | | | 326 | | | | 6,709 | |
| | | | | | | | 254,412 | |
| Internet & Catalog Retail — 1.0% | | | | | | | | |
1-800-FLOWERS.COM, Inc. - Class A | | | 473 | | | | 4,044 | |
Amazon.com, Inc. | | | 37 | | | | 12,530 | |
Coupons.com, Inc. | | | 206 | | | | 3,146 | |
Groupon, Inc. | | | 1,756 | | | | 13,223 | |
HomeAway, Inc. | | | 352 | | | | 11,039 | |
| Liberty Interactive Corporation - Series A | | | 367 | | | | 10,698 | |
Liberty Ventures Group - Series A | | | 42 | | | | 1,539 | |
NetFlix, Inc. | | | 27 | | | | 9,358 | |
NutriSystem, Inc. | | | 438 | | | | 8,309 | |
BARROW ALL-CAP LONG/SHORT FUND
SCHEDULE OF SECURITIES SOLD SHORT (Continued) | |
| COMMON STOCKS — 87.3% (Continued) | | Shares | | | Value | |
| Consumer Discretionary — 20.5% (Continued) | | | | | | |
| Internet & Catalog Retail — 1.0% (Continued) | | | | | | |
Orbitz Worldwide, Inc. | | | 124 | | | $ | 947 | |
Overstock.com, Inc. | | | 55 | | | | 1,367 | |
RetailMeNot, Inc. | | | 50 | | | | 736 | |
TripAdvisor, Inc. | | | 129 | | | | 9,501 | |
Wayfair, Inc. - Class A | | | 113 | | | | 2,741 | |
| | | | | | | | 89,178 | |
| Leisure Products — 0.2% | | | | | | | | |
Callaway Golf Company | | | 1,987 | | | | 14,724 | |
Hasbro, Inc. | | | 63 | | | | 3,729 | |
Mattel, Inc. | | | 45 | | | | 1,420 | |
| | | | | | | | 19,873 | |
| Media — 2.2% | | | | | | | | |
| AMC Entertainment Holdings, Inc. - Class A | | | 60 | | | | 1,573 | |
Carmike Cinemas, Inc. | | | 189 | | | | 5,602 | |
Charter Communications, Inc. - Class A | | | 53 | | | | 8,994 | |
DISH Network Corporation - Class A | | | 188 | | | | 14,929 | |
| DreamWorks Animation SKG, Inc. - Class A | | | 566 | | | | 13,494 | |
E.W. Scripps Company - Class A | | | 846 | | | | 16,565 | |
Lamar Advertising Company - Class A | | | 278 | | | | 14,815 | |
Liberty Broadband Corporation - Class A | | | 25 | | | | 1,371 | |
Liberty Broadband Corporation - Class C | | | 16 | | | | 870 | |
Liberty Media Corporation - Class A | | | 129 | | | | 4,743 | |
Liberty Media Corporation - Class C | | | 66 | | | | 2,411 | |
Lions Gate Entertainment Corporation | | | 34 | | | | 1,153 | |
Live Nation, Inc. | | | 624 | | | | 16,723 | |
| Madison Square Garden Company (The) - Class A | | | 235 | | | | 17,164 | |
Media General, Inc. | | | 167 | | | | 2,557 | |
Morningstar, Inc. | | | 22 | | | | 1,468 | |
New Media Investment Group, Inc. | | | 252 | | | | 5,121 | |
| New York Times Company (The) - Class A | | | 299 | | | | 3,794 | |
News Corporation - Class A | | | 283 | | | | 4,392 | |
| Nexstar Broadcasting Group, Inc. - Class A | | | 203 | | | | 10,416 | |
Regal Entertainment Group - Class A | | | 248 | | | | 5,726 | |
Rentrak Corporation | | | 239 | | | | 20,100 | |
Scholastic Corporation | | | 477 | | | | 16,934 | |
Sirius XM Holdings, Inc. | | | 2,999 | | | | 10,886 | |
Tribune Media Company - Class A | | | 93 | | | | 6,320 | |
Tribune Publishing Company | | | 7 | | | | 148 | |
Twenty-First Century Fox, Inc. | | | 53 | | | | 1,950 | |
BARROW ALL-CAP LONG/SHORT FUND
SCHEDULE OF SECURITIES SOLD SHORT (Continued) | |
| COMMON STOCKS — 87.3% (Continued) | | Shares | | | Value | |
| Consumer Discretionary — 20.5% (Continued) | | | | | | |
| Media — 2.2% (Continued) | | | | | | |
Walt Disney Company (The) | | | 13 | | | $ | 1,203 | |
| | | | | | | | 211,422 | |
| Multiline Retail — 0.8% | | | | | | | | |
Big Lots, Inc. | | | 211 | | | | 10,719 | |
Burlington Stores, Inc. | | | 297 | | | | 13,267 | |
Fred's, Inc. - Class A | | | 972 | | | | 15,066 | |
Kohl's Corporation | | | 48 | | | | 2,862 | |
Target Corporation | | | 203 | | | | 15,022 | |
Tuesday Morning Corporation | | | 989 | | | | 21,065 | |
| | | | | | | | 78,001 | |
| Specialty Retail — 3.5% | | | | | | | | |
Aaron's, Inc. | | | 148 | | | | 4,200 | |
Abercrombie & Fitch Company - Class A | | | 403 | | | | 11,626 | |
Advance Auto Parts, Inc. | | | 43 | | | | 6,324 | |
Aéropostale, Inc. | | | 637 | | | | 2,217 | |
Asbury Automotive Group, Inc. | | | 71 | | | | 5,375 | |
AutoNation, Inc. | | | 215 | | | | 12,780 | |
Barnes & Noble, Inc. | | | 811 | | | | 18,945 | |
bebe stores, inc. | | | 380 | | | | 1,148 | |
Cabela's, Inc. | | | 237 | | | | 12,855 | |
CarMax, Inc. | | | 240 | | | | 13,675 | |
Chico's FAS, Inc. | | | 338 | | | | 5,364 | |
CST Brands, Inc. | | | 238 | | | | 10,391 | |
Dick's Sporting Goods, Inc. | | | 38 | | | | 1,923 | |
Five Below, Inc. | | | 358 | | | | 16,704 | |
Lithia Motors, Inc. - Class A | | | 196 | | | | 14,408 | |
Lowe's Companies, Inc. | | | 232 | | | | 14,809 | |
Lumber Liquidators Holdings, Inc. | | | 49 | | | | 3,116 | |
MarineMax, Inc. | | | 138 | | | | 2,554 | |
Mattress Firm Holding Corporation | | | 85 | | | | 6,037 | |
Men's Wearhouse, Inc. (The) | | | 248 | | | | 11,587 | |
Monro Muffler Brake, Inc. | | | 199 | | | | 10,903 | |
Office Depot, Inc. | | | 2,879 | | | | 19,088 | |
O'Reilly Automotive, Inc. | | | 5 | | | | 914 | |
Penske Automotive Group, Inc. | | | 288 | | | | 13,637 | |
Pep Boys - Manny Moe & Jack (The) | | | 1,490 | | | | 14,513 | |
Rent-A-Center, Inc. | | | 76 | | | | 2,622 | |
Restoration Hardware Holdings, Inc. | | | 217 | | | | 18,330 | |
Sears Hometown and Outlet Stores, Inc. | | | 129 | | | | 1,694 | |
Stage Stores, Inc. | | | 845 | | | | 17,314 | |
BARROW ALL-CAP LONG/SHORT FUND
SCHEDULE OF SECURITIES SOLD SHORT (Continued) | |
| COMMON STOCKS — 87.3% (Continued) | | Shares | | | Value | |
| Consumer Discretionary — 20.5% (Continued) | | | | | | |
| Specialty Retail — 3.5% (Continued) | | | | | | |
Stein Mart, Inc. | | | 480 | | | $ | 6,816 | |
Systemax, Inc. | | | 193 | | | | 2,494 | |
Tiffany & Company | | | 123 | | | | 13,274 | |
Tractor Supply Company | | | 154 | | | | 11,847 | |
Ulta Salon Cosmetics & Fragrance, Inc. | | | 121 | | | | 15,305 | |
| | | | | | | | 324,789 | |
| Textiles, Apparel & Luxury Goods — 1.7% | | | | | | | | |
Columbia Sportswear Company | | | 343 | | | | 15,452 | |
CROCS, Inc. | | | 711 | | | | 9,442 | |
Deckers Outdoor Corporation | | | 53 | | | | 5,126 | |
Hanesbrands, Inc. | | | 125 | | | | 14,465 | |
Kate Spade & Company | | | 461 | | | | 14,766 | |
NIKE, Inc. - Class B | | | 144 | | | | 14,298 | |
Oxford Industries, Inc. | | | 38 | | | | 2,517 | |
PVH Corporation | | | 93 | | | | 11,824 | |
Quiksilver, Inc. | | | 927 | | | | 1,891 | |
Skechers U.S.A., Inc. - Class A | | | 308 | | | | 18,914 | |
Under Armour, Inc. - Class A | | | 211 | | | | 15,295 | |
Unifi, Inc. | | | 369 | | | | 10,509 | |
VF Corporation | | | 111 | | | | 8,344 | |
Vince Holding Corporation | | | 266 | | | | 9,877 | |
Wolverine World Wide, Inc. | | | 275 | | | | 8,390 | |
| | | | | | | | 161,110 | |
| Consumer Staples — 16.7% | | | | | | | | |
| Beverages — 2.6% | | | | | | | | |
Boston Beer Company, Inc. - Class A | | | 228 | | | | 59,957 | |
Brown-Forman Corporation - Class B | | | 303 | | | | 29,406 | |
| Coca-Cola Bottling Company Consolidated | | | 561 | | | | 53,048 | |
Coca-Cola Company (The) | | | 323 | | | | 14,480 | |
Coca-Cola Enterprises, Inc. | | | 576 | | | | 25,310 | |
Constellation Brands, Inc. - Class A | | | 309 | | | | 29,788 | |
| Molson Coors Brewing Company - Class B | | | 363 | | | | 28,078 | |
Monster Beverage Corporation | | | 79 | | | | 8,860 | |
| | | | | | | | 248,927 | |
| Food & Staples Retailing — 4.7% | | | | | | | | |
Anderson's, Inc. (The) | | | 838 | | | | 45,286 | |
Casey's General Stores, Inc. | | | 293 | | | | 24,530 | |
Chefs' Warehouse, Inc. (The) | | | 870 | | | | 14,981 | |
Costco Wholesale Corporation | | | 219 | | | | 31,124 | |
Fresh Market, Inc. (The) | | | 604 | | | | 24,740 | |
BARROW ALL-CAP LONG/SHORT FUND
SCHEDULE OF SECURITIES SOLD SHORT (Continued) | |
| COMMON STOCKS — 87.3% (Continued) | | Shares | | | Value | |
| Consumer Staples — 16.7% (Continued) | | | | | | |
| Food & Staples Retailing — 4.7% (Continued) | | | | | | |
Kroger Company (The) | | | 495 | | | $ | 29,621 | |
Natural Grocers by Vitamin Cottage, Inc. | | | 957 | | | | 21,513 | |
PriceSmart, Inc. | | | 333 | | | | 32,288 | |
Rite Aid Corporation | | | 2,131 | | | | 11,678 | |
SpartanNash Company | | | 1,289 | | | | 30,072 | |
Sprouts Farmers Market, Inc. | | | 835 | | | | 26,545 | |
Sysco Corporation | | | 703 | | | | 28,303 | |
United Natural Foods, Inc. | | | 760 | | | | 57,144 | |
Walgreen Company | | | 400 | | | | 27,444 | |
Wal-Mart Stores, Inc. | | | 55 | | | | 4,815 | |
Whole Foods Market, Inc. | | | 580 | | | | 28,437 | |
| | | | | | | | 438,521 | |
| Food Products — 7.3% | | | | | | | | |
Archer-Daniels-Midland Company | | | 578 | | | | 30,449 | |
Boulder Brands, Inc. | | | 2,199 | | | | 23,749 | |
Bunge Ltd. | | | 327 | | | | 29,682 | |
Calavo Growers, Inc. | | | 250 | | | | 10,735 | |
Campbell Soup Company | | | 232 | | | | 10,505 | |
ConAgra Foods, Inc. | | | 825 | | | | 30,129 | |
Darling Ingredients, Inc. | | | 1,200 | | | | 22,320 | |
Dean Foods Company | | | 2,240 | | | | 38,192 | |
Diamond Foods, Inc. | | | 1,426 | | | | 42,481 | |
Farmer Brothers Company | | | 389 | | | | 11,094 | |
Flowers Foods, Inc. | | | 1,264 | | | | 24,648 | |
Fresh Del Monte Produce, Inc. | | | 1,545 | | | | 52,159 | |
Hain Celestial Group, Inc. (The) | | | 443 | | | | 50,156 | |
Hershey Company (The) | | | 91 | | | | 9,126 | |
Keurig Green Mountain, Inc. | | | 180 | | | | 25,585 | |
McCormick & Company, Inc. | | | 373 | | | | 27,725 | |
Mead Johnson Nutrition Company | | | 103 | | | | 10,696 | |
| Mondelēz International, Inc. - Class A | | | 727 | | | | 28,498 | |
Post Holdings, Inc. | | | 272 | | | | 10,880 | |
Snyder's-Lance, Inc. | | | 1,591 | | | | 48,176 | |
Tootsie Roll Industries, Inc. | | | 1,489 | | | | 43,389 | |
TreeHouse Foods, Inc. | | | 697 | | | | 56,422 | |
WhiteWave Foods Company (The) | | | 1,259 | | | | 46,117 | |
| | | | | | | | 682,913 | |
| Household Products — 0.5% | | | | | | | | |
Colgate-Palmolive Company | | | 355 | | | | 24,704 | |
Kimberly Clark Corporation | | | 184 | | | | 21,453 | |
BARROW ALL-CAP LONG/SHORT FUND
SCHEDULE OF SECURITIES SOLD SHORT (Continued) | |
| COMMON STOCKS — 87.3% (Continued) | | Shares | | | Value | |
| Consumer Staples — 16.7% (Continued) | | | | | | |
| Household Products — 0.5% (Continued) | | | | | | |
Procter & Gamble Company (The) | | | 28 | | | $ | 2,532 | |
| | | | | | | | 48,689 | |
| Personal Products — 1.6% | | | | | | | | |
Avon Products, Inc. | | | 1,901 | | | | 18,592 | |
Coty, Inc. - Class A | | | 1,018 | | | | 20,604 | |
Elizabeth Arden, Inc. | | | 2,256 | | | | 39,209 | |
| Estée Lauder Companies, Inc. (The) - Class A | | | 259 | | | | 19,202 | |
IGI Laboratories, Inc. | | | 1,213 | | | | 12,700 | |
Inter Parfums, Inc. | | | 1,538 | | | | 39,450 | |
Synutra International, Inc. | | | 361 | | | | 1,921 | |
| | | | | | | | 151,678 | |
| Energy — 8.6% | | | | | | | | |
| Energy Equipment & Services — 1.2% | | | | | | | | |
Basic Energy Services, Inc. | | | 337 | | | | 3,009 | |
Bristow Group, Inc. | | | 126 | | | | 8,077 | |
CSI Compressco, L.P. | | | 165 | | | | 3,371 | |
Era Group, Inc. | | | 499 | | | | 10,504 | |
Exterran Holdings, Inc. | | | 189 | | | | 6,331 | |
Exterran Partners, L.P. | | | 341 | | | | 8,430 | |
Gulfmark Offshore, Inc. - Class A | | | 65 | | | | 1,693 | |
Helix Energy Solutions Group, Inc. | | | 139 | | | | 3,179 | |
ION Geophysical Corporation | | | 1,708 | | | | 4,219 | |
Key Energy Services, Inc. | | | 1,561 | | | | 2,935 | |
McDermott International, Inc. | | | 2,367 | | | | 8,403 | |
Parker Drilling Company | | | 549 | | | | 1,949 | |
Patterson-UTI Energy, Inc. | | | 292 | | | | 5,165 | |
Pioneer Energy Services Corporation | | | 700 | | | | 4,228 | |
Rowan Companies plc - Class A | | | 378 | | | | 8,229 | |
SEACOR Holdings, Inc. | | | 149 | | | | 10,600 | |
Superior Energy Services, Inc. | | | 66 | | | | 1,274 | |
TETRA Technologies, Inc. | | | 1,443 | | | | 9,163 | |
Tidewater, Inc. | | | 80 | | | | 2,473 | |
USA Compression Partners, L.P. | | | 300 | | | | 5,700 | |
Willbros Group, Inc. | | | 383 | | | | 1,743 | |
| | | | | | | | 110,675 | |
| Oil, Gas & Consumable Fuels — 7.4% | | | | | | | | |
Access Midstream Partners, L.P. | | | 198 | | | | 12,411 | |
Alon USA Energy, Inc. | | | 992 | | | | 13,848 | |
Antero Resources Corporation | | | 150 | | | | 7,038 | |
Atlas Energy, L.P. | | | 344 | | | | 12,205 | |
BARROW ALL-CAP LONG/SHORT FUND
SCHEDULE OF SECURITIES SOLD SHORT (Continued) | |
| COMMON STOCKS — 87.3% (Continued) | | Shares | | | Value | |
| Energy — 8.6% (Continued) | | | | | | |
| Oil, Gas & Consumable Fuels — 7.4% (Continued) | | | | | | |
Bill Barrett Corporation | | | 320 | | | $ | 3,242 | |
Boardwalk Pipeline Partners, L.P. | | | 598 | | | | 9,867 | |
Bonanza Creek Energy, Inc. | | | 58 | | | | 1,579 | |
Buckeye Partners, L.P. | | | 142 | | | | 10,916 | |
Cabot Oil & Gas Corporation | | | 238 | | | | 7,864 | |
Callon Petroleum Company | | | 300 | | | | 1,473 | |
Carrizo Oil & Gas, Inc. | | | 179 | | | | 7,063 | |
Cheniere Energy Partners, L.P. | | | 198 | | | | 5,758 | |
Cheniere Energy, Inc. | | | 202 | | | | 13,330 | |
Chesapeake Energy Corporation | | | 179 | | | | 3,627 | |
Cloud Peak Energy, Inc. | | | 367 | | | | 4,283 | |
Cobalt International Energy, Inc. | | | 793 | | | | 7,137 | |
Comstock Resources, Inc. | | | 357 | | | | 3,163 | |
Concho Resources, Inc. | | | 98 | | | | 9,335 | |
CONSOL Energy, Inc. | | | 301 | | | | 11,778 | |
Crestwood Equity Partners, L.P. | | | 488 | | | | 4,392 | |
Crestwood Midstream Partners, L.P. | | | 356 | | | | 7,148 | |
CrossAmerica Partners, L.P. | | | 110 | | | | 3,631 | |
DCP Midstream Partners, L.P. | | | 173 | | | | 8,288 | |
Diamondback Energy, Inc. | | | 221 | | | | 12,464 | |
Enbridge Energy Partners, L.P. | | | 351 | | | | 13,163 | |
Energen Corporation | | | 159 | | | | 9,495 | |
Energy Transfer Equity, L.P. | | | 233 | | | | 13,838 | |
Energy Transfer Partners, L.P. | | | 138 | | | | 8,993 | |
EnLink Midstream Partners, L.P. | | | 415 | | | | 11,574 | |
Enlink Midstream, LLC | | | 322 | | | | 11,647 | |
Enterprise Products Partners, L.P. | | | 322 | | | | 12,023 | |
EQT Corporation | | | 122 | | | | 11,100 | |
EQT Midstream Partners, L.P. | | | 147 | | | | 12,295 | |
EV Energy Partners, L.P. | | | 399 | | | | 11,304 | |
Gastar Exploration, Inc. | | | 304 | | | | 897 | |
Genesis Energy, L.P. | | | 270 | | | | 11,888 | |
Gulfport Energy Corporation | | | 229 | | | | 10,930 | |
Hess Corporation | | | 35 | | | | 2,553 | |
Holly Energy Partners, L.P. | | | 99 | | | | 3,331 | |
Jones Energy, Inc. - Class A | | | 667 | | | | 6,770 | |
Kinder Morgan, Inc. | | | 273 | | | | 11,289 | |
Laredo Petroleum, Inc. | | | 567 | | | | 5,925 | |
Legacy Reserves, L.P. | | | 33 | | | | 588 | |
LinnCo, LLC | | | 257 | | | | 4,217 | |
BARROW ALL-CAP LONG/SHORT FUND
SCHEDULE OF SECURITIES SOLD SHORT (Continued) | |
| COMMON STOCKS — 87.3% (Continued) | | Shares | | | Value | |
| Energy — 8.6% (Continued) | | | | | | |
| Oil, Gas & Consumable Fuels — 7.4% (Continued) | | | | | | |
Magellan Midstream Partners, L.P. | | | 73 | | | $ | 6,051 | |
Magnum Hunter Resources Corporation | | | 2,411 | | | | 9,644 | |
MarkWest Energy Partners, L.P. | | | 157 | | | | 11,156 | |
Matador Resources Company | | | 384 | | | | 6,755 | |
Memorial Production Partners, L.P. | | | 310 | | | | 4,266 | |
MPLX, L.P. | | | 174 | | | | 11,555 | |
Newfield Exploration Company | | | 97 | | | | 2,641 | |
NGL Energy Partners, L.P. | | | 349 | | | | 12,180 | |
Noble Energy, Inc. | | | 111 | | | | 5,459 | |
NuStar Energy, L.P. | | | 239 | | | | 13,384 | |
Oiltanking Partners, L.P. | | | 55 | | | | 2,655 | |
ONEOK Partners, L.P. | | | 79 | | | | 3,482 | |
ONEOK, Inc. | | | 152 | | | | 8,232 | |
Par Petroleum Corporation | | | 243 | | | | 3,657 | |
PDC Energy, Inc. | | | 266 | | | | 7,850 | |
Phillips 66 | | | 123 | | | | 8,981 | |
Pioneer Natural Resources Company | | | 63 | | | | 9,024 | |
Plains All American Pipeline, L.P. | | | 74 | | | | 3,807 | |
Plains GP Holdings, L.P. - Class A | | | 40 | | | | 1,039 | |
QEP Midstream Partners, L.P. | | | 50 | | | | 803 | |
QEP Resources, Inc. | | | 265 | | | | 5,417 | |
Range Resources Corporation | | | 149 | | | | 9,782 | |
Regency Energy Partners, L.P. | | | 282 | | | | 8,034 | |
Rentech, Inc. | | | 3,361 | | | | 4,336 | |
Resolute Energy Corporation | | | 486 | | | | 914 | |
Rex Energy Corporation | | | 415 | | | | 2,913 | |
Rice Energy, Inc. | | | 65 | | | | 1,619 | |
Rose Rock Midstream, L.P. | | | 204 | | | | 10,951 | |
RSP Permian, Inc. | | | 174 | | | | 3,786 | |
Sanchez Energy Corporation | | | 319 | | | | 3,602 | |
SemGroup Corporation - Class A | | | 199 | | | | 14,724 | |
Seventy Seven Energy, Inc. | | | 66 | | | | 513 | |
SM Energy Company | | | 29 | | | | 1,260 | |
Spectra Energy Corporation | | | 302 | | | | 11,440 | |
Stone Energy Corporation | | | 104 | | | | 1,643 | |
Sunoco Logistics Partners, L.P. | | | 231 | | | | 11,120 | |
Synergy Resources Corporation | | | 1,208 | | | | 11,850 | |
Tallgrass Energy Partners, L.P. | | | 160 | | | | 6,837 | |
Targa Resources Corporation | | | 102 | | | | 11,642 | |
Targa Resources Partners, L.P. | | | 175 | | | | 9,595 | |
BARROW ALL-CAP LONG/SHORT FUND
SCHEDULE OF SECURITIES SOLD SHORT (Continued) | |
| COMMON STOCKS — 87.3% (Continued) | | Shares | | | Value | |
| Energy — 8.6% (Continued) | | | | | | |
| Oil, Gas & Consumable Fuels — 7.4% (Continued) | | | | | | |
Tesoro Logistics, L.P. | | | 234 | | | $ | 13,401 | |
Triangle Petroleum Corporation | | | 739 | | | | 3,562 | |
W&T Offshore, Inc. | | | 66 | | | | 497 | |
Western Gas Equity Partners, L.P. | | | 186 | | | | 11,681 | |
Western Gas Partners, L.P. | | | 162 | | | | 11,491 | |
Western Refining Logistics, L.P. | | | 195 | | | | 6,065 | |
Whiting Petroleum Corporation | | | 68 | | | | 2,840 | |
Williams Companies, Inc. | | | 255 | | | | 13,196 | |
Williams Partners, L.P. | | | 211 | | | | 10,917 | |
WPX Energy, Inc. | | | 691 | | | | 9,377 | |
| | | | | | | | 703,286 | |
Financials — 0.0% (a) | | | | | | | | |
Real Estate Investment Trusts — 0.0% (a) | | | | | | | | |
OUTFRONT Media, Inc. | | | 77 | | | | 2,084 | |
| | | | | | | | | |
| Health Care — 15.6% | | | | | | | | |
Biotechnology — 0.0% (a) | | | | | | | | |
Asterias Biotherapeutics, Inc. | | | 1 | | | | 4 | |
| | | | | | | | | |
| Health Care Equipment & Supplies — 7.9% | | | | | | | | |
Abaxis, Inc. | | | 56 | | | | 3,214 | |
Abiomed, Inc. | | | 477 | | | | 16,943 | |
Accuray, Inc. | | | 1,961 | | | | 13,511 | |
Align Technology, Inc. | | | 68 | | | | 3,869 | |
Analogic Corporation | | | 171 | | | | 12,456 | |
AngioDynamics, Inc. | | | 463 | | | | 8,102 | |
Antares Pharma, Inc. | | | 1,175 | | | | 2,702 | |
AtriCure, Inc. | | | 372 | | | | 6,968 | |
Baxter International, Inc. | | | 363 | | | | 26,499 | |
Becton, Dickinson and Company | | | 222 | | | | 31,153 | |
Boston Scientific Corporation | | | 2,023 | | | | 26,036 | |
Cardiovascular Systems, Inc. | | | 542 | | | | 16,618 | |
Cerus Corporation | | | 358 | | | | 1,622 | |
CONMED Corporation | | | 134 | | | | 5,686 | |
Cooper Companies, Inc. (The) | | | 181 | | | | 30,571 | |
Cynosure, Inc. - Class A | | | 549 | | | | 15,136 | |
DENTSPLY International, Inc. | | | 543 | | | | 29,854 | |
DexCom, Inc. | | | 854 | | | | 43,947 | |
Endologix, Inc. | | | 1,147 | | | | 14,716 | |
GenMark Diagnostics, Inc. | | | 795 | | | | 9,031 | |
BARROW ALL-CAP LONG/SHORT FUND
SCHEDULE OF SECURITIES SOLD SHORT (Continued) | |
| COMMON STOCKS — 87.3% (Continued) | | Shares | | | Value | |
| Health Care — 15.6% (Continued) | | | | | | |
| Health Care Equipment & Supplies — 7.9% (Continued) | | | | | | |
Haemonetics Corporation | | | 732 | | | $ | 27,033 | |
Halyard Health, Inc. | | | 23 | | | | 902 | |
HeartWare International, Inc. | | | 187 | | | | 13,750 | |
Hill-Rom Holdings, Inc. | | | 259 | | | | 11,852 | |
Hologic, Inc. | | | 1,087 | | | | 29,132 | |
IDEXX Laboratories, Inc. | | | 206 | | | | 30,766 | |
Inogen, Inc. | | | 61 | | | | 1,482 | |
Insulet Corporation | | | 821 | | | | 38,250 | |
| Integra LifeSciences Holdings Corporation | | | 328 | | | | 16,151 | |
Intuitive Surgical, Inc. | | | 17 | | | | 8,802 | |
Invacare Corporation | | | 726 | | | | 10,984 | |
LDR Holding Corporation | | | 140 | | | | 4,568 | |
Merit Medical Systems, Inc. | | | 1,051 | | | | 15,555 | |
Neogen Corporation | | | 48 | | | | 2,127 | |
NuVasive, Inc. | | | 471 | | | | 20,691 | |
NxStage Medical, Inc. | | | 1,220 | | | | 21,082 | |
OraSure Technologies, Inc. | | | 644 | | | | 5,802 | |
Quidel Corporation | | | 489 | | | | 13,624 | |
Spectranetics Corporation (The) | | | 607 | | | | 19,928 | |
St. Jude Medical, Inc. | | | 63 | | | | 4,281 | |
STAAR Surgical Company | | | 670 | | | | 6,171 | |
STERIS Corporation | | | 42 | | | | 2,677 | |
Stryker Corporation | | | 313 | | | | 29,081 | |
Teleflex, Inc. | | | 52 | | | | 6,196 | |
Volcano Corporation | | | 1,021 | | | | 11,292 | |
West Pharmaceutical Services, Inc. | | | 738 | | | | 38,383 | |
Wright Medical Group, Inc. | | | 531 | | | | 15,553 | |
ZELTIQ Aesthetics, Inc. | | | 765 | | | | 20,938 | |
| | | | | | | | 745,687 | |
| Health Care Providers & Services — 3.6% | | | | | | | | |
Acadia Healthcare Company, Inc. | | | 699 | | | | 43,345 | |
Adeptus Health, Inc. - Class A | | | 214 | | | | 6,514 | |
Air Methods Corporation | | | 580 | | | | 25,740 | |
Amedisys, Inc. | | | 855 | | | | 21,734 | |
AmerisourceBergen Corporation | | | 160 | | | | 14,568 | |
BioScrip, Inc. | | | 1,378 | | | | 8,929 | |
Brookdale Senior Living, Inc. | | | 895 | | | | 31,701 | |
Capital Senior Living Corporation | | | 547 | | | | 13,921 | |
Envision Healthcare Holdings, Inc. | | | 229 | | | | 8,097 | |
ExamWorks Group, Inc. | | | 443 | | | | 17,432 | |
BARROW ALL-CAP LONG/SHORT FUND
SCHEDULE OF SECURITIES SOLD SHORT (Continued) | |
| COMMON STOCKS — 87.3% (Continued) | | Shares | | | Value | |
| Health Care — 15.6% (Continued) | | | | | | |
| Health Care Providers & Services — 3.6% (Continued) | | | | | | |
Express Scripts Holding Company | | | 121 | | | $ | 10,061 | |
Healthways, Inc. | | | 1,008 | | | | 15,705 | |
Henry Schein, Inc. | | | 108 | | | | 14,818 | |
HMS Holdings Corporation | | | 438 | | | | 9,137 | |
LifePoint Hospitals, Inc. | | | 551 | | | | 38,124 | |
McKesson Corporation | | | 113 | | | | 23,816 | |
MWI Veterinary Supply, Inc. | | | 103 | | | | 16,832 | |
Omnicare, Inc. | | | 26 | | | | 1,828 | |
Team Health Holdings, Inc. | | | 125 | | | | 7,145 | |
Universal Health Services, Inc. - Class B | | | 83 | | | | 8,684 | |
| | | | | | | | 338,131 | |
| Health Care Technology — 1.5% | | | | | | | | |
Allscripts Healthcare Solutions, Inc. | | | 2,205 | | | | 26,504 | |
athenahealth, Inc. | | | 234 | | | | 27,448 | |
Cerner Corporation | | | 457 | | | | 29,431 | |
IMS Health Holdings, Inc. | | | 92 | | | | 2,300 | |
Medidata Solutions, Inc. | | | 723 | | | | 30,879 | |
Quality Systems, Inc. | | | 401 | | | | 5,907 | |
Veeva Systems, Inc. - Class A | | | 364 | | | | 11,958 | |
| | | | | | | | 134,427 | |
| Pharmaceuticals — 2.6% | | | | | | | | |
Abbott Laboratories | | | 645 | | | | 28,709 | |
Actavis plc | | | 119 | | | | 32,203 | |
Bristol-Myers Squibb Company | | | 400 | | | | 23,620 | |
ContraVir Pharmaceuticals, Inc. | | | 1 | | | | 1 | |
Hospira, Inc. | | | 519 | | | | 30,953 | |
Jazz Pharmaceuticals plc | | | 60 | | | | 10,625 | |
Mallinckrodt plc | | | 91 | | | | 8,392 | |
Merck & Company, Inc. | | | 387 | | | | 23,375 | |
Mylan, Inc. | | | 483 | | | | 28,309 | |
Perrigo Company plc | | | 34 | | | | 5,446 | |
Salix Pharmaceuticals Ltd. | | | 198 | | | | 20,333 | |
Zoetis, Inc. | | | 753 | | | | 33,832 | |
| | | | | | | | 245,798 | |
| Industrials — 16.8% | | | | | | | | |
| Aerospace & Defense — 2.4% | | | | | | | | |
AAR Corporation | | | 232 | | | | 5,946 | |
AeroVironment, Inc. | | | 310 | | | | 8,590 | |
American Science & Engineering, Inc. | | | 71 | | | | 3,470 | |
Astronics Corporation | | | 174 | | | | 8,529 | |
BARROW ALL-CAP LONG/SHORT FUND
SCHEDULE OF SECURITIES SOLD SHORT (Continued) | |
| COMMON STOCKS — 87.3% (Continued) | | Shares | | | Value | |
| Industrials — 16.8% (Continued) | | | | | | |
| Aerospace & Defense — 2.4% (Continued) | | | | | | |
B/E Aerospace, Inc. | | | 140 | | | $ | 10,902 | |
Boeing Company (The) | | | 87 | | | | 11,689 | |
Curtiss-Wright Corporation | | | 233 | | | | 16,520 | |
DigitalGlobe, Inc. | | | 470 | | | | 12,695 | |
Esterline Technologies Corporation | | | 137 | | | | 16,280 | |
GenCorp, Inc. | | | 487 | | | | 8,133 | |
General Dynamics Corporation | | | 23 | | | | 3,343 | |
HEICO Corporation | | | 65 | | | | 3,446 | |
Hexcel Corporation | | | 357 | | | | 15,455 | |
Honeywell International, Inc. | | | 30 | | | | 2,972 | |
Huntington Ingalls Industries, Inc. | | | 62 | | | | 6,756 | |
MOOG, Inc. - Class A | | | 219 | | | | 15,939 | |
Orbital Sciences Corporation | | | 85 | | | | 2,314 | |
Precision Castparts Corporation | | | 10 | | | | 2,379 | |
Rockwell Collins, Inc. | | | 119 | | | | 10,178 | |
| Spirit Aerosystems Holdings, Inc. - Class A | | | 412 | | | | 17,761 | |
Taser International, Inc. | | | 220 | | | | 4,726 | |
Teledyne Technologies, Inc. | | | 134 | | | | 14,326 | |
Textron, Inc. | | | 311 | | | | 13,472 | |
Triumph Group, Inc. | | | 20 | | | | 1,361 | |
United Technologies Corporation | | | 63 | | | | 6,935 | |
| | | | | | | | 224,117 | |
| Air Freight & Logistics — 0.6% | | | | | | | | |
Air Transport Services Group, Inc. | | | 1,083 | | | | 8,610 | |
Echo Global Logistics, Inc. | | | 126 | | | | 3,534 | |
FedEx Corporation | | | 77 | | | | 13,720 | |
Hub Group, Inc. - Class A | | | 44 | | | | 1,655 | |
United Parcel Service, Inc. - Class B | | | 91 | | | | 10,003 | |
UTi Worldwide, Inc. | | | 875 | | | | 10,325 | |
XPO Logistics, Inc. | | | 284 | | | | 10,985 | |
| | | | | | | | 58,832 | |
| Building Products — 1.8% | | | | | | | | |
A.O. Smith Corporation | | | 45 | | | | 2,427 | |
Apogee Enterprises, Inc. | | | 274 | | | | 12,393 | |
Armstrong World Industries, Inc. | | | 272 | | | | 13,627 | |
Builders FirstSource, Inc. | | | 1,217 | | | | 7,497 | |
Continental Building Products, Inc. | | | 167 | | | | 2,789 | |
Fortune Brands Home & Security, Inc. | | | 281 | | | | 12,623 | |
Gibraltar Industries, Inc. | | | 491 | | | | 7,046 | |
Griffon Corporation | | | 123 | | | | 1,531 | |
BARROW ALL-CAP LONG/SHORT FUND
SCHEDULE OF SECURITIES SOLD SHORT (Continued) | |
| COMMON STOCKS — 87.3% (Continued) | | Shares | | | Value | |
| Industrials — 16.8% (Continued) | | | | | | |
| Building Products — 1.8% (Continued) | | | | | | |
Lennox International, Inc. | | | 45 | | | $ | 4,215 | |
Masco Corporation | | | 355 | | | | 8,591 | |
Masonite International Corporation | | | 181 | | | | 10,608 | |
NCI Building Systems, Inc. | | | 542 | | | | 10,114 | |
Nortek, Inc. | | | 58 | | | | 4,624 | |
Owens Corning, Inc. | | | 377 | | | | 13,135 | |
PGT, Inc. | | | 283 | | | | 2,663 | |
Ply Gem Holdings, Inc. | | | 269 | | | | 3,368 | |
Quanex Building Products Corporation | | | 528 | | | | 10,444 | |
Simpson Manufacturing Company, Inc. | | | 206 | | | | 6,839 | |
Trex Company, Inc. | | | 243 | | | | 10,240 | |
Universal Forest Products, Inc. | | | 138 | | | | 6,588 | |
USG Corporation | | | 503 | | | | 14,491 | |
| | | | | | | | 165,853 | |
| Commercial Services & Supplies — 2.3% | | | | | | | | |
ABM Industries, Inc. | | | 144 | | | | 3,901 | |
ARC Document Solutions, Inc. | | | 163 | | | | 1,570 | |
Brady Corporation - Class A | | | 37 | | | | 925 | |
Brink's Company (The) | | | 227 | | | | 4,926 | |
CECO Environmental Corporation | | | 41 | | | | 580 | |
Cintas Corporation | | | 14 | | | | 1,024 | |
Clean Harbors, Inc. | | | 269 | | | | 12,576 | |
Copart, Inc. | | | 96 | | | | 3,489 | |
Covanta Holding Corporation | | | 620 | | | | 15,543 | |
G&K Services, Inc. - Class A | | | 13 | | | | 846 | |
Healthcare Services Group, Inc. | | | 435 | | | | 13,120 | |
Herman Miller, Inc. | | | 299 | | | | 9,087 | |
InnerWorkings, Inc. | | | 87 | | | | 651 | |
Interface, Inc. | | | 464 | | | | 7,016 | |
Iron Mountain, Inc. | | | 332 | | | | 12,619 | |
KAR Auction Services, Inc. | | | 493 | | | | 17,082 | |
Kimball International, Inc. - Class B | | | 374 | | | | 3,512 | |
Knoll, Inc. | | | 341 | | | | 6,319 | |
McGrath RentCorp | | | 260 | | | | 9,168 | |
Mobile Mini, Inc. | | | 175 | | | | 7,261 | |
MSA Safety, Inc. | | | 115 | | | | 6,317 | |
Multi-Color Corporation | | | 17 | | | | 932 | |
Republic Services, Inc. | | | 322 | | | | 12,754 | |
SP Plus Corporation | | | 131 | | | | 2,722 | |
Stericycle, Inc. | | | 99 | | | | 12,763 | |
BARROW ALL-CAP LONG/SHORT FUND
SCHEDULE OF SECURITIES SOLD SHORT (Continued) | |
| COMMON STOCKS — 87.3% (Continued) | | Shares | | | Value | |
| Industrials — 16.8% (Continued) | | | | | | |
| Commercial Services & Supplies — 2.3% (Continued) | | | | | | |
Team, Inc. | | | 203 | | | $ | 8,244 | |
Tetra Tech, Inc. | | | 279 | | | | 7,583 | |
US Ecology, Inc. | | | 57 | | | | 2,270 | |
Viad Corporation | | | 96 | | | | 2,307 | |
Waste Connections, Inc. | | | 254 | | | | 11,991 | |
Waste Management, Inc. | | | 265 | | | | 12,913 | |
| | | | | | | | 212,011 | |
| Construction & Engineering — 0.6% | | | | | | | | |
AECOM Technology Corporation | | | 116 | | | | 3,713 | |
Aegion Corporation | | | 395 | | | | 7,525 | |
Ameresco, Inc. - Class A | | | 174 | | | | 1,342 | |
Comfort Systems USA, Inc. | | | 255 | | | | 3,664 | |
Dycom Industries, Inc. | | | 326 | | | | 9,972 | |
Granite Construction, Inc. | | | 280 | | | | 10,038 | |
Great Lakes Dredge & Dock Company | | | 782 | | | | 5,928 | |
Jacobs Engineering Group, Inc. | | | 152 | | | | 7,060 | |
MasTec, Inc. | | | 105 | | | | 2,531 | |
Quanta Services, Inc. | | | 248 | | | | 7,564 | |
| | | | | | | | 59,337 | |
| Electrical Equipment — 0.7% | | | | | | | | |
Acuity Brands, Inc. | | | 60 | | | | 8,292 | |
Eaton Corporation plc | | | 109 | | | | 7,393 | |
Encore Wire Corporation | | | 60 | | | | 2,200 | |
Enphase Energy, Inc. | | | 143 | | | | 1,503 | |
Franklin Electric Company, Inc. | | | 143 | | | | 5,371 | |
General Cable Corporation | | | 85 | | | | 1,170 | |
GrafTech International Ltd. | | | 1,184 | | | | 4,831 | |
Polypore International, Inc. | | | 157 | | | | 8,079 | |
Power Solutions International, Inc. | | | 136 | | | | 8,928 | |
PowerSecure International, Inc. | | | 70 | | | | 701 | |
Regal-Beloit Corporation | | | 124 | | | | 8,968 | |
SolarCity Corporation | | | 149 | | | | 8,195 | |
Vicor Corporation | | | 199 | | | | 2,428 | |
| | | | | | | | 68,059 | |
Industrial Conglomerates — 0.0% (a) | | | | | | | | |
General Electric Company | | | 83 | | | | 2,199 | |
| | | | | | | | | |
| Machinery — 3.9% | | | | | | | | |
Alamo Group, Inc. | | | 39 | | | | 1,858 | |
| Albany International Corporation - Class A | | | 237 | | | | 8,857 | |
BARROW ALL-CAP LONG/SHORT FUND
SCHEDULE OF SECURITIES SOLD SHORT (Continued) | |
| COMMON STOCKS — 87.3% (Continued) | | Shares | | | Value | |
| Industrials — 16.8% (Continued) | | | | | | |
| Machinery — 3.9% (Continued) | | | | | | |
Altra Industrial Motion Corporation | | | 106 | | | $ | 3,247 | |
Astec Industries, Inc. | | | 244 | | | | 9,582 | |
Barnes Group, Inc. | | | 390 | | | | 14,325 | |
Blount International, Inc. | | | 209 | | | | 3,432 | |
Briggs & Stratton Corporation | | | 464 | | | | 9,303 | |
Caterpillar, Inc. | | | 110 | | | | 11,066 | |
Chart Industries, Inc. | | | 153 | | | | 6,076 | |
CIRCOR International, Inc. | | | 63 | | | | 4,218 | |
CLARCOR, Inc. | | | 124 | | | | 8,170 | |
Colfax Corporation | | | 189 | | | | 9,739 | |
Cummins, Inc. | | | 49 | | | | 7,135 | |
Donaldson Company, Inc. | | | 284 | | | | 11,076 | |
EnPro Industries, Inc. | | | 145 | | | | 9,355 | |
ESCO Technologies, Inc. | | | 156 | | | | 5,619 | |
Federal Signal Corporation | | | 53 | | | | 791 | |
Flowserve Corporation | | | 131 | | | | 7,712 | |
Gorman-Rupp Company (The) | | | 279 | | | | 8,733 | |
Harsco Corporation | | | 567 | | | | 10,977 | |
Ingersoll-Rand plc | | | 66 | | | | 4,162 | |
ITT Corporation | | | 306 | | | | 12,668 | |
John Bean Technologies Corporation | | | 211 | | | | 6,402 | |
Kennametal, Inc. | | | 336 | | | | 12,372 | |
Lydall, Inc. | | | 169 | | | | 4,490 | |
Manitowoc Company, Inc. (The) | | | 2 | | | | 40 | |
Meritor, Inc. | | | 480 | | | | 6,758 | |
Middleby Corporation (The) | | | 127 | | | | 12,146 | |
Mueller Industries, Inc. | | | 38 | | | | 1,247 | |
Mueller Water Products, Inc. - Class A | | | 601 | | | | 5,704 | |
NACCO Industries, Inc. - Class A | | | 53 | | | | 3,076 | |
Nordson Corporation | | | 11 | | | | 860 | |
Pall Corporation | | | 137 | | | | 13,167 | |
Parker Hannifin Corporation | | | 42 | | | | 5,419 | |
Proto Labs, Inc. | | | 107 | | | | 6,944 | |
RBC Bearings, Inc. | | | 71 | | | | 4,514 | |
Rexnord Corporation | | | 259 | | | | 7,135 | |
SPX Corporation | | | 150 | | | | 13,454 | |
Tennant Company | | | 100 | | | | 6,745 | |
Terex Corporation | | | 232 | | | | 6,658 | |
Timken Company | | | 156 | | | | 6,675 | |
Titan International, Inc. | | | 650 | | | | 6,435 | |
BARROW ALL-CAP LONG/SHORT FUND
SCHEDULE OF SECURITIES SOLD SHORT (Continued) | |
| COMMON STOCKS — 87.3% (Continued) | | Shares | | | Value | |
| Industrials — 16.8% (Continued) | | | | | | |
| Machinery — 3.9% (Continued) | | | | | | |
Trimas Corporation | | | 109 | | | $ | 3,393 | |
Trinity Industries, Inc. | | | 193 | | | | 6,188 | |
WABCO Holdings, Inc. | | | 116 | | | | 11,904 | |
Watts Water Technologies, Inc. - Class A | | | 249 | | | | 15,055 | |
| Westinghouse Air Brake Technologies Corporation | | | 66 | | | | 5,840 | |
Woodward, Inc. | | | 317 | | | | 16,383 | |
Xylem, Inc. | | | 321 | | | | 12,307 | |
| | | | | | | | 369,412 | |
| Marine — 0.2% | | | | | | | | |
Kirby Corporation | | | 110 | | | | 10,575 | |
Matson, Inc. | | | 136 | | | | 4,789 | |
Scorpio Bulkers, Inc. | | | 222 | | | | 726 | |
| | | | | | | | 16,090 | |
| Professional Services — 1.3% | | | | | | | | |
Acacia Research Corporation | | | 594 | | | | 11,298 | |
Advisory Board Company (The) | | | 262 | | | | 11,161 | |
Barrett Business Services, Inc. | | | 22 | | | | 480 | |
| Corporate Executive Board Company (The) | | | 216 | | | | 15,813 | |
IHS, Inc. - Class A | | | 92 | | | | 11,266 | |
Kelly Services, Inc. - Class A | | | 498 | | | | 7,689 | |
Kforce, Inc. | | | 370 | | | | 8,636 | |
ManpowerGroup, Inc. | | | 60 | | | | 4,012 | |
Mistras Group, Inc. | | | 446 | | | | 7,622 | |
Nielsen Holdings N.V. | | | 240 | | | | 10,025 | |
Paylocity Holding Corporation | | | 322 | | | | 9,367 | |
Pendrell Corporation | | | 1,319 | | | | 1,860 | |
TriNet Group, Inc. | | | 140 | | | | 4,432 | |
TrueBlue, Inc. | | | 89 | | | | 2,043 | |
WageWorks, Inc. | | | 183 | | | | 10,691 | |
| | | | | | | | 116,395 | |
| Road & Rail — 2.3% | | | | | | | | |
Amerco, Inc. | | | 7 | | | | 1,947 | |
ArcBest Corporation | | | 261 | | | | 11,333 | |
Celadon Group, Inc. | | | 413 | | | | 9,102 | |
Con-Way, Inc. | | | 339 | | | | 16,794 | |
CSX Corporation | | | 361 | | | | 13,173 | |
Genesee & Wyoming, Inc. - Class A | | | 118 | | | | 11,634 | |
Heartland Express, Inc. | | | 527 | | | | 13,981 | |
J.B. Hunt Transport Services, Inc. | | | 158 | | | | 13,040 | |
Kansas City Southern | | | 102 | | | | 12,132 | |
BARROW ALL-CAP LONG/SHORT FUND
SCHEDULE OF SECURITIES SOLD SHORT (Continued) | |
| COMMON STOCKS — 87.3% (Continued) | | Shares | | | Value | |
| Industrials — 16.8% (Continued) | | | | | | |
| Road & Rail — 2.3% (Continued) | | | | | | |
Knight Transportation, Inc. | | | 460 | | | $ | 15,304 | |
Marten Transport Ltd. | | | 463 | | | | 9,954 | |
Norfolk Southern Corporation | | | 119 | | | | 13,285 | |
Old Dominion Freight Line, Inc. | | | 191 | | | | 15,479 | |
Ryder System, Inc. | | | 69 | | | | 6,591 | |
Saia, Inc. | | | 121 | | | | 6,712 | |
Swift Transportation Company | | | 579 | | | | 16,832 | |
Union Pacific Corporation | | | 120 | | | | 14,012 | |
Werner Enterprises, Inc. | | | 430 | | | | 13,339 | |
| | | | | | | | 214,644 | |
| Trading Companies & Distributors — 0.5% | | | | | | | | |
Aceto Corporation | | | 39 | | | | 819 | |
Beacon Roofing Supply, Inc. | | | 168 | | | | 4,549 | |
DXP Enterprises, Inc. | | | 7 | | | | 411 | |
Fastenal Company | | | 253 | | | | 11,436 | |
H&E Equipment Services, Inc. | | | 267 | | | | 9,345 | |
Kaman Corporation | | | 59 | | | | 2,321 | |
MRC Global, Inc. | | | 286 | | | | 5,780 | |
| MSC Industrial Direct Company, Inc. - Class A | | | 53 | | | | 4,117 | |
Rush Enterprises, Inc. - Class A | | | 170 | | | | 5,964 | |
Stock Building Supply Holdings, Inc. | | | 207 | | | | 3,314 | |
Veritiv Corporation | | | 5 | | | | 251 | |
Watsco, Inc. | | | 15 | | | | 1,522 | |
| | | | | | | | 49,829 | |
| Transportation Infrastructure — 0.2% | | | | | | | | |
Macquarie Infrastructure Company, LLC | | | 244 | | | | 17,153 | |
Wesco Aircraft Holdings, Inc. | | | 313 | | | | 4,379 | |
| | | | | | | | 21,532 | |
| Materials — 9.1% | | | | | | | | |
| Chemicals — 3.2% | | | | | | | | |
Advanced Emissions Solutions, Inc. | | | 442 | | | | 8,840 | |
Air Products and Chemicals, Inc. | | | 121 | | | | 17,403 | |
Airgas, Inc. | | | 136 | | | | 15,726 | |
Ashland, Inc. | | | 12 | | | | 1,369 | |
Axiall Corporation | | | 139 | | | | 6,016 | |
Balchem Corporation | | | 48 | | | | 3,120 | |
Cabot Corporation | | | 292 | | | | 12,579 | |
Chemtura Corporation | | | 855 | | | | 19,922 | |
Dow Chemical Company (The) | | | 304 | | | | 14,796 | |
E.I. du Pont de Nemours and Company | | | 181 | | | | 12,923 | |
BARROW ALL-CAP LONG/SHORT FUND
SCHEDULE OF SECURITIES SOLD SHORT (Continued) | |
| COMMON STOCKS — 87.3% (Continued) | | Shares | | | Value | |
| Materials — 9.1% (Continued) | | | | | | |
| Chemicals — 3.2% (Continued) | | | | | | |
Ecolab, Inc. | | | 137 | | | $ | 14,926 | |
FMC Corporation | | | 128 | | | | 6,963 | |
H.B. Fuller Company | | | 44 | | | | 1,900 | |
Huntsman Corporation | | | 579 | | | | 14,776 | |
International Flavors & Fragrances, Inc. | | | 22 | | | | 2,226 | |
Intrepid Potash, Inc. | | | 800 | | | | 11,416 | |
Kraton Performance Polymers, Inc. | | | 661 | | | | 12,162 | |
Kronos Worldwide, Inc. | | | 1,044 | | | | 13,582 | |
Monsanto Company | | | 9 | | | | 1,079 | |
Mosaic Company (The) | | | 119 | | | | 5,447 | |
OM Group, Inc. | | | 491 | | | | 13,360 | |
PolyOne Corporation | | | 643 | | | | 23,984 | |
Praxair, Inc. | | | 110 | | | | 14,122 | |
Sensient Technologies Corporation | | | 358 | | | | 21,104 | |
Tronox Ltd. - Class A | | | 876 | | | | 19,754 | |
Valhi, Inc. | | | 1,837 | | | | 10,600 | |
| | | | | | | | 300,095 | |
| Construction Materials — 0.7% | | | | | | | | |
Eagle Materials, Inc. | | | 268 | | | | 22,081 | |
Headwaters, Inc. | | | 566 | | | | 7,924 | |
Martin Marietta Materials, Inc. | | | 134 | | | | 16,085 | |
Vulcan Materials Company | | | 230 | | | | 15,203 | |
| | | | | | | | 61,293 | |
| Containers & Packaging — 0.4% | | | | | | | | |
Graphic Packaging Holding Company | | | 640 | | | | 7,968 | |
Myers Industries, Inc. | | | 316 | | | | 5,142 | |
Packaging Corporation of America | | | 176 | | | | 13,073 | |
Rock-Tenn Company - Class A | | | 109 | | | | 6,192 | |
Sealed Air Corporation | | | 138 | | | | 5,455 | |
| | | | | | | | 37,830 | |
| Metals & Mining — 3.8% | | | | | | | | |
Alcoa, Inc. | | | 1,089 | | | | 18,829 | |
Allegheny Technologies, Inc. | | | 645 | | | | 21,730 | |
Carpenter Technology Corporation | | | 411 | | | | 20,723 | |
Century Aluminum Company | | | 1,045 | | | | 28,894 | |
Coeur Mining, Inc. | | | 1,579 | | | | 6,490 | |
Commercial Metals Company | | | 1,078 | | | | 17,614 | |
Freeport-McMoRan Copper & Gold, Inc. | | | 243 | | | | 6,524 | |
Globe Specialty Metals, Inc. | | | 760 | | | | 13,171 | |
Haynes International, Inc. | | | 266 | | | | 11,941 | |
BARROW ALL-CAP LONG/SHORT FUND
SCHEDULE OF SECURITIES SOLD SHORT (Continued) | |
| COMMON STOCKS — 87.3% (Continued) | | Shares | | | Value | |
| Materials — 9.1% (Continued) | | | | | | |
| Metals & Mining — 3.8% (Continued) | | | | | | |
Hecla Mining Company | | | 4,859 | | | $ | 11,467 | |
Hi-Crush Partners, L.P. | | | 42 | | | | 1,547 | |
Horsehead Holding Corporation | | | 863 | | | | 13,480 | |
Materion Corporation | | | 440 | | | | 15,299 | |
Newmont Mining Corporation | | | 609 | | | | 11,206 | |
NN, Inc. | | | 57 | | | | 1,207 | |
Nucor Corporation | | | 281 | | | | 15,070 | |
Reliance Steel & Aluminum Company | | | 138 | | | | 8,824 | |
Royal Gold, Inc. | | | 365 | | | | 23,243 | |
RTI International Metals, Inc. | | | 206 | | | | 4,724 | |
Schnitzer Steel Industries, Inc. - Class A | | | 553 | | | | 12,608 | |
Steel Dynamics, Inc. | | | 1,133 | | | | 25,538 | |
Stillwater Mining Company | | | 1,300 | | | | 17,069 | |
SunCoke Energy, Inc. | | | 668 | | | | 13,580 | |
TimkenSteel Corporation | | | 57 | | | | 2,030 | |
United States Steel Corporation | | | 286 | | | | 9,538 | |
US Silica Holdings, Inc. | | | 295 | | | | 9,269 | |
Worthington Industries, Inc. | | | 496 | | | | 18,704 | |
| | | | | | | | 360,319 | |
| Paper & Forest Products — 1.0% | | | | | | | | |
Clearwater Paper Corporation | | | 185 | | | | 12,258 | |
Deltic Timber Corporation | | | 233 | | | | 14,504 | |
International Paper Company | | | 270 | | | | 14,531 | |
| KapStone Paper and Packaging Corporation | | | 495 | | | | 14,786 | |
MeadWestvaco Corporation | | | 365 | | | | 16,352 | |
P.H. Glatfelter Company | | | 547 | | | | 13,850 | |
Wausau Paper Corporation | | | 1,151 | | | | 11,453 | |
| | | | | | | | 97,734 | |
| | | | | | | | | |
Total Common Stocks (Proceeds $7,753,847) | | | | | | $ | 8,215,318 | |
BARROW ALL-CAP LONG/SHORT FUND
SCHEDULE OF SECURITIES SOLD SHORT (Continued) | |
WARRANTS — 0.0% (a) | | Shares | | | Value | |
BioTime, Inc. | | | 1 | | | $ | 1 | |
Magnum Hunter Resources Corporation (b) | | | 97 | | | | 0 | |
Total Warrants (Proceeds $2) | | | | | | $ | 1 | |
| | | | | | | | | |
Total Securities Sold Short — 87.3% (Proceeds $7,753,849) | | | | | | $ | 8,215,319 | |
(a) | Percentage rounds to less than 0.1%. |
(b) | Security value has been determined in good faith pursuant to procedures adopted by the Board of Trustees. The total value of such securities is $0 at November 30, 2014, representing 0.0% of net assets (Note 2). |
| See accompanying notes to financial statements. |
BARROW FUNDS
STATEMENTS OF ASSETS AND LIABILITIES
November 30, 2014 (Unaudited) | |
| | | Barrow
All-Cap Core Fund | | | Barrow
All-Cap Long/Short Fund | |
| ASSETS | | | | | | |
| Investments in securities: | | | | | | |
At acquisition cost | | $ | 18,639,086 | | | $ | 11,698,610 | |
At value (Note 2) | | $ | 22,011,106 | | | $ | 12,663,594 | |
| Deposits with brokers for securities sold short (Note 2) | | | — | | | | 4,946,532 | |
Dividends and interest receivable | | | 37,833 | | | | 21,635 | |
Receivable for capital shares sold | | | — | | | | 100 | |
Receivable from Adviser (Note 4) | | | — | | | | 6,217 | |
Other assets | | | 22,036 | | | | 21,989 | |
TOTAL ASSETS | | | 22,070,975 | | | | 17,660,067 | |
| | | | | | | | | |
| LIABILITIES | | | | | | | | |
| Securities sold short, at value (Note 2) (proceeds $7,753,849) | | | — | | | | 8,215,319 | |
Line of credit payable (Note 5) | | | 15,040 | | | | — | |
Dividends payable on securities sold short (Note 2) | | | — | | | | 7,377 | |
Payable to Adviser (Note 4) | | | 2,369 | | | | — | |
Payable to administrator (Note 4) | | | 8,180 | | | | 8,330 | |
| Accrued brokerage expense on securities sold short (Note 2) | | | — | | | | 805 | |
Other accrued expenses and liabilities | | | 6,142 | | | | 13,621 | |
TOTAL LIABILITIES | | | 31,731 | | | | 8,245,452 | |
| | | | | | | | | |
NET ASSETS | | $ | 22,039,244 | | | $ | 9,414,615 | |
| | | | | | | | | |
| Net assets consist of: | | | | | | | | |
Paid-in capital | | $ | 16,685,058 | | | $ | 9,133,864 | |
Accumulated net investment income | | | 221,614 | | | | 5,025 | |
| Accumulated net realized gains (losses) from security transactions | | | 1,760,552 | | | | (227,788 | ) |
| Net unrealized appreciation (depreciation) on: | | | | | | | | |
Investments | | | 3,372,020 | | | | 964,984 | |
Short positions | | | — | | | | (461,470 | ) |
Net assets | | $ | 22,039,244 | | | $ | 9,414,615 | |
| | | | | | | | | |
| NET ASSET VALUE PER SHARE: | | | | | | | | |
| INSTITUTIONAL CLASS | | | | | | | | |
Net assets applicable to Institutional Class | | $ | 21,730,547 | | | $ | 9,240,661 | |
| Institutional Class shares of beneficial interest outstanding | | | 794,289 | | | | 888,088 | |
Net asset value, offering price and redemption price per share (Note 2) | | $ | 27.36 | | | $ | 10.41 | |
| | | | | | | | | |
| INVESTOR CLASS | | | | | | | | |
Net assets applicable to Investor Class | | $ | 308,697 | | | $ | 173,954 | |
| Investor Class shares of beneficial interest outstanding | | | 11,311 | | | | 16,758 | |
Net asset value, offering price and redemption price per share (Note 2) | | $ | 27.29 | | | $ | 10.38 | |
| See accompanying notes to financial statements. |
BARROW FUNDS
STATEMENTS OF OPERATIONS
For the Six Months Ended November 30, 2014 (Unaudited) | |
| | | Barrow
All-Cap Core Fund | | | Barrow
All-Cap Long/Short Fund | |
| INVESTMENT INCOME | | | | | | |
Dividends | | $ | 248,909 | | | $ | 85,070 | |
Interest | | | — | | | | 8,285 | |
TOTAL INVESTMENT INCOME | | | 248,909 | | | | 93,355 | |
| | | | | | | | | |
| EXPENSES | | | | | | | | |
Investment advisory fees (Note 4) | | | 107,612 | | | | 40,795 | |
Professional fees | | | 17,812 | | | | 17,812 | |
Accounting services fees (Note 4) | | | 16,837 | | | | 16,023 | |
Registration and filing fees | | | 15,237 | | | | 15,775 | |
Dividend expense on securities sold short (Note 2) | | | — | | | | 30,953 | |
Administration fees (Note 4) | | | 12,750 | | | | 12,500 | |
Custodian fees | | | 10,787 | | | | 14,034 | |
Transfer agent fees (Note 4) | | | 12,000 | | | | 12,000 | |
Brokerage expense on securities sold short (Note 2) | | | — | | | | 21,559 | |
Pricing fees | | | 2,141 | | | | 10,911 | |
Compliance service fees (Note 4) | | | 6,000 | | | | 6,000 | |
Trustees’ fees and expenses (Note 4) | | | 3,791 | | | | 3,791 | |
Printing of shareholder reports | | | 1,995 | | | | 1,995 | |
Insurance expense | | | 1,669 | | | | 1,669 | |
Postage and supplies | | | 1,543 | | | | 1,619 | |
Borrowing costs (Note 5) | | | 859 | | | | — | |
Distribution fees, Investor Class (Note 4) | | | 293 | | | | 216 | |
Other expenses | | | 4,345 | | | | 4,353 | |
TOTAL EXPENSES | | | 215,671 | | | | 212,005 | |
| Investment advisory fee reductions and/or expense reimbursements by Advisor (Note 4) | | | (89,514 | ) | | | (111,954 | ) |
NET EXPENSES | | | 126,157 | | | | 100,051 | |
| | | | | | | | | |
NET INVESTMENT INCOME (LOSS) | | | 122,752 | | | | (6,696 | ) |
| | | | | | | | | |
| REALIZED AND UNREALIZED GAINS (LOSSES) ON INVESTMENTS AND SECURITIES SOLD SHORT | | | | | | | | |
| Net realized gains (losses) from: | | | | | | | | |
Investments | | $ | 90,093 | | | $ | (10,666 | ) |
Securities sold short | | | — | | | | (259,371 | ) |
| Net change in unrealized appreciation (depreciation) on: | | | | | | | | |
Investments | | | 543,769 | | | | 625,660 | |
Securities sold short | | | — | | | | (220,611 | ) |
| NET REALIZED AND UNREALIZED GAINS ON INVESTMENTS | | | 633,862 | | | | 135,012 | |
| | | | | | | | | |
| NET INCREASE IN NET ASSETS RESULTING FROM OPERATIONS | | $ | 756,614 | | | $ | 128,316 | |
| See accompanying notes to financial statements. |
BARROW ALL-CAP CORE FUND
STATEMENTS OF CHANGES IN NET ASSETS | |
| | | Six Months Ended November 30, 2014 (Unaudited) | | | Period Ended
May 31, 2014 (a) | |
| FROM OPERATIONS | | | | | | |
Net investment income | | $ | 122,752 | | | $ | 147,458 | |
Net realized gains from security transactions | | | 90,093 | | | | 2,033,616 | |
Net change in unrealized appreciation (depreciation) on investments | | | 543,769 | | | | 550,715 | |
Net increase in net assets resulting from operations | | | 756,614 | | | | 2,731,789 | |
| | | | | | | | | |
| DISTRIBUTIONS TO SHAREHOLDERS (Note 2) | | | | | | | | |
Investment income, Institutional Class | | | — | | | | (48,373 | ) |
Investment income, Investor Class | | | — | | | | (223 | ) |
Realized gains, Institutional Class | | | — | | | | (360,767 | ) |
Realized gains, Investor Class | | | — | | | | (2,390 | ) |
| Decrease in net assets from distributions to shareholders | | | — | | | | (411,753 | ) |
| | | | | | | | | |
| CAPITAL SHARE TRANSACTIONS | | | | | | | | |
| Institutional Class | | | | | | | | |
Proceeds from shares sold | | | 392,385 | | | | 2,180,472 | |
| Net asset value of shares issued in reinvestment of distributions | | | — | | | | 409,139 | |
Proceeds from tax-free reorganization (Note 1) | | | — | | | | 16,732,894 | |
Payments for shares redeemed | | | (788,199 | ) | | | (243,555 | ) |
Net increase (decrease) in Institutional Class net assets from capital share transactions | | | (395,814 | ) | | | 19,078,950 | |
| | | | | | | | | |
| Investor Class | | | | | | | | |
Proceeds from shares sold | | | 279,891 | | | | 337,567 | |
| Net asset value of shares issued in reinvestment of distributions | | | — | | | | 2,613 | |
Payments for shares redeemed | | | (340,613 | ) | | | — | |
Net increase (decrease) in Investor Class net assets from capital share transactions | | | (60,722 | ) | | | 340,180 | |
| | | | | | | | | |
TOTAL INCREASE IN NET ASSETS | | | 300,078 | | | | 21,739,166 | |
| | | | | | | | | |
| NET ASSETS | | | | | | | | |
Beginning of period | | | 21,739,166 | | | | — | |
End of period | | $ | 22,039,244 | | | $ | 21,739,166 | |
| | | | | | | | | |
| ACCUMULATED NET INVESTMENT INCOME | | $ | 221,614 | | | $ | 98,862 | |
(a) | Represents the period from the commencement of operations (close of business August 30, 2013) through May 31, 2014 (Note 1). |
| See accompanying notes to financial statements. |
BARROW ALL-CAP CORE FUND
STATEMENTS OF CHANGES IN NET ASSETS (Continued) | |
| | | Six Months Ended November 30, 2014 (Unaudited) | | | Period Ended
May 31, 2014 (a) | |
| CAPITAL SHARE ACTIVITY | | | | | | |
| Institutional Class | | | | | | |
Shares sold | | | 14,832 | | | | 85,541 | |
Shares reinvested | | | — | | | | 15,791 | |
Shares issued from tax-free reorganization (Note 1) | | | — | | | | 718,150 | |
Shares redeemed | | | (30,255 | ) | | | (9,769 | ) |
Net increase (decrease) in shares outstanding | | | (15,423 | ) | | | 809,713 | |
Shares outstanding, beginning of period | | | 809,712 | | | | — | |
Shares outstanding, end of period | | | 794,289 | | | | 809,713 | |
| | | | | | | | | |
| Investor Class | | | | | | | | |
Shares sold | | | 10,547 | | | | 13,501 | |
Shares reinvested | | | — | | | | 101 | |
Shares redeemed | | | (12,838 | ) | | | — | |
Net increase (decrease) in shares outstanding | | | (2,291 | ) | | | 13,602 | |
Shares outstanding, beginning of period | | | 13,602 | | | | — | |
Shares outstanding, end of period | | | 11,311 | | | | 13,602 | |
(a) | Represents the period from the commencement of operations (close of business August 30, 2013) through May 31, 2014 (Note 1). |
| See accompanying notes to financial statements. |
BARROW ALL-CAP LONG/SHORT FUND
STATEMENTS OF CHANGES IN NET ASSETS | |
| | | Six Months Ended November 30, 2014 (Unaudited) | | | Period Ended
May 31, 2014(a) | |
| FROM OPERATIONS | | | | | | |
Net investment loss | | $ | (6,696 | ) | | $ | (10,870 | ) |
| Net realized gains (losses) from: | | | | | | | | |
Investments | | | (10,666 | ) | | | 253,094 | |
Securities sold short | | | (259,371 | ) | | | (188,254 | ) |
| Net change in unrealized appreciation (depreciation) on: | | | | | | | | |
Investments | | | 625,660 | | | | 339,324 | |
Securities sold short | | | (220,611 | ) | | | (240,859 | ) |
Net increase in net assets resulting from operations | | | 128,316 | | | | 152,435 | |
| | | | | | | | | |
| CAPITAL SHARE TRANSACTIONS | | | | | | | | |
| Institutional Class | | | | | | | | |
Proceeds from shares sold | | | 5,001,025 | | | | 5,510,279 | |
Payments for shares redeemed | | | (100,996 | ) | | | (1,444,928 | ) |
Net increase in Institutional Class net assets from capital share transactions | | | 4,900,029 | | | | 4,065,351 | |
| | | | | | | | | |
| Investor Class | | | | | | | | |
Proceeds from shares sold | | | — | | | | 201,389 | |
Payments for shares redeemed | | | — | | | | (32,905 | ) |
Net increase in Investor Class net assets from capital share transactions | | | — | | | | 168,484 | |
| | | | | | | | | |
TOTAL INCREASE IN NET ASSETS | | | 5,028,345 | | | | 4,386,270 | |
| | | | | | | | | |
| NET ASSETS | | | | | | | | |
Beginning of period | | | 4,386,270 | | | | — | |
End of period | | $ | 9,414,615 | | | $ | 4,386,270 | |
| | | | | | | | | |
| ACCUMULATED NET INVESTMENT INCOME | | $ | 5,025 | | | $ | 11,721 | |
(a) | Represents the period from the commencement of operations (close of business August 30, 2013) through May 31, 2014 (Note 1). |
| See accompanying notes to financial statements. |
BARROW ALL-CAP LONG/SHORT FUND
STATEMENTS OF CHANGES IN NET ASSETS (Continued) | |
| | | Six Months Ended November 30, 2014 (Unaudited) | | | Period Ended
May 31, 2014(a) | |
| CAPITAL SHARE ACTIVITY | | | | | | |
| Institutional Class | | | | | | |
Shares sold | | | 493,196 | | | | 546,033 | |
Shares redeemed | | | (9,873 | ) | | | (141,268 | ) |
Net increase in shares outstanding | | | 483,323 | | | | 404,765 | |
Shares outstanding, beginning of period | | | 404,765 | | | | — | |
Shares outstanding, end of period | | | 888,088 | | | | 404,765 | |
| | | | | | | | | |
| Investor Class | | | | | | | | |
Shares sold | | | — | | | | 19,972 | |
Shares redeemed | | | — | | | | (3,214 | ) |
Net increase in shares outstanding | | | — | | | | 16,758 | |
Shares outstanding, beginning of period | | | 16,758 | | | | — | |
Shares outstanding, end of period | | | 16,758 | | | | 16,758 | |
(a) | Represents the period from the commencement of operations (close of business August 30, 2013) through May 31, 2014 (Note 1). |
| See accompanying notes to financial statements. |
BARROW ALL-CAP CORE FUND
INSTITUTIONAL CLASS
FINANCIAL HIGHLIGHTS | |
| Per share data for a share outstanding throughout each period: | |
| | | Six Months Ended November 30, 2014 (Unaudited) | | | Period Ended
May 31, 2014(a) | |
Net asset value at beginning of period | | $ | 26.40 | | | $ | 23.30 | |
| | | | | | | | | |
| Income from investment operations: | | | | | | | | |
Net investment income | | | 0.16 | | | | 0.18 | |
| Net realized and unrealized gains on investments | | | 0.80 | | | | 3.47 | |
Total from investment operations | | | 0.96 | | | | 3.65 | |
| | | | | | | | | |
| Less distributions: | | | | | | | | |
From net investment income | | | — | | | | (0.06 | ) |
From net realized gains from investments | | | — | | | | (0.49 | ) |
Total from investment operations | | | — | | | | (0.55 | ) |
| | | | | | | | | |
Net asset value at end of period | | $ | 27.36 | | | $ | 26.40 | |
| | | | | | | | | |
Total return (b) | | | 3.64 | %(c) | | | 15.73 | %(c) |
| | | | | | | | | |
| Ratios and supplemental data: | | | | | | | | |
Net assets at end of period (000’s) | | $ | 21,731 | | | $ | 21,380 | |
| | | | | | | | | |
Ratio of total expenses to average net assets | | | 1.84 | %(d) | | | 1.86 | %(d) |
| | | | | | | | | |
Ratio of net expenses to average net assets (e) | | | 1.16 | %(d) | | | 1.15 | %(d) |
| | | | | | | | | |
Ratio of net expenses to average net assets excluding borrowing costs (e) | | | 1.15 | %(d) | | | 1.15 | %(d) |
| | | | | | | | | |
Ratio of net investment income to average net assets (e) | | | 1.13 | %(d) | | | 1.01 | %(d) |
| | | | | | | | | |
Portfolio turnover rate | | | 53 | %(c) | | | 45 | %(c) |
(a) | Represents the period from the commencement of operations (close of business August 30, 2013) through May 31, 2014 (Note 1). |
(b) | Total return is a measure of the change in value of an investment in the Fund over the periods covered, which assumes any dividends or capital gains distributions are reinvested in shares of the Fund. The returns shown do not reflect the deduction of taxes a shareholder would pay on Fund distributions or the redemption of Fund shares. The total returns would have been lower if the Adviser had not reduced advisory fees and reimbursed expenses. |
(c) | Not annualized. |
(d) | Annualized. |
(e) | Ratio was determined after fee reductions and expense reimbursements by the Adviser (Note 4). |
| See accompanying notes to financial statements. |
BARROW ALL-CAP CORE FUND
INVESTOR CLASS
FINANCIAL HIGHLIGHTS | |
| Per share data for a share outstanding throughout each period: | |
| | | Six Months Ended November 30, 2014 (Unaudited) | | | Period Ended
May 31, 2014(a) | |
Net asset value at beginning of period | | $ | 26.37 | | | $ | 23.30 | |
| | | | | | | | | |
| Income from investment operations: | | | | | | | | |
Net investment income | | | 0.12 | | | | 0.09 | |
| Net realized and unrealized gains on investments | | | 0.80 | | | | 3.51 | |
Total from investment operations | | | 0.92 | | | | 3.60 | |
| | | | | | | | | |
| Less distributions: | | | | | | | | |
From net investment income | | | — | | | | (0.04 | ) |
From net realized gains from investments | | | — | | | | (0.49 | ) |
Total from investment operations | | | — | | | | (0.53 | ) |
| | | | | | | | | |
Net asset value at end of period | | $ | 27.29 | | | $ | 26.37 | |
| | | | | | | | | |
Total return (b) | | | 3.49 | %(c) | | | 15.51 | %(c) |
| | | | | | | | | |
| Ratios and supplemental data: | | | | | | | | |
Net assets at end of period (000’s) | | $ | 309 | | | $ | 359 | |
| | | | | | | | | |
Ratio of total expenses to average net assets | | | 14.97 | %(d) | | | 16.03 | %(d) |
| | | | | | | | | |
Ratio of net expenses to average net assets (e) | | | 1.41 | %(d) | | | 1.40 | %(d) |
| | | | | | | | | |
Ratio of net expenses to average net assets excluding borrowing costs (e) | | | 1.40 | %(d) | | | 1.40 | %(d) |
| | | | | | | | | |
Ratio of net investment income to average net assets (e) | | | 1.04 | %(d) | | | 0.76 | %(d) |
| | | | | | | | | |
Portfolio turnover rate | | | 53 | %(c) | | | 45 | %(c) |
(a) | Represents the period from the commencement of operations (close of business August 30, 2013) through May 31, 2014 (Note 1). |
(b) | Total return is a measure of the change in value of an investment in the Fund over the periods covered, which assumes any dividends or capital gains distributions are reinvested in shares of the Fund. The returns shown do not reflect the deduction of taxes a shareholder would pay on Fund distributions or the redemption of Fund shares. The total returns would have been lower if the Adviser had not reduced advisory fees and reimbursed expenses. |
(c) | Not annualized. |
(d) | Annualized. |
(e) | Ratio was determined after fee reductions and expense reimbursements by the Adviser (Note 4). |
| See accompanying notes to financial statements. |
BARROW ALL-CAP LONG/SHORT FUND
INSTITUTIONAL CLASS
FINANCIAL HIGHLIGHTS | |
| Per share data for a share outstanding throughout each period: | |
| | | Six Months Ended
November 30, 2014 (Unaudited) | | | Period Ended
May 31, 2014(a) | |
Net asset value at beginning of period | | $ | 10.41 | | | $ | 10.00 | |
| | | | | | | | | |
| Income (loss) from investment operations: | | | | | | | | |
Net investment loss | | | (0.02 | ) | | | (0.03 | ) |
| Net realized and unrealized gains on investments | | | 0.02 | | | | 0.44 | |
Total from investment operations | | | 0.00 | (b) | | | 0.41 | |
| | | | | | | | | |
Net asset value at end of period | | $ | 10.41 | | | $ | 10.41 | |
| | | | | | | | | |
Total return (c) | | | 0.00 | %(d) | | | 4.10 | %(d) |
| | | | | | | | | |
| Ratios and supplemental data: | | | | | | | | |
Net assets at end of period (000’s) | | $ | 9,241 | | | $ | 4,212 | |
| | | | | | | | | |
Ratio of total expenses to average net assets (e) | | | 7.23 | %(f) | | | 8.69 | %(f) |
| | | | | | | | | |
Ratio of net expenses to average net assets (e) (g) | | | 3.67 | %(f) | | | 3.51 | %(f) |
| | | | | | | | | |
Ratio of net expenses to average net assets excluding dividend expense (e) (g) | | | 2.53 | %(f) | | | 2.51 | %(f) |
| | | | | | | | | |
Ratio of net expenses to average net assets excluding dividend expense and brokerage expense on securities sold short (g) | | | 1.74 | %(f) | | | 1.74 | %(f) |
| | | | | | | | | |
Ratio of net investment loss to average net assets (g) | | | (0.24 | %)(f) | | | (0.37 | %)(f) |
| | | | | | | | | |
Portfolio turnover rate | | | 54 | %(d) | | | 76 | %(d) |
(a) | Represents the period from the commencement of operations (close of business August 30, 2013) through May 31, 2014 (Note 1). |
(b) | Amount rounds to less than $0.01 per share. |
(c) | Total return is a measure of the change in value of an investment in the Fund over the periods covered, which assumes any dividends or capital gains distributions are reinvested in shares of the Fund. The returns shown do not reflect the deduction of taxes a shareholder would pay on Fund distributions or the redemption of Fund shares. The total returns would have been lower if the Adviser had not reduced advisory fees and reimbursed expenses. |
(d) | Not annualized. |
(e) | The Fund earns interest income on the margin account balance that is associated with securities sold short. The ratio of interest income to average net assets for the periods ended November 30, 2014 and May 31, 2014 is 0.30%(f) and 0.28%(f), respectively. |
(f) | Annualized. |
(g) | Ratio was determined after fee reductions and expense reimbursements by the Adviser (Note 4). |
| See accompanying notes to financial statements. |
BARROW ALL-CAP LONG/SHORT FUND
INVESTOR CLASS
FINANCIAL HIGHLIGHTS | |
| Per share data for a share outstanding throughout each period: | |
| | | Six Months Ended
November 30, 2014 (Unaudited) | | | Period Ended
May 31, 2014(a) | |
Net asset value at beginning of period | | $ | 10.39 | | | $ | 10.00 | |
| | | | | | | | | |
| Income (loss) from investment operations: | | | | | | | | |
Net investment loss | | | (0.03 | ) | | | (0.04 | ) |
| Net realized and unrealized gains on investments | | | 0.02 | | | | 0.43 | |
Total from investment operations | | | (0.01 | ) | | | 0.39 | |
| | | | | | | | | |
Net asset value at end of period | | $ | 10.38 | | | $ | 10.39 | |
| | | | | | | | | |
Total return (b) | | | (0.10% | )(c) | | | 3.90 | %(c) |
| | | | | | | | | |
| Ratios and supplemental data: | | | | | | | | |
Net assets at end of period (000’s) | | $ | 174 | | | $ | 174 | |
| | | | | | | | | |
Ratio of total expenses to average net assets (d) | | | 24.89 | %(e) | | | 21.15 | %(e) |
| | | | | | | | | |
Ratio of net expenses to average net assets (d) (f) | | | 3.92 | %(e) | | | 3.76 | %(e) |
| | | | | | | | | |
Ratio of net expenses to average net assets excluding dividend expense (d) (f) | | | 2.78 | %(e) | | | 2.76 | %(e) |
| | | | | | | | | |
Ratio of net expenses to average net assets excluding dividend expense and brokerage expense on securities sold short (f) | | | 1.99 | %(e) | | | 1.99 | %(e) |
| | | | | | | | | |
Ratio of net investment loss to average net assets (f) | | | (0.54 | %)(e) | | | (0.62 | %)(e) |
| | | | | | | | | |
Portfolio turnover rate | | | 54 | %(c) | | | 76 | %(c) |
(a) | Represents the period from the commencement of operations (close of business August 30, 2013) through May 31, 2014 (Note 1). |
(b) | Total return is a measure of the change in value of an investment in the Fund over the periods covered, which assumes any dividends or capital gains distributions are reinvested in shares of the Fund. The returns shown do not reflect the deduction of taxes a shareholder would pay on Fund distributions or the redemption of Fund shares. The total returns would have been lower if the Adviser had not reduced advisory fees and reimbursed expenses. |
(c) | Not annualized. |
(d) | The Fund earns interest income on the margin account balance that is associated with securities sold short. The ratio of interest income to average net assets for the periods ended November 30, 2014 and May 31, 2014 is 0.30%(f) and 0.28%(f), respectively. |
(e) | Annualized. |
(f) | Ratio was determined after fee reductions and expense reimbursements by the Adviser (Note 4). |
| See accompanying notes to financial statements. |
BARROW FUNDS
NOTES TO FINANCIAL STATEMENTS
November 30, 2014 (Unaudited)
1. Organization
Barrow All-Cap Core Fund and Barrow All-Cap Long/Short Fund (individually, a “Fund” and collectively, the “Funds”) are each a diversified series of Ultimus Managers Trust (the “Trust”), an open-end investment company established as an Ohio business trust under a Declaration of Trust dated February 28, 2012. Other series of the Trust are not incorporated in this report. The Funds commenced operations at the close of business on August 30, 2013.
The investment objective of Barrow All-Cap Core Fund is to generate long-term capital appreciation. The investment objective of Barrow All-Cap Long/Short Fund is to generate above-average returns through capital appreciation, while also attempting to reduce volatility and preserve capital during market downturns.
Barrow All-Cap Core Fund acquired the assets and liabilities of Barrow Street Fund LP, a Delaware limited partnership (the “Predecessor Private Fund”), in a tax-free reorganization completed at the close of business on August 30, 2013, the date the Barrow All-Cap Core Fund commenced operations. The Predecessor Private Fund had an investment objective and investment policies that were, in all material respects, equivalent to those of Barrow All-Cap Core Fund. However, the Predecessor Private Fund was not a registered investment company under the Investment Company Act of 1940, as amended (the “1940 Act”), and was not subject to certain investment limitations, diversification requirements, liquidity requirements, and other restrictions imposed by the 1940 Act and the Internal Revenue Code of 1986, as amended (the “Code”). These requirements and restrictions would have affected the Predecessor Private Fund’s performance. In addition, the Predecessor Private Fund charged an annual management fee of 1.50% of assets and, until October 7, 2012, a 20% performance fee after it reached certain performance benchmarks. Barrow All-Cap Core Fund pays a management fee equal to 0.99% of average daily net assets and does not charge a performance fee.
Upon completion of the reorganization, the net assets of Barrow All-Cap Core Fund were $16,732,894. The number of shares of Barrow All-Cap Core Fund issued in connection with the reorganization was 718,150, and the amount of net unrealized gains on the portfolio securities transferred to Barrow All-Cap Core Fund was $2,277,536.
Each Fund offers two classes of shares: Institutional Class shares (sold without any sales loads or distribution fees and requires a $250,000 initial investment) and Investor Class shares (sold without any sales loads, but subject to a distribution fee of up to 0.25% of the average daily net assets attributable to Investor Class shares and requires a $2,500 initial investment). Each class of shares represents an ownership interest in the same investment portfolio.
BARROW FUNDS
NOTES TO FINANCIAL STATEMENTS (Continued) |
2. Significant Accounting Policies
The following is a summary of the Funds’ significant accounting policies. The policies are in conformity with accounting principles generally accepted in the United States of America (“GAAP”). As an investment company, as defined in Financial Accounting Standards Board (“FASB”) Accounting Standards Update 2013-08, the Funds follow accounting and reporting guidance under FASB Accounting Standards Codification Topic 946, “Financial Services – Investment Companies.”
Securities valuation – Each Fund values its portfolio securities at market value as of the close of regular trading on the New York Stock Exchange (the “NYSE”) (normally 4:00 p.m. Eastern time) on each business day the NYSE is open for business. The pricing and valuation of portfolio securities is determined in good faith in accordance with procedures established by and under the direction of the Board of Trustees (the “Board”) of the Trust. The Funds value their listed securities on the basis of the security’s last sale price on the security’s primary exchange, if available, otherwise at the exchange’s most recently quoted bid price. NASDAQ-listed securities are valued at the NASDAQ Official Closing Price. The Funds value their over-the-counter securities at the last sale price, if available, otherwise at the most recently quoted bid price. In the event that market quotations are not readily available or are considered unreliable due to market or other events, the Funds value their securities and other assets at fair value pursuant to the procedures adopted by the Board. Under these procedures, the securities will be classified as Level 2 or 3 within the fair value hierarchy (see below), depending on the inputs used. Unavailable or unreliable market quotes may be due to the following factors: a substantial bid-ask spread; infrequent sales resulting in stale prices; insufficient trading volume; small trade sizes; a temporary lapse in any reliable pricing source; and actions of the securities or futures markets, such as the suspension or limitation of trading. As a result, the prices of securities used to calculate each Fund’s net asset value may differ from quoted or published prices for the same securities.
GAAP establishes a single authoritative definition of fair value, sets out a framework for measuring fair value, and requires additional disclosures about fair value measurements.
Various inputs are used in determining the value of each Fund’s investments and other financial instruments. These inputs are summarized in the three broad levels listed below:
| • | Level 1 – quoted prices in active markets for identical securities |
| • | Level 2 – other significant observable inputs |
| • | Level 3 – significant unobservable inputs |
BARROW FUNDS
NOTES TO FINANCIAL STATEMENTS (Continued) |
The inputs or methods used for valuing securities are not necessarily an indication of the risks associated with investing in those securities. The inputs used to measure fair value may fall into different levels of the fair value hierarchy. In such cases, for disclosure purposes, the level in the fair value hierarchy within which the fair value measurement falls in its entirety is determined based on the lowest level input that is significant to the fair value measurement.
The following is a summary of the inputs used to value the Funds’ investments as of November 30, 2014:
| Barrow All-Cap Core Fund | | Level 1 | | | Level 2 | | | Level 3 | | | Total | |
| Investments in Securities: | | | | | | | | | | | | |
| Common Stocks | | $ | 21,971,215 | | | $ | — | | | $ | — | | | $ | 21,971,215 | |
| Money Market Funds | | | 39,891 | | | | — | | | | — | | | | 39,891 | |
Total | | $ | 22,011,106 | | | $ | — | | | $ | — | | | $ | 22,011,106 | |
| | | | | | | | | | | | | |
| Barrow All-Cap Long/Short Fund | | Level 1 | | | Level 2 | | | Level 3 | | | Total | |
| Investments in Securities: | | | | | | | | | | | | | | | | |
| Common Stocks | | $ | 12,024,650 | | | $ | 0 | (a) | | $ | — | | | $ | 12,024,650 | |
| Money Market Funds | | | 638,944 | | | | — | | | | — | | | | 638,944 | |
Total | | $ | 12,663,594 | | | $ | 0 | (a) | | $ | — | | | $ | 12,663,594 | |
| Other Financial Instruments: | | | | | | | | | | | | | | | | |
| Common Stocks – Sold Short | | $ | (8,215,318 | ) | | $ | — | | | $ | — | | | $ | (8,215,318 | ) |
| Warrants – Sold Short | | | (1 | ) | | | 0 | (a) | | | — | | | | (1 | ) |
Total | | $ | (8,215,319 | ) | | $ | 0 | (a) | | $ | — | | | $ | (8,215,319 | ) |
(a) | Barrow All-Cap Long/Short Fund holds Level 2 securities which are valued at $0. |
Refer to each Fund’s Schedule of Investments and Schedule of Securities Sold Short, as applicable, for a listing of securities by industry type. As of November 30, 2014, the Funds did not have any transfers in and out of any Level. There were no Level 3 securities or derivative instruments held by the Funds as of November 30, 2014. It is the Funds’ policy to recognize transfers into and out of any Level at the end of the reporting period.
Share valuation – The net asset value per share of each class of each Fund is calculated daily by dividing the total value of the assets attributable to that class, less liabilities attributable to that class, by the number of shares of that class outstanding. The offering price and redemption price per share of each class of each Fund is equal to the net asset value per share of such class.
BARROW FUNDS
NOTES TO FINANCIAL STATEMENTS (Continued) |
Investment income – Dividend income is recorded on the ex-dividend date. Interest income is accrued as earned.
Security transactions – Security transactions are accounted for on the trade date. Gains and losses on securities sold are determined on a specific identification basis.
Allocation between classes – Investment income earned, realized capital gains and losses, and unrealized appreciation and depreciation are allocated daily to each class of shares based upon its proportionate share of total net assets of each Fund. Class specific expenses are charged directly to the class incurring the expense. Fund-level expenses of each Fund that are not attributable to a specific class are allocated daily to each class of shares of that Fund based upon the class' proportionate share of total net assets of the Fund.
Common expenses – Common expenses of the Trust are allocated among the Funds and the other series of the Trust based on the relative net assets of each series or the nature of the services performed and the relative applicability to each series.
Distributions to shareholders – The Funds distribute to shareholders any net investment income dividends and net realized capital gains distributions at least once each year. The amount of such dividends and distributions are determined in accordance with federal income tax regulations, which may differ from GAAP. Dividends and distributions to shareholders are recorded on the ex-dividend date. There were no distributions paid by either Fund during the six months ended November 30, 2014. The tax character of distributions paid by Barrow All-Cap Core Fund during the period ended May 31, 2014 was as follows:
| | | Ordinary Income | | | Long-Term Capital Gains | | | Total | |
| Institutional Class | | $ | 193,861 | | | $ | 215,279 | | | $ | 409,140 | |
| Investor Class | | $ | 1,187 | | | $ | 1,426 | | | $ | 2,613 | |
BARROW FUNDS
NOTES TO FINANCIAL STATEMENTS (Continued) |
The Funds made the following distributions subsequent to November 30, 2014 to shareholders of record on the record dates as stated below:
| | | Per Share | |
| | Record Date | Ex-Date | | Ordinary
Income | | | Long-term
Capital Gain | |
| Barrow All-Cap Core Fund - Institutional Class | 12/1/2014 | 12/2/2014 | | $ | 0.1334 | | | $ | 2.0089 | |
| Barrow All-Cap Core Fund - Institutional Class | 12/30/2014 | 12/31/2014 | | | 0.1933 | | | | — | |
| Barrow All-Cap Core Fund - Investor Class | 12/1/2014 | 12/2/2014 | | | 0.1334 | | | | 2.0089 | |
| Barrow All-Cap Core Fund - Investor Class | 12/30/2014 | 12/31/2014 | | | 0.1496 | | | | — | |
| Barrow All-Cap Long/Short Fund - Institutional Class | 12/1/2014 | 12/2/2014 | | | 0.1908 | | | | — | |
| Barrow All-Cap Long/Short Fund - Investor Class | 12/1/2014 | 12/2/2014 | | | 0.1908 | | | | — | |
Short Positions – Barrow All-Cap Long/Short Fund may sell securities short. For financial statement purposes, an amount equal to the settlement amount is included in the Statements of Assets and Liabilities as an asset and an equivalent liability is then subsequently marked-to-market daily to reflect the current value of the short position. Subsequent fluctuations in the market prices of securities sold, but not yet purchased, may require purchasing the securities at prices which may differ from the market value reflected on the Statements of Assets and Liabilities. The Fund is liable for any dividends payable on securities while those securities are in a short position and will also bear other costs, such as charges for the prime brokerage accounts, in connection with the short positions. These costs are reported as brokerage expenses on securities sold short in the Statements of Operations. As collateral for its short positions, the Fund is required under the 1940 Act to maintain assets consisting of cash, cash equivalents or other liquid securities equal to the market value of the securities sold short. The deposits with brokers for securities sold short are reported on the Statements of Assets and Liabilities. The amount of collateral is required to be adjusted daily to reflect changes in the value of the securities sold short. To the extent Barrow All-Cap Long/Short Fund invests the proceeds received from selling securities short, the Fund is engaging in a form of leverage. The use of leverage by the Fund may make any change in the Fund’s net asset value greater than it would be without the use of leverage. Short sales are speculative transactions and subject a fund to the potential for unlimited losses.
BARROW FUNDS
NOTES TO FINANCIAL STATEMENTS (Continued) |
Estimates – The preparation of financial statements in conformity with GAAP requires management to make estimates and assumptions that affect the reported amounts of assets and liabilities and disclosure of contingent assets and liabilities as of the date of the financial statements and the reported amounts of income and expenses during the reporting period. Actual results could differ from those estimates.
Federal income tax – Each Fund has qualified and intends to continue to qualify each year as a regulated investment company under the Code. Qualification generally will relieve each Fund of liability for federal income taxes to the extent 100% of its net investment income and net realized capital gains are distributed in accordance with the Code. Accordingly, no provision for income tax has been made.
In order to avoid imposition of the excise tax applicable to regulated investment companies, it is also each Fund’s intention to declare as dividends in each calendar year at least 98% of its net investment income (earned during the calendar year) and 98.2% of its net realized capital gains (earned during the twelve months ended October 31) plus undistributed amounts from prior years.
| | | Barrow All-Cap Core Fund | | | Barrow All-Cap Long/Short Fund | |
| Cost of portfolio investments | | $ | 18,597,867 | | | $ | 11,725,402 | |
| Gross unrealized appreciation | | $ | 3,812,226 | | | $ | 1,193,842 | |
| Gross unrealized depreciation | | | (398,987 | ) | | | (255,650 | ) |
| Net unrealized appreciation | | | 3,413,239 | | | | 938,192 | |
| Net unrealized depreciation on securities sold short | | | — | | | | (658,306 | ) |
| Undistributed ordinary income | | | 161,229 | | | | 172,629 | |
| Accumulated ordinary income (loss) | | | 79,402 | | | | (25,665 | ) |
| Undistributed long-term gains | | | 1,593,054 | | | | — | |
| Other gains (losses) | | | 107,262 | | | | (146,099 | ) |
| Accumulated earnings | | $ | 5,354,186 | | | $ | 280,751 | |
As of November 30, 2014, the proceeds of securities sold short on a tax basis is $7,557,013 for Barrow All-Cap Long/Short Fund.
The value of the federal income tax cost of portfolio investments, securities sold short, tax components of accumulated earnings, and financial statement cost and components of net assets may be temporarily different (“book/tax differences”). These book/tax differences are due to the recognition of capital gains or losses under income tax regulations and GAAP, primarily the tax deferral of losses on wash sales and the tax treatment of income and capital gains on publicly-traded partnerships held by the Funds.
BARROW FUNDS
NOTES TO FINANCIAL STATEMENTS (Continued) |
The Funds recognize tax benefits or expenses of uncertain tax positions only when the position is “more likely than not” of being sustained assuming examination by tax authorities. Management has reviewed tax positions taken on federal income tax returns for the current year and for the tax period ended May 31, 2014 and has concluded that no provision for unrecognized tax benefits or expenses is required in these financial statements.
3. Investment Transactions
During the six months ended November 30, 2014, cost of purchases and proceeds from sales of investment securities, other than short-term investments and short positions, amounted to $11,648,846 and $11,587,552, respectively, for Barrow All-Cap Core Fund and $9,696,350 and $4,029,938, respectively, for Barrow All-Cap Long/Short Fund.
4. Transactions with Related Parties
INVESTMENT ADVISORY AGREEMENT
Each Fund’s investments are managed by Barrow Street Advisors, LLC (the "Adviser")pursuant to the terms of an Investment Advisory Agreement. Barrow All-Cap Core Fund pays the Adviser an investment advisory fee, computed and accrued daily and paid monthly, at the annual rate of 0.99% of its average daily net assets. Barrow All-Cap Long/Short Fund pays the Adviser an investment advisory fee, computed and accrued daily and paid monthly, at the annual rate of 1.50% of its average daily net assets.
Pursuant to an expense limitation agreement (the “Expense Limitation Agreement”), the Adviser has contractually agreed, until October 1, 2016, to reduce investment advisory fees and reimburse other expenses to the extent necessary to limit total annual fund operating expenses (exclusive of brokerage costs, taxes, borrowing costs such as interest and dividend expenses on securities sold short, interest, acquired fund fees and expenses, extraordinary expenses, and other expenses not incurred in the ordinary course of the Funds’ business) to an amount not exceeding the following percentages of average daily net assets attributable to each respective Class:
| | Institutional Class | Investor Class |
| Barrow All-Cap Core Fund | 1.15% | 1.40% |
| Barrow All-Cap Long/Short Fund | 1.74% | 1.99% |
BARROW FUNDS
NOTES TO FINANCIAL STATEMENTS (Continued) |
Accordingly, during the six months ended November 30, 2014, the Adviser reduced its investment advisory fees and reimbursed expenses as follows:
| | | Investment Advisory Fee Reduced | | | Expenses Reimbursed | | | Total | |
| Barrow All-Cap Core Fund | | $ | 64,637 | | | $ | 24,877 | | | $ | 89,514 | |
| Barrow All-Cap Long/Short Fund | | $ | 40,795 | | | $ | 71,159 | | | $ | 111,954 | |
Under the terms of the Expense Limitation Agreement, investment advisory fee reductions and expense reimbursements by the Adviser are subject to repayment by each Fund for a period of three years after such fees and expenses were incurred, provided that the repayments do not cause total annual fund operating expenses to exceed the foregoing expense limitations. As of November 30, 2014, the Adviser may seek repayment of investment advisory fee reductions and expense reimbursements no later than the dates as stated below:
| | | May 31,
2017 | | | November 30,
2017 | | | Total | |
| Barrow All-Cap Core Fund | | $ | 118,161 | | | $ | 89,514 | | | $ | 207,675 | |
| Barrow All-Cap Long/Short Fund | | $ | 156,927 | | | $ | 111,954 | | | $ | 268,881 | |
The Principle Executive Officer of the Funds is also an officer of the Adviser.
OTHER SERVICE PROVIDERS
Ultimus Fund Solutions, LLC (“Ultimus”) provides fund administration, fund accounting, compliance, and transfer agency services to the Funds. Each Fund pays Ultimus fees in accordance with the agreements for such services. In addition, each Fund pays out-of-pocket expenses including, but not limited to, postage, supplies, and costs of pricing its portfolio securities.
DISTRIBUTION AGREEMENT
Under the terms of a Distribution Agreement with the Trust, Ultimus Fund Distributors, LLC (the “Distributor”) serves as principal underwriter to each Fund. The Distributor is a wholly-owned subsidiary of Ultimus.
Certain Trustees and officers of the Trust are also officers of Ultimus and the Distributor.
BARROW FUNDS
NOTES TO FINANCIAL STATEMENTS (Continued) |
DISTRIBUTION PLAN
Each Fund has adopted a distribution plan under Rule 12b-1 under the 1940 Act (the “Plan”) pursuant to which each Fund may pay intermediaries and other persons for rendering distribution and shareholder services and for bearing any related expenses with respect to the Investor Class of each Fund. These distribution and shareholder service fees will not exceed the annual rate of 0.25% of each Fund's average daily net assets allocable to Investor Class Shares. During the six months ended November 30, 2014, the Investor Class of Barrow All-Cap Core Fund and Barrow All-Cap Long/Short Fund incurred $293 and $216, respectively, of distribution fees under the Plan.
TRUSTEE COMPENSATION
Each Independent Trustee receives from each Fund of the Trust a fee of $500 for each Board meeting attended plus reimbursement of travel and other meeting-related expenses. Trustees affiliated with the Advisor or Ultimus are not compensated by the Funds for their services.
PRINCIPAL HOLDERS OF FUND SHARES
As of November 30, 2014, the following shareholders owned of record more than 5% of the outstanding shares of each class of each Fund:
| Name of Record Owner | % Ownership |
| Barrow All-Cap Core Fund – Institutional Class: | |
| Socatean Partners | 69% |
| Robert F. Greenhill, Jr. (a principal of the Adviser) | 20% |
| Barrow All-Cap Core Fund – Investor Class: | |
| Robert F. Greenhill, Jr. | 33% |
| Charles Schwab & Company, Inc. (for the benefit of its customers) | 18% |
| National Financial Services Corporation (for the benefit of its customers) | 14% |
| Peter Jennings | 9% |
| Seshadri Narasimhan | 8% |
| Isaac Brauner | 7% |
| Nicholas Chermayeff (a principal of the Adviser) | 5% |
Barrow All-Cap Long/Short Fund – Institutional Class: | |
| Socatean Partners | 56% |
| Robert F. Greenhill, Jr. | 25% |
| Charles Schwab & Company, Inc. (for the benefit of its customers) | 6% |
| Barrow All-Cap Long/Short Fund – Investor Class: | |
| Robert F. Greenhill, Jr. | 53% |
| Charles Schwab & Company, Inc. (for the benefit of its customers) | 29% |
| James E. King | 12% |
| Nicholas Chermayeff | 6% |
BARROW FUNDS
NOTES TO FINANCIAL STATEMENTS (Continued) |
A shareholder owning of record or beneficially more than 25% of a Fund’s outstanding shares may be considered a controlling person. That shareholder’s vote could have a more significant effect on matters presented at a shareholder’s meeting.
5. Borrowing Costs
Barrow All-Cap Core Fund has a secured bank line of credit with BNP Paribas that provides a maximum borrowing of up to one-third of Barrow Street All-Cap Core Fund’s net assets. The line of credit may be used to maintain necessary liquidity to make payments for redemptions of Fund shares or for temporary emergency purposes. Borrowings under this arrangement bear interest at an annual rate equal to the one-month LIBOR at the time of borrowing plus 0.85%. During the six months ended November 30, 2014, Barrow All-Cap Core Fund incurred $859 of borrowing costs. Barrow All-Cap Long/Short Fund incurred no borrowing costs during the six months ended November 30, 2014. As of November 30, 2014, Barrow All-Cap Core Fund had outstanding borrowings of $15,040. The average outstanding borrowings and average interest rate on such borrowings by Barrow All-Cap Core Fund during the six months ended November 30, 2014 were $163,869 and 1.05%, respectively.
6. Contingencies and Commitments
The Funds indemnify the Trust’s officers and Trustees for certain liabilities that might arise from their performance of their duties to the Funds. Additionally, in the normal course of business the Funds enter into contracts that contain a variety of representations and warranties and which provide general indemnifications. The Funds’ maximum exposure under these arrangements is unknown, as this would involve future claims that may be made against the Funds that have not yet occurred. However, based on experience, the Funds expect the risk of loss to be remote.
BARROW FUNDS
NOTES TO FINANCIAL STATEMENTS (Continued) |
7. Sector Risk
If a Fund has significant investments in the securities of issuers within a particular sector, any development affecting that sector will have a greater impact on the value of the net assets of the Fund than would be the case if the Fund did not have significant investments in that sector. In addition, this may increase the risk of loss in the Fund and increase the volatility of the Fund’s net asset value per share. Occasionally, market conditions, regulatory changes, or other developments may negatively impact this sector, and therefore the value of the Fund’s portfolio will be adversely affected. As of November 30, 2014, Barrow All-Cap Long/Short Fund had the following percentages of the value of its net assets invested or sold short in stocks within the following sectors:
| Sector | Long
Positions | Short
Positions | Net
Exposure |
| Consumer Discretionary | 28.8% | -20.5% | 8.3% |
| Consumer Staples | 25.3% | -16.7% | 8.6% |
As shown above, although the Fund has greater than 25% of the Fund’s net assets invested in long positions in the sectors noted, each sector exposure is mitigated by short positions. As stated in the Fund’s principal investment strategy, the Adviser monitors the Fund’s industry exposure to ensure the Fund’s portfolio is significantly diversified.
8. Subsequent Events
The Funds are required to recognize in the financial statements the effects of all subsequent events that provide additional evidence about conditions that existed as of the date of the Statements of Assets and Liabilities. For non-recognized subsequent events that must be disclosed to keep the financial statements from being misleading, the Funds are required to disclose the nature of the event as well as an estimate of its financial effect, or a statement that such an estimate cannot be made. Management has evaluated subsequent events through the issuance of these financial statements and has noted no such events.
BARROW FUNDS
ABOUT YOUR FUNDS’ EXPENSES (Unaudited) |
We believe it is important for you to understand the impact of costs on your investment. As a shareholder of the Funds, you incur ongoing costs, including management fees, class specific fees (such as Rule 12b-1 distribution fees) and other operating expenses. The following examples are intended to help you understand your ongoing costs (in dollars) of investing in the Funds and to compare these costs with the ongoing costs of investing in other mutual funds.
A mutual fund’s ongoing costs are expressed as a percentage of its average net assets. This figure is known as the expense ratio. The expenses in the table below are based on an investment of $1,000 made at the beginning of the most recent period (June 1, 2014) and held until the end of the period (November 30, 2014).
The table below illustrates each Fund’s ongoing costs in two ways:
Actual fund return – This section helps you to estimate the actual expenses that you paid over the period. The “Ending Account Value” shown is derived from each Fund’s actual return, and the third column shows the dollar amount of operating expenses that would have been paid by an investor who started with $1,000 in the Funds. You may use the information here, together with the amount you invested, to estimate the expenses that you paid over the period.
To do so, simply divide your account value by $1,000 (for example, an $8,600 account value divided by $1,000 = 8.6), then multiply the result by the number given for the Funds under the heading “Expenses Paid During Period.”
Hypothetical 5% return – This section is intended to help you compare the Funds’ ongoing costs with those of other mutual funds. It assumes that each Fund had an annual return of 5% before expenses during the period shown, but that the expense ratio is unchanged. In this case, because the return used is not the Funds’ actual return, the results do not apply to your investment. The example is useful in making comparisons because the Securities and Exchange Commission (the “SEC”) requires all mutual funds to calculate expenses based on a 5% return. You can assess each Fund’s ongoing costs by comparing this hypothetical example with the hypothetical examples that appear in shareholder reports of other funds.
Note that expenses shown in the table are meant to highlight and help you compare ongoing costs only. The Funds do not charge transaction fees, such as purchase or redemption fees, nor do they carry a “sales load.”
The calculations assume no shares were bought or sold during the period. Your actual costs may have been higher or lower, depending on the amount of your investment and the timing of any purchases or redemptions.
BARROW FUNDS
ABOUT YOUR FUNDS’ EXPENSES (Unaudited) (Continued) |
More information about the Funds’ expenses can be found in this report. For additional information on operating expenses and other shareholder costs, please refer to the Funds’ prospectus.
| | Beginning
Account Value
June 1, 2014 | Ending
Account Value
November 30, 2014 | Net
Expense
Ratio(a) | Expenses Paid During Period(b) |
| Barrow All-Cap Core Fund | | | | |
| Institutional Class | | | | |
Actual | $1,000.00 | $1,036.40 | 1.16% | $5.92 |
Hypothetical 5% Return (before expenses) | $1,000.00 | $1,019.25 | 1.16% | $5.87 |
| Investor Class | | | | |
Actual | $1,000.00 | $1,034.90 | 1.41% | $7.19 |
Hypothetical 5% Return (before expenses) | $1,000.00 | $1,018.00 | 1.41% | $7.13 |
| Barrow All-Cap Long/Short Fund | | | | |
| Institutional Class | | | | |
Actual | $1,000.00 | $1,000.00 | 3.67% | $18.40 |
Hypothetical 5% Return (before expenses) | $1,000.00 | $1,006.67 | 3.67% | $18.46 |
| Investor Class | | | | |
Actual | $1,000.00 | $999.00 | 3.92% | $19.64 |
Hypothetical 5% Return (before expenses) | $1,000.00 | $1,005.41 | 3.92% | $19.71 |
(a) | Annualized, based on the Fund's most recent one-half year expenses. |
(b) | Expenses are equal to the Funds' annualized expense ratio multiplied by the average account value over the period, multiplied by 183/365 (to reflect the one-half year period). |
BARROW FUNDS
OTHER INFORMATION (Unaudited) |
A description of the policies and procedures that the Funds use to vote proxies relating to portfolio securities is available without charge upon request by calling toll-free 1-877-767-6633, or on the SEC’s website at http://www.sec.gov. Information regarding how the Funds voted proxies relating to portfolio securities during the most recent period ended June 30 is also available without charge upon request by calling toll-free 1-877-767-6633, or on the SEC’s website at http://www.sec.gov.
The Trust files a complete listing of portfolio holdings for each of the Funds with the SEC as of the end of the first and third quarters of each fiscal year on Form N-Q. These filings are available upon request by calling 1-877-767-6633. Furthermore, you may obtain a copy of the filings on the SEC’s website at http://www.sec.gov. The Trust’s Forms N-Q may also be reviewed and copied at the SEC’s Public Reference Room in Washington, DC, and information on the operation of the Public Reference Room may be obtained by calling 1-800-SEC-0330.
This page intentionally left blank.
This page intentionally left blank.
This page intentionally left blank.

CINCINNATI ASSET MANAGEMENT FUNDS:
BROAD MARKET STRATEGIC INCOME FUND
Semi-Annual Report
November 30, 2014
(Unaudited)
CINCINNATI ASSET MANAGEMENT FUNDS:
BROAD MARKET STRATEGIC INCOME FUND
LETTER TO SHAREHOLDERS | January 16, 2015 |
Dear Fellow Shareholders,
The Semi-Annual report for the Cincinnati Asset Management Funds: Broad Market Strategic Income Fund (the “Fund”) presents data and performance for the six months ended November 30, 2014. All of us at Cincinnati Asset Management want to thank you for your investment in the Fund. We appreciate your confidence in our investment management.
The Fund is currently invested primarily in investment-grade corporate bonds (approximately 62%) and high-yield corporate bonds (approximately 38%) that we consider undervalued. The portfolio’s weighted-average credit rating is investment grade. We believe that our proprietary analysis enhances our ability to identify opportunities and enables us to sell securities when more attractive opportunities present themselves. These investment decisions are made with the important discipline of maintaining portfolio diversification and with the dual objectives of achieving a high level of income while preserving capital.
Our disciplined investment strategy resulted in the Fund holding 86 positions in the bonds of 75 different corporations at November 30. At that time, cash balances amounted to approximately 1% of the Fund’s net assets, and the Fund continues to be fully invested, as is its objective. The weighted-average maturity of the Fund’s investments was approximately 7 years at November 30, which is more than 3 years shorter than the average maturity of the Fund’s benchmark (Barclays US Corporate BBB Index). Over the six month period, longer-maturity bonds outperformed shorter-maturity bonds and, consequently, the Fund underperformed its benchmark (1.12% versus 1.64%). The Fund infrequently purchases securities with a maturity beyond 10 years, so we expect the Fund’s performance to trail the benchmark during periods of strong performance by longer maturity bonds.
During the past several months, interest rates have declined; the yield on the 10-year Treasury Bond was 2.48% at May 31 and was 2.17% at November 30 (that rate has continued to decline and was below 2.00% early in January 2015). Since bond prices decline as rates increase, the price of your Fund shares will reflect those changes in interest rates. Bonds that the Fund owns were yielding, on average, around 2.0% more than Treasury yields at November 30.
While the performance of the investment-grade bonds owned by the Fund respond more closely to changes in interest rates, the performance of the high-yield bonds may respond more to the overall risk perception that investors associate with the asset class. For example, during the last quarter, $3 billion was withdrawn from high-yield bond funds, and the premium over Treasuries that investors demanded increased by approximately 1%. This resulted in high-yield bond prices declining by 4.5%. However, given the relative weighting of investment-grade and high-yield bonds in the Fund, performance remained positive at 1.12%. We believe that the Fund’s current positioning should provide excellent value relative to other investment-grade fixed income alternatives.
Although the third calendar quarter adjusted GDP was 5%, many economists believe that 2015 GDP will be in the 2-3% range. For example, the World Bank has recently adjusted its 2015 Global GDP forecast to 3%. Although the unemployment rate has declined significantly
since the depths of the recent recession, the labor participation rate hovers at the 60% level and the “underemployed” represent a significant portion of the work force. Inflation is “benign” and, with the recent decline of over 50% in oil prices, inflation expectations are quite low. Given these factors, it is difficult to see how or when the Federal Reserve (the “FED”) will begin to increase interest rates. It’s important to note that the FED’s actions typically affect only the short end of the yield curve (30 days to 2 years), so longer maturity bonds may be less impacted by the FED’s actions.
During the last six calendar months, there have been two significant events that have and will continue to impact financial markets. First, the rapid and significant decline in oil prices are inuring to the benefit of the consumer. Increased disposable income should have a positive effect on consumption and, therefore, should have a positive impact on the economy. At the same time, some lower-quality companies in the energy sector may have a difficult time in servicing their debt. We are being cautious and dilligent with respect to the positions we hold in this sector.
The second significant event has been the decline in the Euro, which is currently trading at near decade lows to the U.S. dollar. To the extent the Eurozone continues to face severe economic difficulty, the European Central Bank is likely to take additional steps to bolster their economy. This could further weaken the Euro, which will have an impact on U.S. exports. As we research companies, we carefully consider how this might impact their credit quality, and our assessment of their relative value.
We believe that the companies in the Fund’s portfolio are positioned to withstand economic adversity and to participate in any economic expansion. While the economy continues to face uncertainty in the face of unemployment, government deficits, tax reform, and a host of other issues, we are reminded that there are still opportunities that can reward investors, and we endeavor to identify these opportunities every day.
Thank you again for your confidence in the Fund. Our fellow investors are very important to us and if you have any questions regarding market conditions or the Fund, please don’t hesitate to call us (513.554.8500).
Sincerely,
Cincinnati Asset Management Funds: Broad Market Strategic Income Fund
Managed by Cincinnati Asset Management, Inc.
Past performance is not predictive of future performance. Investment results and principal value will fluctuate so that shares, when redeemed, may be worth more or less than their original cost. Current performance may be higher or lower than the performance data quoted. Performance data current to the most recent month end are available by calling 1-866-738-1128.
An investor should consider the investment objectives, risks, charges and expenses of the Fund carefully before investing. The Fund’s prospectus contains this and other important information. To obtain a copy of the Fund’s prospectus please call 1-866-738-1128 and a copy will be sent to you free of charge. Please read the prospectus carefully before you invest. Cincinnati Asset Management Funds: Broad Market Strategic Income Fund is distributed by Ultimus Fund Distributors, LLC.
The Letter to Shareholders seeks to describe some of the adviser’s current opinions and views of the financial markets. Although the adviser believes it has a reasonable basis for any opinions or views expressed, actual results may differ, sometimes significantly so, from those expected or expressed.
CINCINNATI ASSET MANAGEMENT FUNDS:
BROAD MARKET STRATEGIC INCOME FUND
PORTFOLIO INFORMATION
November 30, 2014 (Unaudited)
Sector Diversification (% of Net Assets)
Top 10 Investments
| Security Description | | % of Net Assets |
| Toll Brothers Finance Corp., 5.875%, due 02/15/22 | | 2.8% |
| Wells Fargo & Co., 4.125%, due 08/15/23 | | 2.7% |
| Bristol-Myers Squibb Co., 3.250%, due 11/01/23 | | 2.6% |
US Airways, Inc., Class A Pass-Through Certificates,
Series 2012-2, 4.625%, due 12/03/26 | | 2.6% |
| U.S. Bancorp, 2.950%, due 07/15/22 | | 2.6% |
| Qwest Corp., 6.750%, due 12/01/21 | | 2.6% |
| JPMorgan Chase & Co., 4.500%, due 01/24/22 | | 2.4% |
| PerkinElmer, Inc., 5.000%, due 11/15/21 | | 2.4% |
| International Lease Finance Corp., 5.875%, due 08/15/22 | | 2.4% |
| Ford Motor Credit Co., LLC, 4.250%, due 09/20/22 | | 2.3% |
| Credit Rating Allocation |
| S&P Credit Quality | | % of Portfolio |
| AA | | 7.8% |
| A | | 41.3% |
| BBB | | 12.5% |
| BB | | 25.9% |
| B | | 12.5% |
CINCINNATI ASSET MANAGEMENT FUNDS:
BROAD MARKET STRATEGIC INCOME FUND
SCHEDULE OF INVESTMENTS
November 30, 2014 (Unaudited) | |
| CORPORATE BONDS — 97.5% | | Coupon | Maturity | | Par Value | | | Value | |
| Consumer Discretionary — 7.6% | | | | | | | | | | |
Avis Budget Car Rental, LLC | | | 5.500 | % | 04/01/23 | | $ | 50,000 | | | $ | 50,750 | |
CCO Holdings, LLC | | | 5.250 | % | 09/30/22 | | | 43,000 | | | | 42,946 | |
CHC Helicopter SA | | | 9.250 | % | 10/15/20 | | | 13,500 | | | | 13,770 | |
Lamar Media Corp. | | | 5.875 | % | 02/01/22 | | | 43,000 | | | | 45,150 | |
Lamar Media Corp. | | | 5.000 | % | 05/01/23 | | | 5,000 | | | | 5,000 | |
MGM Resorts International | | | 6.625 | % | 12/15/21 | | | 45,000 | | | | 48,262 | |
Penske Auto Group, Inc. | | | 5.750 | % | 10/01/22 | | | 52,000 | | | | 54,210 | |
Penske Auto Group, Inc. | | | 5.375 | % | 12/01/24 | | | 8,000 | | | | 8,060 | |
Regal Entertainment Group | | | 5.750 | % | 03/15/22 | | | 6,000 | | | | 5,745 | |
Regal Entertainment Group | | | 5.750 | % | 02/01/25 | | | 45,000 | | | | 41,963 | |
Royal Caribbean Cruises Ltd. | | | 5.250 | % | 11/15/22 | | | 52,000 | | | | 54,600 | |
Walt Disney Co. (The) | | | 2.350 | % | 12/01/22 | | | 150,000 | | | | 146,790 | |
| | | | | | | | | | | | | 517,246 | |
| Consumer Staples — 3.6% | | | | | | | | | | | | | |
Anheuser-Busch InBev SA/NV | | | 2.625 | % | 01/17/23 | | | 100,000 | | | | 96,970 | |
B&G Foods, Inc. | | | 4.625 | % | 06/01/21 | | | 58,000 | | | | 55,970 | |
Spectrum Brands, Inc. | | | 6.625 | % | 11/15/22 | | | 2,000 | | | | 2,140 | |
Wal-Mart Stores, Inc. | | | 2.550 | % | 04/11/23 | | | 90,000 | | | | 88,671 | |
| | | | | | | | | | | | | 243,751 | |
| Energy — 14.5% | | | | | | | | | | | | | |
Apache Corp. | | | 3.250 | % | 04/15/22 | | | 109,000 | | | | 109,733 | |
Bristow Group, Inc. | | | 6.250 | % | 10/15/22 | | | 55,000 | | | | 55,963 | |
Chesapeake Energy Corp. | | | 6.125 | % | 02/15/21 | | | 42,000 | | | | 45,675 | |
Chevron Corp. | | | 2.355 | % | 12/05/22 | | | 150,000 | | | | 145,992 | |
Cloud Peak Energy Resources, LLC | | | 6.375 | % | 03/15/24 | | | 29,000 | | | | 28,493 | |
ConocoPhillips | | | 2.400 | % | 12/15/22 | | | 150,000 | | | | 145,301 | |
Denbury Resources, Inc. | | | 4.625 | % | 07/15/23 | | | 56,000 | | | | 47,320 | |
Offshore Group Investment Ltd. | | | 7.500 | % | 11/01/19 | | | 20,000 | | | | 15,200 | |
Offshore Group Investment Ltd. | | | 7.125 | % | 04/01/23 | | | 42,000 | | | | 29,820 | |
Peabody Energy Corp. | | | 6.250 | % | 11/15/21 | | | 18,000 | | | | 16,943 | |
Peabody Energy Corp. | | | 7.875 | % | 11/01/26 | | | 50,000 | | | | 46,625 | |
Range Resources Corp. | | | 5.000 | % | 08/15/22 | | | 46,000 | | | | 47,725 | |
Rosetta Resources, Inc. | | | 5.875 | % | 06/01/22 | | | 60,000 | | | | 57,900 | |
Sabine Pass Liquefaction, LLC | | | 5.625 | % | 04/15/23 | | | 56,000 | | | | 57,400 | |
Schlumberger Ltd. | | | 3.650 | % | 12/01/23 | | | 125,000 | | | | 131,426 | |
| | | | | | | | | | | | | 981,516 | |
| Financials — 24.1% | | | | | | | | | | | | | |
Bank of America Corp. | | | 3.300 | % | 01/11/23 | | | 150,000 | | | | 150,275 | |
Ford Motor Credit Co., LLC | | | 4.250 | % | 09/20/22 | | | 150,000 | | | | 158,992 | |
General Electric Capital Corp. | | | 3.150 | % | 09/07/22 | | | 150,000 | | | | 153,543 | |
CINCINNATI ASSET MANAGEMENT FUNDS:
BROAD MARKET STRATEGIC INCOME FUND
SCHEDULE OF INVESTMENTS (Continued) | |
| CORPORATE BONDS — 97.5% (Continued) | | Coupon | Maturity | | Par Value | | | Value | |
| Financials — 24.1% (Continued) | | | | | | | | | | |
International Lease Finance Corp. | | | 8.625 | % | 01/15/22 | | $ | 35,000 | | | $ | 43,488 | |
International Lease Finance Corp. | | | 5.875 | % | 08/15/22 | | | 150,000 | | | | 162,750 | |
JPMorgan Chase & Co. | | | 4.500 | % | 01/24/22 | | | 150,000 | | | | 164,881 | |
PNC Financial Services Group, Inc. (The) | | | 2.854 | % | 11/09/22 | | | 150,000 | | | | 147,436 | |
Simon Property Group, L.P. | | | 3.750 | % | 02/01/24 | | | 100,000 | | | | 104,878 | |
Toll Brothers Finance Corp. | | | 5.875 | % | 02/15/22 | | | 175,000 | | | | 190,531 | |
U.S. Bancorp | | | 2.950 | % | 07/15/22 | | | 175,000 | | | | 173,947 | |
Wells Fargo & Co. | | | 4.125 | % | 08/15/23 | | | 175,000 | | | | 184,158 | |
| | | | | | | | | | | | | 1,634,879 | |
| Health Care — 8.4% | | | | | | | | | | | | | |
Bristol-Myers Squibb Co. | | | 3.250 | % | 11/01/23 | | | 175,000 | | | | 179,517 | |
Community Health Systems, Inc. | | | 6.875 | % | 02/01/22 | | | 54,000 | | | | 57,442 | |
DaVita HealthCare Partners, Inc. | | | 5.125 | % | 07/15/24 | | | 54,000 | | | | 55,485 | |
HCA Holdings, Inc. | | | 6.250 | % | 02/15/21 | | | 40,000 | | | | 42,500 | |
HCA Holdings, Inc. | | | 5.875 | % | 05/01/23 | | | 17,000 | | | | 17,999 | |
HealthSouth Corp. | | | 5.750 | % | 11/01/24 | | | 54,000 | | | | 56,430 | |
PerkinElmer, Inc. | | | 5.000 | % | 11/15/21 | | | 150,000 | | | | 164,096 | |
| | | | | | | | | | | | | 573,469 | |
| Industrials — 16.1% | | | | | | | | | | | | | |
B/E Aerospace, Inc. | | | 5.250 | % | 04/01/22 | | | 46,000 | | | | 51,290 | |
General Dynamics Corp. | | | 2.250 | % | 11/15/22 | | | 150,000 | | | | 144,950 | |
Hawaiian Airlines, Inc., Series 2013-1A | | | 3.900 | % | 01/15/26 | | | 75,000 | | | | 73,500 | |
Iron Mountain, Inc. | | | 5.750 | % | 08/15/24 | | | 57,000 | | | | 58,069 | |
R.R. Donnelley & Sons Co. | | | 7.625 | % | 06/15/20 | | | 4,000 | | | | 4,430 | |
R.R. Donnelley & Sons Co. | | | 7.875 | % | 03/15/21 | | | 41,000 | | | | 46,330 | |
Raytheon Co. | | | 2.500 | % | 12/15/22 | | | 150,000 | | | | 146,901 | |
Service Corp. International | | | 7.500 | % | 04/01/27 | | | 50,000 | | | | 56,750 | |
Stanley Black & Decker, Inc. | | | 2.900 | % | 11/01/22 | | | 150,000 | | | | 149,590 | |
Teekay Corp. | | | 8.500 | % | 01/15/20 | | | 47,000 | | | | 53,345 | |
| United Airlines, Inc., Class B Pass-Through Certificates, Series 2013-1 | | | 5.375 | % | 02/15/23 | | | 43,000 | | | | 43,645 | |
United Rentals North America, Inc. | | | 6.125 | % | 06/15/23 | | | 45,000 | | | | 47,813 | |
| US Airways, Inc., Class A Pass-Through Certificates, Series 2012-2 | | | 4.625 | % | 12/03/26 | | | 167,284 | | | | 175,648 | |
| US Airways, Inc., Class B Pass-Through Certificates, Series 2012-1 | | | 8.000 | % | 04/01/21 | | | 35,819 | | | | 39,579 | |
| | | | | | | | | | | | | 1,091,840 | |
CINCINNATI ASSET MANAGEMENT FUNDS:
BROAD MARKET STRATEGIC INCOME FUND
SCHEDULE OF INVESTMENTS (Continued) | |
| CORPORATE BONDS — 97.5% (Continued) | | Coupon | Maturity | | Par Value | | | Value | |
| Information Technology — 5.4% | | | | | | | | | | |
Equinix, Inc. | | | 5.375 | % | 04/01/23 | | $ | 55,000 | | | $ | 55,481 | |
Hewlett-Packard Co. | | | 4.375 | % | 09/15/21 | | | 150,000 | | | | 158,612 | |
Intel Corp. | | | 2.700 | % | 12/15/22 | | | 150,000 | | | | 149,261 | |
| | | | | | | | | | | | | 363,354 | |
| Materials — 2.9% | | | | | | | | | | | | | |
Graphic Packaging International, Inc. | | | 4.750 | % | 04/15/21 | | | 55,000 | | | | 55,412 | |
Praxair, Inc. | | | 2.200 | % | 08/15/22 | | | 150,000 | | | | 143,412 | |
| | | | | | | | | | | | | 198,824 | |
| Telecommunication Services — 10.4% | | | | | | | | | | | | | |
AT&T, Inc. | | | 2.625 | % | 12/01/22 | | | 140,000 | | | | 134,325 | |
CenturyLink, Inc. | | | 5.800 | % | 03/15/22 | | | 5,000 | | | | 5,275 | |
Comcast Corp. | | | 3.600 | % | 03/01/24 | | | 80,000 | | | | 83,494 | |
Embarq Corp. | | | 7.995 | % | 06/01/36 | | | 40,000 | | | | 44,600 | |
Frontier Communications Corp. | | | 9.000 | % | 08/15/31 | | | 55,000 | | | | 59,537 | |
Intelsat Jackson Holdings S.A. | | | 7.500 | % | 04/01/21 | | | 40,000 | | | | 43,050 | |
Mediacom, LLC/Mediacom Capital Corp. | | | 7.250 | % | 02/15/22 | | | 43,000 | | | | 46,118 | |
Qwest Corp. | | | 6.750 | % | 12/01/21 | | | 150,000 | | | | 173,085 | |
Sprint Communications Co., L.P. | | | 6.000 | % | 11/15/22 | | | 56,000 | | | | 54,110 | |
Sprint Corp. | | | 7.875 | % | 09/15/23 | | | 8,000 | | | | 8,420 | |
Verizon Communications, Inc. | | | 5.150 | % | 09/15/23 | | | 50,000 | | | | 56,251 | |
| | | | | | | | | | | | | 708,265 | |
| Utilities — 4.5% | | | | | | | | | | | | | |
AES Corp. (The) | | | 5.500 | % | 03/15/24 | | | 55,000 | | | | 56,375 | |
Amerigas Finance, LLC | | | 7.000 | % | 05/20/22 | | | 55,000 | | | | 58,300 | |
Ferrellgas, L.P. | | | 6.500 | % | 05/01/21 | | | 55,000 | | | | 54,725 | |
Ferrellgas, L.P. | | | 6.750 | % | 01/15/22 | | | 2,000 | | | | 2,000 | |
GenOn Americas Generation, LLC | | | 8.500 | % | 10/01/21 | | | 28,000 | | | | 26,320 | |
NRG Energy, Inc. | | | 6.625 | % | 03/15/23 | | | 46,000 | | | | 48,415 | |
Suburban Propane Partners, L.P. | | | 5.500 | % | 06/01/24 | | | 60,000 | | | | 58,350 | |
| | | | | | | | | | | | | 304,485 | |
| | | | | | | | | | | | | | |
Total Investments at Value — 97.5% (Cost $6,620,079) | | | $ | 6,617,629 | |
| | | | | |
| Other Assets in Excess of Liabilities — 2.5% | | | | 167,751 | |
| | | | | |
Net Assets — 100.0% | | | $ | 6,785,380 | |
See accompanying notes to financial statements.
CINCINNATI ASSET MANAGEMENT FUNDS:
BROAD MARKET STRATEGIC INCOME FUND
STATEMENT OF ASSETS AND LIABILITIES
November 30, 2014 (Unaudited) | |
| ASSETS | | | |
| Investments in securities: | | | |
At acquisition cost | | $ | 6,620,079 | |
At value (Note 2) | | $ | 6,617,629 | |
Cash | | | 68,387 | |
Interest receivable | | | 82,772 | |
Receivable from Adviser (Note 4) | | | 12,951 | |
Other assets | | | 17,522 | |
Total assets | | | 6,799,261 | |
| | | | | |
| LIABILITIES | | | | |
Payable to administrator (Note 4) | | | 7,000 | |
Accrued distribution fees (Note 4) | | | 281 | |
Other accrued expenses | | | 6,600 | |
Total liabilities | | | 13,881 | |
| | | | | |
NET ASSETS | | $ | 6,785,380 | |
| | | | | |
| NET ASSETS CONSIST OF: | | | | |
Paid-in capital | | $ | 6,765,258 | |
Accumulated net investment income | | | 37,753 | |
| Accumulated net realized losses from security transactions | | | (15,181 | ) |
Net unrealized depreciation on investments | | | (2,450 | ) |
NET ASSETS | | $ | 6,785,380 | |
| | | | | |
| Shares of beneficial interest outstanding (unlimited number of shares authorized, no par value) | | | 678,308 | |
| | | | | |
| Net asset value, offering price and redemption price per share (Note 2) | | $ | 10.00 | |
See accompanying notes to financial statements.
CINCINNATI ASSET MANAGEMENT FUNDS:
BROAD MARKET STRATEGIC INCOME FUND
STATEMENT OF OPERATIONS
Six Months Ended November 30, 2014 (Unaudited) | |
| INVESTMENT INCOME | | | |
Interest | | $ | 132,868 | |
| | | | | |
| EXPENSES | | | | |
Investment advisory fees (Note 4) | | | 24,979 | |
Professional fees | | | 17,888 | |
Fund accounting fees (Note 4) | | | 14,030 | |
Administration fees (Note 4) | | | 13,750 | |
Pricing fees | | | 10,824 | |
Registration and filing fees | | | 10,728 | |
Distribution fees (Note 4) | | | 8,326 | |
Compliance fees (Note 4) | | | 6,000 | |
Transfer agent fees (Note 4) | | | 6,000 | |
Custody and bank service fees | | | 4,188 | |
Trustees' fees and expenses (Note 4) | | | 3,435 | |
Insurance expense | | | 1,717 | |
Postage and supplies | | | 1,541 | |
Other expenses | | | 3,571 | |
Total expenses | | | 126,977 | |
| Less fee reductions and expense reimbursements by the Adviser (Note 4) | | | (105,329 | ) |
Net expenses | | | 21,648 | |
| | | | | |
NET INVESTMENT INCOME | | | 111,220 | |
| | | | | |
| REALIZED AND UNREALIZED LOSSES ON INVESTMENTS | | | | |
Net realized losses from security transactions | | | (11,013 | ) |
| Net change in unrealized appreciation/depreciation on investments | | | (25,441 | ) |
| NET REALIZED AND UNREALIZED LOSSES ON INVESTMENTS | | | (36,454 | ) |
| | | | | |
NET INCREASE IN NET ASSETS RESULTING FROM OPERATIONS | | $ | 74,766 | |
See accompanying notes to financial statements.
CINCINNATI ASSET MANAGEMENT FUNDS:
BROAD MARKET STRATEGIC INCOME FUND
STATEMENTS OF CHANGES IN NET ASSETS | |
| | | Six Months
Ended
November 30,
2014 (Unaudited) | | | Year
Ended
May 31,
2014 | |
| FROM OPERATIONS | | | | | | |
Net investment income | | $ | 111,220 | | | $ | 178,886 | |
Net realized losses from security transactions | | | (11,013 | ) | | | (3,453 | ) |
Net change in unrealized appreciation/depreciation on investments | | | (25,441 | ) | | | 80,934 | |
Net increase in net assets resulting from operations | | | 74,766 | | | | 256,367 | |
| | | | | | | | | |
| DISTRIBUTIONS TO SHAREHOLDERS | | | | | | | | |
From net investment income | | | (105,200 | ) | | | (175,744 | ) |
| | | | | | | | | |
| FROM CAPITAL SHARE TRANSACTIONS | | | | | | | | |
Proceeds from shares sold | | | 353,395 | | | | 1,179,992 | |
Net asset value of shares issued in reinvestment of distributions to shareholders | | | 105,200 | | | | 175,744 | |
Payments for shares redeemed | | | (50,193 | ) | | | (248,777 | ) |
| Net increase in net assets from capital share transactions | | | 408,402 | | | | 1,106,959 | |
| | | | | | | | | |
TOTAL INCREASE IN NET ASSETS | | | 377,968 | | | | 1,187,582 | |
| | | | | | | | | |
| NET ASSETS | | | | | | | | |
Beginning of period | | | 6,407,412 | | | | 5,219,830 | |
End of period | | $ | 6,785,380 | | | $ | 6,407,412 | |
| | | | | | | | | |
| ACCUMULATED NET INVESTMENT INCOME | | $ | 37,753 | | | $ | 31,733 | |
| | | | | | | | | |
| CAPITAL SHARE ACTIVITY | | | | | | | | |
Shares sold | | | 35,320 | | | | 119,978 | |
Shares reinvested | | | 10,602 | | | | 18,333 | |
Shares redeemed | | | (5,017 | ) | | | (25,837 | ) |
Net increase in shares outstanding | | | 40,905 | | | | 112,474 | |
Shares outstanding at beginning of period | | | 637,403 | | | | 524,929 | |
Shares outstanding at end of period | | | 678,308 | | | | 637,403 | |
See accompanying notes to financial statements.
CINCINNATI ASSET MANAGEMENT FUNDS:
BROAD MARKET STRATEGIC INCOME FUND
FINANCIAL HIGHLIGHTS | |
| Per Share Data for a Share Outstanding Throughout Each Period | |
| | | Six Months
Ended
November 30,
2014 (Unaudited) | | | Year
Ended
May 31,
2014 | | | Period
Ended
May 31,
2013(a) | |
Net asset value at beginning of period | | $ | 10.05 | | | $ | 9.94 | | | $ | 10.00 | |
| | | | | | | | | | | | | |
| Income (loss) from investment operations: | | | | | | | | | | | | |
Net investment income | | | 0.17 | | | | 0.33 | | | | 0.16 | |
Net realized and unrealized gains (losses) on investments | | | (0.06 | ) | | | 0.11 | | | | (0.11 | ) |
Total from investment operations | | | 0.11 | | | | 0.44 | | | | 0.05 | |
| | | | | | | | | | | | | |
| Less distributions: | | | | | | | | | | | | |
From net investment income | | | (0.16 | ) | | | (0.33 | ) | | | (0.11 | ) |
| | | | | | | | | | | | | |
Net asset value at end of period | | $ | 10.00 | | | $ | 10.05 | | | $ | 9.94 | |
| | | | | | | | | | | | | |
Total return (b) | | | 1.12 | %(c) | | | 4.68 | % | | | 0.48 | %(c) |
| | | | | | | | | | | | | |
Net assets at end of period | | $ | 6,785,380 | | | $ | 6,407,412 | | | $ | 5,219,830 | |
| | | | | | | | | | | | | |
| Ratios/supplementary data: | | | | | | | | | | | | |
Ratio of total expenses to average net assets | | | 3.81 | %(d) | | | 4.53 | % | | | 3.69 | %(d) |
| | | | | | | | | | | | | |
Ratio of net expenses to average net assets (e) | | | 0.65 | %(d) | | | 0.65 | % | | | 0.65 | %(d) |
| | | | | | | | | | | | | |
Ratio of net investment income to average net assets (e) | | | 3.34 | %(d) | | | 3.41 | % | | | 2.81 | %(d) |
| | | | | | | | | | | | | |
Portfolio turnover rate | | | 5 | %(c) | | | 11 | % | | | 13 | %(c) |
(a) | Represents the period from the commencement of operations (October 26, 2012) through May 31, 2013. |
(b) | Total return is a measure of the change in value of an investment in the Fund over the period covered. The returns shown do not reflect the deduction of taxes a shareholder would pay on Fund distributions, if any, or the redemption of Fund shares. The total returns would be lower if the Adviser had not reduced advisory fees and reimbursed expenses. |
(c) | Not annualized. |
(d) | Annualized. |
(e) | Ratio was determined after advisory fee reductions and expense reimbursements (Note 4). |
See accompanying notes to financial statements.
CINCINNATI ASSET MANAGEMENT FUNDS:
BROAD MARKET STRATEGIC INCOME FUND
NOTES TO FINANCIAL STATEMENTS
November 30, 2014 (Unaudited)
1. Organization
Cincinnati Asset Management Funds: Broad Market Strategic Income Fund (the “Fund”) is a diversified series of Ultimus Managers Trust (the “Trust”), an open-end investment company established as an Ohio business trust under a Declaration of Trust dated February 28, 2012. Other series of the Trust are not incorporated in this report. The Fund commenced operations on October 26, 2012.
The investment objective of the Fund is to achieve a high level of income consistent with a secondary goal of capital preservation.
2. Significant Accounting Policies
The following is a summary of the Fund’s significant accounting policies. The policies are in conformity with accounting principles generally accepted in the United States of America (“GAAP”). As an investment company, as defined in Financial Accounting Standards Board (“FASB”) Accounting Standards Update 2013-08, the Fund follows accounting and reporting guidance under FASB Accounting Standards Codification Topic 946, “Financial Services – Investment Companies.”
Securities valuation – The Fund’s fixed income securities are generally valued using prices provided by an independent pricing service approved by the Trust’s Board of Trustees (the “Board”). The independent pricing service uses information with respect to transactions in bonds, quotations from bond dealers, market transactions in comparable securities, and various relationships between securities in determining these prices. The methods used by the independent pricing service and the quality of valuations so established are reviewed by Cincinnati Asset Management, Inc. (the “Adviser”), under the general supervision of the Board. Securities for which market quotations are not readily available are valued at fair value as determined in good faith under procedures adopted by the Board.
GAAP establishes a single authoritative definition of fair value, sets out a framework for measuring fair value, and requires additional disclosures about fair value measurements.
Various inputs are used in determining the value of the Fund’s investments. These inputs are summarized in the three broad levels listed below:
| • | Level 1 – quoted prices in active markets for identical securities |
| • | Level 2 – other significant observable inputs |
| • | Level 3 – significant unobservable inputs |
CINCINNATI ASSET MANAGEMENT FUNDS:
BROAD MARKET STRATEGIC INCOME FUND
NOTES TO FINANCIAL STATEMENTS (Continued) |
Corporate bonds are classified as Level 2 since values are based on prices provided by an independent pricing service that utilizes various “other significant observable inputs” including bid and ask quotations, prices of similar securities, and interest rates, among other factors. The inputs or methods used for valuing securities are not necessarily an indication of the risks associated with investing in those securities. The inputs used to measure fair value may fall into different levels of the fair value hierarchy. In such cases, for disclosure purposes, the level in the fair value hierarchy within which the fair value measurement falls in its entirety is determined based on the lowest level input that is significant to the fair value measurement.
The following is a summary of the inputs used to value the Fund’s investments as of November 30, 2014:
| | | Level 1 | | | Level 2 | | | Level 3 | | | Total | |
| Corporate Bonds | | $ | — | | | $ | 6,617,629 | | | $ | — | | | $ | 6,617,629 | |
Refer to the Fund’s Schedule of Investments for a listing of the securities by sector type. As of November 30, 2014, the Fund did not have any transfers in and out of any Level. In addition, the Fund did not have derivative instruments or any assets or liabilities that were measured at fair value on a recurring basis using significant unobservable inputs (Level 3) as of November 30, 2014. It is the Fund’s policy to recognize transfers into and out of any Level at the end of the reporting period.
Share valuation – The net asset value per share of the Fund is calculated daily by dividing the total value of the Fund’s assets, less liabilities, by the number of shares outstanding. The offering price and redemption price per share of the Fund is equal to the net asset value per share.
Investment income – Interest income is accrued as earned. Discounts and premiums on fixed income securities purchased are accreted or amortized using the effective interest method. Dividend income is recorded on the ex-dividend date.
Security transactions – Security transactions are accounted for on the trade date. Gains and losses on securities sold are determined on a specific identification basis.
Common expenses – Common expenses of the Trust are allocated among the Fund and other series of the Trust based on the relative net assets of each series or the nature of the services performed and the relative applicability to each series.
Distributions to shareholders – Dividends from net investment income are declared and paid quarterly to shareholders. Net realized capital gains, if any, are distributed at least once each year. The amount of distributions from net investment income and net realized gains are determined in accordance with federal income tax regulations, which may differ from GAAP. Dividends and distributions to shareholders are recorded on the ex-dividend date. The tax
CINCINNATI ASSET MANAGEMENT FUNDS:
BROAD MARKET STRATEGIC INCOME FUND
NOTES TO FINANCIAL STATEMENTS (Continued) |
character of the Fund’s distributions during the periods ended November 30, 2014 and May 31, 2014 was ordinary income. On December 31, 2014, the Fund paid an ordinary income dividend of $0.0808 per share to shareholders of record on December 30, 2014.
Estimates – The preparation of financial statements in conformity with GAAP requires management to make estimates and assumptions that affect the reported amounts of assets and liabilities and disclosure of contingent assets and liabilities as of the date of the financial statements and the reported amounts of income and expenses during the reporting period. Actual results could differ from those estimates.
Federal income tax – The Fund has qualified and intends to continue to qualify as a regulated investment company under the Internal Revenue Code of 1986 (the “Code”). Qualification generally will relieve the Fund of liability for federal income taxes to the extent 100% of its net investment income and net realized gains are distributed in accordance with the Code. Accordingly, no provision for income tax has been made.
In order to avoid imposition of the excise tax applicable to regulated investment companies, it is also the Fund’s intention to declare as dividends in each calendar year at least 98% of its net investment income (earned during the calendar year) and 98.2% of its net realized capital gains (earned during the twelve months ended October 31) plus undistributed amounts from prior years.
The following information is computed on a tax basis for each item as of November 30, 2014:
| Tax cost of portfolio investments | | $ | 6,620,079 | |
| Gross unrealized appreciation | | $ | 102,062 | |
| Gross unrealized depreciation | | | (104,512 | ) |
| Net unrealized depreciation on investments | | | (2,450 | ) |
| Undistributed ordinary income | | | 37,753 | |
| Capital loss carryforwards | | | (4,168 | ) |
| Other losses | | | (11,013 | ) |
| Accumulated earnings | | $ | 20,122 | |
As of May 31, 2014, the Fund had short-term and long-term capital loss carryforwards of $1,524 and $2,644, respectively. These capital loss carryforwards, which do not expire, may be utilized in the current and future years to offset net realized capital gains, if any, prior to distributing such gains to shareholders.
The Fund recognizes the tax benefits or expenses of uncertain tax positions only when the position is “more likely than not” to be sustained assuming examination by tax authorities. Management has reviewed the Fund’s tax positions for the current and all open tax periods (periods ended May 31, 2013 and May 31, 2014) and has concluded that no provision for unrecognized tax benefits or expenses is required in these financial statements.
CINCINNATI ASSET MANAGEMENT FUNDS:
BROAD MARKET STRATEGIC INCOME FUND
NOTES TO FINANCIAL STATEMENTS (Continued) |
3. Investment Transactions
During the six months ended November 30, 2014, cost of purchases and proceeds from sales of investment securities, other than short-term investments, were $796,277 and $321,085, respectively.
4. Transactions with Related Parties
INVESTMENT ADVISORY AGREEMENT
The Fund’s investments are managed by the Adviser pursuant to the terms of an Investment Advisory Agreement. Under the Investment Advisory Agreement, the Fund pays the Adviser an advisory fee, computed and accrued daily and paid monthly, at the annual rate of 0.75% of its average daily net assets.
Pursuant to an expense limitation agreement, the Adviser has contractually agreed until October 1, 2017, to reduce advisory fees and reimburse other expenses to the extent necessary to limit total annual fund operating expenses (exclusive of brokerage costs; taxes; interest; borrowing costs such as interest and dividend expense on securities sold short; acquired fund fees and expenses; extraordinary expenses; and other expenses not incurred in the ordinary course of the Fund’s business) to an amount not exceeding 0.65% of the Fund’s average daily net assets. Accordingly, the Adviser did not collect any of its advisory fees and, in addition, reimbursed other operating expenses totaling $80,350 during the six months ended November 30, 2014.
Certain officers of the Fund are also officers of the Adviser.
DISTRIBUTION PLAN
The Fund has adopted a distribution plan pursuant to Rule 12b-1 under the Investment Company Act of 1940 (the “Rule 12b-1 Plan”), pursuant to which the Fund may incur certain costs for distribution and/or shareholder servicing expenses not to exceed 0.25% per annum of the Fund’s average daily net assets. During the six months ended November 30, 2014, the Fund incurred $8,326 in distribution and service fees under the Rule 12b-1 Plan.
OTHER SERVICE PROVIDERS
Ultimus Fund Solutions, LLC (“Ultimus”) provides fund administration, fund accounting, compliance and transfer agency services to the Fund. The Fund pays Ultimus fees in accordance with the agreements for such services. In addition, the Fund pays out-of-pocket expenses including, but not limited to postage, supplies and costs of pricing the Fund’s portfolio securities.
DISTRIBUTION AGREEMENT
Under the terms of a Distribution Agreement with the Trust, Ultimus Fund Distributors, LLC (the “Distributor”) serves as principal underwriter to the Fund. The Distributor is a wholly-owned subsidiary of Ultimus.
Certain Trustees and officers of the Trust are also officers of Ultimus and the Distributor.
CINCINNATI ASSET MANAGEMENT FUNDS:
BROAD MARKET STRATEGIC INCOME FUND
NOTES TO FINANCIAL STATEMENTS (Continued) |
TRUSTEE COMPENSATION
Each Independent Trustee receives from each Fund of the Trust a fee of $500 for each Board meeting attended plus reimbursement of travel and other meeting-related expenses. Trustees affiliated with the Adviser or Ultimus are not compensated by the Trust for their services.
PRINCIPAL HOLDERS OF FUND SHARES
As of November 30, 2014, the following shareholders owned of record more than 5% of the outstanding shares of the Fund:
| Name of Record Owner | % Ownership |
| Mary S. Sloneker | 47% |
| Cincinnati Asset Management, Inc. | 27% |
| William S. Sloneker | 20% |
| UBS Financial Services, Inc. (for the benefit of its customers) | 5% |
A shareholder owning of record or beneficially more than 25% of a Fund’s outstanding shares may be considered a controlling person. That shareholder’s vote could have a more significant effect on matters presented at a shareholder’s meeting.
5. Contingencies and Commitments
The Fund indemnifies the Trust’s officers and Trustees for certain liabilities that might arise from their performance of their duties to the Fund. Additionally, in the normal course of business, the Fund enters into contracts that contain a variety of representations and warranties and which provide general indemnifications. The Fund’s maximum exposure under these arrangements is unknown, as this would involve future claims that may be made against the Fund that have not yet occurred. However, based on experience, the Fund expects the risk of loss to be remote.
6. Subsequent Events
The Fund is required to recognize in the financial statements the effects of all subsequent events that provide additional evidence about conditions that existed as of the date of the Statement of Assets and Liabilities. For non-recognized subsequent events that must be disclosed to keep the financial statements from being misleading, the Fund is required to disclose the nature of the event as well as an estimate of its financial effect, or a statement that such an estimate cannot be made. Management has evaluated subsequent events through the issuance of these financial statements and has noted no such events.
CINCINNATI ASSET MANAGEMENT FUNDS:
BROAD MARKET STRATEGIC INCOME FUND
ABOUT YOUR FUND’S EXPENSES (Unaudited) |
We believe it is important for you to understand the impact of costs on your investment. As a shareholder of the Fund, you incur ongoing costs, including management fees, distribution (12b-1) fees and other operating expenses. The following examples are intended to help you understand your ongoing costs (in dollars) of investing in the Fund and to compare these costs with the ongoing costs of investing in other mutual funds.
A mutual fund’s ongoing costs are expressed as a percentage of its average net assets. This figure is known as the expense ratio. The expenses in the table below are based on an investment of $1,000 made at the beginning of the most recent period (June 1, 2014) and held until the end of the period (November 30, 2014).
The table below illustrates the Fund’s ongoing costs in two ways:
Actual fund return – This section helps you to estimate the actual expenses that you paid over the period. The “Ending Account Value” shown is derived from the Fund’s actual return, and the third column shows the dollar amount of operating expenses that would have been paid by an investor who started with $1,000 in the Fund. You may use the information here, together with the amount you invested, to estimate the expenses that you paid over the period.
To do so, simply divide your account value by $1,000 (for example, an $8,600 account value divided by $1,000 = 8.6), then multiply the result by the number given for the Fund under the heading “Expenses Paid During Period.”
Hypothetical 5% return – This section is intended to help you compare the Fund’s ongoing costs with those of other mutual funds. It assumes that the Fund had an annual return of 5% before expenses during the period shown, but that the expense ratio is unchanged. In this case, because the return used is not the Fund’s actual return, the results do not apply to your investment. The example is useful in making comparisons because the SEC requires all mutual funds to calculate expenses based on a 5% return. You can assess the Fund’s ongoing costs by comparing this hypothetical example with the hypothetical examples that appear in shareholder reports of other funds.
Note that expenses shown in the table are meant to highlight and help you compare ongoing costs only. The Fund does not charge transaction fees, such as purchase or redemption fees, nor does it carry a “sales load.” The calculations assume no shares were bought or sold during the period. Your actual costs may have been higher or lower, depending on the amount of your investment and the timing of any purchases or redemptions.
CINCINNATI ASSET MANAGEMENT FUNDS:
BROAD MARKET STRATEGIC INCOME FUND
ABOUT YOUR FUND’S EXPENSES (Unaudited) (Continued) |
More information about the Fund’s expenses can be found in this report. For additional information on operating expenses and other shareholder costs, please refer to the Fund’s prospectus.
| | Beginning
Account Value
June 1, 2014 | Ending
Account Value
November 30, 2014 | Expenses Paid During Period* |
Based on Actual Fund Return | $1,000.00 | $1,011.20 | $3.28 |
| Based on Hypothetical 5% Return (before expenses) | $1,000.00 | $1,021.81 | $3.29 |
| * | Expenses are equal to the Fund’s annualized expense ratio of 0.65% for the period, multiplied by the average account value over the period, multiplied by 183/365 (to reflect the one-half year period). |
OTHER INFORMATION (Unaudited)
A description of the policies and procedures that the Fund uses to vote proxies relating to portfolio securities is available without charge upon request by calling toll-free 1-866-738-1128, or on the SEC’s website at http://www.sec.gov. Information regarding how the Fund voted proxies relating to portfolio securities during the most recent 12-month period ended June 30 is available without charge upon request by calling toll-free 1-866-738-1128, or on the SEC’s website at http://www.sec.gov.
The Trust files a complete listing of portfolio holdings for the Fund with the SEC as of the end of the first and third quarters of each fiscal year on Form N-Q. These filings are available upon request by calling 1-866-738-1128. Furthermore, you may obtain a copy of the filings on the SEC’s website at http://www.sec.gov. The Trust’s Forms N-Q may also be reviewed and copied at the SEC’s Public Reference Room in Washington, DC, and information on the operation of the Public Reference Room may be obtained by calling 1-800-SEC-0330.
This page intentionally left blank
This page intentionally left blank
This page intentionally left blank
WAVELENGTH INTEREST RATE NEUTRAL FUND
LETTER TO SHAREHOLDERS | January 22, 2015 |
Dear Fellow Shareholders:
In the months since our last shareholder letter, financial markets have rotated through a wide range of themes as both rising and falling growth expectations resulted in heightened market volatility. Uncertainty around the trajectory of the US economy and related policy decisions caused many investors to sell assets and increase cash holdings. This dynamic created challenging conditions for a number of investment strategies over the period.
What follows is designed to provide context around returns in a way that builds a deeper understanding of the investment process that supports them. Through this we hope to build on the partnership your investment creates.
PERFORMANCE SUMMARY
For the six months ended November 30, 2014, the Wavelength Interest Rate Neutral Fund (the “Fund”) delivered a return of -0.97% versus a benchmark return of +0.01% for the S&P / BGCantor 0-3 Month US Treasury Bill Index (which seeks to represent the return from not taking risk in financial markets). The Fund’s modest underperformance came amidst changing expectations for growth, inflation and related policy decisions, and these results are in line with our expected range for performance volatility while targeting long-term investment objectives.
WAVELENGTH PHILOSOPHY
We believe that macroeconomic conditions drive asset prices and central banks use interest rates to manage macroeconomic conditions. Based on this fundamental logic, we seek to build a portfolio that is hedged to changes in interest rates by balancing investment exposure between instruments we expect to outperform in rising and falling macroeconomic conditions.
INVESTMENT ENVIRONMENT
As an extension of our investment philosophy we believe that changing expectations for macroeconomic conditions drive investment decisions, which in turn drive market prices. This logic played out over the period, as changing growth and inflation expectations resulted in increasingly volatile markets.
The pickup in growth witnessed over the second and third quarters of 2014 subsided modestly entering the fourth quarter. This was met by a risk asset sell-off in early October, followed by a recovery throughout the second half of the month. Corporate and credit-sensitive securities experienced the largest performance swings over this period as expectations of corporate profitability were pared back amidst lower-than-expected growth. Government securities became more attractive on a relative basis and moved diametrically to this market action as they rallied across the treasury curve then sold off into month-end.
Inflation conditions remained subdued over the period, and expectations for an extended period of low inflation were similarly unchanged. As a result, assets which tend to outperform in rising inflation environments continued to underperform, most notably in the case of commodities. A drop of close to $10 in October was followed by a drop of over $14 in November for West Texas Intermediate Crude Oil. The effects of this were seen in inflation expectations and instruments such as inflation-linked government bonds which continued to underperform nominal government bonds over the period.
These events combined with others to create broad-based uncertainty among market participants which resulted in general deleveraging and a pickup in volatility levels across asset classes.
PERFORMANCE DISCUSSION
The Fund maintained its targeted balance to growth and inflation conditions during the period in line with its investment objectives. This portfolio-level hedge limited the downside impact of underperformance experienced by rising growth exposures, and similarly helped manage increasing levels of volatility across markets traded.
September’s deleveraging resulted in reduced exposure levels for many US-dollar denominated assets, conditions which produced losses overall for the fund. Both government and corporate securities were challenged in this environment, and commodity-related exposures further impacted returns to the downside. Following this sell-off, however, macroeconomic conditions returned to relevance in market pricing and the Fund responded with positive performance in October. As described above, no one market drove performance during the period, and instead government, corporate, and emerging market assets each contributed positively at different times to produce the portfolio’s overall balanced positive return for the month. Returns in November were flat, as profits from government assets were offset by additional deleveraging in corporate assets and the drag of rising inflation assets in the portfolio which remained under pressure throughout the period.
OUTLOOK
Following the recent experience of deleveraging across markets, we expect asset prices to return to their long-term, fundamental macroeconomic drivers. As investors become increasingly comfortable with mechanisms put in place by the Federal Reserve to manage growth and inflation conditions, we expect markets to respond accordingly and move in response to related data. In line with this logic, we believe targeting a balance to potential macroeconomic outcomes continues to be a prudent investment approach and will continue to deliver value through investment returns.
Thank you for your trust and support through investment.
Sincerely,
Andrew Dassori
Founding Partner & Chief Investment Officer
Wavelength Capital Management
Past performance is not predictive of future performance. Investment results and principal value will fluctuate so that shares, when redeemed, may be worth more or less than their original cost. Current performance may be higher or lower than the performance data quoted. Performance data current to the most recent month end are available by calling 1-866-896-9292.
An investor should consider the investment objectives, risks, charges and expenses of the Fund carefully before investing. The Fund’s prospectus contains this and other important information. To obtain a copy of the Fund’s prospectus please call 1-866-896-9292 and a copy will be sent to you free of charge. Please read the prospectus carefully before you invest. The Wavelength Interest Rate Neutral Fund is distributed by Ultimus Fund Distributors, LLC.
The Letter to Shareholders seeks to describe some of the Adviser’s current opinions and views of the financial markets. Although the Adviser believes it has a reasonable basis for any opinions or views expressed, actual results may differ, sometimes significantly so, from those expected or expressed.
WAVELENGTH INTEREST RATE NEUTRAL FUND
PORTFOLIO INFORMATION
November 30, 2014 (Unaudited)
Portfolio Allocation (% of Net Assets)
Top 10 Equity Holdings
| Security Description | | % of
Net Assets |
iShares® TIPS Bond Fund | | 20.1% |
PowerShares Senior Loan Portfolio | | 19.3% |
SPDR® Barclays Convertible Securities ETF | | 13.9% |
iShares® J.P. Morgan USD Emerging Markets Bond ETF | | 10.4% |
SPDR® Barclays Short Term High Yield Bond ETF | | 8.6% |
iShares® iBoxx $ High Yield Corporate Bond Fund | | 7.5% |
PowerShares Emerging Markets Sovereign Debt Portfolio | | 6.4% |
SPDR® Barclays High Yield Bond ETF | | 4.3% |
Market Vectors Emerging Markets High Yield Bond ETF | | 2.4% |
Vanguard REIT ETF | | 0.9% |
WAVELENGTH INTEREST RATE NEUTRAL FUND
SCHEDULE OF INVESTMENTS
November 30, 2014 (Unaudited) | |
| EXCHANGE-TRADED FUNDS — 96.8% | | Shares | | | Value | |
Commodities — 0.0% (a) | | | | | | |
SPDR® Gold Shares (b) (c) | | | 50 | | | $ | 5,605 | |
| | | | | | | | | |
| Emerging Market Debt — 19.2% | | | | | | | | |
iShares® J.P. Morgan USD Emerging Markets Bond ETF | | | 12,766 | | | | 1,452,771 | |
Market Vectors Emerging Markets High Yield Bond ETF | | | 13,366 | | | | 330,937 | |
PowerShares Emerging Markets Sovereign Debt Portfolio | | | 31,175 | | | | 900,646 | |
| | | | | | | | 2,684,354 | |
| Large Cap Index — 0.2% | | | | | | | | |
SPDR® S&P 500® ETF | | | 100 | | | | 20,720 | |
| | | | | | | | | |
| Real Estate Investment Trusts (REIT) - 1.5% | | | | | | | | |
SPDR® Dow Jones REIT ETF | | | 925 | | | | 83,398 | |
Vanguard REIT ETF | | | 1,600 | | | | 128,912 | |
| | | | | | | | 212,310 | |
| U.S. Fixed Income — 75.9% | | | | | | | | |
Highland/iBoxx Senior Loan ETF | | | 3,206 | | | | 62,773 | |
iShares® 3-7 Year Treasury Bond ETF | | | 454 | | | | 55,860 | |
iShares® 7-10 Year Treasury Bond ETF | | | 940 | | | | 99,819 | |
iShares® 20+ Year Treasury Bond ETF | | | 925 | | | | 113,303 | |
iShares® iBoxx $ High Yield Corporate Bond Fund | | | 11,475 | | | | 1,045,717 | |
iShares® TIPS Bond ETF | | | 24,826 | | | | 2,811,793 | |
PowerShares Senior Loan Portfolio | | | 111,038 | | | | 2,703,775 | |
SPDR® Barclays Convertible Securities ETF | | | 38,659 | | | | 1,944,934 | |
SPDR® Barclays High Yield Bond ETF | | | 15,155 | | | | 599,835 | |
SPDR® Barclays Short Term High Yield Bond ETF | | | 40,925 | | | | 1,207,697 | |
| | | | | | | | 10,645,506 | |
Total Exchange-Traded Funds (Cost $13,642,876) | | | | | | $ | 13,568,495 | |
WAVELENGTH INTEREST RATE NEUTRAL FUND
SCHEDULE OF INVESTMENTS (Continued) | |
| MONEY MARKET FUNDS — 1.7% | | Shares | | | Value | |
Fidelity Institutional Money Market Government Portfolio - Class I, 0.01%(d) (Cost $236,433) | | | 236,433 | | | $ | 236,433 | |
| | | | | | | | | |
Total Investments at Value — 98.5% (Cost $13,879,309) | | | | | | $ | 13,804,928 | |
| | | | | | | | | |
| Other Assets in Excess of Liabilities — 1.5% | | | | | | | 212,335 | |
| | | | | | | | | |
Net Assets — 100.0% | | | | | | $ | 14,017,263 | |
(a) | Percentage rounds to less than 0.1%. |
(b) | Non-income producing security. |
(c) | For federal income tax purposes, structured as a grantor trust. |
(d) | The rate shown is the 7-day effective yield as of November 30, 2014. |
| See accompanying notes to financial statements. |
WAVELENGTH INTEREST RATE NEUTRAL FUND
SCHEDULE OF FUTURES CONTRACTS
November 30, 2014 (Unaudited) | |
| FUTURES CONTRACTS | Expiration Date | | Contracts | | | Aggregate Market Value of Contracts | | | Unrealized Appreciation (Depreciation) | |
| Commodity Futures | | | | | | | | | | |
COMEX miNY Gold Future | 1/28/2015 | | | 4 | | | $ | 233,550 | | | $ | (6,819 | ) |
S&P® GSCI® Future | 12/15/2014 | | | 2 | | | | 242,850 | | | | (16,756 | ) |
Total Commodity Futures | | | | | | | | 476,400 | | | | (23,575 | ) |
| | | | | | | | | | | | | | |
| Index Futures | | | | | | | | | | | | | |
E-Mini S&P 500® Future | 12/19/2014 | | | 5 | | | | 516,313 | | | | 21,015 | |
| | | | | | | | | | | | | | |
| Treasury Futures | | | | | | | | | | | | | |
5-Year U.S. Treasury Note Future | 3/31/2015 | | | 21 | | | | 2,508,516 | | | | 6,696 | |
10-Year U.S. Treasury Note Future | 3/20/2015 | | | 11 | | | | 1,397,000 | | | | 5,484 | |
U.S. Treasury Long Bond Future | 3/20/2015 | | | 6 | | | | 855,187 | | | | 7,304 | |
Total Treasury Futures | | | | | | | | 4,760,703 | | | | 19,484 | |
Total Futures Contracts | | | | | | | $ | 5,753,416 | | | $ | 16,924 | |
| See accompanying notes to financial statements. |
WAVELENGTH INTEREST RATE NEUTRAL FUND
STATEMENT OF ASSETS AND LIABILITIES
November 30, 2014 (Unaudited) | |
| ASSETS | | | |
| Investments in securities: | | | |
At acquisition cost | | $ | 13,879,309 | |
At value (Note 2) | | $ | 13,804,928 | |
Cash | | | 3,451 | |
| Margin deposits for futures contracts (Notes 2 and 5) | | | 243,551 | |
Dividends receivable | | | 3 | |
Receivable from Adviser (Note 4) | | | 68 | |
Other assets | | | 11,282 | |
Total assets | | | 14,063,283 | |
| | | | | |
| LIABILITIES | | | | |
Payable for investment securities purchased | | | 21,492 | |
Payable to administrator (Note 4) | | | 6,860 | |
Variation margin payable (Notes 2 and 5) | | | 12,558 | |
Other accrued expenses | | | 5,110 | |
Total liabilities | | | 46,020 | |
| | | | | |
NET ASSETS | | $ | 14,017,263 | |
| | | | | |
| NET ASSETS CONSIST OF: | | | | |
Paid-in capital | | $ | 14,064,321 | |
Accumulated net investment income | | | 49,510 | |
| Accumulated net realized losses from security transactions | | | (39,111 | ) |
| Net unrealized appreciation (depreciation) on: | | | | |
Investments | | | (74,381 | ) |
Futures contracts | | | 16,924 | |
NET ASSETS | | $ | 14,017,263 | |
| | | | | |
| Shares of beneficial interest outstanding (unlimited number of shares authorized, no par value) | | | 1,375,414 | |
| | | | | |
| Net asset value, offering price and redemption price per share (Note 2) | | $ | 10.19 | |
| See accompanying notes to financial statements. |
WAVELENGTH INTEREST RATE NEUTRAL FUND
STATEMENT OF OPERATIONS
For the Six Months Ended November 30, 2014 (Unaudited) | |
| INVESTMENT INCOME | | | |
Dividends | | $ | 178,213 | |
| | | | | |
| EXPENSES | | | | |
Investment advisory fees (Note 4) | | | 51,894 | |
Professional fees | | | 19,265 | |
Fund accounting fees (Note 4) | | | 13,042 | |
Administration fees (Note 4) | | | 12,500 | |
Custody and bank service fees | | | 8,517 | |
Transfer agent fees (Note 4) | | | 6,750 | |
Compliance fees (Note 4) | | | 6,000 | |
Registration and filing fees | | | 5,846 | |
Trustees' fees and expenses (Note 4) | | | 3,658 | |
Insurance expense | | | 1,717 | |
Postage and supplies | | | 1,436 | |
Other expenses | | | 4,854 | |
Total expenses | | | 135,479 | |
| Less fee reductions and expense reimbursements by the Adviser (Note 4) | | | (81,400 | ) |
Net expenses | | | 54,079 | |
| | | | | |
NET INVESTMENT INCOME | | | 124,134 | |
| | | | | |
| REALIZED AND UNREALIZED GAINS (LOSSES) ON INVESTMENTS AND FUTURES CONTRACTS | | | | |
| Net realized losses from: | | | | |
Investments | | | (21,745 | ) |
Futures contracts (Note 5) | | | (48,992 | ) |
| Net change in unrealized appreciation/depreciation on: | | | | |
Investments | | | (181,792 | ) |
Futures contracts (Note 5) | | | 6,791 | |
| NET REALIZED AND UNREALIZED LOSSES ON INVESTMENTS | | | (245,738 | ) |
| | | | | |
NET DECREASE IN NET ASSETS RESULTING FROM OPERATIONS | | $ | (121,604 | ) |
| See accompanying notes to financial statements. |
WAVELENGTH INTEREST RATE NEUTRAL FUND
STATEMENT OF CHANGES IN NET ASSETS | |
| | | Six Months Ended
November 30,
2014 (Unaudited) | | | Period
Ended
May 31,
2014(a) | |
| FROM OPERATIONS | | | | | | |
Net investment income | | $ | 124,134 | | | $ | 41,316 | |
| Net realized gains (losses) from: | | | | | | | | |
Investments | | | (21,745 | ) | | | 22,444 | |
Futures contracts (Note 5) | | | (48,992 | ) | | | 13,061 | |
Capital gain distributions from regulated investment companies | | | — | | | | 39 | |
| Net change in unrealized appreciation/depreciation on: | | | | | | | | |
Investments | | | (181,792 | ) | | | 107,411 | |
Futures contracts (Note 5) | | | 6,791 | | | | 10,133 | |
Net increase (decrease) in net assets from operations | | | (121,604 | ) | | | 194,404 | |
| | | | | | | | | |
| DISTRIBUTIONS TO SHAREHOLDERS | | | | | | | | |
From net investment income | | | (87,996 | ) | | | (27,944 | ) |
From net realized gains | | | — | | | | (3,918 | ) |
| Decrease in net assets from distributions to shareholders | | | (87,996 | ) | | | (31,862 | ) |
| | | | | | | | | |
| CAPITAL SHARE TRANSACTIONS | | | | | | | | |
Proceeds from shares sold | | | 9,525,774 | | | | 4,572,557 | |
| Net asset value of shares issued in reinvestment of distributions to shareholders | | | 87,111 | | | | 31,862 | |
Payments for shares redeemed | | | (102,983 | ) | | | (50,000 | ) |
| Net increase in net assets from capital share transactions | | | 9,509,902 | | | | 4,554,419 | |
| | | | | | | | | |
TOTAL INCREASE IN NET ASSETS | | | 9,300,302 | | | | 4,716,961 | |
| | | | | | | | | |
| NET ASSETS | | | | | | | | |
Beginning of period | | | 4,716,961 | | | | — | |
End of period | | $ | 14,017,263 | | | $ | 4,716,961 | |
| | | | | | | | | |
| ACCUMULATED NET INVESTMENT INCOME | | $ | 49,510 | | | $ | 13,372 | |
| | | | | | | | | |
| CAPITAL SHARE ACTIVITY | | | | | | | | |
Shares sold | | | 922,292 | | | | 456,307 | |
Shares issued in reinvestment of distributions to shareholders | | | 8,565 | | | | 3,190 | |
Shares redeemed | | | (10,081 | ) | | | (4,859 | ) |
Net increase in shares outstanding | | | 920,776 | | | | 454,638 | |
Shares outstanding at beginning of period | | | 454,638 | | | | — | |
Shares outstanding at end of period | | | 1,375,414 | | | | 454,638 | |
(a) | Represents the period from the commencement of operations (September 30, 2013) through May 31, 2014. |
| See accompanying notes to financial statements. |
WAVELENGTH INTEREST RATE NEUTRAL FUND
FINANCIAL HIGHLIGHTS | |
| Per Share Data for a Share Outstanding Throughout Each Period | |
| | | Six Months Ended
November 30,
2014 (Unaudited) | | | Period
Ended
May 31,
2014(a) | |
Net asset value at beginning of period | | $ | 10.38 | | | $ | 10.00 | |
| | | | | | | | | |
| Income (loss) from investment operations: | | | | | | | | |
Net investment income | | | 0.10 | | | | 0.10 | |
| Net realized and unrealized gains (losses) on investments and futures contracts | | | (0.20 | ) | | | 0.36 | |
Total from investment operations | | | (0.10 | ) | | | 0.46 | |
| | | | | | | | | |
| Less distributions: | | | | | | | | |
Distributions from net investment income | | | (0.09 | ) | | | (0.07 | ) |
Distributions from net realized gains | | | — | | | | (0.01 | ) |
Total distributions | | | (0.09 | ) | | | (0.08 | ) |
| | | | | | | | | |
Net asset value at end of period | | $ | 10.19 | | | $ | 10.38 | |
| | | | | | | | | |
Total return (b) | | | (0.97% | )(c) | | | 4.62 | %(c) |
| | | | | | | | | |
Net assets at end of period (000's) | | $ | 14,017 | | | $ | 4,717 | |
| | | | | | | | | |
| Ratios/supplementary data: | | | | | | | | |
Ratio of total expenses to average net assets (d) | | | 2.47 | %(e) | | | 4.42 | %(e) |
| | | | | | | | | |
Ratio of net expenses to average net assets (d) (f) | | | 0.99 | %(e) | | | 0.99 | %(e) |
| | | | | | | | | |
Ratio of net investment income to
average net assets (f) (g) | | | 2.26 | %(e) | | | 1.55 | %(e) |
| | | | | | | | | |
Portfolio turnover rate | | | 15 | %(c) | | | 114 | %(c) |
(a) | Represents the period from the commencement of operations (September 30, 2013) through May 31, 2014. |
(b) | Total return is a measure of the change in value of an investment in the Fund over the period covered. The returns shown do not reflect the deduction of taxes a shareholder would pay on Fund distributions, if any, or the redemption of Fund shares. The total returns would be lower if the Adviser had not reduced advisory fees and reimbursed expenses. |
(c) | Not annualized. |
(d) | The ratios of expenses to average net assets do not reflect the Fund's proportionate share of expenses of the underlying investment companies in which the Fund invests. |
(e) | Annualized. |
(f) | Ratio was determined after advisory fee reductions and expense reimbursements (Note 4). |
(g) | Recognition of net investment income by the Fund is affected by the timing of the declarations of dividends by the underlying investment companies in which the Fund invests. |
| See accompanying notes to financial statements. |
WAVELENGTH INTEREST RATE NEUTRAL FUND
NOTES TO FINANCIAL STATEMENTS
November 30, 2014 (Unaudited)
1. Organization
Wavelength Interest Rate Neutral Fund (the “Fund”) is a non-diversified series of Ultimus Managers Trust (the “Trust”), an open-end investment company established as an Ohio business trust under a Declaration of Trust dated February 28, 2012. Other series of the Trust are not incorporated in this report. The Fund commenced operations on September 30, 2013.
The investment objective of the Fund is total return.
2. Significant Accounting Policies
The following is a summary of the Fund’s significant accounting policies. The policies are in conformity with accounting principles generally accepted in the United States of America (“GAAP”). As an investment company, as defined in Financial Accounting Standards Board (“FASB”) Accounting Standards Update 2013-08, the Fund follows accounting and reporting guidance under FASB Accounting Standards Codification Topic 946, “Financial Services – Investment Companies”.
Securities and futures valuation – The Fund values its portfolio securities at market value as of the close of regular trading on the New York Stock Exchange (the “NYSE”) (normally 4:00 p.m. Eastern time) on each business day the NYSE is open. The Fund values its listed securities on the basis of the security’s last sale price on the security’s primary exchange, if available, otherwise at the exchange’s most recently quoted bid price. NASDAQ-listed securities are valued at the NASDAQ Official Closing Price. The Fund values its exchange-traded futures contracts at their last sale price as of the close of regular trading on the primary exchange on which the contract is traded (normally 4:00 p.m. Eastern time). Prices for these futures contracts are monitored daily by the Adviser until the close of regular trading to determine if fair valuation is required.
In the event that market quotations are not readily available or are considered unreliable due to market or other events, the Fund values its securities and other assets at fair value pursuant to the procedures adopted by the Trust’s Board of Trustees (the “Board”). Under these procedures, the securities will be classified as Level 2 or 3 within the fair value hierarchy (see below), depending on the inputs used. Unreliable market quotes may be due to the following factors: a substantial bid-ask spread; infrequent sales resulting in stale prices; insufficient trading volume; small trade sizes; a temporary lapse in any reliable pricing source; and actions of the securities or futures markets, such as the suspension or limitation of trading.
GAAP establishes a single authoritative definition of fair value, sets out a framework for measuring fair value, and requires additional disclosures about fair value measurements.
WAVELENGTH INTEREST RATE NEUTRAL FUND
NOTES TO FINANCIAL STATEMENTS (Continued)
Various inputs are used in determining the value of the Fund’s investments. These inputs are summarized in the three broad levels listed below:
| • | Level 1 – quoted prices in active markets for identical securities |
| • | Level 2 – other significant observable inputs |
| • | Level 3 – significant unobservable inputs |
The inputs or methods used for valuing securities are not necessarily an indication of the risks associated with investing in those securities. The inputs used to measure fair value may fall into different levels of the fair value hierarchy. In such cases, for disclosure purposes, the level in the fair value hierarchy within which the fair value measurement falls in its entirety is determined based on the lowest level input that is significant to the fair value measurement.
The following is a summary of the inputs used to value the Fund’s investments as of November 30, 2014:
| | | Level 1 | | | Level 2 | | | Level 3 | | | Total | |
| Investments in Securities | | | | | | | | | | | | |
| Exchange-Traded Funds | | $ | 13,568,495 | | | $ | — | | | $ | — | | | $ | 13,568,495 | |
| Money Market Funds | | | 236,433 | | | | — | | | | — | | | | 236,433 | |
Total | | $ | 13,804,928 | | | $ | — | | | $ | — | | | $ | 13,804,928 | |
Other Financial Instruments | | | | | | | | | | | | | | | | |
| Futures Contracts | | $ | 16,924 | | | $ | — | | | $ | — | | | $ | 16,924 | |
As of November 30, 2014, the Fund did not have any transfers in and out of any Level. In addition, the Fund did not have any assets or liabilities that were measured at fair value on a recurring basis using significant unobservable inputs (Level 3) as of November 30, 2014. It is the Fund’s policy to recognize transfers into and out of any Level at the end of the reporting period.
Share valuation – The net asset value per share of the Fund is calculated daily by dividing the total value of the Fund’s assets, less liabilities, by the number of shares outstanding. The offering price and redemption price per share of the Fund is equal to the net asset value per share.
Investment income – Dividend income is recorded on the ex-dividend date. Interest income is accrued as earned.
Security transactions – Security transactions are accounted for on the trade date. Gains and losses on securities sold are determined on a specific identification basis.
WAVELENGTH INTEREST RATE NEUTRAL FUND
NOTES TO FINANCIAL STATEMENTS (Continued)
Common expenses – Common expenses of the Trust are allocated among the Fund and the other series of the Trust based on the relative net assets of each series or the nature of the services performed and the relative applicability to each series.
Distributions to shareholders – The Fund will distribute to shareholders any net investment income dividends on a quarterly basis and net realized capital gains distributions at least annually. The amount of such dividends and distributions are determined in accordance with federal income tax regulations, which may differ from GAAP. Dividends and distributions are recorded on the ex-dividend date. During the periods ended November 30, 2014 and May 31, 2014, the tax character of the Fund’s distributions was ordinary income. On December 31, 2014, the Fund paid an ordinary income dividend of $0.1418 per share and a long-term capital distribution of $0.0101 per share to shareholders of record on December 30, 2014.
Futures contracts – The Fund may use futures contracts to gain exposure to or to hedge against changes in the value of equities, real estate, interest rates or commodities. A futures contract represents a commitment for the future purchase or sale of an asset at a specified price on a specified date. When the Fund purchases or sells a futures contract, no price is paid to or received by the Fund. Instead, the Fund is required to deposit in a segregated asset account an amount of cash or qualifying securities currently ranging from 2% to 10% of the contract amount. This is called the “initial margin deposit.” Subsequent payments, known as “variation margin,” are made or received by the Fund each day, depending on the daily fluctuations in the fair value of the underlying asset. The Fund recognizes an unrealized gain or loss equal to the daily variation margin. If market conditions move unexpectedly, the Fund may not achieve the anticipated benefits of the futures contracts and may realize a loss. The margin deposits for futures contracts and the variation margin payable are reported on the Statement of Assets and Liabilities.
Estimates – The preparation of financial statements in conformity with GAAP requires management to make estimates and assumptions that affect the reported amounts of assets and liabilities and disclosure of contingent assets and liabilities as of the date of the financial statements and the reported amounts of income and expenses during the reporting period. Actual results could differ from those estimates.
Federal income tax – The Fund has qualified and intends to continue to qualify as a regulated investment company under the Internal Revenue Code of 1986 (the “Code”). Qualification generally will relieve the Fund of liability for federal income taxes to the extent 100% of its net investment income and net realized gains are distributed in accordance with the Code. Accordingly, no provision for income tax has been made.
In order to avoid imposition of the excise tax applicable to regulated investment companies, it is also the Fund’s intention to declare as dividends in each calendar year at least 98% of its net investment income (earned during the calendar year) and 98.2% of its net realized capital gains (earned during the twelve months ended October 31) plus undistributed amounts from prior years.
WAVELENGTH INTEREST RATE NEUTRAL FUND
NOTES TO FINANCIAL STATEMENTS (Continued)
The following information is computed on a tax basis for each item as of November 30, 2014:
| Tax cost of portfolio investments | | $ | 13,897,414 | |
| Gross unrealized appreciation | | $ | 106,348 | |
| Gross unrealized depreciation | | | (198,834 | ) |
| Net unrealized depreciation | | | (92,486 | ) |
| Accumulated ordinary income | | | 84,104 | |
| Undistributed long-term gains | | | 13,956 | |
| Other losses | | | (52,632 | ) |
| Accumulated deficit | | $ | (47,058 | ) |
The value of the federal income tax cost of portfolio investments and the tax components of accumulated earnings and the financial statement cost and components of net assets may be temporarily different (“book/tax difference”). These book/tax differences are due to the recognition of capital gains or losses under income tax regulations and GAAP, primarily the tax deferral of losses on wash sales and the tax treatment of realized and unrealized gains and losses on futures contracts.
The Fund recognizes the tax benefits or expenses of uncertain tax positions only when the position is “more likely than not” to be sustained assuming examination by tax authorities. Management has reviewed the Fund’s tax positions for the current year and for the tax period ended May 31, 2014 and has concluded that no provision for unrecognized tax benefits or expenses is required in these financial statements.
3. Investment Transactions
During the six months ended November 30, 2014, cost of purchases and proceeds from sales of investment securities, other than short-term investments, were $11,070,217 and $1,550,742, respectively.
4. Transactions with Related Parties
INVESTMENT ADVISORY AGREEMENT
The Fund’s investments are managed by Wavelength Capital Management, LLC (the “Adviser”) pursuant to the terms of an Investment Advisory Agreement. Under the Investment Advisory Agreement, the Fund pays the Adviser an advisory fee, computed and accrued daily and paid monthly, at the annual rate of 0.95% of its average daily net assets.
WAVELENGTH INTEREST RATE NEUTRAL FUND
NOTES TO FINANCIAL STATEMENTS (Continued)
Pursuant to an expense limitation agreement between the Fund and the Adviser (the “Expense Limitation Agreement”), the Adviser has contractually agreed, until October 1, 2016, to waive a portion of investment advisory fees and reimburse certain other expenses to limit total annual operating expenses (exclusive of brokerage costs; taxes; interest; borrowing costs such as interest and dividend expenses on securities sold short; acquired fund fees and expenses; extraordinary expenses; and other expenses not incurred in the ordinary course of the Fund’s business) to an amount not exceeding 0.99% of the Fund’s average daily net assets for the Fund until October 1, 2016. During the six months ended November 30, 2014, the Adviser did not collect any of its advisory fees and, in addition, reimbursed the Fund for other operating expenses totaling $29,506.
Under the terms of the Expense Limitation Agreement, management fee reductions and expense reimbursements by the Adviser are subject to repayment by the Fund for a period of three years after such fees and expenses were incurred, provided the repayments do not cause total annual fund operating expenses to exceed the foregoing expense limitations. As of November 30, 2014, the Adviser may seek repayment of management fee reductions and expense reimbursements as follows:
| May 31, 2017 | November 30, 2017 |
| $91,664 | $81,400 |
An officer of the Fund is also an officer of the Adviser.
OTHER SERVICE PROVIDERS
Ultimus Fund Solutions, LLC (“Ultimus”) provides fund administration, fund accounting, compliance and transfer agency services to the Fund. The Fund pays Ultimus fees in accordance with the agreements for such services. In addition, the Fund pays out-of-pocket expenses including, but not limited to, postage, supplies and costs of pricing the Fund’s portfolio securities.
DISTRIBUTION AGREEMENT
Under the terms of a Distribution Agreement with the Trust, Ultimus Fund Distributors, LLC (the “Distributor”) serves as the principal underwriter to the Fund. The Distributor is a wholly-owned subsidiary of Ultimus. The Distributor is compensated by the Adviser (not the Fund) for acting as principal underwriter.
Certain Trustees and officers of the Trust are also officers of Ultimus and the Distributor.
TRUSTEE COMPENSATION
Each Independent Trustee receives from each Fund of the Trust a fee of $500 for each Board meeting attended plus reimbursement of travel and other meeting-related expenses. Trustees affiliated with the Adviser or Ultimus are not compensated by the Trust for their services.
WAVELENGTH INTEREST RATE NEUTRAL FUND
NOTES TO FINANCIAL STATEMENTS (Continued)
PRINCIPAL HOLDER OF FUND SHARES
As of November 30, 2014, Interactive Brokers, LLC, for the benefit of its customers, owned of record 87% of the outstanding shares of the Fund. A shareholder owning of record or beneficially more than 25% of a Fund’s outstanding shares may be considered a controlling person. That shareholder’s vote could have a more significant effect on matters presented at a shareholder’s meeting.
5. Derivatives Transactions
The Fund’s position in derivative instruments as of November 30, 2014 are recorded in the following location in the Statement of Assets and Liabilities:
| Derivative Investment Type | Location |
| Futures contracts | Variation margin payable |
The following table sets forth the values of futures contracts of the Fund as of November 30, 2014:
| | | Variation Margin | | | | |
| | | Receivable | | | (Payable) | | | Total | |
| Asset Derivatives | | | | | | | | | |
| Futures Contracts | | | | | | | | | |
| Commodity | | $ | — | | | $ | (20,350 | ) | | $ | (20,350 | ) |
| Index | | | — | | | | (1,763 | ) | | | (1,763 | ) |
| Treasury | | | 9,555 | | | | — | | | | 9,555 | |
| Total Asset Derivatives | | $ | 9,555 | | | $ | (22,113 | ) | | $ | (12,558 | ) |
Transactions in derivative instruments for the Fund during the six months ended November 30, 2014 are recorded in the following locations in the Statement of Operations:
| Derivative Investment Type | Location |
| Futures contracts | Net realized gains (losses) from futures contracts |
| | Net change in unrealized appreciation/depreciation on futures contracts |
WAVELENGTH INTEREST RATE NEUTRAL FUND
NOTES TO FINANCIAL STATEMENTS (Continued)
The following is a summary of the Fund’s net realized gains (losses) and net change in unrealized appreciation/depreciation on derivative instruments recognized in the Statement of Operations during the six months ended November 30, 2014:
| Type of Derivative | | Net Realized Gains (Losses) | | | Net Change in Unrealized Appreciation/ Depreciation | |
| Futures Contracts | | | | | | |
| Commodity | | $ | (145,908 | ) | | $ | (23,575 | ) |
| Index | | | 15,204 | | | | 13,569 | |
| Treasury | | | 81,712 | | | | 16,797 | |
| Total futures contracts | | $ | (48,992 | ) | | $ | 6,791 | |
The average monthly notional amount of futures contracts purchased during the six months ended November 30, 2014, was $4,450,332, and the gross notional amount of futures contracts outstanding at November 30, 2014 was $5,753,416.
In the ordinary course of business, the Fund may enter into transactions subject to enforceable netting agreements or other similar arrangements (“netting agreements”). Generally, the right to offset in netting agreements allows the Fund to offset any exposure to a specific counterparty with any collateral received or delivered to that counterparty based on the terms of the agreements. Generally, the Fund manages its cash collateral securities and securities collateral on a counterparty basis. As of November 30, 2014, the offsetting of financial assets and derivatives assets is as follows:
| Description | | Gross Amounts
of Recognized
Assets | | | Gross Amounts
Offset in
Statements
of Assets and
Liabilities | | | Net Amounts
of Liabilities
Presented in
Statements of
Assets and
Liabilities | | | Collateral
Pledged | | | Net Amount | |
| Variation margin receivable (payable) - futures contracts | | $ | 9,555 | | | $ | (22,113 | ) | | $ | (12,558 | ) | | $ | 243,551 | | | $ | 230,993 | |
| Total subject to a master netting or similar arrangement | | $ | 9,555 | | | $ | (22,113 | ) | | $ | (12,558 | ) | | $ | 243,551 | | | $ | 230,993 | |
WAVELENGTH INTEREST RATE NEUTRAL FUND
NOTES TO FINANCIAL STATEMENTS (Continued)
6. Certain Investments and Risks
The securities in which the Fund invests, as well as the risks associated with these securities, are described in the Fund’s prospectus. Among these risks are those associated with investments in exchange-traded funds (“ETFs”). ETFs provide their shares to authorized participants in return for a specific basket of securities. The authorized participant then sells the ETF’s shares on the secondary market. In other words, ETF shares are traded on a securities exchange based on their market value. Investments in ETFs are subject to the risk that the ETF’s shares may trade at a premium (creating the risk that the Fund pays more than net asset value (“NAV”) for an ETF when making a purchase) or discount (creating the risk that the Fund receives less than NAV when selling an ETF) to the ETF’s NAV. Investments in ETFs are also subject to index-tracking risk because the total return generated by the securities will be reduced by transaction costs and expenses not incurred by the indices. Certain securities comprising the index tracked by an ETF may, from time to time, temporarily be unavailable, which may further impede the ETF’s ability to track the applicable index or match the index’s performance. To the extent that the Fund invests in an ETF, the Fund incurs additional expenses because the Fund bears its pro-rata portion of such ETF’s advisory fees and operational expenses. Finally, ETF shares are also subject to the risks applicable to the underlying basket of securities. As of November 30, 2014, the Fund had 96.8% of the value of its net assets invested in ETFs.
7. Contingencies and Commitments
The Fund indemnifies the Trust’s officers and Trustees for certain liabilities that might arise from their performance of their duties to the Fund. Additionally, in the normal course of business, the Fund enters into contracts that contain a variety of representations and warranties and which provide general indemnifications. The Fund’s maximum exposure under these arrangements is unknown, as this would involve future claims that may be made against the Fund that have not yet occurred. However, based on experience, the Fund expects the risk of loss to be remote.
8. Subsequent Events
The Fund is required to recognize in the financial statements the effects of all subsequent events that provide additional evidence about conditions that existed as of the date of the Statement of Assets and Liabilities. For non-recognized subsequent events that must be disclosed to keep the financial statements from being misleading, the Fund is required to disclose the nature of the event as well as an estimate of its financial effect, or a statement that such an estimate cannot be made. Management has evaluated subsequent events through the issuance of these financial statements and has noted no such events.
WAVELENGTH INTEREST RATE NEUTRAL FUND
ABOUT YOUR FUND’S EXPENSES (Unaudited)
We believe it is important for you to understand the impact of costs on your investment. As a shareholder of the Fund, you incur ongoing costs, including management fees and other operating expenses. The following examples are intended to help you understand your ongoing costs (in dollars) of investing in the Fund and to compare these costs with the ongoing costs of investing in other mutual funds.
A mutual fund’s ongoing costs are expressed as a percentage of its average net assets. This figure is known as the expense ratio. The expenses in the table below are based on an investment of $1,000 made at the beginning of the most recent period (June 1, 2014) and held until the end of the period (November 30, 2014).
The table below illustrates the Fund’s ongoing costs in two ways:
Actual fund return – This section helps you to estimate the actual expenses that you paid over the period. The “Ending Account Value” shown is derived from the Fund’s actual return, and the third column shows the dollar amount of operating expenses that would have been paid by an investor who started with $1,000 in the Fund. You may use the information here, together with the amount you invested, to estimate the expenses that you paid over the period.
To do so, simply divide your account value by $1,000 (for example, an $8,600 account value divided by $1,000 = 8.6), then multiply the result by the number given for the Fund under the heading “Expenses Paid During Period.”
Hypothetical 5% return – This section is intended to help you compare the Fund’s ongoing costs with those of other mutual funds. It assumes that the Fund had an annual return of 5% before expenses during the period shown, but that the expense ratio is unchanged. In this case, because the return used is not the Fund’s actual return, the results do not apply to your investment. The example is useful in making comparisons because the SEC requires all mutual funds to calculate expenses based on a 5% return. You can assess the Fund’s ongoing costs by comparing this hypothetical example with the hypothetical examples that appear in shareholder reports of other funds.
Note that expenses shown in the table are meant to highlight and help you compare ongoing costs only. The Fund does not charge transaction fees, such as purchase or redemption fees, nor does it carry a “sales load.”
The calculations assume no shares were bought or sold during the period. Your actual costs may have been higher or lower, depending on the amount of your investment and the timing of any purchases or redemptions.
WAVELENGTH INTEREST RATE NEUTRAL FUND
ABOUT YOUR FUND’S EXPENSES (Unaudited)
More information about the Fund’s expenses can be found in this report. For additional information on operating expenses and other shareholder costs, please refer to the Fund’s prospectus.
| | Beginning
Account Value
June 1, 2014 | Ending
Account Value
November 30, 2014 | Expenses
Paid During
Period* |
Based on Actual Fund Return | $1,000.00 | $990.30 | $4.94 |
Based on Hypothetical 5% Return (before expenses) | $1,000.00 | $1,020.10 | $5.01 |
| * | Expenses are equal to the Fund’s annualized expense ratio of 0.99% for the period, multiplied by the average account value over the period, multiplied by 183/365 (to reflect the one-half year period). |
OTHER INFORMATION (Unaudited)
A description of the policies and procedures that the Fund uses to vote proxies relating to portfolio securities is available without charge upon request by calling toll-free 1-866-896-9292, or on the SEC’s website at http://www.sec.gov. Information regarding how the Fund voted proxies relating to portfolio securities during the most recent period ended June 30 is available without charge upon request by calling toll-free 1-866-896-9292, or on the SEC’s website at http://www.sec.gov.
The Trust files a complete listing of portfolio holdings for the Fund with the SEC as of the end of the first and third quarters of each fiscal year on Form N-Q. These filings are available upon request by calling 1-866-896-9292. Furthermore, you may obtain a copy of the filings on the SEC’s website at http://www.sec.gov. The Trust’s Forms N-Q may also be reviewed and copied at the SEC’s Public Reference Room in Washington, DC, and information on the operation of the Public Reference Room may be obtained by calling 1-800-SEC-0330.
Item 2. Code of Ethics.
Not required
Item 3. Audit Committee Financial Expert.
Not required
Item 4. Principal Accountant Fees and Services.
Not required
Item 5. Audit Committee of Listed Registrants.
Not applicable
Item 6. Schedule of Investments.
| (a) | Not applicable [schedule filed with Item 1] |
Item 7. Disclosure of Proxy Voting Policies and Procedures for Closed-End Management Investment Companies.
Not applicable
Item 8. Portfolio Managers of Closed-End Management Investment Companies.
Not applicable
Item 9. Purchases of Equity Securities by Closed-End Management Investment Company and Affiliated Purchasers.
Not applicable
Item 10. Submission of Matters to a Vote of Security Holders.
The registrant’s Committee of Independent Trustees shall review shareholder recommendations to fill vacancies on the registrant’s board of trustees if such recommendations are submitted in writing, addressed to the Committee at the registrant’s offices and meet any minimum qualifications adopted by the Committee. The Committee may adopt, by resolution, a policy regarding its procedures for considering candidates for the board of trustees, including any recommended by shareholders.
Item 11. Controls and Procedures.
(a) Based on their evaluation of the registrant’s disclosure controls and procedures (as defined in Rule 30a-3(c) under the Investment Company Act of 1940) as of a date within 90 days of the filing date of this report, the registrant’s principal executive officers and principal financial officer have concluded that such disclosure controls and procedures are reasonably designed and are operating effectively to ensure that material information relating to the registrant, including its consolidated subsidiaries, is made known to them by others within those entities, particularly during the period in which this report is being prepared, and that the information required in filings on Form N-CSR is recorded, processed, summarized, and reported on a timely basis.
(b) There were no changes in the registrant’s internal control over financial reporting (as defined in Rule 30a-3(d) under the Investment Company Act of 1940) that occurred during the second fiscal quarter of the period covered by this report that have materially affected, or are reasonably likely to materially affect, the registrant’s internal control over financial reporting.
Item 12. Exhibits.
File the exhibits listed below as part of this Form. Letter or number the exhibits in the sequence indicated.
(a)(1) Any code of ethics, or amendment thereto, that is the subject of the disclosure required by Item 2, to the extent that the registrant intends to satisfy the Item 2 requirements through filing of an exhibit: Not required
(a)(2) A separate certification for each principal executive officer and principal financial officer of the registrant as required by Rule 30a-2(a) under the Act (17 CFR 270.30a-2(a)): Attached hereto
(a)(3) Any written solicitation to purchase securities under Rule 23c-1 under the Act (17 CFR 270.23c-1) sent or given during the period covered by the report by or on behalf of the registrant to 10 or more persons: Not applicable
(b) Certifications required by Rule 30a-2(b) under the Act (17 CFR 270.30a-2(b)): Attached hereto
| Exhibit 99.CERT | Certifications required by Rule 30a-2(a) under the Act |
| Exhibit 99.906CERT | Certifications required by Rule 30a-2(b) under the Act |
SIGNATURES
Pursuant to the requirements of the Securities Exchange Act of 1934 and the Investment Company Act of 1940, the registrant has duly caused this report to be signed on its behalf by the undersigned, thereunto duly authorized.
| (Registrant) | Ultimus Managers Trust | | |
| By (Signature and Title)* | /s/ Frank L. Newbauer | |
| | | Frank L. Newbauer, Secretary | |
| | | | |
| Date | February 4, 2015 | | |
| | | | |
| Pursuant to the requirements of the Securities Exchange Act of 1934 and the Investment Company Act of 1940, this report has been signed below by the following persons on behalf of the registrant and in the capacities and on the dates indicated. |
| | | | |
| By (Signature and Title)* | /s/ Nitin N. Kumbhani | |
| | | Nitin N. Kumbhani, Principal Executive Officer (APEXcm Small/Mid Cap Growth Fund) |
| | | | |
| Date | February 4, 2015 | | |
| | | | |
| By (Signature and Title)* | /s/ William S. Sloneker | |
| | | William S. Sloneker, Principal Executive Officer (Cincinnati Asset Management Funds: Broad Market Strategic Income Fund) |
| | | | |
| Date | February 4, 2015 | | |
| | | | |
| By (Signature and Title)* | /s/ Nicholas Chermayeff | |
| | | Nicholas Chermayeff, Principal Executive Officer (Barrow All-Cap Core Fund and Barrow All-Cap Long/Short Fund) |
| | | | |
| Date | February 4, 2015 | | |
| | | | |
| By (Signature and Title)* | /s/ Andrew G. Dassori | |
| | | Andrew G. Dassori, Principal Executive Officer (Wavelength Interest Rate Neutral Fund) |
| | | | |
| Date | February 4, 2015 | | |
| | | | |
| By (Signature and Title)* | /s/ Jennifer L. Leamer | |
| | | Jennifer L. Leamer, Treasurer | |
| | | | |
| Date | February 4, 2015 | | |
* Print the name and title of each signing officer under his or her signature.