ADR - American Depositary Receipt. |
(a) | Non-income producing security. |
(b) | The rate shown is the 7-day effective yield as of May 31, 2015. |
See accompanying notes to financial statements. |
GALAPAGOS PARTNERS SELECT EQUITY FUND
STATEMENT OF ASSETS AND LIABILITIES
May 31, 2015 (Unaudited) |
ASSETS | | | |
Investments in securities: | | | |
At acquisition cost | | $ | 1,088,185 | |
At value (Note 2) | | $ | 1,159,400 | |
Dividends receivable | | | 264 | |
Receivable for investment securities sold | | | 160,467 | |
Receivable from Adviser (Note 4) | | | 8,045 | |
Other assets | | | 1,830 | |
Total assets | | | 1,330,006 | |
| | | | | |
LIABILITIES | | | | |
Payable for investment securities purchased | | | 202,420 | |
Payable to administrator (Note 4) | | | 6,000 | |
Other accrued expenses | | | 2,925 | |
Total liabilities | | | 211,345 | |
| | | | | |
NET ASSETS | | $ | 1,118,661 | |
| | | | | |
NET ASSETS CONSIST OF: | | | | |
Paid-in capital | | $ | 1,060,415 | |
Accumulated net investment loss | | | (2,989 | ) |
Accumulated net realized losses from security transactions | | | (9,980 | ) |
Net unrealized appreciation on investments | | | 71,215 | |
NET ASSETS | | $ | 1,118,661 | |
| | | | | |
Shares of beneficial interest outstanding (unlimited number of shares authorized, no par value) | | | 105,606 | |
| | | | | |
Net asset value, offering price and redemption price per share (Note 2) | | $ | 10.59 | |
See accompanying notes to financial statements. |
GALAPAGOS PARTNERS SELECT EQUITY FUND
STATEMENT OF OPERATIONS
For the Period Ended May 31, 2015 (a) (Unaudited) |
INVESTMENT INCOME | | | |
Dividend income | | $ | 2,226 | |
| | | | | |
EXPENSES | | | | |
Fund accounting fees (Note 4) | | | 10,021 | |
Administration fees (Note 4) | | | 10,000 | |
Professional fees | | | 6,384 | |
Trustees' fees and expenses (Note 4) | | | 5,534 | |
Compliance fees (Note 4) | | | 5,000 | |
Transfer agent fees (Note 4) | | | 5,000 | |
Investment advisory fees (Note 4) | | | 4,346 | |
Custody and bank service fees | | | 3,728 | |
Registration and filing fees | | | 2,418 | |
Postage and supplies | | | 1,853 | |
Insurance expense | | | 1,068 | |
Other expenses | | | 2,560 | |
Total expenses | | | 57,912 | |
Less fee waivers and expense reimbursements by the Adviser (Note 4) | | | (46,697 | ) |
Less fee waivers by the administrator (Note 4) | | | (6,000 | ) |
Net expenses | | | 5,215 | |
| | | | | |
NET INVESTMENT LOSS | | | (2,989 | ) |
| | | | | |
REALIZED AND UNREALIZED GAINS (LOSSES) ON INVESTMENTS | | | | |
Net realized losses from security transactions | | | (9,980 | ) |
Net change in unrealized appreciation/depreciation on investments | | | 71,215 | |
NET REALIZED AND UNREALIZED GAINS ON INVESTMENTS | | | 61,235 | |
| | | | | |
NET INCREASE IN NET ASSETS RESULTING FROM OPERATIONS | | $ | 58,246 | |
(a) | Represents the period from the commencement of operations (December 30, 2014) through May 31, 2015. |
See accompanying notes to financial statements. |
GALAPAGOS PARTNERS SELECT EQUITY FUND
STATEMENT OF CHANGES IN NET ASSETS |
| | Period Ended
May 31, 2015 (a)
(Unaudited) | |
FROM OPERATIONS | | | |
Net investment loss | | $ | (2,989 | ) |
Net realized losses from security transactions | | | (9,980 | ) |
Net change in unrealized appreciation/depreciation on investments | | | 71,215 | |
Net increase in net assets resulting from operations | | | 58,246 | |
| | | | | |
CAPITAL SHARE TRANSACTIONS | | | | |
Proceeds from shares sold | | | 1,060,415 | |
| | | | | |
TOTAL INCREASE IN NET ASSETS | | | 1,118,661 | |
| | | | | |
NET ASSETS | | | | |
Beginning of period | | | — | |
End of period | | $ | 1,118,661 | |
| | | | | |
ACCUMULATED NET INVESTMENT LOSS | | $ | (2,989 | ) |
| | | | | |
CAPITAL SHARE ACTIVITY | | | | |
Shares sold | | | 105,606 | |
Shares outstanding at beginning of period | | | — | |
Shares outstanding at end of period | | | 105,606 | |
(a) | Represents the period from the commencement of operations (December 30, 2014) through May 31, 2015. |
See accompanying notes to financial statements. |
GALAPAGOS PARTNERS SELECT EQUITY FUND
FINANCIAL HIGHLIGHTS |
Per Share Data for a Share Outstanding Throughout the Period |
| | Period
Ended
May 31,
2015 (a)
(Unaudited) | |
Net asset value at beginning of period | | $ | 10.00 | |
| | | | | |
Income (loss) from investment operations: | | | | |
Net investment loss | | | (0.03 | ) |
Net realized and unrealized gains on investments | | | 0.62 | |
Total from investment operations | | | 0.59 | |
| | | | | |
Net asset value at end of period | | $ | 10.59 | |
| | | | | |
Total return (b) | | | 5.90 | %(c) |
| | | | | |
Net assets at end of period (000's) | | $ | 1,119 | |
| | | | | |
Ratios/supplementary data: | | | | |
Ratio of total expenses to average net assets | | | 16.66 | %(d) |
| | | | | |
Ratio of net expenses to average net assets (e) | | | 1.50 | %(d) |
| | | | | |
Ratio of net investment loss to average net assets (e) | | | (0.86% | )(d) |
| | | | | |
Portfolio turnover rate | | | 329 | %(c) |
(a) | Represents the period from the commencement of operations (December 30, 2014) through May 31, 2015. |
(b) | Total return is a measure of the change in value of an investment in the Fund over the period covered. The return shown does not reflect the deduction of taxes a shareholder would pay on Fund distributions, if any, or the redemption of Fund shares. The total return would be lower if the Adviser had not waived advisory fees and/or reimbursed expenses. |
(c) | Not annualized. |
(d) | Annualized. |
(e) | Ratio was determined after advisory fee waivers and/or expense reimbursements (Note 4). |
See accompanying notes to financial statements. |
GALAPAGOS PARTNERS SELECT EQUITY FUND
NOTES TO FINANCIAL STATEMENTS
May 31, 2015 (Unaudited)
1. Organization
Galapagos Partners Select Equity Fund (the “Fund”) is a diversified series of Ultimus Managers Trust (the “Trust”), an open-end investment company established as an Ohio business trust under a Declaration of Trust dated February 28, 2012. Other series of the Trust are not incorporated in this report. The Fund commenced operations on December 30, 2014.
The investment objective of the Fund is capital appreciation.
2. Significant Accounting Policies
The following is a summary of the Fund’s significant accounting policies used in the preparation of its financial statements. These policies are in conformity with accounting principles generally accepted in the United States of America (“GAAP”). As an investment company, as defined in Financial Accounting Standards Board (“FASB”) Accounting Standards Update 2013-08, the Fund follows accounting and reporting guidance under FASB Accounting Standards Codification Topic 946, “Financial Services – Investment Companies.”
Securities valuation – The Fund values its portfolio securities at market value as of the close of regular trading on the New York Stock Exchange (the “NYSE”) (normally 4:00 p.m. Eastern time) on each business day the NYSE is open for business. The Fund values its listed securities on the basis of the security’s last sale price on the primary exchange, if available, otherwise at the exchange’s most recently quoted bid price. NASDAQ-listed securities are valued at the NASDAQ Official Closing Price. In the event that market quotations are not readily available or are considered unreliable due to market or other events, the Fund values its securities and other assets at fair value in accordance with procedures established by and under the general supervision of the Board of Trustees (the “Board”). Under these procedures, the securities will be classified as Level 2 or 3 within the fair value hierarchy (see below), depending on the inputs used. Unavailable or unreliable market quotes may be due to the following factors: a substantial bid-ask spread; infrequent sales resulting in stale prices; insufficient trading volume; small trade sizes; a temporary lapse in any reliable pricing source; and actions of the securities or futures markets, such as the suspension or limitation of trading. As a result, the prices of securities used to calculate the Fund’s net asset value may differ from quoted or published prices for the same securities.
GAAP establishes a single authoritative definition of fair value, sets out a framework for measuring fair value, and requires additional disclosures about fair value measurements.
Various inputs are used in determining the value of the Fund’s investments. These inputs are summarized in the three broad levels listed below:
● | Level 1 – quoted prices in active markets for identical securities |
GALAPAGOS PARTNERS SELECT EQUITY FUND
NOTES TO FINANCIAL STATEMENTS (Continued) |
● | Level 2 – other significant observable inputs |
● | Level 3 – significant unobservable inputs |
The inputs or methods used for valuing securities are not necessarily an indication of the risks associated with investing in those securities. The inputs used to measure fair value may fall into different levels of the fair value hierarchy. In such cases, for disclosure purposes, the level in the fair value hierarchy within which the fair value measurement falls in its entirety is determined based on the lowest level input that is significant to the fair value measurement.
The following is a summary of the inputs used to value the Fund’s investments as of May 31, 2015:
| | Level 1 | | | Level 2 | | | Level 3 | | | Total | |
Common Stocks | | $ | 1,014,084 | | | $ | — | | | $ | — | | | $ | 1,014,084 | |
Exchange-Traded Funds | | | 101,974 | | | | — | | | | — | | | | 101,974 | |
Money Market Funds | | | 43,342 | | | | — | | | | — | | | | 43,342 | |
Total | | $ | 1,159,400 | | | $ | — | | | $ | — | | | $ | 1,159,400 | |
Refer to the Fund’s Schedule of Investments for a listing of the common stocks by industry type. As of May 31, 2015, the Fund did not hold any transfers into and out of any Level. In addition, the Fund did not have derivative instruments or any assets or liabilities that were measured at fair value on a recurring basis using significant unobservable inputs (Level 3). It is the Fund’s policy to recognize transfers into and out of any Level at the end of the reporting period.
Share valuation – The net asset value per share of the Fund is calculated daily by dividing the total value of the Fund’s assets, less liabilities, by the number of shares outstanding. The offering price and redemption price per share of the Fund is equal to the net asset value per share.
Investment income – Dividend income is recorded on the ex-dividend date. Interest income is accrued as earned.
Security transactions – Security transactions are accounted for on the trade date. Gains and losses on securities sold are determined on a specific identification basis.
Common expenses – Common expenses of the Trust are allocated among the Fund and the other series of the Trust based on the relative net assets of each series or the nature of the services performed and the relative applicability to each series.
Distributions to shareholders – The Fund will distribute to shareholders any net investment income dividends and net realized capital gains distributions at least once each year. The amount of such dividends and distributions are determined in accordance with
GALAPAGOS PARTNERS SELECT EQUITY FUND
NOTES TO FINANCIAL STATEMENTS (Continued) |
federal income tax regulations, which may differ from GAAP. Dividends and distributions to shareholders are recorded on the ex-dividend date. There were no distributions paid to shareholders during the period ended May 31, 2015.
Estimates – The preparation of financial statements in conformity with GAAP requires management to make estimates and assumptions that affect the reported amounts of assets and liabilities and disclosure of contingent assets and liabilities as of the date of the financial statements and the reported amounts of income and expenses during the reporting period. Actual results could differ from those estimates.
Federal income tax – The Fund intends to qualify as a regulated investment company under the Internal Revenue Code of 1986 (the “Code”). Qualification generally will relieve the Fund of liability for federal income taxes to the extent 100% of its net investment income and net realized gains are distributed in accordance with the Code. Accordingly, no provision for income tax has been made.
In order to avoid imposition of the excise tax applicable to regulated investment companies, it is also the Fund’s intention to declare as dividends in each calendar year at least 98% of its net investment income (earned during the calendar year) and 98.2% of its net realized capital gains (earned during the twelve months ended October 31) plus undistributed amounts from prior years.
The following information is computed on a tax basis for each item as of May 31, 2015:
Tax cost of portfolio investments | | $ | 1,093,423 | |
Gross unrealized appreciation | | $ | 71,801 | |
Gross unrealized depreciation | | | (5,824 | ) |
Net unrealized appreciation on investments | | | 65,977 | |
Accumulated ordinary loss | | | (3,388 | ) |
Other losses | | | (4,343 | ) |
Accumulated earnings | | $ | 58,246 | |
The difference between the federal income tax cost of portfolio investments and the financial statement cost of portfolio investments is due to certain timing differences in the recognition of capital gains or losses under income tax regulations and GAAP. These “book/tax” differences are temporary in nature and are primarily due to the tax deferral of losses on wash sales.
The Fund recognizes the tax benefits or expenses of uncertain tax positions only when the position is “more likely than not” to be sustained assuming examination by tax authorities. Management has reviewed the Fund’s tax positions for the current tax period and has concluded that no provision for unrecognized tax benefits or expenses is required in these financial statements. The Fund identifies its major tax jurisdiction as U.S. Federal.
GALAPAGOS PARTNERS SELECT EQUITY FUND
NOTES TO FINANCIAL STATEMENTS (Continued) |
3. Investment Transactions
During the period ended May 31, 2015, cost of purchases and proceeds from sales of investment securities, other than short-term investments, were $3,572,168 and $2,517,344, respectively.
4. Transactions with Related Parties
INVESTMENT ADVISORY AGREEMENT
The Fund’s investments are managed by Galapagos Partners, L.P. (the “Adviser”) pursuant to the terms of an Investment Advisory Agreement. Under the Investment Advisory Agreement, the Fund pays the Adviser an advisory fee, computed and accrued daily and paid monthly, at the annual rate of 1.25% of its average daily net assets.
Pursuant to an Expense Limitation Agreement (“ELA”) between the Fund and the Adviser, the Adviser has agreed, until March 31, 2017, to waive investment advisory fees and reimburse other operating expenses to limit Total Annual Fund Operating Expenses (exclusive of brokerage costs, taxes, interest, acquired fund fees and expenses, extraordinary expenses such as litigation and merger or reorganization costs, and other expenses not incurred in the ordinary course of the Fund’s business) to an amount not exceeding 1.50% of the Fund’s average daily net assets. Accordingly, during the period ended May 31, 2015, the Adviser waived all of its advisory fees and, in addition, reimbursed other operating expenses totaling $42,351.
Under the terms of the ELA, investment advisory fee waivers and expense reimbursements by the Adviser are subject to recoupment by the Adviser for a period of three years after such fees and expenses were incurred, provided the recoupments do not cause Total Annual Fund Operating Expenses to exceed the foregoing expense limitations. As of May 31, 2015, the Adviser may seek recoupment of investment advisory fee waivers and expense reimbursements totaling $46,697 no later than May 31, 2018.
An officer of the Fund is also an officer of the Adviser.
OTHER SERVICE PROVIDERS
Ultimus Fund Solutions, LLC (“Ultimus”) provides fund administration, fund accounting, compliance and transfer agency services to the Fund. The Fund pays Ultimus fees in accordance with the agreements for such services. In addition, the Fund pays out-of-pocket expenses including but not limited to postage, supplies and costs of pricing the Fund’s portfolio securities. During the period end May 31, 2015, Ultimus voluntarily waived fees in the amount of $6,000.
GALAPAGOS PARTNERS SELECT EQUITY FUND
NOTES TO FINANCIAL STATEMENTS (Continued) |
DISTRIBUTION AGREEMENT
Under the terms of a Distribution Agreement with the Trust, Ultimus Fund Distributors, LLC (the “Distributor”) serves as principal underwriter to the Fund. The Distributor is a wholly-owned subsidiary of Ultimus. The Distributor is compensated by the Adviser (not the Fund) for acting as principal underwriter.
Certain Trustees and officers of the Trust are also officers of Ultimus and/or the Distributor.
TRUSTEE COMPENSATION
Each Trustee who is not an “interested person” of the Trust (“Independent Trustee”) receives from the Fund a fee of $500 for each Board meeting attended plus reimbursement of travel and other meeting-related expenses. In addition, effective January 1, 2015, each Independent Trustee also receives a $500 annual retainer from the Fund. Trustees affiliated with the Adviser or Ultimus are not compensated by the Trust for their services.
PRINCIPAL HOLDERS OF FUND SHARES
As of May 31, 2015, the following shareholders owned of record 5% or more of the outstanding shares of the Fund:
Name of Record Owner | % Ownership |
Lack Holdings, Inc. | 46% |
Birdwood Associates, L.P. | 19% |
Carolyn R. Holmes 1996 Great Grandchildren Trust | 9% |
Courtney Kubesch | 7% |
Michelle Anderson | 6% |
A beneficial owner of 25% or more of the Fund’s outstanding shares may be considered a controlling person. That shareholder’s vote could have a more significant effect on matters presented at a shareholder’s meeting.
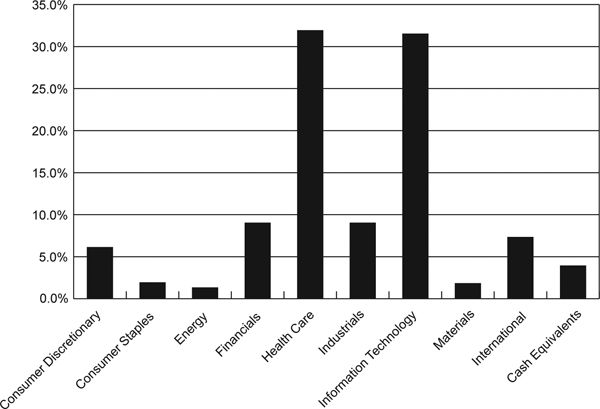
5. Sector Risk
If a Fund has significant investments in the securities of issuers within a particular sector, any development affecting that sector will have a greater impact on the value of the net assets of the Fund than would be the case if the Fund did not have significant investments in that sector. In addition, this may increase the risk of loss in the Fund and increase the volatility of the Fund’s net asset value per share. Occasionally, market conditions, regulatory changes or other developments may negatively impact this sector, and therefore the value of the Fund’s portfolio will be adversely affected. As of May 31, 2015, the Fund had 31.9% and 31.5% of the value of its net assets invested in stocks within the Health Care and Information Technology sectors, respectively.
GALAPAGOS PARTNERS SELECT EQUITY FUND
NOTES TO FINANCIAL STATEMENTS (Continued) |
6. Contingencies and Commitments
The Fund indemnifies the Trust’s officers and Trustees for certain liabilities that might arise from their performance of their duties to the Fund. Additionally, in the normal course of business the Fund enters into contracts that contain a variety of representations and warranties and which provide general indemnifications. The Fund’s maximum exposure under these arrangements is unknown, as this would involve future claims that may be made against the Fund that have not yet occurred. However, based on experience, the Fund expects the risk of loss to be remote.
7. Subsequent Events
The Fund is required to recognize in the financial statements the effects of all subsequent events that provide additional evidence about conditions that existed as of the date of the Statement of Assets and Liabilities. For non-recognized subsequent events that must be disclosed to keep the financial statements from being misleading, the Fund is required to disclose the nature of the event as well as an estimate of its financial effect, or a statement that such an estimate cannot be made. Management has evaluated subsequent events through the issuance of these financial statements and has noted no such events.
GALAPAGOS PARTNERS SELECT EQUITY FUND
ABOUT YOUR FUND’S EXPENSES (Unaudited) |
We believe it is important for you to understand the impact of costs on your investment. As a shareholder of the Fund, you incur ongoing costs, including management fees and other operating expenses. The following examples are intended to help you understand your ongoing costs (in dollars) of investing in the Fund and to compare these costs with the ongoing costs of investing in other mutual funds.
A mutual fund’s ongoing costs are expressed as a percentage of its average net assets. This figure is known as the expense ratio. The expenses in the table below are based on an investment of $1,000 made at the beginning of the most recent period (December 30, 2014) and held until the end of the period (May 31, 2015).
The table below illustrates the Fund’s ongoing costs in two ways:
Actual fund return – This section helps you to estimate the actual expenses that you paid over the period. The “Ending Account Value” shown is derived from the Fund’s actual return, and the third column shows the dollar amount of operating expenses that would have been paid by an investor who started with $1,000 in the Fund. You may use the information here, together with the amount you invested, to estimate the expenses that you paid over the period.
To do so, simply divide your account value by $1,000 (for example, an $8,600 account value divided by $1,000 = 8.6), then multiply the result by the number given for the Fund under the heading “Expenses Paid During Period.”
Hypothetical 5% return – This section is intended to help you compare the Fund’s ongoing costs with those of other mutual funds. It assumes that the Fund had an annual return of 5% before expenses during the period shown, but that the expense ratio is unchanged. In this case, because the return used is not the Fund’s actual return, the results do not apply to your investment. The example is useful in making comparisons because the U.S. Securities and Exchange Comission (“SEC”) requires all mutual funds to calculate expenses based on a 5% return. You can assess the Fund’s ongoing costs by comparing this hypothetical example with the hypothetical examples that appear in shareholder reports of other funds.
Note that expenses shown in the table are meant to highlight and help you compare ongoing costs only. The Fund does not charge transaction fees, such as purchase or redemption fees, nor does it carry a “sales load.”
The calculations assume no shares were bought or sold during the period. Your actual costs may have been higher or lower, depending on the amount of your investment and the timing of any purchases or redemptions.
GALAPAGOS PARTNERS SELECT EQUITY FUND
ABOUT YOUR FUND’S EXPENSES (Unaudited) (Continued) |
More information about the Fund’s expenses can be found in this report. For additional information on operating expenses and other shareholder costs, please refer to the Fund’s prospectus.
| Beginning
Account Value
December 1,
2014 (a) | Ending
Account Value
May 31,
2015 | Net
Expense Radio (b) | Expenses
Paid During
Period (c) |
Based on Actual Fund Return | $ 1,000.00 | $ 1,066.00 | 1.50% | $ 6.45 |
Based on Hypothetical 5% Return (before expenses) | $ 1,000.00 | $ 1,017.45 | 1.50% | $ 7.54 |
(a) | Beginning Account Value is as of December 30, 2014 (date of commencement of operations) for the Actual Fund Return information. |
(b) | Annualized, based on the Fund’s net expenses for the period since inception. |
(c) | Expenses are equal to the Fund’s annualized expense ratio multiplied by the average account value over the period, multiplied by 153/365 (to reflect the period since inception) and 182/365 (to reflect the one-half year period), for Actual Fund Return and Hypothetical 5% Return information, respectively. |
OTHER INFORMATION (Unaudited)
A description of the policies and procedures that the Fund uses to vote proxies relating to portfolio securities is available without charge upon request by calling toll-free 1-800-592-7722, or on the SEC’s website at http://www.sec.gov. Information regarding how the Fund voted proxies relating to portfolio securities during the period ended June 30, 2015, will be available without charge upon request on or before August 31, 2015 by calling toll-free 1-800-592-7722, or on the SEC’s website at http://www.sec.gov.
The Trust files a complete listing of portfolio holdings for the Fund with the SEC as of the end of the first and third quarters of each fiscal year on Form N-Q. These filings are available upon request by calling 1-800-592-7722. Furthermore, you may obtain a copy of the filings on the SEC’s website at http://www.sec.gov. The Trust’s Forms N-Q may also be reviewed and copied at the SEC’s Public Reference Room in Washington, DC, and information on the operation of the Public Reference Room may be obtained by calling 1-800-SEC-0330.
GALAPAGOS PARTNERS SELECT EQUITY FUND
DISCLOSURE REGARDING APPROVAL OF
INVESTMENT ADVISORY AGREEMENT (Unaudited) |
The Board of Trustees (the “Board”), including the Independent Trustees voting separately, has reviewed and approved the Fund’s Investment Advisory Agreement with Galapagos Partners, L.P. (the “Adviser”) for an initial two-year term. Approval took place at an in-person meeting held on October 20, 2014, at which all of the Trustees were present.
In the course of their deliberations, the Board was advised by legal counsel. The Board received and reviewed information provided by the Advisor in response to requests of the Board and counsel.
In considering the Investment Advisory Agreement and reaching their conclusions with respect thereto, the Board reviewed and analyzed various factors that they determined were relevant, including the factors described below.
The nature, extent, and quality of the services to be provided by the Adviser. In this regard, the Board considered the responsibilities the Adviser would have under the Investment Advisory Agreement. The Board also considered the anticipated services to be provided by the Adviser to the Fund including without limitation the Adviser’s procedures for formulating investment recommendations and assuring compliance with the Fund’s investment objective and limitations, proposed initial marketing and distribution efforts, and compliance procedures and practices. After reviewing the foregoing and further information regarding the Adviser’s business, the Board concluded that the quality, extent, and nature of the services to be provided by the Adviser were satisfactory and adequate for the Fund.
The investment management capabilities and experience of the Adviser. In this regard, the Board considered the investment management experience of the Adviser. The Board discussed with the Adviser the investment objective and strategies for the Fund and the Adviser’s experience and plans for implementing such strategies. In particular, the Board received information from the Adviser regarding the experience of the Fund’s portfolio managers in managing substantially similar strategies. The Board also noted the Adviser’s prior experience and performance with pooled investment vehicles and separate accounts that had similar investment objectives and strategies as the Fund. After consideration of these factors, as well as other factors, the Board determined that the Adviser has the requisite experience to serve as manager for the Fund.
The costs of the services provided and profits to be realized by the Adviser and its affiliates from the relationship with the Fund. In this regard, the Board considered the Adviser’s staffing, personnel, and methods of operation; the education and experience of its personnel; its compliance program, policies, and procedures; its financial condition and the level of commitment to the Fund and its other advisory business; the projected asset levels of the Fund; and the overall expenses of the Fund, including the advisory fee. The Board reviewed the Adviser’s Expense Limitation Agreement (the “ELA”),
GALAPAGOS PARTNERS SELECT EQUITY FUND
DISCLOSURE REGARDING APPROVAL OF
INVESTMENT ADVISORY AGREEMENT (Unaudited) |
and noted the benefit that would result to the Fund from the Adviser’s commitment to waive its advisory fee or reimburse other operating expenses until March 31, 2017. The Board discussed the financial condition of the Adviser and its ability to satisfy its financial commitments to the Fund. The Board also considered potential benefits for the Adviser in managing the Fund. The Board compared the Fund’s proposed advisory fee and overall expense ratio to other comparable funds (in terms of the type of fund, the style of investment management, the projected size of the Fund, and the nature of the investment strategy) and the fees charged by the Adviser to its other managed accounts. The Board noted that while the Fund’s annual advisory fee of 1.25 percent was above the average and median for funds in its peer groups and that the proposed overall annual expense ratio of 1.50 percent (after fee waivers and expense reimbursements) is higher than the peer group’s average and median expense ratios, the investment strategy and process to be used by the Adviser for the Fund was unique. Upon further consideration and discussion of the foregoing, the Board concluded that the proposed advisory fee for the Fund is fair and reasonable.
The extent to which the Fund and its investors would benefit from economies of scale. In this regard, the Board considered the Adviser’s Investment Advisory Agreement and the Adviser’s ELA. The Board determined that since the proposed advisory fee was flat and would stay the same as asset levels increased, the shareholders of the Fund would benefit from the Adviser’s ELA until the Fund’s assets grew to a level where its expenses otherwise fell below the expense limit. Following further discussion of the Fund’s projected asset levels, expectations for growth, and level of fees, the Board determined that the Fund’s fee arrangements with the Adviser would provide benefits for the next two years, and the Board can review the arrangements going forward as necessary, including at each renewal period. After further discussion, the Board concluded that the Fund’s arrangements with the Adviser were fair and reasonable in relation to the nature and quality of services to be provided by the Adviser.
Brokerage and portfolio transactions. In this regard, the Board considered the Adviser’s policies and procedures as it relates to seeking best execution for its clients, including the Fund. The Board also considered the anticipated portfolio turnover rate for the Fund; the method and basis for selecting and evaluating the broker-dealers used; and any anticipated allocation of portfolio business to persons affiliated with the Adviser. After further review and discussion, the Board determined that the Adviser’s practices regarding brokerage and portfolio transactions were satisfactory.
Possible conflicts of interest. In evaluating the possibility for conflicts of interest, the Board considered such matters as the Adviser’s process for allocating trades among its different clients, including other clients with similar investment objectives and strategies as the Fund. The Board also considered the substance and administration of the Adviser’s code of ethics and its personnel’s own investment in the Fund. Following
GALAPAGOS PARTNERS SELECT EQUITY FUND
DISCLOSURE REGARDING APPROVAL OF
INVESTMENT ADVISORY AGREEMENT (Unaudited) (Continued) |
further consideration and discussion, the Board determined that the Adviser’s standards and practices relating to the identification and mitigation of potential conflicts of interests were satisfactory.
Conclusion
After consideration of the above factors as well as other factors, the Board unanimously concluded that approval of the Investment Advisory Agreement was in the best interests of the Fund and its shareholders.
This Page Intentionally Left Blank
This Page Intentionally Left Blank
This Page Intentionally Left Blank
LYRICAL FUNDS
LETTER TO SHAREHOLDERS | June 22, 2015 |
Dear Fellow Shareholders,
Enclosed is the semi-annual report to shareholders of Lyrical U.S. Value Equity Fund (the “Value Fund”) and Lyrical U.S. Hedged Value Fund (the “Hedged Value Fund”) (collectively, the “Funds”). On behalf of the Funds and their investment adviser, Lyrical Asset Management LP, I would like to thank you for your investment.
Lyrical U.S. Value Equity Fund
Since its launch on February 4, 2013 through the period ended May 31, 2015, the Value Fund – Institutional Class has produced a cumulative total return of +74.82%, compared to the +47.95% cumulative total return for the S&P 500 Index (the “S&P 500”). For the six months ended May 31, 2015, the Value Fund – Institutional Class produced a total return of 6.25% compared to the total return for the S&P 500 of 2.97%.
In analyzing our portfolio’s performance attribution, we find it helpful to examine both the investment success rate and any skew in the distribution of returns. Our success rate has been high over the life of the Value Fund, as 82% of our investments posted gains, and 68% outperformed the S&P 500. Skew has also been a positive factor, as our outperformers have outperformed by 53% while our underperformers have underperformed by 30%.
During the life of the Value Fund we sold eleven positions, as three companies announced they were being acquired, seven approached fair value, and for one we lost conviction in our thesis. For each sale we added a new position from our pipeline of opportunities. We are still finding attractive stock opportunities to add to the portfolio, even as some of our existing positions begin to approach our estimates of fair value.
As of the reporting date, the valuation of our portfolio is 13.6x next twelve months consensus earnings. The S&P 500 has a valuation of 16.9x on this same basis, a premium of 25%. The discounted valuation of our portfolio prevails even as growth estimates for our portfolio are only slightly lower than those of the S&P 500, at 3.5% versus 4.8%, respectively.
Lyrical U.S. Hedged Value Fund
In July 2014, we launched the Hedged Value Fund as a liquid alternatives product that employs the same long portfolio as the Value Fund. Sector ETF hedges are used on the short side to create a portfolio that aims to maintain exposures of 100% long and 50% short. This provides a hedged option for those wishing exposure to the long portfolio but unwilling to accept unhedged equity market exposure.
Since its launch on July 14, 2014 through May 31, 2015, the Hedged Value Fund – Institutional Class has produced a cumulative total return of +2.51%, compared to the +8.53% cumulative total return for the S&P 500. For the six months ended May 31, 2015, the Hedged Value Fund – Institutional Class produced a total return of 4.49% compared
to the total return for the S&P 500 of 2.97%. In rising equity markets one should expect Hedged Value Fund’s performance to lag that of the Value Fund, as it did for both the above periods, as our hedges detract from total return.
Lyrical Asset Management’s Investment Philosophy and Portfolio Construction
As there have been a significant number of new investors since our previous year-end letter to the Funds’ shareholders, we’d like to briefly outline our investment philosophy and portfolio construction approach.
We believe our strategy and approach to investing differentiates us from other investment managers, even those that share a value approach to investing. We are deep value investors and by this we mean that we look to invest in companies that trade significantly below intrinsic value. This separates us from other value managers who focus on relative value or core value approaches and whose portfolio characteristics have higher Price/Earnings, Price/Book and Price/Cash Flow multiples. We assess valuation based on current price relative to long-term normalized earnings, which contrasts us to those that rely on Price/Book or dividend yield. We only invest in what we consider to be quality businesses that we believe should earn good returns on invested capital, and avoid volatile businesses and companies with excessive leverage. Other value investors will consider owning any business regardless of quality if they believe the price is low enough. Lastly, we only invest in businesses we can understand, and avoid those that are excessively complex or require specialized technical knowledge, even though they may appear cheap from a high-level perspective.
We construct our portfolio purely bottom up and without regard to what is or is not contained in a benchmark. We are concerned with concentration risk, and have strict limits on how much capital can be invested in any one position or any one industry. Our long portfolio is constructed to be balanced and diversified across approximately 33 positions, giving us exposure to many different types of companies and situations without sacrificing our strict investment standards.
Thank you for your continued trust and interest in Lyrical Asset Management.
Sincerely,
Andrew Wellington
Portfolio Manager
Past performance is not predictive of future performance. Investment results and principal value will fluctuate so that shares, when redeemed, may be worth more or less than their original cost. Current performance may be higher or lower than the performance data quoted. Performance data current to the most recent month end are available by calling 1-888-884-8099.
An investor should consider the investment objectives, risks, charges and expenses of the Funds carefully before investing. The Funds’ prospectus contains this and other important information. To obtain a copy of the Funds’ prospectus please call 1-888-884-8099 and a copy will be sent to you free of charge. Please read the prospectus carefully before you invest. The Funds are distributed by Ultimus Fund Distributors, LLC.
The Letter to Shareholders seeks to describe some of the Adviser’s current opinions and views of the financial markets. Although the Adviser believes it has a reasonable basis for any opinions or views expressed, actual results may differ, sometimes significantly so, from those expected or expressed.
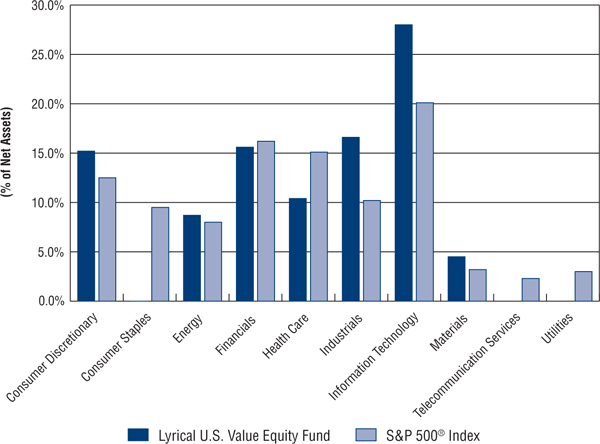
LYRICAL U.S. VALUE EQUITY FUND
PORTFOLIO INFORMATION
May 31, 2015 (Unaudited)
Lyrical U.S. Value Equity Fund vs S&P 500® Index
Sector Diversification
Top Ten Equity Holdings
Security Description | % of
Net Assets |
Avago Technologies Ltd. | 6.8% |
Anthem, Inc. | 5.2% |
Aetna, Inc. | 5.2% |
TE Connectivity Ltd. | 4.1% |
Comcast Corporation - Class A | 4.0% |
Raytheon Company | 4.0% |
Symantec Corporation | 3.9% |
Johnson Controls, Inc. | 3.9% |
Aflac, Inc. | 3.8% |
Ameriprise Financial, Inc. | 3.8% |
LYRICAL U.S. HEDGED VALUE FUND
PORTFOLIO INFORMATION
May 31, 2015 (Unaudited)
Lyrical U.S. Hedged Value Fund vs S&P 500® Index
Sector Diversification
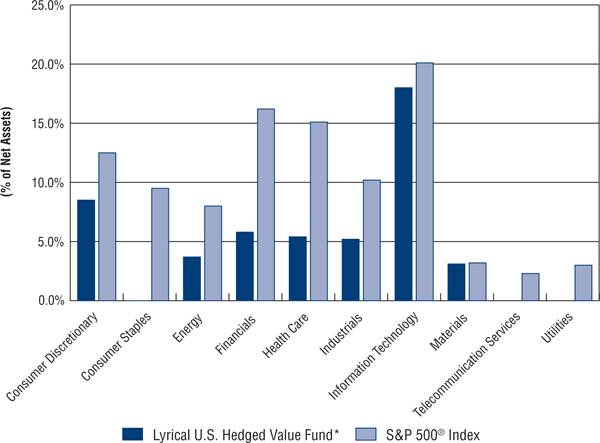
* | The percentages above for Lyrical U.S. Hedged Value Fund represent the net percentages for the Fund and are computed by taking the net dollar exposure, including short positions, and dividing by the net assets of the Fund. |
Top Ten Long Positions
Security Description | % of
Net Assets |
Avago Technologies Ltd. | 6.9% |
Anthem, Inc. | 5.2% |
Aetna, Inc. | 5.1% |
TE Connectivity Ltd. | 4.0% |
Comcast Corporation - Class A | 4.0% |
Raytheon Company | 3.9% |
Symantec Corporation | 3.9% |
Johnson Controls, Inc. | 3.8% |
Ameriprise Financial, Inc. | 3.7% |
Aflac, Inc. | 3.7% |
LYRICAL U.S. VALUE EQUITY FUND
SCHEDULE OF INVESTMENTS
May 31, 2015 (Unaudited) |
COMMON STOCKS — 98.9% | | Shares | | | Value | |
Consumer Discretionary — 15.2% | | | | | | |
Auto Components — 7.5% | | | | | | |
Goodyear Tire & Rubber Company (The) | | | 583,060 | | | $ | 18,567,546 | |
Johnson Controls, Inc. | | | 562,324 | | | | 29,252,094 | |
Tenneco, Inc. (a) | | | 135,179 | | | | 7,937,711 | |
| | | | | | | | 55,757,351 | |
Internet & Catalog Retail — 3.7% | | | | | | | | |
Liberty Interactive Corporation - Series A (a) | | | 984,946 | | | | 27,548,940 | |
| | | | | | | | | |
Media — 4.0% | | | | | | | | |
Comcast Corporation - Class A | | | 508,192 | | | | 29,708,904 | |
| | | | | | | | | |
Energy — 8.7% | | | | | | | | |
Energy Equipment & Services — 2.6% | | | | | | | | |
National Oilwell Varco, Inc. | | | 387,607 | | | | 19,066,388 | |
| | | | | | | | | |
Oil, Gas & Consumable Fuels — 6.1% | | | | | | | | |
EOG Resources, Inc. | | | 266,256 | | | | 23,614,245 | |
Suncor Energy, Inc. | | | 756,362 | | | | 22,108,461 | |
| | | | | | | | 45,722,706 | |
Financials — 15.6% | | | | | | | | |
Capital Markets — 3.8% | | | | | | | | |
Ameriprise Financial, Inc. | | | 225,481 | | | | 28,092,678 | |
| | | | | | | | | |
Diversified Financial Services — 2.7% | | | | | | | | |
NASDAQ OMX Group, Inc. (The) | | | 383,465 | | | | 19,844,314 | |
| | | | | | | | | |
Insurance — 9.1% | | | | | | | | |
Aflac, Inc. | | | 451,672 | | | | 28,103,032 | |
AmTrust Financial Services, Inc. | | | 172,411 | | | | 10,375,694 | |
Assurant, Inc. | | | 159,884 | | | | 10,528,361 | |
Willis Group Holdings plc | | | 401,679 | | | | 19,063,685 | |
| | | | | | | | 68,070,772 | |
Health Care — 10.4% | | | | | | | | |
Health Care Providers & Services — 10.4% | | | | | | | | |
Aetna, Inc. | | | 326,210 | | | | 38,482,994 | |
Anthem, Inc. | | | 233,227 | | | | 39,147,152 | |
| | | | | | | | 77,630,146 | |
Industrials — 16.6% | | | | | | | | |
Aerospace & Defense — 4.0% | | | | | | | | |
Raytheon Company | | | 286,855 | | | | 29,620,647 | |
LYRICAL U.S. VALUE EQUITY FUND
SCHEDULE OF INVESTMENTS (Continued) |
COMMON STOCKS — 98.9% (Continued) | | Shares | | | Value | |
Industrials — 16.6% (Continued) | | | | | | |
Construction & Engineering — 1.2% | | | | | | |
AECOM (a) | | | 260,761 | | | $ | 8,612,936 | |
| | | | | | | | | |
Electrical Equipment — 3.6% | | | | | | | | |
Eaton Corporation plc | | | 379,573 | | | | 27,173,631 | |
| | | | | | | | | |
Road & Rail — 4.2% | | | | | | | | |
Avis Budget Group, Inc. (a) | | | 237,847 | | | | 12,130,197 | |
Hertz Global Holdings, Inc. (a) | | | 976,522 | | | | 19,423,023 | |
| | | | | | | | 31,553,220 | |
Trading Companies & Distributors — 3.6% | | | | | | | | |
AerCap Holdings N.V. (a) | | | 477,169 | | | | 23,018,632 | |
MRC Global, Inc. (a) | | | 230,428 | | | | 3,527,853 | |
| | | | | | | | 26,546,485 | |
Information Technology — 28.0% | | | | | | | | |
Electronic Equipment, Instruments & Components — 7.7% | | | | | | | | |
Corning, Inc. | | | 1,284,241 | | | | 26,866,322 | |
TE Connectivity Ltd. | | | 437,966 | | | | 30,219,654 | |
| | | | | | | | 57,085,976 | |
IT Services — 3.6% | | | | | | | | |
Western Union Company (The) | | | 1,203,337 | | | | 26,413,247 | |
| | | | | | | | | |
Semiconductors & Semiconductor Equipment — 6.8% | | | | | | | | |
Avago Technologies Ltd. | | | 340,396 | | | | 50,402,436 | |
| | | | | | | | | |
Software — 3.9% | | | | | | | | |
Symantec Corporation | | | 1,192,589 | | | | 29,367,504 | |
| | | | | | | | | |
Technology Hardware, Storage & Peripherals — 6.0% | | | | | | | | |
Lexmark International, Inc. - Class A | | | 136,196 | | | | 6,262,292 | |
NCR Corporation (a) | | | 371,847 | | | | 11,174,002 | |
Western Digital Corporation | | | 282,423 | | | | 27,496,703 | |
| | | | | | | | 44,932,997 | |
Materials — 4.4% | | | | | | | | |
Chemicals — 3.2% | | | | | | | | |
Celanese Corporation - Series A | | | 350,232 | | | | 24,113,473 | |
| | | | | | | | | |
Containers & Packaging — 1.2% | | | | | | | | |
Owens-Illinois, Inc. (a) | | | 371,577 | | | | 8,880,691 | |
| | | | | | | | | |
Total Common Stocks (Cost $659,045,080) | | | | | | $ | 736,145,442 | |
LYRICAL U.S. VALUE EQUITY FUND
SCHEDULE OF INVESTMENTS (Continued) |
MONEY MARKET FUNDS — 1.7% | | Shares | | | Value | |
Fidelity Institutional Money Market Portfolio - Class I, 0.10% (b) (Cost $12,256,122) | | | 12,256,122 | | | $ | 12,256,122 | |
| | | | | | | | | |
Total Investments at Value — 100.6% (Cost $671,301,202) | | | | | | $ | 748,401,564 | |
| | | | | | | | | |
Liabilities in Excess of Other Assets — (0.6%) | | | | | | | (4,223,970 | ) |
| | | | | | | | | |
Net Assets — 100.0% | | | | | | $ | 744,177,594 | |
(a) | Non-income producing security. |
(b) | The rate shown is the 7-day effective yield as of May 31, 2015. |
See accompanying notes to financial statements. |
LYRICAL U.S. HEDGED VALUE FUND
SCHEDULE OF INVESTMENTS
May 31, 2015 (Unaudited) |
COMMON STOCKS — 97.8% | | Shares | | | Value | |
Consumer Discretionary — 14.9% | | | | | | |
Auto Components — 7.3% | | | | | | |
Goodyear Tire & Rubber Company (The) (a) | | | 1,176 | | | $ | 37,450 | |
Johnson Controls, Inc. (a) | | | 1,120 | | | | 58,262 | |
Tenneco, Inc. (b) | | | 259 | | | | 15,209 | |
| | | | | | | | 110,921 | |
Internet & Catalog Retail — 3.6% | | | | | | | | |
Liberty Interactive Corporation - Series A (a) (b) | | | 1,958 | | | | 54,765 | |
| | | | | | | | | |
Media — 4.0% | | | | | | | | |
Comcast Corporation - Class A (a) | | | 1,024 | | | | 59,863 | |
| | | | | | | | | |
Energy — 8.2% | | | | | | | | |
Energy Equipment & Services — 2.4% | | | | | | | | |
National Oilwell Varco, Inc. (a) | | | 736 | | | | 36,204 | |
| | | | | | | | | |
Oil, Gas & Consumable Fuels — 5.8% | | | | | | | | |
EOG Resources, Inc. (a) | | | 517 | | | | 45,853 | |
Suncor Energy, Inc. (a) | | | 1,454 | | | | 42,500 | |
| | | | | | | | 88,353 | |
Financials — 15.5% | | | | | | | | |
Capital Markets — 3.7% | | | | | | | | |
Ameriprise Financial, Inc. (a) | | | 456 | | | | 56,813 | |
| | | | | | | | | |
Diversified Financial Services — 2.7% | | | | | | | | |
NASDAQ OMX Group, Inc. (The) (a) | | | 778 | | | | 40,261 | |
| | | | | | | | | |
Insurance — 9.1% | | | | | | | | |
Aflac, Inc. (a) | | | 903 | | | | 56,185 | |
AmTrust Financial Services, Inc. (a) | | | 351 | | | | 21,123 | |
Assurant, Inc. (a) | | | 325 | | | | 21,401 | |
Willis Group Holdings plc (a) | | | 815 | | | | 38,680 | |
| | | | | | | | 137,389 | |
Health Care — 10.3% | | | | | | | | |
Health Care Providers & Services — 10.3% | | | | | | | | |
Aetna, Inc. (a) | | | 654 | | | | 77,152 | |
Anthem, Inc. (a) | | | 470 | | | | 78,890 | |
| | | | | | | | 156,042 | |
Industrials — 16.4% | | | | | | | | |
Aerospace & Defense — 3.9% | | | | | | | | |
Raytheon Company (a) | | | 579 | | | | 59,788 | |
LYRICAL U.S. HEDGED VALUE FUND
SCHEDULE OF INVESTMENTS (Continued) |
COMMON STOCKS — 97.8% (Continued) | | Shares | | | Value | |
Industrials — 16.4% (Continued) | | | | | | |
Construction & Engineering — 1.1% | | | | | | |
AECOM (a) (b) | | | 513 | | | $ | 16,944 | |
| | | | | | | | | |
Electrical Equipment — 3.6% | | | | | | | | |
Eaton Corporation plc (a) | | | 756 | | | | 54,122 | |
| | | | | | | | | |
Road & Rail — 4.2% | | | | | | | | |
Avis Budget Group, Inc. (a) (b) | | | 484 | | | | 24,684 | |
Hertz Global Holdings, Inc. (a) (b) | | | 1,968 | | | | 39,143 | |
| | | | | | | | 63,827 | |
Trading Companies & Distributors — 3.6% | | | | | | | | |
AerCap Holdings N.V. (a) (b) | | | 970 | | | | 46,793 | |
MRC Global, Inc. (a) (b) | | | 468 | | | | 7,165 | |
| | | | | | | | 53,958 | |
Information Technology — 28.1% | | | | | | | | |
Electronic Equipment, Instruments & Components — 7.7% | | | | | | | | |
Corning, Inc. (a) | | | 2,607 | | | | 54,538 | |
TE Connectivity Ltd. (a) | | | 887 | | | | 61,203 | |
| | | | | | | | 115,741 | |
IT Services — 3.5% | | | | | | | | |
Western Union Company (The) (a) | | | 2,441 | | | | 53,580 | |
| | | | | | | | | |
Semiconductors & Semiconductor Equipment — 6.9% | | | | | | | | |
Avago Technologies Ltd. (a) | | | 710 | | | | 105,130 | |
| | | | | | | | | |
Software — 3.9% | | | | | | | | |
Symantec Corporation (a) | | | 2,380 | | | | 58,608 | |
| | | | | | | | | |
Technology Hardware, Storage & Peripherals — 6.1% | | | | | | | | |
Lexmark International, Inc. - Class A (a) | | | 285 | | | | 13,104 | |
NCR Corporation (b) | | | 768 | | | | 23,079 | |
Western Digital Corporation (a) | | | 573 | | | | 55,787 | |
| | | | | | | | 91,970 | |
Materials — 4.4% | | | | | | | | |
Chemicals — 3.2% | | | | | | | | |
Celanese Corporation - Series A (a) | | | 711 | | | | 48,952 | |
| | | | | | | | | |
Containers & Packaging — 1.2% | | | | | | | | |
Owens-Illinois, Inc. (a) (b) | | | 753 | | | | 17,997 | |
| | | | | | | | | |
Total Common Stocks (Cost $1,406,919) | | | | | | $ | 1,481,228 | |
LYRICAL U.S. HEDGED VALUE FUND
SCHEDULE OF INVESTMENTS (Continued) |
MONEY MARKET FUNDS — 4.3% | | Shares | | | Value | |
Invesco Liquid Assets Portfolio (The) - Institutional Shares, 0.10%(c) (Cost $64,301) | | | 64,301 | | | $ | 64,301 | |
| | | | | | | | | |
Total Investments at Value — 102.1% (Cost $1,471,220) | | | | | | $ | 1,545,529 | |
| | | | | | | | | |
Liabilities in Excess of Other Assets (d) — (2.1%) | | | | | | | (31,430 | ) |
| | | | | | | | | |
Net Assets — 100.0% | | | | | | $ | 1,514,099 | |
(a) | All or a portion of the shares have been committed as collateral for open short positions (Note 2). |
(b) | Non-income producing security. |
(c) | The rate shown is the 7-day effective yield as of May 31, 2015. |
(d) | Includes cash held as margin deposits for open short positions. |
See accompanying notes to financial statements. |
LYRICAL U.S. HEDGED VALUE FUND
SCHEDULE OF SECURITIES SOLD SHORT
May 31, 2015 (Unaudited) |
EXCHANGE-TRADED FUNDS — 48.2% | | Shares | | | Value | |
Consumer Discretionary Select Sector SPDR® Fund (The) | | | 1,267 | | | $ | 96,672 | |
Energy Select Sector SPDR® Fund (The) | | | 882 | | | | 69,122 | |
Financial Select Sector SPDR® Fund (The) | | | 5,982 | | | | 147,157 | |
Health Care Select Sector SPDR® Fund (The) | | | 988 | | | | 74,100 | |
Industrial Select Sector SPDR® Fund (The) | | | 3,049 | | | | 170,165 | |
Materials Select Sector SPDR® Fund (The) | | | 410 | | | | 20,750 | |
Technology Select Sector SPDR® Fund (The) | | | 3,505 | | | | 152,012 | |
Total Securities Sold Short — 48.2% (Proceeds $702,316) | | | | | | $ | 729,978 | |
See accompanying notes to financial statements. |
LYRICAL FAMILY OF FUNDS
STATEMENTS OF ASSETS AND LIABILITIES
May 31, 2015 (Unaudited) |
| | Lyrical U.S.
Value
Equity Fund | | | Lyrical U.S. Hedged
Value Fund | |
ASSETS | | | | | | |
Investments in securities: | | | | | | |
At acquisition cost | | $ | 671,301,202 | | | $ | 1,471,220 | |
At value (Note 2) | | $ | 748,401,564 | | | $ | 1,545,529 | |
Deposits with brokers for securities sold short (Note 2) | | | — | | | | 685,151 | |
Dividends receivable | | | 600,584 | | | | 1,233 | |
Receivable for capital shares sold | | | 1,572,893 | | | | 150 | |
Receivable from Adviser (Note 4) | | | — | | | | 13,101 | |
Other assets | | | 51,273 | | | | 10,206 | |
Total assets | | | 750,626,314 | | | | 2,255,370 | |
| | | | | | | | | |
LIABILITIES | | | | | | | | |
Securities sold short, at value (Note 2) (proceeds $— and $702,316, respectively) | | | — | | | | 729,978 | |
Payable for investment securities purchased | | | 4,941,830 | | | | — | |
Payable for capital shares redeemed | | | 444,058 | | | | — | |
Payable to Adviser (Note 4) | | | 921,737 | | | | — | |
Payable to administrator (Note 4) | | | 67,390 | | | | 7,510 | |
Accrued distribution fees (Note 4) | | | 40,797 | | | | — | |
Accrued brokerage expense on securities sold short (Note 2) | | | — | | | | 462 | |
Other accrued expenses | | | 32,908 | | | | 3,321 | |
Total liabilities | | | 6,448,720 | | | | 741,271 | |
| | | | | | | | | |
NET ASSETS | | $ | 744,177,594 | | | $ | 1,514,099 | |
| | | | | | | | | |
NET ASSETS CONSIST OF: | | | | | | | | |
Paid-in capital | | $ | 656,031,967 | | | $ | 1,475,183 | |
Accumulated net investment loss | | | (354,484 | ) | | | (11,683 | ) |
Accumulated net realized gains from security transactions | | | 11,399,749 | | | | 3,952 | |
Net unrealized appreciation (depreciation) on: | | | | | | | | |
Investments | | | 77,100,362 | | | | 74,309 | |
Short positions | | | — | | | | (27,662 | ) |
NET ASSETS | | $ | 744,177,594 | | | $ | 1,514,099 | |
| | | | | | | | | |
NET ASSET VALUE PER SHARE: | | | | | | | | |
INSTITUTIONAL CLASS | | | | | | | | |
Net assets applicable to Institutional Class | | $ | 623,820,646 | | | $ | 821,146 | |
Institutional Class shares of beneficial interest outstanding (unlimited number of shares authorized, no par value) | | | 36,840,321 | | | | 80,096 | |
Net asset value, offering price and redemption price per share (Note 2) | | $ | 16.93 | | | $ | 10.25 | |
| | | | | | | | | |
INVESTOR CLASS | | | | | | | | |
Net assets applicable to Investor Class | | $ | 120,356,948 | | | $ | 692,953 | |
Investor Class shares of beneficial interest outstanding (unlimited number of shares authorized, no par value) | | | 7,123,708 | | | | 67,735 | |
Net asset value, offering price and redemption price per share (Note 2) | | $ | 16.90 | | | $ | 10.23 | |
See accompanying notes to financial statements. |
LYRICAL FAMILY OF FUNDS
STATEMENTS OF OPERATIONS
Six Months Ended May 31, 2015 (Unaudited) |
| | Lyrical U.S.
Value
Equity Fund | | | Lyrical U.S. Hedged
Value Fund | |
INVESTMENT INCOME | | | | | | |
Dividend income | | $ | 4,732,703 | | | $ | 9,560 | |
Foreign withholding taxes on dividends | | | (70,773 | ) | | | (138 | ) |
Total investment income | | | 4,661,930 | | | | 9,422 | |
| | | | | | | | | |
EXPENSES | | | | | | | | |
Investment advisory fees (Note 4) | | | 4,263,698 | (a) | | | 10,307 | |
Administration fees (Note 4) | | | 257,989 | | | | 12,000 | |
Distribution fees - Investor Class (Note 4) | | | 87,742 | | | | 838 | |
Fund accounting fees (Note 4) | | | 46,158 | | | | 15,063 | |
Registration and filing fees | | | 56,355 | | | | 4,644 | |
Transfer agent fees (Note 4) | | | 36,176 | | | | 12,000 | |
Custody and bank service fees | | | 43,205 | | | | 3,825 | |
Compliance fees (Note 4) | | | 33,913 | | | | 5,990 | |
Professional fees | | | 16,572 | | | | 15,072 | |
Postage and supplies | | | 8,293 | | | | 1,997 | |
Trustees' fees and expenses (Note 4) | | | 4,106 | | | | 4,106 | |
Printing of shareholder reports | | | 5,360 | | | | 2,600 | |
Dividend expense on securities sold short (Note 2) | | | — | | | | 5,683 | |
Prime brokerage expense on securities sold short (Note 2) | | | — | | | | 2,946 | |
Insurance expense | | | 1,299 | | | | 1,299 | |
Other expenses | | | 9,690 | | | | 3,658 | |
Total expenses | | | 4,870,556 | | | | 102,028 | |
Advisory fees waived and/or expense reimbursements by Adviser (Note 4) | | | (22,613 | ) | | | (80,923 | ) |
Net expenses | | | 4,847,943 | | | | 21,105 | |
| | | | | | | | | |
NET INVESTMENT LOSS | | | (186,013 | ) | | | (11,683 | ) |
| | | | | | | | | |
REALIZED AND UNREALIZED GAINS (LOSSES) ON INVESTMENTS AND SECURITIES SOLD SHORT | | | | | | | | |
Net realized gains (losses) from: | | | | | | | | |
Investments | | | 11,468,112 | | | | 9,024 | |
Securities sold short | | | — | | | | (1,937 | ) |
Net change in unrealized appreciation/depreciation on: | | | | | | | | |
Investments | | | 30,855,287 | | | | 74,310 | |
Securities sold short | | | — | | | | (10,742 | ) |
NET REALIZED AND UNREALIZED GAINS ON INVESTMENTS AND SECURITIES SOLD SHORT | | | 42,323,399 | | | | 70,655 | |
| | | | | | | | | |
NET INCREASE IN NET ASSETS RESULTING FROM OPERATIONS | | $ | 42,137,386 | | | $ | 58,972 | |
(a) | Includes $160,074 of prior years’ investment advisory fee waivers and expense reimbursements recouped by the Adviser (Note 4). |
See accompanying notes to financial statements. |
LYRICAL U.S. VALUE EQUITY FUND
STATEMENTS OF CHANGES IN NET ASSETS |
| | Six Months
Ended
May 31, 2015 (Unaudited) | | | Year
Ended
November 30, 2014 | |
FROM OPERATIONS | | | | | | |
Net investment loss | | $ | (186,013 | ) | | $ | (15,582 | ) |
Net realized gains from security transactions | | | 11,468,112 | | | | 11,870,000 | |
Net change in unrealized appreciation/depreciation on investments | | | 30,855,287 | | | | 37,708,433 | |
Net increase in net assets resulting from operations | | | 42,137,386 | | | | 49,562,851 | |
| | | | | | | | | |
DISTRIBUTIONS TO SHAREHOLDERS | | | | | | | | |
From net investment income, Institutional Class | | | (168,471 | ) | | | (17,629 | ) |
From net realized gains, Institutional Class | | | (11,690,275 | ) | | | (1,211,369 | ) |
From net realized gains, Investor Class | | | (193,318 | ) | | | — | |
Decrease in net assets from distributions to shareholders | | | (12,052,064 | ) | | | (1,228,998 | ) |
| | | | | | | | | |
CAPITAL SHARE TRANSACTIONS | | | | | | | | |
Institutional Class | | | | | | | | |
Proceeds from shares sold | | | 205,166,520 | | | | 460,875,190 | |
Net asset value of shares issued in reinvestment of distributions to shareholders | | | 9,377,973 | | | | 1,000,129 | |
Payments for shares redeemed | | | (164,728,274 | ) | | | (60,859,243 | ) |
Net increase in Institutional Class net assets from capital share transactions | | | 49,816,219 | | | | 401,016,076 | |
| | | | | | | | | |
Investor Class | | | | | | | | |
Proceeds from shares sold | | | 112,291,431 | | | | 11,209,228 | |
Net asset value of shares issued in reinvestment of distributions to shareholders | | | 181,114 | | | | — | |
Payments for shares redeemed | | | (4,250,410 | ) | | | (2,453,295 | ) |
Net increase in Investor Class net assets from capital share transactions | | | 108,222,135 | | | | 8,755,933 | |
| | | | | | | | | |
TOTAL INCREASE IN NET ASSETS | | | 188,123,676 | | | | 458,105,862 | |
| | | | | | | | | |
NET ASSETS | | | | | | | | |
Beginning of period | | | 556,053,918 | | | | 97,948,056 | |
End of period | | $ | 744,177,594 | | | $ | 556,053,918 | |
| | | | | | | | | |
ACCUMULATED NET INVESTMENT LOSS | | $ | (354,484 | ) | | $ | — | |
See accompanying notes to financial statements. |
LYRICAL U.S. VALUE EQUITY FUND
STATEMENTS OF CHANGES IN NET ASSETS (Continued) |
| | Six Months
Ended
May 31, 2015
(Unaudited) | | | Year
Ended
November 30,
2014 | |
CAPITAL SHARE ACTIVITY | | | | | | |
Institutional Class | | | | | | |
Shares sold | | | 12,628,193 | | | | 30,358,655 | |
Shares issued in reinvestment of distributions to shareholders | | | 592,967 | | | | 68,785 | |
Shares redeemed | | | (9,954,286 | ) | | | (3,961,000 | ) |
Net increase in shares outstanding | | | 3,266,874 | | | | 26,466,440 | |
Shares outstanding at beginning of period | | | 33,573,447 | | | | 7,107,007 | |
Shares outstanding at end of period | | | 36,840,321 | | | | 33,573,447 | |
| | | | | | | | | |
Investor Class | | | | | | | | |
Shares sold | | | 6,815,739 | | | | 712,342 | |
Shares issued in reinvestment of distributions to shareholders | | | 11,470 | | | | — | |
Shares redeemed | | | (258,695 | ) | | | (157,148 | ) |
Net increase in shares outstanding | | | 6,568,514 | | | | 555,194 | |
Shares outstanding at beginning of period | | | 555,194 | | | | — | |
Shares outstanding at end of period | | | 7,123,708 | | | | 555,194 | |
See accompanying notes to financial statements. |
LYRICAL U.S. HEDGED VALUE FUND
STATEMENTS OF CHANGES IN NET ASSETS |
| | Six Months
Ended
May 31, 2015
(Unaudited) | | | Period
Ended
November 30,
2014(a) | |
FROM OPERATIONS | | | | | | |
Net investment loss | | $ | (11,683 | ) | | $ | (5,347 | ) |
Net realized gains (losses) from: | | | | | | | | |
Investments | | | 9,024 | | | | 5,822 | |
Securities sold short | | | (1,937 | ) | | | (3,499 | ) |
Net change in unrealized appreciation/depreciation on: | | | | | | | | |
Investments | | | 74,310 | | | | (1 | ) |
Securities sold short | | | (10,742 | ) | | | (16,920 | ) |
Net increase (decrease) in net assets resulting from operations | | | 58,972 | | | | (19,945 | ) |
| | | | | | | | | |
DISTRIBUTIONS TO SHAREHOLDERS | | | | | | | | |
From net realized gains, Institutional Class | | | (54 | ) | | | — | |
From net realized gains, Investor Class | | | (57 | ) | | | — | |
Decrease in net assets from distributions to shareholders | | | (111 | ) | | | — | |
| | | | | | | | | |
CAPITAL SHARE TRANSACTIONS | | | | | | | | |
Institutional Class | | | | | | | | |
Proceeds from shares sold | | | 200,000 | | | | 600,000 | |
Net asset value of shares issued in reinvestment of distributions to shareholders | | | 54 | | | | — | |
Net increase in Institutional Class net assets from capital share transactions | | | 200,054 | | | | 600,000 | |
| | | | | | | | | |
Investor Class | | | | | | | | |
Proceeds from shares sold | | | 78,309 | | | | 668,686 | |
Net asset value of shares issued in reinvestment of distributions to shareholders | | | 54 | | | | — | |
Payments for shares redeemed | | | (28,861 | ) | | | (43,059 | ) |
Net increase in Investor Class net assets from capital share transactions | | | 49,502 | | | | 625,627 | |
| | | | | | | | | |
TOTAL INCREASE IN NET ASSETS | | | 308,417 | | | | 1,205,682 | |
| | | | | | | | | |
NET ASSETS | | | | | | | | |
Beginning of period | | | 1,205,682 | | | | — | |
End of period | | $ | 1,514,099 | | | $ | 1,205,682 | |
| | | | | | | | | |
ACCUMULATED NET INVESTMENT LOSS | | $ | (11,683 | ) | | $ | — | |
(a) | Represents the period from the commencement of operations (July 14, 2014) through November 30, 2014. |
See accompanying notes to financial statements. |
LYRICAL U.S. HEDGED VALUE FUND
STATEMENTS OF CHANGES IN NET ASSETS (Continued) |
| | Six Months
Ended
May 31, 2015
(Unaudited) | | | Period
Ended
November 30,
2014(a) | |
CAPITAL SHARE ACTIVITY | | | | | | |
Institutional Class | | | | | | |
Shares sold | | | 19,802 | | | | 60,288 | |
Shares issued in reinvestment of distributions to shareholders | | | 6 | | | | — | |
Net increase in shares outstanding | | | 19,808 | | | | 60,288 | |
Shares outstanding at beginning of period | | | 60,288 | | | | — | |
Shares outstanding at end of period | | | 80,096 | | | | 60,288 | |
| | | | | | | | | |
Investor Class | | | | | | | | |
Shares sold | | | 7,912 | | | | 67,265 | |
Shares issued in reinvestment of distributions to shareholders | | | 6 | | | | — | |
Shares redeemed | | | (2,886 | ) | | | (4,562 | ) |
Net increase in shares outstanding | | | 5,032 | | | | 62,703 | |
Shares outstanding at beginning of period | | | 62,703 | | | | — | |
Shares outstanding at end of period | | | 67,735 | | | | 62,703 | |
(a) | Represents the period from the commencement of operations (July 14, 2014) through November 30, 2014. |
See accompanying notes to financial statements. |
LYRICAL U.S. VALUE EQUITY FUND
INSTITUTIONAL CLASS
FINANCIAL HIGHLIGHTS |
Per Share Data for a Share Outstanding Throughout Each Period: |
| | Six Months
Ended
May 31, 2015
(Unaudited) | | | Year
Ended
November 30, 2014 | | | Period
Ended
November 30,
2013(a) | |
Net asset value at beginning of period | | $ | 16.29 | | | $ | 13.78 | | | $ | 10.00 | |
| | | | | | | | | | | | | |
Income (loss) from investment operations: | | | | | | | | | | | | |
Net investment loss | | | (0.00 | )(b) | | | (0.00 | )(b) | | | (0.00 | )(b) |
Net realized and unrealized gains on investments | | | 0.99 | | | | 2.66 | | | | 3.78 | |
Total from investment operations | | | 0.99 | | | | 2.66 | | | | 3.78 | |
| | | | | | | | | | | | | |
Less distributions: | | | | | | | | | | | | |
Dividends from net investment income | | | (0.00 | )(b) | | | (0.00 | )(b) | | | — | |
Distributions from net realized gains | | | (0.35 | ) | | | (0.15 | ) | | | — | |
Total distributions | | | (0.35 | ) | | | (0.15 | ) | | | — | |
| | | | | | | | | | | | | |
Net asset value at end of period | | $ | 16.93 | | | $ | 16.29 | | | $ | 13.78 | |
| | | | | | | | | | | | | |
Total return (c) | | | 6.25 | %(d) | | | 19.41 | % | | | 37.80 | %(d) |
| | | | | | | | | | | | | |
Net assets at end of period (000's) | | $ | 623,821 | | | $ | 547,021 | | | $ | 97,948 | |
| | | | | | | | | | | | | |
Ratios/supplementary data: | | | | | | | | | | | | |
Ratio of total expenses to average net assets | | | 1.45 | %(e) | | | 1.45 | % | | | 1.93 | %(e) |
| | | | | | | | | | | | | |
Ratio of net expenses to average net assets (f) | | | 1.45 | %(e) | | | 1.44 | % | | | 1.45 | %(e) |
| | | | | | | | | | | | | |
Ratio of net investment income (loss) to average net assets (f) | | | (0.04% | )(e) | | | (0.00% | )(g) | | | 0.01 | %(e) |
| | | | | | | | | | | | | |
Portfolio turnover rate | | | 7 | %(d) | | | 20 | % | | | 26 | %(d) |
(a) | Represents the period from the commencement of operations (February 4, 2013) through November 30, 2013. |
(b) | Amount rounds to less than $0.01 per share. |
(c) | Total return is a measure of the change in value of an investment in the Fund over the periods covered. The returns shown do not reflect the deduction of taxes a shareholder would pay on Fund distributions, if any, or the redemption of Fund shares. The total returns would be lower if the Adviser had not waived advisory fees and reimbursed expenses (Note 4). |
(d) | Not annualized. |
(e) | Annualized. |
(f) | Ratio was determined after advisory fee waivers and expense reimbursements (Note 4). |
(g) | Amount rounds to less than 0.01%. |
See accompanying notes to financial statements. |
LYRICAL U.S. VALUE EQUITY FUND
INVESTOR CLASS
FINANCIAL HIGHLIGHTS |
Per Share Data for a Share Outstanding Throughout Each Period: |
| | Six Months
Ended
May 31, 2015
(Unaudited) | | | Period
Ended
November 30,
2014(a) | |
Net asset value at beginning of period | | $ | 16.27 | | | $ | 14.68 | |
| | | | | | | | | |
Income (loss) from investment operations: | | | | | | | | |
Net investment loss | | | (0.01 | ) | | | (0.01 | ) |
Net realized and unrealized gains on investments | | | 0.99 | | | | 1.60 | |
Total from investment operations | | | 0.98 | | | | 1.59 | |
| | | | | | | | | |
Less distributions: | | | | | | | | |
Distributions from net realized gains | | | (0.35 | ) | | | — | |
| | | | | | | | | |
Net asset value at end of period | | $ | 16.90 | | | $ | 16.27 | |
| | | | | | | | | |
Total return (b) | | | 6.16 | %(c) | | | 10.83 | %(c) |
| | | | | | | | | |
Net assets at end of period (000's) | | $ | 120,357 | | | $ | 9,033 | |
| | | | | | | | | |
Ratios/supplementary data: | | | | | | | | |
Ratio of total expenses to average net assets | | | 1.74 | %(d) | | | 2.39 | %(d) |
| | | | | | | | | |
Ratio of net expenses to average net assets (e) | | | 1.70 | %(d) | | | 1.70 | %(d) |
| | | | | | | | | |
Ratio of net investment loss to average net assets (e) | | | (0.20% | )(d) | | | (0.18% | )(d) |
| | | | | | | | | |
Portfolio turnover rate | | | 7 | %(c) | | | 20 | %(c)(f) |
(a) | Represents the period from the commencement of operations (February 25, 2014) through November 30, 2014. |
(b) | Total return is a measure of the change in value of an investment in the Fund over the periods covered. The returns shown do not reflect the deduction of taxes a shareholder would pay on Fund distributions, if any, or the redemption of Fund shares. The total returns would be lower if the Adviser had not waived advisory fees and reimbursed expenses (Note 4). |
(c) | Not annualized. |
(d) | Annualized. |
(e) | Ratio was determined after advisory fee waivers and expense reimbursements (Note 4). |
(f) | Represents the year ended November 30, 2014. |
See accompanying notes to financial statements. |
LYRICAL U.S. HEDGED VALUE FUND
INSTITUTIONAL CLASS
FINANCIAL HIGHLIGHTS |
Per Share Data for a Share Outstanding Throughout Each Period: |
| | Six Months
Ended
May 31, 2015
(Unaudited) | | | Period
Ended
November 30,
2014(a) | |
Net asset value at beginning of period | | $ | 9.81 | | | $ | 10.00 | |
| | | | | | | | | |
Income (loss) from investment operations: | | | | | | | | |
Net investment loss | | | (0.07 | ) | | | (0.04 | ) |
Net realized and unrealized gains (losses) on investments and securities sold short | | | 0.51 | | | | (0.15 | ) |
Total from investment operations | | | 0.44 | | | | (0.19 | ) |
| | | | | | | | | |
Less distributions: | | | | | | | | |
Distributions from net realized gains | | | (0.00 | )(b) | | | — | |
| | | | | | | | | |
Net asset value at end of period | | $ | 10.25 | | | $ | 9.81 | |
| | | | | | | | | |
Total return (c) | | | 4.49 | %(d) | | | (1.90% | )(d) |
| | | | | | | | | |
Net assets at end of period (000's) | | $ | 821 | | | $ | 591 | |
| | | | | | | | | |
Ratios/supplementary data: | | | | | | | | |
Ratio of total expenses to average net assets | | | 15.07 | %(e) | | | 16.57 | %(e) |
| | | | | | | | | |
Ratio of net expenses to average net assets (f) | | | 3.04 | %(e) | | | 2.59 | %(e) |
| | | | | | | | | |
Ratio of net expenses to average net assets excluding dividend expense (f) | | | 2.19 | %(e) | | | 1.99 | %(e) |
| | | | | | | | | |
Ratio of net expenses to average net assets excluding dividend expense and prime brokerage expense on securities sold short (f) | | | 1.75 | %(e) | | | 1.75 | %(e) |
| | | | | | | | | |
Ratio of net investment loss to average net assets (f) | | | (1.61% | )(e) | | | (1.15% | )(e) |
| | | | | | | | | |
Portfolio turnover rate | | | 3 | %(d) | | | 9 | %(d) |
(a) | Represents the period from the commencement of operations (July 14, 2014) through November 30, 2014. |
(b) | Amount rounds to less than $0.01 per share. |
(c) | Total return is a measure of the change in value of an investment in the Fund over the periods covered. The returns shown do not reflect the deduction of taxes a shareholder would pay on Fund distributions, if any, or the redemption of Fund shares. The total returns would be lower if the Adviser had not waived advisory fees and reimbursed expenses (Note 4). |
(d) | Not annualized. |
(e) | Annualized. |
(f) | Ratio was determined after advisory fee waivers and expense reimbursements (Note 4). |
See accompanying notes to financial statements. |
LYRICAL U.S. HEDGED VALUE FUND
INVESTOR CLASS
FINANCIAL HIGHLIGHTS |
Per Share Data for a Share Outstanding Throughout Each Period: |
| | Six Months
Ended
May 31, 2015
(Unaudited) | | | Period
Ended
November 30,
2014(a) | |
Net asset value at beginning of period | | $ | 9.80 | | | $ | 10.00 | |
| | | | | | | | | |
Income (loss) from investment operations: | | | | | | | | |
Net investment loss | | | (0.09 | ) | | | (0.05 | ) |
Net realized and unrealized gains (losses) on investments and securities sold short | | | 0.52 | | | | (0.15 | ) |
Total from investment operations | | | 0.43 | | | | (0.20 | ) |
| | | | | | | | | |
Less distributions: | | | | | | | | |
Distributions from net realized gains | | | (0.00 | )(b) | | | — | |
| | | | | | | | | |
Net asset value at end of period | | $ | 10.23 | | | $ | 9.80 | |
| | | | | | | | | |
Total return (c) | | | 4.40 | %(d) | | | (2.00% | )(d) |
| | | | | | | | | |
Net assets at end of period (000's) | | $ | 693 | | | $ | 614 | |
| | | | | | | | | |
Ratios/supplementary data: | | | | | | | | |
Ratio of total expenses to average net assets | | | 15.58 | %(e) | | | 16.95 | %(e) |
| | | | | | | | | |
Ratio of net expenses to average net assets (f) | | | 3.29 | %(e) | | | 2.84 | %(e) |
| | | | | | | | | |
Ratio of net expenses to average net assets excluding dividend expense (f) | | | 2.44 | %(e) | | | 2.24 | %(e) |
| | | | | | | | | |
Ratio of net expenses to average net assets excluding dividend expense and prime brokerage expense on securities sold short (f) | | | 2.00 | %(e) | | | 2.00 | %(e) |
| | | | | | | | | |
Ratio of net investment loss to average net assets (f) | | | (1.90% | )(e) | | | (1.38% | )(e) |
| | | | | | | | | |
Portfolio turnover rate | | | 3 | %(d) | | | 9 | %(d) |
(a) | Represents the period from the commencement of operations (July 14, 2014) through November 30, 2014. |
(b) | Amount rounds to less than $0.01 per share. |
(c) | Total return is a measure of the change in value of an investment in the Fund over the periods covered. The returns shown do not reflect the deduction of taxes a shareholder would pay on Fund distributions, if any, or the redemption of Fund shares. The total returns would be lower if the Adviser had not waived advisory fees and reimbursed expenses (Note 4). |
(d) | Not annualized. |
(e) | Annualized. |
(f) | Ratio was determined after advisory fee waivers and expense reimbursements (Note 4). |
See accompanying notes to financial statements. |
LYRICAL FUNDS
NOTES TO FINANCIAL STATEMENTS
May 31, 2015 (Unaudited)
1. Organization
Lyrical U.S. Value Equity Fund and Lyrical U.S. Hedged Value Fund (individually, a “Fund” and collectively, the “Funds”) are each a diversified series of Ultimus Managers Trust (the “Trust”), an open-end investment company established as an Ohio business trust under a Declaration of Trust dated February 28, 2012. Other series of the Trust are not incorporated in this report. Lyrical U.S. Value Equity Fund commenced operations on February 4, 2013. Lyrical U.S. Hedged Value Fund commenced operations on July 14, 2014.
The investment objective of each Fund is long-term capital growth.
Each Fund offers two classes of shares: Institutional Class shares (sold without any sales loads and distribution and/or shareholder service fees and require a $100,000 initial investment) and Investor Class shares (sold without any sales loads, but subject to a distribution and/or shareholder service fee of up to 0.25% of the average daily net assets attributable to Investor Class shares and require a $2,500 initial investment). Each share class represents an ownership interest in the same investment portfolio.
2. Significant Accounting Policies
The following is a summary of the Funds’ significant accounting policies. The policies are in conformity with accounting principles generally accepted in the United States of America (“GAAP”). As an investment company, as defined in Financial Accounting Standards Board (“FASB”) Accounting Standards Update 2013-08, the Funds follow accounting and reporting guidance under FASB Accounting Standards Codification Topic 946, “Financial Services – Investment Companies.”
Securities valuation – Each Fund values its portfolio securities at market value as of the close of regular trading on the New York Stock Exchange (the “NYSE”) (normally 4:00 p.m. Eastern time) on each business day the NYSE is open for business. The Funds value their listed securities on the basis of the security’s last sale price on the security’s primary exchange, if available, otherwise at the exchange’s most recently quoted bid price. NASDAQ-listed securities are valued at the NASDAQ Official Closing Price. In the event that market quotations are not readily available or are considered unreliable due to market or other events, the Funds value their securities and other assets at fair value in accordance with procedures established by and under the general supervision of the Board of Trustees (the “Board”). Under these procedures, the securities will be classified as Level 2 or 3 within the fair value hierarchy (see below), depending on the inputs used. Unavailable or unreliable market quotes may be due to the following factors: a substantial bid-ask spread; infrequent sales resulting in stale prices; insufficient trading volume; small trade sizes; a temporary lapse in any reliable pricing source; and actions of the securities or futures markets, such as the suspension or limitation of trading. As a result, the prices of securities used to calculate each Fund’s net asset value may differ from quoted or published prices for the same securities.
LYRICAL FUNDS
NOTES TO FINANCIAL STATEMENTS (Continued) |
GAAP establishes a single authoritative definition of fair value, sets out a framework for measuring fair value, and requires additional disclosures about fair value measurements.
Various inputs are used in determining the value of each Fund’s investments. These inputs are summarized in the three broad levels listed below:
● | Level 1 – quoted prices in active markets for identical securities |
● | Level 2 – other significant observable inputs |
● | Level 3 – significant unobservable inputs |
The inputs or methods used for valuing securities are not necessarily an indication of the risks associated with investing in those securities. The inputs used to measure fair value may fall into different levels of the fair value hierarchy. In such cases, for disclosure purposes, the level in the fair value hierarchy within which the fair value measurement falls in its entirety is determined based on the lowest level input that is significant to the fair value measurement.
The following is a summary of the inputs used to value the Funds’ investments as of May 31, 2015:
Lyrical U.S. Value
Equity Fund | | Level 1 | | | Level 2 | | | Level 3 | | | Total | |
Investments in Securities | | | | | | | | | | | | |
Common Stocks | | $ | 736,145,442 | | | $ | — | | | $ | — | | | $ | 736,145,442 | |
Money Market Funds | | | 12,256,122 | | | | — | | | | — | | | | 12,256,122 | |
Total | | $ | 748,401,564 | | | $ | — | | | $ | — | | | $ | 748,401,564 | |
Lyrical U.S. Hedged
Value Fund | | Level 1 | | | Level 2 | | | Level 3 | | | Total | |
Investments in Securities | | | | | | | | | | | | |
Common Stocks | | $ | 1,481,228 | | | $ | — | | | $ | — | | | $ | 1,481,228 | |
Money Market Funds | | | 64,301 | | | | — | | | | — | | | | 64,301 | |
Total | | $ | 1,545,529 | | | $ | — | | | $ | — | | | $ | 1,545,529 | |
| | | | | | | | | | | | | | | | | |
Other Financial Instruments | | | | | | | | | | | | | |
Exchange-Traded Funds - Sold Short | | $ | (729,978 | ) | | $ | — | | | $ | — | | | $ | (729,978 | ) |
Refer to the Funds’ Schedules of Investments and Schedule of Securities Sold Short, as applicable, for a listing of securities by industry type. As of May 31, 2015, the Funds did not have any transfers into and out of any Level. In addition, the Funds did not hold any
LYRICAL FUNDS
NOTES TO FINANCIAL STATEMENTS (Continued) |
derivative instruments or any assets or liabilities that were measured at fair value on a recurring basis using significant unobservable inputs (Level 3). It is the Funds’ policy to recognize transfers into and out of any Level at the end of the reporting period.
Share valuation – The net asset value per share of each class of each Fund is calculated daily by dividing the total value of the assets attributable to that class, less liabilities attributable to that class, by the number of shares outstanding of that class. The offering price and redemption price per share of each class of each Fund is equal to the net asset value per share of such class.
Investment income – Dividend income is recorded on the ex-dividend date. Interest income is accrued as earned.
Security transactions – Security transactions are accounted for on the trade date. Gains and losses on securities sold are determined on a specific identification basis.
Common expenses – Common expenses of the Trust are allocated among the Funds and the other series of the Trust based on the relative net assets of each series or the nature of the services performed and the relative applicability to each series.
Distributions to shareholders – The Funds distribute to shareholders any net investment income dividends and net realized capital gains distributions at least once each year. The amount of such dividends and distributions are determined in accordance with federal income tax regulations, which may differ from GAAP. Dividends and distributions to shareholders are recorded on the ex-dividend date. The tax character of distributions paid to shareholders by the Funds during the periods ended May 31, 2015 and November 30, 2014 was as follows:
Periods Ended | | Ordinary
Income | | | Long-Term Capital Gains | | | Total
Distributions | |
Lyrical U.S. Value Equity Fund - Institutional Class | |
May 31, 2015 | | $ | 7,662,064 | | | $ | 4,196,682 | | | $ | 11,858,746 | |
November 30, 2014 | | $ | 1,228,998 | | | $ | — | | | $ | 1,228,998 | |
Lyrical U.S. Value Equity Fund - Investor Class | |
May 31, 2015 | | $ | 123,919 | | | $ | 69,399 | | | $ | 193,318 | |
November 30, 2014 | | $ | — | | | $ | — | | | $ | — | |
Lyrical U.S. Hedged Value Fund - Institutional Class | |
May 31, 2015 | | $ | 54 | | | $ | — | | | $ | 54 | |
November 30, 2014 | | $ | — | | | $ | — | | | $ | — | |
Lyrical U.S. Hedged Value Fund - Investor Class | |
May 31, 2015 | | $ | 57 | | | $ | — | | | $ | 57 | |
November 30, 2014 | | $ | — | | | $ | — | | | $ | — | |
LYRICAL FUNDS
NOTES TO FINANCIAL STATEMENTS (Continued) |
Short Positions – Lyrical U.S. Hedged Value Fund may sell securities short. For financial statement purposes, an amount equal to the settlement amount is included in the Statements of Assets and Liabilities as an asset and an equivalent liability is then subsequently marked-to-market daily to reflect the current value of the short position. Subsequent fluctuations in the market prices of securities sold, but not yet purchased, may require purchasing the securities at prices which may differ from the market value reflected on the Statements of Assets and Liabilities. The Fund is liable for any dividends payable on securities while those securities are in a short position and will also bear other costs, such as charges for the prime brokerage accounts, in connection with the short positions. These costs are reported as dividend expense and prime brokerage expense on securities sold short, respectively, in the Statements of Operations. As collateral for its short positions, the Fund is required under the Investment Company Act of 1940 (“1940 Act”) to maintain assets consisting of cash, cash equivalents or other liquid securities equal to the market value of the securities sold short. The deposits with brokers for securities sold short are reported on the Statements of Assets and Liabilities. The amount of collateral is required to be adjusted daily to reflect changes in the value of the securities sold short. To the extent Lyrical U.S. Hedged Value Fund invests the proceeds received from selling securities short, the Fund is engaging in a form of leverage. The use of leverage by the Fund may make any change in the Fund’s net asset value greater than it would be without the use of leverage. Short sales are speculative transactions and involve special risks, including greater reliance on the ability of Lyrical Asset Management LP (the “Adviser”) to accurately anticipate the future value of a security.
The Fund may also take short positions in shares of exchange-traded funds (“ETFs”), which are subject to additional risks including premium or discount risk (when the market value of an ETF’s shares trade at a premium or discount to the ETF’s net asset value) and index-tracking risk.
Estimates – The preparation of financial statements in conformity with GAAP requires management to make estimates and assumptions that affect the reported amounts of assets and liabilities and disclosure of contingent assets and liabilities as of the date of the financial statements and the reported amounts of income and expenses during the reporting period. Actual results could differ from those estimates.
Federal income tax – Each Fund has qualified and intends to continue to qualify as a regulated investment company under the Internal Revenue Code of 1986 (the “Code”). Qualification generally will relieve each Fund of liability for federal income taxes to the extent 100% of its net investment income and net realized capital gains are distributed in accordance with the Code. Accordingly, no provision for income tax has been made.
LYRICAL FUNDS
NOTES TO FINANCIAL STATEMENTS (Continued) |
In order to avoid imposition of the excise tax applicable to regulated investment companies, it is also each Fund’s intention to declare as dividends in each calendar year at least 98% of its net investment income (earned during the calendar year) and 98.2% of its net realized capital gains (earned during the twelve months ended October 31) plus undistributed amounts from prior years.
The following information is computed on a tax basis for each item as of May 31, 2015:
| | Lyrical U.S. Value Equity Fund | | | Lyrical U.S. Hedged Value Fund | |
Tax cost of portfolio investments | | $ | 671,824,975 | | | $ | 1,471,220 | |
Gross unrealized appreciation | | $ | 105,322,642 | | | $ | 160,189 | |
Gross unrealized depreciation | | | (28,746,053 | ) | | | (85,880 | ) |
Net unrealized appreciation | | | 76,576,589 | | | | 74,309 | |
Net unrealized depreciation on securities sold short | | | — | | | | (30,741 | ) |
Accumulated net investment loss | | | (354,484 | ) | | | (11,683 | ) |
Other gains | | | 11,923,522 | | | | 7,031 | |
Distributable earnings | | $ | 88,145,627 | | | $ | 38,916 | |
As of May 31, 2015, the proceeds of securities sold short on a tax basis is $699,237 for Lyrical U.S. Hedged Value Fund.
The difference between the federal income tax cost of portfolio investments and securities sold short and the financial statement cost of portfolio investments and securities sold short is due to certain timing differences in the recognition of capital gains or losses under income tax regulations and GAAP. These “book/tax” differences are temporary in nature and are primarily due to the tax deferral of losses on wash sales.
The Funds recognize the tax benefits or expenses of uncertain tax positions only when the position is “more likely than not” of being sustained assuming examination by tax authorities. Management has reviewed the Funds’ tax positions for the current and all open tax periods (periods ended November 30, 2013 and November 30, 2014 for Lyrical U.S. Value Equity Fund and November 30, 2014 for Lyrical U.S. Hedged Value Fund) and has concluded that no provision for unrecognized tax benefits or expenses is required in these financial statements. The Funds indentify their major tax jurisdiction as U.S. Federal.
3. Investment Transactions
During the six months ended May 31, 2015, cost of purchases and proceeds from sales of investment securities, other than short-term investments and short positions, amounted to $193,665,666 and $46,655,778, respectively, for Lyrical U.S. Value Equity Fund and $229,770 and $45,059, respectively, for Lyrical U.S. Hedged Value Fund.
LYRICAL FUNDS
NOTES TO FINANCIAL STATEMENTS (Continued) |
4. Transactions with Related Parties
INVESTMENT ADVISORY AGREEMENT
Each Fund’s investments are managed by the Adviser pursuant to the terms of an Investment Advisory Agreement. Lyrical U.S. Value Equity Fund and Lyrical U.S. Hedged Value Fund pay the Adviser an investment advisory fee, computed and accrued daily and paid monthly, at the annual rate of 1.25% and 1.55%, respectively, of each fund’s average daily net assets.
Pursuant to an Expense Limitation Agreement between each Fund and the Adviser, the Adviser has contractually agreed, until March 31, 2017, to waive investment advisory fees and reimburse other operating expenses to limit Total Annual Fund Operating Expenses (exclusive of brokerage costs, taxes, borrowing costs such as interest and dividend expenses on securities sold short, interest, acquired fund fees and expenses, extraordinary expenses such as litigation and merger or reorganization costs, and other expenses not incurred in the ordinary course of the Fund’s business) to an amount not exceeding the following amounts of average daily net assets attributable to each respective class:
| Institutional Class | Investor Class |
Lyrical U.S. Value Equity Fund | 1.45% | 1.70% |
Lyrical U.S. Hedged Value Fund | 1.75% | 2.00% |
Accordingly, during the six months ended May 31, 2015, the Adviser waived its investment advisory fees and reimbursed expenses as follows:
| | Investment Advisory Fees Waived | | | Expenses Reimbursed | | | Total | |
Lyrical U.S. Value Equity Fund | | $ | — | | | $ | 22,613 | | | $ | 22,613 | |
Lyrical U.S. Hedged Value Fund | | $ | 10,307 | | | $ | 70,616 | | | $ | 80,923 | |
LYRICAL FUNDS
NOTES TO FINANCIAL STATEMENTS (Continued) |
Under the terms of the Expense Limitation Agreement, investment advisory fee waivers and expense reimbursements by the Adviser are subject to recoupment by the Adviser for a period of three years after such fees and expenses were incurred, provided the recoupments do not cause Total Annual Fund Operating Expenses to exceed the foregoing expense limitations. During the six months ended May 31, 2015, the Adviser recouped $160,074 of prior years’ investment advisory fee waivers and expenses reimbursed from Lyrical U.S. Value Equity Fund. As of May 31, 2015, the Adviser may seek recoupment of investment advisory fee waivers and expense reimbursements no later than the dates as stated below:
| | November 30, 2017 | | | May 31,
2018 | | | Total | |
Lyrical U.S. Value Equity Fund | | $ | 4,673 | | | $ | 22,613 | | | $ | 27,286 | |
Lyrical U.S. Hedged Value Fund | | $ | 59,418 | | | $ | 80,923 | | | $ | 140,341 | |
The Principal Executive Officer of the Funds is also an officer of the Adviser.
OTHER SERVICE PROVIDERS
Ultimus Fund Solutions, LLC (“Ultimus”) provides fund administration, fund accounting, compliance and transfer agency services to the Funds. Each Fund pays Ultimus fees in accordance with the agreements for such services. In addition, each Fund pays out-of-pocket expenses including but not limited to postage, supplies and costs of pricing its portfolio securities.
DISTRIBUTION AGREEMENT
Under the terms of a Distribution Agreement with the Trust, Ultimus Fund Distributors, LLC (the “Distributor”) serves as the principal underwriter to each Fund. The Distributor is a wholly-owned subsidiary of Ultimus.
Certain Trustees and officers of the Trust are also officers of Ultimus and/or the Distributor.
DISTRIBUTION PLAN
The Fund has adopted a plan of distribution (the “Plan”) pursuant to Rule 12b-1 under the 1940 Act, which permits Investor Class shares of each Fund to directly incur or reimburse the Funds’ principal underwriter for certain expenses related to the distribution of its shares. The annual limitation for payment of expenses pursuant to the Plan is 0.25% of each Fund’s average daily net assets allocable to Investor Class shares. The Funds have not adopted a plan of distribution with respect to the Institutional Class shares. During the six months ended May 31, 2015, the Investor Class shares of Lyrical U.S. Value Equity Fund and Lyrical U.S. Hedged Value Fund incurred $87,742 and $838, respectively, of distribution fees under the Plan.
LYRICAL FUNDS
NOTES TO FINANCIAL STATEMENTS (Continued) |
TRUSTEE COMPENSATION
Each Trustee who is not an “interested person” of the Trust (“Independent Trustee”) receives from each Fund a fee of $500 for each Board meeting attended plus reimbursement of travel and other meeting-related expenses. In addition, effective January 1, 2015, each Independent Trustee also receives a $500 annual retainer from each Fund. Trustees affiliated with the Adviser or Ultimus are not compensated by the Trust for their services.
PRINCIPAL HOLDERS OF FUND SHARES
As of May 31, 2015, the following shareholders owned of record 5% or more of the outstanding shares of each class of each Fund:
NAME OF RECORD OWNER | % Ownership |
Lyrical U.S. Value Equity Fund - Institutional Class | |
Charles Schwab & Company, Inc. (for the benefit of its customers) | 28% |
Merrill Lynch, Pierce Fenner & Smith (for the benefit of its customers) | 15% |
UBS Financial Services, Inc. (for the benefit of its customers) | 9% |
Lyrical U.S. Value Equity Fund - Investor Class | |
Pershing LLC (for the benefit of its customers) | 6% |
Lyrical U.S. Hedged Value Fund - Institutional Class | |
Lyrical Asset Management LP | 62% |
Ann S. Riesenberg | 25% |
George Wellington | 13% |
Lyrical U.S. Hedged Value Fund - Investor Class | |
Lyrical Asset Management LP | 74% |
Oppenheimer & Company, Inc. (for the benefit of its customers) | 6% |
A beneficial owner of 25% or more of either Fund’s outstanding shares may be considered a controlling person. That shareholder’s vote could have a more significant effect on matters presented at a shareholder’s meeting.
5. Sector Risk
If a Fund has significant investments in the securities of issuers within a particular sector, any development affecting that sector will have a greater impact on the value of the net assets of the Fund than would be the case if the Fund did not have significant investments in that sector. In addition, this may increase the risk of loss in the Fund and increase the volatility of the Fund’s net asset value per share. Occasionally, market conditions, regulatory changes or other developments may negatively impact this sector, and therefore the value of the Fund’s portfolio will be adversely affected. As of May 31, 2015, Lyrical U.S. Value Equity Fund and Lyrical U.S. Hedged Value Fund had 28.0% and 28.1% respectively, of the value of its net assets invested in stocks within the Information Technology sector.
LYRICAL FUNDS
NOTES TO FINANCIAL STATEMENTS (Continued) |
6. Contingencies and Commitments
The Funds indemnify the Trust’s officers and Trustees for certain liabilities that might arise from their performance of their duties to the Funds. Additionally, in the normal course of business the Funds enter into contracts that contain a variety of representations and warranties and which provide general indemnifications. The Funds’ maximum exposure under these arrangements is unknown, as this would involve future claims that may be made against the Funds that have not yet occurred. However, based on experience, the Funds expect the risk of loss to be remote.
7. Subsequent Events
The Funds are required to recognize in the financial statements the effects of all subsequent events that provide additional evidence about conditions that existed as of the date of the Statements of Assets and Liabilities. For non-recognized subsequent events that must be disclosed to keep the financial statements from being misleading, the Funds are required to disclose the nature of the event as well as an estimate of its financial effect, or a statement that such an estimate cannot be made. Management has evaluated subsequent events through the issuance of these financial statements and has noted no such events.
LYRICAL FUNDS
ABOUT YOUR FUNDS’ EXPENSES (Unaudited) |
We believe it is important for you to understand the impact of costs on your investment. As a shareholder of the Funds, you incur ongoing costs, including management fees, class-specific expenses (such as distribution fees (e.g., 12b-1 fees)) and other operating expenses. The following examples are intended to help you understand your ongoing costs (in dollars) of investing in the Funds and to compare these costs with the ongoing costs of investing in other mutual funds.
A mutual fund’s ongoing costs are expressed as a percentage of its average net assets. This figure is known as the expense ratio. The expenses in the table below are based on an investment of $1,000 made at the beginning of the most recent period (December 1, 2014) and held until the end of the period (May 31, 2015).
The table below illustrates each Fund’s ongoing costs in two ways:
Actual fund return – This section helps you to estimate the actual expenses that you paid over the period. The “Ending Account Value” shown is derived from each Fund’s actual return, and the third column shows the dollar amount of operating expenses that would have been paid by an investor who started with $1,000 in the Funds. You may use the information here, together with the amount you invested, to estimate the expenses that you paid over the period.
To do so, simply divide your account value by $1,000 (for example, an $8,600 account value divided by $1,000 = 8.6), then multiply the result by the number given for the Fund under the heading “Expenses Paid During Period.”
Hypothetical 5% return – This section is intended to help you compare each Fund’s ongoing costs with those of other mutual funds. It assumes that the Funds had an annual return of 5% before expenses during the period shown, but that the expense ratio is unchanged. In this case, because the return used is not the Funds’ actual return, the results do not apply to your investment. The example is useful in making comparisons because the U.S. Securities and Exchange Commission (“SEC”) requires all mutual funds to calculate expenses based on a 5% return. You can assess each Fund’s ongoing costs by comparing this hypothetical example with the hypothetical examples that appear in shareholder reports of other funds.
Note that expenses shown in the table are meant to highlight and help you compare ongoing costs only. The Funds do not charge transaction fees, such as purchase or redemption fees, nor do they carry a “sales load.”
The calculations assume no shares were bought or sold during the period. Your actual costs may have been higher or lower, depending on the amount of your investment and the timing of any purchases or redemptions.
LYRICAL FUNDS
ABOUT YOUR FUNDS’ EXPENSES (Unaudited) (Continued)
More information about the Funds’ expenses can be found in this report. For additional information on operating expenses and other shareholder costs, please refer to each Fund’s prospectus.
| Beginning
Account Value
December 1, 2014 | Ending
Account Value
May 31, 2015 | Net
Expense Ratio(a) | Expenses Paid During Period(b) |
Lyrical U.S. Value Equity Fund |
Institutional Class | | | | |
Actual | $1,000.00 | $1,062.50 | 1.45% | $ 7.46 |
Hypothetical 5% Return (before expenses) | $1,000.00 | $1,017.70 | 1.45% | $ 7.29 |
Investor Class | | | | |
Actual | $1,000.00 | $1,061.60 | 1.70% | $ 8.74 |
Hypothetical 5% Return (before expenses) | $1,000.00 | $1,016.45 | 1.70% | $ 8.55 |
Lyrical U.S. Hedged Value Fund |
Institutional Class | | | | |
Actual | $1,000.00 | $1,044.90 | 3.04% | $ 15.50 |
Hypothetical 5% Return (before expenses) | $1,000.00 | $1,009.77 | 3.04% | $ 15.23 |
Investor Class | | | | |
Actual | $1,000.00 | $1,044.00 | 3.29% | $ 16.77 |
Hypothetical 5% Return (before expenses) | $1,000.00 | $1,008.53 | 3.29% | $ 16.47 |
(a) | Annualized, based on the Fund’s most recent one-half year expenses. |
(b) | Expenses are equal to the Funds’ annualized expense ratio multiplied by the average account value over the period, multiplied by 182/365 (to reflect the one-half year period), for Actual and Hypothetical 5% Return information, respectively. |
LYRICAL FUNDS
OTHER INFORMATION (Unaudited)
A description of the policies and procedures that the Funds use to vote proxies relating to portfolio securities is available without charge upon request by calling toll-free 1-888-884-8099, or on the SEC’s website at http://www.sec.gov. Information regarding how the Funds voted proxies relating to portfolio securities during the most recent period ended June 30 is available without charge upon request by calling toll-free 1-888-884-8099, or on the SEC’s website at http://www.sec.gov.
The Trust files a complete listing of portfolio holdings for the Funds with the SEC as of the end of the first and third quarters of each fiscal year on Form N-Q. These filings are available upon request by calling 1-888-884-8099. Furthermore, you may obtain a copy of the filings on the SEC’s website at http://www.sec.gov. The Trust’s Forms N-Q may also be reviewed and copied at the SEC’s Public Reference Room in Washington, DC, and information on the operation of the Public Reference Room may be obtained by calling 1-800-SEC-0330.
RYAN LABS CORE BOND FUND
LETTER TO SHAREHOLDERS | June 26, 2015 |
Dear Shareholders,
INVESTMENT PHILOSOPHY
The overall investment objective of Ryan Labs Core Bond Fund (the “Fund”) is to seek total return versus the Barclays U.S. Aggregate Bond Index (the “Benchmark”) while providing protection against interest rate risk. We attempt to accomplish these investment objectives by investing at least 80% of Fund assets in US dollar-denominated, investment-grade fixed income securities. The sensitivity to interest rate changes is intended to track the market for domestic, investment-grade fixed income securities. The modified duration of the Fund’s investment portfolio at the end of each calendar month during a fiscal year will typically be within half a year of the Benchmark. The primary strategies utilized for value-add are sector rotation, issue selection, and yield curve positioning.
PERFORMANCE SUMMARY
Since the Fund’s inception on December 29, 2014 through May 31, 2015, the Fund returned +1.55% compared to the Benchmark return of +1.00%, therefore outperforming the Benchmark by +55 bps.
MARKET SUMMARY
Economic news has been mixed and investors are carefully watching the Federal Reserve (the “Fed”) as the US economy improves. The fallout related to oil’s sharp sell-off has also unnerved parts of the credit market, as energy-related names have experienced substantial volatility. A stronger USD has generally gone hand-in-hand with inflows to US assets, such as US Treasuries and other US fixed income assets. Low global bond yields from many developed nations, particularly the Eurozone and Germany’s Bunds, make longer duration US yields look attractive relative to their developed-nation counterparts. Inflation has still remained relatively subdued with the Fed’s preferred measure, the Core PCE Deflator recently coming in below analyst expectations at 1.2%. The most recent May CPI release was at 1.7% year-over-year (“YoY”) for the Core CPI, which excludes Food and Energy, while the overall CPI was flat at 0% YoY. Inflationary pressure has not been a major problem for the last several years which has allowed the Fed to remain dovish. Greece, and the Eurozone’s handling of Greece austerity, continues to impact macroeconomics globally. The European Central Bank has stepped forward with unprecedented quantitative easing, and their bond purchases have helped drive Eurozone yields down. Overall, our position is that we are in a late-cycle domestic recovery.
PERFORMANCE DISCUSSION
The Fund’s portfolio was overweight corporate bonds and securitized products relative to the Benchmark. The portfolio was underweight US Treasuries and government-related securities. The calendar year-to-date (“YTD”) excess returns, versus duration-neutral US Treasuries, was +4 bps for the Barclays Credit Index and -86 bps for Barclays Long Credit Index. For the first time in this year, the 30-year treasury yield was above 3%. For a historical context, within high-grade fixed income, credit spreads in the Benchmark ended 2011 at 217
bps, 2012 at 133 bps, tightened to 111 bps to end 2013, widened to 125 bps to end 2014 and were at 127 bps off Treasuries at the end of the May 2015. Spreads on Financial sector credits ended May at 119 bps, versus the end of 2014 at 117 bps. Industrials also finished the period flat, ending May at 141 bps versus 140 bps off US Treasuries at the end of 2014. YTD Agency mortgage-backed securities (“MBS”) underperformed duration-neutral US Treasuries by -24 bps, while Commercial MBS outperformed by 50 bps.
OUTLOOK
In the short- and intermediate-duration space, we are still finding relative value in the securitized credit space, particularly in lower-leveraged post-crisis Commercial MBS subordinate bonds. In the Asset-Backed Securities (“ABS”) space, we continue to like the Auto sector, particularly the larger subprime auto shelves such as GM Financial (Americredit/AMCAR) and Santander Drive Auto securitizations (SDART).
Within corporate credit, we are mindful of potential M&A and credit event risk at this stage of the credit cycle. We are also paying attention to names that are re-leveraging their balance sheet through excessive debt issuance or increased stock buybacks, and we are trying to avoid asymmetric downside in these names. We think in a post Dodd-Frank world and increased bank regulatory environment, much of the financial and major money-center bank names are running less-risky debt profiles making them attractive, even at the expense of return-on-equity and growth.

Sean McShea
President, Ryan Labs Asset Management
Past performance is not predictive of future performance. Investment results and principal value will fluctuate so that shares, when redeemed, may be worth more or less than their original cost. Current performance may be higher or lower than the performance data quoted. Performance data current to the most recent month end are available by calling 1-866-561-3087.
An investor should consider the investment objectives, risks, charges and expenses of the Fund carefully before investing. The Fund’s prospectus contains this and other important information. To obtain a copy of the Fund’s prospectus, please visit our website at www.apexcmfund.com or call 1-866-561-3087 and a copy will be sent to you free of charge. Please read the prospectus carefully before you invest. Ryan Labs Core Bond Fund is distributed by Ultimus Fund Distributors, LLC.
The Letter to Shareholders seeks to describe some of the Adviser’s current opinions and views of the financial markets. Although the Adviser believes it has a reasonable basis for any opinions or views expressed, actual results may differ, sometimes significantly so, from those expected or expressed. The securities held by the Fund that are discussed in the Letter to Shareholders were held during the period covered by this Report. They do not comprise the entire investment portfolio of the Fund, may be sold at any time and may no longer be held by the Fund. The opinions of the Fund’s Adviser with respect to those securities may change at any time.
RYAN LABS CORE BOND FUND
PORTFOLIO INFORMATION
May 31, 2015 (Unaudited)
Asset Allocation (% of Net Assets)
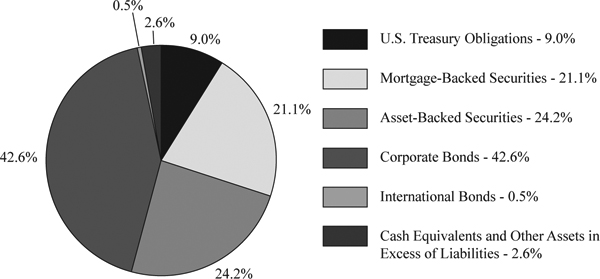
Top 10 Bond Holdings
Security Description | % of
Net Assets |
U.S. Treasury Notes, 0.250%, due 04/15/16 | 3.7% |
U.S. Treasury Notes, 1.000%, due 02/15/18 | 3.0% |
Federal National Mortgage Association, Pool #AB9345, 3.000%, due 05/01/43 | 2.8% |
Federal National Mortgage Association, Pool #AB9558, 3.000%, due 06/01/43 | 2.7% |
Federal Home Loan Mortgage Corporation, Pool #Q20576, 3.000%, due 08/01/43 | 2.5% |
AmeriCredit Automobile Receivables Trust, Series 2013-5, 2.860%, due 06/08/20 | 2.5% |
Santander Drive Auto Receivables Trust, Series 2014-4, 3.100%, due 11/16/20 | 2.5% |
J.P. Morgan Chase Commercial Mortgage Securities Corporation, Series 2013-C17, 4.887%(a), due 12/15/23 | 2.3% |
J.P. Morgan Chase Commercial Mortgage Securities Corporation, Series 2013-C13, 4.056%(a), due 07/15/23 | 2.2% |
Federal National Mortgage Association, Pool #AB3419, 4.500%, due 08/01/41 | 1.9% |
(a) | Variable rate security. The rate shown is the effective interest rate as of May 31, 2015. |
RYAN LABS CORE BOND FUND
SCHEDULE OF INVESTMENTS
May 31, 2015 (Unaudited) |
U.S. TREASURY OBLIGATIONS — 9.0% | | Coupon | Maturity | | Par Value | | | Value | |
U.S. Treasury Notes — 7.2% | | | | | | | | | | |
U.S. Treasury Notes | | | 0.250 | % | 04/15/16 | | $ | 695,000 | | | $ | 694,946 | |
U.S. Treasury Notes | | | 1.000 | % | 02/15/18 | | | 560,000 | | | | 562,100 | |
U.S. Treasury Notes | | | 1.375 | % | 04/30/20 | | | 95,000 | | | | 94,577 | |
| | | | | | | | | | | | | 1,351,623 | |
U.S. Treasury Bonds — 1.8% | | | | | | | | | | | | | |
U.S. Treasury Bonds | | | 3.375 | % | 05/15/44 | | | 305,000 | | | | 335,905 | |
| | | | | | | | | | | | | | |
Total U.S. Treasury Obligations (Cost $1,689,424) | | | | | | | | | | | $ | 1,687,528 | |
|
MORTGAGE-BACKED SECURITIES — 21.1% | | Coupon | Maturity | | Par Value | | | Value | |
Federal Home Loan Mortgage Corporation — 4.7% | | | | | | | | | | |
Federal Home Loan Mortgage Corporation, Pool #A93093 | | | 4.500 | % | 07/01/40 | | $ | 168,529 | | | $ | 185,513 | |
Federal Home Loan Mortgage Corporation, Pool #Q20576 | | | 3.000 | % | 08/01/43 | | | 463,435 | | | | 469,608 | |
Federal Home Loan Mortgage Corporation, Pool #G08572 | | | 3.500 | % | 02/01/44 | | | 209,267 | | | | 218,518 | |
| | | | | | | | | | | | | 873,639 | |
Federal National Mortgage Association — 14.1% | | | | | | | | | | | | | |
Federal National Mortgage Association, Series 2015-M7 | | | 2.502 | % | 12/25/24 | | | 80,000 | | | | 78,813 | |
Federal National Mortgage Association, Pool #AB5490 | | | 3.000 | % | 06/01/27 | | | 121,896 | | | | 127,640 | |
Federal National Mortgage Association, Pool #AO7976 | | | 3.000 | % | 06/01/27 | | | 123,694 | | | | 129,547 | |
Federal National Mortgage Association, Pool #AL3773 | | | 3.000 | % | 06/01/28 | | | 133,787 | | | | 140,110 | |
Federal National Mortgage Association, Pool #AB3419 | | | 4.500 | % | 08/01/41 | | | 328,959 | | | | 358,675 | |
Federal National Mortgage Association, Pool #AB6670 | | | 3.000 | % | 10/01/42 | | | 238,207 | | | | 242,292 | |
Federal National Mortgage Association, Pool #AB9345 | | | 3.000 | % | 05/01/43 | | | 505,906 | | | | 513,997 | |
Federal National Mortgage Association, Pool #AB9558 | | | 3.000 | % | 06/01/43 | | | 494,546 | | | | 502,462 | |
RYAN LABS CORE BOND FUND
SCHEDULE OF INVESTMENTS (Continued) |
MORTGAGE-BACKED SECURITIES — 21.1% (Continued) | | Coupon | Maturity | | Par Value | | | Value | |
Federal National Mortgage Association — 14.1% (Continued) | | | | | | | | | | |
Federal National Mortgage Association, Pool #AE0443 | | | 6.500 | % | 06/01/43 | | $ | 41,893 | | | $ | 48,225 | |
Federal National Mortgage Association, Pool #AL4010 | | | 3.500 | % | 07/01/43 | | | 217,004 | | | | 227,928 | |
Federal National Mortgage Association, Pool #AL5625 | | | 3.500 | % | 03/01/44 | | | 137,700 | | | | 144,514 | |
Federal National Mortgage Association, Pool #AL5538 | | | 4.000 | % | 07/01/44 | | | 103,726 | | | | 111,761 | |
| | | | | | | | | | | | | 2,625,964 | |
Government National Mortgage Association — 2.3% | | | | | | | | | | | | | |
Government National Mortgage Association, Pool #5175 | | | 4.500 | % | 09/20/41 | | | 160,904 | | | | 176,643 | |
Government National Mortgage Association, Series 2014-135 | | | 2.400 | % | 08/16/45 | | | 249,343 | | | | 253,346 | |
| | | | | | | | | | | | | 429,989 | |
Total Mortgage-Backed Securities (Cost $3,914,377) | | | | | | | | | | | $ | 3,929,592 | |
| |
ASSET-BACKED SECURITIES — 24.2% | | Coupon | Maturity | | Par Value | | | Value | |
AmeriCredit Automobile Receivables Trust, Series 2014-3 | | | 3.130 | % | 09/08/18 | | $ | 250,000 | | | $ | 252,893 | |
AmeriCredit Automobile Receivables Trust, Series 2013-5 | | | 2.860 | % | 06/08/20 | | | 460,000 | | | | 466,958 | |
AmeriCredit Automobile Receivables Trust, Series 2014-1 | | | 2.540 | % | 06/08/20 | | | 50,000 | | | | 49,901 | |
AmeriCredit Automobile Receivables Trust, Series 2014-2 | | | 2.570 | % | 06/08/20 | | | 180,000 | | | | 180,531 | |
AmeriCredit Automobile Receivables Trust, Series 2014-4 | | | 3.070 | % | 06/08/20 | | | 240,000 | | | | 242,264 | |
AmeriCredit Automobile Receivables Trust, Series 2015-2 | | | 3.000 | % | 06/08/21 | | | 100,000 | | | | 99,845 | |
Capital Auto Receivables Asset Trust, Series 2014-1 | | | 3.390 | % | 07/22/19 | | | 330,000 | | | | 337,867 | |
Capital Auto Receivables Asset Trust, Series 2014-3 | | | 3.140 | % | 02/20/20 | | | 300,000 | | | | 303,392 | |
CSAIL Commercial Mortgage Trust, Series 2015-C1 | | | 4.445 | % | 02/15/25 | | | 275,000 | | | | 282,212 | |
RYAN LABS CORE BOND FUND
SCHEDULE OF INVESTMENTS (Continued) | |
ASSET-BACKED SECURITIES — 24.2% (Continued) | | Coupon | Maturity | | Par Value | | | Value | |
CSAIL Commercial Mortgage Trust, Series 2015-C2 (a) | | | 4.354 | % | 05/15/25 | | $ | 80,000 | | | $ | 72,781 | |
J.P. Morgan Chase Commercial Mortgage Securities Corporation, Series 2013-C13 (a) | | | 4.056 | % | 07/15/23 | | | 410,000 | | | | 417,899 | |
J.P. Morgan Chase Commercial Mortgage Securities Corporation, Series 2013-C17 (a) | | | 4.887 | % | 12/15/23 | | | 390,000 | | | | 420,428 | |
J.P. Morgan Chase Commercial Mortgage Securities Corporation, Series 2014-C19 (a) | | | 4.677 | % | 04/15/24 | | | 240,000 | | | | 254,861 | |
Santander Drive Auto Receivables Trust, Series 2014-2 | | | 2.760 | % | 02/18/20 | | | 110,000 | | | | 111,401 | |
Santander Drive Auto Receivables Trust, Series 2014-3 | | | 2.650 | % | 08/17/20 | | | 200,000 | | | | 199,723 | |
Santander Drive Auto Receivables Trust, Series 2014-4 | | | 3.100 | % | 11/16/20 | | | 450,000 | | | | 457,631 | |
Santander Drive Auto Receivables Trust, Series 2015-1 | | | 3.240 | % | 04/15/21 | | | 90,000 | | | | 91,022 | |
Structured Agency Credit Risk Debt Notes, Series 15-DN1 (a) | | | 2.585 | % | 01/25/25 | | | 150,000 | | | | 151,980 | |
Structured Agency Credit Risk Debt Notes, Series 15-DNA1 (a) | | | 2.035 | % | 10/25/27 | | | 115,000 | | | | 114,906 | |
Total Asset-Backed Securities (Cost $4,458,748) | | | | | | | | | | | $ | 4,508,495 | |
|
CORPORATE BONDS — 42.6% | | Coupon | Maturity | | Par Value | | | Value | |
Consumer Discretionary — 3.7% | | | | | | | | | | |
AmerisourceBergen Corporation | | | 4.250 | % | 03/01/45 | | $ | 55,000 | | | $ | 53,667 | |
Coach, Inc. | | | 4.250 | % | 04/01/25 | | | 90,000 | | | | 88,488 | |
Comcast Corporation | | | 3.600 | % | 03/01/24 | | | 130,000 | | | | 134,519 | |
Comcast Corporation | | | 4.200 | % | 08/15/34 | | | 35,000 | | | | 35,059 | |
DIRECTV Holdings, LLC | | | 4.600 | % | 02/15/21 | | | 95,000 | | | | 102,296 | |
Home Depot, Inc. (The) | | | 4.400 | % | 03/15/45 | | | 95,000 | | | | 98,075 | |
Lowe's Companies, Inc. | | | 4.250 | % | 09/15/44 | | | 65,000 | | | | 66,232 | |
Starbucks Corporation | | | 2.000 | % | 12/05/18 | | | 110,000 | | | | 111,969 | |
| | | | | | | | | | | | | 690,305 | |
Consumer Staples — 0.2% | | | | | | | | | | | | | |
Walgreens Boots Alliance, Inc. | | | 2.700 | % | 11/18/19 | | | 35,000 | | | | 35,523 | |
RYAN LABS CORE BOND FUND
SCHEDULE OF INVESTMENTS (Continued) |
CORPORATE BONDS — 42.6% (Continued) | | Coupon | Maturity | | Par Value | | | Value | |
Energy — 2.5% | | | | | | | | | | |
BP Capital Markets plc | | | 1.375 | % | 05/10/18 | | $ | 100,000 | | | $ | 99,793 | |
Chevron Corporation | | | 1.375 | % | 06/24/18 | | | 190,000 | | | | 191,910 | |
Ensco plc | | | 5.750 | % | 10/01/44 | | | 90,000 | | | | 86,706 | |
Noble Holding International Ltd. | | | 6.950 | % | 04/01/45 | | | 50,000 | | | | 48,665 | |
Shell International Finance B.V. | | | 4.125 | % | 05/11/35 | | | 40,000 | | | | 40,372 | |
| | | | | | | | | | | | | 467,446 | |
Financials — 18.0% | | | | | | | | | | | | | |
Bank of America Corporation | | | 1.650 | % | 03/26/18 | | | 190,000 | | | | 190,040 | |
Bank of America Corporation | | | 5.875 | % | 01/05/21 | | | 35,000 | | | | 40,396 | |
Bank of New York Mellon Corporation | | | 2.100 | % | 01/15/19 | | | 210,000 | | | | 211,189 | |
Bear Stearns Companies, LLC | | | 7.250 | % | 02/01/18 | | | 85,000 | | | | 97,096 | |
Berkshire Hathaway, Inc. | | | 2.100 | % | 08/14/19 | | | 100,000 | | | | 101,738 | |
BNP Paribas | | | 2.400 | % | 12/12/18 | | | 185,000 | | | | 188,063 | |
Branch Banking & Trust Company | | | 3.800 | % | 10/30/26 | | | 215,000 | | | | 223,606 | |
Citigroup, Inc. | | | 8.500 | % | 05/22/19 | | | 90,000 | | | | 111,036 | |
Citigroup, Inc. | | | 3.300 | % | 04/27/25 | | | 95,000 | | | | 93,445 | |
CME Group, Inc. | | | 5.300 | % | 09/15/43 | | | 105,000 | | | | 123,704 | |
Duke Realty, L.P. | | | 3.750 | % | 12/01/24 | | | 35,000 | | | | 35,599 | |
Ford Motor Credit Company, LLC | | | 5.875 | % | 08/02/21 | | | 175,000 | | | | 202,802 | |
Goldman Sachs Group, Inc. | | | 6.250 | % | 09/01/17 | | | 250,000 | | | | 274,948 | |
Goldman Sachs Group, Inc. | | | 3.850 | % | 07/08/24 | | | 185,000 | | | | 188,876 | |
Goldman Sachs Group, Inc. | | | 5.150 | % | 05/22/45 | | | 25,000 | | | | 25,514 | |
Health Care REIT, Inc. | | | 3.625 | % | 03/15/16 | | | 85,000 | | | | 86,741 | |
Hospitality Properties Trust | | | 4.500 | % | 03/15/25 | | | 85,000 | | | | 85,949 | |
Huntington Bancshares, Inc. | | | 2.600 | % | 08/02/18 | | | 115,000 | | | | 116,975 | |
JPMorgan Chase & Company | | | 2.250 | % | 01/23/20 | | | 340,000 | | | | 338,225 | |
JPMorgan Chase & Company | | | 3.125 | % | 01/23/25 | | | 85,000 | | | | 83,284 | |
JPMorgan Chase & Company | | | 4.950 | % | 06/01/45 | | | 60,000 | | | | 60,786 | |
Mastercard, Inc. | | | 2.000 | % | 04/01/19 | | | 105,000 | | | | 106,009 | |
NYSE Euronext | | | 2.000 | % | 10/05/17 | | | 165,000 | | | | 167,047 | |
Simon Property Group, L.P. | | | 2.200 | % | 02/01/19 | | | 205,000 | | | | 208,184 | |
| | | | | | | | | | | | | 3,361,252 | |
Health Care — 4.3% | | | | | | | | | | | | | |
AbbVie, Inc. | | | 4.700 | % | 05/14/45 | | | 70,000 | | | | 71,162 | |
Actavis Funding SCS | | | 4.750 | % | 03/15/45 | | | 130,000 | | | | 128,733 | |
Aetna, Inc. | | | 3.500 | % | 11/15/24 | | | 120,000 | | | | 121,590 | |
Amgen, Inc. | | | 2.200 | % | 05/22/19 | | | 100,000 | | | | 100,524 | |
Amgen, Inc. | | | 4.400 | % | 05/01/45 | | | 95,000 | | | | 91,980 | |
Anthem, Inc. | | | 4.650 | % | 08/15/44 | | | 15,000 | | | | 15,200 | |
RYAN LABS CORE BOND FUND
SCHEDULE OF INVESTMENTS (Continued) |
CORPORATE BONDS — 42.6% (Continued) | | Coupon | Maturity | | Par Value | | | Value | |
Health Care — 4.3% (Continued) | | | | | | | | | | |
Becton, Dickinson and Company | | | 3.734 | % | 12/15/24 | | $ | 100,000 | | | $ | 102,068 | |
Gilead Sciences, Inc. | | | 4.500 | % | 02/01/45 | | | 30,000 | | | | 30,654 | |
Mylan, Inc. | | | 2.550 | % | 03/28/19 | | | 55,000 | | | | 55,110 | |
UnitedHealth Group, Inc. | | | 2.875 | % | 12/15/21 | | | 90,000 | | | | 91,428 | |
| | | | | | | | | | | | | 808,449 | |
Industrials — 2.1% | | | | | | | | | | | | | |
Illinois Tool Works, Inc. | | | 6.250 | % | 04/01/19 | | | 95,000 | | | | 109,549 | |
Lockheed Martin Corporation | | | 3.800 | % | 03/01/45 | | | 95,000 | | | | 88,324 | |
Raytheon Company | | | 3.150 | % | 12/15/24 | | | 90,000 | | | | 91,882 | |
United Technologies Corporation | | | 4.150 | % | 05/15/45 | | | 100,000 | | | | 98,537 | |
| | | | | | | | | | | | | 388,292 | |
Information Technology — 3.5% | | | | | | | | | | | | | |
Apple, Inc. | | | 2.500 | % | 02/09/25 | | | 95,000 | | | | 90,786 | |
Apple, Inc. | | | 3.200 | % | 05/13/25 | | | 15,000 | | | | 15,151 | |
Apple, Inc. | | | 4.375 | % | 05/13/45 | | | 95,000 | | | | 96,249 | |
Dun & Bradstreet Corporation | | | 2.875 | % | 11/15/15 | | | 150,000 | | | | 151,487 | |
Microsoft Corporation | | | 3.500 | % | 02/12/35 | | | 90,000 | | | | 84,062 | |
Motorola Solutions, Inc. | | | 3.750 | % | 05/15/22 | | | 95,000 | | | | 94,949 | |
Oracle Corporation | | | 2.950 | % | 05/15/25 | | | 90,000 | | | | 88,344 | |
QUALCOMM, Inc. | | | 4.650 | % | 05/20/35 | | | 20,000 | | | | 19,932 | |
| | | | | | | | | | | | | 640,960 | |
Materials — 4.1% | | | | | | | | | | | | | |
Agrium, Inc. | | | 3.375 | % | 03/15/25 | | | 30,000 | | | | 29,345 | |
CF Industries, Inc. | | | 5.150 | % | 03/15/34 | | | 150,000 | | | | 157,410 | |
Ecolab, Inc. | | | 1.450 | % | 12/08/17 | | | 100,000 | | | | 99,685 | |
Freeport-McMoRan, Inc. | | | 2.375 | % | 03/15/18 | | | 200,000 | | | | 199,211 | |
LyondellBasell Industries N.V. | | | 5.000 | % | 04/15/19 | | | 185,000 | | | | 202,853 | |
Southern Copper Corporation | | | 3.875 | % | 04/23/25 | | | 70,000 | | | | 68,496 | |
| | | | | | | | | | | | | 757,000 | |
Telecommunication Services — 1.5% | | | | | | | | | | | | | |
AT&T, Inc. | | | 4.500 | % | 05/15/35 | | | 95,000 | | | | 90,060 | |
Verizon Communications, Inc. | | | 2.500 | % | 09/15/16 | | | 103,000 | | | | 104,781 | |
Verizon Communications, Inc. | | | 6.550 | % | 09/15/43 | | | 75,000 | | | | 91,101 | |
| | | | | | | | | | | | | 285,942 | |
Utilities — 2.7% | | | | | | | | | | | | | |
Buckeye Partners, L.P. | | | 2.650 | % | 11/15/18 | | | 125,000 | | | | 124,704 | |
Commonwealth Edison Company | | | 2.150 | % | 01/15/19 | | | 75,000 | | | | 76,206 | |
Duke Energy Carolinas | | | 5.300 | % | 02/15/40 | | | 105,000 | | | | 124,330 | |
Oglethorpe Power Corporation | | | 6.100 | % | 03/15/19 | | | 60,000 | | | | 68,286 | |
RYAN LABS CORE BOND FUND
SCHEDULE OF INVESTMENTS (Continued) |
CORPORATE BONDS — 42.6% (Continued) | | Coupon | Maturity | | Par Value | | | Value | |
Utilities — 2.7% (Continued) | | | | | | | | | | |
PacifiCorp | | | 4.100 | % | 02/01/42 | | $ | 105,000 | | | $ | 106,238 | |
| | | | | | | | | | | | | 499,764 | |
Total Corporate Bonds (Cost $7,957,050) | | | | | | | | | | | $ | 7,934,933 | |
| |
INTERNATIONAL BONDS — 0.5% | | Coupon | Maturity | | Par Value | | | Value | |
United Mexican States (Cost $99,436) | | | 4.000 | % | 10/02/23 | | $ | 95,000 | | | $ | 99,038 | |
| |
MONEY MARKET FUNDS — 1.5% | | Shares | | | Value | |
Invesco Short-Term Investments Trust - Treasury Portfolio - Institutional Shares, 0.02% (b) (Cost $286,091) | | | 286,091 | | | $ | 286,091 | |
| | | | | | | | | |
Total Investments at Value — 98.9% (Cost $18,405,126) | | | | | | $ | 18,445,677 | |
| | | | | | | | | |
Other Assets in Excess of Liabilities 1.1% | | | | | | | 198,946 | |
| | | | | | | | | |
Net Assets — 100.0% | | | | | | $ | 18,644,623 | |
(a) | Variable rate security. The rate shown is the effective interest rate as of May 31, 2015. |
(b) | The rate shown is the 7-day effective yield as of May 31, 2015. |
See accompanying notes to financial statements. |
RYAN LABS CORE BOND FUND
STATEMENT OF ASSETS AND LIABILITIES
May 31, 2015 (Unaudited) |
ASSETS | | | |
Investments in securities: | | | |
At acquisition cost | | $ | 18,405,126 | |
At value (Note 2) | | $ | 18,445,677 | |
Dividends and interest receivable | | | 89,656 | |
Receivable from Adviser (Note 4) | | | 5,154 | |
Receivable for securities sold | | | 460,444 | |
Other assets | | | 3,148 | |
TOTAL ASSETS | | | 19,004,079 | |
| | | | | |
LIABILITIES | | | | |
Payable for securities purchased | | | 345,486 | |
Payable to administrator (Note 4) | | | 6,200 | |
Other accrued expenses | | | 7,770 | |
TOTAL LIABILITIES | | | 359,456 | |
| | | | | |
NET ASSETS | | $ | 18,644,623 | |
| | | | | |
NET ASSETS CONSIST OF: | | | | |
Paid-in capital | | $ | 18,524,932 | |
Accumulated net investment income | | | 100 | |
Accumulated net realized gains from security transactions | | | 79,040 | |
Net unrealized appreciation on investments | | | 40,551 | |
NET ASSETS | | $ | 18,644,623 | |
| | | | | |
Shares of beneficial interest outstanding (unlimited number of shares authorized, no par value) | | | 1,852,433 | |
| | | | | |
Net asset value, offering price and redemption price per share (Note 2) | | $ | 10.06 | |
See accompanying notes to financial statements. |
RYAN LABS CORE BOND FUND
STATEMENT OF OPERATIONS
For the Period Ended May 31, 2015 (a) (Unaudited) |
INVESTMENT INCOME | | | |
Dividend income | | $ | 59 | |
Interest | | | 206,995 | |
| | | | 207,054 | |
EXPENSES | | | | |
Investment advisory fees (Note 4) | | | 31,362 | |
Fund accounting fees (Note 4) | | | 10,816 | |
Administration fees (Note 4) | | | 10,000 | |
Pricing costs | | | 7,809 | |
Registration and filing fees | | | 7,031 | |
Professional fees | | | 6,488 | |
Trustees’ fees and expenses (Note 4) | | | 5,429 | |
Transfer agent fees (Note 4) | | | 5,000 | |
Compliance fees (Note 4) | | | 5,000 | |
Custody and bank service fees | | | 3,230 | |
Postage and supplies | | | 1,913 | |
Printing of shareholder reports | | | 1,170 | |
Insurance expense | | | 1,069 | |
Other expenses | | | 1,551 | |
TOTAL EXPENSES | | | 97,868 | |
Less fee waivers and expense reimbursements by the Adviser (Note 4) | | | (66,506 | ) |
NET EXPENSES | | | 31,362 | |
| | | | | |
NET INVESTMENT INCOME | | | 175,692 | |
| | | | | |
REALIZED AND UNREALIZED GAINS ON INVESTMENTS | | | | |
Net realized gains from investment transactions | | | 79,040 | |
Net change in unrealized appreciation/depreciation on investments | | | 40,551 | |
NET REALIZED AND UNREALIZED GAINS ON INVESTMENTS | | | 119,591 | |
| | | | | |
NET INCREASE IN NET ASSETS FROM OPERATIONS | | $ | 295,283 | |
(a) | Represents the period from the commencement of operations (December 29, 2014) through May 31, 2015. |
See accompanying notes to financial statements. |
RYAN LABS CORE BOND FUND
STATEMENT OF CHANGES IN NET ASSETS |
| | Period
Ended
May 31,
2015 (a)
(Unaudited) | |
FROM OPERATIONS | | | |
Net investment income | | $ | 175,692 | |
Net realized gains from investment transactions | | | 79,040 | |
Net change in unrealized appreciation/depreciation on investments | | | 40,551 | |
Net increase in net assets from operations | | | 295,283 | |
| | | | | |
DISTRIBUTIONS TO SHAREHOLDERS | | | | |
From net investment income | | | (175,592 | ) |
| | | | | |
CAPITAL SHARE TRANSACTIONS | | | | |
Proceeds from shares sold | | | 18,457,495 | |
Net asset value of shares issued in reinvestment
of distributions to shareholders | | | 67,437 | |
Increase from capital share transactions | | | 18,524,932 | |
| | | | | |
TOTAL INCREASE IN NET ASSETS | | | 18,644,623 | |
| | | | | |
NET ASSETS | | | | |
Beginning of period | | | — | |
End of period | | $ | 18,644,623 | |
| | | | | |
ACCUMULATED NET INVESTMENT INCOME | | $ | 100 | |
| | | | | |
CAPITAL SHARE ACTIVITY | | | | |
Shares sold | | | 1,845,750 | |
Shares reinvested | | | 6,683 | |
Increase in shares outstanding | | | 1,852,433 | |
Shares outstanding at beginning of period | | | — | |
Shares outstanding at end of period | | | 1,852,433 | |
(a) | Represents the period from the commencement of operations (December 29, 2014) through May 31, 2015. |
See accompanying notes to financial statements. |
RYAN LABS CORE BOND FUND
FINANCIAL HIGHLIGHTS |
Per Share Data for a Share Outstanding Throughout the Period |
| | Period
Ended
May 31,
2015 (a) (Unaudited) | |
Net asset value at beginning of period | | $ | 10.00 | |
| | | | | |
Income from investment operations: | | | | |
Net investment income | | | 0.10 | |
Net realized and unrealized gains on investments | | | 0.06 | |
Total from investment operations | | | 0.16 | |
| | | | | |
Less distributions from: | | | | |
Net investment income | | | (0.10 | ) |
| | | | | |
Net asset value at end of period | | $ | 10.06 | |
| | | | | |
Total return (b) | | | 1.55 | %(c) |
| | | | | |
Net assets at end of period (000’s) | | $ | 18,645 | |
| | | | | |
Ratios/supplementary data: | | | | |
| | | | | |
Ratio of total expenses to average net assets | | | 1.24 | %(d) |
| | | | | |
Ratio of net expenses to average net assets (e) | | | 0.40 | %(d) |
| | | | | |
Ratio of net investment income to average net assets (e) | | | 2.23 | %(d) |
| | | | | |
Portfolio turnover rate | | | 46 | %(c) |
(a) | Represents the period from the commencement of operations (December 29, 2014) through May 31, 2015. |
(b) | Total return is a measure of the change in value of an investment in the Fund over the period covered, which assumes any dividends or capital gains distributions are reinvested in shares of the Fund. The return shown does not reflect the deduction of taxes a shareholder would pay on Fund distributions or the redemption of Fund shares. The total return would be lower if the Adviser had not waived advisory fees or reimbursed expenses (Note 4). |
(c) | Not annualized. |
(d) | Annualized. |
(e) | Ratio was determined after investment advisory fee waivers and expense reimbursements. (Note 4). |
See accompanying notes to financial statements. |
RYAN LABS CORE BOND FUND
NOTES TO FINANCIAL STATEMENTS
May 31, 2015 (Unaudited)
1. Organization
Ryan Labs Core Bond Fund (the “Fund”) is a diversified series of Ultimus Managers Trust (the “Trust”), an open-end investment company established as an Ohio business trust under a Declaration of Trust dated February 28, 2012. Other series of the Trust are not incorporated in this report. The Fund commenced operations on December 29, 2014.
The investment objective of the Fund is total return, consisting of current income and capital appreciation.
2. Significant Accounting Policies
The following is a summary of the Fund’s significant accounting policies. The policies are in conformity with accounting principles generally accepted in the United States of America (“GAAP”). As an investment company, as defined in Financial Accounting Standards Board (“FASB”) Accounting Standards Update 2013-08, the Fund follows accounting and reporting guidance under FASB Accounting Standards Codification Topic 946, “Financial Services – Investment Companies.”
Securities valuation – The Fund’s fixed income securities are generally valued using prices provided by an independent pricing service approved by the Trust’s Board of Trustees (the “Board”). The independent pricing service uses information with respect to transactions in bonds, quotations from bond dealers, market transactions in comparable securities, and various relationships between securities in determining these prices. The methods used by the independent pricing service and the quality of valuations so established are reviewed by Ryan Labs, Inc. (the “Adviser”), under the general supervision of the Board. Securities for which market quotations are not readily available are valued at fair value as determined in good faith under procedures adopted by the Board.
GAAP establishes a single authoritative definition of fair value, sets out a framework for measuring fair value, and requires additional disclosures about fair value measurements.
Various inputs are used in determining the value of the Fund’s investments. These inputs are summarized in the three broad levels listed below:
| | ● | Level 1 – quoted prices in active markets for identical securities |
| | ● | Level 2 – other significant observable inputs |
| | ● | Level 3 – significant unobservable inputs |
Fixed income securities held by the Fund are classified as Level 2 since values are based on prices provided by an independent pricing service that utilizes various “other significant observable inputs” including bid and ask quotations, prices of similar securities, and interest rates, among other factors.
RYAN LABS CORE BOND FUND
NOTES TO FINANCIAL STATEMENTS (Continued) |
The inputs or methods used for valuing securities are not necessarily an indication of the risks associated with investing in those securities. The inputs used to measure fair value may fall into different levels of the fair value hierarchy. In such cases, for disclosure purposes, the level in the fair value hierarchy within which the fair value measurement falls in its entirety is determined based on the lowest level input that is significant to the fair value measurement.
The following is a summary of the inputs used to value the Fund’s investments as of May 31, 2015:
| | Level 1 | | | Level 2 | | | Level 3 | | | Total | |
U.S. Treasury Obligations | | $ | — | | | $ | 1,687,528 | | | $ | — | | | $ | 1,687,528 | |
Mortgage-Backed Securities | | | — | | | | 3,929,592 | | | | — | | | | 3,929,592 | |
Asset-Backed Securities | | | — | | | | 4,508,495 | | | | — | | | | 4,508,495 | |
Corporate Bonds | | | — | | | | 7,934,933 | | | | — | | | | 7,934,933 | |
International Bonds | | | — | | | | 99,038 | | | | — | | | | 99,038 | |
Money Market Funds | | | 286,091 | | | | — | | | | — | | | | 286,091 | |
Total | | $ | 286,091 | | | $ | 18,159,586 | | | $ | — | | | $ | 18,445,677 | |
As of May 31, 2015, the Fund did not have any transfers into and out of any Level. In addition, the Fund did not hold derivative instruments or any assets or liabilities that were measured at fair value on a recurring basis using significant unobservable inputs (Level 3). It is the Fund’s policy to recognize transfers into and out of any Level at the end of the reporting period.
Share valuation – The net asset value per share of the Fund is calculated daily by dividing the total value of the Fund’s assets, less liabilities, by the number of shares outstanding. The offering price and redemption price per share of the Fund is equal to the net asset value per share.
Investment income – Interest income is accrued as earned. Discounts and premiums on fixed income securities purchased are accreted or amortized using the effective interest method. Dividend income is recorded on the ex-dividend date.
Security transactions – Security transactions are accounted for on the trade date. Gains and losses on securities sold are determined on a specific identification basis.
Common expenses – Common expenses of the Trust are allocated among the Fund and other series of the Trust based on the relative net assets of each series or the nature of the services performed and the relative applicability to each series.
Distributions to shareholders – Dividends from net investment income are declared and paid monthly to shareholders. Net realized capital gains, if any, are distributed at least once each year. The amount of distributions from net investment income and net realized capital gains are determined in accordance with federal income tax regulations, which may differ
RYAN LABS CORE BOND FUND
NOTES TO FINANCIAL STATEMENTS (Continued) |
from GAAP. Dividends and distributions to shareholders are recorded on the ex-dividend date. The tax character of distributions paid during the period ended May 31, 2015 was ordinary income. On June 30, 2015, the Fund paid an ordinary income dividend of $0.0196 per share to shareholders of record on June 29, 2015.
Estimates – The preparation of financial statements in conformity with GAAP requires management to make estimates and assumptions that affect the reported amounts of assets and liabilities and disclosure of contingent assets and liabilities as of the date of the financial statements and the reported amounts of income and expenses during the reporting period. Actual results could differ from those estimates.
Federal income tax – The Fund intends to qualify as a regulated investment company under the Internal Revenue Code of 1986 (the “Code”). Qualification generally will relieve the Fund of liability for federal income taxes to the extent 100% of its net investment income and net realized capital gains are distributed in accordance with the Code. Accordingly, no provision for income tax has been made.
In order to avoid imposition of the excise tax applicable to regulated investment companies, it is also the Fund’s intention to declare as dividends in each calendar year at least 98% of its net investment income (earned during the calendar year) and 98.2% of its net realized capital gains (earned during the twelve months ended October 31) plus undistributed amounts from prior years.
The following information is computed on a tax basis for each item as of May 31, 2015:
Tax cost of portfolio investments | | $ | 18,405,126 | |
Gross unrealized appreciation | | $ | 117,676 | |
Gross unrealized depreciation | | | (77,125 | ) |
Net unrealized appreciation on investments | | | 40,551 | |
Accumulated ordinary income | | | 100 | |
Other gains | | | 79,040 | |
Total distributable earnings | | $ | 119,691 | |
The Fund recognizes the tax benefits or expenses of uncertain tax positions only when the position is “more likely than not” to be sustained assuming examination by tax authorities. Management has reviewed the Fund’s tax positions for the current period and has concluded that no provision for unrecognized tax benefits or expenses is required in these financial statements. The Fund indentifies its major tax jurisdiction as U.S. Federal.
3. Investment Transactions
During the period ended May 31, 2015, cost of purchases and proceeds from sales of investment securities, other than short-term investments and U.S. government securities, were $16,385,250 and $4,052,189, respectively.
RYAN LABS CORE BOND FUND
NOTES TO FINANCIAL STATEMENTS (Continued) |
4. Transactions with Related Parties
INVESTMENT ADVISORY AGREEMENT
The Fund’s investments are managed by the Adviser pursuant to the terms of an Investment Advisory Agreement. Under the Investment Advisory Agreement, the Fund pays the Adviser an advisory fee, computed and accrued daily and paid monthly, at the annual rate of 0.40% of its average daily net assets.
Pursuant to an Expense Limitation Agreement between the Fund and the Adviser, the Adviser has agreed until March 31, 2017, to waive advisory fees and reimburse Other Expenses to limit Total Annual Fund Operating Expenses (exclusive of brokerage transaction costs and commissions; taxes; interest; costs related to any securities lending program; transaction charges and interest on borrowed money; Acquired Fund fees and expenses; distribution and/or shareholder servicing fees, including, without limitation, any amounts, if any, payable pursuant to a plan adopted in accordance with Rule 12b-1 under the 1940 Act; extraordinary expenses such as litigation and merger or reorganization costs; proxy solicitation and liquidation costs; indemnification payments to Fund service providers, including, without limitation, the Adviser; other expenses not incurred in the ordinary course of such Fund’s business; and any other expenses the exclusion of which may from time to time be deemed appropriate as an excludable expense and specifically approved by the Trustees of the Trust) to an amount not exceeding 0.40% of the Fund’s average daily net assets. Accordingly, the Adviser waived all of its advisory fees and, in addition, reimbursed other operating expenses totaling $35,144 during the period ended May 31, 2015.
Under the terms of the Expense Limitation Agreement, investment advisory fee waivers and expense reimbursements by the Adviser are subject to recoupment by the Adviser for a period of three years after such fees and expenses were incurred, provided the recoupments do not cause Total Annual Fund Operating Expenses to exceed the foregoing expense limitations. As of May 31, 2015, the Adviser may seek recoupment of investment advisory fee reductions and expense reimbursements totaling $66,506 no later than May 31, 2018.
An officer of the Fund is also an officer of the Adviser.
OTHER SERVICE PROVIDERS
Ultimus Fund Solutions, LLC (“Ultimus”) provides fund administration, fund accounting, compliance and transfer agency services to the Fund. The Fund pays Ultimus fees in accordance with the agreements for such services. In addition, the Fund pays out-of-pocket expenses including, but not limited to, postage, supplies and costs of pricing the Fund’s portfolio securities.
DISTRIBUTION AGREEMENT
Under the terms of a Distribution Agreement with the Trust, Ultimus Fund Distributors, LLC (the “Distributor”) serves as principal underwriter to the Fund. The Distributor is a wholly-owned subsidiary of Ultimus. The Distributor is compensated by the Adviser (not the Fund) for acting as principal underwriter.
RYAN LABS CORE BOND FUND
NOTES TO FINANCIAL STATEMENTS (Continued) |
Certain officers of the Trust are also officers of Ultimus and/or the Distributor.
TRUSTEE COMPENSATION
Each Trustee who is not an “interested person” of the Trust (“Independent Trustee”) receives from the Fund a fee of $500 for each Board meeting attended plus reimbursement of travel and other meeting-related expenses. In addition, effective January 1, 2015, each Independent Trustee receives from the Fund an annual retainer of $500. Trustees affiliated with the Adviser or Ultimus are not compensated by the Trust for their services.
PRINCIPAL HOLDER OF FUND SHARES
As of May 31, 2015, TriMet Retirement Plan owned of record 99.99% of the outstanding shares of the Fund. A beneficial owner of 25% or more of the Fund’s outstanding shares may be considered a controlling person. That shareholder’s vote could have a more significant effect on matters presented at a shareholder’s meeting.
5. Contingencies and Commitments
The Fund indemnifies the Trust’s officers and Trustees for certain liabilities that might arise from their performance of their duties to the Fund. Additionally, in the normal course of business the Fund enters into contracts that contain a variety of representations and warranties and which provide general indemnifications. The Fund’s maximum exposure under these arrangements is unknown, as this would involve future claims that may be made against the Fund that have not yet occurred. However, based on experience, the Fund expects the risk of loss to be remote.
6. Subsequent Events
The Fund is required to recognize in the financial statements the effects of all subsequent events that provide additional evidence about conditions that existed as of the date of the Statement of Assets and Liabilities. For non-recognized subsequent events that must be disclosed to keep the financial statements from being misleading, the Fund is required to disclose the nature of the event as well as an estimate of its financial effect, or a statement that such an estimate cannot be made. Management has evaluated subsequent events through the issuance of these financial statements and has noted no such events.
RYAN LABS CORE BOND FUND
ABOUT YOUR FUND’S EXPENSES (Unaudited) |
We believe it is important for you to understand the impact of costs on your investment. As a shareholder of the Fund, you incur ongoing costs, including management fees and other operating expenses. The following examples are intended to help you understand your ongoing costs (in dollars) of investing in the Fund and to compare these costs with the ongoing costs of investing in other mutual funds.
A mutual fund’s ongoing costs are expressed as a percentage of its average net assets. This figure is known as the expense ratio. The expenses in the table below are based on an investment of $1,000 made at the beginning of the most recent period (December 29, 2014) and held until the end of the period (May 31, 2015).
The table below illustrates the Fund’s ongoing costs in two ways:
Actual fund return – This section helps you to estimate the actual expenses that you paid over the period. The “Ending Account Value” shown is derived from the Fund’s actual return, and the third column shows the dollar amount of operating expenses that would have been paid by an investor who started with $1,000 in the Fund. You may use the information here, together with the amount you invested, to estimate the expenses that you paid over the period.
To do so, simply divide your account value by $1,000 (for example, an $8,600 account value divided by $1,000 = 8.6), then multiply the result by the number given for the Fund under the heading “Expenses Paid During Period.”
Hypothetical 5% return – This section is intended to help you compare the Fund’s ongoing costs with those of other mutual funds. It assumes that the Fund had an annual return of 5% before expenses during the period shown, but that the expense ratio is unchanged. In this case, because the return used is not the Fund’s actual return, the results do not apply to your investment. The example is useful in making comparisons because the SEC requires all mutual funds to calculate expenses based on a 5% return. You can assess the Fund’s ongoing costs by comparing this hypothetical example with the hypothetical examples that appear in shareholder reports of other funds.
Note that expenses shown in the table are meant to highlight and help you compare ongoing costs only. The Fund does not charge transaction fees, such as purchase or redemption fees, nor does it carry a “sales load.”
The calculations assume no shares were bought or sold during the period. Your actual costs may have been higher or lower, depending on the amount of your investment and the timing of any purchases or redemptions.
RYAN LABS CORE BOND FUND
ABOUT YOUR FUND’S EXPENSES (Unaudited) (Continued) |
More information about the Fund’s expenses can be found in this report. For additional information on operating expenses and other shareholder costs, please refer to the Fund’s prospectus.
| Beginning
Account Value
December 1, 2014 (a) | Ending
Account Value
May 31,
2015 | Net Expense Ratio (b) | Expenses
Paid During
Period (c) |
Based on Actual Fund Return | $1,000.00 | $1,015.50 | 0.40% | $1.70 |
Based on Hypothetical 5% Return (before expenses) | $1,000.00 | $1,022.94 | 0.40% | $2.02 |
(a) | Beginning Account Value is as of December 29, 2014 (date of commencement of operations) for the Actual Fund Return information. |
(b) | Annualized, based on the Fund’s expenses for the period since inception. |
(c) | Expenses are equal to the Fund’s annualized expense ratio multiplied by the average account value over the period, multiplied by 154/365 (to reflect the period since inception) and 182/365 (to reflect the one-half year period), for Actual Fund and Hypothetical 5% Return information, respectively. |
OTHER INFORMATION (Unaudited)
A description of the policies and procedures that the Fund uses to vote proxies relating to portfolio securities is available without charge upon request by calling toll-free 1-866-561-3087, or on the SEC’s website at http://www.sec.gov. Information regarding how the Fund voted proxies relating to portfolio securities during the period ended June 30, 2015 will be available without charge upon request on or before August 31, 2015 by calling toll-free 1-866-561-3087, or on the SEC’s website at http://www.sec.gov.
The Trust files a complete listing of portfolio holdings for the Fund with the SEC as of the end of the first and third quarters of each fiscal year on Form N-Q. These filings are available upon request by calling 1-866-561-3087. Furthermore, you may obtain a copy of the filings on the SEC’s website at http://www.sec.gov. The Trust’s Forms N-Q may also be reviewed and copied at the SEC’s Public Reference Room in Washington, DC, and information on the operation of the Public Reference Room may be obtained by calling 1-800-SEC-0330.
RYAN LABS CORE BOND FUND
DISCLOSURE REGARDING APPROVAL OF INVESTMENT
ADVISORY AGREEMENT (Unaudited) |
The Board of Trustees (the “Board”), including the Independent Trustees voting separately, has reviewed and approved the Fund’s Investment Advisory Agreement with Ryan Labs, Inc. (the “Adviser”) for an initial two-year term. The Board approved an Initial Investment Advisory Agreement with the Adviser on October 20, 2014, and the Fund commenced operations on December 29, 2014.
In the course of their deliberations, the Board was advised by legal counsel. The Board received and reviewed information provided by the Adviser in response to requests of the Board and counsel.
In considering the Initial Investment Advisory Agreement and reaching their conclusions with respect thereto, the Board reviewed and analyzed various factors that they determined were relevant, including the factors described below.
The nature, extent, and quality of the services to be provided by the Adviser. The Board considered the responsibilities the Adviser would have under the Initial Advisory Agreement. The Board also considered the anticipated services to be provided by the Adviser to the Fund including, without limitation, the Adviser’s procedures for formulating investment recommendations and assuring compliance with the Fund’s investment objective and limitations, proposed initial marketing and distribution efforts, and compliance procedures and practices. After reviewing the foregoing and further information provided to the Board regarding the Adviser’s business, the Board concluded that the quality, extent, and nature of the services to be provided by the Adviser were satisfactory and adequate for the Fund.
The investment management capabilities and experience of the Adviser. The Board considered the investment management experience of the Adviser. The Board discussed with the Adviser the investment objective and strategies for the Fund and the Adviser’s experience and plans for implementing such strategies. In particular, the Board received information from the Adviser regarding the experience of the Fund’s portfolio managers in managing substantially similar strategies. The Board also noted the Adviser’s prior experience and performance with separate accounts that had similar investment objectives and strategies as the Fund. After consideration of these factors, as well as other factors, the Board determined that the Adviser has the requisite experience to serve as investment adviser for the Fund.
The costs of the services to be provided and profits to be realized by the Adviser and its affiliates from the relationship with the Fund. The Board considered the Adviser’s staffing, personnel, and methods of operation; the education and experience of its personnel; its compliance program, policies, and procedures; its financial condition and the level of commitment to the Fund; the projected asset levels of the Fund; and the overall expenses of the Fund, including the advisory fee. The Board reviewed the Adviser’s Initial Expense Limitation Agreement, and noted the benefit that would result to the Fund from the Adviser’s commitment to waive its advisory fee or reimburse other operating expenses until March 31, 2017. The Board discussed the financial condition of the Adviser and its ability to satisfy
RYAN LABS CORE BOND FUND
DISCLOSURE REGARDING APPROVAL OF INVESTMENT
ADVISORY AGREEMENT (Unaudited) (Continued) |
its financial commitments to the Fund. The Board also considered potential benefits for the Adviser in managing the Fund, including promotion of the Adviser’s name. The Board compared the Fund’s proposed advisory fee and overall expense ratio to other comparable funds (in terms of the type of fund, the style of investment management, the projected size of the Fund and the nature of the investment strategy) and the fees charged by the Adviser to its other managed accounts. The Board noted that the Fund’s advisory fee of 0.40 percent was at the average and median for funds in the Adviser’s Custom Peer Group. It further noted that the proposed overall annual expense ratio of 0.40 percent for Institutional Class shares with the Adviser’s Initial Expense Limitation Agreement is lower than the Custom Peer Group’s average expense ratio (0.64 percent) and median expense ratio (0.60 percent). Upon further consideration and discussion of the foregoing, the Board concluded that the proposed advisory fee for the Fund is fair and reasonable.
The extent to which the Fund and its investors would benefit from economies of scale. The Board considered the Initial Advisory Agreement and the Initial Expense Limitation Agreement. The Board determined that, because the proposed advisory fee is flat and equals the expense limit, the shareholders of the Fund would benefit from the Initial Expense Limitation Agreement until the Fund’s assets grew to a level where its expenses otherwise fell below the expense limit. Following further discussion of the Fund’s projected asset levels, expectations for growth, and level of fees, the Board determined that the Fund’s fee arrangements with the Adviser would provide benefits for the next two years, and the Board can review the arrangements going forward as necessary, including at each renewal period. After further discussion, the Board concluded the Fund’s arrangements with the Adviser were fair and reasonable in relation to the nature and quality of services to be provided by the Adviser.
Brokerage and portfolio transactions. The Board considered the Adviser’s policies and procedures as it relates to seeking best execution for its clients, including the Fund. The Board also considered the anticipated portfolio turnover rate for the Fund; the method and basis for selecting and evaluating the broker-dealers used; any anticipated allocation of portfolio business to persons affiliated with the Adviser; and the extent to which the Fund’s trades may be allocated to soft-dollar arrangements. After further review and discussion, the Board determined that the Adviser’s practices regarding brokerage and portfolio transactions were satisfactory.
Possible conflicts of interest. In evaluating the possibility for conflicts of interest, the Board considered such matters as the Adviser’s process for allocating trades among its different clients, including other clients with similar investment objectives and strategies as the Fund. The Board also considered the substance and administration of the Adviser’s code of ethics. Following further consideration and discussion, the Board determined that the Adviser’s standards and practices relating to the identification and mitigation of potential conflicts of interests were satisfactory.
RYAN LABS CORE BOND FUND
DISCLOSURE REGARDING APPROVAL OF INVESTMENT
ADVISORY AGREEMENT (Unaudited) (Continued) |
Conclusion
After consideration of the above factors as well as other factors, the Board unanimously concluded that approval of the Initial Investment Advisory Agreement was in the best interests of the Fund and its shareholders.
The Adviser was acquired by Sun Life Financial, Inc. (“Sun Life”) (the “Transaction”) in 2015, which acquisition constituted a change of control of the Adviser and, as mandated by the Investment Company Act of 1940 (the “1940 Act”), the Initial Investment Advisory Agreement terminated. The Board approved the New Investment Advisory Agreement, which was substantially similar to the Initial Investment Advisory Agreement. Approval of the New Investment Advisory Agreement took place at an in-person meeting held on February 27, 2015, at which all of the Trustees were present. The New Investment Advisory Agreement was approved by the Fund’s shareholders by Written Consent to Action Without a Meeting on March 31, 2015.
In the course of their deliberations, the Board was advised by legal counsel. The Board received and reviewed information provided by the Adviser in response to requests of the Board and counsel.
In considering the New Investment Advisory Agreement and reaching their conclusions with respect thereto, the Board reviewed and analyzed various factors that they determined were relevant, including the factors described below.
The nature, extent, and quality of the services provided by the Adviser. The Board reviewed the services being provided by the Adviser to the Fund including, without limitation, its investment advisory services since the Fund’s inception, its coordination of services for the Fund by the Fund’s service providers, its compliance procedures and practices, and its efforts to promote the Fund. The Board also considered representations by the Adviser that the Transaction would not result in any adverse impact or changes to the management of the Fund or the personnel of the Adviser involved in the management of the Fund. After reviewing the foregoing information and the materials provided to the Board regarding the Adviser’s business, the Board concluded that the quality, extent, and nature of the services provided by the Adviser are satisfactory and adequate for the Fund.
The investment performance of the Fund and the Adviser. The Board compared the performance of the Fund with the performance of benchmark indices. In this regard, among other things, the Board noted that the Fund only had a very short operating history to date, but was performing competitively against its benchmark and peers. The Board also considered the consistency of the Adviser’s management of the Fund with the Fund’s investment objective and policies. Following discussion of the investment performance of the Fund, the Adviser’s experience in managing the Fund and separate accounts, the Adviser’s historical investment performance and other factors, the Board concluded that the investment performance of the Fund and the Adviser has been satisfactory.
RYAN LABS CORE BOND FUND
DISCLOSURE REGARDING APPROVAL OF INVESTMENT
ADVISORY AGREEMENT (Unaudited) (Continued) |
The costs of the services to be provided and profits to be realized by the Adviser from its relationship with the Fund. The Board considered the Adviser’s staffing, personnel, and operations; the Adviser’s compliance policies and procedures; the financial condition of the Adviser and Sun Life, and each entity’s level of commitment to the Fund and the Adviser’s business; the asset levels of the Fund; the Adviser’s prior payment of startup costs for the Fund, the growth of the Fund; and the overall expenses of the Fund, including certain fee waivers and expense reimbursements by the Adviser on behalf of the Fund under the Initial Expense Limitation Agreement. The Board also considered representations by the Adviser that the Transaction would not result in any adverse impact or changes to the staffing, personnel or operations of the Adviser. The Board also considered that the aggregate fees charged to the Fund under the New Advisory Agreement and New Expense Limitation Agreement would be the same as those charged under the Initial Advisory Agreement and Initial Expense Limitation Agreement.
The Board considered the Adviser’s profitability, taking into account the extent to which the Fund generates revenue and profits for the Adviser. Finally, the Board considered the impact, or potential impact, of the Transaction on the Adviser’s profitability and potential profitability. The Board also considered potential benefits to the Adviser other than management fees from managing the Fund, including promotion of the Adviser’s name.
Following these comparisons and upon further consideration and discussion of the foregoing, the Board concluded that the fees paid to the Adviser by the Fund under the New Advisory Agreement are appropriate and within the range of fees that would have been negotiated at arm’s length.
The extent to which economies of scale would be realized as the Fund grows and whether management fee levels reflect these economies of scale for the benefit of the Fund’s investors. The Board considered that the Fund’s fee arrangement with the Adviser involve both a management fee and an expense limitation agreement. The Board determined that, because the proposed advisory fee is flat and equals the expense limit, the shareholders of the Fund benefit from the Current Expense Limitation Agreement and would continue to benefit under the New Expense Limitation Agreement. The Board noted that the Fund has the potential to benefit from economies of scale under its agreements with its other service providers. Following further discussion of the Fund’s asset levels, expectations for growth and levels of fees, the Board determined that the Fund’s fee arrangement with the Adviser continues to provide benefits through the New Expense Limitation Agreement, and that, at the Fund’s current and projected asset levels for the next two years, the Fund’s arrangements with the Adviser are fair and reasonable.
The likely effects of the Transaction on the Fund and its shareholders. The Board considered the history, reputation, qualifications and background of the Adviser and Sun Life and their respective financial conditions, as well as the qualifications of their personnel. The Board also considered the potential resources of Sun Life that may benefit the Adviser as a result
RYAN LABS CORE BOND FUND
DISCLOSURE REGARDING APPROVAL OF INVESTMENT
ADVISORY AGREEMENT (Unaudited) (Continued) |
of the Transaction. The Board noted that Sun Life offers strategic resources and a significant network of contacts to its portfolio of companies, and that the additional resources could expand the extent and quality of services provided to the Fund by the Adviser.
The Board also noted (i) that the Transaction would likely benefit the Adviser and the Fund by preserving the Adviser’s independent management structure and portfolio management style, while providing stability, strengthening the Adviser’s balance sheet, and increasing resources for the Adviser’s operations; (ii) that the Adviser had represented that the Transaction should not materially affect the Adviser’s operations or the level or quality of advisory services provided to the Fund; (iii) that the Adviser represented that the same personnel of the Adviser who currently provide services to the Fund will continue to do so upon the closing of the Transaction; (iv) the commitment of the Adviser to continue to pay or reimburse the Fund for the expenses as provided in the New Expense Limitation Agreement; (v) the Adviser’s agreement to indemnify the Fund with respect to certain aspects of the Transaction and the information provided for shareholder approval of the New Investment Advisory Agreement and pay for the Fund’s costs and expenses incurred in connection with the Transaction; and (vi) that based upon the representations and agreements from the Adviser, the Fund will not be subject to any “unfair burden” as a result of the Transaction within the meaning of Section 15(f) under the 1940 Act.
The Trustees also determined that the scope, quality, and nature of services, to be provided by the Adviser, and the fees to be paid to the Adviser, under the New Advisory Agreement will be substantially identical to the services and fees under the Initial Advisory Agreement. Following its consideration of all of the foregoing, the Board, including a majority of the Independent Trustees voting separately, unanimously approved the New Advisory Agreement and recommended approval of the New Advisory Agreement by shareholders of the Fund. No single factor was considered in isolation or to be determinative to the decision of the Trustees to approve the New Advisory Agreement and recommend approval to the Fund’s shareholders. Rather, the Trustees concluded, in light of their weighing and balancing all factors, that approval of the New Advisory Agreement was in the best interests of the Fund and its shareholders.
Conclusion
After consideration of the above factors as well as other factors, the Board unanimously concluded that approval of the New Investment Advisory Agreement was in the best interests of the Fund and its shareholders.
RYAN LABS CORE BOND FUND
DISCLOSURE REGARDING SUBMISSION OF MATTERS TO A VOTE OF SECURITY HOLDERS (Unaudited) |
On March 31, 2015, a Written Consent To Action Without A Meeting (the “Written Consent”) of the shareholders of the Fund, was presented for the purpose of voting on a proposal to approve a new Investment Advisory Agreement (the “Advisory Agreement”) with the Adviser. The following proposal was the subject of the Written Consent:
To approve, with respect to the Fund, a new Advisory Agreement with the Adviser.
The total number of shares of the Fund executing the Written Consent represented 100% of the shares entitled to vote on the proposal.
The shareholders of the Fund voted to approve the new Advisory Agreement. The votes cast with respect to the new Advisory Agreement were as follows:
Number of Shares |
For | Against | Abstain |
1,845,749.913 | 0 | 0 |
This page intentionally left blank.
This page intentionally left blank.
This page intentionally left blank.
Not required
| Item 3. | Audit Committee Financial Expert. |
Not required
| Item 4. | Principal Accountant Fees and Services. |
Not required
| Item 5. | Audit Committee of Listed Registrants. |
Not applicable
| Item 6. | Schedule of Investments. |
| (a) | Not applicable [schedule filed with Item 1] |
| Item 7. | Disclosure of Proxy Voting Policies and Procedures for Closed-End Management Investment Companies. |
Not applicable
| Item 8. | Portfolio Managers of Closed-End Management Investment Companies. |
Not applicable
| Item 9. | Purchases of Equity Securities by Closed-End Management Investment Company and Affiliated Purchasers. |
Not applicable
| Item 10. | Submission of Matters to a Vote of Security Holders. |
The registrant’s Committee of Independent Trustees shall review shareholder recommendations for nominations to fill vacancies on the registrant’s board of trustees if such recommendations are submitted in writing and addressed to the Committee at the registrant’s offices. The Committee may adopt, by resolution, a policy regarding its procedures for considering candidates for the board of trustees, including any recommended by shareholders.
| Item 11. | Controls and Procedures. |
(a) Based on their evaluation of the registrant’s disclosure controls and procedures (as defined in Rule 30a-3(c) under the Investment Company Act of 1940) as of a date within 90 days of the filing date of this report, the registrant’s principal executive officer and principal financial officer have concluded that such disclosure controls and procedures are reasonably designed and are operating effectively to ensure that material information relating to the registrant, including its consolidated subsidiaries, is made known to them by others within those entities, particularly during the period in which this report is being prepared, and that the information required in filings on Form N-CSR is recorded, processed, summarized, and reported on a timely basis.
(b) There were no changes in the registrant’s internal control over financial reporting (as defined in Rule 30a-3(d) under the Investment Company Act of 1940) that occurred during the second fiscal quarter of the period covered by this report that have materially affected, or are reasonably likely to materially affect, the registrant’s internal control over financial reporting.
File the exhibits listed below as part of this Form. Letter or number the exhibits in the sequence indicated.
(a)(1) Any code of ethics, or amendment thereto, that is the subject of the disclosure required by Item 2, to the extent that the registrant intends to satisfy the Item 2 requirements through filing of an exhibit: Not required
(a)(2) A separate certification for each principal executive officer and principal financial officer of the registrant as required by Rule 30a-2(a) under the Act (17 CFR 270.30a-2(a)): Attached hereto
(a)(3) Any written solicitation to purchase securities under Rule 23c-1 under the Act (17 CFR 270.23c-1) sent or given during the period covered by the report by or on behalf of the registrant to 10 or more persons: Not applicable
(b) Certifications required by Rule 30a-2(b) under the Act (17 CFR 270.30a-2(b)): Attached hereto
| Exhibit 99.CERT | Certifications required by Rule 30a-2(a) under the Act |
| Exhibit 99.906CERT | Certifications required by Rule 30a-2(b) under the Act |
SIGNATURES
Pursuant to the requirements of the Securities Exchange Act of 1934 and the Investment Company Act of 1940, the registrant has duly caused this report to be signed on its behalf by the undersigned, thereunto duly authorized.
| (Registrant) | Ultimus Managers Trust | | |
| | | | |
| By (Signature and Title)* | /s/ Frank L. Newbauer | |
| | | Frank L. Newbauer, Assistant Secretary | |
| | | | |
| Date | August 7, 2015 | | |
Pursuant to the requirements of the Securities Exchange Act of 1934 and the Investment Company Act of 1940, this report has been signed below by the following persons on behalf of the registrant and in the capacities and on the dates indicated.
| By (Signature and Title)* | /s/ Andrew B. Wellington | |
| | | Andrew B. Wellington, Principal Executive Officer of Lyrical U.S. Value Equity Fund and Lyrical U.S. Hedged Value Fund | |
| | | | |
| Date | August 7, 2015 | | |
| | | | |
| By (Signature and Title)* | /s/ Stephen P. Lack | |
| | | Stephen P. Lack, Principal Executive Officer of Galapagos Partners Select Equity Fund | |
| | | | |
| Date | August 7, 2015 | | |
| | | | |
| By (Signature and Title)* | /s/ David R. Carson | |
| | | David R. Carson, Principal Executive Officer of Ryan Labs Core Bond Fund | |
| | | | |
| Date | August 7, 2015 | | |
| | | | |
| By (Signature and Title)* | /s/ Jennifer L. Leamer | |
| | | Jennifer L. Leamer, Treasurer | |
| | | | |
| Date | August 7, 2015 | | |
* Print the name and title of each signing officer under his or her signature.