| OMB APPROVAL |
OMB Number: 3235-0570 Expires: January 31, 2017 Estimated average burden hours per response: 20.6 |
UNITED STATES
SECURITIES AND EXCHANGE COMMISSION
Washington, D.C. 20549
FORM N-CSR
CERTIFIED SHAREHOLDER REPORT OF REGISTERED
MANAGEMENT INVESTMENT COMPANY
| Investment Company Act file number | 811-22680 | |
| Ultimus Managers Trust |
| (Exact name of registrant as specified in charter) |
| 225 Pictoria Drive, Suite 450 Cincinnati, Ohio | 45246 |
| (Address of principal executive offices) | (Zip code) |
Frank L. Newbauer, Esq.
Ultimus Fund Solutions, LLC 225 Pictoria Drive, Suite 450 Cincinnati, Ohio 45246_ |
| (Name and address of agent for service) |
| Registrant's telephone number, including area code: | (513) 587-3400 | |
| Date of fiscal year end: | August 31 | |
| | | |
| Date of reporting period: | February 29, 2016 | |
Form N-CSR is to be used by management investment companies to file reports with the Commission not later than 10 days after the transmission to stockholders of any report that is required to be transmitted to stockholders under Rule 30e-1 under the Investment Company Act of 1940 (17 CFR 270.30e-1). The Commission may use the information provided on Form N-CSR in its regulatory, disclosure review, inspection, and policymaking roles.
A registrant is required to disclose the information specified by Form N-CSR, and the Commission will make this information public. A registrant is not required to respond to the collection of information contained in Form N-CSR unless the Form displays a currently valid Office of Management and Budget ("OMB") control number. Please direct comments concerning the accuracy of the information collection burden estimate and any suggestions for reducing the burden to the Secretary, Securities and Exchange Commission, 450 Fifth Street, NW, Washington, DC 20549-0609. The OMB has reviewed this collection of information under the clearance requirements of 44 U.S.C. § 3507.
Item 1. Reports to Stockholders.

ALAMBIC SMALL CAP VALUE PLUS FUND
ALAMBIC SMALL CAP GROWTH PLUS FUND
Semi-Annual Report
February 29, 2016
(Unaudited)
ALAMBIC FUNDS
LETTER TO SHAREHOLDERS | March 18, 2016 |
Dear Fellow Shareholders:
Despite the recent rebound in U.S. equities, small cap stock performance over the past 6 months continues to be hampered by higher volatility, widening credit spreads, and generally weak earnings growth, although recent performance has lifted small caps out of bear market territory relative to their June 2015 highs. Small caps tend to be negatively correlated with credit spreads and volatility and, with high-yield spreads widening and the CBOE Volatility Index above 20, performance continues to suffer. Although the Russell 2000® Index was flat for the month of February 2015 and is down only 8.97% through February this year, we expect this cycle of low liquidity and tighter credit spreads to persist this year, which will continue to weigh on the performance of small cap stocks.
Within that macro market backdrop, since inception (September 1, 2015) through February 29, 2016, the Alambic Small Cap Value Plus Fund (“ALAMX” or the “Value Fund”) has delivered a total return of -4.84% versus the Value Fund’s benchmark, the Russell 2000 Value Index, at -4.03% for the same period. Year to date, ALAMX is down -6.69% versus the Russell 2000 Value Index at -6.08%. Although month-to-month comparisons vary significantly, our tracking error to our benchmark averaged 4.38% during this same period, which is well within our expectations.
The following chart summarizes ALAMX’s cumulative performance over the past 6 months versus the Morningstar Small Cap Value category, which summarizes the average performance of small cap value managers reported in the Morningstar database.
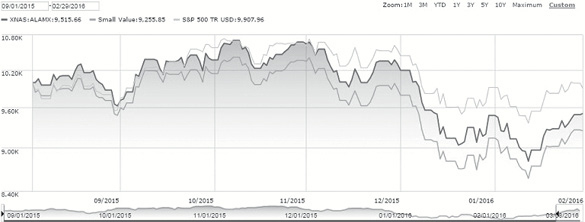
While our stated objective is to provide returns that exceed the benchmark and the Value Fund’s peer group averages over time, we are pleased with ALAMX’s recent performance relative to its peers and we are now focused on improving performance relative to the Russell 2000 Value Index. To that end, as we look to identify the underlying factors, other than macro market trends, that have impacted the Fund’s first 6 months of performance, we note that ALAMX’s sector weights often (and most often intentionally) vary significantly from those of the benchmark. During the past 6 months, ALAMX tended to be significantly underweight in the interest rate sensitive sectors, particularly financial services and utilities. Since these sectors improved as rates declined going into the first quarter, ALAMX’s performance relative to the benchmark was negatively impacted.
1
Investment style weights can also contribute to performance. Although the largest style component of ALAMX’s portfolio is value, significant parts of the portfolio could be classified as small cap blend or small cap growth and can cause a variance in performance relative to the benchmark. We do not believe investment style weights had a material impact on the Fund’s performance relative to the benchmark in the past 6 months.
On December 29, 2015, we launched our second registered mutual fund, the Alambic Small Cap Growth Plus Fund (“ALGSX” or the “Growth Fund”). As with ALAMX, our stock selection process for the Growth Fund is also based on the systematic application of fundamental equity research principals, but for ALGSX the benchmark is the Russell 2000 Growth Index. Since inception through February 29, 2016, ALGSX has delivered a return of -7.30% versus the benchmark’s return of -13.32%. We attribute ALGSX’s strong relative performance during this period to a combination of stock selection and to an intentional investment style shift during the period that resulted in a higher value-weight than that of the Growth Fund’s benchmark.
Although macro market conditions for small caps have been challenging the past few months, we have used this period to continuously optimize our portfolio management processes. As a result, our two funds have performed well relative to their benchmarks and category peers. This validates our stated objective of consistently outperforming the benchmark indices over time.
Thank you for your ongoing trust and commitment.
Sincerely
Albert Richards | Brian Thompson | Rob Slaymaker |
CEO | CRO | Partner |
2
Past performance is not predictive of future performance. Investment results and principal value will fluctuate so that shares, when redeemed, may be worth more or less than their original cost. Current performance may be higher or lower than the performance data quoted. Performance data current to the most recent month-end are available by calling 1-888-890-8988.
An investor should consider the investment objectives, risks, charges and expenses of the Funds carefully before investing. The Funds’ prospectus contains this and other important information. To obtain a copy of the Funds’ prospectus please visit our website at https://alambicfunds.com or call 1-888-890-8988 and a copy will be sent to you free of charge. Please read the prospectus carefully before you invest. The Alambic Funds are distributed by Ultimus Fund Distributors, LLC.
The Letter to Shareholders seeks to describe some of the Adviser’s current opinions and views of the financial markets. Although the Adviser believes it has a reasonable basis for any opinions or views expressed, actual results may differ, sometimes significantly so, from those expected or expressed. The securities held by the Funds that are discussed in the Letter to Shareholders were held during the period covered by this Report. They do not comprise the entire investment portfolio of the Funds, may be sold at any time and may no longer be held by the Funds. For a complete listing of securities held in the Funds as of February 29, 2016, please see the Schedule of Investments section of the Semi-Annual Report. The opinions of the Adviser with respect to those securities may change at any time.
Statements in the Letter to Shareholders that reflect projections or expectations for future financial or economic performance of the Funds and the market in general and statements of the Funds’ plans and objectives for future operations are forward-looking statements. No assurance can be given that actual results or events will not differ materially from those projected, estimated, assumed, or anticipated in any such forward-looking statements. Important factors that could result in such differences, in addition to factors noted with such forward-looking statements, include, without limitation, general economic conditions, such as inflation, recession, and interest rates. Past performance is not a guarantee of future results.
3
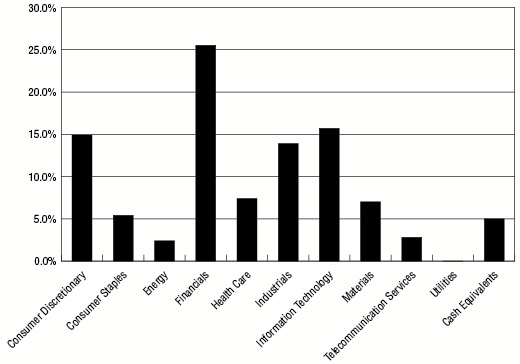
ALAMBIC SMALL CAP VALUE PLUS FUND
PORTFOLIO INFORMATION
February 29, 2016 (Unaudited)
Sector Diversification (% of Net Assets)
Top 10 Equity Holdings
Security Description | % of Net Assets |
Prestige Brands Holdings, Inc. | 1.5% |
Haverty Furniture Companies, Inc. | 1.4% |
FairPoint Communications, Inc. | 1.4% |
Alpha & Omega Semiconductor Ltd. | 1.3% |
DHI Group, Inc. | 1.3% |
Dean Foods Company | 1.2% |
Chase Corporation | 1.2% |
Bridgepoint Education, Inc. | 1.1% |
ManTech International Corporation - Class A | 1.1% |
Greif, Inc. - Class A | 1.0% |
4
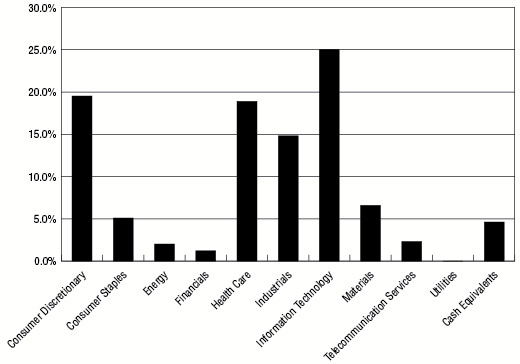
ALAMBIC SMALL CAP GROWTH PLUS FUND
PORTFOLIO INFORMATION
February 29, 2016 (Unaudited)
Sector Diversification (% of Net Assets)
Top 10 Equity Holdings
Security Description | % of Net Assets |
Greif, Inc. - Class A | 1.2% |
Del Taco Restaurants, Inc. | 1.2% |
Dean Foods Company | 1.1% |
EVERTEC, Inc. | 1.0% |
Vitamin Shoppe, Inc. | 0.9% |
Prestige Brands Holdings, Inc. | 0.9% |
Knowles Corporation | 0.9% |
Syntel, Inc. | 0.9% |
Axiall Corporation | 0.9% |
Carlisle Companies, Inc. | 0.8% |
5
ALAMBIC SMALL CAP VALUE PLUS FUND
SCHEDULE OF INVESTMENTS
February 29, 2016 (Unaudited) |
COMMON STOCKS — 95.0% | | Shares | | | Value | |
Consumer Discretionary — 14.9% | | | | | | |
Distributors — 0.3% | | | | | | |
Weyco Group, Inc. | | | 200 | | | $ | 5,444 | |
| | | | | | | | | |
Diversified Consumer Services — 1.3% | | | | | | | | |
Bridgepoint Education, Inc. (a) | | | 3,400 | | | | 21,522 | |
K12, Inc. (a) | | | 300 | | | | 2,937 | |
| | | | | | | | 24,459 | |
Hotels, Restaurants & Leisure — 4.4% | | | | | | | | |
Caesars Acquisition Company - Class A (a) | | | 1,500 | | | | 9,090 | |
Carrols Restaurant Group, Inc. (a) | | | 1,000 | | | | 13,270 | |
Century Casinos, Inc. (a) | | | 2,600 | | | | 17,498 | |
Del Taco Restaurants, Inc. (a) | | | 900 | | | | 9,747 | |
J. Alexander's Holdings, Inc. (a) | | | 300 | | | | 3,114 | |
Monarch Casino & Resort, Inc. (a) | | | 200 | | | | 4,024 | |
Potbelly Corporation (a) | | | 1,100 | | | | 13,805 | |
Ruby Tuesday, Inc. (a) | | | 100 | | | | 529 | |
Speedway Motorsports, Inc. | | | 700 | | | | 12,754 | |
| | | | | | | | 83,831 | |
Household Durables — 1.0% | | | | | | | | |
CSS Industries, Inc. | | | 200 | | | | 5,414 | |
Ethan Allen Interiors, Inc. | | | 150 | | | | 4,280 | |
iRobot Corporation (a) | | | 200 | | | | 6,268 | |
Lifetime Brands, Inc. | | | 300 | | | | 3,588 | |
Skullcandy, Inc. (a) | | | 100 | | | | 354 | |
| | | | | | | | 19,904 | |
Internet & Catalog Retail — 1.0% | | | | | | | | |
1-800-FLOWERS.COM, Inc. - Class A (a) | | | 400 | | | | 3,124 | |
Gaiam, Inc. - Class A (a) | | | 500 | | | | 2,835 | |
PetMed Express, Inc. | | | 300 | | | | 4,950 | |
Shutterfly, Inc. (a) | | | 200 | | | | 8,888 | |
| | | | | | | | 19,797 | |
Leisure Products — 0.1% | | | | | | | | |
JAKKS Pacific, Inc. (a) | | | 300 | | | | 2,172 | |
| | | | | | | | | |
Media — 1.2% | | | | | | | | |
A.H. Belo Corporation - Class A | | | 535 | | | | 3,199 | |
Crown Media Holdings, Inc. - Class A (a) | | | 700 | | | | 3,073 | |
Discovery Communications, Inc. - Series A (a) | | | 100 | | | | 2,500 | |
Lee Enterprises, Inc. (a) | | | 3,400 | | | | 4,522 | |
Starz - Series A (a) | | | 200 | | | | 5,038 | |
Time, Inc. | | | 300 | | | | 4,230 | |
| | | | | | | | 22,562 | |
6
ALAMBIC SMALL CAP VALUE PLUS FUND
SCHEDULE OF INVESTMENTS (Continued) |
COMMON STOCKS — 95.0% (Continued) | | Shares | | | Value | |
Consumer Discretionary — 14.9% (Continued) | | | | | | |
Multiline Retail — 0.9% | | | | | | |
Tuesday Morning Corporation (a) | | | 2,400 | | | $ | 16,152 | |
| | | | | | | | | |
Specialty Retail — 4.2% | | | | | | | | |
Barnes & Noble Education, Inc. (a) | | | 1,200 | | | | 12,816 | |
Christopher & Banks Corporation (a) | | | 2,500 | | | | 3,525 | |
Haverty Furniture Companies, Inc. | | | 1,400 | | | | 27,216 | |
Office Depot, Inc. (a) | | | 800 | | | | 4,064 | |
Outerwall, Inc. | | | 150 | | | | 4,678 | |
Rent-A-Center, Inc. | | | 900 | | | | 11,493 | |
Tilly's, Inc. - Class A (a) | | | 100 | | | | 719 | |
West Marine, Inc. (a) | | | 400 | | | | 3,272 | |
Zumiez, Inc. (a) | | | 600 | | | | 12,396 | |
| | | | | | | | 80,179 | |
Textiles, Apparel & Luxury Goods — 0.5% | | | | | | | | |
Movado Group, Inc. | | | 300 | | | | 8,763 | |
| | | | | | | | | |
Consumer Staples — 5.4% | | | | | | | | |
Food & Staples Retailing — 1.6% | | | | | | | | |
SUPERVALU, Inc. (a) | | | 3,800 | | | | 19,418 | |
Village Super Market, Inc. - Class A | | | 400 | | | | 10,604 | |
| | | | | | | | 30,022 | |
Food Products — 2.6% | | | | | | | | |
Dean Foods Company | | | 1,200 | | | | 23,148 | |
Farmer Brothers Company (a) | | | 600 | | | | 15,816 | |
John B. Sanfilippo & Son, Inc. | | | 20 | | | | 1,392 | |
Seaboard Corporation (a) | | | 3 | | | | 8,775 | |
Seneca Foods Corporation - Class A (a) | | | 50 | | | | 1,663 | |
| | | | | | | | 50,794 | |
Household Products — 1.2% | | | | | | | | |
Energizer Holdings, Inc. | | | 200 | | | | 7,788 | |
Oil-Dri Corporation of America | | | 400 | | | | 14,736 | |
| | | | | | | | 22,524 | |
Energy — 2.4% | | | | | | | | |
Energy Equipment & Services — 1.2% | | | | | | | | |
Dawson Geophysical Company (a) | | | 800 | | | | 2,728 | |
Gulf Island Fabrication, Inc. | | | 400 | | | | 3,564 | |
PHI, Inc. (a) | | | 400 | | | | 7,296 | |
RigNet, Inc. (a) | | | 400 | | | | 5,280 | |
Unit Corporation (a) | | | 700 | | | | 3,752 | |
| | | | | | | | 22,620 | |
7
ALAMBIC SMALL CAP VALUE PLUS FUND
SCHEDULE OF INVESTMENTS (Continued) |
COMMON STOCKS — 95.0% (Continued) | | Shares | | | Value | |
Energy — 2.4% (Continued) | | | | | | |
Oil, Gas & Consumable Fuels — 1.2% | | | | | | |
Adams Resources & Energy, Inc. | | | 50 | | | $ | 1,636 | |
Alon USA Energy, Inc. | | | 400 | | | | 3,944 | |
Cloud Peak Energy, Inc. (a) | | | 1,400 | | | | 2,380 | |
EP Energy Corporation - Class A (a) | | | 4,300 | | | | 7,396 | |
Marathon Petroleum Corporation | | | 150 | | | | 5,138 | |
PBF Energy, Inc. - Class A | | | 50 | | | | 1,510 | |
Whiting Petroleum Corporation (a) | | | 300 | | | | 1,203 | |
| | | | | | | | 23,207 | |
Financials — 25.5% | | | | | | | | |
Banks — 10.9% | | | | | | | | |
BancorpSouth, Inc. | | | 100 | | | | 1,992 | |
Bank of the Ozarks, Inc. | | | 150 | | | | 5,676 | |
BankUnited, Inc. | | | 200 | | | | 6,424 | |
BOK Financial Corporation | | | 100 | | | | 4,887 | |
Cathay General Bancorp | | | 200 | | | | 5,338 | |
Citigroup, Inc. | | | 150 | | | | 5,827 | |
Commerce Bancshares, Inc. | | | 262 | | | | 11,130 | |
Cullen/Frost Bankers, Inc. | | | 150 | | | | 7,189 | |
East West Bancorp, Inc. | | | 350 | | | | 10,489 | |
F.N.B. Corporation | | | 100 | | | | 1,228 | |
First Citizens BancShares, Inc. - Class A | | | 10 | | | | 2,341 | |
First Financial Bankshares, Inc. | | | 100 | | | | 2,641 | |
First Horizon National Corporation | | | 300 | | | | 3,606 | |
First Niagara Financial Group, Inc. | | | 300 | | | | 2,772 | |
FirstMerit Corporation | | | 400 | | | | 7,852 | |
Hancock Holding Company | | | 200 | | | | 4,614 | |
Hilltop Holdings, Inc. (a) | | | 100 | | | | 1,668 | |
IBERIABANK Corporation | | | 50 | | | | 2,384 | |
Investors Bancorp, Inc. | | | 300 | | | | 3,396 | |
MB Financial, Inc. | | | 300 | | | | 9,156 | |
PacWest Bancorp | | | 300 | | | | 9,654 | |
People's United Financial, Inc. | | | 200 | | | | 2,922 | |
Pinnacle Financial Partners, Inc. | | | 100 | | | | 4,637 | |
PrivateBancorp, Inc. | | | 50 | | | | 1,718 | |
Prosperity Bancshares, Inc. | | | 350 | | | | 14,158 | |
Sterling Bancorp | | | 300 | | | | 4,323 | |
SVB Financial Group (a) | | | 100 | | | | 8,885 | |
Synovus Financial Corporation | | | 350 | | | | 9,307 | |
Texas Capital Bancshares, Inc. (a) | | | 100 | | | | 3,233 | |
U.S. Bancorp | | | 100 | | | | 3,852 | |
UMB Financial Corporation | | | 50 | | | | 2,456 | |
8
ALAMBIC SMALL CAP VALUE PLUS FUND
SCHEDULE OF INVESTMENTS (Continued) |
COMMON STOCKS — 95.0% (Continued) | | Shares | | | Value | |
Financials — 25.5% (Continued) | | | | | | |
Banks — 10.9% (Continued) | | | | | | |
Umpqua Holdings Corporation | | | 1,100 | | | $ | 16,544 | |
United Bankshares, Inc. | | | 100 | | | | 3,504 | |
Webster Financial Corporation | | | 200 | | | | 6,722 | |
Wells Fargo & Company | | | 60 | | | | 2,815 | |
Western Alliance Bancorp (a) | | | 150 | | | | 4,458 | |
Zions Bancorporation | | | 400 | | | | 8,528 | |
| | | | | | | | 208,326 | |
Capital Markets — 0.4% | | | | | | | | |
American Capital Ltd. (a) | | | 200 | | | | 2,738 | |
Charles Schwab Corporation (The) | | | 150 | | | | 3,758 | |
| | | | | | | | 6,496 | |
Consumer Finance — 0.2% | | | | | | | | |
OneMain Holdings, Inc. (a) | | | 200 | | | | 4,514 | |
| | | | | | | | | |
Diversified Financial Services — 0.9% | | | | | | | | |
Intercontinental Exchange, Inc. | | | 30 | | | | 7,154 | |
Leucadia National Corporation | | | 400 | | | | 5,780 | |
MarketAxess Holdings, Inc. | | | 40 | | | | 4,738 | |
| | | | | | | | 17,672 | |
Insurance — 2.0% | | | | | | | | |
Assurant, Inc. | | | 20 | | | | 1,422 | |
Brown & Brown, Inc. | | | 300 | | | | 9,693 | |
CNO Financial Group, Inc. | | | 800 | | | | 13,944 | |
Marsh & McLennan Companies, Inc. | | | 120 | | | | 6,846 | |
Primerica, Inc. | | | 50 | | | | 2,109 | |
RLI Corporation | | | 50 | | | | 3,139 | |
| | | | | | | | 37,153 | |
Real Estate Investment Trusts (REITs) — 11.1% | | | | | | | | |
Acadia Realty Trust | | | 500 | | | | 16,525 | |
Alexander's, Inc. | | | 10 | | | | 3,848 | |
Altisource Residential Corporation | | | 100 | | | | 938 | |
American Campus Communities, Inc. | | | 150 | | | | 6,565 | |
American Tower Corporation | | | 70 | | | | 6,454 | |
AvalonBay Communities, Inc. | | | 30 | | | | 5,149 | |
Capstead Mortgage Corporation | | | 600 | | | | 5,826 | |
Communications Sales & Leasing, Inc. | | | 100 | | | | 1,885 | |
Crown Castle International Corporation | | | 20 | | | | 1,730 | |
CubeSmart | | | 400 | | | | 11,960 | |
CyrusOne, Inc. | | | 100 | | | | 3,964 | |
DCT Industrial Trust, Inc. | | | 150 | | | | 5,429 | |
Douglas Emmett, Inc. | | | 100 | | | | 2,684 | |
9
ALAMBIC SMALL CAP VALUE PLUS FUND
SCHEDULE OF INVESTMENTS (Continued) |
COMMON STOCKS — 95.0% (Continued) | | Shares | | | Value | |
Financials — 25.5% (Continued) | | | | | | |
Real Estate Investment Trusts (REITs) — 11.1% (Continued) | | | | | | |
Education Realty Trust, Inc. | | | 250 | | | $ | 9,913 | |
Equity One, Inc. | | | 200 | | | | 5,482 | |
Equity Residential | | | 60 | | | | 4,469 | |
Extra Space Storage, Inc. | | | 120 | | | | 9,858 | |
Federal Realty Investment Trust | | | 50 | | | | 7,403 | |
Forest City Realty Trust, Inc. - Class A (a) | | | 200 | | | | 3,730 | |
Hannon Armstrong Sustainable Infrastructure Capital, Inc. | | | 650 | | | | 11,447 | |
Kilroy Realty Corporation | | | 140 | | | | 7,598 | |
Ladder Capital Corporation | | | 319 | | | | 3,298 | |
MFA Financial, Inc. | | | 700 | | | | 4,767 | |
Paramount Group, Inc. | | | 200 | | | | 3,024 | |
Physicians Realty Trust | | | 200 | | | | 3,436 | |
Prologis, Inc. | | | 350 | | | | 13,461 | |
Public Storage | | | 50 | | | | 12,475 | |
Simon Property Group, Inc. | | | 25 | | | | 4,743 | |
Sovran Self Storage, Inc. | | | 60 | | | | 6,386 | |
Starwood Property Trust, Inc. | | | 100 | | | | 1,754 | |
STORE Capital Corporation | | | 500 | | | | 12,075 | |
Taubman Centers, Inc. | | | 100 | | | | 7,082 | |
Two Harbors Investment Corporation | | | 300 | | | | 2,325 | |
Vornado Realty Trust | | | 20 | | | | 1,727 | |
Weingarten Realty Investors | | | 50 | | | | 1,762 | |
| | | | | | | | 211,172 | |
Health Care — 7.4% | | | | | | | | |
Biotechnology — 1.7% | | | | | | | | |
Acorda Therapeutics, Inc. (a) | | | 100 | | | | 3,271 | |
Aegerion Pharmaceuticals, Inc. (a) | | | 300 | | | | 1,692 | |
ArQule, Inc. (a) | | | 400 | | | | 756 | |
aTyr Pharma, Inc. (a) | | | 300 | | | | 1,341 | |
Catabasis Pharmaceuticals, Inc. (a) | | | 800 | | | | 3,360 | |
Emergent BioSolutions, Inc. (a) | | | 100 | | | | 3,383 | |
Myriad Genetics, Inc. (a) | | | 50 | | | | 1,750 | |
PDL BioPharma, Inc. | | | 2,100 | | | | 6,321 | |
Rigel Pharmaceuticals, Inc. (a) | | | 4,600 | | | | 10,442 | |
| | | | | | | | 32,316 | |
Health Care Equipment & Supplies — 1.5% | | | | | | | | |
Accuray, Inc. (a) | | | 900 | | | | 4,545 | |
CryoLife, Inc. | | | 400 | | | | 4,284 | |
Exactech, Inc. (a) | | | 700 | | | | 13,055 | |
FONAR Corporation (a) | | | 100 | | | | 1,644 | |
Halyard Health, Inc. (a) | | | 100 | | | | 2,552 | |
10
ALAMBIC SMALL CAP VALUE PLUS FUND
SCHEDULE OF INVESTMENTS (Continued) |
COMMON STOCKS — 95.0% (Continued) | | Shares | | | Value | |
Health Care — 7.4% (Continued) | | | | | | |
Health Care Equipment & Supplies — 1.5% (Continued) | | | | | | |
Natus Medical, Inc. (a) | | | 50 | | | $ | 1,816 | |
| | | | | | | | 27,896 | |
Health Care Providers & Services — 1.4% | | | | | | | | |
Alliance HealthCare Services, Inc. (a) | | | 500 | | | | 3,575 | |
Cross Country Healthcare, Inc. (a) | | | 100 | | | | 1,241 | |
Express Scripts Holding Company (a) | | | 60 | | | | 4,223 | |
Five Star Quality Care, Inc. (a) | | | 3,900 | | | | 9,243 | |
Healthways, Inc. (a) | | | 300 | | | | 3,159 | |
RadNet, Inc. (a) | | | 900 | | | | 5,130 | |
| | | | | | | | 26,571 | |
Health Care Technology — 0.9% | | | | | | | | |
Allscripts Healthcare Solutions, Inc. (a) | | | 800 | | | | 10,016 | |
Quality Systems, Inc. | | | 500 | | | | 7,775 | |
| | | | | | | | 17,791 | |
Pharmaceuticals — 1.9% | | | | | | | | |
AcelRx Pharmaceuticals, Inc. (a) | | | 500 | | | | 1,855 | |
Juniper Pharmaceuticals, Inc. (a) | | | 300 | | | | 2,247 | |
Phibro Animal Health Corporation - Class A | | | 100 | | | | 2,766 | |
Prestige Brands Holdings, Inc. (a) | | | 590 | | | | 28,851 | |
Sagent Pharmaceuticals, Inc. (a) | | | 100 | | | | 1,418 | |
| | | | | | | | 37,137 | |
Industrials — 13.9% | | | | | | | | |
Aerospace & Defense — 2.4% | | | | | | | | |
AAR Corporation | | | 800 | | | | 17,032 | |
Astronics Corporation (a) | | | 250 | | | | 7,952 | |
Moog, Inc. - Class A (a) | | | 100 | | | | 4,318 | |
Vectrus, Inc. (a) | | | 900 | | | | 17,325 | |
| | | | | | | | 46,627 | |
Building Products — 0.9% | | | | | | | | |
Ply Gem Holdings, Inc. (a) | | | 1,400 | | | | 14,280 | |
Quanex Building Products Corporation | | | 200 | | | | 3,444 | |
| | | | | | | | 17,724 | |
Commercial Services & Supplies — 2.2% | | | | | | | | |
ACCO Brands Corporation (a) | | | 1,900 | | | | 13,889 | |
ARC Document Solutions, Inc. (a) | | | 2,500 | | | | 8,750 | |
Brink's Company (The) | | | 100 | | | | 2,925 | |
Ennis, Inc. | | | 100 | | | | 1,974 | |
Kimball International, Inc. - Class B | | | 700 | | | | 7,371 | |
Quad/Graphics, Inc. | | | 500 | | | | 6,330 | |
| | | | | | | | 41,239 | |
11
ALAMBIC SMALL CAP VALUE PLUS FUND
SCHEDULE OF INVESTMENTS (Continued) |
COMMON STOCKS — 95.0% (Continued) | | Shares | | | Value | |
Industrials — 13.9% (Continued) | | | | | | |
Construction & Engineering — 0.4% | | | | | | |
Sterling Construction Company, Inc. (a) | | | 1,500 | | | $ | 8,100 | |
| | | | | | | | | |
Electrical Equipment — 1.1% | | | | | | | | |
Allied Motion Technologies, Inc. | | | 500 | | | | 9,230 | |
General Cable Corporation | | | 1,100 | | | | 9,449 | |
Preformed Line Products Company | | | 50 | | | | 1,635 | |
| | | | | | | | 20,314 | |
Machinery — 3.7% | | | | | | | | |
Alamo Group, Inc. | | | 50 | | | | 2,594 | |
Albany International Corporation - Class A | | | 500 | | | | 18,310 | |
Commercial Vehicle Group, Inc. (a) | | | 3,800 | | | | 9,538 | |
Eastern Company (The) | | | 100 | | | | 1,584 | |
FreightCar America, Inc. | | | 400 | | | | 5,948 | |
Hurco Companies, Inc. | | | 200 | | | | 5,190 | |
Kadant, Inc. | | | 300 | | | | 11,451 | |
L.B. Foster Company - Class A | | | 300 | | | | 4,122 | |
L.S. Starrett Company (The) - Class A | | | 200 | | | | 1,886 | |
Lydall, Inc. (a) | | | 100 | | | | 2,895 | |
Navistar International Corporation (a) | | | 900 | | | | 7,569 | |
| | | | | | | | 71,087 | |
Marine — 0.1% | | | | | | | | |
Matson, Inc. | | | 50 | | | | 2,005 | |
| | | | | | | | | |
Professional Services — 1.2% | | | | | | | | |
Acacia Research Corporation | | | 1,100 | | | | 3,476 | |
Kforce, Inc. | | | 600 | | | | 9,564 | |
Resources Connection, Inc. | | | 700 | | | | 9,709 | |
| | | | | | | | 22,749 | |
Road & Rail — 0.8% | | | | | | | | |
ArcBest Corporation | | | 400 | | | | 7,828 | |
Avis Budget Group, Inc. (a) | | | 100 | | | | 2,564 | |
Hertz Global Holdings, Inc. (a) | | | 300 | | | | 2,550 | |
Swift Transportation Company (a) | | | 100 | | | | 1,704 | |
| | | | | | | | 14,646 | |
Trading Companies & Distributors — 0.4% | | | | | | | | |
WESCO International, Inc. (a) | | | 150 | | | | 6,608 | |
| | | | | | | | | |
Transportation Infrastructure — 0.7% | | | | | | | | |
Wesco Aircraft Holdings, Inc. (a) | | | 1,000 | | | | 12,790 | |
12
ALAMBIC SMALL CAP VALUE PLUS FUND
SCHEDULE OF INVESTMENTS (Continued) |
COMMON STOCKS — 95.0% (Continued) | | Shares | | | Value | |
Information Technology — 15.7% | | | | | | |
Communications Equipment — 1.1% | | | | | | |
Arris International plc (a) | | | 300 | | | $ | 7,167 | |
Bel Fuse, Inc. - Class B | | | 100 | | | | 1,485 | |
Digi International, Inc. (a) | | | 400 | | | | 3,396 | |
Extreme Networks, Inc. (a) | | | 2,300 | | | | 6,486 | |
Polycom, Inc. (a) | | | 100 | | | | 1,041 | |
Sonus Networks, Inc. (a) | | | 300 | | | | 2,337 | |
| | | | | | | | 21,912 | |
Electronic Equipment, Instruments & Components — 0.8% | | | | | | | | |
Identiv, Inc. (a) | | | 700 | | | | 1,533 | |
KEMET Corporation (a) | | | 300 | | | | 552 | |
Knowles Corporation (a) | | | 500 | | | | 5,690 | |
QLogic Corporation (a) | | | 300 | | | | 3,867 | |
Radisys Corporation (a) | | | 1,700 | | | | 4,386 | |
| | | | | | | | 16,028 | |
Internet Software & Services — 4.0% | | | | | | | | |
Carbonite, Inc. (a) | | | 100 | | | | 757 | |
DHI Group, Inc. (a) | | | 3,100 | | | | 24,118 | |
EarthLink Holdings Corporation | | | 700 | | | | 3,948 | |
Marchex, Inc. - Class B | | | 3,200 | | | | 13,728 | |
Marin Software, Inc. (a) | | | 1,500 | | | | 4,500 | |
Match Group, Inc. (a) | | | 300 | | | | 3,267 | |
Monster Worldwide, Inc. (a) | | | 2,800 | | | | 8,344 | |
Travelzoo, Inc. (a) | | | 200 | | | | 1,570 | |
United Online, Inc. (a) | | | 800 | | | | 9,848 | |
XO Group, Inc. (a) | | | 400 | | | | 5,712 | |
| | | | | | | | 75,792 | |
IT Services — 3.1% | | | | | | | | |
Computer Task Group, Inc. | | | 2,800 | | | | 13,244 | |
CSG Systems International, Inc. | | | 300 | | | | 11,388 | |
Datalink Corporation (a) | | | 600 | | | | 4,296 | |
Everi Holdings, Inc. (a) | | | 1,200 | | | | 3,528 | |
Higher One Holdings, Inc. (a) | | | 200 | | | | 860 | |
ManTech International Corporation - Class A | | | 700 | | | | 20,391 | |
Unisys Corporation (a) | | | 500 | | | | 5,385 | |
| | | | | | | | 59,092 | |
Semiconductors & Semiconductor Equipment — 3.3% | | | | | | | | |
Advanced Energy Industries, Inc. (a) | | | 50 | | | | 1,491 | |
Alpha & Omega Semiconductor Ltd. (a) | | | 2,100 | | | | 24,843 | |
Axcelis Technologies, Inc. (a) | | | 5,600 | | | | 14,000 | |
IXYS Corporation | | | 1,000 | | | | 11,280 | |
Sigma Designs, Inc. (a) | | | 500 | | | | 3,440 | |
13
ALAMBIC SMALL CAP VALUE PLUS FUND
SCHEDULE OF INVESTMENTS (Continued) |
COMMON STOCKS — 95.0% (Continued) | | Shares | | | Value | |
Information Technology — 15.7% (Continued) | | | | | | |
Semiconductors & Semiconductor Equipment — 3.3% (Continued) | | | | | | |
SunEdison Semiconductor Ltd. (a) | | | 1,200 | | | $ | 8,196 | |
| | | | | | | | 63,250 | |
Software — 2.7% | | | | | | | | |
ACI Worldwide, Inc. (a) | | | 300 | | | | 5,598 | |
American Software, Inc. - Class A | | | 1,900 | | | | 17,860 | |
BSQUARE Corporation (a) | | | 400 | | | | 2,280 | |
EnerNOC, Inc. (a) | | | 400 | | | | 2,456 | |
GlobalSCAPE, Inc. | | | 300 | | | | 1,131 | |
Glu Mobile, Inc. (a) | | | 2,200 | | | | 8,162 | |
MicroStrategy, Inc. - Class A (a) | | | 30 | | | | 4,827 | |
Progress Software Corporation (a) | | | 100 | | | | 2,522 | |
QAD, Inc. - Class A | | | 200 | | | | 3,914 | |
Rovi Corporation (a) | | | 100 | | | | 2,278 | |
| | | | | | | | 51,028 | |
Technology Hardware, Storage & Peripherals — 0.7% | | | | | | | | |
HP, Inc. | | | 1,200 | | | | 12,828 | |
| | | | | | | | | |
Materials — 7.0% | | | | | | | | |
Chemicals — 4.6% | | | | | | | | |
AgroFresh Solutions, Inc. (a) | | | 2,500 | | | | 12,225 | |
Chase Corporation | | | 490 | | | | 23,040 | |
Codexis, Inc. (a) | | | 1,100 | | | | 4,466 | |
Core Molding Technologies, Inc. (a) | | | 100 | | | | 1,138 | |
KMG Chemicals, Inc. | | | 200 | | | | 4,290 | |
OMNOVA Solutions, Inc. (a) | | | 2,630 | | | | 13,781 | |
Trecora Resources (a) | | | 300 | | | | 2,898 | |
Tredegar Corporation | | | 1,300 | | | | 17,849 | |
Trinseo S.A. (a) | | | 300 | | | | 8,943 | |
| | | | | | | | 88,630 | |
Construction Materials — 0.5% | | | | | | | | |
United States Lime & Minerals, Inc. | | | 170 | | | | 9,040 | |
| | | | | | | | | |
Containers & Packaging — 1.2% | | | | | | | | |
AEP Industries, Inc. | | | 20 | | | | 1,574 | |
Greif, Inc. - Class A | | | 750 | | | | 19,883 | |
UFP Technologies, Inc. (a) | | | 100 | | | | 2,237 | |
| | | | | | | | 23,694 | |
Metals & Mining — 0.7% | | | | | | | | |
Commercial Metals Company | | | 200 | | | | 2,938 | |
Handy & Harman Ltd. (a) | | | 100 | | | | 1,995 | |
Materion Corporation | | | 300 | | | | 7,824 | |
| | | | | | | | 12,757 | |
14
ALAMBIC SMALL CAP VALUE PLUS FUND
SCHEDULE OF INVESTMENTS (Continued) |
| COMMON STOCKS — 95.0% (Continued) | | Shares | | | Value | |
| Telecommunication Services — 2.8% | | | | | | |
| Diversified Telecommunication Services — 1.9% | | | | | | |
| CenturyLink, Inc. | | | 100 | | | $ | 3,059 | |
FairPoint Communications, Inc. (a) | | | 1,800 | | | | 27,054 | |
| Windstream Holdings, Inc. | | | 800 | | | | 6,016 | |
| | | | | | | | 36,129 | |
| Wireless Telecommunication Services — 0.9% | | | | | | | | |
Spōk Holdings, Inc. | | | 1,000 | | | | 17,720 | |
| | | | | | | | | |
Total Common Stocks — 95.0% (Cost $1,763,341) | | | | | | $ | 1,811,263 | |
| | | | | | | | | |
| Other Assets in Excess of Liabilities — 5.0% | | | | | | | 94,696 | |
| | | | | | | | | |
| Net Assets — 100.0% | | | | | | $ | 1,905,959 | |
(a) | Non-income producing security. |
See accompanying notes to financial statements. |
15
ALAMBIC SMALL CAP GROWTH PLUS FUND
SCHEDULE OF INVESTMENTS
February 29, 2016 (Unaudited) |
COMMON STOCKS — 95.4% | | Shares | | | Value | |
Consumer Discretionary — 19.5% | | | | | | |
Auto Components — 1.3% | | | | | | |
Dana Holding Corporation | | | 300 | | | $ | 3,732 | |
Goodyear Tire & Rubber Company (The) | | | 300 | | | | 9,036 | |
Tenneco, Inc. (a) | | | 60 | | | | 2,731 | |
| | | | | | | | 15,499 | |
Distributors — 0.4% | | | | | | | | |
Weyco Group, Inc. | | | 150 | | | | 4,083 | |
| | | | | | | | | |
Diversified Consumer Services — 0.3% | | | | | | | | |
Bridgepoint Education, Inc. (a) | | | 317 | | | | 2,007 | |
K12, Inc. (a) | | | 200 | | | | 1,958 | |
| | | | | | | | 3,965 | |
Hotels, Restaurants & Leisure — 3.8% | | | | | | | | |
Caesars Acquisition Company - Class A (a) | | | 500 | | | | 3,030 | |
Carrols Restaurant Group, Inc. (a) | | | 300 | | | | 3,981 | |
Del Taco Restaurants, Inc. (a) | | | 1,300 | | | | 14,079 | |
Hyatt Hotels Corporation - Class A (a) | | | 120 | | | | 5,538 | |
Isle of Capri Casinos, Inc. (a) | | | 400 | | | | 4,540 | |
J. Alexander's Holdings, Inc. (a) | | | 200 | | | | 2,076 | |
Monarch Casino & Resort, Inc. (a) | | | 50 | | | | 1,006 | |
Nathan's Famous, Inc. | | | 100 | | | | 5,051 | |
Potbelly Corporation (a) | | | 200 | | | | 2,510 | |
Scientific Games Corporation - Class A (a) | | | 300 | | | | 2,553 | |
| | | | | | | | 44,364 | |
Household Durables — 2.7% | | | | | | | | |
CSS Industries, Inc. | | | 180 | | | | 4,873 | |
Ethan Allen Interiors, Inc. | | | 50 | | | | 1,426 | |
Hovnanian Enterprises, Inc. - Class A (a) | | | 1,500 | | | | 2,265 | |
iRobot Corporation (a) | | | 150 | | | | 4,701 | |
La-Z-Boy, Inc. | | | 300 | | | | 7,305 | |
Lifetime Brands, Inc. | | | 300 | | | | 3,588 | |
Skullcandy, Inc. (a) | | | 600 | | | | 2,124 | |
Tempur Sealy International, Inc. (a) | | | 40 | | | | 2,307 | |
ZAGG, Inc. (a) | | | 300 | | | | 3,126 | |
| | | | | | | | 31,715 | |
Internet & Catalog Retail — 1.4% | | | | | | | | |
Gaiam, Inc. - Class A (a) | | | 500 | | | | 2,835 | |
NutriSystem, Inc. | | | 400 | | | | 8,140 | |
PetMed Express, Inc. | | | 300 | | | | 4,950 | |
| | | | | | | | 15,925 | |
16
ALAMBIC SMALL CAP GROWTH PLUS FUND
SCHEDULE OF INVESTMENTS (Continued) |
COMMON STOCKS — 95.4% (Continued) | | Shares | | | Value | |
Consumer Discretionary — 19.5% (Continued) | | | | | | |
Leisure Products — 0.5% | | | | | | |
JAKKS Pacific, Inc. (a) | | | 400 | | | $ | 2,896 | |
Johnson Outdoors, Inc. - Class A | | | 150 | | | | 3,290 | |
| | | | | | | | 6,186 | |
Media — 3.3% | | | | | | | | |
Crown Media Holdings, Inc. - Class A (a) | | | 1,700 | | | | 7,463 | |
Discovery Communications, Inc. - Series A (a) | | | 150 | | | | 3,750 | |
Harte-Hanks, Inc. | | | 2,300 | | | | 7,107 | |
Lee Enterprises, Inc. (a) | | | 2,400 | | | | 3,192 | |
MSG Networks, Inc. - Class A (a) | | | 500 | | | | 8,210 | |
Time, Inc. | | | 600 | | | | 8,460 | |
| | | | | | | | 38,182 | |
Multiline Retail — 0.7% | | | | | | | | |
Fred's, Inc. - Class A | | | 300 | | | | 4,287 | |
Tuesday Morning Corporation (a) | | | 600 | | | | 4,038 | |
| | | | | | | | 8,325 | |
Specialty Retail — 4.5% | | | | | | | | |
American Eagle Outfitters, Inc. | | | 200 | | | | 3,052 | |
Barnes & Noble Education, Inc. (a) | | | 200 | | | | 2,136 | |
Buckle, Inc. (The) | | | 150 | | | | 4,770 | |
Christopher & Banks Corporation (a) | | | 3,500 | | | | 4,935 | |
Haverty Furniture Companies, Inc. | | | 500 | | | | 9,720 | |
Murphy USA, Inc. (a) | | | 20 | | | | 1,274 | |
Office Depot, Inc. (a) | | | 800 | | | | 4,064 | |
Rent-A-Center, Inc. | | | 100 | | | | 1,277 | |
Shoe Carnival, Inc. | | | 100 | | | | 2,357 | |
Staples, Inc. | | | 600 | | | | 5,670 | |
Tilly's, Inc. - Class A (a) | | | 300 | | | | 2,157 | |
Vitamin Shoppe, Inc. (a) | | | 400 | | | | 11,036 | |
| | | | | | | | 52,448 | |
Textiles, Apparel & Luxury Goods — 0.6% | | | | | | | | |
Fossil Group, Inc. (a) | | | 140 | | | | 6,567 | |
| | | | | | | | | |
Consumer Staples — 5.1% | | | | | | | | |
Food & Staples Retailing — 0.8% | | | | | | | | |
SpartanNash Company | | | 200 | | | | 5,490 | |
SUPERVALU, Inc. (a) | | | 300 | | | | 1,533 | |
Village Super Market, Inc. - Class A | | | 100 | | | | 2,651 | |
| | | | | | | | 9,674 | |
Food Products — 2.9% | | | | | | | | |
Bunge Ltd. | | | 140 | | | | 6,961 | |
Dean Foods Company | | | 650 | | | | 12,539 | |
17
ALAMBIC SMALL CAP GROWTH PLUS FUND
SCHEDULE OF INVESTMENTS (Continued) |
COMMON STOCKS — 95.4% (Continued) | | Shares | | | Value | |
Consumer Staples — 5.1% (Continued) | | | | | | |
Food Products — 2.9% (Continued) | | | | | | |
Farmer Brothers Company (a) | | | 240 | | | $ | 6,326 | |
General Mills, Inc. | | | 140 | | | | 8,239 | |
| | | | | | | | 34,065 | |
Household Products — 0.6% | | | | | | | | |
Energizer Holdings, Inc. | | | 80 | | | | 3,115 | |
Oil-Dri Corporation of America | | | 100 | | | | 3,684 | |
| | | | | | | | 6,799 | |
Personal Products — 0.8% | | | | | | | | |
Natural Alternatives International, Inc. (a) | | | 700 | | | | 8,666 | |
| | | | | | | | | |
Energy — 2.0% | | | | | | | | |
Energy Equipment & Services — 0.5% | | | | | | | | |
Dawson Geophysical Company (a) | | | 400 | | | | 1,364 | |
Gulf Island Fabrication, Inc. | | | 200 | | | | 1,782 | |
RigNet, Inc. (a) | | | 200 | | | | 2,640 | |
| | | | | | | | 5,786 | |
Oil, Gas & Consumable Fuels — 1.5% | | | | | | | | |
Alon USA Energy, Inc. | | | 350 | | | | 3,451 | |
EP Energy Corporation - Class A (a) | | | 2,300 | | | | 3,956 | |
Marathon Oil Corporation | | | 400 | | | | 3,284 | |
Murphy Oil Corporation | | | 150 | | | | 2,577 | |
ONEOK, Inc. | | | 150 | | | | 3,600 | |
| | | | | | | | 16,868 | |
Financials — 1.2% | | | | | | | | |
Capital Markets — 0.2% | | | | | | | | |
Charles Schwab Corporation (The) | | | 50 | | | | 1,252 | |
E*TRADE Financial Corporation (a) | | | 50 | | | | 1,173 | |
| | | | | | | | 2,425 | |
Consumer Finance — 0.1% | | | | | | | | |
OneMain Holdings, Inc. (a) | | | 50 | | | | 1,129 | |
| | | | | | | | | |
Insurance — 0.4% | | | | | | | | |
American Equity Investment Life Holding Company | | | 150 | | | | 2,040 | |
CNO Financial Group, Inc. | | | 100 | | | | 1,743 | |
Genworth Financial, Inc. - Class A (a) | | | 500 | | | | 1,060 | |
| | | | | | | | 4,843 | |
Real Estate Investment Trusts (REITs) — 0.5% | | | | | | | | |
Ladder Capital Corporation | | | 400 | | | | 4,136 | |
MFA Financial, Inc. | | | 200 | | | | 1,362 | |
| | | | | | | | 5,498 | |
18
ALAMBIC SMALL CAP GROWTH PLUS FUND
SCHEDULE OF INVESTMENTS (Continued) |
COMMON STOCKS — 95.4% (Continued) | | Shares | | | Value | |
Health Care — 18.9% | | | | | | |
Biotechnology — 7.0% | | | | | | |
Acceleron Pharma, Inc. (a) | | | 60 | | | $ | 1,520 | |
Aegerion Pharmaceuticals, Inc. (a) | | | 800 | | | | 4,512 | |
Alder Biopharmaceuticals, Inc. (a) | | | 50 | | | | 949 | |
Alexion Pharmaceuticals, Inc. (a) | | | 10 | | | | 1,408 | |
Anacor Pharmaceuticals, Inc. (a) | | | 100 | | | | 6,378 | |
Anavex Life Sciences Corporation (a) | | | 300 | | | | 1,341 | |
Applied Genetic Technologies Corporation (a) | | | 100 | | | | 1,327 | |
ARCA biopharma, Inc. (a) | | | 300 | | | | 1,032 | |
ArQule, Inc. (a) | | | 1,600 | | | | 3,024 | |
Array BioPharma, Inc. (a) | | | 400 | | | | 1,004 | |
aTyr Pharma, Inc. (a) | | | 400 | | | | 1,788 | |
Baxalta, Inc. | | | 40 | | | | 1,541 | |
Biogen, Inc. (a) | | | 10 | | | | 2,594 | |
Catabasis Pharmaceuticals, Inc. (a) | | | 300 | | | | 1,260 | |
Cepheid, Inc. (a) | | | 100 | | | | 2,968 | |
ContraFect Corporation (a) | | | 200 | | | | 680 | |
Cytokinetics, Inc. (a) | | | 200 | | | | 1,260 | |
Emergent BioSolutions, Inc. (a) | | | 100 | | | | 3,383 | |
Exelixis, Inc. (a) | | | 500 | | | | 1,820 | |
Geron Corporation (a) | | | 500 | | | | 1,205 | |
Gilead Sciences, Inc. | | | 20 | | | | 1,745 | |
Halozyme Therapeutics, Inc. (a) | | | 400 | | | | 3,252 | |
Incyte Corporation (a) | | | 20 | | | | 1,470 | |
Inovio Pharmaceuticals, Inc. (a) | | | 200 | | | | 1,260 | |
Intrexon Corporation (a) | | | 100 | | | | 3,095 | |
Ionis Pharmaceuticals, Inc. (a) | | | 80 | | | | 2,765 | |
Ironwood Pharmaceuticals, Inc. (a) | | | 300 | | | | 2,895 | |
MacroGenics, Inc. (a) | | | 100 | | | | 1,598 | |
Medivation, Inc. (a) | | | 50 | | | | 1,788 | |
MiMedx Group, Inc. (a) | | | 300 | | | | 2,469 | |
Novavax, Inc. (a) | | | 200 | | | | 872 | |
Osiris Therapeutics, Inc. (a) | | | 100 | | | | 714 | |
Repligen Corporation (a) | | | 50 | | | | 1,287 | |
Retrophin, Inc. (a) | | | 150 | | | | 2,135 | |
Rigel Pharmaceuticals, Inc. (a) | | | 600 | | | | 1,362 | |
Sage Therapeutics, Inc. (a) | | | 60 | | | | 1,764 | |
Seattle Genetics, Inc. (a) | | | 160 | | | | 4,830 | |
Spectrum Pharmaceuticals, Inc. (a) | | | 300 | | | | 1,356 | |
Vanda Pharmaceuticals, Inc. (a) | | | 300 | | | | 2,355 | |
Vertex Pharmaceuticals, Inc. (a) | | | 20 | | | | 1,710 | |
| | | | | | | | 81,716 | |
19
ALAMBIC SMALL CAP GROWTH PLUS FUND
SCHEDULE OF INVESTMENTS (Continued) |
COMMON STOCKS — 95.4% (Continued) | | Shares | | | Value | |
Health Care — 18.9% (Continued) | | | | | | |
Health Care Equipment & Supplies — 3.8% | | | | | | |
AngioDynamics, Inc. (a) | | | 900 | | | $ | 9,783 | |
Baxter International, Inc. | | | 40 | | | | 1,581 | |
DENTSPLY International, Inc. | | | 140 | | | | 8,534 | |
Exactech, Inc. (a) | | | 250 | | | | 4,663 | |
HeartWare International, Inc. (a) | | | 50 | | | | 1,598 | |
Hologic, Inc. (a) | | | 100 | | | | 3,463 | |
Integra LifeSciences Holdings Corporation (a) | | | 40 | | | | 2,454 | |
InVivo Therapeutics Holdings Corporation (a) | | | 1,000 | | | | 4,690 | |
Lantheus Holdings, Inc. (a) | | | 600 | | | | 1,272 | |
SurModics, Inc. (a) | | | 300 | | | | 5,598 | |
| | | | | | | | 43,636 | |
Health Care Providers & Services — 2.7% | | | | | | | | |
Alliance HealthCare Services, Inc. (a) | | | 400 | | | | 2,860 | |
BioTelemetry, Inc. (a) | | | 400 | | | | 4,824 | |
Express Scripts Holding Company (a) | | | 60 | | | | 4,223 | |
Health Net, Inc. (a) | | | 20 | | | | 1,244 | |
Healthways, Inc. (a) | | | 100 | | | | 1,053 | |
HMS Holdings Corporation (a) | | | 300 | | | | 3,951 | |
Landauer, Inc. | | | 50 | | | | 1,454 | |
National Research Corporation - Class A | | | 285 | | | | 4,266 | |
Quest Diagnostics, Inc. | | | 80 | | | | 5,322 | |
RadNet, Inc. (a) | | | 300 | | | | 1,710 | |
VCA, Inc. (a) | | | 20 | | | | 1,021 | |
| | | | | | | | 31,928 | |
Health Care Technology — 1.1% | | | | | | | | |
IMS Health Holdings, Inc. (a) | | | 200 | | | | 5,156 | |
Omnicell, Inc. (a) | | | 50 | | | | 1,369 | |
Quality Systems, Inc. | | | 400 | | | | 6,220 | |
| | | | | | | | 12,745 | |
Life Sciences Tools & Services — 1.4% | | | | | | | | |
Bruker Corporation (a) | | | 150 | | | | 3,897 | |
Charles River Laboratories International, Inc. (a) | | | 30 | | | | 2,203 | |
PAREXEL International Corporation (a) | | | 40 | | | | 2,347 | |
PerkinElmer, Inc. | | | 160 | | | | 7,562 | |
| | | | | | | | 16,009 | |
Pharmaceuticals — 2.9% | | | | | | | | |
AbbVie, Inc. | | | 20 | | | | 1,092 | |
Bristol-Myers Squibb Company | | | 60 | | | | 3,716 | |
Cempra, Inc. (a) | | | 150 | | | | 2,524 | |
Corcept Therapeutics, Inc. (a) | | | 300 | | | | 1,146 | |
Juniper Pharmaceuticals, Inc. (a) | | | 300 | | | | 2,247 | |
20
ALAMBIC SMALL CAP GROWTH PLUS FUND
SCHEDULE OF INVESTMENTS (Continued) |
COMMON STOCKS — 95.4% (Continued) | | Shares | | | Value | |
Health Care — 18.9% (Continued) | | | | | | |
Pharmaceuticals — 2.9% (Continued) | | | | | | |
Merck & Company, Inc. | | | 60 | | | $ | 3,013 | |
Nektar Therapeutics (a) | | | 100 | | | | 1,117 | |
Phibro Animal Health Corporation - Class A | | | 180 | | | | 4,979 | |
Prestige Brands Holdings, Inc. (a) | | | 220 | | | | 10,758 | |
Sagent Pharmaceuticals, Inc. (a) | | | 150 | | | | 2,127 | |
TherapeuticsMD, Inc. (a) | | | 200 | | | | 1,222 | |
| | | | | | | | 33,941 | |
Industrials — 14.8% | | | | | | | | |
Aerospace & Defense — 1.3% | | | | | | | | |
AAR Corporation | | | 50 | | | | 1,064 | |
Astronics Corporation (a) | | | 150 | | | | 4,772 | |
Teledyne Technologies, Inc. (a) | | | 90 | | | | 7,666 | |
Vectrus, Inc. (a) | | | 100 | | | | 1,925 | |
| | | | | | | | 15,427 | |
Building Products — 1.0% | | | | | | | | |
Insteel Industries, Inc. | | | 150 | | | | 3,927 | |
Ply Gem Holdings, Inc. (a) | | | 200 | | | | 2,040 | |
Quanex Building Products Corporation | | | 100 | | | | 1,722 | |
Simpson Manufacturing Company, Inc. | | | 100 | | | | 3,394 | |
| | | | | | | | 11,083 | |
Commercial Services & Supplies — 1.5% | | | | | | | | |
ARC Document Solutions, Inc. (a) | | | 300 | | | | 1,050 | |
Brink's Company (The) | | | 180 | | | | 5,265 | |
Deluxe Corporation | | | 60 | | | | 3,445 | |
Kimball International, Inc. - Class B | | | 351 | | | | 3,696 | |
Quad/Graphics, Inc. | | | 300 | | | | 3,798 | |
| | | | | | | | 17,254 | |
Construction & Engineering — 1.0% | | | | | | | | |
Aegion Corporation (a) | | | 100 | | | | 1,811 | |
Granite Construction, Inc. | | | 60 | | | | 2,487 | |
Jacobs Engineering Group, Inc. (a) | | | 60 | | | | 2,319 | |
Sterling Construction Company, Inc. (a) | | | 900 | | | | 4,860 | |
| | | | | | | | 11,477 | |
Electrical Equipment — 1.1% | | | | | | | | |
Allied Motion Technologies, Inc. | | | 250 | | | | 4,615 | |
Belden, Inc. | | | 100 | | | | 5,477 | |
EnerSys | | | 40 | | | | 2,054 | |
General Cable Corporation | | | 130 | | | | 1,117 | |
| | | | | | | | 13,263 | |
Industrial Conglomerates — 0.8% | | | | | | | | |
Carlisle Companies, Inc. | | | 110 | | | | 9,917 | |
21
ALAMBIC SMALL CAP GROWTH PLUS FUND
SCHEDULE OF INVESTMENTS (Continued) |
COMMON STOCKS — 95.4% (Continued) | | Shares | | | Value | |
Industrials — 14.8% (Continued) | | | | | | |
Machinery — 3.9% | | | | | | |
AGCO Corporation | | | 80 | | | $ | 3,959 | |
Altra Industrial Motion Corporation | | | 50 | | | | 1,215 | |
CIRCOR International, Inc. | | | 80 | | | | 3,207 | |
Commercial Vehicle Group, Inc. (a) | | | 852 | | | | 2,139 | |
FreightCar America, Inc. | | | 350 | | | | 5,204 | |
Hurco Companies, Inc. | | | 50 | | | | 1,297 | |
ITT Corporation | | | 60 | | | | 2,116 | |
Joy Global, Inc. | | | 100 | | | | 1,292 | |
Kadant, Inc. | | | 80 | | | | 3,054 | |
L.B. Foster Company - Class A | | | 100 | | | | 1,374 | |
L.S. Starrett Company (The) - Class A | | | 400 | | | | 3,772 | |
Lydall, Inc. (a) | | | 150 | | | | 4,343 | |
Navistar International Corporation (a) | | | 700 | | | | 5,887 | |
Terex Corporation | | | 250 | | | | 5,595 | |
Timken Company (The) | | | 50 | | | | 1,492 | |
| | | | | | | | 45,946 | |
Professional Services — 0.8% | | | | | | | | |
CDI Corporation | | | 600 | | | | 2,928 | |
Mistras Group, Inc. (a) | | | 150 | | | | 3,219 | |
Resources Connection, Inc. | | | 200 | | | | 2,774 | |
| | | | | | | | 8,921 | |
Road & Rail — 1.8% | | | | | | | | |
Avis Budget Group, Inc. (a) | | | 310 | | | | 7,948 | |
Hertz Global Holdings, Inc. (a) | | | 850 | | | | 7,225 | |
PAM Transportation Services, Inc. (a) | | | 150 | | | | 4,286 | |
Swift Transportation Company (a) | | | 100 | | | | 1,704 | |
| | | | | | | | 21,163 | |
Trading Companies & Distributors — 0.8% | | | | | | | | |
H&E Equipment Services, Inc. | | | 100 | | | | 1,317 | |
HD Supply Holdings, Inc. (a) | | | 50 | | | | 1,390 | |
United Rentals, Inc. (a) | | | 120 | | | | 6,188 | |
| | | | | | | | 8,895 | |
Transportation Infrastructure — 0.8% | | | | | | | | |
Wesco Aircraft Holdings, Inc. (a) | | | 700 | | | | 8,953 | |
| | | | | | | | | |
Information Technology — 25.0% | | | | | | | | |
Communications Equipment — 2.0% | | | | | | | | |
Arris International plc (a) | | | 250 | | | | 5,973 | |
Bel Fuse, Inc. - Class B | | | 250 | | | | 3,712 | |
Extreme Networks, Inc. (a) | | | 1,400 | | | | 3,948 | |
Ixia (a) | | | 100 | | | | 1,141 | |
22
ALAMBIC SMALL CAP GROWTH PLUS FUND
SCHEDULE OF INVESTMENTS (Continued) |
COMMON STOCKS — 95.4% (Continued) | | Shares | | | Value | |
Information Technology — 25.0% (Continued) | | | | | | |
Communications Equipment — 2.0% (Continued) | | | | | | |
Polycom, Inc. (a) | | | 200 | | | $ | 2,082 | |
Sonus Networks, Inc. (a) | | | 600 | | | | 4,674 | |
TESSCO Technologies, Inc. | | | 100 | | | | 1,750 | |
| | | | | | | | 23,280 | |
Electronic Equipment, Instruments & Components — 3.5% | | | | | | | | |
Identiv, Inc. (a) | | | 900 | | | | 1,971 | |
Itron, Inc. (a) | | | 40 | | | | 1,594 | |
KEMET Corporation (a) | | | 1,100 | | | | 2,024 | |
Knowles Corporation (a) | | | 900 | | | | 10,242 | |
Methode Electronics, Inc. | | | 50 | | | | 1,428 | |
Multi-Fineline Electronix, Inc. (a) | | | 300 | | | | 6,771 | |
Newport Corporation (a) | | | 200 | | | | 4,554 | |
OSI Systems, Inc. (a) | | | 100 | | | | 6,037 | |
QLogic Corporation (a) | | | 100 | | | | 1,289 | |
Radisys Corporation (a) | | | 1,700 | | | | 4,386 | |
| | | | | | | | 40,296 | |
Internet Software & Services — 2.9% | | | | | | | | |
Bankrate, Inc. (a) | | | 600 | | | | 4,596 | |
Brightcove, Inc. (a) | | | 400 | | | | 2,400 | |
comScore, Inc. (a) | | | 40 | | | | 1,646 | |
DHI Group, Inc. (a) | | | 300 | | | | 2,334 | |
GrubHub, Inc. (a) | | | 50 | | | | 1,177 | |
LivePerson, Inc. (a) | | | 400 | | | | 2,052 | |
Marchex, Inc. - Class B | | | 300 | | | | 1,287 | |
Marin Software, Inc. (a) | | | 500 | | | | 1,500 | |
MeetMe, Inc. (a) | | | 500 | | | | 1,555 | |
Monster Worldwide, Inc. (a) | | | 700 | | | | 2,086 | |
Perficient, Inc. (a) | | | 150 | | | | 2,708 | |
Travelzoo, Inc. (a) | | | 200 | | | | 1,570 | |
United Online, Inc. (a) | | | 600 | | | | 7,386 | |
Web.com Group, Inc. (a) | | | 100 | | | | 1,815 | |
| | | | | | | | 34,112 | |
IT Services — 5.1% | | | | | | | | |
CACI International, Inc. - Class A (a) | | | 50 | | | | 4,831 | |
Computer Task Group, Inc. | | | 1,100 | | | | 5,203 | |
CSRA, Inc. | | | 50 | | | | 1,297 | |
Everi Holdings, Inc. (a) | | | 500 | | | | 1,470 | |
EVERTEC, Inc. | | | 1,000 | | | | 11,900 | |
Leidos Holdings, Inc. | | | 100 | | | | 4,322 | |
NeuStar, Inc. - Class A (a) | | | 250 | | | | 6,218 | |
Syntel, Inc. (a) | | | 220 | | | | 10,058 | |
23
ALAMBIC SMALL CAP GROWTH PLUS FUND
SCHEDULE OF INVESTMENTS (Continued) |
COMMON STOCKS — 95.4% (Continued) | | Shares | | | Value | |
Information Technology — 25.0% (Continued) | | | | | | |
IT Services — 5.1% (Continued) | | | | | | |
Teradata Corporation (a) | | | 200 | | | $ | 4,990 | |
Unisys Corporation (a) | | | 200 | | | | 2,154 | |
VeriFone Systems, Inc. (a) | | | 300 | | | | 7,167 | |
| | | | | | | | 59,610 | |
Semiconductors & Semiconductor Equipment — 3.7% | | | | | | | | |
Advanced Energy Industries, Inc. (a) | | | 50 | | | | 1,491 | |
Alpha & Omega Semiconductor Ltd. (a) | | | 600 | | | | 7,098 | |
Ambarella, Inc. (a) | | | 40 | | | | 1,856 | |
Axcelis Technologies, Inc. (a) | | | 1,400 | | | | 3,500 | |
CVD Equipment Corporation (a) | | | 100 | | | | 839 | |
Qorvo, Inc. (a) | | | 60 | | | | 2,705 | |
Rudolph Technologies, Inc. (a) | | | 500 | | | | 6,480 | |
Sigma Designs, Inc. (a) | | | 400 | | | | 2,752 | |
Synaptics, Inc. (a) | | | 60 | | | | 4,873 | |
Texas Instruments, Inc. | | | 100 | | | | 5,302 | |
Veeco Instruments, Inc. (a) | | | 300 | | | | 5,565 | |
| | | | | | | | 42,461 | |
Software — 6.2% | | | | | | | | |
ACI Worldwide, Inc. (a) | | | 150 | | | | 2,799 | |
Autodesk, Inc. (a) | | | 20 | | | | 1,035 | |
BSQUARE Corporation (a) | | | 1,100 | | | | 6,270 | |
CA, Inc. | | | 50 | | | | 1,464 | |
Cadence Design Systems, Inc. (a) | | | 50 | | | | 1,077 | |
CDK Global, Inc. | | | 140 | | | | 6,285 | |
EnerNOC, Inc. (a) | | | 1,100 | | | | 6,754 | |
EPIQ Systems, Inc. | | | 350 | | | | 4,788 | |
Glu Mobile, Inc. (a) | | | 700 | | | | 2,597 | |
Interactive Intelligence Group, Inc. (a) | | | 150 | | | | 4,489 | |
MicroStrategy, Inc. - Class A (a) | | | 10 | | | | 1,609 | |
Pegasystems, Inc. | | | 100 | | | | 2,435 | |
Progress Software Corporation (a) | | | 100 | | | | 2,522 | |
PTC, Inc. (a) | | | 160 | | | | 4,946 | |
Rovi Corporation (a) | | | 400 | | | | 9,112 | |
Solera Holdings, Inc. | | | 20 | | | | 1,114 | |
Synchronoss Technologies, Inc. (a) | | | 180 | | | | 5,042 | |
TiVo, Inc. (a) | | | 500 | | | | 4,195 | |
Zynga, Inc. - Class A (a) | | | 1,900 | | | | 4,009 | |
| | | | | | | | 72,542 | |
Technology Hardware, Storage & Peripherals — 1.6% | | | | | | | | |
Avid Technology, Inc. (a) | | | 700 | | | | 5,355 | |
CPI Card Group, Inc. (a) | | | 400 | | | | 3,164 | |
24
ALAMBIC SMALL CAP GROWTH PLUS FUND
SCHEDULE OF INVESTMENTS (Continued) |
COMMON STOCKS — 95.4% (Continued) | | Shares | | | Value | |
Information Technology — 25.0% (Continued) | | | | | | |
Technology Hardware, Storage & Peripherals — 1.6% (Continued) | | | | | | |
Cray, Inc. (a) | | | 50 | | | $ | 2,121 | |
HP, Inc. | | | 700 | | | | 7,483 | |
| | | | | | | | 18,123 | |
Materials — 6.6% | | | | | | | | |
Chemicals — 3.8% | | | | | | | | |
AgroFresh Solutions, Inc. (a) | | | 800 | | | | 3,912 | |
Axiall Corporation | | | 500 | | | | 9,950 | |
Chase Corporation | | | 160 | | | | 7,523 | |
Codexis, Inc. (a) | | | 600 | | | | 2,436 | |
OMNOVA Solutions, Inc. (a) | | | 411 | | | | 2,154 | |
PolyOne Corporation | | | 100 | | | | 2,691 | |
Stepan Company | | | 120 | | | | 5,961 | |
Trecora Resources (a) | | | 100 | | | | 966 | |
Tredegar Corporation | | | 400 | | | | 5,492 | |
Trinseo S.A. (a) | | | 100 | | | | 2,981 | |
| | | | | | | | 44,066 | |
Construction Materials — 0.5% | | | | | | | | |
Headwaters, Inc. (a) | | | 300 | | | | 5,286 | |
| | | | | | | | | |
Containers & Packaging — 1.2% | | | | | | | | |
Greif, Inc. - Class A | | | 550 | | | | 14,581 | |
| | | | | | | | | |
Metals & Mining — 1.1% | | | | | | | | |
Commercial Metals Company | | | 100 | | | | 1,469 | |
Handy & Harman Ltd. (a) | | | 100 | | | | 1,995 | |
Materion Corporation | | | 150 | | | | 3,912 | |
Reliance Steel & Aluminum Company | | | 60 | | | | 3,653 | |
Schnitzer Steel Industries, Inc. - Class A | | | 100 | | | | 1,464 | |
| | | | | | | | 12,493 | |
Telecommunication Services — 2.3% | | | | | | | | |
Diversified Telecommunication Services — 1.5% | | | | | | | | |
CenturyLink, Inc. | | | 150 | | | | 4,588 | |
FairPoint Communications, Inc. (a) | | | 300 | | | | 4,509 | |
Verizon Communications, Inc. | | | 160 | | | | 8,117 | |
| | | | | | | | 17,214 | |
25
ALAMBIC SMALL CAP GROWTH PLUS FUND
SCHEDULE OF INVESTMENTS (Continued) |
| COMMON STOCKS — 95.4% (Continued) | | Shares | | | Value | |
| Telecommunication Services — 2.3% (Continued) | | | | | | |
| Wireless Telecommunication Services — 0.8% | | | | | | |
Spōk Holdings, Inc. | | | 450 | | | $ | 7,974 | |
United States Cellular Corporation (a) | | | 40 | | | | 1,656 | |
| | | | | | | | 9,630 | |
| | | | | | | | | |
Total Common Stocks — 95.4% (Cost $1,124,578) | | | | | | $ | 1,108,980 | |
| | | | | | | | | |
| Other Assets in Excess of Liabilities — 4.6% | | | | | | | 54,226 | |
| | | | | | | | | |
| Net Assets — 100.0% | | | | | | $ | 1,163,206 | |
(a) | Non-income producing security. |
See accompanying notes to financial sttements. |
26
ALAMBIC FUNDS
STATEMENTS OF ASSETS AND LIABILITIES
February 29, 2016 (Unaudited) |
| | Alambic Small Cap Value Plus Fund | | | Alambic Small Cap Growth Plus Fund | |
ASSETS | | | | | | |
Investments in securities: | | | | | | |
At acquisition cost | | $ | 1,763,341 | | | $ | 1,124,578 | |
At value (Note 2) | | $ | 1,811,263 | | | $ | 1,108,980 | |
Cash | | | 88,513 | | | | 79,527 | |
Dividends receivable | | | 1,182 | | | | 1,071 | |
Receivable for investment securities sold | | | 122,149 | | | | 28,971 | |
Receivable from Adviser (Note 4) | | | 18,984 | | | | 21,334 | |
Other assets | | | 918 | | | | — | |
Total assets | | | 2,043,009 | | | | 1,239,883 | |
| | | | | | | | | |
LIABILITIES | | | | | | | | |
Payable for investment securities purchased | | | 127,155 | | | | 67,625 | |
Payable to administrator (Note 4) | | | 6,003 | | | | 6,001 | |
Other accrued expenses | | | 3,892 | | | | 3,051 | |
Total liabilities | | | 137,050 | | | | 76,677 | |
| | | | | | | | | |
NET ASSETS | | $ | 1,905,959 | | | $ | 1,163,206 | |
| | | | | | | | | |
NET ASSETS CONSIST OF: | | | | | | | | |
Paid-in capital | | $ | 2,010,507 | | | $ | 1,230,000 | |
Accumulated (distributions in excess of) net investment income | | | (793 | ) | | | 49 | |
Accumulated net realized losses from security transactions | | | (151,677 | ) | | | (51,245 | ) |
Net unrealized appreciation (depreciation) on investments | | | 47,922 | | | | (15,598 | ) |
NET ASSETS | | $ | 1,905,959 | | | $ | 1,163,206 | |
| | | | | | | | | |
Shares of beneficial interest outstanding (unlimied number of shares authorized, no par value) | | | 200,792 | | | | 125,442 | |
| | | | | | | | | |
Net asset value, offering price and redemption price per share (Note 2) | | $ | 9.49 | | | $ | 9.27 | |
See accompanying notes to financial statements. |
27
ALAMBIC FUNDS
STATEMENTS OF OPERATIONS
For the Periods Ended February 29, 2016 (Unaudited) |
| | Alambic Small Cap Value Plus Fund(a) | | | Alambic Small Cap Growth Plus Fund(b) | |
INVESTMENT INCOME | | | | | | |
Dividend income | | $ | 15,916 | | | $ | 1,921 | |
Foreign withholding taxes on dividends | | | (2 | ) | | | (1 | ) |
Total investment income | | | 15,914 | | | | 1,920 | |
| | | | | | | | | |
EXPENSES | | | | | | | | |
Fund accounting fees (Note 4) | | | 12,082 | | | | 4,009 | |
Administration fees (Note 4) | | | 12,000 | | | | 4,000 | |
Professional fees | | | 9,781 | | | | 2,716 | |
Investment advisory fees (Note 4) | | | 8,867 | | | | 1,481 | |
Compliance fees (Note 4) | | | 6,000 | | | | 2,000 | |
Transfer agent fees (Note 4) | | | 6,000 | | | | 2,000 | |
Trustees' fees and expenses (Note 4) | | | 5,189 | | | | 2,637 | |
Custody and bank service fees | | | 4,477 | | | | 1,475 | |
Registration and filing fees | | | 2,651 | | | | 1,948 | |
Postage and supplies | | | 3,533 | | | | 1,023 | |
Printing of shareholder reports | | | 810 | | | | 840 | |
Other expenses | | | 2,922 | | | | 558 | |
Total expenses | | | 74,312 | | | | 24,687 | |
Less fee reductions and expense reimbursements by the Adviser (Note 4) | | | (63,112 | ) | | | (22,816 | ) |
Net expenses | | | 11,200 | | | | 1,871 | |
| | | | | | | | | |
NET INVESTMENT INCOME | | | 4,714 | | | | 49 | |
| | | | | | | | | |
REALIZED AND UNREALIZED GAINS (LOSSES) ON INVESTMENTS | | | | | | | | |
Net realized losses from investment transactions | | | (151,677 | ) | | | (51,245 | ) |
Net change in unrealized appreciation (depreciation) on investments | | | 47,922 | | | | (15,598 | ) |
NET REALIZED AND UNREALIZED LOSSES ON INVESTMENTS | | | (103,755 | ) | | | (66,843 | ) |
| | | | | | | | | |
NET DECREASE IN NET ASSETS RESULTING FROM OPERATIONS | | $ | (99,041 | ) | | $ | (66,794 | ) |
(a) | Represents the period from the commencement of operations (September 1, 2015) through February 29, 2016. |
(b) | Represents the period from the commencement of operations (December 29, 2015) through February 29, 2016. |
See accompanying notes to financial statements. |
28
ALAMBIC FUNDS
STATEMENTS OF CHANGES IN NET ASSETS
For the Periods Ended February 29, 2016 (Unaudited) |
| | Alambic Small Cap Value Plus Fund(a) | | | Alambic Small Cap Growth Plus Fund(b) | |
FROM OPERATIONS | | | | | | |
Net investment income | | $ | 4,714 | | | $ | 49 | |
Net realized losses from security transactions | | | (151,677 | ) | | | (51,245 | ) |
Net change in unrealized appreciation (depreciation) on investments | | | 47,922 | | | | (15,598 | ) |
Net decrease in net assets resulting from operations | | | (99,041 | ) | | | (66,794 | ) |
| | | | | | | | | |
DISTRIBUTIONS TO SHAREHOLDERS | | | | | | | | |
From net investment income | | | (5,507 | ) | | | — | |
| | | | | | | | | |
CAPITAL SHARE TRANSACTIONS | | | | | | | | |
Proceeds from shares sold | | | 2,005,000 | | | | 1,230,000 | |
Net asset value of shares issued in reinvestment of distributions to shareholders | | | 5,507 | | | | — | |
Net increase from capital share transactions | | | 2,010,507 | | | | 1,230,000 | |
| | | | | | | | | |
TOTAL INCREASE IN NET ASSETS | | | 1,905,959 | | | | 1,163,206 | |
| | | | | | | | | |
NET ASSETS | | | | | | | | |
Beginning of period | | | — | | | | — | |
End of period | | $ | 1,905,959 | | | $ | 1,163,206 | |
| | | | | | | | | |
ACCUMULATED (DISTRIBUTIONS IN EXCESS OF) NET INVESTMENT INCOME | | $ | (793 | ) | | $ | 49 | |
| | | | | | | | | |
CAPITAL SHARE ACTIVITY | | | | | | | | |
Shares sold | | | 200,250 | | | | 125,442 | |
Shares issued in reinvestment of distributions to shareholders | | | 542 | | | | — | |
Net increase in shares outstanding | | | 200,792 | | | | 125,442 | |
Shares outstanding at beginning of period | | | — | | | | — | |
Shares outstanding at end of period | | | 200,792 | | | | 125,442 | |
(a) | Represents the period from the commencement of operations (September 1, 2015) through February 29, 2016. |
(b) | Represents the period from the commencement of operations (December 29, 2015) through February 29, 2016. |
See accompanying notes to financial statements. |
29
ALAMBIC SMALL CAP VALUE PLUS FUND
FINANCIAL HIGHLIGHTS |
Per Share Data for a Share Outstanding Throughout the Period |
| | Period Ended February 29, 2016(a) (Unaudited) | |
Net asset value at beginning of period | | $ | 10.00 | |
| | | | | |
Income (loss) from investment operations: | | | | |
Net investment income | | | 0.02 | |
Net realized and unrealized losses on investments | | | (0.50 | ) |
Total from investment operations | | | (0.48 | ) |
| | | | | |
Less distributions: | | | | |
Dividends from net investment income | | | (0.03 | ) |
| | | | | |
Net asset value at end of period | | $ | 9.49 | |
| | | | | |
Total return (b) | | | (4.84% | )(c) |
| | | | | |
Net assets at end of period (000's) | | $ | 1,906 | |
| | | | | |
Ratios/supplementary data: | | | | |
Ratio of total expenses to average net assets | | | 7.93 | %(d) |
| | | | | |
Ratio of net expenses to average net assets (e) | | | 1.20 | %(d) |
| | | | | |
Ratio of net investment income to average net assets (e) | | | 0.50 | %(d) |
| | | | | |
Portfolio turnover rate | | | 176 | %(c) |
(a) | Represents the period from the commencement of operations (September 1, 2015) through February 29, 2016. |
(b) | Total return is a measure of the change in value of an investment in the Fund over the period covered. The return shown does not reflect the deduction of taxes a shareholder would pay on Fund distributions, if any, or the redemption of Fund shares. The total return would be lower if the Adviser had not reduced advisory fees and reimbursed expenses (Note 4). |
(c) | Not annualized. |
(d) | Annualized. |
(e) | Ratio was determined after advisory fee reductions and expense reimbursements (Note 4). |
See accompanying notes to financial statements. |
30
ALAMBIC SMALL CAP GROWTH PLUS FUND
FINANCIAL HIGHLIGHTS |
Per Share Data for a Share Outstanding Throughout the Period |
| | Period Ended February 29, 2016(a)
(Unaudited) | |
Net asset value at beginning of period | | $ | 10.00 | |
| | | | | |
Income (loss) from investment operations: | | | | |
Net investment income | | | 0.00 | (b) |
Net realized and unrealized losses on investments | | | (0.73 | ) |
Total from investment operations | | | (0.73 | ) |
| | | | | |
Net asset value at end of period | | $ | 9.27 | |
| | | | | |
Total return (c) | | | (7.30% | )(d) |
| | | | | |
Net assets at end of period (000's) | | $ | 1,163 | |
| | | | | |
Ratios/supplementary data: | | | | |
Ratio of total expenses to average net assets | | | 15.83 | %(e) |
| | | | | |
Ratio of net expenses to average net assets (f) | | | 1.20 | %(e) |
| | | | | |
Ratio of net investment income to average net assets (f) | | | 0.03 | %(e) |
| | | | | |
Portfolio turnover rate | | | 124 | %(d) |
(a) | Represents the period from the commencement of operations (December 29, 2015) through February 29, 2016. |
(b) | Amount rounds to less than $0.01 per share. |
(c) | Total return is a measure of the change in value of an investment in the Fund over the period covered. The return shown does not reflect the deduction of taxes a shareholder would pay on Fund distributions, if any, or the redemption of Fund shares. The total return would be lower if the Adviser had not reduced advisory fees and reimbursed expenses (Note 4). |
(d) | Not annualized. |
(e) | Annualized. |
(f) | Ratio was determined after advisory fee reductions and expense reimbursements (Note 4). |
See accompanying notes to financial statements. |
31
ALAMBIC FUNDS
NOTES TO FINANCIAL STATEMENTS
February 29, 2016 (Unaudited)
1. Organization
Alambic Small Cap Value Plus Fund and Alambic Small Cap Growth Plus Fund (individually, a “Fund” and collectively, the “Funds”) are each a diversified series of Ultimus Managers Trust (the “Trust”), an open-end investment company established as an Ohio business trust under a Declaration of Trust dated February 28, 2012. Other series of the Trust are not incorporated in this report. Alambic Small Cap Value Plus Fund commenced operations on September 1, 2015. Alambic Small Cap Growth Plus Fund commenced operations on December 29, 2015.
The investment objective of each Fund is long-term capital appreciation.
2. Significant Accounting Policies
The following is a summary of the Funds’ significant accounting policies. The policies are in conformity with accounting principles generally accepted in the United States of America (“GAAP”). As an investment company, as defined in Financial Accounting Standards Board (“FASB”) Accounting Standards Update 2013-08, the Funds follow accounting and reporting guidance under FASB Accounting Standards Codification Topic 946, “Financial Services – Investment Companies.”
Securities valuation – Each Fund values its portfolio securities at market value as of the close of regular trading on the New York Stock Exchange (the “NYSE”) (normally 4:00 p.m. Eastern time) on each business day the NYSE is open for business. The Funds value their listed securities on the basis of the security’s last sale price on the security’s primary exchange, if available, otherwise at the exchange’s most recently quoted bid price. NASDAQ-listed securities are valued at the NASDAQ Official Closing Price. The Funds value securities traded in the over-the-counter market at the last sale price, if available, otherwise at the most recently quoted bid price. In the event that market quotations are not readily available or are considered unreliable due to market or other events, the Funds value their securities and other assets at fair value pursuant to procedures established by and under the direction of the Board of Trustees (the “Board”) of the Trust. Under these procedures, the securities will be classified as Level 2 or 3 within the fair value hierarchy (see below), depending on the inputs used. Unavailable or unreliable market quotes may be due to the following factors: a substantial bid-ask spread; infrequent sales resulting in stale prices; insufficient trading volume; small trade sizes; a temporary lapse in any reliable pricing source; and actions of the securities or futures markets, such as the suspension or limitation of trading. As a result, the prices of securities used to calculate each Fund’s net asset value (“NAV”) may differ from quoted or published prices for the same securities.
GAAP establishes a single authoritative definition of fair value, sets out a framework for measuring fair value, and requires additional disclosures about fair value measurements.
Various inputs are used in determining the value of each Fund’s investments. These inputs are summarized in the three broad levels listed below:
● | Level 1 – quoted prices in active markets for identical securities |
32
ALAMBIC FUNDS
NOTES TO FINANCIAL STATEMENTS (Continued) |
● | Level 2 – other significant observable inputs |
● | Level 3 – significant unobservable inputs |
The inputs or methods used for valuing securities are not necessarily an indication of the risks associated with investing in those securities. The inputs used to measure fair value may fall into different levels of the fair value hierarchy. In such cases, for disclosure purposes, the level in the fair value hierarchy within which the fair value measurement falls in its entirety is determined based on the lowest level input that is significant to the fair value measurement.
The following is a summary of the inputs used to value the Funds’ investments as of February 29, 2016:
Alambic Small Cap Value Plus Fund | | Level 1 | | | Level 2 | | | Level 3 | | | Total | |
Common Stocks | | $ | 1,811,263 | | | $ | — | | | $ | — | | | $ | 1,811,263 | |
Alambic Small Cap Growth Plus Fund | | Level 1 | | | Level 2 | | | Level 3 | | | Total | |
Common Stocks | | $ | 1,108,980 | | | $ | — | | | $ | — | | | $ | 1,108,980 | |
Refer to the Funds’ Schedules of Investments for a listing of common stock by industry type. As of February 29, 2016, the Funds did not have any transfers between Levels. In addition, the Funds did not have derivative instruments or any assets or liabilities that were measured at fair value on a recurring basis using significant unobservable inputs (Level 3) as of February 29, 2016. It is the Funds’ policy to recognize transfers between Levels at the end of the reporting period.
Share valuation – The NAV per share of each Fund is calculated daily by dividing the total value of its assets, less liabilities, by the number of shares outstanding. The offering price and redemption price per share of each Fund is equal to the NAV per share.
Investment income – Dividend income is recorded on the ex-dividend date. Interest income is accrued as earned.
Security transactions – Security transactions are accounted for on the trade date. Gains and losses on securities sold are determined on a specific identification basis.
Common expenses – Common expenses of the Trust are allocated among the Funds and the other series of the Trust based on the relative net assets of each series or the nature of the services performed and the relative applicability to each series.
Distributions to shareholders – The Funds distribute to shareholders any net investment income dividends and net realized capital gains distributions at least once each year. The amount of such dividends and distributions are determined in accordance with federal income tax regulations, which may differ from GAAP. Dividends and distributions to shareholders are recorded on the ex-dividend date. The tax character of distributions paid by Alambic Small
33
ALAMBIC FUNDS
NOTES TO FINANCIAL STATEMENTS (Continued) |
Cap Value Plus Fund to shareholders during the period ended February 29, 2016 was ordinary income. There were no distributions paid by Alambic Small Cap Growth Plus Fund during the period ended February 29, 2016.
Estimates – The preparation of financial statements in conformity with GAAP requires management to make estimates and assumptions which affect the reported amounts of assets and liabilities and disclosure of contingent assets and liabilities as of the date of the financial statements and the reported amounts of income and expenses during the reporting period. Actual results could differ from those estimates.
Federal income tax – Each Fund intends to qualify as a regulated investment company under the Internal Revenue Code of 1986 (the “Code”). Qualification generally will relieve each Fund of liability for federal income taxes to the extent 100% of its net investment income and net realized capital gains are distributed in accordance with the Code. Accordingly, no provision for income tax has been made.
In order to avoid imposition of the excise tax applicable to regulated investment companies, it is also each Fund’s intention to declare as dividends in each calendar year at least 98% of its net investment income (earned during the calendar year) and 98.2% of its net realized capital gains (earned during the 12 months ended October 31) plus undistributed amounts from prior years.
The following information is computed on a tax basis for each item as of February 29, 2016:
| | Alambic Small Cap Value Plus Fund | | | Alambic Small Cap Growth Plus Fund | |
Tax cost of portfolio investments | | $ | 1,808,955 | | | $ | 1,126,788 | |
Gross unrealized appreciation | | $ | 95,995 | | | $ | 58,225 | |
Gross unrealized depreciation | | | (93,687 | ) | | | (76,033 | ) |
Net unrealized appreciation (depreciation) | | | 2,308 | | | | (17,808 | ) |
Accumulated ordinary income | | | — | | | | 49 | |
Other losses | | | (106,856 | ) | | | (49,035 | ) |
Accumulated deficit | | $ | (104,548 | ) | | $ | (66,794 | ) |
The difference between the federal income tax cost of portfolio investments and the financial statement cost of each Fund is due to certain timing differences in the recognition of capital gains or losses under income tax regulations and GAAP. These “book/tax” differences are temporary in nature and are due primarily to the tax deferral of losses on wash sales.
The Funds recognize the tax benefits or expenses of uncertain tax positions only when the position is “more likely than not” of being sustained assuming examination by tax authorities. Management has reviewed each Fund’s tax positions for the current period and has concluded that no provision for unrecognized tax benefits or expenses is required in these financial statements. The Funds indentify their major tax jurisdiction as U.S. Federal.
34
ALAMBIC FUNDS
NOTES TO FINANCIAL STATEMENTS (Continued) |
3. Investment Transactions
During the periods ended February 29, 2016, cost of purchases and proceeds from sales of investment securities, other than short-term investments were as follows:
| | Alambic Small Cap Value Plus Fund | | | Alambic Small Cap Growth Plus Fund | |
Purchases of investment securities | | $ | 5,145,047 | | | $ | 2,357,094 | |
Proceeds from sales of investment securities | | $ | 3,230,029 | | | $ | 1,181,271 | |
4. Transactions with Related Parties
INVESTMENT ADVISORY AGREEMENT
Each Fund’s investments are managed by Alambic Investment Management, L.P. (the “Adviser”) pursuant to the terms of an Investment Advisory Agreement. Under the Investment Advisory Agreement (the “Alambic Agreement”), each Fund pays the Adviser an investment advisory fee, computed and accrued daily and paid monthly, at the annual rate of 0.95% of its average daily net assets.
Pursuant to an Expense Limitation Agreement (“ELA”), the Adviser has contractually agreed, until August 31, 2018, to reduce investment advisory fees and reimburse other expenses to the extent necessary to limit Total Annual Fund Operating Expenses (exclusive of brokerage costs; taxes; borrowing costs; interest; costs to organize the Fund; acquired fund fees and expenses such as litigation and merger or reorganization costs; extraordinary expenses and other expenses not incurred in the ordinary course of the Funds’ business; and amounts, if any, payable pursuant to a plan adopted in accordance with Rule 12b-1 under the Investment Company Act of 1940, as amended (the “1940 Act”)) to an amount not exceeding 1.20% of each Fund’s average daily net assets. Accordingly, during the periods ended February 29, 2016, the Adviser did not collect any of its investment advisory fees and reimbursed other operating expenses totaling $54,245 and $21,335 for Alambic Small Cap Value Plus Fund and Alambic Small Cap Growth Plus Fund, respectively, during the periods ended February 29, 2016.
Under the terms of the ELA, investment advisory fee reductions and expense reimbursements by the Adviser are subject to repayment by each Fund for a period of three years after such fees and expenses were incurred, provided the repayments do not cause Total Annual Fund Operating Expenses to exceed the (i) the expense limitations then in effect, if any, and (ii) the expense limitations in effect at the time the expensesto be repaid were incurred. As of February 29, 2016, the Adviser may seek repayment of investment advisory fee reductions and expense reimbursements totaling $63,112 and $22,816 for Alambic Small Cap Value Plus Fund and Alambic Small Cap Growth Plus Fund, respectively, no later than February 28, 2019.
An officer of the Funds is also an officer of the Adviser.
35
ALAMBIC FUNDS
NOTES TO FINANCIAL STATEMENTS (Continued) |
OTHER SERVICE PROVIDERS
Ultimus Fund Solutions, LLC (“Ultimus”) provides fund administration, fund accounting, compliance and transfer agency services to the Funds. Each Fund pays Ultimus fees in accordance with the agreements for such services. In addition, each Fund pays out-of-pocket expenses including but not limited to postage, supplies and costs of pricing its portfolio securities.
Under the terms of a Distribution Agreement with the Trust, Ultimus Fund Distributors, LLC (the “Distributor”) serves as the principal underwriter to each Fund. The Distributor is a wholly-owned subsidiary of Ultimus. The Distributor is compensated by the Adviser (not the Funds) for acting as principal underwriter.
Certain officers and a Trustee of the Trust are also officers of Ultimus and the Distributor and are not paid by the Funds for serving in such capacities.
TRUSTEE COMPENSATION
Each Independent Trustee receives from each Fund of the Trust a fee of $500 for each Board meeting attended plus reimbursement of travel and other meeting-related expenses. Each Independent Trustee also receives a $500 annual retainer from each Fund of the Trust.
PRINCIPAL HOLDERS OF FUND SHARES
As of February 29, 2016, the following shareholders owned of record 5% or more of the outstanding shares of each Fund:
Name of Record Owner | % Ownership |
Alambic Small Cap Value Plus Fund | |
Kawishiwi Partners Trust | 50% |
Robert T. Slaymaker | 25% |
Alambic Small Cap Growth Plus Fund | |
Kawishiwi Partners Trust | 80% |
Robert T. Slaymaker | 20% |
A beneficial owner of 25% or more of a Fund’s outstanding shares may be considered a controlling person. That shareholder’s vote could have a more significant effect on matters presented at a shareholder’s meeting.
5. Sector Risk
If a Fund has significant investments in the securities of issuers within a particular sector, any development affecting that sector will have a greater impact on the value of the net assets of the Fund than would be the case if the Fund did not have significant investments in that sector. In addition, this may increase the risk of loss in the Fund and increase the volatility of the Fund’s NAV per share. Occasionally, market conditions, regulatory changes or other developments may negatively impact this sector, and therefore the value of the Fund’s portfolio will be adversely affected. As of February 29, 2016, Alambic Small Cap Value Plus Fund had
36
ALAMBIC FUNDS
NOTES TO FINANCIAL STATEMENTS (Continued) |
25.5% of the value of its net assets invested in securities within the Financials sector and Alambic Small Cap Growth Plus Fund had 25.0% of the value of its net assets invested in securities within the Information Technology sector.
6. Contingencies and Commitments
The Funds indemnify the Trust’s officers and Trustees for certain liabilities that might arise from their performance of their duties to the Funds. Additionally, in the normal course of business the Funds enter into contracts that contain a variety of representations and warranties and which provide general indemnifications. The Funds’ maximum exposure under these arrangements is unknown, as this would involve future claims that may be made against the Funds that have not yet occurred. However, based on experience, the Funds expect the risk of loss to be remote.
7. Subsequent Events
The Funds are required to recognize in the financial statements the effects of all subsequent events that provide additional evidence about conditions that existed as of the date of the Statements of Assets and Liabilities. For non-recognized subsequent events that must be disclosed to keep the financial statements from being misleading, the Funds are required to disclose the nature of the event as well as an estimate of its financial effect, or a statement that such an estimate cannot be made. Management has evaluated subsequent events through the issuance of these financial statements and has noted no such events.
37
ALAMBIC FUNDS
ABOUT YOUR FUNDS’ EXPENSES (Unaudited) |
We believe it is important for you to understand the impact of costs on your investment. As a shareholder of the Funds, you incur ongoing costs, including management fees and other operating expenses. The following examples are intended to help you understand your ongoing costs (in dollars) of investing in the Funds and to compare these costs with the ongoing costs of investing in other mutual funds.
A mutual fund’s ongoing costs are expressed as a percentage of its average net assets. This figure is known as the expense ratio. The expenses in the table below are based on an investment of $1,000 made at the beginning of the most recent period (September 1, 2015 and December 29, 2015 for Alambic Small Cap Value Plus Fund and Alambic Small Cap Growth Plus Fund, respectively) and held until the end of the period (February 29, 2016).
The table below illustrates each Fund’s ongoing costs in two ways:
Actual fund return – This section helps you to estimate the actual expenses that you paid over the period. The “Ending Account Value” shown is derived from each Fund’s actual return, and the fourth column shows the dollar amount of operating expenses that would have been paid by an investor who started with $1,000 in the Funds. You may use the information here, together with the amount you invested, to estimate the expenses that you paid over the period.
To do so, simply divide your account value by $1,000 (for example, an $8,600 account value divided by $1,000 = 8.6), then multiply the result by the number given for the Fund under the heading “Expenses Paid During Period.”
Hypothetical 5% return – This section is intended to help you compare each Fund’s ongoing costs with those of other mutual funds. It assumes that the Funds had an annual return of 5% before expenses during the period shown, but that the expense ratio is unchanged. In this case, because the return used is not the Funds’ actual return, the results do not apply to your investment. The example is useful in making comparisons because the SEC requires all mutual funds to calculate expenses based on a 5% return. You can assess each Fund’s ongoing costs by comparing this hypothetical example with the hypothetical examples that appear in shareholder reports of other funds. The hypothetical returns example does not reflect actual trading in any Fund, but is used for illustrative purposes only.
Note that expenses shown in the table are meant to highlight and help you compare ongoing costs only. The Funds do not charge transaction fees, such as purchase or redemption fees, nor do they carry a “sales load.”
The calculations assume no shares were bought or sold during the period. Your actual costs may have been higher or lower, depending on the amount of your investment and the timing of any purchases or redemptions.
More information about the Funds’ expenses can be found in this report. For additional information on operating expenses and other shareholder costs, please refer to each Fund’s prospectus.
38
ALAMBIC FUNDS
ABOUT YOUR FUNDS’ EXPENSES (Unaudited) (Continued) |
| Beginning
Account Value
September 1,
2015 | Ending
Account Value
February 29,
2016 | Net
Expense
Ratio(a) | Expenses
Paid During
Period(b) |
Alambic Small Cap Value Plus Fund | | |
Actual Fund Return | $1,000.00 | $ 951.60 | 1.20% | $5.82 |
Hypothetical 5% Return (before expenses) | $1,000.00 | $ 1,018.90 | 1.20% | $6.02 |
(a) | Annualized, based on the Fund’s most recent one-half year expenses. |
(b) | Expenses are equal to the Fund’s annualized expense ratio multiplied by the average account value over the period, multiplied by 182/366 (to reflect the one-half year period). |
| Beginning
Account Value
September 1,
2015(a) | Ending
Account Value
February 29,
2016 | Net
Expense
Ratio(b) | Expenses
Paid During
Period(c) |
Alambic Small Cap Growth Plus Fund | | |
Actual Fund Return | $1,000.00 | $ 927.00 | 1.20% | $1.99 |
Hypothetical 5% Return (before expenses) | $1,000.00 | $ 1,018.90 | 1.20% | $6.02 |
(a) | Beginning Account Value is as of December 29, 2015 (date of commencement of operations) for the Actual Fund Return Information. |
(b) | Annualized, based on the Fund’s expenses for the period since inception. |
(c) | Expenses are equal to the Fund’s annualized expense ratio multiplied by the average account value over the period, multiplied by 63/366 (to reflect the period since inception) and 182/366 (to reflect the one-half year period), for Actual Fund Return and Hypothetical 5% Return information, respectively. |
39
ALAMBIC FUNDS
OTHER INFORMATION (Unaudited) |
A description of the policies and procedures that the Funds use to vote proxies relating to portfolio securities is available without charge upon request by calling toll-free 1-888-890-8988, or on the U.S. Securities and Exchange Commission (“SEC”) website at http://www.sec.gov. Information regarding how the Funds voted proxies relating to portfolio securities during the period ended June 30 will be available on or before August 31, 2016 without charge upon request by calling toll-free 1-888-890-8988, or on the SEC’s website at http://www.sec.gov.
The Trust files a complete listing of portfolio holdings for the Funds with the SEC as of the end of the first and third quarters of each fiscal year on Form N-Q. These filings are available upon request by calling 1-888-890-8988. Furthermore, you may obtain a copy of the filings on the SEC’s website at http://www.sec.gov. The Trust’s Forms N-Q may also be reviewed and copied at the SEC’s Public Reference Room in Washington, DC, and information on the operation of the Public Reference Room may be obtained by calling 1-800-SEC-0330.
40
ALAMBIC FUNDS
DISCLOSURE REGARDING APPROVAL OF
INVESTMENT ADVISORY AGREEMENTS (Unaudited) |
The Board, including the Independent Trustees voting separately, reviewed and approved the Alambic Agreement with the Adviser for an initial two-year term for the Alambic Small Cap Value Plus Fund (the “Alambic Value Fund”) and a term of about 20 months for the Alambic Small Cap Growth Plus Fund (the “Alambic Growth Fund”). For the Alambic Value Fund, the Board approved the Alambic Agreement at an in-person meeting held on July 20 and 21, 2015, at which all of the Trustees were present; for the Alambic Growth Fund, the Board approved an amendment to Schedule A to the Alambic Agreement to include the Alambic Growth Fund at a similar meeting held on October 19 and 20, 2015.
In the course of their deliberations, the Board was advised by legal counsel. The Board received and reviewed a substantial amount of information provided by the Adviser in response to requests of the Board and counsel.
In considering the Alambic Agreement and reaching its conclusions with respect thereto, the Board reviewed and analyzed various factors that it determined were relevant, including the factors described below.
The nature, extent, and quality of the Adviser’s services to the Funds. In this regard, the Board considered the Adviser’s responsibilities and services under the Alambic Agreement, including, without limitation, the Adviser’s procedures for formulating investment recommendations and assuring compliance with each Fund’s investment objective and limitations, proposed initial marketing and distribution efforts, and compliance procedures and practices. After reviewing the foregoing and further information regarding the Adviser’s services, the Board concluded that the quality, extent, and nature of the services to be provided by the Adviser are satisfactory and adequate for each Fund.
The Adviser’s investment management capabilities and experience. In this regard, the Board considered the investment management experience of the Adviser, including the Adviser’s experience and plans for implementing each Fund’s investment objective and strategies. The Board also considered the Adviser’s experience in managing similar types of strategies and building quantitative models, and its plans for implementing such strategies and models. In particular, the Board reviewed the Adviser’s prior experience and performance with other accounts that had similar investment objectives and strategies for each Fund. The Board also considered the similarities and differences between Alambic Value Fund and Alambic Growth Fund. After consideration of these factors, as well as other factors, the Board determined that the Adviser has the requisite experience to serve as investment adviser for each Fund.
The costs of the services to be provided and profits to be realized by the Adviser from the relationship with the Funds. In this regard, the Board considered the Adviser’s staffing, personnel, and methods of operation; the education and experience of its key personnel; its compliance program, policies, and procedures; its financial condition; the projected asset levels of each Fund; and the overall expenses of the Funds, including their respective advisory fee. The Board reviewed the ELA, and noted the benefits that would result to each Fund from the Adviser’s commitment to reduce its advisory fee or reimburse other operating expenses until August 31, 2018. The Board considered the Adviser’s financial condition and its ability to
41
ALAMBIC FUNDS
DISCLOSURE REGARDING APPROVAL OF
INVESTMENT ADVISORY AGREEMENTS (Unaudited) (Continued) |
satisfy its financial commitments to each Fund. The Board also considered potential benefits for the Adviser in managing the Funds, including promotion of the Adviser’s name. The Board compared each Fund’s proposed advisory fee and overall expense ratio to other comparable funds (in terms of the type of fund, the style of investment management, the projected size of the Fund, and the nature of the investment strategy) and the fees charged by the Adviser to its other managed accounts.
For Alambic Value Fund, the Board noted that its advisory fee of 0.95% was equal to the average and slightly above the median for funds in its custom peer group, and the fee was in the third quartile of the larger Morningstar Small Cap Value Category. The Board further noted that the proposed overall annual expense ratio of 1.20% for the Fund is in the top quartile of the Fund’s custom peer group (i.e., at the less expensive end of the range). Additionally, the proposed overall annual expense ratio is also in the top quartile of the Morningstar Small Cap Value Category.
For Alambic Growth Fund, the Board noted that its advisory fee of 0.95% was slightly above the average and slightly below the median for its custom peer group, and the fee was in the third quartile of the Morningstar Small Cap Growth Category. The Board further noted that the proposed total expense ratio of 1.20% is above the average and median for the Fund’s custom peer group, but below the average and median of the Morningstar Small Cap Growth Category.
Upon further consideration of the foregoing, the Board concluded that the proposed advisory fees to be paid to the Adviser by each Fund are fair and reasonable.
The extent to which the Funds and their investors would benefit from economies of scale. In this regard, the Board considered the Alambic Agreement and the ELA. The Board determined that the shareholders of each Fund would benefit from the ELA until each Fund’s assets grew to a level where its expenses are below the expense limit. The Board considered each Fund’s projected asset levels, expectations for growth, and fees, and determined that the Funds’ fee arrangements with the Adviser would provide benefits for the next two years (for the Alambic Value Fund) and 20 months (for the Alambic Growth Fund). The Board concluded the Funds’ arrangements with the Adviser were fair and reasonable in relation to the nature and quality of the Adviser’s services.
Brokerage and portfolio transactions. In this regard, the Board considered the Adviser’s policies and procedures as it relates to seeking best execution for its clients, including the Funds. The Board also considered the anticipated portfolio turnover rate for each Fund; the method and basis for selecting and evaluating the broker-dealers used by the Adviser; any anticipated allocation of portfolio business to persons affiliated with the Adviser; and the extent to which the Funds’ trades may be allocated to soft-dollar arrangements. After further review and discussion, the Board determined that the Adviser’s practices regarding brokerage and portfolio transactions were satisfactory.
42
ALAMBIC FUNDS
DISCLOSURE REGARDING APPROVAL OF
INVESTMENT ADVISORY AGREEMENTS (Unaudited) (Continued) |
Possible conflicts of interest. In evaluating the possibility for conflicts of interest, the Board considered such matters as the Adviser’s processes and best execution procedures. The Board also considered the substance and administration of the Adviser’s code of ethics. Following further consideration and discussion, the Board determined that the Adviser’s standards and practices relating to the identification and mitigation of potential conflicts of interests were satisfactory.
After full consideration of the above factors as well as other factors, the Board unanimously concluded that approval of the Alambic Agreement was in the best interests of each Fund and its shareholders.
43
This page intentionally left blank.
This page intentionally left blank.

BLUE CURRENT GLOBAL DIVIDEND FUND
INSTITUTIONAL CLASS (BCGDX)
Semi-Annual Report
February 29, 2016
(Unaudited)
BLUE CURRENT GLOBAL DIVIDEND FUND
LETTER TO SHAREHOLDERS | March 29, 2016 |
Dear Shareholders:
The global equity markets continue to be volatile and influenced by global central bank tinkering, a global currency war, and a commodity bear market. All three factors have led to uncertainty over global growth prospects and have resulted in a profits recession. The S&P 500 Index, for example, has experienced three consecutive quarters of declining earnings through year-end 2015, which has not occurred since 2008-2009.
Not surprisingly, global equities were down over 5% over the six month period ending February 29, 2016. The Blue Current Global Dividend Fund (the “Fund”) has navigated through the six months of rough seas relatively well with a -1.5% return. Year-to-date through February 29th, the Fund was down -2.5% while the US and global equity markets were down between -4 to -8% during this period. While we do not manage the Fund to a specific index, the Fund’s benchmark, the MSCI World High Dividend Yield Index, was down -2.8% since the beginning of the year, and down -0.5% during the six months ended February 29, 2016. Since inception, the Fund has proved the benefits of its high quality dividend approach by outperforming the Fund’s benchmark by 3.8%.
The top 5 contributors to the Fund over the last six months were Kimberly Clark, ACE/Chubb, Microsoft, Spectra Energy, and National Health Investors. These 5 winners contributed with a +2.3% return. However, they were equally offset by the top 5 losers in the portfolio which were Novartis, Volkswagen, Abbot Labs, Wells Fargo, and BB&T. Broadly speaking, our stock selection was solid during the six month period as measured by 52% of the Fund’s stocks up, while 48% were down.
The Fund was particularly active during the last quarter to take advantage of the dislocation in the equity markets over fears from China, central bank policy, and declining commodity prices. New positions include Spectra Energy, Home Depot, Exxon Mobil, Walgreens Boots, Brinker International, Bank of NY Mellon, Apple, Intercontinental Hotels, and Schlumberger. We exited BB&T, Kingfisher, Pentair, Ford, Cinemark, and Target. We are excited about upgrading the Fund with these new positions which offer attractive dividend yields, dividend growth, and total return potential. In fact, the Fund has owned several of the new positions before, including Apple, which we last sold 25% higher than our re-entry price, and we are thrilled to see them decline to another attractive entry point for the Fund to own again.
For the first time since the inception of the Fund, the Fund was fully invested, with cash representing 0.3% of the portfolio. The Fund’s geographic exposure is measured under two criteria. From a domicile perspective, 37% of the portfolio is domiciled outside the US. From a sales perspective, 53% of the portfolio consists of companies whose revenues outside the US are greater than 50%.
1
It is important to remind shareholders of our philosophy and objectives. In the current environment, investors need to make every penny work for them. With yield in short supply and safe income streams providing little return, high quality companies with growing and sustainable cash flow from across the globe might be less risky than you think – and more fruitful. Over the long run, we believe dividends matter.
The Fund utilizes its investment expertise in growing cash flow through what we believe is a niche universe of high quality, dividend-paying companies with sustainable business models and dividend policies. The primary objectives are to pay a stable and increasing dividend each quarter and deliver attractive long term capital appreciation to investors.
The Blue Current investment team concentrates on a select portfolio of 25-50 companies across developed markets that meet our stringent quality standards. We focus on companies that we believe have a strong history of rewarding shareholders and have the financial ability to continue to increase the dividend over time. We also focus on the future earnings potential of each company and strive to purchase those businesses when they are trading at a discount to what we believe is their true value.
At the time of this writing, the markets have recovered from their February 11 bottom. The increase in volatility continues to be associated with central bank policies which impact rates, currencies and commodity prices. The near-term high correlation of oil and stock prices is unprecedented. When oil drops, stocks drop and vice versa.
What currently keeps us up at night is a negative feedback loop from the Federal Reserve’s (the “Fed”) policy. For example, an increase in US rates potentially strengthens the dollar, decreases commodity prices, pressures the high yield and equity markets, and ultimately increases savings (wealth effect) which leads to a slowdown in consumer spending and a US recession. Meanwhile, a stronger dollar from Fed tightening potentially leads to another China Yuan devaluation which could lead to further weakness in emerging markets. This all leads to a decline in oil/commodities which feeds back to lower asset prices.
To illustrate the impact of currency and commodities further in the US as an example, the S&P 500 Index is in a profits recession since Q3 2014 due to a 25% appreciation in the dollar and a 60% decline in commodity prices. As discussed earlier, this is the first time since 2008-2009 that the S&P 500 Index’s earnings-per-share has declined for three consecutive quarters, resulting in a 22% decline in quarterly earnings since its Q3 2014 peak (Source: Standard & Poors).
Our outlook is straightforward: the US consumer is critical to the global economy. Right now we believe the US consumer is healthy, and personal consumption, which represents 69% of US GDP, is moderate. Meanwhile, oil declines of this magnitude have never led to a US recession. A global recession has never occurred without a US recession. Our base case is that the market’s earnings contribution from energy cannot get much worse from its current low base (a negative 4.2% earnings contribution over the last year compared to a positive 11.6% one-year earnings contribution from the third quarter of 2014) and that the US energy market only represents 1% of total US employment. The focus is on the consumer and, as mentioned before, Fed policy may ultimately determine the outcome of consumer health and confidence by its actions.
2
In summary, our near-term outlook continues to be for a low return stock market environment which makes us thankful for the strategy we run: dividends will likely make up a greater portion of total equity returns. We remain disciplined with our process to not overpay for the companies we seek: a select portfolio of high quality businesses that offer a high dividend yield (>3%) and a high dividend growth rate (>10%). The portfolio today is yielding 3.3% and we anticipate achieving a 10% growth rate in dividends by the end of the year (the Fund’s 30-day SEC yield as of February 29, 2016 was 1.9%).
Our focus on high quality companies with strong balance sheets and business models that can sustain current and higher dividend payouts should be a relative winner in the environment we anticipate, particularly if value stocks come into fashion again – which appears to be the case thus far in the first two months of 2016.
Sincerely,

| 
|
Henry “Harry” M. T. Jones
Co-Portfolio Manager
Blue Current Global Dividend Fund | Dennis Sabo, CFA
Co-Portfolio Manager
Blue Current Global Dividend Fund |
3
Disclosure and Risk Summary
Past performance is not predictive of future performance. Investment results and principal value will fluctuate so that shares, when redeemed, may be worth more or less than their original cost. Current performance may be higher or lower than the performance data quoted. Performance data current to the most recent month-end are available by calling 1-800-514-3583.
An investor should consider the investment objectives, risks, charges and expenses of the Fund carefully before investing. The Fund’s prospectus contains this and other important information. To obtain a copy of the Fund’s prospectus please visit our website at www.bluecurrentfunds.com or call 1-800-514-3583 and a copy will be sent to you free of charge. Please read the prospectus carefully before you invest. The Fund is distributed by Ultimus Fund Distributors, LLC.
The Letter to Shareholders seeks to describe some of the Adviser’s current opinions and views of the financial markets. Although the Adviser believes it has a reasonable basis for any opinions or views expressed, actual results may differ, sometimes significantly so, from those expected or expressed. The securities held by the Fund that are discussed in the Letter to Shareholders were held during the period covered by this Report. They do not comprise the entire investment portfolio of the Fund, may be sold at any time, and may no longer be held by the Fund. For a complete list of securities held by the Fund as of February 29, 2016, please see the Schedule of Investments section of the Semi-Annual Report. The opinions of the Fund’s adviser with respect to those securities may change at any time.
Statements in the Letter to Shareholders that reflect projections or expectations for future financial or economic performance of the Fund and the market in general and statements of the Fund’s plans and objectives for future operations are forward-looking statements. No assurance can be given that actual results or events will not differ materially from those projected, estimated, assumed, or anticipated in any such forward-looking statements. Important factors that could result in such differences, in addition to factors noted with such forward-looking statements, include, without limitation, general economic conditions, such as inflation, recession, and interest rates. Past performance is not a guarantee of future results.
4
BLUE CURRENT GLOBAL DIVIDEND FUND
PORTFOLIO INFORMATION
February 29, 2016 (Unaudited)
Sector Diversification
(% of Net Assets)
Top Ten Equity Holdings
Security Description | | % of Net Assets |
Comcast Corporation - Class A | | 4.0% |
Chubb Ltd. | | 4.0% |
Wells Fargo & Company | | 3.9% |
Vodafone Group plc - ADR | | 3.3% |
Unilever plc - ADR | | 3.0% |
C.H. Robinson Worldwide, Inc. | | 3.0% |
Accenture plc - Class A | | 3.0% |
Stanley Black & Decker, Inc. | | 3.0% |
Abbott Laboratories | | 2.9% |
United Parcel Service, Inc. - Class B | | 2.9% |
5
BLUE CURRENT GLOBAL DIVIDEND FUND
SCHEDULE OF INVESTMENTS
February 29, 2016 (Unaudited) |
COMMON STOCKS — 98.7% | | Shares | | | Value | |
Consumer Discretionary — 21.3% | | | | | | |
Hotels, Resturants & Leisure — 3.5% | | | | | | |
Brinker International, Inc. | | | 9,450 | | | $ | 470,610 | |
InterContinental Hotels Group plc - ADR | | | 17,860 | | | | 674,929 | |
| | | | | | | | 1,145,539 | |
Household Durables — 1.6% | | | | | | | | |
Leggett & Platt, Inc. | | | 11,240 | | | | 501,978 | |
| | | | | | | | | |
Leisure Products — 2.0% | | | | | | | | |
Hasbro, Inc. | | | 8,445 | | | | 640,722 | |
| | | | | | | | | |
Media — 10.4% | | | | | | | | |
Cinemark Holdings, Inc. | | | 22,500 | | | | 744,750 | |
Comcast Corporation - Class A | | | 22,530 | | | | 1,300,657 | |
Sky plc (a) | | | 48,460 | | | | 699,938 | |
WPP plc (a) | | | 30,420 | | | | 640,780 | |
| | | | | | | | 3,386,125 | |
Specialty Retail — 2.0% | | | | | | | | |
Home Depot, Inc. (The) | | | 5,175 | | | | 642,321 | |
| | | | | | | | | |
Textiles, Apparel & Luxury Goods — 1.8% | | | | | | | | |
Christian Dior SE (a) | | | 3,390 | | | | 596,138 | |
| | | | | | | | | |
Consumer Staples — 14.9% | | | | | | | | |
Beverages — 2.0% | | | | | | | | |
Diageo plc - ADR | | | 6,307 | | | | 647,098 | |
| | | | | | | | | |
Food & Staples Retailing — 3.9% | | | | | | | | |
Walgreens Boots Alliance, Inc. | | | 6,000 | | | | 473,640 | |
Wal-Mart Stores, Inc. | | | 12,054 | | | | 799,662 | |
| | | | | | | | 1,273,302 | |
Food Products — 7.5% | | | | | | | | |
Danone SA (a) | | | 11,700 | | | | 813,706 | |
Nestlé SA - ADR | | | 9,225 | | | | 644,459 | |
Unilever plc - ADR | | | 22,735 | | | | 973,513 | |
| | | | | | | | 2,431,678 | |
Household Products — 1.5% | | | | | | | | |
Kimberly-Clark Corporation | | | 3,730 | | | | 486,019 | |
See accompanying notes to financial statements. |
6
BLUE CURRENT GLOBAL DIVIDEND FUND
SCHEDULE OF INVESTMENTS (Continued) |
COMMON STOCKS — 98.7% (Continued) | | Shares | | | Value | |
Energy — 8.6% | | | | | | |
Energy Equipment & Services — 1.5% | | | | | | |
Schlumberger Ltd. | | | 6,766 | | | $ | 485,257 | |
| | | | | | | | | |
Oil, Gas & Consumable Fuels — 7.1% | | | | | | | | |
Enterprise Products Partners, L.P. | | | 28,300 | | | | 661,371 | |
Exxon Mobil Corporation | | | 3,860 | | | | 309,379 | |
Magellan Midstream Partners, L.P. | | | 9,860 | | | | 666,339 | |
Spectra Energy Partners, L.P. | | | 14,300 | | | | 662,233 | |
| | | | | | | | 2,299,322 | |
Financials — 14.0% | | | | | | | | |
Banks — 3.9% | | | | | | | | |
Wells Fargo & Company | | | 27,195 | | | | 1,275,989 | |
| | | | | | | | | |
Capital Markets — 2.1% | | | | | | | | |
Bank of New York Mellon Corporation (The) | | | 19,300 | | | | 683,027 | |
| | | | | | | | | |
Insurance — 6.1% | | | | | | | | |
Allianz SE (a) | | | 4,700 | | | | 697,133 | |
Chubb Ltd. | | | 11,120 | | | | 1,284,694 | |
| | | | | | | | 1,981,827 | |
Real Estate Investment Trusts (REITs) — 1.9% | | | | | | | | |
National Health Investors, Inc. | | | 9,900 | | | | 622,809 | |
| | | | | | | | | |
Health Care — 8.8% | | | | | | | | |
Health Care Equipment & Supplies — 2.9% | | | | | | | | |
Abbott Laboratories | | | 24,815 | | | | 961,333 | |
| | | | | | | | | |
Pharmaceuticals — 5.9% | | | | | | | | |
Johnson & Johnson | | | 5,900 | | | | 620,739 | |
Novartis AG - ADR | | | 9,080 | | | | 645,679 | |
Pfizer, Inc. | | | 21,600 | | | | 640,872 | |
| | | | | | | | 1,907,290 | |
Industrials — 11.6% | | | | | | | | |
Air Freight & Logistics — 5.9% | | | | | | | | |
C.H. Robinson Worldwide, Inc. | | | 13,920 | | | | 972,034 | |
United Parcel Service, Inc. - Class B | | | 9,780 | | | | 944,259 | |
| | | | | | | | 1,916,293 | |
Electrical Equipment — 2.7% | | | | | | | | |
Eaton Corporation plc | | | 15,694 | | | | 890,007 | |
| | | | | | | | | |
Machinery — 3.0% | | | | | | | | |
Stanley Black & Decker, Inc. | | | 10,255 | | | | 964,073 | |
See accompanying notes to financial statements. |
7
BLUE CURRENT GLOBAL DIVIDEND FUND
SCHEDULE OF INVESTMENTS (Continued) |
COMMON STOCKS — 98.7% (Continued) | | Shares | | | Value | |
Information Technology — 11.0% | | | | | | |
IT Services — 5.5% | | | | | | |
Accenture plc - Class A | | | 9,690 | | | $ | 971,519 | |
Amadeus IT Holding SA - A Shares (a) | | | 20,000 | | | | 802,807 | |
| | | | | | | | 1,774,326 | |
Semiconductors & Semiconductor Equipment — 2.0% | | | | | | | | |
Texas Instruments, Inc. | | | 12,255 | | | | 649,760 | |
| | | | | | | | | |
Software — 2.5% | | | | | | | | |
Microsoft Corporation | | | 15,920 | | | | 810,010 | |
| | | | | | | | | |
Technology Hardware, Storage & Peripherals — 1.0% | | | | | | | | |
Apple, Inc. | | | 3,370 | | | | 325,845 | |
| | | | | | | | | |
Materials — 2.5% | | | | | | | | |
Chemicals — 2.5% | | | | | | | | |
Dow Chemical Company (The) | | | 17,000 | | | | 826,370 | |
| | | | | | | | | |
Telecommunication Services — 6.0% | | | | | | | | |
Diversified Telecommunication Services — 2.7% | | | | | | | | |
Verizon Communications, Inc. | | | 17,285 | | | | 876,868 | |
| | | | | | | | | |
Wireless Telecommunication Services — 3.3% | | | | | | | | |
Vodafone Group plc - ADR | | | 34,910 | | | | 1,061,264 | |
| | | | | | | | | |
Total Common Stocks (Cost $32,579,642) | | | | | | $ | 32,062,590 | |
| |
MONEY MARKET FUNDS — 0.3% | | Shares | | | Value | |
First American Government Obligations Fund - Class Z, 0.174% (b) (Cost $101,425) | | | 101,425 | | | $ | 101,425 | |
| | | | | | | | | |
Total Investments at Value — 99.0% (Cost $32,681,067) | | | | | | $ | 32,164,015 | |
| | | | | | | | | |
Other Assets in Excess of Liabilities — 1.0% | | | | | | | 335,655 | |
| | | | | | | | | |
Net Assets — 100.0% | | | | | | $ | 32,499,670 | |
ADR - American Depositary Receipt |
(a) | Fair value priced (Note 1). Fair valued securities totaled $4,250,502 at February 29, 2016, representing 13.1% of net assets. |
(b) | The rate shown is the 7-day effective yield as of February 29, 2016. |
See accompanying notes to financial statements. |
8
BLUE CURRENT GLOBAL DIVIDEND FUND
SUMMARY OF COMMON STOCKS BY COUNTRY
February 29, 2016 (Unaudited) |
Country | | Values | | | % of Net Assets | |
United States | | $ | 19,533,669 | | | | 60.1 | % |
United Kingdom | | | 4,056,742 | | | | 12.5 | % |
Switzerland | | | 2,574,832 | | | | 7.9 | % |
Ireland | | | 1,861,526 | | | | 5.7 | % |
France | | | 1,409,844 | | | | 4.4 | % |
Spain | | | 802,807 | | | | 2.5 | % |
Germany | | | 697,133 | | | | 2.1 | % |
Jersey | | | 640,780 | | | | 2.0 | % |
Netherlands | | | 485,257 | | | | 1.5 | % |
| | | $ | 32,062,590 | | | | 98.7 | % |
See accompanying notes to financial statements.
9
BLUE CURRENT GLOBAL DIVIDEND FUND
STATEMENT OF ASSETS AND LIABILITIES
February 29, 2016 (Unaudited) |
ASSETS | | | |
Investments in securities: | | | |
At acquisition cost | | $ | 32,681,067 | |
At value (Note 2) | | $ | 32,164,015 | |
Dividends receivable | | | 75,340 | |
Receivable for capital shares sold | | | 1,801,063 | |
Other assets | | | 13,169 | |
TOTAL ASSETS | | | 34,053,587 | |
| | | | |
LIABILITIES | | | | |
Payable for investment securities purchased | | | 1,530,316 | |
Payable for capital shares redeemed | | | 4,063 | |
Payable to Adviser (Note 4) | | | 8,413 | |
Payable to administrator (Note 4) | | | 5,840 | |
Other accrued expenses | | | 5,285 | |
TOTAL LIABILITIES | | | 1,553,917 | |
| | | | |
NET ASSETS | | $ | 32,499,670 | |
| | | | |
NET ASSETS CONSIST OF: | | | | |
Paid-in capital | | $ | 34,283,477 | |
Accumulated net investment income | | | 136,041 | |
Accumulated net realized losses from securities transactions | | | (1,402,796 | ) |
Net unrealized depreciation on investments | | | (517,052 | ) |
NET ASSETS | | $ | 32,499,670 | |
| | | | |
PRICING OF INSTITUTIONAL SHARES (Note 1) | | | | |
Net assets applicable to Institutional Shares | | $ | 32,499,670 | |
Shares of Institutional Shares outstanding (no par value, unlimited number of shares outstanding) | | | 3,529,472 | |
Net asset value, offering and redemption price per share (Note 2) | | $ | 9.21 | |
See accompanying notes to financial statements. |
10
BLUE CURRENT GLOBAL DIVIDEND FUND
STATEMENT OF OPERATIONS
For the Six Months Ended February 29, 2016 (Unaudited) |
INVESTMENT INCOME | | | |
Dividends | | $ | 412,707 | |
Foreign withholding taxes on dividends | | | (8,099 | ) |
| | | 404,608 | |
EXPENSES | | | | |
Investment advisory fees (Note 4) | | | 151,907 | |
Professional fees | | | 18,650 | |
Administration fees (Note 4) | | | 15,334 | |
Fund accounting fees (Note 4) | | | 14,204 | |
Transfer agent fees (Note 4) | | | 8,500 | |
Registration and filing fees | | | 7,476 | |
Custodian and bank service fees | | | 7,167 | |
Compliance fees and expenses (Note 4) | | | 6,669 | |
Trustees’ fees and expenses (Note 4) | | | 5,154 | |
Printing of shareholder reports | | | 4,440 | |
Postage and supplies | | | 2,806 | |
Insurance expense | | | 2,060 | |
Pricing fees | | | 1,999 | |
Other expenses | | | 4,337 | |
TOTAL EXPENSES | | | 250,703 | |
Fee reductions by the Adviser (Note 4) | | | (98,796 | ) |
NET EXPENSES | | | 151,907 | |
| | | | |
NET INVESTMENT INCOME | | | 252,701 | |
| | | | |
REALIZED AND UNREALIZED GAINS (LOSSES) ON INVESTMENTS AND FOREIGN CURRENCY TRANSLATION | | | | |
Net realized gains (losses) from: | | | | |
Security transactions | | | (1,374,758 | ) |
Foreign currency transactions (Note 5) | | | 16,088 | |
Net change in unrealized appreciation/depreciation on: | | | | |
Investments | | | 549,947 | |
Forward foreign currency contracts (Note 5) | | | 21,077 | |
NET REALIZED AND UNREALIZED LOSSES ON INVESTMENTS AND FOREIGN CURRENCY TRANSLATION | | | (787,646 | ) |
| | | | |
NET DECREASE IN NET ASSETS RESULTING FROM OPERATIONS | | $ | (534,945 | ) |
See accompanying notes to financial statements. |
11
BLUE CURRENT GLOBAL DIVIDEND FUND
STATEMENTS OF CHANGES IN NET ASSETS |
| | Six Months
Ended
February 29,
2016
(Unaudited) | | | Period
Ended
August 31,
2015(a) | |
FROM OPERATIONS | | | | | | |
Net investment income | | $ | 252,701 | | | $ | 477,077 | |
Net realized gains (losses) from: | | | | | | | | |
Security transactions | | | (1,374,758 | ) | | | (401,152 | ) |
Foreign currency transactions | | | 16,088 | | | | 1,290 | |
Net change in unrealized appreciation/depreciation on: | | | | | | | | |
Investments | | | 549,947 | | | | (1,066,999 | ) |
Forward foreign currency contracts | | | 21,077 | | | | (21,077 | ) |
Net decrease in net assets resulting from operations | | | (534,945 | ) | | | (1,010,861 | ) |
| | | | | | | | |
DISTRIBUTIONS TO SHAREHOLDERS | | | | | | | | |
Net investment income, Institutional Shares | | | (226,324 | ) | | | (334,811 | ) |
| | | | | | | | |
FROM CAPITAL SHARE TRANSACTIONS | | | | | | | | |
Institutional Shares | | | | | | | | |
Proceeds from shares sold and issued from transfer in-kind (Note 1) | | | 7,040,148 | | | | 32,922,241 | |
Net asset value of shares issued in reinvestment of distributions | | | 113,448 | | | | 116,698 | |
Payments for shares redeemed | | | (3,990,901 | ) | | | (1,595,023 | ) |
Net increase in Institutional Shares net assets from capital share transactions | | | 3,162,695 | | | | 31,443,916 | |
| | | | | | | | |
TOTAL INCREASE IN NET ASSETS | | | 2,401,426 | | | | 30,098,244 | |
| | | | | | | | |
NET ASSETS | | | | | | | | |
Beginning of period | | | 30,098,244 | | | | — | |
End of period | | $ | 32,499,670 | | | $ | 30,098,244 | |
| | | | | | | | |
ACCUMULATED NET INVESTMENT INCOME | | $ | 136,041 | | | $ | 93,576 | |
| | | | | | | | |
CAPITAL SHARE ACTIVITY | | | | | | | | |
Institutional Shares | | | | | | | | |
Shares sold and issued from transfer in-kind (Note 1) | | | 754,439 | | | | 3,342,251 | |
Shares reinvested | | | 12,086 | | | | 11,832 | |
Shares redeemed | | | (431,020 | ) | | | (160,116 | ) |
Net increase in shares outstanding | | | 335,505 | | | | 3,193,967 | |
Shares outstanding, beginning of period | | | 3,193,967 | | | | — | |
Shares outstanding, end of period | | | 3,529,472 | | | | 3,193,967 | |
(a) | Represents the period from the commencement of operations (September 18, 2014) through August 31, 2015. |
See accompanying notes to financial statements. |
12
BLUE CURRENT GLOBAL DIVIDEND FUND
INSTITUTIONAL SHARES
FINANCIAL HIGHLIGHTS |
Per Share Data for a Share Outstanding Throughout Each Period |
| | Six Months
Ended
February 29,
2016
(Unaudited) | | | Period
Ended
August 31,
2015(a) | |
Net asset value at beginning of period | | $ | 9.42 | | | $ | 10.00 | |
| | | | | | | | | |
Income (loss) from investment operations: | | | | | | | | |
Net investment income | | | 0.07 | | | | 0.16 | |
Net realized and unrealized losses on investments | | | (0.21 | ) | | | (0.62 | ) |
Total from investment operations | | | (0.14 | ) | | | (0.46 | ) |
| | | | | | | | | |
Less distributions: | | | | | | | | |
From net investment income | | | (0.07 | ) | | | (0.12 | ) |
| | | | | | | | | |
Net asset value at end of period | | $ | 9.21 | | | $ | 9.42 | |
| | | | | | | | | |
Total return (b) | | | (1.53% | )(c) | | | (4.65% | )(c) |
| | | | | | | | | |
Net assets at end of period | | $ | 32,499,670 | | | $ | 30,098,244 | |
| | | | | | | | | |
Ratios/supplementary data: | | | | | | | | |
Ratio of total expenses to average net assets | | | 1.64 | %(d) | | | 1.68 | %(d) |
Ratio of net expenses to average net assets (e) | | | 0.99 | %(d) | | | 0.99 | %(d) |
Ratio of net investment income to average net assets (e) | | | 1.65 | %(d) | | | 2.04 | %(d) |
Portfolio turnover rate | | | 36 | %(c) | | | 72 | %(c) |
(a) | Represents the period from the commencement of operations (September 18, 2014) through August 31, 2015. |
(b) | Total return is a measure of the change in value of an investment in the Fund over the periods covered, which assumes any dividends and capital gain distributions are reinvested in shares of the Fund. The returns shown do not reflect the deduction of taxes a shareholder would pay on Fund distributions, if any, or the redemption of Fund shares. The total returns would be lower if the Adviser had not reduced advisory fees and/or reimbursed expenses (Note 4). |
(c) | Not annualized. |
(d) | Annualized. |
(e) | Ratio was determined after advisory fee reductions and/or expense reimbursements (Note 4). |
See accompanying notes to financial statements. |
13
BLUE CURRENT GLOBAL DIVIDEND FUND
NOTES TO FINANCIAL STATEMENTS
February 29, 2016 (Unaudited)
1. Organization
Blue Current Global Dividend Fund (the “Fund”) is a diversified series of Ultimus Managers Trust (the “Trust”), an open-end investment company established as an Ohio business trust under a Declaration of Trust dated February 28, 2012. Other series of the Trust are not incorporated in this report.
On September 18, 2014, the Fund accepted cash and securities at fair value, pursuant to the Fund’s valuation procedures, from certain clients of Edge Advisors, LLC (the “Adviser”). For book purposes, the cost basis recorded was equal to the securities’ fair value as of the close of the New York Stock Exchange (“NYSE”) on September 18, 2014. The net assets and shares issued resulting from these tax-free transactions were as follows:
Net
Assets | Shares
Issued |
$6,789,313 | 678,931.3 |
After the Fund acquired the cash and securities of the Adviser’s clients in exchange for Fund shares, the Fund commenced operations on September 18, 2014.
The investment objective of the Fund is current income and capital appreciation.
The Fund currently offers one class of shares: Institutional Class shares (sold without any sales loads or 12b-1 fees and subject to a $100,000 initial investment requirement). As of February 29, 2016, the Investor Class shares (to be sold without any sales loads, but subject to a 12b-1 fee of up to 0.25% of the class’ average daily net assets and subject to a $2,500 initial investment requirement) are not currently offered. When both classes are offered, each share class will represent an ownership interest in the same investment portfolio.
2. Significant Accounting Policies
The following is a summary of the Fund’s significant accounting policies. The policies are in conformity with accounting principles generally accepted in the United States of America (“GAAP”). As an investment company, as defined in Financial Accounting Standards Board (“FASB”) Accounting Standards Update 2013-08, the Fund follows accounting and reporting guidance under FASB Accounting Standards Codification Topic 946, “Financial Services – Investment Companies.”
Securities valuation – The Fund values its portfolio securities at market value as of the close of regular trading on the NYSE (normally 4:00 p.m. Eastern Time) on each day the NYSE is open for business. The Fund values its listed securities on the basis of the security’s last sale price on the security’s primary exchange, if available, otherwise at
14
BLUE CURRENT GLOBAL DIVIDEND FUND
NOTES TO FINANCIAL STATEMENTS (Continued)
the exchange’s most recently quoted bid price. NASDAQ-listed securities are valued at the NASDAQ Official Closing Price. In the event that market quotations are not readily available or are considered unreliable due to market or other events, the Fund values its securities and other assets at fair value in accordance with procedures established by and under the general supervision of the Board of Trustees (the “Board”) of the Trust. Under these procedures, the securities will be classified as Level 2 or 3 within the fair value hierarchy (see below), depending on the inputs used. Unavailable or unreliable market quotes may be due to the following factors: a substantial bid-ask spread; infrequent sales resulting in stale prices; insufficient trading volume; small trade sizes; a temporary lapse in any reliable pricing source; and actions of the securities or futures markets, such as the suspension or limitation of trading. As a result, the prices of securities used to calculate the Fund’s net asset value (“NAV”) may differ from quoted or published prices for the same securities. All foreign securities are fair valued and translated from the local currency into U.S. dollars using currency exchange rates supplied by an independent pricing quotation service.
GAAP establishes a single authoritative definition of fair value, sets out a framework for measuring fair value, and requires additional disclosures about fair value measurements.
Various inputs are used in determining the value of the Fund’s investments. These inputs are summarized in the three broad levels listed below:
● | Level 1 – quoted prices in active markets for identical securities |
● | Level 2 – other significant observable inputs |
● | Level 3 – significant unobservable inputs |
The inputs or methods used for valuing securities are not necessarily an indication of the risks associated with investing in those securities. The inputs used to measure fair value may fall into different levels of the fair value hierarchy. In such cases, for disclosure purposes, the level in the fair value hierarchy within which the fair value measurement falls in its entirety is determined based on the lowest level input that is significant to the fair value measurement.
The Fund’s foreign equity securities actively traded in foreign markets may be classified as Level 2 despite the availability of closing prices because such securities are typically valued at their fair value as determined by an independent pricing service. The Board has authorized the Fund to retain an independent pricing service to determine the fair value of its foreign securities because the value of such securities may be materially affected by events occurring before the Fund’s pricing time but after the close of the primary markets or exchanges on which such foreign securities are traded. These intervening events might be country-specific (e.g., natural disaster, economic or political developments, interest rate change); issuer specific (e.g., earnings report, merger announcement); or U.S. markets-specific (such as a significant movement in the U.S. markets that is deemed to affect the value of foreign securities). The pricing service uses an automated system
15
BLUE CURRENT GLOBAL DIVIDEND FUND
NOTES TO FINANCIAL STATEMENTS (Continued)
incorporating a model based on multiple parameters, including a security’s local closing price, relevant general and sector indices, currency fluctuations, trading in depositary receipts and futures, if applicable, and/or research valuations by its staff, in determining what it believes is the fair value of the securities.
The following is a summary of the inputs used to value the Fund’s investments as of February 29, 2016:
| | Level 1 | | | Level 2 | | | Level 3 | | | Total | |
Common Stocks | | $ | 27,812,088 | | | $ | 4,250,502 | | | $ | — | | | $ | 32,062,590 | |
Money Market Funds | | | 101,425 | | | | — | | | | — | | | | 101,425 | |
Total | | $ | 27,913,513 | | | $ | 4,250,502 | | | $ | — | | | $ | 32,164,015 | |
Refer to the Fund’s Schedule of Investments for a listing of the common stocks by industry type. As of February 29, 2016, the Fund did not have any transfers between Levels. In addition, the Fund did not have any assets or liabilities that were measured at fair value on a recurring basis using significant unobservable inputs (Level 3) as of February 29, 2016. It is the Fund’s policy to recognize transfers between Levels at the end of the reporting period.
Foreign currency translation – Amounts and securities denominated in or expected to settle in foreign currencies are translated into U.S. dollars based on exchange rates on the following basis:
| | A. | The fair values of investment securities and other assets and liabilities are translated as of the close of the NYSE each day. |
| | B. | Purchases and sales of investment securities and income and expenses are translated at the rate of exchange prevailing as of 4:00 p.m. EST on the respective date of such transactions. |
| | C. | The Fund does not isolate that portion of the results of operations caused by changes in foreign exchange rates on investments from those caused by changes in market prices of securities held. Such fluctuations are included with the net realized and unrealized gains or losses on investments. |
Reported net realized foreign exchange gains or losses arise from 1) purchases and sales of foreign currencies, 2) currency gains or losses realized between the trade and settlement dates on securities transactions and 3) the difference between the amounts of dividends and foreign withholding taxes recorded on the Fund’s books and the U.S. dollar equivalent of the amounts actually received or paid. Reported net unrealized foreign exchange gains and losses arise from changes in the value of assets and liabilities that result from changes in exchange rates.
16
BLUE CURRENT GLOBAL DIVIDEND FUND
NOTES TO FINANCIAL STATEMENTS (Continued)
Forward foreign currency exchange contracts – The Fund may use forward foreign currency exchange contracts to hedge exposure to foreign currency. All foreign currency exchange contracts are “marked-to-market” daily at the applicable translation rates, resulting in unrealized gains or losses. Realized and unrealized gains or losses from transactions in foreign currency exchange contracts will be included in the Fund’s Statement of Assets and Liabilities and Statement of Operations. Risks associated with these contracts include the potential inability of counterparties to meet the terms of their contracts and unanticipated movements in the value of a foreign currency relative to the U.S. dollar.
Share valuation – The NAV per share of each class of the Fund is calculated daily by dividing the total value of the assets attributable to that class, less liabilities attributable to that class, by the number of shares outstanding of that class. The offering price and redemption price per share of each class of the Fund is equal to the NAV per share of such class, except that shareholders of the Fund are subject to a redemption fee equal to 2.00% of the NAV of the Fund shares redeemed within 7 days of purchase, except for involuntary redemptions of accounts that fall below the minimum investment amount or the redemption of Fund shares representing reinvested dividends, capital gain distributions, or capital appreciation (the “Redemption Fee”). During the periods ended February 29, 2016 and August 31, 2015, no shareholder transactions were subject to the Redemption Fee.
Investment income – Dividend income is recorded on the ex-dividend date. Interest income is accrued as earned. The Fund may invest in real estate investment trusts (REITs) that pay distributions to their shareholders based on available funds from operations. It is common for these distributions to exceed the REIT’s taxable earnings and profits resulting in the excess portion of such distribution to be designated as return of capital. Distributions received from REITs are generally recorded as dividend income and, if necessary, are reclassified annually in accordance with tax information provided by the underlying REITs. The Fund may also invest in master limited partnerships (“MLPs”) whose distributions generally are comprised of ordinary income, capital gains and return of capital from the MLP. For financial statement purposes, the Fund records all income received as ordinary income. This amount may be subsequently revised based on information received from MLPs after their tax reporting periods are concluded, as the actual character of these distributions is not known until after the fiscal year end of the Fund. Withholding taxes on foreign dividends have been provided for in accordance with the Fund’s understanding of the applicable country’s tax rules and rates.
Security transactions – Security transactions are accounted for on the trade date. Gains and losses on securities sold are determined on a specific identification basis.
Common expenses – Common expenses of the Trust are allocated among the Fund and the other series of the Trust based on the relative net assets of each series or the nature of the services performed and the relative applicability to each series.
17
BLUE CURRENT GLOBAL DIVIDEND FUND
NOTES TO FINANCIAL STATEMENTS (Continued)
Distributions to shareholders – Distributions to shareholders arising from net investment income are declared and paid quarterly to shareholders. Net realized capital gains, if any, are distributed at least annually. The amount of distributions from net investment income and net realized capital gains are determined in accordance with federal income tax regulations, which may differ from GAAP. Dividends and distributions to shareholders are recorded on the ex-dividend date. The tax character of distributions paid during the periods ended February 29, 2016 and August 31, 2015 was ordinary income. On March 31, 2016, the Fund paid an ordinary income dividend of $0.0298 per share to shareholders of record on March 30, 2016.
Estimates – The preparation of financial statements in conformity with GAAP requires management to make estimates and assumptions that affect the reported amounts of assets and liabilities and disclosure of contingent assets and liabilities, each as of the date of the financial statements and the reported amounts of income and expenses during the reporting period. Actual results could differ from those estimates.
Federal income tax – The Fund has qualified and intends to continue to qualify as a regulated investment company under the Internal Revenue Code of 1986, as amended (the “Code”). Qualification generally will relieve the Fund of liability for federal income taxes to the extent 100% of its net investment income and net realized capital gains are distributed in accordance with the Code. Accordingly, no provision for income tax has been made.
In order to avoid imposition of the excise tax applicable to regulated investment companies, it is also the Fund’s intention to declare as dividends in each calendar year at least 98% of its net investment income (earned during the calendar year) and 98.2% of its net realized capital gains (earned during the 12 months ended October 31) plus undistributed amounts from prior years.
The following information is computed on a tax basis for each item as of February 29, 2016:
Tax cost of portfolio investments | | $ | 32,563,449 | |
Gross unrealized appreciation | | $ | 1,204,882 | |
Gross unrealized depreciation | | | (1,604,316 | ) |
Net unrealized depreciation on investments | | | (399,434 | ) |
Undistributed ordinary income | | | 50,490 | |
Capital loss carryforward | | | (51,424 | ) |
Other losses | | | (1,309,346 | ) |
Accumulated deficit | | $ | (1,709,714 | ) |
The difference between the federal income tax cost of portfolio investments and the financial statement cost is due to certain timing differences in the recognition of capital gains or losses under income tax regulations and GAAP. These “book/tax” differences
18
BLUE CURRENT GLOBAL DIVIDEND FUND
NOTES TO FINANCIAL STATEMENTS (Continued)
are temporary in nature and are primarily due to the tax deferral of losses on wash sales, the tax treatment of the cost of securities received as in-kind subscriptions at the inception of the Fund, and the tax treatment of income and capital gains on publicly-traded partnerships held by the Fund.
After the Fund acquired the cash and securities of the Adviser’s clients in exchange for Fund shares, the Fund began operations on September 18, 2014. As these transactions were determined to be non-taxable transactions by management, the Fund elected to retain the securities’ original cost basis for tax purposes. The cost of the contributed securities as of September 18, 2014, was $6,216,553, resulting in unrealized appreciation on investments of $400,241 as of that date.
As of August 31, 2015, the Fund had a short-term capital loss carryforward of $51,424 for federal income tax purposes. This capital loss carryforward, which does not expire, may be utilized in the current and future years to offset net realized capital gains, if any, prior to distributing such gains to shareholders.
For the six months ended February 29, 2016, the following reclassifications were made on the Statement of Assets and Liabilities as a result of permanent differences in the recognition of capital gains or losses under income tax regulations and GAAP:
Accumulated net investment income | | $ | 16,088 | |
Accumulated net realized losses from securities transactions | | $ | 33,299 | |
Paid-in capital | | $ | (49,387 | ) |
These differences are primarily due to the tax treatment of the following: the cost of in-kind subscriptions received from shareholders at the inception of the Fund, income and capital gains on publicly-traded partnerships held by the Fund, and net realized gains from foreign currency transactions. Such reclassifications, the result of permanent differences between financial statement and income tax reporting requirements, have no effect on the Fund’s net assets or NAV per share.
The Fund recognizes the tax benefits or expenses of uncertain tax positions only when the position is “more likely than not” to be sustained assuming examination by tax authorities. Management has reviewed the Fund’s tax positions for the current period and has concluded that no provision for unrecognized tax benefits or expenses is required in these financial statements.
3. Investment Transactions
During the six months ended February 29, 2016, cost of purchases and proceeds from sales of investment securities, other than short-term investments, were $14,778,145 and $10,893,031, respectively.
19
BLUE CURRENT GLOBAL DIVIDEND FUND
NOTES TO FINANCIAL STATEMENTS (Continued)
4. Transactions with Related Parties
INVESTMENT ADVISORY AGREEMENT
The Fund’s investments are managed by the Adviser pursuant to the terms of an Investment Advisory Agreement. Under the Investment Advisory Agreement, the Fund pays the Adviser an advisory fee, computed and accrued daily and paid monthly, at the annual rate of 0.99% of its average daily net assets.
Pursuant to an Expense Limitation Agreement between the Fund and the Adviser (the “ELA”), the Adviser has agreed, until January 1, 2018, to reduce its investment advisory fees and reimburse other expenses to limit Total Annual Fund Operating Expenses (exclusive of brokerage costs; taxes; interest; Acquired Fund fees and expenses; extraordinary expenses such as litigation and merger or reorganization costs; and other expenses not incurred in the ordinary course of the Fund’s business; and amounts, if any, payable pursuant to a plan adopted in accordance with Rule 12b-1 of the Investment Company Act of 1940, as amended) to an amount not exceeding 0.99% of the Fund’s average daily net assets. Accordingly, the Adviser reduced its investment advisory fees in the amount of $98,796 during the six months ended February 29, 2016.
Under the terms of the ELA, investment advisory fee reductions and expense reimbursements by the Adviser are subject to repayment by the Fund for a period of three years after such fees and expense reimbursements were incurred, provided that the repayments do not cause Total Annual Fund Operating Expenses to exceed the foregoing expense limitation. As of February 29, 2016, the Adviser may seek recoupment of investment advisory fee reductions no later than the dates stated below:
August 31, 2018 | February 28, 2019 | Total |
$159,675 | $98,796 | $258,471 |
An officer of the Fund is also an officer of the Adviser.
OTHER SERVICE PROVIDERS
Ultimus Fund Solutions, LLC (“Ultimus”) provides administration, fund accounting, compliance and transfer agency services to the Fund. The Fund pays Ultimus fees in accordance with the agreements for such services. In addition, the Fund pays out-of-pocket expenses including but not limited to postage, supplies and costs of pricing the Fund’s portfolio securities.
DISTRIBUTION AGREEMENT
Under the terms of a Distribution Agreement with the Trust, Ultimus Fund Distributors, LLC (the “Distributor”) serves as principal underwriter to the Fund. The Distributor is a wholly-owned subsidiary of Ultimus. The Distributor is compensated by the Adviser for acting as principal underwriter.
20
BLUE CURRENT GLOBAL DIVIDEND FUND
NOTES TO FINANCIAL STATEMENTS (Continued)
Certain officers and a Trustee of the Trust are also officers of Ultimus and the Distributor and are not paid by the Fund for serving in such capacities.
TRUSTEE COMPENSATION
Each Independent Trustee receives from the Fund a $500 annual retainer and a fee of $500 for each Board meeting attended plus reimbursement of travel and other meeting-related expenses. Trustees affiliated with the Adviser or Ultimus are not compensated by the Trust for their services.
PRINCIPAL HOLDERS OF FUND SHARES
As of February 29, 2016, the following account holders owned of record 5% or more of the outstanding shares of the Fund:
Name of Record Owner | % Ownership |
Pershing, LLC (for the benefit of one shareholder) | 10% |
Atlantic Capital Bancshares, Inc. (for the benefit of one shareholder) | 6% |
Charles Schwab & Co., Inc. (for the benefit of multiple shareholders) | 6% |
5. Derivatives Transactions
There were no outstanding derivative contracts held by the Fund as of February 29, 2016.
The Funds transactions in derivative instruments during the six months ended February 29, 2016 are recorded in the following locations in the Statement of Operations:
Derivative Investment Type | Location |
Forward foreign currency exchange contracts | Net realized gains from foreign currency transactions |
| | Net change in unrealized appreciation/depreciation on forward foreign currency contracts |
The following is a summary of net realized gains and net change in unrealized appreciation (depreciation) on derivative instruments recognized in the Statement of Operations during the six months ended February 29, 2016:
| | Net realized gains | | | Net change in Unrealized Appreciation/ Depreciation | |
Forward foreign currency exchange contracts | | $ | 3,775 | | | $ | 21,077 | |
21
BLUE CURRENT GLOBAL DIVIDEND FUND
NOTES TO FINANCIAL STATEMENTS (Continued)
The difference between the net realized gains from forward foreign currency exchange contracts per the table above and the net realized gains from foreign currency transactions per the Statement of Operations is the foreign exchange gains (losses) on income and security transactions and spot foreign currency contracts. The net realized gains reflected in the table is for the forward currency exchange contracts only.
The average net monthly notional value of forward foreign currency exchange contracts for the six months ended February 29, 2016 is $266,410.
In the ordinary course of business, the Fund may enter into transactions subject to enforceable netting agreements or other similar arrangements (“netting agreements”). Generally, the right to offset in netting agreements allows the Fund to offset the exposure it has on any transaction with a specific counterparty with any collateral it has received or delivered in connection with other transactions with that counterparty. Although offsetting the exposures is permitted, it is the Fund’s policy to disclose the arrangements on a gross basis. Generally, the Fund manages its cash and securities collateral on a counterparty basis. There is no offsetting of financial assets and derivatives assets to disclose as of February 29, 2016.
6. Foreign Investment Risk
Compared with investing in the United States, investing in foreign markets involves a greater degree and variety of risk. Investors in foreign markets may face delayed settlements, currency controls and adverse economic developments as well as higher overall transaction costs. In addition, fluctuations in the U.S. dollar’s value versus other currencies may erode or reverse gains from investments denominated in foreign currencies or increase losses. Foreign governments may expropriate assets, impose capital or currency controls, impose punitive taxes, impose limits on ownership or nationalize a company or industry. Any of these actions could have a severe effect on security prices and impair an investor’s ability to bring its capital or income back to the U.S. Finally, the value of foreign securities may be affected by incomplete, less frequent or inaccurate financial information about their issuers, social upheavals or political actions ranging from tax code changes to government collapse. Foreign companies may also receive less coverage than U.S. companies by market analysts and may be subject to different reporting standards or regulatory requirements than those applicable to U.S. companies.
22
BLUE CURRENT GLOBAL DIVIDEND FUND
NOTES TO FINANCIAL STATEMENTS (Continued)
7. Contingencies and Commitments
The Fund indemnifies the Trust’s officers and Trustees for certain liabilities that might arise from their performance of their duties to the Fund. Additionally, in the normal course of business, the Fund enters into contracts that contain a variety of representations, warranties, and general indemnifications. The Fund’s maximum exposure under these arrangements is unknown, as this would involve future claims that may be made against the Fund that have not yet occurred. However, based on experience, the Fund expects the risk of loss to be remote.
8. Subsequent Events
The Fund is required to recognize in the financial statements the effects of all subsequent events that provide additional evidence about conditions that existed as of the date of the Statement of Assets and Liabilities. For non-recognized subsequent events that must be disclosed to keep the financial statements from being misleading, the Fund is required to disclose the nature of the event as well as an estimate of its financial effect, or a statement that such an estimate cannot be made. Management has evaluated subsequent events through the issuance of these financial statements and has noted no such events except the ordinary income dividend paid subsequent to February 29, 2016, as disclosed in Note 2.
23
BLUE CURRENT GLOBAL DIVIDEND FUND
ABOUT YOUR FUND’S EXPENSES (Unaudited)
We believe it is important for you to understand the impact of costs on your investment. As a shareholder of the Fund, you incur ongoing costs, including management fees and other operating expenses. The following examples are intended to help you understand your ongoing costs (in dollars) of investing in the Fund and to compare these costs with the ongoing costs of investing in other mutual funds.
A mutual fund’s ongoing costs are expressed as a percentage of its average net assets. This figure is known as the expense ratio. The expenses in the table below are based on an investment of $1,000 made at the beginning of the most recent period (September 1, 2015) and held until the end of the period (February 29, 2016).
The table below illustrates the Fund’s ongoing costs in two ways:
Actual fund return – This section helps you to estimate the actual expenses that you paid over the period. The “Ending Account Value” shown is derived from the Fund’s actual return, and the fourth column shows the dollar amount of operating expenses that would have been paid by an investor who started with $1,000 in the Fund. You may use the information here, together with the amount you invested, to estimate the expenses that you paid over the period.
To do so, simply divide your account value by $1,000 (for example, an $8,600 account value divided by $1,000 = 8.6), then multiply the result by the number given for the Fund under the heading “Expenses Paid During Period.”
Hypothetical 5% return – This section is intended to help you compare the Fund’s ongoing costs with those of other mutual funds. It assumes that the Fund had an annual return of 5% before expenses during the period shown, but that the expense ratio is unchanged. In this case, because the return used is not the Fund’s actual return, the results do not apply to your investment. The example is useful in making comparisons because the U.S. Securities and Exchange Commission (the “SEC”) requires all mutual funds to calculate expenses based on a 5% return. You can assess the Fund’s ongoing costs by comparing this hypothetical example with the hypothetical examples that appear in shareholder reports of other funds.
Note that expenses shown in the table are meant to highlight and help you compare ongoing costs only. The Fund does not charge transaction fees, such as purchase or redemption fees, nor does it carry a “sales load.”
The calculations assume no shares were bought or sold during the period. Your actual costs may have been higher or lower, depending on the amount of your investment and the timing of any purchases or redemptions.
More information about the Fund’s expenses can be found in this report. For additional information on operating expenses and other shareholder costs, please refer to the Fund’s prospectus.
24
BLUE CURRENT GLOBAL DIVIDEND FUND
ABOUT YOUR FUND’S EXPENSES (Unaudited) (Continued)
Institutional Class | Beginning
Account Value
September 1, 2015 | Ending
Account Value
February 29, 2016 | Net Expense Ratio | Expenses
Paid During
Period(a) |
Based on Actual Fund Return | $1,000.00 | $ 984.70 | 0.99% | $4.89 |
Based on Hypothetical 5% Return (before expenses) | $1,000.00 | $ 1,019.94 | 0.99% | $4.97 |
(a) | Expenses are equal to the Fund’s annualized expense ratio multiplied by the average account value over the period, multiplied by 182/366 (to reflect the one-half year period). |
25
BLUE CURRENT GLOBAL DIVIDEND FUND
OTHER INFORMATION (Unaudited)
A description of the policies and procedures that the Fund uses to vote proxies relating to portfolio securities is available without charge upon request by calling 1-800-514-3583, or on the SEC’s website at http://www.sec.gov. Information regarding how the Fund voted proxies relating to portfolio securities during the most recent 12-month period ended June 30 is also available without charge upon request by calling 1-800-514-3583, or on the SEC’s website at http://www.sec.gov.
The Trust files a complete listing of portfolio holdings for the Fund with the SEC as of the end of the first and third quarters of each fiscal year on Form N-Q. These filings are available upon request by calling 1-800-514-3583. Furthermore, you may obtain a copy of the filings on the SEC’s website at http://www.sec.gov. The Trust’s Forms N-Q may also be reviewed and copied at the SEC’s Public Reference Room in Washington, DC, and information on the operation of the Public Reference Room may be obtained by calling 1-800-SEC-0330.
26
This page intentionally left blank.
This page intentionally left blank.
This page intentionally left blank.
CASTLEMAINE FUNDS
Castlemaine Emerging Markets Opportunities Fund (CNEMX)
Castlemaine Event Driven Fund (CNEVX)
Castlemaine Long/Short Fund (CNLSX)
Castlemaine Market Neutral Fund (CNMNX)
Castlemaine Multi-Strategy Fund (CNMSX)
Semi-Annual Report
February 29, 2016
(Unaudited)
CASTLEMAINE EMERGING MARKETS OPPORTUNITIES FUND
PORTFOLIO INFORMATION
February 29, 2016 (Unaudited)
Net Sector Exposure*
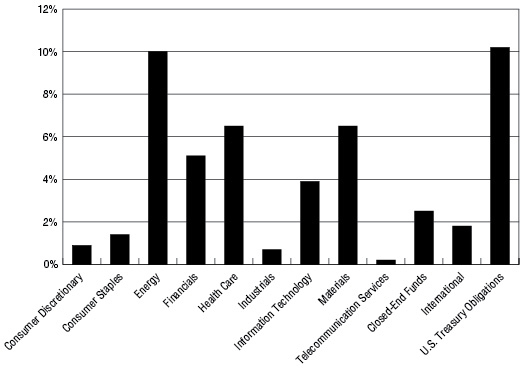
* | The net percentages are computed by taking the net dollar exposure, including short positions, and dividing by the net assets of the Fund. Consequently, the percentages will not total to 100%. |
Top 10 Long Equity Holdings |
Security Description | % of
Net Assets |
AngloGold Ashanti Ltd. - ADR | 3.7% |
iShares MSCI Emerging Markets ETF | 3.7% |
Teva Pharmaceutical Industries Ltd. - ADR | 3.6% |
YPF S.A. - ADR | 3.0% |
Dr. Reddy's Laboratories Ltd. - ADR | 2.9% |
CEMEX, S.A.B. de C.V. - ADR | 2.7% |
China Mobile Ltd. - ADR | 2.6% |
CNOOC Ltd. - ADR | 2.6% |
Trina Solar Ltd. - ADR | 2.5% |
India Fund, Inc. (The) | 2.5% |
Top 10 Short Equity Holdings |
Security Description | % of
Net Assets |
Chunghwa Telecom Company Ltd. - ADR | (3.8%) |
PT Telekomunikasi Indonesia Tbk - ADR | (2.8%) |
iShares MSCI Hong Kong ETF | (2.2%) |
Copa Holdings, S.A. - Class A | (2.0%) |
Melco Crown Entertainment Ltd. - ADR | (2.0%) |
Taiwan Semiconductor Manufacturing Company Ltd. - ADR | (1.9%) |
iShares MSCI Singapore ETF | (1.6%) |
Grupo Financiero Santander México, S.A.B. de C.V. - ADR - Class B | (1.3%) |
Mobile TeleSystems PJSC - ADR | (1.2%) |
iShares MSCI Taiwan ETF | (1.0%) |
1
CASTLEMAINE EVENT DRIVEN FUND
PORTFOLIO INFORMATION
February 29, 2016 (Unaudited)
Net Sector Exposure*
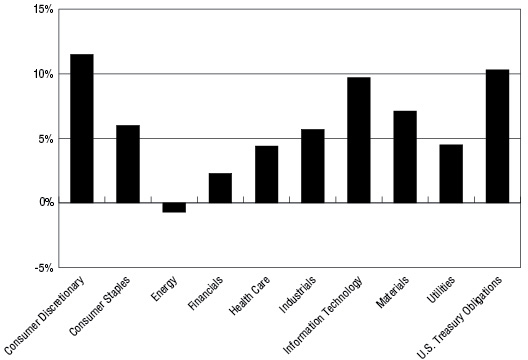
* | The net percentages are computed by taking the net dollar exposure, including short positions, and dividing by the net assets of the Fund. Consequently, the percentages will not total to 100%. |
Top 10 Long Equity Holdings |
Security Description | % of
Net Assets |
Media General, Inc. | 5.5% |
AGL Resources, Inc. | 3.7% |
Jarden Corporation | 3.1% |
Keurig Green Mountain, Inc. | 3.0% |
SanDisk Corporation | 3.0% |
Western Digital Corporation | 2.9% |
ADT Corporation (The) | 2.7% |
Alere, Inc. | 2.7% |
Yahoo!, Inc. | 2.6% |
Airgas, Inc. | 2.3% |
All Short Equity Holdings |
Security Description | % of
Net Assets |
Market Vectors® Semiconductor ETF | (2.5%) |
Market Vectors® Retail ETF | (2.4%) |
Nexstar Broadcasting Group, Inc. - Class A | (1.8%) |
Halliburton Company | (1.6%) |
Newell Rubbermaid, Inc. | (1.6%) |
Shire plc - ADR | (1.3%) |
Energy Select Sector SPDR® Fund | (1.0%) |
2
CASTLEMAINE LONG/SHORT FUND
PORTFOLIO INFORMATION
February 29, 2016 (Unaudited)
Net Sector Exposure*
* | The net percentages are computed by taking the net dollar exposure, including short positions, and dividing by the net assets of the Fund. Consequently, the percentages will not total to 100%. |
Top 10 Long Equity Holdings |
Security Description | % of
Net Assets |
Agnico Eagle Mines Ltd. | 4.3% |
Newmont Mining Corporation | 4.2% |
Apple, Inc. | 3.9% |
Market Vectors® Gold Miners ETF | 3.2% |
SolarEdge Technologies, Inc. | 3.0% |
Canadian Solar, Inc. | 2.8% |
Level 3 Communications, Inc. | 2.8% |
Micron Technology, Inc. | 2.6% |
Celgene Corporation | 2.5% |
DHT Holdings, Inc. | 2.4% |
Top 10 Short Equity Holdings |
Security Description | % of
Net Assets |
SPDR® Gold Shares | (3.9%) |
iShares U.S. Basic Materials ETF | (3.9%) |
Market Vectors® Semiconductor ETF | (3.7%) |
Royal Bank of Canada | (3.3%) |
Monster Beverage Corporation | (3.1%) |
Nextera Energy, Inc. | (2.8%) |
iShares U.S. Telecommunications ETF | (2.4%) |
Western Union Company (The) | (2.2%) |
Tyson Foods, Inc. - Class A | (2.1%) |
iShares Nasdaq Biotechnology ETF | (2.1%) |
3
CASTLEMAINE MARKET NEUTRAL FUND
PORTFOLIO INFORMATION
February 29, 2016 (Unaudited)
Net Sector Exposure*
* | The net percentages are computed by taking the net dollar exposure, including short positions, and dividing by the net assets of the Fund. Consequently, the percentages will not total to 100%. |
Top 10 Long Equity Holdings |
Security Description | % of
Net Assets |
Agnico Eagle Mines Ltd. | 5.8% |
Market Vectors® Gold Miners ETF | 4.8% |
Newmont Mining Corporation | 3.2% |
Level 3 Communications, Inc. | 2.4% |
Apple, Inc. | 2.4% |
Cisco Systems, Inc. | 2.2% |
Rio Tinto plc - ADR | 2.2% |
Biogen, Inc. | 2.1% |
Ford Motor Company | 2.1% |
SPDR® S&P® Oil & Gas Exploration & Production ETF | 2.1% |
Top 10 Short Equity Holdings |
Security Description | % of
Net Assets |
iShares U.S. Telecommunications ETF | (4.9%) |
iShares U.S. Basic Materials ETF | (4.5%) |
SPDR® Gold Shares | (3.9%) |
Royal Bank of Canada | (2.9%) |
Market Vectors® Semiconductor ETF | (2.9%) |
iShares Nasdaq Biotechnology ETF | (2.1%) |
Monster Beverage Corporation | (2.1%) |
iShares U.S. Home Construction ETF | (2.0%) |
Sanofi - ADR | (2.0%) |
Health Care Select Sector SPDR® Fund | (1.6%) |
4
CASTLEMAINE MULTI-STRATEGY FUND
PORTFOLIO INFORMATION
February 29, 2016 (Unaudited)
Net Sector Exposure*

* | The net percentages are computed by taking the net dollar exposure, including short positions, and dividing by the net assets of the Fund. Consequently, the percentages will not total to 100%. |
** | Percentage rounds to 0.0%. |
Long Equity Holdings |
Security Description | % of
Net Assets |
Castlemaine Long/Short Fund | 20.1% |
Castlemaine Emerging Markets Opportunities Fund | 20.1% |
Castlemaine Market Neutral Fund | 19.8% |
Castlemaine Event Driven Fund | 19.8% |
iShares iBoxx $ High Yield Corporate Bond ETF | 4.7% |
iShares 20+ Year Treasury Bond ETF | 2.6% |
iShares TIPS Bond ETF | 2.2% |
Market Vectors® Gold Miners ETF | 1.9% |
Deutsche X-Trackers MSCI Europe Hedged Equity ETF | 1.2% |
Short Equity Holdings |
Security Description | % of
Net Assets |
CurrencyShares Swiss Franc Trust | (2.8%) |
5
CASTLEMAINE EMERGING MARKETS OPPORTUNITIES FUND
SCHEDULE OF INVESTMENTS
February 29, 2016 (Unaudited) |
COMMON STOCKS — 51.2% | | Shares | | | Value | |
Consumer Discretionary — 2.9% | | | | | | |
Automobiles — 1.8% | | | | | | |
Tata Motors Ltd. - ADR (a) | | | 1,000 | | | $ | 22,230 | |
| | | | | | | | | |
Multiline Retail — 1.1% | | | | | | | | |
JD.com, Inc. - ADR (a) | | | 500 | | | | 12,855 | |
| | | | | | | | | |
Consumer Staples — 1.4% | | | | | | | | |
Beverages — 1.4% | | | | | | | | |
Ambev S.A. - ADR | | | 4,000 | | | | 17,360 | |
| | | | | | | | | |
Energy — 10.0% | | | | | | | | |
Oil, Gas & Consumable Fuels — 10.0% | | | | | | | | |
China Petroleum & Chemical Corporation - ADR | | | 500 | | | | 28,435 | |
CNOOC Ltd. - ADR | | | 300 | | | | 31,530 | |
Sasol Ltd. - ADR | | | 1,000 | | | | 27,110 | |
YPF S.A. - ADR | | | 2,000 | | | | 36,240 | |
| | | | | | | | 123,315 | |
Financials — 6.4% | | | | | | | | |
Banks — 4.2% | | | | | | | | |
Banco Bardesco S.A. - ADR | | | 5,000 | | | | 26,500 | |
Itau Unibanco Holding S.A. - ADR | | | 4,000 | | | | 25,200 | |
| | | | | | | | 51,700 | |
Insurance — 2.2% | | | | | | | | |
China Life Insurance Company Ltd. - ADR | | | 2,500 | | | | 27,275 | |
| | | | | | | | | |
Health Care — 6.5% | | | | | | | | |
Pharmaceuticals — 6.5% | | | | | | | | |
Dr. Reddy's Laboratories Ltd. - ADR | | | 800 | | | | 35,184 | |
Teva Pharmaceutical Industries Ltd. - ADR | | | 800 | | | | 44,480 | |
| | | | | | | | 79,664 | |
Industrials — 2.7% | | | | | | | | |
Building Products — 2.7% | | | | | | | | |
CEMEX, S.A.B. de C.V. - ADR (a) | | | 6,000 | | | | 33,240 | |
| | | | | | | | | |
Information Technology — 5.8% | | | | | | | | |
Semiconductors & Semiconductor Equipment — 5.8% | | | | | | | | |
Petrobras Argentina S.A. - ADR | | | 4,000 | | | | 24,960 | |
Siliconware Precision Industries Company Ltd. - ADR | | | 2,000 | | | | 15,160 | |
Trina Solar Ltd. - ADR (a) | | | 3,000 | | | | 31,170 | |
| | | | | | | | 71,290 | |
6
CASTLEMAINE EMERGING MARKETS OPPORTUNITIES FUND
SCHEDULE OF INVESTMENTS (Continued) |
COMMON STOCKS — 51.2% (Continued) | | Shares | | | Value | |
Materials — 7.5% | | | | | | |
Metals & Mining — 5.3% | | | | | | |
AngloGold Ashanti Ltd. - ADR (a) | | | 3,500 | | | $ | 45,570 | |
Compania de Minas Buenaventura S.A. - ADR (a) | | | 2,000 | | | | 10,440 | |
Gold Fields Ltd. - ADR | | | 2,000 | | | | 8,540 | |
| | | | | | | | 64,550 | |
Paper & Forest Products — 2.2% | | | | | | | | |
Fibria Celulouse S.A. - ADR | | | 2,500 | | | | 27,050 | |
| | | | | | | | | |
Telecommunication Services — 8.0% | | | | | | | | |
Diversified Telecommunication Services — 3.9% | | | | | | | | |
Telecom Argentina S.A. - ADR | | | 1,000 | | | | 18,460 | |
Telefonica Brasil S.A. - ADR | | | 3,000 | | | | 28,740 | |
| | | | | | | | 47,200 | |
Wireless Telecommunication Services — 4.1% | | | | | | | | |
China Mobile Ltd. - ADR | | | 600 | | | | 32,094 | |
Turkcell Iletisim Hizmetleri A.S. - ADR | | | 2,000 | | | | 18,660 | |
| | | | | | | | 50,754 | |
| | | | | | | | | |
Total Common Stocks (Cost $594,220) | | | | | | $ | 628,483 | |
|
CLOSED-END FUNDS — 2.5% | | Shares | | | Value | |
India Fund, Inc. (The) (Cost $31,548) | | | 1,500 | | | $ | 29,969 | |
|
EXCHANGE-TRADED FUNDS — 6.6% | | Shares | | | Value | |
iShares MSCI Brazil Capped ETF | | | 1,000 | | | $ | 20,490 | |
iShares MSCI Emerging Markets ETF | | | 1,500 | | | | 45,465 | |
Vanguard FTSE Emerging Markets ETF | | | 500 | | | | 15,365 | |
Total Exchange-Traded Funds (Cost $79,538) | | | | | | $ | 81,320 | |
7
CASTLEMAINE EMERGING MARKETS OPPORTUNITIES FUND
SCHEDULE OF INVESTMENTS (Continued) |
PURCHASED OPTION CONTRACTS — 0.8% | Expiration Date | | Strike
Price | | | Contracts | | | Value | |
Call Option Contracts — 0.4% | | | | | | | | | | |
iShares China Large-Cap ETF | 03/18/16 | | $ | 32.00 | | | | 25 | | | $ | 775 | |
iShares MSCI Brazil Capped ETF | 03/18/16 | | | 21.00 | | | | 50 | | | | 3,100 | |
iShares MSCI Brazil Capped ETF | 03/18/16 | | | 32.00 | | | | 100 | | | | 1,400 | |
| | | | | | | | | | | | | 5,275 | |
Put Option Contracts — 0.4% | | | | | | | | | | | | | |
SPDR® S&P 500® ETF Trust | 04/15/16 | | | 190.00 | | | | 10 | | | | 4,190 | |
| | | | | | | | | | | | | | |
Total Purchased Option Contracts (Cost $10,767) | | | | | | | | | | | $ | 9,465 | |
| |
U.S. TREASURY OBLIGATIONS — 10.2% | Maturity | | Coupon | | | Par Value | | | Value | |
U.S. Treasury Bills (b) (Cost $124,943) | 05/12/16 | | | 0.230 | %(c) | | $ | 125,000 | | | $ | 124,928 | |
| | | | | | |
Total Investments at Value — 71.3% (Cost $841,016) | | | $ | 874,165 | |
| | | | | | |
Other Assets in Excess of Liabilities (d) — 28.7% | | | | 352,558 | |
| | | | | | |
Net Assets — 100.0% | | | $ | 1,226,723 | |
ADR - American Depositary Receipt. |
(a) | Non-income producing security. |
(b) | All or a portion of the shares have been committed as collateral for open short positions. |
(c) | Rate shown is the annualized yield at time of purchase, not a coupon rate. |
(d) | Includes cash held as margin deposits for open short positions and futures contracts. |
See accompanying notes to financial statements. |
8
CASTLEMAINE EMERGING MARKETS OPPORTUNITIES FUND
SUMMARY OF COMMON STOCKS BY COUNTRY
February 29, 2016 (Unaudited) |
Country | | Value | | | % of
Net Assets | |
United States | | $ | 216,930 | | | | 17.7 | % |
Brazil | | | 97,800 | | | | 8.0 | % |
Taiwan Province of China | | | 67,170 | | | | 5.5 | % |
India | | | 57,414 | | | | 4.7 | % |
Mexico | | | 33,240 | | | | 2.7 | % |
Hong Kong | | | 32,094 | | | | 2.6 | % |
Cayman Islands | | | 31,170 | | | | 2.5 | % |
China | | | 28,435 | | | | 2.3 | % |
South Africa | | | 27,110 | | | | 2.2 | % |
Turkey | | | 18,660 | | | | 1.5 | % |
Argentina | | | 18,460 | | | | 1.5 | % |
| | | $ | 628,483 | | | | 51.2 | % |
See accompanying notes to financial statements. |
9
CASTLEMAINE EMERGING MARKETS OPPORTUNITIES FUND
SCHEDULE OF SECURITIES SOLD SHORT
February 29, 2016 (Unaudited) |
COMMON STOCKS — 16.0% | | Shares | | | Value | |
Consumer Discretionary — 2.0% | | | | | | |
Hotels, Restaurants & Leisure — 2.0% | | | | | | |
Melco Crown Entertainment Ltd. - ADR | | | 1,500 | | | $ | 23,685 | |
| | | | | | | | | |
Financials — 1.3% | | | | | | | | |
Banks — 1.3% | | | | | | | | |
Grupo Financiero Santander México, S.A.B. de C.V. - ADR - Class B | | | 2,000 | | | | 15,980 | |
| | | | | | | | | |
Industrials — 2.0% | | | | | | | | |
Airlines — 2.0% | | | | | | | | |
Copa Holdings, S.A. - Class A | | | 400 | | | | 24,424 | |
| | | | | | | | | |
Information Technology — 1.9% | | | | | | | | |
Semiconductors & Semiconductor Equipment — 1.9% | | | | | | | | |
Taiwan Semiconductor Manufacturing Company Ltd. - ADR | | | 1,000 | | | | 23,550 | |
| | | | | | | | | |
Materials — 1.0% | | | | | | | | |
Chemicals — 1.0% | | | | | | | | |
Brakem S.A. - ADR | | | 1,000 | | | | 12,630 | |
| | | | | | | | | |
Telecommunication Services — 7.8% | | | | | | | | |
Diversified Telecommunication Services — 7.8% | | | | | | | | |
Chunghwa Telecom Company Ltd. - ADR | | | 1,500 | | | | 47,085 | |
Mobile TeleSystems PJSC - ADR | | | 2,000 | | | | 14,000 | |
PT Telekomunikasi Indonesia Tbk - ADR | | | 700 | | | | 34,335 | |
| | | | | | | | 95,420 | |
| | | | | | | | | |
Total Common Stocks (Proceeds $195,182) | | | | | | $ | 195,689 | |
|
EXCHANGE-TRADED FUNDS — 4.8% | | Shares | | | Value | |
iShares MSCI Hong Kong ETF | | | 1,500 | | | $ | 27,135 | |
iShares MSCI Singapore ETF | | | 2,000 | | | | 19,400 | |
iShares MSCI Taiwan ETF | | | 1,000 | | | | 12,840 | |
Total Exchange-Traded Funds (Proceeds $58,848) | | | | | | $ | 59,375 | |
| | | | | | | | | |
Total Securities Sold Short — 20.8% (Proceeds $254,030) | | | | | | $ | 255,064 | |
ADR - American Depositary Receipt. |
See accompanying notes to financial statements. |
10
CASTLEMAINE EMERGING MARKETS OPPORTUNITIES FUND
SUMMARY OF COMMON STOCKS SOLD SHORT BY COUNTRY
February 29, 2016 (Unaudited) |
Country | | Value | | | % of
Net Assets | |
Taiwan Province of China | | $ | 70,635 | | | | 5.8 | % |
Indonesia | | | 34,335 | | | | 2.8 | % |
Panama | | | 24,424 | | | | 2.0 | % |
Hong Kong | | | 23,685 | | | | 2.0 | % |
Mexico | | | 15,980 | | | | 1.3 | % |
Russian Federation | | | 14,000 | | | | 1.1 | % |
Brazil | | | 12,630 | | | | 1.0 | % |
| | | $ | 195,689 | | | | 16.0 | % |
CASTLEMAINE EMERGING MARKETS OPPORTUNITIES FUND
SCHEDULE OF OPEN WRITTEN OPTION CONTRACTS
February 29, 2016 (Unaudited) |
WRITTEN OPTION CONTRACTS | Expiration Date | | Strike
Price | | | Contracts | | | Value of Options | | | Premiums Received | |
Put Option Contracts | | | | | | | | | | | | | |
iShares China Large-Cap ETF | 03/18/16 | | $ | 28.00 | | | | 25 | | | $ | 700 | | | $ | 899 | |
iShares MSCI Emerging Markets ETF | 03/18/16 | | | 29.00 | | | | 25 | | | | 750 | | | | 880 | |
SPDR® S&P 500® ETF Trust | 04/15/16 | | | 175.00 | | | | 10 | | | | 1,220 | | | | 1,137 | |
Total Written Option Contracts | | | | | | | | | | | $ | 2,670 | | | $ | 2,916 | |
See accompanying notes to financial statements. |
11
CASTLEMAINE EVENT DRIVEN FUND
SCHEDULE OF INVESTMENTS
February 29, 2016 (Unaudited) |
COMMON STOCKS — 62.6% | | Shares | | | Value | |
Consumer Discretionary — 17.3% | | | | | | |
Diversified Consumer Services — 1.3% | | | | | | |
Apollo Education Group, Inc. (a) | | | 2,000 | | | $ | 16,380 | |
| | | | | | | | | |
Household Durables — 3.1% | | | | | | | | |
Jarden Corporation (a) | | | 700 | | | | 37,016 | |
| | | | | | | | | |
Media — 7.6% | | | | | | | | |
Media General, Inc. (a) | | | 4,000 | | | | 66,480 | |
Starz - Series A (a) | | | 1,000 | | | | 25,190 | |
| | | | | | | | 91,670 | |
Multiline Retail — 3.7% | | | | | | | | |
Kohl's Corporation | | | 600 | | | | 28,002 | |
Macy's, Inc. | | | 400 | | | | 17,284 | |
| | | | | | | | 45,286 | |
Specialty Retail — 1.6% | | | | | | | | |
Barnes & Noble, Inc. | | | 2,000 | | | | 19,400 | |
| | | | | | | | | |
Consumer Staples — 6.0% | | | | | | | | |
Food & Staples Retailing — 2.0% | | | | | | | | |
Rite Aid Corporation (a) | | | 3,000 | | | | 23,850 | |
| | | | | | | | | |
Food Products — 4.0% | | | | | | | | |
Keurig Green Mountain, Inc. | | | 400 | | | | 36,776 | |
Mondelēz International, Inc. - Class A | | | 300 | | | | 12,159 | |
| | | | | | | | 48,935 | |
Energy — 1.8% | | | | | | | | |
Energy Equipment & Services — 1.8% | | | | | | | | |
Baker Hughes, Inc. | | | 500 | | | | 21,435 | |
| | | | | | | | | |
Financials — 2.3% | | | | | | | | |
Insurance — 2.3% | | | | | | | | |
PartnerRe Ltd. | | | 200 | | | | 28,054 | |
| | | | | | | | | |
Health Care — 5.7% | | | | | | | | |
Biotechnology — 1.9% | | | | | | | | |
Baxalta, Inc. | | | 600 | | | | 23,112 | |
| | | | | | | | | |
Health Care Equipment & Supplies — 2.7% | | | | | | | | |
Alere, Inc. (a) | | | 600 | | | | 31,980 | |
| | | | | | | | | |
Pharmaceuticals — 1.1% | | | | | | | | |
Akorn, Inc. (a) | | | 500 | | | | 13,295 | |
12
CASTLEMAINE EVENT DRIVEN FUND
SCHEDULE OF INVESTMENTS (Continued) |
COMMON STOCKS — 62.6% (Continued) | | Shares | | | Value | |
Industrials — 5.7% | | | | | | |
Aerospace & Defense — 1.6% | | | | | | |
United Technologies Corporation | | | 200 | | | $ | 19,324 | |
| | | | | | | | | |
Commercial Services & Supplies — 2.7% | | | | | | | | |
ADT Corporation (The) | | | 800 | | | | 32,296 | |
| | | | | | | | | |
Professional Services — 1.4% | | | | | | | | |
Hill International, Inc. (a) | | | 5,000 | | | | 17,500 | |
| | | | | | | | | |
Information Technology — 12.2% | | | | | | | | |
Electronic Equipment, Instruments & Components — 1.5% | | | | | | | | |
Ingram Micro, Inc. - Class A | | | 500 | | | | 17,900 | |
| | | | | | | | | |
Internet Software & Services — 2.6% | | | | | | | | |
Yahoo!, Inc. (a) | | | 1,000 | | | | 31,790 | |
| | | | | | | | | |
Semiconductors & Semiconductor Equipment — 2.2% | | | | | | | | |
Micron Technology, Inc. (a) | | | 2,500 | | | | 26,575 | |
| | | | | | | | | |
Technology Hardware, Storage & Peripherals — 5.9% | | | | | | | | |
SanDisk Corporation | | | 500 | | | | 36,130 | |
Western Digital Corporation | | | 800 | | | | 34,824 | |
| | | | | | | | 70,954 | |
Materials — 7.1% | | | | | | | | |
Chemicals — 7.1% | | | | | | | | |
Airgas, Inc. | | | 200 | | | | 28,304 | |
Axiall Corporation | | | 1,000 | | | | 19,900 | |
Ferro Corporation (a) | | | 2,000 | | | | 19,860 | |
Monsanto Company | | | 200 | | | | 17,998 | |
| | | | | | | | 86,062 | |
Utilities — 4.5% | | | | | | | | |
Electric Utilities — 0.8% | | | | | | | | |
Cleco Corporation | | | 200 | | | | 9,182 | |
| | | | | | | | | |
Gas Utilities — 3.7% | | | | | | | | |
AGL Resources, Inc. | | | 700 | | | | 45,255 | |
| | | | | | | | | |
Total Common Stocks (Cost $738,257) | | | | | | $ | 757,251 | |
13
CASTLEMAINE EVENT DRIVEN FUND
SCHEDULE OF INVESTMENTS (Continued) |
PURCHASED OPTION CONTRACTS — 0.8% | Expiration Date | | Strike
Price | | | Contracts | | | Value | |
Call Option Contracts — 0.4% | | | | | | | | | | |
Micron Technology, Inc. | 03/18/16 | | $ | 12.00 | | | | 75 | | | $ | 1,350 | |
Micron Technology, Inc. | 04/15/16 | | | 13.00 | | | | 30 | | | | 750 | |
United Technologies Corporation | 05/20/16 | | | 105.00 | | | | 10 | | | | 1,200 | |
Yahoo! Inc. | 03/18/16 | | | 31.00 | | | | 10 | | | | 1,720 | |
| | | | | | | | | | | | | 5,020 | |
Put Option Contracts — 0.4% | | | | | | | | | | | | | |
SPDR® S&P 500® ETF Trust | 04/15/16 | | | 190.00 | | | | 10 | | | | 4,190 | |
| | | | | | | | | | | | | | |
Total Purchased Option Contracts (Cost $9,689) | | | | | | | | | | | $ | 9,210 | |
| |
U.S. TREASURY OBLIGATIONS — 10.3% | Maturity | | Coupon | | | Par Value | | | Value | |
U.S. Treasury Bills (b) (Cost $124,943) | 05/12/16 | | | 0.230 | %(c) | | $ | 125,000 | | | $ | 124,928 | |
| | | | | | |
Total Investments at Value — 73.7% (Cost $872,889) | | | $ | 891,389 | |
| | | | | | |
Other Assets in Excess of Liabilities (d) — 26.3% | | | | 318,463 | |
| | | | | | |
Net Assets — 100.0% | | | $ | 1,209,852 | |
(a) | Non-income producing security. |
(b) | All or a portion of the shares have been committed as collateral for open short positions. |
(c) | Rate shown is the annualized yield at time of purchase, not a coupon rate. |
(d) | Includes cash held as margin deposits for open short positions and futures contracts. |
See accompanying notes to financial statements. |
14
CASTLEMAINE EVENT DRIVEN FUND
SCHEDULE OF SECURITIES SOLD SHORT
February 29, 2016 (Unaudited) |
COMMON STOCKS — 6.3% | | Shares | | | Value | |
Consumer Discretionary — 3.4% | | | | | | |
Household Durables — 1.6% | | | | | | |
Newell Rubbermaid, Inc. | | | 500 | | | $ | 19,005 | |
| | | | | | | | | |
Media — 1.8% | | | | | | | | |
Nexstar Broadcasting Group, Inc. - Class A | | | 500 | | | | 22,340 | |
| | | | | | | | | |
Energy — 1.6% | | | | | | | | |
Energy Equipment & Services — 1.6% | | | | | | | | |
Halliburton Company | | | 600 | | | | 19,368 | |
| | | | | | | | | |
Health Care — 1.3% | | | | | | | | |
Pharmaceuticals — 1.3% | | | | | | | | |
Shire plc - ADR | | | 100 | | | | 15,611 | |
| | | | | | | | | |
Total Common Stocks (Proceeds $75,156) | | | | | | $ | 76,324 | |
|
EXCHANGE-TRADED FUNDS — 5.9% | | Shares | | | Value | |
Energy Select Sector SPDR® Fund | | | 200 | | | $ | 11,332 | |
Market Vectors® Semiconductor ETF | | | 600 | | | | 30,258 | |
Market Vectors® Retail ETF | | | 400 | | | | 29,324 | |
Total Exchange-Traded Funds (Proceeds $69,901) | | | | | | $ | 70,914 | |
| | | | | | | | | |
Total Securities Sold Short — 12.2% (Proceeds $145,057) | | | | | | $ | 147,238 | |
ADR - American Depositary Receipt. |
See accompanying notes to financial statements. |
15
CASTLEMAINE EVENT DRIVEN FUND
SCHEDULE OF OPEN WRITTEN OPTION CONTRACTS
February 29, 2016 (Unaudited) |
WRITTEN OPTION CONTRACTS | Expiration Date | | Strike
Price | | | Contracts | | | Value of Options | | | Premiums Received | |
Put Option Contracts | | | | | | | | | | | | | |
Micron Technology, Inc. | 04/15/16 | | $ | 9.00 | | | | 30 | | | $ | 1,050 | | | $ | 1,251 | |
SPDR® S&P 500® ETF Trust | 04/15/16 | | | 175.00 | | | | 10 | | | | 1,220 | | | | 1,136 | |
Total Written Option Contracts | | | | | | | | | | | $ | 2,270 | | | $ | 2,387 | |
See accompanying notes to financial statements. |
16
CASTLEMAINE LONG/SHORT FUND
SCHEDULE OF INVESTMENTS
February 29, 2016 (Unaudited) |
COMMON STOCKS — 65.3% | | Shares | | | Value | |
Consumer Discretionary — 4.7% | | | | | | |
Automobiles — 2.0% | | | | | | |
Ford Motor Company | | | 2,000 | | | $ | 25,020 | |
| | | | | | | | | |
Hotels, Restaurants & Leisure — 1.9% | | | | | | | | |
McDonald's Corporation | | | 200 | | | | 23,438 | |
| | | | | | | | | |
Specialty Retail — 0.8% | | | | | | | | |
Barnes & Noble, Inc. | | | 1,000 | | | | 9,700 | |
| | | | | | | | | |
Energy — 5.1% | | | | | | | | |
Oil, Gas & Consumable Fuels — 5.1% | | | | | | | | |
DHT Holdings, Inc. | | | 5,000 | | | | 29,150 | |
Gener8 Maritime, Inc. (a) | | | 4,000 | | | | 24,840 | |
Phillips 66 | | | 100 | | | | 7,939 | |
| | | | | | | | 61,929 | |
Health Care — 12.4% | | | | | | | | |
Biotechnology — 9.0% | | | | | | | | |
Amgen, Inc. | | | 200 | | | | 28,456 | |
Biogen, Inc. (a) | | | 100 | | | | 25,942 | |
Celgene Corporation (a) | | | 300 | | | | 30,249 | |
Gilead Sciences, Inc. | | | 300 | | | | 26,175 | |
| | | | | | | | 110,822 | |
Pharmaceuticals — 3.4% | | | | | | | | |
GlaxoSmithKline plc - ADR | | | 500 | | | | 19,335 | |
Mylan N.V. (a) | | | 500 | | | | 22,535 | |
| | | | | | | | 41,870 | |
Information Technology — 20.0% | | | | | | | | |
Communications Equipment — 2.1% | | | | | | | | |
Cisco Systems, Inc. | | | 1,000 | | | | 26,180 | |
| | | | | | | | | |
Electronic Equipment, Instruments & Components — 2.2% | | | | | | | | |
Corning, Inc. | | | 1,500 | | | | 27,450 | |
| | | | | | | | | |
Semiconductors & Semiconductor Equipment — 9.7% | | | | | | | | |
Canadian Solar, Inc. (a) | | | 1,500 | | | | 34,155 | |
Micron Technology, Inc. (a) | | | 3,000 | | | | 31,890 | |
NVIDIA Corporation | | | 500 | | | | 15,680 | |
SolarEdge Technologies, Inc. (a) | | | 1,500 | | | | 36,705 | |
| | | | | | | | 118,430 | |
Software — 2.1% | | | | | | | | |
Electronic Arts, Inc. (a) | | | 400 | | | | 25,696 | |
17
CASTLEMAINE LONG/SHORT FUND
SCHEDULE OF INVESTMENTS (Continued) |
COMMON STOCKS — 65.3% (Continued) | | Shares | | | Value | |
Information Technology — 20.0% (Continued) | | | | | | |
Technology Hardware, Storage & Peripherals — 3.9% | | | | | | |
Apple, Inc. (b) | | | 500 | | | $ | 48,345 | |
| | | | | | | | | |
Materials — 18.0% | | | | | | | | |
Chemicals — 4.4% | | | | | | | | |
Monsanto Company | | | 300 | | | | 26,997 | |
Mosaic Company (The) | | | 1,000 | | | | 26,650 | |
| | | | | | | | 53,647 | |
Metals & Mining — 13.6% | | | | | | | | |
Agnico Eagle Mines Ltd. | | | 1,500 | | | | 52,800 | |
BHP Billiton Ltd. - ADR (c) | | | 1,000 | | | | 22,610 | |
Goldcorp, Inc. | | | 1,000 | | | | 14,320 | |
Newmont Mining Corporation | | | 2,000 | | | | 51,660 | |
Rio Tinto plc - ADR (c) | | | 1,000 | | | | 26,100 | |
| | | | | | | | 167,490 | |
Telecommunication Services — 2.8% | | | | | | | | |
Diversified Telecommunication Services — 2.8% | | | | | | | | |
Level 3 Communications, Inc. (a) | | | 700 | | | | 33,985 | |
| | | | | | | | | |
Utilities — 2.3% | | | | | | | | |
Multi-Utilities — 2.3% | | | | | | | | |
Dominion Resources, Inc. | | | 400 | | | | 27,968 | |
| | | | | | | | | |
Total Common Stocks (Cost $775,617) | | | | | | $ | 801,970 | |
|
EXCHANGE-TRADED FUNDS — 5.2% | | Shares | | | Value | |
Market Vectors® Gold Miners ETF | | | 2,000 | | | $ | 38,760 | |
SPDR® S&P® Oil & Gas Exploration & Production ETF | | | 1,000 | | | | 24,600 | |
Total Exchange-Traded Funds (Cost $59,105) | | | | | | $ | 63,360 | |
18
CASTLEMAINE LONG/SHORT FUND
SCHEDULE OF INVESTMENTS (Continued) |
PURCHASED OPTION CONTRACTS — 0.6% | Expiration Date | | Strike
Price | | | Contracts | | | Value | |
Call Option Contracts — 0.2% | | | | | | | | | | |
SPDR® S&P® Oil & Gas Exploration & Production ETF | 06/17/16 | | $ | 27.00 | | | | 20 | | | $ | 3,040 | |
| | | | | | | | | | | | | | |
Put Option Contracts — 0.4% | | | | | | | | | | | | | |
Netflix, Inc. | 03/04/16 | | | 85.00 | | | | 5 | | | | 100 | |
Netflix, Inc. | 03/18/16 | | | 85.00 | | | | 5 | | | | 645 | |
SPDR® S&P 500® ETF Trust | 04/15/16 | | | 190.00 | | | | 10 | | | | 4,190 | |
| | | | | | | | | | | | | 4,935 | |
Total Purchased Option Contracts (Cost $9,652) | | | | | | | | | | | $ | 7,975 | |
| |
U.S. TREASURY OBLIGATIONS — 10.2% | Maturity | | Coupon | | | Par Value | | | Value | |
U.S. Treasury Bills (c) (Cost $124,942) | 05/12/16 | | | 0.230 | %(d) | | $ | 125,000 | | | $ | 124,928 | |
| | | | | | |
Total Investments at Value — 81.3% (Cost $969,316) | | | $ | 998,233 | |
| | | | | | |
Other Assets in Excess of Liabilities (e) — 18.7% | | | | 229,623 | |
| | | | | | |
Net Assets — 100.0% | | | $ | 1,227,856 | |
ADR - American Depositary Receipt. |
(a) | Non-income producing security. |
(b) | Security covers a written call option. |
(c) | All or a portion of the shares have been committed as collateral for open short positions. |
(d) | Rate shown is the annualized yield at time of purchase, not a coupon rate. |
(e) | Includes cash held as margin deposits for open short positions and futures contacts. |
See accompanying notes to financial statements. |
19
CASTLEMAINE LONG/SHORT FUND
SCHEDULE OF SECURITIES SOLD SHORT
February 29, 2016 (Unaudited) |
COMMON STOCKS — 15.0% | | Shares | | | Value | |
Consumer Discretionary — 1.5% | | | | | | |
Internet & Catalog Retail — 1.5% | | | | | | |
Netflix, Inc. | | | 200 | | | $ | 18,682 | |
| | | | | | | | | |
Consumer Staples — 5.2% | | | | | | | | |
Beverages — 3.1% | | | | | | | | |
Monster Beverage Corporation | | | 300 | | | | 37,650 | |
| | | | | | | | | |
Food Products — 2.1% | | | | | | | | |
Tyson Foods, Inc. - Class A | | | 400 | | | | 25,900 | |
| | | | | | | | | |
Financials — 3.3% | | | | | | | | |
Banks — 3.3% | | | | | | | | |
Royal Bank of Canada | | | 800 | | | | 40,776 | |
| | | | | | | | | |
Information Technology — 2.2% | | | | | | | | |
IT Services — 2.2% | | | | | | | | |
Western Union Company (The) | | | 1,500 | | | | 27,390 | |
| | | | | | | | | |
Utilities — 2.8% | | | | | | | | |
Electric Utilities — 2.8% | | | | | | | | |
Nextera Energy, Inc. | | | 300 | | | | 33,846 | |
| | | | | | | | | |
Total Common Stocks (Proceeds $181,501) | | | | | | $ | 184,244 | |
| |
EXCHANGE-TRADED FUNDS — 20.0% | | Shares | | | Value | |
Energy Select Sector SPDR® Fund | | | 400 | | | $ | 22,664 | |
Health Care Select Sector SPDR® Fund | | | 200 | | | | 13,240 | |
iShares Nasdaq Biotechnology ETF | | | 100 | | | | 25,409 | |
iShares U.S. Basic Materials ETF | | | 700 | | | | 47,320 | |
iShares U.S. Telecommunications ETF | | | 1,000 | | | | 29,590 | |
Market Vectors® Semiconductor ETF | | | 900 | | | | 45,387 | |
SPDR® Gold Shares | | | 400 | | | | 47,456 | |
Utilities Select Sector SPDR® Fund | | | 300 | | | | 13,890 | |
Total Exchange-Traded Funds (Proceeds $235,648) | | | | | | $ | 244,956 | |
| | | | | | | | | |
Total Securities Sold Short — 35.0% (Proceeds $417,149) | | | | | | $ | 429,200 | |
See accompanying notes to financial statements. |
20
CASTLEMAINE LONG/SHORT FUND
SCHEDULE OF OPEN WRITTEN OPTION CONTRACTS
February 29, 2016 (Unaudited) |
WRITTEN OPTION CONTRACTS | Expiration Date | | Strike
Price | | | Contracts | | | Value of Options | | | Premiums Received | |
Call Option Contracts | | | | | | | | �� | | | | | |
Apple, Inc. | 03/18/16 | | $ | 100.00 | | | | 5 | | | $ | 365 | | | $ | 506 | |
| | | | | | | | | | | | | | | | | | |
Put Option Contracts | | | | | | | | | | | | | | | | | |
Netflix, Inc. | 03/04/16 | | | 75.00 | | | | 5 | | | | 15 | | | | 252 | |
Netflix, Inc. | 03/18/16 | | | 75.00 | | | | 5 | | | | 130 | | | | 852 | |
Royal Bank of Canada | 04/15/16 | | | 40.00 | | | | 10 | | | | 250 | | | | 600 | |
SPDR® S&P® 500® ETF Trust | 04/15/16 | | | 175.00 | | | | 10 | | | | 1,220 | | | | 1,137 | |
SPDR® S&P® Oil & Gas Exploration & Production ETF | 06/17/16 | | | 20.00 | | | | 20 | | | | 1,860 | | | | 2,520 | |
| | | | | | | | | | | | | 3,475 | | | | 5,361 | |
Total Written Option Contracts | | | | | | | | | | | $ | 3,840 | | | $ | 5,867 | |
See accompanying notes to financial statements. |
21
CASTLEMAINE MARKET NEUTRAL FUND
SCHEDULE OF INVESTMENTS
February 29, 2016 (Unaudited) |
COMMON STOCKS — 40.1% | | Shares | | | Value | |
Consumer Discretionary — 6.0% | | | | | | |
Automobiles — 2.1% | | | | | | |
Ford Motor Company | | | 2,000 | | | $ | 25,020 | |
| | | | | | | | | |
Hotels, Restaurants & Leisure — 1.9% | | | | | | | | |
McDonald's Corporation | | | 200 | | | | 23,438 | |
| | | | | | | | | |
Household Durables — 2.0% | | | | | | | | |
D.R. Horton, Inc. | | | 500 | | | | 13,360 | |
MDC Holdings, Inc. | | | 500 | | | | 11,055 | |
| | | | | | | | 24,415 | |
Health Care — 8.1% | | | | | | | | |
Biotechnology — 5.0% | | | | | | | | |
Amgen, Inc. | | | 100 | | | | 14,228 | |
Biogen, Inc. (a) | | | 100 | | | | 25,942 | |
Celgene Corporation (a) | | | 200 | | | | 20,166 | |
| | | | | | | | 60,336 | |
Pharmaceuticals — 3.1% | | | | | | | | |
GlaxoSmithKline plc - ADR | | | 500 | | | | 19,335 | |
Mylan N.V. (a) | | | 400 | | | | 18,028 | |
| | | | | | | | 37,363 | |
Information Technology — 8.9% | | | | | | | | |
Communications Equipment — 2.2% | | | | | | | | |
Cisco Systems, Inc. (b) | | | 1,000 | | | | 26,180 | |
| | | | | | | | | |
Electronic Equipment, Instruments & Components — 1.5% | | | | | | | | |
Corning, Inc. | | | 1,000 | | | | 18,300 | |
| | | | | | | | | |
Semiconductors & Semiconductor Equipment — 2.8% | | | | | | | | |
Micron Technology, Inc. (a) | | | 2,000 | | | | 21,260 | |
NVIDIA Corporation | | | 400 | | | | 12,544 | |
| | | | | | | | 33,804 | |
Technology Hardware, Storage & Peripherals — 2.4% | | | | | | | | |
Apple, Inc. | | | 300 | | | | 29,007 | |
| | | | | | | | | |
Materials — 13.0% | | | | | | | | |
Metals & Mining — 13.0% | | | | | | | | |
Agnico Eagle Mines Ltd. (b) | | | 2,000 | | | | 70,400 | |
BHP Billiton Ltd. - ADR (b) | | | 1,000 | | | | 22,610 | |
Newmont Mining Corporation (b) | | | 1,500 | | | | 38,745 | |
Rio Tinto plc - ADR (b) | | | 1,000 | | | | 26,100 | |
| | | | | | | | 157,855 | |
22
CASTLEMAINE MARKET NEUTRAL FUND
SCHEDULE OF INVESTMENTS |
COMMON STOCKS — 40.1% (Continued) | | Shares | | | Value | |
Telecommunication Services — 2.4% | | | | | | |
Diversified Telecommunication Services — 2.4% | | | | | | |
Level 3 Communications, Inc. (a) | | | 600 | | | $ | 29,130 | |
| | | | | | | | | |
Utilities — 1.7% | | | | | | | | |
Multi-Utilities — 1.7% | | | | | | | | |
Dominion Resources, Inc. | | | 300 | | | | 20,976 | |
| | | | | | | | | |
Total Common Stocks (Cost $471,735) | | | | | | $ | 485,824 | |
| |
EXCHANGE-TRADED FUNDS — 6.9% | | Shares | | | Value | |
Market Vectors® Gold Miners ETF | | | 3,000 | | | $ | 58,140 | |
SPDR® S&P® Oil & Gas Exploration & Production ETF | | | 1,000 | | | | 24,600 | |
Total Exchange-Traded Funds (Cost $74,370) | | | | | | $ | 82,740 | |
| |
U.S. TREASURY OBLIGATIONS — 10.3% | Maturity | | Coupon | | | Par Value | | | Value | |
U.S. Treasury Bills (b) (Cost $124,943) | 05/12/16 | | | 0.230 | %(c) | | $ | 125,000 | | | $ | 124,928 | |
| | | | | | |
Total Investments at Value — 57.3% (Cost $671,048) | | | $ | 693,492 | |
| | | | | | |
Other Assets in Excess of Liabilities (d) — 42.7% | | | | 517,149 | |
| | | | | | |
Net Assets — 100.0% | | | $ | 1,210,641 | |
ADR - American Depositary Receipt. |
(a) | Non-income producing security. |
(b) | All or a portion of the shares have been committed as collateral for open short positions. |
(c) | Rate shown is the annualized yield at time of purchase, not a coupon rate. |
(d) | Includes cash held as margin deposits for open short positions and futures contracts. |
See accompanying notes to financial statements. |
23
CASTLEMAINE MARKET NEUTRAL FUND
SCHEDULE OF SECURITIES SOLD SHORT
February 29, 2016 (Unaudited) |
COMMON STOCKS — 11.6% | | Shares | | | Value | |
Consumer Discretionary — 1.5% | | | | | | |
Internet & Catalog Retail — 1.5% | | | | | | |
Netflix, Inc. | | | 200 | | | $ | 18,682 | |
| | | | | | | | | |
Consumer Staples — 3.7% | | | | | | | | |
Beverages — 2.1% | | | | | | | | |
Monster Beverage Corporation | | | 200 | | | | 25,100 | |
| | | | | | | | | |
Food Products — 1.6% | | | | | | | | |
Tyson Foods, Inc. - Class A | | | 300 | | | | 19,425 | |
| | | | | | | | | |
Financials — 2.9% | | | | | | | | |
Banks — 2.9% | | | | | | | | |
Royal Bank of Canada | | | 700 | | | | 35,679 | |
| | | | | | | | | |
Health Care — 2.0% | | | | | | | | |
Pharmaceuticals — 2.0% | | | | | | | | |
Sanofi - ADR | | | 600 | | | | 23,730 | |
| | | | | | | | | |
Information Technology — 1.5% | | | | | | | | |
IT Services — 1.5% | | | | | | | | |
Western Union Company (The) | | | 1,000 | | | | 18,260 | |
| | | | | | | | | |
Total Common Stocks (Proceeds $141,431) | | | | | | $ | 140,876 | |
| |
EXCHANGE-TRADED FUNDS — 24.9% | | Shares | | | Value | |
Energy Select Sector SPDR® Fund | | | 300 | | | $ | 16,998 | |
Health Care Select Sector SPDR® Fund | | | 300 | | | | 19,860 | |
iShares Nasdaq Biotechnology ETF | | | 100 | | | | 25,409 | |
iShares U.S. Basic Materials ETF | | | 800 | | | | 54,080 | |
iShares U.S. Home Construction ETF | | | 1,000 | | | | 24,480 | |
iShares U.S. Telecommunications ETF | | | 2,000 | | | | 59,180 | |
Market Vectors® Semiconductor ETF | | | 700 | | | | 35,301 | |
SPDR® Gold Shares | | | 400 | | | | 47,456 | |
Utilities Select Sector SPDR Fund | | | 400 | | | | 18,520 | |
Total Exchange-Traded Funds (Proceeds $289,409) | | | | | | $ | 301,284 | |
| | | | | | | | | |
Total Securities Sold Short — 36.5% (Proceeds $430,840) | | | | | | $ | 442,160 | |
ADR - American Depositary Receipt. |
See accompanying notes to financial statements. |
24
CASTLEMAINE MULTI-STRATEGY FUND
SCHEDULE OF INVESTMENTS
February 29, 2016 (Unaudited) |
EXCHANGE-TRADED FUNDS — 12.6% | | Shares | | | Value | |
Deutsche X-Trackers MSCI Europe Hedged Equity ETF | | | 500 | | | $ | 12,025 | |
iShares 20+ Year Treasury Bond ETF (a) | | | 200 | | | | 26,196 | |
iShares iBoxx $ High Yield Corporate Bond ETF | | | 600 | | | | 48,048 | |
iShares TIPS Bond ETF | | | 200 | | | | 22,552 | |
Market Vectors® Gold Miners ETF | | | 1,000 | | | | 19,380 | |
Total Exchange-Traded Funds (Cost $124,111) | | | | | | $ | 128,201 | |
| |
OPEN-END FUNDS — 79.8% | | Shares | | | Value | |
Castlemaine Emerging Markets Opportunities Fund (b)(c) | | | 20,000 | | | $ | 204,400 | |
Castlemaine Event Driven Fund (b)(c) | | | 20,000 | | | | 201,600 | |
Castlemaine Long/Short Fund (b)(c) | | | 20,000 | | | | 204,600 | |
Castlemaine Market Neutral Fund (b)(c) | | | 20,000 | | | | 201,800 | |
Total Open-End Funds (Cost $800,000) | | | | | | $ | 812,400 | |
| |
PURCHASED OPTION CONTRACTS — 0.2% | Expiration Date | | Strike
Price | | | Contracts | | | Value | |
Put Option Contracts — 0.2% | | | | | | | | | | |
CurrencyShares Japanese Yen Trust (Cost $1,960) | 03/18/16 | | $ | 87.00 | | | | 10 | | | $ | 1,880 | |
| | | | | | |
Total Investments at Value — 92.6% (Cost $926,071) | | | $ | 942,481 | |
| | | | | | |
Other Assets in Excess of Liabilities (d) — 7.4% | | | | 74,937 | |
| | | | | | |
Net Assets — 100.0% | | | $ | 1,017,418 | |
(a) | All or a portion of the shares have been committed as collateral for open short positions. |
(b) | Non-income producing security. |
(c) | The security is an investment company advised by the Fund’s adviser, thereby making the company an affiliated company as defined under the Investment Company Act of 1940, as amended (the “1940 Act”) (Note 4). |
(d) | Includes cash held as margin deposits for open short positions. |
See accompanying notes to financial statements. |
25
CASTLEMAINE MULTI-STRATEGY FUND
SCHEDULE OF SECURITIES SOLD SHORT
February 29, 2016 (Unaudited) |
EXCHANGE-TRADED FUNDS — 2.8% | | Shares | | | Value | |
CurrencyShares Swiss Franc Trust (Proceeds $28,930) | | | 300 | | | $ | 28,956 | |
See accompanying notes to financial statements. |
26
CASTLEMAINE FUNDS
STATEMENTS OF ASSETS AND LIABILITIES
February 29, 2016 (Unaudited) |
| | Castlemaine Emerging Markets Opportunities
Fund | | | Castlemaine
Event Driven
Fund | | | Castlemaine
Long/Short
Fund | |
ASSETS | | | | | | | | | |
Investments in securities: | | | | | | | | | |
At acquisition cost | | $ | 841,016 | | | $ | 872,889 | | | $ | 969,316 | |
At value (Note 2) | | $ | 874,165 | | | $ | 891,389 | | | $ | 998,233 | |
Cash | | | 291,181 | | | | 207,268 | | | | 157,418 | |
Deposits with brokers for securities sold short (Note 2) | | | 101,595 | | | | 139,012 | | | | 400,752 | |
Margin deposits for futures contracts (Notes 2 and 5) | | | 148,997 | | | | 122,163 | | | | 149,290 | |
Dividends receivable | | | 525 | | | | 962 | | | | 2,867 | |
Receivable for investment securities sold | | | 164,141 | | | | 75,269 | | | | 42,578 | |
Unrealized appreciation on forward foreign currency exchange contracts
(Notes 2 and 5) | | | 2,115 | | | | — | | | | — | |
Receivable from Adviser (Note 4) | | | 6,483 | | | | 5,488 | | | | 5,475 | |
TOTAL ASSETS | | | 1,589,202 | | | | 1,441,551 | | | | 1,756,613 | |
| | | | | | | | | | | | | |
LIABILITIES | | | | | | | | | | | | |
Securities sold short, at value (Note 2) (proceeds $254,030, $145,057 and
$417,149, respectively) | | | 255,064 | | | | 147,238 | | | | 429,200 | |
Written options, at value (Notes 2 and 5) (premiums received $2,916, $2,387 and
$5,867, respectively) | | | 2,670 | | | | 2,270 | | | | 3,840 | |
Dividends payable on securities sold short (Note 2) | | | 580 | | | | 203 | | | | 321 | |
Payable for investment securities purchased | | | 89,415 | | | | 73,677 | | | | 87,020 | |
Unrealized depreciation on forward foreign currency exchange contracts
(Notes 2 and 5) | | | 5,989 | | | | — | | | | — | |
Payable to administrator (Note 4) | | | 5,513 | | | | 5,012 | | | | 5,013 | |
Accrued brokerage expense on securities sold short (Note 2) | | | 26 | | | | 77 | | | | 141 | |
Other accrued expenses | | | 3,222 | | | | 3,222 | | | | 3,222 | |
TOTAL LIABILITIES | | | 362,479 | | | | 231,699 | | | | 528,757 | |
| | | | | | | | | | | | | |
NET ASSETS | | $ | 1,226,723 | | | $ | 1,209,852 | | | $ | 1,227,856 | |
See accompanying notes to financial statements. |
27
CASTLEMAINE FUNDS
STATEMENTS OF ASSETS AND LIABILITIES
February 29, 2016 (Unaudited) (Continued) |
| | Castlemaine Emerging Markets Opportunities
Fund | | | Castlemaine
Event Driven
Fund | | | Castlemaine
Long/Short
Fund | |
Net assets consist of: | | | | | | | | | |
Paid-in capital | | $ | 1,200,000 | | | $ | 1,200,000 | | | $ | 1,200,000 | |
Accumulated net investment income (loss) | | | (2,946 | ) | | | (2,044 | ) | | | 681 | |
Accumulated net realized gain (losses) from security transactions | | | 1,182 | | | | (4,540 | ) | | | 8,282 | |
Net unrealized appreciation (depreciation) on: | | | | | | | | | | | | |
Investments | | | 33,149 | | | | 18,500 | | | | 28,917 | |
Short positions | | | (1,034 | ) | | | (2,181 | ) | | | (12,051 | ) |
Written option contracts | | | 246 | | | | 117 | | | | 2,027 | |
Forward foreign currency exchange contracts (Note 5) | | | (3,874 | ) | | | — | | | | — | |
Net assets | | $ | 1,226,723 | | | $ | 1,209,852 | | | $ | 1,227,856 | |
| | | | | | | | | | | | | |
Shares of beneficial interest outstanding (unlimited number of shares authorized,
no par value) | | | 120,000 | | | | 120,000 | | | | 120,000 | |
| | | | | | | | | | | | | |
Net asset value, offering price and redemption price per share (Note 2) | | $ | 10.22 | | | $ | 10.08 | | | $ | 10.23 | |
See accompanying notes to financial statements. |
28
CASTLEMAINE FUNDS
STATEMENTS OF ASSETS AND LIABILITIES
February 29, 2016 (Unaudited) (Continued) |
| | Castlemaine Market Neutral Fund | | | Castlemaine
Multi-Strategy Fund | |
ASSETS | | | | | | |
Investments in securities at acquisition cost: | | | | | | |
Unaffiliated investments | | $ | 671,048 | | | $ | 126,071 | |
Affiliated investments | | | — | | | | 800,000 | |
| | | $ | 671,048 | | | $ | 926,071 | |
Investments in securities at value: | | | | | | | | |
Unaffiliated investments | | $ | 693,492 | | | $ | 130,081 | |
Affiliated investments | | | — | | | | 812,400 | |
| | | | 693,492 | | | | 942,481 | |
Cash | | | 395,127 | | | | 77,383 | |
Deposits with brokers for securities sold short (Note 2) | | | 459,557 | | | | 28,652 | |
Margin deposits for futures contracts (Notes 2 and 5) | | | 124,690 | | | | — | |
Dividends receivable | | | 2,698 | | | | — | |
Receivable for investment securities sold | | | 48,101 | | | | — | |
Receivable from Adviser (Note 4) | | | 5,480 | | | | 6,060 | |
TOTAL ASSETS | | | 1,729,145 | | | | 1,054,576 | |
| | | | | | | | | |
LIABILITIES | | | | | | | | |
Securities sold short, at value (Note 2) (proceeds $430,840 and $28,930, respectively) | | | 442,160 | | | | 28,956 | |
Dividends payable on securities sold short (Note 2) | | | 45 | | | | — | |
Payable for investment securities purchased | | | 67,873 | | | | — | |
Payable to administrator (Note 4) | | | 5,013 | | | | 5,010 | |
Accrued brokerage expense on securities sold short (Note 2) | | | 191 | | | | 43 | |
Other accrued expenses | | | 3,222 | | | | 3,149 | |
TOTAL LIABILITIES | | | 518,504 | | | | 37,158 | |
| | | | | | | | | |
NET ASSETS | | $ | 1,210,641 | | | $ | 1,017,418 | |
| | | | | | | | | |
Net assets consist of: | | | | | | | | |
Paid-in capital | | $ | 1,200,000 | | | $ | 1,000,000 | |
Accumulated net investment loss | | | (409 | ) | | | (1,679 | ) |
Accumulated net realized gains (losses) from security transactions | | | (74 | ) | | | 2,713 | |
Net unrealized appreciation (depreciation) on: | | | | | | | | |
Unaffiliated investments | | | 22,444 | | | | 4,010 | |
Affiliated investments | | | — | | | | 12,400 | |
Short positions | | | (11,320 | ) | | | (26 | ) |
Net assets | | $ | 1,210,641 | | | $ | 1,017,418 | |
| | | | | | | | | |
Shares of beneficial interest outstanding (unlimited number of shares authorized, no par value) | | | 120,000 | | | | 100,000 | |
| | | | | | | | | |
Net asset value, offering price and redemption price per share (Note 2) | | $ | 10.09 | | | $ | 10.17 | |
See accompanying notes to financial statements. |
29
CASTLEMAINE FUNDS
STATEMENTS OF OPERATIONS
For the Period Ended February 29, 2016(a) (Unaudited) |
| | Castlemaine Emerging Markets Opportunities
Fund | | | Castlemaine
Event Driven
Fund | | | Castlemaine
Long/Short
Fund | |
INVESTMENT INCOME | | | | | | | | | |
Dividends | | $ | 538 | | | $ | 1,122 | | | $ | 4,038 | |
Foreign tax withholding | | | (10 | ) | | | — | | | | (18 | ) |
Interest | | | 92 | | | | 93 | | | | 96 | |
TOTAL INVESTMENT INCOME | | | 620 | | | | 1,215 | | | | 4,116 | |
| | | | | | | | | | | | | |
EXPENSES | | | | | | | | | | | | |
Accounting services fees (Note 4) | | | 5,020 | | | | 4,019 | | | | 4,020 | |
Administration fees (Note 4) | | | 4,000 | | | | 4,000 | | | | 4,000 | |
Trustees’ fees and expenses (Note 4) | | | 2,637 | | | | 2,637 | | | | 2,637 | |
Professional fees | | | 2,566 | | | | 2,566 | | | | 2,566 | |
Investment advisory fees (Note 4) | | | 2,464 | | | | 2,459 | | | | 2,471 | |
Compliance service fees (Note 4) | | | 2,000 | | | | 2,000 | | | | 2,000 | |
Postage and supplies | | | 1,086 | | | | 1,086 | | | | 1,086 | |
Custodian and bank service fees | | | 963 | | | | 963 | | | | 963 | |
Insurance expense | | | 600 | | | | 600 | | | | 600 | |
Dividend expense on securities sold short (Note 2) | | | 580 | | | | 227 | | | | 325 | |
Registration and filing fees | | | 139 | | | | 139 | | | | 139 | |
Pricing fees | | | 100 | | | | 100 | | | | 100 | |
Brokerage expense on securities sold short (Note 2) | | | 26 | | | | 78 | | | | 141 | |
Transfer agent fees (Note 4) | | | 6 | | | | 6 | | | | 6 | |
Other expenses | | | 400 | | | | 400 | | | | 400 | |
TOTAL EXPENSES | | | 22,587 | | | | 21,280 | | | | 21,454 | |
Less fee reductions and expense reimbursements by Adviser (Note 4) | | | (19,021 | ) | | | (18,021 | ) | | | (18,019 | ) |
NET EXPENSES | | | 3,566 | | | | 3,259 | | | | 3,435 | |
| | | | | | | | | | | | | |
NET INVESTMENT INCOME (LOSS) | | | (2,946 | ) | | | (2,044 | ) | | | 681 | |
(a) | Represents the period from the commencement of operations (December 29, 2015) through February 29, 2016. |
See accompanying notes to financial statements. |
30
CASTLEMAINE FUNDS
STATEMENTS OF OPERATIONS
For the Period Ended February 29, 2016(a) (Unaudited) (Continued) |
| | Castlemaine Emerging Markets Opportunities
Fund | | | Castlemaine
Event Driven
Fund | | | Castlemaine
Long/Short
Fund | |
REALIZED AND UNREALIZED GAINS (LOSSES) ON INVESTMENTS, SECURITIES SOLD SHORT, FUTURES CONTRACTS, OPTION CONTRACTS, AND FORWARD FOREIGN CURRENCY EXCHANGE CONTRACTS | | | | | | | | | |
Net realized gains (losses) from: | | | | | | | | | |
Investments | | $ | (645 | ) | | $ | (1,917 | ) | | $ | 2,764 | |
Securities sold short | | | — | | | | (25 | ) | | | 2,339 | |
Written option contracts (Note 5) | | | 4,739 | | | | 2,468 | | | | 9,122 | |
Futures contracts (Note 5) | | | (2,912 | ) | | | (5,066 | ) | | | (5,943 | ) |
Net change in unrealized appreciation (depreciation) on: | | | | | | | | | | | | |
Investments | | | 33,149 | | | | 18,500 | | | | 28,917 | |
Securities sold short | | | (1,034 | ) | | | (2,181 | ) | | | (12,051 | ) |
Written option contracts (Note 5) | | | 246 | | | | 117 | | | | 2,027 | |
Forward foreign currency exchange contracts (Note 5) | | | (3,874 | ) | | | — | | | | — | |
NET REALIZED AND UNREALIZED GAINS ON INVESTMENTS, SECURITIES SOLD SHORT, FUTURES CONTRACTS, OPTION CONTRACTS, AND FORWARD FOREIGN CURRENCY
EXCHANGE CONTRACTS | | | 29,669 | | | | 11,896 | | | | 27,175 | |
| | | | | | | | | | | | | |
NET INCREASE IN NET ASSETS RESULTING FROM OPERATIONS | | $ | 26,723 | | | $ | 9,852 | | | $ | 27,856 | |
(a) | Represents the period from the commencement of operations (December 29, 2015) through February 29, 2016. |
See accompanying notes to financial statements. |
31
CASTLEMAINE FUNDS
STATEMENTS OF OPERATIONS
For the Period Ended February 29, 2016(a) (Unaudited) (Continued) |
| | Castlemaine Market Neutral Fund | | | Castlemaine Multi-Strategy Fund | |
INVESTMENT INCOME | | | | | | |
Dividends from unaffiliated issuers | | $ | 2,709 | | | $ | 24 | |
Foreign tax withholding | | | (12 | ) | | | — | |
Interest | | | 100 | | | | 17 | |
TOTAL INVESTMENT INCOME | | | 2,797 | | | | 41 | |
| | | | | | | | | |
EXPENSES | | | | | | | | |
Accounting services fees (Note 4) | | | 4,020 | | | | 4,016 | |
Administration fees (Note 4) | | | 4,000 | | | | 4,000 | |
Trustees’ fees and expenses (Note 4) | | | 2,636 | | | | 2,636 | |
Professional fees | | | 2,566 | | | | 2,566 | |
Compliance service fees (Note 4) | | | 2,000 | | | | 2,000 | |
Investment advisory fees (Note 4) | | | 2,472 | | | | 638 | |
Postage and supplies | | | 1,090 | | | | 1,086 | |
Custodian and bank service fees | | | 963 | | | | 960 | |
Insurance expense | | | 600 | | | | 600 | |
Registration and filing fees | | | 139 | | | | 116 | |
Brokerage expense on securities sold short (Note 2) | | | 192 | | | | 43 | |
Pricing fees | | | 100 | | | | 50 | |
Dividend expense on securities sold short (Note 2) | | | 45 | | | | — | |
Transfer agent fees (Note 4) | | | 6 | | | | 4 | |
Other expenses | | | 400 | | | | 400 | |
TOTAL EXPENSES | | | 21,229 | | | | 19,115 | |
Less fee reductions and expense reimbursements by Adviser (Note 4) | | | (18,023 | ) | | | (17,395 | ) |
NET EXPENSES | | | 3,206 | | | | 1,720 | |
| | | | | | | | | |
NET INVESTMENT LOSS | | | (409 | ) | | | (1,679 | ) |
(a) | Represents the period from the commencement of operations (December 29, 2015) through February 29, 2016. |
See accompanying notes to financial statements. |
32
CASTLEMAINE FUNDS
STATEMENTS OF OPERATIONS
For the Period Ended February 29, 2016(a) (Unaudited) (Continued) |
| | Castlemaine Market Neutral Fund | | | Castlemaine Multi-Strategy Fund | |
REALIZED AND UNREALIZED GAINS (LOSSES) ON INVESTMENTS, SECURITIES SOLD SHORT, FUTURES CONTRACTS, AND OPTION CONTRACTS | | | | | | |
Net realized gains (losses) from: | | | | | | |
Unaffiliated investments | | $ | (1,841 | ) | | $ | 1,031 | |
Securities sold short | | | 427 | | | | 776 | |
Written option contracts (Note 5) | | | 4,252 | | | | 906 | |
Futures contracts (Note 5) | | | (2,912 | ) | | | — | |
Net change in unrealized appreciation (depreciation) on: | | | | | | | | |
Unaffiliated investments | | | 22,444 | | | | 4,010 | |
Affiliated investments (Note 4) | | | — | | | | 12,400 | |
Securities sold short | | | (11,320 | ) | | | (26 | ) |
NET REALIZED AND UNREALIZED GAINS ON INVESTMENTS, SECURITIES SOLD SHORT, FUTURES CONTRACTS, AND OPTION CONTRACTS | | | 11,050 | | | | 19,097 | |
| | | | | | | | | |
NET INCREASE IN NET ASSETS RESULTING FROM OPERATIONS | | $ | 10,641 | | | $ | 17,418 | |
(a) | Represents the period from the commencement of operations (December 29, 2015) through February 29, 2016. |
See accompanying notes to financial statements. |
33
CASTLEMAINE FUNDS
STATEMENTS OF CHANGES IN NET ASSETS
For the Period Ended February 29, 2016(a) (Unaudited) |
| | Castlemaine Emerging Markets Opportunities Fund | | | Castlemaine
Event Driven
Fund | | | Castlemaine Long/Short
Fund | |
FROM OPERATIONS | | | | | | | | | |
Net investment income (loss) | | $ | (2,946 | ) | | $ | (2,044 | ) | | $ | 681 | |
Net realized gains (losses) from: | | | | | | | | | | | | |
Investments | | | (645 | ) | | | (1,917 | ) | | | 2,764 | |
Securities sold short | | | — | | | | (25 | ) | | | 2,339 | |
Written option contracts (Note 5) | | | 4,739 | | | | 2,468 | | | | 9,122 | |
Futures contracts (Note 5) | | | (2,912 | ) | | | (5,066 | ) | | | (5,943 | ) |
Net change in unrealized appreciation (depreciation) on: | | | | | | | | | | | | |
Investments | | | 33,149 | | | | 18,500 | | | | 28,917 | |
Securities sold short | | | (1,034 | ) | | | (2,181 | ) | | | (12,051 | ) |
Written option contracts (Note 5) | | | 246 | | | | 117 | | | | 2,027 | |
Forward foreign currency exchange contracts (Note 5) | | | (3,874 | ) | | | — | | | | — | |
Net increase in net assets resulting from operations | | | 26,723 | | | | 9,852 | | | | 27,856 | |
| | | | | | | | | | | | | |
CAPITAL SHARE TRANSACTIONS | | | | | | | | | | | | |
Proceeds from shares sold | | | 1,200,000 | | | | 1,200,000 | | | | 1,200,000 | |
| | | | | | | | | | | | | |
TOTAL INCREASE IN NET ASSETS | | | 1,226,723 | | | | 1,209,852 | | | | 1,227,856 | |
| | | | | | | | | | | | | |
NET ASSETS | | | | | | | | | | | | |
Beginning of period | | | — | | | | — | | | | — | |
End of period | | $ | 1,226,723 | | | $ | 1,209,852 | | | $ | 1,227,856 | |
| | | | | | | | | | | | | |
ACCUMULATED NET INVESTMENT INCOME (LOSS) | | $ | (2,946 | ) | | $ | (2,044 | ) | | $ | 681 | |
| | | | | | | | | | | | | |
CAPITAL SHARE ACTIVITY | | | | | | | | | | | | |
Shares sold | | | 120,000 | | | | 120,000 | | | | 120,000 | |
Shares outstanding, beginning of period | | | — | | | | — | | | | — | |
Shares outstanding, end of period | | | 120,000 | | | | 120,000 | | | | 120,000 | |
(a) | Represents the period from the commencement of operations (December 29, 2015) through February 29, 2016. |
See accompanying notes to financial statements. |
34
CASTLEMAINE FUNDS
STATEMENTS OF CHANGES IN NET ASSETS
For the Period Ended February 29, 2016(a) (Unaudited) (Continued) |
| | Castlemaine Market Neutral Fund | | | Castlemaine Multi-Strategy Fund | |
FROM OPERATIONS | | | | | | |
Net investment loss | | $ | (409 | ) | | $ | (1,679 | ) |
Net realized gains (losses) from: | | | | | | | | |
Unaffiliated investments | | | (1,841 | ) | | | 1,031 | |
Securities sold short | | | 427 | | | | 776 | |
Written option contracts (Note 5) | | | 4,252 | | | | 906 | |
Futures contracts (Note 5) | | | (2,912 | ) | | | — | |
Net change in unrealized appreciation (depreciation) on: | | | | | | | | |
Unaffiliated investments | | | 22,444 | | | | 4,010 | |
Affiliated investments (Note 4) | | | — | | | | 12,400 | |
Securities sold short | | | (11,320 | ) | | | (26 | ) |
Net increase in net assets resulting from operations | | | 10,641 | | | | 17,418 | |
| | | | | | | | | |
CAPITAL SHARE TRANSACTIONS | | | | | | | | |
Proceeds from shares sold | | | 1,200,000 | | | | 1,000,000 | |
| | | | | | | | | |
TOTAL INCREASE IN NET ASSETS | | | 1,210,641 | | | | 1,017,418 | |
| | | | | | | | | |
NET ASSETS | | | | | | | | |
Beginning of period | | | — | | | | — | |
End of period | | $ | 1,210,641 | | | $ | 1,017,418 | |
| | | | | | | | | |
ACCUMULATED NET INVESTMENT LOSS | | $ | (409 | ) | | $ | (1,679 | ) |
| | | | | | | | | |
CAPITAL SHARE ACTIVITY | | | | | | | | |
Shares sold | | | 120,000 | | | | 100,000 | |
Shares outstanding, beginning of period | | | — | | | | — | |
Shares outstanding, end of period | | | 120,000 | | | | 100,000 | |
(a) | Represents the period from the commencement of operations (December 29, 2015) through February 29, 2016. |
See accompanying notes to financial statements. |
35
CASTLEMAINE EMERGING MARKETS OPPORTUNITIES FUND
FINANCIAL HIGHLIGHTS |
Per share data for a share outstanding throughout the period: |
| | Period Ended
February 29,
2016(a)
(Unaudited) | |
Net asset value at beginning of period | | $ | 10.00 | |
| | | | | |
Income (loss) from investment operations: | | | | |
Net investment loss | | | (0.02 | ) |
Net realized and unrealized gains on investments | | | 0.24 | |
Total from investment operations | | | 0.22 | |
| | | | | |
Net asset value at end of period | | $ | 10.22 | |
| | | | | |
Total return (b) | | | 2.20 | %(c) |
| | | | | |
Ratios and supplemental data: | | | | |
Net assets at end of period (000’s) | | $ | 1,227 | |
| | | | | |
Ratio of total expenses to average net assets | | | 11.37 | %(d) |
| | | | | |
Ratio of net expenses to average net assets (e) | | | 1.79 | %(d) |
| | | | | |
Ratio of net expenses to average net assets excluding dividend expense (e) | | | 1.50 | %(d) |
| | | | | |
Ratio of net expense to average net assets excluding dividend expense and brokerage expense on securities sold short (e) | | | 1.49 | %(d) |
| | | | | |
Ratio of net investment loss to average net assets (e) | | | (1.48% | )(d) |
| | | | | |
Portfolio turnover rate | | | 5 | %(c) |
(a) | Represents the period from the commencement of operations (December 29, 2015) through February 29, 2016. |
(b) | Total return is a measure of the change in value of an investment in the Fund over the period covered, which assumes any dividends or capital gains distributions are reinvested in shares of the Fund. The return shown does not reflect the deduction of taxes a shareholder would pay on Fund distributions or the redemption of Fund shares. The total return would have been lower if the Adviser had not reduced advisory fees and reimbursed expenses. |
(c) | Not annualized. |
(d) | Annualized. |
(e) | Ratio was determined after fee reductions and expense reimbursements by the Adviser (Note 4). |
See accompanying notes to financial statements. |
36
CASTLEMAINE EVENT DRIVEN FUND
FINANCIAL HIGHLIGHTS |
Per share data for a share outstanding throughout the period: |
| | Period Ended
February 29,
2016(a)
(Unaudited) | |
Net asset value at beginning of period | | $ | 10.00 | |
| | | | | |
Income (loss) from investment operations: | | | | |
Net investment loss | | | (0.02 | ) |
Net realized and unrealized gains on investments | | | 0.10 | |
Total from investment operations | | | 0.08 | |
| | | | | |
Net asset value at end of period | | $ | 10.08 | |
| | | | | |
Total return (b) | | | 0.80 | %(c) |
| | | | | |
Ratios and supplemental data: | | | | |
Net assets at end of period (000’s) | | $ | 1,210 | |
| | | | | |
Ratio of total expenses to average net assets | | | 10.73 | %(d) |
| | | | | |
Ratio of net expenses to average net assets (e) | | | 1.64 | %(d) |
| | | | | |
Ratio of net expenses to average net assets excluding dividend expense (e) | | | 1.53 | %(d) |
| | | | | |
Ratio of net expenses to average net assets excluding dividend expense and brokerage expense on securities sold short (e) | | | 1.49 | %(d) |
| | | | | |
Ratio of net investment loss to average net assets (e) | | | (1.03% | )(d) |
| | | | | |
Portfolio turnover rate | | | 68 | %(c) |
(a) | Represents the period from the commencement of operations (December 29, 2015) through February 29, 2016. |
(b) | Total return is a measure of the change in value of an investment in the Fund over the period covered, which assumes any dividends or capital gains distributions are reinvested in shares of the Fund. The return shown does not reflect the deduction of taxes a shareholder would pay on Fund distributions or the redemption of Fund shares. The total return would have been lower if the Adviser had not reduced advisory fees and reimbursed expenses. |
(c) | Not annualized. |
(d) | Annualized. |
(e) | Ratio was determined after fee reductions and expense reimbursements by the Adviser (Note 4). |
See accompanying notes to financial statements. |
37
CASTLEMAINE LONG/SHORT FUND
FINANCIAL HIGHLIGHTS |
Per share data for a share outstanding throughout the period: |
| | Period Ended
February 29,
2016(a)
(Unaudited) | |
Net asset value at beginning of period | | $ | 10.00 | |
| | | | | |
Income from investment operations: | | | | |
Net investment income | | | 0.01 | |
Net realized and unrealized gains on investments | | | 0.22 | |
Total from investment operations | | | 0.23 | |
| | | | | |
Net asset value at end of period | | $ | 10.23 | |
| | | | | |
Total return (b) | | | 2.30 | %(c) |
| | | | | |
Ratios and supplemental data: | | | | |
Net assets at end of period (000’s) | | $ | 1,228 | |
| | | | | |
Ratio of total expenses to average net assets | | | 10.77 | %(d) |
| | | | | |
Ratio of net expenses to average net assets (e) | | | 1.72 | %(d) |
| | | | | |
Ratio of net expenses to average net assets excluding dividend expense (e) | | | 1.56 | %(d) |
| | | | | |
Ratio of net expenses to average net assets excluding dividend expense and brokerage expense on securities sold short (e) | | | 1.49 | %(d) |
| | | | | |
Ratio of net investment income to average net assets (e) | | | 0.34 | %(d) |
| | | | | |
Portfolio turnover rate | | | 57 | %(c) |
(a) | Represents the period from the commencement of operations (December 29, 2015) through February 29, 2016. |
(b) | Total return is a measure of the change in value of an investment in the Fund over the period covered, which assumes any dividends or capital gains distributions are reinvested in shares of the Fund. The return shown does not reflect the deduction of taxes a shareholder would pay on Fund distributions or the redemption of Fund shares. The total return would have been lower if the Adviser had not reduced advisory fees and reimbursed expenses. |
(c) | Not annualized. |
(d) | Annualized. |
(e) | Ratio was determined after fee reductions and expense reimbursements by the Adviser (Note 4). |
See accompanying notes to financial statements. |
38
CASTLEMAINE MARKET NEUTRAL FUND
FINANCIAL HIGHLIGHTS |
Per share data for a share outstanding throughout the period: |
| | Period Ended
February 29,
2016(a)
(Unaudited) | |
Net asset value at beginning of period | | $ | 10.00 | |
| | | | | |
Income (loss) from investment operations: | | | | |
Net investment loss | | | (0.00 | )(b) |
Net realized and unrealized gains on investments | | | 0.09 | |
Total from investment operations | | | 0.09 | |
| | | | | |
Net asset value at end of period | | $ | 10.09 | |
| | | | | |
Total return (c) | | | 0.90 | %(d) |
| | | | | |
Ratios and supplemental data: | | | | |
Net assets at end of period (000’s) | | $ | 1,211 | |
| | | | | |
Ratio of total expenses to average net assets | | | 10.65 | %(e) |
| | | | | |
Ratio of net expenses to average net assets (f) | | | 1.61 | %(e) |
| | | | | |
Ratio of net expenses to average net assets excluding dividend expense (f) | | | 1.59 | %(e) |
| | | | | |
Ratio of net expenses to average net assets excluding dividend expense and brokerage expense on securities sold short (f) | | | 1.49 | %(e) |
| | | | | |
Ratio of net investment loss to average net assets (f) | | | (0.21% | )(e) |
| | | | | |
Portfolio turnover rate | | | 102 | %(d) |
(a) | Represents the period from the commencement of operations (December 29, 2015) through February 29, 2016. |
(b) | Amount rounds to less than $0.01 per share. |
(c) | Total return is a measure of the change in value of an investment in the Fund over the period covered, which assumes any dividends or capital gains distributions are reinvested in shares of the Fund. The return shown does not reflect the deduction of taxes a shareholder would pay on Fund distributions or the redemption of Fund shares. The total return would have been lower if the Adviser had not reduced advisory fees and reimbursed expenses. |
(d) | Not annualized. |
(e) | Annualized. |
(f) | Ratio was determined after fee reductions and expense reimbursements by the Adviser (Note 4). |
See accompanying notes to financial statements. |
39
CASTLEMAINE MULTI-STRATEGY FUND
FINANCIAL HIGHLIGHTS |
Per share data for a share outstanding throughout the period: |
| | Period Ended
February 29,
2016(a)
(Unaudited) | |
Net asset value at beginning of period | | $ | 10.00 | |
| | | | | |
Income (loss) from investment operations: | | | | |
Net investment loss | | | (0.01 | ) |
Net realized and unrealized gains on investments | | | 0.18 | |
Total from investment operations | | | 0.17 | |
| | | | | |
Net asset value at end of period | | $ | 10.17 | |
| | | | | |
Total return (b) | | | 1.70 | %(c) |
| | | | | |
Ratios and supplemental data: | | | | |
Net assets at end of period (000’s) | | $ | 1,017 | |
| | | | | |
Ratio of total expenses to average net assets | | | 11.28 | %(d) |
| | | | | |
Ratio of net expenses to average net assets (e) | | | 1.02 | %(d) |
| | | | | |
Ratio of net expenses to average net assets excluding dividend expense (e) | | | 1.02 | %(d) |
| | | | | |
Ratio of net expenses to average net assets excluding dividend expense and brokerage expense on securities sold short (e) | | | 0.99 | %(d) |
| | | | | |
Ratio of net investment loss to average net assets (e) | | | (0.99% | )(d) |
| | | | | |
Portfolio turnover rate | | | 3 | %(c) |
(a) | Represents the period from the commencement of operations (December 29, 2015) through February 29, 2016. |
(b) | Total return is a measure of the change in value of an investment in the Fund over the period covered, which assumes any dividends or capital gains distributions are reinvested in shares of the Fund. The return shown does not reflect the deduction of taxes a shareholder would pay on Fund distributions or the redemption of Fund shares. The total return would have been lower if the Adviser had not reduced advisory fees and reimbursed expenses. |
(c) | Not annualized. |
(d) | Annualized. |
(e) | Ratio was determined after fee reductions and expense reimbursements by the Adviser (Note 4). |
See accompanying notes to financial statements. |
40
CASTLEMAINE FUNDS
NOTES TO FINANCIAL STATEMENTS
February 29, 2016 (Unaudited)
1. Organization
Castlemaine Emerging Markets Opportunities Fund, Castlemaine Event Driven Fund, Castlemaine Long/Short Fund, Castlemaine Market Neutral Fund, and Castlemaine Multi-Strategy Fund (individually, a “Fund,” and collectively, the “Funds”) are each a diversified series of Ultimus Managers Trust (the “Trust”), an open-end investment company established as an Ohio business trust under a Declaration of Trust dated February 28, 2012. Other series of the Trust are not incorporated in this report. The Funds commenced operations on December 29, 2015.
The investment objectives of the Funds are as follows:
| | ● | Castlemaine Emerging Markets Opportunities Fund seeks to provide high total return, consisting of income and capital appreciation. |
| | ● | Castlemaine Event Driven Fund, Castlemaine Long/Short Fund, and Castlemaine Multi-Strategy Fund seek capital appreciation. |
| | ● | Castlemaine Market Neutral Fund seeks total return, consisting of income and capital appreciation. |
2. Significant Accounting Policies
The following is a summary of the Funds’ significant accounting policies. These policies are in conformity with accounting principles generally accepted in the United States of America (“GAAP”). As an investment company, as defined in Financial Accounting Standards Board (“FASB”) Accounting Standards Update 2013-08, the Funds follow accounting and reporting guidance under FASB Accounting Standards Codification Topic 946, “Financial Services – Investment Companies.”
Securities valuation – The Funds’ portfolio securities are value at market value as of the close of regular trading on the New York Stock Exchange (the “NYSE”) (normally 4:00 p.m. Eastern time) on each day the NYSE is open for business. Listed securities are valued on the basis of the security’s last sale price on the security’s primary exchange, if available, otherwise at the exchange’s most recently quoted bid price. NASDAQ-listed securities are valued at the NASDAQ Official Closing Price. Option contracts are valued at the closing price on the exchanges on which they are primarily traded; if no closing price is available at the time of valuation, the option will be valued at the mean of the closing bid and ask prices for that day. Futures contracts are valued at their last sale price as of the close of trading on the NYSE; prices for these contracts are monitored by Castlemaine LLC (the “Adviser”) until the close of regular trading to determine if fair valuation is required. Investments in shares of other open-end investment companies are valued at their net asset value (“NAV”) as reported by such companies.
In the event that market quotations are not readily available or are considered unreliable due to market or other events, the securities and other assets are valued at fair value in accordance with procedures established by and under the general supervision of the Board of Trustees
41
CASTLEMAINE FUNDS
NOTES TO FINANCIAL STATEMENTS (Continued)
(the “Board”) of the Trust. Under these procedures, the securities will be classified as Level 2 or 3 within the fair value hierarchy (see below), depending on the inputs used. Unavailable or unreliable market quotes may be due to the following factors: a substantial bid-ask spread; infrequent sales resulting in stale prices; insufficient trading volume; small trade sizes; a temporary lapse in any reliable pricing source; and actions of the securities or futures markets, such as the suspension or limitation of trading. As a result, the prices of securities used to calculate each Fund’s NAV may differ from quoted or published prices for the same securities.
GAAP establishes a single authoritative definition of fair value, sets out a framework for measuring fair value, and requires additional disclosures about fair value measurements.
Various inputs are used in determining the value of the Funds’ investments. These inputs are summarized in the three broad levels listed below:
| | ● | Level 1 – quoted prices in active markets for identical securities |
| | ● | Level 2 – other significant observable inputs |
| | ● | Level 3 – significant unobservable inputs |
The inputs or methods used for valuing securities are not necessarily an indication of the risks associated with investing in those securities. The inputs used to measure fair value may fall into different levels of the fair value hierarchy. In such cases, for disclosure purposes, the level in the fair value hierarchy within which the fair value measurement falls in its entirety is determined based on the lowest level input that is significant to the fair value measurement.
The following is a summary of the inputs used to value each Fund’s investments and other financial instruments as of February 29, 2016:
Castlemaine Emerging Markets Opportunities Fund | | Level 1 | | | Level 2 | | | Level 3 | | | Total | |
Investments in Securities | | | | | | | | | | | | |
Common Stocks | | $ | 628,483 | | | $ | — | | | $ | — | | | $ | 628,483 | |
Closed-End Funds | | | 29,969 | | | | — | | | | — | | | | 29,969 | |
Exchange-Traded Funds | | | 81,320 | | | | — | | | | — | | | | 81,320 | |
Purchased Option Contracts | | | 9,465 | | | | — | | | | — | | | | 9,465 | |
U.S. Treasury Obligations | | | — | | | | 124,928 | | | | — | | | | 124,928 | |
Total | | $ | 749,237 | | | $ | 124,928 | | | $ | — | | | $ | 874,165 | |
Other Financial Instruments | | | | | | | | | | | | | | | | |
Common Stocks – Sold Short | | $ | (195,689 | ) | | $ | — | | | $ | — | | | $ | (195,689 | ) |
Exchange-Traded Funds – Sold Short | | | (59,375 | ) | | | — | | | | — | | | | (59,375 | ) |
Written Option Contracts | | | (2,670 | ) | | | — | | | | — | | | | (2,670 | ) |
Total | | $ | (257,734 | ) | | $ | — | | | $ | — | | | $ | (257,734 | ) |
42
CASTLEMAINE FUNDS
NOTES TO FINANCIAL STATEMENTS (Continued)
Castlemaine Event Driven Fund | | Level 1 | | | Level 2 | | | Level 3 | | | Total | |
Investments in Securities | | | | | | | | | | | | |
Common Stocks | | $ | 757,251 | | | $ | ��� | | | $ | — | | | $ | 757,251 | |
Purchased Option Contracts | | | 9,210 | | | | — | | | | — | | | | 9,210 | |
U.S. Treasury Obligations | | | — | | | | 124,928 | | | | — | | | | 124,928 | |
Total | | $ | 766,461 | | | $ | 124,928 | | | $ | — | | | $ | 891,389 | |
Other Financial Instruments | | | | | | | | | | | | | | | | |
Common Stocks – Sold Short | | $ | (76,324 | ) | | $ | — | | | $ | — | | | $ | (76,324 | ) |
Exchange-Traded Funds – Sold Short | | | (70,914 | ) | | | — | | | | — | | | | (70,914 | ) |
Written Option Contracts | | | (2,270 | ) | | | — | | | | — | | | | (2,270 | ) |
Total | | $ | (149,508 | ) | | $ | — | | | $ | — | | | $ | (149,508 | ) |
Castlemaine Long/Short Fund | | Level 1 | | | Level 2 | | | Level 3 | | | Total | |
Investments in Securities | | | | | | | | | | | | |
Common Stocks | | $ | 801,970 | | | $ | — | | | $ | — | | | $ | 801,970 | |
Exchange-Traded Fund | | | 63,360 | | | | — | | | | — | | | | 63,360 | |
Purchased Option Contracts | | | 7,975 | | | | — | | | | — | | | | 7,975 | |
U.S. Treasury Obligations | | | — | | | | 124,928 | | | | — | | | | 124,928 | |
Total | | $ | 873,305 | | | $ | 124,928 | | | $ | — | | | $ | 998,233 | |
Other Financial Instruments | | | | | | | | | | | | | | | | |
Common Stocks – Sold Short | | $ | (184,244 | ) | | $ | — | | | $ | — | | | $ | (184,244 | ) |
Exchange-Traded Funds – Sold Short | | | (244,956 | ) | | | — | | | | — | | | | (244,956 | ) |
Written Option Contracts | | | (3,840 | ) | | | — | | | | — | | | | (3,840 | ) |
Total | | $ | (433,040 | ) | | $ | — | | | $ | — | | | $ | (433,040 | ) |
Castlemaine Market Neutral Fund | | Level 1 | | | Level 2 | | | Level 3 | | | Total | |
Investments in Securities | | | | | | | | | | | | |
Common Stocks | | $ | 485,824 | | | $ | — | | | $ | — | | | $ | 485,824 | |
Exchange-Traded Funds | | | 82,740 | | | | — | | | | — | | | | 82,740 | |
U.S. Treasury Obligations | | | — | | | | 124,928 | | | | — | | | | 124,928 | |
Total | | $ | 568,564 | | | $ | 124,928 | | | $ | — | | | $ | 693,492 | |
Other Financial Instruments | | | | | | | | | | | | | | | | |
Common Stocks – Sold Short | | $ | (140,876 | ) | | $ | — | | | $ | — | | | $ | (140,876 | ) |
Exchange-Traded Funds – Sold Short | | | (301,284 | ) | | | — | | | | — | | | | (301,824 | ) |
Total | | $ | (442,160 | ) | | $ | — | | | $ | — | | | $ | (442,160 | ) |
43
CASTLEMAINE FUNDS
NOTES TO FINANCIAL STATEMENTS (Continued)
Castlemaine Multi-Strategy Fund | | Level 1 | | | Level 2 | | | Level 3 | | | Total | |
Investments in Securities | | | | | | | | | | | | |
Exchange-Traded Funds | | $ | 128,201 | | | $ | — | | | $ | — | | | $ | 128,201 | |
Open-End Funds | | | 812,400 | | | | — | | | | — | | | | 812,400 | |
Purchased Option Contracts | | | 1,880 | | | | — | | | | — | | | | 1,880 | |
Total | | $ | 942,481 | | | $ | — | | | $ | — | | | $ | 942,481 | |
Other Financial Instruments | | | | | | | | | | | | | | | | |
Common Stocks – Sold Short | | $ | (28,956 | ) | | $ | — | | | $ | — | | | $ | (28,956 | ) |
Refer to each Fund’s Schedule of Investments and Schedule of Securities Sold Short for a listing of the common stocks by industry type. As of February 29, 2016, the Funds did not have any transfers between Levels. In addition, the Funds did not hold derivative instruments or have any assets or liabilities that were measured at fair value on a recurring basis using significant unobservable inputs (Level 3) as of February 29, 2016. It is the Funds’ policy to recognize transfers between Levels at the end of the reporting period.
Share valuation – The NAV per share of each Fund is calculated daily by dividing the total value of its assets, less liabilities, by the number of shares outstanding. The offering price and redemption price per share of each Fund is equal to the NAV per share.
Investment income – Dividend income is recorded on the ex-dividend date. Interest income is accrued as earned. Discounts and premiums on fixed income securities are amortized using the interest method.
Security transactions – Security transactions are accounted for on the trade date. Gains and losses on securities sold are determined on a specific identification basis.
Common expenses – Common expenses of the Trust are allocated among the Funds and the other series of the Trust based on the relative net assets of each series or the nature of the services performed and the relative applicability to each series.
Distributions to shareholders – Distributions to shareholders arising from net investment income, if any, are declared and paid annually to shareholders. Net realized capital gains, if any, are distributed at least annually. The amount of distributions from net investment income and net realized capital gains are determined in accordance with federal income tax regulations, which may differ from GAAP. Dividends and distributions to shareholders are recorded on the ex-dividend date. There were no distributions paid to shareholders during the period ended February 29, 2016.
Short sales – The Funds may sell securities short. For financial statement purposes, an amount equal to the settlement amount is included in the Statements of Assets and Liabilities as an asset and an equivalent liability is then subsequently marked-to-market daily to reflect the current value of the short position. Subsequent fluctuations in the market prices of securities sold, but not yet purchased, may require purchasing the
44
CASTLEMAINE FUNDS
NOTES TO FINANCIAL STATEMENTS (Continued)
securities at prices that may differ from the market value reflected on the Statements of Assets and Liabilities. The Funds are liable for any dividends payable on securities while those securities are in a short position and will also bear other costs, such as charges for the prime brokerage accounts, in connection with the short position. These costs are reported as dividend expense and brokerage expense on securities sold short, respectively, in the Statements of Operations. As collateral for its short positions, the Funds are required under the Investment Company Act of 1940, as amended (the “1940 Act”), to maintain assets consisting of cash, cash equivalents, or other liquid securities equal to the market value of the securities sold short. The cash deposits with brokers for securities sold short are reported on the Statements of Assets and Liabilities. The amount of collateral is required to be adjusted daily to reflect changes in the value of the securities sold short. To the extent the Funds invest the proceeds received from selling securities short, it is engaging in a form of leverage. The use of leverage by the Funds may make any change in the Fund’s NAV greater than it would be without the use of leverage. Short sales are speculative transactions and involve special risks, including greater reliance on the ability of the Adviser to accurately anticipate the future value of a security.
Option contracts – The Funds may use option contracts in any manner consistent with their investment objectives and as long as their use is consistent with relevant provisions of the 1940 Act. The Funds may use options for speculative purposes as well as for the purpose of seeking to reduce the overall investment risk that would otherwise be associated with the securities in which the Funds invest.
Purchased option contracts – When a Fund purchases a call or put option, an amount equal to the total premium (the premium plus the commission) paid by the Fund is recorded as an asset in the Fund’s Statement of Assets and Liabilities and is subsequently marked-to-market daily. Premiums paid in the purchase of options which expire are treated as realized losses. Premiums paid in the purchase of call options which are exercised increase the cost of the security purchased. Premiums paid in the purchase of put options which are exercised decrease the proceeds used to calculate the realized gain or loss on the sale of the security.
Written option contracts – When a Fund writes a call or put option, an amount equal to the net premium (the premium less the commission) received by the Fund is recorded as a liability in the Fund’s Statement of Assets and Liabilities and is subsequently market-to-market daily. Premiums received from writing call and put options which expire are treated as realized gains. Premiums received from writing call options which are exercised increase the proceeds used to calculate the realized gain or loss on the sale of the security. Premiums received from writing put options which are exercised decrease the basis of the security purchased.
If a closing purchase or sale transaction is used to terminate a Fund’s obligation on an option, a gain or loss will be realized, depending upon whether the price of the closing transaction is more or less than the premium previously paid on the option purchased or received on the option written.
45
CASTLEMAINE FUNDS
NOTES TO FINANCIAL STATEMENTS (Continued)
Futures contracts – The Funds may use futures contracts to gain exposure to or hedge against changes in the value of equities, real estate, interest rates, foreign currencies, or commodities. A futures contract represents a commitment for the future purchase or sale of an asset at a specified price on a specified date. When a Fund purchases or sells a futures contract, no price is paid to or received by the Fund. Instead, the Fund is required to deposit in a segregated asset account an amount of cash or qualifying securities. This is called the “initial margin deposit.” Subsequent payments, known as “variation margin,” are made or received by the Fund each day, depending on the daily fluctuations in the fair value of the underlying asset. The Fund recognizes an unrealized gain or loss equal to the daily variation margin. If market conditions move unexpectedly, the Fund may not achieve the anticipated benefits of the futures contracts and may realize a loss. The margin deposits for futures contracts are reported on the Statements of Assets and Liabilities.
Estimates – The preparation of financial statements in conformity with GAAP requires management to make estimates and assumptions that affect the reported amounts of assets and liabilities and disclosure of contingent assets and liabilities, as of the date of the financial statements and the reported amounts of income and expenses during the reporting period. Actual results could differ from those estimates.
Federal income tax – Each Fund intends to qualify as a regulated investment company under the Internal Revenue Code of 1986 (the “Code”). Qualification generally will relieve a Fund of liability for federal income taxes to the extent 100% of its net investment income and net realized capital gains are distributed in accordance with the Code. Accordingly, no provision for income tax has been made.
In order to avoid imposition of the excise tax applicable to regulated investment companies, it is also each Fund’s intention to declare as dividends in each calendar year at least 98% of its net investment income (earned during the calendar year) and 98.2% of its net realized capital gains (earned during the 12 months ended October 31) plus undistributed amounts from prior years.
46
CASTLEMAINE FUNDS
NOTES TO FINANCIAL STATEMENTS (Continued)
The following information is computed on a tax basis for each item as of February 29, 2016:
| | Castlemaine Emerging Markets Opportunities
Fund | | | Castlemaine
Event Driven
Fund | | | Castlemaine
Long/Short
Fund | |
Tax cost of portfolio investments | | $ | 841,402 | | | $ | 874,064 | | | $ | 970,252 | |
Gross unrealized appreciation | | $ | 40,940 | | | $ | 25,401 | | | $ | 41,952 | |
Gross unrealized depreciation | | | (8,177 | ) | | | (8,076 | ) | | | (13,971 | ) |
Net unrealized appreciation | | | 32,763 | | | | 17,325 | | | | 27,981 | |
Net unrealized depreciation on securities sold short | | | (1,034 | ) | | | (2,181 | ) | | | (12,051 | ) |
Net unrealized appreciation on written option contracts | | | 246 | | | | 117 | | | | 2,027 | |
Other gains (losses) | | | (5,252 | ) | | | (5,409 | ) | | | 9,899 | |
Accumulated earnings | | $ | 26,723 | | | $ | 9,852 | | | $ | 27,856 | |
| | Castlemaine Market Neutral Fund | | | Castlemaine
Multi-Strategy Fund | |
Tax cost of portfolio investments | | $ | 675,613 | | | $ | 926,071 | |
Gross unrealized appreciation | | $ | 25,511 | | | $ | 16,782 | |
Gross unrealized depreciation | | | (7,632 | ) | | | (372 | ) |
Net unrealized appreciation | | | 17,879 | | | | 16,410 | |
Net unrealized depreciation on securities sold short | | | (11,320 | ) | | | (26 | ) |
Other gains | | | 4,082 | | | | 1,034 | |
Accumulated earnings | | $ | 10,641 | | | $ | 17,418 | |
47
CASTLEMAINE FUNDS
NOTES TO FINANCIAL STATEMENTS (Continued)
As of February 29, 2016, the proceeds of securities sold short and premiums received on written options on a tax basis are as follows:
| | | Tax Basis of: | |
| | Proceeds of securities sold short | | | Premiums
received on
written option contracts | |
Castlemaine Emerging Markets Opportunities Fund | | $ | 254,030 | | | $ | 2,916 | |
Castlemaine Event Driven Fund | | | 145,057 | | | | 2,387 | |
Castlemaine Long/Short Fund | | | 417,149 | | | | 5,867 | |
Castlemaine Market Neutral Fund | | | 430,840 | | | | — | |
Castlemaine Multi-Strategy Fund | | | 28,930 | | | | — | |
The difference between the federal income tax cost of portfolio investments and the financial statement cost of portfolio investments for Castlemaine Emerging Markets Opportunities Fund, Castlemaine Event Driven Fund, Castlemaine Long/Short Fund, and Castlemaine Market Neutral Fund is due to certain timing differences in the recognition of capital gains or losses under income tax regulations and GAAP. These “book/tax” differences are temporary in nature and are due primarily to the tax deferral of losses on wash sales.
The Funds recognize the tax benefits or expenses of uncertain tax positions only when the position is “more likely than not” to be sustained assuming examination by tax authorities. Management has reviewed each Fund’s tax positions for the period ended February 29, 2016 and has concluded that no provision for unrecognized tax benefits or expenses is required in these financial statements. Each Fund is subject to examination by U.S. federal tax authorities for the current interim tax period.
3. Investment Transactions
During the period ended February 29, 2016, cost of purchases and proceeds from sales of investment securities, other than short-term investments, U.S. government securities, and short positions, were as follows:
| | Cost of
Purchases | | | Proceeds
from Sales | |
Castlemaine Emerging Markets Opportunities Fund | | $ | 718,249 | | | $ | 12,297 | |
Castlemaine Event Driven Fund | | | 933,075 | | | | 192,900 | |
Castlemaine Long/Short Fund | | | 1,005,879 | | | | 173,110 | |
Castlemaine Market Neutral Fund | | | 765,724 | | | | 215,484 | |
Castlemaine Multi-Strategy Fund | | | 941,381 | | | | 18,302 | |
48
CASTLEMAINE FUNDS
NOTES TO FINANCIAL STATEMENTS (Continued)
4. Transactions with Related Parties
INVESTMENT ADVISORY AGREEMENT
Each Fund’s investments are managed by the Adviser pursuant to the terms of an Investment Advisory Agreement (the “Castlemaine Agreement”). Under the Castlemaine Agreement, the Funds pay the Adviser an advisory fee, computed and accrued daily and paid monthly, at the annual rate of 1.24% of the average daily net assets of each of Castlemaine Emerging Markets Opportunities Fund, Castlemaine Event Driven Fund, Castlemaine Long/Short Fund, and Castlemaine Market Neutral Fund; and at the annual rate of 1.24% of the average daily net assets of Castlemaine Multi-Strategy Fund excluding that portion of the Fund’s average net assets invested in any affiliated fund managed by the Adviser.
Pursuant to an Expense Limitation Agreement (the “ELA”) between each Fund and the Adviser, the Adviser has contractually agreed, until December 31, 2018, to reduce investment advisory fees and reimburse other expenses to limit Total Annual Fund Operating Expenses (exclusive of brokerage costs; taxes; interest; acquired fund fees and expenses; costs to organize the fund; extraordinary expenses such as litigation and merger or reorganization costs and other expenses not incurred in the ordinary course of the Fund’s business; and amounts, if any, payable pursuant to a plan adopted in accordance with Rule 12b-1 under the 1940 Act), to an amount not exceeding 1.49% of the average daily net assets of Castlemaine Emerging Markets Opportunities Fund, Castlemaine Event Driven Fund, Castlemaine Long/Short Fund, and Castlemaine Market Neutral Fund and to an amount not exceeding 0.99% of the average daily net assets of Castlemaine Multi-Strategy Fund. Accordingly, during the period ended February 29, 2016, the Adviser did not collect any of its advisory fees and, in addition, reimbursed other operating expenses as follows:
Castlemaine Emerging Markets Opportunities Fund | | $ | 16,557 | |
Castlemaine Event Driven Fund | | | 15,562 | |
Castlemaine Long/Short Fund | | | 15,548 | |
Castlemaine Market Neutral Fund | | | 15,551 | |
Castlemaine Multi-Strategy Fund | | | 16,757 | |
Under the terms of the ELA, investment advisory fee reductions and expense reimbursements by the Adviser are subject to repayment by each Fund for a period of three years after such fees and expense reimbursements were incurred, provided that the repayments do not cause Total Annual Fund Operating Expenses to exceed (i) the expense limitation then in effect, if any, and (ii) the expense limitation in effect at the time
49
CASTLEMAINE FUNDS
NOTES TO FINANCIAL STATEMENTS (Continued)
the expenses to be repaid were incurred. As of February 29, 2016, the Adviser may seek repayment of investment advisory fee reductions and expense reimbursements no later than February 28, 2019 in the following amounts:
Castlemaine Emerging Markets Opportunities Fund | | $ | 19,021 | |
Castlemaine Event Driven Fund | | | 18,021 | |
Castlemaine Long/Short Fund | | | 18,019 | |
Castlemaine Market Neutral Fund | | | 18,023 | |
Castlemaine Multi-Strategy Fund | | | 17,395 | |
An officer of the Funds is also an officer of the Adviser.
OTHER SERVICE PROVIDERS
Ultimus Fund Solutions, LLC (“Ultimus”) provides fund administration, fund accounting, compliance and transfer agency services to the Funds. The Funds pay Ultimus fees in accordance with the agreements for such services. In addition, the Funds pay out-of-pocket expenses including but not limited to postage, supplies, and costs of pricing each Fund’s portfolio securities.
DISTRIBUTION AGREEMENT
Under the terms of a Distribution Agreement with the Trust, Ultimus Fund Distributors, LLC (the “Distributor”) serves as principal underwriter to the Funds. The Distributor is a wholly-owned subsidiary of Ultimus. The Distributor is compensated by the Adviser (not the Funds) for acting as principal underwriter.
Certain officers and a Trustee of the Trust are also officers of Ultimus and the Distributor.
TRUSTEE COMPENSATION
Each Independent Trustee receives from each Fund a $500 annual retainer and a fee of $500 for each Board meeting attended plus reimbursement of travel and other meeting-related expenses. Trustees affiliated with the Adviser or Ultimus are not compensated by the Funds for their services.
50
CASTLEMAINE FUNDS
NOTES TO FINANCIAL STATEMENTS (Continued)
PRINCIPAL HOLDERS OF FUND SHARES
As of February 29, 2016, the following shareholders owned of record 5% or more of the outstanding shares of the Funds:
| | % Ownership |
Name of Record
Owner | Castlemaine Emerging Markets Opportunities Fund | Castlemaine Event Driven Fund | Castlemaine Long/Short Fund | Castlemaine Market Neutral Fund | Castlemaine Multi-Strategy Fund |
| Colm O’Shea | 83% | 83% | 83% | 83% | 100% |
| Castlemaine Multi-Strategy Fund | 17% | 17% | 17% | 17% | — |
A beneficial owner of 25% or more of a Fund’s outstanding shares may be considered a controlling person. That shareholder’s vote could have a more significant effect on matters presented at a shareholder’s meeting.
AFFILIATED INVESTMENTS
Certain open-end investment companies held by Castlemaine Multi-Strategy Fund are managed by the Adviser, thereby making such funds affiliated companies as defined by the 1940 Act.
As of February 29, 2016, Castlemaine Multi-Strategy Fund owned shares of Castlemaine Emerging Markets Opportunities Fund, Castlemaine Event Driven Fund, Castlemaine Long/Short Fund, and Castlemaine Market Neutral Fund (the “Afflilated Investments”). Information regarding Castlemaine Multi-Strategy Fund’s holdings in the Affiliated Investments during the period ended February 29, 2016 is as follows:
| | December 29, 2015(a)
Value | | | Purchases | | | Change in Unrealized Appreciation | | | February 29, 2016
Value | |
Castlemaine Emerging Markets Opportunities Fund | | $ | — | | | $ | 200,000 | | | $ | 4,400 | | | $ | 204,400 | |
Castlemaine Event Driven Fund | | | — | | | | 200,000 | | | | 1,600 | | | | 201,600 | |
Castlemaine Long/Short Fund | | | — | | | | 200,000 | | | | 4,600 | | | | 204,600 | |
Castlemaine Market Neutral Fund | | | — | | | | 200,000 | | | | 1,800 | | | | 201,800 | |
Total | | $ | — | | | $ | 800,000 | | | $ | 12,400 | | | $ | 812,400 | |
(a) | Castlemaine Multi-Strategy Fund commenced operations on December 29, 2015. |
51
CASTLEMAINE FUNDS
NOTES TO FINANCIAL STATEMENTS (Continued)
Castlemaine Multi-Strategy Fund did not realize any capital gains or losses or receive any dividend income from the Affiliated Investments during the period ended February 29, 2016.
5. Derivatives Transactions
Transactions in option contracts written by the Funds during the period ended February 29, 2016 were as follows:
| | Option
Contracts | | | Option
Premiums | |
Castlemaine Emerging Markets Opportunities Fund | | | | | | |
Options outstanding at beginning of period | | | — | | | $ | — | |
Options written | | | 147 | | | | 12,618 | |
Options cancelled in a closing purchase transaction | | | (86 | ) | | | (9,363 | ) |
Options expired | | | (1 | ) | | | (339 | ) |
Options outstanding at end of period | | | 60 | | | $ | 2,916 | |
| | | | | | | | | |
Castlemaine Event Driven Fund | | | | | | | | |
Options outstanding at beginning of period | | | — | | | $ | — | |
Options written | | | 68 | | | | 8,696 | |
Options cancelled in a closing purchase transaction | | | (27 | ) | | | (5,970 | ) |
Options expired | | | (1 | ) | | | (339 | ) |
Options outstanding at end of period | | | 40 | | | $ | 2,387 | |
| | | | | | | | | |
Castlemaine Long/Short Fund | | | | | | | | |
Options outstanding at beginning of period | | | — | | | $ | — | |
Options written | | | 137 | | | | 21,981 | |
Options cancelled in a closing purchase transaction | | | (32 | ) | | | (10,793 | ) |
Options expired | | | (39 | ) | | | (3,984 | ) |
Options exercised | | | (11 | ) | | | (1,337 | ) |
Options outstanding at end of period | | | 55 | | | $ | 5,867 | |
| | | | | | | | | |
Castlemaine Market Neutral Fund | | | | | | | | |
Options outstanding at beginning of period | | | — | | | $ | — | |
Options written | | | 69 | | | | 10,071 | |
Options cancelled in a closing purchase transaction | | | (7 | ) | | | (5,353 | ) |
Options expired | | | (22 | ) | | | (2,424 | ) |
Options exercised | | | (40 | ) | | | (2,294 | ) |
Options outstanding at end of period | | | — | | | $ | — | |
52
CASTLEMAINE FUNDS
NOTES TO FINANCIAL STATEMENTS (Continued)
| | Option
Contracts | | | Option
Premiums | |
Castlemaine Multi-Strategy Fund | | | | | | |
Options outstanding at beginning of period | | | — | | | $ | — | |
Options written | | | 10 | | | | 906 | |
Options expired | | | (10 | ) | | | (906 | ) |
Options outstanding at end of period | | | — | | | $ | — | |
Derivative positions of Castlemaine Emerging Markets Opportunities Fund, Castlemaine Event Driven Fund, Castlemaine Long/Short Fund, and Castlemaine Multi-Strategy Fund as of February 29, 2016 are recorded in the following locations in the Statements of Assets and Liabilities:
| | | | Fair value | |
Type of derivative | Location | | Asset Derivatives | | | Liability Derivatives | |
Castlemaine Emerging Markets Opportunities Fund | | | | | | |
Equity options purchased | Investments in securities, at value | | $ | 9,465 | | | $ | — | |
Equity options written | Written options, at value | | | — | | | | (2,670 | ) |
Total | | | $ | 9,465 | | | $ | (2,670 | ) |
| |
Castlemaine Event Driven Fund | | | | | | | | |
Equity options purchased | Investments in securities, at value | | $ | 9,210 | | | $ | — | |
Equity options written | Written options, at value | | | — | | | | (2,270 | ) |
Total | | | $ | 9,210 | | | $ | (2,270 | ) |
| |
Castlemaine Long/Short Fund | | | | | | | | | |
Equity options purchased | Investments in securities, at value | | $ | 7,975 | | | $ | — | |
Equity options written | Written options, at value | | | — | | | | (3,840 | ) |
Total | | | $ | 7,975 | | | $ | (3,840 | ) |
| |
Castlemaine Multi-Strategy Fund | | | | | | | | |
Equity options purchased | Investments in securities, at value | | $ | 1,880 | | | $ | — | |
Total | | | $ | 1,880 | | | $ | — | |
53
CASTLEMAINE FUNDS
NOTES TO FINANCIAL STATEMENTS (Continued)
Castlemaine Emerging Markets Opportunities Fund
Forward Foreign Currency Exchange Contracts | |
Settlement Date | | To Deliver | | To Receive | | Initial
Value | | | Market
Value | | | Unrealized Appreciation | | | Unrealized Depreciation | | | Net Unrealized Appreciation (Depreciation) | |
Asset Derivatives | |
7/29/2016 | | | 2,000,000 | | MXP | | | 106,869 | | USD | | | 106,869 | | | | 108,984 | | | $ | 2,115 | | | $ | — | | | $ | 2,115 | |
| | | | | | | | | | | | | | | | | | | | | | | | | | | | | | | |
Liability Derivatives | |
7/12/2016 | | | 131,406 | | USD | | | 500,000 | | SAR | | | (131,406 | ) | | | (132,935 | ) | | | — | | | | (1,529 | ) | | | (1,529 | ) |
7/14/2016 | | | 135,465 | | USD | | | 5,000,000 | | THB | | | (135,465 | ) | | | (139,925 | ) | | | — | | | | (4,460 | ) | | | (4,460 | ) |
| | | | | | | | | | | | | | | | | | | | | | — | | | | (5,989 | ) | | | (5,989 | ) |
| | | | | | | | | | | | | | | | | | | | | | | | | | | | | | | |
Total | | | $ | 2,115 | | | $ | (5,989 | ) | | $ | (3,874 | ) |
MXP - Mexican Peso |
SAR - Saudi Arabian Riyal |
THB - Thailand Baht |
As of February 29, 2016, the Funds did not hold any futures contracts. In addition, Castlemaine Market Neutral Fund did not hold any derivative instruments as of February 29, 2016.
Transactions in derivative instruments for the Funds during the period ended February 29, 2016 are recorded in the following locations in the Statements of Operations:
Derivative Investment Type | Location |
Futures contracts | Net realized gains (losses) from futures contracts |
Option contracts | Net realized gains (losses) from options |
| | Net change in unrealized appreciation (depreciation) on option contracts |
Forward foreign currency exchange contracts | Net change in unrealized appreciation (depreciation) on foreign currency translation |
54
CASTLEMAINE FUNDS
NOTES TO FINANCIAL STATEMENTS (Continued)
The following is a summary of net realized gains (losses) and net change in unrealized appreciation (depreciation) on derivative instruments for the Funds during the period ended February 29, 2016:
Type of Derivative | | Net Realized Gains (Losses) | | | Net Change in Unrealized Appreciation (Depreciation) | | | Net Realized Gains (Losses) | | | Net Change in Unrealized Appreciation (Depreciation) | |
| | | Castlemaine Emerging
Markets Opportunties Fund | | | Castlemaine
Event Driven Fund | |
Option contracts | | | | | | | | | | | | |
Purchased equity options | | $ | — | | | $ | (1,302 | ) | | $ | — | | | $ | (479 | ) |
Written equity options | | | 2,830 | | | | 246 | | | | 239 | | | | 117 | |
Written options on financial futures | | | 1,909 | | | | — | | | | 2,229 | | | | — | |
Total option contracts | | | 4,739 | | | | (1,056 | ) | | | 2,468 | | | | (362 | ) |
| | | | | | | | | | | | | | | | | |
Financial futures contracts | | | (2,912 | ) | | | — | | | | (5,066 | ) | | | — | |
| | | | | | | | | | | | | | | | | |
Forward foreign currency exchange contracts | | | — | | | | (3,874 | ) | | | — | | | | — | |
| | | | | | | | | | | | | | | | | |
Total | | $ | 1,827 | | | $ | (4,930 | ) | | $ | (2,598 | ) | | $ | (362 | ) |
| | | | | | | | | | | | | �� | | | | |
| | | Castlemaine
Long/Short Fund | | | Castlemaine
Market Neutral Fund | |
Option contracts | | | | | | | | | | | | | | | | |
Purchased equity options | | $ | — | | | $ | (1,677 | ) | | $ | — | | | $ | — | |
Written equity options | | | 3,889 | | | | 2,027 | | | | 1,649 | | | | — | |
Written options on financial futures | | | 5,233 | | | | — | | | | 2,603 | | | | — | |
Total option contracts | | | 9,122 | | | | 350 | | | | 4,252 | | | | — | |
| | | | | | | | | | | | | | | | | |
Financial futures contracts | | | (5,943 | ) | | | — | | | | (2,912 | ) | | | — | |
| | | | | | | | | | | | | | | | | |
Total | | $ | 3,179 | | | $ | 350 | | | $ | 1,340 | | | $ | — | |
| | | Castlemaine
Multi-Strategies Fund | | | | | | | | | |
Option contracts | | | | | | | | | | | | | | | | |
Purchased equity options | | $ | — | | | $ | (80 | ) | | | | | | | | |
Written equity options | | | 906 | | | | — | | | | | | | | | |
| | | | | | | | | | | | | | | | | |
Total | | $ | 906 | | | $ | (80 | ) | | | | | | | | |
55
CASTLEMAINE FUNDS
NOTES TO FINANCIAL STATEMENTS (Continued)
In the ordinary course of business, each Fund may enter into transactions subject to enforceable netting agreements or other similar arrangements (“netting agreements”). Generally, the right to offset in netting agreements allows each Fund to offset any exposure to a specific counterparty with any collateral received or delivered to that counterparty based on the terms of the agreements. Generally, each Fund manages its cash collateral securities and securities collateral on a counterparty basis.
As of February 29, 2016, the offsetting of financial assets and derivatives assets is as follows:
Castlemaine Emerging Markets Opportunities Fund | |
Description | | Gross Amounts of Recognized Assets | | | Gross Amounts Offset in Statements of Assets and Liabilities | | | Net Amounts of Assets Presented in Statements of Assets and Liabilities | | | Collateral Pledged | | | Net Amount | |
Unrealized appreciation on forward foreign currency exchange contracts | | $ | 2,115 | | | $ | — | | | $ | 2,115 | | | $ | — | | | $ | 2,115 | |
Total subject to a master netting or similar arrangement | | $ | 2,115 | | | $ | — | | | $ | 2,115 | | | $ | — | | | $ | 2,115 | |
As of February 29, 2016, the offsetting of financial liabilities and derivative liabilities is as follows:
Castlemaine Emerging Markets Opportunities Fund | |
Description | | Gross Amounts of Recognized Liabilities | | | Gross Amounts Offset in Statements of Assets and Liabilities | | | Net Amounts of Liabilities Presented in Statements of Assets and Liabilities | | | Collateral Pledged | | | Net Amount | |
Unrealized depreciation on forward foreign currency exchange contracts | | $ | 5,989 | | | $ | — | | | $ | 5,989 | | | $ | — | | | $ | 5,989 | |
Written options at market value | | | 2,670 | | | | — | | | | 2,670 | | | | — | | | | 2,670 | |
Total subject to a master netting or similar arrangement | | $ | 8,659 | | | $ | — | | | $ | 8,659 | | | $ | — | | | $ | 8,659 | |
56
CASTLEMAINE FUNDS
NOTES TO FINANCIAL STATEMENTS (Continued)
Castlemaine Event Driven Fund | |
Description | | Gross Amounts of Recognized Liabilities | | | Gross Amounts Offset in Statements of Assets and Liabilities | | | Net Amounts of Liabilities Presented in Statements of Assets and Liabilities | | | Collateral Pledged | | | Net Amount | |
Written options at
market value | | $ | 2,270 | | | $ | — | | | $ | 2,270 | | | $ | — | | | $ | 2,270 | |
Total subject to a master netting or similar arrangement | | $ | 2,270 | | | $ | — | | | $ | 2,270 | | | $ | — | | | $ | 2,270 | |
Castlemaine Long/Short Fund | |
Description | | Gross Amounts of Recognized Liabilities | | | Gross Amounts Offset in Statements of Assets and Liabilities | | | Net Amounts of Liabilities Presented in Statements of Assets and Liabilities | | | Collateral Pledged | | | Net Amount | |
Written options at
market value | | $ | 3,840 | | | $ | — | | | $ | 3,840 | | | $ | — | | | $ | 3,840 | |
Total subject to a master netting or similar arrangement | | $ | 3,840 | | | $ | — | | | $ | 3,840 | | | $ | — | | | $ | 3,840 | |
As of February 29, 2016, Castlemaine Market Neutral Fund and Castlemaine Multi-Strategy Fund were not engaged in any netting arrangements.
6. Contingencies and Commitments
The Funds indemnify the Trust’s officers and Trustees for certain liabilities that might arise from their performance of their duties to the Funds. Additionally, in the normal course of business the Funds enter into contracts that contain a variety of representations and warranties and which provide general indemnifications. Each Fund’s maximum exposure under these arrangements is unknown, as this would involve future claims that may be made against the Funds that have not yet occurred. However, based on experience, the Funds expect the risk of loss to be remote.
57
CASTLEMAINE FUNDS
NOTES TO FINANCIAL STATEMENTS (Continued)
7. Subsequent Events
The Funds are required to recognize in the financial statements the effects of all subsequent events that provide additional evidence about conditions that existed as of the date of the Statements of Assets and Liabilities. For non-recognized subsequent events that must be disclosed to keep the financial statements from being misleading, the Funds are required to disclose the nature of the event as well as an estimate of its financial effect, or a statement that such an estimate cannot be made. Management has evaluated subsequent events through the issuance of these financial statements and has noted no such events.
58
CASTLEMAINE FUNDS
ABOUT YOUR FUND’S EXPENSES (Unaudited)
We believe it is important for you to understand the impact of costs on your investment. As a shareholder of the Funds, you incur ongoing costs, including management fees and other operating expenses. The following examples are intended to help you understand your ongoing costs (in dollars) of investing in the Funds and to compare these costs with the ongoing costs of investing in other mutual funds.
A mutual fund’s ongoing costs are expressed as a percentage of its average net assets. This figure is known as the expense ratio. The expenses in the table below are based on an investment of $1,000 made at the beginning of the most recent period (December 29, 2015) and held until the end of the period (February 29, 2016).
The table below illustrates each Fund’s ongoing costs in two ways:
Actual fund return – This section helps you to estimate the actual expenses that you paid over the period. The “Ending Account Value” shown is derived from each Fund’s actual return, and the fourth column shows the dollar amount of operating expenses that would have been paid by an investor who started with $1,000 in each Fund. You may use the information here, together with the amount you invested, to estimate the expenses that you paid over the period.
To do so, simply divide your account value by $1,000 (for example, an $8,600 account value divided by $1,000 = 8.6), then multiply the result by the number given for the Fund under the heading “Expenses Paid During Period.”
Hypothetical 5% return – This section is intended to help you compare each Fund’s ongoing costs with those of other mutual funds. It assumes that the Funds had an annual return of 5% before expenses during the period shown, but that the expense ratio is unchanged. In this case, because the return used is not the Funds’ actual return, the results do not apply to your investment. The example is useful in making comparisons because the U.S. Securities and Exchange Commission (“SEC”) requires all mutual funds to calculate expenses based on a 5% return. You can assess each Fund’s ongoing costs by comparing this hypothetical example with the hypothetical examples that appear in shareholder reports of other funds.
Note that expenses shown in the table are meant to highlight and help you compare ongoing costs only. The Funds do not charge transaction fees, such as purchase or redemption fees, nor do they carry a “sales load.”
The calculations assume no shares were bought or sold during the period. Your actual costs may have been higher or lower, depending on the amount of your investment and the timing of any purchases or redemptions.
More information about each Fund’s expenses can be found in this report. For additional information on operating expenses and other shareholder costs, please refer to the Funds’ prospectus.
59
CASTLEMAINE FUNDS
ABOUT YOUR FUND’S EXPENSES (Unaudited) (Continued)
| Beginning Account Value September 1, 2015(a) | Ending
Account Value
February 29,
2016 | Net Expense Ratio(b) | Expenses Paid During Period(c) |
Castlemaine Emerging Markets Opportunities Fund |
Based on Actual Fund Return | $1,000.00 | $1,022.00 | 1.79% | $3.12 |
Based on Hypothetical 5% Return (before expenses) | $1,000.00 | $1,015.96 | 1.79% | $8.97 |
|
Castlemaine Event Driven Fund |
Based on Actual Fund Return | $1,000.00 | $1,008.00 | 1.64% | $2.83 |
Based on Hypothetical 5% Return (before expenses) | $1,000.00 | $1,016.71 | 1.64% | $8.22 |
|
Castlemaine Long/Short Fund |
Based on Actual Fund Return | $1,000.00 | $1,023.00 | 1.72% | $2.99 |
Based on Hypothetical 5% Return (before expenses) | $1,000.00 | $1,016.31 | 1.72% | $8.62 |
|
Castlemaine Market Neutral Fund |
Based on Actual Fund Return | $1,000.00 | $1,009.00 | 1.61% | $2.78 |
Based on Hypothetical 5% Return (before expenses) | $1,000.00 | $1,016.86 | 1.61% | $8.07 |
|
Castlemaine Multi-Strategy Fund |
Based on Actual Fund Return | $1,000.00 | $1,017.00 | 1.02% | $1.77 |
Based on Hypothetical 5% Return (before expenses) | $1,000.00 | $1,019.79 | 1.02% | $5.12 |
(a) | Beginning Account Value is as of December 29, 2015 (date of commencement of operations for each Fund) for Actual Fund Return information. |
(b) | Annualized, based on each Fund’s expenses for the period since inception. |
(c) | Expenses are equal to each Fund's annualized expense ratio multiplied by the average account value over the period, multiplied by 63/366 (to reflect the period since inception) and 182/366 (to reflect the one-half year period) for Actual Fund Return and Hypothetical 5% Return information, respectively. |
60
CASTLEMAINE FUNDS
OTHER INFORMATION (Unaudited)
A description of the policies and procedures that the Funds use to vote proxies relating to portfolio securities is available without charge upon request by calling toll-free 1-888-594-0006, or on the SEC’s website at http://www.sec.gov. Information regarding how the Funds voted proxies relating to portfolio securities during the period ended June 30, 2016 will be available prior to September 1, 2016 without charge upon request by calling toll-free 1-888-594-0006, or on the SEC’s website at http://www.sec.gov.
The Trust files a complete listing of portfolio holdings for the Funds with the SEC as of the end of the first and third quarters of each fiscal year on Form N-Q. These filings are available upon request by calling 1-888-594-0006. Furthermore, you may obtain a copy of the filings on the SEC’s website at http://www.sec.gov. The Trust’s Forms N-Q may also be reviewed and copied at the SEC’s Public Reference Room in Washington, DC, and information on the operation of the Public Reference Room may be obtained by calling 1-800-SEC-0330.
61
CASTLEMAINE FUNDS
APPROVAL OF INVESTMENT ADVISORY AGREEMENTS
(Unaudited)
The Board of Trustees (the “Board”), including the Independent Trustees voting separately, reviewed and approved the Funds’ Castlemaine Agreement with the Adviser for an initial two-year term. Approval took place at an in-person meeting held on October 19-20, 2015, at which all of the Trustees were present.
In the course of their deliberations, the Board was advised by legal counsel. The Board received and reviewed a substantial amount of information provided by the Adviser in response to requests of the Board and legal counsel.
In considering the Castlemaine Agreement and reaching their conclusions with respect thereto, the Board reviewed and analyzed various factors that they determined were relevant, including the factors described below.
The nature, extent, and quality of the services to be provided by the Adviser. In this regard, the Board considered the responsibilities the Adviser would have under the Castlemaine Agreement for each Fund. The Board also considered the anticipated services that the Adviser would provide to each Fund including, without limitation, the Adviser’s procedures for formulating investment recommendations and assuring compliance with the Fund’s investment objective and limitations, proposed initial marketing and distribution efforts, and compliance procedures and practices. After reviewing the foregoing and further information provided to the Board (e.g., descriptions of the Adviser’s business and Form ADV), the Board concluded that the quality, extent, and nature of the services to be provided by the Adviser to each Fund were satisfactory and adequate.
The investment management capabilities and experience of the Adviser. In this regard, the Board considered the investment management experience of the portfolio manager. The Board considered its discussion with the Adviser’s representatives regarding the investment objective and strategies for each Fund and the Adviser’s experience and plans for implementing such strategies. In particular, the Board received information from the Adviser regarding the experience of the portfolio manager of the Funds in managing in the past substantially similar or like strategies as the Funds. After consideration of these and other factors, the Board determined that the Adviser has the requisite experience to serve as investment adviser for each Fund.
The costs of the services to be provided and profits to be realized by the Adviser and its affiliates from the relationship with the Funds. In this regard, the Board considered the Adviser’s methods of operation; the education and experience of its personnel; its compliance program, policies, and procedures; its financial condition and the level of commitment to the Funds; the projected asset levels of the Funds; and the overall expenses of the Funds, including the advisory fees. The Board reviewed the Expense Limitation Agreement (the “ELA”), and noted the benefit to each Fund from the Adviser’s commitment to reduce its advisory fee or reimburse other operating expenses until December 31, 2018. The Board reviewed the Adviser’s financial condition and its ability to satisfy its financial commitments to the Funds. The Board considered the support
62
CASTLEMAINE FUNDS
APPROVAL OF INVESTMENT ADVISORY AGREEMENTS
(Unaudited) (Continued)
of the principals of the Adviser in assuring that it has adequate capital to meet its obligations. The Board also considered potential benefits for the Adviser in managing the Funds, including promotion of the Adviser’s name. The Board compared each Fund’s proposed advisory fee and overall expense ratio to other comparable funds (in terms of the type of fund, the style of investment management, the projected size of the Funds, and the nature of the investment strategies) and the fees charged by the Adviser to other managed accounts with similar investment strategies. The Board noted that for Castlemaine Emerging Markets Opportunities Fund the Fund’s advisory fee (1.24%) is below the peer group’s average and median, but above the category average and median for the Morningstar Emerging Markets Category. The Board noted that for Castlemaine Event Driven Fund, the Fund’s advisory fee (1.24%) is below the peer group’s average and median, and there is no comparable Morningstar category. The Board noted that for Castlemaine Long/Short Fund, the Fund’s advisory fee (1.24%) is below the peer group’s average and median, but close to the average and median for the Morningstar Long/Short Category. The Board noted that for Castlemaine Market Neutral Fund, the Fund’s advisory fee (1.24%) is below the peer group’s average and median, but above the average and median for the Morningstar Market Neutral Category. The Board noted that for Castlemaine Multi-Strategy Fund (the “Multi-Strategy Fund”), while the Fund’s advisory fee (1.24%) is below the peer group’s average and median, it is above the Morningstar Multi-Alternative Category. The Board further noted that the proposed overall annual expense ratio (1.49%) for each Fund (except the Multi-Strategy Fund) is below the peer group’s and category’s average and median expense ratios—with the exception of the median for the Emerging Markets Category, which is one basis point lower. For the Multi-Strategy Fund, the proposed expense limit of 0.99% is substantially below the Morningstar Multi-Alternative Category average and median, and places that Fund in the category’s top quartile. The Board also considered the investment style and strategy of each Fund versus its peer groups. Upon further consideration and discussion of the foregoing, the Board concluded that the proposed advisory fee and total expense limit for each Fund is fair and reasonable.
The extent to which the Funds and their investors would benefit from economies of scale. In this regard, the Board considered the Castlemaine Agreement and the ELA. The Board determined that although the proposed advisory fee was flat and would stay the same as asset level increased, the shareholders of each Fund would benefit from the ELA until the fund’s assets grew to a level where its expenses otherwise fall below the expense limit. Following further consideration of each Fund’s projected asset levels, expectations for growth, and level of fees, the Board determined that the Funds’ fee arrangements with the Adviser would provide benefits for the next few years, and the Board can review the arrangements going forward as necessary. The Board concluded each Fund’s arrangements with the Adviser were fair and reasonable in relation to the nature and quality of services to be provided by the Adviser and would benefit the Fund and its shareholders.
63
CASTLEMAINE FUNDS
APPROVAL OF INVESTMENT ADVISORY AGREEMENTS
(Unaudited) (Continued)
Brokerage and portfolio transactions. The Board considered the Adviser’s policies and procedures as it relates to seeking best execution for its clients. The Board also considered for each Fund the anticipated portfolio turnover rate for the fund; the method and basis for selecting and evaluating broker-dealers; any anticipated allocation of portfolio business to persons affiliated with the Adviser; and the extent to which the Fund’s trades may be allocated to soft-dollar arrangements. The Board determined for each Fund that the Adviser’s practices regarding brokerage and portfolio transactions were satisfactory.
Possible conflicts of interest. In evaluating the possibility for conflicts of interest, the Board considered such matters as the Adviser’s process for allocating trades among the Funds and potential future clients with similar types of investment objectives and strategies. The Board also considered the substance and administration of the Adviser’s Code of Ethics. Following consideration of these factors, the Board determined for each Fund that the Adviser’s standards and practices relating to the identification and mitigation of potential conflicts of interests were satisfactory.
Conclusion
After full consideration of the above factors as well as other factors, the Board unanimously concluded that approval of the Castlemaine Agreement was in the best interests of each of the Funds and their shareholders.
64
This page intentionally left blank.

Semi-Annual Report
February 29, 2016
(Unaudited)
MARSHFIELD CONCENTRATED OPPORTUNITIES FUND |
LETTER TO SHAREHOLDERS | March 15, 2016 |
Since its launch on December 29, 2015 through the period ended February 29, 2016, the Marshfield Concentrated Opportunity Fund produced a cumulative total return of -6.50% compared to -6.65% for the S&P 500 Index over the same period. Marshfield believes that its conservative approach to investing, which encompasses a willingness to hold cash when it does not see sufficient opportunities to invest in high caliber companies at a reasonable price, an emphasis on company quality, and a sell discipline that takes into account (among other things) extreme overvaluation, helps buoy its portfolio performance in down markets. This has been true for its managed portfolios generally over Marshfield’s history and we believe that this is reflected in the Fund results for the first quarter.
The beginning of 2016 could be entitled “Volatility: the Force Awakens”. We believe strongly in market volatility as a source of energy for our investing; without it, we think that building an intelligent and resilient portfolio is nigh on impossible. Exploiting the misjudgments of those who sell based on temporary, unfounded fears is a powerful tool for assembling a low cost team of great companies able to navigate the dark forces of a highly competitive world. For a variety of reasons, however, volatility since the financial crisis has been artificially dampened—not because of deep investor faith in the robustness of the U.S. economic recovery, but, strangely, because of its opposite. The Federal Reserve, wielding the weapon of ultra-low interest rates to combat the combined perils of lethargic consumer spending, high unemployment, and sluggish business investment, has spurred investors to seek reward in asset categories such as stocks that promised greater than the anemic returns available on cash and fixed income. High dividend stocks looked particularly appealing to many investors in this environment, thereby reinforcing the inherent “what have you done for me lately” bias of the market. Now that the Fed is loosening its grip, the latent restlessness of market participants has reemerged, enabling us to dip in and out as buyers on the downside and sellers on the upside, paring back or supplementing existing holdings as circumstances dictated. The market’s caprices have also enabled us to establish newer beachheads in certain stocks that we have been following for some time.
Let’s back up a bit and review some first principles of investing. Ben Graham, who invented our way of investing in the 1930’s, viewed the stock market as a barometer of investor sentiment. As such, it was dangerous to impute too much meaning to its movements. This is particularly true during periods of steep downdraft when emotional investing tends to gather momentum simply from the decline itself. Having said that, clear-eyed analysis of the kernels of truth to which the market might be (overly) responding needs to be examined and viewed in proportion to the actual risks that they pose.
The reasons for sharp moves in the market as a whole can therefore never be evaluated without understanding the prevailing psychology of market participants. It is our view that what we see today is not so much investors responding rationally to the failure of China to sustain its supercharged growth, the strengthening of the U.S. dollar, the decline of oil and gas prices, or even the elevated levels of the stock
1
market itself but rather investors frightened by disruptions to their expectations about each of these. Discontinuities are inherently destabilizing from an emotional perspective, and when they cumulate, the impact is amplified. You have—literally and figuratively—disturbed the equilibrium of market participants and they respond the way they have historically done, by selling indiscriminately.
Ironically, the very rosiness of the economic scenario running up to the current choppiness may have set things up for this moment. What looked like smooth sailing after years of post-recession anticipation (jobs are being created, wages have started to increase, house prices are steadily rising) have turned out to be a fragile set of expectations unable to support the level of endorphins that had been feeding the stock market for years. As often occurs, the world was not as interested in sustaining the fantasy as market participants were. If you bet, as a lot of people have, that the future will be a continuation of the recent past, then discontinuities like we’re seeing today mean that you are suddenly wrong. That’s why people become angry and frightened.
Having said all this, it is important to note that this period has not been without real economic events. The beginning of 2016 witnessed the continued slide of energy and commodity prices. While we have no first order investments in energy companies and have long steered clear of other commodities, several of our holdings are viewed by the market as (and to some extent are) secondary or tertiary plays on oil, gas or coal: e.g., Fastenal, Union Pacific and even Goldman Sachs. In addition, the strong dollar of late affected not just Fastenal but our other manufacturing businesses such as Deere and Cummins as well. We believe that each of these companies continues to have a vigorous underlying business, and to the extent volatility has given us opportunities to buy their shares over the last few months we did so—as did each of these companies itself.
In sum, our approach to a period such as this is to stick to our discipline. What does that entail? Understanding what’s real (e.g., gas prices are down, so certain sectors are affected, probably only temporarily, but others, such as consumers and manufacturers are benefited) and what’s fantasy. Acting with equanimity to exploit the misjudgments of the crowd. Being patient and not pulling the trigger before your buy price, with a fat margin of safety embedded in it, has been reached. And, if the buying opportunities surpass your store of cash, figuring out what you’d like to sell (what might be most overpriced, for example) so that you can stock up on the goodies others have impetuously put on sale. As we see it, only in a galaxy far, far away will energy prices persist at uneconomically low levels indefinitely and U.S. manufacturers prove incapable over time of adapting to the challenges posed by a strong currency. While we wait for the (as we see it) inevitable equilibration, we’re content to hold stock in companies that need no special effects in order to have a shot at earning decent returns.
Sincerely,
Christopher M. Niemczewski
Portfolio Manager | Elise J. Hoffmann
Portfolio Manager |
2
Past performance is not predictive of future performance. Investment results and principal value will fluctuate so that shares, when redeemed, may be worth more or less than their original cost. Current performance may be higher or lower than the performance data quoted. Performance data current to the most recent month-end are available by calling 1-855-691-5288.
An investor should consider the investment objectives, risks, charges and expenses of the Fund carefully before investing. The Fund’s prospectus contains this and other important information. To obtain a copy of the Fund’s prospectus please call 1-855-691-5288 and a copy will be sent to you free of charge. Please read the prospectus carefully before you invest. The Fund is distributed by Ultimus Fund Distributors, LLC.
The Letter to Shareholders seeks to describe some of the Adviser’s current opinions and views of the financial markets. Although the Adviser believes it has a reasonable basis for any opinions or views expressed, actual results may differ, sometimes significantly so, from those expected or expressed. The securities held by the Fund that are discussed in the Letter to Shareholders were held during the period covered by this Report. They do not comprise the entire investment portfolio of the Fund, may be sold at any time, and may no longer be held by the Fund. For a complete list of securities held by the Fund as of February 29, 2016, please see the Schedule of Investments section of the Semi-Annual Report. The opinions of the Fund’s adviser with respect to those securities may change at any time.
Statements in the Letter to Shareholders that reflect projections or expectations for future financial or economic performance of the Fund and the market in general and statements of the Fund’s plans and objectives for future operations are forward-looking statements. No assurance can be given that actual results or events will not differ materially from those projected, estimated, assumed, or anticipated in any such forward-looking statements. Important factors that could result in such differences, in addition to factors noted with such forward-looking statements, include, without limitation, general economic conditions, such as inflation, recession, and interest rates. Past performance is not a guarantee of future results.
3
MARSHFIELD CONCENTRATED OPPORTUNITIES FUND
PORTFOLIO INFORMATION
February 29, 2016 (Unaudited)
Portfolio Allocation (% of Net Assets)
Top 10 Holdings
Security Description | % of Net Assets |
Arch Capital Group Ltd. | 9.1% |
Moody's Corp. | 8.7% |
Wells Fargo & Co. | 6.7% |
Fastenal Co. | 6.2% |
Goldman Sachs Group, Inc. (The) | 6.0% |
NVR, Inc. | 5.9% |
Deere & Co. | 5.1% |
YUM! Brands, Inc. | 5.1% |
Cummins, Inc. | 4.9% |
Expeditors International of Washington, Inc. | 4.7% |
4
MARSHFIELD CONCENTRATED OPPORTUNITIES FUND
SCHEDULE OF INVESTMENTS
February 29, 2016 (Unaudited) |
COMMON STOCKS — 95.4% | | Shares | | | Value | |
Consumer Discretionary — 20.4% | | | | | | |
Diversified Consumer Services — 1.6% | | | | | | |
Strayer Education, Inc. * | | | 1,774 | | | $ | 80,061 | |
| | | | | | | | | |
Hotels, Restaurants & Leisure — 5.2% | | | | | | | | |
Chipotle Mexican Grill, Inc. * | | | 10 | | | | 5,092 | |
YUM! Brands, Inc. | | | 3,443 | | | | 249,514 | |
| | | | | | | | 254,606 | |
Household Durables — 10.0% | | | | | | | | |
NVR, Inc. * | | | 177 | | | | 289,749 | |
Toll Brothers, Inc. * | | | 7,343 | | | | 201,565 | |
| | | | | | | | 491,314 | |
Specialty Retail — 3.6% | | | | | | | | |
Ross Stores, Inc. | | | 3,266 | | | | 179,565 | |
| | | | | | | | | |
Financials — 40.9% | | | | | | | | |
Banks — 10.6% | | | | | | | | |
U.S. Bancorp | | | 4,969 | | | | 191,406 | |
Wells Fargo & Co. | | | 7,064 | | | | 331,443 | |
| | | | | | | | 522,849 | |
Capital Markets — 6.0% | | | | | | | | |
Goldman Sachs Group, Inc. (The) | | | 1,973 | | | | 295,023 | |
| | | | | | | | | |
Diversified Financial Services — 10.7% | | | | | | | | |
Leucadia National Corp. | | | 6,872 | | | | 99,300 | |
Moody's Corp. | | | 4,850 | | | | 430,680 | |
| | | | | | | | 529,980 | |
Insurance — 13.6% | | | | | | | | |
Allied World Assurance Co. Holdings, AG | | | 6,959 | | | | 225,402 | |
Arch Capital Group Ltd. * | | | 6,588 | | | | 447,589 | |
| | | | | | | | 672,991 | |
Health Care — 1.3% | | | | | | | | |
Life Sciences Tools & Services — 1.3% | | | | | | | | |
Waters Corp. * | | | 547 | | | | 65,809 | |
| | | | | | | | | |
Industrials — 24.9% | | | | | | | | |
Air Freight & Logistics — 4.7% | | | | | | | | |
Expeditors International of Washington, Inc. | | | 5,116 | | | | 234,210 | |
5
MARSHFIELD CONCENTRATED OPPORTUNITIES FUND
SCHEDULE OF INVESTMENTS (Continued) |
COMMON STOCKS — 95.4% (Continued) | | Shares | | | Value | |
Industrials — 24.9% (Continued) | | | | | | |
Machinery — 10.0% | | | | | | |
Cummins, Inc. | | | 2,500 | | | $ | 243,925 | |
Deere & Co. | | | 3,138 | | | | 251,605 | |
| | | | | | | | 495,530 | |
Road & Rail — 4.0% | | | | | | | | |
Union Pacific Corp. | | | 2,484 | | | | 195,888 | |
| | | | | | | | | |
Trading Companies & Distributors — 6.2% | | | | | | | | |
Fastenal Co. | | | 6,727 | | | | 304,666 | |
| | | | | | | | | |
Information Technology — 7.9% | | | | | | | | |
IT Services — 7.9% | | | | | | | | |
MasterCard, Inc. - Class A | | | 2,183 | | | | 189,746 | |
Visa, Inc. - Class A | | | 2,746 | | | | 198,783 | |
| | | | | | | | 388,529 | |
| | | | | | | | | |
Total Investments at Value — 95.4% (Cost $4,741,287) | | | | | | $ | 4,711,021 | |
| | | | | | | | | |
Other Assets in Excess of Liabilities — 4.6% | | | | | | | 226,031 | |
| | | | | | | | |
Net Assets — 100.0% | | | | | | $ | 4,937,052 | |
* | Non-income producing security. |
See accompanying notes to financial statements. |
6
MARSHFIELD CONCENTRATED OPPORTUNITIES FUND
STATEMENT OF ASSETS AND LIABILITIES
February 29, 2016 (Unaudited) |
ASSETS | | | |
Investments in securities: | | | |
At acquisition cost | | $ | 4,741,287 | |
At value (Note 2) | | $ | 4,711,021 | |
Cash | | | 215,144 | |
Dividends receivable | | | 9,130 | |
Receivable for investment securities sold | | | 5,512 | |
Receivable from Adviser (Note 4) | | | 5,384 | |
Other assets | | | 4,242 | |
Total assets | | | 4,950,433 | |
| | | | | |
LIABILITIES | | | | |
Payable to administrator (Note 4) | | | 6,280 | |
Payable for investment securities purchased | | | 4,168 | |
Other accrued expenses | | | 2,933 | |
Total liabilities | | | 13,381 | |
| | | | | |
NET ASSETS | | $ | 4,937,052 | |
| | | | | |
NET ASSETS CONSIST OF: | | | | |
Paid-in capital | | $ | 4,964,483 | |
Accumulated net investment income | | | 4,111 | |
Accumulated net realized losses from security transactions | | | (1,276 | ) |
Net unrealized depreciation on investments | | | (30,266 | ) |
NET ASSETS | | $ | 4,937,052 | |
| | | | | |
Shares of beneficial interest outstanding (unlimited number of shares authorized, no par value) | | | 527,890 | |
| | | | | |
Net asset value, offering price and redemption price per share (Note 2) | | $ | 9.35 | |
See accompanying notes to financial statements. |
7
MARSHFIELD CONCENTRATED OPPORTUNITIES FUND
STATEMENT OF OPERATIONS
For the Period Ended February 29, 2016 (a) (Unaudited) |
INVESTMENT INCOME | | | |
Dividend income | | $ | 11,356 | |
| | | | | |
EXPENSES | | | | |
Investment advisory fees (Note 4) | | | 5,796 | |
Fund accounting fees (Note 4) | | | 4,053 | |
Administration fees (Note 4) | | | 4,000 | |
Registration and filing fees | | | 3,117 | |
Professional fees | | | 2,966 | |
Trustees' fees and expenses (Note 4) | | | 2,637 | |
Transfer agent fees (Note 4) | | | 2,500 | |
Compliance fees (Note 4) | | | 2,000 | |
Postage and supplies | | | 1,491 | |
Custody and bank service fees | | | 927 | |
Other expenses | | | 753 | |
Total expenses | | | 30,240 | |
Less fee reductions and expense reimbursements by the Adviser (Note 4) | | | (22,995 | ) |
Net expenses | | | 7,245 | |
| | | | | |
NET INVESTMENT INCOME | | | 4,111 | |
| | | | | |
REALIZED AND UNREALIZED LOSSES ON INVESTMENTS | | | | |
Net realized losses from security transactions | | | (1,276 | ) |
Net change in unrealized appreciation (depreciation) on investments | | | (30,266 | ) |
NET REALIZED AND UNREALIZED LOSSES ON INVESTMENTS | | | (31,542 | ) |
| | | | | |
NET DECREASE IN NET ASSETS RESULTING FROM OPERATIONS | | $ | (27,431 | ) |
(a) | Represents the period from the commencement of operations (December 29, 2015) through February 29, 2016. |
See accompanying notes to financial statements. |
8
MARSHFIELD CONCENTRATED OPPORTUNITIES FUND
STATEMENT OF CHANGES IN NET ASSETS |
| | Period
Ended
February 29,
2016 (a)
(Unaudited) | |
FROM OPERATIONS | | | |
Net investment income | | $ | 4,111 | |
Net realized losses from security transactions | | | (1,276 | ) |
Net change in unrealized appreciation (depreciation) on investments | | | (30,266 | ) |
Net decrease in net assets resulting from operations | | | (27,431 | ) |
| | | | | |
CAPITAL SHARE TRANSACTIONS | | | | |
Proceeds from shares sold | | | 4,964,483 | |
| | | | | |
TOTAL INCREASE IN NET ASSETS | | | 4,937,052 | |
| | | | | |
NET ASSETS | | | | |
Beginning of period | | | — | |
End of period | | $ | 4,937,052 | |
| | | | | |
ACCUMULATED NET INVESTMENT INCOME | | $ | 4,111 | |
| | | | | |
CAPITAL SHARE ACTIVITY | | | | |
Shares sold | | | 527,890 | |
Shares outstanding at beginning of period | | | — | |
Shares outstanding at end of period | | | 527,890 | |
(a) | Represents the period from the commencement of operations (December 29, 2015) through February 29, 2016. |
See accompanying notes to financial statements. |
9
MARSHFIELD CONCENTRATED OPPORTUNITIES FUND
FINANCIAL HIGHLIGHTS |
Per Share Data for a Share Outstanding Throughout the Period |
| | Period
Ended
February 29,
2016 (a)
(Unaudited) | |
Net asset value at beginning of period | | $ | 10.00 | |
| | | | | |
Income (loss) from investment operations: | | | | |
Net investment income | | | 0.01 | |
Net realized and unrealized losses on investments | | | (0.66 | ) |
Total from investment operations | | | (0.65 | ) |
| | | | | |
Net asset value at end of period | | $ | 9.35 | |
| | | | | |
Total return (b) | | | (6.50% | )(c) |
| | | | | |
Net assets at end of period (000's) | | $ | 4,937 | |
| | | | | |
Ratios/supplementary data: | | | | |
Ratio of total expenses to average net assets | | | 5.22 | %(d) |
| | | | | |
Ratio of net expenses to average net assets (e) | | | 1.25 | %(d) |
| | | | | |
Ratio of net investment income to average net assets (e) | | | 0.71 | %(d) |
| | | | | |
Portfolio turnover rate | | | 1 | %(c) |
(a) | Represents the period from the commencement of operations (December 29, 2015) through February 29, 2016. |
(b) | Total return is a measure of the change in value of an investment in the Fund over the period covered. The return shown does not reflect the deduction of taxes a shareholder would pay on Fund distributions, if any, or the redemption of Fund shares. The total return would be lower if the Adviser had not reduced advisory fees and reimbursed expenses (Note 4). |
(c) | Not annualized. |
(d) | Annualized. |
(e) | Ratio was determined after advisory fee reductions and expense reimbursements (Note 4). |
See accompanying notes to financial statements. |
10
MARSHFIELD CONCENTRATED OPPORTUNITIES FUND
NOTES TO FINANCIAL STATEMENTS
February 29, 2016 (Unaudited)
1. Organization
Marshfield Concentrated Opportunities Fund (the “Fund”) is a non-diversified series of Ultimus Managers Trust (the “Trust”), an open-end investment company established as an Ohio business trust under a Declaration of Trust dated February 28, 2012. Other series of the Trust are not incorporated in this report. The Fund commenced operations on December 29, 2015.
The investment objective of the Fund is long-term capital growth.
2. Significant Accounting Policies
The following is a summary of the Fund’s significant accounting policies. The policies are in conformity with accounting principles generally accepted in the United States of America (“GAAP”). As an investment company, as defined in Financial Accounting Standards Board (“FASB”) Accounting Standards Update 2013-08, the Fund follows accounting and reporting guidance under FASB Accounting Standards Codification Topic 946, “Financial Services – Investment Companies.”
Securities valuation – The Fund values its portfolio securities at market value as of the close of regular trading on the New York Stock Exchange (the “NYSE”) (normally 4:00 p.m. Eastern time) on each business day the NYSE is open for business. The Fund values its listed securities on the basis of the security’s last sale price on the security’s primary exchange, if available, otherwise at the exchange’s most recently quoted bid price. NASDAQ-listed securities are valued at the NASDAQ Official Closing Price. In the event that market quotations are not readily available or are considered unreliable due to market or other events, the Fund values its securities and other assets at fair value in accordance with procedures established by and under the general supervision of the Board of Trustees (the “Board”) of the Trust. Under these procedures, the securities will be classified as Level 2 or 3 within the fair value hierarchy (see below), depending on the inputs used. Unavailable or unreliable market quotes may be due to the following factors: a substantial bid-ask spread; infrequent sales resulting in stale prices; insufficient trading volume; small trade sizes; a temporary lapse in any reliable pricing source; and actions of the securities or futures markets, such as the suspension or limitation of trading. As a result, the prices of securities used to calculate the Fund’s net asset value (“NAV”) may differ from quoted or published prices for the same securities.
GAAP establishes a single authoritative definition of fair value, sets out a framework for measuring fair value, and requires additional disclosures about fair value measurements.
Various inputs are used in determining the value of the Fund’s investments. These inputs are summarized in the three broad levels listed below:
| | ● | Level 1 – quoted prices in active markets for identical securities |
11
MARSHFIELD CONCENTRATED OPPORTUNITIES FUND
NOTES TO FINANCIAL STATEMENTS (Continued) |
| | ● | Level 2 – other significant observable inputs |
| | ● | Level 3 – significant unobservable inputs |
The inputs or methods used for valuing securities are not necessarily an indication of the risks associated with investing in those securities. The inputs used to measure fair value may fall into different levels of the fair value hierarchy. In such cases, for disclosure purposes, the level in the fair value hierarchy within which the fair value measurement falls in its entirety is determined based on the lowest level input that is significant to the fair value measurement.
The following is a summary of the inputs used to value the Fund’s investments as of February 29, 2016:
| | Level 1 | | | Level 2 | | | Level 3 | | | Total | |
Common Stocks | | $ | 4,711,021 | | | $ | — | | | $ | — | | | $ | 4,711,021 | |
Refer to the Fund’s Schedule of Investments for a listing of the common stocks by industry type. As of February 29, 2016, the Fund did not have any transfers between Levels. In addition, the Fund did not hold derivative instruments or any assets or liabilities that were measured at fair value on a recurring basis using significant unobservable inputs (Level 3) as of February 29, 2016. It is the Fund’s policy to recognize transfers between Levels at the end of the reporting period.
Share valuation – The NAV per share of the Fund is calculated daily by dividing the total value of the Fund’s assets, less liabilities, by the number of shares outstanding. The offering price and redemption price per share of the Fund is equal to the NAV, except that shares of the Fund are subject to a redemption fee of 2% if redeemed within 90 days of the date of purchase. During the period ended February 29, 2016, no shareholder transactions were subject to the redemption fee.
Investment income – Dividend income is recorded on the ex-dividend date. Interest income is accrued as earned.
Security transactions – Security transactions are accounted for on the trade date. Gains and losses on securities sold are determined on a specific identification basis.
Common expenses – Common expenses of the Trust are allocated among the Fund and the other series of the Trust based on the relative net assets of each series or the nature of the services performed and the relative applicability to each series.
Distributions to shareholders – The Fund will distribute to shareholders any net investment income dividends and net realized capital gains distributions at least once each year. The amount of such dividends and distributions are determined in accordance with federal income tax regulations, which may differ from GAAP. Dividends and distributions are recorded on the ex-dividend date. There were no distributions to shareholders during the period ended February 29, 2016.
12
MARSHFIELD CONCENTRATED OPPORTUNITIES FUND
NOTES TO FINANCIAL STATEMENTS (Continued) |
Estimates – The preparation of financial statements in conformity with GAAP requires management to make estimates and assumptions that affect the reported amounts of assets and liabilities and disclosure of contingent assets and liabilities as of the date of the financial statements and the reported amounts of income and expenses during the reporting period. Actual results could differ from those estimates.
Federal income tax – The Fund intends to qualify as a regulated investment company under the Internal Revenue Code of 1986 (the “Code”). Qualification generally will relieve the Fund of liability for federal income taxes to the extent 100% of its net investment income and net realized capital gains are distributed in accordance with the Code. Accordingly, no provision for income tax has been made.
In order to avoid imposition of the excise tax applicable to regulated investment companies, it is also the Fund’s intention to declare as dividends in each calendar year at least 98% of its net investment income (earned during the calendar year) and 98.2% of its net realized capital gains (earned during the 12 months ended October 31) plus undistributed amounts from prior years.
The following information is computed on a tax basis for each item as of February 29, 2016:
Tax cost of portfolio investments | | $ | 4,741,460 | |
Gross unrealized appreciation | | $ | 141,902 | |
Gross unrealized depreciation | | | (172,341 | ) |
Net unrealized depreciation | | | (30,439 | ) |
Accumulated ordinary income | | | 4,111 | |
Other losses | | | (1,103 | ) |
Accumulated deficit | | $ | (27,431 | ) |
The value of the federal income tax cost of portfolio investments and the tax components of accumulated deficit and the financial statement cost of portfolio investments and components of net assets may be temporarily different (“book/tax differences”). These book/tax differences are due to the recognition of capital gains or losses under income tax regulations and GAAP, primarily due to the tax deferral of losses on wash sales.
The Fund recognizes the tax benefits or expenses of uncertain tax positions only when the position is “more likely than not” to be sustained assuming examination by tax authorities. Management has reviewed the Fund’s tax positions for the current period and has concluded that no provision for unrecognized tax benefits or expenses is required in these financial statements. The Fund identifies its major tax jurisdiction as U.S. Federal.
13
MARSHFIELD CONCENTRATED OPPORTUNITIES FUND
NOTES TO FINANCIAL STATEMENTS (Continued) |
3. Investment Transactions
During the period ended February 29, 2016, cost of purchases and proceeds from sales of investment securities, other than short-term investments, were $4,773,358 and $30,795, respectively.
4. Transactions with Related Parties
INVESTMENT ADVISORY AGREEMENT
The Fund’s investments are managed by Marshfield Associates, Inc. (the “Adviser”) pursuant to the terms of an Investment Advisory Agreement (the “Advisory Agreement”). Under the Advisory Agreement, the Fund pays the Adviser an advisory fee, computed and accrued daily and paid monthly, at the annual rate of 1.00% of its average daily net assets.
Pursuant to an Expense Limitation Agreement (“ELA”) between the Fund and the Adviser, the Adviser has contractually agreed, until December 31, 2018, to reduce its investment advisory fees and reimburse other expenses to limit Total Annual Operating Expenses (exclusive of brokerage costs; taxes; interest; costs to organize the Fund; acquired fund fees and expenses such as litigation and merger or reorganization costs; extraordinary expenses and other expenses not incurred in the ordinary course of the Fund’s business; and amounts, if any, payable pursuant to a plan adopted in accordance with Rule 12b-1 under the Investment Company Act of 1940) to an amount not exceeding 1.25% of the Fund’s average daily net assets. Accordingly, during the period ended February 29, 2016, the Adviser did not collect any of its advisory fees and reimbursed other operating expenses totaling $17,199.
Under the terms of the ELA, investment advisory fee reductions and expense reimbursements by the Adviser are subject to repayment by the Fund for a period of three years after such fees and expenses were incurred, provided the repayments do not cause Total Annual Operating Expenses to exceed the (i) the expense limitation then in effect, if any, and (ii) the expense limitation in effect at the time the expenses to be repaid were incurred. As of February 29, 2016, the Adviser may seek repayment of investment advisory fee reductions and expense reimbursements totaling $22,995 no later than February 28, 2019.
An officer of the Fund is also an officer of the Adviser.
OTHER SERVICE PROVIDERS
Ultimus Fund Solutions, LLC (“Ultimus”) provides fund administration, fund accounting, compliance and transfer agency services to the Fund. The Fund pays Ultimus fees in accordance with the agreements for such services. In addition, the Fund pays out-of-pocket expenses including but not limited to postage, supplies and costs of pricing the Fund’s portfolio securities.
14
MARSHFIELD CONCENTRATED OPPORTUNITIES FUND
NOTES TO FINANCIAL STATEMENTS (Continued) |
Under the terms of a Distribution Agreement with the Trust, Ultimus Fund Distributors, LLC (the “Distributor”) serves as principal underwriter to the Fund. The Distributor is a wholly-owned subsidiary of Ultimus. The Distributor is compensated by the Adviser (not the Fund) for acting as principal underwriter.
Certain officers and a Trustee of the Trust are also officers of Ultimus and the Distributor and are not paid by the Fund for serving in such capacities.
TRUSTEE COMPENSATION
Each Independent Trustee receives from the Fund a fee of $500 for each Board meeting attended plus reimbursement of travel and other meeting-related expenses. Each Independent Trustee also receives a $500 annual retainer from the Fund.
PRINICIPAL HOLDERS OF FUND SHARES
As of February 29, 2016, the following shareholders owned of record 5% or more of the outstanding shares of the Fund:
Name of Record Owner | % Ownership |
Christopher M. Niemczewski | 20% |
Elise J. Hoffman | 20% |
Melissa Vinick Gilbert | 13% |
Carolyn Miller | 12% |
5. Sector Risk
If a Fund has significant investments in the securities of issuers within a particular sector, any development affecting that sector will have a greater impact on the value of the net assets of the Fund than would be the case if the Fund did not have significant investments in that sector. In addition, this may increase the risk of loss in the Fund and increase the volatility of the Fund’s NAV per share. Occasionally, market conditions, regulatory changes or other developments may negatively impact this sector, and therefore the value of the Fund’s portfolio will be adversely affected. As of February 29, 2016, the Fund had 40.9% of the value of its net assets invested in securities within the Financials sector.
6. Contingencies and Commitments
The Fund indemnifies the Trust’s officers and Trustees for certain liabilities that might arise from their performance of their duties to the Fund. Additionally, in the normal course of business the Fund enters into contracts that contain a variety of representations and warranties and which provide general indemnifications. The Fund’s maximum exposure under these arrangements is unknown, as this would involve future claims that may be made against the Fund that have not yet occurred. However, based on experience, the Fund expects the risk of loss to be remote.
15
MARSHFIELD CONCENTRATED OPPORTUNITIES FUND
NOTES TO FINANCIAL STATEMENTS (Continued) |
7. Subsequent Events
The Fund is required to recognize in the financial statements the effects of all subsequent events that provide additional evidence about conditions that existed as of the date of the Statement of Assets and Liabilities. For non-recognized subsequent events that must be disclosed to keep the financial statements from being misleading, the Fund is required to disclose the nature of the event as well as an estimate of its financial effect, or a statement that such an estimate cannot be made. Management has evaluated subsequent events through the issuance of these financial statements and has noted no such events.
16
MARSHFIELD CONCENTRATED OPPORTUNITIES FUND
ABOUT YOUR FUND’S EXPENSES (Unaudited) |
We believe it is important for you to understand the impact of costs on your investment. As a shareholder of the Fund, you incur ongoing costs, including management fees and other operating expenses. The following examples are intended to help you understand your ongoing costs (in dollars) of investing in the Fund and to compare these costs with the ongoing costs of investing in other mutual funds.
A mutual fund’s ongoing costs are expressed as a percentage of its average net assets. This figure is known as the expense ratio. The expenses in the table below are based on an investment of $1,000 made at the beginning of the most recent period (December 29, 2015) and held until the end of the period (February 29, 2016).
The table below illustrates the Fund’s ongoing costs in two ways:
Actual fund return – This section helps you to estimate the actual expenses that you paid over the period. The “Ending Account Value” shown is derived from the Fund’s actual return, and the fourth column shows the dollar amount of operating expenses that would have been paid by an investor who started with $1,000 in the Fund. You may use the information here, together with the amount you invested, to estimate the expenses that you paid over the period.
To do so, simply divide your account value by $1,000 (for example, an $8,600 account value divided by $1,000 = 8.6), then multiply the result by the number given for the Fund under the heading “Expenses Paid During Period.”
Hypothetical 5% return – This section is intended to help you compare the Fund’s ongoing costs with those of other mutual funds. It assumes that the Fund had an annual return of 5% before expenses during the period shown, but that the expense ratio is unchanged. In this case, because the return used is not the Fund’s actual return, the results do not apply to your investment. The example is useful in making comparisons because the U.S. Securities and Exchange Commission (“SEC”) requires all mutual funds to calculate expenses based on a 5% return. You can assess the Fund’s ongoing costs by comparing this hypothetical example with the hypothetical examples that appear in shareholder reports of other funds.
Note that expenses shown in the table are meant to highlight and help you compare ongoing costs only. The Fund does not charge transaction fees, such as purchase or redemption fees, nor does it carry a “sales load.”
The calculations assume no shares were bought or sold during the period. Your actual costs may have been higher or lower, depending on the amount of your investment and the timing of any purchases or redemptions.
More information about the Fund’s expenses can be found in this report. For additional information on operating expenses and other shareholder costs, please refer to the Fund’s prospectus.
17
MARSHFIELD CONCENTRATED OPPORTUNITIES FUND
ABOUT YOUR FUND’S EXPENSES (Unaudited) (Continued) |
| Beginning Account Value September 1, 2015 (a) | Ending
Account Value February 29, 2016 | Net Expense Ratio (b) | Expenses Paid During Period (c) |
Based on Actual Fund Return | $1,000.00 | $ 935.00 | 1.25% | $2.08 |
Based on Hypothetical 5% Return (before expenses) | $1,000.00 | $ 1,018.65 | 1.25% | $6.27 |
(a) | Beginning Account Value is as of December 29, 2015 (date of commencement of operations) for Actual Fund Return information. |
(b) | Annualized, based on the Fund’s expenses for the period since inception. |
(c) | Expenses are equal to the Fund’s annualized expense ratio multiplied by the average account value over the period, multiplied by 63/366 (to reflect the period since inception) and 182/366 (to reflect the one-half year period), for Actual Fund Return and Hypothetical 5% Return information, respectively. |
OTHER INFORMATION (Unaudited)
A description of the policies and procedures that the Fund uses to vote proxies relating to portfolio securities is available without charge upon request by calling toll-free 1-855-691-5288, or on the SEC’s website at http://www.sec.gov. Information regarding how the Fund voted proxies relating to portfolio securities during the period ended June 30, 2016 will be available on or before August 31, 2016 without charge upon request by calling toll-free 1-855-691-5288, or on the SEC’s website at http://www.sec.gov.
The Trust files a complete listing of portfolio holdings for the Fund with the SEC as of the end of the first and third quarters of each fiscal year on Form N-Q. These filings are available upon request by calling 1-855-691-5288. Furthermore, you may obtain a copy of the filings on the SEC’s website at http://www.sec.gov. The Trust’s Forms N-Q may also be reviewed and copied at the SEC’s Public Reference Room in Washington, DC, and information on the operation of the Public Reference Room may be obtained by calling 1-800-SEC-0330.
18
MARSHFIELD CONCENTRATED OPPORTUNITIES FUND
DISCLOSURE REGARDING APPROVAL OF
INVESTMENT ADVISORY AGREEMENT (Unaudited) |
The Board, including the Independent Trustees voting separately, has reviewed and approved the Fund’s Advisory Agreement with the Adviser for an initial two-year term. Approval of the Advisory Agreement took place at an in-person meeting held on October 19 and 20, 2015, at which all of the Trustees were present.
In the course of their deliberations, the Board was advised by legal counsel. The Board received and reviewed information provided by the Adviser in response to requests of the Board and counsel.
In considering the Advisory Agreement and reaching their conclusions with respect thereto, the Board reviewed and analyzed various factors that they determined were relevant, including the factors described below.
The nature, extent, and quality of the services to be provided by the Adviser. In this regard, the Board considered the responsibilities the Adviser would have under the Advisory Agreement. The Board also considered the anticipated services that the Adviser would provide to the Fund including, without limitation, the Adviser’s procedures for formulating investment recommendations and assuring compliance with the Fund’s investment objective and limitations, proposed initial marketing and distribution efforts, and compliance procedures and practices. After reviewing the foregoing and further information provided by the Adviser to the Board (e.g., descriptions of the Adviser’s business, compliance program, and Form ADV), the Board concluded that the quality, extent, and nature of the services to be provided by the Adviser to the Fund were satisfactory and adequate.
The investment management capabilities and experience of the Adviser. In this regard, the Board considered the investment management experience of the portfolio managers. The Board considered it’s discussion with the Adviser’s representatives the investment objective and strategies for the Fund and the Adviser’s experience and plans for implementing such strategies. In particular, the Board received information from the Adviser regarding the experience of the Fund’s portfolio managers in managing substantially similar strategies. After consideration of these factors, as well as other factors, the Board determined that the Adviser has the requisite capabilities and experience to serve as investment adviser for the Fund.
The costs of the services to be provided and profits to be realized by the Adviser and its affiliates from the relationship with the Fund. In this regard, the Board considered the Adviser’s methods of operation; the education and experience of its personnel; its compliance program, policies, and procedures; its financial condition and the level of commitment to the Fund; the projected asset levels of the Fund; and the overall expenses of the Fund, including the advisory fee. The Board reviewed the ELA, and noted the benefit to the Fund from the Adviser’s commitment to reduce its advisory fee or reimburse other operating expenses until December 31, 2018. The Board considered the Adviser’s financial condition and its ability to satisfy its financial commitments to the Fund. The Board also considered potential benefits
19
MARSHFIELD CONCENTRATED OPPORTUNITIES FUND
DISCLOSURE REGARDING APPROVAL OF
INVESTMENT ADVISORY AGREEMENT (Unaudited) (Continued) |
to the Adviser in managing the Fund, including promotion of the Adviser’s name. The Board compared the Fund’s proposed advisory fee and overall expense ratio to other comparable funds (in terms of the type of fund, the style of investment management, the projected size of the Fund, and the nature of the investment strategy) and the fees charged by the Adviser to its other managed accounts. The Board noted that, while the Fund’s advisory fee (1.00%) is above the peer group’s average and average of the larger Morningstar Large Cap Value Category, the fee is equal to the peer group’s median and less than the maximum fee in the Morningstar Large Cap Value Category. The Board further noted that the proposed overall annual net expense ratio (1.25%) is above the average and median expense ratios of the peer group and the Morningstar Large Cap Value Category; the Fund would have the highest expense ratio in the peer group but its expense ratio would be less than the twenty-fifth percentile of the Morningstar Large Cap Value Category. The Board also considered the investment style and strategy of the Fund versus the funds in its peer group. Upon further consideration of the foregoing, the Board concluded that the proposed advisory fee and total expense limit for the Fund are fair and reasonable.
The extent to which the Fund and its investors would benefit from economies of scale. In this regard, the Board considered the Advisory Agreement and the ELA. The Board determined that although the proposed advisory fee did not have breakpoints and would stay the same as the Fund’s asset level increased, the shareholders of the Fund would benefit from the ELA until the Fund’s assets grew to a level where its expenses otherwise fall below the expense limit. Following further consideration of the Fund’s projected asset levels, expectations for growth, and level of fees, the Board determined that the Fund’s fee arrangements with the Adviser would provide benefits in the near term, and the Board can review the arrangements going forward as necessary. The Board concluded the Fund’s arrangements with the Adviser were fair and reasonable in relation to the nature and quality of services to be provided by the Adviser and would benefit the Fund and its shareholders.
Brokerage and portfolio transactions. The Board considered the Adviser’s policies and procedures as it relates to seeking best execution for its clients. The Board also considered the anticipated portfolio turnover rate for the Fund; the method and basis for selecting and evaluating broker-dealers; any anticipated allocation of portfolio business to persons affiliated with the Adviser; and the extent to which the Fund’s trades may be allocated to soft-dollar arrangements. The Board determined that the Adviser’s practices regarding brokerage and portfolio transactions were satisfactory.
Possible conflicts of interest. In evaluating the possibility for conflicts of interest, the Board considered such matters as the Adviser’s process for allocating trades among its different clients, including other clients with similar types of investment objectives and strategies as the Fund. The Board also considered the substance
20
MARSHFIELD CONCENTRATED OPPORTUNITIES FUND
DISCLOSURE REGARDING APPROVAL OF
INVESTMENT ADVISORY AGREEMENT (Unaudited) (Continued) |
and administration of the Adviser’s Code of Ethics. Following its consideration of the factors, the Board determined that the Adviser’s standards and practices relating to the identification and mitigation of potential conflicts of interests were satisfactory.
Conclusion
After consideration of the above factors and in reliance on the information provided by the Adviser and Trust Management, the Board unanimously concluded that approval of the Advisory Agreement was in the best interests of the Fund and its shareholders.
21

Topturn OneEighty Fund
Semi-Annual Report
February 29, 2016
(Unaudited)
Topturn OneEighty Fund
LETTER TO SHAREHOLDERS | March 21, 2016 |
Dear Fellow Shareholders:
Since its launch on September 1, 2015 through February 29, 2016 the Topturn OneEighty Fund (TTFOX, the “Fund”) delivered a cumulative return of +1.03% versus cumulative benchmark returns of +2.09% for the S&P 500 Index and -1.8% for the Morningstar Diversified Alternatives Total Return Index. In general, a trend-following strategy, like that employed by the Fund, may be slow to adjust to new patterns during periods of significant volatility. While this factor caused the Fund to trail the S&P 500 during the reporting period, the same set of circumstances benefited the Fund when compared to the range of strategies comprising the Morningstar Diversified Alternatives Total Return Index.
For the six months ended February 29, 2016, increased fears over plummeting oil prices, widening credit spreads, negative interest rates, weakening economic data, and valuation concerns led to a significant increase in volatility accompanied by a pullback in most capital markets as investors sought more “safe haven” type assets.
Although the Fund was impacted due to exposure to risk assets that were positively correlated to equity markets, as the pullback progressed, the Fund’s investment model signaled several exposure changes, with allocation to risk assets being reduced, and exposure to safe-haven assets being increased. These adjustments helped to shield against downside during the six- month reporting period.
What is our outlook? We believe that we are in a period where buy-and-hold returns from traditional asset classes offer unattractive long-term value. The recent volatility in equity & fixed income markets has not alleviated the valuation headwinds that we have alluded to in prior communications.
Compounding the valuation problem is uncertainty over the current macroeconomic environment. While we believe recession risks in the U.S. remain low, recent data has continued to weaken. The fears are not so much that the U.S. economy is currently contracting (outside of the energy sector) but rather that China, commodities and the global financial system could ultimately infect the U.S. Meanwhile, here in the U.S., industrial production is falling, inventory/sales ratios are near 7-year highs, retail sales are declining, leading indicators are falling, and labor demand is weakening. In addition, there is increasing uncertainty surrounding this year’s U.S. presidential election and the corresponding effect this will have on taxes, policy, and the business environment. These issues would appear to have the potential to keep pressure on the markets, with higher than average volatility during the course of 2016.
If our premise is correct, investors will need to identify strategies that offer sources of return that are not highly correlated to traditional asset classes. The goal of the Topturn OneEighty Fund is to offer this type of return by tactically allocating assets among non-correlating asset classes as trends are identified.
Thank you for your continued trust and interest in Topturn OneEighty Fund.
Sincerely,
Greg Stewart
Chief Investment Officer / Portfolio Manager
1
Past performance is not predictive of future performance. Investment results and principal value will fluctuate so that shares, when redeemed, may be worth more or less than their original cost. Current performance may be higher or lower than the performance data quoted. Performance data current to the most recent month-end are available by calling 1-888-261-2884.
An investor should consider the investment objectives, risks, charges and expenses of the Fund carefully before investing. The Fund’s prospectus contains this and other important information. To obtain a copy of the Fund’s prospectus please visit our website at www.topturnfunds.com or call 1-888-261-2884 and a copy will be sent to you free of charge. Please read the prospectus carefully before you invest. The Fund is distributed by Ultimus Fund Distributors, LLC.
The Letter to Shareholders seeks to describe some of the Adviser’s current opinions and views of the financial markets. Although the Adviser believes it has a reasonable basis for any opinions or views expressed, actual results may differ, sometimes significantly so, from those expected or expressed. The securities held by the Fund that are discussed in the Letter to Shareholders were held during the period covered by this Report. They do not comprise the entire investment portfolio of the Fund, may be sold at any time, and may no longer be held by the Fund. For a complete listing of the securities held in the Fund as of February 29, 2016, please see the Schedule of Investments section of the annual report. The opinions of the Fund’s adviser with respect to those securities may change at any time.
Statements in the Letter to Shareholders that reflect projections or expectations for future financial or economic performance of the Fund and the market in general and statements of the Fund’s plans and objectives for future operations are forward-looking statements. No assurance can be given that actual results or events will not differ materially from those projected, estimated, assumed, or anticipated in any such forward-looking statements. Important factors that could result in such differences, in addition to factors noted with such forward-looking statements, include, without limitation, general economic conditions, such as inflation, recession, and interest rates. Past performance is not a guarantee of future results.
2
Topturn OneEighty Fund
PORTFOLIO INFORMATION
February 29, 2016 (Unaudited)
Sector Diversification (% of Net Assets)
Top 10 Holdings
Security Description | % of Net Assets |
SPDR® S&P 500® ETF Trust | 26.0% |
iShares® 7-10 Year Treasury Bond ETF | 22.1% |
iShares® 20+ Year Treasury Bond ETF | 5.9% |
Vanguard Total International Bond ETF | 5.7% |
SPDR® S&P® Dividend ETF | 4.7% |
iShares® U.S. Telecommunications ETF | 4.0% |
Consumer Staples Select Sector SPDR® Fund | 3.9% |
Utilities Select Sector SPDR® Fund | 3.8% |
iShares® J.P. Morgan USD Emerging Markets Bond ETF | 3.6% |
iShares® MSCI USA Minimum Volatility ETF | 3.6% |
3
Topturn OneEighty Fund
SCHEDULE OF INVESTMENTS
February 29, 2016 (Unaudited) |
U.S.TREASURY OBLIGATIONS — 3.5% | | Par Value | | | Value | |
U.S. Treasury Bills (a) — 3.5% | | | | | | |
0.068%, due 03/31/16 | | $ | 250,000 | | | $ | 249,948 | |
0.333%, due 06/30/16 | | | 250,000 | | | | 249,718 | |
Total U.S. Treasury Obligations (Cost $499,706) | | | | | | $ | 499,666 | |
|
EXCHANGE-TRADED FUNDS — 95.1% | | Shares | | | Value | |
Commodities & Currencies — 4.5% | | | | | | |
CurrencyShares Japanese Yen Trust (b) | | | 2,540 | | | $ | 218,135 | |
iShares® Gold Trust (b) | | | 36,500 | | | | 437,635 | |
| | | | | | | | 655,770 | |
International Equities — 1.8% | | | | | | | | |
iShares® MSCI Emerging Markets ETF | | | 8,400 | | | | 254,604 | |
| | | | | | | | | |
International Fixed Income — 9.3% | | | | | | | | |
iShares® J.P. Morgan USD Emerging Markets Bond ETF | | | 4,860 | | | | 521,867 | |
Vanguard Total International Bond ETF | | | 15,070 | | | | 816,643 | |
| | | | | | | | 1,338,510 | |
U.S. Fixed Income — 29.6% | | | | | | | | |
iShares® 7-10 Year Treasury Bond ETF | | | 28,840 | | | | 3,188,551 | |
iShares® 20+ Year Treasury Bond ETF | | | 6,530 | | | | 855,299 | |
iShares® iBoxx® $ Investment Grade Corporate Bond ETF | | | 1,960 | | | | 225,420 | |
| | | | | | | | 4,269,270 | |
U.S. Large Cap Equities — 48.8% | | | | | | | | |
Consumer Staples Select Sector SPDR® Fund | | | 10,930 | | | | 556,555 | |
iShares® MSCI USA Minimum Volatility ETF | | | 12,440 | | | | 518,375 | |
iShares® U.S. Telecommunications ETF | | | 19,730 | | | | 583,811 | |
PowerShares QQQ TrustSM, Series 1 | | | 3,870 | | | | 396,675 | |
SPDR® S&P 500® ETF Trust | | | 19,400 | | | | 3,755,064 | |
SPDR® S&P® Dividend ETF | | | 9,190 | | | | 683,920 | |
Utilities Select Sector SPDR® Fund | | | 11,720 | | | | 542,636 | |
| | | | | | | | 7,037,036 | |
U.S. Small Cap Equities — 1.1% | | | | | | | | |
iShares® Core S&P Small-Cap ETF | | | 1,570 | | | | 164,002 | |
| | | | | | | | | |
Total Exchange-Traded Funds (Cost $13,748,073) | | | | | | $ | 13,719,192 | |
4
Topturn OneEighty Fund
SCHEDULE OF INVESTMENTS (Continued) |
MONEY MARKET FUNDS — 1.4% | | Shares | | | Value | |
Fidelity Institutional Money Market Government Portfolio - Class I, 0.21% (c) (Cost $202,173) | | | 202,173 | | | $ | 202,173 | |
| | | | | | | | | |
Total Investments at Value — 100.0% (Cost $14,449,952) | | | | | | $ | 14,421,031 | |
| | | | | | | | | |
Other Assets in Excess of Liabilities — 0.0%(d) | | | | | | | 4,154 | |
| | | | | | | | | |
Net Assets — 100.0% | | | | | | $ | 14,425,185 | |
(a) | The rate shown is the annualized yield at time of purchase, not a coupon rate. |
(b) | Non-income producing security. |
(c) | The rate shown is the 7-day effective yield as of February 29, 2016. |
(d) | Percentage rounds to less than 0.1%. |
See accompanying notes to financial statements. |
5
Topturn OneEighty Fund
STATEMENT OF ASSETS AND LIABILITIES
February 29, 2016 (Unaudited) |
ASSETS | | | |
Investments in securities: | | | |
At acquisition cost | | $ | 14,449,952 | |
At value (Note 2) | | $ | 14,421,031 | |
Dividends receivable | | | 92 | |
Receivable for investment securities sold | | | 1,133,175 | |
Other assets | | | 1,508 | |
Total assets | | | 15,555,806 | |
| | | | | |
LIABILITIES | | | | |
Payable for investment securities purchased | | | 1,110,109 | |
Payable to Adviser (Note 4) | | | 9,933 | |
Payable to administrator (Note 4) | | | 6,110 | |
Other accrued expenses | | | 4,469 | |
Total liabilities | | | 1,130,621 | |
| | | | | |
NET ASSETS | | $ | 14,425,185 | |
| | | | | |
NET ASSETS CONSIST OF: | | | | |
Paid-in capital | | $ | 14,753,601 | |
Distributions in excess of net investment income | | | (29,826 | ) |
Accumulated net realized losses from security transactions | | | (269,669 | ) |
Net unrealized depreciation on investments | | | (28,921 | ) |
NET ASSETS | | $ | 14,425,185 | |
| | | | | |
Shares of beneficial interest outstanding (unlimited number of shares authorized, no par value) | | | 1,432,202 | |
| | | | | |
Net asset value, offering price and redemption price per share (Note 2) | | $ | 10.07 | |
See accompanying notes to financial statements. |
6
Topturn OneEighty Fund
STATEMENT OF OPERATIONS
For the Period Ended February 29, 2016 (a) (Unaudited) |
INVESTMENT INCOME | | | |
Dividend income | | $ | 78,299 | |
Interest | | | 153 | |
Total investment income | | | 78,452 | |
| | | | | |
EXPENSES | | | | |
Investment advisory fees (Note 4) | | | 47,668 | |
Fund accounting fees (Note 4) | | | 12,384 | |
Administration fees (Note 4) | | | 12,000 | |
Professional fees | | | 10,033 | |
Compliance fees (Note 4) | | | 6,000 | |
Transfer agent fees (Note 4) | | | 6,000 | |
Trustees' fees and expenses (Note 4) | | | 5,181 | |
Registration and filing fees | | | 4,774 | |
Custody and bank service fees | | | 3,826 | |
Postage and supplies | | | 2,542 | |
Printing of shareholder reports | | | 1,110 | |
Other expenses | | | 2,805 | |
Total expenses | | | 114,323 | |
Less fee reductions by the Adviser (Note 4) | | | (47,588 | ) |
Net expenses | | | 66,735 | |
| | | | | |
NET INVESTMENT INCOME | | | 11,717 | |
| | | | | |
REALIZED AND UNREALIZED GAINS (LOSSES) ON INVESTMENTS | | | | |
Net realized losses from security transactions | | | (283,449 | ) |
Capital gain distributions from regulated investment companies | | | 17,141 | |
Net change in unrealized appreciation (depreciation) on investments | | | (28,921 | ) |
NET REALIZED AND UNREALIZED LOSSES ON INVESTMENTS | | | (295,229 | ) |
| | | | | |
NET DECREASE IN NET ASSETS RESULTING FROM OPERATIONS | | $ | (283,512 | ) |
(a) | Represents the period from the commencement of operations (September 1, 2015) through February 29, 2016. |
See accompanying notes to financial statements. |
7
Topturn OneEighty Fund
STATEMENT OF CHANGES IN NET ASSETS |
| | Period
Ended
February 29,
2016 (a)
(Unaudited) | |
FROM OPERATIONS | | | |
Net investment income | | $ | 11,717 | |
Net realized losses from security transactions | | | (283,449 | ) |
Capital gain distributions from regulated investment companies | | | 17,141 | |
Net change in unrealized appreciation (depreciation) on investments | | | (28,921 | ) |
Net decrease in net assets resulting from operations | | | (283,512 | ) |
| | | | | |
DISTRIBUTIONS TO SHAREHOLDERS | | | | |
From net investment income | | | (41,543 | ) |
From net realized gains on investments | | | (3,361 | ) |
Decrease in net assets from distributions to shareholders | | | (44,904 | ) |
| | | | | |
CAPITAL SHARE TRANSACTIONS | | | | |
Proceeds from shares sold | | | 14,891,797 | |
Net asset value of shares issued in reinvestment of distributions to shareholders | | | 44,904 | |
Payments for shares redeemed | | | (183,100 | ) |
Net increase in net assets from capital share transactions | | | 14,753,601 | |
| | | | | |
TOTAL INCREASE IN NET ASSETS | | | 14,425,185 | |
| | | | | |
NET ASSETS | | | | |
Beginning of period | | | — | |
End of period | | $ | 14,425,185 | |
| | | | | |
DISTRIBUTIONS IN EXCESS OF NET INVESTMENT INCOME | | $ | (29,826 | ) |
| | | | | |
CAPITAL SHARE ACTIVITY | | | | |
Shares sold | | | 1,446,444 | |
Shares reinvested | | | 4,419 | |
Shares redeemed | | | (18,661 | ) |
Net increase in shares outstanding | | | 1,432,202 | |
Shares outstanding at beginning of period | | | — | |
Shares outstanding at end of period | | | 1,432,202 | |
(a) | Represents the period from the commencement of operations (September 1, 2015) through February 29, 2016. |
See accompanying notes to financial statements. |
8
Topturn OneEighty Fund
FINANCIAL HIGHLIGHTS |
Per Share Data for a Share Outstanding Throughout the Period |
| | Period
Ended
February 29,
2016 (a)
(Unaudited) | |
Net asset value at beginning of period | | $ | 10.00 | |
| | | | | |
Income from investment operations: | | | | |
Net investment income | | | 0.01 | |
Net realized and unrealized gains on investments | | | 0.09 | (b) |
Total from investment operations | | | 0.10 | |
| | | | | |
Less distributions: | | | | |
From net investment income | | | (0.03 | ) |
From net realized gains on investments | | | (0.00 | )(c) |
Total distributions | | | (0.03 | ) |
| | | | | |
Net asset value at end of period | | $ | 10.07 | |
| | | | | |
Total return (d) | | | 1.03 | %(e) |
| | | | | |
Net assets at end of period (000's) | | $ | 14,425 | |
| | | | | |
Ratios/supplementary data: | | | | |
Ratio of total expenses to average net assets | | | 3.00 | %(f) |
| | | | | |
Ratio of net expenses to average net assets (g) | | | 1.75 | %(f) |
| | | | | |
Ratio of net investment income to average net assets (g) | | | 0.31 | %(f) |
| | | | | |
Portfolio turnover rate | | | 83 | %(e) |
(a) | Represents the period from the commencement of operations (September 1, 2016) through February 29, 2016. |
(b) | Realized and unrealized gains per share are based on average shares outstanding during the period. |
(c) | Amount rounds to less than $0.01 per share. |
(d) | Total return is a measure of the change in value of an investment in the Fund over the period covered. The return shown does not reflect the deduction of taxes a shareholder would pay on Fund distributions, if any, or the redemption of Fund shares. The total return would be lower if the Adviser had not reduced advisory fees. |
(e) | Not annualized. |
(f) | Annualized. |
(g) | Ratio was determined after advisory fee reductions (Note 4). |
See accompanying notes to financial statements. |
9
Topturn OneEighty Fund
NOTES TO FINANCIAL STATEMENTS
February 29, 2016 (Unaudited)
1. Organization
Topturn OneEighty Fund (the “Fund”) is a diversified series of Ultimus Managers Trust (the “Trust”), an open-end investment company established as an Ohio business trust under a Declaration of Trust dated February 28, 2012. Other series of the Trust are not incorporated in this report. The Fund commenced operations on September 1, 2015.
The investment objective of the Fund is long-term capital appreciation.
2. Significant Accounting Policies
The following is a summary of the Fund’s significant accounting policies used in the preparation of its financial statements. These policies are in conformity with accounting principles generally accepted in the United States of America (“GAAP”). As an investment company, as defined in Financial Accounting Standards Board (“FASB”) Accounting Standards Update 2013-08, the Fund follows accounting and reporting guidance under FASB Accounting Standards Codification Topic 946, “Financial Services – Investment Companies.”
Securities valuation – The Fund values its portfolio securities at market value as of the close of regular trading on the New York Stock Exchange (the “NYSE”) (normally 4:00 p.m. Eastern time) on each business day the NYSE is open for business. Exchange-traded funds (“ETFs”) are valued at the security’s last sale price on the primary exchange, if available, otherwise at the exchange’s most recently quoted bid price. In the event that market quotations are not readily available or are considered unreliable due to market or other events, the Fund values its securities and other assets at fair value in accordance with procedures established by and under the general supervision of the Board of Trustees (the “Board”) of the Trust. Under these procedures, the securities will be classified as Level 2 or 3 within the fair value hierarchy (see below), depending on the inputs used. Unavailable or unreliable market quotes may be due to the following factors: a substantial bid-ask spread; infrequent sales resulting in stale prices; insufficient trading volume; small trade sizes; a temporary lapse in any reliable pricing source; and actions of the securities or futures markets, such as the suspension or limitation of trading. As a result, the prices of securities used to calculate the Fund’s net asset value (“NAV”) may differ from quoted or published prices for the same securities.
Fixed income securities are generally valued using prices provided by an independent pricing service approved by the Board. The independent pricing service will employ methodologies that they believe are appropriate, including actual market transactions, broker-dealer supplied valuations, matrix pricing, or other electronic data processing techniques. These techniques generally consider such factors as security prices, yields, maturities, call features, ratings, and developments relating to specific securities in arriving at valuations.
GAAP establishes a single authoritative definition of fair value, sets out a framework for measuring fair value, and requires additional disclosures about fair value measurements.
10
Topturn OneEighty Fund
NOTES TO FINANCIAL STATEMENTS (Continued) |
Various inputs are used in determining the value of the Fund’s investments. These inputs are summarized in the three broad levels listed below:
● | Level 1 – quoted prices in active markets for identical securities |
● | Level 2 – other significant observable inputs |
● | Level 3 – significant unobservable inputs |
The inputs or methods used for valuing securities are not necessarily an indication of the risks associated with investing in those securities. The inputs used to measure fair value may fall into different levels of the fair value hierarchy. In such cases, for disclosure purposes, the level in the fair value hierarchy within which the fair value measurement falls in its entirety is determined based on the lowest level input that is significant to the fair value measurement.
The following is a summary of the inputs used to value the Fund’s investments as of February 29, 2016:
| | Level 1 | | | Level 2 | | | Level 3 | | | Total | |
U.S. Treasury Obligations | | $ | — | | | $ | 499,666 | | | $ | — | | | $ | 499,666 | |
Exchange-Traded Funds | | | 13,719,192 | | | | — | | | | — | | | | 13,719,192 | |
Money Market Funds | | | 202,173 | | | | — | | | | — | | | | 202,173 | |
Total | | $ | 13,921,365 | | | $ | 499,666 | | | $ | — | | | $ | 14,421,031 | |
As of February 29, 2016, the Fund did not have any transfers between Levels. In addition, the Fund did not have derivative instruments or any assets or liabilities that were measured at fair value on a recurring basis using significant unobservable inputs (Level 3) as of February 29, 2016. It is the Fund’s policy to recognize transfers between Levels at the end of the reporting period.
Share valuation – The NAV per share of the Fund is calculated daily by dividing the total value of the Fund’s assets, less liabilities, by the number of shares outstanding. The offering price and redemption price per share of the Fund is equal to the NAV per share.
Investment income – Dividend income is recorded on the ex-dividend date. Interest income is accrued as earned.
Security transactions – Security transactions are accounted for on the trade date. Gains and losses on securities sold are determined on a specific identification basis.
Common expenses – Common expenses of the Trust are allocated among the Fund and the other series of the Trust based on the relative net assets of each series or the nature of the services performed and the relative applicability to each series.
Distributions to shareholders – The Fund will distribute to shareholders any net investment income dividends and net realized capital gains distributions at least once each year. The amount of such dividends and distributions are determined in accordance with federal
11
Topturn OneEighty Fund
NOTES TO FINANCIAL STATEMENTS (Continued) |
income tax regulations, which may differ from GAAP. Dividends and distributions to shareholders are recorded on the ex-dividend date. During the period ended February 29, 2016, the tax character of distributions paid to shareholders was ordinary income.
Estimates – The preparation of financial statements in conformity with GAAP requires management to make estimates and assumptions that affect the reported amounts of assets and liabilities and disclosure of contingent assets and liabilities as of the date of the financial statements and the reported amounts of income and expenses during the reporting period. Actual results could differ from those estimates.
Federal income tax – The Fund intends to qualify as a regulated investment company under the Internal Revenue Code of 1986 (the “Code”). Qualification generally will relieve the Fund of liability for federal income taxes to the extent 100% of its net investment income and net realized capital gains are distributed in accordance with the Code. Accordingly, no provision for income tax has been made.
In order to avoid imposition of the excise tax applicable to regulated investment companies, it is also the Fund’s intention to declare as dividends in each calendar year at least 98% of its net investment income (earned during the calendar year) and 98.2% of its net realized capital gains (earned during the 12 months ended October 31) plus undistributed amounts from prior years.
The following information is computed on a tax basis for each item as of February 29, 2016:
Tax cost of portfolio investments | | $ | 14,519,703 | |
Gross unrealized appreciation | | $ | 268,887 | |
Gross unrealized depreciation | | | (367,559 | ) |
Net unrealized depreciation on investments | | | (98,672 | ) |
Late-year ordinary loss | | | (29,826 | ) |
Other losses | | | (199,918 | ) |
Accumulated deficit | | $ | (328,416 | ) |
The difference between the federal income tax cost of portfolio investments and the financial statement cost of portfolio investments is due to certain timing differences in the recognition of capital gains or losses under income tax regulations and GAAP. These “book/tax” differences are temporary in nature and are primarily due to the tax deferral of losses on wash sales.
The Fund recognizes the tax benefits or expenses of uncertain tax positions only when the position is “more likely than not” to be sustained assuming examination by tax authorities. Management has reviewed the Fund’s tax positions for the current tax period and has concluded that no provision for unrecognized tax benefits or expenses is required in these financial statements. The Fund identifies its major tax jurisdiction as U.S. Federal.
12
Topturn OneEighty Fund
NOTES TO FINANCIAL STATEMENTS (Continued) |
3. Investment Transactions
During the period ended February 29, 2016, cost of purchases and proceeds from sales of investment securities, other than short-term investments, were $21,568,454 and $7,536,932, respectively.
4. Transactions with Related Parties
INVESTMENT ADVISORY AGREEMENT
The Fund’s investments are managed by Topturn Fund Advisors, LLC (the “Adviser”) pursuant to the terms of an Investment Advisory Agreement. Under the Investment Advisory Agreement, the Fund pays the Adviser an advisory fee, computed and accrued daily and paid monthly, at the annual rate of 1.25% of its average daily net assets.
Pursuant to an Expense Limitation Agreement (“ELA”), the Adviser has contractually agreed, until August 31, 2018, to reduce investment advisory fees and reimburse other expenses to the extent necessary to limit Total Annual Fund Operating Expenses (exclusive of brokerage costs; taxes; interest; acquired fund fees and expenses; costs to organize the Fund; extraordinary expenses such as litigation and merger or reorganization costs; other expenses not incurred in the ordinary course of the Funds’ business; and amounts, if any, payable pursuant to a plan adopted in accordance with Rule 12b-1 under the Investment Company Act of 1940, as amended (the “1940 Act”)) to an amount not exceeding 1.75% of the Fund’s average daily net assets. Accordingly, during the period ended February 29, 2016, the Adviser reduced its advisory fees in the amount of $47,588.
Under the terms of the ELA, investment advisory fee reductions and expense reimbursements by the Adviser are subject to repayment by the Fund for a period of three years after such fees and expenses were incurred, provided the repayments do not cause Total Annual Fund Operating Expenses to exceed (i) the expense limitation then in effect, if any and (ii) the expense limitation in effect at the time the expenses to be repaid were incurred. As of February 29, 2016, the Adviser may seek repayment of investment advisory fee reductions totaling $47,588 no later than February 28, 2019.
An officer of the Fund is also an officer of the Adviser.
OTHER SERVICE PROVIDERS
Ultimus Fund Solutions, LLC (“Ultimus”) provides fund administration, fund accounting, compliance, and transfer agency services to the Fund. The Fund pays Ultimus fees in accordance with the agreements for such services. In addition, the Fund pays out-of-pocket expenses, including, but not limited to postage, supplies and costs of pricing the Fund’s portfolio securities.
Under the terms of a Distribution Agreement with the Trust, Ultimus Fund Distributors, LLC (the “Distributor”) serves as principal underwriter to the Fund. The Distributor is a wholly-owned subsidiary of Ultimus. The Distributor is compensated by the Adviser for acting as principal underwriter.
13
Topturn OneEighty Fund
NOTES TO FINANCIAL STATEMENTS (Continued) |
Certain officers and a Trustee of the Trust are also officers of Ultimus and the Distributor and are not paid by the Fund for serving in such capacities.
TRUSTEE COMPENSATION
Each Independent Trustee receives from the Fund a fee of $500 for each Board meeting attended plus reimbursement of travel and other meeting-related expenses. Each Independent Trustee also receives a $500 annual retainer from the Fund.
PRINCIPAL HOLDER OF FUND SHARES
As of February 29, 2016, the following shareholder owned of record 5% or more of the outstanding shares of the Fund:
Name of Record Owner | % Ownership |
Charles Schwab & Company, Inc. (for the benefit of its customers) | 100% |
A beneficial owner of 25% or more of the Fund’s outstanding shares may be considered a controlling person. That shareholder’s vote could have a more significant effect on matters presented at a shareholder’s meeting.
5. Investment in Other Investment Companies
The Fund may invest a significant portion of its assets in shares of one or more investment companies (i.e., ETFs and money market mutual funds). The Fund will incur additional indirect expenses due to acquired fund fees and expenses and other costs to the extent it invests in shares of other investment companies. From time to time, the Fund may invest greater than 25% of its net assets in one or more investment companies. As of February 29, 2016, the SPDR® S&P 500® ETF Trust represented 26.0% of the Fund’s net assets. Additional information for this security, including its financial statements, is available from the Securities and Exchange Commission’s website at www.sec.gov. ETFs issue their shares to authorized participants in return for a specific basket of securities. The authorized participants then sell the ETF’s shares on the secondary market. In other words, ETF shares are traded on a securities exchange based on their market value. There are certain risks associated with investments in ETFs. Investments in ETFs are subject to the risk that the ETF’s shares may trade at a premium (creating the risk that the Fund pays more than NAV for an ETF when making a purchase) or discount (creating the risk that the Fund receives less than NAV when selling an ETF) to the ETF’s NAV. Investments in ETFs are also subject to index-tracking risk because the total return generated by the securities will be reduced by transaction costs and expenses not incurred by the indices. Certain securities comprising the index tracked by an ETF may temporarily be unavailable, which may further impede the ETF’s ability to track their applicable index or match the index’s performance. Finally, ETF shares are also subject to the risks applicable to the underlying basket of securities. As of February 29, 2016, the Fund had 95.1% of the value of its net assets invested in ETFs.
14
Topturn OneEighty Fund
NOTES TO FINANCIAL STATEMENTS (Continued) |
6. Contingencies and Commitments
The Fund indemnifies the Trust’s officers and Trustees for certain liabilities that might arise from their performance of their duties to the Fund. Additionally, in the normal course of business the Fund enters into contracts that contain a variety of representations and warranties and which provide general indemnifications. The Fund’s maximum exposure under these arrangements is unknown, as this would involve future claims that may be made against the Fund that have not yet occurred. However, based on experience, the Fund expects the risk of loss to be remote.
7. Subsequent Events
The Fund is required to recognize in the financial statements the effects of all subsequent events that provide additional evidence about conditions that existed as of the date of the Statement of Assets and Liabilities. For non-recognized subsequent events that must be disclosed to keep the financial statements from being misleading, the Fund is required to disclose the nature of the event as well as an estimate of its financial effect, or a statement that such an estimate cannot be made. Management has evaluated subsequent events through the issuance of these financial statements and has noted no such events.
15
Topturn OneEighty Fund
ABOUT YOUR FUND’S EXPENSES (Unaudited) |
We believe it is important for you to understand the impact of costs on your investment. As a shareholder of the Fund, you incur ongoing costs, including management fees and other operating expenses. The following examples are intended to help you understand your ongoing costs (in dollars) of investing in the Fund and to compare these costs with the ongoing costs of investing in other mutual funds.
A mutual fund’s ongoing costs are expressed as a percentage of its average net assets. This figure is known as the expense ratio. The expenses in the table below are based on an investment of $1,000 made at the beginning of the most recent period (September 1, 2015) and held until the end of the period (February 29, 2016).
The table below illustrates the Fund’s ongoing costs in two ways:
Actual fund return – This section helps you to estimate the actual expenses that you paid over the period. The “Ending Account Value” shown is derived from the Fund’s actual return, and the fourth column shows the dollar amount of operating expenses that would have been paid by an investor who started with $1,000 in the Fund. You may use the information here, together with the amount you invested, to estimate the expenses that you paid over the period.
To do so, simply divide your account value by $1,000 (for example, an $8,600 account value divided by $1,000 = 8.6), then multiply the result by the number given for the Fund under the heading “Expenses Paid During Period.”
Hypothetical 5% return – This section is intended to help you compare the Fund’s ongoing costs with those of other mutual funds. It assumes that the Fund had an annual return of 5% before expenses during the period shown, but that the expense ratio is unchanged. In this case, because the return used is not the Fund’s actual return, the results do not apply to your investment. The example is useful in making comparisons because the U.S. Securities and Exchange Comission (“SEC”) requires all mutual funds to calculate expenses based on a 5% return. You can assess the Fund’s ongoing costs by comparing this hypothetical example with the hypothetical examples that appear in shareholder reports of other funds.
Note that expenses shown in the table are meant to highlight and help you compare ongoing costs only. The Fund does not charge transaction fees, such as purchase or redemption fees, nor does it carry a “sales load.”
The calculations assume no shares were bought or sold during the period. Your actual costs may have been higher or lower, depending on the amount of your investment and the timing of any purchases or redemptions.
More information about the Fund’s expenses can be found in this report. For additional information on operating expenses and other shareholder costs, please refer to the Fund’s prospectus.
16
Topturn OneEighty Fund
ABOUT YOUR FUND’S EXPENSES (Unaudited) (Continued) |
| Beginning Account Value September 1, 2015 | Ending
Account Value February 29, 2016 | Net Expense Ratio (a) | Expenses Paid During Period (b) |
Based on Actual Fund Return | $1,000.00 | $1,010.30 | 1.75% | $8.75 |
Based on Hypothetical 5% Return (before expenses) | $1,000.00 | $1,016.16 | 1.75% | $8.77 |
(a) | Annualized, based on the Fund’s net expenses for the period since inception. |
(b) | Expenses are equal to the Fund’s annualized expense ratio multiplied by the average account value over the period, multiplied by 182/366 (to reflect the one-half year period). |
OTHER INFORMATION (Unaudited)
A description of the policies and procedures that the Fund uses to vote proxies relating to portfolio securities is available without charge upon request by calling toll-free 1-888-261-2884, or on the SEC’s website at http://www.sec.gov. Information regarding how the Fund voted proxies relating to portfolio securities during the period ending June 30, 2016, will be available without charge upon request on or before August 31, 2016 by calling toll-free 1-888-261-2884, or on the SEC’s website at http://www.sec.gov.
The Trust files a complete listing of portfolio holdings for the Fund with the SEC as of the end of the first and third quarters of each fiscal year on Form N-Q. These filings are available upon request by calling 1-888-261-2884. Furthermore, you may obtain a copy of the filings on the SEC’s website at http://www.sec.gov. The Trust’s Forms N-Q may also be reviewed and copied at the SEC’s Public Reference Room in Washington, DC, and information on the operation of the Public Reference Room may be obtained by calling 1-800-SEC-0330.
17
TopturnFund
DISCLOSURE REGARDING APPROVAL OF INVESTMENT ADVISORY AGREEMENT (Unaudited) |
The Board including the Independent Trustees voting separately, reviewed and approved the Fund’s Investment Advisory Agreement (the “Topturn Agreement”) with the Adviser for an initial two-year term. The Board approved the Topturn Agreement at an in-person meeting held on July 20 and 21, 2015, at which all of the Trustees were present.
In the course of their deliberations, the Board was advised by legal counsel. The Board received and reviewed a substantial amount of information provided by the Adviser in response to requests of the Board and counsel.
In considering the Topturn Agreement and reaching its conclusions with respect thereto, the Board reviewed and analyzed various factors that it determined were relevant, including the factors described below.
The nature, extent, and quality of services to be provided by the Adviser. In this regard, the Board considered the Adviser’s responsibilities and services under the Topturn Agreement, including, without limitation, the Adviser’s procedures for formulating investment recommendations and assuring compliance with the Fund’s investment objective and limitations, proposed initial marketing and distribution efforts, and compliance procedures and practices. After reviewing the foregoing and further information regarding the Adviser’s services, the Board concluded that the quality, extent, and nature of the services to be provided by the Adviser are satisfactory and adequate for the Fund.
The Adviser’s investment management capabilities and experience. In this regard, the Board considered the investment management experience of the Adviser, including the Adviser’s experience and plans for implementing the Fund’s investment objective and strategies. The Board also considered the Adviser’s experience in managing similar types of strategies and its plans for implementing such strategies. In particular, the Board reviewed the Adviser’s prior experience and performance with other accounts that had similar investment objectives and strategies. After consideration of these factors, as well as other factors, the Board determined that the Adviser has the requisite experience to serve as investment adviser for the Fund.
The costs of the services to be provided and profits to be realized by the Adviser and its affiliates from the relationship with the Fund. In this regard, the Board considered the Adviser’s staffing, personnel, and methods of operation; the education and experience of its key personnel; its compliance program, policies, and procedures; its financial condition; the projected asset levels of the Fund; and the overall expenses of the Fund, including its advisory fee. The Board reviewed the ELA, and noted the benefits that would result to the Fund from the Adviser’s commitment to reduce its advisory fee or reimburse other operating expenses until August 31, 2018. The Board discussed the Adviser’s financial condition and its ability to satisfy its financial commitments to the Fund. The Board also considered potential benefits for the Adviser in managing the Fund, including promotion of the Adviser’s name. The Board compared the Fund’s proposed advisory fee and overall expense ratio to other comparable funds (in terms of the type of fund, the style of investment management, the projected size of the Fund, and the nature of the investment strategy) and the fees charged by the Adviser to its other managed accounts. The Board noted that the Fund’s advisory
18
TopturnFund
DISCLOSURE REGARDING APPROVAL OF INVESTMENT ADVISORY AGREEMENT (Unaudited) (Continued) |
fee of 1.25% was above the average and median for the Fund’s custom peer group and the Morningstar Tactical Allocation Category. The Board further noted that the proposed overall annual expense ratio of 1.75% for the Fund is above the average expense ratio (1.42%) and median expense ratio (1.55%) of the Fund’s custom peer group, and the Fund would have the highest expense ratio in the peer group (1.61%). The Board considered that compared to the broader Morningstar Tactical Allocation category, the Fund’s average expense ratio is closer to the category’s average expense ratio (1.70%), which would place the Fund in the second quartile. The Board also considered the investment style and strategy of the Fund versus its peer groups. Upon further consideration of the foregoing, the Board concluded that the proposed advisory fee to be paid to the Adviser by the Fund is fair and reasonable.
The extent to which the Fund and its investors would benefit from economies of scale. In this regard, the Board considered the Topturn Agreement and the ELA. The Board determined that the shareholders of the Fund would benefit from the ELA until the Fund’s assets grew to a level where its expenses are below the expense limit. The Board considered the Fund’s projected asset levels, expectations for growth, and fees, and determined that the Fund’ fee arrangements with the Adviser would provide benefits for the next two years. After further discussion, the Board concluded the Fund’s arrangements with the Adviser were fair and reasonable in relation to the nature and quality of the Adviser’s services.
Brokerage and portfolio transactions. In this regard, the Board considered the Adviser’s policies and procedures as it relates to seeking best execution for its clients, including the Fund. The Board also considered the anticipated portfolio turnover rate for the Fund; the method and basis for selecting and evaluating the broker-dealers used by the Adviser; any anticipated allocation of portfolio business to persons affiliated with the Adviser; and the extent to which the Fund’s trades may be allocated to soft-dollar arrangements. After further review and discussion, the Board determined that the Adviser’s practices regarding brokerage and portfolio transactions were satisfactory.
Possible conflicts of interest. In evaluating the possibility for conflicts of interest, the Board considered such matters as the Adviser’s process for allocating trades among its different clients, including other clients with similar investment objectives and strategies as the Fund. The Board also considered the substance and administration of the Adviser’s code of ethics. Following further consideration and discussion, the Board determined that the Adviser’s standards and practices relating to the identification and mitigation of potential conflicts of interests were satisfactory.
After full consideration of the above factors as well as other factors, the Board unanimously concluded that approval of the Topturn Agreement was in the best interests of the Fund and its shareholders.
19
This page intentionally left blank.
This page intentionally left blank.
Item 2. Code of Ethics.
Not required
Item 3. Audit Committee Financial Expert.
Not required
Item 4. Principal Accountant Fees and Services.
Not required
Item 5. Audit Committee of Listed Registrants.
Not applicable
Item 6. Schedule of Investments.
| (a) | Not applicable [schedule filed with Item 1] |
Item 7. Disclosure of Proxy Voting Policies and Procedures for Closed-End Management Investment Companies.
Not applicable
Item 8. Portfolio Managers of Closed-End Management Investment Companies.
Not applicable
Item 9. Purchases of Equity Securities by Closed-End Management Investment Company and Affiliated Purchasers.
Not applicable
Item 10. Submission of Matters to a Vote of Security Holders.
The registrant’s Committee of Independent Trustees shall review shareholder recommendations for nominations to fill vacancies on the registrant’s board of trustees if such recommendations are submitted in writing and addressed to the Committee at the registrant’s offices. The Committee may adopt, by resolution, a policy regarding its procedures for considering candidates for the board of trustees, including any recommended by shareholders.
Item 11. Controls and Procedures.
(a) Based on their evaluation of the registrant’s disclosure controls and procedures (as defined in Rule 30a-3(c) under the Investment Company Act of 1940) as of a date within 90 days of the filing date of this report, the registrant’s principal executive officer and principal financial officer have concluded that such disclosure controls and procedures are reasonably designed and are operating effectively to ensure that material information relating to the registrant, including its consolidated subsidiaries, is made known to them by others within those entities, particularly during the period in which this report is being prepared, and that the information required in filings on Form N-CSR is recorded, processed, summarized, and reported on a timely basis.
(b) There were no changes in the registrant’s internal control over financial reporting (as defined in Rule 30a-3(d) under the Investment Company Act of 1940) that occurred during the second fiscal quarter of the period covered by this report that have materially affected, or are reasonably likely to materially affect, the registrant’s internal control over financial reporting.
Item 12. Exhibits.
File the exhibits listed below as part of this Form. Letter or number the exhibits in the sequence indicated.
(a)(1) Any code of ethics, or amendment thereto, that is the subject of the disclosure required by Item 2, to the extent that the registrant intends to satisfy the Item 2 requirements through filing of an exhibit: Not required
(a)(2) A separate certification for each principal executive officer and principal financial officer of the registrant as required by Rule 30a-2(a) under the Act (17 CFR 270.30a-2(a)): Attached hereto
(a)(3) Any written solicitation to purchase securities under Rule 23c-1 under the Act (17 CFR 270.23c-1) sent or given during the period covered by the report by or on behalf of the registrant to 10 or more persons: Not applicable
(b) Certifications required by Rule 30a-2(b) under the Act (17 CFR 270.30a-2(b)): Attached hereto
| Exhibit 99.CERT | Certifications required by Rule 30a-2(a) under the Act |
| Exhibit 99.906CERT | Certifications required by Rule 30a-2(b) under the Act |
SIGNATURES
Pursuant to the requirements of the Securities Exchange Act of 1934 and the Investment Company Act of 1940, the registrant has duly caused this report to be signed on its behalf by the undersigned, thereunto duly authorized.
| (Registrant) | Ultimus Managers Trust | | |
| | | | |
| By (Signature and Title)* | /s/ Frank L. Newbauer | |
| | | Frank L. Newbauer, Assistant Secretary | |
| | | | |
| Date | May 9, 2016 | | |
| | | | |
| Pursuant to the requirements of the Securities Exchange Act of 1934 and the Investment Company Act of 1940, this report has been signed below by the following persons on behalf of the registrant and in the capacities and on the dates indicated. |
| | | | |
| By (Signature and Title)* | /s/ Henry M. T. Jones | |
| | | Henry M. T. Jones, Principal Executive Officer of Blue Current Global Dividend Fund | |
| | | | |
| Date | May 9, 2016 | | |
| | | | |
| By (Signature and Title)* | /s/ Robert T. Slaymaker | |
| | | Robert T. Slaymaker, Principal Executive Officer of Alambic Small Cap Value Plus Fund and Alambic Small Cap Growth Fund | |
| | | | |
| Date | May 9, 2016 | | |
| | | | |
| By (Signature and Title)* | /s/ Daniel Darchuck | |
| | | Daniel Darchuck, Principal Executive Officer of Topturn OneEighty Fund | |
| | | | |
| Date | May 9, 2016 | | |
| | | | |
| By (Signature and Title)* | /s/ Afredo Viegas | |
| | | Alfredo Viegas, Principal Executive Officer of Castlemain Emerging Markets Fund, Castlemaine Event Driven Fund, Castlemaine Long/Short Fund, Castlemaine Market Neutral Fund and Castlemaine Multi-Strategy Fund | |
| | | | |
| Date | May 9, 2016 | | |
| | | | |
| By (Signature and Title)* | /s/ Christopher M. Niemczewski | |
| | | Christopher M. Niemczewski, Principal Executive Officer of Marshfield Concentrated Opportunity Fund | |
| | | | |
| Date | May 9, 2016 | | |
| | | | |
| By (Signature and Title)* | /s/ Jennifer L. Leamer | |
| | | Jennifer L. Leamer, Treasurer and Principal Accounting Officer | |
| | | | |
| Date | May 9, 2016 | | |
* Print the name and title of each signing officer under his or her signature.