WAYCROSS LONG/SHORT EQUITY FUND LETTER TO SHAREHOLDERS | August 31, 2016 |
Dear Shareholders,
We are pleased to provide this update for the Waycross Long/Short Equity Fund (the “Fund”). At Waycross Partners, we believe that through deep comprehensive analysis a portfolio can be carefully constructed using both long and short positions that meet investors’ growth objectives while reducing short-term volatility. This belief represents a guiding principle that shapes our investment decision-making process. The Fund’s investment approach is based on bottom-up company research that combines a thorough examination of a company’s fundamentals, its valuation, and market sentiment. We actively manage the Fund to seek consistent, positive returns by continually researching new opportunities for profitable stock selection.
Performance Review
Over the trailing six months, the Fund produced a cumulative total return of +6.0% compared to +13.6% for the S&P 500® Index and +4.0% for the Credit Suisse AllHedge Long/Short Index.
Dividend payers and defensive sectors were the market leaders over the last year. This was most evident in June following the Brexit event in the United Kingdom, as plummeting global interest rates and uncertainty sent investors reaching for yield and safety. The Fund did not perform well in this environment. We underestimated the impact that a macro-economic or non-company specific factor such as global interest rates could have on the Fund in a relatively short period. However, as is usually the case, there has been a mean-reversion in recent months and investors are exiting Utilities and Consumer Staples stocks where valuations are stretched in favor of growth companies. As a result, the Fund has recently benefited from its portfolio positioning and stock selection.
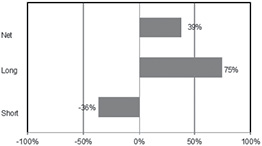
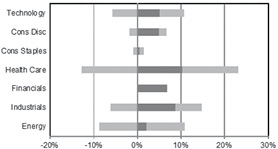
Exposures Summary
The Fund’s overall net long exposure (long positions minus short positions) ranged from +28% to +36% throughout the period and was +36% as of the end of August. Short exposure decreased modestly during the period. Beta, also known as beta coefficient, is a measure of volatility. The Fund maintained a beta of 0.49 relative to the S&P 500 Index, which represents the market as a whole with a beta of 1.
In terms of sector exposure, the Fund increased its net long position in Health Care. Within the group, we are diversified across hospitals, biotech, and medical device companies. We increased the Fund’s net exposure to Industrials during the period, emphasizing U.S. rail companies on the long side while shorting trucking and agriculture industries. We maintain a neutral position in Energy stocks. The sector continues to be volatile due to fluctuating crude oil prices. Within the Energy sector, we favor U.S. onshore drillers, which tend to be more nimble and have lowered their production cost through innovation as compared to offshore drillers that require significant upfront capital spending per project.
1
Fund Exposures |
Total Portfolio Exposures | Long/Short Exposure By Sector |
| 
|
Top Five Long Positions | | Top Five Short Positions |
Security Name | Sector | % of Portfolio | | Security Name | Sector | % of Portfolio |
Intuitive Surgical Inc. | Health Care | 3.9% | | Chevron Corp. | Energy | -3.0% |
Time Warner, Inc. | Cons Disc | 3.9% | | UnitedHealth Group Inc. | Health Care | -2.4% |
AbbVie, Inc. | Health Care | 3.9% | | Helmeric & Payne | Energy | -2.2% |
Honeywell International | Industrials | 3.8% | | Accenture PLC-CL A | Technology | -2.1% |
Aetna, Inc. | Health Care | 3.7% | | HCA Holdings, Inc. | Health Care | -2.0% |
Market Outlook
According to the Bureau of Labor Statistics, unemployment remains relatively low at 4.9% and average hourly earnings have risen by 2.6% over the last year. Second quarter gross domestic product (“GDP”) came in at +1.1% year-over-year, making this the ninth consecutive quarter of annual GDP growth. Although policymakers have kept the Federal Reserve’s Funds Rate unchanged throughout the year, recent comments from Chairperson Janet Yellen have shifted to a more hawkish tone, igniting speculation as to the timing of the next rate hike.
U.S. equities remain attractive, especially from a relative perspective. Increased international and geopolitical risks highlight the stability of the U.S. economy. Strong demand for U.S. Treasuries has pushed 10-year yields to historically low levels. Looking ahead to the remainder of 2016, we expect increased volatility surrounding the Federal Reserve’s monetary policy, the U.S. presidential election, and the impact of looming changes in the European Union.
On behalf of Waycross Partners, LLC, we thank you for investing in the Fund.
Sincerely,
Benjamin H. Thomas, CFA
Managing Partner | Portfolio Manager
2
Past performance is not predictive of future performance. Investment results and principal value will fluctuate so that shares, when redeemed, may be worth more or less than their original cost. Current performance may be higher or lower than the performance data quoted. Performance data current to the most recent month-end are available by calling 1-866-267-4304.
An investor should consider the investment objectives, risks, charges, and expenses of the Fund carefully before investing. The Fund’s prospectus contains this and other important information. To obtain a copy of the Fund’s prospectus please visit our website at www.waycrossfunds.com or call 1-866-267-4304 and a copy will be sent to you free of charge. Please read the prospectus carefully before you invest. The Fund is distributed by Ultimus Fund Distributors, LLC.
The Letter to Shareholders seeks to describe some of the Adviser’s current opinions and views of the financial markets. Although the Adviser believes it has a reasonable basis for any opinions or views expressed, actual results may differ, sometimes significantly so, from those expected or expressed. The securities held by the Fund that are discussed in the Letter to Shareholders were held during the period covered by this Report. They do not comprise the entire investment portfolio of the Fund, may be sold at any time, and may no longer be held by the Fund. For a complete list of securities held by the Fund as of August 31, 2016, please see the Schedule of Investments section of the semi-annual report. The opinions of the Fund’s adviser with respect to those securities may change at any time.
Statements in the Letter to Shareholders that reflect projections or expectations for future financial or economic performance of the Fund and the market in general and statements of the Fund’s plans and objectives for future operations are forward-looking statements. No assurance can be given that actual results or events will not differ materially from those projected, estimated, assumed, or anticipated in any such forward-looking statements. Important factors that could result in such differences, in addition to factors noted with such forward-looking statements, include, without limitation, general economic conditions, such as inflation, recession, and interest rates. Past performance is not a guarantee of future results.
3
WAYCROSS LONG/SHORT EQUITY FUND
PORTFOLIO INFORMATION
August 31, 2016 (Unaudited)
Net Sector Exposure versus S&P 500® Index*
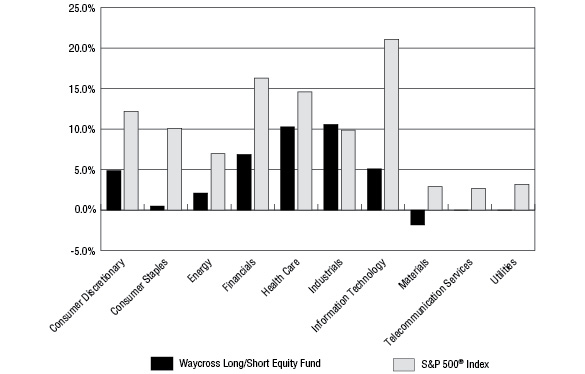
* | The net percentages are computed by taking the net dollar exposure, including short positions, and dividing by the net assets of the Fund. Consequently, the percentages will not total to 100%. |
Top 10 Long Equity Holdings | | Top 10 Short Equity Holdings |
Security Description | % of
Net Assets | | Security Description | % of
Net Assets |
Intuitive Surgical, Inc. | 3.9% | | Chevron Corporation | 3.0% |
Time Warner, Inc. | 3.9% | | UnitedHealth Group, Inc. | 2.4% |
AbbVie, Inc. | 3.9% | | Helmerich & Payne, Inc. | 2.2% |
Honeywell International, Inc. | 3.8% | | Accenture plc - Class A | 2.1% |
Aetna, Inc. | 3.7% | | HCA Holdings, Inc. | 2.0% |
Edwards Lifesciences Corporation | 3.6% | | QUALCOMM, Inc. | 2.0% |
Norfolk Southern Corporation | 3.5% | | Gilead Sciences, Inc. | 2.0% |
Mylan N.V. | 3.4% | | Walt Disney Company (The) | 1.9% |
Baker Hughes, Inc. | 3.0% | | Hess Corporation | 1.8% |
Newfield Exploration Company | 2.8% | | Patterson-UTI Energy, Inc. | 1.8% |
4
WAYCROSS LONG/SHORT EQUITY FUND
SCHEDULE OF INVESTMENTS
August 31, 2016 (Unaudited) | |
COMMON STOCKS — 74.8% | | Shares | | | Value | |
Consumer Discretionary — 6.8% | | | | | | |
Hotels, Restaurants & Leisure — 1.3% | | | | | | |
Starbucks Corporation | | | 1,680 | | | $ | 94,466 | |
| | | | | | | | | |
Media — 3.9% | | | | | | | | |
Time Warner, Inc. | | | 3,732 | | | | 292,626 | |
| | | | | | | | | |
Specialty Retail — 1.6% | | | | | | | | |
Home Depot, Inc. (The) | | | 920 | | | | 123,391 | |
| | | | | | | | | |
Consumer Staples — 1.5% | | | | | | | | |
Beverages — 1.5% | | | | | | | | |
Coca-Cola Company (The) | | | 2,660 | | | | 115,524 | |
| | | | | | | | | |
Energy — 10.9% | | | | | | | | |
Energy Equipment & Services — 5.3% | | | | | | | | |
Baker Hughes, Inc. | | | 4,660 | | | | 228,946 | |
Schlumberger Ltd. | | | 2,160 | | | | 170,640 | |
| | | | | | | | 399,586 | |
Oil, Gas & Consumable Fuels — 5.6% | | | | | | | | |
Newfield Exploration Company (a) | | | 4,900 | | | | 212,464 | |
Pioneer Natural Resources Company | | | 1,170 | | | | 209,488 | |
| | | | | | | | 421,952 | |
Financials — 6.9% | | | | | | | | |
Banks — 5.0% | | | | | | | | |
Bank of America Corporation | | | 11,588 | | | | 187,030 | |
JPMorgan Chase & Company | | | 2,819 | | | | 190,283 | |
| | | | | | | | 377,313 | |
Insurance — 1.9% | | | | | | | | |
Allstate Corporation (The) | | | 2,100 | | | | 144,816 | |
| | | | | | | | | |
Health Care — 23.1% | | | | | | | | |
Biotechnology — 5.5% | | | | | | | | |
AbbVie, Inc. | | | 4,550 | | | | 291,655 | |
Celgene Corporation (a) | | | 1,150 | | | | 122,751 | |
| | | | | | | | 414,406 | |
Health Care Equipment & Supplies — 10.5% | | | | | | | | |
Boston Scientific Corporation (a) | | | 4,530 | | | | 107,905 | |
DexCom, Inc. (a) | | | 1,330 | | | | 121,150 | |
Edwards Lifesciences Corporation (a) | | | 2,350 | | | | 270,626 | |
Intuitive Surgical, Inc. (a) | | | 430 | | | | 295,160 | |
| | | | | | | | 794,841 | |
5
WAYCROSS LONG/SHORT EQUITY FUND
SCHEDULE OF INVESTMENTS (Continued) | |
COMMON STOCKS — 74.8% (Continued) | | Shares | | | Value | |
Health Care — 23.1% (Continued) | | | | | | |
Health Care Providers & Services — 3.7% | | | | | | |
Aetna, Inc. | | | 2,370 | | | $ | 277,575 | |
| | | | | | | | | |
Pharmaceuticals — 3.4% | | | | | | | | |
Mylan N.V. (a) | | | 6,170 | | | | 261,361 | |
| | | | | | | | | |
Industrials — 14.9% | | | | | | | | |
Aerospace & Defense — 3.8% | | | | | | | | |
Honeywell International, Inc. | | | 2,454 | | | | 286,406 | |
| | | | | | | | | |
Air Freight & Logistics — 2.0% | | | | | | | | |
Fedex Corporation | | | 930 | | | | 153,385 | |
| | | | | | | | | |
Machinery — 3.1% | | | | | | | | |
Ingersoll-Rand plc | | | 1,646 | | | | 111,912 | |
Oshkosh Corporation | | | 2,210 | | | | 119,185 | |
| | | | | | | | 231,097 | |
Road & Rail — 6.0% | | | | | | | | |
Norfolk Southern Corporation | | | 2,830 | | | | 265,737 | |
Union Pacific Corporation | | | 1,942 | | | | 185,519 | |
| | | | | | | | 451,256 | |
Information Technology — 10.7% | | | | | | | | |
Internet Software & Services — 3.5% | | | | | | | | |
Alphabet, Inc. - Class A (a) | | | 213 | | | | 168,238 | |
Facebook, Inc. - Class A (a) | | | 768 | | | | 96,860 | |
| | | | | | | | 265,098 | |
IT Services — 1.4% | | | | | | | | |
Visa, Inc. - Class A | | | 1,340 | | | | 108,406 | |
| | | | | | | | | |
Semiconductors & Semiconductor Equipment — 2.2% | | | | | | | | |
Applied Materials, Inc. | | | 5,440 | | | | 162,330 | |
| | | | | | | | | |
Software — 2.7% | | | | | | | | |
Microsoft Corporation | | | 3,600 | | | | 206,856 | |
| | | | | | | | | |
Technology Hardware, Storage & Peripherals — 0.9% | | | | | | | | |
Apple, Inc. | | | 650 | | | | 68,965 | |
| | | | | | | | | |
Total Common Stocks (Cost $4,928,912) | | | | | | $ | 5,651,656 | |
6
WAYCROSS LONG/SHORT EQUITY FUND
SCHEDULE OF INVESTMENTS (Continued) | |
MONEY MARKET FUNDS — 14.1% | | Shares | | | Value | |
Fidelity Institutional Money Market Government Portfolio - Class I, 0.26% (b) (Cost $1,062,636) | | | 1,062,636 | | | $ | 1,062,636 | |
| | | | | | | | | |
Total Investments at Value — 88.9% (Cost $5,991,548) | | | | | | $ | 6,714,292 | |
| | | | | | | | | |
Other Assets in Excess of Liabilities (c) — 11.1% | | | | | | | 839,346 | |
| | | | | | | | | |
Net Assets — 100.0% | | | | | | $ | 7,553,638 | |
(a) | Non-income producing security. |
| | |
(b) | The rate shown is the 7-day effective yield as of August 31, 2016. |
| | |
(c) | Includes cash held as collateral and margin deposits for open short positions. |
| | |
See accompanying notes to financial statements. |
7
WAYCROSS LONG/SHORT EQUITY FUND
SCHEDULE OF SECURITIES SOLD SHORT
August 31, 2016 (Unaudited) | |
COMMON STOCKS — 36.2% | | Shares | | | Value | |
Consumer Discretionary — 1.9% | | | | | | |
Media — 1.9% | | | | | | |
Walt Disney Company (The) | | | 1,508 | | | $ | 142,446 | |
| | | | | | | | | |
Consumer Staples — 1.0% | | | | | | | | |
Food Products — 1.0% | | | | | | | | |
Mondelēz International, Inc. - Class A | | | 1,650 | | | | 74,283 | |
| | | | | | | | | |
Energy — 8.8% | | | | | | | | |
Energy Equipment & Services — 4.0% | | | | | | | | |
Helmerich & Payne, Inc. | | | 2,740 | | | | 165,660 | |
Patterson-UTI Energy, Inc. | | | 7,070 | | | | 137,794 | |
| | | | | | | | 303,454 | |
Oil, Gas & Consumable Fuels — 4.8% | | | | | | | | |
Chevron Corporation | | | 2,210 | | | | 222,282 | |
Hess Corporation | | | 2,540 | | | | 137,922 | |
| | | | | | | | 360,204 | |
Health Care — 12.8% | | | | | | | | |
Biotechnology — 2.0% | | | | | | | | |
Gilead Sciences, Inc. | | | 1,870 | | | | 146,571 | |
| | | | | | | | | |
Health Care Equipment & Supplies — 3.3% | | | | | | | | |
Medtronic plc | | | 1,460 | | | | 127,064 | |
Stryker Corporation | | | 1,082 | | | | 125,144 | |
| | | | | | | | 252,208 | |
Health Care Providers & Services — 6.0% | | | | | | | | |
DaVita HealthCare Partners, Inc. | | | 1,800 | | | | 116,334 | |
HCA Holdings, Inc. | | | 2,030 | | | | 153,366 | |
UnitedHealth Group, Inc. | | | 1,352 | | | | 183,940 | |
| | | | | | | | 453,640 | |
Pharmaceuticals — 1.5% | | | | | | | | |
Johnson & Johnson | | | 960 | | | | 114,566 | |
| | | | | | | | | |
Industrials — 4.3% | | | | | | | | |
Aerospace & Defense — 1.6% | | | | | | | | |
Boeing Company (The) | | | 960 | | | | 124,272 | |
| | | | | | | | | |
Machinery — 1.6% | | | | | | | | |
Deere & Company | | | 1,440 | | | | 121,752 | |
| | | | | | | | | |
Road & Rail — 1.1% | | | | | | | | |
J.B. Hunt Transport Services, Inc. | | | 1,020 | | | | 80,978 | |
8
WAYCROSS LONG/SHORT EQUITY FUND
SCHEDULE OF SECURITIES SOLD SHORT (Continued) | |
COMMON STOCKS — 36.2% (Continued) | | Shares | | | Value | |
Information Technology — 5.6% | | | | | | |
IT Services — 2.1% | | | | | | |
Accenture plc - Class A | | | 1,410 | | | $ | 162,150 | |
| | | | | | | | | |
Semiconductors & Semiconductor Equipment — 2.0% | | | | | | | | |
QUALCOMM, Inc. | | | 2,390 | | | | 150,737 | |
| | | | | | | | | |
Software — 1.5% | | | | | | | | |
Check Point Software Technologies Ltd. | | | 1,470 | | | | 112,808 | |
| | | | | | | | | |
Materials — 1.8% | | | | | | | | |
Construction Materials — 1.8% | | | | | | | | |
Vulcan Materials Company | | | 1,170 | | | | 133,228 | |
| | | | | | | | | |
Total Securities Sold Short — 36.2% (Proceeds $2,635,187) | | | | | | $ | 2,733,297 | |
See accompanying notes to financial statements. |
9
WAYCROSS LONG/SHORT EQUITY FUND
STATEMENT OF ASSETS AND LIABILITIES
August 31, 2016 (Unaudited) | |
ASSETS | | | |
Investments in securities: | | | |
At acquisition cost | | $ | 5,991,548 | |
At value (Note 2) | | $ | 6,714,292 | |
Cash deposits for securities sold short (Note 2) | | | 3,569,716 | |
Dividends receivable | | | 11,538 | |
Other assets | | | 13,425 | |
Total assets | | | 10,308,971 | |
| | | | | |
LIABILITIES | | | | |
Securities sold short, at value (proceeds $2,635,187) (Note 2) | | | 2,733,297 | |
Dividends payable on securities sold short (Note 2) | | | 9,443 | |
Payable to Adviser (Note 4) | | | 2,969 | |
Payable to administrator (Note 4) | | | 6,066 | |
Accrued brokerage expense on securities sold short (Note 2) | | | 8 | |
Other accrued expenses | | | 3,550 | |
Total liabilities | | | 2,755,333 | |
| | | | | |
NET ASSETS | | $ | 7,553,638 | |
| | | | | |
NET ASSETS CONSIST OF: | | | | |
Paid-in capital | | $ | 7,405,375 | |
Accumulated net investment loss | | | (94,668 | ) |
Accumulated net realized losses from security transactions | | | (381,703 | ) |
Net unrealized appreciation (depreciation) on: | | | | |
Investments | | | 722,744 | |
Short positions | | | (98,110 | ) |
NET ASSETS | | $ | 7,553,638 | |
| | | | | |
Shares of beneficial interest outstanding (unlimited number of shares authorized, no par value) | | | 782,813 | |
| | | | | |
Net asset value, offering price and redemption price per share (Note 2) | | $ | 9.65 | |
See accompanying notes to financial statements. |
10
WAYCROSS LONG/SHORT EQUITY FUND
STATEMENT OF OPERATIONS
For the Six Months Ended August 31, 2016 (Unaudited) | |
INVESTMENT INCOME | | | |
Dividend income | | $ | 48,054 | |
| | | | | |
EXPENSES | | | | |
Investment advisory fees (Note 4) | | | 78,137 | |
Dividend expense on securities sold short (Note 2) | | | 37,920 | |
Professional fees | | | 18,160 | |
Fund accounting fees (Note 4) | | | 13,145 | |
Administration fees (Note 4) | | | 12,750 | |
Compliance fees (Note 4) | | | 6,000 | |
Transfer agent fees (Note 4) | | | 6,000 | |
Registration and filing fees | | | 5,318 | |
Trustees' fees and expenses (Note 4) | | | 4,865 | |
Custody and bank service fees | | | 4,082 | |
Brokerage expense on securities sold short (Note 2) | | | 3,935 | |
Printing of shareholder reports | | | 2,176 | |
Insurance expense | | | 896 | |
Postage and supplies | | | 640 | |
Other expenses | | | 3,937 | |
Total expenses | | | 197,961 | |
Less fee reductions by the Adviser (Note 4) | | | (71,687 | ) |
Net expenses | | | 126,274 | |
| | | | | |
NET INVESTMENT LOSS | | | (78,220 | ) |
| | | | | |
REALIZED AND UNREALIZED GAINS (LOSSES) ON INVESTMENTS | | | | |
Net realized gains (losses) from: | | | | |
Investments | | | 350,008 | |
Securities sold short | | | (459,543 | ) |
Net change in unrealized appreciation (depreciation) on: | | | | |
Investments | | | 802,511 | |
Securities sold short | | | (162,006 | ) |
NET REALIZED AND UNREALIZED GAINS ON INVESTMENTS | | | 530,970 | |
| | | | | |
NET INCREASE IN NET ASSETS RESULTING FROM OPERATIONS | | $ | 452,750 | |
See accompanying notes to financial statements. |
11
WAYCROSS LONG/SHORT EQUITY FUND
STATEMENTS OF CHANGES IN NET ASSETS | |
| | | Six Months Ended August 31, 2016
(Unaudited) | | | Period Ended
February 29,
2016 (a) | |
FROM OPERATIONS | | | | | | |
Net investment loss | | $ | (78,220 | ) | | $ | (66,502 | ) |
Net realized gains (losses) from: | | | | | | | | |
Investments | | | 350,008 | | | | (407,027 | ) |
Securities sold short | | | (459,543 | ) | | | 137,019 | |
Net change in unrealized appreciation (depreciation) on: | | | | | | | | |
Investments | | | 802,511 | | | | (79,767 | ) |
Securities sold short | | | (162,006 | ) | | | 63,896 | |
Net increase (decrease) in net assets resulting from operations | | | 452,750 | | | | (352,381 | ) |
| | | | | | | | | |
CAPITAL SHARE TRANSACTIONS | | | | | | | | |
Proceeds from shares sold | | | 3,796,307 | | | | 5,517,869 | |
Payments for shares redeemed | | | (1,475,262 | ) | | | (385,645 | ) |
Net increase in net assets from capital share transactions | | | 2,321,045 | | | | 5,132,224 | |
| | | | | | | | | |
TOTAL INCREASE IN NET ASSETS | | | 2,773,795 | | | | 4,779,843 | |
| | | | | | | | | |
NET ASSETS | | | | | | | | |
Beginning of period | | | 4,779,843 | | | | — | |
End of period | | $ | 7,553,638 | | | $ | 4,779,843 | |
| | | | | | | | | |
ACCUMULATED NET INVESTMENT LOSS | | $ | (94,668 | ) | | $ | (16,448 | ) |
| | | | | | | | | |
CAPITAL SHARE ACTIVITY | | | | | | | | |
Shares sold | | | 414,089 | | | | 565,823 | |
Shares redeemed | | | (156,540 | ) | | | (40,559 | ) |
Net increase in shares outstanding | | | 257,549 | | | | 525,264 | |
Shares outstanding at beginning of period | | | 525,264 | | | | — | |
Shares outstanding at end of period | | | 782,813 | | | | 525,264 | |
(a) | Represents the period from the commencement of operations (April 29, 2015) through February 29, 2016. |
| | |
See accompanying notes to financial statements. |
12
WAYCROSS LONG/SHORT EQUITY FUND
FINANCIAL HIGHLIGHTS | |
Per Share Data for a Share Outstanding Throughout Each Period | |
| | | Six Months Ended August 31, 2016
(Unaudited) | | | Period Ended
February 29,
2016 (a) | |
Net asset value at beginning of period | | $ | 9.10 | | | $ | 10.00 | |
| | | | | | | | | |
Income (loss) from investment operations: | | | | | | | | |
Net investment loss | | | (0.09 | ) | | | (0.13 | ) |
Net realized and unrealized gains (losses) on investments | | | 0.64 | | | | (0.77 | ) |
Total from investment operations | | | 0.55 | | | | (0.90 | ) |
| | | | | | | | | |
Net asset value at end of period | | $ | 9.65 | | | $ | 9.10 | |
| | | | | | | | | |
Total return (b) | | | 6.04 | %(c) | | | (9.00 | %)(c) |
| | | | | | | | | |
Net assets at end of period (000's) | | $ | 7,554 | | | $ | 4,780 | |
| | | | | | | | | |
Ratios/supplementary data: | | | | | | | | |
Ratio of total expenses to average net assets | | | 5.03 | %(d) | | | 7.25 | %(d) |
| | | | | | | | | |
Ratio of net expenses to average net assets (e) | | | 3.21 | %(d) | | | 3.30 | %(d) |
| | | | | | | | | |
Ratio of net expenses to average net assets excluding dividend expense,
borrowing costs and brokerage expense on securities sold short (e) | | | 2.15 | %(d) | | | 2.15 | %(d) |
| | | | | | | | | |
Ratio of net investment loss to average net assets (e) | | | (2.00 | %)(d) | | | (2.34 | %)(d) |
| | | | | | | | | |
Portfolio turnover rate | | | 91 | %(c) | | | 134 | %(c) |
(a) | Represents the period from the commencement of operations (April 29, 2015) through February 29, 2016. |
| | |
(b) | Total return is a measure of the change in value of an investment in the Fund over the periods covered. The returns shown do not reflect the deduction of taxes a shareholder would pay on Fund distributions, if any, or the redemption of Fund shares. The total returns would be lower if the Adviser and administrator had not reduced fees and reimbursed expenses (Note 4). |
| | |
(c) | Not annualized. |
| | |
(d) | Annualized. |
| | |
(e) | Ratio was determined after advisory fee waivers and/or expense reimbursements (Note 4). |
| | |
See accompanying notes to financial statements. |
13
WAYCROSS LONG/SHORT EQUITY FUND
NOTES TO FINANCIAL STATEMENTS
August 31, 2016 (Unaudited)
1. Organization
Waycross Long/Short Equity Fund (the “Fund”) is a diversified series of Ultimus Managers Trust (the “Trust”), an open-end investment company established as an Ohio business trust under a Declaration of Trust dated February 28, 2012. Other series of the Trust are not incorporated in this report. The Fund commenced operations on April 29, 2015.
The investment objective of the Fund is long-term capital appreciation with a secondary emphasis on capital preservation.
2. Significant Accounting Policies
The following is a summary of the Fund’s significant accounting policies. These policies are in conformity with accounting principles generally accepted in the United States of America (“GAAP”). As an investment company, as defined in Financial Accounting Standards Board (“FASB”) Accounting Standards Update 2013-08, the Fund follows accounting and reporting guidance under FASB Accounting Standards Codification Topic 946, “Financial Services – Investment Companies.”
Securities valuation – The Fund values its portfolio securities at market value as of the close of regular trading on the New York Stock Exchange (the “NYSE”) (normally 4:00 p.m. Eastern time) on each day the NYSE is open for business. The Fund values its listed securities on the basis of the security’s last sale price on the security’s primary exchange, if available, otherwise at the exchange’s most recently quoted mean price. NASDAQ-listed securities are valued at the NASDAQ Official Closing Price. In the event that market quotations are not readily available or are considered unreliable due to market or other events, the Fund values its securities and other assets at fair value in accordance with procedures established by and under the general supervision of the Board of Trustees (the “Board”) of the Trust. Under these procedures, the securities will be classified as Level 2 or 3 within the fair value hierarchy (see below), depending on the inputs used. Unavailable or unreliable market quotes may be due to the following factors: a substantial bid-ask spread; infrequent sales resulting in stale prices; insufficient trading volume; small trade sizes; a temporary lapse in any reliable pricing source; and actions of the securities or futures markets, such as the suspension or limitation of trading. As a result, the prices of securities used to calculate the Fund’s net asset value (“NAV”) may differ from quoted or published prices for the same securities.
GAAP establishes a single authoritative definition of fair value, sets out a framework for measuring fair value, and requires additional disclosures about fair value measurements.
Various inputs are used in determining the value of the Fund’s investments. These inputs are summarized in the three broad levels listed below:
| | ● | Level 1 – quoted prices in active markets for identical securities |
14
WAYCROSS LONG/SHORT EQUITY FUND
NOTES TO FINANCIAL STATEMENTS (Continued)
| | ● | Level 2 – other significant observable inputs |
| | ● | Level 3 – significant unobservable inputs |
The inputs or methods used for valuing securities are not necessarily an indication of the risks associated with investing in those securities. The inputs used to measure fair value may fall into different levels of the fair value hierarchy. In such cases, for disclosure purposes, the level in the fair value hierarchy within which the fair value measurement falls in its entirety is determined based on the lowest level input that is significant to the fair value measurement.
The following is a summary of the inputs used to value the Fund’s investments and other financial instruments as of August 31, 2016:
| | | Level 1 | | | Level 2 | | | Level 3 | | | Total | |
Investments in Securities | | | | | | | | | | | | |
Common Stocks | | $ | 5,651,656 | | | $ | — | | | $ | — | | | $ | 5,651,656 | |
Money Market Funds | | | 1,062,636 | | | | — | | | | — | | | | 1,062,636 | |
Total | | $ | 6,714,292 | | | $ | — | | | $ | — | | | $ | 6,714,292 | |
Other Financial Instruments | | | | | | | | | | | | | | | | |
Common Stocks - Sold Short | | $ | (2,733,297 | ) | | $ | — | | | $ | — | | | $ | (2,733,297 | ) |
Refer to the Fund’s Schedule of Investments and Schedule of Securities Sold Short for a listing of the common stocks by industry type. As of August 31, 2016, the Fund did not have any transfers between Levels. In addition, the Fund did not hold derivative instruments or have any assets or liabilities that were measured at fair value on a recurring basis using significant unobservable inputs (Level 3) as of August 31, 2016. It is the Fund’s policy to recognize transfers between Levels at the end of the reporting period.
Share valuation – The NAV per share of the Fund is calculated daily by dividing the total value of the Fund’s assets, less liabilities, by the number of shares outstanding. The offering price and redemption price per share of the Fund is equal to the NAV per share.
Investment income – Dividend income and expense is recorded on the ex-dividend date. Interest income, if any, is accrued as earned.
Security transactions – Security transactions are accounted for on the trade date. Realized gains and losses on securities sold are determined on a specific identification basis.
Common expenses – Common expenses of the Trust are allocated among the Fund and the other series of the Trust based on the relative net assets of each series or the nature of the services performed and the relative applicability to each series.
Distributions to shareholders – Distributions to shareholders arising from net investment income, if any, are declared and paid annually to shareholders. Net realized capital gains, if any, are distributed at least annually. The amount of distributions from net investment
15
WAYCROSS LONG/SHORT EQUITY FUND
NOTES TO FINANCIAL STATEMENTS (Continued)
income and net realized capital gains are determined in accordance with federal income tax regulations, which may differ from GAAP. Dividends and distributions to shareholders are recorded on the ex-dividend date. There were no distributions paid to shareholders during the periods ended August 31, 2016 and February 29, 2016.
Short sales – The Fund may sell securities short. For financial statement purposes, an amount equal to the settlement amount is included in the Statement of Assets and Liabilities as an asset and an equivalent liability is then subsequently marked-to-market daily to reflect the current value of the short position. Subsequent fluctuations in the market prices of securities sold, but not yet purchased, may require purchasing the securities at prices that may differ from the market value reflected on the Statement of Assets and Liabilities. The Fund is liable for any dividends payable on securities while those securities are in a short position and will also bear other costs, such as charges for the prime brokerage accounts, in connection with the short position. These costs are reported as dividend expense and brokerage expense on securities sold short, respectively, in the Statement of Operations. As collateral for its short positions, the Fund is required under the Investment Company Act of 1940, as amended (the “1940 Act”), to maintain assets consisting of cash, cash equivalents or other liquid securities equal to the market value of the securities sold short. The cash deposits with brokers for securities sold short are reported on the Statement of Assets and Liabilities. The amount of collateral is required to be adjusted daily to reflect changes in the value of the securities sold short. To the extent the Fund invests the proceeds received from selling securities short, it is engaging in a form of leverage. The use of leverage by the Fund may make any change in the Fund’s NAV greater than it would be without the use of leverage. Short sales are speculative transactions and involve special risks, including greater reliance on the ability of Waycross Partners, LLC (the “Adviser”) to accurately anticipate the future value of a security.
Estimates – The preparation of financial statements in conformity with GAAP requires management to make estimates and assumptions that affect the reported amounts of assets and liabilities and disclosure of contingent assets and liabilities, as of the date of the financial statements and the reported amounts of income and expenses during the reporting period. Actual results could differ from those estimates.
Federal income tax – The Fund has qualified and intends to continue to qualify as a regulated investment company under the Internal Revenue Code of 1986 (the “Code”). Qualification generally will relieve the Fund of liability for federal income taxes to the extent 100% of its net investment income and net realized capital gains are distributed in accordance with the Code.
16
WAYCROSS LONG/SHORT EQUITY FUND
NOTES TO FINANCIAL STATEMENTS (Continued)
In order to avoid imposition of the excise tax applicable to regulated investment companies, it is also the Fund’s intention to declare as dividends in each calendar year at least 98% of its net investment income (earned during the calendar year) and 98.2% of its net realized capital gains (earned during the 12 months ended October 31) plus undistributed amounts from prior years.
The following information is computed on a tax basis for each item as of August 31, 2016:
Tax cost of investments in securities | | $ | 6,026,516 | |
Gross unrealized appreciation | | $ | 735,656 | |
Gross unrealized depreciation | | | (47,880 | ) |
Net unrealized appreciation | | | 687,776 | |
Net unrealized depreciation on securities sold short | | | (125,909 | ) |
Accumulated capital and other losses | | | (413,604 | ) |
Accumulated earnings | | $ | 148,263 | |
As of August 31, 2016, the proceeds of securities sold short on a tax basis is $2,607,388.
The federal income tax cost of portfolio investments and securities sold short and the tax components of accumulated earnings and the financial statement cost of portfolio investments and components of net assets may be temporarily different (“book/tax difference”). These book/tax differences are due to the recognition of capital gains or losses under income tax regulations and GAAP, primarily due to the tax deferral of losses on wash sales.
As of February 29, 2016, the Fund had a short-term capital loss carryforward of $129,820 for federal income tax purposes, which does not expire. This capital loss carryforward may be utilized in the current and future years to offset net realized capital gains, if any, prior to distribution to shareholders.
The Fund recognizes the tax benefits or expenses of uncertain tax positions only when the position is “more likely than not” to be sustained assuming examination by tax authorities. Management has reviewed the Fund’s tax positions for the current and open tax period (February 29, 2016) and has concluded that no provision for unrecognized tax benefits or expenses is required in these financial statements. The Fund is subject to examination by U.S. federal tax authorities for the current interim tax period.
3. Investment Transactions
During the six months ended August 31, 2016, cost of purchases and proceeds from sales of investment securities, other than short-term investments and short positions, were $6,047,768 and $5,437,425, respectively.
17
WAYCROSS LONG/SHORT EQUITY FUND
NOTES TO FINANCIAL STATEMENTS (Continued)
4. Transactions with Related Parties
INVESTMENT ADVISORY AGREEMENT
The Fund’s investments are managed by the Adviser pursuant to the terms of an Investment Advisory Agreement. Under the Investment Advisory Agreement, the Fund pays the Adviser an investment advisory fee, computed and accrued daily and paid monthly, at the annual rate of 1.99% of its average daily net assets.
Pursuant to an Expense Limitation Agreement between the Fund and the Adviser (the “ELA”), the Adviser has contractually agreed, until March 31, 2018, to reduce investment advisory fees and reimburse other expenses to limit Total Annual Fund Operating Expenses (exclusive of brokerage costs; taxes; borrowing costs such as interest and dividend expenses on securities sold short; interest; costs to organize the Fund; acquired fund fees and expenses; extraordinary expenses such as litigation and merger or reorganization costs and other expenses not incurred in the ordinary course of the Fund’s business; and amounts, if any, payable pursuant to a plan adopted in accordance with Rule 12b-1 under the 1940 Act) to an amount not exceeding 2.15% of the Fund’s average daily net assets. Accordingly, during the six months ended August 31, 2016, the Adviser reduced its investment advisory fees in the amount of $71,687.
Under the terms of the ELA, investment advisory fee reductions and expense reimbursements by the Adviser are subject to repayment by the Fund for a period of three years after such fees and expense reimbursements were incurred, provided that the repayments do not cause Total Annual Fund Operating Expenses to exceed (i) the expense limitation then in effect, if any, and (ii) the expense limitation in effect at the time the expenses to be repaid were incurred. As of August 31, 2016, the Adviser may seek repayment of investment advisory fee reductions and expense reimbursements totaling $179,348 no later than the dates listed below:
February 28, 2019 | August 31, 2019 | Total |
$ 107,661 | $ 71,687 | $ 179,348 |
An officer of the Fund is also an officer of the Adviser.
OTHER SERVICE PROVIDERS
Ultimus Fund Solutions, LLC (“Ultimus”) provides fund administration, fund accounting, compliance and transfer agency services to the Fund. The Fund pays Ultimus fees in accordance with the agreements for such services. In addition, the Fund pays out-of-pocket expenses including, but not limited to, postage, supplies and costs of pricing the Fund’s portfolio securities.
18
WAYCROSS LONG/SHORT EQUITY FUND
NOTES TO FINANCIAL STATEMENTS (Continued)
Under the terms of a Distribution Agreement with the Trust, Ultimus Fund Distributors, LLC (the “Distributor”) serves as principal underwriter to the Fund. The Distributor is a wholly-owned subsidiary of Ultimus. The Distributor is compensated by the Adviser (not the Fund) for acting as principal underwriter.
Certain officers and a Trustee of the Trust are also officers of Ultimus and the Distributor.
TRUSTEE COMPENSATION
During the six months ended August 31, 2016, each Trustee who is not an “interested person” of the Trust (“Independent Trustee”) received from the Fund a fee of $500 for each Board meeting attended plus reimbursement of travel and other meeting-related expenses. Each Independent Trustee also received a $500 annual retainer from the Fund. Effective October 1, 2016, each Independent Trustee will receive a $1,000 annual retainer from the Fund, except for the Board Chairman, who will receive a $1,200 annual retainer from the Fund.
PRINCIPAL HOLDERS OF FUND SHARES
As of August 31, 2016, the following shareholders owned of record 5% or more of the outstanding shares of the Fund:
Name of Record Owner | % Ownership |
National Financial Services, LLC (for benefit of its customers) | 56% |
Maril & Co. (for benefit of BMO Harris Bank, N.A.) | 33% |
Charles Schwab & Co., Inc. (for benefit of its customers) | 7% |
A beneficial owner of 25% or more of the Fund’s outstanding shares may be considered a controlling person. That shareholder’s vote could have a more significant effect on matters presented at a shareholders’ meeting.
5. Contingencies and Commitments
The Fund indemnifies the Trust’s officers and Trustees for certain liabilities that might arise from their performance of their duties to the Fund. Additionally, in the normal course of business the Fund enters into contracts that contain a variety of representations and warranties and which provide general indemnifications. The Fund’s maximum exposure under these arrangements is unknown, as this would involve future claims that may be made against the Fund that have not yet occurred. However, based on experience, the Fund expects the risk of loss to be remote.
19
WAYCROSS LONG/SHORT EQUITY FUND
NOTES TO FINANCIAL STATEMENTS (Continued)
6. Subsequent Events
The Fund is required to recognize in the financial statements the effects of all subsequent events that provide additional evidence about conditions that existed as of the date of the Statement of Assets and Liabilities. For non-recognized subsequent events that must be disclosed to keep the financial statements from being misleading, the Fund is required to disclose the nature of the event as well as an estimate of its financial effect, or a statement that such an estimate cannot be made. Management has evaluated subsequent events through the issuance of these financial statements and has noted no such events other than the increase in trustee fees as noted in Note 4.
20
WAYCROSS LONG/SHORT EQUITY FUND
ABOUT YOUR FUND’S EXPENSES (Unaudited)
We believe it is important for you to understand the impact of costs on your investment. As a shareholder of the Fund, you incur ongoing costs, including management fees and other operating expenses. The following examples are intended to help you understand your ongoing costs (in dollars) of investing in the Fund and to compare these costs with the ongoing costs of investing in other mutual funds.
A mutual fund’s ongoing costs are expressed as a percentage of its average net assets. This figure is known as the expense ratio. The expenses in the table below are based on an investment of $1,000 made at the beginning of the most recent period (March 1, 2016) and held until the end of the period (August 31, 2016).
The table below illustrates the Fund’s ongoing costs in two ways:
Actual fund return – This section helps you to estimate the actual expenses that you paid over the period. The “Ending Account Value” shown is derived from the Fund’s actual return, and the fourth column shows the dollar amount of operating expenses that would have been paid by an investor who started with $1,000 in the Fund. You may use the information here, together with the amount you invested, to estimate the expenses that you paid over the period.
To do so, simply divide your account value by $1,000 (for example, an $8,600 account value divided by $1,000 = 8.6), then multiply the result by the number given for the Fund under the heading “Expenses Paid During Period.”
Hypothetical 5% return – This section is intended to help you compare the Fund’s ongoing costs with those of other mutual funds. It assumes that the Fund had an annual return of 5% before expenses during the period shown, but that the expense ratio is unchanged. In this case, because the return used is not the Fund’s actual return, the results do not apply to your investment. The example is useful in making comparisons because the U.S. Securities and Exchange Commission (“SEC”) requires all mutual funds to calculate expenses based on a 5% return. You can assess the Fund’s ongoing costs by comparing this hypothetical example with the hypothetical examples that appear in shareholder reports of other funds.
Note that expenses shown in the table are meant to highlight and help you compare ongoing costs only. The Fund does not charge transaction fees, such as purchase or redemption fees, nor does it carry a “sales load.”
The calculations assume no shares were bought or sold during the period. Your actual costs may have been higher or lower, depending on the amount of your investment and the timing of any purchases or redemptions.
21
WAYCROSS LONG/SHORT EQUITY FUND
ABOUT YOUR FUND’S EXPENSES (Unaudited) (Continued)
More information about the Fund’s expenses can be found in this report. For additional information on operating expenses and other shareholder costs, please refer to the Fund’s prospectus.
| | Beginning
Account Value March 1, 2016 | Ending
Account Value
August 31, 2016 | Net
Expense
Ratio(a) | Expenses
Paid During
Period(b) |
Based on Actual Fund Return | $1,000.00 | $1,060.40 | 3.21% | $16.63 |
Based on Hypothetical 5% Return (before expenses) | $1,000.00 | $1,009.00 | 3.21% | $16.21 |
(a) | Annualized, based on the Fund's most recent one-half year expenses. |
(b) | Expenses are equal to the Fund's annualized net expense ratio multiplied by the average account value over the period, multiplied by 184/366 (to reflect the one-half year period). |
22
WAYCROSS LONG/SHORT EQUITY FUND
OTHER INFORMATION (Unaudited)
A description of the policies and procedures that the Fund uses to vote proxies relating to portfolio securities is available without charge upon request by calling toll-free 1-866-267-4304, or on the SEC’s website at http://www.sec.gov. Information regarding how the Fund voted proxies relating to portfolio securities during the most recent period ended June 30 is available without charge upon request by calling toll-free 1-866-267-4304, or on the SEC’s website at http://www.sec.gov.
The Trust files a complete listing of the Fund’s portfolio holdings with the SEC as of the end of the first and third quarters of each fiscal year on Form N-Q. These filings are available upon request by calling 1-866-267-4304. Furthermore, you may obtain a copy of the filings on the SEC’s website at http://www.sec.gov. The Trust’s Forms N-Q may also be reviewed and copied at the SEC’s Public Reference Room in Washington, DC, and information on the operation of the Public Reference Room may be obtained by calling 1-800-SEC-0330.
23
This page intentionally left blank.
This page intentionally left blank.
Item 2. Code of Ethics.
Not required
Item 3. Audit Committee Financial Expert.
Not required
Item 4. Principal Accountant Fees and Services.
Not required
Item 5. Audit Committee of Listed Registrants.
Not applicable
Item 6. Schedule of Investments.
| (a) | Not applicable [schedule filed with Item 1] |
Item 7. Disclosure of Proxy Voting Policies and Procedures for Closed-End Management Investment Companies.
Not applicable
Item 8. Portfolio Managers of Closed-End Management Investment Companies.
Not applicable
Item 9. Purchases of Equity Securities by Closed-End Management Investment Company and Affiliated Purchasers.
Not applicable
Item 10. Submission of Matters to a Vote of Security Holders.
The registrant’s Committee of Independent Trustees shall review shareholder recommendations for nominations to fill vacancies on the registrant’s board of trustees if such recommendations are submitted in writing and addressed to the Committee at the registrant’s offices. The Committee may adopt, by resolution, a policy regarding its procedures for considering candidates for the board of trustees, including any recommended by shareholders.
Item 11. Controls and Procedures.
(a) Based on their evaluation of the registrant’s disclosure controls and procedures (as defined in Rule 30a-3(c) under the Investment Company Act of 1940) as of a date within 90 days of the filing date of this report, the registrant’s principal executive officer and principal financial officer have concluded that such disclosure controls and procedures are reasonably designed and are operating effectively to ensure that material information relating to the registrant, including its consolidated subsidiaries, is made known to them by others within those entities, particularly during the period in which this report is being prepared, and that the information required in filings on Form N-CSR is recorded, processed, summarized, and reported on a timely basis.
(b) There were no changes in the registrant’s internal control over financial reporting (as defined in Rule 30a-3(d) under the Investment Company Act of 1940) that occurred during the second fiscal quarter of the period covered by this report that have materially affected, or are reasonably likely to materially affect, the registrant’s internal control over financial reporting.
Item 12. Exhibits.
File the exhibits listed below as part of this Form. Letter or number the exhibits in the sequence indicated.
(a)(1) Any code of ethics, or amendment thereto, that is the subject of the disclosure required by Item 2, to the extent that the registrant intends to satisfy the Item 2 requirements through filing of an exhibit: Not required
(a)(2) A separate certification for each principal executive officer and principal financial officer of the registrant as required by Rule 30a-2(a) under the Act (17 CFR 270.30a-2(a)): Attached hereto
(a)(3) Any written solicitation to purchase securities under Rule 23c-1 under the Act (17 CFR 270.23c-1) sent or given during the period covered by the report by or on behalf of the registrant to 10 or more persons: Not applicable
(b) Certifications required by Rule 30a-2(b) under the Act (17 CFR 270.30a-2(b)): Attached hereto
| Exhibit 99.CERT | Certifications required by Rule 30a-2(a) under the Act |
| Exhibit 99.906CERT | Certifications required by Rule 30a-2(b) under the Act |
SIGNATURES
Pursuant to the requirements of the Securities Exchange Act of 1934 and the Investment Company Act of 1940, the registrant has duly caused this report to be signed on its behalf by the undersigned, thereunto duly authorized.
| (Registrant) | Ultimus Managers Trust | | |
| | | | |
| By (Signature and Title)* | /s/ Frank L. Newbauer | |
| | | Frank L. Newbauer, Assistant Secretary | |
| | | | |
| Date | October 27, 2016 | | |
| | | | |
| Pursuant to the requirements of the Securities Exchange Act of 1934 and the Investment Company Act of 1940, this report has been signed below by the following persons on behalf of the registrant and in the capacities and on the dates indicated. |
| | | | |
| By (Signature and Title)* | /s/ Benjamin H. Thomas | |
| | | Benjamin H. Thomas, Principal Executive Officer of Waycross Long/Short Equity Fund | |
| | | | |
| Date | October 27, 2016 | | |
| | | | |
| | | | |
| By (Signature and Title)* | /s/ Jennifer L. Leamer | |
| | | Jennifer L. Leamer, Treasurer Principal Accounting Officer |
| | | | |
| Date | October 27, 2016 | | |
* Print the name and title of each signing officer under his or her signature.
