UNITED STATES
SECURITIES AND EXCHANGE COMMISSION
Washington, D.C. 20549
FORM N-CSR
CERTIFIED SHAREHOLDER REPORT OF REGISTERED
MANAGEMENT INVESTMENT COMPANY
| Investment Company Act file number | 811-22680 | |
| Ultimus Managers Trust |
| (Exact name of registrant as specified in charter) |
| 225 Pictoria Drive, Suite 450 Cincinnati, Ohio | 45246 |
| (Address of principal executive offices) | (Zip code) |
Frank L. Newbauer, Esq.
Ultimus Fund Solutions, LLC 225 Pictoria Drive, Suite 450 Cincinnati, Ohio 45246_ |
| (Name and address of agent for service) |
| Registrant's telephone number, including area code: | (513) 587-3400 | |
| Date of fiscal year end: | August 31 | |
| | | |
| Date of reporting period: | February 28, 2017 | |
Form N-CSR is to be used by management investment companies to file reports with the Commission not later than 10 days after the transmission to stockholders of any report that is required to be transmitted to stockholders under Rule 30e-1 under the Investment Company Act of 1940 (17 CFR 270.30e-1). The Commission may use the information provided on Form N-CSR in its regulatory, disclosure review, inspection, and policymaking roles.
A registrant is required to disclose the information specified by Form N-CSR, and the Commission will make this information public. A registrant is not required to respond to the collection of information contained in Form N-CSR unless the Form displays a currently valid Office of Management and Budget ("OMB") control number. Please direct comments concerning the accuracy of the information collection burden estimate and any suggestions for reducing the burden to the Secretary, Securities and Exchange Commission, 450 Fifth Street, NW, Washington, DC 20549-0609. The OMB has reviewed this collection of information under the clearance requirements of 44 U.S.C. § 3507.
| Item 1. | Reports to Stockholders. |

Alambic Small Cap Value Plus Fund (ALAMX)
Alambic Small Cap Growth Plus Fund (ALGSX)
Alambic Mid Cap Value Plus Fund (ALMVX)
Alambic Mid Cap Growth Plus Fund (ALMGX)
Semi-Annual Report
February 28, 2017
(Unaudited)
ALAMBIC FUNDS
LETTER TO SHAREHOLDERS | March 17, 2017 |
The past six months have been busy for Alambic Investment Management LP and Alambic Funds. We completed full calendar years for both the Alambic Small Cap Value Plus and the Alambic Small Cap Growth Plus Funds and, at year end, we seeded and launched two new mid cap funds. We have also published Fact Sheets for the two small cap funds, ALAMX and ALGSX, and posted them to our website www.alambicim.com in the Alambic Funds section and to the funds’ website www.alambicfunds.com.
Meanwhile, US markets experienced discord and volatility both preceding and following the presidential election. While the Dow Jones Industrial Average has impressed with seemingly continuous new highs, there have been large shifts in stock market leadership from the 4th Quarter of 2016 to the 1st Quarter of 2017. Following the election, the rally was led by small caps, cyclicals, value, and low quality names. Since early December, those leaders are now lagging. Small cap stocks are roughly flat since early December, underperforming large caps, and thus eliminating a substantial part of their initial outperformance.
On the positive side, while the impact of corporate tax reform may not be as fruitful as initially anticipated, corporate tax reform combined with deregulation and possible cuts to personal income tax rates could boost the economy and corporate profits over the next few years. Even though small caps are currently trading at extremely high valuations, they are potentially well positioned to benefit from these pro-growth policies while being less exposed to the risks of protectionism.
We have seen several shifts in the drivers of performance over the past six months with larger caps beating smaller caps and higher quality beating lower quality. Value remains expensive to growth and in the past three months, we have seen the fastest growth stocks (based on sales) beat the slowest growth value names by a substantial margin after trailing them for most of last year. We think this will continue until the growth/value relationship swings back to its historical norm.
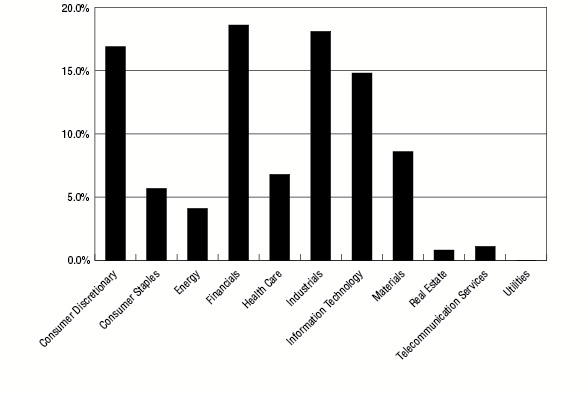
For the six months ended February 28, 2017, ALAMX delivered a return of 11.40% versus its benchmark, the Russell 2000 Value Index, at 15.80%. Since inception, ALAMX has delivered an annualized return of 18.95% versus the Russell 2000 Value at 22.62%. Our tracking error to our benchmark is currently 3.50% annualized, which is slightly lower than the first half of 2016. Our lag to the index was primarily a result of our underweight in financials, which have outperformed every other sector since the election. We also tend to be more heavily weighted than our index in smaller small cap stocks, which have underperformed larger small cap stocks now for several months. Like the relationship between value and growth, these two performance factors tend to be cyclical and could benefit us under different market conditions.
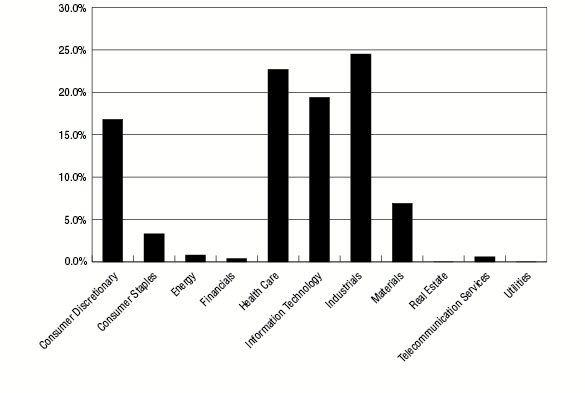
For the six months that ended February 28, 2017, ALGSX delivered a return of 12.57% versus its benchmark, the Russell 2000 Growth Index, at 9.39%. Since inception, ALGSX has delivered an annualized return of 21.40% versus the Russell 2000 Growth at 11.44%. Our tracking error to our benchmark is currently 3.36% annualized, which is a substantial improvement over the third quarter of last year and reflects our efforts to shift the portfolio from value/growth to core/growth. During most of 2016, the slowest growing stocks in the indexes consistently outperformed while the fastest growing stocks in the growth indexes lost ground. Because of our inherent tilt towards fundamental value in all our portfolios, the ALGSX has a value style tilt
1
that benefited us in 2016. To date in 2017, this appears to be shifting and the fastest growers are outperforming more value oriented stocks. In this environment, it will be difficult to repeat the outperformance we experienced in 2016.
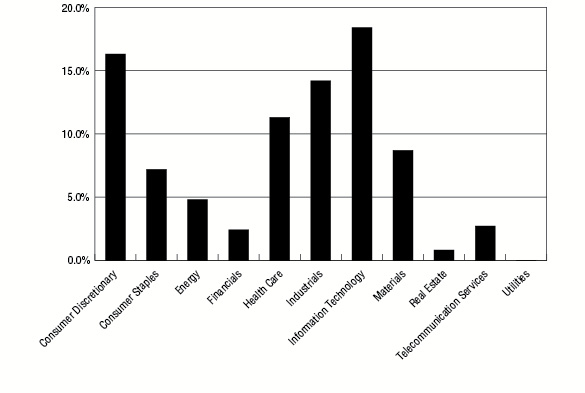
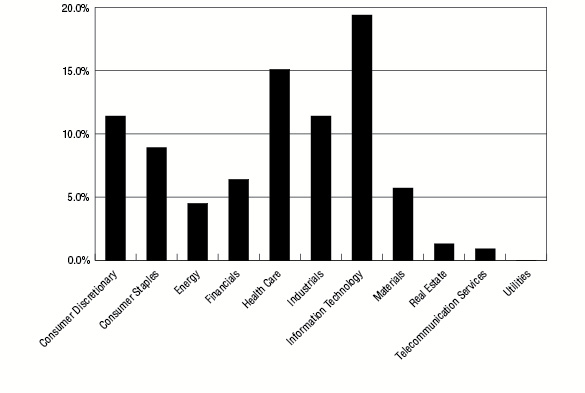
Since the launch of our two new funds ALMVX and ALMGX at year end 2016, we have been actively managing the new portfolios to achieve targeted tracking errors and returns that are in line with our early expectations. For the period since inception through February 28, 2017, ALMVX delivered a return of 4.40% versus its benchmark, the Russell Mid Cap Value Index, at 4.29%. Since inception through late March, ALMVX is up 4.60% versus its benchmark, the Russell Mid Cap Value Index at 3.31% for the same period. For the period since inception through February 28, 2017, ALMGX delivered a return of 5.50% versus its benchmark, the Russell Mid Cap Growth Index, at 5.72%. Since inception through late March, ALMGX is up 5.90% versus the Russell Mid Cap Growth Index at 6.51%. We are still in the process of seeding these new funds and still have much work to do achieving sector and individual stock weights that will produce attractive returns going forward.
Although we have experienced some volatility in the performance of ALAMX relative to our benchmarks recently, we are very pleased with the performance of all four funds since inception, particularly ALGSX and ALMVX, and we are validating our premise that a quantitative approach to fundamental valuation-based stock selection will perform well over time.
Thank you for your ongoing trust and commitment.
Albert Richards | Brian Thompson | Rob Slaymaker |
CEO | CRO | Partner |
2
Past performance is not predictive of future performance. Investment results and principal value will fluctuate so that shares, when redeemed, may be worth more or less than their original cost. Current performance may be higher or lower than the performance data quoted. Performance data current to the most recent month-end are available by calling 1-888-890-8988.
An investor should consider the investment objectives, risks, charges and expenses of the Funds carefully before investing. The Funds’ prospectus contains this and other important information. To obtain a copy of the Funds’ prospectus please visit our website at https://alambicfunds.com or call 1-888-890-8988 and a copy will be sent to you free of charge. Please read the prospectus carefully before you invest. The Alambic Funds are distributed by Ultimus Fund Distributors, LLC.
The Letter to Shareholders seeks to describe some of the Adviser’s current opinions and views of the financial markets. Although the Adviser believes it has a reasonable basis for any opinions or views expressed, actual results may differ, sometimes significantly so, from those expected or expressed. The securities held by the Funds that are discussed in the Letter to Shareholders were held during the period covered by this Report. They do not comprise the entire investment portfolio of the Funds, may be sold at any time and may no longer be held by the Funds. For a complete list of securities held by the Funds as of February 28, 2017, please see the Schedules of Investments sections of the semi-annual report. The opinions of the Adviser with respect to those securities may change at any time.
Statements in the Letter to Shareholders that reflect projections or expectations for future financial or economic performance of the Funds and the market in general and statements of the Funds’ plans and objectives for future operations are forward-looking statements. No assurance can be given that actual results or events will not differ materially from those projected, estimated, assumed, or anticipated in any such forward-looking statements. Important factors that could result in such differences, in addition to factors noted with such forward-looking statements, include, without limitation, general economic conditions, such as inflation, recession, and interest rates. Past performance is not a guarantee of future results.
3
ALAMBIC SMALL CAP VALUE PLUS FUND
PORTFOLIO INFORMATION
February 28, 2017 (Unaudited)
Sector Diversification (% of Net Assets)
Top 10 Equity Holdings
Security Description | % of Net Assets |
MSG Networks, Inc. - Class A | 2.0% |
Greif, Inc. - Class A | 1.6% |
AngioDynamics, Inc. | 1.4% |
YRC Worldwide, Inc. | 1.4% |
SpartanNash Company | 1.4% |
Cohu, Inc. | 1.4% |
Progress Software Corporation | 1.2% |
Knowles Corporation | 1.1% |
Armstrong Flooring, Inc. | 1.1% |
Teradyne, Inc. | 1.1% |
4
ALAMBIC SMALL CAP GROWTH PLUS FUND
PORTFOLIO INFORMATION
February 28, 2017 (Unaudited)
Sector Diversification (% of Net Assets)
Top 10 Equity Holdings
Security Description | % of Net Assets |
Scientific Games Corporation - Class A | 2.0% |
Potbelly Corporation | 1.9% |
Unisys Corporation | 1.7% |
Chase Corporation | 1.7% |
Prestige Brands Holdings, Inc. | 1.7% |
Kimball International, Inc. - Class B | 1.5% |
Chico's FAS, Inc. | 1.5% |
Ironwood Pharmaceuticals, Inc. | 1.5% |
MSG Networks, Inc. - Class A | 1.4% |
American Axle & Manufacturing Holdings, Inc. | 1.3% |
5
ALAMBIC MID CAP VALUE PLUS FUND
PORTFOLIO INFORMATION
February 28, 2017 (Unaudited)
Sector Diversification (% of Net Assets)
Top 10 Equity Holdings
Security Description | % of Net Assets |
Staples, Inc. | 2.0% |
Archer-Daniels-Midland Company | 1.6% |
Baxter International, Inc. | 1.6% |
Computer Sciences Corporation | 1.5% |
CenturyLink, Inc. | 1.4% |
AptarGroup, Inc. | 1.4% |
Greif, Inc. - Class A | 1.3% |
Bunge Ltd. | 1.3% |
Huntsman Corporation | 1.3% |
Carlisle Companies, Inc. | 1.2% |
6
ALAMBIC MID CAP GROWTH PLUS FUND
PORTFOLIO INFORMATION
February 28, 2017 (Unaudited)
Sector Diversification (% of Net Assets)
Top 10 Equity Holdings
Security Description | % of Net Assets |
Booz Allen Hamilton Holding Corporation | 1.4% |
Discovery Communications, Inc. - Series A | 1.3% |
Huntsman Corporation | 1.2% |
Carlisle Companies, Inc. | 1.1% |
Hanesbrands, Inc. | 1.1% |
Dr Pepper Snapple Group, Inc. | 1.1% |
ResMed, Inc. | 1.1% |
Jacobs Engineering Group, Inc. | 1.1% |
Cognizant Technology Solutions Corporation - Class A | 1.0% |
MasTec, Inc. | 0.9% |
7
ALAMBIC SMALL CAP VALUE PLUS FUND
SCHEDULE OF INVESTMENTS
February 28, 2017 (Unaudited) |
COMMON STOCKS — 95.5% | | Shares | | | Value | |
Consumer Discretionary — 16.9% | | | | | | |
Auto Components — 0.6% | | | | | | |
Tower International, Inc. | | | 600 | | | $ | 16,590 | |
| | | | | | | | | |
Diversified Consumer Services — 2.3% | | | | | | | | |
American Public Education, Inc. (a) | | | 300 | | | | 7,245 | |
Ascent Capital Group, Inc. - Class A (a) | | | 1,200 | | | | 19,260 | |
Bridgepoint Education, Inc. (a) | | | 1,600 | | | | 14,928 | |
Career Education Corporation (a) | | | 1,500 | | | | 12,495 | |
K12, Inc. (a) | | | 700 | | | | 12,502 | |
| | | | | | | | 66,430 | |
Hotels, Restaurants & Leisure — 2.3% | | | | | | | | |
Golden Entertainment, Inc. | | | 800 | | | | 9,480 | |
Monarch Casino & Resort, Inc. (a) | | | 700 | | | | 17,836 | |
Potbelly Corporation (a) | | | 400 | | | | 5,220 | |
RCI Hospitality Holdings, Inc. | | | 200 | | | | 3,406 | |
Red Lion Hotels Corporation (a) | | | 1,100 | | | | 8,195 | |
Scientific Games Corporation - Class A (a) | | | 200 | | | | 4,130 | |
Speedway Motorsports, Inc. | | | 800 | | | | 17,056 | |
| | | | | | | | 65,323 | |
Household Durables — 2.0% | | | | | | | | |
Bassett Furniture Industries, Inc. | | | 300 | | | | 8,205 | |
CSS Industries, Inc. | | | 300 | | | | 7,374 | |
Flexsteel Industries, Inc. | | | 300 | | | | 15,084 | |
Hooker Furniture Corporation | | | 200 | | | | 6,600 | |
Hovnanian Enterprises, Inc. - Class A (a) | | | 700 | | | | 1,659 | |
Libbey, Inc. | | | 200 | | | | 2,800 | |
ZAGG, Inc. (a) | | | 2,700 | | | | 16,335 | |
| | | | | | | | 58,057 | |
Internet & Direct Marketing Retail — 0.3% | | | | | | | | |
RetailMeNot, Inc. (a) | | | 1,000 | | | | 8,950 | |
| | | | | | | | | |
Media — 3.8% | | | | | | | | |
Lee Enterprises, Inc. (a) | | | 3,300 | | | | 8,580 | |
MSG Networks, Inc. - Class A (a) | | | 2,600 | | | | 56,680 | |
TEGNA, Inc. | | | 900 | | | | 23,067 | |
Time, Inc. | | | 900 | | | | 15,795 | |
Townsquare Media, Inc. - Class A (a) | | | 240 | | | | 2,609 | |
| | | | | | | | 106,731 | |
Multi-Line Retail — 0.1% | | | | | | | | |
Tuesday Morning Corporation (a) | | | 1,100 | | | | 4,015 | |
8
See accompanying notes to financial statements.
ALAMBIC SMALL CAP VALUE PLUS FUND
SCHEDULE OF INVESTMENTS (Continued) |
COMMON STOCKS — 95.5% (Continued) | | Shares | | | Value | |
Consumer Discretionary — 16.9% (Continued) | | | | | | |
Specialty Retail — 4.6% | | | | | | |
Aaron’s, Inc. | | | 1,100 | | | $ | 30,008 | |
Barnes & Noble Education, Inc. (a) | | | 1,400 | | | | 13,440 | |
Big 5 Sporting Goods Corporation | | | 300 | | | | 4,035 | |
Haverty Furniture Companies, Inc. | | | 700 | | | | 16,240 | |
Office Depot, Inc. | | | 1,300 | | | | 5,421 | |
Rent-A-Center, Inc. | | | 1,000 | | | | 8,670 | |
Shoe Carnival, Inc. | | | 403 | | | | 10,212 | |
Tilly’s, Inc. - Class A | | | 2,405 | | | | 26,527 | |
West Marine, Inc. (a) | | | 14 | | | | 129 | |
Zumiez, Inc. (a) | | | 700 | | | | 14,280 | |
| | | | | | | | 128,962 | |
Textiles, Apparel & Luxury Goods — 0.9% | | | | | | | | |
Deckers Outdoor Corporation (a) | | | 100 | | | | 5,283 | |
Movado Group, Inc. | | | 800 | | | | 19,400 | |
| | | | | | | | 24,683 | |
Consumer Staples — 5.7% | | | | | | | | |
Food & Staples Retailing — 2.9% | | | | | | | | |
Natural Grocers by Vitamin Cottage, Inc. (a) | | | 200 | | | | 2,414 | |
SpartanNash Company | | | 1,100 | | | | 38,390 | |
Village Super Market, Inc. - Class A | | | 1,000 | | | | 29,610 | |
Weis Markets, Inc. | | | 200 | | | | 12,000 | |
| | | | | | | | 82,414 | |
Food Products — 1.4% | | | | | | | | |
Dean Foods Company | | | 800 | | | | 14,592 | |
John B. Sanfilippo & Son, Inc. | | | 150 | | | | 9,210 | |
Omega Protein Corporation | | | 600 | | | | 15,270 | |
| | | | | | | | 39,072 | |
Household Products — 0.4% | | | | | | | | |
Energizer Holdings, Inc. | | | 200 | | | | 10,972 | |
| | | | | | | | | |
Personal Products — 0.5% | | | | | | | | |
Avon Products, Inc. (a) | | | 2,900 | | | | 12,760 | |
| | | | | | | | | |
Tobacco — 0.5% | | | | | | | | |
Universal Corporation | | | 230 | | | | 15,571 | |
| | | | | | | | | |
Energy — 4.1% | | | | | | | | |
Energy Equipment & Services — 1.5% | | | | | | | | |
Archrock, Inc. | | | 264 | | | | 3,603 | |
Gulf Island Fabrication, Inc. | | | 600 | | | | 6,840 | |
Matrix Service Company (a) | | | 600 | | | | 9,720 | |
9
See accompanying notes to financial statements.
ALAMBIC SMALL CAP VALUE PLUS FUND
SCHEDULE OF INVESTMENTS (Continued) |
COMMON STOCKS — 95.5% (Continued) | | Shares | | | Value | |
Energy — 4.1% (Continued) | | | | | | |
Energy Equipment & Services — 1.5% (Continued) | | | | | | |
Natural Gas Services Group, Inc. (a) | | | 200 | | | $ | 5,210 | |
Oceaneering International, Inc. | | | 100 | | | | 2,832 | |
RigNet, Inc. (a) | | | 500 | | | | 8,825 | |
Unit Corporation (a) | | | 200 | | | | 5,428 | |
| | | | | | | | 42,458 | |
Oil, Gas & Consumable Fuels — 2.6% | | | | | | | | |
HollyFrontier Corporation | | | 200 | | | | 5,856 | |
Midstates Petroleum Company, Inc. (a) | | | 300 | | | | 5,979 | |
Northern Oil and Gas, Inc. (a) | | | 1,900 | | | | 5,700 | |
Overseas Shipholding Group, Inc. - Class A | | | 891 | | | | 4,455 | |
Renewable Energy Group, Inc. (a) | | | 1,346 | | | | 11,980 | |
REX American Resources Corporation (a) | | | 320 | | | | 26,630 | |
W&T Offshore, Inc. (a) | | | 1,900 | | | | 4,769 | |
Western Refining, Inc. | | | 200 | | | | 7,304 | |
| | | | | | | | 72,673 | |
Financials — 18.6% | | | | | | | | |
Banks — 15.9% | | | | | | | | |
Associated Banc-Corp | | | 200 | | | | 5,150 | |
BancorpSouth, Inc. | | | 500 | | | | 15,500 | |
Bank of Hawaii Corporation | | | 40 | | | | 3,378 | |
Banner Corporation | | | 50 | | | | 2,906 | |
Cathay General Bancorp | | | 300 | | | | 11,784 | |
Citigroup, Inc. | | | 150 | | | | 8,971 | |
Columbia Banking System, Inc. | | | 350 | | | | 13,961 | |
Community Bank System, Inc. | | | 100 | | | | 5,941 | |
CVB Financial Corporation | | | 400 | | | | 9,500 | |
East West Bancorp, Inc. | | | 100 | | | | 5,412 | |
F.N.B. Corporation | | | 500 | | | | 7,785 | |
First BanCorp (a) | | | 900 | | | | 5,742 | |
First Citizens BancShares, Inc. - Class A | | | 30 | | | | 10,689 | |
First Hawaiian, Inc. | | | 100 | | | | 3,168 | |
First Horizon National Corporation | | | 800 | | | | 15,952 | |
First Interstate BancSystem, Inc. - Class A | | | 50 | | | | 2,192 | |
First Midwest Bancorp, Inc. | | | 200 | | | | 4,886 | |
Fulton Financial Corporation | | | 600 | | | | 11,475 | |
Glacier Bancorp, Inc. | | | 200 | | | | 7,384 | |
Great Western Bancorp, Inc. | | | 150 | | | | 6,411 | |
Hancock Holding Company | | | 250 | | | | 11,862 | |
Hilltop Holdings, Inc. | | | 500 | | | | 14,190 | |
Hope Bancorp, Inc. | | | 700 | | | | 14,980 | |
Huntington Bancshares, Inc. | | | 604 | | | | 8,541 | |
10
See accompanying notes to financial statements.
ALAMBIC SMALL CAP VALUE PLUS FUND
SCHEDULE OF INVESTMENTS (Continued) |
COMMON STOCKS — 95.5% (Continued) | | Shares | | | Value | |
Financials — 18.6% (Continued) | | | | | | |
Banks — 15.9% (Continued) | | | | | | |
IBERIABANK Corporation | | | 150 | | | $ | 12,713 | |
International Bancshares Corporation | | | 150 | | | | 5,708 | |
Investors Bancorp, Inc. | | | 100 | | | | 1,463 | |
LegacyTexas Financial Group, Inc. | | | 200 | | | | 8,518 | |
MB Financial, Inc. | | | 300 | | | | 13,506 | |
NBT Bancorp, Inc. | | | 100 | | | | 4,038 | |
Old National Bancorp | | | 400 | | | | 7,340 | |
PacWest Bancorp | | | 150 | | | | 8,265 | |
Pinnacle Financial Partners, Inc. | | | 50 | | | | 3,470 | |
Popular, Inc. | | | 100 | | | | 4,406 | |
PrivateBancorp, Inc. | | | 250 | | | | 14,150 | |
Prosperity Bancshares, Inc. | | | 250 | | | | 18,635 | |
Renasant Corporation | | | 50 | | | | 2,052 | |
South State Corporation | | | 40 | | | | 3,580 | |
Sterling Bancorp | | | 500 | | | | 12,375 | |
Synovus Financial Corporation | | | 250 | | | | 10,555 | |
TCF Financial Corporation | | | 800 | | | | 13,920 | |
Texas Capital Bancshares, Inc. (a) | | | 150 | | | | 13,373 | |
Tompkins Financial Corporation | | | 20 | | | | 1,794 | |
TowneBank | | | 100 | | | | 3,255 | |
Trustmark Corporation | | | 200 | | | | 6,608 | |
UMB Financial Corporation | | | 170 | | | | 13,399 | |
Umpqua Holdings Corporation | | | 1,000 | | | | 18,810 | |
United Bankshares, Inc. | | | 50 | | | | 2,238 | |
Valley National Bancorp | | | 400 | | | | 4,948 | |
Webster Financial Corporation | | | 350 | | | | 19,226 | |
Wintrust Financial Corporation | | | 200 | | | | 14,740 | |
| | | | | | | | 450,845 | |
Capital Markets — 0.3% | | | | | | | | |
Interactive Brokers Group, Inc. - Class A | | | 100 | | | | 3,671 | |
Stifel Financial Corporation (a) | | | 100 | | | | 5,396 | |
| | | | | | | | 9,067 | |
Insurance — 0.9% | | | | | | | | |
American Equity Investment Life Holding Company | | | 200 | | | | 5,382 | |
CNO Financial Group, Inc. | | | 700 | | | | 14,637 | |
Genworth Financial, Inc. - Class A (a) | | | 700 | | | | 2,863 | |
Kemper Corporation | | | 50 | | | | 2,122 | |
| | | | | | | | 25,004 | |
Mortgage Real Estate Investment Trusts (REITs) — 1.3% | | | | | | | | |
Altisource Residential Corporation | | | 100 | | | | 1,342 | |
Ladder Capital Corporation | | | 700 | | | | 10,101 | |
11
See accompanying notes to financial statements.
ALAMBIC SMALL CAP VALUE PLUS FUND
SCHEDULE OF INVESTMENTS (Continued) |
COMMON STOCKS — 95.5% (Continued) | | Shares | | | Value | |
Financials — 18.6% (Continued) | | | | | | |
Mortgage Real Estate Investment Trusts (REITs) — 1.3% (Continued) | | | | | | |
MFA Financial, Inc. | | | 600 | | | $ | 4,812 | |
New Residential Investment Corporation | | | 500 | | | | 8,435 | |
Starwood Property Trust, Inc. | | | 500 | | | | 11,430 | |
| | | | | | | | 36,120 | |
Thrifts & Mortgage Finance — 0.2% | | | | | | | | |
Radian Group, Inc. | | | 300 | | | | 5,583 | |
| | | | | | | | | |
Health Care — 6.8% | | | | | | | | |
Biotechnology — 1.9% | | | | | | | | |
Acorda Therapeutics, Inc. (a) | | | 500 | | | | 13,225 | |
Array BioPharma, Inc. (a) | | | 1,300 | | | | 14,950 | |
Coherus Biosciences, Inc. (a) | | | 400 | | | | 9,440 | |
Exelixis, Inc. (a) | | | 100 | | | | 2,153 | |
Retrophin, Inc. (a) | | | 400 | | | | 8,508 | |
Versartis, Inc. (a) | | | 300 | | | | 6,555 | |
| | | | | | | | 54,831 | |
Health Care Equipment & Supplies — 3.6% | | | | | | | | |
AngioDynamics, Inc. (a) | | | 2,400 | | | | 39,240 | |
CONMED Corporation | | | 250 | | | | 10,405 | |
Halyard Health, Inc. (a) | | | 700 | | | | 27,342 | |
Invacare Corporation | | | 1,100 | | | | 13,310 | |
Lantheus Holdings, Inc. (a) | | | 800 | | | | 10,240 | |
| | | | | | | | 100,537 | |
Health Care Providers & Services — 0.4% | | | | | | | | |
Five Star Quality Care, Inc. (a) | | | 1,700 | | | | 3,910 | |
National HealthCare Corporation | | | 50 | | | | 3,731 | |
Tivity Health, Inc. (a) | | | 100 | | | | 2,890 | |
| | | | | | | | 10,531 | |
Health Care Technology — 0.7% | | | | | | | | |
Allscripts Healthcare Solutions, Inc. (a) | | | 1,400 | | | | 17,052 | |
Quality Systems, Inc. (a) | | | 200 | | | | 3,052 | |
| | | | | | | | 20,104 | |
Pharmaceuticals — 0.2% | | | | | | | | |
Prestige Brands Holdings, Inc. (a) | | | 100 | | | | 5,662 | |
| | | | | | | | | |
Industrials — 18.1% | | | | | | | | |
Aerospace & Defense — 2.6% | | | | | | | | |
AAR Corporation | | | 100 | | | | 3,442 | |
Moog, Inc. - Class A (a) | | | 400 | | | | 27,032 | |
National Presto Industries, Inc. | | | 300 | | | | 29,880 | |
12
See accompanying notes to financial statements.
ALAMBIC SMALL CAP VALUE PLUS FUND
SCHEDULE OF INVESTMENTS (Continued) |
COMMON STOCKS — 95.5% (Continued) | | Shares | | | Value | |
Industrials — 18.1% (Continued) | | | | | | |
Aerospace & Defense — 2.6% (Continued) | | | | | | |
Triumph Group, Inc. | | | 300 | | | $ | 8,340 | |
Vectrus, Inc. (a) | | | 200 | | | | 4,842 | |
| | | | | | | | 73,536 | |
Air Freight & Logistics — 0.6% | | | | | | | | |
Park-Ohio Holdings Corporation | | | 400 | | | | 17,860 | |
| | | | | | | | | |
Building Products — 2.5% | | | | | | | | |
Armstrong Flooring, Inc. (a) | | | 1,500 | | | | 32,055 | |
Continental Building Products, Inc. (a) | | | 200 | | | | 4,890 | |
Ply Gem Holdings, Inc. (a) | | | 1,500 | | | | 26,100 | |
Quanex Building Products Corporation | | | 400 | | | | 7,820 | |
| | | | | | | | 70,865 | |
Commercial Services & Supplies — 3.2% | | | | | | | | |
ACCO Brands Corporation (a) | | | 800 | | | | 10,720 | |
ARC Document Solutions, Inc. (a) | | | 1,580 | | | | 6,352 | |
Ennis, Inc. | | | 1,700 | | | | 27,795 | |
Essendant, Inc. | | | 1,500 | | | | 23,895 | |
Quad/Graphics, Inc. | | | 700 | | | | 19,005 | |
West Corporation | | | 100 | | | | 2,391 | |
| | | | | | | | 90,158 | |
Construction & Engineering — 1.1% | | | | | | | | |
Goldfield Corporation (The) (a) | | | 612 | | | | 4,437 | |
Sterling Construction Company, Inc. (a) | | | 1,900 | | | | 17,081 | |
Tutor Perini Corporation (a) | | | 300 | | | | 9,135 | |
| | | | | | | | 30,653 | |
Electrical Equipment — 0.1% | | | | | | | | |
Atkore International Group, Inc. (a) | | | 100 | | | | 2,622 | |
General Cable Corporation | | | 100 | | | | 1,670 | |
| | | | | | | | 4,292 | |
Machinery — 4.1% | | | | | | | | |
Alamo Group, Inc. | | | 240 | | | | 18,036 | |
Chart Industries, Inc. (a) | | | 100 | | | | 3,559 | |
Columbus McKinnon Corporation | | | 200 | | | | 5,162 | |
Commercial Vehicle Group, Inc. (a) | | | 2,100 | | | | 13,230 | |
FreightCar America, Inc. | | | 1,000 | | | | 13,710 | |
Gencor Industries, Inc. (a) | | | 650 | | | | 9,262 | |
Harsco Corporation (a) | | | 300 | | | | 4,230 | |
Hurco Companies, Inc. | | | 300 | | | | 8,250 | |
Meritor, Inc. (a) | | | 300 | | | | 4,905 | |
Navistar International Corporation (a) | | | 900 | | | | 24,327 | |
Supreme Industries, Inc. - Class A | | | 300 | | | | 5,865 | |
13
See accompanying notes to financial statements.
ALAMBIC SMALL CAP VALUE PLUS FUND
SCHEDULE OF INVESTMENTS (Continued) |
COMMON STOCKS — 95.5% (Continued) | | Shares | | | Value | |
Industrials — 18.1% (Continued) | | | | | | |
Machinery — 4.1% (Continued) | | | | | | |
Wabash National Corporation | | | 300 | | | $ | 6,345 | |
| | | | | | | | 116,881 | |
Professional Services — 1.5% | | | | | | | | |
Acacia Research Corporation (a) | | | 3,500 | | | | 20,475 | |
Heidrick & Struggles International, Inc. | | | 300 | | | | 7,335 | |
RPX Corporation (a) | | | 600 | | | | 6,450 | |
TrueBlue, Inc. (a) | | | 300 | | | | 7,785 | |
| | | | | | | | 42,045 | |
Road & Rail — 2.3% | | | | | | | | |
ArcBest Corporation | | | 900 | | | | 26,415 | |
YRC Worldwide, Inc. (a) | | | 3,000 | | | | 38,520 | |
| | | | | | | | 64,935 | |
Trading Companies & Distributors — 0.1% | | | | | | | | |
Veritiv Corporation (a) | | | 50 | | | | 2,783 | |
| | | | | | | | | |
Information Technology — 14.8% | | | | | | | | |
Communications Equipment — 1.8% | | | | | | | | |
ARRIS International plc (a) | | | 100 | | | | 2,580 | |
Bel Fuse, Inc. - Class B | | | 1,000 | | | | 26,100 | |
Digi International, Inc. (a) | | | 846 | | | | 10,406 | |
KVH Industries, Inc. (a) | | | 700 | | | | 7,035 | |
Sonus Networks, Inc. (a) | | | 600 | | | | 3,540 | |
| | | | | | | | 49,661 | |
Electronic Equipment, Instruments & Components — 2.3% | | | | | | | | |
Control4 Corporation (a) | | | 600 | | | | 8,958 | |
Insight Enterprises, Inc. (a) | | | 300 | | | | 12,708 | |
Knowles Corporation (a) | | | 1,700 | | | | 32,181 | |
PC Connection, Inc. | | | 100 | | | | 2,676 | |
TTM Technologies, Inc. (a) | | | 500 | | | | 8,080 | |
| | | | | | | | 64,603 | |
Internet Software & Services — 0.4% | | | | | | | | |
Autobytel, Inc. (a) | | | 576 | | | | 7,200 | |
Limelight Networks, Inc. (a) | | | 1,893 | | | | 4,259 | |
MeetMe, Inc. (a) | | | 100 | | | | 483 | |
| | | | | | | | 11,942 | |
IT Services — 2.1% | | | | | | | | |
Convergys Corporation | | | 300 | | | | 6,564 | |
Everi Holdings, Inc. (a) | | | 3,500 | | | | 11,375 | |
NeuStar, Inc. - Class A (a) | | | 400 | | | | 13,260 | |
Unisys Corporation (a) | | | 2,100 | | | | 29,190 | |
| | | | | | | | 60,389 | |
14
See accompanying notes to financial statements.
ALAMBIC SMALL CAP VALUE PLUS FUND
SCHEDULE OF INVESTMENTS (Continued) |
COMMON STOCKS — 95.5% (Continued) | | Shares | | | Value | |
Information Technology — 14.8% (Continued) | | | | | | |
Semiconductors & Semiconductor Equipment — 6.0% | | | | | | |
Cohu, Inc. | | | 2,300 | | | $ | 38,295 | |
IXYS Corporation | | | 1,900 | | | | 23,465 | |
Kopin Corporation (a) | | | 1,100 | | | | 3,883 | |
Photronics, Inc. (a) | | | 1,200 | | | | 12,840 | |
Rambus, Inc. (a) | | | 300 | | | | 3,768 | |
Rudolph Technologies, Inc. (a) | | | 600 | | | | 12,900 | |
Sigma Designs, Inc. (a) | | | 4,700 | | | | 27,495 | |
Teradyne, Inc. | | | 1,100 | | | | 31,284 | |
Xcerra Corporation (a) | | | 2,000 | | | | 17,480 | |
| | | | | | | | 171,410 | |
Software — 2.2% | | | | | | | | |
Jive Software, Inc. (a) | | | 1,256 | | | | 5,527 | |
Progress Software Corporation | | | 1,200 | | | | 34,416 | |
QAD, Inc. - Class A | | | 823 | | | | 22,591 | |
| | | | | | | | 62,534 | |
Materials — 8.6% | | | | | | | | |
Chemicals — 3.5% | | | | | | | | |
Cabot Corporation | | | 300 | | | | 17,394 | |
Codexis, Inc. (a) | | | 1,700 | | | | 6,970 | |
Core Molding Technologies, Inc. (a) | | | 200 | | | | 3,238 | |
Huntsman Corporation | | | 100 | | | | 2,260 | |
Koppers Holdings, Inc. (a) | | | 100 | | | | 4,385 | |
OMNOVA Solutions, Inc. (a) | | | 2,030 | | | | 18,778 | |
Rayonier Advanced Materials, Inc. | | | 300 | | | | 3,978 | |
Stepan Company | | | 400 | | | | 30,244 | |
Tredegar Corporation | | | 600 | | | | 11,400 | |
| | | | | | | | 98,647 | |
Construction Materials — 0.6% | | | | | | | | |
United States Lime & Minerals, Inc. | | | 240 | | | | 18,278 | |
| | | | | | | | | |
Containers & Packaging — 2.4% | | | | | | | | |
Greif, Inc. - Class A | | | 800 | | | | 45,624 | |
UFP Technologies, Inc. (a) | | | 900 | | | | 21,600 | |
| | | | | | | | 67,224 | |
Metals & Mining — 1.8% | | | | | | | | |
AK Steel Holding Corporation (a) | | | 1,900 | | | | 15,827 | |
Cliffs Natural Resources, Inc. (a) | | | 800 | | | | 8,528 | |
Materion Corporation | | | 650 | | | | 22,652 | |
Schnitzer Steel Industries, Inc. - Class A | | | 200 | | | | 4,760 | |
| | | | | | | | 51,767 | |
15
See accompanying notes to financial statements.
ALAMBIC SMALL CAP VALUE PLUS FUND
SCHEDULE OF INVESTMENTS (Continued) |
COMMON STOCKS — 95.5% (Continued) | | Shares | | | Value | |
Materials — 8.6% (Continued) | | | | | | |
Paper & Forest Products — 0.3% | | | | | | |
Domtar Corporation | | | 200 | | | $ | 7,618 | |
| | | | | | | | | |
Real Estate — 0.8% | | | | | | | | |
Equity Real Estate Investment Trusts (REITs) — 0.8% | | | | | | | | |
Cousins Properties, Inc. | | | 200 | | | | 1,710 | |
LaSalle Hotel Properties | | | 100 | | | | 2,890 | |
Monogram Residential Trust, Inc. | | | 200 | | | | 2,058 | |
Pebblebrook Hotel Trust | | | 100 | | | | 2,875 | |
RLJ Lodging Trust | | | 200 | | | | 4,552 | |
Sunstone Hotel Investors, Inc. | | | 300 | | | | 4,425 | |
Uniti Group, Inc. | | | 100 | | | | 2,897 | |
| | | | | | | | 21,407 | |
Telecommunication Services — 1.1% | | | | | | | | |
Diversified Telecommunication Services — 0.6% | | | | | | | | |
CenturyLink, Inc. | | | 700 | | | | 16,982 | |
| | | | | | | | | |
Wireless Telecommunication Services — 0.5% | | | | | | | | |
United States Cellular Corporation (a) | | | 400 | | | | 14,956 | |
| | | | | | | | | |
Total Common Stocks (Cost $2,205,774) | | | | | | $ | 2,705,371 | |
| | |
RIGHTS — 0.0% | | Shares | | | Value | |
Media General, Inc. - CVR (b) (Cost $0) | | | 100 | | | $ | 0 | |
| | | | | | | | | |
Total Investments at Value — 95.5% (Cost $2,205,774) | | | | | | $ | 2,705,371 | |
| | | | | | | | | |
Other Assets in Excess of Liabilities — 4.5% | | | | | | | 128,048 | |
| | | | | | | | | |
Net Assets — 100.0% | | | | | | $ | 2,833,419 | |
CVR - Contingent Value Right. |
(a) | Non-income producing security. |
(b) | Security value has been determined in good faith pursuant to procedures adopted by the Board of Trustees. The total value of such securities is $0 at February 28, 2017, representing 0.0% of net assets (Note 2). |
16
See accompanying notes to financial statements.
ALAMBIC SMALL CAP GROWTH PLUS FUND
SCHEDULE OF INVESTMENTS
February 28, 2017 (Unaudited) |
COMMON STOCKS — 95.4% | | Shares | | | Value | |
Consumer Discretionary — 16.8% | | | | | | |
Auto Components — 1.4% | | | | | | |
American Axle & Manufacturing Holdings, Inc. (a) | | | 1,700 | | | $ | 33,694 | |
Metaldyne Performance Group, Inc. | | | 100 | | | | 2,330 | |
| | | | | | | | 36,024 | |
Diversified Consumer Services — 0.8% | | | | | | | | |
Ascent Capital Group, Inc. - Class A (a) | | | 600 | | | | 9,630 | |
Bridgepoint Education, Inc. (a) | | | 870 | | | | 8,117 | |
Career Education Corporation (a) | | | 300 | | | | 2,499 | |
K12, Inc. (a) | | | 100 | | | | 1,786 | |
| | | | | | | | 22,032 | |
Hotels, Restaurants & Leisure — 6.4% | | | | | | | | |
Bloomin' Brands, Inc. | | | 700 | | | | 11,963 | |
Bojangles', Inc. (a) | | | 700 | | | | 14,735 | |
Eldorado Resorts, Inc. (a) | | | 700 | | | | 11,410 | |
Isle of Capri Casinos, Inc. (a) | | | 300 | | | | 7,287 | |
Nathan's Famous, Inc. (a) | | | 58 | | | | 3,596 | |
Potbelly Corporation (a) | | | 3,800 | | | | 49,590 | |
RCI Hospitality Holdings, Inc. | | | 300 | | | | 5,109 | |
Scientific Games Corporation - Class A (a) | | | 2,500 | | | | 51,625 | |
SeaWorld Entertainment, Inc. | | | 300 | | | | 5,781 | |
Speedway Motorsports, Inc. | | | 100 | | | | 2,132 | |
| | | | | | | | 163,228 | |
Household Durables — 0.7% | | | | | | | | |
Bassett Furniture Industries, Inc. | | | 100 | | | | 2,735 | |
Hooker Furniture Corporation | | | 200 | | | | 6,600 | |
ZAGG, Inc. (a) | | | 1,300 | | | | 7,865 | |
| | | | | | | | 17,200 | |
Internet & Direct Marketing Retail — 2.1% | | | | | | | | |
Nutrisystem, Inc. | | | 700 | | | | 32,550 | |
Shutterfly, Inc. (a) | | | 450 | | | | 20,421 | |
| | | | | | | | 52,971 | |
Media — 2.4% | | | | | | | | |
DISH Network Corporation - Class A (a) | | | 50 | | | | 3,100 | |
Lee Enterprises, Inc. (a) | | | 3,200 | | | | 8,320 | |
MSG Networks, Inc. - Class A (a) | | | 1,700 | | | | 37,060 | |
TEGNA, Inc. | | | 200 | | | | 5,126 | |
tronc, Inc. (a) | | | 500 | | | | 7,300 | |
| | | | | | | | 60,906 | |
Multi-Line Retail — 0.1% | | | | | | | | |
Tuesday Morning Corporation (a) | | | 600 | | | | 2,190 | |
17
See accompanying notes to financial statements.
ALAMBIC SMALL CAP GROWTH PLUS FUND
SCHEDULE OF INVESTMENTS (Continued) |
COMMON STOCKS — 95.4% (Continued) | | Shares | | | Value | |
Consumer Discretionary — 16.8% (Continued) | | | | | | |
Specialty Retail — 2.4% | | | | | | |
Chico's FAS, Inc. | | | 2,575 | | | $ | 37,286 | |
Haverty Furniture Companies, Inc. | | | 500 | | | | 11,600 | |
Select Comfort Corporation (a) | | | 100 | | | | 2,349 | |
Tilly's, Inc. - Class A | | | 1,046 | | | | 11,538 | |
| | | | | | | | 62,773 | |
Textiles, Apparel & Luxury Goods — 0.5% | | | | | | | | |
Columbia Sportswear Company | | | 150 | | | | 8,241 | |
G-III Apparel Group Ltd. (a) | | | 100 | | | | 2,573 | |
Vera Bradley, Inc. (a) | | | 100 | | | | 1,046 | |
| | | | | | | | 11,860 | |
Consumer Staples — 3.3% | | | | | | | | |
Food & Staples Retailing — 0.8% | | | | | | | | |
Chefs' Warehouse, Inc. (The) (a) | | | 400 | | | | 5,600 | |
Natural Grocers by Vitamin Cottage, Inc. (a) | | | 400 | | | | 4,828 | |
SpartanNash Company | | | 150 | | | | 5,235 | |
Weis Markets, Inc. | | | 100 | | | | 6,000 | |
| | | | | | | | 21,663 | |
Food Products — 1.2% | | | | | | | | |
Dean Foods Company | | | 900 | | | | 16,416 | |
Omega Protein Corporation | | | 100 | | | | 2,545 | |
Tootsie Roll Industries, Inc. | | | 300 | | | | 11,745 | |
| | | | | | | | 30,706 | |
Household Products — 0.8% | | | | | | | | |
Energizer Holdings, Inc. | | | 50 | | | | 2,743 | |
HRG Group, Inc. (a) | | | 1,000 | | | | 18,380 | |
| | | | | | | | 21,123 | |
Personal Products — 0.5% | | | | | | | | |
Avon Products, Inc. (a) | | | 700 | | | | 3,080 | |
Medifast, Inc. | | | 200 | | | | 8,968 | |
| | | | | | | | 12,048 | |
Energy — 0.8% | | | | | | | | |
Energy Equipment & Services — 0.3% | | | | | | | | |
Gulf Island Fabrication, Inc. | | | 600 | | | | 6,840 | |
RigNet, Inc. (a) | | | 100 | | | | 1,765 | |
| | | | | | | | 8,605 | |
Oil, Gas & Consumable Fuels — 0.5% | | | | | | | | |
Carrizo Oil & Gas, Inc. (a) | | | 100 | | | | 3,255 | |
Midstates Petroleum Company, Inc. (a) | | | 400 | | | | 7,972 | |
Southwestern Energy Company (a) | | | 100 | | | | 751 | |
| | | | | | | | 11,978 | |
18
See accompanying notes to financial statements.
ALAMBIC SMALL CAP GROWTH PLUS FUND
SCHEDULE OF INVESTMENTS (Continued) |
COMMON STOCKS — 95.4% (Continued) | | Shares | | | Value | |
Financials — 0.4% | | | | | | |
Capital Markets — 0.1% | | | | | | |
Charles Schwab Corporation (The) | | | 100 | | | $ | 4,041 | |
| | | | | | | | | |
Consumer Finance — 0.3% | | | | | | | | |
LendingClub Corporation (a) | | | 1,300 | | | | 6,942 | |
| | | | | | | | | |
Health Care — 22.7% | | | | | | | | |
Biotechnology — 9.3% | | | | | | | | |
AbbVie, Inc. | | | 270 | | | | 16,697 | |
Acorda Therapeutics, Inc. (a) | | | 400 | | | | 10,580 | |
Aevi Genomic Medicine, Inc (a) | | | 359 | | | | 1,684 | |
Arena Pharmaceuticals, Inc. (a) | | | 2,200 | | | | 3,476 | |
Biogen, Inc. (a) | | | 20 | | | | 5,772 | |
BioSpecifics Technologies Corporation (a) | | | 50 | | | | 2,643 | |
Celgene Corporation (a) | | | 80 | | | | 9,881 | |
Coherus Biosciences, Inc. (a) | | | 1,200 | | | | 28,320 | |
Cytokinetics, Inc. (a) | | | 500 | | | | 5,300 | |
Exelixis, Inc. (a) | | | 600 | | | | 12,918 | |
FibroGen, Inc. (a) | | | 200 | | | | 5,000 | |
Genomic Health, Inc. (a) | | | 400 | | | | 12,076 | |
Halozyme Therapeutics, Inc. (a) | | | 1,300 | | | | 16,666 | |
Ironwood Pharmaceuticals, Inc. (a) | | | 2,200 | | | | 37,158 | |
Lexicon Pharmaceuticals, Inc. (a) | | | 200 | | | | 3,210 | |
Myriad Genetics, Inc. (a) | | | 600 | | | | 11,658 | |
Pfenex, Inc. (a) | | | 700 | | | | 5,061 | |
Progenics Pharmaceuticals, Inc. (a) | | | 1,400 | | | | 15,736 | |
SciClone Pharmaceuticals, Inc. (a) | | | 700 | | | | 6,930 | |
Seattle Genetics, Inc. (a) | | | 110 | | | | 7,221 | |
Synergy Pharmaceuticals, Inc. (a) | | | 300 | | | | 1,737 | |
TESARO, Inc. (a) | | | 40 | | | | 7,535 | |
Versartis, Inc. (a) | | | 300 | | | | 6,555 | |
Vertex Pharmaceuticals, Inc. (a) | | | 40 | | | | 3,625 | |
| | | | | | | | 237,439 | |
Health Care Equipment & Supplies — 4.3% | | | | | | | | |
Accuray, Inc. (a) | | | 4,624 | | | | 23,814 | |
AngioDynamics, Inc. (a) | | | 600 | | | | 9,810 | |
FONAR Corporation (a) | | | 100 | | | | 1,850 | |
Halyard Health, Inc. (a) | | | 200 | | | | 7,812 | |
Hill-Rom Holdings, Inc. | | | 460 | | | | 30,567 | |
Hologic, Inc. (a) | | | 350 | | | | 14,203 | |
Insulet Corporation (a) | | | 50 | | | | 2,178 | |
19
See accompanying notes to financial statements.
ALAMBIC SMALL CAP GROWTH PLUS FUND
SCHEDULE OF INVESTMENTS (Continued) |
COMMON STOCKS — 95.4% (Continued) | | Shares | | | Value | |
Health Care — 22.7% (Continued) | | | | | | |
Health Care Equipment & Supplies — 4.3% (Continued) | | | | | | |
Lantheus Holdings, Inc. (a) | | | 623 | | | $ | 7,974 | |
Natus Medical, Inc. (a) | | | 300 | | | | 11,107 | |
| | | | | | | | 109,315 | |
Health Care Providers & Services — 2.8% | | | | | | | | |
Civitas Solutions, Inc. (a) | | | 300 | | | | 5,550 | |
Cross Country Healthcare, Inc. (a) | | | 100 | | | | 1,547 | |
Express Scripts Holding Company (a) | | | 280 | | | | 19,782 | |
Five Star Quality Care, Inc. (a) | | | 1,800 | | | | 4,140 | |
HMS Holdings Corporation (a) | | | 700 | | | | 13,041 | |
Magellan Health, Inc. (a) | | | 220 | | | | 15,213 | |
National Research Corporation - Class A | | | 367 | | | | 6,845 | |
Quorum Health Corporation (a) | | | 700 | | | | 5,985 | |
| | | | | | | | 72,103 | |
Health Care Technology — 1.4% | | | | | | | | |
HealthStream, Inc. (a) | | | 100 | | | | 2,447 | |
Quality Systems, Inc. (a) | | | 2,200 | | | | 33,572 | |
| | | | | | | | 36,019 | |
Life Sciences Tools & Services — 1.7% | | | | | | | | |
Bruker Corporation | | | 800 | | | | 19,320 | |
Charles River Laboratories International, Inc. (a) | | | 80 | | | | 6,958 | |
INC Research Holdings, Inc. - Class A (a) | | | 400 | | | | 17,460 | |
| | | | | | | | 43,738 | |
Pharmaceuticals — 3.2% | | | | | | | | |
Akorn, Inc. (a) | | | 300 | | | | 6,243 | |
Corcept Therapeutics, Inc. (a) | | | 2,100 | | | | 18,879 | |
Depomed, Inc. (a) | | | 200 | | | | 3,278 | |
Nektar Therapeutics (a) | | | 100 | | | | 1,308 | |
Phibro Animal Health Corporation - Class A | | | 300 | | | | 8,355 | |
Prestige Brands Holdings, Inc. (a) | | | 750 | | | | 42,465 | |
| | | | | | | | 80,528 | |
Industrials — 19.4% | | | | | | | | |
Aerospace & Defense — 1.7% | | | | | | | | |
AdvanSix, Inc. (a) | | | 100 | | | | 2,728 | |
Astronics Corporation (a) | | | 200 | | | | 6,702 | |
Moog, Inc. - Class A (a) | | | 150 | | | | 10,137 | |
National Presto Industries, Inc. | | | 180 | | | | 17,928 | |
Vectrus, Inc. (a) | | | 200 | | | | 4,842 | |
| | | | | | | | 42,337 | |
Air Freight & Logistics — 0.1% | | | | | | | | |
Park-Ohio Holdings Corporation | | | 50 | | | | 2,233 | |
20
See accompanying notes to financial statements.
ALAMBIC SMALL CAP GROWTH PLUS FUND
SCHEDULE OF INVESTMENTS (Continued) |
COMMON STOCKS — 95.4% (Continued) | | Shares | | | Value | |
Industrials — 19.4% (Continued) | | | | | | |
Airlines — 0.7% | | | | | | |
Hawaiian Holdings, Inc. (a) | | | 350 | | | $ | 17,027 | |
| | | | | | | | | |
Building Products — 2.7% | | | | | | | | |
American Woodmark Corporation (a) | | | 40 | | | | 3,458 | |
Armstrong Flooring, Inc. (a) | | | 700 | | | | 14,959 | |
Builders FirstSource, Inc. (a) | | | 300 | | | | 3,882 | |
Continental Building Products, Inc. (a) | | | 300 | | | | 7,335 | |
NCI Building Systems, Inc. (a) | | | 383 | | | | 6,128 | |
PGT Innovations, Inc. (a) | | | 300 | | | | 3,015 | |
Ply Gem Holdings, Inc. (a) | | | 1,800 | | | | 31,320 | |
| | | | | | | | 70,097 | |
Commercial Services & Supplies — 3.7% | | | | | | | | |
Brady Corporation - Class A | | | 250 | | | | 9,563 | |
Deluxe Corporation | | | 220 | | | | 16,190 | |
Ennis, Inc. | | | 800 | | | | 13,080 | |
Kimball International, Inc. - Class B | | | 2,351 | | | | 38,556 | |
SP Plus Corporation (a) | | | 400 | | | | 12,900 | |
Steelcase, Inc. - Class A | | | 300 | | | | 4,800 | |
| | | | | | | | 95,089 | |
Construction & Engineering — 1.9% | | | | | | | | |
Argan, Inc. | | | 100 | | | | 6,890 | |
MasTec, Inc. (a) | | | 600 | | | | 23,550 | |
Sterling Construction Company, Inc. (a) | | | 1,900 | | | | 17,081 | |
| | | | | | | | 47,521 | |
Electrical Equipment — 1.8% | | | | | | | | |
Allied Motion Technologies, Inc. | | | 200 | | | | 4,830 | |
Belden, Inc. | | | 120 | | | | 8,478 | |
General Cable Corporation | | | 1,930 | | | | 32,231 | |
| | | | | | | | 45,539 | |
Machinery — 3.5% | | | | | | | | |
Alamo Group, Inc. | | | 20 | | | | 1,503 | |
Altra Industrial Motion Corporation | | | 300 | | | | 11,655 | |
Commercial Vehicle Group, Inc. (a) | | | 2,552 | | | | 16,078 | |
Gencor Industries, Inc. (a) | | | 250 | | | | 3,562 | |
Global Brass & Copper Holdings, Inc. | | | 600 | | | | 20,190 | |
Hillenbrand, Inc. | | | 200 | | | | 7,270 | |
Navistar International Corporation (a) | | | 700 | | | | 18,921 | |
Supreme Industries, Inc. - Class A | | | 600 | | | | 11,730 | |
| | | | | | | | 90,909 | |
21
See accompanying notes to financial statements.
ALAMBIC SMALL CAP GROWTH PLUS FUND
SCHEDULE OF INVESTMENTS (Continued) |
COMMON STOCKS — 95.4% (Continued) | | Shares | | | Value | |
Industrials — 19.4% (Continued) | | | | | | |
Professional Services — 0.7% | | | | | | |
Acacia Research Corporation (a) | | | 2,000 | | | $ | 11,700 | |
GP Strategies Corporation (a) | | | 100 | | | | 2,465 | |
On Assignment, Inc. (a) | | | 100 | | | | 4,719 | |
| | | | | | | | 18,884 | |
Road & Rail — 1.6% | | | | | | | | |
Avis Budget Group, Inc. (a) | | | 100 | | | | 3,458 | |
Heartland Express, Inc. | | | 400 | | | | 8,296 | |
Swift Transportation Company (a) | | | 500 | | | | 10,860 | |
YRC Worldwide, Inc. (a) | | | 1,500 | | | | 19,260 | |
| | | | | | | | 41,874 | |
Trading Companies & Distributors — 1.0% | | | | | | | | |
H&E Equipment Services, Inc. | | | 500 | | | | 13,120 | |
HD Supply Holdings, Inc. (a) | | | 200 | | | | 8,600 | |
Lawson Products, Inc. (a) | | | 100 | | | | 2,765 | |
| | | | | | | | 24,485 | |
Information Technology — 24.5% | | | | | | | | |
Communications Equipment — 1.2% | | | | | | | | |
ARRIS International plc (a) | | | 150 | | | | 3,870 | |
Digi International, Inc. (a) | | | 500 | | | | 6,150 | |
Extreme Networks, Inc. (a) | | | 900 | | | | 5,625 | |
InterDigital, Inc. | | | 20 | | | | 1,681 | |
NETGEAR, Inc. (a) | | | 50 | | | | 2,740 | |
Sonus Networks, Inc. (a) | | | 1,500 | | | | 8,850 | |
| | | | | | | | 28,916 | |
Electronic Equipment, Instruments & Components — 0.9% | | | | | | | | |
Itron, Inc. (a) | | | 50 | | | | 3,235 | |
KEMET Corporation (a) | | | 200 | | | | 2,166 | |
Knowles Corporation (a) | | | 600 | | | | 11,358 | |
Methode Electronics, Inc. | | | 150 | | | | 6,225 | |
| | | | | | | | 22,984 | |
Internet Software & Services — 5.0% | | | | | | | | |
Angie's List, Inc. (a) | | | 1,000 | | | | 5,330 | |
Carbonite, Inc. (a) | | | 200 | | | | 3,890 | |
Care.com, Inc. (a) | | | 1,000 | | | | 10,200 | |
ChannelAdvisor Corporation (a) | | | 1,000 | | | | 10,750 | |
DHI Group, Inc. (a) | | | 548 | | | | 2,712 | |
Endurance International Group Holdings, Inc. (a) | | | 3,300 | | | | 28,050 | |
GTT Communications, Inc. (a) | | | 300 | | | | 8,370 | |
MeetMe, Inc. (a) | | | 2,200 | | | | 10,626 | |
NIC, Inc. | | | 400 | | | | 8,440 | |
Quotient Technology, Inc. (a) | | | 600 | | | | 7,140 | |
22
See accompanying notes to financial statements.
ALAMBIC SMALL CAP GROWTH PLUS FUND
SCHEDULE OF INVESTMENTS (Continued) |
COMMON STOCKS — 95.4% (Continued) | | Shares | | | Value | |
Information Technology — 24.5% (Continued) | | | | | | |
Internet Software & Services — 5.0% (Continued) | | | | | | |
Web.com Group, Inc. (a) | | | 700 | | | $ | 13,475 | |
XO Group, Inc. (a) | | | 1,000 | | | | 18,430 | |
| | | | | | | | 127,413 | |
IT Services — 5.1% | | | | | | | | |
Cardtronics plc - Class A (a) | | | 150 | | | | 6,612 | |
CSG Systems International, Inc. | | | 400 | | | | 15,764 | |
Everi Holdings, Inc. (a) | | | 3,400 | | | | 11,050 | |
EVERTEC, Inc. | | | 100 | | | | 1,685 | |
Lionbridge Technologies, Inc. (a) | | | 1,147 | | | | 6,595 | |
MAXIMUS, Inc. | | | 100 | | | | 5,967 | |
Science Applications International Corporation | | | 20 | | | | 1,740 | |
Syntel, Inc. | | | 700 | | | | 12,383 | |
TeleTech Holdings, Inc. | | | 200 | | | | 6,060 | |
Teradata Corporation (a) | | | 650 | | | | 20,215 | |
Unisys Corporation (a) | | | 3,100 | | | | 43,090 | |
| | | | | | | | 131,161 | |
Semiconductors & Semiconductor Equipment — 5.1% | | | | | | | | |
AXT, Inc. (a) | | | 700 | | | | 4,970 | |
Cirrus Logic, Inc. (a) | | | 550 | | | | 29,744 | |
Cohu, Inc. | | | 800 | | | | 13,320 | |
Entegris, Inc. (a) | | | 100 | | | | 2,120 | |
IXYS Corporation | | | 600 | | | | 7,410 | |
MaxLinear, Inc. - Class A (a) | | | 300 | | | | 7,812 | |
Microsemi Corporation (a) | | | 250 | | | | 12,955 | |
Nanometrics, Inc. (a) | | | 100 | | | | 2,721 | |
Semtech Corporation (a) | | | 300 | | | | 10,035 | |
Sigma Designs, Inc. (a) | | | 600 | | | | 3,510 | |
Synaptics, Inc. (a) | | | 550 | | | | 29,232 | |
Teradyne, Inc. | | | 100 | | | | 2,844 | |
Xcerra Corporation (a) | | | 500 | | | | 4,370 | |
| | | | | | | | 131,043 | |
Software — 6.3% | | | | | | | | |
A10 Networks, Inc. (a) | | | 1,100 | | | | 10,406 | |
American Software, Inc. - Class A | | | 3,000 | | | | 31,020 | |
Aspen Technology, Inc. (a) | | | 500 | | | | 29,070 | |
Barracuda Networks, Inc. (a) | | | 300 | | | | 7,098 | |
Blackbaud, Inc. | | | 50 | | | | 3,576 | |
Fair Isaac Corporation | | | 40 | | | | 5,203 | |
Jive Software, Inc. (a) | | | 6,421 | | | | 28,252 | |
Manhattan Associates, Inc. (a) | | | 250 | | | | 12,537 | |
Monotype Imaging Holdings, Inc. | | | 100 | | | | 2,015 | |
23
See accompanying notes to financial statements.
ALAMBIC SMALL CAP GROWTH PLUS FUND
SCHEDULE OF INVESTMENTS (Continued) |
COMMON STOCKS — 95.4% (Continued) | | Shares | | | Value | |
Information Technology — 24.5% (Continued) | | | | | | |
Software — 6.3% (Continued) | | | | | | |
Nuance Communications, Inc. (a) | | | 500 | | | $ | 8,515 | |
Progress Software Corporation | | | 600 | | | | 17,208 | |
VASCO Data Security International, Inc. (a) | | | 500 | | | | 6,500 | |
| | | | | | | | 161,400 | |
Technology Hardware, Storage & Peripherals — 0.9% | | | | | | | | |
Avid Technology, Inc. (a) | | | 500 | | | | 2,810 | |
Cray, Inc. (a) | | | 300 | | | | 6,255 | |
NCR Corporation (a) | | | 300 | | | | 14,421 | |
| | | | | | | | 23,486 | |
Materials — 6.9% | | | | | | | | |
Chemicals — 5.1% | | | | | | | | |
Chase Corporation | | | 470 | | | | 42,981 | |
Chemours Company (The) | | | 300 | | | | 10,098 | |
Codexis, Inc. (a) | | | 300 | | | | 1,230 | |
Core Molding Technologies, Inc. (a) | | | 100 | | | | 1,619 | |
H.B. Fuller Company | | | 50 | | | | 2,470 | |
Koppers Holdings, Inc. (a) | | | 150 | | | | 6,578 | |
OMNOVA Solutions, Inc. (a) | | | 2,311 | | | | 21,377 | |
PolyOne Corporation | | | 250 | | | | 8,420 | |
Rayonier Advanced Materials, Inc. | | | 478 | | | | 6,338 | |
Stepan Company | | | 20 | | | | 1,512 | |
Trinseo S.A. | | | 390 | | | | 26,969 | |
| | | | | | | | 129,592 | |
Construction Materials — 0.6% | | | | | | | | |
Summit Materials, Inc. - Class A (a) | | | 200 | | | | 4,778 | |
United States Lime & Minerals, Inc. | | | 60 | | | | 4,570 | |
US Concrete, Inc. (a) | | | 100 | | | | 6,300 | |
| | | | | | | | 15,648 | |
Containers & Packaging — 1.0% | | | | | | | | |
Berry Plastics Group, Inc. (a) | | | 135 | | | | 6,795 | |
Greif, Inc. - Class A | | | 250 | | | | 14,257 | |
Multi Packaging Solutions International Ltd. (a) | | | 200 | | | | 3,564 | |
Owens-Illinois, Inc. (a) | | | 100 | | | | 1,980 | |
| | | | | | | | 26,596 | |
Metals & Mining — 0.2% | | | | | | | | |
Materion Corporation | | | 150 | | | | 5,227 | |
24
See accompanying notes to financial statements.
ALAMBIC SMALL CAP GROWTH PLUS FUND
SCHEDULE OF INVESTMENTS (Continued) |
COMMON STOCKS — 95.4% (Continued) | | Shares | | | Value | |
Telecommunication Services — 0.6% | | | | | | |
Diversified Telecommunication Services — 0.6% | | | | | | |
FairPoint Communications, Inc. (a) | | | 200 | | | $ | 3,170 | |
Windstream Holdings, Inc. | | | 1,472 | | | | 10,999 | |
| | | | | | | | 14,169 | |
| | | | | | | | | |
Total Investments at Value — 95.4% (Cost $1,995,947) | | | | | | $ | 2,439,062 | |
| | | | | | | | | |
Other Assets in Excess of Liabilities — 4.6% | | | | | | | 118,253 | |
| | | | | | | | | |
Net Assets — 100.0% | | | | | | $ | 2,557,315 | |
(a) | Non-income producing security. |
25
See accompanying notes to financial statements.
ALAMBIC MID CAP VALUE PLUS FUND
SCHEDULE OF INVESTMENTS
February 28, 2017 (Unaudited) |
COMMON STOCKS — 86.8% | | Shares | | | Value | |
Consumer Discretionary — 16.3% | | | | | | |
Auto Components — 1.1% | | | | | | |
BorgWarner, Inc. | | | 60 | | | $ | 2,532 | |
Goodyear Tire & Rubber Company (The) | | | 140 | | | | 4,907 | |
| | | | | | | | 7,439 | |
Automobiles — 0.9% | | | | | | | | |
Ford Motor Company | | | 180 | | | | 2,256 | |
General Motors Company | | | 60 | | | | 2,210 | |
Thor Industries, Inc. | | | 15 | | | | 1,662 | |
| | | | | | | | 6,128 | |
Hotels, Restaurants & Leisure — 0.4% | | | | | | | | |
Aramark | | | 80 | | | | 2,859 | |
| | | | | | | | | |
Household Durables — 1.9% | | | | | | | | |
CalAtlantic Group, Inc. | | | 120 | | | | 4,240 | |
NVR, Inc. (a) | | | 1 | | | | 1,935 | |
PulteGroup, Inc. | | | 200 | | | | 4,410 | |
Whirlpool Corporation | | | 14 | | | | 2,500 | |
| | | | | | | | 13,085 | |
Internet & Direct Marketing Retail — 0.5% | | | | | | | | |
Liberty Interactive Corporation QVC Group - Series A (a) | | | 180 | | | | 3,398 | |
| | | | | | | | | |
Media — 5.2% | | | | | | | | |
Discovery Communications, Inc. - Series A (a) | | | 200 | | | | 5,752 | |
Meredith Corporation | | | 90 | | | | 5,643 | |
New York Times Company (The) - Class A | | | 350 | | | | 5,040 | |
News Corporation - Class A | | | 500 | | | | 6,410 | |
Regal Entertainment Group - Class A | | | 220 | | | | 4,747 | |
TEGNA, Inc. | | | 320 | | | | 8,202 | |
| | | | | | | | 35,794 | |
Multi-Line Retail — 1.3% | | | | | | | | |
Kohl's Corporation | | | 80 | | | | 3,410 | |
Macy's, Inc. | | | 170 | | | | 5,647 | |
| | | | | | | | 9,057 | |
Specialty Retail — 3.8% | | | | | | | | |
Aaron's, Inc. | | | 210 | | | | 5,729 | |
Best Buy Company, Inc. | | | 60 | | | | 2,648 | |
Gap, Inc. (The) | | | 140 | | | | 3,475 | |
Staples, Inc. | | | 1,550 | | | | 13,934 | |
| | | | | | | | 25,786 | |
26
See accompanying notes to financial statements.
ALAMBIC MID CAP VALUE PLUS FUND
SCHEDULE OF INVESTMENTS (Continued) |
COMMON STOCKS — 86.8% (Continued) | | Shares | | | Value | |
Consumer Discretionary — 16.3% (Continued) | | | | | | |
Textiles, Apparel & Luxury Goods — 1.2% | | | | | | |
Coach, Inc. | | | 40 | | | $ | 1,524 | |
Columbia Sportswear Company | | | 45 | | | | 2,472 | |
PVH Corporation | | | 20 | | | | 1,832 | |
Ralph Lauren Corporation | | | 25 | | | | 1,983 | |
| | | | | | | | 7,811 | |
Consumer Staples — 7.2% | | | | | | | | |
Food & Staples Retailing — 0.7% | | | | | | | | |
Whole Foods Market, Inc. | | | 160 | | | | 4,907 | |
| | | | | | | | | |
Food Products — 6.0% | | | | | | | | |
Archer-Daniels-Midland Company | | | 230 | | | | 10,803 | |
Bunge Ltd. | | | 110 | | | | 9,004 | |
Campbell Soup Company | | | 50 | | | | 2,967 | |
Conagra Brands, Inc. | | | 60 | | | | 2,473 | |
Ingredion, Inc. | | | 5 | | | | 604 | |
J.M. Smucker Company (The) | | | 53 | | | | 7,512 | |
Seaboard Corporation | | | 1 | | | | 3,632 | |
Tyson Foods, Inc. - Class A | | | 60 | | | | 3,754 | |
| | | | | | | | 40,749 | |
Household Products — 0.5% | | | | | | | | |
Energizer Holdings, Inc. | | | 60 | | | | 3,292 | |
| | | | | | | | | |
Energy — 4.8% | | | | | | | | |
Energy Equipment & Services — 1.1% | | | | | | | | |
Baker Hughes, Inc. | | | 125 | | | | 7,535 | |
| | | | | | | | | |
Oil, Gas & Consumable Fuels — 3.7% | | | | | | | | |
Apache Corporation | | | 20 | | | | 1,052 | |
ConocoPhillips | | | 60 | | | | 2,854 | |
Devon Energy Corporation | | | 100 | | | | 4,336 | |
Hess Corporation | | | 20 | | | | 1,029 | |
HollyFrontier Corporation | | | 110 | | | | 3,221 | |
Marathon Oil Corporation | | | 150 | | | | 2,400 | |
Marathon Petroleum Corporation | | | 40 | | | | 1,984 | |
Murphy Oil Corporation | | | 40 | | | | 1,132 | |
Newfield Exploration Company (a) | | | 40 | | | | 1,458 | |
Noble Energy, Inc. | | | 50 | | | | 1,820 | |
Southwestern Energy Company (a) | | | 200 | | | | 1,502 | |
Valero Energy Corporation | | | 20 | | | | 1,359 | |
Williams Companies, Inc. (The) | | | 40 | | | | 1,134 | |
| | | | | | | | 25,281 | |
27
See accompanying notes to financial statements.
ALAMBIC MID CAP VALUE PLUS FUND
SCHEDULE OF INVESTMENTS (Continued) |
COMMON STOCKS — 86.8% (Continued) | | Shares | | | Value | |
Financials — 2.4% | | | | | | |
Banks — 0.3% | | | | | | |
CIT Group, Inc. | | | 40 | | | $ | 1,716 | |
| | | | | | | | | |
Capital Markets — 1.1% | | | | | | | | |
E*TRADE Financial Corporation (a) | | | 40 | | | | 1,380 | |
Franklin Resources, Inc. | | | 40 | | | | 1,722 | |
Northern Trust Corporation | | | 50 | | | | 4,367 | |
| | | | | | | | 7,469 | |
Consumer Finance — 0.6% | | | | | | | | |
Navient Corporation | | | 50 | | | | 770 | |
Synchrony Financial | | | 100 | | | | 3,624 | |
| | | | | | | | 4,394 | |
Insurance — 0.4% | | | | | | | | |
Cincinnati Financial Corporation | | | 15 | | | | 1,095 | |
Principal Financial Group, Inc. | | | 30 | | | | 1,876 | |
| | | | | | | | 2,971 | |
Health Care — 11.3% | | | | | | | | |
Biotechnology — 2.5% | | | | | | | | |
AbbVie, Inc. | | | 50 | | | | 3,092 | |
Exelixis, Inc. (a) | | | 150 | | | | 3,230 | |
Incyte Corporation (a) | | | 10 | | | | 1,331 | |
Ionis Pharmaceuticals, Inc. (a) | | | 30 | | | | 1,493 | |
United Therapeutics Corporation (a) | | | 47 | | | | 6,943 | |
Vertex Pharmaceuticals, Inc. (a) | | | 15 | | | | 1,359 | |
| | | | | | | | 17,448 | |
Health Care Equipment & Supplies — 4.0% | | | | | | | | |
Abbott Laboratories | | | 40 | | | | 1,803 | |
Baxter International, Inc. | | | 210 | | | | 10,693 | |
DENTSPLY SIRONA, Inc. | | | 40 | | | | 2,541 | |
Hill-Rom Holdings, Inc. | | | 60 | | | | 3,987 | |
Hologic, Inc. (a) | | | 100 | | | | 4,058 | |
ResMed, Inc. | | | 10 | | | | 720 | |
Varian Medical Systems, Inc. (a) | | | 15 | | | | 1,258 | |
Zimmer Biomet Holdings, Inc. | | | 20 | | | | 2,342 | |
| | | | | | | | 27,402 | |
Health Care Providers & Services — 1.0% | | | | | | | | |
Brookdale Senior Living, Inc. (a) | | | 100 | | | | 1,440 | |
Express Scripts Holding Company (a) | | | 25 | | | | 1,766 | |
Laboratory Corporation of America Holdings (a) | | | 15 | | | | 2,134 | |
Quest Diagnostics, Inc. | | | 15 | | | | 1,462 | |
| | | | | | | | 6,802 | |
28
See accompanying notes to financial statements.
ALAMBIC MID CAP VALUE PLUS FUND
SCHEDULE OF INVESTMENTS (Continued) |
COMMON STOCKS — 86.8% (Continued) | | Shares | | | Value | |
Health Care — 11.3% (Continued) | | | | | | |
Health Care Technology — 0.4% | | | | | | |
Allscripts Healthcare Solutions, Inc. (a) | | | 200 | | | $ | 2,436 | |
| | | | | | | | | |
Life Sciences Tools & Services — 2.3% | | | | | | | | |
Agilent Technologies, Inc. | | | 100 | | | | 5,130 | |
Bruker Corporation | | | 260 | | | | 6,279 | |
PAREXEL International Corporation (a) | | | 10 | | | | 647 | |
PerkinElmer, Inc. | | | 65 | | | | 3,527 | |
| | | | | | | | 15,583 | |
Pharmaceuticals — 1.1% | | | | | | | | |
Johnson & Johnson | | | 15 | | | | 1,833 | |
Merck & Company, Inc. | | | 30 | | | | 1,976 | |
Pfizer, Inc. | | | 50 | | | | 1,706 | |
Prestige Brands Holdings, Inc. (a) | | | 40 | | | | 2,265 | |
| | | | | | | | 7,780 | |
Industrials — 14.2% | | | | | | | | |
Aerospace & Defense — 2.5% | | | | | | | | |
Arconic, Inc. | | | 260 | | | | 7,485 | |
Moog, Inc. - Class A (a) | | | 25 | | | | 1,690 | |
Textron, Inc. | | | 170 | | | | 8,041 | |
| | | | | | | | 17,216 | |
Air Freight & Logistics — 0.6% | | | | | | | | |
XPO Logistics, Inc. (a) | | | 80 | | | | 4,079 | |
| | | | | | | | | |
Airlines — 2.0% | | | | | | | | |
JetBlue Airways Corporation (a) | | | 410 | | | | 8,184 | |
United Continental Holdings, Inc. (a) | | | 70 | | | | 5,186 | |
| | | | | | | | 13,370 | |
Building Products — 0.4% | | | | | | | | |
Owens Corning | | | 50 | | | | 2,924 | |
| | | | | | | | | |
Construction & Engineering — 1.6% | | | | | | | | |
Fluor Corporation | | | 20 | | | | 1,108 | |
Jacobs Engineering Group, Inc. | | | 70 | | | | 3,949 | |
MasTec, Inc. (a) | | | 30 | | | | 1,177 | |
Quanta Services, Inc. (a) | | | 120 | | | | 4,478 | |
| | | | | | | | 10,712 | |
Industrial Conglomerates — 1.2% | | | | | | | | |
Carlisle Companies, Inc. | | | 82 | | | | 8,471 | |
29
See accompanying notes to financial statements.
ALAMBIC MID CAP VALUE PLUS FUND
SCHEDULE OF INVESTMENTS (Continued) |
COMMON STOCKS — 86.8% (Continued) | | Shares | | | Value | |
Industrials — 14.2% (Continued) | | | | | | |
Machinery — 3.8% | | | | | | |
AGCO Corporation | | | 110 | | | $ | 6,701 | |
Colfax Corporation (a) | | | 40 | | | | 1,522 | |
Crane Company | | | 40 | | | | 2,892 | |
Cummins, Inc. | | | 16 | | | | 2,376 | |
PACCAR, Inc. | | | 120 | | | | 8,017 | |
Parker-Hannifin Corporation | | | 12 | | | | 1,858 | |
Stanley Black & Decker, Inc. | | | 20 | | | | 2,543 | |
| | | | | | | | 25,909 | |
Professional Services — 1.0% | | | | | | | | |
ManpowerGroup, Inc. | | | 70 | | | | 6,793 | |
| | | | | | | | | |
Road & Rail — 0.3% | | | | | | | | |
Ryder System, Inc. | | | 30 | | | | 2,285 | |
| | | | | | | | | |
Trading Companies & Distributors — 0.8% | | | | | | | | |
United Rentals, Inc. (a) | | | 15 | | | | 1,920 | |
WESCO International, Inc. (a) | | | 50 | | | | 3,475 | |
| | | | | | | | 5,395 | |
Information Technology — 18.4% | | | | | | | | |
Communications Equipment — 2.3% | | | | | | | | |
ARRIS International plc (a) | | | 280 | | | | 7,224 | |
Harris Corporation | | | 40 | | | | 4,396 | |
Juniper Networks, Inc. | | | 60 | | | | 1,680 | |
Motorola Solutions, Inc. | | | 30 | | | | 2,369 | |
| | | | | | | | 15,669 | |
Electronic Equipment, Instruments & Components — 2.3% | | | | | | | | |
Avnet, Inc. | | | 100 | | | | 4,608 | |
Corning, Inc. | | | 120 | | | | 3,313 | |
Keysight Technologies, Inc. (a) | | | 70 | | | | 2,632 | |
SYNNEX Corporation | | | 20 | | | | 2,339 | |
Zebra Technologies Corporation - Class A (a) | | | 30 | | | | 2,721 | |
| | | | | | | | 15,613 | |
IT Services — 3.9% | | | | | | | | |
Amdocs Ltd. | | | 50 | | | | 3,032 | |
Computer Sciences Corporation | | | 150 | | | | 10,284 | |
CSRA, Inc. | | | 140 | | | | 4,175 | |
MAXIMUS, Inc. | | | 70 | | | | 4,177 | |
Teradata Corporation (a) | | | 100 | | | | 3,110 | |
Xerox Corporation | | | 250 | | | | 1,860 | |
| | | | | | | | 26,638 | |
30
See accompanying notes to financial statements.
ALAMBIC MID CAP VALUE PLUS FUND
SCHEDULE OF INVESTMENTS (Continued) |
COMMON STOCKS — 86.8% (Continued) | | Shares | | | Value | |
Information Technology — 18.4% (Continued) | | | | | | |
Semiconductors & Semiconductor Equipment — 3.4% | | | | | | |
Cirrus Logic, Inc. (a) | | | 70 | | | $ | 3,786 | |
Cree, Inc. (a) | | | 80 | | | | 2,171 | |
Cypress Semiconductor Corporation | | | 300 | | | | 3,981 | |
Micron Technology, Inc. (a) | | | 80 | | | | 1,875 | |
Qorvo, Inc. (a) | | | 30 | | | | 1,983 | |
QUALCOMM, Inc. | | | 50 | | | | 2,824 | |
Teradyne, Inc. | | | 220 | | | | 6,257 | |
| | | | | | | | 22,877 | |
Software — 5.0% | | | | | | | | |
ANSYS, Inc. (a) | | | 30 | | | | 3,203 | |
Aspen Technology, Inc. (a) | | | 60 | | | | 3,488 | |
CA, Inc. | | | 260 | | | | 8,390 | |
Cadence Design Systems, Inc. (a) | | | 100 | | | | 3,090 | |
Citrix Systems, Inc. (a) | | | 25 | | | | 1,974 | |
Nuance Communications, Inc. (a) | | | 320 | | | | 5,450 | |
Symantec Corporation | | | 60 | | | | 1,714 | |
Synopsys, Inc. (a) | | | 100 | | | | 7,144 | |
| | | | | | | | 34,453 | |
Technology Hardware, Storage & Peripherals — 1.5% | | | | | | | | |
HP, Inc. | | | 180 | | | | 3,126 | |
Western Digital Corporation | | | 95 | | | | 7,304 | |
| | | | | | | | 10,430 | |
Materials — 8.7% | | | | | | | | |
Chemicals — 2.5% | | | | | | | | |
Cabot Corporation | | | 110 | | | | 6,378 | |
Eastman Chemical Company | | | 25 | | | | 2,006 | |
Huntsman Corporation | | | 380 | | | | 8,588 | |
| | | | | | | | 16,972 | |
Containers & Packaging — 3.6% | | | | | | | | |
AptarGroup, Inc. | | | 130 | | | | 9,686 | |
Greif, Inc. - Class A | | | 160 | | | | 9,125 | |
Sonoco Products Company | | | 30 | | | | 1,599 | |
WestRock Company | | | 80 | | | | 4,298 | |
| | | | | | | | 24,708 | |
Metals & Mining — 2.3% | | | | | | | | |
Freeport-McMoRan, Inc. (a) | | | 320 | | | | 4,288 | |
Reliance Steel & Aluminum Company | | | 60 | | | | 5,079 | |
Steel Dynamics, Inc. | | | 120 | | | | 4,392 | |
United States Steel Corporation | | | 50 | | | | 1,936 | |
| | | | | | | | 15,695 | |
31
See accompanying notes to financial statements.
ALAMBIC MID CAP VALUE PLUS FUND
SCHEDULE OF INVESTMENTS (Continued) |
COMMON STOCKS — 86.8% (Continued) | | Shares | | | Value | |
Materials — 8.7% (Continued) | | | | | | |
Paper & Forest Products — 0.3% | | | | | | |
Domtar Corporation | | | 60 | | | $ | 2,286 | |
| | | | | | | | | |
Real Estate — 0.8% | | | | | | | | |
Equity Real Estate Investment Trusts (REITs) — 0.8% | | | | | | | | |
Duke Realty Corporation | | | 40 | | | | 1,025 | |
Prologis, Inc. | | | 40 | | | | 2,042 | |
VEREIT, Inc. | | | 100 | | | | 907 | |
Weyerhaeuser Company | | | 40 | | | | 1,349 | |
| | | | | | | | 5,323 | |
Telecommunication Services — 2.7% | | | | | | | | |
Diversified Telecommunication Services — 1.6% | | | | | | | | |
CenturyLink, Inc. | | | 400 | | | | 9,704 | |
Frontier Communications Corporation | | | 400 | | | | 1,172 | |
| | | | | | | | 10,876 | |
Wireless Telecommunication Services — 1.1% | | | | | | | | |
United States Cellular Corporation (a) | | | 200 | | | | 7,478 | |
| | | | | | | | | |
Total Common Stocks (Cost $580,949) | | | | | | $ | 593,294 | |
| |
RIGHTS — 0.0% | | Shares | | | Value | |
Media General, Inc. - CVR (b) (Cost $0) | | | 120 | | | $ | 0 | |
| | | | | | | | | |
Total Investments at Value — 86.8% (Cost $580,949) | | | | | | $ | 593,294 | |
| | | | | | | | | |
Other Assets in Excess of Liabilities — 13.2% | | | | | | | 90,324 | |
| | | | | | | | | |
Net Assets — 100.0% | | | | | | $ | 683,618 | |
CVR - Contingent Value Right. |
(a) | Non-income producing security. |
(b) | Security value has been determined in good faith pursuant to procedures adopted by the Board of Trustees. The total value of such securities is $0 at February 28, 2017, representing 0.0% of net assets (Note 2). |
32
See accompanying notes to financial statements.
ALAMBIC MID CAP GROWTH PLUS FUND
SCHEDULE OF INVESTMENTS
February 28, 2017 (Unaudited) |
COMMON STOCKS — 85.0% | | Shares | | | Value | |
Consumer Discretionary — 11.4% | | | | | | |
Automobiles — 1.3% | | | | | | |
General Motors Company | | | 80 | | | $ | 2,947 | |
Harley-Davidson, Inc. | | | 50 | | | | 2,819 | |
Thor Industries, Inc. | | | 35 | | | | 3,879 | |
| | | | | | | | 9,645 | |
Distributors — 0.5% | | | | | | | | |
Genuine Parts Company | | | 40 | | | | 3,828 | |
| | | | | | | | | |
Hotels, Restaurants & Leisure — 0.9% | | | | | | | | |
Wyndham Worldwide Corporation | | | 80 | | | | 6,659 | |
| | | | | | | | | |
Household Durables — 0.8% | | | | | | | | |
NVR, Inc. (a) | | | 2 | | | | 3,870 | |
Tempur Sealy International, Inc. (a) | | | 40 | | | | 1,848 | |
| | | | | | | | 5,718 | |
Internet & Direct Marketing Retail — 0.7% | | | | | | | | |
Expedia, Inc. | | | 25 | | | | 2,976 | |
Liberty Interactive Corporation QVC Group - Series A (a) | | | 120 | | | | 2,266 | |
| | | | | | | | 5,242 | |
Leisure Products — 0.6% | | | | | | | | |
Mattel, Inc. | | | 180 | | | | 4,631 | |
| | | | | | | | | |
Media — 2.8% | | | | | | | | |
Cinemark Holdings, Inc. | | | 50 | | | | 2,094 | |
Discovery Communications, Inc. - Series A (a) | | | 340 | | | | 9,778 | |
DISH Network Corporation - Class A (a) | | | 20 | | | | 1,240 | |
News Corporation - Class A | | | 150 | | | | 1,923 | |
Sinclair Broadcast Group, Inc. - Class A | | | 100 | | | | 3,990 | |
Viacom, Inc. - Class B | | | 40 | | | | 1,738 | |
| | | | | | | | 20,763 | |
Multi-Line Retail — 0.4% | | | | | | | | |
Nordstrom, Inc. | | | 70 | | | | 3,266 | |
| | | | | | | | | |
Specialty Retail — 1.1% | | | | | | | | |
Gap, Inc. (The) | | | 160 | | | | 3,971 | |
Staples, Inc. | | | 450 | | | | 4,046 | |
| | | | | | | | 8,017 | |
Textiles, Apparel & Luxury Goods — 2.3% | | | | | | | | |
Carter's, Inc. | | | 15 | | | | 1,320 | |
Columbia Sportswear Company | | | 70 | | | | 3,846 | |
Hanesbrands, Inc. | | | 400 | | | | 8,004 | |
33
See accompanying notes to financial statements.
ALAMBIC MID CAP GROWTH PLUS FUND
SCHEDULE OF INVESTMENTS (Continued) |
COMMON STOCKS — 85.0% (Continued) | | Shares | | | Value | |
Consumer Discretionary — 11.4% (Continued) | | | | | | |
Textiles, Apparel & Luxury Goods — 2.3% (Continued) | | | | | | |
VF Corporation | | | 70 | | | $ | 3,671 | |
| | | | | | | | 16,841 | |
Consumer Staples — 8.9% | | | | | | | | |
Beverages — 1.1% | | | | | | | | |
Dr Pepper Snapple Group, Inc. | | | 85 | | | | 7,942 | |
| | | | | | | | | |
Food & Staples Retailing — 1.7% | | | | | | | | |
CVS Health Corporation | | | 80 | | | | 6,447 | |
US Foods Holding Corporation (a) | | | 220 | | | | 6,061 | |
| | | | | | | | 12,508 | |
Food Products — 4.5% | | | | | | | | |
Archer-Daniels-Midland Company | | | 30 | | | | 1,409 | |
Bunge Ltd. | | | 20 | | | | 1,637 | |
Campbell Soup Company | | | 60 | | | | 3,561 | |
Conagra Brands, Inc. | | | 80 | | | | 3,297 | |
General Mills, Inc. | | | 60 | | | | 3,622 | |
Hershey Company (The) | | | 25 | | | | 2,709 | |
Hormel Foods Corporation | | | 140 | | | | 4,935 | |
Ingredion, Inc. | | | 20 | | | | 2,418 | |
J.M. Smucker Company (The) | | | 25 | | | | 3,543 | |
Tyson Foods, Inc. - Class A | | | 105 | | | | 6,569 | |
| | | | | | | | 33,700 | |
Household Products — 1.6% | | | | | | | | |
Clorox Company (The) | | | 15 | | | | 2,052 | |
Energizer Holdings, Inc. | | | 40 | | | | 2,194 | |
HRG Group, Inc. (a) | | | 120 | | | | 2,206 | |
Kimberly-Clark Corporation | | | 40 | | | | 5,302 | |
| | | | | | | | 11,754 | |
Energy — 4.5% | | | | | | | | |
Energy Equipment & Services — 0.3% | | | | | | | | |
Baker Hughes, Inc. | | | 40 | | | | 2,411 | |
| | | | | | | | | |
Oil, Gas & Consumable Fuels — 4.2% | | | | | | | | |
Apache Corporation | | | 70 | | | | 3,681 | |
ConocoPhillips | | | 100 | | | | 4,757 | |
HollyFrontier Corporation | | | 70 | | | | 2,049 | |
Murphy Oil Corporation | | | 200 | | | | 5,658 | |
Newfield Exploration Company (a) | | | 50 | | | | 1,823 | |
ONEOK, Inc. | | | 75 | | | | 4,054 | |
Southwestern Energy Company (a) | | | 700 | | | | 5,257 | |
Tesoro Corporation | | | 30 | | | | 2,556 | |
34
See accompanying notes to financial statements.
ALAMBIC MID CAP GROWTH PLUS FUND
SCHEDULE OF INVESTMENTS (Continued) |
COMMON STOCKS — 85.0% (Continued) | | Shares | | | Value | |
Energy — 4.5% (Continued) | | | | | | |
Oil, Gas & Consumable Fuels — 4.2% (Continued) | | | | | | |
Valero Energy Corporation | | | 20 | | | $ | 1,359 | |
| | | | | | | | 31,194 | |
Financials — 6.4% | | | | | | | | |
Banks — 2.1% | | | | | | | | |
Bank of the Ozarks, Inc. | | | 30 | | | | 1,642 | |
Citizens Financial Group, Inc. | | | 50 | | | | 1,869 | |
First Hawaiian, Inc. | | | 100 | | | | 3,168 | |
First Republic Bank | | | 25 | | | | 2,346 | |
Signature Bank (a) | | | 20 | | | | 3,150 | |
SVB Financial Group (a) | | | 16 | | | | 3,054 | |
| | | | | | | | 15,229 | |
Capital Markets — 2.8% | | | | | | | | |
Affiliated Managers Group, Inc. | | | 26 | | | | 4,366 | |
Charles Schwab Corporation (The) | | | 60 | | | | 2,425 | |
E*TRADE Financial Corporation (a) | | | 40 | | | | 1,381 | |
Eaton Vance Corporation | | | 30 | | | | 1,399 | |
Invesco Ltd. | | | 80 | | | | 2,575 | |
Moody's Corporation | | | 25 | | | | 2,784 | |
SEI Investments Company | | | 40 | | | | 2,014 | |
T. Rowe Price Group, Inc. | | | 30 | | | | 2,136 | |
TD Ameritrade Holding Corporation | | | 40 | | | | 1,564 | |
| | | | | | | | 20,644 | |
Consumer Finance — 0.5% | | | | | | | | |
Credit Acceptance Corporation (a) | | | 18 | | | | 3,608 | |
| | | | | | | | | |
Diversified Financial Services — 0.2% | | | | | | | | |
CBOE Holdings, Inc. | | | 20 | | | | 1,561 | |
| | | | | | | | | |
Insurance — 0.8% | | | | | | | | |
Brown & Brown, Inc. | | | 40 | | | | 1,724 | |
Marsh & McLennan Companies, Inc. | | | 30 | | | | 2,204 | |
MetLife, Inc. | | | 40 | | | | 2,098 | |
| | | | | | | | 6,026 | |
Health Care — 15.1% | | | | | | | | |
Biotechnology — 4.7% | | | | | | | | |
AbbVie, Inc. | | | 25 | | | | 1,546 | |
Alexion Pharmaceuticals, Inc. (a) | | | 10 | | | | 1,313 | |
Amgen, Inc. | | | 10 | | | | 1,765 | |
Biogen, Inc. (a) | | | 18 | | | | 5,195 | |
BioMarin Pharmaceutical, Inc. (a) | | | 15 | | | | 1,409 | |
Celgene Corporation (a) | | | 18 | | | | 2,223 | |
35
See accompanying notes to financial statements.
ALAMBIC MID CAP GROWTH PLUS FUND
SCHEDULE OF INVESTMENTS (Continued) |
COMMON STOCKS — 85.0% (Continued) | | Shares | | | Value | |
Health Care — 15.1% (Continued) | | | | | | |
Biotechnology — 4.7% (Continued) | | | | | | |
Exelixis, Inc. (a) | | | 50 | | | $ | 1,077 | |
Gilead Sciences, Inc. | | | 30 | | | | 2,114 | |
Incyte Corporation (a) | | | 14 | | | | 1,863 | |
Ionis Pharmaceuticals, Inc. (a) | | | 60 | | | | 2,986 | |
OPKO Health, Inc. (a) | | | 200 | | | | 1,678 | |
Regeneron Pharmaceuticals, Inc. (a) | | | 14 | | | | 5,229 | |
Seattle Genetics, Inc. (a) | | | 35 | | | | 2,298 | |
Vertex Pharmaceuticals, Inc. (a) | | | 45 | | | | 4,078 | |
| | | | | | | | 34,774 | |
Health Care Equipment & Supplies — 3.9% | | | | | | | | |
Becton, Dickinson and Company | | | 8 | | | | 1,464 | |
C.R. Bard, Inc. | | | 10 | | | | 2,452 | |
Edwards Lifesciences Corporation (a) | | | 60 | | | | 5,642 | |
Hill-Rom Holdings, Inc. | | | 60 | | | | 3,987 | |
Hologic, Inc. (a) | | | 70 | | | | 2,841 | |
ResMed, Inc. | | | 110 | | | | 7,923 | |
Varian Medical Systems, Inc. (a) | | | 40 | | | | 3,356 | |
Zimmer Biomet Holdings, Inc. | | | 10 | | | | 1,171 | |
| | | | | | | | 28,836 | |
Health Care Providers & Services — 1.1% | | | | | | | | |
Express Scripts Holding Company (a) | | | 70 | | | | 4,945 | |
McKesson Corporation | | | 20 | | | | 3,003 | |
| | | | | | | | 7,948 | |
Health Care Technology — 0.1% | | | | | | | | |
athenahealth, Inc. (a) | | | 10 | | | | 1,179 | |
| | | | | | | | | |
Life Sciences Tools & Services — 3.5% | | | | | | | | |
Bruker Corporation | | | 140 | | | | 3,381 | |
Charles River Laboratories International, Inc. (a) | | | 25 | | | | 2,174 | |
INC Research Holdings, Inc. - Class A (a) | | | 20 | | | | 873 | |
PAREXEL International Corporation (a) | | | 40 | | | | 2,588 | |
PerkinElmer, Inc. | | | 120 | | | | 6,511 | |
Quintiles IMS Holdings, Inc. (a) | | | 50 | | | | 3,870 | |
Thermo Fisher Scientific, Inc. | | | 40 | | | | 6,307 | |
| | | | | | | | 25,704 | |
Pharmaceuticals — 1.8% | | | | | | | | |
Bristol-Myers Squibb Company | | | 50 | | | | 2,836 | |
Eli Lilly & Company | | | 20 | | | | 1,656 | |
Prestige Brands Holdings, Inc. (a) | | | 120 | | | | 6,795 | |
Zoetis, Inc. | | | 40 | | | | 2,132 | |
| | | | | | | | 13,419 | |
36
See accompanying notes to financial statements.
ALAMBIC MID CAP GROWTH PLUS FUND
SCHEDULE OF INVESTMENTS (Continued) |
COMMON STOCKS — 85.0% (Continued) | | Shares | | | Value | |
Industrials — 11.4% | | | | | | |
Aerospace & Defense — 1.8% | | | | | | |
Arconic, Inc. | | | 80 | | | $ | 2,303 | |
Curtiss-Wright Corporation | | | 40 | | | | 3,913 | |
Moog, Inc. - Class A (a) | | | 20 | | | | 1,352 | |
Spirit AeroSystems Holdings, Inc. - Class A | | | 20 | | | | 1,232 | |
Textron, Inc. | | | 100 | | | | 4,730 | |
| | | | | | | | 13,530 | |
Air Freight & Logistics — 0.4% | | | | | | | | |
FedEx Corporation | | | 14 | | | | 2,702 | |
| | | | | | | | | |
Airlines — 1.8% | | | | | | | | |
Alaska Air Group, Inc. | | | 40 | | | | 3,913 | |
Delta Air Lines, Inc. | | | 80 | | | | 3,994 | |
Hawaiian Holdings, Inc. (a) | | | 60 | | | | 2,919 | |
JetBlue Airways Corporation (a) | | | 120 | | | | 2,395 | |
| | | | | | | | 13,221 | |
Commercial Services & Supplies — 0.2% | | | | | | | | |
Deluxe Corporation | | | 25 | | | | 1,840 | |
| | | | | | | | | |
Construction & Engineering — 2.0% | | | | | | | | |
Jacobs Engineering Group, Inc. | | | 140 | | | | 7,897 | |
MasTec, Inc. (a) | | | 180 | | | | 7,065 | |
| | | | | | | | 14,962 | |
Electrical Equipment — 0.6% | | | | | | | | |
Belden, Inc. | | | 20 | | | | 1,413 | |
Rockwell Automation, Inc. | | | 20 | | | | 3,022 | |
| | | | | | | | 4,435 | |
Industrial Conglomerates — 1.3% | | | | | | | | |
3M Company | | | 10 | | | | 1,864 | |
Carlisle Companies, Inc. | | | 78 | | | | 8,057 | |
| | | | | | | | 9,921 | |
Machinery — 1.5% | | | | | | | | |
Crane Company | | | 70 | | | | 5,060 | |
Snap-on, Inc. | | | 35 | | | | 5,939 | |
| | | | | | | | 10,999 | |
Professional Services — 0.3% | | | | | | | | |
Robert Half International, Inc. | | | 30 | | | | 1,447 | |
TransUnion (a) | | | 20 | | | | 742 | |
| | | | | | | | 2,189 | |
Road & Rail — 0.6% | | | | | | | | |
Avis Budget Group, Inc. (a) | | | 40 | | | | 1,383 | |
Swift Transportation Company (a) | | | 140 | | | | 3,041 | |
| | | | | | | | 4,424 | |
37
See accompanying notes to financial statements.
ALAMBIC MID CAP GROWTH PLUS FUND
SCHEDULE OF INVESTMENTS (Continued) |
COMMON STOCKS — 85.0% (Continued) | | Shares | | | Value | |
Industrials — 11.4% (Continued) | | | | | | |
Trading Companies & Distributors — 0.9% | | | | | | |
United Rentals, Inc. (a) | | | 50 | | | $ | 6,402 | |
| | | | | | | | | |
Information Technology — 19.4% | | | | | | | | |
Communications Equipment — 1.2% | | | | | | | | |
ARRIS International plc (a) | | | 140 | | | | 3,612 | |
CommScope Holding Company, Inc. (a) | | | 50 | | | | 1,902 | |
Harris Corporation | | | 10 | | | | 1,099 | |
Juniper Networks, Inc. | | | 80 | | | | 2,240 | |
| | | | | | | | 8,853 | |
Electronic Equipment, Instruments & Components — 1.1% | | | | | | | | |
CDW Corporation | | | 100 | | | | 5,890 | |
Zebra Technologies Corporation - Class A (a) | | | 25 | | | | 2,268 | |
| | | | | | | | 8,158 | |
Internet Software & Services — 1.5% | | | | | | | | |
eBay, Inc. (a) | | | 60 | | | | 2,034 | |
GoDaddy, Inc. - Class A (a) | | | 50 | | | | 1,842 | |
IAC/InterActiveCorp (a) | | | 50 | | | | 3,697 | |
Zillow Group, Inc. - Class C (a) | | | 100 | | | | 3,394 | |
| | | | | | | | 10,967 | |
IT Services — 4.9% | | | | | | | | |
Booz Allen Hamilton Holding Corporation | | | 300 | | | | 10,731 | |
Cognizant Technology Solutions Corporation - Class A (a) | | | 120 | | | | 7,112 | |
Computer Sciences Corporation | | | 25 | | | | 1,714 | |
CSRA, Inc. | | | 100 | | | | 2,982 | |
DST Systems, Inc. | | | 10 | | | | 1,196 | |
MAXIMUS, Inc. | | | 50 | | | | 2,984 | |
Science Applications International Corporation | | | 40 | | | | 3,479 | |
Teradata Corporation (a) | | | 200 | | | | 6,220 | |
| | | | | | | | 36,418 | |
Semiconductors & Semiconductor Equipment — 4.3% | | | | | | | | |
Applied Materials, Inc. | | | 60 | | | | 2,173 | |
Cirrus Logic, Inc. (a) | | | 80 | | | | 4,327 | |
Cree, Inc. (a) | | | 60 | | | | 1,628 | |
Lam Research Corporation | | | 15 | | | | 1,778 | |
Maxim Integrated Products, Inc. | | | 80 | | | | 3,544 | |
Microsemi Corporation (a) | | | 20 | | | | 1,036 | |
NVIDIA Corporation | | | 55 | | | | 5,581 | |
QUALCOMM, Inc. | | | 60 | | | | 3,389 | |
Skyworks Solutions, Inc. | | | 55 | | | | 5,215 | |
Texas Instruments, Inc. | | | 40 | | | | 3,065 | |
| | | | | | | | 31,736 | |
38
See accompanying notes to financial statements.
ALAMBIC MID CAP GROWTH PLUS FUND
SCHEDULE OF INVESTMENTS (Continued) |
COMMON STOCKS — 85.0% (Continued) | | Shares | | | Value | |
Information Technology — 19.4% (Continued) | | | | | | |
Software — 5.8% | | | | | | |
Activision Blizzard, Inc. | | | 40 | | | $ | 1,805 | |
ANSYS, Inc. (a) | | | 20 | | | | 2,135 | |
Aspen Technology, Inc. (a) | | | 50 | | | | 2,907 | |
CA, Inc. | | | 50 | | | | 1,614 | |
Cadence Design Systems, Inc. (a) | | | 160 | | | | 4,944 | |
CDK Global, Inc. | | | 75 | | | | 4,982 | |
Citrix Systems, Inc. (a) | | | 45 | | | | 3,553 | |
Electronic Arts, Inc. (a) | | | 20 | | | | 1,730 | |
Fair Isaac Corporation | | | 30 | | | | 3,902 | |
Manhattan Associates, Inc. (a) | | | 80 | | | | 4,012 | |
Nuance Communications, Inc. (a) | | | 160 | | | | 2,725 | |
Red Hat, Inc. (a) | | | 20 | | | | 1,656 | |
SS&C Technologies Holdings, Inc. | | | 80 | | | | 2,802 | |
Take-Two Interactive Software, Inc. (a) | | | 80 | | | | 4,558 | |
| | | | | | | | 43,325 | |
Technology Hardware, Storage & Peripherals — 0.6% | | | | | | | | |
NCR Corporation (a) | | | 60 | | | | 2,884 | |
Western Digital Corporation | | | 20 | | | | 1,538 | |
| | | | | | | | 4,422 | |
Materials — 5.7% | | | | | | | | |
Chemicals — 2.0% | | | | | | | | |
Chemours Company (The) | | | 100 | | | | 3,366 | |
Huntsman Corporation | | | 390 | | | | 8,814 | |
Trinseo S.A. | | | 35 | | | | 2,420 | |
| | | | | | | | 14,600 | |
Containers & Packaging — 2.4% | | | | | | | | |
AptarGroup, Inc. | | | 90 | | | | 6,706 | |
Greif, Inc. - Class A | | | 90 | | | | 5,133 | |
Packaging Corporation of America | | | 30 | | | | 2,773 | |
Sonoco Products Company | | | 60 | | | | 3,199 | |
| | | | | | | | 17,811 | |
Metals & Mining — 1.3% | | | | | | | | |
Freeport-McMoRan, Inc. (a) | | | 200 | | | | 2,680 | |
Reliance Steel & Aluminum Company | | | 30 | | | | 2,540 | |
Steel Dynamics, Inc. | | | 89 | | | | 3,257 | |
United States Steel Corporation | | | 40 | | | | 1,549 | |
| | | | | | | | 10,026 | |
Real Estate — 1.3% | | | | | | | | |
Equity Real Estate Investment Trusts (REITs) — 0.6% | | | | | | | | |
Extra Space Storage, Inc. | | | 30 | | | | 2,376 | |
Public Storage | | | 10 | | | | 2,274 | |
| | | | | | | | 4,650 | |
39
See accompanying notes to financial statements.
ALAMBIC MID CAP GROWTH PLUS FUND
SCHEDULE OF INVESTMENTS (Continued) |
COMMON STOCKS — 85.0% (Continued) | | Shares | | | Value | |
Real Estate — 1.3% (Continued) | | | | | | |
Real Estate Management & Development — 0.7% | | | | | | |
CBRE Group, Inc. - Class A (a) | | | 140 | | | $ | 4,987 | |
| | | | | | | | | |
Telecommunication Services — 0.9% | | | | | | | | |
Diversified Telecommunication Services — 0.5% | | | | | | | | |
CenturyLink, Inc. | | | 80 | | | | 1,941 | |
Verizon Communications, Inc. | | | 30 | | | | 1,489 | |
| | | | | | | | 3,430 | |
Wireless Telecommunication Services — 0.4% | | | | | | | | |
United States Cellular Corporation (a) | | | 80 | | | | 2,991 | |
| | | | | | | | | |
Total Investments at Value — 85.0% (Cost $608,679) | | | | | | $ | 630,046 | |
| | | | | | | | | |
Other Assets in Excess of Liabilities — 15.0% | | | | | | | 111,119 | |
| | | | | | | | | |
Net Assets — 100.0% | | | | | | $ | 741,165 | |
(a) | Non-income producing security. |
40
See accompanying notes to financial statements.
ALAMBIC FUNDS
STATEMENTS OF ASSETS AND LIABILITIES
February 28, 2017 (Unaudited) |
| | Alambic Small Cap Value Plus Fund | | | Alambic Small Cap Growth Plus Fund | |
ASSETS | | | | | | |
Investments in securities: | | | | | | |
At acquisition cost | | $ | 2,205,774 | | | $ | 1,995,947 | |
At value (Note 2) | | $ | 2,705,371 | | | $ | 2,439,062 | |
Cash (Note 2) | | | 111,910 | | | | 91,162 | |
Dividends receivable | | | 3,505 | | | | 1,259 | |
Receivable for investment securities sold | | | 39,504 | | | | 83,914 | |
Receivable from Adviser (Note 4) | | | 12,015 | | | | 10,890 | |
Other assets | | | 9,374 | | | | 9,281 | |
Total assets | | | 2,881,679 | | | | 2,635,568 | |
| | | | | | | | | |
LIABILITIES | | | | | | | | |
Payable for investment securities purchased | | | 35,878 | | | | 65,938 | |
Payable for capital shares redeemed | | | 15 | | | | — | |
Payable to administrator (Note 4) | | | 6,522 | | | | 6,520 | |
Other accrued expenses | | | 5,845 | | | | 5,795 | |
Total liabilities | | | 48,260 | | | | 78,253 | |
| | | | | | | | | |
NET ASSETS | | $ | 2,833,419 | | | $ | 2,557,315 | |
| | | | | | | | | |
NET ASSETS CONSIST OF: | | | | | | | | |
Paid-in capital | | $ | 2,203,517 | | | $ | 2,017,875 | |
Accumulated net investment income (loss) | | | 1,525 | | | | (5,689 | ) |
Accumulated net realized gains from security transactions | | | 128,780 | | | | 102,014 | |
Net unrealized appreciation on investments | | | 499,597 | | | | 443,115 | |
NET ASSETS | | $ | 2,833,419 | | | $ | 2,557,315 | |
| | | | | | | | | |
Shares of beneficial interest outstanding (unlimited number of shares authorized, no par value) | | | 219,948 | | | | 203,869 | |
| | | | | | | | | |
Net asset value, offering price and redemption price (Note 2) | | $ | 12.88 | | | $ | 12.54 | |
See accompanying notes to financial statements. |
41
ALAMBIC FUNDS
STATEMENTS OF ASSETS AND LIABILITIES
February 28, 2017 (Unaudited) (Continued) |
| | Alambic Mid Cap Value Plus Fund | | | Alambic Mid Cap Growth Plus Fund | |
ASSETS | | | | | | |
Investments in securities: | | | | | | |
At acquisition cost | | $ | 580,949 | | | $ | 608,679 | |
At value (Note 2) | | $ | 593,294 | | | $ | 630,046 | |
Cash (Note 2) | | | 90,208 | | | | 113,623 | |
Dividends receivable | | | 876 | | | | 956 | |
Receivable for investment securities sold | | | 33,971 | | | | 8,783 | |
Receivable from Adviser (Note 4) | | | 11,155 | | | | 11,119 | |
Total assets | | | 729,504 | | | | 764,527 | |
| | | | | | | | | |
LIABILITIES | | | | | | | | |
Payable for investment securities purchased | | | 34,586 | | | | 12,061 | |
Payable to administrator (Note 4) | | | 6,005 | | | | 6,006 | |
Other accrued expenses | | | 5,295 | | | | 5,295 | |
Total liabilities | | | 45,886 | | | | 23,362 | |
| | | | | | | | | |
NET ASSETS | | $ | 683,618 | | | $ | 741,165 | |
| | | | | | | | | |
NET ASSETS CONSIST OF: | | | | | | | | |
Paid-in capital | | $ | 658,596 | | | $ | 709,635 | |
Accumulated net investment income | | | 324 | | | | 426 | |
Accumulated net realized gains from security transactions | | | 12,353 | | | | 9,737 | |
Net unrealized appreciation on investments | | | 12,345 | | | | 21,367 | |
NET ASSETS | | $ | 683,618 | | | $ | 741,165 | |
| | | | | | | | | |
Shares of beneficial interest outstanding (unlimited number of shares authorized, no par value) | | | 65,477 | | | | 70,238 | |
| | | | | | | | | |
Net asset value, offering price and redemption price (Note 2) | | $ | 10.44 | | | $ | 10.55 | |
See accompanying notes to financial statements. |
42
ALAMBIC FUNDS
STATEMENTS OF OPERATIONS
For the Six Months Ended February 28, 2017 (Unaudited) |
| | Alambic Small Cap Value Plus Fund | | | Alambic Small Cap Growth Plus Fund | |
INVESTMENT INCOME | | | | | | |
Dividend income | | $ | 21,847 | | | $ | 10,160 | |
Foreign withholding taxes on dividends | | | (3 | ) | | | — | |
Total investment income | | | 21,844 | | | | 10,160 | |
| | | | | | | | | |
EXPENSES | | | | | | | | |
Professional fees | | | 19,701 | | | | 19,701 | |
Fund accounting fees (Note 4) | | | 13,636 | | | | 12,619 | |
Administration fees (Note 4) | | | 13,500 | | | | 12,500 | |
Investment advisory fees (Note 4) | | | 12,858 | | | | 11,203 | |
Custody and bank service fees | | | 6,648 | | | | 6,633 | |
Compliance fees (Note 4) | | | 6,000 | | | | 6,000 | |
Transfer agent fees (Note 4) | | | 6,000 | | | | 6,000 | |
Trustees' fees and expenses (Note 4) | | | 4,989 | | | | 4,989 | |
Registration and filing fees | | | 2,086 | | | | 1,971 | |
Pricing costs | | | 1,793 | | | | 1,943 | |
Postage and supplies | | | 1,688 | | | | 1,284 | |
Printing of shareholder reports | | | 1,363 | | | | 1,363 | |
Other expenses | | | 4,858 | | | | 6,209 | |
Total expenses | | | 95,120 | | | | 92,415 | |
Less fee reductions and expense reimbursements by the Adviser (Note 4) | | | (78,878 | ) | | | (78,263 | ) |
Net expenses | | | 16,242 | | | | 14,152 | |
| | | | | | | | | |
NET INVESTMENT INCOME (LOSS) | | | 5,602 | | | | (3,992 | ) |
| | | | | | | | | |
REALIZED AND UNREALIZED GAINS
ON INVESTMENTS | | | | | | | | |
Net realized gains from investment transactions | | | 187,473 | | | | 121,308 | |
Net change in unrealized appreciation (depreciation) on investments | | | 100,360 | | | | 165,966 | |
NET REALIZED AND UNREALIZED GAINS ON INVESTMENTS | | | 287,833 | | | | 287,274 | |
| | | | | | | | | |
NET INCREASE IN NET ASSETS RESULTING FROM OPERATIONS | | $ | 293,435 | | | $ | 283,282 | |
See accompanying notes to financial statements. |
43
ALAMBIC FUNDS
STATEMENTS OF OPERATIONS
For the Period Ended February 28, 2017 (a) (Unaudited) |
| | Alambic Mid Cap Value Plus Fund | | | Alambic Mid Cap Growth Plus Fund | |
INVESTMENT INCOME | | | | | | |
Dividend income | | $ | 1,078 | | | $ | 1,218 | |
| | | | | | | | | |
EXPENSES | | | | | | | | |
Professional fees | | | 4,419 | | | | 4,419 | |
Fund accounting fees (Note 4) | | | 4,009 | | | | 4,010 | |
Administration fees (Note 4) | | | 4,000 | | | | 4,000 | |
Trustees' fees and expenses (Note 4) | | | 3,880 | | | | 3,880 | |
Compliance fees (Note 4) | | | 2,000 | | | | 2,000 | |
Transfer agent fees (Note 4) | | | 2,000 | | | | 2,000 | |
Custody and bank service fees | | | 1,911 | | | | 1,911 | |
Registration and filing fees | | | 1,175 | | | | 1,175 | |
Postage and supplies | | | 650 | | | | 650 | |
Investment advisory fees (Note 4) | | | 621 | | | | 652 | |
Printing of shareholder reports | | | 510 | | | | 510 | |
Pricing costs | | | 500 | | | | 500 | |
Other expenses | | | 527 | | | | 527 | |
Total expenses | | | 26,202 | | | | 26,234 | |
Less fee reductions and expense reimbursements by the Adviser (Note 4) | | | (25,448 | ) | | | (25,442 | ) |
Net expenses | | | 754 | | | | 792 | |
| | | | | | | | | |
NET INVESTMENT INCOME | | | 324 | | | | 426 | |
| | | | | | | | | |
REALIZED AND UNREALIZED GAINS ON INVESTMENTS | | | | | | | | |
Net realized gains from investment transactions | | | 12,353 | | | | 9,737 | |
Net change in unrealized appreciation (depreciation) on investments | | | 12,345 | | | | 21,367 | |
NET REALIZED AND UNREALIZED GAINS ON INVESTMENTS | | | 24,698 | | | | 31,104 | |
| | | | | | | | | |
NET INCREASE IN NET ASSETS RESULTING FROM OPERATIONS | | $ | 25,022 | | | $ | 31,530 | |
(a) | Represents the period from the commencement of operations (December 29, 2016) through February 28, 2017. |
See accompanying notes to financial statements. |
44
ALAMBIC SMALL CAP VALUE PLUS FUND
STATEMENTS OF CHANGES IN NET ASSETS |
| | Six Months
Ended
February 28,
2017
(Unaudited) | | | Period
Ended
August 31,
2016(a) | |
FROM OPERATIONS | | | | | | |
Net investment income | | $ | 5,602 | | | $ | 11,157 | |
Net realized gains (losses) from security transactions | | | 187,473 | | | | (58,693 | ) |
Net change in unrealized appreciation (depreciation) on investments | | | 100,360 | | | | 399,237 | |
Net increase in net assets resulting from operations | | | 293,435 | | | | 351,701 | |
| | | | | | | | | |
DISTRIBUTIONS TO SHAREHOLDERS | | | | | | | | |
From net investment income | | | (9,727 | ) | | | (5,507 | ) |
| | | | | | | | | |
CAPITAL SHARE TRANSACTIONS | | | | | | | | |
Proceeds from shares sold | | | 932,000 | | | | 2,215,345 | |
Net asset value of shares issued in reinvestment of distributions to shareholders | | | 9,727 | | | | 5,507 | |
Payments for shares redeemed | | | (959,062 | ) | | | — | |
Net increase (decrease) from capital share transactions | | | (17,335 | ) | | | 2,220,852 | |
| | | | | | | | | |
TOTAL INCREASE IN NET ASSETS | | | 266,373 | | | | 2,567,046 | |
| | | | | | | | | |
NET ASSETS | | | | | | | | |
Beginning of period | | | 2,567,046 | | | | — | |
End of period | | $ | 2,833,419 | | | $ | 2,567,046 | |
| | | | | | | | | |
ACCUMULATED NET INVESTMENT INCOME | | $ | 1,525 | | | $ | 5,650 | |
| | | | | | | | | |
CAPITAL SHARE ACTIVITY | | | | | | | | |
Shares sold | | | 71,727 | | | | 220,726 | |
Shares issued in reinvestment of distributions to shareholders | | | 742 | | | | 542 | |
Shares redeemed | | | (73,789 | ) | | | — | |
Net increase (decrease) in shares outstanding | | | (1,320 | ) | | | 221,268 | |
Shares outstanding at beginning of period | | | 221,268 | | | | — | |
Shares outstanding at end of period | | | 219,948 | | | | 221,268 | |
(a) | Represents the period from the commencement of operations (September 1, 2015) through August 31, 2016. |
See accompanying notes to financial statements. |
45
ALAMBIC SMALL CAP GROWTH PLUS FUND
STATEMENTS OF CHANGES IN NET ASSETS |
| | Six Months
Ended
February 28,
2017
(Unaudited) | | | Period
Ended
August 31,
2016(a) | |
FROM OPERATIONS | | | | | | |
Net investment loss | | $ | (3,992 | ) | | $ | (1,761 | ) |
Net realized gains (losses) from security transactions | | | 121,308 | | | | (19,294 | ) |
Net change in unrealized appreciation (depreciation) on investments | | | 165,966 | | | | 277,149 | |
Net increase in net assets resulting from operations | | | 283,282 | | | | 256,094 | |
| | | | | | | | | |
CAPITAL SHARE TRANSACTIONS | | | | | | | | |
Proceeds from shares sold | | | 488,000 | | | | 1,989,605 | |
Payments for shares redeemed | | | (459,666 | ) | | | — | |
Net increase from capital share transactions | | | 28,334 | | | | 1,989,605 | |
| | | | | | | | | |
TOTAL INCREASE IN NET ASSETS | | | 311,616 | | | | 2,245,699 | |
| | | | | | | | | |
NET ASSETS | | | | | | | | |
Beginning of period | | | 2,245,699 | | | | — | |
End of period | | $ | 2,557,315 | | | $ | 2,245,699 | |
| | | | | | | | | |
ACCUMULATED NET INVESTMENT LOSS | | $ | (5,689 | ) | | $ | (1,697 | ) |
| | | | | | | | | |
CAPITAL SHARE ACTIVITY | | | | | | | | |
Shares sold | | | 40,438 | | | | 201,597 | |
Shares redeemed | | | (38,166 | ) | | | — | |
Net increase in shares outstanding | | | 2,272 | | | | 201,597 | |
Shares outstanding at beginning of period | | | 201,597 | | | | — | |
Shares outstanding at end of period | | | 203,869 | | | | 201,597 | |
(a) | Represents the period from the commencement of operations (December 29, 2015) through August 31, 2016. |
See accompanying notes to financial statements. |
46
ALAMBIC MID CAP VALUE PLUS FUND
STATEMENT OF CHANGES IN NET ASSETS |
| | Period
Ended
February 28,
2017(a)
(Unaudited) | |
FROM OPERATIONS | | | |
Net investment income | | $ | 324 | |
Net realized gains from security transactions | | | 12,353 | |
Net change in unrealized appreciation (depreciation) on investments | | | 12,345 | |
Net increase in net assets resulting from operations | | | 25,022 | |
| | | | | |
CAPITAL SHARE TRANSACTIONS | | | | |
Proceeds from shares sold | | | 658,596 | |
| | | | | |
TOTAL INCREASE IN NET ASSETS | | | 683,618 | |
| | | | | |
NET ASSETS | | | | |
Beginning of period | | | — | |
End of period | | $ | 683,618 | |
| | | | | |
ACCUMULATED NET INVESTMENT INCOME | | $ | 324 | |
| | | | | |
CAPITAL SHARE ACTIVITY | | | | |
Shares sold | | | 65,477 | |
Shares outstanding at beginning of period | | | — | |
Shares outstanding at end of period | | | 65,477 | |
(a) | Represents the period from the commencement of operations (December 29, 2016) through February 28, 2017. |
See accompanying notes to financial statements. |
47
ALAMBIC MID CAP GROWTH PLUS FUND
STATEMENT OF CHANGES IN NET ASSETS |
| | Period
Ended
February 28,
2017(a)
(Unaudited) | |
FROM OPERATIONS | | | |
Net investment income | | $ | 426 | |
Net realized gains from security transactions | | | 9,737 | |
Net change in unrealized appreciation (depreciation) on investments | | | 21,367 | |
Net increase in net assets resulting from operations | | | 31,530 | |
| | | | | |
CAPITAL SHARE TRANSACTIONS | | | | |
Proceeds from shares sold | | | 709,635 | |
| | | | | |
TOTAL INCREASE IN NET ASSETS | | | 741,165 | |
| | | | | |
NET ASSETS | | | | |
Beginning of period | | | — | |
End of period | | $ | 741,165 | |
| | | | | |
ACCUMULATED NET INVESTMENT INCOME | | $ | 426 | |
| | | | | |
CAPITAL SHARE ACTIVITY | | | | |
Shares sold | | | 70,238 | |
Shares outstanding at beginning of period | | | — | |
Shares outstanding at end of period | | | 70,238 | |
(a) | Represents the period from the commencement of operations (December 29, 2016) through February 28, 2017. |
See accompanying notes to financial statements. |
48
ALAMBIC SMALL CAP VALUE PLUS FUND
FINANCIAL HIGHLIGHTS |
Per Share Data for a Share Outstanding Throughout Each Period |
| | Six Months
Ended
February 28,
2017
(Unaudited) | | | Period
Ended
August 31, 2016(a) | |
Net asset value at beginning of period | | $ | 11.60 | | | $ | 10.00 | |
| | | | | | | | | |
Income from investment operations: | | | | | | | | |
Net investment income | | | 0.03 | | | | 0.05 | |
Net realized and unrealized gains on investments | | | 1.29 | | | | 1.58 | |
Total from investment operations | | | 1.32 | | | | 1.63 | |
| | | | | | | | | |
Less distributions: | | | | | | | | |
Dividends from net investment income | | | (0.04 | ) | | | (0.03 | ) |
| | | | | | | | | |
Net asset value at end of period | | $ | 12.88 | | | $ | 11.60 | |
| | | | | | | | | |
Total return (b) | | | 11.40 | %(c) | | | 16.31 | %(c) |
| | | | | | | | | |
Net assets at end of period (000's) | | $ | 2,833 | | | $ | 2,567 | |
| | | | | | | | | |
Ratios/supplementary data: | | | | | | | | |
Ratio of total expenses to average net assets | | | 7.01 | %(d) | | | 7.24 | %(d) |
| | | | | | | | | |
Ratio of net expenses to average net assets (e) | | | 1.20 | %(d) | | | 1.20 | %(d) |
| | | | | | | | | |
Ratio of net investment income to average net assets (e) | | | 0.41 | %(d) | | | 0.53 | %(d) |
| | | | | | | | | |
Portfolio turnover rate | | | 102 | %(c) | | | 350 | %(c) |
(a) | Represents the period from the commencement of operations (September 1, 2015) through August 31, 2016. |
(b) | Total return is a measure of the change in value of an investment in the Fund over the periods covered. The returns shown do not reflect the deduction of taxes a shareholder would pay on Fund distributions, if any, or the redemption of Fund shares. The total returns would be lower if the Adviser had not reduced advisory fees and reimbursed expenses (Note 4). |
(c) | Not annualized. |
(d) | Annualized. |
(e) | Ratio was determined after advisory fee reductions and expense reimbursements (Note 4). |
See accompanying notes to financial statements. |
49
ALAMBIC SMALL CAP GROWTH PLUS FUND
FINANCIAL HIGHLIGHTS |
Per Share Data for a Share Outstanding Throughout Each Period |
| | Six Months
Ended
February 28,
2017
(Unaudited) | | | Period
Ended
August 31, 2016(a) | |
Net asset value at beginning of period | | $ | 11.14 | | | $ | 10.00 | |
| | | | | | | | | |
Income (loss) from investment operations: | | | | | | | | |
Net investment loss | | | (0.02 | ) | | | (0.01 | ) |
Net realized and unrealized gains on investments | | | 1.42 | | | | 1.15 | |
Total from investment operations | | | 1.40 | | | | 1.14 | |
| | | | | | | | | |
Net asset value at end of period | | $ | 12.54 | | | $ | 11.14 | |
| | | | | | | | | |
Total return (b) | | | 12.57 | %(c) | | | 11.40 | %(c) |
| | | | | | | | | |
Net assets at end of period (000's) | | $ | 2,557 | | | $ | 2,246 | |
| | | | | | | | | |
Ratios/supplementary data: | | | | | | | | |
Ratio of total expenses to average net assets | | | 7.82 | %(d) | | | 8.89 | %(d) |
| | | | | | | | | |
Ratio of net expenses to average net assets (e) | | | 1.20 | %(d) | | | 1.20 | %(d) |
| | | | | | | | | |
Ratio of net investment loss to average net assets (e) | | | (0.34 | %)(d) | | | (0.16 | %)(d) |
| | | | | | | | | |
Portfolio turnover rate | | | 112 | %(c) | | | 309 | %(c) |
(a) | Represents the period from the commencement of operations (December 29, 2015) through August 31, 2016. |
(b) | Total return is a measure of the change in value of an investment in the Fund over the periods covered. The returns shown do not reflect the deduction of taxes a shareholder would pay on Fund distributions, if any, or the redemption of Fund shares. The total returns would be lower if the Adviser had not reduced advisory fees and reimbursed expenses (Note 4). |
(c) | Not annualized. |
(d) | Annualized. |
(e) | Ratio was determined after advisory fee reductions and expense reimbursements (Note 4). |
See accompanying notes to financial statements. |
50
ALAMBIC MID CAP VALUE PLUS FUND
FINANCIAL HIGHLIGHTS |
Per Share Data for a Share Outstanding Throughout the Period |
| | Period Ended
February 28, 2017(a)
(Unaudited) | |
Net asset value at beginning of period | | $ | 10.00 | |
| | | | | |
Income from investment operations: | | | | |
Net investment income | | | 0.00 | (b) |
Net realized and unrealized gains on investments | | | 0.44 | |
Total from investment operations | | | 0.44 | |
| | | | | |
Net asset value at end of period | | $ | 10.44 | |
| | | | | |
Total return (c) | | | 4.40 | %(d) |
| | | | | |
Net assets at end of period (000's) | | $ | 684 | |
| | | | | |
Ratios/supplementary data: | | | | |
Ratio of total expenses to average net assets | | | 29.07 | %(e) |
| | | | | |
Ratio of net expenses to average net assets (f) | | | 0.85 | %(e) |
| | | | | |
Ratio of net investment income to average net assets (f) | | | 0.36 | %(e) |
| | | | | |
Portfolio turnover rate | | | 167 | %(d) |
(a) | Represents the period from the commencement of operations (December 29, 2016) through February 28, 2017. |
(b) | Amount rounds to less than $0.01 per share. |
(c) | Total return is a measure of the change in value of an investment in the Fund over the period covered. The return shown does not reflect the deduction of taxes a shareholder would pay on Fund distributions, if any, or the redemption of Fund shares. The total return would be lower if the Adviser had not reduced advisory fees and reimbursed expenses (Note 4). |
(d) | Not annualized. |
(e) | Annualized. |
(f) | Ratio was determined after advisory fee reductions and expense reimbursements (Note 4). |
See accompanying notes to financial statements. |
51
ALAMBIC MID CAP GROWTH PLUS FUND
FINANCIAL HIGHLIGHTS |
Per Share Data for a Share Outstanding Throughout the Period |
| | Period Ended
February 28, 2017(a)
(Unaudited) | |
Net asset value at beginning of period | | $ | 10.00 | |
| | | | | |
Income from investment operations: | | | | |
Net investment income | | | 0.01 | |
Net realized and unrealized gains on investments | | | 0.54 | |
Total from investment operations | | | 0.55 | |
| | | | | |
Net asset value at end of period | | $ | 10.55 | |
| | | | | |
Total return (b) | | | 5.50 | %(c) |
| | | | | |
Net assets at end of period (000's) | | $ | 741 | |
| | | | | |
Ratios/supplementary data: | | | | |
Ratio of total expenses to average net assets | | | 27.71 | %(d) |
| | | | | |
Ratio of net expenses to average net assets (e) | | | 0.85 | %(d) |
| | | | | |
Ratio of net investment income to average net assets (e) | | | 0.45 | %(d) |
| | | | | |
Portfolio turnover rate | | | 130 | %(c) |
(a) | Represents the period from the commencement of operations (December 29, 2016) through February 28, 2017. |
(b) | Total return is a measure of the change in value of an investment in the Fund over the period covered. The return shown does not reflect the deduction of taxes a shareholder would pay on Fund distributions, if any, or the redemption of Fund shares. The total return would be lower if the Adviser had not reduced advisory fees and reimbursed expenses (Note 4). |
(c) | Not annualized. |
(d) | Annualized. |
(e) | Ratio was determined after advisory fee reductions and expense reimbursements (Note 4). |
See accompanying notes to financial statements. |
52
ALAMBIC FUNDS
NOTES TO FINANCIAL STATEMENTS
February 28, 2017 (Unaudited)
1. Organization
Alambic Small Cap Value Plus Fund, Alambic Small Cap Growth Plus Fund, Alambic Mid Cap Value Plus Fund and Alambic Mid Cap Growth Plus Fund (individually, a “Fund” and collectively, the “Funds”) are each a diversified series of Ultimus Managers Trust (the “Trust”), an open-end investment company established as an Ohio business trust under a Declaration of Trust dated February 28, 2012. Other series of the Trust are not incorporated in this report. Alambic Small Cap Value Plus Fund commenced operations on September 1, 2015. Alambic Small Cap Growth Plus Fund commenced operations on December 29, 2015. Alambic Mid Cap Value Plus Fund and Alambic Mid Cap Growth Plus Fund commenced operations on December 29, 2016.
The investment objective of each Fund is long-term capital appreciation.
2. Significant Accounting Policies
The following is a summary of the Funds’ significant accounting policies. The policies are in conformity with accounting principles generally accepted in the United States of America (“GAAP”). As an investment company, as defined in Financial Accounting Standards Board (“FASB”) Accounting Standards Update 2013-08, the Funds follow accounting and reporting guidance under FASB Accounting Standards Codification Topic 946, “Financial Services – Investment Companies.”
In October 2016, the U.S. Securities and Exchange Commission (the “SEC”) released its final rule on Investment Company Reporting Modernization (the “Rule”). The Rule, which introduces two new regulatory reporting forms for investment companies – Form N-PORT and Form N-CEN, also contains amendments to Regulation S-X which impacts financial statement presentation, particularly the presentation of derivative investments. Although it is still evaluating the impact of the Rule, management believes that many of the Regulation S-X amendments are consistent with the Funds’ current financial statement preparation and expects that the Funds will be able to comply with the Rule’s Regulation S-X amendments by the August 1, 2017 compliance date.
Securities valuation – Each Fund values its portfolio securities at market value as of the close of regular trading on the New York Stock Exchange (the “NYSE”) (normally 4:00 p.m. Eastern time) on each business day the NYSE is open for business. The Funds value their listed securities, including common stocks, on the basis of the security’s last sale price on the security’s primary exchange, if available, otherwise at the exchange’s most recently quoted mean price. NASDAQ-listed securities are valued at the NASDAQ Official Closing Price. The Funds value securities traded in the over-the-counter market at the last sale price, if available, otherwise at the most recently quoted mean price. When using a quoted price and when the market for the security is considered active, the security will be classified as Level 1 within the fair value hierarchy. In the event that market quotations are not readily available or are considered unreliable due to market or other events, the Funds value their securities and other assets at fair value pursuant to procedures established by and under the direction of the Board of Trustees (the “Board”) of the Trust. Under these procedures, the securities will be classified
53
ALAMBIC FUNDS
NOTES TO FINANCIAL STATEMENTS (Continued) |
as Level 2 or 3 within the fair value hierarchy (see below), depending on the inputs used. Unavailable or unreliable market quotes may be due to the following factors: a substantial bid-ask spread; infrequent sales resulting in stale prices; insufficient trading volume; small trade sizes; a temporary lapse in any reliable pricing source; and actions of the securities or futures markets, such as the suspension or limitation of trading. As a result, the prices of securities used to calculate each Fund’s net asset value (“NAV”) may differ from quoted or published prices for the same securities.
GAAP establishes a single authoritative definition of fair value, sets out a framework for measuring fair value, and requires additional disclosures about fair value measurements.
Various inputs are used in determining the value of each Fund’s investments. These inputs are summarized in the three broad levels listed below:
● | Level 1 – quoted prices in active markets for identical securities |
● | Level 2 – other significant observable inputs |
● | Level 3 – significant unobservable inputs |
The inputs or methods used for valuing securities are not necessarily an indication of the risks associated with investing in those securities. The inputs used to measure fair value may fall into different levels of the fair value hierarchy. In such cases, for disclosure purposes, the level in the fair value hierarchy within which the fair value measurement falls in its entirety is determined based on the lowest level input that is significant to the fair value measurement.
The following is a summary of the inputs used to value the Funds’ investments as of February 28, 2017:
Alambic Small Cap Value Plus Fund | | Level 1 | | | Level 2 | | | Level 3 | | | Total | |
Common Stocks | | $ | 2,705,371 | | | $ | — | | | $ | — | | | $ | 2,705,371 | |
Rights | | | — | | | | — | | | | 0 | * | | | 0 | |
Total | | $ | 2,705,371 | | | $ | — | | | $ | 0 | | | $ | 2,705,371 | |
Alambic Small Cap Growth Plus Fund | | Level 1 | | | Level 2 | | | Level 3 | | | Total | |
Common Stocks | | $ | 2,439,062 | | | $ | — | | | $ | — | | | $ | 2,439,062 | |
Alambic Mid Cap Value Plus Fund | | Level 1 | | | Level 2 | | | Level 3 | | | Total | |
Common Stocks | | $ | 593,294 | | | $ | — | | | $ | — | | | $ | 593,294 | |
Rights | | | — | | | | — | | | | 0 | * | | | 0 | |
Total | | $ | 593,294 | | | $ | — | | | $ | 0 | | | $ | 593,294 | |
54
ALAMBIC FUNDS
NOTES TO FINANCIAL STATEMENTS (Continued) |
Alambic Mid Cap Growth Plus Fund | | Level 1 | | | Level 2 | | | Level 3 | | | Total | |
Common Stocks | | $ | 630,046 | | | $ | — | | | $ | — | | | $ | 630,046 | |
* | Alambic Small Cap Value Plus Fund and Alambic Mid Cap Value Plus Fund hold a Right which has been fair valued at $0. |
Refer to the Funds’ Schedules of Investments for a listing of the common stocks by industry type. As of February 28, 2017, the Funds did not have any transfers between Levels. It is the Funds’ policy to recognize transfers between Levels at the end of the reporting period. There were no Level 3 securities held by Alambic Small Cap Growth Plus Fund and Alambic Mid Cap Growth Plus Fund as of February 28, 2017.
The following is a reconciliation of Level 3 securities of Alambic Small Cap Value Plus Fund and Alambic Mid Cap Value Plus Fund for which significant unobservable inputs were used to determine fair value between August 31, 2016 and February 28, 2017.
| | Alambic Small Cap Value Plus Fund | | | Alambic Mid Cap Value Plus Fund(a) | |
Balance as of August 31, 2016 | | $ | — | | | $ | — | |
Receipts of rights from corporate actions | | | 0 | * | | | 0 | * |
Balance as of February 28, 2017 | | $ | 0 | | | $ | 0 | |
(a) | Represents the period from the commencement of operations (December 29, 2016) through February 28, 2017. |
* | Alambic Small Cap Value Plus Fund and Alambic Mid Cap Value Plus Fund each hold a Right which has been fair valued at $0. |
The total amount of unrealized appreciation on Level 3 securities was $0 for both Alambic Small Cap Value Plus Fund and Alambic Mid Cap Value Plus Fund as of February 28, 2017.
The following table summarizes the valuation techniques used and unobservable inputs developed by the Board to determine the fair value of the Level 3 investments:
Alambic Small Cap Value Plus Fund
| Fair Value at
02/28/2017 | Valuation
Technique | Unobersvable
Input | Range | Impact to Valuation from an
Increase in Input** |
Rights | $ 0* | Deemed Worthless | Discount Percentage | 100% | Increase |
55
ALAMBIC FUNDS
NOTES TO FINANCIAL STATEMENTS (Continued) |
Alambic Mid Cap Value Plus Fund
| Fair Value at
02/28/2017 | Valuation
Technique | Unobersvable
Input | Range | Impact to Valuation from an
Increase in Input** |
Rights | $ 0* | Deemed Worthless | Discount Percentage | 100% | Increase |
* | Alambic Small Cap Value Plus Fund and Alambic Mid Cap Value Plus Fund each hold a Right which has been fair valued at $0. |
** | This column represents the directional change in fair value of the Level 3 investments that would result in an increase from the corresponding input. A decrease to the unobservable input would have the opposite effect. Significant increases and decreases in these inputs in isolation could result in significantly higher or lower fair value measurements. |
Cash account – Each Fund’s cash is held in a bank account with balances which may exceed the amount covered by federal deposit insurance. As of February 28, 2017, the cash balances reflected on the Statements of Assets and Liabilities for each Fund represent the amount held in a deposit sweep account.
Share valuation – The NAV per share of each Fund is calculated daily by dividing the total value of its assets, less liabilities, by the number of shares outstanding. The offering price and redemption price per share of each Fund is equal to the NAV per share.
Investment income – Dividend income is recorded on the ex-dividend date. Interest income, if any, is accrued as earned. Withholding taxes on foreign dividends have been recorded for in accordance with the Funds’ understanding of the applicable country’s tax rules and rates.
Security transactions – Security transactions are accounted for on the trade date. Realized gains and losses on securities sold are determined on a specific identification basis.
Common expenses – Common expenses of the Trust are allocated among the Funds and the other series of the Trust based on the relative net assets of each series or the nature of the services performed and the relative applicability to each series.
Distributions to shareholders – The Funds distribute to shareholders any net investment income dividends and net realized capital gains distributions at least once each year. The amount of such dividends and distributions are determined in accordance with federal income tax regulations, which may differ from GAAP. Dividends and distributions to shareholders are recorded on the ex-dividend date. The tax character of distributions paid by Alambic Small Cap Value Plus Fund to shareholders during the periods ended February 28, 2017 and August 31, 2016 was ordinary income. There were no distributions paid by Alambic Small Cap Growth Plus Fund, Alambic Mid Cap Value Plus Fund or Alambic Mid Cap Growth Plus Fund during the periods ended February 28, 2017 and August 31, 2016.
56
ALAMBIC FUNDS
NOTES TO FINANCIAL STATEMENTS (Continued) |
Estimates – The preparation of financial statements in conformity with GAAP requires management to make estimates and assumptions which affect the reported amounts of assets and liabilities and disclosure of contingent assets and liabilities as of the date of the financial statements and the reported amounts of income and expenses during the reporting period. Actual results could differ from those estimates.
Federal income tax – Each Fund has qualified and intends to continue to qualify as a regulated investment company under the Internal Revenue Code of 1986 (the “Code”). Qualification generally will relieve each Fund of liability for federal income taxes to the extent 100% of its net investment income and net realized capital gains are distributed in accordance with the Code.
In order to avoid imposition of the excise tax applicable to regulated investment companies, it is also each Fund’s intention to declare as dividends in each calendar year at least 98% of its net investment income (earned during the calendar year) and 98.2% of its net realized capital gains (earned during the 12 months ended October 31) plus undistributed amounts from prior years.
The following information is computed on a tax basis for each item as of February 28, 2017:
| | Alambic Small Cap Value Plus Fund | | | Alambic Small Cap Growth Plus Fund | | | Alambic
Mid Cap Value Plus Fund | | | Alambic
Mid Cap Growth Plus Fund | |
Tax cost of portfolio investments | | $ | 2,212,504 | | | $ | 2,001,862 | | | $ | 580,951 | | | $ | 608,748 | |
Gross unrealized appreciation | | $ | 525,916 | | | $ | 463,048 | | | $ | 22,208 | | | $ | 30,579 | |
Gross unrealized depreciation | | | (33,049 | ) | | | (25,848 | ) | | | (9,865 | ) | | | (9,281 | ) |
Net unrealized appreciation | | | 492,867 | | | | 437,200 | | | | 12,343 | | | | 21,298 | |
Accumulated ordinary income (loss) | | | 1,525 | | | | (5,689 | ) | | | 324 | | | | 426 | |
Accumulated capital and other gains | | | 135,510 | | | | 107,929 | | | | 12,355 | | | | 9,806 | |
Accumulated earnings | | $ | 629,902 | | | $ | 539,440 | | | $ | 25,022 | | | $ | 31,530 | |
The difference between the federal income tax cost of portfolio investments and the financial statement cost of each Fund is due to certain timing differences in the recognition of capital gains or losses under income tax regulations and GAAP. These “book/tax” differences are temporary in nature and are due primarily to the tax deferral of losses on wash sales.
As of August 31, 2016, Alambic Small Cap Value Plus Fund had a short-term capital loss carryforward of $6,420 for federal income tax purposes. This capital loss carryforward, which does not expire, may be utilized in the current and future years to offset net realized capital gains, if any, prior to distributing such gains to shareholders.
The Funds recognize the tax benefits or expenses of uncertain tax positions only when the position is “more likely than not” of being sustained assuming examination by tax authorities. Management has reviewed each Fund’s tax positions for the current and open tax periods
57
ALAMBIC FUNDS
NOTES TO FINANCIAL STATEMENTS (Continued) |
(periods ended August 31, 2016, if applicable) and has concluded that no provision for unrecognized tax benefits or expenses is required in these financial statements. The Funds identify their major tax jurisdiction as U.S. Federal.
3. Investment Transactions
During the periods ended February 28, 2017, cost of purchases and proceeds from sales of investment securities, other than short-term investments were as follows:
| | Alambic Small Cap Value Plus Fund | | | Alambic Small Cap Growth Plus Fund | | | Alambic
Mid Cap Value Plus Fund | | | Alambic
Mid Cap Growth Plus Fund | |
Purchases of investment securities | | $ | 2,638,160 | | | $ | 2,561,964 | | | $ | 1,073,239 | | | $ | 1,003,185 | |
Proceeds from sales of investment securities | | $ | 2,696,639 | | | $ | 2,584,761 | | | $ | 504,643 | | | $ | 404,243 | |
4. Transactions with Related Parties
INVESTMENT ADVISORY AGREEMENT
Each Fund’s investments are managed by Alambic Investment Management, L.P. (the “Adviser”) pursuant to the terms of an Investment Advisory Agreement. Under the Investment Advisory Agreement, each Fund pays the Adviser an investment advisory fee, computed and accrued daily and paid monthly, at the annual rate of 0.95% of average daily net assets with respect to Alambic Small Cap Value Plus Fund and Alambic Small Cap Growth Plus Fund and at the annual rate of 0.70% of average daily net assets with respect to Alambic Mid Cap Value Plus Fund and Alambic Mid Cap Growth Plus Fund.
Pursuant to an Expense Limitation Agreement (the “ELA”) between each Fund and the Adviser, the Adviser has contractually agreed, until August 31, 2018, to reduce investment advisory fees and reimburse other expenses to the extent necessary to limit total annual fund operating expenses (exclusive of brokerage costs; taxes; interest; acquired fund fees and expenses; costs to organize the Fund; extraordinary expenses such as litigation and merger or reorganization costs; and other expenses not incurred in the ordinary course of the Fund’s business; and amounts, if any, payable pursuant to a plan adopted in accordance with Rule 12b-1 under the Investment Company Act of 1940, as amended (the “1940 Act”)) to 1.20% of average daily net assets with respect to Alambic Small Cap Value Plus Fund and Alambic Small Cap Growth Plus Fund and to 0.85% of average daily net assets with respect to Alambic Mid Cap Value Plus Fund and Alambic Mid Cap Growth Plus Fund. Accordingly, during the periods ended February 28, 2017, the Adviser did not collect any of its investment advisory fees and reimbursed other operating expenses totaling $66,020, $67,060, $24,827 and $24,790 for Alambic Small Cap Value Plus Fund, Alambic Small Cap Growth Plus Fund, Alambic Mid Cap Value Plus Fund and Alambic Mid Cap Growth Plus Fund, respectively.
58
ALAMBIC FUNDS
NOTES TO FINANCIAL STATEMENTS (Continued) |
Under the terms of the ELA, investment advisory fee reductions and expense reimbursements by the Adviser are subject to repayment by each Fund for a period of three years after such fees and expenses were incurred, provided the repayments do not cause total annual fund operating expenses to exceed (i) the expense limitation then in effect, if any, and (ii) the expense limitations in effect at the time the expenses to be repaid were incurred. As of February 28, 2017, the Adviser may seek repayment of investment advisory fee reductions and expense reimbursements totaling $205,284, $161,165, $25,448, and $25,442 for Alambic Small Cap Value Plus Fund, Alambic Small Cap Growth Plus Fund, Alambic Mid Cap Value Plus Fund and Alambic Mid Cap Growth Plus Fund, respectively, no later than the dates as stated below:
| | Alambic Small Cap Value Plus Fund | | | Alambic Small Cap Growth Plus Fund | | | Alambic
Mid Cap Value Plus Fund | | | Alambic
Mid Cap Growth Plus Fund | |
August 31, 2019 | | $ | 126,406 | | | $ | 82,902 | | | $ | — | | | $ | — | |
February 29, 2020 | | | 78,878 | | | | 78,263 | | | | 25,448 | | | | 25,442 | |
| | | $ | 205,284 | | | $ | 161,165 | | | $ | 25,448 | | | $ | 25,442 | |
The Adviser has paid all expenses incurred related to the organization, offering and initial registrations of the Funds. Such expenses are not subject to recoupment by the Funds to the Adviser.
Until April 25, 2017, an officer of the Funds was also an officer of the Adviser.
OTHER SERVICE PROVIDERS
Ultimus Fund Solutions, LLC (“Ultimus”) provides administration, fund accounting, compliance and transfer agency services to the Funds. Each Fund pays Ultimus fees in accordance with the agreements for such services. In addition, each Fund pays out-of-pocket expenses including, but not limited to, postage, supplies and costs of pricing its portfolio securities.
Under the terms of a Distribution Agreement with the Trust, Ultimus Fund Distributors, LLC (the “Distributor”) serves as the principal underwriter to each Fund. The Distributor is a wholly-owned subsidiary of Ultimus. The Distributor is compensated by the Adviser (not the Funds) for acting as principal underwriter.
Certain officers and a Trustee of the Trust are also officers of Ultimus and the Distributor and are not paid by the Funds for serving in such capacities.
TRUSTEE COMPENSATION
Effective October 1, 2016, each Trustee who is not an “interested person” of the Trust (“Independent Trustee”) receives a $1,000 annual retainer from each Fund, paid quarterly, except for the Board Chairperson who receives a $1,200 annual retainer from each Fund, paid quarterly. Each Independent Trustee also receives from each Fund a fee of $500 for each Board meeting attended plus reimbursement for travel and other meeting-related expenses. Prior to October 1, 2016, each Fund paid each Independent Trustee a fee of $500 for each Board meeting attended, plus a $500 annual retainer.
59
ALAMBIC FUNDS
NOTES TO FINANCIAL STATEMENTS (Continued) |
PRINCIPAL HOLDERS OF FUND SHARES
As of February 28, 2017, the following shareholders owned of record 5% or more of the outstanding shares of each Fund:
Name of Record Owner | % Ownership |
Alambic Small Cap Value Plus Fund | |
Charles Schwab & Co. (for the benefit of its customers) | 35% |
Kawishiwi Partners Trust | 47% |
Lauren Richards | 6% |
William Richards | 6% |
Jonathan Richards | 6% |
Alambic Small Cap Growth Plus Fund | |
Kawishiwi Partners Trust | 43% |
Charles Schwab & Co. (for the benefit of its customers) | 30% |
Lauren Richards | 8% |
William Richards | 8% |
Jonathan Richards | 8% |
Alambic Mid Cap Value Plus Fund | |
Robert T. Slaymaker | 69% |
Lauren Richards | 8% |
William Richards | 8% |
Jonathan Richards | 8% |
Kawishiwi Partners Trust | 7% |
Alambic Mid Cap Growth Plus Fund | |
Robert T. Slaymaker | 72% |
Kawishiwi Partners Trust | 7% |
Lauren Richards | 7% |
William Richards | 7% |
Jonathan Richards | 7% |
A beneficial owner of 25% or more of a Fund’s outstanding shares may be considered a controlling person. That shareholder’s vote could have a more significant effect on matters presented at a shareholder’s meeting.
5. Contingencies and Commitments
The Funds indemnify the Trust’s officers and Trustees for certain liabilities that might arise from their performance of their duties to the Funds. Additionally, in the normal course of business the Funds enter into contracts that contain a variety of representations and warranties and which provide general indemnifications. The Funds’ maximum exposure under these arrangements is unknown, as this would involve future claims that may be made against the Funds that have not yet occurred. However, based on experience, the Funds expect the risk of loss to be remote.
60
ALAMBIC FUNDS
NOTES TO FINANCIAL STATEMENTS (Continued) |
6. Subsequent Events
The Funds are required to recognize in the financial statements the effects of all subsequent events that provide additional evidence about conditions that existed as of the date of the Statements of Assets and Liabilities. For non-recognized subsequent events that must be disclosed to keep the financial statements from being misleading, the Funds are required to disclose the nature of the event as well as an estimate of its financial effect, or a statement that such an estimate cannot be made. Management has evaluated subsequent events through the issuance of these financial statements and has noted the following: On April 25, 2017, David R. Carson was elected Principal Executive Officer of the Funds.
61
ALAMBIC FUNDS
ABOUT YOUR FUNDS’ EXPENSES (Unaudited) |
We believe it is important for you to understand the impact of costs on your investment. As a shareholder of the Funds, you incur ongoing costs, including management fees and other operating expenses. The following examples are intended to help you understand your ongoing costs (in dollars) of investing in the Funds and to compare these costs with the ongoing costs of investing in other mutual funds.
A mutual fund’s ongoing costs are expressed as a percentage of its average net assets. This figure is known as the expense ratio. The expenses in the table below are based on an investment of $1,000 made at the beginning of the most recent period (September 1, 2016 for Alambic Small Cap Value Plus Fund and Alambic Small Cap Growth Plus Fund and December 29, 2016 for Alambic Mid Cap Value Plus Fund and Alambic Mid Cap Growth Plus Fund) and held until the end of the period (February 28, 2017).
The table below illustrates each Fund’s ongoing costs in two ways:
Actual fund return – This section helps you to estimate the actual expenses that you paid over the period. The “Ending Account Value” shown is derived from each Fund’s actual return, and the fourth column shows the dollar amount of operating expenses that would have been paid by an investor who started with $1,000 in the Funds. You may use the information here, together with the amount you invested, to estimate the expenses that you paid over the period.
To do so, simply divide your account value by $1,000 (for example, an $8,600 account value divided by $1,000 = 8.6), then multiply the result by the number given for the applicable Fund under the heading “Expenses Paid During Period.”
Hypothetical 5% return – This section is intended to help you compare each Fund’s ongoing costs with those of other mutual funds. It assumes that each Fund had an annual return of 5% before expenses during the period shown, but that the expense ratio is unchanged. In this case, because the return used is not the Funds’ actual return, the results do not apply to your investment. The example is useful in making comparisons because the SEC requires all mutual funds to calculate expenses based on a 5% return. You can assess each Fund’s ongoing costs by comparing this hypothetical example with the hypothetical examples that appear in shareholder reports of other funds. The hypothetical returns example does not reflect actual trading in any Fund, but is used for illustrative purposes only.
Note that expenses shown in the table are meant to highlight and help you compare ongoing costs only. The Funds do not charge transaction fees, such as purchase or redemption fees, nor do they carry a “sales load.”
The calculations assume no shares were bought or sold during the period. Your actual costs may have been higher or lower, depending on the amount of your investment and the timing of any purchases or redemptions.
More information about the Funds’ expenses can be found in this report. For additional information on operating expenses and other shareholder costs, please refer to each Fund’s prospectus.
62
ALAMBIC FUNDS
ABOUT YOUR FUNDS’ EXPENSES (Unaudited) (Continued) |
| Beginning
Account Value
September 1,
2016 | Ending
Account Value
February 28,
2017 | Net
Expense
Ratio(a) | Expenses
Paid During
Period(b) |
Alambic Small Cap Value Plus Fund | | |
Actual Fund Return | $1,000.00 | $1,114.00 | 1.20% | $6.29 |
Hypothetical 5% Return (before expenses) | $1,000.00 | $1,018.84 | 1.20% | $6.01 |
| | | | | |
Alambic Small Cap Growth Plus Fund | | |
Actual Fund Return | $1,000.00 | $1,125.70 | 1.20% | $6.32 |
Hypothetical 5% Return (before expenses) | $1,000.00 | $1,018.84 | 1.20% | $6.01 |
(a) | Annualized, based on the Fund’s expenses for the period since inception. |
(b) | Expenses are equal to the Funds’ annualized net expense ratio multiplied by the average account value over the period, multiplied by 181/365 (to reflect the one-half year period). |
| Beginning
Account Value
September 1,
2016(a) | Ending
Account Value
February 28,
2017 | Net
Expense
Ratio(b) | Expenses
Paid During
Period(c) |
Alambic Mid Cap Value Plus Fund | | |
Actual Fund Return | $1,000.00 | $1,044.00 | 0.85% | $1.48 |
Hypothetical 5% Return (before expenses) | $1,000.00 | $1,020.58 | 0.85% | $4.26 |
| | | | | |
Alambic Mid Cap Growth Plus Fund | | |
Actual Fund Return | $1,000.00 | $1,055.00 | 0.85% | $1.48 |
Hypothetical 5% Return (before expenses) | $1,000.00 | $1,020.58 | 0.85% | $4.26 |
(a) | Beginning Account Value is as of December 29, 2016 (date of commencement of operations) for the Actual Fund Return. |
(b) | Annualized, based on the Fund’s expenses for the period since inception. |
(c) | Expenses are equal to the Funds’ annualized net expense ratio multiplied by the average account value over the period, multiplied by 62/365 (to reflect the period since inception) and 181/365 (to reflect the one-half year period), for Actual Fund Return and Hypothetical 5% Return, respectively. |
63
ALAMBIC FUNDS
OTHER INFORMATION (Unaudited) |
A description of the policies and procedures that the Funds use to vote proxies relating to portfolio securities is available without charge upon request by calling toll-free 1-888-890-8988, or on the SEC website at http://www.sec.gov. Information regarding how the Funds voted proxies relating to portfolio securities during the most recent 12-month period ended June 30 is available without charge upon request by calling toll-free 1-888-890-8988, or on the SEC’s website at http://www.sec.gov.
The Trust files a complete listing of portfolio holdings for the Funds with the SEC as of the end of the first and third quarters of each fiscal year on Form N-Q. These filings are available upon request by calling 1-888-890-8988. Furthermore, you may obtain a copy of the filings on the SEC’s website at http://www.sec.gov. The Trust’s Forms N-Q may also be reviewed and copied at the SEC’s Public Reference Room in Washington, DC, and information on the operation of the Public Reference Room may be obtained by calling 1-800-SEC-0330.
64
ALAMBIC FUNDS
DISCLOSURE REGARDING APPROVAL OF
INVESTMENT ADVISORY AGREEMENTS (Unaudited) |
On behalf of the Alambic Mid Cap Growth Fund and Alambic Mid Cap Value Fund (collectively, the “Mid Cap Funds”), the Board, including the Independent Trustees voting separately, has reviewed and approved the Investment Advisory Agreement with the Adviser for an initial two-year term (the “Agreement”). The Board approved the Agreement at an in-person meeting held on October 24-25, 2016, at which all the Trustees were present.
Legal counsel advised the Board during its deliberations. Additionally, the Board received and reviewed a substantial amount of information provided by the Adviser in response to requests of the Board and counsel. In deciding to approve the Agreement on behalf of the Mid Cap Funds, the Board recalled its review of the materials related to the Adviser throughout the last several months and its numerous discussions with Trust management and the Adviser about the operations and performance of the Adviser in connection with Alambic Small Cap Growth Plus Fund and Alambic Small Cap Value Plus Fund (collectively, the “Small Cap Funds”). The Board further considered those materials and discussions and numerous other factors, including the following factors:
The nature, extent, and quality of the services to be provided by the Adviser. In this regard, the Board considered the responsibilities that the Adviser would have under the Agreement and the Adviser’s proposed services to the Mid Cap Funds including, without limitation: the Adviser’s procedures for formulating investment recommendations and assuring compliance with the Mid Cap Funds’ investment objective and limitations; the proposed initial marketing and distribution efforts; and the Adviser’s compliance procedures and practices. After reviewing the foregoing and further information (e.g., descriptions of the Adviser’s business and Form ADV), the Board concluded that the quality, extent, and nature of the services to be provided by the Adviser to each Mid Cap Fund were satisfactory and adequate.
The investment management capabilities and experience of the Adviser. The Board considered the investment management experience of the Adviser and thoroughly discussed with the Adviser the investment objective and strategies for the Mid Cap Funds. The Board also discussed the Adviser’s experience in managing similar types of strategies and building quantitative models. In particular, the Board reviewed the Adviser’s prior experience and performance with the Small Cap Funds and with other accounts that had similar investment objectives and strategies as the Mid Cap Funds, including the Adviser’s private fund. The Board also considered the similarities and differences between these products. After consideration of these and other factors, the Board determined that the Adviser has the requisite experience to serve as investment adviser for each Mid Cap Fund.
The costs of the services to be provided and profits to be realized by the Adviser and its affiliates from the relationship with the Mid Cap Funds. The Board considered the Adviser’s personnel and methods of operation; the education and experience of its personnel; its compliance program, policies, and procedures; its financial condition and the level of financial commitment to the Mid Cap Funds; the projected asset levels of the Mid Cap Funds; and the overall expenses of the Mid Cap Funds, including the advisory fee. The Board reviewed the Adviser’s ELA with the Mid Cap Funds and noted the benefit to the Mid Cap Funds from the Adviser’s contractual obligation to reduce its advisory fee or reimburse other operating
65
ALAMBIC FUNDS
DISCLOSURE REGARDING APPROVAL OF
INVESTMENT ADVISORY AGREEMENTS (Unaudited) (Continued) |
expenses through August 31, 2018. The Board discussed the Adviser’s financial condition and its ability to satisfy its financial commitments to the Mid Cap Funds. The Board also considered potential benefits for the Adviser in managing the Mid Cap Funds, including the promotion of the Adviser’s name. The Board compared the Mid Cap Funds’ proposed advisory fee and overall expense ratio to other comparable funds (in terms of the type of fund, the style of investment management, the projected size of each Mid Cap Fund, and the nature of the investment strategy) and the fees charged by the Adviser to its other managed accounts, including the Small Cap Funds. The Board noted that the Mid Cap Funds’ advisory fee of 0.70% was slightly above the average and median for the Mid Cap Value Plus Fund’s peer group and slightly below the average and median for the Mid Cap Growth Plus Fund’s peer group. The Board also noted that the advisory fee was below the average and median for each fund’s Morningstar category. The Board further noted that the proposed total expense ratio of 0.85% is below the average and median for each fund’s peer group and Morningstar category. Upon further consideration and discussion of the foregoing, the Board concluded that the proposed advisory fee and total expense limit for each Mid Cap Fund is fair and reasonable.
The extent to which the Mid Cap Funds and their investors would benefit from economies of scale. In this regard, the Board considered the Agreement and the ELA. The Board determined that the shareholders of each Mid Cap Fund would benefit from the ELA until the fund’s assets grew to a level where its expenses otherwise fall below the expense limit. The Board also noted that the Adviser would consider breakpoints for the Mid Cap Funds as they grow. Following further discussion of the Mid Cap Funds’ projected asset levels, expectations for growth, and level of fees, the Board determined that the Mid Cap Funds’ fee arrangements with the Adviser would provide benefits through the new two years, and the Board could review the arrangements going forward as necessary. After further discussion, the Board concluded the arrangements for each Mid Cap Fund with the Adviser were fair and reasonable in relationship to the nature and quality of services to be provided by the Adviser and would benefit the fund and its shareholders.
Brokerage and portfolio transactions. The Board considered the Adviser’s policies and procedures as it relates to seeking best execution for its clients. The Board also considered the anticipated portfolio turnover rate for the Mid Cap Funds; the method and basis for selecting and evaluating the broker-dealers used to complete each fund’s portfolio transactions (including the Adviser’s new order management system); any anticipated allocation of portfolio business to persons affiliated with the Adviser; and the extent to which the Mid Cap Funds’ trades may be allocated to soft-dollar arrangements. After further review and discussion, the Board determined for each Mid Cap Fund that the Adviser’s practices regarding brokerage and portfolio transactions were satisfactory.
Possible conflicts of interest. In evaluating the possibility for conflicts of interest, the Board considered such matters as the Adviser’s process for allocating trades among its different clients, including the Adviser’s private fund and the Small Cap Funds. The Board also considered the substance and administration of the Adviser’s Code of Ethics. Following further
66
ALAMBIC FUNDS
DISCLOSURE REGARDING APPROVAL OF
INVESTMENT ADVISORY AGREEMENTS (Unaudited) (Continued) |
consideration and discussion, the Board determined for each Mid Cap Fund that the Adviser’s standards and practices relating to the identification and mitigation of potential conflicts of interests were satisfactory.
After full consideration of the above factors as well as other factors, the Board unanimously concluded that approval of the Agreement was in the best interests of the Mid Cap Funds and their shareholders.
67
This page intentionally left blank.
This page intentionally left blank.

BLUE CURRENT GLOBAL DIVIDEND FUND
INSTITUTIONAL CLASS (BCGDX)
Semi-Annual Report
February 28, 2017
(Unaudited)
BLUE CURRENT GLOBAL DIVIDEND FUND
LETTER TO SHAREHOLDERS | February 28, 2017 |
Dear Shareholders:
One year ago, equity investors were tending to their wounds after a meaningful correction lopped more than 10% from the S&P 500 and much more from other global indices. The equity selloff punctuated a broader economic and financial market hangover that saw oil prices collapse from over $100 per barrel, and investor frustration peak over multiple quarters of declining earnings growth. Many investor pundits called for the end of the recent bull market!
The juxtaposition of the current backdrop is stark and is the culmination of investor excitement around political, economic, and financial change that could have the ability to extend the current bull market to be one of the longest in modern history. The optimism is not unsupported by real economic data. Job growth, manufacturing data, inflation expectations (and interest rates) are moving in tandem and it is not localized to the US. European equities are, perhaps mistakenly, looking through political uncertainty in the region to improving earnings growth and attractive valuations – especially relative to what is now available in the US. Even emerging markets are participating in the recent rally, likely with the expectation that stronger US and European economic growth (combined with weaker EM currencies) is enough to boost local GDP due to the export sensitivity across the region. To summarize, the equity rally is broad-based and supported by an improving backdrop for global growth, improving earnings potential, and optimism that US policy is stimulative for all.
We have been at this long enough to know that when the pendulum of optimism swings far in one direction, it is prudent to watch your backside and identify areas that could disappoint higher expectations. Policy implementation, despite receiving the benefit of doubt, remains one of the largest risk factors that could disappoint to the downside if legislation falls short of expectations. Should the new Trump administration not follow-through on tax reform and broad infrastructure spending, market support will likely weaken in the short- term. Outside of the US, election risk remains elevated across the Eurozone and will likely be an overhang until ballots are cast as polling data has lost its credibility after two failed predictions. An unfavorable outcome in France has the potential to undermine years of hard work by ECB leaders to strengthen the integrity of the Eurozone.
For these reasons, we believe a global perspective and a process capable of allocating capital to regions that offer attractive relative valuations are warranted. Our analysis suggests that there are attractive valuation opportunities outside of the US, but stronger dividend growth rates and share buyback programs within our local market. We also continue to believe that the current investment environment, especially in the US, favors dividend growth over dividend yield. Higher interest rates are likely to remain a thorn in the backside of yield chasers, specifically investors that have relied on the steady (but flat) stream of cash flows from utilities, staples, and telecom companies. We remain materially underweight in these areas of the market relative to peers and popular yield ETFs. Our
1
focus on companies that are benefitting from increasing free cash flow and applying that cash flow to share buybacks and dividend growth have steered the portfolio to other sectors that we believe have better overall growth prospects.
For the three month period ended February 28, 2017, the Blue Current Global Dividend Fund (the “Fund”) returned +7.22%, which compares to the primary index return of +7.44% (MSCI World High Dividend Yield Index). For the six month period (ended February 28, 2017), the Fund returned +5.97%, outperforming the MSCI World High Dividend Yield Index return of +4.84%. Since inception in September 18, 2014, the Fund has returned +10.06%, outperforming the MSCI World High Dividend Yield Index return of +5.75%. All performance detail is cumulative.
The Fund’s performance relative to the peer group selected above remains competitive quarter-to-date, while the performance over the since inception period remains elevated when compared to the peer average.
The top five contributors to the Fund over the last three months were Unilever, Apple, Abbott Labs, Dow Chemical, and LVMH. These positions contributed approximately 210bps to the Fund’s performance. The biggest returner in the portfolio was Apple (+25%), followed by Schlumberger (+21%), and Unilever (+20%). The largest detractors were Qualcomm, United Parcel Service, Williams Sonoma, Johnson Controls, and Swiss Re. In aggregate, these positions detracted 120bps from performance.
During the quarter, we initiated a position in GKN Group, a UK-based diversified manufacturing firm with exposure to aerospace, both commercial and military, and automobile drivetrains. We initiated the position at less than 10x earnings with a forward yield of 2.8%. We believe GKN is significantly undervalued and with recent platform wins across both commercial and military aerospace sectors, there are catalysts that should close the valuation gap. In addition, we initiated a position in Dominion Midstream, a limited partnership that we expect will grow distributions at 20% per year for the foreseeable future due to significant LNG (Liquefied Natural Gas) drop-down opportunities from the parent company. To fund those purchases, we exited positions in Verizon, Qualcomm, Williams Sonoma, and Schlumberger.
2
The Fund’s exposure to opportunities located outside of the US is the highest in recent memory at approximately 44% of assets. Recent sales of US equity positions combined with the initiation of GKN has contributed to the increase in the Fund’s international, developed exposure.
| * | In this table, country was determined using the Morningstar Business Methodology. |
BLUE CURRENT PHILOSOPHY & OBJECTIVES
It is important to remind shareholders of our philosophy and objectives. In the current environment, investors need to make every penny work for them. With yield in short supply and safe income streams providing little return, high quality companies with growing and sustainable cash flow from across the globe might be less risky than you think – and more fruitful. Over the long run, dividends matter, and dividend growth investors have outperformed.
The Fund utilizes its investment expertise in growing cash flow through what we believe is a niche universe of high quality, dividend-paying companies with sustainable business models and dividend policies. The primary goals are to pay a stable and increasing dividend each quarter and deliver attractive long term capital appreciation to investors.
The Blue Current investment team concentrates on a select portfolio of 25-50 companies across developed markets that meet our stringent qualities. We focus on companies that we believe have a strong history of rewarding shareholders and have the financial ability to continue to increase the dividend over time. We also focus on the future earnings potential of each company and strive to purchase those businesses when they are trading at a discount to their true value.
OUTLOOK SUMMARY
Spurred by optimism in the US, a slightly weaker dollar, and green shoots of economic activity abroad, global equities have started the year on a strong note. The ingredients are in place for another strong year of equity returns; however, experience has taught us that a simultaneous advance by all three major regions of the world (US, EAFE, EM) is unusual and likely not sustainable. With major policy initiatives under way in the US, critical political elections on the horizon in Europe, and vital trade agreements under revision across Asia, all netted against the backdrop of a commodity recovery supported
3
by a fragile OPEC agreement, there is much that could surprise in the coming quarters. For the time being, optimism prevails that the world’s struggle with deflation is ending and sharp fiscal policy can grab the steering wheel away from central banks.
The current environment favors flexibility for portfolio managers to look across regions to uncover valuation opportunities with attractive dividend growth prospects. As the US market continues to advance, our process has led us to examine opportunities in Europe and Japan where valuations are lower and dividend yields exceed domestic markets. As of the end of February, the portfolio’s blended 2017 price-to-earnings (P/E) ratio based on 2017 estimated earnings is 16x, approximately 2.5 multiples cheaper than the broader US market. We continue to identify opportunities outside the US, therefore, investors could expect the portfolio’s allocation to international securities to increase in coming months. Until that time, we remain overweight the US and continue to benefit from strong company balance sheets and excess cash flow allocations to both share buybacks and dividend increases.
Sincerely,
| |
Henry “Harry” M. T. Jones
Co-Portfolio Manager
Blue Current Global Dividend Fund | Dennis Sabo, CFA
Co-Portfolio Manager
Blue Current Global Dividend Fund |
4
Disclosure and Risk Summary
The Letter to Shareholders seeks to describe some of the current opinions and views of the financial markets of Edge Advisors, LLC (the “Adviser”). Although the Adviser believes it has a reasonable basis for any opinions or views expressed, actual results may differ, sometimes significantly so, from those expected or expressed. The securities held by the Fund that are discussed in the Letter to Shareholders were held during the period covered by this Report. They do not comprise the entire investment portfolio of the Fund, may be sold at any time and may no longer be held by the Fund. For a complete list of securities held in the Fund as of February 28, 2017, please see the Schedule of Investments section of the semi-annual report. The opinions of the Adviser with respect to those securities may change at any time.
The opinions expressed herein are those of the Adviser, and the report is not meant as legal, tax, or financial advice. You should consult your own professional advisors as to the legal, tax, financial, or other matters relevant to the suitability of investing. The external data presented in this report have been obtained from independent sources (as noted) and are believed to be accurate, but no independent verification has been made and accuracy is not guaranteed. The information contained in this report is not intended to address the needs of any particular investor.
The information contained in this document does not constitute an offer to sell any securities nor a solicitation to purchase any securities. Index returns reflect the reinvestment of dividends. An investor should consider the investment objectives, risks, charges and expenses of the Fund carefully before investing. The Fund’s prospectus contains this and other important information. To obtain a copy of the Fund’s prospectus please visit our website at www.bluecurrentfunds.com or call 1-800-514-3583 and a copy will be sent to you free of charge. Please read the prospectus carefully before you invest. The Blue Current Global Dividend Fund is distributed by Ultimus Fund Distributors, LLC.
PAST PERFORMANCE CANNOT BE CONSTRUED AS AN INDICATOR OF FUTURE RESULTS BECAUSE OF, AMONG OTHER THINGS, POSSIBLE DIFFERENCES IN MARKET CONDITIONS, INVESTMENT STRATEGY, AND REGULATORY CLIMATE. THERE IS NO ASSURANCE THAT THE FUND WILL ACHIEVE ITS INVESTMENT OBJECTIVE. INVESTMENT RESULTS AND PRINCIPAL VALUE WILL FLUCTUATE SO THAT SHARES, WHEN REDEEMED, MAY BE WORTH MORE OR LESS THAN THEIR ORIGINAL COST. CURRENT PERFORMANCE MAY BE HIGHER OR LOWER THAN THE PERFORMANCE DATA QUOTED. PERFORMANCE DATA CURRENT TO THE MOST RECENT MONTH END IS AVAILABLE BY CALLING 1-800-514-3583. THE FUND INVESTS PRIMARILY IN DIVIDEND PAYING COMPANIES AND IT IS POSSIBLE THESE COMPANIES MAY ELIMINATE OR REDUCE THEIR DIVIDEND PAYMENTS. INDEX INFORMATION (I) IS INCLUDED MERELY TO SHOW THE GENERAL TREND IN THE EQUITY MARKETS FOR THE PERIOD INDICATED AND IS NOT INTENDED TO IMPLY THAT THE FUND’S PORTFOLIO WILL BE SIMILAR TO THE INDICES EITHER IN COMPOSITION OR RISK AND (II) HAS BEEN OBTAINED FROM SOURCES BELIEVED TO BE ACCURATE.
5
BLUE CURRENT GLOBAL DIVIDEND FUND
PORTFOLIO INFORMATION
February 28, 2017 (Unaudited)
Sector Diversification
(% of Net Assets)
Top Ten Equity Holdings
| Security Description | | % of Net Assets |
| Unilever plc - ADR | | 3.3% |
| Comcast Corporation - Class A | | 3.0% |
| Stanley Black & Decker, Inc. | | 3.0% |
| Johnson Controls International plc | | 2.9% |
| Diageo plc - ADR | | 2.8% |
| Enterprise Products Partners, L.P. | | 2.8% |
| Vodafone Group plc - ADR | | 2.8% |
| Dow Chemical Company (The) | | 2.7% |
| Abbott Laboratories | | 2.7% |
| Microsoft Corporation | | 2.7% |
6
BLUE CURRENT GLOBAL DIVIDEND FUND
SCHEDULE OF INVESTMENTS
February 28, 2017 (Unaudited) |
| COMMON STOCKS — 93.2% | | Shares | | | Value | |
| Consumer Discretionary — 9.8% | | | | | | |
| Auto Components — 2.2% | | | | | | |
GKN plc (a) | | | 234,615 | | | $ | 1,047,997 | |
| | | | | | | | | |
| Hotels, Restaurants & Leisure — 2.0% | | | | | | | | |
| InterContinental Hotels Group plc - ADR | | | 21,071 | | | | 991,180 | |
| | | | | | | | | |
| Media — 3.0% | | | | | | | | |
| Comcast Corporation - Class A | | | 38,520 | | | | 1,441,418 | |
| | | | | | | | | |
| Textiles, Apparel & Luxury Goods — 2.6% | | | | | | | | |
LVMH Moet Hennessy Louis Vuitton SE (a) | | | 6,320 | | | | 1,269,607 | |
| | | | | | | | | |
| Consumer Staples — 15.0% | | | | | | | | |
| Beverages — 4.5% | | | | | | | | |
| Anheuser-Busch InBev SA/NV - ADR | | | 7,200 | | | | 788,328 | |
| Diageo plc - ADR | | | 12,047 | | | | 1,377,093 | |
| | | | | | | | 2,165,421 | |
| Food & Staples Retailing — 2.4% | | | | | | | | |
| Walgreens Boots Alliance, Inc. | | | 13,750 | | | | 1,187,725 | |
| | | | | | | | | |
| Food Products — 8.1% | | | | | | | | |
Danone SA (a) | | | 17,930 | | | | 1,186,253 | |
| Nestlé SA - ADR | | | 15,855 | | | | 1,168,355 | |
| Unilever plc - ADR | | | 33,465 | | | | 1,588,918 | |
| | | | | | | | 3,943,526 | |
| | | | | | | | | |
| Energy — 9.8% | | | | | | | | |
| Oil, Gas & Consumable Fuels — 9.8% | | | | | | | | |
| BP plc - ADR | | | 28,125 | | | | 954,000 | |
| Dominion Midstream Partners, L.P. | | | 27,600 | | | | 854,220 | |
| Enbridge, Inc. | | | 20,900 | | | | 879,679 | |
| Enterprise Products Partners, L.P. | | | 48,805 | | | | 1,368,004 | |
| Valero Energy Corporation | | | 10,620 | | | | 721,629 | |
| | | | | | | | 4,777,532 | |
| Financials — 14.6% | | | | | | | | |
| Banks — 6.7% | | | | | | | | |
| BB&T Corporation | | | 23,370 | | | | 1,126,901 | |
| Royal Bank of Canada | | | 13,000 | | | | 944,710 | |
| Wells Fargo & Company | | | 20,345 | | | | 1,177,569 | |
| | | | | | | | 3,249,180 | |
| See accompanying notes to financial statements. |
7
BLUE CURRENT GLOBAL DIVIDEND FUND
SCHEDULE OF INVESTMENTS (Continued) |
| COMMON STOCKS — 93.2% (Continued) | | Shares | | | Value | |
| Financials — 14.6% (Continued) | | | | | | |
| Insurance — 7.9% | | | | | | |
Allianz SE (a) | | | 5,140 | | | $ | 895,249 | |
| American International Group, Inc. | | | 14,100 | | | | 901,272 | |
| Chubb Ltd. | | | 8,670 | | | | 1,197,934 | |
Swiss Re AG (a) | | | 9,400 | | | | 840,857 | |
| | | | | | | | 3,835,312 | |
| Health Care — 15.3% | | | | | | | | |
| Health Care Equipment & Supplies — 2.7% | | | | | | | | |
| Abbott Laboratories | | | 29,465 | | | | 1,328,282 | |
| | | | | | | | | |
| Pharmaceuticals — 12.6% | | | | | | | | |
Bayer AG (a) | | | 10,615 | | | | 1,168,409 | |
| Johnson & Johnson | | | 10,275 | | | | 1,255,708 | |
| Novartis AG - ADR | | | 9,420 | | | | 736,361 | |
| Pfizer, Inc. | | | 29,550 | | | | 1,008,246 | |
| Roche Holdings AG - ADR | | | 31,200 | | | | 949,104 | |
| Sanofi - ADR | | | 23,265 | | | | 1,003,420 | |
| | | | | | | | 6,121,248 | |
| Industrials — 10.0% | | | | | | | | |
| Air Freight & Logistics — 2.0% | | | | | | | | |
| United Parcel Service, Inc. - Class B | | | 9,240 | | | | 977,222 | |
| | | | | | | | | |
| Building Products — 2.9% | | | | | | | | |
| Johnson Controls International plc | | | 33,843 | | | | 1,419,375 | |
| | | | | | | | | |
| Electrical Equipment — 2.1% | | | | | | | | |
| Eaton Corporation plc | | | 14,089 | | | | 1,014,126 | |
| | | | | | | | | |
| Machinery — 3.0% | | | | | | | | |
| Stanley Black & Decker, Inc. | | | 11,265 | | | | 1,432,345 | |
| | | | | | | | | |
| Information Technology — 9.7% | | | | | | | | |
| Communications Equipment — 2.1% | | | | | | | | |
| Cisco Systems, Inc. | | | 29,525 | | | | 1,009,165 | |
| | | | | | | | | |
| Semiconductors & Semiconductor Equipment — 2.5% | | | | | | | | |
| Texas Instruments, Inc. | | | 16,005 | | | | 1,226,303 | |
| | | | | | | | | |
| Software — 2.7% | | | | | | | | |
| Microsoft Corporation | | | 20,355 | | | | 1,302,313 | |
| See accompanying notes to financial statements. |
8
BLUE CURRENT GLOBAL DIVIDEND FUND
SCHEDULE OF INVESTMENTS (Continued) |
| COMMON STOCKS — 93.2% (Continued) | | Shares | | | Value | |
| Information Technology — 9.7% (Continued) | | | | | | |
| Technology Hardware, Storage & Peripherals — 2.4% | | | | | | |
| Apple, Inc. | | | 8,330 | | | $ | 1,141,127 | |
| | | | | | | | | |
| Materials — 2.7% | | | | | | | | |
| Chemicals — 2.7% | | | | | | | | |
| Dow Chemical Company (The) | | | 21,340 | | | | 1,328,628 | |
| | | | | | | | | |
| Real Estate — 3.5% | | | | | | | | |
| Equity Real Estate Investment Trusts — 3.5% | | | | | | | | |
| Crown Castle International Corporation | | | 10,400 | | | | 972,712 | |
Hammerson plc (a) | | | 96,400 | | | | 703,240 | |
| | | | | | | | 1,675,952 | |
| Telecommunication Services — 2.8% | | | | | | | | |
| Wireless Telecommunication Services — 2.8% | | | | | | | | |
| Vodafone Group plc - ADR | | | 53,590 | | | | 1,361,722 | |
| | | | | | | | | |
Total Common Stocks (Cost $41,414,038) | | | | | | $ | 45,246,706 | |
| |
| PREFERRED STOCKS — 3.8% | | Shares | | | Value | |
| Financials — 3.8% | | | | | | |
| Banks — 3.8% | | | | | | |
| Bank of America Corporation | | | 35,200 | | | $ | 937,376 | |
| Wells Fargo & Company | | | 36,173 | | | | 907,219 | |
Total Preferred Stocks (Cost $1,802,280) | | | | | | $ | 1,844,595 | |
| |
| MONEY MARKET FUNDS — 2.2% | | Shares | | | Value | |
First American Government Obligations Fund - Class Z, 0.45% (b) (Cost $1,070,354) | | | 1,070,354 | | | $ | 1,070,354 | |
| | | | | | | | | |
Total Investments at Value — 99.2% (Cost $44,286,672) | | | | | | $ | 48,161,655 | |
| | | | | | | | | |
Other Assets in Excess of Liabilities — 0.8% | | | | | | | 393,597 | |
| | | | | | | | | |
Net Assets — 100.0% | | | | | | $ | 48,555,252 | |
| ADR - American Depositary Receipt |
(a) | Fair value priced (Note 1). Fair valued securities totaled $7,111,612 at February 28, 2017, representing 14.6% of net assets. |
(b) | The rate shown is the 7-day effective yield as of February 28, 2017. |
| See accompanying notes to financial statements. |
9
BLUE CURRENT GLOBAL DIVIDEND FUND
SUMMARY OF STOCKS BY COUNTRY
February 28, 2017 (Unaudited) |
| Country | | Values | | | % of Net Assets | |
| United States | | $ | 23,605,384 | | | | 48.6 | % |
| United Kingdom | | | 8,024,150 | | | | 16.5 | % |
| Switzerland | | | 4,892,611 | | | | 10.1 | % |
| France | | | 3,459,280 | | | | 7.1 | % |
| Ireland | | | 2,433,501 | | | | 5.0 | % |
| Germany | | | 2,063,658 | | | | 4.3 | % |
| Canada | | | 1,824,389 | | | | 3.8 | % |
| Belgium | | | 788,328 | | | | 1.6 | % |
| | | $ | 47,091,301 | | | | 97.0 | % |
See accompanying notes to financial statements.
10
BLUE CURRENT GLOBAL DIVIDEND FUND
STATEMENT OF ASSETS AND LIABILITIES
February 28, 2017 (Unaudited) |
| ASSETS | | | |
| Investments in securities: | | | |
| At acquisition cost | | $ | 44,286,672 | |
| At value (Note 2) | | $ | 48,161,655 | |
| Dividends receivable | | | 132,819 | |
| Receivable for investment securities sold | | | 278,241 | |
| Receivable for capital shares sold | | | 31 | |
| Other assets | | | 13,693 | |
| TOTAL ASSETS | | | 48,586,439 | |
| | | | | |
| LIABILITIES | | | | |
| Payable to Adviser (Note 4) | | | 14,197 | |
| Payable to administrator (Note 4) | | | 8,580 | |
| Other accrued expenses | | | 8,410 | |
| TOTAL LIABILITIES | | | 31,187 | |
| | | | |
NET ASSETS | | $ | 48,555,252 | |
| | | | |
| NET ASSETS CONSIST OF: | | | | |
| Paid-in capital | | $ | 44,722,266 | |
| Accumulated net investment income | | | 291,941 | |
| Accumulated net realized losses from securities transactions | | | (333,815 | ) |
| Net unrealized appreciation on investments | | | 3,874,983 | |
| Net unrealized depreciation on translation of assets in foreign currencies | | | (123 | ) |
NET ASSETS | | $ | 48,555,252 | |
| | | | | |
| PRICING OF INSTITUTIONAL SHARES (Note 1) | | | | |
| Net assets applicable to Institutional Shares | | $ | 48,555,252 | |
| Shares of Institutional Shares outstanding (no par value, unlimited number of shares outstanding) | | | 4,589,694 | |
Net asset value, offering and redemption price per share (a) (Note 2) | | $ | 10.58 | |
(a) | Redemption fee may apply to redemptions of shares held for 7 days or less. |
| See accompanying notes to financial statements. |
11
BLUE CURRENT GLOBAL DIVIDEND FUND
STATEMENT OF OPERATIONS
For the Six Months Ended February 28, 2017 (Unaudited) |
| INVESTMENT INCOME | | | |
| Dividends | | $ | 649,312 | |
| Foreign withholding taxes on dividends | | | (3,697 | ) |
| | | | 645,615 | |
| EXPENSES | | | | |
| Investment advisory fees (Note 4) | | | 210,098 | |
| Professional fees | | | 23,509 | |
| Administration fees (Note 4) | | | 21,290 | |
| Fund accounting fees (Note 4) | | | 16,948 | |
| Transfer agent fees (Note 4) | | | 8,000 | |
| Custodian and bank service fees | | | 7,763 | |
| Registration and filing fees | | | 6,914 | |
| Compliance fees and expenses (Note 4) | | | 6,748 | |
| Printing of shareholder reports | | | 5,044 | |
| Trustees’ fees and expenses (Note 4) | | | 4,979 | |
| Postage and supplies | | | 3,453 | |
| Pricing fees | | | 1,407 | |
| Insurance expense | | | 949 | |
| Other expenses | | | 5,914 | |
| TOTAL EXPENSES | | | 323,016 | |
| Fee reductions by the Adviser (Note 4) | | | (112,919 | ) |
| NET EXPENSES | | | 210,097 | |
| | | | | |
NET INVESTMENT INCOME | | | 435,518 | |
| | | | | |
| REALIZED AND UNREALIZED GAINS (LOSSES) ON INVESTMENTS AND FOREIGN CURRENCY TRANSLATION | | | | |
| Net realized gains (losses) from: | | | | |
| Security transactions | | | 799,764 | |
| Foreign currency transactions (Note 2) | | | (20,534 | ) |
| Net change in unrealized appreciation (depreciation) on: | | | | |
| Investments | | | 1,603,521 | |
| Foreign currency translation (Note 2) | | | (123 | ) |
NET REALIZED AND UNREALIZED GAINS ON INVESTMENTS AND FOREIGN CURRENCY TRANSLATION | | | 2,382,628 | |
| | | | | |
NET INCREASE IN NET ASSETS RESULTING FROM OPERATIONS | | $ | 2,818,146 | |
| See accompanying notes to financial statements. |
12
BLUE CURRENT GLOBAL DIVIDEND FUND
STATEMENTS OF CHANGES IN NET ASSETS |
| | | Six Months
Ended
February 28,
2017
(Unaudited) | | | Year
Ended
August 31,
2016 | |
| FROM OPERATIONS | | | | | | |
| Net investment income | | $ | 435,518 | | | $ | 794,230 | |
| Net realized gains (losses) from: | | | | | | | | |
| Security transactions | | | 799,764 | | | | (1,179,634 | ) |
| Foreign currency transactions | | | (20,534 | ) | | | 11,371 | |
| Net change in unrealized appreciation (depreciation) on: | | | | | | | | |
| Investments | | | 1,603,521 | | | | 3,338,461 | |
| Foreign currency translation | | | (123 | ) | | | 21,077 | |
| Net increase in net assets resulting from operations | | | 2,818,146 | | | | 2,985,505 | |
| | | | | | | | | |
| DISTRIBUTIONS TO SHAREHOLDERS | | | | | | | | |
| Net investment income, Institutional Shares | | | (336,122 | ) | | | (686,629 | ) |
| | | | | | | | | |
| FROM CAPITAL SHARE TRANSACTIONS | | | | | | | | |
| Institutional Shares | | | | | | | | |
| Proceeds from shares sold | | | 8,096,405 | | | | 13,257,398 | |
| Net asset value of shares issued in reinvestment of distributions | | | 252,696 | | | | 453,272 | |
| Payments for shares redeemed | | | (1,907,684 | ) | | | (6,475,979 | ) |
| Net increase in Institutional Shares net assets from capital share transactions | | | 6,441,417 | | | | 7,234,691 | |
| | | | | | | | | |
TOTAL INCREASE IN NET ASSETS | | | 8,923,441 | | | | 9,533,567 | |
| | | | | | | | | |
| NET ASSETS | | | | | | | | |
| Beginning of period | | | 39,631,811 | | | | 30,098,244 | |
| End of period | | $ | 48,555,252 | | | $ | 39,631,811 | |
| | | | | | | | | |
ACCUMULATED NET INVESTMENT INCOME | | $ | 291,941 | | | $ | 213,079 | |
| | | | | | | | | |
| CAPITAL SHARE ACTIVITY | | | | | | | | |
| Institutional Shares | | | | | | | | |
| Shares sold | | | 814,743 | | | | 1,384,963 | |
| Shares reinvested | | | 25,069 | | | | 46,833 | |
| Shares redeemed | | | (191,405 | ) | | | (684,476 | ) |
| Net increase in shares outstanding | | | 648,407 | | | | 747,320 | |
| Shares outstanding, beginning of period | | | 3,941,287 | | | | 3,193,967 | |
| Shares outstanding, end of period | | | 4,589,694 | | | | 3,941,287 | |
| See accompanying notes to financial statements. |
13
BLUE CURRENT GLOBAL DIVIDEND FUND
INSTITUTIONAL SHARES
FINANCIAL HIGHLIGHTS |
| Per Share Data for a Share Outstanding Throughout Each Period |
| | | Six Months Ended February 28, 2017 (Unaudited) | | | Year Ended August 31, 2016 | | | Period Ended August 31, 2015(a) | |
| Net asset value at beginning of period | | $ | 10.06 | | | $ | 9.42 | | | $ | 10.00 | |
| | | | | | | | | | | | | |
| Income (loss) from investment operations: | | | | | | | | | | | | |
| Net investment income | | | 0.09 | | | | 0.22 | | | | 0.16 | |
| Net realized and unrealized gains (losses) on investments | | | 0.51 | | | | 0.61 | | | | (0.62 | ) |
| Total from investment operations | | | 0.60 | | | | 0.83 | | | | (0.46 | ) |
| | | | | | | | | | | | | |
| Less distributions: | | | | | | | | | | | | |
| From net investment income | | | (0.08 | ) | | | (0.19 | ) | | | (0.12 | ) |
| | | | | | | | | | | | | |
| Net asset value at end of period | | $ | 10.58 | | | $ | 10.06 | | | $ | 9.42 | |
| | | | | | | | | | | | | |
Total return (b) | | | 5.97 | %(c) | | | 8.92 | % | | | (4.65 | %)(c) |
| | | | | | | | | | | | | |
| Net assets at end of period (000’s) | | $ | 48,555 | | | $ | 39,632 | | | $ | 30,098 | |
| | | | | | | | | | | | | |
| Ratios/supplementary data: | | | | | | | | | | | | |
| Ratio of total expenses to average net assets | | | 1.52 | %(d) | | | 1.55 | % | | | 1.68 | %(d) |
Ratio of net expenses to average net assets (e) | | | 0.99 | %(d) | | | 0.99 | % | | | 0.99 | %(d) |
Ratio of net investment income to average net assets (e) | | | 2.05 | %(d) | | | 2.37 | % | | | 2.04 | %(d) |
| Portfolio turnover rate | | | 35 | %(c) | | | 58 | % | | | 72 | %(c) |
(a) | Represents the period from the commencement of operations (September 18, 2014) through August 31, 2015. |
(b) | Total return is a measure of the change in value of an investment in the Fund over the periods covered, which assumes any dividends and capital gain distributions are reinvested in shares of the Fund. The returns shown do not reflect the deduction of taxes a shareholder would pay on Fund distributions or the redemption of Fund shares. The total returns would be lower if the Adviser had not reduced advisory fees (Note 4). |
(c) | Not annualized. |
(d) | Annualized. |
(e) | Ratio was determined after advisory fee reductions by the Adviser (Note 4). |
| See accompanying notes to financial statements. |
14
BLUE CURRENT GLOBAL DIVIDEND FUND
NOTES TO FINANCIAL STATEMENTS
February 28, 2017 (Unaudited)
1. Organization
Blue Current Global Dividend Fund (the “Fund”) is a diversified series of Ultimus Managers Trust (the “Trust”), an open-end investment company established as an Ohio business trust under a Declaration of Trust dated February 28, 2012. Other series of the Trust are not incorporated in this report.
The investment objective of the Fund is to seek current income and capital appreciation.
The Fund currently offers one class of shares: Institutional Class shares (sold without any sales loads or distribution fees and subject to a $100,000 initial investment requirement). As of February 28, 2017, the Investor Class shares (to be sold without any sales loads, but subject to a distribution fee of up to 0.25% of the class’ average daily net assets and subject to a $2,500 initial investment requirement) are not currently offered. When both classes are offered, each share class will represent an ownership interest in the same investment portfolio.
2. Significant Accounting Policies
The following is a summary of the Fund’s significant accounting policies. The policies are in conformity with accounting principles generally accepted in the United States of America (“GAAP”). As an investment company, as defined in Financial Accounting Standards Board (“FASB”) Accounting Standards Update 2013-08, the Fund follows accounting and reporting guidance under FASB Accounting Standards Codification Topic 946, “Financial Services – Investment Companies.”
In October 2016, the Securities and Exchange Commission (the “SEC”) released its final rule on Investment Company Reporting Modernization (the “Rule”). The Rule which introduces two new regulatory reporting forms for investment companies – Form N-PORT and Form N-CEN, also contains amendments to Regulation S-X that impact financial statement presentation, particularly the presentation of derivative investments. Although it is still evaluating the impact of the Rule, management believes that many of the Regulation S-X amendments are consistent with the Fund’s current financial statement presentation and expects that the Fund will be able to comply with the Rule’s Regulation S-X amendments by the August 1, 2017 compliance date.
Securities valuation – The Fund values its portfolio securities at market value as of the close of regular trading on the New York Stock Exchange (the “NYSE”) (normally 4:00 p.m. Eastern Time) on each day the NYSE is open for business. The Fund values its listed securities on the basis of the security’s last sale price on the security’s primary exchange, if available, otherwise at the exchange’s most recently quoted mean price. NASDAQ-listed securities are valued at the NASDAQ Official Closing Price. In the event that market quotations are not readily available or are considered unreliable due to market or other events, the Fund values its securities and other assets at fair value in accordance with
15
BLUE CURRENT GLOBAL DIVIDEND FUND
NOTES TO FINANCIAL STATEMENTS (Continued)
procedures established by and under the general supervision of the Board of Trustees (the “Board”) of the Trust. Under these procedures, the securities will be classified as Level 2 or 3 within the fair value hierarchy (see below), depending on the inputs used. Unavailable or unreliable market quotes may be due to the following factors: a substantial bid-ask spread; infrequent sales resulting in stale prices; insufficient trading volume; small trade sizes; a temporary lapse in any reliable pricing source; and actions of the securities or futures markets, such as the suspension or limitation of trading. As a result, the prices of securities used to calculate the Fund’s net asset value (“NAV”) may differ from quoted or published prices for the same securities. Securities traded on foreign exchanges are typically fair valued by an independent pricing service and translated from the local currency into U.S. dollars using currency exchange rates supplied by an independent pricing quotation service.
GAAP establishes a single authoritative definition of fair value, sets out a framework for measuring fair value, and requires additional disclosures about fair value measurements.
Various inputs are used in determining the value of the Fund’s investments. These inputs are summarized in the three broad levels listed below:
| ● | Level 1 – quoted prices in active markets for identical securities |
| ● | Level 2 – other significant observable inputs |
| ● | Level 3 – significant unobservable inputs |
The inputs or methods used for valuing securities are not necessarily an indication of the risks associated with investing in those securities. The inputs used to measure fair value may fall into different levels of the fair value hierarchy. In such cases, for disclosure purposes, the level in the fair value hierarchy within which the fair value measurement falls in its entirety is determined based on the lowest level input that is significant to the fair value measurement.
The Fund’s foreign equity securities actively traded in foreign markets may be classified as Level 2 despite the availability of closing prices because such securities are typically fair valued by an independent pricing service. The Board has authorized the Fund to retain an independent pricing service to determine the fair value of its foreign securities because the value of such securities may be materially affected by events occurring before the Fund’s pricing time but after the close of the primary markets or exchanges on which such foreign securities are traded. These intervening events might be country-specific (e.g., natural disaster, economic or political developments, interest rate change); issuer specific (e.g., earnings report or merger announcement); or U.S. market-specific (such as a significant movement in the U.S. market that is deemed to affect the value of foreign securities). The pricing service uses an automated system that incorporates a model based on multiple parameters, including a security’s local closing price, relevant general
16
BLUE CURRENT GLOBAL DIVIDEND FUND
NOTES TO FINANCIAL STATEMENTS (Continued)
and sector indices, currency fluctuations, trading in depositary receipts and futures, if applicable, and/or research valuations by its staff, in determining what it believes is the fair value of the securities.
The following is a summary of the inputs used to value the Fund’s investments as of February 28, 2017:
| | | Level 1 | | | Level 2 | | | Level 3 | | | Total | |
| Common Stocks | | $ | 38,135,094 | | | $ | 7,111,612 | | | $ | — | | | $ | 45,246,706 | |
| Preferred Stocks | | | 1,844,595 | | | | — | | | | — | | | | 1,844,595 | |
| Money Market Funds | | | 1,070,354 | | | | — | | | | — | | | | 1,070,354 | |
| Total | | $ | 41,050,043 | | | $ | 7,111,612 | | | $ | — | | | $ | 48,161,655 | |
Refer to the Fund’s Schedule of Investments for a listing of the common stocks and preferred stocks by industry type. As of February 28, 2017, the Fund did not have any transfers between Levels. In addition, the Fund did not have any assets or liabilities that were measured at fair value on a recurring basis using significant unobservable inputs (Level 3) as of February 28, 2017. It is the Fund’s policy to recognize transfers between Levels at the end of the reporting period.
Foreign currency translation – Amounts and securities denominated in or expected to settle in foreign currencies are translated into U.S. dollars based on exchange rates on the following basis:
| | A. | The fair values of investment securities and other assets and liabilities are translated as of the close of the NYSE each day. |
| | B. | Purchases and sales of investment securities and income and expenses are translated at the rate of exchange prevailing as of 4:00 p.m. Eastern Time on the respective date of such transactions. |
| | C. | The Fund does not isolate that portion of the results of operations caused by changes in foreign exchange rates on investments from those caused by changes in market prices of securities held. Such fluctuations are included with the net realized and unrealized gains or losses on investments. |
Reported net realized foreign exchange gains or losses arise from 1) purchases and sales of foreign currencies, 2) currency gains or losses realized between the trade and settlement dates on securities transactions and 3) the difference between the amounts of dividends and foreign withholding taxes recorded on the Fund’s books and the U.S. dollar equivalent of the amounts actually received or paid. Reported net unrealized foreign exchange gains and losses arise from changes in the value of assets and liabilities that result from changes in exchange rates.
17
BLUE CURRENT GLOBAL DIVIDEND FUND
NOTES TO FINANCIAL STATEMENTS (Continued)
Forward foreign currency exchange contracts – The Fund may use forward foreign currency exchange contracts to hedge exposure to foreign currency. All foreign currency exchange contracts are “marked-to-market” daily at the applicable translation rates, resulting in unrealized gains or losses. Realized and unrealized gains or losses from transactions in foreign currency exchange contracts will be included in the Fund’s Statement of Assets and Liabilities and Statement of Operations. Risks associated with these contracts include the potential inability of counterparties to meet the terms of their contracts and unanticipated movements in the value of a foreign currency relative to the U.S. dollar.
Share valuation – The NAV per share of each class of the Fund is calculated daily by dividing the total value of the assets attributable to that class, less liabilities attributable to that class, by the number of shares outstanding of that class. The offering price and redemption price per share of each class of the Fund is equal to the NAV per share of such class, except that shareholders of the Fund are subject to a redemption fee equal to 2.00% of the NAV of Fund shares redeemed within 7 days of purchase, excluding involuntary redemptions of accounts that fall below the minimum investment amount or the redemption of Fund shares representing reinvested dividends, capital gain distributions, or capital appreciation. During the periods ended February 28, 2017 and August 31, 2016, no shareholder transactions were subject to the redemption fee.
Investment income – Dividend income is recorded on the ex-dividend date. Interest income is accrued as earned. The Fund may invest in real estate investment trusts (“REITs”) that pay distributions to their shareholders based on available funds from operations. It is common for these distributions to exceed the REIT’s taxable earnings and profits resulting in the excess portion of such distribution to be designated as return of capital. Distributions received from REITs are generally recorded as dividend income and, if necessary, are reclassified annually in accordance with tax information provided by the underlying REITs. The Fund may also invest in master limited partnerships (“MLPs”) whose distributions generally are comprised of ordinary income, capital gains and return of capital from the MLP. For financial statement purposes, the Fund records all income received as ordinary income. This amount may be subsequently revised based on information received from MLPs after their tax reporting periods are concluded, as the actual character of these distributions is not known until after the fiscal year end of the Fund. Withholding taxes on foreign dividends have been provided for in accordance with the Fund’s understanding of the applicable country’s tax rules and rates.
Security transactions – Security transactions are accounted for on the trade date. Realized gains and losses on securities sold are determined on a specific identification basis.
Common expenses – Common expenses of the Trust are allocated among the Fund and the other series of the Trust based on the relative net assets of each series or the nature of the services performed and the relative applicability to each series.
18
BLUE CURRENT GLOBAL DIVIDEND FUND
NOTES TO FINANCIAL STATEMENTS (Continued)
Distributions to shareholders – Distributions to shareholders arising from net investment income are declared and paid quarterly to shareholders. Net realized capital gains, if any, are distributed at least annually. The amount of distributions from net investment income and net realized capital gains are determined in accordance with federal income tax regulations, which may differ from GAAP. Dividends and distributions to shareholders are recorded on the ex-dividend date. The tax character of distributions paid during the periods ended February 28, 2017 and August 31, 2016 was ordinary income. On March 31, 2017, the Fund paid an ordinary income dividend of $x.xx per share to shareholders of record on March 30, 2017.
Estimates – The preparation of financial statements in conformity with GAAP requires management to make estimates and assumptions that affect the reported amounts of assets and liabilities and disclosure of contingent assets and liabilities, each as of the date of the financial statements, and the reported amounts of income and expenses during the reporting period. Actual results could differ from those estimates.
Federal income tax – The Fund has qualified and intends to continue to qualify as a regulated investment company under the Internal Revenue Code of 1986, as amended (the “Code”). Qualification generally will relieve the Fund of liability for federal income taxes to the extent 100% of its net investment income and net realized capital gains are distributed in accordance with the Code.
In order to avoid imposition of the excise tax applicable to regulated investment companies, it is also the Fund’s intention to declare as dividends in each calendar year at least 98% of its net investment income (earned during the calendar year) and 98.2% of its net realized capital gains (earned during the 12 months ended October 31) plus undistributed amounts from prior years.
The following information is computed on a tax basis for each item as of February 28, 2017:
| Tax cost of portfolio investments | | $ | 44,286,692 | |
| Gross unrealized appreciation | | $ | 4,565,979 | |
| Gross unrealized depreciation | | | (691,016 | ) |
| Net unrealized appreciation on investments | | | 3,874,963 | |
| Net unrealized depreciation of translation of assets in foreign currencies | | | (123 | ) |
| Accumulated ordinary income | | | 129,541 | |
| Capital loss carryforward | | | (856,966 | ) |
| Other gains | | | 685,571 | |
| Accumulated earnings | | $ | 3,832,986 | |
The difference between the federal income tax cost of portfolio investments and the financial statement cost is due to certain timing differences in the recognition of capital gains or losses under income tax regulations and GAAP. These “book/tax” differences
19
BLUE CURRENT GLOBAL DIVIDEND FUND
NOTES TO FINANCIAL STATEMENTS (Continued)
are temporary in nature and are primarily due to the tax deferral of losses on wash sales, the tax treatment of the cost of securities received as in-kind subscriptions at the inception of the Fund, and the tax treatment of income and capital gains on publicly-traded partnerships held by the Fund.
As of August 31, 2016, the Fund had capital loss carryforwards of $856,966 for federal income tax purposes, of which $818,712 was short-term and $38,254 was long-term. These capital loss carryforwards, which do not expire, may be utilized in the current and future years to offset net realized capital gains, if any, prior to distributing such gains to shareholders.
For the six months ended February 28, 2017, the following reclassifications were made on the Statement of Assets and Liabilities as a result of permanent differences in the recognition of capital gains or losses under income tax regulations and GAAP:
| Accumulated net investment income | | $ | (20,534 | ) |
| Accumulated net realized losses from securities transactions | | $ | 20,534 | |
These differences are primarily due to the tax treatment of net realized losses from foreign currency transactions. Such reclassifications, the result of permanent differences between financial statement and income tax reporting requirements, have no effect on the Fund’s net assets or NAV per share.
The Fund recognizes the tax benefits or expenses of uncertain tax positions only when the position is “more likely than not” to be sustained assuming examination by tax authorities. Management has reviewed the Fund’s tax positions for the current and all open tax periods (tax years ended August 31, 2015 and August 31, 2016) and has concluded that no provision for unrecognized tax benefits or expenses is required in these financial statements. The Fund identifies its major tax jurisdiction as U.S. federal.
3. Investment Transactions
During the six months ended February 28, 2017, cost of purchases and proceeds from sales of investment securities, other than short-term investments, were $20,843,632 and $14,392,134, respectively.
4. Transactions with Related Parties
INVESTMENT ADVISORY AGREEMENT
The Fund’s investments are managed by Edge Advisors, LLC (the “Adviser”) pursuant to the terms of an Investment Advisory Agreement. Under the Investment Advisory Agreement, the Fund pays the Adviser an investment advisory fee, computed and accrued daily and paid monthly, at the annual rate of 0.99% of its average daily net assets.
20
BLUE CURRENT GLOBAL DIVIDEND FUND
NOTES TO FINANCIAL STATEMENTS (Continued)
Pursuant to an Expense Limitation Agreement between the Fund and the Adviser (the “ELA”), the Adviser has agreed, until January 1, 2018, to reduce its investment advisory fees and reimburse other expenses to limit Total Annual Fund Operating Expenses (exclusive of brokerage costs; taxes; interest; acquired fund fees and expenses; extraordinary expenses such as litigation and merger or reorganization costs and other expenses not incurred in the ordinary course of the Fund’s business; and amounts, if any, payable pursuant to a plan adopted in accordance with Rule 12b-1 of the Investment Company Act of 1940) to an amount not exceeding 0.99% of the Fund’s average daily net assets. Accordingly, the Adviser reduced its investment advisory fees in the amount of $112,919 during the six months ended February 28, 2017.
Under the terms of the ELA, investment advisory fee reductions and expense reimbursements by the Adviser are subject to repayment by the Fund for a period of three years after such fees and expenses were incurred, provided that the repayments do not cause Total Annual Fund Operating Expenses to exceed (i) the expense limitation then in effect, if any , and (ii) the expense limitation in effect at the time the expenses to be repaid were incurred. As of February 28, 2017, the Adviser may seek recoupment of investment advisory fee reductions no later than the dates stated below:
| August 31, 2018 | August 31, 2019 | February 29, 2020 | Total |
| $159,675 | $189,186 | $112,919 | $461,780 |
Until April 25, 2017, an officer of the Fund was also an officer of the Adviser.
OTHER SERVICE PROVIDERS
Ultimus Fund Solutions, LLC (“Ultimus”) provides administration, fund accounting, compliance and transfer agency services to the Fund. The Fund pays Ultimus fees in accordance with the agreements for such services. In addition, the Fund pays out-of-pocket expenses including, but not limited to, postage, supplies, and costs of pricing the Fund’s portfolio securities.
DISTRIBUTION AGREEMENT
Under the terms of a Distribution Agreement with the Trust, Ultimus Fund Distributors, LLC (the “Distributor”) serves as principal underwriter to the Fund. The Distributor is a wholly-owned subsidiary of Ultimus. The Distributor is compensated by the Adviser (not the Fund) for acting as principal underwriter.
Certain officers and a Trustee of the Trust are also officers of Ultimus and the Distributor and are not paid by the Fund for serving in such capacities.
TRUSTEE COMPENSATION
Effective October 1, 2016 each Trustee, who is not an “interested person” of the Trust (“Independent Trustee”), receives a $1,000 annual retainer from the Fund, paid quarterly, except for the Board Chair person who receives a $1,200 annual retainer from the Fund,
21
BLUE CURRENT GLOBAL DIVIDEND FUND
NOTES TO FINANCIAL STATEMENTS (Continued)
paid quarterly. Each Independent Trustee also receives from the Fund a fee of $500 for each Board meeting attended plus reimbursement for travel and other meeting-related expenses. Prior to October 1, 2016, the Fund paid each Independent Trustee a fee of $500 for each Board meeting attended, plus a $500 annual retainer. Trustees affiliated with the Adviser or Ultimus are not compensated by the Trust for their services.
PRINCIPAL HOLDERS OF FUND SHARES
As of February 28, 2017, the following shareholders owned of record 5% or more of the outstanding shares of the Fund:
| Name of Record Owner | % Ownership |
| Pershing, LLC (for the benefit of multiple shareholders) | 85% |
| Charles Schwab & Co., Inc. (for the benefit of multiple shareholders) | 8% |
A beneficial owner of 25% or more of a Fund’s outstanding shares may be considered a controlling person. That shareholder’s vote could have a more significant effect on matters presented at a shareholder’s meeting.
5. Derivatives Transactions
There were no transactions in derivative instruments during the six months ended February 28, 2017.
6. Foreign Investment Risk
Compared with investing in the U.S., investing in foreign markets involves a greater degree and variety of risk. Investors in foreign markets may face delayed settlements, currency controls, and adverse economic developments as well as higher overall transaction costs. In addition, fluctuations in the U.S. dollar’s value versus other currencies may erode or reverse gains or increase losses from investments denominated in foreign currencies. Foreign governments may expropriate assets, impose capital or currency controls, impose punitive taxes, impose limits on ownership or nationalize a company or industry. Any of these actions could have a severe effect on security prices and impair an investor’s ability to bring its capital or income back to the U.S. The value of foreign securities may be affected by incomplete, less frequent, or inaccurate financial information about their issuers, social upheavals, or political actions ranging from tax code changes to government collapse. Foreign companies may also receive less coverage by market analysts than U.S. companies and may be subject to different reporting standards or regulatory requirements than those applicable to U.S. companies.
22
BLUE CURRENT GLOBAL DIVIDEND FUND
NOTES TO FINANCIAL STATEMENTS (Continued)
7. Contingencies and Commitments
The Fund indemnifies the Trust’s officers and Trustees for certain liabilities that might arise from their performance of their duties to the Fund. Additionally, in the normal course of business, the Fund enters into contracts that contain a variety of representations, warranties, and general indemnifications. The Fund’s maximum exposure under these arrangements is unknown, as this would involve future claims that may be made against the Fund that have not yet occurred. However, based on experience, the Fund expects the risk of loss to be remote.
8. Subsequent Events
The Fund is required to recognize in the financial statements the effects of all subsequent events that provide additional evidence about conditions that existed as of the date of the Statement of Assets and Liabilities. For non-recognized subsequent events that must be disclosed to keep the financial statements from being misleading, the Fund is required to disclose the nature of the event as well as an estimate of its financial effect, or a statement that such an estimate cannot be made. Management has evaluated subsequent events through the issuance of these financial statements and has noted the following:
| | ● | The subsequent ordinary income dividend disclosed in Note 2. |
| | ● | On April 25, 2017, David R. Carson was elected Principal Executive Officer of the Fund. |
23
BLUE CURRENT GLOBAL DIVIDEND FUND
ABOUT YOUR FUND’S EXPENSES (Unaudited)
We believe it is important for you to understand the impact of costs on your investment. As a shareholder of the Fund, you incur ongoing costs, including management fees and other operating expenses. The following examples are intended to help you understand your ongoing costs (in dollars) of investing in the Fund and to compare these costs with the ongoing costs of investing in other mutual funds.
A mutual fund’s ongoing costs are expressed as a percentage of its average net assets. This figure is known as the expense ratio. The expenses in the table below are based on an investment of $1,000 made at the beginning of the most recent period (September 1, 2016) and held until the end of the period (February 28, 2017).
The table below illustrates the Fund’s ongoing costs in two ways:
Actual fund return – This section helps you to estimate the actual expenses that you paid over the period. The “Ending Account Value” shown is derived from the Fund’s actual return, and the fourth column shows the dollar amount of operating expenses that would have been paid by an investor who started with $1,000 in the Fund. You may use the information here, together with the amount you invested, to estimate the expenses that you paid over the period.
To do so, simply divide your account value by $1,000 (for example, an $8,600 account value divided by $1,000 = 8.6), then multiply the result by the number given for the Fund under the heading “Expenses Paid During Period.”
Hypothetical 5% return – This section is intended to help you compare the Fund’s ongoing costs with those of other mutual funds. It assumes that the Fund had an annual return of 5% before expenses during the period shown, but that the expense ratio is unchanged. In this case, because the return used is not the Fund’s actual return, the results do not apply to your investment. The example is useful in making comparisons because the SEC requires all mutual funds to calculate expenses based on a 5% return. You can assess the Fund’s ongoing costs by comparing this hypothetical example with the hypothetical examples that appear in shareholder reports of other funds.
Note that expenses shown in the table are meant to highlight and help you compare ongoing costs only. The Fund does not charge sales loads. However, a redemption fee of 2% is applied on the sale of shares held for less than 7 days.
The calculations assume no shares were bought or sold during the period. Your actual costs may have been higher or lower, depending on the amount of your investment and the timing of any purchases or redemptions.
More information about the Fund’s expenses can be found in this report. For additional information on operating expenses and other shareholder costs, please refer to the Fund’s prospectus.
24
BLUE CURRENT GLOBAL DIVIDEND FUND
ABOUT YOUR FUND’S EXPENSES (Unaudited) (Continued)
| Institutional Class | Beginning
Account Value
September 1,
2016 | Ending
Account Value
February 28,
2017 | Net Expense Ratio | Expenses
Paid During
Period(a) |
| Based on Actual Fund Return | $1,000.00 | $1,059.70 | 0.99% | $5.06 |
| Based on Hypothetical 5% Return (before expenses) | $1,000.00 | $1,019.89 | 0.99% | $4.96 |
(a) | Expenses are equal to the Fund’s annualized net expense ratio multiplied by the average account value over the period, multiplied by 181/365 (to reflect the one-half year period). |
25
BLUE CURRENT GLOBAL DIVIDEND FUND
OTHER INFORMATION (Unaudited)
A description of the policies and procedures that the Fund uses to vote proxies relating to portfolio securities is available without charge upon request by calling 1-800-514-3583, or on the SEC’s website at http://www.sec.gov. Information regarding how the Fund voted proxies relating to portfolio securities during the most recent 12-month period ended June 30 is also available without charge upon request by calling 1-800-514-3583, or on the SEC’s website at http://www.sec.gov.
The Trust files a complete listing of portfolio holdings for the Fund with the SEC as of the end of the first and third quarters of each fiscal year on Form N-Q. These filings are available upon request by calling 1-800-514-3583. Furthermore, you may obtain a copy of the filings on the SEC’s website at http://www.sec.gov. The Trust’s Forms N-Q may also be reviewed and copied at the SEC’s Public Reference Room in Washington, DC, and information on the operation of the Public Reference Room may be obtained by calling 1-800-SEC-0330.
26
This page intentionally left blank.
CASTLEMAINE FUNDS
Castlemaine Emerging Markets Opportunities Fund (CNEMX)
Castlemaine Event Driven Fund (CNEVX)
Castlemaine Long/Short Fund (CNLSX)
Castlemaine Market Neutral Fund (CNMNX)
Castlemaine Multi-Strategy Fund (CNMSX)
Semi-Annual Report
February 28, 2017
(Unaudited)
CASTLEMAINE FUNDS LETTER TO SHAREHOLDERS | February 28, 2017 |
Dear Shareholders,
This is the Semi-Annual Report to Shareholders of Castlemaine Emerging Markets Opportunities Fund, Castlemaine Event Driven Fund, Castlemaine Long/Short Fund, Castlemaine Market Neutral Fund, and Castlemaine Multi-Strategy Fund, (collectively, the “Castlemaine Funds”) for the six months ended February 28, 2017. On behalf of the investment manager, Castlemaine LLC (the “Adviser”), we would like to thank you for your continued investment in the funds.
Over the past six months the Castlemaine Market Neutral Fund has strongly outperformed its relevant benchmarks while Emerging Markets, and Event Driven lagged their respective benchmarks. Both Castlemaine Long/Short and Multi Strategy kept pace with their respective benchmarks.
Castlemaine Funds Performance vs. benchmarks for six months ended February 28, 2017
| Emerging
Markets | Event
Driven | Long
Short | Market
Neutral | Multi
Strategy |
| | CNEMX | CNEVX | CNLSX | CNMNX | CNMSX |
Performance Since Aug. 31, 2016 | -5.85% | 5.71% | 4.53% | 7.23% | 0.48% |
— Relevant Benchmark (1) | -0.01% | 6.42% | 4.40% | -0.13% | 2.87% |
(1) | Benchmarks: HFRX Emerging Markets Index, HFRX Event Driven Index, HFRX Equity Hedge Index, HFRX EH Market Neutral Index and HFRX RV Multi Strategy Index |
Market & Economic Conditions Summary
The period from August 2016 through February 2017 was historic, both in terms of the outcome of the US President Election as well as in terms of market impact. The election of Donald Trump caused US equity markets to surge, while Emerging Markets tanked, the dollar rallied and US bonds sold off. February 2017 has seen the euphoria continue with another strong month for US Equities, as the S&P 500 and Dow Jones Indices made all-time highs. Driving the rally was a surge of optimism regarding potentially lower government tax policies and better than expected earnings for many large US companies. Historical perspective or rational economic analysis does not seem to be working in the markets today. Valuations are high when compared to earnings growth, and interest rates are expected to rise next month. The inexorable climb higher in US Equity markets seems to be a function of asset allocation flows (out of bonds and into equities) and of buoyant optimism regarding tax and business policies of the Trump administration. Cash on the side-lines remains high, private equity & venture capital firms continue to raise money with ease and we just witnessed the return of the Internet mega-IPO with the successful listing of Snapchat (NYSE:SNAP) at over 40x future 2017 sales. Overall the biggest challenge to managing portfolios in this uncertain market environment is finding effective hedges and offsets. Traditional index puts and long volatility products have not worked well. Indeed, we continue to see extremely high intra-market daily dispersion yet the end-result is the
1
recorded calm of minimal overall index price movement. Consequently, on any given day there may be moves of 1-2% in certain sectors which are totally offset by equally large moves in other sectors. What is further consternating to active managers is that this type of behavior does not trend but is often quickly reversed or reshuffled making portfolios that are allocated with biases to specific themes, assets or sectors much more volatile than a casual glance to S&P 500 daily volatility would imply. This market behavior is an important regime change from the last few years of much higher inter-sector correlations. Ideally, this type of breakdown and increase in dispersion should provide much greater opportunities to source individual security alpha.
The Castlemaine Funds are managed with a flexible investment approach and utilize alternative market hedging strategies which we expect to result in lower overall risk without sacrificing market returns. Although each Castlemaine Fund is managed in accordance with its investment objectives, we nonetheless strive to provide a commonality of investment philosophy with an overlap of research and an incorporation of prudent risk budgeting.
Castlemaine Emerging Markets Opportunities Fund
The Castlemaine Emerging Markets Opportunities Fund seeks to provide high total return by investing primarily in securities and other investments that are related to companies or governments economically tied to international emerging markets. The Fund invests in long and short positions in securities, including common and preferred stocks, depositary receipts, exchange traded funds (“ETFs”), and warrants. The Fund may also invest in foreign currency forward contracts (“forwards”) for both hedging and speculative purposes. The Adviser allocates the Fund’s assets among different asset classes and markets using a macro-economic risk-allocation approach to portfolio construction. The Fund’s asset allocation is derived from the Adviser’s view on global macro-economic factors such as central bank interest rate policies, economic growth, equity market risk factors, and political risks.
For the six months ended February 28, 2017, the Castlemaine Emerging Markets Opportunities Fund lost -5.85% compared to the HFRX Emerging Markets Index, which lost -0.01%. The top contributor to performance over the period was the Fund’s exposure to energy sector stocks in Latin America which performed strongly post the decision by OPEC to limit crude oil production. The Fund also recorded its largest losers among gold stocks, which sold off following the election of President Trump and the subsequent surge in the US dollar. Since inception in December of 2015 the Fund has outperformed the HFRX Emerging Markets Index by approximately 250bp.
2
Castlemaine Emerging Markets Opportunities Fund Performance vs. HFRX Emerging Markets Index since inception (December 29, 2015) through February 28, 2017
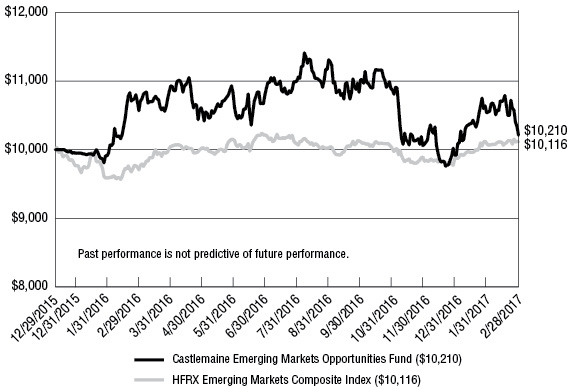
Castlemaine Emerging Markets Opportunities Fund Sector Allocation at February 28, 2017
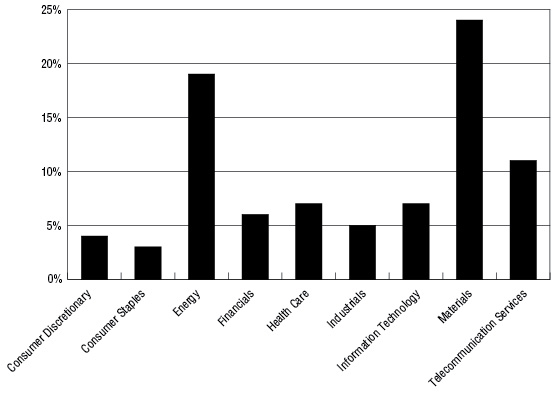
3
Castlemaine Emerging Markets Opportunities Fund Top 5 holdings at February 28, 2017
Top 5 Equity Holdings |
Security Description | Net
Assets |
CEMEX SAB-SPONS ADR PART | 6.18% |
CHINA MOBILE LTD-SPON ADR | 4.93% |
YPF S.A.-SPONSORED ADR | 4.71% |
TEVA PHARMACEUTICAL-SP AD | 4.26% |
ALIBABA GROUP HOLDING-SP | 4.17% |
Castlemaine Event Driven Fund
The Castlemaine Event Driven Fund seeks capital appreciation through an event-driven strategy that primarily invests in long and short positions in equity securities undergoing event-driven situations, which may include: initial and seasoned equity offerings; extraordinary corporate transactions such as mergers, spin-offs, recapitalizations, tender offers, or other restructurings; upcoming critical dates for launches of new products; regulatory changes; analysts meetings; earnings announcements; covenant issues; bankruptcies; corporate reorganizations; shareholder activism; and significant management and external changes that dramatically change the firm’s profit margins. The Fund seeks to invest in transactions with an identifiable event period and calculable rates of return based on the Adviser’s appraisal of the “event-dynamics”. The Adviser uses a multi-factor model to create a system by which it assigns high reward/low risk investments.
For the six months ended February 28, 2017 the Castlemaine Event Driven Fund returned 5.71% compared to the HFRX Event Driven Index which was up 6.42%. Top contributors to performance over the period were situations involving takeovers in which the Fund held positions in underlying shares or call options. S&P 500 based index puts were the primary detractor to performance. Overall, since inception the Fund trails its benchmark by approximately 100bp.
4
Castlemaine Event Driven Fund Performance vs. HFRX Event Driven Index since inception (December 29, 2015) through February 28, 2017

Castlemaine Event Driven Fund Sector Allocation at February 28, 2017
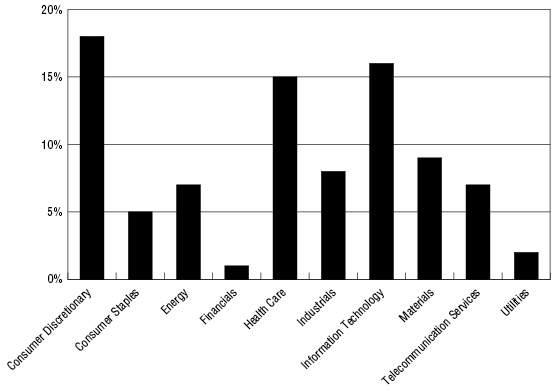
5
Castlemaine Event Driven Fund Top 5 holdings at February 28, 2017
Top 5 Equity Holdings |
Security Description | Net
Assets |
T-MOBILE US INC | 4.96% |
REYNOLDS AMERICAN INC | 3.55% |
TIME WARNER INC | 3.54% |
CYPRESS SEMICONDUCTOR CO | 3.35% |
UNITED TECHNOLOGIES CORP | 3.25% |
Castlemaine Long/Short Fund
The Castlemaine Long/Short Fund seeks capital appreciation by primarily investing in long and short positions in equity securities. The Fund may also invest in options and futures on securities. The Adviser allocates the Fund’s assets among different asset classes and markets using a macro-economic risk-allocation approach to portfolio construction. The Adviser uses these factors to determine overall gross and net exposure to various assets and markets. The investment selection process is not limited to fundamental security considerations, but the Adviser takes long positions in companies and sectors that are increasing cash flow, improving operating margins, or growing top-line revenues, while taking short positions in those companies and sectors exhibiting a negative trend in the aforementioned fundamental factors. Usually, the Fund’s portfolio will be net long, but it may at times invest all of its assets in short positions. This investment latitude allows the Adviser the flexibility in balancing the risk and return profile of the Fund during bull markets (rising asset prices) and bear markets (falling asset prices).
For the six months ended February 28, 2017 the Castlemaine Long Short Fund returned 4.53% compared to the HFRX Equity Hedge Index, which gained 4.40%. Outperformance was driven by our exposure to the technology sector and to stocks such as Apple and Micron, while equity put options on major indices and exchange traded index funds were the primary contributors to losses. Overall, since inception in December 2015 the Fund has outperformed its relevant benchmark by approximately 380bp.
6
Castlemaine Long/Short Fund Performance vs. HFRX Equity Hedge Index since inception (December 29, 2015) through February 28, 2017
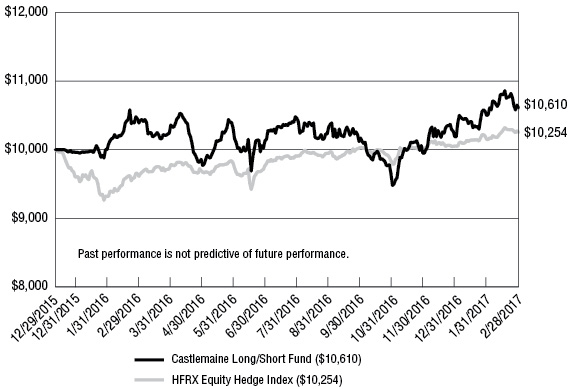
Castlemaine Long/Short Fund Sector Allocation at February 28, 2017
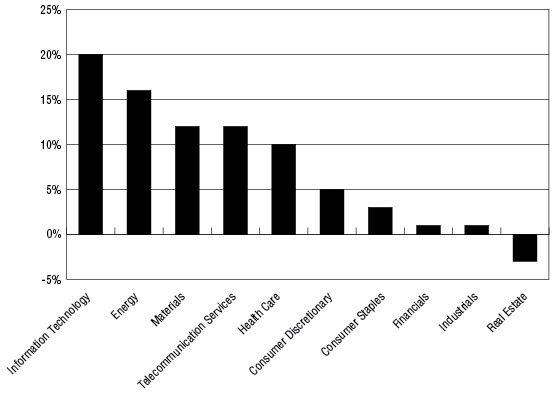
7
Castlemaine Long/Short Fund Top 5 holdings at February 28, 2017
Top 5 Equity Holdings |
Security Description | Net
Assets |
APPLE INC | 5.38% |
AMGEN INC | 4.16% |
LEVEL 3 COMMUNICATIONS INC | 4.05% |
T-MOBILE US INC | 3.93% |
SEAGATE TECHNOLOGY | 3.78% |
Castlemaine Market Neutral Fund
The Castlemaine Market Neutral Fund seeks total return, consisting of income and capital appreciation, by employing a market neutral investment strategy, which the Fund defines as a strategy that attempts to create a portfolio that has a low correlation to the fluctuation in the general US equity markets. The Adviser seeks to implement this strategy by investing in long and short positions of equity securities and options on securities. The Adviser uses a macro-economic framework to determine gross and net exposure to various assets and markets. The Adviser generally seeks to build a portfolio of offsetting investments where securities are paired with other securities that often exhibit a high negative correlation of price movement. Therefore, as the value of securities markets increase (or decrease), the value of the paired assets will inversely decrease (or increase), which generates a market-neutral return. The Fund’s portfolio will alternate between net long and net short exposure depending on market conditions. This investment latitude allows the Adviser to have the flexibility in balancing the risk and return profile of the Fund.
For the six months ended February 28, 2017 the Castlemaine Market Neutral Fund returned 7.23% compared to the HFRX Market Neutral Index, which recorded a loss of -0.13%. Outperformance was driven by the Fund’s exposure to large cap defense stocks such as Boeing and to technology leaders such as Apple while equity put options on major indices and exchange traded index funds were the primary contributors to losses. Overall, since inception the Fund has significantly outperformed its benchmark by nearly 1400bp.
8
Castlemaine Market Neutral Fund Performance vs. HFRX Equity Market Neutral Index since inception (December 29, 2015) through February 28, 2017
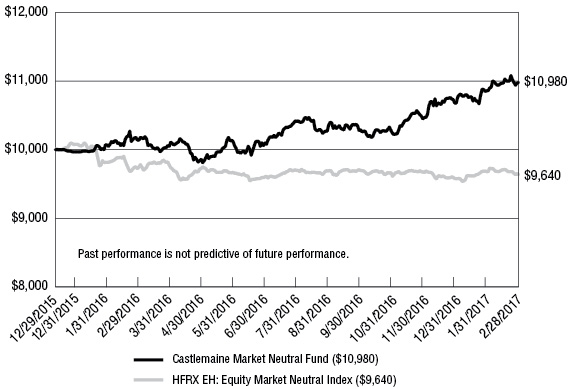
Castlemaine Market Neutral Fund Sector Allocation at February 28, 2017

9
Castlemaine Market Neutral Fund Top 5 holdings at February 28, 2017
Top 5 Equity Holdings |
Security Description | Net
Assets |
BOEING CO/THE | 5.47% |
CORNING INC | 4.19% |
APPLE INC | 4.16% |
RIO TINTO PLC-SPON ADR | 3.15% |
JETBLUE AIRWAYS CORP | 3.03% |
Castlemaine Multi-Strategy Fund
The Castlemaine Multi-Strategy Fund seeks capital appreciation by using a flexible allocation strategy that includes both direct investments in securities and investments in affiliated and unaffiliated investment companies, including mutual funds, closed-end funds, and ETFs, that employ various investment strategies as discussed below. Typically, the Fund’s portfolio will consist of about 50% of its net assets invested in affiliated funds (i.e., investment companies advised by the Adviser), including Castlemaine Emerging Markets Opportunities Fund, Castlemaine Event Driven Fund, Castlemaine Long/Short Fund, Castlemaine Market Neutral Fund, and other funds that may be managed by the Adviser in the future. The balance of the Fund’s portfolio will normally be invested in unaffiliated funds and directly in equity securities that provide exposure to other strategies.
For the six months ended February 28, 2017 the Castlemaine Multi-Strategy Fund returned 0.48% compared to the HFRX Multi Strategy Index, which gained 0.86%. Top contributors to performance over the period were 20% allocation to each of the Castlemaine Event Driven and Castlemaine Market Neutral Fund, which posted returns of 5.7% and 7.2%, respectively, over the period. Investments in a Japanese market ETF and in the Castlemaine Emerging Market Fund detracted from performance over the period. Overall, since inception the Fund has outperformed the benchmark by 455bp.
10
Castlemaine Multi-Strategy Fund Performance vs. HFRX Multi Strategy Index since inception (December 29, 2015) through February 28, 2017
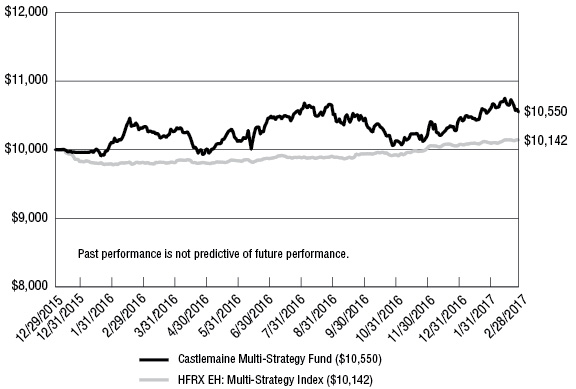
Castlemaine Multi-Strategy Top 5 holdings at February 28, 2017
Top 5 Equity Holdings |
Security Description | Net
Assets |
Castlemaine Event Driven Fund | 21.93% |
Castlemaine Market Neutral Fund | 20.82% |
Castlemaine Long/Short Fund | 20.12% |
Castlemaine Emerging Markets Opportunity Fund | 19.48% |
Ishares Iboxx USD High Yield ETF | 7.54% |
On behalf of the investment manager, Castlemaine LLC, we would like to thank you for your continued investment.
Sincerely,
Alfredo Viegas
Chief Investment Officer, Castlemaine LLC
11
Past performance is not predictive of future performance. Investment results and principal value will fluctuate so that shares, when redeemed, may be worth more or less than their original cost. Current performance may be higher or lower than the performance data quoted. Performance data current to the most recent month end are available by calling 1-888-594-0006.
An investor should consider the investment objectives, risks, charges and expenses of the Funds carefully before investing. The Funds’ prospectus contains this and other important information. To obtain a copy of the Funds’ prospectus please call 1-888-594-0006 and a copy will be sent to you free of charge. Please read the prospectus carefully before you invest. The Castlemaine Funds are distributed by Ultimus Fund Distributors, LLC.
This Letter to Shareholders seeks to describe some of the Adviser’s current opinions and views of the financial markets. Although the Adviser believes it has a reasonable basis for any opinions or views expressed, actual results may differ, sometimes significantly so, from those expected or expressed. The securities held by the Funds that are discussed in the Letter to Shareholders were held during the period covered by this Report. They do not comprise the entire investment portfolios of the Funds, may be sold at any time and may no longer be held by the Funds. For a complete list of securities held by the Funds as of February 28, 2017, please see the Schedules of Investments and Schedules of Securities Sold Short sections of this report. The opinions of the Adviser with respect to those securities may change at any time.
Statements in the Letter to Shareholders that reflect projections or expectations for future financial or economic performance of the Funds and the market in general and statements of the Funds’ plans and objectives for future operations are forward-looking statements. No assurance can be given that actual results or events will not differ materially from those projected, estimated, assumed, or anticipated in any such forward-looking statements. Important factors that could result in such differences, in addition to factors noted with such forward-looking statements include, without limitation, general economic conditions, such as inflation, recession, and interest rates. Past performance is not a guarantee of future results.
12
CASTLEMAINE EMERGING MARKETS OPPORTUNITIES FUND
PORTFOLIO INFORMATION
February 28, 2017 (Unaudited)
Net Sector Exposure*
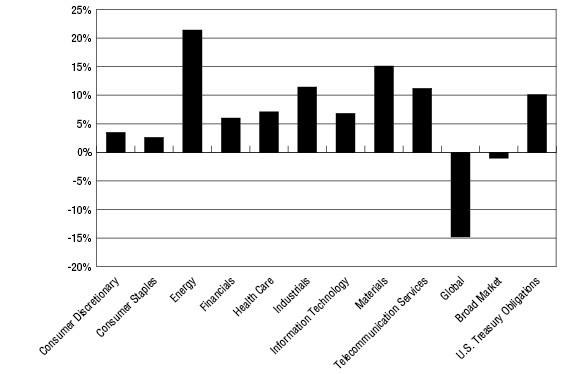
* | The net percentages are computed by taking the net dollar exposure, including short positions, and dividing by the net assets of the Fund. Consequently, the percentages will not total to 100%. |
Top 10 Long Equity Holdings |
Security Description | % of
Net Assets |
CEMEX, S.A.B. de C.V. - ADR | 6.2% |
China Mobile Ltd. - ADR | 4.9% |
YPF S.A. - ADR | 4.7% |
Teva Pharmaceutical Industries Ltd. - ADR | 4.3% |
Alibaba Group Holding Ltd. - ADR | 4.2% |
iShares MSCI Mexico Capped ETF | 4.1% |
Sociedad Quimica y Minera de Chile S.A. - ADR | 3.8% |
China Life Insurance Company Ltd. - ADR | 3.7% |
iShares MSCI South Africa ETF | 3.6% |
Telecom Argentina S.A. - ADR | 3.4% |
All Short Equity Holdings |
Security Description | % of
Net Assets |
iShares MSCI EAFE ETF | (4.9%) |
iShares MSCI South Korea Capped ETF | (4.8%) |
iShares JPMorgan USD Emerging Markets Bond ETF | (4.6%) |
iShares MSCI Singapore Capped ETF | (3.6%) |
iShares MSCI India ETF | (3.6%) |
iShares MSCI Hong Kong ETF | (1.7%) |
ProShares Short VIX Short-Term Futures ETF | (1.0%) |
13
CASTLEMAINE EVENT DRIVEN FUND
PORTFOLIO INFORMATION
February 28, 2017 (Unaudited)
Net Sector Exposure*
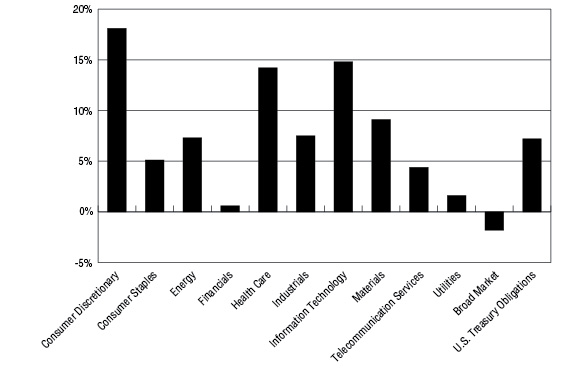
* | The net percentages are computed by taking the net dollar exposure, including short positions, and dividing by the net assets of the Fund. Consequently, the percentages will not total to 100%. |
Top 10 Long Equity Holdings |
Security Description | % of
Net Assets |
Reynolds American, Inc. | 3.6% |
Time Warner, Inc. | 3.5% |
Cypress Semiconductor Corporation | 3.3% |
United Technologies Corporation | 3.2% |
Nexstar Media Group, Inc. - Class A | 3.0% |
BioMarin Pharmaceutical, Inc. | 2.7% |
T-Mobile US, Inc. | 2.7% |
InvenSense, Inc. | 2.7% |
Basic Energy Services, Inc. | 2.6% |
Amgen, Inc. | 2.5% |
All Short Equity Holdings |
Security Description | % of
Net Assets |
British American Tobacco plc - ADR | (1.8%) |
ProShares Short VIX Short-Term Futures ETF | (1.8%) |
14
CASTLEMAINE LONG/SHORT FUND
PORTFOLIO INFORMATION
February 28, 2017 (Unaudited)
Net Sector Exposure*

* | The net percentages are computed by taking the net dollar exposure, including short positions, and dividing by the net assets of the Fund. Consequently, the percentages will not total to 100%. |
Top 10 Long Equity Holdings |
Security Description | % of
Net Assets |
Apple, Inc. | 5.4% |
Amgen, Inc. | 4.2% |
Level 3 Communications, Inc. | 4.0% |
Seagate Technology plc | 3.8% |
DHT Holdings, Inc. | 3.6% |
Gilead Sciences, Inc. | 3.3% |
Rio Tinto plc - ADR | 3.3% |
Corning, Inc. | 3.2% |
Cypress Semiconductor Corporation | 3.1% |
BHP Billiton Ltd. - ADR | 2.9% |
All Short Equity Holdings |
Security Description | % of
Net Assets |
AvalonBay Communities, Inc. | (2.9%) |
iShares 20+ Year Treasury Bond ETF | (2.9%) |
Caterpillar, Inc. | (2.3%) |
Facebook, Inc. - Class A | (2.1%) |
Baxter International, Inc. | (2.0%) |
ProShares Short VIX Short-Term Futures ETF | (1.9%) |
Domino's Pizza, Inc. | (1.5%) |
Harley-Davidson, Inc. | (1.3%) |
Comcast Corporation - Class A | (1.2%) |
CarMax, Inc. | (1.0%) |
15
CASTLEMAINE MARKET NEUTRAL FUND
PORTFOLIO INFORMATION
February 28, 2017 (Unaudited)
Net Sector Exposure*
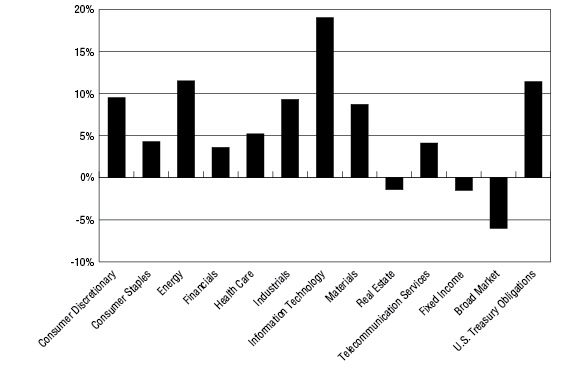
* | The net percentages are computed by taking the net dollar exposure, including short positions, and dividing by the net assets of the Fund. Consequently, the percentages will not total to 100%. |
Top 10 Long Equity Holdings |
Security Description | % of
Net Assets |
Boeing Company (The) | 5.5% |
Corning, Inc. | 4.2% |
Apple, Inc. | 4.2% |
Rio Tinto plc - ADR | 3.2% |
JetBlue Airways Corporation | 3.0% |
Cypress Semiconductor Corporation | 3.0% |
Seagate Technology plc | 2.9% |
BHP Billiton Ltd. - ADR | 2.9% |
Bank of America Corporation | 2.8% |
CenturyLink, Inc. | 2.8% |
Top 10 Short Equity Holdings |
Security Description | % of
Net Assets |
iShares Russell 2000 ETF | (3.1%) |
ProShares Short VIX Short-Term Futures ETF | (2.8%) |
iShares 20+ Year Treasury Bond ETF | (2.8%) |
Caterpillar, Inc. | (2.2%) |
Facebook, Inc. - Class A | (2.1%) |
Baxter International, Inc. | (1.5%) |
CarMax, Inc. | (1.5%) |
AvalonBay Communities, Inc. | (1.4%) |
iShares U.S. Telecommunications ETF | (1.3%) |
iShares U.S. Home Construction ETF | (1.1%) |
16
CASTLEMAINE MULTI-STRATEGY FUND
PORTFOLIO INFORMATION
February 28, 2017 (Unaudited)
Sector Exposure
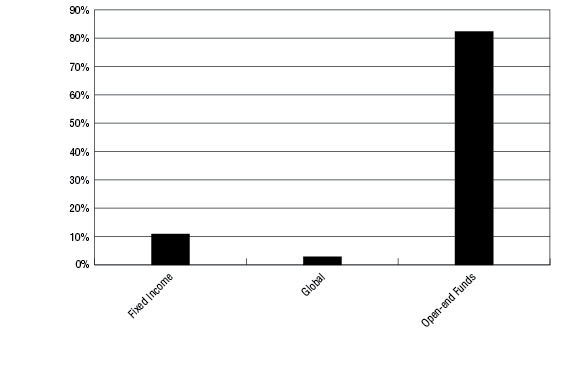
All Long Equity Holdings |
Security Description | % of
Net Assets |
Castlemaine Event Driven Fund | 22.0% |
Castlemaine Market Neutral Fund | 20.8% |
Castlemaine Long/Short Fund | 20.1% |
Castlemaine Emerging Markets Opportunities Fund | 19.5% |
iShares iBoxx $ High Yield Corporate Bond ETF | 7.5% |
iShares TIPS Bond ETF | 3.3% |
ProShares UltraShort Euro | 1.5% |
Deutsche X-trackers MSCI Europe Hedged Equity ETF | 1.2% |
17
CASTLEMAINE EMERGING MARKETS OPPORTUNITIES FUND
SCHEDULE OF INVESTMENTS
February 28, 2017 (Unaudited) | |
COMMON STOCKS — 85.1% | | Shares | | | Value | |
Consumer Discretionary — 3.5% | | | | | | |
Automobiles — 1.4% | | | | | | |
Tata Motors Ltd. - ADR | | | 500 | | | $ | 16,795 | |
| | | | | | | | | |
Internet & Direct Marketing Retail — 2.1% | | | | | | | | |
Vipshop Holdings Ltd. - ADR (a) | | | 2,000 | | | | 26,020 | |
| | | | | | | | | |
Consumer Staples — 2.6% | | | | | | | | |
Beverages — 2.6% | | | | | | | | |
Fomento Economico Mexicano, S.A.B. de C.V. - ADR (b) | | | 400 | | | | 32,216 | |
| | | | | | | | | |
Energy — 21.4% | | | | | | | | |
Oil, Gas & Consumable Fuels — 21.4% | | | | | | | | |
China Petroleum & Chemical Corporation - ADR | | | 400 | | | | 31,028 | |
CNOOC Ltd. - ADR | | | 300 | | | | 35,607 | |
Ecopetrol S.A. - ADR (a) | | | 2,000 | | | | 18,040 | |
Gazprom PJSC - ADR | | | 2,000 | | | | 8,920 | |
PetroChina Company Ltd. - ADR | | | 500 | | | | 37,980 | |
Petroleo Brasileiro S.A. - ADR (a) | | | 2,500 | | | | 25,200 | |
Sasol Ltd. - ADR | | | 1,000 | | | | 28,360 | |
Ultrapar Participacoes S.A. - ADR | | | 1,000 | | | | 20,750 | |
YPF S.A. - ADR (b) | | | 2,800 | | | | 58,100 | |
| | | | | | | | 263,985 | |
Financials — 6.0% | | | | | | | | |
Banks — 2.3% | | | | | | | | |
Banco Bilbao Vizcaya Argentaria S.A. - ADR | | | 2,000 | | | | 13,080 | |
Grupo Financiero Santander México, S.A.B. de C.V. - Class B - ADR | | | 2,000 | | | | 15,040 | |
| | | | | | | | 28,120 | |
Insurance — 3.7% | | | | | | | | |
China Life Insurance Company Ltd. - ADR | | | 3,000 | | | | 45,630 | |
| | | | | | | | | |
Health Care — 7.0% | | | | | | | | |
Pharmaceuticals — 7.0% | | | | | | | | |
Dr. Reddy's Laboratories Ltd. - ADR (b) | | | 800 | | | | 34,368 | |
Teva Pharmaceutical Industries Ltd. - ADR (b) | | | 1,500 | | | | 52,530 | |
| | | | | | | | 86,898 | |
Industrials — 11.4% | | | | | | | | |
Air Freight & Logistics — 2.1% | | | | | | | | |
ZTO Express Cayman, Inc. - ADR (a) | | | 2,000 | | | | 25,780 | |
See accompanying notes to financial statements. |
18
CASTLEMAINE EMERGING MARKETS OPPORTUNITIES FUND
SCHEDULE OF INVESTMENTS (Continued) | |
COMMON STOCKS — 85.1% (Continued) | | Shares | | | Value | |
Industrials — 11.4% (Continued) | | | | | | |
Airlines — 3.1% | | | | | | |
Avianca Holdings S.A. - ADR | | | 1,000 | | | $ | 7,760 | |
Controladora Vuela Cia de Aviacion S.A.B de C.V. - ADR (a) | | | 2,500 | | | | 30,300 | |
| | | | | | | | 38,060 | |
Building Products — 6.2% | | | | | | | | |
CEMEX, S.A.B. de C.V. - ADR (a) | | | 9,000 | | | | 76,140 | |
| | | | | | | | | |
Information Technology — 6.8% | | | | | | | | |
Internet Software & Services — 4.2% | | | | | | | | |
Alibaba Group Holding Ltd. - ADR (a) (c) | | | 500 | | | | 51,450 | |
| | | | | | | | | |
Semiconductors & Semiconductor Equipment — 2.6% | | | | | | | | |
Silicon Motion Technology Corporation - ADR | | | 800 | | | | 32,472 | |
| | | | | | | | | |
Materials — 15.1% | | | | | | | | |
Chemicals — 5.5% | | | | | | | | |
Braskem S.A. - ADR | | | 1,000 | | | | 20,610 | |
Sociedad Quimica y Minera de Chile S.A. - ADR | | | 1,500 | | | | 47,250 | |
| | | | | | | | 67,860 | |
Metals & Mining — 9.6% | | | | | | | | |
AngloGold Ashanti Ltd. - ADR (a) | | | 3,000 | | | | 33,060 | |
Cia de Minas Buenaventura S.A.A. - ADR | | | 2,500 | | | | 30,750 | |
Gold Fields Ltd. - ADR | | | 11,000 | | | | 33,990 | |
Sibanye Gold Ltd. - ADR | | | 2,500 | | | | 20,275 | |
| | | | | | | | 118,075 | |
Telecommunication Services — 11.3% | | | | | | | | |
Diversified Telecommunication Services — 6.4% | | | | | | | | |
Telecom Argentina S.A. - ADR | | | 2,000 | | | | 42,320 | |
Telefonica Brasil S.A. - ADR | | | 2,500 | | | | 36,025 | |
| | | | | | | | 78,345 | |
Wireless Telecommunication Services — 4.9% | | | | | | | | |
China Mobile Ltd. - ADR (b) | | | 1,100 | | | | 60,786 | |
| | | | | | | | | |
Total Common Stocks (Cost $957,934) | | | | | | $ | 1,048,632 | |
| |
EXCHANGE-TRADED FUNDS — 8.5% | | Shares | | | Value | |
iShares MSCI Mexico Capped ETF (b) (c) | | | 1,100 | | | $ | 50,688 | |
iShares MSCI South Africa ETF (b) | | | 800 | | | | 43,992 | |
VanEck Vectors Russia ETF | | | 500 | | | | 10,085 | |
Total Exchange-Traded Funds (Cost $106,535) | | | | | | $ | 104,765 | |
See accompanying notes to financial statements. |
19
CASTLEMAINE EMERGING MARKETS OPPORTUNITIES FUND
SCHEDULE OF INVESTMENTS (Continued) | |
PURCHASED OPTION CONTRACTS — 1.3% | Expiration Date | | Strike Price | | | Contracts | | | Value | |
Call Option Contracts — 1.2% | | | | | | | | | | |
CEMEX, S.A.B. de C.V. | 03/17/17 | | $ | 9.00 | | | | 100 | | | $ | 1,600 | |
iPath S&P® 500 VIX Short-Term Futures ETN (c) | 03/17/17 | | | 20.00 | | | | 35 | | | | 1,960 | |
iShares MSCI Brazil Capped ETF (c) | 03/17/17 | | | 36.00 | | | | 10 | | | | 2,320 | |
iShares MSCI Mexico Capped ETF (c) | 03/17/17 | | | 47.00 | | | | 90 | | | | 4,860 | |
Silicon Motion Technology Corporation | 03/17/17 | | | 45.00 | | | | 15 | | | | 300 | |
Tata Motors Ltd. | 04/21/17 | | | 35.00 | | | | 15 | | | | 1,200 | |
Teva Pharmaceutical Industries Ltd. | 03/17/17 | | | 35.00 | | | | 25 | | | | 2,375 | |
Teva Pharmaceutical Industries Ltd. | 03/17/17 | | | 40.00 | | | | 15 | | | | 60 | |
| | | | | | | | | | | | | 14,675 | |
Put Option Contracts — 0.1% | | | | | | | | | | | | | |
SPDR® S&P® 500 ETF Trust (c) | 03/17/17 | | | 225.00 | | | | 10 | | | | 370 | |
SPDR® S&P® 500 ETF Trust | 03/17/17 | | | 230.00 | | | | 10 | | | | 790 | |
| | | | | | | | | | | | | 1,160 | |
Total Purchased Option Contracts (Cost $21,130) | | | | | | | | | | | $ | 15,835 | |
| |
U.S. TREASURY OBLIGATIONS — 10.1% | Maturity | | Coupon | | | Par Value | | | Value | |
U.S. Treasury Bills (d) (Cost $124,910) | 04/27/17 | | | 0.453 | % | | $ | 125,000 | | | $ | 124,904 | |
| | | | | | |
Total Investments at Value — 105.0% (Cost $1,210,509) | | | $ | 1,294,136 | |
| | | | | | |
Liabilities in Excess of Other Assets (e) — (5.0%) | | | | (61,362 | ) |
| | | | | | |
Net Assets — 100.0% | | | $ | 1,232,774 | |
ADR - American Depositary Receipt |
(a) | Non-income producing security. |
(b) | All or a portion of the shares have been committed as collateral for open short positions. |
(c) | All or a portion of the security covers written option contracts. |
(d) | Rate shown is the annualized yield at time of purchase, not a coupon rate. |
(e) | Includes cash held as margin deposits for open short positions. |
See accompanying notes to financial statements. |
20
CASTLEMAINE EMERGING MARKETS OPPORTUNITIES FUND
SUMMARY OF COMMON STOCKS AND ETFs BY COUNTRY
February 28, 2017 (Unaudited) | |
Country | | Value | | | % of
Net Assets | |
Mexico | | $ | 204,384 | | | | 16.6 | % |
China | | | 166,088 | | | | 13.5 | % |
South Africa | | | 159,677 | | | | 13.0 | % |
Brazil | | | 102,585 | | | | 8.3 | % |
Argentina | | | 100,420 | | | | 8.1 | % |
Hong Kong | | | 96,393 | | | | 7.8 | % |
Cayman Islands | | | 84,272 | | | | 6.8 | % |
Israel | | | 52,530 | | | | 4.3 | % |
India | | | 51,163 | | | | 4.2 | % |
Chile | | | 47,250 | | | | 3.8 | % |
Peru | | | 30,750 | | | | 2.5 | % |
Russian Federation | | | 19,005 | | | | 1.5 | % |
Colombia | | | 18,040 | | | | 1.5 | % |
Spain | | | 13,080 | | | | 1.1 | % |
Panama | | | 7,760 | | | | 0.6 | % |
| | | $ | 1,153,397 | | | | 93.6 | % |
See accompanying notes to financial statements. |
21
CASTLEMAINE EMERGING MARKETS OPPORTUNITIES FUND
SCHEDULE OF SECURITIES SOLD SHORT
February 28, 2017 (Unaudited) | |
EXCHANGE-TRADED FUNDS — 24.2% | | Shares | | | Value | |
iShares JPMorgan USD Emerging Markets Bond ETF | | | 500 | | | $ | 56,780 | |
iShares MSCI EAFE ETF | | | 1,000 | | | | 60,340 | |
iShares MSCI Hong Kong ETF | | | 1,000 | | | | 21,610 | |
iShares MSCI India ETF | | | 1,500 | | | | 44,505 | |
iShares MSCI Singapore Capped ETF | | | 2,000 | | | | 44,640 | |
iShares MSCI South Korea Capped ETF | | | 1,000 | | | | 58,560 | |
ProShares Short VIX Short-Term Futures ETF | | | 100 | | | | 12,250 | |
Total Securities Sold Short — 24.2% (Proceeds $281,800) | | | | | | $ | 298,685 | |
CASTLEMAINE EMERGING MARKETS OPPORTUNITIES FUND
SUMMARY OF ETFs SOLD SHORT BY COUNTRY OR REGION
February 28, 2017 (Unaudited) | |
Country or Region | | Value | | | % of
Net Assets | |
Europe, Australasia and Far East | | $ | 60,340 | | | | 4.9 | % |
South Korea | | | 58,560 | | | | 4.8 | % |
Asia, Europe, Latin America, and Middle East/Africa | | | 56,780 | | | | 4.6 | % |
Singapore | | | 44,640 | | | | 3.6 | % |
India | | | 44,505 | | | | 3.6 | % |
Hong Kong | | | 21,610 | | | | 1.7 | % |
United States | | | 12,250 | | | | 1.0 | % |
| | | $ | 298,685 | | | | 24.2 | % |
See accompanying notes to financial statements. |
22
CASTLEMAINE EMERGING MARKETS OPPORTUNITIES FUND
SCHEDULE OF OPEN WRITTEN OPTION CONTRACTS
February 28, 2017 (Unaudited) | |
WRITTEN OPTION CONTRACTS | Expiration Date | | Strike Price | | | Contracts | | | Value of Options | | | Premiums Received | |
Call Option Contracts | | | | | | | | | | | | | |
Alibaba Group Holding Ltd. - ADR | 03/17/17 | | $ | 109.00 | | | | 5 | | | $ | 140 | | | $ | 532 | |
iPath S&P® 500 VIX Short-Term Futures ETN | 03/17/17 | | | 25.00 | | | | 10 | | | | 150 | | | | 662 | |
iShares MSCI Brazil Capped ETF | 03/17/17 | | | 40.50 | | | | 10 | | | | 190 | | | | 722 | |
iShares MSCI Mexico Capped ETF | 03/17/17 | | | 48.00 | | | | 30 | | | | 750 | | | | 1,541 | |
| | | | | | | | | | | | | 1,230 | | | | 3,457 | |
Put Option Contracts | | | | | | | | | | | | | | | | | |
SPDR® S&P® 500 ETF Trust | 03/17/17 | | | 212.00 | | | | 10 | | | | 100 | | | | 476 | |
| | | | | | | | | | | | | | | | | | |
Total Written Option Contracts | | | | | | | | | | | $ | 1,330 | | | $ | 3,933 | |
See accompanying notes to financial statements. |
23
CASTLEMAINE EVENT DRIVEN FUND
SCHEDULE OF INVESTMENTS
February 28, 2017 (Unaudited) | |
COMMON STOCKS — 84.5% | | Shares | | | Value | |
Consumer Discretionary — 18.1% | | | | | | |
Household Durables — 1.1% | | | | | | |
Sony Corporation - ADR | | | 500 | | | $ | 15,480 | |
| | | | | | | | | |
Leisure Products — 0.2% | | | | | | | | |
Performance Sports Group Ltd. (a) | | | 2,500 | | | | 2,425 | |
| | | | | | | | | |
Media — 15.1% | | | | | | | | |
AMC Entertainment Holdings, Inc. - Class A | | | 533 | | | | 16,710 | |
ITV plc - ADR | | | 500 | | | | 12,570 | |
Lions Gate Entertainment Corporation - Class A | | | 500 | | | | 13,385 | |
Nexstar Media Group, Inc. - Class A | | | 600 | | | | 41,342 | |
Time Warner, Inc. | | | 500 | | | | 49,105 | |
Time, Inc. | | | 1,500 | | | | 26,325 | |
tronc, Inc. | | | 1,900 | | | | 27,740 | |
Walt Disney Company (The) (b) | | | 200 | | | | 22,018 | |
| | | | | | | | 209,195 | |
Multi-Line Retail — 1.7% | | | | | | | | |
Macy's, Inc. | | | 700 | | | | 23,254 | |
| | | | | | | | | |
Consumer Staples — 7.0% | | | | | | | | |
Food Products — 2.4% | | | | | | | | |
Hershey Company (The) | | | 300 | | | | 32,505 | |
| | | | | | | | | |
Tobacco — 4.6% | | | | | | | | |
Altria Group, Inc. | | | 200 | | | | 14,984 | |
Reynolds American, Inc. | | | 800 | | | | 49,256 | |
| | | | | | | | 64,240 | |
Energy — 7.2% | | | | | | | | |
Oil, Gas & Consumable Fuels — 7.2% | | | | | | | | |
Apache Corporation | | | 500 | | | | 26,295 | |
Basic Energy Services, Inc. (a) | | | 900 | | | | 35,442 | |
Exxon Mobil Corporation | | | 164 | | | | 13,318 | |
SM Energy Company | | | 1,000 | | | | 24,650 | |
| | | | | | | | 99,705 | |
Financials — 0.6% | | | | | | | | |
Thrifts & Mortgage Finance — 0.6% | | | | | | | | |
Federal National Mortgage Association (a) | | | 3,000 | | | | 8,843 | |
See accompanying notes to financial statements. |
24
CASTLEMAINE EVENT DRIVEN FUND
SCHEDULE OF INVESTMENTS (Continued) | |
COMMON STOCKS — 84.5% (Continued) | | Shares | | | Value | |
Health Care — 14.2% | | | | | | |
Biotechnology — 11.6% | | | | | | |
Actelion Ltd. - ADR (a) | | | 300 | | | $ | 20,210 | |
Amgen, Inc. | | | 200 | | | | 35,306 | |
BioMarin Pharmaceutical, Inc. (a) | | | 400 | | | | 37,572 | |
Gilead Sciences, Inc. (c) | | | 400 | | | | 28,192 | |
Heron Therapeutics, Inc. (a) | | | 1,000 | | | | 14,300 | |
Ophthotech Corporation (a) | | | 1,000 | | | | 3,580 | |
Sarepta Therapeutics, Inc. (a) | | | 700 | | | | 21,777 | |
| | | | | | | | 160,937 | |
Health Care Equipment & Supplies — 0.8% | | | | | | | | |
Alere, Inc. (a) | | | 300 | | | | 11,490 | |
| | | | | | | | | |
Pharmaceuticals — 1.8% | | | | | | | | |
Depomed, Inc. (a) | | | 1,500 | | | | 24,585 | |
| | | | | | | | | |
Industrials — 7.5% | | | | | | | | |
Aerospace & Defense — 3.2% | | | | | | | | |
United Technologies Corporation (c) | | | 400 | | | | 45,020 | |
| | | | | | | | | |
Building Products — 1.0% | | | | | | | | |
Ply Gem Holdings, Inc. (a) | | | 800 | | | | 13,920 | |
| | | | | | | | | |
Electrical Equipment — 1.7% | | | | | | | | |
Energous Corporation (a) | | | 1,500 | | | | 23,010 | |
| | | | | | | | | |
Machinery — 1.6% | | | | | | | | |
Rexnord Corporation (a) | | | 1,000 | | | | 22,170 | |
| | | | | | | | | |
Information Technology — 14.9% | | | | | | | | |
Electronic Equipment, Instruments & Components — 2.7% | | | | | | | | |
InvenSense, Inc. (a) | | | 3,000 | | | | 37,050 | |
| | | | | | | | | |
Internet Software & Services — 1.6% | | | | | | | | |
Yahoo!, Inc. (a) | | | 500 | | | | 22,830 | |
| | | | | | | | | |
IT Services — 0.9% | | | | | | | | |
PayPal Holdings, Inc. (a) | | | 300 | | | | 12,600 | |
| | | | | | | | | |
Semiconductors & Semiconductor Equipment — 8.8% | | | | | | | | |
Cypress Semiconductor Corporation | | | 3,500 | | | | 46,445 | |
Marvell Technology Group Ltd. | | | 2,000 | | | | 31,200 | |
See accompanying notes to financial statements. |
25
CASTLEMAINE EVENT DRIVEN FUND
SCHEDULE OF INVESTMENTS (Continued) | |
COMMON STOCKS — 84.5% (Continued) | | Shares | | | Value | |
Information Technology — 14.9% (Continued) | | | | | | |
Semiconductors & Semiconductor Equipment — 8.8% (Continued) | | | | | | |
Micron Technology, Inc. (a) | | | 1,000 | | | $ | 23,440 | |
NXP Semiconductors N.V. (a) | | | 200 | | | | 20,562 | |
| | | | | | | | 121,647 | |
Software — 0.9% | | | | | | | | |
Imperva, Inc. (a) | | | 300 | | | | 12,300 | |
| | | | | | | | | |
Materials — 9.1% | | | | | | | | |
Chemicals — 5.7% | | | | | | | | |
Monsanto Company | | | 200 | | | | 22,766 | |
Syngenta AG - ADR | | | 400 | | | | 34,540 | |
Valspar Corporation (The) | | | 200 | | | | 22,244 | |
| | | | | | | | 79,550 | |
Metals & Mining — 3.4% | | | | | | | | |
Pretium Resources, Inc. (a) | | | 3,000 | | | | 30,330 | |
Sibanye Gold Ltd. - ADR | | | 2,000 | | | | 16,220 | |
| | | | | | | | 46,550 | |
Telecommunication Services — 4.4% | | | | | | | | |
Diversified Telecommunication Services — 1.7% | | | | | | | | |
CenturyLink, Inc. | | | 1,000 | | | | 24,260 | |
| | | | | | | | | |
Wireless Telecommunication Services — 2.7% | | | | | | | | |
T-Mobile US, Inc. (a) | | | 600 | | | | 37,518 | |
| | | | | | | | | |
Utilities — 1.5% | | | | | | | | |
Electric Utilities — 1.5% | | | | | | | | |
Westar Energy, Inc. | | | 400 | | | | 21,592 | |
| | | | | | | | | |
Total Common Stocks (Cost $1,109,832) | | | | | | $ | 1,172,676 | |
| |
RIGHTS — 0.0% | | Shares | | | Value | |
Interoil Corporation - CRPR (d) | | | 300 | | | $ | 0 | |
Media General, Inc. - CVR (d) | | | 4,000 | | | | 0 | |
Total Rights (Cost $1,129) | | | | | | $ | 0 | |
See accompanying notes to financial statements. |
26
CASTLEMAINE EVENT DRIVEN FUND
SCHEDULE OF INVESTMENTS (Continued) | |
PURCHASED OPTION CONTRACTS — 2.4% | Expiration Date | | Strike Price | | | Contracts | | | Value | |
Call Option Contracts — 2.2% | | | | | | | | | | |
Acadia Pharmaceuticals, Inc. | 03/17/17 | | $ | 35.00 | | | | 15 | | | $ | 6,300 | |
Apache Corporation | 03/17/17 | | | 60.00 | | | | 30 | | | | 90 | |
Apache Corporation | 04/21/17 | | | 57.50 | | | | 20 | | | | 1,240 | |
Depomed, Inc. | 03/17/17 | | | 30.00 | | | | 20 | | | | 300 | |
Energous Corporation | 03/17/17 | | | 17.50 | | | | 20 | | | | 500 | |
iPath S&P® 500 VIX Short-Term Futures ETN (b) | 03/17/17 | | | 20.00 | | | | 40 | | | | 2,240 | |
Micron Technology, Inc. | 04/21/17 | | | 24.00 | | | | 10 | | | | 1,210 | |
Mobileye N.V. | 03/17/17 | | | 45.00 | | | | 15 | | | | 2,925 | |
NXP Semiconductors N.V. | 03/17/17 | | | 97.50 | | | | 15 | | | | 8,625 | |
PayPal Holdings, Inc. | 03/17/17 | | | 40.00 | | | | 10 | | | | 2,140 | |
PayPal Holdings, Inc. | 04/21/17 | | | 44.00 | | | | 10 | | | | 500 | |
Pretium Resources, Inc. | 04/21/17 | | | 11.00 | | | | 35 | | | | 1,925 | |
SM Energy Company | 03/17/17 | | | 35.00 | | | | 20 | | | | 80 | |
Theravance Biopharma, Inc. | 03/17/17 | | | 35.00 | | | | 10 | | | | 150 | |
T-Mobile US, Inc. | 04/21/17 | | | 65.00 | | | | 10 | | | | 1,890 | |
| | | | | | | | | | | | | 30,115 | |
Put Option Contracts — 0.2% | | | | | | | | | | | | | |
iShares Russell 2000 Index Fund | 03/17/17 | | | 135.00 | | | | 10 | | | | 1,200 | |
SPDR® S&P® 500 ETF Trust (b) | 03/17/17 | | | 225.00 | | | | 10 | | | | 370 | |
SPDR® S&P® 500 ETF Trust | 03/17/17 | | | 230.00 | | | | 10 | | | | 790 | |
| | | | | | | | | | | | 2,360 | |
Total Purchased Option Contracts (Cost $27,845) | | | | | | | | | | | $ | 32,475 | |
27
CASTLEMAINE EVENT DRIVEN FUND
SCHEDULE OF INVESTMENTS (Continued) | |
U.S. TREASURY OBLIGATIONS — 7.2% | Maturity | | Coupon | | | Par Value | | | Value | |
U.S. Treasury Bills (e) (Cost $99,928) | 04/27/17 | | | 0.453 | % | | $ | 100,000 | | | $ | 99,923 | |
| | | | | | |
Total Investments at Value — 94.1% (Cost $1,238,734) | | | $ | 1,305,074 | |
| | | | | | |
Other Assets in Excess of Liabilities (f) — 5.9% | | | | 82,234 | |
| | | | | | |
Net Assets — 100.0% | | | $ | 1,387,308 | |
ADR - American Depositary Receipt |
CRPR - Contingent Resource Payment Right |
CVR - Contingent Value Right |
(a) | Non-income producing security. |
(b) | All or a portion of the security covers written option contracts. |
(c) | All or a portion of the shares have been committed as collateral for open short positions. |
(d) | Security value has been determined in good faith pursuant to procedures adopted by the Board of Trustees. The total value of such securities is $0 at February 28, 2017, representing 0.0% of net assets (Note 2). |
(e) | Rate shown is the annualized yield at time of purchase, not a coupon rate. |
(f) | Includes cash held as margin deposits for open short positions. |
See accompanying notes to financial statements. |
28
CASTLEMAINE EVENT DRIVEN FUND
SCHEDULE OF SECURITIES SOLD SHORT
February 28, 2017 (Unaudited) | |
COMMON STOCKS — 1.8% | | Shares | | | Value | |
Consumer Staples — 1.8% | | | | | | |
Tobacco — 1.8% | | | | | | |
British American Tobacco plc - ADR (Proceeds $22,428) | | | 400 | | | $ | 25,536 | |
| |
EXCHANGE-TRADED FUNDS — 1.8% | | Shares | | | Value | |
ProShares Short VIX Short-Term Futures ETF (Proceeds $20,001) | | | 200 | | | $ | 24,500 | |
| | | | | | | | | |
Total Securities Sold Short — 3.6% (Proceeds $42,429) | | | | | | $ | 50,036 | |
CASTLEMAINE EVENT DRIVEN FUND
SCHEDULE OF OPEN WRITTEN OPTION CONTRACTS
February 28, 2017 (Unaudited) | |
WRITTEN OPTION CONTRACTS | Expiration Date | | Strike Price | | | Contracts | | | Value of Options | | | Premiums Received | |
Call Option Contracts | | | | | | | | | | | | | |
iPath S&P® 500 VIX Short-Term Futures ETN | 03/17/17 | | $ | 25.00 | | | | 10 | | | $ | 150 | | | $ | 701 | |
Walt Disney Company (The) | 03/17/17 | | | 112.00 | | | | 2 | | | | 104 | | | | 145 | |
| | | | | | | | | | | | | 254 | | | | 846 | |
Put Option Contracts | | | | | | | | | | | | | | | | | |
ProShares Short VIX Short-Term Futures ETF | 03/17/17 | | | 97.00 | | | | 3 | | | | 300 | | | | 921 | |
SPDR® S&P® 500 ETF Trust | 03/17/17 | | | 212.00 | | | | 10 | | | | 100 | | | | 477 | |
| | | | | | | | | | | | | 400 | | | | 1,398 | |
Total Written Option Contracts | | | | | | | | | | | $ | 654 | | | $ | 2,244 | |
ADR - American Depositary Receipt |
See accompanying notes to financial statements. |
29
CASTLEMAINE LONG/SHORT FUND
SCHEDULE OF INVESTMENTS
February 28, 2017 (Unaudited) | |
COMMON STOCKS — 87.6% | | Shares | | | Value | |
Consumer Discretionary — 9.8% | | | | | | |
Automobiles — 2.0% | | | | | | |
Ford Motor Company | | | 2,000 | | | $ | 25,060 | |
| | | | | | | | | |
Household Durables — 3.6% | | | | | | | | |
CalAtlantic Group, Inc. | | | 600 | | | | 21,198 | |
Sony Corporation - ADR | | | 800 | | | | 24,768 | |
| | | | | | | | 45,966 | |
Media — 2.8% | | | | | | | | |
Lions Gate Entertainment Corporation - Class A | | | 500 | | | | 13,385 | |
Walt Disney Company (The) (b) | | | 200 | | | | 22,018 | |
| | | | | | | | 35,403 | |
Textiles, Apparel & Luxury Goods — 1.4% | | | | | | | | |
Michael Kors Holdings Ltd. (a) | | | 500 | | | | 18,250 | |
| | | | | | | | | |
Consumer Staples — 3.2% | | | | | | | | |
Food Products — 3.2% | | | | | | | | |
Hershey Company (The) | | | 200 | | | | 21,670 | |
Tyson Foods, Inc. - Class A | | | 300 | | | | 18,768 | |
| | | | | | | | 40,438 | |
Energy — 15.8% | | | | | | | | |
Oil, Gas & Consumable Fuels — 15.8% | | | | | | | | |
Apache Corporation | | | 500 | | | | 26,295 | |
Basic Energy Services, Inc. (a) | | | 600 | | | | 23,628 | |
Cabot Oil & Gas Corporation | | | 1,000 | | | | 21,900 | |
ConocoPhillips | | | 300 | | | | 14,271 | |
DHT Holdings, Inc. | | | 10,000 | | | | 46,300 | |
Gener8 Maritime, Inc. (a) | | | 6,000 | | | | 29,280 | |
SM Energy Company | | | 1,100 | | | | 27,115 | |
WPX Energy, Inc. (a) | | | 1,000 | | | | 12,900 | |
| | | | | | | | 201,689 | |
Financials — 1.3% | | | | | | | | |
Banks — 1.3% | | | | | | | | |
Webster Financial Corporation | | | 300 | | | | 16,479 | |
| | | | | | | | | |
Health Care — 12.4% | | | | | | | | |
Biotechnology — 10.5% | | | | | | | | |
Amgen, Inc. | | | 300 | | | | 52,959 | |
BioMarin Pharmaceutical, Inc. (a) | | | 400 | | | | 37,572 | |
Gilead Sciences, Inc. (c) | | | 600 | | | | 42,288 | |
| | | | | | | | 132,819 | |
See accompanying notes to financial statements. |
30
CASTLEMAINE LONG/SHORT FUND
SCHEDULE OF INVESTMENTS (Continued) | |
COMMON STOCKS — 87.6% (Continued) | | Shares | | | Value | |
Health Care — 12.4% (Continued) | | | | | | |
Health Care Equipment & Supplies — 1.9% | | | | | | |
Boston Scientific Corporation (a) | | | 1,000 | | | $ | 24,550 | |
| | | | | | | | | |
Industrials — 2.8% | | | | | | | | |
Airlines — 2.8% | | | | | | | | |
JetBlue Airways Corporation (a) | | | 1,800 | | | | 35,928 | |
| | | | | | | | | |
Information Technology — 21.7% | | | | | | | | |
Electronic Equipment, Instruments & Components — 3.2% | | | | | | | | |
Corning, Inc. (b) | | | 1,500 | | | | 41,415 | |
| | | | | | | | | |
Semiconductors & Semiconductor Equipment — 6.8% | | | | | | | | |
Cypress Semiconductor Corporation | | | 3,000 | | | | 39,810 | |
Marvell Technology Group Ltd. | | | 1,500 | | | | 23,400 | |
Micron Technology, Inc. (a) | | | 1,000 | | | | 23,440 | |
| | | | | | | | 86,650 | |
Software — 2.5% | | | | | | | | |
Microsoft Corporation | | | 500 | | | | 31,990 | |
| | | | | | | | | |
Technology Hardware, Storage & Peripherals — 9.2% | | | | | | | | |
Apple, Inc. (c) | | | 500 | | | | 68,495 | |
Seagate Technology plc (b) | | | 1,000 | | | | 48,190 | |
| | | | | | | | 116,685 | |
Materials — 11.5% | | | | | | | | |
Chemicals — 2.5% | | | | | | | | |
Mosaic Company (The) | | | 1,000 | | | | 31,190 | |
| | | | | | | | | |
Construction Materials — 2.8% | | | | | | | | |
Vulcan Materials Company | | | 300 | | | | 36,183 | |
| | | | | | | | | |
Metals & Mining — 6.2% | | | | | | | | |
BHP Billiton Ltd. - ADR (c) | | | 1,000 | | | | 37,820 | |
Rio Tinto plc - ADR (c) | | | 1,000 | | | | 41,520 | |
| | | | | | | | 79,340 | |
Telecommunication Services — 9.1% | | | | | | | | |
Diversified Telecommunication Services — 6.9% | | | | | | | | |
CenturyLink, Inc. | | | 1,500 | | | | 36,390 | |
Level 3 Communications, Inc. (a) (c) | | | 900 | | | | 51,525 | |
| | | | | | | | 87,915 | |
See accompanying notes to financial statements. |
31
CASTLEMAINE LONG/SHORT FUND
SCHEDULE OF INVESTMENTS (Continued) | |
COMMON STOCKS — 87.6% (Continued) | | Shares | | | Value | |
Telecommunication Services — 9.1% (Continued) | | | | | | |
Wireless Telecommunication Services — 2.2% | | | | | | |
Sprint Corporation (a) | | | 1,000 | | | $ | 8,810 | |
T-Mobile US, Inc. (a) | | | 300 | | | | 18,759 | |
| | | | | | | | 27,569 | |
| | | | | | | | | |
Total Common Stocks (Cost $994,020) | | | | | | $ | 1,115,519 | |
| |
PURCHASED OPTION CONTRACTS — 2.4% | Expiration Date | | Strike Price | | | Contracts | | | Value | |
Call Option Contracts — 2.2% | | | | | | | | | | |
Activision Blizzard, Inc. | 03/17/17 | | $ | 45.00 | | | | 20 | | | $ | 1,940 | |
Agnico Eagle Mines Ltd. | 03/17/17 | | | 50.00 | | | | 45 | | | | 780 | |
Apache Corporation | 04/21/17 | | | 57.50 | | | | 20 | | | | 1,240 | |
Apache Corporation | 03/17/17 | | | 60.00 | | | | 30 | | | | 90 | |
Apple, Inc. | 03/17/17 | | | 130.00 | | | | 5 | | | | 3,625 | |
Cabot Oil & Gas Corporation | 03/17/17 | | | 23.00 | | | | 10 | | | | 450 | |
Citigroup, Inc. | 03/17/17 | | | 60.00 | | | | 10 | | | | 1,070 | |
Financial Select Sector SPDR® Fund (The) | 03/17/17 | | | 24.00 | | | | 25 | | | | 1,750 | |
iPath S&P® 500 VIX Short-Term Futures ETN (b) | 03/17/17 | | | 20.00 | | | | 40 | | | | 2,240 | |
Lowe's Companies, Inc. | 04/21/17 | | | 77.50 | | | | 5 | | | | 695 | |
Micron Technology, Inc. | 04/21/17 | | | 24.00 | | | | 10 | | | | 1,210 | |
Mobileye N.V. | 03/17/17 | | | 40.00 | | | | 5 | | | | 3,000 | |
Newmont Mining Corporation | 03/17/17 | | | 39.00 | | | | 10 | | | | 80 | |
Newmont Mining Corporation | 04/21/17 | | | 38.00 | | | | 20 | | | | 1,260 | |
PayPal Holdings, Inc. | 03/17/17 | | | 40.00 | | | | 10 | | | | 2,140 | |
Range Resources Corporation | 03/17/17 | | | 38.00 | | | | 30 | | | | 150 | |
Range Resources Corporation | 04/21/17 | | | 30.00 | | | | 15 | | | | 1,200 | |
Raytheon Company | 03/17/17 | | | 155.00 | | | | 10 | | | | 1,940 | |
SM Energy Company | 03/17/17 | | | 35.00 | | | | 20 | | | | 80 | |
SM Energy Company | 04/21/17 | | | 30.00 | | | | 25 | | | | 1,250 | |
T-Mobile US, Inc. | 04/21/17 | | | 65.00 | | | | 10 | | | | 1,890 | |
Vulcan Materials Company | 03/17/17 | | | 130.00 | | | | 10 | | | | 400 | |
Vulcan Materials Company | 03/17/17 | | | 135.00 | | | | 10 | | | | 110 | |
| | | | | | | | | | | | | 28,590 | |
See accompanying notes to financial statements. |
32
CASTLEMAINE LONG/SHORT FUND
SCHEDULE OF INVESTMENTS (Continued) | |
PURCHASED OPTION CONTRACTS — 2.4% (Continued) | Expiration Date | | Strike Price | | | Contracts | | | Value | |
Put Option Contracts — 0.2% | | | | | | | | | | |
iShares Russell 2000 Index Fund | 03/17/17 | | $ | 135.00 | | | | 10 | | | $ | 1,200 | |
SPDR® S&P® 500 ETF Trust (b) | 03/17/17 | | | 225.00 | | | | 10 | | | | 370 | |
SPDR® S&P® 500 ETF Trust | 03/17/17 | | | 230.00 | | | | 10 | | | | 790 | |
| | | | | | | | | | | | | 2,360 | |
Total Purchased Option Contracts (Cost $37,800) | | | | | | | | | | | $ | 30,950 | |
| |
U.S. TREASURY OBLIGATIONS — 9.8% | Maturity | | Coupon | | | Par Value | | | Value | |
U.S. Treasury Bills (d) (Cost $124,910) | 04/27/17 | | | 0.453 | % | | $ | 125,000 | | | $ | 124,904 | |
| | | | | | |
Total Investments at Value — 99.8% (Cost $1,156,730) | | | $ | 1,271,373 | |
| | | | | | |
Other Assets in Excess of Liabilities (e) — 0.2% | | | | 2,336 | |
| | | | | | |
Net Assets — 100.0% | | | $ | 1,273,709 | |
ADR - American Depositary Receipt |
(a) | Non-income producing security. |
(b) | All or a portion of the secuirty covers written option contracts. |
(c) | All or a portion of the shares have been committed as collateral for open short positions. |
(d) | Rate shown is the annualized yield at time of purchase, not a coupon rate. |
(e) | Includes cash held as margin deposits for open short positions. |
See accompanying notes to financial statements. |
33
CASTLEMAINE LONG/SHORT FUND
SCHEDULE OF SECURITIES SOLD SHORT
February 28, 2017 (Unaudited) | |
COMMON STOCKS — 14.3% | | Shares | | | Value | |
Consumer Discretionary — 5.0% | | | | | | |
Automobiles — 1.3% | | | | | | |
Harley-Davidson, Inc. | | | 300 | | | $ | 16,914 | |
| | | | | | | | | |
Hotels, Restaurants & Leisure — 1.5% | | | | | | | | |
Domino's Pizza, Inc. | | | 100 | | | | 18,981 | |
| | | | | | | | | |
Media — 1.2% | | | | | | | | |
Comcast Corporation - Class A | | | 400 | | | | 14,968 | |
| | | | | | | | | |
Specialty Retail — 1.0% | | | | | | | | |
CarMax, Inc. | | | 200 | | | | 12,908 | |
| | | | | | | | | |
Health Care — 2.0% | | | | | | | | |
Health Care Equipment & Supplies — 2.0% | | | | | | | | |
Baxter International, Inc. | | | 500 | | | | 25,460 | |
| | | | | | | | | |
Industrials — 2.3% | | | | | | | | |
Machinery — 2.3% | | | | | | | | |
Caterpillar, Inc. | | | 300 | | | | 28,998 | |
| | | | | | | | | |
Information Technology — 2.1% | | | | | | | | |
Internet Software & Services — 2.1% | | | | | | | | |
Facebook, Inc. - Class A | | | 200 | | | | 27,108 | |
| | | | | | | | | |
Real Estate — 2.9% | | | | | | | | |
Equity Real Estate Investment Trusts (REITs) — 2.9% | | | | | | | | |
AvalonBay Communities, Inc. | | | 200 | | | | 36,756 | |
| | | | | | | | | |
Total Common Stocks (Proceeds $174,176) | | | | | | $ | 182,093 | |
| |
EXCHANGE-TRADED FUNDS — 4.8% | | Shares | | | Value | |
iShares 20+ Year Treasury Bond ETF | | | 300 | | | $ | 36,522 | |
ProShares Short VIX Short-Term Futures ETF | | | 200 | | | | 24,500 | |
Total Exchange-Traded Funds (Proceeds $55,848) | | | | | | $ | 61,022 | |
| | | | | | | | | |
Total Securities Sold Short — 19.1% (Proceeds $230,024) | | | | | | $ | 243,115 | |
See accompanying notes to financial statements. |
34
CASTLEMAINE LONG/SHORT FUND
SCHEDULE OF OPEN WRITTEN OPTION CONTRACTS
February 28, 2017 (Unaudited) | |
WRITTEN OPTION CONTRACTS | Expiration Date | | Strike Price | | | Contracts | | | Value of Options | | | Premiums Received | |
Call Option Contracts | | | | | | | | | | | | | |
Corning, Inc. | 03/17/17 | | $ | 27.00 | | | | 15 | | | $ | 1,110 | | | $ | 1,226 | |
iPath S&P® 500 VIX Short-Term Futures ETN | 03/17/17 | | | 25.00 | | | | 10 | | | | 150 | | | | 701 | |
Seagate Technology | 03/17/17 | | | 47.00 | | | | 10 | | | | 1,890 | | | | 1,242 | |
Walt Disney Company (The) | 03/17/17 | | | 112.00 | | | | 2 | | | | 104 | | | | 145 | |
| | | | | | | | | | | | | 3,254 | | | | 3,314 | |
Put Option Contracts | | | | | | | | | | | | | | | | | |
ProShares Short VIX Short-Term Futures | 03/17/17 | | | 97.00 | | | | 3 | | | | 300 | | | | 921 | |
SPDR® S&P® 500 ETF Trust | 03/17/17 | | | 212.00 | | | | 10 | | | | 100 | | | | 477 | |
| | | | | | | | | | | | | 400 | | | | 1,398 | |
Total Written Option Contracts | | | | | | | | | | | $ | 3,654 | | | $ | 4,712 | |
See accompanying notes to financial statements. |
35
CASTLEMAINE MARKET NEUTRAL FUND
SCHEDULE OF INVESTMENTS
February 28, 2017 (Unaudited) | |
COMMON STOCKS — 86.9% | | Shares | | | Value | |
Consumer Discretionary — 14.2% | | | | | | |
Automobiles — 1.9% | | | | | | |
Ford Motor Company | | | 2,000 | | | $ | 25,060 | |
| | | | | | | | | |
Hotels, Restaurants & Leisure — 1.9% | | | | | | | | |
McDonald's Corporation | | | 200 | | | | 25,530 | |
| | | | | | | | | |
Household Durables — 7.6% | | | | | | | | |
Beazer Homes USA, Inc. (a) | | | 2,500 | | | | 30,500 | |
CalAtlantic Group, Inc. | | | 600 | | | | 21,198 | |
Lennar Corporation - Class A | | | 600 | | | | 29,274 | |
Sony Corporation - ADR | | | 600 | | | | 18,576 | |
| | | | | | | | 99,548 | |
Media — 1.7% | | | | | | | | |
Walt Disney Company (The) (b) | | | 200 | | | | 22,018 | |
| | | | | | | | | |
Textiles, Apparel & Luxury Goods — 1.1% | | | | | | | | |
Michael Kors Holdings Ltd. (a) | | | 400 | | | | 14,600 | |
| | | | | | | | | |
Consumer Staples — 4.3% | | | | | | | | |
Food & Staples Retailing — 2.7% | | | | | | | | |
Wal-Mart Stores, Inc. | | | 500 | | | | 35,465 | |
| | | | | | | | | |
Food Products — 1.6% | | | | | | | | |
Hershey Company (The) | | | 200 | | | | 21,670 | |
| | | | | | | | | |
Energy — 11.4% | | | | | | | | |
Oil, Gas & Consumable Fuels — 11.4% | | | | | | | | |
BP plc - ADR | | | 1,000 | | | | 33,920 | |
Chevron Corporation | | | 200 | | | | 22,500 | |
ConocoPhillips | | | 200 | | | | 9,514 | |
DHT Holdings, Inc. | | | 7,000 | | | | 32,410 | |
Gener8 Maritime, Inc. (a) | | | 3,000 | | | | 14,640 | |
Range Resources Corporation | | | 500 | | | | 13,810 | |
SM Energy Company | | | 700 | | | | 17,255 | |
WPX Energy, Inc. (a) | | | 500 | | | | 6,450 | |
| | | | | | | | 150,499 | |
Financials — 3.6% | | | | | | | | |
Banks — 3.6% | | | | | | | | |
Bank of America Corporation | | | 1,500 | | | | 37,020 | |
Webster Financial Corporation | | | 200 | | | | 10,986 | |
| | | | | | | | 48,006 | |
See accompanying notes to financial statements. |
36
CASTLEMAINE MARKET NEUTRAL FUND
SCHEDULE OF INVESTMENTS (Continued) | |
COMMON STOCKS — 86.9% (Continued) | | Shares | | | Value | |
Health Care — 6.7% | | | | | | |
Biotechnology — 4.8% | | | | | | |
Amgen, Inc. | | | 200 | | | $ | 35,306 | |
Gilead Sciences, Inc. (c) | | | 400 | | | | 28,192 | |
| | | | | | | | 63,498 | |
Pharmaceuticals — 1.9% | | | | | | | | |
Eli Lilly & Company (b) | | | 300 | | | | 24,843 | |
| | | | | | | | | |
Industrials — 11.6% | | | | | | | | |
Aerospace & Defense — 7.8% | | | | | | | | |
Boeing Company (The) (b) | | | 400 | | | | 72,092 | |
Raytheon Company | | | 200 | | | | 30,830 | |
| | | | | | | | 102,922 | |
Airlines — 3.8% | | | | | | | | |
Hawaiian Holdings, Inc. (a) | | | 200 | | | | 9,730 | |
JetBlue Airways Corporation (a) | | | 2,000 | | | | 39,920 | |
| | | | | | | | 49,650 | |
Information Technology — 21.1% | | | | | | | | |
Communications Equipment — 2.6% | | | | | | | | |
Cisco Systems, Inc. (c) | | | 1,000 | | | | 34,180 | |
| | | | | | | | | |
Electronic Equipment, Instruments & Components — 4.2% | | | | | | | | |
Corning, Inc. (b) | | | 2,000 | | | | 55,220 | |
| | | | | | | | | |
Semiconductors & Semiconductor Equipment — 4.8% | | | | | | | | |
Cypress Semiconductor Corporation | | | 3,000 | | | | 39,810 | |
Micron Technology, Inc. (a) | | | 1,000 | | | | 23,440 | |
| | | | | | | | 63,250 | |
Software — 2.4% | | | | | | | | |
Microsoft Corporation | | | 500 | | | | 31,990 | |
| | | | | | | | | |
Technology Hardware, Storage & Peripherals — 7.1% | | | | | | | | |
Apple, Inc. | | | 400 | | | | 54,796 | |
Seagate Technology plc (b) | | | 800 | | | | 38,552 | |
| | | | | | | | 93,348 | |
Materials — 8.6% | | | | | | | | |
Metals & Mining — 8.6% | | | | | | | | |
BHP Billiton Ltd. - ADR (c) | | | 1,000 | | | | 37,820 | |
Newmont Mining Corporation (c) | | | 1,000 | | | | 34,240 | |
Rio Tinto plc - ADR (b) (c) | | | 1,000 | | | | 41,520 | |
| | | | | | | | 113,580 | |
See accompanying notes to financial statements. |
37
CASTLEMAINE MARKET NEUTRAL FUND
SCHEDULE OF INVESTMENTS (Continued) | |
COMMON STOCKS — 86.9% (Continued) | | Shares | | | Value | |
Telecommunication Services — 5.4% | | | | | | |
Diversified Telecommunication Services — 5.4% | | | | | | |
CenturyLink, Inc. | | | 1,500 | | | $ | 36,390 | |
Level 3 Communications, Inc. (a) | | | 600 | | | | 34,350 | |
| | | | | | | | 70,740 | |
| | | | | | | | | |
Total Common Stocks (Cost $948,627) | | | | | | $ | 1,145,617 | |
| |
EXCHANGE-TRADED FUNDS — 1.4% | | Shares | | | Value | |
iShares iBoxx $ High Yield Corporate Bond ETF (Cost $16,729) | | | 200 | | | $ | 17,658 | |
| |
PURCHASED OPTION CONTRACTS — 0.5% | Expiration Date | | Strike Price | | | Contracts | | | Value | |
Call Option Contracts — 0.3% | | | | | | | | | | |
iPath S&P® 500 VIX Short-Term Futures ETN (b) | 03/17/17 | | $ | 20.00 | | | | 40 | | | $ | 2,240 | |
Micron Technology, Inc. | 04/21/17 | | | 24.00 | | | | 10 | | | | 1,210 | |
PayPal Holdings, Inc. | 03/17/17 | | | 40.00 | | | | 5 | | | | 1,070 | |
| | | | | | | | | | | | | 4,520 | |
Put Option Contracts — 0.2% | | | | | | | | | | | | | |
iShares Russell 2000 Index Fund | 03/17/17 | | | 135.00 | | | | 10 | | | | 1,200 | |
SPDR® S&P® 500 ETF Trust (b) | 03/17/17 | | | 225.00 | | | | 10 | | | | 370 | |
SPDR® S&P® 500 ETF Trust | 03/17/17 | | | 230.00 | | | | 10 | | | | 790 | |
| | | | | | | | | | | | | 2,360 | |
Total Purchased Option Contracts (Cost $8,700) | | | | | | | | | | | $ | 6,880 | |
See accompanying notes to financial statements. |
38
CASTLEMAINE MARKET NEUTRAL FUND
SCHEDULE OF INVESTMENTS (Continued) | |
U.S. TREASURY OBLIGATIONS — 11.4% | Maturity | | Coupon | | | Par Value | | | Value | |
U.S. Treasury Bills (d) (Cost $149,892) | 04/27/17 | | | 0.453 | % | | $ | 150,000 | | | $ | 149,885 | |
| | | | | | |
Total Investments at Value — 100.2% (Cost $1,123,948) | | | $ | 1,320,040 | |
| | | | | | |
Liabilities in Excess of Other Assets (e) — (0.2%) | | | | (2,272 | ) |
| | | | | | |
Net Assets — 100.0% | | | $ | 1,317,768 | |
ADR - American Depositary Receipt |
(a) | Non-income producing security. |
(b) | All or a portion of the security covers written option contracts. |
(c) | All or a portion of the shares have been committed as collateral for open short positions. |
(d) | Rate shown is the annualized yield at time of purchase, not a coupon rate. |
(e) | Includes cash held as margin deposits for open short positions. |
See accompanying notes to financial statements. |
39
CASTLEMAINE MARKET NEUTRAL FUND
SCHEDULE OF SECURITIES SOLD SHORT
February 28, 2017 (Unaudited) | |
COMMON STOCKS — 10.7% | | Shares | | | Value | |
Consumer Discretionary — 3.5% | | | | | | |
Automobiles — 0.9% | | | | | | |
Harley-Davidson, Inc. | | | 200 | | | $ | 11,276 | |
| | | | | | | | | |
Media — 1.1% | | | | | | | | |
Comcast Corporation - Class A | | | 400 | | | | 14,968 | |
| | | | | | | | | |
Specialty Retail — 1.5% | | | | | | | | |
CarMax, Inc. | | | 300 | | | | 19,362 | |
| | | | | | | | | |
Health Care — 1.5% | | | | | | | | |
Health Care Equipment & Supplies — 1.5% | | | | | | | | |
Baxter International, Inc. | | | 400 | | | | 20,368 | |
| | | | | | | | | |
Industrials — 2.2% | | | | | | | | |
Machinery — 2.2% | | | | | | | | |
Caterpillar, Inc. | | | 300 | | | | 28,998 | |
| | | | | | | | | |
Information Technology — 2.1% | | | | | | | | |
Internet Software & Services — 2.1% | | | | | | | | |
Facebook, Inc. - Class A | | | 200 | | | | 27,108 | |
| | | | | | | | | |
Real Estate — 1.4% | | | | | | | | |
Equity Real Estate Investment Trusts (REITs) — 1.4% | | | | | | | | |
AvalonBay Communities, Inc. | | | 100 | | | | 18,378 | |
| | | | | | | | | |
Total Common Stocks (Proceeds $134,235) | | | | | | $ | 140,458 | |
| |
EXCHANGE-TRADED FUNDS — 11.1% | | Shares | | | Value | |
iShares 20+ Year Treasury Bond ETF | | | 300 | | | $ | 36,522 | |
iShares Russell 2000 ETF | | | 300 | | | | 41,352 | |
iShares U.S. Home Construction ETF | | | 500 | | | | 15,235 | |
iShares U.S. Telecommunications ETF | | | 500 | | | | 16,630 | |
ProShares Short VIX Short-Term Futures ETF | | | 300 | | | | 36,750 | |
Total Exchange-Traded Funds (Proceeds $127,033) | | | | | | $ | 146,489 | |
| | | | | | | | | |
Total Securities Sold Short — 21.8% (Proceeds $261,268) | | | | | | $ | 286,947 | |
See accompanying notes to financial statements. |
40
CASTLEMAINE MARKET NEUTRAL FUND
SCHEDULE OF OPEN WRITTEN OPTION CONTRACTS
February 28, 2017 (Unaudited) | |
WRITTEN OPTION CONTRACTS | Expiration Date | | Strike Price | | | Contracts | | | Value of Options | | | Premiums Received | |
Call Option Contracts | | | | | | | | | | | | | |
Boeing Company (The) | 03/17/17 | | $ | 175.00 | | | | 4 | | | $ | 2,540 | | | $ | 550 | |
Corning, Inc. | 03/17/17 | | | 27.00 | | | | 20 | | | | 1,480 | | | | 1,620 | |
Eli Lilly & Company | 03/17/17 | | | 82.50 | | | | 3 | | | | 456 | | | | 236 | |
iPath S&P® 500® VIX Short-Term Futures ETN | 03/17/17 | | | 25.00 | | | | 10 | | | | 150 | | | | 701 | |
Rio Tinto plc | 03/17/17 | | | 47.50 | | | | 10 | | | | 70 | | | | 515 | |
Seagate Technology plc | 03/17/17 | | | 47.00 | | | | 8 | | | | 1,512 | | | | 994 | |
Walt Disney (The) | 03/17/17 | | | 112.00 | | | | 2 | | | | 104 | | | | 145 | |
| | | | | | | | | | | | | 6,312 | | | | 4,761 | |
Put Option Contracts | | | | | | | | | | | | | | | | | |
ProShares Short VIX Short-Term Futures ETF | 03/17/17 | | | 97.00 | | | | 3 | | | | 300 | | | | 921 | |
SDPR® S&P 500® ETF Trust | 03/17/17 | | | 212.00 | | | | 10 | | | | 100 | | | | 477 | |
| | | | | | | | | | | | | 400 | | | | 1,398 | |
Total Written Option Contracts | | | | | | | | | | | $ | 6,712 | | | $ | 6,159 | |
See accompanying notes to financial statements. |
41
CASTLEMAINE MULTI-STRATEGY FUND
SCHEDULE OF INVESTMENTS
February 28, 2017 (Unaudited) | |
OPEN-END FUNDS — 82.4% | | Shares | | | Value | |
Castlemaine Emerging Markets Opportunities Fund (a) | | | 20,121 | | | $ | 205,431 | |
Castlemaine Event Driven Fund (a) | | | 20,615 | | | | 231,295 | |
Castlemaine Long/Short Fund (a) (b) | | | 20,000 | | | | 212,200 | |
Castlemaine Market Neutral Fund (a) (b) | | | 20,000 | | | | 219,600 | |
Total Open-End Funds (Cost $807,870) | | | | | | $ | 868,526 | |
| |
EXCHANGE-TRADED FUNDS — 13.5% | | Shares | | | Value | |
Deutsche X-trackers MSCI Europe Hedged Equity ETF | | | 500 | | | $ | 13,035 | |
iShares iBoxx $ High Yield Corporate Bond ETF (c) | | | 900 | | | | 79,461 | |
iShares TIPS Bond ETF (c) | | | 300 | | | | 34,395 | |
ProShares UltraShort Euro (b) | | | 600 | | | | 16,050 | |
Total Exchange-Traded Funds (Cost $133,242) | | | | | | $ | 142,941 | |
| | | | | | | | | |
Total Investments at Value — 95.9% (Cost $941,112) | | | | | | $ | 1,011,467 | |
| | | | | | | | | |
Other Assets in Excess of Liabilities — 4.1% | | | | | | | 43,071 | |
| | | | | | | | | |
Net Assets — 100.0% | | | | | | $ | 1,054,538 | |
(a) | The security is an investment company advised by the Fund’s adviser, thereby making the company an affiliated company as defined under the Investment Company Act of 1940 (Note 4). |
(b) | Non-income producing security. |
(c) | All or a portion of the shares have been committed as collateral for open short positions, if any. |
See accompanying notes to financial statements. |
42
CASTLEMAINE FUNDS
STATEMENTS OF ASSETS AND LIABILITIES
February 28, 2017 (Unaudited) | |
| | Castlemaine Emerging Markets Opportunities
Fund | | | Castlemaine
Event Driven
Fund | | | Castlemaine
Long/Short
Fund | |
ASSETS | | | | | | | | | |
Investments in securities: | | | | | | | | | |
At acquisition cost | | $ | 1,210,509 | | | $ | 1,238,734 | | | $ | 1,156,730 | |
At value (Note 2) | | $ | 1,294,136 | | | $ | 1,305,074 | | | $ | 1,271,373 | |
Cash | | | 69,524 | | | | 69,042 | | | | 44,187 | |
Deposits with brokers for securities sold short and written options (Note 2) | | | 136,956 | | | | 21,194 | | | | 78,599 | |
Dividends receivable | | | 1,201 | | | | 1,372 | | | | 3,104 | |
Receivable for investment securities sold | | | 44,959 | | | | 57,027 | | | | 141,060 | |
Receivable from Adviser (Note 4) | | | 13,097 | | | | 12,481 | | | | 12,654 | |
Other assets | | | 11,640 | | | | 11,636 | | | | 11,636 | |
TOTAL ASSETS | | | 1,571,513 | | | | 1,477,826 | | | | 1,562,613 | |
| | | | | | | | | | | | | |
LIABILITIES | | | | | | | | | | | | |
Securities sold short, at value (Note 2) (proceeds $281,800, $42,429 and $230,024, respectively) | | | 298,685 | | | | 50,036 | | | | 243,115 | |
Written options, at value (Notes 2 and 5) (premiums received $3,933, $2,244 and $4,712, respectively) | | | 1,330 | | | | 654 | | | | 3,654 | |
Dividends payable on securities sold short (Note 2) | | | — | | | | — | | | | 1,368 | |
Payable for investment securities purchased | | | 28,085 | | | | 30,000 | | | | 30,748 | |
Payable to administrator (Note 4) | | | 6,013 | | | | 5,514 | | | | 5,513 | |
Accrued brokerage expense on securities sold short (Note 2) | | | 753 | | | | 488 | | | | 680 | |
Other accrued expenses | | | 3,873 | | | | 3,826 | | | | 3,826 | |
TOTAL LIABILITIES | | | 338,739 | | | | 90,518 | | | | 288,904 | |
| | | | | | | | | | | | | |
NET ASSETS | | $ | 1,232,774 | | | $ | 1,387,308 | | | $ | 1,273,709 | |
See accompanying notes to financial statements. |
43
CASTLEMAINE FUNDS
STATEMENTS OF ASSETS AND LIABILITIES
February 28, 2017 (Unaudited) (Continued) | |
| | Castlemaine Emerging Markets Opportunities
Fund | | | Castlemaine
Event Driven
Fund | | | Castlemaine
Long/Short
Fund | |
Net assets consist of: | | | | | | | | | |
Paid-in capital | | $ | 1,207,176 | | | $ | 1,240,044 | | | $ | 1,200,000 | |
Accumulated net investment loss | | | (12,429 | ) | | | (6,076 | ) | | | (4,959 | ) |
Accumulated net realized gains (losses) from security transactions | | | (31,318 | ) | | | 93,017 | | | | (23,942 | ) |
Net unrealized appreciation (depreciation) on: | | | | | | | | | | | | |
Investments | | | 83,627 | | | | 66,340 | | | | 114,643 | |
Short positions | | | (16,885 | ) | | | (7,607 | ) | | | (13,091 | ) |
Written option contracts | | | 2,603 | | | | 1,590 | | | | 1,058 | |
Net assets | | $ | 1,232,774 | | | $ | 1,387,308 | | | $ | 1,273,709 | |
| | | | | | | | | | | | | |
Shares of beneficial interest outstanding (unlimited number of shares authorized, no par value) | | | 120,723 | | | | 123,687 | | | | 120,000 | |
| | | | | | | | | | | | | |
Net asset value, offering price and redemption price per share (Note 2) | | $ | 10.21 | | | $ | 11.22 | | | $ | 10.61 | |
See accompanying notes to financial statements. |
44
CASTLEMAINE FUNDS
STATEMENTS OF ASSETS AND LIABILITIES
February 28, 2017 (Unaudited) (Continued) | |
| | Castlemaine Market Neutral Fund | | | Castlemaine
Multi-Strategy Fund | |
ASSETS | | | | | | |
Investments in securities at acquisition cost: | | | | | | |
Unaffiliated investments | | $ | 1,123,948 | | | $ | 133,242 | |
Affiliated investments | | | — | | | | 807,870 | |
Total investment in securities at acquisition cost | | $ | 1,123,948 | | | $ | 941,112 | |
Investments in securities at value: | | | | | | | | |
Unaffiliated investments | | $ | 1,320,040 | | | $ | 142,941 | |
Affiliated investments (Note 4) | | | — | | | | 868,526 | |
Total investments in securities at value | | | 1,320,040 | | | | 1,011,467 | |
Cash | | | 93,416 | | | | 30,473 | |
Deposits with brokers for securities sold short and written options (Note 2) | | | 106,082 | | | | — | |
Dividends receivable | | | 4,351 | | | | — | |
Receivable for investment securities sold | | | 73,653 | | | | — | |
Receivable from Adviser (Note 4) | | | 12,585 | | | | 12,700 | |
Other assets | | | 11,636 | | | | 9,135 | |
TOTAL ASSETS | | | 1,621,763 | | | | 1,063,775 | |
| | | | | | | | | |
LIABILITIES | | | | | | | | |
Securities sold short, at value (Note 2) (proceeds $261,268 and $—, respectively) | | | 286,947 | | | | — | |
Written options, at value (Notes 2 and 5) (premiums received $6,159 and $—, respectively) | | | 6,712 | | | | — | |
Due to prime broker (Note 2) | | | — | | | | 51 | |
Dividends payable on securities sold short (Note 2) | | | 73 | | | | — | |
Payable to administrator (Note 4) | | | 5,513 | | | | 5,510 | |
Accrued brokerage expense on securities sold short (Note 2) | | | 924 | | | | — | |
Other accrued expenses | | | 3,826 | | | | 3,676 | |
TOTAL LIABILITIES | | | 303,995 | | | | 9,237 | |
| | | | | | | | | |
NET ASSETS | | $ | 1,317,768 | | | $ | 1,054,538 | |
| | | | | | | | | |
Net assets consist of: | | | | | | | | |
Paid-in capital | | $ | 1,200,000 | | | $ | 999,946 | |
Accumulated net investment income (loss) | | | (7,476 | ) | | | 907 | |
Accumulated net realized losses from security transactions | | | (44,616 | ) | | | (16,670 | ) |
Net unrealized appreciation (depreciation) on: | | | | | | | | |
Unaffiliated investments | | | 196,092 | | | | 9,699 | |
Affiliated investments | | | — | | | | 60,656 | |
Short positions | | | (25,679 | ) | | | — | |
Written option contracts | | | (553 | ) | | | — | |
Net assets | | $ | 1,317,768 | | | $ | 1,054,538 | |
| | | | | | | | | |
Shares of beneficial interest outstanding (unlimited number of shares authorized, no par value) | | | 120,000 | | | | 100,000 | |
| | | | | | | | | |
Net asset value, offering price and redemption price per share (Note 2) | | $ | 10.98 | | | $ | 10.55 | |
See accompanying notes to financial statements. |
45
CASTLEMAINE FUNDS
STATEMENTS OF OPERATIONS
For the Six Months Ended February 28, 2017 (Unaudited) | |
| | Castlemaine Emerging Markets Opportunities
Fund | | | Castlemaine
Event Driven
Fund | | | Castlemaine
Long/Short
Fund | |
INVESTMENT INCOME | | | | | | | | | |
Dividends | | $ | 10,892 | | | $ | 5,334 | | | $ | 11,335 | |
Foreign tax withholding | | | (758 | ) | | | — | | | | (6 | ) |
Interest | | | 266 | | | | 229 | | | | 266 | |
TOTAL INVESTMENT INCOME | | | 10,400 | | | | 5,563 | | | | 11,595 | |
| | | | | | | | | | | | | |
EXPENSES | | | | | | | | | | | | |
Professional fees | | | 20,834 | | | | 20,834 | | | | 20,834 | |
Accounting services fees (Note 4) | | | 15,563 | | | | 12,567 | | | | 12,561 | |
Administration fees (Note 4) | | | 12,500 | | | | 12,500 | | | | 12,500 | |
Investment advisory fees (Note 4) | | | 7,783 | | | | 8,240 | | | | 7,538 | |
Compliance service fees (Note 4) | | | 6,108 | | | | 6,108 | | | | 6,108 | |
Trustees’ fees and expenses (Note 4) | | | 4,994 | | | | 4,994 | | | | 4,994 | |
Brokerage expense on securities sold short (Note 2) | | | 4,124 | | | | 1,737 | | | | 3,971 | |
Custodian and bank service fees | | | 3,143 | | | | 2,136 | | | | 2,461 | |
Dividend expense on securities sold short (Note 2) | | | 3,183 | | | | — | | | | 3,524 | |
Insurance expense | | | 1,564 | | | | 1,564 | | | | 1,564 | |
Registration and filing fees | | | 1,487 | | | | 1,487 | | | | 1,487 | |
Shareholder report printing | | | 1,295 | | | | 1,235 | | | | 1,295 | |
Postage and supplies | | | 1,172 | | | | 1,092 | | | | 1,007 | |
Transfer agent fees (Note 4) | | | 20 | | | | 20 | | | | 20 | |
Other expenses | | | 4,076 | | | | 4,191 | | | | 4,348 | |
TOTAL EXPENSES | | | 87,846 | | | | 78,705 | | | | 84,212 | |
Less fee reductions and expense reimbursements by Adviser (Note 4) | | | (71,186 | ) | | | (67,066 | ) | | | (67,658 | ) |
NET EXPENSES | | | 16,660 | | | | 11,639 | | | | 16,554 | |
| | | | | | | | | | | | | |
NET INVESTMENT LOSS | | | (6,260 | ) | | | (6,076 | ) | | | (4,959 | ) |
See accompanying notes to financial statements. |
46
CASTLEMAINE FUNDS
STATEMENTS OF OPERATIONS
For the Six Months Ended February 28, 2017 (Unaudited) (Continued) | |
| | Castlemaine Emerging Markets Opportunities
Fund | | | Castlemaine
Event Driven
Fund | | | Castlemaine
Long/Short
Fund | |
REALIZED AND UNREALIZED GAINS (LOSSES) | | | | | | | | | |
Net realized gains (losses) from: | | | | | | | | | |
Investments | | $ | (3,492 | ) | | $ | 101,920 | | | $ | 2,490 | |
Securities sold short | | | (22,994 | ) | | | (6,817 | ) | | | (41,942 | ) |
Written option contracts (Note 5) | | | 7,081 | | | | 13,871 | | | | 22,630 | |
Foreign currency transactions | | | (1,250 | ) | | | — | | | | — | |
Net change in unrealized appreciation (depreciation) on: | | | | | | | | | | | | |
Investments | | | (47,127 | ) | | | (19,932 | ) | | | 60,475 | |
Securities sold short | | | (4,445 | ) | | | (8,172 | ) | | | 19,027 | |
Written option contracts (Note 5) | | | 1,281 | | | | (878 | ) | | | (1,425 | ) |
Forward foreign currency exchange contracts (Note 5) | | | 1,170 | | | | — | | | | — | |
NET REALIZED AND UNREALIZED GAINS (LOSSES) | | | (69,776 | ) | | | 79,992 | | | | 61,255 | |
| | | | | | | | | | | | | |
NET INCREASE (DECREASE) IN NET ASSETS RESULTING FROM OPERATIONS | | $ | (76,036 | ) | | $ | 73,916 | | | $ | 56,296 | |
See accompanying notes to financial statements. |
47
CASTLEMAINE FUNDS
STATEMENTS OF OPERATIONS
For the Six Months Ended February 28, 2017 (Unaudited) (Continued) | |
| | Castlemaine Market Neutral Fund | | | Castlemaine Multi-Strategy Fund | |
INVESTMENT INCOME | | | | | | |
Dividends from unaffiliated issuers | | $ | 13,119 | | | $ | 2,881 | |
Dividends from affiliated issuers (Note 4) | | | — | | | | 7,870 | |
Foreign tax withholding | | | (10 | ) | | | — | |
Interest | | | 304 | | | | — | |
TOTAL INVESTMENT INCOME | | | 13,413 | | | | 10,751 | |
| | | | | | | | | |
EXPENSES | | | | | | | | |
Professional fees | | | 20,834 | | | | 18,923 | |
Accounting services fees (Note 4) | | | 12,562 | | | | 12,551 | |
Administration fees (Note 4) | | | 12,500 | | | | 12,500 | |
Investment advisory fees (Note 4) | | | 7,777 | | | | 1,162 | |
Compliance service fees (Note 4) | | | 6,108 | | | | 6,108 | |
Trustees’ fees and expenses (Note 4) | | | 4,994 | | | | 4,994 | |
Brokerage expense on securities sold short (Note 2) | | | 5,659 | | | | 364 | |
Custodian and bank service fees | | | 2,682 | | | | 2,660 | |
Dividend expense on securities sold short (Note 2) | | | 3,318 | | | | — | |
Insurance expense | | | 1,564 | | | | 1,564 | |
Registration and filing fees | | | 1,487 | | | | 1,487 | |
Shareholder report printing | | | 1,295 | | | | 1,175 | |
Postage and supplies | | | 1,007 | | | | 1,007 | |
Transfer agent fees (Note 4) | | | 20 | | | | 10 | |
Other expenses | | | 4,204 | | | | 3,507 | |
TOTAL EXPENSES | | | 86,011 | | | | 68,012 | |
Less fee reductions and expense reimbursements by Adviser (Note 4) | | | (67,689 | ) | | | (62,552 | ) |
NET EXPENSES | | | 18,322 | | | | 5,460 | |
| | | | | | | | | |
NET INVESTMENT INCOME (LOSS) | | | (4,909 | ) | | | 5,291 | |
See accompanying notes to financial statements. |
48
CASTLEMAINE FUNDS
STATEMENTS OF OPERATIONS
For the Six Months Ended February 28, 2017 (Unaudited) (Continued) | |
| | Castlemaine Market Neutral Fund | | | Castlemaine Multi-Strategy Fund | |
REALIZED AND UNREALIZED GAINS (LOSSES) | | | | | | |
Net realized gains (losses) from: | | | | | | |
Unaffiliated investments | | $ | 28,300 | | | $ | (10,056 | ) |
Securities sold short | | | (73,787 | ) | | | (959 | ) |
Written option contracts (Note 5) | | | 8,635 | | | | 236 | |
Net change in unrealized appreciation (depreciation) on: | | | | | | | | |
Unaffiliated investments | | | 94,959 | | | | (6,076 | ) |
Affiliated investments (Note 4) | | | — | | | | 15,856 | |
Securities sold short | | | 37,223 | | | | — | |
Written option contracts (Note 5) | | | (1,516 | ) | | | — | |
NET REALIZED AND UNREALIZED GAINS (LOSSES) | | | 93,814 | | | | (999 | ) |
| | | | | | | | | |
NET INCREASE IN NET ASSETS RESULTING FROM OPERATIONS | | $ | 88,905 | | | $ | 4,292 | |
See accompanying notes to financial statements. |
49
CASTLEMAINE EMERGING MARKETS OPPORTUNITIES FUND
STATEMENTS OF CHANGES IN NET ASSETS | |
| | Six Months
Ended
February 28,
2017
(Unaudited) | | | Period
Ended
August 31,
2016(a) | |
FROM OPERATIONS | | | | | | |
Net investment loss | | $ | (6,260 | ) | | $ | (13,823 | ) |
Net realized gains (losses) from: | | | | | | | | |
Investments | | | (3,492 | ) | | | 33,290 | |
Securities sold short | | | (22,994 | ) | | | (43,358 | ) |
Written option contracts (Note 5) | | | 7,081 | | | | 24,793 | |
Futures contracts | | | — | | | | (2,912 | ) |
Foreign currency transactions | | | (1,250 | ) | | | (7,646 | ) |
Net change in unrealized appreciation (depreciation) on: | | | | | | | | |
Investments | | | (47,127 | ) | | | 130,754 | |
Securities sold short | | | (4,445 | ) | | | (12,440 | ) |
Written option contracts (Note 5) | | | 1,281 | | | | 1,322 | |
Forward foreign currency exchange contracts (Note 5) | | | 1,170 | | | | (1,170 | ) |
Net increase (decrease) in net assets resulting from operations | | | (76,036 | ) | | | 108,810 | |
| | | | | | | | | |
DISTRIBUTIONS TO SHAREHOLDERS | | | | | | | | |
From net realized gains | | | (7,176 | ) | | | — | |
| | | | | | | | | |
CAPITAL SHARE TRANSACTIONS | | | | | | | | |
Proceeds from shares sold | | | — | | | | 1,200,000 | |
Net asset value of shares issued in reinvestment of distributions to shareholders | | | 7,176 | | | | — | |
Net increase in net assets from capital share transactions | | | 7,176 | | | | 1,200,000 | |
| | | | | | | | | |
TOTAL INCREASE (DECREASE) IN NET ASSETS | | | (76,036 | ) | | | 1,308,810 | |
| | | | | | | | | |
NET ASSETS | | | | | | | | |
Beginning of period | | | 1,308,810 | | | | — | |
End of period | | $ | 1,232,774 | | | $ | 1,308,810 | |
| | | | | | | | | |
ACCUMULATED NET INVESTMENT LOSS | | $ | (12,429 | ) | | $ | (4,919 | ) |
| | | | | | | | | |
CAPITAL SHARE ACTIVITY | | | | | | | | |
Shares sold | | | — | | | | 120,000 | |
Shares reinvested | | | 723 | | | | — | |
Net increase in shares outstanding | | | 723 | | | | 120,000 | |
Shares outstanding, beginning of period | | | 120,000 | | | | — | |
Shares outstanding, end of period | | | 120,723 | | | | 120,000 | |
(a) | Represents the period from the commencement of operations (December 29, 2015) through August 31, 2016. |
See accompanying notes to financial statements. |
50
CASTLEMAINE EVENT DRIVEN FUND
STATEMENTS OF CHANGES IN NET ASSETS | |
| | Six Months
Ended
February 28,
2017
(Unaudited) | | | Period
Ended
August 31,
2016(a) | |
FROM OPERATIONS | | | | | | |
Net investment loss | | $ | (6,076 | ) | | $ | (4,704 | ) |
Net realized gains (losses) from: | | | | | | | | |
Investments | | | 101,920 | | | | (5,983 | ) |
Securities sold short | | | (6,817 | ) | | | 19,052 | |
Written option contracts (Note 5) | | | 13,871 | | | | 20,788 | |
Futures contracts | | | — | | | | (5,066 | ) |
Net change in unrealized appreciation (depreciation) on: | | | | | | | | |
Investments | | | (19,932 | ) | | | 86,272 | |
Securities sold short | | | (8,172 | ) | | | 565 | |
Written option contracts (Note 5) | | | (878 | ) | | | 2,468 | |
Net increase in net assets resulting from operations | | | 73,916 | | | | 113,392 | |
| | | | | | | | | |
DISTRIBUTIONS TO SHAREHOLDERS | | | | | | | | |
From net realized gains | | | (40,044 | ) | | | — | |
| | | | | | | | | |
CAPITAL SHARE TRANSACTIONS | | | | | | | | |
Proceeds from shares sold | | | — | | | | 1,200,000 | |
Net asset value of shares issued in reinvestment of distributions to shareholders | | | 40,044 | | | | — | |
Net increase in net assets from capital share transactions | | | 40,044 | | | | 1,200,000 | |
| | | | | | | | | |
TOTAL INCREASE IN NET ASSETS | | | 73,916 | | | | 1,313,392 | |
| | | | | | | | | |
NET ASSETS | | | | | | | | |
Beginning of period | | | 1,313,392 | | | | — | |
End of period | | $ | 1,387,308 | | | $ | 1,313,392 | |
| | | | | | | | | |
ACCUMULATED NET INVESTMENT LOSS | | $ | (6,076 | ) | | $ | — | |
| | | | | | | | | |
CAPITAL SHARE ACTIVITY | | | | | | | | |
Shares sold | | | — | | | | 120,000 | |
Shares reinvested | | | 3,687 | | | | — | |
Net increase in shares outstanding | | | 3,687 | | | | 120,000 | |
Shares outstanding, beginning of period | | | 120,000 | | | | — | |
Shares outstanding, end of period | | | 123,687 | | | | 120,000 | |
(a) | Represents the period from the commencement of operations (December 29, 2015) through August 31, 2016. |
See accompanying notes to financial statements. |
51
CASTLEMAINE LONG/SHORT FUND
STATEMENTS OF CHANGES IN NET ASSETS | |
| | Six Months
Ended
February 28,
2017
(Unaudited) | | | Period
Ended
August 31,
2016(a) | |
FROM OPERATIONS | | | | | | |
Net investment loss | | $ | (4,959 | ) | | $ | (3,981 | ) |
Net realized gains (losses) from: | | | | | | | | |
Investments | | | 2,490 | | | | (14,736 | ) |
Securities sold short | | | (41,942 | ) | | | (25,066 | ) |
Written option contracts (Note 5) | | | 22,630 | | | | 42,606 | |
Futures contracts | | | — | | | | (5,943 | ) |
Net change in unrealized appreciation (depreciation) on: | | | | | | | | |
Investments | | | 60,475 | | | | 54,168 | |
Securities sold short | | | 19,027 | | | | (32,118 | ) |
Written option contracts (Note 5) | | | (1,425 | ) | | | 2,483 | |
Net increase in net assets resulting from operations | | | 56,296 | | | | 17,413 | |
| | | | | | | | | |
CAPITAL SHARE TRANSACTIONS | | | | | | | | |
Proceeds from shares sold | | | — | | | | 1,200,000 | |
| | | | | | | | | |
TOTAL INCREASE IN NET ASSETS | | | 56,296 | | | | 1,217,413 | |
| | | | | | | | | |
NET ASSETS | | | | | | | | |
Beginning of period | | | 1,217,413 | | | | — | |
End of period | | $ | 1,273,709 | | | $ | 1,217,413 | |
| | | | | | | | | |
ACCUMULATED NET INVESTMENT LOSS | | $ | (4,959 | ) | | $ | — | |
| | | | | | | | | |
CAPITAL SHARE ACTIVITY | | | | | | | | |
Shares sold | | | — | | | | 120,000 | |
Shares outstanding, beginning of period | | | 120,000 | | | | — | |
Shares outstanding, end of period | | | 120,000 | | | | 120,000 | |
(a) | Represents the period from the commencement of operations (December 29, 2015) through August 31, 2016. |
See accompanying notes to financial statements. |
52
CASTLEMAINE MARKET NEUTRAL FUND
STATEMENTS OF CHANGES IN NET ASSETS | |
| | Six Months
Ended
February 28,
2017
(Unaudited) | | | Period
Ended
August 31,
2016(a) | |
FROM OPERATIONS | | | | | | |
Net investment loss | | $ | (4,909 | ) | | $ | (7,658 | ) |
Net realized gains (losses) from: | | | | | | | | |
Investments | | | 28,300 | | | | (16,725 | ) |
Securities sold short | | | (73,787 | ) | | | (2,590 | ) |
Futures contracts | | | — | | | | (2,912 | ) |
Written option contracts (Note 5) | | | 8,635 | | | | 19,554 | |
Net change in unrealized appreciation (depreciation) on: | | | | | | | | |
Investments | | | 94,959 | | | | 101,133 | |
Securities sold short | | | 37,223 | | | | (62,902 | ) |
Written option contracts (Note 5) | | | (1,516 | ) | | | 963 | |
Net increase in net assets resulting from operations | | | 88,905 | | | | 28,863 | |
| | | | | | | | | |
CAPITAL SHARE TRANSACTIONS | | | | | | | | |
Proceeds from shares sold | | | — | | | | 1,200,000 | |
| | | | | | | | | |
TOTAL INCREASE IN NET ASSETS | | | 88,905 | | | | 1,228,863 | |
| | | | | | | | | |
NET ASSETS | | | | | | | | |
Beginning of period | | | 1,228,863 | | | | — | |
End of period | | $ | 1,317,768 | | | $ | 1,228,863 | |
| | | | | | | | | |
ACCUMULATED NET INVESTMENT LOSS | | $ | (7,476 | ) | | $ | (2,567 | ) |
| | | | | | | | | |
CAPITAL SHARE ACTIVITY | | | | | | | | |
Shares sold | | | — | | | | 120,000 | |
Shares outstanding, beginning of period | | | 120,000 | | | | — | |
Shares outstanding, end of period | | | 120,000 | | | | 120,000 | |
(a) | Represents the period from the commencement of operations (December 29, 2015) through August 31, 2016. |
See accompanying notes to financial statements. |
53
CASTLEMAINE MULTI-STRATEGY FUND
STATEMENTS OF CHANGES IN NET ASSETS | |
| | Six Months
Ended
February 28,
2017
(Unaudited) | | | Period
Ended
August 31,
2016(a) | |
FROM OPERATIONS | | | | | | |
Net investment income (loss) | | $ | 5,291 | | | $ | (4,438 | ) |
Net realized gains (losses) from: | | | | | | | | |
Unaffiliated investments | | | (10,056 | ) | | | (12,602 | ) |
Securities sold short | | | (959 | ) | | | 2,724 | |
Written option contracts (Note 5) | | | 236 | | | | 3,987 | |
Net change in unrealized appreciation (depreciation) on: | | | | | | | | |
Unaffiliated investments | | | (6,076 | ) | | | 15,775 | |
Affiliated investments (Note 4) | | | 15,856 | | | | 44,800 | |
Net increase in net assets resulting from operations | | | 4,292 | | | | 50,246 | |
| | | | | | | | | |
CAPITAL SHARE TRANSACTIONS | | | | | | | | |
Proceeds from shares sold | | | — | | | | 1,000,000 | |
| | | | | | | | | |
TOTAL INCREASE IN NET ASSETS | | | 4,292 | | | | 1,050,246 | |
| | | | | | | | | |
NET ASSETS | | | | | | | | |
Beginning of period | | | 1,050,246 | | | | — | |
End of period | | $ | 1,054,538 | | | $ | 1,050,246 | |
| | | | | | | | | |
ACCUMULATED NET INVESTMENT INCOME (LOSS) | | $ | 907 | | | $ | (4,384 | ) |
| | | | | | | | | |
CAPITAL SHARE ACTIVITY | | | | | | | | |
Shares sold | | | — | | | | 100,000 | |
Shares outstanding, beginning of period | | | 100,000 | | | | — | |
Shares outstanding, end of period | | | 100,000 | | | | 100,000 | |
(a) | Represents the period from the commencement of operations (December 29, 2015) through August 31, 2016. |
See accompanying notes to financial statements. |
54
CASTLEMAINE FUNDS
STATEMENTS OF CASH FLOWS
For the Six Months Ended February 28, 2017 (Unaudited) | |
| | Castlemaine
Emerging Markets Opportunities
Fund | | | Castlemaine
Event Driven
Fund | | | Castlemaine
Long/Short
Fund | |
CASH FLOWS FROM OPERATING ACTIVITIES | | | | | | | | | |
Net increase (decrease) in net assets resulting from operations | | $ | (76,036 | ) | | $ | 73,916 | | | $ | 56,296 | |
Adjustments to reconcile net increase in net assets resulting from operations to net cash used in operating activities: | | | | | | | | | | | | |
Net realized (gains) losses from investments | | | 3,492 | | | | (101,920 | ) | | | (2,490 | ) |
Net realized losses from securities sold short | | | 22,994 | | | | 6,817 | | | | 41,942 | |
Net realized gains from written option contracts | | | (7,081 | ) | | | (13,871 | ) | | | (22,630 | ) |
Net realized losses from foreign currency transactions | | | 1,250 | | | | — | | | | — | |
Purchase of investment securities | | | (825,184 | ) | | | (1,826,771 | ) | | | (1,372,845 | ) |
Purchase of short-term investments, net | | | 25,011 | | | | 49,993 | | | | 25,011 | |
Proceeds from sales of investment securities | | | 714,987 | | | | 1,728,145 | | | | 1,284,034 | |
Proceeds from securities sold short | | | 603,050 | | | | 191,149 | | | | 586,256 | |
Cover of securities sold short | | | (600,998 | ) | | | (162,390 | ) | | | (627,174 | ) |
Return of capital adjustments | | | 3,720 | | | | 3,269 | | | | 10,044 | |
Purchase of options | | | (102,430 | ) | | | (129,885 | ) | | | (153,846 | ) |
Proceeds from sales of options | | | 46,944 | | | | 100,989 | | | | 116,756 | |
Premiums received from written options | | | 11,208 | | | | 18,055 | | | | 38,177 | |
Written options cancelled in a closing purchase transaction | | | (1,149 | ) | | | (4,873 | ) | | | (11,646 | ) |
Net change in unrealized appreciation/depreciation on investments | | | 47,127 | | | | 19,932 | | | | (60,475 | ) |
Net change in unrealized appreciation/depreciation on securities sold short | | | 4,445 | | | | 8,172 | | | | (19,027 | ) |
Net change in unrealized appreciation/depreciation on written option contracts | | | (1,281 | ) | | | 878 | | | | 1,425 | |
Net change in unrealized appreciation/depreciation on forward foreign currency exchange contracts | | | (1,170 | ) | | | — | | | | — | |
(Increase) decrease in operating assets: | | | | | | | | | | | | |
(Increase) decrease in deposits with brokers for securities sold short, written options and futures contracts | | | 65,880 | | | | (9,041 | ) | | | 121,436 | |
(Increase) decrease in dividends receivable | | | 1,897 | | | | (49 | ) | | | (555 | ) |
Decrease in receivable for investment securities sold | | | (1,926 | ) | | | (31,913 | ) | | | (130,235 | ) |
Increase in receivable from Adviser | | | (6,331 | ) | | | (5,952 | ) | | | (6,275 | ) |
(Increase) decrease in other assets | | | (9,033 | ) | | | 1,444 | | | | (9,029 | ) |
55
CASTLEMAINE FUNDS
STATEMENTS OF CASH FLOWS
For the Six Months Ended February 28, 2017 (Unaudited) (Continued) | |
| | Castlemaine
Emerging Markets Opportunities
Fund | | | Castlemaine
Event Driven
Fund | | | Castlemaine
Long/Short
Fund | |
Increase (decrease) in operating liabilities: | | | | | | | | | |
Increase (decrease) in dividends payable on securities sold short | | $ | (3,532 | ) | | $ | — | | | $ | 1,368 | |
Increase (decrease) in payable for investment securities purchased | | | 5,360 | | | | (1,456 | ) | | | 30,748 | |
Increase in payable to administrator | | | 499 | | | | 500 | | | | 499 | |
Increase (decrease) in accrued brokerage expense on securities sold short | | | 82 | | | | 219 | | | | (104 | ) |
Increase in other accrued expenses | | | 658 | | | | 508 | | | | 842 | |
NET CASH USED IN OPERATING ACTIVITIES | | | (77,547 | ) | | | (84,135 | ) | | | (101,497 | ) |
| | | | | | | | | | | | | |
CASH FLOWS FROM FINANCING ACTIVITIES | | | | | | | | | | | | |
Decrease in due to prime broker | | | — | | | | (25,868 | ) | | | — | |
| | | | | | | | | | | | | |
NET CHANGE IN CASH | | | (77,547 | ) | | | (110,003 | ) | | | (101,497 | ) |
Cash, beginning of period | | | 147,071 | | | | 179,045 | | | | 145,684 | |
Cash, end of period | | $ | 69,524 | | | $ | 69,042 | | | $ | 44,187 | |
| | | | | | | | | | | | | |
Non-cash financing activities consisting of reinvestment of distributions | | $ | 7,176 | | | $ | 40,044 | | | $ | — | |
See accompanying notes to financial statements. |
56
CASTLEMAINE FUNDS
STATEMENTS OF CASH FLOWS
For the Six Months Ended February 28, 2017 (Unaudited) (Continued) | |
| | Castlemaine Market Neutral Fund | | | Castlemaine Multi-Strategy Fund | |
CASH FLOWS FROM OPERATING ACTIVITIES | | | | | | |
Net increase in net assets resulting from operations | | $ | 88,905 | | | $ | 4,292 | |
Adjustments to reconcile net increase in net assets resulting from operations to net cash used in operating activities: | | | | | | | | |
Net realized (gains) losses from investments | | | (28,300 | ) | | | 10,056 | |
Net realized losses from securities sold short | | | 73,787 | | | | 959 | |
Net realized gains from written option contracts | | | (8,635 | ) | | | (236 | ) |
Purchase of investment securities | | | (706,456 | ) | | | (58,364 | ) |
Proceeds from sales of short-term investments, net | | | 29 | | | | — | |
Proceeds from sales of investment securities | | | 684,241 | | | | 64,238 | |
Proceeds from securities sold short | | | 476,565 | | | | 94,292 | |
Cover of securities sold short | | | (843,781 | ) | | | (95,251 | ) |
Return of capital adjustments | | | — | | | | 980 | |
Purchase of options | | | (56,535 | ) | | | (1,685 | ) |
Proceeds from sales of options | | | 43,443 | | | | 302 | |
Premiums received from written options | | | 28,132 | | | | 236 | |
Written options cancelled in a closing purchase transaction | | | (12,580 | ) | | | — | |
Net change in unrealized appreciation/depreciation on investments | | | (94,959 | ) | | | (9,780 | ) |
Net change in unrealized appreciation/depreciation on securities sold short | | | (37,223 | ) | | | — | |
Net change in unrealized appreciation/depreciation on written option contracts | | | 1,516 | | | | — | |
(Increase) decrease in operating assets: | | | | | | | | |
Decrease in deposits with brokers for securities sold short, written options and futures contracts | | | 378,831 | | | | — | |
Increase in dividends receivable | | | (1,273 | ) | | | — | |
(Increase) decrease in receivable for investment securities sold | | | (62,827 | ) | | | 43,426 | |
Increase in receivable from Adviser | | | (6,426 | ) | | | (5,889 | ) |
Increase in other assets | | | (9,029 | ) | | | (6,528 | ) |
57
CASTLEMAINE FUNDS
STATEMENTS OF CASH FLOWS
For the Six Months Ended February 28, 2017 (Unaudited) (Continued) | |
| | Castlemaine Market Neutral Fund | | | Castlemaine Multi-Strategy Fund | |
Increase (decrease) in operating liabilities: | | | | | | |
Increase in dividends payable on securities sold short | | $ | 28 | | | $ | — | |
Decrease in payable for investment securities purchased | | | — | | | | (42,500 | ) |
Increase in payable to administrator | | | 499 | | | | 499 | |
Decrease in accrued brokerage expense on securities sold short | | | (110 | ) | | | (57 | ) |
Increase in other accrued expenses | | | 1,054 | | | | 1,077 | |
NET CASH USED IN OPERATING ACTIVITIES | | | (91,104 | ) | | | 67 | |
| | | | | | | | | |
CASH FLOWS FROM FINANCING ACTIVITIES | | | | | | | | |
Decrease in due to prime broker | | | — | | | | (18,660 | ) |
| | | | | | | | | |
NET CHANGE IN CASH | | | (91,104 | ) | | | (18,593 | ) |
Cash, beginning of period | | | 184,520 | | | | 49,066 | |
Cash, end of period | | $ | 93,416 | | | $ | 30,473 | |
See accompanying notes to financial statements. |
58
CASTLEMAINE EMERGING MARKETS OPPORTUNITIES FUND
FINANCIAL HIGHLIGHTS | |
Per share data for a share outstanding throughout each period: | |
| | Six Months
Ended
February 28,
2017
(Unaudited) | | | Period Ended
August 31,
2016(a) | |
Net asset value at beginning of period | | $ | 10.91 | | | $ | 10.00 | |
| | | | | | | | | |
Income (loss) from investment operations: | | | | | | | | |
Net investment loss | | | (0.05 | ) | | | (0.12 | ) |
Net realized and unrealized gains (losses) on investments | | | (0.59 | ) | | | 1.03 | |
Total from investment operations | | | (0.64 | ) | | | 0.91 | |
| | | | | | | | | |
Less distributions: | | | | | | | | |
From net realized gains | | | (0.06 | ) | | | — | |
| | | | | | | | | |
Net asset value at end of period | | $ | 10.21 | | | $ | 10.91 | |
| | | | | | | | | |
Total return (b) | | | (5.85 | %)(c) | | | 9.10 | %(c) |
| | | | | | | | | |
Ratios and supplemental data: | | | | | | | | |
Net assets at end of period (000’s) | | $ | 1,233 | | | $ | 1,309 | |
| | | | | | | | | |
Ratio of total expenses to average net assets | | | 13.97 | %(d) | | | 11.55 | %(d) |
| | | | | | | | | |
Ratio of net expenses to average net assets (e) | | | 2.65 | %(d) | | | 3.25 | %(d) |
| | | | | | | | | |
Ratio of net expenses to average net assets excluding dividend expense, borrowing costs and brokerage expense on securities sold short (e) | | | 1.49 | %(d) | | | 1.49 | %(d) |
| | | | | | | | | |
Ratio of net investment loss to average net assets (e) | | | (1.00 | %)(d) | | | (1.63 | %)(d) |
| | | | | | | | | |
Portfolio turnover rate | | | 65 | %(c) | | | 189 | %(c) |
(a) | Represents the period from the commencement of operations (December 29, 2015) through August 31, 2016. |
(b) | Total return is a measure of the change in value of an investment in the Fund over the periods covered, which assumes any dividends or capital gains distributions are reinvested in shares of the Fund. The returns shown do not reflect the deduction of taxes a shareholder would pay on Fund distributions or the redemption of Fund shares. The total returns would have been lower if the Adviser had not reduced advisory fees and reimbursed expenses. |
(c) | Not annualized. |
(d) | Annualized. |
(e) | Ratio was determined after fee reductions and expense reimbursements by the Adviser (Note 4). |
See accompanying notes to financial statements. |
59
CASTLEMAINE EVENT DRIVEN FUND
FINANCIAL HIGHLIGHTS | |
Per share data for a share outstanding throughout each period: | |
| | Six Months
Ended
February 28,
2017
(Unaudited) | | | Period Ended
August 31,
2016(a) | |
Net asset value at beginning of period | | $ | 10.94 | | | $ | 10.00 | |
| | | | | | | | | |
Income (loss) from investment operations: | | | | | | | | |
Net investment loss | | | (0.05 | ) | | | (0.04 | ) |
Net realized and unrealized gains on investments | | | 0.66 | | | | 0.98 | |
Total from investment operations | | | 0.61 | | | | 0.94 | |
| | | | | | | | | |
Less distributions: | | | | | | | | |
From net realized gains | | | (0.33 | ) | | | — | |
| | | | | | | | | |
Net asset value at end of period | | $ | 11.22 | | | $ | 10.94 | |
| | | | | | | | | |
Total return (b) | | | 5.71 | %(c) | | | 9.40 | %(c) |
| | | | | | | | | |
Ratios and supplemental data: | | | | | | | | |
Net assets at end of period (000’s) | | $ | 1,387 | | | $ | 1,313 | |
| | | | | | | | | |
Ratio of total expenses to average net assets | | | 11.82 | %(d) | | | 9.90 | %(d) |
| | | | | | | | | |
Ratio of net expenses to average net assets (e) | | | 1.75 | %(d) | | | 1.81 | %(d) |
| | | | | | | | | |
Ratio of net expenses to average net assets excluding dividend expense, borrowing costs and brokerage expense on securities sold short (e) | | | 1.49 | %(d) | | | 1.49 | %(d) |
| | | | | | | | | |
Ratio of net investment loss to average net assets (e) | | | (0.91 | %)(d) | | | (0.57 | %)(d) |
| | | | | | | | | |
Portfolio turnover rate | | | 156 | %(c) | | | 220 | %(c) |
(a) | Represents the period from the commencement of operations (December 29, 2015) through August 31, 2016. |
(b) | Total return is a measure of the change in value of an investment in the Fund over the periods covered, which assumes any dividends or capital gains distributions are reinvested in shares of the Fund. The returns shown do not reflect the deduction of taxes a shareholder would pay on Fund distributions or the redemption of Fund shares. The total returns would have been lower if the Adviser had not reduced advisory fees and reimbursed expenses. |
(c) | Not annualized. |
(d) | Annualized. |
(e) | Ratio was determined after fee reductions and expense reimbursements by the Adviser (Note 4). |
See accompanying notes to financial statements. |
60
CASTLEMAINE LONG/SHORT FUND
FINANCIAL HIGHLIGHTS | |
Per share data for a share outstanding throughout each period: | |
| | Six Months
Ended
February 28,
2017
(Unaudited) | | | Period Ended
August 31,
2016(a) | |
Net asset value at beginning of period | | $ | 10.15 | | | $ | 10.00 | |
| | | | | | | | | |
Income (loss) from investment operations: | | | | | | | | |
Net investment loss | | | (0.04 | ) | | | (0.03 | ) |
Net realized and unrealized gains on investments | | | 0.50 | | | | 0.18 | |
Total from investment operations | | | 0.46 | | | | 0.15 | |
| | | | | | | | | |
Net asset value at end of period | | $ | 10.61 | | | $ | 10.15 | |
| | | | | | | | | |
Total return (b) | | | 4.53 | %(c) | | | 1.50 | %(c) |
| | | | | | | | | |
Ratios and supplemental data: | | | | | | | | |
Net assets at end of period (000’s) | | $ | 1,274 | | | $ | 1,217 | |
| | | | | | | | | |
Ratio of total expenses to average net assets | | | 13.82 | %(d) | | | 10.63 | %(d) |
| | | | | | | | | |
Ratio of net expenses to average net assets (e) | | | 2.72 | %(d) | | | 2.50 | %(d) |
| | | | | | | | | |
Ratio of net expenses to average net assets excluding dividend expense, borrowing costs and brokerage expense on securities sold short (e) | | | 1.49 | %(d) | | | 1.49 | %(d) |
| | | | | | | | | |
Ratio of net investment loss to average net assets (e) | | | (0.81 | %)(d) | | | (0.49 | %)(d) |
| | | | | | | | | |
Portfolio turnover rate | | | 119 | %(c) | | | 133 | %(c) |
(a) | Represents the period from the commencement of operations (December 29, 2015) through August 31, 2016. |
(b) | Total return is a measure of the change in value of an investment in the Fund over the periods covered, which assumes any dividends or capital gains distributions are reinvested in shares of the Fund. The returns shown do not reflect the deduction of taxes a shareholder would pay on Fund distributions or the redemption of Fund shares. The total returns would have been lower if the Adviser had not reduced advisory fees and reimbursed expenses. |
(c) | Not annualized. |
(d) | Annualized. |
(e) | Ratio was determined after fee reductions and expense reimbursements by the Adviser (Note 4). |
See accompanying notes to financial statements. |
61
CASTLEMAINE MARKET NEUTRAL FUND
FINANCIAL HIGHLIGHTS | |
Per share data for a share outstanding throughout each period: | |
| | Six Months
Ended
February 28,
2017
(Unaudited) | | | Period Ended
August 31,
2016(a) | |
Net asset value at beginning of period | | $ | 10.24 | | | $ | 10.00 | |
| | | | | | | | | |
Income (loss) from investment operations: | | | | | | | | |
Net investment loss | | | (0.06 | ) | | | (0.06 | ) |
Net realized and unrealized gains on investments | | | 0.80 | | | | 0.30 | |
Total from investment operations | | | 0.74 | | | | 0.24 | |
| | | | | | | | | |
Net asset value at end of period | | $ | 10.98 | | | $ | 10.24 | |
| | | | | | | | | |
Total return (b) | | | 7.23 | %(c) | | | 2.40 | %(c) |
| | | | | | | | | |
Ratios and supplemental data: | | | | | | | | |
Net assets at end of period (000’s) | | $ | 1,318 | | | $ | 1,229 | |
| | | | | | | | | |
Ratio of total expenses to average net assets | | | 13.68 | %(d) | | | 10.88 | %(d) |
| | | | | | | | | |
Ratio of net expenses to average net assets (e) | | | 2.91 | %(d) | | | 2.74 | %(d) |
| | | | | | | | | |
Ratio of net expenses to average net assets excluding dividend expense, borrowing costs and brokerage expense on securities sold short (e) | | | 1.49 | %(d) | | | 1.49 | %(d) |
| | | | | | | | | |
Ratio of net investment loss to average net assets (e) | | | (0.78 | %)(d) | | | (0.95 | %)(d) |
| | | | | | | | | |
Portfolio turnover rate | | | 63 | %(c) | | | 150 | %(c) |
(a) | Represents the period from the commencement of operations (December 29, 2015) through August 31, 2016. |
(b) | Total return is a measure of the change in value of an investment in the Fund over the periods covered, which assumes any dividends or capital gains distributions are reinvested in shares of the Fund. The returns shown do not reflect the deduction of taxes a shareholder would pay on Fund distributions or the redemption of Fund shares. The total returns would have been lower if the Adviser had not reduced advisory fees and reimbursed expenses. |
(c) | Not annualized. |
(d) | Annualized. |
(e) | Ratio was determined after fee reductions and expense reimbursements by the Adviser (Note 4). |
See accompanying notes to financial statements. |
62
CASTLEMAINE MULTI-STRATEGY FUND
FINANCIAL HIGHLIGHTS | |
Per share data for a share outstanding throughout each period: | |
| | Six Months
Ended
February 28,
2017
(Unaudited) | | | Period Ended
August 31,
2016(a) | |
Net asset value at beginning of period | | $ | 10.50 | | | $ | 10.00 | |
| | | | | | | | | |
Income (loss) from investment operations: | | | | | | | | |
Net investment income (loss) | | | 0.05 | | | | (0.04 | ) |
Net realized and unrealized gains (losses) on investments | | | (0.00 | )(b) | | | 0.54 | |
Total from investment operations | | | 0.05 | | | | 0.50 | |
| | | | | | | | | |
Net asset value at end of period | | $ | 10.55 | | | $ | 10.50 | |
| | | | | | | | | |
Total return (c) | | | 0.48 | %(d) | | | 5.00 | %(d) |
| | | | | | | | | |
Ratios and supplemental data: | | | | | | | | |
Net assets at end of period (000’s) | | $ | 1,055 | | | $ | 1,050 | |
| | | | | | | | | |
Ratio of total expenses to average net assets | | | 13.19 | %(e) | | | 10.15 | %(e) |
| | | | | | | | | |
Ratio of net expenses to average net assets (f) | | | 1.06 | %(e) | | | 1.06 | %(e) |
| | | | | | | | | |
Ratio of net expenses to average net assets excluding dividend expense, borrowing costs and brokerage expense on securities sold short (f) | | | 0.99 | %(e) | | | 0.99 | %(e) |
| | | | | | | | | |
Ratio of net investment income (loss) to average net assets (f) | | | 1.03 | %(e) | | | (0.65 | %)(e) |
| | | | | | | | | |
Portfolio turnover rate | | | 6 | %(d) | | | 25 | %(d) |
(a) | Represents the period from the commencement of operations (December 29, 2015) through August 31, 2016. |
(b) | Amount rounds to less than $0.01 per share. |
(c) | Total return is a measure of the change in value of an investment in the Fund over the periods covered, which assumes any dividends or capital gains distributions are reinvested in shares of the Fund. The returns shown do not reflect the deduction of taxes a shareholder would pay on Fund distributions or the redemption of Fund shares. The total returns would have been lower if the Adviser had not reduced advisory fees and reimbursed expenses. |
(d) | Not annualized. |
(e) | Annualized. |
(f) | Ratio was determined after fee reductions and expense reimbursements by the Adviser (Note 4). |
See accompanying notes to financial statements. |
63
CASTLEMAINE FUNDS
NOTES TO FINANCIAL STATEMENTS
February 28, 2017 (Unaudited)
1. Organization
Castlemaine Emerging Markets Opportunities Fund, Castlemaine Event Driven Fund, Castlemaine Long/Short Fund, Castlemaine Market Neutral Fund, and Castlemaine Multi-Strategy Fund (individually, a “Fund,” and collectively, the “Funds”) are each a diversified series of Ultimus Managers Trust (the “Trust”), an open-end investment company established as an Ohio business trust under a Declaration of Trust dated February 28, 2012. Other series of the Trust are not incorporated in this report. The Funds commenced operations on December 29, 2015.
The investment objectives of the Funds are as follows:
| | ● | Castlemaine Emerging Markets Opportunities Fund seeks to provide high total return, consisting of income and capital appreciation. |
| | ● | Castlemaine Event Driven Fund, Castlemaine Long/Short Fund, and Castlemaine Multi-Strategy Fund seek capital appreciation. |
| | ● | Castlemaine Market Neutral Fund seeks total return, consisting of income and capital appreciation. |
2. Significant Accounting Policies
The following is a summary of the Funds’ significant accounting policies. These policies are in conformity with accounting principles generally accepted in the United States of America (“GAAP”). As an investment company, as defined in Financial Accounting Standards Board (“FASB”) Accounting Standards Update 2013-08, each Fund follows accounting and reporting guidance under FASB Accounting Standards Codification Topic 946, “Financial Services – Investment Companies.”
In October 2016, the U.S. Securities and Exchange Commission (the “SEC”) released its final rule on Investment Company Reporting Modernization (the “Rule”). The Rule, which introduces two new regulatory reporting forms for investment companies – Form N-PORT and Form N-CEN, also contains amendments to Regulation S-X which impacts financial statement presentation, particularly the presentation of derivative investments. Although it is still evaluating the impact of the Rule, management believes that many of the Regulation S-X amendments are consistent with the Funds’ current financial statement preparation and expects that the Funds will be able to comply with the Rule’s Regulation S-X amendments by the August 1, 2017 compliance date.
Securities valuation – The Funds’ portfolio securities are valued at market value as of the close of regular trading on the New York Stock Exchange (the “NYSE”) (normally 4:00 p.m. Eastern time) on each day the NYSE is open for business. Listed securities are valued on the basis of the security’s last sale price on the security’s primary exchange, if available, otherwise at the exchange’s most recently quoted mean price. NASDAQ-listed securities are valued at the NASDAQ Official Closing Price. Fixed income securities are
64
CASTLEMAINE FUNDS
NOTES TO FINANCIAL STATEMENTS (Continued)
generally valued using prices provided by an independent pricing service approved by the Trust’s Board of Trustees (the “Board”). The independent pricing service uses information with respect to transactions in bonds, quotations from bond dealers, market transactions in comparable securities, and various relationships between securities in determining these prices. Option contracts are valued at the closing price on the exchanges on which they are primarily traded; if no closing price is available at the time of valuation, the option will be valued at the mean of the closing bid and ask prices for that day. Futures contracts are valued at their last sale price as of the close of trading on the NYSE; prices for these contracts are monitored by Castlemaine LLC (the “Adviser”) until the close of regular trading to determine if fair valuation is required. Investments in shares of other open-end investment companies are valued at their net asset value (“NAV”) as reported by such companies.
When using a quoted price and when the market for the security is considered active, the security will be classified as Level 1 within the fair value hierarchy. In the event that market quotations are not readily available or are considered unreliable due to market or other events, the securities and other assets are valued at fair value in accordance with procedures established by and under the general supervision of the Board of the Trust. Under these procedures, the securities will be classified as Level 2 or 3 within the fair value hierarchy (see below), depending on the inputs used. Unavailable or unreliable market quotes may be due to the following factors: a substantial bid-ask spread; infrequent sales resulting in stale prices; insufficient trading volume; small trade sizes; a temporary lapse in any reliable pricing source; and actions of the securities or futures markets, such as the suspension or limitation of trading. As a result, the prices of securities used to calculate each Fund’s NAV may differ from quoted or published prices for the same securities.
GAAP establishes a single authoritative definition of fair value, sets out a framework for measuring fair value, and requires additional disclosures about fair value measurements.
Various inputs are used in determining the value of the Funds’ investments. These inputs are summarized in the three broad levels listed below:
| | ● | Level 1 – quoted prices in active markets for identical securities |
| | ● | Level 2 – other significant observable inputs |
| | ● | Level 3 – significant unobservable inputs |
The inputs or methods used for valuing securities are not necessarily an indication of the risks associated with investing in those securities. The inputs used to measure fair value may fall into different levels of the fair value hierarchy. In such cases, for disclosure purposes, the level in the fair value hierarchy within which the fair value measurement falls in its entirety is determined based on the lowest level input that is significant to the fair value measurement.
65
CASTLEMAINE FUNDS
NOTES TO FINANCIAL STATEMENTS (Continued)
The following is a summary of the inputs used to value each Fund’s investments and other financial instruments as of February 28, 2017:
Castlemaine Emerging Markets Opportunities Fund | | Level 1 | | | Level 2 | | | Level 3 | | | Total | |
Investments in Securities | | | | | | | | | | | | |
Common Stocks | | $ | 1,048,632 | | | $ | — | | | $ | — | | | $ | 1,048,632 | |
Exchange-Traded Funds | | | 104,765 | | | | — | | | | — | | | | 104,765 | |
Purchased Option Contracts | | | 15,835 | | | | — | | | | — | | | | 15,835 | |
U.S. Treasury Obligations | | | — | | | | 124,904 | | | | — | | | | 124,904 | |
Total | | $ | 1,169,232 | | | $ | 124,904 | | | $ | — | | | $ | 1,294,136 | |
Other Financial Instruments | | | | | | | | | | | | | | | | |
Exchange-Traded Funds – Sold Short | | $ | (298,685 | ) | | $ | — | | | $ | — | | | $ | (298,685 | ) |
Written Option Contracts | | | (1,330 | ) | | | — | | | | — | | | | (1,330 | ) |
Total | | $ | (300,015 | ) | | $ | — | | | $ | — | | | $ | (300,015 | ) |
Castlemaine Event Driven Fund | | Level 1 | | | Level 2 | | | Level 3 | | | Total | |
Investments in Securities | | | | | | | | | | | | |
Common Stocks | | $ | 1,172,676 | | | $ | — | | | $ | — | | | $ | 1,172,676 | |
Rights | | | — | | | | — | | | | 0 | * | | | 0 | |
Purchased Option Contracts | | | 32,175 | | | | 300 | | | | — | | | | 32,475 | |
U.S. Treasury Obligations | | | — | | | | 99,923 | | | | — | | | | 99,923 | |
Total | | $ | 1,204,851 | | | $ | 100,223 | | | $ | 0 | | | $ | 1,305,074 | |
Other Financial Instruments | | | | | | | | | | | | | | | | |
Common Stocks – Sold Short | | $ | (25,536 | ) | | $ | — | | | $ | — | | | $ | (25,536 | ) |
Exchange-Traded Funds – Sold Short | | | (24,500 | ) | | | — | | | | — | | | | (24,500 | ) |
Written Option Contracts | | | (654 | ) | | | — | | | | — | | | | (654 | ) |
Total | | $ | (50,690 | ) | | $ | — | | | $ | — | | | $ | (50,690 | ) |
66
CASTLEMAINE FUNDS
NOTES TO FINANCIAL STATEMENTS (Continued)
Castlemaine Long/Short Fund | | Level 1 | | | Level 2 | | | Level 3 | | | Total | |
Investments in Securities | | | | | | | | | | | | |
Common Stocks | | $ | 1,115,519 | | | $ | — | | | $ | — | | | $ | 1,115,519 | |
Purchased Option Contracts | | | 30,950 | | | | — | | | | — | | | | 30,950 | |
U.S. Treasury Obligations | | | — | | | | 124,904 | | | | — | | | | 124,904 | |
Total | | $ | 1,146,469 | | | $ | 124,904 | | | $ | — | | | $ | 1,271,373 | |
Other Financial Instruments | | | | | | | | | | | | | | | | |
Common Stocks – Sold Short | | $ | (182,093 | ) | | $ | — | | | $ | — | | | $ | (182,093 | ) |
Exchange-Traded Funds – Sold Short | | | (61,022 | ) | | | — | | | | — | | | | (61,022 | ) |
Written Option Contracts | | | (3,654 | ) | | | — | | | | — | | | | (3,654 | ) |
Total | | $ | (246,769 | ) | | $ | — | | | $ | — | | | $ | (246,769 | ) |
Castlemaine Market Neutral Fund | | Level 1 | | | Level 2 | | | Level 3 | | | Total | |
Investments in Securities | | | | | | | | | | | | |
Common Stocks | | $ | 1,145,617 | | | $ | — | | | $ | — | | | $ | 1,145,617 | |
Exchange-Traded Funds | | | 17,658 | | | | — | | | | — | | | | 17,658 | |
Purchased Option Contracts | | | 6,880 | | | | — | | | | — | | | | 6,880 | |
U.S. Treasury Obligations | | | — | | | | 149,885 | | | | — | | | | 149,885 | |
Total | | $ | 1,170,155 | | | $ | 149,885 | | | $ | — | | | $ | 1,320,040 | |
Other Financial Instruments | | | | | | | | | | | | | | | | |
Common Stocks – Sold Short | | $ | (140,458 | ) | | $ | — | | | $ | — | | | $ | (140,458 | ) |
Exchange-Traded Funds – Sold Short | | | (146,489 | ) | | | — | | | | — | | | | (146,489 | ) |
Written Option Contracts | | | (6,712 | ) | | | — | | | | — | | | | (6,712 | ) |
Total | | $ | (293,659 | ) | | $ | — | | | $ | — | | | $ | (293,659 | ) |
Castlemaine Multi-Strategy Fund | | Level 1 | | | Level 2 | | | Level 3 | | | Total | |
Investments in Securities | | | | | | | | | | | | |
Open-End Funds | | $ | 868,526 | | | $ | — | | | $ | — | | | $ | 868,526 | |
Exchange-Traded Funds | | | 142,941 | | | | — | | | | — | | | | 142,941 | |
Total | | $ | 1,011,467 | | | $ | — | | | $ | — | | | $ | 1,011,467 | |
* | Castlemaine Event Driven Fund holds Rights which have been fair valued at $0. |
Refer to each Fund’s Schedule of Investments and Schedule of Securities Sold Short, if applicable, for a listing of the common stocks by industry type. As of February 28, 2017, the Funds did not have any transfers between Levels. It is the Funds’ policy to recognize transfers between Levels at the end of the reporting period. There were no Level 3
67
CASTLEMAINE FUNDS
NOTES TO FINANCIAL STATEMENTS (Continued)
securities held by Castlemaine Emerging Markets Opportunities Fund, Castlemaine Long/Short Fund, Castlemaine Market Neutral Fund and Castlemaine Multi-Strategy Fund as of February 28, 2017.
The following is a reconciliation of Level 3 securities of Castlemaine Event Driven Fund for which significant unobservable inputs were used to determine fair value between August 31, 2016 and February 28, 2017.
| | Castlemaine
Event Driven Fund | |
Balance as of August 31, 2016 | | $ | — | |
Receipt of rights from corporate actions | | | 0 | * |
Balance as of February 28, 2017 | | $ | 0 | |
* | Castlemaine Event Driven Fund holds Rights which have been fair valued at $0. |
The total amount of unrealized appreciation on Level 3 securities was $0 for Castlemaine Event Driven Fund as of February 28, 2017.
The following table summarizes the valuation techniques used and unobservable inputs developed by the Board to determine the fair value of the Level 3 investments:
Castlemaine Event Driven Fund |
| Fair Value at 02/28/2017 | Valuation Technique | Unobservable Input | Range | Impact to Valuation from an Increase in Input** |
Rights | $ 0* | Deemed Worthless | Discount Percentage | 100% | Increase |
* | Castlemaine Event Driven Fund holds Rights which have been fair valued at $0. |
** | This column represents the directional change in fair value of the Level 3 investments that would result in an increase from the corresponding input. A decrease to the unobservable input would have the opposite effect. Significant increases and decreases in these inputs in isolation could result in significantly higher or lower fair value measurements. |
Share valuation – The NAV per share of each Fund is calculated daily by dividing the total value of its assets, less liabilities, by the number of shares outstanding. The offering price and redemption price per share of each Fund is equal to the NAV per share.
Investment income – Dividend income is recorded on the ex-dividend date. Interest income is accrued as earned. Discounts and premiums on fixed income securities are amortized using the interest method. Withholding taxes on foreign dividends have been recorded for in accordance with the Funds’ understanding of the applicable country’s tax rules and rates.
68
CASTLEMAINE FUNDS
NOTES TO FINANCIAL STATEMENTS (Continued)
Security transactions – Security transactions are accounted for on the trade date. Realized gains and losses on securities sold are determined on a specific identification basis.
Common expenses – Common expenses of the Trust are allocated among the Funds and the other series of the Trust based on the relative net assets of each series or the nature of the services performed and the relative applicability to each series.
Distributions to shareholders – Distributions to shareholders arising from net investment income, if any, are declared and paid annually to shareholders. Net realized capital gains, if any, are distributed at least annually. The amount of distributions from net investment income and net realized capital gains are determined in accordance with federal income tax regulations, which may differ from GAAP. Dividends and distributions to shareholders are recorded on the ex-dividend date. The tax character of the distributions paid to shareholders of Castlemaine Emerging Markets Opportunities Fund and Castlemaine Event Driven Fund during the six months ended February 28, 2017 was ordinary income. There were no distributions paid to shareholders of Castlemaine Long/Short Fund, Castlemaine Market Neutral Fund and Castlemaine Multi-Strategy Fund during the six months ended February 28, 2017. None of the Funds paid distributions to shareholders during the period ended August 31, 2016.
Short sales – The Funds may sell securities short. For financial statement purposes, an amount equal to the settlement amount is included in the Statements of Assets and Liabilities as an asset and an equivalent liability is then subsequently marked-to-market daily to reflect the current value of the short position. Subsequent fluctuations in the market prices of securities sold, but not yet purchased, may require purchasing the securities at prices that may differ from the value reflected on the Statements of Assets and Liabilities. The Funds are liable for any dividends payable on securities while those securities are in a short position and will also bear other costs, such as charges for the prime brokerage accounts, in connection with the short position. These costs are reported as dividend expense and brokerage expense on securities sold short, respectively, in the Statements of Operations. As collateral for its short positions, the Funds are required under the Investment Company Act of 1940, as amended (the “1940 Act”), to maintain assets consisting of cash, cash equivalents, or other liquid securities equal to the market value of the securities sold short. The cash deposits with brokers or amounts due to prime broker for securities sold short are reported on the Statements of Assets and Liabilities. These amounts are considered in conjunction with securities held in the Funds’ collateral accounts. The amount of collateral is required to be adjusted daily to reflect changes in the value of the securities sold short. To the extent a Fund invests the proceeds received from selling securities short, it is engaging in a form of leverage. The use of leverage by a Fund may make any change in the Fund’s NAV greater than it would be without the use of leverage. Short sales are speculative transactions and involve special risks, including greater reliance on the ability of the Adviser to accurately anticipate the future value of a security.
69
CASTLEMAINE FUNDS
NOTES TO FINANCIAL STATEMENTS (Continued)
Option contracts – The Funds may use option contracts in any manner consistent with their investment objectives and the 1940 Act. The Funds may use options for speculative purposes as well as for the purpose of seeking to reduce the overall investment risk that would otherwise be associated with the securities in which the Funds invest.
Purchased option contracts – When a Fund purchases a call or put option, an amount equal to the total premium (the premium plus the commission) paid by the Fund is recorded as an asset in the Fund’s Statement of Assets and Liabilities and is subsequently marked-to-market daily. Premiums paid in the purchase of options that expire are treated as realized losses. Premiums paid in the purchase of call options that are exercised will increase the cost of the underlying security purchased. Premiums paid in the purchase of put options that are exercised will decrease the proceeds used to calculate the realized capital gain or loss on the sale of the underlying security.
Written option contracts – When a Fund writes a call or put option, an amount equal to the net premium (the premium less the commission) received by the Fund is recorded as a liability in the Fund’s Statement of Assets and Liabilities and is subsequently marked-to-market daily. Premiums received from writing call and put options that expire are treated as realized capital gains. Premiums received from writing call options that are exercised will increase the proceeds used to calculate the realized capital gain or loss on the sale of the underlying security. Premiums received from writing put options that are exercised will decrease the basis of the underlying security purchased.
If a closing purchase or sale transaction is used to terminate a Fund’s obligation on an option, a capital gain or loss will be realized, depending upon whether the price of the closing transaction is more or less than the premium previously paid on the option purchased or received on the option written.
Futures contracts – The Funds may use futures contracts to gain exposure to or hedge against changes in the value of equity securities, real estate investments, interest rates, foreign currencies, or commodities. A futures contract represents a commitment for the future purchase or sale of an asset at a specified price on a specified date. When a Fund purchases or sells a futures contract, no price is paid to or received by the Fund. Instead, the Fund is required to deposit in a segregated asset account an amount of cash or qualifying securities to cover part of the futures contract’s value. This is called the “initial margin deposit.” Subsequent payments, known as “variation margin,” are made or received by the Fund each day, depending on the daily fluctuations in the fair value of the underlying asset. The Fund recognizes an unrealized gain or loss equal to the daily variation margin. If market conditions move unexpectedly, the Fund may not achieve the anticipated benefits of the futures contracts and may realize a loss. Any margin deposits for futures contracts are reported on the Statements of Assets and Liabilities.
Forward Foreign Currency Exchange Contracts – The Funds may enter into contracts for the purchase or sale of a specific currency at a fixed price on a future date as a hedge or cross-hedge against either specific transactions, portfolio positions or exposure to
70
CASTLEMAINE FUNDS
NOTES TO FINANCIAL STATEMENTS (Continued)
foreign currency. When the Adviser believes that the currency of a particular country may produce positive returns against the currency of another country, each of those Funds may purchase or sell forward foreign currency exchange contracts to gain exposure to the differential in currency returns. All foreign currency exchange contracts are “marked-to-market” daily at the applicable translation rates resulting in unrealized gains or losses. Realized and unrealized gains or losses from transactions in foreign currency exchange contracts will be included in a Fund’s Statement of Assets and Liabilities and Statement of Operations. Risks associated with these contracts include the potential inability of counterparties to meet the terms of their contracts and unanticipated movements in the value of a foreign currency relative to the U.S. dollar.
Estimates – The preparation of financial statements in conformity with GAAP requires management to make estimates and assumptions that affect the reported amounts of assets and liabilities and disclosure of contingent assets and liabilities as of the date of the financial statements and the reported amounts of income and expenses during the reporting period. Actual results could differ from those estimates.
Federal income tax – Each Fund has qualified and intends to continue to qualify as a regulated investment company under the Internal Revenue Code of 1986 (the “Code”). Qualification generally will relieve a Fund of liability for federal income taxes to the extent 100% of its net investment income and net realized capital gains are distributed in accordance with the Code.
In order to avoid imposition of the excise tax applicable to regulated investment companies, it is each Fund’s intention to declare as dividends in each calendar year at least 98% of its net investment income (earned during the calendar year) and 98.2% of its net realized capital gains (earned during the 12 months ended October 31) plus undistributed amounts from prior years.
71
CASTLEMAINE FUNDS
NOTES TO FINANCIAL STATEMENTS (Continued)
The following information is computed on a tax basis for each item as of February 28, 2017:
| | Castlemaine Emerging Markets Oppportunities Fund | | | Castlemaine Event Drive Fund | | | Castlemaine Long/Short Fund | |
Tax cost of portfolio investments | | $ | 1,228,022 | | | $ | 1,242,507 | | | $ | 1,159,196 | |
Gross unrealized appreciation | | $ | 134,203 | | | $ | 115,622 | | | $ | 158,754 | |
Gross unrealized depreciation | | | (68,089 | ) | | | (53,055 | ) | | | (46,577 | ) |
Net unrealized appreciation | | | 66,114 | | | | 62,567 | | | | 112,177 | |
Net unrealized depreciation on securities sold short | | | (20,359 | ) | | | (7,607 | ) | | | (13,091 | ) |
Net unrealized appreciation on written option contracts | | | 2,603 | | | | 1,590 | | | | 1,058 | |
Accumulated capital and other net gains(losses) | | | (22,760 | ) | | | 90,714 | | | | (26,435 | ) |
Accumulated earnings | | $ | 25,598 | | | $ | 147,264 | | | $ | 73,709 | |
| | Castlemaine Market Neutral Fund | | | Castlemaine Multi-Strategy Fund | |
Tax cost of portfolio investments | | $ | 1,126,613 | | | $ | 941,112 | |
Gross unrealized appreciation | | $ | 218,570 | | | $ | 70,355 | |
Gross unrealized depreciation | | | (25,143 | ) | | | — | |
Net unrealized appreciation | | | 193,427 | | | | 70,355 | |
Net unrealized depreciation on securities sold short | | | (25,679 | ) | | | — | |
Net unrealized depreciation on written option contracts | | | (553 | ) | | | — | |
Accumulated capital and other net losses | | | (49,427 | ) | | | (15,763 | ) |
Accumulated earnings | | $ | 117,768 | | | $ | 54,592 | |
As of February 28, 2017, the proceeds of securities sold short and premiums received on written options on a tax basis are as follows:
| | | Tax Basis of: | |
| | Proceeds of securities sold short | | | Premiums
received on
written option contracts | |
Castlemaine Emerging Markets Opportunities Fund | | $ | 278,326 | | | $ | 3,933 | |
Castlemaine Event Driven Fund | | | 42,429 | | | | 2,244 | |
Castlemaine Long/Short Fund | | | 230,024 | | | | 4,712 | |
Castlemaine Market Neutral Fund | | | 261,268 | | | | 6,159 | |
Castlemaine Multi-Strategy Fund | | | — | | | | — | |
72
CASTLEMAINE FUNDS
NOTES TO FINANCIAL STATEMENTS (Continued)
The difference between the federal income tax cost of portfolio investments and the financial statement cost of portfolio investments for Castlemaine Emerging Markets Opportunities Fund, Castlemaine Event Driven Fund, Castlemaine Long/Short Fund and Castlemaine Market Neutral Fund is due to certain timing differences in the recognition of capital gains or losses under income tax regulations and GAAP. These “book/tax” differences are temporary in nature and are due primarily to the tax deferral of losses on wash sales, the mark to market on forward currency contracts, and adjustments to basis on publicly traded partnerships.
For the six months ended February 28, 2017, Castlemaine Emerging Markets Opportunities Fund reclassified $1,250 of net realized losses on foreign currency transactions against accumulated net investment loss on the Statements of Assets and Liabilities. This reclassification is the result of permanent differences between the financial statement and income tax reporting requirements. It had no effect on the Fund’s net assets or NAV per share.
The Funds recognize the tax benefits or expenses of uncertain tax positions only when the position is “more likely than not” to be sustained assuming examination by tax authorities. Management has reviewed each Fund’s tax positions for the current and open tax period (tax year ended August 31, 2016) and has concluded that no provision for unrecognized tax benefits or expenses is required in these financial statements. Each Fund is subject to examination by U.S. federal tax authorities for such tax periods.
3. Investment Transactions
During the six months ended February 28, 2017, cost of purchases and proceeds from sales of investment securities, other than short-term investments, U.S. government securities, and short positions, were as follows:
| | Cost of
Purchases | | | Proceeds
from Sales | |
Castlemaine Emerging Markets Opportunities Fund | | $ | 825,184 | | | $ | 714,987 | |
Castlemaine Event Driven Fund | | | 1,826,771 | | | | 1,728,145 | |
Castlemaine Long/Short Fund | | | 1,372,845 | | | | 1,284,034 | |
Castlemaine Market Neutral Fund | | | 706,456 | | | | 684,241 | |
Castlemaine Multi-Strategy Fund | | | 58,364 | | | | 64,238 | |
73
CASTLEMAINE FUNDS
NOTES TO FINANCIAL STATEMENTS (Continued)
4. Transactions with Related Parties
INVESTMENT ADVISORY AGREEMENT
Each Fund’s investments are managed by Castlemaine LLC (the “Adviser”) pursuant to the terms of an Investment Advisory Agreement (the “Advisory Agreement”). Under the Advisory Agreement, each of Castlemaine Emerging Markets Opportunities Fund, Castlemaine Event Driven Fund, Castlemaine Long/Short Fund and Castlemaine Market Neutral Fund pays the Adviser an advisory fee, computed and accrued daily and paid monthly, at the annual rate of 1.24% of its average daily net assets. Additionally, Castlemaine Multi-Strategy Fund pays the Adviser an advisory fee, computed and accrued daily and paid monthly, at the annual rate of 1.24% of its average daily net assets, excluding that portion of the Fund’s average net assets invested in any affiliated fund managed by the Adviser.
Pursuant to an Expense Limitation Agreement (the “ELA”) between each Fund and the Adviser, the Adviser has contractually agreed, until December 31, 2018, to reduce investment advisory fees and reimburse other expenses to the extent necessary to limit Total Annual Fund Operating Expenses (excluding brokerage costs; taxes; interest; costs to organize the Fund; acquired fund fees and expenses; extraordinary expenses such as litigation and merger or reorganization costs and other expenses not incurred in the ordinary course of the Fund’s business; and amounts, if any, payable pursuant to a plan adopted in accordance with Rule 12b-1 under the 1940 Act) to 1.49% of the average daily net assets for Castlemaine Emerging Markets Opportunities Fund, Castlemaine Event Driven Fund, Castlemaine Long/Short Fund and Castlemaine Market Neutral Fund, and to 0.99% of the average daily net assets for Castlemaine Multi-Strategy Fund. Accordingly, during the six months ended February 28, 2017, the Adviser did not collect any of its investment advisory fees and, in addition, reimbursed other operating expenses as follows:
Castlemaine Emerging Markets Opportunities Fund | | $ | 63,403 | |
Castlemaine Event Driven Fund | | | 58,826 | |
Castlemaine Long/Short Fund | | | 60,120 | |
Castlemaine Market Neutral Fund | | | 59,912 | |
Castlemaine Multi-Strategy Fund | | | 61,390 | |
74
CASTLEMAINE FUNDS
NOTES TO FINANCIAL STATEMENTS (Continued)
Under the terms of the ELA, investment advisory fee reductions and expense reimbursements by the Adviser are subject to repayment by each Fund for a period of three years after such fees and expenses were incurred, provided that the repayments do not cause Total Annual Fund Operating Expenses to exceed the lesser of (i) the expense limitation then in effect, if any, and (ii) the expense limitation in effect at the time the expenses to be repaid were incurred. As of February 28, 2017, the Adviser may seek repayment of investment advisory fee reductions and expense reimbursements no later than the dates listed below in the following amounts:
| | August 31,
2019 | | | February 28,
2020 | | | Total | |
Castlemaine Emerging Markets Opportunities Fund | | $ | 70,562 | | | $ | 71,186 | | | $ | 141,748 | |
Castlemaine Event Driven Fund | | | 66,542 | | | | 67,066 | | | | 133,608 | |
Castlemaine Long/Short Fund | | | 66,279 | | | | 67,658 | | | | 133,937 | |
Castlemaine Market Neutral Fund | | | 65,939 | | | | 67,689 | | | | 133,628 | |
Castlemaine Multi-Strategy Fund | | | 62,419 | | | | 62,552 | | | | 124,971 | |
Until April 25, 2017, an officer of the Funds was also an officer of the Adviser.
OTHER SERVICE PROVIDERS
Ultimus Fund Solutions, LLC (“Ultimus”) provides administration, fund accounting, compliance and transfer agency services to the Funds. The Funds pay Ultimus fees in accordance with the agreements for such services. In addition, the Funds pay out-of-pocket expenses including, but not limited to, postage, supplies, and costs of pricing each Fund’s portfolio securities.
Under the terms of a Distribution Agreement with the Trust, Ultimus Fund Distributors, LLC (the “Distributor”) serves as principal underwriter to the Funds. The Distributor is a wholly-owned subsidiary of Ultimus. The Distributor is compensated by the Adviser (not the Funds) for acting as principal underwriter.
Certain officers and a Trustee of the Trust are also officers of Ultimus and the Distributor.
TRUSTEE COMPENSATION
Effective October 1, 2016 each Trustee who is not an “interested person” of the Trust (“Independent Trustee”) receives a $1,000 annual retainer from each Fund, paid quarterly, except for the Board Chairperson who receives a $1,200 annual retainer from each Fund, paid quarterly. Each Independent Trustee also receives from each Fund a fee of $500 for each Board meeting attended plus reimbursement for travel and other meeting-related expenses. Prior to October 1, 2016, each Fund paid each Independent Trustee a fee of $500 for each Board meeting attended, plus a $500 annual retainer.
75
CASTLEMAINE FUNDS
NOTES TO FINANCIAL STATEMENTS (Continued)
PRINCIPAL HOLDERS OF FUND SHARES
As of February 28, 2017, the following shareholders owned of record 5% or more of the outstanding shares of the Funds:
| | % Ownership |
Name of Record
Owner | Castlemaine Emerging Markets Opportunities Fund | Castlemaine Event Driven Fund | Castlemaine Long/Short Fund | Castlemaine Market Neutral Fund | Castlemaine Multi-Strategy Fund |
Colm O’Shea | 83% | 83% | 83% | 83% | 100% |
Castlemaine Multi-Strategy Fund | 17% | 17% | 17% | 17% | — |
Colm O’Shea owns a majority of the Adviser.
A beneficial owner of 25% or more of a Fund’s outstanding shares may be considered a controlling person. That shareholder’s vote could have a more significant effect on matters presented at a shareholder’s meeting.
AFFILIATED INVESTMENTS
Certain open-end investment companies held by Castlemaine Multi-Strategy Fund are managed by the Adviser, thereby making such funds affiliated companies as defined by the 1940 Act.
As of February 28, 2017, Castlemaine Multi-Strategy Fund owned shares of Castlemaine Emerging Markets Opportunities Fund, Castlemaine Event Driven Fund, Castlemaine Long/Short Fund, and Castlemaine Market Neutral Fund (the “Affiliated Investments”). Information regarding Castlemaine Multi-Strategy Fund’s holdings in the Affiliated Investments during the six months ended February 28, 2017 is as follows:
| | August 31, 2016
Value | | | Purchases | | | Change in Unrealized Appreciation | | | February 28, 2017 Value | | | Income
Distributions | |
Castlemaine Emerging Markets Opportunities Fund | | $ | 218,200 | | | $ | 1,196 | | | $ | (13,965 | ) | | $ | 205,431 | | | $ | 1,196 | |
Castlemaine Event Driven Fund | | | 218,800 | | | | 6,674 | | | | 5,821 | | | | 231,295 | | | | 6,674 | |
Castlemaine Long/Short Fund | | | 203,000 | | | | — | | | | 9,200 | | | | 212,200 | | | | — | |
Castlemaine Market Neutral Fund | | | 204,800 | | | | — | | | | 14,800 | | | | 219,600 | | | | — | |
Total | | $ | 844,800 | | | $ | 7,870 | | | $ | 15,856 | | | $ | 868,526 | | | $ | 7,870 | |
76
CASTLEMAINE FUNDS
NOTES TO FINANCIAL STATEMENTS (Continued)
5. Derivatives Transactions
Transactions in long option contracts by the Funds during the six months ended February 28, 2017 were as follows:
| | Option
Contracts | | | Option
Premiums | |
Castlemaine Emerging Markets Opportunities Fund | | | | | | |
Options outstanding at beginning of period | | | 265 | | | $ | 31,249 | |
Options purchased | | | 1,285 | | | | 102,430 | |
Options sold | | | (250 | ) | | | (32,790 | ) |
Options expired | | | (925 | ) | | | (74,787 | ) |
Options exercised | | | (50 | ) | | | (4,972 | ) |
Options outstanding at end of period | | | 325 | | | $ | 21,130 | |
Castlemaine Event Driven Fund | | | | | | |
Options outstanding at beginning of period | | | 227 | | | $ | 28,207 | |
Options purchased | | | 1,561 | | | | 129,885 | |
Options sold | | | (557 | ) | | | (47,586 | ) |
Options expired | | | (753 | ) | | | (68,373 | ) |
Options exercised | | | (168 | ) | | | (14,288 | ) |
Options outstanding at end of period | | | 310 | | | $ | 27,845 | |
Castlemaine Long/Short Fund | | | | | | |
Options outstanding at beginning of period | | | 330 | | | $ | 37,196 | |
Options purchased | | | 1,777 | | | | 153,846 | |
Options sold | | | (675 | ) | | | (60,031 | ) |
Options expired | | | (872 | ) | | | (80,485 | ) |
Options exercised | | | (135 | ) | | | (12,726 | ) |
Options outstanding at end of period | | | 425 | | | $ | 37,800 | |
Castlemaine Market Neutral Fund | | | | | | |
Options outstanding at beginning of period | | | 125 | | | $ | 18,881 | |
Options purchased | | | 474 | | | | 56,535 | |
Options sold | | | (220 | ) | | | (27,826 | ) |
Options expired | | | (289 | ) | | | (37,981 | ) |
Options exercised | | | (5 | ) | | | (909 | ) |
Options outstanding at end of period | | | 85 | | | $ | 8,700 | |
77
CASTLEMAINE FUNDS
NOTES TO FINANCIAL STATEMENTS (Continued)
| | Option
Contracts | | | Option
Premiums | |
Castlemaine Multi-Strategy Fund | | | | | | |
Options outstanding at beginning of period | | | 145 | | | $ | 7,894 | |
Options purchased | | | 15 | | | | 1,685 | |
Options sold | | | (25 | ) | | | (517 | ) |
Options expired | | | (125 | ) | | | (8,356 | ) |
Options exercised | | | (10 | ) | | | (706 | ) |
Options outstanding at end of period | | | — | | | $ | — | |
Transactions in option contracts written by the Funds during the six months ended February 28, 2017 were as follows:
| | Option
Contracts | | | Option
Premiums | |
Castlemaine Emerging Markets Opportunities Fund | | | | | | |
Options outstanding at beginning of period | | | 40 | | | $ | 2,322 | |
Options written | | | 167 | | | | 11,208 | |
Options cancelled in a closing purchase transaction | | | (56 | ) | | | (3,673 | ) |
Options expired | | | (56 | ) | | | (4,556 | ) |
Options exercised | | | (30 | ) | | | (1,368 | ) |
Options outstanding at end of period | | | 65 | | | $ | 3,933 | |
Castlemaine Event Driven Fund | | | | | | |
Options outstanding at beginning of period | | | 35 | | | $ | 3,478 | |
Options written | | | 229 | | | | 18,055 | |
Options cancelled in a closing purchase transaction | | | (126 | ) | | | (11,180 | ) |
Options expired | | | (103 | ) | | | (7,564 | ) |
Options exercised | | | (10 | ) | | | (545 | ) |
Options outstanding at end of period | | | 25 | | | $ | 2,244 | |
Castlemaine Long/Short Fund | | | | | | |
Options outstanding at beginning of period | | | 35 | | | $ | 3,493 | |
Options written | | | 432 | | | | 38,177 | |
Options cancelled in a closing purchase transaction | | | (206 | ) | | | (22,264 | ) |
Options expired | | | (184 | ) | | | (12,013 | ) |
Options exercised | | | (27 | ) | | | (2,681 | ) |
Options outstanding at end of period | | | 50 | | | $ | 4,712 | |
78
CASTLEMAINE FUNDS
NOTES TO FINANCIAL STATEMENTS (Continued)
| | Option
Contracts | | | Option
Premiums | |
Castlemaine Market Neutral Fund | | | | | | |
Options outstanding at beginning of period | | | 30 | | | $ | 1,953 | |
Options written | | | 333 | | | | 28,132 | |
Options cancelled in a closing purchase transaction | | | (170 | ) | | | (14,093 | ) |
Options expired | | | (99 | ) | | | (7,123 | ) |
Options exercised | | | (24 | ) | | | (2,710 | ) |
Options outstanding at end of period | | | 70 | | | $ | 6,159 | |
Castlemaine Multi-Strategy Fund | | | | | | |
Options outstanding at beginning of period | | | — | | | $ | — | |
Options written | | | 5 | | | | 236 | |
Options expired | | | (5 | ) | | | (236 | ) |
Options outstanding at end of period | | | — | | | $ | — | |
The average volume of activity of financial derivatives for the Funds during the six months ended February 28, 2017 is as follows:
| | Castlemaine Emerging Markets Opportunities Fund | | | Castlemaine Event Driven Fund | | | Castlemaine Long/Short Fund | | | Castlemaine Market Neutral Fund | | | Castlemaine Multi-Strategy Fund | |
Average notional value of: | |
Foreign currency contracts | | $ | 30,335 | | | $ | — | | | $ | — | | | $ | — | | | $ | — | |
79
CASTLEMAINE FUNDS
NOTES TO FINANCIAL STATEMENTS (Continued)
Derivative positions of the Funds as of February 28, 2017 are recorded in the following locations in the Statements of Assets and Liabilities:
| | | | Fair value | |
Type of derivative | Location | | Asset Derivatives | | | Liability Derivatives | |
Castlemaine Emerging Markets Opportunities Fund | | | | | | |
Equity options purchased | Investments in securities, at value | | $ | 15,835 | | | $ | — | |
Equity options written | Written options, at value | | | — | | | | (1,330 | ) |
Total | | | $ | 15,835 | | | $ | (1,330 | ) |
Castlemaine Event Driven Fund | | | | | | |
Equity options purchased | Investments in securities, at value | | $ | 32,475 | | | $ | — | |
Equity options written | Written options, at value | | | — | | | | (654 | ) |
Total | | | $ | 32,475 | | | $ | (654 | ) |
Castlemaine Long/Short Fund | | | | | | | |
Equity options purchased | Investments in securities, at value | | $ | 30,950 | | | $ | — | |
Equity options written | Written options, at value | | | — | | | | (3,654 | ) |
Total | | | $ | 30,950 | | | $ | (3,654 | ) |
Castlemaine Market Neutral Fund | | | | | | |
Equity options purchased | Investments in securities, at value | | $ | 6,880 | | | $ | — | |
Equity options written | Written options, at value | | | — | | | | (6,712 | ) |
Total | | | $ | 6,880 | | | $ | (6,712 | ) |
As of February 28, 2017, the Funds did not hold any forward currency exchange or futures contracts.
Transactions in derivative instruments for the Funds during the period ended February 28, 2017 are recorded in the following locations in the Statements of Operations:
Derivative Investment Type | Location |
Written option contracts | Net realized gains (losses) from written option contracts |
| | Net change in unrealized appreciation (depreciation) on written option contracts |
Purchased option contracts | Net realized gains (losses) from investments |
| | Net change in unrealized appreciation (depreciation) on investments |
Forward foreign currency exchange contracts | Net realized losses from foreign currency transactions |
80
CASTLEMAINE FUNDS
NOTES TO FINANCIAL STATEMENTS (Continued)
The following is a summary of net realized gains (losses) and net change in unrealized appreciation (depreciation) on derivative instruments for the Funds during the six months ended February 28, 2017:
Risk | Type of Derivative | | Net
Realized
Gains
(Losses) | | | Net Change in Unrealized Appreciation (Depreciation) | | | Net
Realized
Gains
(Losses) | | | Net Change in Unrealized Appreciation (Depreciation) | |
| | | | Castlemaine Emerging
Markets Opportunities Fund | | | Castlemaine
Event Driven Fund | |
Equity | Option contracts | | | | | | | | | | | | |
| Purchased equity options | | $ | (60,633 | ) | | $ | 3,413 | | | $ | (14,970 | ) | | $ | 9,717 | |
| Written equity options | | | 7,081 | | | | 1,281 | | | | 13,871 | | | | (878 | ) |
| Total option contracts | | | (53,552 | ) | | | 4,694 | | | | (1,099 | ) | | | 8,839 | |
| | | | | | | | | | | | | | | | | | |
Currency | Forward foreign currency contracts | | | (1,250 | ) | | | — | | | | — | | | | — | |
| | | | | | | | | | | | | | | | | | |
| Total | | $ | (54,802 | ) | | $ | 4,694 | | | $ | (1,099 | ) | | $ | 8,839 | |
| | | | | | | | | | | | | | | | | | |
| | | | Castlemaine
Long/Short Fund | | | Castlemaine
Market Neutral Fund | |
Equity | Option contracts | | | | | | | | | | | | | | | | |
| Purchased equity options | | $ | (23,760 | ) | | $ | 1,256 | | | $ | (20,561 | ) | | $ | 2,101 | |
| Written equity options | | | 22,630 | | | | (1,425 | ) | | | 8,635 | | | | (1,516 | ) |
| | | | | | | | | | | | | | | | | | |
| Total | | $ | (1,130 | ) | | $ | (169 | ) | | $ | (11,926 | ) | | $ | 585 | |
| | | | | | | | | | | | | | | | | | |
| | | | Castlemaine
Multi-Strategies Fund | | | | | | | | | |
Equity | Option contracts | | | | | | | | | | | | | | | | |
| Purchased equity options | | $ | (8,571 | ) | | $ | (3,186 | ) | | | | | | | | |
| Written equity options | | | 236 | | | | — | | | | | | | | | |
| | | | | | | | | | | | | | | | | | |
| Total | | $ | (8,335 | ) | | $ | (3,186 | ) | | | | | | | | |
81
CASTLEMAINE FUNDS
NOTES TO FINANCIAL STATEMENTS (Continued)
In the ordinary course of business, each Fund may enter into transactions subject to enforceable netting agreements or other similar arrangements (“netting agreements”). Generally, the right to offset in netting agreements allows each Fund to offset any exposure to a specific counterparty with any collateral received or delivered to that counterparty based on the terms of the agreements. Generally, each Fund manages its cash collateral securities and securities collateral on a counterparty basis.
As of February 28, 2017, the offsetting of financial liabilities and derivative liabilities is as follows:
Castlemaine Emerging Markets Opportunities Fund | |
Description | | Gross Amounts of Recognized Assets | | | Gross Amounts Offset in Statements of Assets and Liabilities | | | Net Amounts of Assets Presented in Statements of Assets and Liabilities | | | Gross Amounts Not
Offset in the Statements of Assets and Liabilities | | | Net Amount | |
| | Cash Collateral | | | Financial Instruments | |
Investments in securities at value | | $ | 15,835 | | | $ | — | | | $ | 15,835 | | | $ | — | | | $ | (1,330 | ) | | $ | 14,505 | |
| Description | | Gross Amounts of Recognized Liabilities | | | Gross Amounts Offset in Statements of Assets and Liabilities | | | Net Amounts of Liabilities Presented in Statements of Assets and Liabilities | | | Gross Amounts Not
Offset in the Statements of Assets and Liabilities | | | Net Amount | |
Cash Collateral | | | Financial Instruments |
Written options, at value | | $ | 1,330 | | | $ | — | | | $ | 1,330 | | | $ | — | | | $ | (1,330 | ) | | $ | — | |
82
CASTLEMAINE FUNDS
NOTES TO FINANCIAL STATEMENTS (Continued)
Castlemaine Event Driven Fund | |
Description | | Gross Amounts of Recognized Assets | | | Gross Amounts Offset in Statements of Assets and Liabilities | | | Net Amounts of Assets Presented in Statements of Assets and Liabilities | | | Gross Amounts Not
Offset in the Statements of Assets and Liabilities | | | Net Amount | |
| | Cash Collateral | | | Financial Instruments | |
Investments in securities at value | | $ | 32,475 | | | $ | — | | | $ | 32,475 | | | $ | — | | | $ | (654 | ) | | $ | 31,821 | |
Description | | Gross Amounts of Recognized Liabilities | | | Gross Amounts Offset in Statements of Assets and Liabilities | | | Net Amounts of Liabilities Presented in Statements of Assets and Liabilities | | | Gross Amounts Not
Offset in the Statements of Assets and Liabilities | | | Net Amount | |
Cash Collateral | | | Financial Instruments |
Written options, at value | | $ | 654 | | | $ | — | | | $ | 654 | | | $ | — | | | $ | (654 | ) | | $ | — | |
Castlemaine Long/Short Fund | |
Description | | Gross Amounts of Recognized Assets | | | Gross Amounts Offset in Statements of Assets and Liabilities | | | Net Amounts of Assets Presented in Statements of Assets and Liabilities | | | Gross Amounts Not
Offset in the Statements of Assets and Liabilities | | | Net Amount | |
| | Cash Collateral | | | Financial Instruments | |
Investments in securities at value | | $ | 30,950 | | | $ | — | | | $ | 30,950 | | | $ | — | | | $ | (3,654 | ) | | $ | 27,296 | |
Description | | Gross Amounts of Recognized Liabilities | | | Gross Amounts Offset in Statements of Assets and Liabilities | | | Net Amounts of Liabilities Presented in Statements of Assets and Liabilities | | | Gross Amounts Not
Offset in the Statements of Assets and Liabilities | | | Net Amount | |
Cash Collateral | | | Financial Instruments |
Written options, at value | | $ | 3,654 | | | $ | — | | | $ | 3,654 | | | $ | — | | | $ | (3,654 | ) | | $ | — | |
83
CASTLEMAINE FUNDS
NOTES TO FINANCIAL STATEMENTS (Continued)
Castlemaine Market Neutral Fund | |
Description | | Gross Amounts of Recognized Assets | | | Gross Amounts Offset in Statements of Assets and Liabilities | | | Net Amounts of Assets Presented in Statements of Assets and Liabilities | | | Gross Amounts Not
Offset in the Statements of Assets and Liabilities | | | Net Amount | |
| | Cash Collateral | | | Financial Instruments | |
Investments in securities at value | | $ | 6,880 | | | $ | — | | | $ | 6,880 | | | $ | — | | | $ | (6,712 | ) | | $ | 168 | |
Description | | Gross Amounts of Recognized Liabilities | | | Gross Amounts Offset in Statements of Assets and Liabilities | | | Net Amounts of Liabilities Presented in Statements of Assets and Liabilities | �� | | Gross Amounts Not
Offset in the Statements of Assets and Liabilities | | | Net Amount | |
Cash Collateral | | | Financial Instruments |
Written options,
at value | | $ | 6,712 | | | $ | — | | | $ | 6,712 | | | $ | — | | | $ | (6,712 | ) | | $ | — | |
6. Contingencies and Commitments
The Funds indemnify the Trust’s officers and Trustees for certain liabilities that might arise from their performance of their duties to the Funds. Additionally, in the normal course of business the Funds enter into contracts that contain a variety of representations and warranties and which provide general indemnifications. Each Fund’s maximum exposure under these arrangements is unknown, as this would involve future claims that may be made against the Funds that have not yet occurred. However, based on experience, the Funds expect the risk of loss to be remote.
7. Subsequent Events
The Funds are required to recognize in the financial statements the effects of all subsequent events that provide additional evidence about conditions that existed as of the date of the Statements of Assets and Liabilities. For non-recognized subsequent events that must be disclosed to keep the financial statements from being misleading, the Funds are required to disclose the nature of the event as well as an estimate of its financial effect, or a statement that such an estimate cannot be made. Management has evaluated subsequent events through the issuance of these financial statements and has noted no such events, except as follows:
On April 25, 2017, David R. Carson was elected Principal Executive Officer of the Funds.
84
CASTLEMAINE FUNDS
ABOUT YOUR FUND’S EXPENSES (Unaudited)
We believe it is important for you to understand the impact of costs on your investment. As a shareholder of the Funds, you incur ongoing costs, including management fees and other operating expenses. The following examples are intended to help you understand your ongoing costs (in dollars) of investing in the Funds and to compare these costs with the ongoing costs of investing in other mutual funds.
A mutual fund’s ongoing costs are expressed as a percentage of its average net assets. This figure is known as the expense ratio. The expenses in the table below are based on an investment of $1,000 made at the beginning of the most recent period (September 1, 2016) and held until the end of the period (February 28, 2017).
The table below illustrates each Fund’s ongoing costs in two ways:
Actual fund return – This section helps you to estimate the actual expenses that you paid over the period. The “Ending Account Value” shown is derived from each Fund’s actual return, and the fourth column shows the dollar amount of operating expenses that would have been paid by an investor who started with $1,000 in each Fund. You may use the information here, together with the amount you invested, to estimate the expenses that you paid over the period.
To do so, simply divide your account value by $1,000 (for example, an $8,600 account value divided by $1,000 = 8.6), then multiply the result by the number given for the Fund under the heading “Expenses Paid During Period.”
Hypothetical 5% return – This section is intended to help you compare each Fund’s ongoing costs with those of other mutual funds. It assumes that each Fund had an annual return of 5% before expenses during the period shown, but that the expense ratio is unchanged. In this case, because the return used is not the Funds’ actual return, the results do not apply to your investment. The example is useful in making comparisons because the SEC requires all mutual funds to calculate expenses based on a 5% return. You can assess each Fund’s ongoing costs by comparing this hypothetical example with the hypothetical examples that appear in shareholder reports of other funds.
Note that expenses shown in the table are meant to highlight and help you compare ongoing costs only. The Funds do not charge transaction fees, such as purchase or redemption fees, nor do they carry a “sales load.”
The calculations assume no shares were bought or sold during the period. Your actual costs may have been higher or lower, depending on the amount of your investment and the timing of any purchases or redemptions.
More information about each Fund’s expenses can be found in this report. For additional information on operating expenses and other shareholder costs, please refer to the Funds’ prospectus.
85
CASTLEMAINE FUNDS
ABOUT YOUR FUND’S EXPENSES (Unaudited) (Continued)
| | Beginning Account Value September 1, 2016 | | | Ending
Account Value
February 28,
2017 | | | Net Expense Ratio(a) | | | Expenses
Paid During Period(b) | |
Castlemaine Emerging Markets Opportunities Fund | |
Based on Actual Fund Return | | $ | 1,000.00 | | | $ | 941.50 | | | | 2.65 | % | | $ | 12.76 | |
Based on Hypothetical 5% Return (before expenses) | | $ | 1,000.00 | | | $ | 1,011.65 | | | | 2.65 | % | | $ | 13.22 | |
Castlemaine Event Driven Fund | |
Based on Actual Fund Return | | $ | 1,000.00 | | | $ | 1,057.10 | | | | 1.75 | % | | $ | 8.93 | |
Based on Hypothetical 5% Return (before expenses) | | $ | 1,000.00 | | | $ | 1,016.12 | | | | 1.75 | % | | $ | 8.75 | |
Castlemaine Long/Short Fund | |
Based on Actual Fund Return | | $ | 1,000.00 | | | $ | 1,045.30 | | | | 2.72 | % | | $ | 13.79 | |
Based on Hypothetical 5% Return (before expenses) | | $ | 1,000.00 | | | $ | 1,011.31 | | | | 2.72 | % | | $ | 13.56 | |
Castlemaine Market Neutral Fund | |
Based on Actual Fund Return | | $ | 1,000.00 | | | $ | 1,072.30 | | | | 2.91 | % | | $ | 14.95 | |
Based on Hypothetical 5% Return (before expenses) | | $ | 1,000.00 | | | $ | 1,010.36 | | | | 2.91 | % | | $ | 14.51 | |
Castlemaine Multi-Strategy Fund | |
Based on Actual Fund Return | | $ | 1,000.00 | | | $ | 1,004.80 | | | | 1.06 | % | | $ | 5.27 | |
Based on Hypothetical 5% Return (before expenses) | | $ | 1,000.00 | | | $ | 1,019.54 | | | | 1.06 | % | | $ | 5.31 | |
(a) | Annualized, based on each Fund’s expenses for the most recent one-half year expenses. |
(b) | Expenses are equal to each Fund's annualized net expense ratio multiplied by the average account value over the period, multiplied by 181/365 (to reflect the one-half year period). |
86
CASTLEMAINE FUNDS
OTHER INFORMATION (Unaudited)
A description of the policies and procedures that the Funds use to vote proxies relating to portfolio securities is available without charge upon request by calling toll-free 1-888-594-0006, or on the SEC’s website at http://www.sec.gov. Information regarding how the Funds voted proxies relating to portfolio securities during the most recent period ended June 30 is available without charge upon request by calling toll-free 1-888-594-0006, or on the SEC’s website at http://www.sec.gov.
The Trust files a complete listing of portfolio holdings for the Funds with the SEC as of the end of the first and third quarters of each fiscal year on Form N-Q. These filings are available upon request by calling 1-888-594-0006. Furthermore, you may obtain a copy of the filings on the SEC’s website at http://www.sec.gov. The Trust’s Forms N-Q may also be reviewed and copied at the SEC’s Public Reference Room in Washington, DC, and information on the operation of the Public Reference Room may be obtained by calling 1-800-SEC-0330.
87
This page intentionally left blank.
This page intentionally left blank.
Semi-Annual Report
February 28, 2017
(Unaudited)
| MARSHFIELD CONCENTRATED OPPORTUNITY FUND |
| LETTER TO SHAREHOLDERS | March 17, 2017 |
From August 31, 2016 through February 28, 2017, the Marshfield Concentrated Opportunity Fund (the “Fund”) produced a cumulative total return of 14.06% compared to 10.01% for the S&P 500® Index. When there is a broad consensus in the market that recent trends will persist indefinitely, as was the case until November, our process and price discipline cause us to position our portfolio very differently from the consensus. When the consensus changes, as happened in November, we tend to benefit.
We are, perhaps obviously, pleased that our portfolio as a whole and several of our stocks in particular performed according to our longer run expectations about how their fundamentals should play out. They just did so in a far shorter timeframe than our investment thesis might have predicted. Strayer Education and Goldman Sachs, notably, shot the lights out in a post-election frenzy that saw stocks that had been burdened (as the market saw it) by restrictive regulation rise precipitously based on the belief that those regulations would soon be eased.
But for all the ebullience of the market, we find that our portfolio stocks are not so expensive that our discipline would lead us to sell them based purely on price. Moreover, the same psychology that fed the portfolio’s winners also held back certain names whose future in the longer term we believe to be every bit as bright, such as Visa and Waters. The market’s assumptions about how the new administration will proceed and what it and its legislative allies might achieve bred not only optimism about deregulation but also pessimism about globally-oriented companies for which restrictive trade policies and a strengthened dollar might prove treacherous.
Having said that, the forward thrust of the market means we found less to buy (indeed, nothing at all during the past six months) and, for various reasons, more to sell. Speaking of Strayer, we sold some of our position (which we’d added to earlier last year), partly based on the very rapid increase in the stock’s price after the election but also because the position had become larger than we were comfortable holding. We sold a significant part of our Wells Fargo position in reaction to their cross-selling imbroglio (e.g., creating accounts for some of their customers without the customers’ permission). That scandal suggested to us that their corporate culture, a critical factor in our investment decision-making, had deteriorated more than we’d thought over the past several years. Finally, we finished selling our position in Allied World, an insurance company. Taken together, these actions increased our cash position to about 15.5%, higher than it has been for some time (and certainly higher than it has been during the time we have been managing the Fund).
Nothing that we’ve done, however, should suggest to you that we think the market is going to fall anytime soon (it might, but we just don’t know, and we don’t think anyone else does either). This is just the kind of prudent adjustment we engage in on an ongoing basis. Even if we are right and valuations are stretched, history would tell you—and we’ve certainly seen a fair amount of that history—that they can get more stretched still. Perhaps all the deregulatory and other pro-business promises will be met, and those whose taxes are increased (if, for example, a border adjustment tax
1
is enacted) will be able to adjust. For our part though, we like to have a margin of safety in the prices we pay for stocks, and we don’t like to pay in advance for good things that haven’t happened yet. We take our obligations as stewards of our clients’ funds seriously.
Again, our approach in any environment is to stick to our discipline. That means: 1) understanding what’s real and what’s fantasy; 2) acting with equanimity to exploit the misjudgments of the crowd; and 3) being patient and not pulling the trigger before our buy or sell price has been reached. These things don’t and won’t change.
Sincerely,
Elise J. Hoffmann
Portfolio Manager | Christopher M. Niemczewski
Portfolio Manager |
Past performance is not predictive of future performance. Investment results and principal value will fluctuate so that shares, when redeemed, may be worth more or less than their original cost. Current performance may be higher or lower than the performance data quoted. Performance data current to the most recent month-end are available by calling 1-855-691-5288.
An investor should consider the investment objectives, risks, charges, and expenses of the Fund carefully before investing. The Fund’s prospectus contains this and other important information. To obtain a copy of the Fund’s prospectus please visit our website at www.MarshfieldFunds.com or call 1-855-691-5288 and a copy will be sent to you free of charge. Please read the prospectus carefully before you invest. The Fund is distributed by Ultimus Fund Distributors, LLC.
The Letter to Shareholders seeks to describe some of the Adviser’s current opinions and views of the financial markets. Although the Adviser believes it has a reasonable basis for any opinions or views expressed, actual results may differ, sometimes significantly so, from those expected or expressed. The securities held by the Fund that are discussed in the Letter to Shareholders were held during the period covered by this Report. They do not comprise the entire investment portfolio of the Fund, may be sold at any time, and may no longer be held by the Fund. For a complete list of securities held by the Fund as of February 28, 2017, please see the Schedule of Investments section of the semi-annual report. The opinions of the Fund’s adviser with respect to those securities may change at any time.
Statements in the Letter to Shareholders that reflect projections or expectations for future financial or economic performance of the Fund and the market in general and statements of the Fund’s plans and objectives for future operations are forward-looking statements. No assurance can be given that actual results or events will not differ materially from those projected, estimated, assumed, or anticipated in any such forward-looking statements. Important factors that could result in such differences, in addition to factors noted with such forward-looking statements, include, without limitation, general economic conditions, such as inflation, recession, and interest rates. Past performance is not a guarantee of future results.
2
MARSHFIELD CONCENTRATED OPPORTUNITY FUND
PORTFOLIO INFORMATION
February 28, 2017 (Unaudited)
Portfolio Allocation (% of Net Assets)
Top 10 Holdings
| Security Description | % of Net Assets |
| Arch Capital Group Ltd. | 9.9% |
| Moody's Corporation | 8.7% |
| Goldman Sachs Group, Inc. (The) | 7.4% |
| NVR, Inc. | 5.7% |
| Cummins, Inc. | 5.6% |
| Deere & Company | 5.3% |
| Fastenal Company | 5.1% |
| Expeditors International of Washington, Inc. | 4.4% |
| U.S. Bancorp | 4.2% |
| YUM! Brands, Inc. | 3.8% |
3
MARSHFIELD CONCENTRATED OPPORTUNITY FUND
SCHEDULE OF INVESTMENTS
February 28, 2017 (Unaudited) |
| COMMON STOCKS — 84.3% | | Shares | | | Value | |
| Consumer Discretionary — 19.0% | | | | | | |
| Diversified Consumer Services — 3.3% | | | | | | |
| Capella Education Company | | | 377 | | | $ | 28,690 | |
| Strayer Education, Inc. * | | | 3,424 | | | | 265,497 | |
| | | | | | | | 294,187 | |
| Hotels, Restaurants & Leisure — 6.6% | | | | | | | | |
| Chipotle Mexican Grill, Inc. * | | | 565 | | | | 236,588 | |
| YUM! Brands, Inc. | | | 5,240 | | | | 342,277 | |
| Yum China Holdings, Inc. * | | | 446 | | | | 11,859 | |
| | | | | | | | 590,724 | |
| Household Durables — 5.7% | | | | | | | | |
| NVR, Inc. * | | | 262 | | | | 506,962 | |
| | | | | | | | | |
| Specialty Retail — 3.4% | | | | | | | | |
| Ross Stores, Inc. | | | 4,383 | | | | 300,586 | |
| | | | | | | | | |
| Financials — 33.1% | | | | | | | | |
| Banks — 7.1% | | | | | | | | |
| U.S. Bancorp | | | 6,830 | | | | 375,650 | |
| Wells Fargo & Company | | | 4,455 | | | | 257,855 | |
| | | | | | | | 633,505 | |
| Capital Markets — 16.1% | | | | | | | | |
| Goldman Sachs Group, Inc. (The) | | | 2,671 | | | | 662,568 | |
| Moody's Corporation | | | 6,917 | | | | 770,346 | |
| | | | | | | | 1,432,914 | |
| Insurance — 9.9% | | | | | | | | |
| Arch Capital Group Ltd. * | | | 9,254 | | | | 875,151 | |
| | | | | | | | | |
| Health Care — 1.0% | | | | | | | | |
| Life Sciences Tools & Services — 1.0% | | | | | | | | |
| Waters Corporation * | | | 546 | | | | 84,624 | |
| | | | | | | | | |
| Industrials — 24.2% | | | | | | | | |
| Air Freight & Logistics — 4.4% | | | | | | | | |
| Expeditors International of Washington, Inc. | | | 6,878 | | | | 387,782 | |
| | | | | | | | | |
| Machinery — 10.9% | | | | | | | | |
| Cummins, Inc. | | | 3,342 | | | | 496,254 | |
| Deere & Company | | | 4,281 | | | | 468,727 | |
| | | | | | | | 964,981 | |
| See accompanying notes to financial statements. |
4
MARSHFIELD CONCENTRATED OPPORTUNITY FUND
SCHEDULE OF INVESTMENTS (Continued) |
| COMMON STOCKS — 84.3% (Continued) | | Shares | | | Value | |
| Industrials — 24.2% (Continued) | | | | | | |
| Road & Rail — 3.8% | | | | | | |
| Union Pacific Corporation | | | 3,155 | | | $ | 340,551 | |
| | | | | | | | | |
| Trading Companies & Distributors — 5.1% | | | | | | | | |
| Fastenal Company | | | 9,099 | | | | 455,223 | |
| | | | | | | | | |
| Information Technology — 7.0% | | | | | | | | |
| IT Services — 7.0% | | | | | | | | |
| MasterCard, Inc. - Class A | | | 2,723 | | | | 300,783 | |
| Visa, Inc. - Class A | | | 3,713 | | | | 326,521 | |
| | | | | | | | 627,304 | |
| | | | | | | | | |
Total Investments at Value — 84.3% (Cost $5,964,190) | | | | | | $ | 7,494,494 | |
| | | | | | | | | |
| Other Assets in Excess of Liabilities — 15.7% | | | | | | | 1,399,074 | |
| | | | | | | | | |
| Net Assets — 100.0% | | | | | | $ | 8,893,568 | |
| * | Non-income producing security. |
| See accompanying notes to financial statements. |
5
MARSHFIELD CONCENTRATED OPPORTUNITY FUND
STATEMENT OF ASSETS AND LIABILITIES
February 28, 2017 (Unaudited) |
| ASSETS | | | |
| Investments in securities: | | | |
| At acquisition cost | | $ | 5,964,190 | |
| At value (Note 2) | | $ | 7,494,494 | |
| Cash (Note 2) | | | 1,453,835 | |
| Dividends receivable | | | 12,213 | |
| Receivable for capital shares sold | | | 175,000 | |
| Receivable for investment securities sold | | | 27,903 | |
| Receivable from Adviser (Note 4) | | | 7,433 | |
| Other assets | | | 11,757 | |
| Total assets | | | 9,182,635 | |
| | | | | |
| LIABILITIES | | | | |
| Payable for investment securities purchased | | | 278,106 | |
| Payable to administrator (Note 4) | | | 6,815 | |
| Other accrued expenses | | | 4,146 | |
| Total liabilities | | | 289,067 | |
| | | | | |
| NET ASSETS | | $ | 8,893,568 | |
| | | | | |
| NET ASSETS CONSIST OF: | | | | |
| Paid-in capital | | $ | 7,330,648 | |
| Accumulated net investment income | | | 7,232 | |
| Accumulated net realized gains from security transactions | | | 25,384 | |
| Net unrealized appreciation on investments | | | 1,530,304 | |
| NET ASSETS | | $ | 8,893,568 | |
| | | | | |
| Shares of beneficial interest outstanding (unlimited number of shares authorized, no par value) | | | 739,314 | |
| | | | | |
| Net asset value, offering price and redemption price per share (Note 2) | | $ | 12.03 | |
| See accompanying notes to financial statements. |
6
MARSHFIELD CONCENTRATED OPPORTUNITY FUND
STATEMENT OF OPERATIONS
For the Six Months Ended February 28, 2017 (Unaudited) |
| INVESTMENT INCOME | | | |
| Dividend income | | $ | 42,802 | |
| | | | | |
| EXPENSES | | | | |
| Investment advisory fees (Note 4) | | | 32,278 | |
| Professional fees | | | 21,313 | |
| Fund accounting fees (Note 4) | | | 12,841 | |
| Administration fees (Note 4) | | | 12,500 | |
| Transfer agent fees (Note 4) | | | 7,500 | |
| Compliance fees (Note 4) | | | 6,000 | |
| Registration and filing fees | | | 5,331 | |
| Trustees' fees and expenses (Note 4) | | | 4,994 | |
| Custody and bank service fees | | | 3,211 | |
| Postage and supplies | | | 1,538 | |
| Other expenses | | | 7,344 | |
| Total expenses | | | 114,850 | |
| Less fee reductions and expense reimbursements by the Adviser (Note 4) | | | (77,476 | ) |
| Net expenses | | | 37,374 | |
| | | | | |
| NET INVESTMENT INCOME | | | 5,428 | |
| | | | | |
| REALIZED AND UNREALIZED GAINS ON INVESTMENTS | | | | |
| Net realized gains from security transactions | | | 36,391 | |
| Net change in unrealized appreciation (depreciation) on investments | | | 914,912 | |
| NET REALIZED AND UNREALIZED GAINS ON INVESTMENTS | | | 951,303 | |
| | | | | |
| NET INCREASE IN NET ASSETS RESULTING FROM OPERATIONS | | $ | 956,731 | |
| See accompanying notes to financial statements. |
7
MARSHFIELD CONCENTRATED OPPORTUNITY FUND
STATEMENTS OF CHANGES IN NET ASSETS |
| | | Six Months
Ended
February 28,
2017
(Unaudited) | | | Period
Ended
August 31,
2016 (a) | |
| FROM OPERATIONS | | | | | | |
| Net investment income | | $ | 5,428 | | | $ | 13,802 | |
| Net realized gains from security transactions | | | 36,391 | | | | 20,496 | |
| Net change in unrealized appreciation (depreciation) on investments | | | 914,912 | | | | 615,392 | |
| Net increase in net assets resulting from operations | | | 956,731 | | | | 649,690 | |
| | | | | | | | | |
| FROM DISTRIBUTIONS TO SHAREHOLDERS (Note 2) | | | | | | | | |
| From net investment income | | | (11,998 | ) | | | — | |
| From net realized gains | | | (31,503 | ) | | | — | |
| Decrease in net assets from distributions to shareholders | | | (43,501 | ) | | | — | |
| | | | | | | | | |
| CAPITAL SHARE TRANSACTIONS | | | | | | | | |
| Proceeds from shares sold | | | 2,107,808 | | | | 5,241,440 | |
| Net asset value of shares issued in reinvestment of distributions to shareholders | | | 43,070 | | | | — | |
| Payments for shares redeemed | | | (61,670 | ) | | | — | |
| Net increase in net assets from capital share transactions | | | 2,089,208 | | | | 5,241,440 | |
| | | | | | | | | |
| TOTAL INCREASE IN NET ASSETS | | | 3,002,438 | | | | 5,891,130 | |
| | | | | | | | | |
| NET ASSETS | | | | | | | | |
| Beginning of period | | | 5,891,130 | | | | — | |
| End of period | | $ | 8,893,568 | | | $ | 5,891,130 | |
| | | | | | | | | |
| ACCUMULATED NET INVESTMENT INCOME | | $ | 7,232 | | | $ | 13,802 | |
| | | | | | | | | |
| CAPITAL SHARE ACTIVITY | | | | | | | | |
| Shares sold | | | 185,898 | | | | 555,314 | |
| Shares reinvested | | | 3,775 | | | | — | |
| Shares redeemed | | | (5,673 | ) | | | — | |
| Net increase in shares outstanding | | | 184,000 | | | | 555,314 | |
| Shares outstanding at beginning of period | | | 555,314 | | | | — | |
| Shares outstanding at end of period | | | 739,314 | | | | 555,314 | |
(a) | Represents the period from the commencement of operations (December 29, 2015) through August 31, 2016. |
| See accompanying notes to financial statements. |
8
MARSHFIELD CONCENTRATED OPPORTUNITY FUND
FINANCIAL HIGHLIGHTS |
| Per Share Data for a Share Outstanding Throughout Each Period |
| | | Six Months
Ended
February 28,
2017
(Unaudited) | | | Period
Ended
August 31,
2016 (a) | |
| Net asset value at beginning of period | | $ | 10.61 | | | $ | 10.00 | |
| | | | | | | | | |
| Income from investment operations: | | | | | | | | |
| Net investment income | | | 0.00 | (b) | | | 0.02 | |
| Net realized and unrealized gains on investments | | | 1.49 | | | | 0.59 | |
| Total from investment operations | | | 1.49 | | | | 0.61 | |
| | | | | | | | | |
| Less distributions: | | | | | | | | |
| From net investment income | | | (0.02 | ) | | | — | |
| From net realized gains | | | (0.05 | ) | | | — | |
| Total distributions | | | (0.07 | ) | | | — | |
| | | | | | | | | |
| Net asset value at end of period | | $ | 12.03 | | | $ | 10.61 | |
| | | | | | | | | |
Total return (c) | | | 14.06 | %(d) | | | 6.10 | %(d) |
| | | | | | | | | |
| Net assets at end of period (000's) | | $ | 8,894 | | | $ | 5,891 | |
| | | | | | | | | |
| Ratios/supplementary data: | | | | | | | | |
| Ratio of total expenses to average net assets | | | 3.37 | %(e) | | | 3.80 | %(e) |
| | | | | | | | | |
Ratio of net expenses to average net assets (f) | | | 1.10 | %(e) | | | 1.22 | %(e) |
| | | | | | | | | |
Ratio of net investment income to average net assets (f) | | | 0.16 | %(e) | | | 0.42 | %(e) |
| | | | | | | | | |
| Portfolio turnover rate | | | 5 | %(d) | | | 18 | %(d) |
(a) | Represents the period from the commencement of operations (December 29, 2015) through August 31, 2016. |
(b) | Amount rounds to less than $0.01 per share. |
(c) | Total return is a measure of the change in value of an investment in the Fund over the period covered. The returns shown do not reflect the deduction of taxes a shareholder would pay on Fund distributions, if any, or the redemption of Fund shares. The total returns would be lower if the Adviser had not reduced advisory fees and reimbursed expenses (Note 4). |
(d) | Not annualized. |
(e) | Annualized. |
(f) | Ratio was determined after advisory fee reductions and expense reimbursements (Note 4). |
| See accompanying notes to financial statements. |
9
MARSHFIELD CONCENTRATED OPPORTUNITY FUND
NOTES TO FINANCIAL STATEMENTS
February 28, 2017 (Unaudited)
1. Organization
Marshfield Concentrated Opportunity Fund (the “Fund”) is a non-diversified series of Ultimus Managers Trust (the “Trust”), an open-end investment company established as an Ohio business trust under a Declaration of Trust dated February 28, 2012. Other series of the Trust are not incorporated in this report. The Fund commenced operations on December 29, 2015.
The investment objective of the Fund is to seek the dual goals of capital preservation and the long-term growth of principal, while targeting a pattern of performance at variance with that of the market.
2. Significant Accounting Policies
The following is a summary of the Fund’s significant accounting policies. The policies are in conformity with accounting principles generally accepted in the United States of America (“GAAP”). As an investment company, as defined in Financial Accounting Standards Board (“FASB”) Accounting Standards Update 2013-08, the Fund follows accounting and reporting guidance under FASB Accounting Standards Codification Topic 946, “Financial Services – Investment Companies.”
In October 2016, the Securities and Exchange Commission (the “SEC”) released its final rule on Investment Company Reporting Modernization (the “Rule”). The Rule, which introduces two new regulatory reporting forms for investment companies – Form N-PORT and Form N-CEN, also contains amendments to Regulation S-X which impact financial statement presentation, particularly the presentation of derivative investments. Although it is still evaluating the impact of the Rule, management believes that many of the Regulation S-X amendments are consistent with the Fund’s current financial statement presentation and expects that the Fund will be able to comply with the Rule’s Regulation S-X amendments by the August 1, 2017 compliance date.
Securities valuation – The Fund values its portfolio securities at market value as of the close of regular trading on the New York Stock Exchange (the “NYSE”) (normally 4:00 p.m. Eastern time) on each business day the NYSE is open for business. The Fund values its common stocks on the basis of the security’s last sale price on the security’s primary exchange, if available, otherwise at the exchange’s most recently quoted mean price. NASDAQ-listed securities are valued at the NASDAQ Official Closing Price. When using a quoted price and when the market is considered active, the security will be classified as Level 1 within the fair value hierarchy. In the event that market quotations are not readily available or are considered unreliable due to market or other events, the Fund values its securities and other assets at fair value in accordance with procedures established by and under the general supervision of the Board of Trustees (the “Board”) of the Trust. Under these procedures, the securities will be classified as Level 2 or 3 within the fair value hierarchy (see below), depending on the inputs used. Unavailable or unreliable market quotes may be
10
MARSHFIELD CONCENTRATED OPPORTUNITY FUND
NOTES TO FINANCIAL STATEMENTS (Continued) |
due to the following factors: a substantial bid-ask spread; infrequent sales resulting in stale prices; insufficient trading volume; small trade sizes; a temporary lapse in any reliable pricing source; and actions of the securities or futures markets, such as the suspension or limitation of trading. As a result, the prices of securities used to calculate the Fund’s net asset value (“NAV”) may differ from quoted or published prices for the same securities.
GAAP establishes a single authoritative definition of fair value, sets out a framework for measuring fair value, and requires additional disclosures about fair value measurements.
Various inputs are used in determining the value of the Fund’s investments. These inputs are summarized in the three broad levels listed below:
| | ● | Level 1 – quoted prices in active markets for identical securities |
| | ● | Level 2 – other significant observable inputs |
| | ● | Level 3 – significant unobservable inputs |
The inputs or methods used for valuing securities are not necessarily an indication of the risks associated with investing in those securities. The inputs used to measure fair value may fall into different levels of the fair value hierarchy. In such cases, for disclosure purposes, the level in the fair value hierarchy within which the fair value measurement falls in its entirety is determined based on the lowest level input that is significant to the fair value measurement.
The following is a summary of the inputs used to value the Fund’s investments as of February 28, 2017:
| | Level 1 | | | Level 2 | | | Level 3 | | | Total | |
| Common Stocks | | $ | 7,494,494 | | | $ | — | | | $ | — | | | $ | 7,494,494 | |
Refer to the Fund’s Schedule of Investments for a listing of the common stocks by industry type. As of February 28, 2017, the Fund did not have any transfers between Levels. In addition, the Fund did not hold derivative instruments or any assets or liabilities that were measured at fair value on a recurring basis using significant unobservable inputs (Level 3) as of February 28, 2017. It is the Fund’s policy to recognize transfers between Levels at the end of the reporting period.
Cash account – The Fund’s cash is held in a bank account with balances which may exceed the amount covered by federal deposit insurance. As of February 28, 2017, the cash balance reflected on the Statement of Assets and Liabilities represents the amount held in a deposit sweep account.
��
Share valuation – The NAV per share of the Fund is calculated daily by dividing the total value of the Fund’s assets, less liabilities, by the number of shares outstanding. The offering price and redemption price per share of the Fund is equal to the NAV,
11
MARSHFIELD CONCENTRATED OPPORTUNITY FUND
NOTES TO FINANCIAL STATEMENTS (Continued) |
except that shares of the Fund are subject to a redemption fee of 2% if redeemed within 90 days of the date of purchase. During the periods ended February 28, 2017 and August 31, 2016, the redemption fee did not apply to any shareholder transactions.
Investment income – Dividend income is recorded on the ex-dividend date. Interest income is accrued as earned.
Security transactions – Security transactions are accounted for on the trade date. Realized gains and losses on securities sold are determined on a specific identification basis.
Common expenses – Common expenses of the Trust are allocated among the Fund and the other series of the Trust based on the relative net assets of each series or the nature of the services performed and the relative applicability to each series.
Distributions to shareholders – The Fund will distribute to shareholders any net investment income dividends and net realized capital gains distributions at least once each year. The amount of such dividends and distributions are determined in accordance with federal income tax regulations, which may differ from GAAP. Dividends and distributions are recorded on the ex-dividend date. The tax character of the Fund’s distributions paid to shareholders during the period ended February 28, 2017 was ordinary income. There were no distributions paid to shareholders during the period ended August 31, 2016.
Estimates – The preparation of financial statements in conformity with GAAP requires management to make estimates and assumptions that affect the reported amounts of assets and liabilities and disclosure of contingent assets and liabilities as of the date of the financial statements and the reported amounts of income and expenses during the reporting period. Actual results could differ from those estimates.
Federal income tax – The Fund has qualified and intends to continue to qualify as a regulated investment company under the Internal Revenue Code of 1986, as amended (the “Code”). Qualification generally will relieve the Fund of liability for federal income taxes to the extent 100% of its net investment income and net realized capital gains are distributed in accordance with the Code.
In order to avoid imposition of the excise tax applicable to regulated investment companies, it is also the Fund’s intention to declare as dividends in each calendar year at least 98% of its net investment income (earned during the calendar year) and 98.2% of its net realized capital gains (earned during the 12 months ended October 31) plus undistributed amounts from prior years.
12
MARSHFIELD CONCENTRATED OPPORTUNITY FUND
NOTES TO FINANCIAL STATEMENTS (Continued) |
The following information is computed on a tax basis for each item as of February 28, 2017:
| Tax cost of portfolio investments | | $ | 5,966,887 | |
| Gross unrealized appreciation | | $ | 1,534,366 | |
| Gross unrealized depreciation | | | (6,759 | ) |
| Net unrealized appreciation | | | 1,527,607 | |
| Accumulated net investment income | | | 7,232 | |
| Other gains | | | 28,081 | |
| Accumulated earnings | | $ | 1,562,920 | |
The values of the federal income tax cost of portfolio investments and the tax components of accumulated earnings and the financial statement cost of portfolio investments and components of net assets may be temporarily different (“book/tax differences”). These book/tax differences are due to the recognition of capital gains or losses under income tax regulations and GAAP, primarily due to the tax deferral of losses on wash sales.
The Fund recognizes the tax benefits or expenses of uncertain tax positions only when the position is “more likely than not” to be sustained assuming examination by tax authorities. Management has reviewed the Fund’s tax positions for the current and open tax periods (period ended September 30, 2016) and has concluded that no provision for unrecognized tax benefits or expenses is required in these financial statements. The Fund identifies its major tax jurisdiction as U.S. Federal.
3. Investment Transactions
During the six months ended February 28, 2017, cost of purchases and proceeds from sales of investment securities, other than short-term investments, were $1,630,276 and $331,170, respectively.
4. Transactions with Related Parties
INVESTMENT ADVISORY AGREEMENT
The Fund’s investments are managed by Marshfield Associates, Inc. (the “Adviser”) pursuant to the terms of an Investment Advisory Agreement (the “Advisory Agreement”). Under the Advisory Agreement, the Fund pays the Adviser an advisory fee, computed and accrued daily and paid monthly, at the annual rate of 0.95% of its average daily net assets.
Pursuant to an Expense Limitation Agreement (“ELA”) between the Fund and the Adviser, the Adviser has contractually agreed, until December 31, 2018, to reduce its investment advisory fees and reimburse other expenses to limit total annual operating expenses (exclusive of brokerage costs; taxes; interest; costs to organize
13
MARSHFIELD CONCENTRATED OPPORTUNITY FUND
NOTES TO FINANCIAL STATEMENTS (Continued) |
the Fund; acquired fund fees and expenses; extraordinary expenses such as litigation and merger or reorganization costs and other expenses not incurred in the ordinary course of the Fund’s business; and amounts, if any, payable pursuant to a plan adopted in accordance with Rule 12b-1 under the Investment Company Act of 1940, as amended (the “1940 Act”)), to an amount not exceeding 1.10% of the Fund’s average daily net assets. Accordingly, during the six months ended February 28, 2017, the Adviser did not collect any of its investment advisory fees and reimbursed other operating expenses totaling $45,198.
Under the terms of the ELA, investment advisory fee reductions and expense reimbursements by the Adviser are subject to repayment by the Fund for a period of three years after such fees and expenses were incurred, provided the repayments do not cause total annual operating expenses to exceed (i) the expense limitation then in effect, if any, and (ii) the expense limitation in effect at the time the expenses to be repaid were incurred. As of February 28, 2017, the Adviser may seek repayment of investment advisory fee reductions and expense reimbursements in the amount of $162,730 no later than the dates as stated below:
| August 31, 2019 | | $ | 85,254 | |
| February 29, 2020 | | | 77,476 | |
Until April 25, 2017, an officer of the Fund was also an officer of the Adviser.
OTHER SERVICE PROVIDERS
Ultimus Fund Solutions, LLC (“Ultimus”) provides administration, fund accounting, compliance and transfer agency services to the Fund. The Fund pays Ultimus fees in accordance with the agreements for such services. In addition, the Fund pays out-of-pocket expenses including but not limited to postage, supplies, and costs of pricing the Fund’s portfolio securities.
Under the terms of a Distribution Agreement with the Trust, Ultimus Fund Distributors, LLC (the “Distributor”) serves as principal underwriter to the Fund. The Distributor is a wholly-owned subsidiary of Ultimus. The Distributor is compensated by the Adviser (not the Fund) for acting as principal underwriter.
Certain officers and a Trustee of the Trust are also officers of Ultimus and the Distributor.
TRUSTEE COMPENSATION
Effective October 1, 2016 each Trustee who is not an “interested person” of the Trust (“Independent Trustee”) receives a $1,000 annual retainer from the Fund, paid quarterly, except for the Board Chairperson who receives a $1,200 annual retainer from the Fund, paid quarterly. Each Independent Trustee also receives from the Fund a fee of $500 for each Board meeting attended plus reimbursement for travel and other meeting-related expenses. Prior to October 1, 2016, the Fund paid each Independent Trustee a fee of $500 for each Board meeting attended, plus a $500 annual retainer.
14
MARSHFIELD CONCENTRATED OPPORTUNITY FUND
NOTES TO FINANCIAL STATEMENTS (Continued) |
PRINICIPAL HOLDERS OF FUND SHARES
As of February 28, 2017, the following shareholders owned of record 5% or more of the outstanding shares of the Fund:
| Name of Record Owner | % Ownership |
| Marshfield Associates 401k Plan | 18% |
| Christopher M. Niemczewski | 17% |
| Elise J. Hoffman | 15% |
| Melissa Vinick Gilbert | 13% |
| D.A. Davidson & Company (for the benefit of its customers) | 12% |
| Carolyn Miller | 10% |
5. Sector Risk
If the Fund has significant investments in the securities of issuers within a particular sector, any development affecting that sector will have a greater impact on the value of the net assets of the Fund than would be the case if the Fund did not have significant investments in that sector. In addition, this may increase the risk of loss in the Fund and increase the volatility of the Fund’s NAV per share. Occasionally, market conditions, regulatory changes or other developments may negatively impact this sector, and therefore the value of the Fund’s portfolio will be adversely affected. As of February 28, 2017, the Fund had 33.1% of the value of its net assets invested in securities within the Financials sector.
6. Contingencies and Commitments
The Fund indemnifies the Trust’s officers and Trustees for certain liabilities that might arise from their performance of their duties to the Fund. Additionally, in the normal course of business the Fund enters into contracts that contain a variety of representations and warranties and which provide general indemnifications. The Fund’s maximum exposure under these arrangements is unknown, as this would involve future claims that may be made against the Fund that have not yet occurred. However, based on experience, the Fund expects the risk of loss to be remote.
7. Subsequent Events
The Fund is required to recognize in the financial statements the effects of all subsequent events that provide additional evidence about conditions that existed as of the date of the Statement of Assets and Liabilities. For non-recognized subsequent events that must be disclosed to keep the financial statements from being misleading, the Fund is required to disclose the nature of the event as well as an estimate of its financial effect, or a statement that such an estimate cannot be made. Management has evaluated subsequent events through the issuance of these financial statements and has noted the following: On April 25, 2017, David R. Carson was elected Principal Executive Officer of the Fund, replacing Christopher M. Niemczewski.
15
MARSHFIELD CONCENTRATED OPPORTUNITY FUND
ABOUT YOUR FUND’S EXPENSES (Unaudited) |
We believe it is important for you to understand the impact of costs on your investment. As a shareholder of the Fund, you incur two types of cost: (1) transaction costs, including redemption fees; and (2) ongoing costs, including management fees and other operating expenses. The following examples are intended to help you understand your ongoing costs (in dollars) of investing in the Fund and to compare these costs with the ongoing costs of investing in other mutual funds.
A mutual fund’s ongoing costs are expressed as a percentage of its average net assets. This figure is known as the expense ratio. The expenses in the table below are based on an investment of $1,000 made at the beginning of the most recent period (September 1, 2016) and held until the end of the period (February 28, 2017).
The table below illustrates the Fund’s ongoing costs in two ways:
Actual fund return – This section helps you to estimate the actual expenses that you paid over the period. The “Ending Account Value” shown is derived from the Fund’s actual return, and the fourth column shows the dollar amount of operating expenses that would have been paid by an investor who started with $1,000 in the Fund. You may use the information here, together with the amount you invested, to estimate the expenses that you paid over the period.
To do so, simply divide your account value by $1,000 (for example, an $8,600 account value divided by $1,000 = 8.6), then multiply the result by the number given for the Fund under the heading “Expenses Paid During Period.”
Hypothetical 5% return – This section is intended to help you compare the Fund’s ongoing costs with those of other mutual funds. It assumes that the Fund had an annual return of 5% before expenses during the period shown, but that the expense ratio is unchanged. In this case, because the return used is not the Fund’s actual return, the results do not apply to your investment. The example is useful in making comparisons because the SEC requires all mutual funds to calculate expenses based on a 5% return. You can assess the Fund’s ongoing costs by comparing this hypothetical example with the hypothetical examples that appear in shareholder reports of other funds.
Note that expenses shown in the table are meant to highlight and help you compare ongoing costs only. The Fund does not charge sales loads. However, a redemption fee of 2% is applied on the sale of shares held for less than 90 days.
The calculations assume no shares were bought or sold during the period. Your actual costs may have been higher or lower, depending on the amount of your investment and the timing of any purchases or redemptions.
More information about the Fund’s expenses can be found in this report. For additional information on operating expenses and other shareholder costs, please refer to the Fund’s prospectus.
16
MARSHFIELD CONCENTRATED OPPORTUNITY FUND
ABOUT YOUR FUND’S EXPENSES (Unaudited) (Continued) |
| Beginning Account Value September 1, 2016 | Ending Account Value February 28, 2017 | Net
Expense Ratio (a) | Expenses Paid During Period (b) |
| Based on Actual Fund Return | $1,000.00 | $1,140.60 | 1.10% | $5.84 |
| Based on Hypothetical 5% Return (before expenses) | $1,000.00 | $1,019.34 | 1.10% | $5.51 |
(a) | Annualized, based on the Fund’s most recent one-half year expenses. |
(b) | Expenses are equal to the Fund’s annualized net expense ratio multiplied by the average account value over the period, multiplied by 181/365 (to reflect the one-half year period). |
OTHER INFORMATION (Unaudited)
A description of the policies and procedures that the Fund uses to vote proxies relating to portfolio securities is available without charge upon request by calling toll-free 1-855-691-5288, or on the SEC’s website at http://www.sec.gov. Information regarding how the Fund voted proxies relating to portfolio securities during the most recent 12-month period ended June 30 is available without charge upon request by calling toll-free 1-855-691-5288, or on the SEC’s website at http://www.sec.gov.
The Trust files a complete listing of portfolio holdings for the Fund with the SEC as of the end of the first and third quarters of each fiscal year on Form N-Q. These filings are available upon request by calling 1-855-691-5288. Furthermore, you may obtain a copy of the filings on the SEC’s website at http://www.sec.gov. The Trust’s Forms N-Q may also be reviewed and copied at the SEC’s Public Reference Room in Washington, DC, and information on the operation of the Public Reference Room may be obtained by calling 1-800-SEC-0330.
17

Topturn OneEighty Fund
Semi-Annual Report
February 28, 2017
(Unaudited)
Topturn OneEighty Fund
LETTER TO SHAREHOLDERS | February 28, 2017 |
Dear Fellow Shareholders:
For the six-month period ending on February 28, 2017, the Topturn OneEighty Fund (TTFOX or the “Fund”) delivered a cumulative return of +2.53% versus a benchmark return of +2.33% for the Morningstar Diversified Alternatives Total Return Index and +10.01% for the S&P 500® Index. The Fund trailed the benchmark for the period, primarily due to the fact that while U.S. equities were the top performing asset for the period, the Fund’s composition during this time included various additional asset classes that did not perfectly correlate with the U.S. stock market. In addition, Trump’s victory in the U.S. Presidential election caused certain previously outperforming assets to fall out of favor, and previously under-performing assets to come into favor. During such periods of reversal, the Fund tactically changes positions when new trends reveal themselves. New trends usually trail the underlying assets as price action is what establishes the new trend.
The beginning of the period was dominated with concerns about a potential rate hike from the U.S. Federal Reserve Board (the “Fed”). Major asset classes all declined as investors moved money to the sidelines as they assessed potential implications. Ultimately, the Fed left rates unchanged, sparking gains through the balance of the September. Despite slowing economic data and a cautious outlook from the Fed, equities ended September near record highs. Investor optimism was quickly doused as poor earnings reports (stoking concerns of broader macro weakness), increasing uncertainty surrounding the U.S. presidential election outcome, and rising global interest rates resulted in all major asset classes turning lower once again.
Election results initially sent global markets into a tailspin, with Dow futures plunging 8.00%, but this initial panic subsided and US equity markets turned higher, setting new records in the process. But not all asset classes were spared. Expectations for greater deficit spending and higher inflation led to a record monthly decline in the bond market as yields on the 10-year Treasury bond jumped 0.6%. This helped fuel a surging U.S. dollar, which pressured emerging markets and sent gold lower. By the end of November, several asset classes had experienced significant drawdowns.
The beginning of December marked a continuation of price action in asset classes set in motion by U.S. election results and anticipated Fed policy action. Expected policies of the new administration helped to propel U.S. domestic equity markets and the U.S. dollar higher, while long U.S. Treasury bonds, emerging markets, and gold continued to struggle. In mid-December the Federal Open Market Committee (the “FOMC”) raised its target for short-term interest rates by 0.25%, signaling confidence in an improving U.S. economy. Asset classes that had been under pressure soon stabilized and began to recover lost ground from the prior quarter, while U.S. equity markets and the U.S. dollar took a breather. The rally in U.S. equity markets resumed after U.S. presidential Inauguration day and saw impressive price strength through the end of the period, led by February where markets were up on 79% of the trading days.
During the period, portfolio returns were initially impacted negatively as all major asset classes trended lower. As the period progressed, the investment model signaled several defensive changes that tilted portfolio exposure towards safe-haven assets to hedge against
1
a continued downward move in risk assets. This position was quickly reversed as a dramatic move in asset prices, post U.S. elections led to trend reversals, with investment models once again adding risk exposure.
The best performing assets during the period were those deemed likely to benefit from an acceleration in economic growth, fueled by hopes that fiscal stimuli in the form of tax cuts, infrastructure spending, and increased defense spending will lead to a significant tailwind in the growth of corporate profits. Safe-haven assets and markets perceived to be hurt by a nationalist agenda and higher interest rates were a drag on performance.
Not much has changed in our long-term outlook. We continue to believe that we are in a period where, due to various conditions, buy-and-hold returns from traditional asset classes offer low long-term return potential. One example, in this instance regarding valuation, is that as central banks have pushed fixed income yields to record lows, including negative nominal yields in some circumstances, stocks have been viewed as a relative favorite for investors in search of returns. This has pushed equity participation to levels that have historically corresponded with low subsequent total returns. As of December 31, 2016, the Fed reported that U.S. Household Stock Allocation as a percentage of total financial assets had reached 53.5%, landing it in the highest quintile of quarterly readings.1 Since 1951, whenever this reading has reached such a level, the average gain per annum over the ensuing 10 years has been a relatively anemic 2.5%. This reading is similar to levels found near prior market tops, such as 1968, 1973, and 2007.
Compounding the valuation problem is that sentiment is extremely optimistic about the success that Congress and the White House will have enacting meaningful tax reform and other economic initiatives, which sets up a negative reaction from markets if these expected stimuli fail to materialize.
We believe investors will need to identify strategies that offer sources of return that are not highly correlated to traditional asset classes. The goal of the Topturn OneEighty Fund is to offer this type of return by tactically allocating assets among non-correlating asset classes as trends are identified.
Thank you for your continued trust and interest in the Topturn OneEighty Fund.
Sincerely,
Greg Stewart
Chief Investment Officer / Portfolio Manager
1 | Source: Federal Reserve Board, as published by Ned Davis Research. |
2
Past performance is not predictive of future performance. Investment results and principal value will fluctuate so that shares, when redeemed, may be worth more or less than their original cost. Current performance may be higher or lower than the performance data quoted. Performance data current to the most recent month-end are available by calling 1-888-261-2884.
An investor should consider the investment objectives, risks, charges, and expenses of the Fund carefully before investing. The Fund’s prospectus contains this and other important information. To obtain a copy of the Fund’s prospectus please visit our website at www.topturnfunds.com or call 1-888-261-2884 and a copy will be sent to you free of charge. Please read the prospectus carefully before you invest. The Fund is distributed by Ultimus Fund Distributors, LLC.
The Letter to Shareholders seeks to describe some of the Adviser’s current opinions and views of the financial markets. Although the Adviser believes it has a reasonable basis for any opinions or views expressed, actual results may differ, sometimes significantly so, from those expected or expressed. The securities held by the Fund that are discussed in the Letter to Shareholders were held during the period covered by this Report. They do not comprise the entire investment portfolio of the Fund, may be sold at any time, and may no longer be held by the Fund. For a complete list of securities held by the Fund as of February 28, 2017, please see the Schedule of Investments section of this report. The opinions of the Adviser with respect to those securities may change at any time.
Statements in the Letter to Shareholders that reflect projections or expectations for future financial or economic performance of the Fund and the market in general and statements of the Fund’s plans and objectives for future operations are forward-looking statements. No assurance can be given that actual results or events will not differ materially from those projected, estimated, assumed, or anticipated in any such forward-looking statements. Important factors that could result in such differences, in addition to factors noted with such forward-looking statements, include, without limitation, general economic conditions, such as inflation, recession, and interest rates. Past performance is not a guarantee of future results.
3
Topturn OneEighty Fund
PORTFOLIO INFORMATION
February 28, 2017 (Unaudited)
Sector Diversification (% of Net Assets)
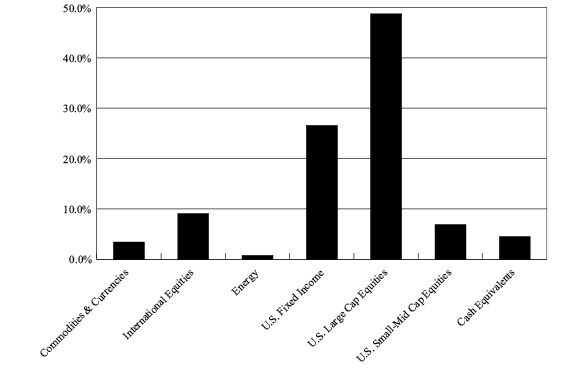
Top 10 Holdings
Security Description | % of Net Assets |
SPDR® S&P 500® ETF Trust | 20.6% |
PowerShares QQQ TrustSM, Series 1 | 11.1% |
iShares® 7-10 Year Treasury Bond ETF | 8.7% |
iShares® TIPS Bond ETF | 8.7% |
iShares® Core S&P® Small-Cap ETF | 6.9% |
SPDR® Bloomberg Barclays High Yield Bond ETF | 5.6% |
iShares® J.P. Morgan USD Emerging Markets Bond ETF | 4.9% |
iShares® Edge MSCI USA Value Factor ETF | 4.5% |
iShares® Edge MSCI USA Momentum Factor ETF | 4.4% |
Vanguard FTSE Emerging Markets ETF | 4.2% |
4
Topturn OneEighty Fund
SCHEDULE OF INVESTMENTS
February 28, 2017 (Unaudited) |
EXCHANGE-TRADED FUNDS — 94.7% | | Shares | | | Value | |
Commodities & Currencies — 3.4% | | | | | | |
PowerShares DB Base Metals Fund (a) | | | 18,030 | | | $ | 296,594 | |
PowerShares DB Commodity Index Tracking Fund (a) | | | 18,910 | | | | 297,265 | |
| | | | | | | | 593,859 | |
International Equities — 9.1% | | | | | | | | |
iShares® J.P. Morgan USD Emerging Markets Bond ETF | | | 7,560 | | | | 858,514 | |
Vanguard FTSE Emerging Markets ETF | | | 18,630 | | | | 720,795 | |
| | | | | | | | 1,579,309 | |
U.S. Fixed Income — 26.6% | | | | | | | | |
iShares® 7-10 Year Treasury Bond ETF | | | 14,370 | | | | 1,518,191 | |
iShares® iBoxx $ Investment Grade Corporate Bond ETF | | | 2,040 | | | | 241,903 | |
iShares® TIPS Bond ETF (a) | | | 13,110 | | | | 1,503,061 | |
PowerShares Senior Loan Portfolio | | | 16,540 | | | | 386,540 | |
SPDR® Bloomberg Barclays High Yield Bond ETF | | | 25,940 | | | | 965,487 | |
| | | | | | | | 4,615,182 | |
U.S. Large Cap Equities — 48.7% | | | | | | | | |
iShares® Edge MSCI USA Momentum Factor ETF | | | 9,510 | | | | 772,402 | |
iShares® Edge MSCI USA Value Factor ETF | | | 10,480 | | | | 778,978 | |
iShares® MSCI EAFE ETF | | | 10,230 | | | | 617,278 | |
PowerShares DB US Dollar Index Bullish Fund (a) | | | 11,380 | | | | 297,132 | |
PowerShares QQQ TrustSM, Series 1 | | | 14,870 | | | | 1,933,397 | |
SPDR® S&P 500® ETF Trust | | | 15,130 | | | | 3,577,791 | |
SPDR® S&P® Dividend ETF | | | 5,480 | | | | 486,460 | |
| | | | | | | | 8,463,438 | |
U.S. Small-Mid Cap Equities — 6.9% | | | | | | | | |
iShares® Core S&P® Small-Cap ETF | | | 17,200 | | | | 1,194,712 | |
| | | | | | | | | |
Total Exchange-Traded Funds (Cost $15,419,810) | | | | | | $ | 16,446,500 | |
| | |
EXCHANGE-TRADED NOTES — 0.8% | | Shares | | | Value | |
Energy — 0.8% | | | | | | |
JPMorgan Alerian MLP Index ETN (Cost $141,067) | | | 4,400 | | | $ | 144,188 | |
5
Topturn OneEighty Fund
SCHEDULE OF INVESTMENTS (Continued) |
MONEY MARKET FUNDS — 4.5% | | Shares | | | Value | |
Fidelity Institutional Money Market Government Portfolio - Class I, 0.22% (b) (Cost $787,520) | | | 787,520 | | | $ | 787,520 | |
| | | | | | | | | |
Total Investments at Value — 100.0% (Cost $16,348,397) | | | | | | $ | 17,378,208 | |
| | | | | | | | | |
Liabilities in Excess of Other Assets — (0.0%) (c) | | | | | | | (6,677 | ) |
| | | | | | | | | |
Net Assets — 100.0% | | | | | | $ | 17,371,531 | |
(a) | Non-income producing security. |
(b) | The rate shown is the 7-day effective yield as of February 28, 2017. |
(c) | Percentage rounds to less than 0.1% |
See accompanying notes to financial statements. |
6
Topturn OneEighty Fund
STATEMENT OF ASSETS AND LIABILITIES
February 28, 2017 (Unaudited) |
ASSETS | | | |
Investments in securities: | | | |
At acquisition cost | | $ | 16,348,397 | |
At value (Note 2) | | $ | 17,378,208 | |
Dividends receivable | | | 2,268 | |
Other assets | | | 10,483 | |
Total assets | | | 17,390,959 | |
| | | | | |
LIABILITIES | | | | |
Payable to Adviser (Note 4) | | | 8,324 | |
Payable to administrator (Note 4) | | | 6,630 | |
Other accrued expenses | | | 4,474 | |
Total liabilities | | | 19,428 | |
| | | | | |
NET ASSETS | | $ | 17,371,531 | |
| | | | | |
NET ASSETS CONSIST OF: | | | | |
Paid-in capital | | $ | 16,459,059 | |
Distributions in excess of net investment income | | | (37,604 | ) |
Accumulated net realized losses from security transactions | | | (79,735 | ) |
Net unrealized appreciation on investments | | | 1,029,811 | |
NET ASSETS | | $ | 17,371,531 | |
| | | | | |
Shares of beneficial interest outstanding (unlimited number of shares authorized, no par value) | | | 1,591,578 | |
| | | | | |
Net asset value, offering price and redemption price per share (Note 2) | | $ | 10.91 | |
See accompanying notes to financial statements. |
7
Topturn OneEighty Fund
STATEMENT OF OPERATIONS
For the Six Months Ended February 28, 2017 (Unaudited) |
INVESTMENT INCOME | | | |
Dividend income | | $ | 162,763 | |
| | | | | |
EXPENSES | | | | |
Investment advisory fees (Note 4) | | | 105,912 | |
Professional fees | | | 20,823 | |
Fund accounting fees (Note 4) | | | 14,346 | |
Administration fees (Note 4) | | | 13,500 | |
Compliance fees (Note 4) | | | 6,000 | |
Transfer agent fees (Note 4) | | | 6,000 | |
Trustees’ fees and expenses (Note 4) | | | 4,989 | |
Custody and bank service fees | | | 3,658 | |
Registration and filing fees | | | 2,632 | |
Printing of shareholder reports | | | 2,466 | |
Insurance expense | | | 1,564 | |
Postage and supplies | | | 1,346 | |
Other expenses | | | 3,145 | |
Total expenses | | | 186,381 | |
Less fee reductions by the Adviser (Note 4) | | | (38,104 | ) |
Net expenses | | | 148,277 | |
| | | | | |
NET INVESTMENT INCOME | | | 14,486 | |
| | | | | |
REALIZED AND UNREALIZED GAINS (LOSSES) ON INVESTMENTS | | | | |
Net realized losses from security transactions | | | (72,890 | ) |
Capital gain distributions from regulated investment companies | | | 5,016 | |
Net change in unrealized appreciation (depreciation) on investments | | | 481,017 | |
NET REALIZED AND UNREALIZED GAINS ON INVESTMENTS | | | 413,143 | |
| | | | | |
NET INCREASE IN NET ASSETS RESULTING FROM OPERATIONS | | $ | 427,629 | |
See accompanying notes to financial statements. |
8
Topturn OneEighty Fund
STATEMENTS OF CHANGES IN NET ASSETS |
| | Six Months Ended
February 28,
2017
(Unaudited) | | | Period
Ended
August 31,
2016 (a) | |
FROM OPERATIONS | | | | | | |
Net investment income | | $ | 14,486 | | | $ | 36,931 | |
Net realized gains (losses) from security transactions | | | (72,890 | ) | | | 65,995 | |
Capital gain distributions from regulated investment companies | | | 5,016 | | | | 17,141 | |
Net change in unrealized appreciation (depreciation) on investments | | | 481,017 | | | | 548,794 | |
Net increase in net assets resulting from operations | | | 427,629 | | | | 668,861 | |
| | | | | | | | | |
DISTRIBUTIONS TO SHAREHOLDERS (Note 2) | | | | | | | | |
From net investment income | | | (47,475 | ) | | | (41,543 | ) |
From net realized gains on investments | | | (91,639 | ) | | | (3,361 | ) |
Decrease in net assets from distributions to shareholders | | | (139,114 | ) | | | (44,904 | ) |
| | | | | | | | | |
CAPITAL SHARE TRANSACTIONS | | | | | | | | |
Proceeds from shares sold | | | 2,541,291 | | | | 16,029,813 | |
Net asset value of shares issued in reinvestment of distributions to shareholders | | | 139,114 | | | | 44,904 | |
Payments for shares redeemed | | | (1,971,479 | ) | | | (324,584 | ) |
Net increase in net assets from capital share transactions | | | 708,926 | | | | 15,750,133 | |
| | | | | | | | | |
TOTAL INCREASE IN NET ASSETS | | | 997,441 | | | | 16,374,090 | |
| | | | | | | | | |
NET ASSETS | | | | | | | | |
Beginning of period | | | 16,374,090 | | | | — | |
End of period | | $ | 17,371,531 | | | $ | 16,374,090 | |
| | | | | | | | | |
DISTRIBUTIONS IN EXCESS OF NET INVESTMENT INCOME | | $ | (37,604 | ) | | $ | (4,615 | ) |
| | | | | | | | | |
CAPITAL SHARE ACTIVITY | | | | | | | | |
Shares sold | | | 237,834 | | | | 1,553,726 | |
Shares reinvested | | | 13,161 | | | | 4,420 | |
Shares redeemed | | | (185,478 | ) | | | (32,085 | ) |
Net increase in shares outstanding | | | 65,517 | | | | 1,526,061 | |
Shares outstanding at beginning of period | | | 1,526,061 | | | | — | |
Shares outstanding at end of period | | | 1,591,578 | | | | 1,526,061 | |
(a) | Represents the period from the commencement of operations (September 1, 2015) through August 31, 2016. |
See accompanying notes to financial statements. |
9
Topturn OneEighty Fund
FINANCIAL HIGHLIGHTS |
Per Share Data for a Share Outstanding Throughout Each Period |
| | Six Months
Ended
February 28,
2017
(Unaudited) | | | Period
Ended
August 31,
2016 (a) | |
Net asset value at beginning of period | | $ | 10.73 | | | $ | 10.00 | |
| | | | | | | | | |
Income from investment operations: | | | | | | | | |
Net investment income | | | 0.01 | | | | 0.03 | |
Net realized and unrealized gains on investments | | | 0.26 | | | | 0.73 | |
Total from investment operations | | | 0.27 | | | | 0.76 | |
| | | | | | | | | |
Less distributions: | | | | | | | | |
From net investment income | | | (0.03 | ) | | | (0.03 | ) |
From net realized gains on investments | | | (0.06 | ) | | | (0.00 | )(b) |
Total distributions | | | (0.09 | ) | | | (0.03 | ) |
| | | | | | | | | |
Net asset value at end of period | | $ | 10.91 | | | $ | 10.73 | |
| | | | | | | | | |
Total return (c) | | | 2.53 | %(d) | | | 7.65 | %(d) |
| | | | | | | | | |
Net assets at end of period (000’s) | | $ | 17,372 | | | $ | 16,374 | |
| | | | | | | | | |
Ratios/supplementary data: | | | | | | | | |
Ratio of total expenses to average net assets (e) | | | 2.19 | %(h) | | | 2.38 | %(h) |
| | | | | | | | | |
Ratio of net expenses to average net assets (e) (f) | | | 1.75 | %(h) | | | 1.75 | %(h) |
| | | | | | | | | |
Ratio of net investment income to average net assets (f) (g) | | | 0.17 | %(h) | | | 0.32 | %(h) |
| | | | | | | | | |
Portfolio turnover rate | | | 118 | %(d) | | | 261 | %(d) |
(a) | Represents the period from the commencement of operations (September 1, 2015) through August 31, 2016. |
(b) | Amount rounds to less than 0.01 per share. |
(c) | Total return is a measure of the change in value of an investment in the Fund over the periods covered, which assumes dividends or capital gains distributions, if any, are reinvested in shares of the Fund. The returns shown do not reflect the deduction of taxes a shareholder would pay on Fund distributions, if any, or the redemption of Fund shares. The total returns would have been lower if the Adviser had not reduced advisory fees. |
(d) | Not annualized. |
(e) | The ratios of expenses to average net assets do not reflect the Fund’s proportionate share of expenses of the underlying investment companies in which the Fund invests (Note 5). |
(f) | Ratio was determined after advisory fee reductions (Note 4). |
(g) | Recognition of net investment income by the Fund is affected by the timing of the declaration of dividends and distributions by the underlying investment companies in which the Fund invests. |
(h) | Annualized. |
See accompanying notes to financial statements. |
10
Topturn OneEighty Fund
NOTES TO FINANCIAL STATEMENTS
February 28, 2017 (Unaudited)
1. Organization
Topturn OneEighty Fund (the “Fund”) is a diversified series of Ultimus Managers Trust (the “Trust”), an open-end investment company established as an Ohio business trust under a Declaration of Trust dated February 28, 2012. Other series of the Trust are not incorporated in this report. The Fund commenced operations on September 1, 2015.
The investment objective of the Fund is long-term capital appreciation.
2. Significant Accounting Policies
The following is a summary of the Fund’s significant accounting policies used in the preparation of its financial statements. These policies are in conformity with accounting principles generally accepted in the United States of America (“GAAP”). As an investment company, as defined in Financial Accounting Standards Board (“FASB”) Accounting Standards Update 2013-08, the Fund follows accounting and reporting guidance under FASB Accounting Standards Codification Topic 946, “Financial Services – Investment Companies.”
In October 2016, the U.S. Securities and Exchange Commission (the “SEC”) released its final rule on Investment Company Reporting Modernization (the “Rule”). The Rule which introduces two new regulatory reporting forms for investment companies – Form N-PORT and Form N-CEN, also contains amendments to Regulation S-X that impact financial statement presentation, particularly the presentation of derivative investments. Although it is still evaluating the impact of the Rule, management believes that many of the Regulation S-X amendments are consistent with the Fund’s current financial statement presentation and expects that the Fund will be able to comply with the Rule’s Regulation S-X amendments by the August 1, 2017 compliance date.
Securities valuation – The Fund values its portfolio securities at market value as of the close of regular trading on the New York Stock Exchange (the “NYSE”) (normally 4:00 p.m. Eastern time) on each business day the NYSE is open for business. Exchange-traded funds (“ETFs”) and exchange-traded notes are valued at the security’s last sale price on the primary exchange, if available, otherwise at the exchange’s most recently quoted mean price. When using a quoted price and when the market is considered active, these securities will be classified as Level 1 within the fair value hierarchy. In the event that market quotations are not readily available or are considered unreliable due to market or other events, the Fund values its securities and other assets at fair value in accordance with procedures established by and under the general supervision of the Board of Trustees (the “Board”) of the Trust. Under these procedures, the securities will be classified as Level 2 or 3 within the fair value hierarchy (see below), depending on the inputs used. Unavailable or unreliable market quotes may be due to the following factors: a substantial bid-ask spread; infrequent sales resulting in stale prices; insufficient trading volume; small trade sizes; a temporary lapse in any reliable pricing source; and actions of the securities or futures markets, such as the suspension or limitation of trading. As a result, the prices of securities used to calculate the Fund’s net asset value (“NAV”) may differ from quoted or published prices for the same securities.
11
Topturn OneEighty Fund
NOTES TO FINANCIAL STATEMENTS (Continued) |
Fixed income securities, if any, are generally valued using prices provided by an independent pricing service approved by the Board. The independent pricing service will employ methodologies that they believe are appropriate, including actual market transactions, broker-dealer supplied valuations, matrix pricing, or other electronic data processing techniques. These techniques generally consider such factors as security prices, yields, maturities, call features, ratings, and developments relating to specific securities in arriving at valuations.
GAAP establishes a single authoritative definition of fair value, sets out a framework for measuring fair value, and requires additional disclosures about fair value measurements.
Various inputs are used in determining the value of the Fund’s investments. These inputs are summarized in the three broad levels listed below:
● | Level 1 – quoted prices in active markets for identical securities |
● | Level 2 – other significant observable inputs |
● | Level 3 – significant unobservable inputs |
The inputs or methods used for valuing securities are not necessarily an indication of the risks associated with investing in those securities. The inputs used to measure fair value may fall into different levels of the fair value hierarchy. In such cases, for disclosure purposes, the level in the fair value hierarchy within which the fair value measurement falls in its entirety is determined based on the lowest level input that is significant to the fair value measurement.
The following is a summary of the inputs used to value the Fund’s investments as of February 28, 2017:
| | Level 1 | | | Level 2 | | | Level 3 | | | Total | |
Exchange-Traded Funds | | $ | 16,446,500 | | | $ | — | | | $ | — | | | $ | 16,446,500 | |
Exchange-Traded Notes | | | 144,188 | | | | — | | | | — | | | | 144,188 | |
Money Market Funds | | | 787,520 | | | | — | | | | — | | | | 787,520 | |
Total | | $ | 17,378,208 | | | $ | — | | | $ | — | | | $ | 17,378,208 | |
As of February 28, 2017, the Fund did not have any transfers between Levels. In addition, the Fund did not have derivative instruments or any assets or liabilities that were measured at fair value on a recurring basis using significant unobservable inputs (Level 3) as of February 28, 2017. It is the Fund’s policy to recognize transfers between Levels at the end of the reporting period.
Share valuation – The NAV per share of the Fund is calculated daily by dividing the total value of the Fund’s assets, less liabilities, by the number of shares outstanding. The offering price and redemption price per share of the Fund is equal to the NAV per share.
Investment income – Dividend income and realized capital gain distributions are recorded on the ex-dividend date or as soon as the information is available (if after the ex-dividend date). Interest income is accrued as earned.
12
Topturn OneEighty Fund
NOTES TO FINANCIAL STATEMENTS (Continued) |
Security transactions – Security transactions are accounted for on the trade date. Realized gains and losses on securities sold are determined on a specific identification basis.
Common expenses – Common expenses of the Trust are allocated among the Fund and the other series of the Trust based on the relative net assets of each series or the nature of the services performed and the relative applicability to each series.
Distributions to shareholders – The Fund will distribute to shareholders any net investment income dividends and net realized capital gains distributions at least once each year. The amount of such dividends and distributions are determined in accordance with federal income tax regulations, which may differ from GAAP. Dividends and distributions to shareholders are recorded on the ex-dividend date. The tax character of distributions paid by the Fund during the periods ended February 28, 2017 and August 31, 2016 was as follows:
Period Ended | | Ordinary
Income | | | Long-Term
Capital Gains | | | Total
Distributions | |
2/28/2017 | | $ | 121,922 | | | $ | 17,192 | | | $ | 139,114 | |
8/31/2016 | | $ | 44,904 | | | $ | — | | | $ | 44,904 | |
Estimates – The preparation of financial statements in conformity with GAAP requires management to make estimates and assumptions that affect the reported amounts of assets and liabilities and disclosure of contingent assets and liabilities as of the date of the financial statements and the reported amounts of income and expenses during the reporting period. Actual results could differ from those estimates.
Federal income tax – The Fund has qualified and intends to continue to qualify as a regulated investment company under the Internal Revenue Code of 1986 (the “Code”). Qualification generally will relieve the Fund of liability for federal income taxes to the extent 100% of its net investment income and net realized capital gains are distributed in accordance with the Code.
In order to avoid imposition of the excise tax applicable to regulated investment companies, it is also the Fund’s intention to declare as dividends in each calendar year at least 98% of its net investment income (earned during the calendar year) and 98.2% of its net realized capital gains (earned during the 12 months ended October 31) plus undistributed amounts from prior years.
The following information is computed on a tax basis for each item as of February 28, 2017:
Tax cost of portfolio investments | | $ | 16,364,016 | |
Gross unrealized appreciation | | $ | 1,038,889 | |
Gross unrealized depreciation | | | (24,697 | ) |
Net unrealized appreciation on investments | | | 1,014,192 | |
Other losses | | | (101,720 | ) |
Accumulated earnings | | $ | 912,472 | |
13
Topturn OneEighty Fund
NOTES TO FINANCIAL STATEMENTS (Continued) |
The difference between the federal income tax cost of portfolio investments and the financial statement cost of portfolio investments is due to certain timing differences in the recognition of capital gains or losses under income tax regulations and GAAP. These “book/tax” differences are temporary in nature and are primarily due to the tax deferral of losses on wash sales.
The Fund recognizes the tax benefits or expenses of uncertain tax positions only when the position is “more likely than not” to be sustained assuming examination by tax authorities. Management has reviewed the Fund’s tax positions for the current and open tax period (period ended August 31, 2016) and has concluded that no provision for unrecognized tax benefits or expenses is required in these financial statements. The Fund identifies its major tax jurisdiction as U.S. Federal.
3. Investment Transactions
During the six months ended February 28, 2017, cost of purchases and proceeds from sales of investment securities, other than short-term investments, were $20,208,227 and $19,177,878, respectively.
4. Transactions with Related Parties
INVESTMENT ADVISORY AGREEMENT
The Fund’s investments are managed by Topturn Fund Advisors, LLC (the “Adviser”) pursuant to the terms of an Investment Advisory Agreement. Under the Investment Advisory Agreement, the Fund pays the Adviser an investment advisory fee, computed and accrued daily and paid monthly, at the annual rate of 1.25% of its average daily net assets.
Pursuant to an Expense Limitation Agreement (“ELA”), the Adviser has contractually agreed, until August 31, 2018, to reduce investment advisory fees and reimburse other expenses to the extent necessary to limit Total Annual Fund Operating Expenses (exclusive of brokerage costs; taxes; interest; acquired fund fees and expenses; costs to organize the Fund; extraordinary expenses such as litigation and merger or reorganization costs; other expenses not incurred in the ordinary course of the Fund’s business; and amounts, if any, payable pursuant to a plan adopted in accordance with Rule 12b-1 under the Investment Company Act of 1940) to an amount not exceeding 1.75% of the Fund’s average daily net assets. Accordingly, during the six months ended February 28, 2017, the Adviser reduced its advisory fees in the amount of $38,104.
Under the terms of the ELA, investment advisory fee reductions and expense reimbursements by the Adviser are subject to repayment by the Fund for a period of three years after such fees and expenses were incurred, provided the repayments do not cause Total Annual Fund Operating Expenses to exceed (i) the expense limitation then in effect, if any, and (ii) the expense limitation in effect at the time the expenses to be repaid were incurred. As of February 28, 2017, the Adviser may seek recoupment of investment advisory fee reductions totaling $110,617 no later than the dates stated below:
August 31, 2019 | February 29, 2020 |
$72,513 | $38,104 |
14
Topturn OneEighty Fund
NOTES TO FINANCIAL STATEMENTS (Continued) |
Until April 25, 2017, an officer of the Fund was also an officer of the Adviser.
OTHER SERVICE PROVIDERS
Ultimus Fund Solutions, LLC (“Ultimus”) provides administration, fund accounting, compliance, and transfer agency services to the Fund. The Fund pays Ultimus fees in accordance with the agreements for such services. In addition, the Fund pays out-of-pocket expenses, including, but not limited to, postage, supplies, and costs of pricing the Fund’s portfolio securities.
Under the terms of a Distribution Agreement with the Trust, Ultimus Fund Distributors, LLC (the “Distributor”) serves as principal underwriter to the Fund. The Distributor is a wholly-owned subsidiary of Ultimus. The Distributor is compensated by the Adviser (not the Fund) for acting as principal underwriter.
Certain officers and a Trustee of the Trust are also officers of Ultimus and the Distributor and are not paid by the Fund for serving in such capacities.
TRUSTEE COMPENSATION
Effective October 1, 2016, each Trustee, who is not an “interested person” of the Trust (“Independent Trustee”), receives a $1,000 annual retainer from the Fund, paid quarterly, except for the Board Chairperson who receives a $1,200 annual retainer from the Fund, paid quarterly. Each Independent Trustee also receives from the Fund a fee of $500 for each Board meeting attended plus reimbursement for travel and other meeting-related expenses. Prior to October 1, 2016, the Fund paid each Independent Trustee a fee of $500 for each Board meeting attended, plus a $500 annual retainer.
PRINCIPAL HOLDER OF FUND SHARES
As of February 28, 2017, the following shareholder owned of record 5% or more of the outstanding shares of the Fund:
Name of Record Owner | % Ownership |
Charles Schwab & Company, Inc. (for the benefit of its customers) | 97.2% |
A beneficial owner of 25% or more of the Fund’s outstanding shares may be considered a controlling person. That shareholder’s vote could have a more significant effect on matters presented at a shareholder’s meeting.
15
Topturn OneEighty Fund
NOTES TO FINANCIAL STATEMENTS (Continued) |
5. Investments in Other Investment Companies
The Fund may invest a significant portion of its assets in shares of one or more investment companies, including ETFs. The Fund will incur additional indirect expenses due to acquired fund fees and expenses to the extent it invests in shares of other investment companies. ETFs issue their shares to authorized participants in return for a specific basket of securities. The authorized participants then sell the ETF’s shares on the secondary market. In other words, ETF shares are traded on a securities exchange based on their market value. There are certain risks associated with investments in ETFs. Investments in ETFs are subject to the risk that the ETF’s shares may trade at a premium (creating the risk that the Fund pays more than NAV for an ETF when making a purchase) or discount (creating the risk that the Fund receives less than NAV when selling an ETF) to the ETF’s NAV. Investments in ETFs are also subject to index-tracking risk because the total return generated by the securities will be reduced by transaction costs and expenses not incurred by the indices. Certain securities comprising the index tracked by an ETF may temporarily be unavailable, which may further impede the ETF’s ability to track their applicable index or match the index’s performance. Finally, ETF shares are also subject to the risks applicable to the underlying basket of securities. As of February 28, 2017, the Fund had 94.7% of the value of its net assets invested in shares of ETFs.
6. Contingencies and Commitments
The Fund indemnifies the Trust’s officers and Trustees for certain liabilities that might arise from their performance of their duties to the Fund. Additionally, in the normal course of business the Fund enters into contracts that contain a variety of representations and warranties and which provide general indemnifications. The Fund’s maximum exposure under these arrangements is unknown, as this would involve future claims that may be made against the Fund that have not yet occurred. However, based on experience, the Fund expects the risk of loss to be remote.
7. Subsequent Events
The Fund is required to recognize in the financial statements the effects of all subsequent events that provide additional evidence about conditions that existed as of the date of the Statement of Assets and Liabilities. For non-recognized subsequent events that must be disclosed to keep the financial statements from being misleading, the Fund is required to disclose the nature of the event as well as an estimate of its financial effect, or a statement that such an estimate cannot be made. Management has evaluated subsequent events through the issuance of these financial statements and has noted no such events except as follows:
On April 25, 2017, David R. Carson was elected Principal Executive Officer of the Fund.
16
Topturn OneEighty Fund
ABOUT YOUR FUND’S EXPENSES (Unaudited) |
We believe it is important for you to understand the impact of costs on your investment. As a shareholder of the Fund, you incur ongoing costs, including management fees and other operating expenses. The following examples are intended to help you understand your ongoing costs (in dollars) of investing in the Fund and to compare these costs with the ongoing costs of investing in other mutual funds.
A mutual fund’s ongoing costs are expressed as a percentage of its average net assets. This figure is known as the expense ratio. The expenses in the table below are based on an investment of $1,000 made at the beginning of the most recent period (September 1, 2016) and held until the end of the period (February 28, 2017).
The table below illustrates the Fund’s ongoing costs in two ways:
Actual fund return – This section helps you to estimate the actual expenses that you paid over the period. The “Ending Account Value” shown is derived from the Fund’s actual return, and the fourth column shows the dollar amount of operating expenses that would have been paid by an investor who started with $1,000 in the Fund. You may use the information here, together with the amount you invested, to estimate the expenses that you paid over the period.
To do so, simply divide your account value by $1,000 (for example, an $8,600 account value divided by $1,000 = 8.6), then multiply the result by the number given for the Fund under the heading “Expenses Paid During Period.”
Hypothetical 5% return – This section is intended to help you compare the Fund’s ongoing costs with those of other mutual funds. It assumes that the Fund had an annual return of 5% before expenses during the period shown, but that the expense ratio is unchanged. In this case, because the return used is not the Fund’s actual return, the results do not apply to your investment. The example is useful in making comparisons because the SEC requires all mutual funds to calculate expenses based on a 5% return. You can assess the Fund’s ongoing costs by comparing this hypothetical example with the hypothetical examples that appear in shareholder reports of other funds.
Note that expenses shown in the table are meant to highlight and help you compare ongoing costs only. The Fund does not charge transaction fees, such as purchase or redemption fees, nor does it carry a “sales load.”
The calculations assume no shares were bought or sold during the period. Your actual costs may have been higher or lower, depending on the amount of your investment and the timing of any purchases or redemptions.
More information about the Fund’s expenses can be found in this report. For additional information on operating expenses and other shareholder costs, please refer to the Fund’s prospectus.
17
Topturn OneEighty Fund
ABOUT YOUR FUND’S EXPENSES (Unaudited) (Continued) |
| Beginning
Account Value
September 1,
2016 | Ending
Account Value February 28,
2017 | Net
Expense
Ratio (a) | Expenses
Paid During Period (b) |
Based on Actual Fund Return | $1,000.00 | $1,025.30 | 1.75% | $8.79 |
Based on Hypothetical 5% Return (before expenses) | $1,000.00 | $1,016.12 | 1.75% | $8.75 |
(a) | Annualized, based on the Fund’s most recent one-half year expenses. |
(b) | Expenses are equal to the Fund’s annualized net expense ratio multiplied by the average account value over the period, multiplied by 181/365 (to reflect the one-half year period). |
OTHER INFORMATION (Unaudited)
A description of the policies and procedures that the Fund uses to vote proxies relating to portfolio securities is available without charge upon request by calling toll-free 1-888-261-2884, or on the SEC’s website at http://www.sec.gov. Information regarding how the Fund voted proxies relating to portfolio securities during the most recent 12-month period ended June 30 is available without charge upon request by calling toll-free 1-888-261-2884, or on the SEC’s website at http://www.sec.gov.
The Trust files a complete listing of the Fund’s portfolio holdings with the SEC as of the end of the first and third quarters of each fiscal year on Form N-Q. These filings are available upon request by calling 1-888-261-2884. Furthermore, you may obtain a copy of the filings on the SEC’s website at http://www.sec.gov. The Trust’s Forms N-Q may also be reviewed and copied at the SEC’s Public Reference Room in Washington, DC, and information on the operation of the Public Reference Room may be obtained by calling 1-800-SEC-0330.
18
Topturn OneEighty Fund
CUSTOMER PRIVACY NOTICE
FACTS | WHAT DOES THE TOPTURN ONEEIGHTY FUND (the “Fund”) DO WITH YOUR PERSONAL INFORMATION? |
| | | | |
Why? | Financial companies choose how they share your personal information. Federal law gives consumers the right to limit some but not all sharing. Federal law also requires us to tell you how we collect, share, and protect your personal information. Please read this notice carefully to understand what we do. |
| | | | |
What? | The types of personal information we collect and share depend on the product or service you have with us. This information can include: ■ Social Security number ■ Assets ■ Retirement Assets ■ Transaction History ■ Checking Account Information ■ Purchase History ■ Account Balances ■ Account Transactions ■ Wire Transfer Instructions When you are no longer our customer, we continue to share your information as described in this notice. |
| | | | |
How? | All financial companies need to share your personal information to run their everyday business. In the section below, we list the reasons financial companies can share their customers’ personal information; the reasons the Fund chooses to share; and whether you can limit this sharing. |
| | | | |
Reasons we can share your personal information | Does the
Fund share? | Can you limit this sharing? |
For our everyday business purposes –
Such as to process your transactions, maintain your account(s), respond to court orders and legal investigations, or report to credit bureaus | Yes | No |
For our marketing purposes –
to offer our products and services to you | No | We don’t share |
For joint marketing with other financial companies | No | We don’t share |
For our affiliates’ everyday business purposes –
information about your transactions and experiences | No | We don’t share |
For our affiliates’ everyday business purposes –
information about your creditworthiness | No | We don’t share |
For nonaffiliates to market to you | No | We don’t share |
| | |
Questions? | Call 1-888-261-2884 |
19
Topturn OneEighty Fund
CUSTOMER PRIVACY NOTICE (Continued)
Who we are |
Who is providing this notice? | Topturn OneEighty Fund
Ultimus Fund Distributors, LLC (Distributor)
Ultimus Fund Solutions, LLC (Administrator) |
What we do |
How does the Fund protect my personal information? | To protect your personal information from unauthorized access and use, we use security measures that comply with federal law. These measures include computer safeguards and secured files and buildings. Our service providers are held accountable for adhering to strict policies and procedures to prevent any misuse of your nonpublic personal information. |
How does the Fund collect my personal information? | We collect your personal information, for example, when you ■ Open an account ■ Provide account information ■ Give us your contact information ■ Make deposits or withdrawals from your account ■ Make a wire transfer ■ Tell us where to send the money ■ Tell us who receives the money ■ Show your government-issued ID ■ Show your driver’s license We also collect your personal information from other companies. |
Why can’t I limit all sharing? | Federal law gives you the right to limit only ■ Sharing for affiliates’ everyday business purposes – information about your creditworthiness ■ Affiliates from using your information to market to you ■ Sharing for nonaffiliates to market to you State laws and individual companies may give you additional rights to limit sharing. |
| | |
Definitions |
Affiliates | Companies related by common ownership or control. They can be financial and nonfinancial companies. ■ Topturn Fund Advisors, LLC, the investment adviser to the Fund, could be deemed to be an affiliate. |
Nonaffiliates | Companies not related by common ownership or control. They can be financial and nonfinancial companies ■ The Fund does not share with nonaffiliates so they can market to you. |
Joint marketing | A formal agreement between nonaffiliated financial companies that together market financial products or services to you. ■ The Fund does not jointly market. |
20
This page intentionally left blank.
Item 2. Code of Ethics.
Not required
Item 3. Audit Committee Financial Expert.
Not required
Item 4. Principal Accountant Fees and Services.
Not required
Item 5. Audit Committee of Listed Registrants.
Not applicable
Item 6. Schedule of Investments.
| (a) | Not applicable [schedule filed with Item 1] |
Item 7. Disclosure of Proxy Voting Policies and Procedures for Closed-End Management Investment Companies.
Not applicable
Item 8. Portfolio Managers of Closed-End Management Investment Companies.
Not applicable
Item 9. Purchases of Equity Securities by Closed-End Management Investment Company and Affiliated Purchasers.
Not applicable
Item 10. Submission of Matters to a Vote of Security Holders.
The registrant’s Committee of Independent Trustees shall review shareholder recommendations for nominations to fill vacancies on the registrant’s board of trustees if such recommendations are submitted in writing and addressed to the Committee at the registrant’s offices. The Committee may adopt, by resolution, a policy regarding its procedures for considering candidates for the board of trustees, including any recommended by shareholders.
Item 11. Controls and Procedures.
(a) Based on their evaluation of the registrant’s disclosure controls and procedures (as defined in Rule 30a-3(c) under the Investment Company Act of 1940) as of a date within 90 days of the filing date of this report, the registrant’s principal executive officer and principal financial officer have concluded that such disclosure controls and procedures are reasonably designed and are operating effectively to ensure that material information relating to the registrant, including its consolidated subsidiaries, is made known to them by others within those entities, particularly during the period in which this report is being prepared, and that the information required in filings on Form N-CSR is recorded, processed, summarized, and reported on a timely basis.
(b) There were no changes in the registrant’s internal control over financial reporting (as defined in Rule 30a-3(d) under the Investment Company Act of 1940) that occurred during the second fiscal quarter of the period covered by this report that have materially affected, or are reasonably likely to materially affect, the registrant’s internal control over financial reporting.
Item 12. Exhibits.
File the exhibits listed below as part of this Form. Letter or number the exhibits in the sequence indicated.
(a)(1) Any code of ethics, or amendment thereto, that is the subject of the disclosure required by Item 2, to the extent that the registrant intends to satisfy the Item 2 requirements through filing of an exhibit: Not required
(a)(2) A separate certification for each principal executive officer and principal financial officer of the registrant as required by Rule 30a-2(a) under the Act (17 CFR 270.30a-2(a)): Attached hereto
(a)(3) Any written solicitation to purchase securities under Rule 23c-1 under the Act (17 CFR 270.23c-1) sent or given during the period covered by the report by or on behalf of the registrant to 10 or more persons: Not applicable
(b) Certifications required by Rule 30a-2(b) under the Act (17 CFR 270.30a-2(b)): Attached hereto
| Exhibit 99.CERT | Certifications required by Rule 30a-2(a) under the Act |
| Exhibit 99.906CERT | Certifications required by Rule 30a-2(b) under the Act |
SIGNATURES
Pursuant to the requirements of the Securities Exchange Act of 1934 and the Investment Company Act of 1940, the registrant has duly caused this report to be signed on its behalf by the undersigned, thereunto duly authorized.
| (Registrant) | Ultimus Managers Trust | | |
| | | | |
| By (Signature and Title)* | /s/ Frank L. Newbauer | |
| | | Frank L. Newbauer, Assistant Secretary | |
| | | | |
| Date | May 9, 2017 | | |
Pursuant to the requirements of the Securities Exchange Act of 1934 and the Investment Company Act of 1940, this report has been signed below by the following persons on behalf of the registrant and in the capacities and on the dates indicated.
| By (Signature and Title)* | /s/ David R. Carson | |
| | | David R. Carson, Principal Executive Officer of Blue Current Global Dividend Fund | |
| | | | |
| Date | May 9, 2017 | | |
| | | | |
| By (Signature and Title)* | /s/ David R. Carson | |
| | | David R. Carson, Principal Executive Officer of Alambic Small Cap Value Plus Fund, Alambic Small Cap Growth Fund, Alambic Mid Cap Value Plus Fund and Alambic Mid Cap Growth Plus Fund | |
| | | | |
| Date | May 9, 2017 | | |
| | | | |
| By (Signature and Title)* | /s/ David R. Carson | |
| | | David R. Carson, Principal Executive Officer of Topturn OneEighty Fund | |
| | | | |
| Date | May 9, 2017 | | |
| | | | |
| By (Signature and Title)* | /s/ David R. Carson | |
| | | David R. Carson, Principal Executive Officer of Castlemain Emerging Markets Fund, Castlemaine Event Driven Fund, Castlemaine Long/Short Fund, Castlemaine Market Neutral Fund and Castlemaine Multi-Strategy Fund | |
| | | | |
| Date | May 9, 2017 | | |
| | | | |
| By (Signature and Title)* | /s/ David R. Carson | |
| | | David R. Carson, Principal Executive Officer of Marshfield Concentrated Opportunity Fund | |
| | | | |
| Date | May 9, 2017 | | |
| | | | |
| By (Signature and Title)* | /s/ Jennifer L. Leamer | |
| | | Jennifer L. Leamer, Treasurer and Principal Accounting Officer | |
| | | | |
| Date | May 9, 2017 | | |
* | Print the name and title of each signing officer under his or her signature. |