| OMB APPROVAL |
OMB Number: 3235-0570 Expires: January 31, 2017 Estimated average burden hours per response: 20.6 |
UNITED STATES
SECURITIES AND EXCHANGE COMMISSION
Washington, D.C. 20549
FORM N-CSR
CERTIFIED SHAREHOLDER REPORT OF REGISTERED
MANAGEMENT INVESTMENT COMPANY
| Investment Company Act file number | 811-22680 | |
| Ultimus Managers Trust |
| (Exact name of registrant as specified in charter) |
| 225 Pictoria Drive, Suite 450 Cincinnati, Ohio | 45246 |
| (Address of principal executive offices) | (Zip code) |
Frank L. Newbauer, Esq.
Ultimus Fund Solutions, LLC 225 Pictoria Drive, Suite 450 Cincinnati, Ohio 45246_ |
| (Name and address of agent for service) |
| Registrant's telephone number, including area code: | (513) 587-3400 | |
| Date of fiscal year end: | May 31 | |
| | | |
| Date of reporting period: | November 30, 2016 | |
Form N-CSR is to be used by management investment companies to file reports with the Commission not later than 10 days after the transmission to stockholders of any report that is required to be transmitted to stockholders under Rule 30e-1 under the Investment Company Act of 1940 (17 CFR 270.30e-1). The Commission may use the information provided on Form N-CSR in its regulatory, disclosure review, inspection, and policymaking roles.
A registrant is required to disclose the information specified by Form N-CSR, and the Commission will make this information public. A registrant is not required to respond to the collection of information contained in Form N-CSR unless the Form displays a currently valid Office of Management and Budget ("OMB") control number. Please direct comments concerning the accuracy of the information collection burden estimate and any suggestions for reducing the burden to Secretary, Securities and Exchange Commission, 450 Fifth Street, NW, Washington, DC 20549-0609. The OMB has reviewed this collection of information under the clearance requirements of 44 U.S.C. § 3507.
| Item 1. | Reports to Stockholders. |

APEXcm SMALL/MID-CAP GROWTH FUND
(APSGX)
Semi-Annual Report
November 30, 2016
(Unaudited)
APEXcm SMALL/MID-CAP GROWTH FUND
LETTER TO SHAREHOLDERS | November 30, 2016 |
Dear APEXcm Small/Mid-Cap Growth Fund Shareholder:
For the semi-annual period ended November 30, 2016, the APEX Small/Mid-Cap Growth Fund (the “Fund”) returned +6.38% (net of fees). For the same six months, the category benchmark, the Russell 2500 Growth Index returned +7.98%. We continue to invest for the long-term and believe a disciplined, prudent approach to this abundance of volatility (driven by what seem to be daily events) will serve investors well. In fact, since the February 12th trough of the difficult start to 2016, our performance has held its own and made significant progress against the style indexes. The Fund (net of fees) is up +30.28% through November 30th slightly trailing the Russell 2500 Growth Index return of +31.30%. The period began with a historic Brexit vote and ended with the U.S. elections; these unpredictable times have taxed active managers and challenged the tried and true factors that have defined successful philosophies. In these demanding markets, we remain steadfast in our proven beliefs and have confidence our philosophy and process will ultimately persevere in this climate as well.
APEX PHILOSOPHY
We believe that the best way to provide value-added returns is to identify companies that exhibit certain favorable fundamental advantages and benefit from secular growth trends, allowing us to structure the portfolio in high-conviction areas of longer-term sustainable growth. Embedded in our portfolio construction is the recognition of companies at different stages of their growth cycle, which we designate as “stable” and “emerging” growth stocks. We believe that having the spectrum of growth companies that are truly innovative and growing rapidly, combined with established growth companies, can provide relative stability while allowing the opportunity to drive outperformance versus our benchmark and peers over time. In addition, we believe the Small/Mid-Cap style provides the opportunity to invest in higher growth companies and capture a longer period of growth as these companies mature.
MARKET ENVIRONMENT
We started off the reporting period in June with voters in the U.K. putting in motion a withdrawal from the European Union, prompting uncertainty and an intense move toward less risky assets. The Bank of England took aggressive action to steady the volatile response and mitigate near term economic concerns. As we moved to the end of the six-month reporting period, the U.S. elections offered up another surprise with the Republicans winning the presidency and maintaining the majority in the House and Senate. We believed the foundation for GDP growth was already in place with the seeds of accelerating wage growth, inventory restocking, the drilling rig count rebounding and unprecedented low borrowing costs starting to blossom. These drivers coupled with synchronized global growth, low inflation, increased housing starts, the early stages of the Fed tightening process, and the likelihood of
1
fiscal stimulus allowed us to believe that the expansion would continue and cyclicals would reflate with Financials poised to be a leader in the advance. Following the election, these beliefs were amplified with the expectations of pro-growth strategies and significant fiscal stimulus to be offered up by president-elect Trump and a Republican Congress. The equity markets have now reached new highs in an environment where it has been 8 years since the last U.S. recession - which already exceeds the average duration of expansion.
FUND PERFORMANCE FOR THE SIX-MONTH PERIOD ENDED NOVEMBER 30, 2016
The Fund and the markets have recovered as some of the anomalies of Q1 dissipated. The historic search for yield enhanced the attractiveness in perceived low-volatility defensive sectors. Sector leadership in bond proxy sectors like Consumer Staples, Real Estate, Utilities, Telecommunications and certain deep value pockets in Industrials and Energy created wide valuations and performance spreads: a situation we sensed was not sustainable. As we moved into Q3, there was increased attention on more cyclical assets as growth was supported by better earnings and improving global economic data.
The portfolio structure was effective as Energy, Financials, Industrials, Information Technology and Materials performed well. Excess performance from portfolio structure approximated +1.50%, driven equally by our overweights in Energy, Information Technology and Financials and our underweights in the bond surrogate sectors of Consumer Staples and Real Estate.
The volatility in stock selection detracted from performance, having an approximate negative impact of (-2.3%). Strong stock selection in Financials, Health Care, Industrials and Materials added ~1.30% but was offset by negative stock selection in Consumer Discretionary, Consumer Staples and Information Technology detracting ~ (-3.5%).
Strong individual stock selection across multiple sectors was observed by top performers such as Medivation, Burlington Stores, Ionis, Foot Locker, United Rentals, Old Dominion, IDEXX labs, F5 Networks, and Advanced Energy - all advancing more than 25%. The Health Care sector continues to exhibit the most volatility and Jazz, Akorn and Opthotech detracted approximately (-1.40%) from performance. Specialty pharma and biotech stocks have been in the crosshairs all year and our performance has not been immune to the downside volatility. We continue to evaluate and challenge our commitment to this area of long term secular growth. Our biggest disappointment for this period was in Information Technology. Although the Tech sector performed well, Apex technology holdings such as Infinera, Manhattan Associates, Fortinet, Global Payments and Tableau were down more than 10%.
2
OUTLOOK
We have confidence that barring an unforeseen significant shock, the business cycle should continue to expand as improving growth, sentiment and inflation expectations take hold. During Q3 we saw improving earnings growth, which we believe will further benefit from pro-growth strategies such as tax reform, repatriation and infrastructure spending. Although we do not see significant excesses in the domestic economy and/or valuations, given the altitude of the market we would expect a pickup in volatility around policy initiatives. Along with multiples moving higher and geopolitical risks continuing, the ushering in of a new administration also delivers uncertainty with respect to a) general acceptance that limits of monetary policy have run their course and that rising yields will impact borrowing costs and might affect the equity multiple, b) stronger US dollar pressuring profits and margin growth while likely keeping a lid on commodity prices and lastly c) potential trade protectionism and the associated impact on global growth. We continue to believe the economy has reaccelerated with disinflation moving to reflation and company fundamentals improving which should be additionally supported by the new administration’s pro-growth strategies. Of course, the potential catalysts (policy initiatives and fiscal stimulus) and the way they ultimately interact with the real economy also offer up the biggest risks in terms of execution and implementation. We remain confident and continue to work diligently to achieve a level of excellence you have come to expect from the Apex team.
Sincerely,
Nitin N. Kumbhani
Vice Chairman and Chief of Growth Equity Strategies
Apex Capital Management
Fiera Capital Inc.
Past performance is not predictive of future performance. Investment results and principal value will fluctuate so that shares, when redeemed, may be worth more or less than their original cost. Current performance may be higher or lower than the performance data quoted. Performance data current to the most recent month end are available by calling 1-888-575-4800.
An investor should consider the investment objectives, risks, charges and expenses of the Fund carefully before investing. The Fund’s prospectus contains this and other important information. To obtain a copy of the Fund’s prospectus please visit our website at www.apexcmfund.com or call 1-888-575-4800 and a copy will be sent to you free of charge. Please read the prospectus carefully before you invest. The APEXcm Small/Mid Cap Growth Fund is distributed by Ultimus Fund Distributors, LLC.
This Letter to Shareholders seeks to describe some of the Adviser’s current opinions and views of the financial markets. Although the Adviser believes it has a reasonable basis for any opinions or views expressed, actual results may differ, sometimes significantly so, from those expected or expressed. The securities held by the Fund
3
that are discussed in the Letter to Shareholders were held during the period covered by this Report. They do not comprise the entire investment portfolio of the Fund, may be sold at any time and may no longer be held by the Fund. For a complete list of securities held by the Fund as of November 30, 2016, please see the Schedule of Investments section of the semi-annual report. The opinions of the Adviser with respect to those securities may change at any time.
Statements in the Letter to Shareholders that reflect projections or expectations for future financial or economic performance of the Fund and the market in general and statements of the Fund’s plans and objectives for future operations are forward-looking statements. No assurance can be given that actual results or events will not differ materially from those projected, estimated, assumed, or anticipated in any such forward-looking statements. Important factors that could result in such differences, in addition to factors noted with such forward-looking statements include, without limitation, general economic conditions, such as inflation, recession, and interest rates. Past performance is not a guarantee of future results.
4
APEXcm SMALL/MID-CAP GROWTH FUND
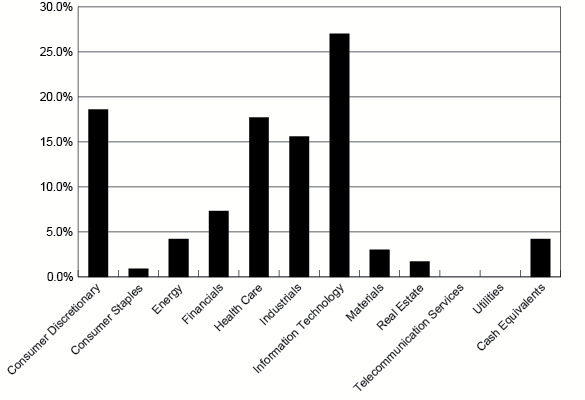
PORTFOLIO INFORMATION
November 30, 2016 (Unaudited)
Sector Diversification (% of Net Assets)
Top 10 Equity Holdings
Security Description | % of
Net Assets |
Foot Locker, Inc. | 2.5% |
MercadoLibre, Inc. | 2.4% |
First Republic Bank/CA | 2.3% |
Align Technology, Inc. | 2.1% |
United Rentals, Inc. | 1.9% |
Middleby Corporation (The) | 1.8% |
Old Dominion Freight Line, Inc. | 1.7% |
CBRE Group, Inc. - Class A | 1.7% |
Nordson Corporation | 1.7% |
IDEXX Laboratories, Inc. | 1.6% |
5
APEXcm SMALL/MID-CAP GROWTH FUND
SCHEDULE OF INVESTMENTS
November 30, 2016 (Unaudited) |
COMMON STOCKS — 96.0% | | Shares | | | Value | |
Consumer Discretionary — 18.6% | | | | | | |
Auto Components — 1.2% | | | | | | |
Autoliv, Inc. | | | 34,588 | | | $ | 3,578,474 | |
| | | | | | | | | |
Hotels, Restaurants & Leisure — 4.8% | | | | | | | | |
China Lodging Group Ltd. - ADS | | | 49,820 | | | | 2,609,572 | |
Dave & Buster's Entertainment, Inc. * | | | 63,555 | | | | 2,977,552 | |
Dunkin' Brands Group, Inc. | | | 80,873 | | | | 4,390,595 | |
Wyndham Worldwide Corporation | | | 51,192 | | | | 3,685,312 | |
| | | | | | | | 13,663,031 | |
Media — 1.6% | | | | | | | | |
Cinemark Holdings, Inc. | | | 50,549 | | | | 2,013,872 | |
IMAX Corporation * | | | 81,139 | | | | 2,592,391 | |
| | | | | | | | 4,606,263 | |
Multi-line Retail — 3.2% | | | | | | | | |
Burlington Stores, Inc. * | | | 51,993 | | | | 4,571,225 | |
Nordstrom, Inc. | | | 79,261 | | | | 4,432,275 | |
| | | | | | | | 9,003,500 | |
Specialty Retail — 6.6% | | | | | | | | |
Bed Bath & Beyond, Inc. | | | 63,539 | | | | 2,847,183 | |
Foot Locker, Inc. | | | 100,225 | | | | 7,183,126 | |
Michaels Companies, Inc. (The) * | | | 175,331 | | | | 4,274,570 | |
Williams-Sonoma, Inc. | | | 80,781 | | | | 4,425,183 | |
| | | | | | | | 18,730,062 | |
Textiles, Apparel & Luxury Goods — 1.2% | | | | | | | | |
Carter's, Inc. | | | 37,859 | | | | 3,456,148 | |
| | | | | | | | | |
Consumer Staples — 0.9% | | | | | | | | |
Beverages — 0.9% | | | | | | | | |
Boston Beer Company, Inc (The) - Class A * | | | 14,799 | | | | 2,561,707 | |
| | | | | | | | | |
Energy — 4.2% | | | | | | | | |
Energy Equipment & Services — 0.7% | | | | | | | | |
Core Laboratories N.V. | | | 16,400 | | | | 1,832,864 | |
| | | | | | | | | |
Oil, Gas & Consumable Fuels — 3.5% | | | | | | | | |
Cheniere Energy, Inc. * | | | 70,014 | | | | 2,860,772 | |
Diamondback Energy, Inc. * | | | 38,225 | | | | 4,122,566 | |
RSP Permian, Inc. * | | | 68,574 | | | | 3,061,829 | |
| | | | | | | | 10,045,167 | |
6
APEXcm SMALL/MID-CAP GROWTH FUND
SCHEDULE OF INVESTMENTS (Continued) |
COMMON STOCKS — 96.0% (Continued) | | Shares | | | Value | |
Financials — 7.3% | | | | | | |
Banks — 3.4% | | | | | | |
Bank of the Ozarks, Inc. | | | 60,980 | | | $ | 2,958,750 | |
First Republic Bank/CA | | | 81,004 | | | | 6,634,228 | |
| | | | | | | | 9,592,978 | |
Capital Markets — 1.4% | | | | | | | | |
Affiliated Managers Group, Inc. * | | | 15,092 | | | | 2,235,125 | |
Interactive Brokers Group, Inc. - Class A | | | 50,760 | | | | 1,863,907 | |
| | | | | | | | 4,099,032 | |
Consumer Finance — 1.5% | | | | | | | | |
Navient Corporation | | | 242,789 | | | | 4,183,254 | |
| | | | | | | | | |
Diversified Financial Services — 1.0% | | | | | | | | |
MarketAxess Holdings, Inc. | | | 17,987 | | | | 2,981,705 | |
| | | | | | | | | |
Health Care — 17.7% | | | | | | | | |
Biotechnology — 3.3% | | | | | | | | |
Ionis Pharmaceuticals, Inc. * | | | 80,100 | | | | 3,505,176 | |
Momenta Pharmaceuticals, Inc. * | | | 150,679 | | | | 2,132,108 | |
Ophthotech Corporation * | | | 47,795 | | | | 1,464,917 | |
Radius Health, Inc. * | | | 42,448 | | | | 2,259,083 | |
| | | | | | | | 9,361,284 | |
Health Care Equipment & Supplies — 5.1% | | | | | | | | |
Align Technology, Inc. * | | | 64,001 | | | | 5,955,293 | |
DexCom, Inc. * | | | 57,249 | | | | 3,737,787 | |
IDEXX Laboratories, Inc. * | | | 39,839 | | | | 4,687,058 | |
| | | | | | | | 14,380,138 | |
Health Care Providers & Services — 1.4% | | | | | | | | |
Centene Corporation * | | | 70,701 | | | | 4,074,499 | |
| | | | | | | | | |
Health Care Technology — 2.1% | | | | | | | | |
Medidata Solutions, Inc. * | | | 66,668 | | | | 3,682,074 | |
Veeva Systems, Inc. - Class A * | | | 52,152 | | | | 2,424,025 | |
| | | | | | | | 6,106,099 | |
Life Sciences Tools & Services — 1.5% | | | | | | | | |
ICON plc * | | | 54,688 | | | | 4,136,600 | |
| | | | | | | | | |
Pharmaceuticals — 4.3% | | | | | | | | |
Akorn, Inc. * | | | 139,806 | | | | 2,966,683 | |
Horizon Pharma plc * | | | 96,428 | | | | 1,909,274 | |
Jazz Pharmaceuticals plc * | | | 27,526 | | | | 2,852,519 | |
Prestige Brands Holdings, Inc. * | | | 45,317 | | | | 2,155,730 | |
7
APEXcm SMALL/MID-CAP GROWTH FUND
SCHEDULE OF INVESTMENTS (Continued) |
COMMON STOCKS — 96.0% (Continued) | | Shares | | | Value | |
Health Care — 17.7% (Continued) | | | | | | |
Pharmaceuticals — 4.3% (Continued) | | | | | | |
Supernus Pharmaceuticals, Inc. * | | | 113,475 | | | $ | 2,445,386 | |
| | | | | | | | 12,329,592 | |
Industrials — 15.6% | | | | | | | | |
Aerospace & Defense — 0.9% | | | | | | | | |
B/E Aerospace, Inc. | | | 41,146 | | | | 2,470,406 | |
| | | | | | | | | |
Airlines — 1.4% | | | | | | | | |
Hawaiian Holdings, Inc. * | | | 74,929 | | | | 3,847,604 | |
| | | | | | | | | |
Construction & Engineering — 1.2% | | | | | | | | |
EMCOR Group, Inc. | | | 49,026 | | | | 3,400,934 | |
| | | | | | | | | |
Machinery — 6.9% | | | | | | | | |
Middleby Corporation (The) * | | | 37,732 | | | | 5,168,529 | |
Nordson Corporation | | | 45,638 | | | | 4,870,944 | |
Proto Labs, Inc. * | | | 42,285 | | | | 2,203,048 | |
Westinghouse Air Brake Technologies Corporation | | | 49,380 | | | | 4,181,005 | |
Xylem, Inc. | | | 61,982 | | | | 3,197,032 | |
| | | | | | | | 19,620,558 | |
Road & Rail — 1.7% | | | | | | | | |
Old Dominion Freight Line, Inc. * | | | 56,238 | | | | 4,909,577 | |
| | | | | | | | | |
Trading Companies & Distributors — 3.5% | | | | | | | | |
HD Supply Holdings, Inc. * | | | 117,006 | | | | 4,591,315 | |
United Rentals, Inc. * | | | 53,182 | | | | 5,377,232 | |
| | | | | | | | 9,968,547 | |
Information Technology — 27.0% | | | | | | | | |
Communications Equipment — 1.6% | | | | | | | | |
Arista Networks, Inc. * | | | 46,973 | | | | 4,453,510 | |
| | | | | | | | | |
Electronic Equipment, Instruments & Components — 2.2% | | | | | | | | |
Dolby Laboratories, Inc. - Class A | | | 68,089 | | | | 3,142,307 | |
Trimble, Inc. * | | | 116,678 | | | | 3,289,153 | |
| | | | | | | | 6,431,460 | |
Internet Software & Services — 3.8% | | | | | | | | |
IAC/InterActiveCorp * | | | 55,944 | | | | 3,768,388 | |
MercadoLibre, Inc. | | | 43,937 | | | | 6,934,137 | |
| | | | | | | | 10,702,525 | |
8
APEXcm SMALL/MID-CAP GROWTH FUND
SCHEDULE OF INVESTMENTS (Continued) |
COMMON STOCKS — 96.0% (Continued) | | Shares | | | Value | |
Information Technology — 27.0% (Continued) | | | | | | |
IT Services — 8.7% | | | | | | |
Broadridge Financial Solutions, Inc. | | | 65,635 | | | $ | 4,249,210 | |
Gartner, Inc. * | | | 34,989 | | | | 3,597,569 | |
Genpact Ltd. * | | | 95,052 | | | | 2,274,594 | |
Global Payments, Inc. | | | 48,970 | | | | 3,356,894 | |
Sabre Corporation | | | 178,641 | | | | 4,617,870 | |
Teradata Corporation * | | | 88,770 | | | | 2,383,475 | |
Total System Services, Inc. | | | 90,164 | | | | 4,437,872 | |
| | | | | | | | 24,917,484 | |
Semiconductors & Semiconductor Equipment — 3.6% | | | | | | | | |
Advanced Energy Industries, Inc. * | | | 57,094 | | | | 3,152,160 | |
Entegris, Inc. * | | | 207,388 | | | | 3,722,615 | |
Power Integrations, Inc. | | | 50,320 | | | | 3,386,536 | |
| | | | | | | | 10,261,311 | |
Software — 7.1% | | | | | | | | |
ACI Worldwide, Inc. * | | | 131,596 | | | | 2,449,002 | |
BroadSoft, Inc. * | | | 81,709 | | | | 3,390,924 | |
Fortinet, Inc. * | | | 123,544 | | | | 3,718,674 | |
Guidewire Software, Inc. * | | | 26,140 | | | | 1,456,259 | |
Manhattan Associates, Inc. * | | | 43,859 | | | | 2,298,212 | |
Splunk, Inc.* | | | 71,520 | | | | 4,120,982 | |
Tableau Software, Inc. - Class A * | | | 60,651 | | | | 2,722,017 | |
| | | | | | | | 20,156,070 | |
Materials — 3.0% | | | | | | | | |
Construction Materials — 1.0% | | | | | | | | |
Eagle Materials Inc. | | | 29,242 | | | | 2,842,322 | |
| | | | | | | | | |
Containers & Packaging — 1.1% | | | | | | | | |
Berry Plastics Group, Inc. * | | | 61,942 | | | | 3,082,853 | |
| | | | | | | | | |
Paper & Forest Products — 0.9% | | | | | | | | |
KapStone Paper and Packaging Corporation | | | 127,319 | | | | 2,601,127 | |
| | | | | | | | | |
Real Estate — 1.7% | | | | | | | | |
Real Estate Management & Development — 1.7% | | | | | | | | |
CBRE Group, Inc. - Class A * | | | 168,928 | | | | 4,905,669 | |
| | | | | | | | | |
Total Common Stocks (Cost $246,476,146) | | | | | | $ | 273,294,354 | |
9
APEXcm SMALL/MID-CAP GROWTH FUND
SCHEDULE OF INVESTMENTS (Continued) |
MONEY MARKET FUNDS — 4.2% | | Shares | | | Value | |
Invesco Short-Term Investments Trust - Treasury Portfolio - Institutional Shares, 0.26% (a) (Cost $11,866,664) | | | 11,866,664 | | | $ | 11,866,664 | |
| | | | | | | | | |
Total Investments at Value — 100.2% (Cost $258,342,810) | | | | | | $ | 285,161,018 | |
| | | | | | | | | |
Liabilities in Excess of Other Assets — (0.2%) | | | | | | | (456,605 | ) |
| | | | | | | | | |
Net Assets — 100.0% | | | | | | $ | 284,704,413 | |
ADS - American Depositary Shares. |
* | Non-income producing security. |
(a) | The rate shown is the 7-day effective yield as of November 30, 2016 |
See accompanying notes to financial statements. |
10
APEXcm SMALL/MID-CAP GROWTH FUND
STATEMENT OF ASSETS AND LIABILITIES
November 30, 2016 (Unaudited) |
ASSETS | | | |
Investments in securities: | | | |
At acquisition cost | | $ | 258,342,810 | |
At value (Note 2) | | $ | 285,161,018 | |
Dividends receivable | | | 172,939 | |
Receivable for capital shares sold | | | 17,291 | |
Other assets | | | 25,292 | |
Total assets | | | 285,376,540 | |
| | | | | |
LIABILITIES | | | | |
Payable for capital shares redeemed | | | 436,557 | |
Payable to Adviser (Note 4) | | | 193,077 | |
Payable to administrator (Note 4) | | | 31,220 | |
Other accrued expenses and liabilities | | | 11,273 | |
Total liabilities | | | 672,127 | |
| | | | | |
NET ASSETS | | $ | 284,704,413 | |
| | | | | |
NET ASSETS CONSIST OF: | | | | |
Paid-in capital | | $ | 270,321,089 | |
Accumulated net investment loss | | | (1,216,522 | ) |
Accumulated net realized losses from security transactions | | | (11,218,362 | ) |
Net unrealized appreciation on investments | | | 26,818,208 | |
NET ASSETS | | $ | 284,704,413 | |
| | | | | |
Shares of beneficial interest outstanding (unlimited number of shares authorized, no par value) | | | 17,416,894 | |
| | | | | |
Net asset value, offering price and redemption price per share (Note 2) | | $ | 16.35 | |
See accompanying notes to financial statements. |
11
APEXcm SMALL/MID-CAP GROWTH FUND
STATEMENT OF OPERATIONS
For the Six Months Ended November 30, 2016 (Unaudited) |
INVESTMENT INCOME | | | |
Dividend income (net of foreign taxes of $2,689) | | $ | 685,350 | |
| | | | | |
EXPENSES | | | | |
Investment advisory fees (Note 4) | | | 1,306,594 | |
Administration fees (Note 4) | | | 129,647 | |
Fund accounting fees (Note 4) | | | 28,118 | |
Professional fees | | | 18,589 | |
Registration and filing fees | | | 17,879 | |
Custody and bank service fees | | | 15,029 | |
Compliance fees (Note 4) | | | 14,096 | |
Transfer agent fees (Note 4) | | | 9,651 | |
Postage and supplies | | | 8,103 | |
Trustees' fees and expenses (Note 4) | | | 4,569 | |
Insurance expense | | | 514 | |
Other expenses | | | 18,898 | |
Total expenses | | | 1,571,687 | |
Less fee reductions by the Adviser (Note 4) | | | (199,774 | ) |
Net expenses | | | 1,371,913 | |
| | | | | |
NET INVESTMENT LOSS | | | (686,563 | ) |
| | | | | |
REALIZED AND UNREALIZED GAINS (LOSSES) ON INVESTMENTS | | | | |
Net realized losses from security transactions | | | (8,402,041 | ) |
Net change in unrealized appreciation (depreciation) on investments | | | 25,005,002 | |
NET REALIZED AND UNREALIZED GAINS ON INVESTMENTS | | | 16,602,961 | |
| | | | | |
NET INCREASE IN NET ASSETS RESULTING FROM OPERATIONS | | $ | 15,916,398 | |
See accompanying notes to financial statements. |
12
APEXcm SMALL/MID-CAP GROWTH FUND
STATEMENTS OF CHANGES IN NET ASSETS |
| | Six Months
Ended
November 30,
2016
(Unaudited) | | | Year
Ended
May 31,
2016 | |
FROM OPERATIONS | | | | | | |
Net investment loss | | $ | (686,563 | ) | | $ | (1,090,736 | ) |
Net realized losses from security transactions | | | (8,402,041 | ) | | | (677,149 | ) |
Net change in unrealized appreciation (depreciation) on investments | | | 25,005,002 | | | | (29,749,518 | ) |
Net increase (decrease) in net assets resulting from operations | | | 15,916,398 | | | | (31,517,403 | ) |
| | | | | | | | | |
DISTRIBUTIONS TO SHAREHOLDERS (Note 2) | | | | | | | | |
From net realized gains | | | — | | | | (1,414,635 | ) |
| | | | | | | | | |
CAPITAL SHARE TRANSACTIONS | | | | | | | | |
Proceeds from shares sold | | | 66,509,818 | | | | 149,542,431 | |
Net asset value of shares issued in reinvestment of distributions to shareholders | | | — | | | | 1,277,590 | |
Payments for shares redeemed | | | (56,672,906 | ) | | | (99,682,011 | ) |
Net increase in net assets from capital share transactions | | | 9,836,912 | | | | 51,138,010 | |
| | | | | | | | | |
TOTAL INCREASE IN NET ASSETS | | | 25,753,310 | | | | 18,205,972 | |
| | | | | | | | | |
NET ASSETS | | | | | | | | |
Beginning of period | | | 258,951,103 | | | | 240,745,131 | |
End of period | | $ | 284,704,413 | | | $ | 258,951,103 | |
| | | | | | | | | |
ACCUMULATED NET INVESTMENT LOSS | | $ | (1,216,522 | ) | | $ | (529,959 | ) |
| | | | | | | | | |
CAPITAL SHARE ACTIVITY | | | | | | | | |
Shares sold | | | 4,192,280 | | | | 9,569,552 | |
Shares reinvested | | | — | | | | 81,740 | |
Shares redeemed | | | (3,625,542 | ) | | | (6,609,395 | ) |
Net increase in shares outstanding | | | 566,738 | | | | 3,041,897 | |
Shares outstanding at beginning of period | | | 16,850,156 | | | | 13,808,259 | |
Shares outstanding at end of period | | | 17,416,894 | | | | 16,850,156 | |
See accompanying notes to financial statements. |
13
APEXcm SMALL/MID-CAP GROWTH FUND
FINANCIAL HIGHLIGHTS |
Per Share Data for a Share Outstanding Throughout Each Period | |
| | Six Months
Ended
Nov. 30,
2016
(Unaudited) | | | Year
Ended
May 31,
2016 | | | Year
Ended
May 31,
2015 | | | Year
Ended
May 31,
2014 | | | Period
Ended
May 31,
2013(a) | |
Net asset value at beginning of period | | $ | 15.37 | | | $ | 17.43 | | | $ | 15.20 | | | $ | 12.69 | | | $ | 10.00 | |
| | | | | | | | | | | | | | | | | | | | | |
Income (loss) from investment operations: | | | | | | | | | | | | | | | | | | | | |
Net investment income (loss) | | | (0.04 | ) | | | (0.06 | ) | | | (0.04 | ) | | | (0.03 | ) | | | 0.04 | (b) |
Net realized and unrealized gains (losses) on investments | | | 1.02 | | | | (1.92 | ) | | | 2.27 | | | | 2.60 | | | | 2.72 | |
Total from investment operations | | | 0.98 | | | | (1.98 | ) | | | 2.23 | | | | 2.57 | | | | 2.76 | |
| | | | | | | | | | | | | | | | | | | | | |
Less distributions: | | | | | | | | | | | | | | | | | | | | |
From net investment income | | | — | | | | — | | | | — | | | | — | | | | (0.07 | ) |
From net realized gains | | | — | | | | (0.08 | ) | | | — | | | | (0.06 | ) | | | — | |
Total distributions | | | — | | | | (0.08 | ) | | | — | | | | (0.06 | ) | | | (0.07 | ) |
| | | | | | | | | | | | | | | | | | | | | |
Net asset value at end of period | | $ | 16.35 | | | $ | 15.37 | | | $ | 17.43 | | | $ | 15.20 | | | $ | 12.69 | |
| | | | | | | | | | | | | | | | | | | | | |
Total return (c) | | | 6.38 | %(d) | | | (11.34 | %) | | | 14.67 | % | | | 20.26 | % | | | 27.65 | %(d) |
| | | | | | | | | | | | | | | | | | | | | |
Net assets at end of period (000's) | | $ | 284,704 | | | $ | 258,951 | | | $ | 240,745 | | | $ | 88,477 | | | $ | 13,153 | |
| | | | | | | | | | | | | | | | | | | | | |
Ratios/supplementary data: | | | | | | | | | | | | | | | | | | | | |
Ratio of total expenses to average net assets | | | 1.20 | %(e) | | | 1.21 | % | | | 1.26 | % | | | 1.49 | % | | | 4.87 | %(e) |
| | | | | | | | | | | | | | | | | | | | | |
Ratio of net expenses to average net assets (f) | | | 1.05 | %(e) | | | 1.05 | % | | | 1.05 | % | | | 1.05 | % | | | 1.05 | %(e) |
| | | | | | | | | | | | | | | | | | | | | |
Ratio of net investment income (loss) to average net assets (f) | | | (0.53% | )(e) | | | (0.42 | %) | | | (0.48 | %) | | | (0.38 | %) | | | 0.26 | %(e) |
| | | | | | | | | | | | | | | | | | | | | |
Portfolio turnover rate | | | 31 | %(d) | | | 35 | % | | | 58 | % | | | 47 | % | | | 18 | %(d) |
(a) | Represents the period from the commencement of operations (June 29, 2012) through May 31, 2013. |
(b) | Calculated using weighted average shares outstanding during the period. |
(c) | Total return is a measure of the change in value of an investment in the Fund over the period covered. The returns shown do not reflect the deduction of taxes a shareholder would pay on Fund distributions, if any, or the redemption of Fund shares. The total returns would be lower if the Adviser had not reduced advisory fees and/or reimbursed expenses (Note 4). |
(f) | Ratio was determined after advisory fee reductions and/or expense reimbursements (Note 4). |
See accompanying notes to financial statements. |
14
APEXcm SMALL/MID-CAP GROWTH FUND
NOTES TO FINANCIAL STATEMENTS
November 30, 2016 (Unaudited)
1. Organization
APEXcm Small/Mid-Cap Growth Fund (the “Fund”) is a diversified series of Ultimus Managers Trust (the “Trust”), an open-end investment company established as an Ohio business trust under a Declaration of Trust dated February 28, 2012. Other series of the Trust are not incorporated in this report. The Fund commenced operations on June 29, 2012.
The investment objective of the Fund is to seek to achieve long-term capital growth.
2. Significant Accounting Policies
The following is a summary of the Fund’s significant accounting policies. These policies are in conformity with accounting principles generally accepted in the United States of America (“GAAP”). As an investment company, as defined in Financial Accounting Standards Board (“FASB”) Accounting Standards Update 2013-08, the Fund follows accounting and reporting guidance under FASB Accounting Standards Codification Topic 946, “Financial Services – Investment Companies.”
In October 2016, the Securities and Exchange Commission (the “SEC”) released its final rule on Investment Company Reporting Modernization (the “Rule”). The Rule, which introduces two new regulatory reporting forms for investment companies – Form N-PORT and Form N-CEN, also contains amendments to Regulation S-X which impact financial statement presentation, particularly the presentation of derivative investments. Although still evaluating the impact of the Rule, management believes that many of the Regulation S-X amendments are consistent with the Fund’s current financial statement presentation and expects that the Fund will be able to comply with the Rule’s Regulation S-X amendments by the August 1, 2017 compliance date.
Securities valuation – The Fund values its portfolio securities at market value as of the close of regular trading on the New York Stock Exchange (the “NYSE”) (normally 4:00 p.m. Eastern time) on each business day the NYSE is open for business. The Fund values its listed securities on the basis of the security’s last sale price on the security’s primary exchange, if available, otherwise at the exchange’s most recently quoted mean price. NASDAQ-listed securities are valued at the NASDAQ Official Closing Price. In the event that market quotations are not readily available or are considered unreliable due to market or other events, the Fund values its securities and other assets at fair value in accordance with procedures established by and under the general supervision of the Board of Trustees (the “Board”). Under these procedures, the securities will be classified as Level 2 or 3 within the fair value hierarchy (see below), depending on the inputs used. Unavailable or unreliable market quotes may be due to the following factors: a substantial bid-ask spread;
15
APEXcm SMALL/MID-CAP GROWTH FUND
NOTES TO FINANCIAL STATEMENTS (Continued)
infrequent sales resulting in stale prices; insufficient trading volume; small trade sizes; a temporary lapse in any reliable pricing source; and actions of the securities or futures markets, such as the suspension or limitation of trading. As a result, the prices of securities used to calculate the Fund’s net asset value (“NAV”) may differ from quoted or published prices for the same securities.
GAAP establishes a single authoritative definition of fair value, sets out a framework for measuring fair value, and requires additional disclosures about fair value measurements.
Various inputs are used in determining the value of the Fund’s investments. These inputs are summarized in the three broad levels listed below:
| | ● | Level 1 – quoted prices in active markets for identical securities |
| | ● | Level 2 – other significant observable inputs |
| | ● | Level 3 – significant unobservable inputs |
The inputs or methods used for valuing securities are not necessarily an indication of the risks associated with investing in those securities. The inputs used to measure fair value may fall into different levels of the fair value hierarchy. In such cases, for disclosure purposes, the level in the fair value hierarchy within which the fair value measurement falls in its entirety is determined based on the lowest level input that is significant to the fair value measurement.
The following is a summary of the inputs used to value the Fund’s investments as of November 30, 2016:
| | Level 1 | | | Level 2 | | | Level 3 | | | Total | |
Common Stocks | | $ | 273,294,354 | | | $ | — | | | $ | — | | | $ | 273,294,354 | |
Money Market Funds | | | 11,866,664 | | | | — | | | | — | | | | 11,866,664 | |
Total | | $ | 285,161,018 | | | $ | — | | | $ | — | | | $ | 285,161,018 | |
Refer to the Fund’s Schedule of Investments for a listing of the common stocks by industry type. As of November 30, 2016, the Fund did not have any transfers between Levels. In addition, the Fund did not hold derivative instruments or any assets or liabilities that were measured at fair value on a recurring basis using significant unobservable inputs (Level 3) as of November 30, 2016. It is the Fund’s policy to recognize transfers between Levels at the end of the reporting period.
Share valuation – The NAV per share of the Fund is calculated daily by dividing the total value of the Fund’s assets, less liabilities, by the number of shares outstanding. The offering price and redemption price per share of the Fund is equal to the NAV per share.
16
APEXcm SMALL/MID-CAP GROWTH FUND
NOTES TO FINANCIAL STATEMENTS (Continued)
Investment income – Dividend income is recorded on the ex-dividend date. Interest income is accrued as earned. Withholding taxes on foreign dividends have been recorded in accordance with the Fund’s understanding of the appropriate country’s rules and tax rates.
Security transactions – Security transactions are accounted for on the trade date. Realized gains and losses on securities sold are determined on a specific identification basis.
Common expenses – Common expenses of the Trust are allocated among the Fund and the other series of the Trust based on the relative net assets of each series or the nature of the services performed and the relative applicability to each series.
Distributions to shareholders – The Fund will distribute to shareholders any net investment income dividends and net realized capital gains distributions at least once each year. The amount of such dividends and distributions are determined in accordance with federal income tax regulations, which may differ from GAAP. Dividends and distributions are recorded on the ex-dividend date. The tax character of the Fund’s distributions paid during the periods ended November 30, 2016 and May 31, 2016 was as follows:
Period Ended | | Ordinary Income | | | Long-Term Capital Gains | | | Total Distributions | |
November 30, 2016 | | $ | — | | | $ | — | | | $ | — | |
May 31, 2016 | | $ | 353,659 | | | $ | 1,060,976 | | | $ | 1,414,635 | |
On December 30, 2016, the Fund paid a long-term capital gain distribution of $0.044406 per share to shareholders of record on December 29, 2016.
Estimates – The preparation of financial statements in conformity with GAAP requires management to make estimates and assumptions that affect the reported amounts of assets and liabilities and disclosure of contingent assets and liabilities as of the date of the financial statements and the reported amounts of income and expenses during the reporting period. Actual results could differ from those estimates.
Federal income tax – The Fund has qualified and intends to continue to qualify as a regulated investment company under the Internal Revenue Code of 1986 (the “Code”). Qualification generally will relieve the Fund of liability for federal income taxes to the extent 100% of its net investment income and net realized capital gains are distributed in accordance with the Code.
17
APEXcm SMALL/MID-CAP GROWTH FUND
NOTES TO FINANCIAL STATEMENTS (Continued)
In order to avoid imposition of the excise tax applicable to regulated investment companies, it is also the Fund’s intention to declare as dividends in each calendar year at least 98% of its net investment income (earned during the calendar year) and 98.2% of its net realized capital gains (earned during the twelve months ended October 31) plus undistributed amounts from prior years.
The following information is computed on a tax basis for each item as of November 30, 2016:
Tax cost of portfolio investments | | $ | 259,845,766 | |
Gross unrealized appreciation | | $ | 42,494,490 | |
Gross unrealized depreciation | | | (17,179,238 | ) |
Net unrealized appreciation | | | 25,315,252 | |
Accumulated capital and other losses | | | (10,931,928 | ) |
Accumulated earnings | | $ | 14,383,324 | |
The federal income tax cost of portfolio investments and the tax components of accumulated earnings may temporarily differ from the financial statement cost of portfolio investments and components of net assets (“book/tax difference”). These book/tax differences are due to the recognition of capital gains or losses under income tax regulations and GAAP, primarily due to the tax deferral of losses on wash sales.
The Fund recognizes the tax benefits or expenses of uncertain tax positions only when the position is “more likely than not” to be sustained assuming examination by tax authorities. Management has reviewed the Fund’s tax positions for the current and all open tax periods (periods ended May 31, 2013 through May 31, 2016) and has concluded that no provision for unrecognized tax benefits or expenses is required in these financial statements. The Fund identifies its major tax jurisdiction as U.S. Federal.
3. Investment Transactions
During the six months ended November 30, 2016, cost of purchases and proceeds from sales of investment securities, other than short-term investments, were $83,282,409 and $77,991,001 respectively.
18
APEXcm SMALL/MID-CAP GROWTH FUND
NOTES TO FINANCIAL STATEMENTS (Continued)
4. Transactions with Related Parties
INVESTMENT ADVISORY AGREEMENT
The Fund’s investments are managed by Fiera Capital, Inc. (the “Adviser”) pursuant to the terms of an Investment Advisory Agreement. Under the Investment Advisory Agreement, the Fund pays the Adviser an advisory fee, computed and accrued daily and paid monthly, at the annual rate of 1.00% of its average daily net assets.
Pursuant to an Expense Limitation Agreement (“ELA”) between the Fund and the Adviser, the Adviser has contractually agreed, until October 1, 2017, to reduce investment advisory fees and reimburse other operating expenses to the extent necessary to limit total annual operating expenses of the Fund (exclusive of brokerage costs, taxes, interest, acquired fund fees and expenses, extraordinary expenses such as litigation and merger or reorganization costs, and other expenses not incurred in the ordinary course of the Fund’s business) to an amount not exceeding 1.05% of the Fund’s average daily net assets. Accordingly, during the six months ended November 30, 2016, the Adviser reduced its advisory fees in the amount of $199,774.
Under the terms of the ELA, investment advisory fee reductions and expense reimbursements by the Adviser are subject to recoupment by the Adviser for a period of three years after such fees and expenses were incurred, provided the recoupments do not cause total annual operating expenses of the Fund to exceed (i) the expense limitation then in effect, if any, and (ii) the expense limitation in effect at the time the expenses to be paid were incurred. As of November 30, 2016, the Adviser may seek recoupment of investment advisory fee reductions and expense reimbursements in the amount of $994,277 no later than the dates as stated below:
May 31, 2017 | | $ | 78,417 | |
May 31, 2018 | | | 317,860 | |
May 31, 2019 | | | 398,226 | |
November 30, 2019 | | | 199,774 | |
Certain officers of the Fund are also officers of the Adviser.
OTHER SERVICE PROVIDERS
Ultimus Fund Solutions, LLC (“Ultimus”) provides administration, fund accounting, compliance and transfer agency services to the Fund. The Fund pays Ultimus fees in accordance with the agreements for such services. In addition, the Fund pays out-of-pocket expenses including but not limited to postage, supplies and costs of pricing the Fund’s portfolio securities.
19
APEXcm SMALL/MID-CAP GROWTH FUND
NOTES TO FINANCIAL STATEMENTS (Continued)
Under the terms of a Distribution Agreement with the Trust, Ultimus Fund Distributors, LLC (the “Distributor”) serves as principal underwriter to the Fund. The Distributor is a wholly-owned subsidiary of Ultimus. The Distributor is compensated by the Adviser (not the Fund) for acting as principal underwriter.
Certain officers and a Trustee of the Trust are also officers of Ultimus and the Distributor.
TRUSTEE COMPENSATION
Effective October 1, 2016 each Trustee who is not an “interested person” of the Trust (“Independent Trustee”) receives a $1,000 annual retainer from the Fund, paid quarterly, except for the Board Chair who receives a $1,200 annual retainer from the Fund, paid quarterly. Each Independent Trustee also receives from the Fund a fee of $500 for each Board meeting attended plus reimbursement for travel and other meeting-related expenses. Prior to October 1, 2016, the Fund paid each Independent Trustee a fee of $500 for each Board meeting attended, plus a $500 annual retainer.
PRINICIPAL HOLDERS OF FUND SHARES
As of November 30, 2016, the following shareholders owned of record 5% or more of the outstanding shares of the Fund:
Name of Record Owner | % Ownership |
UBS Financial Services, Inc. (for the benefit of its customers) | 33% |
Charles Schwab & Company, Inc. (for the benefit of its customers) | 24% |
National Financial Services LLC (for the benefit of its customers) | 15% |
US Bank, N.A. (for the benefit of its customers) | 5% |
A beneficial owner of 25% or more of a Fund’s outstanding shares may be considered a controlling person. That shareholder’s vote could have a more significant effect on matters presented at a shareholder’s meeting.
5. Sector Risk
If a Fund has significant investments in the securities of issuers within a particular sector, any development affecting that sector will have a greater impact on the value of the net assets of the Fund than would be the case if the Fund did not have significant investments in that sector. In addition, this may increase the risk of loss in the Fund and increase the volatility of the Fund’s NAV per share. For instance, economic or market factors, regulatory changes or other developments may negatively impact all companies in a particular sector, and therefore the value of the Fund’s portfolio will be adversely affected. As of November 30, 2016, the Fund had 27.0% of the value of its net assets invested in stocks within the Information Technology sector.
20
APEXcm SMALL/MID-CAP GROWTH FUND
NOTES TO FINANCIAL STATEMENTS (Continued)
6. Contingencies and Commitments
The Fund indemnifies the Trust’s officers and Trustees for certain liabilities that might arise from their performance of their duties to the Fund. Additionally, in the normal course of business the Fund enters into contracts that contain a variety of representations and warranties and which provide general indemnifications. The Fund’s maximum exposure under these arrangements is unknown, as this would involve future claims that may be made against the Fund that have not yet occurred. However, based on experience, the Fund expects the risk of loss to be remote.
7. Subsequent Events
The Fund is required to recognize in the financial statements the effects of all subsequent events that provide additional evidence about conditions that existed as of the date of the Statement of Assets and Liabilities. For non-recognized subsequent events that must be disclosed to keep the financial statements from being misleading, the Fund is required to disclose the nature of the event as well as an estimate of its financial effect, or a statement that such an estimate cannot be made. Management has evaluated subsequent events through the issuance of these financial statements and has noted no such events other than the long-term capital gain distribution paid on December 30, 2016, as noted in Note 2.
21
APEXcm SMALL/MID-CAP GROWTH FUND
ABOUT YOUR FUND’S EXPENSES (Unaudited)
We believe it is important for you to understand the impact of costs on your investment. As a shareholder of the Fund, you incur ongoing costs, including management fees and other operating expenses. The following examples are intended to help you understand your ongoing costs (in dollars) of investing in the Fund and to compare these costs with the ongoing costs of investing in other mutual funds.
A mutual fund’s ongoing costs are expressed as a percentage of its average net assets. This figure is known as the expense ratio. The expenses in the table below are based on an investment of $1,000 made at the beginning of the most recent period (June 1, 2016) and held until the end of the period (November 30, 2016).
The table below illustrates the Fund’s ongoing costs in two ways:
Actual fund return – This section helps you to estimate the actual expenses that you paid over the period. The “Ending Account Value” shown is derived from the Fund’s actual return, and the third column shows the dollar amount of operating expenses that would have been paid by an investor who started with $1,000 in the Fund. You may use the information here, together with the amount you invested, to estimate the expenses that you paid over the period.
To do so, simply divide your account value by $1,000 (for example, an $8,600 account value divided by $1,000 = 8.6), then multiply the result by the number given for the Fund under the heading “Expenses Paid During Period.”
Hypothetical 5% return – This section is intended to help you compare the Fund’s ongoing costs with those of other mutual funds. It assumes that the Fund had an annual return of 5% before expenses during the period shown, but that the expense ratio is unchanged. In this case, because the return used is not the Fund’s actual return, the results do not apply to your investment. The example is useful in making comparisons because the U.S. Securities and Exchange Commission (“SEC”) requires all mutual funds to calculate expenses based on a 5% return. You can assess the Fund’s ongoing costs by comparing this hypothetical example with the hypothetical examples that appear in shareholder reports of other funds.
Note that expenses shown in the table are meant to highlight and help you compare ongoing costs only. The Fund does not charge transaction fees, such as purchase or redemption fees, nor does it carry a “sales load.”
The calculations assume no shares were bought or sold during the period. Your actual costs may have been higher or lower, depending on the amount of your investment and the timing of any purchases or redemptions.
22
APEXcm SMALL/MID-CAP GROWTH FUND
ABOUT YOUR FUND’S EXPENSES (Unaudited) (Continued)
More information about the Fund’s expenses can be found in this report. For additional information on operating expenses and other shareholder costs, please refer to the Fund’s prospectus.
| Beginning
Account Value
June 1,
2016 | Ending
Account Value
November 30,
2016 | Expenses
Paid During
Period* |
Based on Actual Fund Return | $ 1,000.00 | $ 1,063.80 | $ 5.42 |
Based on Hypothetical 5% Return (before expenses) | $ 1,000.00 | $ 1,019.75 | $ 5.30 |
* | Expenses are equal to the Fund’s annualized net expense ratio of 1.05% for the period, multiplied by the average account value over the period, multiplied by 183/366 (to reflect the one-half year period). |
OTHER INFORMATION (Unaudited)
A description of the policies and procedures that the Fund uses to vote proxies relating to portfolio securities is available without charge upon request by calling toll-free 1-888-575-4800, or on the SEC’s website at http://www.sec.gov. Information regarding how the Fund voted proxies relating to portfolio securities during the most recent 12-month period ended June 30 is available without charge upon request by calling toll-free 1-888-575-4800, or on the SEC’s website at http://www.sec.gov.
The Trust files a complete listing of portfolio holdings for the Fund with the SEC as of the end of the first and third quarters of each fiscal year on Form N-Q. These filings are available upon request by calling 1-888-575-4800. Furthermore, you may obtain a copy of the filings on the SEC’s website at http://www.sec.gov. The Trust’s Forms N-Q may also be reviewed and copied at the SEC’s Public Reference Room in Washington, DC, and information on the operation of the Public Reference Room may be obtained by calling 1-800-SEC-0330.
23
APEXcm SMALL/MID-CAP GROWTH FUND
RESULTS OF SPECIAL MEETING OF SHAREHOLDERS
(Unaudited)
On October 24, 2016 a Special Meeting of Shareholders of APEXcm Small/Mid-Cap Growth Fund (the “Fund”), a series of Ultimus Managers Trust (the “Trust”), was held for the purpose of voting on the following Proposal:
Proposal 1: To approve a new investment advisory agreement between the Trust, on behalf of the Fund, and Fiera Capital Inc. (the “Advisory Agreement”).
A total of 15,829,675 shares of the Fund were entitled to vote on the Proposal. A total of 7,930,667 shares constitute a quorum of voters for purposes of the Proposal. A total of 8,042,215 shares were voted, representing 50.80% of total shares.
Shareholders of record on August 22, 2016 voted to approve the Advisory Agreement. The votes cast with respect to Proposal 1 were as follows:
| | Number of shares |
| For | Against | Abstain |
Proposal 1 | 7,335,775 | 5,347 | 701,093 |
24
This page intentionally left blank.
BARROW VALUE OPPORTUNITY FUND
(BALIX)
BARROW LONG/SHORT OPPORTUNITY FUND
(BFSLX)
Semi-Annual Report
November 30, 2016
(Unaudited)
BARROW VALUE OPPORTUNITY FUND
LETTER TO SHAREHOLDERS | January 6, 2017 |
Dear Shareholder,
We are pleased to report on the status and performance of the Barrow Value Opportunity Fund (“the Fund”) for the six months ended November 30, 2016.
We believe that the Fund owns a well-positioned portfolio of equity interests in excellent businesses at attractive valuations. This portfolio is highly diversified by market capitalization segments (large, middle, small), industry sectors, and issuers. In selecting investments for the Fund, we search for businesses that feature high returns on capital, wide operating margins, and low debt loads. Based on our estimates of intrinsic value, we believe our portfolio’s valuation is attractively low on an absolute basis and less expensive than the U.S. stock market as represented by the S&P 500® Index (the “S&P 500”).
We believe the Fund’s long-term performance has been excellent; with an annual average total return of 14.62% since inception. The Fund has exceeded the total return of the S&P 500 in five of the past seven calendar years1. During the most recent six months ended November 30, 2016, the Fund returned +4.72% net of all fees and expenses, which underperformed the S&P 500 by 1.29%.
Barrow Street Advisors, LLC (the “Adviser”) continues to use its proprietary private-equity approach to uncover companies that exhibit its Quality-meets-Value criteria. Based on extensive research by the Adviser, the Fund seeks to generate long-term capital appreciation by investing in companies with fundamental operating and financial attributes representative of both quality and value. To increase the Fund’s chances for success, we invest in a variety of positions that are diversified across market capitalization and industry sectors.
Over the past six-months, we uncovered 52 new investment opportunities, composed of 17 small-caps, 9 mid-caps, and 26 large-caps, and representing seven different industry sectors. We believe all of these new additions to the Fund’s portfolio are excellent companies with strong balance sheets. These companies are generally using their ample free cash flow to: a) re-invest in growth opportunities at high rates of return on investment; b) pay dividends; c) repurchase stock at attractive valuations; and/or d) retire outstanding debt.
In keeping with our practice since the beginning of 2009, over the past six months the Fund’s investments were sourced by taking account of the opportunity set of all companies in our broad investment universe each time we committed capital to a new position. We think this approach allows us to uncover excellent investment opportunities that arise from temporary market inefficiencies and to gather up the most compelling investments across a wide array of industries and market capitalizations, while avoiding the destructive behavioral biases inherent in concentrated-stock and sector-specialized investing.
1
Seven of the Fund’s holdings were announced as take-over targets over the past six months, which was approximately 2.7x the market average. The Fund has had investments in 87 take-overs since December 31, 20081, or roughly 3.6x the market average2. The control premiums we have captured by virtue of holding stocks that end up being merger targets have made repeated and meaningful contributions to the Fund’s total returns, and we expect continued benefits from this effect going forward. We typically sell companies from the Fund’s portfolio soon after they are announced as take-over targets and re-invest that capital.
Over the past six months, the Fund’s portfolio generated total returns, before fees and expenses, of +5.33%, including +4.08% for large-caps, +2.82% for mid-caps and +7.86% for small-caps. This compares to +6.01% for the S&P 500 (for large-caps), +9.93% for the S&P 400 Midcap (for mid-caps), and +15.37% for the Russell 2000 (for small-caps) over the same period. The Fund’s sectors with the best absolute performance were Materials and Information Technology, which generated total returns of +14.36% and +13.29%, respectively. The Fund’s sectors with the worst absolute performance were Health Care and Energy, which returned -1.39% and +0.07%, respectively.
You can find additional commentary and reports about the Adviser’s management of the Fund’s portfolio on the Barrow Funds’ website (www.barrowfunds.com).
Sincerely,
Nicholas Chermayeff | Robert F. Greenhill, Jr. | David R. Bechtel |
Co-Portfolio Manager, | Co-Portfolio Manager, | Principal, |
Investment Committee | Investment Committee | Investment Committee |
1 | The investment related and performance information discussed above for periods prior to Barrow Value Opportunity Fund’s reorganization date (August 30, 2013) are based on the activities of the Fund’s predecessor, the Barrow Street Fund L.P., an unregistered limited partnership managed by the portfolio managers of Barrow Value Opportunity Fund (the “Predecessor Private Fund”). The Predecessor Private Fund was reorganized into the Institutional Class shares of the Barrow Value Opportunity Fund on August 30, 2013, the date that the Fund commenced operations (the “Reorganization”). Barrow Value Opportunity Fund has been managed in the same style and by the same portfolio managers since the Predecessor Private Fund’s inception on December 31, 2008. The performance information shows the Predecessor Private Fund’s returns calculated using the actual fees and expenses charged by the Predecessor Private Fund. This prior performance is net of management fees and other expenses, but does not include the effect of the Predecessor Private Fund’s performance fee, which was in place until October 7, 2012. Prior to the Reorganization, the Predecessor Private Fund was not subject to certain investment restrictions, diversification requirements, and other restrictions of the Investment Company Act of 1940, as amended, or Subchapter M of the Internal Revenue Code of 1986, as amended, which, if they had been applicable, might have adversely affected Barrow Value Opportunity Fund’s performance. |
2 | The frequency of merger and acquisition (“M&A”) activity in the Fund’s portfolio is calculated on a quarterly basis by dividing the cumulative number of portfolio holdings that have been announced as merger or acquisition targets by the cumulative number of unique holdings held in the Fund’s portfolio. The frequency of M&A activity in the market is calculated on a quarterly basis by dividing the cumulative number of publicly-traded U.S. common stocks that have been announced as acquisition targets per Bloomberg by the total universe of publicly-traded U.S. common stocks as identified by Bloomberg (approximately 10,000). |
2
Past performance is not predictive of future performance. Investment results and principal value will fluctuate so that shares, when redeemed, may be worth more or less than their original cost. Current performance may be higher or lower than the performance data quoted. Performance data current to the most recent month end are available by calling 1-877-767-6633.
An investor should consider the investment objectives, risks, charges and expenses of the Fund carefully before investing. The Fund’s prospectus contains this and other important information. To obtain a copy of the Fund’s prospectus please visit our website at www.barrowfunds.com or call 1-877-767-6633 and a copy will be sent to you free of charge. Please read the prospectus carefully before you invest. The Fund is distributed by Ultimus Fund Distributors, LLC.
The Letter to Shareholders seeks to describe some of the Adviser’s current opinions and views of the financial markets. Although the Adviser believes it has a reasonable basis for any opinions or views expressed, actual results may differ, sometimes significantly so, from those expected or expressed. The securities held by the Fund that are discussed in the Letter to Shareholders were held during the period covered by this Report. They do not comprise the entire investment portfolio of the Fund, may be sold at any time and may no longer be held by the Fund. For a complete list of securities held by the Fund as of November 30, 2016, please see the Schedule of Investments section of the Semi-Annual Report. The opinions of the Fund’s Adviser with respect to those securities may change at any time.
Statements in the Letter to Shareholders that reflect projections or expectations for future financial or economic performance of the Fund and the market in general and statements of the Fund’s plans and objectives for future operations are forward-looking statements. No assurance can be given that actual results or events will not differ materially from those projected, estimated, assumed, or anticipated in any such forward-looking statements. Important factors that could result in such differences, in addition to factors noted with such forward-looking statements include, without limitation, general economic conditions, such as inflation, recession, and interest rates. Past performance is not a guarantee of future results.
3
BARROW VALUE OPPORTUNITY FUND
PERFORMANCE INFORMATION
November 30, 2016 (Unaudited)
Comparison of the Change in Value of a $10,000 Investment in
Barrow Value Opportunity Fund
versus the S&P 500® Index
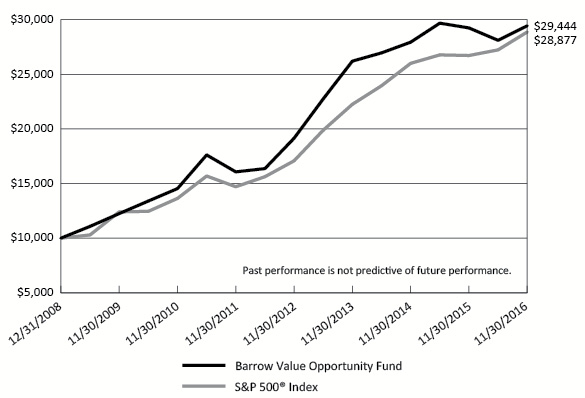
Average Annual Total Returns
For the periods ended November 30, 2016 |
| | 1 Year | 5 Years | Since
Inception(c) |
Barrow Value Opportunity Fund(a)(b) | 0.66% | 12.87% | 14.62% |
S&P 500® Index | 8.06% | 14.45% | 14.34% |
4
BARROW VALUE OPPORTUNITY FUND
PERFORMANCE INFORMATION
November 30, 2016 (Unaudited) (Continued)
Comparison of Yearly Returns with the S&P 500® Index |
| | Barrow Value Opportunity Fund(a) | S&P 500®
Index | Difference |
Yearly Total Returns for Calendar Years: | | | |
2009 | 30.10% | 26.46% | 3.64% |
2010 | 18.75% | 15.06% | 3.69% |
2011 | 5.50% | 2.11% | 3.39% |
2012 | 18.77% | 16.00% | 2.77% |
2013 | 36.69% | 32.39% | 4.30% |
2014 | 5.13% | 13.69% | (8.56%) |
2015 | 0.81% | 1.38% | (0.57%) |
2016 (through 11/30/16) | 4.98% | 9.79% | (4.81%) |
| | | | |
Total Return Since Inception (not annualized, as of 11/30/16) | 194.44% | 188.77% | 5.67% |
(a) | The Barrow Value Opportunity Fund (the “Fund”) performance includes the performance of the Barrow Street Fund L.P. (the “Predecessor Private Fund”), the Fund’s predecessor, for the periods before the Fund’s registration statement became effective. The Predecessor Private Fund was reorganized into the Fund at the close of business on August 30, 2013 (the “Reorganization”), the date the Fund commenced operations. The Fund has been managed in the same style and by the same portfolio managers since the Predecessor Private Fund’s inception on December 31, 2008. The Fund’s investment goals, policies, guidelines and restrictions are, in all material respects, equivalent to those of the Predecessor Private Fund. The performance of the Predecessor Private Fund is net of management fees of 1.50% of assets but does not include the effect of a 20% performance fee which was in place until October 7, 2012. Prior to the Reorganization, the Predecessor Private Fund was not subject to certain investment restrictions, diversification requirements and other restrictions of the Investment Company Act of 1940, as amended, or Subchapter M of the Internal Revenue Code of 1986, as amended. If such restrictions had been applicable, they might have adversely affected the Predecessor Private Fund’s performance. |
(b) | The Fund’s total returns do not reflect the deduction of taxes a shareholder would pay on Fund distributions, if any, or the redemption of Fund shares. |
(c) | Represents the period from December 31, 2008(a) through November 30, 2016. |
5
BARROW LONG/SHORT OPPORTUNITY FUND |
LETTER TO SHAREHOLDERS | January 6, 2017 |
Dear Shareholder,
We are pleased to report on the status and performance of the Barrow Long/Short Opportunity Fund (“the Fund”) for the six months ended November 30, 2016.
We believe the Fund owns a well-positioned long portfolio of equity positions in excellent businesses at attractive valuations that feature high returns on capital, wide operating margins, and low debt load. The Fund also maintains short positions in the common stock of companies that we believe have poor business characteristics and are trading at high prices. The Fund’s long and short portfolios are highly diversified by market cap segments (large, mid, small), industry sectors, and issuers.
We believe the Fund is well positioned to do well in most future market conditions, especially a bear market. In our opinion, the Fund’s long and short portfolios are cheap and expensive, respectively, on an absolute basis and in relation to the U.S. stock market as represented by the S&P 500® Index (“S&P 500”). We believe the Fund’s short portfolio (the Fund’s net exposure is roughly 40%) provides a meaningful hedge against the market’s potential downside volatility.
For the six months ended November 30, 2016, the Fund posted a total return of -3.09%, which compares to +6.01% for the S&P 500. The Fund underperformed the S&P 500 due mainly to the underperformance of its long positions.
The Fund maintains a target gross exposure of approximately 220% of its net assets, with long exposure of 130%, short exposure of 90%, and net exposure of 40%. For the six months ended November 30, 2016, the Fund’s long portfolio generated an unleveraged total return before fees and expenses of +5.33%, which underperformed the S&P 500 by 0.68%. The Fund’s short portfolio generated an unleveraged total return, before fees and expenses, of +10.43% or 4.42% more than the S&P 500. A positive return in the short portfolio results in negative return contributions to the Fund.
Barrow Street Advisors, LLC (the “Adviser”) continues to use its proprietary private equity approach to uncover companies that exhibit its Quality-meets-Value criteria. Based on extensive research by the Adviser, the Fund seeks to generate above-average returns through capital appreciation by investing long in companies with fundamental operating and financial attributes representative of both quality and value and selling short companies of both lower quality and high price. Using this approach the Fund continued to uncover potential opportunities to: 1) purchase quality companies trading at temporary discounts to their intrinsic values; and 2) sell short the stock of lower quality companies trading at prices well above their intrinsic values. To increase the Fund’s chances for success, we invest in a variety of positions diversified across market capitalization and industry sectors.
Over the past six months, we uncovered 52 new long opportunities in seven industry sectors, including 17 small-caps, 9 mid-caps, and 26 large-caps. We believe all of these new additions to the Fund’s portfolio are excellent companies with strong balance
6
sheets. They are generally using their ample free cash flow to: a) re-invest in growth opportunities at high rates of return on investment; b) pay dividends; c) repurchase stock at attractive valuations; and/or d) retire outstanding debt. In tandem, we initiated 154 new short positions, including 77 small-caps, 46 mid-caps and 31 large-caps. We believe these companies are overpriced and exhibit weak quality characteristics.
In keeping with our past practice, over the past six months the Fund’s investments were sourced by taking account of the opportunity set of all companies in our broad investment universe each time we committed capital to a new position. We think this approach allows us to uncover excellent investment opportunities that arise from temporary market inefficiencies and to gather up the most compelling investments across a wide array of industries and market capitalizations while avoiding the destructive behavioral biases inherent in concentrated-stock and sector-specialized investing.
Over the past six months, the Fund’s long portfolio generated unleveraged total returns before fees and expenses of +5.33%, including +4.08% for large-caps, +2.82% for mid-caps and +7.86% for small-caps. This compares to +6.01% for the S&P 500 (for large-caps), +9.93% for the S&P 400 Midcap (for mid-caps), and +15.37% for the Russell 2000 (for small-caps) over the same period. The Fund’s sectors with the best absolute performance were Materials and Information Technology, which generated total returns of +14.36% and +13.29%, respectively. The Fund’s sectors with the worst absolute performance were Health Care and Energy, which returned -1.39% and +0.07%, respectively.
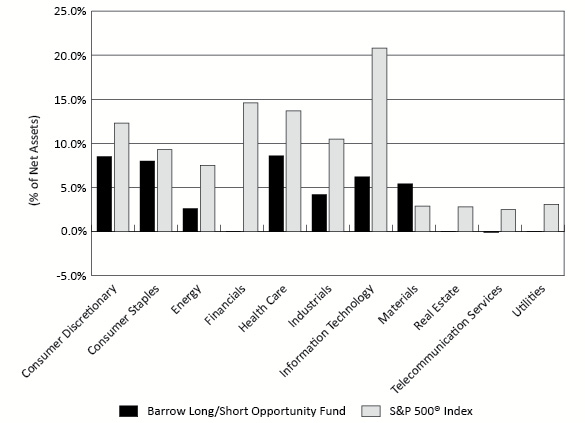
Over the same period, the Fund’s short portfolio generated total returns before fees and expenses of +10.43%, including +4.49% for large-caps, +9.22% for mid-caps and +15.83% for small-caps. A positive return in the short portfolio results in negative return contribution to the Fund. The Fund’s sectors with the best absolute performance were Consumer Discretionary and Consumer Staples, which returned +6.47% and +6.91%, respectively. The Fund’s sectors that provided the most negative return contribution were Materials and Industrials, which generated total returns of +23.97% and +14.17%, respectively.
You can find more information about the Fund’s portfolio on the Barrow Funds website (www.barrowfunds.com).
Sincerely,
Nicholas Chermayeff | Robert F. Greenhill, Jr. | David R. Bechtel |
Co-Portfolio Manager, | Co-Portfolio Manager, | Principal, |
Investment Committee | Investment Committee | Investment Committee |
7
1 | The frequency of merger and acquisition (“M&A”) activity in the Fund’s portfolio is calculated on a quarterly basis by dividing the cumulative number of portfolio holdings that have been announced as merger or acquisition targets by the cumulative number of unique holdings held in the Fund’s portfolio. The frequency of M&A activity in the market is calculated on a quarterly basis by dividing the cumulative number of publicly-traded U.S. common stocks that have been announced as acquisition targets per Bloomberg by the total universe of publicly-traded U.S. common stocks as identified by Bloomberg (approximately 10,000). |
Past performance is not predictive of future performance. Investment results and principal value will fluctuate so that shares, when redeemed, may be worth more or less than their original cost. Current performance may be higher or lower than the performance data quoted. Performance data current to the most recent month end are available by calling 1-877-767-6633.
An investor should consider the investment objectives, risks, charges and expenses of the Fund carefully before investing. The Fund’s prospectus contains this and other important information. To obtain a copy of the Fund’s prospectus please visit our website at www.barrowfunds.com or call 1-877-767-6633 and a copy will be sent to you free of charge. Please read the prospectus carefully before you invest. The Fund is distributed by Ultimus Fund Distributors, LLC.
The Letter to Shareholders seeks to describe some of the Adviser’s current opinions and views of the financial markets. Although the Adviser believes it has a reasonable basis for any opinions or views expressed, actual results may differ, sometimes significantly so, from those expected or expressed. The securities held by the Fund that are discussed in the Letter to Shareholders were held during the period covered by this Report. They do not comprise the entire investment portfolio of the Fund, may be sold at any time and may no longer be held by the Fund. For a complete list of securities held by the Fund as of November 30, 2016, please see the Schedule of Investments and Schedule of Securities Sold Short sections of the Semi-Annual Report. The opinions of the Fund’s Adviser with respect to those securities may change at any time.
Statements in the Letter to Shareholders that reflect projections or expectations for future financial or economic performance of the Fund and the market in general and statements of the Fund’s plans and objectives for future operations are forward-looking statements. No assurance can be given that actual results or events will not differ materially from those projected, estimated, assumed, or anticipated in any such forward-looking statements. Important factors that could result in such differences, in addition to factors noted with such forward-looking statements include, without limitation, general economic conditions, such as inflation, recession, and interest rates. Past performance is not a guarantee of future results.
8
BARROW LONG/SHORT OPPORTUNITY FUND
PERFORMANCE INFORMATION
November 30, 2016 (Unaudited)
Comparison of the Change in Value of a $10,000 Investment in
Barrow Long/Short Opportunity Fund
versus the S&P 500® Index
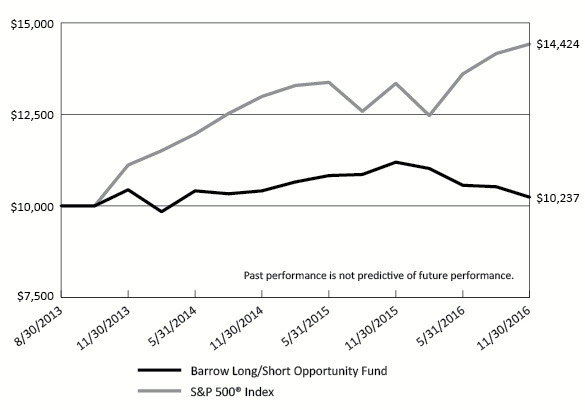
Average Annual Total Returns
For the periods ended November 30, 2016 |
| | 1 Year | Since
Inception(b) |
Barrow Long/Short Opportunity Fund(a) | (8.55%) | 0.72% |
S&P 500® Index | 8.06% | 11.92% |
(a) | The Fund's total returns do not reflect the deduction of taxes a shareholder would pay on Fund distributions, if any, or the redemption of Fund shares. |
(b) | The Fund commenced operations on August 30, 2013. |
9
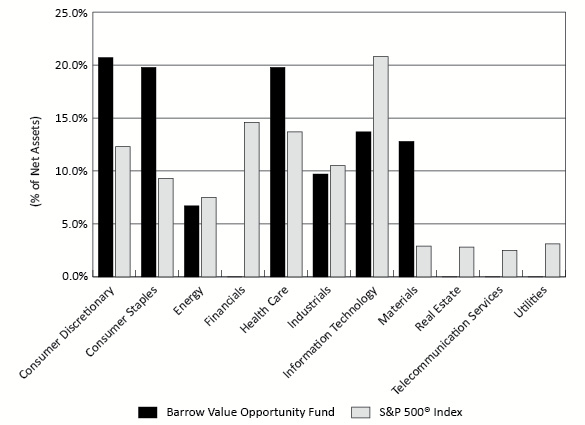
BARROW VALUE OPPORTUNITY FUND
PORTFOLIO INFORMATION
November 30, 2016 (Unaudited)
Sector Diversification
Top 10 Long Equity Holdings
Security Description | % of
Net Assets |
LyondellBasell Industries N.V. - Class A | 2.3% |
Omnicom Group, Inc. | 1.6% |
Greenbrier Companies, Inc. (The) | 1.5% |
InterDigital, Inc. | 1.5% |
Steven Madden Ltd. | 1.4% |
Westlake Chemical Corporation | 1.3% |
Inter Parfums, Inc. | 1.3% |
Viacom, Inc. - Class B | 1.3% |
Quest Diagnostics, Inc. | 1.3% |
Chemed Corporation | 1.2% |
10
BARROW LONG/SHORT OPPORTUNITY FUND
PORTFOLIO INFORMATION
November 30, 2016 (Unaudited)
Net Sector Exposure Diversification*
Barrow Long/Short Opportunity Fund | | Level 1 | | | Level 2 | | | Level 3 | | | Total | |
Investments in Securities: | | | | | | | | | | | | | | | | |
Common Stocks | | $ | 45,524,707 | | | $ | 0 | (a) | | $ | — | | | $ | 45,524,707 | |
Money Market Funds | | | 7,536,578 | | | | — | | | | — | | | | 7,536,578 | |
Total | | $ | 53,061,285 | | | $ | 0 | | | $ | — | | | $ | 53,061,285 | |
Other Financial Instruments: | | | | | | | | | | | | | | | | |
Common Stocks – Sold Short | | $ | (31,074,531 | ) | | $ | — | | | $ | — | | | $ | (31,074,531 | ) |
Warrants – Sold Short | | | (1 | ) | | | — | | | | — | | | | (1 | ) |
Total | | $ | (31,074,532 | ) | | $ | — | | | $ | — | | | $ | (31,074,532 | ) |
(a) | Barrow Long/Short Opportunity Fund holds a Level 2 security which is valued at $0. |
Refer to each Fund’s Schedule of Investments and Schedule of Securities Sold Short, as applicable, for a listing of securities by industry type. As of November 30, 2016, the Funds did not have any transfers between Levels. There were no Level 3 securities or derivative instruments held by the Funds as of November 30, 2016. It is the Funds’ policy to recognize transfers between Levels at the end of the reporting period.
Share valuation – The NAV per share of each Fund is calculated daily by dividing the total value of its assets, less liabilities, by the number of shares outstanding. The offering price and redemption price per share of each Fund is equal to the NAV per share.
Investment income/expense – Dividend income and expense are recorded on the ex-dividend date. Interest income is accrued as earned.
Security transactions – Security transactions are accounted for on the trade date. Realized gains and losses on securities sold are determined on a specific identification basis.
Common expenses – Common expenses of the Trust are allocated among the Funds and the other series of the Trust based on the relative net assets of each series or the nature of the services performed and the relative applicability to each series.
59
BARROW FUNDS
NOTES TO FINANCIAL STATEMENTS (Continued) |
Distributions to shareholders – The Funds distribute to shareholders any net investment income dividends and net realized capital gains distributions at least once each year. The amount of such dividends and distributions are determined in accordance with federal income tax regulations, which may differ from GAAP. Dividends and distributions to shareholders are recorded on the ex-dividend date. The tax character of distributions paid to shareholders of Barrow Value Opportunity Fund during the periods ended November 30, 2016 and May 31, 2016 was as follows:
Period Ended | Ordinary Income | Long-Term Capital Gains | Total Distributions |
Institutional Class | | | |
November 30, 2016 | $ — | $ — | $ — |
May 31, 2016 | $ 266,621 | $ 281,697 | $ 548,318 |
| | | | |
Investor Class | | | |
November 30, 2016 | $ — | $ — | $ — |
May 31, 2016 | $ — | $ — | $ — |
Barrow Long/Short Opportunity Fund did not pay any distribution to shareholders during the periods ended November 30, 2016 and May 31, 2016.
On December 30, 2016, Barrow Value Opportunity Fund paid an ordinary income dividend and long-term capital gain distribution of $0.1350 and $0.0460 per share, respectively, to shareholders of record on December 29, 2016.
Short Sales – Barrow Long/Short Opportunity Fund may sell securities short. For financial statement purposes, an amount equal to the settlement amount is included in the Statements of Assets and Liabilities as an asset and an equivalent liability is then subsequently marked-to-market daily to reflect the current value of the short position. Subsequent fluctuations in the market prices of securities sold, but not yet purchased, may require purchasing the securities at prices which may differ from the market value reflected on the Statements of Assets and Liabilities. The Fund is liable for any dividends payable on securities while those securities are in a short position and will also bear other costs, such as charges for the prime brokerage accounts, in connection with the short positions. These costs are reported as dividend expense and brokerage expense on securities sold short, respectively, in the Statements of Operations. As collateral for its short positions, the Fund is required under the Investment Company Act of 1940 (the “1940 Act”) to maintain assets consisting of cash, cash equivalents or other liquid securities equal to the market value of the securities sold short. The cash deposits with brokers for securities sold short are reported on the Statements of Assets and Liabilities. The amount of collateral is required to be adjusted daily to reflect changes in the value of the securities sold short. To the extent Barrow Long/Short Opportunity Fund invests the proceeds received from selling securities short, the Fund is engaging in a form of leverage. The use of leverage by the Fund may make any
60
BARROW FUNDS
NOTES TO FINANCIAL STATEMENTS (Continued) |
change in the Fund’s NAV greater than it would be without the use of leverage. Short sales are speculative transactions and involve special risks, including greater reliance on the ability of Barrow Street Advisers LLC (the “Adviser”) to accurately anticipate the future value of a security.
Estimates – The preparation of financial statements in conformity with GAAP requires management to make estimates and assumptions that affect the reported amounts of assets and liabilities and disclosure of contingent assets and liabilities as of the date of the financial statements and the reported amounts of income and expenses during the reporting period. Actual results could differ from those estimates.
Federal income tax – Each Fund has qualified and intends to continue to qualify each year as a regulated investment company under the Internal Revenue Code of 1986, as amended (the “Code”). Qualification generally will relieve each Fund of liability for federal income taxes to the extent 100% of its net investment income and net realized capital gains are distributed in accordance with the Code.
In order to avoid imposition of the excise tax applicable to regulated investment companies, it is also each Fund’s intention to declare as dividends in each calendar year at least 98% of its net investment income (earned during the calendar year) and 98.2% of its net realized capital gains (earned during the twelve months ended October 31) plus undistributed amounts from prior years.
The following information is computed on a tax basis for each item as of November 30, 2016:
| | Barrow Value Opportunity Fund | | | Barrow Long/Short Opportunity Fund | |
Cost of portfolio investments | | $ | 30,526,661 | | | $ | 49,522,011 | |
Gross unrealized appreciation | | $ | 5,019,878 | | | $ | 5,408,619 | |
Gross unrealized depreciation | | | (1,413,859 | ) | | | (1,869,345 | ) |
Net unrealized appreciation | | | 3,606,019 | | | | 3,539,274 | |
Net unrealized depreciation on securities sold short | | | — | | | | (2,590,895 | ) |
Accumulated ordinary income (loss) | | | 518,065 | | | | (100,116 | ) |
Accumulated capital and other losses | | | (28,882 | ) | | | (2,802,628 | ) |
Accumulated earnings (deficit) | | $ | 4,095,202 | | | $ | (1,954,365 | ) |
As of November 30, 2016, the proceeds of securities sold short on a tax basis is $28,483,637 for Barrow Long/Short Opportunity Fund.
61
BARROW FUNDS
NOTES TO FINANCIAL STATEMENTS (Continued) |
The value of the federal income tax cost of portfolio investments and securities sold short and tax components of accumulated earnings (deficit) may temporarily differ from the financial statement cost of portfolio investments and securities sold short and components of net assets (“book/tax differences”). These book/tax differences are due to the recognition of capital gains or losses under income tax regulations and GAAP, primarily the tax deferral of losses on wash sales and the tax treatment of income and capital gains on publicly-traded partnerships held by the Funds.
As of May 31, 2016, Barrow Long/Short Opportunity Fund had a short-term capital loss carryforward of $146,311 for federal income tax purposes. This capital loss carryforward, which does not expire, may be utilized in the current and future years to offset net realized capital gains, if any, prior to distributing such gains to shareholders.
The Funds recognize tax benefits or expenses of uncertain tax positions only when the position is “more likely than not” of being sustained assuming examination by tax authorities. Management has reviewed the tax positions taken on Federal income tax returns for the current and all open tax years (tax years ended May 31, 2014 through May 31, 2016) and has concluded that no provision for unrecognized tax benefits or expenses is required in these financial statements. The Funds identify their major tax jurisdiction as U.S. Federal.
3. Investment Transactions
During the six months ended November 30, 2016, cost of purchases and proceeds from sales of investment securities, other than short-term investments and short positions, amounted to $16,829,415 and $18,648,988, respectively, for Barrow Value Opportunity Fund and $22,581,440 and $28,295,712, respectively, for Barrow Long/Short Opportunity Fund.
4. Transactions with Related Parties
INVESTMENT ADVISORY AGREEMENT
Each Fund’s investments are managed by the Adviser pursuant to the terms of an Investment Advisory Agreement. Barrow Value Opportunity Fund pays the Adviser an investment advisory fee, computed and accrued daily and paid monthly, at the annual rate of 0.99% of its average daily net assets. Barrow Long/Short Opportunity Fund pays the Adviser an investment advisory fee, computed and accrued daily and paid monthly, at the annual rate of 1.50% of its average daily net assets.
62
BARROW FUNDS
NOTES TO FINANCIAL STATEMENTS (Continued) |
Pursuant to an Expense Limitation Agreement (“ELA”) between the Funds and the Adviser, the Adviser has contractually agreed, until October 1, 2017, to reduce investment advisory fees and reimburse other operating expenses to limit total annual operating expenses of the Funds (exclusive of brokerage fees and commissions, taxes, borrowing costs such as interest and dividend expenses on securities sold short, interest, acquired fund fees and expenses, extraordinary expenses such as litigation and merger or reorganization costs, and other expenses not incurred in the ordinary course of the Funds’ business, and amounts, if any, payable to a plan adopted in accordance with Rule 12b-1 under the 1940 Act) to an amount not exceeding the following percentages of each Fund’s average daily net assets:
Barrow Value Opportunity Fund | 1.15% |
Barrow Long/Short Opportunity Fund | 1.74% |
Accordingly, during the six months ended November 30, 2016, the Adviser reduced its investment advisory fees as follows:
| Investment Advisory Fee Reductions |
Barrow Value Opportunity Fund | $ 74,779 |
Barrow Long/Short Opportunity Fund | $ 78,062 |
Under the terms of the ELA, investment advisory fee reductions and expense reimbursements by the Adviser are subject to recoupment by the Adviser for a period of three years after such fees and expenses were incurred, provided that the recoupments do not cause total annual operating expenses of the Funds to exceed (i) the expense limitation then in effect, if any, and (ii) the expense limitation in effect at the time the expenses to be repaid were incurred. As of November 30, 2016, the Adviser may seek recoupment of investment advisory fee reductions and/or expense reimbursements no later than the dates as stated below:
| May 31,
2017 | May 31,
2018 | May 31,
2019 | November 30,
2019 | Total |
Barrow Value Opportunity Fund | $ 77,044 | $ 180,140 | $ 157,109 | $ 74,779 | $ 489,072 |
Barrow Long/Short Opportunity Fund | $ 106,338 | $ 212,647 | $ 193,578 | $ 78,062 | $ 590,625 |
The Principle Executive Officer of the Funds is also an officer of the Adviser.
63
BARROW FUNDS
NOTES TO FINANCIAL STATEMENTS (Continued) |
OTHER SERVICE PROVIDERS
Ultimus Fund Solutions, LLC (“Ultimus”) provides administration, fund accounting, compliance, and transfer agency services to the Funds. Each Fund pays Ultimus fees in accordance with the agreements for such services. In addition, each Fund pays out-of-pocket expenses including, but not limited to, postage, supplies, and costs of pricing its portfolio securities.
Under the terms of a Distribution Agreement with the Trust, Ultimus Fund Distributors, LLC (the “Distributor”) serves as principal underwriter to each Fund. The Distributor is a wholly-owned subsidiary of Ultimus.
Certain officers and a Trustee of the Trust are also officers of Ultimus and the Distributor.
TRUSTEE COMPENSATION
Effective October 1, 2016 each Trustee who is not an “interested person” of the Trust (“Independent Trustee”) receives a $1,000 annual retainer from each Fund, paid quarterly, except for the Board Chair who receives a $1,200 annual retainer from each Fund, paid quarterly. Each Independent Trustee also receives from each Fund a fee of $500 for each Board meeting attended plus reimbursement for travel and other meeting-related expenses. Prior to October 1, 2016, each Fund paid each Independent Trustee a fee of $500 for each Board meeting attended, plus a $500 annual retainer.
PRINCIPAL HOLDERS OF FUND SHARES
As of November 30, 2016, the following shareholders owned of record 5% or more of the outstanding shares of each Fund:
Name of Record Owner | % Ownership |
Barrow Value Opportunity Fund: | |
Socatean Partners | 48% |
Charles Schwab & Company, Inc. (for the benefit of its customers) | 29% |
Robert F. Greenhill, Jr. (a principal of the Adviser) | 14% |
Barrow Long/Short Opportunity Fund: | |
Charles Schwab & Company, Inc. (for the benefit of its customers) | 60% |
Socatean Partners | 15% |
A beneficial owner of 25% or more of a Fund’s outstanding shares may be considered a controlling person. That shareholder’s vote could have a more significant effect on matters presented at a shareholder’s meeting.
64
BARROW FUNDS
NOTES TO FINANCIAL STATEMENTS (Continued) |
5. Borrowing Costs
From time to time, a Fund may have an overdrawn cash balance at the custodian due to redemptions or market movements. When this occurs, the Fund will incur borrowing costs charged by the custodian. Accordingly, during the six months ended November 30, 2016, Barrow Value Opportunity Fund and Barrow Long/Short Opportunity Fund incurred $2,599 and $474, respectively, of borrowing costs charged by the custodian.
6. Contingencies and Commitments
The Funds indemnify the Trust’s officers and Trustees for certain liabilities that might arise from their performance of their duties to the Funds. Additionally, in the normal course of business the Funds enter into contracts that contain a variety of representations and warranties and which provide general indemnifications. The Funds’ maximum exposure under these arrangements is unknown, as this would involve future claims that may be made against the Funds that have not yet occurred. However, based on experience, the Funds expect the risk of loss to be remote.
7. Sector Risk
If a Fund has significant investments in the securities of issuers within a particular sector, any development affecting that sector will have a greater impact on the value of the net assets of the Fund than would be the case if the Fund did not have significant investments in that sector. In addition, this may increase the risk of loss in the Fund and increase the volatility of the Fund’s NAV per share. Occasionally, market conditions, regulatory changes, or other developments may negatively impact a particular sector, and therefore the value of the Fund’s portfolio will be adversely affected. As of November 30, 2016, Barrow Long/Short Opportunity Fund had the following percentages of the value of its net assets invested or sold short in stocks within the following sectors:
Sector | Long
Positions | Short
Positions | Net
Exposure |
Consumer Discretionary | 27.7% | (19.2%) | 8.5% |
Consumer Staples | 25.1% | (17.1%) | 8.0% |
Health Care | 26.8% | (18.2%) | 8.6% |
As shown above, although the Fund has greater than 25% of the Fund’s net assets invested in long positions in the sector noted, the sector exposure is mitigated by short positions. As part of the Fund’s principal investment strategies, the Adviser monitors the Fund’s sector exposure to ensure the Fund’s portfolio is adequately diversified.
65
BARROW FUNDS
NOTES TO FINANCIAL STATEMENTS (Continued) |
8. Subsequent Events
The Funds are required to recognize in the financial statements the effects of all subsequent events that provide additional evidence about conditions that existed as of the date of the Statements of Assets and Liabilities. For non-recognized subsequent events that must be disclosed to keep the financial statements from being misleading, the Funds are required to disclose the nature of the event as well as an estimate of its financial effect, or a statement that such an estimate cannot be made. Management has evaluated subsequent events through the issuance of these financial statements and has noted no such events other than the ordinary income dividend and long-term capital gain distribution paid by Barrow Value Opportunity Fund on December 30, 2016, as noted in Note 2.
66
BARROW FUNDS
ABOUT YOUR FUNDS’ EXPENSES (Unaudited) |
We believe it is important for you to understand the impact of costs on your investment. As a shareholder of the Funds, you incur ongoing costs, including management fees and other operating expenses. The following examples are intended to help you understand your ongoing costs (in dollars) of investing in the Funds and to compare these costs with the ongoing costs of investing in other mutual funds.
A mutual fund’s ongoing costs are expressed as a percentage of its average net assets. This figure is known as the expense ratio. The expenses in the table below are based on an investment of $1,000 made at the beginning of the most recent period (June 1, 2016) and held until the end of the period (November 30, 2016).
The table below illustrates each Fund’s ongoing costs in two ways:
Actual fund return – This section helps you to estimate the actual expenses that you paid over the period. The “Ending Account Value” shown is derived from each Fund’s actual return, and the fourth column shows the dollar amount of operating expenses that would have been paid by an investor who started with $1,000 in the Funds. You may use the information here, together with the amount you invested, to estimate the expenses that you paid over the period.
To do so, simply divide your account value by $1,000 (for example, an $8,600 account value divided by $1,000 = 8.6), then multiply the result by the number given for the Funds under the heading “Expenses Paid During Period.”
Hypothetical 5% return – This section is intended to help you compare the Funds’ ongoing costs with those of other mutual funds. It assumes that each Fund had an annual return of 5% before expenses during the period shown, but that the expense ratio is unchanged. In this case, because the return used is not the Funds’ actual return, the results do not apply to your investment. The example is useful in making comparisons because the U.S. Securities and Exchange Commission (the “SEC”) requires all mutual funds to calculate expenses based on a 5% return. You can assess each Fund’s ongoing costs by comparing this hypothetical example with the hypothetical examples that appear in shareholder reports of other funds.
Note that expenses shown in the table are meant to highlight and help you compare ongoing costs only. The Funds do not charge transaction fees, such as purchase or redemption fees, nor do they carry a “sales load.”
The calculations assume no shares were bought or sold during the period. Your actual costs may have been higher or lower, depending on the amount of your investment and the timing of any purchases or redemptions.
67
BARROW FUNDS
ABOUT YOUR FUNDS’ EXPENSES (Unaudited) (Continued) |
More information about the Funds’ expenses can be found in this report. For additional information on operating expenses and other shareholder costs, please refer to the Funds’ prospectus.
| Beginning
Account Value
June 1, 2016 | Ending
Account Value
November 30, 2016 | Net
Expense
Ratio(a) | Expenses
Paid During Period(b) |
Barrow Value Opportunity Fund | | | | |
Based on Actual Fund Return | $1,000.00 | $ 1,047.20 | 1.17% | $ 5.99 |
Based on Hypothetical 5% Return (before expenses) | $1,000.00 | $ 1,019.15 | 1.17% | $ 5.91 |
Barrow Long/Short Opportunity Fund | | | |
Based on Actual Fund Return | $1,000.00 | $ 969.10 | 3.93% | $ 19.35 |
Based on Hypothetical 5% Return (before expenses) | $1,000.00 | $ 1,005.35 | 3.93% | $ 19.70 |
(a) | Annualized, based on each Fund’s most recent one-half year expenses. |
(b) | Expenses are equal to each Fund’s annualized net expense ratio multiplied by the average account value over the period, multiplied by 183/366 (to reflect the one-half year period). |
68
BARROW FUNDS
OTHER INFORMATION (Unaudited) |
A description of the policies and procedures that the Funds use to vote proxies relating to portfolio securities is available without charge upon request by calling toll-free 1-877-767-6633, or on the SEC’s website at http://www.sec.gov. Information regarding how the Funds voted proxies relating to portfolio securities during the most recent 12 month period ended June 30 is also available without charge upon request by calling toll-free 1-877-767-6633, or on the SEC’s website at http://www.sec.gov.
The Trust files a complete listing of portfolio holdings for each Fund with the SEC as of the end of the first and third quarters of each fiscal year on Form N-Q. These filings are available upon request by calling 1-877-767-6633. Furthermore, you may obtain a copy of the filings on the SEC’s website at http://www.sec.gov. The Trust’s Forms N-Q may also be reviewed and copied at the SEC’s Public Reference Room in Washington, DC, and information on the operation of the Public Reference Room may be obtained by calling 1-800-SEC-0330.
69

CINCINNATI ASSET MANAGEMENT FUNDS:
BROAD MARKET STRATEGIC INCOME FUND
Semi-Annual Report
November 30, 2016
(Unaudited)
CINCINNATI ASSET MANAGEMENT FUNDS:
BROAD MARKET STRATEGIC INCOME FUND
LETTER TO SHAREHOLDERS | January 3, 2016 |
Dear Fellow Shareholders,
Our Semi-Annual report for the Cincinnati Asset Management Funds: Broad Market Strategic Income Fund (the “Fund”) presents data and performance for the six months ended November 30, 2016. All of us at Cincinnati Asset Management, Inc. want to thank you for your investment with us, and we appreciate your confidence in our investment management.
The Fund is invested primarily in investment-grade and high-yield corporate bonds that we consider undervalued. We believe that our proprietary analysis enhances our ability to identify such opportunities and enables us to sell securities when more attractive opportunities present themselves. These investment decisions are made with the important discipline of maintaining portfolio diversification and with the dual objectives of seeking to achieve a high level of income while preserving capital. Our goal is to improve quality, increase yield and shorten maturity.
Our disciplined investing strategy resulted in the Fund holding 88 positions in the bonds of 73 different corporations on November 30. The Fund continues to be fully invested, as is its objective. The Fund underperformed the Barclays U.S. Corporate BAA Index (the “Benchmark”) for the 6-month fiscal period ended November 30, with a total return of 0.31% compared to a return of 0.86% for the Benchmark. The Fund uses a credit quality barbell to achieve an investment grade rating target, and the overweight position in high quality corporates was a detriment to the Fund’s 6-month performance versus the Benchmark.
During the past six months interest rates increased. On June 1, 2016, the yield on the 10-year Treasury Bond was 1.84%, and on November 30, it was 2.38%. During that period, the premium yield on A-rated corporate bonds versus Treasuries declined from 1.16% to 1.05% and on BBB rated corporate bonds the premium declined from 2.01% to 1.69%. Significantly, the premium yield on BB- and B-rated securities declined by 0.73% and 1.27%, respectively. Although bond prices decline as rates increase, and the net asset value of the Fund will reflect those changes in interest rates, the compression in the premium yields that corporate bonds offered versus Treasuries during the six months enabled the Fund to incur less loss than what the Treasury market itself incurred. After November 30, the Federal Reserve Board (the “FED”) increased the Federal Funds Target Rate by ¼% during December, a move that had been generally anticipated for several months. Typically, changes in the Target Rate don’t significantly influence the 10-year Treasury rate, which is 2.54% as of the date of this letter (slightly lower than it was on December 15 when the Target Rate change was announced). At this time, the timing of additional rate increases is less critical than the questions of “how high” and “how fast.” As of November 30, bonds that the Fund owns were yielding 3.96% to average maturity, around 1.6% more than U.S. Treasury yields. We believe that the Fund’s positions will continue to provide excellent value relative to other investment-grade rated fixed-income alternatives.
During the first half of the Fund’s fiscal year, revised gross domestic product (“GDP”) for the third calendar quarter of 2016 was +3.2%, while the revised second calendar quarter of 2016 was +1.4%. The current consensus forecast for GDP growth for all of calendar 2016 is 1.6%. The unemployment picture seems to be fairly steady by most metrics as were initial
1
jobless claims during the last six months. The FED’s measure of inflation is below their target of 2.0%. Although interest rates will be impacted by “headline” news and the so-called “risk-off/risk-on” trades that cause short-term volatility, we intend to focus on the relative value of corporate and high-yield bonds and will maintain our focus on the intermediate-term maturity of the portfolio. It is the underlying credit quality of the companies we purchase that influences our investment decisions, not short-term interest rate fluctuations.
A predominant theme for the last 6 months has been the gradual increase and the current relative stability of oil prices, increasing from the mid-$40 range to the current $50-$55 range. Many corporations engaged in exploration and production, as well as many corporations providing services to the Energy sector, have enjoyed improving results, and their bonds have experienced recovery from their depressed prices of the first calendar quarter of 2016. The Fund holds several positions in these companies as well as issues of a coal company that had been adversely impacted by the pressures of low commodity prices, and those positions are exhibiting recovering strength. We continue to actively monitor these credits to determine how they may perform over a full market cycle, always seeking to be rewarded for the risks we assume.
We expect increased volatility in fixed-income markets as some participants continually readjust positioning. High yield bond funds saw significant inflows during the first half of December, and 2016 should show strong performance for that market as a whole. As always, we will continue to search for value and adjust positions as we uncover compelling situations.
Thank you again for your confidence in our Fund. Our fellow investors are very important to us and if you have any questions regarding market conditions or the Fund, please don’t hesitate to call us (513.554.8500).
Sincerely,
Cincinnati Asset Management Funds:
Broad Market Strategic Income Fund
Managed by Cincinnati Asset Management, Inc.
Past performance is not predictive of future performance. Investment results and principal value will fluctuate so that shares, when redeemed, may be worth more or less than their original cost. Current performance may be higher or lower than the performance data quoted. Performance data current to the most recent month end are available by calling 1-866-738-1128.
An investor should consider the investment objectives, risks, charges and expenses of the Fund carefully before investing. The Fund’s prospectus contains this and other important information. To obtain a copy of the Fund’s prospectus please visit the Fund’s website at www.cambondfunds.com or call 1-866-738-1128 and a copy will be sent to you free of charge. Please read the prospectus carefully before you invest. Cincinnati Asset Management Funds: Broad Market Strategic Income Fund is distributed by Ultimus Fund Distributors, LLC.
The Letter to Shareholders seeks to describe some of the adviser’s current opinions and views of the financial markets. Although the adviser believes it has a reasonable basis for any opinions or views expressed, actual results may differ, sometimes significantly so, from
2
those expected or expressed. The securities held by the Fund that are discussed in the Letter to Shareholders were held during the period covered by this Report. They do not comprise the entire investment portfolio of the Fund, may be sold at any time and may no longer be held by the Fund. For a complete list of securities held by the Fund as of November 30, 2016, please see the Schedule of Investments section of the Semi-Annual Report. The opinions of the Fund’s adviser with respect to those securities may change at any time.
Statements in the Letter to Shareholders that reflect projections or expectations for future financial or economic performance of the Fund and the market in general and statements of the Fund’s plans and objectives for future operations are forward-looking statements. No assurance can be given that actual results or events will not differ materially from those projected, estimated, assumed, or anticipated in any such forward-looking statements. Important factors that could result in such differences, in addition to factors noted with such forward-looking statements include, without limitation, general economic conditions, such as inflation, recession, and interest rates. Past performance is not a guarantee of future results.
3
CINCINNATI ASSET MANAGEMENT FUNDS:
BROAD MARKET STRATEGIC INCOME FUND
PORTFOLIO INFORMATION
November 30, 2016 (Unaudited)
Sector Diversification (% of Net Assets)
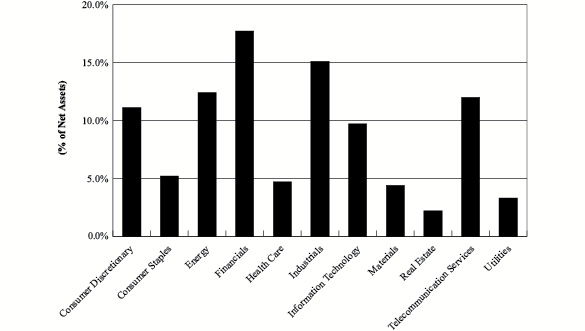
Top 10 Investments
Security Description | % of Net Assets |
Exxon Mobil Corp., 3.043%, due 03/01/26 | 3.1% |
Apple, Inc., 3.250%, due 02/23/26 | 2.5% |
L-3 Communications Corp., 3.950%, due 05/28/24 | 2.4% |
United Airlines, Inc., Class A Pass-Through Certificates, Series 2014-2, 3.750%, 03/03/28 | 2.4% |
Toll Brothers Finance Corp., 5.875%, due 02/15/22 | 2.3% |
Microsoft Corp., 2.400%, due 08/08/26 | 2.3% |
Wells Fargo & Co., 4.125%, due 8/15/23 | 2.2% |
Morgan Stanley, 3.700%, due 10/23/24 | 2.2% |
U.S. Bancorp, 2.950%, due 07/15/22 | 2.2% |
Halliburton Co., 3.500%, due 08/01/23 | 2.2% |
Credit Rating Allocation |
S&P Credit Quality | | % of Portfolio |
AAA | | 5.5% |
AA | | 13.5% |
A | | 26.2% |
BBB | | 26.3% |
BB | | 18.0% |
B | | 10.3% |
CCC | | 0.2% |
4
CINCINNATI ASSET MANAGEMENT FUNDS:
BROAD MARKET STRATEGIC INCOME FUND
SCHEDULE OF INVESTMENTS
November 30, 2016 (Unaudited) |
CORPORATE BONDS — 97.8% | | Coupon | | Maturity | | Par Value | | | Value | |
Consumer Discretionary — 11.1% | | | | | | | | | | |
Avis Budget Car Rental, LLC | | | 5.500 | % | 04/01/23 | | $ | 75,000 | | | $ | 72,750 | |
Cinemark USA, Inc. | | | 4.875 | % | 06/01/23 | | | 65,000 | | | | 65,975 | |
Constellation Brands, Inc. | | | 4.750 | % | 12/01/25 | | | 54,000 | | | | 58,320 | |
Ford Motor Credit Co., LLC | | | 4.250 | % | 09/20/22 | | | 150,000 | | | | 155,380 | |
Penske Auto Group, Inc. | | | 5.375 | % | 12/01/24 | | | 60,000 | | | | 59,250 | |
Regal Entertainment Group | | | 5.750 | % | 02/01/25 | | | 70,000 | | | | 70,700 | |
Royal Caribbean Cruises Ltd. | | | 7.500 | % | 10/15/27 | | | 59,000 | | | | 70,210 | |
Service Corp. International | | | 7.500 | % | 04/01/27 | | | 55,000 | | | | 64,075 | |
Tenneco, Inc. | | | 5.375 | % | 12/15/24 | | | 55,000 | | | | 56,925 | |
Tenneco, Inc. | | | 5.000 | % | 07/15/26 | | | 15,000 | | | | 14,780 | |
Toll Brothers Finance Corp. | | | 5.875 | % | 02/15/22 | | | 175,000 | | | | 190,531 | |
United Rentals, Inc. | | | 5.875 | % | 09/15/26 | | | 25,000 | | | | 25,625 | |
| | | | | | | | | | | | | 904,521 | |
Consumer Staples — 5.2% | | | | | | | | | | | | | |
Anheuser-Busch InBev SA/NV | | | 2.625 | % | 01/17/23 | | | 100,000 | | | | 97,866 | |
B&G Foods, Inc. | | | 4.625 | % | 06/01/21 | | | 58,000 | | | | 59,450 | |
Ingles Markets, Inc. | | | 5.750 | % | 06/15/23 | | | 75,000 | | | | 77,086 | |
Pinn Foods Finance, LLC | | | 5.875 | % | 01/15/24 | | | 67,000 | | | | 70,853 | |
Spectrum Brands, Inc. | | | 6.625 | % | 11/15/22 | | | 50,000 | | | | 53,250 | |
Wal-Mart Stores, Inc. | | | 2.550 | % | 04/11/23 | | | 65,000 | | | | 64,458 | |
| | | | | | | | | | | | | 422,963 | |
Energy — 12.4% | | | | | | | | | | | | | |
Apache Corp. | | | 3.250 | % | 04/15/22 | | | 109,000 | | | | 109,723 | |
Chevron Corp. | | | 2.355 | % | 12/05/22 | | | 150,000 | | | | 147,114 | |
Chevron Corp. | | | 2.954 | % | 05/16/26 | | | 100,000 | | | | 97,938 | |
Cloud Peak Energy Resources, LLC | | | 8.500 | % | 12/15/19 | | | 12,000 | | | | 11,100 | |
Exxon Mobil Corp. | | | 3.043 | % | 03/01/26 | | | 250,000 | | | | 248,156 | |
Halliburton Co. | | | 3.500 | % | 08/01/23 | | | 175,000 | | | | 176,324 | |
Sabine Pass Liquefaction, LLC | | | 5.625 | % | 04/15/23 | | | 59,000 | | | | 61,950 | |
Schlumberger Ltd. | | | 3.650 | % | 12/01/23 | | | 150,000 | | | | 155,880 | |
| | | | | | | | | | | | | 1,008,185 | |
Financials — 17.7% | | | | | | | | | | | | | |
Aircastle Ltd. | | | 5.500 | % | 02/15/22 | | | 58,000 | | | | 61,190 | |
Bank of New York Mellon Corp. (The) | | | 3.000 | % | 02/24/25 | | | 100,000 | | | | 98,827 | |
Berkshire Hathaway, Inc. | | | 3.125 | % | 03/15/26 | | | 125,000 | | | | 124,168 | |
Branch Banking & Trust Co. | | | 3.625 | % | 09/16/25 | | | 150,000 | | | | 152,944 | |
Corrections Corp. of America | | | 5.000 | % | 10/15/22 | | | 70,000 | | | | 69,475 | |
Corrections Corp. of America | | | 4.625 | % | 05/01/23 | | | 10,000 | | | | 9,775 | |
International Lease Finance Corp. | | | 5.875 | % | 08/15/22 | | | 150,000 | | | | 164,292 | |
Morgan Stanley | | | 3.700 | % | 10/23/24 | | | 175,000 | | | | 177,523 | |
5
CINCINNATI ASSET MANAGEMENT FUNDS:
BROAD MARKET STRATEGIC INCOME FUND
SCHEDULE OF INVESTMENTS (Continued) |
CORPORATE BONDS — 97.8% (Continued) | | Coupon | | Maturity | | Par Value | | | Value | |
Financials — 17.7% (Continued) | | | | | | | | | | |
PNC Financial Services Group, Inc. (The) (a) | | | 3.900 | % | 04/29/24 | | $ | 150,000 | | | $ | 154,261 | |
Progressive Corp. (The) | | | 2.450 | % | 01/15/27 | | | 75,000 | | | | 69,846 | |
U.S. Bancorp | | | 2.950 | % | 07/15/22 | | | 175,000 | | | | 176,635 | |
Wells Fargo & Co. | | | 4.125 | % | 08/15/23 | | | 175,000 | | | | 181,458 | |
| | | | | | | | | | | | | 1,440,394 | |
Health Care — 4.7% | | | | | | | | | | | | | |
DaVita HealthCare Partners, Inc. | | | 5.000 | % | 05/01/25 | | | 80,000 | | | | 78,200 | |
HCA Holdings, Inc. | | | 5.375 | % | 02/01/25 | | | 60,000 | | | | 58,800 | |
HCA Holdings, Inc. | | | 5.875 | % | 02/15/26 | | | 10,000 | | | | 9,987 | |
HealthSouth Corp. | | | 5.750 | % | 11/01/24 | | | 60,000 | | | | 60,450 | |
HealthSouth Corp. | | | 5.750 | % | 09/15/25 | | | 10,000 | | | | 10,025 | |
PerkinElmer, Inc. | | | 5.000 | % | 11/15/21 | | | 150,000 | | | | 160,244 | |
| | | | | | | | | | | | | 377,706 | |
Industrials — 15.1% | | | | | | | | | | | | | |
General Dynamics Corp. | | | 2.250 | % | 11/15/22 | | | 100,000 | | | | 98,837 | |
Hawaiian Airlines, Inc., Series 2013-1A | | | 3.900 | % | 01/15/26 | | | 65,046 | | | | 66,672 | |
Iron Mountain, Inc. | | | 5.750 | % | 08/15/24 | | | 85,000 | | | | 86,683 | |
L-3 Communications Corp. | | | 3.950 | % | 05/28/24 | | | 195,000 | | | | 198,495 | |
Raytheon Co. | | | 2.500 | % | 12/15/22 | | | 150,000 | | | | 149,732 | |
Stanley Black & Decker, Inc. | | | 2.900 | % | 11/01/22 | | | 150,000 | | | | 151,618 | |
United Airlines, Inc., Class A Pass-Through Certificates, Series 2014-2 | | | 3.750 | % | 03/03/28 | | | 188,465 | | | | 192,469 | |
United Airlines, Inc., Class B Pass-Through Certificates, Series 2013-1 | | | 5.375 | % | 02/15/23 | | | 35,151 | | | | 36,776 | |
United Rentals North America, Inc. | | | 5.500 | % | 07/15/25 | | | 60,000 | | | | 60,675 | |
US Airways, Inc., Class A Pass-Through Certificates, Series 2012-2 | | | 4.625 | % | 06/03/25 | | | 139,346 | | | | 149,275 | |
US Airways, Inc., Class B Pass-Through Certificates, Series 2012-2 | | | 6.750 | % | 12/03/22 | | | 33,905 | | | | 36,491 | |
| | | | | | | | | | | | | 1,227,723 | |
Information Technology — 9.7% | | | | | | | | | | | | | |
Apple, Inc. | | | 3.250 | % | 02/23/26 | | | 205,000 | | | | 206,527 | |
Equinix, Inc. | | | 5.375 | % | 04/01/23 | | | 55,000 | | | | 56,719 | |
Equinix, Inc. | | | 5.875 | % | 01/15/26 | | | 20,000 | | | | 20,800 | |
Hewlett-Packard Co. | | | 4.375 | % | 09/15/21 | | | 150,000 | | | | 157,803 | |
Intel Corp. | | | 2.700 | % | 12/15/22 | | | 150,000 | | | | 151,413 | |
Microsoft Corp. | | | 2.400 | % | 08/08/26 | | | 200,000 | | | | 190,153 | |
| | | | | | | | | | | | | 783,415 | |
6
CINCINNATI ASSET MANAGEMENT FUNDS:
BROAD MARKET STRATEGIC INCOME FUND
SCHEDULE OF INVESTMENTS (Continued) |
CORPORATE BONDS — 97.8% (Continued) | | Coupon | | Maturity | | Par Value | | | Value | |
Materials — 4.4% | | | | | | | | | | |
Graphic Packaging International, Inc. | | | 4.125 | % | 08/15/24 | | $ | 65,000 | | | $ | 63,050 | |
Huntsman International, LLC | | | 4.875 | % | 11/15/20 | | | 75,000 | | | | 77,438 | |
Huntsman International, LLC | | | 5.125 | % | 11/15/22 | | | 10,000 | | | | 10,200 | |
Praxair, Inc. | | | 2.200 | % | 08/15/22 | | | 150,000 | | | | 147,333 | |
Vulcan Materials Co. | | | 7.150 | % | 11/30/37 | | | 50,000 | | | | 60,375 | |
| | | | | | | | | | | | | 358,396 | |
Real Estate — 2.2% | | | | | | | | | | | | | |
Simon Property Group, L.P. | | | 3.750 | % | 02/01/24 | | | 150,000 | | | | 155,519 | |
Simon Property Group, L.P. | | | 3.250 | % | 11/30/26 | | | 25,000 | | | | 24,645 | |
| | | | | | | | | | | | | 180,164 | |
Telecommunication Services — 12.0% | | | | | | | | | | | | | |
AT&T, Inc. | | | 2.625 | % | 12/01/22 | | | 100,000 | | | | 95,907 | |
CCO Holdings, LLC/CCO Holdings Capital Corp. | | | 5.750 | % | 01/15/24 | | | 65,000 | | | | 68,169 | |
Comcast Corp. | | | 3.600 | % | 03/01/24 | | | 80,000 | | | | 82,877 | |
Comcast Corp. | | | 3.150 | % | 03/01/26 | | | 115,000 | | | | 114,401 | |
Frontier Communications Corp. | | | 11.000 | % | 09/15/25 | | | 15,000 | | | | 15,094 | |
Frontier Communications Corp. | | | 9.000 | % | 08/15/31 | | | 55,000 | | | | 46,475 | |
Lamar Media Corp. | | | 5.750 | % | 02/01/26 | | | 67,000 | | | | 70,983 | |
Level 3 Financing, Inc. | | | 5.375 | % | 05/01/25 | | | 66,000 | | | | 65,835 | |
Mediacom, LLC/Mediacom Capital Corp. | | | 5.500 | % | 04/15/21 | | | 17,000 | | | | 17,574 | |
Mediacom, LLC/Mediacom Capital Corp. | | | 7.250 | % | 02/15/22 | | | 50,000 | | | | 51,938 | |
Mediacom, LLC/Mediacom Capital Corp. | | | 6.375 | % | 04/01/23 | | | 10,000 | | | | 10,550 | |
Qwest Corp. | | | 6.750 | % | 12/01/21 | | | 150,000 | | | | 162,975 | |
T-Mobile USA, Inc. | | | 6.500 | % | 01/15/24 | | | 55,000 | | | | 58,901 | |
Verizon Communications, Inc. | | | 5.150 | % | 09/15/23 | | | 25,000 | | | | 27,718 | |
Zayo Group, LLC | | | 6.375 | % | 05/15/25 | | | 80,000 | | | | 83,500 | |
| | | | | | | | | | | | | 972,897 | |
Utilities — 3.3% | | | | | | | | | | | | | |
AES Corp. (The) | | | 5.500 | % | 03/15/24 | | | 43,000 | | | | 42,570 | |
AES Corp. (The) | | | 5.500 | % | 04/15/25 | | | 30,000 | | | | 29,325 | |
Amerigas Finance, LLC | | | 5.875 | % | 08/20/26 | | | 72,000 | | | | 71,977 | |
Calpine Corp. | | | 5.750 | % | 01/15/25 | | | 65,000 | | | | 62,319 | |
Suburban Propane Partners, L.P. | | | 5.500 | % | 06/01/24 | | | 60,000 | | | | 60,450 | |
| | | | | | | | | | | | | 266,641 | |
| | | | | | |
Total Investments at Value — 97.8% (Cost $7,973,059) | | | $ | 7,943,005 | |
| | | | | | |
Other Assets in Excess of Liabilities — 2.2% | | | | 180,807 | |
| | | | | | |
Net Assets — 100.0% | | | $ | 8,123,812 | |
(a) | Step coupon security. The rate shown is the effective interest rate as of November 30, 2016. |
See accompanying notes to financial statements. |
7
CINCINNATI ASSET MANAGEMENT FUNDS:
BROAD MARKET STRATEGIC INCOME FUND
STATEMENT OF ASSETS AND LIABILITIES
November 30, 2016 (Unaudited) |
ASSETS | | | |
Investments in securities: | | | |
At acquisition cost | | $ | 7,973,059 | |
At value (Note 2) | | $ | 7,943,005 | |
Cash | | | 80,057 | |
Interest receivable | | | 89,474 | |
Receivable from Adviser (Note 4) | | | 16,339 | |
Other assets | | | 18,916 | |
Total assets | | | 8,147,791 | |
| | | | | |
LIABILITIES | | | | |
Payable to administrator (Note 4) | | | 7,070 | |
Accrued distribution fees (Note 4) | | | 1,531 | |
Other accrued expenses | | | 15,378 | |
Total liabilities | | | 23,979 | |
| | | | | |
NET ASSETS | | $ | 8,123,812 | |
| | | | | |
NET ASSETS CONSIST OF: | | | | |
Paid-in capital | | $ | 8,432,902 | |
Accumulated net investment income | | | 42,540 | |
Accumulated net realized losses from security transactions | | | (321,576 | ) |
Net unrealized depreciation on investments | | | (30,054 | ) |
NET ASSETS | | $ | 8,123,812 | |
| | | | | |
Shares of beneficial interest outstanding (unlimited number of shares authorized, no par value) | | | 849,252 | |
| | | | | |
Net asset value, offering price and redemption price per share (Note 2) | | $ | 9.57 | |
See accompanying notes to financial statements. |
8
CINCINNATI ASSET MANAGEMENT FUNDS:
BROAD MARKET STRATEGIC INCOME FUND
STATEMENT OF OPERATIONS
For the Six Months Ended November 30, 2016 (Unaudited) |
INVESTMENT INCOME | | | |
Interest | | $ | 147,551 | |
| | | | | |
EXPENSES | | | | |
Investment advisory fees (Note 4) | | | 30,600 | |
Professional fees | | | 20,398 | |
Fund accounting fees (Note 4) | | | 15,416 | |
Administration fees (Note 4) | | | 15,000 | |
Registration and filing fees | | | 11,409 | |
Distribution fees (Note 4) | | | 10,200 | |
Pricing fees | | | 9,576 | |
Compliance fees (Note 4) | | | 6,000 | |
Transfer agent fees (Note 4) | | | 6,000 | |
Trustees’ fees and expenses (Note 4) | | | 4,569 | |
Custody and bank service fees | | | 3,849 | |
Postage and supplies | | | 931 | |
Insurance expense | | | 514 | |
Other expenses | | | 6,120 | |
Total expenses | | | 140,582 | |
Less fee waivers and expense reimbursements by the Adviser (Note 4) | | | (114,061 | ) |
Net expenses | | | 26,521 | |
| | | | | |
NET INVESTMENT INCOME | | | 121,030 | |
| | | | | |
REALIZED AND UNREALIZED GAINS (LOSSES) ON INVESTMENTS | | | | |
Net realized gains from security transactions | | | 12,470 | |
Net change in unrealized appreciation (depreciation) on investments | | | (123,658 | ) |
NET REALIZED AND UNREALIZED LOSSES ON INVESTMENTS | | | (111,188 | ) |
| | | | | |
NET INCREASE IN NET ASSETS RESULTING FROM OPERATIONS | | $ | 9,842 | |
See accompanying notes to financial statements. |
9
CINCINNATI ASSET MANAGEMENT FUNDS:
BROAD MARKET STRATEGIC INCOME FUND
STATEMENT OF CHANGES IN NET ASSETS |
| | Six Months
Ended
November 30,
2016
(Unaudited) | | | Year
Ended
May 31,
2016 | |
FROM OPERATIONS | | | | | | |
Net investment income | | $ | 121,030 | | | $ | 234,307 | |
Net realized gains (losses) from security transactions | | | 12,470 | | | | (331,563 | ) |
Net change in unrealized appreciation (depreciation) on investments | | | (123,658 | ) | | | 99,081 | |
Net increase in net assets resulting from operations | | | 9,842 | | | | 1,825 | |
| | | | | | | | | |
DISTRIBUTIONS TO SHAREHOLDERS | | | | | | | | |
From net investment income | | | (116,589 | ) | | | (238,438 | ) |
| | | | | | | | | |
FROM CAPITAL SHARE TRANSACTIONS | | | | | | | | |
Proceeds from shares sold | | | 1,009,349 | | | | 506,515 | |
Net asset value of shares issued in reinvestment of distributions to shareholders | | | 116,589 | | | | 238,438 | |
Payments for shares redeemed | | | (461,096 | ) | | | (174,874 | ) |
Net increase in net assets from capital share transactions | | | 664,842 | | | | 570,079 | |
| | | | | | | | | |
TOTAL INCREASE IN NET ASSETS | | | 558,095 | | | | 333,466 | |
| | | | | | | | | |
NET ASSETS | | | | | | | | |
Beginning of period | | | 7,565,717 | | | | 7,232,251 | |
End of period | | $ | 8,123,812 | | | $ | 7,565,717 | |
| | | | | | | | | |
ACCUMULATED NET INVESTMENT INCOME | | $ | 42,540 | | | $ | 37,840 | |
| | | | | | | | | |
CAPITAL SHARE ACTIVITY | | | | | | | | |
Shares sold | | | 102,937 | | | | 53,320 | |
Shares reinvested | | | 11,919 | | | | 24,991 | |
Shares redeemed | | | (47,227 | ) | | | (18,186 | ) |
Net increase in shares outstanding | | | 67,629 | | | | 60,125 | |
Shares outstanding at beginning of period | | | 781,623 | | | | 721,498 | |
Shares outstanding at end of period | | | 849,252 | | | | 781,623 | |
See accompanying notes to financial statements. |
10
CINCINNATI ASSET MANAGEMENT FUNDS:
BROAD MARKET STRATEGIC INCOME FUND
FINANCIAL HIGHLIGHTS |
Per Share Data for a Share Outstanding Throughout Each Period |
| | Six Months
Ended
Nov. 30,
2016
(Unaudited) | | | Year
Ended
May 31,
2016 | | | Year
Ended
May 31,
2015 | | | Year
Ended
May 31,
2014 | | | Period
Ended
May 31,
2013(a) | |
Net asset value at beginning of period | | $ | 9.68 | | | $ | 10.02 | | | $ | 10.05 | | | $ | 9.94 | | | $ | 10.00 | |
| | | | | | | | | | | | | | | | | | | | | |
Income (loss) from investment operations: | | | | | | | | | | | | | | | | | | | | |
Net investment income | | | 0.14 | | | | 0.32 | | | | 0.33 | | | | 0.33 | | | | 0.16 | |
Net realized and unrealized gains (losses) on investments | | | (0.11 | ) | | | (0.33 | ) | | | (0.04 | ) | | | 0.11 | | | | (0.11 | ) |
Total from investment operations | | | 0.03 | | | | (0.01 | ) | | | 0.29 | | | | 0.44 | | | | 0.05 | |
| | | | | | | | | | | | | | | | | | | | | |
Less distributions: | | | | | | | | | | | | | | | | | | | | |
From net investment income | | | (0.14 | ) | | | (0.33 | ) | | | (0.32 | ) | | | (0.33 | ) | | | (0.11 | ) |
| | | | | | | | | | | | | | | | | | | | | |
Net asset value at end of period | | $ | 9.57 | | | $ | 9.68 | | | $ | 10.02 | | | $ | 10.05 | | | $ | 9.94 | |
| | | | | | | | | | | | | | | | | | | | | |
Total return (b) | | | 0.31 | %(c) | | | (0.06 | %) | | | 2.99 | % | | | 4.68 | % | | | 0.48 | %(c) |
| | | | | | | | | | | | | | | | | | | | | |
Net assets at end of period (000’s) | | $ | 8,124 | | | $ | 7,566 | | | $ | 7,232 | | | $ | 6,407 | | | $ | 5,220 | |
| | | | | | | | | | | | | | | | | | | | | |
Ratios/supplementary data: | | | | | | | | | | | | | | | | | | | | |
Ratio of total expenses to average net assets | | | 3.44 | %(d) | | | 3.77 | % | | | 3.71 | % | | | 4.53 | % | | | 3.69 | %(d) |
| | | | | | | | | | | | | | | | | | | | | |
Ratio of net expenses to average net assets (e) | | | 0.65 | %(d) | | | 0.65 | % | | | 0.65 | % | | | 0.65 | % | | | 0.65 | %(d) |
| | | | | | | | | | | | | | | | | | | | | |
Ratio of net investment income to average net assets (e) | | | 2.97 | %(d) | | | 3.30 | % | | | 3.35 | % | | | 3.41 | % | | | 2.81 | %(d) |
| | | | | | | | | | | | | | | | | | | | | |
Portfolio turnover rate | | | 11 | %(c) | | | 18 | % | | | 23 | % | | | 11 | % | | | 13 | %(c) |
(a) | Represents the period from the commencement of operations (October 26, 2012) through May 31, 2013. |
(b) | Total return is a measure of the change in value of an investment in the Fund over the period covered. The returns shown do not reflect the deduction of taxes a shareholder would pay on Fund distributions, if any, or the redemption of Fund shares. The total returns would be lower if the Adviser had not waived advisory fees and reimbursed expenses. |
(e) | Ratio was determined after advisory fee waivers and expense reimbursements (Note 4). |
See accompanying notes to financial statements. |
11
CINCINNATI ASSET MANAGEMENT FUNDS:
BROAD MARKET STRATEGIC INCOME FUND
NOTES TO FINANCIAL STATEMENTS
November 30, 2016 (Unaudited)
1. Organization
Cincinnati Asset Management Funds: Broad Market Strategic Income Fund (the “Fund”) is a diversified series of Ultimus Managers Trust (the “Trust”), an open-end investment company established as an Ohio business trust under a Declaration of Trust dated February 28, 2012. Other series of the Trust are not incorporated in this report. The Fund commenced operations on October 26, 2012.
The investment objective of the Fund is to seek to achieve a high level of income consistent with a secondary goal of capital preservation.
2. Significant Accounting Policies
The following is a summary of the Fund’s significant accounting policies. These policies are in conformity with accounting principles generally accepted in the United States of America (“GAAP”). As an investment company, as defined in Financial Accounting Standards Board (“FASB”) Accounting Standards Update 2013-08, the Fund follows accounting and reporting guidance under FASB Accounting Standards Codification Topic 946, “Financial Services – Investment Companies.”
In October 2016, the Securities and Exchange Commission (the “SEC”) released its final rule on Investment Company Reporting Modernization (the “Rule”). The Rule, which introduces two new regulatory reporting forms for investment companies – Form N-PORT and Form N-CEN, also contains amendments to Regulation S-X which impact financial statement presentation, particularly the presentation of derivative investments. Although still evaluating the impact of the Rule, management believes that many of the Regulation S-X amendments are consistent with the Fund’s current financial statement presentation and expects that the Fund will be able to comply with the Rule’s Regulation S-X amendments by the August 1, 2017 compliance date.
Securities valuation – The Fund’s fixed income securities are valued using prices provided by an independent pricing service approved by the Trust’s Board of Trustees (the “Board”). The independent pricing service uses information with respect to transactions in bonds, quotations from bond dealers, market transactions in comparable securities, and various relationships between securities in determining these prices. The methods used by the independent pricing service and the quality of valuations so established are reviewed by Cincinnati Asset Management, Inc. (the “Adviser”), under the general supervision of the Board. Securities for which market quotations are not readily available are valued at fair value as determined in good faith under procedures adopted by the Board.
GAAP establishes a single authoritative definition of fair value, sets out a framework for measuring fair value, and requires additional disclosures about fair value measurements.
12
CINCINNATI ASSET MANAGEMENT FUNDS:
BROAD MARKET STRATEGIC INCOME FUND
NOTES TO FINANCIAL STATEMENTS (Continued) |
Various inputs are used in determining the value of the Fund’s investments. These inputs are summarized in the three broad levels listed below:
● | Level 1 – quoted prices in active markets for identical securities |
● | Level 2 – other significant observable inputs |
● | Level 3 – significant unobservable inputs |
Corporate bonds are classified as Level 2 since values are based on prices provided by an independent pricing service that utilizes various “other significant observable inputs” including bid and ask quotations, prices of similar securities, and interest rates, among other factors. The inputs or methods used for valuing securities are not necessarily an indication of the risks associated with investing in those securities. The inputs used to measure fair value may fall into different levels of the fair value hierarchy. In such cases, for disclosure purposes, the level in the fair value hierarchy within which the fair value measurement falls in its entirety is determined based on the lowest level input that is significant to the fair value measurement.
The following is a summary of the inputs used to value the Fund’s investments as of November 30, 2016:
| | Level 1 | | | Level 2 | | | Level 3 | | | Total | |
Corporate Bonds | | $ | — | | | $ | 7,943,005 | | | $ | — | | | $ | 7,943,005 | |
Refer to the Fund’s Schedule of Investments for a listing of the securities by sector type. As of November 30, 2016, the Fund did not have any transfers between Levels. In addition, the Fund did not have derivative instruments or any assets or liabilities that were measured at fair value on a recurring basis using significant unobservable inputs (Level 3) as of November 30, 2016. It is the Fund’s policy to recognize transfers between Levels at the end of the reporting period.
Share valuation – The net asset value (“NAV”) per share of the Fund is calculated daily by dividing the total value of the Fund’s assets, less liabilities, by the number of shares outstanding. The offering price and redemption price per share of the Fund is equal to the NAV per share.
Investment income – Interest income is accrued as earned. Discounts and premiums on fixed income securities purchased are accreted or amortized using the effective interest method. Dividend income is recorded on the ex-dividend date.
Security transactions – Security transactions are accounted for on the trade date. Realized gains and losses on securities sold are determined on a specific identification basis.
Common expenses – Common expenses of the Trust are allocated among the Fund and other series of the Trust based on the relative net assets of each series or the nature of the services performed and the relative applicability to each series.
13
CINCINNATI ASSET MANAGEMENT FUNDS:
BROAD MARKET STRATEGIC INCOME FUND
NOTES TO FINANCIAL STATEMENTS (Continued) |
Distributions to shareholders – Dividends from net investment income are declared and paid quarterly to shareholders. Net realized capital gains, if any, are distributed at least once each year. The amount of distributions from net investment income and net realized capital gains are determined in accordance with federal income tax regulations, which may differ from GAAP. Dividends and distributions to shareholders are recorded on the ex-dividend date. The tax character of the Fund’s distributions during the periods ended November 30, 2016 and May 31, 2016 was ordinary income. On December 30, 2016, the Fund paid an ordinary income dividend of $0.0750 per share to shareholders of record on December 29, 2016.
Estimates – The preparation of financial statements in conformity with GAAP requires management to make estimates and assumptions that affect the reported amounts of assets and liabilities and disclosure of contingent assets and liabilities as of the date of the financial statements and the reported amounts of income and expenses during the reporting period. Actual results could differ from those estimates.
Federal income tax – The Fund has qualified and intends to continue to qualify as a regulated investment company under the Internal Revenue Code of 1986 (the “Code”). Qualification generally will relieve the Fund of liability for federal income taxes to the extent 100% of its net investment income and net realized capital gains are distributed in accordance with the Code.
In order to avoid imposition of the excise tax applicable to regulated investment companies, it is also the Fund’s intention to declare as dividends in each calendar year at least 98% of its net investment income (earned during the calendar year) and 98.2% of its net realized capital gains (earned during the twelve months ended October 31) plus undistributed amounts from prior years.
The following information is computed on a tax basis for each item as of November 30, 2016:
Tax cost of portfolio investments | | $ | 7,973,059 | |
Gross unrealized appreciation | | $ | 96,392 | |
Gross unrealized depreciation | | | (126,446 | ) |
Net unrealized depreciation on investments | | | (30,054 | ) |
Accumulated ordinary income | | | 42,540 | |
Accumulated capital and other losses | | | (321,576 | ) |
Accumulated deficit | | $ | (309,090 | ) |
As of May 31, 2016, the Fund had short-term capital loss carryforwards of $94,191 and long-term capital loss carryfowards of $239,596. These capital loss carryforwards, which do not expire, may be utilized in the current and future years to offset net realized capital gains, if any, prior to distributing such gains to shareholders.
14
CINCINNATI ASSET MANAGEMENT FUNDS:
BROAD MARKET STRATEGIC INCOME FUND
NOTES TO FINANCIAL STATEMENTS (Continued) |
For the six months ended November 30, 2016, the Fund reclassified $259 of accumulated net investment income against accumulated net realized losses from security transactions on the Statement of Assets and Liabilities due to permanent differences in the recognition of capital gains or losses under income tax regulations and GAAP. This difference is due to the tax treatment of paydown adjustments. Such reclassification had no effect on the Fund’s net assets or NAV per share.
The Fund recognizes the tax benefits or expenses of uncertain tax positions only when the position is “more likely than not” to be sustained assuming examination by tax authorities. Management has reviewed the Fund’s tax positions for the current and all open tax periods (periods ended May 31, 2013 through May 31, 2016) and has concluded that no provision for unrecognized tax benefits or expenses is required in these financial statements. The Fund identifies its major tax jurisdiction as U.S. Federal.
3. Investment Transactions
During the six months ended November 30, 2016, cost of purchases and proceeds from sales of investment securities, other than short-term investments, were $1,849,301 and $884,006, respectively.
4. Transactions with Related Parties
INVESTMENT ADVISORY AGREEMENT
The Fund’s investments are managed by the Adviser pursuant to the terms of an Investment Advisory Agreement. Under the Investment Advisory Agreement, the Fund pays the Adviser an advisory fee, computed and accrued daily and paid monthly, at the annual rate of 0.75% of its average daily net assets.
Pursuant to an expense limitation agreement between the Fund and the Adviser, the Adviser has contractually agreed until October 1, 2017 to waive investment advisory fees and reimburse certain other operating expenses in order to limit total annual operating expenses of the Fund (exclusive of brokerage costs such as fees and commissions; taxes; borrowing costs such as interest and dividend expenses on securities sold short; acquired fund fees and expenses; other expenditures which are capitalized in accordance with GAAP; extraordinary costs such as expenses related to organizing a fund, mergers or organizations, litigation and other expenses not incurred in the ordinary course of the Fund’s business, and amounts, if any, payable to a plan adopted in accordance with Rule 12b-1 under the Investment Company Act of 1940 (the “1940 Act”), as amended) to an amount not exceeding 0.65% of the Fund’s average daily net assets. Accordingly, the Adviser did not collect any of its advisory fees and, in addition, reimbursed other operating expenses totaling $83,461 during the period ended November 30, 2016.
An officer of the Fund is also an officer of the Adviser.
15
CINCINNATI ASSET MANAGEMENT FUNDS:
BROAD MARKET STRATEGIC INCOME FUND
NOTES TO FINANCIAL STATEMENTS (Continued) |
DISTRIBUTION PLAN
The Fund has adopted a distribution plan pursuant to Rule 12b-1 under the 1940 Act (the “Rule 12b-1 Plan”), pursuant to which the Fund may incur certain costs for distribution and/or shareholder servicing expenses not to exceed 0.25% per annum of the Fund’s average daily net assets. During the six months ended November 30, 2016, the Fund incurred $10,200 in distribution and service fees under the Rule 12b-1 Plan.
OTHER SERVICE PROVIDERS
Ultimus Fund Solutions, LLC (“Ultimus”) provides administration, fund accounting, compliance and transfer agency services to the Fund. The Fund pays Ultimus fees in accordance with the agreements for such services. In addition, the Fund pays out-of-pocket expenses including, but not limited to, postage, supplies and costs of pricing the Fund’s portfolio securities.
Under the terms of a Distribution Agreement with the Trust, Ultimus Fund Distributors, LLC (the “Distributor”) serves as principal underwriter to the Fund. The Distributor is a wholly-owned subsidiary of Ultimus.
Certain officers and a Trustee of the Trust are also officers of Ultimus and the Distributor.
TRUSTEE COMPENSATION
Effective October 1, 2016 each Trustee who is not an “interested person” of the Trust (“Independent Trustee”) receives a $1,000 annual retainer from the Fund, paid quarterly, except for the Board Chair who receives a $1,200 annual retainer from the Fund, paid quarterly. Each Independent Trustee also receives from the Fund a fee of $500 for each Board meeting attended plus reimbursement for travel and other meeting-related expenses. Prior to October 1, 2016, the Fund paid each Independent Trustee a fee of $500 for each Board meeting attended, plus a $500 annual retainer.
PRINCIPAL HOLDERS OF FUND SHARES
As of November 30, 2016, the following shareholders owned of record 5% or more of the outstanding shares of the Fund:
Name of Record Owner | % Ownership |
Mary S. Sloneker | 37% |
Cincinnati Asset Management, Inc. | 29% |
William S. Sloneker | 17% |
Charles Schwab & Co., Inc. (for the benefit of its customers) | 12% |
A beneficial owner of 25% or more of the Fund’s outstanding shares may be considered a controlling person. That shareholder’s vote could have a more significant effect on matters presented at a shareholder’s meeting.
16
CINCINNATI ASSET MANAGEMENT FUNDS:
BROAD MARKET STRATEGIC INCOME FUND
NOTES TO FINANCIAL STATEMENTS (Continued) |
5. Contingencies and Commitments
The Fund indemnifies the Trust’s officers and Trustees for certain liabilities that might arise from their performance of their duties to the Fund. Additionally, in the normal course of business, the Fund enters into contracts that contain a variety of representations and warranties and which provide general indemnifications. The Fund’s maximum exposure under these arrangements is unknown, as this would involve future claims that may be made against the Fund that have not yet occurred. However, based on experience, the Fund expects the risk of loss to be remote.
6. Subsequent Events
The Fund is required to recognize in the financial statements the effects of all subsequent events that provide additional evidence about conditions that existed as of the date of the Statement of Assets and Liabilities. For non-recognized subsequent events that must be disclosed to keep the financial statements from being misleading, the Fund is required to disclose the nature of the event as well as an estimate of its financial effect, or a statement that such an estimate cannot be made. Management has evaluated subsequent events through the issuance of these financial statements and has noted no such events other than the ordinary income dividend paid on December 30, 2016, as noted in Note 2.
17
CINCINNATI ASSET MANAGEMENT FUNDS:
BROAD MARKET STRATEGIC INCOME FUND
ABOUT YOUR FUND’S EXPENSES (Unaudited) |
We believe it is important for you to understand the impact of costs on your investment. As a shareholder of the Fund, you incur ongoing costs, including management fees, distribution (12b-1) fees and other operating expenses. The following examples are intended to help you understand your ongoing costs (in dollars) of investing in the Fund and to compare these costs with the ongoing costs of investing in other mutual funds.
A mutual fund’s ongoing costs are expressed as a percentage of its average net assets. This figure is known as the expense ratio. The expenses in the table below are based on an investment of $1,000 made at the beginning of the most recent period (June 1, 2016) and held until the end of the period (November 30, 2016).
The table below illustrates the Fund’s ongoing costs in two ways:
Actual fund return – This section helps you to estimate the actual expenses that you paid over the period. The “Ending Account Value” shown is derived from the Fund’s actual return, and the third column shows the dollar amount of operating expenses that would have been paid by an investor who started with $1,000 in the Fund. You may use the information here, together with the amount you invested, to estimate the expenses that you paid over the period.
To do so, simply divide your account value by $1,000 (for example, an $8,600 account value divided by $1,000 = 8.6), then multiply the result by the number given for the Fund under the heading “Expenses Paid During Period.”
Hypothetical 5% return – This section is intended to help you compare the Fund’s ongoing costs with those of other mutual funds. It assumes that the Fund had an annual return of 5% before expenses during the period shown, but that the expense ratio is unchanged. In this case, because the return used is not the Fund’s actual return, the results do not apply to your investment. The example is useful in making comparisons because the U.S. Securities and Exchange Commission (“SEC”) requires all mutual funds to calculate expenses based on a 5% return. You can assess the Fund’s ongoing costs by comparing this hypothetical example with the hypothetical examples that appear in shareholder reports of other funds.
Note that expenses shown in the table are meant to highlight and help you compare ongoing costs only. The Fund does not charge transaction fees, such as purchase or redemption fees, nor does it carry a “sales load.” The calculations assume no shares were bought or sold during the period. Your actual costs may have been higher or lower, depending on the amount of your investment and the timing of any purchases or redemptions.
18
CINCINNATI ASSET MANAGEMENT FUNDS:
BROAD MARKET STRATEGIC INCOME FUND
ABOUT YOUR FUND’S EXPENSES (Unaudited) (Continued) |
More information about the Fund’s expenses can be found in this report. For additional information on operating expenses and other shareholder costs, please refer to the Fund’s prospectus.
| Beginning
Account Value
June 1, 2016 | Ending
Account Value
November 30, 2016 | Expenses Paid During Period* |
Based on Actual Fund Return | $1,000.00 | $1,003.10 | $3.26 |
Based on Hypothetical 5% Return (before expenses) | $1,000.00 | $1,021.75 | $3.29 |
* | Expenses are equal to the Fund’s annualized net expense ratio of 0.65% for the period, multiplied by the average account value over the period, multiplied by 183/366 (to reflect the one-half year period). |
OTHER INFORMATION (Unaudited)
A description of the policies and procedures that the Fund uses to vote proxies relating to portfolio securities is available without charge upon request by calling toll-free 1-866-738-1128, or on the SEC’s website at http://www.sec.gov. Information regarding how the Fund voted proxies relating to portfolio securities during the most recent 12-month period ended June 30 is available without charge upon request by calling toll-free 1-866-738-1128, or on the SEC’s website at http://www.sec.gov.
The Trust files a complete listing of portfolio holdings for the Fund with the SEC as of the end of the first and third quarters of each fiscal year on Form N-Q. These filings are available upon request by calling 1-866-738-1128. Furthermore, you may obtain a copy of the filings on the SEC’s website at http://www.sec.gov. The Trust’s Forms N-Q may also be reviewed and copied at the SEC’s Public Reference Room in Washington, DC, and information on the operation of the Public Reference Room may be obtained by calling 1-800-SEC-0330.
19
This page intentionally left blank.
This page intentionally left blank.
WAVELENGTH INTEREST RATE NEUTRAL FUND |
LETTER TO SHAREHOLDERS | January 11, 2017 |
Dear Fellow Shareholders;
Since our last shareholder letter, the markets have reestablished fundamental relationships to the economic drivers that shape our long-term investment principles. Uncertainty over the outlook for growth and inflation has subsided, and market participants have moved from cash back into investments that seek a positive real rate of return.
We have invested through this cycle according to the established logic of our process and have benefited from a balanced exposure to those areas into which cash was redeployed. As the markets react to a changing outlook for policy, politics and the economy, we believe a balanced exposure to potential outcomes remains a prudent approach.
What follows is designed to provide a context for returns that fosters a deeper understanding of the investment process that supports them. By doing so we hope to build on the partnership your investment creates.
PERFORMANCE SUMMARY
For the six months ended November 30, 2016, the Wavelength Interest Rate Neutral Fund (the “Fund”) delivered a return of +2.46% versus a benchmark return of +0.13% for the S&P / BGCantor 0-3 Month US Treasury Bill Index (which seeks to represent the return from not taking risk in financial markets). Performance over the period remained within targeted risk parameters, and the Fund has maintained its portfolio balance in line with investment strategies.
WAVELENGTH PHILOSOPHY
We believe that macroeconomic conditions drive asset prices and central banks use interest rates to manage macroeconomic conditions. Based on this fundamental logic, we seek to build a portfolio that is hedged to changes in interest rates by balancing investment exposure between instruments we expect to outperform in rising and falling macroeconomic conditions.
INVESTMENT ENVIRONMENT
As an extension of our investment philosophy we believe that changing expectations for these conditions drive investment decisions, which in turn drive market prices. Over the period since our last letter, markets reconnected with their fundamental drivers of growth and inflation and responded to a broad-based recalibration of the economic outlook.
With a backdrop of political uncertainty, economic output rose in the third quarter of 2016 and many underlying datapoints exceeded consensus expectations. Inflation measures also increased from the lows experienced in 2015 but remain subdued relative to history and the Federal Reserve’s inflation target. In this context, markets responded to changing conditions punctuated by periods of short-term volatility.
1
The UK’s Brexit vote foreshadowed the next six months, and political events were particularly impactful during the period. Safe haven assets, such as government bonds and gold, outperformed to begin with, then these gains faded as the outlook grew more constructive for growth and corporate securities. In July investors started to process this new normal, which led to an inflection point for long-term government bond yields.
August and September continued with this change in sentiment, and markets tied to growth, such as corporate credit, outperformed. The other change taking place was related to inflation, where breakeven levels bounced off lows heading into quarter-end.
Uncertainty returned in October with the US election approaching and concerns over the Federal Reserve’s December meeting. Volatility increased as market participants moved into cash, but like earlier in the year this proved to only be temporary.
November represented a turning point beyond the election results, as clarity around politics led to investment decisions. Corporate assets tied to growth outperformed government securities substantially, and inflation expectations rose rapidly toward historical norms.
PERFORMANCE DISCUSSION
The Fund delivered positive results by design over the period, monetizing opportunities amidst uncertainty and regime change. Active signals were effective as markets transitioned to a new environment, and a balanced exposure to potential outcomes reduced risk in this context.
While volatility was challenging for many markets in June, the Fund was well-positioned over the month and produced solid profits. Falling growth assets, such as US Treasuries and TIPS, made positive contributions to the portfolio. As these positions began to sell-off in July and August, rising growth assets produced meaningful profits. Corporate credit and emerging market debt outperformed over this period and were key drivers of portfolio performance.
In September, corporate credit continued to deliver strong returns, as did bank loans and emerging market debt. Government bond exposures were mixed on the month, as the short end of the yield curve outperformed the long end and reversed the previous trend of curve flattening.
Rising yields in October and November created challenging conditions for fixed income, as markets recalibrated to a new normal for the economy. Losses were experienced in falling growth assets, such as investment grade bonds and inflation-linked securities, in addition to emerging market debt where policy concerns became increasingly important. The Fund benefited from a steepening US yield curve and bank loans outperformed, continuing their recovery from the third quarter.
OUTLOOK
In the wake of November’s election, markets have shifted focus to the new administration’s policies and the potential impact of upcoming decisions. The substantial price moves experienced thus far have created meaningful opportunities for investments based on fundamental economic logic.
2
The portfolio maintains a targeted balance to growth and inflation and seeks to capitalize on opportunities as the policy outlook becomes clear. We believe our investment process will continue to deliver value by harvesting absolute returns consistently and will be a prudent approach over the long-term.
Thank you for your trust and commitment through investment.
Sincerely,

Andrew Dassori
Founding Partner & Chief Investment Officer
Wavelength Capital Management
Past performance is not predictive of future performance. Investment results and principal value will fluctuate so that shares, when redeemed, may be worth more or less than their original cost. Current performance may be higher or lower than the performance data quoted. Performance data current to the most recent month end are available by calling 1-866-896-9292.
An investor should consider the investment objectives, risks, charges and expenses of the Fund carefully before investing. The Fund’s prospectus contains this and other important information. To obtain a copy of the Fund’s prospectus please visit the Fund’s website at www.wavelengthfunds.com or call 1-866-896-9292 and a copy will be sent to you free of charge. Please read the prospectus carefully before you invest. The Wavelength Interest Rate Neutral Fund is distributed by Ultimus Fund Distributors, LLC.
The Letter to Shareholders seeks to describe some of the Adviser’s current opinions and views of the financial markets. Although the Adviser believes it has a reasonable basis for any opinions or views expressed, actual results may differ, sometimes significantly so, from those expected or expressed. The securities held by the Fund that are discussed in the Letter to Shareholders were held during the period covered by this Report. They do not comprise the entire investment portfolio of the Fund, may be sold at any time and may no longer be held by the Fund. For a complete list of securities held by the Fund as of November 30, 2016, please see the Schedule of Investments section of the Semi-Annual Report. The opinions of the Adviser with respect to those securities may change at any time.
Statements in the Letter to Shareholders that reflect projections or expectations for future financial or economic performance of the Fund and the market in general and statements of the Fund’s plans and objectives for future operations are forward-looking statements. No assurance can be given that actual results or events will not differ materially from those projected, estimated, assumed, or anticipated in any such forward-looking statements. Important factors that could result in such differences, in addition to factors noted with such forward-looking statements include, without limitation, general economic conditions, such as inflation, recession, and interest rates. Past performance is not a guarantee of future results.
3
WAVELENGTH INTEREST RATE NEUTRAL FUND
PORTFOLIO INFORMATION
November 30, 2016 (Unaudited)
Portfolio Allocation (% of Net Assets)
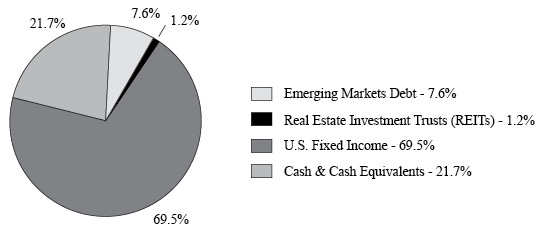
Top 10 Holdings
Security Description | % of
Net Assets |
PowerShares Senior Loan Portfolio | 18.7% |
Vanguard Short-Term Corporate Bond ETF | 15.3% |
iShares® TIPS Bond ETF | 11.8% |
iShares® iBoxx $ High Yield Corporate Bond ETF | 5.7% |
SPDR® Bloomberg Barclays High Yield Bond ETF | 5.4% |
SPDR® Bloomberg Barclays Short Term High Yield Bond ETF | 5.0% |
PowerShares Emerging Markets Sovereign Debt Portfolio | 3.0% |
iShares® iBoxx $ Investment Grade Corporate Bond ETF | 2.8% |
VanEck Vectors Emerging Markets High Yield Bond ETF | 2.7% |
SPDR® Bloomberg Barclays Convertible Securities ETF | 1.8% |
4
WAVELENGTH INTEREST RATE NEUTRAL FUND
SCHEDULE OF INVESTMENTS
November 30, 2016 (Unaudited) |
EXCHANGE-TRADED FUNDS — 78.3% | | Shares | | | Value | |
Emerging Markets Debt — 7.6% | | | | | | |
iShares® J.P. Morgan USD Emerging Markets Bond ETF | | | 2,996 | | | $ | 327,493 | |
PowerShares Emerging Markets Sovereign Debt Portfolio | | | 19,577 | | | | 547,177 | |
VanEck Vectors Emerging Markets High Yield Bond ETF | | | 20,557 | | | | 490,696 | |
| | | | | | | | 1,365,366 | |
Real Estate Investment Trusts (REITs) — 1.2% | | | | | | | | |
SPDR® Dow Jones REIT ETF | | | 300 | | | | 27,186 | |
Vanguard REIT ETF | | | 2,300 | | | | 184,897 | |
| | | | | | | | 212,083 | |
U.S. Fixed Income — 69.5% | | | | | | | | |
iShares® iBoxx $ High Yield Corporate Bond ETF | | | 11,910 | | | | 1,020,091 | |
iShares® iBoxx $ Investment Grade Corporate Bond ETF | | | 4,340 | | | | 507,086 | |
iShares® TIPS Bond ETF | | | 18,803 | | | | 2,133,388 | |
PowerShares Senior Loan Portfolio | | | 145,831 | | | | 3,374,529 | |
SPDR® Bloomberg Barclays Convertible Securities ETF | | | 7,200 | | | | 329,760 | |
SPDR® Bloomberg Barclays High Yield Bond ETF | | | 27,123 | | | | 979,683 | |
SPDR® Bloomberg Barclays Short Term High Yield Bond ETF | | | 32,934 | | | | 905,026 | |
Vanguard Mortgage-Backed Securities ETF | | | 3,536 | | | | 186,206 | |
Vanguard Short-Term Corporate Bond ETF | | | 34,807 | | | | 2,764,372 | |
Vanguard Short-Term Inflation-Protected Securities ETF * | | | 6,656 | | | | 328,607 | |
| | | | | | | | 12,528,748 | |
| | | | | | | | | |
Total Exchange-Traded Funds (Cost $14,090,000) | | | | | | $ | 14,106,197 | |
| |
MONEY MARKET FUNDS — 17.1% | | Shares | | | Value | |
Fidelity Institutional Money Market Government Portfolio - Class I, 0.28% (a) | | | 1,716,046 | | | $ | 1,716,046 | |
Invesco Short-Term Investments Trust - Treasury Portfolio - Institutional Shares, 0.26% (a) | | | 1,373,303 | | | | 1,373,303 | |
Total Money Market Funds (Cost $3,089,349) | | | | | | $ | 3,089,349 | |
| | | | | | | | | |
Total Investments at Value — 95.4% (Cost $17,179,349) | | | | | | $ | 17,195,546 | |
| | | | | | | | | |
Other Assets in Excess of Liabilities — 4.6% | | | | | | | 822,858 | |
| | | | | | | | | |
Net Assets — 100.0% | | | | | | $ | 18,018,404 | |
* | Non-income producing security. |
(a) | The rate shown is the 7-day effective yield as of November 30, 2016. |
See accompanying notes to financial statements. |
5
WAVELENGTH INTEREST RATE NEUTRAL FUND
SCHEDULE OF FUTURES CONTRACTS
November 30, 2016 (Unaudited) |
FUTURES CONTRACTS | Expiration Date | | Contracts | | | Aggregate Market Value of Contracts | | | Unrealized Appreciation
(Depreciation) | |
Commodity Futures | | | | | | | | | | |
E-Mini Crude Oil Future | 12/19/2016 | | | 2 | | | $ | 48,950 | | | $ | 808 | |
| | | | | | | | | | | | | | |
Index Futures | | | | | | | | | | | | | |
E-Mini Dow CBOT DJIA Future | 12/16/2016 | | | 1 | | | | 95,760 | | | | 363 | |
E-Mini Nasdaq 100 Future | 12/16/2016 | | | 9 | | | | 866,970 | | | | 777 | |
E-Mini S&P 500® Future | 12/16/2016 | | | 2 | | | | 219,850 | | | | (92 | ) |
Total Index Futures | | | | | | | | 1,182,580 | | | | 1,048 | |
| | | | | | | | | | | | | | |
Treasury Futures | | | | | | | | | | | | | |
5-Year U.S. Treasury Note Future | 3/31/2017 | | | 13 | | | | 1,531,766 | | | | (2,191 | ) |
| | | | | | | | | | | | | | |
Total Futures Contracts | | | | | | | $ | 2,763,296 | | | $ | (335 | ) |
| |
FUTURES CONTRACTS SOLD SHORT | Expiration Date | | Contracts | | | Aggregate Market Value of Contracts | | | Unrealized Appreciation
(Depreciation) | |
Commodity Futures | | | | | | | | | | |
COMEX miNY Gold Future | 1/27/2017 | | | 2 | | | $ | 117,400 | | | $ | 1,184 | |
| | | | | | | | | | | | | | |
Treasury Futures | | | | | | | | | | | | | |
10-Year U.S. Treasury Note Future | 3/22/2017 | | | 1 | | | | 124,438 | | | | 14 | |
U.S. Treasury Long Bond Future | 12/20/2016 | | | 2 | | | | 305,062 | | | | (1,316 | ) |
Total Treasury Futures Sold Short | | | | | | | | 429,500 | | | | (1,302 | ) |
| | | | | | | | | | | | | | |
Total Futures Contracts Sold Short | | | | | | | $ | 546,900 | | | $ | (118 | ) |
See accompanying notes to financial statements. |
6
WAVELENGTH INTEREST RATE NEUTRAL FUND
STATEMENT OF ASSETS AND LIABILITIES
November 30, 2016 (Unaudited) |
ASSETS | | | |
Investments in securities: | | | |
At acquisition cost | | $ | 17,179,349 | |
At value (Note 2) | | $ | 17,195,546 | |
Cash | | | 2,366 | |
Margin deposits for futures contracts (Notes 2 and 5) | | | 674,113 | |
Dividends receivable | | | 607 | |
Receivable for investment securities sold | | | 531,749 | |
Other assets | | | 12,012 | |
Total assets | | | 18,416,393 | |
| | | | | |
LIABILITIES | | | | |
Payable for investment securities purchased | | | 383,359 | |
Payable to Adviser (Note 4) | | | 1,311 | |
Payable to administrator (Note 4) | | | 7,400 | |
Variation margin payable (Notes 2 and 5) | | | 1,080 | |
Other accrued expenses | | | 4,839 | |
Total liabilities | | | 397,989 | |
| | | | | |
NET ASSETS | | $ | 18,018,404 | |
| | | | | |
NET ASSETS CONSIST OF: | | | | |
Paid-in capital | | $ | 18,961,658 | |
Accumulated net investment income | | | 47,970 | |
Accumulated net realized losses from security transactions and other financial instruments | | | (1,006,968 | ) |
Net unrealized appreciation (depreciation) on: | | | | |
Investments | | | 16,197 | |
Futures contracts | | | (453 | ) |
NET ASSETS | | $ | 18,018,404 | |
| | | | | |
Shares of beneficial interest outstanding (unlimited number of shares authorized, no par value) | | | 1,864,544 | |
| | | | | |
Net asset value, offering price and redemption price per share (Note 2) | | $ | 9.66 | |
See accompanying notes to financial statements. |
7
WAVELENGTH INTEREST RATE NEUTRAL FUND
STATEMENT OF OPERATIONS
For the Six Months Ended November 30, 2016 (Unaudited) |
INVESTMENT INCOME | | | |
Dividends | | $ | 291,309 | |
| | | | | |
EXPENSES | | | | |
Investment advisory fees (Note 4) | | | 83,452 | |
Professional fees | | | 20,148 | |
Fund accounting fees (Note 4) | | | 15,886 | |
Administration fees (Note 4) | | | 15,000 | |
Transfer agent fees (Note 4) | | | 7,500 | |
Compliance fees (Note 4) | | | 6,169 | |
Trustees' fees and expenses (Note 4) | | | 4,569 | |
Registration and filing fees | | | 4,011 | |
Custody and bank service fees | | | 3,709 | |
Postage and supplies | | | 894 | |
Insurance expense | | | 518 | |
Other expenses | | | 7,541 | |
Total expenses | | | 169,397 | |
Less fee reductions by the Adviser (Note 4) | | | (82,431 | ) |
Net expenses | | | 86,966 | |
| | | | | |
NET INVESTMENT INCOME | | | 204,343 | |
| | | | | |
REALIZED AND UNREALIZED GAINS (LOSSES) ON INVESTMENTS AND FUTURES CONTRACTS | | | | |
Net realized gains from: | | | | |
Investments | | | 41,136 | |
Futures contracts (Note 5) | | | 155,404 | |
Net change in unrealized appreciation (depreciation) on: | | | | |
Investments | | | 29,132 | |
Futures contracts (Note 5) | | | (19,145 | ) |
NET REALIZED AND UNREALIZED GAINS ON INVESTMENTS AND FUTURES CONTRACTS | | | 206,527 | |
| | | | | |
NET INCREASE IN NET ASSETS RESULTING FROM OPERATIONS | | $ | 410,870 | |
See accompanying notes to financial statements. |
8
WAVELENGTH INTEREST RATE NEUTRAL FUND
STATEMENTS OF CHANGES IN NET ASSETS |
| | Six Months
Ended
November 30,
2016
(Unaudited) | | | Year
Ended
May 31,
2016 | |
FROM OPERATIONS | | | | | | |
Net investment income | | $ | 204,343 | | | $ | 356,903 | |
Net realized gains (losses) from: | | | | | | | | |
Investments | | | 41,136 | | | | (791,771 | ) |
Futures contracts (Note 5) | | | 155,404 | | | | (242,528 | ) |
Long-term capital gain distributions from regulated investment companies | | | — | | | | 1,602 | |
Net change in unrealized appreciation (depreciation) on: | | | | | | | | |
Investments | | | 29,132 | | | | 33,201 | |
Futures contracts (Note 5) | | | (19,145 | ) | | | 26,867 | |
Net increase (decrease) in net assets from operations | | | 410,870 | | | | (615,726 | ) |
| | | | | | | | | |
DISTRIBUTIONS TO SHAREHOLDERS (Note 2) | | | | | | | | |
From net investment income | | | (205,858 | ) | | | (355,504 | ) |
| | | | | | | | | |
CAPITAL SHARE TRANSACTIONS | | | | | | | | |
Proceeds from shares sold | | | 906,973 | | | | 544,904 | |
Net asset value of shares issued in reinvestment of distributions to shareholders | | | 205,858 | | | | 350,339 | |
Payments for shares redeemed | | | (60,618 | ) | | | (978,011 | ) |
Net increase (decrease) in net assets from capital share transactions | | | 1,052,213 | | | | (82,768 | ) |
| | | | | | | | | |
TOTAL INCREASE (DECREASE) IN NET ASSETS | | | 1,257,225 | | | | (1,053,998 | ) |
| | | | | | | | | |
NET ASSETS | | | | | | | | |
Beginning of period | | | 16,761,179 | | | | 17,815,177 | |
End of period | | $ | 18,018,404 | | | $ | 16,761,179 | |
| | | | | | | | | |
ACCUMULATED NET INVESTMENT INCOME | | $ | 47,970 | | | $ | 49,485 | |
See accompanying notes to financial statements. |
9
WAVELENGTH INTEREST RATE NEUTRAL FUND
STATEMENT OF CHANGES IN NET ASSETS (Continued) |
| | Six Months
Ended
November 30,
2016
(Unaudited) | | | Year
Ended
May 31,
2016 | |
CAPITAL SHARE ACTIVITY | | | | | | |
Shares sold | | | 92,782 | | | | 57,617 | |
Shares issued in reinvestment of distributions to shareholders | | | 21,142 | | | | 37,420 | |
Shares redeemed | | | (6,220 | ) | | | (103,873 | ) |
Net increase (decrease) in shares outstanding | | | 107,704 | | | | (8,836 | ) |
Shares outstanding at beginning of period | | | 1,756,840 | | | | 1,765,676 | |
Shares outstanding at end of period | | | 1,864,544 | | | | 1,756,840 | |
See accompanying notes to financial statements. |
10
WAVELENGTH INTEREST RATE NEUTRAL FUND
FINANCIAL HIGHLIGHTS |
Per Share Data for a Share Outstanding Throughout Each Period |
| | Six Months
Ended
Nov. 30,
2016
(Unaudited) | | | Year
Ended
May 31,
2016 | | | Year
Ended
May 31,
2015 | | | Period
Ended
May 31,
2014 (a) | |
Net asset value at beginning of period | | $ | 9.54 | | | $ | 10.09 | | | $ | 10.38 | | | $ | 10.00 | |
| | | | | | | | | | | | | | | | | |
Income (loss) from investment operations: | | | | | | | | | | | | | | | | |
Net investment income | | | 0.11 | | | | 0.21 | | | | 0.23 | | | | 0.10 | |
Net realized and unrealized gains (losses) on investments and futures contracts | | | 0.12 | | | | (0.56 | ) | | | (0.25 | ) | | | 0.36 | |
Total from investment operations | | | 0.23 | | | | (0.35 | ) | | | (0.02 | ) | | | 0.46 | |
| | | | | | | | | | | | | | | | | |
Less distributions: | | | | | | | | | | | | | | | | |
Distributions from net investment income | | | (0.11 | ) | | | (0.20 | ) | | | (0.23 | ) | | | (0.07 | ) |
Distributions from net realized gains | | | — | | | | — | | | | (0.04 | ) | | | (0.01 | ) |
Total distributions | | | (0.11 | ) | | | (0.20 | ) | | | (0.27 | ) | | | (0.08 | ) |
| | | | | | | | | | | | | | | | | |
Net asset value at end of period | | $ | 9.66 | | | $ | 9.54 | | | $ | 10.09 | | | $ | 10.38 | |
| | | | | | | | | | | | | | | | | |
Total return (b) | | | 2.46 | %(c) | | | (3.37 | %) | | | (0.17 | %) | | | 4.62 | %(c) |
| | | | | | | | | | | | | | | | | |
Net assets at end of period (000's) | | $ | 18,018 | | | $ | 16,761 | | | $ | 17,815 | | | $ | 4,717 | |
| | | | | | | | | | | | | | | | | |
Ratios/supplementary data: | | | | | | | | | | | | | | | | |
Ratio of total expenses to average net assets (d) | | | 1.93 | %(e) | | | 2.00 | % | | | 2.19 | % | | | 4.42 | %(e) |
| | | | | | | | | | | | | | | | | |
Ratio of net expenses to average net assets (d) (f) | | | 0.99 | %(e) | | | 0.99 | % | | | 0.99 | % | | | 0.99 | %(e) |
| | | | | | | | | | | | | | | | | |
Ratio of net investment income to average net assets (f) (g) | | | 2.33 | %(e) | | | 2.16 | % | | | 2.52 | % | | | 1.55 | %(e) |
| | | | | | | | | | | | | | | | | |
Portfolio turnover rate | | | 33 | %(c) | | | 103 | % | | | 107 | % | | | 114 | %(c) |
(a) | Represents the period from the commencement of operations (September 30, 2013) through May 31, 2014. |
(b) | Total return is a measure of the change in value of an investment in the Fund over the period covered. The returns shown do not reflect the deduction of taxes a shareholder would pay on Fund distributions, if any, or the redemption of Fund shares. The total returns would be lower if the Adviser had not reduced advisory fees and/or reimbursed expenses. |
(d) | The ratios of expenses to average net assets do not reflect the Fund's proportionate share of expenses of the underlying investment companies in which the Fund invests. |
(f) | Ratio was determined after advisory fee reductions and/or expense reimbursements (Note 4). |
(g) | Recognition of net investment income by the Fund is affected by the timing of the declarations of dividends by the underlying investment companies in which the Fund invests. |
See accompanying notes to financial statements. |
11
WAVELENGTH INTEREST RATE NEUTRAL FUND
NOTES TO FINANCIAL STATEMENTS
November 30, 2016 (Unaudited)
1. Organization
Wavelength Interest Rate Neutral Fund (the “Fund”) is a non-diversified series of Ultimus Managers Trust (the “Trust”), an open-end investment company established as an Ohio business trust under a Declaration of Trust dated February 28, 2012. Other series of the Trust are not incorporated in this report. The Fund commenced operations on September 30, 2013.
The investment objective of the Fund is to seek total return.
2. Significant Accounting Policies
The following is a summary of the Fund’s significant accounting policies. The policies are in conformity with Generally Accepted Accounting Principles in the United States of America (“GAAP”). As an investment company, as defined in Financial Accounting Standards Board (“FASB”) Accounting Standards Update 2013-08, the Fund follows accounting and reporting guidance under FASB Accounting Standards Codification Topic 946, “Financial Services – Investment Companies.”
In October 2016, the Securities and Exchange Commission (the “SEC”) released its final rule on Investment Company Reporting Modernization (the “Rule”). The Rule, which introduces two new regulatory reporting forms for investment companies – Form N-PORT and Form N-CEN, also contains amendments to Regulation S-X which impact financial statement presentation, particularly the presentation of derivative investments. Although still evaluating the impact of the Rule, management believes that many of the Regulation S-X amendments are consistent with the Fund’s current financial statement presentation and expects that the Fund will be able to comply with the Rule’s Regulation S-X amendments by the August 1, 2017 compliance date.
Securities and futures valuation – The Fund values its portfolio securities at market value as of the close of regular trading on the New York Stock Exchange (the “NYSE”) (normally 4:00 p.m. Eastern time) on each business day the NYSE is open. The Fund values its listed securities on the basis of the security’s last sale price on the security’s primary exchange, if available, otherwise at the exchange’s most recently quoted mean price. NASDAQ-listed securities are valued at the NASDAQ Official Closing Price. The Fund values its exchange-traded futures contracts at their last sale price as of the close of regular trading on the NYSE. Prices for these futures contracts are monitored daily by Wavelength Capital Management, LLC, (the “Adviser”) until the close of regular trading to determine if fair valuation is required.
In the event that market quotations are not readily available or are considered unreliable due to market or other events, the Fund values its securities and other assets at fair value pursuant to the procedures adopted by and under the general supervision of the Trust’s Board of Trustees (the “Board”). Under these procedures, the securities will be classified as Level 2 or 3 within the fair value hierarchy (see below), depending on the inputs used. Unavailable or unreliable market quotes may be due to the following factors: a substantial
12
WAVELENGTH INTEREST RATE NEUTRAL FUND
NOTES TO FINANCIAL STATEMENTS (Continued)
bid-ask spread; infrequent sales resulting in stale prices; insufficient trading volume; small trade sizes; a temporary lapse in any reliable pricing source; and actions of the securities or futures markets, such as the suspension or limitation of trading.
GAAP establishes a single authoritative definition of fair value, sets out a framework for measuring fair value, and requires additional disclosures about fair value measurements.
Various inputs are used in determining the value of the Fund’s investments. These inputs are summarized in the three broad levels listed below:
● | Level 1 – quoted prices in active markets for identical securities |
● | Level 2 – other significant observable inputs |
● | Level 3 – significant unobservable inputs |
The inputs or methods used for valuing securities are not necessarily an indication of the risks associated with investing in those securities. The inputs used to measure fair value may fall into different levels of the fair value hierarchy. In such cases, for disclosure purposes, the level in the fair value hierarchy within which the fair value measurement falls in its entirety is determined based on the lowest level input that is significant to the fair value measurement.
The following is a summary of the inputs used to value the Fund’s investments and other financial instruments as of November 30, 2016:
| | Level 1 | | | Level 2 | | | Level 3 | | | Total | |
Investments in Securities | | | | | | | | | | | | |
Exchange-Traded Funds | | $ | 14,106,197 | | | $ | — | | | $ | — | | | $ | 14,106,197 | |
Money Market Funds | | | 3,089,349 | | | | — | | | | — | | | | 3,089,349 | |
Total | | $ | 17,195,546 | | | $ | — | | | $ | — | | | $ | 17,195,546 | |
Other Financial Instruments | | | | | | | | | | | | | | | | |
Futures Contracts | | $ | (335 | ) | | $ | — | | | $ | — | | | $ | (335 | ) |
Futures Contracts Sold Short | | | (118 | ) | | | — | | | | — | | | | (118 | ) |
Total | | $ | (453 | ) | | $ | — | | | $ | — | | | $ | (453 | ) |
As of November 30, 2016, the Fund did not have any transfers between Levels. In addition, the Fund did not have any assets or liabilities that were measured at fair value on a recurring basis using significant unobservable inputs (Level 3) as of November 30, 2016. It is the Fund’s policy to recognize transfers between Levels at the end of the reporting period.
Share valuation – The net asset value (“NAV”) per share of the Fund is calculated daily by dividing the total value of the Fund’s assets, less liabilities, by the number of shares outstanding. The offering price and redemption price per share of the Fund is equal to the NAV per share.
Investment income – Dividend income is recorded on the ex-dividend date. Interest income is accrued as earned.
13
WAVELENGTH INTEREST RATE NEUTRAL FUND
NOTES TO FINANCIAL STATEMENTS (Continued)
Security transactions – Security transactions are accounted for on the trade date. Realized gains and losses on securities sold are determined on a specific identification basis.
Common expenses – Common expenses of the Trust are allocated among the Fund and the other series of the Trust based on the relative net assets of each series or the nature of the services performed and the relative applicability to each series.
Distributions to shareholders – The Fund will distribute to shareholders any net investment income on a quarterly basis and any net realized capital gains at least annually. The amount of such dividends and distributions are determined in accordance with federal income tax regulations, which may differ from GAAP. Dividends and distributions to shareholders are recorded on the ex-dividend date. The tax character of distributions paid during the periods ended November 30, 2016 and May 31, 2016 was ordinary income. On December 30, 2016, the Fund paid an ordinary income dividend of $0.0622 per share to shareholders of record on December 29, 2016.
Futures contracts – The Fund may use futures contracts to gain exposure to or to hedge against changes in the value of equities, real estate, interest rates or commodities. A futures contract represents a commitment for the future purchase or sale of an asset at a specified price on a specified date. When the Fund purchases or sells a futures contract, no price is paid to or received by the Fund. Instead, the Fund is required to deposit in a segregated asset account an amount of cash or qualifying securities currently ranging from 2% to 10% of the contract amount. This is called the “initial margin deposit.” Subsequent payments, known as “variation margin,” are made or received by the Fund each day, depending on the daily fluctuations in the fair value of the underlying asset. The Fund recognizes an unrealized gain or loss equal to the daily variation margin. If market conditions move unexpectedly, the Fund may not achieve the anticipated benefits of the futures contracts and may realize a loss. The margin deposits for futures contracts and the variation margin payable are reported on the Statement of Assets and Liabilities.
Estimates – The preparation of financial statements in conformity with GAAP requires management to make estimates and assumptions that affect the reported amounts of assets and liabilities and disclosure of contingent assets and liabilities as of the date of the financial statements and the reported amounts of income and expenses during the reporting period. Actual results could differ from those estimates.
Federal income tax – The Fund has qualified and intends to continue to qualify as a regulated investment company under the Internal Revenue Code of 1986 (the “Code”). Qualification generally will relieve the Fund of liability for federal income taxes to the extent 100% of its net investment income and net realized captial gains are distributed in accordance with the Code.
In order to avoid imposition of the excise tax applicable to regulated investment companies, it is also the Fund’s intention to declare as dividends in each calendar year at least 98% of its net investment income (earned during the calendar year) and 98.2% of its net realized capital gains (earned during the twelve months ended October 31) plus undistributed amounts from prior years.
14
WAVELENGTH INTEREST RATE NEUTRAL FUND
NOTES TO FINANCIAL STATEMENTS (Continued)
The following information is computed on a tax basis for each item as of November 30, 2016:
Tax cost of portfolio investments | | $ | 17,452,538 | |
Gross unrealized appreciation | | $ | 46,945 | |
Gross unrealized depreciation | | | (303,937 | ) |
Net unrealized depreciation | | | (256,992 | ) |
Accumulated ordinary income | | | 47,970 | |
Accumulated capital and other losses | | | (734,232 | ) |
Total accumulated deficit | | $ | (943,254 | ) |
The value of the federal income tax cost of portfolio investments and the tax components of the accumulated deficit may temporarily differ from the financial statement cost and components of net assets (“book/tax difference”). These book/tax differences are due to the recognition of capital gains or losses under income tax regulations and GAAP, primarily the tax deferral of losses on wash sales and the tax treatment of realized and unrealized gains and losses on futures contracts.
As of May 31, 2016, the Fund had a short-term capital loss carryforward of $343,823 and a long-term capital loss carryforward of $298,968 for federal income tax purposes. These capital loss carryforwards, which do not expire, may be utilized in the current and future years to offset net realized capital gains, if any, prior to distributing such gains to shareholders.
The Fund recognizes the tax benefits or expenses of uncertain tax positions only when the position is “more likely than not” to be sustained assuming examination by tax authorities. Management has reviewed the Fund’s tax positions for the current and all open tax periods (periods ended May 31, 2014 through May 31, 2016) and has concluded that no provision for unrecognized tax benefits or expenses is required in these financial statements. The Fund identifies its major tax jurisdiction as U.S. Federal.
3. Investment Transactions
During the six months ended November 30, 2016, cost of purchases and proceeds from sales of investment securities, other than short-term investments, were $4,969,218 and $5,586,662, respectively.
4. Transactions with Related Parties
INVESTMENT ADVISORY AGREEMENT
The Fund’s investments are managed by the Adviser pursuant to the terms of an Investment Advisory Agreement. Under the Investment Advisory Agreement, the Fund pays the Adviser an advisory fee, computed and accrued daily and paid monthly, at the annual rate of 0.95% of its average daily net assets.
15
WAVELENGTH INTEREST RATE NEUTRAL FUND
NOTES TO FINANCIAL STATEMENTS (Continued)
Pursuant to an Expense Limitation Agreement (“ELA”) between the Fund and the Adviser, the Adviser has contractually agreed, until October 1, 2017, to reduce investment advisory fees and reimburse other operating expenses in order to limit total annual operating expenses of the Fund (exclusive of brokerage costs; taxes; interest; acquired fund fees and expenses; extraordinary expenses such as litigation and merger or reorganization costs; other expenses not incurred in the ordinary course of the Fund’s business; and amounts, if any, payable pursuant to a plan adopted in accordance with Rule 12b-1 under the Investment Company Act of 1940, as amended) to an amount not exceeding 0.99% of the Fund’s average daily net assets. During the six months ended November 30, 2016, the Adviser reduced its investment advisory fees by $82,431.
Under the terms of the ELA, investment advisory fee reductions and expense reimbursements by the Adviser are subject to recoupment by the Adviser for a period of three years after such fees and expenses were incurred, provided that the recoupments do not cause total annual operating expenses of the Fund to exceed (i) the expense limitation then in effect, if any and (ii) the expense limitation in effect at the time the expenses to be repaid were incurred. As of November 30, 2016, the Adviser may seek recoupment of investment advisory fee reductions and expense reimbursements in the amount of $473,533 no later than the dates as stated below:
May 31, 2017 | May 31, 2018 | May 31, 2018 | November 30, 2019 | Total |
$67,206 | $157,675 | $166,221 | $82,431 | $473,533 |
The principal executive officer of the Fund is also an officer of the Adviser.
OTHER SERVICE PROVIDERS
Ultimus Fund Solutions, LLC (“Ultimus”) provides administration, fund accounting, compliance and transfer agency services to the Fund. The Fund pays Ultimus fees in accordance with the agreements for such services. In addition, the Fund pays out-of-pocket expenses including, but not limited to, postage, supplies and costs of pricing the Fund’s portfolio securities.
Under the terms of a Distribution Agreement with the Trust, Ultimus Fund Distributors, LLC (the “Distributor”) serves as the principal underwriter to the Fund. The Distributor is a wholly-owned subsidiary of Ultimus. The Distributor is compensated by the Adviser (not the Fund) for acting as principal underwriter.
Certain officers and a Trustee of the Trust are also officers of Ultimus and the Distributor.
TRUSTEE COMPENSATION
Effective October 1, 2016 each Trustee who is not an “interested person” of the Trust (“Independent Trustee”) receives a $1,000 annual retainer from the Fund, paid quarterly, except for the Board Chair who receives a $1,200 annual retainer from the Fund, paid quarterly. Each Independent Trustee also receives from the Fund a fee of $500 for each Board
16
WAVELENGTH INTEREST RATE NEUTRAL FUND
NOTES TO FINANCIAL STATEMENTS (Continued)
meeting attended plus reimbursement for travel and other meeting-related expenses. Prior to October 1, 2016, the Fund paid each Independent Trustee a fee of $500 for each Board meeting attended, plus a $500 annual retainer.
PRINCIPAL HOLDERS OF FUND SHARES
As of November 30, 2016, the following shareholders owned of record 5% or more of the outstanding shares of the Fund:
Name of Record Owner | % Ownership |
Interactive Brokers, LLC (for the benefit of its customers) | 68% |
R&T Partners, LLC (for the benefit of its customers) | 11% |
Charles Schwab & Co., Inc. (for the benefit of its customers) | 9% |
A shareholder owning of record or beneficially 25% or more of the Fund’s outstanding shares may be considered a controlling person. That shareholder’s vote could have a more significant effect on matters presented at a shareholders’ meeting.
5. Derivatives Transactions
The Fund’s positions in derivative instruments as of November 30, 2016 are recorded in the following location in the Statement of Assets and Liabilities:
Derivative Investment Type | Location |
Futures contracts | Variation margin payable |
The following table sets forth the values of variation margin of the Fund as of November 30, 2016:
| | | Variation Margin | | | | |
| | Receivable | | | (Payable) | | | Total | |
Asset Derivatives | | | | | | | | | |
Futures contracts | | | | | | | | | |
Commodity | | $ | 3,720 | | | $ | — | | | $ | 3,720 | |
Index | | | 2,746 | | | | (11,578 | ) | | | (8,832 | ) |
Treasury | | | — | | | | (3,859 | ) | | | (3,859 | ) |
Total Asset Derivatives | | | 6,466 | | | | (15,437 | ) | | | (8,971 | ) |
Liability Derivatives | | | | | | | | | | | | |
Futures contracts | | | | | | | | | | | | |
Commodity | | $ | 1,338 | | | $ | — | | | $ | 1,338 | |
Treasury | | | 6,553 | | | | — | | | | 6,553 | |
Total Liability Derivatives | | | 7,891 | | | | — | | | | 7,891 | |
Total | | $ | 14,357 | | | $ | (15,437 | ) | | $ | (1,080 | ) |
17
WAVELENGTH INTEREST RATE NEUTRAL FUND
NOTES TO FINANCIAL STATEMENTS (Continued)
The Fund’s transactions in derivative instruments during the six months ended November 30, 2016 are recorded in the following locations in the Statement of Operations:
Derivative Investment Type | Location |
Futures contracts | Net realized gains from futures contracts |
| | Net change in unrealized appreciation (depreciation) on futures contracts |
The following is a summary of the Fund’s net realized gains (losses) and net change in unrealized appreciation (depreciation) on derivative instruments recognized in the Statement of Operations during the six months ended November 30, 2016:
Type of Derivative | | Net Realized Gains (Losses) | | | Net Change in Unrealized Appreciation (Depreciation) | |
Futures contracts | | | | | | |
Commodity | | $ | (1,622 | ) | | $ | 988 | |
Index | | | 120,067 | | | | (18,854 | ) |
Treasury | | | 36,959 | | | | (1,279 | ) |
Total | | $ | 155,404 | | | $ | (19,145 | ) |
The average monthly notional amount of futures contracts purchased during the six months ended November 30, 2016 was $2,265,976, and the gross notional amount of futures contracts and future contracts sold short outstanding at November 30, 2016 was $2,763,296 and $(546,900), respectively.
In the ordinary course of business, the Fund may enter into transactions subject to enforceable netting agreements or other similar arrangements (“netting agreements”). Generally, the right to offset in netting agreements allows the Fund to offset any exposure to a specific counterparty with any collateral received or delivered to that counterparty based on the terms of the agreements. Generally, the Fund manages its cash collateral and collateral on a counterparty basis.
18
WAVELENGTH INTEREST RATE NEUTRAL FUND
NOTES TO FINANCIAL STATEMENTS (Continued)
As of November 30, 2016, the offsetting of financial assets and derivative assets is as follows:
Description | | Gross Amount of Recognized Assets | | | Gross Amounts Offset in Statement of Assets and Liabilities | | | Net Amounts of Assets Presented in Statement of Assets and Liabilities | | | Collateral Pledged | | | Net Amount | |
Variation margin receivable -
futures contracts | | $ | 6,466 | | | $ | (15,437 | ) | | $ | (8,971 | ) | | $ | 507,774 | | | $ | 498,803 | |
Total subject to a master netting or similar arrangement | | $ | 6,466 | | | $ | (15,437 | ) | | $ | (8,971 | ) | | $ | 507,774 | | | $ | 498,803 | |
As of November 30, 2016, the offsetting of financial liabilities and derivative liabilities is as follows:
Description | | Gross Amount of Recognized Liabilities | | | Gross Amounts Offset in Statement of Assets and Liabilities | | | Net Amounts of Liabilities Presented in Statement of Assets and Liabilities | | | Collateral Pledged | | | Net Amount | |
Variation margin receivable - futures contracts | | $ | 7,891 | | | $ | — | | | $ | 7,891 | | | $ | 166,339 | | | $ | 174,230 | |
Total subject to a master netting or similar arrangement | | $ | 7,891 | | | $ | — | | | $ | 7,891 | | | $ | 166,339 | | | $ | 174,230 | |
6. Certain Investments and Risks
The securities in which the Fund invests, as well as the risks associated with these securities, are described in the Fund’s prospectus. Among these risks are those associated with investments in exchange-traded funds (“ETFs”). ETFs issue their shares to authorized participants in return for a specific basket of securities. The authorized participants then sell the ETF’s shares on the secondary market. In other words, ETF shares are traded on a securities exchange based on their market value. Investments in ETFs are subject to the risk that the ETF’s shares may trade at a premium (creating the risk that the Fund pays more than NAV for an ETF when making a purchase) or discount (creating the risk that the Fund receives less than NAV when selling an ETF) to the ETF’s NAV. Investments in ETFs are also subject to index-tracking risk because the total return generated by the securities will be reduced by transaction costs and expenses not incurred by the indices. Certain
19
WAVELENGTH INTEREST RATE NEUTRAL FUND
NOTES TO FINANCIAL STATEMENTS (Continued)
securities comprising the index tracked by an ETF may, from time to time, temporarily be unavailable, which may further impede the ETF’s ability to track its applicable index or match the index’s performance. To the extent that the Fund invests in an ETF, the Fund incurs additional expenses because the Fund bears its pro-rata portion of such ETF’s advisory fees and operational expenses. Finally, ETF shares are also subject to the risks applicable to the underlying basket of securities. As of November 30, 2016, the Fund had 78.3% of the value of its net assets invested in ETFs.
7. Contingencies and Commitments
The Fund indemnifies the Trust’s officers and Trustees for certain liabilities that might arise from their performance of their duties to the Fund. Additionally, in the normal course of business, the Fund enters into contracts that contain a variety of representations and warranties and which provide general indemnifications. The Fund’s maximum exposure under these arrangements is unknown, as this would involve future claims that may be made against the Fund that have not yet occurred. However, based on experience, the Fund expects the risk of loss to be remote.
8. Subsequent Events
The Fund is required to recognize in the financial statements the effects of all subsequent events that provide additional evidence about conditions that existed as of the date of the Statement of Assets and Liabilities. For non-recognized subsequent events that must be disclosed to keep the financial statements from being misleading, the Fund is required to disclose the nature of the event as well as an estimate of its financial effect, or a statement that such an estimate cannot be made. Management has evaluated subsequent events through the issuance of these financial statements and has noted no such events other than the ordinary income dividend paid on December 30, 2016, as noted in Note 2.
20
WAVELENGTH INTEREST RATE NEUTRAL FUND
ABOUT YOUR FUND’S EXPENSES (Unaudited)
We believe it is important for you to understand the impact of costs on your investment. As a shareholder of the Fund, you incur ongoing costs, including management fees and other operating expenses. The following examples are intended to help you understand your ongoing costs (in dollars) of investing in the Fund and to compare these costs with the ongoing costs of investing in other mutual funds.
A mutual fund’s ongoing costs are expressed as a percentage of its average net assets. This figure is known as the expense ratio. The expenses in the table below are based on an investment of $1,000 made at the beginning of the most recent period (June 1, 2016) and held until the end of the period (November 30, 2016).
The table below illustrates the Fund’s ongoing costs in two ways:
Actual fund return – This section helps you to estimate the actual expenses that you paid over the period. The “Ending Account Value” shown is derived from the Fund’s actual return, and the third column shows the dollar amount of operating expenses that would have been paid by an investor who started with $1,000 in the Fund. You may use the information here, together with the amount you invested, to estimate the expenses that you paid over the period.
To do so, simply divide your account value by $1,000 (for example, an $8,600 account value divided by $1,000 = 8.6), then multiply the result by the number given for the Fund under the heading “Expenses Paid During Period.”
Hypothetical 5% return – This section is intended to help you compare the Fund’s ongoing costs with those of other mutual funds. It assumes that the Fund had an annual return of 5% before expenses during the period shown, but that the expense ratio is unchanged. In this case, because the return used is not the Fund’s actual return, the results do not apply to your investment. The example is useful in making comparisons because the SEC requires all mutual funds to calculate expenses based on a 5% return. You can assess the Fund’s ongoing costs by comparing this hypothetical example with the hypothetical examples that appear in shareholder reports of other funds.
Note that expenses shown in the table are meant to highlight and help you compare ongoing costs only. The Fund does not charge transaction fees, such as purchase or redemption fees, nor does it carry a “sales load.”
The calculations assume no shares were bought or sold during the period. Your actual costs may have been higher or lower, depending on the amount of your investment and the timing of any purchases or redemptions.
21
WAVELENGTH INTEREST RATE NEUTRAL FUND
ABOUT YOUR FUND’S EXPENSES (Unaudited)
More information about the Fund’s expenses can be found in this report. For additional information on operating expenses and other shareholder costs, please refer to the Fund’s prospectus.
| | Beginning Account Value June 1, 2016 | Ending
Account Value
November 30, 2016 | Expenses
Paid During
Period* |
Based on Actual Fund Return | $1,000.00 | $1,024.60 | $5.01 |
| Based on Hypothetical 5% Return (before expenses) | $1,000.00 | $1,020.05 | $5.00 |
* | Expenses are equal to the Fund’s annualized net expense ratio of 0.99% for the period, multiplied by the average account value over the period, multiplied by 183/366 (to reflect the one-half year period). |
OTHER INFORMATION (Unaudited)
A description of the policies and procedures that the Fund uses to vote proxies relating to portfolio securities is available without charge upon request by calling toll-free 1-866-896-9292, or on the SEC’s website at http://www.sec.gov. Information regarding how the Fund voted proxies relating to portfolio securities during the most recent 12-month period ended June 30 is available without charge upon request by calling toll-free 1-866-896-9292, or on the SEC’s website at http://www.sec.gov.
The Trust files a complete listing of portfolio holdings for the Fund with the SEC as of the end of the first and third quarters of each fiscal year on Form N-Q. These filings are available upon request by calling 1-866-896-9292. Furthermore, you may obtain a copy of the filings on the SEC’s website at http://www.sec.gov. The Trust’s Forms N-Q may also be reviewed and copied at the SEC’s Public Reference Room in Washington, DC, and information on the operation of the Public Reference Room may be obtained by calling 1-800-SEC-0330.
22
This page intentionally left blank.
This page intentionally left blank.
This page intentionally left blank.
Not required
| Item 3. | Audit Committee Financial Expert. |
Not required
| Item 4. | Principal Accountant Fees and Services. |
Not required
| Item 5. | Audit Committee of Listed Registrants. |
Not applicable
| Item 6. | Schedule of Investments. |
| (a) | Not applicable [schedule filed with Item 1] |
| Item 7. | Disclosure of Proxy Voting Policies and Procedures for Closed-End Management Investment Companies. |
Not applicable
| Item 8. | Portfolio Managers of Closed-End Management Investment Companies. |
Not applicable
| Item 9. | Purchases of Equity Securities by Closed-End Management Investment Company and Affiliated Purchasers. |
Not applicable
| Item 10. | Submission of Matters to a Vote of Security Holders. |
The registrant’s Committee of Independent Trustees shall review shareholder recommendations to fill vacancies on the registrant’s board of trustees if such recommendations are submitted in writing, addressed to the Committee at the registrant’s offices and meet any minimum qualifications adopted by the Committee. The Committee may adopt, by resolution, a policy regarding its procedures for considering candidates for the board of trustees, including any recommended by shareholders.
| Item 11. | Controls and Procedures. |
(a) Based on their evaluation of the registrant’s disclosure controls and procedures (as defined in Rule 30a-3(c) under the Investment Company Act of 1940) as of a date within 90 days of the filing date of this report, the registrant’s principal executive officer and principal financial officer have concluded that such disclosure controls and procedures are reasonably designed and are operating effectively to ensure that material information relating to the registrant, including its consolidated subsidiaries, is made known to them by others within those entities, particularly during the period in which this report is being prepared, and that the information required in filings on Form N-CSR is recorded, processed, summarized, and reported on a timely basis.
(b) There were no changes in the registrant’s internal control over financial reporting (as defined in Rule 30a-3(d) under the Investment Company Act of 1940) that occurred during the second fiscal quarter of the period covered by this report that have materially affected, or are reasonably likely to materially affect, the registrant’s internal control over financial reporting.
File the exhibits listed below as part of this Form. Letter or number the exhibits in the sequence indicated.
(a)(1) Any code of ethics, or amendment thereto, that is the subject of the disclosure required by Item 2, to the extent that the registrant intends to satisfy the Item 2 requirements through filing of an exhibit: Not required
(a)(2) A separate certification for each principal executive officer and principal financial officer of the registrant as required by Rule 30a-2(a) under the Act (17 CFR 270.30a-2(a)): Attached hereto
(a)(3) Any written solicitation to purchase securities under Rule 23c-1 under the Act (17 CFR 270.23c-1) sent or given during the period covered by the report by or on behalf of the registrant to 10 or more persons: Not applicable
(b) Certifications required by Rule 30a-2(b) under the Act (17 CFR 270.30a-2(b)): Attached hereto
| Exhibit 99.CERT | Certifications required by Rule 30a-2(a) under the Act |
| Exhibit 99.906CERT | Certifications required by Rule 30a-2(b) under the Act |
SIGNATURES
Pursuant to the requirements of the Securities Exchange Act of 1934 and the Investment Company Act of 1940, the registrant has duly caused this report to be signed on its behalf by the undersigned, thereunto duly authorized.
| (Registrant) | Ultimus Managers Trust | | |
| | | | |
| By (Signature and Title)* | /s/ Frank L. Newbauer | |
| | | Frank L. Newbauer, Assistant Secretary | |
| | | | |
| Date | February 2, 2017 | | |
Pursuant to the requirements of the Securities Exchange Act of 1934 and the Investment Company Act of 1940, this report has been signed below by the following persons on behalf of the registrant and in the capacities and on the dates indicated.
| By (Signature and Title)* | /s/ Nitin N. Kumbhani | |
| | | Nitin N. Kumbhani, Principal Executive Officer of APEXcm Small/Mid-Cap Growth Fund | |
| | | | |
| Date | February 2, 2017 | | |
| | | | |
| By (Signature and Title)* | /s/ William S. Sloneker | |
| | | William S. Sloneker, Principal Executive Officer of Cincinnati Asset Management Funds: Broadmarket Strategic Income Fund | |
| | | | |
| Date | February 2, 2017 | | |
| | | | |
| By (Signature and Title)* | /s/ Nicholas Chermayeff | |
| | | Nicholas Chermayeff, Principal Executive Officer of Barrow Value Opportunity Fund and Barrow Long/Short Opportunity Fund | |
| | | | |
| Date | February 2, 2017 | | |
| | | | |
| By (Signature and Title)* | /s/ Andrew G. Dassori | |
| | | Andrew G. Dassori, Principal Executive Officer of Wavelength Interest Rate Neutral Fund | |
| | | | |
| Date | February 2, 2017 | | |
| | | | |
| By (Signature and Title)* | /s/ Jennifer L. Leamer | |
| | | Jennifer L. Leamer, Treasurer and Principal Financial Officer | |
| | | | |
| Date | February 2, 2017 | | |
* | Print the name and title of each signing officer under his or her signature. |