GALAPAGOS PARTNERS SELECT EQUITY FUND |
LETTER TO SHAREHOLDERS | June 15, 2016 |
Dear Fellow Galapagos Partners Select Equity Fund Shareholder:
I am pleased to report on our performance and investment outlook for the fiscal period ended May 31, 2016.
PERFORMANCE SUMMARY
From inception on December 30, 2014 through May 31, 2016, the Galapagos Partners Select Equity Fund (the “Fund”) delivered a return of -10.30% versus a benchmark return of +0.01% for the Russell 3000 Index (the ���Russell”) and +3.92% for the S&P 500 TR Index (the S&P 500). For the six months ended May 31, 2016, the Fund delivered a return of -7.05% versus a benchmark return of +1.29% for the Russell and +1.93% for the S&P 500. The Fund’s underperformance for the six month period is largely due to an overweight energy allocation during the oil bear market, however some of that underperformance has been made up recently with oil prices rising.
GALAPAGOS PARTNERS’ PHILOSOPHY
The Fund seeks to outperform its benchmark by targeting investments that include a number of firms whose share prices might be influenced by high insider buying, spun-off divisions, reduced float, and activist shareholders, as well as by focusing on firms with strong valuations or growth potential, such as those companies exhibiting strong free cash flow and/or dividend growth. This is the adviser’s long-term thesis. Additionally, we will rotate into sectors or countries across the globe depending upon the adviser’s perceived opportunities.
INVESTMENT ENVIRONMENT
There is a large difference in opinion in the economy amongst analysts. The Federal Reserve (the “Fed”) believes that the economy is strong enough for one or two rate hikes in 2016, down from their projection of four at the beginning of the year. However, the Fed fund futures market is projecting less than a 50% chance of a single rate hike this year.
The Fed is stuck in a cycle that will make it difficult for them to raise rates. The issue is that as the Fed becomes more hawkish, investors grow concerned with a stronger dollar and tightening conditions. This inevitably leads to an equity pullback where the Fed has to calm investors down by being more accommodative. The more dovish positioning causes the dollar to fall and conditions to ease, with equities usually rallying as a result. The cycle then repeats itself.
It is unclear which direction the market will head at this point. Folks who are bearish have many arguments including elevated stock market valuations, several quarters of declining earnings, Brexit, increasing debt around the world along with negative interest rates, companies buying back their stock instead of reinvesting or paying down debt,
1
etc. Folks who are bullish can point to the lack of attractive alternatives due to interest rates levels, oil prices stabilizing, earnings expecting to improve in the back half of the year, high inflation tail risk, and the level of bearishness currently in the market usually being a contrarian indicator.
PERFORMANCE DISCUSSION
The Fund performed below expectations for the six-month period ended May 31, 2016 but has been doing better recently. The underperformance occurred in late 2015 and during the beginning of 2016 as the price of oil collapsed. The Fund was overweight energy at the time, which hurt performance but we think the Fund’s positioning will pay off in the long term as oil prices recover. The Fund underperformed its benchmarks during the period as the Fund was down 7.05% compared to +1.29% for the Russell and +1.93% for the S&P 500.
The Fund’s biggest winners and losers based on contribution to return were mostly in the energy space. The biggest winner for the Fund over this timeframe was Energy Transfer Partners (ETP). We saw ETP as a quality name that was oversold and took advantage. It was bought for just under $20 and sold for almost $29 a few weeks later. ETP was a short term trade because we already had a large allocation to Energy Transfer Equity (ETE), which is the parent company of ETP and has the potential for larger price appreciation. The other biggest winners were Enterprise Product Partners (EPD) and Great Western Bancorp (GWB). EPD is another energy name that benefitted from the upturn in oil prices and having a strong balance sheet. GWB is a well-managed regional bank that has been making all-time highs after declining with the rest of the bank sector at the start of the year.
The Fund’s biggest losers for the period were Kinder Morgan (KMI), Energy Transfer Equity (ETE), and Palo Alto Networks (PANW). KMI and ETE suffered as energy prices collapsed. We sold the Fund’s position in KMI after management cut its dividend by 75%. We remain invested in ETE as we believe there is still large upside, however we have reduced the size of this position as there is still risk with the Williams merger and it is 200% off its low. PANW is a high growth company but its growth expectations have recently suffered. We sold the Fund’s position due to the changed outlook and because it is a high beta stock that will suffer if there is a big downturn.
Given the Fund’s portfolio characteristics, we are confident that the Fund owns better companies, on average, than the market. The portfolio characteristics are shown below:

* | Bench represents the S&P 500 in the table above |
2
INVESTMENT OUTLOOK
It is unclear which direction the market will head at this point, but we continue to believe that our focus on selecting a portfolio with superior valuation metrics will lead to shareholder value over the long-term.
Sincerely,
Stephen Lack
Managing Partner/Chief Investment Officer
Galapagos Partners L.P.
Past performance is not predictive of future performance. Investment results and principal value will fluctuate so that shares, when redeemed, may be worth more or less than their original cost. Current performance may be higher or lower than the performance data quoted. Performance data current to the most recent month end are available by calling 1-800-592-7722.
An investor should consider the investment objectives, risks, charges and expenses of the Fund carefully before investing. The Fund’s prospectus contains this and other important information. To obtain a copy of the Fund’s prospectus, please visit our website at www.apexcmfund.com or call 1-800-592-7722 and a copy will be sent to you free of charge. Please read the prospectus carefully before you invest. The Galapagos Partners Select Equity Fund is distributed by Ultimus Fund Distributors, LLC.
The Letter to Shareholders seeks to describe some of the Adviser’s current opinions and views of the financial markets. Although the Adviser believes it has a reasonable basis for any opinions or views expressed, actual results may differ, sometimes significantly so, from those expected or expressed. The securities held by the Fund that are discussed in the Letter to Shareholders were held during the period covered by this Report. They do not comprise the entire investment portfolio of the Fund, may be sold at any time and may no longer be held by the Fund. For a complete list of securities held by the Fund as of May 31, 2016, please see the Schedule of Investments section of the Semi-Annual Report. The opinions of the Adviser with respect to those securities may change at any time.
Statements in the Letter to Shareholders that reflect projections or expectations for future financial or economic performance of the Fund and the market in general and statements of the Fund’s plans and objectives for future operations are forward-looking statements. No assurance can be given that actual results or events will not differ materially from those projected, estimated, assumed, or anticipated in any such forward-looking statements. Important factors that could result in such differences, in addition to factors noted with such forward-looking statements include, without limitation, general economic conditions, such as inflation, recession, and interest rates. Past performance is not a guarantee of future results.
3
GALAPAGOS PARTNERS SELECT EQUITY FUND
PORTFOLIO INFORMATION
May 31, 2016 (Unaudited)
Sector Diversification (% of Net Assets)

Top 10 Equity Holdings
Security Description | % of
Net Assets |
Enterprise Products Partners, L.P. | 7.1% |
Alerian MLP ETF | 3.8% |
Great Western Bancorp, Inc. | 2.9% |
Boeing Company (The) | 2.8% |
CGI Group, Inc. - Class A | 2.7% |
Star Gas Partners, L.P. | 2.6% |
F5 Networks, Inc. | 2.4% |
RMR Group, Inc. (The) - Class A | 2.4% |
Lincoln National Corporation | 2.3% |
Energy Transfer Equity, L.P. | 2.3% |
4
GALAPAGOS PARTNERS SELECT EQUITY FUND
SCHEDULE OF INVESTMENTS
May 31, 2016 (Unaudited) |
COMMON STOCKS — 79.8% | | Shares | | | Value | |
Consumer Discretionary — 6.1% | | | | | | |
Auto Components — 2.1% | | | | | | |
Lear Corporation | | | 571 | | | $ | 67,812 | |
| | | | | | | | | |
Automobiles — 2.0% | | | | | | | | |
General Motors Company | | | 2,063 | | | | 64,531 | |
| | | | | | | | | |
Multi-line Retail — 2.0% | | | | | | | | |
Target Corporation | | | 927 | | | | 63,759 | |
| | | | | | | | | |
Consumer Staples — 2.0% | | | | | | | | |
Food & Staples Retailing — 2.0% | | | | | | | | |
Wal-Mart Stores, Inc. | | | 902 | | | | 63,844 | |
| | | | | | | | | |
Energy — 13.5% | | | | | | | | |
Energy Equipment & Services — 0.1% | | | | | | | | |
SAExploration Holdings, Inc. (a) | | | 4,006 | | | | 2,283 | |
| | | | | | | | | |
Oil, Gas & Consumable Fuels — 13.4% | | | | | | | | |
Diamondback Energy, Inc. (a) | | | 713 | | | | 64,847 | |
Energy Transfer Equity, L.P. | | | 5,786 | | | | 73,135 | |
Enterprise Products Partners, L.P. | | | 8,185 | | | | 227,216 | |
Valero Energy Corporation | | | 1,184 | | | | 64,765 | |
| | | | | | | | 429,963 | |
Financials — 19.9% | | | | | | | | |
Banks — 6.8% | | | | | | | | |
Great Western Bancorp, Inc. | | | 2,744 | | | | 93,351 | |
JPMorgan Chase & Company | | | 991 | | | | 64,683 | |
Sierra Bancorp | | | 3,530 | | | | 60,963 | |
| | | | | | | | 218,997 | |
Insurance — 6.3% | | | | | | | | |
AmTrust Financial Services, Inc. | | | 2,414 | | | | 64,019 | |
Lincoln National Corporation | | | 1,619 | | | | 74,231 | |
Prudential Financial, Inc. | | | 811 | | | | 64,272 | |
| | | | | | | | 202,522 | |
Real Estate Investment Trusts (REITs) — 4.5% | | | | | | | | |
Ares Commercial Real Estate Corporation | | | 5,761 | | | | 69,017 | |
RMR Group, Inc. (The) - Class A | | | 2,571 | | | | 76,204 | |
| | | | | | | | 145,221 | |
5
GALAPAGOS PARTNERS SELECT EQUITY FUND
SCHEDULE OF INVESTMENTS (Continued) |
COMMON STOCKS — 79.8% (Continued) | | Shares | | | Value | |
Financials — 19.9% (Continued) | | | | | | |
Thrifts & Mortgage Finance — 2.3% | | | | | | |
Essent Group Ltd. (a) | | | 3,273 | | | $ | 71,548 | |
| | | | | | | | | |
Health Care — 14.9% | | | | | | | | |
Biotechnology — 3.9% | | | | | | | | |
Gilead Sciences, Inc. | | | 747 | | | | 65,034 | |
United Therapeutics Corporation (a) | | | 517 | | | | 61,559 | |
| | | | | | | | 126,593 | |
Health Care Providers & Services — 4.4% | | | | | | | | |
Cigna Corporation | | | 537 | | | | 68,795 | |
McKesson Corporation | | | 393 | | | | 71,974 | |
| | | | | | | | 140,769 | |
Life Sciences Tools & Services — 4.4% | | | | | | | | |
ICON plc (a) | | | 1,024 | | | | 72,130 | |
INC Research Holdings, Inc. - Class A (a) | | | 1,570 | | | | 68,311 | |
| | | | | | | | 140,441 | |
Pharmaceuticals — 2.2% | | | | | | | | |
Taro Pharmaceutical Industries Ltd. (a) | | | 494 | | | | 72,183 | |
| | | | | | | | | |
Industrials — 7.7% | | | | | | | | |
Aerospace & Defense — 7.2% | | | | | | | | |
Boeing Company (The) | | | 717 | | | | 90,449 | |
Huntington Ingalls Industries, Inc. | | | 464 | | | | 71,182 | |
Spirit AeroSystems Holdings, Inc. - Class A (a) | | | 1,487 | | | | 69,562 | |
| | | | | | | | 231,193 | |
Marine — 0.5% | | | | | | | | |
Pangaea Logistics Solutions Ltd. (a) | | | 6,700 | | | | 15,343 | |
| | | | | | | | | |
Information Technology — 11.0% | | | | | | | | |
Communications Equipment — 2.4% | | | | | | | | |
F5 Networks, Inc. (a) | | | 699 | | | | 77,030 | |
| | | | | | | | | |
IT Services — 2.7% | | | | | | | | |
CGI Group, Inc. - Class A (a) | | | 1,838 | | | | 85,982 | |
| | | | | | | | | |
Software — 5.9% | | | | | | | | |
Check Point Software Technologies Ltd. (a) | | | 744 | | | | 63,218 | |
CyberArk Software Ltd. (a) | | | 1,415 | | | | 64,269 | |
FireEye, Inc. (a) | | | 3,993 | | | | 63,569 | |
| | | | | | | | 191,056 | |
6
GALAPAGOS PARTNERS SELECT EQUITY FUND
SCHEDULE OF INVESTMENTS (Continued) |
COMMON STOCKS — 79.8% (Continued) | | Shares | | | Value | |
Materials — 2.1% | | | | | | |
Chemicals — 2.1% | | | | | | |
Trinseo S.A. (a) | | | 1,412 | | | $ | 66,491 | |
| | | | | | | | | |
Utilities — 2.6% | | | | | | | | |
Gas Utilities — 2.6% | | | | | | | | |
Star Gas Partners, L.P. | | | 9,831 | | | | 84,448 | |
| | | | | | | | | |
Total Common Stocks (Cost $2,505,659) | | | | | | $ | 2,562,009 | |
| |
EXCHANGE-TRADED FUNDS — 3.8% | | Shares | | | Value | |
Energy — 3.8% | | | | | | |
Alerian MLP ETF (Cost $120,777) | | | 9,915 | | | $ | 121,062 | |
| |
MONEY MARKET FUNDS — 26.1% | | Shares | | | Value | |
Invesco Short-Term Investments Trust - Treasury Portfolio - Institutional Shares, 0.24% (b) (Cost $839,594) | | | 839,594 | | | $ | 839,594 | |
| | | | | | | | | |
Total Investments at Value — 109.7% (Cost $3,466,030) | | | | | | $ | 3,522,665 | |
| | | | | | | | | |
Liabilities in Excess of Other Assets — (9.7%) | | | | | | | (310,069 | ) |
| | | | | | | | | |
Net Assets — 100.0% | | | | | | $ | 3,212,596 | |
(a) | Non-income producing security. |
(b) | The rate shown is the 7-day effective yield as of May 31, 2016. |
See accompanying notes to financial statements. |
7
GALAPAGOS PARTNERS SELECT EQUITY FUND
STATEMENT OF ASSETS AND LIABILITIES
May 31, 2016 (Unaudited) |
ASSETS | | | |
Investments in securities: | | | |
At acquisition cost | | $ | 3,466,030 | |
At value (Note 2) | | $ | 3,522,665 | |
Dividends receivable | | | 1,719 | |
Receivable from Adviser (Note 4) | | | 8,827 | |
Other assets | | | 8,570 | |
Total assets | | | 3,541,781 | |
| | | | | |
LIABILITIES | | | | |
Payable for investment securities purchased | | | 319,832 | |
Payable to administrator (Note 4) | | | 6,530 | |
Other accrued expenses | | | 2,823 | |
Total liabilities | | | 329,185 | |
| | | | | |
NET ASSETS | | $ | 3,212,596 | |
| | | | | |
NET ASSETS CONSIST OF: | | | | |
Paid-in capital | | $ | 3,864,967 | |
Accumulated net investment income | | | 34,925 | |
Accumulated net realized losses from security transactions | | | (743,931 | ) |
Net unrealized appreciation on investments | | | 56,635 | |
NET ASSETS | | $ | 3,212,596 | |
| | | | | |
Shares of beneficial interest outstanding (unlimited number of shares authorized, no par value) | | | 358,024 | |
| | | | | |
Net asset value, offering price and redemption price per share (Note 2) | | $ | 8.97 | |
See accompanying notes to financial statements. |
8
GALAPAGOS PARTNERS SELECT EQUITY FUND
STATEMENT OF OPERATIONS
For the Six Months Ended May 31, 2016 (Unaudited) |
INVESTMENT INCOME | | | |
Dividend income | | $ | 47,473 | |
| | | | | |
EXPENSES | | | | |
Investment advisory fees (Note 4) | | | 21,139 | |
Professional fees | | | 16,060 | |
Fund accounting fees (Note 4) | | | 13,176 | |
Administration fees (Note 4) | | | 13,000 | |
Compliance fees (Note 4) | | | 6,000 | |
Transfer agent fees (Note 4) | | | 6,000 | |
Trustees' fees and expenses (Note 4) | | | 5,597 | |
Registration and filing fees | | | 4,146 | |
Custody and bank service fees | | | 3,651 | |
Printing of shareholder reports | | | 2,992 | |
Insurance expense | | | 2,060 | |
Postage and supplies | | | 1,441 | |
Other expenses | | | 3,524 | |
Total expenses | | | 98,786 | |
Less fee reductions and expense reimbursements by the Adviser (Note 4) | | | (73,419 | ) |
Net expenses | | | 25,367 | |
| | | | | |
NET INVESTMENT INCOME | | | 22,106 | |
| | | | | |
REALIZED AND UNREALIZED LOSSES ON INVESTMENTS | | | | |
Net realized losses from security transactions | | | (260,867 | ) |
Net change in unrealized appreciation (depreciation) on investments | | | (84,027 | ) |
NET REALIZED AND UNREALIZED LOSSES ON INVESTMENTS | | | (344,894 | ) |
| | | | | |
NET DECREASE IN NET ASSETS RESULTING FROM OPERATIONS | | $ | (322,788 | ) |
See accompanying notes to financial statements. |
9
GALAPAGOS PARTNERS SELECT EQUITY FUND
STATEMENTS OF CHANGES IN NET ASSETS |
| | Six Months
Ended
May 31, 2016
(Unaudited) | | | Period Ended
November 30, 2015 (a) | |
FROM OPERATIONS | | | | | | |
Net investment income | | $ | 22,106 | | | $ | 8,525 | |
Net realized losses from security transactions | | | (260,867 | ) | | | (484,299 | ) |
Net change in unrealized appreciation (depreciation) on investments | | | (84,027 | ) | | | 140,662 | |
Net decrease in net assets resulting from operations | | | (322,788 | ) | | | (335,112 | ) |
| | | | | | | | | |
CAPITAL SHARE TRANSACTIONS | | | | | | | | |
Proceeds from shares sold | | | 31,237 | | | | 5,036,117 | |
Payments for shares redeemed | | | (653,003 | ) | | | (543,855 | ) |
Net increase (decrease) in net assets resulting from capital share transactions | | | (621,766 | ) | | | 4,492,262 | |
| | | | | | | | | |
TOTAL INCREASE (DECREASE) IN NET ASSETS | | | (944,554 | ) | | | 4,157,150 | |
| | | | | | | | | |
NET ASSETS | | | | | | | | |
Beginning of period | | | 4,157,150 | | | | — | |
End of period | | $ | 3,212,596 | | | $ | 4,157,150 | |
| | | | | | | | | |
ACCUMULATED NET INVESTMENT INCOME | | $ | 34,925 | | | $ | 12,819 | |
| | | | | | | | | |
CAPITAL SHARE ACTIVITY | | | | | | | | |
Shares sold | | | 3,668 | | | | 488,198 | |
Shares redeemed | | | (76,294 | ) | | | (57,548 | ) |
Net increase (decrease) in shares outstanding | | | (72,626 | ) | | | 430,650 | |
Shares outstanding at beginning of period | | | 430,650 | | | | — | |
Shares outstanding at end of period | | | 358,024 | | | | 430,650 | |
(a) | Represents the period from the commencement of operations (December 30, 2014) through November 30, 2015. |
See accompanying notes to financial statements. |
10
GALAPAGOS PARTNERS SELECT EQUITY FUND
FINANCIAL HIGHLIGHTS |
Per Share Data for a Share Outstanding Throughout Each Period |
| | Six Months
Ended
May 31, 2016
(Unaudited) | | | Period
Ended
November 30,
2015 (a) | |
Net asset value at beginning of period | | $ | 9.65 | | | $ | 10.00 | |
| | | | | | | | | |
Income (loss) from investment operations: | | | | | | | | |
Net investment income | | | 0.07 | | | | 0.02 | |
Net realized and unrealized losses on investments | | | (0.75 | ) | | | (0.37 | ) |
Total from investment operations | | | (0.68 | ) | | | (0.35 | ) |
| | | | | | | | | |
Net asset value at end of period | | $ | 8.97 | | | $ | 9.65 | |
| | | | | | | | | |
Total return (b) | | | (7.05% | )(c) | | | (3.50% | )(c) |
| | | | | | | | | |
Net assets at end of period (000's) | | $ | 3,213 | | | $ | 4,157 | |
| | | | | | | | | |
Ratios/supplementary data: | | | | | | | | |
Ratio of total expenses to average net assets (e) | | | 5.85 | %(d) | | | 6.82 | %(d) |
| | | | | | | | | |
Ratio of net expenses to average net assets (e) (f) | | | 1.50 | %(d) | | | 1.50 | %(d) |
| | | | | | | | | |
Ratio of net investment income to average net assets (e) (f) (g) | | | 1.31 | %(d) | | | 0.38 | %(d) |
| | | | | | | | | |
Portfolio turnover rate | | | 149 | %(c) | | | 1,244 | %(c) |
(a) | Represents the period from the commencement of operations (December 30, 2014) through November 30, 2015. |
(b) | Total return is a measure of the change in value of an investment in the Fund over the periods covered. The returns shown do not reflect the deduction of taxes a shareholder would pay on Fund distributions, if any, or the redemption of Fund shares. The total returns would be lower if the Adviser had not reduced advisory fees and/or reimbursed expenses. |
(c) | Not annualized. |
(d) | Annualized. |
(e) | Ratios do not reflect the Fund’s proportionate share of expenses of the underlying investment companies in which the Fund invests. |
(f) | Ratio was determined after advisory fee reductions and/or expense reimbursements (Note 4). |
(g) | Recognition of net investment income by the Fund is affected by the timing of the declaration of dividends by the underlying investment companies in which the Fund invests. |
See accompanying notes to financial statements. |
11
GALAPAGOS PARTNERS SELECT EQUITY FUND
NOTES TO FINANCIAL STATEMENTS
May 31, 2016 (Unaudited)
1. Organization
Galapagos Partners Select Equity Fund (the “Fund”) is a diversified series of Ultimus Managers Trust (the “Trust”), an open-end investment company established as an Ohio business trust under a Declaration of Trust dated February 28, 2012. Other series of the Trust are not incorporated in this report. The Fund commenced operations on December 30, 2014.
The investment objective of the Fund is capital appreciation.
2. Significant Accounting Policies
The following is a summary of the Fund’s significant accounting policies used in the preparation of its financial statements. These policies are in conformity with accounting principles generally accepted in the United States of America (“GAAP”). As an investment company, as defined in Financial Accounting Standards Board (“FASB”) Accounting Standards Update 2013-08, the Fund follows accounting and reporting guidance under FASB Accounting Standards Codification Topic 946, “Financial Services – Investment Companies.”
Securities valuation – The Fund values its portfolio securities at market value as of the close of regular trading on the New York Stock Exchange (the “NYSE”) (normally 4:00 p.m. Eastern time) on each business day the NYSE is open for business. The Fund values its listed securities on the basis of the security’s last sale price on the primary exchange, if available, otherwise at the exchange’s most recently quoted mean price. NASDAQ-listed securities are valued at the NASDAQ Official Closing Price. In the event that market quotations are not readily available or are considered unreliable due to market or other events, the Fund values its securities and other assets at fair value in accordance with procedures established by and under the general supervision of the Board of Trustees (the “Board”). Under these procedures, the securities will be classified as Level 2 or 3 within the fair value hierarchy (see below), depending on the inputs used. Unavailable or unreliable market quotes may be due to the following factors: a substantial bid-ask spread; infrequent sales resulting in stale prices; insufficient trading volume; small trade sizes; a temporary lapse in any reliable pricing source; and actions of the securities or futures markets, such as the suspension or limitation of trading. As a result, the prices of securities used to calculate the Fund’s net asset value (“NAV”) may differ from quoted or published prices for the same securities.
GAAP establishes a single authoritative definition of fair value, sets out a framework for measuring fair value, and requires additional disclosures about fair value measurements.
12
GALAPAGOS PARTNERS SELECT EQUITY FUND
NOTES TO FINANCIAL STATEMENTS (Continued) |
Various inputs are used in determining the value of the Fund’s investments. These inputs are summarized in the three broad levels listed below:
● | Level 1 – quoted prices in active markets for identical securities |
● | Level 2 – other significant observable inputs |
● | Level 3 – significant unobservable inputs |
The inputs or methods used for valuing securities are not necessarily an indication of the risks associated with investing in those securities. The inputs used to measure fair value may fall into different levels of the fair value hierarchy. In such cases, for disclosure purposes, the level in the fair value hierarchy within which the fair value measurement falls in its entirety is determined based on the lowest level input that is significant to the fair value measurement.
The following is a summary of the inputs used to value the Fund’s investments as of May 31, 2016:
| | Level 1 | | | Level 2 | | | Level 3 | | | Total | |
Investments in Securities: | | | | | | | | | | | | |
Common Stocks | | $ | 2,562,009 | | | $ | — | | | $ | — | | | $ | 2,562,009 | |
Exchange-Traded Funds | | | 121,062 | | | | — | | | | — | | | | 121,062 | |
Money Market Funds | | | 839,594 | | | | — | | | | — | | | | 839,594 | |
Total | | $ | 3,522,665 | | | $ | — | | | $ | — | | | $ | 3,522,665 | |
Refer to the Fund’s Schedule of Investments for a listing of the common stocks by industry type. As of May 31, 2016, the Fund did not have any transfers between Levels. In addition, the Fund did not have derivative instruments or any assets or liabilities that were measured at fair value on a recurring basis using significant unobservable inputs (Level 3) as of May 31, 2016. It is the Fund’s policy to recognize transfers between Levels at the end of the reporting period.
Share valuation – The NAV per share of the Fund is calculated daily by dividing the total value of the Fund’s assets, less liabilities, by the number of shares outstanding. The offering price and redemption price per share of the Fund is equal to the NAV per share.
Investment income – Dividend income is recorded on the ex-dividend date. Interest income is accrued as earned.
Security transactions – Security transactions are accounted for on the trade date. Realized gains and losses on securities sold are determined on a specific identification basis.
13
GALAPAGOS PARTNERS SELECT EQUITY FUND
NOTES TO FINANCIAL STATEMENTS (Continued) |
Common expenses – Common expenses of the Trust are allocated among the Fund and the other series of the Trust based on the relative net assets of each series or the nature of the services performed and the relative applicability to each series.
Distributions to shareholders – The Fund will distribute to shareholders any net investment income and net realized capital gains at least once each year. The amount of such dividends and distributions are determined in accordance with federal income tax regulations, which may differ from GAAP. Dividends and distributions to shareholders are recorded on the ex-dividend date. There were no distributions paid to shareholders during the periods ended May31, 2016 and November 30, 2015.
Estimates – The preparation of financial statements in conformity with GAAP requires management to make estimates and assumptions that affect the reported amounts of assets and liabilities and disclosure of contingent assets and liabilities as of the date of the financial statements and the reported amounts of income and expenses during the reporting period. Actual results could differ from those estimates.
Federal income tax – The Fund has qualified and intends to continue to qualify as a regulated investment company under the Internal Revenue Code of 1986 (the “Code”). Qualification generally will relieve the Fund of liability for federal income taxes to the extent 100% of its net investment income and net realized capital gains are distributed in accordance with the Code.
In order to avoid imposition of the excise tax applicable to regulated investment companies, it is also the Fund’s intention to declare as dividends in each calendar year at least 98% of its net investment income (earned during the calendar year) and 98.2% of its net realized capital gains (earned during the twelve months ended October 31) plus undistributed amounts from prior years.
The following information is computed on a tax basis for each item as of May 31, 2016:
Tax cost of portfolio investments | | $ | 3,462,371 | |
Gross unrealized appreciation | | $ | 136,920 | |
Gross unrealized depreciation | | | (76,626 | ) |
Net unrealized appreciation on investments | | | 60,294 | |
Accumulated ordinary income | | | 22,106 | |
Other losses | | | (296,321 | ) |
Capital loss carryforward | | | (438,450 | ) |
Accumulated deficit | | $ | (652,371 | ) |
14
GALAPAGOS PARTNERS SELECT EQUITY FUND
NOTES TO FINANCIAL STATEMENTS (Continued) |
The difference between the federal income tax cost of portfolio investments and the financial statement cost of portfolio investments is due to certain timing differences in the recognition of capital gains or losses under income tax regulations and GAAP. These “book/tax” differences are temporary in nature and are primarily due to the tax deferral of losses on wash sales and the tax treatment of income and capital gains on publicly-traded partnerships held by the Fund.
As of November 30, 2015, the Fund had a short-term capital loss carryforward of $438,450 for federal income tax purposes. This capital loss carryforward, which does not expire, may be utilized in the current and future years to offset net realized capital gains, if any, prior to distributing such gains to shareholders.
The Fund recognizes the tax benefits or expenses of uncertain tax positions only when the position is “more likely than not” to be sustained assuming examination by tax authorities. Management has reviewed the Fund’s tax positions for the current year and the tax period ended November 30, 2015 and has concluded that no provision for unrecognized tax benefits or expenses is required in these financial statements. The Fund identifies its major tax jurisdiction as U.S. Federal.
3. Investment Transactions
During the six months ended May 31, 2016, cost of purchases and proceeds from sales of investment securities, other than short-term investments, were $4,702,309 and $5,604,322, respectively.
4. Transactions with Related Parties
INVESTMENT ADVISORY AGREEMENT
The Fund’s investments are managed by Galapagos Partners, L.P. (the “Adviser”) pursuant to the terms of an Investment Advisory Agreement. Under the Investment Advisory Agreement, the Fund pays the Adviser an advisory fee, computed and accrued daily and paid monthly, at the annual rate of 1.25% of its average daily net assets.
Pursuant to an Expense Limitation Agreement (“ELA”) between the Fund and the Adviser, the Adviser has agreed, until March 31, 2017, to reduce investment advisory fees and reimburse other operating expenses to limit total annual operating expenses of the Fund (exclusive of brokerage costs, taxes, interest, costs to organize the Fund, acquired fund fees and expenses, extraordinary expenses such as litigation and merger or reorganization costs, and other expenses not incurred in the ordinary course of the Fund’s business and amounts, if any, payable pursuant to a plan adopted in accordance with Rule 12b-1 under the Investment Company Act of 1940 (the “1940 Act”), as amended) to an amount not exceeding 1.50% of the Fund’s average daily net assets. Accordingly, during the six months ended May 31, 2016, the Adviser did not collect any of its advisory fees and, in addition, reimbursed other operating expenses totaling $52,280.
15
GALAPAGOS PARTNERS SELECT EQUITY FUND
NOTES TO FINANCIAL STATEMENTS (Continued) |
Under the terms of the ELA, investment advisory fee reductions and expense reimbursements by the Adviser are subject to recoupment by the Adviser for a period of three years after such fees and expenses were incurred, provided the recoupments do not cause total annual operating expenses of the Fund to exceed 1.50% of the average daily net assets. As of May 31, 2016, the Adviser may seek recoupment of investment advisory fee reductions and expense reimbursements in the amount of $185,396 no later than the dates stated below:
November 30, 2018 | May 31, 2019 | Total |
$111,977 | $73,419 | $185,396 |
The principal executive officer of the Fund is also an officer of the Adviser.
OTHER SERVICE PROVIDERS
Ultimus Fund Solutions, LLC (“Ultimus”) provides fund administration, fund accounting, compliance and transfer agency services to the Fund. The Fund pays Ultimus fees in accordance with the agreements for such services. In addition, the Fund pays out-of-pocket expenses including but not limited to postage, supplies and costs of pricing the Fund’s portfolio securities.
Under the terms of a Distribution Agreement with the Trust, Ultimus Fund Distributors, LLC (the “Distributor”) serves as principal underwriter to the Fund. The Distributor is a wholly-owned subsidiary of Ultimus. The Distributor is compensated by the Adviser (not the Fund) for acting as principal underwriter.
Certain officers and a Trustee of the Trust are also officers of Ultimus and the Distributor.
TRUSTEE COMPENSATION
Each Trustee who is not an “interested person” of the Trust (“Independent Trustee”) receives from the Fund a fee of $500 for each Board meeting attended plus reimbursement of travel and other meeting-related expenses. Each Independent Trustee also receives a $500 annual retainer from the Fund. Trustees affiliated with the Adviser or Ultimus are not compensated by the Fund for their services.
PRINCIPAL HOLDERS OF FUND SHARES
As of May 31, 2016, the following shareholders owned of record 5% or more of the outstanding shares of the Fund:
Name of Record Owner | % Ownership |
Charles Schwab & Co., Inc. (for the benefit of its customers) | 64% |
Lack Holdings, Inc. | 14% |
Clifford B. Sondock | 6% |
Birdwood Associates Limited Partner | 6% |
16
GALAPAGOS PARTNERS SELECT EQUITY FUND
NOTES TO FINANCIAL STATEMENTS (Continued) |
A beneficial owner of 25% or more of the Fund’s outstanding shares may be considered a controlling person. That shareholder’s vote could have a more significant effect on matters presented at a shareholder’s meeting.
5. Investments in Money Market Mutual Funds
In order to maintain sufficient liquidity to implement investment strategies, or for temporary defensive purposes, the Fund may invest a significant portion of its assets in shares of one or more money market mutual funds. As of May 31, 2016, the Fund had 26.1% of the value of its net assets invested in a single money market mutual fund registered under the 1940 Act. An investment in a money market mutual fund is not insured or guaranteed by the Federal Deposit Insurance Corporation or any other governmental agency, entity or person. While investor losses in money market mutual funds have been rare, they are possible. In addition, the Fund incurs additional indirect expenses due to acquired fund fees and other costs to the extent it invests in shares of money market mutual funds.
6. Contingencies and Commitments
The Fund indemnifies the Trust’s officers and Trustees for certain liabilities that might arise from their performance of their duties to the Fund. Additionally, in the normal course of business the Fund enters into contracts that contain a variety of representations and warranties and which provide general indemnifications. The Fund’s maximum exposure under these arrangements is unknown, as this would involve future claims that may be made against the Fund that have not yet occurred. However, based on experience, the Fund expects the risk of loss to be remote.
7. Subsequent Events
The Fund is required to recognize in the financial statements the effects of all subsequent events that provide additional evidence about conditions that existed as of the date of the Statement of Assets and Liabilities. For non-recognized subsequent events that must be disclosed to keep the financial statements from being misleading, the Fund is required to disclose the nature of the event as well as an estimate of its financial effect, or a statement that such an estimate cannot be made. Management has evaluated subsequent events through the issuance of these financial statements and has noted no such events except as reflected in the following paragraph.
Effective September 26, 2016 (the “Effective Date”) the Fund will change its name to “Galapagos Partners Select Fund” and remove the following principal investment policy: “Under normal circumstances, the Fund will invest at least 80% of its net assets (including the amount of any borrowings for investment purposes) in U.S. and foreign equity securities listed on U.S. stock exchanges.” Therefore on and after the Effective Date the Fund will no longer be required to meet the 80% investment policy.
17
GALAPAGOS PARTNERS SELECT EQUITY FUND
ABOUT YOUR FUND’S EXPENSES (Unaudited) |
We believe it is important for you to understand the impact of costs on your investment. As a shareholder of the Fund, you incur ongoing costs, including management fees and other operating expenses. The following examples are intended to help you understand your ongoing costs (in dollars) of investing in the Fund and to compare these costs with the ongoing costs of investing in other mutual funds.
A mutual fund’s ongoing costs are expressed as a percentage of its average net assets. This figure is known as the expense ratio. The expenses in the table below are based on an investment of $1,000 made at the beginning of the most recent period (December 1, 2015) and held until the end of the period (May 31, 2016).
The table below illustrates the Fund’s ongoing costs in two ways:
Actual fund return – This section helps you to estimate the actual expenses that you paid over the period. The “Ending Account Value” shown is derived from the Fund’s actual return, and the fourth column shows the dollar amount of operating expenses that would have been paid by an investor who started with $1,000 in the Fund. You may use the information here, together with the amount you invested, to estimate the expenses that you paid over the period.
To do so, simply divide your account value by $1,000 (for example, an $8,600 account value divided by $1,000 = 8.6), then multiply the result by the number given for the Fund under the heading “Expenses Paid During Period.”
Hypothetical 5% return – This section is intended to help you compare the Fund’s ongoing costs with those of other mutual funds. It assumes that the Fund had an annual return of 5% before expenses during the period shown, but that the expense ratio is unchanged. In this case, because the return used is not the Fund’s actual return, the results do not apply to your investment. The example is useful in making comparisons because the U.S. Securities and Exchange Comission (“SEC”) requires all mutual funds to calculate expenses based on a 5% return. You can assess the Fund’s ongoing costs by comparing this hypothetical example with the hypothetical examples that appear in shareholder reports of other funds.
Note that expenses shown in the table are meant to highlight and help you compare ongoing costs only. The Fund does not charge transaction fees, such as purchase or redemption fees, nor does it carry a “sales load.”
The calculations assume no shares were bought or sold during the period. Your actual costs may have been higher or lower, depending on the amount of your investment and the timing of any purchases or redemptions.
18
GALAPAGOS PARTNERS SELECT EQUITY FUND
ABOUT YOUR FUND’S EXPENSES (Unaudited) (Continued) |
More information about the Fund’s expenses can be found in this report. For additional information on operating expenses and other shareholder costs, please refer to the Fund’s prospectus.
| Beginning Account Value December 1, 2015 | Ending Account Value May 31, 2016 | Net
Expense Ratio (a) | Expenses Paid During Period (b) |
Based on Actual Fund Return | $ 1,000.00 | $ 929.50 | 1.50% | $ 7.24 |
Based on Hypothetical 5% Return (before expenses) | $ 1,000.00 | $ 1,017.50 | 1.50% | $ 7.57 |
(a) | Annualized, based on the Fund’s most recent one-half year expenses. |
(b) | Expenses are equal to the Fund’s annualized net expense ratio multiplied by the average account value over the period, multiplied by 183/366 (to reflect the one-half year period). |
OTHER INFORMATION (Unaudited)
A description of the policies and procedures that the Fund uses to vote proxies relating to portfolio securities is available without charge upon request by calling toll-free 1-800-592-7722, or on the SEC’s website at http://www.sec.gov. Information regarding how the Fund voted proxies relating to portfolio securities during the most recent 12-month period ended June 30 is available without charge upon request by calling toll-free 1-800-592-7722, or on the SEC’s website at http://www.sec.gov.
The Trust files a complete listing of portfolio holdings for the Fund with the SEC as of the end of the first and third quarters of each fiscal year on Form N-Q. These filings are available upon request by calling 1-800-592-7722. Furthermore, you may obtain a copy of the filings on the SEC’s website at http://www.sec.gov. The Trust’s Forms N-Q may also be reviewed and copied at the SEC’s Public Reference Room in Washington, DC, and information on the operation of the Public Reference Room may be obtained by calling 1-800-SEC-0330.
19
This Page Intentionally Left Blank
This Page Intentionally Left Blank

LYRICAL U.S. VALUE EQUITY FUND
Institutional Class (LYRIX)
Investor Class (LYRBX)
LYRICAL U.S. HEDGED VALUE FUND
Institutional Class (LYRHX)
Investor Class (LYRDX)
Semi-Annual Report
May 31, 2016
(Unaudited)
LYRICAL FUNDS
LETTER TO SHAREHOLDERS | June 13, 2016 |
Dear Fellow Shareholders,
Enclosed is the semi-annual report to shareholders of the Lyrical U.S. Value Equity Fund (the “Value Fund”) and Lyrical U.S. Hedged Value Fund (the “Hedged Value Fund”) (collectively, the “Funds”). On behalf of the Funds and their investment adviser, Lyrical Asset Management LP, I would like to thank you for your investment.
Lyrical U.S. Value Equity Fund
Since its launch on February 4, 2013 through the period ended May 31, 2016, the Value Fund – Institutional Class has produced a cumulative total return of +60.42%, compared to the +50.49% cumulative total return for the S&P 500 Index (the “S&P 500”). For the six months ended May 31, 2016, the Value Fund – Institutional Class produced a total return of -0.60% compared to the total return for the S&P 500 of +1.93%. The Value Fund’s biggest winners for the six month period ended May 31, 2016 were AVGO (+19%), NCR (+14%), and GLW (+13%). The biggest losers were HTZ (-39%), WDC (-24%) and ARRS (-21%). The Value Fund maintains its positions in all of these largest winners and detractors.
In analyzing the Value Fund’s portfolio’s performance attribution, we find it helpful to examine both the investment success rate and any skew in the distribution of returns. Our success rate has been high over the life of the Value Fund, as 77% of the Fund’s investments posted gains, and 63% outperformed the S&P 500. Skew has also been a positive factor, as the Fund’s outperformers have outperformed by 44%, while our underperformers have underperformed by 37%. For the six month period ended May 31, 2016, the Value Fund’s underperformance is explained by a lower success rate, as only 53% of the Fund’s investments posted gains, and only 41% outperformed the S&P 500. For the six month period skew has been a negative factor as the Fund’s outperformers have outperformed by 7%, while our underperformers have underperformed by 12%.
During the life of the Value Fund we have sold fourteen positions, as four companies announced they were being acquired, nine approached our estimates of fair value, and for one we lost conviction in our thesis. For each sale we added a new position from our pipeline of opportunities. We are still finding attractive stock opportunities to add to the portfolio, even as some of our existing positions begin to approach our estimates of fair value.
As of the reporting date, the valuation of the Value Fund’s portfolio is 13.0x next twelve months consensus earnings. The S&P 500 has a valuation of 16.6x on this same basis, a premium of 28%.
Lyrical U.S. Hedged Value Fund
In July 2014, we launched the Hedged Value Fund as a liquid alternatives product that employs a similar long portfolio as the Value Fund. Sector ETF hedges are used on the short side to create a portfolio that aims to maintain net long exposures of 50%. This provides a hedged option for those wishing exposure to the long portfolio but unwilling to accept unhedged equity market exposure.
1
Since its launch on July 14, 2014 through May 31, 2016, the Hedged Value Fund – Institutional Class has produced a cumulative total return of -6.14%, compared to the +10.39% cumulative total return for the S&P 500. For the six months ended May 31, 2016, the Hedged Value Fund – Institutional Class produced a total return of -0.69% compared to the total return for the S&P 500 of +1.93%. In rising equity markets one should expect Hedged Value Fund’s performance to lag that of the S&P 500, as it did for both the above periods, as the Fund’s hedges detract from total return.
Lyrical Asset Management’s Investment Philosophy and Portfolio Construction
As there have been a significant number of new investors since our previous letter to the Funds’ shareholders, we’d like to briefly outline our investment philosophy and portfolio construction approach.
We believe our strategy and approach to investing differentiates us from other investment managers, even those that share a value approach to investing. We are deep value investors and by this we mean that we look to invest in companies that trade significantly below intrinsic value. This separates us from other value managers who focus on relative value or core value approaches and whose portfolio characteristics have higher Price/Earnings, Price/Book and Price/Cash Flow multiples. We assess valuation based on current price relative to long-term normalized earnings, which contrasts us to those that rely on Price/Book or dividend yield. We only invest in what we consider to be quality businesses that we believe should earn good returns on invested capital, and avoid volatile businesses and companies with excessive leverage. Other value investors may consider owning any business regardless of quality if they believe the price is low enough. Lastly, we only invest in businesses we can understand, and avoid those that are excessively complex or require specialized technical knowledge, even though they may appear cheap from a high-level perspective.
We construct our portfolio purely bottom up and without regard to what is or is not contained in a benchmark. We are concerned with concentration risk, and have strict limits on how much capital can be invested in any one position or any one industry. Our long portfolio is constructed to be diversified across approximately 33 positions, giving us exposure to many different types of companies and situations without sacrificing our strict investment standards.
Thank you for your continued trust and interest in Lyrical Asset Management.
Sincerely,
Andrew Wellington
Portfolio Manager
2
Past performance is not predictive of future performance. Investment results and principal value will fluctuate so that shares, when redeemed, may be worth more or less than their original cost. Current performance may be higher or lower than the performance data quoted. Performance data current to the most recent month end are available by calling 1-888-884-8099.
An investor should consider the investment objectives, risks, charges and expenses of the Funds carefully before investing. The Funds’ prospectus contains this and other important information. To obtain a copy of the Funds’ prospectus please call 1-888-884-8099 and a copy will be sent to you free of charge. Please read the prospectus carefully before you invest. The Funds are distributed by Ultimus Fund Distributors, LLC.
The Letter to Shareholders seeks to describe some of the Adviser’s current opinions and views of the financial markets. Although the Adviser believes it has a reasonable basis for any opinions or views expressed, actual results may differ, sometimes significantly so, from those expected or expressed. The securities held by the Funds that are discussed in the Letter to Shareholders were held during the period covered by this Report. They do not comprise the entire investment portfolio of the Funds, may be sold at any time, and may no longer be held by the Funds. For a complete list of securities held by the Funds as of May 31, 2016, please see the Schedules of Investments and Schedule of Securities Sold Short sections of the Semi-Annual Report. The opinions of the Funds’ adviser with respect to those securities may change at any time.
Statements in the Letter to Shareholders that reflect projections or expectations for future financial or economic performance of the Funds and the market in general and statements of the Funds’ plans and objectives for future operations are forward-looking statements. No assurance can be given that actual results or events will not differ materially from those projected, estimated, assumed, or anticipated in any such forward-looking statements. Important factors that could result in such differences, in addition to factors noted with such forward-looking statements include, without limitation, general economic conditions, such as inflation, recession, and interest rates. Past performance is not a guarantee of future results.
3
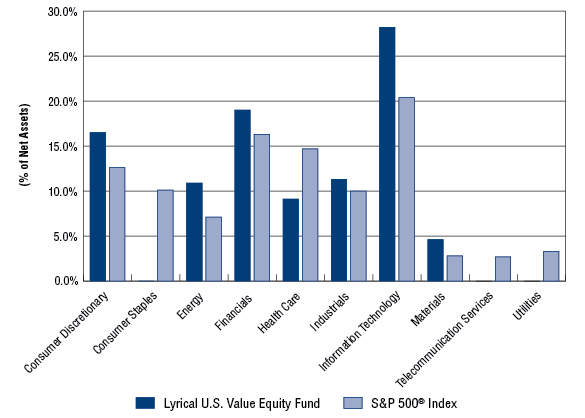
LYRICAL U.S. VALUE EQUITY FUND
PORTFOLIO INFORMATION
May 31, 2016 (Unaudited)
Lyrical U.S. Value Equity Fund vs S&P 500® Index
Sector Diversification
Top Ten Equity Holdings
Security Description | % of
Net Assets |
Broadcom Ltd. | 6.4% |
Aetna, Inc. | 4.9% |
Aflac, Inc. | 4.7% |
Comcast Corporation - Class A | 4.6% |
Corning, Inc. | 4.4% |
Johnson Controls, Inc. | 4.2% |
Anthem, Inc. | 4.2% |
Eaton Corporation plc | 4.2% |
Liberty Interactive Corporation QVC Group - Series A | 4.1% |
EOG Resources, Inc. | 4.0% |
4
LYRICAL U.S. HEDGED VALUE FUND
PORTFOLIO INFORMATION
May 31, 2016 (Unaudited)
Lyrical U.S. Hedged Value Fund vs S&P 500® Index
Sector Diversification
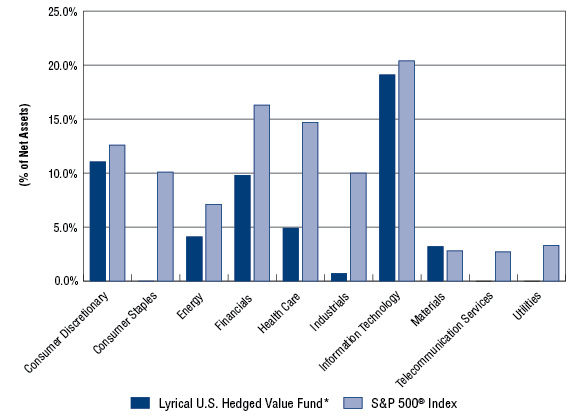
* | The percentages above for Lyrical U.S. Hedged Value Fund represent the net percentages for the Fund and are computed by taking the net dollar exposure, including short positions, and dividing by the net assets of the Fund. |
Top Ten Long Positions
Security Description | % of
Net Assets |
Broadcom Ltd. | 8.5% |
Aetna, Inc. | 5.9% |
Comcast Corporation - Class A | 5.2% |
Aflac, Inc. | 5.0% |
Anthem, Inc. | 4.9% |
Corning, Inc. | 4.4% |
TE Connectivity Ltd. | 4.3% |
Liberty Interactive Corporation QVC Group - Series A | 4.3% |
Johnson Controls, Inc. | 4.1% |
Celanese Corporation - Series A | 4.0% |
5
LYRICAL U.S. VALUE EQUITY FUND
SCHEDULE OF INVESTMENTS
May 31, 2016 (Unaudited) | |
COMMON STOCKS — 99.6% | | Shares | | | Value | |
Consumer Discretionary — 16.5% | | | | | | |
Auto Components — 7.8% | | | | | | |
Goodyear Tire & Rubber Company (The) | | | 910,780 | | | $ | 25,474,517 | |
Johnson Controls, Inc. | | | 984,328 | | | | 43,458,081 | |
Tenneco, Inc. (a) | | | 204,299 | | | | 10,974,942 | |
| | | | | | | | 79,907,540 | |
Internet & Catalog Retail — 4.1% | | | | | | | | |
Liberty Interactive Corporation QVC Group - Series A (a) | | | 1,567,535 | | | | 42,292,094 | |
| | | | | | | | | |
Media — 4.6% | | | | | | | | |
Comcast Corporation - Class A | | | 756,877 | | | | 47,910,314 | |
| | | | | | | | | |
Energy — 10.9% | | | | | | | | |
Energy Equipment & Services — 3.0% | | | | | | | | |
National Oilwell Varco, Inc. | | | 929,787 | | | | 30,636,482 | |
| | | | | | | | | |
Oil, Gas & Consumable Fuels — 7.9% | | | | | | | | |
EOG Resources, Inc. | | | 504,560 | | | | 41,051,002 | |
Suncor Energy, Inc. | | | 1,469,419 | | | | 40,629,435 | |
| | | | | | | | 81,680,437 | |
Financials — 19.0% | | | | | | | | |
Capital Markets — 3.8% | | | | | | | | |
Ameriprise Financial, Inc. | | | 388,340 | | | | 39,482,528 | |
| | | | | | | | | |
Insurance — 15.2% | | | | | | | | |
Aflac, Inc. | | | 700,437 | | | | 48,652,354 | |
AmTrust Financial Services, Inc. | | | 562,749 | | | | 14,924,104 | |
Assurant, Inc. | | | 236,058 | | | | 20,629,109 | |
Lincoln National Corporation | | | 762,490 | | | | 34,960,166 | |
Willis Towers Watson plc | | | 287,204 | | | | 36,767,856 | |
| | | | | | | | 155,933,589 | |
Health Care — 9.1% | | | | | | | | |
Health Care Providers & Services — 9.1% | | | | | | | | |
Aetna, Inc. | | | 442,960 | | | | 50,156,361 | |
Anthem, Inc. | | | 326,832 | | | | 43,194,117 | |
| | | | | | | | 93,350,478 | |
Industrials — 11.3% | | | | | | | | |
Construction & Engineering — 1.4% | | | | | | | | |
AECOM (a) | | | 459,439 | | | | 14,752,586 | |
6
LYRICAL U.S. VALUE EQUITY FUND
SCHEDULE OF INVESTMENTS (Continued) | |
COMMON STOCKS — 99.6% (Continued) | | Shares | | | Value | |
Industrials — 11.3% (Continued) | | | | | | |
Electrical Equipment — 4.2% | | | | | | |
Eaton Corporation plc | | | 694,132 | | | $ | 42,779,355 | |
| | | | | | | | | |
Road & Rail — 2.5% | | | | | | | | |
Avis Budget Group, Inc. (a) | | | 355,287 | | | | 10,658,610 | |
Hertz Global Holdings, Inc. (a) | | | 1,514,877 | | | | 14,679,158 | |
| | | | | | | | 25,337,768 | |
Trading Companies & Distributors — 3.2% | | | | | | | | |
AerCap Holdings N.V. (a) | | | 709,541 | | | | 27,735,958 | |
MRC Global, Inc. (a) | | | 353,817 | | | | 5,020,663 | |
| | | | | | | | 32,756,621 | |
Information Technology — 28.2% | | | | | | | | |
Communications Equipment — 1.2% | | | | | | | | |
ARRIS International plc (a) | | | 499,550 | | | | 12,039,155 | |
| | | | | | | | | |
Electronic Equipment, Instruments & Components — 8.3% | | | | | | | | |
Corning, Inc. | | | 2,153,743 | | | | 44,991,691 | |
TE Connectivity Ltd. | | | 682,914 | | | | 40,974,840 | |
| | | | | | | | 85,966,531 | |
IT Services — 3.4% | | | | | | | | |
Western Union Company (The) | | | 1,795,413 | | | | 34,920,783 | |
| | | | | | | | | |
Semiconductors & Semiconductor Equipment — 7.5% | | | | | | | | |
Broadcom Ltd. | | | 423,746 | | | | 65,409,433 | |
Microsemi Corporation (a) | | | 336,589 | | | | 11,386,806 | |
| | | | | | | | 76,796,239 | |
Software — 3.3% | | | | | | | | |
Symantec Corporation | | | 1,973,017 | | | | 34,251,575 | |
| | | | | | | | | |
Technology Hardware, Storage & Peripherals — 4.5% | | | | | | | | |
NCR Corporation (a) | | | 572,816 | | | | 17,688,558 | |
Western Digital Corporation | | | 606,956 | | | | 28,247,732 | |
| | | | | | | | 45,936,290 | |
Materials — 4.6% | | | | | | | | |
Chemicals — 3.6% | | | | | | | | |
Celanese Corporation - Series A | | | 518,279 | | | | 36,528,304 | |
| | | | | | | | | |
Containers & Packaging — 1.0% | | | | | | | | |
Owens-Illinois, Inc. (a) | | | 564,093 | | | | 10,661,358 | |
| | | | | | | | | |
Total Common Stocks (Cost $982,282,103) | | | | | | $ | 1,023,920,027 | |
7
LYRICAL U.S. VALUE EQUITY FUND
SCHEDULE OF INVESTMENTS (Continued) | |
MONEY MARKET FUNDS — 0.5% | | Shares | | | Value | |
Fidelity Institutional Money Market Portfolio - Class I, 0.33% (b) (Cost $5,549,908) | | | 5,549,908 | | | $ | 5,549,908 | |
| | | | | | | | | |
Total Investments at Value — 100.1% (Cost $987,832,011) | | | | | | $ | 1,029,469,935 | |
| | | | | | | | | |
Liabilities in Excess of Other Assets — (0.1%) | | | | | | | (1,269,700 | ) |
| | | | | | | | | |
Net Assets — 100.0% | | | | | | $ | 1,028,200,235 | |
(a) | Non-income producing security. |
(b) | The rate shown is the 7-day effective yield as of May 31, 2016. |
See accompanying notes to financial statements. |
8
LYRICAL U.S. HEDGED VALUE FUND
SCHEDULE OF INVESTMENTS
May 31, 2016 (Unaudited) | |
COMMON STOCKS — 103.8% | | Shares | | | Value | |
Consumer Discretionary — 17.3% | | | | | | |
Auto Components — 7.8% | | | | | | |
Goodyear Tire & Rubber Company (The) (a) | | | 1,288 | | | $ | 36,025 | |
Johnson Controls, Inc. (a) | | | 1,248 | | | | 55,099 | |
Tenneco, Inc. (b) | | | 283 | | | | 15,203 | |
| | | | | | | | 106,327 | |
Internet & Catalog Retail — 4.3% | | | | | | | | |
Liberty Interactive Corporation QVC Group - Series A (a)(b) | | | 2,156 | | | | 58,169 | |
| | | | | | | | | |
Media — 5.2% | | | | | | | | |
Comcast Corporation - Class A (a) | | | 1,110 | | | | 70,263 | |
| | | | | | | | | |
Energy — 9.0% | | | | | | | | |
Energy Equipment & Services — 2.1% | | | | | | | | |
National Oilwell Varco, Inc. (a) | | | 871 | | | | 28,699 | |
| | | | | | | | | |
Oil, Gas & Consumable Fuels — 6.9% | | | | | | | | |
EOG Resources, Inc. (a) | | | 585 | | | | 47,596 | |
Suncor Energy, Inc. (a) | | | 1,657 | | | | 45,816 | |
| | | | | | | | 93,412 | |
Financials — 19.3% | | | | | | | | |
Capital Markets — 3.8% | | | | | | | | |
Ameriprise Financial, Inc. (a) | | | 509 | | | | 51,750 | |
| | | | | | | | | |
Insurance — 15.5% | | | | | | | | |
Aflac, Inc. (a) | | | 989 | | | | 68,696 | |
AmTrust Financial Services, Inc. (a) | | | 771 | | | | 20,447 | |
Assurant, Inc. (a) | | | 352 | | | | 30,761 | |
Lincoln National Corporation | | | 1,021 | | | | 46,813 | |
Willis Towers Watson plc (a) | | | 346 | | | | 44,295 | |
| | | | | | | | 211,012 | |
Health Care — 10.8% | | | | | | | | |
Health Care Providers & Services — 10.8% | | | | | | | | |
Aetna, Inc. (a) | | | 701 | | | | 79,375 | |
Anthem, Inc. (a) | | | 507 | | | | 67,005 | |
| | | | | | | | 146,380 | |
Industrials — 11.4% | | | | | | | | |
Construction & Engineering — 1.4% | | | | | | | | |
AECOM (a)(b) | | | 577 | | | | 18,528 | |
9
LYRICAL U.S. HEDGED VALUE FUND
SCHEDULE OF INVESTMENTS (Continued) | |
COMMON STOCKS — 103.8% (Continued) | | Shares | | | Value | |
Industrials — 11.4% (Continued) | | | | | | |
Electrical Equipment — 3.8% | | | | | | |
Eaton Corporation plc (a) | | | 842 | | | $ | 51,892 | |
| | | | | | | | | |
Road & Rail — 2.7% | | | | | | | | |
Avis Budget Group, Inc. (a)(b) | | | 527 | | | | 15,810 | |
Hertz Global Holdings, Inc. (a)(b) | | | 2,158 | | | | 20,911 | |
| | | | | | | | 36,721 | |
Trading Companies & Distributors — 3.5% | | | | | | | | |
AerCap Holdings N.V. (a)(b) | | | 1,052 | | | | 41,123 | |
MRC Global, Inc. (a)(b) | | | 508 | | | | 7,208 | |
| | | | | | | | 48,331 | |
Information Technology — 30.9% | | | | | | | | |
Communications Equipment — 1.2% | | | | | | | | |
ARRIS International plc (b) | | | 703 | | | | 16,943 | |
| | | | | | | | | |
Electronic Equipment, Instruments & Components — 8.7% | | | | | | | | |
Corning, Inc. (a) | | | 2,880 | | | | 60,163 | |
TE Connectivity Ltd. (a) | | | 975 | | | | 58,500 | |
| | | | | | | | 118,663 | |
IT Services — 3.8% | | | | | | | | |
Western Union Company (The) (a) | | | 2,662 | | | | 51,776 | |
| | | | | | | | | |
Semiconductors & Semiconductor Equipment — 9.7% | | | | | | | | |
Broadcom Ltd. (a) | | | 748 | | | | 115,461 | |
Microsemi Corporation (b) | | | 466 | | | | 15,765 | |
| | | | | | | | 131,226 | |
Software — 3.4% | | | | | | | | |
Symantec Corporation (a) | | | 2,628 | | | | 45,622 | |
| | | | | | | | | |
Technology Hardware, Storage & Peripherals — 4.1% | | | | | | | | |
NCR Corporation (b) | | | 836 | | | | 25,816 | |
Western Digital Corporation (a) | | | 656 | | | | 30,530 | |
| | | | | | | | 56,346 | |
Materials — 5.1% | | | | | | | | |
Chemicals — 4.0% | | | | | | | | |
Celanese Corporation - Series A (a) | | | 774 | | | | 54,551 | |
| | | | | | | | | |
Containers & Packaging — 1.1% | | | | | | | | |
Owens-Illinois, Inc. (a)(b) | | | 824 | | | | 15,574 | |
| | | | | | | | | |
Total Common Stocks (Cost $1,501,414) | | | | | | $ | 1,412,185 | |
10
LYRICAL U.S. HEDGED VALUE FUND
SCHEDULE OF INVESTMENTS (Continued) | |
MONEY MARKET FUNDS — 0.4% | | Shares | | | Value | |
Invesco Liquid Assets Portfolio (The) - Institutional Class, 0.44% (c) (Cost $4,681) | | | 4,681 | | | $ | 4,681 | |
| | | | | | | | | |
Total Investments at Value — 104.2% (Cost $1,506,095) | | | | | | $ | 1,416,866 | |
| | | | | | | | | |
Liabilities in Excess of Other Assets (d) — (4.2%) | | | | | | | (56,492 | ) |
| | | | | | | | | |
Net Assets — 100.0% | | | | | | $ | 1,360,374 | |
(a) | All or a portion of the shares have been committed as collateral for open short positions (Note 2). |
(b) | Non-income producing security. |
(c) | The rate shown is the 7-day effective yield as of May 31, 2016. |
(d) | Includes cash held as margin deposits for open short positions. |
See accompanying notes to financial statements. |
11
LYRICAL U.S. HEDGED VALUE FUND
SCHEDULE OF SECURITIES SOLD SHORT
May 31, 2016 (Unaudited) | |
EXCHANGE-TRADED FUNDS — 50.7% | | Shares | | | Value | |
Consumer Discretionary Select Sector SPDR® Fund (The) | | | 1,017 | | | $ | 80,587 | |
Energy Select Sector SPDR® Fund (The) | | | 997 | | | | 66,669 | |
Financial Select Sector SPDR® Fund (The) | | | 5,457 | | | | 129,386 | |
Health Care Select Sector SPDR® Fund (The) | | | 1,121 | | | | 79,972 | |
Industrial Select Sector SPDR® Fund (The) | | | 2,615 | | | | 146,257 | |
Materials Select Sector SPDR® Fund (The) | | | 561 | | | | 26,333 | |
Technology Select Sector SPDR® Fund (The) | | | 3,622 | | | | 160,129 | |
Total Securities Sold Short — 50.7% (Proceeds $679,090) | | | | | | $ | 689,333 | |
See accompanying notes to financial statements. |
12
LYRICAL FUNDS
STATEMENTS OF ASSETS AND LIABILITIES
May 31, 2016 (Unaudited) | |
| | Lyrical U.S.
Value Equity Fund | | | Lyrical U.S. Hedged Value Fund | |
ASSETS | | | | | | |
Investments in securities: | | | | | | |
At acquisition cost | | $ | 987,832,011 | | | $ | 1,506,095 | |
At value (Note 2) | | $ | 1,029,469,935 | | | $ | 1,416,866 | |
Deposits with brokers for securities sold short (Note 2) | | | — | | | | 617,655 | |
Dividends receivable | | | 1,018,288 | | | | 1,429 | |
Receivable for capital shares sold | | | 600,987 | | | | 150 | |
Receivable from Adviser (Note 4) | | | — | | | | 15,968 | |
Other assets | | | 49,293 | | | | 10,655 | |
Total assets | | | 1,031,138,503 | | | | 2,062,723 | |
| | | | | | | | | |
LIABILITIES | | | | | | | | |
Securities sold short, at value (Note 2) (proceeds $— and $679,090 respectively) | | | — | | | | 689,333 | |
Payable for capital shares redeemed | | | 1,722,471 | | | | — | |
Payable to Adviser (Note 4) | | | 1,065,471 | | | | — | |
Payable to administrator (Note 4) | | | 84,320 | | | | 8,010 | |
Accrued distribution fees (Note 4) | | | 20,255 | | | | — | |
Accrued brokerage expense on securities sold short (Note 2) | | | — | | | | 176 | |
Other accrued expenses | | | 45,751 | | | | 4,830 | |
Total liabilities | | | 2,938,268 | | | | 702,349 | |
| | | | | | | | | |
NET ASSETS | | $ | 1,028,200,235 | | | $ | 1,360,374 | |
| | | | | | | | | |
NET ASSETS CONSIST OF: | | | | | | | | |
Paid-in capital | | $ | 970,280,826 | | | $ | 1,452,255 | |
Accumulated net investment income (loss) | | | 10,033,973 | | | | (557 | ) |
Accumulated net realized gains from security transactions | | | 6,247,512 | | | | 8,148 | |
Net unrealized appreciation (depreciation) on: | | | | | | | | |
Investments | | | 41,637,924 | | | | (89,229 | ) |
Securities sold short | | | — | | | | (10,243 | ) |
NET ASSETS | | $ | 1,028,200,235 | | | $ | 1,360,374 | |
| | | | | | | | | |
NET ASSET VALUE PER SHARE: | | | | | | | | |
INSTITUTIONAL CLASS | | | | | | | | |
Net assets applicable to Institutional Class | | $ | 969,418,322 | | | $ | 770,673 | |
Institutional Class shares of beneficial interest outstanding (unlimited number of shares authorized, no par value) | | | 64,081,925 | | | | 82,822 | |
Net asset value, offering price and redemption price per share (Note 2) | | $ | 15.13 | | | $ | 9.31 | |
INVESTOR CLASS | | | | | | | | |
Net assets applicable to Investor Class | | $ | 58,781,913 | | | $ | 589,701 | |
Investor Class shares of beneficial interest outstanding (unlimited number of shares authorized, no par value) | | | 3,896,261 | | | | 63,668 | |
Net asset value, offering price and redemption price per share (Note 2) | | $ | 15.09 | | | $ | 9.26 | |
See accompanying notes to financial statements. |
13
LYRICAL FUNDS
STATEMENTS OF OPERATIONS
Six Months Ended May 31, 2016 (Unaudited) | |
| | Lyrical U.S. Value Equity Fund | | | Lyrical U.S. Hedged Value Fund | |
INVESTMENT INCOME | | | | | | |
Dividend income | | $ | 16,671,775 | | | $ | 22,004 | |
Foreign withholding taxes on dividends | | | (98,625 | ) | | | (117 | ) |
Total investment income | | | 16,573,150 | | | | 21,887 | |
| | | | | | | | | |
EXPENSES | | | | | | | | |
Investment advisory fees (Note 4) | | | 5,646,005 | | | | 10,276 | |
Administration fees (Note 4) | | | 319,349 | | | | 13,500 | |
Distribution fees - Investor Class (Note 4) | | | 117,857 | | | | 723 | |
Registration and filing fees | | | 69,009 | | | | 5,660 | |
Fund accounting fees (Note 4) | | | 53,222 | | | | 16,567 | |
Custody and bank service fees | | | 50,954 | | | | 3,329 | |
Transfer agent fees (Note 4) | | | 41,816 | | | | 12,000 | |
Compliance fees (Note 4) | | | 46,356 | | | | 6,000 | |
Professional fees | | | 18,611 | | | | 15,911 | |
Postage and supplies | | | 22,721 | | | | 2,547 | |
Trustees' fees and expenses (Note 4) | | | 5,597 | | | | 5,597 | |
Printing of shareholder reports | | | 6,781 | | | | 2,592 | |
Dividend expense on securities sold short (Note 2) | | | — | | | | 7,474 | |
Insurance expense | | | 2,032 | | | | 2,032 | |
Prime brokerage expense on securities sold short (Note 2) | | | — | | | | 2,645 | |
Other expenses | | | 6,849 | | | | 7,636 | |
Total expenses | | | 6,407,159 | | | | 114,489 | |
Fee reductions and expense reimbursements by Adviser (Note 4) | | | — | | | | (92,045 | ) |
Net expenses | | | 6,407,159 | | | | 22,444 | |
| | | | | | | | | |
NET INVESTMENT INCOME (LOSS) | | | 10,165,991 | | | | (557 | ) |
| | | | | | | | | |
REALIZED AND UNREALIZED GAINS (LOSSES) ON INVESTMENTS AND SECURITIES SOLD SHORT | | | | | | | | |
Net realized gains (losses) from: | | | | | | | | |
Investments | | | 9,295,254 | | | | 12,555 | |
Securities sold short | | | — | | | | (1,443 | ) |
Net change in unrealized appreciation (depreciation) on: | | | | | | | | |
Investments | | | 26,713,051 | | | | (28,911 | ) |
Securities sold short | | | — | | | | 4,470 | |
NET REALIZED AND UNREALIZED GAINS (LOSSES) ON INVESTMENTS AND SECURITIES SOLD SHORT | | | 36,008,305 | | | | (13,329 | ) |
| | | | | | | | | |
NET INCREASE (DECREASE) IN NET ASSETS RESULTING FROM OPERATIONS | | $ | 46,174,296 | | | $ | (13,886 | ) |
See accompanying notes to financial statements. |
14
LYRICAL U.S. VALUE EQUITY FUND
STATEMENTS OF CHANGES IN NET ASSETS | |
| | Six Months
Ended
May 31, 2016
(Unaudited) | | | Year
Ended
November 30, 2015 | |
FROM OPERATIONS | | | | | | |
Net investment income | | $ | 10,165,991 | | | $ | 1,440,862 | |
Net realized gains from security transactions | | | 9,295,254 | | | | 12,579,532 | |
Net change in unrealized appreciation (depreciation) on investments | | | 26,713,051 | | | | (31,320,202 | ) |
Net increase (decrease) in net assets resulting from operations | | | 46,174,296 | | | | (17,299,808 | ) |
| | | | | | | | | |
DISTRIBUTIONS TO SHAREHOLDERS (Note 2) | | | | | | | | |
From net investment income, Institutional Class | | | (1,403,762 | ) | | | (168,471 | ) |
From net investment income, Investor Class | | | (6,340 | ) | | | — | |
From net realized gains, Institutional Class | | | (14,083,967 | ) | | | (11,690,275 | ) |
From net realized gains, Investor Class | | | (1,469,251 | ) | | | (193,318 | ) |
Decrease in net assets from distributions to shareholders | | | (16,963,320 | ) | | | (12,052,064 | ) |
| | | | | | | | | |
CAPITAL SHARE TRANSACTIONS | | | | | | | | |
Institutional Class | | | | | | | | |
Proceeds from shares sold | | | 576,171,995 | | | | 339,352,309 | |
Net asset value of shares issued in reinvestment of distributions to shareholders | | | 11,534,459 | | | | 9,377,973 | |
Payments for shares redeemed | | | (241,620,578 | ) | | | (282,422,299 | ) |
Net increase in Institutional Class net assets from capital share transactions | | | 346,085,876 | | | | 66,307,983 | |
| | | | | | | | | |
Investor Class | | | | | | | | |
Proceeds from shares sold | | | 57,442,392 | | | | 118,329,002 | |
Net asset value of shares issued in reinvestment of distributions to shareholders | | | 1,458,715 | | | | 181,114 | |
Payments for shares redeemed | | | (57,954,564 | ) | | | (59,563,305 | ) |
Net increase in Investor Class net assets from capital share transactions | | | 946,543 | | | | 58,946,811 | |
| | | | | | | | | |
TOTAL INCREASE IN NET ASSETS | | | 376,243,395 | | | | 95,902,922 | |
| | | | | | | | | |
NET ASSETS | | | | | | | | |
Beginning of period | | | 651,956,840 | | | | 556,053,918 | |
End of period | | $ | 1,028,200,235 | | | $ | 651,956,840 | |
| | | | | | | | | |
ACCUMULATED NET INVESTMENT INCOME | | $ | 10,033,973 | | | $ | 1,278,084 | |
See accompanying notes to financial statements. |
15
LYRICAL U.S. VALUE EQUITY FUND
STATEMENTS OF CHANGES IN NET ASSETS (Continued) | |
| | Six Months
Ended
May 31, 2016
(Unaudited) | | | Year
Ended
November 30, 2015 | |
CAPITAL SHARE ACTIVITY | | | | | | |
Institutional Class | | | | | | |
Shares sold | | | 42,258,821 | | | | 21,132,995 | |
Shares issued in reinvestment of distributions to shareholders | | | 750,525 | | | | 592,967 | |
Shares redeemed | | | (16,716,439 | ) | | | (17,510,391 | ) |
Net increase in shares outstanding | | | 26,292,907 | | | | 4,215,571 | |
Shares outstanding at beginning of period | | | 37,789,018 | | | | 33,573,447 | |
Shares outstanding at end of period | | | 64,081,925 | | | | 37,789,018 | |
| | | | | | | | | |
Investor Class | | | | | | | | |
Shares sold | | | 3,797,000 | | | | 7,202,116 | |
Shares issued in reinvestment of distributions to shareholders | | | 94,924 | | | | 11,470 | |
Shares redeemed | | | (3,937,844 | ) | | | (3,826,599 | ) |
Net increase (decrease) in shares outstanding | | | (45,920 | ) | | | 3,386,987 | |
Shares outstanding at beginning of period | | | 3,942,181 | | | | 555,194 | |
Shares outstanding at end of period | | | 3,896,261 | | | | 3,942,181 | |
See accompanying notes to financial statements. |
16
LYRICAL U.S. HEDGED VALUE FUND
STATEMENTS OF CHANGES IN NET ASSETS | |
| | Six Months
Ended
May 31, 2016
(Unaudited) | | | Year
Ended
November 30, 2015 | |
FROM OPERATIONS | | | | | | |
Net investment loss | | $ | (557 | ) | | $ | (22,709 | ) |
Net realized gains (losses) from: | | | | | | | | |
Investments | | | 12,555 | | | | 21,575 | |
Securities sold short | | | (1,443 | ) | | | (3,393 | ) |
Net change in unrealized appreciation (depreciation) on: | | | | | | | | |
Investments | | | (28,911 | ) | | | (60,317 | ) |
Securities sold short | | | 4,470 | | | | 2,207 | |
Net decrease in net assets resulting from operations | | | (13,886 | ) | | | (62,637 | ) |
| | | | | | | | | |
DISTRIBUTIONS TO SHAREHOLDERS (Note 2) | | | | | | | | |
From net realized gains, Institutional Class | | | (6,246 | ) | | | (54 | ) |
From net realized gains, Investor Class | | | (4,994 | ) | | | (57 | ) |
Decrease in net assets from distributions to shareholders | | | (11,240 | ) | | | (111 | ) |
| | | | | | | | | |
CAPITAL SHARE TRANSACTIONS | | | | | | | | |
Institutional Class | | | | | | | | |
Proceeds from shares sold | | | — | | | | 220,000 | |
Net asset value of shares issued in reinvestment of distributions to shareholders | | | 6,087 | | | | 54 | |
Net increase in Institutional Class net assets from capital share transactions | | | 6,087 | | | | 220,054 | |
| | | | | | | | | |
Investor Class | | | | | | | | |
Proceeds from shares sold | | | 12,473 | | | | 126,747 | |
Net asset value of shares issued in reinvestment of distributions to shareholders | | | 4,784 | | | | 54 | |
Payments for shares redeemed | | | (33,274 | ) | | | (94,359 | ) |
Net increase (decrease) in Investor Class net assets from capital share transactions | | | (16,017 | ) | | | 32,442 | |
| | | | | | | | | |
TOTAL INCREASE (DECREASE) IN NET ASSETS | | | (35,056 | ) | | | 189,748 | |
| | | | | | | | | |
NET ASSETS | | | | | | | | |
Beginning of period | | | 1,395,430 | | | | 1,205,682 | |
End of period | | $ | 1,360,374 | | | $ | 1,395,430 | |
| | | | | | | | | |
ACCUMULATED NET INVESTMENT LOSS | | $ | (557 | ) | | $ | — | |
See accompanying notes to financial statements. |
17
LYRICAL U.S. HEDGED VALUE FUND
STATEMENTS OF CHANGES IN NET ASSETS (Continued) | |
| | Six Months
Ended
May 31, 2016
(Unaudited) | | | Year
Ended
November 30, 2015 | |
CAPITAL SHARE ACTIVITY | | | | | | |
Institutional Class | | | | | | |
Shares sold | | | — | | | | 21,883 | |
Shares issued in reinvestment of distributions to shareholders | | | 645 | | | | 6 | |
Net increase in shares outstanding | | | 645 | | | | 21,889 | |
Shares outstanding at beginning of period | | | 82,177 | | | | 60,288 | |
Shares outstanding at end of period | | | 82,822 | | | | 82,177 | |
| | | | | | | | | |
Investor Class | | | | | | | | |
Shares sold | | | 1,375 | | | | 12,770 | |
Shares issued in reinvestment of distributions to shareholders | | | 508 | | | | 6 | |
Shares redeemed | | | (3,931 | ) | | | (9,763 | ) |
Net increase (decrease) in shares outstanding | | | (2,048 | ) | | | 3,013 | |
Shares outstanding at beginning of period | | | 65,716 | | | | 62,703 | |
Shares outstanding at end of period | | | 63,668 | | | | 65,716 | |
See accompanying notes to financial statements. |
18
LYRICAL U.S. VALUE EQUITY FUND
INSTITUTIONAL CLASS
FINANCIAL HIGHLIGHTS | |
Per Share Data for a Share Outstanding Throughout Each Period: | |
| | Six Months
Ended
May 31, 2016
(Unaudited) | | | Year
Ended
November 30, 2015 | | | Year
Ended
November 30, 2014 | | | Period
Ended
November 30,
2013 (a) | |
Net asset value at beginning of period | | $ | 15.63 | | | $ | 16.29 | | | $ | 13.78 | | | $ | 10.00 | |
| | | | | | | | | | | | | | | | | |
Income (loss) from investment operations: | | | | | | | | | | | | | | | | |
Net investment income (loss) | | | 0.15 | | | | 0.04 | | | | (0.00 | )(b) | | | 0.00 | (b) |
Net realized and unrealized gains (losses) on investments | | | (0.24 | ) | | | (0.35 | ) | | | 2.66 | | | | 3.78 | |
Total from investment operations | | | (0.09 | ) | | | (0.31 | ) | | | 2.66 | | | | 3.78 | |
| | | | | | | | | | | | | | | | | |
Less distributions: | | | | | | | | | | | | | | | | |
Dividends from net investment income | | | (0.04 | ) | | | (0.00 | )(b) | | | (0.00 | )(b) | | | — | |
Distributions from net realized gains | | | (0.37 | ) | | | (0.35 | ) | | | (0.15 | ) | | | — | |
Total distributions | | | (0.41 | ) | | | (0.35 | ) | | | (0.15 | ) | | | — | |
| | | | | | | | | | | | | | | | | |
Net asset value at end of period | | $ | 15.13 | | | $ | 15.63 | | | $ | 16.29 | | | $ | 13.78 | |
| | | | | | | | | | | | | | | | | |
Total return (c) | | | (0.60 | %)(d) | | | (1.91 | %) | | | 19.41 | % | | | 37.80 | %(d) |
| | | | | | | | | | | | | | | | | |
Net assets at end of period (000's) | | $ | 969,418 | | | $ | 590,582 | | | $ | 547,021 | | | $ | 97,948 | |
| | | | | | | | | | | | | | | | | |
Ratios/supplementary data: | | | | | | | | | | | | | | | | |
Ratio of total expenses to average net assets | | | 1.38 | %(e) | | | 1.42 | % | | | 1.45 | % | | | 1.93 | %(e) |
| | | | | | | | | | | | | | | | | |
Ratio of net expenses to average net assets (f) | | | 1.38 | %(e) | | | 1.42 | % | | | 1.44 | % | | | 1.45 | %(e) |
| | | | | | | | | | | | | | | | | |
Ratio of net investment income (loss) to average net assets (f) | | | 1.15 | %(e) | | | 0.24 | % | | | (0.00 | %)(g) | | | 0.01 | %(e) |
| | | | | | | | | | | | | | | | | |
Portfolio turnover rate | | | 21 | %(d) | | | 21 | % | | | 20 | % | | | 26 | %(d) |
(a) | Represents the period from the commencement of operations (February 4, 2013) through November 30, 2013. |
(b) | Amount rounds to less than $0.01 per share. |
(c) | Total return is a measure of the change in value of an investment in the Fund over the periods covered. The returns shown do not reflect the deduction of taxes a shareholder would pay on Fund distributions, if any, or the redemption of Fund shares. The total returns would be lower if the Adviser had not reduced advisory fees and/or reimbursed expenses (Note 4). |
(d) | Not annualized. |
(e) | Annualized. |
(f) | Ratio was determined after advisory fee reductions and/or expense reimbursements (Note 4). |
(g) | Amount rounds to less than 0.01%. |
See accompanying notes to financial statements. |
19
LYRICAL U.S. VALUE EQUITY FUND
INVESTOR CLASS
FINANCIAL HIGHLIGHTS | |
Per Share Data for a Share Outstanding Throughout Each Period: | |
| | Six Months
Ended
May 31, 2016
(Unaudited) | | | Year
Ended
November 30, 2015 | | | Period
Ended
November 30,
2014 (a) | |
Net asset value at beginning of period | | $ | 15.57 | | | $ | 16.27 | | | $ | 14.68 | |
| | | | | | | | | | | | | |
Income (loss) from investment operations: | | | | | | | | | | | | |
Net investment income (loss) | | | 0.22 | | | | 0.01 | | | | (0.01 | ) |
Net realized and unrealized gains (losses) on investments | | | (0.33 | ) | | | (0.36 | ) | | | 1.60 | |
Total from investment operations | | | (0.11 | ) | | | (0.35 | ) | | | 1.59 | |
| | | | | | | | | | | | | |
Less distributions: | | | | | | | | | | | | |
Distributions from net investment income | | | (0.00 | )(b) | | | — | | | | — | |
Distributions from net realized gains | | | (0.37 | ) | | | (0.35 | ) | | | — | |
Total distributions | | | (0.37 | ) | | | (0.35 | ) | | | — | |
| | | | | | | | | | | | | |
Net asset value at end of period | | $ | 15.09 | | | $ | 15.57 | | | $ | 16.27 | |
| | | | | | | | | | | | | |
Total return (c) | | | (0.73 | %)(d) | | | (2.19 | %) | | | 10.83 | %(d) |
| | | | | | | | | | | | | |
Net assets at end of period (000's) | | $ | 58,782 | | | $ | 61,375 | | | $ | 9,033 | |
| | | | | | | | | | | | | |
Ratios/supplementary data: | | | | | | | | | | | | |
Ratio of total expenses to average net assets | | | 1.70 | %(e) | | | 1.72 | % | | | 2.39 | %(e) |
| | | | | | | | | | | | | |
Ratio of net expenses to average net assets (f) | | | 1.70 | %(e) | | | 1.70 | % | | | 1.70 | %(e) |
| | | | | | | | | | | | | |
Ratio of net investment income (loss) to average net assets (f) | | | 0.90 | %(e) | | | 0.03 | % | | | (0.18 | %)(e) |
| | | | | | | | | | | | | |
Portfolio turnover rate | | | 21 | %(d) | | | 21 | % | | | 20 | %(d)(g) |
(a) | Represents the period from the commencement of operations (February 24, 2014) through November 30, 2014. |
(b) | Amount rounds to less than $0.01 per share. |
(c) | Total return is a measure of the change in value of an investment in the Fund over the periods covered. The returns shown do not reflect the deduction of taxes a shareholder would pay on Fund distributions, if any, or the redemption of Fund shares. The total returns would be lower if the Adviser had not reduced advisory fees and/or reimbursed expenses (Note 4). |
(d) | Not annualized. |
(e) | Annualized. |
(f) | Ratio was determined after advisory fee reductions and/or expense reimbursements (Note 4). |
(g) | Represents the year ended November 30, 2014. |
See accompanying notes to financial statements. |
20
LYRICAL U.S. HEDGED VALUE FUND
INSTITUTIONAL CLASS
FINANCIAL HIGHLIGHTS | |
Per Share Data for a Share Outstanding Throughout Each Period: | |
| | Six Months
Ended
May 31, 2016
(Unaudited) | | | Year
Ended
November 30,
2015 | | | Period
Ended
November 30,
2014 (a) | |
Net asset value at beginning of period | | $ | 9.45 | | | $ | 9.81 | | | $ | 10.00 | |
| | | | | | | | | | | | | |
Income (loss) from investment operations: | | | | | | | | | | | | |
Net investment income (loss) | | | 0.00 | (b) | | | (0.13 | ) | | | (0.04 | ) |
Net realized and unrealized losses on investments and securities sold short | | | (0.06 | ) | | | (0.23 | ) | | | (0.15 | ) |
Total from investment operations | | | (0.06 | ) | | | (0.36 | ) | | | (0.19 | ) |
| | | | | | | | | | | | | |
Less distributions: | | | | | | | | | | | | |
Distributions from net realized gains | | | (0.08 | ) | | | (0.00 | )(b) | | | — | |
| | | | | | | | | | | | | |
Net asset value at end of period | | $ | 9.31 | | | $ | 9.45 | | | $ | 9.81 | |
| | | | | | | | | | | | | |
Total return (c) | | | (0.69 | %)(d) | | | (3.66 | %) | | | (1.90% | )(d) |
| | | | | | | | | | | | | |
Net assets at end of period (000's) | | $ | 771 | | | $ | 777 | | | $ | 591 | |
| | | | | | | | | | | | | |
Ratios/supplementary data: | | | | | | | | | | | | |
Ratio of total expenses to average net assets | | | 16.89 | %(e) | | | 14.76 | % | | | 16.57 | %(e) |
| | | | | | | | | | | | | |
Ratio of net expenses to average net assets (f) | | | 3.28 | %(e) | | | 3.16 | % | | | 2.59 | %(e) |
| | | | | | | | | | | | | |
Ratio of net expenses to average net assets excluding dividend expense (f) | | | 2.15 | %(e) | | | 2.27 | % | | | 1.99 | %(e) |
| | | | | | | | | | | | | |
Ratio of net expenses to average net assets excluding dividend expense and prime brokerage expense on securities sold short (f) | | | 1.75 | %(e) | | | 1.75 | % | | | 1.75 | %(e) |
| | | | | | | | | | | | | |
Ratio of net investment income (loss) to average net assets (f) | | | 0.03 | %(e) | | | (1.49 | %) | | | (1.15 | %)(e) |
| | | | | | | | | | | | | |
Portfolio turnover rate | | | 7 | %(d) | | | 7 | % | | | 9 | %(d) |
(a) | Represents the period from the commencement of operations (July 14, 2014) through November 30, 2014. |
(b) | Amount rounds to less than $0.01 per share. |
(c) | Total return is a measure of the change in value of an investment in the Fund over the periods covered. The returns shown do not reflect the deduction of taxes a shareholder would pay on Fund distributions, if any, or the redemption of Fund shares. The total returns would be lower if the Adviser had not reduced advisory fees and reimbursed expenses (Note 4). |
(d) | Not annualized. |
(e) | Annualized. |
(f) | Ratio was determined after advisory fee reductions and expense reimbursements (Note 4). |
See accompanying notes to financial statements. |
21
LYRICAL U.S. HEDGED VALUE FUND
INVESTOR CLASS
FINANCIAL HIGHLIGHTS | |
Per Share Data for a Share Outstanding Throughout Each Period: | |
| | Six Months
Ended
May 31, 2016
(Unaudited) | | | Year
Ended
November 30,
2015 | | | Period
Ended
November 30,
2014 (a) | |
Net asset value at beginning of period | | $ | 9.42 | | | $ | 9.80 | | | $ | 10.00 | |
| | | | | | | | | | | | | |
Loss from investment operations: | | | | | | | | | | | | |
Net investment loss | | | (0.01 | ) | | | (0.18 | ) | | | (0.05 | ) |
Net realized and unrealized losses on investments and securities sold short | | | (0.07 | ) | | | (0.20 | ) | | | (0.15 | ) |
Total from investment operations | | | (0.08 | ) | | | (0.38 | ) | | | (0.20 | ) |
| | | | | | | | | | | | | |
Less distributions: | | | | | | | | | | | | |
Distributions from net realized gains | | | (0.08 | ) | | | (0.00 | )(b) | | | — | |
| | | | | | | | | | | | | |
Net asset value at end of period | | $ | 9.26 | | | $ | 9.42 | | | $ | 9.80 | |
| | | | | | | | | | | | | |
Total return (c) | | | (0.90 | %)(d) | | | (3.87 | %) | | | (2.00 | %)(d) |
| | | | | | | | | | | | | |
Net assets at end of period (000's) | | $ | 590 | | | $ | 619 | | | $ | 614 | |
| | | | | | | | | | | | | |
Ratios/supplementary data: | | | | | | | | | | | | |
Ratio of total expenses to average net assets | | | 17.79 | %(e) | | | 15.49 | % | | | 16.95 | %(e) |
| | | | | | | | | | | | | |
Ratio of net expenses to average net assets (f) | | | 3.53 | %(e) | | | 3.41 | % | | | 2.84 | %(e) |
| | | | | | | | | | | | | |
Ratio of net expenses to average net assets excluding dividend expense (f) | | | 2.40 | %(e) | | | 2.52 | % | | | 2.24 | %(e) |
| | | | | | | | | | | | | |
Ratio of net expenses to average net assets excluding dividend expense and prime brokerage expense on securities sold short (f) | | | 2.00 | %(e) | | | 2.00 | % | | | 2.00 | %(e) |
| | | | | | | | | | | | | |
Ratio of net investment loss to average net assets (f) | | | (0.13 | %)(e) | | | (1.78 | %) | | | (1.38 | %)(e) |
| | | | | | | | | | | | | |
Portfolio turnover rate | | | 7 | %(d) | | | 7 | % | | | 9 | %(d) |
(a) | Represents the period from the commencement of operations (July 14, 2014) through November 30, 2014. |
(b) | Amount rounds to less than $0.01 per share. |
(c) | Total return is a measure of the change in value of an investment in the Fund over the periods covered. The returns shown do not reflect the deduction of taxes a shareholder would pay on Fund distributions, if any, or the redemption of Fund shares. The total returns would be lower if the Adviser had not reduced advisory fees and reimbursed expenses (Note 4). |
(d) | Not annualized. |
(e) | Annualized. |
(f) | Ratio was determined after advisory fee reductions and expense reimbursements (Note 4). |
See accompanying notes to financial statements. |
22
LYRICAL FUNDS
NOTES TO FINANCIAL STATEMENTS
May 31, 2016 (Unaudited)
1. Organization
Lyrical U.S. Value Equity Fund and Lyrical U.S. Hedged Value Fund (individually, a “Fund” and collectively, the “Funds”) are each a diversified series of Ultimus Managers Trust (the “Trust”), an open-end investment company established as an Ohio business trust under a Declaration of Trust dated February 28, 2012. Other series of the Trust are not incorporated in this report. Lyrical U.S. Value Equity Fund commenced operations on February 4, 2013. Lyrical U.S. Hedged Value Fund commenced operations on July 14, 2014.
The investment objective of each Fund is to seek to achieve long-term capital growth.
Each Fund offers two classes of shares: Institutional Class shares (sold without any sales loads and distribution and/or shareholder service fees and require a $100,000 initial investment) and Investor Class shares (sold without any sales loads, but subject to a distribution and/or shareholder service fee of up to 0.25% of the average daily net assets attributable to Investor Class shares, and require a $2,500 initial investment). Each share class represents an ownership interest in the same investment portfolio.
2. Significant Accounting Policies
The following is a summary of the Funds’ significant accounting policies. The policies are in conformity with accounting principles generally accepted in the United States of America (“GAAP”). As an investment company, as defined in Financial Accounting Standards Board (“FASB”) Accounting Standards Update 2013-08, the Funds follow accounting and reporting guidance under FASB Accounting Standards Codification Topic 946, “Financial Services – Investment Companies.”
Securities valuation – Each Fund values its portfolio securities at market value as of the close of regular trading on the New York Stock Exchange (the “NYSE”) (normally 4:00 p.m. Eastern time) on each business day the NYSE is open for business. The Funds value their listed securities on the basis of the security’s last sale price on the security’s primary exchange, if available, otherwise at the exchange’s most recently quoted mean price. NASDAQ-listed securities are valued at the NASDAQ Official Closing Price. In the event that market quotations are not readily available or are considered unreliable due to market or other events, the Funds value their securities and other assets at fair value in accordance with procedures established by and under the general supervision of the Board of Trustees (the “Board”). Under these procedures, the securities will be classified as Level 2 or 3 within the fair value hierarchy (see below), depending on the inputs used. Unavailable or unreliable market quotes may be due to the following factors: a substantial bid-ask spread; infrequent sales resulting in stale prices; insufficient trading volume; small trade sizes; a temporary lapse in any reliable pricing source; and actions of the securities or futures markets, such as the suspension or limitation of trading. As a result, the prices of securities used to calculate each Fund’s net asset value (“NAV”) may differ from quoted or published prices for the same securities.
23
LYRICAL FUNDS
NOTES TO FINANCIAL STATEMENTS (Continued) |
GAAP establishes a single authoritative definition of fair value, sets out a framework for measuring fair value, and requires additional disclosures about fair value measurements.
Various inputs are used in determining the value of each Fund’s investments. These inputs are summarized in the three broad levels listed below:
● | Level 1 – quoted prices in active markets for identical securities |
● | Level 2 – other significant observable inputs |
● | Level 3 – significant unobservable inputs |
The inputs or methods used for valuing securities are not necessarily an indication of the risks associated with investing in those securities. The inputs used to measure fair value may fall into different levels of the fair value hierarchy. In such cases, for disclosure purposes, the level in the fair value hierarchy within which the fair value measurement falls in its entirety is determined based on the lowest level input that is significant to the fair value measurement.
The following is a summary of the inputs used to value the Funds’ investments and other financial instruments as of May 31, 2016:
Lyrical U.S. Value Equity Fund | | Level 1 | | | Level 2 | | | Level 3 | | | Total | |
Investments in Securities | | | | | | | | | | | | |
Common Stocks | | $ | 1,023,920,027 | | | $ | — | | | $ | — | | | $ | 1,023,920,027 | |
Money Market Funds | | | 5,549,908 | | | | — | | | | — | | | | 5,549,908 | |
Total | | $ | 1,029,469,935 | | | $ | — | | | $ | — | | | $ | 1,029,469,935 | |
Lyrical U.S. Hedged Value Fund | | Level 1 | | | Level 2 | | | Level 3 | | | Total | |
Investments in Securities | | | | | | | | | | | | |
Common Stocks | | $ | 1,412,185 | | | $ | — | | | $ | — | | | $ | 1,412,185 | |
Money Market Funds | | | 4,681 | | | | — | | | | — | | | | 4,681 | |
Total | | $ | 1,416,866 | | | $ | — | | | $ | — | | | $ | 1,416,866 | |
| | | | | | | | | | | | | | | | | |
Other Financial Instruments | | | | | | | | | | | | | |
Exchange-Traded Funds - Sold Short | | $ | (689,333 | ) | | $ | — | | | $ | — | | | $ | (689,333 | ) |
Refer to the Funds’ Schedules of Investments and Schedule of Securities Sold Short, as applicable, for a listing of securities by industry type. As of May 31, 2016, the Funds did not have any transfers between Levels. In addition, the Funds did not hold any derivative instruments or any assets or liabilities that were measured at fair value on a recurring basis using significant unobservable inputs (Level 3) as of May 31, 2016. It is the Funds’ policy to recognize transfers between Levels at the end of the reporting period.
24
LYRICAL FUNDS
NOTES TO FINANCIAL STATEMENTS (Continued) |
Share valuation – The NAV per share of each class of each Fund is calculated daily by dividing the total value of the assets attributable to that class, less liabilities attributable to that class, by the number of shares outstanding of that class. The offering price and redemption price per share of each class of each Fund is equal to the NAV per share of such class.
Investment income – Dividend income is recorded on the ex-dividend date. Interest income is accrued as earned. Withholding taxes on foreign dividends have been recorded in accordance with the Fund’s understanding of the appropriate country’s rules and tax rates.
Security transactions – Security transactions are accounted for on the trade date. Realized gains and losses on securities sold are determined on a specific identification basis.
Common expenses – Common expenses of the Trust are allocated among the Funds and the other series of the Trust based on the relative net assets of each series or the nature of the services performed and the relative applicability to each series.
Distributions to shareholders – The Funds distribute to shareholders any net investment income dividends and net realized capital gains distributions at least once each year. The amount of such dividends and distributions are determined in accordance with federal income tax regulations, which may differ from GAAP. Dividends and distributions to shareholders are recorded on the ex-dividend date. The tax character of distributions paid to shareholders by the Funds during the periods ended May 31, 2016 and November 30, 2015 was as follows:
| Period Ended | | Ordinary Income | | | Long-Term Capital Gains | | | Total
Distributions | |
Lyrical U.S. Value Equity Fund - | 5/31/2016 | | $ | 1,403,762 | | | $ | 14,083,967 | | | $ | 15,487,729 | |
Institutional Class | 11/30/2015 | | $ | 7,662,064 | | | $ | 4,196,682 | | | $ | 11,858,746 | |
Lyrical U.S. Value Equity Fund - | 5/31/2016 | | $ | 6,340 | | | $ | 1,469,251 | | | $ | 1,475,591 | |
Investor Class | 11/30/2015 | | $ | 123,919 | | | $ | 69,399 | | | $ | 193,318 | |
Lyrical U.S. Hedged Value Fund - | 5/31/2016 | | $ | — | | | $ | 6,246 | | | $ | 6,246 | |
Institutional Class | 11/30/2015 | | $ | 34 | | | $ | 20 | | | $ | 54 | |
Lyrical U.S. Hedged Value Fund - | 5/31/2016 | | $ | — | | | $ | 4,994 | | | $ | 4,994 | |
Investor Class | 11/30/2015 | | $ | 36 | | | $ | 21 | | | $ | 57 | |
Short Positions – Lyrical U.S. Hedged Value Fund may sell securities short. For financial statement purposes, an amount equal to the settlement amount is included in the Statements of Assets and Liabilities as an asset and an equivalent liability is then subsequently marked-to-market daily to reflect the current value of the short position. Subsequent fluctuations in the market prices of securities sold, but not yet purchased, may require purchasing the securities at prices which may differ from the market value
25
LYRICAL FUNDS
NOTES TO FINANCIAL STATEMENTS (Continued) |
reflected on the Statements of Assets and Liabilities. The Fund is liable for any dividends payable on securities while those securities are in a short position and will also bear other costs, such as charges for the prime brokerage accounts, in connection with the short positions. These costs are reported as dividend expense and prime brokerage expense on securities sold short, respectively, in the Statements of Operations. As collateral for its short positions, the Fund is required under the Investment Company Act of 1940 (“1940 Act”) to maintain assets consisting of cash, cash equivalents or other liquid securities equal to the market value of the securities sold short. The deposits with brokers for securities sold short are reported on the Statements of Assets and Liabilities. The amount of collateral is required to be adjusted daily to reflect changes in the value of the securities sold short. To the extent Lyrical U.S. Hedged Value Fund invests the proceeds received from selling securities short, the Fund is engaging in a form of leverage. The use of leverage by the Fund may make any change in the Fund’s NAV greater than it would be without the use of leverage. Short sales are speculative transactions and involve special risks, including greater reliance on the ability of Lyrical Asset Management LP (the “Adviser”) to accurately anticipate the future value of a security.
The Fund typically takes short positions in shares of exchange-traded funds (“ETFs”), which are subject to additional risks including premium or discount risk (when the market value of an ETF’s shares trade at a premium or discount to the ETF’s NAV) and index-tracking risk.
Estimates – The preparation of financial statements in conformity with GAAP requires management to make estimates and assumptions that affect the reported amounts of assets and liabilities and disclosure of contingent assets and liabilities as of the date of the financial statements and the reported amounts of income and expenses during the reporting period. Actual results could differ from those estimates.
Federal income tax – Each Fund has qualified and intends to continue to qualify as a regulated investment company under the Internal Revenue Code of 1986 (the “Code”). Qualification generally will relieve each Fund of liability for federal income taxes to the extent 100% of its net investment income and net realized capital gains are distributed in accordance with the Code.
26
LYRICAL FUNDS
NOTES TO FINANCIAL STATEMENTS (Continued) |
In order to avoid imposition of the excise tax applicable to regulated investment companies, it is also each Fund’s intention to declare as dividends in each calendar year at least 98% of its net investment income (earned during the calendar year) and 98.2% of its net realized capital gains (earned during the twelve months ended October 31) plus undistributed amounts from prior years.
The following information is computed on a tax basis for each item as of May 31, 2016:
| | Lyrical U.S. Value Equity Fund | | | Lyrical U.S. Hedged Value Fund | |
Tax cost of portfolio investments | | $ | 1,001,026,102 | | | $ | 1,506,095 | |
Gross unrealized appreciation | | $ | 107,809,100 | | | $ | 135,016 | |
Gross unrealized depreciation | | | (79,365,267 | ) | | | (224,245 | ) |
Net unrealized appreciation (depreciation) | | | 28,443,833 | | | | (89,229 | ) |
Net unrealized depreciation on securities sold short | | | — | | | | (13,105 | ) |
Accumulated ordinary income (loss) | | | 10,033,973 | | | | (557 | ) |
Other gains | | | 19,441,603 | | | | 11,010 | |
Distributable earnings (accumulated deficit) | | $ | 57,919,409 | | | $ | (91,881 | ) |
As of May 31, 2016, the proceeds of securities sold short on a tax basis is $676,228 for Lyrical U.S. Hedged Value Fund.
The difference between the federal income tax cost of portfolio investments and securities sold short and the financial statement cost of portfolio investments and securities sold short is due to certain timing differences in the recognition of capital gains or losses under income tax regulations and GAAP. These “book/tax” differences are temporary in nature and are primarily due to the tax deferral of losses on wash sales.
The Funds recognize the tax benefits or expenses of uncertain tax positions only when the position is “more likely than not” of being sustained assuming examination by tax authorities. Management has reviewed the Funds’ tax positions for the current and all open tax periods (periods ended November 30, 2013 through November 30, 2015 for Lyrical U.S. Value Equity Fund and November 30, 2014 and November 30, 2015 for Lyrical U.S. Hedged Value Fund) and has concluded that no provision for unrecognized tax benefits or expenses is required in these financial statements. The Funds indentify their major tax jurisdiction as U.S. Federal.
27
LYRICAL FUNDS
NOTES TO FINANCIAL STATEMENTS (Continued) |
3. Investment Transactions
During the six months ended May 31, 2016, cost of purchases and proceeds from sales of investment securities, other than short-term investments and short positions, amounted to $535,927,840 and $188,046,704, respectively, for Lyrical U.S. Value Equity Fund and $134,180 and $86,933, respectively, for Lyrical U.S. Hedged Value Fund.
4. Transactions with Related Parties
INVESTMENT ADVISORY AGREEMENT
Each Fund’s investments are managed by the Adviser pursuant to the terms of an Investment Advisory Agreement. Lyrical U.S. Value Equity Fund and Lyrical U.S. Hedged Value Fund pay the Adviser an investment advisory fee, computed and accrued daily and paid monthly, at the annual rate of 1.25% and 1.55%, respectively, of average daily net assets.
Pursuant to an Expense Limitation Agreement (“ELA”) between each Fund and the Adviser, the Adviser has contractually agreed, until March 31, 2017, to reduce investment advisory fees and reimburse other operating expenses to limit total annual operating expenses of the Funds (exclusive of brokerage costs, taxes, borrowing costs such as interest and dividend expenses on securities sold short, interest, acquired fund fees and expenses, extraordinary expenses such as litigation and merger or reorganization costs, and other expenses not incurred in the ordinary course of each Fund’s business) to an amount not exceeding the following percentages of average daily net assets attributable to each respective class:
| Institutional Class | Investor Class |
Lyrical U.S. Value Equity Fund | 1.45% | 1.70% |
Lyrical U.S. Hedged Value Fund | 1.75% | 2.00% |
Accordingly, during the six months ended May 31, 2016, the Adviser did not collect any of its investment advisory fees from Lyrical U.S. Hedged Value Fund and, in addition, reimbursed other operating expenses of $81,769.
28
LYRICAL FUNDS
NOTES TO FINANCIAL STATEMENTS (Continued) |
Under the terms of the ELA, investment advisory fee reductions and expense reimbursements by the Adviser are subject to recoupment by the Adviser for a period of three years after such fees and expenses were incurred, provided the recoupments do not cause total annual operating expenses of the Funds to exceed the foregoing expense limitations. As of May 31, 2016, the Adviser may seek recoupment of investment advisory fee reductions and expense reimbursements no later than the dates as stated below:
| | November 30, 2017 | | | November 30, 2018 | | | May 31,
2019 | | | Total | |
Lyrical U.S. Value Equity Fund | | $ | 10,189 | | | $ | 14,881 | | | $ | — | | | $ | 25,070 | |
Lyrical U.S. Hedged Value Fund | | $ | 59,418 | | | $ | 164,816 | | | $ | 92,045 | | | $ | 316,279 | |
The Principal Executive Officer of the Funds is also an officer of the Adviser.
OTHER SERVICE PROVIDERS
Ultimus Fund Solutions, LLC (“Ultimus”) provides fund administration, fund accounting, compliance and transfer agency services to the Funds. Each Fund pays Ultimus fees in accordance with the agreements for such services. In addition, each Fund pays out-of-pocket expenses including but not limited to postage, supplies and costs of pricing its portfolio securities.
Under the terms of a Distribution Agreement with the Trust, Ultimus Fund Distributors, LLC (the “Distributor”) serves as the principal underwriter to each Fund. The Distributor is a wholly-owned subsidiary of Ultimus.
Certain Trustees and officers of the Trust are also officers of Ultimus and/or the Distributor.
DISTRIBUTION PLAN
The Funds have adopted plans of distribution (the “Plan”) pursuant to Rule 12b-1 under the 1940 Act, which permits Investor Class shares of each Fund to directly incur or reimburse the Funds’ principal underwriter for certain expenses related to the distribution of its shares. The annual limitation for payment of expenses pursuant to the Plan is 0.25% of each Fund’s average daily net assets allocable to Investor Class shares. The Funds have not adopted a plan of distribution with respect to the Institutional Class shares. During the six months ended May 31, 2016, the Investor Class shares of Lyrical U.S. Value Equity Fund and Lyrical U.S. Hedged Value Fund incurred $117,857 and $723, respectively, of distribution fees under the Plan.
29
LYRICAL FUNDS
NOTES TO FINANCIAL STATEMENTS (Continued) |
TRUSTEE COMPENSATION
Each Trustee who is not an “interested person” of the Trust (“Independent Trustee”) receives from each Fund a fee of $500 for each Board meeting attended plus reimbursement of travel and other meeting-related expenses. Each Independent Trustee also receives a $500 annual retainer from each Fund. Trustees affiliated with the Adviser or Ultimus are not compensated by the Trust for their services.
PRINCIPAL HOLDERS OF FUND SHARES
As of May 31, 2016, the following shareholders owned of record 5% or more of the outstanding shares of each class of each Fund:
NAME OF RECORD OWNER | % Ownership |
Lyrical U.S. Value Equity Fund - Institutional Class | |
Morgan Stanley Smith Barney LLC (for the benefit of its customers) | 39% |
Charles Schwab & Company, Inc. (for the benefit of its customers) | 18% |
Merrill Lynch, Pierce Fenner & Smith (for the benefit of its customers) | 6% |
Lyrical U.S. Value Equity Fund - Investor Class | |
Charles Schwab & Company, Inc. (for the benefit of its customers) | 86% |
Lyrical U.S. Hedged Value Fund - Institutional Class | |
Lyrical Asset Management LP | 61% |
Ann S. Riesenberg | 24% |
George Wellington | 13% |
Lyrical U.S. Hedged Value Fund - Investor Class | |
Lyrical Asset Management LP | 79% |
Oppenheimer & Company, Inc. (for the benefit of its customers) | 7% |
A beneficial owner of 25% or more of either Fund’s outstanding shares may be considered a controlling person. That shareholder’s vote could have a more significant effect on matters presented at a shareholder’s meeting.
5. Sector Risk
If a Fund has significant investments in the securities of issuers within a particular sector, any development affecting that sector will have a greater impact on the value of the net assets of the Fund than would be the case if the Fund did not have significant investments in that sector. In addition, this may increase the risk of loss in the Fund and increase the volatility of the Fund’s NAV per share. Occasionally, market conditions, regulatory changes or other developments may negatively impact a particular sector. As of May 31, 2016, Lyrical U.S. Value Equity Fund and Lyrical U.S. Hedged Value Fund had 28.2% and 30.9%, respectively, of the value of their net assets invested in stocks within the Information Technology sector.
30
LYRICAL FUNDS
NOTES TO FINANCIAL STATEMENTS (Continued) |
6. Contingencies and Commitments
The Funds indemnify the Trust’s officers and Trustees for certain liabilities that might arise from their performance of their duties to the Funds. Additionally, in the normal course of business the Funds enter into contracts that contain a variety of representations and warranties and which provide general indemnifications. The Funds’ maximum exposure under these arrangements is unknown, as this would involve future claims that may be made against the Funds that have not yet occurred. However, based on experience, the Funds expect the risk of loss to be remote.
7. Subsequent Events
The Funds are required to recognize in the financial statements the effects of all subsequent events that provide additional evidence about conditions that existed as of the date of the Statements of Assets and Liabilities. For non-recognized subsequent events that must be disclosed to keep the financial statements from being misleading, the Funds are required to disclose the nature of the event as well as an estimate of its financial effect, or a statement that such an estimate cannot be made. Management has evaluated subsequent events through the issuance of these financial statements and has noted no such events.
31
LYRICAL FUNDS
ABOUT YOUR FUNDS’ EXPENSES (Unaudited) |
We believe it is important for you to understand the impact of costs on your investment. As a shareholder of the Funds, you incur ongoing costs, including management fees, class-specific expenses (such as distribution fees) and other operating expenses. The following examples are intended to help you understand your ongoing costs (in dollars) of investing in the Funds and to compare these costs with the ongoing costs of investing in other mutual funds.
A mutual fund’s ongoing costs are expressed as a percentage of its average net assets. This figure is known as the expense ratio. The expenses in the table below are based on an investment of $1,000 made at the beginning of the most recent period (December 1, 2015) and held until the end of the period (May 31, 2016).
The table below illustrates each Fund’s ongoing costs in two ways:
Actual fund return – This section helps you to estimate the actual expenses that you paid over the period. The “Ending Account Value” shown is derived from each Fund’s actual return, and the fourth column shows the dollar amount of operating expenses that would have been paid by an investor who started with $1,000 in the Funds. You may use the information here, together with the amount you invested, to estimate the expenses that you paid over the period.
To do so, simply divide your account value by $1,000 (for example, an $8,600 account value divided by $1,000 = 8.6), then multiply the result by the number given for the Fund under the heading “Expenses Paid During Period.”
Hypothetical 5% return – This section is intended to help you compare each Fund’s ongoing costs with those of other mutual funds. It assumes that each Fund had an annual return of 5% before expenses during the period shown, but that the expense ratio is unchanged. In this case, because the return used is not the Funds’ actual return, the results do not apply to your investment. The example is useful in making comparisons because the U.S. Securities and Exchange Commission (“SEC”) requires all mutual funds to calculate expenses based on a 5% return. You can assess each Fund’s ongoing costs by comparing this hypothetical example with the hypothetical examples that appear in shareholder reports of other funds.
Note that expenses shown in the table are meant to highlight and help you compare ongoing costs only. The Funds do not charge transaction fees, such as purchase or redemption fees, nor do they carry a “sales load.”
The calculations assume no shares were bought or sold during the period. Your actual costs may have been higher or lower, depending on the amount of your investment and the timing of any purchases or redemptions.
32
LYRICAL FUNDS
ABOUT YOUR FUNDS’ EXPENSES (Unaudited) (Continued)
More information about the Funds’ expenses can be found in this report. For additional information on operating expenses and other shareholder costs, please refer to each Fund’s prospectus.
| Beginning
Account Value
December 1, 2015 | Ending
Account Value
May 31, 2016 | Net
Expense Ratio(a) | Expenses Paid During Period(b) |
Lyrical U.S. Value Equity Fund |
Institutional Class | | | | |
Based on Actual Fund Returns | $ 1,000.00 | $ 994.00 | 1.38% | $ 6.88 |
Based on Hypothetical 5% Return (before expenses) | $ 1,000.00 | $ 1,018.10 | 1.38% | $ 6.96 |
Investor Class | | | | |
Based on Actual Fund Returns | $ 1,000.00 | $ 992.70 | 1.70% | $ 8.47 |
Based on Hypothetical 5% Return (before expenses) | $ 1,000.00 | $ 1,016.50 | 1.70% | $ 8.57 |
Lyrical U.S. Hedged Value Fund |
Institutional Class | | | | |
Based on Actual Fund Returns | $ 1,000.00 | $ 993.10 | 3.28% | $ 16.34 |
Based on Hypothetical 5% Return (before expenses) | $ 1,000.00 | $ 1,008.60 | 3.28% | $ 16.47 |
Investor Class | | | | |
Based on Actual Fund Returns | $ 1,000.00 | $ 991.00 | 3.53% | $ 17.57 |
Based on Hypothetical 5% Return (before expenses) | $ 1,000.00 | $ 1,007.35 | 3.53% | $ 17.71 |
(a) | Annualized, based on the Fund's most recent one-half year expenses. |
(b) | Expenses are equal to the Funds' annualized net expense ratio multiplied by the average account value over the period, multiplied by 183/366 (to reflect the one-half year period). |
33
LYRICAL FUNDS
OTHER INFORMATION (Unaudited)
A description of the policies and procedures that the Funds use to vote proxies relating to portfolio securities is available without charge upon request by calling toll-free 1-888-884-8099, or on the SEC’s website at http://www.sec.gov. Information regarding how the Funds voted proxies relating to portfolio securities during the most recent 12-month period ended June 30 is available without charge upon request by calling toll-free 1-888-884-8099, or on the SEC’s website at http://www.sec.gov.
The Trust files a complete listing of portfolio holdings for the Funds with the SEC as of the end of the first and third quarters of each fiscal year on Form N-Q. These filings are available upon request by calling 1-888-884-8099. Furthermore, you may obtain a copy of the filings on the SEC’s website at http://www.sec.gov. The Trust’s Forms N-Q may also be reviewed and copied at the SEC’s Public Reference Room in Washington, DC, and information on the operation of the Public Reference Room may be obtained by calling 1-800-SEC-0330.
34
This page intentionally left blank.
This page intentionally left blank.
This page intentionally left blank.

RYAN LABS CORE BOND FUND
(RLCBX)
RYAN LABS LONG CREDIT FUND
(RLLCX)
Semi-Annual Report
May 31, 2016
(Unaudited)
RYAN LABS FUNDS
LETTER TO SHAREHOLDERS | June 16, 2016 |
Dear Shareholders,
Following is the Semi-Annual Report to shareholders of Ryan Labs Core Bond Fund and Ryan Labs Long Credit Fund for the six month period ended May 31, 2016. On behalf of the investment manager, Ryan Labs Asset Management, Inc., we would like to thank you for your continued investment.
MARKET SUMMARY
The first few months of the year were a tale of two starkly contrasting environments for credit, stocks, and liquidity. From January to mid-February, we saw one of the sharpest sell-offs in the S&P which coincided with plummeting oil prices and markedly wider spreads in both the high yield and the investment grade space. Late February into April we saw a dramatic turn with corporate credit nearly retracing all its widening. Commodity-related sectors including energy, basics, metals and mining posted the strongest performance after being the worst performers in the first month of the year. Year-to-date, U.S. Corporate debt issuance has been approximately $720 billion. Foreign demand for U.S. bonds has been strong due to the European Central Bank’s corporate bond buying program and negative interest rate policy in Japan. On the macroeconomic front, the slow global economy has been on the Federal Reserve’s radar, especially for Europe and China, whose central banks have been more dovish. The “Brexit” issue also remains a concern.
RYAN LABS CORE BOND FUND
INVESTMENT PHILOSOPHY
The investment objective of Ryan Labs Core Bond Fund (the “Core Bond Fund”) is to seek total return (consisting of current income and capital appreciation). The Core Bond Fund seeks this investment objective while providing protection against interest rate risk. We attempt to accomplish this investment objective by investing at least 80% of the Core Bond Fund’s assets in U.S. dollar-denominated, investment-grade debt securities. The portfolio’s sensitivity to interest rate changes is intended to track the market for domestic, investment-grade fixed-income securities. The modified duration of the Core Bond Fund’s investment portfolio at the end of each calendar month will typically be within half a year of the Barclays U.S. Aggregate Bond Index (the “Core Bond Benchmark”). The primary strategies utilized for value-add are sector rotation, issue selection, and yield curve positioning.
PERFORMANCE SUMMARY
For the six months ended May 31, 2016, the Core Bond Fund returned +3.09% compared to the Core Bond Benchmark return of +3.12%, underperforming the Benchmark by 0.03%. The Fund’s portfolio was underweight corporate bonds and overweight securitized products relative to the Benchmark. For the fiscal quarter ended May 31, 2016, the Core Bond Fund returned 2.15% compared to the Core Bond Benchmark return of 1.33%, outperforming by 82bps. Overweighting the securitized sector contributed significantly towards outperformance. The top 5 outperformers included issuers of asset-backed and collateralized mortgage-backed securities.
1
RYAN LABS LONG CREDIT FUND
INVESTMENT PHILOSOPHY
The investment objective of Ryan Labs Long Credit Fund (the “Long Credit Fund”) is to seek total return (consisting of current income and capital appreciation). The benchmark for this strategy is the Barclays U.S. Long Credit Index (the “Long Credit Benchmark”). We attempt to accomplish this investment objective by investing at least 80% of the Long Credit Fund’s assets in U.S. dollar-denominated investment-grade debt securities. The portfolio’s sensitivity to interest rate changes is intended to track the market for domestic, investment-grade fixed-income securities. The modified duration of the Long Credit Fund’s investment portfolio at the end of each calendar month will typically be within half a year of the Long Credit Benchmark. The primary strategies utilized for value-add are sector rotation, issue selection, and yield curve positioning.
PERFORMANCE SUMMARY
For the six months ended May 31, 2016, the Long Credit Fund’s total return was 8.25% compared to the Long Credit Benchmark return of 8.00%, outperforming the Benchmark by 0.25%. For the fiscal quarter ended May 31, 2016, the Long Credit Fund returned 7.99% compared to the Long Credit Benchmark return of 7.26%, outperforming by 73bps. The portfolio was underweight industrials while being overweight the financials sector. This positioning of the portfolio contributed towards positive excess returns relative to the Long Credit Benchmark. Top performers included Energy Transfer Partners, Enterprise Products Partners, Verizon, Kinder Morgan and Twenty-First Century Fox. Underperformers were Marathon Petroleum, Lincoln National Corp, Apple and Pepsi.
OUTLOOK
Credit spreads tightened substantially from their local wides of mid-February, alongside a recovery in oil prices and the domestic equity market. Since posting their recent tights of the year in late April, investors’ risk appetite has waned and we have seen spreads leaking wider. In the near term, macroeconomic headwinds in the Eurozone with the uncertainty of Brexit combined with weak growth have weighed on domestic credit spreads. Uncertainty in Asia, particularly China’s slowdown, also remains a concern. Fundamentally, credit metrics such as Debt/EBITDA and FCF growth have seen moderate weakness recently. Combined with a forecasted $1.2 trillion in issuance, credit appears range-bound in the near term. While we do not believe a recession is imminent in the very near-term, we remain cautious at this stage of the credit cycle. We are looking to exploit dislocations and relationships in individual names or subsectors to uncover relative value.

Sean McShea
President, Ryan Labs Asset Management
2
Past performance is not predictive of future performance. Investment results and principal value will fluctuate so that shares, when redeemed, may be worth more or less than their original cost. Current performance may be higher or lower than the performance data quoted. Performance data current to the most recent month end are available by calling 1-866-561-3087.
An investor should consider the investment objectives, risks, charges and expenses of the Funds carefully before investing. The Funds’ prospectus contains this and other important information. To obtain a copy of the Funds’ prospectus, please visit our website at www.ryanlabsfunds.com or call 1-866-561-3087 and a copy will be sent to you free of charge. Please read the prospectus carefully before you invest. Ryan Labs Core Bond Fund and Ryan Labs Long Credit Fund are distributed by Ultimus Fund Distributors, LLC.
The Letter to Shareholders seeks to describe some of the Adviser’s current opinions and views of the financial markets. Although the Adviser believes it has a reasonable basis for any opinions or views expressed, actual results may differ, sometimes significantly so, from those expected or expressed. The securities held by the Funds that are discussed in the Letter to Shareholders were held during the period covered by this Report. They do not comprise the entire investment portfolios of the Funds, may be sold at any time and may no longer be held by the Funds. For a complete list of securities held by the Funds as of May 31, 2016, please see the Schedules of Investments sections of the Semi-Annual Report. The opinions of the Funds’ Adviser with respect to those securities may change at any time.
Statements in the Letter to Shareholders that reflect projections or expectations for future financial or economic performance of the Funds and the market in general and statements of the Funds’ plans and objectives for future operations are forward-looking statements. No assurance can be given that actual results or events will not differ materially from those projected, estimated, assumed, or anticipated in any such forward-looking statements. Important factors that could result in such differences, in addition to factors noted with such forward-looking statements include, without limitation, general economic conditions, such as inflation, recession, and interest rates. Past performance is not a guarantee of future results.
3
RYAN LABS CORE BOND FUND
PORTFOLIO INFORMATION
May 31, 2016 (Unaudited)
Asset Allocation (% of Net Assets)
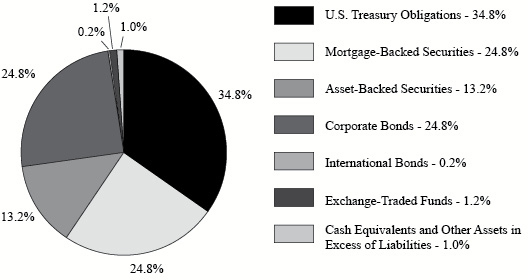
Top 10 Holdings
Security Description | % of
Net Assets |
U.S. Treasury Notes, 1.375%, due 10/31/20 | 9.2% |
U.S. Treasury Notes, 0.750%, due 10/31/17 | 8.6% |
U.S. Treasury Bonds, 3.000%, due 11/15/45 | 2.8% |
Federal National Mortgage Association, Pool #AB5379, 3.500%, due 06/01/42 | 2.5% |
U.S. Treasury Bonds, 4.500%, due 02/15/36 | 2.4% |
Santander Drive Auto Receivables Trust, Series 2014-4, 3.100%, due 11/16/20 | 2.2% |
U.S. Treasury Notes, 1.125%, due 05/31/19 | 2.1% |
U.S. Treasury Notes, 1.500%, due 02/28/23 | 1.9% |
Santander Drive Auto Receivables Trust, Series 2015-3, 3.490%, due 05/17/21 | 1.8% |
UBS-Citigroup Commercial Mortgage Trust, Series 2011-C1, Class E, 144A, 5.888%(a), due 01/10/45 | 1.5% |
(a) | Variable rate security. The rate shown is the effective interest rate as of May 31, 2016. |
4
RYAN LABS LONG CREDIT FUND
PORTFOLIO INFORMATION
May 31, 2016 (Unaudited)
Asset Allocation (% of Net Assets)
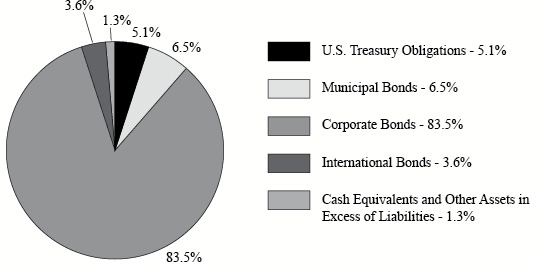
Top 10 Holdings
Security Description | % of
Net Assets |
AT&T, Inc., 4.500%, due 05/15/35 | 2.8% |
U.S. Treasury Notes, 1.625%, due 02/15/26 | 2.1% |
Verizon Communications, Inc., 4.400%, due 11/01/34 | 2.0% |
GE Capital International Funding Company, 144A, 4.418%, due 11/15/35 | 2.0% |
Apple, Inc., 3.450%, due 02/09/45 | 1.7% |
Comcast Corporation, 4.250%, due 01/15/33 | 1.7% |
Anheuser-Busch InBev SA/NV, 4.900%, due 02/01/46 | 1.6% |
UnitedHealth Group, Inc., 4.750%, due 07/15/45 | 1.6% |
PacifiCorp, 6.350%, due 07/15/38 | 1.6% |
Teachers Insurance & Annuity Association of America, 144A, 4.900%, due 09/15/44 | 1.5% |
5
RYAN LABS CORE BOND FUND
SCHEDULE OF INVESTMENTS
May 31, 2016 (Unaudited) |
U.S. TREASURY OBLIGATIONS — 34.8% | | Coupon | Maturity | | Par Value | | | Value | |
U.S. Treasury Notes — 28.1% | | | | | | | | | | |
U.S. Treasury Notes | | | 0.750 | % | 10/31/17 | | $ | 6,185,000 | | | $ | 6,179,928 | |
U.S. Treasury Notes | | | 0.625 | % | 04/30/18 | | | 60,000 | | | | 59,724 | |
U.S. Treasury Notes | | | 1.000 | % | 05/31/18 | | | 700,000 | | | | 701,559 | |
U.S. Treasury Notes | | | 1.000 | % | 03/15/19 | | | 85,000 | | | | 85,000 | |
U.S. Treasury Notes | | | 0.875 | % | 04/15/19 | | | 135,000 | | | | 134,467 | |
U.S. Treasury Notes | | | 1.125 | % | 05/31/19 | | | 1,530,000 | | | | 1,534,543 | |
U.S. Treasury Notes | | | 1.000 | % | 11/30/19 | | | 250,000 | | | | 248,906 | |
U.S. Treasury Notes | | | 1.375 | % | 08/31/20 | | | 165,000 | | | | 165,541 | |
U.S. Treasury Notes | | | 1.375 | % | 09/30/20 | | | 170,000 | | | | 170,458 | |
U.S. Treasury Notes | | | 1.375 | % | 10/31/20 | | | 6,580,000 | | | | 6,594,397 | |
U.S. Treasury Notes | | | 1.125 | % | 02/28/21 | | | 285,000 | | | | 282,028 | |
U.S. Treasury Notes | | | 1.250 | % | 03/31/21 | | | 355,000 | | | | 353,072 | |
U.S. Treasury Notes | | | 1.375 | % | 04/30/21 | | | 455,000 | | | | 455,142 | |
U.S. Treasury Notes | | | 2.250 | % | 04/30/21 | | | 160,000 | | | | 166,656 | |
U.S. Treasury Notes | | | 2.125 | % | 09/30/21 | | | 360,000 | | | | 372,502 | |
U.S. Treasury Notes | | | 1.500 | % | 02/28/23 | | | 1,340,000 | | | | 1,328,641 | |
U.S. Treasury Notes | | | 1.625 | % | 02/15/26 | | | 405,000 | | | | 396,979 | |
U.S. Treasury Notes | | | 1.625 | % | 05/15/26 | | | 865,000 | | | | 848,579 | |
| | | | | | | | | | | | | 20,078,122 | |
U.S. Treasury Bonds — 6.7% | | | | | | | | | | | | | |
U.S. Treasury Bonds | | | 4.500 | % | 02/15/36 | | | 1,235,000 | | | | 1,689,682 | |
U.S. Treasury Bonds | | | 4.250 | % | 05/15/39 | | | 810,000 | | | | 1,070,782 | |
U.S. Treasury Bonds | | | 3.000 | % | 11/15/45 | | | 1,855,000 | | | | 1,996,733 | |
U.S. Treasury Bonds | | | 2.500 | % | 02/15/46 | | | 45,000 | | | | 43,747 | |
| | | | | | | | | | | | | 4,800,944 | |
Total U.S. Treasury Obligations (Cost $24,670,914) | | | | | | | | | | | $ | 24,879,066 | |
| |
MORTGAGE-BACKED SECURITIES — 24.8% | | Coupon | Maturity | | Par Value | | | Value | |
Commercial — 13.0% | | | | | | | | | | |
Commercial Mortgage Trust,
Series 2012-CR4, Class D, 144A (a) | | | 4.572 | % | 10/15/45 | | $ | 20,000 | | | $ | 19,013 | |
Commercial Mortgage Trust,
Series 2013-LC6, Class AM | | | 3.282 | % | 01/10/46 | | | 49,000 | | | | 50,426 | |
6
RYAN LABS CORE BOND FUND
SCHEDULE OF INVESTMENTS (Continued) |
MORTGAGE-BACKED SECURITIES — 24.8% (Continued) | | Coupon | Maturity | | Par Value | | | Value | |
Commercial — 13.0% (Continued) | | | | | | | | | | |
Connecticut Avenue Securities,
Series 2016-C01, Class 1M1 (a) | | | 2.396 | % | 08/25/28 | | $ | 659,591 | | | $ | 664,212 | |
Credit Suisse Mortgage Trust,
Series 2013-IVR3, Class A1, 144A | | | 2.500 | % | 05/25/43 | | | 476,727 | | | | 467,322 | |
CSAIL Commercial Mortgage Trust,
Series 2015-C3, Class D (a) | | | 3.361 | % | 08/15/48 | | | 808,687 | | | | 566,744 | |
CSAIL Commercial Mortgage Trust,
Series 2015-C2, Class D (a) | | | 4.212 | % | 06/15/57 | | | 260,000 | | | | 192,379 | |
Drive Auto Receivables Trust,
Series 2016-BA, Class C, 144A (a) | | | 3.190 | % | 07/15/22 | | | 540,000 | | | | 539,344 | |
J.P. Morgan Chase Commercial Mortgage Securities Corporation, Series 2013-C13, Class D, 144A (a) | | | 4.053 | % | 01/15/46 | | | 735,000 | | | | 645,385 | |
J.P. Morgan Chase Commercial Mortgage Securities Corporation, Series 2013-C17, Class C (a) | | | 4.887 | % | 01/15/47 | | | 390,000 | | | | 402,228 | |
J.P. Morgan Chase Commercial Mortgage Securities Corporation, Series 2014-C19, Class C (a) | | | 4.674 | % | 04/15/47 | | | 240,000 | | | | 238,488 | |
J.P. Morgan Chase Commercial Mortgage Securities Corporation, Series 2012-LC9, Class E, 144A (a) | | | 4.417 | % | 12/15/47 | | | 711,000 | | | | 658,668 | |
J.P. Morgan Chase Commercial Mortgage Securities Corporation, Series 2015-C28, Class C (a) | | | 4.239 | % | 10/15/48 | | | 195,000 | | | | 171,713 | |
Morgan Stanley Capital I Trust,
Series 2011-C2, Class D, 144A (a) | | | 5.465 | % | 06/15/44 | | | 250,000 | | | | 261,554 | |
Starwood Retail Property Trust,
Series 2014-STAR, Class C, 144A (a) | | | 2.932 | % | 11/15/27 | | | 45,000 | | | | 43,993 | |
UBS-Barclays Commercial Mortgage Trust,
Series 2012-C2, Class D, 144A (a) | | | 5.043 | % | 05/10/63 | | | 230,000 | | | | 229,856 | |
UBS-Citigroup Commercial Mortgage Trust,
Series 2011-C1, Class E, 144A (a) | | | 5.888 | % | 01/10/45 | | | 1,000,000 | | | | 1,075,730 | |
Wells Fargo Home Equity Trust,
Series 2005-4, Class M1 (a) | | | 0.906 | % | 12/25/35 | | | 730,000 | | | | 701,685 | |
WF-RBS Commercial Mortgage Trust,
Series 2011-C2, Class D, 144A (a) | | | 5.601 | % | 02/15/44 | | | 1,000,000 | | | | 1,049,125 | |
WF-RBS Commercial Mortgage Trust,
Series 2012-C10, Class D, 144A (a) | | | 4.453 | % | 12/15/45 | | | 625,000 | | | | 577,107 | |
WF-RBS Commercial Mortgage Trust,
Series 2014-C22, Class D (a) | | | 3.908 | % | 09/15/57 | | | 1,000,000 | | | | 740,494 | |
| | | | | | | | | | | | | 9,295,466 | |
7
RYAN LABS CORE BOND FUND
SCHEDULE OF INVESTMENTS (Continued) |
MORTGAGE-BACKED SECURITIES — 24.8% (Continued) | | Coupon | Maturity | | Par Value | | | Value | |
Federal Home Loan Mortgage Corporation — 3.9% | | | | | | | | | | |
Federal Home Loan Mortgage Corporation, Pool #J19087 | | | 3.000 | % | 05/01/27 | | $ | 400,964 | | | $ | 419,432 | |
Federal Home Loan Mortgage Corporation, Pool #G18481 | | | 3.000 | % | 09/01/28 | | | 293,521 | | | | 306,714 | |
Federal Home Loan Mortgage Corporation, Pool #A93093 | | | 4.500 | % | 07/01/40 | | | 132,752 | | | | 146,437 | |
Federal Home Loan Mortgage Corporation, Pool #A94472 | | | 4.000 | % | 10/01/40 | | | 216,343 | | | | 231,277 | |
Federal Home Loan Mortgage Corporation, Pool #Q19470 | | | 3.000 | % | 06/01/43 | | | 235,778 | | | | 241,946 | |
Federal Home Loan Mortgage Corporation, Pool #Q20576 | | | 3.000 | % | 08/01/43 | | | 433,057 | | | | 443,906 | |
Federal Home Loan Mortgage Corporation, Pool #G08572 | | | 3.500 | % | 02/01/44 | | | 176,984 | | | | 185,179 | |
Federal Home Loan Mortgage Corporation, Pool #G08677 | | | 4.000 | % | 11/01/45 | | | 769,124 | | | | 821,013 | |
| | | | | | | | | | | | | 2,795,904 | |
Federal National Mortgage Association — 7.7% | | | | | | | | | | | | | |
Federal National Mortgage Association,
Series 2015-M7, Class AB2 | | | 2.502 | % | 12/25/24 | | | 80,000 | | | | 80,514 | |
Federal National Mortgage Association, Pool #AJ7494 | | | 3.000 | % | 12/01/26 | | | 275,592 | | | | 288,202 | |
Federal National Mortgage Association, Pool #AB5490 | | | 3.000 | % | 06/01/27 | | | 100,613 | | | | 105,054 | |
Federal National Mortgage Association, Pool #AO7976 | | | 3.000 | % | 06/01/27 | | | 102,201 | | | | 106,725 | |
Federal National Mortgage Association, Pool #AB5379 | | | 3.500 | % | 06/01/42 | | | 1,686,987 | | | | 1,769,140 | |
Federal National Mortgage Association, Pool #AB6670 | | | 3.000 | % | 10/01/42 | | | 214,235 | | | | 220,462 | |
Federal National Mortgage Association, Pool #AB9345 | | | 3.000 | % | 05/01/43 | | | 441,739 | | | | 453,349 | |
Federal National Mortgage Association, Pool #AB9350 | | | 3.000 | % | 05/01/43 | | | 191,910 | | | | 196,984 | |
Federal National Mortgage Association, Pool #AB9558 | | | 3.000 | % | 06/01/43 | | | 438,076 | | | | 449,582 | |
Federal National Mortgage Association, Pool #AE0443 | | | 6.500 | % | 06/01/43 | | | 30,480 | | | | 34,905 | |
Federal National Mortgage Association, Pool #AT5860 | | | 3.500 | % | 06/01/43 | | | 803,397 | | | | 842,245 | |
8
RYAN LABS CORE BOND FUND
SCHEDULE OF INVESTMENTS (Continued) |
MORTGAGE-BACKED SECURITIES — 24.8% (Continued) | | Coupon | Maturity | | Par Value | | | Value | |
Federal National Mortgage Association — 7.7% (Continued) | | | | | | | | | | |
Federal National Mortgage Association, Pool #AL4010 | | | 3.500 | % | 07/01/43 | | $ | 193,966 | | | $ | 204,509 | |
Federal National Mortgage Association, Pool #AS1338 | | | 5.000 | % | 12/01/43 | | | 266,986 | | | | 296,241 | |
Federal National Mortgage Association, Pool #AL5625 | | | 3.500 | % | 03/01/44 | | | 119,013 | | | | 125,426 | |
Federal National Mortgage Association, Pool #AL5538 | | | 4.000 | % | 07/01/44 | | | 87,969 | | | | 94,925 | |
Federal National Mortgage Association, Pool #AS5165 | | | 3.000 | % | 06/01/45 | | | 225,461 | | | | 231,679 | |
| | | | | | | | | | | | | 5,499,942 | |
Government National Mortgage Association — 0.2% | | | | | | | | | | | | | |
Government National Mortgage Association, Pool #5175 | | | 4.500 | % | 09/20/41 | | | 123,393 | | | | 134,740 | |
| | | | | | | | | | | | | | |
Total Mortgage-Backed Securities (Cost $17,825,826) | | | | | | | | | | | $ | 17,726,052 | |
| |
ASSET-BACKED SECURITIES — 13.2% | | Coupon | Maturity | | Par Value | | | Value | |
American Credit Acceptance Receivable Trust,
Series 2014-4, 144A | | | 4.250 | % | 10/12/20 | | $ | 1,000,000 | | | $ | 987,089 | |
American Credit Acceptance Receivable Trust,
Series 2016-2, 144A (a) | | | 6.090 | % | 05/12/22 | | | 365,000 | | | | 363,463 | |
American Credit Acceptance Receivable Trust,
Series 2016-1A | | | 5.550 | % | 06/13/22 | | | 520,000 | | | | 515,416 | |
AmeriCredit Automobile Receivables Trust,
Series 2014-2 | | | 2.570 | % | 07/08/20 | | | 230,000 | | | | 230,523 | |
AmeriCredit Automobile Receivables Trust,
Series 2014-4 | | | 3.070 | % | 11/09/20 | | | 240,000 | | | | 242,256 | |
AmeriCredit Automobile Receivables Trust,
Series 2015-2 | | | 3.000 | % | 06/08/21 | | | 570,000 | | | | 574,748 | |
AmeriCredit Automobile Receivables Trust,
Series 2016-1 | | | 3.590 | % | 06/08/21 | | | 275,000 | | | | 279,286 | |
Avis Budget Rental Car Funding (AESOP), LLC,
Series 2012-3A, 144A | | | 3.040 | % | 03/20/19 | | | 50,000 | | | | 50,332 | |
Capital Auto Receivables Asset Trust,
Series 2014-3 | | | 3.140 | % | 02/20/20 | | | 300,000 | | | | 301,928 | |
9
RYAN LABS CORE BOND FUND
SCHEDULE OF INVESTMENTS (Continued) |
ASSET-BACKED SECURITIES — 13.2% (Continued) | | Coupon | Maturity | | Par Value | | | Value | |
Cronos Containers Program Ltd.,
Series 2013-1A, 144A | | | 3.080 | % | 04/18/28 | | $ | 27,667 | | | $ | 26,236 | |
MVW Owner Trust,
Series 2013-1A, 144A | | | 2.740 | % | 04/22/30 | | | 16,440 | | | | 16,323 | |
Santander Drive Auto Receivables Trust,
Series 2014-3 | | | 2.650 | % | 08/17/20 | | | 240,000 | | | | 241,612 | |
Santander Drive Auto Receivables Trust,
Series 2014-4 | | | 3.100 | % | 11/16/20 | | | 1,540,000 | | | | 1,560,424 | |
Santander Drive Auto Receivables Trust,
Series 2014-5 | | | 3.210 | % | 01/15/21 | | | 40,000 | | | | 40,638 | |
Santander Drive Auto Receivables Trust,
Series 2015-1 | | | 3.240 | % | 04/15/21 | | | 150,000 | | | | 152,005 | |
Santander Drive Auto Receivables Trust,
Series 2015-3 | | | 3.490 | % | 05/17/21 | | | 1,280,000 | | | | 1,300,947 | |
Santander Drive Auto Receivables Trust,
Series 2015-4 | | | 3.530 | % | 08/16/21 | | | 460,000 | | | | 468,643 | |
Santander Drive Auto Receivables Trust,
Series 2016-1 | | | 4.020 | % | 04/15/22 | | | 600,000 | | | | 614,766 | |
Santander Drive Auto Receivables Trust,
Series 2016-2 (a) | | | 3.390 | % | 04/15/22 | | | 290,000 | | | | 291,976 | |
Sierra Receivables Funding Company, LLC,
Series 2013-3A, 144A | | | 2.700 | % | 10/20/30 | | | 256,057 | | | | 255,150 | |
Sierra Receivables Funding Company, LLC,
Series 2014-2A | | | 2.400 | % | 06/20/31 | | | 109,667 | | | | 108,935 | |
Structured Agency Credit Risk Debt Notes,
Series 15-DN1 (a) | | | 2.846 | % | 01/25/25 | | | 530,000 | | | | 536,983 | |
Structured Agency Credit Risk Debt Notes,
Series 15-DNA1 (a) | | | 2.296 | % | 10/25/27 | | | 115,000 | | | | 114,749 | |
Structured Agency Credit Risk Debt Notes,
Series 2016-DNA2 (a) | | | 2.635 | % | 10/25/28 | | | 180,000 | | | | 180,888 | |
Total Asset-Backed Securities (Cost $9,393,571) | | | | | | | | | | | $ | 9,455,316 | |
| |
CORPORATE BONDS — 24.8% | | Coupon | Maturity | | Par Value | | | Value | |
Consumer Discretionary — 3.1% | | | | | | | | | | |
Comcast Corporation | | | 3.600 | % | 03/01/24 | | $ | 510,000 | | | $ | 547,624 | |
Comcast Corporation | | | 4.250 | % | 01/15/33 | | | 100,000 | | | | 106,994 | |
Home Depot, Inc. | | | 4.250 | % | 04/01/46 | | | 360,000 | | | | 391,552 | |
Kimberly-Clark Corporation | | | 2.750 | % | 02/15/26 | | | 360,000 | | | | 367,002 | |
Lowe's Companies, Inc. | | | 3.700 | % | 04/15/46 | | | 315,000 | | | | 308,718 | |
Newell Brands, Inc. | | | 3.900 | % | 11/01/25 | | | 15,000 | | | | 15,364 | |
Newell Brands, Inc. | | | 5.375 | % | 04/01/36 | | | 45,000 | | | | 50,074 | |
10
RYAN LABS CORE BOND FUND
SCHEDULE OF INVESTMENTS (Continued) |
CORPORATE BONDS — 24.8% (Continued) | | Coupon | Maturity | | Par Value | | | Value | |
Consumer Discretionary — 3.1% (Continued) | | | | | | | | | | |
Priceline Group, Inc. (The) | | | 3.600 | % | 06/01/26 | | $ | 320,000 | | | $ | 320,735 | |
Time Warner, Inc. | | | 2.950 | % | 07/15/26 | | | 120,000 | | | | 117,867 | |
| | | | | | | | | | | | | 2,225,930 | |
Consumer Staples — 1.1% | | | | | | | | | | | | | |
Kraft Heinz Foods Company, 144A | | | 5.200 | % | 07/15/45 | | | 370,000 | | | | 415,904 | |
Sysco Corporation | | | 4.500 | % | 04/01/46 | | | 340,000 | | | | 350,511 | |
| | | | | | | | | | | | | 766,415 | |
Energy — 1.4% | | | | | | | | | | | | | |
Chevron Corporation | | | 1.561 | % | 05/16/19 | | | 250,000 | | | | 250,046 | |
Chevron Corporation | | | 2.954 | % | 05/16/26 | | | 340,000 | | | | 341,619 | |
Kinder Morgan Energy Partners, L.P. | | | 3.500 | % | 09/01/23 | | | 385,000 | | | | 359,586 | |
ONEOK Partners, L.P. | | | 3.375 | % | 10/01/22 | | | 15,000 | | | | 14,272 | |
Sunoco Logistics Partners Operations, L.P. | | | 5.350 | % | 05/15/45 | | | 40,000 | | | | 36,015 | |
Total Capital Canada Ltd. | | | 1.550 | % | 06/28/17 | | | 40,000 | | | | 40,155 | |
| | | | | | | | | | | | | 1,041,693 | |
Financials — 11.1% | | | | | | | | | | | | | |
American International Group, Inc. | | | 3.900 | % | 04/01/26 | | | 335,000 | | | | 339,706 | |
AvalonBay Communities, Inc. | | | 2.950 | % | 05/11/26 | | | 195,000 | | | | 193,885 | |
Bank of America Corporation | | | 1.650 | % | 03/26/18 | | | 715,000 | | | | 715,154 | |
Bank of America Corporation | | | 7.625 | % | 06/01/19 | | | 175,000 | | | | 201,941 | |
Bank of America Corporation | | | 5.875 | % | 01/05/21 | | | 135,000 | | | | 153,836 | |
Bank of America Corporation | | | 3.500 | % | 04/19/26 | | | 340,000 | | | | 345,013 | |
Bear Stearns Companies, LLC | | | 7.250 | % | 02/01/18 | | | 320,000 | | | | 348,819 | |
BNP Paribas | | | 2.400 | % | 12/12/18 | | | 230,000 | | | | 234,045 | |
BNP Paribas, 144A | | | 4.375 | % | 05/12/26 | | | 240,000 | | | | 242,095 | |
Citigroup, Inc. | | | 2.050 | % | 12/07/18 | | | 105,000 | | | | 105,449 | |
Citigroup, Inc. | | | 3.300 | % | 04/27/25 | | | 185,000 | | | | 186,422 | |
Citigroup, Inc. | | | 4.600 | % | 03/09/26 | | | 370,000 | | | | 384,033 | |
General Electric Capital Corporation | | | 6.750 | % | 03/15/32 | | | 280,000 | | | | 387,272 | |
Goldman Sachs Group, Inc. | | | 6.250 | % | 09/01/17 | | | 325,000 | | | | 343,109 | |
Goldman Sachs Group, Inc. | | | 2.625 | % | 01/31/19 | | | 300,000 | | | | 305,137 | |
Goldman Sachs Group, Inc. | | | 2.750 | % | 09/15/20 | | | 190,000 | | | | 192,547 | |
Goldman Sachs Group, Inc. | | | 3.750 | % | 02/25/26 | | | 225,000 | | | | 231,661 | |
Hospitality Properties Trust | | | 4.500 | % | 03/15/25 | | | 290,000 | | | | 282,788 | |
Huntington Bancshares, Inc. | | | 2.600 | % | 08/02/18 | | | 115,000 | | | | 116,363 | |
JPMorgan Chase & Company | | | 2.250 | % | 01/23/20 | | | 1,045,000 | | | | 1,049,360 | |
Markel Corporation | | | 5.000 | % | 04/05/46 | | | 75,000 | | | | 76,936 | |
Morgan Stanley | | | 5.550 | % | 04/27/17 | | | 285,000 | | | | 296,025 | |
11
RYAN LABS CORE BOND FUND
SCHEDULE OF INVESTMENTS (Continued) |
CORPORATE BONDS — 24.8% (Continued) | | Coupon | Maturity | | Par Value | | | Value | |
Financials — 11.1% (Continued) | | | | | | | | | | |
Stifel Financial Corporation | | | 3.500 | % | 12/01/20 | | $ | 445,000 | | | $ | 443,903 | |
UBS Group Funding Ltd., 144A | | | 4.125 | % | 04/15/26 | | | 200,000 | | | | 205,596 | |
Wells Fargo & Company | | | 4.100 | % | 06/03/26 | | | 200,000 | | | | 211,026 | |
Wells Fargo & Company | | | 4.300 | % | 07/22/27 | | | 370,000 | | | | 392,277 | |
| | | | | | | | | | | | | 7,984,398 | |
Health Care — 3.6% | | | | | | | | | | | | | |
Abbvie, Inc. | | | 4.450 | % | 05/14/46 | | | 80,000 | | | | 79,414 | |
Actavis Funding SCS | | | 3.450 | % | 03/15/22 | | | 25,000 | | | | 25,398 | |
Actavis Funding SCS | | | 4.750 | % | 03/15/45 | | | 405,000 | | | | 400,104 | |
Actavis, Inc. | | | 1.875 | % | 10/01/17 | | | 630,000 | | | | 631,038 | |
Amgen, Inc. | | | 2.200 | % | 05/22/19 | | | 125,000 | | | | 126,755 | |
Biogen, Inc. | | | 4.050 | % | 09/15/25 | | | 385,000 | | | | 410,978 | |
Celgene Corporation | | | 3.875 | % | 08/15/25 | | | 10,000 | | | | 10,463 | |
Celgene Corporation | | | 5.000 | % | 08/15/45 | | | 185,000 | | | | 196,632 | |
Johnson & Johnson | | | 3.700 | % | 03/01/46 | | | 85,000 | | | | 89,978 | |
Medtronic, Inc. | | | 2.500 | % | 03/15/20 | | | 30,000 | | | | 30,818 | |
Medtronic, Inc. | | | 3.500 | % | 03/15/25 | | | 135,000 | | | | 143,996 | |
Medtronic, Inc. | | | 4.625 | % | 03/15/45 | | | 120,000 | | | | 134,624 | |
Mylan, Inc. | | | 1.800 | % | 06/24/16 | | | 10,000 | | | | 10,005 | |
Mylan, Inc., 144A (b) | | | 5.250 | % | 06/15/46 | | | 90,000 | | | | 89,986 | |
Stryker Corporation | | | 3.500 | % | 03/15/26 | | | 165,000 | | | | 171,343 | |
Welltower, Inc. | | | 2.250 | % | 03/15/18 | | | 25,000 | | | | 25,159 | |
| | | | | | | | | | | | | 2,576,691 | |
Industrials — 0.7% | | | | | | | | | | | | | |
Fedex Corporation | | | 4.550 | % | 04/01/46 | | | 80,000 | | | | 82,515 | |
Glencore Funding, LLC, 144A | | | 2.500 | % | 01/15/19 | | | 64,000 | | | | 60,480 | |
Lockheed Martin Corporation | | | 3.800 | % | 03/01/45 | | | 355,000 | | | | 346,438 | |
| | | | | | | | | | | | | 489,433 | |
Information Technology — 0.5% | | | | | | | | | | | | | |
Lam Research Corporation | | | 3.450 | % | 06/15/23 | | | 80,000 | | | | 80,591 | |
Motorola Solutions, Inc. | | | 3.750 | % | 05/15/22 | | | 270,000 | | | | 265,104 | |
| | | | | | | | | | | | | 345,695 | |
Materials — 0.7% | | | | | | | | | | | | | |
Ecolab, Inc. | | | 1.450 | % | 12/08/17 | | | 125,000 | | | | 125,038 | |
LyondellBasell Industries N.V. | | | 5.000 | % | 04/15/19 | | | 65,000 | | | | 69,731 | |
Southern Copper Corporation | | | 3.875 | % | 04/23/25 | | | 290,000 | | | | 278,888 | |
| | | | | | | | | | | | | 473,657 | |
Telecommunication Services — 1.5% | | | | | | | | | | | | | |
AT&T, Inc. | | | 4.600 | % | 02/15/21 | | | 315,000 | | | | 342,147 | |
AT&T, Inc. | | | 3.400 | % | 05/15/25 | | | 25,000 | | | | 25,042 | |
12
RYAN LABS CORE BOND FUND
SCHEDULE OF INVESTMENTS (Continued) |
CORPORATE BONDS — 24.8% (Continued) | | Coupon | Maturity | | Par Value | | | Value | |
Telecommunication Services — 1.5% (Continued) | | | | | | | | | | |
AT&T, Inc. | | | 4.500 | % | 05/15/35 | | $ | 385,000 | | | $ | 385,552 | |
Verizon Communications, Inc. | | | 4.500 | % | 09/15/20 | | | 15,000 | | | | 16,460 | |
Verizon Communications, Inc. | | | 6.550 | % | 09/15/43 | | | 256,000 | | | | 335,345 | |
| | | | | | | | | | | | | 1,104,546 | |
Utilities — 1.1% | | | | | | | | | | | | | |
Buckeye Partners, L.P. | | | 6.050 | % | 01/15/18 | | | 305,000 | | | | 321,898 | |
Buckeye Partners, L.P. | | | 2.650 | % | 11/15/18 | | | 125,000 | | | | 125,552 | |
Duke Energy Carolinas, LLC | | | 5.300 | % | 02/15/40 | | | 105,000 | | | | 129,664 | |
Electricite de France S.A., 144A | | | 3.625 | % | 10/13/25 | | | 15,000 | | | | 15,304 | |
Oglethorpe Power Corporation | | | 6.100 | % | 03/15/19 | | | 60,000 | | | | 66,431 | |
PacifiCorp | | | 4.100 | % | 02/01/42 | | | 105,000 | | | | 111,239 | |
| | | | | | | | | | | | | 770,088 | |
Total Corporate Bonds (Cost $17,443,562) | | | | | | | | | | | $ | 17,778,546 | |
| |
INTERNATIONAL BONDS — 0.2% | | Coupon | Maturity | | Par Value | | | Value | |
United Mexican States (Cost $124,574) | | | 4.000 | % | 10/02/23 | | $ | 120,000 | | | $ | 125,100 | |
| |
EXCHANGE-TRADED FUNDS — 1.2% | | Shares | | | Value | |
iShares iBoxx $ Investment Grade Corporate Bond ETF (Cost $809,786) | | | 7,030 | | | $ | 839,311 | |
13
RYAN LABS CORE BOND FUND
SCHEDULE OF INVESTMENTS (Continued) |
MONEY MARKET FUNDS — 0.9% | | Shares | | | Value | |
Invesco Short-Term Investments Trust - Treasury Portfolio - Institutional Shares, 0.24% (c) (Cost $669,887) | | | 669,887 | | | $ | 669,887 | |
| | | | | | | | | |
Total Investments at Value — 99.9% (Cost $70,938,120) | | | | | | $ | 71,473,278 | |
| | | | | | | | | |
Other Assets in Excess of Liabilities — 0.1% | | | | | | | 76,892 | |
| | | | | | | | | |
Net Assets — 100.0% | | | | | | $ | 71,550,170 | |
144A - | This is a restricted security that was acquired in a transaction exempt from Rule 144A of the Securities Act of 1933. This security may be sold in transactions exempt from registration, normally to qualified institutional buyers. The total value of such securities is $8,295,055 at May 31, 2016, representing 11.6% of net assets. |
(a) | Variable rate security. The rate shown is the effective interest rate as of May 31, 2016. |
(b) | Security value has been determined in good faith pursuant to procedures adopted by the Board of Trustees. The total value of such securities is $89,986 at May 31, 2016, representing 0.1% of net assets (Note 2). |
(c) | The rate shown is the 7-day effective yield as of May 31, 2016. |
See accompanying notes to financial statements. |
14
RYAN LABS LONG CREDIT FUND
SCHEDULE OF INVESTMENTS
May 31, 2016 (Unaudited) |
U.S. TREASURY OBLIGATIONS — 5.1% | | Coupon | Maturity | | Par Value | | | Value | |
U.S. Treasury Notes — 3.3% | | | | | | | | | | |
U.S. Treasury Notes | | | 1.625 | % | 02/15/26 | | $ | 1,140,000 | | | $ | 1,117,422 | |
U.S. Treasury Notes | | | 1.625 | % | 05/15/26 | | | 655,000 | | | | 642,566 | |
| | | | | | | | | | | | | 1,759,988 | |
U.S. Treasury Bonds — 1.8% | | | | | | | | | | | | | |
U.S. Treasury Bonds | | | 3.000 | % | 11/15/45 | | | 640,000 | | | | 688,900 | |
U.S. Treasury Bonds | | | 2.500 | % | 02/15/46 | | | 260,000 | | | | 252,758 | |
| | | | | | | | | | | | | 941,658 | |
Total U.S. Treasury Obligations (Cost $2,688,571) | | | | | | | | | | | $ | 2,701,646 | |
| |
MUNICIPAL BONDS — 6.5% | | Coupon | Maturity | | Par Value | | | Value | |
Bay Area, CA, Toll Authority Toll Bridge, Revenue | | | 6.263 | % | 04/01/49 | | $ | 500,000 | | | $ | 738,105 | |
California State, Build America Bonds, General Obligation | | | 7.550 | % | 04/01/39 | | | 500,000 | | | | 772,105 | |
New York City Water & Sewer System, Build America Bonds, Revenue | | | 5.750 | % | 06/15/41 | | | 485,000 | | | | 652,078 | |
Port Authority of New York & New Jersey Bonds, Revenue | | | 4.926 | % | 10/01/51 | | | 130,000 | | | | 156,168 | |
San Diego County, CA, Water Authority Financing Agency, Series B, Revenue | | | 6.138 | % | 05/01/49 | | | 430,000 | | | | 588,769 | |
University of California, Revenue | | | 4.131 | % | 05/15/45 | | | 540,000 | | | | 573,960 | |
Total Municipal Bonds (Cost $3,361,201) | | | | | | | | | | | $ | 3,481,185 | |
| |
CORPORATE BONDS — 83.5% | | Coupon | Maturity | | Par Value | | | Value | |
Consumer Discretionary — 12.5% | | | | | | | | | | |
21st Century Fox America, Inc. | | | 4.950 | % | 10/15/45 | | $ | 720,000 | | | $ | 784,012 | |
Anheuser-Busch InBev SA/NV | | | 4.900 | % | 02/01/46 | | | 775,000 | | | | 865,152 | |
Comcast Corporation | | | 4.250 | % | 01/15/33 | | | 850,000 | | | | 909,452 | |
Hasbro, Inc. | | | 6.350 | % | 03/15/40 | | | 300,000 | | | | 356,283 | |
Home Depot, Inc. | | | 4.250 | % | 04/01/46 | | | 540,000 | | | | 587,327 | |
Johnson (S.C.) & Son, Inc., 144A | | | 4.800 | % | 09/01/40 | | | 105,000 | | | | 117,331 | |
Johnson (S.C.) & Son, Inc., 144A | | | 4.350 | % | 09/30/44 | | | 460,000 | | | | 484,765 | |
Kimberly-Clark Corporation | | | 2.750 | % | 02/15/26 | | | 150,000 | | | | 152,917 | |
Lowe's Companies, Inc. | | | 6.650 | % | 09/15/37 | | | 418,000 | | | | 570,119 | |
15
RYAN LABS LONG CREDIT FUND
SCHEDULE OF INVESTMENTS (Continued) |
CORPORATE BONDS — 83.5% (Continued) | | Coupon | Maturity | | Par Value | | | Value | |
Consumer Discretionary — 12.5% (Continued) | | | | | | | | | | |
Macy's Retail Holdings, Inc. | | | 6.650 | % | 07/15/24 | | $ | 255,000 | | | $ | 286,719 | |
Newell Brands, Inc. | | | 5.500 | % | 04/01/46 | | | 365,000 | | | | 417,110 | |
Time Warner, Inc. | | | 7.700 | % | 05/01/32 | | | 410,000 | | | | 547,577 | |
Time Warner, Inc. | | | 6.750 | % | 06/15/39 | | | 200,000 | | | | 227,150 | |
Viacom, Inc. | | | 5.250 | % | 04/01/44 | | | 400,000 | | | | 360,421 | |
| | | | | | | | | | | | | 6,666,335 | |
Consumer Staples — 1.7% | | | | | | | | | | | | | |
PepsiCo, Inc. | | | 4.450 | % | 04/14/46 | | | 455,000 | | | | 500,565 | |
Walgreens Boots Alliance, Inc. | | | 4.650 | % | 06/01/46 | | | 60,000 | | | | 60,820 | |
Wal-Mart Stores, Inc. | | | 4.300 | % | 04/22/44 | | | 330,000 | | | | 363,652 | |
| | | | | | | | | | | | | 925,037 | |
Energy — 6.8% | | | | | | | | | | | | | |
Energy Transfer Partners, L.P. | | | 6.500 | % | 02/01/42 | | | 600,000 | | | | 579,873 | |
Enterprise Products Operating, L.P. | | | 5.100 | % | 02/15/45 | | | 525,000 | | | | 533,800 | |
Exxon Mobil Corporation | | | 4.114 | % | 03/01/46 | | | 530,000 | | | | 562,435 | |
Kinder Morgan Energy Partners, L.P. | | | 6.500 | % | 09/01/39 | | | 535,000 | | | | 521,446 | |
Marathon Petroleum Corporation | | | 5.850 | % | 12/15/45 | | | 425,000 | | | | 398,486 | |
Petroleos Mexicanos | | | 5.500 | % | 06/27/44 | | | 380,000 | | | | 317,376 | |
Shell International Finance B.V. | | | 4.375 | % | 05/11/45 | | | 340,000 | | | | 351,197 | |
Statoil ASA | | | 3.950 | % | 05/15/43 | | | 65,000 | | | | 63,484 | |
Williams Partners, L.P. | | | 4.000 | % | 09/15/25 | | | 325,000 | | | | 280,662 | |
| | | | | | | | | | | | | 3,608,759 | |
Financials — 21.3% | | | | | | | | | | | | | |
Alleghany Corporation | | | 4.900 | % | 09/15/44 | | | 525,000 | | | | 521,237 | |
Citigroup, Inc. | | | 4.450 | % | 09/29/27 | | | 525,000 | | | | 532,679 | |
FMR, LLC, 144A | | | 6.500 | % | 12/14/40 | | | 445,000 | | | | 560,456 | |
GE Capital International Funding Company, 144A | | | 4.418 | % | 11/15/35 | | | 960,000 | | | | 1,044,381 | |
Goldman Sachs Group, Inc. | | | 4.250 | % | 10/21/25 | | | 125,000 | | | | 127,392 | |
Goldman Sachs Group, Inc. | | | 4.750 | % | 10/21/45 | | | 710,000 | | | | 760,722 | |
Health Care REIT, Inc. | | | 4.000 | % | 06/01/25 | | | 665,000 | | | | 680,789 | |
Hospitality Properties Trust | | | 4.650 | % | 03/15/24 | | | 630,000 | | | | 629,046 | |
Host Hotels & Resorts, L.P. | | | 4.000 | % | 06/15/25 | | | 500,000 | | | | 496,942 | |
HSBC Bank USA | | | 5.875 | % | 11/01/34 | | | 500,000 | | | | 596,966 | |
Jefferies Group, LLC | | | 6.500 | % | 01/20/43 | | | 295,000 | | | | 289,290 | |
Lincoln National Corporation | | | 7.000 | % | 06/15/40 | | | 480,000 | | | | 593,560 | |
MetLife, Inc. | | | 4.875 | % | 11/13/43 | | | 500,000 | | | | 542,814 | |
Nationwide Financial Services, Inc., 144A | | | 5.300 | % | 11/18/44 | | | 250,000 | | | | 259,801 | |
16
RYAN LABS LONG CREDIT FUND
SCHEDULE OF INVESTMENTS (Continued) |
CORPORATE BONDS — 83.5% (Continued) | | Coupon | Maturity | | Par Value | | | Value | |
Financials — 21.3% (Continued) | | | | | | | | | | |
Pacific Lifecorp, 144A | | | 5.125 | % | 01/30/43 | | $ | 490,000 | | | $ | 510,689 | |
Protective Life Corporation | | | 8.450 | % | 10/15/39 | | | 400,000 | | | | 542,254 | |
Santander Issuances S.A. | | | 5.179 | % | 11/19/25 | | | 400,000 | | | | 397,676 | |
Societe Generale, 144A | | | 4.750 | % | 11/24/25 | | | 310,000 | | | | 312,863 | |
Teachers Insurance & Annuity Association of America, 144A | | | 4.900 | % | 09/15/44 | | | 750,000 | | | | 814,930 | |
Visa, Inc. | | | 4.150 | % | 12/14/35 | | | 230,000 | | | | 250,830 | |
Wells Fargo & Company | | | 4.300 | % | 07/22/27 | | | 750,000 | | | | 795,156 | |
Wells Fargo & Company | | | 3.900 | % | 05/01/45 | | | 105,000 | | | | 106,146 | |
| | | | | | | | | | | | | 11,366,619 | |
Health Care — 11.2% | | | | | | | | | | | | | |
AbbVie, Inc. | | | 4.300 | % | 05/14/36 | | | 550,000 | | | | 545,258 | |
Baxalta, Inc. | | | 4.000 | % | 06/23/25 | | | 500,000 | | | | 500,385 | |
Biogen, Inc. | | | 5.200 | % | 09/15/45 | | | 365,000 | | | | 401,597 | |
Celgene Corporation | | | 5.000 | % | 08/15/45 | | | 390,000 | | | | 414,521 | |
Gilead Sciences, Inc. | | | 4.750 | % | 03/01/46 | | | 110,000 | | | | 117,714 | |
Johnson & Johnson | | | 3.550 | % | 03/01/36 | | | 545,000 | | | | 569,127 | |
Koninklijke Philips N.V. | | | 5.000 | % | 03/15/42 | | | 300,000 | | | | 317,676 | |
Medtronic, Inc. | | | 4.625 | % | 03/15/45 | | | 500,000 | | | | 560,935 | |
Merck & Company, Inc. | | | 3.700 | % | 02/10/45 | | | 295,000 | | | | 296,314 | |
Novartis Capital Corporation | | | 4.000 | % | 11/20/45 | | | 480,000 | | | | 517,484 | |
Roche Holding, Inc., 144A | | | 2.625 | % | 05/15/26 | | | 400,000 | | | | 401,652 | |
Stryker Corporation | | | 4.625 | % | 03/15/46 | | | 440,000 | | | | 474,461 | |
UnitedHealth Group, Inc. | | | 4.750 | % | 07/15/45 | | | 750,000 | | | | 858,696 | |
| | | | | | | | | | | | | 5,975,820 | |
Industrials — 3.6% | | | | | | | | | | | | | |
Burlington Northern Santa Fe, LLC | | | 3.900 | % | 08/01/46 | | | 110,000 | | | | 110,251 | |
Ford Motor Company | | | 4.750 | % | 01/15/43 | | | 270,000 | | | | 276,013 | |
Mosaic Company | | | 5.625 | % | 11/15/43 | | | 500,000 | | | | 527,765 | |
Siemens AG, 144A | | | 4.400 | % | 05/27/45 | | | 350,000 | | | | 383,154 | |
Textron, Inc. | | | 4.000 | % | 03/15/26 | | | 125,000 | | | | 128,144 | |
United Technologies Corporation | | | 4.500 | % | 06/01/42 | | | 460,000 | | | | 503,197 | |
| | | | | | | | | | | | | 1,928,524 | |
Information Technology — 6.7% | | | | | | | | | | | | | |
Apple, Inc. | | | 4.500 | % | 02/23/36 | | | 150,000 | | | | 162,752 | |
Apple, Inc. | | | 3.450 | % | 02/09/45 | | | 1,000,000 | | | | 911,917 | |
HP Enterprise Company, 144A | | | 6.350 | % | 10/15/45 | | | 250,000 | | | | 239,173 | |
International Business Machines Corporation | | | 5.875 | % | 11/29/32 | | | 220,000 | | | | 277,410 | |
Intel Corporation | | | 4.900 | % | 07/29/45 | | | 85,000 | | | | 95,103 | |
17
RYAN LABS LONG CREDIT FUND
SCHEDULE OF INVESTMENTS (Continued) |
CORPORATE BONDS — 83.5% (Continued) | | Coupon | Maturity | | Par Value | | | Value | |
Information Technology — 6.7% (Continued) | | | | | | | | | | |
Intel Corporation | | | 4.100 | % | 05/19/46 | | $ | 345,000 | | | $ | 345,984 | |
KLA-Tencor Corporation | | | 5.650 | % | 11/01/34 | | | 400,000 | | | | 424,112 | |
Lam Research Corporation | | | 3.800 | % | 03/15/25 | | | 275,000 | | | | 276,602 | |
Oracle Corporation | | | 6.500 | % | 04/15/38 | | | 600,000 | | | | 814,274 | |
| | | | | | | | | | | | | 3,547,327 | |
Materials — 2.6% | | | | | | | | | | | | | |
BHP Billiton Finance USA Ltd. | | | 5.000 | % | 09/30/43 | | | 520,000 | | | | 552,325 | |
Burlington Resources Finance Company | | | 7.200 | % | 08/15/31 | | | 400,000 | | | | 483,179 | |
Southern Copper Corporation | | | 5.875 | % | 04/23/45 | | | 420,000 | | | | 365,891 | |
| | | | | | | | | | | | | 1,401,395 | |
Telecommunication Services — 5.2% | | | | | | | | | | | | | |
AT&T, Inc. | | | 4.500 | % | 05/15/35 | | | 1,500,000 | | | | 1,502,149 | |
Motorola Solutions, Inc. | | | 5.500 | % | 09/01/44 | | | 250,000 | | | | 217,669 | |
Verizon Communications, Inc. | | | 4.400 | % | 11/01/34 | | | 1,050,000 | | | | 1,064,936 | |
| | | | | | | | | | | | | 2,784,754 | |
Utilities — 11.9% | | | | | | | | | | | | | |
Buckeye Partners, L.P. | | | 5.600 | % | 10/15/44 | | | 350,000 | | | | 310,396 | |
Consolidated Edison Company | | | 4.500 | % | 12/01/45 | | | 500,000 | | | | 553,754 | |
DTE Electric Company | | | 3.700 | % | 06/01/46 | | | 440,000 | | | | 441,234 | |
Duke Energy Progress, Inc. | | | 4.375 | % | 03/30/44 | | | 700,000 | | | | 766,373 | |
Électricité de France S.A., 144A | | | 4.950 | % | 10/13/45 | | | 750,000 | | | | 802,211 | |
Exelon Generation Company, LLC | | | 5.600 | % | 06/15/42 | | | 500,000 | | | | 509,637 | |
Florida Power & Light Company | | | 5.950 | % | 10/01/33 | | | 350,000 | | | | 452,911 | |
PacifiCorp | | | 6.250 | % | 10/15/37 | | | 100,000 | | | | 133,720 | |
PacifiCorp | | | 6.350 | % | 07/15/38 | | | 635,000 | | | | 845,418 | |
Southern California Edison Company | | | 4.650 | % | 10/01/43 | | | 160,000 | | | | 184,136 | |
Southern Company | | | 4.400 | % | 07/01/46 | | | 115,000 | | | | 117,039 | |
Southwestern Public Service Company | | | 4.500 | % | 08/15/41 | | | 575,000 | | | | 640,501 | |
Virginia Electric & Power Company | | | 6.350 | % | 11/30/37 | | | 425,000 | | | | 567,825 | |
| | | | | | | | | | | | | 6,325,155 | |
Total Corporate Bonds (Cost $42,738,586) | | | | | | | | | | | $ | 44,529,725 | |
18
RYAN LABS LONG CREDIT FUND
SCHEDULE OF INVESTMENTS (Continued) |
INTERNATIONAL BONDS — 3.6% | | Coupon | Maturity | | Par Value | | | Value | |
Republic of Colombia | | | 5.000 | % | 06/15/45 | | $ | 375,000 | | | $ | 347,812 | |
Republic of Peru | | | 6.550 | % | 03/14/37 | | | 250,000 | | | | 314,375 | |
Republic of Turkey | | | 4.250 | % | 04/14/26 | | | 500,000 | | | | 486,250 | |
United Mexican States | | | 4.750 | % | 03/08/44 | | | 770,000 | | | | 764,225 | |
Total International Bonds (Cost $1,811,078) | | | | | | | | | | | $ | 1,912,662 | |
| |
MONEY MARKET FUNDS — 0.6% | | Shares | | | Value | |
Invesco Short-Term Investments Trust - Treasury Portfolio - Institutional Shares, 0.24% (a) (Cost $345,011) | | | 345,011 | | | $ | 345,011 | |
| | | | | | | | | |
Total Investments at Value — 99.3% (Cost $50,944,447) | | | | | | $ | 52,970,229 | |
| | | | | | | | | |
Other Assets in Excess of Liabilities — 0.7% | | | | | | | 352,915 | |
| | | | | | | | | |
Net Assets — 100.0% | | | | | | $ | 53,323,144 | |
144A - | This is a restricted security that was acquired in a transaction exempt from Rule 144A of the Securities Act of 1933. This security may be sold in transactions exempt from registration, normally to qualified institutional buyers. The total value of such securities is $5,931,406 at May 31, 2016, representing 11.1% of net assets. |
(a) | The rate shown is the 7-day effective yield as of May 31, 2016. |
See accompanying notes to financial statements. |
19
RYAN LABS FUNDS
STATEMENTS OF ASSETS AND LIABILITIES
May 31, 2016 (Unaudited) |
| | Ryan Labs Core Bond Fund | | | Ryan Labs Long Credit Fund | |
ASSETS | | | | | | |
Investments in securities: | | | | | | |
At acquisition cost | | $ | 70,938,120 | | | $ | 50,944,447 | |
At value (Note 2) | | $ | 71,473,278 | | | $ | 52,970,229 | |
Dividends and interest receivable | | | 271,002 | | | | 514,254 | |
Receivable for securities sold | | | 367,227 | | | | 316,575 | |
Other assets | | | 9,993 | | | | 6,412 | |
TOTAL ASSETS | | | 72,121,500 | | | | 53,807,470 | |
| | | | | | | | | |
LIABILITIES | | | | | | | | |
Payable for securities purchased | | | 444,102 | | | | 295,690 | |
Distributions payable | | | 103,226 | | | | 167,589 | |
Payable to Adviser (Note 4) | | | 2,477 | | | | 6,582 | |
Payable to administrator (Note 4) | | | 10,690 | | | | 9,050 | |
Other accrued expenses | | | 10,835 | | | | 5,415 | |
TOTAL LIABILITIES | | | 571,330 | | | | 484,326 | |
| | | | | | | | | |
NET ASSETS | | $ | 71,550,170 | | | $ | 53,323,144 | |
| | | | | | | | | |
NET ASSETS CONSIST OF: | | | | | | | | |
Paid-in capital | | $ | 70,400,307 | | | $ | 50,174,013 | |
Accumulated net investment income | | | 485 | | | | 456 | |
Accumulated net realized gains from security transactions | | | 614,220 | | | | 1,122,893 | |
Net unrealized appreciation on investments | | | 535,158 | | | | 2,025,782 | |
NET ASSETS | | $ | 71,550,170 | | | $ | 53,323,144 | |
| | | | | | | | | |
Shares of beneficial interest outstanding (unlimited number of shares authorized, no par value) | | | 7,126,291 | | | | 5,017,683 | |
| | | | | | | | | |
Net asset value, offering price and redemption price per share (Note 2) | | $ | 10.04 | | | $ | 10.63 | |
See accompanying notes to financial statements. |
20
RYAN LABS FUNDS
STATEMENTS OF OPERATIONS
For the Six Months Ended May 31, 2016 (Unaudited) |
| | Ryan Labs Core Bond Fund | | | Ryan Labs Long Credit Fund | |
INVESTMENT INCOME | | | | | | |
Dividend income | | $ | 42,990 | | | $ | 585 | |
Interest | | | 952,405 | | | | 1,185,549 | |
TOTAL INCOME | | | 995,395 | | | | 1,186,134 | |
| | | | | | | | | |
EXPENSES | | | | | | | | |
Investment advisory fees (Note 4) | | | 141,658 | | | | 127,775 | |
Administration fees (Note 4) | | | 35,497 | | | | 25,223 | |
Professional fees | | | 16,835 | | | | 14,210 | |
Fund accounting fees (Note 4) | | | 16,507 | | | | 13,614 | |
Pricing costs | | | 21,768 | | | | 6,833 | |
Compliance fees (Note 4) | | | 6,141 | | | | 6,141 | |
Transfer agent fees (Note 4) | | | 6,000 | | | | 6,000 | |
Trustees’ fees and expenses (Note 4) | | | 5,629 | | | | 5,339 | |
Custody and bank service fees | | | 4,498 | | | | 3,374 | |
Registration and filing fees | | | 3,056 | | | | 2,580 | |
Printing of shareholder reports | | | 1,995 | | | | 1,845 | |
Postage and supplies | | | 1,496 | | | | 1,388 | |
Insurance expense | | | 2,060 | | | | — | |
Other expenses | | | 3,431 | | | | 1,756 | |
TOTAL EXPENSES | | | 266,571 | | | | 216,078 | |
Less fee reductions by the Adviser (Note 4) | | | (124,913 | ) | | | (88,303 | ) |
NET EXPENSES | | | 141,658 | | | | 127,775 | |
| | | | | | | | | |
NET INVESTMENT INCOME | | | 853,737 | | | | 1,058,359 | |
| | | | | | | | | |
REALIZED AND UNREALIZED GAINS ON INVESTMENTS | | | | | | | | |
Net realized gains from investment transactions | | | 670,326 | | | | 1,122,865 | |
Net change in unrealized appreciation (depreciation) on investments | | | 610,029 | | | | 1,921,727 | |
NET REALIZED AND UNREALIZED GAINS ON INVESTMENTS | | | 1,280,355 | | | | 3,044,592 | |
| | | | | | | | | |
NET INCREASE IN NET ASSETS FROM OPERATIONS | | $ | 2,134,092 | | | $ | 4,102,951 | |
See accompanying notes to financial statements. |
21
RYAN LABS CORE BOND FUND
STATEMENTS OF CHANGES IN NET ASSETS |
| | Six Months
Ended
May 31, 2016
(Unaudited) | | | Period Ended
November 30,
2015 (a) | |
FROM OPERATIONS | | | | | | |
Net investment income | | $ | 853,737 | | | $ | 425,356 | |
Net realized gains from investment transactions | | | 670,326 | | | | 40,150 | |
Net change in unrealized appreciation (depreciation) on investments | | | 610,029 | | | | (74,871 | ) |
Net increase in net assets from operations | | | 2,134,092 | | | | 390,635 | |
| | | | | | | | | |
DISTRIBUTIONS TO SHAREHOLDERS | | | | | | | | |
From net investment income | | | (898,285 | ) | | | (425,350 | ) |
From net realized gains from security transactions | | | (51,229 | ) | | | — | |
Decrease in net assets from distributions to shareholders | | | (949,514 | ) | | | (425,350 | ) |
| | | | | | | | | |
CAPITAL SHARE TRANSACTIONS | | | | | | | | |
Proceeds from shares sold | | | — | | | | 72,008,782 | |
Net asset value of shares issued in reinvestment of distributions to shareholders | | | 308,366 | | | | 283,659 | |
Payments for shares redeemed | | | (200,000 | ) | | | (2,000,500 | ) |
Net increase from capital share transactions | | | 108,366 | | | | 70,291,941 | |
| | | | | | | | | |
TOTAL INCREASE IN NET ASSETS | | | 1,292,944 | | | | 70,257,226 | |
| | | | | | | | | |
NET ASSETS | | | | | | | | |
Beginning of period | | | 70,257,226 | | | | — | |
End of period | | $ | 71,550,170 | | | $ | 70,257,226 | |
| | | | | | | | | |
ACCUMULATED NET INVESTMENT INCOME | | $ | 485 | | | $ | 24,345 | |
| | | | | | | | | |
CAPITAL SHARE ACTIVITY | | | | | | | | |
Shares sold | | | — | | | | 7,286,856 | |
Shares reinvested | | | 31,092 | | | | 28,495 | |
Shares redeemed | | | (19,901 | ) | | | (200,251 | ) |
Net increase in shares outstanding | | | 11,191 | | | | 7,115,100 | |
Shares outstanding at beginning of period | | | 7,115,100 | | | | — | |
Shares outstanding at end of period | | | 7,126,291 | | | | 7,115,100 | |
(a) | Represents the period from the commencement of operations (December 29, 2014) through November 30, 2015. |
See accompanying notes to financial statements. |
22
RYAN LABS LONG CREDIT FUND
STATEMENTS OF CHANGES IN NET ASSETS |
| | Six Months
Ended
May 31, 2016
(Unaudited) | | | Period Ended
November 30,
2015 (a) | |
FROM OPERATIONS | | | | | | |
Net investment income | | $ | 1,058,359 | | | $ | 55,705 | |
Net realized gains from investment transactions | | | 1,122,865 | | | | 173,530 | |
Net change in unrealized appreciation (depreciation) on investments | | | 1,921,727 | | | | 104,055 | |
Net increase in net assets from operations | | | 4,102,951 | | | | 333,290 | |
| | | | | | | | | |
DISTRIBUTIONS TO SHAREHOLDERS | | | | | | | | |
From net investment income | | | (1,058,107 | ) | | | (55,501 | ) |
From net realized gains from security transactions | | | (173,502 | ) | | | — | |
Decrease in net assets from distributions to shareholders | | | (1,231,609 | ) | | | (55,501 | ) |
| | | | | | | | | |
CAPITAL SHARE TRANSACTIONS | | | | | | | | |
Proceeds from shares sold | | | — | | | | 50,000,500 | |
Net asset value of shares issued in reinvestment of distributions to shareholders | | | 173,512 | | | | 1 | |
Net increase from capital share transactions | | | 173,512 | | | | 50,000,501 | |
| | | | | | | | | |
TOTAL INCREASE IN NET ASSETS | | | 3,044,854 | | | | 50,278,290 | |
| | | | | | | | | |
NET ASSETS | | | | | | | | |
Beginning of period | | | 50,278,290 | | | | — | |
End of period | | $ | 53,323,144 | | | $ | 50,278,290 | |
| | | | | | | | | |
ACCUMULATED NET INVESTMENT INCOME | | $ | 456 | | | $ | 204 | |
| | | | | | | | | |
CAPITAL SHARE ACTIVITY | | | | | | | | |
Shares sold | | | — | | | | 5,000,050 | |
Shares reinvested | | | 17,633 | | | | 0 | (b) |
Increase in shares outstanding | | | 17,633 | | | | 5,000,050 | |
Shares outstanding at beginning of period | | | 5,000,050 | | | | — | |
Shares outstanding at end of period | | | 5,017,683 | | | | 5,000,050 | |
(a) | Represents the period from the commencement of operations (November 13, 2015) through November 30, 2015. |
(b) | Rounds to less than 1 share. |
See accompanying notes to financial statements. |
23
RYAN LABS CORE BOND FUND
FINANCIAL HIGHLIGHTS |
Per Share Data for a Share Outstanding Throughout Each Period |
| | Six Months
Ended
May 31, 2016
(Unaudited) | | | Period Ended November 30,
2015 (a) | |
Net asset value at beginning of period | | $ | 9.87 | | | $ | 10.00 | |
| | | | | | | | | |
Income (loss) from investment operations: | | | | | | | | |
Net investment income | | | 0.12 | | | | 0.21 | |
Net realized and unrealized gains (losses) on investments | | | 0.19 | | | | (0.13 | ) |
Total from investment operations | | | 0.31 | | | | 0.08 | |
| | | | | | | | | |
Less distributions from: | | | | | | | | |
Net investment income | | | (0.13 | ) | | | (0.21 | ) |
Net realized gains from security transactions | | | (0.01 | ) | | | — | |
Total distributions | | | (0.14 | ) | | | (0.21 | ) |
| | | | | | | | | |
Net asset value at end of period | | $ | 10.04 | | | $ | 9.87 | |
| | | | | | | | | |
Total return (b) | | | 3.09 | %(c) | | | 0.81 | %(c) |
| | | | | | | | | |
Net assets at end of period (000’s) | | $ | 71,550 | | | $ | 70,257 | |
| | | | | | | | | |
Ratios/supplementary data: | | | | | | | | |
| | | | | | | | | |
Ratio of total expenses to average net assets (e) | | | 0.75 | %(d) | | | 1.18 | %(d) |
| | | | | | | | | |
Ratio of net expenses to average net assets (e) (f) | | | 0.40 | %(d) | | | 0.40 | %(d) |
| | | | | | | | | |
Ratio of net investment income to average net assets (e) (f) (g) | | | 2.41 | %(d) | | | 2.21 | %(d) |
| | | | | | | | | |
Portfolio turnover rate | | | 52 | %(c) | | | 161 | %(c) |
(a) | Represents the period from the commencement of operations (December 29, 2014) through November 30, 2015. |
(b) | Total return is a measure of the change in value of an investment in the Fund over the periods covered, which assumes any dividends or capital gains distributions are reinvested in shares of the Fund. The returns shown do not reflect the deduction of taxes a shareholder would pay on Fund distributions or the redemption of Fund shares. The total returns would have been lower if the Adviser had not reduced advisory fees and reimbursed expenses (Note 4). |
(c) | Not annualized. |
(d) | Annualized. |
(e) | Ratios do not reflect the Fund’s proportionate share of expenses of the underlying investment companies in which the Fund invests. |
(f) | Ratio was determined after investment advisory fee reductions and/or expense reimbursements. (Note 4). |
(g) | Recognition of net investment income by the Fund is affected by the timing of the declaration of dividends by the underlying investment companies in which the Fund invests. |
See accompanying notes to financial statements. |
24
RYAN LABS LONG CREDIT FUND
FINANCIAL HIGHLIGHTS |
Per Share Data for a Share Outstanding Throughout Each Period |
| | Six Months
Ended
May 31, 2016
(Unaudited) | | | Period Ended November 30,
2015 (a) | |
Net asset value at beginning of period | | $ | 10.06 | | | $ | 10.00 | |
| | | | | | | | | |
Income from investment operations: | | | | | | | | |
Net investment income | | | 0.21 | | | | 0.01 | |
Net realized and unrealized gains on investments | | | 0.60 | | | | 0.06 | |
Total from investment operations | | | 0.81 | | | | 0.07 | |
| | | | | | | | | |
Less distributions from: | | | | | | | | |
Net investment income | | | (0.21 | ) | | | (0.01 | ) |
Net realized gains from security transactions | | | (0.03 | ) | | | — | |
Total distributions | | | (0.24 | ) | | | (0.01 | ) |
| | | | | | | | | |
Net asset value at end of period | | $ | 10.63 | | | $ | 10.06 | |
| | | | | | | | | |
Total return (b) | | | 8.25 | %(c) | | | 0.71 | %(c) |
| | | | | | | | | |
Net assets at end of period (000’s) | | $ | 53,323 | | | $ | 50,278 | |
| | | | | | | | | |
Ratios/supplementary data: | | | | | | | | |
| | | | | | | | | |
Ratio of total expenses to average net assets | | | 0.85 | %(d) | | | 1.12 | %(d) |
| | | | | | | | | |
Ratio of net expenses to average net assets (e) | | | 0.50 | %(d) | | | 0.50 | %(d) |
| | | | | | | | | |
Ratio of net investment income to average net assets (e) | | | 4.14 | %(d) | | | 2.38 | %(d) |
| | | | | | | | | |
Portfolio turnover rate | | | 93 | %(c) | | | 93 | %(c) |
(a) | Represents the period from the commencement of operations (November 13, 2015) through November 30, 2015. |
(b) | Total return is a measure of the change in value of an investment in the Fund over the periods covered, which assumes any dividends or capital gains distributions are reinvested in shares of the Fund. The returns shown do not reflect the deduction of taxes a shareholder would pay on Fund distributions or the redemption of Fund shares. The total returns would have been lower if the Adviser had not reduced advisory fees and reimbursed expenses (Note 4). |
(c) | Not annualized. |
(d) | Annualized. |
(e) | Ratio was determined after investment advisory fee reductions and/or expense reimbursements. (Note 4). |
See accompanying notes to financial statements. |
25
RYAN LABS FUNDS
NOTES TO FINANCIAL STATEMENTS
May 31, 2016 (Unaudited)
1. Organization
Ryan Labs Core Bond Fund and Ryan Labs Long Credit Fund (individually, a “Fund,” and collectively, the “Funds”) are each a diversified series of Ultimus Managers Trust (the “Trust”), an open-end investment company established as an Ohio business trust under a Declaration of Trust dated February 28, 2012. Other series of the Trust are not incorporated in this report. Ryan Labs Core Bond Fund and Ryan Labs Long Credit Fund commenced operations on December 29, 2014 and November 13, 2015, respectively.
Each Fund’s investment objective is total return, consisting of current income and capital appreciation.
2. Significant Accounting Policies
The following is a summary of the Funds’ significant accounting policies. The policies are in conformity with Generally Accepted Accounting Principals in the United States of America (“GAAP”). As an investment company, as defined in Financial Accounting Standards Board (“FASB”) Accounting Standards Update 2013-08, the Funds follow accounting and reporting guidance under FASB Accounting Standards Codification Topic 946, “Financial Services – Investment Companies.”
Securities valuation – The Funds’ fixed income securities are generally valued using prices provided by an independent pricing service approved by the Trust’s Board of Trustees (the “Board”). The independent pricing service uses information with respect to transactions in bonds, quotations from bond dealers, market transactions in comparable securities, and various relationships between securities in determining these prices. The methods used by the independent pricing service and the quality of valuations so established are reviewed by Ryan Labs, Inc. (the “Adviser”), under the general supervision of the Board. Exchange-traded funds (“ETFs”) are valued at market value as of the close of regular trading on the New York Stock Exchange (the “NYSE”) (normally 4:00 p.m. Eastern time) on each business day the NYSE is open for business. ETFs are valued at the security’s last sale price on the primary exchange, if available, otherwise at the exchange’s most recently quoted mean price. Securities for which market quotations are not readily available are valued at fair value as determined in good faith under procedures adopted by the Board.
GAAP establishes a single authoritative definition of fair value, sets out a framework for measuring fair value, and requires additional disclosures about fair value measurements.
Various inputs are used in determining the value of the Funds’ investments. These inputs are summarized in the three broad levels listed below:
| | ● | Level 1 – quoted prices in active markets for identical securities |
| | ● | Level 2 – other significant observable inputs |
| | ● | Level 3 – significant unobservable inputs |
26
RYAN LABS FUNDS
NOTES TO FINANCIAL STATEMENTS (Continued) |
Fixed income securities held by the Funds are classified as Level 2 since values are based on prices provided by an independent pricing service that utilizes various “other significant observable inputs” including bid and ask quotations, prices of similar securities, and interest rates, among other factors.
The inputs or methods used for valuing securities are not necessarily an indication of the risks associated with investing in those securities. The inputs used to measure fair value may fall into different levels of the fair value hierarchy. In such cases, for disclosure purposes, the level in the fair value hierarchy within which the fair value measurement falls in its entirety is determined based on the lowest level input that is significant to the fair value measurement.
The following is a summary of the inputs used to value each Fund’s investments as of May 31, 2016:
Ryan Labs
Core Bond Fund | | Level 1 | | | Level 2 | | | Level 3 | | | Total | |
U.S. Treasury Obligations | | $ | — | | | $ | 24,879,066 | | | $ | — | | | $ | 24,879,066 | |
Mortgage-Backed Securities | | | — | | | | 17,726,052 | | | | — | | | | 17,726,052 | |
Asset-Backed Securities | | | — | | | | 9,455,316 | | | | — | | | | 9,455,316 | |
Corporate Bonds | | | — | | | | 17,778,546 | | | | — | | | | 17,778,546 | |
International Bonds | | | — | | | | 125,100 | | | | — | | | | 125,100 | |
Exchange-Traded Funds | | | 839,311 | | | | — | | | | — | | | | 839,311 | |
Money Market Funds | | | 669,887 | | | | — | | | | — | | | | 669,887 | |
Total | | $ | 1,509,198 | | | $ | 69,964,080 | | | $ | — | | | $ | 71,473,278 | |
Ryan Labs
Long Credit Fund | | Level 1 | | | Level 2 | | | Level 3 | | | Total | |
U.S. Treasury Obligations | | $ | — | | | $ | 2,701,646 | | | $ | — | | | $ | 2,701,646 | |
Municipal Bonds | | | — | | | | 3,481,185 | | | | — | | | | 3,481,185 | |
Corporate Bonds | | | — | | | | 44,529,725 | | | | — | | | | 44,529,725 | |
International Bonds | | | — | | | | 1,912,662 | | | | — | | | | 1,912,662 | |
Money Market Funds | | | 345,011 | | | | — | | | | — | | | | 345,011 | |
Total | | $ | 345,011 | | | $ | 52,625,218 | | | $ | — | | | $ | 52,970,229 | |
As of May 31, 2016, the Funds did not have any transfers between Levels. In addition, the Funds did not hold derivative instruments or any assets or liabilities that were measured at fair value on a recurring basis using significant unobservable inputs (Level 3) as of May 31, 2016. It is the Funds’ policy to recognize transfers between Levels at the end of the reporting period.
27
RYAN LABS FUNDS
NOTES TO FINANCIAL STATEMENTS (Continued) |
Share valuation – The net asset value (“NAV”) per share of each Fund is calculated daily by dividing the total value of its assets, less liabilities, by the number of shares outstanding. The offering price and redemption price per share of each Fund is equal to the NAV per share.
Investment income – Interest income is accrued as earned. Discounts and premiums on fixed income securities purchased are accreted or amortized using the effective interest method. Dividend income is recorded on the ex-dividend date.
Security transactions – Security transactions are accounted for on the trade date. Realized gains and losses on securities sold are determined on a specific identification basis.
Common expenses – Common expenses of the Trust are allocated among the Funds and other series of the Trust based on the relative net assets of each series or the nature of the services performed and the relative applicability to each series.
Distributions to shareholders – Dividends from net investment income are declared and paid monthly to shareholders. Net realized capital gains, if any, are distributed at least once each year. The amount of distributions from net investment income and net realized capital gains are determined in accordance with federal income tax regulations, which may differ from GAAP. Dividends and distributions to shareholders are recorded on the ex-dividend date. The tax character of distributions paid by the Funds during the periods ended May 31, 2016 and November 30, 2015 was ordinary income.
Estimates – The preparation of financial statements in conformity with GAAP requires management to make estimates and assumptions that affect the reported amounts of assets and liabilities and disclosure of contingent assets and liabilities as of the date of the financial statements and the reported amounts of income and expenses during the reporting period. Actual results could differ from those estimates.
Federal income tax – Each Fund has qualified and intends to continue to qualify as a regulated investment company under the Internal Revenue Code of 1986 (the “Code”). Qualification generally will relieve each Fund of liability for federal income taxes to the extent 100% of its net investment income and net realized capital gains are distributed in accordance with the Code.
In order to avoid imposition of the excise tax applicable to regulated investment companies, it is also each Fund’s intention to declare as dividends in each calendar year at least 98% of its net investment income (earned during the calendar year) and 98.2% of its net realized capital gains (earned during the twelve months ended October 31) plus undistributed amounts from prior years.
28
RYAN LABS FUNDS
NOTES TO FINANCIAL STATEMENTS (Continued) |
The following information is computed on a tax basis for each item as of May 31, 2016:
| | Ryan Labs
Core Bond Fund | | | Ryan Labs
Long Credit Fund | |
Tax cost of portfolio investments | | $ | 70,975,093 | | | $ | 50,960,324 | |
Gross unrealized appreciation | | $ | 886,497 | | | $ | 2,159,998 | |
Gross unrealized depreciation | | | (388,312 | ) | | | (150,093 | ) |
Net unrealized appreciation on investments | | | 498,185 | | | | 2,009,905 | |
Accumulated undistributed ordinary income | | | 485 | | | | 456 | |
Other gains | | | 754,419 | | | | 1,306,359 | |
Other temporary differences | | | (103,226 | ) | | | (167,589 | ) |
Accumulated earnings | | $ | 1,149,863 | | | $ | 3,149,131 | |
The difference between the federal income tax cost of portfolio investments and the financial statement cost for the Funds is due to certain timing differences in the recognition of capital gains or losses under income tax regulations and GAAP. These “book/tax” differences are temporary in nature and are primarily due to the tax deferral of losses on wash sales.
For the six months ended May 31, 2016, Ryan Labs Core Bond Fund reclassified $20,688 of accumulated net investment income against accumulated net realized gains from security transactions on the Statements of Assets and Liabilities due to permanent differences in the recognition of capital gains or losses under income tax regulations and GAAP. These differences are due to the tax treatment of paydown adjustments. Such reclassification had no effect on the Fund’s net assets or NAV per share.
The Funds recognize the tax benefits or expenses of uncertain tax positions only when the position is “more likely than not” to be sustained assuming examination by tax authorities. Management has reviewed each Fund’s tax positions for the current tax period and the tax period ended November 30, 2015 and has concluded that no provision for unrecognized tax benefits or expenses is required in these financial statements. The Funds indentify their major tax jurisdiction as U.S. Federal.
29
RYAN LABS FUNDS
NOTES TO FINANCIAL STATEMENTS (Continued) |
3. Investment Transactions
During the six months ended May 31, 2016, cost of purchases and proceeds from sales of investment securities, other than U.S. Government securities and short-term investments, were as follows:
| | Ryan Labs
Core Bond Fund | | | Ryan Labs
Long Credit Fund | |
Purchase of investment securities | | $ | 23,141,769 | | | $ | 26,445,669 | |
Proceeds from sales of investment securities | | $ | 15,940,306 | | | $ | 25,022,055 | |
During the six months ended May 31, 2016, cost of purchases and proceeds from sales of U.S. Government long-term securities were as follows:
| | Ryan Labs
Core Bond Fund | | | Ryan Labs
Long Credit Fund | |
Purchase of U.S. Government securities | | $ | 15,239,568 | | | $ | 20,440,296 | |
Proceeds from sales of U.S. Government securities | | $ | 19,890,690 | | | $ | 21,455,412 | |
4. Transactions with Related Parties
INVESTMENT ADVISORY AGREEMENT
The Adviser is a wholly-owned subsidiary of Sun Life Financial, Inc. Each Fund is managed by the Adviser pursuant to the terms of an Investment Advisory Agreement. Under the Investment Advisory Agreements, Ryan Labs Core Bond Fund and Ryan Labs Long Credit Fund pay the Adviser an advisory fee, computed and accrued daily and paid monthly, at the annual rate of 0.40% and 0.50%, respectively, of each Fund’s average daily net assets.
Pursuant to Expense Limitation Agreements (“ELAs”) between each Fund and the Adviser, the Adviser has agreed, until March 31, 2017 for Ryan Labs Core Bond Fund and until March 31, 2018 for Ryan Labs Long Credit Fund to reduce advisory fees and reimburse other expenses in order to limit total annual operating expenses (exclusive of brokerage transaction costs and commissions; taxes; interest; costs related to any securities lending program; transaction charges and interest on borrowed money; acquired fund fees and expenses; distribution and/or shareholder servicing fees, including, without limitation, any amounts, if any, payable pursuant to a plan adopted in accordance with Rule 12b-1 under the Investment Company Act of 1940, as amended; extraordinary expenses such as litigation and merger or reorganization costs; proxy solicitation and liquidation costs; indemnification payments to the Funds’ service providers, including, without limitation, the Adviser; other expenses not incurred in the ordinary course of business; and any other expenses the exclusion of which may from time to time be deemed appropriate as an excludable expense and specifically approved by the Trustees of the Trust) to an amount not exceeding 0.40% and 0.50% of the
30
RYAN LABS FUNDS
NOTES TO FINANCIAL STATEMENTS (Continued) |
average daily net assets of Ryan Labs Core Bond Fund and Ryan Labs Long Credit Fund, respectively. Accordingly, during the six months ended May 31, 2016, the Adviser reduced advisory fees in the amounts of $124,913 and $88,303 for Ryan Labs Core Bond Fund and Ryan Labs Long Credit Fund, respectively.
Under the terms of the ELAs, investment advisory fee reductions and expense reimbursements by the Adviser are subject to recoupment by the Adviser for a period of three years after such fees and expenses were incurred, provided the recoupments do not cause total annual operating expenses to exceed 0.40% and 0.50% of the average daily net assets of Ryan Labs Core Bond Fund and Ryan Labs Long Credit Fund, respectively. As of May 31, 2016, the Adviser may seek recoupment of investment advisory fee reductions and expense reimbursements no later than the dates as stated below:
| | November 30, 2018 | | | May 31,
2019 | | | Total | |
Ryan Labs Core Bond Fund | | $ | 151,891 | | | $ | 124,913 | | | $ | 276,804 | |
Ryan Labs Long Credit Fund | | $ | 14,580 | | | $ | 88,303 | | | $ | 102,883 | |
OTHER SERVICE PROVIDERS
Ultimus Fund Solutions, LLC (“Ultimus”) provides fund administration, fund accounting, compliance and transfer agency services to the Funds. The Funds pay Ultimus fees in accordance with the agreements for such services. In addition, the Funds pay out-of-pocket expenses including, but not limited to, postage, supplies and costs of pricing the Funds’ portfolio securities.
Under the terms of a Distribution Agreement with the Trust, Ultimus Fund Distributors, LLC (the “Distributor”) serves as principal underwriter to the Funds. The Distributor is a wholly-owned subsidiary of Ultimus. The Distributor is compensated by the Adviser (not the Funds) for acting as principal underwriter.
Certain officers and a Trustee of the Trust are also officers of Ultimus and the Distributor and are not paid by the Funds for serving in such capacities.
TRUSTEE COMPENSATION
Each Trustee who is not an “interested person” of the Trust (“Independent Trustee”) receives from each Fund a fee of $500 for each Board meeting attended plus reimbursement of travel and other meeting-related expenses. In addition, each Independent Trustee receives from each Fund an annual retainer of $500. Trustees affiliated with the Adviser or Ultimus are not compensated by the Funds for their services.
31
RYAN LABS FUNDS
NOTES TO FINANCIAL STATEMENTS (Continued) |
PRINCIPAL HOLDERS OF FUND SHARES
As of May 31, 2016, the following shareholders owned of record 5% or more of the outstanding shares of each Fund:
NAME OF RECORD OWNER | % Ownership |
Ryan Labs Core Bond Fund | |
Citibank, N.A. (for the benefit of its customers) | 71% |
U.S. Bank, N.A. (for the benefit of its customers) | 24% |
Northern Trust Company (for the benefit of its customers) | 5% |
Ryan Labs Long Credit Fund | |
Citibank, N.A. (for the benefit of its customers) | 100% |
A beneficial owner of 25% or more of a Fund’s outstanding shares may be considered a controlling person of that Fund. That shareholder’s vote could have a more significant effect on matters presented at a shareholder’s meeting.
5. Contingencies and Commitments
The Funds indemnify the Trust’s officers and Trustees for certain liabilities that might arise from their performance of their duties to the Funds. Additionally, in the normal course of business the Funds enter into contracts that contain a variety of representations and warranties and which provide general indemnifications. The Funds’ maximum exposure under these arrangements is unknown, as this would involve future claims that may be made against the Funds that have not yet occurred. However, based on experience, the Funds expect the risk of loss to be remote.
6. Subsequent Events
The Funds are required to recognize in the financial statements the effects of all subsequent events that provide additional evidence about conditions that existed as of the date of the Statements of Assets and Liabilities. For non-recognized subsequent events that must be disclosed to keep the financial statements from being misleading, the Funds are required to disclose the nature of the event as well as an estimate of its financial effect, or a statement that such an estimate cannot be made. Management has evaluated subsequent events through the issuance of these financial statements and has noted no such events.
32
RYAN LABS FUNDS
ABOUT YOUR FUNDS’ EXPENSES (Unaudited) |
We believe it is important for you to understand the impact of costs on your investment. As a shareholder of the Funds, you incur ongoing costs, including management fees and other operating expenses. The following examples are intended to help you understand your ongoing costs (in dollars) of investing in the Funds and to compare these costs with the ongoing costs of investing in other mutual funds.
A mutual fund’s ongoing costs are expressed as a percentage of its average net assets. This figure is known as the expense ratio. The expenses in the table below are based on an investment of $1,000 made at the beginning of the most recent period (December 1, 2015) and held until the end of the period (May 31, 2016).
The table below illustrates each Fund’s ongoing costs in two ways:
Actual fund return – This section helps you to estimate the actual expenses that you paid over the period. The “Ending Account Value” shown is derived from each Fund’s actual return, and the fourth column shows the dollar amount of operating expenses that would have been paid by an investor who started with $1,000 in the Funds. You may use the information here, together with the amount you invested, to estimate the expenses that you paid over the period.
To do so, simply divide your account value by $1,000 (for example, an $8,600 account value divided by $1,000 = 8.6), then multiply the result by the number given for each Fund under the heading “Expenses Paid During Period.”
Hypothetical 5% return – This section is intended to help you compare each Fund’s ongoing costs with those of other mutual funds. It assumes that each Fund had an annual return of 5% before expenses during the period shown, but that the expense ratio is unchanged. In this case, because the return used is not each Fund’s actual return, the results do not apply to your investment. The example is useful in making comparisons because the U.S. Securities and Exchange Commission (the “SEC”) requires all mutual funds to calculate expenses based on a 5% return. You can assess each Fund’s ongoing costs by comparing this hypothetical example with the hypothetical examples that appear in shareholder reports of other funds.
Note that expenses shown in the table are meant to highlight and help you compare ongoing costs only. The Funds do not charge transaction fees, such as purchase or redemption fees, nor do they carry a “sales load.”
The calculations assume no shares were bought or sold during the period. Your actual costs may have been higher or lower, depending on the amount of your investment and the timing of any purchases or redemptions.
33
RYAN LABS FUNDS
ABOUT YOUR FUNDS’ EXPENSES (Unaudited) (Continued) |
More information about each Fund’s expenses can be found in this report. For additional information on operating expenses and other shareholder costs, please refer to each Fund’s prospectus.
| Beginning Account Value December 1, 2015 | Ending Account Value May 31, 2016 | Net Expense Ratio (a) | Expenses Paid During Period (b) |
Ryan Labs Core Bond Fund | | | | |
Based on Actual Fund Return | $1,000.00 | $1,030.90 | 0.40% | $2.03 |
Based on Hypothetical 5% Return (before expenses) | $1,000.00 | $1,023.00 | 0.40% | $2.02 |
| | | | | |
Ryan Labs Long Credit Fund | | | | |
Based on Actual Fund Return | $1,000.00 | $1,082.50 | 0.50% | $2.60 |
Based on Hypothetical 5% Return (before expenses) | $1,000.00 | $1,022.50 | 0.50% | $2.53 |
(a) | Annualized, based on each Fund’s most recent one-half year expenses. |
(b) | Expenses are equal to each Fund’s annualized net expense ratio multiplied by the average account value over the period, multiplied by 183/366 (to reflect the one-half year period). |
34
RYAN LABS FUNDS
OTHER INFORMATION (Unaudited) |
A description of the policies and procedures that the Funds use to vote proxies relating to portfolio securities is available without charge upon request by calling toll-free 1-866-561-3087, or on the SEC’s website at http://www.sec.gov. Information regarding how the Funds voted proxies relating to portfolio securities during the most recent 12-month period ended June 30 is available without charge upon request on or before August 31, 2016 by calling toll-free 1-866-561-3087, or on the SEC’s website at http://www.sec.gov.
The Trust files a complete listing of portfolio holdings for the Funds with the SEC as of the end of the first and third quarters of each fiscal year on Form N-Q. These filings are available upon request by calling 1-866-561-3087. Furthermore, you may obtain a copy of the filings on the SEC’s website at http://www.sec.gov. The Trust’s Forms N-Q may also be reviewed and copied at the SEC’s Public Reference Room in Washington, DC, and information on the operation of the Public Reference Room may be obtained by calling 1-800-SEC-0330.
35
This page intentionally left blank.
This page intentionally left blank.
Item 2. Code of Ethics.
Not required
Item 3. Audit Committee Financial Expert.
Not required
Item 4. Principal Accountant Fees and Services.
Not required
Item 5. Audit Committee of Listed Registrants.
Not applicable
Item 6. Schedule of Investments.
| (a) | Not applicable [schedule filed with Item 1] |
Item 7. Disclosure of Proxy Voting Policies and Procedures for Closed-End Management Investment Companies.
Not applicable
Item 8. Portfolio Managers of Closed-End Management Investment Companies.
Not applicable
Item 9. Purchases of Equity Securities by Closed-End Management Investment Company and Affiliated Purchasers.
Not applicable
Item 10. Submission of Matters to a Vote of Security Holders.
The registrant’s Committee of Independent Trustees shall review shareholder recommendations for nominations to fill vacancies on the registrant’s board of trustees if such recommendations are submitted in writing and addressed to the Committee at the registrant’s offices. The Committee may adopt, by resolution, a policy regarding its procedures for considering candidates for the board of trustees, including any recommended by shareholders.
Item 11. Controls and Procedures.
(a) Based on their evaluation of the registrant’s disclosure controls and procedures (as defined in Rule 30a-3(c) under the Investment Company Act of 1940) as of a date within 90 days of the filing date of this report, the registrant’s principal executive officer and principal financial officer have concluded that such disclosure controls and procedures are reasonably designed and are operating effectively to ensure that material information relating to the registrant, including its consolidated subsidiaries, is made known to them by others within those entities, particularly during the period in which this report is being prepared, and that the information required in filings on Form N-CSR is recorded, processed, summarized, and reported on a timely basis.
(b) There were no changes in the registrant’s internal control over financial reporting (as defined in Rule 30a-3(d) under the Investment Company Act of 1940) that occurred during the second fiscal quarter of the period covered by this report that have materially affected, or are reasonably likely to materially affect, the registrant’s internal control over financial reporting.
Item 12. Exhibits.
File the exhibits listed below as part of this Form. Letter or number the exhibits in the sequence indicated.
(a)(1) Any code of ethics, or amendment thereto, that is the subject of the disclosure required by Item 2, to the extent that the registrant intends to satisfy the Item 2 requirements through filing of an exhibit: Not required
(a)(2) A separate certification for each principal executive officer and principal financial officer of the registrant as required by Rule 30a-2(a) under the Act (17 CFR 270.30a-2(a)): Attached hereto
(a)(3) Any written solicitation to purchase securities under Rule 23c-1 under the Act (17 CFR 270.23c-1) sent or given during the period covered by the report by or on behalf of the registrant to 10 or more persons: Not applicable
(b) Certifications required by Rule 30a-2(b) under the Act (17 CFR 270.30a-2(b)): Attached hereto
| Exhibit 99.CERT | Certifications required by Rule 30a-2(a) under the Act |
| Exhibit 99.906CERT | Certifications required by Rule 30a-2(b) under the Act |
SIGNATURES
Pursuant to the requirements of the Securities Exchange Act of 1934 and the Investment Company Act of 1940, the registrant has duly caused this report to be signed on its behalf by the undersigned, thereunto duly authorized.
| (Registrant) | Ultimus Managers Trust | | |
| | | | |
| By (Signature and Title)* | /s/ Frank L. Newbauer | |
| | | Frank L. Newbauer, Assistant Secretary | |
| | | | |
| Date | August 9, 2016 | | |
| | | | |
| Pursuant to the requirements of the Securities Exchange Act of 1934 and the Investment Company Act of 1940, this report has been signed below by the following persons on behalf of the registrant and in the capacities and on the dates indicated. |
| By (Signature and Title)* | /s/ Andrew B. Wellington | |
| | | Andrew B. Wellington, Principal Executive Officer of Lyrical U.S. Value Equity Fund and Lyrical U.S. Hedged Value Fund | |
| | | | |
| Date | August 9, 2016 | | |
| | | | |
| By (Signature and Title)* | /s/ Stephen P. Lack | |
| | | Stephen P. Lack, Principal Executive Officer of Galapagos Partners Select Equity Fund | |
| | | | |
| Date | August 9, 2016 | | |
| | | | |
| By (Signature and Title)* | /s/ David R. Carson | |
| | | David R. Carson, Principal Executive Officer of Ryan Labs Core Bond Fund | |
| | | | |
| Date | August 9, 2016 | | |
| | | | |
| By (Signature and Title)* | /s/ Jennifer L. Leamer | |
| | | Jennifer L. Leamer, Treasurer | |
| | | | |
| Date | August 9, 2016 | | |
* Print the name and title of each signing officer under his or her signature.