| OMB APPROVAL |
OMB Number: 3235-0570 Expires: January 31, 2017 Estimated average burden hours per response: 20.6 |
UNITED STATES
SECURITIES AND EXCHANGE COMMISSION
Washington, D.C. 20549
FORM N-CSR
CERTIFIED SHAREHOLDER REPORT OF REGISTERED
MANAGEMENT INVESTMENT COMPANY
| Investment Company Act file number | 811-22680 | |
| Ultimus Managers Trust |
| (Exact name of registrant as specified in charter) |
| 225 Pictoria Drive, Suite 450 Cincinnati, Ohio | 45246 |
| (Address of principal executive offices) | (Zip code) |
Frank L. Newbauer, Esq.
Ultimus Fund Solutions, LLC 225 Pictoria Drive, Suite 450 Cincinnati, Ohio 45246_ |
| (Name and address of agent for service) |
| Registrant's telephone number, including area code: | (513) 587-3400 | |
| Date of fiscal year end: | May 31 | |
| | | |
| Date of reporting period: | November 30, 2015 | |
Form N-CSR is to be used by management investment companies to file reports with the Commission not later than 10 days after the transmission to stockholders of any report that is required to be transmitted to stockholders under Rule 30e-1 under the Investment Company Act of 1940 (17 CFR 270.30e-1). The Commission may use the information provided on Form N-CSR in its regulatory, disclosure review, inspection, and policymaking roles.
A registrant is required to disclose the information specified by Form N-CSR, and the Commission will make this information public. A registrant is not required to respond to the collection of information contained in Form N-CSR unless the Form displays a currently valid Office of Management and Budget ("OMB") control number. Please direct comments concerning the accuracy of the information collection burden estimate and any suggestions for reducing the burden to Secretary, Securities and Exchange Commission, 450 Fifth Street, NW, Washington, DC 20549-0609. The OMB has reviewed this collection of information under the clearance requirements of 44 U.S.C. § 3507.
| Item 1. | Reports to Stockholders. |

APEXcm SMALL/MID-CAP GROWTH FUND
(APSGX)
Semi-Annual Report
November 30, 2015
(Unaudited)
APEXcm SMALL/MID-CAP GROWTH FUND
LETTER TO SHAREHOLDERS | November 30, 2015 |
Dear APEXcm Small/Mid-Cap Growth Fund Shareholder:
For the six month semi-annual period ended November 30, 2015, the APEX Small/Mid-Cap Growth Fund (the “Fund”) returned -6.37% (net of fees). For the same period the benchmark, Russell 2500 Growth index returned -4.59%. During this period, equity markets were generally weak while exhibiting higher than normal volatility.
APEX PHILOSOPHY
We believe that the best way to provide value-added returns is to identify companies that exhibit certain favorable fundamental advantages and benefit from secular growth trends, allowing us to structure the portfolio in high-conviction areas of longer-term sustainable growth. Embedded in our portfolio construction is the recognition of companies at different stages of their growth cycle, which we designate as “stable” and “emerging” growth stocks. We believe that having the spectrum of growth companies that are truly innovative and growing rapidly, combined with established growth companies, can provide relative stability while allowing the opportunity to drive outperformance versus our benchmark and peers over time. In addition, we believe the SMID style provides the opportunity to invest in higher growth companies and capture a longer period of growth as these companies mature.
MARKET ENVIRONMENT
Macroeconomic events have caused volatility in financial markets to increase. For instance, there was a five-day stretch in August when the S&P 500 Index dropped 11%, which was the first greater than 10% correction in U.S. equity markets since 2011. The reasons for the increased volatility are diverse and complex. Stubborn weakness in the worldwide commodity complex, a slowdown in the Chinese economy, potential interest rate hikes in the U.S., and the resulting policy divergence of the Federal Reserve and other central banks throughout the world are some of the reasons (not necessarily in order of importance) for the heightened volatility. Actions by Japan, China, and others to devalue their currencies in an effort to increase the competitiveness of their economies have made the U.S. dollar stronger. Recently the strength of the U.S. dollar has stoked fears about the fate of emerging market countries, which had issued enormous debt denominated in U.S. dollars. We live in a global economy and U.S. dollar strength has impacted the competitiveness of U.S. exporters while depressing reported earnings of U.S. companies (since dollar strength depresses the growth rate of profits earned abroad).
FUND PERFORMANCE
Relative to the benchmark, the Russell 2500 Growth Index, the Fund benefited from the exposure to Information Technology and Consumer Discretionary and was negatively affected by its weightings in Financials and Health Care. Stock
1
selection in Energy and Information Technology contributed to performance while stock selection in Healthcare and Industrials hurt performance. During the period, Healthcare and Industrials were especially weak.
SECTOR OBSERVATIONS
Information Technology: The expected capital expenditure recovery has not come through as corporate America is still digesting the overall macroeconomic environment after the financial crisis. Relative to the benchmark, we have maintained an overweight in Information Technology with our investments in payments and processing companies, which exhibit steady cash flows and less economic cyclicality, providing strong returns from Global Payments, Heartland Payments and Total Systems Services. A major detractor from performance included cybersecurity-focused FireEye where management changes, competition, and valuations priced for perfect execution put downward pressure on the stock.
Financials: The low interest rates and continued regulatory burden have dampened earnings growth within the Financials sector. Banks have been forced to fortify their capital levels by the Federal Reserve. At the same time, valuation levels are reasonable and the U.S. banking system seems to be in pretty good shape to withstand any future stresses. Although the Fund was underweight in this positive-performing sector, performance benefitted from First Republic Bank, which continues to grow at a level that is multiples above peer banks while maintaining a stronger credit profile.
Energy and Materials: These sectors’ stocks have been hurt by oversupply. Oil supply has been driven by the Saudis refusing to be swing producers, in part due to new supply from the U.S. The surplus in Materials has resulted from overbuilding within China or for the Chinese market, which doesn’t need as much as the world can produce. The oil situation may resolve itself quickly if the Saudis decide to revert to their traditional role, but the materials glut is likely to exist for awhile. Although our slight overweight in Energy detracted from performance, stock selection in Core Labs, with its reservoir management platform, held up much better than the production companies during the volatile time.
Health Care: The biotech portion of Health Care had been especially strong the past few years. We have maintained a slight overweight in the Health Care sector with weakness resulting from political risk related to drug pricing, potential for setbacks in drug pipelines, and overvaluation of nascent biotech companies. A biotech company in our portfolio, Receptos, was acquired at a healthy premium and returned 40% during the period. The Specialty Pharmaceuticals portion of Health Care has come under pressure because of the heightened awareness of Valeant Pharmaceutical-like business models. (i.e., acquire older drugs, cut R&D, and raise prices). This hurt our investments in drug companies Horizon Pharmaceutical and AMAG Pharmaceutical. Also, we were successful with our investment in DexCom, a leader in continuous glucose monitoring systems used in diabetes care; however several successes were offset by quality businesses such as Medivation and Akorn exhibiting harsh pullbacks from their successful advances.
2
Consumer Discretionary: In spite of low oil prices, Consumer Discretionary had disappointing earnings because of an unusually warm winter, thanks to El Nino. Department stores continued to perform poorly, but the Entertainment industry did well due to a slew of new movie releases. The Auto industry also continued to show resilience. Although slightly underweight the Consumer Discretionary sector, our continued focus on the strategic advantages of e-commerce platforms once again provided positive contribution to the Fund’s portfolio, as Expedia performed very well during the fiscal period. With its continued success and acquisition spree, Expedia reached our capitalization limit, and we sold it during the period.
Consumer Staples: Although a big beneficiary of lower oil prices, we have maintained an underweight position as this traditionally defensive sector has been weak due to a combination of low growth and stretched valuation metrics relative to growth. Hain Celestial continues to grow its natural/organic footprint world-wide, but it had disappointing results during the fiscal period.
Industrials: Weakness in Industrials was driven by the economic malaise throughout the world, the lack of pricing power, and the lack of demand in a slow growth environment. We have maintained an underweight in Industrials given the sector’s sensitivity to declining GDP growth, the declining energy markets, and the slowdown in China. We have focused on more service-oriented opportunities (e.g., Robert Half, Proto Labs, and Towers Watson) as well as the Aerospace and Defense industries. We continue to evaluate areas that may benefit from the global recovery, such as Europe and Japan, but remain cautious given the slow capital expenditure recovery, and subdued signs of a reacceleration in global growth. During the reporting period, Westinghouse Air Brake underperformed as the slowdown in passenger and freight rails, as well as delay in the implementation of positive train control, impacted the Company’s projected guidance. Also, Avis Budget Group performed poorly as the consolidating industry continues to put turf war pressure on rental pricing. As we evaluate moving forward, the risk-reward calculus (attractive valuations) has improved dramatically, but any additional commitment is dependent on a bottoming in oil and reacceleration of global growth.
OUTLOOK
At Apex, one of the foundations of our firm is focusing on the long-term sustainability of secular growth trends. During challenging times, we remain committed to the opportunities provided in such areas as payments and processing, consumer mobility, big data and cloud computing, the U.S. manufacturing renaissance, personalized medicine and genomics, and energy independence. As we navigate through the early stages of the self-sustaining U.S. economy, coupled with global growth concerns and the divergence of global monetary policies, our emphasis will continue to be on selective opportunities that could benefit from these trends. We are monitoring the strength of the employment markets and the service economy with its notable wage pressures and corresponding margin impact as well as the current deterioration in the credit markets. In our stable growth names, we will continue to focus on balance sheet flexibility (as depicted by accelerating cash flow) along with organic revenue and earnings growth. These companies should also be more levered to U.S. growth, with
3
identified catalysts and capital deployment strategies. While maintaining our emphasis on the long-term, emerging growth companies in key strategic areas will be highly scrutinized in order to determine their viability in this more volatile environment.
Thank you for your continued confidence in the APEXcm Small/Mid Cap Growth Fund.
Sincerely,
Nitin N. Kumbhani
President and Chief Investment Officer
Past performance is not predictive of future performance. Investment results and principal value will fluctuate so that shares, when redeemed, may be worth more or less than their original cost. Current performance may be higher or lower than the performance data quoted. Performance data current to the most recent month end are available by calling 1-888-575-4800.
An investor should consider the investment objectives, risks, charges and expenses of the Fund carefully before investing. The Fund’s prospectus contains this and other important information. To obtain a copy of the Fund’s prospectus please visit our website at www.apexcmfund.com or call 1-888-575-4800 and a copy will be sent to you free of charge. Please read the prospectus carefully before you invest. The APEXcm Small/Mid Cap Growth Fund is distributed by Ultimus Fund Distributors, LLC.
The Letter to Shareholders seeks to describe some of the Adviser’s current opinions and views of the financial markets. Although the Adviser believes it has a reasonable basis for any opinions or views expressed, actual results may differ, sometimes significantly so, from those expected or expressed. The securities held by the Fund that are discussed in the Letter to Shareholders were held during the period covered by this Report. They do not comprise the entire investment portfolio of the Fund, may be sold at any time and may no longer be held by the Fund. The opinions of the Adviser with respect to those securities may change at any time.
Statements in the Letter to Shareholders that reflect projections or expectations for future financial or economic performance of the Fund and the market in general and statements of the Fund’s plans and objectives for future operations are forward-looking statements. No assurance can be given that actual results or events will not differ materially from those projected, estimated, assumed, or anticipated in any such forward-looking statements. Important factors that could result in such differences, in addition to factors noted with such forward-looking statements include, without limitation, general economic conditions, such as inflation, recession, and interest rates. Past performance is not a guarantee of future results.
4
APEXcm SMALL/MID-CAP GROWTH FUND
PORTFOLIO INFORMATION
November 30, 2015 (Unaudited)
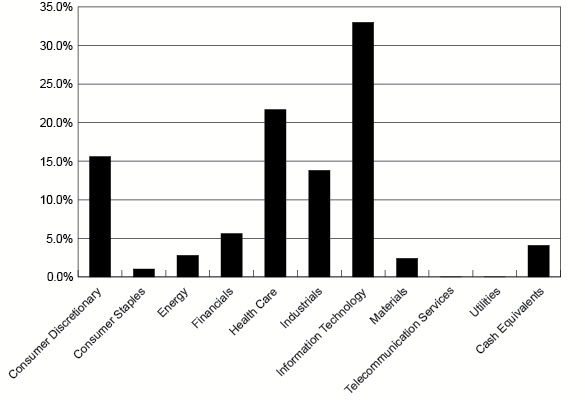
Sector Diversification (% of Net Assets)
Top 10 Equity Holdings
Security Description | % of Net Assets |
Total System Services, Inc. | 3.1% |
Global Payments, Inc. | 2.8% |
Autoliv, Inc. | 2.4% |
Foot Locker, Inc. | 2.3% |
CBRE Group, Inc. - Class A | 2.2% |
Tableau Software, Inc. - Class A | 2.1% |
Heartland Payment Systems, Inc. | 2.0% |
IAC/InterActiveCorp | 2.0% |
Wabtec Corp. | 2.0% |
First Republic Bank/CA | 2.0% |
5
APEXcm SMALL/MID-CAP GROWTH FUND
SCHEDULE OF INVESTMENTS
November 30, 2015 (Unaudited) |
COMMON STOCKS — 95.9% | | Shares | | | Value | |
Consumer Discretionary — 15.6% | | | | | | |
Auto Components — 2.4% | | | | | | |
Autoliv, Inc. | | | 53,110 | | | $ | 6,682,831 | |
| | | | | | | | | |
Hotels, Restaurants & Leisure — 2.2% | | | | | | | | |
Dunkin' Brands Group, Inc. | | | 57,347 | | | | 2,432,660 | |
Wyndham Worldwide Corp. | | | 50,506 | | | | 3,834,416 | |
| | | | | | | | 6,267,076 | |
Media — 1.1% | | | | | | | | |
IMAX Corp. * | | | 80,930 | | | | 3,065,628 | |
| | | | | | | | | |
Multi-Line Retail — 2.0% | | | | | | | | |
Burlington Stores, Inc. * | | | 77,549 | | | | 3,730,882 | |
Dillard's, Inc. - Class A | | | 23,892 | | | | 1,791,900 | |
| | | | | | | | 5,522,782 | |
Specialty Retail — 5.5% | | | | | | | | |
Foot Locker, Inc. | | | 99,560 | | | | 6,471,400 | |
Signet Jewelers Ltd. | | | 31,325 | | | | 4,115,792 | |
Williams-Sonoma, Inc. | | | 80,207 | | | | 5,079,509 | |
| | | | | | | | 15,666,701 | |
Textiles, Apparel & Luxury Goods — 2.4% | | | | | | | | |
Carter's, Inc. | | | 29,983 | | | | 2,585,434 | |
Sketchers U.S.A., Inc. - Class A * | | | 136,556 | | | | 4,123,991 | |
| | | | | | | | 6,709,425 | |
Consumer Staples — 1.0% | | | | | | | | |
Food Products — 1.0% | | | | | | | | |
Hain Celestial Group, Inc. (The) * | | | 63,405 | | | | 2,707,393 | |
| | | | | | | | | |
Energy — 2.8% | | | | | | | | |
Energy Equipment & Services — 0.7% | | | | | | | | |
Core Laboratories N.V. | | | 16,430 | | | | 1,941,205 | |
| | | | | | | | | |
Oil, Gas & Consumable Fuels — 2.1% | | | | | | | | |
Carrizo Oil & Gas, Inc. * | | | 75,357 | | | | 3,042,916 | |
Diamondback Energy, Inc. * | | | 38,089 | | | | 2,971,704 | |
| | | | | | | | 6,014,620 | |
Financials — 5.6% | | | | | | | | |
Banks — 2.0% | | | | | | | | |
First Republic Bank/CA | | | 80,757 | | | | 5,560,927 | |
| | | | | | | | | |
Diversified Financial Services — 1.4% | | | | | | | | |
Interactive Brokers Group, Inc. - Class A | | | 50,492 | | | | 2,189,333 | |
MarketAxess Holdings, Inc. | | | 17,975 | | | | 1,919,370 | |
| | | | | | | | 4,108,703 | |
6
APEXcm SMALL/MID-CAP GROWTH FUND
SCHEDULE OF INVESTMENTS (Continued) |
COMMON STOCKS — 95.9% (Continued) | | Shares | | | Value | |
Financials — 5.6% (Continued) | | | | | | |
Real Estate Management & Development — 2.2% | | | | | | |
CBRE Group, Inc. - Class A * | | | 166,447 | | | $ | 6,236,769 | |
| | | | | | | | | |
Health Care — 21.7% | | | | | | | | |
Biotechnology — 6.2% | | | | | | | | |
Agios Pharmaceuticals, Inc. * | | | 13,518 | | | | 873,128 | |
AMAG Pharmaceuticals, Inc. * | | | 23,135 | | | | 615,854 | |
Enanta Pharmaceuticals, Inc. * | | | 80,509 | | | | 2,536,034 | |
Isis Pharmaceuticals, Inc. * | | | 78,948 | | | | 4,818,986 | |
Medivation, Inc. * | | | 96,997 | | | | 4,101,033 | |
Momenta Pharmaceuticals, Inc. * | | | 69,435 | | | | 1,240,109 | |
Radius Health, Inc. * | | | 13,210 | | | | 803,300 | |
United Therapeutics Corp. * | | | 15,343 | | | | 2,341,802 | |
| | | | | | | | 17,330,246 | |
Health Care Equipment & Supplies — 4.1% | | | | | | | | |
Align Technology, Inc. * | | | 63,440 | | | | 4,233,986 | |
DexCom, Inc. * | | | 47,385 | | | | 4,028,673 | |
IDEXX Laboratories, Inc. * | | | 39,599 | | | | 2,804,401 | |
Tandem Diabetes Care, Inc. * | | | 52,165 | | | | 537,821 | |
| | | | | | | | 11,604,881 | |
Health Care Providers & Services — 2.7% | | | | | | | | |
Centene Corp. * | | | 70,297 | | | | 4,059,652 | |
Universal Health Services, Inc. - Class B | | | 29,634 | | | | 3,601,124 | |
| | | | | | | | 7,660,776 | |
Health Care Technology — 1.6% | | | | | | | | |
Medidata Solutions, Inc. * | | | 66,009 | | | | 3,025,192 | |
Veeva Systems, Inc. - Class A * | | | 51,345 | | | | 1,481,817 | |
| | | | | | | | 4,507,009 | |
Life Sciences Tools & Services — 3.1% | | | | | | | | |
ICON plc * | | | 53,796 | | | | 3,998,657 | |
WuXi PharmaTech (Cayman), Inc. - ADR * | | | 104,887 | | | | 4,793,336 | |
| | | | | | | | 8,791,993 | |
Pharmaceuticals — 4.0% | | | | | | | | |
Akorn, Inc. * | | | 118,217 | | | | 3,936,626 | |
Horizon Pharma plc * | | | 95,331 | | | | 2,052,476 | |
Jazz Pharmaceuticals plc * | | | 23,623 | | | | 3,462,896 | |
Supernus Pharmaceuticals, Inc.* | | | 113,017 | | | | 1,826,355 | |
| | | | | | | | 11,278,353 | |
Industrials — 13.8% | | | | | | | | |
Aerospace & Defense — 0.7% | | | | | | | | |
B/E Aerospace, Inc. | | | 41,396 | | | | 1,913,323 | |
7
APEXcm SMALL/MID-CAP GROWTH FUND
SCHEDULE OF INVESTMENTS (Continued) |
COMMON STOCKS — 95.9% (Continued) | | Shares | | | Value | |
Industrials — 13.8% (Continued) | | | | | | |
Machinery — 5.3% | | | | | | |
Middleby Corp. (The) * | | | 37,335 | | | $ | 4,108,343 | |
Nordson Corp. | | | 45,297 | | | | 3,285,391 | |
Proto Labs, Inc. * | | | 29,591 | | | | 2,003,015 | |
Wabtec Corp. | | | 69,765 | | | | 5,589,572 | |
| | | | | | | | 14,986,321 | |
Professional Services — 3.4% | | | | | | | | |
Robert Half International, Inc. | | | 84,208 | | | | 4,309,765 | |
Towers Watson & Co. - Class A | | | 38,658 | | | | 5,199,888 | |
| | | | | | | | 9,509,653 | |
Road & Rail — 2.5% | | | | | | | | |
Avis Budget Group, Inc. * | | | 61,896 | | | | 2,314,291 | |
Old Dominion Freight Line, Inc. * | | | 75,487 | | | | 4,809,277 | |
| | | | | | | | 7,123,568 | |
Trading Companies & Distributors — 1.9% | | | | | | | | |
HD Supply Holdings, Inc. * | | | 169,545 | | | | 5,362,708 | |
| | | | | | | | | |
Information Technology — 33.0% | | | | | | | | |
Communications Equipment — 4.6% | | | | | | | | |
Ciena Corp. * | | | 156,361 | | | | 3,915,279 | |
F5 Networks, Inc. * | | | 40,395 | | | | 4,160,685 | |
Infinera Corp. * | | | 218,832 | | | | 4,928,097 | |
| | | | | | | | 13,004,061 | |
Electronic Equipment, Instruments &
Components — 0.8% | | | | | | | | |
Dolby Laboratories, Inc. - Class A | | | 67,648 | | | | 2,339,268 | |
| | | | | | | | | |
Internet Software & Services — 5.5% | | | | | | | | |
Bitauto Holdings Ltd. - ADR * | | | 49,174 | | | | 1,320,322 | |
IAC/InterActiveCorp | | | 89,094 | | | | 5,594,212 | |
MercadoLibre, Inc. | | | 43,854 | | | | 5,404,567 | |
YY, Inc. - ADR * | | | 51,197 | | | | 3,101,514 | |
| | | | | | | | 15,420,615 | |
IT Services — 10.4% | | | | | | | | |
Gartner, Inc. * | | | 34,079 | | | | 3,179,571 | |
Global Payments, Inc. | | | 110,704 | | | | 7,843,378 | |
Heartland Payment Systems, Inc. | | | 72,589 | | | | 5,759,211 | |
Sabre Corp. | | | 130,474 | | | | 3,817,669 | |
Total System Services, Inc. | | | 155,735 | | | | 8,714,931 | |
| | | | | | | | 29,314,760 | |
Semiconductors & Semiconductor Equipment — 1.9% | | | | | | | | |
Entegris, Inc. * | | | 205,633 | | | | 2,800,721 | |
Power Integrations, Inc. | | | 50,003 | | | | 2,585,155 | |
| | | | | | | | 5,385,876 | |
8
APEXcm SMALL/MID-CAP GROWTH FUND
SCHEDULE OF INVESTMENTS (Continued) |
COMMON STOCKS — 95.9% (Continued) | | Shares | | | Value | |
Information Technology — 33.0% (Continued) | | | | | | |
Software — 9.8% | | | | | | |
ACI Worldwide, Inc. * | | | 130,935 | | | $ | 3,079,591 | |
BroadSoft, Inc. * | | | 43,156 | | | | 1,727,535 | |
FireEye, Inc. * | | | 65,311 | | | | 1,494,316 | |
Fortinet, Inc. * | | | 120,436 | | | | 4,338,105 | |
Guidewire Software, Inc. * | | | 26,295 | | | | 1,560,082 | |
Manhattan Associates, Inc. * | | | 43,832 | | | | 3,357,531 | |
Splunk, Inc.* | | | 71,161 | | | | 4,234,080 | |
Tableau Software, Inc. - Class A * | | | 59,844 | | | | 5,806,663 | |
Verint Systems, Inc. * | | | 47,539 | | | | 2,227,202 | |
| | | | | | | | 27,825,105 | |
Materials — 2.4% | | | | | | | | |
Containers & Packaging — 1.3% | | | | | | | | |
Silgan Holdings, Inc. | | | 67,545 | | | | 3,669,720 | |
| | | | | | | | | |
Paper & Forest Products — 1.1% | | | | | | | | |
KapStone Paper and Packaging Corp. | | | 127,439 | | | | 3,092,945 | |
| | | | | | | | | |
Total Common Stocks (Cost $259,981,004) | | | | | | $ | 270,605,241 | |
MONEY MARKET FUNDS — 4.0% | | Shares | | | Value | |
Fidelity Institutional Money Market Portfolio - Class I, 0.12% (a) Cost ($11,239,141) | | | 11,239,141 | | | $ | 11,239,141 | |
| | | | | | | | | |
TotalInvestments at Value — 99.9% (Cost $271,220,145) | | | | | | $ | 281,844,382 | |
| | | | | | | | | |
Other Assets in Excess of Liabilities — 0.1% | | | | | | | 412,339 | |
| | | | | | | | | |
Net Assets — 100.0% | | | | | | $ | 282,256,721 | |
ADR - American Depositary Receipt. |
* | Non-income producing security. |
(a) | The rate shown is the 7-day effective yield as of November 30, 2015. |
See accompanying notes to financial statements. |
9
APEXcm SMALL/MID-CAP GROWTH FUND
STATEMENT OF ASSETS AND LIABILITIES
November 30, 2015 (Unaudited) |
ASSETS | | | |
Investments in securities: | | | |
At acquisition cost | | $ | 271,220,145 | |
At value (Note 2) | | $ | 281,844,382 | |
Dividends receivable | | | 165,144 | |
Receivable for capital shares sold | | | 1,182,429 | |
Other assets | | | 27,074 | |
Total assets | | | 283,219,029 | |
| | | | | |
LIABILITIES | | | | |
Payable for investment securities purchased | | | 617,987 | |
Payable for capital shares redeemed | | | 107,955 | |
Payable to Adviser (Note 4) | | | 190,136 | |
Payable to administrator (Note 4) | | | 32,450 | |
Other accrued expenses | | | 13,780 | |
Total liabilities | | | 962,308 | |
| | | | | |
NET ASSETS | | $ | 282,256,721 | |
| | | | | |
NET ASSETS CONSIST OF: | | | | |
Paid-in capital | | $ | 267,568,721 | |
Accumulated net investment loss | | | (1,161,445 | ) |
Accumulated net realized gains from security transactions | | | 5,225,208 | |
Net unrealized appreciation on investments | | | 10,624,237 | |
NET ASSETS | | $ | 282,256,721 | |
| | | | | |
Shares of beneficial interest outstanding (unlimited number of shares authorized, no par value) | | | 17,295,086 | |
| | | | | |
Net asset value, offering price and redemption price per share (Note 2) | | $ | 16.32 | |
See accompanying notes to financial statements. |
10
APEXcm SMALL/MID-CAP GROWTH FUND
STATEMENT OF OPERATIONS
For the Six Months Ended November 30, 2015 (Unaudited) |
INVESTMENT INCOME | | | |
Dividend income (net of foreign taxes of $2,486) | | $ | 607,426 | |
| | | | | |
EXPENSES | | | | |
Investment advisory fees (Note 4) | | | 1,308,005 | |
Administration fees (Note 4) | | | 129,556 | |
Fund accounting fees (Note 4) | | | 28,095 | |
Registration and filing fees | | | 26,088 | |
Professional fees | | | 19,143 | |
Custody and bank service fees | | | 16,743 | |
Transfer agent fees (Note 4) | | | 16,638 | |
Compliance fees (Note 4) | | | 14,084 | |
Postage and supplies | | | 6,673 | |
Trustees' fees and expenses (Note 4) | | | 4,167 | |
Insurance expense | | | 1,879 | |
Other expenses | | | 8,601 | |
Total expenses | | | 1,579,672 | |
Less fee reductions by the Adviser (Note 4) | | | (206,265 | ) |
Net expenses | | | 1,373,407 | |
| | | | | |
NET INVESTMENT LOSS | | | (765,981 | ) |
| | | | | |
REALIZED AND UNREALIZED GAINS (LOSSES) ON INVESTMENTS | | | | |
Net realized gains from security transactions | | | 4,852,122 | |
Net change in unrealized appreciation/depreciation on investments | | | (20,938,487 | ) |
NET REALIZED AND UNREALIZED LOSSES ON INVESTMENTS | | | (16,086,365 | ) |
| | | | | |
NET DECREASE IN NET ASSETS RESULTING FROM OPERATIONS | | $ | (16,852,346 | ) |
See accompanying notes to financial statements. |
11
APEXcm SMALL/MID-CAP GROWTH FUND
STATEMENTS OF CHANGES IN NET ASSETS |
| | Six Months
Ended
November 30,
2015
(Unaudited) | | | Year
Ended
May 31,
2015 | |
FROM OPERATIONS | | | | | | |
Net investment loss | | $ | (765,981 | ) | | $ | (704,526 | ) |
Net realized gains from security transactions | | | 4,852,122 | | | | 830,411 | |
Net change in unrealized appreciation (depreciation) on investments | | | (20,938,487 | ) | | | 21,795,162 | |
Net increase (decrease) in net assets resulting from operations | | | (16,852,346 | ) | | | 21,921,047 | |
| | | | | | | | | |
CAPITAL SHARE TRANSACTIONS | | | | | | | | |
Proceeds from shares sold | | | 88,949,597 | | | | 154,037,822 | |
Payments for shares redeemed | | | (30,585,661 | ) | | | (23,690,438 | ) |
Net increase in net assets from capital share transactions | | | 58,363,936 | | | | 130,347,384 | |
| | | | | | | | | |
TOTAL INCREASE IN NET ASSETS | | | 41,511,590 | | | | 152,268,431 | |
| | | | | | | | | |
NET ASSETS | | | | | | | | |
Beginning of period | | | 240,745,131 | | | | 88,476,700 | |
End of period | | $ | 282,256,721 | | | $ | 240,745,131 | |
| | | | | | | | | |
ACCUMULATED NET INVESTMENT LOSS | | $ | (1,161,445 | ) | | $ | (395,464 | ) |
| | | | | | | | | |
CAPITAL SHARE ACTIVITY | | | | | | | | |
Shares sold | | | 5,357,671 | | | | 9,429,777 | |
Shares redeemed | | | (1,870,844 | ) | | | (1,443,740 | ) |
Net increase in shares outstanding | | | 3,486,827 | | | | 7,986,037 | |
Shares outstanding at beginning of period | | | 13,808,259 | | | | 5,822,222 | |
Shares outstanding at end of period | | | 17,295,086 | | | | 13,808,259 | |
See accompanying notes to financial statements. |
12
APEXcm SMALL/MID-CAP GROWTH FUND
FINANCIAL HIGHLIGHTS |
Per Share Data for a Share Outstanding Throughout Each Period | |
| | Six Months
Ended
Nov. 30,
2015
(Unaudited) | | | Year
Ended
May 31,
2015 | | | Year
Ended
May 31,
2014 | | | Period
Ended
May 31,
2013(a) | |
Net asset value at beginning of period | | $ | 17.43 | | | $ | 15.20 | | | $ | 12.69 | | | $ | 10.00 | |
| | | | | | | | | | | | | | | | | |
Income (loss) from investment operations: | | | | | | | | | | | | | | | | |
Net investment income (loss) | | | (0.04 | ) | | | (0.04 | ) | | | (0.03 | ) | | | 0.04 | (b) |
Net realized and unrealized gains (losses) on investments | | | (1.07 | ) | | | 2.27 | | | | 2.60 | | | | 2.72 | |
Total from investment operations | | | (1.11 | ) | | | 2.23 | | | | 2.57 | | | | 2.76 | |
| | | | | | | | | | | | | | | | | |
Less distributions: | | | | | | | | | | | | | | | | |
From net investment income | | | — | | | | — | | | | — | | | | (0.07 | ) |
From net realized gains | | | — | | | | — | | | | (0.06 | ) | | | — | |
Total distributions | | | — | | | | — | | | | (0.06 | ) | | | (0.07 | ) |
| | | | | | | | | | | | | | | | | |
Net asset value at end of period | | $ | 16.32 | | | $ | 17.43 | | | $ | 15.20 | | | $ | 12.69 | |
| | | | | | | | | | | | | | | | | |
Total return (c) | | | (6.37% | )(d) | | | 14.67 | % | | | 20.26 | % | | | 27.65 | %(d) |
| | | | | | | | | | | | | | | | | |
Net assets at end of period (000's) | | $ | 282,257 | | | $ | 240,745 | | | $ | 88,477 | | | $ | 13,153 | |
| | | | | | | | | | | | | | | | | |
Ratios/supplementary data: | | | | | | | | | | | | | | | | |
Ratio of total expenses to average net assets | | | 1.21 | %(e) | | | 1.26 | % | | | 1.49 | % | | | 4.87 | %(e) |
| | | | | | | | | | | | | | | | | |
Ratio of net expenses to average net assets (f) | | | 1.05 | %(e) | | | 1.05 | % | | | 1.05 | % | | | 1.05 | %(e) |
| | | | | | | | | | | | | | | | | |
Ratio of net investment income (loss) to average net assets (f) | | | (0.59% | )(e) | | | (0.48 | %) | | | (0.38 | %) | | | 0.26 | %(e) |
| | | | | | | | | | | | | | | | | |
Portfolio turnover rate | | | 9 | %(d) | | | 58 | % | | | 47 | % | | | 18 | %(d) |
(a) | Represents the period from the commencement of operations (June 29, 2012) through May 31, 2013. |
(b) | Calculated using weighted average shares outstanding during the period. |
(c) | Total return is a measure of the change in value of an investment in the Fund over the periods covered. The returns shown do not reflect the deduction of taxes a shareholder would pay on Fund distributions, if any, or the redemption of Fund shares. The total returns would be lower if the Adviser had not reduced advisory fees and/or reimbursed expenses (Note 4). |
(d) | Not annualized. |
(e) | Annualized. |
(f) | Ratio was determined after advisory fee reductions and/or expense reimbursements (Note 4). |
See accompanying notes to financial statements. |
13
APEXcm SMALL/MID-CAP GROWTH FUND
NOTES TO FINANCIAL STATEMENTS
November 30, 2015 (Unaudited)
1. Organization
APEXcm Small/Mid-Cap Growth Fund (the “Fund”) is a diversified series of Ultimus Managers Trust (the “Trust”), an open-end investment company established as an Ohio business trust under a Declaration of Trust dated February 28, 2012. Other series of the Trust are not incorporated in this report. The Fund commenced operations on June 29, 2012.
The investment objective of the Fund is long-term capital growth.
2. Significant Accounting Policies
The following is a summary of the Fund’s significant accounting policies. The policies are in conformity with Generally Accepted Accounting Principles in the United States of America (“GAAP”). As an investment company, as defined in Financial Accounting Standards Board (“FASB”) Accounting Standards Update 2013-08, the Fund follows accounting and reporting guidance under FASB Accounting Standards Codification Topic 946, “Financial Services – Investment Companies.”
Securities valuation – The Fund values its portfolio securities at market value as of the close of regular trading on the New York Stock Exchange (the “NYSE”) (normally 4:00 p.m. Eastern time) on each business day the NYSE is open for business. The Fund values its listed securities on the basis of the security’s last sale price on the security’s primary exchange, if available, otherwise at the exchange’s most recently quoted bid price. NASDAQ-listed securities are valued at the NASDAQ Official Closing Price. In the event that market quotations are not readily available or are considered unreliable due to market or other events, the Fund values its securities and other assets at fair value in accordance with procedures established by and under the general supervision of the Board of Trustees (the “Board”). Under these procedures, the securities will be classified as Level 2 or 3 within the fair value hierarchy (see below), depending on the inputs used. Unavailable or unreliable market quotes may be due to the following factors: a substantial bid-ask spread; infrequent sales resulting in stale prices; insufficient trading volume; small trade sizes; a temporary lapse in any reliable pricing source; and actions of the securities or futures markets, such as the suspension or limitation of trading. As a result, the prices of securities used to calculate the Fund’s net asset value may differ from quoted or published prices for the same securities.
GAAP establishes a single authoritative definition of fair value, sets out a framework for measuring fair value, and requires additional disclosures about fair value measurements.
14
APEXcm SMALL/MID-CAP GROWTH FUND
NOTES TO FINANCIAL STATEMENTS (Continued)
Various inputs are used in determining the value of the Fund’s investments. These inputs are summarized in the three broad levels listed below:
● Level 1 – quoted prices in active markets for identical securities
● Level 2 – other significant observable inputs
● Level 3 – significant unobservable inputs
The inputs or methods used for valuing securities are not necessarily an indication of the risks associated with investing in those securities. The inputs used to measure fair value may fall into different levels of the fair value hierarchy. In such cases, for disclosure purposes, the level in the fair value hierarchy within which the fair value measurement falls in its entirety is determined based on the lowest level input that is significant to the fair value measurement.
The following is a summary of the inputs used to value the Fund’s investments as of November 30, 2015:
| | Level 1 | | | Level 2 | | | Level 3 | | | Total | |
Common Stocks | | $ | 270,605,241 | | | $ | — | | | $ | — | | | $ | 270,605,241 | |
Money Market Funds | | | 11,239,141 | | | | — | | | | — | | | | 11,239,141 | |
Total | | $ | 281,844,382 | | | $ | — | | | $ | — | | | $ | 281,844,382 | |
Refer to the Fund’s Schedule of Investments for a listing of the common stocks by industry type. As of November 30, 2015, the Fund did not have any transfers into and out of any Level. In addition, the Fund did not hold derivative instruments or any assets or liabilities that were measured at fair value on a recurring basis using significant unobservable inputs (Level 3) as of November 30, 2015. It is the Fund’s policy to recognize transfers into and out of any Level at the end of the reporting period.
Share valuation – The net asset value per share of the Fund is calculated daily by dividing the total value of the Fund’s assets, less liabilities, by the number of shares outstanding. The offering price and redemption price per share of the Fund is equal to the net asset value per share.
Investment income – Dividend income is recorded on the ex-dividend date. Interest income is accrued as earned.
Security transactions – Security transactions are accounted for on the trade date. Gains and losses on securities sold are determined on a specific identification basis.
Common expenses – Common expenses of the Trust are allocated among the Fund and the other series of the Trust based on the relative net assets of each series or the nature of the services performed and the relative applicability to each series.
15
APEXcm SMALL/MID-CAP GROWTH FUND
NOTES TO FINANCIAL STATEMENTS (Continued)
Distributions to shareholders – The Fund will distribute to shareholders any net investment income and net realized capital gains at least once each year. The amount of such dividends and distributions are determined in accordance with federal income tax regulations, which may differ from GAAP. Dividends and distributions are recorded on the ex-dividend date. There were no distributions paid to shareholders during the periods ended November 30, 2015 or May 31, 2015.
Estimates – The preparation of financial statements in conformity with GAAP requires management to make estimates and assumptions that affect the reported amounts of assets and liabilities and disclosure of contingent assets and liabilities as of the date of the financial statements and the reported amounts of income and expenses during the reporting period. Actual results could differ from those estimates.
Federal income tax – The Fund has qualified and intends to continue to qualify as a regulated investment company under the Internal Revenue Code of 1986 (the “Code”). Qualification generally will relieve the Fund of liability for federal income taxes to the extent 100% of its net investment income and net realized capital gains are distributed in accordance with the Code. Accordingly, no provision for income tax has been made.
In order to avoid imposition of the excise tax applicable to regulated investment companies, it is also the Fund’s intention to declare as dividends in each calendar year at least 98% of its net investment income (earned during the calendar year) and 98.2% of its net realized capital gains (earned during the twelve months ended October 31) plus undistributed amounts from prior years.
The following information is computed on a tax basis for each item as of November 30, 2015:
Tax cost of portfolio investments | | $ | 271,232,232 | |
Gross unrealized appreciation | | $ | 32,453,671 | |
Gross unrealized depreciation | | | (21,841,521 | ) |
Net unrealized appreciation | | | 10,612,150 | |
Accumulated net investment loss | | | (1,161,445 | ) |
Undistributed long term gains | | | 385,173 | |
Other gains | | | 4,852,122 | |
Accumulated earnings | | $ | 14,688,000 | |
16
APEXcm SMALL/MID-CAP GROWTH FUND
NOTES TO FINANCIAL STATEMENTS (Continued)
The federal income tax cost of portfolio investments and the tax components of accumulated earnings may temporarily differ from the financial statement cost of portfolio investments and components of net assets (“book/tax difference”). These book/tax differences are due to the recognition of capital gains or losses under income tax regulations and GAAP, primarily due to the tax deferral of losses on wash sales.
The Fund recognizes the tax benefits or expenses of uncertain tax positions only when the position is “more likely than not” to be sustained assuming examination by tax authorities. Management has reviewed the Fund’s tax positions for the current and all open tax periods (periods ended May 31, 2013 through May 31, 2015) and has concluded that no provision for unrecognized tax benefits or expenses is required in these financial statements. The Fund identifies its major tax jurisdiction as U.S. Federal.
3. Investment Transactions
During the six months ended November 30, 2015, cost of purchases and proceeds from sales of investment securities, other than short-term investments, were $76,573,686 and $22,357,425, respectively.
4. Transactions with Related Parties
INVESTMENT ADVISORY AGREEMENT
The Fund’s investments are managed by Apex Capital Management, Inc. (the “Adviser”) pursuant to the terms of an Investment Advisory Agreement. Under the Investment Advisory Agreement, the Fund pays the Adviser an advisory fee, computed and accrued daily and paid monthly, at the annual rate of 1.00% of its average daily net assets.
Pursuant to an Expense Limitation Agreement (“ELA”) between the Fund and the Adviser, the Adviser has contractually agreed, until October 1, 2017, to reduce investment advisory fees and reimburse other operating expenses to limit total annual operating expenses of the Fund (exclusive of brokerage costs, taxes, interest, acquired fund fees and expenses, extraordinary expenses such as litigation and merger or reorganization costs, and other expenses not incurred in the ordinary course of the Fund’s business) to an amount not exceeding 1.05% of the Fund’s average daily net assets. Accordingly, during the six months ended November 30, 2015, the Adviser reduced its advisory fees in the amount of $206,265.
17
APEXcm SMALL/MID-CAP GROWTH FUND
NOTES TO FINANCIAL STATEMENTS (Continued)
Under the terms of the ELA, investment advisory fee reductions and expense reimbursements by the Adviser are subject to recoupment by the Adviser for a period of three years after such fees and expenses were incurred, provided the recoupments do not cause total annual operating expenses of the Fund to exceed 1.05% of average daily net assets. As of November 30, 2015, the Adviser may seek recoupment of investment advisory fee reductions and expense reimbursements no later than the dates as stated below:
May 31, 2016 | | $ | 77,487 | |
May 31, 2017 | | | 223,293 | |
May 31, 2018 | | | 317,860 | |
November 30, 2018 | | | 206,265 | |
Certain officers of the Fund are also officers of the Adviser.
OTHER SERVICE PROVIDERS
Ultimus Fund Solutions, LLC (“Ultimus”) provides fund administration, fund accounting, compliance and transfer agency services to the Fund. The Fund pays Ultimus fees in accordance with the agreements for such services. In addition, the Fund pays out-of-pocket expenses including but not limited to postage, supplies and costs of pricing the Fund’s portfolio securities.
Under the terms of a Distribution Agreement with the Trust, Ultimus Fund Distributors, LLC (the “Distributor”) serves as principal underwriter to the Fund. The Distributor is a wholly-owned subsidiary of Ultimus. The Distributor is compensated by the Adviser (not the Fund) for acting as principal underwriter.
Certain officers and a Trustee of the Trust are also officers of Ultimus and the Distributor.
TRUSTEE COMPENSATION
Each Trustee who is not an “interested person” of the Trust (“Independent Trustee”) receives from the Fund a fee of $500 for each Board meeting attended plus reimbursement of travel and other meeting-related expenses. In addition, each Independent Trustee receives a $500 annual retainer from the Fund. Trustees affiliated with the Adviser or Ultimus are not compensated by the Fund for their services.
18
APEXcm SMALL/MID-CAP GROWTH FUND
NOTES TO FINANCIAL STATEMENTS (Continued)
PRINICIPAL HOLDERS OF FUND SHARES
As of November 30, 2015, the following shareholders owned of record 5% or more of the outstanding shares of the Fund:
Name of Record Owner | % Ownership |
UBS Financial Services, Inc. (for the benefit of its customers) | 37% |
Charles Schwab & Company, Inc. (for the benefit of its customers) | 26% |
A beneficial owner of 25% or more of the Fund’s outstanding shares may be considered a controlling person. That shareholder’s vote could have a more significant effect on matters presented at a shareholder’s meeting.
5. Sector Risk
If the Fund has significant investments in the securities of issuers within a particular sector, any development affecting that sector will have a greater impact on the value of the net assets of the Fund than would be the case if the Fund did not have significant investments in that sector. In addition, this may increase the risk of loss in the Fund and increase the volatility of the Fund’s net asset value per share. For instance, economic or market factors, regulatory changes or other developments may negatively impact all companies in a particular sector, and therefore the value of the Fund’s portfolio will be adversely affected. As of November 30, 2015, the Fund had 33.0% of the value of its net assets invested in stocks within the Information Technology sector.
6. Contingencies and Commitments
The Fund indemnifies the Trust’s officers and Trustees for certain liabilities that might arise from their performance of their duties to the Fund. Additionally, in the normal course of business the Fund enters into contracts that contain a variety of representations and warranties and which provide general indemnifications. The Fund’s maximum exposure under these arrangements is unknown, as this would involve future claims that may be made against the Fund that have not yet occurred. However, based on experience, the Fund expects the risk of loss to be remote.
7. Subsequent Events
The Fund is required to recognize in the financial statements the effects of all subsequent events that provide additional evidence about conditions that existed as of the date of the Statement of Assets and Liabilities. For non-recognized subsequent events that must be disclosed to keep the financial statements from being misleading, the Fund is required to disclose the nature of the event as well as an estimate of its financial effect, or a statement that such an estimate cannot be made. Management has evaluated subsequent events through the issuance of these financial statements and has noted no such events.
19
APEXcm SMALL/MID-CAP GROWTH FUND
ABOUT YOUR FUND’S EXPENSES (Unaudited)
We believe it is important for you to understand the impact of costs on your investment. As a shareholder of the Fund, you incur ongoing costs, including management fees and other operating expenses. The following examples are intended to help you understand your ongoing costs (in dollars) of investing in the Fund and to compare these costs with the ongoing costs of investing in other mutual funds.
A mutual fund’s ongoing costs are expressed as a percentage of its average net assets. This figure is known as the expense ratio. The expenses in the table below are based on an investment of $1,000 made at the beginning of the most recent period (June 1, 2015) and held until the end of the period (November 30, 2015).
The table below illustrates the Fund’s ongoing costs in two ways:
Actual fund return – This section helps you to estimate the actual expenses that you paid over the period. The “Ending Account Value” shown is derived from the Fund’s actual return, and the third column shows the dollar amount of operating expenses that would have been paid by an investor who started with $1,000 in the Fund. You may use the information here, together with the amount you invested, to estimate the expenses that you paid over the period.
To do so, simply divide your account value by $1,000 (for example, an $8,600 account value divided by $1,000 = 8.6), then multiply the result by the number given for the Fund under the heading “Expenses Paid During Period.”
Hypothetical 5% return – This section is intended to help you compare the Fund’s ongoing costs with those of other mutual funds. It assumes that the Fund had an annual return of 5% before expenses during the period shown, but that the expense ratio is unchanged. In this case, because the return used is not the Fund’s actual return, the results do not apply to your investment. The example is useful in making comparisons because the U.S. Securities and Exchange Commission (“SEC”) requires all mutual funds to calculate expenses based on a 5% return. You can assess the Fund’s ongoing costs by comparing this hypothetical example with the hypothetical examples that appear in shareholder reports of other funds.
Note that expenses shown in the table are meant to highlight and help you compare ongoing costs only. The Fund does not charge transaction fees, such as purchase or redemption fees, nor does it carry a “sales load.”
The calculations assume no shares were bought or sold during the period. Your actual costs may have been higher or lower, depending on the amount of your investment and the timing of any purchases or redemptions.
20
APEXcm SMALL/MID-CAP GROWTH FUND
ABOUT YOUR FUND’S EXPENSES (Unaudited) (Continued)
More information about the Fund’s expenses can be found in this report. For additional information on operating expenses and other shareholder costs, please refer to the Fund’s prospectus.
| Beginning
Account Value
June 1, 2015 | Ending
Account Value
November 30, 2015 | Expenses
Paid During
Period* |
Based on Actual Fund Return | $1,000.00 | $936.30 | $5.10 |
Based on Hypothetical 5% Return (before expenses) | $1,000.00 | $1,019.80 | $5.32 |
* | Expenses are equal to the Fund’s annualized expense ratio of 1.05% for the period, multiplied by the average account value over the period, multiplied by 183/365 (to reflect the one-half year period). |
OTHER INFORMATION (Unaudited)
A description of the policies and procedures that the Fund uses to vote proxies relating to portfolio securities is available without charge upon request by calling toll-free 1-888-575-4800, or on the SEC’s website at http://www.sec.gov. Information regarding how the Fund voted proxies relating to portfolio securities during the most recent 12-month period ended June 30 is available without charge upon request by calling toll-free 1-888-575-4800, or on the SEC’s website at http://www.sec.gov.
The Trust files a complete listing of portfolio holdings for the Fund with the SEC as of the end of the first and third quarters of each fiscal year on Form N-Q. These filings are available upon request by calling 1-888-575-4800. Furthermore, you may obtain a copy of the filings on the SEC’s website at http://www.sec.gov. The Trust’s Forms N-Q may also be reviewed and copied at the SEC’s Public Reference Room in Washington, DC, and information on the operation of the Public Reference Room may be obtained by calling 1-800-SEC-0330.
21
BARROW VALUE OPPORTUNITY FUND
(BALIX)
BARROW LONG/SHORT OPPORTUNITY FUND
(BFSLX)
Semi-Annual Report
November 30, 2015
(Unaudited)
BARROW VALUE OPPORTUNITY FUND
LETTER TO SHAREHOLDERS | December 22, 2015 |
Dear Shareholder,
We are pleased to report on the status and performance of the Barrow Value Opportunity Fund (“the Fund”) for the six months ended November 30, 2015.
We believe that the Fund owns a well-positioned portfolio of equity interests in excellent businesses at attractive valuations. This portfolio is highly diversified by market capitalization segments (large, middle, small), industry sectors, and issuers. In selecting investments for the Fund, we search for businesses that feature high returns on capital, wide operating margins, and low debt loads. Based on our estimates of intrinsic value, we believe our portfolio’s valuation is attractively low on an absolute basis and less expensive than the U.S. stock market as represented by the S&P 500® Index (the “S&P 500”).
On August 30, 2013, the Fund was reorganized as a mutual fund from a private limited partnership, which had commenced operations on December 31, 2008. Please refer to the Performance Information on pages 4 and 5 for a summary of Fund performance versus the S&P 500 over various periods since the Fund’s inception.
The Fund’s long-term performance has been excellent relative to the S&P 500. The Fund has exceeded the total return of the S&P 500 in five of the past six calendar years1. During the most recent six months ended November 30, 2015, the Fund returned -1.47% net of all fees and expenses, which underperformed the S&P 500 by 1.26%. This underperformance is primarily attributable to the Fund’s mid-cap and small-cap positions.
Barrow Street Advisors, LLC (the “Adviser”) continues to use its proprietary private-equity approach to uncover companies that exhibit its Quality-meets-Value criteria. Based on extensive research by the Adviser, the Fund seeks to generate long-term capital appreciation by investing in companies with fundamental operating and financial attributes representative of both quality and value. To increase the Fund’s chances for success, we invest in a variety of positions that are diversified across market capitalization and industry sectors.
Over the past six months, we uncovered 44 new investment opportunities, composed of 20 small-caps, 12 mid-caps, and 12 large-caps, and representing seven different industry sectors. We believe all of these new additions to the Fund’s portfolio are excellent companies with strong balance sheets. These companies are generally using their ample free cash flow to: a) re-invest in growth opportunities at high rates of return on investment; b) pay dividends; c) repurchase stock at attractive valuations; and/or d) retire outstanding debt.
In keeping with our practice since the beginning of 2009, over the past six months the Fund’s investments were sourced by taking account of the opportunity set of all companies in our broad investment universe each time we committed capital to a new position. We think this approach allows us to uncover excellent investment
1
opportunities that arise from temporary market inefficiencies and to gather up the most compelling investments across a wide array of industries and market capitalizations, while avoiding the destructive behavioral biases inherent in concentrated-stock and sector-specialized investing.
Seven of the Fund’s holdings were announced as take-over targets over the past six months, which was approximately twice the market average. The Fund has had investments in 74 take-overs since December 31, 20081, or roughly quadruple the market average2. The control premiums we have captured by virtue of holding stocks that end up being merger targets has made repeated and meaningful contributions to the Fund’s total returns, and we expect continued benefits from this effect going forward. We typically sell companies from the Fund’s portfolio soon after they are announced as take-over targets and re-invest that capital.
Over the past six months, the Fund’s portfolio generated total returns, before fees and expenses, of -0.97%, including +5.44% for large-caps, -2.86% for mid-caps and -1.91% for small-caps. This compares to -0.21% for the S&P 500 (for large-caps), -3.32% for the S&P 400 Midcap (for mid-caps), and -3.21% for the Russell 2000 (for small-caps) over the same period. The Fund’s sectors with the best absolute performance were Consumer Staples and Health Care, which generated total returns of +10.89% and +4.99%, respectively. The Fund’s sectors with the worst absolute performance were Materials and Industrials, which returned -9.28% and -8.83%, respectively.
You can find additional commentary and reports about the Adviser’s management of the Fund’s portfolio on the Barrow Funds’ website (www.barrowfunds.com), including our unique “consolidated look-through” report in which we compare the portfolio of the Fund with the S&P 500 as if they were both public holding companies like Berkshire Hathaway. The consolidated look-through analysis is another example of how we look at the Fund’s portfolio through a private-equity lens. We focus on the key characteristics of good business, such as total enterprise value (not just equity market capitalization), unleveraged cash flow, return on capital, leverage, growth, and insider ownership. We believe this unique approach has served our investors well, and we remain confident in the future.
Sincerely,
Nicholas Chermayeff | Robert F. Greenhill, Jr. | David R. Bechtel |
Co-Portfolio Manager, | Co-Portfolio Manager, | Principal, |
Investment Committee | Investment Committee | Investment Committee |
2
1 | The investment related and performance information discussed above for periods prior to Barrow Value Opportunity Fund’s reorganization date (August 30, 2013) are based on the activities of the Fund’s predecessor, the Barrow Street Fund L.P., an unregistered limited partnership managed by the portfolio managers of Barrow Value Opportunity Fund (the “Predecessor Private Fund”). The Predecessor Private Fund was reorganized into the Institutional Class shares of the Barrow Value Opportunity Fund on August 30, 2013, the date that the Fund commenced operations (the “Reorganization”). Barrow Value Opportunity Fund has been managed in the same style and by the same portfolio managers since the Predecessor Private Fund’s inception on December 31, 2008. The performance information shows the Predecessor Private Fund’s returns calculated using the actual fees and expenses charged by the Predecessor Private Fund. This prior performance is net of management fees and other expenses, but does not include the effect of the Predecessor Private Fund’s performance fee, which was in place until October 7, 2012. Prior to the Reorganization, the Predecessor Private Fund was not subject to certain investment restrictions, diversification requirements, and other restrictions of the Investment Company Act of 1940, as amended, or Subchapter M of the Internal Revenue Code of 1986, as amended, which, if they had been applicable, might have adversely affected Barrow Value Opportunity Fund’s performance. |
2 | The frequency of merger and acquisition (“M&A”) activity in the Fund’s portfolio is calculated on a quarterly basis by dividing the cumulative number of portfolio holdings that have been announced as merger or acquisition targets by the cumulative number of unique holdings held in the Fund’s portfolio. The frequency of M&A activity in the market is calculated on a quarterly basis by dividing the cumulative number of publicly-traded U.S. common stocks that have been announced as acquisition targets per Bloomberg by the total universe of publicly-traded U.S. common stocks as identified by Bloomberg (approximately 10,000). |
Past performance is not predictive of future performance. Investment results and principal value will fluctuate so that shares, when redeemed, may be worth more or less than their original cost. Current performance may be higher or lower than the performance data quoted.Performance data current to the most recent month end are available by calling 1-877-767-6633.
An investor should consider the investment objectives, risks, charges and expenses of the Fund carefully before investing. The Fund’s prospectus contains this and other important information. To obtain a copy of the Fund’s prospectus please visit our website at www.barrowfunds.com or call 1-877-767-6633 and a copy will be sent to you free of charge. Please read the prospectus carefully before you invest. The Fund is distributed by Ultimus Fund Distributors, LLC.
The Letter to Shareholders seeks to describe some of the Adviser’s current opinions and views of the financial markets. Although the Adviser believes it has a reasonable basis for any opinions or views expressed, actual results may differ, sometimes significantly so, from those expected or expressed. The securities held by the Fund that are discussed in the Letter to Shareholders were held during the period covered by this Report. They do not comprise the entire investment portfolio of the Fund, may be sold at any time and may no longer be held by the Fund. The opinions of the Fund’s Adviser with respect to those securities may change at any time.
Statements in the Letter to Shareholders that reflect projections or expectations for future financial or economic performance of the Fund and the market in general and statements of the Fund’s plans and objectives for future operations are forward-looking statements.No assurance can be given that actual results or events will not differ materially from those projected, estimated, assumed, or anticipated in any such forward-looking statements.Important factors that could result in such differences, in addition to factors noted with such forward-looking statements include, without limitation, general economic conditions, such as inflation, recession, and interest rates.Past performance is not a guarantee of future results.
3
BARROW VALUE OPPORTUNITY FUND
PERFORMANCE INFORMATION
November 30, 2015 (Unaudited)
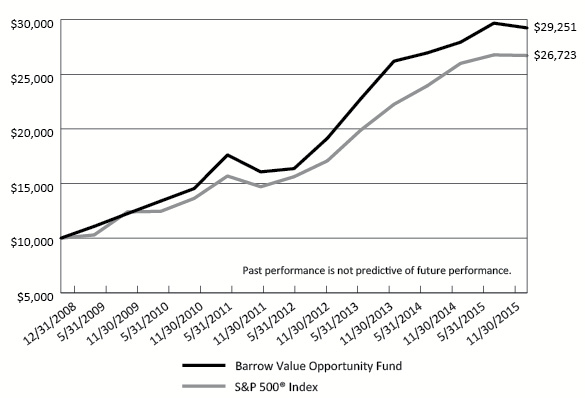
Comparison of the Change in Value of a $10,000 Investment in
Barrow Value Opportunity Fund(a)
versus the S&P 500® Index
Average Annual Total Returns For the periods ended November 30, 2015 |
| | 1 Year | 5 Years | Since Inception(c) |
Barrow Value Opportunity Fund(a)(b) | 4.67% | 15.00% | 16.79% |
S&P 500® Index | 2.75% | 14.40% | 15.27% |
4
BARROW VALUE OPPORTUNITY FUND
PERFORMANCE INFORMATION
November 30, 2015 (Unaudited) (Continued)
Comparison of Yearly Returns with the S&P 500® Index |
For the periods ended November 30, 2015(a) |
| | Barrow Value Opportunity Fund | S&P 500® Index | Difference |
Yearly Total Returns for Calendar Years: | | | |
2009 | 30.10% | 26.46% | 3.64% |
2010 | 18.75% | 15.06% | 3.69% |
2011 | 5.50% | 2.11% | 3.39% |
2012 | 18.77% | 16.00% | 2.77% |
2013 | 36.69% | 32.39% | 4.30% |
2014 | 5.13% | 13.69% | (8.56%) |
2015 (through 11/30/15) | 5.14% | 3.01% | 2.13% |
| | | | |
Total Return Since Inception (not annualized, as of 11/30/15) | 192.51% | 167.23% | 25.28% |
(a) | The Barrow Value Opportunity Fund (the "Fund") performance includes the performance of the Barrow Street Fund L.P. (the "Predecessor Private Fund"), the Fund's predecessor, for the periods before the Fund's registration statement became effective. The Predecessor Private Fund was reorganized into the Fund at the close of business on August 30, 2013 (the "Reorganization"), the date the Fund commenced operations. The Fund has been managed in the same style and by the same portfolio managers since the Predecessor Private Fund’s inception on December 31, 2008. The Fund’s investment goals, policies, guidelines and restrictions are, in all material respects, equivalent to those of the Predecessor Private Fund. The performance of the Predecessor Private Fund is net of management fees of 1.50% of assets but does not include the effect of a 20% performance fee which was in place until October 7, 2012. Prior to the Reorganization, the Predecessor Private Fund was not subject to certain investment restrictions, diversification requirements and other restrictions of the Investment Company Act of 1940, as amended, or Subchapter M of the Internal Revenue Code of 1986, as amended. If such restrictions had been applicable, they might have adversely affected the Predecessor Private Fund’s performance. |
(b) | The Fund’s total returns do not reflect the deduction of taxes a shareholder would pay on Fund distributions, if any, or the redemption of Fund shares. |
(c) | Represents the period from December 31, 2008(a) through November 30, 2015. |
5
BARROW LONG/SHORT OPPORTUNITY FUND LETTER TO SHAREHOLDERS | December 22, 2015 |
Dear Shareholder,
We are pleased to report on the status and performance of the Barrow Long/Short Opportunity Fund (“the Fund”) for the six months ended November 30, 2015.
We believe the Fund owns a well-positioned long portfolio of equity positions in excellent businesses at attractive valuations that feature high returns on capital, wide operating margins, and low debt load. The Fund also maintains short positions the common stock of companies that we believe represent poor business characteristics and are trading at high prices. The Fund’s long and short portfolios are highly diversified by market cap segments (large, mid, small), industry sectors, and issuers.
We believe the Fund is well positioned to do well in most future market conditions, especially a bear market. In our opinion, the Fund’s long and short portfolios are cheap and expensive, respectively, on an absolute basis and in relation to the U.S. stock market as represented by the S&P 500® Index (“S&P 500”). We believe the Fund’s short portfolio provides a meaningful hedge against the market’s potential downside volatility.
For the six months ended November 30, 2015, the Fund posted a total return of +3.39%, which compares to -0.21% for the S&P 500 and -4.44% for the HFRI Equity Hedge Index. The Fund outperformed the S&P 500 due primarily to the significant negative return of its short portfolio, which generated a positive return for the Fund.
The Fund maintains a target gross exposure of approximately 220% of its net assets, with long exposure of 130%, short exposure of 90%, and net exposure of 40%. For the six months ended November 30, 2015, the Fund’s long portfolio generated an unleveraged total return before fees and expenses of -0.97%, which underperformed the S&P 500 by 0.76%. This underperformance is primarily attributable to the Fund’s mid-cap and small-cap long positions. With respect to its short portfolio, the Fund experienced attractive performance as the companies that the Fund sold short had a negative overall return (positive for the Fund). The Fund’s short portfolio generated an unleveraged total return, before fees and expenses, of -5.98%, or 5.77% less than the S&P 500, with strong contributions from all three market cap segments.
Barrow Street Advisors, LLC (the “Adviser”) continues to use its proprietary private equity approach to uncover companies that exhibit its Quality-meets-Value criteria. Based on extensive research by the Adviser, the Fund seeks to generate above-average returns through capital appreciation by investing long in companies with fundamental operating and financial attributes representative of both quality and value and selling short companies of both lower quality and high price. Using this approach the Fund continued to uncover potential opportunities to: 1) purchase quality companies trading at temporary discounts to their intrinsic values; and 2) sell short the stock of lower
6
quality companies trading at prices well above their intrinsic values. To increase the Fund’s chances for success, we invest in a variety of positions diversified across market capitalization and industry sectors.
Over the past six months, we uncovered 44 new long opportunities in seven industry sectors, including 20 small-caps, 12 mid-caps, and 12 large-caps. We believe all of these new additions to the Fund’s portfolio are excellent companies with strong balance sheets. They are generally using their ample free cash flow to: a) re-invest in growth opportunities at high rates of return on investment; b) pay dividends; c) repurchase stock at attractive valuations; and/or d) retire outstanding debt. In tandem, we initiated 228 new short positions, including 113 small-caps, 57 mid-caps and 58 large-caps. We believe these companies are overpriced and exhibit weak quality characteristics.
In keeping with our past practice, over the past six months the Fund’s investments were sourced by taking account of the opportunity set of all companies in our broad investment universe each time we committed capital to a new position. We think this approach allows us to uncover excellent investment opportunities that arise from temporary market inefficiencies and to gather up the most compelling investments across a wide array of industries and market capitalizations while avoiding the destructive behavioral biases inherent in concentrated-stock and sector-specialized investing.
Seven of the Fund’s long positions were announced as take-over targets over the past six months, which was approximately twice the market average. On the short side, 28 of the Fund’s positions were announced as take-over targets over the past six months, which was approximately twice the market average1. The control premiums we have captured by virtue of holding stocks that end up being merger targets has made repeated and meaningful contributions to the Fund’s total returns, and we expect continued benefits from this effect going forward. We typically sell companies from the Fund’s portfolio soon after they are announced as take-over targets and re-invest that capital.
Over the past six months, the Fund’s long portfolio generated unleveraged total returns before fees and expenses of -0.97%, including +5.44% for large-caps, -2.86% for mid-caps and -1.91% for small-caps. This compares to -0.21% for the S&P 500 (for large-caps), -3.32% for the S&P 400 Midcap (for mid-caps), and -3.21% for the Russell 2000 (for small-caps). The Fund’s sectors with the best absolute performance were Consumer Staples and Health Care, which generated total returns of +10.89% and +4.99%, respectively. The Fund’s sectors with the worst absolute performance were Materials and Industrials, which returned -9.28% and -8.83%, respectively.
Over the same period, the Fund’s short portfolio generated total returns before fees and expenses of -2.23% for large-caps, -8.61% for mid-caps and -5.17% for small-caps. The Fund’s sectors with the best absolute performance were Energy and Materials, which returned -20.80% and -18.71%, respectively. The Fund’s sectors that did least well were Consumer Staples and Health Care, which generated total returns of +3.35% and -3.60%, respectively.
7
You can find more information about the Fund’s portfolio on the Barrow Funds website (www.barrowfunds.com), including our unique “consolidated look-through” report in which we compare the portfolio of the Fund with the S&P 500 as if they were public holding companies like Berkshire Hathaway. The consolidated look-through analysis is another example of how we look at the Fund’s portfolio through a private equity lens. We focus on the key characteristics of good business, such as total enterprise value (not just equity market capitalization), unleveraged cash flow, return on capital, leverage, growth, and insider ownership. We believe this unique approach has served our investors well, and we remain confident in the future.
Sincerely,
Nicholas Chermayeff | Robert F. Greenhill, Jr. | David R. Bechtel |
Co-Portfolio Manager, | Co-Portfolio Manager, | Principal, |
Investment Committee | Investment Committee | Investment Committee |
1 | The frequency of merger and acquisition (“M&A”) activity in the Fund’s portfolio is calculated on a quarterly basis by dividing the cumulative number of portfolio holdings that have been announced as merger or acquisition targets by the cumulative number of unique holdings held in the Fund’s portfolio. The frequency of M&A activity in the market is calculated on a quarterly basis by dividing the cumulative number of publicly-traded U.S. common stocks that have been announced as acquisition targets per Bloomberg by the total universe of publicly-traded U.S. common stocks as identified by Bloomberg (approximately 10,000). |
Past performance is not predictive of future performance. Investment results and principal value will fluctuate so that shares, when redeemed, may be worth more or less than their original cost. Current performance may be higher or lower than the performance data quoted.Performance data current to the most recent month end are available by calling 1-877-767-6633.
An investor should consider the investment objectives, risks, charges and expenses of the Fund carefully before investing. The Fund’s prospectus contains this and other important information. To obtain a copy of the Fund’s prospectus please visit our website at www.barrowfunds.com or call 1-877-767-6633 and a copy will be sent to you free of charge. Please read the prospectus carefully before you invest. The Fund is distributed by Ultimus Fund Distributors, LLC.
The Letter to Shareholders seeks to describe some of the Adviser’s current opinions and views of the financial markets. Although the Adviser believes it has a reasonable basis for any opinions or views expressed, actual results may differ, sometimes significantly so, from those expected or expressed. The securities held by the Fund that are discussed in the Letter to Shareholders were held during the period covered by this Report. They do not comprise the entire investment portfolio of the Fund, may be sold at any time and may no longer be held by the Fund. The opinions of the Fund’s Adviser with respect to those securities may change at any time.
8
Statements in the Letter to Shareholders that reflect projections or expectations for future financial or economic performance of the Fund and the market in general and statements of the Fund’s plans and objectives for future operations are forward-looking statements.No assurance can be given that actual results or events will not differ materially from those projected, estimated, assumed, or anticipated in any such forward-looking statements.Important factors that could result in such differences, in addition to factors noted with such forward-looking statements include, without limitation, general economic conditions, such as inflation, recession, and interest rates.Past performance is not a guarantee of future results.
9
BARROW LONG/SHORT OPPORTUNITY FUND
PERFORMANCE INFORMATION
November 30, 2015 (Unaudited)
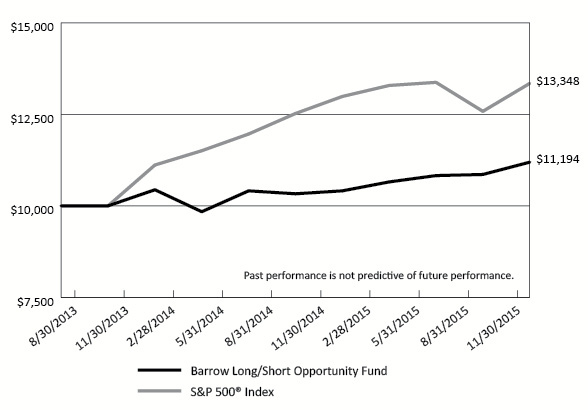
Comparison of the Change in Value of a $10,000 Investment in
Barrow Long/Short Opportunity Fund
versus the S&P 500® Index
Average Annual Total Returns
For the periods ended November 30, 2015 |
| | 1 Year | Since
Inception(b) |
Barrow Long/Short Opportunity Fund(a) | 7.53% | 5.14% |
S&P 500® Index | 2.75% | 13.68% |
(a) | The Fund's total returns do not reflect the deduction of taxes a shareholder would pay on Fund distributions, if any, or the redemption of Fund shares. |
(b) | The Fund commenced operations on August 30, 2013. |
10
BARROW VALUE OPPORTUNITY FUND
PORTFOLIO INFORMATION
November 30, 2015 (Unaudited)
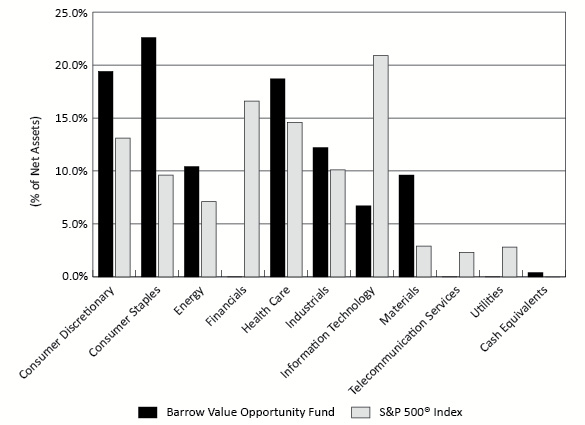
Sector Diversification
Top 10 Equity Holdings
Security Description | % of
Net Assets |
Western Refining, Inc. | 1.9% |
H&R Block, Inc. | 1.7% |
WD-40 Company | 1.7% |
Herbalife Ltd. | 1.7% |
USANA Health Sciences, Inc. | 1.7% |
Omnicom Group, Inc. | 1.5% |
AmSurg Corporation | 1.5% |
Vector Group Ltd. | 1.4% |
RPX Corporation | 1.4% |
National Beverage Corporation | 1.4% |
11
BARROW LONG/SHORT OPPORTUNITY FUND
PORTFOLIO INFORMATION
November 30, 2015 (Unaudited)
Net Sector Exposure Diversification*
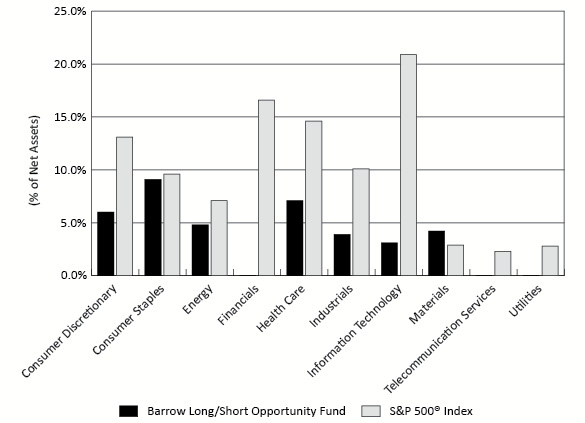
* | The net percentages are computed by taking the net dollar exposure, including short positions, and dividing by the net assets of the Fund. Consequently, the percentages will not total to 100%. |
Top 10 Long Equity Holdings | | Top 10 Short Equity Holdings |
Security Description | % of
Net Assets | | Security Description | % of
Net Assets |
Western Refining, Inc. | 2.4% | | Dean Foods Company | 0.9% |
H&R Block, Inc. | 2.2% | | Calavo Growers, Inc. | 0.8% |
WD-40 Company | 2.1% | | Coca-Cola Bottling Company Consolidated | 0.8% |
Herbalife Ltd. | 2.1% | | Casey's General Stores, Inc. | 0.7% |
USANA Health Sciences, Inc. | 2.1% | | Fresh Del Monte Produce, Inc. | 0.7% |
Omnicom Group, Inc. | 1.9% | | Snyder's-Lance, Inc. | 0.7% |
AmSurg Corporation | 1.9% | | Boulder Brands, Inc. | 0.7% |
Vector Group Ltd. | 1.8% | | Anderson's, Inc. (The) | 0.7% |
RPX Corporation | 1.7% | | TreeHouse Foods, Inc. | 0.6% |
National Beverage Corporation | 1.7% | | Natural Grocers by Vitamin Cottage, Inc. | 0.5% |
12
BARROW VALUE OPPORTUNITY FUND
SCHEDULE OF INVESTMENTS
November 30, 2015 (Unaudited) |
COMMON STOCKS — 99.6% | | Shares | | | Value | |
Consumer Discretionary — 19.4% | | | | | | |
Auto Components — 1.2% | | | | | | |
Gentex Corporation | | | 11,845 | | | $ | 198,226 | |
Motorcar Parts of America, Inc. (a) | | | 2,330 | | | | 93,340 | |
Visteon Corporation (a) | | | 930 | | | | 111,516 | |
| | | | | | | | 403,082 | |
Automobiles — 0.9% | | | | | | | | |
Thor Industries, Inc. | | | 5,546 | | | | 321,224 | |
| | | | | | | | | |
Diversified Consumer Services — 1.7% | | | | | | | | |
H&R Block, Inc. (b) | | | 16,422 | | | | 602,523 | |
| | | | | | | | | |
Hotels, Restaurants & Leisure — 0.4% | | | | | | | | |
Interval Leisure Group, Inc. (b) | | | 7,893 | | | | 123,289 | |
| | | | | | | | | |
Household Durables — 0.5% | | | | | | | | |
GoPro, Inc. - Class A (a) | | | 4,262 | | | | 86,945 | |
Tupperware Brands Corporation (b) | | | 1,844 | | | | 104,684 | |
| | | | | | | | 191,629 | |
Internet & Catalog Retail — 0.5% | | | | | | | | |
Lands' End, Inc. (a) | | | 7,207 | | | | 173,256 | |
| | | | | | | | | |
Leisure Products — 1.8% | | | | | | | | |
Nautilus, Inc. (a) | | | 11,565 | | | | 222,164 | |
Polaris Industries, Inc. | | | 322 | | | | 33,948 | |
Smith & Wesson Holding Corporation (a) | | | 11,083 | | | | 203,262 | |
Sturm, Ruger & Company, Inc. | | | 3,176 | | | | 165,470 | |
| | | | | | | | 624,844 | |
Media — 5.1% | | | | | | | | |
Crown Media Holdings, Inc. - Class A (a) | | | 29,414 | | | | 166,777 | |
Interpublic Group of Companies, Inc. (b) | | | 19,847 | | | | 456,481 | |
MSG Networks, Inc. - Class A (a) | | | 4,766 | | | | 94,271 | |
National CineMedia, Inc. | | | 12,946 | | | | 205,453 | |
Omnicom Group, Inc. (b) | | | 7,219 | | | | 533,629 | |
Scripps Networks Interactive, Inc. - Class A | | | 2,236 | | | | 127,005 | |
TEGNA, Inc. | | | 1,266 | | | | 35,765 | |
Time, Inc. | | | 5,157 | | | | 85,812 | |
Viacom, Inc. - Class B | | | 1,486 | | | | 73,988 | |
| | | | | | | | 1,779,181 | |
13
BARROW VALUE OPPORTUNITY FUND
SCHEDULE OF INVESTMENTS (Continued) |
COMMON STOCKS — 99.6% (Continued) | | Shares | | | Value | |
Consumer Discretionary — 19.4% (Continued) | | | | | | |
Specialty Retail — 5.7% | | | | | | |
Bed Bath & Beyond, Inc. (a)(b) | | | 1,366 | | | $ | 74,474 | |
Buckle, Inc. (The) (b) | | | 5,516 | | | | 175,133 | |
Cato Corporation (The) - Class A (b) | | | 4,423 | | | | 173,735 | |
Foot Locker, Inc. (b) | | | 1,085 | | | | 70,525 | |
Francesca's Holdings Corporation (a) | | | 16,669 | | | | 248,868 | |
GameStop Corporation - Class A (b) | | | 13,432 | | | | 470,523 | |
Gap, Inc. (The) | | | 2,485 | | | | 66,424 | |
GNC Holdings, Inc. - Class A | | | 2,856 | | | | 85,137 | |
Michaels Companies, Inc. (The) (a) | | | 2,861 | | | | 63,543 | |
Outerwall, Inc. (b) | | | 7,115 | | | | 440,419 | |
Winmark Corporation | | | 971 | | | | 92,731 | |
Zumiez, Inc. (a) | | | 1,425 | | | | 21,503 | |
| | | | | | | | 1,983,015 | |
Textiles, Apparel & Luxury Goods — 1.6% | | | | | | | | |
Coach, Inc. | | | 1,790 | | | | 56,868 | |
Deckers Outdoor Corporation (a) | | | 1,297 | | | | 63,475 | |
Fossil Group, Inc. (a) | | | 1,006 | | | | 38,701 | |
Iconix Brand Group, Inc. (a)(b) | | | 1,584 | | | | 11,152 | |
Steven Madden Ltd. (a)(b) | | | 10,770 | | | | 343,563 | |
Tumi Holdings, Inc. (a) | | | 2,009 | | | | 35,479 | |
| | | | | | | | 549,238 | |
Consumer Staples — 22.6% | | | | | | | | |
Beverages — 3.1% | | | | | | | | |
Boston Beer Company, Inc. (The) - Class A (a) | | | 436 | | | | 93,138 | |
Dr Pepper Snapple Group, Inc. (b) | | | 4,637 | | | | 416,171 | |
National Beverage Corporation (a)(b) | | | 11,029 | | | | 479,210 | |
PepsiCo, Inc. | | | 1,046 | | | | 104,767 | |
| | | | | | | | 1,093,286 | |
Food & Staples Retailing — 1.2% | | | | | | | | |
CVS Health Corporation | | | 379 | | | | 35,660 | |
Fresh Market, Inc. (The) (a) | | | 10,190 | | | | 244,356 | |
Smart & Final Stores, Inc. (a) | | | 4,991 | | | | 87,692 | |
Sprouts Farmers Market, Inc. (a) | | | 2,743 | | | | 66,189 | |
| | | | | | | | 433,897 | |
Food Products — 5.1% | | | | | | | | |
B&G Foods, Inc. (b) | | | 6,207 | | | | 234,500 | |
Cal-Maine Foods, Inc. | | | 4,999 | | | | 272,496 | |
Hormel Foods Corporation | | | 1,146 | | | | 85,858 | |
John B. Sanfilippo & Son, Inc. | | | 2,917 | | | | 167,873 | |
14
BARROW VALUE OPPORTUNITY FUND
SCHEDULE OF INVESTMENTS (Continued) |
COMMON STOCKS — 99.6% (Continued) | | Shares | | | Value | |
Consumer Staples — 22.6% (Continued) | | | | | | |
Food Products — 5.1% (Continued) | | | | | | |
Kellogg Company | | | 1,415 | | | $ | 97,310 | |
Keurig Green Mountain, Inc. | | | 3,567 | | | | 186,911 | |
Lancaster Colony Corporation (b) | | | 2,335 | | | | 271,467 | |
Mead Johnson Nutrition Company | | | 432 | | | | 34,815 | |
Mondelēz International, Inc. - Class A | | | 767 | | | | 33,487 | |
Pilgrim's Pride Corporation (b) | | | 6,292 | | | | 135,467 | |
Pinnacle Foods, Inc. | | | 5,053 | | | | 220,008 | |
Seaboard Corporation (a) | | | 10 | | | | 33,000 | |
| | | | | | | | 1,773,192 | |
Household Products — 2.4% | | | | | | | | |
Clorox Company (The) | | | 1,810 | | | | 224,983 | |
WD-40 Company (b) | | | 6,042 | | | | 596,768 | |
| | | | | | | | 821,751 | |
Personal Products — 4.8% | | | | | | | | |
Avon Products, Inc. | | | 4,899 | | | | 16,902 | |
Herbalife Ltd. (a)(b) | | | 10,027 | | | | 578,859 | |
Natural Health Trends Corporation | | | 4,211 | | | | 203,770 | |
Nu Skin Enterprises, Inc. - Class A | | | 5,918 | | | | 206,361 | |
Revlon, Inc. - Class A (a) | | | 2,766 | | | | 75,733 | |
USANA Health Sciences, Inc. (a)(b) | | | 4,311 | | | | 577,415 | |
| | | | | | | | 1,659,040 | |
Tobacco — 6.0% | | | | | | | | |
Altria Group, Inc. (b) | | | 7,910 | | | | 455,616 | |
Philip Morris International, Inc. (b) | | | 5,089 | | | | 444,727 | |
Reynolds American, Inc. (b) | | | 10,091 | | | | 466,709 | |
Universal Corporation | | | 4,018 | | | | 227,178 | |
Vector Group Ltd. (b) | | | 19,459 | | | | 492,507 | |
| | | | | | | | 2,086,737 | |
Energy — 10.4% | | | | | | | | |
Energy Equipment & Services — 2.7% | | | | | | | | |
Forum Energy Technologies, Inc. (a) | | | 4,997 | | | | 78,253 | |
Halliburton Company | | | 1,577 | | | | 62,843 | |
Helmerich & Payne, Inc. | | | 896 | | | | 52,192 | |
National Oilwell Varco, Inc. | | | 5,296 | | | | 197,753 | |
Oceaneering International, Inc. | | | 6,071 | | | | 265,546 | |
Oil States International, Inc. (a) | | | 2,552 | | | | 80,949 | |
RPC, Inc. | | | 9,335 | | | | 123,689 | |
Schlumberger Ltd. | | | 789 | | | | 60,871 | |
| | | | | | | | 922,096 | |
15
BARROW VALUE OPPORTUNITY FUND
SCHEDULE OF INVESTMENTS (Continued) |
COMMON STOCKS — 99.6% (Continued) | | Shares | | | Value | |
Energy — 10.4% (Continued) | | | | | | |
Oil, Gas & Consumable Fuels — 7.7% | | | | | | |
Alliance Resource Partners, L.P. | | | 5,677 | | | $ | 97,361 | |
Alon USA Energy, Inc. | | | 4,256 | | | | 74,863 | |
Alon USA Partners, L.P. (b) | | | 14,144 | | | | 359,116 | |
CVR Energy, Inc. | | | 2,514 | | | | 120,043 | |
CVR Refining, L.P. | | | 3,825 | | | | 82,850 | |
Exxon Mobil Corporation | | | 323 | | | | 26,376 | |
Green Plains, Inc. | | | 3,464 | | | | 82,062 | |
HollyFrontier Corporation (b) | | | 905 | | | | 43,512 | |
Marathon Petroleum Corporation (b) | | | 7,525 | | | | 439,535 | |
PBF Logistics, L.P. | | | 5,067 | | | | 99,972 | |
Permian Basin Royalty Trust | | | 625 | | | | 4,031 | |
REX American Resources Corporation (a) | | | 1,469 | | | | 92,327 | |
Tesoro Corporation | | | 1,151 | | | | 132,561 | |
Valero Energy Corporation | | | 3,465 | | | | 248,995 | |
Western Refining, Inc. (b) | | | 14,608 | | | | 661,158 | |
World Fuel Services Corporation | | | 2,739 | | | | 119,393 | |
| | | | | | | | 2,684,155 | |
Health Care — 18.7% | | | | | | | | |
Health Care Equipment & Supplies — 4.3% | | | | | | | | |
Align Technology, Inc. (a) | | | 542 | | | | 36,173 | |
Anika Therapeutics, Inc. (a) | | | 6,934 | | | | 290,951 | |
Atrion Corporation | | | 160 | | | | 67,344 | |
C.R. Bard, Inc. | | | 379 | | | | 70,805 | |
Edwards Lifesciences Corporation (a) | | | 740 | | | | 120,620 | |
Globus Medical, Inc. - Class A (a)(b) | | | 14,330 | | | | 388,773 | |
LivaNova plc (a) | | | 2,017 | | | | 120,717 | |
Meridian Bioscience, Inc. | | | 15,180 | | | | 297,072 | |
Varian Medical Systems, Inc. (a) | | | 1,206 | | | | 97,421 | |
| | | | | | | | 1,489,876 | |
Health Care Providers & Services — 10.4% | | | | | | | | |
AmSurg Corporation (a)(b) | | | 6,316 | | | | 530,923 | |
Cardinal Health, Inc. (b) | | | 2,666 | | | | 231,542 | |
Chemed Corporation (b) | | | 3,070 | | | | 474,284 | |
CorVel Corporation (a) | | | 3,514 | | | | 136,167 | |
DaVita HealthCare Partners, Inc. (a) | | | 1,592 | | | | 116,280 | |
Ensign Group, Inc. (The) | | | 1,422 | | | | 67,645 | |
HCA Holdings, Inc. (a) | | | 799 | | | | 54,380 | |
HealthSouth Corporation (b) | | | 7,764 | | | | 273,215 | |
Laboratory Corporation of America Holdings (a)(b) | | | 310 | | | | 37,677 | |
16
BARROW VALUE OPPORTUNITY FUND
SCHEDULE OF INVESTMENTS (Continued) |
COMMON STOCKS — 99.6% (Continued) | | Shares | | | Value | |
Health Care — 18.7% (Continued) | | | | | | |
Health Care Providers & Services — 10.4% (Continued) | | | | | | |
LHC Group, Inc. (a) | | | 2,593 | | | $ | 120,704 | |
McKesson Corporation | | | 186 | | | | 35,219 | |
MEDNAX, Inc. (a)(b) | | | 5,770 | | | | 411,805 | |
Patterson Companies, Inc. (b) | | | 694 | | | | 31,626 | |
Premier, Inc. - Class A (a) | | | 9,109 | | | | 312,985 | |
Quest Diagnostics, Inc. (b) | | | 5,983 | | | | 408,759 | |
Select Medical Holdings Corporation | | | 4,262 | | | | 51,442 | |
U.S. Physical Therapy, Inc. | | | 6,227 | | | | 329,035 | |
| | | | | | | | 3,623,688 | |
Health Care Technology — 0.8% | | | | | | | | |
Computer Programs & Systems, Inc. | | | 5,979 | | | | 291,297 | |
| | | | | | | | | |
Pharmaceuticals — 3.2% | | | | | | | | |
ANI Pharmaceuticals, Inc. (a) | | | 1,407 | | | | 61,655 | |
Johnson & Johnson | | | 4,196 | | | | 424,803 | |
Prestige Brands Holdings, Inc. (a)(b) | | | 5,070 | | | | 258,012 | |
Sucampo Pharmaceuticals, Inc. - Class A (a) | | | 5,209 | | | | 89,334 | |
Supernus Pharmaceuticals, Inc. (a) | | | 17,447 | | | | 281,944 | |
| | | | | | | | 1,115,748 | |
Industrials — 12.2% | | | | | | | | |
Aerospace & Defense — 2.3% | | | | | | | | |
B/E Aerospace, Inc. | | | 487 | | | | 22,509 | |
BWX Technologies, Inc. | | | 4,466 | | | | 135,990 | |
Honeywell International, Inc. | | | 623 | | | | 64,761 | |
Northrop Grumman Corporation (b) | | | 1,737 | | | | 323,707 | |
Raytheon Company (b) | | | 1,480 | | | | 183,564 | |
United Technologies Corporation | | | 636 | | | | 61,088 | |
| | | | | | | | 791,619 | |
Air Freight & Logistics — 0.5% | | | | | | | | |
C.H. Robinson Worldwide, Inc. | | | 881 | | | | 59,406 | |
Expeditors International of Washington, Inc. | | | 2,644 | | | | 128,340 | |
| | | | | | | | 187,746 | |
Commercial Services & Supplies — 1.7% | | | | | | | | |
Deluxe Corporation (b) | | | 7,289 | | | | 427,500 | |
Pitney Bowes, Inc. (b) | | | 6,058 | | | | 130,853 | |
UniFirst Corporation | | | 230 | | | | 24,973 | |
| | | | | | | | 583,326 | |
Construction & Engineering — 0.6% | | | | | | | | |
Argan, Inc. | | | 4,942 | | | | 194,270 | |
17
BARROW VALUE OPPORTUNITY FUND
SCHEDULE OF INVESTMENTS (Continued) |
COMMON STOCKS — 99.6% (Continued) | | Shares | | | Value | |
Industrials — 12.2% (Continued) | | | | | | |
Electrical Equipment — 1.9% | | | | | | |
Babcock & Wilcox Enterprises, Inc. (a) | | | 2,371 | | | $ | 45,405 | |
Generac Holdings, Inc. (a) | | | 957 | | | | 30,720 | |
Hubbell, Inc. - Class B | | | 681 | | | | 67,616 | |
Rockwell Automation, Inc. | | | 2,409 | | | | 256,414 | |
Thermon Group Holdings, Inc. (a) | | | 14,223 | | | | 259,001 | |
| | | | | | | | 659,156 | |
Machinery — 1.5% | | | | | | | | |
Actuant Corporation - Class A | | | 318 | | | | 7,874 | |
Douglas Dynamics, Inc. | | | 4,083 | | | | 94,971 | |
Federal Signal Corporation | | | 8,479 | | | | 142,956 | |
Graco, Inc. | | | 436 | | | | 32,901 | |
Hillenbrand, Inc. | | | 1,157 | | | | 35,045 | |
ITT Corporation | | | 855 | | | | 33,952 | |
Oshkosh Corporation (b) | | | 749 | | | | 32,851 | |
PACCAR, Inc. | | | 541 | | | | 28,110 | |
Sun Hydraulics Corporation | | | 852 | | | | 28,056 | |
Valmont Industries, Inc. (b) | | | 147 | | | | 17,236 | |
Wabash National Corporation (a) | | | 4,905 | | | | 63,618 | |
| | | | | | | | 517,570 | |
Professional Services — 3.0% | | | | | | | | |
Dun & Bradstreet Corporation (The) (b) | | | 1,504 | | | | 162,116 | |
Huron Consulting Group, Inc. (a)(b) | | | 717 | | | | 41,593 | |
Insperity, Inc. | | | 562 | | | | 24,256 | |
Korn/Ferry International | | | 1,885 | | | | 69,368 | |
Resources Connection, Inc. (b) | | | 7,742 | | | | 141,291 | |
Robert Half International, Inc. | | | 2,509 | | | | 128,411 | |
RPX Corporation (a)(b) | | | 34,860 | | | | 483,508 | |
| | | | | | | | 1,050,543 | |
Road & Rail — 0.5% | | | | | | | | |
Landstar System, Inc. | | | 2,559 | | | | 159,733 | |
Universal Truckload Services, Inc. | | | 1,588 | | | | 25,789 | |
| | | | | | | | 185,522 | |
Trading Companies & Distributors — 0.2% | | | | | | | | |
Grainger (W.W.), Inc. | | | 309 | | | | 61,967 | |
MSC Industrial Direct Company, Inc. - Class A | | | 406 | | | | 25,050 | |
| | | | | | | | 87,017 | |
18
BARROW VALUE OPPORTUNITY FUND
SCHEDULE OF INVESTMENTS (Continued) |
COMMON STOCKS — 99.6% (Continued) | | Shares | | | Value | |
Information Technology — 6.7% | | | | | | |
Communications Equipment — 1.6% | | | | | | |
Brocade Communications Systems, Inc. | | | 18,385 | | | $ | 172,543 | |
Cisco Systems, Inc. | | | 1,261 | | | | 34,362 | |
InterDigital, Inc. | | | 3,787 | | | | 199,537 | |
QUALCOMM, Inc. | | | 2,154 | | | | 105,094 | |
Ubiquiti Networks, Inc. (a) | | | 1,041 | | | | 36,321 | |
| | | | | | | | 547,857 | |
Electronic Equipment, Instruments &
Components — 1.1% | | | | | | | | |
Dolby Laboratories, Inc. - Class A | | | 1,009 | | | | 34,891 | |
IPG Photonics Corporation (a) | | | 795 | | | | 72,496 | |
Methode Electronics, Inc. | | | 5,365 | | | | 193,569 | |
Park Electrochemical Corporation | | | 1,539 | | | | 26,948 | |
PC Connection, Inc. (a) | | | 2,698 | | | | 60,220 | |
| | | | | | | | 388,124 | |
Internet Software & Services — 0.3% | | | | | | | | |
eBay, Inc. (a) | | | 3,688 | | | | 109,128 | |
| | | | | | | | | |
IT Services — 1.9% | | | | | | | | |
NeuStar, Inc. - Class A (a) | | | 7,130 | | | | 179,676 | |
Science Applications International Corporation | | | 3,406 | | | | 171,117 | |
Syntel, Inc. (a) | | | 4,339 | | | | 210,138 | |
Western Union Company (The) | | | 5,019 | | | | 94,658 | |
| | | | | | | | 655,589 | |
Software — 1.3% | | | | | | | | |
CA, Inc. | | | 6,773 | | | | 190,389 | |
ePlus, Inc. (a) | | | 386 | | | | 34,041 | |
MicroStrategy, Inc. - Class A (a) | | | 197 | | | | 34,154 | |
TiVo, Inc. (a) | | | 20,448 | | | | 183,828 | |
| | | | | | | | 442,412 | |
Technology Hardware, Storage & Peripherals — 0.5% | | | | | | | | |
Apple, Inc. | | | 1,666 | | | | 197,088 | |
| | | | | | | | | |
Materials — 9.6% | | | | | | | | |
Chemicals — 7.2% | | | | | | | | |
Albemarle Corporation | | | 1,111 | | | | 59,505 | |
Celanese Corporation - Series A | | | 1,103 | | | | 78,037 | |
CF Industries Holdings, Inc. (b) | | | 2,746 | | | | 126,701 | |
Chemtura Corporation (a) | | | 11,227 | | | | 344,894 | |
Ferro Corporation (a) | | | 5,016 | | | | 60,242 | |
Flotek Industries, Inc. (a) | | | 5,634 | | | | 64,340 | |
19
BARROW VALUE OPPORTUNITY FUND
SCHEDULE OF INVESTMENTS (Continued) |
COMMON STOCKS — 99.6% (Continued) | | Shares | | | Value | |
Materials — 9.6% (Continued) | | | | | | |
Chemicals — 7.2% (Continued) | | | | | | |
FutureFuel Corporation | | | 13,498 | | | $ | 193,291 | |
Innospec, Inc. | | | 5,836 | | | | 340,822 | |
LyondellBasell Industries N.V. - Class A | | | 3,528 | | | | 338,053 | |
NewMarket Corporation (b) | | | 168 | | | | 69,409 | |
OCI Partners, L.P. | | | 3,231 | | | | 26,204 | |
Terra Nitrogen Company, L.P. | | | 2,225 | | | | 234,070 | |
Trinseo S.A. (a) | | | 1,152 | | | | 32,901 | |
Valspar Corporation (The) | | | 927 | | | | 78,322 | |
Westlake Chemical Corporation | | | 5,189 | | | | 311,600 | |
Westlake Chemical Partners, L.P. | | | 8,773 | | | | 136,683 | |
| | | | | | | | 2,495,074 | |
Containers & Packaging — 1.0% | | | | | | | | |
Avery Dennison Corporation | | | 3,189 | | | | 210,347 | |
Owens-Illinois, Inc. (a) | | | 2,456 | | | | 47,376 | |
Sonoco Products Company | | | 2,183 | | | | 95,659 | |
| | | | | | | | 353,382 | |
Metals & Mining — 1.4% | | | | | | | | |
Ciner Resources, L.P. | | | 4,634 | | | | 103,848 | |
Compass Minerals International, Inc | | | 4,384 | | | | 368,870 | |
| | | | | | | | 472,718 | |
| | | | | | | | | |
Total Common Stocks (Cost $30,524,587) | | | | | | $ | 34,664,185 | |
EXCHANGE-TRADED FUNDS — 0.0% (c) | | Shares | | | Value | |
SPDR® S&P 500® ETF Trust (Cost $1,447) | | | 7 | | | $ | 1,461 | |
20
BARROW VALUE OPPORTUNITY FUND
SCHEDULE OF INVESTMENTS (Continued) |
MONEY MARKET FUNDS — 0.3% | | Shares | | | Value | |
Fidelity Institutional Money Market Government Portfolio - Class I, 0.01% (d) (Cost $89,745) | | | 89,745 | | | $ | 89,745 | |
| | | | | | | | | |
Total Investments at Value — 99.9% (Cost $30,615,779) | | | | | | $ | 34,755,391 | |
| | | | | | | | | |
Other Assets in Excess of Liabilities — 0.1% | | | | | | | 50,114 | |
| | | | | | | | | |
Net Assets — 100.0% | | | | | | $ | 34,805,505 | |
(a) | Non-income producing security. |
(b) | All or a portion of the shares have been pledged as collateral for the bank line of credit (Note 5). |
(c) | Percentage rounds to less than 0.1%. |
(d) | The rate shown is the 7-day effective yield as of November 30, 2015. |
See accompanying notes to financial statements. |
21
BARROW LONG/SHORT OPPORTUNITY FUND
SCHEDULE OF INVESTMENTS
November 30, 2015 (Unaudited) |
COMMON STOCKS — 122.0% | | Shares | | | Value | |
Consumer Discretionary — 24.1% | | | | | | |
Auto Components — 1.4% | | | | | | |
Gentex Corporation (b) | | | 8,502 | | | $ | 142,281 | |
Motorcar Parts of America, Inc. (a)(b) | | | 1,667 | | | | 66,780 | |
Visteon Corporation (a)(b) | | | 594 | | | | 71,227 | |
| | | | | | | | 280,288 | |
Automobiles — 1.2% | | | | | | | | |
Thor Industries, Inc. (b) | | | 3,991 | | | | 231,159 | |
| | | | | | | | | |
Diversified Consumer Services — 2.2% | | | | | | | | |
H&R Block, Inc. (b) | | | 11,825 | | | | 433,859 | |
| | | | | | | | | |
Hotels, Restaurants & Leisure — 0.4% | | | | | | | | |
Interval Leisure Group, Inc. (b) | | | 5,779 | | | | 90,268 | |
| | | | | | | | | |
Household Durables — 0.7% | | | | | | | | |
GoPro, Inc. - Class A (a)(b) | | | 3,094 | | | | 63,117 | |
Tupperware Brands Corporation (b) | | | 1,353 | | | | 76,810 | |
| | | | | | | | 139,927 | |
Internet & Catalog Retail — 0.6% | | | | | | | | |
Lands' End, Inc. (a)(b) | | | 5,126 | | | | 123,229 | |
| | | | | | | | | |
Leisure Products — 2.2% | | | | | | | | |
Nautilus, Inc. (a)(b) | | | 8,330 | | | | 160,019 | |
Polaris Industries, Inc. (b) | | | 237 | | | | 24,987 | |
Smith & Wesson Holding Corporation (a)(b) | | | 8,160 | | | | 149,654 | |
Sturm, Ruger & Company, Inc. (b) | | | 2,066 | | | | 107,639 | |
| | | | | | | | 442,299 | |
Media — 6.3% | | | | | | | | |
Crown Media Holdings, Inc. - Class A (a)(b) | | | 21,135 | | | | 119,835 | |
Interpublic Group of Companies, Inc. (b) | | | 14,189 | | | | 326,347 | |
MSG Networks, Inc. - Class A (a)(b) | | | 3,369 | | | | 66,639 | |
National CineMedia, Inc. (b) | | | 9,348 | | | | 148,353 | |
Omnicom Group, Inc. (b) | | | 5,201 | | | | 384,458 | |
Scripps Networks Interactive, Inc. - Class A (b) | | | 1,586 | | | | 90,085 | |
TEGNA, Inc. (b) | | | 932 | | | | 26,329 | |
Time, Inc. (b) | | | 3,318 | | | | 55,212 | |
Viacom, Inc. - Class B (b) | | | 1,055 | | | | 52,528 | |
| | | | | | | | 1,269,786 | |
22
BARROW LONG/SHORT OPPORTUNITY FUND
SCHEDULE OF INVESTMENTS (Continued) |
COMMON STOCKS — 122.0% (Continued) | | Shares | | | Value | |
Consumer Discretionary — 24.1% (Continued) | | | | | | |
Specialty Retail — 7.1% | | | | | | |
Bed Bath & Beyond, Inc. (a)(b) | | | 970 | | | $ | 52,884 | |
Buckle, Inc. (The) (b) | | | 3,954 | | | | 125,540 | |
Cato Corporation (The) - Class A (b) | | | 3,144 | | | | 123,496 | |
Foot Locker, Inc. (b) | | | 769 | | | | 49,985 | |
Francesca's Holdings Corporation (a)(b) | | | 11,942 | | | | 178,294 | |
GameStop Corporation - Class A (b) | | | 9,675 | | | | 338,915 | |
Gap, Inc. (The) (b) | | | 1,813 | | | | 48,461 | |
GNC Holdings, Inc. - Class A (b) | | | 2,027 | | | | 60,425 | |
Michaels Companies, Inc. (The) (a)(b) | | | 2,061 | | | | 45,775 | |
Outerwall, Inc. (b) | | | 5,123 | | | | 317,114 | |
Winmark Corporation (b) | | | 679 | | | | 64,845 | |
Zumiez, Inc. (a)(b) | | | 993 | | | | 14,984 | |
| | | | | | | | 1,420,718 | |
Textiles, Apparel & Luxury Goods — 2.0% | | | | | | | | |
Coach, Inc. (b) | | | 1,328 | | | | 42,191 | |
Deckers Outdoor Corporation (a)(b) | | | 920 | | | | 45,025 | |
Fossil Group, Inc. (a)(b) | | | 717 | | | | 27,583 | |
Iconix Brand Group, Inc. (a)(b) | | | 1,155 | | | | 8,131 | |
Steven Madden Ltd. (a)(b) | | | 7,805 | | | | 248,980 | |
Tumi Holdings, Inc. (a)(b) | | | 1,434 | | | | 25,324 | |
| | | | | | | | 397,234 | |
Consumer Staples — 26.7% | | | | | | | | |
Beverages — 3.6% | | | | | | | | |
Boston Beer Company, Inc. (The) - Class A (a)(b) | | | 91 | | | | 19,440 | |
Brown-Forman Corporation - Class B (b) | | | 2 | | | | 205 | |
Dr Pepper Snapple Group, Inc. (b) | | | 3,327 | | | | 298,598 | |
National Beverage Corporation (a)(b) | | | 7,909 | | | | 343,646 | |
PepsiCo, Inc. (b) | | | 645 | | | | 64,603 | |
| | | | | | | | 726,492 | |
Food & Staples Retailing — 1.2% | | | | | | | | |
CVS Health Corporation (b) | | | 271 | | | | 25,498 | |
Fresh Market, Inc. (The) (a)(b) | | | 6,398 | | | | 153,424 | |
Smart & Final Stores, Inc. (a)(b) | | | 2,760 | | | | 48,493 | |
Sprouts Farmers Market, Inc. (a)(b) | | | 782 | | | | 18,870 | |
| | | | | | | | 246,285 | |
Food Products — 5.7% | | | | | | | | |
B&G Foods, Inc. (b) | | | 3,836 | | | | 144,924 | |
Cal-Maine Foods, Inc. (b) | | | 3,556 | | | | 193,838 | |
Hormel Foods Corporation (b) | | | 802 | | | | 60,086 | |
John B. Sanfilippo & Son, Inc. (b) | | | 2,124 | | | | 122,236 | |
23
BARROW LONG/SHORT OPPORTUNITY FUND
SCHEDULE OF INVESTMENTS (Continued) |
COMMON STOCKS — 122.0% (Continued) | | Shares | | | Value | |
Consumer Staples — 26.7% (Continued) | | | | | | |
Food Products — 5.7% (Continued) | | | | | | |
Kellogg Company (b) | | | 314 | | | $ | 21,594 | |
Keurig Green Mountain, Inc. (b) | | | 2,346 | | | | 122,930 | |
Lancaster Colony Corporation (b) | | | 1,667 | | | | 193,805 | |
Mead Johnson Nutrition Company (b) | | | 259 | | | | 20,873 | |
Pilgrim's Pride Corporation (b) | | | 3,816 | | | | 82,159 | |
Pinnacle Foods, Inc. (b) | | | 3,656 | | | | 159,182 | |
Seaboard Corporation (a)(b) | | | 7 | | | | 23,100 | |
| | | | | | | | 1,144,727 | |
Household Products — 3.0% | | | | | | | | |
Clorox Company (The) (b) | | | 1,283 | | | | 159,477 | |
WD-40 Company (b) | | | 4,335 | | | | 428,168 | |
| | | | | | | | 587,645 | |
Personal Products — 5.9% | | | | | | | | |
Avon Products, Inc. (b) | | | 368 | | | | 1,270 | |
Herbalife Ltd. (a)(b) | | | 7,228 | | | | 417,272 | |
Natural Health Trends Corporation (b) | | | 3,012 | | | | 145,751 | |
Nu Skin Enterprises, Inc. - Class A (b) | | | 4,258 | | | | 148,476 | |
Revlon, Inc. - Class A (a)(b) | | | 1,941 | | | | 53,145 | |
USANA Health Sciences, Inc. (a)(b) | | | 3,111 | | | | 416,687 | |
| | | | | | | | 1,182,601 | |
Tobacco — 7.3% | | | | | | | | |
Altria Group, Inc. (b) | | | 5,678 | | | | 327,053 | |
Philip Morris International, Inc. (b) | | | 3,653 | | | | 319,236 | |
Reynolds American, Inc. (b) | | | 7,273 | | | | 336,376 | |
Universal Corporation (b) | | | 2,278 | | | | 128,798 | |
Vector Group Ltd. (b) | | | 13,994 | | | | 354,188 | |
| | | | | | | | 1,465,651 | |
Energy — 13.1% | | | | | | | | |
Energy Equipment & Services — 3.3% | | | | | | | | |
Forum Energy Technologies, Inc. (a)(b) | | | 3,573 | | | | 55,953 | |
Halliburton Company (b) | | | 1,095 | | | | 43,636 | |
Helmerich & Payne, Inc. (b) | | | 641 | | | | 37,338 | |
National Oilwell Varco, Inc. (b) | | | 3,780 | | | | 141,145 | |
Oceaneering International, Inc. (b) | | | 4,369 | | | | 191,100 | |
Oil States International, Inc. (a)(b) | | | 1,831 | | | | 58,079 | |
RPC, Inc. (b) | | | 6,441 | | | | 85,343 | |
Schlumberger Ltd. (b) | | | 583 | | | | 44,979 | |
| | | | | | | | 657,573 | |
24
BARROW LONG/SHORT OPPORTUNITY FUND
SCHEDULE OF INVESTMENTS (Continued) |
COMMON STOCKS — 122.0% (Continued) | | Shares | | | Value | |
Energy — 13.1% (Continued) | | | | | | |
Oil, Gas & Consumable Fuels — 9.8% | | | | | | |
Alliance Resource Partners, L.P. (b) | | | 4,030 | | | $ | 69,114 | |
Alon USA Energy, Inc. (b) | | | 3,537 | | | | 62,216 | |
Alon USA Partners, L.P. (b) | | | 10,232 | | | | 259,790 | |
CVR Energy, Inc. (b) | | | 1,801 | | | | 85,998 | |
CVR Refining, L.P. (b) | | | 2,919 | | | | 63,226 | |
Exxon Mobil Corporation (b) | | | 242 | | | | 19,762 | |
Green Plains, Inc. (b) | | | 2,477 | | | | 58,680 | |
HollyFrontier Corporation (b) | | | 681 | | | | 32,742 | |
Marathon Oil Corporation (b) | | | 209 | | | | 3,660 | |
Marathon Petroleum Corporation (b) | | | 5,403 | | | | 315,589 | |
PBF Logistics, L.P. (b) | | | 3,660 | | | | 72,212 | |
Permian Basin Royalty Trust (b) | | | 458 | | | | 2,954 | |
Phillips 66 (b) | | | 57 | | | | 5,217 | |
REX American Resources Corporation (a)(b) | | | 1,066 | | | | 66,998 | |
Tesoro Corporation (b) | | | 833 | | | | 95,937 | |
Valero Energy Corporation (b) | | | 2,482 | | | | 178,356 | |
Western Refining, Inc. (b) | | | 10,515 | | | | 475,909 | |
World Fuel Services Corporation (b) | | | 1,967 | | | | 85,742 | |
| | | | | | | | 1,954,102 | |
Financials — 0.0% | | | | | | | | |
Insurance — 0.0% | | | | | | | | |
Gerova Financial Group Ltd. (a)(b)(c) | | | 2 | | | | 0 | |
| | | | | | | | | |
Health Care — 23.1% | | | | | | | | |
Health Care Equipment & Supplies — 5.3% | | | | | | | | |
Align Technology, Inc. (a)(b) | | | 459 | | | | 30,634 | |
Anika Therapeutics, Inc. (a)(b) | | | 4,963 | | | | 208,247 | |
Atrion Corporation (b) | | | 114 | | | | 47,983 | |
C.R. Bard, Inc. (b) | | | 270 | | | | 50,441 | |
Edwards Lifesciences Corporation (a)(b) | | | 467 | | | | 76,121 | |
Globus Medical, Inc. - Class A (a)(b) | | | 10,284 | | | | 279,005 | |
LivaNova plc (a)(b) | | | 1,425 | | | | 85,286 | |
Meridian Bioscience, Inc. (b) | | | 10,841 | | | | 212,158 | |
Varian Medical Systems, Inc. (a)(b) | | | 861 | | | | 69,552 | |
| | | | | | | | 1,059,427 | |
Health Care Providers & Services — 12.8% | | | | | | | | |
AmerisourceBergen Corporation (b) | | | 4 | | | | 395 | |
AmSurg Corporation (a)(b) | | | 4,550 | | | | 382,473 | |
Cardinal Health, Inc. (b) | | | 1,892 | | | | 164,320 | |
Chemed Corporation (b) | | | 2,190 | | | | 338,333 | |
25
BARROW LONG/SHORT OPPORTUNITY FUND
SCHEDULE OF INVESTMENTS (Continued) |
COMMON STOCKS — 122.0% (Continued) | | Shares | | | Value | |
Health Care — 23.1% (Continued) | | | | | | |
Health Care Providers & Services — 12.8% (Continued) | | | | | | |
CorVel Corporation (a)(b) | | | 2,504 | | | $ | 97,030 | |
DaVita HealthCare Partners, Inc. (a)(b) | | | 1,162 | | | | 84,873 | |
Ensign Group, Inc. (The) (b) | | | 1,022 | | | | 48,617 | |
HCA Holdings, Inc. (a)(b) | | | 557 | | | | 37,909 | |
HealthSouth Corporation (b) | | | 5,581 | | | | 196,395 | |
Laboratory Corporation of America Holdings (a)(b) | | | 23 | | | | 2,795 | |
LHC Group, Inc. (a)(b) | | | 1,877 | | | | 87,374 | |
McKesson Corporation (b) | | | 31 | | | | 5,870 | |
MEDNAX, Inc. (a)(b) | | | 4,145 | | | | 295,829 | |
Patterson Companies, Inc. (b) | | | 485 | | | | 22,102 | |
Premier, Inc. - Class A (a)(b) | | | 6,588 | | | | 226,364 | |
Quest Diagnostics, Inc. (b) | | | 4,301 | | | | 293,844 | |
Select Medical Holdings Corporation (b) | | | 3,054 | | | | 36,862 | |
U.S. Physical Therapy, Inc. (b) | | | 4,436 | | | | 234,398 | |
| | | | | | | | 2,555,783 | |
Health Care Technology — 1.0% | | | | | | | | |
Computer Programs & Systems, Inc. (b) | | | 4,273 | | | | 208,181 | |
| | | | | | | | | |
Pharmaceuticals — 4.0% | | | | | | | | |
ANI Pharmaceuticals, Inc. (a)(b) | | | 1,019 | | | | 44,653 | |
Johnson & Johnson (b) | | | 3,018 | | | | 305,542 | |
Prestige Brands Holdings, Inc. (a)(b) | | | 3,642 | | | | 185,341 | |
Sucampo Pharmaceuticals, Inc. - Class A (a)(b) | | | 3,769 | | | | 64,638 | |
Supernus Pharmaceuticals, Inc. (a)(b) | | | 12,561 | | | | 202,986 | |
| | | | | | | | 803,160 | |
Industrials — 15.2% | | | | | | | | |
Aerospace & Defense — 2.7% | | | | | | | | |
B/E Aerospace, Inc. (b) | | | 284 | | | | 13,126 | |
BWX Technologies, Inc. (b) | | | 2,645 | | | | 80,540 | |
Honeywell International, Inc. (b) | | | 446 | | | | 46,362 | |
Northrop Grumman Corporation (b) | | | 1,257 | | | | 234,254 | |
Raytheon Company (b) | | | 1,054 | | | | 130,728 | |
United Technologies Corporation (b) | | | 460 | | | | 44,183 | |
| | | | | | | | 549,193 | |
Air Freight & Logistics — 0.7% | | | | | | | | |
C.H. Robinson Worldwide, Inc. (b) | | | 633 | | | | 42,683 | |
Expeditors International of Washington, Inc. (b) | | | 1,905 | | | | 92,469 | |
| | | | | | | | 135,152 | |
26
BARROW LONG/SHORT OPPORTUNITY FUND
SCHEDULE OF INVESTMENTS (Continued) |
COMMON STOCKS — 122.0% (Continued) | | Shares | | | Value | |
Industrials — 15.2% (Continued) | | | | | | |
Commercial Services & Supplies — 2.1% | | | | | | |
Deluxe Corporation (b) | | | 5,249 | | | $ | 307,854 | |
Pitney Bowes, Inc. (b) | | | 4,338 | | | | 93,700 | |
UniFirst Corporation (b) | | | 167 | | | | 18,133 | |
| | | | | | | | 419,687 | |
Construction & Engineering — 0.7% | | | | | | | | |
Argan, Inc. (b) | | | 3,606 | | | | 141,752 | |
| | | | | | | | | |
Electrical Equipment — 2.4% | | | | | | | | |
Babcock & Wilcox Enterprises, Inc. (a)(b) | | | 1,678 | | | | 32,134 | |
Generac Holdings, Inc. (a)(b) | | | 687 | | | | 22,052 | |
Hubbell, Inc. - Class B (b) | | | 490 | | | | 48,652 | |
Rockwell Automation, Inc. (b) | | | 1,743 | | | | 185,525 | |
Thermon Group Holdings, Inc. (a)(b) | | | 10,238 | | | | 186,434 | |
| | | | | | | | 474,797 | |
Machinery — 1.8% | | | | | | | | |
Douglas Dynamics, Inc. (b) | | | 2,909 | | | | 67,664 | |
Federal Signal Corporation (b) | | | 6,055 | | | | 102,087 | |
Graco, Inc. (b) | | | 308 | | | | 23,242 | |
Hillenbrand, Inc. (b) | | | 852 | | | | 25,807 | |
ITT Corporation (b) | | | 606 | | | | 24,064 | |
Joy Global, Inc. (b) | | | 86 | | | | 1,320 | |
Oshkosh Corporation (b) | | | 563 | | | | 24,693 | |
PACCAR, Inc. (b) | | | 384 | | | | 19,953 | |
Sun Hydraulics Corporation (b) | | | 611 | | | | 20,120 | |
Valmont Industries, Inc. (b) | | | 111 | | | | 13,015 | |
Wabash National Corporation (a)(b) | | | 3,565 | | | | 46,238 | |
| | | | | | | | 368,203 | |
Professional Services — 3.8% | | | | | | | | |
Dun & Bradstreet Corporation (The) (b) | | | 1,096 | | | | 118,138 | |
Huron Consulting Group, Inc. (a)(b) | | | 533 | | | | 30,919 | |
Insperity, Inc. (b) | | | 397 | | | | 17,135 | |
Korn/Ferry International (b) | | | 1,375 | | | | 50,600 | |
Resources Connection, Inc. (b) | | | 5,614 | | | | 102,455 | |
Robert Half International, Inc. (b) | | | 1,816 | | | | 92,943 | |
RPX Corporation (a)(b) | | | 25,122 | | | | 348,442 | |
| | | | | | | | 760,632 | |
Road & Rail — 0.7% | | | | | | | | |
Landstar System, Inc. (b) | | | 1,851 | | | | 115,540 | |
Universal Truckload Services, Inc. (b) | | | 1,139 | | | | 18,497 | |
| | | | | | | | 134,037 | |
27
BARROW LONG/SHORT OPPORTUNITY FUND
SCHEDULE OF INVESTMENTS (Continued) |
COMMON STOCKS — 122.0% (Continued) | | Shares | | | Value | |
Industrials — 15.2% (Continued) | | | | | | |
Trading Companies & Distributors — 0.3% | | | | | | |
Grainger (W.W.), Inc. (b) | | | 219 | | | $ | 43,918 | |
MSC Industrial Direct Company, Inc. - Class A (b) | | | 292 | | | | 18,017 | |
| | | | | | | | 61,935 | |
Information Technology — 8.3% | | | | | | | | |
Communications Equipment — 1.9% | | | | | | | | |
Brocade Communications Systems, Inc. (b) | | | 13,103 | | | | 122,972 | |
Cisco Systems, Inc. (b) | | | 928 | | | | 25,288 | |
InterDigital, Inc. (b) | | | 2,699 | | | | 142,210 | |
QUALCOMM, Inc. (b) | | | 1,527 | | | | 74,502 | |
Ubiquiti Networks, Inc. (a)(b) | | | 724 | | | | 25,261 | |
| | | | | | | | 390,233 | |
Electronic Equipment, Instruments &
Components — 1.4% | | | | | | | | |
Dolby Laboratories, Inc. - Class A | | | 716 | | | | 24,759 | |
IPG Photonics Corporation (a)(b) | | | 569 | | | | 51,887 | |
Methode Electronics, Inc. (b) | | | 3,832 | | | | 138,259 | |
Park Electrochemical Corporation (b) | | | 1,072 | | | | 18,771 | |
PC Connection, Inc. (a)(b) | | | 1,882 | | | | 42,006 | |
| | | | | | | | 275,682 | |
Internet Software & Services — 0.4% | | | | | | | | |
eBay, Inc. (a)(b) | | | 2,632 | | | | 77,881 | |
| | | | | | | | | |
IT Services — 2.3% | | | | | | | | |
NeuStar, Inc. - Class A (a)(b) | | | 5,086 | | | | 128,167 | |
Science Applications International Corporation (b) | | | 2,409 | | | | 121,028 | |
Syntel, Inc. (a)(b) | | | 3,089 | | | | 149,601 | |
Western Union Company (The) (b) | | | 3,571 | | | | 67,349 | |
| | | | | | | | 466,145 | |
Software — 1.6% | | | | | | | | |
CA, Inc. (b) | | | 4,825 | | | | 135,631 | |
ePlus, Inc. (a)(b) | | | 284 | | | | 25,046 | |
MicroStrategy, Inc. - Class A (a)(b) | | | 131 | | | | 22,711 | |
TiVo, Inc. (a)(b) | | | 14,581 | | | | 131,083 | |
| | | | | | | | 314,471 | |
Technology Hardware, Storage & Peripherals — 0.7% | | | | | | | | |
Apple, Inc. (b) | | | 1,187 | | | | 140,422 | |
28
BARROW LONG/SHORT OPPORTUNITY FUND
SCHEDULE OF INVESTMENTS (Continued) |
COMMON STOCKS — 122.0% (Continued) | | Shares | | | Value | |
Materials — 11.5% | | | | | | |
Chemicals — 8.5% | | | | | | |
Albemarle Corporation (b) | | | 267 | | | $ | 14,300 | |
Celanese Corporation - Series A (b) | | | 599 | | | | 42,379 | |
CF Industries Holdings, Inc. (b) | | | 1,991 | | | | 91,865 | |
Chemtura Corporation (a)(b) | | | 7,647 | | | | 234,916 | |
Ferro Corporation (a)(b) | | | 1,652 | | | | 19,841 | |
Flotek Industries, Inc. (a)(b) | | | 3,374 | | | | 38,531 | |
FutureFuel Corporation (b) | | | 9,726 | | | | 139,276 | |
Innospec, Inc. (b) | | | 4,179 | | | | 244,054 | |
Koppers Holdings, Inc. (a)(b) | | | 196 | | | | 4,475 | |
LyondellBasell Industries N.V. - Class A (b) | | | 2,538 | | | | 243,191 | |
NewMarket Corporation (b) | | | 121 | | | | 49,991 | |
OCI Partners, L.P. (b) | | | 2,179 | | | | 17,672 | |
Terra Nitrogen Company, L.P. (b) | | | 1,596 | | | | 167,899 | |
Trinseo S.A. (a)(b) | | | 600 | | | | 17,136 | |
Valspar Corporation (The) (b) | | | 648 | | | | 54,750 | |
Westlake Chemical Corporation (b) | | | 3,710 | | | | 222,785 | |
Westlake Chemical Partners, L.P. (b) | | | 6,222 | | | | 96,939 | |
| | | | | | | | 1,700,000 | |
Containers & Packaging — 1.3% | | | | | | | | |
Avery Dennison Corporation (b) | | | 2,325 | | | | 153,357 | |
Owens-Illinois, Inc. (a)(b) | | | 1,792 | | | | 34,568 | |
Sonoco Products Company (b) | | | 1,541 | | | | 67,526 | |
| | | | | | | | 255,451 | |
Metals & Mining — 1.7% | | | | | | | | |
Ciner Resources, L.P. (b) | | | 3,275 | | | | 73,393 | |
Compass Minerals International, Inc. (b) | | | 3,142 | | | | 264,368 | |
Reliance Steel & Aluminum Company (b) | | | 7 | | | | 411 | |
| | | | | | | | 338,172 | |
| | | | | | | | | |
Total Common Stocks (Cost $22,635,858) | | | | | | $ | 24,424,239 | |
29
BARROW LONG/SHORT OPPORTUNITY FUND
SCHEDULE OF INVESTMENTS (Continued) |
EXCHANGE-TRADED FUNDS — 0.1% | | Shares | | | Value | |
SPDR® S&P 500® ETF Trust (Cost $11,035) | | | 53 | | | $ | 11,060 | |
MONEY MARKET FUNDS — 2.6% | | Shares | | | Value | |
Fidelity Institutional Money Market Government Portfolio - Class I, 0.01% (d) (Cost $529,259) | | | 529,259 | | | $ | 529,259 | |
| | | | | | | | | |
Total Investments at Value — 124.7% (Cost $23,176,152) | | | | | | $ | 24,964,558 | |
| | | | | | | | | |
Liabilities in Excess of Other Assets (e) — (24.7%) | | | | | | | (4,937,687 | ) |
| | | | | | | | | |
Net Assets — 100.0% | | | | | | $ | 20,026,871 | |
(a) | Non-income producing security. |
(b) | All or a portion of the shares have been pledged as collateral for open short positions (Note 2). |
(c) | Security value has been determined in good faith pursuant to procedures adopted by the Board of Trustees. The total value of such securities is $0 at November 30, 2015 representing 0.0%of net assets (Note 2). |
(d) | The rate shown is the 7-day effective yield as of November 30, 2015. |
(e) | Includes cash held as margin deposits for open short positions. |
See accompanying notes to financial statements. |
30
BARROW LONG/SHORT OPPORTUNITY FUND
SCHEDULE OF SECURITIES SOLD SHORT
November 30, 2015 (Unaudited) |
COMMON STOCKS — 83.8% | | Shares | | | Value | |
Consumer Discretionary — 18.1% | | | | | | |
Auto Components — 0.3% | | | | | | |
BorgWarner, Inc. | | | 58 | | | $ | 2,476 | |
Cooper-Standard Holdings, Inc. | | | 32 | | | | 2,366 | |
Fox Factory Holding Corporation | | | 530 | | | | 9,418 | |
Horizon Global Corporation | | | 37 | | | | 321 | |
Johnson Controls, Inc. | | | 80 | | | | 3,680 | |
Modine Manufacturing Company | | | 1,202 | | | | 11,287 | |
Superior Industries International, Inc. | | | 1,545 | | | | 30,143 | |
| | | | | | | | 59,691 | |
Automobiles — 0.2% | | | | | | | | |
General Motors Company | | | 440 | | | | 15,928 | |
Tesla Motors, Inc. | | | 98 | | | | 22,566 | |
| | | | | | | | 38,494 | |
Distributors — 0.3% | | | | | | | | |
Core-Mark Holding Company, Inc. | | | 456 | | | | 38,892 | |
LKQ Corporation | | | 395 | | | | 11,649 | |
| | | | | | | | 50,541 | |
Diversified Consumer Services — 0.4% | | | | | | | | |
Carriage Services, Inc. | | | 108 | | | | 2,667 | |
Liberty Tax, Inc. | | | 77 | | | | 1,705 | |
LifeLock, Inc. | | | 691 | | | | 9,978 | |
Matthews International Corporation - Class A | | | 360 | | | | 21,532 | |
Regis Corporation | | | 2,228 | | | | 37,118 | |
Sotheby's | | | 277 | | | | 7,842 | |
StoneMor Partners, L.P. | | | 66 | | | | 1,837 | |
| | | | | | | | 82,679 | |
Hotels, Restaurants & Leisure — 5.9% | | | | | | | | |
Aramark | | | 737 | | | | 24,041 | |
Biglari Holdings, Inc. | | | 88 | | | | 32,475 | |
BJ's Restaurants, Inc. | | | 619 | | | | 28,350 | |
Bloomin' Brands, Inc. | | | 1,581 | | | | 27,367 | |
Bob Evans Farms, Inc. | | | 717 | | | | 28,572 | |
Brinker International, Inc. | | | 261 | | | | 11,907 | |
Buffalo Wild Wings, Inc. | | | 198 | | | | 31,728 | |
Carnival Corporation | | | 483 | | | | 24,406 | |
Carrols Restaurant Group, Inc. | | | 165 | | | | 1,987 | |
Cedar Fair, L.P. | | | 566 | | | | 31,877 | |
Cheesecake Factory, Inc. (The) | | | 669 | | | | 31,530 | |
Chipotle Mexican Grill, Inc. | | | 34 | | | | 19,705 | |
31
BARROW LONG/SHORT OPPORTUNITY FUND
SCHEDULE OF SECURITIES SOLD SHORT (Continued) |
COMMON STOCKS — 83.8% (Continued) | | Shares | | | Value | |
Consumer Discretionary — 18.1% (Continued) | | | | | | |
Hotels, Restaurants & Leisure — 5.9% (Continued) | | | | | | |
Churchill Downs, Inc. | | | 283 | | | $ | 41,587 | |
Chuy's Holdings, Inc. | | | 352 | | | | 11,704 | |
ClubCorp Holdings, Inc. | | | 1,655 | | | | 29,707 | |
Cracker Barrel Old Country Store, Inc. | | | 77 | | | | 9,696 | |
Darden Restaurants, Inc. | | | 365 | | | | 20,502 | |
Dave & Buster's Entertainment, Inc. | | | 525 | | | | 20,129 | |
Del Frisco's Restaurant Group, Inc. | | | 600 | | | | 8,994 | |
Del Taco Restaurants, Inc. | | | 873 | | | | 9,638 | |
Diamond Resorts International, Inc. | | | 603 | | | | 16,950 | |
Extended Stay America, Inc. | | | 1,828 | | | | 31,277 | |
Fiesta Restaurant Group, Inc. | | | 414 | | | | 15,910 | |
Four Corners Property Trust, Inc. | | | 110 | | | | 2,171 | |
Habit Restaurants, Inc. (The) - Class A | | | 97 | | | | 2,337 | |
Hilton Worldwide Holdings, Inc. | | | 864 | | | | 20,062 | |
Hyatt Hotels Corporation - Class A | | | 404 | | | | 19,913 | |
International Speedway Corporation - Class A | | | 841 | | | | 29,931 | |
Jack in the Box, Inc. | | | 263 | | | | 19,499 | |
Krispy Kreme Doughnuts, Inc. | | | 991 | | | | 14,013 | |
La Quinta Holdings, Inc. | | | 1,714 | | | | 25,693 | |
Las Vegas Sands Corporation | | | 248 | | | | 10,927 | |
Marcus Corporation (The) | | | 1,460 | | | | 29,054 | |
Marriott International, Inc. - Class A | | | 143 | | | | 10,140 | |
Marriott Vacations Worldwide Corporation | | | 447 | | | | 27,191 | |
McDonald's Corporation | | | 35 | | | | 3,996 | |
MGM Resorts International | | | 934 | | | | 21,239 | |
Norwegian Cruise Line Holdings Ltd. | | | 443 | | | | 25,446 | |
Panera Bread Company - Class A | | | 56 | | | | 10,181 | |
Papa John's International, Inc. | | | 271 | | | | 15,577 | |
Penn National Gaming, Inc. | | | 1,321 | | | | 21,070 | |
Red Robin Gourmet Burgers, Inc. | | | 357 | | | | 24,090 | |
Royal Caribbean Cruises Ltd. | | | 276 | | | | 25,560 | |
Ruby Tuesday, Inc. | | | 318 | | | | 1,759 | |
Ruth's Hospitality Group, Inc. | | | 1,506 | | | | 25,978 | |
SeaWorld Entertainment, Inc. | | | 1,148 | | | | 20,101 | |
Six Flags Entertainment Corporation | | | 748 | | | | 38,821 | |
Sonic Corporation | | | 567 | | | | 16,477 | |
Speedway Motorsports, Inc. | | | 1,622 | | | | 31,613 | |
Starbucks Corporation | | | 400 | | | | 24,556 | |
Starwood Hotels & Resorts Worldwide, Inc. | | | 294 | | | | 21,121 | |
Texas Roadhouse, Inc. | | | 957 | | | | 33,495 | |
32
BARROW LONG/SHORT OPPORTUNITY FUND
SCHEDULE OF SECURITIES SOLD SHORT (Continued) |
COMMON STOCKS — 83.8% (Continued) | | Shares | | | Value | |
Consumer Discretionary — 18.1% (Continued) | | | | | | |
Hotels, Restaurants & Leisure — 5.9% (Continued) | | | | | | |
Vail Resorts, Inc. | | | 347 | | | $ | 41,848 | |
Wendy's Company (The) | | | 3,405 | | | | 35,787 | |
Wynn Resorts Ltd. | | | 122 | | | | 7,658 | |
Yum! Brands, Inc. | | | 230 | | | | 16,677 | |
Zoe's Kitchen, Inc. | | | 62 | | | | 2,109 | |
| | | | | | | | 1,186,129 | |
Household Durables — 2.5% | | | | | | | | |
CalAtlantic Group, Inc. | | | 690 | | | | 29,049 | |
Cavco Industries, Inc. | | | 56 | | | | 5,191 | |
Century Communities, Inc. | | | 198 | | | | 3,778 | |
D.R. Horton, Inc. | | | 819 | | | | 26,462 | |
Harman International Industries, Inc. | | | 146 | | | | 15,061 | |
Helen of Troy Ltd. | | | 30 | | | | 3,102 | |
Installed Building Products, Inc. | | | 1,277 | | | | 32,002 | |
Jarden Corporation | | | 450 | | | | 21,006 | |
Leggett & Platt, Inc. | | | 461 | | | | 21,483 | |
Lennar Corporation - Class A | | | 460 | | | | 23,557 | |
LGI Homes, Inc. | | | 91 | | | | 3,027 | |
Libbey, Inc. | | | 752 | | | | 18,868 | |
M/I Homes, Inc. | | | 1,098 | | | | 25,649 | |
MDC Holdings, Inc. | | | 1,028 | | | | 26,964 | |
Meritage Homes Corporation | | | 524 | | | | 19,550 | |
Mohawk Industries, Inc. | | | 119 | | | | 22,696 | |
Newell Rubbermaid, Inc. | | | 578 | | | | 25,813 | |
PulteGroup, Inc. | | | 724 | | | | 14,104 | |
Stanley Black & Decker, Inc. | | | 44 | | | | 4,803 | |
Taylor Morrison Home Corporation - Class A | | | 985 | | | | 17,237 | |
Tempur Sealy International, Inc. | | | 141 | | | | 11,209 | |
Toll Brothers, Inc. | | | 628 | | | | 23,349 | |
TRI Pointe Group, Inc. | | | 2,378 | | | | 33,173 | |
Universal Electronics, Inc. | | | 432 | | | | 22,892 | |
WCI Communities, Inc. | | | 1,255 | | | | 30,384 | |
Whirlpool Corporation | | | 102 | | | | 16,577 | |
| | | | | | | | 496,986 | |
Internet & Catalog Retail — 0.9% | | | | | | | | |
1-800-FLOWERS.COM, Inc. - Class A | | | 1,508 | | | | 11,657 | |
Amazon.com, Inc. | | | 53 | | | | 35,235 | |
Etsy, Inc. | | | 194 | | | | 1,806 | |
Expedia, Inc. | | | 108 | | | | 13,296 | |
FTD Companies, Inc. | | | 387 | | | | 10,263 | |
33
BARROW LONG/SHORT OPPORTUNITY FUND
SCHEDULE OF SECURITIES SOLD SHORT (Continued) |
COMMON STOCKS — 83.8% (Continued) | | Shares | | | Value | |
Consumer Discretionary — 18.1% (Continued) | | | | | | |
Internet & Catalog Retail — 0.9% (Continued) | | | | | | |
Groupon, Inc. | | | 6,193 | | | $ | 17,898 | |
Liberty TripAdvisor Holdings, Inc. - Series A | | | 182 | | | | 5,449 | |
Netflix, Inc. | | | 295 | | | | 36,382 | |
Overstock.com, Inc. | | | 731 | | | | 9,620 | |
Shutterfly, Inc. | | | 221 | | | | 10,144 | |
TripAdvisor, Inc. | | | 289 | | | | 23,805 | |
| | | | | | | | 175,555 | |
Leisure Products — 0.3% | | | | | | | | |
Callaway Golf Company | | | 3,782 | | | | 38,123 | |
Hasbro, Inc. | | | 26 | | | | 1,900 | |
Mattel, Inc. | | | 511 | | | | 12,703 | |
| | | | | | | | 52,726 | |
Media — 2.2% | | | | | | | | |
AMC Entertainment Holdings, Inc. - Class A | | | 1,186 | | | | 30,136 | |
Carmike Cinemas, Inc. | | | 1,072 | | | | 23,423 | |
Cinemark Holdings, Inc. | | | 127 | | | | 4,407 | |
DISH Network Corporation - Class A | | | 330 | | | | 20,694 | |
DreamWorks Animation SKG, Inc. - Class A | | | 623 | | | | 15,351 | |
E.W. Scripps Company (The) - Class A | | | 1,701 | | | | 37,320 | |
Global Eagle Entertainment, Inc. | | | 2,649 | | | | 28,689 | |
Journal Media Group, Inc. | | | 1 | | | | 9 | |
Lamar Advertising Company - Class A | | | 42 | | | | 2,453 | |
Liberty Media Corporation - Series A | | | 468 | | | | 18,959 | |
Lions Gate Entertainment Corporation | | | 377 | | | | 12,795 | |
Live Nation Entertainment, Inc. | | | 912 | | | | 23,156 | |
Loral Space & Communications, Inc. | | | 191 | | | | 8,450 | |
Madison Square Garden Company (The) - Class A | | | 29 | | | | 4,657 | |
Morningstar, Inc. | | | 279 | | | | 22,529 | |
New Media Investment Group, Inc. | | | 1,502 | | | | 27,351 | |
New York Times Company (The) - Class A | | | 2,626 | | | | 36,974 | |
News Corporation - Class A | | | 1,537 | | | | 22,056 | |
Pandora Media, Inc. | | | 502 | | | | 6,928 | |
Regal Entertainment Group - Class A | | | 1,378 | | | | 25,837 | |
Scholastic Corporation | | | 826 | | | | 35,287 | |
Sirius XM Holdings, Inc. | | | 3,106 | | | | 12,766 | |
Tribune Media Company - Class A | | | 463 | | | | 18,062 | |
| | | | | | | | 438,289 | |
Multiline Retail — 0.6% | | | | | | | | |
Big Lots, Inc. | | | 59 | | | | 2,654 | |
Burlington Stores, Inc. | | | 677 | | | | 32,570 | |
34
BARROW LONG/SHORT OPPORTUNITY FUND
SCHEDULE OF SECURITIES SOLD SHORT (Continued) |
COMMON STOCKS — 83.8% (Continued) | | Shares | | | Value | |
Consumer Discretionary — 18.1% (Continued) | | | | | | |
Multiline Retail — 0.6% (Continued) | | | | | | |
Dollar Tree, Inc. | | | 157 | | | $ | 11,847 | |
Fred's, Inc. - Class A | | | 2,166 | | | | 35,696 | |
Kohl's Corporation | | | 104 | | | | 4,902 | |
Nordstrom, Inc. | | | 75 | | | | 4,223 | |
Target Corporation | | | 293 | | | | 21,243 | |
Tuesday Morning Corporation | | | 1,178 | | | | 7,869 | |
| | | | | | | | 121,004 | |
Specialty Retail — 3.3% | | | | | | | | |
Aaron's, Inc. | | | 960 | | | | 23,299 | |
Abercrombie & Fitch Company - Class A | | | 1,566 | | | | 40,043 | |
Advance Auto Parts, Inc. | | | 88 | | | | 14,320 | |
American Eagle Outfitters, Inc. | | | 1,482 | | | | 23,075 | |
America's Car-Mart, Inc. | | | 143 | | | | 3,787 | |
Asbury Automotive Group, Inc. | | | 120 | | | | 9,012 | |
Ascena Retail Group, Inc. | | | 1,980 | | | | 22,433 | |
AutoNation, Inc. | | | 366 | | | | 23,395 | |
Barnes & Noble Education, Inc. | | | 498 | | | | 7,196 | |
Barnes & Noble, Inc. | | | 971 | | | | 12,429 | |
Boot Barn Holdings, Inc. | | | 229 | | | | 2,405 | |
Cabela's, Inc. | | | 618 | | | | 28,966 | |
CarMax, Inc. | | | 360 | | | | 20,628 | |
Chico's FAS, Inc. | | | 1,612 | | | | 19,344 | |
Children's Place, Inc. (The) | | | 34 | | | | 1,643 | |
Conn's, Inc. | | | 78 | | | | 2,080 | |
CST Brands, Inc. | | | 864 | | | | 32,175 | |
Five Below, Inc. | | | 550 | | | | 15,406 | |
Haverty Furniture Companies, Inc. | | | 790 | | | | 19,071 | |
Home Depot, Inc. (The) | | | 31 | | | | 4,150 | |
Lithia Motors, Inc. - Class A | | | 345 | | | | 42,863 | |
Lowe's Companies, Inc. | | | 320 | | | | 24,512 | |
MarineMax, Inc. | | | 854 | | | | 15,500 | |
Mattress Firm Holding Corporation | | | 472 | | | | 23,298 | |
Men's Wearhouse, Inc. (The) | | | 644 | | | | 12,874 | |
Monro Muffler Brake, Inc. | | | 530 | | | | 39,241 | |
O'Reilly Automotive, Inc. | | | 16 | | | | 4,222 | |
Penske Automotive Group, Inc. | | | 612 | | | | 28,556 | |
Rent-A-Center, Inc. | | | 334 | | | | 5,731 | |
Restoration Hardware Holdings, Inc. | | | 329 | | | | 29,567 | |
Shoe Carnival, Inc. | | | 390 | | | | 7,597 | |
Signet Jewelers Ltd. | | | 14 | | | | 1,839 | |
35
BARROW LONG/SHORT OPPORTUNITY FUND
SCHEDULE OF SECURITIES SOLD SHORT (Continued) |
COMMON STOCKS — 83.8% (Continued) | | Shares | | | Value | |
Consumer Discretionary — 18.1% (Continued) | | | | | | |
Specialty Retail — 3.3% (Continued) | | | | | | |
Stage Stores, Inc. | | | 487 | | | $ | 3,769 | |
Staples, Inc. | | | 1,373 | | | | 16,572 | |
Stein Mart, Inc. | | | 349 | | | | 2,698 | |
Tiffany & Company | | | 83 | | | | 6,613 | |
Tile Shop Holdings, Inc. | | | 1,183 | | | | 20,040 | |
Tractor Supply Company | | | 263 | | | | 23,499 | |
TravelCenters of America, LLC | | | 582 | | | | 5,785 | |
Ulta Salon Cosmetics & Fragrance, Inc. | | | 145 | | | | 24,215 | |
Williams-Sonoma, Inc. | | | 21 | | | | 1,330 | |
| | | | | | | | 665,178 | |
Textiles, Apparel & Luxury Goods — 1.2% | | | | | | | | |
Columbia Sportswear Company | | | 446 | | | | 20,886 | |
Crocs, Inc. | | | 2,767 | | | | 30,783 | |
G-III Apparel Group Ltd. | | | 187 | | | | 8,578 | |
Hanesbrands, Inc. | | | 754 | | | | 23,125 | |
Kate Spade & Company | | | 1,391 | | | | 27,876 | |
NIKE, Inc. - Class B | | | 214 | | | | 28,308 | |
PVH Corporation | | | 205 | | | | 18,714 | |
Sequential Brands Group, Inc. | | | 184 | | | | 1,647 | |
Skechers U.S.A., Inc. - Class A | | | 250 | | | | 7,550 | |
Under Armour, Inc. - Class A | | | 280 | | | | 24,142 | |
Unifi, Inc. | | | 904 | | | | 26,966 | |
VF Corporation | | | 286 | | | | 18,504 | |
Wolverine World Wide, Inc. | | | 213 | | | | 3,874 | |
| | | | | | | | 240,953 | |
Consumer Staples — 17.6% | | | | | | | | |
Beverages — 2.2% | | | | | | | | |
Brown-Forman Corporation - Class B | | | 275 | | | | 28,199 | |
Coca-Cola Bottling Company Consolidated | | | 802 | | | | 155,323 | |
Coca-Cola Company (The) | | | 1,144 | | | | 48,757 | |
Coca-Cola Enterprises, Inc. | | | 111 | | | | 5,583 | |
Constellation Brands, Inc. - Class A | | | 530 | | | | 74,338 | |
Molson Coors Brewing Company - Class B | | | 877 | | | | 80,710 | |
Monster Beverage Corporation | | | 244 | | | | 37,725 | |
| | | | | | | | 430,635 | |
Food & Staples Retailing — 5.8% | | | | | | | | |
Anderson's, Inc. (The) | | | 3,846 | | | | 132,572 | |
Casey's General Stores, Inc. | | | 1,238 | | | | 143,942 | |
Chefs' Warehouse, Inc. (The) | | | 4,201 | | | | 82,256 | |
Costco Wholesale Corporation | | | 430 | | | | 69,411 | |
36
BARROW LONG/SHORT OPPORTUNITY FUND
SCHEDULE OF SECURITIES SOLD SHORT (Continued) |
COMMON STOCKS — 83.8% (Continued) | | Shares | | | Value | |
Consumer Staples — 17.6% (Continued) | | | | | | |
Food & Staples Retailing — 5.8% (Continued) | | | | | | |
Diplomat Pharmacy, Inc. | | | 1,679 | | | $ | 58,983 | |
Ingles Markets, Inc. - Class A | | | 1,461 | | | | 79,581 | |
Kroger Company (The) | | | 1,755 | | | | 66,093 | |
Natural Grocers by Vitamin Cottage, Inc. | | | 5,196 | | | | 108,129 | |
PriceSmart, Inc. | | | 642 | | | | 59,834 | |
Smart & Final Stores, Inc. | | | 881 | | | | 15,479 | |
SpartanNash Company | | | 2,451 | | | | 52,991 | |
Sysco Corporation | | | 1,740 | | | | 71,514 | |
United Natural Foods, Inc. | | | 1,743 | | | | 76,535 | |
Walgreens Boots Alliance, Inc. | | | 816 | | | | 68,568 | |
Wal-Mart Stores, Inc. | | | 121 | | | | 7,120 | |
Weis Markets, Inc. | | | 951 | | | | 39,400 | |
Whole Foods Market, Inc. | | | 642 | | | | 18,714 | |
| | | | | | | | 1,151,122 | |
Food Products — 8.6% | | | | | | | | |
Archer-Daniels-Midland Company | | | 905 | | | | 33,023 | |
Boulder Brands, Inc. | | | 12,368 | | | | 135,182 | |
Bunge Ltd. | | | 763 | | | | 50,823 | |
Calavo Growers, Inc. | | | 2,776 | | | | 157,066 | |
ConAgra Foods, Inc. | | | 1,743 | | | | 71,341 | |
Darling Ingredients, Inc. | | | 6,463 | | | | 70,770 | |
Dean Foods Company | | | 9,267 | | | | 173,849 | |
Farmer Brothers Company | | | 2,544 | | | | 74,361 | |
Flowers Foods, Inc. | | | 2,952 | | | | 69,431 | |
Fresh Del Monte Produce, Inc. | | | 3,160 | | | | 138,124 | |
General Mills, Inc. | | | 261 | | | | 15,075 | |
Hain Celestial Group, Inc. (The) | | | 1,198 | | | | 51,155 | |
Hershey Company (The) | | | 335 | | | | 28,914 | |
Ingredion, Inc. | | | 165 | | | | 16,264 | |
JM Smucker Company (The) | | | 366 | | | | 44,356 | |
Kellogg Company | | | 69 | | | | 4,745 | |
Kraft Heinz Company (The) | | | 79 | | | | 5,821 | |
McCormick & Company, Inc. | | | 735 | | | | 63,151 | |
Mondelēz International, Inc. - Class A | | | 868 | | | | 37,897 | |
Post Holdings, Inc. | | | 176 | | | | 12,236 | |
Snyder's-Lance, Inc. | | | 3,697 | | | | 137,048 | |
Tootsie Roll Industries, Inc. | | | 2,775 | | | | 88,939 | |
TreeHouse Foods, Inc. | | | 1,475 | | | | 127,528 | |
Tyson Foods, Inc. - Class A | | | 1,029 | | | | 51,450 | |
37
BARROW LONG/SHORT OPPORTUNITY FUND
SCHEDULE OF SECURITIES SOLD SHORT (Continued) |
COMMON STOCKS — 83.8% (Continued) | | Shares | | | Value | |
Consumer Staples — 17.6% (Continued) | | | | | | �� |
Food Products — 8.6% (Continued) | | | | | | |
WhiteWave Foods Company (The) | | | 1,625 | | | $ | 66,024 | |
| | | | | | | | 1,724,573 | |
Household Products — 0.5% | | | | | | | | |
Colgate-Palmolive Company | | | 80 | | | | 5,254 | |
Energizer Holdings, Inc. | | | 81 | | | | 2,739 | |
Kimberly Clark Corporation | | | 513 | | | | 61,124 | |
Procter & Gamble Company (The) | | | 128 | | | | 9,580 | |
Spectrum Brands Holdings, Inc. | | | 318 | | | | 30,118 | |
| | | | | | | | 108,815 | |
Personal Products — 0.5% | | | | | | | | |
Coty, Inc. - Class A | | | 2,583 | | | | 71,756 | |
Edgewell Personal Care Company | | | 426 | | | | 34,293 | |
Inter Parfums, Inc. | | | 80 | | | | 2,133 | |
| | | | | | | | 108,182 | |
Energy — 8.3% | | | | | | | | |
Energy Equipment & Services — 1.0% | | | | | | | | |
Archrock Partners, L.P. | | | 228 | | | | 3,664 | |
Archrock, Inc. | | | 557 | | | | 5,887 | |
Bristow Group, Inc. | | | 488 | | | | 14,908 | |
Exterran Corporation | | | 274 | | | | 4,485 | |
Matrix Service Company | | | 1,396 | | | | 32,094 | |
McDermott International, Inc. | | | 5,584 | | | | 24,737 | |
Patterson-UTI Energy, Inc. | | | 667 | | | | 10,819 | |
Pioneer Energy Services Corporation | | | 1,115 | | | | 2,821 | |
RigNet, Inc. | | | 173 | | | | 3,822 | |
Rowan Companies plc - Class A | | | 424 | | | | 8,620 | |
SEACOR Holdings, Inc. | | | 175 | | | | 9,936 | |
Superior Energy Services, Inc. | | | 1,246 | | | | 19,525 | |
TETRA Technologies, Inc. | | | 2,336 | | | | 21,772 | |
Unit Corporation | | | 398 | | | | 7,192 | |
USA Compression Partners, L.P. | | | 2,330 | | | | 35,463 | |
| | | | | | | | 205,745 | |
Oil, Gas & Consumable Fuels — 7.3% | | | | | | | | |
Alon USA Energy, Inc. | | | 492 | | | | 8,654 | |
Anadarko Petroleum Corporation | | | 293 | | | | 17,551 | |
Apache Corporation | | | 504 | | | | 24,787 | |
Atlas Energy Group, LLC | | | 1 | | | | 1 | |
Boardwalk Pipeline Partners, L.P. | | | 845 | | | | 10,715 | |
Bonanza Creek Energy, Inc. | | | 867 | | | | 7,361 | |
Buckeye Partners, L.P. | | | 239 | | | | 16,178 | |
38
BARROW LONG/SHORT OPPORTUNITY FUND
SCHEDULE OF SECURITIES SOLD SHORT (Continued) |
COMMON STOCKS — 83.8% (Continued) | | Shares | | | Value | |
Energy — 8.3% (Continued) | | | | | | |
Oil, Gas & Consumable Fuels — 7.3% (Continued) | | | | | | |
Cabot Oil & Gas Corporation | | | 1,069 | | | $ | 20,129 | |
Callon Petroleum Company | | | 4,549 | | | | 43,170 | |
Calumet Specialty Products Partners, L.P. | | | 366 | | | | 9,311 | |
Carrizo Oil & Gas, Inc. | | | 439 | | | | 17,727 | |
Cheniere Energy Partners, L.P. | | | 325 | | | | 8,352 | |
Cheniere Energy, Inc. | | | 360 | | | | 17,118 | |
Chevron Corporation | | | 100 | | | | 9,132 | |
Cimarex Energy Company | | | 174 | | | | 20,709 | |
Clayton Williams Energy, Inc. | | | 72 | | | | 4,062 | |
Cobalt International Energy, Inc. | | | 4,155 | | | | 30,622 | |
Columbia Pipeline Partners, L.P. | | | 243 | | | | 3,655 | |
Concho Resources, Inc. | | | 264 | | | | 28,892 | |
ConocoPhillips | | | 259 | | | | 13,999 | |
CONSOL Energy, Inc. | | | 518 | | | | 4,082 | |
Contango Oil & Gas Company | | | 356 | | | | 2,745 | |
Continental Resources, Inc. | | | 268 | | | | 9,728 | |
CrossAmerica Partners, L.P. | | | 455 | | | | 11,138 | |
DCP Midstream Partners, L.P. | | | 128 | | | | 3,251 | |
Devon Energy Corporation | | | 398 | | | | 18,312 | |
Diamondback Energy, Inc. | | | 520 | | | | 40,570 | |
Dominion Midstream Partners, L.P. | | | 156 | | | | 4,928 | |
Dorian LPG Ltd. | | | 251 | | | | 3,316 | |
Enbridge Energy Partners, L.P. | | | 663 | | | | 16,476 | |
Energen Corporation | | | 522 | | | | 30,949 | |
Energy Transfer Equity, L.P. | | | 965 | | | | 18,277 | |
Energy Transfer Partners, L.P. | | | 406 | | | | 15,513 | |
EnLink Midstream Partners, L.P. | | | 1,108 | | | | 16,531 | |
EnLink Midstream, LLC | | | 1,064 | | | | 17,950 | |
Enterprise Products Partners, L.P. | | | 487 | | | | 12,365 | |
EOG Resources, Inc. | | | 106 | | | | 8,844 | |
EQT Corporation | | | 247 | | | | 14,133 | |
EQT Midstream Partners, L.P. | | | 31 | | | | 2,097 | |
Genesis Energy, L.P. | | | 844 | | | | 33,211 | |
Gulfport Energy Corporation | | | 645 | | | | 16,396 | |
Hess Corporation | | | 205 | | | | 12,095 | |
Jones Energy, Inc. - Class A | | | 353 | | | | 1,980 | |
Kinder Morgan, Inc. | | | 504 | | | | 11,879 | |
Kosmos Energy Ltd. | | | 2,435 | | | | 16,339 | |
Magellan Midstream Partners, L.P. | | | 97 | | | | 6,065 | |
Marathon Oil Corporation | | | 1,165 | | | | 20,399 | |
39
BARROW LONG/SHORT OPPORTUNITY FUND
SCHEDULE OF SECURITIES SOLD SHORT (Continued) |
COMMON STOCKS — 83.8% (Continued) | | Shares | | | Value | |
Energy — 8.3% (Continued) | | | | | | |
Oil, Gas & Consumable Fuels — 7.3% (Continued) | | | | | | |
Martin Midstream Partners, L.P. | | | 89 | | | $ | 2,243 | |
Matador Resources Company | | | 1,320 | | | | 33,924 | |
Memorial Resource Development Corporation | | | 635 | | | | 10,344 | |
MPLX, L.P. | | | 225 | | | | 9,662 | |
Murphy Oil Corporation | | | 96 | | | | 2,744 | |
Newfield Exploration Company | | | 660 | | | | 25,252 | |
NGL Energy Partners, L.P. | | | 1,120 | | | | 19,656 | |
Noble Energy, Inc. | | | 641 | | | | 23,505 | |
NuStar Energy, L.P. | | | 247 | | | | 9,885 | |
NuStar GP Holdings, LLC | | | 455 | | | | 11,311 | |
Occidental Petroleum Corporation | | | 242 | | | | 18,293 | |
ONEOK, Inc. | | | 264 | | | | 7,783 | |
Par Pacific Holdings, Inc. | | | 2,471 | | | | 61,899 | |
Parsley Energy, Inc. - Class A | | | 1,744 | | | | 34,270 | |
PBF Energy, Inc. - Class A | | | 625 | | | | 25,306 | |
PDC Energy, Inc. | | | 727 | | | | 41,068 | |
Phillips 66 | | | 57 | | | | 5,217 | |
Phillips 66 Partners, L.P. | | | 61 | | | | 3,538 | |
Pioneer Natural Resources Company | | | 174 | | | | 25,187 | |
Plains All American Pipeline, L.P. | | | 154 | | | | 3,816 | |
Plains GP Holdings, L.P. - Class A | | | 91 | | | | 1,116 | |
QEP Resources, Inc. | | | 1,851 | | | | 29,246 | |
Range Resources Corporation | | | 252 | | | | 7,202 | |
Rice Energy, Inc. | | | 1,850 | | | | 24,938 | |
Rice Midstream Partners, L.P. | | | 239 | | | | 3,327 | |
RSP Permian, Inc. | | | 1,033 | | | | 29,317 | |
SemGroup Corporation - Class A | | | 590 | | | | 20,491 | |
Shell Midstream Partners, L.P. | | | 52 | | | | 1,813 | |
Southcross Energy Partners, L.P. | | | 317 | | | | 1,458 | |
Southwestern Energy Company | | | 826 | | | | 7,442 | |
Spectra Energy Corporation | | | 458 | | | | 12,000 | |
Summit Midstream Partners, L.P. | | | 1,149 | | | | 21,383 | |
Sunoco Logistics Partners, L.P. | | | 453 | | | | 12,625 | |
Sunoco, L.P. | | | 699 | | | | 26,003 | |
Synergy Resources Corporation | | | 3,883 | | | | 44,227 | |
Tallgrass Energy Partners, L.P. | | | 729 | | | | 31,383 | |
Targa Resources Corporation | | | 205 | | | | 8,057 | |
Tesoro Logistics, L.P. | | | 507 | | | | 25,325 | |
Valero Energy Partners, L.P. | | | 568 | | | | 26,315 | |
Western Gas Equity Partners, L.P. | | | 336 | | | | 14,018 | |
40
BARROW LONG/SHORT OPPORTUNITY FUND
SCHEDULE OF SECURITIES SOLD SHORT (Continued) |
COMMON STOCKS — 83.8% (Continued) | | Shares | | | Value | |
Energy — 8.3% (Continued) | | | | | | |
Oil, Gas & Consumable Fuels — 7.3% (Continued) | | | | | | |
Western Gas Partners, L.P. | | | 265 | | | $ | 12,725 | |
Western Refining Logistics, L.P. | | | 551 | | | | 12,904 | |
Whiting Petroleum Corporation | | | 352 | | | | 5,812 | |
Williams Partners, L.P. | | | 278 | | | | 7,611 | |
WPX Energy, Inc. | | | 2,114 | | | | 18,138 | |
| | | | | | | | 1,461,473 | |
Financials — 0.0% (a) | | | | | | | | |
Real Estate Investment Trusts (REITs) — 0.0% (a) | | | | | | | | |
Equinix, Inc. | | | 3 | | | | 890 | |
OUTFRONT Media, Inc. | | | 17 | | | | 388 | |
| | | | | | | | 1,278 | |
Health Care — 16.0% | | | | | | | | |
Health Care Equipment & Supplies — 9.7% | | | | | | | | |
Abiomed, Inc. | | | 634 | | | | 51,715 | |
Accuray, Inc. | | | 6,219 | | | | 43,782 | |
Alere, Inc. | | | 932 | | | | 38,464 | |
Align Technology, Inc. | | | 68 | | | | 4,538 | |
Analogic Corporation | | | 391 | | | | 32,668 | |
AngioDynamics, Inc. | | | 2,318 | | | | 27,584 | |
AtriCure, Inc. | | | 2,440 | | | | 52,411 | |
Baxter International, Inc. | | | 495 | | | | 18,637 | |
Becton, Dickinson and Company | | | 286 | | | | 42,972 | |
Boston Scientific Corporation | | | 3,224 | | | | 58,935 | |
Cantel Medical Corporation | | | 264 | | | | 17,115 | |
Cardiovascular Systems, Inc. | | | 2,223 | | | | 35,568 | |
CONMED Corporation | | | 820 | | | | 34,850 | |
Cooper Companies, Inc. (The) | | | 313 | | | | 45,776 | |
Cynosure, Inc. - Class A | | | 94 | | | | 3,954 | |
DENTSPLY International, Inc. | | | 637 | | | | 38,640 | |
DexCom, Inc. | | | 820 | | | | 69,716 | |
Endologix, Inc. | | | 3,887 | | | | 39,570 | |
Entellus Medical, Inc. | | | 432 | | | | 7,534 | |
GenMark Diagnostics, Inc. | | | 1,246 | | | | 9,931 | |
Glaukos Corporation | | | 959 | | | | 24,838 | |
Greatbatch, Inc. | | | 222 | | | | 12,885 | |
Haemonetics Corporation | | | 1,937 | | | | 62,449 | |
HeartWare International, Inc. | | | 791 | | | | 37,857 | |
Hill-Rom Holdings, Inc. | | | 1,529 | | | | 77,841 | |
Hologic, Inc. | | | 1,538 | | | | 62,058 | |
ICU Medical, Inc. | | | 127 | | | | 14,407 | |
41
BARROW LONG/SHORT OPPORTUNITY FUND
SCHEDULE OF SECURITIES SOLD SHORT (Continued) |
COMMON STOCKS — 83.8% (Continued) | | Shares | | | Value | |
Health Care — 16.0% (Continued) | | | | | | |
Health Care Equipment & Supplies — 9.7% (Continued) | | | | | | |
IDEXX Laboratories, Inc. | | | 689 | | | $ | 48,795 | |
Inogen, Inc. | | | 1,080 | | | | 41,310 | |
Insulet Corporation | | | 1,714 | | | | 62,715 | |
Integra LifeSciences Holdings Corporation | | | 1,329 | | | | 83,342 | |
Intuitive Surgical, Inc. | | | 35 | | | | 18,201 | |
Invacare Corporation | | | 2,817 | | | | 56,115 | |
K2M Group Holdings, Inc. | | | 1,816 | | | | 36,701 | |
LDR Holding Corporation | | | 1,534 | | | | 41,449 | |
Merit Medical Systems, Inc. | | | 2,230 | | | | 43,195 | |
Neogen Corporation | | | 624 | | | | 36,853 | |
Nevro Corporation | | | 358 | | | | 21,616 | |
NuVasive, Inc. | | | 1,145 | | | | 59,700 | |
NxStage Medical, Inc. | | | 2,777 | | | | 54,179 | |
OraSure Technologies, Inc. | | | 650 | | | | 4,063 | |
Quidel Corporation | | | 2,062 | | | | 44,725 | |
ResMed, Inc. | | | 106 | | | | 6,314 | |
SeaSpine Holdings Corporation | | | 185 | | | | 3,049 | |
Spectranetics Corporation (The) | | | 2,582 | | | | 35,709 | |
St. Jude Medical, Inc. | | | 239 | | | | 15,081 | |
STERIS plc | | | 347 | | | | 26,504 | |
Stryker Corporation | | | 406 | | | | 39,163 | |
Teleflex, Inc. | | | 307 | | | | 40,432 | |
West Pharmaceutical Services, Inc. | | | 1,382 | | | | 87,135 | |
ZELTIQ Aesthetics, Inc. | | | 1,433 | | | | 43,535 | |
Zimmer Biomet Holdings, Inc. | | | 332 | | | | 33,535 | |
| | | | | | | | 1,950,111 | |
Health Care Providers & Services — 3.0% | | | | | | | | |
Acadia Healthcare Company, Inc. | | | 975 | | | | 67,285 | |
Aceto Corporation | | | 240 | | | | 6,771 | |
Adeptus Health, Inc. - Class A | | | 915 | | | | 54,982 | |
Amedisys, Inc. | | | 1,370 | | | | 55,608 | |
AmerisourceBergen Corporation | | | 266 | | | | 26,238 | |
BioScrip, Inc. | | | 11 | | | | 23 | |
Brookdale Senior Living, Inc. | | | 701 | | | | 15,759 | |
Capital Senior Living Corporation | | | 1,196 | | | | 27,412 | |
Cross Country Healthcare, Inc. | | | 793 | | | | 14,472 | |
Envision Healthcare Holdings, Inc. | | | 1,452 | | | | 39,930 | |
ExamWorks Group, Inc. | | | 234 | | | | 6,182 | |
Express Scripts Holding Company | | | 55 | | | | 4,702 | |
Genesis Healthcare, Inc. | | | 1,445 | | | | 7,052 | |
42
BARROW LONG/SHORT OPPORTUNITY FUND
SCHEDULE OF SECURITIES SOLD SHORT (Continued) |
COMMON STOCKS — 83.8% (Continued) | | Shares | | | Value | |
Health Care — 16.0% (Continued) | | | | | | |
Health Care Providers & Services — 3.0% (Continued) | | | | | | |
Healthways, Inc. | | | 1,764 | | | $ | 23,408 | |
Henry Schein, Inc. | | | 88 | | | | 13,770 | |
HMS Holdings Corporation | | | 3,360 | | | | 40,757 | |
Kindred Healthcare, Inc. | | | 143 | | | | 1,909 | |
Laboratory Corporation of America Holdings | | | 30 | | | | 3,646 | |
LifePoint Hospitals, Inc. | | | 1,035 | | | | 74,116 | |
Owens & Minor, Inc. | | | 767 | | | | 29,537 | |
PharMerica Corporation | | | 1,173 | | | | 39,906 | |
Team Health Holdings, Inc. | | | 787 | | | | 43,395 | |
Universal Health Services, Inc. - Class B | | | 30 | | | | 3,646 | |
| | | | | | | | 600,506 | |
Health Care Technology — 1.9% | | | | | | | | |
Allscripts Healthcare Solutions, Inc. | | | 6,271 | | | | 95,507 | |
athenahealth, Inc. | | | 490 | | | | 82,198 | |
Cerner Corporation | | | 809 | | | | 48,217 | |
Imprivata, Inc. | | | 474 | | | | 5,650 | |
IMS Health Holdings, Inc. | | | 1,883 | | | | 52,197 | |
Medidata Solutions, Inc. | | | 1,733 | | | | 79,423 | |
Press Ganey Holdings, Inc. | | | 453 | | | | 14,627 | |
Quality Systems, Inc. | | | 424 | | | | 6,890 | |
| | | | | | | | 384,709 | |
Pharmaceuticals — 1.4% | | | | | | | | |
Abbott Laboratories | | | 1,153 | | | | 51,793 | |
Akorn, Inc. | | | 357 | | | | 11,888 | |
Allergan plc | | | 187 | | | | 58,697 | |
ContraVir Pharmaceuticals, Inc. | | | 1 | | | | 1 | |
Eli Lilly & Company | | | 538 | | | | 44,138 | |
Mallinckrodt plc | | | 573 | | | | 38,912 | |
Merck & Company, Inc. | | | 751 | | | | 39,810 | |
Mylan N.V. | | | 40 | | | | 2,052 | |
Ocular Therapeutix, Inc. | | | 110 | | | | 1,043 | |
Zoetis, Inc. | | | 517 | | | | 24,144 | |
| | | | | | | | 272,478 | |
Aerospace & Defense — 1.4% | | | | | | | | |
AAR Corporation | | | 590 | | | | 14,490 | |
Aerojet Rocketdyne Holdings, Inc. | | | 957 | | | | 16,786 | |
AeroVironment, Inc. | | | 755 | | | | 19,313 | |
Astronics Corporation | | | 136 | | | | 5,262 | |
Astronics Corporation - Class B | | | 14 | | | | 541 | |
Boeing Company (The) | | | 151 | | | | 21,963 | |
43
BARROW LONG/SHORT OPPORTUNITY FUND
SCHEDULE OF SECURITIES SOLD SHORT (Continued) |
COMMON STOCKS — 83.8% (Continued) | | Shares | | | Value | |
Industrials — 11.3% | | | | | | |
Aerospace & Defense — 1.4% (Continued) | | | | | | |
BWX Technologies, Inc. | | | 41 | | | $ | 1,248 | |
Cubic Corporation | | | 32 | | | | 1,554 | |
Curtiss-Wright Corporation | | | 80 | | | | 5,633 | |
DigitalGlobe, Inc. | | | 977 | | | | 16,511 | |
Esterline Technologies Corporation | | | 294 | | | | 27,954 | |
HEICO Corporation | | | 99 | | | | 5,097 | |
Hexcel Corporation | | | 500 | | | | 23,545 | |
KLX, Inc. | | | 14 | | | | 449 | |
L-3 Communications Holdings, Inc. | | | 120 | | | | 14,689 | |
Moog, Inc. - Class A | | | 412 | | | | 27,221 | |
Orbital ATK, Inc. | | | 127 | | | | 10,911 | |
Rockwell Collins, Inc. | | | 131 | | | | 12,141 | |
Spirit AeroSystems Holdings, Inc. - Class A | | | 425 | | | | 22,291 | |
TASER International, Inc. | | | 305 | | | | 5,704 | |
Textron, Inc. | | | 487 | | | | 20,780 | |
Triumph Group, Inc. | | | 226 | | | | 9,051 | |
| | | | | | | | 283,134 | |
Air Freight & Logistics — 0.4% | | | | | | | | |
Air Transport Services Group, Inc. | | | 1,907 | | | | 18,136 | |
Echo Global Logistics, Inc. | | | 537 | | | | 12,673 | |
FedEx Corporation | | | 122 | | | | 19,342 | |
Hub Group, Inc. - Class A | | | 406 | | | | 15,643 | |
United Parcel Service, Inc. - Class B | | | 201 | | | | 20,705 | |
| | | | | | | | 86,499 | |
Building Products — 1.7% | | | | | | | | |
A.O. Smith Corporation | | | 289 | | | | 23,051 | |
Advanced Drainage Systems, Inc. | | | 543 | | | | 14,558 | |
Apogee Enterprises, Inc. | | | 301 | | | | 15,116 | |
Armstrong World Industries, Inc. | | | 553 | | | | 27,473 | |
Builders FirstSource, Inc. | | | 1,853 | | | | 24,941 | |
Continental Building Products, Inc. | | | 885 | | | | 16,142 | |
Fortune Brands Home & Security, Inc. | | | 432 | | | | 23,747 | |
Gibraltar Industries, Inc. | | | 947 | | | | 25,275 | |
Griffon Corporation | | | 438 | | | | 7,945 | |
Lennox International, Inc. | | | 215 | | | | 29,223 | |
Masco Corporation | | | 186 | | | | 5,563 | |
Masonite International Corporation | | | 437 | | | | 28,825 | |
NCI Building Systems, Inc. | | | 1,313 | | | | 15,572 | |
Nortek, Inc. | | | 36 | | | | 1,733 | |
Owens Corning | | | 616 | | | | 28,854 | |
44
BARROW LONG/SHORT OPPORTUNITY FUND
SCHEDULE OF SECURITIES SOLD SHORT (Continued) |
COMMON STOCKS — 83.8% (Continued) | | Shares | | | Value | |
Industrials — 11.3% (Continued) | | | | | | |
Building Products — 1.7% (Continued) | | | | | | |
Quanex Building Products Corporation | | | 960 | | | $ | 17,866 | |
Simpson Manufacturing Company, Inc. | | | 131 | | | | 4,864 | |
TopBuild Corporation | | | 30 | | | | 914 | |
Trex Company, Inc. | | | 134 | | | | 5,802 | |
USG Corporation | | | 1,118 | | | | 26,922 | |
| | | | | | | | 344,386 | |
Commercial Services & Supplies — 2.2% | | | | | | | | |
ABM Industries, Inc. | | | 538 | | | | 15,962 | |
ADT Corporation (The) | | | 598 | | | | 21,211 | |
Brady Corporation - Class A | | | 765 | | | | 20,188 | |
Brink's Company (The) | | | 674 | | | | 21,689 | |
Cintas Corporation | | | 105 | | | | 9,617 | |
Clean Harbors, Inc. | | | 615 | | | | 26,623 | |
Covanta Holding Corporation | | | 1,208 | | | | 19,509 | |
Ennis, Inc. | | | 319 | | | | 6,377 | |
Healthcare Services Group, Inc. | | | 913 | | | | 33,726 | |
Herman Miller, Inc. | | | 57 | | | | 1,807 | |
HNI Corporation | | | 403 | | | | 17,837 | |
Interface, Inc. | | | 797 | | | | 15,844 | |
KAR Auction Services, Inc. | | | 649 | | | | 24,617 | |
Knoll, Inc. | | | 314 | | | | 6,996 | |
McGrath RentCorp | | | 486 | | | | 14,182 | |
Mobile Mini, Inc. | | | 423 | | | | 14,995 | |
MSA Safety, Inc. | | | 115 | | | | 5,394 | |
Multi-Color Corporation | | | 71 | | | | 4,438 | |
R.R. Donnelley & Sons Company | | | 302 | | | | 4,859 | |
Republic Services, Inc. | | | 515 | | | | 22,624 | |
Rollins, Inc. | | | 441 | | | | 11,973 | |
Steelcase, Inc. - Class A | | | 587 | | | | 11,740 | |
Stericycle, Inc. | | | 148 | | | | 17,867 | |
Team, Inc. | | | 37 | | | | 1,413 | |
Tetra Tech, Inc. | | | 52 | | | | 1,445 | |
Tyco International plc | | | 529 | | | | 18,679 | |
US Ecology, Inc. | | | 287 | | | | 10,860 | |
Viad Corporation | | | 210 | | | | 6,483 | |
Waste Connections, Inc. | | | 446 | | | | 24,307 | |
Waste Management, Inc. | | | 397 | | | | 21,347 | |
| | | | | | | | 434,609 | |
45
BARROW LONG/SHORT OPPORTUNITY FUND
SCHEDULE OF SECURITIES SOLD SHORT (Continued) |
COMMON STOCKS — 83.8% (Continued) | | Shares | | | Value | |
Industrials — 11.3% (Continued) | | | | | | |
Construction & Engineering — 0.5% | | | | | | |
AECOM | | | 354 | | | $ | 11,268 | |
Aegion Corporation | | | 477 | | | | 10,513 | |
Comfort Systems USA, Inc. | | | 466 | | | | 14,791 | |
Dycom Industries, Inc. | | | 212 | | | | 18,524 | |
Granite Construction, Inc. | | | 234 | | | | 9,540 | |
Great Lakes Dredge & Dock Corporation | | | 616 | | | | 2,790 | |
Jacobs Engineering Group, Inc. | | | 42 | | | | 1,854 | |
KBR, Inc. | | | 902 | | | | 17,535 | |
Quanta Services, Inc. | | | 373 | | | | 8,225 | |
| | | | | | | | 95,040 | |
Electrical Equipment — 0.6% | | | | | | | | |
Acuity Brands, Inc. | | | 119 | | | | 27,475 | |
Belden, Inc. | | | 204 | | | | 12,805 | |
Eaton Corporation plc | | | 224 | | | | 13,028 | |
Encore Wire Corporation | | | 207 | | | | 9,040 | |
Enphase Energy, Inc. | | | 769 | | | | 1,284 | |
Franklin Electric Company, Inc. | | | 561 | | | | 18,294 | |
II-VI, Inc. | | | 380 | | | | 7,075 | |
Powell Industries, Inc. | | | 108 | | | | 3,792 | |
Regal-Beloit Corporation | | | 441 | | | | 28,427 | |
Sensata Technologies Holding N.V. | | | 33 | | | | 1,512 | |
Vicor Corporation | | | 693 | | | | 6,417 | |
| | | | | | | | 129,149 | |
Industrial Conglomerates — 0.2% | | | | | | | | |
Carlisle Companies, Inc. | | | 73 | | | | 6,457 | |
Danaher Corporation | | | 66 | | | | 6,361 | |
General Electric Company | | | 454 | | | | 13,593 | |
Raven Industries, Inc. | | | 564 | | | | 9,402 | |
| | | | | | | | 35,813 | |
Machinery — 1.6% | | | | | | | | |
Actuant Corporation - Class A | | | 118 | | | | 2,922 | |
Alamo Group, Inc. | | | 30 | | | | 1,715 | |
Albany International Corporation - Class A | | | 472 | | | | 18,389 | |
Astec Industries, Inc. | | | 447 | | | | 18,014 | |
Barnes Group, Inc. | | | 232 | | | | 8,937 | |
Blount International, Inc. | | | 774 | | | | 4,489 | |
Briggs & Stratton Corporation | | | 885 | | | | 16,850 | |
Caterpillar, Inc. | | | 129 | | | | 9,372 | |
CIRCOR International, Inc. | | | 117 | | | | 5,318 | |
CLARCOR, Inc. | | | 219 | | | | 11,570 | |
46
BARROW LONG/SHORT OPPORTUNITY FUND
SCHEDULE OF SECURITIES SOLD SHORT (Continued) |
COMMON STOCKS — 83.8% (Continued) | | Shares | | | Value | |
Industrials — 11.3% (Continued) | | | | | | |
Machinery — 1.6% (Continued) | | | | | | |
Colfax Corporation | | | 224 | | | $ | 6,064 | |
Donaldson Company, Inc. | | | 286 | | | | 8,980 | |
EnPro Industries, Inc. | | | 299 | | | | 14,992 | |
Gorman-Rupp Company (The) | | | 163 | | | | 5,234 | |
Harsco Corporation | | | 849 | | | | 8,863 | |
Ingersoll-Rand plc | | | 77 | | | | 4,518 | |
John Bean Technologies Corporation | | | 278 | | | | 13,594 | |
Joy Global, Inc. | | | 142 | | | | 2,180 | |
Kennametal, Inc. | | | 416 | | | | 12,168 | |
Lydall, Inc. | | | 270 | | | | 9,833 | |
Middleby Corporation (The) | | | 109 | | | | 11,994 | |
Mueller Industries, Inc. | | | 172 | | | | 5,416 | |
Parker-Hannifin Corporation | | | 40 | | | | 4,186 | |
Proto Labs, Inc. | | | 156 | | | | 10,560 | |
RBC Bearings, Inc. | | | 153 | | | | 10,805 | |
Rexnord Corporation | | | 318 | | | | 6,497 | |
SPX Corporation | | | 171 | | | | 1,888 | |
SPX FLOW, Inc. | | | 171 | | | | 5,746 | |
Tennant Company | | | 94 | | | | 5,853 | |
Timken Company (The) | | | 341 | | | | 10,994 | |
Titan International, Inc. | | | 1,357 | | | | 5,889 | |
TriMas Corporation | | | 171 | | | | 3,699 | |
WABCO Holdings, Inc. | | | 97 | | | | 10,425 | |
Watts Water Technologies, Inc. - Class A | | | 268 | | | | 14,877 | |
Westinghouse Air Brake Technologies Corporation | | | 22 | | | | 1,763 | |
Woodward, Inc. | | | 123 | | | | 6,203 | |
Xylem, Inc. | | | 303 | | | | 11,308 | |
| | | | | | | | 312,105 | |
Marine — 0.0% (a) | | | | | | | | |
Matson, Inc. | | | 208 | | | | 10,756 | |
Scorpio Bulkers, Inc. | | | 712 | | | | 642 | |
| | | | | | | | 11,398 | |
Professional Services — 1.1% | | | | | | | | |
Acacia Research Corporation | | | 1,270 | | | | 7,506 | |
Advisory Board Company (The) | | | 570 | | | | 30,689 | |
CEB, Inc. | | | 258 | | | | 19,936 | |
Equifax, Inc. | | | 20 | | | | 2,230 | |
IHS, Inc. - Class A | | | 173 | | | | 21,333 | |
Insperity, Inc. | | | 26 | | | | 1,122 | |
Kelly Services, Inc. - Class A | | | 1,163 | | | | 19,573 | |
47
BARROW LONG/SHORT OPPORTUNITY FUND
SCHEDULE OF SECURITIES SOLD SHORT (Continued) |
COMMON STOCKS — 83.8% (Continued) | | Shares | | | Value | |
Industrials — 11.3% (Continued) | | | | | | |
Professional Services — 1.1% (Continued) | | | | | | |
Kforce, Inc. | | | 213 | | | $ | 5,738 | |
Mistras Group, Inc. | | | 654 | | | | 14,081 | |
Navigant Consulting, Inc. | | | 853 | | | | 14,927 | |
Nielsen Holdings Plc | | | 353 | | | | 16,478 | |
On Assignment, Inc. | | | 95 | | | | 4,435 | |
Paylocity Holding Corporation | | | 547 | | | | 24,035 | |
TransUnion | | | 391 | | | | 9,998 | |
TriNet Group, Inc. | | | 174 | | | | 3,436 | |
Verisk Analytics, Inc. | | | 17 | | | | 1,274 | |
WageWorks, Inc. | | | 392 | | | | 16,676 | |
| | | | | | | | 213,467 | |
Road & Rail — 1.1% | | | | | | | | |
AMERCO | | | 6 | | | | 2,432 | |
ArcBest Corporation | | | 204 | | | | 4,912 | |
Celadon Group, Inc. | | | 579 | | | | 8,048 | |
Covenant Transportation Group, Inc. - Class A | | | 279 | | | | 5,862 | |
CSX Corporation | | | 645 | | | | 18,337 | |
Genesee & Wyoming, Inc. - Class A | | | 327 | | | | 22,651 | |
Heartland Express, Inc. | | | 574 | | | | 10,998 | |
J.B. Hunt Transport Services, Inc. | | | 254 | | | | 19,873 | |
Kansas City Southern | | | 201 | | | | 18,275 | |
Knight Transportation, Inc. | | | 523 | | | | 13,870 | |
Marten Transport Ltd. | | | 373 | | | | 6,744 | |
Norfolk Southern Corporation | | | 215 | | | | 20,438 | |
Old Dominion Freight Line, Inc. | | | 164 | | | | 10,449 | |
P.A.M. Transportation Services, Inc. | | | 18 | | | | 556 | |
Ryder System, Inc. | | | 203 | | | | 13,390 | |
Saia, Inc. | | | 137 | | | | 3,358 | |
Swift Transportation Company | | | 529 | | | | 8,448 | |
Union Pacific Corporation | | | 152 | | | | 12,761 | |
Werner Enterprises, Inc. | | | 468 | | | | 12,617 | |
| | | | | | | | 214,019 | |
Trading Companies & Distributors — 0.4% | | | | | | | | |
Beacon Roofing Supply, Inc. | | | 530 | | | | 22,668 | |
DXP Enterprises, Inc. | | | 232 | | | | 7,598 | |
Fastenal Company | | | 201 | | | | 8,157 | |
HD Supply Holdings, Inc. | | | 459 | | | | 14,518 | |
Kaman Corporation | | | 128 | | | | 5,138 | |
NOW, Inc. | | | 406 | | | | 7,462 | |
Rush Enterprises, Inc. - Class A | | | 50 | | | | 1,216 | |
48
BARROW LONG/SHORT OPPORTUNITY FUND
SCHEDULE OF SECURITIES SOLD SHORT (Continued) |
COMMON STOCKS — 83.8% (Continued) | | Shares | | | Value | |
Industrials — 11.3% (Continued) | | | | | | |
Trading Companies & Distributors — 0.4% (Continued) | | | | | | |
Stock Building Supply Holdings, Inc. | | | 562 | | | $ | 9,661 | |
Univar, Inc. | | | 253 | | | | 4,792 | |
| | | | | | | | 81,210 | |
Transportation Infrastructure — 0.1% | | | | | | | | |
Macquarie Infrastructure Corporation | | | 291 | | | | 21,834 | |
| | | | | | | | | |
Information Technology — 5.2% | | | | | | | | |
Communications Equipment — 1.1% | | | | | | | | |
ADTRAN, Inc. | | | 639 | | | | 10,422 | |
Arista Networks, Inc. | | | 156 | | | | 11,469 | |
Ciena Corporation | | | 519 | | | | 12,996 | |
CommScope Holding Company, Inc. | | | 361 | | | | 10,332 | |
EchoStar Corporation - Class A | | | 268 | | | | 10,481 | |
Finisar Corporation | | | 767 | | | | 9,258 | |
Harmonic, Inc. | | | 1,398 | | | | 7,731 | |
Harris Corporation | | | 159 | | | | 13,218 | |
Infinera Corporation | | | 592 | | | | 13,332 | |
Ixia | | | 759 | | | | 9,912 | |
Juniper Networks, Inc. | | | 622 | | | | 18,741 | |
Lumentum Holdings, Inc. | | | 66 | | | | 1,320 | |
Motorola Solutions, Inc. | | | 266 | | | | 19,093 | |
NETGEAR, Inc. | | | 328 | | | | 14,468 | |
Palo Alto Networks, Inc. | | | 99 | | | | 18,547 | |
Ruckus Wireless, Inc. | | | 875 | | | | 10,019 | |
ShoreTel, Inc. | | | 1,365 | | | | 14,005 | |
ViaSat, Inc. | | | 196 | | | | 12,148 | |
Viavi Solutions, Inc. | | | 342 | | | | 2,175 | |
| | | | | | | | 219,667 | |
Electronic Equipment, Instruments & Components — 1.1% | | | | | | | | |
Amphenol Corporation - Class A | | | 195 | | | | 10,735 | |
Arrow Electronics, Inc. | | | 300 | | | | 16,968 | |
Avnet, Inc. | | | 329 | | | | 14,910 | |
Badger Meter, Inc. | | | 163 | | | | 9,915 | |
Corning, Inc. | | | 943 | | | | 17,662 | |
CTS Corporation | | | 89 | | | | 1,689 | |
DTS, Inc. | | | 180 | | | | 4,631 | |
FARO Technologies, Inc. | | | 125 | | | | 3,761 | |
FEI Company | | | 105 | | | | 8,401 | |
Flextronics International Ltd. | | | 1,550 | | | | 17,438 | |
49
BARROW LONG/SHORT OPPORTUNITY FUND
SCHEDULE OF SECURITIES SOLD SHORT (Continued) |
COMMON STOCKS — 83.8% (Continued) | | Shares | | | Value | |
Information Technology — 5.2% (Continued) | | | | | | |
Electronic Equipment, Instruments & Components — 1.1% (Continued) | | | | | | |
GSI Group, Inc. | | | 621 | | | $ | 8,899 | |
Ingram Micro, Inc. - Class A | | | 137 | | | | 4,237 | |
InvenSense, Inc. | | | 630 | | | | 7,302 | |
Itron, Inc. | | | 317 | | | | 11,396 | |
Jabil Circuit, Inc. | | | 84 | | | | 2,150 | |
Knowles Corporation | | | 303 | | | | 4,991 | |
Littelfuse, Inc. | | | 19 | | | | 2,063 | |
Mercury Systems, Inc. | | | 654 | | | | 12,805 | |
Multi-Fineline Electronix, Inc. | | | 98 | | | | 2,419 | |
National Instruments Corporation | | | 417 | | | | 13,094 | |
Newport Corporation | | | 99 | | | | 1,642 | |
OSI Systems, Inc. | | | 84 | | | | 7,865 | |
Rofin-Sinar Technologies, Inc. | | | 123 | | | | 3,535 | |
Trimble Navigation Ltd. | | | 728 | | | | 16,671 | |
TTM Technologies, Inc. | | | 337 | | | | 2,642 | |
Universal Display Corporation | | | 235 | | | | 12,352 | |
Vishay Intertechnology, Inc. | | | 144 | | | | 1,717 | |
Zebra Technologies Corporation - Class A | | | 147 | | | | 11,789 | |
| | | | | | | | 233,679 | |
Internet Software & Services — 0.8% | | | | | | | | |
Actua Corporation | | | 495 | | | | 5,737 | |
Akamai Technologies, Inc. | | | 85 | | | | 4,897 | |
Alaphabet, Inc. - Class A | | | 4 | | | | 3,051 | |
Bazaarvoice, Inc. | | | 356 | | | | 1,648 | |
Benefitfocus, Inc. | | | 23 | | | | 932 | |
Blucora, Inc. | | | 371 | | | | 3,944 | |
comScore, Inc. | | | 142 | | | | 5,978 | |
Cornerstone OnDemand, Inc. | | | 227 | | | | 8,152 | |
CoStar Group, Inc. | | | 30 | | | | 6,277 | |
Cvent, Inc. | | | 214 | | | | 7,732 | |
Demandware, Inc. | | | 127 | | | | 6,496 | |
EarthLink Holdings Corporation | | | 389 | | | | 3,575 | |
Facebook, Inc. - Class A | | | 67 | | | | 6,984 | |
GoDaddy, Inc. - Class A | | | 290 | | | | 9,010 | |
Gogo, Inc. | | | 52 | | | | 934 | |
GTT Communications, Inc. | | | 280 | | | | 5,933 | |
Hortonworks, Inc. | | | 66 | | | | 1,121 | |
Internap Corporation | | | 468 | | | | 3,360 | |
Intralinks Holdings, Inc. | | | 632 | | | | 6,465 | |
50
BARROW LONG/SHORT OPPORTUNITY FUND
SCHEDULE OF SECURITIES SOLD SHORT (Continued) |
COMMON STOCKS — 83.8% (Continued) | | Shares | | | Value | |
Information Technology — 5.2% (Continued) | | | | | | |
Internet Software & Services — 0.8% (Continued) | | | | | | |
LinkedIn Corporation - Class A | | | 25 | | | $ | 6,078 | |
LivePerson, Inc. | | | 600 | | | | 4,680 | |
Marketo, Inc. | | | 227 | | | | 6,871 | |
Monster Worldwide, Inc. | | | 968 | | | | 6,234 | |
New Relic, Inc. | | | 155 | | | | 5,830 | |
PayPal Holdings, Inc. | | | 56 | | | | 1,975 | |
Q2 Holdings, Inc. | | | 239 | | | | 6,568 | |
Rackspace Hosting, Inc. | | | 234 | | | | 6,697 | |
Stamps.com, Inc. | | | 53 | | | | 5,372 | |
Textura Corporation | | | 166 | | | | 4,009 | |
Twitter, Inc. | | | 199 | | | | 5,055 | |
Yahoo!, Inc. | | | 172 | | | | 5,815 | |
Yelp, Inc. | | | 214 | | | | 6,448 | |
| | | | | | | | 163,858 | |
IT Services — 0.3% | | | | | | | | |
Acxiom Corporation | | | 101 | | | | 2,313 | |
Blackhawk Network Holdings, Inc. | | | 90 | | | | 4,262 | |
Computer Sciences Corporation | | | 89 | | | | 2,788 | |
CSRA, Inc. | | | 89 | | | | 2,804 | |
FleetCor Technologies, Inc. | | | 14 | | | | 2,152 | |
Gartner, Inc. | | | 69 | | | | 6,438 | |
Heartland Payment Systems, Inc. | | | 120 | | | | 9,521 | |
Leidos Holdings, Inc. | | | 63 | | | | 3,650 | |
Sabre Corporation | | | 182 | | | | 5,325 | |
ServiceSource International, Inc. | | | 381 | | | | 2,057 | |
Teradata Corporation | | | 180 | | | | 5,384 | |
Vantiv, Inc. - Class A | | | 137 | | | | 7,221 | |
VeriFone Systems, Inc. | | | 243 | | | | 6,969 | |
Xerox Corporation | | | 382 | | | | 4,030 | |
| | | | | | | | 64,914 | |
Software — 1.5% | | | | | | | | |
Adobe Systems, Inc. | | | 70 | | | | 6,402 | |
Autodesk, Inc. | | | 112 | | | | 7,109 | |
Barracuda Networks, Inc. | | | 260 | | | | 4,948 | |
Blackbaud, Inc. | | | 130 | | | | 8,031 | |
Bottomline Technologies (de), Inc. | | | 113 | | | | 3,493 | |
BroadSoft, Inc. | | | 28 | | | | 1,121 | |
Callidus Software, Inc. | | | 383 | | | | 7,947 | |
CDK Global, Inc. | | | 20 | | | | 948 | |
Citrix Systems, Inc. | | | 81 | | | | 6,210 | |
51
BARROW LONG/SHORT OPPORTUNITY FUND
SCHEDULE OF SECURITIES SOLD SHORT (Continued) |
COMMON STOCKS — 83.8% (Continued) | | Shares | | | Value | |
Information Technology — 5.2% (Continued) | | | | | | |
Software — 1.5% (Continued) | | | | | | |
CommVault Systems, Inc. | | | 85 | | | $ | 3,483 | |
Ellie Mae, Inc. | | | 110 | | | | 7,022 | |
FireEye, Inc. | | | 220 | | | | 5,034 | |
Fortinet, Inc. | | | 144 | | | | 5,187 | |
Gigamon, Inc. | | | 200 | | | | 5,418 | |
Guidewire Software, Inc. | | | 142 | | | | 8,425 | |
HubSpot, Inc. | | | 134 | | | | 7,264 | |
Imperva, Inc. | | | 125 | | | | 9,329 | |
Infoblox, Inc. | | | 327 | | | | 4,918 | |
Interactive Intelligence Group, Inc. | | | 171 | | | | 5,893 | |
Intuit, Inc. | | | 61 | | | | 6,112 | |
Manhattan Associates, Inc. | | | 14 | | | | 1,072 | |
MobileIron, Inc. | | | 166 | | | | 720 | |
NetScout Systems, Inc. | | | 62 | | | | 2,052 | |
NetSuite, Inc. | | | 63 | | | | 5,380 | |
Nuance Communications, Inc. | | | 344 | | | | 7,200 | |
Paycom Software, Inc. | | | 71 | | | | 3,096 | |
Pegasystems, Inc. | | | 147 | | | | 4,342 | |
Proofpoint, Inc. | | | 136 | | | | 9,970 | |
PROS Holdings, Inc. | | | 300 | | | | 7,377 | |
PTC, Inc. | | | 111 | | | | 4,000 | |
Qlik Technologies, Inc. | | | 212 | | | | 6,744 | |
RealPage, Inc. | | | 334 | | | | 7,418 | |
Red Hat, Inc. | | | 78 | | | | 6,350 | |
Rubicon Project, Inc. (The) | | | 416 | | | | 6,136 | |
salesforce.com, inc. | | | 84 | | | | 6,694 | |
ServiceNow, Inc. | | | 77 | | | | 6,700 | |
Silver Spring Networks, Inc. | | | 409 | | | | 5,452 | |
Splunk, Inc. | | | 93 | | | | 5,534 | |
SS&C Technologies Holdings, Inc. | | | 44 | | | | 3,164 | |
Synchronoss Technologies, Inc. | | | 78 | | | | 3,071 | |
Synopsys, Inc. | | | 121 | | | | 6,060 | |
Tableau Software, Inc. - Class A | | | 61 | | | | 5,919 | |
Take-Two Interactive Software, Inc. | | | 274 | | | | 9,691 | |
Tyler Technologies, Inc. | | | 21 | | | | 3,747 | |
Ultimate Software Group, Inc. (The) | | | 38 | | | | 7,505 | |
Varonis Systems, Inc. | | | 141 | | | | 2,517 | |
Verint Systems, Inc. | | | 146 | | | | 6,840 | |
VMware, Inc. - Class A | | | 47 | | | | 2,886 | |
Workday, Inc. - Class A | | | 76 | | | | 6,362 | |
52
BARROW LONG/SHORT OPPORTUNITY FUND
SCHEDULE OF SECURITIES SOLD SHORT (Continued) |
COMMON STOCKS — 83.8% (Continued) | | Shares | | | Value | |
Information Technology — 5.2% (Continued) | | | | | | |
Software — 1.5% (Continued) | | | | | | |
Workiva, Inc. | | | 432 | | | $ | 8,100 | |
Xura, Inc. | | | 176 | | | | 4,553 | |
Zendesk, Inc. | | | 375 | | | | 9,604 | |
Zynga, Inc. - Class A | | | 3,194 | | | | 8,241 | |
| | | | | | | | 298,791 | |
Technology Hardware, Storage & Peripherals — 0.4% | | | | | | | | |
3D Systems Corporation | | | 595 | | | | 5,426 | |
Avid Technology, Inc. | | | 242 | | | | 1,837 | |
Cray, Inc. | | | 400 | | | | 13,868 | |
Diebold, Inc. | | | 358 | | | | 12,412 | |
Eastman Kodak Company | | | 100 | | | | 1,304 | |
Electronics for Imaging, Inc. | | | 272 | | | | 13,350 | |
Lexmark International, Inc. - Class A | | | 353 | | | | 12,122 | |
NCR Corporation | | | 456 | | | | 12,362 | |
Nimble Storage, Inc. | | | 147 | | | | 1,539 | |
Quantum Corporation | | | 879 | | | | 774 | |
Stratasys Ltd. | | | 58 | | | | 1,450 | |
| | | | | | | | 76,444 | |
Materials — 7.3% | | | | | | | | |
Chemicals — 3.0% | | | | | | | | |
A. Schulman, Inc. | | | 619 | | | | 21,424 | |
Air Products and Chemicals, Inc. | | | 225 | | | | 30,800 | |
Airgas, Inc. | | | 270 | | | | 37,314 | |
Ashland, Inc. | | | 280 | | | | 31,542 | |
Axalta Coating Systems Ltd. | | | 422 | | | | 12,246 | |
Axiall Corporation | | | 1,041 | | | | 21,694 | |
Balchem Corporation | | | 248 | | | | 16,985 | |
Cabot Corporation | | | 105 | | | | 4,572 | |
Chemours Company (The) | | | 44 | | | | 275 | |
E.I. du Pont de Nemours and Company | | | 440 | | | | 29,630 | |
Eastman Chemical Company | | | 244 | | | | 17,727 | |
Ecolab, Inc. | | | 157 | | | | 18,708 | |
Ferro Corporation | | | 179 | | | | 2,150 | |
FMC Corporation | | | 576 | | | | 24,751 | |
H.B. Fuller Company | | | 1,147 | | | | 45,662 | |
Huntsman Corporation | | | 836 | | | | 10,467 | |
Intrepid Potash, Inc. | | | 3,529 | | | | 12,669 | |
Koppers Holdings, Inc. | | | 196 | | | | 4,475 | |
Kraton Performance Polymers, Inc. | | | 1,699 | | | | 37,803 | |
Kronos Worldwide, Inc. | | | 943 | | | | 6,101 | |
53
BARROW LONG/SHORT OPPORTUNITY FUND
SCHEDULE OF SECURITIES SOLD SHORT (Continued) |
COMMON STOCKS — 83.8% (Continued) | | Shares | | | Value | |
Materials — 7.3% (Continued) | | | | | | |
Chemicals — 3.0% (Continued) | | | | | | |
LSB Industries, Inc. | | | 502 | | | $ | 3,569 | |
Minerals Technologies, Inc. | | | 633 | | | | 38,955 | |
Mosaic Company (The) | | | 308 | | | | 9,745 | |
Olin Corporation | | | 211 | | | | 4,593 | |
Platform Specialty Products Corporation | | | 732 | | | | 9,194 | |
PolyOne Corporation | | | 957 | | | | 34,433 | |
PPG Industries, Inc. | | | 99 | | | | 10,468 | |
Praxair, Inc. | | | 247 | | | | 27,862 | |
Sensient Technologies Corporation | | | 762 | | | | 50,932 | |
Stepan Company | | | 52 | | | | 2,707 | |
Tredegar Corporation | | | 645 | | | | 10,165 | |
Tronox Ltd. - Class A | | | 1,036 | | | | 6,029 | |
W.R. Grace & Company | | | 22 | | | | 2,161 | |
| | | | | | | | 597,808 | |
Construction Materials — 0.7% | | | | | | | | |
Eagle Materials, Inc. | | | 511 | | | | 35,300 | |
Headwaters, Inc. | | | 1,189 | | | | 22,793 | |
Martin Marietta Materials, Inc. | | | 240 | | | | 37,776 | |
U.S. Concrete, Inc. | | | 184 | | | | 10,806 | |
Vulcan Materials Company | | | 388 | | | | 39,836 | |
| | | | | | | | 146,511 | |
Containers & Packaging — 0.7% | | | | | | | | |
Ball Corporation | | | 57 | | | | 3,957 | |
Berry Plastics Group, Inc. | | | 1,176 | | | | 42,760 | |
Graphic Packaging Holding Company | | | 2,336 | | | | 31,933 | |
Greif, Inc. - Class A | | | 204 | | | | 7,236 | |
Myers Industries, Inc. | | | 1,303 | | | | 20,197 | |
Packaging Corporation of America | | | 78 | | | | 5,303 | |
Sealed Air Corporation | | | 267 | | | | 12,111 | |
WestRock Company | | | 191 | | | | 9,670 | |
| | | | | | | | 133,167 | |
Metals & Mining — 2.1% | | | | | | | | |
Alcoa, Inc. | | | 2,412 | | | | 22,576 | |
Allegheny Technologies, Inc. | | | 1,882 | | | | 23,845 | |
Carpenter Technology Corporation | | | 1,177 | | | | 42,302 | |
Century Aluminum Company | | | 566 | | | | 2,111 | |
Coeur Mining, Inc. | | | 3,178 | | | | 8,136 | |
Freeport-McMoRan, Inc. | | | 772 | | | | 6,315 | |
Globe Specialty Metals, Inc. | | | 1,925 | | | | 19,577 | |
Haynes International, Inc. | | | 443 | | | | 17,321 | |
54
BARROW LONG/SHORT OPPORTUNITY FUND
SCHEDULE OF SECURITIES SOLD SHORT (Continued) |
COMMON STOCKS — 83.8% (Continued) | | Shares | | | Value | |
Materials — 7.3% (Continued) | | | | | | |
Metals & Mining — 2.1% (Continued) | | | | | | |
Hecla Mining Company | | | 13,198 | | | $ | 25,472 | |
Horsehead Holding Corporation | | | 1,824 | | | | 4,487 | |
Kaiser Aluminum Corporation | | | 282 | | | | 24,173 | |
Materion Corporation | | | 445 | | | | 12,914 | |
Newmont Mining Corporation | | | 1,286 | | | | 23,675 | |
NN, Inc. | | | 519 | | | | 8,849 | |
Nucor Corporation | | | 356 | | | | 14,756 | |
Reliance Steel & Aluminum Company | | | 7 | | | | 412 | |
Royal Gold, Inc. | | | 855 | | | | 30,737 | |
Schnitzer Steel Industries, Inc. - Class A | | | 1,252 | | | | 20,671 | |
Steel Dynamics, Inc. | | | 2,270 | | | | 39,475 | |
Stillwater Mining Company | | | 1,960 | | | | 18,346 | |
SunCoke Energy, Inc. | | | 1,635 | | | | 6,180 | |
TimkenSteel Corporation | | | 767 | | | | 7,831 | |
Worthington Industries, Inc. | | | 1,152 | | | | 35,447 | |
| | | | | | | | 415,608 | |
Paper & Forest Products — 0.8% | | | | | | | | |
Clearwater Paper Corporation | | | 518 | | | | 25,284 | |
Deltic Timber Corporation | | | 566 | | | | 37,107 | |
International Paper Company | | | 485 | | | | 20,287 | |
KapStone Paper and Packaging Corporation | | | 724 | | | | 17,571 | |
Louisiana-Pacific Corporation | | | 2,962 | | | | 54,501 | |
P.H. Glatfelter Company | | | 497 | | | | 8,842 | |
| | | | | | | | 163,592 | |
Telecommunication Services — 0.0% (a) | | | | | | | | |
Wireless Telecommunication Services — 0.0% (a) | | | | | | | | |
RingCentral, Inc. - Class A | | | 166 | | | | 3,803 | |
| | | | | | | | | |
Total Common Stocks (Proceeds $16,774,224) | | | | | | $ | 16,788,357 | |
55
BARROW LONG/SHORT OPPORTUNITY FUND
SCHEDULE OF SECURITIES SOLD SHORT (Continued) |
WARRANTS — 0.0% (a) | | Shares | | | Value | |
BioTime, Inc. | | | 1 | | | $ | 1 | |
Magnum Hunter Resources Corporation (b) | | | 97 | | | | 0 | |
Total Warrants (Cost $2) | | | | | | $ | 1 | |
| | | | | | | | | |
Total Securities Sold Short — 83.8% (Proceeds $16,774,226) | | | | | | $ | 16,788,358 | |
(a) | Percentage rounds to less than 0.1%. |
(b) | Security value has been determined in good faith pursuant to procedures adopted by the Board of Trustees. The total value of such securities is $0 at November 30, 2015, representing 0.0% of net assets. (Note 2). |
See accompanying notes to financial statements. |
56
BARROW FUNDS
STATEMENTS OF ASSETS AND LIABILITIES
November 30, 2015 (Unaudited) |
| | Barrow Value Opportunity Fund | | | Barrow Long/Short Opportunity Fund | |
ASSETS | | | | | | |
Investments in securities: | | | | | | |
At acquisition cost | | $ | 30,615,779 | | | $ | 23,176,152 | |
At value (Note 2) | | $ | 34,755,391 | | | $ | 24,964,558 | |
Deposits with brokers for securities sold short (Note 2) | | | — | | | | 11,532,371 | |
Dividends receivable | | | 57,235 | | | | 40,579 | |
Receivable for capital shares sold | | | — | | | | 304,677 | |
Other assets | | | 19,969 | | | | 19,628 | |
TOTAL ASSETS | | | 34,832,595 | | | | 36,861,813 | |
| | | | | | | | | |
LIABILITIES | | | | | | | | |
Securities sold short, at value (Note 2) (proceeds $— and $16,774,226, respectively) | | | — | | | | 16,788,358 | |
Dividends payable on securities sold short (Note 2) | | | — | | | | 16,543 | |
Payable to Adviser (Note 4) | | | 13,038 | | | | 2,877 | |
Payable to administrator (Note 4) | | | 7,830 | | | | 7,180 | |
Accrued brokerage expense on securities sold short (Note 2) | | | — | | | | 1,299 | |
Accrued line of credit expense (Note 5) | | | 7 | | | | — | |
Other accrued expenses and liabilities | | | 6,215 | | | | 18,685 | |
TOTAL LIABILITIES | | | 27,090 | | | | 16,834,942 | |
| | | | | | | | | |
NET ASSETS | | $ | 34,805,505 | | | $ | 20,026,871 | |
| | | | | | | | | |
Net assets consist of: | | | | | | | | |
Paid-in capital | | $ | 30,358,509 | | | $ | 19,042,694 | |
Accumulated net investment income (loss) | | | 374,327 | | | | (11,475 | ) |
Accumulated net realized losses from security transactions | | | (66,943 | ) | | | (778,622 | ) |
Net unrealized appreciation (depreciation) on: | | | | | | | | |
Investments | | | 4,139,612 | | | | 1,788,406 | |
Short positions | | | — | | | | (14,132 | ) |
Net assets | | $ | 34,805,505 | | | $ | 20,026,871 | |
| | | | | | | | | |
Shares of beneficial interest outstanding (unlimited number of shares authorized, no par value) | | | 1,328,797 | | | | 1,821,786 | |
| | | | | | | | | |
Net asset value, offering price and redemption price per share (Note 2) | | $ | 26.19 | | | $ | 10.99 | |
See accompanying notes to financial statements. |
57
BARROW FUNDS
STATEMENTS OF OPERATIONS
For the Six Months Ended November 30, 2015 (Unaudited) |
| | Barrow Value Opportunity Fund | | | Barrow Long/Short Opportunity Fund | |
INVESTMENT INCOME | | | | | | |
Dividends | | $ | 367,784 | | | $ | 179,352 | |
Interest | | | — | | | | 19,432 | |
TOTAL INVESTMENT INCOME | | | 367,784 | | | | 198,784 | |
| | | | | | | | | |
EXPENSES | | | | | | | | |
Investment advisory fees (Note 4) | | | 165,078 | | | | 91,415 | |
Dividend expense on securities sold short (Note 2) | | | — | | | | 69,728 | |
Brokerage expense on securities sold short (Note 2) | | | — | | | | 47,308 | |
Professional fees | | | 19,058 | | | | 19,558 | |
Accounting services fees (Note 4) | | | 16,418 | | | | 15,373 | |
Administration fees (Note 4) | | | 16,675 | | | | 14,250 | |
Custodian and bank service fees | | | 9,303 | | | | 19,712 | |
Registration and filing fees | | | 13,739 | | | | 13,799 | |
Transfer agent fees (Note 4) | | | 8,250 | | | | 7,000 | |
Compliance service fees (Note 4) | | | 6,000 | | | | 6,000 | |
Pricing fees | | | 1,949 | | | | 9,920 | |
Trustees’ fees and expenses (Note 4) | | | 4,355 | | | | 4,355 | |
Printing of shareholder reports | | | 4,226 | | | | 3,732 | |
Postage and supplies | | | 2,528 | | | | 2,318 | |
Insurance expense | | | 1,865 | | | | 1,865 | |
Borrowing costs (Note 5) | | | 363 | | | | — | |
Distribution fees, Investor Class (Note 4) | | | 57 | | | | 39 | |
Other expenses | | | 3,354 | | | | 3,354 | |
TOTAL EXPENSES | | | 273,218 | | | | 329,726 | |
Investment advisory fee reductions and expense reimbursements by Adviser (Note 4) | | | (81,040 | ) | | | (106,609 | ) |
NET EXPENSES | | | 192,178 | | | | 223,117 | |
| | | | | | | | | |
NET INVESTMENT INCOME (LOSS) | | | 175,606 | | | | (24,333 | ) |
| | | | | | | | | |
REALIZED AND UNREALIZED GAINS (LOSSES) ON INVESTMENTS AND SECURITIES SOLD SHORT | | | | | | | | |
Net realized losses from: | | | | | | | | |
Investments | | $ | (215,348 | ) | | $ | (167,572 | ) |
Securities sold short | | | — | | | | (150,714 | ) |
Net change in unrealized appreciation (depreciation) on: | | | | | | | | |
Investments | | | (504,319 | ) | | | 279,107 | |
Securities sold short | | | — | | | | 540,620 | |
NET REALIZED AND UNREALIZED GAINS (LOSSES) ON INVESTMENTS | | | (719,667 | ) | | | 501,441 | |
| | | | | | | | | |
NET INCREASE (DECREASE) IN NET ASSETS RESULTING FROM OPERATIONS | | $ | (544,061 | ) | | $ | 477,108 | |
See accompanying notes to financial statements. |
58
BARROW VALUE OPPORTUNITY FUND
STATEMENTS OF CHANGES IN NET ASSETS |
| | Six Months Ended November 30, 2015 (Unaudited) | | | Year Ended May 31, 2015 | |
FROM OPERATIONS | | | | | | |
Net investment income | | $ | 175,606 | | | $ | 308,510 | |
Net realized gains (losses) from security transactions | | | (215,348 | ) | | | 163,178 | |
Net change in unrealized appreciation (depreciation) on investments | | | (504,319 | ) | | | 1,815,680 | |
Net increase (decrease) in net assets resulting from operations | | | (544,061 | ) | | | 2,287,368 | |
| | | | | | | | | |
DISTRIBUTIONS TO SHAREHOLDERS (Note 2) | | | | | | | | |
Investment income, Institutional Class | | | — | | | | (166,316 | ) |
Investment income, Investor Class | | | — | | | | (1,730 | ) |
Realized gains, Institutional Class | | | — | | | | (1,701,605 | ) |
Realized gains, Investor Class | | | — | | | | (24,232 | ) |
Decrease in net assets from distributions to shareholders | | | — | | | | (1,893,883 | ) |
| | | | | | | | | |
CAPITAL SHARE TRANSACTIONS (Note 1) | | | | | | | | |
Institutional Class | | | | | | | | |
Proceeds from shares sold | | | 4,541,708 | | | | 9,208,231 | |
Net asset value of shares issued in reinvestment of distributions | | | — | | | | 1,843,520 | |
Payments for shares redeemed | | | (1,136,967 | ) | | | (881,565 | ) |
Net increase in Institutional Class net assets from
capital share transactions | | | 3,404,741 | | | | 10,170,186 | |
| | | | | | | | | |
Investor Class | | | | | | | | |
Proceeds from shares sold | | | — | | | | 293,091 | |
Net asset value of shares issued in reinvestment of distributions | | | — | | | | 25,962 | |
Payments for shares redeemed | | | (275,749 | ) | | | (401,316 | ) |
Net decrease in Investor Class net assets from capital share transactions | | | (275,749 | ) | | | (82,263 | ) |
| | | | | | | | | |
TOTAL INCREASE IN NET ASSETS | | | 2,584,931 | | | | 10,481,408 | |
| | | | | | | | | |
NET ASSETS | | | | | | | | |
Beginning of period | | | 32,220,574 | | | | 21,739,166 | |
End of period | | $ | 34,805,505 | | | $ | 32,220,574 | |
| | | | | | | | | |
ACCUMULATED NET INVESTMENT INCOME | | $ | 374,327 | | | $ | 198,721 | |
See accompanying notes to financial statements. |
59
BARROW VALUE OPPORTUNITY FUND
STATEMENTS OF CHANGES IN NET ASSETS (Continued) |
| | Six Months Ended November 30, 2015 (Unaudited) | | | Year Ended May 31, 2015 | |
CAPITAL SHARE ACTIVITY (Note 1) | | | | | | |
Institutional Class | | | | | | |
Shares sold | | | 171,771 | | | | 352,569 | |
Shares reinvested | | | — | | | | 73,284 | |
Shares redeemed | | | (44,716 | ) | | | (33,824 | ) |
Net increase in shares outstanding | | | 127,055 | | | | 392,029 | |
Shares outstanding, beginning of period | | | 1,201,742 | | | | 809,713 | |
Shares outstanding, end of period | | | 1,328,797 | | | | 1,201,742 | |
| | | | | | | | | |
Investor Class | | | | | | | | |
Shares sold | | | — | | | | 11,054 | |
Shares reinvested | | | — | | | | 1,035 | |
Shares redeemed | | | (10,392 | ) | | | (15,299 | ) |
Net decrease in shares outstanding | | | (10,392 | ) | | | (3,210 | ) |
Shares outstanding, beginning of period | | | 10,392 | | | | 13,602 | |
Shares outstanding, end of period | | | — | | | | 10,392 | |
See accompanying notes to financial statements. |
60
BARROW LONG/SHORT OPPORTUNITY FUND
STATEMENTS OF CHANGES IN NET ASSETS |
| | Six Months Ended November 30, 2015 (Unaudited) | | | Year Ended May 31, 2015 | |
FROM OPERATIONS | | | | | | |
Net investment loss | | $ | (24,333 | ) | | $ | (4,122 | ) |
Net realized gains (losses) from: | | | | | | | | |
Investments | | | (167,572 | ) | | | 133,151 | |
Securities sold short | | | (150,714 | ) | | | (474,610 | ) |
Net change in unrealized appreciation (depreciation) on: | | | | | | | | |
Investments | | | 279,107 | | | | 1,169,975 | |
Securities sold short | | | 540,620 | | | | (313,893 | ) |
Net increase in net assets resulting from operations | | | 477,108 | | | | 510,501 | |
| | | | | | | | | |
DISTRIBUTIONS TO SHAREHOLDERS (Note 2) | | | | | | | | |
Realized gains, Institutional Class | | | — | | | | (169,448 | ) |
Realized gains, Investor Class | | | — | | | | (3,197 | ) |
Decrease in net assets from distributions to shareholders | | | — | | | | (172,645 | ) |
| | | | | | | | | |
CAPITAL SHARE TRANSACTIONS (Note 1) | | | | | | | | |
Institutional Class | | | | | | | | |
Proceeds from shares sold | | | 9,882,266 | | | | 5,065,056 | |
Net asset value of shares issued in reinvestment of distributions | | | — | | | | 165,696 | |
Payments for shares redeemed | | | (3,020 | ) | | | (106,526 | ) |
Net increase in Institutional Class net assets from capital share transactions | | | 9,879,246 | | | | 5,124,226 | |
| | | | | | | | | |
Investor Class | | | | | | | | |
Proceeds from shares sold | | | — | | | | 10,500 | |
Net asset value of shares issued in reinvestment of distributions | | | — | | | | 3,197 | |
Payments for shares redeemed | | | (191,532 | ) | | | — | |
Net increase (decrease) in Investor Class net assets from capital share transactions | | | (191,532 | ) | | | 13,697 | |
| | | | | | | | | |
TOTAL INCREASE IN NET ASSETS | | | 10,164,822 | | | | 5,475,779 | |
| | | | | | | | | |
NET ASSETS | | | | | | | | |
Beginning of period | | | 9,862,049 | | | | 4,386,270 | |
End of period | | $ | 20,026,871 | | | $ | 9,862,049 | |
| | | | | | | | | |
ACCUMULATED NET INVESTMENT INCOME (LOSS) | | $ | (11,475 | ) | | $ | 12,858 | |
See accompanying notes to financial statements. |
61
BARROW LONG/SHORT OPPORTUNITY FUND
STATEMENTS OF CHANGES IN NET ASSETS (Continued) |
| | Six Months Ended November 30, 2015 (Unaudited) | | | Year Ended May 31, 2015 | |
CAPITAL SHARE ACTIVITY (Note 1) | | | | | | |
Institutional Class | | | | | | |
Shares sold | | | 912,236 | | | | 499,343 | |
Shares reinvested | | | — | | | | 16,134 | |
Shares redeemed | | | (282 | ) | | | (10,410 | ) |
Net increase in shares outstanding | | | 911,954 | | | | 505,067 | |
Shares outstanding, beginning of period | | | 909,832 | | | | 404,765 | |
Shares outstanding, end of period | | | 1,821,786 | | | | 909,832 | |
| | | | | | | | | |
Investor Class | | | | | | | | |
Shares sold | | | — | | | | 1,004 | |
Shares reinvested | | | — | | | | 312 | |
Shares redeemed | | | (18,074 | ) | | | — | |
Net increase (decrease) in shares outstanding | | | (18,074 | ) | | | 1,316 | |
Shares outstanding, beginning of period | | | 18,074 | | | | 16,758 | |
Shares outstanding, end of period | | | — | | | | 18,074 | |
See accompanying notes to financial statements. |
62
BARROW VALUE OPPORTUNITY FUND*
FINANCIAL HIGHLIGHTS |
Per share data for a share outstanding throughout each period: | |
| | Six Months Ended November 30,
2015 (Unaudited) | | | Year Ended May 31, 2015 | | | Period Ended May 31, 2014(a) | |
Net asset value at beginning of period | | $ | 26.58 | | | $ | 26.40 | | | $ | 23.30 | |
| | | | | | | | | | | | | |
Income (loss) from investment operations: | | | | | | | | | | | | |
Net investment income | | | 0.12 | | | | 0.27 | | | | 0.18 | |
Net realized and unrealized gains (losses) on investments | | | (0.51 | ) | | | 2.25 | | | | 3.47 | |
Total from investment operations | | | (0.39 | ) | | | 2.52 | | | | 3.65 | |
| | | | | | | | | | | | | |
Less distributions: | | | | | | | | | | | | |
From net investment income | | | — | | | | (0.20 | ) | | | (0.06 | ) |
From net realized gains from investments | | | — | | | | (2.14 | ) | | | (0.49 | ) |
Total from investment operations | | | — | | | | (2.34 | ) | | | (0.55 | ) |
| | | | | | | | | | | | | |
Net asset value at end of period | | $ | 26.19 | | | $ | 26.58 | | | $ | 26.40 | |
| | | | | | | | | | | | | |
Total return (b) | | | (1.47% | )(c) | | | 10.10 | % | | | 15.73 | %(c) |
| | | | | | | | | | | | | |
Ratios and supplemental data: | | | | | | | | | | | | |
Net assets at end of period (000’s) | | $ | 34,806 | | | $ | 31,945 | | | $ | 21,380 | |
| | | | | | | | | | | | | |
Ratio of total expenses to average net assets | | | 1.64 | %(d) | | | 1.79 | % | | | 1.86 | %(d) |
| | | | | | | | | | | | | |
Ratio of net expenses to average net assets (e) | | | 1.15 | %(d) | | | 1.15 | % | | | 1.15 | %(d) |
| | | | | | | | | | | | | |
Ratio of net investment income to average net assets (e) | | | 1.05 | %(d) | | | 1.29 | % | | | 1.01 | %(d) |
| | | | | | | | | | | | | |
Portfolio turnover rate | | | 45 | %(c) | | | 112 | % | | | 45 | %(c) |
* | Prior to July 1, 2015, formally known as Barrow Value Opportunity Fund - Institutional Class (Note 1). |
(a) | Represents the period from the commencement of operations (close of business August 30, 2013) through May 31, 2014 (Note 1). |
(b) | Total return is a measure of the change in value of an investment in the Fund over the periods covered, which assumes any dividends or capital gains distributions are reinvested in shares of the Fund. The returns shown do not reflect the deduction of taxes a shareholder would pay on Fund distributions or the redemption of Fund shares. The total returns would have been lower if the Adviser had not reduced advisory fees and reimbursed expenses. |
(c) | Not annualized. |
(d) | Annualized. |
(e) | Ratio was determined after fee reductions and expense reimbursements by the Adviser (Note 4). |
See accompanying notes to financial statements. |
63
BARROW LONG/SHORT OPPORTUNITY FUND*
FINANCIAL HIGHLIGHTS |
Per share data for a share outstanding throughout each period: | |
| | Six Months Ended November 30, 2015 (Unaudited) | | | Year Ended May 31, 2015 | | | Period Ended May 31, 2014(a) | |
Net asset value at beginning of period | | $ | 10.63 | | | $ | 10.41 | | | $ | 10.00 | |
| | | | | | | | | | | | | |
Income (loss) from investment operations: | | | | | | | | | | | | |
Net investment loss | | | (0.02 | ) | | | (0.02 | ) | | | (0.03 | ) |
Net realized and unrealized gains on investments | | | 0.38 | | | | 0.43 | | | | 0.44 | |
Total from investment operations | | | 0.36 | | | | 0.41 | | | | 0.41 | |
| | | | | | | | | | | | | |
Less distributions: | | | | | | | | | | | | |
From net realized gains from investments | | | — | | | | (0.19 | ) | | | — | |
| | | | | | | | | | | | | |
Net asset value at end of period | | $ | 10.99 | | | $ | 10.63 | | | $ | 10.41 | |
| | | | | | | | | | | | | |
Total return (b) | | | 3.39 | %(c) | | | 4.01 | % | | | 4.10 | %(c) |
| | | | | | | | | | | | | |
Ratios and supplemental data: | | | | | | | | | | | | |
Net assets at end of period (000’s) | | $ | 20,027 | | | $ | 9,671 | | | $ | 4,212 | |
| | | | | | | | | | | | | |
Ratio of total expenses to average net assets | | | 5.41 | %(e) | | | 6.16 | % | | | 8.69 | %(e) |
| | | | | | | | | | | | | |
Ratio of net expenses to average net assets (d) | | | 3.66 | %(e) | | | 3.70 | % | | | 3.51 | %(e) |
| | | | | | | | | | | | | |
Ratio of net expenses to average net assets excluding dividend expense (d) | | | 2.52 | %(e) | | | 2.54 | % | | | 2.51 | %(e) |
| | | | | | | | | | | | | |
Ratio of net expenses to average net assets excluding dividend expense and brokerage expense on securities sold short (d) | | | 1.74 | %(e) | | | 1.74 | % | | | 1.74 | %(e) |
| | | | | | | | | | | | | |
Ratio of net investment loss to
average net assets (d) (f) | | | (0.40% | )(e) | | | (0.05 | %) | | | (0.37% | )(e) |
| | | | | | | | | | | | | |
Portfolio turnover rate | | | 49 | %(c) | | | 111 | % | | | 76 | %(c) |
* | Prior to July 1, 2015, formally known as Barrow Long/Short Opportunity Fund - Institutional Class (Note 1). |
(a) | Represents the period from the commencement of operations (close of business August 30, 2013) through May 31, 2014 (Note 1). |
(b) | Total return is a measure of the change in value of an investment in the Fund over the periods covered, which assumes any dividends or capital gains distributions are reinvested in shares of the Fund. The returns shown do not reflect the deduction of taxes a shareholder would pay on Fund distributions or the redemption of Fund shares. The total returns would have been lower if the Adviser had not reduced advisory fees and reimbursed expenses. |
(c) | Not annualized. |
(d) | Ratio was determined after fee reductions and expense reimbursements by the Adviser (Note 4). |
(e) | Annualized. |
(f) | The Fund earns interest income on the margin account balance that is associated with securities sold short. The ratio of interest income to average net assets for the periods ended November 30, 2015, May 31, 2015 and May 31, 2014 is 0.32%(e), 0.30% and 0.28%(e), respectively. |
See accompanying notes to financial statements. |
64
BARROW FUNDS
NOTES TO FINANCIAL STATEMENTS
November 30, 2015 (Unaudited)
1. Organization
Barrow Value Opportunity Fund (formerly Barrow All-Cap Core Fund) and Barrow Long/Short Opportunity Fund (formerly Barrow All-Cap Long/Short Fund) (individually, a “Fund” and collectively, the “Funds”) are each a diversified series of Ultimus Managers Trust (the “Trust”), an open-end investment company established as an Ohio business trust under a Declaration of Trust dated February 28, 2012. Other series of the Trust are not incorporated in this report. The Funds commenced operations at the close of business on August 30, 2013.
The investment objective of Barrow Value Opportunity Fund is to seek to generate long-term capital appreciation. The investment objective of Barrow Long/Short Opportunity Fund is to seek to generate above-average returns through capital appreciation, while also attempting to reduce volatility and preserve capital during market downturns.
The Funds currently offer one class of shares which is sold without any sales loads or distribution fees. Prior to July 1, 2015, each Fund offered two classes of shares: Institutional Class shares (sold without any sales loads or distribution fees and required a $250,000 initial investment) and Investor Class shares (sold without any sales loads, but subject to a distribution fee of up to 0.25% of the average daily net assets attributable to Investor Class shares, and required a $2,500 initial investment). Each class of shares represented an ownership interest in the same investment portfolio. On June 30, 2015, all existing Investor Class shares of each Fund were converted into Institutional Class shares and the initial minimum investment was reduced to $2,500 (the “Conversion”). After the Conversion, the Institutional Class designation no longer applied to shares of the Fund.
2. Significant Accounting Policies
The following is a summary of the Funds’ significant accounting policies. The policies are in conformity with accounting principles generally accepted in the United States of America (“GAAP”). As an investment company, as defined in Financial Accounting Standards Board (“FASB”) Accounting Standards Update 2013-08, the Funds follow accounting and reporting guidance under FASB Accounting Standards Codification Topic 946, “Financial Services – Investment Companies.”
65
BARROW FUNDS
NOTES TO FINANCIAL STATEMENTS (Continued) |
Securities valuation – Each Fund values its portfolio securities at market value as of the close of regular trading on the New York Stock Exchange (the “NYSE”) (normally 4:00 p.m. Eastern time) on each business day the NYSE is open for business. The Funds value their listed securities on the basis of the security’s last sale price on the security’s primary exchange, if available, otherwise at the exchange’s most recently quoted bid price. NASDAQ-listed securities are valued at the NASDAQ Official Closing Price. In the event that market quotations are not readily available or are considered unreliable due to market or other events, the Funds value their securities and other assets at fair value in accordance with procedures established by and under the general supervision of the Trust’s Board of Trustees (the “Board”). Under these procedures, the securities will be classified as Level 2 or 3 within the fair value hierarchy (see below), depending on the inputs used. Unavailable or unreliable market quotes may be due to the following factors: a substantial bid-ask spread; infrequent sales resulting in stale prices; insufficient trading volume; small trade sizes; a temporary lapse in any reliable pricing source; and actions of the securities or futures markets, such as the suspension or limitation of trading. As a result, the prices of securities used to calculate each Fund’s net asset value may differ from quoted or published prices for the same securities.
GAAP establishes a single authoritative definition of fair value, sets out a framework for measuring fair value, and requires additional disclosures about fair value measurements.
Various inputs are used in determining the value of each Fund’s investments and other financial instruments. These inputs are summarized in the three broad levels listed below:
● | Level 1 – quoted prices in active markets for identical securities |
● | Level 2 – other significant observable inputs |
● | Level 3 – significant unobservable inputs |
The inputs or methods used for valuing securities are not necessarily an indication of the risks associated with investing in those securities. The inputs used to measure fair value may fall into different levels of the fair value hierarchy. In such cases, for disclosure purposes, the level in the fair value hierarchy within which the fair value measurement falls in its entirety is determined based on the lowest level input that is significant to the fair value measurement.
66
BARROW FUNDS
NOTES TO FINANCIAL STATEMENTS (Continued) |
The following is a summary of the inputs used to value the Funds’ investments and other financial instruments as of November 30, 2015:
Barrow Value Opportunity Fund | | Level 1 | | | Level 2 | | | Level 3 | | | Total | |
Investments in Securities: | | | | | | | | | | | | |
Common Stocks | | $ | 34,664,185 | | | $ | — | | | $ | — | | | $ | 34,664,185 | |
Exchange-Traded Funds | | | 1,461 | | | | — | | | | — | | | | 1,461 | |
Money Market Funds | | | 89,745 | | | | — | | | | — | | | | 89,745 | |
Total | | $ | 34,755,391 | | | $ | — | | | $ | — | | | $ | 34,755,391 | |
Barrow Long/Short Opportunity Fund | | Level 1 | | | Level 2 | | | Level 3 | | | Total | |
Investments in Securities: | | | | | | | | | | | | | | | | |
Common Stocks | | $ | 24,424,239 | | | $ | 0 | (a) | | $ | — | | | $ | 24,424,239 | |
Exchange-Traded Funds | | | 11,060 | | | | — | | | | — | | | | 11,060 | |
Money Market Funds | | | 529,259 | | | | — | | | | — | | | | 529,259 | |
Total | | $ | 24,964,558 | | | $ | 0 | | | $ | — | | | $ | 24,964,558 | |
Other Financial Instruments: | | | | | | | | | | | | | | | | |
Common Stocks – Sold Short | | $ | (16,788,357 | ) | | $ | — | | | $ | — | | | $ | (16,788,357 | ) |
Warrants – Sold Short | | | (1 | ) | | | (0 | )(a) | | | — | | | | (1 | ) |
Total | | $ | (16,788,358 | ) | | $ | (0 | ) | | $ | — | | | $ | (16,788,358 | ) |
(a) | Barrow Long/Short Opportunity Fund holds Level 2 securities and other financial instruments which are valued at $0. |
Refer to each Fund’s Schedule of Investments and Schedule of Securities Sold Short, as applicable, for a listing of securities by industry type. As of November 30, 2015, the Funds did not have any transfers into and out of any Level. There were no Level 3 securities or derivative instruments held by the Funds as of November 30, 2015. It is the Funds’ policy to recognize transfers into and out of any Level at the end of the reporting period.
Share valuation – The net asset value per share of each Fund is calculated daily by dividing the total value of its assets, less liabilities, by the number of shares outstanding. The offering price and redemption price per share of each Fund is equal to the net asset value per share.
Investment income/expense – Dividend income and expense are recorded on the ex-dividend date. Interest income is accrued as earned.
Security transactions – Security transactions are accounted for on the trade date. Gains and losses on securities sold are determined on a specific identification basis.
67
BARROW FUNDS
NOTES TO FINANCIAL STATEMENTS (Continued) |
Common expenses – Common expenses of the Trust are allocated among the Funds and the other series of the Trust based on the relative net assets of each series or the nature of the services performed and the relative applicability to each series.
Distributions to shareholders – The Funds distribute to shareholders any net investment income dividends and net realized capital gains distributions at least once each year. The amount of such dividends and distributions are determined in accordance with federal income tax regulations, which may differ from GAAP. Dividends and distributions to shareholders are recorded on the ex-dividend date. The tax character of distributions paid to shareholders during the periods ended November 30, 2015 and May 31, 2015 was as follows:
Barrow Value Opportunity Fund |
Period Ended | Ordinary Income | Long-Term Capital Gains | Total Distributions |
Institutional Class | | | |
November, 2015 | $ — | $ — | $ — |
May 31, 2015 | $ 272,298 | $ 1,595,623 | $ 1,867,921 |
| | | | |
Investor Class | | | |
November, 2015 | $ — | $ — | $ — |
May 31, 2015 | $ 3,239 | $ 22,723 | $ 25,962 |
Barrow Long/Short Opportunity Fund |
Period Ended | Ordinary Income | Long-Term Capital Gains | Total Distributions |
Institutional Class | | | |
November, 2015 | $ — | $ — | $ — |
May 31, 2015 | $ 169,448 | $ — | $ 169,448 |
| | | | |
Investor Class | | | |
November, 2015 | $ — | $ — | $ — |
May 31, 2015 | $ 3,197 | $ — | $ 3,197 |
Barrow Value Opportunity Fund made the following distributions to shareholders of record on December 30, 2015:
| | | Per Share |
Record Date | Ex-Date | Ordinary Income | Long-term Capital Gains |
12/30/2015 | 12/31/2015 | $ 0.1910 | $ 0.2018 |
68
BARROW FUNDS
NOTES TO FINANCIAL STATEMENTS (Continued) |
Short Sales – Barrow Long/Short Opportunity Fund may sell securities short. For financial statement purposes, an amount equal to the settlement amount is included in the Statements of Assets and Liabilities as an asset and an equivalent liability is then subsequently marked-to-market daily to reflect the current value of the short position. Subsequent fluctuations in the market prices of securities sold, but not yet purchased, may require purchasing the securities at prices which may differ from the market value reflected on the Statements of Assets and Liabilities. The Fund is liable for any dividends payable on securities while those securities are in a short position and will also bear other costs, such as charges for the prime brokerage accounts, in connection with the short positions. These costs are reported as dividend expense and brokerage expense on securities sold short, respectively, in the Statements of Operations. As collateral for its short positions, the Fund is required under the Investment Company Act of 1940 (the “1940 Act”) to maintain assets consisting of cash, cash equivalents or other liquid securities equal to the market value of the securities sold short. The cash deposits with brokers for securities sold short are reported on the Statements of Assets and Liabilities. The amount of collateral is required to be adjusted daily to reflect changes in the value of the securities sold short. To the extent Barrow Long/Short Opportunity Fund invests the proceeds received from selling securities short, the Fund is engaging in a form of leverage. The use of leverage by the Fund may make any change in the Fund’s net asset value greater than it would be without the use of leverage. Short sales are speculative transactions and involve special risks, including greater reliance on the ability of Barrow Street Advisers, LLC (the “Adviser”) to accurately anticipate the future value of a security.
Estimates – The preparation of financial statements in conformity with GAAP requires management to make estimates and assumptions that affect the reported amounts of assets and liabilities and disclosure of contingent assets and liabilities as of the date of the financial statements and the reported amounts of income and expenses during the reporting period. Actual results could differ from those estimates.
Federal income tax – Each Fund has qualified and intends to continue to qualify each year as a regulated investment company under the Internal Revenue Code of 1986, as amended (the “Code”). Qualification generally will relieve each Fund of liability for federal income taxes to the extent 100% of its net investment income and net realized capital gains are distributed in accordance with the Code. Accordingly, no provision for income tax has been made.
In order to avoid imposition of the excise tax applicable to regulated investment companies, it is also each Fund’s intention to declare as dividends in each calendar year at least 98% of its net investment income (earned during the calendar year) and 98.2% of its net realized capital gains (earned during the twelve months ended October 31) plus undistributed amounts from prior years.
69
BARROW FUNDS
NOTES TO FINANCIAL STATEMENTS (Continued) |
The following information is computed on a tax basis for each item as of November 30, 2015:
| | Barrow Value Opportunity Fund | | | Barrow Long/Short Opportunity Fund | |
Cost of portfolio investments | | $ | 30,605,452 | | | $ | 23,279,235 | |
Gross unrealized appreciation | | $ | 5,325,729 | | | $ | 2,431,751 | |
Gross unrealized depreciation | | | (1,175,790 | ) | | | (746,428 | ) |
Net unrealized appreciation | | | 4,149,939 | | | | 1,685,323 | |
Net unrealized depreciation on securities sold short | | | — | | | | (324,824 | ) |
Accumulated ordinary income (loss) | | | 226,396 | | | | (60,090 | ) |
Undistributed long-term gains | | | 281,634 | | | | — | |
Capital loss carryforward | | | — | | | | (218,049 | ) |
Other losses | | | (210,973 | ) | | | (98,183 | ) |
Accumulated earnings | | $ | 4,446,996 | | | $ | 984,177 | |
As of November 30, 2015, the proceeds of securities sold short on a tax basis is $16,463,534 for Barrow Long/Short Opportunity Fund.
The value of the federal income tax cost of portfolio investments, securities sold short and tax components of accumulated earnings may temporarily differ from the financial statement cost of portfolio investments and securities sold short and components of net assets (“book/tax differences”). These book/tax differences are due to the recognition of capital gains or losses under income tax regulations and GAAP, primarily the tax deferral of losses on wash sales and the tax treatment of income and capital gains on publicly-traded partnerships held by the Funds.
As of May 31, 2015, Barrow Long/Short Opportunity Fund had a short-term capital loss carryforward of $218,049 for federal income tax purposes. This capital loss carryforward, which does not expire, may be utilized in the current and future years to offset net realized capital gains, if any, prior to distributing such gains to shareholders.
The Funds recognize tax benefits or expenses of uncertain tax positions only when the position is “more likely than not” of being sustained assuming examination by tax authorities. Management has reviewed the tax positions taken on Federal income tax returns for the current and all open tax years (tax years ended May 31, 2014 and May 31, 2015) and has concluded that no provision for unrecognized tax benefits or expenses is required in these financial statements. The Funds identify their major tax jurisdiction as U.S. Federal.
70
BARROW FUNDS
NOTES TO FINANCIAL STATEMENTS (Continued) |
3. Investment Transactions
During the six months ended November 30, 2015, cost of purchases and proceeds from sales of investment securities, other than short-term investments and short positions, amounted to $18,539,314 and $14,796,852, respectively, for Barrow Value Opportunity Fund and $19,207,226 and $7,581,896, respectively, for Barrow Long/Short Opportunity Fund.
4. Transactions with Related Parties
INVESTMENT ADVISORY AGREEMENT
Each Fund’s investments are managed by the Adviser pursuant to the terms of an Investment Advisory Agreement. Barrow Value Opportunity Fund pays the Adviser an investment advisory fee, computed and accrued daily and paid monthly, at the annual rate of 0.99% of its average daily net assets. Barrow Long/Short Opportunity Fund pays the Adviser an investment advisory fee, computed and accrued daily and paid monthly, at the annual rate of 1.50% of its average daily net assets.
Pursuant to an Expense Limitation Agreement (“ELA”) between the Funds and the Adviser, the Adviser has contractually agreed, until October 1, 2016, to reduce investment advisory fees and reimburse other operating expenses to limit total annual operating expenses of the Funds (exclusive of brokerage costs, taxes, borrowing costs such as interest and dividend expenses on securities sold short, interest, acquired fund fees and expenses, extraordinary expenses such as litigation and merger or reorganization costs, and other expenses not incurred in the ordinary course of the Funds’ business) to an amount not exceeding the following percentages of each Fund’s average daily net assets:
Barrow Value Opportunity Fund | 1.15% |
Barrow Long/Short Opportunity Fund | 1.74% |
Accordingly, during the six months ended November 30, 2015, the Adviser reduced its investment advisory fees and reimbursed other operating expenses as follows:
| | Investment Advisory Fee Reductions | | | Expense Reimbursements | | | Total | |
Barrow Value Opportunity Fund | | | $ 63,200 | | | | $ 17,840 | | | | $ 81,040 | |
Barrow Long/Short Opportunity Fund | | | $ 90,852 | | | | $ 15,757 | | | | $ 106,609 | |
71
BARROW FUNDS
NOTES TO FINANCIAL STATEMENTS (Continued) |
Under the terms of the ELA, investment advisory fee reductions and expense reimbursements by the Adviser are subject to recoupment by the Adviser for a period of three years after such fees and expenses were incurred, provided that the recoupments do not cause total annual operating expenses of the Funds to exceed the foregoing expense limitations. As of November 30, 2015, the Adviser may seek recoupment of investment advisory fee reductions and expense reimbursements no later than the dates as stated below:
| May 31, 2017 | May 31, 2018 | November 30, 2018 | Total |
Barrow Value Opportunity Fund | $ 118,161 | $180,140 | $ 81,040 | $ 379,341 |
Barrow Long/Short Opportunity Fund | $ 156,927 | $ 212,647 | $ 106,609 | $ 476,183 |
The Principle Executive Officer of the Funds is also an officer of the Adviser.
OTHER SERVICE PROVIDERS
Ultimus Fund Solutions, LLC (“Ultimus”) provides fund administration, fund accounting, compliance, and transfer agency services to the Funds. Each Fund pays Ultimus fees in accordance with the agreements for such services. In addition, each Fund pays out-of-pocket expenses including, but not limited to, postage, supplies, and costs of pricing its portfolio securities.
Under the terms of a Distribution Agreement with the Trust, Ultimus Fund Distributors, LLC (the “Distributor”) serves as principal underwriter to each Fund. The Distributor is a wholly-owned subsidiary of Ultimus.
Certain Trustees and officers of the Trust are also officers of Ultimus and the Distributor.
DISTRIBUTION PLAN
Prior to July 1, 2015, each Fund had adopted a distribution plan under Rule 12b-1 under the 1940 Act (the “Plan”) pursuant to which each Fund could pay intermediaries and other persons for rendering distribution and shareholder services and for bearing any related expenses with respect to the Investor Class of each Fund. These distribution and shareholder service fees could not exceed the annual rate of 0.25% of each Fund’s average daily net assets allocable to Investor Class Shares. During the six months ended November 30, 2015, the Investor Class of Barrow Value Opportunity Fund and Barrow Long/Short Opportunity Fund incurred $57 and $39, respectively, of distribution fees under the Plan.
72
BARROW FUNDS
NOTES TO FINANCIAL STATEMENTS (Continued) |
TRUSTEE COMPENSATION
Each Trustee who is not an “interested person” of the Trust (“Independent Trustee”) receives from each Fund a fee of $500 for each Board meeting attended plus reimbursement of travel and other meeting-related expenses. Each Independent Trustee also receives a $500 annual retainer from each Fund. Trustees affiliated with the Adviser or Ultimus are not compensated by the Funds for their services.
PRINCIPAL HOLDERS OF FUND SHARES
As of November 30, 2015, the following shareholders owned of record 5% or more of the outstanding shares of each Fund:
Name of Record Owner | % Ownership |
Barrow Value Opportunity Fund: | |
Socatean Partners | 45% |
Charles Schwab & Company, Inc. (for the benefit of its customers) | 34% |
Robert F. Greenhill, Jr. (a principal of the Adviser) | 13% |
Barrow Long/Short Opportunity Fund: | |
Charles Schwab & Company, Inc. (for the benefit of its customers) | 52% |
Socatean Partners | 28% |
Robert F. Greenhill, Jr. | 13% |
A beneficial owner of 25% or more of either Fund’s outstanding shares may be considered a controlling person. That shareholder’s vote could have a more significant effect on matters presented at a shareholder’s meeting.
5. Borrowing Costs
Barrow Value Opportunity Fund has a secured bank line of credit with BNP Paribas that provides a maximum borrowing of up to one-third of its net assets. The line of credit may be used to maintain necessary liquidity to make payments for redemptions of Fund shares or for temporary emergency purposes. Borrowings under this arrangement bear interest at an annual rate equal to the one-month LIBOR at the time of borrowing plus 0.85%. During the six months ended November 30, 2015, Barrow Value Opportunity Fund incurred $363 of borrowing costs. As of November 30, 2015, Barrow Value Opportunity Fund did not have any outstanding borrowings. The average outstanding borrowings and average interest rate on such borrowings by Barrow Value Opportunity Fund during the six months ended November 30, 2015 were $71,296 and 1.03%, respectively. Barrow Long/Short Opportunity Fund does not have a bank line of credit.
73
BARROW FUNDS
NOTES TO FINANCIAL STATEMENTS (Continued) |
6. Contingencies and Commitments
The Funds indemnify the Trust’s officers and Trustees for certain liabilities that might arise from their performance of their duties to the Funds. Additionally, in the normal course of business the Funds enter into contracts that contain a variety of representations and warranties and which provide general indemnifications. The Funds’ maximum exposure under these arrangements is unknown, as this would involve future claims that may be made against the Funds that have not yet occurred. However, based on experience, the Funds expect the risk of loss to be remote.
7. Sector Risk
If a Fund has significant investments in the securities of issuers within a particular sector, any development affecting that sector will have a greater impact on the value of the net assets of the Fund than would be the case if the Fund did not have significant investments in that sector. In addition, this may increase the risk of loss in the Fund and increase the volatility of the Fund’s net asset value per share. Occasionally, market conditions, regulatory changes, or other developments may negatively impact a particular sector, and therefore the value of the Fund’s portfolio will be adversely affected. As of November 30, 2015, Barrow Long/Short Opportunity Fund had the following percentages of the value of its net assets invested or sold short in stocks within the following sectors:
Sector | Long Positions | Short Positions | Net Exposure |
Consumer Staples | 26.7% | (17.6%) | 9.1% |
As shown above, although the Fund has greater than 25% of the Fund’s net assets invested in long positions in the sector noted, the sector exposure is mitigated by short positions. As part of the Fund’s principal investment strategies, the Adviser monitors the Fund’s sector exposure to ensure the Fund’s portfolio is significantly diversified.
8. Subsequent Events
The Funds are required to recognize in the financial statements the effects of all subsequent events that provide additional evidence about conditions that existed as of the date of the Statements of Assets and Liabilities. For non-recognized subsequent events that must be disclosed to keep the financial statements from being misleading, the Funds are required to disclose the nature of the event as well as an estimate of its financial effect, or a statement that such an estimate cannot be made. Management has evaluated subsequent events through the issuance of these financial statements and has noted the following:
● | The subsequent payment of ordinary income dividends and long-term capital gain distributions for Barrow Value Opportunity Fund as disclosed in Note 2. |
● | The secured bank line of credit that Barrow Value Opportunity Fund had with BNP Paribas was closed on December 30, 2015. |
74
BARROW FUNDS
ABOUT YOUR FUNDS’ EXPENSES (Unaudited) |
We believe it is important for you to understand the impact of costs on your investment. As a shareholder of the Funds, you incur ongoing costs, including management fees and other operating expenses. The following examples are intended to help you understand your ongoing costs (in dollars) of investing in the Funds and to compare these costs with the ongoing costs of investing in other mutual funds.
A mutual fund’s ongoing costs are expressed as a percentage of its average net assets. This figure is known as the expense ratio. The expenses in the table below are based on an investment of $1,000 made at the beginning of the most recent period (June 1, 2015) and held until the end of the period (November 30, 2015).
The table below illustrates each Fund’s ongoing costs in two ways:
Actual fund return – This section helps you to estimate the actual expenses that you paid over the period. The “Ending Account Value” shown is derived from each Fund’s actual return, and the fourth column shows the dollar amount of operating expenses that would have been paid by an investor who started with $1,000 in the Funds. You may use the information here, together with the amount you invested, to estimate the expenses that you paid over the period.
To do so, simply divide your account value by $1,000 (for example, an $8,600 account value divided by $1,000 = 8.6), then multiply the result by the number given for the Funds under the heading “Expenses Paid During Period.”
Hypothetical 5% return – This section is intended to help you compare the Funds’ ongoing costs with those of other mutual funds. It assumes that each Fund had an annual return of 5% before expenses during the period shown, but that the expense ratio is unchanged. In this case, because the return used is not the Funds’ actual return, the results do not apply to your investment. The example is useful in making comparisons because the U.S. Securities and Exchange Commission (the “SEC”) requires all mutual funds to calculate expenses based on a 5% return. You can assess each Fund’s ongoing costs by comparing this hypothetical example with the hypothetical examples that appear in shareholder reports of other funds.
Note that expenses shown in the table are meant to highlight and help you compare ongoing costs only. The Funds do not charge transaction fees, such as purchase or redemption fees, nor do they carry a “sales load.”
The calculations assume no shares were bought or sold during the period. Your actual costs may have been higher or lower, depending on the amount of your investment and the timing of any purchases or redemptions.
75
BARROW FUNDS
ABOUT YOUR FUNDS’ EXPENSES (Unaudited) (Continued) |
More information about the Funds’ expenses can be found in this report. For additional information on operating expenses and other shareholder costs, please refer to the Funds’ prospectus.
| Beginning Account Value June 1, 2015 | Ending Account Value November 30, 2015 | Net Expense Ratio(a) | Expenses Paid During Period(b) |
Barrow Value Opportunity Fund | | | | |
Actual | $1,000.00 | $985.30 | 1.15% | $5.72 |
Hypothetical 5% Return (before expenses) | $1,000.00 | $1,019.30 | 1.15% | $5.82 |
Barrow Long/Short Opportunity Fund | | | |
Actual | $1,000.00 | $1,033.90 | 3.66% | $18.66 |
Hypothetical 5% Return (before expenses) | $1,000.00 | $1,006.72 | 3.66% | $18.41 |
(a) | Annualized, based on the Fund’s most recent one-half year expenses. |
(b) | Expenses are equal to the Funds’ annualized expense ratio multiplied by the average account value over the period, multiplied by 183/365 (to reflect the one-half year period). |
76
BARROW FUNDS
OTHER INFORMATION (Unaudited) |
A description of the policies and procedures that the Funds use to vote proxies relating to portfolio securities is available without charge upon request by calling toll-free 1-877-767-6633, or on the SEC’s website at http://www.sec.gov. Information regarding how the Funds voted proxies relating to portfolio securities during the most recent 12 month period ended June 30 is also available without charge upon request by calling toll-free 1-877-767-6633, or on the SEC’s website at http://www.sec.gov.
The Trust files a complete listing of portfolio holdings for each Fund with the SEC as of the end of the first and third quarters of each fiscal year on Form N-Q. These filings are available upon request by calling 1-877-767-6633. Furthermore, you may obtain a copy of the filings on the SEC’s website at http://www.sec.gov. The Trust’s Forms N-Q may also be reviewed and copied at the SEC’s Public Reference Room in Washington, DC, and information on the operation of the Public Reference Room may be obtained by calling 1-800-SEC-0330.
77

CINCINNATI ASSET MANAGEMENT FUNDS:
BROAD MARKET STRATEGIC INCOME FUND
Semi-Annual Report
November 30, 2015
(Unaudited)
CINCINNATI ASSET MANAGEMENT FUNDS:
BROAD MARKET STRATEGIC INCOME FUND
LETTER TO SHAREHOLDERS | January 5, 2015 |
Dear Shareholders,
Our Semi-Annual report for the Cincinnati Asset Management Funds: Broad Market Strategic Income Fund (the “Fund”) presents data and performance for the 6 months ended November 30, 2015. All of us at Cincinnati Asset Management, Inc. want to thank you for your investment with us, and we appreciate your confidence in our investment management.
The Fund invests primarily in a broad market of investment-grade and high-yield corporate bonds that we consider undervalued. We believe that our proprietary analysis enhances our ability to identify such opportunities and enables us to sell securities when opportunities that are more attractive present themselves. These investment decisions are made with the important discipline of maintaining portfolio diversification and with the dual objectives of achieving a high level of income while preserving capital. Our goal is to improve quality, increase yield, and shorten maturity in the Fund’s portfolio.
Our disciplined investing strategy resulted in the Fund holding 80 positions in the bonds of 75 different corporations on November 30, 2015. The Fund continues to be fully invested. The Fund’s performance matched the Barclays U.S. Corporate BAA Index (the “Benchmark”) for the 6-month fiscal period ended November 30, with a total return of -2.48% for both the Fund and the Benchmark. The difficult environment in the high-yield market resulted in the negative returns for both the Fund and Benchmark.
During the past 6 months, interest rates increased. On June 1, 2015, the yield on the 10-year Treasury Bond was 2.12%, and on November 30, 2015 it was 2.21%. Moreover, the premium yield on A-rated corporate bonds versus Treasuries increased from 1.09% to 1.17%, and on BBB-rated corporate bonds the premium rose from 1.78% to 2.14%. Bond prices decline as rates increase, and the lower net asset value of the Fund reflects the higher interest rates. The Federal Reserve Board (the “Fed”) increased the Federal Funds Target Rate by 0.25% during December 2015, a move that had been generally anticipated for several months. Typically, changes in the Target Rate don’t significantly influence the 10-year Treasury rate, which is 2.24% as of the date of this letter (almost the same as it was on November 30, 2015). At this time, the timing of additional rate increases is less critical than the questions of “how high” and “how fast”. As of November 30, 2015, bonds that the Fund owns were yielding 4.54% to average maturity, around 2.3% more than U.S. Treasury yields. We believe that the Fund’s positions will continue to provide excellent value relative to other investment-grade, fixed-income alternatives.
During the first half of the Fund’s fiscal year, revised gross domestic product (“GDP”) for the third calendar quarter of 2015 was +2.1%, while revised second calendar quarter of 2015 was +3.9%. Current consensus forecast for GDP growth in the fourth calendar quarter is 2.2%. Unemployment settled at 5.0% on November 30, 2015 while continuing jobless claims and initial jobless claims showed improvement. The Fed’s measure of inflation was approximately +1.5%, well below its target of 2.0%. Although interest rates will be impacted by “headline” news and the so-called “risk-off/risk-on” trades that cause short-term volatility, we intend to focus on the relative value of corporate and high-yield bonds
1
and on the intermediate-term maturity of the portfolio; it is the underlying credit quality of the companies whose bonds we purchase that influences our investment decisions, not short-term interest rate fluctuations.
Additionally, a predominant theme for the last 6 to 12 months has been the rapid decline of oil prices falling from over $100 per barrel to less than $50 per barrel, rebounding to the $60 range, and then declining to the $35 to $37 range. Many corporations engaged in exploration and production of oil, as well as many corporations providing services to the Energy sector, have experienced a significant negative impact on their revenue, and their bonds have underperformed market averages. The Fund holds several positions in these companies as well as issues of coal companies that have been adversely impacted by the pressures of a struggling coal market. We continue to actively monitor these positions to determine how they may perform over a full market cycle, always seeking to be rewarded for the risks we assume.
We expect increased volatility in fixed-income markets as some participants continually readjust positioning. High-yield bond funds saw significant liquidations in the first half of December 2015 though many experienced inflows later in the month. Although many market observers expect positive returns for high–yield debt for 2016, this will not be without volatility, in our opinion. As always, we will continue to search for value and adjust positions as we uncover compelling situations.
Thank you again for your confidence in our Fund. Our investors are very important to us and if you have any questions regarding market conditions or the Fund, please don’t hesitate to call us (513.554.8500).
Sincerely,
Cincinnati Asset Management Funds:
Broad Market Strategic Income Fund
Managed by Cincinnati Asset Management, Inc.
Past performance is not predictive of future performance. Investment results and principal value will fluctuate so that shares, when redeemed, may be worth more or less than their original cost. Current performance may be higher or lower than the performance data quoted. Performance data current to the most recent month end are available by calling 1-866-738-1128.
An investor should consider the investment objectives, risks, charges and expenses of the Fund carefully before investing. The Fund’s prospectus contains this and other important information. To obtain a copy of the Fund’s prospectus please call 1-866-738-1128 and a copy will be sent to you free of charge. Please read the prospectus carefully before you invest. Cincinnati Asset Management Funds: Broad Market Strategic Income Fund is distributed by Ultimus Fund Distributors, LLC.
The Letter to Shareholders seeks to describe some of the adviser’s current opinions and views of the financial markets. Although the adviser believes it has a reasonable basis for any opinions or views expressed, actual results may differ, sometimes significantly so, from those expected or expressed. The securities held by the Fund that are discussed in the Letter to Shareholders were held during the period covered by this Report. They do not comprise
2
the entire investment portfolio of the Fund, may be sold at any time and may no longer be held by the Fund. The opinions of the Fund’s adviser with respect to those securities may change at any time.
Statements in the Letter to Shareholders that reflect projections or expectations for future financial or economic performance of the Fund and the market in general and statements of the Fund’s plans and objectives for future operations are forward-looking statements. No assurance can be given that actual results or events will not differ materially from those projected, estimated, assumed, or anticipated in any such forward-looking statements. Important factors that could result in such differences, in addition to factors noted with such forward-looking statements include, without limitation, general economic conditions, such as inflation, recession, and interest rates. Past performance is not a guarantee of future results.
3
CINCINNATI ASSET MANAGEMENT FUNDS:
BROAD MARKET STRATEGIC INCOME FUND
PORTFOLIO INFORMATION
November 30, 2015 (Unaudited)
Sector Diversification (% of Net Assets)
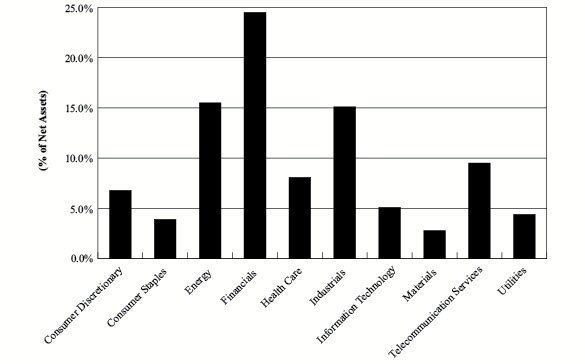
Top 10 Investments
Security Description | % of Net Assets |
Toll Brothers Finance Corp., 5.875%, due 02/15/22 | 2.7% |
L-3 Communications Corp., 3.950%, due 05/28/24 | 2.6% |
Wells Fargo & Co., 4.125%, due 08/15/23 | 2.6% |
Bristol-Myers Squibb Co., 3.250%, due 11/01/23 | 2.6% |
Morgan Stanley, 3.700%, due 10/23/24 | 2.5% |
U.S. Bancorp, 2.950%, due 07/15/22 | 2.5% |
Halliburton Co., 3.500%, due 08/01/23 | 2.5% |
International Lease Finance Corp., 5.875%, due 08/15/22 | 2.3% |
PerkinElmer, Inc., 5.000%, due 11/15/21 | 2.3% |
Qwest Corp., 6.750%, due 12/01/21 | 2.2% |
Credit Rating Allocation |
S&P Credit Quality | | % of Portfolio |
AA | | 4.1% |
A | | 46.6% |
BBB | | 17.4% |
BB | | 14.5% |
B | | 17.4% |
4
CINCINNATI ASSET MANAGEMENT FUNDS:
BROAD MARKET STRATEGIC INCOME FUND
SCHEDULE OF INVESTMENTS
November 30, 2015 (Unaudited) | |
CORPORATE BONDS — 95.7% | | Coupon | | Maturity | | Par Value | | | Value | |
Consumer Discretionary — 6.8% | | | | | | | | | | |
Avis Budget Car Rental, LLC | | | 5.500% | 04/01/23 | | $ | 57,000 | | | $ | 58,354 | |
Cinemark USA, Inc. | | | 4.875% | 06/01/23 | | | 65,000 | | | | 63,944 | |
Penske Auto Group, Inc. | | | 5.375% | 12/01/24 | | | 60,000 | | | | 61,050 | |
Regal Entertainment Group | | | 5.750% | 02/01/25 | | | 61,000 | | | | 59,704 | |
Royal Caribbean Cruises Ltd. | | | 5.250% | 11/15/22 | | | 60,000 | | | | 62,400 | |
Service Corp. International | | | 5.375% | 05/15/24 | | | 9,000 | | | | 9,472 | |
Service Corp. International | | | 7.500% | 04/01/27 | | | 50,000 | | | | 58,500 | |
Tenneco, Inc. | | | 5.375% | 12/15/24 | | | 4,000 | | | | 4,120 | |
Walt Disney Co. (The) | | | 2.350% | 12/01/22 | | | 100,000 | | | | 99,205 | |
| | | | | | | | | | | | | 476,749 | |
Consumer Staples — 3.9% | | | | | | | | | | | | | |
Anheuser-Busch InBev SA/NV | | | 2.625% | 01/17/23 | | | 100,000 | | | | 96,815 | |
B&G Foods, Inc. | | | 4.625% | 06/01/21 | | | 58,000 | | | | 57,492 | |
Spectrum Brands, Inc. | | | 6.625% | 11/15/22 | | | 50,000 | | | | 53,625 | |
Wal-Mart Stores, Inc. | | | 2.550% | 04/11/23 | | | 65,000 | | | | 64,190 | |
| | | | | | | | | | | | | 272,122 | |
Energy — 15.5% | | | | | | | | | | | | | |
Apache Corp. | | | 3.250% | 04/15/22 | | | 109,000 | | | | 107,576 | |
Bristow Group, Inc. | | | 6.250% | 10/15/22 | | | 65,000 | | | | 56,550 | |
Chesapeake Energy Corp. | | | 5.750% | 03/15/23 | | | 7,000 | | | | 3,010 | |
Chevron Corp. | | | 2.355% | 12/05/22 | | | 150,000 | | | | 145,921 | |
Cloud Peak Energy Resources, LLC | | | 8.500% | 12/15/19 | | | 12,000 | | | | 6,840 | |
Cloud Peak Energy Resources, LLC | | | 6.375% | 03/15/24 | | | 29,000 | | | | 13,195 | |
ConocoPhillips Co. | | | 2.400% | 12/15/22 | | | 150,000 | | | | 141,520 | |
Continental Resources, Inc. | | | 5.000% | 09/15/22 | | | 63,000 | | | | 55,361 | |
Denbury Resources, Inc. | | | 4.625% | 07/15/23 | | | 56,000 | | | | 32,760 | |
Halliburton Co. | | | 3.500% | 08/01/23 | | | 175,000 | | | | 174,746 | |
Noble Energy, Inc. | | | 5.875% | 06/01/22 | | | 65,000 | | | | 65,319 | |
Peabody Energy Corp. | | | 7.875% | 11/01/26 | | | 50,000 | | | | 8,375 | |
Range Resources Corp. | | | 5.000% | 08/15/22 | | | 56,000 | | | | 49,840 | |
Sabine Pass Liquefaction, LLC | | | 5.625% | 04/15/23 | | | 59,000 | | | | 54,723 | |
Schlumberger Ltd. | | | 3.650% | 12/01/23 | | | 125,000 | | | | 129,505 | |
Williams Partners, L.P. | | | 4.875% | 05/15/23 | | | 55,000 | | | | 48,468 | |
| | | | | | | | | | | | | 1,093,709 | |
Financials — 24.5% | | | | | | | | | | | | | |
Aircastle Ltd. | | | 5.500% | 02/15/22 | | | 40,000 | | | | 42,000 | |
Bank of America Corp. | | | 3.300% | 01/11/23 | | | 150,000 | | | | 150,118 | |
Bank of New York Mellon Corp. (The) | | | 3.000% | 02/24/25 | | | 100,000 | | | | 98,866 | |
Ford Motor Credit Co., LLC | | | 4.250% | 09/20/22 | | | 150,000 | | | | 155,897 | |
5
CINCINNATI ASSET MANAGEMENT FUNDS:
BROAD MARKET STRATEGIC INCOME FUND
SCHEDULE OF INVESTMENTS (Continued) |
CORPORATE BONDS — 95.7% (Continued) | | Coupon | | Maturity | | Par Value | | | Value | |
Financials — 24.5% (Continued) | | | | | | | | | | |
General Electric Capital Corp. | | | 3.150% | 09/07/22 | | $ | 80,000 | | | $ | 81,945 | |
International Lease Finance Corp. | | | 5.875% | 08/15/22 | | | 150,000 | | | | 162,487 | |
Morgan Stanley | | | 3.700% | 10/23/24 | | | 175,000 | | | | 178,171 | |
PNC Financial Services Group, Inc. (The) (a) | | | 2.854% | 11/09/22 | | | 150,000 | | | | 148,374 | |
Simon Property Group, L.P. | | | 3.750% | 02/01/24 | | | 150,000 | | | | 156,052 | |
Toll Brothers Finance Corp. | | | 5.875% | 02/15/22 | | | 175,000 | | | | 188,125 | |
U.S. Bancorp | | | 2.950% | 07/15/22 | | | 175,000 | | | | 175,440 | |
Wells Fargo & Co. | | | 4.125% | 08/15/23 | | | 175,000 | | | | 182,637 | |
| | | | | | | | | | | | | 1,720,112 | |
Health Care — 8.1% | | | | | | | | | | | | | |
Bristol-Myers Squibb Co. | | | 3.250% | 11/01/23 | | | 175,000 | | | | 181,345 | |
Community Health Systems, Inc. | | | 6.875% | 02/01/22 | | | 56,000 | | | | 54,460 | |
DaVita HealthCare Partners, Inc. | | | 5.000% | 05/01/25 | | | 60,000 | | | | 57,750 | |
HCA Holdings, Inc. | | | 5.375% | 02/01/25 | | | 60,000 | | | | 59,175 | |
HealthSouth Corp. | | | 5.750% | 11/01/24 | | | 60,000 | | | | 58,200 | |
PerkinElmer, Inc. | | | 5.000% | 11/15/21 | | | 150,000 | | | | 159,065 | |
| | | | | | | | | | | | | 569,995 | |
Industrials — 15.1% | | | | | | | | | | | | | |
General Dynamics Corp. | | | 2.250% | 11/15/22 | | | 150,000 | | | | 144,573 | |
Hawaiian Airlines, Inc., Series 2013-1A | | | 3.900% | 01/15/26 | | | 70,053 | | | | 68,389 | |
Iron Mountain, Inc. | | | 5.750% | 08/15/24 | | | 57,000 | | | | 56,786 | |
L-3 Communications Corp. | | | 3.950% | 05/28/24 | | | 195,000 | | | | 185,626 | |
Raytheon Co. | | | 2.500% | 12/15/22 | | | 150,000 | | | | 147,293 | |
Stanley Black & Decker, Inc. | | | 2.900% | 11/01/22 | | | 150,000 | | | | 148,892 | |
Teekay Corp. | | | 8.500% | 01/15/20 | | | 55,000 | | | | 54,174 | |
United Airlines, Inc., Class B Pass-Through Certificates, Series 2013-1 | | | 5.375% | 02/15/23 | | | 39,114 | | | | 40,435 | |
United Rentals North America, Inc. | | | 5.500% | 07/15/25 | | | 60,000 | | | | 60,225 | |
US Airways, Inc., Class A Pass-Through Certificates, Series 2012-2 | | | 4.625% | 06/03/25 | | | 151,484 | | | | 153,946 | |
| | | | | | | | | | | | | 1,060,339 | |
Information Technology — 5.1% | | | | | | | | | | | | | |
Equinix, Inc. | | | 5.375% | 04/01/23 | | | 55,000 | | | | 56,306 | |
Hewlett-Packard Co. | | | 4.375% | 09/15/21 | | | 150,000 | | | | 150,697 | |
Intel Corp. | | | 2.700% | 12/15/22 | | | 150,000 | | | | 150,049 | |
| | | | | | | | | | | | | 357,052 | |
Materials — 2.8% | | | | | | | | | | | | | |
Graphic Packaging International, Inc. | | | 4.750% | 04/15/21 | | | 55,000 | | | | 56,513 | |
Praxair, Inc. | | | 2.200% | 08/15/22 | | | 150,000 | | | | 142,904 | |
| | | | | | | | | | | | | 199,417 | |
6
CINCINNATI ASSET MANAGEMENT FUNDS:
BROAD MARKET STRATEGIC INCOME FUND
SCHEDULE OF INVESTMENTS (Continued) |
CORPORATE BONDS — 95.7% (Continued) | | Coupon | | Maturity | | Par Value | | | Value | |
Telecommunication Services — 9.5% | | | | | | | | | | |
AT&T, Inc. | | | 2.625% | 12/01/22 | | $ | 140,000 | | | $ | 134,570 | |
CCO Holdings, LLC/CCO Holdings Capital Corp. | | | 5.750% | 01/15/24 | | | 58,000 | | | | 59,722 | |
CenturyLink, Inc. | | | 5.800% | 03/15/22 | | | 5,000 | | | | 4,656 | |
Comcast Corp. | | | 3.600% | 03/01/24 | | | 80,000 | | | | 83,589 | |
Frontier Communications Corp. | | | 9.000% | 08/15/31 | | | 55,000 | | | | 46,475 | |
Mediacom, LLC/Mediacom Capital Corp. | | | 5.500% | 04/15/21 | | | 17,000 | | | | 16,596 | |
Mediacom, LLC/Mediacom Capital Corp. | | | 7.250% | 02/15/22 | | | 43,000 | | | | 43,269 | |
Qwest Corp. | | | 6.750% | 12/01/21 | | | 150,000 | | | | 157,674 | |
Qwest Corp. | | | 6.875% | 09/15/33 | | | 47,000 | | | | 46,221 | |
Sprint Corp. | | | 7.625% | 02/15/25 | | | 60,000 | | | | 47,288 | |
Verizon Communications, Inc. | | | 5.150% | 09/15/23 | | | 25,000 | | | | 27,991 | |
| | | | | | | | | | | | | 668,051 | |
Utilities — 4.4% | | | | | | | | | | | | | |
AES Corp. (The) | | | 5.500% | 03/15/24 | | | 43,000 | | | | 39,396 | |
AES Corp. (The) | | | 5.500% | 04/15/25 | | | 30,000 | | | | 27,075 | |
Amerigas Finance, LLC | | | 7.000% | 05/20/22 | | | 55,000 | | | | 56,925 | |
Calpine Corp. | | | 5.750% | 01/15/25 | | | 65,000 | | | | 61,100 | |
GenOn Americas Generation, LLC | | | 8.500% | 10/01/21 | | | 28,000 | | | | 23,940 | |
NRG Energy, Inc. | | | 6.625% | 03/15/23 | | | 46,000 | | | | 42,550 | |
Suburban Propane Partners, L.P. | | | 5.500% | 06/01/24 | | | 60,000 | | | | 57,096 | |
| | | | | | | | | | | | | 308,082 | |
| | | | | |
Total Investments at Value — 95.7% (Cost $6,956,166) | | | $ | 6,725,628 | |
| | | | | |
Other Assets in Excess of Liabilities — 4.3% | | | | 304,692 | |
| | | | | |
Net Assets — 100.0% | | | $ | 7,030,320 | |
(a) | Step coupon security. The rate shown is the effective interest rate as of November 30, 2015. |
See accompanying notes to financial statements. |
7
CINCINNATI ASSET MANAGEMENT FUNDS:
BROAD MARKET STRATEGIC INCOME FUND
STATEMENT OF ASSETS AND LIABILITIES
November 30, 2015 (Unaudited) |
ASSETS | | | |
Investments in securities: | | | |
At acquisition cost | | $ | 6,956,166 | |
At value (Note 2) | | $ | 6,725,628 | |
Cash | | | 201,270 | |
Interest receivable | | | 81,840 | |
Receivable from Adviser (Note 4) | | | 16,050 | |
Other assets | | | 19,346 | |
Total assets | | | 7,044,134 | |
| | | | | |
LIABILITIES | | | | |
Payable to administrator (Note 4) | | | 7,000 | |
Other accrued expenses | | | 6,814 | |
Total liabilities | | | 13,814 | |
| | | | | |
NET ASSETS | | $ | 7,030,320 | |
| | | | | |
NET ASSETS CONSIST OF: | | | | |
Paid-in capital | | $ | 7,303,000 | |
Accumulated net investment income | | | 39,701 | |
Accumulated net realized losses from security transactions | | | (81,843 | ) |
Net unrealized depreciation on investments | | | (230,538 | ) |
NET ASSETS | | $ | 7,030,320 | |
| | | | | |
Shares of beneficial interest outstanding (unlimited number of shares authorized, no par value) | | | 732,448 | |
| | | | | |
Net asset value, offering price and redemption price per share (Note 2) | | $ | 9.60 | |
See accompanying notes to financial statements. |
8
CINCINNATI ASSET MANAGEMENT FUNDS:
BROAD MARKET STRATEGIC INCOME FUND
STATEMENT OF OPERATIONS
For the Six Months Ended November 30, 2015 (Unaudited) |
INVESTMENT INCOME | | | |
Interest | | $ | 145,025 | |
| | | | | |
EXPENSES | | | | |
Investment advisory fees (Note 4) | | | 26,487 | |
Professional fees | | | 19,392 | |
Fund accounting fees (Note 4) | | | 15,357 | |
Administration fees (Note 4) | | | 15,000 | |
Registration and filing fees | | | 12,174 | |
Pricing fees | | | 10,793 | |
Distribution fees (Note 4) | | | 8,829 | |
Compliance fees (Note 4) | | | 6,000 | |
Transfer agent fees (Note 4) | | | 6,000 | |
Trustees' fees and expenses (Note 4) | | | 4,355 | |
Custody and bank service fees | | | 3,839 | |
Insurance expense | | | 1,970 | |
Postage and supplies | | | 1,044 | |
Other expenses | | | 3,907 | |
Total expenses | | | 135,147 | |
Less fee reductions and expense reimbursements by the Adviser (Note 4) | | | (112,192 | ) |
Net expenses | | | 22,955 | |
| | | | | |
NET INVESTMENT INCOME | | | 122,070 | |
| | | | | |
REALIZED AND UNREALIZED LOSSES ON INVESTMENTS | | | | |
Net realized losses from security transactions | | | (80,005 | ) |
Net change in unrealized appreciation/depreciation on investments | | | (225,061 | ) |
NET REALIZED AND UNREALIZED LOSSES ON INVESTMENTS | | | (305,066 | ) |
| | | | | |
NET DECREASE IN NET ASSETS RESULTING FROM OPERATIONS | | $ | (182,996 | ) |
See accompanying notes to financial statements. |
9
CINCINNATI ASSET MANAGEMENT FUNDS:
BROAD MARKET STRATEGIC INCOME FUND
STATEMENTS OF CHANGES IN NET ASSETS |
| | Six Months Ended November 30, 2015
(Unaudited) | | | Year
Ended
May 31,
2015 | |
FROM OPERATIONS | | | | | | |
Net investment income | | $ | 122,070 | | | $ | 231,416 | |
Net realized gains (losses) from security transactions | | | (80,005 | ) | | | 2,330 | |
Net change in unrealized appreciation/depreciation on investments | | | (225,061 | ) | | | (28,468 | ) |
Net increase (decrease) in net assets resulting from operations | | | (182,996 | ) | | | 205,278 | |
| | | | | | | | | |
DISTRIBUTIONS TO SHAREHOLDERS | | | | | | | | |
From net investment income | | | (123,954 | ) | | | (221,564 | ) |
| | | | | | | | | |
FROM CAPITAL SHARE TRANSACTIONS | | | | | | | | |
Proceeds from shares sold | | | 47,600 | | | | 1,022,639 | |
Net asset value of shares issued in reinvestment of distributions to shareholders | | | 123,954 | | | | 221,564 | |
Payments for shares redeemed | | | (66,535 | ) | | | (403,078 | ) |
Net increase in net assets from capital share transactions | | | 105,019 | | | | 841,125 | |
| | | | | | | | | |
TOTAL INCREASE (DECREASE) IN NET ASSETS | | | (201,931 | ) | | | 824,839 | |
| | | | | | | | | |
NET ASSETS | | | | | | | | |
Beginning of period | | | 7,232,251 | | | | 6,407,412 | |
End of period | | $ | 7,030,320 | | | $ | 7,232,251 | |
| | | | | | | | | |
ACCUMULATED NET INVESTMENT INCOME | | $ | 39,701 | | | $ | 41,585 | |
| | | | | | | | | |
CAPITAL SHARE ACTIVITY | | | | | | | | |
Shares sold | | | 4,898 | | | | 102,166 | |
Shares reinvested | | | 12,887 | | | | 22,290 | |
Shares redeemed | | | (6,835 | ) | | | (40,361 | ) |
Net increase in shares outstanding | | | 10,950 | | | | 84,095 | |
Shares outstanding at beginning of period | | | 721,498 | | | | 637,403 | |
Shares outstanding at end of period | | | 732,448 | | | | 721,498 | |
See accompanying notes to financial statements. |
10
CINCINNATI ASSET MANAGEMENT FUNDS:
BROAD MARKET STRATEGIC INCOME FUND
FINANCIAL HIGHLIGHTS |
Per Share Data for a Share Outstanding Throughout Each Period | |
| | Six Months Ended November 30, 2015 (Unaudited) | | | Year
Ended
May 31,
2015 | | | Year
Ended
May 31,
2014 | | | Period
Ended
May 31,
2013(a) | |
Net asset value at beginning of period | | $ | 10.02 | | | $ | 10.05 | | | $ | 9.94 | | | $ | 10.00 | |
| | | | | | | | | | | | | | | | | |
Income (loss) from investment operations: | | | | | | | | | | | | | | | | |
Net investment income | | | 0.17 | | | | 0.33 | | | | 0.33 | | | | 0.16 | |
Net realized and unrealized gains (losses) on investments | | | (0.42 | ) | | | (0.04 | ) | | | 0.11 | | | | (0.11 | ) |
Total from investment operations | | | (0.25 | ) | | | 0.29 | | | | 0.44 | | | | 0.05 | |
| | | | | | | | | | | | | | | | | |
Less distributions: | | | | | | | | | | | | | | | | |
From net investment income | | | (0.17 | ) | | | (0.32 | ) | | | (0.33 | ) | | | (0.11 | ) |
| | | | | | | | | | | | | | | | | |
Net asset value at end of period | | $ | 9.60 | | | $ | 10.02 | | | $ | 10.05 | | | $ | 9.94 | |
| | | | | | | | | | | | | | | | | |
Total return (b) | | | (2.48% | )(c) | | | 2.99 | % | | | 4.68 | % | | | 0.48 | %(c) |
| | | | | | | | | | | | | | | | | |
Net assets at end of period (000’s) | | $ | 7,030 | | | $ | 7,232 | | | $ | 6,407 | | | $ | 5,220 | |
| | | | | | | | | | | | | | | | | |
Ratios/supplementary data: | | | | | | | | | | | | | | | | |
Ratio of total expenses to average net assets | | | 3.83 | %(d) | | | 3.71 | % | | | 4.53 | % | | | 3.69 | %(d) |
| | | | | | | | | | | | | | | | | |
Ratio of net expenses to average net assets (e) | | | 0.65 | %(d) | | | 0.65 | % | | | 0.65 | % | | | 0.65 | %(d) |
| | | | | | | | | | | | | | | | | |
Ratio of net investment income to average net assets (e) | | | 3.46 | %(d) | | | 3.35 | % | | | 3.41 | % | | | 2.81 | %(d) |
| | | | | | | | | | | | | | | | | |
Portfolio turnover rate | | | 4 | %(c) | | | 23 | % | | | 11 | % | | | 13 | %(c) |
(a) | Represents the period from the commencement of operations (October 26, 2012) through May 31, 2013. |
(b) | Total return is a measure of the change in value of an investment in the Fund over the periods covered. The returns shown do not reflect the deduction of taxes a shareholder would pay on Fund distributions, if any, or the redemption of Fund shares. The total returns would be lower if the Adviser had not reduced advisory fees and reimbursed expenses. |
(c) | Not annualized. |
(d) | Annualized. |
(e) | Ratio was determined after advisory fee reductions and expense reimbursements (Note 4). |
See accompanying notes to financial statements. |
11
CINCINNATI ASSET MANAGEMENT FUNDS:
BROAD MARKET STRATEGIC INCOME FUND
NOTES TO FINANCIAL STATEMENTS
November 30, 2015 (Unaudited)
1. Organization
Cincinnati Asset Management Funds: Broad Market Strategic Income Fund (the “Fund”) is a diversified series of Ultimus Managers Trust (the “Trust”), an open-end investment company established as an Ohio business trust under a Declaration of Trust dated February 28, 2012. Other series of the Trust are not incorporated in this report. The Fund commenced operations on October 26, 2012.
The investment objective of the Fund is to achieve a high level of income consistent with a secondary goal of capital preservation.
2. Significant Accounting Policies
The following is a summary of the Fund’s significant accounting policies. The policies are in conformity with Generally Accepted Accounting Principals in the United States of America (“GAAP”). As an investment company, as defined in Financial Accounting Standards Board (“FASB”) Accounting Standards Update 2013-08, the Fund follows accounting and reporting guidance under FASB Accounting Standards Codification Topic 946, “Financial Services – Investment Companies.”
Securities valuation – The Fund’s fixed income securities are generally valued using prices provided by an independent pricing service approved by the Trust’s Board of Trustees (the “Board”). The independent pricing service uses information with respect to transactions in bonds, quotations from bond dealers, market transactions in comparable securities, and various relationships between securities in determining these prices. The methods used by the independent pricing service and the quality of valuations so established are reviewed by Cincinnati Asset Management, Inc. (the “Adviser”), under the general supervision of the Board. Securities for which market quotations are not readily available are valued at fair value as determined in good faith under procedures adopted by the Board.
GAAP establishes a single authoritative definition of fair value, sets out a framework for measuring fair value, and requires additional disclosures about fair value measurements.
Various inputs are used in determining the value of the Fund’s investments. These inputs are summarized in the three broad levels listed below:
● | Level 1 – quoted prices in active markets for identical securities |
● | Level 2 – other significant observable inputs |
● | Level 3 – significant unobservable inputs |
Corporate bonds are classified as Level 2 since values are based on prices provided by an independent pricing service that utilizes various “other significant observable inputs” including bid and ask quotations, prices of similar securities, and interest rates, among other factors. The inputs or methods used for valuing securities are not necessarily an indication of the risks associated with investing in those securities. The inputs used to measure fair
12
CINCINNATI ASSET MANAGEMENT FUNDS:
BROAD MARKET STRATEGIC INCOME FUND
NOTES TO FINANCIAL STATEMENTS (Continued) |
value may fall into different levels of the fair value hierarchy. In such cases, for disclosure purposes, the level in the fair value hierarchy within which the fair value measurement falls in its entirety is determined based on the lowest level input that is significant to the fair value measurement.
The following is a summary of the inputs used to value the Fund’s investments as of November 30, 2015:
| | Level 1 | | | Level 2 | | | Level 3 | | | Total | |
Corporate Bonds | | $ | — | | | $ | 6,725,628 | | | $ | — | | | $ | 6,725,628 | |
Refer to the Fund’s Schedule of Investments for a listing of the securities by sector type. As of November 30, 2015, the Fund did not have any transfers into and out of any Level. In addition, the Fund did not have derivative instruments or any assets or liabilities that were measured at fair value on a recurring basis using significant unobservable inputs (Level 3) as of November 30, 2015. It is the Fund’s policy to recognize transfers into and out of any Level at the end of the reporting period.
Share valuation – The net asset value per share of the Fund is calculated daily by dividing the total value of the Fund’s assets, less liabilities, by the number of shares outstanding. The offering price and redemption price per share of the Fund is equal to the net asset value per share.
Investment income – Interest income is accrued as earned. Discounts and premiums on fixed income securities purchased are accreted or amortized using the effective interest method. Dividend income is recorded on the ex-dividend date.
Security transactions – Security transactions are accounted for on the trade date. Gains and losses on securities sold are determined on a specific identification basis.
Common expenses – Common expenses of the Trust are allocated among the Fund and other series of the Trust based on the relative net assets of each series or the nature of the services performed and the relative applicability to each series.
Distributions to shareholders – Dividends from net investment income are declared and paid quarterly to shareholders. Net realized capital gains, if any, are distributed at least once each year. The amount of distributions from net investment income and net realized capital gains are determined in accordance with federal income tax regulations, which may differ from GAAP. Dividends and distributions to shareholders are recorded on the ex-dividend date. The tax character of the Fund’s distributions during the periods ended November 30, 2015 and May 31, 2015 was ordinary income. On December 31, 2015, the Fund paid an ordinary income dividend of $0.0820 per share to shareholders of record on December 30, 2015.
13
CINCINNATI ASSET MANAGEMENT FUNDS:
BROAD MARKET STRATEGIC INCOME FUND
NOTES TO FINANCIAL STATEMENTS (Continued) |
Estimates – The preparation of financial statements in conformity with GAAP requires management to make estimates and assumptions that affect the reported amounts of assets and liabilities and disclosure of contingent assets and liabilities as of the date of the financial statements and the reported amounts of income and expenses during the reporting period. Actual results could differ from those estimates.
Federal income tax – The Fund has qualified and intends to continue to qualify as a regulated investment company under the Internal Revenue Code of 1986 (the “Code”). Qualification generally will relieve the Fund of liability for federal income taxes to the extent 100% of its net investment income and net realized capital gains are distributed in accordance with the Code. Accordingly, no provision for income tax has been made.
In order to avoid imposition of the excise tax applicable to regulated investment companies, it is also the Fund’s intention to declare as dividends in each calendar year at least 98% of its net investment income (earned during the calendar year) and 98.2% of its net realized capital gains (earned during the twelve months ended October 31) plus undistributed amounts from prior years.
The following information is computed on a tax basis for each item as of November 30, 2015:
Tax cost of portfolio investments | | $ | 6,956,166 | |
Gross unrealized appreciation | | $ | 53,567 | |
Gross unrealized depreciation | | | (284,105 | ) |
Net unrealized depreciation on investments | | | (230,538 | ) |
Accumulated ordinary income | | | 39,701 | |
Capital loss carryforwards | | | (1,838 | ) |
Other losses | | | (80,005 | ) |
Accumulated deficit | | $ | (272,680 | ) |
As of May 31, 2015, the Fund had a short-term capital loss carryforward of $1,838. This capital loss carryforward, which does not expire, may be utilized in the current and future years to offset net realized capital gains, if any, prior to distributing such gains to shareholders.
The Fund recognizes the tax benefits or expenses of uncertain tax positions only when the position is “more likely than not” to be sustained assuming examination by tax authorities. Management has reviewed the Fund’s tax positions for the current and all open tax periods (periods ended May 31, 2013 through May 31, 2015) and has concluded that no provision for unrecognized tax benefits or expenses is required in these financial statements. The Fund identifies its major tax jurisdiction as U.S. Federal.
14
CINCINNATI ASSET MANAGEMENT FUNDS:
BROAD MARKET STRATEGIC INCOME FUND
NOTES TO FINANCIAL STATEMENTS (Continued) |
3. Investment Transactions
During the six months ended November 30, 2015, cost of purchases and proceeds from sales of investment securities, other than short-term investments, were $339,475 and $241,761, respectively.
4. Transactions with Related Parties
INVESTMENT ADVISORY AGREEMENT
The Fund’s investments are managed by the Adviser pursuant to the terms of an Investment Advisory Agreement. Under the Investment Advisory Agreement, the Fund pays the Adviser an advisory fee, computed and accrued daily and paid monthly, at the annual rate of 0.75% of its average daily net assets.
Pursuant to an expense limitation agreement between the Fund and the Adviser, the Adviser has contractually agreed until October 1, 2016 to reduce investment advisory fees and reimburse certain other operating expenses in order to limit total annual operating expenses of the Fund (exclusive of brokerage costs; taxes; interest; acquired fund fees and expenses; extraordinary expenses such as litigation and merger or reorganization costs; and other expenses not incurred in the ordinary course of the Fund’s business) to an amount not exceeding 0.65% of the Fund’s average daily net assets. Accordingly, the Adviser did not collect any of its advisory fees and, in addition, reimbursed other operating expenses totaling $85,705 during the six months ended November 30, 2015.
Certain officers of the Fund are also officers of the Adviser.
DISTRIBUTION PLAN
The Fund has adopted a distribution plan pursuant to Rule 12b-1 under the Investment Company Act of 1940 (the “Rule 12b-1 Plan”), pursuant to which the Fund may incur certain costs for distribution and/or shareholder servicing expenses not to exceed 0.25% per annum of the Fund’s average daily net assets. During the six months ended November 30, 2015, the Fund incurred $8,829 in distribution and service fees under the Rule 12b-1 Plan.
OTHER SERVICE PROVIDERS
Ultimus Fund Solutions, LLC (“Ultimus”) provides fund administration, fund accounting, compliance and transfer agency services to the Fund. The Fund pays Ultimus fees in accordance with the agreements for such services. In addition, the Fund pays out-of-pocket expenses including, but not limited to, postage, supplies and costs of pricing the Fund’s portfolio securities.
Under the terms of a Distribution Agreement with the Trust, Ultimus Fund Distributors, LLC (the “Distributor”) serves as principal underwriter to the Fund. The Distributor is a wholly-owned subsidiary of Ultimus.
Certain officers and a Trustee of the Trust are also officers of Ultimus and the Distributor.
15
CINCINNATI ASSET MANAGEMENT FUNDS:
BROAD MARKET STRATEGIC INCOME FUND
NOTES TO FINANCIAL STATEMENTS (Continued) |
TRUSTEE COMPENSATION
Each Trustee who is not an “interested person” of the Trust (“Independent Trustee”) receives from the Fund a fee of $500 for each Board meeting attended plus reimbursement of travel and other meeting-related expenses. In addition, each Independent Trustee receives a $500 annual retainer from the Fund. Trustees affiliated with the Adviser or Ultimus are not compensated by the Fund for their services.
PRINCIPAL HOLDERS OF FUND SHARES
As of November 30, 2015, the following shareholders owned of record 5% or more of the outstanding shares of the Fund:
Name of Record Owner | % Ownership |
Mary S. Sloneker | 43% |
Cincinnati Asset Management, Inc. | 26% |
William S. Sloneker | 19% |
Charles Schwab & Co., Inc. (for the benefit of its customers) | 6% |
A beneficial owner of 25% or more of the Fund’s outstanding shares may be considered a controlling person. That shareholder’s vote could have a more significant effect on matters presented at a shareholder’s meeting.
5. Contingencies and Commitments
The Fund indemnifies the Trust’s officers and Trustees for certain liabilities that might arise from their performance of their duties to the Fund. Additionally, in the normal course of business, the Fund enters into contracts that contain a variety of representations and warranties and which provide general indemnifications. The Fund’s maximum exposure under these arrangements is unknown, as this would involve future claims that may be made against the Fund that have not yet occurred. However, based on experience, the Fund expects the risk of loss to be remote.
6. Subsequent Events
The Fund is required to recognize in the financial statements the effects of all subsequent events that provide additional evidence about conditions that existed as of the date of the Statement of Assets and Liabilities. For non-recognized subsequent events that must be disclosed to keep the financial statements from being misleading, the Fund is required to disclose the nature of the event as well as an estimate of its financial effect, or a statement that such an estimate cannot be made. Management has evaluated subsequent events through the issuance of these financial statements and has noted no such events.
16
CINCINNATI ASSET MANAGEMENT FUNDS:
BROAD MARKET STRATEGIC INCOME FUND
ABOUT YOUR FUND’S EXPENSES (Unaudited) |
We believe it is important for you to understand the impact of costs on your investment. As a shareholder of the Fund, you incur ongoing costs, including management fees, distribution (12b-1) fees and other operating expenses. The following examples are intended to help you understand your ongoing costs (in dollars) of investing in the Fund and to compare these costs with the ongoing costs of investing in other mutual funds.
A mutual fund’s ongoing costs are expressed as a percentage of its average net assets. This figure is known as the expense ratio. The expenses in the table below are based on an investment of $1,000 made at the beginning of the most recent period (June 1, 2015) and held until the end of the period (November 30, 2015).
The table below illustrates the Fund’s ongoing costs in two ways:
Actual fund return – This section helps you to estimate the actual expenses that you paid over the period. The “Ending Account Value” shown is derived from the Fund’s actual return, and the third column shows the dollar amount of operating expenses that would have been paid by an investor who started with $1,000 in the Fund. You may use the information here, together with the amount you invested, to estimate the expenses that you paid over the period.
To do so, simply divide your account value by $1,000 (for example, an $8,600 account value divided by $1,000 = 8.6), then multiply the result by the number given for the Fund under the heading “Expenses Paid During Period.”
Hypothetical 5% return – This section is intended to help you compare the Fund’s ongoing costs with those of other mutual funds. It assumes that the Fund had an annual return of 5% before expenses during the period shown, but that the expense ratio is unchanged. In this case, because the return used is not the Fund’s actual return, the results do not apply to your investment. The example is useful in making comparisons because the U.S. Securities and Exchange Commission (“SEC”) requires all mutual funds to calculate expenses based on a 5% return. You can assess the Fund’s ongoing costs by comparing this hypothetical example with the hypothetical examples that appear in shareholder reports of other funds.
Note that expenses shown in the table are meant to highlight and help you compare ongoing costs only. The Fund does not charge transaction fees, such as purchase or redemption fees, nor does it carry a “sales load.” The calculations assume no shares were bought or sold during the period. Your actual costs may have been higher or lower, depending on the amount of your investment and the timing of any purchases or redemptions.
17
CINCINNATI ASSET MANAGEMENT FUNDS:
BROAD MARKET STRATEGIC INCOME FUND
ABOUT YOUR FUND’S EXPENSES (Unaudited) (Continued) |
More information about the Fund’s expenses can be found in this report. For additional information on operating expenses and other shareholder costs, please refer to the Fund’s prospectus.
| Beginning
Account Value
June 1, 2015 | Ending
Account Value
November 30, 2015 | Expenses Paid During Period* |
Based on Actual Fund Return | $1,000.00 | $975.20 | $3.22 |
Based on Hypothetical 5% Return (before expenses) | $1,000.00 | $1,021.81 | $3.29 |
* | Expenses are equal to the Fund’s annualized expense ratio of 0.65% for the period, multiplied by the average account value over the period, multiplied by 183/365 (to reflect the one-half year period). |
OTHER INFORMATION (Unaudited)
A description of the policies and procedures that the Fund uses to vote proxies relating to portfolio securities is available without charge upon request by calling toll-free 1-866-738-1128, or on the SEC’s website at http://www.sec.gov. Information regarding how the Fund voted proxies relating to portfolio securities during the most recent 12-month period ended June 30 is available without charge upon request by calling toll-free 1-866-738-1128, or on the SEC’s website at http://www.sec.gov.
The Trust files a complete listing of portfolio holdings for the Fund with the SEC as of the end of the first and third quarters of each fiscal year on Form N-Q. These filings are available upon request by calling 1-866-738-1128. Furthermore, you may obtain a copy of the filings on the SEC’s website at http://www.sec.gov. The Trust’s Forms N-Q may also be reviewed and copied at the SEC’s Public Reference Room in Washington, DC, and information on the operation of the Public Reference Room may be obtained by calling 1-800-SEC-0330.
18
This page intentionally left blank.
This page intentionally left blank.
This page intentionally left blank.
WAVELENGTH INTEREST RATE NEUTRAL FUND LETTER TO SHAREHOLDERS | January 6, 2016 |
Dear Fellow Shareholders:
The market environment has varied widely in the months since our last letter, based in large part on expectations for Federal Reserve (“Fed”) policy. Market pricing exhibited an unstable relationship with economic conditions as short-term fears frequently outweighed long-term fundamentals on a day-to-day basis. The resulting price volatility introduced meaningful downside risk across markets, particularly in credit and energy-related instruments. In the face of challenging conditions, we maintained a disciplined balance to growth and inflation in line with our investment mandate over the long-term.
What follows is designed to provide context around returns in a way that builds a deeper understanding of the investment process that supports them. Through this we hope to build on the partnership your investment creates.
PERFORMANCE SUMMARY
For the six months ended November 30, 2015, the Wavelength Interest Rate Neutral Fund (the “Fund”) delivered a return of -5.56% versus a benchmark return of +0.01% for the S&P / BGCantor 0-3 Month US Treasury Bill Index (which seeks to represent the return from not taking risk in financial markets). Performance over the period remained within targeted risk parameters, and the Fund has maintained its portfolio balance in line with investment objectives.
WAVELENGTH PHILOSOPHY
We believe that macroeconomic conditions drive asset prices and central banks use interest rates to manage macroeconomic conditions. Based on this fundamental logic, we seek to build a portfolio that is hedged to changes in interest rates by balancing investment exposure between instruments we expect to outperform in rising and falling macroeconomic conditions.
INVESTMENT ENVIRONMENT
As an extension of our investment philosophy we believe that changing expectations for these conditions drive investment decisions, which in turn drive market prices. While markets periodically reconnected with their macroeconomic drivers, long-term fundamental linkages were less stable due to short-term fears as uncertainty continued to drive investors in and out of cash.
Over the six months from June through November of 2015, US economic output recovered modestly from negative surprises earlier in the year, yet still lagged behind consensus expectations. Inflation similarly remained at subdued levels and was consistently below what had been forecast by economists. Downside surprises amidst prospects of rising rates resulted in conflicting signals for many asset classes.
Rising growth assets experienced one of their most challenging periods since the crisis, while falling growth assets failed to respond meaningfully to changing expectations. In line with this, rising inflation assets underperformed as energy prices continued to fall, and falling inflation assets delivered modestly positive returns.
1
Lower energy prices impacted corporate credit most intensely due to default risk concerns in the oil and gas sector. This resulted in a disconnect between high yield bonds and other rising growth assets, such as equities and convertibles. While equities bounced back from a late September sell-off, credit’s recovery was short-lived as corporate spreads remained under pressure throughout November.
Amidst uncertainty around Fed policy, US government bonds were volatile, dropping in June then recovering through mid-August, only to fall again towards the end of the period. Despite wide-ranging price moves, there was little difference in total returns between Treasuries with short, medium, and long-term maturities.
In inflation-related markets, commodities and TIPS underperformed, as expectations remained subdued throughout the period. Sovereign and corporate emerging market debt produced mixed results over the period due to a broad-based sell-off through August followed by a strong rebound when spreads to Treasuries became sufficiently attractive.
PERFORMANCE DISCUSSION
During the period from May 31, 2015 through November 30, 2015, short-term fear in markets outweighed the Fund’s long-term hedge to growth and inflation, producing negative returns overall. In the face of widespread volatility, however, this balance limited the impact of any individual market and effectively hedged away idiosyncratic risks experienced over the period.
In this context, June brought the first notable headwinds, as financial assets became correlated and investors moved to cash. Losses were suffered across the portfolio’s sub-sectors, led by rising growth assets including convertible bonds, credit and emerging market debt. The Fund recovered in July based on the rebound of many holdings that came back from relatively stressed levels.
July’s rebound proved temporary and selling pressure returned, sinking markets to levels experienced in June. The portfolio’s targeted balance, however, was more effective in this scenario, as profits from 10-year Treasuries and gold helped mitigate impacts of selling experienced elsewhere.
In October the Fund produced strong positive returns based on performance across a robust set of assets. Holdings such as corporate credit which had previously suffered most were among the portfolio’s top contributors. While government bonds and TIPS limited upside, negative returns were only modest and diversification benefits were seen more substantially in risk-adjusted results.
Assets became correlated once again in November as uncertainty around rate hikes drove investors into cash. Negative performance came from both corporate and government assets as energy prices put pressure on high yield credit and increased volatility overall. A rebound in US Treasuries, however, drove positive returns heading into month-end which helped minimize downside risk and reconnect markets with fundamental drivers.
OUTLOOK
Following the Fed’s December 16th decision to increase interest rates, further clarity around policy decisions has been provided to investors. We expect transparency to reduce uncertainty built up within the financial system and for investors to recalibrate their expectations
2
accordingly. In line with this, we believe financial markets will reconnect with their economic drivers and re-establish relationships with growth and inflation conditions maintained over the long-term.
Based on the logic detailed above and consistent with our investment process, we are positioned with a targeted balance to economic outcomes. We believe the supporting investment process remains a prudent approach that will deliver value to our investors through absolute returns.
Thank you for your trust and commitment through investment.
Sincerely,

Andrew Dassori
Founding Partner & Chief Investment Officer
Wavelength Capital Management
Past performance is not predictive of future performance. Investment results and principal value will fluctuate so that shares, when redeemed, may be worth more or less than their original cost. Current performance may be higher or lower than the performance data quoted.Performance data current to the most recent month end are available by calling 1-866-896-9292.
An investor should consider the investment objectives, risks, charges and expenses of the Fund carefully before investing. The Fund’s prospectus contains this and other important information. To obtain a copy of the Fund’s prospectus please call 1-866-896-9292 and a copy will be sent to you free of charge. Please read the prospectus carefully before you invest. The Wavelength Interest Rate Neutral Fund is distributed by Ultimus Fund Distributors, LLC.
The Letter to Shareholders seeks to describe some of the Adviser’s current opinions and views of the financial markets. Although the Adviser believes it has a reasonable basis for any opinions or views expressed, actual results may differ, sometimes significantly so, from those expected or expressed. The securities held by the Fund that are discussed in the Letter to Shareholders were held during the period covered by this Report. They do not comprise the entire investment portfolio of the Fund, may be sold at any time and may no longer be held by the Fund. The opinions of the Adviser with respect to those securities may change at any time.
Statements in the Letter to Shareholders that reflect projections or expectations for future financial or economic performance of the Fund and the market in general and statements of the Fund’s plans and objectives for future operations are forward-looking statements.No assurance can be given that actual results or events will not differ materially from those projected, estimated, assumed, or anticipated in any such forward-looking statements.Important factors that could result in such differences, in addition to factors noted with such forward-looking statements include, without limitation, general economic conditions, such as inflation, recession, and interest rates.Past performance is not a guarantee of future results.
3
WAVELENGTH INTEREST RATE NEUTRAL FUND
PORTFOLIO INFORMATION
November 30, 2015 (Unaudited)
Portfolio Allocation (% of Net Assets)
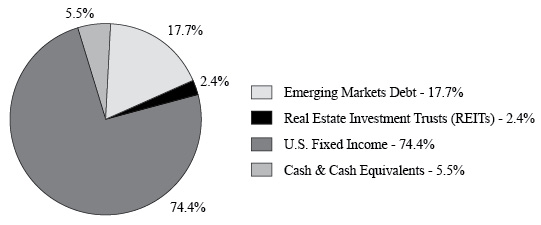
Top 10 Holdings
Security Description | % of
Net Assets |
iShares® TIPS Bond ETF | 17.8% |
PowerShares Senior Loan Portfolio | 15.6% |
Vanguard Short-Term Corporate Bond ETF | 12.3% |
SPDR® Barclays Short Term High Yield Bond ETF | 11.3% |
SPDR® Barclays High Yield Bond ETF | 8.6% |
iShares® J.P. Morgan USD Emerging Markets Bond ETF | 8.4% |
PowerShares Emerging Markets Sovereign Debt Portfolio | 5.1% |
iShares® iBoxx $ Investment Grade Corporate Bond ETF | 5.1% |
Market Vectors Emerging Markets High Yield Bond ETF | 4.2% |
iShares® iBoxx $ High Yield Corporate Bond ETF | 3.1% |
4
WAVELENGTH INTEREST RATE NEUTRAL FUND
SCHEDULE OF INVESTMENTS
November 30, 2015 (Unaudited) |
EXCHANGE-TRADED FUNDS — 94.5% | | Shares | | | Value | |
Emerging Markets Debt — 17.7% | | | | | | |
iShares® J.P. Morgan USD Emerging Markets Bond ETF | | | 12,781 | | | $ | 1,385,333 | |
Market Vectors Emerging Markets High Yield Bond ETF | | | 30,063 | | | | 693,253 | |
PowerShares Emerging Markets Sovereign Debt Portfolio | | | 30,277 | | | | 845,031 | |
| | | | | | | | 2,923,617 | |
Real Estate Investment Trusts (REITs) — 2.4% | | | | | | | | |
Vanguard REIT ETF | | | 4,900 | | | | 389,011 | |
| | | | | | | | | |
U.S. Fixed Income — 74.4% | | | | | | | | |
iShares® iBoxx $ High Yield Corporate Bond ETF | | | 6,110 | | | | 507,435 | |
iShares® iBoxx $ Investment Grade Corporate Bond ETF | | | 7,240 | | | | 839,188 | |
iShares® TIPS Bond ETF | | | 26,426 | | | | 2,928,001 | |
PowerShares Senior Loan Portfolio | | | 113,611 | | | | 2,577,834 | |
SPDR® Barclays High Yield Bond ETF | | | 40,023 | | | | 1,415,213 | |
SPDR® Barclays Short Term High Yield Bond ETF | | | 69,869 | | | | 1,855,022 | |
Vanguard Short-Term Corporate Bond ETF | | | 25,507 | | | | 2,028,827 | |
Vanguard Short-Term Inflation-Protected Securities ETF | | | 2,100 | | | | 101,493 | |
| | | | | | | | 12,253,013 | |
Total Exchange-Traded Funds — 94.5% (Cost $16,019,808) | | | | | | $ | 15,565,641 | |
5
WAVELENGTH INTEREST RATE NEUTRAL FUND
SCHEDULE OF INVESTMENTS (Continued) |
MONEY MARKET FUNDS — 1.5% | | Shares | | | Value | |
Fidelity Institutional Money Market Government Portfolio - Class I, 0.01%(a) (Cost $250,597) | | | 250,597 | | | $ | 250,597 | |
| | | | | | | | | |
Total Investments at Value — 96.0% (Cost $16,270,405) | | | | | | $ | 15,816,238 | |
| | | | | | | | | |
Other Assets in Excess of Liabilities — 4.0% | | | | | | | 657,378 | |
| | | | | | | | | |
Net Assets — 100.0% | | | | | | $ | 16,473,616 | |
(a) | The rate shown is the 7-day effective yield as of November 30, 2015. |
See accompanying notes to financial statements. |
6
WAVELENGTH INTEREST RATE NEUTRAL FUND
SCHEDULE OF FUTURES CONTRACTS
November 30, 2015 (Unaudited) |
FUTURES CONTRACTS | Expiration Date | | Contracts | | | Aggregate Market Value of Contracts | | | Unrealized Appreciation (Depreciation) | |
Commodity Futures | | | | | | | | | | |
COMEX miNY Gold Future | 1/27/2016 | | | 5 | | | $ | 266,313 | | | $ | 1,279 | |
| | | | | | | | | | | | | | |
Index Futures | | | | | | | | | | | | | |
E-Mini Dow CBOT DJIA Future | 12/18/2015 | | | 8 | | | | 708,560 | | | | 4,874 | |
E-Mini Nasdaq 100 Future | 12/18/2015 | | | 4 | | | | 373,540 | | | | 5,022 | |
E-Mini S&P 500® Future | 12/18/2015 | | | 8 | | | | 832,400 | | | | 6,709 | |
Total Index Futures | | | | | | | | 1,914,500 | | | | 16,605 | |
| | | | | | | | | | | | | | |
Treasury Futures | | | | | | | | | | | | | |
5-Year U.S. Treasury Note Future | 3/31/2016 | | | 17 | | | | 2,017,820 | | | | (1,112 | ) |
U.S. Treasury Long Bond Future | 3/21/2016 | | | 3 | | | | 462,563 | | | | 933 | |
Total Treasury Futures | | | | | | | | 2,480,383 | | | | (179 | ) |
| | | | | | | | | | | | | | |
Total Futures Contracts | | | | | | | $ | 4,661,196 | | | $ | 17,705 | |
See accompanying notes to financial statements. |
7
WAVELENGTH INTEREST RATE NEUTRAL FUND
SCHEDULE OF FUTURES CONTRACTS SOLD SHORT
November 30, 2015 (Unaudited) |
FUTURES CONTRACTS
SOLD SHORT | Expiration Date | | Contracts | | | Aggregate Market Value of Contracts | | | Unrealized Appreciation | |
Commodity Futures | | | | | | | | | | |
E-Mini Crude Oil Future | 12/18/2015 | | | 3 | | | $ | 62,400 | | | $ | 431 | |
| | | | | | | | | | | | | | |
Treasury Futures | | | | | | | | | | | | | |
10-Year U.S. Treasury Note Future | 3/21/2016 | | | 5 | | | | 632,188 | | | | 86 | |
| | | | | | | | | | | | | | |
Total Futures Contracts Sold Short | | | | | | | $ | 694,588 | | | $ | 517 | |
See accompanying notes to financial statements. |
8
WAVELENGTH INTEREST RATE NEUTRAL FUND
STATEMENT OF ASSETS AND LIABILITIES
November 30, 2015 (Unaudited) |
ASSETS | | | |
Investments in securities: | | | |
At acquisition cost | | $ | 16,270,405 | |
At value (Note 2) | | $ | 15,816,238 | |
Cash | | | 3,728 | |
Margin deposits for futures contracts (Notes 2 and 5) | | | 512,587 | |
Dividends receivable | | | 4 | |
Receivable for investment securities sold | | | 153,674 | |
Receivable from Adviser (Note 4) | | | 1,980 | |
Other assets | | | 12,979 | |
Total assets | | | 16,501,190 | |
| | | | | |
LIABILITIES | | | | |
Payable for investment securities purchased | | | 7,968 | |
Payable to administrator (Note 4) | | | 7,390 | |
Variation margin payable (Notes 2 and 5) | | | 8,492 | |
Other accrued expenses | | | 3,724 | |
Total liabilities | | | 27,574 | |
| | | | | |
NET ASSETS | | $ | 16,473,616 | |
| | | | | |
NET ASSETS CONSIST OF: | | | | |
Paid-in capital | | $ | 17,810,168 | |
Accumulated net investment income | | | 65,045 | |
Accumulated net realized losses from security transactions and other financial instruments | | | (965,652 | ) |
Net unrealized appreciation (depreciation) on: | | | | |
Investments | | | (454,167 | ) |
Futures contracts | | | 18,222 | |
NET ASSETS | | $ | 16,473,616 | |
| | | | | |
Shares of beneficial interest outstanding (unlimited number of shares authorized, no par value) | | | 1,746,469 | |
| | | | | |
Net asset value, offering price and redemption price per share (Note 2) | | $ | 9.43 | |
See accompanying notes to financial statements. |
9
WAVELENGTH INTEREST RATE NEUTRAL FUND
STATEMENT OF OPERATIONS
For the Six Months Ended November 30, 2015 (Unaudited) |
INVESTMENT INCOME | | | |
Dividends | | $ | 274,110 | |
| | | | | |
EXPENSES | | | | |
Investment advisory fees (Note 4) | | | 80,515 | |
Professional fees | | | 19,217 | |
Fund accounting fees (Note 4) | | | 14,849 | |
Administration fees (Note 4) | | | 14,000 | |
Transfer agent fees (Note 4) | | | 7,500 | |
Custody and bank service fees | | | 6,768 | |
Compliance fees (Note 4) | | | 6,615 | |
Trustees' fees and expenses (Note 4) | | | 4,378 | |
Registration and filing fees | | | 3,699 | |
Insurance expense | | | 1,938 | |
Postage and supplies | | | 1,154 | |
Other expenses | | | 8,304 | |
Total expenses | | | 168,937 | |
Less fee reductions and expense reimbursements by the Adviser (Note 4) | | | (85,031 | ) |
Net expenses | | | 83,906 | |
| | | | | |
NET INVESTMENT INCOME | | | 190,204 | |
| | | | | |
REALIZED AND UNREALIZED GAINS (LOSSES) ON INVESTMENTS AND FUTURES CONTRACTS | | | | |
Net realized losses from: | | | | |
Investments | | | (519,048 | ) |
Futures contracts (Note 5) | | | (275,793 | ) |
Net change in unrealized appreciation/depreciation on: | | | | |
Investments | | | (408,031 | ) |
Futures contracts (Note 5) | | | 26,397 | |
NET REALIZED AND UNREALIZED LOSSES ON INVESTMENTS | | | (1,176,475 | ) |
| | | | | |
NET DECREASE IN NET ASSETS RESULTING FROM OPERATIONS | | $ | (986,271 | ) |
See accompanying notes to financial statements. |
10
WAVELENGTH INTEREST RATE NEUTRAL FUND
STATEMENTS OF CHANGES IN NET ASSETS |
| | Six Months Ended November 30, 2015 (Unaudited) | | | Year
Ended
May 31,
2015 | |
FROM OPERATIONS | | | | | | |
Net investment income | | $ | 190,204 | | | $ | 329,154 | |
Net realized losses from: | | | | | | | | |
Investments | | | (519,048 | ) | | | (168,620 | ) |
Option contracts (Note 5) | | | — | | | | (8,464 | ) |
Futures contracts (Note 5) | | | (275,793 | ) | | | (14,863 | ) |
Capital gain distributions from regulated investment companies | | | — | | | | 37,148 | |
Net change in unrealized appreciation/depreciation on: | | | | | | | | |
Investments | | | (408,031 | ) | | | (153,547 | ) |
Futures contracts (Note 5) | | | 26,397 | | | | (18,308 | ) |
Net increase (decrease) in net assets from operations | | | (986,271 | ) | | | 2,500 | |
| | | | | | | | | |
DISTRIBUTIONS TO SHAREHOLDERS | | | | | | | | |
From net investment income | | | (173,245 | ) | | | (293,521 | ) |
From net realized gains | | | — | | | | (48,557 | ) |
Decrease in net assets from distributions to shareholders | | | (173,245 | ) | | | (342,078 | ) |
| | | | | | | | | |
CAPITAL SHARE TRANSACTIONS | | | | | | | | |
Proceeds from shares sold | | | 124,924 | | | | 13,413,165 | |
Net asset value of shares issued in reinvestment of distributions to shareholders | | | 168,080 | | | | 339,021 | |
Payments for shares redeemed | | | (475,049 | ) | | | (314,392 | ) |
Net increase (decrease) in net assets from capital share transactions | | | (182,045 | ) | | | 13,437,794 | |
| | | | | | | | | |
TOTAL INCREASE (DECREASE) IN NET ASSETS | | | (1,341,561 | ) | | | 13,098,216 | |
| | | | | | | | | |
NET ASSETS | | | | | | | | |
Beginning of period | | | 17,815,177 | | | | 4,716,961 | |
End of period | | $ | 16,473,616 | | | $ | 17,815,177 | |
| | | | | | | | | |
ACCUMULATED NET INVESTMENT INCOME | | $ | 65,045 | | | $ | 48,086 | |
See accompanying notes to financial statements. |
11
WAVELENGTH INTEREST RATE NEUTRAL FUND
STATEMENTS OF CHANGES IN NET ASSETS (Continued) |
| | Six Months Ended November 30,
2015 (Unaudited) | | | Year
Ended
May 31,
2015 | |
CAPITAL SHARE ACTIVITY | | | | | | |
Shares sold | | | 12,473 | | | | 1,308,050 | |
Shares issued in reinvestment of distributions to shareholders | | | 17,746 | | | | 34,071 | |
Shares redeemed | | | (49,426 | ) | | | (31,083 | ) |
Net increase (decrease) in shares outstanding | | | (19,207 | ) | | | 1,311,038 | |
Shares outstanding at beginning of period | | | 1,765,676 | | | | 454,638 | |
Shares outstanding at end of period | | | 1,746,469 | | | | 1,765,676 | |
See accompanying notes to financial statements. |
12
WAVELENGTH INTEREST RATE NEUTRAL FUND
FINANCIAL HIGHLIGHTS |
Per Share Data for a Share Outstanding Throughout Each Period | |
| | Six Months Ended November 30, 2015 (Unaudited) | | | Year
Ended
May 31,
2015 | | | Period
Ended
May 31,
2014(a) | |
Net asset value at beginning of period | | $ | 10.09 | | | $ | 10.38 | | | $ | 10.00 | |
| | | | | | | | | | | | | |
Income (loss) from investment operations: | | | | | | | | | | | | |
Net investment income | | | 0.11 | | | | 0.23 | | | | 0.10 | |
Net realized and unrealized gains (losses) on investments and futures contracts | | | (0.67 | ) | | | (0.25 | ) | | | 0.36 | |
Total from investment operations | | | (0.56 | ) | | | (0.02 | ) | | | 0.46 | |
| | | | | | | | | | | | | |
Less distributions: | | | | | | | | | | | | |
Distributions from net investment income | | | (0.10 | ) | | | (0.23 | ) | | | (0.07 | ) |
Distributions from net realized gains | | | — | | | | (0.04 | ) | | | (0.01 | ) |
Total distributions | | | (0.10 | ) | | | (0.27 | ) | | | (0.08 | ) |
| | | | | | | | | | | | | |
Net asset value at end of period | | $ | 9.43 | | | $ | 10.09 | | | $ | 10.38 | |
| | | | | | | | | | | | | |
Total return (b) | | | (5.56% | )(c) | | | (0.17 | %) | | | 4.62 | %(c) |
| | | | | | | | | | | | | |
Net assets at end of period (000's) | | $ | 16,474 | | | $ | 17,815 | | | $ | 4,717 | |
| | | | | | | | | | | | | |
Ratios/supplementary data: | | | | | | | | | | | | |
Ratio of total expenses to average net assets (d) | | | 1.99 | %(e) | | | 2.19 | % | | | 4.42 | %(e) |
| | | | | | | | | | | | | |
Ratio of net expenses to average net assets (d)(f) | | | 0.99 | %(e) | | | 0.99 | % | | | 0.99 | %(e) |
| | | | | | | | | | | | | |
Ratio of net investment income to average net assets (f)(g) | | | 2.25 | %(e) | | | 2.52 | % | | | 1.55 | %(e) |
| | | | | | | | | | | | | |
Portfolio turnover rate | | | 75 | %(c) | | | 107 | % | | | 114 | %(c) |
(a) | Represents the period from the commencement of operations (September 30, 2013) through May 31, 2014. |
(b) | Total return is a measure of the change in value of an investment in the Fund over the periods covered. The returns shown do not reflect the deduction of taxes a shareholder would pay on Fund distributions, if any, or the redemption of Fund shares. The total returns would be lower if the Adviser had not reduced advisory fees and reimbursed expenses. |
(c) | Not annualized. |
(d) | The ratios of expenses to average net assets do not reflect the Fund's proportionate share of expenses of the underlying investment companies in which the Fund invests. |
(e) | Annualized. |
(f) | Ratio was determined after advisory fee reductions and expense reimbursements (Note 4). |
(g) | Recognition of net investment income by the Fund is affected by the timing of the declarations of dividends by the underlying investment companies in which the Fund invests. |
See accompanying notes to financial statements. |
13
WAVELENGTH INTEREST RATE NEUTRAL FUND
NOTES TO FINANCIAL STATEMENTS
November 30, 2015 (Unaudited)
1. Organization
Wavelength Interest Rate Neutral Fund (the “Fund”) is a non-diversified series of Ultimus Managers Trust (the “Trust”), an open-end investment company established as an Ohio business trust under a Declaration of Trust dated February 28, 2012. Other series of the Trust are not incorporated in this report. The Fund commenced operations on September 30, 2013.
The investment objective of the Fund is total return.
2. Significant Accounting Policies
The following is a summary of the Fund’s significant accounting policies. The policies are in conformity with Generally Accepted Accounting Principles in the United States of America (“GAAP”). As an investment company, as defined in Financial Accounting Standards Board (“FASB”) Accounting Standards Update 2013-08, the Fund follows accounting and reporting guidance under FASB Accounting Standards Codification Topic 946, “Financial Services – Investment Companies.”
Securities and futures valuation – The Fund values its portfolio securities at market value as of the close of regular trading on the New York Stock Exchange (the “NYSE”) (normally 4:00 p.m. Eastern time) on each business day the NYSE is open. The Fund values its listed securities on the basis of the security’s last sale price on the security’s primary exchange, if available, otherwise at the exchange’s most recently quoted bid price. NASDAQ-listed securities are valued at the NASDAQ Official Closing Price. Option contracts are valued at the closing price as quoted on the exchanges in which they are primarily traded. If no closing price is readily available at the time of valuation, the option will be valued at the closing bid price for that day. The Fund values its exchange-traded futures contracts at their last sale price as of the close of regular trading on the NYSE. Prices for these futures contracts are monitored daily by the Adviser until the close of regular trading to determine if fair valuation is required.
In the event that market quotations are not readily available or are considered unreliable due to market or other events, the Fund values its securities and other assets at fair value pursuant to the procedures adopted by the Trust’s Board of Trustees (the “Board”). Under these procedures, the securities will be classified as Level 2 or 3 within the fair value hierarchy (see below), depending on the inputs used. Unavailable or unreliable market quotes may be due to the following factors: a substantial bid-ask spread; infrequent sales resulting in stale prices; insufficient trading volume; small trade sizes; a temporary lapse in any reliable pricing source; and actions of the securities or futures markets, such as the suspension or limitation of trading.
GAAP establishes a single authoritative definition of fair value, sets out a framework for measuring fair value, and requires additional disclosures about fair value measurements.
14
WAVELENGTH INTEREST RATE NEUTRAL FUND
NOTES TO FINANCIAL STATEMENTS (Continued)
Various inputs are used in determining the value of the Fund’s investments. These inputs are summarized in the three broad levels listed below:
● | Level 1 – quoted prices in active markets for identical securities |
● | Level 2 – other significant observable inputs |
● | Level 3 – significant unobservable inputs |
The inputs or methods used for valuing securities are not necessarily an indication of the risks associated with investing in those securities. The inputs used to measure fair value may fall into different levels of the fair value hierarchy. In such cases, for disclosure purposes, the level in the fair value hierarchy within which the fair value measurement falls in its entirety is determined based on the lowest level input that is significant to the fair value measurement.
The following is a summary of the inputs used to value the Fund’s investments and other financial instruments as of November 30, 2015:
| | Level 1 | | | Level 2 | | | Level 3 | | | Total | |
Investments in Securities | | | | | | | | | | | | |
Exchange-Traded Funds | | $ | 15,565,641 | | | $ | — | | | $ | — | | | $ | 15,565,641 | |
Money Market Funds | | | 250,597 | | | | — | | | | — | | | | 250,597 | |
Total | | $ | 15,816,238 | | | $ | — | | | $ | — | | | $ | 15,816,238 | |
Other Financial Instruments | | | | | | | | | | | | | | | | |
Futures Contracts | | $ | 17,705 | | | $ | — | | | $ | — | | | $ | 17,705 | |
Futures Contracts Sold Short | | | 517 | | | | — | | | | — | | | | 517 | |
Total | | $ | 18,222 | | | $ | — | | | $ | — | | | $ | 18,222 | |
As of November 30, 2015, the Fund did not have any transfers into and out of any Level. In addition, the Fund did not have any assets or liabilities that were measured at fair value on a recurring basis using significant unobservable inputs (Level 3) as of November 30, 2015. It is the Fund’s policy to recognize transfers into and out of any Level at the end of the reporting period.
Share valuation – The net asset value per share of the Fund is calculated daily by dividing the total value of the Fund’s assets, less liabilities, by the number of shares outstanding. The offering price and redemption price per share of the Fund is equal to the net asset value per share.
Investment income – Dividend income is recorded on the ex-dividend date. Interest income is accrued as earned.
Security transactions – Security transactions are accounted for on the trade date. Gains and losses on securities sold are determined on a specific identification basis.
Common expenses – Common expenses of the Trust are allocated among the Fund and the other series of the Trust based on the relative net assets of each series or the nature of the services performed and the relative applicability to each series.
15
WAVELENGTH INTEREST RATE NEUTRAL FUND
NOTES TO FINANCIAL STATEMENTS (Continued)
Distributions to shareholders – The Fund will distribute to shareholders any net investment income on a quarterly basis and any net realized capital gains at least annually. The amount of such dividends and distributions are determined in accordance with federal income tax regulations, which may differ from GAAP. Dividends and distributions to shareholders are recorded on the ex-dividend date. The tax character of distributions paid during the periods ended November 30, 2015 and May 31, 2015 was as follows:
Periods Ended | | Ordinary Income | | | Long-Term Capital Gains | | | Total Distributions | |
November 30, 2015 | | $ | 173,245 | | | $ | — | | | $ | 173,245 | |
May 31, 2015 | | $ | 328,122 | | | $ | 13,956 | | | $ | 342,078 | |
Option contracts – The Fund may use option contracts in any manner consistent with its investment objective and as long as the use is consistent with relevant provisions of the Investment Company Act of 1940. The Fund may use options for speculative investment purposes as well as for the purpose of seeking to reduce the overall investment risk that would otherwise be associated with the securities in which the Fund invests. When the Fund purchases an option, an amount equal to the total premium (the premium plus the commission) paid by the Fund is recorded as an asset in the Fund’s Statement of Assets and Liabilities and is subsequently marked-to-market daily. Premiums paid in the purchase of options which expire are treated as realized losses. Premiums paid in the purchase of call options which are exercised increase the cost of the security purchased. If a closing sale transaction is used to terminate the Fund’s obligation on an option, a gain or loss will be realized depending upon whether the price of the closing sale transaction is more or less than the premium previously paid on the option purchased.
Futures contracts – The Fund may use futures contracts to gain exposure to or to hedge against changes in the value of equities, real estate, interest rates or commodities. A futures contract represents a commitment for the future purchase or sale of an asset at a specified price on a specified date. When the Fund purchases or sells a futures contract, no price is paid to or received by the Fund. Instead, the Fund is required to deposit in a segregated asset account an amount of cash or qualifying securities currently ranging from 2% to 10% of the contract amount. This is called the “initial margin deposit.” Subsequent payments, known as “variation margin,” are made or received by the Fund each day, depending on the daily fluctuations in the fair value of the underlying asset. The Fund recognizes an unrealized gain or loss equal to the daily variation margin. If market conditions move unexpectedly, the Fund may not achieve the anticipated benefits of the futures contracts and may realize a loss. The margin deposits for futures contracts and the variation margin payable are reported on the Statement of Assets and Liabilities.
Estimates – The preparation of financial statements in conformity with GAAP requires management to make estimates and assumptions that affect the reported amounts of assets and liabilities and disclosure of contingent assets and liabilities as of the date of the financial statements and the reported amounts of income and expenses during the reporting period. Actual results could differ from those estimates.
16
WAVELENGTH INTEREST RATE NEUTRAL FUND
NOTES TO FINANCIAL STATEMENTS (Continued)
Federal income tax – The Fund has qualified and intends to continue to qualify as a regulated investment company under the Internal Revenue Code of 1986 (the “Code”). Qualification generally will relieve the Fund of liability for federal income taxes to the extent 100% of its net investment income and net realized captial gains are distributed in accordance with the Code. Accordingly, no provision for income tax has been made.
In order to avoid imposition of the excise tax applicable to regulated investment companies, it is also the Fund’s intention to declare as dividends in each calendar year at least 98% of its net investment income (earned during the calendar year) and 98.2% of its net realized capital gains (earned during the twelve months ended October 31) plus undistributed amounts from prior years.
The following information is computed on a tax basis for each item as of November 30, 2015:
Tax cost of portfolio investments | | $ | 16,571,857 | |
Gross unrealized appreciation | | $ | 11,697 | |
Gross unrealized depreciation | | | (767,316 | ) |
Net unrealized depreciation | | | (755,619 | ) |
Accumulated ordinary income | | | 65,045 | |
Capital loss carryforward | | | (38,753 | ) |
Other losses | | | (607,225 | ) |
Total accumulated deficit | | $ | (1,336,552 | ) |
The value of the federal income tax cost of portfolio investments and the tax components of the accumulated deficit may temporarily differ from the financial statement cost and components of net assets (“book/tax difference”). These book/tax differences are due to the recognition of capital gains or losses under income tax regulations and GAAP, primarily the tax deferral of losses on wash sales and the tax treatment of realized and unrealized gains and losses on futures contracts.
As of May 31, 2015, the Fund had a short-term capital loss carryforward of $38,753 for federal income tax purposes. This capital loss carryforward, which does not expire, may be utilized in the current and future years to offset net realized capital gains, if any, prior to distributing such gains to shareholders.
The Fund recognizes the tax benefits or expenses of uncertain tax positions only when the position is “more likely than not” to be sustained assuming examination by tax authorities. Management has reviewed the Fund’s tax positions for the current and all open tax periods (periods ended May 31, 2014 and May 31, 2015) and has concluded that no provision for unrecognized tax benefits or expenses is required in these financial statements. The Fund identifies its major tax jurisdiction as U.S. Federal.
17
WAVELENGTH INTEREST RATE NEUTRAL FUND
NOTES TO FINANCIAL STATEMENTS (Continued)
3. Investment Transactions
During the six months ended November 30, 2015, cost of purchases and proceeds from sales of investment securities, other than short-term investments, were $12,891,134 and $11,667,391, respectively.
4. Transactions with Related Parties
INVESTMENT ADVISORY AGREEMENT
The Fund’s investments are managed by Wavelength Capital Management, LLC (the “Adviser”) pursuant to the terms of an Investment Advisory Agreement. Under the Investment Advisory Agreement, the Fund pays the Adviser an advisory fee, computed and accrued daily and paid monthly, at the annual rate of 0.95% of its average daily net assets.
Pursuant to an Expense Limitation Agreement (“ELA”) between the Fund and the Adviser, the Adviser has contractually agreed, until October 1, 2016, to reduce investment advisory fees and reimburse other operating expenses in order to limit total annual operating expenses of the Fund (exclusive of brokerage costs; taxes; interest; borrowing costs such as interest and dividend expenses on securities sold short; acquired fund fees and expenses; extraordinary expenses such as litigation and merger or reorganization costs; and other expenses not incurred in the ordinary course of the Fund’s business) to an amount not exceeding 0.99% of the Fund’s average daily net assets. During the six months ended November 30, 2015, the Adviser did not collect any of its investment advisory fees and, in addition, reimbursed the Fund for other operating expenses totaling $4,516.
Under the terms of the ELA, investment advisory fee reductions and expense reimbursements by the Adviser are subject to recoupment by the Adviser for a period of three years after such fees and expenses were incurred, provided that the recoupments do not cause total annual operating expenses of the Fund to exceed 0.99% of the Fund’s average daily net assets. As of November 30, 2015, the Adviser may seek recoupment of investment advisory fee reductions and expense reimbursements no later than the dates as stated below:
May 31, 2017 | May 31, 2018 | November 30, 2018 | Total |
$91,664 | $157,675 | $85,031 | $334,370 |
The principal executive officer of the Fund is also an officer of the Adviser.
18
WAVELENGTH INTEREST RATE NEUTRAL FUND
NOTES TO FINANCIAL STATEMENTS (Continued)
OTHER SERVICE PROVIDERS
Ultimus Fund Solutions, LLC (“Ultimus”) provides fund administration, fund accounting, compliance and transfer agency services to the Fund. The Fund pays Ultimus fees in accordance with the agreements for such services. In addition, the Fund pays out-of-pocket expenses including, but not limited to, postage, supplies and costs of pricing the Fund’s portfolio securities.
Under the terms of a Distribution Agreement with the Trust, Ultimus Fund Distributors, LLC (the “Distributor”) serves as the principal underwriter to the Fund. The Distributor is a wholly-owned subsidiary of Ultimus. The Distributor is compensated by the Adviser (not the Fund) for acting as principal underwriter.
Certain officers and a Trustee of the Trust are also officers of Ultimus and the Distributor.
TRUSTEE COMPENSATION
Each Trustee who is not an “interested person” of the Trust (“Independent Trustee”) receives from the Fund a fee of $500 for each Board meeting attended plus reimbursement of travel and other meeting-related expenses. In addition, each Independent Trustee receives a $500 annual retainer from the Fund. Trustees affiliated with the Adviser or Ultimus are not compensated by the Fund for their services.
PRINCIPAL HOLDERS OF FUND SHARES
As of November 30, 2015, the following shareholders owned of record 5% or more of the outstanding shares of the Fund:
Name of Record Owner | % Ownership |
Interactive Brokers, LLC (for the benefit of its customers) | 70% |
R&T Partners, LLC (for the benefit of its customers) | 11% |
A shareholder owning of record or beneficially 25% or more of the Fund’s outstanding shares may be considered a controlling person. That shareholder’s vote could have a more significant effect on matters presented at a shareholders’ meeting.
5. Derivatives Transactions
The Fund’s positions in derivative instruments as of November 30, 2015 are recorded in the following location in the Statement of Assets and Liabilities:
Derivative Investment Type | Location |
Futures contracts | Variation margin payable |
19
WAVELENGTH INTEREST RATE NEUTRAL FUND
NOTES TO FINANCIAL STATEMENTS (Continued)
The following table sets forth the values of variation margin of the Fund as of November 30, 2015:
| | | Variation Margin | | | | |
| | Receivable | | | (Payable) | | | Total | |
Asset Derivatives | | | | | | | | | |
Futures contracts | | | | | | | | | |
Commodity | | $ | 1,442 | | | $ | — | | | $ | 1,442 | |
Index | | | 231 | | | | (10,916 | ) | | | (10,685 | ) |
Treasury | | | 1,031 | | | | (531 | ) | | | 500 | |
Total Asset Derivatives | | | 2,704 | | | | (11,447 | ) | | | (8,743 | ) |
Liability Derivatives | | | | | | | | | | | | |
Futures contracts | | | | | | | | | | | | |
Commodity | | | 165 | | | | — | | | | 165 | |
Treasury | | | 86 | | | | — | | | | 86 | |
Total Liability Derivatives | | | 251 | | | | — | | | | 251 | |
Total | | $ | 2,955 | | | $ | (11,447 | ) | | $ | (8,492 | ) |
The Fund’s transactions in derivative instruments during the six months ended November 30, 2015 are recorded in the following locations in the Statement of Operations:
Derivative Investment Type | Location |
Futures contracts | Net realized losses from futures contracts |
| | Net change in unrealized appreciation/depreciation on futures contracts |
The following is a summary of the Fund’s net realized gains (losses) and net change in unrealized appreciation/depreciation on derivative instruments recognized in the Statement of Operations during the six months ended November 30, 2015:
Type of Derivative | | Net Realized Gains (Losses) | | | Net Change in Unrealized Appreciation/ Depreciation | |
Futures contracts | | | | | | |
Commodity | | $ | (24,205 | ) | | $ | 10,949 | |
Index | | | (253,588 | ) | | | 25,770 | |
Treasury | | | 2,000 | | | | (10,322 | ) |
Total | | $ | (275,793 | ) | | $ | 26,397 | |
20
WAVELENGTH INTEREST RATE NEUTRAL FUND
NOTES TO FINANCIAL STATEMENTS (Continued)
The average monthly notional amount of futures contracts purchased during the six months ended November 30, 2015 was $7,110,935, and the gross notional amount of futures contracts and future contracts sold short outstanding at November 30, 2015 was $4,661,196 and $(694,588), respectively.
In the ordinary course of business, the Fund may enter into transactions subject to enforceable netting agreements or other similar arrangements (“netting agreements”). Generally, the right to offset in netting agreements allows the Fund to offset any exposure to a specific counterparty with any collateral received or delivered to that counterparty based on the terms of the agreements. Generally, the Fund manages its cash collateral securities and securities collateral on a counterparty basis.
As of November 30 2015, the offsetting of financial assets and derivative assets is as follows:
Description | | Gross Amounts of Recognized Assets | | | Gross Amounts Offset in Statements of Assets and Liabilities | | | Net Amounts of Assets Presented in Statements of Assets and Liabilities | | | Collateral Pledged | | | Net Amount | |
Variation margin receivable (payable) -
futures contracts | | $ | 2,704 | | | $ | (11,447 | ) | | $ | (8,743 | ) | | $ | 422,829 | | | $ | 414,086 | |
Total subject to a master netting or similar arrangement | | $ | 2,704 | | | $ | (11,447 | ) | | $ | (8,743 | ) | | $ | 422,829 | | | $ | 414,086 | |
As of November 30, 2015, the offsetting of financial liabilities and derivative liabilities is as follows:
Description | | Gross Amounts of Recognized Liabilities | | | Gross Amounts Offset in Statements of Assets and Liabilities | | | Net Amounts of Assets Presented in Statements of Assets and Liabilities | | | Collateral Pledged | | | Net Amount | |
Variation margin receivable -
futures contracts | | $ | 251 | | | $ | — | | | $ | 251 | | | $ | 89,758 | | | $ | 90,009 | |
Total subject to a master netting or similar arrangement | | $ | 251 | | | $ | — | | | $ | 251 | | | $ | 89,758 | | | $ | 90,009 | |
21
WAVELENGTH INTEREST RATE NEUTRAL FUND
NOTES TO FINANCIAL STATEMENTS (Continued)
6. Certain Investments and Risks
The securities in which the Fund invests, as well as the risks associated with these securities, are described in the Fund’s prospectus. Among these risks are those associated with investments in exchange-traded funds (“ETFs”). ETFs issue their shares to authorized participants in return for a specific basket of securities. The authorized participants then sell the ETF’s shares on the secondary market. In other words, ETF shares are traded on a securities exchange based on their market value. Investments in ETFs are subject to the risk that the ETF’s shares may trade at a premium (creating the risk that the Fund pays more than net asset value (“NAV”) for an ETF when making a purchase) or discount (creating the risk that the Fund receives less than NAV when selling an ETF) to the ETF’s NAV. Investments in ETFs are also subject to index-tracking risk because the total return generated by the securities will be reduced by transaction costs and expenses not incurred by the indices. Certain securities comprising the index tracked by an ETF may, from time to time, temporarily be unavailable, which may further impede the ETF’s ability to track its applicable index or match the index’s performance. To the extent that the Fund invests in an ETF, the Fund incurs additional expenses because the Fund bears its pro-rata portion of such ETF’s advisory fees and operational expenses. Finally, ETF shares are also subject to the risks applicable to the underlying basket of securities. As of November 30, 2015, the Fund had 94.5% of the value of its net assets invested in ETFs.
7. Contingencies and Commitments
The Fund indemnifies the Trust’s officers and Trustees for certain liabilities that might arise from their performance of their duties to the Fund. Additionally, in the normal course of business, the Fund enters into contracts that contain a variety of representations and warranties and which provide general indemnifications. The Fund’s maximum exposure under these arrangements is unknown, as this would involve future claims that may be made against the Fund that have not yet occurred. However, based on experience, the Fund expects the risk of loss to be remote.
8. Subsequent Events
The Fund is required to recognize in the financial statements the effects of all subsequent events that provide additional evidence about conditions that existed as of the date of the Statement of Assets and Liabilities. For non-recognized subsequent events that must be disclosed to keep the financial statements from being misleading, the Fund is required to disclose the nature of the event as well as an estimate of its financial effect, or a statement that such an estimate cannot be made. Management has evaluated subsequent events through the issuance of these financial statements and has noted no such events.
22
WAVELENGTH INTEREST RATE NEUTRAL FUND
ABOUT YOUR FUND’S EXPENSES (Unaudited)
We believe it is important for you to understand the impact of costs on your investment. As a shareholder of the Fund, you incur ongoing costs, including management fees and other operating expenses. The following examples are intended to help you understand your ongoing costs (in dollars) of investing in the Fund and to compare these costs with the ongoing costs of investing in other mutual funds.
A mutual fund’s ongoing costs are expressed as a percentage of its average net assets. This figure is known as the expense ratio. The expenses in the table below are based on an investment of $1,000 made at the beginning of the most recent period (June 1, 2015) and held until the end of the period (November 30, 2015).
The table below illustrates the Fund’s ongoing costs in two ways:
Actual fund return – This section helps you to estimate the actual expenses that you paid over the period. The “Ending Account Value” shown is derived from the Fund’s actual return, and the third column shows the dollar amount of operating expenses that would have been paid by an investor who started with $1,000 in the Fund. You may use the information here, together with the amount you invested, to estimate the expenses that you paid over the period.
To do so, simply divide your account value by $1,000 (for example, an $8,600 account value divided by $1,000 = 8.6), then multiply the result by the number given for the Fund under the heading “Expenses Paid During Period.”
Hypothetical 5% return – This section is intended to help you compare the Fund’s ongoing costs with those of other mutual funds. It assumes that the Fund had an annual return of 5% before expenses during the period shown, but that the expense ratio is unchanged. In this case, because the return used is not the Fund’s actual return, the results do not apply to your investment. The example is useful in making comparisons because the SEC requires all mutual funds to calculate expenses based on a 5% return. You can assess the Fund’s ongoing costs by comparing this hypothetical example with the hypothetical examples that appear in shareholder reports of other funds.
Note that expenses shown in the table are meant to highlight and help you compare ongoing costs only. The Fund does not charge transaction fees, such as purchase or redemption fees, nor does it carry a “sales load.”
The calculations assume no shares were bought or sold during the period. Your actual costs may have been higher or lower, depending on the amount of your investment and the timing of any purchases or redemptions.
23
WAVELENGTH INTEREST RATE NEUTRAL FUND
ABOUT YOUR FUND’S EXPENSES (Unaudited)
More information about the Fund’s expenses can be found in this report. For additional information on operating expenses and other shareholder costs, please refer to the Fund’s prospectus.
| Beginning Account Value June 1, 2015 | Ending
Account Value
November 30, 2015 | Expenses
Paid During
Period* |
Based on Actual Fund Return | $1,000.00 | $944.40 | $4.83 |
Based on Hypothetical 5% Return (before expenses) | $1,000.00 | $1,020.10 | $5.01 |
* | Expenses are equal to the Fund’s annualized expense ratio of 0.99% for the period, multiplied by the average account value over the period, multiplied by 183/365 (to reflect the one-half year period). |
OTHER INFORMATION (Unaudited)
A description of the policies and procedures that the Fund uses to vote proxies relating to portfolio securities is available without charge upon request by calling toll-free 1-866-896-9292, or on the SEC’s website at http://www.sec.gov. Information regarding how the Fund voted proxies relating to portfolio securities during the most recent 12-month period ended June 30 is available without charge upon request by calling toll-free 1-866-896-9292, or on the SEC’s website at http://www.sec.gov.
The Trust files a complete listing of portfolio holdings for the Fund with the SEC as of the end of the first and third quarters of each fiscal year on Form N-Q. These filings are available upon request by calling 1-866-896-9292. Furthermore, you may obtain a copy of the filings on the SEC’s website at http://www.sec.gov. The Trust’s Forms N-Q may also be reviewed and copied at the SEC’s Public Reference Room in Washington, DC, and information on the operation of the Public Reference Room may be obtained by calling 1-800-SEC-0330.
24
This page intentionally left blank.
Not required
| Item 3. | Audit Committee Financial Expert. |
Not required
| Item 4. | Principal Accountant Fees and Services. |
Not required
| Item 5. | Audit Committee of Listed Registrants. |
Not applicable
| Item 6. | Schedule of Investments. |
| (a) | Not applicable [schedule filed with Item 1] |
| Item 7. | Disclosure of Proxy Voting Policies and Procedures for Closed-End Management Investment Companies. |
Not applicable
| Item 8. | Portfolio Managers of Closed-End Management Investment Companies. |
Not applicable
| Item 9. | Purchases of Equity Securities by Closed-End Management Investment Company and Affiliated Purchasers. |
Not applicable
| Item 10. | Submission of Matters to a Vote of Security Holders. |
The registrant’s Committee of Independent Trustees shall review shareholder recommendations to fill vacancies on the registrant’s board of trustees if such recommendations are submitted in writing, addressed to the Committee at the registrant’s offices and meet any minimum qualifications adopted by the Committee. The Committee may adopt, by resolution, a policy regarding its procedures for considering candidates for the board of trustees, including any recommended by shareholders.
| Item 11. | Controls and Procedures. |
(a) Based on their evaluation of the registrant’s disclosure controls and procedures (as defined in Rule 30a-3(c) under the Investment Company Act of 1940) as of a date within 90 days of the filing date of this report, the registrant’s principal executive officer and principal financial officer have concluded that such disclosure controls and procedures are reasonably designed and are operating effectively to ensure that material information relating to the registrant, including its consolidated subsidiaries, is made known to them by others within those entities, particularly during the period in which this report is being prepared, and that the information required in filings on Form N-CSR is recorded, processed, summarized, and reported on a timely basis.
(b) There were no changes in the registrant’s internal control over financial reporting (as defined in Rule 30a-3(d) under the Investment Company Act of 1940) that occurred during the second fiscal quarter of the period covered by this report that have materially affected, or are reasonably likely to materially affect, the registrant’s internal control over financial reporting.
File the exhibits listed below as part of this Form. Letter or number the exhibits in the sequence indicated.
(a)(1) Any code of ethics, or amendment thereto, that is the subject of the disclosure required by Item 2, to the extent that the registrant intends to satisfy the Item 2 requirements through filing of an exhibit: Not required
(a)(2) A separate certification for each principal executive officer and principal financial officer of the registrant as required by Rule 30a-2(a) under the Act (17 CFR 270.30a-2(a)): Attached hereto
(a)(3) Any written solicitation to purchase securities under Rule 23c-1 under the Act (17 CFR 270.23c-1) sent or given during the period covered by the report by or on behalf of the registrant to 10 or more persons: Not applicable
(b) Certifications required by Rule 30a-2(b) under the Act (17 CFR 270.30a-2(b)): Attached hereto
| Exhibit 99.CERT | Certifications required by Rule 30a-2(a) under the Act |
| Exhibit 99.906CERT | Certifications required by Rule 30a-2(b) under the Act |
SIGNATURES
Pursuant to the requirements of the Securities Exchange Act of 1934 and the Investment Company Act of 1940, the registrant has duly caused this report to be signed on its behalf by the undersigned, thereunto duly authorized.
| (Registrant) | Ultimus Managers Trust | |
| | | |
| By (Signature and Title)* | /s/ Frank L. Newbauer | |
| | Frank L. Newbauer, Assistant Secretary | |
| | | |
| Date | February 5, 2016 | |
| | | |
| Pursuant to the requirements of the Securities Exchange Act of 1934 and the Investment Company Act of 1940, this report has been signed below by the following persons on behalf of the registrant and in the capacities and on the dates indicated. |
| | | |
| By (Signature and Title)* | /s/ Nitin N. Kumbhani | |
| | | Nitin N. Kumbhani, Principal Executive Officer of APEXcm Small/Mid Cap Growth Fund |
| | | |
| Date | February 5, 2016 | |
| | | |
| By (Signature and Title)* | /s/ William S. Sloneker | |
| | | William S. Sloneker, Principal Executive Officer of Cincinnati Asset Management Funds: Broadmarket Strategic Income Fund |
| | | |
| Date | February 5, 2016 | |
| | | |
| By (Signature and Title)* | /s/ Nicholas Chermayeff | |
| | | Nicholas Chermayeff, Principal Executive Officer of Barrow Value Opportunity Fund and Barrow Long/Short Opportunity Fund |
| | | |
| Date | February 5, 2016 | |
| | | |
| By (Signature and Title)* | /s/ Andrew G. Dassori | |
| | | Andrew G. Dassori, Principal Executive Officer of Wavelength Interest Rate Neutral Fund |
| | | |
| Date | February 5, 2016 | |
| | | |
| By (Signature and Title)* | /s/ Jennifer L. Leamer | |
| | | Jennifer L. Leamer, Treasurer and Principal Financial Officer |
| | | |
| Date | February 5, 2016 | |
| * | Print the name and title of each signing officer under his or her signature. |