UNITED STATES
SECURITIES AND EXCHANGE COMMISSION
Washington, D.C. 20549
FORM N-CSR
CERTIFIED SHAREHOLDER REPORT OF REGISTERED
MANAGEMENT INVESTMENT COMPANIES
| Investment Company Act file number | 811-22680 | |
| Ultimus Managers Trust |
| (Exact name of registrant as specified in charter) |
| 225 Pictoria Drive, Suite 450 Cincinnati, Ohio | 45246 |
| (Address of principal executive offices) | (Zip code) |
Karen Jacoppo-Wood
| Ultimus Fund Solutions, LLC 225 Pictoria Drive, Suite 450 Cincinnati, Ohio 45246_ |
| (Name and address of agent for service) |
| Registrant's telephone number, including area code: | (513) 587-3400 | |
| Date of fiscal year end: | February 28 | |
| | | |
| Date of reporting period: | August 31, 2023 | |
Form N-CSR is to be used by management investment companies to file reports with the Commission not later than 10 days after the transmission to stockholders of any report that is required to be transmitted to stockholders under Rule 30e-1 under the Investment Company Act of 1940 (17 CFR 270.30e-1). The Commission may use the information provided on Form N-CSR in its regulatory, disclosure review, inspection, and policymaking roles.
A registrant is required to disclose the information specified by Form N-CSR, and the Commission will make this information public. A registrant is not required to respond to the collection of information contained in Form N-CSR unless the Form displays a currently valid Office of Management and Budget ("OMB") control number. Please direct comments concerning the accuracy of the information collection burden estimate and any suggestions for reducing the burden to the Secretary, Securities and Exchange Commission, 450 Fifth Street, NW, Washington, DC 20549-0609. The OMB has reviewed this collection of information under the clearance requirements of 44 U.S.C. § 3507.
| Item 1. | Reports to Stockholders. |

Blueprint Adaptive
Growth Allocation Fund
Institutional Class: (BLUIX)
Investor Class: (BLUPX)
Semi-Annual Report
August 31, 2023
(Unaudited)
| BLUEPRINT ADAPTIVE GROWTH ALLOCATION FUND |
| LETTER TO SHAREHOLDERS | September 7, 2023 |
Dear Shareholders,
The Fund’s return for the six months ended August 31, 2023 was 9.27% versus the Morningstar Global Allocation Index return of 6.36%, due in large part to the Fund’s strategy of increased exposure in the growth and technology sectors and the overall equity market.
Currently, it appears the market will be driven by a potential soft landing in the economy combined with visibility on interest rates (how high and how long). We believe the equity markets have been boosted by the change in sentiment from a year ago that a recession was a foregone conclusion to now being less and less likely. Stubborn inflation and higher rate talk from the Fed has not significantly hampered equity returns as economic data has remained robust yet just weak enough to show interest rate hikes are working. On the other hand, higher rates have negatively affected real estate securities and the bond market. As a result, the fund’s portfolio continues to be overweight equities, particularly in the U.S. but underweight real estate and bonds of any duration.
We often say that the best indication of what will happen in the near future is what is happening now, as trends tend to persist. Consequently, we expect continued strength in U.S. stocks, particularly technology names and growth segments. If inflation forecasts maintain their trajectory in the right direction and the Fed can declare or at least hint at a peak in interest rates, without the odds of recession increasing, we believe that the equity and bond markets will respond positively. Regardless, we believe the fund’s tactical approach will allow it to capitalize on current trends or adjust to changing market conditions should they occur.
Thank you for your continued confidence and support of the Blueprint Adaptive Growth Allocation Fund.
Best,
 |  |
| Jon Robinson | Brandon Langley |
Blueprint Fund Management, LLC
www.blueprintmutualfunds.com
Past performance is not predictive of future performance. Investment results and principal value will fluctuate so that shares, when redeemed, may be worth more or less than their original cost. Current performance may be higher or lower than the performance data quoted. Performance data current to the most recent month-end are available by calling 1-866-983-4525.
An investor should consider the investment objectives, risks, charges, and expenses of the Fund carefully before investing. The Fund’s prospectus contains this and other important information. To obtain a copy of the Fund’s prospectus please visit the Fund’s website at www.blueprintmutualfunds.com or call 1-866-983-4525 and a copy will be sent to you free of charge. Please read the prospectus carefully before you invest. The Fund is distributed by Ultimus Fund Distributors, LLC.
The Letter to Shareholders seeks to describe some of the Adviser’s current opinions and views of the financial markets. Although the Adviser believes it has a reasonable basis for any opinions or views expressed, actual results may differ, sometimes significantly so, from those expected or expressed. The securities held by the Fund that are discussed in the Letter to Shareholders were held during the period covered by this Report. They do not comprise the entire investment portfolio of the Fund, may be sold at any time, and may no longer be held by the Fund. For a complete list of securities held by the Fund as of August 31st, 2023, please see the Schedule of Investments section of the semi-annual report. The opinions of the Fund’s adviser with respect to those securities may change at any time.
Statements in the Letter to Shareholders that reflect projections or expectations for future financial or economic performance of the Fund and the market in general and statements of the Fund’s plans and objectives for future operations are forward-looking statements. No assurance can be given that actual results or events will not differ materially from those projected, estimated, assumed, or anticipated in any such forward- looking statements. Important factors that could result in such differences, in addition to factors noted with such forward-looking statements include, without limitation, general economic conditions, such as inflation, recession, and interest rates.
Blueprint Adaptive Growth Allocation Fund (the “Fund”) is not sponsored, endorsed, sold or promoted by Morningstar, Inc. or any of its affiliates (all such entities, collectively, “Morningstar Entities”). The Morningstar Entities make no representation or warranty, express or implied, to individuals who invest in the Fund or any member of the public regarding the advisability of investing in equity securities generally or in the Fund in particular of the ability of the Fund to track the Morningstar Indices or general equity market performance. THE MORNINGSTAR ENTITIES DO NOT GUARANTEE THE ACCURACY AND/OR THE COMPLETENESS OF THE FUND OR ANY DATA INCLUDED THEREIN AND MORNINGSTAR ENTITIES SHALL HAVE NO LIABILITY FOR ANY ERRORS, OMISSIONS, OR INTERRUPTIONS THEREIN.
| BLUEPRINT ADAPTIVE GROWTH ALLOCATION FUND |
| PORTFOLIO INFORMATION |
| August 31, 2023 (Unaudited) |
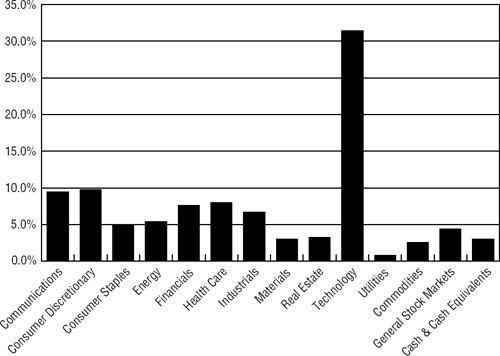
Sector Diversification (% of Net Assets)
| Top 10 Equity Holdings |
| | % of |
| | Net Assets |
| Apple, Inc. | 9.1% |
| Microsoft Corporation | 8.3% |
| Alphabet, Inc. - Classes A & C | 4.4% |
| Amazon.com, Inc. | 3.7% |
| NVIDIA Corporation | 3.6% |
| iShares Gold Trust | 2.5% |
| Tesla, Inc. | 2.3% |
| iShares MSCI India ETF | 2.2% |
| Berkshire Hathaway, Inc. - Class B | 2.1% |
| Meta Platforms, Inc. - Class A | 2.0% |
| BLUEPRINT ADAPTIVE GROWTH ALLOCATION FUND |
| SCHEDULE OF INVESTMENTS |
| August 31, 2023 (Unaudited) |
| COMMON STOCKS — 90.0% | | Shares | | | Value | |
| Communications — 9.4% | | | | | | | | |
| Cable & Satellite — 0.7% | | | | | | | | |
| Charter Communications, Inc. - Class A (a) | | | 318 | | | $ | 139,322 | |
| Comcast Corporation - Class A | | | 13,155 | | | | 615,128 | |
| | | | | | | | 754,450 | |
| Internet Media & Services — 7.6% | | | | | | | | |
| Alphabet, Inc. - Class A (a) | | | 18,111 | | | | 2,466,175 | |
| Alphabet, Inc. - Class C (a) | | | 16,269 | | | | 2,234,547 | |
| Booking Holdings, Inc. (a) | | | 116 | | | | 360,183 | |
| Meta Platforms, Inc. - Class A (a) | | | 7,405 | | | | 2,191,065 | |
| Netflix, Inc. (a) | | | 1,495 | | | | 648,352 | |
| Shopify, Inc. - Class A (a) | | | 3,993 | | | | 265,495 | |
| | | | | | | | 8,165,817 | |
| Publishing & Broadcasting — 0.2% | | | | | | | | |
| Scholastic Corporation | | | 1,219 | | | | 52,966 | |
| World Wrestling Entertainment, Inc. - Class A | | | 1,339 | | | | 129,280 | |
| | | | | | | | 182,246 | |
| Telecommunications — 0.9% | | | | | | | | |
| Deutsche Telekom AG - ADR | | | 20,253 | | | | 433,212 | |
| SoftBank Group Corporation - ADR | | | 22,951 | | | | 514,102 | |
| | | | | | | | 947,314 | |
| Consumer Discretionary — 9.7% | | | | | | | | |
| Apparel & Textile Products — 0.2% | | | | | | | | |
| LVMH Moet Hennessy Louis Vuitton SE - ADR | | | 1,491 | | | | 252,396 | |
| | | | | | | | | |
| Automotive — 3.0% | | | | | | | | |
| Mercedes-Benz Group AG - ADR | | | 13,989 | | | | 255,439 | |
| Tesla, Inc. (a) | | | 9,518 | | | | 2,456,406 | |
| Toyota Motor Corporation - ADR | | | 3,132 | | | | 539,111 | |
| | | | | | | | 3,250,956 | |
| Consumer Services — 0.1% | | | | | | | | |
| Perdoceo Education Corporation | | | 1,302 | | | | 21,574 | |
| Stride, Inc. (a) | | | 1,267 | | | | 53,835 | |
| | | | | | | | 75,409 | |
| E-Commerce Discretionary — 3.7% | | | | | | | | |
| Amazon.com, Inc. (a) | | | 28,470 | | | | 3,929,145 | |
| | | | | | | | | |
| Home Construction — 0.0% (b) | | | | | | | | |
| Griffon Corporation | | | 1,272 | | | | 53,259 | |
| BLUEPRINT ADAPTIVE GROWTH ALLOCATION FUND |
| SCHEDULE OF INVESTMENTS (Continued) |
| COMMON STOCKS — 90.0% (Continued) | | Shares | | | Value | |
| Consumer Discretionary — 9.7% (Continued) | | | | | | | | |
| Leisure Facilities & Services — 0.5% | | | | | | | | |
| McDonald’s Corporation | | | 1,926 | | | $ | 541,495 | |
| | | | | | | | | |
| Retail - Discretionary — 2.1% | | | | | | | | |
| Avis Budget Group, Inc. (a) | | | 837 | | | | 178,607 | |
| Builders FirstSource, Inc. (a) | | | 2,781 | | | | 403,356 | |
| Home Depot, Inc. (The) | | | 3,422 | | | | 1,130,287 | |
| Lowe’s Companies, Inc. | | | 2,208 | | | | 508,900 | |
| | | | | | | | 2,221,150 | |
| Wholesale - Discretionary — 0.1% | | | | | | | | |
| ePlus, Inc. (a) | | | 480 | | | | 31,862 | |
| Veritiv Corporation | | | 545 | | | | 91,740 | |
| | | | | | | | 123,602 | |
| Consumer Staples — 4.8% | | | | | | | | |
| Beverages — 0.8% | | | | | | | | |
| Coca-Cola Consolidated, Inc. | | | 76 | | | | 53,117 | |
| MGP Ingredients, Inc. | | | 657 | | | | 78,774 | |
| National Beverage Corporation (a) | | | 617 | | | | 31,658 | |
| PepsiCo, Inc. | | | 3,663 | | | | 651,721 | |
| | | | | | | | 815,270 | |
| Food — 0.4% | | | | | | | | |
| Mondelez International, Inc. - Class A | | | 3,477 | | | | 247,771 | |
| Pilgrim’s Pride Corporation (a) | | | 1,269 | | | | 31,928 | |
| Post Holdings, Inc. (a) | | | 1,665 | | | | 149,367 | |
| | | | | | | | 429,066 | |
| Household Products — 1.8% | | | | | | | | |
| Inter Parfums, Inc. | | | 152 | | | | 21,239 | |
| L’Oreal S.A. - ADR | | | 2,887 | | | | 253,652 | |
| Procter & Gamble Company (The) | | | 8,730 | | | | 1,347,388 | |
| Unilever plc - ADR | | | 4,984 | | | | 254,284 | |
| | | | | | | | 1,876,563 | |
| Retail - Consumer Staples — 1.8% | | | | | | | | |
| Costco Wholesale Corporation | | | 1,570 | | | | 862,370 | |
| Grocery Outlet Holding Corporation (a) | | | 2,082 | | | | 64,230 | |
| Murphy USA, Inc. | | | 880 | | | | 279,523 | |
| Walmart, Inc. | | | 4,704 | | | | 764,917 | |
| | | | | | | | 1,971,040 | |
| Wholesale - Consumer Staples — 0.0% (b) | | | | | | | | |
| Andersons, Inc. (The) | | | 826 | | | | 42,423 | |
| BLUEPRINT ADAPTIVE GROWTH ALLOCATION FUND |
| SCHEDULE OF INVESTMENTS (Continued) |
| COMMON STOCKS — 90.0% (Continued) | | Shares | | | Value | |
| Energy — 5.4% | | | | | | | | |
| Oil & Gas Producers — 4.9% | | | | | | | | |
| Baytex Energy Corporation (a) | | | 1,984 | | | $ | 8,075 | |
| BP plc - ADR | | | 6,893 | | | | 256,282 | |
| Civitas Resources, Inc. | | | 1,456 | | | | 119,712 | |
| CNX Resources Corporation (a) | | | 3,873 | | | | 86,562 | |
| ConocoPhillips | | | 4,057 | | | | 482,905 | |
| DT Midstream, Inc. | | | 3,261 | | | | 170,518 | |
| Exxon Mobil Corporation | | | 13,150 | | | | 1,462,148 | |
| HF Sinclair Corporation | | | 5,231 | | | | 288,176 | |
| Matador Resources Company | | | 4,096 | | | | 260,096 | |
| Murphy Oil Corporation | | | 4,303 | | | | 195,356 | |
| PBF Energy, Inc. - Class A | | | 4,461 | | | | 209,176 | |
| Range Resources Corporation | | | 8,848 | | | | 286,498 | |
| Shell plc - ADR | | | 8,321 | | | | 516,651 | |
| SM Energy Company | | | 3,806 | | | | 161,032 | |
| Southwestern Energy Company (a) | | | 21,563 | | | | 146,197 | |
| Talos Energy, Inc. (a) | | | 1,857 | | | | 31,977 | |
| TotalEnergies SE - ADR | | | 8,138 | | | | 511,962 | |
| Woodside Energy Group Ltd. - ADR | | | 1,543 | | | | 36,847 | |
| | | | | | | | 5,230,170 | |
| Oil & Gas Services & Equipment — 0.5% | | | | | | | | |
| Helmerich & Payne, Inc. | | | 3,719 | | | | 148,723 | |
| Nov, Inc. | | | 10,181 | | | | 215,125 | |
| Patterson-UTI Energy, Inc. | | | 9,094 | | | | 128,589 | |
| RPC, Inc. | | | 3,978 | | | | 31,784 | |
| | | | | | | | 524,221 | |
| Financials — 7.6% | | | | | | | | |
| Asset Management — 0.2% | | | | | | | | |
| BlackRock, Inc. | | | 392 | | | | 274,612 | |
| | | | | | | | | |
| Banking — 3.6% | | | | | | | | |
| BancFirst Corporation | | | 751 | | | | 71,781 | |
| BNP Paribas S.A. - ADR | | | 15,574 | | | | 503,819 | |
| City Holding Company | | | 235 | | | | 21,470 | |
| CVB Financial Corporation | | | 4,031 | | | | 70,381 | |
| First BanCorporation | | | 5,358 | | | | 74,262 | |
| Home BancShares, Inc. | | | 2,390 | | | | 53,010 | |
| HSBC Holdings plc - ADR | | | 6,827 | | | | 254,784 | |
| International Bancshares Corporation | | | 705 | | | | 31,570 | |
| JPMorgan Chase & Company | | | 10,929 | | | | 1,599,240 | |
| Mitsubishi UFJ Financial Group, Inc. - ADR | | | 70,584 | | | | 559,731 | |
| BLUEPRINT ADAPTIVE GROWTH ALLOCATION FUND |
| SCHEDULE OF INVESTMENTS (Continued) |
| COMMON STOCKS — 90.0% (Continued) | | Shares | | | Value | |
| Financials — 7.6% (Continued) | | | | | | | | |
| Banking — 3.6% (Continued) | | | | | | | | |
| OFG Bancorp | | | 1,059 | | | $ | 31,939 | |
| Preferred Bank | | | 516 | | | | 32,049 | |
| ServisFirst Bancshares, Inc. | | | 954 | | | | 53,462 | |
| Southside Bancshares, Inc. | | | 352 | | | | 10,595 | |
| Wells Fargo & Company | | | 9,527 | | | | 393,370 | |
| Wintrust Financial Corporation | | | 822 | | | | 63,795 | |
| | | | | | | | 3,825,258 | |
| Institutional Financial Services — 0.0% (b) | | | | | | | | |
| StoneX Group, Inc. (a) | | | 563 | | | | 52,854 | |
| | | | | | | | | |
| Insurance — 3.4% | | | | | | | | |
| Allianz SE - ADR | | | 21,578 | | | | 524,130 | |
| American Equity Investment Life Holding Company | | | 1,169 | | | | 62,752 | |
| American International Group, Inc. | | | 2,567 | | | | 150,221 | |
| Assured Guaranty Ltd. | | | 1,790 | | | | 105,323 | |
| Berkshire Hathaway, Inc. - Class B (a) | | | 6,294 | | | | 2,267,099 | |
| Genworth Financial, Inc. - Class A (a) | | | 12,987 | | | | 75,195 | |
| Kinsale Capital Group, Inc. | | | 544 | | | | 216,855 | |
| MetLife, Inc. | | | 1,013 | | | | 64,163 | |
| Unum Group | | | 3,738 | | | | 183,872 | |
| | | | | | | | 3,649,610 | |
| Specialty Finance — 0.4% | | | | | | | | |
| American Express Company | | | 1,540 | | | | 243,305 | |
| Capital One Financial Corporation | | | 745 | | | | 76,281 | |
| Mr. Cooper Group, Inc. (a) | | | 1,431 | | | | 81,080 | |
| | | | | | | | 400,666 | |
| Health Care — 8.0% | | | | | | | | |
| Biotech & Pharma — 6.4% | | | | | | | | |
| AbbVie, Inc. | | | 2,884 | | | | 423,833 | |
| Amgen, Inc. | | | 1,663 | | | | 426,293 | |
| Amphastar Pharmaceuticals, Inc. (a) | | | 991 | | | | 52,830 | |
| AstraZeneca plc - ADR | | | 3,634 | | | | 246,458 | |
| Corcept Therapeutics, Inc. (a) | | | 1,626 | | | | 53,219 | |
| Dynavax Technologies Corporation (a) | | | 2,201 | | | | 31,606 | |
| Eli Lilly & Company | | | 2,308 | | | | 1,279,093 | |
| Exelixis, Inc. (a) | | | 6,347 | | | | 142,109 | |
| Halozyme Therapeutics, Inc. (a) | | | 1,753 | | | | 74,608 | |
| Johnson & Johnson | | | 9,382 | | | | 1,516,882 | |
| Merck & Company, Inc. | | | 8,461 | | | | 922,080 | |
| Novartis AG - ADR | | | 4,958 | | | | 498,180 | |
| Novo Nordisk A/S - ADR | | | 2,754 | | | | 511,197 | |
| BLUEPRINT ADAPTIVE GROWTH ALLOCATION FUND |
| SCHEDULE OF INVESTMENTS (Continued) |
| COMMON STOCKS — 90.0% (Continued) | | Shares | | | Value | |
| Health Care — 8.0% (Continued) | | | | | | | | |
| Biotech & Pharma — 6.4% (Continued) | | | | | | | | |
| Prestige Consumer Healthcare, Inc. (a) | | | 542 | | | $ | 31,615 | |
| Sanofi - ADR | | | 9,893 | | | | 526,110 | |
| United Therapeutics Corporation (a) | | | 658 | | | | 147,629 | |
| | | | | | | | 6,883,742 | |
| Health Care Facilities & Services — 1.0% | | | | | | | | |
| Acadia Healthcare Company, Inc. (a) | | | 2,749 | | | | 211,948 | |
| UnitedHealth Group, Inc. | | | 1,660 | | | | 791,123 | |
| | | | | | | | 1,003,071 | |
| Medical Equipment & Devices — 0.6% | | | | | | | | |
| Danaher Corporation | | | 1,084 | | | | 287,260 | |
| Thermo Fisher Scientific, Inc. | | | 666 | | | | 371,029 | |
| | | | | | | | 658,289 | |
| Industrials — 6.7% | | | | | | | | |
| Aerospace & Defense — 1.3% | | | | | | | | |
| AAR Corporation (a) | | | 688 | | | | 42,381 | |
| Airbus SE - ADR | | | 14,570 | | | | 534,282 | |
| Boeing Company (The) (a) | | | 2,201 | | | | 493,090 | |
| Curtiss-Wright Corporation | | | 957 | | | | 199,046 | |
| General Dynamics Corporation | | | 375 | | | | 84,990 | |
| | | | | | | | 1,353,789 | |
| Commercial Support Services — 0.8% | | | | | | | | |
| CorVel Corporation (a) | | | 145 | | | | 31,385 | |
| FTI Consulting, Inc. (a) | | | 339 | | | | 62,993 | |
| H&R Block, Inc. | | | 6,725 | | | | 268,866 | |
| Recruit Holdings Company Ltd. - ADR | | | 74,902 | | | | 532,553 | |
| | | | | | | | 895,797 | |
| Diversified Industrials — 0.8% | | | | | | | | |
| Emerson Electric Company | | | 1,839 | | | | 180,682 | |
| General Electric Company | | | 3,844 | | | | 439,984 | |
| Siemens AG - ADR | | | 3,399 | | | | 255,401 | |
| | | | | | | | 876,067 | |
| Electrical Equipment — 0.5% | | | | | | | | |
| Belden, Inc. | | | 570 | | | | 53,523 | |
| nVent Electric plc | | | 3,096 | | | | 175,048 | |
| Schneider Electric SE - ADR | | | 7,445 | | | | 255,587 | |
| | | | | | | | 484,158 | |
| Engineering & Construction — 0.8% | | | | | | | | |
| AECOM | | | 3,034 | | | | 266,233 | |
| Comfort Systems USA, Inc. | | | 904 | | | | 166,851 | |
| Dycom Industries, Inc. (a) | | | 319 | | | | 31,878 | |
| BLUEPRINT ADAPTIVE GROWTH ALLOCATION FUND |
| SCHEDULE OF INVESTMENTS (Continued) |
| COMMON STOCKS — 90.0% (Continued) | | Shares | | | Value | |
| Industrials — 6.7% (Continued) | | | | | | | | |
| Engineering & Construction — 0.8% (Continued) | | | | | | | | |
| Fluor Corporation (a) | | | 4,839 | | | $ | 169,317 | |
| KBR, Inc. | | | 4,252 | | | | 261,583 | |
| | | | | | | | 895,862 | |
| Industrial Intermediate Products — 0.2% | | | | | | | | |
| Chart Industries, Inc. (a) | | | 533 | | | | 96,249 | |
| Mueller Industries, Inc. | | | 1,101 | | | | 84,953 | |
| | | | | | | | 181,202 | |
| Industrial Support Services — 0.1% | | | | | | | | |
| Applied Industrial Technologies, Inc. | | | 784 | | | | 121,026 | |
| | | | | | | | | |
| Machinery — 0.4% | | | | | | | | |
| Caterpillar, Inc. | | | 1,630 | | | | 458,242 | |
| Titan International, Inc. (a) | | | 849 | | | | 10,689 | |
| | | | | | | | 468,931 | |
| Transportation & Logistics — 1.8% | | | | | | | | |
| ArcBest Corporation | | | 642 | | | | 67,789 | |
| Canadian Pacific Kansas City Ltd. | | | 9,348 | | | | 742,044 | |
| DHL Group - ADR | | | 5,486 | | | | 256,086 | |
| FedEx Corporation | | | 769 | | | | 200,724 | |
| Hub Group, Inc. - Class A (a) | | | 401 | | | | 31,294 | |
| Knight-Swift Transportation Holdings, Inc. | | | 1,575 | | | | 86,342 | |
| Marten Transport Ltd. | | | 2,007 | | | | 42,147 | |
| Matson, Inc. | | | 930 | | | | 81,728 | |
| Union Pacific Corporation | | | 2,017 | | | | 444,890 | |
| | | | | | | | 1,953,044 | |
| Materials — 3.0% | | | | | | | | |
| Chemicals — 1.3% | | | | | | | | |
| Dow, Inc. | | | 2,343 | | | | 127,834 | |
| Innospec, Inc. | | | 590 | | | | 63,378 | |
| Linde plc | | | 3,009 | | | | 1,164,603 | |
| | | | | | | | 1,355,815 | |
| Construction Materials — 0.5% | | | | | | | | |
| Carlisle Companies, Inc. | | | 2,092 | | | | 550,238 | |
| | | | | | | | | |
| Containers & Packaging — 0.0% (b) | | | | | | | | |
| Greif, Inc. - Class A | | | 597 | | | | 43,336 | |
| BLUEPRINT ADAPTIVE GROWTH ALLOCATION FUND |
| SCHEDULE OF INVESTMENTS (Continued) |
| COMMON STOCKS — 90.0% (Continued) | | Shares | | | Value | |
| Materials — 3.0% (Continued) | | | | | | | | |
| Forestry, Paper & Wood Products — 0.3% | | | | | | | | |
| Boise Cascade Company | | | 933 | | | $ | 102,042 | |
| Louisiana-Pacific Corporation | | | 680 | | | | 42,487 | |
| UFP Industries, Inc. | | | 1,280 | | | | 133,568 | |
| | | | | | | | 278,097 | |
| Metals & Mining — 0.2% | | | | | | | | |
| CONSOL Energy, Inc. | | | 1,214 | | | | 104,453 | |
| Encore Wire Corporation | | | 450 | | | | 74,164 | |
| Warrior Met Coal, Inc. | | | 1,853 | | | | 73,305 | |
| | | | | | | | 251,922 | |
| Steel — 0.7% | | | | | | | | |
| Commercial Metals Company | | | 2,760 | | | | 155,360 | |
| Reliance Steel & Aluminum Company | | | 1,287 | | | | 366,744 | |
| Steel Dynamics, Inc. | | | 2,310 | | | | 246,223 | |
| | | | | | | | 768,327 | |
| Real Estate — 3.2% | | | | | | | | |
| REITs — 3.2% | | | | | | | | |
| AvalonBay Communities, Inc. | | | 1,102 | | | | 202,570 | |
| Boston Properties, Inc. | | | 1,273 | | | | 84,998 | |
| Digital Realty Trust, Inc. | | | 4,180 | | | | 550,590 | |
| Equinix, Inc. | | | 1,316 | | | | 1,028,296 | |
| Essex Property Trust, Inc. | | | 1,029 | | | | 245,303 | |
| Invitation Homes, Inc. | | | 4,705 | | | | 160,393 | |
| Kilroy Realty Corporation | | | 868 | | | | 32,073 | |
| Regency Centers Corporation | | | 1,377 | | | | 85,649 | |
| Simon Property Group, Inc. | | | 3,794 | | | | 430,581 | |
| Welltower, Inc. | | | 7,410 | | | | 614,141 | |
| | | | | | | | 3,434,594 | |
| Technology — 31.4% | | | | | | | | |
| Semiconductors — 6.4% | | | | | | | | |
| Advanced Micro Devices, Inc. (a) | | | 5,784 | | | | 611,484 | |
| ASML Holding N.V. | | | 386 | | | | 254,965 | |
| Axcelis Technologies, Inc. (a) | | | 713 | | | | 137,003 | |
| Broadcom, Inc. | | | 1,439 | | | | 1,328,039 | |
| Intel Corporation | | | 13,998 | | | | 491,890 | |
| NVIDIA Corporation | | | 7,787 | | | | 3,843,274 | |
| Onto Innovation, Inc. (a) | | | 797 | | | | 110,767 | |
| Photronics, Inc. (a) | | | 1,790 | | | | 42,530 | |
| | | | | | | | 6,819,952 | |
| Software — 10.9% | | | | | | | | |
| Adobe, Inc. (a) | | | 1,468 | | | | 821,111 | |
| BLUEPRINT ADAPTIVE GROWTH ALLOCATION FUND |
| SCHEDULE OF INVESTMENTS (Continued) |
| COMMON STOCKS — 90.0% (Continued) | | Shares | | | Value | |
| Technology — 31.4% (Continued) | | | | | | | | |
| Software — 10.9% (Continued) | | | | | | | | |
| Aspen Technology, Inc. (a) | | | 491 | | | $ | 95,254 | |
| Microsoft Corporation | | | 27,151 | | | | 8,899,011 | |
| Oracle Corporation | | | 5,123 | | | | 616,758 | |
| PDF Solutions, Inc. (a) | | | 288 | | | | 10,466 | |
| Salesforce, Inc. (a) | | | 3,356 | | | | 743,220 | |
| SAP SE - ADR | | | 3,958 | | | | 552,893 | |
| | | | | | | | 11,738,713 | |
| Technology Hardware — 10.2% | | | | | | | | |
| Apple, Inc. | | | 51,988 | | | | 9,766,986 | |
| Avnet, Inc. | | | 2,092 | | | | 106,169 | |
| Cisco Systems, Inc. | | | 13,093 | | | | 750,883 | |
| Extreme Networks, Inc. (a) | | | 1,974 | | | | 54,186 | |
| Nintendo Company Ltd. - ADR | | | 24,025 | | | | 256,347 | |
| Sanmina Corporation (a) | | | 761 | | | | 42,388 | |
| | | | | | | | 10,976,959 | |
| Technology Services — 3.9% | | | | | | | | |
| Accenture plc - Class A | | | 2,105 | | | | 681,536 | |
| CACI International, Inc. - Class A (a) | | | 425 | | | | 139,404 | |
| CSG Systems International, Inc. | | | 770 | | | | 41,819 | |
| International Business Machines Corporation | | | 2,904 | | | | 426,394 | |
| Mastercard, Inc. - Class A | | | 3,030 | | | | 1,250,299 | |
| Science Applications International Corporation | | | 1,094 | | | | 128,720 | |
| Visa, Inc. - Class A | | | 6,019 | | | | 1,478,748 | |
| | | | | | | | 4,146,920 | |
| Utilities — 0.8% | | | | | | | | |
| Electric Utilities — 0.8% | | | | | | | | |
| Constellation Energy Corporation | | | 778 | | | | 81,037 | |
| Enel S.p.A. - ADR | | | 74,668 | | | | 497,662 | |
| Iberdrola S.A. - ADR | | | 5,370 | | | | 254,699 | |
| | | | | | | | 833,398 | |
| Gas & Water Utilities — 0.0% (b) | | | | | | | | |
| Southwest Gas Holdings, Inc. | | | 976 | | | | 60,443 | |
| | | | | | | | | |
| Total Common Stocks (Cost $82,746,978) | | | | | | $ | 96,622,684 | |
| BLUEPRINT ADAPTIVE GROWTH ALLOCATION FUND |
| SCHEDULE OF INVESTMENTS (Continued) |
| EXCHANGE-TRADED FUNDS — 7.0% | | Shares | | | Value | |
| Global X MSCI Greece ETF | | | 3,193 | | | $ | 119,993 | |
| iShares Gold Trust (a) | | | 71,732 | | | | 2,636,151 | |
| iShares MSCI Brazil ETF | | | 16,182 | | | | 499,215 | |
| iShares MSCI Chile ETF | | | 5,276 | | | | 148,730 | |
| iShares MSCI India ETF | | | 52,739 | | | | 2,318,934 | |
| iShares MSCI Mexico ETF | | | 7,526 | | | | 464,053 | |
| iShares MSCI Saudi Arabia ETF | | | 2,614 | | | | 106,913 | |
| iShares MSCI South Korea ETF | | | 14,152 | | | | 883,792 | |
| iShares MSCI Turkey ETF | | | 7,361 | | | | 275,817 | |
| iShares MSCI UAE ETF | | | 4,232 | | | | 63,607 | |
| Total Exchange-Traded Funds (Cost $7,029,775) | | | | | | $ | 7,517,205 | |
| | | | | | | | | |
| MONEY MARKET FUNDS — 2.6% | | Shares | | | Value | |
| Federated Government Obligations Fund - Institutional Class, 5.18% (c) | | | 524,658 | | | $ | 524,658 | |
| First American Government Obligations Fund - Class X, 5.25% (c) | | | 2,282,720 | | | | 2,282,720 | |
| Total Money Market Funds (Cost $2,807,378) | | | | | | $ | 2,807,378 | |
| | | | | | | | | |
| Investments at Value — 99.6% (Cost $92,584,131) | | | | | | $ | 106,947,267 | |
| | | | | | | | | |
| Other Assets in Excess of Liabilities — 0.4% | | | | | | | 376,576 | |
| | | | | | | | | |
| Net Assets — 100.0% | | | | | | $ | 107,323,843 | |
| (a) | Non-income producing security. |
| (b) | Percentage rounds to less than 0.1%. |
| (c) | The rate shown is the 7-day effective yield as of August 31, 2023. |
| A/S - Aktieselskab |
| |
| ADR - American Depositary Receipt |
| |
| AG - Aktiengesellschaft |
| |
| N.V. - Naamloze Vennootschap |
| |
| plc - Public Limited Company |
| |
| S.A. - Societe Anonyme |
| |
| SE - Societe Europaea |
| |
| S.p.A - Societa per azioni |
| |
See accompanying notes to financial statements.
| BLUEPRINT ADAPTIVE GROWTH ALLOCATION FUND |
| STATEMENT OF ASSETS AND LIABILITIES |
| August 31, 2023 (Unaudited) |
| ASSETS | | | | |
| Investments: | | | | |
| At cost | | $ | 92,584,131 | |
| At value (Note 2) | | $ | 106,947,267 | |
| Cash | | | 314 | |
| Receivable for capital shares sold | | | 235,129 | |
| Receivable for investment securities sold | | | 17,189,741 | |
| Dividends and interest receivable | | | 133,903 | |
| Tax reclaims receivable | | | 3,935 | |
| Other assets | | | 29,910 | |
| Total assets | | | 124,540,199 | |
| | | | | |
| LIABILITIES | | | | |
| Payable for capital shares redeemed | | | 66,599 | |
| Payable for investment securities purchased | | | 17,028,176 | |
| Payable to the Adviser (Note 4) | | | 83,683 | |
| Payable to administrator (Note 4) | | | 16,851 | |
| Accrued distribution fees (Note 4) | | | 1,336 | |
| Other accrued expenses and liabilities | | | 19,711 | |
| Total liabilities | | | 17,216,356 | |
| | | | | |
| NET ASSETS | | $ | 107,323,843 | |
| | | | | |
| NET ASSETS CONSIST OF: | | | | |
| Paid-in capital | | $ | 105,096,129 | |
| Accumulated earnings | | | 2,227,714 | |
| NET ASSETS | | $ | 107,323,843 | |
| | | | | |
| NET ASSET VALUE PER SHARE: | | | | |
| INVESTOR CLASS | | | | |
| Net assets applicable to Investor Class | | $ | 1,945,598 | |
| Investor Class shares of beneficial interest outstanding (unlimited number of shares authorized, no par value) | | | 161,869 | |
| Net asset value, offering price and redemption price per share (Note 2) | | $ | 12.02 | |
| | | | | |
| INSTITUTIONAL CLASS | | | | |
| Net assets applicable to Institutional Class | | $ | 105,378,245 | |
| Institutional Class shares of beneficial interest outstanding (unlimited number of shares authorized, no par value) | | | 8,714,746 | |
| Net asset value, offering price and redemption price per share (Note 2) | | $ | 12.09 | |
See accompanying notes to financial statements.
| BLUEPRINT ADAPTIVE GROWTH ALLOCATION FUND |
| STATEMENT OF OPERATIONS |
| For the Six Months Ended August 31, 2023 (Unaudited) |
| INVESTMENT INCOME | | | | |
| Dividend income (net of foreign withholding taxes of $76,354) | | $ | 1,152,724 | |
| | | | | |
| EXPENSES | | | | |
| Management fees (Note 4) | | | 478,531 | |
| Administration fees (Note 4) | | | 50,255 | |
| Fund accounting fees (Note 4) | | | 23,998 | |
| Registration and filing fees | | | 16,757 | |
| Transfer agent fees - Investor Class (Note 4) | | | 6,320 | |
| Transfer agent fees - Institutional Class (Note 4) | | | 9,480 | |
| Legal fees | | | 13,719 | |
| Custodian and bank service fees | | | 10,948 | |
| Trustees’ fees and expenses (Note 4) | | | 9,670 | |
| Audit and tax services fees | | | 8,665 | |
| Shareholder report expense | | | 6,170 | |
| Compliance service fees (Note 4) | | | 6,088 | |
| Postage and supplies | | | 3,371 | |
| Distribution fees - Investor Class (Note 4) | | | 2,262 | |
| Insurance expense | | | 1,823 | |
| Other expenses | | | 12,876 | |
| Total Expenses | | | 660,933 | |
| Fee reductions by the Adviser (Note 4) | | | (29,024 | ) |
| Net Expenses | | | 631,909 | |
| | | | | |
| NET INVESTMENT INCOME | | | 520,815 | |
| | | | | |
| REALIZED AND UNREALIZED GAINS (LOSSES) ON INVESTMENTS AND FOREIGN CURRENCIES | | | | |
| Net realized losses from: | | | | |
| Investment transactions | | | (3,352,824 | ) |
| Foreign currency transactions | | | (45 | ) |
| Net change in unrealized appreciation (depreciation) on: | | | | |
| Investments | | | 11,757,576 | |
| Foreign currency translations | | | 61 | |
| NET REALIZED AND UNREALIZED GAINS ON INVESTMENTS AND FOREIGN CURRENCIES | | | 8,404,768 | |
| | | | | |
| NET INCREASE IN NET ASSETS RESULTING FROM OPERATIONS | | $ | 8,925,583 | |
See accompanying notes to financial statements.
| BLUEPRINT ADAPTIVE GROWTH ALLOCATION FUND |
| STATEMENTS OF CHANGES IN NET ASSETS |
| | | Six Months Ended | | | Year Ended | |
| | | August 31, 2023 | | | February 28, | |
| | | (Unaudited) | | | 2023 | |
| FROM OPERATIONS | | | | | | | | |
| Net investment income | | $ | 520,815 | | | $ | 676,510 | |
| Net realized losses from: | | | | | | | | |
| Investment transactions | | | (3,352,824 | ) | | | (7,143,695 | ) |
| Foreign currency transactions | | | (45 | ) | | | (152 | ) |
| Net change in unrealized appreciation (depreciation) on: | | | | | | | | |
| Investments | | | 11,757,576 | | | | (5,590,208 | ) |
| Foreign currency translations | | | 61 | | | | (61 | ) |
| Net increase (decrease) in net assets resulting from operations | | | 8,925,583 | | | | (12,057,606 | ) |
| | | | | | | | | |
| FROM DISTRIBUTIONS TO SHAREHOLDERS (Note 2) | | | | | | | | |
| Investor Class | | | — | | | | (4,381 | ) |
| Institutional Class | | | — | | | | (506,299 | ) |
| Decrease in net assets from distributions to shareholders | | | — | | | | (510,680 | ) |
| | | | | | | | | |
| CAPITAL SHARE TRANSACTIONS | | | | | | | | |
| Investor Class | | | | | | | | |
| Proceeds from shares sold | | | 431,372 | | | | 1,101,743 | |
| Net asset value of shares issued in reinvestment of distributions to shareholders | | | — | | | | 4,381 | |
| Payments for shares redeemed | | | (201,335 | ) | | | (251,761 | ) |
| Net increase in Investor Class net assets from capital share transactions | | | 230,037 | | | | 854,363 | |
| | | | | | | | | |
| Institutional Class | | | | | | | | |
| Proceeds from shares sold | | | 13,135,364 | | | | 58,518,038 | |
| Net asset value of shares issued in reinvestment of distributions to shareholders | | | — | | | | 505,883 | |
| Payments for shares redeemed | | | (10,729,274 | ) | | | (32,438,634 | ) |
| Net increase in Institutional Class net assets from capital share transactions | | | 2,406,090 | | | | 26,585,287 | |
| | | | | | | | | |
| TOTAL INCREASE IN NET ASSETS | | | 11,561,710 | | | | 14,871,364 | |
| | | | | | | | | |
| NET ASSETS | | | | | | | | |
| Beginning of period | | | 95,762,133 | | | | 80,890,769 | |
| End of period | | $ | 107,323,843 | | | $ | 95,762,133 | |
See accompanying notes to financial statements.
| BLUEPRINT ADAPTIVE GROWTH ALLOCATION FUND |
| STATEMENTS OF CHANGES IN NET ASSETS (Continued) |
| | | Six Months Ended | | | Year Ended | |
| | | August 31, 2023 | | | February 28, | |
| | | (Unaudited) | | | 2022 | |
| CAPITAL SHARES ACTIVITY | | | | | | | | |
| Investor Class | | | | | | | | |
| Shares sold | | | 37,590 | | | | 94,984 | |
| Shares issued in reinvestment of distributions to shareholders | | | — | | | | 396 | |
| Shares redeemed | | | (17,142 | ) | | | (21,599 | ) |
| Net increase in shares outstanding | | | 20,448 | | | | 73,781 | |
| Shares outstanding at beginning of period | | | 141,421 | | | | 67,640 | |
| Shares outstanding at end of period | | | 161,869 | | | | 141,421 | |
| | | | | | | | | |
| Institutional Class | | | | | | | | |
| Shares sold | | | 1,129,172 | | | | 4,969,005 | |
| Shares issued in reinvestment of distributions to shareholders | | | — | | | | 45,575 | |
| Shares redeemed | | | (943,022 | ) | | | (2,769,081 | ) |
| Net increase in shares outstanding | | | 186,150 | | | | 2,245,499 | |
| Shares outstanding at beginning of period | | | 8,528,596 | | | | 6,283,097 | |
| Shares outstanding at end of period | | | 8,714,746 | | | | 8,528,596 | |
See accompanying notes to financial statements.
| BLUEPRINT ADAPTIVE GROWTH ALLOCATION FUND |
| INVESTOR CLASS |
| FINANCIAL HIGHLIGHTS |
Per Share Data for a Share Outstanding Throughout Each Period
| | | Six Months | | | | | | | | | | |
| | | Ended | | | | | | | | | | |
| | | August 31, | | | Year Ended | | | Year Ended | | | Period Ended | |
| | | 2023 | | | February 28, | | | February 28, | | | February 28, | |
| | | (Unaudited) | | | 2023 | | | 2022 | | | 2021(a) | |
| Net asset value at beginning of period | | $ | 11.00 | | | $ | 12.69 | | | $ | 12.02 | | | $ | 10.00 | |
| Income (loss) from investment operations: | | | | | | | | | | | | | | | | |
| Net investment income (loss) (b)(c) | | | 0.04 | | | | 0.06 | | | | 0.04 | | | | (0.02 | ) |
| Net realized and unrealized gains (losses) on investments and foreign currencies | | | 0.98 | | | | (1.71 | ) | | | 0.68 | | | | 2.07 | |
| Total from investment operations | | | 1.02 | | | | (1.65 | ) | | | 0.72 | | | | 2.05 | |
| Less distributions from: | | | | | | | | | | | | | | | | |
| Net investment income | | | — | | | | (0.04 | ) | | | (0.05 | ) | | | (0.03 | ) |
| Net asset value at end of period | | $ | 12.02 | | | $ | 11.00 | | | $ | 12.69 | | | $ | 12.02 | |
| Total return (d) | | | 9.27 | % (e) | | | (13.03 | %) | | | 5.95 | % | | | 20.48 | % (e) |
| Net assets at end of period (000’s) | | $ | 1,946 | | | $ | 1,555 | | | $ | 858 | | | $ | 72 | |
| Ratios/supplementary data: | | | | | | | | | | | | | | | | |
| Ratio of total expenses to average net assets (f) | | | 2.60 | % (g) | | | 3.29 | % | | | 6.96 | % | | | 104.34 | % (g) |
| Ratio of net expenses to average net assets (f)(h) | | | 1.50 | % (g) | | | 1.50 | % | | | 1.50 | %(i) | | | 1.60 | %(g)(i) |
| Ratio of net investment income (loss) to average net assets (c)(f)(h) | | | 0.77 | % (g) | | | 0.55 | % | | | 0.30 | % | | | (0.16 | %) (g) |
| Portfolio turnover rate | | | 103 | % (e) | | | 278 | % | | | 130 | % | | | 95 | % (e) |
| (a) | Represents the period from the commencement of operations (March 31, 2020) through February 28, 2021. |
| (b) | Per share net investment income (loss) has been determined on the basis of average number of shares outstanding during the period. |
| (c) | Recognition of net investment income (loss) by the Fund is affected by the timing of the declaration of the dividends by the underlying companies in which the Fund invests. |
| (d) | Total return is a measure of the change in value of an investment in the Fund over the periods covered. The returns shown do not reflect the deduction of taxes a shareholder would pay on Fund distributions, if any, or the redemption of Fund shares. The total returns would have been lower had the Adviser not reduced management fees and reimbursed expenses (Note 4). |
| (f) | Ratio does not include expenses of the investment companies in which the Fund invests. |
| (h) | Ratio was determined after management fees reductions and expense reimbursements (Note 4). |
| (i) | Includes costs to organize the Fund of less than 0.005% and 0.10% for the year ended February 28, 2022 and period ended February 28, 2021, respectively, which are excluded from the Expense Limitation Agreement (Note 4). |
See accompanying notes to financial statements.
| BLUEPRINT ADAPTIVE GROWTH ALLOCATION FUND |
| INSTITUTIONAL CLASS |
| FINANCIAL HIGHLIGHTS |
Per Share Data for a Share Outstanding Throughout Each Period
| | | Six Months | | | | | | | | | | |
| | | Ended | | | | | | | | | | |
| | | August 31, | | | Year Ended | | | Year Ended | | | Period Ended | |
| | | 2023 | | | February 28, | | | February 28, | | | February 28, | |
| | | (Unaudited) | | | 2023 | | | 2022 | | | 2021(a) | |
| Net asset value at beginning of period | | $ | 11.05 | | | $ | 12.74 | | | $ | 12.04 | | | $ | 10.00 | |
| Income (loss) from investment operations: | | | | | | | | | | | | | | | | |
| Net investment income (b)(c) | | | 0.06 | | | | 0.09 | | | | 0.07 | | | | 0.02 | |
| Net realized and unrealized gains (losses) on investments and foreign currencies | | | 0.98 | | | | (1.72 | ) | | | 0.69 | | | | 2.06 | |
| Total from investment operations | | | 1.04 | | | | (1.63 | ) | | | 0.76 | | | | 2.08 | |
| Less distributions from: | | | | | | | | | | | | | | | | |
| Net investment income | | | — | | | | (0.06 | ) | | | (0.06 | ) | | | (0.04 | ) |
| Net asset value at end of period | | $ | 12.09 | | | $ | 11.05 | | | $ | 12.74 | | | $ | 12.04 | |
| Total return (d) | | | 9.41 | % (e) | | | (12.82 | %) | | | 6.29 | % | | | 20.80 | % (e) |
| Net assets at end of period (000’s) | | $ | 105,378 | | | $ | 94,207 | | | $ | 80,032 | | | $ | 53,273 | |
| Ratios/supplementary data: | | | | | | | | | | | | | | | | |
| Ratio of total expenses to average net assets (f) | | | 1.29 | % (g) | | | 1.33 | % | | | 1.40 | % | | | 1.93 | % (g) |
| Ratio of net expenses to average net assets (f)(h) | | | 1.25 | % (g) | | | 1.25 | % | | | 1.26 | %(i) | | | 1.35 | %(g)(i) |
| Ratio of net investment income to average net assets (c)(f)(h) | | | 1.04 | % (g) | | | 0.76 | % | | | 0.54 | % | | | 0.20 | % (g) |
| Portfolio turnover rate | | | 103 | % (e) | | | 278 | % | | | 130 | % | | | 95 | % (e) |
| (a) | Represents the period from the commencement of operations (March 31, 2020) through February 28, 2021. |
| (b) | Per share net investment income has been determined on the basis of average number of shares outstanding during the period. |
| (c) | Recognition of net investment income by the Fund is affected by the timing of the declaration of the dividends by the underlying companies in which the Fund invests. |
| (d) | Total return is a measure of the change in value of an investment in the Fund over the periods covered. The returns shown do not reflect the deduction of taxes a shareholder would pay on Fund distributions, if any, or the redemption of Fund shares. The total returns would have been lower had the Adviser not reduced management fees and reimbursed expenses (Note 4). |
| (f) | Ratio does not include expenses of the investment companies in which the Fund invests. |
| (h) | Ratio was determined after management fees reductions and expense reimbursements (Note 4). |
| (i) | Includes costs to organize the Fund of 0.01% and 0.10% for the year ended February 28, 2022 and period ended February 28, 2021, respectively, which are excluded from the Expense Limitation Agreement (Note 4). |
See accompanying notes to financial statements.
| BLUEPRINT ADAPTIVE GROWTH ALLOCATION FUND |
| NOTES TO FINANCIAL STATEMENTS |
| August 31, 2023 (Unaudited) |
Blueprint Adaptive Growth Allocation Fund (formerly Blueprint Growth Fund) (the “Fund”) is a diversified series of Ultimus Managers Trust (the “Trust”). The Trust is an open-end management investment company established as an Ohio business trust under a Declaration of Trust dated February 28, 2012. Other series of the Trust are not incorporated in this report. The Fund commenced operations on March 31, 2020.
The investment objective of the Fund is to seek capital appreciation while managing risk.
The Fund currently offers two classes of shares: Investor Class shares (sold without any sales loads, but subject to a distribution and/or shareholder servicing fee of up to 0.25% of the average daily net assets attributable to Investor Class shares and requiring a $5,000 initial investment) and Institutional Class shares (sold without any sales loads and distribution and/or shareholder servicing fees and requiring a $15,000 initial investment). Each share class represents an ownership interest in the same investment portfolio.
| 2. | Significant Accounting Policies |
The following is a summary of the Fund’s significant accounting policies used in the preparation of its financial statements. These policies are in conformity with accounting principles generally accepted in the United States of America (“GAAP”). The Fund follows accounting and reporting guidance under Financial Accounting Standards Board Accounting Standards Codification Topic 946, “Financial Services – Investment Companies.”
Regulatory update – Tailored Shareholder Reports for Mutual Funds and Exchange-Traded Funds (“ETFs”) – Effective January 24, 2023, the Securities and Exchange Commission (the “SEC”) adopted rule and form amendments to require mutual funds and ETFs to transmit concise and visually engaging streamlined annual and semiannual reports to shareholders that highlight key information. Other information, including financial statements, will no longer appear in a streamlined shareholder report but must be available online, delivered free of charge upon request, and filed on a semiannual basis on Form N-CSR. The rule and form amendments have a compliance date of July 24, 2024. At this time, management is evaluating the impact of these amendments on the shareholder reports for the Fund.
Securities valuation – The Fund values its portfolio securities at fair value as of the close of regular trading on the New York Stock Exchange (the “NYSE”) (normally 4:00 p.m. Eastern time) on each business day the NYSE is open for business. The Fund values its listed securities, including common stocks and exchange-traded funds (“ETFs”), on the basis of the security’s last sale price on the security’s primary exchange, if available, otherwise at the exchange’s most recently quoted mean price. NASDAQ-listed securities are valued at the NASDAQ Official Closing Price. Option contracts, if any, are valued at
| BLUEPRINT ADAPTIVE GROWTH ALLOCATION FUND |
| NOTES TO FINANCIAL STATEMENTS (Unaudited) (Continued) |
the closing price on the exchanges on which they are primarily traded; if no closing price is available at the time of valuation, the option will be valued at the mean of the closing bid and ask prices for that day. When using a quoted price and when the market for the security is considered active, the security will be classified as Level 1 within the fair value hierarchy (see below). In the event that market quotations are not readily available or are considered unreliable due to market or other events, the Fund values its securities and other assets at fair value as determined by Blueprint Fund Management, LLC (the “Adviser”), as the Fund’s valuation designee, in accordance with procedures adopted by the Board of Trustees (the “Board”) pursuant to Rule 2a-5 under the Investment Company Act of 1940, as amended (the “1940 Act”). Under these procedures, the securities will be classified as Level 2 or 3 within the fair value hierarchy, depending on the inputs used. Unavailable or unreliable market quotes may be due to the following factors: a substantial bid-ask spread; infrequent sales resulting in stale prices; insufficient trading volume; small trade sizes; a temporary lapse in any reliable pricing source; and actions of the securities or futures markets, such as the suspension or limitation of trading. As a result, the prices of securities used to calculate the Fund’s net asset value (“NAV”) may differ from quoted or published prices for the same securities.
GAAP establishes a single authoritative definition of fair value, sets out a framework for measuring fair value, and requires additional disclosures about fair value measurements.
Various inputs are used in determining the value of the Fund’s investments. These inputs are summarized in the three broad levels listed below:
| ● | Level 1 – quoted prices in active markets for identical securities |
| ● | Level 2 – other significant observable inputs |
| ● | Level 3 – significant unobservable inputs |
The inputs or methods used for valuing securities are not necessarily an indication of the risks associated with investing in those securities. The inputs used to measure fair value may fall into different levels of the fair value hierarchy. In such cases, for disclosure purposes, the level in the fair value hierarchy within which the fair value measurement falls in its entirety is determined based on the lowest level input that is significant to the fair value measurement.
The following is a summary of the Fund’s investments and the level of inputs used to value the investments as of August 31, 2023:
| | | Level 1 | | | Level 2 | | | Level 3 | | | Total | |
| Common Stocks | | $ | 96,622,684 | | | $ | — | | | $ | — | | | $ | 96,622,684 | |
| Exchange-Traded Funds | | | 7,517,205 | | | | — | | | | — | | | | 7,517,205 | |
| Money Market Funds | | | 2,807,378 | | | | — | | | | — | | | | 2,807,378 | |
| Total | | $ | 106,947,267 | | | $ | — | | | $ | — | | | $ | 106,947,267 | |
| | | | | | | | | | | | | | | | | |
| BLUEPRINT ADAPTIVE GROWTH ALLOCATION FUND |
| NOTES TO FINANCIAL STATEMENTS (Unaudited) (Continued) |
Refer to the Fund’s Schedule of Investments for a listing of the common stocks by sector and industry type. The Fund did not hold any derivative instruments or any assets or liabilities that were measured at fair value on a recurring basis using significant unobservable inputs (Level 3) as of or during the six months ended August 31, 2023.
Foreign currency translation – Securities and other assets and liabilities denominated in or expected to settle in foreign currencies, if any, are translated into U.S. dollars based on exchange rates on the following basis:
| A. | The fair values of investment securities and other assets and liabilities are translated as of the close of the NYSE each day. |
| B. | Purchases and sales of investment securities and income and expenses are translated at the rate of exchange prevailing as of 4:00 p.m. Eastern Time on the respective date of such transactions. |
| C. | The Fund does not isolate that portion of the results of operations caused by changes in foreign exchange rates on investments from those caused by changes in market prices of securities held. Such fluctuations are included with the net realized and unrealized gains or losses on investments. |
Reported net realized foreign exchange gains or losses arise from 1) purchases and sales of foreign currencies, 2) currency gains or losses realized between the trade and settlement dates on securities transactions, and 3) the difference between the amounts of dividends and foreign withholding taxes recorded on the Fund’s books and the U.S. dollar equivalent of the amounts actually received or paid. Reported net unrealized foreign exchange gains and losses arise from changes in the value of assets and liabilities that result from changes in exchange rates.
Cash – The Fund’s cash, if any, is held in a bank account with balances which, at times, may exceed United States federally insured limits set by the Federal Deposit Insurance Corporation. The Fund maintains these balances with a high quality financial institution and may incur charges on cash overdrafts.
Share valuation – The NAV per share of each class of the Fund is calculated daily by dividing the total value of the assets attributable to that class, less liabilities attributable to that class, by the number of shares outstanding of that class. The offering price and redemption price per share of each class of the Fund is equal to the NAV per share of such class.
Investment income – Dividend income is recorded on the ex-dividend date. Non-cash dividends included in dividend income, if any, are recorded at the fair market value of the security received. Interest income is accrued as earned. Withholding taxes on foreign dividends, if any, have been recorded in accordance with the Fund’s understanding of the applicable country’s rules and tax rates.
| BLUEPRINT ADAPTIVE GROWTH ALLOCATION FUND |
| NOTES TO FINANCIAL STATEMENTS (Unaudited) (Continued) |
Investment transactions – Investment transactions are accounted for on the trade date. Realized gains and losses on investments sold are determined on a specific identification basis.
Common expenses – Common expenses of the Trust are allocated among the Fund and the other series of the Trust based on the relative net assets of each series, the number of series in the Trust, or the nature of the services performed and the relative applicability to each series.
Allocation between Classes – Investment income earned, realized capital gains and losses, and unrealized appreciation and depreciation are allocated daily to each Class of the Fund based upon its proportionate share of total net assets of the Fund. Class-specific expenses are charged directly to the Class incurring the expense. Common expenses which are not attributable to a specific Class are allocated daily to the Class of shares of the Fund based upon its proportionate share of total net assets of the Fund. Distribution fees, registration and filing fees and transfer agent fees are class specific expenses.
Distributions to shareholders – The Fund distributes to shareholders any net investment income dividends and net realized capital gains on an annual basis. The amount of such dividends and distributions are determined in accordance with federal income tax regulations, which may differ from GAAP. Dividends and distributions to shareholders are recorded on the ex-dividend date. The tax character of distributions paid to shareholders by the Fund during the year ended February 28, 2023, was ordinary income. No distributions were paid to shareholders during the six months ended August 31, 2023.
Purchased option contracts – The Fund may use option contracts in any manner consistent with its investment objectives and as long as its use is consistent with relevant provisions of the 1940 Act, as amended. The Fund may use options for speculative purposes as well as for the purpose of seeking to reduce the overall investment risk that would otherwise be associated with the securities in which the Fund invests. When the Fund purchases a call or put option, an amount equal to the total premium (the premium plus the commission) paid by the Fund is recorded as an asset on the Fund’s Statement of Assets and Liabilities and is subsequently marked-to-market daily. Premiums paid in the purchase of options which expire are treated as realized losses. Premiums paid in the purchase of call options which are exercised increase the cost of the security purchased. Premiums paid in the purchase of put options which are exercised decrease the proceeds used to calculate the realized capital gain or loss on the sale of the security.
Estimates – The preparation of financial statements in conformity with GAAP requires management to make estimates and assumptions that affect the reported amounts of assets and liabilities and disclosure of contingent assets and liabilities as of the date of the financial statements and the reported amounts of increase (decrease) in net assets from operations during the reporting period. Actual results could differ from those estimates.
| BLUEPRINT ADAPTIVE GROWTH ALLOCATION FUND |
| NOTES TO FINANCIAL STATEMENTS (Unaudited) (Continued) |
Federal tax – The Fund has qualified and intends to continue to qualify as a regulated investment company under the Internal Revenue Code of 1986, as amended (the “Code”). Qualification generally will relieve the Fund of liability for federal income taxes to the extent 100% of its net investment income and net realized capital gains are distributed in accordance with the Code.
In order to avoid imposition of the excise tax applicable to regulated investment companies, it is also the Fund’s intention to declare as dividends in each calendar year equal to at least 98% of its net investment income (earned during the calendar year) and 98.2% of its net realized capital gains (earned during the twelve months ended October 31) plus undistributed amounts from prior years.
The following information is computed on a tax basis for each item as of February 28, 2023:
| | | | |
| Cost of investments | | $ | 92,271,836 | |
| Gross unrealized appreciation | | $ | 3,942,390 | |
| Gross unrealized depreciation | | | (1,634,383 | ) |
| Net unrealized appreciation | | | 2,308,007 | |
| Net unrealized depreciation on foreign currency translation | | | (61 | ) |
| Undistributed ordinary income | | | 115,292 | |
| Accumulated capital and other losses | | | (9,121,107 | ) |
| Accumulated deficit | | $ | (6,697,869 | ) |
| | | | | |
As of February 28, 2023, the Fund had short-term capital loss carryforwards of $9,121,107 for federal income tax purposes. These capital loss carryforwards, which do not expire, may be utilized in the current and future years to offset net realized capital gains, if any.
The federal tax cost, unrealized appreciation (depreciation) as of August 31, 2023 is as follows:
| | | | | |
| Cost of portfolio investments | | $ | 92,831,493 | |
| Gross unrealized appreciation | | $ | 14,588,736 | |
| Gross unrealized depreciation | | | (472,962 | ) |
| Net unrealized appreciation | | $ | 14,115,774 | |
| | | | | |
The difference between the federal income tax cost of investments and the financial statement cost of investments is due to certain timing differences in the recognition of capital gains or losses under income tax regulations and GAAP. These “book/tax” differences are temporary in nature and are primarily due to the tax deferral of losses on wash sales and adjustments to basis for grantor trusts.
| BLUEPRINT ADAPTIVE GROWTH ALLOCATION FUND |
| NOTES TO FINANCIAL STATEMENTS (Unaudited) (Continued) |
The Fund recognizes the tax benefits or expenses of uncertain tax positions only when the position is “more likely than not” of being sustained assuming examination by tax authorities. Management has reviewed the Fund’s tax positions for current and all open tax years (generally, three years) and has concluded that no provision for unrecognized tax benefits or expenses is required in these financial statements. The Fund identifies its major tax jurisdiction as U.S. Federal. The Fund recognizes interest and penalties, if any, related to unrecognized tax benefits as income tax on the Statement of Operations. During the six months ended August 31, 2023, the Fund did not incur any interest of penalties.
| 3. | Investment Transactions |
During the six months ended August 31, 2023, cost of purchases and proceeds from sales of investment securities, other than short-term investments, amounted to $104,710,803 and $101,245,946, respectively.
| 4. | Transactions with Related Parties |
ADVISORY AND SUB-ADVISORY AGREEMENTS
Pursuant to the terms of the Advisory Agreement the Adviser serves as the investment adviser to the Fund. The Adviser provides the Fund with the selection of a sub-investment advisor and the compliance and managerial oversight of that sub-adviser and its services to the Fund. The Fund pays the Adviser a management fee, computed and accrued daily and paid monthly, at the annual rate of 0.95% of average daily net assets.
Blueprint Investment Partners, LLC (the “Sub-Adviser”) serves as the Funds sub-adviser. Pursuant to the Sub-Advisory Agreement, the Sub-Adviser provides the Fund with a continuous program of investing the Fund’s assets and determining the composition of the Fund’s portfolio. For its services, the Adviser pays the Sub-Adviser an investment sub-advisory fee computed at the annual rate of 0.20% of the Fund’s average daily net assets. The Fund does not directly pay the sub-advisory fee.
Pursuant to an Expense Limitation Agreement (“ELA”) between the Fund and the Adviser, the Adviser has agreed contractually, until June 30, 2024, to reduce its management fees and reimburse other expenses to the extent necessary to limit total annual fund operating expenses (excluding brokerage costs, taxes, interest, borrowing costs such as interest and dividend expenses on securities sold short, acquired fund fees and expenses, costs to organize the Fund, extraordinary expenses such as litigation and merger or reorganization costs and other expenses not incurred in the ordinary course of the Fund’s business) to 1.50% and 1.25% of average daily net assets for Investor Class and Institutional Class shares, respectively. Accordingly, during the six months ended August 31, 2023, the Adviser reduced its management fees in the amount of $29,024.
Management reductions and expense reimbursements by the Adviser are subject to repayment by the Fund for a period of three years after such fees and expenses were incurred, provided that the repayments do not cause total annual fund operating expenses
| BLUEPRINT ADAPTIVE GROWTH ALLOCATION FUND |
| NOTES TO FINANCIAL STATEMENTS (Unaudited) (Continued) |
(exclusive of such reductions and reimbursements) to exceed the lesser of (i) the expense limitation then in effect, if any, and (ii) the expense limitation in effect at the time the expenses to be repaid were incurred. Prior to June 30, 2024, the agreement may not be modified or terminated without the approval of the Board. After June 30, 2024, the ELA may continue from year-to-year provided such continuance is approved by the Board. The ELA may be terminated by the Adviser, or the Board, without approval by the other party, at the end of the then current term upon not less than 90 days’ notice to the other parties as set forth in the ELA. As of August 31, 2023, the Adviser may seek repayment of expense reimbursements no later than the dates below:
| | | | | |
| February 29, 2024 | | $ | 67,606 | |
| February 28, 2025 | | | 113,574 | |
| February 28, 2026 | | | 88,786 | |
| August 31, 2026 | | | 29,024 | |
| Total | | $ | 298,990 | |
| | | | | |
OTHER SERVICE PROVIDERS
Ultimus Fund Solutions, LLC (“Ultimus”) provides administration, fund accounting, compliance and transfer agency services to the Fund. The Fund pays Ultimus fees in accordance with the agreements for such services. In addition, the Fund pays out-of-pocket expenses including, but not limited to, postage, supplies and certain costs related to the pricing of the Fund’s portfolio securities.
Under the terms of a Distribution Agreement with the Trust, Ultimus Fund Distributors, LLC (the “Distributor”) serves as principal underwriter to the Fund. The Distributor is a wholly-owned subsidiary of Ultimus. The Distributor is compensated partially by the Adviser and partially by the Investor Class shares of the Fund for acting as principal underwriter.
A Trustee and certain officers of the Trust are also officers of Ultimus and are not paid by the Trust or the Fund for serving in such capacities.
DISTRIBUTION PLAN
The Fund has adopted a plan of distribution (the “Plan”), pursuant to Rule 12b-1 under the 1940 Act which permits Investor Class shares of the Fund to make payments to securities dealers and other financial organizations (including payments directly to the Adviser and the Distributor) for expenses related to the distribution and servicing of the Fund’s Investor Class shares. The annual limitation for payment of expenses pursuant to the Plan is 0.25% of the Fund’s average daily net assets allocable to Investor Class shares. The Fund has not adopted a plan of distribution with respect to Institutional Class shares. During the six months ended August 31, 2023, Investor Class shares of the Fund incurred $2,262 of distribution fees under the Plan.
| BLUEPRINT ADAPTIVE GROWTH ALLOCATION FUND |
| NOTES TO FINANCIAL STATEMENTS (Unaudited) (Continued) |
TRUSTEE COMPENSATION
Each member of the Board (a “Trustee”) who is not an “interested person” (as defined by the 1940 Act, as amended) of the Trust (“Independent Trustee”) receives a $1,300 annual retainer from the Fund, paid quarterly, except for the Board Chairperson who receives a $1,700 annual retainer from the Fund, paid quarterly and the Audit Committee Chairperson who receives $1,500 annual retainer from the Fund, paid quarterly. Each Independent Trustee also receives from the Fund a fee of $550 for each Board meeting attended plus reimbursement for travel and other meeting-related expenses.
PRINCIPAL HOLDER OF FUND SHARES
As of August 31, 2023, the following shareholder owned of record 25% or more of the outstanding shares of the Fund:
| NAME OF RECORD OWNER | | % OWNERSHIP |
| TD Ameritrade, Inc. (for the benefit of its customers) | | 52% |
A beneficial owner of 25% or more of the Fund’s outstanding shares may be considered a controlling person. That shareholder’s vote could have a more significant effect on matters presented at a shareholders’ meeting.
| 5. | Derivative Transactions |
Realized and unrealized gains and losses associated with transactions in derivative instruments for the Fund during the six months ended August 31, 2023 are recorded in the following locations on the Statement of Operations:
| | | | | | | | | | | | Change in | |
| | | | | | | | | | | | Unrealized | |
| | | | | | | | | | | | Appreciation | |
| Type of Derivative | | Risk | | Location | | Realized Losses | | | Location | | (Depreciation) | |
| Equity call options purchased | | Equity | | Net realized gains (losses) on investment transactions | | $ | (609,858 | ) | | Net change in unrealized appreciation (depreciation) on investments | | $ | 396,511 | |
As of August 31, 2023, the Fund did not hold any derivative securities.
From time to time, the Fund may have an overdrawn cash balance at the custodian due to redemptions or market movements. When this occurs, the Fund will incur borrowing costs charged by the custodian. Accordingly, during the six months ended August 31, 2023, the Fund did not incur any borrowing costs by the custodian.
| BLUEPRINT ADAPTIVE GROWTH ALLOCATION FUND |
| NOTES TO FINANCIAL STATEMENTS (Unaudited) (Continued) |
| 7. | Contingencies and Commitments |
The Fund indemnifies the Trust’s officers and Trustees for certain liabilities that might arise from their performance of their duties to the Fund. Additionally, in the normal course of business the Fund enters into contracts that contain a variety of representations and warranties and which provide general indemnifications. The Fund’s maximum exposure under these arrangements is unknown, as this would involve future claims that may be made against the Fund that have not yet occurred. However, based on experience, the Fund expects the risk of loss to be remote.
| 8. | Investment in Other Investment Companies |
The Fund may invest a significant portion of its assets in shares of one or more investment companies, including ETFs, open-end mutual funds and money market mutual funds. The Fund will incur additional indirect expenses (acquired fund fees and expenses) to the extent it invests in shares of other investment companies.
If a Fund has significant investments in the securities of issuers in industries within a particular business sector, any development generally affecting that sector will have a greater impact on the value of the net assets of the Fund than would be the case if the Fund did not have significant investments in that sector. This may increase the risk of loss of an investment in a Fund and increase the volatility of a Fund’s NAV per share. From time to time, circumstances may affect a particular sector and the companies within such sector. For instance, economic or market factors, regulation or deregulation, and technological or other developments, may negatively impact all companies in a particular sector and therefore the value of a Fund’s portfolio could be adversely affected if it has significant holdings of securities of issuers in that sector. As of August 31, 2023, the Fund had 31.4% of the value of its net assets invested in stocks in the Technology sector.
The Fund is required to recognize in the financial statements the effects of all subsequent events that provide additional evidence about conditions that existed as of the date of the Statement of Assets and Liabilities. For non-recognized subsequent events that must be disclosed to keep the financial statements from being misleading, the Fund is required to disclose the nature of the event as well as an estimate of its financial effect, or a statement that such an estimate cannot be made. Management has evaluated subsequent events through the issuance of these financial statements and has noted no such events.
| BLUEPRINT ADAPTIVE GROWTH ALLOCATION FUND |
| ABOUT YOUR FUND’S EXPENSES (Unaudited) |
We believe it is important for you to understand the impact of costs on your investment. As a shareholder of the Fund, you incur ongoing costs, including management fees, class-specific expenses (such as distribution fees) and other operating expenses. The following examples are intended to help you understand your ongoing costs (in dollars) of investing in the Fund and to compare these costs with the ongoing costs of investing in other mutual funds.
A mutual fund’s ongoing costs are expressed as a percentage of its average net assets. This figure is known as the expense ratio. The expenses in the table below are based on an investment of $1,000 made at the beginning of the most recent period (March 1, 2023) and held until the end of the period (August 31, 2023).
The table below illustrates the Fund’s ongoing costs in two ways:
Actual fund return – This section helps you to estimate the actual expenses that you paid over the period. The “Ending Account Value” shown is derived from the Fund’s actual return, and the fourth column shows the dollar amount of operating expenses that would have been paid by an investor who started with $1,000 in the Fund. You may use the information here, together with the amount you invested, to estimate the expenses that you paid over the period.
To do so, simply divide your account value by $1,000 (for example, an $8,600 account value divided by $1,000 = 8.6), then multiply the result by the number given for the Fund under the heading “Expenses Paid During Period.”
Hypothetical 5% return – This section is intended to help you compare the Fund’s ongoing costs with those of other mutual funds. It assumes that the Fund had an annual return of 5% before expenses during the period shown, but that the expense ratio is unchanged. In this case, because the return used is not the Fund’s actual return, the results do not apply to your investment. The example is useful in making comparisons because the U.S. Securities and Exchange Commission (the “SEC”) requires all mutual funds to calculate expenses based on a 5% return. You can assess the Fund’s ongoing costs by comparing this hypothetical example with the hypothetical examples that appear in shareholder reports of other funds.
Note that expenses shown in the table are meant to highlight and help you compare ongoing costs only. The Fund does not charge transaction fees, such as purchase or redemption fees, nor does it carry a “sales load.”
The calculations assume no shares were bought or sold during the period. Your actual costs may have been higher or lower, depending on the amount of your investment and the timing of any purchases or redemptions.
| BLUEPRINT ADAPTIVE GROWTH ALLOCATION FUND |
| ABOUT YOUR FUND’S EXPENSES (Unaudited) (Continued) |
More information about the Fund’s expenses can be found in this report. For additional information on operating expenses and other shareholder costs, please refer to the Fund’s prospectus.
| | | Beginning | | Ending | | | | |
| | | Account Value | | Account Value | | | | Expenses |
| | | March 1, | | August 31, | | Net Expense | | Paid During |
| | | 2023 | | 2023 | | Ratio(a) | | Period(b) |
| Investor Class | | | | | | | | |
| Based on Actual Fund Return | | $1,000.00 | | $1,092.70 | | 1.50% | | $7.91 |
| Based on Hypothetical 5% Return (before expenses) | | $1,000.00 | | $1,017.64 | | 1.50% | | $7.63 |
| Institutional Class | | | | | | | | |
| Based on Actual Fund Return | | $1,000.00 | | $1,094.10 | | 1.25% | | $6.60 |
| Based on Hypothetical 5% Return (before expenses) | | $1,000.00 | | $1,018.90 | | 1.25% | | $6.36 |
| (a) | Annualized, based on the most recent one-half year expenses. |
| (b) | Expenses are equal to the annualized net expense ratio of each Class, multiplied by the average account value over the period, multiplied by 184/365 (to reflect the one-half year period). |
| BLUEPRINT ADAPTIVE GROWTH ALLOCATION FUND |
| OTHER INFORMATION (Unaudited) |
A description of the policies and procedures that the Fund uses to vote proxies relating to portfolio securities is available without charge upon request by calling toll-free 1-866-983-4525, or on the SEC’s website at www.sec.gov. Information regarding how the Fund voted proxies relating to portfolio securities during the most recent 12-month period ended June 30 is available without charge upon request by calling toll-free 1-866-983-4525, or on the SEC’s website at www.sec.gov.
The Trust files a complete listing of portfolio holdings for the Fund with the SEC as of the end of the first and third quarters of each fiscal year as an exhibit to Form N-PORT. These filings are available upon request by calling 1-866-983-4525. Furthermore, you may obtain a copy of the filings on the SEC’s website at www.sec.gov and on the Fund’s website www.blueprintmutualfunds.com.
| CUSTOMER PRIVACY NOTICE |
| |
| FACTS | WHAT DOES THE BLUEPRINT ADAPTIVE GROWTH ALLOCATION FUND (the “Fund”) DO WITH YOUR PERSONAL INFORMATION? |
| |
| Why? | Financial companies choose how they share your personal information. Federal law gives consumers the right to limit some but not all sharing. Federal law also requires us to tell you how we collect, share, and protect your personal information. Please read this notice carefully to understand what we do. |
| |
| What? | The types of personal information we collect and share depend on the product or service you have with us. This information can include: ■ Social Security number ■ Assets ■ Retirement Assets ■ Transaction History ■ Checking Account Information ■ Purchase History ■ Account Balances ■ Account Transactions ■ Wire Transfer Instructions When you are no longer our customer, we continue to share your information as described in this notice. |
| |
| How? | All financial companies need to share your personal information to run their everyday business. In the section below, we list the reasons financial companies can share their customers’ personal information; the reasons the Fund chooses to share; and whether you can limit this sharing. |
| |
| Reasons we can share your personal information | Does the Fund
share? | Can you limit
this sharing? |
| For our everyday business purposes – Such as to process your transactions, maintain your account(s), respond to court orders and legal investigations, or report to credit bureaus | Yes | No |
| For our marketing purposes – to offer our products and services to you | No | We don’t share |
| For joint marketing with other financial companies | No | We don’t share |
| For our affiliates’ everyday business purposes – information about your transactions and experiences | No | We don’t share |
| For our affiliates’ everyday business purposes – information about your creditworthiness | No | We don’t share |
| For nonaffiliates to market to you | No | We don’t share |
| | | | |
| Questions? | Call 1-866-983-4525 |
| Who we are |
| Who is providing this notice? | Blueprint Adaptive Growth Allocation Fund Ultimus Fund Distributors, LLC (Distributor) Ultimus Fund Solutions, LLC (Administrator) |
| What we do |
| How does the Fund protect my personal information? | To protect your personal information from unauthorized access and use, we use security measures that comply with federal law. These measures include computer safeguards and secured files and buildings. Our service providers are held accountable for adhering to strict policies and procedures to prevent any misuse of your nonpublic personal information. |
| How does the Fund collect my personal information? | We collect your personal information, for example, when you ■ Open an account ■ Provide account information ■ Give us your contact information ■ Make deposits or withdrawals from your account ■ Make a wire transfer ■ Tell us where to send the money ■ Tell us who receives the money ■ Show your government-issued ID ■ Show your driver’s license We also collect your personal information from other companies. |
| Why can’t I limit all sharing? | Federal law gives you the right to limit only ■ Sharing for affiliates’ everyday business purposes – information about your creditworthiness ■ Affiliates from using your information to market to you ■ Sharing for nonaffiliates to market to you State laws and individual companies may give you additional rights to limit sharing. |
| |
| Definitions |
| Affiliates | Companies related by common ownership or control. They can be financial and nonfinancial companies. ■ Blueprint Fund Management, LLC, the investment adviser to the Fund, could be deemed to be an affiliate. ■ Blueprint Investment Partners, the investment sub-adviser to the Fund, could be deemed to be an affiliate. |
| Nonaffiliates | Companies not related by common ownership or control. They can be financial and nonfinancial companies. ■ The Fund does not share with nonaffiliates so they can market to you. |
| Joint marketing | A formal agreement between nonaffiliated financial companies that together market financial products or services to you. ■ The Fund does not jointly market. |
This page intentionally left blank.
Blueprint-SAR-23

HVIA EQUITY FUND
INSTITUTIONAL CLASS (HVEIX)
Managed by
Hudson Valley Investment Advisors, Inc.
SEMI-ANNUAL REPORT
August 31, 2023
(Unaudited)
| HVIA EQUITY FUND | |
| LETTER TO SHAREHOLDERS (Unaudited) | September 2023 |
HVIA Equity Fund for the Period Ending August 31, 2023
The HVIA Equity Fund utilizes a growth at a reasonable price (GARP) investment framework and invests principally in a diversified portfolio of common stock of large-capitalization companies. We focus on companies that are showing improving asset utilization, margin expansion and efficient capital allocation.
For the six-month period ending August 31, 2023, HVEIX recorded a return of 16.41% vs. 14.50% for the S&P 500 Index.
Economic Environment
Starting over a year ago, the Federal Reserve has been determined to tame inflation by raising interest rates which is a major factor in the volatility in asset values. Inflation, however, appears to have peaked as both core Consumer Price Index (CPI) and core Personal Consumption Expenditures (PCE) slowed and are now moving down from their highs. Supply chains have normalized and higher levels of individuals have returned to work. Overall earnings and margins are holding up better than expected while valuations have improved significantly since the start of the year.
Worldwide inflation levels have followed the pattern seen in the U.S. They appear to be following the lower inflation trend, but seem to be about six month behind U.S. markets. Inflation in the goods markets, real estate and now labor appears to have moved lower. As a result, the U.S. Dollar has declined versus its overseas counterparts and acts as a tailwind for U.S. based companies. We believe the U.S. markets are well positioned for a soft landing and for continued economic expansion.
Investment Environment
What a difference a few months makes... Keep in mind how bad things felt in September of 2022 when the S&P Index fell more than 18% and the US Aggregate Bond Index fell more than 13%. There was no place to hide and many market prognosticators predicted further declines in the equity markets heading into 2023.
The first few months of 2023 were fraught with investing peril. Record high inflation, rising interest rates, a looming debt-ceiling crisis and regional bank failures appeared to buoy the cases for the market bears. Nevertheless, the US equity markets deftly navigated these potential economic landmines, and evinced a steely resilience to the gloomy forecasts.
In our opinion, the equity markets have entered a new bull market as they have rallied hard off the October 2022 lows. Those investors that stayed the course and tuned out the noise from the talking heads have been rewarded.
S&P 500 company earnings remain a vital driver for the stock market and we expect corporate earnings to increase from Q2 through Q4 and into 2024. Again, inflation has declined significantly from its recent peak and it continues to slow due to the unprecedented speed of the rate hikes instituted by the Federal Reserve. The lagged effects of tighter central
bank policy appear to be arriving on schedule. That being said, we believe we are close to the end of the rate-hike cycle but that because inflation remains “stickier” than expected, the higher rate environment is likely to last longer than expected.
Equities markets remain solidly in positive territory but the market rally to date has been concentrated in technology. That being said, we do expect the market rally to continue to broaden out to other sectors in the ensuing months.
The Federal Reserve
One of the most important jobs of the Federal Reserve (the “Fed”) is to keep the U.S. economy healthy. In fact, the Fed has a dual mandate – pursuing the economic goals of maximum employment and price stability. In other words, the Fed needs to keep both unemployment and inflation low over the long run so that the purchasing power of consumers does not wane. The Fed seeks to achieve its goals by deploying a variety of economic tools to manage financial conditions. One such tool used to keep inflation in check is interest rate hikes. As the theory goes, if it is more expensive to borrow money or carry a balance on a credit card, consumers tend to spend less. When spending declines, the price of goods typically follows. The Fed also can implement fiscal policy changes to correct supply-demand imbalances including accelerated depreciation plans that spur investment and lead to increased supply levels.
The Fed was very aggressive with its rate hikes in 2022. As we entered 2023, inflationary trends still were stronger than the Fed wanted so it hiked rates in February, March, May and July. Rate hikes typically work with a lag effect – meaning it takes time for their impact to take hold. Inflation has slowed significantly and given monetary tightening lags we believe it is likely to continue to slow.
The S&P 500 Index is up 15% so far in 2023 after falling over 18% in 2022. We expect earnings to grow and margins to strengthen in the second half of 2023. We believe we are in a market that is currently margin driven. Why do we say this? It’s based on a rolling recession that has occurred in many sectors that have reset industry groups to rationalize employment and become more efficient helping to support future earnings.
In terms of sectors, 8 of 11 S&P 500 sectors have posted positive year-to-date returns in 2023. The consumer staples and healthcare sectors are barely negative year-to-date while the utility sector is the worst performing sector with a -8% return thus far in 2023 which should not be too surprising given the rising rate environment.
Investment Performance
For the 6 months ending August 31, 2023, HVEIX showed a net gain of +16.41% vs. + 14.50% for the S&P500. The following three positions had the largest total return for the first 6 months:
| | Nvidia Inc. | +117.5% |
| | Eli Lilly & Co. | +77.23% |
| | Adobe Inc. | +72.97% |
Nvidia (NVDA) is a leading, global semiconductor company that designs Graphics Processing Units (GPUs) and Application Programming Interfaces (APIs) for high-performance computing and returned +117.5% for the 6 months ending August 31, 20023. NVDA also is a de facto leader in Artificial Intelligence (AI) technology which has helped propel the shares this year and it is one of the reasons HVIA remained committed to the stock when it was a poor performer in 2022. The second biggest contributor to the performance in the first 6 months of our fiscal year was Eli Lilly & Co. (LLY) which returned +77.23%. LLY share price appreciation has been driven, in large part, by the potential revenue forecasts for its obesity drug. The third biggest contributor to performance in the first half of our fiscal year was Adobe Inc. (ADBE) which returned +72.97%, ADBE is a software company which specializes in the creation and publication of a wide range of content, including graphics, photography, illustration and multimedia/video.
The following positions had the greatest negative impact to the portfolio for the 6 months ending August 31, 2023:
| | Dollar General | -34.81% |
| | AES Corp. | -26.13% |
| | Illumina | -16.78% |
Dollar General (DG) was the fund’s worst performing stock in the 6 months ending August 31,2023 with a total return of -34.81%. DG is a nationwide discount retailer that experienced market share loss due to the strong inflationary headwinds. DG management has implemented some changes to combat the market share loss which we will monitor for any progress. The second detractor to performance was AES Corp. (AES) which returned-26.13%. AES is a utility and power generation company which has made progress on its renewable energy goals and, in our opinion, has an attractive valuation. However, AES company earnings and cash flow were down compared to the previous year, in part, due to higher year-over-year interest expenses. Illumina Inc. (ILMN) was the fund’s third-worst performing stock in the 6 months ending August 31, 2023 with a total return of -16.78%. ILMN is a biotechnology company which develops, manufactures and markets life science tools for genetic analysis and genomic sequencing. We believe a major reason for the recent underperformance is due to the earnings dilution from a recent acquisition. ILMN recently named a new CEO and we believe this could serve as a catalyst for the shares in the coming months.
As portfolio managers we are not only managing the holdings that go into the portfolio but the sizing of positions to enhance returns. Over the first six months of the year we made the decision to lower the number of names in the portfolio and increase position sizes to take advantage of an improving market. This change has helped us outperform the index and position us to take advantage of what we believe will be an upward trending market for the final quarters of the calendar year.
Sincerely,
 |  |
| Gustave J. Scacco | Ron Mayfield |
| Portfolio Manager | Co-Portfolio Manager |
Past performance is not predictive of future performance. Investment results and principal value will fluctuate so that shares, when redeemed, may be worth more or less than their original cost. Current performance may be higher or lower than the performance data quoted. Performance data current to the most recent month-end is available by calling 1-888-209-8710.
An investor should consider the investment objectives, risks, charges, and expenses of the Fund carefully before investing. The Fund’s prospectus contains this and other important information. To obtain a copy of the Fund’s prospectus please visit the Fund’s website at www.hviafunds.com or call 1-888-209-8710 and a copy will be sent to you free of charge. Please read the prospectus carefully before you invest. The Fund is distributed by Ultimus Fund Distributors, LLC.
The Letter to Shareholders seeks to describe some of the Adviser’s current opinions and views of the financial markets. Although the Adviser believes it has a reasonable basis for any opinions or views expressed, actual results may differ, sometimes significantly so, from those expected or expressed. The securities held by the Fund that are discussed in the Letter to Shareholders were held during the period covered by this Report. They do not comprise the entire investment portfolio of the Fund, may be sold at any time, and may no longer be held by the Fund. For a complete list of securities held by the Fund as of August 31, 2023, please see the Schedule of Investments section of the semi-annual report. The opinions of the Fund’s adviser with respect to those securities may change at any time.
HVIA EQUITY FUND
PORTFOLIO INFORMATION
August 31, 2023 (Unaudited) |
Sector Diversification (% of Net Assets)
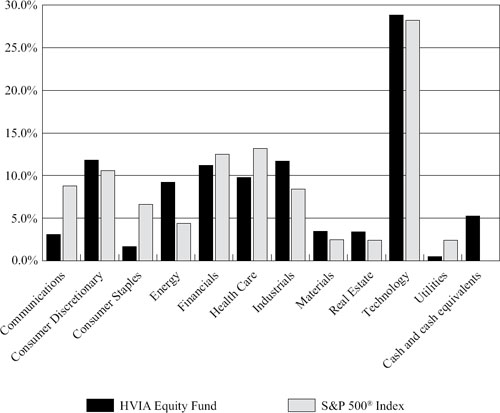
| Top 10 Equity Holdings |
| |
| | % of |
| Security Description | Net Assets |
| NVIDIA Corporation | 5.4% |
| Microsoft Corporation | 4.4% |
| KLA Corporation | 4.4% |
| Baker Hughes Company | 3.7% |
| Advanced Micro Devices, Inc. | 3.3% |
| Apple, Inc. | 3.2% |
| Alphabet, Inc. - Class C | 3.1% |
| Schlumberger Ltd. | 3.0% |
| American Express Company | 3.0% |
| Eli Lilly & Company | 2.9% |
| HVIA EQUITY FUND |
| SCHEDULE OF INVESTMENTS |
| August 31, 2023 (Unaudited) |
| COMMON STOCKS — 94.7% | | Shares | | | Value | |
| Communications — 3.1% | | | | | | | | |
| Internet Media & Services — 3.1% | | | | | | | | |
| Alphabet, Inc. - Class C (a) | | | 9,720 | | | $ | 1,335,042 | |
| | | | | | | | | |
| Consumer Discretionary — 11.8% | | | | | | | | |
| E-Commerce Discretionary — 2.5% | | | | | | | | |
| Amazon.com, Inc. (a) | | | 7,830 | | | | 1,080,618 | |
| | | | | | | | | |
| Home Construction — 2.0% | | | | | | | | |
| Lennar Corporation - Class A | | | 7,300 | | | | 869,357 | |
| | | | | | | | | |
| Leisure Facilities & Services — 5.5% | | | | | | | | |
| Chipotle Mexican Grill, Inc. (a) | | | 590 | | | | 1,136,718 | |
| Starbucks Corporation | | | 12,170 | | | | 1,185,845 | |
| | | | | | | | 2,322,563 | |
| Retail - Discretionary — 1.8% | | | | | | | | |
| AutoZone, Inc. (a) | | | 300 | | | | 759,399 | |
| | | | | | | | | |
| Consumer Staples — 1.7% | | | | | | | | |
| Beverages — 0.6% | | | | | | | | |
| PepsiCo, Inc. | | | 1,580 | | | | 281,114 | |
| | | | | | | | | |
| Food — 0.7% | | | | | | | | |
| Mondelez International, Inc. - Class A | | | 4,210 | | | | 300,004 | |
| | | | | | | | | |
| Retail - Consumer Staples — 0.4% | | | | | | | | |
| Dollar General Corporation | | | 1,150 | | | | 159,275 | |
| | | | | | | | | |
| Energy — 9.2% | | | | | | | | |
| Oil & Gas Producers — 2.5% | | | | | | | | |
| Exxon Mobil Corporation | | | 9,520 | | | | 1,058,529 | |
| | | | | | | | | |
| Oil & Gas Services & Equipment — 6.7% | | | | | | | | |
| Baker Hughes Company | | | 43,390 | | | | 1,570,284 | |
| Schlumberger Ltd. | | | 21,610 | | | | 1,274,126 | |
| | | | | | | | 2,844,410 | |
| HVIA EQUITY FUND |
| SCHEDULE OF INVESTMENTS (Continued) |
| COMMON STOCKS — 94.7% (Continued) | | Shares | | | Value | |
| Financials — 11.2% | | | | | | | | |
| Banking — 3.5% | | | | | | | | |
| Bank of America Corporation | | | 20,670 | | | $ | 592,609 | |
| JPMorgan Chase & Company | | | 6,180 | | | | 904,319 | |
| | | | | | | | 1,496,928 | |
| Institutional Financial Services — 2.2% | | | | | | | | |
| Morgan Stanley | | | 10,980 | | | | 934,947 | |
| | | | | | | | | |
| Insurance — 2.5% | | | | | | | | |
| Marsh & McLennan Companies, Inc. | | | 5,440 | | | | 1,060,746 | |
| | | | | | | | | |
| Specialty Finance — 3.0% | | | | | | | | |
| American Express Company | | | 8,010 | | | | 1,265,500 | |
| | | | | | | | | |
| Health Care — 9.8% | | | | | | | | |
| Biotech & Pharma — 5.2% | | | | | | | | |
| AbbVie, Inc. | | | 4,550 | | | | 668,668 | |
| Eli Lilly & Company | | | 2,230 | | | | 1,235,866 | |
| Pfizer, Inc. | | | 8,750 | | | | 309,575 | |
| | | | | | | | 2,214,109 | |
| Health Care Facilities & Services — 0.8% | | | | | | | | |
| UnitedHealth Group, Inc. | | | 740 | | | | 352,669 | |
| | | | | | | | | |
| Medical Equipment & Devices — 3.8% | | | | | | | | |
| Danaher Corporation | | | 3,580 | | | | 948,700 | |
| Illumina, Inc. (a) | | | 1,780 | | | | 294,092 | |
| Thermo Fisher Scientific, Inc. | | | 650 | | | | 362,115 | |
| | | | | | | | 1,604,907 | |
| Industrials — 11.7% | | | | | | | | |
| Engineering & Construction — 1.5% | | | | | | | | |
| Fluor Corporation (a) | | | 18,830 | | | | 658,861 | |
| | | | | | | | | |
| Industrial Intermediate Products — 2.8% | | | | | | | | |
| Chart Industries, Inc. (a) | | | 6,550 | | | | 1,182,799 | |
| | | | | | | | | |
| Industrial Support Services — 3.9% | | | | | | | | |
| Grainger (W.W.), Inc. | | | 1,050 | | | | 749,847 | |
| United Rentals, Inc. | | | 1,870 | | | | 891,130 | |
| | | | | | | | 1,640,977 | |
| Machinery — 1.9% | | | | | | | | |
| Lincoln Electric Holdings, Inc. | | | 4,180 | | | | 804,483 | |
| HVIA EQUITY FUND |
| SCHEDULE OF INVESTMENTS (Continued) |
| COMMON STOCKS — 94.7% (Continued) | | Shares | | | Value | |
| Industrials — 11.7% (Continued) | | | | | | | | |
| Transportation & Logistics — 1.6% | | | | | | | | |
| CSX Corporation | | | 22,900 | | | $ | 691,580 | |
| | | | | | | | | |
| Materials — 3.5% | | | | | | | | |
| Chemicals — 1.0% | | | | | | | | |
| Sherwin-Williams Company (The) | | | 1,620 | | | | 440,186 | |
| | | | | | | | | |
| Steel — 2.5% | | | | | | | | |
| Nucor Corporation | | | 6,170 | | | | 1,061,857 | |
| | | | | | | | | |
| Real Estate — 3.4% | | | | | | | | |
| REITs — 3.4% | | | | | | | | |
| Prologis, Inc. | | | 5,800 | | | | 720,360 | |
| Weyerhaeuser Company | | | 22,320 | | | | 730,980 | |
| | | | | | | | 1,451,340 | |
| Technology — 28.8% | | | | | | | | |
| Semiconductors — 13.1% | | | | | | | | |
| Advanced Micro Devices, Inc. (a) | | | 13,510 | | | | 1,428,277 | |
| KLA Corporation | | | 3,710 | | | | 1,861,938 | |
| NVIDIA Corporation | | | 4,690 | | | | 2,314,749 | |
| | | | | | | | 5,604,964 | |
| Software — 6.9% | | | | | | | | |
| Adobe, Inc. (a) | | | 1,090 | | | | 609,681 | |
| Microsoft Corporation | | | 5,700 | | | | 1,868,232 | |
| Salesforce, Inc. (a) | | | 2,120 | | | | 469,495 | |
| | | | | | | | 2,947,408 | |
| Technology Hardware — 6.9% | | | | | | | | |
| Apple, Inc. | | | 7,250 | | | | 1,362,058 | |
| Ciena Corporation (a) | | | 10,900 | | | | 544,782 | |
| Cisco Systems, Inc. | | | 18,260 | | | | 1,047,211 | |
| | | | | | | | 2,954,051 | |
| Technology Services — 1.9% | | | | | | | | |
| Visa, Inc. - Class A | | | 3,230 | | | | 793,546 | |
| | | | | | | | | |
| Utilities — 0.5% | | | | | | | | |
| Electric Utilities — 0.5% | | | | | | | | |
| AES Corporation (The) | | | 11,390 | | | | 204,223 | |
| | | | | | | | | |
| Total Common Stocks (Cost $25,411,664) | | | | | | $ | 40,376,392 | |
| HVIA EQUITY FUND |
| SCHEDULE OF INVESTMENTS (Continued) |
| MONEY MARKET FUNDS — 6.7% | | Shares | | | Value | |
| First American Government Obligations Fund - Class X, 5.25% (b) (Cost $2,874,906) | | | 2,874,906 | | | $ | 2,874,906 | |
| | | | | | | | | |
| Investments at Value — 101.4% (Cost $28,286,570) | | | | | | $ | 43,251,298 | |
| | | | | | | | | |
| Liabilities in Excess of Other Assets — (1.4%) | | | | | | | (593,731 | ) |
| | | | | | | | | |
| Net Assets — 100.0% | | | | | | $ | 42,657,567 | |
| (a) | Non-income producing security. |
| (b) | The rate shown is the 7-day effective yield as of August 31, 2023. |
See accompanying notes to financial statements.
| HVIA EQUITY FUND |
| STATEMENT OF ASSETS AND LIABILITIES |
| August 31, 2023 (Unaudited) |
| ASSETS | | | | |
| Investments in securities: | | | | |
| At cost | | $ | 28,286,570 | |
| At value (Note 2) | | $ | 43,251,298 | |
| Receivable for capital shares sold | | | 23,138 | |
| Dividends receivable | | | 51,331 | |
| Other assets | | | 20,384 | |
| TOTAL ASSETS | | | 43,346,151 | |
| | | | | |
| LIABILITIES | | | | |
| Payable for capital shares redeemed | | | 5,748 | |
| Payable for investment securities purchased | | | 647,144 | |
| Payable to Adviser (Note 4) | | | 15,706 | |
| Payable to administrator (Note 4) | | | 9,421 | |
| Other accrued expenses | | | 10,565 | |
| TOTAL LIABILITIES | | | 688,584 | |
| | | | | |
| NET ASSETS | | $ | 42,657,567 | |
| | | | | |
| NET ASSETS CONSIST OF: | | | | |
| Paid-in capital | | $ | 26,992,012 | |
| Accumulated earnings | | | 15,665,555 | |
| NET ASSETS | | $ | 42,657,567 | |
| | | | | |
| PRICING OF INSTITUTIONAL SHARES (NOTE 1) | | | | |
| Net assets applicable to Institutional Shares | | $ | 42,657,567 | |
| Shares of Institutional Shares outstanding (unlimited number of shares authorized, no par value) | | | 2,018,313 | |
| | | | | |
| Net asset value, offering price and redemption price per share (Note 2) | | $ | 21.14 | |
See accompanying notes to financial statements.
| HVIA EQUITY FUND |
| STATEMENT OF OPERATIONS |
| For the Six Months Ended August 31, 2023 (Unaudited) |
| INVESTMENT INCOME | | | | |
| Dividend income | | $ | 279,161 | |
| | | | | |
| EXPENSES | | | | |
| Management fees (Note 4) | | | 141,234 | |
| Administration fees (Note 4) | | | 19,087 | |
| Fund accounting fees (Note 4) | | | 18,445 | |
| Legal fees | | | 14,418 | |
| Registration and filing fees | | | 10,632 | |
| Transfer agent fees (Note 4) | | | 9,920 | |
| Trustees’ fees and expenses (Note 4) | | | 9,670 | |
| Audit and tax services fees | | | 8,665 | |
| Shareholder reporting expense | | | 6,284 | |
| Compliance fees (Note 4) | | | 6,000 | |
| Custody and bank service fees | | | 4,289 | |
| Networking fees | | | 3,220 | |
| Postage and supplies | | | 2,315 | |
| Insurance expense | | | 1,634 | |
| Other expenses | | | 4,669 | |
| TOTAL EXPENSES | | | 260,482 | |
| Less fee reductions by the Adviser (Note 4) | | | (71,534 | ) |
| NET EXPENSES | | | 188,948 | |
| | | | | |
| NET INVESTMENT INCOME | | | 90,213 | |
| | | | | |
| REALIZED AND UNREALIZED GAINS (LOSSES) ON INVESTMENTS AND FOREIGN CURRENCIES | | | | |
| Net realized gains (losses) from: | | | | |
| Investments | | | 763,971 | |
| Foreign currency transactions | | | (134 | ) |
| Net change in unrealized appreciation (depreciation) on: | | | | |
| Investments | | | 4,946,215 | |
| Foreign currency translations | | | 131 | |
| NET REALIZED AND UNREALIZED GAINS ON INVESTMENTS AND FOREIGN CURRENCIES | | | 5,710,183 | |
| | | | | |
| NET INCREASE IN NET ASSETS RESULTING FROM OPERATIONS | | $ | 5,800,396 | |
See accompanying notes to financial statements.
| HVIA EQUITY FUND |
| STATEMENTS OF CHANGES IN NET ASSETS |
| | | Six Months | | | | |
| | | Ended | | | Year | |
| | | August 31, | | | Ended | |
| | | 2023 | | | February 28, | |
| | | (Unaudited) | | | 2023 | |
| FROM OPERATIONS | | | | | | | | |
| Net investment income | | $ | 90,213 | | | $ | 281,559 | |
| Net realized gains (losses) from: | | | | | | | | |
| Investments | | | 763,971 | | | | 1,562,908 | |
| Foreign currency transactions | | | (134 | ) | | | (80 | ) |
| Net change in unrealized appreciation (depreciation) on: | | | | | | | | |
| Investments | | | 4,946,215 | | | | (5,241,648 | ) |
| Foreign currency translations | | | 131 | | | | (160 | ) |
| Net increase (decrease) in net assets resulting | | | 5,800,396 | | | | (3,397,421 | ) |
| | | | | | | | | |
| DISTRIBUTIONS TO SHAREHOLDERS (Note 2) | | | | | | | | |
| Institutional Shares | | | — | | | | (2,911,317 | ) |
| | | | | | | | | |
| CAPITAL SHARE TRANSACTIONS | | | | | | | | |
| Institutional Shares | | | | | | | | |
| Proceeds from shares sold | | | 6,689,562 | | | | 6,716,847 | |
| Net asset value of shares issued in reinvestment of distributions to shareholders | | | — | | | | 173,744 | |
| Payments for shares redeemed | | | (5,010,367 | ) | | | (3,135,479 | ) |
| Net increase in Institutional Shares net assets from capital share transactions | | | 1,679,195 | | | | 3,755,112 | |
| | | | | | | | | |
| TOTAL INCREASE (DECREASE) IN NET ASSETS | | | 7,479,591 | | | | (2,553,626 | ) |
| | | | | | | | | |
| NET ASSETS | | | | | | | | |
| Beginning of period | | | 35,177,976 | | | | 37,731,602 | |
| End of period | | $ | 42,657,567 | | | $ | 35,177,976 | |
| | | | | | | | | |
| CAPITAL SHARE ACTIVITY | | | | | | | | |
| Institutional Shares | | | | | | | | |
| Shares sold | | | 346,431 | | | | 345,964 | |
| Shares reinvested | | | — | | | | 9,900 | |
| Shares redeemed | | | (265,391 | ) | | | (159,642 | ) |
| Net increase in shares outstanding | | | 81,040 | | | | 196,222 | |
| Shares outstanding at beginning of period | | | 1,937,273 | | | | 1,741,051 | |
| Shares outstanding at end of period | | | 2,018,313 | | | | 1,937,273 | |
See accompanying notes to financial statements.
| HVIA EQUITY FUND |
| INSTITUTIONAL SHARES |
| FINANCIAL HIGHLIGHTS |
Per Share Data for a Share Outstanding Throughout Each Period
| | | Six Months | | | | | | | | | | | | | | | | |
| | | Ended | | | Year | | | Year | | | Year | | | Year | | | Year | |
| | | August 31, | | | Ended | | | Ended | | | Ended | | | Ended | | | Ended | |
| | | 2023 | | | Feb. 28, | | | Feb. 28, | | | Feb. 28, | | | Feb. 29, | | | Feb. 28, | |
| | | (Unaudited) | | | 2023 | | | 2022 | | | 2021 | | | 2020 | | | 2019 | |
| Net asset value at beginning of period | | $ | 18.16 | | | $ | 21.67 | | | $ | 19.38 | | | $ | 14.00 | | | $ | 13.28 | | | $ | 13.17 | |
| Income from investment operations: | | | | | | | | | | | | | | | | | | | | | | | | |
| Net investment income | | | 0.04 | | | | 0.15 | | | | 0.02 | | | | 0.02 | | | | 0.06 | | | | 0.09 | |
| Net realized and unrealized gains (losses) on investments and foreign currencies | | | 2.94 | | | | (2.08 | ) | | | 2.88 | | | | 5.45 | | | | 0.76 | | | | 0.43 | |
| Total from investment operations | | | 2.98 | | | | (1.93 | ) | | | 2.90 | | | | 5.47 | | | | 0.82 | | | | 0.52 | |
| Less distributions from: | | | | | | | | | | | | | | | | | | | | | | | | |
| Net investment income | | | — | | | | (0.13 | ) | | | (0.03 | ) | | | (0.00 | ) (a) | | | (0.07 | ) | | | (0.08 | ) |
| Net realized gains | | | — | | | | (1.45 | ) | | | (0.58 | ) | | | (0.09 | ) | | | (0.03 | ) | | | (0.33 | ) |
| Total distributions | | | — | | | | (1.58 | ) | | | (0.61 | ) | | | (0.09 | ) | | | (0.10 | ) | | | (0.41 | ) |
| Net asset value at end of period | | $ | 21.14 | | | $ | 18.16 | | | $ | 21.67 | | | $ | 19.38 | | | $ | 14.00 | | | $ | 13.28 | |
| Total return (b) | | | 16.41 | % (c) | | | (8.62 | %) | | | 14.66 | % | | | 39.10 | % | | | 6.11 | % | | | 4.34 | % |
| Net assets at end of period (000’s) | | $ | 42,658 | | | $ | 35,178 | | | $ | 37,732 | | | $ | 30,410 | | | $ | 20,229 | | | $ | 17,929 | |
| Ratios/supplementary data: | | | | | | | | | | | | | | | | | | | | | | | | |
| Ratio of total expenses to average net assets | | | 1.36 | % (d) | | | 1.40 | % | | | 1.35 | % | | | 1.59 | % | | | 1.76 | % | | | 1.86 | % |
| Ratio of net expenses to average net assets (e) | | | 0.99 | % (d) | | | 0.99 | % | | | 0.99 | % | | | 0.99 | % | | | 0.99 | % | | | 0.99 | % |
| Ratio of net investment income to average net assets (e) | | | 0.47 | % (d) | | | 0.80 | % | | | 0.09 | % | | | 0.13 | % | | | 0.42 | % | | | 0.70 | % |
| Portfolio turnover rate | | | 23 | % (c) | | | 30 | % | | | 11 | % | | | 11 | % | | | 16 | % | | | 29 | % |
| (a) | Amount rounds to less than $0.01 per share. |
| (b) | Total return is a measure of the change in value of an investment in the Fund over the periods covered. The returns shown do not reflect the deduction of taxes a shareholders would pay on Fund distributions, if any, or the redemption of Fund shares. The total returns would be lower if the Adviser had not reduced management fees and/or reimbursed expenses. |
| (e) | Ratio was determined after management fee reductions and expense reimbursements (Note 4). |
See accompanying notes to financial statements.
| HVIA EQUITY FUND |
| NOTES TO FINANCIAL STATEMENTS |
| August 31, 2023 (Unaudited) |
HVIA Equity Fund (the “Fund”) is a diversified series of Ultimus Managers Trust (the “Trust”), an open-end investment company established as an Ohio business trust under a Declaration of Trust dated February 28, 2012. Other series of the Trust are not incorporated in this report.
The investment objective of the Fund is to seek growth at a reasonable price.
The Fund currently offers one class of shares: Institutional Class shares (sold without any sales loads or distribution fees and subject to a $25,000 initial investment requirement). As of August 31, 2023, the Investor Class shares (to be sold without any sales load, but subject to a distribution fee of up to 0.25% of the class’s average daily net assets and subject to a $2,500 initial investment requirement) are not currently offered. When both classes are offered, each share class will represent an ownership interest in the same investment portfolio.
| 2. | Significant Accounting Policies |
The following is a summary of the Fund’s significant accounting policies. The policies are in conformity with accounting principles generally accepted in the United States of America (“GAAP”). The Fund follows accounting and reporting guidance under Financial Accounting Standards Board Accounting Standards Codification Topic 946, “Financial Services – Investment Companies.”
Regulatory update – Tailored Shareholder Reports for Mutual Funds and Exchange-Traded Funds (“ETFs”) – Effective January 24, 2023, the Securities and Exchange Commission (the “SEC”) adopted rule and form amendments to require mutual funds and ETFs to transmit concise and visually engaging streamlined annual and semiannual reports to shareholders that highlight key information. Other information, including financial statements, will no longer appear in a streamlined shareholder report but must be available online, delivered free of charge upon request, and filed on a semiannual basis on Form N-CSR. The rule and form amendments have a compliance date of July 24, 2024. At this time, management is evaluating the impact of these amendments on the shareholder reports for the Fund.
Securities valuation – The Fund values its portfolio securities at fair value as of the close of regular trading on the New York Stock Exchange (the “NYSE”) (normally 4:00 p.m. Eastern time) on each business day the NYSE is open for business. The Fund values its common stocks on the basis of the security’s last sale price on the security’s primary exchange, if available, otherwise at the exchange’s most recently quoted mean price. NASDAQ-listed securities are valued at the NASDAQ Official Closing Price. Investments representing shares of other registered open-end investment companies that are not listed on an exchange, including money market funds, are valued at their net asset value (“NAV”) as reported by such companies. The Fund values securities traded in the over-the-counter market at the last sale price, if available, otherwise at the most recently quoted mean price. When using
| HVIA EQUITY FUND |
| NOTES TO FINANCIAL STATEMENTS (Continued) |
a quoted price and when the market is considered active, the security will be classified as Level 1 within the fair value hierarchy (see below). In the event that market quotations are not readily available or are considered unreliable due to market or other events, the Fund values its securities and other assets at fair value as determined by Hudson Valley Investment Advisors, Inc. (the “Adviser”), as the Fund’s valuation designee, in accordance with procedures adopted by the Board of Trustees (the “Board”) pursuant to Rule 2a-5 under the Investment Company Act of 1940, as amended (the “1940 Act”). Under these procedures, the securities will be classified as Level 2 or 3 within the fair value hierarchy, depending on the inputs used. Unavailable or unreliable market quotes may be due to the following factors: a substantial bid-ask spread; infrequent sales resulting in stale prices; insufficient trading volume; small trade sizes; a temporary lapse in any reliable pricing source; and actions of the securities or futures markets, such as the suspension or limitation of trading. As a result, the prices of securities used to calculate the Fund’s NAV may differ from quoted or published prices for the same securities.
GAAP establishes a single authoritative definition of fair value, sets out a framework for measuring fair value, and requires additional disclosures about fair value measurements.
Various inputs are used in determining the value of the Fund’s investments. These inputs are summarized in the three broad levels listed below:
| ● | Level 1 – quoted prices in active markets for identical securities |
| ● | Level 2 – other significant observable inputs |
| ● | Level 3 – significant unobservable inputs |
The inputs or methods used for valuing securities are not necessarily an indication of the risks associated with investing in those securities. The inputs used to measure fair value may fall into different levels of the fair value hierarchy. In such cases, for disclosure purposes, the level in the fair value hierarchy within which the fair value measurement falls in its entirety is determined based on the lowest level input that is significant to the fair value measurement.
The following is a summary of the Fund’s investments and the level of inputs used to value the investments as of August 31, 2023:
| | | Level 1 | | | Level 2 | | | Level 3 | | | Total | |
| Common Stocks | | $ | 40,376,392 | | | $ | — | | | $ | — | | | $ | 40,376,392 | |
| Money Market Funds | | | 2,874,906 | | | | — | | | | — | | | | 2,874,906 | |
| Total | | $ | 43,251,298 | | | $ | — | | | $ | — | | | $ | 43,251,298 | |
| | | | | | | | | | | | | | | | | |
Refer to the Fund’s Schedule of Investments for a listing of the common stocks by sector and industry type. The Fund did not have any derivative instruments or any assets or liabilities that were measured at fair value on a recurring basis using significant unobservable inputs (Level 3) as of or during six months ended August 31, 2023.
| HVIA EQUITY FUND |
| NOTES TO FINANCIAL STATEMENTS (Continued) |
Foreign currency translation – Securities and other assets and liabilities denominated in or expected to settle in foreign currencies, if any, are translated into U.S. dollars based on exchange rates on the following basis:
| A. | The fair values of investment securities and other assets and liabilities are translated as of the close of the NYSE each day. |
| B. | Purchases and sales of investment securities and income and expenses are translated at the rate of exchange prevailing as of 4:00 p.m. Eastern Time on the respective date of such transactions. |
| C. | The Fund does not isolate that portion of the results of operations caused by changes in foreign exchange rates on investments from those caused by changes in market prices of securities held. Such fluctuations are included with the net realized and unrealized gains or losses on investments. |
Reported net realized foreign exchange gains or losses arise from 1) purchases and sales of foreign currencies, 2) currency gains or losses realized between the trade and settlement dates on securities transactions, and 3) the difference between the amounts of dividends and foreign withholding taxes recorded on the Fund’s books and the U.S. dollar equivalent of the amounts actually received or paid. Reported net unrealized foreign exchange gains and losses arise from changes in the value of assets and liabilities that result from changes in exchange rates.
Cash – The Fund’s cash, if any, is held in a bank account with balances which, at times, may exceed United States federally insured limits set by the Federal Deposit Insurance Corporation. The Fund maintains these balances with a high-quality financial institution and may incur charges on cash overdrafts.
Share valuation – The NAV per share of each class of the Fund is calculated daily by dividing the total value of its assets attributable to that class, less liabilities attributable to that class, by the number of shares outstanding of that class. The offering price and redemption price per share of each class of the Fund is equal to the NAV per share of such class.
Investment income – Dividend income is recorded on the ex-dividend date. Non-cash dividends included in dividend income, if any, are recorded at the fair market value of the security received. Interest income is accrued as earned. Withholding taxes on foreign dividends have been recorded in accordance with the Fund’s understanding of the applicable country’s tax rules and rates.
Investment transactions – Investment transactions are accounted for on the trade date. Realized gains and losses on investments sold are determined on a specific identification basis.
Common expenses – Common expenses of the Trust are allocated among the Fund and the other series of the Trust based on the relative net assets of each series, the number of series in the Trust, or the nature of the services performed and the relative applicability to each series.
| HVIA EQUITY FUND |
| NOTES TO FINANCIAL STATEMENTS (Continued) |
Distributions to shareholders – The Fund will distribute to shareholders any net investment income dividends and net realized capital gains distributions at least once each year. The amount of such dividends and distributions are determined in accordance with federal income tax regulations, which may differ from GAAP. Dividends and distributions to shareholders are recorded on the ex-dividend date. The tax character of the Fund’s distributions during the periods ended August 31, 2023 and February 28, 2023 was as follows:
| | | Ordinary | | | Long-Term | | | Total | |
| Period Ended | | Income | | | Capital Gains | | | Distributions | |
| August 31, 2023 | | $ | — | | | $ | — | | | $ | — | |
| February 28, 2023 | | $ | 244,467 | | | $ | 2,666,850 | | | $ | 2,911,317 | |
| | | | | | | | | | | | | |
Estimates – The preparation of financial statements in conformity with GAAP requires management to make estimates and assumptions which affect the reported amounts of assets and liabilities and disclosure of contingent assets and liabilities as of the date of the financial statements and the reported amounts of increase (decrease) in net assets from operations during the reporting period. Actual results could differ from those estimates.
Federal income tax – The Fund has qualified and intends to continue to qualify as a regulated investment company under the Internal Revenue Code of 1986, as amended (the “Code”). Qualification generally will relieve the Fund of liability for federal income taxes to the extent 100% of its net investment income and net realized capital gains are distributed in accordance with the Code.
In order to avoid imposition of the excise tax applicable to regulated investment companies, it is also the Fund’s intention to declare as dividends in each calendar year at least 98% of its net investment income (earned during the calendar year) and 98.2% of its net realized capital gains (earned during the 12 months ended October 31) plus undistributed amounts from prior years.
The following information is computed on a tax basis for each item as of February 28, 2023:
| | | | |
| Tax cost of investments | | $ | 25,125,243 | |
| Gross unrealized appreciation | | $ | 11,161,932 | |
| Gross unrealized depreciation | | | (1,143,419 | ) |
| Net unrealized appreciation | | | 10,018,513 | |
| Net unrealized depreciation on foreign currency translations | | | (131 | ) |
| Undistributed ordinary income | | | 48,434 | |
| Accumulated capital and other losses | | | (201,657 | ) |
| Distributable earnings | | $ | 9,865,159 | |
| | | | | |
| HVIA EQUITY FUND |
| NOTES TO FINANCIAL STATEMENTS (Continued) |
The federal tax cost, unrealized appreciation (depreciation) as of August 31, 2023 is as follows:
| | | | | |
| Tax cost of portfolio investments | | $ | 28,286,570 | |
| Gross unrealized appreciation | | $ | 15,557,588 | |
| Gross unrealized depreciation | | | (592,860 | ) |
| Net unrealized appreciation | | $ | 14,964,728 | |
| | | | | |
The Fund recognizes the tax benefits or expenses of uncertain tax positions only when the position is “more likely than not” of being sustained assuming examination by tax authorities. Management has reviewed the Fund’s tax positions for the current and all open tax periods (generally, three years) and has concluded that no provision for unrecognized tax benefits or expenses is required in these financial statements.
The Fund identifies its major tax jurisdiction as U.S. Federal. The Fund recognizes interest and penalties, if any, related to unrecognized tax benefits as income tax on the Statement of Operations. During the six months ended August 31, 2023, the Fund did not incur any interest of penalties.
| 3. | Investment Transactions |
During the six months ended August 31, 2023, cost of purchases and proceeds from sales of investment securities, other than short-term investments, amounted to $9,730,299 and $8,459,099, respectively.
| 4. | Transactions with Related Parties |
INVESTMENT ADVISORY AGREEMENT
The Fund’s investments are managed by the Adviser pursuant to the terms of an Investment Advisory Agreement. Under the Investment Advisory Agreement, the Fund pays the Adviser a management fee, computed and accrued daily and paid monthly, at the annual rate of 0.74% of its average daily net assets.
Pursuant to an Expense Limitation Agreement (“ELA”), the Adviser has contractually agreed, until July 1, 2024, to reduce management fees and reimburse other expenses to the extent necessary to limit total annual operating expenses (exclusive of brokerage costs, taxes, interest, borrowing costs such as interest and dividend expense on securities sold short, costs to organize the Fund, acquired fund fees and expenses, extraordinary expenses such as litigation and merger or reorganization costs and other expenses not incurred in the ordinary course of the Fund’s business) to an amount not exceeding 0.99% of average daily net assets of the Institutional Class shares and 1.24% of the average daily net assets of the Investor class shares. Accordingly, the Adviser reduced its management fees in the amount of $71,534 during the six months ended August 31, 2023.
| HVIA EQUITY FUND |
| NOTES TO FINANCIAL STATEMENTS (Continued) |
Under the terms of the ELA, management fee reductions and expense reimbursements by the Adviser are subject to repayment by the Fund for a period of three years after such fees and expenses were incurred, provided the repayments do not cause total annual operating expenses to exceed the lesser of: (i) the expense limitation then in effect, if any, and (ii) the expense limitation in effect at the time the expenses to be repaid were incurred. As of August 31, 2023, the Adviser may seek repayment of management fee reductions and expense reimbursements in the amount of $419,701 no later than the dates listed below:
| | | | |
| February 29, 2024 | | $ | 70,324 | |
| February 28, 2025 | | | 134,504 | |
| February 28, 2026 | | | 143,339 | |
| August 31, 2026 | | | 71,534 | |
| Total | | $ | 419,701 | |
| | | | | |
OTHER SERVICE PROVIDERS
Ultimus Fund Solutions, LLC (“Ultimus”) provides administration, fund accounting, compliance and transfer agency services to the Fund. The Fund pays Ultimus fees in accordance with the agreements for such services. In addition, the Fund pays out-of-pocket expenses including, but not limited to, postage, supplies, and certain costs related to the pricing of the Fund’s portfolio securities.
Under the terms of a Distribution Agreement with the Trust, Ultimus Fund Distributors, LLC (the “Distributor”) serves as the principal underwriter to the Fund. The Distributor is a wholly-owned subsidiary of Ultimus. The Distributor is currently compensated by the Adviser (not the Fund) for acting as principal underwriter.
Certain officers and a Trustee of the Trust are also officers of Ultimus and are not paid by the Trust or the Fund for serving in such capacities.
TRUSTEE COMPENSATION
Each member of the Board (a “Trustee”) who is not an “interested person” (as defined by the 1940 Act) of the Trust (“Independent Trustee”) receives a $1,300 annual retainer from the Fund, paid quarterly, except for the Board Chairperson who receives a $1,700 annual retainer from the Fund, paid quarterly and the Audit Committee Chairperson who receives a $1,500 annual retainer from the Fund, paid quarterly. Each Independent Trustee also receives from the Fund a fee of $550 for each Board meeting attended plus reimbursement for travel and other meeting-related expenses.
| HVIA EQUITY FUND |
| NOTES TO FINANCIAL STATEMENTS (Continued) |
PRINCIPAL HOLDER OF FUND SHARES
As of August 31, 2023, the following shareholder owned of record more than 25% of the outstanding shares of the Fund:
| NAME OF RECORD OWNER | | % Ownership |
| Pershing, LLC (for the benefit of its customers) | | 99.7% |
A beneficial owner of 25% or more of the Fund’s outstanding shares may be considered a controlling person. That shareholder’s vote could have a more significant effect on matters presented at a shareholders’ meeting.
If the Fund has significant investments in the securities of issuers in industries within a particular sector, any development affecting that sector will have a greater impact on the value of the net assets of the Fund than would be the case if the Fund did not have significant investments in that sector. In addition, this may increase the risk of loss of an investment in the Fund and increase the volatility of the Fund’s net asset value per share. From time to time, a particular set of circumstances may affect this sector or companies within the sector. For instance, economic or market factors, regulation or deregulation, or other developments may negatively impact all companies in a particular sector and therefore the value of the Fund’s portfolio will be adversely affected. As of August 31, 2023, the Fund had 28.8% of the value of its net assets invested in stocks within the Technology sector.
| 6. | Contingencies and Commitments |
The Fund indemnifies the Trust’s officers and Trustees for certain liabilities that might arise from the performance of their duties to the Fund. Additionally, in the normal course of business the Fund enters into contracts that contain a variety of representations and warranties and which provide general indemnifications. The Fund’s maximum exposure under these arrangements is unknown, as this would involve future claims that may be made against the Fund that have not yet occurred. However, based on experience, the Fund expects the risk of loss to be remote.
The Fund is required to recognize in the financial statements the effects of all subsequent events that provide additional evidence about conditions that existed as of the date of the Statement of Assets and Liabilities. For non-recognized subsequent events that must be disclosed to keep the financial statements from being misleading, the Fund is required to disclose the nature of the event as well as an estimate of its financial effect, or a statement that such an estimate cannot be made. Management has evaluated subsequent events through the issuance of these financial statements and has noted no such events.
| HVIA EQUITY FUND |
| ABOUT YOUR FUND’S EXPENSES (Unaudited) |
We believe it is important for you to understand the impact of costs on your investment. As a shareholder of the Fund, you incur ongoing costs, including management fees and other operating expenses. The following examples are intended to help you understand your ongoing costs (in dollars) of investing in the Fund and to compare these costs with the ongoing costs of investing in other mutual funds.
A mutual fund’s ongoing costs are expressed as a percentage of its average net assets. This figure is known as the expense ratio. The expenses in the table below are based on an investment of $1,000 made at the beginning of the most recent period (March 1, 2023) and held until the end of the period (August 31, 2023).
The table below illustrates the Fund’s ongoing costs in two ways:
Actual fund return – This section helps you to estimate the actual expenses that you paid over the period. The “Ending Account Value” shown is derived from the Fund’s actual return, and the fourth column shows the dollar amount of operating expenses that would have been paid by an investor who started with $1,000 in the Fund. You may use the information here, together with the amount you invested, to estimate the expenses that you paid over the period.
To do so, simply divide your account value by $1,000 (for example, an $8,600 account value divided by $1,000 = 8.6), then multiply the result by the number given for the Fund under the heading “Expenses Paid During Period.”
Hypothetical 5% return – This section is intended to help you compare the Fund’s ongoing costs with those of other mutual funds. It assumes that the Fund had an annual return of 5% before expenses during the period shown, but that the expense ratio is unchanged. In this case, because the return used is not the Fund’s actual return, the results do not apply to your investment. The example is useful in making comparisons because the U.S. Securities and Exchange Commission (the “SEC”) requires all mutual funds to calculate expenses based on a 5% return. You can assess the Fund’s ongoing costs by comparing this hypothetical example with the hypothetical examples that appear in shareholder reports of other funds.
Note that expenses shown in the table are meant to highlight and help you compare ongoing costs only. The Fund does not charge transaction fees, such as purchase or redemption fees, nor does it carry a “sales load.” The calculations assume no shares were bought or sold during the period. Your actual costs may have been higher or lower, depending on the amount of your investment and the timing of any purchases or redemptions.
| HVIA EQUITY FUND |
| ABOUT YOUR FUND’S EXPENSES (Unaudited) (Continued) |
More information about the Fund’s expenses can be found in this report. For additional information on operating expenses and other shareholder costs, please refer to the Fund’s prospectus.
| | | Beginning | | | Ending | | | | | | |
| | | Account Value | | | Account Value | | | | | Expenses | |
| | | March 1, | | | August 31, | | | Net Expense | | Paid During | |
| Institutional Class | | 2023 | | | 2023 | | | Ratio (a) | | Period (b) | |
| Based on Actual Fund Return | | $ | 1,000.00 | | | $ | 1,164.10 | | | 0.99% | | $ | 5.40 | |
| Based on Hypothetical 5% Return (before expenses) | | $ | 1,000.00 | | | $ | 1,020.21 | | | 0.99% | | $ | 5.04 | |
| (a) | Annualized, based on the Fund’s most recent one-half year expenses. |
| (b) | Expenses are equal to the Fund’s annualized net expense ratio multiplied by the average account value over the period, multiplied by 184/365 (to reflect the one-half year period). |
| HVIA EQUITY FUND |
| OTHER INFORMATION (Unaudited) |
A description of the policies and procedures that the Fund uses to vote proxies relating to portfolio securities is available without charge upon request by calling toll- free 1-888-209-8710, or on the SEC’s website at www.sec.gov. Information regarding how the Fund voted proxies relating to portfolio securities during the most recent 12-month period ended June 30 is available without charge upon request by calling toll-free 1-888-209-8710, or on the SEC’s website at www.sec.gov.
The Trust files a complete listing of portfolio holdings for the Fund with the SEC as of the end of the first and third quarters of each fiscal year as an exhibit to its reports on Form N-PORT. These filings are available upon request by calling 1-888-209-8710. Furthermore, you may obtain a copy of the filings on the SEC’s website at www.sec.gov and on the Fund’s website www.hviafunds.com.
| HVIA EQUITY FUND |
| DISCLOSURE REGARDING APPROVAL OF INVESTMENT |
| ADVISORY AGREEMENT (Unaudited) |
The Board of Trustees (the “Board”), including the Independent Trustees voting separately, has reviewed and approved the continuance of the Fund’s Investment Advisory Agreement (the “Agreement”) with Hudson Valley Investment Advisors, Inc. (the “Adviser” or “Hudson Valley”) for an additional one-year term. The Board approved the Agreement at a meeting held on April 19-21, 2023 (“Meeting”), at which all of the Trustees were present.
Prior to the Board meeting, the Adviser provided a response to a letter sent by the counsel to the Independent Trustees, on their behalf, requesting various information relevant to the Independent Trustees’ consideration of the renewal of the Agreement with respect to the Fund. In approving the continuance of the Agreement, the Independent Trustees considered all information they deemed reasonably necessary to evaluate the terms of the Agreement. The principal areas of review by the Independent Trustees were (i) the nature, extent and quality of the services provided by the Adviser, (ii) the investment performance of the Fund, (iii) the costs of the services provided and profits realized by the Adviser and its affiliates from the Adviser’s relationship with the Fund, (iv) the other “fall-out” benefits derived by Adviser and its affiliates from the Adviser’s relationship with the Fund and (v) the extent to which economies of scale would be realized as the Fund grows and whether advisory fee levels reflect those economies of scale for the benefit of the Fund’s investors. The Independent Trustees’ evaluation of the quality of the Adviser’s services also took into consideration their knowledge gained through presentations and reports from the Adviser over the course of the preceding year. The Independent Trustees’ analysis of these factors is set forth below.
The nature, extent, and quality of the services provided by the Adviser. In this regard, the Board reviewed the services being provided by Hudson Valley to the Fund including, without limitation, providing a continuous investment program for the Fund, adhering to the Fund’s investment restrictions, complying with the Trust’s policies and procedures, and voting proxies on behalf of the Fund. The Board considered the qualifications and experience of Hudson Valley’s portfolio managers who are responsible for the day to day management of the Fund, as well as the qualifications and experience of the other individuals at Hudson Valley who provide services to the Fund. The Board concluded that the quality, extent, and nature of the services provided by Hudson Valley to the Fund were satisfactory and adequate.
The investment performance of the Fund. In this regard, the Board compared the performance of the Fund with the performance of its benchmark index, custom peer group, and Morningstar category. The Board concluded that the investment performance of the Fund has been satisfactory.
The costs of the services provided and profits realized by the Adviser and its affiliates from their relationship with the Fund. In this regard, the Board considered Hudson Valley’s staffing, methods of operating, its financial condition, the asset level of the Fund; the overall expenses of the Fund, including the advisory fee; and the differences in fees and services to Hudson Valley’s other similar clients. The Board considered the current and anticipated
| HVIA EQUITY FUND |
| DISCLOSURE REGARDING APPROVAL OF INVESTMENT |
| ADVISORY AGREEMENT (Unaudited) (Continued) |
profitability of the Fund to Hudson Valley, if any. The Board considered its discussion with Hudson Valley regarding the Hudson Valley expense limitation agreement (the “ELA”), and considered Hudson Valley’s past fee reductions and expense reimbursements for the Fund. The Board concluded that the advisory fee to be paid to Hudson Valley by the Fund is reasonable in light of the nature and quality of services provided by Hudson Valley.
The extent to which economics of scale would be realized as the Fund grows and whether advisory fee levels reflect these economies of scale for the benefit of the Fund’s investors. In this regard, the Board considered that the Fund’s fee arrangements with Hudson Valley involve both the advisory fee and the ELA. The Board determined that while the advisory fee rate remained the same as asset levels increased, the shareholders of the Fund have experienced in the past, and will experience in the future, benefits from the ELA. The Board concluded that the advisory fee was reasonable in light of the information that was provided to the Trustees by Hudson Valley with respect to economies of scale.
After further discussion of the factors noted above and in reliance on the information provided by the Adviser and Trust Management, and taking into account the totality of all factors discussed and information presented at the meeting and previous meetings, the Board indicated its agreement to approve the continuance of the Agreement and the ELA. It was noted that in the Trustees’ deliberations regarding the approval of the continuance of the Agreement, the Trustees did not identify any particular information or factor that was all-important or controlling, and that each individual Trustee may have attributed different weights to various factors listed above. After full consideration of the above factors as well as other factors, the Board unanimously concluded that approval of the continuance of the Agreement was in the best interests of the Fund and its shareholders.
| CUSTOMER PRIVACY NOTICE |
| |
| FACTS | WHAT DOES THE HVIA EQUITY FUND (the “Fund”) DO WITH YOUR PERSONAL INFORMATION? |
| |
| Why? | Financial companies choose how they share your personal information. Federal law gives consumers the right to limit some but not all sharing. Federal law also requires us to tell you how we collect, share, and protect your personal information. Please read this notice carefully to understand what we do. |
| |
| What? | The types of personal information we collect and share depend on the product or service you have with us. This information can include: ■ Social Security number ■ Assets ■ Retirement Assets ■ Transaction History ■ Checking Account Information ■ Purchase History ■ Account Balances ■ Account Transactions ■ Wire Transfer Instructions When you are no longer our customer, we continue to share your information as described in this notice. |
| |
| How? | All financial companies need to share your personal information to run their everyday business. In the section below, we list the reasons financial companies can share their customers’ personal information; the reasons the Fund chooses to share; and whether you can limit this sharing. |
| |
| Reasons we can share your personal information | Does the
Fund share? | Can you limit
this sharing? |
For our everyday business purposes – Such as to process your transactions, maintain your account(s), respond to court orders and legal investigations, or report to credit bureaus | Yes | No |
For our marketing purposes – to offer our products and services to you | No | We don’t share |
| For joint marketing with other financial companies | No | We don’t share |
For our affiliates’ everyday business purposes – information about your transactions and experiences | No | We don’t share |
For our affiliates’ everyday business purposes – information about your creditworthiness | No | We don’t share |
| For nonaffiliates to market to you | No | We don’t share |
| | | | |
| Questions? | Call 1-888-209-8710 |
| Who we are |
| Who is providing this notice? | HVIA Equity Fund Ultimus Fund Distributors, LLC (Distributor) Ultimus Fund Solutions, LLC (Administrator) |
| What we do |
How does the Fund protect my personal information? | To protect your personal information from unauthorized access and use, we use security measures that comply with federal law. These measures include computer safeguards and secured files and buildings. Our service providers are held accountable for adhering to strict policies and procedures to prevent any misuse of your nonpublic personal information. |
How does the Fund collect my personal information? | We collect your personal information, for example, when you ■ Open an account ■ Provide account information ■ Give us your contact information ■ Make deposits or withdrawals from your account ■ Make a wire transfer ■ Tell us where to send the money ■ Tell us who receives the money ■ Show your government-issued ID ■ Show your driver’s license We also collect your personal information from other companies. |
Why can’t I limit all sharing? | Federal law gives you the right to limit only ■ Sharing for affiliates’ everyday business purposes – information about your creditworthiness ■ Affiliates from using your information to market to you ■ Sharing for nonaffiliates to market to you State laws and individual companies may give you additional rights to limit sharing. |
| |
| Definitions |
| Affiliates | Companies related by common ownership or control. They can be financial and nonfinancial companies. ■ Hudson Valley Investment Advisor, Inc., the investment adviser to the Fund, could be deemed to be an affiliate. |
| Nonaffiliates | Companies not related by common ownership or control. They can be financial and nonfinancial companies ■ The Fund does not share with nonaffiliates so they can market to you. |
| Joint marketing | A formal agreement between nonaffiliated financial companies that together market financial products or services to you. ■ The Fund does not jointly market. |
This page intentionally left blank.
This page intentionally left blank.
HVIA-SAR-23

NIA IMPACT SOLUTIONS FUND
SEMI-ANNUAL REPORT
August 31, 2023
(Unaudited)
| NIA IMPACT SOLUTIONS FUND | |
| LETTER TO SHAREHOLDERS (Unaudited) | September 18, 2023 |
Dear Shareholder,
We hope this letter finds you staying well. We are writing to share updates on the Nia Impact Solutions Fund (NIAGX). NIAGX initially launched May 10, 2022, and since inception has returned 2.05% (cumulative). Over the last six months through August 31, 2023, the fund was down -1.07%. The Fund’s top performing sectors were Financial, Consumer Services, and Energy. For this period, the bottom performing sectors were Technology, Industrials, and Healthcare. The top three positive contributing holdings were Palo Alto Networks, Inc., Vertex Pharmaceuticals, Inc., and Iron Mountain, Inc. The three individual holdings that detracted the most from performance were SolarEdge Technologies, Inc., Amalgamated Financial Corp, and TPI Composites, Inc.
Investment Environment
This six-month period from March through August was marked throughout by a mix of unusually contradicting economic indicators with much market volatility. The month of March stands out with the US banking crisis, resulting in part from interest rate hikes by the Federal Reserve (Fed). Several banks experienced deposit runs that led to failure, including one that became the largest U.S. bank failure since 2008. Representatives from the Fed and the U.S. Treasury, together with representatives from the Systemically Important Banks (SIBs), acted quickly to prevent further contagion, calm depositors, and maintain relative faith in the banking system. While legitimate concerns remained, these efforts appear to have been largely successful in preventing further crises for now.
Despite turmoil and price drops in the Financial sector, indices were broadly up in March, largely due to reemerging hope for a possible pause in interest rate hikes. The strongest financial performance came from large cap technology companies, which continued throughout April and May. While the markets seemingly also shrugged off the looming risk of the U.S. debt ceiling crisis through April, we saw broad weakness across large parts of the market in May. Fortunately, before month-end, progress towards raising the debt ceiling averted what could have become a more dramatic sell-off.
Broadly speaking, economic indicators over the course of these three months supported the thesis that inflation is cooling slightly, and that the global economy is also slowing. Despite many solid first quarter earnings reports from medium and small banks, the banking sub-sector continued to struggle in April. Loan officers tightening lending standards introduced concern that reduced access to capital for businesses as well as consumers could further contribute to a slowdown.
Amidst the banking volatility, a small number of large tech company stocks powered by the artificial intelligence (AI) trend, took off. Relatedly, a striking trend in the first quarter of the year was that seven stocks of large tech companies accounted for 88% of the S&P 500 gain and 74% of the NASDAQ Composite’s 17% gain. This concentrated performance continued through May and is one of this period’s most striking events. The dramatic spread between large cap (S&P 500) and small cap companies (Russell 2000), as well as between the tech heavy companies (NASDAQ Composite) and non-tech companies is also notable. The spread between the cap weighted S&P 500 and the equal weighted S&P 500 offers another window into the extremely concentrated performance of these large cap tech companies in this period.
Throughout June, and continuing through July and August, equity markets reacted positively to economic data and second quarter earnings reports, reflecting broad expectations for a soft landing and moderate concern over economic cooling. While there was some broadening of positive performance across sectors and stocks, the tech sector led, driven by a small number of mega caps stocks.
U.S. markets were buoyed by the promise of an imminent resolution to the looming debt ceiling crisis as we entered June. Shortly thereafter, the Fed announced after its June meeting that it would pause interest rate increases, the first since it began hiking rates to cool inflation some 13 months earlier. The Fed explained that this pause would allow time for the impact of past interest rate hikes to flow through the economy and be reflected in macroeconomic indicators. However, after its July meeting, the Fed increased interest rates by an additional 0.25%, yet determined to pause rates once more at its September meeting.
Two of the Fed’s most often referenced economic indicators are the Consumer Price Index (CPI) and core Personal Consumption Expenditures (PCE). The June and July CPI reports demonstrated more economic cooling than expected. However, with a large portion of the increase in the CPI attributable to a higher cost of shelter, which in our view is unlikely to change, we are concerned that the impacts of higher costs of both energy and food could result in higher inflation rates and reverse progress in cooling the economy in future quarters. Core PCE, which excludes food and energy costs, has stayed largely in the 4% range this year.
Constrained supply has been the key reason for strong pricing in the housing market, as high mortgage rates provide a strong disincentive for low-rate mortgage holders to move. As for energy, while prices did decline from higher levels last year, more recently they have increased due in part to efforts by oil producers to adhere to price supporting behavior. The recent trajectory of oil prices has been upward and the recent coup in Gabon, a member of OPEC, presents an additional political uncertainty as well as volatile pricing for oil.
On the more bullish end of the spectrum, many of the jobs and employment indicators remained objectively strong, which are typically at odds with an economic slowdown. For example, even though initial jobless claims began to increase, unemployment remains at historically low levels. The latest jobs numbers showed the US economy added jobs more in line with an expansion. Another bullish data point was the second quarter GDP of 2.4%, stronger than expected and far from the last negative GDP reading in the second quarter of 2022.
This second quarter earnings season had many companies beating earnings expectations through cost controls or moderating cost inflation, more than through revenue growth. Tech companies performed well in this period compared to the previous quarter.
We are certainly seeing parallels of the AI boom and the dot com boom, as AI enabled innovations disrupt and transform many aspects of our economy.
The MSCI ACWI IMI holds several of the seven tech stocks driving the major indices. Most of these companies do not satisfy our investment criteria, which include meeting our solution themes, gender inclusivity, and positive impact. From a fundamental analyst perspective, we continue to watch these seven companies driving MSCI and S&P 500 returns, understanding that these companies’ vulnerabilities, if unaddressed, could possibly be the source of their future weakness.
In many settings we believe that wider adoption of AI will be a clear positive and will likely enable improvements in every company that we hold. However, as we evaluate the use of AI in our company holdings, a primary consideration is unconscious and inherent bias, whether gender, racial, or socio-economic. The use of historic data and models by AI to form prescriptive solutions presents obvious risks and obstacles to resolving many of our societal problems today. Ethics, intellectual property rights, and data privacy are just some of the concerns that will need to be addressed with the use of AI.
Looking forward, we believe there are three key areas to watch for signs about what lies ahead. One is the yield curve, another is the consumer, and the third is China. With respect to the yield curve, while equity markets have lifted over the past several months, the bond market has signaled greater concern, with the interest rate on 2-year Treasury bonds higher than the rate on 10-year Treasuries.
With about 70% of our economy dependent on the consumer, employment and wage growth will need to keep pace with inflationary pressures and the resumption of student loan repayments. Consumers already have spent approximately $2 trillion in savings accumulated during the pandemic (Federal Reserve Bank of San Francisco) and both auto loan and credit card delinquencies are above pre-pandemic levels (Federal Reserve Bank of New York). With uncertainty of income and higher expenses, consumers are shifting their priorities for expenditures.
Finally, slower than expected growth in China following the relaxation of COVID restrictions has disappointed not just China, but the global economy. Some implications are lower contribution to global demand growth for commodities and consumer products, as well as lower global commodity prices. Overbuilding in the real estate sector led the country’s second largest property developer to file for bankruptcy in August, with several others following on its heels. As China seeks to regain its footing, we anticipate U.S. and international markets also shifting to adapt to supply chain issues.
Performance
Inception to date, the Fund (NIAGX) returned- 2.05% (cumulative), compared to the MSCI ACWI Investable Market Index (IMI)- which returned 12.25% (cumulative). In the six-month period ended August 31,2023, the NIAGX was down -1.07%, while the MSCI ACWI IMI returned 9.40%.
The clean energy sub-sector, which supports Nia’s Sustainable Planet solutions theme, was hit extremely hard during the period. These companies, which are currently categorized as either belonging to the Tech or Industrial, rather than the Energy sector, experienced a range of fundamental headwinds in the past quarter. In solar energy, higher interest rates caused a drop in residential demand that became a negative catalyst for the businesses more broadly, with some companies also experiencing supply constraints where demand remained. In wind energy, manufacturing problems and resulting supply chain disruptions impacted several companies, while counterparty risk has also emerged. While these companies provide important solutions for our future, their fundamental underperformance has been the primary challenge to the Fund in this performance period.
The strongest sectors for NIAGX in this period were Finance, Consumer Services, and traditional Energy, the latter two areas being sectors in which the Fund has little to no exposure. Our weakest sector by far was Technology, due to the underperformance of clean energy companies classified as tech, as well as our lack of direct exposure to the mega cap tech stocks driving benchmark performance. While many of these names are lauded as attractive AI plays, they do not meet our investment criteria for the Fund.
Similarly, within Industrials, clean energy holdings detracted from performance while companies benefiting from nearshoring trends and infrastructure spend continued to be a positive theme in the quarter.
The top three NIAGX contributors during this six-month period were Palo Alto Networks, Inc., Vertex Pharmaceuticals, Inc., and Iron Mountain, Inc. The top three detractors were SolarEdge Technologies, Inc., Amalgamated Financial Corp, and TPI Composites, Inc.. Detailed performance explanations for these names are included below, as well as their total return and total attribution effect.
Portfolio Holdings
Top Performers - Nia Roses:
Palo Alto Networks, Inc. (29.16% return, 0.52% attribution) This network security solutions company provides cybersecurity and firewalls to a wide range of customers, aligning with our Education, Communications & Financial Services solution theme, while also satisfying our gender representation criteria with a quarter of the executive suite and 40% of the board comprised of women. The company’s fourth quarter earnings report in mid-August not only beat expectations, but also provided positive forward-looking comments that included expectations for 17-19% billings growth. Despite some cautious customer spending in the market, aggregate demand remains strong for Palo Alto Networks. Strong execution of the company’s strategies across areas like Platformization (comprehensive platforms), cloud initiatives, and leveraging AI across strategies, all supported the company’s strong results. Going forward, we expect to hear more about how the company is leveraging AI to support its cybersecurity capabilities.
Vertex Pharmaceuticals, Inc. (20.00% return, 0.33% attribution) This global biotechnology company has invested in developing and growing its portfolio of Cystic Fibrosis (CF) treatments, as well as a pipeline of treatments beyond CF. Exciting examples include early-stage trials for gene-editing therapy in sickle cell disease and transfusion-dependent beta-thalassemia, as well as a treatment for acute pain. The company reported a strong second quarter and raised earning guidance. The company appears well positioned, with many potential trial data and approval catalysts possible in the second half of 2023 and into next year. This company’s business is aligned with our Healthcare solution theme, and in addition to meeting our gender representation criteria, it is also led by a female CEO.
Iron Mountain, Inc. (23.21% return, 0.31% attribution) Over the years, this company’s business of helping customers manage their information, has evolved, and expanded from secure paper file storage, to secure digital storage, cloud services, and even extends to regulatory compliance and disaster recovery. Having 95% of the Fortune 1000 companies as customers, Iron Mountain’s services support a wide range of objectives related to securing data, including those aligned with our Education, Communications, & Financial Services solution themes. With 20% of the executive suite and 40% of the board positions held by women, Iron Mountain meets our gender representation criteria. With strong experience providing data management, Iron Mountain is exploring AI to support its customers with their information needs. The stock gradually increased in value during the year due to growing appreciation of the low relative valuation. We continue to like the company’s valuation, solid cash flow generation, and dividend payments.
Top Detractors - Nia Thorns:
SolarEdge Technologies, Inc. (-48.86% return, -1.22% attribution) Solaredge (SEDG) is a producer of renewable energy technology with a focus on inverter solutions. Deriving revenue entirely from the provision of renewable energy for both residential and commercial uses, Solaredge fits Nia’s “Sustainable Planet” solution theme. SEDG released Q2 results against the backdrop of softening residential demand for renewable energy systems due to higher interest rates and the introduction of Net Energy Metering 3.0 in California, which led to lower residential shipments for SEDG. This factor combined with inventory build-up in Europe produced a relatively conservative outlook on sales for the next quarter as well as the fiscal year. This narrowed outlook is likely to be compounded by a seasonally weaker winter quarter for solar energy while the inventory and demand normalization is likely to continue into the next fiscal year. Due to these challenges, despite SEDG’s promising business model, we decided to exit our position.
Amalgamated Financial Corp (-23.00% return, -0.93% attribution) Amalgamated Bank is a certified B-corp that considers environmental, social, and governance (ESG) principles in every aspect of its business model. Examples include not financing fossil fuel projects and ensuring that the bank’s cash is in money market funds with no ties to fossil fuels. Amalgamated is majority owned by Workers United and has origins rooted in labor rights. It is committed to increasing access to affordable banking and financial services through efforts such as expansion of ATM locations and offering free financial counseling to all customers and a suite of services tailored for small business owners. These elements support our Education, Communications, & Financial Services solution theme. Besides being led by a female CEO who is a person of color (POC), the board’s gender representation is 50% and management adheres to leading DEI practices.
In March, the company’s stock declined sharply along with all other small banks, due to the banking crisis. In sharp contrast to the distressed banks, however, virtually all of Amalgamated’s demand deposits were and are Federally insured. Financial results for the first quarter confirmed the overall strength of the bank’s positioning with respect to both securities classified as held-to-maturity, net deposit outflows, and commercial real estate exposure. While the need to increase rates paid on deposits has created a near-term profit headwind, this does not diminish what we view as the long-term value of the business.
TPI Composites, Inc. (-56.31% return, -0.86% attribution) Similar to most companies in the renewable energy space, the stock of this maker of composite materials for the wind turbine market has experienced significant volatility over the past year. A critically important provider of material used in clean energy applications like wind turbines and electric vehicles (EVs), aligned with Nia’s Sustainable Planet and Sustainable & Affordable Transportation solution themes, while satisfying our minimum gender representation criteria. Last year, TPI Composite’s stock reacted very positively to passage of The Inflation Reduction Act, though this year, concerns around the pace of the build out of wind projects have weighed on the sector. In late July, the company pre-released disappointing second quarter earnings and forward earnings guidance. Production challenges at its Mexican facility were partly to blame though, unfortunately, there were additional problems. Besides a slowing pace of build out of customer wind projects, a customer in the EV bus market filed for Chapter 11 bankruptcy in August. Given these current difficulties and challenging outlook, we have decreased our holding during this challenging time.
With much care,
The Nia Team
Past performance is not predictive of future performance. Investment results and principal value will fluctuate so that shares, when redeemed, may be worth more or less than their original cost. Current performance may be higher or lower than the performance data quoted. Performance data current to the most recent month end are available by calling 1-833-571-2833.
Investors are advised to consider the investment objectives, risks, charges and expenses of the Fund carefully before investing. The Fund’s prospectus contains this and other important information. To obtain a copy of the Fund’s prospectus call 1-833-571-2833 or visit the Fund’s website at www.niaimpactfunds.com and a copy will be sent to you free of charge. Please read the prospectus carefully before you invest. The Fund is distributed by Ultimus Fund Distributors, LLC.
This Letter to Shareholders seeks to describe some of the Adviser’s current opinions and views of the financial markets. Although the Adviser believes it has a reasonable basis for any opinions or views expressed, actual results may differ, sometimes significantly so, from those expected or expressed. The securities held by the Fund that are discussed in the Letter to Shareholders were held during the period covered by this Report. They do not comprise the entire investment portfolio of the Fund, may be sold at any time and may no longer be held by the Fund. For a complete list of securities held by the Fund as of August 31, 2023, please see the Schedule of Investments section of the semi-annual report. The opinions of the Adviser with respect to those securities may change at any time.
Statements in the Letter to Shareholders that reflect projections or expectations for future financial or economic performance of the Fund and the market in general and statements of the Fund’s plans and objectives for future operations are forward-looking statements. No assurance can be given that actual results or events will not differ materially from those projected, estimated, assumed, or anticipated in any such forward-looking statements. Important factors that could result in such differences, in addition to factors noted with such forward-looking statements include, without limitation, general economic conditions, such as inflation, recession, and interest rates.
NIA IMPACT SOLUTIONS FUND
PORTFOLIO INFORMATION
August 31, 2023 (Unaudited)
Sector Diversification (% of Net Assets)
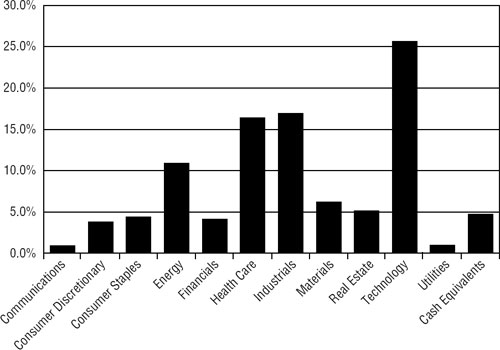
| | % of |
| Top 10 Equity Holdings | Net Assets |
| Stantec, Inc. | 4.0% |
| International Business Machines Corporation | 4.0% |
| Vertex Pharmaceuticals, Inc. | 3.8% |
| First Solar, Inc. | 3.6% |
| AECOM | 3.5% |
| Palo Alto Networks, Inc. | 3.5% |
| Gilead Sciences, Inc. | 3.3% |
| Danone S.A. - ADR | 2.9% |
| Iron Mountain, Inc. | 2.9% |
| Splunk, Inc. | 2.7% |
| NIA IMPACT SOLUTIONS FUND |
| SCHEDULE OF INVESTMENTS |
| August 31, 2023 (Unaudited) |
| COMMON STOCKS — 95.3% | | Shares | | | Value | |
| Communications — 0.9% | | | | | | | | |
| Telecommunications — 0.9% | | | | | | | | |
| PLDT, Inc. - ADR | | | 28,438 | | | $ | 580,420 | |
| | | | | | | | | |
| Consumer Discretionary — 3.8% | | | | | | | | |
| Consumer Services — 2.3% | | | | | | | | |
| Stride, Inc. (a) | | | 32,780 | | | | 1,392,822 | |
| | | | | | | | | |
| E-Commerce Discretionary — 0.4% | | | | | | | | |
| Etsy, Inc. (a) | | | 3,752 | | | | 276,035 | |
| | | | | | | | | |
| Home & Office Products — 1.1% | | | | | | | | |
| Steelcase, Inc. - Class A | | | 75,344 | | | | 683,370 | |
| | | | | | | | | |
| Consumer Staples — 4.4% | | | | | | | | |
| Beverages — 1.1% | | | | | | | | |
| Vita Coco Company, Inc. (The) (a) | | | 23,677 | | | | 669,822 | |
| | | | | | | | | |
| Food — 3.3% | | | | | | | | |
| Danone S.A. - ADR | | | 155,729 | | | | 1,818,915 | |
| Hain Celestial Group, Inc. (The) (a) | | | 23,851 | | | | 252,582 | |
| | | | | | | | 2,071,497 | |
| Energy — 10.9% | | | | | | | | |
| Renewable Energy — 10.9% | | | | | | | | |
| Ameresco, Inc. - Class A (a) | | | 12,185 | | | | 529,926 | |
| Brookfield Renewable Corporation - Class A | | | 31,019 | | | | 866,981 | |
| First Solar, Inc. (a) | | | 11,799 | | | | 2,231,427 | |
| Maxeon Solar Technologies Ltd. (a) | | | 24,894 | | | | 392,329 | |
| SolarEdge Technologies, Inc. (a) | | | 4,218 | | | | 685,720 | |
| SunPower Corporation (a) | | | 42,811 | | | | 306,527 | |
| Sunrun, Inc. (a) | | | 29,866 | | | | 466,806 | |
| TPI Composites, Inc. (a) | | | 68,471 | | | | 345,778 | |
| Vestas Wind Systems A/S - ADR (a) | | | 121,422 | | | | 927,664 | |
| | | | | | | | 6,753,158 | |
| Financials — 4.1% | | | | | | | | |
| Asset Management — 1.9% | | | | | | | | |
| Sanlam Ltd. - ADR | | | 161,764 | | | | 1,158,230 | |
| | | | | | | | | |
| Banking — 2.2% | | | | | | | | |
| Amalgamated Financial Corporation | | | 77,593 | | | | 1,390,467 | |
| NIA IMPACT SOLUTIONS FUND |
| SCHEDULE OF INVESTMENTS (Continued) |
| COMMON STOCKS — 95.3% (Continued) | | Shares | | | Value | |
| Health Care — 16.4% | | | | | | | | |
| Biotech & Pharma — 11.4% | | | | | | | | |
| Daiichi Sankyo Company Ltd. - ADR | | | 36,209 | | | $ | 1,067,079 | |
| Gilead Sciences, Inc. | | | 27,105 | | | | 2,072,990 | |
| Moderna, Inc. (a) | | | 7,163 | | | | 809,921 | |
| Organon & Company | | | 33,368 | | | | 732,761 | |
| Vertex Pharmaceuticals, Inc. (a) | | | 6,809 | | | | 2,371,847 | |
| | | | | | | | 7,054,598 | |
| Medical Equipment & Devices — 5.0% | | | | | | | | |
| Hologic, Inc. (a) | | | 20,151 | | | | 1,506,086 | |
| Thermo Fisher Scientific, Inc. | | | 2,844 | | | | 1,584,392 | |
| | | | | | | | 3,090,478 | |
| Industrials — 16.9% | | | | | | | | |
| Commercial Support Services — 3.9% | | | | | | | | |
| AMN Healthcare Services, Inc. (a) | | | 15,460 | | | | 1,366,355 | |
| Schnitzer Steel Industries, Inc. - Class A | | | 30,519 | | | | 1,013,231 | |
| | | | | | | | 2,379,586 | |
| Electrical Equipment — 2.6% | | | | | | | | |
| Schneider Electric SE - ADR | | | 46,430 | | | | 1,593,942 | |
| | | | | | | | | |
| Engineering & Construction — 7.5% | | | | | | | | |
| AECOM | | | 25,098 | | | | 2,202,350 | |
| Stantec, Inc. | | | 36,940 | | | | 2,468,700 | |
| | | | | | | | 4,671,050 | |
| Machinery — 2.9% | | | | | | | | |
| Mueller Water Products, Inc. - Series A | | | 45,956 | | | | 648,898 | |
| Xylem, Inc. | | | 11,233 | | | | 1,163,065 | |
| | | | | | | | 1,811,963 | |
| Materials — 6.2% | | | | | | | | |
| Chemicals — 1.3% | | | | | | | | |
| Chr. Hansen Holding A/S - ADR | | | 48,592 | | | | 795,937 | |
| | | | | | | | | |
| Construction Materials — 2.5% | | | | | | | | |
| Carlisle Companies, Inc. | | | 5,948 | | | | 1,564,443 | |
| | | | | | | | | |
| Containers & Packaging — 1.5% | | | | | | | | |
| Brambles Ltd. - ADR | | | 46,685 | | | | 902,421 | |
| | | | | | | | | |
| Forestry, Paper & Wood Products — 0.9% | | | | | | | | |
| Sylvamo Corporation | | | 13,009 | | | | 543,386 | |
| NIA IMPACT SOLUTIONS FUND |
| SCHEDULE OF INVESTMENTS (Continued) |
| COMMON STOCKS — 95.3% (Continued) | | Shares | | | Value | |
| Real Estate — 5.1% | | | | | | | | |
| Real Estate Owners & Developers — 0.8% | | | | | | | | |
| City Developments Ltd. - ADR | | | 99,694 | | | $ | 492,987 | |
| | | | | | | | | |
| REITs — 4.3% | | | | | | | | |
| Hannon Armstrong Sustainable Infrastructure Capital, Inc. | | | 40,810 | | | | 912,920 | |
| Iron Mountain, Inc. | | | 27,893 | | | | 1,772,321 | |
| | | | | | | | 2,685,241 | |
| Technology — 25.6% | | | | | | | | |
| Semiconductors — 7.2% | | | | | | | | |
| Infineon Technologies AG - ADR | | | 38,844 | | | | 1,393,723 | |
| STMicroelectronics N.V. | | | 29,207 | | | | 1,380,323 | |
| Taiwan Semiconductor Manufacturing Company Ltd. - ADR | | | 18,065 | | | | 1,690,342 | |
| | | | | | | | 4,464,388 | |
| Software — 9.8% | | | | | | | | |
| Autodesk, Inc. (a) | | | 2,751 | | | | 610,557 | |
| Fortinet, Inc. (a) | | | 26,363 | | | | 1,587,316 | |
| Palo Alto Networks, Inc. (a) | | | 8,811 | | | | 2,143,717 | |
| Splunk, Inc. (a) | | | 13,997 | | | | 1,697,276 | |
| | | | | | | | 6,038,866 | |
| Technology Hardware — 2.4% | | | | | | | | |
| Apple, Inc. | | | 7,830 | | | | 1,471,022 | |
| | | | | | | | | |
| Technology Services — 6.2% | | | | | | | | |
| International Business Machines Corporation | | | 16,811 | | | | 2,468,359 | |
| Wolters Kluwer N.V. - ADR | | | 11,476 | | | | 1,382,743 | |
| | | | | | | | 3,851,102 | |
| Utilities — 1.0% | | | | | | | | |
| Gas & Water Utilities — 1.0% | | | | | | | | |
| California Water Service Group | | | 12,784 | | | | 642,396 | |
| | | | | | | | | |
| Total Common Stocks (Cost $59,561,233) | | | | | | $ | 59,029,627 | |
| NIA IMPACT SOLUTIONS FUND |
| SCHEDULE OF INVESTMENTS (Continued) |
| MONEY MARKET FUNDS — 4.5% | | Shares | | | Value | |
| First American Government Obligations Fund - Class X, 5.25% (b) (Cost $2,780,945) | | | 2,780,945 | | | $ | 2,780,945 | |
| | | | | | | | | |
| Investments at Value — 99.8% (Cost $62,342,178) | | | | | | $ | 61,810,572 | |
| | | | | | | | | |
| Other Assets in Excess of Liabilities — 0.2% | | | | | | | 149,337 | |
| | | | | | | | | |
| Net Assets — 100.0% | | | | | | $ | 61,959,909 | |
A/S - Aktieselskab
ADR - American Depositary Receipt
AG - Aktiengesellschaft
N.V. - Naamloze Vennootschap
S.A. - Societe Anonyme
SE - Societe Europaea
| (a) | Non-income producing security. |
| (b) | The rate shown is the 7-day effective yield as of August 31, 2023. |
See accompanying notes to financial statements.
| NIA IMPACT SOLUTIONS FUND |
| STATEMENT OF ASSETS AND LIABILITIES |
| August 31, 2023 (Unaudited) |
| ASSETS | | | | |
| Investments in securities: | | | | |
| At cost | | $ | 62,342,178 | |
| At value (Note 2) | | $ | 61,810,572 | |
| Receivable for capital shares sold | | | 45,465 | |
| Dividends receivable | | | 93,374 | |
| Tax reclaims receivable | | | 18,944 | |
| Other assets | | | 30,679 | |
| Total assets | | | 61,999,034 | |
| | | | | |
| LIABILITIES | | | | |
| Payable to Adviser (Note 4) | | | 16,828 | |
| Payable to administrator (Note 4) | | | 10,380 | |
| Other accrued expenses | | | 11,917 | |
| Total liabilities | | | 39,125 | |
| | | | | |
| NET ASSETS | | $ | 61,959,909 | |
| | | | | |
| NET ASSETS CONSIST OF: | | | | |
| Paid-in capital | | $ | 64,044,879 | |
| Accumulated deficit | | | (2,084,970 | ) |
| NET ASSETS | | $ | 61,959,909 | |
| | | | | |
| Shares of beneficial interest outstanding (unlimited number of shares authorized, no par value) | | | 6,089,234 | |
| | | | | |
| Net asset value, offering price and redemption price per share (Note 2) | | $ | 10.18 | |
See accompanying notes to financial statements.
| NIA IMPACT SOLUTIONS FUND |
| STATEMENT OF OPERATIONS |
| For the Six Months Ended August 31, 2023 (Unaudited) |
| INVESTMENT INCOME | | | | |
| Dividends | | $ | 577,164 | |
| Foreign witholding taxes on dividends | | | (40,619 | ) |
| Total investment income | | | 536,545 | |
| | | | | |
| EXPENSES | | | | |
| Management fees (Note 4) | | | 258,597 | |
| Administration fees (Note 4) | | | 28,419 | |
| Registration and filing fees | | | 22,451 | |
| Transfer agent fees (Note 4) | | | 16,964 | |
| Fund accounting fees (Note 4) | | | 15,150 | |
| Legal fees | | | 12,534 | |
| Offering costs (Note 2) | | | 11,513 | |
| Trustees’ fees and expenses (Note 4) | | | 9,670 | |
| Audit and tax services fees | | | 9,415 | |
| Compliance fees (Note 4) | | | 7,500 | |
| Shareholder reporting expenses | | | 5,280 | |
| Custodian and bank service fees | | | 4,607 | |
| Networking fees | | | 3,011 | |
| Postage and supplies | | | 1,916 | |
| Insurance expense | | | 1,654 | |
| Other expenses | | | 3,624 | |
| Total expenses | | | 412,305 | |
| Less fee reductions by the Adviser (Note 4) | | | (142,820 | ) |
| Net expenses | | | 269,485 | |
| | | | | |
| NET INVESTMENT INCOME | | | 267,060 | |
| | | | | |
| REALIZED AND UNREALIZED LOSSES ON INVESTMENTS | | | | |
| Net realized losses from investments transactions | | | (921,370 | ) |
| Net change in unrealized appreciation (depreciation) on investments | | | (312,558 | ) |
| NET REALIZED AND UNREALIZED LOSSES ON INVESTMENTS | | | (1,233,928 | ) |
| | | | | |
| NET DECREASE IN NET ASSETS RESULTING FROM OPERATIONS | | $ | (966,868 | ) |
See accompanying notes to financial statements.
| NIA IMPACT SOLUTIONS FUND |
| STATEMENT OF CHANGES IN NET ASSETS |
| | | Six Months | | | | |
| | | Ended | | | Period | |
| | | August 31, | | | Ended | |
| | | 2023 | | | February 28, | |
| | | (Unaudited) | | | 2023(a) | |
| FROM OPERATIONS | | | | | | | | |
| Net investment income | | $ | 267,060 | | | $ | 90,249 | |
| Net realized losses from investment transactions | | | (921,370 | ) | | | (879,962 | ) |
| Net change in unrealized appreciation (depreciation) on investments | | | (312,558 | ) | | | (219,048 | ) |
| Net decrease in net assets resulting from operations | | | (966,868 | ) | | | (1,008,761 | ) |
| | | | | | | | | |
| DISTRIBUTIONS TO SHAREHOLDERS | | | — | | | | (109,730 | ) |
| | | | | | | | | |
| FROM CAPITAL SHARE TRANSACTIONS | | | | | | | | |
| Proceeds from shares sold | | | 13,739,614 | | | | 50,545,648 | |
| Net asset value of shares issued in reinvestment of distributions to shareholders | | | — | | | | 106,407 | |
| Payments for shares redeemed | | | (258,517 | ) | | | (87,884 | ) |
| Net increase in net assets from capital share transactions | | | 13,481,097 | | | | 50,564,171 | |
| | | | | | | | | |
| TOTAL INCREASE IN NET ASSETS | | | 12,514,229 | | | | 49,445,680 | |
| | | | | | | | | |
| NET ASSETS | | | | | | | | |
| Beginning of period | | | 49,445,680 | | | | — | |
| End of period | | $ | 61,959,909 | | | $ | 49,445,680 | |
| | | | | | | | | |
| CAPITAL SHARES ACTIVITY | | | | | | | | |
| Shares sold | | | 1,309,026 | | | | 4,802,990 | |
| Shares reinvested | | | — | | | | 10,803 | |
| Shares redeemed | | | (25,185 | ) | | | (8,400 | ) |
| Net increase in shares outstanding | | | 1,283,841 | | | | 4,805,393 | |
| Shares outstanding, beginning of period | | | 4,805,393 | | | | — | |
| Shares outstanding, end of period | | | 6,089,234 | | | | 4,805,393 | |
| (a) | Represents the period from the commencement of operations (May 10, 2022) through February 28, 2023. |
See accompanying notes to financial statements.
| NIA IMPACT SOLUTIONS FUND |
| FINANCIAL HIGHLIGHTS |
Per Share Data for a Share Outstanding Throughout each Period
| | | Six Months | | | | |
| | | Ended | | | | |
| | | August 31, | | | Period Ended | |
| | | 2023 | | | February 28, | |
| | | (Unaudited) | | | 2023(a) | |
| Net asset value at beginning of period | | $ | 10.29 | | | $ | 10.00 | |
| | | | | | | | | |
| Income (loss) from investment operations: | | | | | | | | |
| Net investment income | | | 0.04 | | | | 0.02 | |
| Net realized and unrealized gains (losses) on investments | | | (0.15 | ) | | | 0.29 | (b) |
| Total from investment operations | | | (0.11 | ) | | | 0.31 | |
| | | | | | | | | |
| Less distributions from net investment income | | | — | | | | (0.02 | ) |
| | | | | | | | | |
| Net asset value at end of period | | $ | 10.18 | | | $ | 10.29 | |
| | | | | | | | | |
| Total return (c) | | | (1.07 | %) (d) | | | 3.16 | % (d) |
| | | | | | | | | |
| Net assets at end of period (000’s) | | $ | 61,960 | | | $ | 49,446 | |
| | | | | | | | | |
| Ratios/supplementary data: | | | | | | | | |
| Ratio of total expenses to average net assets | | | 1.51 | % (e)(g) | | | 1.57 | % (e)(g) |
| Ratio of net expenses to average net assets (f) | | | 0.99 | % (e)(g) | | | 0.99 | % (e)(g) |
| Ratio of net investment income to average net assets (f) | | | 0.98 | % (e) | | | 0.30 | % (e) |
| Portfolio turnover rate | | | 3 | % (d) | | | 10 | % (d) |
| (a) | Represents the period from the commencement of operations (May 10, 2022) through February 28, 2023. |
| (b) | Represents a balancing figure derived from other amounts in the financial highlights table that captures all other changes affecting net asset value per share. This per share amount does not correlate to the aggregate of the net realized and unrealized losses on the Statement of Operations for the same period. |
| (c) | Total return is a measure of the change in value of an investment in the Fund over the periods covered. The returns shown do not reflect the deduction of taxes a shareholder would pay on Fund distributions, if any, or the redemption of Fund shares. The total returns would be lower if the Adviser had not reduced fees (Note 4). |
| (f) | Ratio was determined after management fee reductions by the Adviser (Note 4). |
| (g) | Includes costs to organize the Fund of 0.04%(e) and 0.01%(e) for the periods ended August 31, 2023 and February 28, 2023. |
See accompanying notes to financial statements.
| NIA IMPACT SOLUTIONS FUND |
| NOTES TO FINANCIAL STATEMENTS |
| August 31, 2023 (Unaudited) |
Nia Impact Solutions Fund (the “Fund”) is a diversified series of Ultimus Managers Trust (the “Trust”). The Trust is an open-end management investment company established as an Ohio business trust under a Declaration of Trust dated February 28, 2012. Other series of the Trust are not incorporated in this report. The Fund commenced operations on May 10, 2022.
The investment objective of the Fund is to seek to achieve long-term capital appreciation by investing in companies that contribute towards advancements in the areas of diversity and inclusion, sustainability and/or social justice.
| 2. | Significant Accounting Policies |
The Fund follows accounting and reporting guidance under Financial Accounting Standards Board Accounting Standards Codification Topic 946, “Financial Services – Investment Companies.” The following is a summary of the Fund’s significant accounting policies used in the preparation of its financial statements. These policies are in conformity with accounting principles generally accepted in the United States of America (“GAAP”).
Regulatory update – Tailored Shareholder Reports for Mutual Funds and Exchange-Traded Funds (“ETFs”) – Effective January 24, 2023, the Securities and Exchange Commission (the “SEC”) adopted rule and form amendments to require mutual funds and ETFs to transmit concise and visually engaging streamlined annual and semiannual reports to shareholders that highlight key information. Other information, including financial statements, will no longer appear in a streamlined shareholder report but must be available online, delivered free of charge upon request, and filed on a semiannual basis on Form N-CSR. The rule and form amendments have a compliance date of July 24, 2024. At this time, management is evaluating the impact of these amendments on the shareholder reports for the Fund.
Securities valuation – The Fund values its portfolio securities at market value as of the close of regular trading on the New York Stock Exchange (the “NYSE”) (normally 4:00 p.m. Eastern time) on each business day the NYSE is open for business. The Fund values its listed securities on the basis of the security’s last sale price on the security’s primary exchange, if available, otherwise at the exchange’s most recently quoted mean price. NASDAQ-listed securities are valued at the NASDAQ Official Closing Price. Investments representing shares of other registered open-end investment companies that are not listed on an exchange, including money market funds, are valued at their net asset value (“NAV”) as reported by such companies. When using a quoted price and when the market is considered active, the security will be classified as Level 1 within the fair value hierarchy (see below). In the event that market quotations are not readily available or are considered unreliable due to market or other events, the Fund values its securities and other assets at fair value as determined by Nia Impact Capital (the “Adviser”), as the Fund’s valuation designee, in accordance with procedures adopted by the Board of Trustees (the “Board”) pursuant to Rule 2a-5 under the
| NIA IMPACT SOLUTIONS FUND |
| NOTES TO FINANCIAL STATEMENTS (Continued) |
Investment Company Act of 1940, as amended (the “1940 Act”). Under these procedures, the securities will be classified as Level 2 or 3 within the fair value hierarchy, depending on the inputs used. Unavailable or unreliable market quotes may be due to the following factors: a substantial bid-ask spread; infrequent sales resulting in stale prices; insufficient trading volume; small trade sizes; a temporary lapse in any reliable pricing source; and actions of the securities or futures markets, such as the suspension or limitation of trading. As a result, the prices of securities used to calculate the Fund’s NAV may differ from quoted or published prices for the same securities.
GAAP establishes a single authoritative definition of fair value, sets out a framework for measuring fair value, and requires additional disclosures about fair value measurements.
Various inputs are used in determining the value of the Fund’s investments. These inputs are summarized in the three broad levels listed below:
| ● | Level 1 – quoted prices in active markets for identical securities |
| ● | Level 2 – other significant observable inputs |
| ● | Level 3 – significant unobservable inputs |
The inputs or methods used for valuing securities are not necessarily an indication of the risks associated with investing in those securities. The inputs used to measure fair value may fall into different levels of the fair value hierarchy. In such cases, for disclosure purposes, the level in the fair value hierarchy within which the fair value measurement falls in its entirety is determined based on the lowest level input that is significant to the fair value measurement.
The following is a summary of the Fund’s investments based on the inputs used to value the investments as of August 31, 2023, by security type:
| | | Level 1 | | | Level 2 | | | Level 3 | | | Total | |
| Common Stocks | | $ | 59,029,627 | | | $ | — | | | $ | — | | | $ | 59,029,627 | |
| Money Market Funds | | | 2,780,945 | | | | — | | | | — | | | | 2,780,945 | |
| Total | | $ | 61,810,572 | | | $ | — | | | $ | — | | | $ | 61,810,572 | |
| | | | | | | | | | | | | | | | | |
Refer to the Fund’s Schedule of Investments for a listing of common stocks by sector and industry type. The Fund did not hold any derivative instruments or any assets or liabilities that were measured at fair value on a recurring basis using significant unobservable inputs (Level 3) as of or during the six months ended August 31, 2023.
Cash – The Fund’s cash, if any, is held in a bank account with balances which, at times, may exceed United States federally insured limits set by the Federal Deposit Insurance Corporation. The Fund maintains these balances with a high quality financial institution and may incur charges on cash overdrafts.
Share valuation – The NAV per share of the Fund is calculated daily by dividing the total value of the Fund’s assets, less liabilities, by the number of shares outstanding. The offering price and redemption price per share of the Fund is equal to the NAV per share.
| NIA IMPACT SOLUTIONS FUND |
| NOTES TO FINANCIAL STATEMENTS (Continued) |
Investment income – Dividend income is recorded on the ex-dividend date. Non-cash dividends included in dividend income, if any, are recorded at the fair market value of the security received. Interest income is accrued as earned. Withholding taxes on foreign dividends, if any, have been recorded in accordance with the Fund’s understanding of the applicable country’s tax rules and rates. Interest income, if any, is accrued as earned.
Investment transactions – Investment transactions are accounted for on the trade date. Realized gains and losses on investments sold are determined on a specific identification basis.
Common expenses – Common expenses of the Trust are allocated among the Fund and the other series of the Trust based on the relative net assets of each series, the number of series in the Trust, or the nature of the services performed and the relative applicability to each series.
Offering costs – The Adviser advanced some of the Fund’s initial offering costs and was subsequently reimbursed by the Fund. Costs of $15,350 incurred in connection with the offering and initial registration had been deferred and are being subsequently amortized on a straight-line basis over the first twelve months after commencement of operations. As of August 31, 2023, there were no unamortized offering costs remaining in the Fund.
Distributions to shareholders – The Fund distributes to shareholders any net investment income dividends and net realized capital gains on an annual basis. The amount of such dividends and distributions are determined in accordance with federal income tax regulations, which may differ from GAAP. Dividends and distributions to shareholders are recorded on the ex-dividend date. For the period ended February 28, 2023, the tax character of all distributions paid to shareholders was ordinary income. There were no distributions paid to shareholders during the six months ended August 31, 2023.
Estimates – The preparation of financial statements in conformity with GAAP requires management to make estimates and assumptions that affect the reported amounts of assets and liabilities and disclosure of contingent assets and liabilities as of the date of the financial statements and the reported amounts of increase (decrease) in net assets from operations during the reporting period. Actual results could differ from those estimates.
Federal income tax – The Fund has qualified and intends to continue to qualify as a regulated investment company under the Internal Revenue Code of 1986, as amended (the “Code”). Qualification generally will relieve the Fund of liability for federal income taxes to the extent 100% of its net investment income and net realized capital gains are distributed in accordance with the Code.
In order to avoid imposition of the excise tax applicable to regulated investment companies, it is also the Fund’s intention to declare as dividends in each calendar year equal to at least 98% of its net investment income (earned during the calendar year) and 98.2% of its net realized capital gains (earned during the twelve months ended October 31) plus undistributed amounts from prior years.
| NIA IMPACT SOLUTIONS FUND |
| NOTES TO FINANCIAL STATEMENTS (Continued) |
The following information is computed on a tax basis for each item as of February 28, 2023:
| | | | |
| Tax cost of investments | | $ | 52,524,308 | |
| Gross unrealized appreciation | | $ | 3,366,170 | |
| Gross unrealized depreciation | | | (3,654,214 | ) |
| Net unrealized depreciation | | | (288,044 | ) |
| Accumulated capital and other losses | | | (830,058 | ) |
| Accumulated deficit | | $ | (1,118,102 | ) |
| | | | | |
The federal tax cost, unrealized appreciation (depreciation) as of August 31, 2023 is as follows:
| | | | |
| Tax cost of investments | | $ | 62,381,339 | |
| Gross unrealized appreciation | | $ | 5,335,024 | |
| Gross unrealized depreciation | | | (5,905,791 | ) |
| Net unrealized depreciation | | $ | (570,767 | ) |
| | | | | |
The values of federal income tax cost of investments and the financial statement cost of investments may be temporarily different (“book/tax differences”). These book/tax differences are due to the timing of the recognition of capital gains or losses under income tax regulations and GAAP, primarily due to the tax deferral of losses on wash sales.
The Fund recognizes the tax benefits or expenses of uncertain tax positions only when the position is “more likely than not” of being sustained assuming examination by tax authorities. Management has reviewed the Fund’s tax positions for the current and all open tax periods and has concluded that no provision for unrecognized tax benefits or expenses is required in these financial statements.
As of February 28, 2023, the Fund had short-term capital loss carryforward of $810,966, for federal income tax purposes, which may be carried forward indefinitely. This capital loss carryforward is available to offset net realized gains in the current and future years, thereby reducing future taxable gains.
The Fund identifies its major tax jurisdiction as U.S. Federal. The Fund recognizes interest and penalties, if any, related to unrecognized tax benefits as income tax on the Statement of Operations. During the six months ended August 31, 2023, the Fund did not incur any interest penalties.
| 3. | Investment Transactions |
During the six months ended August 31, 2023, cost of purchases and proceeds from sales of investment securities, other than short-term investments, amounted to $14,634,432 and $1,778,962, respectively.
| NIA IMPACT SOLUTIONS FUND |
| NOTES TO FINANCIAL STATEMENTS (Continued) |
| 4. | Transactions with Related Parties |
INVESTMENT ADVISORY AGREEMENT
The Fund’s investments are managed by Nia Impact Capital (the “Adviser”) pursuant to the terms of an Investment Advisory Agreement. The Fund pays the Adviser a management fee, computed and accrued daily and paid monthly, at the annual rate of 0.95% of average daily net assets.
Pursuant to an Expense Limitation Agreement (“ELA”) between the Fund and the Adviser, the Adviser has agreed contractually, until June 30, 2025, to reduce its management fees and reimburse other expenses to the extent necessary to limit total annual fund operating expenses (exclusive of brokerage costs, taxes, interest, borrowing costs such as interest and dividend expenses on securities sold short, costs to organize the Fund, acquired fund fees and expenses, and extraordinary expenses such as litigation and merger or reorganization costs and other expenses not incurred in the ordinary course of the Fund’s business) to an amount not exceeding 0.99% of the Fund’s average daily net assets. Accordingly, during the six months ended August 31, 2023, the Adviser reduced its management fees in the amount of $142,820.
Under the terms of the ELA, management fee reductions and/or expense reimbursements by the Adviser are subject to repayment by the Fund for a period of three years after such date that fees and expenses were incurred, provided that the repayments do not cause total annual fund operating expenses to exceed the lesser of (i) the expense limitation then in effect, if any, and (ii) the expense limitation in effect at the time the expenses to be repaid were incurred. Prior to June 30, 2025, this agreement may not be modified or terminated without the approval of the Fund’s Board. This agreement will terminate automatically if the Fund’s investment advisory agreement with the Adviser is terminated. As of August 31, 2023, the Adviser may seek repayment of management fee reductions and expense reimbursements in the amount of $319,943 no later than the dates listed below:
| | | | |
| February 28, 2026 | | $ | 177,123 | |
| August 31, 2026 | | | 142,820 | |
| Total | | $ | 319,943 | |
| | | | | |
OTHER SERVICE PROVIDERS
Ultimus Fund Solutions, LLC (“Ultimus”) provides administration, fund accounting, compliance and transfer agency services to the Fund. The Fund pays Ultimus fees in accordance with the agreements for such services. In addition, the Fund pays out-of-pocket expenses including, but not limited to, postage, supplies and certain costs related to the pricing of the Fund’s portfolio securities.
Under the terms of a Distribution Agreement with the Trust, Ultimus Fund Distributors, LLC (the “Distributor”) serves as principal underwriter to the Fund. The Distributor is a wholly-owned subsidiary of Ultimus. The Distributor is compensated by the Adviser (not the Fund) for acting as principal underwriter.
Certain officers and a Trustee of the Trust are also officers of Ultimus and are not paid by the Trust or the Fund for serving in such capacities.
| NIA IMPACT SOLUTIONS FUND |
| NOTES TO FINANCIAL STATEMENTS (Continued) |
TRUSTEE COMPENSATION
Each member of the Board (a “Trustee”) who is not an “interested person” (as defined by the 1940 Act) of the Trust (“Independent Trustee”) receives a $1,300 annual retainer from the Fund, paid quarterly, except for the Board Chairperson who receives a $1,700 annual retainer from the Fund, paid quarterly and the Audit Committee Chairperson who receives a $1,500 annual retainer from the Fund, paid quarterly. Each Independent Trustee also receives from the Fund a fee of $550 for each Board meeting attended plus reimbursement for travel and other meeting-related expenses.
PRINCIPAL HOLDER OF FUND SHARES
As of August 31, 2023, the following shareholder owned of record more than 25% of the outstanding shares of the Fund:
| Name of Record Owner | | % Ownership |
| Northern Trust (for the benefit of its customers) | | 59% |
A beneficial owner of 25% or more of the Fund’s outstanding shares may be considered a controlling person. That shareholder’s vote could have a more significant effect on matters presented at a shareholders’ meeting.
The Fund’s incorporation of environmental, social and/or governance considerations (“ESG”) in its investment process may cause it to make different investments than funds that have a similar investment universe and/or investment style but that do not incorporate such considerations in their investment strategy processes. In applying ESG criteria to its investment decisions, the Fund may forgo higher yielding investments that it would invest in absent the application of its ESG investing criteria. The Fund’s investment process may affect the Fund’s exposure to certain investments, which may impact the Fund’s relative investment performance depending on whether such investments are in or out of favor with the market. In addition, the Fund investments in certain companies may be susceptible to various factors that may impact their businesses or operations, including costs associated with government budgetary constraints that impact publicly funded projects and clean energy initiatives, the effects of general economic conditions throughout the world, increased competition from other providers of services, unfavorable tax laws or accounting policies and high leverage. The Fund’s Adviser relies on available information to assist in the ESG evaluation process, and the process employed for the Fund may differ from processes employed for other funds. The Fund will seek to identify companies that it believes meet its ESG criteria based on data provided by third parties. The data provided by third parties may be incomplete, inaccurate or unavailable, which could cause the Adviser to incorrectly assess a company’s ESG practices.
If the Fund has significant investments in the securities of issuers in industries within a particular sector, any development affecting that sector will have a greater impact on the value of the net assets of the Fund than would be the case if the Fund did not have significant investments in that sector. In
| NIA IMPACT SOLUTIONS FUND |
| NOTES TO FINANCIAL STATEMENTS (Continued) |
addition, this may increase the risk of loss of an investment in the Fund and increase the volatility of the Fund’s net asset value per share. From time to time, a particular set of circumstances may affect this sector or companies within the sector. For instance, economic or market factors, regulation or deregulation, or other developments may negatively impact all companies in a particular sector and therefore the value of the Fund’s portfolio will be adversely affected. As of August 31, 2023, the Fund had 25.6% of the value of its net assets invested in stocks within the Technology sector.
| 7. | Contingencies and Commitments |
The Fund indemnifies the Trust’s officers and Trustees for certain liabilities that might arise from their performance of their duties to the Fund. Additionally, in the normal course of business the Fund enters into contracts that contain a variety of representations and warranties and which provide general indemnifications. The Fund’s maximum exposure under these arrangements is unknown, as this would involve future claims that may be made against the Fund that have not yet occurred. However, based on experience, the Fund expects the risk of loss to be remote.
The Fund is required to recognize in the financial statements the effects of all subsequent events that provide additional evidence about conditions that existed as of the date of the Statement of Assets and Liabilities. For non-recognized subsequent events that must be disclosed to keep the financial statements from being misleading, the Fund is required to disclose the nature of the event as well as an estimate of its financial effect, or a statement that such an estimate cannot be made. Management has evaluated subsequent events through the issuance of these financial statements and has noted no such events.
| NIA IMPACT SOLUTIONS FUND |
| ABOUT YOUR FUND’S EXPENSES (Unaudited) |
We believe it is important for you to understand the impact of costs on your investment. As a shareholder of the Fund, you incur ongoing costs, including management fees, and other operating expenses. The following examples are intended to help you understand your ongoing costs (in dollars) of investing in the Fund and to compare these costs with the ongoing costs of investing in other mutual funds.
A mutual fund’s ongoing costs are expressed as a percentage of its average net assets. This figure is known as the expense ratio. The expenses in the table below are based on an investment of $1,000 made at the beginning of the most recent period (March 1, 2023) and held until the end of the period (August 31, 2023).
The table below illustrates the Fund’s ongoing costs in two ways:
Actual fund return – This section helps you to estimate the actual expenses that you paid over the period. The “Ending Account Value” shown is derived from the Fund’s actual return, and the fourth column shows the dollar amount of operating expenses that would have been paid by an investor who started with $1,000 in the Fund. You may use the information here, together with the amount you invested, to estimate the expenses that you paid over the period.
To do so, simply divide your account value by $1,000 (for example, an $8,600 account value divided by $1,000 = 8.6), then multiply the result by the number given for the Fund under the heading “Expenses Paid During Period.”
Hypothetical 5% return – This section is intended to help you compare the Fund’s ongoing costs with those of other mutual funds. It assumes that the Fund had an annual return of 5% before expenses during the period shown, but that the expense ratio is unchanged. In this case, because the return used is not the Fund’s actual return, the results do not apply to your investment. The example is useful in making comparisons because the U.S. Securities and Exchange Commission (the “SEC”) requires all mutual funds to calculate expenses based on a 5% return. You can assess the Fund’s ongoing costs by comparing this hypothetical example with the hypothetical examples that appear in shareholder reports of other funds.
Note that expenses shown in the table are meant to highlight and help you compare ongoing costs only. The Fund does not charge transaction fees, such as purchase or redemption fees, nor does it carry a “sales load.”
The calculations assume no shares were bought or sold during the period. Your actual costs may have been higher or lower, depending on the amount of your investment and the timing of any purchases or redemptions.
More information about the Fund’s expenses can be found in this report. For additional information on operating expenses and other shareholder costs, please refer to the Fund’s prospectus.
| NIA IMPACT SOLUTIONS FUND |
| ABOUT YOUR FUND’S EXPENSES (Unaudited) (Continued) |
| | | Beginning | | Ending | | Net | | Expenses Paid | |
| | | Account Value | | Account Value | | Expense | | During | |
| | | March 1, 2023 | | August 31, 2023 | | Ratio (a) | | Period (b) | |
| Based on Actual Fund Return | | $1,000.00 | | $989.30 | | 0.99% | | $ | 4.96 | |
| Based on Hypothetical 5% Return (before expenses) | | $1,000.00 | | $1,020.21 | | 0.99% | | $ | 5.04 | |
| (a) | Annualized, based on the Fund’s most recent one-half year expenses. |
| (b) | Expenses are equal to the Fund’s annualized net expense ratio multiplied by the average account value over the period, multiplied by 184/365 (to reflect the one-half year period). |
| OTHER INFORMATION (Unaudited) |
A description of the policies and procedures that the Fund uses to vote proxies relating to portfolio securities is available without charge upon request by calling toll-free 1-833-571-2833, or on the SEC’s website at www.sec.gov. Information regarding how the Fund voted proxies relating to portfolio securities during the most recent period ended June 30 is available without charge upon request by calling toll-free 1-833-571-2833, or on the SEC’s website at www.sec.gov.
The Trust files a complete listing of portfolio holdings for the Fund with the SEC as of the end of the first and third quarters of each fiscal year as an exhibit to Form N-PORT. These filings are available upon request by calling 1-833-571-2833. Furthermore, you may obtain a copy of the filings on the SEC’s website at www.sec.gov and on the Fund’s website www.niaimpactfunds.com.
| FACTS | WHAT DOES THE NIA IMPACT SOLUTIONS FUND (the “Fund”) DO WITH YOUR PERSONAL INFORMATION? |
| | |
| Why? | Financial companies choose how they share your personal information. Federal law gives consumers the right to limit some but not all sharing. Federal law also requires us to tell you how we collect, share, and protect your personal information. Please read this notice carefully to understand what we do. |
| | |
| What? | The types of personal information we collect and share depend on the product or service you have with us. This information can include: ■ Social Security number ■ Assets ■ Retirement Assets ■ Transaction History ■ Checking Account Information ■ Purchase History ■ Account Balances ■ Account Transactions ■ Wire Transfer Instructions When you are no longer our customer, we continue to share your information as described in this notice. |
| | |
| How? | All financial companies need to share your personal information to run their everyday business. In the section below, we list the reasons financial companies can share their customers’ personal information; the reasons the Fund chooses to share; and whether you can limit this sharing. |
| Reasons we can share your personal information | Does the
Fund share? | Can you limit
this sharing? |
For our everyday business purposes –
Such as to process your transactions, maintain your account(s), respond to court orders and legal investigations, or report to credit bureaus | Yes | No |
For our marketing purposes –
to offer our products and services to you | No | We don’t share |
| For joint marketing with other financial companies | No | We don’t share |
For our affiliates’ everyday business purposes –
information about your transactions and experiences | No | We don’t share |
For our affiliates’ everyday business purposes –
information about your creditworthiness | No | We don’t share |
| For non-affiliates to market to you | No | We don’t share |
| Questions? | Call 833-571-2833 |
| Who we are |
| Who is providing this notice? | Nia Impact Solutions Fund Ultimus Fund Distributors, LLC (Distributor) Ultimus Fund Solutions, LLC (Administrator) |
| What we do |
| How does the Fund protect my personal information? | To protect your personal information from unauthorized access and use, we use security measures that comply with federal law. These measures include computer safeguards and secured files and buildings. Our service providers are held accountable for adhering to strict policies and procedures to prevent any misuse of your nonpublic personal information. |
| How does the Fund collect my personal information? | We collect your personal information, for example, when you ■ Open an account ■ Provide account information ■ Give us your contact information ■ Make deposits or withdrawals from your account ■ Make a wire transfer ■ Tell us where to send the money ■ Tell us who receives the money ■ Show your government-issued ID ■ Show your driver’s license We also collect your personal information from other companies. |
| Why can’t I limit all sharing? | Federal law gives you the right to limit only ■ Sharing for affiliates’ everyday business purposes – information about your creditworthiness ■ Affiliates from using your information to market to you ■ Sharing for non-affiliates to market to you State laws and individual companies may give you additional rights to limit sharing. |
| | |
| Definitions |
| Affiliates | Companies related by common ownership or control. They can be financial and nonfinancial companies. ■ Nia Impact Capital, the investment adviser to the Fund, could be deemed to be an affiliate. |
| Non-affiliates | Companies not related by common ownership or control. They can be financial and nonfinancial companies ■ The Fund does not share with non-affiliates so they can market to you. |
| Joint marketing | A formal agreement between nonaffiliated financial companies that together market financial products or services to you. ■ The Fund does not jointly market. |
This page intentionally left blank.
This page intentionally left blank.
This page intentionally left blank.
Nia Impact-SAR-23
(a).
(b). Not applicable
Item 2. Code of Ethics.
Not required
Item 3. Audit Committee Financial Expert.
Not required
Item 4. Principal Accountant Fees and Services.
Not required
Item 5. Audit Committee of Listed Registrants.
Not applicable
Item 6. Schedule of Investments.
| (a) | Not applicable [schedule filed with Item 1] |
Item 7. Disclosure of Proxy Voting Policies and Procedures for Closed-End Management Investment Companies.
Not applicable
| Item 8. | Portfolio Managers of Closed-End Management Investment Companies. |
Not applicable
Item 9. Purchases of Equity Securities by Closed-End Management Investment Company and Affiliated Purchasers.
Not applicable
Item 10. Submission of Matters to a Vote of Security Holders.
There has been no material changes to the manner in which shareholders may recommend nominees to the Registrant’s Board of Trustees or the Nominations & Governance Committee (the “Committee”). The Registrant does not have formal procedures by which shareholders may recommend nominees to the Registrant’s Board of Trustees. While the Registrant does not have formal procedure, the Committee shall to the extent required under applicable law, when identifying potential candidates for the position of Independent Trustee, consider any such candidate recommended by a shareholder.
Item 11. Controls and Procedures.
(a) Based on their evaluation of the registrant’s disclosure controls and procedures (as defined in Rule 30a-3(c) under the Investment Company Act of 1940) as of a date within 90 days of the filing date of this report, the registrant’s principal executive officer and principal financial officer have concluded that such disclosure controls and procedures are reasonably designed and are operating effectively to ensure that material information relating to the registrant, including its consolidated subsidiaries, is made known to them by others within those entities, particularly during the period in which this report is being prepared, and that the information required in filings on Form N-CSR is recorded, processed, summarized, and reported on a timely basis.
(b) There were no changes in the registrant’s internal control over financial reporting (as defined in Rule 30a-3(d) under the Investment Company Act of 1940) that occurred during the the period covered by this report that have materially affected, or are reasonably likely to materially affect, the registrant’s internal control over financial reporting.
Item 12. Disclosure of Securities Lending Activities for Closed-End Management Investment Companies.
Not applicable
File the exhibits listed below as part of this Form. Letter or number the exhibits in the sequence indicated.
(a)(1) Any code of ethics, or amendment thereto, that is the subject of the disclosure required by Item 2, to the extent that the registrant intends to satisfy the Item 2 requirements through filing of an exhibit: Not required
(a)(2) A separate certification for each principal executive officer and principal financial officer of the registrant as required by Rule 30a-2(a) under the Act (17 CFR 270.30a-2(a)): Attached hereto
(1) Any written solicitation to purchase securities under Rule 23c-1 under the Act (17 CFR 270.23c-1) sent or given during the period covered by the report by or on behalf of the registrant to 10 or more persons: Not applicable
(2) Change in the registrant’s independent public accountants: Not applicable
(b) Certifications required by Rule 30a-2(b) under the Act (17 CFR 270.30a-2(b)): Attached hereto
Exhibit 99.CERT Certifications required by Rule 30a-2(a) under the Act
Exhibit 99.906CERT Certifications required by Rule 30a-2(b) under the Act
SIGNATURES
Pursuant to the requirements of the Securities Exchange Act of 1934 and the Investment Company Act of 1940, the registrant has duly caused this report to be signed on its behalf by the undersigned, thereunto duly authorized.
| (Registrant) | Ultimus Managers Trust | | |
| | | | |
| By (Signature and Title)* | /s/ Todd E. Heim | |
| | | Todd E. Heim, President | |
| | | | |
| Date | November 1, 2023 | | |
| | | | |
| Pursuant to the requirements of the Securities Exchange Act of 1934 and the Investment Company Act of 1940, this report has been signed below by the following persons on behalf of the registrant and in the capacities and on the dates indicated. |
| | | |
| By (Signature and Title)* | /s/ Todd E. Heim |
| | | Todd E. Heim, Principal Executive Officer |
| | | |
| Date | November 1, 2023 | |
| | | |
| By (Signature and Title)* | /s/ Jennifer L. Leamer |
| | | Jennifer L. Leamer, Treasurer and Principal Financial Officer |
| | | |
| Date | November 1, 2023 | |
* Print the name and title of each signing officer under his or her signature.