UNITED STATES
SECURITIES AND EXCHANGE COMMISSION
Washington, D.C. 20549
FORM N-CSR
CERTIFIED SHAREHOLDER REPORT OF REGISTERED
MANAGEMENT INVESTMENT COMPANIES
| Investment Company Act file number | 811-22680 |
| Ultimus Managers Trust |
| (Exact name of registrant as specified in charter) |
| 225 Pictoria Drive, Suite 450 Cincinnati, Ohio | 45246 |
| (Address of principal executive offices) | (Zip code) |
Karen Jacoppo-Wood
| Ultimus Fund Solutions, LLC 225 Pictoria Drive, Suite 450 Cincinnati, Ohio 45246_ |
| (Name and address of agent for service) |
| Registrant's telephone number, including area code: | (513) 587-3400 |
| Date of fiscal year end: | October 31 | |
| Date of reporting period: | April 30, 2023 |
Form N-CSR is to be used by management investment companies to file reports with the Commission not later than 10 days after the transmission to stockholders of any report that is required to be transmitted to stockholders under Rule 30e-1 under the Investment Company Act of 1940 (17 CFR 270.30e-1). The Commission may use the information provided on Form N-CSR in its regulatory, disclosure review, inspection, and policymaking roles.
A registrant is required to disclose the information specified by Form N-CSR, and the Commission will make this information public. A registrant is not required to respond to the collection of information contained in Form N-CSR unless the Form displays a currently valid Office of Management and Budget ("OMB") control number. Please direct comments concerning the accuracy of the information collection burden estimate and any suggestions for reducing the burden to the Secretary, Securities and Exchange Commission, 450 Fifth Street, NW, Washington, DC 20549-0609. The OMB has reviewed this collection of information under the clearance requirements of 44 U.S.C. § 3507.
| Item 1. | Reports to Stockholders. |
(a).

Westwood Quality Value Fund
Westwood Quality MidCap Fund
Westwood Quality SMidCap Fund
Westwood Quality SmallCap Fund
Westwood Quality AllCap Fund
Westwood Total Return Fund
Westwood Income Opportunity Fund
Westwood High Income Fund
Westwood Alternative Income Fund
Westwood SmallCap Growth Fund
| Semi-Annual Report | April 30, 2023 |
| Investment Adviser: | |
| Westwood Management Corp. | |
WESTWOOD FUNDS
| TABLE OF CONTENTS |
| Shareholder Letter | 1 |
| Schedules of Investments | |
| Westwood Quality Value Fund | 13 |
| Westwood Quality MidCap Fund | 15 |
| Westwood Quality SMidCap Fund | 17 |
| Westwood Quality SmallCap Fund | 19 |
| Westwood Quality AllCap Fund | 21 |
| Westwood Total Return Fund | 23 |
| Westwood Income Opportunity Fund | 28 |
| Westwood High Income Fund | 34 |
| Westwood Alternative Income Fund | 40 |
| Westwood SmallCap Growth Fund | 46 |
| Statements of Assets and Liabilities | 49 |
| Statements of Operations | 52 |
| Statements of Changes in Net Assets | 55 |
| Financial Highlights | 63 |
| Notes to Financial Statements | 73 |
| About Your Funds’ Expenses | 95 |
| Other Information | 100 |
| Change in Independent Registered Public Accounting Firm | 101 |
| Liquidity Risk Management Program | 102 |
| Customer Privacy Notice | 103 |
| WESTWOOD FUNDS (Unaudited) |
October 31, 2022 – April 30, 2023
Dear Shareholders,
Fed Still Has Work to Do, Equities Show Resilience
Equities, though range-bound for much of the period, remained fairly resilient against the backdrop of an economy supposedly nearing the brink of recession along with the onset of a mini-banking crisis (which was really more of a liquidity event). In addition, the Federal Reserve (Fed) continued to raise interest rates, increasing the federal funds rate by another 200 basis points. Most experts believe that more rate hikes are likely, as inflation and the labor market remain strong. Stocks are also digesting a largely telegraphed earnings slowdown, but, on average, have not experienced the “earnings cliff” that many had feared. Actually, as we stated in our previous letter, investors still sought opportunity in high-quality tech and other value names over the last six months. By the numbers, the Nasdaq surged +11.3%, handily outperforming the Dow Jones, which managed to only edge +4.2% higher; the S&P 500 logged a +7.7% gain in the period.
Stocks began the period with a rally in late 2022, which continued into February 2023 amid optimism that global central banks, with the Fed leading, might soon halt interest rate hikes and even transition to rate cuts or more accommodative policies by end of the year. Unfortunately, choppy earnings, mixed economic data and a stubbornly hawkish Fed, fueled by still-sticky inflation and a tight labor market, were factors that quelled early momentum back toward highs in the S&P 500.
Mid-March gave way to a banking “crisis” that took a toll on regional banks, related small caps and some larger names, but most major indices managed to rally back as systemic risk was unfounded. As we approached May, hopes (and bets) for a fall or even winter rate cut had diminished greatly from predictions made late last year. It’s also important to note that performance in small caps would have been far stronger if not for the banking debacle. Shifting from financials, money flowed into tech names, which had their best quarter (Q1) since the second quarter of 2020. The rise of these growth/tech names is another sign that investors are looking past the headline hyperbole for high-quality, value plays in distressed equities. What’s particularly interesting is that growth stocks gained favor despite a longer-than-expected elevated interest rate environment or what could be continued increases — one of many odd correlations or de-correlations we see in today’s marketplace.
Debt Markets Volatile
American debt instruments experienced their own roller coaster ride over the last six months as market participants jockeyed to best position themselves in a still uncertain rate and economic climate. A bond rally early in the year was followed quickly by a selloff, then a rush back into high- quality debt (U.S. Treasuries) as financial system jitters shook confidence in this fragile late-cycle expansion phase. To put this uncertainty in perspective, the yield on the two-year U.S. Treasury surged to 5.05% on March 8, only to plummet to a low of 3.76% on March 24 — volatility in the bond market remains at nearly twice its long-term levels for the fifth quarter in a row. This disconnect between the bond market and the Fed’s policy further diverged during the sudden banking crisis. Markets viewed this event as a sign of economic weakness and began pricing in bets for the Fed to cut rates to ease financial strain. However, the Fed quickly stepped in to shore up deposit issues but did not telegraph a need for rates to come down, as they believed their supportive actions were enough.
In general, investors remained concerned about recession as the yield curve (2- versus 10-year) in Q1 became the most inverted it had been since 1981. Historically, the yield curve has been a reliable leading indicator of economic weakness and, on average, inversions during a late cycle tend to occur one year before recession. Gold, another safe-haven asset, increased to an all-time high (not inflation adjusted) of $1,990.60 per troy ounce in April, while crude oil and natural gas trended lower in the quarter. And though energy price declines have been helpful in reducing global inflation, OPEC+ decided late in the quarter to further cut production, which may hamper inflation-fighting efforts. So far, their tricks have done little to buoy energy prices.
1
| WESTWOOD FUNDS (Unaudited) |
On that topic, the Fed continues to work frantically to control inflation without completely stifling the economy, but we see more rate hikes likely. The Federal Open Market Committee (FOMC) ended the period with rates set at a range of 5.00% to 5.25%, its highest since 2007. Debt ceiling issues dominated the headlines toward the end of the period, as earnings guidance and a potential “selective” or “soft” landing dominated the trades, and recession started to be assigned based on major industry group classification. We believe a debt ceiling deal will be reached1, but the details will need to be seen to best anticipate any economic effects.
The Road Ahead
While markets seem extremely optimistic here, it’s still critical that investors remain vigilant of the headwinds that America faces and continue to approach the broad equity markets with a highly tactical approach, as upside catalysts are not abundant across all sectors. The current environment is particularly abnormal and, in many ways, unprecedented. Consumer confidence continues to slowly erode, while wages are not keeping up with inflation. On that note, there’s been a resurgence in price appreciation that is not only likely to affect consumer spending but also influence future Fed responses. Perhaps the biggest irony here is that the stock market shows little sign of recession, but Fed watchers are predicting a VERY high likelihood that rates will be somewhere between 3% and 4% by year end. In fact, the CME FedWatch Tool shows a near-zero percent chance rates will be above 4.75% come mid-December. Put simply, the smart money is betting on a recession and subsequent reversal in recent hawkish Fed action.
We do agree the Fed will pause its interest rate increases at the June 13-14, 2023 meeting2, but don’t see aggressive cuts coming in 2023 unless an unknown crisis occurs. Let’s not forget, the Fed is still grappling with record low unemployment and 40-year highs in inflation. The reality is that a greater level of uncertainty prevails, and investors continue to scour the data seeking hard-to-find clues on where the economy and markets are headed from here. The picture is anything but clear, but we do not see systematic risk in the broad financial sector as was the case during the Great Recession.
Interest rate hikes are most certainly taking their toll on housing, consumers and the commercial real estate market, which we are watching closely. As the prime rate and mortgage rates have surged higher, consumers continue to throttle back and change their habits, which we believe will equate to a continued drag on corporate earnings into the latter half of 2023. Currently, we see the risk of a recession in the U.S. growing, but it’s unlikely to “feel” as “painful” as more recent downturns.
At the end of the day, the narrative the FOMC offers can either be solace or stress for both consumers and investors, but we suspect they may have an increasingly difficult task as consumers become overwhelmed with debt/costs and an increasing number of layoffs.
Thank you for your trust.
Sincerely,
The Investment Team
The Westwood Funds
| 1 | In May 2023, the debt ceiling deal was reached. The deal suspended the debt ceiling until January 2025, averting a potential default on the national debt. |
| 2 | On June 14, 2023, the Fed held rates steady for the first time since March 2022, but signaled more hikes later this year. |
The information contained herein represents the views of the manager at a specific point in time and is based on information believed to be reliable. No representation or warranty is made concerning the accuracy or completeness of any data compiled herein. Any statements non-factual in nature constitute only current opinion, which is subject to change. Any statements concerning financial market trends are based on current market conditions, which will fluctuate.
2
| WESTWOOD FUNDS (Unaudited) |
Past performance is not indicative of future results. All information provided herein is for informational purposes only and is not intended to be, and should not be interpreted as, an offer, solicitation, or recommendation to buy or sell or otherwise invest in any of the securities/sectors/countries that may be mentioned. Investing involves risk, including possible loss of principal. A discussion of each fund’s performance during the semiannual period ending April 30, 2023, is presented below.
Westwood Quality Value Fund
The performance of the Westwood Quality Value Fund for the period ending April 30, 2023 was as follows:
| 2023 | ||
| 6 Months | Year to Date | |
| Westwood Quality Value Fund – I Shares (WHGLX) | 2.81% | 1.52% |
| Westwood Quality Value Fund – A Shares (WWLAX)* | 2.71% | 1.51% |
| Westwood Quality Value Fund – C Shares (WWLCX) | 2.37% | 1.30% |
| Westwood Quality Value Fund –Ultra Shares (WHSQX) | 3.13%** | 1.68% |
| Russell 1000 Value Index | 4.54% | 2.53% |
| * | Without sales charge |
| ** | Ultra Share inception date 11/30/2022. Return shown represents the return for the period from inception through April 30, 2023. |
The performance data quoted represents past performance. Past performance does not guarantee future results. The investment return and principal value of an investment will fluctuate so that an investor’s shares, when redeemed, may be worth more or less than their original cost and current performance may be lower or higher than the performance quoted. The Adviser has contractually agreed to waive fees and reimburse expenses until March 1, 2024. In the absence of current fee waivers, total return and yield would have been reduced.
The Fund underperformed the benchmark, delivering returns of 2.81% for the I Shares in the period while the benchmark returned 4.54%. Positive stock selection and tactical allocations in Information Technology, Consumer Staples and Financials were the top contributors to relative performance versus the benchmark. Our overweight positions in high-quality tech names such as Microsoft Corporation, ASML Holdings, Microchip Technology Incorporated and Google-parent Alphabet all added to overall performance in what was a volatile period. Money continued to flow into best-in-breed tech during the period as investors’ risk appetite remained relatively strong. Stand-out earnings performance from electrical/industrial giant Eaton also helped boost relative performance. Industrial names were bifurcated during the period as investors’ opinions about global economic strength grew more polarized.
Negative stock selection in Communication Services, Industrials and Energy weighed on relative performance. Our underweight overall position in Communication Services was a large detractor as the sector experienced the highest returns relative to its peers. Bank of America and Western Alliance Bancorp were two of the worst portfolio performers in the period as they faced selling pressure due to the banking liquidity crisis in March. Western Alliance seems to have weathered the storm and reported relatively positive earnings later in the period. L3Harris Technologies, ConocoPhillips and UnitedHealth Group rounded out the top five detractors from overall performance.
3
| WESTWOOD FUNDS (Unaudited) |
Westwood Quality MidCap Fund
The performance of the Westwood SmallCap Growth Fund for the period ending April 30, 2023, was as follows:
| 2023 | ||
| 6 Months | Year to Date | |
| Westwood Quality MidCap Fund – I Shares (WWMCX) | 3.81% | 2.28% |
| Russell Midcap Value Index | 2.26% | 1.33% |
The performance data quoted represents past performance. Past performance does not guarantee future results. The investment return and principal value of an investment will fluctuate so that an investor’s shares, when redeemed, may be worth more or less than their original cost and current performance may be lower or higher than the performance quoted. The Adviser has contractually agreed to waive fees and reimburse expenses until March 1, 2024.
The Fund outperformed the benchmark, delivering returns of 3.81% in the period while the benchmark returned 2.26%. Relative performance was aided by positive stock selection within the Information Technology, Real Estate and Consumer Discretionary sectors. The top five contributors were scattered throughout different sectors such as real estate, industry (chemicals and ingredients) and semiconductors, which has seen a surge in 2023. Investors still have a risk appetite but are picking through sectors with a fine tooth comb. Chipmaker Rambus, Inc. was our top contributor, followed by home builder PulteGroup, Cooper Companies, Univar Solutions and finally, coatings manufacturer Axalta Coating Systems, all of which delivered better-than-expected earnings in the period.
Unfavorable selection in Health Care and Materials, as well as unfavorable selection and an under-allocation to Industrials, detracted from relative performance. As was the case for several of our funds, financials were a tricky sector to navigate during the period as investors became not only skittish but overly critical of metrics they perceived to be overly risky, such as deposit trends. Cullen/Frost Bankers, Western Alliance Bancorp and Glacier Bancorp were all part of the portfolio’s top detractors list, with fertilizer maker CF Industries falling on lower commodity prices and managed care specialist Centene Corporation rounding out the biggest detractors list.
Westwood Quality SMidCap Fund
The performance of the Westwood Quality SMidCap Fund for the period ending April 30, 2023, was as follows:
| 2023 | ||
| 6 Months | Year to Date | |
| Westwood Quality SMidCap Fund – I Shares (WHGMX) | 1.89% | 1.89% |
| Westwood Quality SMidCap Fund – Ultra Shares (WWSMX) | 1.93% | 1.89% |
| Russell 2500 Value Index | -1.18% | 0.04% |
The performance data quoted represents past performance. Past performance does not guarantee future results. The investment return and principal value of an investment will fluctuate so that an investor’s shares, when redeemed, may be worth more or less than their original cost and current performance may be lower or higher than the performance quoted. The Adviser has contractually agreed to waive fees and reimburse expenses until March 1, 2024.
The Fund outperformed the benchmark, delivering returns of 1.89% for the I Shares in the period while the benchmark returned -1.18%. During a period of elevated volatility and uncertainty in the broad equity market, performance was driven mainly by tactical stock selection. Positive stock selection in Information Technology, Health Care and Communication Services, and most other sectors aided relative performance. Strong earnings and an acquisition fueled our top three performers, which were Lattice Semiconductor Corp., Rambus Inc. and Radius Global Infrastructure, Inc. Radius was acquired by EQT Active Core Infrastructure. Cooper Companies also contributed
4
| WESTWOOD FUNDS (Unaudited) |
to performance as shares surged to 52-week highs on strong earnings and revenue growth that was better than expectations. Niche insurance provider RenaissanceRe Holdings was also a large contributor to outperformance as favorable conditions fostered the growth of net premiums written by $341.1 million, or 18.7%, in the first quarter, driven by growth in Casualty and Specialty net premiums of $459.4 million, or 56.3%, in that same period.
Negative stock selection in Consumer Discretionary and an overweight allocation in Financials detracted from relative performance in the period. A global provider of communications network test, monitoring, and assurance solutions saw its earnings slow down due to decreased demand for its test equipment and rising semiconductor research and development costs. Cullen/Frost Bankers, Inc., Glacier Bancorp and Wintrust Financial Corporation all underperformed as fallout from the Silicon Valley Bank failure rippled through the industry. And finally, auto parts supplier Advance Auto Parts detracted from performance as competition and demand weighed on earnings results.
Westwood Quality SmallCap Fund
The performance of the Westwood SmallCap Fund for the period ending April 30, 2023, was as follows:
| 2023 | ||
| 6 Months | Year to Date | |
| Westwood Quality SmallCap Fund – I Shares (WHGSX) | 0.23% | 0.22% |
| Westwood Quality SmallCap Fund – A Shares (WHGAX)* | 0.18% | 0.17% |
| Westwood Quality SmallCap Fund – C Shares (WHGCX) | -0.23% | -0.11% |
| Westwood Quality SmallCap Fund – Ultra Shares (WWSYX) | 0.27% | 0.22% |
| Russell 2000 Value Index | -6.72% | -3.13% |
| * | Without sales charge |
The performance data quoted represents past performance. Past performance does not guarantee future results. The investment return and principal value of an investment will fluctuate so that an investor’s shares, when redeemed, may be worth more or less than their original cost and current performance may be lower or higher than the performance quoted. The Adviser has contractually agreed to waive fees and reimburse expenses until March 1, 2024. In the absence of current fee waivers, total return and yield would have been reduced.
The Fund outperformed the benchmark, delivering returns of 0.23% for the I Shares in the period while the benchmark returned -6.72%. During a particularly tough period for SmallCap amid elevated volatility and uncertainty in the broad equity market, the Fund handily outperformed its benchmark during the period, driven by both tactical stock selection and smart allocation choices.
The portfolio experienced outperformance in nearly all sectors, but positive stock selection in Health Care, Energy and Industrials were the top contributors to relative performance. We added to pure-play mineral and royalty company Sitio as its long-term prospects for cash flow are strong. Medical device maker CONMED was our second-largest contributor to outperformance as global demand increased, while semiconductor firm Rambus Inc. continued to best analysts’ expectations for earnings growth. Radius Global Infrastructure was acquired by EQT Active Core Infrastructure.
The Financials and Information Technology sectors detracted from relative performance due to unfavorable stock selection. The merger between Brigham Minerals, Inc. and Sitio Royalties was completed in the period, creating a temporary performance draw as shares were withdrawn. Veritex Holdings, VIAVI Solutions and Sandy Spring Bancorp were also some of the top detractors from performance, while telecom solutions provider ADTRAN Holdings rounded out the top five after it guided revenues lower for the quarter, noting oversupply issues.
5
| WESTWOOD FUNDS (Unaudited) |
Westwood Quality AllCap Fund
The performance of the Westwood Quality AllCap Fund for the period ending April 30, 2023, was as follows:
| 2023 | ||
| 6 Months | Year to Date | |
| Westwood Quality AllCap Fund – I Shares (WQAIX) | 5.82% | 3.06% |
| Westwood Quality AllCap Fund – Ultra Shares (WQAUX) | 5.78% | 3.06% |
| Russell 3000 Value Index | 3.86% | 2.21% |
The performance data quoted represents past performance. Past performance does not guarantee future results. The investment return and principal value of an investment will fluctuate so that an investor’s shares, when redeemed, may be worth more or less than their original cost and current performance may be lower or higher than the performance quoted. The Adviser has contractually agreed to waive fees and reimburse expenses until March. 1, 2024. In the absence of current fee waivers, total return and yield would have been reduced.
The Fund outperformed the benchmark, delivering returns of 5.82% for the I Shares in the period while the benchmark returned 3.86%. Relative performance was aided by positive stock selection within the Information Technology and Financial sectors with further support from Health Care. Top individual contributors included several semiconductor names and a medical device firm. Strong earnings and an acquisition fueled our top three performers, which were Lattice Semiconductor Corporation, chipmaker Rambus Inc., chip supplier ASML Holdings and Radius Global Infrastructure, Inc. Radius was acquired by EQT Active Core Infrastructure. Cooper Companies rounded out our top five equity performance contributors.
Unfavorable selection and allocation in Industrials, Communication Services and Energy detracted from relative performance. Top individual detractors included Pinnacle Financial Partners and Bank of America. The former was eliminated from the portfolio, while we slightly increased our Bank of America position as earnings growth remains relatively strong and its internals look good. Investors are watching deposit trends closely. Glacier Bancorp also struggled in the quarter mainly due to pressure from the Silicon Valley Bank failure and subsequent fallout. Portfolio performance was also bogged down by weakness in L3Harris Technologies and UnitedHealth Group, which is showing strong revenue momentum and has increased its dividend generously.
Westwood Total Return Fund
The performance of the Westwood Total Return Fund for the period ending April 30, 2023, was as follows:
| 2023 | ||
| 6 Months | Year to Date | |
| Westwood Total Return Fund – I Shares (WLVIX) | 4.38% | 3.37% |
| Westwood Total Return Fund – A Shares (WWTAX)* | 4.26% | 3.15% |
| Westwood Total Return Fund – C Shares (WTOCX) | 3.92% | 2.95% |
| 60% S&P 500 Index / 40% Bloomberg US Aggregate Bond Index | 8.00% | 6.92% |
| * | Without sales charge |
The performance data quoted represents past performance. Past performance does not guarantee future results. The investment return and principal value of an investment will fluctuate so that an investor’s shares, when redeemed, may be worth more or less than their original cost and current performance may be lower or higher than the performance quoted.
6
| WESTWOOD FUNDS (Unaudited) |
The Adviser has contractually agreed to waive fees and reimburse expenses until March 1, 2024. In the absence of current fee waivers, total return and yield would have been reduced.
The Westwood Total Return Fund was formerly known as Westwood Low Volatility Fund. Prior to Nov. 1, 2019, the Fund employed different investment strategies. Therefore, the past statistics and performance shown for periods prior to Nov. 1, 2019, may have differed had the Fund’s current investment strategy been in effect.
In what was an increasingly volatile period, the Fund underperformed the benchmark, delivering returns of 4.38% for the I shares in the period while the benchmark returned 8.00%.
We were underweight equities overall, which proved to be a detractor as risk tolerance returned in the latter part of the period. Fortunately, we were more heavily allocated to high-quality names such as Microsoft and Apple, both of which were the top two performers in the period. Homebuilder Toll Brothers was also a significant contributor to performance as low inventory and relatively stable housing prices drove sales despite unfavorable interest rates. American mining company Freeport-McMoRan delivered strong earnings growth that beat analysts’ expectations, aiding its strong performance as yet another top equity performer.
Our bond positions, generally, were a net positive on performance during the volatile period. Shorter duration corporates combined with some longer duration U.S. government paper were some of the best performers, while short-duration Livent Corp bonds were some of the worst performers in the period.
Some equity positions were detrimental to total return as well. Positions in the Financials and banking sector struggled as the failure of Silicon Valley Bank triggered perceived systematic risk and an investor exodus from a fair number of financials including Texas Capital Bancshares and Charles Schwab. Shares of energy companies Devon and NextEra were among the laggards for the period.
Westwood Income Opportunity Fund
The performance of the Westwood Income Opportunity Fund for the period ending April 30, 2023, was as follows:
| 2023 | ||
| 6 Months | Year to Date | |
| Westwood Income Opportunity Fund – I Shares (WHGIX) | 6.76% | 3.48% |
| Westwood Income Opportunity Fund – A Shares (WWIAX)* | 6.66% | 3.35% |
| Westwood Income Opportunity Fund – C Shares (WWICX) | 6.20% | 3.16% |
| Westwood Income Opportunity Fund – Ultra Shares (WHGOX) | 1.61%** | 3.41% |
| 60% Bloomberg US Aggregate Bond Index / 40% S&P 500 Index | 7.66% | 5.80% |
| Bloomberg US Aggregate Bond Index | 6.91% | 3.59% |
| S&P 500 Index | 8.63% | 9.17% |
| * | Without sales charge |
| ** | Ultra Shares inception date 11/30/2022. Return shown represents the return for the period from inception through April 30, 2023. |
The performance data quoted represents past performance. Past performance does not guarantee future results. The investment return and principal value of an investment will fluctuate so that an investor’s shares, when redeemed, may be worth more or less than their original cost and current performance may be lower or higher than the performance quoted. The Adviser has contractually agreed to waive fees and reimburse expenses until March 1, 2024. In the absence of current fee waivers, total return and yield would have been reduced.
7
| WESTWOOD FUNDS (Unaudited) |
The I Shares of the Fund increased by 6.76% in the period even as debt and equity markets increased in volatility and dislocations. Our fixed-income positions performed exceptionally well, but the overall comparison against the blended benchmark was negatively affected by underperformance in the equity portion of the portfolio.
Three stocks were the biggest contributors in the period with Microsoft enjoying a flight to high-quality tech names, while Toll Brothers benefited from low inventory and relatively healthy demand in the housing market. Barrick Gold saw its shares rise as the valuable metal rose to all-time highs.
Freeport-McMoRan, Meta Platforms Inc. and JPMorgan Chase rounded out our top-performing equity positions. But not all energy and financial firms fared well, as Charles Schwab and Bank of America were some of the biggest detractors of performance, along with Bristol Myers Squibb Company and independent upstream oil and gas company EOG Resources struggled in the period. We see an increasing sector bifurcation occurring as investors seek more “best-in-breed” or perceived value names that are delivering stable earnings growth.
Westwood High Income Fund
The performance of the Westwood High Income Fund for the period ending April 30, 2023, was as follows:
| 2023 | ||
| 6 Months | Year to Date | |
| Westwood High Income Fund – I Shares (WHGHX) | 5.96% | 3.59% |
| Westwood High Income Fund – A Shares (WSDAX)* | 5.82% | 3.50% |
| Westwood High Income Fund – C Shares (WWHCX) | 5.52% | 3.23% |
| 80% Bloomberg US Aggregate Bond Index / 20% S&P 500 Index | 7.29% | 4.69% |
| * | Without sales charge |
The performance data quoted represents past performance. Past performance does not guarantee future results. The investment return and principal value of an investment will fluctuate so that an investor’s shares, when redeemed, may be worth more or less than their original cost and current performance may be lower or higher than the performance quoted. The Adviser has contractually agreed to waive fees and reimburse expenses until March 1, 2024.
The Westwood High Income Fund was formerly known as Westwood Short Duration High Yield. Prior to Nov. 1, 2019, the Fund employed different investment strategies. Therefore, the past statistics and performance shown for periods prior to Nov. 1, 2019, may have differed had the Fund’s current investment strategy been in effect.
The I Shares of the Fund increased by 5.96% in the period even as debt and equity markets increased in volatility and dislocations. Our fixed-income positions continued to perform exceptionally well, but the overall performance against the blended benchmark was negatively affected by underperformance and a slight overallocation in the equity portion of the portfolio; the blended benchmark returned 7.29%.
Microsoft remained a major contributor in the period as high-quality tech names continued to garner investor favor. And though financials were especially volatile over the last few months since the Silicon Valley Bank failure, Sumitomo Mitsui Financial Group, Inc. was the second-largest contributing equity to the portfolio. A few more top performers were bonds issued by EMC Corporation, Radius Global Infrastructure (which was acquired by EQT Active Core Infrastructure) and Boeing.
Energy and financial firms continued to experience a bifurcation as some were rewarded, while others languished. Our top detractors included Devon Energy and EOG Resources, while Bank of America and Charles Schwab were some of the biggest detractors of performance, along with Truist Financial Corporation. Short-term bonds issued by Audacy Capital Corp were the biggest detractors of relative performance in the period.
8
| WESTWOOD FUNDS (Unaudited) |
Westwood Alternative Income Fund
The performance of the Westwood Alternative Income Fund for the period ending April 30, 2023, was as follows:
| 2023 | ||
| 6 Months | Year to Date | |
| Westwood Alternative Income Fund – I Shares (WMNIX) | 3.66% | 2.08% |
| Westwood Alternative Income Fund – A Shares (WMNAX)* | 3.49% | 2.05% |
| Westwood Alternative Income Fund – C Shares (WWACX) | 3.14% | 1.75% |
| Westwood Alternative Income Fund – Ultra Shares (WMNUX) | 3.61% | 2.11% |
| FTSE 1-Month Treasury Bill | 2.15% | 1.49% |
| * | Without sales charge |
The performance data quoted represents past performance. Past performance does not guarantee future results. The investment return and principal value of an investment will fluctuate so that an investor’s shares, when redeemed, may be worth more or less than their original cost and current performance may be lower or higher than the performance quoted. The Adviser has contractually agreed to waive fees and reimburse expenses until March 1, 2024.
Prior to Nov. 1, 2019, the Westwood Alternative Income Fund was formerly known as the Westwood Market Neutral Fund.
As of Nov. 1, 2019, the Fund began following the Sensible FeesTM framework.
The Fund outperformed the benchmark, delivering returns of 3.66% for the I Shares in the period while the benchmark returned 2.15% . Over the past six months, the market has become more optimistic about a soft landing. Global supply issues are mostly behind us, energy costs have moderated, the war in Ukraine has fallen off the front page and the U,S, economy has proven more resilient than most expected. U.S. inflation has appeared to have peaked and unemployment has remained low, all great news for the Bull camp. Bears see it differently. The U.S. has just experienced a regional banking crisis which may lead to additional unexpected downside surprises as the year progresses. The U.S. Federal Reserve continues to push rates higher with no definitive terminal rate or the duration of keeping the foot on the brake. Inflation, although lower, has been persistently higher than the target level with few signs that the Fed’s aggressive moves are working to slow the economy down.
As a result of the optimism, large cap equities have risen, investment grade and high yield credit spreads have declined and equity volatility has declined significantly. Although growth equities have led the charge higher, it has been isolated to large cap companies. Small cap growth equities have been left behind. Of note is that the market is expanding its earnings multiple despite cautionary guidance from many corporate CFOs.
The convertible market is dominated by mid to small cap companies. As a result, returns for the asset class have been muted. We have been positioned cautiously in Alternative Income as we believe the soft-landing scenario is a coin flip at best, and equities markets may see volatility return as the Fed’s tightening action finally takes hold and the economy slows markedly. We are optimistic that the performance gap between large caps and mid to small growth companies will shrink as investors recognize the relative value.
Within the portfolio’s fixed income yield book, our holdings performed in line, as both investment grade and high yield were flat. Credit spreads did improve slightly as the soft-landing thesis has spilled over to fixed income. We were positioned in higher-grade and low-duration names as we are still cautiously optimistic about the future path of the U.S. economy.
The convertible arbitrage strategy has performed as we expected. Convertible valuations have been mostly unchanged, as investors have been cautious in their risk allocation. As mentioned previously, small and mid-cap
9
| WESTWOOD FUNDS (Unaudited) |
companies have been left out of this rally. The cost of capital continues to increase, and these companies feel it the most as growth requires continued capital raises. We continue to look for cheap convertibles, as markets like this provide opportunities to source oversold securities. Activity in the primary market has improved but has been limited to higher quality issuers but in less exciting, low-volatility sectors. We expect issuance to pick up as non-traditional, higher-grade issuers find the asset class attractive for its lower interest rate costs.
Macro tail hedges have reduced portfolio returns marginally as improving equity performance and lower volatility reduce the hedge’s value. We continue to monitor and systematically adjust these positions for maximum fund flexibility and as a means of capital preservation during periods of unforeseen market volatility.
Westwood SmallCap Growth Fund
The performance of the Westwood SmallCap Growth Fund for the period ending April 30, 2023, was as follows:
| 2023 | ||
| 6 Months | Year to Date | |
| Westwood SmallCap Growth Fund – I Shares (WSCIX) | -5.51% | -0.52% |
| Russell 2000 Growth Index | -0.29% | 4.84% |
The performance data quoted represents past performance. Past performance does not guarantee future results. The investment return and principal value of an investment will fluctuate so that an investor’s shares, when redeemed, may be worth more or less than their original cost and current performance may be lower or higher than the performance quoted. The Adviser has contractually agreed to waive fees and reimburse expenses until March 1, 2024. In the absence of current fee waivers, total return and yield would have been reduced.
The Fund underperformed the benchmark, delivering returns of -5.51% in the period while the benchmark returned -0.29%. Overall, the portfolio underperformed the benchmark, driven mainly by positive stock selection within the Energy and Industrial sectors, was not enough to overcome lag in several others. Top individual contributors included pure-play mineral rights holder Sitio Royalties, with diversified engineered service provider Oceaneering International surprising analysts and investors with stronger-than-expected results. Semiconductor test and measurement equipment maker FormFactor, Inc. also gained as much of that sector rose. And niche MRI-related device maker IRadimed Corporation showed continued strong sales growth.
Unfortunately, unfavorable selection in Financials, Health Care, Consumer Discretionary and Information Technology detracted heavily from relative performance. Top individual detractors included Brigham Minerals, which completed its merger with Sitio Royalties in the period. Niche toy company Funko and networking and communications solutions provider ADTRAN were also both large detractors of performance. Biopharma company Aurinia Pharmaceuticals came under pressure after it missed earnings expectations in November, and was later eliminated from the portfolio.
An investor should consider the investment objectives, risks, charges and expenses of each Fund carefully before investing. The Funds’ prospectus contains this and other important information. To obtain a copy of the Funds’ prospectus please visit the Funds’ website at www.westwoodfunds.com or call 1-877-386-3944 and a copy will be sent to you free of charge. Please read the prospectus carefully before you invest. The Funds are distributed by Ultimus Fund Distributors, LLC.
The Letter to Shareholders seeks to describe some of the Adviser’s current opinions and views of the financial markets. Although the Adviser believes it has a reasonable basis for any opinions or views expressed, actual results may differ, sometimes significantly so, from those expected or expressed. The securities held by the Funds that are discussed in the Letter to Shareholders were held during the period covered by this Report. They do not comprise the entire investment portfolios of the Funds, may be sold at any time, and may no longer be held by the Funds. For a complete list of securities
10
| WESTWOOD FUNDS (Unaudited) |
held by the Funds as of April 30, 2023, please see the Schedules of Investments section of this Report. The opinions of the Funds’ adviser with respect to those securities may change at any time.
Statements in the Letter to Shareholders that reflect projections or expectations for future financial or economic performance of the Funds and the market in general and statements of the Funds’ plans and objectives for future operations are forward-looking statements. No assurance can be given that actual results or events will not differ materially from those projected, estimated, assumed, or anticipated in any such forward-looking statements. Important factors that could result in such differences, in addition to factors noted with such forward-looking statements include, without limitation, general economic conditions, such as inflation, recession, and interest rates. Past performance is not a guarantee of future results.
11
| WESTWOOD FUNDS (Unaudited) |
Definition of the Comparative Indices & Key Terms
Alpha is the measure of risk-adjusted performance.
Bloomberg U.S. Aggregate Bond Index is a broad-based flagship benchmark that measures the investment grade, US dollar-denominated, fixed-rate taxable bond market.
Compound Annual Growth Rate: The rate of return that would be required for an investment to grow from its beginning balance to its ending balance, assuming the profits are reinvested at the end of each year of the investment’s lifespan.
FTSE 1-Month Treasury Bill Index is a market value-weighted index of public obligations of the U.S. Treasury bills with maturities of one month. The Index reflects no deduction for fees, expenses or taxes.
Gamma is the rate of change for delta with respect to the underlying asset’s price. Gamma is an important measure of the convexity of a derivative’s value, in relation to the underlying assets.
Russell 1000 Index measures the performance of the large-cap segment of the U.S. equity universe. It is a subset of the Russell 3000 Index and includes approximately 1,000 of the largest securities based on a combination of their market cap and current index membership. The Russell 1000 represents approximately 92% of the Russell 3000 Index. The Russell 1000 Index is constructed to provide a comprehensive and unbiased barometer for the large-cap segment and is completely reconstituted annually to ensure new and growing equities are reflected.
Russell 1000 Value Index measures the performance of the large-cap value segment of the U.S. equity universe. It includes those Russell 1000 companies with lower price-to-book ratios and lower expected and historical growth rates.
Russell 2000 Value Index is a broadly diversified index predominantly made up of value stocks of small U.S. companies.
Russell 2500 Index measures the performance of the 2,500 smallest companies in the Russell 3000 Index, which represents approximately 16% of the total market capitalization of the Russell 3000 Index.
Russell 2500 Value Index measures the performance of the small to mid-cap value segment of the U.S. equity universe. It includes those Russell 2500 companies with lower price-to-book ratio and lower forecasted growth values.
S&P 500 Index is an unmanaged capitalization-weighted index of 500 stocks designed to measure performance of the broad domestic stock market through changes in the aggregate market value of 500 stocks representing all major industries.
12
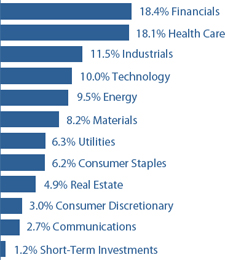
| WESTWOOD QUALITY VALUE FUND |
| APRIL 30, 2023 (Unaudited) |
| Sector Weightings (Unaudited)† |
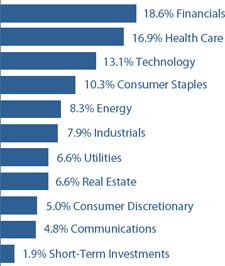
| † | Percentages are based on total investments. |
| SCHEDULE OF INVESTMENTS |
| COMMON STOCKS — 97.9% |
| Shares | Value | |||||||
| Communications — 4.9% | ||||||||
| Internet Media & Services — 3.1% | ||||||||
| Alphabet, Inc. - Class A (a) | 72,169 | $ | 7,746,620 | |||||
| Telecommunications — 1.8% | ||||||||
| AT&T, Inc. | 251,373 | 4,441,761 | ||||||
| Consumer Discretionary — 5.0% | ||||||||
| Leisure Facilities & Services — 1.9% | ||||||||
| Domino’s Pizza, Inc. | 15,115 | 4,798,559 | ||||||
| Retail - Discretionary — 3.1% | ||||||||
| Home Depot, Inc. (The) | 16,759 | 5,036,750 | ||||||
| O’Reilly Automotive, Inc. (a) | 2,903 | 2,662,951 | ||||||
| 7,699,701 | ||||||||
| Consumer Staples — 10.3% | ||||||||
| Beverages — 1.9% | ||||||||
| PepsiCo, Inc. | 25,625 | 4,891,556 | ||||||
| Food — 1.0% | ||||||||
| McCormick & Company, Inc. | 29,166 | 2,562,233 | ||||||
| Household Products — 3.8% | ||||||||
| Church & Dwight Company, Inc. | 53,148 | 5,161,734 | ||||||
| Estee Lauder Companies, Inc. (The) - Class A | 17,799 | 4,391,369 | ||||||
| 9,553,103 | ||||||||
| COMMON STOCKS — continued |
| Shares | Value | |||||||
| Consumer Staples — continued | ||||||||
| Retail - Consumer Staples — 3.6% | ||||||||
| Dollar General Corporation | 10,515 | $ | 2,328,652 | |||||
| Walmart, Inc. | 43,869 | 6,622,903 | ||||||
| 8,951,555 | ||||||||
| Energy — 8.2% | ||||||||
| Oil & Gas Producers — 8.2% | ||||||||
| Chevron Corporation | 35,330 | 5,955,932 | ||||||
| ConocoPhillips | 42,291 | 4,351,321 | ||||||
| EOG Resources, Inc. | 45,039 | 5,380,809 | ||||||
| Exxon Mobil Corporation | 42,800 | 5,064,952 | ||||||
| 20,753,014 | ||||||||
| Financials — 18.5% | ||||||||
| Banking — 7.0% | ||||||||
| Bank of America Corporation | 279,552 | 8,185,283 | ||||||
| JPMorgan Chase & Company | 68,055 | 9,407,923 | ||||||
| 17,593,206 | ||||||||
| Institutional Financial Services — 2.3% | ||||||||
| Goldman Sachs Group, Inc. (The) | 17,035 | 5,850,500 | ||||||
| Insurance — 9.2% | ||||||||
| American International Group, Inc. | 122,260 | 6,484,671 | ||||||
| Arthur J. Gallagher & Company | 32,340 | 6,728,660 | ||||||
| Berkshire Hathaway, Inc. - Class B (a) | 15,640 | 5,138,522 | ||||||
| Progressive Corporation (The) | 35,754 | 4,876,846 | ||||||
| 23,228,699 | ||||||||
| Health Care — 16.8% | ||||||||
| Biotech & Pharma — 6.5% | ||||||||
| Gilead Sciences, Inc. | 96,332 | 7,919,454 | ||||||
| Johnson & Johnson | 52,561 | 8,604,235 | ||||||
| 16,523,689 | ||||||||
| Health Care Facilities & Services — 3.5% | ||||||||
| HCA Healthcare, Inc. | 9,448 | 2,714,694 | ||||||
| UnitedHealth Group, Inc. | 12,438 | 6,120,615 | ||||||
| 8,835,309 | ||||||||
| Medical Equipment & Devices — 6.8% | ||||||||
| Abbott Laboratories | 45,446 | 5,020,420 | ||||||
| Becton, Dickinson and Company | 27,588 | 7,291,784 | ||||||
| Danaher Corporation | 20,046 | 4,749,098 | ||||||
| 17,061,302 | ||||||||
| Industrials — 7.9% | ||||||||
| Diversified Industrials — 4.5% | ||||||||
| Eaton Corporation plc | 28,919 | 4,832,943 | ||||||
| Honeywell International, Inc. | 32,321 | 6,459,029 | ||||||
| 11,291,972 | ||||||||
The accompanying notes are an integral part of the financial statements.
13
| WESTWOOD QUALITY VALUE FUND |
| APRIL 30, 2023 (Unaudited) |
| COMMON STOCKS — continued |
| Shares | Value | |||||||
| Industrials — continued | ||||||||
| Transportation & Logistics — 3.4% | ||||||||
| FedEx Corporation | 21,034 | $ | 4,791,125 | |||||
| Union Pacific Corporation | 18,773 | 3,673,876 | ||||||
| 8,465,001 | ||||||||
| Real Estate — 6.6% | ||||||||
| REITs — 6.6% | ||||||||
| Prologis, Inc. | 24,614 | 3,082,903 | ||||||
| Public Storage | 16,065 | 4,736,444 | ||||||
| Ventas, Inc. | 78,482 | 3,771,060 | ||||||
| VICI Properties, Inc. | 150,936 | 5,122,768 | ||||||
| 16,713,175 | ||||||||
| Technology — 13.1% | ||||||||
| Semiconductors — 1.8% | ||||||||
| Microchip Technology, Inc. | 61,889 | 4,517,278 | ||||||
| Software — 3.2% | ||||||||
| Microsoft Corporation | 25,941 | 7,970,632 | ||||||
| Technology Hardware — 4.0% | ||||||||
| Apple, Inc. | 30,063 | 5,101,090 | ||||||
| Motorola Solutions, Inc. | 17,424 | 5,077,353 | ||||||
| 10,178,443 | ||||||||
| Technology Services — 4.1% | ||||||||
| CACI International, Inc. - Class A (a) | 16,669 | 5,222,731 | ||||||
| Visa, Inc. - Class A | 22,056 | 5,133,093 | ||||||
| 10,355,824 | ||||||||
| Utilities — 6.6% | ||||||||
| Electric Utilities — 6.6% | ||||||||
| DTE Energy Company | 45,666 | 5,133,315 | ||||||
| NextEra Energy, Inc. | 65,093 | 4,988,077 | ||||||
| WEC Energy Group, Inc. | 68,636 | 6,600,724 | ||||||
| 16,722,116 | ||||||||
| Total Common Stocks (Cost $198,639,123) | $ | 246,705,248 | ||||||
| MONEY MARKET FUNDS — 1.9% |
| Shares | Value | |||||||
| SEI Daily Income Trust, Government Fund - Class F, 4.50% (b) (Cost $4,678,135) | 4,678,135 | $ | 4,678,135 | |||||
| Investments at Value — 99.8% (Cost $203,317,258) | $ | 251,383,383 | ||||||
| Other Assets in Excess of Liabilities — 0.2% | 615,122 | |||||||
| Net Assets — 100.0% | $ | 251,998,505 | ||||||
plc - Public Limited Company
| (a) | Non-income producing security. |
| (b) | The rate shown is the 7-day effective yield as of April 30, 2023. |
The accompanying notes are an integral part of the financial statements.
14
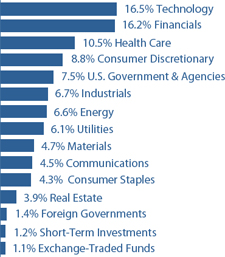
| WESTWOOD QUALITY MIDCAP FUND |
| APRIL 30, 2023 (Unaudited) |
| Sector Weightings (Unaudited)† |
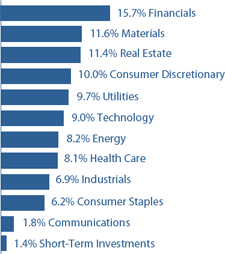
| † | Percentages are based on total investments. |
| SCHEDULE OF INVESTMENTS |
| COMMON STOCKS — 99.6% |
| Shares | Value | |||||||
| Communications — 1.8% | ||||||||
| Entertainment Content — 1.8% | ||||||||
| Activision Blizzard, Inc. (a) | 134 | $ | 10,413 | |||||
| Consumer Discretionary — 10.1% | ||||||||
| Home Construction — 4.0% | ||||||||
| Armstrong World Industries, Inc. | 107 | 7,347 | ||||||
| Masonite International Corporation (a) | 94 | 8,592 | ||||||
| PulteGroup, Inc. | 102 | 6,849 | ||||||
| 22,788 | ||||||||
| Leisure Facilities & Services — 2.0% | ||||||||
| Texas Roadhouse, Inc. | 106 | 11,726 | ||||||
| Retail - Discretionary — 4.1% | ||||||||
| Academy Sports & Outdoors, Inc. | 91 | 5,780 | ||||||
| Bath & Body Works, Inc. | 166 | 5,827 | ||||||
| O’Reilly Automotive, Inc. (a) | 13 | 11,925 | ||||||
| 23,532 | ||||||||
| Consumer Staples — 6.3% | ||||||||
| Food — 2.7% | ||||||||
| McCormick & Company, Inc. | 173 | 15,198 | ||||||
| Household Products — 1.6% | ||||||||
| Church & Dwight Company, Inc. | 97 | 9,421 | ||||||
| Retail - Consumer Staples — 2.0% | ||||||||
| BJ’s Wholesale Club Holdings, Inc. (a) | 146 | 11,150 | ||||||
| COMMON STOCKS — continued |
| Shares | Value | |||||||
| Energy — 8.3% | ||||||||
| Oil & Gas Producers — 8.3% | ||||||||
| Chord Energy Corporation | 64 | $ | 9,109 | |||||
| Diamondback Energy, Inc. | 110 | 15,642 | ||||||
| EOG Resources, Inc. | 101 | 12,067 | ||||||
| Valero Energy Corporation | 95 | 10,894 | ||||||
| 47,712 | ||||||||
| Financials — 15.9% | ||||||||
| Banking — 6.8% | ||||||||
| Atlantic Union Bankshares Corporation | 159 | 4,551 | ||||||
| Cullen/Frost Bankers, Inc. | 82 | 9,041 | ||||||
| Glacier Bancorp, Inc. | 260 | 8,640 | ||||||
| Prosperity Bancshares, Inc. | 136 | 8,516 | ||||||
| Western Alliance Bancorp | 228 | 8,463 | ||||||
| 39,211 | ||||||||
| Institutional Financial Services — 3.0% | ||||||||
| Intercontinental Exchange, Inc. | 76 | 8,279 | ||||||
| Piper Sandler Companies | 65 | 8,803 | ||||||
| 17,082 | ||||||||
| Insurance — 6.1% | ||||||||
| American International Group, Inc. | 279 | 14,798 | ||||||
| Arthur J. Gallagher & Company | 69 | 14,356 | ||||||
| Everest Re Group Ltd. | 15 | 5,670 | ||||||
| 34,824 | ||||||||
| Health Care — 8.1% | ||||||||
| Health Care Facilities & Services — 3.0% | ||||||||
| McKesson Corporation | 48 | 17,483 | ||||||
| Medical Equipment & Devices — 5.1% | ||||||||
| Avantor, Inc. (a) | 556 | 10,831 | ||||||
| Cooper Companies, Inc. (The) | 31 | 11,825 | ||||||
| ICU Medical, Inc. (a) | 34 | 6,431 | ||||||
| 29,087 | ||||||||
| Industrials — 6.9% | ||||||||
| Aerospace & Defense — 1.4% | ||||||||
| Mercury Systems, Inc. (a) | 164 | 7,818 | ||||||
| Electrical Equipment — 1.6% | ||||||||
| Veritiv Holdings Company | 620 | 9,250 | ||||||
| Machinery — 3.9% | ||||||||
| AGCO Corporation | 87 | 10,783 | ||||||
| Albany International Corporation - Class A | 129 | 11,766 | ||||||
| 22,549 | ||||||||
The accompanying notes are an integral part of the financial statements.
15
| WESTWOOD QUALITY MIDCAP FUND |
| APRIL 30, 2023 (Unaudited) |
| COMMON STOCKS — continued |
| Shares | Value | |||||||
| Materials — 11.7% | ||||||||
| Chemicals — 4.0% | ||||||||
| Axalta Coating Systems Ltd. (a) | 367 | $ | 11,586 | |||||
| CF Industries Holdings, Inc. | 160 | 11,453 | ||||||
| 23,039 | ||||||||
| Construction Materials — 2.1% | ||||||||
| Eagle Materials, Inc. | 40 | 5,929 | ||||||
| Summit Materials, Inc. - Class A (a) | 213 | 5,838 | ||||||
| 11,767 | ||||||||
| Containers & Packaging — 4.0% | ||||||||
| Crown Holdings, Inc. | 130 | 11,151 | ||||||
| WestRock Company | 393 | 11,763 | ||||||
| 22,914 | ||||||||
| Forestry, Paper & Wood Products — 1.6% | ||||||||
| Boise Cascade Company | 137 | 9,358 | ||||||
| Real Estate — 11.5% | ||||||||
| REITs — 11.5% | ||||||||
| Americold Realty Trust, Inc. | 379 | 11,215 | ||||||
| National Storage Affiliates Trust | 217 | 8,365 | ||||||
| Realty Income Corporation | 184 | 11,563 | ||||||
| Ventas, Inc. | 313 | 15,040 | ||||||
| VICI Properties, Inc. | 335 | 11,370 | ||||||
| Weyerhaeuser Company | 284 | 8,494 | ||||||
| 66,047 | ||||||||
| Technology — 9.1% | ||||||||
| Semiconductors — 4.2% | ||||||||
| Microchip Technology, Inc. | 182 | 13,284 | ||||||
| Rambus, Inc. (a) | 241 | 10,686 | ||||||
| 23,970 | ||||||||
| Software — 2.2% | ||||||||
| Tyler Technologies, Inc. (a) | 33 | 12,508 | ||||||
| Technology Services — 2.7% | ||||||||
| CACI International, Inc. - Class A (a) | 50 | 15,666 | ||||||
| COMMON STOCKS — continued |
| Shares | Value | |||||||
| Utilities — 9.9% | ||||||||
| Electric Utilities — 9.9% | ||||||||
| Alliant Energy Corporation | 279 | $ | 15,384 | |||||
| CMS Energy Corporation | 249 | 15,503 | ||||||
| DTE Energy Company | 124 | 13,939 | ||||||
| Evergy, Inc. | 186 | 11,552 | ||||||
| 56,378 | ||||||||
| Total Common Stocks (Cost $551,606) | $ | 570,891 | ||||||
| MONEY MARKET FUNDS — 1.4% | ||||||||
| First American Treasury Obligations Fund - Class X, 4.72% (b) (Cost $8,237) | 8,237 | $ | 8,237 | |||||
| Investments at Value — 101.0% (Cost $559,843) | $ | 579,128 | ||||||
| Liabilities in Excess of Other Assets — (1.0%) | (5,605 | ) | ||||||
| Net Assets — 100.0% | $ | 573,523 | ||||||
| (a) | Non-income producing security. |
| (b) | The rate shown is the 7-day effective yield as of April 30, 2023. |
The accompanying notes are an integral part of the financial statements.
16
| WESTWOOD QUALITY SMIDCAP FUND |
| APRIL 30, 2023 (Unaudited) |
| Sector Weightings (Unaudited)† |
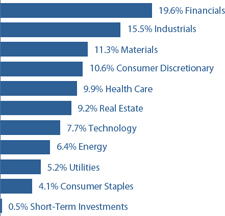
| † | Percentages are based on total investments. |
| SCHEDULE OF INVESTMENTS |
| COMMON STOCKS — 99.4% |
| Shares | Value | |||||||
| Consumer Discretionary — 10.5% | ||||||||
| Apparel & Textile Products — 2.1% | ||||||||
| Deckers Outdoor Corporation (a) | 12,571 | $ | 6,025,783 | |||||
| Leisure Facilities & Services — 3.0% | ||||||||
| Papa John’s International, Inc. | 37,035 | 2,769,848 | ||||||
| Texas Roadhouse, Inc. | 53,017 | 5,864,740 | ||||||
| 8,634,588 | ||||||||
| Leisure Products — 0.9% | ||||||||
| Topgolf Callaway Brands Corporation (a) | 126,316 | 2,800,426 | ||||||
| Retail - Discretionary — 4.5% | ||||||||
| Academy Sports & Outdoors, Inc. | 45,009 | 2,858,971 | ||||||
| Advance Auto Parts, Inc. | 47,900 | 6,012,887 | ||||||
| Lithia Motors, Inc. | 19,221 | 4,245,727 | ||||||
| 13,117,585 | ||||||||
| Consumer Staples — 4.1% | ||||||||
| Food — 4.1% | ||||||||
| Hostess Brands, Inc. (a) | 233,598 | 6,017,484 | ||||||
| J & J Snack Foods Corporation | 38,373 | 5,878,744 | ||||||
| 11,896,228 | ||||||||
| Energy — 6.4% | ||||||||
| Oil & Gas Producers — 6.4% | ||||||||
| Chord Energy Corporation | 40,373 | 5,746,289 | ||||||
| Diamondback Energy, Inc. | 39,949 | 5,680,748 | ||||||
| Magnolia Oil & Gas Corporation - Class A | 130,063 | 2,746,931 | ||||||
| PDC Energy, Inc. | 67,948 | 4,420,017 | ||||||
| 18,593,985 | ||||||||
| COMMON STOCKS — continued |
| Shares | Value | |||||||
| Financials — 19.6% | ||||||||
| Banking — 11.5% | ||||||||
| Atlantic Union Bankshares Corporation | 205,175 | $ | 5,872,108 | |||||
| Cullen/Frost Bankers, Inc. | 51,366 | 5,663,102 | ||||||
| Glacier Bancorp, Inc. | 172,628 | 5,736,428 | ||||||
| Seacoast Banking Corporation of Florida | 129,642 | 2,876,756 | ||||||
| Texas Capital Bancshares, Inc. (a) | 95,182 | 4,782,896 | ||||||
| Triumph Financial, Inc. (a) | 53,256 | 2,767,182 | ||||||
| Wintrust Financial Corporation | 81,290 | 5,557,797 | ||||||
| 33,256,269 | ||||||||
| Institutional Financial Services — 1.9% | ||||||||
| Perella Weinberg Partners | 180,363 | 1,424,868 | ||||||
| Piper Sandler Companies | 29,384 | 3,979,769 | ||||||
| 5,404,637 | ||||||||
| Insurance — 6.2% | ||||||||
| BRP Group, Inc. - Class A (a) | 225,718 | 5,685,836 | ||||||
| International General Insurance Holdings Ltd. | 374,497 | 3,100,835 | ||||||
| RenaissanceRe Holdings Ltd. | 28,625 | 6,166,111 | ||||||
| Voya Financial, Inc. | 41,616 | 3,182,792 | ||||||
| 18,135,574 | ||||||||
| Health Care — 9.9% | ||||||||
| Biotech & Pharma — 2.0% | ||||||||
| Prestige Consumer Healthcare, Inc. (a) | 94,989 | 5,844,673 | ||||||
| Health Care Facilities & Services — 1.0% | ||||||||
| Premier, Inc. - Class A | 88,620 | 2,953,705 | ||||||
| Medical Equipment & Devices — 6.9% | ||||||||
| Avantor, Inc. (a) | 283,027 | 5,513,366 | ||||||
| Cooper Companies, Inc. (The) | 15,209 | 5,801,473 | ||||||
| Integer Holdings Corporation (a) | 69,834 | 5,750,830 | ||||||
| Integra LifeSciences Holdings Corporation (a) | 50,184 | 2,776,179 | ||||||
| 19,841,848 | ||||||||
| Industrials — 15.5% | ||||||||
| Aerospace & Defense — 5.9% | ||||||||
| Hexcel Corporation | 85,414 | 6,156,641 | ||||||
| Mercury Systems, Inc. (a) | 117,155 | 5,584,779 | ||||||
| Moog, Inc. - Class A | 58,829 | 5,301,081 | ||||||
| 17,042,501 | ||||||||
The accompanying notes are an integral part of the financial statements.
17
| WESTWOOD QUALITY SMIDCAP FUND |
| APRIL 30, 2023 (Unaudited) |
| COMMON STOCKS — continued |
| Shares | Value | |||||||
| Industrials — continued | ||||||||
| Electrical Equipment — 5.9% | ||||||||
| Hubbell, Inc. | 21,804 | $ | 5,872,254 | |||||
| Littelfuse, Inc. | 22,634 | 5,482,860 | ||||||
| Veritiv Holdings Company | 391,252 | 5,837,480 | ||||||
| 17,192,594 | ||||||||
| Machinery — 3.7% | ||||||||
| AGCO Corporation | 34,916 | 4,327,489 | ||||||
| Albany International Corporation - Class A | 68,243 | 6,224,444 | ||||||
| 10,551,933 | ||||||||
| Materials — 11.3% | ||||||||
| Chemicals — 4.3% | ||||||||
| Axalta Coating Systems Ltd. (a) | 186,430 | 5,885,595 | ||||||
| Ecovyst, Inc. (a) | 581,579 | 6,600,922 | ||||||
| 12,486,517 | ||||||||
| Construction Materials — 2.0% | ||||||||
| Eagle Materials, Inc. | 38,796 | 5,749,955 | ||||||
| Containers & Packaging — 2.0% | ||||||||
| WestRock Company | 188,804 | 5,650,904 | ||||||
| Forestry, Paper & Wood Products — 2.1% | ||||||||
| Boise Cascade Company | 87,897 | 6,004,244 | ||||||
| Metals & Mining — 0.9% | ||||||||
| Encore Wire Corporation | 17,420 | 2,723,268 | ||||||
| Real Estate — 9.2% | ||||||||
| REITs — 9.2% | ||||||||
| Americold Realty Trust, Inc. | 200,874 | 5,943,861 | ||||||
| Corporate Office Properties Trust | 246,718 | 5,647,375 | ||||||
| First Industrial Realty Trust, Inc. | 81,793 | 4,291,679 | ||||||
| National Retail Properties, Inc. | 67,940 | 2,955,390 | ||||||
| National Storage Affiliates Trust | 72,878 | 2,809,447 | ||||||
| Urban Edge Properties | 343,501 | 5,039,160 | ||||||
| 26,686,912 | ||||||||
| Technology — 7.7% | ||||||||
| Semiconductors — 2.6% | ||||||||
| Amkor Technology, Inc. | 122,189 | 2,733,368 | ||||||
| Lattice Semiconductor Corporation (a) | 30,004 | 2,391,318 | ||||||
| Rambus, Inc. (a) | 56,723 | 2,515,098 | ||||||
| 7,639,784 | ||||||||
| Software — 2.2% | ||||||||
| Tyler Technologies, Inc. (a) | 16,489 | 6,249,826 | ||||||
| COMMON STOCKS — continued |
| Shares | Value | |||||||
| Technology — continued | ||||||||
| Technology Services — 2.9% | ||||||||
| CACI International, Inc. - Class A (a) | 18,809 | $ | 5,893,236 | |||||
| Science Applications International Corporation | 26,205 | 2,673,696 | ||||||
| 8,566,932 | ||||||||
| Utilities — 5.2% | ||||||||
| Electric Utilities — 5.2% | ||||||||
| Alliant Energy Corporation | 54,104 | 2,983,294 | ||||||
| IDACORP, Inc. | 54,418 | 6,046,928 | ||||||
| NorthWestern Corporation | 102,438 | 6,004,916 | ||||||
| 15,035,138 | ||||||||
| Total Common Stocks (Cost $266,818,247) | $ | 288,085,809 | ||||||
| MONEY MARKET FUNDS — 0.5% | ||||||||
| SEI Daily Income Trust, Government Fund - Class F, 4.50% (b) (Cost $1,427,442) | 1,427,442 | $ | 1,427,442 | |||||
| Investments at Value — 99.9% (Cost $268,245,689) | $ | 289,513,251 | ||||||
| Other Assets in Excess of Liabilities — 0.1% | 317,250 | |||||||
| Net Assets — 100.0% | $ | 289,830,501 | ||||||
| (a) | Non-income producing security. |
| (b) | The rate shown is the 7-day effective yield as of April 30, 2023. |
The accompanying notes are an integral part of the financial statements.
18
| WESTWOOD QUALITY SMALLCAP FUND |
| APRIL 30, 2023 (Unaudited) |
| Sector Weightings (Unaudited)† |
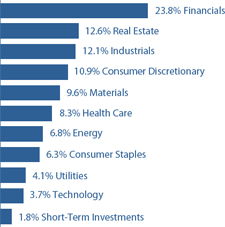
| † | Percentages are based on total investments. |
| SCHEDULE OF INVESTMENTS |
| COMMON STOCKS — 96.8% |
| Shares | Value | |||||||
| Consumer Discretionary — 10.7% | ||||||||
| Automotive — 1.0% | ||||||||
| Methode Electronics, Inc. | 266,377 | $ | 10,918,793 | |||||
| Home Construction — 3.3% | ||||||||
| Century Communities, Inc. | 178,068 | 11,991,099 | ||||||
| Masonite International Corporation (a) | 249,943 | 22,847,290 | ||||||
| 34,838,389 | ||||||||
| Leisure Facilities & Services — 3.3% | ||||||||
| Chuy’s Holdings, Inc. (a) | 366,822 | 12,794,751 | ||||||
| Papa John’s International, Inc. | 301,662 | 22,561,301 | ||||||
| 35,356,052 | ||||||||
| Retail - Discretionary — 3.1% | ||||||||
| Academy Sports & Outdoors, Inc. | 167,652 | 10,649,255 | ||||||
| Monro, Inc. | 459,250 | 22,448,140 | ||||||
| 33,097,395 | ||||||||
| Consumer Staples — 6.2% | ||||||||
| Beverages — 1.1% | ||||||||
| Duckhorn Portfolio, Inc. (The) (a) | 749,080 | 11,311,108 | ||||||
| Food — 4.2% | ||||||||
| Hostess Brands, Inc. (a) | 840,914 | 21,661,945 | ||||||
| J & J Snack Foods Corporation | 149,308 | 22,873,985 | ||||||
| 44,535,930 | ||||||||
| Household Products — 0.9% | ||||||||
| Central Garden & Pet Company - Class A (a) | 283,357 | 10,011,003 | ||||||
| COMMON STOCKS — continued |
| Shares | Value | |||||||
| Energy — 6.7% | ||||||||
| Oil & Gas Producers — 6.7% | ||||||||
| Chord Energy Corporation | 87,529 | $ | 12,458,003 | |||||
| Enerplus Corporation | 925,667 | 13,847,978 | ||||||
| Northern Oil and Gas, Inc. | 690,084 | 22,890,086 | ||||||
| Sitio Royalties Corporation - Class A | 879,240 | 22,323,904 | ||||||
| 71,519,971 | ||||||||
| Financials — 23.5% | ||||||||
| Banking — 16.9% | ||||||||
| Atlantic Union Bankshares Corporation | 751,763 | 21,515,457 | ||||||
| Banner Corporation | 229,636 | 11,463,429 | ||||||
| City Holding Company | 248,920 | 22,699,015 | ||||||
| First Bancorp | 630,009 | 19,391,677 | ||||||
| National Bank Holdings Corporation - Class A | 349,188 | 11,104,178 | ||||||
| Provident Financial Services, Inc. | 596,474 | 10,426,365 | ||||||
| Renasant Corporation | 724,064 | 20,360,680 | ||||||
| Sandy Spring Bancorp, Inc. | 481,754 | 10,829,830 | ||||||
| Seacoast Banking Corporation of Florida | 979,615 | 21,737,657 | ||||||
| Triumph Financial, Inc. (a) | 374,262 | 19,446,654 | ||||||
| Veritex Holdings, Inc. | 625,780 | 10,769,674 | ||||||
| 179,744,616 | ||||||||
| Institutional Financial Services — 3.8% | ||||||||
| Moelis & Company - Class A | 511,384 | 19,371,226 | ||||||
| Piper Sandler Companies | 154,300 | 20,898,392 | ||||||
| 40,269,618 | ||||||||
| Insurance — 2.8% | ||||||||
| AMERISAFE, Inc. | 205,756 | 11,450,321 | ||||||
| BRP Group, Inc. - Class A (a) | 475,391 | 11,975,099 | ||||||
| Skyward Specialty Insurance Group, Inc. (a) | 287,834 | 6,153,891 | ||||||
| 29,579,311 | ||||||||
| Health Care — 8.2% | ||||||||
| Biotech & Pharma — 2.1% | ||||||||
| Prestige Consumer Healthcare, Inc. (a) | 370,154 | 22,775,576 | ||||||
| Health Care Facilities & Services — 2.1% | ||||||||
| Patterson Companies, Inc. | 805,064 | 21,825,285 | ||||||
The accompanying notes are an integral part of the financial statements.
19
| WESTWOOD QUALITY SMALLCAP FUND |
| APRIL 30, 2023 (Unaudited) |
| COMMON STOCKS — continued |
| Shares | Value | |||||||
| Health Care — continued | ||||||||
| Medical Equipment & Devices — 4.0% | ||||||||
| Avanos Medical, Inc. (a) | 365,418 | $ | 10,794,448 | |||||
| CONMED Corporation | 168,628 | 21,174,618 | ||||||
| Merit Medical Systems, Inc. (a) | 128,639 | 10,457,064 | ||||||
| 42,426,130 | ||||||||
| Industrials — 11.9% | ||||||||
| Aerospace & Defense — 2.1% | ||||||||
| Moog, Inc. - Class A | 248,696 | 22,409,996 | ||||||
| Engineering & Construction — 2.0% | ||||||||
| Comfort Systems USA, Inc. | 144,318 | 21,574,098 | ||||||
| Industrial Intermediate Products — 1.0% | ||||||||
| AZZ, Inc. | 285,875 | 10,786,064 | ||||||
| Machinery — 6.1% | ||||||||
| Alamo Group, Inc. | 121,386 | 21,452,548 | ||||||
| Albany International Corporation - Class A | 251,002 | 22,893,892 | ||||||
| Federal Signal Corporation | 399,849 | 20,544,242 | ||||||
| 64,890,682 | ||||||||
| Transportation & Logistics — 0.7% | ||||||||
| ArcBest Corporation | 79,924 | 7,544,825 | ||||||
| Materials — 9.4% | ||||||||
| Chemicals — 4.6% | ||||||||
| Ecovyst, Inc. (a) | 1,437,826 | 16,319,325 | ||||||
| Innospec, Inc. | 117,652 | 11,956,973 | ||||||
| Stepan Company | 229,652 | 21,173,914 | ||||||
| 49,450,212 | ||||||||
| Construction Materials — 0.5% | ||||||||
| Summit Materials, Inc. - Class A (a) | 201,622 | 5,526,459 | ||||||
| Forestry, Paper & Wood Products — 2.0% | ||||||||
| Boise Cascade Company | 229,591 | 15,683,361 | ||||||
| UFP Industries, Inc. | 66,532 | 5,224,093 | ||||||
| 20,907,454 | ||||||||
| Metals & Mining — 2.3% | ||||||||
| Encore Wire Corporation | 85,347 | 13,342,297 | ||||||
| Livent Corporation (a) | 498,420 | 10,890,477 | ||||||
| 24,232,774 | ||||||||
| COMMON STOCKS — continued |
| Shares | Value | |||||||
| Real Estate — 12.4% | ||||||||
| REITs — 12.4% | ||||||||
| Corporate Office Properties Trust | 944,076 | $ | 21,609,900 | |||||
| Easterly Government Properties, Inc. | 815,450 | 11,473,381 | ||||||
| Four Corners Property Trust, Inc. | 855,902 | 21,834,060 | ||||||
| Plymouth Industrial REIT, Inc. | 1,062,208 | 21,499,090 | ||||||
| PotlatchDeltic Corporation | 469,039 | 21,683,673 | ||||||
| Sunstone Hotel Investors, Inc. | 1,125,740 | 10,728,302 | ||||||
| Urban Edge Properties | 1,589,992 | 23,325,183 | ||||||
| 132,153,589 | ||||||||
| Technology — 3.6% | ||||||||
| Semiconductors — 1.9% | ||||||||
| Rambus, Inc. (a) | 456,391 | 20,236,377 | ||||||
| Technology Hardware — 1.7% | ||||||||
| Viavi Solutions, Inc. (a) | 2,048,522 | 18,354,757 | ||||||
| Utilities — 4.1% | ||||||||
| Electric Utilities — 4.1% | ||||||||
| Avista Corporation | 488,135 | 21,512,109 | ||||||
| NorthWestern Corporation | 374,333 | 21,943,401 | ||||||
| 43,455,510 | ||||||||
| Total Common Stocks (Cost $964,630,977) | $ | 1,029,731,974 | ||||||
| MONEY MARKET FUNDS — 1.8% | ||||||||
| SEI Daily Income Trust, Government Fund - Class F, 4.50% (b) (Cost $18,931,699) | 18,931,699 | $ | 18,931,699 | |||||
| Investments at Value — 98.5% (Cost $983,562,676) | $ | 1,048,663,673 | ||||||
| Other Assets in Excess of Liabilities — 1.5% | 15,461,489 | |||||||
| Net Assets — 100.0% | $ | 1,064,125,162 | ||||||
| (a) | Non-income producing security. |
| (b) | The rate shown is the 7-day effective yield as of April 30, 2023. |
The accompanying notes are an integral part of the financial statements.
20
| WESTWOOD QUALITY ALLCAP FUND |
| APRIL 30, 2023 (Unaudited) |
| Sector Weightings (Unaudited)† |
| † | Percentages are based on total investments. |
| SCHEDULE OF INVESTMENTS |
| COMMON STOCKS — 98.3% |
| Shares | Value | |||||||
| Communications — 2.7% | ||||||||
| Telecommunications — 2.7% | ||||||||
| AT&T, Inc. | 34,703 | $ | 613,202 | |||||
| Consumer Discretionary — 3.0% | ||||||||
| Leisure Facilities & Services — 1.0% | ||||||||
| Papa John’s International, Inc. | 3,038 | 227,212 | ||||||
| Retail - Discretionary — 2.0% | ||||||||
| O’Reilly Automotive, Inc. (a) | 493 | 452,234 | ||||||
| Consumer Staples — 6.2% | ||||||||
| Beverages — 2.3% | ||||||||
| PepsiCo, Inc. | 2,722 | 519,603 | ||||||
| Household Products — 1.9% | ||||||||
| Estee Lauder Companies, Inc. (The) - Class A | 1,698 | 418,930 | ||||||
| Retail - Consumer Staples — 2.0% | ||||||||
| Walmart, Inc. | 3,070 | 463,478 | ||||||
| Energy — 9.4% | ||||||||
| Oil & Gas Producers — 9.4% | ||||||||
| Chevron Corporation | 4,030 | 679,377 | ||||||
| Diamondback Energy, Inc. | 3,466 | 492,865 | ||||||
| EOG Resources, Inc. | 3,503 | 418,504 | ||||||
| Pioneer Natural Resources Company | 2,471 | 537,566 | ||||||
| 2,128,312 | ||||||||
| COMMON STOCKS — continued |
| Shares | Value | |||||||
| Financials — 18.4% | ||||||||
| Banking — 6.8% | ||||||||
| Bank of America Corporation | 19,408 | $ | 568,266 | |||||
| Glacier Bancorp, Inc. | 8,109 | 269,462 | ||||||
| JPMorgan Chase & Company | 4,981 | 688,574 | ||||||
| 1,526,302 | ||||||||
| Institutional Financial Services — 2.2% | ||||||||
| Goldman Sachs Group, Inc. (The) | 1,026 | 352,369 | ||||||
| Perella Weinberg Partners | 16,891 | 133,439 | ||||||
| 485,808 | ||||||||
| Insurance — 9.4% | ||||||||
| Arthur J. Gallagher & Company | 2,206 | 458,980 | ||||||
| Berkshire Hathaway, Inc. - Class B (a) | 1,573 | 516,809 | ||||||
| Chubb Ltd. | 2,251 | 453,712 | ||||||
| Everest Re Group Ltd. | 1,237 | 467,586 | ||||||
| International General Insurance Holdings Ltd. | 28,011 | 231,931 | ||||||
| 2,129,018 | ||||||||
| Health Care — 18.0% | ||||||||
| Biotech & Pharma — 6.0% | ||||||||
| Gilead Sciences, Inc. | 8,053 | 662,037 | ||||||
| Johnson & Johnson | 4,196 | 686,886 | ||||||
| 1,348,923 | ||||||||
| Health Care Facilities & Services — 3.1% | ||||||||
| HCA Healthcare, Inc. | 863 | 247,966 | ||||||
| UnitedHealth Group, Inc. | 913 | 449,278 | ||||||
| 697,244 | ||||||||
| Medical Equipment & Devices — 8.9% | ||||||||
| Abbott Laboratories | 4,074 | 450,055 | ||||||
| Avantor, Inc. (a) | 14,970 | 291,616 | ||||||
| Becton, Dickinson and Company | 1,589 | 419,988 | ||||||
| Cooper Companies, Inc. (The) | 1,189 | 453,544 | ||||||
| Danaher Corporation | 1,656 | 392,323 | ||||||
| 2,007,526 | ||||||||
| Industrials — 11.4% | ||||||||
| Aerospace & Defense — 5.4% | ||||||||
| Hexcel Corporation | 4,842 | 349,012 | ||||||
| L3Harris Technologies, Inc. | 2,109 | 411,571 | ||||||
| Mercury Systems, Inc. (a) | 9,558 | 455,630 | ||||||
| 1,216,213 | ||||||||
| Electrical Equipment — 1.6% | ||||||||
| Veritiv Holdings Company | 24,601 | 367,047 | ||||||
The accompanying notes are an integral part of the financial statements.
21
| WESTWOOD QUALITY ALLCAP FUND |
| APRIL 30, 2023 (Unaudited) |
| COMMON STOCKS — continued |
| Shares | Value | |||||||
| Industrials — continued | ||||||||
| Machinery — 3.0% | ||||||||
| AGCO Corporation | 1,618 | $ | 200,535 | |||||
| Albany International Corporation - Class A | 5,340 | 487,061 | ||||||
| 687,596 | ||||||||
| Transportation & Logistics — 1.4% | ||||||||
| FedEx Corporation | 1,365 | 310,920 | ||||||
| Materials — 8.2% | ||||||||
| Chemicals — 8.2% | ||||||||
| Axalta Coating Systems Ltd. (a) | 16,179 | 510,771 | ||||||
| CF Industries Holdings, Inc. | 4,565 | 326,763 | ||||||
| Corteva, Inc. | 7,085 | 433,035 | ||||||
| Ecovyst, Inc. (a) | 50,195 | 569,713 | ||||||
| 1,840,282 | ||||||||
| Real Estate — 4.9% | ||||||||
| REITs — 4.9% | ||||||||
| Americold Realty Trust, Inc. | 14,923 | 441,571 | ||||||
| Ventas, Inc. | 6,820 | 327,701 | ||||||
| VICI Properties, Inc. | 9,940 | 337,364 | ||||||
| 1,106,636 | ||||||||
| Technology — 9.9% | ||||||||
| Semiconductors — 2.2% | ||||||||
| ASML Holding N.V. | 338 | 215,259 | ||||||
| Rambus, Inc. (a) | 6,500 | 288,210 | ||||||
| 503,469 | ||||||||
| Software — 3.6% | ||||||||
| Microsoft Corporation | 1,162 | 357,036 | ||||||
| Tyler Technologies, Inc. (a) | 1,194 | 452,562 | ||||||
| 809,598 | ||||||||
| Technology Hardware — 2.0% | ||||||||
| Motorola Solutions, Inc. | 1,569 | 457,207 | ||||||
| Technology Services — 2.1% | ||||||||
| CACI International, Inc. - Class A (a) | 1,498 | 469,353 | ||||||
| COMMON STOCKS — continued |
| Shares | Value | |||||||
| Utilities — 6.2% | ||||||||
| Electric Utilities — 6.2% | ||||||||
| CMS Energy Corporation | 8,320 | $ | 518,003 | |||||
| IDACORP, Inc. | 3,022 | 335,805 | ||||||
| WEC Energy Group, Inc. | 5,714 | 549,515 | ||||||
| 1,403,323 | ||||||||
| Total Common Stocks (Cost $20,821,667) | $ | 22,189,436 | ||||||
| MONEY MARKET FUNDS — 1.2% | ||||||||
| First American Treasury Obligations Fund - Class X, 4.72% (b) (Cost $269,693) | 269,693 | $ | 269,693 | |||||
| Investments at Value — 99.5% (Cost $21,091,360) | $ | 22,459,129 | ||||||
| Other Assets in Excess of Liabilities — 0.5% | 106,776 | |||||||
| Net Assets — 100.0% | $ | 22,565,905 | ||||||
N.V. — Naamloze Vennootschap
| (a) | Non-income producing security. |
| (b) | The rate shown is the 7-day effective yield as of April 30, 2023. |
The accompanying notes are an integral part of the financial statements.
22
| WESTWOOD TOTAL RETURN FUND |
| APRIL 30, 2023 (Unaudited) |
| Sector Weightings (Unaudited)† |
| † | Percentages are based on total investments. |
| SCHEDULE OF INVESTMENTS |
| U.S. GOVERNMENT & AGENCIES — 7.5% |
| Coupon | Maturity | Par Value | Value | |||||||||
| U.S. Treasury Bills — 3.4% (a) | ||||||||||||
| U.S. Treasury Bills | 4.546% | 06/01/23 | $ | 4,250,000 | $ | 4,234,101 | ||||||
| U.S. Treasury Bonds — 3.2% | ||||||||||||
| U.S. Treasury Bonds | 2.875% | 05/15/52 | 2,225,000 | 1,901,854 | ||||||||
| U.S. Treasury Bonds | 3.000% | 08/15/52 | 2,400,000 | 2,106,000 | ||||||||
| 4,007,854 | ||||||||||||
| U.S. Treasury Notes — 0.9% | ||||||||||||
| U.S. Treasury Notes | 4.125% | 09/30/27 | 1,100,000 | 1,122,902 | ||||||||
| Total U.S. Government & Agencies (Cost $9,347,267) | $ | 9,364,857 | ||||||||||
| CONVERTIBLE BONDS — 3.1% | ||||||||||||
| Consumer Discretionary — 0.5% | ||||||||||||
| Live Nation Entertainment, Inc., 144A | 3.125% | 01/15/29 | $ | 630,000 | $ | 608,895 | ||||||
| Health Care — 0.9% | ||||||||||||
| CONMED Corporation | 2.625% | 02/01/24 | 810,000 | 1,161,540 | ||||||||
| Technology — 1.7% | ||||||||||||
| Akamai Technologies, Inc. | 0.125% | 05/01/25 | 985,000 | 1,014,092 | ||||||||
| Ziff Davis, Inc., 144A | 1.750% | 11/01/26 | 1,182,000 | 1,126,446 | ||||||||
| 2,140,538 | ||||||||||||
| Total Convertible Bonds (Cost $3,828,625) | $ | 3,910,973 | ||||||||||
The accompanying notes are an integral part of the financial statements.
23
| WESTWOOD TOTAL RETURN FUND |
| APRIL 30, 2023 (Unaudited) |
| CORPORATE BONDS — 34.4% |
| Coupon | Maturity | Par Value | Value | |||||||||
| Communications — 0.3% | ||||||||||||
| América Móvil S.A.B. de C.V., 144A | 5.375% | 04/04/32 | $ | 465,000 | $ | 424,661 | ||||||
| Consumer Discretionary — 3.2% | ||||||||||||
| Brunswick Corporation | 2.400% | 08/18/31 | 297,000 | 226,565 | ||||||||
| Cinemark USA, Inc., 144A | 5.875% | 03/15/26 | 750,000 | 716,602 | ||||||||
| Darden Restaurants, Inc. | 4.550% | 02/15/48 | 690,000 | 586,182 | ||||||||
| Ford Motor Credit Company, LLC | 4.271% | 01/09/27 | 485,000 | 448,955 | ||||||||
| General Motors Financial Company, Inc. | 2.350% | 01/08/31 | 550,000 | 433,577 | ||||||||
| Lowe’s Companies, Inc. | 5.625% | 04/15/53 | 420,000 | 422,381 | ||||||||
| Royal Caribbean Cruises Ltd., 144A | 9.250% | 01/15/29 | 1,110,000 | 1,184,333 | ||||||||
| 4,018,595 | ||||||||||||
| Consumer Staples — 1.5% | ||||||||||||
| Pilgrim’s Pride Corporation | 6.250% | 07/01/33 | 740,000 | 730,054 | ||||||||
| Vector Group Ltd., 144A | 5.750% | 02/01/29 | 700,000 | 626,293 | ||||||||
| Viterra Finance B.V., 144A | 2.000% | 04/21/26 | 627,000 | 559,764 | ||||||||
| 1,916,111 | ||||||||||||
| Energy — 3.1% | ||||||||||||
| Diamondback Energy, Inc. | 4.400% | 03/24/51 | 900,000 | 733,270 | ||||||||
| MPLX, L.P. | 4.950% | 09/01/32 | 850,000 | 833,306 | ||||||||
| NGL Energy Operating, LLC, 144A | 7.500% | 02/01/26 | 825,000 | 791,020 | ||||||||
| Petróleos Mexicanos | 6.700% | 02/16/32 | 1,345,000 | 1,034,344 | ||||||||
| TransCanada Trust | 5.600% | 03/07/82 | 590,000 | 498,868 | ||||||||
| 3,890,808 | ||||||||||||
| Financials — 9.5% | ||||||||||||
| AerCap Ireland Capital Ltd. | 3.300% | 01/30/32 | 691,000 | 565,745 | ||||||||
| AerCap Ireland Capital Ltd. | 3.850% | 10/29/41 | 646,000 | 485,143 | ||||||||
| Aircastle Ltd., 144A | 5.250% | 08/11/25 | 510,000 | 499,614 | ||||||||
| Apollo Management Holdings, L.P., 144A | 4.872% | 02/15/29 | 480,000 | 460,177 | ||||||||
| Ares Capital Corporation, 144A | 3.875% | 01/15/26 | 1,625,000 | 1,513,046 | ||||||||
| Avolon Holdings Funding Ltd., 144A | 2.750% | 02/21/28 | 1,500,000 | 1,260,757 | ||||||||
| Bank of America Corporation, Series N (3MO LIBOR + 131) (b) | 4.271% | 07/23/29 | 470,000 | 449,561 | ||||||||
| Barclays plc (b) | 7.437% | 11/02/33 | 380,000 | 417,835 | ||||||||
| Capital One Financial Corporation (Yield of U.S. T-Note 1.625% 02/31 + 112) (b) | 2.359% | 07/29/32 | 415,000 | 300,108 | ||||||||
| Compass Group Diversified Holdings, LLC, 144A | 5.250% | 04/15/29 | 1,121,000 | 1,009,313 | ||||||||
| HSBC Holdings plc | 6.254% | 03/09/34 | 555,000 | 577,359 | ||||||||
| HSBC Holdings plc (c) | 8.000% | 12/31/49 | 695,000 | 689,787 | ||||||||
| Lincoln National Corporation (c) | 9.250% | 12/31/49 | 400,000 | 401,000 | ||||||||
| Lincoln National Corporation (3MO LIBOR + 235.8) (b) | 7.234% | 05/17/66 | 340,000 | 214,200 | ||||||||
| National Australia Bank Ltd., 144A | 6.429% | 01/12/33 | 590,000 | 609,723 | ||||||||
| NatWest Group plc | 5.516% | 09/30/28 | 900,000 | 902,380 | ||||||||
| Protective Life Global Funding, 144A | 5.366% | 01/06/26 | 760,000 | 771,620 | ||||||||
| UBS Group AG, 144A (Yield of U.S. T-Note 0.625% 07/26 + 85) (b) | 1.494% | 08/10/27 | 865,000 | 750,223 | ||||||||
| 11,877,591 | ||||||||||||
| Health Care — 2.9% | ||||||||||||
| Bausch Health Companies, Inc., 144A | 5.500% | 11/01/25 | 1,000,000 | 871,934 | ||||||||
| Community Health Systems, Inc., 144A | 5.250% | 05/15/30 | 1,400,000 | 1,166,793 | ||||||||
| Flex Ltd. | 6.000% | 01/15/28 | 930,000 | 948,121 | ||||||||
The accompanying notes are an integral part of the financial statements.
24
| WESTWOOD TOTAL RETURN FUND |
| APRIL 30, 2023 (Unaudited) |
| CORPORATE BONDS — continued |
| Coupon | Maturity | Par Value | Value | |||||||||
| Health Care — continued | ||||||||||||
| Fresenius Medical Care US Finance III, Inc., 144A | 3.000% | 12/01/31 | $ | 810,000 | $ | 638,313 | ||||||
| 3,625,161 | ||||||||||||
| Industrials — 3.3% | ||||||||||||
| American Airlines Pass Through Trust, Series 2021-1B | 3.950% | 07/11/30 | 840,400 | 740,139 | ||||||||
| AP Moller - Maersk A/S, 144A | 4.500% | 06/20/29 | 600,000 | 592,132 | ||||||||
| Deluxe Corporation, 144A | 8.000% | 06/01/29 | 1,000,000 | 772,591 | ||||||||
| GEO Group, Inc. (The) | 10.500% | 06/30/28 | 1,000,000 | 1,011,250 | ||||||||
| Triton Container International Ltd., 144A | 0.800% | 08/01/23 | 965,000 | 950,993 | ||||||||
| 4,067,105 | ||||||||||||
| Materials — 1.9% | ||||||||||||
| Livent Corporation | 4.125% | 07/15/25 | 460,000 | 1,181,510 | ||||||||
| SSR Mining, Inc. | 2.500% | 04/01/39 | 1,155,000 | 1,234,695 | ||||||||
| 2,416,205 | ||||||||||||
| Real Estate — 2.1% | ||||||||||||
| Corporate Office Properties, L.P. | 2.250% | 03/15/26 | 974,000 | 868,767 | ||||||||
| Iron Mountain, Inc., 144A | 5.000% | 07/15/28 | 730,000 | 686,489 | ||||||||
| Kimco Realty Corporation | 4.600% | 02/01/33 | 575,000 | 541,812 | ||||||||
| MPT Operating Partnership, L.P. | 4.625% | 08/01/29 | 729,000 | 551,645 | ||||||||
| 2,648,713 | ||||||||||||
| Technology — 4.3% | ||||||||||||
| Dell International, LLC / EMC Corporation | 5.750% | 02/01/33 | 910,000 | 919,605 | ||||||||
| MongoDB, Inc. | 0.250% | 01/15/26 | 550,000 | 723,855 | ||||||||
| MPH Acquisition Holdings, LLC, 144A | 5.500% | 09/01/28 | 1,100,000 | 841,294 | ||||||||
| NICE Ltd. | 0.000% | 09/15/25 | 1,040,000 | 965,120 | ||||||||
| Oracle Corporation | 6.900% | 11/09/52 | 395,000 | 443,041 | ||||||||
| TIBCO Software, Inc., 144A | 6.500% | 03/31/29 | 1,000,000 | 901,181 | ||||||||
| Verisk Analytics, Inc. | 5.750% | 04/01/33 | 585,000 | 615,665 | ||||||||
| 5,409,761 | ||||||||||||
| Utilities — 2.3% | ||||||||||||
| Consolidated Edison Company, Inc. | 3.850% | 06/15/46 | 1,069,000 | 867,613 | ||||||||
| NextEra Energy Capital Holdings, Inc. | 5.000% | 07/15/32 | 1,010,000 | 1,017,651 | ||||||||
| Piedmont Natural Gas Company, Inc. | 5.050% | 05/15/52 | 1,000,000 | 943,994 | ||||||||
| 2,829,258 | ||||||||||||
| Total Corporate Bonds (Cost $44,757,881) | $ | 43,123,969 | ||||||||||
| FOREIGN GOVERNMENTS — 1.4% | ||||||||||||
| Chile Government International Bonds | 3.500% | 01/31/34 | $ | 1,000,000 | $ | 903,537 | ||||||
| Republic of South Africa Government Bonds | 5.875% | 04/20/32 | 885,000 | 802,695 | ||||||||
| Total Foreign Governments (Cost $1,884,340) | $ | 1,706,232 | ||||||||||
The accompanying notes are an integral part of the financial statements.
25
| WESTWOOD TOTAL RETURN FUND |
| APRIL 30, 2023 (Unaudited) |
| COMMON STOCKS — 46.5% |
| Shares | Value | |||||||
| Communications — 2.9% | ||||||||
| Entertainment Content — 1.4% | ||||||||
| Activision Blizzard, Inc. (d) | 23,058 | $ | 1,791,837 | |||||
| Internet Media & Services — 0.8% | ||||||||
| Netflix, Inc. (d) | 2,927 | 965,705 | ||||||
| Telecommunications — 0.7% | ||||||||
| AT&T, Inc. | 47,306 | 835,897 | ||||||
| Consumer Discretionary — 5.1% | ||||||||
| Automotive — 0.7% | ||||||||
| Harley-Davidson, Inc. | 23,010 | 853,671 | ||||||
| E-Commerce Discretionary — 0.5% | ||||||||
| Amazon.com, Inc. (d) | 6,257 | 659,801 | ||||||
| Home Construction — 0.9% | ||||||||
| Toll Brothers, Inc. | 18,007 | 1,150,827 | ||||||
| Leisure Facilities & Services — 2.0% | ||||||||
| McDonald’s Corporation | 5,444 | 1,610,063 | ||||||
| Six Flags Entertainment Corporation (d) | 35,527 | 862,240 | ||||||
| 2,472,303 | ||||||||
| Retail - Discretionary — 1.0% | ||||||||
| Home Depot, Inc. (The) | 4,336 | 1,303,142 | ||||||
| Consumer Staples — 2.7% | ||||||||
| Household Products — 0.7% | ||||||||
| Estee Lauder Companies, Inc. (The) - Class A | 3,569 | 880,544 | ||||||
| Retail - Consumer Staples — 2.0% | ||||||||
| Costco Wholesale Corporation | 2,238 | 1,126,206 | ||||||
| Walmart, Inc. | 9,449 | 1,426,516 | ||||||
| 2,552,722 | ||||||||
| Energy — 3.4% | ||||||||
| Oil & Gas Producers — 3.4% | ||||||||
| Devon Energy Corporation | 30,683 | 1,639,392 | ||||||
| Energy Transfer, L.P. | 203,019 | 2,614,885 | ||||||
| 4,254,277 | ||||||||
| Oil & Gas Services & Equipment — 0.0% (e) | ||||||||
| Atlas Energy Solutions, Inc. (d) | 3,261 | 58,829 | ||||||
| COMMON STOCKS — continued |
| Shares | Value | |||||||
| Financials — 6.7% | ||||||||
| Asset Management — 0.7% | ||||||||
| Charles Schwab Corporation (The) | 16,554 | $ | 864,781 | |||||
| Banking — 4.4% | ||||||||
| Comerica, Inc. | 13,781 | 597,682 | ||||||
| JPMorgan Chase & Company | 18,866 | 2,608,036 | ||||||
| Texas Capital Bancshares, Inc. (d) | 30,288 | 1,521,972 | ||||||
| Wells Fargo & Company | 20,128 | 800,088 | ||||||
| 5,527,778 | ||||||||
| Insurance — 1.6% | ||||||||
| Chubb Ltd. | 4,711 | 949,549 | ||||||
| Progressive Corporation (The) | 7,282 | 993,265 | ||||||
| 1,942,814 | ||||||||
| Health Care — 5.2% | ||||||||
| Biotech & Pharma — 4.6% | ||||||||
| Amgen, Inc. | 6,515 | 1,561,906 | ||||||
| Bristol-Myers Squibb Company | 23,417 | 1,563,553 | ||||||
| Gilead Sciences, Inc. | 25,188 | 2,070,705 | ||||||
| Johnson & Johnson | 3,815 | 624,516 | ||||||
| 5,820,680 | ||||||||
| Medical Equipment & Devices — 0.6% | ||||||||
| Medtronic plc | 8,138 | 740,151 | ||||||
| Industrials — 3.4% | ||||||||
| Aerospace & Defense — 0.9% | ||||||||
| Moog, Inc. - Class A | 13,248 | 1,193,777 | ||||||
| Diversified Industrials — 0.8% | ||||||||
| Honeywell International, Inc. | 4,902 | 979,616 | ||||||
| Machinery — 0.9% | ||||||||
| Deere & Company | 2,998 | 1,133,304 | ||||||
| Transportation & Logistics — 0.8% | ||||||||
| Union Pacific Corporation | 5,187 | 1,015,096 | ||||||
| Materials — 2.8% | ||||||||
| Metals & Mining — 2.8% | ||||||||
| Barrick Gold Corporation | 49,296 | 938,596 | ||||||
| Freeport-McMoRan, Inc. | 44,473 | 1,685,971 | ||||||
| Glencore plc - ADR | 76,176 | 894,306 | ||||||
| 3,518,873 | ||||||||
The accompanying notes are an integral part of the financial statements.
26
| WESTWOOD TOTAL RETURN FUND |
| APRIL 30, 2023 (Unaudited) |
| COMMON STOCKS — continued |
| Shares | Value | |||||||
| Real Estate — 1.7% | ||||||||
| REITs — 1.7% | ||||||||
| Simon Property Group, Inc. | 12,242 | $ | 1,387,263 | |||||
| VICI Properties, Inc. | 23,165 | 786,220 | ||||||
| 2,173,483 | ||||||||
| Technology — 10.5% | ||||||||
| Semiconductors — 1.8% | ||||||||
| ASML Holding N.V. | 1,958 | 1,246,972 | ||||||
| Rambus, Inc. (d) | 23,399 | 1,037,512 | ||||||
| 2,284,484 | ||||||||
| Software — 3.3% | ||||||||
| Microsoft Corporation | 10,883 | 3,343,911 | ||||||
| Workday, Inc. - Class A (d) | 4,346 | 808,964 | ||||||
| 4,152,875 | ||||||||
| Technology Hardware — 4.0% | ||||||||
| Apple, Inc. | 29,264 | 4,965,515 | ||||||
| Technology Services — 1.4% | ||||||||
| International Business Machines | ||||||||
| Corporation | 6,433 | 813,196 | ||||||
| PayPal Holdings, Inc. (d) | 11,829 | 899,004 | ||||||
| 1,712,200 | ||||||||
| Utilities — 2.1% | ||||||||
| Electric Utilities — 2.1% | ||||||||
| CMS Energy Corporation | 9,832 | 612,140 | ||||||
| NextEra Energy Partners, L.P. | 19,541 | 1,123,803 | ||||||
| WEC Energy Group, Inc. | 8,722 | 838,795 | ||||||
| 2,574,738 | ||||||||
| Total Common Stocks (Cost $49,648,093) | $ | 58,379,720 | ||||||
| EXCHANGE-TRADED FUNDS — 1.1% | ||||||||
| JPMorgan Nasdaq Equity Premium Income ETF (Cost $1,278,248) | 30,232 | $ | 1,383,719 | |||||
| PREFERRED STOCKS — 4.5% | ||||||||
| Communications — 1.3% | ||||||||
| Telecommunications — 1.3% | ||||||||
| 2020 Cash Mandatory Exchangeable Trust, 5.250%, 144A (d) | 1,425 | $ | 1,659,498 | |||||
| PREFERRED STOCKS — continued |
| Shares | Value | |||||||
| Health Care — 1.4% | ||||||||
| Medical Equipment & Devices — 1.4% | ||||||||
| Boston Scientific Corporation, 5.500% - Series A | 14,200 | $ | 1,785,366 | |||||
| Utilities — 1.8% | ||||||||
| Electric Utilities — 1.8% | ||||||||
| AES Corporation (The), 6.875% | 12,250 | 1,102,622 | ||||||
| American Electric Power Company, Inc., 6.125% | 21,450 | 1,090,518 | ||||||
| 2,193,140 | ||||||||
| Total Preferred Stocks (Cost $5,307,270) | $ | 5,638,004 | ||||||
| MONEY MARKET FUNDS — 1.2% | ||||||||
| SEI Daily Income Trust, Government Fund - Class F, 4.50% (f) (Cost $1,458,179) | 1,458,179 | $ | 1,458,179 | |||||
| Investments at Value — 99.7% (Cost $117,509,903) | $ | 124,965,653 | ||||||
| Other Assets in Excess of Liabilities — 0.3% | 447,726 | |||||||
| Net Assets — 100.0% | $ | 125,413,379 | ||||||
144A - Security was purchased in a transaction exempt from registration in compliance with Rule 144A of the Securities Act of 1933. This security may be resold in transactions exempt from registration, normally to qualified institutional buyers. The total value of such securities is $21,993,705 as of April 30, 2023, representing 17.5% of net assets.
A/S - Aktieselskab
ADR - American Depositary Receipt
AG - Aktiengesellschaft
B.V. - Besloten Vennootschap
LIBOR - London Interbank Offered Rate
N.V - Naamloze Vennootschap
plc - Public Limited Company
S.A.B. de C.V. - Societe Anonima Bursatil de Capital Variable
T-Note - U.S. Treasury Note
| (a) | The rate shown represents effective yield at time of purchase. |
| (b) | Variable rate security. Interest rate resets periodically. The rate shown is the effective interest rate as of April 30, 2023. For securities based on a published reference rate and spread, the reference rate and spread (in basis points) are indicated parenthetically. Certain variable rate securities are not based on a published reference rate and spread but are determined by the issuer or agent and are based on current market conditions. These securities, therefore, do not indicate a reference rate and spread. |
| (c) | Security has a perpetual maturity date. |
| (d) | Non-income producing security. |
| (e) | Percentage rounds to less than 0.1%. |
| (f) | The rate shown is the 7-day effective yield as of April 30, 2023. |
The accompanying notes are an integral part of the financial statements.
27
| WESTWOOD INCOME OPPORTUNITY FUND |
| APRIL 30, 2023 (Unaudited) |
| Sector Weightings (Unaudited)† |
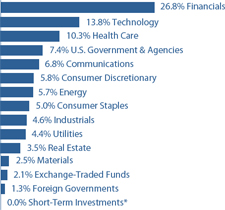
| † | Percentages are based on total investments. |
| * | Percentage rounds to less than 0.1% |
| SCHEDULE OF INVESTMENTS |
| U.S. GOVERNMENT & AGENCIES — 7.4% |
| Coupon | Maturity | Par Value | Value | |||||||||
| U.S. Treasury Bills — 0.6% (a) | ||||||||||||
| U.S. Treasury Bills | 4.995% | 08/17/23 | $ | 4,000,000 | $ | 3,940,120 | ||||||
| U.S. Treasury Bonds — 2.6% | ||||||||||||
| U.S. Treasury Bonds | 1.875% | 11/15/51 | 6,753,000 | 4,595,733 | ||||||||
| U.S. Treasury Bonds | 2.875% | 05/15/52 | 4,055,000 | 3,466,075 | ||||||||
| U.S. Treasury Bonds | 3.000% | 08/15/52 | 8,933,000 | 7,838,707 | ||||||||
| 15,900,515 | ||||||||||||
| U.S. Treasury Notes — 4.2% | ||||||||||||
| U.S. Treasury Notes | 2.875% | 06/15/25 | 7,000,000 | 6,834,297 | ||||||||
| U.S. Treasury Notes | 2.500% | 03/31/27 | 9,735,000 | 9,327,347 | ||||||||
| U.S. Treasury Notes | 2.625% | 05/31/27 | 5,000,000 | 4,808,203 | ||||||||
| U.S. Treasury Notes | 3.250% | 06/30/27 | 3,000,000 | 2,955,469 | ||||||||
| U.S. Treasury Notes | 4.125% | 09/30/27 | 2,000,000 | 2,041,640 | ||||||||
| 25,966,956 | ||||||||||||
| Total U.S. Government & Agencies (Cost $47,174,297) | $ | 45,807,591 | ||||||||||
| CONVERTIBLE BONDS — 2.6% | ||||||||||||
| Communications — 0.4% | ||||||||||||
| Snap, Inc. | 0.125% | 03/01/28 | $ | 3,439,000 | $ | 2,364,313 | ||||||
| Consumer Discretionary — 0.3% | ||||||||||||
| Live Nation Entertainment, Inc., 144A | 3.125% | 01/15/29 | 2,175,000 | 2,102,138 | ||||||||
| Health Care — 1.0% | ||||||||||||
| Exact Sciences Corporation | 0.375% | 03/15/27 | 6,523,000 | 5,942,655 | ||||||||
The accompanying notes are an integral part of the financial statements.
28
| WESTWOOD INCOME OPPORTUNITY FUND |
| APRIL 30, 2023 (Unaudited) |
| CONVERTIBLE BONDS — continued |
| Coupon | Maturity | Par Value | Value | |||||||||
| Technology — 0.9% | ||||||||||||
| Akamai Technologies, Inc. | 0.125% | 05/01/25 | $ | 5,733,000 | $ | 5,902,322 | ||||||
| Total Convertible Bonds (Cost $18,909,394) | $ | 16,311,428 | ||||||||||
| CORPORATE BONDS — 47.9% | ||||||||||||
| Communications — 3.0% | ||||||||||||
| América Móvil S.A.B. de C.V., 144A | 5.375% | 04/04/32 | $ | 3,050,000 | $ | 2,785,410 | ||||||
| Charter Communications Operating, LLC | 3.500% | 03/01/42 | 6,705,000 | 4,509,935 | ||||||||
| Comcast Corporation | 0.250% | 05/20/27 | 3,000,000 | 2,916,331 | ||||||||
| DISH DBS Corporation | 5.875% | 11/15/24 | 4,300,000 | 3,551,746 | ||||||||
| Vodafone Group plc | 4.875% | 06/19/49 | 2,877,000 | 2,579,959 | ||||||||
| WarnerMedia Holdings, Inc., 144A | 4.054% | 03/15/29 | 2,630,000 | 2,429,095 | ||||||||
| 18,772,476 | ||||||||||||
| Consumer Discretionary — 3.4% | ||||||||||||
| AutoNation, Inc. | 3.850% | 03/01/32 | 3,280,000 | 2,768,008 | ||||||||
| Brunswick Corporation | 2.400% | 08/18/31 | 1,834,000 | 1,399,059 | ||||||||
| Lowe’s Companies, Inc. | 5.625% | 04/15/53 | 2,555,000 | 2,569,485 | ||||||||
| Ross Stores, Inc. | 4.600% | 04/15/25 | 6,085,000 | 6,047,645 | ||||||||
| Royal Caribbean Cruises Ltd., 144A | 9.250% | 01/15/29 | 3,540,000 | 3,777,063 | ||||||||
| Thor Industries, Inc., 144A | 4.000% | 10/15/29 | 1,330,000 | 1,090,589 | ||||||||
| Whirlpool Corporation | 4.750% | 02/26/29 | 3,540,000 | 3,533,302 | ||||||||
| 21,185,151 | ||||||||||||
| Consumer Staples — 3.4% | ||||||||||||
| 7-Eleven, Inc., 144A | 0.950% | 02/10/26 | 2,170,000 | 1,959,135 | ||||||||
| BAT Capital Corporation | 7.750% | 10/19/32 | 3,576,000 | 3,975,050 | ||||||||
| Pilgrim’s Pride Corporation | 6.250% | 07/01/33 | 3,720,000 | 3,670,003 | ||||||||
| Smithfield Foods, Inc., 144A | 3.000% | 10/15/30 | 2,799,000 | 2,227,537 | ||||||||
| Vector Group Ltd., 144A | 5.750% | 02/01/29 | 3,727,000 | 3,334,564 | ||||||||
| Viterra Finance B.V., 144A | 2.000% | 04/21/26 | 4,528,000 | 4,042,442 | ||||||||
| Viterra Finance B.V., 144A | 4.900% | 04/21/27 | 1,869,000 | 1,804,141 | ||||||||
| 21,012,872 | ||||||||||||
| Energy — 2.8% | ||||||||||||
| Colonial Pipeline Company, 144A | 3.750% | 10/01/25 | 4,560,000 | 4,498,113 | ||||||||
| Diamondback Energy, Inc. | 6.250% | 03/15/33 | 1,955,000 | 2,081,784 | ||||||||
| NGL Energy Operating, LLC, 144A | 7.500% | 02/01/26 | 3,313,000 | 3,176,542 | ||||||||
| Petróleos Mexicanos | 6.700% | 02/16/32 | 6,515,000 | 5,010,224 | ||||||||
| TransCanada Trust | 5.600% | 03/07/82 | 2,918,000 | 2,467,285 | ||||||||
| 17,233,948 | ||||||||||||
| Financials — 20.7% | ||||||||||||
| AerCap Ireland Capital Ltd. | 6.500% | 07/15/25 | 1,184,000 | 1,194,688 | ||||||||
| AerCap Ireland Capital Ltd. | 3.300% | 01/30/32 | 3,939,000 | 3,224,992 | ||||||||
| AerCap Ireland Capital Ltd. | 3.850% | 10/29/41 | 3,927,000 | 2,949,159 | ||||||||
| Aircastle Ltd., 144A | 5.250% | 08/11/25 | 4,209,000 | 4,123,283 | ||||||||
| Ally Financial, Inc. | 1.450% | 10/02/23 | 382,000 | 373,454 | ||||||||
| Apollo Management Holdings, L.P., 144A | 4.872% | 02/15/29 | 4,325,000 | 4,146,383 | ||||||||
| Bank of America Corporation | 3.311% | 04/22/42 | 8,650,000 | 6,709,771 | ||||||||
| Barclays plc | 7.437% | 11/02/33 | 2,400,000 | 2,638,961 | ||||||||
The accompanying notes are an integral part of the financial statements.
29
| WESTWOOD INCOME OPPORTUNITY FUND |
| APRIL 30, 2023 (Unaudited) |
| CORPORATE BONDS — continued |
| Coupon | Maturity | Par Value | Value | |||||||||
| Financials — continued | ||||||||||||
| BNP Paribas S.A., 144A (b) | 4.625% | 02/25/31 | $ | 4,146,000 | $ | 2,941,172 | ||||||
| Capital One Financial Corporation (Yield of U.S. T-Note 1.625% 02/31 + 112) (c) | 2.359% | 07/29/32 | 6,635,000 | 4,798,113 | ||||||||
| Compass Group Diversified Holdings, LLC, 144A | 5.250% | 04/15/29 | 5,893,000 | 5,305,873 | ||||||||
| Corebridge Financial, Inc., 144A | 3.500% | 04/04/25 | 2,259,000 | 2,169,030 | ||||||||
| Equitable Financial Life, 144A | 1.800% | 03/08/28 | 3,964,000 | 3,379,733 | ||||||||
| Five Corners Funding Trust IV, 144A | 5.997% | 02/15/53 | 3,425,000 | 3,507,172 | ||||||||
| Goldman Sachs Group Inc (3MO LIBOR + 130.1) (c) | 4.223% | 05/01/29 | 3,861,000 | 3,702,234 | ||||||||
| Hercules Capital, Inc. | 2.625% | 09/16/26 | 3,959,000 | 3,379,789 | ||||||||
| HSBC Holdings plc | 6.254% | 03/09/34 | 2,760,000 | 2,871,189 | ||||||||
| HSBC Holdings plc (b) | 8.000% | 12/31/49 | 3,455,000 | 3,429,087 | ||||||||
| JPMorgan Chase & Company | 1.561% | 12/10/25 | 3,170,000 | 2,974,664 | ||||||||
| JPMorgan Chase & Company (b) | 3.650% | 12/31/49 | 6,940,000 | 6,084,298 | ||||||||
| Lincoln National Corporation (b) | 9.250% | 12/31/49 | 2,065,000 | 2,070,162 | ||||||||
| Lincoln National Corporation (3MO LIBOR + 235.8) (c) | 7.234% | 05/17/66 | 1,720,000 | 1,083,600 | ||||||||
| Mitsubishi UFJ Financial Group, Inc. (Yield of U.S. T-Note with a constant maturity of 1 year + 55) (c) | 0.953% | 07/19/25 | 5,075,000 | 4,790,380 | ||||||||
| Morgan Stanley (c) | 1.512% | 07/20/27 | 6,715,000 | 5,958,768 | ||||||||
| Morgan Stanley (SOFR + 262) (c) | 5.297% | 04/20/37 | 4,138,000 | 3,938,084 | ||||||||
| National Australia Bank Ltd., 144A | 6.429% | 01/12/33 | 2,870,000 | 2,965,941 | ||||||||
| NatWest Group plc | 5.516% | 09/30/28 | 5,300,000 | 5,314,017 | ||||||||
| Nomura Holdings, Inc. | 2.679% | 07/16/30 | 2,331,000 | 1,919,603 | ||||||||
| PNC Financial Services Group, Inc. (The) (b) | 3.400% | 12/31/49 | 4,880,000 | 3,733,712 | ||||||||
| Protective Life Global Funding, 144A | 5.366% | 01/06/26 | 3,735,000 | 3,792,104 | ||||||||
| Royal Bank of Canada | 6.000% | 11/01/27 | 2,170,000 | 2,276,613 | ||||||||
| U.S. Bancorp (b) | 3.700% | 12/31/49 | 3,675,000 | 2,829,750 | ||||||||
| UBS Group AG, 144A (Yield of U.S. T-Note 0.625% 07/26 + 85) (c) | 1.494% | 08/10/27 | 6,675,000 | 5,789,296 | ||||||||
| Unum Group | 4.125% | 06/15/51 | 3,257,000 | 2,361,908 | ||||||||
| Wells Fargo & Company (Yield of U.S. T-Note with a constant maturity of 5 years + 345.3) (b)(c) | 3.900% | 12/31/49 | 6,699,000 | 5,829,420 | ||||||||
| Westpac Banking Corporation | 3.133% | 11/18/41 | 6,479,000 | 4,499,411 | ||||||||
| 129,055,814 | ||||||||||||
| Health Care — 2.5% | ||||||||||||
| Bausch Health Companies, Inc., 144A | 6.125% | 02/01/27 | 4,177,000 | 3,009,828 | ||||||||
| Community Health Systems, Inc., 144A | 5.250% | 05/15/30 | 5,575,000 | 4,646,337 | ||||||||
| Flex Ltd. | 6.000% | 01/15/28 | 4,735,000 | 4,827,261 | ||||||||
| Fresenius Medical Care US Finance III, Inc., 144A | 3.000% | 12/01/31 | 4,125,000 | 3,250,665 | ||||||||
| 15,734,091 | ||||||||||||
| Industrials — 1.5% | ||||||||||||
| Delta Air Lines, Inc. | 7.375% | 01/15/26 | 557,000 | 587,103 | ||||||||
| Flowserve Corporation | 3.500% | 10/01/30 | 1,867,000 | 1,645,287 | ||||||||
| Regal Rexnord Corporation, 144A | 6.300% | 02/15/30 | 3,050,000 | 3,102,275 | ||||||||
| Sempra Infrastructure, 144A | 3.250% | 01/15/32 | 5,198,000 | 4,309,955 | ||||||||
| 9,644,620 | ||||||||||||
| Materials — 0.4% | ||||||||||||
| Braskem Netherlands Finance BV, 144A | 7.250% | 02/13/33 | 2,480,000 | 2,375,263 | ||||||||
The accompanying notes are an integral part of the financial statements.
30
| WESTWOOD INCOME OPPORTUNITY FUND |
| APRIL 30, 2023 (Unaudited) |
| CORPORATE BONDS — continued |
| Coupon | Maturity | Par Value | Value | |||||||||
| Real Estate — 2.4% | ||||||||||||
| American Tower Corporation | 2.950% | 01/15/51 | $ | 2,070,000 | $ | 1,332,312 | ||||||
| Kimco Realty Corporation | 4.600% | 02/01/33 | 4,600,000 | 4,334,498 | ||||||||
| MPT Operating Partnership, L.P. | 4.625% | 08/01/29 | 2,446,000 | 1,850,923 | ||||||||
| Sabra Health Care, L.P. | 3.200% | 12/01/31 | 3,313,000 | 2,482,031 | ||||||||
| Simon Property Group, L.P. | 5.500% | 03/08/33 | 3,490,000 | 3,550,079 | ||||||||
| Vornado Realty, L.P. | 3.400% | 06/01/31 | 1,757,000 | 1,246,332 | ||||||||
| 14,796,175 | ||||||||||||
| Technology — 5.5% | ||||||||||||
| Dell International, LLC | 8.350% | 07/15/46 | 3,980,000 | 4,899,934 | ||||||||
| DXC Technology Company | 1.800% | 09/15/26 | 4,104,000 | 3,601,204 | ||||||||
| Jabil, Inc. | 1.700% | 04/15/26 | 2,909,000 | 2,638,152 | ||||||||
| Kyndryl Holdings, Inc. | 2.050% | 10/15/26 | 2,124,000 | 1,858,399 | ||||||||
| Microchip Technology, Inc. | 2.670% | 09/01/23 | 1,266,000 | 1,253,897 | ||||||||
| Micron Technology, Inc. | 2.703% | 04/15/32 | 188,000 | 150,306 | ||||||||
| NXP B.V./NXP Funding, LLC | 5.000% | 01/15/33 | 4,350,000 | 4,249,107 | ||||||||
| Oracle Corporation | 6.250% | 11/09/32 | 3,720,000 | 4,009,545 | ||||||||
| Oracle Corporation | 6.900% | 11/09/52 | 2,075,000 | 2,327,365 | ||||||||
| TIBCO Software, Inc., 144A | 6.500% | 03/31/29 | 3,675,000 | 3,311,841 | ||||||||
| Verisk Analytics, Inc. | 5.750% | 04/01/33 | 2,910,000 | 3,062,541 | ||||||||
| VMware, Inc. | 4.700% | 05/15/30 | 2,911,000 | 2,801,460 | ||||||||
| 34,163,751 | ||||||||||||
| Utilities — 2.3% | ||||||||||||
| NextEra Energy Capital Holdings, Inc. | 2.440% | 01/15/32 | 1,313,000 | 1,088,506 | ||||||||
| NextEra Energy Capital Holdings, Inc. | 5.000% | 07/15/32 | 5,092,000 | 5,130,574 | ||||||||
| Pacific Gas and Electric Company | 4.950% | 07/01/50 | 4,895,000 | 3,985,103 | ||||||||
| Piedmont Natural Gas Company, Inc. | 5.050% | 05/15/52 | 4,166,000 | 3,932,676 | ||||||||
| 14,136,859 | ||||||||||||
| Total Corporate Bonds (Cost $320,016,719) | $ | 298,111,020 | ||||||||||
| FOREIGN GOVERNMENTS — 1.3% | ||||||||||||
| Chile Government International Bonds | 2.750% | 01/31/27 | $ | 266,000 | $ | 250,920 | ||||||
| Chile Government International Bonds | 4.340% | 03/07/42 | 270,000 | 244,742 | ||||||||
| Indonesia Government International Bonds | 4.550% | 01/11/28 | 250,000 | 250,409 | ||||||||
| Mexico Government International Bonds | 4.875% | 05/19/33 | 482,000 | 467,020 | ||||||||
| Mexico Government International Bonds | 3.500% | 02/12/34 | 1,018,000 | 871,434 | ||||||||
| Mexico Government International Bonds | 6.350% | 02/09/35 | 385,000 | 412,117 | ||||||||
| Mexico Government International Bonds | 3.771% | 05/24/61 | 835,000 | 575,550 | ||||||||
| Panama Government International Bonds | 3.870% | 07/23/60 | 508,000 | 339,527 | ||||||||
| Saudi Government International Bonds, 144A | 2.250% | 02/02/33 | 5,835,000 | 4,850,414 | ||||||||
| Total Foreign Governments (Cost $9,838,434) | $ | 8,262,133 | ||||||||||
The accompanying notes are an integral part of the financial statements.
31
| WESTWOOD INCOME OPPORTUNITY FUND |
| APRIL 30, 2023 (Unaudited) |
| COMMON STOCKS — 32.3% |
| Shares | Value | |||||||
| Communications — 2.1% | ||||||||
| Entertainment Content — 1.4% | ||||||||
| Activision Blizzard, Inc. (d) | 112,119 | $ | 8,712,767 | |||||
| Telecommunications — 0.7% | ||||||||
| AT&T, Inc. | 255,931 | 4,522,301 | ||||||
| Consumer Discretionary — 2.0% | ||||||||
| Home Construction — 0.9% | ||||||||
| Toll Brothers, Inc. | 87,207 | 5,573,400 | ||||||
| Retail - Discretionary — 1.1% | ||||||||
| Home Depot, Inc. (The) | 23,552 | 7,078,318 | ||||||
| Consumer Staples — 1.6% | ||||||||
| Household Products — 0.7% | ||||||||
| Estee Lauder Companies, Inc. (The) - Class A | 18,044 | 4,451,815 | ||||||
| Retail - Consumer Staples — 0.9% | ||||||||
| Walmart, Inc. | 37,609 | 5,677,831 | ||||||
| Energy — 2.9% | ||||||||
| Oil & Gas Producers — 1.7% | ||||||||
| Energy Transfer, L.P. | 821,075 | 10,575,446 | ||||||
| Oil & Gas Services & Equipment — 0.8% | ||||||||
| Schlumberger Ltd. | 101,912 | 5,029,357 | ||||||
| Renewable Energy — 0.4% | ||||||||
| Atlantica Sustainable Infrastructure plc | 91,158 | 2,426,626 | ||||||
| Financials — 5.1% | ||||||||
| Asset Management — 1.4% | ||||||||
| Blackstone, Inc. | 45,960 | 4,105,607 | ||||||
| Charles Schwab Corporation (The) | 80,827 | 4,222,403 | ||||||
| 8,328,010 | ||||||||
| Banking — 2.9% | ||||||||
| Bank of America Corporation | 172,247 | 5,043,392 | ||||||
| Comerica, Inc. | 69,925 | 3,032,647 | ||||||
| JPMorgan Chase & Company | 73,473 | 10,156,908 | ||||||
| 18,232,947 | ||||||||
| Insurance — 0.8% | ||||||||
| Progressive Corporation (The) | 36,193 | 4,936,725 | ||||||
| COMMON STOCKS — continued |
| Shares | Value | |||||||
| Health Care — 5.1% | ||||||||
| Biotech & Pharma — 3.7% | ||||||||
| Amgen, Inc. | 27,189 | $ | 6,518,291 | |||||
| Bristol-Myers Squibb Company | 146,585 | 9,787,480 | ||||||
| Gilead Sciences, Inc. | 76,327 | 6,274,843 | ||||||
| 22,580,614 | ||||||||
| Medical Equipment & Devices — 1.4% | ||||||||
| Becton, Dickinson and Company | 16,108 | 4,257,505 | ||||||
| Medtronic plc | 49,806 | 4,529,856 | ||||||
| 8,787,361 | ||||||||
| Industrials — 3.0% | ||||||||
| Aerospace & Defense — 0.7% | ||||||||
| Lockheed Martin Corporation | 8,727 | 4,053,255 | ||||||
| Diversified Industrials — 0.9% | ||||||||
| Honeywell International, Inc. | 28,712 | 5,737,806 | ||||||
| Machinery — 0.7% | ||||||||
| Deere & Company | 11,320 | 4,279,186 | ||||||
| Transportation & Logistics — 0.7% | ||||||||
| Union Pacific Corporation | 23,538 | 4,606,387 | ||||||
| Materials — 2.1% | ||||||||
| Metals & Mining — 2.1% | ||||||||
| Barrick Gold Corporation | 372,278 | 7,088,173 | ||||||
| Freeport-McMoRan, Inc. | 152,786 | 5,792,117 | ||||||
| 12,880,290 | ||||||||
| Real Estate — 1.1% | ||||||||
| REITs — 1.1% | ||||||||
| Simon Property Group, Inc. | 35,254 | 3,994,983 | ||||||
| VICI Properties, Inc. | 89,611 | 3,041,398 | ||||||
| 7,036,381 | ||||||||
| Technology — 7.3% | ||||||||
| Semiconductors — 0.8% | ||||||||
| ASML Holding N.V. | 7,395 | 4,709,580 | ||||||
| Software — 2.7% | ||||||||
| Microsoft Corporation | 55,044 | 16,912,819 | ||||||
| Technology Hardware — 2.2% | ||||||||
| Apple, Inc. | 82,146 | 13,938,533 | ||||||
The accompanying notes are an integral part of the financial statements.
32
| WESTWOOD INCOME OPPORTUNITY FUND |
| APRIL 30, 2023 (Unaudited) |
| COMMON STOCKS — continued |
| Shares | Value | |||||||
| Technology — continued | ||||||||
| Technology Services — 1.6% | ||||||||
| International Business Machines Corporation | 39,297 | $ | 4,967,534 | |||||
| PayPal Holdings, Inc. (d) | 62,232 | 4,729,632 | ||||||
| 9,697,166 | ||||||||
| Total Common Stocks (Cost $164,808,544) | $ | 200,764,921 | ||||||
| EXCHANGE-TRADED FUNDS — 2.1% | ||||||||
| Global X Nasdaq 100 Covered Call ETF | 353,879 | $ | 6,118,568 | |||||
| JPMorgan Nasdaq Equity Premium Income ETF | 152,886 | 6,997,592 | ||||||
| Total Exchange-Traded Funds (Cost $13,409,228) | $ | 13,116,160 | ||||||
| PREFERRED STOCKS — 5.8% | ||||||||
| Communications — 1.2% | ||||||||
| Telecommunications — 1.2% | ||||||||
| 2020 Cash Mandatory Exchangeable Trust, 5.250%, 144A | 6,575 | $ | 7,656,982 | |||||
| Financials — 0.8% | ||||||||
| Banking — 0.8% | ||||||||
| Truist Financial Corporation, 6.400% - Series G (3MO LIBOR + 310.2) (c) | 5,483,000 | 5,263,680 | ||||||
| Health Care — 1.7% | ||||||||
| Medical Equipment & Devices — 1.7% | ||||||||
| Boston Scientific Corporation, 5.500% - Series A | 82,775 | 10,407,301 | ||||||
| Utilities — 2.1% | ||||||||
| Electric Utilities — 2.1% | ||||||||
| AES Corporation (The), 6.875% | 60,310 | 5,428,503 | ||||||
| American Electric Power Company, Inc., 6.125% | 146,780 | 7,462,295 | ||||||
| 12,890,798 | ||||||||
| Total Preferred Stocks (Cost $34,349,181) | $ | 36,218,761 | ||||||
| MONEY MARKET FUNDS — 0.0% (e) |
| Shares | Value | |||||||
| SEI Daily Income Trust, Government Fund - Class F, 4.50% (f) (Cost $267,048) | 267,048 | $ | 267,048 | |||||
| Investments at Value — 99.4% (Cost $608,772,845) | $ | 618,859,062 | ||||||
| Other Assets in Excess of Liabilities — 0.6% | 3,660,365 | |||||||
| Net Assets — 100.0% | $ | 622,519,427 | ||||||
144A - Security was purchased in a transaction exempt from registration in compliance with Rule 144A of the Securities Act of 1933. This security may be resold in transactions exempt from registration, normally to qualified institutional buyers. The total value of such securities is $107,860,316 as of April 30, 2023, representing 17.3% of net assets.
AG - Aktiengesellschaft
B.V. - Besloten Vennootschap
LIBOR - London Interbank Offered Rate
N.V. - Naamloze Vennootschap
plc - Public Limited Company
S.A. - Societe Anonyme
S.A.B. de C.V. - Societe Anonima Bursatil de Capital Variable
SOFR - Secured Overnight Financing Rate
T-Note - U.S. Treasury Note
| (a) | The rate shown represents effective yield at time of purchase. |
| (b) | Security has a perpetual maturity date. |
| (c) | Variable rate security. Interest rate resets periodically. The rate shown is the effective interest rate as of April 30, 2023. For securities based on a published reference rate and spread, the reference rate and spread (in basis points) are indicated parenthetically. Certain variable rate securities are not based on a published reference rate and spread but are determined by the issuer or agent and are based on current market conditions. These securities, therefore, do not indicate a reference rate and spread. |
| (d) | Non-income producing security. |
| (e) | Percentage rounds to less than 0.1%. |
| (f) | The rate shown is the 7-day effective yield as of April 30, 2023. |
The accompanying notes are an integral part of the financial statements.
33
| WESTWOOD HIGH INCOME FUND |
| APRIL 30, 2023 (Unaudited) |
| Sector Weightings (Unaudited) † |
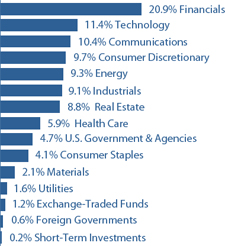
| † | Percentages are based on total investments. |
| SCHEDULE OF INVESTMENTS |
| U.S. GOVERNMENT & AGENCIES — 4.7% |
| Coupon | Maturity | Par Value | Value | |||||||||
| U.S. Treasury Bills — 2.9% (a) | ||||||||||||
| U.S. Treasury Bills | 4.832% | 09/28/23 | $ | 3,250,000 | $ | 3,184,799 | ||||||
| U.S. Treasury Bonds — 1.8% | ||||||||||||
| U.S. Treasury Bonds | 2.250% | 02/15/52 | 475,000 | 354,061 | ||||||||
| U.S. Treasury Bonds | 3.000% | 08/15/52 | 1,751,000 | 1,536,502 | ||||||||
| 1,890,563 | ||||||||||||
| Total U.S. Government & Agencies | ||||||||||||
| (Cost $5,129,121) | $ | 5,075,362 | ||||||||||
| CONVERTIBLE BONDS — 1.1% | ||||||||||||
| Consumer Discretionary — 0.9% | ||||||||||||
| Live Nation Entertainment, Inc., 144A | 3.125% | 01/15/29 | $ | 1,000,000 | $ | 966,500 | ||||||
| Consumer Staples — 0.2% | ||||||||||||
| Tilray, Inc. | 5.000% | 10/01/23 | 250,000 | 245,121 | ||||||||
| Total Convertible Bonds | ||||||||||||
| (Cost $1,278,294) | $ | 1,211,621 | ||||||||||
| CORPORATE BONDS — 71.4% | ||||||||||||
| Communications — 8.0% | ||||||||||||
| América Móvil S.A.B. de C.V., 144A | 5.375% | 04/04/32 | $ | 360,000 | $ | 328,770 | ||||||
| Charter Communications Operating, LLC | 2.300% | 02/01/32 | 1,400,000 | 1,064,272 | ||||||||
| Clear Channel Outdoor Holdings, Inc., 144A | 5.125% | 08/15/27 | 1,000,000 | 903,211 | ||||||||
| CSC Holdings, LLC, 144A | 6.500% | 02/01/29 | 1,000,000 | 834,992 | ||||||||
| DISH DBS Corporation | 5.875% | 11/15/24 | 1,250,000 | 1,032,484 | ||||||||
| Entercom Media Corporation, 144A | 6.500% | 05/01/27 | 3,000,000 | 217,500 | ||||||||
| Liberty Media Corporation, 144A | 2.750% | 12/01/49 | 954,807 | 850,733 | ||||||||
| Telesat Canada / Telesat, LLC, 144A | 4.875% | 06/01/27 | 1,500,000 | 802,796 | ||||||||
| T-Mobile USA, Inc. | 2.550% | 02/15/31 | 1,250,000 | 1,061,152 | ||||||||
The accompanying notes are an integral part of the financial statements.
34
| WESTWOOD HIGH INCOME FUND |
| APRIL 30, 2023 (Unaudited) |
| CORPORATE BONDS — continued |
| Coupon | Maturity | Par Value | Value | |||||||||
| Communications — continued | ||||||||||||
| Vodafone Group plc | 4.875% | 06/19/49 | $ | 500,000 | $ | 448,377 | ||||||
| Zayo Group Holdings, Inc., 144A | 4.000% | 03/01/27 | 1,465,000 | 1,109,419 | ||||||||
| 8,653,706 | ||||||||||||
| Consumer Discretionary — 7.2% | ||||||||||||
| At Home Group, Inc., 144A | 4.875% | 07/15/28 | 1,250,000 | 811,486 | ||||||||
| Cinemark USA, Inc., 144A | 5.875% | 03/15/26 | 1,000,000 | 955,470 | ||||||||
| Darden Restaurants, Inc. | 4.550% | 02/15/48 | 790,000 | 671,136 | ||||||||
| Ford Motor Credit Company, LLC | 4.271% | 01/09/27 | 1,000,000 | 925,680 | ||||||||
| G-III Apparel Group Ltd., 144A | 7.875% | 08/15/25 | 1,250,000 | 1,176,100 | ||||||||
| Lowe’s Companies, Inc. | 5.625% | 04/15/53 | 325,000 | 326,842 | ||||||||
| Nordstrom, Inc. | 2.300% | 04/08/24 | 500,000 | 476,295 | ||||||||
| Odeon Finco plc, 144A | 12.750% | 11/01/27 | 1,000,000 | 952,500 | ||||||||
| Royal Caribbean Cruises Ltd., 144A | 9.250% | 01/15/29 | 1,070,000 | 1,141,655 | ||||||||
| Thor Industries, Inc., 144A | 4.000% | 10/15/29 | 500,000 | 409,996 | ||||||||
| 7,847,160 | ||||||||||||
| Consumer Staples — 2.3% | ||||||||||||
| BAT Capital Corporation | 7.750% | 10/19/32 | 552,000 | 613,598 | ||||||||
| Pilgrim’s Pride Corporation | 6.250% | 07/01/33 | 620,000 | 611,667 | ||||||||
| Vector Group Ltd., 144A | 5.750% | 02/01/29 | 1,000,000 | 894,705 | ||||||||
| Viterra Finance B.V., 144A | 2.000% | 04/21/26 | 428,000 | 382,104 | ||||||||
| 2,502,074 | ||||||||||||
| Energy — 7.4% | ||||||||||||
| CNX Midstream Partners, L.P., 144A | 4.750% | 04/15/30 | 1,250,000 | 1,046,787 | ||||||||
| Crestwood Midstream Partners, L.P., 144A | 6.000% | 02/01/29 | 1,000,000 | 946,610 | ||||||||
| Energy Transfer, L.P. | 5.550% | 02/15/28 | 1,000,000 | 1,019,544 | ||||||||
| Martin Midstream Partners, L.P., 144A | 11.500% | 02/15/28 | 500,000 | 487,023 | ||||||||
| NGL Energy Operating, LLC, 144A | 7.500% | 02/01/26 | 1,100,000 | 1,054,693 | ||||||||
| Northern Oil and Gas, Inc., 144A | 8.125% | 03/01/28 | 1,100,000 | 1,086,250 | ||||||||
| Petróleos Mexicanos | 6.700% | 02/16/32 | 940,000 | 722,887 | ||||||||
| Summit Midstream Holdings, LLC, 144A | 8.500% | 10/15/26 | 1,250,000 | 1,200,000 | ||||||||
| TransCanada Trust | 5.600% | 03/07/82 | 478,000 | 404,168 | ||||||||
| 7,967,962 | ||||||||||||
| Financials — 17.3% | ||||||||||||
| AerCap Ireland Capital Ltd. | 3.300% | 01/30/32 | 650,000 | 532,177 | ||||||||
| AerCap Ireland Capital Ltd. | 3.850% | 10/29/41 | 458,000 | 343,956 | ||||||||
| Aircastle Ltd., 144A | 5.250% | 08/11/25 | 435,000 | 426,141 | ||||||||
| Apollo Commercial Real Estate Finance, Inc. | 5.375% | 10/15/23 | 850,000 | 835,125 | ||||||||
| Apollo Commercial Real Estate Finance, Inc., 144A | 4.625% | 06/15/29 | 1,000,000 | 756,367 | ||||||||
| Ares Capital Corporation, 144A | 3.875% | 01/15/26 | 1,225,000 | 1,140,604 | ||||||||
| Bank of America Corporation, Series N (3MO LIBOR + 131) (b) | 4.271% | 07/23/29 | 605,000 | 578,690 | ||||||||
| Barclays plc | 7.437% | 11/02/33 | 320,000 | 351,861 | ||||||||
| Blackstone Private Credit Fund, 144A | 7.050% | 09/29/25 | 1,000,000 | 1,001,164 | ||||||||
| Capital One Financial Corporation (Yield of U.S. T-Note 1.625% 02/31 + 112) (b) | 2.359% | 07/29/32 | 330,000 | 238,640 | ||||||||
| Chubb INA Holdings, Inc. | 2.850% | 12/15/51 | 500,000 | 352,022 | ||||||||
| Comerica, Inc. | 3.700% | 07/31/23 | 500,000 | 494,895 | ||||||||
| Compass Group Diversified Holdings, LLC, 144A | 5.250% | 04/15/29 | 1,423,000 | 1,281,225 | ||||||||
| Five Corners Funding Trust IV, 144A | 5.997% | 02/15/53 | 570,000 | 583,675 | ||||||||
The accompanying notes are an integral part of the financial statements.
35
| WESTWOOD HIGH INCOME FUND |
| APRIL 30, 2023 (Unaudited) |
| CORPORATE BONDS — continued |
| Coupon | Maturity | Par Value | Value | |||||||||
| Financials — continued | ||||||||||||
| Hercules Capital, Inc. | 2.625% | 09/16/26 | $ | 422,000 | $ | 360,260 | ||||||
| HSBC Holdings plc | 6.254% | 03/09/34 | 470,000 | 488,934 | ||||||||
| HSBC Holdings plc | 8.000% | 12/31/49 | 615,000 | 610,387 | ||||||||
| Icahn Enterprises, L.P./Icahn Enterprises Holdings, L.P. | 5.250% | 05/15/27 | 1,075,000 | 1,013,046 | ||||||||
| Jackson Financial, Inc. | 4.000% | 11/23/51 | 500,000 | 331,906 | ||||||||
| Lincoln National Corporation (c) | 9.250% | 12/31/49 | 320,000 | 320,800 | ||||||||
| Lincoln National Corporation (3MO LIBOR + 235.8) (b) | 7.234% | 05/17/66 | 285,000 | 179,550 | ||||||||
| Morgan Stanley (SOFR + 262) (b) | 5.297% | 04/20/37 | 529,000 | 503,443 | ||||||||
| National Australia Bank Ltd., 144A | 6.429% | 01/12/33 | 485,000 | 501,213 | ||||||||
| NatWest Group plc | 5.516% | 09/30/28 | 800,000 | 802,116 | ||||||||
| Nomura Holdings, Inc. | 2.329% | 01/22/27 | 885,000 | 785,711 | ||||||||
| Owl Rock Capital Corporation | 3.400% | 07/15/26 | 1,250,000 | 1,118,201 | ||||||||
| Penske Truck Leasing Company, 144A | 4.400% | 07/01/27 | 500,000 | 481,869 | ||||||||
| Prospect Capital Corporation | 3.364% | 11/15/26 | 710,000 | 596,450 | ||||||||
| Protective Life Global Funding, 144A | 5.366% | 01/06/26 | 305,000 | 309,663 | ||||||||
| UBS Group AG, 144A (Yield of U.S. T-Note 0.625% 07/26 + 85) (b) | 1.494% | 08/10/27 | 610,000 | 529,059 | ||||||||
| Unum Group | 4.125% | 06/15/51 | 460,000 | 333,582 | ||||||||
| Westpac Banking Corporation | 3.133% | 11/18/41 | 850,000 | 590,292 | ||||||||
| 18,773,024 | ||||||||||||
| Health Care — 3.4% | ||||||||||||
| Bausch Health Companies, Inc., 144A | 6.125% | 02/01/27 | 1,112,000 | 801,276 | ||||||||
| Community Health Systems, Inc., 144A | 5.250% | 05/15/30 | 1,100,000 | 916,766 | ||||||||
| Flex Ltd. | 6.000% | 01/15/28 | 745,000 | 759,516 | ||||||||
| Par Pharmaceutical, Inc., 144A | 0.000% | 04/01/27 | 750,000 | 532,560 | ||||||||
| Royalty Pharma plc | 3.550% | 09/02/50 | 1,000,000 | 684,523 | ||||||||
| 3,694,641 | ||||||||||||
| Industrials — 8.2% | ||||||||||||
| American Airlines Pass Through Trust, Series 2021-1B | 3.950% | 07/11/30 | 568,225 | 500,435 | ||||||||
| Boeing Company (The) | 5.805% | 05/01/50 | 1,000,000 | 996,955 | ||||||||
| Bombardier, Inc. | 7.125% | 06/15/26 | 1,000,000 | 996,860 | ||||||||
| CoreCivic, Inc. | 8.250% | 04/15/26 | 1,000,000 | 1,010,210 | ||||||||
| Deluxe Corporation, 144A | 8.000% | 06/01/29 | 1,000,000 | 772,592 | ||||||||
| GEO Group, Inc. (The) | 10.500% | 06/30/28 | 1,000,000 | 1,011,250 | ||||||||
| Rand Parent, LLC, 144A | 8.500% | 02/15/30 | 500,000 | 452,998 | ||||||||
| Regal Rexnord Corporation, 144A | 6.300% | 02/15/30 | 1,000,000 | 1,017,139 | ||||||||
| Sempra Infrastructure, 144A | 3.250% | 01/15/32 | 658,000 | 545,585 | ||||||||
| Sotheby’s, 144A | 7.375% | 10/15/27 | 1,225,000 | 1,148,118 | ||||||||
| Titan Acquisition Ltd. / Titan Co-Borrower, LLC, 144A | 7.750% | 04/15/26 | 500,000 | 445,000 | ||||||||
| 8,897,142 | ||||||||||||
| Materials — 1.0% | ||||||||||||
| Axalta Coating Systems, LLC, 144A | 4.750% | 06/15/27 | 700,000 | 669,984 | ||||||||
| Braskem Netherlands Finance B.V., 144A | 7.250% | 02/13/33 | 370,000 | 354,374 | ||||||||
| Mauser Packaging Solutions Holding Company, 144A | 7.875% | 08/15/26 | 100,000 | 101,084 | ||||||||
| 1,125,442 | ||||||||||||
| Real Estate — 7.3% | ||||||||||||
| American Homes 4 Rent, L.P. | 4.300% | 04/15/52 | 900,000 | 698,427 | ||||||||
| American Tower Corporation | 2.950% | 01/15/51 | 225,000 | 144,817 | ||||||||
The accompanying notes are an integral part of the financial statements.
36
| WESTWOOD HIGH INCOME FUND |
| APRIL 30, 2023 (Unaudited) |
| CORPORATE BONDS — continued |
| Coupon | Maturity | Par Value | Value | |||||||||
| Real Estate — continued | ||||||||||||
| Brixmor Operating Partnership, L.P. | 4.050% | 07/01/30 | $ | 475,000 | $ | 428,726 | ||||||
| Corporate Office Properties, L.P. | 2.250% | 03/15/26 | 870,000 | 776,004 | ||||||||
| Host Hotels & Resorts, Inc. | 3.500% | 09/15/30 | 375,000 | 318,838 | ||||||||
| Iron Mountain, Inc., 144A | 5.000% | 07/15/28 | 1,020,000 | 959,203 | ||||||||
| MPT Operating Partnership, L.P. | 4.625% | 08/01/29 | 810,000 | 612,938 | ||||||||
| New Residential Investment Corporation, 144A | 6.250% | 10/15/25 | 1,000,000 | 916,230 | ||||||||
| Sabra Health Care, L.P. | 3.200% | 12/01/31 | 750,000 | 561,885 | ||||||||
| Service Properties Trust | 7.500% | 09/15/25 | 1,000,000 | 980,440 | ||||||||
| Simon Property Group, L.P. | 5.500% | 03/08/33 | 435,000 | 442,488 | ||||||||
| VICI Properties, L.P. | 5.125% | 05/15/32 | 1,000,000 | 950,931 | ||||||||
| Vornado Realty, L.P. | 3.400% | 06/01/31 | 181,000 | 128,393 | ||||||||
| 7,919,320 | ||||||||||||
| Technology — 7.7% | ||||||||||||
| Broadcom, Inc., 144A | 3.500% | 02/15/41 | 1,000,000 | 752,639 | ||||||||
| CommScope Finance, LLC, 144A | 6.000% | 03/01/26 | 940,000 | 897,664 | ||||||||
| Dell International, LLC | 8.350% | 07/15/46 | 800,000 | 984,911 | ||||||||
| DXC Technology Company | 1.800% | 09/15/26 | 420,000 | 368,544 | ||||||||
| NXP B.V./NXP Funding, LLC | 2.500% | 05/11/31 | 1,000,000 | 824,902 | ||||||||
| NXP B.V./NXP Funding, LLC | 5.000% | 01/15/33 | 570,000 | 556,779 | ||||||||
| Oracle Corporation | 2.950% | 04/01/30 | 1,175,000 | 1,039,533 | ||||||||
| Oracle Corporation | 6.250% | 11/09/32 | 575,000 | 619,755 | ||||||||
| Oracle Corporation | 6.900% | 11/09/52 | 320,000 | 358,919 | ||||||||
| TIBCO Software, Inc., 144A | 6.500% | 03/31/29 | 1,125,000 | 1,013,829 | ||||||||
| VMware, Inc. | 4.650% | 05/15/27 | 957,000 | 947,581 | ||||||||
| 8,365,056 | ||||||||||||
| Utilities — 1.6% | ||||||||||||
| Consolidated Edison Company, Inc. | 3.850% | 06/15/46 | 1,069,000 | 867,613 | ||||||||
| Pacific Gas and Electric Company | 4.950% | 07/01/50 | 1,000,000 | 814,117 | ||||||||
| 1,681,730 | ||||||||||||
| Total Corporate Bonds | ||||||||||||
| (Cost $86,104,455) | $ | 77,427,257 | ||||||||||
| FOREIGN GOVERNMENTS — 0.6% | ||||||||||||
| Republic of South Africa Government (Cost $695,000) | 5.875% | 04/20/32 | $ | 695,000 | $ | 630,365 | ||||||
The accompanying notes are an integral part of the financial statements.
37
| WESTWOOD HIGH INCOME FUND |
| APRIL 30, 2023 (Unaudited) |
| COMMON STOCKS — 18.9% |
| Shares | Value | |||||||
| Communications — 1.8% | ||||||||
| Entertainment Content — 1.2% | ||||||||
| Activision Blizzard, Inc. (d) | 17,438 | $ | 1,355,107 | |||||
| Telecommunications — 0.6% | ||||||||
| AT&T, Inc. | 34,209 | 604,473 | ||||||
| Consumer Discretionary — 1.4% | ||||||||
| Retail - Discretionary — 1.4% | ||||||||
| Home Depot, Inc. (The) | 2,974 | 893,806 | ||||||
| TJX Companies, Inc. (The) | 8,722 | 687,468 | ||||||
| 1,581,274 | ||||||||
| Consumer Staples — 1.5% | ||||||||
| Retail - Consumer Staples — 0.9% | ||||||||
| Walmart, Inc. | 6,497 | 980,852 | ||||||
| Tobacco & Cannabis — 0.6% | ||||||||
| Altria Group, Inc. | 13,843 | 657,681 | ||||||
| Energy — 1.8% | ||||||||
| Oil & Gas Producers — 1.5% | ||||||||
| Devon Energy Corporation | 8,791 | 469,703 | ||||||
| Energy Transfer, L.P. | 39,016 | 502,526 | ||||||
| Enterprise Products Partners, L.P. | 23,050 | 606,446 | ||||||
| 1,578,675 | ||||||||
| Renewable Energy — 0.3% | ||||||||
| Atlantica Sustainable Infrastructure plc | 12,896 | 343,291 | ||||||
| Financials — 3.3% | ||||||||
| Asset Management — 0.9% | ||||||||
| Blackstone, Inc. | 8,280 | 739,652 | ||||||
| Charles Schwab Corporation (The) | 5,198 | 271,544 | ||||||
| 1,011,196 | ||||||||
| Banking — 2.4% | ||||||||
| Bank of America Corporation | 23,375 | 684,420 | ||||||
| Comerica, Inc. | 12,395 | 537,571 | ||||||
| Sumitomo Mitsui Financial Group, Inc. - ADR | 102,789 | 843,898 | ||||||
| Truist Financial Corporation | 16,115 | 525,027 | ||||||
| 2,590,916 | ||||||||
| Health Care — 2.4% | ||||||||
| Biotech & Pharma — 2.4% | ||||||||
| Amgen, Inc. | 3,575 | 857,071 | ||||||
| Bristol-Myers Squibb Company | 12,885 | 860,331 | ||||||
| Gilead Sciences, Inc. | 10,568 | 868,795 | ||||||
| 2,586,197 | ||||||||
| COMMON STOCKS — continued |
| Shares | Value | |||||||
| Industrials — 0.7% | ||||||||
| Aerospace & Defense — 0.7% | ||||||||
| Moog, Inc. - Class A | 8,502 | $ | 766,115 | |||||
| Materials — 1.1% | ||||||||
| Containers & Packaging — 0.3% | ||||||||
| WestRock Company | 8,799 | 263,354 | ||||||
| Metals & Mining — 0.8% | ||||||||
| Barrick Gold Corporation | 26,200 | 498,848 | ||||||
| Freeport-McMoRan, Inc. | 10,166 | 385,393 | ||||||
| 884,241 | ||||||||
| Real Estate — 1.4% | ||||||||
| REITs — 1.4% | ||||||||
| National Retail Properties, Inc. | 15,602 | 678,687 | ||||||
| VICI Properties, Inc. | 24,132 | 819,040 | ||||||
| 1,497,727 | ||||||||
| Technology — 3.5% | ||||||||
| Semiconductors — 0.5% | ||||||||
| ASML Holding N.V. | 885 | 563,621 | ||||||
| Software — 1.1% | ||||||||
| Microsoft Corporation | 3,922 | 1,205,074 | ||||||
| Technology Hardware — 1.9% | ||||||||
| Apple, Inc. | 7,515 | 1,275,145 | ||||||
| Cisco Systems, Inc. | 15,876 | 750,141 | ||||||
| 2,025,286 | ||||||||
| Total Common Stocks | ||||||||
| (Cost $19,094,455) | $ | 20,495,080 | ||||||
| EXCHANGE-TRADED FUNDS — 1.1% | ||||||||
| JPMorgan Nasdaq Equity Premium Income ETF (Cost $1,223,723) | 27,479 | $ | 1,257,714 | |||||
| PREFERRED STOCKS — 0.5% | ||||||||
| Communications — 0.5% | ||||||||
| Telecommunications — 0.5% | ||||||||
| 2020 Cash Mandatory Exchangeable Trust, 5.250%, 144A (d) (Cost $533,411) | 465 | $ | 541,520 | |||||
The accompanying notes are an integral part of the financial statements.
38
| WESTWOOD HIGH INCOME FUND |
| APRIL 30, 2023 (Unaudited) |
| MONEY MARKET FUNDS — 0.2% | ||||||||
| Shares | Value | |||||||
| SEI Daily Income Trust, Government Fund - Class F, 4.50% (e) | ||||||||
| (Cost $188,941) | 188,941 | $ | 188,941 | |||||
| Investments at Value — 98.5% | ||||||||
| (Cost $114,247,400) | $ | 106,827,860 | ||||||
| Other Assets in Excess of Liabilities — 1.5% | 1,641,802 | |||||||
| Net Assets — 100.0% | $ | 108,469,662 | ||||||
144A - Security was purchased in a transaction exempt from registration in compliance with Rule 144A of the Securities Act of 1933. This security may be resold in transactions exempt from registration, normally to qualified institutional buyers. The total value of such securities is $38,408,841 as of April 30, 2023, representing 35.4% of net assets.
ADR - American Depositary Receipt
AG - Aktiengesellschaft
B.V. - Besloten Vennootschap
LIBOR - London Interbank Offered Rate
N.V. - Naamloze Vennootschap
plc - Public Limited Company
S.A.B. de C.V. - Societe Anonima Bursatil de Capital Variable
SOFR - Secured Overnight Financing Rate
T-Note - U.S. Treasury Note
| (a) | The rate shown represents effective yield at time of purchase. |
| (b) | Variable rate security. Interest rate resets periodically. The rate shown is the effective interest rate as of April 30, 2023. For securities based on a published reference rate and spread, the reference rate and spread (in basis points) are indicated parenthetically. Certain variable rate securities are not based on a published reference rate and spread but are determined by the issuer or agent and are based on current market conditions. These securities, therefore, do not indicate a reference rate and spread. |
| (c) | Security has a perpetual maturity date. |
| (d) | Non-income producing security. |
| (e) | The rate shown is the 7-day effective yield as of April 30, 2023. |
The accompanying notes are an integral part of the financial statements.
39
| WESTWOOD ALTERNATIVE INCOME FUND |
| APRIL 30, 2023 (Unaudited) |
| Sector Weightings (Unaudited) † |
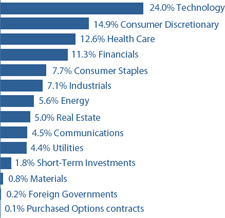
| † | Percentages are based on total investments. |
| SCHEDULE OF INVESTMENTS |
| CONVERTIBLE BONDS — 68.2% |
| Coupon | Maturity | Par Value | Value | |||||||||
| Communications — 4.5% | ||||||||||||
| Airbnb, Inc. * | 0.000% | 03/15/26 | $ | 2,800,000 | $ | 2,441,600 | ||||||
| Liberty Broadband Corporation, 144A | 3.125% | 03/31/53 | 2,500,000 | 2,470,000 | ||||||||
| Liberty Media Corporation - Liberty Formula One, 144A | 2.250% | 08/15/27 | 1,000,000 | 1,059,500 | ||||||||
| 5,971,100 | ||||||||||||
| Consumer Discretionary — 9.4% | ||||||||||||
| Chegg, Inc. | 0.125% | 03/15/25 | 1,500,000 | 1,334,250 | ||||||||
| Cinemark Holdings, Inc. | 4.500% | 08/15/25 | 2,000,000 | 2,787,359 | ||||||||
| Etsy, Inc. | 0.125% | 09/01/27 | 3,000,000 | 2,630,457 | ||||||||
| Ford Motor Company | 0.000% | 03/15/26 | 3,000,000 | 2,926,500 | ||||||||
| Huazhu Group Ltd. | 3.000% | 05/01/26 | 785,000 | 1,006,763 | ||||||||
| Live Nation Entertainment, Inc., 144A * | 3.125% | 01/15/29 | 2,000,000 | 1,933,000 | ||||||||
| 12,618,329 | ||||||||||||
| Consumer Staples — 5.9% | ||||||||||||
| MGP Ingredients, Inc. | 1.875% | 11/15/41 | 3,000,000 | 3,546,000 | ||||||||
| Post Holdings, Inc., 144A * | 2.500% | 08/15/27 | 2,000,000 | 2,094,600 | ||||||||
| Tilray, Inc. * | 5.000% | 10/01/23 | 2,275,000 | 2,230,601 | ||||||||
| 7,871,201 | ||||||||||||
| Energy — 2.5% | ||||||||||||
| Northern Oil and Gas, Inc., 144A * | 3.625% | 04/15/29 | 3,000,000 | 3,384,793 | ||||||||
| Financials — 3.3% | ||||||||||||
| Avolon Holdings Funding Ltd., 144A | 4.250% | 04/15/26 | 250,000 | 233,825 | ||||||||
| KKR Real Estate Finance Trust, Inc. | 6.125% | 05/15/23 | 3,250,000 | 3,215,876 | ||||||||
| Redwood Trust, Inc. | 5.625% | 07/15/24 | 1,097,000 | 1,020,132 | ||||||||
| 4,469,833 | ||||||||||||
| Health Care — 12.4% | ||||||||||||
| Alnylam Pharmaceuticals, Inc., 144A | 1.000% | 09/15/27 | 3,000,000 | 2,976,904 | ||||||||
| CONMED Corporation, 144A | 2.250% | 06/15/27 | 2,500,000 | 2,703,750 | ||||||||
| Halozyme Therapeutics, Inc., 144A | 1.000% | 08/15/28 | 2,250,000 | 1,964,531 | ||||||||
The accompanying notes are an integral part of the financial statements.
40
| WESTWOOD ALTERNATIVE INCOME FUND |
| APRIL 30, 2023 (Unaudited) |
| CONVERTIBLE BONDS — continued |
| Coupon | Maturity | Par Value | Value | |||||||||
| Health Care — continued | ||||||||||||
| Integer Holdings Corporation, 144A | 2.125% | 02/15/28 | $ | 2,000,000 | $ | 2,270,000 | ||||||
| Jazz Investments I Ltd. | 2.000% | 06/15/26 | 2,500,000 | 2,715,625 | ||||||||
| Ligand Pharmaceuticals, Inc. * | 0.750% | 05/15/23 | 4,000,000 | 3,967,707 | ||||||||
| 16,598,517 | ||||||||||||
| Industrials — 5.1% | ||||||||||||
| American Airlines Group, Inc. | 6.500% | 07/01/25 | 1,500,000 | 1,662,750 | ||||||||
| Axon Enterprise, Inc., 144A | 0.500% | 12/15/27 | 1,000,000 | 1,125,000 | ||||||||
| Camtek Ltd., 144A | 0.000% | 12/01/26 | 1,400,000 | 1,138,200 | ||||||||
| SFL Corporation Ltd. | 4.875% | 05/01/23 | 2,838,000 | 2,823,810 | ||||||||
| 6,749,760 | ||||||||||||
| Real Estate — 3.7% | ||||||||||||
| Marriott Vacations Worldwide Corporation, 144A | 3.250% | 12/15/27 | 2,000,000 | 1,956,000 | ||||||||
| Radius Global Infrastructure, Inc., 144A | 2.500% | 09/15/26 | 3,000,000 | 2,919,000 | ||||||||
| 4,875,000 | ||||||||||||
| Technology — 17.8% | ||||||||||||
| Bentley Systems, Inc. | 0.125% | 01/15/26 | 2,400,000 | 2,257,786 | ||||||||
| Bill.com Holdings, Inc. | 0.000% | 04/01/27 | 2,391,000 | 1,881,717 | ||||||||
| Dropbox, Inc. | 0.000% | 03/01/28 | 1,500,000 | 1,280,250 | ||||||||
| Envestnet, Inc., 144A | 2.625% | 12/01/27 | 2,500,000 | 2,727,499 | ||||||||
| Lumentum Holdings, Inc. | 0.500% | 06/15/28 | 2,000,000 | 1,499,151 | ||||||||
| NextGen Healthcare, Inc., 144A | 3.750% | 11/15/27 | 500,000 | 484,750 | ||||||||
| ON Semiconductor Corporation | 0.500% | 03/01/29 | 2,500,000 | 2,407,733 | ||||||||
| Splunk, Inc. * | 1.125% | 06/15/27 | 3,000,000 | 2,565,000 | ||||||||
| Tyler Technologies, Inc. | 0.250% | 03/15/26 | 2,106,000 | 2,113,889 | ||||||||
| Vishay Intertechnology, Inc. | 2.250% | 06/15/25 | 2,000,000 | 1,956,255 | ||||||||
| Wolfspeed, Inc. | 0.250% | 02/15/28 | 2,000,000 | 1,449,080 | ||||||||
| Wolfspeed, Inc., 144A | 1.875% | 12/01/29 | 1,000,000 | 738,500 | ||||||||
| Ziff Davis, Inc., 144A * | 1.750% | 11/01/26 | 2,500,000 | 2,382,500 | ||||||||
| 23,744,110 | ||||||||||||
| Utilities — 3.6% | ||||||||||||
| Ormat Technologies, Inc. | 2.500% | 07/15/27 | 2,000,000 | 2,257,000 | ||||||||
| PPL Capital Funding, Inc., 144A | 2.875% | 03/15/28 | 2,500,000 | 2,507,500 | ||||||||
| 4,764,500 | ||||||||||||
| Total Convertible Bonds | ||||||||||||
| (Cost $91,852,163) | $ | 91,047,143 | ||||||||||
| CORPORATE BONDS — 28.6% | ||||||||||||
| Consumer Discretionary — 5.3% | ||||||||||||
| Carnival Corporation | 7.200% | 10/01/23 | $ | 775,000 | $ | 772,675 | ||||||
| Ford Motor Credit Company, LLC * | 6.950% | 03/06/26 | 1,000,000 | 1,009,296 | ||||||||
| Nordstrom, Inc. | 2.300% | 04/08/24 | 2,000,000 | 1,905,180 | ||||||||
| Royal Caribbean Cruises Ltd., 144A | 6.000% | 08/15/25 | 1,500,000 | 2,288,250 | ||||||||
| Royal Caribbean Cruises Ltd., 144A | 9.250% | 01/15/29 | 1,070,000 | 1,141,655 | ||||||||
| 7,117,056 | ||||||||||||
The accompanying notes are an integral part of the financial statements.
41
| WESTWOOD ALTERNATIVE INCOME FUND |
| APRIL 30, 2023 (Unaudited) |
| CORPORATE BONDS — continued |
| Coupon | Maturity | Par Value | Value | |||||||||
| Consumer Staples — 1.7% | ||||||||||||
| Vector Group Ltd., 144A * | 5.750% | 02/01/29 | $ | 1,000,000 | $ | 894,705 | ||||||
| Viterra Finance B.V., 144A * | 2.000% | 04/21/26 | 1,500,000 | 1,339,148 | ||||||||
| 2,233,853 | ||||||||||||
| Energy — 3.0% | ||||||||||||
| Enphase Energy, Inc. * | 0.000% | 03/01/28 | 1,500,000 | 1,403,728 | ||||||||
| NGL Energy Operating, LLC, 144A | 7.500% | 02/01/26 | 1,225,000 | 1,174,543 | ||||||||
| Phillips 66 * | 0.900% | 02/15/24 | 500,000 | 483,286 | ||||||||
| Yum! Brands, Inc. | 3.875% | 11/01/23 | 1,000,000 | 990,599 | ||||||||
| 4,052,156 | ||||||||||||
| Financials — 7.9% | ||||||||||||
| Aircastle Ltd., 144A | 5.250% | 08/11/25 | 1,200,000 | 1,175,562 | ||||||||
| Apollo Commercial Real Estate Finance, Inc. | 5.375% | 10/15/23 | 3,000,000 | 2,947,499 | ||||||||
| Compass Group Diversified Holdings, LLC, 144A | 5.250% | 04/15/29 | 1,000,000 | 900,369 | ||||||||
| Corebridge Financial, Inc., 144A | 3.500% | 04/04/25 | 1,200,000 | 1,152,207 | ||||||||
| Mitsubishi UFJ Financial Group | 4.788% | 07/18/25 | 1,100,000 | 1,089,622 | ||||||||
| PennyMac Mortgage Investment Trust * | 5.500% | 11/01/24 | 2,500,000 | 2,276,250 | ||||||||
| Royal Bank of Canada | 1.600% | 01/21/25 | 1,000,000 | 947,383 | ||||||||
| 10,488,892 | ||||||||||||
| Industrials — 2.0% | ||||||||||||
| Alarm.com Holdings, Inc. | 0.000% | 01/15/26 | 2,000,000 | 1,685,008 | ||||||||
| Triton Container International Ltd., 144A | 0.800% | 08/01/23 | 1,000,000 | 985,485 | ||||||||
| 2,670,493 | ||||||||||||
| Materials — 0.7% | ||||||||||||
| Celanese US Holdings, LLC | 5.900% | 07/05/24 | 1,000,000 | 1,000,694 | ||||||||
| Real Estate — 1.3% | ||||||||||||
| Iron Mountain, Inc., 144A | 5.000% | 07/15/28 | 1,000,000 | 940,396 | ||||||||
| VICI Properties, Inc., 144A | 5.625% | 05/01/24 | 750,000 | 746,307 | ||||||||
| 1,686,703 | ||||||||||||
| Technology — 6.0% | ||||||||||||
| Dell International, LLC / EMC Corporation * | 6.020% | 06/15/26 | 750,000 | 771,013 | ||||||||
| Micron Technology, Inc. | 2.703% | 04/15/32 | 60,000 | 47,970 | ||||||||
| MongoDB, Inc. | 0.250% | 01/15/26 | 2,855,000 | 3,757,466 | ||||||||
| Progress Software Corporation | 1.000% | 04/15/26 | 2,500,000 | 2,655,420 | ||||||||
| TIBCO Software, Inc., 144A | 6.500% | 03/31/29 | 825,000 | 743,474 | ||||||||
| 7,975,343 | ||||||||||||
| Utilities — 0.7% | ||||||||||||
| Georgia Power Company, Series A * | 2.100% | 07/30/23 | 1,000,000 | 991,681 | ||||||||
| Total Corporate Bonds | ||||||||||||
| (Cost $37,442,878) | $ | 38,216,871 | ||||||||||
| FOREIGN GOVERNMENTS — 0.1% | ||||||||||||
| Mexico Government International Bonds (Cost $199,600) | 5.400% | 02/09/28 | $ | 200,000 | $ | 206,430 | ||||||
The accompanying notes are an integral part of the financial statements.
42
| WESTWOOD ALTERNATIVE INCOME FUND |
| APRIL 30, 2023 (Unaudited) |
| PURCHASED OPTION CONTRACTS — 0.1% |
| Notional | ||||||||||||||
| Strike Price | Contracts | Value | Value | |||||||||||
| Put Option Contracts — 0.1% | ||||||||||||||
| S&P Dow Jones Index, 06/30/23 | $ | 3,800.00 | 10 | $ | 4,169,480 | $ | 25,000 | |||||||
| S&P Dow Jones Index, 08/31/23 | 3,900.00 | 10 | 4,169,480 | 74,410 | ||||||||||
| Total Purchased Option Contracts | ||||||||||||||
| (Cost $175,861) | $ | 8,338,960 | $ | 99,410 | ||||||||||
| MONEY MARKET FUNDS — 1.8% | ||||||||||||||
| Shares | Value | |||||||||||||
| SEI Daily Income Trust, Government Fund - Class F, 4.50% (a) | ||||||||||||||
| (Cost $2,430,995) | 2,430,995 | $ | 2,430,995 | |||||||||||
| Investments at Value — 98.8% | ||||||||||||||
| (Cost $132,101,497) | $ | 132,000,849 | ||||||||||||
| Other Assets in Excess of Liabilities — 1.2% | . | 1,555,530 | ||||||||||||
| Net Assets — 100.0% | $ | 133,556,379 | ||||||||||||
144A - Security was purchased in a transaction exempt from registration in compliance with Rule 144A of the Securities Act of 1933. This security may be resold in transactions exempt from registration, normally to qualified institutional buyers. The total value of such securities is $50,551,953 as of April 30, 2023, representing 37.9% of net assets.
B.V. - Besloten Vennootschap
| * | All or a part of this security has been pledged as collateral for derivative instruments held by the Fund. |
| (a) | The rate shown is the 7-day effective yield as of April 30, 2023. |
The average monthly notional value of purchased option contracts during the six months ended April 30, 2023 was $5,415,790.
The accompanying notes are an integral part of the financial statements.
43
| WESTWOOD ALTERNATIVE INCOME FUND |
| APRIL 30, 2023 (Unaudited) |
| A list of open OTC swap agreements as of April 30, 2023, is as follows: |
| Total Return Swap Agreements |
| Net Unrealized | ||||||||||||||||||
| Number of | Notional | Termination | Appreciation / | |||||||||||||||
| Shares | Reference Entity | Amount | Interest Rate Receivable (a) | Date | Counterparty | (Depreciation) | ||||||||||||
| Short Positions | ||||||||||||||||||
| (2,200 | ) | Airbnb, Inc. | $ | (257,695 | ) | 4.47% OBFR 4.82% minus 35bp | 5/17/2023 | BNP Paribas | $ | (4,259 | ) | |||||||
| (2,800 | ) | Alarm.com Holdings, Inc. | (136,444 | ) | 4.57% OBFR 4.82% minus 32bp | 5/17/2023 | BNP Paribas | 3,622 | ||||||||||
| (6,800 | ) | Alnylam Pharmaceuticals, Inc. | (1,400,188 | ) | 4.47% OBFR 4.82% minus 35bp | 5/17/2023 | BNP Paribas | 52,802 | ||||||||||
| (55,500 | ) | American Airlines Group, Inc. | (727,050 | ) | 4.47% OBFR 4.82% minus 35bp | 5/17/2023 | BNP Paribas | (25,744 | ) | |||||||||
| (3,200 | ) | Axon Enterprise, Inc. | (721,824 | ) | 4.47% OBFR 4.82% minus 35bp | 5/17/2023 | BNP Paribas | 51,251 | ||||||||||
| (15,800 | ) | Bentley Systems, Inc. | (674,976 | ) | 4.47% OBFR 4.82% minus 35bp | 5/17/2023 | BNP Paribas | 5,987 | ||||||||||
| (850 | ) | Bill.com Holdings, Inc. | (66,266 | ) | 4.47% OBFR 4.82% minus 35bp | 5/17/2023 | BNP Paribas | 1,317 | ||||||||||
| (10,800 | ) | Camtek Ltd. | (273,132 | ) | 4.47% OBFR 4.82% minus 35bp | 5/17/2023 | BNP Paribas | (10,048 | ) | |||||||||
| (2,100 | ) | Charter Communications, Inc. | (726,999 | ) | 4.57% OBFR 4.82% minus 25bp | 5/17/2023 | BNP Paribas | (43,485 | ) | |||||||||
| (5,800 | ) | Chegg, Inc. | (104,052 | ) | 4.47% OBFR 4.82% minus 35bp | 5/17/2023 | BNP Paribas | 301 | ||||||||||
| (111,500 | ) | Cinemark Holdings, Inc. | (1,855,706 | ) | 4.47% OBFR 4.82% minus 35bp | 5/17/2023 | BNP Paribas | (18,068 | ) | |||||||||
| (11,600 | ) | CONMED Corporation | (1,307,643 | ) | 4.47% OBFR 4.82% minus 35bp | 5/17/2023 | BNP Paribas | (142,599 | ) | |||||||||
| (22,500 | ) | Dropbox, Inc. | (496,125 | ) | 4.47% OBFR 4.82% minus 35bp | 5/17/2023 | BNP Paribas | 41,017 | ||||||||||
| (3,200 | ) | Enphase Energy, Inc. | (719,744 | ) | 4.47% OBFR 4.82% minus 35bp | 5/17/2023 | BNP Paribas | 201,363 | ||||||||||
| (22,500 | ) | Envestnet, Inc. | (1,471,148 | ) | 4.47% OBFR 4.82% minus 35bp | 5/17/2023 | BNP Paribas | 52,636 | ||||||||||
| (8,300 | ) | Etsy, Inc. | (719,123 | ) | 4.47% OBFR 4.82% minus 35bp | 5/17/2023 | BNP Paribas | 24,575 | ||||||||||
| (106,000 | ) | Ford Motor Company | (1,338,626 | ) | 4.47% OBFR 4.82% minus 35bp | 5/17/2023 | BNP Paribas | 70,305 | ||||||||||
| (24,000 | ) | Halozyme Therapeutics, Inc. | (864,000 | ) | 4.47% OBFR 4.82% minus 35bp | 5/17/2023 | BNP Paribas | 97,307 | ||||||||||
| (12,600 | ) | Huazhu Group Ltd. | (621,936 | ) | 4.47% OBFR 4.82% minus 35bp | 5/17/2023 | BNP Paribas | 34,183 | ||||||||||
| (15,100 | ) | Integer Holdings Corporation | (1,228,838 | ) | 4.47% OBFR 4.82% minus 35bp | 5/17/2023 | BNP Paribas | (12,672 | ) | |||||||||
| (10,200 | ) | Jazz Pharmaceuticals plc | (1,488,486 | ) | 4.47% OBFR 4.82% minus 35bp | 5/17/2023 | BNP Paribas | 63,319 | ||||||||||
| (8,200 | ) | Liberty Media Corporation - Liberty Formula One | (604,012 | ) | 4.47% OBFR 4.82% minus 35bp | 5/17/2023 | BNP Paribas | 15,526 | ||||||||||
| (11,800 | ) | Live Nation Entertainment, Inc. | (807,474 | ) | 4.47% OBFR 4.82% minus 35bp | 5/17/2023 | BNP Paribas | 11,807 | ||||||||||
| (5,400 | ) | Lumentum Holdings, Inc. | (249,588 | ) | 4.25% OBFR 4.82% minus 57bp | 5/17/2023 | BNP Paribas | (9,729 | ) | |||||||||
| (5,300 | ) | Marriott Vacations Worldwide Corporation | (728,008 | ) | 4.47% OBFR 4.82% minus 35bp | 5/17/2023 | BNP Paribas | 18,570 | ||||||||||
| (20,000 | ) | MGP Ingredients, Inc. | (1,954,399 | ) | 4.47% OBFR 4.82% minus 35bp | 5/17/2023 | BNP Paribas | (9,186 | ) | |||||||||
| (9,700 | ) | MongoDB, Inc. | (2,182,531 | ) | 4.47% OBFR 4.82% minus 35bp | 5/17/2023 | BNP Paribas | (133,897 | ) | |||||||||
| (9,700 | ) | NextGen Healthcare, Inc. | (170,720 | ) | 4.47% OBFR 4.82% minus 35bp | 5/17/2023 | BNP Paribas | 9,217 | ||||||||||
| (52,700 | ) | Northern Oil and Gas, Inc. | (1,798,900 | ) | 4.47% OBFR 4.82% minus 35bp | 5/17/2023 | BNP Paribas | 60,058 | ||||||||||
| (16,368 | ) | ON Semiconductor Corporation | (1,280,705 | ) | 4.57% OBFR 4.82% minus 25bp | 5/17/2023 | BNP Paribas | 109,533 | ||||||||||
| (16,200 | ) | Ormat Technologies, Inc. | (1,405,188 | ) | 4.47% OBFR 4.82% minus 35bp | 5/17/2023 | BNP Paribas | 22,266 | ||||||||||
| (12,200 | ) | Post Holdings, Inc. | (1,072,258 | ) | 4.47% OBFR 4.82% minus 35bp | 5/17/2023 | BNP Paribas | (26,226 | ) | |||||||||
| (25,600 | ) | PPL Corporation | (735,232 | ) | 4.57% OBFR 4.82% minus 25bp | 5/17/2023 | BNP Paribas | 3,829 | ||||||||||
| (30,600 | ) | Progress Software Corporation | (1,737,774 | ) | 4.47% OBFR 4.82% minus 35bp | 5/17/2023 | BNP Paribas | 67,350 | ||||||||||
| (23,000 | ) | Royal Caribbean Cruises Ltd. | (1,452,680 | ) | 4.47% OBFR 4.82% minus 35bp | 5/17/2023 | BNP Paribas | (44,767 | ) | |||||||||
| (4,100 | ) | Splunk, Inc. | (382,079 | ) | 4.47% OBFR 4.82% minus 35bp | 5/17/2023 | BNP Paribas | 30,453 | ||||||||||
| (1,950 | ) | Tyler Technologies, Inc. | (707,070 | ) | 4.47% OBFR 4.82% minus 35bp | 5/17/2023 | BNP Paribas | (28,416 | ) | |||||||||
| (23,700 | ) | Vishay Intertechnology, Inc. | (514,764 | ) | 4.47% OBFR 4.82% minus 35bp | 5/17/2023 | BNP Paribas | 12,829 | ||||||||||
The accompanying notes are an integral part of the financial statements.
44
| WESTWOOD ALTERNATIVE INCOME FUND |
| APRIL 30, 2023 (Unaudited) |
| Total Return Swap Agreements - continued |
| Net Unrealized | ||||||||||||||||||
| Number of | Notional | Termination | Appreciation / | |||||||||||||||
| Shares | Reference Entity | Amount | Interest Rate Receivable (a) | Date | Counterparty | (Depreciation) | ||||||||||||
| (10,700 | ) | Wolfspeed, Inc. | $ | (608,295 | ) | 4.47% OBFR 4.82% minus 35bp | 5/17/2023 | BNP Paribas | $ | 114,259 | ||||||||
| (13,300 | ) | Ziff Davis, Inc. | (1,028,622 | ) | 4.47% OBFR 4.82% minus 35bp | 5/17/2023 | BNP Paribas | 61,131 | ||||||||||
| Total Short Positions | 727,717 | |||||||||||||||||
| Total swap agreements at value (assets) | $ | 1,236,813 | ||||||||||||||||
| Total swap agreements at value (liabilities) | (509,096 | ) | ||||||||||||||||
| Net swap agreements at value | $ | 727,717 | ||||||||||||||||
OBFR - Overnight Bank Funding Rate
OTC - Over the Counter
| (a) | Payment frequency is monthly. |
The average monthly notional value for Swap Agreements - appreciation during the six months ended April 30, 2023 was $970,903.
The average monthly notional value for Swap Agreements - depreciation during the six months ended April 30, 2023 was $(36,691,050).
The accompanying notes are an integral part of the financial statements.
45
| WESTWOOD SMALLCAP GROWTH FUND |
| APRIL 30, 2023 (Unaudited) |
| Sector Weightings (Unaudited) † |
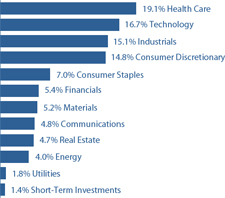
| † | Percentages are based on total investments. |
| SCHEDULE OF INVESTMENTS |
| COMMON STOCKS — 98.5% |
| Shares | Value | |||||||
| Communications — 4.8% | ||||||||
| Advertising & Marketing — 2.0% | ||||||||
| Gambling.com Group, Ltd. (a) | 46,474 | $ | 456,375 | |||||
| Internet Media & Services — 2.8% | ||||||||
| HealthStream, Inc. | 17,497 | 431,126 | ||||||
| Shutterstock, Inc. | 3,044 | 203,948 | ||||||
| 635,074 | ||||||||
| Consumer Discretionary — 14.8% | ||||||||
| Apparel & Textile Products — 0.5% | ||||||||
| Steven Madden Ltd. | 3,292 | 115,352 | ||||||
| Automotive — 0.5% | ||||||||
| Dorman Products, Inc. (a) | 1,395 | 120,193 | ||||||
| Consumer Services — 0.6% | ||||||||
| Coursera, Inc. (a) | 10,680 | 132,859 | ||||||
| Home & Office Products — 2.6% | ||||||||
| HNI Corporation | 4,275 | 111,065 | ||||||
| Lovesac Company (The) (a) | 18,501 | 486,391 | ||||||
| 597,456 | ||||||||
| Home Construction — 6.2% | ||||||||
| Century Communities, Inc. | 1,885 | 126,936 | ||||||
| Interface, Inc. | 14,784 | 115,906 | ||||||
| PGT Innovations, Inc. (a) | 21,860 | 560,928 | ||||||
| Skyline Champion Corporation (a) | 7,928 | 588,020 | ||||||
| 1,391,790 | ||||||||
| COMMON STOCKS — continued |
| Shares | Value | |||||||
| Consumer Discretionary — continued | ||||||||
| Leisure Facilities & Services — 1.6% | ||||||||
| Jack in the Box, Inc. | 1,372 | $ | 127,171 | |||||
| Monarch Casino & Resort, Inc. | 1,626 | 112,779 | ||||||
| Ruth’s Hospitality Group, Inc. | 7,160 | 115,706 | ||||||
| 355,656 | ||||||||
| Leisure Products — 2.2% | ||||||||
| Fox Factory Holding Corporation (a) | 3,441 | 381,503 | ||||||
| LCI Industries | 1,105 | 124,821 | ||||||
| 506,324 | ||||||||
| Wholesale - Discretionary — 0.6% | ||||||||
| ePlus, Inc. (a) | 2,983 | 129,880 | ||||||
| Consumer Staples — 7.0% | ||||||||
| Food — 5.3% | ||||||||
| John B. Sanfilippo & Son, Inc. | 4,815 | 500,519 | ||||||
| Krispy Kreme, Inc. | 29,713 | 456,986 | ||||||
| Phibro Animal Health Corporation - Class A | 8,147 | 126,768 | ||||||
| USANA Health Sciences, Inc. (a) | 1,881 | 124,842 | ||||||
| 1,209,115 | ||||||||
| Retail - Consumer Staples — 1.1% | ||||||||
| Natural Grocers by Vitamin Cottage, Inc. | 10,631 | 114,708 | ||||||
| Sprouts Farmers Market, Inc. (a) | 3,459 | 119,889 | ||||||
| 234,597 | ||||||||
| Tobacco & Cannabis — 0.6% | ||||||||
| Turning Point Brands, Inc. | 5,981 | 142,288 | ||||||
| Energy — 4.0% | ||||||||
| Oil & Gas Producers — 2.1% | ||||||||
| Berry Corporation | 15,649 | 119,558 | ||||||
| Chord Energy Corporation | 927 | 131,940 | ||||||
| CNX Resources Corporation (a) | 7,292 | 113,245 | ||||||
| Delek US Holdings, Inc. | 5,225 | 113,644 | ||||||
| 478,387 | ||||||||
| Oil & Gas Services & Equipment — 1.9% | ||||||||
| DMC Global, Inc. (a) | 22,667 | 429,313 | ||||||
| Financials — 5.4% | ||||||||
| Asset Management — 0.0% (b) | ||||||||
| OmniAb Operations, Inc. (a) | 870 | 3,027 | ||||||
| OmniAb Operations, Inc. (a) | 870 | 3,028 | ||||||
| 6,055 | ||||||||
The accompanying notes are an integral part of the financial statements.
46
| WESTWOOD SMALLCAP GROWTH FUND |
| APRIL 30, 2023 (Unaudited) |
| COMMON STOCKS — continued |
| Shares | Value | |||||||
| Financials — continued | ||||||||
| Banking — 5.4% | ||||||||
| BancFirst Corporation | 1,794 | $ | 143,323 | |||||
| Farmers & Merchants Bancorp, Inc. | 5,975 | 136,230 | ||||||
| Glacier Bancorp, Inc. | 3,528 | 117,235 | ||||||
| Greene County Bancorp, Inc. | 8,963 | 184,190 | ||||||
| Live Oak Bancshares, Inc. | 20,697 | 487,621 | ||||||
| Pathward Financial, Inc. | 3,542 | 157,725 | ||||||
| 1,226,324 | ||||||||
| Health Care — 19.1% | ||||||||
| Biotech & Pharma — 10.8% | ||||||||
| AbCellera Biologics, Inc. (a) | 16,309 | 110,575 | ||||||
| Arvinas, Inc. (a) | 10,376 | 271,955 | ||||||
| Corcept Therapeutics, Inc. (a) | 49 | 1,104 | ||||||
| Crinetics Pharmaceuticals, Inc. (a) | 30,033 | 586,845 | ||||||
| Dynavax Technologies Corporation (a) | 49,566 | 515,982 | ||||||
| Enanta Pharmaceuticals, Inc. (a) | 3,021 | 107,396 | ||||||
| Recursion Pharmaceuticals, Inc. - Class A (a) | 71,741 | 342,205 | ||||||
| Twist Bioscience Corporation (a) | 29,684 | 370,456 | ||||||
| Verve Therapeutics, Inc. (a) | 8,343 | 132,904 | ||||||
| 2,439,422 | ||||||||
| Health Care Facilities & Services — 2.7% | ||||||||
| Ensign Group, Inc. (The) | 2,106 | 204,472 | ||||||
| Patterson Companies, Inc. | 4,506 | 122,158 | ||||||
| Surgery Partners, Inc. (a) | 3,810 | 151,105 | ||||||
| U.S. Physical Therapy, Inc. | 1,275 | 135,736 | ||||||
| 613,471 | ||||||||
| Medical Equipment & Devices — 5.6% | ||||||||
| Adaptive Biotechnologies Corporation (a) | 51,869 | 370,345 | ||||||
| Atrion Corporation | 185 | 113,830 | ||||||
| iRadimed Corporation | 12,451 | 518,335 | ||||||
| Quanterix Corporation (a) | 11,453 | 144,766 | ||||||
| Utah Medical Products, Inc. | 1,301 | 123,387 | ||||||
| 1,270,663 | ||||||||
| Industrials — 15.0% | ||||||||
| Commercial Support Services — 5.1% | ||||||||
| ASGN, Inc. (a) | 1,463 | 104,736 | ||||||
| Brady Corporation - Class A | 2,197 | 112,113 | ||||||
| Healthcare Services Group, Inc. | 8,853 | 138,195 | ||||||
| Kforce, Inc. | 1,870 | 110,592 | ||||||
| Korn Ferry | 2,531 | 121,539 | ||||||
| Li-Cycle Holdings Corporation (a) | 96,020 | 456,095 | ||||||
| Schnitzer Steel Industries, Inc. - Class A | 3,933 | 113,624 | ||||||
| 1,156,894 | ||||||||
| COMMON STOCKS — continued |
| Shares | Value | |||||||
| Industrials — continued | ||||||||
| Electrical Equipment — 2.0% | ||||||||
| Alarm.com Holdings, Inc. (a) | 3,399 | $ | 162,098 | |||||
| Mesa Laboratories, Inc. | 710 | 118,222 | ||||||
| OSI Systems, Inc. (a) | 1,466 | 165,600 | ||||||
| 445,920 | ||||||||
| Engineering & Construction — 0.5% | ||||||||
| Primoris Services Corporation | 4,840 | 122,452 | ||||||
| Industrial Intermediate Prod — 2.1% | ||||||||
| Insteel Industries, Inc. | 17,388 | 478,692 | ||||||
| Machinery — 2.7% | ||||||||
| ESCO Technologies, Inc. | 5,203 | 486,845 | ||||||
| Hillenbrand, Inc. | 2,614 | 119,250 | ||||||
| 606,095 | ||||||||
| Transportation & Logistics — 0.5% | ||||||||
| Werner Enterprises, Inc. | 2,715 | 122,637 | ||||||
| Transportation Equipment — 2.1% | ||||||||
| Trinity Industries, Inc. | 20,151 | 482,616 | ||||||
| Materials — 5.2% | ||||||||
| Chemicals — 3.6% | ||||||||
| H.B. Fuller Company | 1,724 | 114,077 | ||||||
| Hawkins, Inc. | 2,760 | 111,338 | ||||||
| Orion Engineered Carbons S.A. | 19,727 | 477,591 | ||||||
| Stepan Company | 1,170 | 107,874 | ||||||
| 810,880 | ||||||||
| Metals & Mining — 1.6% | ||||||||
| Arch Resources, Inc. | 2,982 | 364,550 | ||||||
| Real Estate — 4.7% | ||||||||
| Real Estate Owners & Developers — 2.2% | ||||||||
| McGrath RentCorp | 5,583 | 496,217 | ||||||
| REITs — 2.5% | ||||||||
| Essential Properties Realty Trust Incorporated | 4,885 | 120,904 | ||||||
| Innovative Industrial Proper | 6,517 | 446,740 | ||||||
| 567,644 | ||||||||
The accompanying notes are an integral part of the financial statements.
47
| WESTWOOD SMALLCAP GROWTH FUND |
| APRIL 30, 2023 (Unaudited) |
| COMMON STOCKS — continued |
| Shares | Value | |||||||
| Technology — 16.7% | ||||||||
| Semiconductors — 6.2% | ||||||||
| ACM Research, Inc. - Class A (a) | 44,194 | $ | 413,214 | |||||
| Amkor Technology, Inc. | 5,689 | 127,263 | ||||||
| Kulicke & Soffa Industries, Inc. | 10,667 | 508,389 | ||||||
| Photronics, Inc. (a) | 8,880 | 128,405 | ||||||
| Semtech Corporation (a) | 4,537 | 88,426 | ||||||
| Ultra Clean Holdings, Inc. (a) | 4,743 | 135,365 | ||||||
| 1,401,062 | ||||||||
| Software — 5.5% | ||||||||
| ACI Worldwide, Inc. (a) | 5,754 | 145,749 | ||||||
| Calix, Inc. (a) | 5,603 | 256,057 | ||||||
| CommVault Systems, Inc. (a) | 2,656 | 154,765 | ||||||
| Digital Turbine, Inc. (a) | 12,945 | 151,845 | ||||||
| Progress Software Corporation | 2,523 | 138,462 | ||||||
| Q2 Holdings, Inc. (a) | 10,847 | 267,053 | ||||||
| Sapiens International Corporation N.V. | 6,818 | 137,247 | ||||||
| 1,251,178 | ||||||||
| Technology Hardware — 3.4% | ||||||||
| ADTRAN Holdings, Inc. | 32,572 | 297,057 | ||||||
| InterDigital, Inc. | 6,975 | 472,486 | ||||||
| 769,543 | ||||||||
| Technology Services — 1.6% | ||||||||
| ICF International, Inc. | 1,090 | 124,260 | ||||||
| Maximus, Inc. | 1,523 | 127,399 | ||||||
| TTEC Holdings, Inc. | 3,193 | 108,785 | ||||||
| 360,444 | ||||||||
| Utilities — 1.8% | ||||||||
| Gas & Water Utilities — 1.8% | ||||||||
| Chesapeake Utilities Corporation | 920 | 113,620 | ||||||
| Pure Cycle Corporation (a) | 30,237 | 298,439 | ||||||
| 412,059 | ||||||||
| Total Common Stocks | ||||||||
| (Cost $23,080,755) | $ | 22,339,477 | ||||||
| MONEY MARKET FUNDS — 1.4% |
| Shares | Value | |||||||
| First American Treasury Obligations Fund - Class X, 4.72% (c) (Cost $320,267) | 320,267 | $ | 320,267 | |||||
| Investments at Value — 99.9% (Cost $23,401,022) | $ | 22,659,744 | ||||||
| Other Assets in Excess of Liabilities — 0.1% | 26,859 | |||||||
| Net Assets — 100.0% | $ | 22,686,603 | ||||||
N.V. - Naamloze Vennootschap
S.A. - Societe Anonyme
| (a) | Non-income producing security. |
| (b) | Percentage rounds to less than 0.1%. |
| (c) | The rate shown is the 7-day effective yield as of April 30, 2023. |
The accompanying notes are an integral part of the financial statements.
48
| WESTWOOD FUNDS |
| APRIL 30, 2023 (Unaudited) |
| STATEMENTS OF ASSETS AND LIABILITIES |
| Westwood | Westwood | |||||||||||||||
| Westwood | Westwood | Quality | Quality | |||||||||||||
| Quality Value | Quality MidCap | SMidCap | SmallCap | |||||||||||||
| Fund | Fund | Fund | Fund | |||||||||||||
| ASSETS | ||||||||||||||||
| Investments in securities: | ||||||||||||||||
| At cost | $ | 203,317,258 | $ | 559,843 | $ | 268,245,689 | $ | 983,562,676 | ||||||||
| At value (Note 2) | $ | 251,383,383 | $ | 579,128 | $ | 289,513,251 | $ | 1,048,663,673 | ||||||||
| Receivable for capital shares sold | 82,672 | — | 147,006 | 140,546 | ||||||||||||
| Receivable for investment securities sold | 1,185,224 | 4,056 | 3,588,606 | 22,700,816 | ||||||||||||
| Receivable from Adviser (Note 4) | — | 2,895 | — | — | ||||||||||||
| Dividends receivable | 155,346 | 211 | 73,799 | 351,256 | ||||||||||||
| Other assets | 33,387 | 1,510 | 15,937 | 57,254 | ||||||||||||
| Total assets | 252,840,012 | 587,800 | 293,338,599 | 1,071,913,545 | ||||||||||||
| LIABILITIES | ||||||||||||||||
| Payable for capital shares redeemed | 54,197 | — | 16,569 | 163,623 | ||||||||||||
| Payable for investment securities purchased | 638,356 | 5,766 | 3,244,413 | 6,930,363 | ||||||||||||
| Payable to Adviser, net of waivers (Note 4) | 73,868 | — | 129,416 | 589,469 | ||||||||||||
| Payable to administrator (Note 4) | 6,111 | 801 | 6,371 | 22,775 | ||||||||||||
| Accrued administrative servicing fees— Institutional Shares (Note 4) | 55,432 | — | 98,289 | 47,773 | ||||||||||||
| Payable for distribution fees— A Class Shares (Note 4) | 895 | — | — | 4,366 | ||||||||||||
| Payable for distribution fees—C Class Shares (Note 4) | 578 | — | — | 4,194 | ||||||||||||
| Other accrued expenses | 12,070 | 7,710 | 13,040 | 25,820 | ||||||||||||
| Total liabilities | 841,507 | 14,277 | 3,508,098 | 7,788,383 | ||||||||||||
| NET ASSETS | $ | 251,998,505 | $ | 573,523 | $ | 289,830,501 | $ | 1,064,125,162 | ||||||||
| NET ASSETS CONSIST OF: | ||||||||||||||||
| Paid-in capital | 204,965,454 | 581,660 | 269,544,086 | 1,002,399,804 | ||||||||||||
| Accumulated earnings (deficit) | 47,033,051 | (8,137 | ) | 20,286,415 | 61,725,358 | |||||||||||
| NET ASSETS | $ | 251,998,505 | $ | 573,523 | $ | 289,830,501 | $ | 1,064,125,162 | ||||||||
| NET ASSET VALUE PER SHARE: | ||||||||||||||||
| INSTITUTIONAL SHARES | ||||||||||||||||
| Net assets applicable to Institutional Shares | $ | 250,549,293 | $ | 573,523 | $ | 169,015,795 | $ | 466,368,294 | ||||||||
| Institutional Shares of beneficial interest outstanding | 19,754,692 | 58,129 | 13,058,373 | 25,529,270 | ||||||||||||
| Net asset value, offering price and redemption price per share (Note 1) | $ | 12.68 | $ | 9.87 | $ | 12.94 | $ | 18.27 | ||||||||
| A CLASS SHARES | ||||||||||||||||
| Net assets applicable to A Class Shares | $ | 1,310,400 | N/A | N/A | $ | 2,039,892 | ||||||||||
| A Class Shares of beneficial interest outstanding | 102,683 | N/A | N/A | 112,050 | ||||||||||||
| Net asset value, offering price and redemption price per share (Note 1) | $ | 12.76 | N/A | N/A | $ | 18.21 | ||||||||||
| Maximum sales charge | 3.00 | % | N/A | N/A | 4.00 | % | ||||||||||
| Maximum offering price per share | $ | 13.15 | N/A | N/A | $ | 18.97 | ||||||||||
| C CLASS SHARES | ||||||||||||||||
| Net assets applicable to C Class Shares | $ | 137,844 | N/A | N/A | $ | 667,680 | ||||||||||
| C Class Shares of beneficial interest outstanding | 11,065 | N/A | N/A | 36,914 | ||||||||||||
| Net asset value, offering price and redemption price per share (Note 1) | $ | 12.46 | N/A | N/A | $ | 18.09 | ||||||||||
| ULTRA SHARES | ||||||||||||||||
| Net assets applicable to Ultra Shares | $ | 968 | N/A | $ | 120,814,706 | $ | 595,049,296 | |||||||||
| Ultra Shares of beneficial interest outstanding | 76 | N/A | 9,340,423 | 32,556,305 | ||||||||||||
| Net asset value, offering price and redemption price per share (Note 1) | $ | 12.69 | * | N/A | $ | 12.93 | $ | 18.28 | ||||||||
| * | Net Assets divided by Shares do not calculate to stated Net Asset Value because Net Assets and Shares are shown rounded. |
Amounts designated as “—” are either $0 or have been rounded to $0.
N/A — Not Applicable
The accompanying notes are an integral part of the financial statements.
49
| WESTWOOD FUNDS |
| APRIL 30, 2023 (Unaudited) |
| STATEMENTS OF ASSETS AND LIABILITIES |
| Westwood | ||||||||||||
| Westwood | Westwood | Income | ||||||||||
| Quality AllCap | Total Return | Opportunity | ||||||||||
| Fund | Fund | Fund | ||||||||||
| ASSETS | ||||||||||||
| Investments in securities: | ||||||||||||
| At cost | $ | 21,091,360 | $ | 117,509,903 | $ | 608,772,845 | ||||||
| At value (Note 2) | $ | 22,459,129 | $ | 124,965,653 | $ | 618,859,062 | ||||||
| Receivable for capital shares sold | — | 19,702 | 69,970 | |||||||||
| Receivable for investment securities sold | 267,881 | 667,973 | — | |||||||||
| Dividends and interest receivable | 16,156 | 739,279 | 4,302,616 | |||||||||
| Reclaim receivable | — | 7,344 | 43,794 | |||||||||
| Other assets | 12,508 | 31,912 | 33,405 | |||||||||
| Total assets | 22,755,674 | 126,431,863 | 623,308,847 | |||||||||
| LIABILITIES | ||||||||||||
| Payable for capital shares redeemed | — | 52,197 | 262,078 | |||||||||
| Payable for investment securities purchased | 178,289 | 874,467 | — | |||||||||
| Payable to Adviser, net of waivers (Note 4) | 1,697 | 76,291 | 328,634 | |||||||||
| Payable to administrator (Note 4) | 1,237 | 3,305 | 17,826 | |||||||||
| Accrued administrative servicing fees— Institutional Shares (Note 4) | 78 | — | 84,133 | |||||||||
| Payable for distribution fees— A Class Shares (Note 4) | — | 9 | 26,141 | |||||||||
| Payable for distribution fees—C Class Shares (Note 4) | — | 325 | 50,268 | |||||||||
| Other accrued expenses | 8,468 | 11,890 | 20,340 | |||||||||
| Total liabilities | 189,769 | 1,018,484 | 789,420 | |||||||||
| NET ASSETS | $ | 22,565,905 | $ | 125,413,379 | $ | 622,519,427 | ||||||
| NET ASSETS CONSIST OF: | ||||||||||||
| Paid-in capital | 21,547,223 | 121,806,440 | 624,874,068 | |||||||||
| Accumulated earnings (deficit) | 1,018,682 | 3,606,939 | (2,354,641 | ) | ||||||||
| NET ASSETS | $ | 22,565,905 | $ | 125,413,379 | $ | 622,519,427 | ||||||
| NET ASSET VALUE PER SHARE: | ||||||||||||
| INSTITUTIONAL SHARES | ||||||||||||
| Net assets applicable to Institutional Shares | $ | 205,558 | $ | 125,327,208 | $ | 497,904,949 | ||||||
| Institutional Shares of beneficial interest outstanding | 19,696 | 20,063,395 | 44,914,910 | |||||||||
| Net asset value, offering price and redemption price per share (Note 1) | $ | 10.44 | $ | 6.25 | $ | 11.09 | ||||||
| A CLASS SHARES | ||||||||||||
| Net assets applicable to A Class Shares | N/A | $ | 28,882 | $ | 49,807,670 | |||||||
| A Class Shares of beneficial interest outstanding | N/A | 4,633 | 4,498,611 | |||||||||
| Net asset value, offering price and redemption price per share (Note 1) | N/A | $ | 6.23 | $ | 11.07 | |||||||
| Maximum sales charge | N/A | 3.00 | % | 3.00 | % | |||||||
| Maximum offering price per share | N/A | $ | 6.42 | $ | 11.41 | |||||||
| C CLASS SHARES | ||||||||||||
| Net assets applicable to C Class Shares | N/A | $ | 57,289 | $ | 12,929,664 | |||||||
| C Class Shares of beneficial interest outstanding | N/A | 9,194 | 1,173,497 | |||||||||
| Net asset value, offering price and redemption price per share (Note 1) | N/A | $ | 6.23 | $ | 11.02 | |||||||
| ULTRA SHARES | ||||||||||||
| Net assets applicable to Ultra Shares | $ | 22,360,347 | N/A | $ | 61,877,144 | |||||||
| Ultra Shares of beneficial interest outstanding | 2,142,155 | N/A | 5,584,113 | |||||||||
| Net asset value, offering price and redemption price per share (Note 1) | $ | 10.44 | N/A | $ | 11.08 | |||||||
Amounts designated as “—” are either $0 or have been rounded to $0.
N/A — Not Applicable
The accompanying notes are an integral part of the financial statements.
50
| WESTWOOD FUNDS |
| APRIL 30, 2023 (Unaudited) |
| STATEMENTS OF ASSETS AND LIABILITIES |
| Westwood | Westwood | Westwood | ||||||||||
| High Income | Alternative | SmallCap | ||||||||||
| Fund | Income Fund | Growth Fund | ||||||||||
| ASSETS | ||||||||||||
| Investments in securities: | ||||||||||||
| At cost | $ | 114,247,400 | $ | 132,101,497 | $ | 23,401,022 | ||||||
| At value (Note 2) | $ | 106,827,860 | $ | 132,000,849 | $ | 22,659,744 | ||||||
| Unrealized appreciation on swap agreements | — | 1,236,813 | — | |||||||||
| Receivable for capital shares sold | — | 8,150 | 32,555 | |||||||||
| Receivable for investment securities sold | 979,973 | — | — | |||||||||
| Receivable from Adviser (Note 4) | 560 | — | — | |||||||||
| Receivable from Prime Broker | — | 4,082 | — | |||||||||
| Cash collateral on option contracts | — | 11,406 | — | |||||||||
| Dividends and interest receivable | 1,382,193 | 950,853 | 5,027 | |||||||||
| Reclaim receivable | 20,958 | — | — | |||||||||
| Other assets | 68,657 | 41,049 | 7,320 | |||||||||
| Total assets | 109,280,201 | 134,253,202 | 22,704,646 | |||||||||
| LIABILITIES | ||||||||||||
| Unrealized depreciation on swap agreements | — | 509,096 | — | |||||||||
| Payable for capital shares redeemed | 1,770 | 33,984 | — | |||||||||
| Payable for investment securities purchased | 781,095 | — | — | |||||||||
| Payable to Adviser, net of waivers (Note 4) | — | 120,424 | 2,348 | |||||||||
| Payable to administrator (Note 4) | 2,976 | 3,414 | 1,237 | |||||||||
| Accrued administrative servicing fees— Institutional Shares (Note 4) | 9,422 | 4,270 | 2,328 | |||||||||
| Payable for distribution fees— A Class Shares (Note 4) | 2,478 | 10 | — | |||||||||
| Payable for distribution fees—C Class Shares (Note 4) | 1,018 | 940 | — | |||||||||
| Other accrued expenses | 11,780 | 24,685 | 12,130 | |||||||||
| Total liabilities | 810,539 | 696,823 | 18,043 | |||||||||
| NET ASSETS | $ | 108,469,662 | $ | 133,556,379 | $ | 22,686,603 | ||||||
| NET ASSETS CONSIST OF: | ||||||||||||
| Paid-in capital | 128,684,417 | 148,428,938 | 26,087,326 | |||||||||
| Accumulated deficit | (20,214,755 | ) | (14,872,559 | ) | (3,400,723 | ) | ||||||
| NET ASSETS | $ | 108,469,662 | $ | 133,556,379 | $ | 22,686,603 | ||||||
| NET ASSET VALUE PER SHARE: | ||||||||||||
| INSTITUTIONAL SHARES | ||||||||||||
| Net assets applicable to Institutional Shares | $ | 100,949,799 | $ | 66,227,138 | $ | 22,686,603 | ||||||
| Institutional Shares of beneficial interest outstanding | 10,944,920 | 7,161,314 | 2,972,548 | |||||||||
| Net asset value, offering price and redemption price per share (Note 1) | $ | 9.22 | $ | 9.25 | $ | 7.63 | ||||||
| A CLASS SHARES | ||||||||||||
| Net assets applicable to A Class Shares | $ | 7,312,694 | $ | 33,439 | N/A | |||||||
| A Class Shares of beneficial interest outstanding | 788,911 | 3,619 | N/A | |||||||||
| Net asset value, offering price and redemption price per share (Note 1) | $ | 9.27 | $ | 9.24 | N/A | |||||||
| Maximum sales charge | 3.00 | % | 3.00 | % | N/A | |||||||
| Maximum offering price per share | $ | 9.56 | $ | 9.53 | N/A | |||||||
| C CLASS SHARES | ||||||||||||
| Net assets applicable to C Class Shares | $ | 207,169 | $ | 240,383 | N/A | |||||||
| C Class Shares of beneficial interest outstanding | 22,288 | 25,981 | N/A | |||||||||
| Net asset value, offering price and redemption price per share (Note 1) | $ | 9.29 | * | $ | 9.25 | N/A | ||||||
| ULTRA SHARES | ||||||||||||
| Net assets applicable to Ultra Shares | N/A | $ | 67,055,419 | N/A | ||||||||
| Ultra Shares of beneficial interest outstanding | N/A | 7,248,256 | N/A | |||||||||
| Net asset value, offering price and redemption price per share (Note 1) | N/A | $ | 9.25 | N/A | ||||||||
| * | Net Assets divided by Shares do not calculate to stated Net Asset Value because Net Assets and Shares are shown rounded. |
Amounts designated as “—” are either $0 or have been rounded to $0.
N/A — Not Applicable
The accompanying notes are an integral part of the financial statements.
51
| WESTWOOD FUNDS |
| SIX MONTHS ENDED APRIL 30, 2023 (Unaudited) |
| STATEMENTS OF OPERATIONS |
| Westwood | Westwood | |||||||||||||||
| Westwood | Westwood | Quality | Quality | |||||||||||||
| Quality Value | Quality MidCap | SMidCap | SmallCap | |||||||||||||
| Fund | Fund | Fund | Fund | |||||||||||||
| INVESTMENT INCOME | ||||||||||||||||
| Dividend income (net of foreign withholding tax of $3,784, $0, $0, and $6,653, respectively) | $ | 2,594,373 | $ | 5,791 | $ | 2,582,924 | $ | 14,094,784 | ||||||||
| EXPENSES | ||||||||||||||||
| Investment management fees (Note 4) | 646,177 | 1,601 | 1,085,174 | 4,472,213 | ||||||||||||
| Administrative service plan fees—Institutional Shares (Note 4) | 104,003 | 9 | 191,037 | 238,226 | ||||||||||||
| Administration fees (Note 4) | 25,408 | 2,538 | 29,465 | 107,339 | ||||||||||||
| Registration and filing fees | 31,135 | 1,685 | 22,166 | 50,026 | ||||||||||||
| Distribution fees—A Class Shares (Note 4) | 1,641 | — | — | 5,712 | ||||||||||||
| Distribution fees—C Class Shares (Note 4) | 621 | — | — | 3,521 | ||||||||||||
| Legal fees | 12,419 | 21 | 12,543 | 45,936 | ||||||||||||
| Trustees’ fees and expenses (Note 4) | 9,094 | 195 | 10,673 | 37,407 | ||||||||||||
| Custody fees | 3,586 | 1,422 | 4,284 | 10,910 | ||||||||||||
| Audit and tax services fees | 7,953 | 7,250 | 8,396 | 10,957 | ||||||||||||
| Transfer agent fees (Note 4) | 9,797 | 5,014 | 6,358 | 17,169 | ||||||||||||
| Insurance expense | 2,655 | 1,574 | 2,800 | 5,573 | ||||||||||||
| Borrowing costs (Note 6) | — | — | 2,128 | 15,981 | ||||||||||||
| Compliance fees (Note 4) | 2,388 | 5 | 2,760 | 10,057 | ||||||||||||
| Networking fees | 1,487 | 1,487 | 1,487 | 1,487 | ||||||||||||
| Other expenses | 32,678 | 4,033 | 20,536 | 103,280 | ||||||||||||
| Total expenses | 891,042 | 26,834 | 1,399,807 | 5,135,794 | ||||||||||||
| Investment management fees reduced and expense reimbursements by the Adviser (Note 4) | (76,036 | ) | (25,224 | ) | (222,751 | ) | (730,390 | ) | ||||||||
| Net expenses | 815,006 | 1,610 | 1,177,056 | 4,405,404 | ||||||||||||
| NET INVESTMENT INCOME | 1,779,367 | 4,181 | 1,405,868 | 9,689,380 | ||||||||||||
| REALIZED AND UNREALIZED GAINS (LOSSES) ON INVESTMENTS AND FOREIGN CURRENCIES | ||||||||||||||||
| Net realized gains (losses) from investment transactions | 808,502 | (12,970 | ) | (518,424 | ) | 3,063,423 | ||||||||||
| Net realized losses from foreign currency transactions | — | — | — | (4,598 | ) | |||||||||||
| Net change in unrealized appreciation (depreciation) on investment transactions | 4,441,902 | 28,272 | 4,493,504 | (14,163,434 | ) | |||||||||||
| NET REALIZED AND UNREALIZED GAINS (LOSSES) ON | ||||||||||||||||
| INVESTMENTS AND FOREIGN CURRENCIES | 5,250,404 | 15,302 | 3,975,080 | (11,104,609 | ) | |||||||||||
| NET INCREASE (DECREASE) IN NET ASSETS RESULTING FROM OPERATIONS | $ | 7,029,771 | $ | 19,483 | $ | 5,380,948 | $ | (1,415,229 | ) | |||||||
Amounts designated as “—” are either $0 or have been rounded to $0.
The accompanying notes are an integral part of the financial statements.
52
| WESTWOOD FUNDS |
| SIX MONTHS ENDED APRIL 30, 2023 (Unaudited) |
| STATEMENTS OF OPERATIONS |
| Westwood | ||||||||||||
| Westwood | Westwood | Income | ||||||||||
| Quality AllCap | Total Return | Opportunity | ||||||||||
| Fund | Fund | Fund | ||||||||||
| INVESTMENT INCOME | ||||||||||||
| Dividend income (net of foreign withholding tax of $256, $2,331, and $16,467,respectively) | $ | 250,074 | $ | 1,083,117 | $ | 4,642,611 | ||||||
| Interest income | — | 1,432,942 | 8,816,898 | |||||||||
| Total investment income | 250,074 | 2,516,059 | 13,459,509 | |||||||||
| EXPENSES | ||||||||||||
| Investment management fees (Note 4) | 50,957 | 252,347 | 2,108,891 | |||||||||
| Administrative service plan fees—Institutional Shares (Note 4) | 73 | — | 189,195 | |||||||||
| Administration fees (Note 4) | 2,461 | 12,735 | 82,608 | |||||||||
| Registration and filing fees | 16,720 | 26,206 | 34,060 | |||||||||
| Distribution fees—A Class Shares (Note 4) | — | 31 | 64,879 | |||||||||
| Distribution fees—C Class Shares (Note 4) | — | 346 | 64,229 | |||||||||
| Legal fees | 1,033 | 5,561 | 28,635 | |||||||||
| Trustees’ fees and expenses (Note 4) | 970 | 4,612 | 23,367 | |||||||||
| Custody fees | 1,877 | 2,644 | 10,501 | |||||||||
| Audit and tax services fees | 7,250 | 8,787 | 11,315 | |||||||||
| Transfer agent fees (Note 4) | 5,127 | 5,796 | 15,393 | |||||||||
| Insurance expense | 1,660 | 2,063 | 4,562 | |||||||||
| Borrowing costs (Note 6) | — | — | 3,726 | |||||||||
| Compliance fees (Note 4) | 216 | 1,195 | 6,026 | |||||||||
| Networking fees | 1,487 | 1,487 | 1,487 | |||||||||
| Other expenses | 10,524 | 21,843 | 60,895 | |||||||||
| Total expenses | 100,355 | 345,653 | 2,709,769 | |||||||||
| Investment management fees reduced by the Adviser (Note 4) | (49,338 | ) | (61,594 | ) | (6,978 | ) | ||||||
| Net expenses | 51,017 | 284,059 | 2,702,791 | |||||||||
| NET INVESTMENT INCOME | 199,057 | 2,232,000 | 10,756,718 | |||||||||
| REALIZED AND UNREALIZED GAINS (LOSSES) ON INVESTMENTS AND FOREIGN CURRENCIES | ||||||||||||
| Net realized gains (losses) from investment transactions | 133,845 | (3,791,711 | ) | (11,647,534 | ) | |||||||
| Net change in unrealized appreciation (depreciation) on investment transactions | 944,391 | 7,085,786 | 42,415,470 | |||||||||
| Net change in unrealized appreciation (depreciation) on currency translations | — | — | 269,291 | |||||||||
| NET REALIZED AND UNREALIZED GAINS ON INVESTMENTS AND FOREIGN CURRENCIES | 1,078,236 | 3,294,075 | 31,037,227 | |||||||||
| NET INCREASE IN NET ASSETS RESULTING FROM OPERATIONS | $ | 1,277,293 | $ | 5,526,075 | $ | 41,793,945 | ||||||
Amounts designated as “—” are either $0 or have been rounded to $0.
The accompanying notes are an integral part of the financial statements.
53
| WESTWOOD FUNDS |
| SIX MONTHS ENDED APRIL 30, 2023 (Unaudited) |
| STATEMENTS OF OPERATIONS |
| Westwood | Westwood | Westwood | ||||||||||
| High Income | Alternative | SmallCap | ||||||||||
| Fund | Income Fund | Growth Fund | ||||||||||
| INVESTMENT INCOME | ||||||||||||
| Dividend income (net of foreign withholding tax of $4,447, $0, and $183, respectively) | $ | 460,158 | $ | 100,149 | $ | 191,106 | ||||||
| Interest income (net of foreign withholding tax of $0, $2,308, and $0 ,respectively) | 2,618,457 | 1,995,884 | — | |||||||||
| Total investment income | 3,078,615 | 2,096,033 | 191,106 | |||||||||
| EXPENSES | ||||||||||||
| Investment management fees (Note 4) | 34,748 | 305,310 | 61,143 | |||||||||
| Administrative service plan fees—Institutional Shares (Note 4) | 15,000 | 32,465 | 2,524 | |||||||||
| Administration fees (Note 4) | 10,487 | 17,745 | 2,423 | |||||||||
| Registration and filing fees | 27,733 | 33,015 | 13,146 | |||||||||
| Distribution fees—A Class Shares (Note 4) | 4,131 | 41 | — | |||||||||
| Distribution fees—C Class Shares (Note 4) | 1,028 | 995 | — | |||||||||
| Legal fees | 4,592 | 9,574 | 952 | |||||||||
| Trustees’ fees and expenses (Note 4) | 3,846 | 5,521 | 982 | |||||||||
| Custody fees | 5,473 | 42,685 | 7,528 | |||||||||
| Audit and tax services fees | 8,625 | 11,793 | 7,250 | |||||||||
| Transfer agent fees (Note 4) | 5,696 | 5,778 | 5,109 | |||||||||
| Insurance expense | 1,990 | 2,222 | 1,672 | |||||||||
| Borrowing costs (Note 6) | 186 | 4,383 | 309 | |||||||||
| Compliance fees (Note 4) | 986 | 1,292 | 213 | |||||||||
| Networking fees | 1,487 | 1,487 | 1,487 | |||||||||
| Other expenses | 22,019 | 29,201 | 6,393 | |||||||||
| Total expenses | 148,027 | 503,507 | 111,131 | |||||||||
| Investment management fees reduced and expense reimbursements by the Adviser (Note 4) | (41,550 | ) | (159,987 | ) | (48,559 | ) | ||||||
| Contractual management fees waived by Adviser (Note 4) | — | (7,121 | ) | — | ||||||||
| Net expenses | 106,477 | 336,399 | 62,572 | |||||||||
| NET INVESTMENT INCOME | 2,972,138 | 1,759,634 | 128,534 | |||||||||
| REALIZED AND UNREALIZED GAINS (LOSSES) ON INVESTMENTS, FUTURES, OPTIONS AND SWAPS | ||||||||||||
| Net realized gains (losses) from investment transactions | (1,683,843 | ) | 1,979,215 | 342,847 | ||||||||
| Net realized gains from futures transactions | — | 69,976 | — | |||||||||
| Net realized losses from purchased option contracts transactions (Note 5) | — | (385,104 | ) | — | ||||||||
| Net realized losses from swap transactions | — | (4,411,015 | ) | — | ||||||||
| Net change in unrealized appreciation (depreciation) on investments | 4,687,921 | 4,080,265 | (1,704,180 | ) | ||||||||
| Net change in unrealized appreciation (depreciation) on futures | — | (83,655 | ) | — | ||||||||
| Net change in unrealized appreciation (depreciation) on purchased option contracts | — | 135,523 | — | |||||||||
| Net change in unrealized appreciation (depreciation) on swaps | — | 1,767,842 | — | |||||||||
| NET REALIZED AND UNREALIZED GAINS (LOSSES) ON INVESTMENTS, FUTURES, OPTIONS AND SWAPS | 3,004,078 | 3,153,047 | (1,361,333 | ) | ||||||||
| NET INCREASE (DECREASE) IN NET ASSETS RESULTING FROM OPERATIONS | $ | 5,976,216 | $ | 4,912,681 | $ | (1,232,799 | ) | |||||
Amounts designated as “—” are either $0 or have been rounded to $0.
The accompanying notes are an integral part of the financial statements.
54
| WESTWOOD FUNDS |
| STATEMENTS OF CHANGES IN NET ASSETS |
| Westwood Quality | Westwood Quality | Westwood Quality | ||||||||||||||||||||||
| Value Fund | MidCap Fund | SMidCap Fund | ||||||||||||||||||||||
| Six Months | Six Months | Six Months | ||||||||||||||||||||||
| Ended | Ended | Ended | ||||||||||||||||||||||
| April 30, | Year Ended | April 30, | Period Ended | April 30, | Year Ended | |||||||||||||||||||
| 2023 | October 31, | 2023 | October 31, | 2023 | October 31, | |||||||||||||||||||
| (Unaudited)(a) | 2022 | (Unaudited) | 2022 (b) | (Unaudited) | 2022 | |||||||||||||||||||
| FROM OPERATIONS | ||||||||||||||||||||||||
| Net investment income | $ | 1,779,367 | $ | 3,559,413 | $ | 4,181 | $ | 5,737 | $ | 1,405,868 | $ | 2,093,486 | ||||||||||||
| Net realized gains (losses) from investments | 808,502 | (1,266,952 | ) | (12,970 | ) | (16,968 | ) | (518,424 | ) | 2,766,641 | ||||||||||||||
| Net change in unrealized appreciation (depreciation) on investments | 4,441,902 | (14,684,865 | ) | 28,272 | (8,987 | ) | 4,493,504 | (37,760,503 | ) | |||||||||||||||
| Net increase (decrease) in net assets resulting from operations | 7,029,771 | (12,392,404 | ) | 19,483 | (20,218 | ) | 5,380,948 | (32,900,376 | ) | |||||||||||||||
| FROM DISTRIBUTIONS TO SHAREHOLDERS | ||||||||||||||||||||||||
| Institutional Shares | (3,769,619 | ) | (39,487,955 | ) | (7,423 | ) | — | (2,978,159 | ) | (33,934,719 | ) | |||||||||||||
| A Class Shares | (15,237 | ) | (130,582 | ) | N/A | N/A | N/A | N/A | ||||||||||||||||
| C Class Shares | (993 | ) | (145 | ) | N/A | N/A | N/A | N/A | ||||||||||||||||
| Ultra Shares | (14 | ) | — | N/A | N/A | (1,504,912 | ) | (14,978,126 | ) | |||||||||||||||
| Total distributions | (3,785,863 | ) | (39,618,682 | ) | (7,423 | ) | — | (4,483,071 | ) | (48,912,845 | ) | |||||||||||||
| CAPITAL SHARE TRANSACTIONS | ||||||||||||||||||||||||
| Institutional Shares | ||||||||||||||||||||||||
| Issued | 6,296,057 | 110,036,446 | 24,282 | 549,976 | 10,112,274 | 38,683,258 | ||||||||||||||||||
| Reinvestment of dividends | 2,563,928 | 27,161,720 | 7,423 | — | 2,977,374 | 33,838,985 | ||||||||||||||||||
| Redeemed | (11,294,131 | ) | (42,331,526 | ) | — | — | (46,190,950 | ) | (51,331,767 | ) | ||||||||||||||
| Net increase (decrease) from Institutional Shares capital share transactions | (2,434,146 | ) | 94,866,640 | 31,705 | 549,976 | (33,101,302 | ) | 21,190,476 | ||||||||||||||||
| A Class Shares | ||||||||||||||||||||||||
| Issued | 303,754 | 610,758 | N/A | N/A | N/A | N/A | ||||||||||||||||||
| Reinvestment of dividends | 15,237 | 130,582 | N/A | N/A | N/A | N/A | ||||||||||||||||||
| Redeemed | (430,103 | ) | (26,195 | ) | N/A | N/A | N/A | N/A | ||||||||||||||||
| Net increase (decrease) from A Class Shares capital share transactions | (111,112 | ) | 715,145 | N/A | N/A | N/A | N/A | |||||||||||||||||
| C Class Shares | ||||||||||||||||||||||||
| Issued | 36,888 | 101,679 | N/A | N/A | N/A | N/A | ||||||||||||||||||
| Reinvestment of dividends | 993 | 145 | N/A | N/A | N/A | N/A | ||||||||||||||||||
| Net increase from C Class Shares capital share transactions | 37,881 | 101,824 | N/A | N/A | N/A | N/A | ||||||||||||||||||
| Ultra Shares | ||||||||||||||||||||||||
| Issued | 1,000 | N/A | N/A | N/A | 33,740,174 | 10,477,959 | ||||||||||||||||||
| Reinvestment of dividends | 14 | N/A | N/A | N/A | 1,504,912 | 14,978,126 | ||||||||||||||||||
| Redeemed | — | N/A | N/A | N/A | (3,705,907 | ) | (12,750,424 | ) | ||||||||||||||||
| Net increase from Ultra Shares capital share transactions | 1,014 | N/A | N/A | N/A | 31,539,179 | 12,705,661 | ||||||||||||||||||
| Net increase (decrease) in net assets from capital share transactions | (2,506,363 | ) | 95,683,609 | 31,705 | 549,976 | (1,562,123 | ) | 33,896,137 | ||||||||||||||||
| TOTAL INCREASE (DECREASE) IN NET ASSETS | 737,545 | 43,672,523 | 43,765 | 529,758 | (664,246 | ) | (47,917,084 | ) | ||||||||||||||||
| NET ASSETS | ||||||||||||||||||||||||
| Beginning of period | 251,260,960 | 207,588,437 | 529,758 | — | 290,494,747 | 338,411,831 | ||||||||||||||||||
| End of period | $ | 251,998,505 | $ | 251,260,960 | $ | 573,523 | $ | 529,758 | $ | 289,830,501 | $ | 290,494,747 | ||||||||||||
Amounts designated as “—” are $0 or rounded to $0.
N/A – Not Applicable
| (a) | For Ultra Shares, represents the period from commencement of operations (November 30, 2022) through April 30, 2023. |
| (b) | Represents the period from the commencement of operations (November 30, 2021) through October 31, 2022. |
The accompanying notes are an integral part of the financial statements.
55
| WESTWOOD FUNDS |
| STATEMENTS OF CHANGES IN NET ASSETS |
| Westwood Quality | Westwood Quality | Westwood Quality | ||||||||||||||||||||||
| Value Fund | MidCap Fund | SMidCap Fund | ||||||||||||||||||||||
| Six Months | Six Months | Six Months | ||||||||||||||||||||||
| Ended | Ended | Ended | ||||||||||||||||||||||
| April 30, | Year Ended | April 30, | Period Ended | April 30, | Year Ended | |||||||||||||||||||
| 2023 | October 31, | 2023 | October 31, | 2023 | October 31, | |||||||||||||||||||
| (Unaudited)(a) | 2022 | (Unaudited) | 2022 (b) | (Unaudited) | 2022 | |||||||||||||||||||
| CAPITAL SHARES ACTIVITY | ||||||||||||||||||||||||
| Institutional Shares | ||||||||||||||||||||||||
| Sold | 496,854 | 7,869,019 | 2,420 | 54,943 | 764,017 | 2,912,499 | ||||||||||||||||||
| Issued in reinvestment of dividends to shareholders | 204,786 | 2,049,946 | 766 | — | 230,280 | 2,351,737 | ||||||||||||||||||
| Redeemed | (895,502 | ) | (3,339,361 | ) | — | — | (3,569,533 | ) | (3,919,333 | ) | ||||||||||||||
| Net increase (decrease) in shares outstanding | (193,862 | ) | 6,579,604 | 3,186 | 54,943 | (2,575,236 | ) | 1,344,903 | ||||||||||||||||
| Shares outstanding at beginning of period | 19,948,554 | 13,368,950 | 54,943 | — | 15,633,609 | 14,288,706 | ||||||||||||||||||
| Shares outstanding at end of period | 19,754,692 | 19,948,554 | 58,129 | 54,943 | 13,058,373 | 15,633,609 | ||||||||||||||||||
| A Class Shares | ||||||||||||||||||||||||
| Sold | 23,763 | 48,433 | N/A | N/A | N/A | N/A | ||||||||||||||||||
| Issued in reinvestment of dividends to shareholders | 1,209 | 9,819 | N/A | N/A | N/A | N/A | ||||||||||||||||||
| Redeemed | (33,782 | ) | (2,033 | ) | N/A | N/A | N/A | N/A | ||||||||||||||||
| Net increase (decrease) in shares outstanding | (8,810 | ) | 56,219 | N/A | N/A | N/A | N/A | |||||||||||||||||
| Shares outstanding at beginning of period | 111,493 | 55,274 | N/A | N/A | N/A | N/A | ||||||||||||||||||
| Shares outstanding at end of period | 102,683 | 111,493 | N/A | N/A | N/A | N/A | ||||||||||||||||||
| C Class Shares | ||||||||||||||||||||||||
| Sold | 2,979 | 7,981 | N/A | N/A | N/A | N/A | ||||||||||||||||||
| Issued in reinvestment of dividends to shareholders | 80 | 11 | N/A | N/A | N/A | N/A | ||||||||||||||||||
| Net increase in shares outstanding | 3,059 | 7,992 | N/A | N/A | N/A | N/A | ||||||||||||||||||
| Shares outstanding at beginning of period | 8,006 | 14 | N/A | N/A | N/A | N/A | ||||||||||||||||||
| Shares outstanding at end of period | 11,065 | 8,006 | N/A | N/A | N/A | N/A | ||||||||||||||||||
| Ultra Shares | ||||||||||||||||||||||||
| Sold | 75 | N/A | N/A | N/A | 2,613,241 | 733,794 | ||||||||||||||||||
| Issued in reinvestment of dividends to shareholders | 1 | N/A | N/A | N/A | 116,635 | 1,040,385 | ||||||||||||||||||
| Redeemed | — | N/A | N/A | N/A | (282,513 | ) | (952,530 | ) | ||||||||||||||||
| Net increase in shares outstanding | 76 | N/A | N/A | N/A | 2,447,363 | 821,649 | ||||||||||||||||||
| Shares outstanding at beginning of period | — | N/A | N/A | N/A | 6,893,060 | 6,071,411 | ||||||||||||||||||
| Shares outstanding at end of period | 76 | N/A | N/A | N/A | 9,340,423 | 6,893,060 | ||||||||||||||||||
Amounts designated as “—” are $0 or rounded to $0.
N/A – Not Applicable
| (a) | For Ultra Shares, represents the period from commencement of operations (November 30, 2022) through April 30, 2023. |
| (b) | Represents the period from the commencement of operations (November 30, 2021) through October 31, 2022. |
The accompanying notes are an integral part of the financial statements.
56
| WESTWOOD FUNDS |
| STATEMENTS OF CHANGES IN NET ASSETS |
| Westwood Quality | Westwood Quality | Westwood Total | ||||||||||||||||||||||
| SmallCap Fund | AllCap Fund | Return Fund | ||||||||||||||||||||||
| Six Months | Six Months | Six Months | ||||||||||||||||||||||
| Ended | Ended | Ended | ||||||||||||||||||||||
| April 30, | Year Ended | April 30, | Year Ended | April 30, | Year Ended | |||||||||||||||||||
| 2023 | October 31, | 2023 | October 31, | 2023 | October 31, | |||||||||||||||||||
| (Unaudited) | 2022 | (Unaudited) | 2022 | (Unaudited) | 2022 | |||||||||||||||||||
| FROM OPERATIONS | ||||||||||||||||||||||||
| Net investment income | $ | 9,689,380 | 10,416,497 | $ | 199,057 | $ | 338,557 | $ | 2,232,000 | $ | 3,339,733 | |||||||||||||
| Net realized gains (losses) from investments and foreign currency transactions | 3,058,825 | 34,401,123 | 133,845 | (595,695 | ) | (3,791,711 | ) | (14,057 | ) | |||||||||||||||
| Net change in unrealized appreciation (depreciation) on investments and foreign currency translations | (14,163,434 | ) | (162,632,712 | ) | 944,391 | (751,670 | ) | 7,085,786 | (21,595,596 | ) | ||||||||||||||
| Net increase (decrease) in net assets resulting from operations | (1,415,229 | ) | (117,815,092 | ) | 1,277,293 | (1,008,808 | ) | 5,526,075 | (18,269,596 | ) | ||||||||||||||
| FROM DISTRIBUTIONS TO SHAREHOLDERS | ||||||||||||||||||||||||
| Institutional Shares | (16,723,396 | ) | (26,825,452 | ) | (9,305 | ) | (2,388 | ) | (2,112,061 | ) | (12,027,441 | ) | ||||||||||||
| A Class Shares | (180,873 | ) | (69,757 | ) | N/A | N/A | (373 | ) | (585 | ) | ||||||||||||||
| C Class Shares | (19,410 | ) | (34,797 | ) | N/A | N/A | (608 | ) | (6,552 | ) | ||||||||||||||
| Ultra Shares | (20,405,338 | ) | (24,288,100 | ) | (356,874 | ) | (113,039 | ) | N/A | N/A | ||||||||||||||
| Total distributions | (37,329,017 | ) | (51,218,106 | ) | (366,179 | ) | (115,427 | ) | (2,113,042 | ) | (12,034,578 | ) | ||||||||||||
| CAPITAL SHARE TRANSACTIONS | ||||||||||||||||||||||||
| Institutional Shares | ||||||||||||||||||||||||
| Issued | 43,873,826 | 120,733,963 | 43,080 | 49,977 | 10,258,265 | 30,276,927 | ||||||||||||||||||
| Reinvestment of dividends | 15,875,942 | 25,833,286 | 9,305 | 2,387 | 2,056,158 | 11,995,434 | ||||||||||||||||||
| Redeemed | (53,673,393 | ) | (173,067,644 | ) | (420,000 | ) | — | (14,364,234 | ) | (31,738,749 | ) | |||||||||||||
| Net increase (decrease) from Institutional Shares capital share transactions | 6,076,375 | (26,500,395 | ) | (367,615 | ) | 52,364 | (2,049,811 | ) | 10,533,612 | |||||||||||||||
| A Class Shares | ||||||||||||||||||||||||
| Issued | 4,176,575 | 1,106,597 | N/A | N/A | 7,137 | 22,317 | ||||||||||||||||||
| Reinvestment of dividends | 179,473 | 69,757 | N/A | N/A | 373 | 585 | ||||||||||||||||||
| Redeemed | (3,577,229 | ) | (876,212 | ) | N/A | N/A | (3,567 | ) | (248 | ) | ||||||||||||||
| Net increase from A Class Shares capital share transactions | 778,819 | 300,142 | N/A | N/A | 3,943 | 22,654 | ||||||||||||||||||
| C Class Shares | ||||||||||||||||||||||||
| Issued | 55,145 | 29,276 | N/A | N/A | 74,141 | 88,608 | ||||||||||||||||||
| Reinvestment of dividends | 19,350 | 31,748 | N/A | N/A | 608 | 6,552 | ||||||||||||||||||
| Redeemed | (95,331 | ) | (71,932 | ) | N/A | N/A | (73,861 | ) | (89,401 | ) | ||||||||||||||
| Net increase (decrease) from C Class Shares capital share transactions | (20,836 | ) | (10,908 | ) | N/A | N/A | 888 | 5,759 | ||||||||||||||||
| Ultra Shares | ||||||||||||||||||||||||
| Issued | 122,841,279 | 197,226,122 | 188,550 | 2,498,217 | N/A | N/A | ||||||||||||||||||
| Reinvestment of dividends | 19,108,062 | 22,576,808 | 356,874 | 113,039 | N/A | N/A | ||||||||||||||||||
| Redeemed | (35,450,970 | ) | (130,219,961 | ) | (825,606 | ) | (1,481,129 | ) | N/A | N/A | ||||||||||||||
| Net increase (decrease) from Ultra Shares capital share transactions | 106,498,371 | 89,582,969 | (280,182 | ) | 1,130,127 | N/A | N/A | |||||||||||||||||
| Net increase (decrease) in net assets from capital share transactions | 113,332,729 | 63,371,808 | (647,797 | ) | 1,182,491 | (2,044,980 | ) | 10,562,025 | ||||||||||||||||
| TOTAL INCREASE (DECREASE) INCREASE IN NET ASSETS | 74,588,483 | (105,661,390 | ) | 263,317 | 58,256 | 1,368,053 | (19,742,149 | ) | ||||||||||||||||
| NET ASSETS | ||||||||||||||||||||||||
| Beginning of period | 989,536,679 | 1,095,198,069 | 22,302,588 | 22,244,332 | 124,045,326 | 143,787,475 | ||||||||||||||||||
| End of period | $ | 1,064,125,162 | 989,536,679 | $ | 22,565,905 | $ | 22,302,588 | $ | 125,413,379 | $ | 124,045,326 | |||||||||||||
Amounts designated as “—” are $0 or rounded to $0.
N/A — Not Applicable
The accompanying notes are an integral part of the financial statements.
57
| WESTWOOD FUNDS |
| STATEMENTS OF CHANGES IN NET ASSETS |
| Westwood Quality | Westwood Quality | Westwood Total | ||||||||||||||||||||||
| SmallCap Fund | AllCap Fund | Return Fund | ||||||||||||||||||||||
| Six Months | Six Months | Six Months | ||||||||||||||||||||||
| Ended | Ended | Ended | ||||||||||||||||||||||
| April 30, | Year Ended | April 30, | Year Ended | April 30, | Year Ended | |||||||||||||||||||
| 2023 | October 31, | 2023 | October 31, | 2023 | October 31, | |||||||||||||||||||
| (Unaudited) | 2022 | (Unaudited) | 2022 | (Unaudited) | 2022 | |||||||||||||||||||
| CAPITAL SHARES ACTIVITY | ||||||||||||||||||||||||
| Institutional Shares | ||||||||||||||||||||||||
| Sold | 2,304,502 | 6,176,952 | 4,274 | 4,900 | 1,645,541 | 4,554,074 | ||||||||||||||||||
| Issued in reinvestment of dividends to shareholders | 843,146 | 1,201,430 | 916 | 225 | 335,372 | 1,716,992 | ||||||||||||||||||
| Redeemed | (2,831,515 | ) | (8,838,361 | ) | (40,619 | ) | — | (2,289,347 | ) | (4,675,931 | ) | |||||||||||||
| Net increase (decrease) in shares outstanding | 316,133 | (1,459,979 | ) | (35,429 | ) | 5,125 | (308,434 | ) | 1,595,135 | |||||||||||||||
| Shares outstanding at beginning of period | 25,213,137 | 26,673,116 | 55,125 | 50,000 | 20,371,829 | 18,776,694 | ||||||||||||||||||
| Shares outstanding at end of period | 25,529,270 | 25,213,137 | 19,696 | 55,125 | 20,063,395 | 20,371,829 | ||||||||||||||||||
| A Class Shares | ||||||||||||||||||||||||
| Sold | 212,869 | 57,169 | N/A | N/A | 1,138 | 3,439 | ||||||||||||||||||
| Issued in reinvestment of dividends to shareholders | 9,556 | 3,251 | N/A | N/A | 61 | 90 | ||||||||||||||||||
| Redeemed | (192,941 | ) | (44,861 | ) | N/A | N/A | (589 | ) | (42 | ) | ||||||||||||||
| Net increase in shares outstanding | 29,484 | 15,559 | N/A | N/A | 610 | 3,487 | ||||||||||||||||||
| Shares outstanding at beginning of period | 82,566 | 67,007 | N/A | N/A | 4,023 | 536 | ||||||||||||||||||
| Shares outstanding at end of period | 112,050 | 82,566 | N/A | N/A | 4,633 | 4,023 | ||||||||||||||||||
| C Class Shares | ||||||||||||||||||||||||
| Sold | 2,941 | 1,425 | N/A | N/A | 11,959 | 12,524 | ||||||||||||||||||
| Issued in reinvestment of dividends to shareholders | 1,035 | 1,494 | N/A | N/A | 99 | 930 | ||||||||||||||||||
| Redeemed | (5,075 | ) | (3,931 | ) | N/A | N/A | (12,010 | ) | (13,921 | ) | ||||||||||||||
| Net increase (decrease) in shares outstanding | (1,099 | ) | (1,012 | ) | N/A | N/A | 48 | (467 | ) | |||||||||||||||
| Shares outstanding at beginning of period | 38,013 | 39,025 | N/A | N/A | 9,146 | 9,613 | ||||||||||||||||||
| Shares outstanding at end of period | 36,914 | 38,013 | N/A | N/A | 9,194 | 9,146 | ||||||||||||||||||
| Ultra Shares | ||||||||||||||||||||||||
| Sold | 6,377,068 | 10,042,232 | 18,146 | 249,069 | N/A | N/A | ||||||||||||||||||
| Issued in reinvestment of dividends to shareholders | 1,014,667 | 1,048,676 | 35,126 | 10,648 | N/A | N/A | ||||||||||||||||||
| Redeemed | (1,867,797 | ) | (7,065,843 | ) | (79,894 | ) | (141,309 | ) | N/A | N/A | ||||||||||||||
| Net increase (decrease) in shares outstanding | 5,523,938 | 4,025,065 | (26,622 | ) | 118,408 | N/A | N/A | |||||||||||||||||
| Shares outstanding at beginning of period | 27,032,367 | 23,007,302 | 2,168,777 | 2,050,369 | N/A | N/A | ||||||||||||||||||
| Shares outstanding at end of period | 32,556,305 | 27,032,367 | 2,142,155 | 2,168,777 | N/A | N/A | ||||||||||||||||||
Amounts designated as “—” are $0 or rounded to $0.
N/A — Not Applicable
The accompanying notes are an integral part of the financial statements.
58
| WESTWOOD FUNDS |
| STATEMENTS OF CHANGES IN NET ASSETS |
| Westwood Income | Westwood High | |||||||||||||||
| Opportunity Fund | Income Fund | |||||||||||||||
| Six Months | Six Months | |||||||||||||||
| Ended | Ended | |||||||||||||||
| April 30, | Year Ended | April 30, | Year Ended | |||||||||||||
| 2023 | October 31, | 2023 | October 31, | |||||||||||||
| (Unaudited)(a) | 2022 | (Unaudited) | 2022 | |||||||||||||
| FROM OPERATIONS | ||||||||||||||||
| Net investment income | $ | 10,756,718 | $ | 19,142,174 | $ | 2,972,138 | $ | 4,346,280 | ||||||||
| Net realized losses from investments | (11,647,534 | ) | (1,587,387 | ) | (1,683,843 | ) | (1,205,135 | ) | ||||||||
| Net change in unrealized appreciation (depreciation) on investments and foreign currency translations | 42,684,761 | (142,557,732 | ) | 4,687,921 | (16,901,273 | ) | ||||||||||
| Net increase (decrease) in net assets resulting from operations | 41,793,945 | (125,002,945 | ) | 5,976,216 | (13,760,128 | ) | ||||||||||
| FROM DISTRIBUTIONS TO SHAREHOLDERS | ||||||||||||||||
| Institutional Shares | (10,411,116 | ) | (82,688,706 | ) | (2,837,613 | ) | (4,328,768 | ) | ||||||||
| A Class Shares | (935,154 | ) | (6,456,020 | ) | (95,838 | ) | (90,847 | ) | ||||||||
| C Class Shares | (187,363 | ) | (1,304,828 | ) | (4,781 | ) | (6,969 | ) | ||||||||
| Ultra Shares | (346,403 | ) | N/A | N/A | N/A | |||||||||||
| Total distributions | (11,880,036 | ) | (90,449,554 | ) | (2,938,232 | ) | (4,426,584 | ) | ||||||||
| CAPITAL SHARE TRANSACTIONS | ||||||||||||||||
| Institutional Shares | ||||||||||||||||
| Issued | 31,363,461 | 141,954,917 | 9,432,112 | 43,338,245 | ||||||||||||
| Reinvestment of dividends | 10,043,078 | 77,994,988 | 2,808,108 | 4,293,860 | ||||||||||||
| Redeemed | (150,771,774 | ) | (259,349,308 | ) | (10,909,199 | ) | (27,604,544 | ) | ||||||||
| Net increase (decrease) from Institutional Shares capital share transactions | (109,365,235 | ) | (39,399,403 | ) | 1,331,021 | 20,027,561 | ||||||||||
| A Class Shares | ||||||||||||||||
| Issued | 3,153,769 | 16,556,183 | 5,104,485 | 2,072,385 | ||||||||||||
| Reinvestment of dividends | 925,025 | 5,584,694 | 68,953 | 61,929 | ||||||||||||
| Redeemed | (12,057,523 | ) | (13,064,332 | ) | (229,876 | ) | (1,040,595 | ) | ||||||||
| Net increase (decrease) from A Class Shares capital share transactions | (7,978,729 | ) | 9,076,545 | 4,943,562 | 1,093,719 | |||||||||||
| C Class Shares | ||||||||||||||||
| Issued | 454,200 | 4,131,539 | — | 135,011 | ||||||||||||
| Reinvestment of dividends | 187,325 | 1,304,828 | 4,781 | 6,969 | ||||||||||||
| Redeemed | (1,056,125 | ) | (2,419,865 | ) | (4,777 | ) | (6,963 | ) | ||||||||
| Net increase (decrease) from C Class Shares capital share transactions | (414,600 | ) | 3,016,502 | 4 | 135,017 | |||||||||||
| Ultra Shares | ||||||||||||||||
| Issued | 62,206,281 | N/A | N/A | N/A | ||||||||||||
| Reinvestment of dividends | 346,403 | N/A | N/A | N/A | ||||||||||||
| Redeemed | — | N/A | N/A | N/A | ||||||||||||
| Net increase from Ultra Shares capital share transactions | 62,552,684 | N/A | N/A | N/A | ||||||||||||
| Net increase (decrease) in net assets from capital share transactions | (55,205,880 | ) | (27,306,356 | ) | 6,274,587 | 21,256,297 | ||||||||||
| TOTAL INCREASE (DECREASE) IN NET ASSETS | (25,291,971 | ) | (242,758,855 | ) | 9,312,571 | 3,069,585 | ||||||||||
| NET ASSETS | ||||||||||||||||
| Beginning of period | 647,811,398 | 890,570,253 | 99,157,091 | 96,087,506 | ||||||||||||
| End of period | $ | 622,519,427 | $ | 647,811,398 | $ | 108,469,662 | $ | 99,157,091 | ||||||||
Amounts designated as “—” are $0 or rounded to $0.
N/A — Not Applicable
| (a) | For Ultra Shares, represents the period from commencement of operations (November 30, 2022) through April 30, 2023. |
The accompanying notes are an integral part of the financial statements.
59
| WESTWOOD FUNDS |
| STATEMENTS OF CHANGES IN NET ASSETS |
| Westwood Income | Westwood High | |||||||||||||||
| Opportunity Fund | Income Fund | |||||||||||||||
| Six Months | Six Months | |||||||||||||||
| Ended | Ended | |||||||||||||||
| April 30, | Year Ended | April 30, | Year Ended | |||||||||||||
| 2023 | October 31, | 2023 | October 31, | |||||||||||||
| (Unaudited)(a) | 2022 | (Unaudited) | 2022 | |||||||||||||
| CAPITAL SHARES ACTIVITY | ||||||||||||||||
| Institutional Shares | ||||||||||||||||
| Sold | 2,836,827 | 11,856,221 | 1,024,457 | 4,320,818 | ||||||||||||
| Issued in reinvestment of dividends to shareholders | 924,564 | 6,245,895 | 305,835 | 441,285 | ||||||||||||
| Redeemed | (13,600,743 | ) | (21,871,789 | ) | (1,187,111 | ) | (2,805,479 | ) | ||||||||
| Net increase (decrease) in shares outstanding | (9,839,352 | ) | (3,769,673 | ) | 143,181 | 1,956,624 | ||||||||||
| Shares outstanding at beginning of period | 54,754,262 | 58,523,935 | 10,801,739 | 8,845,115 | ||||||||||||
| Shares outstanding at end of period | 44,914,910 | 54,754,262 | 10,944,920 | 10,801,739 | ||||||||||||
| A Class Shares | ||||||||||||||||
| Sold | 284,361 | 1,384,742 | 548,398 | 205,334 | ||||||||||||
| Issued in reinvestment of dividends to shareholders | 85,229 | 449,151 | 7,470 | 6,312 | ||||||||||||
| Redeemed | (1,099,954 | ) | (1,108,390 | ) | (24,918 | ) | (105,050 | ) | ||||||||
| Net increase (decrease) in shares outstanding | (730,364 | ) | 725,503 | 530,950 | 106,596 | |||||||||||
| Shares outstanding at beginning of period | 5,228,975 | 4,503,472 | 257,961 | 151,365 | ||||||||||||
| Shares outstanding at end of period | 4,498,611 | 5,228,975 | 788,911 | 257,961 | ||||||||||||
| C Class Shares | ||||||||||||||||
| Sold | 41,662 | 353,871 | — | 12,566 | ||||||||||||
| Issued in reinvestment of dividends to shareholders | 17,333 | 104,760 | 517 | 712 | ||||||||||||
| Redeemed | (96,226 | ) | (210,241 | ) | (517 | ) | (711 | ) | ||||||||
| Net increase (decrease) in shares outstanding | (37,231 | ) | 248,390 | — | 12,567 | |||||||||||
| Shares outstanding at beginning of period | 1,210,728 | 962,338 | 22,288 | 9,721 | ||||||||||||
| Shares outstanding at end of period | 1,173,497 | 1,210,728 | 22,288 | 22,288 | ||||||||||||
| Ultra Shares | ||||||||||||||||
| Sold | 5,552,391 | N/A | N/A | N/A | ||||||||||||
| Issued in reinvestment of dividends to shareholders | 31,722 | N/A | N/A | N/A | ||||||||||||
| Redeemed | — | N/A | N/A | N/A | ||||||||||||
| Net increase in shares outstanding | 5,584,113 | N/A | N/A | N/A | ||||||||||||
| Shares outstanding at beginning of period | — | N/A | N/A | N/A | ||||||||||||
| Shares outstanding at end of period | 5,584,113 | N/A | N/A | N/A | ||||||||||||
Amounts designated as “—” are $0 or rounded to $0.
N/A — Not Applicable
| (a) | For Ultra Shares, represents the period from commencement of operations (November 30, 2022) through April 30, 2023. |
The accompanying notes are an integral part of the financial statements.
60
| WESTWOOD FUNDS |
| STATEMENTS OF CHANGES IN NET ASSETS |
| Westwood Alternative | Westwood SmallCap | |||||||||||||||
| Income Fund | Growth Fund | |||||||||||||||
| Six Months | Six Months | |||||||||||||||
| Ended | Ended | |||||||||||||||
| April 30, | Year Ended | April 30, | Year Ended | |||||||||||||
| 2023 | October 31, | 2023 | October 31, | |||||||||||||
| (Unaudited) | 2022 | (Unaudited) | 2022 | |||||||||||||
| FROM OPERATIONS | ||||||||||||||||
| Net investment income | $ | 1,759,634 | $ | 3,031,301 | $ | 128,534 | $ | 51,717 | ||||||||
| Net realized gains (losses) from investments, futures, options and swap transactions | (2,746,928 | ) | 6,677,384 | 342,847 | (3,058,584 | ) | ||||||||||
| Net change in unrealized appreciation (depreciation) on investments, futures,options and swaps | 5,899,975 | (14,130,214 | ) | (1,704,180 | ) | 946,654 | ||||||||||
| Net increase (decrease) in net assets resulting from operations | 4,912,681 | (4,421,529 | ) | (1,232,799 | ) | (2,060,213 | ) | |||||||||
| FROM DISTRIBUTIONS TO SHAREHOLDERS | ||||||||||||||||
| Institutional Shares | (9,347,180 | ) | (1,650,351 | ) | (119,172 | ) | (14,715 | ) | ||||||||
| A Class Shares | (4,701 | ) | (1,010 | ) | N/A | N/A | ||||||||||
| C Class Shares | (24,913 | ) | (989 | ) | N/A | N/A | ||||||||||
| Ultra Shares | (10,761,010 | ) | (3,424,654 | ) | N/A | N/A | ||||||||||
| Total distributions | (20,137,804 | ) | (5,077,004 | ) | (119,172 | ) | (14,715 | ) | ||||||||
| CAPITAL SHARE TRANSACTIONS | ||||||||||||||||
| Institutional Shares | ||||||||||||||||
| Issued | 21,526,814 | 50,924,775 | 2,911,581 | 24,972,480 | ||||||||||||
| Reinvestment of dividends | 9,347,180 | 1,650,350 | 119,172 | 14,715 | ||||||||||||
| Proceeds from redemption fees collected (Note 2) | 3,039 | — | — | — | ||||||||||||
| Redeemed | (24,943,127 | ) | (35,727,633 | ) | (1,200,203 | ) | (1,730,419 | ) | ||||||||
| Net increase from Institutional Shares capital share transactions | 5,933,906 | 16,847,492 | 1,830,550 | 23,256,776 | ||||||||||||
| A Class Shares | ||||||||||||||||
| Issued | — | 11 | N/A | N/A | ||||||||||||
| Reinvestment of dividends | 4,701 | 1,010 | N/A | N/A | ||||||||||||
| Redeemed | (388 | ) | (34,079 | ) | N/A | N/A | ||||||||||
| Net increase (decrease) from A Class Shares capital share transactions | 4,313 | (33,058 | ) | N/A | N/A | |||||||||||
| C Class Shares | ||||||||||||||||
| Issued | 79,379 | 170,723 | N/A | N/A | ||||||||||||
| Reinvestment of dividends | 24,913 | 989 | N/A | N/A | ||||||||||||
| Redeemed | (1,032 | ) | (54,008 | ) | N/A | N/A | ||||||||||
| Net increase from C Class Shares capital share transactions | 103,260 | 117,704 | N/A | N/A | ||||||||||||
| Ultra Shares | ||||||||||||||||
| Issued | 2,603,406 | 18,133,075 | N/A | N/A | ||||||||||||
| Reinvestment of dividends | 10,753,541 | 3,424,654 | N/A | N/A | ||||||||||||
| Redeemed | (26,852,747 | ) | (54,926,341 | ) | N/A | N/A | ||||||||||
| Net decrease from Ultra Shares capital share transactions | (13,495,800 | ) | (33,368,612 | ) | N/A | N/A | ||||||||||
| Net increase (decrease) in net assets from capital share transactions | (7,454,321 | ) | (16,436,474 | ) | 1,830,550 | 23,256,776 | ||||||||||
| TOTAL INCREASE (DECREASE) IN NET ASSETS | (22,679,444 | ) | (25,935,007 | ) | 478,579 | 21,181,848 | ||||||||||
| NET ASSETS | ||||||||||||||||
| Beginning of period | 156,235,823 | 182,170,830 | 22,208,024 | 1,026,176 | ||||||||||||
| End of period | $ | 133,556,379 | $ | 156,235,823 | $ | 22,686,603 | $ | 22,208,024 | ||||||||
Amounts designated as “—” are $0 or rounded to $0.
N/A — Not Applicable
The accompanying notes are an integral part of the financial statements.
61
| WESTWOOD FUNDS |
| STATEMENTS OF CHANGES IN NET ASSETS |
| Westwood Alternative | Westwood SmallCap | |||||||||||||||
| Income Fund | Growth Fund | |||||||||||||||
| Six Months | Six Months | |||||||||||||||
| Ended | Ended | |||||||||||||||
| April 30, | Year Ended | April 30, | Year Ended | |||||||||||||
| 2023 | October 31, | 2023 | October 31, | |||||||||||||
| (Unaudited) | 2022 | (Unaudited) | 2022 | |||||||||||||
| CAPITAL SHARES ACTIVITY | ||||||||||||||||
| Institutional Shares | ||||||||||||||||
| Sold | 2,268,893 | 4,827,678 | 367,128 | 2,841,249 | ||||||||||||
| Issued in reinvestment of dividends to shareholders | 1,022,352 | 154,968 | 15,477 | 1,444 | ||||||||||||
| Redeemed | (2,605,484 | ) | (3,385,097 | ) | (144,909 | ) | (207,841 | ) | ||||||||
| Net increase in shares outstanding | 685,761 | 1,597,549 | 237,696 | 2,634,852 | ||||||||||||
| Shares outstanding at beginning of period | 6,475,553 | 4,878,004 | 2,734,852 | 100,000 | ||||||||||||
| Shares outstanding at end of period | 7,161,314 | 6,475,553 | 2,972,548 | 2,734,852 | ||||||||||||
| A Class Shares | ||||||||||||||||
| Sold | — | 1 | N/A | N/A | ||||||||||||
| Issued in reinvestment of dividends to shareholders | 515 | 95 | N/A | N/A | ||||||||||||
| Redeemed | (43 | ) | (3,113 | ) | N/A | N/A | ||||||||||
| Net increase (decrease) in shares outstanding | 472 | (3,017 | ) | N/A | N/A | |||||||||||
| Shares outstanding at beginning of period | 3,147 | 6,164 | N/A | N/A | ||||||||||||
| Shares outstanding at end of period | 3,619 | 3,147 | N/A | N/A | ||||||||||||
| C Class Shares | ||||||||||||||||
| Sold | 8,348 | 16,377 | N/A | N/A | ||||||||||||
| Issued in reinvestment of dividends to shareholders | 2,722 | 93 | N/A | N/A | ||||||||||||
| Redeemed | (113 | ) | (5,098 | ) | N/A | N/A | ||||||||||
| Net increase in shares outstanding | 10,957 | 11,372 | N/A | N/A | ||||||||||||
| Shares outstanding at beginning of period | 15,024 | 3,652 | N/A | N/A | ||||||||||||
| Shares outstanding at end of period | 25,981 | 15,024 | N/A | N/A | ||||||||||||
| Ultra Shares | ||||||||||||||||
| Sold | 280,549 | 1,694,949 | N/A | N/A | ||||||||||||
| Issued in reinvestment of dividends to shareholders | 1,176,119 | 320,452 | N/A | N/A | ||||||||||||
| Redeemed | (2,740,782 | ) | (5,128,481 | ) | N/A | N/A | ||||||||||
| Net decrease in shares outstanding | (1,284,114 | ) | (3,113,080 | ) | N/A | N/A | ||||||||||
| Shares outstanding at beginning of period | 8,532,370 | 11,645,450 | N/A | N/A | ||||||||||||
| Shares outstanding at end of period | 7,248,256 | 8,532,370 | N/A | N/A | ||||||||||||
Amounts designated as “—” are $0 or rounded to $0.
N/A — Not Applicable
The accompanying notes are an integral part of the financial statements.
62
| WESTWOOD FUNDS |
| FINANCIAL HIGHLIGHTS |
| SELECTED PER SHARE DATA & RATIOS |
| FOR A SHARE OUTSTANDING THROUGHOUT THE YEAR OR PERIOD |
| Net realized | ||||||||||||||||||||||||
| Net asset value, | and unrealized | Total from | Dividends from | Distributions | ||||||||||||||||||||
| beginning of | Net investment | gains (losses) on | investment | net investment | from net realized | |||||||||||||||||||
| period | income (a) | investments | operations | income | capital gains | |||||||||||||||||||
| Westwood Quality Value Fund (1) | ||||||||||||||||||||||||
| Institutional Shares | ||||||||||||||||||||||||
| Six months ended April 30, 2023 (Unaudited) | $ | 12.52 | 0.09 | 0.26 | 0.35 | (0.19 | ) | — | ||||||||||||||||
| Year Ended October 31, 2022 | $ | 15.46 | 0.18 | (0.74 | ) | (0.56 | ) | (0.10 | ) | (2.28 | ) | |||||||||||||
| Year Ended October 31, 2021 | $ | 11.80 | 0.13 | 4.28 | 4.41 | (0.17 | ) | (0.58 | ) | |||||||||||||||
| Year Ended October 31, 2020 | $ | 13.16 | 0.20 | (0.95 | ) | (0.75 | ) | (0.21 | ) | (0.40 | ) | |||||||||||||
| Year Ended October 31, 2019 | $ | 13.07 | 0.22 | 1.21 | 1.43 | (0.19 | ) | (1.15 | ) | |||||||||||||||
| Year Ended October 31, 2018 | $ | 13.10 | 0.20 | 0.62 | 0.82 | (0.15 | ) | (0.70 | ) | |||||||||||||||
| A Class Shares | ||||||||||||||||||||||||
| Six months ended April 30, 2023 (Unaudited) | $ | 12.58 | 0.08 | 0.26 | 0.34 | (0.16 | ) | — | ||||||||||||||||
| Year Ended October 31, 2022 | $ | 15.53 | 0.15 | (0.75 | ) | (0.60 | ) | (0.07 | ) | (2.28 | ) | |||||||||||||
| Year Ended October 31, 2021 | $ | 11.84 | 0.08 | 4.31 | 4.39 | (0.12 | ) | (0.58 | ) | |||||||||||||||
| Year Ended October 31, 2020 | $ | 13.20 | 0.18 | (0.96 | ) | (0.78 | ) | (0.18 | ) | (0.40 | ) | |||||||||||||
| Year Ended October 31, 2019 | $ | 13.12 | 0.19 | 1.21 | 1.40 | (0.17 | ) | (1.15 | ) | |||||||||||||||
| Year Ended October 31, 2018 | $ | 13.15 | 0.17 | 0.62 | 0.79 | (0.12 | ) | (0.70 | ) | |||||||||||||||
| C Class Shares | ||||||||||||||||||||||||
| Six months ended April 30, 2023 (Unaudited) | $ | 12.28 | 0.03 | 0.26 | 0.29 | (0.11 | ) | — | ||||||||||||||||
| Year Ended October 31, 2022 | $ | 15.33 | 0.06 | (0.74 | ) | (0.68 | ) | (0.09 | ) | (2.28 | ) | |||||||||||||
| Year Ended October 31, 2021 | $ | 11.80 | 0.01 | 4.27 | 4.28 | (0.17 | ) | (0.58 | ) | |||||||||||||||
| Period Ended October 31, 2020(g) | $ | 10.17 | 0.16 | 1.47 | 1.63 | — | — | |||||||||||||||||
| Ultra Shares | ||||||||||||||||||||||||
| Period ended April 30, 2023 (Unaudited)(i) | $ | 13.30 | 0.08 | (0.50 | ) | (0.42 | ) | (0.19 | ) | — | ||||||||||||||
| Westwood Quality MidCap Fund | ||||||||||||||||||||||||
| Institutional Shares | ||||||||||||||||||||||||
| Six months ended April 30, 2023 (Unaudited) | $ | 9.64 | 0.07 | 0.30 | 0.37 | (0.14 | ) | — | ||||||||||||||||
| Period Ended October 31, 2022(j) | $ | 10.00 | 0.11 | (0.47 | ) | (0.36 | ) | — | — | |||||||||||||||
| Westwood Quality SMidCap Fund (2) | ||||||||||||||||||||||||
| Institutional Shares | ||||||||||||||||||||||||
| Six months ended April 30, 2023 (Unaudited) | $ | 12.89 | 0.06 | 0.18 | 0.24 | (0.09 | ) | (0.10 | ) | |||||||||||||||
| Year Ended October 31, 2022 | $ | 16.62 | 0.08 | (1.45 | ) | (1.37 | ) | (0.11 | ) | (2.25 | ) | |||||||||||||
| Year Ended October 31, 2021 | $ | 11.97 | 0.15 | 4.89 | 5.04 | (0.13 | ) | (0.26 | ) | |||||||||||||||
| Year Ended October 31, 2020 | $ | 14.21 | 0.11 | (0.75 | ) | (0.64 | ) | (0.11 | ) | (1.49 | ) | |||||||||||||
| Year Ended October 31, 2019 | $ | 15.50 | 0.10 | 0.84 | 0.94 | (0.11 | ) | (2.12 | ) | |||||||||||||||
| Year Ended October 31, 2018 | $ | 17.44 | 0.08 | (0.11 | ) | (0.03 | ) | (0.04 | ) | (1.87 | ) | |||||||||||||
| Ultra Shares | ||||||||||||||||||||||||
| Six months ended April 30, 2023 (Unaudited) | $ | 12.90 | 0.07 | 0.17 | 0.24 | (0.11 | ) | (0.10 | ) | |||||||||||||||
| Year Ended October 31, 2022 | $ | 16.62 | 0.11 | (1.44 | ) | (1.33 | ) | (0.14 | ) | (2.25 | ) | |||||||||||||
| Year Ended October 31, 2021 | $ | 11.96 | 0.16 | 4.91 | 5.07 | (0.15 | ) | (0.26 | ) | |||||||||||||||
| Period Ended October 31, 2020(l) | $ | 11.44 | — | 0.52 | 0.52 | — | — | |||||||||||||||||
Amounts designated as “—” are either $0.00 or have been rounded to $0.00.
| (a) | Per share net income has been determined on the basis of average number of shares outstanding during the period. |
| (b) | Total return is a measure of the change in value of an investment in the Fund over the period covered. The returns shown do not reflect the deduction of taxes a shareholder would pay on Fund distributions, if any or the redemption of Fund shares. The total returns would be lower if the Adviser had not reduced investment management fees and/or reimbursed expenses (Note 4). |
| (c) | Ratio was determined after investment management fee reductions and/or reimbursed expenses (Note 4). |
| (d) | Portfolio turnover rate is calculated on the basis of the Fund as a whole without distinguishing between classes of shares issued. |
| (e) | Not annualized. |
| (f) | Annualized. |
The accompanying notes are an integral part of the financial statements.
63
| WESTWOOD FUNDS |
| FINANCIAL HIGHLIGHTS |
| SELECTED PER SHARE DATA & RATIOS |
| FOR A SHARE OUTSTANDING THROUGHOUT THE YEAR OR PERIOD |
| Ratio of total net | Ratio of total gross | Ratio of net | ||||||||||||||||||||||||||||
| Total | Net asset value, | Net assets, | expenses to average | expenses to average | investment income to | Portfolio | ||||||||||||||||||||||||
| distributions | end of period | Total return (b) | end of period (000’s) | net assets (c) | net assets | average net assets (c) | turnover rate (d) | |||||||||||||||||||||||
| (0.19 | ) | $ | 12.68 | 2.81 | % (e) | $ | 250,549 | 0.65 | % (f) | 0.71 | % (f) | 1.42 | % (f) | 40 | % (e) | |||||||||||||||
| (2.38 | ) | $ | 12.52 | (4.37 | )% | $ | 249,760 | 0.65 | % | 0.69 | % | 1.38 | % | 77 | % | |||||||||||||||
| (0.75 | ) | $ | 15.46 | 38.80 | % | $ | 206,730 | 0.65 | % | 0.76 | % | 0.91 | % | 72 | % | |||||||||||||||
| (0.61 | ) | $ | 11.80 | (6.11 | )% | $ | 172,349 | 0.65 | % | 0.77 | % | 1.66 | % | 52 | % | |||||||||||||||
| (1.34 | ) | $ | 13.16 | 13.23 | % | $ | 224,664 | 0.65 | % | 0.73 | % | 1.80 | % | 36 | % | |||||||||||||||
| (0.85 | ) | $ | 13.07 | 6.30 | % | $ | 213,175 | 0.65 | % | 0.72 | % | 1.50 | % | 49 | % | |||||||||||||||
| (0.16 | ) | $ | 12.76 | 2.71 | % (e) | $ | 1,310 | 0.82 | % (f) | 0.88 | % (f) | 1.29 | % (f) | 40 | % (e) | |||||||||||||||
| (2.35 | ) | $ | 12.58 | (4.64 | )% | $ | 1,402 | 0.90 | % | 0.94 | % | 1.15 | % | 77 | % | |||||||||||||||
| (0.70 | ) | $ | 15.53 | 38.46 | % | $ | 858 | 0.90 | % | 1.01 | % | 0.58 | % | 72 | % | |||||||||||||||
| (0.58 | ) | $ | 11.84 | (6.32 | )% | $ | 2,143 | 0.90 | % | 1.00 | % | 1.43 | % | 52 | % | |||||||||||||||
| (1.32 | ) | $ | 13.20 | 12.92 | % | $ | 13,174 | 0.90 | % | 0.98 | % | 1.54 | % | 36 | % | |||||||||||||||
| (0.82 | ) | $ | 13.12 | 6.02 | % | $ | 13,183 | 0.90 | % | 0.97 | % | 1.25 | % | 49 | % | |||||||||||||||
| (0.11 | ) | $ | 12.46 | 2.37 | % (e) | $ | 138 | 1.56 | % (f) | 1.62 | % (f) | 0.48 | % (f) | 40 | % (e) | |||||||||||||||
| (2.37 | ) | $ | 12.28 | (5.36 | )% | $ | 98 | 1.65 | % | 1.68 | % | 0.46 | % | 77 | % | |||||||||||||||
| (0.75 | ) | $ | 15.33 | 37.62 | % | $ | — | 1.48 | % | 1.48 | % | 0.08 | % | 72 | % | |||||||||||||||
| — | $ | 11.80 | 16.03 | % (e) | $ | — | 0.00 | % (f)(h) | 0.00 | % (f)(h) | 2.29 | % (f) | 52 | % (e) | ||||||||||||||||
| (0.19 | ) | $ | 12.69 | (3.13 | )% (e) | $ | 1 | 0.40 | % (f) | 0.40 | % (f) | 1.48 | % (f) | 40 | % (e) | |||||||||||||||
| (0.14 | ) | $ | 9.87 | 3.81 | % (e) | $ | 574 | 0.58 | % (f) | 9.72 | % (f) | 1.51 | % (f) | 48 | % (e) | |||||||||||||||
| — | $ | 9.64 | (3.60 | )% (e) | $ | 530 | 0.58 | % (f)(k) | 20.06 | % (f) | 1.21 | % (f) | 96 | % (e) | ||||||||||||||||
| (0.19 | ) | $ | 12.94 | 1.89 | % (e) | $ | 169,016 | 0.88 | % (f) | 1.04 | % (f) | 0.92 | % (f) | 45 | % (e) | |||||||||||||||
| (2.36 | ) | $ | 12.89 | (9.64 | )% | $ | 201,586 | 0.87 | % | 1.02 | % | 0.62 | % | 104 | % | |||||||||||||||
| (0.39 | ) | $ | 16.62 | 42.85 | % | $ | 237,479 | 0.88 | % | 1.10 | % | 0.99 | % | 106 | % | |||||||||||||||
| (1.60 | ) | $ | 11.97 | (5.39 | )% | $ | 164,350 | 0.88 | % | 1.05 | % | 0.90 | % | 69 | % | |||||||||||||||
| (2.23 | ) | $ | 14.21 | 9.46 | % | $ | 187,341 | 0.88 | % | 1.02 | % | 0.75 | % | 56 | % | |||||||||||||||
| (1.91 | ) | $ | 15.50 | (0.33 | )% | $ | 315,140 | 0.88 | % | 1.03 | % | 0.50 | % | 58 | % | |||||||||||||||
| (0.21 | ) | $ | 12.93 | 1.93 | % (e) | $ | 120,815 | 0.68 | % (f) | 0.84 | % (f) | 1.07 | % (f) | 45 | % (e) | |||||||||||||||
| (2.39 | ) | $ | 12.90 | (9.41 | )% | $ | 88,909 | 0.68 | % | 0.83 | % | 0.80 | % | 104 | % | |||||||||||||||
| (0.41 | ) | $ | 16.62 | 43.19 | % | $ | 100,933 | 0.68 | % | 0.90 | % | 1.00 | % | 106 | % | |||||||||||||||
| — | $ | 11.96 | 4.55 | % (e) | $ | 2,072 | 0.70 | % (f) | 1.02 | % (f) | 0.08 | % (f) | 69 | % (e) | ||||||||||||||||
| (g) | Represents the period from the commencement of operations (March 31, 2020) through October 31, 2020. |
| (h) | The ratio rounds to 0.00% due to the impact of the low level of average net assets. The share class is expected to run at the expense limit of 1.65% (1.73% excluding waivers) when assets are contributed. |
| (i) | Represents the period from the commencement of operations (November 30, 2022) through April 30, 2023. |
| (j) | Represents the period from the commencement of operations (November 30, 2021) through October 31, 2022. |
| (k) | Includes federal excise taxes of 0.01% of average net assets with respect to the period ending October 31, 2022. |
| (l) | Represents the period from the commencement of operations (July 31, 2020) through October 31, 2020. |
| (1) | Effective March 1, 2021, Westwood LargeCap Fund was renamed as Westwood Quality Value Fund. |
| (2) | Effective March 1, 2021, Westwood SMIDCap Fund was renamed as Westwood Quality SMIDCap Fund. |
The accompanying notes are an integral part of the financial statements.
64
| WESTWOOD FUNDS |
| FINANCIAL HIGHLIGHTS |
| SELECTED PER SHARE DATA & RATIOS |
| FOR A SHARE OUTSTANDING THROUGHOUT THE YEAR OR PERIOD |
| Net realized | ||||||||||||||||||||||||
| Net asset value, | and unrealized | Total from | Dividends from | Distributions | ||||||||||||||||||||
| beginning of | Net investment | gains (losses) on | investment | net investment | from net realized | |||||||||||||||||||
| period | income (loss) (a) | investments | operations | income | capital gains | |||||||||||||||||||
| Westwood Quality SmallCap Fund (1) | ||||||||||||||||||||||||
| Institutional Shares | ||||||||||||||||||||||||
| Six months ended April 30, 2023 (Unaudited) | $ | 18.88 | 0.17 | (0.11 | ) | 0.06 | (0.19 | ) | (0.48 | ) | ||||||||||||||
| Year Ended October 31, 2022 | $ | 21.99 | 0.18 | (2.28 | ) | (2.10 | ) | (0.20 | ) | (0.81 | ) | |||||||||||||
| Year Ended October 31, 2021 | $ | 14.46 | 0.18 | 7.47 | 7.65 | (0.12 | ) | — | ||||||||||||||||
| Year Ended October 31, 2020 | $ | 16.97 | 0.12 | (2.45 | ) | (2.33 | ) | (0.12 | ) | (0.06 | ) | |||||||||||||
| Year Ended October 31, 2019 | $ | 16.76 | 0.11 | 1.10 | 1.21 | (0.12 | ) | (0.88 | ) | |||||||||||||||
| Year Ended October 31, 2018 | $ | 18.39 | 0.10 | (0.47 | ) | (0.37 | ) | (0.07 | ) | (1.19 | ) | |||||||||||||
| A Class Shares | ||||||||||||||||||||||||
| Six months ended April 30, 2023 (Unaudited) | $ | 18.84 | 0.15 | (0.10 | ) | 0.05 | (0.20 | ) | (0.48 | ) | ||||||||||||||
| Year Ended October 31, 2022 | $ | 21.94 | 0.16 | (2.27 | ) | (2.11 | ) | (0.18 | ) | (0.81 | ) | |||||||||||||
| Year Ended October 31, 2021 | $ | 14.44 | 0.16 | 7.45 | 7.61 | (0.11 | ) | — | ||||||||||||||||
| Year Ended October 31, 2020 | $ | 16.99 | 0.08 | (2.43 | ) | (2.35 | ) | (0.14 | ) | (0.06 | ) | |||||||||||||
| Period Ended October 31, 2019(g) | $ | 15.78 | (0.02 | ) | 1.23 | 1.21 | — | — | ||||||||||||||||
| C Class Shares | ||||||||||||||||||||||||
| Six months ended April 30, 2023 (Unaudited) | $ | 18.62 | 0.08 | (0.11 | ) | (0.03 | ) | (0.02 | ) | (0.48 | ) | |||||||||||||
| Year Ended October 31, 2022 | $ | 21.75 | 0.01 | (2.25 | ) | (2.24 | ) | (0.08 | ) | (0.81 | ) | |||||||||||||
| Year Ended October 31, 2021 | $ | 14.34 | (0.01 | ) | 7.44 | 7.43 | (0.02 | ) | — | |||||||||||||||
| Year Ended October 31, 2020 | $ | 16.98 | (0.01 | ) | (2.45 | ) | (2.46 | ) | (0.12 | ) | (0.06 | ) | ||||||||||||
| Period Ended October 31, 2019(g) | $ | 15.78 | (0.04 | ) | (1.24 | ) | 1.20 | — | — | |||||||||||||||
| Ultra Shares | ||||||||||||||||||||||||
| Six months ended April 30, 2023 (Unaudited) | $ | 18.91 | 0.18 | (0.12 | ) | 0.06 | (0.21 | ) | (0.48 | ) | ||||||||||||||
| Year Ended October 31, 2022 | $ | 22.01 | 0.21 | (2.28 | ) | (2.07 | ) | (0.22 | ) | (0.81 | ) | |||||||||||||
| Year Ended October 31, 2021 | $ | 14.47 | 0.20 | 7.48 | 7.68 | (0.14 | ) | — | ||||||||||||||||
| Period Ended October 31, 2020(h) | $ | 11.72 | 0.05 | 2.70 | 2.75 | — | — | |||||||||||||||||
| Westwood Quality AllCap Fund | ||||||||||||||||||||||||
| Institutional Shares | ||||||||||||||||||||||||
| Six months ended April 30, 2023 (Unaudited) | $ | 10.03 | 0.08 | 0.50 | 0.58 | (0.17 | ) | — | ||||||||||||||||
| Year Ended October 31, 2022 | $ | 10.59 | 0.16 | (0.67 | ) | (0.51 | ) | (0.03 | ) | (0.02 | ) | |||||||||||||
| Period Ended October 31, 2021(i) | $ | 10.00 | — | 0.59 | 0.59 | — | — | |||||||||||||||||
| Ultra Shares | ||||||||||||||||||||||||
| Six months ended April 30, 2023 (Unaudited) | $ | 10.03 | 0.09 | 0.49 | 0.58 | (0.17 | ) | — | ||||||||||||||||
| Year Ended October 31, 2022 | $ | 10.59 | 0.16 | (0.67 | ) | (0.51 | ) | (0.03 | ) | (0.02 | ) | |||||||||||||
| Period Ended October 31, 2021(i) | $ | 10.00 | — | 0.59 | 0.59 | — | — | |||||||||||||||||
Amounts designated as “—” are either $0.00 or have been rounded to $0.00.
| (a) | Per share net income (loss) has been determined on the basis of average number of shares outstanding during the period. |
| (b) | Total return is a measure of the change in value of an investment in the Fund over the period covered. The returns shown do not reflect the deduction of taxes a shareholder would pay on Fund distributions, if any or the redemption of Fund shares. The total returns would be lower if the Adviser had not reduced investment management fees and/or reimbursed expenses (Note 4). |
| (c) | Ratio was determined after investment management fee reductions and/or reimbursed expenses (Note 4). |
| (d) | Portfolio turnover rate is calculated on the basis of the Fund as a whole without distinguishing between classes of shares issued. |
| (e) | Not annualized. |
| (f) | Annualized. |
| (g) | Represents the period from the commencement of operations (September 3, 2019) through October 31, 2019. |
| (h) | Represents the period from the commencement of operations (March 31, 2020) through October 31, 2020. |
| (i) | Represents the period from the commencement of operations (September 30, 2021) through October 31, 2021. |
| (1) | Effective March 1, 2021, Westwood SmallCap Fund was renamed as Westwood Quality SmallCap Fund. |
The accompanying notes are an integral part of the financial statements.
65
| WESTWOOD FUNDS |
| FINANCIAL HIGHLIGHTS |
| SELECTED PER SHARE DATA & RATIOS |
| FOR A SHARE OUTSTANDING THROUGHOUT THE YEAR OR PERIOD |
| Ratio of net | ||||||||||||||||||||||||||||||
| Ratio of total net | Ratio of total gross | investment income | ||||||||||||||||||||||||||||
| Total | Net asset value, | Net assets, | expenses to average | expenses to average | (loss) to average net | Portfolio | ||||||||||||||||||||||||
| distributions | end of period | Total return (b) | end of period (000’s) | net assets (c) | net assets | assets (c) | turnover rate (d) | |||||||||||||||||||||||
| (0.67 | ) | $ | 18.27 | 0.23 | % (e) | $ | 466,368 | 0.89 | % (f) | 1.03 | % (f) | 1.81 | % (f) | 30 | % (e) | |||||||||||||||
| (1.01 | ) | $ | 18.88 | (10.08 | )% | $ | 476,094 | 0.92 | % | 1.04 | % | 0.94 | % | 60 | % | |||||||||||||||
| (0.12 | ) | $ | 21.99 | 53.07 | % | $ | 586,435 | 0.92 | % | 1.09 | % | 0.90 | % | 58 | % | |||||||||||||||
| (0.18 | ) | $ | 14.46 | (13.90 | )% | $ | 357,901 | 0.99 | % | 1.16 | % | 0.81 | % | 67 | % | |||||||||||||||
| (1.00 | ) | $ | 16.97 | 8.65 | % | $ | 418,949 | 0.99 | % | 1.11 | % | 0.66 | % | 64 | % | |||||||||||||||
| (1.26 | ) | $ | 16.76 | (2.28 | )% | $ | 341,713 | 0.99 | % | 1.08 | % | 0.58 | % | 50 | % | |||||||||||||||
| �� | ||||||||||||||||||||||||||||||
| (0.68 | ) | $ | 18.21 | 0.18 | % (e) | $ | 2,040 | 1.04 | % (f) | 1.18 | % (f) | 1.60 | % (f) | 30 | % (e) | |||||||||||||||
| (0.99 | ) | $ | 18.84 | (10.15 | )% | $ | 1,556 | 1.04 | % | 1.16 | % | 0.81 | % | 60 | % | |||||||||||||||
| (0.11 | ) | $ | 21.94 | 52.90 | % | $ | 1,470 | 1.04 | % | 1.22 | % | 0.77 | % | 58 | % | |||||||||||||||
| (0.20 | ) | $ | 14.44 | (14.04 | )% | $ | 881 | 1.09 | % | 1.28 | % | 0.55 | % | 67 | % | |||||||||||||||
| — | $ | 16.99 | 7.67 | % (e) | $ | 96 | 1.08 | % (f) | 1.30 | % (f) | (0.90 | )% (f) | 64 | % (e) | ||||||||||||||||
| (0.50 | ) | $ | 18.09 | (0.23 | )% (e) | $ | 668 | 1.79 | % (f) | 1.93 | % (f) | 0.91 | % (f) | 30 | % (e) | |||||||||||||||
| (0.89 | ) | $ | 18.62 | (10.84 | )% | $ | 708 | 1.79 | % | 1.91 | % | 0.07 | % | 60 | % | |||||||||||||||
| (0.02 | ) | $ | 21.75 | 51.81 | % | $ | 849 | 1.79 | % | 1.97 | % | (0.04 | )% | 58 | % | |||||||||||||||
| (0.18 | ) | $ | 14.34 | (14.67 | )% | $ | 186 | 1.84 | % | 2.02 | % | (0.08 | )% | 67 | % | |||||||||||||||
| — | $ | 16.98 | 7.60 | % (e) | $ | 51 | 1.79 | % (f) | 2.05 | % (f) | (1.67 | )% (f) | 64 | % (e) | ||||||||||||||||
| (0.69 | ) | $ | 18.28 | 0.27 | % (e) | $ | 595,049 | 0.79 | % (f) | 0.93 | % (f) | 1.87 | % (f) | 30 | % (e) | |||||||||||||||
| (1.03 | ) | $ | 18.91 | (9.91 | )% | $ | 511,179 | 0.79 | % | 0.91 | % | 1.07 | % | 60 | % | |||||||||||||||
| (0.14 | ) | $ | 22.01 | 53.29 | % | $ | 506,444 | 0.79 | % | 0.97 | % | 0.95 | % | 58 | % | |||||||||||||||
| — | $ | 14.47 | 23.46 | % (e) | $ | 151,903 | 0.81 | % (f) | 1.10 | % (f) | 0.63 | % (f) | 67 | % (e) | ||||||||||||||||
| (0.17 | ) | $ | 10.44 | 5.82 | % (e) | $ | 206 | 0.48 | % (f) | 0.94 | % (f) | 1.65 | % (f) | 50 | % (e) | |||||||||||||||
| (0.05 | ) | $ | 10.03 | (4.86 | )% | $ | 553 | 0.45 | % | 0.93 | % | 1.55 | % | 101 | % | |||||||||||||||
| — | $ | 10.59 | 5.90 | % (e) | $ | 529 | 0.65 | % (f) | 2.25 | % (f) | 0.22 | % (f) | 4 | % (e) | ||||||||||||||||
| (0.17 | ) | $ | 10.44 | 5.78 | % (e) | $ | 22,360 | 0.45 | % (f) | 0.89 | % (f) | 1.76 | % (f) | 50 | % (e) | |||||||||||||||
| (0.05 | ) | $ | 10.03 | (4.81 | )% | $ | 21,750 | 0.45 | % | 0.93 | % | 1.55 | % | 101 | % | |||||||||||||||
| — | $ | 10.59 | 5.90 | % (e) | $ | 21,715 | 0.45 | % (f) | 2.07 | % (f) | 0.44 | % (f) | 4 | % (e) | ||||||||||||||||
The accompanying notes are an integral part of the financial statements.
66
| WESTWOOD FUNDS |
| FINANCIAL HIGHLIGHTS |
| SELECTED PER SHARE DATA & RATIOS |
| FOR A SHARE OUTSTANDING THROUGHOUT THE YEAR OR PERIOD |
| Net realized | ||||||||||||||||||||||||
| Net asset value, | and unrealized | Total from | Dividends from | Distributions | ||||||||||||||||||||
| beginning of | Net investment | gains (losses) on | investment | net investment | from net realized | |||||||||||||||||||
| period | income (a) | investments | operations | income | capital gains | |||||||||||||||||||
| Westwood Total Return Fund (1) | ||||||||||||||||||||||||
| Institutional Shares | ||||||||||||||||||||||||
| Six months ended April 30, 2023 (Unaudited) | $ | 6.09 | 0.11 | 0.15 | 0.26 | (0.10 | ) | — | ||||||||||||||||
| Year Ended October 31, 2022 | $ | 7.65 | 0.17 | (1.10 | ) | (0.93 | ) | (0.16 | ) | (0.47 | ) | |||||||||||||
| Year Ended October 31, 2021 | $ | 6.43 | 0.13 | 1.41 | 1.54 | (0.13 | ) | (0.19 | ) | |||||||||||||||
| Year Ended October 31, 2020 | $ | 6.64 | 0.07 | 0.92 | 0.99 | (0.06 | ) | (1.14 | ) | |||||||||||||||
| Year Ended October 31, 2019 | $ | 10.46 | 0.12 | 0.53 | 0.65 | (0.36 | ) | (4.11 | ) | |||||||||||||||
| Year Ended October 31, 2018 | $ | 11.94 | 0.14 | 0.15 | 0.29 | (0.12 | ) | (1.65 | ) | |||||||||||||||
| A Class Shares | ||||||||||||||||||||||||
| Six months ended April 30, 2023 (Unaudited) | $ | 6.07 | 0.10 | 0.16 | 0.26 | (0.10 | ) | — | ||||||||||||||||
| Year Ended October 31, 2022 | $ | 7.64 | 0.14 | (1.09 | ) | (0.95 | ) | (0.15 | ) | (0.47 | ) | |||||||||||||
| Year Ended October 31, 2021 | $ | 6.43 | 0.11 | 1.40 | 1.51 | (0.11 | ) | (0.19 | ) | |||||||||||||||
| Period Ended October 31, 2020(g) | $ | 5.20 | 0.03 | 1.23 | 1.26 | (0.03 | ) | — | ||||||||||||||||
| C Class Shares | ||||||||||||||||||||||||
| Six months ended April 30, 2023 (Unaudited) | $ | 6.06 | 0.08 | 0.16 | 0.24 | (0.07 | ) | — | ||||||||||||||||
| Year Ended October 31, 2022 | $ | 7.63 | 0.11 | (1.11 | ) | (1.00 | ) | (0.10 | ) | (0.47 | ) | |||||||||||||
| Year Ended October 31, 2021 | $ | 6.43 | 0.02 | 1.44 | 1.46 | (0.07 | ) | (0.19 | ) | |||||||||||||||
| Period Ended October 31, 2020(g) | $ | 5.20 | 0.03 | 1.23 | 1.26 | (0.03 | ) | — | ||||||||||||||||
| Westwood Income Opportunity Fund | ||||||||||||||||||||||||
| Institutional Shares | ||||||||||||||||||||||||
| Six months ended April 30, 2023 (Unaudited) | $ | 10.59 | 0.19 | 0.52 | 0.71 | (0.21 | ) | — | ||||||||||||||||
| Year Ended October 31, 2022 | $ | 13.92 | 0.30 | (2.19 | ) | (1.89 | ) | (0.28 | ) | (1.16 | ) | |||||||||||||
| Year Ended October 31, 2021 | $ | 12.84 | 0.23 | 1.90 | 2.13 | (0.50 | ) | (0.55 | ) | |||||||||||||||
| Year Ended October 31, 2020 | $ | 15.89 | 0.22 | 0.34 | 0.56 | (0.20 | ) | (3.41 | ) | |||||||||||||||
| Year Ended October 31, 2019 | $ | 15.31 | 0.32 | 1.25 | 1.57 | (0.36 | ) | (0.63 | ) | |||||||||||||||
| Year Ended October 31, 2018 | $ | 15.72 | 0.28 | (0.11 | ) | 0.17 | (0.28 | ) | (0.30 | ) | ||||||||||||||
| A Class Shares | ||||||||||||||||||||||||
| Six months ended April 30, 2023 (Unaudited) | $ | 10.57 | 0.18 | 0.52 | 0.70 | (0.20 | ) | — | ||||||||||||||||
| Year Ended October 31, 2022 | $ | 13.90 | 0.27 | (2.19 | ) | (1.92 | ) | (0.25 | ) | (1.16 | ) | |||||||||||||
| Year Ended October 31, 2021 | $ | 12.83 | 0.20 | 1.88 | 2.08 | (0.46 | ) | (0.55 | ) | |||||||||||||||
| Year Ended October 31, 2020 | $ | 15.88 | 0.18 | 0.34 | 0.52 | (0.16 | ) | (3.41 | ) | |||||||||||||||
| Year Ended October 31, 2019 | $ | 15.30 | 0.28 | 1.25 | 1.53 | (0.32 | ) | (0.63 | ) | |||||||||||||||
| Year Ended October 31, 2018 | $ | 15.71 | 0.24 | (0.11 | ) | 0.13 | (0.24 | ) | (0.30 | ) | ||||||||||||||
| C Class Shares | ||||||||||||||||||||||||
| Six months ended April 30, 2023 (Unaudited) | $ | 10.53 | 0.14 | 0.51 | 0.65 | (0.16 | ) | — | ||||||||||||||||
| Year Ended October 31, 2022 | $ | 13.84 | 0.18 | (2.16 | ) | (1.98 | ) | (0.17 | ) | (1.16 | ) | |||||||||||||
| Year Ended October 31, 2021 | $ | 12.79 | 0.10 | 1.88 | 1.98 | (0.38 | ) | (0.55 | ) | |||||||||||||||
| Year Ended October 31, 2020 | $ | 15.88 | 0.06 | 0.36 | 0.42 | (0.10 | ) | (3.41 | ) | |||||||||||||||
| Period Ended October 31, 2019(h) | $ | 15.77 | 0.03 | 0.16 | 0.19 | (0.08 | ) | — | ||||||||||||||||
| Ultra Shares | ||||||||||||||||||||||||
| Period ended April 30, 2023 (Unaudited)(i) | $ | 11.12 | 0.16 | 0.01 | 0.17 | (0.21 | ) | — | ||||||||||||||||
Amounts designated as “—” are either $0.00 or have been rounded to $0.00.
| (a) | Per share net income has been determined on the basis of average number of shares outstanding during the period. |
| (b) | Total return is a measure of the change in value of an investment in the Fund over the period covered. The returns shown do not reflect the deduction of taxes a shareholder would pay on Fund distributions, if any or the redemption of Fund shares. The total returns would be lower if the Adviser had not reduced investment management fees and/or reimbursed expenses (Note 4). |
| (c) | Ratio was determined after investment management fee reductions and/or reimbursed expenses (Note 4). |
| (d) | Portfolio turnover rate is calculated on the basis of the Fund as a whole without distinguishing between classes of shares issued. |
The accompanying notes are an integral part of the financial statements.
67
| WESTWOOD FUNDS |
| FINANCIAL HIGHLIGHTS |
| SELECTED PER SHARE DATA & RATIOS |
| FOR A SHARE OUTSTANDING THROUGHOUT THE YEAR OR PERIOD |
| Ratio of total net | Ratio of total gross | Ratio of net | ||||||||||||||||||||||||||||
| Total | Net asset value, | Net assets, | expenses to average | expenses to average | investment income to | Portfolio | ||||||||||||||||||||||||
| distributions | end of period | Total return (b) | end of period (000’s) | net assets (c) | net assets | average net assets (c) | turnover rate (d) | |||||||||||||||||||||||
| (0.10 | ) | $ | 6.25 | 4.38 | % (e) | $ | 125,327 | 0.45 | % (f) | 0.55 | % (f) | 3.56 | % (f) | 22 | % (e) | |||||||||||||||
| (0.63 | ) | $ | 6.09 | (13.05 | )% | $ | 123,965 | 0.64 | % | 0.72 | % | 2.60 | % | 63 | % | |||||||||||||||
| (0.32 | ) | $ | 7.65 | 24.46 | % | $ | 143,710 | 0.35 | % | 0.51 | % | 1.79 | % | 66 | % | |||||||||||||||
| (1.20 | ) | $ | 6.43 | 17.59 | % | $ | 86,040 | 0.75 | % | 1.10 | % | 1.11 | % | 62 | % | |||||||||||||||
| (4.47 | ) | $ | 6.64 | 16.55 | % | $ | 4,722 | 0.75 | % | 2.13 | % | 1.76 | % | 66 | % | |||||||||||||||
| (1.77 | ) | $ | 10.46 | 2.35 | % | $ | 7,803 | 0.75 | % | 1.05 | % | 1.30 | % | 26 | % | |||||||||||||||
| (0.10 | ) | $ | 6.23 | 4.26 | % (e) | $ | 29 | 0.69 | % (f) | 0.79 | % (f) | 3.30 | % (f) | 22 | % (e) | |||||||||||||||
| (0.62 | ) | $ | 6.07 | (13.41 | )% | $ | 24 | 0.77 | % | 0.85 | % | 2.31 | % | 63 | % | |||||||||||||||
| (0.30 | ) | $ | 7.64 | 24.04 | % | $ | 4 | 0.64 | % | 0.78 | % | 1.47 | % | 66 | % | |||||||||||||||
| (0.03 | ) | $ | 6.43 | 24.30 | % (e) | $ | — | 0.01 | % (f) | 0.01 | % (f) | 0.90 | % (f) | 62 | % (e) | |||||||||||||||
| (0.07 | ) | $ | 6.23 | 3.92 | % (e) | $ | 57 | 1.44 | % (f) | 1.53 | % (f) | 2.64 | % (f) | 22 | % (e) | |||||||||||||||
| (0.57 | ) | $ | 6.06 | (14.10 | )% | $ | 55 | 1.63 | % | 1.71 | % | 1.70 | % | 63 | % | |||||||||||||||
| (0.26 | ) | $ | 7.63 | 23.13 | % | $ | 73 | 1.37 | % | 1.56 | % | 0.24 | % | 66 | % | |||||||||||||||
| (0.03 | ) | $ | 6.43 | 24.30 | % (e) | $ | — | 0.01 | % (f) | 0.01 | % (f) | 0.88 | % (f) | 62 | % (e) | |||||||||||||||
| (0.21 | ) | $ | 11.09 | 6.76 | % (e) | $ | 497,905 | 0.82 | % (f) | 0.83 | % (f) | 3.43 | % (f) | 25 | % (e) | |||||||||||||||
| (1.44 | ) | $ | 10.59 | (14.97 | )% | $ | 579,772 | 0.81 | % | 0.81 | % | 2.52 | % | 81 | % | |||||||||||||||
| (1.05 | ) | $ | 13.92 | 17.21 | % | $ | 814,633 | 0.85 | % | 0.86 | % | 1.68 | % | 82 | % | |||||||||||||||
| (3.61 | ) | $ | 12.84 | 4.59 | % | $ | 662,612 | 0.89 | % | 0.89 | % | 1.69 | % | 111 | % | |||||||||||||||
| (0.99 | ) | $ | 15.89 | 10.99 | % | $ | 1,056,504 | 0.85 | % | 0.85 | % | 2.08 | % | 66 | % | |||||||||||||||
| (0.58 | ) | $ | 15.31 | 1.04 | % | $ | 2,408,695 | 0.83 | % | 0.83 | % | 1.80 | % | 42 | % | |||||||||||||||
| (0.20 | ) | $ | 11.07 | 6.66 | % (e) | $ | 49,808 | 1.00 | % (f) | 1.01 | % (f) | 3.26 | % (f) | 25 | % (e) | |||||||||||||||
| (1.41 | ) | $ | 10.57 | (15.21 | )% | $ | 55,296 | 1.06 | % | 1.06 | % | 2.27 | % | 81 | % | |||||||||||||||
| (1.01 | ) | $ | 13.90 | 16.86 | % | $ | 62,614 | 1.10 | % | 1.11 | % | 1.44 | % | 82 | % | |||||||||||||||
| (3.57 | ) | $ | 12.83 | 4.34 | % | $ | 48,051 | 1.14 | % | 1.14 | % | 1.43 | % | 111 | % | |||||||||||||||
| (0.95 | ) | $ | 15.88 | 10.71 | % | $ | 64,450 | 1.10 | % | 1.10 | % | 1.86 | % | 66 | % | |||||||||||||||
| (0.54 | ) | $ | 15.30 | 0.78 | % | $ | 74,510 | 1.08 | % | 1.08 | % | 1.56 | % | 42 | % | |||||||||||||||
| (0.16 | ) | $ | 11.02 | 6.20 | % (e) | $ | 12,930 | 1.75 | % (f) | 1.76 | % (f) | 2.50 | % (f) | 25 | % (e) | |||||||||||||||
| (1.33 | ) | $ | 10.53 | (15.75 | )% | $ | 12,743 | 1.81 | % | 1.81 | % | 1.52 | % | 81 | % | |||||||||||||||
| (0.93 | ) | $ | 13.84 | 16.03 | % | $ | 13,323 | 1.85 | % | 1.86 | % | 0.70 | % | 82 | % | |||||||||||||||
| (3.51 | ) | $ | 12.79 | 3.52 | % | $ | 4,453 | 1.90 | % | 1.90 | % | 0.48 | % | 111 | % | |||||||||||||||
| (0.08 | ) | $ | 15.88 | 1.23 | % (e) | $ | 273 | 1.90 | % (f) | 1.90 | % (f) | 1.11 | % (f) | 66 | % (e) | |||||||||||||||
| (0.21 | ) | $ | 11.08 | 1.61 | % (e) | $ | 61,877 | 0.74 | % (f) | 0.74 | % (f) | 3.42 | % (f) | 25 | % (e) | |||||||||||||||
| (e) | Not annualized. |
| (f) | Annualized. |
| (g) | Represents the period from the commencement of operations (March 31, 2020) through October 31, 2020. |
| (h) | Represents the period from the commencement of operations (September 3, 2019) through October 31, 2019. |
| (i) | Represents the period from the commencement of operations (November 30, 2022) through April 30, 2023. |
| (1) | Effective November 1, 2021, Westwood Low Volatility Equity Fund was renamed as Westwood Total Return Fund. |
The accompanying notes are an integral part of the financial statements.
68
| WESTWOOD FUNDS |
| FINANCIAL HIGHLIGHTS |
| SELECTED PER SHARE DATA & RATIOS |
| FOR A SHARE OUTSTANDING THROUGHOUT THE YEAR OR PERIOD |
| Net realized | ||||||||||||||||||||||||
| Net asset value, | and unrealized | Total from | Dividends from | Distributions | ||||||||||||||||||||
| beginning of | Net investment | gains (losses) on | investment | net investment | from net realized | |||||||||||||||||||
| period | income (a) | investments | operations | income | capital gains | |||||||||||||||||||
| Westwood High Income Fund (1) | ||||||||||||||||||||||||
| Institutional Shares | ||||||||||||||||||||||||
| Six months ended April 30, 2023 (Unaudited) | $ | 8.95 | 0.26 | 0.27 | 0.53 | (0.26 | ) | — | ||||||||||||||||
| Year Ended October 31, 2022 | $ | 10.67 | 0.42 | (1.71 | ) | (1.29 | ) | (0.43 | ) | — | ||||||||||||||
| Year Ended October 31, 2021 | $ | 9.55 | 0.35 | 1.14 | 1.49 | (0.37 | ) | — | ||||||||||||||||
| Year Ended October 31, 2020 | $ | 9.25 | 0.35 | 0.29 | 0.64 | (0.34 | ) | — | ||||||||||||||||
| Year Ended October 31, 2019 | $ | 9.12 | 0.41 | 0.15 | 0.56 | (0.43 | ) | — | ||||||||||||||||
| Year Ended October 31, 2018 | $ | 9.37 | 0.42 | (0.24 | ) | 0.18 | (0.43 | ) | — | |||||||||||||||
| A Class Shares | ||||||||||||||||||||||||
| Six months ended April 30, 2023 (Unaudited) | $ | 9.00 | 0.26 | 0.26 | 0.52 | (0.25 | ) | — | ||||||||||||||||
| Year Ended October 31, 2022 | $ | 10.72 | 0.39 | (1.71 | ) | (1.32 | ) | (0.40 | ) | — | ||||||||||||||
| Year Ended October 31, 2021 | $ | 9.60 | 0.33 | 1.13 | 1.46 | (0.34 | ) | — | ||||||||||||||||
| Year Ended October 31, 2020 | $ | 9.29 | 0.34 | 0.29 | 0.63 | (0.32 | ) | — | ||||||||||||||||
| Year Ended October 31, 2019 | $ | 9.15 | 0.39 | 0.14 | 0.53 | (0.39 | ) | — | ||||||||||||||||
| Year Ended October 31, 2018 | $ | 9.37 | 0.40 | (0.23 | ) | 0.17 | (0.39 | ) | — | |||||||||||||||
| C Class Shares | ||||||||||||||||||||||||
| Six months ended April 30, 2023 (Unaudited) | $ | 9.01 | 0.22 | 0.27 | 0.49 | (0.21 | ) | — | ||||||||||||||||
| Year Ended October 31, 2022 | $ | 10.75 | 0.33 | (1.74 | ) | (1.41 | ) | (0.33 | ) | — | ||||||||||||||
| Year Ended October 31, 2021 | $ | 9.55 | 0.22 | 1.28 | 1.50 | (0.30 | ) | — | ||||||||||||||||
| Period Ended October 31, 2020(g) | $ | 8.23 | 0.24 | 1.28 | 1.52 | (0.20 | ) | — | ||||||||||||||||
Amounts designated as “—” are either $0.00 or have been rounded to $0.00.
| (a) | Per share net income has been determined on the basis of average number of shares outstanding during the period. |
| (b) | Total return is a measure of the change in value of an investment in the Fund over the period covered. The returns shown do not reflect the deduction of taxes a shareholder would pay on Fund distributions, if any or the redemption of Fund shares. The total returns would be lower if the Adviser had not reduced investment management fees and/or reimbursed expenses (Note 4). |
| (c) | Ratio was determined after investment management fee reductions and/or reimbursed expenses (Note 4). |
| (d) | Portfolio turnover rate is calculated on the basis of the Fund as a whole without distinguishing between classes of shares issued. |
| (e) | Not annualized. |
| (f) | Annualized. |
| (g) | Represents the period from the commencement of operations (March 31, 2020) through October 31, 2020. |
| (1) | Effective November 1, 2019, Westwood Short Duration High Yield Fund was renamed as Westwood High Income Fund. |
The accompanying notes are an integral part of the financial statements.
69
| WESTWOOD FUNDS |
| FINANCIAL HIGHLIGHTS |
| SELECTED PER SHARE DATA & RATIOS |
| FOR A SHARE OUTSTANDING THROUGHOUT THE YEAR OR PERIOD |
| Ratio of total net | Ratio of total gross | Ratio of net | ||||||||||||||||||||||||||||
| Total | Net asset value, | Net assets, | expenses to average | expenses to average | investment income to | Portfolio | ||||||||||||||||||||||||
| distributions | end of period | Total return (b) | end of period (000’s) | net assets (c) | net assets | average net assets (c) | turnover rate (d) | |||||||||||||||||||||||
| (0.26 | ) | $ | 9.22 | 5.96 | % (e) | $ | 100,950 | 0.20 | % (f) | 0.28 | % (f) | 5.75 | % (f) | 19 | % (e) | |||||||||||||||
| (0.43 | ) | $ | 8.95 | (12.38 | )% | $ | 96,636 | 0.80 | % | 0.87 | % | 4.31 | % | 62 | % | |||||||||||||||
| (0.37 | ) | $ | 10.67 | 15.69 | % | $ | 94,360 | 0.80 | % | 0.96 | % | 3.37 | % | 67 | % | |||||||||||||||
| (0.34 | ) | $ | 9.55 | 7.14 | % | $ | 72,914 | 0.27 | % | 0.59 | % | 3.78 | % | 130 | % | |||||||||||||||
| (0.43 | ) | $ | 9.25 | 6.25 | % | $ | 65,168 | 0.80 | % | 1.05 | % | 4.48 | % | 59 | % | |||||||||||||||
| (0.43 | ) | $ | 9.12 | 1.92 | % | $ | 64,926 | 0.80 | % | 1.02 | % | 4.57 | % | 37 | % | |||||||||||||||
| (0.25 | ) | $ | 9.27 | 5.82 | % (e) | $ | 7,313 | 0.40 | % (f) | 0.48 | % (f) | 5.55 | % (f) | 19 | % (e) | |||||||||||||||
| (0.40 | ) | $ | 9.00 | (12.54 | )% | $ | 2,321 | 1.15 | % | 1.22 | % | 3.95 | % | 62 | % | |||||||||||||||
| (0.34 | ) | $ | 10.72 | 15.34 | % | $ | 1,623 | 1.05 | % | 1.21 | % | 3.05 | % | 67 | % | |||||||||||||||
| (0.32 | ) | $ | 9.60 | 7.01 | % | $ | 320 | 0.48 | % | 0.82 | % | 3.61 | % | 130 | % | |||||||||||||||
| (0.39 | ) | $ | 9.29 | 5.93 | % | $ | 46 | 1.05 | % | 1.26 | % | 4.26 | % | 59 | % | |||||||||||||||
| (0.39 | ) | $ | 9.15 | 1.91 | % | $ | 31 | 1.05 | % | 1.26 | % | 4.26 | % | 37 | % | |||||||||||||||
| (0.21 | ) | $ | 9.29 | 5.52 | % (e) | $ | 207 | 1.16 | % (f) | 1.24 | % (f) | 4.78 | % (f) | 19 | % (e) | |||||||||||||||
| (0.33 | ) | $ | 9.01 | (13.32 | )% | $ | 201 | 1.83 | % | 1.90 | % | 3.31 | % | 62 | % | |||||||||||||||
| (0.30 | ) | $ | 10.75 | 15.77 | % | $ | 104 | 1.80 | % | 1.98 | % | 2.03 | % | 67 | % | |||||||||||||||
| (0.20 | ) | $ | 9.55 | 18.51 | % (e) | $ | — | 0.02 | % (f) | 0.03 | % (f) | 4.46 | % (f) | 130 | % (e) | |||||||||||||||
The accompanying notes are an integral part of the financial statements.
70
| WESTWOOD FUNDS |
| FINANCIAL HIGHLIGHTS |
| SELECTED PER SHARE DATA & RATIOS |
| FOR A SHARE OUTSTANDING THROUGHOUT THE YEAR OR PERIOD |
| Net realized | ||||||||||||||||||||||||||||
| Net asset value, | and unrealized | Total from | Dividends from | Distributions | ||||||||||||||||||||||||
| beginning of | Net investment | gains (losses) on | investment | net investment | from net realized | |||||||||||||||||||||||
| period | income (a) | investments | operations | income | capital gains | Return of capital | ||||||||||||||||||||||
| Westwood Alternative Income Fund (1) | ||||||||||||||||||||||||||||
| Institutional Shares | ||||||||||||||||||||||||||||
| Six months ended April 30, 2023 (Unaudited) | $ | 10.39 | 0.12 | 0.23 | 0.35 | (1.49 | ) | — | — | |||||||||||||||||||
| Year Ended October 31, 2022 | $ | 11.02 | 0.20 | (0.51 | ) | (0.31 | ) | (0.17 | ) | (0.15 | ) | — | ||||||||||||||||
| Year Ended October 31, 2021 | $ | 10.47 | 0.16 | 0.49 | 0.65 | (0.10 | ) | — | — | |||||||||||||||||||
| Year Ended October 31, 2020 | $ | 10.25 | 0.18 | 0.46 | 0.64 | (0.10 | ) | (0.32 | ) | — | ||||||||||||||||||
| Year Ended October 31, 2019 | $ | 9.82 | 0.23 | 0.41 | 0.64 | (0.21 | ) | — | — | |||||||||||||||||||
| Year Ended October 31, 2018 | $ | 10.12 | 0.18 | (0.29 | ) | (0.11 | ) | (0.16 | ) | — | (0.03 | ) | ||||||||||||||||
| A Class Shares | ||||||||||||||||||||||||||||
| Six months ended April 30, 2023 (Unaudited) | $ | 10.39 | 0.11 | 0.22 | 0.33 | (1.48 | ) | — | — | |||||||||||||||||||
| Year Ended October 31, 2022 | $ | 11.00 | 0.18 | (0.49 | ) | (0.31 | ) | (0.15 | ) | (0.15 | ) | — | ||||||||||||||||
| Year Ended October 31, 2021 | $ | 10.46 | 0.14 | 0.48 | 0.62 | (0.08 | ) | — | — | |||||||||||||||||||
| Period Ended October 31, 2020(g) | $ | 9.78 | 0.10 | 0.62 | 0.72 | (0.04 | ) | — | — | |||||||||||||||||||
| C Class Shares | ||||||||||||||||||||||||||||
| Six months ended April 30, 2023 (Unaudited) | $ | 10.40 | 0.08 | 0.22 | 0.30 | (1.45 | ) | — | — | |||||||||||||||||||
| Year Ended October 31, 2022 | $ | 11.01 | 0.13 | (0.52 | ) | (0.39 | ) | (0.07 | ) | (0.15 | ) | — | ||||||||||||||||
| Year Ended October 31, 2021 | $ | 10.46 | 0.06 | 0.50 | 0.56 | (0.01 | ) | — | — | |||||||||||||||||||
| Period Ended October 31, 2020(g) | $ | 9.78 | 0.05 | 0.65 | 0.70 | (0.02 | ) | — | — | |||||||||||||||||||
| Ultra Shares | ||||||||||||||||||||||||||||
| Six months ended April 30, 2023 (Unaudited) | $ | 10.40 | 0.13 | 0.22 | 0.35 | (1.50 | ) | — | — | |||||||||||||||||||
| Year Ended October 31, 2022 | $ | 11.02 | 0.20 | (0.49 | ) | (0.29 | ) | (0.18 | ) | (0.15 | ) | — | ||||||||||||||||
| Year Ended October 31, 2021 | $ | 10.47 | 0.17 | 0.48 | 0.65 | (0.10 | ) | — | — | |||||||||||||||||||
| Year Ended October 31, 2020 | $ | 10.25 | 0.19 | 0.46 | 0.65 | (0.11 | ) | (0.32 | ) | — | ||||||||||||||||||
| Year Ended October 31, 2019 | $ | 9.82 | 0.24 | 0.41 | 0.65 | (0.22 | ) | — | — | |||||||||||||||||||
| Year Ended October 31, 2018 | $ | 10.13 | 0.19 | (0.29 | ) | (0.10 | ) | (0.18 | ) | — | (0.03 | ) | ||||||||||||||||
| Westwood SmallCap Growth Fund | ||||||||||||||||||||||||||||
| Institutional Shares | ||||||||||||||||||||||||||||
| Six months ended April 30, 2023 (Unaudited) | $ | 8.12 | 0.05 | (0.50 | ) | (0.45 | ) | (0.04 | ) | — | — | |||||||||||||||||
| Year Ended October 31, 2022 | $ | 10.26 | 0.03 | (2.14 | ) | (2.11 | ) | (0.01 | ) | (0.02 | ) | — | ||||||||||||||||
| Period Ended October 31, 2021(j) | $ | 10.00 | — | 0.26 | 0.26 | — | — | — | ||||||||||||||||||||
Amounts designated as “—” are either $0.00 or have been rounded to $0.00.
| (a) | Per share net income has been determined on the basis of average number of shares outstanding during the period. |
| (b) | Total return is a measure of the change in value of an investment in the Fund over the period covered. The returns shown do not reflect the deduction of taxes a shareholder would pay on Fund distributions, if any or the redemption of Fund shares. The total returns would be lower if the Adviser had not reduced investment management fees and/or reimbursed expenses (Note 4). |
| (c) | Ratio was determined after investment management fee reductions and/or reimbursed expenses (Note 4). |
| (d) | Portfolio turnover rate is calculated on the basis of the Fund as a whole without distinguishing between classes of shares issued. |
| (e) | Not annualized. |
| (f) | Annualized. |
| (g) | Represents the period from the commencement of operations (March 31, 2020) through October 31, 2020. |
| (h) | Excluding stock loan fees, and dividends on securities sold short, the ratio of expenses to average net assets would have been 1.12% and 1.05% for Institutional Shares and Ultra Shares, respectively. |
| (i) | Excluding stock loan fees, and dividends on securities sold short, the ratio of expenses to average net assets would have been 1.15% and 1.05% for Institutional Shares and Ultra Shares, respectively |
| (j) | Represents the period from the commencement of operations (September 30, 2021) through October 31, 2021. |
| (1) | Effective November 1, 2019, Westwood Market Neutral Income Fund was renamed as Westwood Alternative Income Fund. |
The accompanying notes are an integral part of the financial statements.
71
| WESTWOOD FUNDS |
| FINANCIAL HIGHLIGHTS |
| SELECTED PER SHARE DATA & RATIOS |
| FOR A SHARE OUTSTANDING THROUGHOUT THE YEAR OR PERIOD |
| Ratio of total net | Ratio of total gross | Ratio of net | ||||||||||||||||||||||||||||
| Total | Net asset value, | Net assets, | expenses to average | expenses to average | investment income to | Portfolio | ||||||||||||||||||||||||
| distributions | end of period | Total return (b) | end of period (000’s) | net assets (c) | net assets | average net assets (c) | turnover rate (d) | |||||||||||||||||||||||
| (1.49 | ) | $ | 9.25 | 3.66 | % (e) | $ | 66,227 | 0.55 | % (f) | 0.80 | % (f) | 2.55 | % (f) | 43 | % (e) | |||||||||||||||
| (0.32 | ) | $ | 10.39 | (2.88 | )% | $ | 67,312 | 0.30 | % | 0.44 | % | 1.91 | % | 128 | % | |||||||||||||||
| (0.10 | ) | $ | 11.02 | 6.19 | % | $ | 53,734 | 0.96 | % | 1.21 | % | 1.45 | % | 125 | % | |||||||||||||||
| (0.42 | ) | $ | 10.47 | 6.44 | % | $ | 22,772 | 0.90 | % | 1.40 | % | 1.79 | % | 137 | % | |||||||||||||||
| (0.21 | ) | $ | 10.25 | 6.57 | % | $ | 7,121 | 1.15 | % (h) | 1.47 | % | 2.33 | % | 106 | % | |||||||||||||||
| (0.19 | ) | $ | 9.82 | (1.09 | )% | $ | 6,193 | 1.22 | % (i) | 1.62 | % | 1.85 | % | 88 | % | |||||||||||||||
| (1.48 | ) | $ | 9.24 | 3.49 | % (e) | $ | 33 | 0.71 | % (f) | 0.95 | % (f) | 2.38 | % (f) | 43 | % (e) | |||||||||||||||
| (0.30 | ) | $ | 10.39 | (2.88 | )% | $ | 33 | 0.45 | % | 0.59 | % | 1.69 | % | 128 | % | |||||||||||||||
| (0.08 | ) | $ | 11.00 | 5.97 | % | $ | 68 | 1.11 | % | 1.38 | % | 1.32 | % | 125 | % | |||||||||||||||
| (0.04 | ) | $ | 10.46 | 7.35 | % (e) | $ | 28 | 1.15 | % (f) | 1.67 | % (f) | 1.61 | % (f) | 137 | % (e) | |||||||||||||||
| (1.45 | ) | $ | 9.25 | 3.14 | % (e) | $ | 240 | 1.45 | % (f) | 1.72 | % (f) | 1.65 | % (f) | 43 | % (e) | |||||||||||||||
| (0.22 | ) | $ | 10.40 | (3.59 | )% | $ | 156 | 1.20 | % | 1.34 | % | 1.24 | % | 128 | % | |||||||||||||||
| (0.01 | ) | $ | 11.01 | 5.93 | % | $ | 40 | 1.83 | % | 2.13 | % | 0.56 | % | 125 | % | |||||||||||||||
| (0.02 | ) | $ | 10.46 | 7.21 | % (e) | $ | 149 | 2.10 | % (f) | 2.62 | % (f) | 0.85 | % (f) | 137 | % | |||||||||||||||
| (1.50 | ) | $ | 9.25 | 3.61 | % (e) | $ | 67,055 | 0.44 | % (f) | 0.69 | % (f) | 2.64 | % (f) | 43 | % (e) | |||||||||||||||
| (0.33 | ) | $ | 10.40 | (2.69 | )% | $ | 88,734 | 0.20 | % | 0.34 | % | 1.95 | % | 128 | % | |||||||||||||||
| (0.10 | ) | $ | 11.02 | 6.26 | % | $ | 128,329 | 0.85 | % | 1.12 | % | 1.53 | % | 125 | % | |||||||||||||||
| (0.43 | ) | $ | 10.47 | 6.54 | % | $ | 86,386 | 0.87 | % | 1.40 | % | 1.86 | % | 137 | % | |||||||||||||||
| (0.22 | ) | $ | 10.25 | 6.64 | % | $ | 31,553 | 1.08 | % (h) | 1.39 | % | 2.39 | % | 106 | % | |||||||||||||||
| (0.21 | ) | $ | 9.82 | (1.02 | )% | $ | 27,312 | 1.12 | % (i) | 1.52 | % | 1.96 | % | 88 | % | |||||||||||||||
| (0.04 | ) | $ | 7.63 | (5.51 | )% (e) | $ | 22,687 | 0.56 | % (f) | 1.00 | % (f) | 1.16 | % (f) | 280 | % (e) | |||||||||||||||
| (0.03 | ) | $ | 8.12 | (20.61 | )% | $ | 22,208 | 0.56 | % | 1.37 | % | 0.39 | % | 860 | % | |||||||||||||||
| — | $ | 10.26 | 2.60 | % (e) | $ | 1,026 | 0.75 | % (f) | 27.56 | % (f) | 0.02 | % (f) | 3 | % (e) | ||||||||||||||||
The accompanying notes are an integral part of the financial statements.
72
WESTWOOD FUNDS
| NOTES TO FINANCIAL STATEMENTS (Unaudited) |
1. Organization
Westwood Quality Value Fund (“Value Fund”), Westwood Quality MidCap Fund (“MidCap Fund”), Westwood Quality SMidCap Fund (“SMidCap Fund”), Westwood Quality SmallCap Fund (“SmallCap Fund”), Westwood Quality AllCap Fund (“AllCap Fund”), Westwood Total Return Fund (“Total Return Fund”), Westwood Income Opportunity Fund (“Income Opportunity Fund”), Westwood High Income Fund (“High Income Fund”), Westwood Alternative Income Fund (“Alternative Income Fund”) and Westwood SmallCap Growth Fund (“SmallCap Growth Fund”), (individually, a “Fund” and collectively, the “Funds”) are each a series of Ultimus Managers Trust (the “Trust”), an open-end investment company established as an Ohio business trust under a Declaration of Trust dated February 28, 2012. The Trust is registered under the Investment Company Act of 1940, as amended, (the “1940 Act”).
The Value, SMidCap, SmallCap, Total Return, Income Opportunity, High Income and Alternative Income Funds (“Predecessor Funds”) were formerly part of The Advisors’ Inner Circle Fund and were acquired by, and reorganized into, the Trust on November 1, 2021, pursuant to an Agreement and Plan of Reorganization dated August 9, 2021. The AllCap and SmallCap Growth Funds commenced operations on September 30, 2021 and MidCap Fund commenced operations on November 30, 2021. Each Fund is classified as a diversified fund.
The investment objective of the Value, MidCap, SMidCap, SmallCap and AllCap Funds is to seek long-term capital appreciation.
The investment objective of Total Return Fund is to seek to provide total return, through a combination of current income and capital appreciation.
The investment objective of Income Opportunity Fund is to provide current income with a secondary investment objective to provide the opportunity for long-term capital appreciation.
The investment objective of High Income Fund is to seek to maximize total return through a high level of current income and capital appreciation.
The investment objective of Alternative Income Fund is to seek to provide absolute returns through a combination of current income and capital appreciation with low correlation to equity and fixed income markets.
The investment objective of SmallCap Growth Fund is to seek to achieve long-term capital growth.
As of April 30, 2023, all of the Funds offer Institutional Shares (sold without any sales loads, but subject to an administrative services plan fee of up to 0.20% of the average daily net assets attributable to Institutional Shares (for all Funds except Value, Total Return and Income Opportunity Funds), requiring a $100,000 minimum investment and offered exclusively to certain retirement plans established for the benefit of employees of the Westwood Management Corporation (the “Adviser”) or its affiliates; defined benefit retirement plans, endowments or foundations; banks and trust companies or law firms acting as trustee or manager for trust accounts; investors who purchase through asset-based fee programs available through financial intermediaries; and insurance companies).
The Value, SmallCap, Total Return, Income Opportunity, High Income and Alternative Income Funds offer A Class Shares (sold with a maximum sales charge of 3.00% (except for SmallCap Fund, which has a maximum sales charge of 4.00%) and a 12b-1 services plan fee up to 0.25% of the average daily net assets attributable to A Class Shares), requiring a $1,000 minimum investment. A Class Shares purchases of $250,000 or more may be subject to a contingent deferred sales charge (“CDSC”) of 1.00% if redeemed within 18 months of purchase (except for SmallCap Fund, in which purchases of $1,000,000 or more may be subject to a 1.00% CDSC fee if redeemed within 18 months of purchase.)
73
WESTWOOD FUNDS
The Value, SmallCap, Total Return, Income Opportunity, High Income and Alternative Income Funds offer C Class Shares (sold without any sales loads, but subject to a 12b-1 services plan fee of up to 1.00% of the average daily net assets attributable to C Class Shares for each Fund), requiring a $1,000 minimum investment. C Class Shares may be subject to a CDSC fee of 1.00% if redeemed within 12 months of purchase. C Class Shares automatically convert to A Class Shares after being held for 10 years.
The Value, SMidCap, SmallCap, AllCap, Income Opportunity, and Alternative Income Funds offer Ultra Shares (sold without any sales loads and distribution and/or administrative services fees, requiring a $20,000,000 initial investment and offered exclusively to employer retirement plans; health savings accounts under section 223 of the Internal Revenue Code of 1986, as amended, if such accounts are maintained by the Fund at an omnibus level; endowments and foundations and local, city and state agencies; unaffiliated registered investment companies; collective investment trusts; banks and trust companies or law firms acting as trustee or manager for trust accounts; and insurance companies).
Each share class of a Fund represents an ownership interest in the same investment portfolio of the Fund.
2. Significant Accounting Policies
The following is a summary of the Funds’ significant accounting policies. The policies are in conformity with accounting principles generally accepted in the United States of America (“GAAP”). The Funds follow accounting and reporting guidance under Financial Accounting Standards Board (“FASB”) Accounting Standards Codification Topic 946, “Financial Services – Investment Companies.”
Regulatory Updates – In March 2020, FASB issued Accounting Standards Update 2020-04, Reference Rate Reform: Facilitation of the Effects of Reference Rate Reform on Financial Reporting (“ASU 2020-04”), in January 2021, the FASB issued Accounting Standards Update 2021-01, Reference Rate Reform (Topic 848): Scope (“ASU 2021-01”), and in December 2022, the FASB issued Accounting Standards Update ASU 2022-06, Reference Rate Reform (Topic 848): Deferral of the Sunset Date of Topic 848 (“ASU 2022-06”), which provides optional, temporary relief with respect to the financial reporting of contracts subject to certain types of modifications due to the planned discontinuation of the London Interbank Offered Rate (“LIBOR”) and other interbank offered rates as of the end of 2021. The temporary relief provided by ASU 2020-04, ASU 2021-01, and ASU 2022-06 are effective for certain reference rate-related contract modifications that occur during the period from March 12, 2020 through December 31, 2024. Management is evaluating the impact of ASU 2020-04, ASU 2021-01, and ASU 2022-06 on the Funds’ investments, derivatives, debt, and other contracts that will undergo reference rate elated modifications as a result of the reference rate reform. Management is also currently actively working with other financial institutions and counterparties to modify contracts as required by applicable regulation and within the regulatory deadlines.
The Securities and Exchange Commission (the “SEC”) adopted Rule 18f-4 under the 1940 Act, which applies to the funds’ use of derivative investments and certain financing transactions. Among other things, Rule 18f-4 requires certain funds that invest in derivative instruments beyond a specified limited amount (generally greater than 10% of a fund’s net assets), such as the Alternative Income Fund, to apply a value-at-risk based limit to their use of certain derivative instruments and financing transactions and to adopt and implement a derivatives risk management program. To the extent a fund uses derivative instruments (excluding certain currency and interest rate hedging transactions) in a limited amount (up to 10% of the fund’s net assets), it will not be subject to the full requirements of Rule 18f-4.
Securities valuation – Each Fund values its portfolio securities at market value as of the close of regular trading on the New York Stock Exchange (the “NYSE”) (normally 4:00 p.m. Eastern time) on each business day the NYSE is open for business. The Funds value their listed securities on the basis of the security’s last sale price on the security’s primary exchange, if available, otherwise at the exchange’s most recently quoted mean price. NASDAQ-listed securities are valued at the NASDAQ Official Closing Price. Investments representing shares of other open-end
74
WESTWOOD FUNDS
investment companies, other than exchange-traded funds (“ETFs”), if any, but including money market funds, are valued at their net asset value (“NAV”) as reported by such companies. Option contracts are valued at the closing price on the exchange on which they are primarily traded; if no closing price is available at the time of valuation, the option will be valued at the mean of the closing bid and ask prices for that day. Future contracts are valued at the final settlement price, or, if a settled price is not available, at the last sale price as of the close of regular trading on the primary exchange on which they are traded. When using a quoted price and when the market is considered active, these securities will be classified as Level 1 within the fair value hierarchy (see below). Fixed income securities are generally valued using prices provided by an independent pricing service approved by the Board of Trustees of the Trust (the “Board”). The independent pricing service uses information with respect to transactions in bonds, quotations from bond dealers, market transactions in comparable securities, and various relationships between securities in determining these prices. Total return swaps are valued as the change in the value of the underlying security plus/minus the accrued income payment based on LIBOR or some other form of indices on the notional amount. In the event that market quotations are not readily available or are considered unreliable due to market or other events, the Funds value their securities and other assets at fair value as determined by the Adviser, as the Fund’s valuation designee, in accordance with procedures adopted by the Board pursuant to Rule 2a-5 under the 1940 Act. Under these procedures, the securities will be classified as Level 2 or 3 within the fair value hierarchy, depending on the inputs used. Unavailable or unreliable market quotes may be due to the following factors: a substantial bid-ask spread; infrequent sales resulting in stale prices; insufficient trading volume; small trade sizes; a temporary lapse in any reliable pricing source; and actions of the securities or futures markets, such as the suspension or limitation of trading. As a result, the prices of securities used to calculate each Fund’s NAV may differ from quoted or published prices for the same securities. Securities traded on foreign exchanges, if any, are fair valued by an independent pricing service and translated from the local currency into U.S. dollars using currency exchange rates supplied by an independent pricing service.
GAAP establishes a single authoritative definition of fair value, sets out a framework for measuring fair value, and requires additional disclosures about fair value measurements.
Various inputs are used in determining the value of each Fund’s investments. These inputs are summarized in the three broad levels listed below:
| ● | Level 1 – quoted prices in active markets for identical securities |
| ● | Level 2 – other significant observable inputs |
| ● | Level 3 – significant unobservable inputs |
Fixed income securities held by the Funds are classified as Level 2 since values are based on prices provided by an independent pricing service that utilizes various “other significant observable inputs” including bid and ask quotations, prices of similar securities, and interest rates, among other factors.
The inputs or methods used for valuing securities are not necessarily an indication of the risks associated with investing in those securities. The inputs used to measure fair value may fall into different levels of the fair value hierarchy. In such cases, for disclosure purposes, the level in the fair value hierarchy within which the fair value measurement falls in its entirety is determined based on the lowest level input that is significant to the fair value measurement.
75
WESTWOOD FUNDS
The following is a summary of each Fund’s investments and the inputs used to value the investments as of April 30, 2023:
| Westwood Quality Value Fund | Level 1 | Level 2 | Level 3 | Total | ||||||||||||
| Common Stocks | $ | 246,705,248 | $ | — | $ | — | $ | 246,705,248 | ||||||||
| Money Market Funds | 4,678,135 | — | — | 4,678,135 | ||||||||||||
| Total Investment Securities | $ | 251,383,383 | $ | — | $ | — | $ | 251,383,383 | ||||||||
| Westwood Quality MidCap Fund | Level 1 | Level 2 | Level 3 | Total | ||||||||||||
| Common Stocks | $ | 570,891 | $ | — | $ | — | $ | 570,891 | ||||||||
| Money Market Funds | 8,237 | — | — | 8,237 | ||||||||||||
| Total Investment Securities | $ | 579,128 | $ | — | $ | — | $ | 579,128 | ||||||||
| Westwood Quality SMIDCap Fund | ||||||||||||||||
| Common Stocks | $ | 288,085,809 | $ | — | $ | — | $ | 288,085,809 | ||||||||
| Money Market Funds | 1,427,442 | — | — | 1,427,442 | ||||||||||||
| Total Investment Securities | $ | 289,513,251 | $ | — | $ | — | $ | 289,513,251 | ||||||||
| Westwood Quality SmallCap Fund | ||||||||||||||||
| Common Stocks | $ | 1,029,731,974 | $ | — | $ | — | $ | 1,029,731,974 | ||||||||
| Money Market Funds | 18,931,699 | — | — | 18,931,699 | ||||||||||||
| Total Investment Securities | $ | 1,048,663,673 | $ | — | $ | — | $ | 1,048,663,673 | ||||||||
| Westwood Quality AllCap Fund | ||||||||||||||||
| Common Stocks | $ | 22,189,436 | $ | — | $ | — | $ | 22,189,436 | ||||||||
| Money Market Funds | 269,693 | — | — | 269,693 | ||||||||||||
| Total Investment Securities | $ | 22,459,129 | $ | — | $ | — | $ | 22,459,129 | ||||||||
| Westwood Total Return Fund | ||||||||||||||||
| U.S. Government & Agencies | $ | — | $ | 9,364,857 | $ | — | $ | 9,364,857 | ||||||||
| Convertible Bonds | — | 3,910,973 | — | 3,910,973 | ||||||||||||
| Corporate Bonds | — | 43,123,969 | — | 43,123,969 | ||||||||||||
| Foreign Governments | — | 1,706,232 | — | 1,706,232 | ||||||||||||
| Common Stocks | 58,379,720 | — | — | 58,379,720 | ||||||||||||
| Exchange-Traded Funds | 1,383,719 | — | — | 1,383,719 | ||||||||||||
| Preferred Stocks | 5,638,004 | — | — | 5,638,004 | ||||||||||||
| Money Market Funds | 1,458,179 | — | — | 1,458,179 | ||||||||||||
| Total Investment Securities | $ | 66,859,622 | $ | 58,106,031 | $ | — | $ | 124,965,653 | ||||||||
76
WESTWOOD FUNDS
| Westwood Income Opportunity Fund | Level 1 | Level 2 | Level 3 | Total | ||||||||||||
| U.S. Government & Agencies | $ | — | $ | 45,807,591 | $ | — | $ | 45,807,591 | ||||||||
| Convertible Bonds | — | 16,311,428 | — | 16,311,428 | ||||||||||||
| Corporate Bonds | — | 298,111,020 | — | 298,111,020 | ||||||||||||
| Foreign Governments | — | 8,262,133 | — | 8,262,133 | ||||||||||||
| Common Stocks | 200,764,921 | — | — | 200,764,921 | ||||||||||||
| Exchange-Traded Funds | 13,116,160 | — | — | 13,116,160 | ||||||||||||
| Preferred Stocks | 36,218,761 | — | — | 36,218,761 | ||||||||||||
| Money Market Funds | 267,048 | — | — | 267,048 | ||||||||||||
| Total Investment Securities | $ | 250,366,890 | $ | 368,492,172 | $ | — | $ | 618,859,062 | ||||||||
| Westwood High Income Fund | ||||||||||||||||
| U.S. Government & Agencies | $ | — | $ | 5,075,362 | $ | — | $ | 5,075,362 | ||||||||
| Convertible Bonds | — | 1,211,621 | — | 1,211,621 | ||||||||||||
| Corporate Bonds | — | 77,427,257 | — | 77,427,257 | ||||||||||||
| Foreign Governments | — | 630,365 | — | 630,365 | ||||||||||||
| Common Stocks | 20,495,080 | — | — | 20,495,080 | ||||||||||||
| Exchange-Traded Funds | 1,257,714 | — | — | 1,257,714 | ||||||||||||
| Preferred Stocks | 541,520 | — | — | 541,520 | ||||||||||||
| Money Market Funds | 188,941 | — | — | 188,941 | ||||||||||||
| Total Investment Securities | $ | 22,483,255 | $ | 84,344,605 | $ | — | $ | 106,827,860 | ||||||||
| Westwood Alternative Income Fund | ||||||||||||||||
| Convertible Bonds | $ | — | $ | 91,047,143 | $ | — | $ | 91,047,143 | ||||||||
| Corporate Bonds | — | 38,216,871 | — | 38,216,871 | ||||||||||||
| Foreign Governments | — | 206,430 | — | 206,430 | ||||||||||||
| Purchased Option Contracts | — | 99,410 | — | 99,410 | ||||||||||||
| Money Market Funds | 2,430,995 | — | — | 2,430,995 | ||||||||||||
| Total Investment Securities | $ | 2,430,995 | $ | 129,569,854 | $ | — | $ | 132,000,849 | ||||||||
| Other Financial Instruments** | ||||||||||||||||
| Total Return Swaps at value (assets) | $ | — | $ | 1,236,813 | $ | — | $ | 1,236,813 | ||||||||
| Total Return Swaps at value (liabilities) | — | (509,096 | ) | — | (509,096 | ) | ||||||||||
| Total Investments | $ | 2,430,995 | $ | 130,297,571 | $ | — | $ | 132,728,566 | ||||||||
77
WESTWOOD FUNDS
| Westwood SmallCap Growth Fund | Level 1 | Level 2 | Level 3 | Total | ||||||||||||
| Common Stocks | $ | 22,339,477 | $ | — | $ | — | $ | 22,339,477 | ||||||||
| Money Market Funds | 320,267 | — | — | 320,267 | ||||||||||||
| Total Investment Securities | $ | 22,659,744 | $ | — | $ | — | $ | 22,659,744 | ||||||||
Amounts designated as “—” are $0 or have been rounded to $0.
| ** | Other financial instruments are derivative instruments not reflected in the Schedule of Investments such as total return swap contracts. These instruments are valued at the unrealized appreciation (depreciation) on the instrument. |
The Funds did not hold any derivative instruments or any assets or liabilities that were measured at fair value on a recurring basis using significant unobservable inputs (Level 3) as of or during six months ended April 30, 2023.
Share valuation – The NAV per share of each class of each Fund is calculated daily by dividing the total value of the assets attributable to that class, less liabilities attributable to that class, by the number of shares outstanding of that class. The offering price and redemption price per share of each class of each Fund is equal to the NAV per share of such class except for A Class Shares. A Class Shares have a front-end sales charge, which is deducted from your purchased price when you buy your shares.
Investment income – Dividend income is recorded on the ex-dividend date. Non-cash dividends included in dividend income, if any, are recorded at the fair value of the security received. Interest income is accrued as earned. Withholding taxes on foreign dividends, if any, have been recorded in accordance with the Funds’ understanding of the applicable country’s tax rules and rates. The Funds may invest in real estate investment trusts (“REITs”) that pay distributions to their shareholders based on available funds from operations. It is common for these distributions to exceed the REIT’s taxable earnings and profits resulting in the excess portion of such distribution to be designated as return of capital. Distributions received from REITs are generally recorded as dividend income and, if necessary, are reclassified annually in accordance with tax information provided by the underlying REITs. Discounts and premiums on fixed income securities, if any, are amortized using the interest method.
Investment transactions – Investment transactions are accounted for on the trade date. Realized gains and losses on investments sold are determined on a specific identification basis.
Allocation between Classes – Investment income earned, realized capital gains and losses, and unrealized appreciation and depreciation are allocated daily to each Class of a Fund based upon its proportionate share of total net assets of that Fund. Class-specific expenses are charged directly to the Class incurring the expense. Common expenses which are not attributable to a specific Class are allocated daily to each Class of shares of a Fund based upon its proportionate share of total net assets of that Fund. Distribution fees are class specific expenses.
Common expenses – Common expenses of the Trust are allocated among the Funds and the other series of the Trust based on the relative net assets of each series, the number of series in the Trust, or the nature of the services performed and the relative applicability to each series.
Futures contracts – A Fund may use futures contracts for tactical hedging purposes as well as to enhance a Fund’s returns. A futures contract represents a commitment for the future purchase or sale of an asset at a specified price on a specified date. When a Fund purchases or sells a futures contract, no price is paid to or received by a Fund. Instead, a Fund is required to deposit in a segregated asset account an amount of cash or qualifying securities. This is called the “initial margin deposit.” Subsequent payments, known as “variation margin,” are made or received by a Fund each day, depending on the daily fluctuations in the fair value of the underlying asset. A Fund recognizes an unrealized gain or loss equal to the daily valuation margin. If market conditions move unexpectedly, a Fund may not achieve
78
WESTWOOD FUNDS
the anticipated benefits of the futures contracts and may realize a loss. The margin deposits for futures contracts and the variation receivable/payable are reported on the Statements of Assets and Liabilities.
Options written/purchased – The Funds may utilize longer maturity options for stock replacement when and as price and volatility relationships become more favorable for options versus underlying stocks or for tax and liquidity management purposes. The Funds are authorized to write (sell) and purchase put and call options. The risk in writing a call option is that the Funds give up the opportunity to profit if the market price of the security increases. The risk in writing a put option is that the Funds may incur a loss if the market price of the security decreases and the option is exercised. The risk in purchasing an option is that the Funds pay a premium whether or not the option is exercised. The Funds also have the additional risk of being unable to enter into a closing transaction at an acceptable price if a liquid secondary market does not exist. Option contracts also involve the risk that they may not work as intended due to unanticipated developments in market conditions or other causes.
Swap contracts – The Funds are authorized to enter into swap contracts for the purposes of managing the Funds’ interest rate duration, yield curve exposure and yield spread sensitivity. Swaps are a two-party contract in which the seller (buyer) will pay to the buyer (seller) the difference between the current value of a security and its value at the time the contract was entered. Interest rate swaps involve the exchange by a Fund with another party of their respective commitment to pay or receive interest (e.g., an exchange of floating rate payments for fixed rate payments) with respect to a notional amount of principal. Swap contracts are privately negotiated in the over-the-counter market (“OTC Swaps”) or may be executed in a multilateral or other trade facility platform, such as a registered commodities exchange (“Centrally Cleared Swaps”).
Total return swaps allow an investor to benefit from the cash flow without ever actually owning the underlying security. The receiver must pay any decline in value to the payer at the end of the total return swaps. However, the investor does not need to make a payment if there is no decline in price. Payments can be made on various indices, bonds (i.e. mortgage backed securities, bank debt and corporate), loans or commodities. The value of a total return swap is equal to the change in value of the underlying asset versus the accrued income payment based on LIBOR or some other form of indices on the notional amount. Payments received or made are recorded as realized gains or loss. A Fund could be exposed to credit or market risk due to unfavorable changes in the fluctuation of interest rates or if the counterparty defaults on its obligation to perform. Risk of loss may exceed amounts recognized on the Statements of Assets and Liabilities. Interest rate and Total Return swap contracts outstanding at period end, if any, are listed after a Fund’s portfolio. In connection with swap agreements, securities may be set aside as collateral by a Fund’s custodian.
Periodic payments made or received are recorded as realized gains or losses. The Statements of Assets and Liabilities reflect, if any, unrealized appreciation or depreciation and accrued periodic payments for swap contracts the Funds may have open.
Entering into swap contracts involve, to varying degrees, elements of credit, interest rate and market risk in excess of the amounts recognized on the Statements of Assets and Liabilities. Such risks involve the possibility that there will be no liquid market for these contracts, that the counterparty to the contract may default on its obligation to perform and that there may be unfavorable changes in market conditions or fluctuations in interest rates. Swaps outstanding at year end, if any, are listed on the Schedules of Investments. Refer to each Fund’s Schedule of Investments for details regarding open swap contracts, if applicable.
There is the risk that the counterparty refuses to continue to enter into swap agreements with the Funds in the future, or requires increased fees, which could impair the Funds’ ability to achieve their investment objective. A counterparty may also increase its collateral requirements, which may limit the Fund’s ability to use leverage and reduce investment returns. In addition, if the Funds cannot locate a counterparty willing to enter into transactions with the Funds, they will not be able to implement their investment strategy.
79
WESTWOOD FUNDS
Foreign currency translation – Securities and other assets and liabilities denominated in or expected to settle in foreign currencies are translated into U.S. dollars based on exchange rates on the following basis:
| A. | The fair values of investment securities and other assets and liabilities are translated as of the close of the NYSE each day. |
| B. | Purchases and sales of investment securities and income and expenses are translated at the rate of exchange prevailing as of 4:00 p.m. Eastern Time on the respective date of such transactions. |
| C. | The Funds do not isolate that portion of the results of operations caused by changes in foreign exchange rates on investments from those caused by changes in market prices of securities held. Such fluctuations are included with the net realized and unrealized gains or losses on investments. |
Reported net realized foreign exchange gains or losses arise from 1) purchases and sales of foreign currencies, 2) currency gains or losses realized between the trade and settlement dates on securities transactions and 3) the difference between the amounts of dividends and foreign withholding taxes recorded on a Fund’s books and the U.S. dollar equivalent of the amounts actually received or paid. Reported net unrealized foreign exchange gains and losses arise from changes in the value of assets and liabilities other than investments in securities that result from changes in exchange rates.
The Funds may be subject to foreign taxes related to foreign income received, capital gain on the sale of securities and certain foreign currency transactions (a portion of which may be reclaimable). All foreign taxes are recorded in accordance with the applicable regulations and rates that exist in the foreign jurisdictions in which a Fund invests.
Forward foreign currency contracts – The Funds may enter into forward foreign currency contracts to offset the exposure to foreign currency. All foreign currency contracts are “marked- to-market” daily at the applicable translation rates, resulting in unrealized gains or losses. Realized and unrealized gains or losses from transactions in foreign contracts, if any, will be included on the Funds’ Statements of Operations. Risks associated with these contracts include the potential inability of counterparties to meet the terms of their contracts and unanticipated movements in the value of a foreign currency relative to the U.S. dollar.
Estimates – The preparation of financial statements in conformity with GAAP requires management to make estimates and assumptions that affect the reported amounts of assets and liabilities and disclosure of contingent assets and liabilities as of the date of the financial statements and the reported amounts of increase (decrease) in net assets from operations during the reporting period. Actual results could differ from those estimates.
Redemption fees – In an effort to discourage short-term trading and defray costs incurred by shareholders as a result of short-term trading, the Alternative Income Fund charges a 1.00% redemption fee on redemptions (including exchanges) of shares that have been held for less than 30 days. The redemption fee is deducted from the Fund’s sale proceeds and cannot be paid separately, and any proceeds of the fee are credited to the assets of the Fund from which the redemption was made. The fee does not apply to shares purchased with reinvested dividends or distributions. Redemption fees collected, if any, are shown on the Statements of Changes in Net Assets.
Distributions to shareholders – Value, MidCap, SMidCap, SmallCap, AllCap and SmallCap Growth Funds distribute to shareholders any net investment income dividends and net realized capital gains distributions, if any, at least once each year. Total Return, Income Opportunity and Alternative Income Funds distribute to shareholders any net investment income dividends quarterly and net realized capital gains distributions, if any, at least once each year. High Income Fund distributes to shareholders any net investment income dividends monthly and net realized capital gains distributions, if any, at least once each year. The amount of such dividends and distributions are determined in accordance with federal income tax regulations, which may differ from GAAP. Dividends and distributions to
80
WESTWOOD FUNDS
shareholders are recorded on the ex-dividend date. The character of dividends paid to shareholders of the Funds for federal income tax purposes during the periods ended April 30, 2023 and October 31, 2022 was as follows:
| Ordinary | Long-Term | Total | ||||||||||
| Period Ended | Income | Capital Gains | Distributions | |||||||||
| Value Fund | ||||||||||||
| April 30, 2023 | $ | 3,785,863 | $ | — | $ | 3,785,863 | ||||||
| October 31, 2022 | $ | 8,370,856 | $ | 31,247,826 | $ | 39,618,682 | ||||||
| MidCap Fund | ||||||||||||
| April 30, 2023 | $ | 7,423 | $ | — | $ | 7,423 | ||||||
| October 31, 2022* | $ | — | $ | — | $ | — | ||||||
| SMidCap Fund | ||||||||||||
| April 30, 2023 | $ | 2,178,453 | $ | 2,304,618 | $ | 4,483,071 | ||||||
| October 31, 2022 | $ | 19,737,893 | $ | 29,174,952 | $ | 48,912,845 | ||||||
| SmallCap Fund | ||||||||||||
| April 30, 2023 | $ | 17,615,343 | $ | 19,713,674 | $ | 37,329,017 | ||||||
| October 31, 2022 | $ | 36,264,336 | $ | 14,953,770 | $ | 51,218,106 | ||||||
| AllCap Fund | ||||||||||||
| April 30, 2023 | $ | 366,179 | $ | — | $ | 366,179 | ||||||
| October 31, 2022 | $ | 115,427 | $ | — | $ | 115,427 | ||||||
| Total Return Fund | ||||||||||||
| April 30, 2023 | $ | 2,113,042 | $ | — | $ | 2,113,042 | ||||||
| October 31, 2022 | $ | 7,513,372 | $ | 4,521,206 | $ | 12,034,578 | ||||||
| Income Opportunity Fund | ||||||||||||
| April 30, 2023 | $ | 11,880,036 | $ | — | $ | 11,880,036 | ||||||
| October 31, 2022 | $ | 50,444,398 | $ | 40,005,156 | $ | 90,449,554 | ||||||
| High Income Fund | ||||||||||||
| April 30, 2023 | $ | 2,938,232 | $ | — | $ | 2,938,232 | ||||||
| October 31, 2022 | $ | 4,426,584 | $ | — | $ | 4,426,584 | ||||||
| Alternative Income Fund | ||||||||||||
| April 30, 2023 | $ | 20,137,804 | $ | — | $ | 20,137,804 | ||||||
| October 31, 2022 | $ | 4,611,634 | $ | 465,370 | $ | 5,077,004 | ||||||
| SmallCap Growth Fund | ||||||||||||
| April 30, 2023 | $ | 119,172 | $ | — | $ | 119,172 | ||||||
| October 31, 2022 | $ | 14,715 | $ | — | $ | 14,715 | ||||||
| * | Represents the period from the commencement of operations (November 30, 2021) through October 31, 2022. |
Federal income tax – Each Fund has qualified and intends to continue to qualify as a regulated investment company under the Internal Revenue Code of 1986, as amended (the “Code”). Qualification generally will relieve the Funds of liability for federal income taxes to the extent 100% of their net investment income and net realized capital gains are distributed in accordance with the Code.
81
WESTWOOD FUNDS
In order to avoid imposition of the excise tax applicable to regulated investment companies, it is also each Fund’s intention to declare as dividends in each calendar year at least 98% of its net investment income (earned during the calendar year) and 98.2% of its net realized capital gains (earned during the twelve months ended October 31) plus undistributed amounts from prior years.
The following information is computed on a tax basis for each item as of October 31, 2022:
| Value | MidCap | SMidCap | SmallCap | AllCap | ||||||||||||||||
| Fund | Fund | Fund | Fund | Fund | ||||||||||||||||
| Federal income tax cost | $ | 210,568,832 | $ | 546,124 | $ | 275,134,240 | $ | 921,870,797 | $ | 21,815,905 | ||||||||||
| Gross unrealized appreciation | $ | 49,669,603 | $ | 39,031 | $ | 34,633,957 | $ | 141,965,648 | $ | 1,556,069 | ||||||||||
| Gross unrealized depreciation | (8,511,338 | ) | (50,419 | ) | (19,011,639 | ) | (73,873,468 | ) | (1,274,097 | ) | ||||||||||
| Net unrealized appreciation (depreciation) | 41,158,265 | (11,388 | ) | 15,622,318 | 68,092,180 | 281,972 | ||||||||||||||
| Undistributed ordinary income | 2,914,886 | 5,758 | 1,463,506 | 12,664,502 | 279,885 | |||||||||||||||
| Undistributed long-term capital gains | — | — | 2,302,714 | 19,712,922 | — | |||||||||||||||
| Accumulated capital and other losses | (284,008 | ) | (14,567 | ) | — | — | (454,289 | ) | ||||||||||||
| Total distributable earnings | $ | 43,789,143 | $ | (20,197 | ) | $ | 19,388,538 | $ | 100,469,604 | $ | 107,568 | |||||||||
| Total | Income | Alternative | SmallCap | |||||||||||||||||
| Return | Opportunity | High | Income | Growth | ||||||||||||||||
| Fund | Fund | Income Fund | Fund | Fund | ||||||||||||||||
| Federal income tax cost | $ | 123,122,729 | $ | 679,349,281 | $ | 110,861,411 | $ | 169,719,620 | $ | 21,258,955 | ||||||||||
| Gross unrealized appreciation | $ | 10,920,462 | $ | 46,682,787 | $ | 2,978,693 | $ | 48,126,225 | $ | 1,305,842 | ||||||||||
| Gross unrealized depreciation | (10,890,409 | ) | (80,502,912 | ) | (15,124,013 | ) | (53,726,760 | ) | (410,200 | ) | ||||||||||
| Net unrealized appreciation (depreciation) | 30,053 | (33,820,125 | ) | (12,145,320 | ) | (5,600,535 | ) | 895,642 | ||||||||||||
| Undistributed ordinary income | 163,853 | 2,596,712 | — | 18,259,898 | 69,565 | |||||||||||||||
| Accumulated capital and other losses | — | (1,045,137 | ) | (11,107,419 | ) | (12,306,799 | ) | (3,013,959 | ) | |||||||||||
| Total distributable earnings (accumulated deficit) | $ | 193,906 | $ | (32,268,550 | ) | $ | (23,252,739 | ) | $ | 352,564 | $ | (2,048,752 | ) | |||||||
82
WESTWOOD FUNDS
The federal tax cost, unrealized appreciation (depreciation) as of April 30, 2023 is as follows
| Value | MidCap | SMidCap | SmallCap | AllCap | ||||||||||||||||
| Fund | Fund | Fund | Fund | Fund | ||||||||||||||||
| Federal income tax cost | $ | 205,975,152 | $ | 563,180 | $ | 269,717,780 | $ | 996,036,698 | $ | 21,309,428 | ||||||||||
| Gross unrealized appreciation | $ | 50,106,666 | $ | 49,244 | $ | 37,705,773 | $ | 158,866,343 | $ | 1,953,055 | ||||||||||
| Gross unrealized depreciation | (4,698,435 | ) | (33,296 | ) | (17,910,302 | ) | (106,239,368 | ) | (803,354 | ) | ||||||||||
| Net unrealized appreciation | 45,408,231 | 15,948 | 19,795,471 | 52,626,975 | 1,149,701 | |||||||||||||||
| Total | Income | Alternative | SmallCap | |||||||||||||||||
| Return | Opportunity | High | Income | Growth | ||||||||||||||||
| Fund | Fund | Income Fund | Fund | Fund | ||||||||||||||||
| Federal income tax cost | $ | 117,817,721 | $ | 609,505,496 | $ | 114,351,814 | $ | 131,412,697 | $ | 23,443,459 | ||||||||||
| Gross unrealized appreciation | $ | 12,594,163 | $ | 53,301,020 | $ | 3,119,860 | $ | 40,207,018 | $ | 831,254 | ||||||||||
| Gross unrealized depreciation | (5,446,231 | ) | (43,947,454 | ) | (10,643,814 | ) | (39,618,866 | ) | (1,614,969 | ) | ||||||||||
| Net unrealized appreciation (depreciation) | 7,147,932 | 9,353,566 | (7,523,954 | ) | 588,152 | (783,715 | ) | |||||||||||||
The difference between the federal income tax cost of investments and the financial statement cost of investments are due to certain timing differences in the recognition of capital gains or losses under income tax regulations and GAAP. These “book/tax” differences are temporary in nature and are primarily due to the tax deferral of losses on wash sales, constructive dividend income and partnership adjustments. Other temporary differences primarily consists of straddle loss deferral, contingent debt adjustment, perpetual bond and options mark to market adjustments.
As of October 31, 2022, the following Funds had short-term and long-term capital loss carryforwards for federal income tax purposes, which may be carried forward indefinitely. These capital loss carryforwards are available to offset net realized capital gains in the current and future years, thereby reducing future taxable gains distributions, if any.
| Capital Loss Carryovers | ||||||||||||
| Fund | Short- term | Long- term | Total | |||||||||
| Value Fund | $ | 284,008 | $ | — | $ | 284,008 | ||||||
| MidCap Fund | 14,567 | — | 14,567 | |||||||||
| AllCap Fund | 424,891 | 29,398 | 454,289 | |||||||||
| Income Opportunity Fund | 1,045,137 | — | 1,045,137 | |||||||||
| High Income Fund | 1,200,789 | 9,906,630 | 11,107,419 | |||||||||
| Alternative Income Fund | 10,591,132 | 1,715,667 | 12,306,799 | |||||||||
| SmallCap Growth Fund | 3,013,959 | — | 3,013,959 | |||||||||
The Funds recognize the tax benefits or expenses of uncertain tax positions only when the position is “more likely than not” of being sustained assuming examination by tax authorities. Management has reviewed each Fund’s tax
83
WESTWOOD FUNDS
positions for the current tax year and has concluded that no provision for unrecognized tax benefits or expenses is required in these financial statements. The Funds identify their major tax jurisdiction as U.S. Federal.
The Funds recognize interest and penalties, if any, related to unrecognized tax benefits as income tax expense on the Statements of Operations. During the six months ended April 30, 2023, the Funds did not incur any interest or penalties.
3. Investment Transactions
The cost of security purchases and proceeds from sales and maturities of securities (excluding short-term debt securities having maturities one year or less and U.S. Government securities) for the six months ended April 30, 2023 were as follows:
| Value | MidCap | SMidCap | SmallCap | AllCap | ||||||||||||||||
| Fund | Fund | Fund | Fund | Fund | ||||||||||||||||
| Purchases of investment securities | $ | 97,802,653 | $ | 303,839 | $ | 129,609,393 | $ | 366,885,004 | $ | 11,141,498 | ||||||||||
| Proceeds from sales of investment securities | $ | 98,021,811 | $ | 261,619 | $ | 134,907,902 | $ | 310,350,766 | $ | 11,483,195 | ||||||||||
| Total | Income | High | Alternative | SmallCap | ||||||||||||||||
| Return | Opportunity | Income | Income | Growth | ||||||||||||||||
| Fund | Fund | Fund | Fund | Fund | ||||||||||||||||
| Purchases of investment securities | $ | 25,541,265 | $ | 142,680,407 | $ | 24,614,458 | $ | 54,015,254 | $ | 64,088,226 | ||||||||||
| Proceeds from sales and maturities of investment securities | $ | 26,580,078 | $ | 157,624,439 | $ | 15,859,245 | $ | 68,920,427 | $ | 62,542,013 | ||||||||||
The cost of security purchases and proceeds from sales and maturities of U.S. Government long-term securities for the period ended April 30, 2023 were as follows:
| Total | Income | High | Alternative | |||||||||||||
| Return | Opportunity | Income | Income | |||||||||||||
| Fund | Fund | Fund | Fund | |||||||||||||
| Purchases of investment securities | $ | 2,117,077 | $ | 15,522,708 | $ | 904,356 | $ | — | ||||||||
| Proceeds from sales and maturities of investment securities | $ | 7,292,246 | $ | 56,116,424 | $ | 2,692,645 | $ | 3,980,913 | ||||||||
4. Transactions with Related Parties
INVESTMENT MANAGEMENT AGREEMENT
The Funds’ investments are managed by the Adviser pursuant to the terms of an Investment Management Agreement. Each Fund pays the Adviser an investment management fee, based on the average net assets of each Fund, computed and accrued daily and paid monthly, at the annual rate shown in the table below. Pursuant to an Expense Limitation Agreement (“ELA”) between each Fund and the Adviser, the Adviser has contractually agreed, until March 1, 2024, to reduce investment management fees and reimburse other expenses to the extent necessary to limit total annual
84
WESTWOOD FUNDS
fund operating expenses of each Fund (exclusive of interest; taxes; brokerage commissions; Rule 12b-1 distribution fees (if any), administrative servicing fees (if any); borrowing expenses such as dividend and interest expenses on securities sold short; acquired fund fees and expenses; costs to organize the Funds; other expenditures which are capitalized in accordance with generally accepted accounting principle; and extraordinary expenses) to an amount not exceeding the following percentages of average daily net assets attributable to each respective class:
| Institutional | A Class | C Class | Ultra Shares | |||||||||||||||||
| Management | Shares Expense | Expense | Expense | Expense | ||||||||||||||||
| Fund | Fee | Limitation | Limitation | Limitation | Limitation | |||||||||||||||
| Value Fund* | 0.50 | % | 0.55 | % | 0.55 | % | 0.55 | % | 0.55 | % | ||||||||||
| MidCap Fund | 0.58 | % | 0.58 | % | n/a | n/a | n/a | |||||||||||||
| SMidCap Fund | 0.75 | % | 0.68 | % | n/a | n/a | 0.68 | % | ||||||||||||
| SmallCap Fund | 0.85 | % | 0.79 | % | 0.79 | % | 0.79 | % | 0.79 | % | ||||||||||
| AllCap Fund | 0.45 | % | 0.45 | % | n/a | n/a | 0.45 | % | ||||||||||||
| Total Return Fund** | 0.50 | % (a) | 0.75 | % | n/a | n/a | n/a | |||||||||||||
| Income Opportunity Fund* | 0.65 | % | 0.74 | % | 0.74 | % | 0.74 | % | 0.74 | % | ||||||||||
| High Income** | 0.38 | % (b) | n/a | n/a | n/a | n/a | ||||||||||||||
| Alternative Income** | 0.53 | % (c) | n/a | n/a | n/a | n/a | ||||||||||||||
| SmallCap Growth Fund | 0.55 | % | 0.55 | % | n/a | n/a | n/a | |||||||||||||
The Adviser has contractually agreed to reduce its fees and reimburse expenses of the Total Return Fund, High Income Fund, and Alternative Income Fund in order to keep net operating expenses (excluding management fees, interest, taxes, brokerage commissions, Rule 12b-1 distribution fees (if any), administrative servicing fees (if any), acquired fund fees and expenses, other expenditures which are capitalized in accordance with generally accepted accounting principles, and extraordinary expenses (collectively, “excluded expenses”)) from exceeding the Funds’ average daily net assets as follows:
| Institutional | A Class | C Class | Ultra Shares | |||||||||||||
| Shares Expense | Expense | Expense | Expense | |||||||||||||
| Fund | Limitation | Limitation | Limitation | Limitation | ||||||||||||
| Total Return Fund | 0.05 | % | 0.05 | % | 0.05 | % | n/a | |||||||||
| High Income | 0.10 | % | 0.10 | % | 0.10 | % | n/a | |||||||||
| Alternative Income | 0.00 | % | 0.00 | % | 0.00 | % | 0.00 | % | ||||||||
In addition, the Adviser has contractually agreed to waive its management fee at an annual rate in the amount of 0.01% of the Alternative Income Fund’s average daily net assets.
| * | Prior to November 30, 2022 the Management Fee and Expense Limitation for each Share class was 0.10% higher than what is listed in the table. |
| ** | In connection with the Adviser’s Sensible Fees™ framework, for its services to each share class of Total Return, High Income and Alternative Income Funds, the Adviser is entitled to a management fee, which consists of a base fee (the “Base Fee”) and a positive or negative performance adjustment (the “Performance Adjustment”) based on whether , and to what extent, the investment performance of each share class of each Fund exceeds, or is exceeded by, the performance of an index hurdle (the “Index Hurdle”) over the 12-month period from November 1 of each year though October 31 of the following year (the “Performance Period”). For each share class of each Fund, the Base Fee and Performance Adjustment are each calculated and accrued daily based on the average daily net assets of the share class during the Performance Period. |
85
WESTWOOD FUNDS
| (a) | The Base Fee is an annual rate of 0.50%. The Index Hurdle is the Blended 60/40 S&P 500® Index/Bloomberg U.S. Aggregate Bond Index plus 1.00%. The Performance Adjustment is calculated according to a schedule that adds or subtracts 0.0020% of the share class’s average daily net assets for each 0.01% by which the performance of the share class exceeds or lags the performance of the Index Hurdle over the Performance Period. The maximum Performance Adjustment (positive or negative) will not exceed an annual rate of +/- 0.20% of the share class’s average daily net assets during the Performance Period, which would occur when the performance of the share class exceeds, or is exceeded by, the performance of the Index Hurdle by 1.00% over the Performance Period. Accordingly, the management fee will range from a minimum annual rate of 0.30% to a maximum annual rate of 0.70%. |
| (b) | The Base Fee is an annual rate of 0.38%. The Index Hurdle is the Blended 80/20 Bloomberg U.S. Aggregate Bond Index/S&P 500® Index plus 1.00%. The Performance Adjustment is calculated according to a schedule that adds or subtracts 0.0032% of the share class’s average daily net assets for each 0.01% by which the performance of the share class exceeds or lags the performance of the Index Hurdle over the Performance Period. The maximum Performance Adjustment (positive or negative) will not exceed an annual rate of +/- 0.32% of the share class’s average daily net assets during the Performance Period, which would occur when the performance of the share class exceeds, or is exceeded by, the performance of the Index Hurdle by 1.00% over the Performance Period. Accordingly, the management fee will range from a minimum annual rate of 0.06% to a maximum annual rate of 0.70%. |
| (c) | The Base Fee is an annual rate of 0.53%. The Index Hurdle is the FTSE 1-Month U.S. Treasury Bill Index plus 2.00%. The Performance Adjustment is calculated according to a schedule that adds or subtracts 0.0016% of the share class’s average daily net assets for each 0.01% by which the performance of the share class exceeds or lags the performance of the Index Hurdle over the Performance Period. The maximum Performance Adjustment (positive or negative) will not exceed an annual rate of +/- 0.32% of the share class’s average daily net assets during the Performance Period, which would occur when the performance of the share class exceeds, or is exceeded by, the performance of the Index Hurdle by 2.00% over the Performance Period. Accordingly, the management fee will range from a minimum annual rate of 0.21% to a maximum annual rate of 0.85%. |
Under the terms of the ELA, investment management fee reductions and expense reimbursements by the Adviser are subject to repayment by the Funds for a period of three years after the date on which such fees and expenses were incurred or waived, provided that the repayments do not cause total annual fund operating expenses (exclusive of such reductions and reimbursements) to exceed (i) the expense limitation then in effect, if any, and (ii) the expense limitation in effect at the time the expenses to be repaid were incurred. Fee waivers/expense reimbursements for the Predecessor Funds prior to the Reorganization on November 1, 2021 are not subject to recoupment by the Adviser. As of April 30, 2023, the Adviser may seek repayment of investment management fee reductions and expense reimbursements no later than the dates below:
| Value | MidCap | SMidCap | SmallCap | AllCap | ||||||||||||||||
| Fund | Fund | Fund | Fund | Fund | ||||||||||||||||
| October 31, 2024 | $ | — | $ | — | $ | — | $ | — | $ | 28,954 | ||||||||||
| October 31, 2025 | 97,530 | 92,127 | 476,566 | 1,251,166 | 105,671 | |||||||||||||||
| April 30, 2026 | 76,036 | 25,224 | 222,751 | 730,390 | 49,338 | |||||||||||||||
| $ | 173,566 | $ | 117,351 | $ | 699,317 | $ | 1,981,556 | $ | 183,963 | |||||||||||
| Total | Income | High | Alternative | SmallCap | ||||||||||||||||
| Return | Opportunity | Income | Income | Growth | ||||||||||||||||
| Fund | Fund | Fund | Fund* | Fund | ||||||||||||||||
| October 31, 2024 | $ | — | $ | — | $ | — | $ | — | $ | 23,034 | ||||||||||
| October 31, 2025 | 105,981 | — | 69,686 | 226,516 | 111,666 | |||||||||||||||
| April 30, 2026 | 61,594 | 6,978 | 41,550 | 159,987 | 48,559 | |||||||||||||||
| $ | 167,575 | $ | 6,978 | $ | 111,236 | $ | 386,503 | $ | 183,259 | |||||||||||
| * | For the year ended October 31, 2022 and the six months ended April 30, 2023, the Fund had $10,233 and $7,121 management fee waiver, respectively, that is not subject to recoupment pursuant to the Management Fee Waiver Agreement |
86
WESTWOOD FUNDS
OTHER SERVICE PROVIDERS
Ultimus Fund Solutions, LLC (“Ultimus”) provides administration, fund accounting, compliance and transfer agency services to the Funds. The Funds pay Ultimus fees in accordance with the agreements for such services. In addition, the Funds pay out-of-pocket expenses including, but not limited to, postage, supplies, and certain costs related to the pricing of the Funds’ portfolio securities.
Under the terms of a Distribution Agreement with the Trust, Ultimus Fund Distributors, LLC (the “Distributor”) serves as the principal underwriter to the Funds. The Distributor is a wholly-owned subsidiary of Ultimus. The Distributor is compensated by the Adviser for acting as principal underwriter.
Certain officers and a Trustee of the Trust are also officers of Ultimus and are not paid by the Funds for servicing in such capacities.
ADMINISTRATIVE SERVICES PLAN
As of April 30, 2023, Value, MidCap, SMidCap, SmallCap, AllCap, Income Opportunity, High Income, Alternative Income and SmallCap Growth Funds have adopted an administrative services plan (the “Plan”) that provides that the Institutional Shares class of each Fund may pay financial intermediaries for shareholder services in an amount not to exceed 0.20% based on the average daily net assets of each Fund’s Institutional Shares of MidCap, SMidCap, SmallCap, AllCap, and SmallCap Growth Funds; in an amount not to exceed 0.19% based on the average daily net assets for the Institutional Shares of High Income Fund; in an amount not to exceed 0.15% based on the average daily net assets for the Institutional Shares of Alternative Income Fund; and in an amount not to exceed 0.10% based on the average daily net assets for the Institutional Shares of Value and Income Opportunity Funds. During the six months ended April 30, 2023, the Institutional Shares of the Funds incurred the following administrative services plan fees under the Plan:
| Administrative service plan fees | ||||
| Institutional Shares | ||||
| Value Fund | $ | 104,003 | ||
| MidCap Fund | 9 | |||
| SMIDCap Fund | 191,037 | |||
| SmallCap Fund | 238,226 | |||
| AllCap Fund | 73 | |||
| Income Opportunity Fund | 189,195 | |||
| High Income Fund | 15,000 | |||
| Alternative Income Fund | 32,465 | |||
| SmallCap Growth Fund | 2,524 |
DISTRIBUTION PLAN
Value, SmallCap, Total Return, Income Opportunity, High Income and Alternative Income Funds have adopted a distribution plan under Rule 12b -1 of the 1940 Act (the “Plan”) for A Class Shares and C Class Shares that allows the Funds to pay distribution and/or service fees for the sale and distribution of Fund shares, and for services provided to shareholders in an amount not to exceed 0.25% based on average daily net assets of each Fund’s A Class Shares
87
WESTWOOD FUNDS
and 1.00% based on the average daily net assets of each Fund’s C Class Shares. During the six months ended April 30, 2023, the A Class Shares and C Class Shares of the Funds incurred the following distribution fees under the Plan:
| Distribution fees | ||||
| Value Fund | ||||
| A Class Shares | $ | 1,641 | ||
| C Class Shares | 621 | |||
| SmallCap Fund | ||||
| A Class Shares | 5,712 | |||
| C Class Shares | 3,521 | |||
| Total Return Fund | ||||
| A Class Shares | 31 | |||
| C Class Shares | 346 | |||
| Income Opportunity Fund | ||||
| A Class Shares | 64,879 | |||
| C Class Shares | 64,229 | |||
| High Income Fund | ||||
| A Class Shares | 4,131 | |||
| C Class Shares | 1,028 | |||
| Alternative Income Fund | ||||
| A Class Shares | 41 | |||
| C Class Shares | 995 |
TRUSTEE COMPENSATION
Each member of the Board (a “Trustee”) who is not an “interested person” (as defined by the 1940 Act, as amended) of the Trust (“Independent Trustee”) receives a $1,300 annual retainer from each Fund, except for the Audit Chairperson who receives a $1,500 annual retainer from each Fund and the Board Chairperson who receives a $1,700 annual retainer from each Fund, paid in quarterly installments. Each Independent Trustee also receives from each Fund a fee of $550 for each Board meeting attended plus reimbursement for travel and other meeting-related expenses.
PRINCIPAL HOLDERS OF FUND SHARES
As of April 30, 2023, the following shareholders owned of record 25% or more of the outstanding shares of the Funds:
| NAME OF RECORD OWNER | % Ownership | |
| Value Fund | ||
| Institutional Shares | ||
| National Financial Services, LLC (for the benefit of its customers) | 30% | |
| SEI Private Trust Co. (for the benefit of its customers) | 28% | |
| C Class Shares | ||
| Raymond James (for the benefit of its customers) | 100% | |
| Ultra Shares | ||
| Westwood Management Corp. (for the benefit of its customers) | 100% |
88
WESTWOOD FUNDS
| NAME OF RECORD OWNER | % Ownership | |
| MidCap Fund | ||
| Institutional Shares | ||
| Westwood Management Corp. (for the benefit of its customers) | 87% | |
| SMIDCap Fund | ||
| Institutional Shares | ||
| Northern Trust Co. (The) (for the benefit of its customers) | 61% | |
| Bart 401(a) Model (for the benefit of its customers) | 26% | |
| Ultra Shares | ||
| National Financial Services, LLC (for the benefit of its customers) | 92% | |
| SmallCap Fund | ||
| Institutional Shares | ||
| National Financial Services, LLC (for the benefit of its customers) | 44% | |
| A Class Shares | ||
| TD Ameritrade, Inc. (for the benefit of its customers) | 34% | |
| Charles Schwab & Co., Inc. (for the benefit of its customers) | 29% | |
| C Class Shares | ||
| Raymond James (for the benefit of its customers) | 58% | |
| Ultra Shares | ||
| National Financial Services, LLC (for the benefit of its customers) | 67% | |
| Quality AllCap Fund | ||
| Institutional Shares | ||
| Westwood Management Corp. (for the benefit of its customers) | 53% | |
| Charles Schwab & Co., Inc. (for the benefit of its customers) | 25% | |
| Ultra Shares | ||
| U.S. Bank San Diego Transit Corp. | 90% | |
| Total Return Fund | ||
| Institutional Shares | ||
| National Financial Services, LLC (for the benefit of its customers) | 87% | |
| A Class Shares | ||
| LPL Financial (for the benefit of its customers) | 87% | |
| C Class Shares | ||
| LPL Financial (for the benefit of its customers) | 100% |
89
WESTWOOD FUNDS
| NAME OF RECORD OWNER | % Ownership | |
| Income Opportunity Fund | ||
| A Class Shares | ||
| Wells Fargo Clearing Services, LLC (for the benefit of its customers) | 37% | |
| C Class Shares | ||
| Raymond James (for the benefit of its customers) | 70% | |
| Ultra Shares | ||
| Capinco C/O U.S. Bank N.A. | 64% | |
| Kuba J. Brown & Howard Rothschild (for the benefit of its customers) | 36% | |
| High Income Fund | ||
| Institutional Shares | ||
| National Financial Services, LLC (for the benefit of its customers) | 78% | |
| A Class Shares | ||
| Stifel Nicolaus & Co. (for the benefit of its customers) | 85% | |
| C Class Shares | ||
| Raymond James (for the benefit of its customers) | 100% | |
| Alternative Income Fund | ||
| Institutional Shares | ||
| LPL Financial (for the benefit of its customers) | 66% | |
| A Class Shares | ||
| Pershing, LLC (for the benefit of its customers) | 59% | |
| C Class Shares | ||
| LPL Financial (for the benefit of its customers) | 67% | |
| Charles Schwab & Co., Inc. (for the benefit of its customers) | 33% | |
| Ultra Shares | ||
| National Financial Services, LLC (for the benefit of its customers) | 98% | |
| SmallCap Growth Fund | ||
| Institutional Shares | ||
| National Financial Services, LLC (for the benefit of its customers) | 85% |
A beneficial owner of 25% or more of a Fund’s outstanding shares may be considered a controlling person of the Fund. That shareholder’s vote could have a more significant effect on matters presented at a shareholders’ meeting.
90
WESTWOOD FUNDS
5. Derivative Transactions
The following is a summary of the fair value of derivative instruments held by the Alternative Income Fund as of April 30, 2023 presented on the Statements of Assets and Liabilities.
| Assets | Liabilities | |||||||||||
| Investments, | Unrealized | Unrealized | ||||||||||
| at value for | appreciation | depreciation | ||||||||||
| purchased | on swap | on swap | ||||||||||
| options | agreements * | agreements * | ||||||||||
| Equity Risk Exposure | $ | 99,410 | $ | 1,236,813 | $ | (509,096 | ) | |||||
Amounts designated as “—” are $0 or have been rounded to $0.
| * | Total fair value is presented by Primary Risk Exposure. For futures contracts, if any, the amounts represent their cumulative appreciation/depreciation, which includes movements of variation margin. |
The following summary of the effect of derivatives instruments for Alternative Income Fund on the Statements of Operations for the six months ended April 30, 2023:
| Net realized | Net realized | Net realized | ||||||||||
| losses from | gains from | gains (losses) | ||||||||||
| purchased | futures | from swap | ||||||||||
| options | contracts | transactions | ||||||||||
| Equity Risk Exposure | $ | (385,104 | ) | $ | — | $ | 357,177 | |||||
| Interest Rate Risk Exposure | — | 69,976 | — | |||||||||
| Credit Risk Exposure | — | — | (4,768,192 | ) | ||||||||
| Total | $ | (385,104 | ) | $ | 69,976 | $ | (4,411,015 | ) | ||||
| Net Change in Unrealized Appreciation (Depreciation) on Derivatives | ||||||||||||
| Recognized as a Result from Operations | ||||||||||||
| Net unrealized | Net unrealized | Net unrealized | ||||||||||
| gains from | losses from | gains (losses) | ||||||||||
| purchased | futures | from swap | ||||||||||
| options | contracts | transactions | ||||||||||
| Equity Risk Exposure | $ | 135,523 | $ | — | $ | 1,957,112 | ||||||
| Interest Rate Risk Exposure | — | (83,655 | ) | — | ||||||||
| Credit Risk Exposure | — | — | (189,270 | ) | ||||||||
| Total | $ | 135,523 | $ | (83,655 | ) | $ | 1,767,842 | |||||
Amounts designated as “—” are $0 or have been rounded to $0.
Offsetting Assets and Liabilities:
Alternative Income Fund is required to disclose the impact of offsetting assets and liabilities represented in the Statements of Assets and Liabilities to enable users of the financial statements to evaluate the effect or potential effect of netting arrangements on its financial position for recognized assets and liabilities. These recognized assets and liabilities are financial instruments and derivative instruments that are either subject to an enforceable master
91
WESTWOOD FUNDS
netting arrangement or similar agreement or meet the following right of setoff criteria: the amounts owed by the Alternative Income Fund to another party are determinable, the Fund has the right to set off the amounts owed with the amounts owed by the other party, the Alternative Income Fund intends to set off, and the Fund’s right of setoff is enforceable at law.
A Fund is subject to various netting arrangements with select counterparties (“Master Agreements”). Master Agreements govern the terms of certain transactions, and reduce the counterparty risk associated with relevant transactions by specifying credit protection mechanisms and providing standardization that improves legal certainty. Since different types of transactions have different mechanics and are sometimes traded out of different legal entities of a particular counterparty organization, each type of transaction may be covered by a different Master Agreement, resulting in the need for multiple agreements with a single counterparty. As the Master Agreements are specific to unique operations of different asset types, they allow a Fund to close out and net its total exposure to a specific counterparty entity in the event of a default with respect to all the transactions governed under a single agreement with a specific counterparty entity.
Master Agreements can also help limit counterparty risk by specifying collateral posting arrangements at pre-arranged exposure levels. Under the Master Agreements, collateral is routinely transferred if the total net exposure to certain transactions (net of existing collateral already in place) governed under the relevant Master Agreement with a counterparty in a given account exceeds a specified threshold, which typically ranges from zero to $250,000 depending on the counterparty and the type of Master Agreement. United States Treasury Securities and U.S. dollar cash are generally the preferred forms of collateral. Securities and cash pledged as collateral are reflected as assets in the Statements of Assets and Liabilities as either a component of investments at value (securities) or deposits due from counterparties (cash). Cash collateral received is not typically held in a segregated account and as such is reflected as a liability in the Statements of Assets and Liabilities as deposits due to counterparties. The market value of any securities received as collateral is not reflected as a component of net asset value. A Fund’s overall exposure to counterparty risk can change substantially within a short period, as it is affected by each transaction subject to the relevant Master Agreement.
Customer account agreements and related addendums govern cleared derivatives transactions such as futures, options on futures, and cleared Over The Counter (“OTC”) derivatives. Cleared derivative transactions require posting of initial margin as determined by each relevant clearing agency which is segregated at a broker account registered with the Commodities Futures Trading Commission (“CFTC”), or the applicable regulator. In the U.S., counterparty risk is believed to be reduced as creditors of the futures broker do not have claim to Fund assets in the segregated account. Additionally, portability of exposure in the event of default further reduces risk to the Funds. Variation margin, or changes in market value, are exchanged daily, but generally may not be netted between futures and cleared OTC derivatives.
International Swaps and Derivatives Association, Inc. Master Agreements and Credit Support Annexes (“ISDA Master Agreements”) govern OTC financial derivative transactions entered into by a Fund and select counterparties. ISDA Master Agreements maintain provisions for general obligations, representations, agreements, collateral and events of default or termination. Events of termination include conditions that may entitle counterparties to elect to terminate early and cause settlement of all outstanding transactions under the applicable ISDA Master Agreement. Any election to terminate early could be material to the financial statements. In limited circumstances, the ISDA Master Agreement may contain additional provisions that add additional counterparty protection beyond coverage of existing daily exposure if the counterparty has a decline in credit quality below a predefined level. These amounts, if any, may be segregated with a third party custodian.
92
WESTWOOD FUNDS
As of April 30, 2023, Alternative Income Fund’s derivative assets and liabilities by type are as follows:
| Description | Assets | Liabilities | ||||||
| Derivative Financial Instruments: | ||||||||
| Options contract* | $ | 99,410 | $ | — | ||||
| Swap agreements | 1,236,813 | (509,096 | ) | |||||
| Total derivative assets and liabilities in the Statement of Assets and Liabilities | 1,336,223 | (509,096 | ) | |||||
| Derivative not subject to a MNA or similar agreement | (99,410 | ) | — | |||||
| Total assets and liabilities subject to a MNA | $ | 1,236,813 | $ | (509,096 | ) | |||
Amounts designated as “—” are $0 or have been rounded to $0.
| * | Includes options contracts purchased at value as reported in the Statements of Assets and Liabilities. |
The following table represents the Alternative Income Fund’s derivative assets by counterparty, net of amounts available for offset under an MNA and net of the related collateral received by the Fund as of April 30, 2023.
| Derivatives | ||||||||||||||||||||
| Derivative | Liabilities | |||||||||||||||||||
| Assets Subject | Subject to | Net Amount | Non-cash | |||||||||||||||||
| to a MNA by | a MNA by | of Derivative | Collateral | |||||||||||||||||
| Counterparty | Counterparty | Assets | Received(a) | Net Exposure | ||||||||||||||||
| BNP Paribas | $ | 1,236,813 | $ | (509,096 | ) | $ | 727,717 | $ | (727,717 | ) | $ | — | ||||||||
| (a) | The actual collateral received or pledged may be in excess of the amounts shown in the tables. The tables only reflect collateral amounts up to the amount of the financial instruments disclosed on the Statements of Assets and Liabilities. |
6. Borrowing Costs
From time to time, the Funds may have an overdrawn cash balance at the custodian due to redemptions or market movements. When this occurs, the Funds will incur borrowing costs charged by the custodian. Borrowing costs for each Fund, if any, for the six months ended April 30, 2023 can be found on the Statements of Operations.
7. Certain Investments and Risks
Below are summaries of some, but not all, of the principal risks of investing in one or more of the Funds, each of which could adversely affect a Fund’s NAV, yield and total return. Each risk listed below does not necessarily apply to each Fund, and you should read each Fund’s prospectus carefully for a description of the principal risks associated with investing in a particular Fund.
RISKS ASSOCIATED WITH LOWER RATE DEBT SECURITIES
High Income Fund invests substantially all of its assets in high yield, or “junk,” bonds, and such investments represent highly speculative securities that are usually issued by smaller, less creditworthy and/or highly leveraged (indebted) companies. Compared with investment-grade bonds, high yield bonds are considered to carry a greater degree of risk and are considered to be less likely to make payments of interest and principal. In particular, lower-quality high yield bonds (rated CCC, CC, C, or unrated securities judged to be of comparable quality) are subject to a greater degree of credit risk than higher-quality high yield bonds and may be near default. High yield bonds rated D are in default. Market developments and the financial and business conditions of the corporation issuing these securities
93
WESTWOOD FUNDS
generally influence their price and liquidity more than changes in interest rates, when compared to investment-grade debt securities. In addition, insufficient liquidity in the non-investment grade bond market may make it more difficult to dispose of non-investment grade bonds and may cause the Fund to experience sudden and substantial price declines.
SECTOR RISK
If a Fund has significant investments in the securities of issuers in industries within a particular business sector, any development affecting that sector will have a greater impact on the value of the net assets of the Fund than would be the case if the Fund did not have significant investments in that sector. In addition, this may increase the risk of loss of an investment in the Fund and increase the volatility of the Fund’s NAV per share. From time to time, circumstances may affect a particular sector and the companies within such sector. For instance, economic or market factors, regulation or deregulation, or other developments may negatively impact all companies in a particular sector and therefore the value of a Fund’s portfolio would be adversely affected. As of April 30, 2023, Income Opportunity Fund had 26.8% of the value of its net assets invested in securities in the Financials sector.
8. Contingencies and Commitments
The Funds indemnify the Trust’s officers and Trustees for certain liabilities that might arise from their performance of their duties to the Funds. Additionally, in the normal course of business the Funds enter into contracts that contain a variety of representations and warranties and which provide general indemnifications. The Funds’ maximum exposure under these arrangements is unknown, as this would involve future claims that may be made against the Funds that have not yet occurred. However, based on experience, the Funds expect the risk of loss to be remote.
9. Subsequent Events
The Funds are required to recognize in the financial statements the effects of all subsequent events that provide additional evidence about conditions that existed as of the date of the Statements of Assets and Liabilities. For non-recognized subsequent events that must be disclosed to keep the financial statements from being misleading, the Funds are required to disclose the nature of the event as well as an estimate of its financial effect, or a statement that such an estimate cannot be made. Management has evaluated subsequent events through the issuance of these financial statements and has noted no such events.
94
WESTWOOD FUNDS
| ABOUT YOUR FUNDS’ EXPENSES (Unaudited) |
We believe it is important for you to understand the impact of costs on your investment. As a shareholder of the Funds, you incur two types of costs: (1) transaction costs, possibly including sales charges (loads) and redemption fees, and (2) ongoing costs, including management fees, class-specific expenses (such as administrative services fees and/or Rule 12b-1 fees) and other operating expenses. The following examples are intended to help you understand your ongoing costs (in dollars) of investing in the Funds and to compare these costs with the ongoing costs of investing in other mutual funds.
A mutual fund’s ongoing costs are expressed as a percentage of its average net assets. This figure is known as the expense ratio. The expenses in the table below are based on an investment of $1,000 made at the beginning of the most recent period (November 1, 2022) and held until the end of the period (April 30, 2023). For the Value Fund Ultra Shares and Income Opportunity Fund Ultra Shares the expenses in the table below are based on an investment of $1,000 made at the commencement of operations (November 30, 2022) and held until the end of the period (April 30, 2023).
The table below illustrates each Fund’s ongoing costs in two ways:
Actual fund return – This section helps you to estimate the actual expenses that you paid over the period. The “Ending Account Value” shown is derived from each Fund’s actual return, and the fourth column shows the dollar amount of operating expenses that would have been paid by an investor who started with $1,000 in the Funds. You may use the information here, together with the amount you invested, to estimate the expenses that you paid over the period.
To do so, simply divide your account value by $1,000 (for example, an $8,600 account value divided by $1,000 = 8.6), then multiply the result by the number given for the Funds under the heading “Expenses Paid During Period.”
Hypothetical 5% return – This section is intended to help you compare each Fund’s ongoing costs with those of other mutual funds. It assumes that the Funds had an annual return of 5% before expenses during the period shown, but that the expense ratio is unchanged. In this case, because the return used is not each Fund’s actual return, the results do not apply to your investment. The example is useful in making comparisons because the SEC requires all mutual funds to calculate expenses based on a 5% return. You can assess each Fund’s ongoing costs by comparing this hypothetical example with the hypothetical examples that appear in shareholder reports of other funds.
Note that expenses shown in the table are meant to highlight and help you compare ongoing costs only. The Funds do not charge transaction fees, such as purchase or redemption fees, nor do they carry a “sales load.”
The calculations assume no shares were bought or sold during the period. Your actual costs may have been higher or lower, depending on the amount of your investment and the timing of any purchases or redemptions.
More information about each Fund’s expenses can be found in this report. For additional information on operating expenses and other shareholder costs, please refer to each Fund’s prospectus.
95
WESTWOOD FUNDS
| Beginning | Ending | |||||||
| Account Value | Account Value | Expenses Paid | ||||||
| November 1, | April 30, | Net Expense | During | |||||
| 2022* | 2023 | Ratio (a) | Period (b) | |||||
| Value Fund | ||||||||
| Institutional Shares | ||||||||
| Based on Actual Fund Return | $1,000.00 | $1,028.10 | 0.65% | $3.27 | ||||
| Based on Hypothetical 5% Return (before expenses) | $1,000.00 | $1,021.57 | 0.65% | $3.26 | ||||
| A Class Shares | ||||||||
| Based on Actual Fund Return | $1,000.00 | $1,027.10 | 0.82% | $4.12 | ||||
| Based on Hypothetical 5% Return (before expenses) | $1,000.00 | $1,020.73 | 0.82% | $4.11 | ||||
| C Class Shares | ||||||||
| Based on Actual Fund Return | $1,000.00 | $1,023.70 | 1.56% | $7.83 | ||||
| Based on Hypothetical 5% Return (before expenses) | $1,000.00 | $1,017.06 | 1.56% | $7.80 | ||||
| Ultra Shares | ||||||||
| Based on Actual Fund Return | $1,000.00 | $968.70 | 0.40% | $1.64 | ||||
| Based on Hypothetical 5% Return (before expenses) | $1,000.00 | $1,022.81 | 0.40% | $2.01 | ||||
| MidCap Fund | ||||||||
| Institutional Shares | ||||||||
| Based on Actual Fund Return | $1,000.00 | $1,038.10 | 0.58% | $2.93 | ||||
| Based on Hypothetical 5% Return (before expenses) | $1,000.00 | $1,021.92 | 0.58% | $2.91 | ||||
| SMidCap Fund | ||||||||
| Institutional Shares | ||||||||
| Based on Actual Fund Return | $1,000.00 | $1,018.90 | 0.88% | $4.41 | ||||
| Based on Hypothetical 5% Return (before expenses) | $1,000.00 | $1,020.43 | 0.88% | $4.41 | ||||
| Ultra Shares | ||||||||
| Based on Actual Fund Return | $1,000.00 | $1,019.30 | 0.68% | $3.40 | ||||
| Based on Hypothetical 5% Return (before expenses) | $1,000.00 | $1,021.42 | 0.68% | $3.41 | ||||
| SmallCap Fund | ||||||||
| Institutional Shares | ||||||||
| Based on Actual Fund Return | $1,000.00 | $1,002.30 | 0.89% | $4.42 | ||||
| Based on Hypothetical 5% Return (before expenses) | $1,000.00 | $1,020.38 | 0.89% | $4.46 |
96
WESTWOOD FUNDS
| Beginning | Ending | |||||||
| Account Value | Account Value | Expenses Paid | ||||||
| November 1, | April 30, | Net Expense | During | |||||
| 2022* | 2023 | Ratio (a) | Period (b) | |||||
| SmallCap Fund (continued) | ||||||||
| A Class Shares | ||||||||
| Based on Actual Fund Return | $1,000.00 | $1,001.80 | 1.04% | $5.16 | ||||
| Based on Hypothetical 5% Return (before expenses) | $1,000.00 | $1,019.64 | 1.04% | $5.21 | ||||
| C Class Shares | ||||||||
| Based on Actual Fund Return | $1,000.00 | $997.70 | 1.79% | $8.87 | ||||
| Based on Hypothetical 5% Return (before expenses) | $1,000.00 | $1,015.92 | 1.79% | $8.95 | ||||
| Ultra Shares | ||||||||
| Based on Actual Fund Return | $1,000.00 | $1,002.70 | 0.79% | $3.92 | ||||
| Based on Hypothetical 5% Return (before expenses) | $1,000.00 | $1,020.88 | 0.79% | $3.96 | ||||
| AllCap Fund | ||||||||
| Institutional Shares | ||||||||
| Based on Actual Fund Return | $1,000.00 | $1,058.20 | 0.48% | $2.45 | ||||
| Based on Hypothetical 5% Return (before expenses) | $1,000.00 | $1,022.41 | 0.48% | $2.41 | ||||
| Ultra Shares | ||||||||
| Based on Actual Fund Return | $1,000.00 | $1,057.80 | 0.45% | $2.30 | ||||
| Based on Hypothetical 5% Return (before expenses) | $1,000.00 | $1,022.56 | 0.45% | $2.26 | ||||
| Total Return Fund | ||||||||
| Institutional Shares | ||||||||
| Based on Actual Fund Return | $1,000.00 | $1,043.80 | 0.45% | $2.28 | ||||
| Based on Hypothetical 5% Return (before | ||||||||
| expenses) | $1,000.00 | $1,022.56 | 0.45% | $2.26 | ||||
| A Class Shares | ||||||||
| Based on Actual Fund Return | $1,000.00 | $1,042.60 | 0.69% | $3.49 | ||||
| Based on Hypothetical 5% Return (before expenses) | $1,000.00 | $1,021.37 | 0.69% | $3.46 | ||||
| C Class Shares | ||||||||
| Based on Actual Fund Return | $1,000.00 | $1,039.20 | 1.44% | $7.28 | ||||
| Based on Hypothetical 5% Return (before expenses) | $1,000.00 | $1,017.65 | 1.44% | $7.20 |
97
WESTWOOD FUNDS
| Beginning | Ending | |||||||
| Account Value | Account Value | Expenses Paid | ||||||
| November 1, | April 30, | Net Expense | During | |||||
| 2022* | 2023 | Ratio (a) | Period (b) | |||||
| Income Opportunity Fund | ||||||||
| Institutional Shares | ||||||||
| Based on Actual Fund Return | $1,000.00 | $1,067.60 | 0.82% | $4.20 | ||||
| Based on Hypothetical 5% Return (before expenses) | $1,000.00 | $1,020.73 | 0.82% | $4.11 | ||||
| A Class Shares | ||||||||
| Based on Actual Fund Return | $1,000.00 | $1,066.60 | 1.00% | $5.12 | ||||
| Based on Hypothetical 5% Return (before expenses) | $1,000.00 | $1,019.84 | 1.00% | $5.01 | ||||
| C Class Shares | ||||||||
| Based on Actual Fund Return | $1,000.00 | $1,062.00 | 1.75% | $8.95 | ||||
| Based on Hypothetical 5% Return (before expenses) | $1,000.00 | $1,016.12 | 1.75% | $8.75 | ||||
| Ultra Shares | ||||||||
| Based on Actual Fund Return | $1,000.00 | $1,016.10 | 0.74% | $3.11 | ||||
| Based on Hypothetical 5% Return (before | ||||||||
| expenses) | $1,000.00 | $1,021.12 | 0.74% | $3.71 | ||||
| High Income Fund | ||||||||
| Institutional Shares | ||||||||
| Based on Actual Fund Return | $1,000.00 | $1,059.60 | 0.20% | $1.02 | ||||
| Based on Hypothetical 5% Return (before expenses) | $1,000.00 | $1,023.80 | 0.20% | $1.00 | ||||
| A Class Shares | ||||||||
| Based on Actual Fund Return | $1,000.00 | $1,058.20 | 0.40% | $2.04 | ||||
| Based on Hypothetical 5% Return (before expenses) | $1,000.00 | $1,022.81 | 0.40% | $2.01 | ||||
| C Class Shares | ||||||||
| Based on Actual Fund Return | $1,000.00 | $1,055.20 | 1.16% | $5.91 | ||||
| Based on Hypothetical 5% Return (before expenses) | $1,000.00 | $1,019.04 | 1.16% | $5.81 | ||||
| Alternative Income Fund | ||||||||
| Institutional Shares | ||||||||
| Based on Actual Fund Return | $1,000.00 | $1,036.60 | 0.55% | $2.78 | ||||
| Based on Hypothetical 5% Return (before expenses) | $1,000.00 | $1,022.07 | 0.55% | $2.76 |
98
WESTWOOD FUNDS
| Beginning | Ending | |||||||
| Account Value | Account Value | Expenses Paid | ||||||
| November 1, | April 30, | Net Expense | During | |||||
| 2022* | 2023 | Ratio (a) | Period (b) | |||||
| Alternative Income Fund (continued) | ||||||||
| A Class Shares | ||||||||
| Based on Actual Fund Return | $1,000.00 | $1,034.90 | 0.71% | $3.58 | ||||
| Based on Hypothetical 5% Return (before expenses) | $1,000.00 | $1,021.27 | 0.71% | $3.56 | ||||
| C Class Shares | ||||||||
| Based on Actual Fund Return | $1,000.00 | $1,031.40 | 1.45% | $7.30 | ||||
| Based on Hypothetical 5% Return (before expenses) | $1,000.00 | $1,017.60 | 1.45% | $7.25 | ||||
| Ultra Shares | ||||||||
| Based on Actual Fund Return | $1,000.00 | $1,036.10 | 0.44% | $2.22 | ||||
| Based on Hypothetical 5% Return (before expenses) | $1,000.00 | $1,022.61 | 0.44% | $2.21 | ||||
| SmallCap Growth Fund | ||||||||
| Institutional Shares | ||||||||
| Based on Actual Fund Return | $1,000.00 | $944.90 | 0.56% | $2.70 | ||||
| Based on Hypothetical 5% Return (before expenses) | $1,000.00 | $1,022.02 | 0.56% | $2.81 |
| * | For the Value Fund Ultra Shares and Income Opportunity Ultra Shares, beginning account value is the commencement of operations, November 30, 2022. |
| (a) | Annualized, based on each Fund’s most recent one-half year expenses. For the Value Fund Ultra Shares and Income Opportunity Ultra Shares, annualized, based on the expenses from the commencement of operations, November 30, 2022, through April 30, 2023. |
| (b) | Expenses are equal to each Fund’s annualized net expense ratio multiplied by the average account value over the period, multiplied by 181/365 (to reflect the one-half year period), for Actual and Hypothetical Return information, respectively. For the Value Fund Ultra Shares and Income Opportunity Ultra Shares, expenses are equal the annualized net expense ratio multiplied by the average account value over the period, multiplied by 152/365 (to reflect the commencement of operations, November 30, 2022 through April 30, 2023), for Actual Return information and multiplied by 181/365 for the Hypothetical Return information. |
99
WESTWOOD FUNDS
| OTHER INFORMATION (Unaudited) |
The Trust files a complete listing of portfolio holdings for the Funds with the U.S. Securities and Exchange Commission (“SEC”) as of the end of the first and third quarters of each fiscal year as an exhibit to its report on Form N-PORT. The filings are available upon request, by calling 1-877-386-3944. Furthermore, you may obtain a copy of these filings on the SEC’s website at www.sec.gov and the Funds’ website at www.westwoodfunds.com.
A description of the policies and procedures that the Funds use to vote proxies relating to portfolio securities is available without charge upon request by calling toll-free 1-877-386-3944, or on the SEC’s website at www.sec.gov. Information regarding how the Funds voted proxies relating to portfolio securities during the period ended June 30, will be available on or about August 31, without charge upon request by calling 1-877-386-3944, or on the SEC’s website at www.sec.gov.
100
WESTWOOD HIGH INCOME FUND
WESTWOOD INCOME OPPORTUNITY FUND
WESTWOOD QUALITY VALUE FUND
WESTWOOD QUALITY SMALLCAP FUND
WESTWOOD ALTERNATIVE INCOME FUND
WESTWOOD QUALITY SMIDCAP FUND
WESTWOOD TOTAL RETURN FUND
WESTWOOD QUALITY MIDCAP FUND
| CHANGE IN INDEPENDENT REGISTERED PUBLIC ACCOUNTING FIRM (Unaudited) |
On March 13, 2023, BBD LLP (“BBD”) ceased to serve as the independent registered public accounting firm of Westwood Funds (The “Fund/Funds”), each a series of Ultimus Managers Trust. The Audit Committee of the Board of Trustees approved the replacement of BBD as a result of Cohen & Company, Ltd.’s (“Cohen”) acquisition of BBD’s investment management group.
The report of BBD on the financial statements of the Funds as of and for the fiscal year ended 2022 and did not contain an adverse opinion or a disclaimer of opinion, and were not qualified or modified as to uncertainties, audit scope or accounting principles. During the fiscal year ended 2022, and during the subsequent interim period through March 13, 2023: (i) there were no disagreements between the registrant and BBD on any matter of accounting principles or practices, financial statement disclosure, or auditing scope or procedure, which disagreements, if not resolved to the satisfaction of BBD, would have caused it to make reference to the subject matter of the disagreements in its report on the financial statements of the Funds for such years or interim period; and (ii) there were no “reportable events,” as defined in Item 304(a)(1)(v) of Regulation S-K under the Securities Exchange Act of 1934, as amended.
On April 21, 2023 the Audit Committee of the Board of Trustees also recommended and approved the appointment of Cohen as the Funds’ independent registered public accounting firm for the fiscal year ending October 31, 2023.
During the fiscal year ended 2022, and during the subsequent interim period through March 13, 2023, neither the registrant, nor anyone acting on its behalf, consulted with Cohen on behalf of the Funds regarding the application of accounting principles to a specified transaction (either completed or proposed), the type of audit opinion that might be rendered on the Funds’ financial statements, or any matter that was either: (i) the subject of a “disagreement,” as defined in Item 304(a)(1)(iv) of Regulation S-K and the instructions thereto; or (ii) “reportable events,” as defined in Item 304(a)(1)(v) of Regulation S-K.
101
WESTWOOD HIGH INCOME FUND
WESTWOOD INCOME OPPORTUNITY FUND
WESTWOOD QUALITY VALUE FUND
WESTWOOD QUALITY SMALLCAP FUND
WESTWOOD ALTERNATIVE INCOME FUND
WESTWOOD QUALITY SMIDCAP FUND
WESTWOOD TOTAL RETURN FUND
WESTWOOD QUALITY MIDCAP FUND
| LIQUIDITY RISK MANAGEMENT PROGRAM |
The Funds have adopted and implemented a written liquidity risk management program (the “Program”) as required by Rule 22e-4 (the “Liquidity Rule”) under the Investment Company Act of 1940, as amended. The Program is reasonably designed to assess and manage each Fund’s liquidity risk, taking into consideration, among other factors, each Fund’s investment strategy and the liquidity of its portfolio investments during normal and reasonably foreseeable stressed conditions; its short- and long-term cash flow projections; and its cash holdings and access to other funding sources. The Funds’ Board of Trustees (the “Board”) approved the appointment of the Liquidity Administrator Committee, comprising of the Funds’ Adviser and certain Trust officers, to be responsible for the Program’s administration and oversight and for reporting to the Board on at least an annual basis regarding the Program’s operation and effectiveness. The annual written report assessing the Program (the “Report”) was presented to the Board at the October 17 – 18, 2022 Board meeting and covered the period from June 1, 2021 to May 31, 2022 (the “Review Period”).
During the Review Period, the Funds did not experience unusual stress or disruption to its operations related to purchase and redemption activity. Also, during the Review Period, the Funds held adequate levels of cash and highly liquid investments to meet shareholder redemption activities in accordance with applicable requirements. The Report concluded that the Program is reasonably designed to prevent violation of the Liquidity Rule and the Program has been effectively implemented.
102
WESTWOOD FUNDS
| CUSTOMER PRIVACY NOTICE |
| FACTS | WHAT DOES THE WESTWOOD FUNDS® (the “Funds”) DO WITH YOUR PERSONAL INFORMATION? |
| Why? | Financial companies choose how they share your personal information. Federal law gives consumers the right to limit some but not all sharing. Federal law also requires us to tell you how we collect, share, and protect your personal information. Please read this notice carefully to understand what we do. |
| What? | The types of personal information we collect and share depend on the product or service you have with us. This information can include:
■ Social Security number
■ Assets
■ Retirement Assets
■ Transaction History
■ Checking Account Information
■ Purchase History
■ Account Balances
■ Account Transactions
■ Wire Transfer Instructions
When you are no longer our customer, we continue to share your information as described in this notice. |
| How? | All financial companies need to share your personal information to run their everyday business. In the section below, we list the reasons financial companies can share their customers’ personal information; the reasons the Fund chooses to share; and whether you can limit this sharing. |
| Reasons we can share your personal information | Does the Fund share? | Can you limit this sharing? |
For our everyday business purposes – Such as to process your transactions, maintain your account(s), respond to court orders and legal investigations, or report to credit bureaus | Yes | No |
For our marketing purposes – to offer our products and services to you | No | We don’t share |
| For joint marketing with other financial companies | No | We don’t share |
For our affiliates’ everyday business purposes – information about your transactions and experiences | No | We don’t share |
For our affiliates’ everyday business purposes – information about your creditworthiness | No | We don’t share |
| For nonaffiliates to market to you | No | We don’t share |
| Questions? | Call 1-877-FUND-WHG |
103
WESTWOOD FUNDS
| Who we are | |
| Who is providing this notice? | Westwood Funds® Ultimus Fund Distributors, LLC (Distributor) Ultimus Fund Solutions, LLC (Administrator) |
| What we do | |
| How does the Fund protect my personal information? | To protect your personal information from unauthorized access and use, we use security measures that comply with federal law. These measures include computer safeguards and secured files and buildings.
Our service providers are held accountable for adhering to strict policies and procedures to prevent any misuse of your nonpublic personal information. |
| How does the Fund collect my personal information? | We collect your personal information, for example, when you
■ Open an account
■ Provide account information
■ Give us your contact information
■ Make deposits or withdrawals from your account
■ Make a wire transfer
■ Tell us where to send the money
■ Tell us who receives the money
■ Show your government-issued ID
■ Show your driver’s license
We also collect your personal information from other companies. |
| Why can’t I limit all sharing? | Federal law gives you the right to limit only
■ Sharing for affiliates’ everyday business purposes – information about your creditworthiness
■ Affiliates from using your information to market to you
■ Sharing for nonaffiliates to market to you
State laws and individual companies may give you additional rights to limit sharing. |
| Definitions | |
| Affiliates | Companies related by common ownership or control. They can be financial and nonfinancial companies.
■ Westwood Management Corp., the investment adviser to the Fund, could be deemed to be an affiliate. |
| Nonaffiliates | Companies not related by common ownership or control. They can be financial and nonfinancial companies
■ The Fund does not share with nonaffiliates so they can market to you. |
| Joint marketing | A formal agreement between nonaffiliated financial companies that together market financial products or services to you.
■ The Fund does not jointly market. |
104
The Westwood Funds
P.O. Box 541150
Omaha, NE 68154
1-877-FUND-WHG
www.westwoodfunds.com
Adviser:
Westwood Management Corp.
200 Crescent Court, Suite 1200
Dallas, TX 75201
Distributor:
Ultimus Fund Distributors, LLC
225 Pictoria Drive
Suite 450
Cincinnati, OH 45246
Administrator:
Ultimus Fund Solutions, LLC
225 Pictoria Drive
Suite 450
Cincinnati, OH 45246
Legal Counsel:
Sullivan & Worcester LLP
1666 K Streeet, NW
Suite 700
Washington, D.C. 20006
Independent Registered Public Accounting Firm:
Cohen & Company, Ltd.
1835 Market Street, Suite 310
Philadelphia, PA 19103
This information must be preceded or accompanied by a current
prospectus for the Funds.
Westwood-SAR-23
(b). Not applicable
Item 2. Code of Ethics.
Not required
Item 3. Audit Committee Financial Expert.
Not required
Item 4. Principal Accountant Fees and Services.
Not required
Item 5. Audit Committee of Listed Registrants.
Not applicable
Item 6. Schedule of Investments.
| (a) | Not applicable [schedule filed with Item 1] |
| (b) | Not applicable |
Item 7. Disclosure of Proxy Voting Policies and Procedures for Closed-End Management Investment Companies.
Not applicable
| Item 8. Portfolio Managers of Closed-End Management Investment Companies. |
Not applicable
Item 9. Purchases of Equity Securities by Closed-End Management Investment Company and Affiliated Purchasers.
Not applicable
Item 10. Submission of Matters to a Vote of Security Holders.
There has been no material changes to the manner in which shareholders may recommend nominees to the Registrant’s Board of Trustees or the Nominations & Governance Committee (the “Committee”). The Registrant does not have formal procedures by which shareholders may recommend nominees to the Registrant’s Board of Trustees. While the Registrant does not have formal procedure, the Committee shall to the extent required under applicable law, when identifying potential candidates for the position of Independent Trustee, consider any such candidate recommended by a shareholder.
Item 11. Controls and Procedures.
(a) Based on their evaluation of the registrant’s disclosure controls and procedures (as defined in Rule 30a-3(c) under the Investment Company Act of 1940) as of a date within 90 days of the filing date of this report, the registrant’s principal executive officer and principal financial officer have concluded that such disclosure controls and procedures are reasonably designed and are operating effectively to ensure that material information relating to the registrant, including its consolidated subsidiaries, is made known to them by others within those entities, particularly during the period in which this report is being prepared, and that the information required in filings on Form N-CSR is recorded, processed, summarized, and reported on a timely basis.
(b) There were no changes in the registrant’s internal control over financial reporting (as defined in Rule 30a-3(d) under the Investment Company Act of 1940) that occurred during the period covered by this report that have materially affected, or are reasonably likely to materially affect, the registrant’s internal control over financial reporting.
Item 12. Disclosure of Securities Lending Activities for Closed-End Management Investment Companies.
Not applicable
| Item 13. | Exhibits. |
File the exhibits listed below as part of this Form. Letter or number the exhibits in the sequence indicated.
(a)(1) Any code of ethics, or amendment thereto, that is the subject of the disclosure required by Item 2, to the extent that the registrant intends to satisfy the Item 2 requirements through filing of an exhibit: Not required
(a)(2) A separate certification for each principal executive officer and principal financial officer of the registrant as required by Rule 30a-2(a) under the Act (17 CFR 270.30a-2(a)): Attached hereto
(1) Not Applicable
(2) Change in the registrant’s independent public accountants. Attached hereto
(b) Certifications required by Rule 30a-2(b) under the Act (17 CFR 270.30a-2(b)): Attached hereto
Exhibit 99.CERT Certifications required by Rule 30a-2(a) under the Act
Exhibit 99.906CERT Certifications required by Rule 30a-2(b) under the Act
Exhibit 99.IND PUB ACCT Change in registrant’s independent public accounting.
SIGNATURES
Pursuant to the requirements of the Securities Exchange Act of 1934 and the Investment Company Act of 1940, the registrant has duly caused this report to be signed on its behalf by the undersigned, thereunto duly authorized.
| (Registrant) | Ultimus Managers Trust | |||
| By (Signature and Title)* | /s/ Todd E. Heim | |||
| Todd E. Heim, President | ||||
| Date | July 6, 2023 | |||
| Pursuant to the requirements of the Securities Exchange Act of 1934 and the Investment Company Act of 1940, this report has been signed below by the following persons on behalf of the registrant and in the capacities and on the dates indicated. | ||||
| By (Signature and Title)* | /s/ Todd E. Heim | |||
| Todd E. Heim, Principal Executive Officer | ||||
| Date | July 6, 2023 | |||
| By (Signature and Title)* | /s/ Jennifer L. Leamer | |||
| Jennifer L. Leamer, Treasurer and Principal Financial Officer | ||||
| Date | July 6, 2023 | |||
* Print the name and title of each signing officer under his or her signature.