UNITED STATES
SECURITIES AND EXCHANGE COMMISSION
Washington, D.C. 20549
FORM N-CSR
CERTIFIED SHAREHOLDER REPORT OF REGISTERED
MANAGEMENT INVESTMENT COMPANIES
| Investment Company Act file number | 811-22680 | |
| Ultimus Managers Trust |
| (Exact name of registrant as specified in charter) |
| 225 Pictoria Drive, Suite 450 Cincinnati, Ohio | 45246 |
| (Address of principal executive offices) | (Zip code) |
Khimmara Greer
| Ultimus Fund Solutions, LLC 225 Pictoria Drive, Suite 450 Cincinnati, Ohio 45246_ |
| (Name and address of agent for service) |
| Registrant's telephone number, including area code: | (513) 587-3400 | |
| Date of fiscal year end: | February 28 | |
| | | |
| Date of reporting period: | August 31, 2022 | |
Form N-CSR is to be used by management investment companies to file reports with the Commission not later than 10 days after the transmission to stockholders of any report that is required to be transmitted to stockholders under Rule 30e-1 under the Investment Company Act of 1940 (17 CFR 270.30e-1). The Commission may use the information provided on Form N-CSR in its regulatory, disclosure review, inspection, and policymaking roles.
A registrant is required to disclose the information specified by Form N-CSR, and the Commission will make this information public. A registrant is not required to respond to the collection of information contained in Form N-CSR unless the Form displays a currently valid Office of Management and Budget ("OMB") control number. Please direct comments concerning the accuracy of the information collection burden estimate and any suggestions for reducing the burden to the Secretary, Securities and Exchange Commission, 450 Fifth Street, NW, Washington, DC 20549-0609. The OMB has reviewed this collection of information under the clearance requirements of 44 U.S.C. § 3507.
| Item 1. | Reports to Stockholders. |
(a).

Blueprint Adaptive
Growth Allocation Fund
Institutional Class: (BLUIX)
Investor Class: (BLUPX)
Semi-Annual Report
August 31, 2022
(Unaudited)
| BLUEPRINT ADAPTIVE GROWTH ALLOCATION FUND | |
| LETTER TO SHAREHOLDERS | August 31, 2022 |
Dear Shareholders,
Our previous letter in the first quarter of 2022 was written with global equity markets just entering correction territory amid plummeting investor sentiment due to spiking inflation and war breaking out in Ukraine. Since then, things have gone from correction to bear market with nearly all segments surpassing the dreaded 20% decline from the previous high. As we race toward the end of the year, time is running out for 2022 to be salvaged in terms of markets doing anything more than eroding outstanding returns produced in 2021.
The current state of trends paints a bleak picture for both equities and bonds alike. Rallies continue to do little more than bring these assets back to downward pointing trendlines in a series of lower local highs. Until this cycle is broken the risk of continuing new lows remains high. For the six months ending in August, the institutional class recorded a loss of -8.7% compared to the -11.2% loss of the Morningstar Global Allocation Total Return Index (the Fund’s benchmark). For the calendar year-to-date performance, the fund is ahead of the benchmark index by 127 basis points.
The strategy’s systematic approach led it to remain exposed or in some cases even increase exposure of new strength in value-oriented assets by increasing allocations to health and communication. Following a process based on price trends simplifies decision-making down to the core component affecting client portfolios and holders of the Fund. The mix of contributors displays the strength of using individual names with trend. The result of removing allocation from weaker assets (unlike a passive portfolio) to a stronger but similar asset instead of cash (unlike most tactical managers) has helped us to advance from underperforming the Fund’s benchmark in January to outperforming for the previous six months and year-to-date overall even with highly elevated cash levels.
In our experience, to consistently sidestep downside one must have a process for methodically reducing exposure without worrying about what might be missed by doing so. Fortunately, with a rules-based process for reducing risk comes a similarly system for maximizing opportunity so the same rules used to reduce exposure are used to increase it if necessary. For this reason, we are confident that no matter what happens next, we will be in a great position to capitalize.
Thank you for your continued confidence and support of the Blueprint Adaptive Growth Allocation Fund.
Best,
 |  |
| Jon Robinson | Brandon Langley |
Blueprint Fund Management, LLC
www.blueprintmutualfunds.com
Past performance is not predictive of future performance. Investment results and principal value will fluctuate so that shares, when redeemed, may be worth more or less than their original cost. Current performance may be higher or lower than the performance data quoted. Performance data current to the most recent month-end are available by calling 1-866-983-4525.
An investor should consider the investment objectives, risks, charges, and expenses of the Fund carefully before investing. The Fund’s prospectus contains this and other important information. To obtain a copy of the Fund’s prospectus please visit the Fund’s website at www.blueprintmutualfunds.com or call 1-866-983-4525 and a copy will be sent to you free of charge. Please read the prospectus carefully before you invest. The Fund is distributed by Ultimus Fund Distributors, LLC.
The Letter to Shareholders seeks to describe some of the Adviser’s current opinions and views of the financial markets. Although the Adviser believes it has a reasonable basis for any opinions or views expressed, actual results may differ, sometimes significantly so, from those expected or expressed. The securities held by the Fund that are discussed in the Letter to Shareholders were held during the period covered by this Report. They do not comprise the entire investment portfolio of the Fund, may be sold at any time, and may no longer be held by the Fund. For a complete list of securities held by the Fund as of February 28th, 2022, please see the Schedule of Investments section of the annual report. The opinions of the Fund’s adviser with respect to those securities may change at any time.
Statements in the Letter to Shareholders that reflect projections or expectations for future financial or economic performance of the Fund and the market in general and statements of the Fund’s plans and objectives for future operations are forward-looking statements. No assurance can be given that actual results or events will not differ materially from those projected, estimated, assumed, or anticipated in any such forward- looking statements. Important factors that could result in such differences, in addition to factors noted with such forward-looking statements include, without limitation, general economic conditions, such as inflation, recession, and interest rates.
Blueprint Adaptive Growth Allocation Fund (the “Fund”) is not sponsored, endorsed, sold or promoted by Morningstar, Inc. or any of its affiliates (all such entities, collectively, “Morningstar Entities”). The Morningstar Entities make no representation or warranty, express or implied, to individuals who invest in the Fund or any member of the public regarding the advisability of investing in equity securities generally or in the Fund in particular of the ability of the Fund to track the Morningstar Indices or general equity market performance. THE MORNINGSTAR ENTITIES DO NOT GUARANTEE THE ACCURACY AND/OR THE COMPLETENESS OF THE FUND OR ANY DATA INCLUDED THEREIN AND MORNINGSTAR ENTITIES SHALL HAVE NO LIABILITY FOR ANY ERRORS, OMISSIONS, OR INTERRUPTIONS THEREIN.
| BLUEPRINT ADAPTIVE GROWTH ALLOCATION FUND |
| PORTFOLIO INFORMATION |
| August 31, 2022 (Unaudited) |
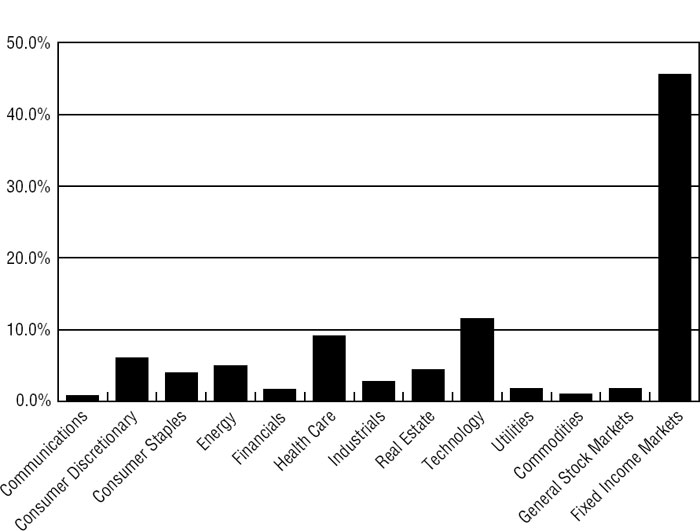
Sector Diversification (% of Net Assets)
| Top 10 Equity Holdings |
| | % of |
| | Net Assets |
| SPDR Bloomberg 1-3 Month T-Bill ETF | 17.7% |
| iShares Short Treasury Bond ETF | 17.7% |
| Apple, Inc. | 11.2% |
| ClearShares Ultra-Short Maturity ETF | 5.9% |
| Amazon.com, Inc. | 2.6% |
| UnitedHealth Group, Inc. | 2.4% |
| iShares 0-3 Month Treasury Bond ETF | 2.2% |
| iShares Treasury Floating Rate Bond ETF | 2.1% |
| Exxon Mobil Corporation | 1.9% |
| Tesla, Inc. | 1.6% |
| BLUEPRINT ADAPTIVE GROWTH ALLOCATION FUND |
| SCHEDULE OF INVESTMENTS |
| August 31, 2022 (Unaudited) |
| COMMON STOCKS — 47.1% | | Shares | | | Value | |
| Communications — 0.8% | | | | | | | | |
| Entertainment Content — 0.4% | | | | | | | | |
| Walt Disney Company (The) (a) | | | 3,729 | | | $ | 417,946 | |
| | | | | | | | | |
| Telecommunications — 0.4% | | | | | | | | |
| T-Mobile US, Inc. (a) | | | 2,564 | | | | 369,114 | |
| | | | | | | | | |
| Consumer Discretionary — 6.0% | | | | | | | | |
| Apparel & Textile Products — 0.1% | | | | | | | | |
| LVMH Moet Hennessy Louis Vuitton S.A. - ADR | | | 996 | | | | 128,942 | |
| | | | | | | | | |
| Automotive — 1.9% | | | | | | | | |
| Ford Motor Company | | | 7,875 | | | | 120,015 | |
| General Motors Company | | | 3,103 | | | | 118,566 | |
| Tesla, Inc. (a) | | | 5,670 | | | | 1,562,709 | |
| | | | | | | | 1,801,290 | |
| E-Commerce Discretionary — 2.6% | | | | | | | | |
| Amazon.com, Inc. (a) | | | 19,034 | | | | 2,412,940 | |
| | | | | | | | | |
| Leisure Facilities & Services — 1.1% | | | | | | | | |
| McDonald’s Corporation | | | 3,371 | | | | 850,436 | |
| Starbucks Corporation | | | 2,655 | | | | 223,206 | |
| | | | | | | | 1,073,642 | |
| Retail - Discretionary — 0.3% | | | | | | | | |
| Lowe’s Companies, Inc. | | | 1,523 | | | | 295,675 | |
| | | | | | | | | |
| Consumer Staples — 4.0% | | | | | | | | |
| Beverages — 2.3% | | | | | | | | |
| Coca-Cola Company (The) | | | 17,824 | | | | 1,099,919 | |
| PepsiCo, Inc. | | | 6,259 | | | | 1,078,238 | |
| | | | | | | | 2,178,157 | |
| Food — 0.2% | | | | | | | | |
| Mondelēz International, Inc. - Class A | | | 3,166 | | | | 195,849 | |
| | | | | | | | | |
| Household Products — 0.3% | | | | | | | | |
| Colgate-Palmolive Company | | | 3,749 | | | | 293,209 | |
| | | | | | | | | |
| Retail - Consumer Staples — 1.2% | | | | | | | | |
| Costco Wholesale Corporation | | | 2,054 | | | | 1,072,393 | |
| BLUEPRINT ADAPTIVE GROWTH ALLOCATION FUND |
| SCHEDULE OF INVESTMENTS (Continued) |
| COMMON STOCKS — 47.1% (Continued) | | Shares | | | Value | |
| Energy — 5.0% | | | | | | | | |
| Oil & Gas Producers — 5.0% | | | | | | | | |
| BP plc - ADR | | | 8,744 | | | $ | 269,665 | |
| Chevron Corporation | | | 8,119 | | | | 1,283,289 | |
| ConocoPhillips | | | 4,628 | | | | 506,534 | |
| Enbridge, Inc. | | | 6,297 | | | | 259,562 | |
| Exxon Mobil Corporation | | | 18,997 | | | | 1,815,923 | |
| Shell plc - ADR | | | 5,064 | | | | 268,291 | |
| TotalEnergies SE - ADR | | | 5,264 | | | | 265,885 | |
| Woodside Energy Group Ltd. - ADR | | | 1,543 | | | | 35,196 | |
| | | | | | | | 4,704,345 | |
| Financials — 1.7% | | | | | | | | |
| Asset Management — 0.5% | | | | | | | | |
| BlackRock, Inc. | | | 316 | | | | 210,579 | |
| Charles Schwab Corporation (The) | | | 3,079 | | | | 218,455 | |
| | | | | | | | 429,034 | |
| Banking — 0.5% | | | | | | | | |
| HSBC Holdings plc - ADR | | | 3,987 | | | | 122,919 | |
| Wells Fargo & Company | | | 8,375 | | | | 366,072 | |
| | | | | | | | 488,991 | |
| Institutional Financial Services — 0.5% | | | | | | | | |
| Goldman Sachs Group, Inc. (The) | | | 745 | | | | 247,839 | |
| Morgan Stanley | | | 3,064 | | | | 261,114 | |
| | | | | | | | 508,953 | |
| Insurance — 0.2% | | | | | | | | |
| MetLife, Inc. | | | 2,996 | | | | 192,733 | |
| | | | | | | | | |
| Health Care — 9.1% | | | | | | | | |
| Biotech & Pharma — 4.7% | | | | | | | | |
| AbbVie, Inc. | | | 4,568 | | | | 614,213 | |
| Amgen, Inc. | | | 2,504 | | | | 601,711 | |
| AstraZeneca plc - ADR | | | 4,300 | | | | 268,234 | |
| Bristol-Myers Squibb Company | | | 5,536 | | | | 373,182 | |
| CSL Ltd. - ADR | | | 2,679 | | | | 268,972 | |
| Eli Lilly & Company | | | 3,973 | | | | 1,196,787 | |
| Merck & Company, Inc. | | | 12,062 | | | | 1,029,612 | |
| Novo Nordisk A/S - ADR | | | 1,204 | | | | 127,745 | |
| | | | | | | | 4,480,456 | |
| BLUEPRINT ADAPTIVE GROWTH ALLOCATION FUND |
| SCHEDULE OF INVESTMENTS (Continued) |
| COMMON STOCKS — 47.1% (Continued) | | Shares | | | Value | |
| Health Care — 9.1% (Continued) | | | | | | | | |
| Health Care Facilities & Services — 3.0% | | | | | | | | |
| CVS Health Corporation | | | 5,700 | | | $ | 559,455 | |
| UnitedHealth Group, Inc. | | | 4,312 | | | | 2,239,351 | |
| | | | | | | | 2,798,806 | |
| Medical Equipment & Devices — 1.4% | | | | | | | | |
| Danaher Corporation | | | 2,982 | | | | 804,871 | |
| Thermo Fisher Scientific, Inc. | | | 902 | | | | 491,879 | |
| | | | | | | | 1,296,750 | |
| Industrials — 2.8% | | | | | | | | |
| Aerospace & Defense — 1.2% | | | | | | | | |
| Boeing Company (The) (a) | | | 1,351 | | | | 216,498 | |
| General Dynamics Corporation | | | 1,002 | | | | 229,388 | |
| Lockheed Martin Corporation | | | 987 | | | | 414,648 | |
| Raytheon Technologies Corporation | | | 3,536 | | | | 317,356 | |
| | | | | | | | 1,177,890 | |
| Diversified Industrials — 0.3% | | | | | | | | |
| Honeywell International, Inc. | | | 1,509 | | | | 285,729 | |
| | | | | | | | | |
| Transportation & Logistics — 1.3% | | | | | | | | |
| Canadian National Railway Company | | | 2,265 | | | | 269,332 | |
| Union Pacific Corporation | | | 1,361 | | | | 305,558 | |
| United Parcel Service, Inc. - Class B | | | 3,198 | | | | 622,043 | |
| | | | | | | | 1,196,933 | |
| Real Estate — 4.4% | | | | | | | | |
| REITs — 4.4% | | | | | | | | |
| American Tower Corporation | | | 6,109 | | | | 1,551,991 | |
| Duke Realty Corporation | | | 4,972 | | | | 292,602 | |
| Extra Space Storage, Inc. | | | 1,566 | | | | 311,211 | |
| Host Hotels & Resorts, Inc. | | | 8,778 | | | | 155,985 | |
| Public Storage | | | 1,922 | | | | 635,855 | |
| Realty Income Corporation | | | 8,238 | | | | 562,491 | |
| SBA Communications Corporation | | | 712 | | | | 231,578 | |
| VICI Properties, Inc | | | 12,623 | | | | 416,433 | |
| | | | | | | | 4,158,146 | |
| BLUEPRINT ADAPTIVE GROWTH ALLOCATION FUND |
| SCHEDULE OF INVESTMENTS (Continued) |
| COMMON STOCKS — 47.1% (Continued) | | Shares | | | Value | |
| Technology — 11.5% | | | | | | | | |
| Technology Hardware — 11.2% | | | | | | | | |
| Apple, Inc. | | | 67,873 | | | $ | 10,670,993 | |
| | | | | | | | | |
| Technology Services — 0.3% | | | | | | | | |
| International Business Machines Corporation | | | 1,981 | | | | 254,459 | |
| | | | | | | | | |
| Utilities — 1.8% | | | | | | | | |
| Electric Utilities — 1.8% | | | | | | | | |
| Constellation Energy Corporation | | | 778 | | | | 63,477 | |
| Duke Energy Corporation | | | 3,466 | | | | 370,550 | |
| Exelon Corporation | | | 4,414 | | | | 193,819 | |
| NextEra Energy, Inc. | | | 8,334 | | | | 708,890 | |
| Southern Company (The) | | | 4,642 | | | | 357,759 | |
| | | | | | | | 1,694,495 | |
| | | | | | | | | |
| Total Common Stocks (Cost $43,448,184) | | | | | | $ | 44,577,870 | |
| BLUEPRINT ADAPTIVE GROWTH ALLOCATION FUND |
| SCHEDULE OF INVESTMENTS (Continued) |
| EXCHANGE-TRADED FUNDS — 48.3% | | Shares | | | Value | |
| ClearShares Ultra-Short Maturity ETF | | | 55,510 | | | $ | 5,559,771 | |
| iShares 0-3 Month Treasury Bond ETF | | | 20,706 | | | | 2,074,741 | |
| iShares Gold Trust (a) | | | 28,267 | | | | 917,547 | |
| iShares MSCI Brazil ETF | | | 6,293 | | | | 192,062 | |
| iShares MSCI Chile ETF | | | 4,303 | | | | 119,494 | |
| iShares MSCI India ETF | | | 21,079 | | | | 906,819 | |
| iShares MSCI Indonesia ETF | | | 2,342 | | | | 55,646 | |
| iShares MSCI Qatar ETF | | | 4,454 | | | | 100,794 | |
| iShares MSCI Saudi Arabia ETF | | | 3,759 | | | | 166,674 | |
| iShares MSCI Turkey ETF | | | 8,570 | | | | 192,739 | |
| iShares Short Treasury Bond ETF | | | 152,097 | | | | 16,750,443 | |
| iShares Treasury Floating Rate Bond ETF | | | 39,465 | | | | 1,991,798 | |
| SPDR Bloomberg 1-3 Month T-Bill ETF | | | 182,969 | | | | 16,750,812 | |
| Total Exchange-Traded Funds (Cost $45,817,528) | | | | | | $ | 45,779,340 | |
| | | | | | | | | |
| MONEY MARKET FUNDS — 11.7% | | Shares | | | Value | |
| Federated Hermes Government Obligations Fund - Institutional Class, 2.11% (b) | | | 100,000 | | | $ | 100,000 | |
| First American Government Obligations Fund - Class X, 2.04% (b) | | | 11,015,020 | | | | 11,015,020 | |
| Total Money Market Funds (Cost $11,115,020) | | | | | | $ | 11,115,020 | |
| | | | | | | | | |
| Investments at Value — 107.1% (Cost $100,380,732) | | | | | | $ | 101,472,230 | |
| | | | | | | | | |
| Liabilities in Excess of Other Assets — (7.1%) | | | | | | | (6,721,360 | ) |
| | | | | | | | | |
| Net Assets — 100.0% | | | | | | $ | 94,750,870 | |
| (a) | Non-income producing security. |
| (b) | The rate shown is the 7-day effective yield as of August 31, 2022. |
A/S - Aktieselskab
ADR - American Depositary Receipt
plc - Public Limited Company
S.A. - Societe Anonyme
SE - Societe Europaea
See accompanying notes to financial statements.
| BLUEPRINT ADAPTIVE GROWTH ALLOCATION FUND |
| STATEMENT OF ASSETS AND LIABILITIES |
| August 31, 2022 (Unaudited) |
| ASSETS | | | | |
| Investments: | | | | |
| At cost | | $ | 100,380,732 | |
| At value (Note 2) | | $ | 101,472,230 | |
| Receivable for capital shares sold | | | 2,364,269 | |
| Receivable for investment securities sold | | | 8,865,814 | |
| Dividends receivable | | | 91,519 | |
| Tax reclaims receivable | | | 185 | |
| Other assets | | | 29,951 | |
| Total assets | | | 112,823,968 | |
| | | | | |
| LIABILITIES | | | | |
| Payable for capital shares redeemed | | | 457,222 | |
| Payable for investment securities purchased | | | 17,533,164 | |
| Payable to the Adviser (Note 4) | | | 54,707 | |
| Payable to administrator (Note 4) | | | 14,975 | |
| Accrued distribution fees (Note 4) | | | 560 | |
| Other accrued expenses | | | 12,470 | |
| Total liabilities | | | 18,073,098 | |
| | | | | |
| NET ASSETS | | $ | 94,750,870 | |
| | | | | |
| NET ASSETS CONSIST OF: | | | | |
| Paid-in capital | | $ | 96,379,841 | |
| Accumulated deficit | | | (1,628,971 | ) |
| NET ASSETS | | $ | 94,750,870 | |
| | | | | |
| NET ASSET VALUE PER SHARE: | | | | |
| INVESTOR CLASS | | | | |
| Net assets applicable to Investor Class | | $ | 1,224,788 | |
| Investor Class shares of beneficial interest outstanding (unlimited number of shares authorized, no par value) | | | 105,723 | |
| Net asset value, offering price and redemption price per share (Note 2) | | $ | 11.58 | |
| | | | | |
| INSTITUTIONAL CLASS | | | | |
| Net assets applicable to Institutional Class | | $ | 93,526,082 | |
| Institutional Class shares of beneficial interest outstanding (unlimited number of shares authorized, no par value) | | | 8,029,823 | |
| Net asset value, offering price and redemption price per share (Note 2) | | $ | 11.65 | |
See accompanying notes to financial statements.
| BLUEPRINT ADAPTIVE GROWTH ALLOCATION FUND |
| STATEMENT OF OPERATIONS |
| Period Ended August 31, 2022 (Unaudited) |
| INVESTMENT INCOME | | | | |
| Dividend income (net of foreign withholding taxes of $14,182) | | $ | 687,107 | |
| | | | | |
| EXPENSES | | | | |
| Management fees (Note 4) | | | 395,379 | |
| Administration fees (Note 4) | | | 41,608 | |
| Registration and filing fees | | | 22,311 | |
| Fund accounting fees (Note 4) | | | 21,660 | |
| Legal fees | | | 17,921 | |
| Transfer agent fees - Institutional Class (Note 4) | | | 9,000 | |
| Transfer agent fees - Investor Class (Note 4) | | | 6,000 | |
| Shareholder report expense | | | 13,590 | |
| Trustees’ fees and expenses (Note 4) | | | 9,582 | |
| Audit and tax services fees | | | 8,250 | |
| Compliance service fees (Note 4) | | | 6,000 | |
| Custodian and bank service fees | | | 5,476 | |
| Postage and supplies | | | 4,545 | |
| Insurance expense | | | 1,930 | |
| Distribution fees - Investor Class (Note 4) | | | 1,174 | |
| Other expenses | | | 11,112 | |
| Total Expenses | | | 575,538 | |
| Fee reductions by the Adviser (Note 4) | | | (54,205 | ) |
| Net Expenses | | | 521,333 | |
| | | | | |
| NET INVESTMENT INCOME | | | 165,774 | |
| | | | | |
| REALIZED AND UNREALIZED LOSSES ON INVESTMENTS AND FOREIGN CURRENCIES | | | | |
| Net realized losses from: | | | | |
| Investments | | | (560,756 | ) |
| Foreign currency transactions | | | (62 | ) |
| Net change in unrealized appreciation (depreciation) on: | | | | |
| Investments | | | (7,104,270 | ) |
| Foreign currency translations | | | (74 | ) |
| NET REALIZED AND UNREALIZED LOSSES ON INVESTMENTS AND FOREIGN CURRENCIES | | | (7,665,162 | ) |
| | | | | |
| NET DECREASE IN NET ASSETS RESULTING FROM OPERATIONS | | $ | (7,499,388 | ) |
See accompanying notes to financial statements.
| BLUEPRINT ADAPTIVE GROWTH ALLOCATION FUND |
| STATEMENTS OF CHANGES IN NET ASSETS |
| | | Six Months Ended | | | Year Ended | |
| | | August 31, 2022 | | | February 28, | |
| | | (Unaudited) | | | 2022 | |
| FROM OPERATIONS | | | | | | | | |
| Net investment income | | $ | 165,774 | | | $ | 364,059 | |
| Net realized losses from: | | | | | | | | |
| Investments | | | (560,756 | ) | | | (1,889,349 | ) |
| Foreign currency transactions | | | (62 | ) | | | (351 | ) |
| Net change in unrealized appreciation (depreciation) on investments and foreign currencies | | | (7,104,344 | ) | | | 4,250,753 | |
| Net increase (decrease) in net assets resulting from operations | | | (7,499,388 | ) | | | 2,725,112 | |
| | | | | | | | | |
| FROM DISTRIBUTIONS TO SHAREHOLDERS (Note 2) | | | | | | | | |
| Investor Class | | | — | | | | (2,772 | ) |
| Institutional Class | | | — | | | | (365,245 | ) |
| Decrease in net assets from distributions to shareholders | | | — | | | | (368,017 | ) |
| | | | | | | | | |
| CAPITAL SHARE TRANSACTIONS | | | | | | | | |
| Investor Class | | | | | | | | |
| Proceeds from shares sold | | | 597,525 | | | | 892,113 | |
| Net asset value of shares issued in reinvestment of distributions to shareholders | | | — | | | | 2,772 | |
| Payments for shares redeemed | | | (145,515 | ) | | | (89,685 | ) |
| Net increase in Investor Class net assets from capital share transactions | | | 452,010 | | | | 805,200 | |
| | | | | | | | | |
| Institutional Class | | | | | | | | |
| Proceeds from shares sold | | | 36,048,473 | | | | 39,522,452 | |
| Net asset value of shares issued in reinvestment of distributions to shareholders | | | — | | | | 365,216 | |
| Payments for shares redeemed | | | (15,140,994 | ) | | | (15,504,692 | ) |
| Net increase in Institutional Class net assets from capital share transactions | | | 20,907,479 | | | | 24,382,976 | |
| | | | | | | | | |
| TOTAL INCREASE IN NET ASSETS | | | 13,860,101 | | | | 27,545,271 | |
| | | | | | | | | |
| NET ASSETS | | | | | | | | |
| Beginning of period | | | 80,890,769 | | | | 53,345,498 | |
| End of period | | $ | 94,750,870 | | | $ | 80,890,769 | |
See accompanying notes to financial statements.
| BLUEPRINT ADAPTIVE GROWTH ALLOCATION FUND |
| STATEMENTS OF CHANGES IN NET ASSETS (Continued) |
| | | Six Months Ended | | | Year Ended | |
| | | August 31, 2022 | | | February 28, | |
| | | (Unaudited) | | | 2022 | |
| CAPITAL SHARES ACTIVITY | | | | | | |
| Investor Class | | | | | | | | |
| Shares sold | | | 50,253 | | | | 68,431 | |
| Shares issued in reinvestment of distributions to shareholders | | | — | | | | 202 | |
| Shares redeemed | | | (12,170 | ) | | | (7,007 | ) |
| Net increase in shares outstanding | | | 38,083 | | | | 61,626 | |
| Shares outstanding at beginning of period | | | 67,640 | | | | 6,014 | |
| Shares outstanding at end of period | | | 105,723 | | | | 67,640 | |
| | | | | | | | | |
| Institutional Class | | | | | | | | |
| Shares sold | | | 2,991,078 | | | | 3,030,556 | |
| Shares issued in reinvestment of distributions to shareholders | | | — | | | | 26,503 | |
| Shares redeemed | | | (1,244,352 | ) | | | (1,196,884 | ) |
| Net increase in shares outstanding | | | 1,746,726 | | | | 1,860,175 | |
| Shares outstanding at beginning of period | | | 6,283,097 | | | | 4,422,922 | |
| Shares outstanding at end of period | | | 8,029,823 | | | | 6,283,097 | |
See accompanying notes to financial statements.
| BLUEPRINT ADAPTIVE GROWTH ALLOCATION FUND |
| INVESTOR CLASS |
| FINANCIAL HIGHLIGHTS |
Per Share Data for a Share Outstanding Throughout Each Period
| | | Six Months | | | | | | |
| | | Ended | | | | | | |
| | | August 31, | | Year Ended | | Period Ended |
| | | 2022 | | February 28, | | February 28, |
| | | (Unaudited) | | 2022 | | 2021(a) |
| Net asset value at beginning of period | | $ | 12.69 | | | $ | 12.02 | | | $ | 10.00 | |
| Income (loss) from investment operations: | | | | | | | | | | | | |
| Net investment income (loss) (b)(c) | | | 0.01 | | | | 0.04 | | | | (0.02 | ) |
| Net realized and unrealized gains (losses) on investments and foreign currencies | | | (1.12 | ) | | | 0.68 | | | | 2.07 | |
| Total from investment operations | | | (1.11 | ) | | | 0.72 | | | | 2.05 | |
| Less distributions from: | | | | | | | | | | | | |
| Net investment income | | | — | | | | (0.05 | ) | | | (0.03 | ) |
| Net asset value at end of period | | $ | 11.58 | | | $ | 12.69 | | | $ | 12.02 | |
| Total return (d) | | | (8.75 | %) (e) | | | 5.95 | % | | | 20.48 | % (e) |
| Net assets at end of period (000’s) | | $ | 1,225 | | | $ | 858 | | | $ | 72 | |
| Ratios/supplementary data: | | | | | | | | | | | | |
| Ratio of total expenses to average net assets (f) | | | 3.77 | % (g) | | | 6.96 | % | | | 104.34 | % (g) |
| Ratio of net expenses to average net assets (f)(h) | | | 1.50 | % (g) | | | 1.50 | % (i) | | | 1.60 | % (g)(i) |
| Ratio of net investment income (loss) to average net assets (c)(f)(h) | | | 0.16 | % (g) | | | 0.30 | % | | | (0.16 | %) (g) |
| Portfolio turnover rate | | | 124 | % (e) | | | 130 | % | | | 95 | % (e) |
| (a) | Represents the period from the commencement of operations (March 31, 2020) through February 28, 2021. |
| (b) | Per share net investment income (loss) has been determined on the basis of average number of shares outstanding during the period. |
| (c) | Recognition of net investment income (loss) by the Fund is affected by the timing of the declaration of the dividends by the underlying companies in which the Fund invests. |
| (d) | Total return is a measure of the change in value of an investment in the Fund over the periods covered. The returns shown do not reflect the deduction of taxes a shareholder would pay on Fund distributions, if any, or the redemption of Fund shares. The total returns would have been lower had the Adviser not reduced management fees and reimbursed expenses (Note 4). |
| (f) | Ratio does not include expenses of the investment companies in which the Fund invests. |
| (h) | Ratio was determined after management fees reductions and expense reimbursements (Note 4). |
| (i) | Includes costs to organize the Fund of less than 0.005% and 0.10% for the year ended February 28, 2022 and period ended February 28, 2021, respectively, which are excluded from the Expense Limitation Agreement (Note 4). |
See accompanying notes to financial statements.
| BLUEPRINT ADAPTIVE GROWTH ALLOCATION FUND |
| INSTITUTIONAL CLASS |
| FINANCIAL HIGHLIGHTS |
Per Share Data for a Share Outstanding Throughout Each Period
| | | Six Months | | | | | | |
| | | Ended | | | | | | |
| | | August 31, | | Year Ended | | Period Ended |
| | | 2022 | | February 28, | | February 28, |
| | | (Unaudited) | | 2022 | | 2021(a) |
| Net asset value at beginning of period | | $ | 12.74 | | | $ | 12.04 | | | $ | 10.00 | |
| Income from investment operations: | | | | | | | | | | | | |
| Net investment income (b)(c) | | | 0.02 | | | | 0.07 | | | | 0.02 | |
| Net realized and unrealized gains (losses) on investments and foreign currencies | | | (1.11 | ) | | | 0.69 | | | | 2.06 | |
| Total from investment operations | | | (1.09 | ) | | | 0.76 | | | | 2.08 | |
| Less distributions from: | | | | | | | | | | | | |
| Net investment income | | | — | | | | (0.06 | ) | | | (0.04 | ) |
| Net asset value at end of period | | $ | 11.65 | | | $ | 12.74 | | | $ | 12.04 | |
| Total return (d) | | | (8.56 | %) (e) | | | 6.29 | % | | | 20.80 | % (e) |
| Net assets at end of period (000’s) | | $ | 93,526 | | | $ | 80,032 | | | $ | 53,273 | |
| Ratios/supplementary data: | | | | | | | | | | | | |
| Ratio of total expenses to average net assets (f) | | | 1.35 | % (g) | | | 1.40 | % | | | 1.93 | % (g) |
| Ratio of net expenses to average net assets (f)(h) | | | 1.25 | % (g) | | | 1.26 | % (i) | | | 1.35 | % (g)(i) |
| Ratio of net investment income to average net assets (c)(f)(h) | | | 0.40 | % (g) | | | 0.54 | % | | | 0.20 | % (g) |
| Portfolio turnover rate | | | 124 | % (e) | | | 130 | % | | | 95 | % (e) |
| (a) | Represents the period from the commencement of operations (March 31, 2020) through February 28, 2021. |
| (b) | Per share net investment income (loss) has been determined on the basis of average number of shares outstanding during the period. |
| (c) | Recognition of net investment income (loss) by the Fund is affected by the timing of the declaration of the dividends by the underlying companies in which the Fund invests. |
| (d) | Total return is a measure of the change in value of an investment in the Fund over the periods covered. The returns shown do not reflect the deduction of taxes a shareholder would pay on Fund distributions, if any, or the redemption of Fund shares. The total returns would have been lower had the Adviser not reduced management fees and reimbursed expenses (Note 4). |
| (f) | Ratio does not include expenses of the investment companies in which the Fund invests. |
| (h) | Ratio was determined after management fees reductions and expense reimbursements (Note 4). |
| (i) | Includes costs to organize the Fund of 0.01% and 0.10% for the year ended February 28, 2022 and period ended February 28, 2021, respectively, which are excluded from the Expense Limitation Agreement (Note 4). |
See accompanying notes to financial statements.
| BLUEPRINT ADAPTIVE GROWTH ALLOCATION FUND |
| NOTES TO FINANCIAL STATEMENTS |
| August 31, 2022 (Unaudited) |
Blueprint Adaptive Growth Allocation Fund (formerly Blueprint Growth Fund) (the “Fund”) is a diversified series of Ultimus Managers Trust (the “Trust”). The Trust is an open-end management investment company established as an Ohio business trust under a Declaration of Trust dated February 28, 2012. Other series of the Trust are not incorporated in this report. The Fund commenced operations on March 31, 2020.
The investment objective of the Fund is to seek capital appreciation while managing risk.
The Fund currently offers two classes of shares: Investor Class shares (sold without any sales loads, but subject to a distribution and/or shareholder servicing fee of up to 0.25% of the average daily net assets attributable to Investor Class shares and requiring a $5,000 initial investment) and Institutional Class shares (sold without any sales loads and distribution and/or shareholder servicing fees and requiring a $15,000 initial investment). Each share class represents an ownership interest in the same investment portfolio.
| 2. | Significant Accounting Policies |
The following is a summary of the Fund’s significant accounting policies used in the preparation of its financial statements. These policies are in conformity with accounting principles generally accepted in the United States of America (“GAAP”). The Fund follows accounting and reporting guidance under Financial Accounting Standards Board Accounting Standards Codification Topic 946, “Financial Services – Investment Companies.”
Securities valuation – The Fund values its portfolio securities at fair value as of the close of regular trading on the New York Stock Exchange (the “NYSE”) (normally 4:00 p.m. Eastern time) on each business day the NYSE is open for business. The Fund values its listed securities, including common stocks and exchange-traded funds (“ETFs”), on the basis of the security’s last sale price on the security’s primary exchange, if available, otherwise at the exchange’s most recently quoted mean price. NASDAQ-listed securities are valued at the NASDAQ Official Closing Price. When using a quoted price and when the market for the security is considered active, the security will be classified as Level 1 within the fair value hierarchy (see below). In the event that market quotations are not readily available or are considered unreliable due to market or other events, the Fund values its securities and other assets at fair value in accordance with procedures adopted by the Board of Trustees of the Trust (the “Board”). Under these procedures, the securities will be classified as Level 2 or 3 within the fair value hierarchy, depending on the inputs used. Unavailable or unreliable market quotes may be due to the following factors: a substantial bid-ask spread; infrequent sales resulting in stale prices; insufficient trading volume; small trade sizes; a temporary lapse in any reliable pricing source; and actions of the
| BLUEPRINT ADAPTIVE GROWTH ALLOCATION FUND |
| NOTES TO FINANCIAL STATEMENTS (Unaudited) (Continued) |
securities or futures markets, such as the suspension or limitation of trading. As a result, the prices of securities used to calculate the Fund’s net asset value (“NAV”) may differ from quoted or published prices for the same securities.
GAAP establishes a single authoritative definition of fair value, sets out a framework for measuring fair value, and requires additional disclosures about fair value measurements.
Various inputs are used in determining the value of the Fund’s investments. These inputs are summarized in the three broad levels listed below:
| ● | Level 1 – quoted prices in active markets for identical securities |
| ● | Level 2 – other significant observable inputs |
| ● | Level 3 – significant unobservable inputs |
The inputs or methods used for valuing securities are not necessarily an indication of the risks associated with investing in those securities. The inputs used to measure fair value may fall into different levels of the fair value hierarchy. In such cases, for disclosure purposes, the level in the fair value hierarchy within which the fair value measurement falls in its entirety is determined based on the lowest level input that is significant to the fair value measurement.
The following is a summary of the Fund’s investments and the level of inputs used to value the investments as of August 31, 2022:
| | | Level 1 | | | Level 2 | | | Level 3 | | | Total | |
| Common Stocks | | $ | 44,577,870 | | | $ | — | | | $ | — | | | $ | 44,577,870 | |
| Exchange-Traded Funds | | | 45,779,340 | | | | — | | | | — | | | | 45,779,340 | |
| Money Market Funds | | | 11,115,020 | | | | — | | | | — | | | | 11,115,020 | |
| Total | | $ | 101,472,230 | | | $ | — | | | $ | — | | | $ | 101,472,230 | |
| | | | | | | | | | | | | | | | | |
Refer to the Fund’s Schedule of Investments for a listing of the common stocks by sector and industry type. The Fund did not hold any derivative instruments or any assets or liabilities that were measured at fair value on a recurring basis using significant unobservable inputs (Level 3) as of or during the six months ended August 31, 2022.
Foreign currency translation – Securities and other assets and liabilities denominated in or expected to settle in foreign currencies, if any, are translated into U.S. dollars based on exchange rates on the following basis:
| A. | The fair values of investment securities and other assets and liabilities are translated as of the close of the NYSE each day. |
| B. | Purchases and sales of investment securities and income and expenses are translated at the rate of exchange prevailing as of 4:00 p.m. Eastern Time on the respective date of such transactions. |
| BLUEPRINT ADAPTIVE GROWTH ALLOCATION FUND |
| NOTES TO FINANCIAL STATEMENTS (Unaudited) (Continued) |
| C. | The Fund does not isolate that portion of the results of operations caused by changes in foreign exchange rates on investments from those caused by changes in market prices of securities held. Such fluctuations are included with the net realized and unrealized gains or losses on investments. |
Reported net realized foreign exchange gains or losses arise from 1) purchases and sales of foreign currencies, 2) currency gains or losses realized between the trade and settlement dates on securities transactions, and 3) the difference between the amounts of dividends and foreign withholding taxes recorded on the Fund’s books and the U.S. dollar equivalent of the amounts actually received or paid. Reported net unrealized foreign exchange gains and losses arise from changes in the value of assets and liabilities that result from changes in exchange rates.
Cash – The Fund’s cash, if any, is held in a bank account with balances which, at times, may exceed United States federally insured limits set by the Federal Deposit Insurance Corporation. The Fund maintains these balances with a high quality financial institution and may incur charges on cash overdrafts.
Share valuation – The NAV per share of each class of the Fund is calculated daily by dividing the total value of the assets attributable to that class, less liabilities attributable to that class, by the number of shares outstanding of that class. The offering price and redemption price per share of each class of the Fund is equal to the NAV per share of such class.
Investment income – Dividend income is recorded on the ex-dividend date. Non-cash dividends included in dividend income, if any, are recorded at the fair market value of the security received. Interest income is accrued as earned. Withholding taxes on foreign dividends, if any, have been recorded in accordance with the Fund’s understanding of the applicable country’s rules and tax rates.
Investment transactions – Investment transactions are accounted for on the trade date. Realized gains and losses on investments sold are determined on a specific identification basis.
Offering costs – The Adviser advanced some of the Fund’s initial offering costs and was subsequently reimbursed by the Fund. Costs of $29,700 incurred in connection with the offering and initial registration had been deferred and were subsequently amortized on a straight-line basis over the first twelve months after commencement of operations. As of August 31, 2022, there were no unamortized offering costs remaining in the Fund.
Common expenses – Common expenses of the Trust are allocated among the Fund and the other series of the Trust based on the relative net assets of each series, the number of series in the Trust, or the nature of the services performed and the relative applicability to each series.
| BLUEPRINT ADAPTIVE GROWTH ALLOCATION FUND |
| NOTES TO FINANCIAL STATEMENTS (Unaudited) (Continued) |
Allocation between Classes – Investment income earned, realized capital gains and losses, and unrealized appreciation and depreciation are allocated daily to each Class of the Fund based upon its proportionate share of total net assets of the Fund. Class-specific expenses are charged directly to the Class incurring the expense. Common expenses which are not attributable to a specific Class are allocated daily to the Class of shares of the Fund based upon its proportionate share of total net assets of the Fund.
Distributions to shareholders – The Fund distributes to shareholders any net investment income dividends and net realized capital gains on an annual basis. The amount of such dividends and distributions are determined in accordance with federal income tax regulations, which may differ from GAAP. Dividends and distributions to shareholders are recorded on the ex-dividend date. The tax character of distributions paid to shareholders by the Fund during the year ended February 28, 2022, was ordinary income. There were no distributions paid to shareholders by the Fund during the six months ended August 31, 2022.
Estimates – The preparation of financial statements in conformity with GAAP requires management to make estimates and assumptions that affect the reported amounts of assets and liabilities and disclosure of contingent assets and liabilities as of the date of the financial statements and the reported amounts of increase (decrease) in net assets from operations during the reporting period. Actual results could differ from those estimates.
Federal tax – The Fund has qualified and intends to continue to qualify as a regulated investment company under the Internal Revenue Code of 1986, as amended (the “Code”). Qualification generally will relieve the Fund of liability for federal income taxes to the extent 100% of its net investment income and net realized capital gains are distributed in accordance with the Code.
In order to avoid imposition of the excise tax applicable to regulated investment companies, it is also the Fund’s intention to declare as dividends in each calendar year equal to at least 98% of its net investment income (earned during the calendar year) and 98.2% of its net realized capital gains (earned during the twelve months ended October 31) plus undistributed amounts from prior years.
The following information is computed on a tax basis for each item as of February 28, 2022:
| | | | |
| Cost of investments | | $ | 72,274,804 | |
| Gross unrealized appreciation | | $ | 8,286,680 | |
| Gross unrealized depreciation | | | (444,667 | ) |
| Net unrealized appreciation | | | 7,842,013 | |
| Accumulated capital and other losses | | | (1,971,596 | ) |
| Distributable earnings | | $ | 5,870,417 | |
| | | | | |
| BLUEPRINT ADAPTIVE GROWTH ALLOCATION FUND |
| NOTES TO FINANCIAL STATEMENTS (Unaudited) (Continued) |
The federal tax cost, unrealized appreciation (depreciation) as of August 31, 2022 is as follows:
| | | | |
| Cost of investments and foreign currency translations | | $ | 100,542,543 | |
| Gross unrealized appreciation | | $ | 1,847,067 | |
| Gross unrealized depreciation | | | (917,380 | ) |
| Net unrealized appreciation | | $ | 929,687 | |
| | | | | |
The difference between the federal income tax cost of investments and the financial statement cost of investments is due to certain timing differences in the recognition of capital gains or losses under income tax regulations and GAAP. These “book/tax” differences are temporary in nature and are primarily due to the tax deferral of losses on wash sales and adjustments to basis for grantor trusts.
Net qualified late year losses, incurred after December 31, 2021 and within the taxable year, are deemed to arise on the first day of the Fund’s next taxable year.
For the year ended February 28, 2022, the Fund deferred $41,466 of late year ordinary losses to March 1, 2022 for federal tax purposes.
As of February 28, 2022, the Fund had short-term capital loss carryforwards of $1,930,130 for federal income tax purposes. These capital loss carryforwards, which do not expire, may be utilized in the current and future years to offset net realized capital gains, if any.
The Fund recognizes the tax benefits or expenses of uncertain tax positions only when the position is “more likely than not” of being sustained assuming examination by tax authorities. Management has reviewed the Fund’s tax positions for the current and all open tax years (generally, three years) and has concluded that no provision for unrecognized tax benefits or expenses is required in these financial statements. The Fund identifies its major tax jurisdiction as U.S. Federal. The Fund recognizes interest and penalties, if any, related to unrecognized tax benefits as income tax on the Statement of Operations. During the six months ended August 31, 2022, the Fund did not incur any interest of penalties.
| 3. | Investment Transactions |
During the six months ended August 31, 2022, cost of purchases and proceeds from sales of investment securities, other than short-term investments, amounted to $118,960,977 and $97,595,462, respectively.
| 4. | Transactions with Related Parties |
ADVISORY AND SUB-ADVISORY AGREEMENTS
Pursuant to the terms of the Advisory Agreement, Blueprint Fund Management, LLC (the “Adviser”) serves as the investment adviser to the Fund. The Adviser provides the Fund with the selection of a sub-investment advisor and the compliance and managerial
| BLUEPRINT ADAPTIVE GROWTH ALLOCATION FUND |
| NOTES TO FINANCIAL STATEMENTS (Unaudited) (Continued) |
oversight of that sub-adviser and its services to the Fund. The Fund pays the Adviser a management fee, computed and accrued daily and paid monthly, at the annual rate of 0.95% of average daily net assets.
Blueprint Investment Partners, LLC (the “Sub-Adviser”) serves as the Funds sub-adviser. Pursuant to the Sub-Advisory Agreement, the Sub-Adviser provides the Fund with a continuous program of investing the Fund’s assets and determining the composition of the Fund’s portfolio. For its services, the Adviser pays the Sub-Adviser an investment sub-advisory fee computed at the annual rate of 0.20% of the Fund’s average daily net assets. The Fund does not directly pay the sub-advisory fee.
Pursuant to an Expense Limitation Agreement (“ELA”) between the Fund and the Adviser, the Adviser has agreed contractually, until June 30, 2024, to reduce its management fees and reimburse other expenses to the extent necessary to limit total annual fund operating expenses (excluding brokerage costs, taxes, interest, borrowing costs such as interest and dividend expenses on securities sold short, acquired fund fees and expenses, costs to organize the Fund, extraordinary expenses such as litigation and merger or reorganization costs and other expenses not incurred in the ordinary course of the Fund’s business) to 1.50% and 1.25% of average daily net assets for Investor Class and Institutional Class shares, respectively. Accordingly, during the six months ended August 31, 2022, the Adviser reduced its management fees in the amount of $22,220, and, in addition, reimbursed other operating expenses of $31,985.
Management reductions and expense reimbursements by the Adviser are subject to repayment by the Fund for a period of three years after such fees and expenses were incurred, provided that the repayments do not cause total annual fund operating expenses (exclusive of such reductions and reimbursements) to exceed (i) the expense limitation then in effect, if any, and (ii) the expense limitation in effect at the time the expenses to be repaid were incurred. Prior to June 30, 2024, the agreement may not be modified or terminated without the approval of the Board. After June 30, 2024, the ELA may continue from year-to-year provided such continuance is approved by the Board. The ELA may be terminated by the Adviser, or the Board, without approval by the other party, at the end of the then current term upon not less than 90 days’ notice to the other parties as set forth in the ELA. As of August 31, 2022, the Adviser may seek repayment of expense reimbursements no later than the dates below:
| | | | | |
| February 29, 2024 | | $ | 141,841 | |
| February 28, 2025 | | | 113,574 | |
| August 31, 2025 | | | 54,205 | |
| Total | | $ | 309,620 | |
| | | | | |
| BLUEPRINT ADAPTIVE GROWTH ALLOCATION FUND |
| NOTES TO FINANCIAL STATEMENTS (Unaudited) (Continued) |
OTHER SERVICE PROVIDERS
Ultimus Fund Solutions, LLC (“Ultimus”) provides administration, fund accounting, compliance and transfer agency services to the Fund. The Fund pays Ultimus fees in accordance with the agreements for such services. In addition, the Fund pays out-of-pocket expenses including, but not limited to, postage, supplies and certain costs related to the pricing of the Fund’s portfolio securities.
Under the terms of a Distribution Agreement with the Trust, Ultimus Fund Distributors, LLC (the “Distributor”) serves as principal underwriter to the Fund. The Distributor is a wholly-owned subsidiary of Ultimus. The Distributor is compensated partially by the Adviser and partially by the Investor Class shares of the Fund for acting as principal underwriter.
A Trustee and certain officers of the Trust are also officers of Ultimus.
DISTRIBUTION PLAN
The Fund has adopted a plan of distribution (the “Plan”), pursuant to Rule 12b-1 under the Investment Company Act of 1940, as amended (the “1940 Act”) which permits Investor Class shares of the Fund to make payments to securities dealers and other financial organizations (including payments directly to the Adviser and the Distributor) for expenses related to the distribution and servicing of the Fund’s Investor Class shares. The annual limitation for payment of expenses pursuant to the Plan is 0.25% of the Fund’s average daily net assets allocable to Investor Class shares. The Fund has not adopted a plan of distribution with respect to Institutional Class shares. During the six months ended August 31, 2022, Investor Class shares of the Fund incurred $1,174 of distribution fees under the Plan.
TRUSTEE COMPENSATION
Each member of the Board (a “Trustee”) who is not an “interested person” (as defined by the 1940 Act, as amended) of the Trust (“Independent Trustee”) receives a $1,300 annual retainer from the Fund, paid quarterly, except for the Board Chairperson who receives a $1,700 annual retainer from the Fund, paid in quarterly installments. Each Independent Trustee also receives from the Fund a fee of $550 for each Board meeting attended plus reimbursement for travel and other meeting-related expenses.
PRINCIPAL HOLDERS OF FUND SHARES
As of August 31, 2022, the following shareholders owned of record 25% or more of the outstanding shares of the Fund:
| NAME OF RECORD OWNER | % OWNERSHIP |
| TD Ameritrade, Inc. (for the benefit of its customers) | 84% |
| BLUEPRINT ADAPTIVE GROWTH ALLOCATION FUND |
| NOTES TO FINANCIAL STATEMENTS (Unaudited) (Continued) |
A beneficial owner of 25% or more of the Fund’s outstanding shares may be considered a controlling person. That shareholder’s vote could have a more significant effect on matters presented at a shareholders’ meeting.
| 5. | Contingencies and Commitments |
The Fund indemnifies the Trust’s officers and Trustees for certain liabilities that might arise from their performance of their duties to the Fund. Additionally, in the normal course of business the Fund enters into contracts that contain a variety of representations and warranties and which provide general indemnifications. The Fund’s maximum exposure under these arrangements is unknown, as this would involve future claims that may be made against the Fund that have not yet occurred. However, based on experience, the Fund expects the risk of loss to be remote.
| 6. | Investment in Other Investment Companies |
The Fund may invest a significant portion of its assets in shares of one or more investment companies, including ETFs, open-end mutual funds and money market mutual funds. The Fund will incur additional indirect expenses (acquired fund fees and expenses) to the extent it invests in shares of other investment companies. As of August 31, 2022, the Fund had 48.3% of the value of its net assets invested in ETFs.
The Fund is required to recognize in the financial statements the effects of all subsequent events that provide additional evidence about conditions that existed as of the date of the Statement of Assets and Liabilities. For non-recognized subsequent events that must be disclosed to keep the financial statements from being misleading, the Fund is required to disclose the nature of the event as well as an estimate of its financial effect, or a statement that such an estimate cannot be made. Management has evaluated subsequent events through the issuance of these financial statements and has noted no such events except for the following:
Effective October 17, 2022 each Independent Trustee will receive a $1,300 annual retainer from the Fund, paid quarterly, except for the Board Chairperson who will receive a $1,700 annual retainer from the Fund, paid quarterly and the Audit Committee Chairperson who will receive a $1,500 annual retainer from the Fund, paid quarterly. Each Independent Trustee will also receive from the Fund a fee of $550 for each Board meeting attended plus reimbursement for travel and other meeting-related expenses.
| BLUEPRINT ADAPTIVE GROWTH ALLOCATION FUND |
| ABOUT YOUR FUND’S EXPENSES (Unaudited) |
We believe it is important for you to understand the impact of costs on your investment. As a shareholder of the Fund, you incur ongoing costs, including management fees, class-specific expenses (such as distribution fees) and other operating expenses. The following examples are intended to help you understand your ongoing costs (in dollars) of investing in the Fund and to compare these costs with the ongoing costs of investing in other mutual funds.
A mutual fund’s ongoing costs are expressed as a percentage of its average net assets. This figure is known as the expense ratio. The expenses in the table below are based on an investment of $1,000 made at the beginning of the most recent period (March 1, 2022) and held until the end of the period (August 31, 2022).
The table below illustrates the Fund’s ongoing costs in two ways:
Actual fund return – This section helps you to estimate the actual expenses that you paid over the period. The “Ending Account Value” shown is derived from the Fund’s actual return, and the fourth column shows the dollar amount of operating expenses that would have been paid by an investor who started with $1,000 in the Fund. You may use the information here, together with the amount you invested, to estimate the expenses that you paid over the period.
To do so, simply divide your account value by $1,000 (for example, an $8,600 account value divided by $1,000 = 8.6), then multiply the result by the number given for the Fund under the heading “Expenses Paid During Period.”
Hypothetical 5% return – This section is intended to help you compare the Fund’s ongoing costs with those of other mutual funds. It assumes that the Fund had an annual return of 5% before expenses during the period shown, but that the expense ratio is unchanged. In this case, because the return used is not the Fund’s actual return, the results do not apply to your investment. The example is useful in making comparisons because the U.S. Securities and Exchange Commission (the “SEC”) requires all mutual funds to calculate expenses based on a 5% return. You can assess the Fund’s ongoing costs by comparing this hypothetical example with the hypothetical examples that appear in shareholder reports of other funds.
Note that expenses shown in the table are meant to highlight and help you compare ongoing costs only. The Fund does not charge transaction fees, such as purchase or redemption fees, nor does it carry a “sales load.”
The calculations assume no shares were bought or sold during the period. Your actual costs may have been higher or lower, depending on the amount of your investment and the timing of any purchases or redemptions.
| BLUEPRINT ADAPTIVE GROWTH ALLOCATION FUND |
| ABOUT YOUR FUND’S EXPENSES (Unaudited) (Continued) |
More information about the Fund’s expenses can be found in this report. For additional information on operating expenses and other shareholder costs, please refer to the Fund’s prospectus.
| | | | | | | | | |
| | | Beginning | | Ending | | | | |
| | | Account Value | | Account Value | | | | Expenses |
| | | March 1, | | August 31, | | Net Expense | | Paid During |
| | | 2022 | | 2022 | | Ratio(a) | | Period(b) |
| | | | | | | | | |
| Investor Class | | | | | | | | |
| Based on Actual Fund Return | | $1,000.00 | | $912.50 | | 1.50% | | $7.23 |
| Based on Hypothetical 5% Return (before expenses) | | $1,000.00 | | $1,017.64 | | 1.50% | | $7.63 |
| | | | | | | | | |
| Institutional Class | | | | | | | | |
| Based on Actual Fund Return | | $1,000.00 | | $914.40 | | 1.25% | | $6.03 |
| Based on Hypothetical 5% Return (before expenses) | | $1,000.00 | | $1,018.90 | | 1.25% | | $6.36 |
| | | | | | | | | |
| (a) | Annualized, based on the most recent one-half year expenses. |
| (b) | Expenses are equal to the annualized net expense ratio of each Class, multiplied by the average account value over the period, multiplied by 184/365 (to reflect the one-half year period). |
| BLUEPRINT ADAPTIVE GROWTH ALLOCATION FUND |
| OTHER INFORMATION (Unaudited) |
A description of the policies and procedures that the Fund uses to vote proxies relating to portfolio securities is available without charge upon request by calling toll-free 1-866-983-4525, or on the SEC’s website at www.sec.gov. Information regarding how the Fund voted proxies relating to portfolio securities during the most recent 12-month period ended June 30 is available without charge upon request by calling toll-free 1-866-983-4525, or on the SEC’s website at www.sec.gov.
The Trust files a complete listing of portfolio holdings for the Fund with the SEC as of the end of the first and third quarters of each fiscal year as an exhibit to Form N-PORT. These filings are available upon request by calling 1-866-983-4525. Furthermore, you may obtain a copy of the filings on the SEC’s website at www.sec.gov and on the Fund’s website www.blueprintmutualfunds.com.
| CUSTOMER PRIVACY NOTICE |
| |
| FACTS | WHAT DOES THE BLUEPRINT ADAPTIVE GROWTH ALLOCATION FUND (the “Fund”) DO WITH YOUR PERSONAL INFORMATION? |
| |
| Why? | Financial companies choose how they share your personal information. Federal law gives consumers the right to limit some but not all sharing. Federal law also requires us to tell you how we collect, share, and protect your personal information. Please read this notice carefully to understand what we do. |
| |
| What? | The types of personal information we collect and share depend on the product or service you have with us. This information can include: ■ Social Security number ■ Assets ■ Retirement Assets ■ Transaction History ■ Checking Account Information ■ Purchase History ■ Account Balances ■ Account Transactions ■ Wire Transfer Instructions When you are no longer our customer, we continue to share your information as described in this notice. |
| |
| How? | All financial companies need to share your personal information to run their everyday business. In the section below, we list the reasons financial companies can share their customers’ personal information; the reasons the Fund chooses to share; and whether you can limit this sharing. |
| |
| Reasons we can share your personal information | Does the Fund
share? | Can you limit
this sharing? |
| For our everyday business purposes – Such as to process your transactions, maintain your account(s), respond to court orders and legal investigations, or report to credit bureaus | Yes | No |
| For our marketing purposes – to offer our products and services to you | No | We don’t share |
| For joint marketing with other financial companies | No | We don’t share |
| For our affiliates’ everyday business purposes – information about your transactions and experiences | No | We don’t share |
| For our affiliates’ everyday business purposes – information about your creditworthiness | No | We don’t share |
| For nonaffiliates to market to you | No | We don’t share |
| | | | |
| Questions? | Call 1-866-983-4525 |
| Who we are |
| Who is providing this notice? | Blueprint Adaptive Growth Allocation Fund Ultimus Fund Distributors, LLC (Distributor) Ultimus Fund Solutions, LLC (Administrator) |
| What we do |
| How does the Fund protect my personal information? | To protect your personal information from unauthorized access and use, we use security measures that comply with federal law. These measures include computer safeguards and secured files and buildings. Our service providers are held accountable for adhering to strict policies and procedures to prevent any misuse of your nonpublic personal information. |
| How does the Fund collect my personal information? | We collect your personal information, for example, when you ■ Open an account ■ Provide account information ■ Give us your contact information ■ Make deposits or withdrawals from your account ■ Make a wire transfer ■ Tell us where to send the money ■ Tell us who receives the money ■ Show your government-issued ID ■ Show your driver’s license We also collect your personal information from other companies. |
| Why can’t I limit all sharing? | Federal law gives you the right to limit only ■ Sharing for affiliates’ everyday business purposes – information about your creditworthiness ■ Affiliates from using your information to market to you ■ Sharing for nonaffiliates to market to you State laws and individual companies may give you additional rights to limit sharing. |
| |
| Definitions |
| Affiliates | Companies related by common ownership or control. They can be financial and nonfinancial companies. ■ Blueprint Fund Management, LLC, the investment adviser to the Fund, could be deemed to be an affiliate. ■ Blueprint Investment Partners, the investment sub-adviser to the Fund, could be deemed to be an affiliate. |
| Nonaffiliates | Companies not related by common ownership or control. They can be financial and nonfinancial companies ■ The Fund does not share with nonaffiliates so they can market to you. |
| Joint marketing | A formal agreement between nonaffiliated financial companies that together market financial products or services to you. ■ The Fund does not jointly market. |
This page intentionally left blank.
This page intentionally left blank.
Blueprint-SAR-22
HVIA EQUITY FUND
INSTITUTIONAL CLASS (HVEIX)
Managed by
Hudson Valley Investment Advisors, Inc.
SEMI-ANNUAL REPORT
August 31, 2022
(Unaudited)
| HVIA EQUITY FUND | |
| LETTER TO SHAREHOLDERS (Unaudited) | September 2022 |
| | |
HVIA Equity Fund for the Period Ending August 31, 2022
The HVIA Equity Fund utilizes a growth at a reasonable price (GARP) investment framework and invests principally in a diversified portfolio of common stock of large-capitalization companies. We focus on companies that are showing improving asset utilization, margin expansion and efficient capital allocation.
While we cannot predict the outcome of the economic uncertainties, we remain committed to our GARP investment framework which blends value, growth and income-producing strategies. The net effect is a portfolio of companies that tend to show an improving Return on Equity (ROE) but are trading at a discount to either their expected growth rate or their specific industry growth rate. In our experience, the GARP investment approach does not fit neatly into months, quarters or years, but is expected to outperform over the longer-term.
For the six-period ending August 31, 2022, HVEIX recorded a return of -10.20% vs. -8.84% for the S&P 500 Index.
Investment Environment and Outlook
To say the 2022 investment year thus far has been tough would be an understatement. In the first half of fiscal 2022, the stock markets suffered the worst first half of the year since 1970. The S&P 500 Index and other stock markets entered bear market territory and many bond markets suffered their worst declines in 40 years. The two main factors in determining equity value is the reward (earnings) and risk (reflected in multiples). Markets do not like uncertainty. Inflation, tightening monetary policy, slower growth owing to supply chain shortages, the war in Ukraine and continued worries about COVID-19 all have combined to cause these widespread declines in the equity markets.
Although we expect continued market volatility given the uncertain economic and geo-political environment, we continue to see demand being positive, although at slower growth than seen over the prior year. The current economic environment differs from recent historical periods. Demand has been strong and the tools that the Federal Reserve has to slow the economy is not optimal to address the rising inflation. Fiscal policy would be a more elegant way to help to alleviate inflationary concerns over a longer period of time by increasing supply and lower prices.
The Federal Reserve has been determined to tame inflation by raising interest rates which is a major factor in the current market upheaval. Inflation, however, appears to have peaked as both core CPI and core PCE slowed but at higher levels than many had expected. We have also seen a plateauing in many end markets while supply chains report improvement. Additionally, unemployment remains at historically low levels and while the impact of the Fed’s rate-hiking plan is unclear, the markets have responded positively to occasional moments of clarity (i.e. Fed Minutes released). Finally, overall earnings and margins are holding up better than expected while valuations have improved.
The United States is not alone with the imbalances that have led to inflation. Worldwide inflation levels are significantly higher as the strength of the U.S. Dollar has driven higher costs for companies outside of the U.S. market. We expect this negative influence to impact international economies for the foreseeable future.
At HVIA, we are expecting the markets to be range bound over the next quarter as we go through a growth recession. This is defined as a low growth economic backdrop that has vacillating stock prices as more economic and policy changes become clearer. The next few months should slow inflation, stabilize interest rates and provide a clearer picture on U.S. elections which often are a catalyst for future equity growth.
Investment Performance
Although we remain committed to the current portfolio of stocks, we always are looking to upgrade when we see opportunities. We believe we are entering a new era in which stocks will see greater analysis on balance sheets and quality of earnings as higher interest rates limit stocks that have longer periods of time to when they become profitable.
For the period discussed, we saw the Energy sector was a strong performer during the first six months of 2022 as evidenced by Devon Energy (+35.50%) and Coterra Energy (+35.29%) both outperformed as higher underlying commodity prices advanced. AES Corporation (+24.93%), which is a utility and power generation company, also performed particularly well as investors continue to gravitate to the company’s defensive nature.
Conversely, several of our holdings declined in value during the six month period and underperformed the market. These include Illumina, Inc. (-38.94%), a leading developer, manufacturer and marketer of life science tools and integrated systems for large-scale analysis of genetic variation and function and two semiconductor companies. Illumina was negatively impacted by the European Union which denied its proposed acquisition of the company Grail which provides testing on life saving early detection before they are symptomatic. Advanced Micro Devices (-25.44%) and Nvidia Corporation (-35.68%) as computer chips companies, were hurt as multiples compressed as interest rates increased. While there are undoubtedly company-specific reasons for each of these declines (supply-chain bottlenecks, geopolitical risks), each of these stocks were among the biggest gainers over the last two years, and we believe each remains well-positioned for future growth.
In closing, we believe that there are currently several risks that impact U.S. and Developing economies. However, we believe that inflation will see a slowdown but will not get back to pre Covid levels. Demand is still positive and consumer’s net worth is near record levels while businesses are financially well positioned to take on the headwinds that higher rates may impact business conditions.
| Sincerely, | |
| | |
 |  |
| | |
| Gustave J. Scacco | Ron Mayfield |
| Portfolio Manager | Co-Portfolio Manager |
| | |
Past performance is not predictive of future performance. Investment results and principal value will fluctuate so that shares, when redeemed, may be worth more or less than their original cost. Current performance may be higher or lower than the performance data quoted. Performance data current to the most recent month-end is available by calling 1-888-209-8710.
An investor should consider the investment objectives, risks, charges, and expenses of the Fund carefully before investing. The Fund’s prospectus contains this and other important information. To obtain a copy of the Fund’s prospectus please visit the Fund’s website at www.hviafunds.com or call 1-888-209-8710 and a copy will be sent to you free of charge. Please read the prospectus carefully before you invest. The Fund is distributed by Ultimus Fund Distributors, LLC.
The Letter to Shareholders seeks to describe some of the Adviser’s current opinions and views of the financial markets. Although the Adviser believes it has a reasonable basis for any opinions or views expressed, actual results may differ, sometimes significantly so, from those expected or expressed. The securities held by the Fund that are discussed in the Letter to Shareholders were held during the period covered by this Report. They do not comprise the entire investment portfolio of the Fund, may be sold at any time, and may no longer be held by the Fund. For a complete list of securities held by the Fund as of August 31, 2022, please see the Schedule of Investments section of the semi-annual report. The opinions of the Fund’s adviser with respect to those securities may change at any time.
| HVIA EQUITY FUND |
| PORTFOLIO INFORMATION |
| August 31, 2022 (Unaudited) |
| |
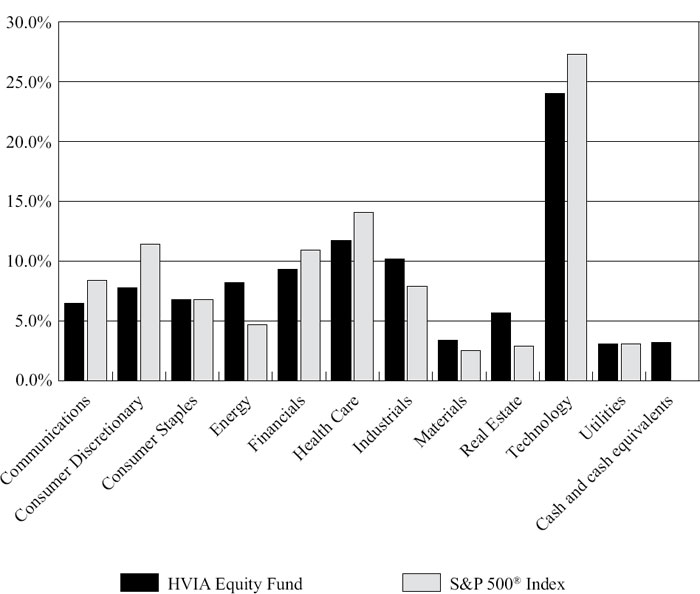
Sector Diversification (% of Net Assets)
| Top 10 Equity Holdings |
| |
| | | % of |
| Security Description | | Net Assets |
| Microsoft Corporation | | 3.7% |
| Apple, Inc. | | 3.6% |
| Alphabet, Inc. - Class C | | 3.3% |
| Advanced Micro Devices. Inc. | | 3.1% |
| KLA Corporation | | 3.0% |
| CSX Corporation | | 2.8% |
| UnitedHealth Group, Inc. | | 2.7% |
| Dollar General Corporation | | 2.6% |
| NVIDIA Corporation | | 2.5% |
| Exxon Mobil Corporation | | 2.5% |
| HVIA EQUITY FUND |
| SCHEDULE OF INVESTMENTS |
| August 31, 2022 (Unaudited) |
| COMMON STOCKS — 96.7% | | Shares | | | Value | |
| Communications — 6.5% | | | | | | | | |
| Entertainment Content — 1.5% | | | | | | | | |
| Walt Disney Company (The) (a) | | | 4,585 | | | $ | 513,887 | |
| | | | | | | | | |
| Internet Media & Services — 4.2% | | | | | | | | |
| Alphabet, Inc. - Class C (a) | | | 10,800 | | | | 1,178,820 | |
| Meta Platforms, Inc. - Class A (a) | | | 1,925 | | | | 313,640 | |
| | | | | | | | 1,492,460 | |
| Telecommunications — 0.8% | | | | | | | | |
| Verizon Communications, Inc. | | | 6,485 | | | | 271,138 | |
| | | | | | | | | |
| Consumer Discretionary — 7.8% | | | | | | | | |
| E-Commerce Discretionary — 1.7% | | | | | | | | |
| Amazon.com, Inc. (a) | | | 4,800 | | | | 608,496 | |
| | | | | | | | | |
| Home Construction — 0.9% | | | | | | | | |
| Lennar Corporation - Class A | | | 4,000 | | | | 309,800 | |
| | | | | | | | | |
| Leisure Facilities & Services — 2.4% | | | | | | | | |
| Chipotle Mexican Grill, Inc. (a) | | | 370 | | | | 590,816 | |
| Starbucks Corporation | | | 3,200 | | | | 269,024 | |
| | | | | | | | 859,840 | |
| Retail - Discretionary — 2.8% | | | | | | | | |
| AutoZone, Inc. (a) | | | 400 | | | | 847,684 | |
| Home Depot, Inc. (The) | | | 430 | | | | 124,021 | |
| | | | | | | | 971,705 | |
| Consumer Staples — 6.8% | | | | | | | | |
| Beverages — 1.4% | | | | | | | | |
| PepsiCo, Inc. | | | 2,850 | | | | 490,969 | |
| | | | | | | | | |
| Food — 1.0% | | | | | | | | |
| Mondel z International, Inc. - Class A | | | 5,850 | | | | 361,881 | |
| | | | | | | | | |
| Household Products — 0.2% | | | | | | | | |
| Estée Lauder Companies, Inc. (The) - Class A | | | 350 | | | | 89,033 | |
| | | | | | | | | |
| Retail - Consumer Staples — 2.6% | | | | | | | | |
| Dollar General Corporation | | | 3,900 | | | | 925,938 | |
| | | | | | | | | |
| Wholesale - Consumer Staples — 1.6% | | | | | | | | |
| Sysco Corporation | | | 6,700 | | | | 550,874 | |
| HVIA EQUITY FUND |
| SCHEDULE OF INVESTMENTS (Continued) |
| COMMON STOCKS — 96.7% (Continued) | | Shares | | | Value | |
| Energy — 8.2% | | | | | | | | |
| Oil & Gas Producers — 7.2% | | | | | | | | |
| Coterra Energy, Inc. | | | 18,900 | | | $ | 584,199 | |
| Devon Energy Corporation | | | 8,200 | | | | 579,084 | |
| Enbridge, Inc. | | | 12,006 | | | | 494,887 | |
| Exxon Mobil Corporation | | | 9,250 | | | | 884,208 | |
| | | | | | | | 2,542,378 | |
| Oil & Gas Services & Equipment — 1.0% | | | | | | | | |
| Schlumberger Ltd. | | | 9,252 | | | | 352,964 | |
| | | | | | | | | |
| Financials — 9.3% | | | | | | | | |
| Banking — 3.5% | | | | | | | | |
| Bank of America Corporation | | | 20,365 | | | | 684,468 | |
| JPMorgan Chase & Company | | | 4,713 | | | | 536,009 | |
| | | | | | | | 1,220,477 | |
| Institutional Financial Services — 1.9% | | | | | | | | |
| Morgan Stanley | | | 8,050 | | | | 686,021 | |
| | | | | | | | | |
| Insurance — 2.1% | | | | | | | | |
| Marsh & McLennan Companies, Inc. | | | 4,700 | | | | 758,439 | |
| | | | | | | | | |
| Specialty Finance — 1.8% | | | | | | | | |
| American Express Company | | | 4,100 | | | | 623,200 | |
| | | | | | | | | |
| Health Care — 11.8% | | | | | | | | |
| Biotech & Pharma — 4.6% | | | | | | | | |
| AbbVie, Inc. | | | 6,300 | | | | 847,098 | |
| Eli Lilly & Company | | | 1,500 | | | | 451,845 | |
| Pfizer, Inc. | | | 7,000 | | | | 316,610 | |
| | | | | | | | 1,615,553 | |
| Health Care Facilities & Services — 2.7% | | | | | | | | |
| UnitedHealth Group, Inc. | | | 1,800 | | | | 934,794 | |
| | | | | | | | | |
| Medical Equipment & Devices — 4.5% | | | | | | | | |
| Danaher Corporation | | | 2,650 | | | | 715,261 | |
| Illumina, Inc. (a) | | | 1,150 | | | | 231,886 | |
| PerkinElmer, Inc. | | | 2,114 | | | | 285,517 | |
| Thermo Fisher Scientific, Inc. | | | 675 | | | | 368,091 | |
| | | | | | | | 1,600,755 | |
| Industrials — 10.1% | | | | | | | | |
| Engineering & Construction — 1.4% | | | | | | | | |
| Fluor Corporation (a) | | | 19,366 | | | | 512,037 | |
| HVIA EQUITY FUND |
| SCHEDULE OF INVESTMENTS (Continued) |
| COMMON STOCKS — 96.7% (Continued) | | Shares | | | Value | |
| Industrials — 10.1% (Continued) | | | | | | | | |
| Industrial Intermediate Products — 1.5% | | | | | | | | |
| Chart Industries, Inc. (a) | | | 2,731 | | | $ | 529,432 | |
| | | | | | | | | |
| Industrial Support Services — 1.3% | | | | | | | | |
| United Rentals, Inc. (a) | | | 1,629 | | | | 475,733 | |
| | | | | | | | | |
| Machinery — 1.2% | | | | | | | | |
| Lincoln Electric Holdings, Inc. | | | 3,000 | | | | 410,070 | |
| | | | | | | | | |
| Transportation & Logistics — 4.7% | | | | | | | | |
| CSX Corporation | | | 30,790 | | | | 974,503 | |
| FedEx Corporation | | | 2,100 | | | | 442,701 | |
| Southwest Airlines Company (a) | | | 6,150 | | | | 225,705 | |
| | | | | | | | 1,642,909 | |
| Materials — 3.4% | | | | | | | | |
| Chemicals — 1.2% | | | | | | | | |
| Sherwin-Williams Company (The) | | | 1,785 | | | | 414,298 | |
| | | | | | | | | |
| Steel — 2.2% | | | | | | | | |
| Nucor Corporation | | | 5,940 | | | | 789,664 | |
| | | | | | | | | |
| Real Estate — 5.7% | | | | | | | | |
| REITs — 5.7% | | | | | | | | |
| American Tower Corporation | | | 1,500 | | | | 381,075 | |
| Prologis, Inc. | | | 4,800 | | | | 597,648 | |
| Simon Property Group, Inc. | | | 5,220 | | | | 532,336 | |
| Weyerhaeuser Company | | | 14,196 | | | | 484,936 | |
| | | | | | | | 1,995,995 | |
| Technology — 24.0% | | | | | | | | |
| Semiconductors — 8.6% | | | | | | | | |
| Advanced Micro Devices, Inc. (a) | | | 12,792 | | | | 1,085,657 | |
| KLA Corporation | | | 3,050 | | | | 1,049,597 | |
| NVIDIA Corporation | | | 5,900 | | | | 890,546 | |
| | | | | | | | 3,025,800 | |
| Software — 6.4% | | | | | | | | |
| Adobe, Inc. (a) | | | 1,050 | | | | 392,112 | |
| Microsoft Corporation | | | 4,935 | | | | 1,290,354 | |
| Salesforce.com, Inc. (a) | | | 3,800 | | | | 593,256 | |
| | | | | | | | 2,275,722 | |
| HVIA EQUITY FUND |
| SCHEDULE OF INVESTMENTS (Continued) |
| COMMON STOCKS — 96.7% (Continued) | | Shares | | | Value | |
| Technology — 24.0% (Continued) | | | | | | | | |
| Technology Hardware — 7.8% | | | | | | | | |
| Apple, Inc. | | | 8,065 | | | $ | 1,267,979 | |
| Ciena Corporation (a) | | | 15,750 | | | | 799,155 | |
| Cisco Systems, Inc. | | | 15,156 | | | | 677,777 | |
| | | | | | | | 2,744,911 | |
| Technology Services — 1.2% | | | | | | | | |
| Visa, Inc. - Class A | | | 2,200 | | | | 437,162 | |
| | | | | | | | | |
| Utilities — 3.1% | | | | | | | | |
| Electric Utilities — 3.1% | | | | | | | | |
| AES Corporation (The) | | | 15,150 | | | | 385,567 | |
| Duke Energy Corporation | | | 6,580 | | | | 703,468 | |
| | | | | | | | 1,089,035 | |
| | | | | | | | | |
| Total Common Stocks (Cost $24,739,867) | | | | | | $ | 34,123,370 | |
| | | | | | | | | |
| MONEY MARKET FUNDS — 3.2% | | Shares | | | Value | |
| First American Government Obligations Fund - Class X, 2.04% (b) (Cost $1,129,534) | | | 1,129,534 | | | $ | 1,129,534 | |
| | | | | | | | | |
| Investments at Value — 99.9% (Cost $25,869,401) | | | | | | $ | 35,252,904 | |
| | | | | | | | | |
| Other Assets in Excess of Liabilities — 0.1% | | | | | | | 51,484 | |
| | | | | | | | | |
| Net Assets — 100.0% | | | | | | $ | 35,304,388 | |
| (a) | Non-income producing security. |
| (b) | The rate shown is the 7-day effective yield as of August 31, 2022. |
See accompanying notes to financial statements.
| HVIA EQUITY FUND |
| STATEMENT OF ASSETS AND LIABILITIES |
| August 31, 2022 (Unaudited) |
| ASSETS | | | | |
| Investments in securities: | | | | |
| At cost | | $ | 25,869,401 | |
| At value (Note 2) | | $ | 35,252,904 | |
| Receivable for capital shares sold | | | 17,400 | |
| Dividends receivable | | | 40,600 | |
| Other assets | | | 20,146 | |
| TOTAL ASSETS | | | 35,331,050 | |
| | | | | |
| LIABILITIES | | | | |
| Payable to Adviser (Note 4) | | | 10,401 | |
| Payable to administrator (Note 4) | | | 8,744 | |
| Other accrued expenses | | | 7,517 | |
| TOTAL LIABILITIES | | | 26,662 | |
| | | | | |
| NET ASSETS | | $ | 35,304,388 | |
| | | | | |
| NET ASSETS CONSIST OF: | | | | |
| Paid-in capital | | $ | 23,050,187 | |
| Accumulated earnings | | | 12,254,201 | |
| NET ASSETS | | $ | 35,304,388 | |
| | | | | |
| PRICING OF INSTITUTIONAL SHARES (NOTE 1) | | | | |
| Net assets applicable to Institutional Shares | | $ | 35,304,388 | |
| Shares of Institutional Shares outstanding (unlimited number of shares authorized, no par value) | | | 1,814,155 | |
| | | | | |
| Net asset value, offering price and redemption price per share (Note 2) | | $ | 19.46 | |
See accompanying notes to financial statements.
| HVIA EQUITY FUND |
| STATEMENT OF OPERATIONS |
| For the Six Months Ended August 31, 2022 (Unaudited) |
| INVESTMENT INCOME | | | | |
| Dividends | | $ | 307,046 | |
| Foreign withholding taxes on dividends | | | (2,264 | ) |
| TOTAL INVESTMENT INCOME | | | 304,782 | |
| | | | | |
| EXPENSES | | | | |
| Management fees (Note 4) | | | 134,562 | |
| Administration fees (Note 4) | | | 18,195 | |
| Fund accounting fees (Note 4) | | | 17,486 | |
| Legal fees | | | 14,593 | |
| Registration and filing fees | | | 11,628 | |
| Trustees’ fees and expenses (Note 4) | | | 9,583 | |
| Transfer agent fees (Note 4) | | | 9,399 | |
| Audit and tax services fees | | | 8,250 | |
| Compliance fees (Note 4) | | | 6,000 | |
| Shareholder reporting expense | | | 4,182 | |
| Custody and bank service fees | | | 3,833 | |
| Postage and supplies | | | 3,375 | |
| Insurance expense | | | 1,794 | |
| Other expenses | | | 7,704 | |
| TOTAL EXPENSES | | | 250,584 | |
| Less fee reductions by the Adviser (Note 4) | | | (70,563 | ) |
| NET EXPENSES | | | 180,021 | |
| | | | | |
| NET INVESTMENT INCOME | | | 124,761 | |
| | | | | |
| REALIZED AND UNREALIZED GAINS (LOSSES) ON INVESTMENTS AND FOREIGN CURRENCIES | | | | |
| Net realized gains from: | | | | |
| Investments | | | 1,832,175 | |
| Foreign currency transactions | | | 211 | |
| Net change in unrealized appreciation (depreciation) on: | | | | |
| Investments | | | (5,876,658 | ) |
| Foreign currency translations | | | (185 | ) |
| NET REALIZED AND UNREALIZED LOSSES ON INVESTMENTS AND FOREIGN CURRENCIES | | | (4,044,457 | ) |
| | | | | |
| NET DECREASE IN NET ASSETS RESULTING FROM OPERATIONS | | $ | (3,919,696 | ) |
See accompanying notes to financial statements.
| HVIA EQUITY FUND |
| STATEMENTS OF CHANGES IN NET ASSETS |
| | | Six Months | | | | |
| | | Ended | | | Year | |
| | | August 31, | | | Ended | |
| | | 2022 | | | February 28, | |
| | | (Unaudited) | | | 2022 | |
| FROM OPERATIONS | | | | | | | | |
| Net investment income | | $ | 124,761 | | | $ | 33,626 | |
| Net realized gains (losses) from: | | | | | | | | |
| Investments | | | 1,832,175 | | | | 1,530,311 | |
| Foreign currency transactions | | | 211 | | | | (326 | ) |
| Net change in unrealized appreciation (depreciation) on: | | | | | | | | |
| Investments | | | (5,876,658 | ) | | | 3,049,260 | |
| Foreign currency translation | | | (185 | ) | | | 26 | |
| Net increase (decrease) in net assets resulting from operations | | | (3,919,696 | ) | | | 4,612,897 | |
| | | | | | | | | |
| DISTRIBUTIONS TO SHAREHOLDERS (Note 2) | | | | | | | | |
| Institutional Shares | | | — | | | | (1,033,718 | ) |
| | | | | | | | | |
| CAPITAL SHARE TRANSACTIONS | | | | | | | | |
| Institutional Shares | | | | | | | | |
| Proceeds from shares sold | | | 2,986,970 | | | | 6,829,941 | |
| Net asset value of shares issued in reinvestment of distributions to shareholders | | | — | | | | 8,401 | |
| Payments for shares redeemed | | | (1,494,488 | ) | | | (3,095,580 | ) |
| Net increase in Institutional Shares net assets from capital share transactions | | | 1,492,482 | | | | 3,742,762 | |
| | | | | | | | | |
| TOTAL INCREASE (DECREASE) IN NET ASSETS | | | (2,427,214 | ) | | | 7,321,941 | |
| | | | | | | | | |
| NET ASSETS | | | | | | | | |
| Beginning of period | | | 37,731,602 | | | | 30,409,661 | |
| End of period | | $ | 35,304,388 | | | $ | 37,731,602 | |
| | | | | | | | | |
| CAPITAL SHARE ACTIVITY | | | | | | | | |
| Institutional Shares | | | | | | | | |
| Shares sold | | | 146,188 | | | | 309,929 | |
| Shares reinvested | | | — | | | | 350 | |
| Shares redeemed | | | (73,084 | ) | | | (138,606 | ) |
| Net increase in shares outstanding | | | 73,104 | | | | 171,673 | |
| Shares outstanding at beginning of period | | | 1,741,051 | | | | 1,569,378 | |
| Shares outstanding at end of period | | | 1,814,155 | | | | 1,741,051 | |
See accompanying notes to financial statements.
| HVIA EQUITY FUND |
| INSTITUTIONAL SHARES |
| FINANCIAL HIGHLIGHTS |
| |
| Per Share Data for a Share Outstanding Throughout Each Period |
| | | Six Months | | | | | | | | | | | | | | | | |
| | | Ended | | | Year | | | Year | | | Year | | | Year | | | Year | |
| | | August 31, | | | Ended | | | Ended | | | Ended | | | Ended | | | Ended | |
| | | 2022 | | | Feb. 28, | | | Feb. 28, | | | Feb. 29, | | | Feb. 28, | | | Feb. 28, | |
| | | (Unaudited) | | | 2022 | | | 2021 | | | 2020 | | | 2019 | | | 2018 | |
| Net asset value at beginning of period | | $ | 21.67 | | | $ | 19.38 | | | $ | 14.00 | | | $ | 13.28 | | | $ | 13.17 | | | $ | 11.39 | |
| Income from investment operations: | | | | | | | | | | | | | | | | | | | | | | | | |
| Net investment income | | | 0.07 | | | | 0.02 | | | | 0.02 | | | | 0.06 | | | | 0.09 | | | | 0.06 | |
| Net realized and unrealized gains (losses) on investments and foreign currencies | | | (2.28 | ) | | | 2.88 | | | | 5.45 | | | | 0.76 | | | | 0.43 | | | | 1.81 | |
| Total from investment operations | | | (2.21 | ) | | | 2.90 | | | | 5.47 | | | | 0.82 | | | | 0.52 | | | | 1.87 | |
| Less distributions from: | | | | | | | | | | | | | | | | | | | | | | | | |
| Net investment income | | | — | | | | (0.03 | ) | | | (0.00 | ) (a) | | | (0.07 | ) | | | (0.08 | ) | | | (0.06 | ) |
| Net realized gains | | | — | | | | (0.58 | ) | | | (0.09 | ) | | | (0.03 | ) | | | (0.33 | ) | | | (0.03 | ) |
| Total distributions | | | — | | | | (0.61 | ) | | | (0.09 | ) | | | (0.10 | ) | | | (0.41 | ) | | | (0.09 | ) |
| Net asset value at end of period | | $ | 19.46 | | | $ | 21.67 | | | $ | 19.38 | | | $ | 14.00 | | | $ | 13.28 | | | $ | 13.17 | |
| Total return (b) | | | (10.20 | %) (c) | | | 14.66 | % | | | 39.10 | % | | | 6.11 | % | | | 4.34 | % | | | 16.45 | % |
| Net assets at end of period (000’s) | | $ | 35,304 | | | $ | 37,732 | | | $ | 30,410 | | | $ | 20,229 | | | $ | 17,929 | | | $ | 15,059 | |
| Ratios/supplementary data: | | | | | | | | | | | | | | | | | | | | | | | | |
| Ratio of total expenses to average net assets | | | 1.38 | % (d) | | | 1.35 | % | | | 1.59 | % | | | 1.76 | % | | | 1.86 | % | | | 2.11 | % |
| Ratio of net expenses to average net assets (e) | | | 0.99 | % (d) | | | 0.99 | % | | | 0.99 | % | | | 0.99 | % | | | 0.99 | % | | | 0.99 | % |
| Ratio of net investment income to average net assets (e) | | | 0.69 | % (d) | | | 0.09 | % | | | 0.13 | % | | | 0.42 | % | | | 0.70 | % | | | 0.53 | % |
| Portfolio turnover rate | | | 25 | % (c) | | | 11 | % | | | 11 | % | | | 16 | % | | | 29 | % | | | 4 | % |
| (a) | Amount rounds to less than $0.01 per share. |
| (b) | Total return is a measure of the change in value of an investment in the Fund over the periods covered. The returns shown do not reflect the deduction of taxes a shareholders would pay on Fund distributions, if any, or the redemption of Fund shares. The total returns would be lower if the Adviser had not reduced management fees and/or reimbursed expenses. |
| (e) | Ratio was determined after management fee reductions and/or expense reimbursements (Note 4). |
See accompanying notes to financial statements.
| HVIA EQUITY FUND |
| NOTES TO FINANCIAL STATEMENTS |
| August 31, 2022 (Unaudited) |
HVIA Equity Fund (the “Fund”) is a diversified series of Ultimus Managers Trust (the “Trust”), an open-end investment company established as an Ohio business trust under a Declaration of Trust dated February 28, 2012. Other series of the Trust are not incorporated in this report.
The investment objective of the Fund is to seek growth at a reasonable price.
The Fund currently offers one class of shares: Institutional Class shares (sold without any sales loads or distribution fees and subject to a $25,000 initial investment requirement). As of August 31, 2022, the Investor Class shares (to be sold without any sales load, but subject to a distribution fee of up to 0.25% of the class’s average daily net assets and subject to a $2,500 initial investment requirement) are not currently offered. When both classes are offered, each share class will represent an ownership interest in the same investment portfolio.
| 2. | Significant Accounting Policies |
The following is a summary of the Fund’s significant accounting policies. The policies are in conformity with accounting principles generally accepted in the United States of America (“GAAP”). The Fund follows accounting and reporting guidance under Financial Accounting Standards Board Accounting Standards Codification Topic 946, “Financial Services – Investment Companies.”
Securities valuation – The Fund values its portfolio securities at fair value as of the close of regular trading on the New York Stock Exchange (the “NYSE”) (normally 4:00 p.m. Eastern time) on each business day the NYSE is open for business. The Fund values its common stocks on the basis of the security’s last sale price on the security’s primary exchange, if available, otherwise at the exchange’s most recently quoted mean price. NASDAQ-listed securities are valued at the NASDAQ Official Closing Price. Investments representing shares of other registered open-end investment companies that are not listed on an exchange, including money market funds, are valued at their net asset value (“NAV”) as reported by such companies. The Fund values securities traded in the over-the-counter market at the last sale price, if available, otherwise at the most recently quoted mean price. When using a quoted price and when the market is considered active, the security will be classified as Level 1 within the fair value hierarchy (see below). In the event that market quotations are not readily available or are considered unreliable due to market or other events, the Fund values its securities and other assets at fair value pursuant to procedures adopted by the Board of Trustees of the Trust (the “Board”). Under these procedures, the securities will be classified as Level 2 or 3 within the fair value hierarchy, depending on the inputs used. Unavailable or unreliable market quotes may be due to the following factors: a substantial bid-ask spread; infrequent sales resulting in stale prices; insufficient trading volume; small trade sizes; a temporary lapse in any reliable pricing source; and actions of the securities
| HVIA EQUITY FUND |
| NOTES TO FINANCIAL STATEMENTS (Continued) |
or futures markets, such as the suspension or limitation of trading. As a result, the prices of securities used to calculate the Fund’s NAV may differ from quoted or published prices for the same securities.
GAAP establishes a single authoritative definition of fair value, sets out a framework for measuring fair value, and requires additional disclosures about fair value measurements.
Various inputs are used in determining the value of the Fund’s investments. These inputs are summarized in the three broad levels listed below:
| ● | Level 1 – quoted prices in active markets for identical securities |
| ● | Level 2 – other significant observable inputs |
| ● | Level 3 – significant unobservable inputs |
The inputs or methods used for valuing securities are not necessarily an indication of the risks associated with investing in those securities. The inputs used to measure fair value may fall into different levels of the fair value hierarchy. In such cases, for disclosure purposes, the level in the fair value hierarchy within which the fair value measurement falls in its entirety is determined based on the lowest level input that is significant to the fair value measurement.
The following is a summary of the Fund’s investments and the level of inputs used to value the investments as of August 31, 2022:
| | | Level 1 | | | Level 2 | | | Level 3 | | | Total | |
| Common Stocks | | $ | 34,123,370 | | | $ | — | | | $ | — | | | $ | 34,123,370 | |
| Money Market Fund | | | 1,129,534 | | | | — | | | | — | | | | 1,129,534 | |
| Total | | $ | 35,252,904 | | | $ | — | | | $ | — | | | $ | 35,252,904 | |
| | | | | | | | | | | | | | | | | |
Refer to the Fund’s Schedule of Investments for a listing of the common stocks by sector and industry type. The Fund did not have any derivative instruments or any assets or liabilities that were measured at fair value on a recurring basis using significant unobservable inputs (Level 3) as of or during the six months ended August 31, 2022.
Foreign currency translation – Securities and other assets and liabilities denominated in or expected to settle in foreign currencies, if any, are translated into U.S. dollars based on exchange rates on the following basis:
| A. | The fair values of investment securities and other assets and liabilities are translated as of the close of the NYSE each day. |
| B. | Purchases and sales of investment securities and income and expenses are translated at the rate of exchange prevailing as of 4:00 p.m. Eastern Time on the respective date of such transactions. |
| HVIA EQUITY FUND |
| NOTES TO FINANCIAL STATEMENTS (Continued) |
| C. | The Fund does not isolate that portion of the results of operations caused by changes in foreign exchange rates on investments from those caused by changes in market prices of securities held. Such fluctuations are included with the net realized and unrealized gains or losses on investments. |
Reported net realized foreign exchange gains or losses arise from 1) purchases and sales of foreign currencies, 2) currency gains or losses realized between the trade and settlement dates on securities transactions, and 3) the difference between the amounts of dividends and foreign withholding taxes recorded on the Fund’s books and the U.S. dollar equivalent of the amounts actually received or paid. Reported net unrealized foreign exchange gains and losses arise from changes in the value of assets and liabilities that result from changes in exchange rates.
Cash – The Fund’s cash, if any, is held in a bank account with balances which, at times, may exceed United States federally insured limits set by the Federal Deposit Insurance Corporation. The Fund maintains these balances with a high-quality financial institution and may incur charges on cash overdrafts.
Share valuation – The NAV per share of each class of the Fund is calculated daily by dividing the total value of its assets attributable to that class, less liabilities attributable to that class, by the number of shares outstanding of that class. The offering price and redemption price per share of each class of the Fund is equal to the NAV per share of such class.
Investment income – Dividend income is recorded on the ex-dividend date. Non-cash dividends included in dividend income, if any, are recorded at the fair market value of the security received. Interest income is accrued as earned. Withholding taxes on foreign dividends have been recorded in accordance with the Fund’s understanding of the applicable country’s tax rules and rates.
Investment transactions – Investment transactions are accounted for on the trade date. Realized gains and losses on investments sold are determined on a specific identification basis.
Common expenses – Common expenses of the Trust are allocated among the Fund and the other series of the Trust based on the relative net assets of each series, the number of series in the Trust, or the nature of the services performed and the relative applicability to each series.
| HVIA EQUITY FUND |
| NOTES TO FINANCIAL STATEMENTS (Continued) |
Distributions to shareholders – The Fund will distribute to shareholders any net investment income dividends and net realized capital gains distributions at least once each year. The amount of such dividends and distributions are determined in accordance with federal income tax regulations, which may differ from GAAP. Dividends and distributions to shareholders are recorded on the ex-dividend date. The tax character of the Fund’s distributions during the periods ended August 31, 2022 and February 28, 2022 was as follows:
| | | Ordinary | | | Long-Term | | | Total | |
| Periods Ended | | Income | | | Capital Gains | | | Distributions | |
| August 31, 2022 | | $ | — | | | $ | — | | | $ | — | |
| February 28, 2022 | | $ | 116,306 | | | $ | 917,412 | | | $ | 1,033,718 | |
| | | | | | | | | | | | | |
Estimates – The preparation of financial statements in conformity with GAAP requires management to make estimates and assumptions which affect the reported amounts of assets and liabilities and disclosure of contingent assets and liabilities as of the date of the financial statements and the reported amounts of increase (decrease) in net assets from operations during the reporting period. Actual results could differ from those estimates.
Federal income tax – The Fund has qualified and intends to continue to qualify as a regulated investment company under the Internal Revenue Code of 1986, as amended (the “Code”). Qualification generally will relieve the Fund of liability for federal income taxes to the extent 100% of its net investment income and net realized capital gains are distributed in accordance with the Code.
In order to avoid imposition of the excise tax applicable to regulated investment companies, it is also the Fund’s intention to declare as dividends in each calendar year at least 98% of its net investment income (earned during the calendar year) and 98.2% of its net realized capital gains (earned during the 12 months ended October 31) plus undistributed amounts from prior years.
The following information is computed on a tax basis for each item as of February 28, 2022:
| | | | | |
| Tax cost of investments | | $ | 22,452,286 | |
| Gross unrealized appreciation | | $ | 15,759,044 | |
| Gross unrealized depreciation | | | (498,883 | ) |
| Net unrealized appreciation | | | 15,260,161 | |
| Net unrealized appreciation on foreign currency translations | | | 29 | |
| Undistributed ordinary income | | | 11,422 | |
| Undistributed long-term capital gains | | | 902,285 | |
| Distributable earnings | | $ | 16,173,897 | |
| | | | | |
| HVIA EQUITY FUND |
| NOTES TO FINANCIAL STATEMENTS (Continued) |
The federal tax cost, unrealized appreciation (depreciation) as of August 31, 2022 is as follows:
| | | | |
| Tax cost of investments and foreign currency translations | | $ | 25,869,557 | |
| Gross unrealized appreciation | | $ | 10,765,794 | |
| Gross unrealized depreciation | | | (1,382,447 | ) |
| Net unrealized appreciation | | $ | 9,383,347 | |
| | | | | |
The Fund recognizes the tax benefits or expenses of uncertain tax positions only when the position is “more likely than not” of being sustained assuming examination by tax authorities. Management has reviewed the Fund’s tax positions for the current and all open tax periods (generally, three years) and has concluded that no provision for unrecognized tax benefits or expenses is required in these financial statements.
The Fund identifies its major tax jurisdiction as U.S. Federal. The Fund recognizes interest and penalties, if any, related to unrecognized tax benefits as income tax on the Statement of Operations. During the six months ended August 31, 2022, the Fund did not incur any interest of penalties.
| 3. | Investment Transactions |
During the six months ended August 31, 2022, cost of purchases and proceeds from sales of investment securities, other than short-term investments, amounted to $11,225,096 and $8,739,118, respectively.
| 4. | Transactions with Related Parties |
INVESTMENT ADVISORY AGREEMENT
The Fund’s investments are managed by Hudson Valley Investment Advisors, Inc. (the “Adviser”) pursuant to the terms of an Investment Advisory Agreement. Under the Investment Advisory Agreement, the Fund pays the Adviser a management fee, computed and accrued daily and paid monthly, at the annual rate of 0.74% of its average daily net assets.
Pursuant to an Expense Limitation Agreement (“ELA”), the Adviser has contractually agreed, until July 1, 2023, to reduce management fees and reimburse other expenses to the extent necessary to limit total annual operating expenses (exclusive of brokerage costs, taxes, interest, borrowing costs such as interest and dividend expense on securities sold short, costs to organize the Fund, acquired fund fees and expenses, extraordinary expenses such as litigation and merger or reorganization costs and other expenses not incurred in the ordinary course of the Fund’s business) to an amount not exceeding 0.99% of average daily net assets
| HVIA EQUITY FUND |
| NOTES TO FINANCIAL STATEMENTS (Continued) |
of the Institutional Class shares and 1.24% of the average daily net assets of the Investor class shares. Accordingly, the Adviser reduced its management fees in the amount of $70,563 during the six months ended August 31, 2022.
Under the terms of the ELA, management fee reductions and expense reimbursements by the Adviser are subject to repayment by the Fund for a period of three years after such fees and expenses were incurred, provided the repayments do not cause total annual operating expenses to exceed: (i) the expense limitation then in effect, if any, and (ii) the expense limitation in effect at the time the expenses to be repaid were incurred. As of August 31, 2022, the Adviser may seek repayment of management fee reductions and expense reimbursements in the amount of $433,127 no later than the dates listed below:
| | | | |
| February 28, 2023 | | $ | 73,404 | |
| February 29, 2024 | | | 154,656 | |
| February 28, 2025 | | | 134,504 | |
| August 31, 2025 | | | 70,563 | |
| Total | | $ | 433,127 | |
| | | | | |
OTHER SERVICE PROVIDERS
Ultimus Fund Solutions, LLC (“Ultimus”) provides administration, fund accounting, compliance and transfer agency services to the Fund. The Fund pays Ultimus fees in accordance with the agreements for such services. In addition, the Fund pays out-of-pocket expenses including, but not limited to, postage, supplies, and certain costs related to the pricing of the Fund’s portfolio securities.
Under the terms of a Distribution Agreement with the Trust, Ultimus Fund Distributors, LLC (the “Distributor”) serves as the principal underwriter to the Fund. The Distributor is a wholly-owned subsidiary of Ultimus. The Distributor is currently compensated by the Adviser (not the Fund) for acting as principal underwriter.
Certain officers and a Trustee of the Trust are also officers of Ultimus.
TRUSTEE COMPENSATION
Each member of the Board (a “Trustee”) who is not an “interested person” (as defined by the 1940 Act, as amended) of the Trust (“Independent Trustee”) receives a $1,300 annual retainer from the Fund, paid quarterly, except for the Board Chairperson who receives a $1,700 annual retainer from the Fund, paid in quarterly installments. Each Independent Trustee also receives from the Fund a fee of $550 for each Board meeting attended plus reimbursement for travel and other meeting-related expenses.
| HVIA EQUITY FUND |
| NOTES TO FINANCIAL STATEMENTS (Continued) |
PRINCIPAL HOLDER OF FUND SHARES
As of August 31, 2022, the following shareholder owned of record more than 25% of the outstanding shares of the Fund:
| NAME OF RECORD OWNER | % Ownership |
| Pershing, LLC (for the benefit of its customers) | 99.7% |
A beneficial owner of 25% or more of the Fund’s outstanding shares may be considered a controlling person. That shareholder’s vote could have a more significant effect on matters presented at a shareholders’ meeting.
| 5. | Contingencies and Commitments |
The Fund indemnifies the Trust’s officers and Trustees for certain liabilities that might arise from the performance of their duties to the Fund. Additionally, in the normal course of business the Fund enters into contracts that contain a variety of representations and warranties and which provide general indemnifications. The Fund’s maximum exposure under these arrangements is unknown, as this would involve future claims that may be made against the Fund that have not yet occurred. However, based on experience, the Fund expects the risk of loss to be remote.
The Fund is required to recognize in the financial statements the effects of all subsequent events that provide additional evidence about conditions that existed as of the date of the Statement of Assets and Liabilities. For non-recognized subsequent events that must be disclosed to keep the financial statements from being misleading, the Fund is required to disclose the nature of the event as well as an estimate of its financial effect, or a statement that such an estimate cannot be made. Management has evaluated subsequent events through the issuance of these financial statements and has noted no such events except for the following:
Effective October 17, 2022 each Independent Trustee will receive a $1,300 annual retainer from the Fund, paid quarterly, except for the Board Chairperson who will receive a $1,700 annual retainer from the Fund, paid quarterly and the Audit Committee Chairperson who will receive a $1,500 annual retainer from the Fund, paid quarterly. Each Independent Trustee will also receive from the Fund a fee of $550 for each Board meeting attended plus reimbursement for travel and other meeting-related expenses.
| HVIA EQUITY FUND |
| ABOUT YOUR FUND’S EXPENSES (Unaudited) |
We believe it is important for you to understand the impact of costs on your investment. As a shareholder of the Fund, you incur ongoing costs, including management fees and other operating expenses. The following examples are intended to help you understand your ongoing costs (in dollars) of investing in the Fund and to compare these costs with the ongoing costs of investing in other mutual funds.
A mutual fund’s ongoing costs are expressed as a percentage of its average net assets. This figure is known as the expense ratio. The expenses in the table below are based on an investment of $1,000 made at the beginning of the most recent period (March 1, 2022) and held until the end of the period (August 31, 2022).
The table below illustrates the Fund’s ongoing costs in two ways:
Actual fund return – This section helps you to estimate the actual expenses that you paid over the period. The “Ending Account Value” shown is derived from the Fund’s actual return, and the fourth column shows the dollar amount of operating expenses that would have been paid by an investor who started with $1,000 in the Fund. You may use the information here, together with the amount you invested, to estimate the expenses that you paid over the period.
To do so, simply divide your account value by $1,000 (for example, an $8,600 account value divided by $1,000 = 8.6), then multiply the result by the number given for the Fund under the heading “Expenses Paid During Period.”
Hypothetical 5% return – This section is intended to help you compare the Fund’s ongoing costs with those of other mutual funds. It assumes that the Fund had an annual return of 5% before expenses during the period shown, but that the expense ratio is unchanged. In this case, because the return used is not the Fund’s actual return, the results do not apply to your investment. The example is useful in making comparisons because the U.S. Securities and Exchange Commission (the “SEC”) requires all mutual funds to calculate expenses based on a 5% return. You can assess the Fund’s ongoing costs by comparing this hypothetical example with the hypothetical examples that appear in shareholder reports of other funds.
Note that expenses shown in the table are meant to highlight and help you compare ongoing costs only. The Fund does not charge transaction fees, such as purchase or redemption fees, nor does it carry a “sales load.” The calculations assume no shares were bought or sold during the period. Your actual costs may have been higher or lower, depending on the amount of your investment and the timing of any purchases or redemptions.
| HVIA EQUITY FUND |
| ABOUT YOUR FUND’S EXPENSES (Unaudited) (Continued) |
More information about the Fund’s expenses can be found in this report. For additional information on operating expenses and other shareholder costs, please refer to the Fund’s prospectus.
| | | | | | | | | |
| | | Beginning | | Ending | | | | |
| | | Account Value | | Account Value | | | | Expenses |
| | | March 1, | | August 31, | | Net Expense | | Paid During |
| Institutional Class | | 2022 | | 2022 | | Ratio (a) | | Period (b) |
| Based on Actual Fund Return | | $1,000.00 | | $898.00 | | 0.99% | | $4.74 |
| Based on Hypothetical 5% Return (before expenses) | | $1,000.00 | | $1,020.21 | | 0.99% | | $5.04 |
| | | | | | | | | |
| (a) | Annualized, based on the Fund’s most recent one-half year expenses. |
| (b) | Expenses are equal to the Fund’s annualized net expense ratio multiplied by the average account value over the period, multiplied by 184/365 (to reflect the one-half year period). |
| HVIA EQUITY FUND |
| OTHER INFORMATION (Unaudited) |
A description of the policies and procedures that the Fund uses to vote proxies relating to portfolio securities is available without charge upon request by calling toll- free 1-888-209-8710, or on the SEC’s website at www.sec.gov. Information regarding how the Fund voted proxies relating to portfolio securities during the most recent 12-month period ended June 30 is available without charge upon request by calling toll-free 1-888-209-8710, or on the SEC’s website at www.sec.gov.
The Trust files a complete listing of portfolio holdings for the Fund with the SEC as of the end of the first and third quarters of each fiscal year as an exhibit to its reports on Form N-PORT. These filings are available upon request by calling 1-888-209-8710. Furthermore, you may obtain a copy of the filings on the SEC’s website at www.sec.gov and on the Fund’s website www.hviafunds.com.
| HVIA EQUITY FUND |
| DISCLOSURE REGARDING APPROVAL OF INVESTMENT |
| ADVISORY AGREEMENT (Unaudited) |
The Board of Trustees (the “Board”), including the Independent Trustees voting separately, reviewed and approved the continuance of the Fund’s Investment Advisory Agreement (the “Agreement”) with Hudson Valley Investment Advisors, Inc. (the “Adviser” or “Hudson Valley”) for an additional one-year term. The Board approved the Agreement at a meeting held on April 19-20, 2022 (“Meeting”), at which all of the Trustees were present.
In deciding whether to approve the continuation of the Agreement, the Board recalled its review of the materials related to the Fund and Hudson Valley throughout the preceding twelve months and its numerous discussions with Trust Management and the Adviser about the operations and performance of the Fund during that period. The Board further considered those materials and discussions and other numerous factors, including the following:
The nature, extent, and quality of the services provided by the Adviser. In this regard, the Board reviewed the services being provided by Hudson Valley to the Fund including, without limitation, providing a continuous investment program for the Fund, adhering to the Fund’s investment restrictions, complying with the Trust’s policies and procedures, and voting proxies on behalf of the Fund. The Board considered the qualifications and experience of Hudson Valley’s portfolio managers who are responsible for the day to day management of the Fund, as well as the qualifications and experience of the other individuals at Hudson Valley who provide services to the Fund. The Board concluded that the quality, extent, and nature of the services provided by Hudson Valley to the Fund were satisfactory and adequate.
The investment performance of the Fund. In this regard, the Board compared the performance of the Fund with the performance of its benchmark index, custom peer group, and Morningstar category. The Board concluded that the investment performance of the Fund has been satisfactory.
The costs of the services provided and profits realized by the Adviser and its affiliates from their relationship with the Fund. In this regard, the Board considered Hudson Valley’s staffing, methods of operating, its financial condition, the asset level of the Fund; the overall expenses of the Fund, including the advisory fee; and the differences in fees and services to Hudson Valley’s other similar clients. The Board considered the current and anticipated profitability of the Fund to Hudson Valley, if any. The Board considered its discussion with Hudson Valley regarding the Hudson Valley ELA, and considered Hudson Valley’s past fee reductions and expense reimbursements for the Fund.
The extent to which economics of scale would be realized as the Fund grows and whether advisory fee levels reflect these economies of scale for the benefit of the Fund’s investors. In this regard, the Board considered that the Fund’s fee arrangements with Hudson Valley involve both the advisory fee and the expense limitation agreement between the Fund and the Adviser (the “ELA”). The Board determined that while the advisory fee rate remained the same as asset levels increased, the shareholders of the Fund have experienced in the past, and
| HVIA EQUITY FUND |
| DISCLOSURE REGARDING APPROVAL OF INVESTMENT |
| ADVISORY AGREEMENT (Unaudited) (Continued) |
will experience in the future, benefits from the ELA. The Board concluded that the advisory fee was reasonable in light of the information that was provided to the Trustees by HVIA with respect to economies of scale.
After further discussion of the factors noted above and in reliance on the information provided by the Adviser and Trust Management, and taking into account the totality of all factors discussed and information presented at the meeting and previous meetings, the Board indicated its agreement to approve the continuance of the Agreement and the ELA. It was noted that in the Trustees’ deliberations regarding the approval of the continuance of the Agreement, the Trustees did not identify any particular information or factor that was all-important or controlling, and that each individual Trustee may have attributed different weights to various factors listed above. After full consideration of the above factors as well as other factors, the Board unanimously concluded that approval of the continuance of the Agreement was in the best interests of the Fund and its shareholders.
| CUSTOMER PRIVACY NOTICE |
| |
| FACTS | WHAT DOES THE HVIA EQUITY FUND (the “Fund”) DO WITH YOUR PERSONAL INFORMATION? |
| |
| Why? | Financial companies choose how they share your personal information. Federal law gives consumers the right to limit some but not all sharing. Federal law also requires us to tell you how we collect, share, and protect your personal information. Please read this notice carefully to understand what we do. |
| |
| What? | The types of personal information we collect and share depend on the product or service you have with us. This information can include: ■ Social Security number ■ Assets ■ Retirement Assets ■ Transaction History ■ Checking Account Information ■ Purchase History ■ Account Balances ■ Account Transactions ■ Wire Transfer Instructions When you are no longer our customer, we continue to share your information as described in this notice. |
| |
| How? | All financial companies need to share your personal information to run their everyday business. In the section below, we list the reasons financial companies can share their customers’ personal information; the reasons the Fund chooses to share; and whether you can limit this sharing. |
| |
| Reasons we can share your personal information | Does the
Fund share? | Can you limit
this sharing? |
For our everyday business purposes – Such as to process your transactions, maintain your account(s), respond to court orders and legal investigations, or report to credit bureaus | Yes | No |
For our marketing purposes – to offer our products and services to you | No | We don’t share |
| For joint marketing with other financial companies | No | We don’t share |
For our affiliates’ everyday business purposes – information about your transactions and experiences | No | We don’t share |
For our affiliates’ everyday business purposes – information about your creditworthiness | No | We don’t share |
| For nonaffiliates to market to you | No | We don’t share |
| | | | |
| Questions? | Call 1-888-209-8710 |
| Who we are |
| Who is providing this notice? | HVIA Equity Fund Ultimus Fund Distributors, LLC (Distributor) Ultimus Fund Solutions, LLC (Administrator) |
| What we do |
How does the Fund protect my personal information? | To protect your personal information from unauthorized access and use, we use security measures that comply with federal law. These measures include computer safeguards and secured files and buildings. Our service providers are held accountable for adhering to strict policies and procedures to prevent any misuse of your nonpublic personal information. |
How does the Fund collect my personal information? | We collect your personal information, for example, when you ■ Open an account ■ Provide account information ■ Give us your contact information ■ Make deposits or withdrawals from your account ■ Make a wire transfer ■ Tell us where to send the money ■ Tell us who receives the money ■ Show your government-issued ID ■ Show your driver’s license We also collect your personal information from other companies. |
Why can’t I limit all sharing? | Federal law gives you the right to limit only ■ Sharing for affiliates’ everyday business purposes – information about your creditworthiness ■ Affiliates from using your information to market to you ■ Sharing for nonaffiliates to market to you State laws and individual companies may give you additional rights to limit sharing. |
| |
| Definitions |
| Affiliates | Companies related by common ownership or control. They can be financial and nonfinancial companies. ■ Hudson Valley Investment Advisor, Inc., the investment adviser to the Fund, could be deemed to be an affiliate. |
| Nonaffiliates | Companies not related by common ownership or control. They can be financial and nonfinancial companies ■ The Fund does not share with nonaffiliates so they can market to you. |
| Joint marketing | A formal agreement between nonaffiliated financial companies that together market financial products or services to you. ■ The Fund does not jointly market. |
This page intentionally left blank.
This page intentionally left blank.
This page intentionally left blank.
HVIA-SAR-22

NIA IMPACT SOLUTIONS FUND
SEMI-ANNUAL REPORT
August 31, 2022
(Unaudited)
| NIA IMPACT SOLUTIONS FUND | |
| LETTER TO SHAREHOLDERS (Unaudited) | August 31, 2022 |
Dear Shareholder,
We hope this letter finds each of you staying well. We were proud and excited to launch the Nia Impact Solutions Fund (NIAGX) on May 10, 2022. Since that date, the fund returned 2.20% through August 31st while the MSCI ACWI IMI index returned -0.95%. For the three-month period from June 1st through August 31, 2022, the fund returned -2.94%, while the MSCI ACWI IMI was down -5.57%. The top three contributors were First Solar Inc., TPI Composites, Inc., and SunPower Corporation. The top three detractors were Azure Power Global Ltd., GSK plc, and Infinion Technologies AG.
Our Investment Approach
Nia invests at the intersection of environmental sustainability and social justice. To that end, our investment approach begins by considering what products and services are needed for the shift toward a more just, sustainable, and inclusive economy. In this process we define the primary threats to people and our planet, our society, resources, and way of life. We examine the issues that could disrupt both human economies and their underlying ecosystems. We focus on the solutions to these risks which include global warming, extreme weather, resource scarcity, increasing population, infectious diseases, access to financial capital, and access to healthy food and water. We identify the technologies, approaches, and innovative businesses with the highest potential for addressing and mitigating these risks, while also providing an economic return for our investors.
Companies that meet our criteria for solutions themes, gender equality and sustainability are evaluated using traditional bottoms up investment analysis. We consider companies’ financial strength by reviewing leverage, cash flows, and sensitivity to interest and debt coverage. While the most important financial items can vary across sectors and within industries, we review key income statement items, such as revenues, margin contribution, and cash flow. And where our ratio analysis screens for underappreciated strengths and weaknesses, we use valuation analysis to assess and select those companies that may be underappreciated by the market.
Investment Environment
Nia Impact Solutions Fund and most indices marked year-to-date lows in mid-June. The sell-off may be attributed to inflation, Federal Reserve rate increases to tame inflation, and slowing growth, all of which are interconnected. Markets rallied from mid-June lows through mid-August, driven by hope and optimism that the worst of the reserve rate increases were behind us. An additional boost came from the surprise resuscitation and passage of the Inflation Reduction Act, thanks to all the positive environmental protection spending and renewable energy infrastructure support this Act contains. Meanwhile, many international markets were buffeted on one side by energy cost inflation from Russian aggression in Ukraine and on the other, by local currency devaluation resulting from the Fed actions driving up the dollar.
Federal Reserve tightening, slowing growth, and inflation will likely continue to weigh upon markets for the near future. Europe will also continue to face headwinds through this winter as it struggles with the challenge of adequate and affordable energy, as well as inflation and slowing growth. At a portfolio level, we see these circumstances posing challenges for less established companies, favoring those most resilient in an economic slowdown and self-sufficient in meeting capital needs.
In the short term this situation is impacting how we are shifting to preserve investor capital. Longer term, however, we believe our exposures to smaller companies with leading edge solutions could see demand grow faster than previously, due to a more widespread understanding of the urgency to act on climate and health solutions.
2022 has presented a long list of difficulties for markets, companies, society, and the environment. Each, from continued supply chain issues, to rising interest rates, increased cost of capital and costs of transportation of goods and services, to workforce loyalty, has caused challenges. This confluence of strains has served to accelerate the movement to disrupt and adapt supply chains, technology, healthcare, and sources of energy to address each of these problems. The market correction is serving to return discipline to both market valuations and the cost of capital. Through this bear market lay the seeds of the next growth cycle, in which the best solutions focused companies will again be assessed and funded based on the value they produce.
Portfolio Holdings
Top Three Performers
First Solar Inc. – This solar module and systems company reported disappointing results in November 2021, accelerating the stock’s sell-off just as the market also began its downturn through the first quarter of 2022. Thanks to issues ranging from supply chain disruptions, to cost inflation, a couple rounds of downward earnings revisions later and no prospects for favorable legislation, the stock reflected modest expectations heading into summer. In late July, revelations around legislation emerged right as the company released better than expected results for the June quarter. With three fully integrated solar panel factories in the U.S., First Solar stands to benefit from both the domestic manufacturing incentives in the Inflation Reduction Act, as well as the long-term trend towards renewable energy. In late August, the company announced plans to build a fourth domestic manufacturing facility.
TPI Composites – This maker of composite materials for the wind turbine market saw its stock react very positively to passage of The Inflation Reduction Act. Similar to many companies in the renewable energy space, the company’s stock had sold off with the market correction and when prospects for passage of favorable legislation had faded. Not yet earnings positive, this small cap stock can be volatile, especially in reaction to news around government energy policy and its customers in the wind energy market. We look forward to tracking the company’s progress in both the U.S. and international markets.
SunPower Corporation – As one of the largest U.S. manufacturers of residential solar panels, SunPower has benefited from the consumer movement towards solar, especially in California. The business and its profitability made great progress through 2020, as was reflected by the company’s stock price. More recently, facing headwinds like other companies in the renewables space, the stock had traded sideways. The acquisition of 51% of the company’s shares in late May by TotalEnergies appeared to set a valuation floor for the company. News and passage of the Inflation Reduction Act a month later reset the revenue and margin outlook to a higher level.
Bottom Three Performers
Azure Power Global – This New Delhi based holding company oversees the development, production, and sale of solar energy, primarily to large Indian utilities across the country. The company received a whistleblower complaint regarding operations at one subsidiary and
subsequently engaged forensic accountants to lead an investigation. Pending the outcome of this investigation, market speculation led to massive selling that, in our estimation, is out of proportion to the probable range of outcomes.
Majority owned by the Quebec public pension fund, Caisse de Depot & Placement du Quebec (CDPQ), Azure has benefited from this relationship, which has provided backstopping on obligations and board representation. Toronto public pension fund, OMERS Administration Corp, which holds a 21% stake, also has board representation. Collaboration with these major investors has supported the issuance of several green bonds, none of which are tied to assets or operations in the subsidiary at issue with the whistleblower allegations. We expect that the large, diversified, asset portfolio, together with growing market demand, will bridge the company’s operations through this period to a more straightforward and higher valuation.
GSK plc – We initially invested in this U.K. based pharmaceutical company for its broad portfolio of solutions, as well as specific products like its HPV vaccine. In addition to female CEO leadership, we also found the modest valuation and stable dividend attractive features of the stock as headwinds in the broader economy picked up. Despite a strong second quarter report in late July, attention shifted to the potential liability from class action lawsuits alleging that the heartburn drug, Zantac, caused cancer. While a case can be made that this liability can be estimated and contained, we ultimately decided that the lawsuits in multiple jurisdictions could lead to a potentially protracted liability overhang on the stock. We sold the position in August.
Infineon Technologies AG – This German semiconductor company is Europe’s largest chipmaker, supplying customers manufacturing products that range from electric vehicles to wind turbines. In 2021, demand for Infineon’s chips soared as disruptions hit their customers’ supply chains. More recently, as news of the easing of supply chain bottlenecks began to emerge, the company’s stock has experienced some negative volatility. While the market interpreted the easing of bottlenecks as cause for concern with the demand outlook, we continue to view the company as a provider of key technology and an attractive long-term holding.
We look forward to updating you again at the end of 2022.
Thank you for your interest in solutions and your investment with Nia!
With much care,
The Nia Team
Past performance is not predictive of future performance. Investment results and principal value will fluctuate so that shares, when redeemed, may be worth more or less than their original cost. Current performance may be higher or lower than the performance data quoted. Performance data current to the most recent month end are available by calling 1-833-571-2833.
An investor should consider the investment objectives, risks, charges and expenses of the Fund carefully before investing. The Fund’s prospectus contains this and other important information. To obtain a copy of the Fund’s prospectus call 1-833-571-2833 or visit the Fund’s website at www.niaimpactfunds.com and a copy will be sent to you free of charge. Please read the prospectus carefully before you invest. The Fund is distributed by Ultimus Fund Distributors, LLC.
This Letter to Shareholders seeks to describe some of the Adviser’s current opinions and views of the financial markets. Although the Adviser believes it has a reasonable basis for any opinions or views expressed, actual results may differ, sometimes significantly so, from those expected or expressed. The securities held by the Fund that are discussed in the Letter to Shareholders were
held during the period covered by this Report. They do not comprise the entire investment portfolio of the Fund, may be sold at any time and may no longer be held by the Fund. For a complete list of securities held by the Fund as of August 31, 2022, please see the Schedule of Investments section of the semi-annual report. The opinions of the Adviser with respect to those securities may change at any time.
Statements in the Letter to Shareholders that reflect projections or expectations for future financial or economic performance of the Fund and the market in general and statements of the Fund’s plans and objectives for future operations are forward-looking statements. No assurance can be given that actual results or events will not differ materially from those projected, estimated, assumed, or anticipated in any such forward-looking statements. Important factors that could result in such differences, in addition to factors noted with such forward-looking statements include, without limitation, general economic conditions, such as inflation, recession, and interest rates.
NIA IMPACT SOLUTIONS FUND
PORTFOLIO INFORMATION
August 31, 2022 (Unaudited)
Sector Diversification (% of Net Assets)
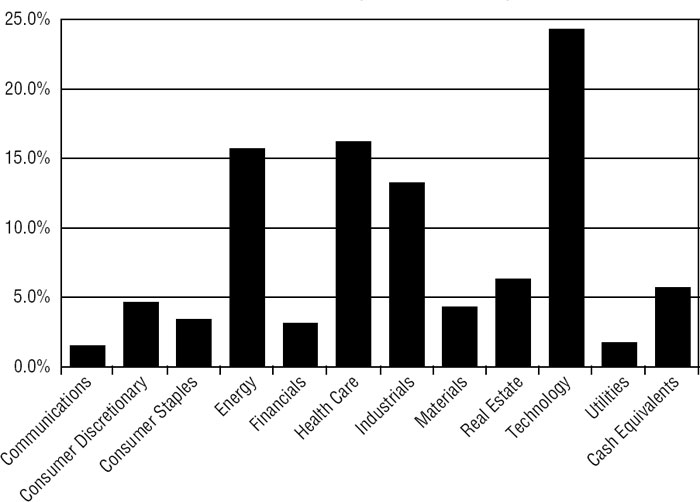
| | % of |
| Top 10 Equity Holdings | Net Assets |
| Brookfield Renewable Corporation - Class A | 3.9% |
| Digital Realty Trust, Inc. | 3.5% |
| International Business Machines Corporation | 3.4% |
| Carlisle Companies, Inc. | 3.0% |
| AECOM | 3.0% |
| Stantec, Inc. | 3.0% |
| Vertex Pharmaceuticals, Inc. | 2.9% |
| Palo Alto Networks, Inc. | 2.9% |
| Taiwan Semiconductor Manufacturing Company Ltd. - ADR | 2.8% |
| Gilead Sciences, Inc. | 2.6% |
| NIA IMPACT SOLUTIONS FUND |
| SCHEDULE OF INVESTMENTS |
| August 31, 2022 (Unaudited) |
| COMMON STOCKS — 94.3% | | Shares | | | Value | |
| Communications — 1.5% | | | | | | | | |
| Telecommunications — 1.5% | | | | | | | | |
| PLDT, Inc. - ADR | | | 19,259 | | | $ | 560,052 | |
| | | | | | | | | |
| Consumer Discretionary — 4.6% | | | | | | | | |
| Automotive — 0.6% | | | | | | | | |
| Rivian Automotive, Inc. - Class A (a) | | | 7,210 | | | | 235,839 | |
| | | | | | | | | |
| Consumer Services — 1.8% | | | | | | | | |
| Stride, Inc. (a) | | | 17,717 | | | | 675,726 | |
| | | | | | | | | |
| E-Commerce Discretionary — 0.7% | | | | | | | | |
| Etsy, Inc. (a) | | | 2,522 | | | | 266,349 | |
| | | | | | | | | |
| Home & Office Products — 1.5% | | | | | | | | |
| Steelcase, Inc. - Class A | | | 49,004 | | | | 547,865 | |
| | | | | | | | | |
| Consumer Staples — 3.4% | | | | | | | | |
| Food — 3.4% | | | | | | | | |
| Danone S.A. - ADR | | | 94,144 | | | | 984,746 | |
| Hain Celestial Group, Inc. (The) (a) | | | 15,185 | | | | 307,648 | |
| | | | | | | | 1,292,394 | |
| Energy — 15.7% | | | | | | | | |
| Oil & Gas Producers — 3.9% | | | | | | | | |
| Brookfield Renewable Corporation - Class A | | | 38,468 | | | | 1,476,786 | |
| | | | | | | | | |
| Renewable Energy — 11.8% | | | | | | | | |
| Ameresco, Inc. - Class A (a) | | | 7,133 | | | | 491,107 | |
| First Solar, Inc. (a) | | | 5,656 | | | | 721,423 | |
| Maxeon Solar Technologies Ltd. (a) | | | 13,771 | | | | 273,354 | |
| SolarEdge Technologies, Inc. (a) | | | 2,800 | | | | 772,716 | |
| SunPower Corporation (a) | | | 21,828 | | | | 523,872 | |
| Sunrun, Inc. (a) | | | 15,104 | | | | 498,885 | |
| TPI Composites, Inc. (a) | | | 26,672 | | | | 495,833 | |
| Vestas Wind Systems A/S - ADR | | | 82,113 | | | | 680,717 | |
| | | | | | | | 4,457,907 | |
| Financials — 3.1% | | | | | | | | |
| Asset Management — 1.8% | | | | | | | | |
| Sanlam Ltd. - ADR | | | 109,229 | | | | 685,958 | |
| | | | | | | | | |
| Banking — 1.3% | | | | | | | | |
| Amalgamated Financial Corporation | | | 21,285 | | | | 478,913 | |
| NIA IMPACT SOLUTIONS FUND |
| SCHEDULE OF INVESTMENTS (Continued) |
| COMMON STOCKS — 94.3% (Continued) | | Shares | | | Value | |
| Health Care — 16.2% | | | | | | | | |
| Biotech & Pharma — 9.2% | | | | | | | | |
| Gilead Sciences, Inc. | | | 15,739 | | | $ | 998,954 | |
| Moderna, Inc. (a) | | | 5,542 | | | | 733,041 | |
| Organon & Company | | | 22,232 | | | | 634,279 | |
| Vertex Pharmaceuticals, Inc. (a) | | | 3,916 | | | | 1,103,372 | |
| | | | | | | | 3,469,646 | |
| Medical Equipment & Devices — 7.0% | | | | | | | | |
| Hologic, Inc. (a) | | | 11,019 | | | | 744,443 | |
| Lantheus Holdings, Inc. (a) | | | 11,441 | | | | 901,551 | |
| Thermo Fisher Scientific, Inc. | | | 1,801 | | | | 982,121 | |
| | | | | | | | 2,628,115 | |
| Industrials — 13.2% | | | | | | | | |
| Commercial Support Services — 3.9% | | | | | | | | |
| AMN Healthcare Services, Inc. (a) | | | 8,159 | | | | 837,439 | |
| Schnitzer Steel Industries, Inc. - Class A | | | 19,446 | | | | 642,496 | |
| | | | | | | | 1,479,935 | |
| Electrical Equipment — 1.9% | | | | | | | | |
| Schneider Electric SE - ADR | | | 29,399 | | | | 697,932 | |
| | | | | | | | | |
| Engineering & Construction — 6.0% | | | | | | | | |
| AECOM | | | 15,423 | | | | 1,128,193 | |
| Stantec, Inc. | | | 23,585 | | | | 1,118,872 | |
| | | | | | | | 2,247,065 | |
| Machinery — 1.4% | | | | | | | | |
| Xylem, Inc. | | | 5,926 | | | | 539,859 | |
| | | | | | | | | |
| Materials — 4.3% | | | | | | | | |
| Chemicals — 1.3% | | | | | | | | |
| Chr. Hansen Holding A/S - ADR | | | 32,991 | | | | 479,029 | |
| | | | | | | | | |
| Construction Materials — 3.0% | | | | | | | | |
| Carlisle Companies, Inc. | | | 3,864 | | | | 1,142,430 | |
| | | | | | | | | |
| Real Estate — 6.3% | | | | | | | | |
| Real Estate Owners & Developers — 1.0% | | | | | | | | |
| City Developments Ltd. - ADR | | | 64,175 | | | | 375,424 | |
| | | | | | | | | |
| REITs — 5.3% | | | | | | | | |
| Digital Realty Trust, Inc. | | | 10,550 | | | | 1,304,296 | |
| Hannon Armstrong Sustainable Infrastructure Capital, Inc. | | | 17,950 | | | | 709,384 | |
| | | | | | | | 2,013,680 | |
| NIA IMPACT SOLUTIONS FUND |
| SCHEDULE OF INVESTMENTS (Continued) |
| COMMON STOCKS — 94.3% (Continued) | | Shares | | | Value | |
| Technology — 24.3% | | | | | | | | |
| Semiconductors — 6.4% | | | | | | | | |
| Infineon Technologies AG - ADR | | | 26,307 | | | $ | 645,311 | |
| STmicroelectronics N.V. | | | 20,126 | | | | 702,397 | |
| Taiwan Semiconductor Manufacturing Company Ltd. - ADR | | | 12,719 | | | | 1,060,129 | |
| | | | | | | | 2,407,837 | |
| Software — 10.7% | | | | | | | | |
| Atlassian Corporation plc - Class A (a) | | | 992 | | | | 245,679 | |
| Autodesk, Inc. (a) | | | 1,933 | | | | 389,963 | |
| Fortinet, Inc. (a) | | | 16,905 | | | | 823,104 | |
| Materialise N.V. - ADR (a) | | | 27,481 | | | | 321,253 | |
| Palo Alto Networks, Inc. (a) | | | 1,949 | | | | 1,085,223 | |
| Rapid7, Inc. (a) | | | 5,674 | | | | 326,255 | |
| Splunk, Inc. (a) | | | 9,205 | | | | 828,726 | |
| | | | | | | | 4,020,203 | |
| Technology Hardware — 2.2% | | | | | | | | |
| Apple, Inc. | | | 5,387 | | | | 846,944 | |
| | | | | | | | | |
| Technology Services — 5.0% | | | | | | | | |
| International Business Machines Corporation | | | 9,987 | | | | 1,282,830 | |
| Wolters Kluwer N.V. - ADR | | | 6,345 | | | | 618,892 | |
| | | | | | | | 1,901,722 | |
| Utilities — 1.7% | | | | | | | | |
| Electric Utilities — 0.3% | | | | | | | | |
| Azure Power Global Ltd. (a) | | | 29,631 | | | | 106,375 | |
| | | | | | | | | |
| Gas & Water Utilities — 1.4% | | | | | | | | |
| California Water Service Group | | | 9,195 | | | | 538,184 | |
| | | | | | | | | |
| Total Common Stocks (Cost $36,780,856) | | | | | | $ | 35,572,169 | |
| NIA IMPACT SOLUTIONS FUND |
| SCHEDULE OF INVESTMENTS (Continued) |
| MONEY MARKET FUNDS — 5.6% | | Shares | | | Value | |
| First American Government Obligations Fund - Class X, 2.04% (b) | | | 1,846,971 | | | $ | 1,846,971 | |
| First American Treasury Obligations Fund - Class X, 2.14% (b) | | | 268,440 | | | | 268,440 | |
| | | | | | | | | |
| Total Money Market Funds (Cost $2,115,411) | | | | | | $ | 2,115,411 | |
| | | | | | | | | |
| Investments at Value — 99.9% (Cost $38,896,267) | | | | | | $ | 37,687,580 | |
| | | | | | | | | |
| Other Assets in Excess of Liabilities — 0.1% | | | | | | | 45,901 | |
| | | | | | | | | |
| Net Assets — 100.0% | | | | | | $ | 37,733,481 | |
| | | | | | | | | |
A/S - Aktieselskab
ADR - American Depositary Receipt
AG - Aktiengesellschaft
N.V. - Naamloze Vennootschap
plc - Public Limited Company
S.A. - Societe Anonyme
SE - Societe Europaea
| (a) | Non-income producing security. |
| (b) | The rate shown is the 7-day effective yield as of August 31, 2022. |
See accompanying notes to financial statements.
| NIA IMPACT SOLUTIONS FUND |
| STATEMENT OF ASSETS AND LIABILITIES |
| August 31, 2022 (Unaudited) |
| ASSETS | | | | |
| Investments in securities: | | | | |
| At cost | | $ | 38,896,267 | |
| At value (Note 2) | | $ | 37,687,580 | |
| Dividends receivable | | | 76,687 | |
| Tax reclaims receivable | | | 241 | |
| Other assets | | | 7,614 | |
| Total assets | | | 37,772,122 | |
| | | | | |
| LIABILITIES | | | | |
| Payable to Adviser (Note 4) | | | 21,480 | |
| Payable to administrator (Note 4) | | | 7,676 | |
| Other accrued expenses | | | 9,485 | |
| Total liabilities | | | 38,641 | |
| | | | | |
| NET ASSETS | | $ | 37,733,481 | |
| | | | | |
| NET ASSETS CONSIST OF: | | | | |
| Paid-in capital | | $ | 39,208,400 | |
| Accumulated deficit | | | (1,474,919 | ) |
| NET ASSETS | | $ | 37,733,481 | |
| | | | | |
| Shares of beneficial interest outstanding (unlimited number of shares authorized, no par value) | | | 3,690,690 | |
| | | | | |
| Net asset value, offering price and redemption price per share (Note 2) | | $ | 10.22 | |
| | | | | |
See accompanying notes to financial statements.
| NIA IMPACT SOLUTIONS FUND |
| STATEMENT OF OPERATIONS |
| For the Period Ended August 31, 2022(a) (Unaudited) |
| INVESTMENT INCOME | | | | |
| Dividends | | $ | 157,233 | |
| Foreign witholding taxes on dividends | | | (13,513 | ) |
| Total investment income | | | 143,720 | |
| | | | | |
| EXPENSES | | | | |
| Management fees (Note 4) | | | 85,698 | |
| Administration fees (Note 4) | | | 10,458 | |
| Legal fees | | | 9,574 | |
| Fund accounting fees (Note 4) | | | 7,501 | |
| Registration and filing fees | | | 6,844 | |
| Trustees’ fees and expenses (Note 4) | | | 4,783 | |
| Compliance fees (Note 4) | | | 4,637 | |
| Transfer agent fees (Note 4) | | | 3,785 | |
| Custodian and bank service fees | | | 2,838 | |
| Shareholder reporting expenses | | | 1,287 | |
| Postage and supplies | | | 1,193 | |
| Insurance expense | | | 575 | |
| Other expenses | | | 4,104 | |
| Total expenses | | | 143,277 | |
| Less fee reductions by the Adviser (Note 4) | | | (53,072 | ) |
| Net expenses | | | 90,205 | |
| | | | | |
| NET INVESTMENT INCOME | | | 53,515 | |
| | | | | |
| REALIZED AND UNREALIZED LOSSES ON INVESTMENTS | | | | |
| Net realized losses from investments transactions | | | (319,747 | ) |
| Net change in unrealized appreciation (depreciation) on investments | | | (1,208,687 | ) |
| NET REALIZED AND UNREALIZED LOSSES ON INVESTMENTS | | | (1,528,434 | ) |
| | | | | |
| NET DECREASE IN NET ASSETS RESULTING FROM OPERATIONS | | $ | (1,474,919 | ) |
| | | | | |
| (a) | Represents the period from the commencement of operations (May 10, 2022) through August 31, 2022. |
See accompanying notes to financial statements.
| NIA IMPACT SOLUTIONS FUND |
| STATEMENT OF CHANGES IN NET ASSETS |
| | | Period | |
| | | Ended | |
| | | August 31, | |
| | | 2022(a) | |
| | | (Unaudited) | |
| FROM OPERATIONS | | | | |
| Net investment income | | $ | 53,515 | |
| Net realized losses from investment transactions | | | (319,747 | ) |
| Net change in unrealized appreciation (depreciation) on investments | | | (1,208,687 | ) |
| Net decrease in net assets resulting from operations | | | (1,474,919 | ) |
| | | | | |
| FROM CAPITAL SHARE TRANSACTIONS | | | | |
| Proceeds from shares sold | | | 39,208,443 | |
| Payments for shares redeemed | | | (43 | ) |
| Net increase in net assets from capital share transactions | | | 39,208,400 | |
| | | | | |
| TOTAL INCREASE IN NET ASSETS | | | 37,733,481 | |
| | | | | |
| NET ASSETS | | | | |
| Beginning of period | | | — | |
| End of period | | $ | 37,733,481 | |
| | | | | |
| CAPITAL SHARES ACTIVITY | | | | |
| Shares sold | | | 3,690,694 | |
| Shares redeemed | | | (4 | ) |
| Net increase in shares outstanding | | | 3,690,690 | |
| Shares outstanding, beginning of period | | | — | |
| Shares outstanding, end of period | | | 3,690,690 | |
| | | | | |
| (a) | Represents the period from the commencement of operations (May 10, 2022) through August 31, 2022. |
See accompanying notes to financial statements.
| NIA IMPACT SOLUTIONS FUND |
| FINANCIAL HIGHLIGHTS |
| |
| Per Share Data for a Share Outstanding Throughout the Period |
| | | Period | |
| | | Ended | |
| | | August 31, | |
| | | 2022(a) | |
| | | (Unaudited) | |
| Net asset value at beginning of period | | $ | 10.00 | |
| | | | | |
| Income from investment operations: | | | | |
| Net investment income | | | 0.01 | |
| Net realized and unrealized gains on investments | | | 0.21 | (b) |
| Total from investment operations | | | 0.22 | |
| | | | | |
| Net asset value at end of period | | $ | 10.22 | |
| | | | | |
| Total return (c) | | | 2.20 | % (d) |
| | | | | |
| Net assets at end of period (000’s) | | $ | 37,733 | |
| | | | | |
| Ratios/supplementary data: | | | | |
| Ratio of total expenses to average net assets | | | 1.59 | % (e) |
| Ratio of net expenses to average net assets (f) | | | 0.99 | % (e) |
| Ratio of net investment income to average net assets (f) | | | 0.59 | % (e) |
| Portfolio turnover rate | | | 4 | % (d) |
| | | | | |
| (a) | Represents the period from the commencement of operations (May 10, 2022) through August 31, 2022. |
| (b) | Represents a balancing figure derived from other amounts in the financial highlights table that captures all other changes affecting net asset value per share. This per share amount does not correlate to the aggregate of the net realized and unrealized losses on the Statement of Operations for the same period. |
| (c) | Total return is a measure of the change in value of an investment in the Fund over the period covered. The return shown does not reflect the deduction of taxes a shareholder would pay on Fund distributions, if any, or the redemption of Fund shares. The total return would be lower if the Adviser had not reduced fees (Note 4). |
| (f) | Ratio was determined after management fee reductions by the Adviser (Note 4). |
See accompanying notes to financial statements.
| NIA IMPACT SOLUTIONS FUND |
| NOTES TO FINANCIAL STATEMENTS |
| August 31, 2022 (Unaudited) |
Nia Impact Solutions Fund (the “Fund”) is a diversified series of Ultimus Managers Trust (the “Trust”). The Trust is an open-end management investment company established as an Ohio business trust under a Declaration of Trust dated February 28, 2012. Other series of the Trust are not incorporated in this report. The Fund commenced operations on May 10, 2022.
The investment objective of the Fund is to seek to achieve long-term capital appreciation by investing in companies that contribute towards advancements in the areas of diversity and inclusion, sustainability and/or social justice.
| 2. | Significant Accounting Policies |
The Fund follows accounting and reporting guidance under Financial Accounting Standards Board Accounting Standards Codification Topic 946, “Financial Services – Investment Companies.” The following is a summary of the Fund’s significant accounting policies used in the preparation of its financial statements. These policies are in conformity with accounting principles generally accepted in the United States of America (“GAAP”).
Securities valuation – The Fund values its portfolio securities at market value as of the close of regular trading on the New York Stock Exchange (the “NYSE”) (normally 4:00 p.m. Eastern time) on each business day the NYSE is open for business. The Fund values its listed securities on the basis of the security’s last sale price on the security’s primary exchange, if available, otherwise at the exchange’s most recently quoted mean price. NASDAQ-listed securities are valued at the NASDAQ Official Closing Price. Investments representing shares of other registered open-end investment companies that are not listed on an exchange, including money market funds, are valued at their net asset value (“NAV”) as reported by such companies. When using a quoted price and when the market is considered active, the security will be classified as Level 1 within the fair value hierarchy (see below). In the event that market quotations are not readily available or are considered unreliable due to market or other events, the Fund values its securities and other assets at fair value in accordance with procedures adopted by the Board of Trustees (the “Board”). Under these procedures, the securities will be classified as Level 2 or 3 within the fair value hierarchy, depending on the inputs used. Unavailable or unreliable market quotes may be due to the following factors: a substantial bid-ask spread; infrequent sales resulting in stale prices; insufficient trading volume; small trade sizes; a temporary lapse in any reliable pricing source; and actions of the securities or futures markets, such as the suspension or limitation of trading. As a result, the prices of securities used to calculate the Fund’s NAV may differ from quoted or published prices for the same securities.
GAAP establishes a single authoritative definition of fair value, sets out a framework for measuring fair value, and requires additional disclosures about fair value measurements.
| NIA IMPACT SOLUTIONS FUND |
| NOTES TO FINANCIAL STATEMENTS (Continued) |
Various inputs are used in determining the value of the Fund’s investments. These inputs are summarized in the three broad levels listed below:
| ● | Level 1 – quoted prices in active markets for identical securities |
| ● | Level 2 – other significant observable inputs |
| ● | Level 3 – significant unobservable inputs |
The inputs or methods used for valuing securities are not necessarily an indication of the risks associated with investing in those securities. The inputs used to measure fair value may fall into different levels of the fair value hierarchy. In such cases, for disclosure purposes, the level in the fair value hierarchy within which the fair value measurement falls in its entirety is determined based on the lowest level input that is significant to the fair value measurement.
The following is a summary of the Fund’s investments based on the inputs used to value the investments as of August 31, 2022, by security type:
| | | Level 1 | | | Level 2 | | | Level 3 | | | Total | |
| Common Stocks | | $ | 35,572,169 | | | $ | — | | | $ | — | | | $ | 35,572,169 | |
| Money Market Funds | | | 2,115,411 | | | | — | | | | — | | | | 2,115,411 | |
| Total | | $ | 37,687,580 | | | $ | — | | | $ | — | | | $ | 37,687,580 | |
| | | | | | | | | | | | | | | | | |
Refer to the Fund’s Schedule of Investments for a listing of common stocks by sector and industry type. The Fund did not hold any derivative instruments or any assets or liabilities that were measured at fair value on a recurring basis using significant unobservable inputs (Level 3) as of or during the period ended August 31, 2022.
Share valuation – The NAV per share of the Fund is calculated daily by dividing the total value of the Fund’s assets, less liabilities, by the number of shares outstanding. The offering price and redemption price per share of the Fund is equal to the NAV per share.
Investment income – Dividend income is recorded on the ex-dividend date. Non-cash dividends included in dividend income, if any, are recorded at the fair market value of the security received. Interest income is accrued as earned. Withholding taxes on foreign dividends, if any, have been recorded in accordance with the Fund’s understanding of the applicable country’s tax rules and rates. Interest income, if any, is accrued as earned.
Investment transactions – Investment transactions are accounted for on the trade date. Realized gains and losses on investments sold are determined on a specific identification basis.
Common expenses – Common expenses of the Trust are allocated among the Fund and the other series of the Trust based on the relative net assets of each series, the number of series in the Trust, or the nature of the services performed and the relative applicability to each series.
| NIA IMPACT SOLUTIONS FUND |
| NOTES TO FINANCIAL STATEMENTS (Continued) |
Distributions to shareholders – The Fund distributes to shareholders any net investment income dividends and net realized capital gains on an annual basis. The amount of such dividends and distributions are determined in accordance with federal income tax regulations, which may differ from GAAP. Dividends and distributions to shareholders are recorded on the ex-dividend date. There were no distributions paid to shareholders by the Fund during the period ended August 31, 2022.
Estimates – The preparation of financial statements in conformity with GAAP requires management to make estimates and assumptions that affect the reported amounts of assets and liabilities and disclosure of contingent assets and liabilities as of the date of the financial statements and the reported amounts of increase (decrease) in net assets from operations during the reporting period. Actual results could differ from those estimates.
Federal income tax – The Fund intends to qualify as a regulated investment company under the Internal Revenue Code of 1986, as amended (the “Code”). Qualification generally will relieve the Fund of liability for federal income taxes to the extent 100% of its net investment income and net realized capital gains are distributed in accordance with the Code.
In order to avoid imposition of the excise tax applicable to regulated investment companies, it is also the Fund’s intention to declare as dividends in each calendar year equal to at least 98% of its net investment income (earned during the calendar year) and 98.2% of its net realized capital gains (earned during the twelve months ended October 31) plus undistributed amounts from prior years.
The following information is computed on a tax basis for each item as of August 31, 2022:
| Tax cost of investments | | $ | 38,909,113 | |
| Gross unrealized appreciation | | $ | 1,636,919 | |
| Gross unrealized depreciation | | | (2,858,452 | ) |
| Net unrealized depreciation | | | (1,221,533 | ) |
| Accumulated ordinary income | | | 53,515 | |
| Other losses | | | (306,901 | ) |
| Accumulated deficit | | $ | (1,474,919 | ) |
| | | | | |
The values of federal income tax cost of investments and the financial statement cost of investments may be temporarily different (“book/tax differences”). These book/tax differences are due to the timing of the recognition of capital gains or losses under income tax regulations and GAAP, primarily due to the tax deferral of losses on wash sales.
The Fund recognizes the tax benefits or expenses of uncertain tax positions only when the position is “more likely than not” of being sustained assuming examination by tax authorities. Management has reviewed the Fund’s tax positions for the current period and has concluded that no provision for unrecognized tax benefits or expenses is required in these financial statements. The Fund identifies its major tax jurisdiction as U.S. Federal.
| NIA IMPACT SOLUTIONS FUND |
| NOTES TO FINANCIAL STATEMENTS (Continued) |
| 3. | Investment Transactions |
During the period ended August 31, 2022, cost of purchases and proceeds from sales of investment securities, other than short-term investments, amounted to $38,146,883 and $1,046,276, respectively.
| 4. | Transactions with Related Parties |
INVESTMENT ADVISORY AGREEMENT
The Fund’s investments are managed by Nia Impact Capital (the “Adviser”) pursuant to the terms of an Investment Advisory Agreement. The Fund pays the Adviser a management fee, computed and accrued daily and paid monthly, at the annual rate of 0.95% of average daily net assets.
Pursuant to an Expense Limitation Agreement (“ELA”) between the Fund and the Adviser, the Adviser has agreed contractually, until June 30, 2025, to reduce its management fees and reimburse other expenses to the extent necessary to limit total annual fund operating expenses (exclusive of brokerage costs, taxes, interest, borrowing costs such as interest and dividend expenses on securities sold short, costs to organize the Fund, acquired fund fees and expenses, and extraordinary expenses such as litigation and merger or reorganization costs and other expenses not incurred in the ordinary course of the Fund’s business) to an amount not exceeding 0.99% of the Fund’s average daily net assets. Accordingly, during the period ended August 31, 2022, the Adviser reduced its management fees in the amount of $53,072.
Under the terms of the ELA, management fee reductions and/or expense reimbursements by the Adviser are subject to repayment by the Fund for a period of three years after such date that fees and expenses were incurred, provided that the repayments do not cause total annual fund operating expenses to exceed (i) the expense limitation then in effect, if any, and (ii) the expense limitation in effect at the time the expenses to be repaid were incurred. Prior to June 30, 2025, this agreement may not be modified or terminated without the approval of the Fund’s Board. This agreement will terminate automatically if the Fund’s investment advisory agreement with the Adviser is terminated. As of August 31, 2022, the Adviser may seek repayment of management fee reductions in the amount of $53,072 no later than August 31, 2025.
OTHER SERVICE PROVIDERS
Ultimus Fund Solutions, LLC (“Ultimus”) provides administration, fund accounting, compliance and transfer agency services to the Fund. The Fund pays Ultimus fees in accordance with the agreements for such services. In addition, the Fund pays out-of-pocket expenses including, but not limited to, postage, supplies and certain costs related to the pricing of the Fund’s portfolio securities.
Under the terms of a Distribution Agreement with the Trust, Ultimus Fund Distributors, LLC (the “Distributor”) serves as principal underwriter to the Fund. The Distributor is a wholly-owned subsidiary of Ultimus. The Distributor is compensated by the Adviser (not the Fund) for acting as principal underwriter.
Certain officers and a Trustee of the Trust are also officers of Ultimus.
| NIA IMPACT SOLUTIONS FUND |
| NOTES TO FINANCIAL STATEMENTS (Continued) |
TRUSTEE COMPENSATION
Each member of the Board (a “Trustee”) who is not an “interested person” (as defined by the Investment Company Act of 1940, as amended (the “1940 Act”)) of the Trust (“Independent Trustee”) receives a $1,300 annual retainer from the Fund, paid quarterly, except for the Board Chairperson who receives a $1,700 annual retainer from the Fund, paid in quarterly installments. Each Independent Trustee also receives from the Fund a fee of $550 for each Board meeting attended plus reimbursement for travel and other meeting-related expenses.
PRINCIPAL HOLDER OF FUND SHARES
As of August 31, 2022, the following shareholder owned of record more than 25% of the outstanding shares of the Fund:
| Name of Record Owner | | % Ownership |
| Northern Trust (for the benefit of its customers) | | 97% |
A beneficial owner of 25% or more of the Fund’s outstanding shares may be considered a controlling person. That shareholder’s vote could have a more significant effect on matters presented at a shareholders’ meeting.
The Fund’s incorporation of environmental, social and/or governance considerations (“ESG”) in its investment process may cause it to make different investments than funds that have a similar investment universe and/or investment style but that do not incorporate such considerations in their investment strategy processes. In applying ESG criteria to its investment decisions, the Fund may forgo higher yielding investments that it would invest in absent the application of its ESG investing criteria. The Fund’s investment process may affect the Fund’s exposure to certain investments, which may impact the Fund’s relative investment performance depending on whether such investments are in or out of favor with the market. In addition, the Fund investments in certain companies may be susceptible to various factors that may impact their businesses or operations, including costs associated with government budgetary constraints that impact publicly funded projects and clean energy initiatives, the effects of general economic conditions throughout the world, increased competition from other providers of services, unfavorable tax laws or accounting policies and high leverage. The Fund’s Adviser relies on available information to assist in the ESG evaluation process, and the process employed for the Fund may differ from processes employed for other funds. The Fund will seek to identify companies that it believes meet its ESG criteria based on date provided by third parties. The data provided by third parties may be incomplete, inaccurate or unavailable, which could cause the Adviser to incorrectly assess a company’s ESG practices.
| NIA IMPACT SOLUTIONS FUND |
| NOTES TO FINANCIAL STATEMENTS (Continued) |
| 6. | Contingencies and Commitments |
The Fund indemnifies the Trust’s officers and Trustees for certain liabilities that might arise from their performance of their duties to the Fund. Additionally, in the normal course of business the Fund enters into contracts that contain a variety of representations and warranties and which provide general indemnifications. The Fund’s maximum exposure under these arrangements is unknown, as this would involve future claims that may be made against the Fund that have not yet occurred. However, based on experience, the Fund expects the risk of loss to be remote.
The Fund is required to recognize in the financial statements the effects of all subsequent events that provide additional evidence about conditions that existed as of the date of the Statement of Assets and Liabilities. For non-recognized subsequent events that must be disclosed to keep the financial statements from being misleading, the Fund is required to disclose the nature of the event as well as an estimate of its financial effect, or a statement that such an estimate cannot be made. Management has evaluated subsequent events through the issuance of these financial statements and has noted no such events except for the following:
Effective October 17, 2022 each Independent Trustee will receive a $1,300 annual retainer from the Fund, paid quarterly, except for the Board Chairperson who will receive a $1,700 annual retainer from the Fund, paid quarterly and the Audit Committee Chairperson who will receive a $1,500 annual retainer from the Fund, paid quarterly. Each Independent Trustee will also receive from the Fund a fee of $550 for each Board meeting attended plus reimbursement for travel and other meeting-related expenses.
| NIA IMPACT SOLUTIONS FUND |
| ABOUT YOUR FUND’S EXPENSES (Unaudited) |
We believe it is important for you to understand the impact of costs on your investment. As a shareholder of the Fund, you incur ongoing costs, including management fees, and other operating expenses. The following examples are intended to help you understand your ongoing costs (in dollars) of investing in the Fund and to compare these costs with the ongoing costs of investing in other mutual funds.
A mutual fund’s ongoing costs are expressed as a percentage of its average net assets. This figure is known as the expense ratio. The expenses in the table below are based on an investment of $1,000 made at the beginning of the most recent period (May 10, 2022) and held until the end of the period (August 31, 2022).
The table below illustrates the Fund’s ongoing costs in two ways:
Actual fund return – This section helps you to estimate the actual expenses that you paid over the period. The “Ending Account Value” shown is derived from the Fund’s actual return, and the fourth column shows the dollar amount of operating expenses that would have been paid by an investor who started with $1,000 in the Fund. You may use the information here, together with the amount you invested, to estimate the expenses that you paid over the period.
To do so, simply divide your account value by $1,000 (for example, an $8,600 account value divided by $1,000 = 8.6), then multiply the result by the number given for the Fund under the heading “Expenses Paid During Period.”
Hypothetical 5% return – This section is intended to help you compare the Fund’s ongoing costs with those of other mutual funds. It assumes that the Fund had an annual return of 5% before expenses during the period shown, but that the expense ratio is unchanged. In this case, because the return used is not the Fund’s actual return, the results do not apply to your investment. The example is useful in making comparisons because the U.S. Securities and Exchange Commission (the “SEC”) requires all mutual funds to calculate expenses based on a 5% return. You can assess the Fund’s ongoing costs by comparing this hypothetical example with the hypothetical examples that appear in shareholder reports of other funds.
Note that expenses shown in the table are meant to highlight and help you compare ongoing costs only. The Fund does not charge transaction fees, such as purchase or redemption fees, nor does it carry a “sales load.”
The calculations assume no shares were bought or sold during the period. Your actual costs may have been higher or lower, depending on the amount of your investment and the timing of any purchases or redemptions.
More information about the Fund’s expenses can be found in this report. For additional information on operating expenses and other shareholder costs, please refer to the Fund’s prospectus.
| NIA IMPACT SOLUTIONS FUND |
| ABOUT YOUR FUND’S EXPENSES (Unaudited) (Continued) |
| | | Beginning | | Ending | | | | |
| | | Account Value | | Account Value | | Net | | Expenses Paid |
| | | March 1, | | August 31, | | Expense | | During |
| | | 2022 (a) | | 2022 | | Ratio (b) | | Period (c) |
| Based on Actual Fund Return | | $1,000.00 | | $1,022.00 | | 0.99% | | $3.10 |
| Based on Hypothetical 5% Return (before expenses) | | $1,000.00 | | $1,020.10 | | 0.99% | | $5.01 |
| (a) | Beginning Account Value is as of May 10, 2022 (date of commencement of operations) for the Actual Fund return information. |
| (b) | Annualized, based on the Fund’s most recent one-half year expenses. |
| (c) | Expenses are equal to the Fund’s annualized net expense ratio multiplied by the average account value over the period, multiplied by 113/365 (to reflect the period since inception) and 184/365 (to reflect the one-half year period), for Actual Fund Return and Hypothetical 5% Return information, respectively. |
OTHER INFORMATION (Unaudited)
A description of the policies and procedures that the Fund uses to vote proxies relating to portfolio securities is available without charge upon request by calling toll-free 1-833-571-2833, or on the SEC’s website at www.sec.gov. Information regarding how the Fund voted proxies relating to portfolio securities during the most recent period ended June 30 is available without charge upon request by calling toll-free 1-833-571-2833, or on the SEC’s website at www.sec.gov.
The Trust files a complete listing of portfolio holdings for the Fund with the SEC as of the end of the first and third quarters of each fiscal year as an exhibit to Form N-PORT. These filings are available upon request by calling 1-833-571-2833. Furthermore, you may obtain a copy of the filings on the SEC’s website at www.sec.gov and on the Fund’s website www.niaimpactfunds.com.
| NIA IMPACT SOLUTIONS FUND |
| DISCLOSURE REGARDING APPROVAL OF INVESTMENT |
| ADVISORY AGREEMENT (Unaudited) |
The Board of Trustees (the “Board”), including the Independent Trustees voting separately, reviewed and approved the Fund’s Investment Advisory Agreement with Nia Impact Capital (the “Adviser” or “Nia”) for an initial two-year term (the “Agreement”). The Board approved the Agreement at a meeting held on January 18-19, 2022, at which all of the Trustees were present.
In deciding whether to approve the Agreement, the Board recalled its discussion with representatives of Nia at the meeting and prior meetings and its review of the various materials related to Nia. The Board further considered those materials and discussions and other numerous factors, including the following:
The nature, extent, and quality of the services provided by the Adviser. In this regard, the Board considered the responsibilities Nia would have under the Agreement for the Fund. The Board also considered the proposed services that Nia would provide to the Fund including, without limitation, providing a continuous investment program for the Fund, adhering to the Fund’s investment restrictions, complying with the Trust’s policies and procedures, and voting proxies on behalf of the Fund. The Board considered the qualifications and experience of the Nia’s portfolio manager who will be responsible for the day to day management of the Fund, as well as, the qualifications and experience of the other individuals at Nia who will provide services to the Fund. The Board concluded that the quality, extent, and nature of the services to be provided by Nia to the Fund were satisfactory.
The investment management capabilities and experience of the Adviser. In this regard, the Board considered the investment management experience of Nia and its personnel. The Board considered its discussion with representatives of Nia regarding the investment objective and strategies for Fund and Nia’s experience and plans for implementing such strategies. In particular, the Board considered the information from Nia regarding prior experience managing other accounts that had similar investment objectives and strategies as the Fund. After consideration of these and other factors, the Board determined that Nia has the requisite knowledge and experience to serve as investment adviser for the Fund.
The costs of the services provided and profits realized by the Adviser and its affiliates from their relationship with the Fund. In this regard, the Board considered the proposed management fee for the Fund and proposed overall expense ratio, each as compared to the other funds in its custom peer group and Morningstar category and to the fees charged by the Nia to other clients with comparable mandates to Fund. The Board considered the anticipated profitability of Nia from the Fund and the potential the indirect benefits that Nia would receive from its management of the Fund. The Board concluded that the advisory fee to be paid to Nia by the Fund is reasonable in light of the nature and quality of the services provided by Nia.
The extent to which economics of scale would be realized as the Fund grows and whether advisory fee levels reflect these economies of scale for the benefit of the Fund’s investors. In this regard, the Board considered the Agreement and the expense limitation agreement between the Fund and the Adviser (the “ELA”). The Board considered economies of scale in connection with the Fund if fund assets grow and the extent to which the benefits of any such economies of scale may be shared
| NIA IMPACT SOLUTIONS FUND |
| DISCLOSURE REGARDING APPROVAL OF INVESTMENT |
| ADVISORY AGREEMENT (Unaudited) (Continued) |
with the funds and fund shareholders. The Board noted that the Fund would benefit from the ELA and the Board will review going forward the advisory fee arrangement as necessary. Based on this evaluation, the Board concluded that the proposed advisory fee for the Fund was reasonable in light of the information that was provided to the Board by Nia with respect to economies of scale.
After further discussion of the factors noted above, as well as other factors, and in reliance on the information provided by the Adviser and Trust management, and taking into account the totality of all factors discussed and information presented at the meeting and previous meetings, the Board indicated its agreement to approve the Agreement. It was noted that in the Trustees’ deliberations regarding the approval of the Agreement, the Trustees did not identify any particular information or factor that was all-important or controlling, and that each individual Trustee may have attributed different weights to various factors listed above. After full consideration of the above factors as well as other factors, the Board unanimously concluded that approval of the Agreement was in the best interests of the Fund and its shareholders.
| FACTS | WHAT DOES THE NIA IMPACT SOLUTIONS FUND (the “Fund”) DO WITH YOUR PERSONAL INFORMATION? |
| | |
| Why? | Financial companies choose how they share your personal information. Federal law gives consumers the right to limit some but not all sharing. Federal law also requires us to tell you how we collect, share, and protect your personal information. Please read this notice carefully to understand what we do. |
| | |
| What? | The types of personal information we collect and share depend on the product or service you have with us. This information can include: ■ Social Security number ■ Assets ■ Retirement Assets ■ Transaction History ■ Checking Account Information ■ Purchase History ■ Account Balances ■ Account Transactions ■ Wire Transfer Instructions When you are no longer our customer, we continue to share your information as described in this notice. |
| | |
| How? | All financial companies need to share your personal information to run their everyday business. In the section below, we list the reasons financial companies can share their customers’ personal information; the reasons the Fund chooses to share; and whether you can limit this sharing. |
| Reasons we can share your personal information | Does the
Fund share? | Can you limit
this sharing? |
For our everyday business purposes –
Such as to process your transactions, maintain your account(s), respond to court orders and legal investigations, or report to credit bureaus | Yes | No |
For our marketing purposes –
to offer our products and services to you | No | We don’t share |
| For joint marketing with other financial companies | No | We don’t share |
For our affiliates’ everyday business purposes –
information about your transactions and experiences | No | We don’t share |
For our affiliates’ everyday business purposes –
information about your creditworthiness | No | We don’t share |
| For non-affiliates to market to you | No | We don’t share |
| Questions? | Call 833-571-2833 |
| Who we are |
| Who is providing this notice? | Nia Impact Solutions Fund Ultimus Fund Distributors, LLC (Distributor) Ultimus Fund Solutions, LLC (Administrator) |
| What we do |
| How does the Fund protect my personal information? | To protect your personal information from unauthorized access and use, we use security measures that comply with federal law. These measures include computer safeguards and secured files and buildings. Our service providers are held accountable for adhering to strict policies and procedures to prevent any misuse of your nonpublic personal information. |
| How does the Fund collect my personal information? | We collect your personal information, for example, when you ■ Open an account ■ Provide account information ■ Give us your contact information ■ Make deposits or withdrawals from your account ■ Make a wire transfer ■ Tell us where to send the money ■ Tell us who receives the money ■ Show your government-issued ID ■ Show your driver’s license We also collect your personal information from other companies. |
| Why can’t I limit all sharing? | Federal law gives you the right to limit only ■ Sharing for affiliates’ everyday business purposes – information about your creditworthiness ■ Affiliates from using your information to market to you ■ Sharing for non-affiliates to market to you State laws and individual companies may give you additional rights to limit sharing. |
| | |
| Definitions |
| Affiliates | Companies related by common ownership or control. They can be financial and nonfinancial companies. ■ Nia Impact Capital, the investment adviser to the Fund, could be deemed to be an affiliate. |
| Non-affiliates | Companies not related by common ownership or control. They can be financial and nonfinancial companies ■ The Fund does not share with non-affiliates so they can market to you. |
| Joint marketing | A formal agreement between nonaffiliated financial companies that together market financial products or services to you. ■ The Fund does not jointly market. |
Nia Impact-SAR-22
(b). Not applicable
Item 2. Code of Ethics.
Not required
Item 3. Audit Committee Financial Expert.
Not required
Item 4. Principal Accountant Fees and Services.
Not required
Item 5. Audit Committee of Listed Registrants.
Not applicable
Item 6. Schedule of Investments.
| (a) | Not applicable [schedule filed with Item 1] |
Item 7. Disclosure of Proxy Voting Policies and Procedures for Closed-End Management Investment Companies.
Not applicable
Item 8. Portfolio Managers of Closed-End Management Investment Companies.
Not applicable
Item 9. Purchases of Equity Securities by Closed-End Management Investment Company and Affiliated Purchasers.
Not applicable
Item 10. Submission of Matters to a Vote of Security Holders.
There has been no material changes to the manner in which shareholders may recommend nominees to the Registrant’s Board of Trustees or the Nominations & Governance Committee (the “Committee”). The Registrant does not have formal procedures by which shareholders may recommend nominees to the Registrant’s Board of Trustees. While the Registrant does not have formal procedure, the Committee shall to the extent required under applicable law, when identifying potential candidates for the position of Independent Trustee, consider any such candidate recommended by a shareholder.
Item 11. Controls and Procedures.
(a) Based on their evaluation of the registrant’s disclosure controls and procedures (as defined in Rule 30a-3(c) under the Investment Company Act of 1940) as of a date within 90 days of the filing date of this report, the registrant’s principal executive officer and principal financial officer have concluded that such disclosure controls and procedures are reasonably designed and are operating effectively to ensure that material information relating to the registrant, including its consolidated subsidiaries, is made known to them by others within those entities, particularly during the period in which this report is being prepared, and that the information required in filings on Form N-CSR is recorded, processed, summarized, and reported on a timely basis.
(b) There were no changes in the registrant’s internal control over financial reporting (as defined in Rule 30a-3(d) under the Investment Company Act of 1940) that occurred during the the period covered by this report that have materially affected, or are reasonably likely to materially affect, the registrant’s internal control over financial reporting.
Item 12. Disclosure of Securities Lending Activities for Closed-End Management Investment Companies.
Not applicable
Item 13. Exhibits.
File the exhibits listed below as part of this Form. Letter or number the exhibits in the sequence indicated.
(a)(1) Any code of ethics, or amendment thereto, that is the subject of the disclosure required by Item 2, to the extent that the registrant intends to satisfy the Item 2 requirements through filing of an exhibit: Not required
(a)(2) A separate certification for each principal executive officer and principal financial officer of the registrant as required by Rule 30a-2(a) under the Act (17 CFR 270.30a-2(a)): Attached hereto
(a)(3) Any written solicitation to purchase securities under Rule 23c-1 under the Act (17 CFR 270.23c-1) sent or given during the period covered by the report by or on behalf of the registrant to 10 or more persons: Not applicable
(a)(4) Change in the registrant’s independent public accountants: Not applicable
(b) Certifications required by Rule 30a-2(b) under the Act (17 CFR 270.30a-2(b)): Attached hereto
Exhibit 99.CERT Certifications required by Rule 30a-2(a) under the Act
Exhibit 99.906CERT Certifications required by Rule 30a-2(b) under the Act
SIGNATURES
Pursuant to the requirements of the Securities Exchange Act of 1934 and the Investment Company Act of 1940, the registrant has duly caused this report to be signed on its behalf by the undersigned, thereunto duly authorized.
| (Registrant) | Ultimus Managers Trust | | |
| | | | |
| By (Signature and Title)* | /s/ Todd E. Heim | |
| | | Todd E. Heim, President | |
| | | | |
| Date | November 3, 2022 | | |
| | | | |
| Pursuant to the requirements of the Securities Exchange Act of 1934 and the Investment Company Act of 1940, this report has been signed below by the following persons on behalf of the registrant and in the capacities and on the dates indicated. |
| | | |
| By (Signature and Title)* | /s/ Todd E. Heim |
| | | Todd E. Heim, Principal Executive Officer |
| | | |
| Date | November 3, 2022 | |
| | | |
| By (Signature and Title)* | /s/ Jennifer L. Leamer |
| | | Jennifer L. Leamer, Treasurer and Principal Financial Officer |
| | | |
| Date | November 3, 2022 | |
* Print the name and title of each signing officer under his or her signature.