UNITED STATES
SECURITIES AND EXCHANGE COMMISSION
Washington, D.C. 20549
FORM N-CSR
CERTIFIED SHAREHOLDER REPORT OF REGISTERED
MANAGEMENT INVESTMENT COMPANY
| Investment Company Act file number | 811-22680 | |
| Ultimus Managers Trust |
| (Exact name of registrant as specified in charter) |
| 225 Pictoria Drive, Suite 450 Cincinnati, Ohio | 45246 |
| (Address of principal executive offices) | (Zip code) |
David K. James
| Ultimus Fund Solutions, LLC 225 Pictoria Drive, Suite 450 Cincinnati, Ohio 45246_ |
| (Name and address of agent for service) |
| Registrant's telephone number, including area code: | (513) 587-3400 | |
| Date of fiscal year end: | August 31 | |
| | | |
| Date of reporting period: | February 28, 2023 | |
Form N-CSR is to be used by management investment companies to file reports with the Commission not later than 10 days after the transmission to stockholders of any report that is required to be transmitted to stockholders under Rule 30e-1 under the Investment Company Act of 1940 (17 CFR 270.30e-1). The Commission may use the information provided on Form N-CSR in its regulatory, disclosure review, inspection, and policymaking roles.
A registrant is required to disclose the information specified by Form N-CSR, and the Commission will make this information public. A registrant is not required to respond to the collection of information contained in Form N-CSR unless the Form displays a currently valid Office of Management and Budget ("OMB") control number. Please direct comments concerning the accuracy of the information collection burden estimate and any suggestions for reducing the burden to the Secretary, Securities and Exchange Commission, 450 Fifth Street, NW, Washington, DC 20549-0609. The OMB has reviewed this collection of information under the clearance requirements of 44 U.S.C. § 3507.
| Item 1. | Reports to Stockholders. |

BLUE CURRENT GLOBAL DIVIDEND FUND
INSTITUTIONAL CLASS (BCGDX)
Semi-Annual Report
February 28, 2023
(Unaudited)
| BLUE CURRENT GLOBAL DIVIDEND FUND | |
| LETTER TO SHAREHOLDERS | April 10, 2023 |
Dear Shareholders.
PERFORMANCE SUMMARY
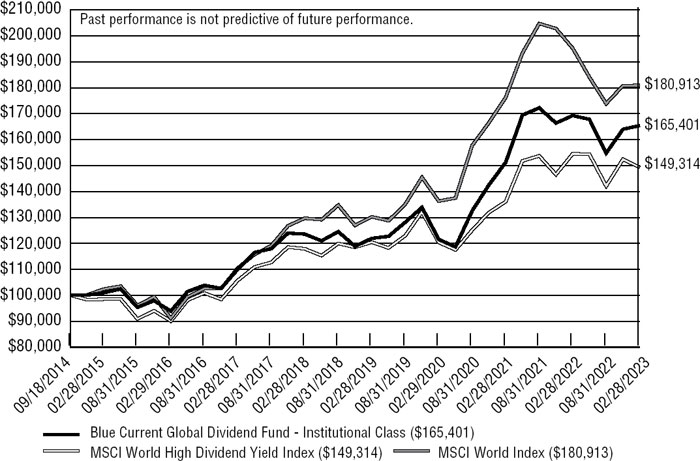
The Blue Current Global Dividend Fund (the “fund”) returned +6.84% over the six month period ending February 28, 2023. The fund’s benchmark, the MSCI World High Dividend Yield Index, returned +5.08% over the same period. The MSCI World High Dividend Yield Index most accurately reflects the fund’s investment objective to invest in high-quality, dividend paying stocks globally. Since its inception, the fund has produced an annualized return of +6.57%, which compares to a +5.21% annualized return for the MSCI World High Dividend Yield Index. It is important to remind our investors that we are not managing the fund to track or beat an index. We do not select securities to align with an index, or the underlying sector and country holdings, but rather aim to construct a portfolio of high quality companies that are committed to dividend growth and offer an attractive yield.
| | Total Returns for period ended February 28th 2023 |
| | | Trailing 1 | Trailing 3 | Trailing 5 | Since |
| Fund Name | QTD (Since | Year (Since | Year (Since | Year (Since | Inception |
| (Institutional Share Class) | 1/30/22) | 2/28/22) | 2/28/20) | 2/28/18) | (9/18/14) |
| Blue Current Global Dividend | 0.85% | -2.29% | 10.82% | 6.00% | 6.57% |
| MSCI World High Div Yield Net Index | -2.04% | -3.38% | 7.44% | 4.83% | 5.21% |
Source: Bloomberg
Past performance is not predictive of future performance. Investment results and principal value will fluctuate so that shares, when redeemed, may be worth more or less than their original cost. Current performance may be higher or lower than the performance data quoted. Performance data current to the most recent month end is available by calling 1-800-514-3583.
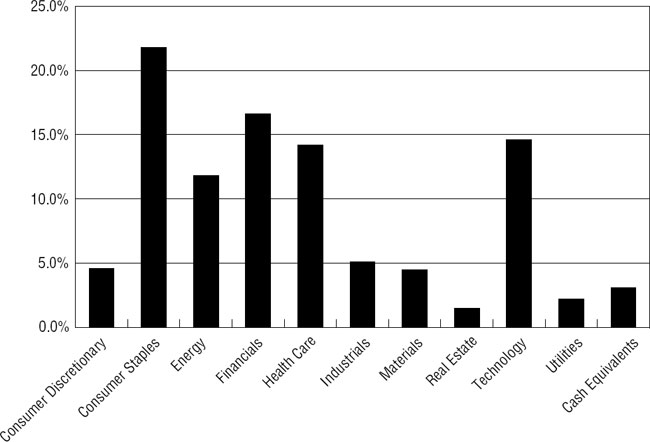
For the quarter, the top contributors by sector were financials (+9.6% return, 1.3% contribution), consumer discretionary (+7.8% return, 0.2% contribution) and materials (+6.5% return, 0.3% contribution). The lowest contributors or detractors by sector for the same period were industrials (-2.4% return, -0.2% contribution), healthcare (-1.9% return, -0.3% contribution), and consumer staples (+0% return, 0.1% contribution). Our largest sector weighting is consumer staples (23.0%), while the smallest sector allocation is to real estate (1.5%).
From an individual stock perspective, the top contributors for the quarter were BNP Paribas (+27.5% return, 0.7% contribution), BE Semiconductor (+24.7% return, 0.3% contribution), and BP (+13.6% return, 0.4% contribution). The bottom contributors include Nextera Energy (-15.6% return, 0.4% detraction), Johnson & Johnson (-13.3% return, 0.4% detraction), and Canadian National Railway (-10.0% return, 0.2% detraction).
We exited three positions during the quarter: Reckitt Benckiser, Nutrien and Union Pacific, due to weakening fundamentals and our inability to justify a significantly higher share price in the near-term. With the proceeds from the three position sales, we increased our cash levels, and reinvested the proceeds in new positions including Michelin, Stellantis, and reinitiated a position in Taiwan Semiconductor.
Michelin and Stellantis represent investments in the automobile sector which we expect will continue to recover in the years ahead as China’s consumer reenters the marketplace and supply chain headwinds normalize. Specific to Michelin, we were attracted to the company’s valuation at a respectable 8x earnings, strong balance sheet with a net cash position, and dominant marketshare in electric-vehicles – a market segment that requires higher tire innovation than legacy combustible engines. Over the prior two years, the company has experienced numerous challenges including rising raw material costs, declining new car sales on account of supply chain headwinds, lower car usage due to work-from-home policies, and legacy exposure to western Europe and Russia. The result was a significant decline in the company’s share price and a investment opportunity.
Unlike Michelin’s global brand, investors are likely less familiar with Stellantis, a company that was created in 2021 via the merger between Fiat Chrysler and PSA Group (manufacturer of Peugeot and Citroen and other European brands). Within the US, Stellantis owns and manufacturers under the Chrysler, Dodge, and Maserati brands. Due to its heightened emphasis on costs, the company possesses one of the highest operating margins in the automobile OEM industry and one of the best balance sheets. The company has a strong cash return program to shareholders that includes buybacks and dividends. Lastly, the company’s valuation is near the bottom of the peer group despite management’s superior operating performance and strong capital position. Ultimately, we believe headwinds experienced over the recent past will dissipate in 2023 and 2024, creating an opportunity for these two well managed global brands to grow operating profits and reward sharehodlers through continued buybacks and dividends.
Our exposure by geography (excluding cash) is approximately 50% US and 50% non-US.
BLUE CURRENT PHILOSOPHY & OBJECTIVES
It is important to remind the Fund’s shareholders of our philosophy and objectives. In the current environment, investors need to make every penny work for them. With yield in short supply and safe income streams providing little return, quality companies with growing and sustainable cash flow from across the globe might be less risky than you think – and more fruitful.
The Fund utilizes the investment team’s expertise in growing cash flow through what we believe is a niche universe of high-quality, dividend-paying companies with sustainable business models and dividend policies. The primary objectives are to pay a stable and increasing dividend each quarter and deliver attractive long-term capital appreciation to investors.
The Blue Current investment team concentrates on a select portfolio of 25-50 companies across developed markets that meet our stringent qualities. We focus on companies that we believe have a strong history of rewarding shareholders and the financial ability
to continue to increase their dividends over time. We also focus on the future earnings potential of each company and strive to purchase those businesses when they are trading at a discount to their true value.
OUTLOOK SUMMARY
While conditions could change quickly, global economic growth is still intact through the first quarter of 2023 despite multi-decade high interest rates across the globe driven by central bank officials best attempts to stall inflation. The soft-landing scenario seems all but impossible given the Federal Reserve’s checkered past but it may just be the path we are currently on as inflation looks to be cooling and the global economy has continued to add jobs. Specific to the US, the unemployment rate continues to be strong aided by continued job growth and recent reports suggesting that wage growth is beginning to moderate also helps monetary policy. Concurrently, corporate profits are proving more durable than expected as different sectors of the economy have strengthened (travel and tourism), offsetting pockets of weakness that are suffering from Covid-inspired stimulus that pulled forward demand by several years.
However, we recognize that we are not out of the woods yet. Signs of stress are evident in the financial sector as several major bank collapses have significantly weakened investor confidence, creating deposit movement away from regional banks towards the best capitalized and largest branded banks. This has already started to curtail lending at the same time that commercial real estate is suffering from a wall of loan maturities and falling property values. The outlook for the rest of 2023 may very well hinge on whether other pockets of the economy can generate earnings growth capable of offsetting what is expected to be declining growth in the financial sector. Outside of the financial sector, we also expect the consumer to be more selective in where and how they allocate their discretionary spending in 2023 leading to shifting market share and earnings volatility in the year ahead.
The shifting outlook will dampen the ability for major market indices to demonstrate a sustained rally in 2023, thereby favoring active managers who can identify those companies capable of deliving earnings growth in a mixed economy. In recent quarters, we have added meaningful exposure to companies domiciled outside of the US as we believe there are more tailwinds to growth and lower valuations than what the US has to offer. Although we do not take an active few on currencies, the outlook for a weakening dollar relative to other major currencies, such as euro and sterling, also favors owning non-US investments. Since we started our strategy in 2014, the strength of the US Dollar has been a constant headwind for investors, however, this cycle may be shifting as US interest rates have likely peaked and the dollar faces its own challenges in the decade ahead.
These factors lead us to believe that a global portfolio comprised of quality businesses with strong balance sheets and ample cash flow to invest through the cycle is the right recipe for investors to weather the policy and economic undertainty that lies ahead.
Sincerely,
 |  |
| | |
| Henry “Harry” M. T. Jones | Dennis Sabo, CFA |
| Co-Portfolio Manager | Co-Portfolio Manager |
Disclosure and Risk Summary
The Letter to Shareholders seeks to describe some of the current opinions and views of the financial markets of Edge Capital Group, LLC (the “Adviser”). Although the Adviser believes it has a reasonable basis for any opinions or views expressed, actual results may differ, sometimes significantly so, from those expected or expressed. The securities held by the Fund that are discussed in the Letter to Shareholders were held during the period covered by this Report. They do not comprise the entire investment portfolio of the Fund, may be sold at any time and may no longer be held by the Fund. For a complete list of securities held in the Fund as of February 28, 2023, please see the Schedule of Investments section of the semi-annual report. The opinions of the Adviser with respect to those securities may change at any time.
The opinions expressed herein are those of the Adviser, and the report is not meant as legal, tax, or financial advice. You should consult your own professional advisors as to the legal, tax, financial, or other matters relevant to the suitability of investing. The external data presented in this report have been obtained from independent sources (as noted) and are believed to be accurate, but no independent verification has been made and accuracy is not guaranteed. The information contained in this report is not intended to address the needs of any particular investor.
The information contained in this document does not constitute an offer to sell any securities nor a solicitation to purchase any securities. Index returns reflect the reinvestment of dividends. An investor should consider the investment objectives, risks, charges and expenses of the Fund carefully before investing. The Fund’s prospectus contains this and other important information. To obtain a copy of the Fund’s prospectus please visit our website at www.bluecurrentfunds.com or call 1-800-514-3583 and a copy will be sent to you free of charge. Please read the prospectus carefully before you invest. The Blue Current Global Dividend Fund is distributed by Ultimus Fund Distributors, LLC.
Statements in the Letter to Shareholders that reflect projections or expectations for future financial or economic performance of the Fund and the market in general and statements of the Fund’s plans and objectives for future operations are forward-looking statements.
No assurance can be given that actual results or events will not differ materially from those projected, estimated, assumed, or anticipated in any such forward- looking statements. Important factors that could result in such differences, in addition to factors noted with such forward-looking statements include, without limitation, general economic conditions, such as inflation, recession, and interest rates.
PAST PERFORMANCE CANNOT BE CONSTRUED AS AN INDICATOR OF FUTURE RESULTS BECAUSE OF, AMONG OTHER THINGS, POSSIBLE DIFFERENCES IN MARKET CONDITIONS, INVESTMENT STRATEGY, AND REGULATORY CLIMATE. THERE IS NO ASSURANCE THAT THE FUND WILL ACHIEVE ITS INVESTMENT OBJECTIVE. INVESTMENT RESULTS AND PRINCIPAL VALUE WILL FLUCTUATE SO THAT SHARES, WHEN REDEEMED, MAY BE WORTH MORE OR LESS THAN THEIR ORIGINAL COST. CURRENT PERFORMANCE MAY BE HIGHER OR LOWER THAN THE PERFORMANCE DATA QUOTED. PERFORMANCE DATA CURRENT TO THE MOST RECENT MONTH END IS AVAILABLE BY CALLING 1-800-514-3583. THE FUND INVESTS PRIMARILY IN DIVIDEND PAYING COMPANIES AND IT IS POSSIBLE THESE COMPANIES MAY ELIMINATE OR REDUCE THEIR DIVIDEND PAYMENTS. INDEX INFORMATION (I) IS INCLUDED MERELY TO SHOW THE GENERAL TREND IN THE EQUITY MARKETS FOR THE PERIOD INDICATED AND IS NOT INTENDED TO IMPLY THAT THE FUND’S PORTFOLIO WILL BE SIMILAR TO THE INDICES EITHER IN COMPOSITION OR RISK AND (II) HAS BEEN OBTAINED FROM SOURCES BELIEVED TO BE ACCURATE.
BLUE CURRENT GLOBAL DIVIDEND FUND
PERFORMANCE INFORMATION
February 28, 2023 (Unaudited)
Comparison of the Change in Value of a $100,000 Investment in
Blue Current Global Dividend Fund -
Institutional Class vs. the MSCI World High Dividend Yield Index
and the MSCI World Index
| | | |
| | Average Annual Total Returns
(for the periods ended February 28, 2023) | |
| | | | | | | | | | |
| | | | | | | | | Since | |
| | | 1 Year | | 3 Years | | 5 Years | | Inception(b) | |
| | | | | | | | | | |
| | Blue Current Global Dividend Fund - Institutional Class(a) | -2.29% | | 10.82% | | 6.00% | | 6.14% | |
| | MSCI World High Dividend Yield Index | -3.38% | | 7.44% | | 4.83% | | 4.86% | |
| | MSCI World Index | -7.33% | | 9.90% | | 6.88% | | 7.27% | |
| | | | | | | | | | |
| (a) | The Fund’s total returns do not reflect the deduction of taxes a shareholder would pay on Fund distributions or the redemption of Fund shares. |
| (b) | The Fund commenced operations on September 18, 2014. |
BLUE CURRENT GLOBAL DIVIDEND FUND
PORTFOLIO INFORMATION
February 28, 2023 (Unaudited)
Sector Diversification
(% of Net Assets)
| Top Ten Equity Holdings |
| | | |
| Security Description | | % of Net Assets |
| Microsoft Corporation | | 3.5% |
| Broadcom, Inc. | | 3.3% |
| Shell plc - ADR | | 3.2% |
| BNP Paribas S.A. | | 3.2% |
| Koninklijke Ahold Delhaize N.V. | | 3.1% |
| BP plc | | 3.1% |
| Raytheon Technologies Corporation | | 3.1% |
| AstraZeneca plc - ADR | | 3.0% |
| Sanofi - ADR | | 3.0% |
| Walmart, Inc. | | 3.0% |
| BLUE CURRENT GLOBAL DIVIDEND FUND |
| SCHEDULE OF INVESTMENTS |
| February 28, 2023 (Unaudited) |
| COMMON STOCKS — 95.1% | | Shares | | | Value | |
| Consumer Discretionary — 2.8% | | | | | | | | |
| Automotive — 2.8% | | | | | | | | |
| Cie Generale des Etablissements Michelin | | | 27,000 | | | $ | 848,456 | |
| Stellantis N.V. | | | 42,500 | | | | 744,600 | |
| | | | | | | | 1,593,056 | |
| Consumer Staples — 21.8% | | | | | | | | |
| Beverages — 7.5% | | | | | | | | |
| Coca-Cola Company (The) | | | 24,365 | | | | 1,449,961 | |
| Coca-Cola European Partners plc | | | 28,730 | | | | 1,580,150 | |
| Diageo plc - ADR | | | 6,996 | | | | 1,210,588 | |
| | | | | | | | 4,240,699 | |
| Food — 5.5% | | | | | | | | |
| Danone S.A. - ADR | | | 56,000 | | | | 633,920 | |
| Danone S.A. | | | 22,500 | | | | 1,265,110 | |
| Kraft Heinz Company (The) | | | 30,200 | | | | 1,175,988 | |
| | | | | | | | 3,075,018 | |
| Retail - Consumer Staples — 8.8% | | | | | | | | |
| Albertsons Companies, Inc. - Class A | | | 48,000 | | | | 954,240 | |
| Koninklijke Ahold Delhaize N.V. | | | 55,400 | | | | 1,759,516 | |
| Target Corporation | | | 3,400 | | | | 572,900 | |
| Walmart, Inc. | | | 11,850 | | | | 1,684,241 | |
| | | | | | | | 4,970,897 | |
| Energy — 11.8% | | | | | | | | |
| Oil & Gas Producers — 10.2% | | | | | | | | |
| BP plc | | | 267,000 | | | | 1,754,512 | |
| Enbridge, Inc. | | | 24,550 | | | | 920,967 | |
| Shell plc - ADR | | | 29,900 | | | | 1,817,023 | |
| Targa Resources Corporation | | | 16,560 | | | | 1,227,096 | |
| | | | | | | | 5,719,598 | |
| Oil & Gas Services & Equipment — 1.6% | | | | | | | | |
| Schlumberger Ltd. | | | 17,250 | | | | 917,873 | |
| | | | | | | | | |
| Financials — 16.6% | | | | | | | | |
| Banking — 8.7% | | | | | | | | |
| BNP Paribas S.A. | | | 25,600 | | | | 1,790,195 | |
| DBS Group Holdings Ltd. - ADR | | | 7,800 | | | | 795,756 | |
| JPMorgan Chase & Company | | | 8,143 | | | | 1,167,299 | |
| National Bank of Canada | | | 15,400 | | | | 1,131,052 | |
| | | | | | | | 4,884,302 | |
| BLUE CURRENT GLOBAL DIVIDEND FUND |
| SCHEDULE OF INVESTMENTS (Unaudited) (Continued) |
| COMMON STOCKS — 95.1% (Continued) | | Shares | | | Value | |
| Financials — 16.6% (Continued) | | | | | | | | |
| Institutional Financial Services — 4.1% | | | | | | | | |
| CME Group, Inc. | | | 6,300 | | | $ | 1,167,768 | |
| Morgan Stanley | | | 12,100 | | | | 1,167,650 | |
| | | | | | | | 2,335,418 | |
| Insurance — 2.4% | | | | | | | | |
| Allianz SE - ADR | | | 28,000 | | | | 655,760 | |
| Allianz SE | | | 2,900 | | | | 681,138 | |
| | | | | | | | 1,336,898 | |
| Specialty Finance — 1.4% | | | | | | | | |
| American Express Company | | | 4,715 | | | | 820,363 | |
| | | | | | | | | |
| Health Care — 14.2% | | | | | | | | |
| Biotech & Pharma — 12.3% | | | | | | | | |
| AstraZeneca plc - ADR | | | 26,300 | | | | 1,714,234 | |
| Johnson & Johnson | | | 5,362 | | | | 821,780 | |
| Merck & Company, Inc. | | | 15,800 | | | | 1,678,592 | |
| Novo Nordisk A/S - ADR | | | 7,100 | | | | 1,001,029 | |
| Sanofi - ADR | | | 36,000 | | | | 1,686,600 | |
| | | | | | | | 6,902,235 | |
| Medical Equipment & Devices — 1.9% | | | | | | | | |
| Medtronic plc | | | 13,200 | | | | 1,092,960 | |
| | | | | | | | | |
| Industrials — 5.1% | | | | | | | | |
| Aerospace & Defense — 3.1% | | | | | | | | |
| Raytheon Technologies Corporation | | | 17,795 | | | | 1,745,511 | |
| | | | | | | | | |
| Transportation & Logistics — 2.0% | | | | | | | | |
| Canadian National Railway Company | | | 9,800 | | | | 1,116,122 | |
| | | | | | | | | |
| Materials — 4.5% | | | | | | | | |
| Chemicals — 2.6% | | | | | | | | |
| Air Liquide S.A. | | | 9,268 | | | | 1,472,853 | |
| | | | | | | | | |
| Forestry, Paper & Wood Products — 1.9% | | | | | | | | |
| UPM-Kymmene OYJ - ADR | | | 15,000 | | | | 543,975 | |
| UPM-Kymmene OYJ | | | 14,200 | | | | 514,692 | |
| | | | | �� | | | 1,058,667 | |
| Real Estate — 1.5% | | | | | | | | |
| REITs — 1.5% | | | | | | | | |
| Prologis, Inc. | | | 6,700 | | | | 826,780 | |
See accompanying notes to financial statements.
| BLUE CURRENT GLOBAL DIVIDEND FUND |
| SCHEDULE OF INVESTMENTS (Unaudited) (Continued) |
| COMMON STOCKS — 95.1% (Continued) | | Shares | | | Value | |
| Technology — 14.6% | | | | | | | | |
| Semiconductors — 9.0% | | | | | | | | |
| BE Semiconductor Industries N.V. | | | 10,260 | | | $ | 792,193 | |
| Broadcom, Inc. | | | 3,125 | | | | 1,857,156 | |
| QUALCOMM, Inc. | | | 13,284 | | | | 1,640,973 | |
| Taiwan Semiconductor Manufacturing Company Ltd. - ADR | | | 9,000 | | | | 783,630 | |
| | | | | | | | 5,073,952 | |
| Software — 3.5% | | | | | | | | |
| Microsoft Corporation | | | 7,920 | | | | 1,975,406 | |
| | | | | | | | | |
| Technology Services — 2.1% | | | | | | | | |
| RELX plc - ADR | | | 40,000 | | | | 1,211,600 | |
| | | | | | | | | |
| Utilities — 2.2% | | | | | | | | |
| Electric Utilities — 2.2% | | | | | | | | |
| NextEra Energy, Inc. | | | 17,400 | | | | 1,235,922 | |
| | | | | | | | | |
| Total Common Stocks (Cost $43,323,276) | | | | | | $ | 53,606,130 | |
| | | | | | | | | |
| PREFERRED STOCKS — 1.8% | | Shares | | | Value | |
| Consumer Discretionary — 1.8% | | | | | | | | |
| Automobiles — 1.8% | | | | | | | | |
| Volkswagon AG (Cost $1,116,985) | | | 7,500 | | | $ | 1,021,210 | |
| BLUE CURRENT GLOBAL DIVIDEND FUND |
| SCHEDULE OF INVESTMENTS (Unaudited) (Continued) |
| MONEY MARKET FUNDS — 2.8% | | Shares | | | Value | |
| First American Government Obligations Fund - Class Z, 4.33% (a) (Cost $1,575,189) | | | 1,575,189 | | | $ | 1,575,189 | |
| | | | | | | | | |
| Investments at Value — 99.7% (Cost $46,015,450) | | | | | | $ | 56,202,529 | |
| | | | | | | | | |
| Other Assets in Excess of Liabilities — 0.3% | | | | | | | 166,170 | |
| | | | | | | | | |
| Net Assets — 100.0% | | | | | | $ | 56,368,699 | |
A/S - Aktieselskab
ADR - American Depositary Receipt
AG - Aktiengesellschaft
N.V. - Naamloze Vennootschap
OYJ - Julkinen Osakeyhtio
plc - Public Limited Company
S.A. - Societe Anonyme
SE - Societe Europaea
| (a) | The rate shown is the 7-day effective yield as of February 28, 2023. |
See accompanying notes to financial statements.
| BLUE CURRENT GLOBAL DIVIDEND FUND |
| SUMMARY OF COMMON STOCKS & |
| PREFERRED STOCKS BY COUNTRY |
| February 28, 2023 (Unaudited) |
| | | | | | % of Net | |
| Country | | Value | | | Assets | |
| United States | | $ | 24,087,499 | | | | 42.7 | % |
| United Kingdom | | | 9,288,107 | | | | 16.5 | % |
| France | | | 7,697,134 | | | | 13.7 | % |
| Netherlands | | | 3,296,309 | | | | 5.8 | % |
| Canada | | | 3,168,141 | | | | 5.6 | % |
| Germany | | | 2,358,108 | | | | 4.2 | % |
| Ireland | | | 1,092,960 | | | | 1.9 | % |
| Finland | | | 1,058,667 | | | | 1.9 | % |
| Denmark | | | 1,001,029 | | | | 1.8 | % |
| Singapore | | | 795,756 | | | | 1.4 | % |
| Taiwan Province of China | | | 783,630 | | | | 1.4 | % |
| | | $ | 54,627,340 | | | | 96.9 | % |
See accompanying notes to financial statements.
| BLUE CURRENT GLOBAL DIVIDEND FUND |
| STATEMENT OF ASSETS AND LIABILITIES |
| February 28, 2023 (Unaudited) |
| ASSETS | | | | |
| Investments in securities: | | | | |
| At cost | | $ | 46,015,450 | |
| At value (Note 2) | | $ | 56,202,529 | |
| Cash denominated in foreign currency (Cost $432,016) | | | 419,144 | |
| Receivable for capital shares sold | | | 42,739 | |
| Dividends receivable | | | 116,403 | |
| Other assets | | | 20,200 | |
| Total assets | | | 56,801,015 | |
| | | | | |
| LIABILITIES | | | | |
| Payable for capital shares redeemed | | | 348,904 | |
| Payable to Adviser (Note 4) | | | 45,419 | |
| Payable to administrator (Note 4) | | | 21,077 | |
| Other accrued expenses | | | 16,916 | |
| Total liabilities | | | 432,316 | |
| | | | | |
| NET ASSETS | | | 56,368,699 | |
| | | | | |
| NET ASSETS CONSIST OF: | | | | |
| Paid-in capital | | $ | 47,754,456 | |
| Accumulated earnings | | | 8,614,243 | |
| NET ASSETS | | $ | 56,368,699 | |
| | | | | |
| PRICING OF INSTITUTIONAL SHARES (Note 1) | | | | |
| Net assets applicable to Institutional Shares | | $ | 56,368,699 | |
| Shares of Institutional Shares outstanding (unlimited number of shares authorized, no par value) | | | 4,429,713 | |
| Net asset value, offering and redemption price per share (a) (Note 2) | | $ | 12.73 | |
| (a) | Redemption fee may apply to redemptions of shares held for 7 days or less. |
See accompanying notes to financial statements.
| BLUE CURRENT GLOBAL DIVIDEND FUND |
| STATEMENT OF OPERATIONS |
| For the Six Months Ended February 28, 2023 (Unaudited) |
| INVESTMENT INCOME | | | | |
| Dividends | | $ | 676,042 | |
| Foreign withholding taxes on dividends | | | (54,836 | ) |
| Total investment income | | | 621,206 | |
| | | | | |
| EXPENSES | | | | |
| Investment advisory fees (Note 4) | | | 263,992 | |
| Administration fees (Note 4) | | | 26,514 | |
| Fund accounting fees (Note 4) | | | 21,112 | |
| Legal fees | | | 12,827 | |
| Registration and filing fees | | | 12,540 | |
| Trustees’ fees and expenses (Note 4) | | | 9,532 | |
| Transfer agent fees (Note 4) | | | 9,270 | |
| Audit and tax services fees | | | 9,161 | |
| Custodian and bank service fees | | | 7,668 | |
| Compliance fees and expenses (Note 4) | | | 6,420 | |
| Shareholder reporting expenses | | | 4,395 | |
| Postage and supplies | | | 2,452 | |
| Insurance expense | | | 1,785 | |
| Pricing fees | | | 1,522 | |
| Other expenses | | | 9,715 | |
| Total expenses | | | 398,905 | |
| Fee reductions by the Adviser (Note 4) | | | (134,912 | ) |
| Net expenses | | | 263,993 | |
| | | | | |
| NET INVESTMENT INCOME | | | 357,213 | |
| | | | | |
| REALIZED AND UNREALIZED GAINS (LOSSES) ON INVESTMENTS AND FOREIGN CURRENCIES | | | | |
| Net realized losses from: | | | | |
| Investments | | | (1,573,508 | ) |
| Foreign currency transactions (Note 2) | | | (28,751 | ) |
| Net change in unrealized appreciation (depreciation) on: | | | | |
| Investments | | | 4,947,569 | |
| Foreign currency translation (Note 2) | | | (11,451 | ) |
| NET REALIZED AND UNREALIZED GAINS ON INVESTMENTS AND FOREIGN CURRENCIES | | | 3,333,859 | |
| | | | | |
| NET INCREASE IN NET ASSETS RESULTING FROM OPERATIONS | | $ | 3,691,072 | |
See accompanying notes to financial statements.
| BLUE CURRENT GLOBAL DIVIDEND FUND |
| STATEMENTS OF CHANGES IN NET ASSETS |
| | | Six Months | | | | |
| | | Ended | | | Year | |
| | | February 28, | | | Ended | |
| | | 2023 | | | August 31, | |
| | | (Unaudited) | | | 2022 | |
| FROM OPERATIONS | | | | | | | | |
| Net investment income | | $ | 357,213 | | | $ | 1,765,272 | |
| Net realized gains (losses) from: | | | | | | | | |
| Investments | | | (1,573,508 | ) | | | 1,813,407 | |
| Foreign currency transactions | | | (28,751 | ) | | | (7,345 | ) |
| Net change in unrealized appreciation (depreciation) on: | | | | | | | | |
| Investments | | | 4,947,569 | | | | (9,140,880 | ) |
| Foreign currency transactions | | | (11,451 | ) | | | (1,530 | ) |
| Net increase (decrease) in net assets from operations | | | 3,691,072 | | | | (5,571,076 | ) |
| | | | | | | | | |
| DISTRIBUTIONS TO SHAREHOLDERS | | | | | | | | |
| Institutional Shares | | | (2,133,029 | ) | | | (4,412,904 | ) |
| | | | | | | | | |
| FROM CAPITAL SHARE TRANSACTIONS | | | | | | | | |
| Institutional Shares | | | | | | | | |
| Proceeds from shares sold | | | 5,884,154 | | | | 9,311,947 | |
| Net asset value of shares issued in reinvestment of distributions to shareholders | | | 1,452,208 | | | | 3,147,040 | |
| Proceeds from redemption fees collected (Note 2) | | | 1 | | | | 1,100 | |
| Payments for shares redeemed | | | (3,811,762 | ) | | | (3,220,647 | ) |
| Net increase in Institutional Shares net assets from capital share transactions | | | 3,524,601 | | | | 9,239,440 | |
| | | | | | | | | |
| TOTAL INCREASE (DECREASE) IN NET ASSETS | | | 5,082,644 | | | | (744,540 | ) |
| | | | | | | | | |
| NET ASSETS | | | | | | | | |
| Beginning of period | | | 51,286,055 | | | | 52,030,595 | |
| End of period | | $ | 56,368,699 | | | $ | 51,286,055 | |
| | | | | | | | | |
| CAPITAL SHARES ACTIVITY | | | | | | | | |
| Shares sold | | | 476,827 | | | | 689,896 | |
| Shares reinvested | | | 118,054 | | | | 224,361 | |
| Shares redeemed | | | (302,096 | ) | | | (232,351 | ) |
| Net increase in shares outstanding | | | 292,785 | | | | 681,906 | |
| Shares outstanding, beginning of period | | | 4,136,928 | | | | 3,455,022 | |
| Shares outstanding, end of period | | | 4,429,713 | | | | 4,136,928 | |
See accompanying notes to financial statements.
| BLUE CURRENT GLOBAL DIVIDEND FUND |
| INSTITUTIONAL SHARES |
| FINANCIAL HIGHLIGHTS |
Per Share Data for a Share Outstanding Throughout Each Period
| | | Six Months | | | | | | | | | | | | | | | | |
| | | Ended | | | Year | | | Year | | | Year | | | Year | | | Year | |
| | | February 28, | | | Ended | | | Ended | | | Ended | | | Ended | | | Ended | |
| | | 2023 | | | August 31, | | | August 31, | | | August 31, | | | August 31, | | | August 31, | |
| | | (Unaudited) | | | 2022 | | | 2021 | | | 2020 | | | 2019 | | | 2018 | |
| Net asset value at beginning of period | | $ | 12.40 | | | $ | 15.06 | | | $ | 11.74 | | | $ | 11.62 | | | $ | 11.47 | | | $ | 11.20 | |
| Income (loss) from investment operations: | | | | | | | | | | | | | | | | | | | | | | | | |
| Net investment income | | | 0.08 | | | | 0.48 | | | | 0.17 | | | | 0.24 | | | | 0.22 | | | | 0.23 | |
| Net realized and unrealized gains (losses) on investments and foreign currencies | | | 0.75 | | | | (1.88 | ) | | | 3.32 | | | | 0.16 | (a) | | | 0.11 | | | | 0.39 | |
| Total from investment operations | | | 0.83 | | | | (1.40 | ) | | | 3.49 | | | | 0.40 | | | | 0.33 | | | | 0.62 | |
| Less distributions from: | | | | | | | | | | | | | | | | | | | | | | | | |
| Net investment income | | | (0.11 | ) | | | (0.49 | ) | | | (0.17 | ) | | | (0.20 | ) | | | (0.18 | ) | | | (0.14 | ) |
| Net realized gains | | | (0.39 | ) | | | (0.77 | ) | | | — | | | | (0.08 | ) | | | — | | | | (0.21 | ) |
| Total distributions | | | (0.50 | ) | | | (1.26 | ) | | | (0.17 | ) | | | (0.28 | ) | | | (0.18 | ) | | | (0.35 | ) |
| Proceeds from redemption fees collected (Note 2) | | | 0.00 | (b) | | | 0.00 | (b) | | | — | | | | 0.00 | (b) | | | 0.00 | (b) | | | 0.00 | (b) |
| Net asset value at end of period | | $ | 12.73 | | | $ | 12.40 | | | $ | 15.06 | | | $ | 11.74 | | | $ | 11.62 | | | $ | 11.47 | |
| Total return (c) | | | 6.84 | %(d) | | | (10.12 | %) | | | 29.91 | % | | | 3.46 | % | | | 2.91 | % | | | 5.58 | % |
| Net assets at end of period (000’s) | | $ | 56,369 | | | $ | 51,286 | | | $ | 52,031 | | | $ | 42,039 | | | $ | 62,302 | | | $ | 65,543 | |
| Ratios/supplementary data: | | | | | | | | | | | | | | | | | | | | | | | | |
| Ratio of total expenses to average net assets | | | 1.50 | % (e) | | | 1.49 | % | | | 1.48 | % | | | 1.48 | % | | | 1.43 | % | | | 1.39 | % |
| Ratio of net expenses to average net assets (f) | | | 0.99 | % (e) | | | 0.99 | % | | | 0.99 | % | | | 0.99 | % | | | 0.99 | % | | | 0.99 | % |
| Ratio of net investment income to average net assets (f) | | | 1.34 | % (e) | | | 3.43 | % | | | 1.27 | % | | | 1.94 | % | | | 1.87 | % | | | 2.06 | % |
| Portfolio turnover rate | | | 33 | % (d) | | | 60 | % | | | 53 | % | | | 66 | % | | | 46 | % | | | 50 | % |
| (a) | Represents a balancing figure from other amounts in the financial highlights table that captures all other changes affecting net asset value per share. This per share amount does not correlate to the aggregate of net realized and unrealized losses on the Statement of Operations for the same period. |
| | |
| (b) | Amount rounds to less than $0.01 per share. |
| | |
| (c) | Total return is a measure of the change in value of an investment in the Fund over the periods covered, which assumes any dividends and capital gain distributions are reinvested in shares of the Fund. The returns shown do not reflect the deduction of taxes a shareholder would pay on Fund distributions or the redemption of Fund shares. The total returns would be lower if the Adviser had not reduced advisory fees (Note 4). |
| | |
| (d) | Not annualized. |
| | |
| (e) | Annualized. |
| | |
| (f) | Ratio was determined after advisory fee reductions by the Adviser (Note 4). |
See accompanying notes to financial statements.
| BLUE CURRENT GLOBAL DIVIDEND FUND |
| NOTES TO FINANCIAL STATEMENTS |
| February 28, 2023 (Unaudited) |
1. Organization
Blue Current Global Dividend Fund (the “Fund”) is a diversified series of Ultimus Managers Trust (the “Trust”), an open-end investment company established as an Ohio business trust under a Declaration of Trust dated February 28, 2012. Other series of the Trust are not incorporated in this report.
The investment objective of the Fund is to seek current income and capital appreciation.
The Fund currently offers one class of shares: Institutional Class shares (sold without any sales loads or distribution fees and subject to a $100,000 initial investment requirement).
2. Significant Accounting Policies
The following is a summary of the Fund’s significant accounting policies. The policies are in conformity with accounting principles generally accepted in the United States of America (“GAAP”). The Fund follows accounting and reporting guidance under Financial Accounting Standards Board Accounting Standards Codification Topic 946, “Financial Services – Investment Companies.”
Securities valuation – The Fund values its portfolio securities including common stocks at fair value as of the close of regular trading on the New York Stock Exchange (the “NYSE”) (normally 4:00 p.m. Eastern Time) on each day the NYSE is open for business. The Fund generally values its listed securities on the basis of the security’s last sale price on the security’s primary exchange, if available, otherwise at the exchange’s most recently quoted mean price. NASDAQ-listed securities are valued at the NASDAQ Official Closing Price. Investments representing shares of other open-end investment companies, other than exchange-traded funds, if any, but including money market funds, are valued at their net asset value (“NAV”) as reported by such companies. When using a quoted price and when the market is considered active, the security will be classified as Level 1 within the fair value hierarchy (see below). In the event that market quotations are not readily available or are considered unreliable due to market or other events, the Fund values its securities and other assets at fair value as determined by Edge Capital Group, LLC (the “Adviser”), as the Fund’s valuation designee, in accordance with procedures adopted by the Board of Trustees (the “Board”) pursuant to Rule 2a-5 under the Investment Company Act of 1940, as amended (the “1940 Act”). Under these procedures, the securities will be classified as Level 2 or 3 within the fair value hierarchy, depending on the inputs used. Unavailable or unreliable market quotes may be due to the following factors: a substantial bid-ask spread; infrequent sales resulting in stale prices; insufficient trading volume; small trade sizes; a temporary lapse in any reliable pricing source; and actions of the securities or futures markets, such as the suspension or limitation of trading. As a result, the prices of securities used to calculate the Fund’s NAV may differ from quoted or published prices for the same securities. Securities traded on foreign exchanges are typically fair valued by an independent pricing service and translated from the local currency into U.S. dollars using
| BLUE CURRENT GLOBAL DIVIDEND FUND |
| NOTES TO FINANCIAL STATEMENTS (Unaudited) (Continued) |
currency exchange rates supplied by an independent pricing service. GAAP establishes a single authoritative definition of fair value, sets out a framework for measuring fair value, and requires additional disclosures about fair value measurements.
Various inputs are used in determining the value of the Fund’s investments. These inputs are summarized in the three broad levels listed below:
| ● | Level 1 – quoted prices in active markets for identical securities |
| ● | Level 2 – other significant observable inputs |
| ● | Level 3 – significant unobservable inputs |
The inputs or methods used for valuing securities are not necessarily an indication of the risks associated with investing in those securities. The inputs used to measure fair value may fall into different levels of the fair value hierarchy. In such cases, for disclosure purposes, the level in the fair value hierarchy within which the fair value measurement falls in its entirety is determined based on the lowest level input that is significant to the fair value measurement.
The Fund’s foreign equity securities actively traded in foreign markets may be classified as Level 2 despite the availability of closing prices because such securities are typically fair valued by an independent pricing service. The Board has authorized the Fund to retain an independent pricing service to determine the fair value of its foreign securities because the value of such securities may be materially affected by events occurring before the Fund’s pricing time but after the close of the primary markets or exchanges on which such foreign securities are traded. These intervening events might be country-specific (e.g., natural disaster, economic or political developments, interest rate change); issuer specific (e.g., earnings report or merger announcement); or U.S. market-specific (such as a significant movement in the U.S. market that is deemed to affect the value of foreign securities). The pricing service uses an automated system that incorporates a model based on multiple parameters, including a security’s local closing price, relevant general and sector indices, currency fluctuations, trading in depositary receipts and futures, if applicable, and/or research valuations by its staff, in determining what it believes is the fair value of the securities.
The following is a summary of the Fund’s investments based on the inputs used to value the investments as of February 28, 2023:
| Investments in Securities | | Level 1 | | | Level 2 | | | Level 3 | | | Total | |
| Common Stocks | | $ | 42,727,465 | | | $ | 10,878,665 | | | $ | — | | | $ | 53,606,130 | |
| Preferred Stocks | | | — | | | | 1,021,210 | | | | — | | | | 1,021,210 | |
| Money Market Funds | | | 1,575,189 | | | | — | | | | — | | | | 1,575,189 | |
| Total | | $ | 44,302,654 | | | $ | 11,899,875 | | | $ | — | | | $ | 56,202,529 | |
| | | | | | | | | | | | | | | | | |
| BLUE CURRENT GLOBAL DIVIDEND FUND |
| NOTES TO FINANCIAL STATEMENTS (Unaudited) (Continued) |
Refer to the Fund’s Schedule of Investments for a listing of the common stocks by sector and industry type. The Fund did not have any assets or liabilities that were measured at fair value on a recurring basis using significant unobservable inputs (Level 3) as of or during the six months ended February 28, 2023.
Foreign currency translation – Securities and other assets and liabilities denominated in or expected to settle in foreign currencies are translated into U.S. dollars based on exchange rates on the following basis:
| A. | The fair values of investment securities and other assets and liabilities are translated as of the close of the NYSE each day. |
| B. | Purchases and sales of investment securities and income and expenses are translated at the rate of exchange prevailing as of 4:00 p.m. Eastern Time on the respective date of such transactions. |
| C. | The Fund does not isolate that portion of the results of operations caused by changes in foreign exchange rates on investments from those caused by changes in market prices of securities held. Such fluctuations are included with the net realized and unrealized gains or losses on investments. |
Reported net realized foreign exchange gains or losses arise from 1) purchases and sales of foreign currencies, 2) currency gains or losses realized between the trade and settlement dates on securities transactions and 3) the difference between the amounts of dividends and foreign withholding taxes recorded on the Fund’s books and the U.S. dollar equivalent of the amounts actually received or paid. Reported net unrealized foreign exchange gains and losses arise from changes in the value of assets and liabilities that result from changes in exchange rates.
The Fund may be subject to foreign taxes related to foreign income received, capital gain on the sale of securities and certain foreign currency transactions (a portion of which may be reclaimable). All foreign taxes are recorded in accordance with the applicable regulations and rates that exist in the foreign jurisdictions in which the Fund invests.
Share valuation – The NAV per share of the Fund is calculated daily by dividing the total value of the assets, less liabilities, by the number of shares outstanding. The offering price and redemption price per share of the Fund is equal to the NAV per share, except that shareholders of the Fund are subject to a redemption fee equal to 2.00% of the value of Fund shares redeemed within 7 days of purchase, excluding involuntary redemptions of accounts that fall below the minimum investment amount or the redemption of Fund shares representing reinvested dividends, capital gain distributions, or capital appreciation. During the periods ended February 28, 2023 and August 31, 2022, proceeds from redemption fees, recorded in capital, totaled $1 and $1,100, respectively.
Investment income – Dividend income is recorded on the ex-dividend date. Non-cash dividends included in dividend income, if any, are recorded at the fair value of the security received. Interest income is accrued as earned. The Fund may invest in real estate
| BLUE CURRENT GLOBAL DIVIDEND FUND |
| NOTES TO FINANCIAL STATEMENTS (Unaudited) (Continued) |
investment trusts (“REITs”) that pay distributions to their shareholders based on available funds from operations. It is common for these distributions to exceed the REIT’s taxable earnings and profits resulting in the excess portion of such distribution to be designated as return of capital. Distributions received from REITs are generally recorded as dividend income and, if necessary, are reclassified annually in accordance with tax information provided by the underlying REITs. The Fund may also invest in master limited partnerships (“MLPs”) whose distributions generally are comprised of ordinary income, capital gains and return of capital from the MLP. For financial statement purposes, the Fund records all income received as ordinary income. This amount may be subsequently revised based on information received from the MLPs after their tax reporting periods are concluded, as the actual character of these distributions is not known until after the fiscal year end of the Fund. Withholding taxes on foreign dividends have been recorded for in accordance with the Fund’s understanding of the applicable country’s tax rules and rates.
Investment transactions – Investment transactions are accounted for on the trade date. Realized gains and losses on investments sold are determined on a specific identification basis.
Common expenses – Common expenses of the Trust are allocated among the Fund and the other series of the Trust based on the relative net assets of each series, the number of series in the Trust, or the nature of the services performed and the relative applicability to each series.
Distributions to shareholders – Distributions to shareholders arising from net investment income are declared and paid quarterly to shareholders. Net realized capital gains, if any, are distributed at least annually. The amount of distributions from net investment income and net realized capital gains are determined in accordance with federal income tax regulations, which may differ from GAAP. Dividends and distributions to shareholders are recorded on the ex-dividend date. The tax character of distributions paid during the periods ended February 28, 2023 and August 31, 2022 was as follows:
| | | Ordinary | | | Long-Term | | | Total | |
| Periods Ended | | Income | | | Capital Gains | | | Distributions | |
| February 28, 2023 | | $ | 486,388 | | | $ | 1,646,641 | | | $ | 2,133,029 | |
| August 31, 2022 | | $ | 1,741,919 | | | $ | 2,670,985 | | | $ | 4,412,904 | |
On March 31, 2023, the Fund paid an ordinary income dividend of $0.0214 per share to shareholders of record on March 30, 2023.
Estimates – The preparation of financial statements in conformity with GAAP requires management to make estimates and assumptions that affect the reported amounts of assets and liabilities and disclosure of contingent assets and liabilities, each as of the date of the financial statements, and the reported amounts of increase (decrease) in net assets from operations during the reporting period. Actual results could differ from those estimates.
| BLUE CURRENT GLOBAL DIVIDEND FUND |
| NOTES TO FINANCIAL STATEMENTS (Unaudited) (Continued) |
Federal income tax – The Fund has qualified and intends to continue to qualify as a regulated investment company under the Internal Revenue Code of 1986, as amended (the “Code”). Qualification generally will relieve the Fund of liability for federal income taxes to the extent 100% of its net investment income and net realized capital gains are distributed in accordance with the Code.
In order to avoid imposition of the excise tax applicable to regulated investment companies, it is also the Fund’s intention to declare as dividends in each calendar year at least 98% of its net investment income (earned during the calendar year) and 98.2% of its net realized capital gains (earned during the 12 months ended October 31) plus undistributed amounts from prior years.
The following information is computed on a tax basis for each item as of August 31, 2022:
| | | | | |
| Tax cost of investments | | $ | 45,869,554 | |
| Gross unrealized appreciation | | $ | 6,979,601 | |
| Gross unrealized depreciation | | | (1,738,390 | ) |
| Net unrealized appreciation on investments | | | 5,241,211 | |
| Net unrealized depreciation on foreign currency translation | | | (1,681 | ) |
| Undistributed ordinary income | | | 170,341 | |
| Undistributed long-term gains | | | 1,646,329 | |
| Distributable earnings | | $ | 7,056,200 | |
| | | | | |
The federal tax cost, unrealized appreciation (depreciation) as of February 28, 2023 is as follows:
| | | | | |
| Tax cost of investments | | $ | 46,013,792 | |
| Gross unrealized appreciation | | $ | 10,704,155 | |
| Gross unrealized depreciation | | | (515,418 | ) |
| Net unrealized appreciation on investments | | $ | 10,188,737 | |
| Net unrealized depreciation on foreign currency translation | | $ | (13,132 | ) |
| | | | | |
The difference between the federal income tax cost of investments and the financial cost is due to certain timing differences in the recognition of capital gains or losses under income tax regulations and GAAP. These “book/tax” differences are temporary in nature and are primarily due to the tax deferral of losses on wash sales and the tax treatment of the cost of securities received as in-kind subscriptions at the inception of the Fund.
The Fund recognizes the tax benefits or expenses of uncertain tax positions only when the position is “more likely than not” to be sustained assuming examination by tax authorities. Management has reviewed the Fund’s tax positions for the current and all open tax years (generally, three years) and has concluded that no provision for unrecognized tax benefits or expenses is required in these financial statements. The Fund identifies its major tax
| BLUE CURRENT GLOBAL DIVIDEND FUND |
| NOTES TO FINANCIAL STATEMENTS (Unaudited) (Continued) |
jurisdiction as U.S. federal. The Fund recognizes interest and penalties, if any, related to unrecognized tax benefits as income tax on the Statement of Operations. During the six months ended February 28, 2023, the Fund did not incur any interest or penalties.
3. Investment Transactions
During the six months ended February 28, 2023, cost of purchases and proceeds from sales of investment securities, other than short-term investments, were $20,905,050 and $16,742,206, respectively.
4. Transactions with Related Parties
INVESTMENT ADVISORY AGREEMENT
The Fund’s investments are managed by the Adviser pursuant to the terms of an Investment Advisory Agreement. Under the Investment Advisory Agreement, the Fund pays the Adviser an investment advisory fee, computed and accrued daily and paid monthly, at the annual rate of 0.99% of its average daily net assets.
Pursuant to an Expense Limitation Agreement between the Fund and the Adviser (the “ELA”), the Adviser had agreed, until April 30, 2024, to reduce its investment advisory fees and reimburse other expenses to limit total annual operating expenses (exclusive of brokerage costs; taxes; interest; borrowing costs such as interest and dividends expenses on securities sold short; costs to organize the Fund; acquired fund fees and expenses; and extraordinary expenses such as litigation and merger or reorganization costs and other expenses not incurred in the ordinary course of the Fund’s business) to an amount not exceeding 0.99% of the average daily net assets of the Institutional Class shares. Accordingly, under the ELA, the Adviser reduced its investment advisory fees in the amount of $134,912 during the six months ended February 28, 2023.
Under the terms of the ELA, investment advisory fee reductions and expense reimbursements by the Adviser are subject to repayment by the Fund for a period of three years after such fees and expenses were incurred, provided that the repayments do not cause the Fund’s total annual operating expenses to exceed the lesser of (i) the expense limitation then in effect, if any, and (ii) the expense limitation in effect at the time the expenses to be repaid were incurred. As of February 28, 2023, the Adviser may seek recoupment of investment advisory fee reductions in the amount of $751,116 no later than the dates stated below:
| | | | | |
| August 31, 2023 | | $ | 127,281 | |
| August 31, 2024 | | | 229,000 | |
| August 31, 2025 | | | 259,923 | |
| February 28, 2026 | | | 134,912 | |
| Total | | $ | 751,116 | |
| | | | | |
| BLUE CURRENT GLOBAL DIVIDEND FUND |
| NOTES TO FINANCIAL STATEMENTS (Unaudited) (Continued) |
OTHER SERVICE PROVIDERS
Ultimus Fund Solutions, LLC (“Ultimus”) provides administration, fund accounting, compliance and transfer agency services to the Fund. The Fund pays Ultimus fees in accordance with the agreements for such services. In addition, the Fund pays out-of-pocket expenses including, but not limited to, postage, supplies, and certain costs related to the pricing of the Fund’s portfolio securities.
Under the terms of a Distribution Agreement with the Trust, Ultimus Fund Distributors, LLC (the “Distributor”) serves as principal underwriter to the Fund. The Distributor is a wholly-owned subsidiary of Ultimus. The Distributor is compensated by the Adviser (not the Fund) for acting as principal underwriter.
Certain officers and a Trustee of the Trust are also officers of Ultimus and are not paid by the Fund for serving in such capacities.
TRUSTEE COMPENSATION
Effective October 17, 2022, each member of the Board (a “Trustee”) who is not an “interested person” (as defined by the 1940 Act) of the Trust (“Independent Trustee”) receives a $1,300 annual retainer from the Fund, paid quarterly, except for the Board Chairperson who receives a $1,700 annual retainer from the Fund, paid quarterly, and the Audit Committee Chairperson who receives a $1,500 annual retainer from the Fund, paid quarterly. Each Independent Trustee also receives from the Fund a fee of $550 for each Board meeting attended plus reimbursement for travel and other meeting-related expenses. Prior to October 17, 2022, no additional annual retainer was designated specifically for the Audit Committee Chairperson.
| BLUE CURRENT GLOBAL DIVIDEND FUND |
| NOTES TO FINANCIAL STATEMENTS (Unaudited) (Continued) |
PRINCIPAL HOLDER OF FUND SHARES
As of February 28, 2023, the following shareholder owned of record 25% or more of the outstanding shares of the Fund:
| Name of Record Owner | | % Ownership |
| Pershing, LLC (for the benefit of multiple shareholders) | | 69% |
A beneficial owner of 25% or more of the Fund’s outstanding shares may be considered a controlling person. The shareholder’s vote could have a more significant effect on matters presented at a shareholders’ meeting.
5. Foreign Investment Risk
Compared with investing in the U.S., investing in foreign markets involves a greater degree and variety of risk. Investors in foreign markets may face delayed settlements, currency controls, and adverse economic developments as well as higher overall transaction costs. In addition, fluctuations in the U.S. dollar’s value versus other currencies may erode or reverse gains or increase losses from investments denominated in foreign currencies. Foreign governments may expropriate assets, impose capital or currency controls, impose punitive taxes, impose limits on ownership or nationalize a company or industry. Any of these actions could have a severe effect on security prices and impair an investor’s ability to bring its capital or income back to the U.S. The value of foreign securities may be affected by incomplete, less frequent, or inaccurate financial information about their issuers, social upheavals, or political actions ranging from tax code changes to government collapse. Foreign companies may also receive less coverage by market analysts than U.S. companies and may be subject to different reporting standards or regulatory requirements than those applicable to U.S. companies.
6. Contingencies and Commitments
The Fund indemnifies the Trust’s officers and Trustees for certain liabilities that might arise from their performance of their duties to the Fund. Additionally, in the normal course of business, the Fund enters into contracts that contain a variety of representations, warranties, and general indemnifications. The Fund’s maximum exposure under these arrangements is unknown, as this would involve future claims that may be made against the Fund that have not yet occurred. However, based on experience, the Fund expects the risk of loss to be remote.
| BLUE CURRENT GLOBAL DIVIDEND FUND |
| NOTES TO FINANCIAL STATEMENTS (Unaudited) (Continued) |
7. Subsequent Events
The Fund is required to recognize in the financial statements the effects of all subsequent events that provide additional evidence about conditions that existed as of the date of the Statement of Assets and Liabilities. For non-recognized subsequent events that must be disclosed to keep the financial statements from being misleading, the Fund is required to disclose the nature of the event as well as an estimate of its financial effect, or a statement that such an estimate cannot be made. Management has evaluated subsequent events through the issuance of these financial statements and has noted no such events other than the ordinary income dividend paid on March 31, 2023, as discussed in Note 2 and the following:
Agreement and Change in Control
Focus Financial Partners Inc., the ultimate parent company of the Adviser, has agreed to be acquired by Clayton, Dubilier & Rice (the “Transaction”). The closing of the Transaction is anticipated to be deemed to be a change in control, and therefore an “assignment” under the 1940 Act, of the Fund’s existing investment advisory agreement with the Adviser and will result in its automatic termination. An interim investment advisory agreement and a new investment advisory agreement, each with substantially the same terms as the existing investment advisory agreement, except for the start and end date of the agreement and other provisions applicable to the interim investment advisory agreement as required under the 1940 Act, are anticipated to be presented to the Trust’s Board of Trustees for approval and submitted to the Fund’s shareholders for approval at a forthcoming special meeting of the Fund’s shareholders. The Transaction is anticipated to close in the third quarter of 2023, subject to customary closing conditions. There can be no assurance that the Transaction will be consummated as contemplated or that necessary closing conditions will be satisfied. The Transaction is not expected to result in any change in the portfolio management of the Fund or in the Fund’s investment objective or principal investment strategies.
| BLUE CURRENT GLOBAL DIVIDEND FUND |
| ABOUT YOUR FUND’S EXPENSES (Unaudited) |
We believe it is important for you to understand the impact of costs on your investment. As a shareholder of the Fund, you incur ongoing costs, including management fees and other operating expenses. The following examples are intended to help you understand your ongoing costs (in dollars) of investing in the Fund and to compare these costs with the ongoing costs of investing in other mutual funds.
A mutual fund’s ongoing costs are expressed as a percentage of its average net assets. This figure is known as the expense ratio. The expenses in the table below are based on an investment of $1,000 made at the beginning of the most recent period (September 1, 2022) and held until the end of the period (February 28, 2023).
The table below illustrates the Fund’s ongoing costs in two ways:
Actual fund return – This section helps you to estimate the actual expenses that you paid over the period. The “Ending Account Value” shown is derived from the Fund’s actual return, and the fourth column shows the dollar amount of operating expenses that would have been paid by an investor who started with $1,000 in the Fund. You may use the information here, together with the amount you invested, to estimate the expenses that you paid over the period.
To do so, simply divide your account value by $1,000 (for example, an $8,600 account value divided by $1,000 = 8.6), then multiply the result by the number given for the Fund under the heading “Expenses Paid During Period.”
Hypothetical 5% return – This section is intended to help you compare the Fund’s ongoing costs with those of other mutual funds. It assumes that the Fund had an annual return of 5% before expenses during the period shown, but that the expense ratio is unchanged. In this case, because the return used is not the Fund’s actual return, the results do not apply to your investment. The example is useful in making comparisons because the U.S. Securities and Exchange Commission (the “SEC”) requires all mutual funds to calculate expenses based on a 5% return. You can assess the Fund’s ongoing costs by comparing this hypothetical example with the hypothetical examples that appear in shareholder reports of other funds.
Note that expenses shown in the table are meant to highlight and help you compare ongoing costs only. The Fund does not charge sales loads. However, a redemption fee of 2% is applied on the sale of shares held for less than 7 days.
The calculations assume no shares were bought or sold during the period. Your actual costs may have been higher or lower, depending on the amount of your investment and the timing of any purchases or redemptions.
| BLUE CURRENT GLOBAL DIVIDEND FUND |
| ABOUT YOUR FUND’S EXPENSES (Unaudited) (Continued) |
More information about the Fund’s expenses can be found in this report. For additional information on operating expenses and other shareholder costs, please refer to the Fund’s prospectus.
| | | Beginning | | Ending | | | | |
| | | Account Value | | Account Value | | | | Expenses |
| | | September 1, | | February 28, | | Net Expense | | Paid During |
| Institutional Class | | 2022 | | 2023 | | Ratio(a) | | Period(b) |
| Based on Actual Fund Return | | $ 1,000.00 | | $ 1,068.40 | | 0.99% | | $5.08 |
| Based on Hypothetical 5% Return (before expenses) | | $ 1,000.00 | | $ 1,019.89 | | 0.99% | | $4.96 |
| (a) | Annualized, based on the Fund’s expenses for the previous six month period. |
| (b) | Expenses are equal to the Fund’s annualized net expense ratio multiplied by the average account value over the period, multiplied by 181/365 (to reflect the one-half year period). |
| BLUE CURRENT GLOBAL DIVIDEND FUND |
| OTHER INFORMATION (Unaudited) |
A description of the policies and procedures that the Fund uses to vote proxies relating to portfolio securities is available without charge upon request by calling 1-800-514-3583, or on the SEC’s website at www.sec.gov. Information regarding how the Fund voted proxies relating to portfolio securities during the most recent 12-month period ended June 30 is also available without charge upon request by calling 1-800-514-3583, or on the SEC’s website at www.sec.gov.
The Trust files a complete listing of portfolio holdings for the Fund with the SEC as of the end of the first and third quarters of each fiscal year an exhibit to Form N-PORT. These filings are available upon request by calling 1-800-514-3583. Furthermore, you may obtain a copy of the filings on the SEC’s website at www.sec.gov and on the Fund’s website www.bluecurrentfunds.com.
| BLUE CURRENT GLOBAL DIVIDEND FUND |
| LIQUIDITY RISK MANAGEMENT PROGRAM (Unaudited) |
The Fund has adopted and implemented a written liquidity risk management program (the “Program”) as required by Rule 22e-4 (the “Liquidity Rule”) under the Investment Company Act of 1940, as amended. The Program is reasonably designed to assess and manage the Fund’s liquidity risk, taking into consideration, among other factors, the Fund’s investment strategy and the liquidity of its portfolio investments during normal and reasonably foreseeable stressed conditions; its short- and long-term cash flow projections; and its cash holdings and access to other funding sources. The Fund’s Board of Trustees (the “Board”) approved the appointment of the Liquidity Administrator Committee, comprising of the Fund’s Adviser and certain Trust officers, to be responsible for the Program’s administration and oversight and for reporting to the Board on at least an annual basis regarding the Program’s operation and effectiveness. The annual written report assessing the Program (the “Report”) was presented to the Board at the October 17 – 18, 2022 Board meeting and covered the period from June 1, 2021 to May 31, 2022 (the “Review Period”).
During the Review Period, the Fund did not experience unusual stress or disruption to its operations related to purchase and redemption activity. Also, during the Review Period, the Fund held adequate levels of cash and highly liquid investments to meet shareholder redemption activities in accordance with applicable requirements. The Report concluded that the Program is reasonably designed to prevent violation of the Liquidity Rule and the Program has been effectively implemented.
CUSTOMER PRIVACY NOTICE
| FACTS | WHAT DOES THE BLUE CURRENT GLOBAL DIVIDEND FUND (the “Fund”) DO WITH YOUR PERSONAL INFORMATION? |
| |
| Why? | Financial companies choose how they share your personal information. Federal law gives consumers the right to limit some but not all sharing. Federal law also requires us to tell you how we collect, share, and protect your personal information. Please read this notice carefully to understand what we do. |
| |
| What? | The types of personal information we collect and share depend on the product or service you have with us. This information can include: ■ Social Security number ■ Assets ■ Retirement Assets ■ Transaction History ■ Checking Account Information ■ Purchase History ■ Account Balances ■ Account Transactions ■ Wire Transfer Instructions When you are no longer our customer, we continue to share your information as described in this notice. |
| |
| How? | All financial companies need to share your personal information to run their everyday business. In the section below, we list the reasons financial companies can share their customers’ personal information; the reasons the Fund chooses to share; and whether you can limit this sharing. |
| Reasons we can share your personal information | Does the
Fund share? | Can you limit
this sharing? |
For our everyday business purposes –
Such as to process your transactions, maintain your account(s), respond to court orders and legal investigations, or report to credit bureaus | Yes | No |
For our marketing purposes –
to offer our products and services to you | No | We don’t share |
| For joint marketing with other financial companies | No | We don’t share |
For our affiliates’ everyday business purposes –
information about your transactions and experiences | No | We don’t share |
For our affiliates’ everyday business purposes –
information about your creditworthiness | No | We don’t share |
| For nonaffiliates to market to you | No | We don’t share |
| Questions? | Call 1-800-514-3583 |
| Who we are |
| Who is providing this notice? | Blue Current Global Dividend Fund Ultimus Fund Distributors, LLC (Distributor) Ultimus Fund Solutions, LLC (Administrator) |
| What we do |
| How does the Fund protect my personal information? | To protect your personal information from unauthorized access and use, we use security measures that comply with federal law. These measures include computer safeguards and secured files and buildings. Our service providers are held accountable for adhering to strict policies and procedures to prevent any misuse of your nonpublic personal information. |
| How does the Fund collect my personal information? | We collect your personal information, for example, when you ■ Open an account ■ Provide account information ■ Give us your contact information ■ Make deposits or withdrawals from your account ■ Make a wire transfer ■ Tell us where to send the money ■ Tell us who receives the money ■ Show your government-issued ID ■ Show your driver’s license We also collect your personal information from other companies. |
| Why can’t I limit all sharing? | Federal law gives you the right to limit only ■ Sharing for affiliates’ everyday business purposes – information about your creditworthiness ■ Affiliates from using your information to market to you ■ Sharing for nonaffiliates to market to you State laws and individual companies may give you additional rights to limit sharing. |
| |
| Definitions |
| Affiliates | Companies related by common ownership or control. They can be financial and nonfinancial companies. ■ Edge Capital Group, LLC, the investment adviser to the Fund, could be deemed to be an affiliate. |
| Nonaffiliates | Companies not related by common ownership or control. They can be financial and nonfinancial companies ■ The Fund does not share with nonaffiliates so they can market to you. |
| Joint marketing | A formal agreement between nonaffiliated financial companies that together market financial products or services to you. ■ The Fund does not jointly market. |
This page intentionally left blank.
This page intentionally left blank.
Blue-SAR-23

Semi-Annual Report
February 28, 2023
(Unaudited)
| MARSHFIELD CONCENTRATED OPPORTUNITY FUND |
| LETTER TO SHAREHOLDERS (Unaudited) | March 20, 2023 |
From September 1, 2022 through February 28, 2023, the Marshfield Concentrated Opportunity Fund (the “Fund”) produced a cumulative total return of 13.33% compared to 1.26% for the S&P 500® Index.
Since the Fund’s inception in late 2015, we have used these letters to, among other things, reiterate the following aspects of our investment approach: we don’t pay much attention to the macroeconomic and political environment; we definitely refrain from predicting economic events and trends because we don’t think those are useful activities; but we do, however, pay some attention to specific current domestic and global developments that bear on our stock holdings. The latter allows us to understand something about how the companies in the Fund’s portfolio perform in different environments, both in terms of their inherent operating flexibility and in terms of management’s ability to pivot in the face of sudden changes in the external environment.
Various significant events during the last few years have provided good opportunities for us to see how the companies in the Fund’s portfolio perform under stress. Perhaps obviously, those events have included the pandemic, the war in Ukraine, The Federal Reserve’s energetic raising of interest rates and, as a partially related matter, the problems developing in the banking industry subsequent to the end of the period. Our companies’ reactions to these events, both initial and over time, tell us a lot about their resilience and ability to pivot when faced with both challenging conditions and the opportunities that emerged from those challenges. AutoZone and O’Reilly and their handling of the pandemic stresses are good examples about which we have written in the past. The supply chain upheaval that was exacerbated by the war in Ukraine affirmatively advantaged one of our companies until conditions eased recently, Expeditors International, which tends to benefit from chaos. Our other companies that rely on complex supply chains—such as Fastenal, TJX, and Ross Stores—were able to get product to customers with nary a hitch as logistics snarls intensified but their own internal systems and strategies were mostly able to adjust. As for rising interest rates, companies such as the homebuilder NVR and the insurance and reinsurance (and mortgage insurer) company Arch Capital were able to conduct business as usual, albeit at a somewhat dampened level, in the case of the former, and thrive due to a hardening pricing environment, in the case of the latter.
Even if we have views about broad industry trends, we always believe it is in the interest of the Fund and its shareholders to make our decisions on a bottom-up basis. Irrespective of the external climate, we ask ourselves if a stock is cheap enough to buy (or expensive enough to sell), if the company has a sufficient moat around its business which cannot easily be penetrated by competitors, and if the company’s corporate culture is appropriate to its business. As managers, we feel comfortable making a judgment about those aspects of a business, thereby making sure our investments can withstand shocks and not only survive, but thrive in any type of external environment. The pandemic and war in Ukraine have tested our ability to do this, but we believe we passed those tests. The turmoil in the banking sector, we imagine, will further test the companies in the Fund’s portfolio and the global economy,
as well as us. While we are ultimately bystanders to those events and how they will shape the world, we are as always monitoring the Fund’s portfolio companies’ financial health, strategy, and choices in the face of events as they occur.
Prices in the US equity market increased slightly during the six months ended February 28, 2023, apparently due to, on balance, increased optimism regarding the economy and interest rates (and yes those expectations sometimes conflict with each other). We don’t, however spend time thinking about the reasons for overall market movements. In fact, what the market does and what we think about the economy and how the companies in the Fund’s portfolio are doing in it are often out of sync. We do spend most of our time analyzing what the companies in the Fund’s portfolio (and other companies that we might want to own in the future) are doing given the environment in which they operate.
We believe that the portfolio has continued to benefit from the emphasis on resilience we have built into our investment process. Stocks in the portfolio which did particularly well and also materially affected performance during the six month period include Arch Capital (which returned 53.11%), Strategic Education, (which returned 34.01%) and Ross Stores (which returned 28.93%). Arch had quite good earnings and was added to the S&P 500. Strategic Education produced perfectly adequate earnings from our point of view but surprised the market on the upside, as did Ross Stores.
When things go well in the portfolio, sometimes they go quite well. That was the case this past six months when even one of our three worst performers outperformed the broader market. That was Expeditors International which rose by 2.21% during the quarter, even as supply chain concerns eased, which in turn reduced the profitability of their business. Our two underperformers were Union Pacific, which returned -6.53%, and Domino’s Pizza, which returned -20.44%.
Our historical track record is one of limited turnover, and that was true again during the past six months. We didn’t introduce any new names to the portfolio but we did add to several existing positions. Specifically, those included most of our retailers (AutoZone, O’Reilly, Ross Stores and TJX), following our change from GIPS to NAICS industry classification methodologies. Also, at various times price declines enabled us to add to the following positions: Domino’s, Goldman Sachs, Moody’s and NVR. We sold nothing during this time period.
Our approach in any environment is to stick to our discipline. That means: 1) understanding what’s real and what’s fantasy; 2) acting with equanimity to exploit the misjudgments of the crowd; and 3) being patient and not pulling the trigger before our buy or sell price has been reached. These things won’t change. Process and discipline (enabled by patience) are why we believe investors choose to invest in the Fund, and we take our mandate to preserve capital and generate risk-adjusted returns very seriously.
We thank you for the opportunity to invest your money and for your confidence in our process, discipline, and patience.
Sincerely,
| Elise J. Hoffmann | Christopher M. Niemczewski | Chad Goldberg |
| Portfolio Manager | Portfolio Manager | Portfolio Manager |
Past performance is not predictive of future performance. Investment results and principal value will fluctuate so that shares, when redeemed, may be worth more or less than their original cost. Current performance may be higher or lower than the performance data quoted. Performance data current to the most recent month-end are available by calling 1-855-691-5288.
An investor should consider the investment objectives, risks, charges and expenses of the Fund carefully before investing. The Fund’s prospectus contains this and other important information. To obtain a copy of the Fund’s prospectus please visit our website at www.MarshfieldFunds.com or call 1-855-691-5288 and a copy will be sent to you free of charge. Please read the prospectus carefully before you invest. The Fund is distributed by Ultimus Fund Distributors, LLC.
The Letter to Shareholders seeks to describe some of the Adviser’s current opinions and views of the financial markets. Although the Adviser believes it has a reasonable basis for any opinions or views expressed, actual results may differ, sometimes significantly so, from those expected or expressed. The securities held by the Fund that are discussed in the Letter to Shareholders were held during the period covered by this Report. They do not comprise the entire investment portfolio of the Fund, may be sold at any time, and may no longer be held by the Fund. For a complete list of securities held by the Fund as of February 28, 2023, please see the Schedule of Investments section of the semi-annual report. The opinions of the Fund’s adviser with respect to those securities may change at any time.
Statements in the Letter to Shareholders that reflect projections or expectations for future financial or economic performance of the Fund and the market in general and statements of the Fund’s plans and objectives for future operations are forward-looking statements. No assurance can be given that actual results or events will not differ materially from those projected, estimated, assumed, or anticipated in any such forward-looking statements. Important factors that could result in such differences, in addition to factors noted with such forward-looking statements, include, without limitation, general economic conditions, such as inflation, recession, and interest rates. Past performance is not a guarantee of future results.
| MARSHFIELD CONCENTRATED OPPORTUNITY FUND |
| PORTFOLIO INFORMATION |
| February 28, 2023 (Unaudited) |
| Portfolio Allocation (% of Net Assets) |
| Sector Allocation | | | % of Net Assets | |
| Retail Trade | | | 30.1 | % |
| Finance and Insurance | | | 27.8 | % |
| Transportation and Warehousing | | | 5.4 | % |
| Manufacturing | | | 5.4 | % |
| Educational Services | | | 4.2 | % |
| Accommodation and Food Services | | | 3.9 | % |
| Construction | | | 3.3 | % |
| Administrative and Support and Waste Management and | | | | |
| Remediation Services | | | 3.0 | % |
| Wholesale Trade | | | 2.4 | % |
| Money Market Funds | | | 14.9 | % |
| Net Other Assets (Liabilities) | | | (0.4 | %) |
| | | | 100.0 | % |
| | | | | |
| Top 10 Equity Holdings |
| Security Description | | | | % of Net Assets | |
| Arch Capital Group Ltd. | | | 10.1% | |
| AutoZone, Inc. | | | 9.7% | |
| Ross Stores, Inc. | | | 9.0% | |
| O’Reilly Automotive, Inc. | | | 5.9% | |
| TJX Companies, Inc. (The) | | | 5.5% | |
| Cummins, Inc. | | | 5.4% | |
| Goldman Sachs Group, Inc. (The) | | | 4.8% | |
| Mastercard, Inc. - Class A | | | 4.5% | |
| Visa, Inc. - Class A | | | 4.3% | |
| Strategic Education, Inc. | | | 4.2% | |
| MARSHFIELD CONCENTRATED OPPORTUNITY FUND |
| SCHEDULE OF INVESTMENTS |
| February 28, 2023 (Unaudited) |
| COMMON STOCKS — 85.5% | | Shares | | | Value | |
| Accommodation and Food Services — 3.9% | | | | | | | | |
| Restaurants and Other Eating Places — 3.9% | | | | | | | | |
| Domino’s Pizza, Inc. | | | 54,175 | | | $ | 15,927,992 | |
| | | | | | | | | |
| Administrative and Support and Waste Management and Remediation Services — 3.0% | | | | | | | | |
| Credit Bureaus — 3.0% | | | | | | | | |
| Moody’s Corporation | | | 41,924 | | | | 12,164,249 | |
| | | | | | | | | |
| Construction — 3.3% | | | | | | | | |
| Residential Building Construction — 3.3% | | | | | | | | |
| NVR, Inc. (a) | | | 2,611 | | | | 13,508,322 | |
| | | | | | | | | |
| Educational Services — 4.2% | | | | | | | | |
| Colleges, Universities, and Professional Schools — 4.2% | | | | | | | | |
| Strategic Education, Inc. | | | 203,617 | | | | 17,358,349 | |
| | | | | | | | | |
| Finance and Insurance — 27.8% | | | | | | | | |
| Direct Insurance (except Life, Health, and Medical) | | | | | | | | |
| Carriers — 14.2% | | | | | | | | |
| Arch Capital Group Ltd. (a) | | | 594,175 | | | | 41,592,250 | |
| Progressive Corporation (The) | | | 117,814 | | | | 16,908,665 | |
| | | | | | | | 58,500,915 | |
| Financial Transactions Processing, Reserve, and | | | | | | | | |
| Clearinghouse Activities — 8.8% | | | | | | | | |
| Mastercard, Inc. - Class A | | | 52,142 | | | | 18,525,531 | |
| Visa, Inc. - Class A | | | 79,728 | | | | 17,535,377 | |
| | | | | | | | 36,060,908 | |
| Investment Banking and Securities Intermediation — 4.8% | | | | | | | | |
| Goldman Sachs Group, Inc. (The) | | | 56,054 | | | | 19,711,389 | |
| | | | | | | | | |
| Manufacturing — 5.4% | | | | | | | | |
| Engine, Turbine, and Power Transmission Equipment — 5.4% | | | | | | | | |
| Cummins, Inc. | | | 91,596 | | | | 22,265,156 | |
| | | | | | | | | |
| Retail Trade — 30.1% | | | | | | | | |
| Automotive Parts and Accessories Retailers — 15.6% | | | | | | | | |
| AutoZone, Inc. (a) | | | 15,964 | | | | 39,695,124 | |
| O’Reilly Automotive, Inc. (a) | | | 29,256 | | | | 24,285,406 | |
| | | | | | | | 63,980,530 | |
| MARSHFIELD CONCENTRATED OPPORTUNITY FUND |
| SCHEDULE OF INVESTMENTS (Unaudited) (Continued) |
| COMMON STOCKS — 85.5% (Continued) | | Shares | | | Value | |
| Retail Trade — 30.1% (Continued) | | | | | | | | |
| Clothing and Clothing Accessories Retailers — 14.5% | | | | | | | | |
| Ross Stores, Inc. | | | 333,077 | | | $ | 36,818,332 | |
| TJX Companies, Inc. (The) | | | 295,454 | | | | 22,631,776 | |
| | | | | | | | 59,450,108 | |
| Transportation and Warehousing — 5.4% | | | | | | | | |
| Freight Transportation Arrangement — 3.8% | | | | | | | | |
| Expeditors International of Washington, Inc. | | | 149,972 | | | | 15,681,072 | |
| | | | | | | | | |
| Rail Transportation — 1.6% | | | | | | | | |
| Union Pacific Corporation | | | 32,442 | | | | 6,724,578 | |
| | | | | | | | | |
| Wholesale Trade — 2.4% | | | | | | | | |
| Industrial Supplies Merchant Wholesalers — 2.4% | | | | | | | | |
| Fastenal Company | | | 193,283 | | | | 9,965,671 | |
| | | | | | | | | |
| Total Common Stocks (Cost $260,518,307) | | | | | | $ | 351,299,239 | |
| | | | | | | | | |
| MONEY MARKET FUNDS — 14.9% | | Shares | | | Value | |
| Goldman Sachs Financial Square Funds - Treasury Instruments Fund - Institutional Shares, 4.45% (b) | | | 20,826,739 | | | $ | 20,826,739 | |
| Vanguard Treasury Money Market Fund - Investor Shares, 4.56% (b) | | | 40,216,741 | | | | 40,216,741 | |
| Total Money Market Funds (Cost $61,043,480) | | | | | | $ | 61,043,480 | |
| | | | | | | | | |
| Investments at Value — 100.4% (Cost $321,561,787) | | | | | | $ | 412,342,719 | |
| | | | | | | | | |
| Liabilities in Excess of Other Assets — (0.4%) | | | | | | | (1,682,750 | ) |
| | | | | | | | | |
| Net Assets — 100.0% | | | | | | $ | 410,659,969 | |
| (a) | Non-income producing security. |
| (b) | The rate shown is the 7-day effective yield as of February 28, 2023. |
See accompanying notes to financial statements.
| MARSHFIELD CONCENTRATED OPPORTUNITY FUND |
| STATEMENT OF ASSETS AND LIABILITIES |
| February 28, 2023 (Unaudited) |
| ASSETS | | | | |
| Investments in securities: | | | | |
| At cost | | $ | 321,561,787 | |
| At value (Note 2) | | $ | 412,342,719 | |
| Receivable for capital shares sold | | | 443,638 | |
| Dividends receivable | | | 602,455 | |
| Other assets | | | 31,004 | |
| Total assets | | | 413,419,816 | |
| | | | | |
| LIABILITIES | | | | |
| Payable for capital shares redeemed | | | 130,839 | |
| Payable for investment securities purchased | | | 2,309,923 | |
| Payable to Adviser (Note 4) | | | 266,756 | |
| Payable to administrator (Note 4) | | | 34,980 | |
| Other accrued expenses | | | 17,349 | |
| Total liabilities | | | 2,759,847 | |
| | | | | |
| NET ASSETS | | $ | 410,659,969 | |
| | | | | |
| NET ASSETS CONSIST OF: | | | | |
| Paid-in capital | | $ | 319,621,585 | |
| Accumulated earnings | | | 91,038,384 | |
| NET ASSETS | | $ | 410,659,969 | |
| | | | | |
| Shares of beneficial interest outstanding (unlimited number of shares authorized, no par value) | | | 16,737,207 | |
| | | | | |
| Net asset value, offering price and redemption price per share (Note 2) | | $ | 24.54 | |
See accompanying notes to financial statements.
| MARSHFIELD CONCENTRATED OPPORTUNITY FUND |
| STATEMENT OF OPERATIONS |
| For the Six Months Ended February 28, 2023 (Unaudited) |
| INVESTMENT INCOME | | | | |
| Dividend income | | $ | 2,564,458 | |
| | | | | |
| EXPENSES | | | | |
| Management fees (Note 4) | | | 1,698,038 | |
| Administration fees (Note 4) | | | 132,887 | |
| Fund accounting fees (Note 4) | | | 33,790 | |
| Registration and filing fees | | | 31,612 | |
| Custody and bank service fees | | | 20,601 | |
| Compliance fees and expenses (Note 4) | | | 19,297 | |
| Transfer agent fees (Note 4) | | | 17,890 | |
| Legal fees | | | 12,056 | |
| Postage and supplies | | | 10,171 | |
| Trustees’ fees and expenses (Note 4) | | | 9,676 | |
| Audit and tax services fees | | | 8,661 | |
| Shareholder reporting expenses | | | 3,655 | |
| Insurance expense | | | 2,843 | |
| Other expenses | | | 8,594 | |
| Total expenses | | | 2,009,771 | |
| Less fee reductions by the Adviser (Note 4) | | | (240,236 | ) |
| Net expenses | | | 1,769,535 | |
| | | | | |
| NET INVESTMENT INCOME | | | 794,923 | |
| | | | | |
| REALIZED AND UNREALIZED GAINS ON INVESTMENTS | | | | |
| Net realized gains from investment transactions | | | 3,540 | |
| Net change in unrealized appreciation (depreciation) on investments | | | 42,027,340 | |
| NET REALIZED AND UNREALIZED GAINS ON INVESTMENTS | | | 42,030,880 | |
| | | | | |
| NET INCREASE IN NET ASSETS RESULTING FROM OPERATIONS | | $ | 42,825,803 | |
See accompanying notes to financial statements.
| MARSHFIELD CONCENTRATED OPPORTUNITY FUND |
| STATEMENTS OF CHANGES IN NET ASSETS |
| | | Six Months | | | | |
| | | Ended | | | Year | |
| | | February 28, | | | Ended | |
| | | 2023 | | | August 31, | |
| | | (Unaudited) | | | 2022 | |
| FROM OPERATIONS | | | | | | | | |
| Net investment income (loss) | | $ | 794,923 | | | $ | (112,294 | ) |
| Net realized gains from investment transactions | | | 3,540 | | | | 825,908 | |
| Net change in unrealized appreciation (depreciation) on investments | | | 42,027,340 | | | | (7,878,746 | ) |
| Net increase (decrease) in net assets resulting from operations | | | 42,825,803 | | | | (7,165,132 | ) |
| | | | | | | | | |
| DISTRIBUTIONS TO SHAREHOLDERS (Note 2) | | | (1,316,545 | ) | | | (19,309,352 | ) |
| | | | | | | | | |
| CAPITAL SHARE TRANSACTIONS | | | | | | | | |
| Proceeds from shares sold | | | 78,480,778 | | | | 74,626,153 | |
| Net asset value of shares issued in reinvestment of distributions to shareholders | | | 1,285,302 | | | | 18,856,278 | |
| Proceeds from redemption fees collected (Note 2) | | | 67,112 | | | | 38,780 | |
| Payments for shares redeemed | | | (22,258,887 | ) | | | (41,585,917 | ) |
| Net increase in net assets from capital share transactions | | | 57,574,305 | | | | 51,935,294 | |
| | | | | | | | | |
| TOTAL INCREASE IN NET ASSETS | | | 99,083,563 | | | | 25,460,810 | |
| | | | | | | | | |
| NET ASSETS | | | | | | | | |
| Beginning of period | | | 311,576,406 | | | | 286,115,596 | |
| End of period | | $ | 410,659,969 | | | $ | 311,576,406 | |
| | | | | | | | | |
| CAPITAL SHARES ACTIVITY | | | | | | | | |
| Shares sold | | | 3,289,606 | | | | 3,320,772 | |
| Shares reinvested | | | 53,733 | | | | 835,828 | |
| Shares redeemed | | | (945,993 | ) | | | (1,857,066 | ) |
| Net increase in shares outstanding | | | 2,397,346 | | | | 2,299,534 | |
| Shares outstanding at beginning of period | | | 14,339,861 | | | | 12,040,327 | |
| Shares outstanding at end of period | | | 16,737,207 | | | | 14,339,861 | |
See accompanying notes to financial statements.
| MARSHFIELD CONCENTRATED OPPORTUNITY FUND |
| FINANCIAL HIGHLIGHTS |
Per Share Data for a Share Outstanding Throughout Each Period
| | | Six Months | | | | | | | | | | | | | | | | |
| | | Ended | | | Year | | | Year | | | Year | | | Year | | | Year | |
| | | February 28, | | | Ended | | | Ended | | | Ended | | | Ended | | | Ended | |
| | | 2023 | | | August 31, | | | August 31, | | | August 31, | | | August 31, | | | August 31, | |
| | | (Unaudited) | | | 2022 | | | 2021 | | | 2020 | | | 2019 | | | 2018 | |
| Net asset value at beginning of period | | $ | 21.73 | | | $ | 23.76 | | | $ | 20.10 | | | $ | 17.65 | | | $ | 15.37 | | | $ | 12.58 | |
| Income (loss) from investment operations: | | | | | | | | | | | | | | | | | | | | | | | | |
| Net investment income (loss) | | | 0.05 | | | | (0.01 | ) | | | (0.06 | ) | | | (0.02 | ) | | | 0.02 | | | | (0.00 | ) (a) |
| Net realized and unrealized gains (losses) on investments | | | 2.84 | | | | (0.46 | ) | | | 4.27 | | | | 2.72 | | | | 2.53 | | | | 3.08 | |
| Total from investment operations | | | 2.89 | | | | (0.47 | ) | | | 4.21 | | | | 2.70 | | | | 2.55 | | | | 3.08 | |
| Less distributions from: | | | | | | | | | | | | | | | | | | | | | | | | |
| Net investment income | | | (0.03 | ) | | | — | | | | — | | | | (0.02 | ) | | | (0.00 | ) (a) | | | (0.01 | ) |
| Net realized gains | | | (0.05 | ) | | | (1.56 | ) | | | (0.56 | ) | | | (0.24 | ) | | | (0.27 | ) | | | (0.28 | ) |
| Total distributions | | | (0.08 | ) | | | (1.56 | ) | | | (0.56 | ) | | | (0.26 | ) | | | (0.27 | ) | | | (0.29 | ) |
| Proceeds from redemption fees collected (Note 2) | | | 0.00 | (a) | | | 0.00 | (a) | | | 0.01 | | | | 0.01 | | | | 0.00 | (a) | | | 0.00 | (a) |
| Net asset value at end of period | | $ | 24.54 | | | $ | 21.73 | | | $ | 23.76 | | | $ | 20.10 | | | $ | 17.65 | | | $ | 15.37 | |
| Total return (b) | | | 13.33 | % (c) | | | (2.21 | %) | | | 21.44 | % | | | 15.47 | % | | | 17.12 | % | | | 24.70 | % |
| Net assets at end of period (000’s) | | $ | 410,660 | | | $ | 311,576 | | | $ | 286,116 | | | $ | 202,381 | | | $ | 88,589 | | | $ | 22,898 | |
| Ratios/supplementary data: | | | | | | | | | | | | | | | | | | | | | | | | |
| Ratio of total expenses to average net assets | | | 1.12 | % (d) | | | 1.14 | % | | | 1.15 | % | | | 1.23 | % | | | 1.48 | % | | | 2.09 | % |
| Ratio of net expenses to average net assets (e) | | | 0.99 | % (d) | | | 0.99 | % | | | 1.01 | % | | | 1.10 | % | | | 1.10 | % | | | 1.10 | % |
| Ratio of net investment income (loss) to average net assets (e) | | | 0.44 | % (d) | | | (0.04 | %) | | | (0.31 | %) | | | (0.10 | %) | | | 0.22 | % | | | (0.01 | %) |
| Portfolio turnover rate | | | 0 | % (c) | | | 3 | % | | | 24 | % | | | 14 | % | | | 14 | % | | | 10 | % |
| (a) | Amount rounds to less than $0.01 per share. |
| (b) | Total return is a measure of the change in value of an investment in the Fund over the periods covered. The returns shown do not reflect the deduction of taxes a shareholders would pay on Fund distributions, if any, or the redemption of Fund shares. The total returns would be lower if the Adviser had not reduced management fees and/or reimbursed expenses (Note 4). |
| (e) | Ratio was determined after management fee reductions and/or expense reimbursements (Note 4). |
See accompanying notes to financial statements.
| MARSHFIELD CONCENTRATED OPPORTUNITY FUND |
| NOTES TO FINANCIAL STATEMENTS |
| February 28, 2023 (Unaudited) |
1. Organization
Marshfield Concentrated Opportunity Fund (the “Fund”) is a non-diversified series of Ultimus Managers Trust (the “Trust”), an open-end investment company established as an Ohio business trust under a Declaration of Trust dated February 28, 2012. Other series of the Trust are not incorporated in this report.
The investment objective of the Fund is to seek the dual goals of capital preservation and the long-term growth of principal, while targeting a pattern of performance at variance with that of the market.
2. Significant Accounting Policies
The Fund follows accounting and reporting guidance under Financial Accounting Standards Board Accounting Standards Codification Topic 946, “Financial Services – Investment Companies.” The following is a summary of the Fund’s significant accounting policies used in the preparation of its financial statements. These policies are in conformity with accounting principles generally accepted in the United States of America (“GAAP”).
Securities valuation – The Fund values its portfolio securities at fair value as of the close of regular trading on the New York Stock Exchange (the “NYSE”) (normally 4:00 p.m. Eastern time) on each business day the NYSE is open for business. The Fund values its listed securities, including common stocks, on the basis of the security’s last sale price on the security’s primary exchange, if available, otherwise at the exchange’s most recently quoted mean price. NASDAQ-listed securities are valued at the NASDAQ Official Closing Price. Investments representing shares of other registered open-end investment companies that are not listed on an exchange, including money market funds, are valued at their net asset value (“NAV”) as reported by such companies. When using a quoted price and when the market is considered active, the security will be classified as Level 1 within the fair value hierarchy (see below). Fixed income securities, if any, are generally valued using prices provided by an independent pricing service. The independent pricing service uses information with respect to transactions in bonds, quotations from bond dealers, market transactions in comparable securities, and various relationships between securities in determining these prices. In the event that market quotations are not readily available or are considered unreliable due to market or other events, the Fund values its securities and other assets at fair value as determined by Marshfield Associates, Inc. (the “Adviser”), as the Fund’s valuation designee, in accordance with procedures adopted by the Board of Trustees (the “Board”) pursuant to Rule 2a-5 under the Investment Company Act of 1940, as amended (the “1940 Act”). Under these procedures, the securities will be classified as Level 2 or 3 within the fair value hierarchy, depending on the inputs used. Unavailable or unreliable market quotes may be due to the following factors: a substantial bid-ask spread; infrequent sales resulting in stale prices; insufficient trading volume; small
| MARSHFIELD CONCENTRATED OPPORTUNITY FUND |
| NOTES TO FINANCIAL STATEMENTS (Continued) |
trade sizes; a temporary lapse in any reliable pricing source; and actions of the securities or futures markets, such as the suspension or limitation of trading. As a result, the prices of securities used to calculate the Fund’s NAV may differ from quoted or published prices for the same securities.
GAAP establishes a single authoritative definition of fair value, sets out a framework for measuring fair value, and requires additional disclosures about fair value measurements.
Various inputs are used in determining the value of the Fund’s investments. These inputs are summarized in the three broad levels listed below:
| ● | Level 1 – quoted prices in active markets for identical securities |
| ● | Level 2 – other significant observable inputs |
| ● | Level 3 – significant unobservable inputs |
Fixed income securities held by the Fund, if any, are classified as Level 2 since values are based on prices provided by an independent pricing service that utilizes various “other significant observable inputs” including bid and ask quotations, prices of similar securities, and interest rates, among other factors.
The inputs or methods used for valuing securities are not necessarily an indication of the risks associated with investing in those securities. The inputs used to measure fair value may fall into different levels of the fair value hierarchy. In such cases, for disclosure purposes, the level in the fair value hierarchy within which the fair value measurement falls in its entirety is determined based on the lowest level input that is significant to the fair value measurement.
The following is a summary of the Fund’s investments by the inputs used to value the investments as of February 28, 2023:
| | | Level 1 | | | Level 2 | | | Level 3 | | | Total | |
| Common Stocks | | $ | 351,299,239 | | | $ | — | | | $ | — | | | $ | 351,299,239 | |
| Money Market Funds | | | 61,043,480 | | | | — | | | | — | | | | 61,043,480 | |
| Total | | $ | 412,342,719 | | | $ | — | | | $ | — | | | $ | 412,342,719 | |
| | | | | | | | | | | | | | | | | |
Refer to the Fund’s Schedule of Investments for a listing of the common stocks by sector and industry type. The Fund did not hold derivative instruments or any assets or liabilities that were measured at fair value on a recurring basis using significant unobservable inputs (Level 3) as of or during the six months ended February 28, 2023.
Share valuation – The NAV per share of the Fund is calculated daily by dividing the total value of the Fund’s assets, less liabilities, by the number of shares outstanding. The offering price and redemption price per share of the Fund is equal to the NAV,
| MARSHFIELD CONCENTRATED OPPORTUNITY FUND |
| NOTES TO FINANCIAL STATEMENTS (Continued) |
except that shares of the Fund are subject to a redemption fee of 2% if redeemed within 90 days of the date of purchase. During the periods ended February 28, 2023 and August 31, 2022, proceeds from the redemption fees, recorded in capital, totaled $67,112 and $38,780, respectively.
Investment income – Dividend income is recorded on the ex-dividend date. Non-cash dividends included in dividend income, if any, are recorded at the fair value of the security received. Interest income is accrued as earned.
Investment transactions – Investment transactions are accounted for on the trade date. Realized gains and losses on investments sold are determined on a specific identification basis.
Common expenses – Common expenses of the Trust are allocated among the Fund and the other series of the Trust based on the relative net assets of each series, the number of series in the Trust, or the nature of the services performed and the relative applicability to each series.
Distributions to shareholders – The Fund will distribute to shareholders any net investment income dividends and net realized capital gains distributions at least once each year. The amount of such dividends and distributions are determined in accordance with federal income tax regulations, which may differ from GAAP. Dividends and distributions are recorded on the ex-dividend date. The tax character of the Fund’s distributions paid to shareholders during the periods ended February 28, 2023 and August 31, 2022 was as follows:
| | | | | | Long-Term | | | | |
| Period | | Ordinary | | | Capital | | | Total | |
| Ended | | Income | | | Gains | | | Distributions | |
| 2/28/2023 | | $ | 532,187 | | | $ | 784,358 | | | $ | 1,316,545 | |
| 8/31/2022 | | $ | 3,899,532 | | | $ | 15,409,820 | | | $ | 19,309,352 | |
Estimates – The preparation of financial statements in conformity with GAAP requires management to make estimates and assumptions that affect the reported amounts of assets and liabilities and disclosure of contingent assets and liabilities as of the date of the financial statements and the reported amounts of increase (decrease) in net assets from operations during the reporting period. Actual results could differ from those estimates.
Federal income tax – The Fund has qualified and intends to continue to qualify as a regulated investment company under the Internal Revenue Code of 1986, as amended (the “Code”). Qualification generally will relieve the Fund of liability for federal income taxes to the extent 100% of its net investment income and net realized capital gains are distributed in accordance with the Code.
| MARSHFIELD CONCENTRATED OPPORTUNITY FUND |
| NOTES TO FINANCIAL STATEMENTS (Continued) |
In order to avoid imposition of the excise tax applicable to regulated investment companies, it is also the Fund’s intention to declare as dividends in each calendar year at least 98% of its net investment income (earned during the calendar year) and 98.2% of its net realized capital gains (earned during the 12 months ended October 31) plus undistributed amounts from prior years.
The following information is computed on a tax basis for each item as of August 31, 2022:
| | | | | |
| Tax cost of investments | | $ | 263,294,261 | |
| Gross unrealized appreciation | | $ | 57,321,868 | |
| Gross unrealized depreciation | | | (8,575,578 | ) |
| Net unrealized appreciation | | | 48,746,290 | |
| Undistributed long-term capital gains | | | 782,836 | |
| Distributable earnings | | $ | 49,529,126 | |
| | | | | |
The federal tax cost, unrealized appreciation (depreciation) as of February 28, 2023 is as follows:
| | | | | |
| Tax cost of investments | | $ | 321,569,089 | |
| Gross unrealized appreciation | | $ | 98,559,700 | |
| Gross unrealized depreciation | | | (7,786,070 | ) |
| Net unrealized appreciation | | $ | 90,773,630 | |
| | | | | |
The values of the federal income tax cost of investments and the financial statement cost of investments may be temporarily different (“book/tax differences”). These book/tax differences are due to the timing of the recognition of capital gains or losses under income tax regulations and GAAP, primarily due to the tax deferral of losses on wash sales.
The Fund recognizes the tax benefits or expenses of uncertain tax positions only when the position is “more likely than not” to be sustained assuming examination by tax authorities. Management has reviewed the Fund’s tax positions for the current and all open tax years (generally, three years) and has concluded that no provision for unrecognized tax benefits or expenses is required in these financial statements. The Fund identifies its major tax jurisdiction as U.S. Federal.
The Fund recognizes interest and penalties, if any, related to unrecognized tax benefits as income tax on the Statement of Operations. During the six months ended February 28, 2023, the Fund did not incur any interest or penalties.
| MARSHFIELD CONCENTRATED OPPORTUNITY FUND |
| NOTES TO FINANCIAL STATEMENTS (Continued) |
3. Investment Transactions
During the six months ended February 28, 2023, cost of purchases and proceeds from sales of investment securities, other than short-term investments, were $59,910,138 and $0, respectively.
4. Transactions with Related Parties
INVESTMENT ADVISORY AGREEMENT
The Fund’s investments are managed by the Adviser pursuant to the terms of an Investment Advisory Agreement. Under the Investment Advisory Agreement, the Fund pays the Adviser a management fee, computed and accrued daily and paid monthly, at the annual rate of 0.95% of its average daily net assets.
Pursuant to an Expense Limitation Agreement (“ELA”) between the Fund and the Adviser, the Adviser has contractually agreed, until January 1, 2024, to reduce its management fees and reimburse other expenses to limit total annual operating expenses (exclusive of brokerage costs; taxes; interest; borrowing costs such as interest and dividend expenses on securities sold short; costs to organize the Fund; acquired fund fees and expenses; extraordinary expenses such as litigation and merger or reorganization costs and other expenses not incurred in the ordinary course of the Fund’s business), to an amount not exceeding 0.99% of the Fund’s average daily net assets. Accordingly, during the six months ended February 28, 2023, the Adviser reduced its management fees by $240,236.
Under the terms of the ELA, investment advisory fee reductions and expense reimbursements by the Adviser are subject to repayment by the Fund for a period of three years after such fees and expenses were incurred, provided the repayments do not cause total annual operating expenses to exceed the lesser of: (i) the expense limitation then in effect, if any, and (ii) the expense limitation in effect at the time the expenses to be repaid were incurred. As of February 28, 2023, the Adviser may seek repayment of management fee reductions and expense reimbursements in the amount of $1,123,204 no later than the dates as stated below:
| | | | | |
| August 31, 2023 | | $ | 90,722 | |
| August 31, 2024 | | | 349,624 | |
| August 31, 2025 | | | 442,622 | |
| February 28, 2026 | | | 240,236 | |
| Total | | $ | 1,123,204 | |
| | | | | |
| MARSHFIELD CONCENTRATED OPPORTUNITY FUND |
| NOTES TO FINANCIAL STATEMENTS (Continued) |
OTHER SERVICE PROVIDERS
Ultimus Fund Solutions, LLC (“Ultimus”) provides administration, fund accounting, compliance and transfer agency services to the Fund. The Fund pays Ultimus fees in accordance with the agreements for such services. In addition, the Fund pays out-of-pocket expenses including, but not limited to, postage, supplies, and certain costs related to the pricing of the Fund’s portfolio securities.
Under the terms of a Distribution Agreement with the Trust, Ultimus Fund Distributors, LLC (the “Distributor”) serves as principal underwriter to the Fund. The Distributor is a wholly -owned subsidiary of Ultimus. The Distributor is compensated by the Adviser (not the Fund) for acting as principal underwriter.
Certain officers and a Trustee of the Trust are also officers of Ultimus.
TRUSTEE COMPENSATION
Effective October 17, 2022 each member of the Board (a “Trustee”) who is not an “interested person” (as defined by the 1940 Act, as amended) of the Trust (“Independent Trustee”) receives a $1,300 annual retainer from the Fund, paid quarterly, except for the Board Chairperson who receives a $1,700 annual retainer from the Fund, paid quarterly and the Audit Committee Chairperson who receives a $1,500 annual retainer from the Fund, paid quarterly. Each Independent Trustee also receives from the Fund a fee of $550 for each Board meeting attended plus reimbursement for travel and other meeting-related expenses. Prior to October 17, 2022, no additional annual retainer was designated specifically for the Audit Committee Chairperson.
PRINCIPAL HOLDER OF FUND SHARES
As of February 28, 2023, the following shareholder owned of record 25% or more of the outstanding shares of the Fund:
| Name of Record Owner | | % Ownership |
| RBC Capital Markets, LLC (for the benefit of its customers) | | 59% |
A beneficial owner of 25% or more of the Fund’s outstanding shares may be considered a controlling person. That shareholder’s vote could have a more significant effect on matters presented at a shareholders’ meeting.
5. Contingencies and Commitments
The Fund indemnifies the Trust’s officers and Trustees for certain liabilities that might arise from their performance of their duties to the Fund. Additionally, in the normal course of business the Fund enters into contracts that contain a variety of representations and warranties and which provide general indemnifications. The
| MARSHFIELD CONCENTRATED OPPORTUNITY FUND |
| NOTES TO FINANCIAL STATEMENTS (Continued) |
Fund’s maximum exposure under these arrangements is unknown, as this would involve future claims that may be made against the Fund that have not yet occurred. However, based on experience, the Fund expects the risk of loss to be remote.
6. Non-Diversified Risk
The Fund is a non-diversified Fund. As a result, the Fund’s holdings may be more concentrated in a limited number of securities and the value of its shares may be more sensitive than a diversified fund to any single economic, business, political, or regulatory occurrence.
7. Sector Risk
If a Fund has significant investments in the securities of issuers in industries within a particular business sector, any development generally affecting that sector will have a greater impact on the value of the net assets of the Fund than would be the case if the Fund did not have significant investments in that sector. This may increase the risk of loss of an investment in a Fund and increase the volatility of a Fund’s NAV per share. From time to time, circumstances may affect a particular sector and the companies within such sector. For instance, economic or market factors, regulation or deregulation, and technological or other developments, may negatively impact all companies in a particular sector and therefore the value of a Fund’s portfolio could be adversely affected if it has significant holdings of securities of issuers in that sector. As of February 28, 2023, the Fund had 30.1% of the value of its net assets invested in stocks in the Retail Trade sector and 27.8% of the value of its net assets invested in stocks in the Finance and Insurance sector.
8. Subsequent Event
The Fund is required to recognize in the financial statements the effects of all subsequent events that provide additional evidence about conditions that existed as of the date of the Statement of Assets and Liabilities. For non-recognized subsequent events that must be disclosed to keep the financial statements from being misleading, the Fund is required to disclose the nature of the event as well as an estimate of its financial effect, or a statement that such an estimate cannot be made. Management has evaluated subsequent events through the issuance of these financial statements and has noted no such events.
| MARSHFIELD CONCENTRATED OPPORTUNITY FUND |
| ABOUT YOUR FUND’S EXPENSES (Unaudited) |
We believe it is important for you to understand the impact of costs on your investment. As a shareholder of the Fund, you incur two types of cost: (1) transaction costs, including redemption fees; and (2) ongoing costs, including management fees and other operating expenses. The following examples are intended to help you understand your ongoing costs (in dollars) of investing in the Fund and to compare these costs with the ongoing costs of investing in other mutual funds.
A mutual fund’s ongoing costs are expressed as a percentage of its average net assets. This figure is known as the expense ratio. The expenses in the table below are based on an investment of $1,000 made at the beginning of the most recent period (September 1, 2022) and held until the end of the period (February 28, 2023).
The table below illustrates the Fund’s ongoing costs in two ways:
Actual fund return – This section helps you to estimate the actual expenses that you paid over the period. The “Ending Account Value” shown is derived from the Fund’s actual return, and the fourth column shows the dollar amount of operating expenses that would have been paid by an investor who started with $1,000 in the Fund. You may use the information here, together with the amount you invested, to estimate the expenses that you paid over the period.
To do so, simply divide your account value by $1,000 (for example, an $8,600 account value divided by $1,000 = 8.6), then multiply the result by the number given for the Fund under the heading “Expenses Paid During Period.”
Hypothetical 5% return – This section is intended to help you compare the Fund’s ongoing costs with those of other mutual funds. It assumes that the Fund had an annual return of 5% before expenses during the period shown, but that the expense ratio is unchanged. In this case, because the return used is not the Fund’s actual return, the results do not apply to your investment. The example is useful in making comparisons because the U.S. Securities and Exchange Commission (“SEC”) requires all mutual funds to calculate expenses based on a 5% return. You can assess the Fund’s ongoing costs by comparing this hypothetical example with the hypothetical examples that appear in shareholder reports of other funds.
Note that expenses shown in the table are meant to highlight and help you compare ongoing costs only. The Fund does not charge sales loads. However, a redemption fee of 2% is applied on the sale of shares held for less than 90 days.
The calculations assume no shares were bought or sold during the period. Your actual costs may have been higher or lower, depending on the amount of your investment and the timing of any purchases or redemptions.
More information about the Fund’s expenses can be found in this report. For additional information on operating expenses and other shareholder costs, please refer to the Fund’s prospectus.
| MARSHFIELD CONCENTRATED OPPORTUNITY FUND |
| ABOUT YOUR FUND’S EXPENSES (Unaudited) (Continued) |
| | | Beginning | | Ending | | | | | |
| | | Account Value | | Account Value | | | Net | | Expenses |
| | | September 1, | | February 28, | | | Expense | | Paid During |
| | | 2022 | | 2023 | | | Ratio (a) | | Period (b) |
| Based on Actual Fund Return | | $1,000.00 | | $ | 1,133.30 | | | 0.99% | | $5.24 |
| Based on Hypothetical 5% Return (before expenses) | | $1,000.00 | | $ | 1,019.89 | | | 0.99% | | $4.96 |
| (a) | Annualized, based on the Fund’s most recent one-half year expenses. |
| (b) | Expenses are equal to the Fund’s annualized net expense ratio multiplied by the average account value over the period, multiplied by 181/365 (to reflect the one-half year period). |
| OTHER INFORMATION (Unaudited) |
A description of the policies and procedures that the Fund uses to vote proxies relating to portfolio securities is available without charge upon request by calling toll-free 1-855-691-5288, or on the SEC’s website at www.sec.gov. Information regarding how the Fund voted proxies relating to portfolio securities during the most recent 12-month period ended June 30 is available without charge upon request by calling toll-free 1-855-691-5288, or on the SEC’s website at www.sec.gov.
The Trust files a complete listing of portfolio holdings for the Fund with the SEC as of the end of the first and third quarters of each fiscal year as an exhibit to its reports on Form N-PORT. These filings are available upon request by calling 1-855-691-5288. Furthermore, you may obtain a copy of the filings on the SEC’s website at www.sec.gov. and on the Fund’s website www.marshfieldfunds.com.
| MARSHFIELD CONCENTRATED OPPORTUNITY FUND |
| DISCLOSURE REGARDING APPROVAL OF INVESTMENT ADVISORY |
| AGREEMENT (Unaudited) |
The Board of Trustees (the “Board”), including the Independent Trustees voting separately, has reviewed and approved the continuance of the Fund’s Investment Advisory Agreement with Marshfield Associates, Inc. (the “Adviser” or “Marshfield”) for an additional one-year term (the “Advisory Agreement”). The Board approved the continuance of the Advisory Agreement at an in-person meeting held on October 17–18, 2022, at which all of the Trustees were present.
In deciding whether to approve the continuation of the Advisory Agreement, the Board recalled its review of the materials related to the Fund and Marshfield at the meeting and throughout the preceding twelve months and its numerous discussions with Trust Management and Marshfield about the operations and performance of the Fund during that period. The Board further considered those materials and discussions and other numerous factors, including the following:
The nature, extent, and quality of the services provided by the Adviser. In this regard, the Board reviewed the services being provided by Marshfield to the Fund including, without limitation, its providing a continuous investment program for the Fund, adhering to the Fund’s investment restrictions, complying with the Trust’s policies and procedures and voting proxies on behalf of the Fund. The Board considered the qualifications and experience of Marshfield’s portfolio managers who are responsible for the day-to day management of the Fund’s portfolio, as well as the qualifications of other individuals at Marshfield who provide services to the Fund. The Board concluded that the quality, extent, and nature of the services provided by Marshfield to the Fund were satisfactory.
The investment performance of the Fund. In this regard, the Board compared the performance of the Fund with the performance of its benchmark index, custom peer group, and Morningstar category. The Board concluded that the investment performance of the Fund has been satisfactory.
The costs of the services provided and profits realized by the Adviser and its affiliates from their relationship with the Fund. In this regard, the Board considered the Fund’s management fee and expense ratio, each as compared to the Fund’s custom peer group and Morningstar category and to the fees charged by Marshfield to other similar clients. The Board considered the revenue earned by Marshfield from the Fund and the current and anticipated profitability of the Fund to Marshfield, if any. The Board also considered Marshfield’s past fee reductions and expense reimbursements for the Fund. The Board concluded that the advisory fee to be paid to Marshfield by the Fund is reasonable in light of the nature and quality of services provided by Marshfield.
MARSHFIELD CONCENTRATED OPPORTUNITY FUND DISCLOSURE REGARDING APPROVAL OF INVESTMENT ADVISORY |
| AGREEMENT (Unaudited) (Continued) |
The extent to which economics of scale would be realized as the Fund grows and whether advisory fee levels reflect these economies of scale for the benefit of the Fund’s investors. In this regard, the Board considered that the Fund’s fee arrangements with Marshfield involve both the advisory fee and the expense limitation agreement (the “ELA”). The Board determined that while the advisory fee rate remained the same as asset levels increased, the shareholders of the Fund have experienced benefits from the ELA and will continue to experience benefits from the ELA. The Board concluded that the advisory fee was reasonable in light of the information that was provided to the Trustees by Marshfield with respect to economies of scale.
After further discussion of the factors noted above and in reliance on the information provided by Marshfield and Trust Management, and taking into account the totality of all the factors discussed and information presented at the meeting and previous meetings, the Board indicated its agreement to approve the continuance of the Advisory Agreement. It was noted that in the Trustees’ deliberations regarding the approval of the renewal of the Advisory Agreement, the Trustees did not identify any particular information or factor that was all-important or controlling, and that each individual Trustee may have attributed different weights to the various factors listed above. After full consideration of the above factors as well as other factors, the Board unanimously concluded that approval of the continuance of the Advisory Agreement was in the best interests of the Fund and its shareholders.
| MARSHFIELD CONCENTRATED OPPORTUNITY FUND |
| LIQUIDITY RISK MANAGEMENT PROGRAM (Unaudited) |
The Fund has adopted and implemented a written liquidity risk management program (the “Program”) as required by Rule 22e-4 (the “Liquidity Rule”) under the Investment Company Act of 1940, as amended. The Program is reasonably designed to assess and manage the Fund’s liquidity risk, taking into consideration, among other factors, the Fund’s investment strategy and the liquidity of its portfolio investments during normal and reasonably foreseeable stressed conditions; its short- and long-term cash flow projections; and its cash holdings and access to other funding sources. The Fund’s Board of Trustees (the “Board”) approved the appointment of the Liquidity Administrator Committee, comprising of the Fund’s Adviser and certain Trust officers, to be responsible for the Program’s administration and oversight and for reporting to the Board on at least an annual basis regarding the Program’s operation and effectiveness. The annual written report assessing the Program (the “Report”) was presented to the Board at the October 17 – 18, 2022 Board meeting and covered the period from June 1, 2021 to May 31, 2022 (the “Review Period”).
During the Review Period, the Fund did not experience unusual stress or disruption to its operations related to purchase and redemption activity. Also, during the Review Period, the Fund held adequate levels of cash and highly liquid investments to meet shareholder redemption activities in accordance with applicable requirements. The Report concluded that the Program is reasonably designed to prevent violation of the Liquidity Rule and the Program has been effectively implemented.
CUSTOMER PRIVACY NOTICE |
| FACTS | WHAT DOES THE MARSHFIELD CONCENTRATED OPPORTUNITY FUND (the “Fund”) DO WITH YOUR PERSONAL INFORMATION? |
| |
| Why? | Financial companies choose how they share your personal information. Federal law gives consumers the right to limit some but not all sharing. Federal law also requires us to tell you how we collect, share, and protect your personal information. Please read this notice carefully to understand what we do. |
| | |
| What? | The types of personal information we collect and share depend on the product or service you have with us. This information can include: ■ Social Security number ■ Assets ■ Retirement Assets ■ Transaction History ■ Checking Account Information ■ Purchase History ■ Account Balances ■ Account Transactions ■ Wire Transfer Instructions When you are no longer our customer, we continue to share your information as described in this notice. |
| | |
| How? | All financial companies need to share your personal information to run their everyday business. In the section below, we list the reasons financial companies can share their customers’ personal information; the reasons the Fund chooses to share; and whether you can limit this sharing. |
Reasons we can share your personal
information | Does the Fund share? | Can you limit this sharing? |
| For our everyday business purposes – Such as to process your transactions, maintain your account(s), respond to court orders and legal investigations, or report to credit bureaus | Yes | No |
| For our marketing purposes – to offer our products and services to you | No | We don’t share |
| For joint marketing with other financial companies | No | We don’t share |
| For our affiliates’ everyday business purposes – information about your transactions and experiences | No | We don’t share |
| For our affiliates’ everyday business purposes – information about your creditworthiness | No | We don’t share |
| For nonaffiliates to market to you | No | We don’t share |
| Questions? | Call 1-855-691-5288 |
| Who we are |
| Who is providing this notice? | Marshfield Concentrated Opportunity Fund Ultimus Fund Distributors, LLC (Distributor) Ultimus Fund Solutions, LLC (Administrator) |
| What we do |
| How does the Fund protect my personal information? | To protect your personal information from unauthorized access and use, we use security measures that comply with federal law. These measures include computer safeguards and secured files and buildings. Our service providers are held accountable for adhering to strict policies and procedures to prevent any misuse of your nonpublic personal information. |
| How does the Fund collect my personal information? | We collect your personal information, for example, when you ■ Open an account ■ Provide account information ■ Give us your contact information ■ Make deposits or withdrawals from your account ■ Make a wire transfer ■ Tell us where to send the money ■ Tell us who receives the money ■ Show your government-issued ID ■ Show your driver’s license We also collect your personal information from other companies. |
| Why can’t I limit all sharing? | Federal law gives you the right to limit only ■ Sharing for affiliates’ everyday business purposes – information about your creditworthiness ■ Affiliates from using your information to market to you ■ Sharing for nonaffiliates to market to you State laws and individual companies may give you additional rights to limit sharing. |
| Definitions |
| Affiliates | Companies related by common ownership or control. They can be financial and nonfinancial companies. ■ Marshfield Associates, Inc., the investment adviser to the Fund, could be deemed to be an affiliate. |
| Nonaffiliates | Companies not related by common ownership or control. They can be financial and nonfinancial companies ■ The Fund does not share with nonaffiliates so they can market to you. |
| Joint marketing | A formal agreement between nonaffiliated financial companies that together market financial products or services to you. ■ The Fund does not jointly market. |
This page intentionally left blank.
Marshfield-SAR-23
MEEHAN FOCUS FUND
SEMI-ANNUAL REPORT
February 28, 2023
(Unaudited)
| This report is for the information of the shareholders of Meehan Focus Fund. Its use in connection with any offering of the Fund’s shares is authorized only in a case of concurrent or prior delivery of the Fund’s current prospectus. Investors should refer to the Fund’s prospectus for a description of risk factors associated with investments in the Fund. |
| Meehan Focus Fund | Distributor: |
| A Series of Ultimus Managers Trust | Ultimus Fund Distributors, LLC |
| 7250 Woodmont Avenue, Suite 315 | 225 Pictoria Drive, Suite 450 |
| Bethesda, MD 20814 | Cincinnati, OH 45246 |
| (866) 884-5968 | (800) 933-8413 |
| MEEHAN FOCUS FUND | |
| LETTER TO SHAREHOLDERS (Unaudited) | March 23, 2023 |
Dear Fellow Shareholders1 :
The Meehan Focus Fund (“the Fund”) gained 3.06% through the first six months of its 2023 fiscal year2; the Fund’s net asset value (“NAV”) per share on February 28, 2023 was $37.88. The Fund’s performance over the past six months was better than the S&P 500 Total Return Index but trailed the S&P 500 Value Index. The Fund has outperformed its benchmarks over the past three years, five years, and since inception.
Stocks continued their choppy performance over the past six months but ended the period higher than they began for the first time since late 2021. It did not start well, as the S&P 500 fell almost 13% from mid-September through October 12 when it touched a new bear market low. Stocks then rallied smartly through November but have not been able to sustain upward momentum since.
Stocks currently seem to be locked in a tug of war. On one side, stronger than expected economic data suggest the economy may weather the Federal Reserve’s (Fed) sharp rate hikes without falling into recession and sending stocks lower. On the other side, several indicators that have traditionally presaged recession and stock declines are pointing down.
Signs of a slowdown that were gathering as 2022 drew to a close have been eclipsed by better-than-expected economic data so far in 2023. The Atlanta Fed’s GDPNow forecasting tool currently projects first quarter 2023 annualized growth of 3.2%, exceeding the 2.7% annual rate of 2022’s fourth quarter.3 Services activity has been resilient over the past year and February numbers, as reported by the Institute for Supply Management (ISM) and S&P Global, show the services sector expanding.4 Although manufacturing activity, as reported by the ISM, has contracted in recent months, recent increases in machinery orders and manufactured goods shipments suggest manufacturing could be rebounding.5
The labor market also continues to defy expectations on the upside, as the U.S. economy produced 504,000 jobs in January and 311,000 in February.6
| 1 | The views expressed herein are not meant as investment advice. Although some of the described portfolio holdings were viewed favorably as of the date of this letter, there is no guarantee that the Fund will continue to hold these securities in the future. Please consider the investment objectives, risks, charges, and expenses of the Fund before investing. Contact the Fund at (866) 884-5968 for a prospectus, which contains this and other important information about the Fund. Read the prospectus carefully before investing. |
| | |
| 2 | Past performance does not guarantee future results. Performance data quoted above represents past performance, and the investment return and principal value of an investment will fluctuate so that an investor’s shares, when redeemed, may be worth more or less than their original cost. Current performance may be lower or higher than the performance data quoted. To obtain more current performance information, please call (866) 884-5968. |
| | |
| 3 | Federal Reserve Bank of Atlanta, Atlanta Fed GDPNow Estimate for 2023: Q1, March 24, 2023. |
| | |
| 4 | Institute for Supply Management, February 2023 Services ISM Report on Business, March 3, 2023; S&P Global US Services PMI, March 3, 2023. |
| | |
| 5 | U.S. Factory Orders Fall as Civilian Aircraft Demand Dives, Lucia Mutikani, Reuters, March 6, 2023. |
| | |
| 6 | U.S. Employers Added a Solid 311,000 Jobs in February, Sarah Chaney Cambon, Wall Street Journal, March 10, 2023. |
The unemployment rate ticked slightly higher in February but for a positive reason, as the labor force participation rate rose, edging closer to its pre-pandemic February 2020 level; initial claims for unemployment remain low.
There are, however, several factors weighing against the positive narrative. The Conference Board Leading Economic Index has now declined for 11 consecutive months and is at levels that are traditionally associated with a coming recession.7 In addition, corporate earnings are decelerating. Fourth quarter 2022 S&P 500 earnings declined 4.6% versus the year ago period, the first earnings decline since the third quarter of 2020, and earnings are projected to decline again in 2023’s first quarter.8 Finally, while inflation has continued to decline in recent months, it is still well above the Fed’s 2% target. Importantly, the rate of decline in inflation has recently slowed, raising the prospect of further Fed rate increases and a higher terminal Fed funds rate.
The Fed, for its part, has stepped back somewhat from its aggressive pace of rate increases. After four consecutive 0.75% hikes, the Fed increased the Fed funds rate by 0.50% in December and 0.25% in February and March, but commentary from many Fed members has remained hawkish. The Fed funds rate now stands at 4.75 %-5.00%, its highest level since 2007.
Outlook
Our outlook for stocks over the next several months is cautious. Stocks, as measured by the S&P 500, are not expensive with a 12-month forward P/E ratio of 17.1, below both the 5-year average of 18.5 and the 10-year average of 17.3, but neither are they cheap, particularly in light of current 2023 earnings expectations.9
The mid-March failure of Silicon Valley Bank and two other regional banks has sent tremors through stock and bond markets and further added to uncertainty. It appears that emergency measures taken by the Fed have prevented contagion, and both Fed Chair Powell and Treasury Secretary Yellen have sought to reassure the public that the U.S. banking system is sound, but markets remain unsettled.
The Fed’s decision to raise rates at its March meeting despite turmoil in the banking sector underscored its continuing concerns about the persistence of inflation. In its commentary, the Fed acknowledged the heightened risks and also softened its language regarding future rate increases, raising hope that it may be ready to pause in its rate raising campaign. Investors will likely remain focused on the interrelated data on employment, inflation and interest rates as they try to handicap future Fed rate actions and their impacts on the economy and markets.
Looking beyond the United States, recent economic reports and stock performance have shown surprising strength to start the year. Results from China, where stringent Covid restrictions have been lifted, and Europe helped propel February global manufacturing output to its first increase in seven months. These results are encouraging, but it is not clear if they are sustainable. The recession forecasted for the eurozone by many after Russia’s invasion of Ukraine has, so far, not materialized; however, inflation continues to rise and the
| 7 | U.S. Leading Indicators, The Conference Board, March 17, 2023. |
| | |
| 8 | FactSet Earnings Insight, John Butters, March 16, 2023. |
| | |
| 9 | FactSet Earnings Insight, John Butters, March 16, 2023. |
war in Ukraine shows no signs of ending. In addition, the potential global economic benefits of China’s reopening are balanced against increasing political tensions between China and the United States which could derail any economic progress.
Portfolio Review
The attached Schedule of Investments identifies the fund’s investments and their market value as of February 28, 2023. Over the past six months long-term holdings United Rentals, Broadcom and Applied Materials made the largest positive contributions to the Fund’s performance.
United Rentals
In a challenging macro environment United Rentals was able to deliver impressive results, with revenue reaching $3.3 billion for the quarter ended December 31, 2022, up 18.7% from the year-ago period. The company stands to benefit from continued growth across its markets, particularly in the United States where spending on federal infrastructure programs related to the $1.2 trillion Infrastructure Investment and Jobs Act and the Inflation Reduction Act is just getting started. This past quarter and fiscal year set new company records for revenues, profitability, margins, and returns. After announcing record year-end results and guidance for strong continued growth in fiscal 2023, United Rentals revealed its plan to return approximately $1.4 billion to shareholders via a $1 billion share repurchase program and the initiation of a quarterly dividend in the amount of $1.48 per share. The company has been able to combat inflation by pushing rising input costs, such as steel, asphalt, resin, and other materials, onto customers through price increases. United Rentals’ strong market position and consistently high margins combined with new infrastructure spending should drive continued earnings growth.
Broadcom
Broadcom’s strong operating performance in recent quarters has propelled the shares higher. Broadcom’s revenue for the quarter ended January 31, 2023 reached $8.9 billion, a 16% increase from the prior-year period, and adjusted earnings per share hit $10.33, a 23% surge over the same time period. The company remains committed to returning excess cash to shareholders, paying out $1.9 billion in cash dividends and repurchasing $1.5 billion of shares, for a total of $3.4 billion. Looking forward, Broadcom is well positioned to benefit from the rapidly growing field of artificial intelligence software, which makes extensive use of the company’s advanced networking switches and custom silicon. We believe the market would also welcome the successful closing of its pending deal to acquire VMware, which is awaiting regulatory approval.
Applied Materials
Applied Materials reported results for its fiscal first quarter, ended January 31, 2023, and delivered revenue of $6.7 billion, up 7% year-over-year, and earnings of $2.03 per share, also an increase of 7% compared to the prior-year period. The company returned $470 million to shareholders during the quarter, including $250 million in share repurchases and $220 million in dividends. We believe Applied Materials will continue to perform well in 2023 as the demand for foundry logic is expected to remain strong given the rising need for specialty nodes in automotive, power, the 5G rollout, the Internet of Things and other end markets. The company also continues to innovate, most recently with its breakthrough
patterning technology that enables chipmakers to manufacture high performance transistors at a lower cost, with less complexity, and a reduced environmental impact. Additionally, Applied Materials enjoys strong services subscription penetration and is less exposed to the struggling memory chip end market, two factors that should continue to benefit the company.
These positive contributions were partially offset by weaker performances from long-term technology holdings Amazon, Alphabet, and Apple.
Amazon.com Inc.
Amazon.com is the largest U.S. e-commerce retailer and its cloud business, Amazon Web Services (AWS), is the largest global provider of cloud-based infrastructure services, with 32% of the market. Fourth quarter revenues of $149.2 billion were up 9% year-over-year and beat expectations, but shares were punished on weaker-than-expected profitability and concerns tied to declining growth at its AWS business. AWS revenues of $21.4 billion grew 20% year-over-year, but disappointed Wall Street analysts who were expecting growth of 28%. Nonetheless, Amazon’s competitive advantages, which include strong network effects, cost advantages, scalability, and intangible assets provide the company a wide moat. Moreover, Amazon’s growth trajectory is promising, with its high-margin AWS, advertising, and subscriptions businesses projected to be the company’s main growth drivers going forward. We believe the company’s dominant position across its various markets, compelling growth prospects, and prevailing valuation metrics will enable shares to rebound from their 2022 decline.
Alphabet, Inc.
Alphabet’s stock has struggled in recent months as growth decelerated, and the company has refocused on increasing efficiency to enhance its competitive position in a difficult market. Alphabet reported total revenue of $76.1 billion in its most recent quarter, a 1% decline from the previous quarter. Strong growth from Google Cloud, which saw revenue expand 32%, was not enough to compensate for declines in other divisions including Google Search, YouTube, and Google Network. In response to these results, Alphabet announced a workforce reduction of approximately 12,000 as well as other cost-cutting measures. Despite its recent struggles, Alphabet maintains dominant positions in internet search, where Google search commands an 80% global market share, and smartphone operating systems, where Google’s Android operating system holds a roughly 85% share of the global market. We also believe Alphabet is positioned to be a strong player in the Artificial Intelligence software market where it recently released Bard, a rival to Microsoft’s ChatGPT. We continue to view the company favorably due to its strong competitive position in its primary business lines and fortress balance sheet.
Apple, Inc.
Apple posted record revenue of $394.3 billion for its fiscal year ended September 24, 2022, an 8% increase year-over-year. However, 2023 fiscal first quarter revenue results were not as strong at $117.2 billion, down 5.5% year-over-year, and the stock has declined as the first quarter revenue prompted concerns among investors. This reduction in revenue can be attributed in part to the COVID lockdown restrictions in China. Although revenue contracted during Apple’s most recent quarter, the company generated nearly $36 billion in operating cash flow, returned $23.2 billion to shareholders, and continued to invest in its long-term
growth plans. Additionally, on September 7, 2022, Apple announced a bevy of new devices, including the new iPhone 14 Pro and Pro Max models, next generation AirPods Pro, and newest Apple Watch. We remain impressed by Apple’s strong long-term sales performance, unmatched customer loyalty, and strength of its iOS ecosystem. In coming quarters, we believe Apple’s revenue and earnings will benefit from China’s reopening and the ongoing rollout of 5G.
We made only minor changes to the Fund’s portfolio over the past six months. We sold the Fund’s position in Medtronic at a modest gain and added to existing positions in Berkshire Hathaway, Amazon, Shell and Blackstone.
Conclusion
We appreciate your confidence in our management of the Fund during this difficult time and look forward to continued success. You can check the Fund’s NAV online at any time by typing in the Fund’s ticker symbol (MEFOX) into most stock quotation services. Please do not hesitate to contact us if you have any questions regarding your investment in the Fund.
Sincerely,
 |  |
| | |
| Thomas P. Meehan | Paul P. Meehan |
| Portfolio Managers, Meehan Focus Fund | |
Past performance is not predictive of future performance. Investment results and principal value will fluctuate so that shares, when redeemed, may be worth more or less than their original cost. Current performance may be higher or lower than the performance data quoted. Performance data current to the most recent month end are available by calling 1-866-884-5968.
An investor should consider the investment objectives, risks, charges and expenses of the Fund carefully before investing. The Fund’s prospectus contains this and other important information. To obtain a copy of the Fund’s prospectus visit the Fund’s website at www.meehanmutualfunds.com or call 1-866-884-5968 and a copy will be sent to you free of charge. Please read the prospectus carefully before you invest. The Meehan Focus Fund is distributed by Ultimus Fund Distributors, LLC.
This Letter to Shareholders seeks to describe some of the Adviser’s current opinions and views of the financial markets. Although the Adviser believes it has a reasonable basis for any opinions or views expressed, actual results may differ, sometimes significantly so, from those expected or expressed. The securities held by the Fund that are discussed in the Letter to Shareholders were held during the period covered by this Report. They do not comprise the entire investment portfolio of the Fund, may be sold at any time and may no longer be held by the Fund. For a complete list of securities held by the Fund as of February 28, 2023, please see the Schedule of Investments section of the semi-annual report. The opinions of the Adviser with respect to those securities may change at any time.
Statements in the Letter to Shareholders that reflect projections or expectations for future financial or economic performance of the Fund and the market in general and statements of the Fund’s plans and objectives for future operations are forward-looking statements. No assurance can be given that actual results or events will not differ materially from those projected, estimated, assumed, or anticipated in any such forward-looking statements. Important factors that could result in such differences, in addition to factors noted with such forward-looking statements include, without limitation, general economic conditions, such as inflation, recession, and interest rates.
| MEEHAN FOCUS FUND |
| PERFORMANCE INFORMATION |
| February 28, 2023 (Unaudited) |
Comparison of Change in Value of a $10,000 Investment in the
Meehan Focus Fund vs. the S&P 500® Total Return Index*
and the S&P 500® Value Index*
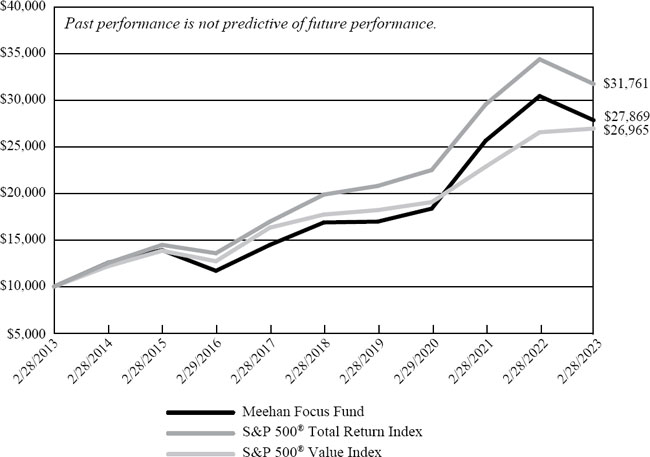
| | | | | | | | |
| | Average Annual Total Returns
(For Periods Ended February 28, 2023) | |
| | | | | | | | |
| | | 1 Year | | 5 Years | | 10 Years | |
| | Meehan Focus Fund (a) | -8.50% | | 10.54% | | 10.79% | |
| | S&P 500® Total Return Index | -7.69% | | 9.82% | | 12.25% | |
| | S&P 500® Value Index | 1.47% | | 8.73% | | 10.43% | |
| | | | | | | | |
| * | The above graph depicts the performance of the Fund versus the S&P 500® Total Return Index and the S&P 500® Value Index. It is important to note that the Fund is a professionally managed mutual fund; the S&P 500® Total Return Index by Standard & Poor’s Corp. is a capitalization-weighted index comprised of 500 issues listed on various exchanges, representing the performance of the stock market generally; and the S&P 500® Value Index measures value stocks using three factors: the ratios of book value, earnings, and sales to price. Constituents are drawn from the S&P 500® Total Return Index. An index is not an investment product available for purchase. The Fund’s performance assumes the reinvestment of all dividends and all capital gains. Index returns assume reinvestment of dividends but, unlike the Fund’s returns, do not reflect any fees or expenses. |
| (a) | Performance presented represents historical data. The investment return and principal value of an investment will fluctuate so that an investor’s shares, when redeemed, may be worth more or less than their original cost. The Fund’s past performance is not indicative of future performance. The table and graph above do not reflect the deduction of taxes that a shareholder would pay on Fund distributions or the redemption of Fund shares. Current performance may be lower or higher than the performance data quoted. To obtain more current performance information, please contact (866) 884-5968. As disclosed in the Fund’s December 29, 2022 prospectus, the Fund’s total annual operating expenses are 1.01%. |
| MEEHAN FOCUS FUND |
| PORTFOLIO INFORMATION |
| February 28, 2023 (Unaudited) |
Sector Diversification (% of Net Assets)
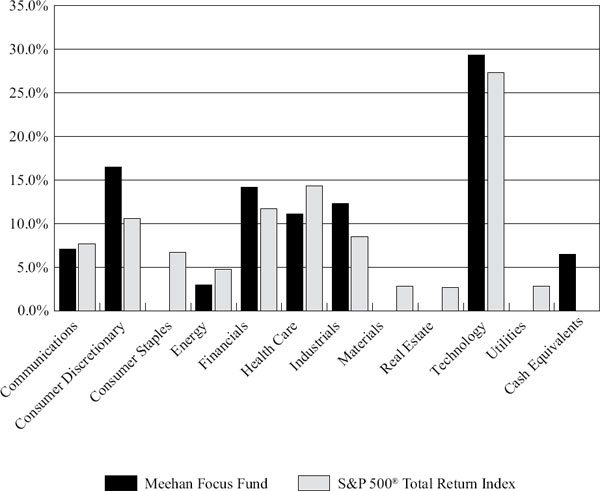
| Top 10 Equity Holdings |
| | |
| | % of |
| Security Description | Net Assets |
| Apple, Inc. | 9.5% |
| Microsoft Corporation | 9.4% |
| Lowe’s Companies, Inc. | 8.7% |
| United Rentals, Inc. | 8.1% |
| Berkshire Hathaway, Inc. - Class B | 8.0% |
| Alphabet, Inc. - Classes A and C | 5.9% |
| Vertex Pharmaceuticals, Inc. | 4.4% |
| Applied Materials, Inc. | 4.2% |
| Amazon.com, Inc. | 4.0% |
| Broadcom, Inc. | 3.7% |
| MEEHAN FOCUS FUND |
| SCHEDULE OF INVESTMENTS |
| February 28, 2023 (Unaudited) |
| COMMON STOCKS — 93.5% | | Shares | | | Value | |
| Communications — 7.1% | | | | | | | | |
| Entertainment Content — 1.2% | | | | | | | | |
| Walt Disney Company (The) (a) | | | 12,150 | | | $ | 1,210,261 | |
| | | | | | | | | |
| Internet Media & Services — 5.9% | | | | | | | | |
| Alphabet, Inc. - Class A (a) | | | 29,900 | | | | 2,692,794 | |
| Alphabet, Inc. - Class C (a) | | | 34,830 | | | | 3,145,149 | |
| | | | | | | | 5,837,943 | |
| Consumer Discretionary — 16.5% | | | | | | | | |
| E-Commerce Discretionary — 4.0% | | | | | | | | |
| Amazon.com, Inc. (a) | | | 41,435 | | | | 3,904,420 | |
| | | | | | | | | |
| Home Construction — 1.6% | | | | | | | | |
| Lennar Corporation - Class A | | | 16,000 | | | | 1,547,840 | |
| | | | | | | | | |
| Leisure Products — 0.9% | | | | | | | | |
| Malibu Boats, Inc. - Class A (a) | | | 14,850 | | | | 887,436 | |
| | | | | | | | | |
| Retail - Discretionary — 10.0% | | | | | | | | |
| Lowe’s Companies, Inc. | | | 41,630 | | | | 8,565,372 | |
| Williams-Sonoma, Inc. | | | 10,730 | | | | 1,340,392 | |
| | | | | | | | 9,905,764 | |
| Energy — 3.0% | | | | | | | | |
| Oil & Gas Producers — 3.0% | | | | | | | | |
| Shell plc - ADR | | | 47,850 | | | | 2,907,845 | |
| | | | | | | | | |
| Financials — 14.2% | | | | | | | | |
| Asset Management — 3.2% | | | | | | | | |
| BlackRock, Inc. | | | 2,925 | | | | 2,016,583 | |
| Blackstone, Inc. | | | 12,200 | | | | 1,107,760 | |
| | | | | | | | 3,124,343 | |
| Banking — 3.0% | | | | | | | | |
| Bank of America Corporation | | | 56,000 | | | | 1,920,800 | |
| Citigroup, Inc. | | | 20,000 | | | | 1,013,800 | |
| | | | | | | | 2,934,600 | |
| Insurance — 8.0% | | | | | | | | |
| Berkshire Hathaway, Inc. - Class B (a) | | | 26,050 | | | | 7,949,939 | |
| MEEHAN FOCUS FUND |
| SCHEDULE OF INVESTMENTS (Continued) |
| COMMON STOCKS — 93.5% (Continued) | | Shares | | | Value | |
| Health Care — 11.1% | | | | | | | | |
| Biotech & Pharma — 7.4% | | | | | | | | |
| Bristol-Myers Squibb Company | | | 18,130 | | | $ | 1,250,245 | |
| Novartis AG - ADR | | | 20,420 | | | | 1,717,730 | |
| Vertex Pharmaceuticals, Inc. (a) | | | 14,800 | | | | 4,296,292 | |
| | | | | | | | 7,264,267 | |
| Health Care Facilities & Services — 3.7% | | | | | | | | |
| CVS Health Corporation | | | 44,000 | | | | 3,675,760 | |
| | | | | | | | | |
| Industrials — 12.3% | | | | | | | | |
| Electrical Equipment — 1.7% | | | | | | | | |
| Johnson Controls International plc | | | 27,275 | | | | 1,710,688 | |
| | | | | | | | | |
| Industrial Support Services — 8.1% | | | | | | | | |
| United Rentals, Inc. | | | 17,050 | | | | 7,988,437 | |
| | | | | | | | | |
| Machinery — 2.5% | | | | | | | | |
| Deere & Company | | | 5,800 | | | | 2,431,592 | |
| | | | | | | | | |
| Technology — 29.3% | | | | | | | | |
| Semiconductors — 7.9% | | | | | | | | |
| Applied Materials, Inc. | | | 35,365 | | | | 4,107,645 | |
| Broadcom, Inc. | | | 6,245 | | | | 3,711,341 | |
| | | | | | | | 7,818,986 | |
| Software — 9.4% | | | | | | | | |
| Microsoft Corporation | | | 37,035 | | | | 9,237,269 | |
| | | | | | | | | |
| Technology Hardware — 9.5% | | | | | | | | |
| Apple, Inc. | | | 63,695 | | | | 9,389,280 | |
| | | | | | | | | |
| Technology Services — 2.5% | | | | | | | | |
| Visa, Inc. - Class A | | | 11,000 | | | | 2,419,340 | |
| | | | | | | | | |
| Total Common Stocks (Cost $36,920,612) | | | | | | $ | 92,146,010 | |
| MEEHAN FOCUS FUND |
| SCHEDULE OF INVESTMENTS (Continued) |
| MONEY MARKET FUNDS — 6.5% | | Shares | | | Value | |
| Invesco Short-Term Investment Trust Government & Agency Portfolio - Institutional Class, 4.52% (b) (Cost $6,431,360) | | | 6,431,360 | | | $ | 6,431,360 | |
| | | | | | | | | |
| Investments at Value — 100.0% (Cost $43,351,972) | | | | | | $ | 98,577,370 | |
| | | | | | | | | |
| Other Assets in Excess of Liabilities — 0.0% (c) | | | | | | | 28,362 | |
| | | | | | | | | |
| Net Assets — 100.0% | | | | | | $ | 98,605,732 | |
ADR - American Depositary Receipt
AG - Aktiengesellschaft
plc - Public Limited Company
| (a) | Non-income producing security. |
| (b) | The rate shown is the 7-day effective yield as of February 28, 2023. |
| (c) | Percentage rounds to less than 0.1%. |
See accompanying notes to financial statements.
| MEEHAN FOCUS FUND |
| STATEMENT OF ASSETS AND LIABILITIES |
| February 28, 2023 (Unaudited) |
| ASSETS | | | | |
| Investments in securities: | | | | |
| At cost | | $ | 43,351,972 | |
| At value (Note 2) | | $ | 98,577,370 | |
| Receivable for capital shares sold | | | 1,730 | |
| Dividends receivable | | | 88,712 | |
| Other assets | | | 12,903 | |
| TOTAL ASSETS | | | 98,680,715 | |
| | | | | |
| LIABILITIES | | | | |
| Payable for capital shares redeemed | | | 2,000 | |
| Payable to Adviser (Note 4) | | | 53,108 | |
| Payable to administrator (Note 4) | | | 13,747 | |
| Other accrued expenses | | | 6,128 | |
| TOTAL LIABILITIES | | | 74,983 | |
| | | | | |
| NET ASSETS | | $ | 98,605,732 | |
| | | | | |
| NET ASSETS CONSIST OF: | | | | |
| Paid-in capital | | $ | 43,255,952 | |
| Accumulated earnings | | | 55,349,780 | |
| NET ASSETS | | $ | 98,605,732 | |
| | | | | |
| Shares of beneficial interest outstanding (unlimited number of shares authorized, no par value) | | | 2,603,041 | |
| | | | | |
| Net asset value, offering price and redemption price per share (a) (Note 2) | | $ | 37.88 | |
| (a) | Redemption price may differ from the net asset value per share depending upon the length of time held. |
See accompanying notes to financial statements.
| MEEHAN FOCUS FUND |
| STATEMENT OF OPERATIONS |
| For the Six Months Ended February 28, 2023 (Unaudited) |
| INVESTMENT INCOME | | | | |
| Dividend income | | $ | 685,766 | |
| | | | | |
| EXPENSES | | | | |
| Management fees (Note 4) | | | 380,586 | |
| Administration fees (Note 4) | | | 47,505 | |
| Fund accounting fees (Note 4) | | | 20,654 | |
| Legal fees | | | 12,056 | |
| Transfer agent fees (Note 4) | | | 9,539 | |
| Trustees’ fees and expenses (Note 4) | | | 9,532 | |
| Audit and tax services fees | | | 8,661 | |
| Registration and filing fees | | | 6,595 | |
| Compliance fees and expenses (Note 4) | | | 6,375 | |
| Custody and bank service fees | | | 5,486 | |
| Postage and supplies | | | 3,625 | |
| Shareholder reporting expenses | | | 3,462 | |
| Insurance expense | | | 1,960 | |
| Other expenses | | | 8,107 | |
| TOTAL EXPENSES | | | 524,143 | |
| Less fee reductions by the Adviser (Note 4) | | | (48,410 | ) |
| NET EXPENSES | | | 475,733 | |
| | | | | |
| NET INVESTMENT INCOME | | | 210,033 | |
| | | | | |
| REALIZED AND UNREALIZED GAINS ON INVESTMENTS | | | | |
| Net realized gains from investments | | | 18,252 | |
| Net realized gains from in-kind redemptions (Note 2) | | | 1,354,124 | |
| Net change in unrealized appreciation (depreciation) on investments | | | 1,394,309 | |
| NET REALIZED AND UNREALIZED GAINS ON INVESTMENTS | | | 2,766,685 | |
| | | | | |
| NET INCREASE IN NET ASSETS FROM OPERATIONS | | $ | 2,976,718 | |
See accompanying notes to financial statements.
| MEEHAN FOCUS FUND |
| STATEMENTS OF CHANGES IN NET ASSETS |
| | | Six Months | | | | |
| | | Ended | | | Year | |
| | | February 28, | | | Ended | |
| | | 2023 | | | August 31, | |
| | | (Unaudited) | | | 2022 | |
| FROM OPERATIONS | | | | | | | | |
| Net investment income | | $ | 210,033 | | | $ | 32,811 | |
| Net realized gains from investments | | | 18,252 | | | | 2,009,156 | |
| Net realized gains from in-kind redemptions (Note 2) | | | 1,354,124 | | | | 1,239,549 | |
| Net change in unrealized appreciation (depreciation) on investments | | | 1,394,309 | | | | (18,000,430 | ) |
| Net increase (decrease) in net assets resulting from operations | | | 2,976,718 | | | | (14,718,914 | ) |
| | | | | | | | | |
| DISTRIBUTIONS TO SHAREHOLDERS (Note 2) | | | (735,325 | ) | | | (3,864,039 | ) |
| | | | | | | | | |
| CAPITAL SHARE TRANSACTIONS | | | | | | | | |
| Proceeds from shares sold | | | 1,074,685 | | | | 9,333,595 | |
| Net asset value of shares issued in reinvestment of distributions to shareholders | | | 729,470 | | | | 3,840,260 | |
| Payments for shares redeemed | | | (2,421,502 | ) | | | (3,897,504 | ) |
| Net increase (decrease) in net assets from capital share transactions | | | (617,347 | ) | | | 9,276,351 | |
| | | | | | | | | |
| TOTAL INCREASE (DECREASE) IN NET ASSETS | | | 1,624,046 | | | | (9,306,602 | ) |
| | | | | | | | | |
| NET ASSETS | | | | | | | | |
| Beginning of period | | | 96,981,686 | | | | 106,288,288 | |
| End of period | | $ | 98,605,732 | | | $ | 96,981,686 | |
| | | | | | | | | |
| CAPITAL SHARE ACTIVITY | | | | | | | | |
| Shares sold | | | 29,113 | | | | 220,487 | |
| Shares reinvested | | | 20,445 | | | | 84,087 | |
| Shares redeemed | | | (64,356 | ) | | | (90,956 | ) |
| Net increase (decrease) in shares outstanding | | | (14,798 | ) | | | 213,618 | |
| Shares outstanding at beginning of period | | | 2,617,839 | | | | 2,404,221 | |
| Shares outstanding at end of period | | | 2,603,041 | | | | 2,617,839 | |
See accompanying notes to financial statements.
| MEEHAN FOCUS FUND |
| FINANCIAL HIGHLIGHTS |
Per Share Data for a Share Outstanding Throughout Each Period
| | | Six Months | | | | | | | | | Ten | | | | | | | | | | |
| | | Ended | | | Year | | | Year | | | Months | | | Year | | | Year | | | Year | |
| | | Feb. 28, | | | Ended | | | Ended | | | Ended | | | Ended | | | Ended | | | Ended | |
| | | 2023 | | | August 31, | | | August 31, | | | August 31, | | | Oct. 31, | | | Oct. 31, | | | Oct. 31, | |
| | | (Unaudited) | | | 2022 | | | 2021 | | | 2020 (a) | | | 2019 | | | 2018 | | | 2017 | |
| Net asset value at beginning of period | | $ | 37.05 | | | $ | 44.21 | | | $ | 32.80 | | | $ | 27.98 | | | $ | 24.99 | | | $ | 24.13 | | | $ | 19.42 | |
| Income (loss) from investment operations: | | | | | | | | | | | | | | | | | | | | | | | | | | | | |
| Net investment income (b) | | | 0.08 | | | | 0.01 | | | | 0.03 | | | | 0.14 | | | | 0.21 | | | | 0.14 | | | | 0.15 | |
| Net realized and unrealized gains (losses) on investments and foreign currencies | | | 1.04 | | | | (5.56 | ) | | | 11.76 | | | | 5.71 | | | | 3.42 | | | | 0.86 | | | | 4.64 | |
| Total from investment operations | | | 1.12 | | | | (5.55 | ) | | | 11.79 | | | | 5.85 | | | | 3.63 | | | | 1.00 | | | | 4.79 | |
| Less distributions from: | | | | | | | | | | | | | | | | | | | | | | | | | | | | |
| Net investment income | | | (0.05 | ) | | | (0.01 | ) | | | (0.12 | ) | | | (0.20 | ) | | | (0.15 | ) | | | (0.14 | ) | | | (0.06 | ) |
| Net realized gains | | | (0.24 | ) | | | (1.60 | ) | | | (0.26 | ) | | | (0.83 | ) | | | (0.49 | ) | | | — | | | | (0.02 | ) |
| Total distributions | | | (0.29 | ) | | | (1.61 | ) | | | (0.38 | ) | | | (1.03 | ) | | | (0.64 | ) | | | (0.14 | ) | | | (0.08 | ) |
| Net asset value at end of period | | $ | 37.88 | | | $ | 37.05 | | | $ | 44.21 | | | $ | 32.80 | | | $ | 27.98 | | | $ | 24.99 | | | $ | 24.13 | |
| Total return (c) | | | 3.06 | % (d) | | | (13.23 | %) | | | 36.25 | % | | | 21.38 | % (d) | | | 15.16 | % | | | 4.15 | % | | | 24.72 | % |
| Net assets at end of period (000’s) | | $ | 98,606 | | | $ | 96,982 | | | $ | 106,288 | | | $ | 80,538 | | | $ | 67,566 | | | $ | 65,818 | | | $ | 63,743 | |
| Ratios/supplementary data: | | | | | | | | | | | | | | | | | | | | | | | | | | | | |
| Ratio of total expenses to average net assets (e) | | | 1.10 | % (f) | | | 1.08 | % | | | 1.09 | % | | | 1.16 | % (f) | | | 1.17 | % | | | 1.12 | % | | | 1.00 | % |
| Ratio of net expenses to average net assets (e)(g) | | | 1.00 | % (f) | | | 1.00 | % | | | 1.00 | % | | | 1.00 | % (f) | | | 1.00 | % | | | 1.00 | % | | | 1.00 | % |
| Ratio of net investment income to average net assets (b)(e)(g) | | | 0.44 | % (f) | | | 0.03 | % | | | 0.07 | % | | | 0.58 | % (f) | | | 0.77 | % | | | 0.54 | % | | | 0.69 | % |
| Portfolio turnover rate | | | 3 | % (d) | | | 13 | % | | | 4 | % | | | 16 | % (d) | | | 20 | % | | | 20 | % | | | 10 | % |
| (a) | Fund changed fiscal year to August 31. |
| (b) | Recognition of net investment income by the Fund is affected by the timing of the declaration of dividends by the underlying investment companies in which the Fund invests. |
| (c) | Total return is a measure of the change in value of an investment in the Fund over the period covered. The returns shown do not reflect the deduction of taxes a shareholder would pay on Fund distributions, if any, or the redemption of Fund shares. Had the Adviser not reduced its fees, total returns would have been lower. |
| (e) | The ratios of expenses and net investment income to average net assets do not reflect the Fund’s proportionate share of expenses of the underlying investments companies in which the Fund invests. |
| (g) | Ratio was determined after management fee reductions (Note 4). |
See accompanying notes to financial statements.
| MEEHAN FOCUS FUND |
| NOTES TO FINANCIAL STATEMENTS |
| February 28, 2023 (Unaudited) |
1. Organization
Meehan Focus Fund (the “Fund”) is a non-diversified series of Ultimus Managers Trust (the “Trust”). The Trust is an open-end management investment company registered under the Investment Company Act of 1940, as amended (the “1940 Act”). The Fund was reorganized into the Trust on October 23, 2017. It was formerly a series of Meehan Mutual Funds, Inc.
The Fund’s investment objective is to seek long-term growth of capital.
2. Significant Accounting Policies
The Fund follows accounting and reporting guidance under Financial Accounting Standards Board Accounting Standards Codification Topic 946, “Financial Services – Investment Companies.” The following is a summary of the Fund’s significant accounting policies used in the preparation of its financial statements. These policies are in conformity with accounting principals generally accepted in the United States of America (“GAAP”).
Securities valuation – The Fund’s portfolio securities are valued at fair value as of the close of regular trading on the New York Stock Exchange (the “NYSE”) (normally 4:00 p.m. Eastern Time) on each business day the NYSE is open. Securities, including common stocks and exchange-traded funds (“ETFs”), if any, listed on the NYSE or other exchanges are valued on the basis of their last sale price on the exchanges on which they are primarily traded. If there are no sales on that day, the securities are valued at the closing mean price on the NYSE or other primary exchange for that day. NASDAQ listed securities are valued at the NASDAQ Official Closing Price. If there are no sales on that day, the securities are valued at the last mean price as reported by NASDAQ. Securities traded in the over-the-counter market are valued at the last reported sale price, if available, otherwise at the most recently quoted mean price. Investments representing shares of money market funds and other open-end investment companies, except for ETFs, are valued at their net asset value (“NAV”) as reported by such companies. When using a quoted price and when the market is considered active, the security will be classified as Level 1 within the fair value hierarchy (see below). In the event that market quotations are not readily available or are considered unreliable due to market or other events, the Fund values its securities and other assets at fair value as determined by Edgemoor Investment Advisors, Inc. (the “Adviser”), as the Fund’s valuation designee, in accordance with procedures adopted by the Board of Trustees (the “Board”) pursuant to Rule 2a-5 under the 1940 Act. Under these procedures, the securities will be classified as Level 2 or 3 within the fair value hierarchy, depending on the inputs used. Unavailable or unreliable market quotes may be due to the following factors: a substantial bid-ask spread; infrequent sales resulting in stale prices; insufficient trading volume; small trade sizes; a temporary lapse in any reliable pricing source; and actions of the securities or futures markets, such as suspension or limitation of trading. As a result, the prices of securities used to calculate the Fund’s NAV may differ from quoted or published prices for the same securities.
| MEEHAN FOCUS FUND |
| NOTES TO FINANCIAL STATEMENTS (Continued) |
GAAP establishes a single authoritative definition of fair value, sets out a framework for measuring fair value and requires additional disclosures about fair value measurements.
Various inputs are used in determining the value of the Fund’s investments. These inputs are summarized in the three broad levels listed below:
| ● | Level 1 – quoted prices in active markets for identical securities |
| ● | Level 2 – other significant observable inputs |
| ● | Level 3 – significant unobservable inputs |
The inputs or methodology used for valuing securities are not necessarily an indication of the risks associated with investing in those securities. The inputs used to measure fair value may fall into different levels of the fair value hierarchy. In such cases, for disclosure purposes, the level in the fair value hierarchy within which the fair value measurement falls in its entirety is determined based on the lowest level input that is significant to the fair value measurement.
The following is a summary of the Fund’s investments by the inputs used to value the investments as of February 28, 2023:
| | | Level 1 | | | Level 2 | | | Level 3 | | | Total | |
| Common Stocks | | $ | 92,146,010 | | | $ | — | | | $ | — | | | $ | 92,146,010 | |
| Money Market Funds | | | 6,431,360 | | | | — | | | | — | | | | 6,431,360 | |
| Total | | $ | 98,577,370 | | | $ | — | | | $ | — | | | $ | 98,577,370 | |
| | | | | | | | | | | | | | | | | |
Refer to the Fund’s Schedule of Investments for a listing of the common stocks by sector and industry type. The Fund did not hold derivative instruments or any assets or liabilities that were measured at fair value on a recurring basis using significant unobservable inputs (Level 3) as of or during the six months ended February 28, 2023.
Foreign currency translation – Securities and other assets and liabilities denominated in or expected to settle in foreign currencies, if any, are translated into U.S. dollars based on exchange rates on the following basis:
| A. | The fair values of investment securities and other assets and liabilities are translated as of the close of the NYSE each day. |
| B. | Purchases and sales of investment securities and income and expenses are translated at the rate of exchange prevailing as of 4:00 p.m. Eastern Time on the respective date of such transactions. |
| C. | The Fund does not isolate that portion of the results of operations caused by changes in foreign exchange rates on investments from those caused by changes in market prices of securities held. Such fluctuations are included with the net realized and unrealized gains or losses on investments. |
| MEEHAN FOCUS FUND |
| NOTES TO FINANCIAL STATEMENTS (Continued) |
Reported net realized foreign exchange gains or losses arise from 1) purchases and sales of foreign currencies and 2) the difference between the amounts of dividends and foreign withholding taxes recorded on the Fund’s books and the U.S. dollar equivalent of the amounts actually received or paid. Reported net unrealized foreign exchange gains and losses arise from changes in the value of assets and liabilities that result from changes in exchange rates.
Share valuation – The NAV per share of the Fund is calculated daily by dividing the total value of the Fund’s assets, less liabilities, by the number of shares outstanding. The offering price and redemption price per share of the Fund is equal to the NAV per share, except that shares of the Fund are subject to a redemption fee of 2% if redeemed within 7 calendar days of the date of purchase. No redemption fees were collected by the Fund during the periods ended February 28, 2023 and August 31, 2022.
Investment income – Dividend income is recorded on the ex-dividend date. Non-cash dividends included in dividend income, if any, are recorded at the fair value of the security received. Interest income is accrued as earned. Withholding taxes on foreign dividends have been recorded in accordance with the Fund’s understanding of the applicable country’s rules and tax rates.
Investment transactions – Investment transactions are accounted for on the trade date. Realized gains and losses on investments sold are determined on a specific identification basis.
Common expenses – Common expenses of the Trust are allocated among the Fund and the other series of the Trust based on the relative net assets of each series, the number of series in the Trust, or the nature of the services performed and the relative applicability to each series.
Distributions to shareholders – Distributions to shareholders arising from net investment income and net realized capital gains, if any, are distributed at least once each year. Distributions to shareholders are recorded on the ex-dividend date. The amount of distributions from net investment income and net realized capital gains are determined in accordance with federal income tax regulations, which may differ from GAAP. The tax character of distributions paid during the periods ended February 28, 2023 and August 31, 2022 was as follows:
| | | Ordinary | | | Long-Term | | | Total | |
| Period Ended | | Income | | | Capital Gains | | | Distributions | |
| February 28, 2023 | | $ | 118,684 | | | $ | 616,641 | | | $ | 735,325 | |
| August 31, 2022 | | $ | 26,564 | | | $ | 3,837,475 | | | $ | 3,864,039 | |
| | | | | | | | | | | | | |
| MEEHAN FOCUS FUND |
| NOTES TO FINANCIAL STATEMENTS (Continued) |
Estimates – The preparation of financial statements in conformity with GAAP requires management to make estimates and assumptions that affect the reported amounts of assets and liabilities and disclosure of contingent assets and liabilities as of the date of the financial statements and the reported amounts of increase (decrease) in net assets from operations during the reporting period. Actual results could differ from those estimates.
Federal income tax – The Fund has qualified and intends to continue to qualify each year as a “regulated investment company” under Subchapter M of the Internal Revenue Code of 1986, as amended (the “Code”). By so qualifying, the Fund will not be subject to federal income taxes to the extent that it distributes its net investment income and any net realized capital gains in accordance with the Code.
In order to avoid imposition of the excise tax applicable to regulated investment companies, it is also the Fund’s intention to declare as dividends in each calendar year at least 98% of its net investment income (earned during the calendar year) and 98.2% of its net realized capital gains (earned during the twelve months ended October 31) plus undistributed amounts from prior years.
The following information is computed on a tax basis for each item as of February 28, 2023:
| | | | | |
| Tax cost of investments | | $ | 43,351,972 | |
| Gross unrealized appreciation | | $ | 56,423,414 | |
| Gross unrealized depreciation | | | (1,198,016 | ) |
| Net unrealized appreciation | | | 55,225,398 | |
| Accumulated ordinary income | | | 124,144 | |
| Other gains | | | 238 | |
| Accumulated earnings | | $ | 55,349,780 | |
| | | | | |
During the six months ended February 28, 2023, a shareholder took delivery of securities from the Fund, rather than cash, in exchange for the redemption of shares. The total fair value of these in-kind redemptions was $1,500,000 for 39,370 shares of the Fund. The Fund realized $1,354,124 of net capital gains resulting from the in-kind redemptions. The Fund recognizes a gain on in-kind redemptions to the extent that the value of the distributed securities on the date of redemption exceeds the cost of those securities and recognizes a loss to the extent that the cost of those securities exceeds the value of the distributed securities on the date of redemption. Such net gains are not taxable to the Fund and are not required to be distributed to shareholders. The Fund has reclassified this amount against paid-in capital on the Statement of Assets and Liabilities. Such reclassification, the result of permanent differences between the financial statement and income tax reporting requirements, has no effect on the Fund’s net assets or NAV per share.
During the year ended August 31, 2022, a shareholder took delivery of securities from the Fund, rather than cash, in exchange for the redemption of shares. The total fair value of these in-kind redemptions was $1,500,000 for 34,083 shares of the Fund. The Fund realized
| MEEHAN FOCUS FUND |
| NOTES TO FINANCIAL STATEMENTS (Continued) |
$1,239,549 of net capital gains resulting from the in-kind redemptions. The Fund recognizes a gain on in-kind redemptions to the extent that the value of the distributed securities on the date of redemption exceeds the cost of those securities and recognizes a loss to the extent that the cost of those securities exceeds the value of the distributed securities on the date of redemption. Such net gains are not taxable to the Fund and are not required to be distributed to shareholders.
The Fund recognizes the tax benefits or expenses of uncertain tax positions only when the position is “more likely than not” to be sustained assuming examination by tax authorities. Management has reviewed the Fund’s tax positions taken on federal income tax returns for the current and all open tax years (generally, three years) and has concluded that no provision for unrecognized tax benefits or expenses is required in these financial statements and does not expect this to change over the next twelve months. The Fund identifies its major tax jurisdiction as U.S. Federal.
The Fund recognizes interest and penalties, if any, related to unrecognized tax benefits as income tax on the Statement of Operations. During the six months ended February 28, 2023, the Fund did not incur any interest or penalties.
3. Investment Transactions
During the six months ended February 28, 2023, cost of purchases and proceeds from sales of investment securities, other than short-term investments, were $2,388,232 and $2,833,249, respectively.
4. Transactions with Related Parties
INVESTMENT ADVISORY AGREEMENT
The Fund’s investments are managed by the Adviser pursuant to the terms of an Investment Advisory Agreement. Under the Investment Advisory Agreement, the Fund pays the Adviser a management fee, computed and accrued daily and paid monthly, at the annual rate of 0.80% of its average daily net assets.
Pursuant to an Expense Limitation Agreement (“ELA”), the Adviser has contractually agreed, until March 1, 2024, to reduce management fees and reimburse other expenses to the extent necessary to limit total annual operating expenses (exclusive of brokerage costs; taxes; interest; borrowing costs such as interest and dividend expenses on securities sold short; costs to organize the Fund; acquired fund fees and expenses; and extraordinary expenses, such as litigation and merger or reorganization costs and other expenses not incurred in the ordinary course of the Fund’s business) to an amount not exceeding 1.00% of the Fund’s average daily net assets. Accordingly, during the six months ended February 28, 2023, the Adviser reduced its management fees in the amount of $48,410.
| MEEHAN FOCUS FUND |
| NOTES TO FINANCIAL STATEMENTS (Continued) |
Under the terms of the ELA, management fee reductions and expense reimbursements by the Adviser are subject to repayment by the Fund for a period of three years after such fees and expenses were incurred, provided the repayments do not cause total annual operating expenses to exceed the lesser of: (i) the expense limitation then in effect, if any, and (ii) the expense limitation in effect at the time the expenses to be repaid were incurred. As of February 28, 2023, the Adviser may seek recoupment of management fee reductions totaling $278,329 no later than the dates listed below:
| | | | | |
| August 31, 2023 | | $ | 59,222 | |
| August 31, 2024 | | | 86,137 | |
| August 31, 2025 | | | 84,560 | |
| February 28, 2026 | | | 48,410 | |
| Total | | $ | 278,329 | |
| | | | | |
OTHER SERVICE PROVIDERS
Ultimus Fund Solutions, LLC (“Ultimus”) provides administration, fund accounting, compliance and transfer agency services to the Fund. The Fund pays Ultimus fees in accordance with the agreements for such services. In addition, the Fund pays out-of-pocket expenses including, but not limited to, postage, supplies, and certain costs related to the pricing of the Fund’s portfolio securities.
Under the terms of a Distribution Agreement with the Trust, Ultimus Fund Distributors, LLC (the “Distributor”) serves as the principal underwriter to the Fund. The Distributor is a wholly-owned subsidiary of Ultimus. The Distributor is compensated by the Adviser (not the Fund) for acting as principal underwriter.
Certain officers and a Trustee of the Trust are also officers of Ultimus.
TRUSTEE COMPENSATION
Effective October 17, 2022, each member of the Board (a “Trustee”) who is not an “interested person” (as defined by the 1940 Act) of the Trust (“Independent Trustee”) receives a $1,300 annual retainer from the Fund, paid quarterly, except for the Board Chairperson who receives a $1,700 annual retainer from the Fund, paid quarterly and the Audit Committee Chairperson who receives a $1,500 annual retainer from the Fund, paid quarterly. Each Independent Trustee also receives from the Fund a fee of $550 for each Board meeting attended plus reimbursement for travel and other meeting-related expenses. Prior to October 17, 2022, no additional annual retainer was specifically designated for the Audit Committee Chairperson.
5. Contingencies and Commitments
The Fund indemnifies the Trust’s officers and Trustees for certain liabilities that might arise from their performance of their duties to the Fund. Additionally, in the normal course of business the Fund enters into contracts that contain a variety of representations and
| MEEHAN FOCUS FUND |
| NOTES TO FINANCIAL STATEMENTS (Continued) |
warranties and which provide general indemnifications. The Fund’s maximum exposure under these arrangements is unknown, as this would involve future claims that may be made against the Fund that have not yet occurred. However, based on experience, the Trust expects the risk of loss to be remote.
6. Non-Diversification Risk
The Fund is a non-diversified Fund. As a result, the Fund’s holdings may be more concentrated in a limited number of securities and the value of its shares may be more sensitive than a diversified fund to any single economic, business, political, or regulatory occurrence.
7. Sector Risk
If a Fund has significant investments in the securities of issuers within a particular sector, any development affecting that sector will have a greater impact on the value of the net assets of the Fund than would be the case if the Fund did not have significant investments in that sector. In addition, this may increase the risk of loss in the Fund and increase the volatility of the Fund’s NAV per share. Occasionally, market conditions, regulatory changes or other developments may negatively impact a particular sector. As of February 28, 2023, the Fund had 29.3% of the value of its net assets invested in stocks within the Technology sector.
8. Subsequent Events
The Fund is required to recognize in the financial statements the effects of all subsequent events that provide additional evidence about conditions that existed as of the date of the Statement of Assets and Liabilities. For non-recognized subsequent events that must be disclosed to keep the financial statements from being misleading, the Fund is required to disclose the nature of the event as well as an estimate of its financial effect, or a statement that such an estimate cannot be made. Management has evaluated subsequent events through the issuance of these financial statements and has noted no such events.
| MEEHAN FOCUS FUND |
| ABOUT YOUR FUND’S EXPENSES (Unaudited) |
We believe it is important for you to understand the impact of costs on your investment. As a shareholder of the Fund, you may incur two types of costs: (1) transaction costs, including redemption fees; and (2) ongoing costs, including management fees and other expenses. The following examples are intended to help you understand your ongoing costs (in dollars) of investing in the Fund and to compare these costs with the ongoing costs of investing in other mutual funds.
A mutual fund’s ongoing costs are expressed as a percentage of its average net assets. This figure is known as the expense ratio. The expenses in the table below are based on an investment of $1,000 made at the beginning of the most recent period (September 1, 2022) and held until the end of the period (February 28, 2023).
The table below illustrates the Fund’s ongoing costs in two ways:
Actual fund return – This section helps you to estimate the actual expenses that you paid over the period. The “Ending Account Value” shown is derived from the Fund’s actual return, and the third column shows the dollar amount of operating expenses that would have been paid by an investor who started with $1,000 in the Fund. You may use the information here, together with the amount you invested, to estimate the expenses that you paid over the period.
To do so, simply divide your account value by $1,000 (for example, an $8,600 account value divided by $1,000 = 8.6), then multiply the result by the number given for the Fund under the heading “Expenses Paid During Period.”
Hypothetical 5% return – This section is intended to help you compare the Fund’s ongoing costs with those of other mutual funds. It assumes that the Fund had an annual return of 5% before expenses during the period shown, but that the expense ratio is unchanged. In this case, because the return used is not the Fund’s actual return, the results do not apply to your investment. The example is useful in making comparisons because the U.S. Securities and Exchange Commission (the “SEC”) requires all mutual funds to calculate expenses based on a 5% return. You can assess the Fund’s ongoing costs by comparing this hypothetical example with the hypothetical examples that appear in shareholder reports of other funds.
Note that expenses shown in the table are meant to highlight and help you compare ongoing costs only. The Fund does not charge sales loads. However, a redemption fee of 2% is applied on the sale of shares of the Fund held for less than 7 calendar days.
The calculations assume no shares were bought or sold during the period. Your actual costs may have been higher or lower, depending on the amount of your investment and the timing of any purchases or redemptions.
More information about the Fund’s expenses, including historical annual expense ratios, can be found in this report. For additional information on operating expenses and other shareholder costs, please refer to the Fund’s prospectus.
| MEEHAN FOCUS FUND |
| ABOUT YOUR FUND’S EXPENSES (Unaudited) (Continued) |
| | | Beginning | | | Ending | | | | |
| | | Account Value | | | Account Value | | | Expenses | |
| | | September 1, | | | February 28, | | | Paid During | |
| | | 2022 | | | 2023 | | | Period * | |
| Based on Actual Fund Return | | $ | 1,000.00 | | | $ | 1,030.60 | | | $ | 5.03 | |
| Based on Hypothetical 5% Return (before expenses) | | $ | 1,000.00 | | | $ | 1,019.84 | | | $ | 5.01 | |
| * | Expenses are equal to the Fund’s annualized net expense ratio of 1.00% for the period, multiplied by the average account value over the period, multiplied by 181/365 (to reflect the one-half year period). |
| OTHER INFORMATION (Unaudited) |
A description of the policies and procedures that the Fund uses to vote proxies relating to portfolio securities is available without charge upon request by calling toll- free 1-866-884-5968, or on the SEC’s website at www.sec.gov. Information regarding how the Fund voted proxies relating to portfolio securities during the most recent 12-month period ended June 30 is available without charge upon request by calling toll-free 1-866-884-5968, or on the SEC’s website at www.sec.gov.
The Trust files a complete listing of portfolio holdings for the Fund with the SEC as of the end of the first and third quarters of each fiscal year as an exhibit to its reports on Form N-PORT. These filings are available upon request by calling 1-866-884-5968. Furthermore, you may obtain a copy of the filings on the SEC’s website at www.sec.gov and on the Fund’s website www.meehanmutualfunds.com.
| MEEHAN FOCUS FUND |
| DISCLOSURE REGARDING APPROVAL OF INVESTMENT |
| ADVISORY AGREEMENT (Unaudited) |
The Board of Trustees (the “Board”), including the Independent Trustees voting separately, has reviewed and approved the continuance of the Fund’s Investment Advisory Agreement with Edgemoor Investment Advisors, Inc. (the “Adviser” or “Edgemoor”) for an additional one-year term (the “Advisory Agreement”). The Board approved the continuance of the Advisory Agreement at an in-person meeting held on October 17 – 18, 2022, at which all of the Trustees were present.
In deciding on whether to approve the continuation of the Advisory Agreement, the Board recalled its review of the materials related to the Fund and Edgemoor at the meeting and throughout the preceding twelve months and its numerous discussions with Trust Management and Edgemoor about the operations and performance of the Fund during that period. The Board further considered those materials and discussions and other numerous factors, including the following:
The nature, extent, and quality of the services provided by the Adviser. In this regard, the Board reviewed the services being provided by Edgemoor to the Fund including, without limitation, its providing a continuous investment program for the Fund, adhering to the Fund’s investment restrictions, complying with the Trust’s policies and procedures and voting proxies on behalf of the Fund. The Board considered the qualifications and experience of Edgemoor’s portfolio managers who are responsible for the day-to day management of the Fund’s portfolio, as well as the qualifications of other individuals at Edgemoor who provide services to the Fund. The Board concluded that the quality, extent, and nature of the services provided by Edgemoor to the Fund were satisfactory.
The investment performance of the Fund. In this regard, the Board compared the performance of the Fund with the performance of its benchmark index, custom peer group, and Morningstar category. The Board concluded that the investment performance of the Fund has been satisfactory.
The costs of the services provided and profits realized by the Adviser and its affiliates from their relationship with the Fund. In this regard, the Board considered the Fund’s management fee and expense ratio, each as compared to the Fund’s custom peer group and Morningstar category and the fees change by Edgemoor to other similar clients. The Board considered the revenue earned from the Fund and the current and anticipated profitability of the Fund to Edgemoor, if any. The Board also considered Edgemoor’s past fee reductions and expense reimbursements for the Fund and the indirect benefits that Edgemoor received from its management of the Fund. The Board concluded that the advisory fee to be paid to Edgemoor by the Fund is reasonable in light of the nature and quality of services provided by Edgemoor.
The extent to which economics of scale would be realized as the Fund grows and whether advisory fee levels reflect these economies of scale for the benefit of the Fund’s investors. In this regard, the Board considered that the Fund’s fee arrangements with Edgemoor involve both the advisory fee and the expense limitation agreement (the “ELA”). The Board
| MEEHAN FOCUS FUND |
| DISCLOSURE REGARDING APPROVAL OF INVESTMENT |
| ADVISORY AGREEMENT (Unaudited) (Continued) |
determined that while the advisory fee rate remained the same as asset levels increased, the shareholders of the Fund have experienced benefits from the ELA and will continue to experience benefits from the ELA. The Board concluded that the advisory fee was reasonable in light of the information that was provided to the Trustees by Edgemoor with respect to economies of scale.
After further discussion of the factors noted above and in reliance on the information provided by Edgemoor and Trust Management, and taking into account the totality of all the factors discussed and information presented at the meeting and previous meetings, the Board indicated its agreement to approve the continuance of the Advisory Agreement. It was noted that in the Trustees’ deliberations regarding the approval of renewal the Advisory Agreement, the Trustees did not identify any particular information or factor that was all-important or controlling, and that each individual Trustee may have attributed different weights to the various factors listed above. After full consideration of the above factors as well as other factors, the Board unanimously concluded that approval of the continuance of the Advisory Agreement was in the best interests of the Fund and its shareholders.
| MEEHAN FOCUS FUND |
| LIQUIDITY RISK MANAGEMENT PROGRAM (Unaudited) |
The Fund has adopted and implemented a written liquidity risk management program (the “Program”) as required by Rule 22e-4 (the “Liquidity Rule”) under the Investment Company Act of 1940, as amended. The Program is reasonably designed to assess and manage the Fund’s liquidity risk, taking into consideration, among other factors, the Fund’s investment strategy and the liquidity of its portfolio investments during normal and reasonably foreseeable stressed conditions; its short- and long-term cash flow projections; and its cash holdings and access to other funding sources. The Fund’s Board of Trustees (the “Board”) approved the appointment of the Liquidity Administrator Committee, comprising of the Fund’s Adviser and certain Trust officers, to be responsible for the Program’s administration and oversight and for reporting to the Board on at least an annual basis regarding the Program’s operation and effectiveness. The annual written report assessing the Program (the “Report”) was presented to the Board at the October 17 – 18, 2022 Board meeting and covered the period from June 1, 2021 to May 31, 2022 (the “Review Period”).
During the Review Period, the Fund did not experience unusual stress or disruption to its operations related to purchase and redemption activity. Also, during the Review Period, the Fund held adequate levels of cash and highly liquid investments to meet shareholder redemption activities in accordance with applicable requirements. The Report concluded that the Program is reasonably designed to prevent violation of the Liquidity Rule and the Program has been effectively implemented.
CUSTOMER PRIVACY NOTICE
| FACTS | WHAT DOES THE MEEHAN FOCUS FUND (the “Fund”) DO WITH YOUR PERSONAL INFORMATION? |
| | |
| Why? | Financial companies choose how they share your personal information. Federal law gives consumers the right to limit some but not all sharing. Federal law also requires us to tell you how we collect, share, and protect your personal information. Please read this notice carefully to understand what we do. |
| | |
| What? | The types of personal information we collect and share depend on the product or service you have with us. This information can include: ■ Social Security number ■ Assets ■ Retirement Assets ■ Transaction History ■ Checking Account Information ■ Purchase History ■ Account Balances ■ Account Transactions ■ Wire Transfer Instructions When you are no longer our customer, we continue to share your information as described in this notice. |
| | |
| How? | All financial companies need to share your personal information to run their everyday business. In the section below, we list the reasons financial companies can share their customers’ personal information; the reasons the Fund chooses to share; and whether you can limit this sharing. |
| Reasons we can share your personal information | Does the
Fund share? | Can you limit
this sharing? |
| For our everyday business purposes – Such as to process your transactions, maintain your account(s), respond to court orders and legal investigations, or report to credit bureaus | Yes | No |
| For our marketing purposes – to offer our products and services to you | No | We don’t share |
| For joint marketing with other financial companies | No | We don’t share |
| For our affiliates’ everyday business purposes – information about your transactions and experiences | No | We don’t share |
| For our affiliates’ everyday business purposes – information about your creditworthiness | No | We don’t share |
| For nonaffiliates to market to you | No | We don’t share |
| Questions? | Call 1-866-884-5968 |
| Who we are |
| Who is providing this notice? | Meehan Focus Fund Ultimus Fund Distributors, LLC (Distributor) Ultimus Fund Solutions, LLC (Administrator) |
| What we do |
| How does the Fund protect my personal information? | To protect your personal information from unauthorized access and use, we use security measures that comply with federal law. These measures include computer safeguards and secured files and buildings. Our service providers are held accountable for adhering to strict policies and procedures to prevent any misuse of your nonpublic personal information. |
| How does the Fund collect my personal information? | We collect your personal information, for example, when you ■ Open an account ■ Provide account information ■ Give us your contact information ■ Make deposits or withdrawals from your account ■ Make a wire transfer ■ Tell us where to send the money ■ Tell us who receives the money ■ Show your government-issued ID ■ Show your driver’s license We also collect your personal information from other companies. |
| Why can’t I limit all sharing? | Federal law gives you the right to limit only ■ Sharing for affiliates’ everyday business purposes – information about your creditworthiness ■ Affiliates from using your information to market to you ■ Sharing for nonaffiliates to market to you State laws and individual companies may give you additional rights to limit sharing. |
| | |
| Definitions |
| Affiliates | Companies related by common ownership or control. They can be financial and nonfinancial companies. ■ Edgemoor Investment Advisors, Inc., the investment adviser to the Fund, could be deemed to be an affiliate. |
| Nonaffiliates | Companies not related by common ownership or control. They can be financial and nonfinancial companies ■ The Fund does not share with nonaffiliates so they can market to you. |
| Joint marketing | A formal agreement between nonaffiliated financial companies that together market financial products or services to you. ■ The Fund does not jointly market. |
Meehan-SAR-23
Item 2. Code of Ethics.
Not required
Item 3. Audit Committee Financial Expert.
Not required
Item 4. Principal Accountant Fees and Services.
Not required
Item 5. Audit Committee of Listed Registrants.
Not applicable
Item 6. Schedule of Investments.
| (a) | Not applicable [schedule filed with Item 1] |
Item 7. Disclosure of Proxy Voting Policies and Procedures for Closed-End Management Investment Companies.
Not applicable
| Item 8. | Portfolio Managers of Closed-End Management Investment Companies. |
Not applicable
Item 9. Purchases of Equity Securities by Closed-End Management Investment Company and Affiliated Purchasers.
Not applicable
Item 10. Submission of Matters to a Vote of Security Holders.
There has been no material changes to the manner in which shareholders may recommend nominees to the Registrant’s Board of Trustees or the Nominations & Governance Committee (the “Committee”). The Registrant does not have formal procedures by which shareholders may recommend nominees to the Registrant’s Board of Trustees. While the Registrant does not have formal procedure, the Committee shall to the extent required under applicable law, when identifying potential candidates for the position of Independent Trustee, consider any such candidate recommended by a shareholder.
Item 11. Controls and Procedures.
(a) Based on their evaluation of the registrant’s disclosure controls and procedures (as defined in Rule 30a-3(c) under the Investment Company Act of 1940) as of a date within 90 days of the filing date of this report, the registrant’s principal executive officer and principal financial officer have concluded that such disclosure controls and procedures are reasonably designed and are operating effectively to ensure that material information relating to the registrant, including its consolidated subsidiaries, is made known to them by others within those entities, particularly during the period in which this report is being prepared, and that the information required in filings on Form N-CSR is recorded, processed, summarized, and reported on a timely basis.
(b) There were no changes in the registrant’s internal control over financial reporting (as defined in Rule 30a-3(d) under the Investment Company Act of 1940) that occurred during the period covered by this report that have materially affected, or are reasonably likely to materially affect, the registrant’s internal control over financial reporting.
Item 12. Disclosure of Securities Lending Activities for Closed-End Management Investment Companies.
Not applicable
File the exhibits listed below as part of this Form. Letter or number the exhibits in the sequence indicated.
(a)(1) Any code of ethics, or amendment thereto, that is the subject of the disclosure required by Item 2, to the extent that the registrant intends to satisfy the Item 2 requirements through filing of an exhibit: Not required
(a)(2) A separate certification for each principal executive officer and principal financial officer of the registrant as required by Rule 30a-2(a) under the Act (17 CFR 270.30a-2(a)): Attached hereto
(1) Not applicable
(2) Change in the registrant’s independent public accountants: Not applicable
(b) Certifications required by Rule 30a-2(b) under the Act (17 CFR 270.30a-2(b)): Attached hereto
Exhibit 99.CERT Certifications required by Rule 30a-2(a) under the Act
Exhibit 99.906CERT Certifications required by Rule 30a-2(b) under the Act
SIGNATURES
Pursuant to the requirements of the Securities Exchange Act of 1934 and the Investment Company Act of 1940, the registrant has duly caused this report to be signed on its behalf by the undersigned, thereunto duly authorized.
| (Registrant) | Ultimus Managers Trust | | |
| | | | |
| By (Signature and Title)* | /s/ Todd E. Heim | |
| | | Todd E. Hein, President and Principal Executive Officer | |
| | | | |
| Date | May 3, 2023 | | |
| | | | |
| Pursuant to the requirements of the Securities Exchange Act of 1934 and the Investment Company Act of 1940, this report has been signed below by the following persons on behalf of the registrant and in the capacities and on the dates indicated. |
| | | | |
| By (Signature and Title)* | /s/ Todd E. Heim | |
| | | Todd E. Hein, President and Principal Executive Officer | |
| | | | |
| Date | May 3, 2023 | | |
| | | | |
| By (Signature and Title)* | /s/ Jennifer L. Leamer | |
| | | Jennifer L. Leamer, Treasurer and Principal Financial Officer | |
| | | | |
| Date | May 3, 2023 | | |
* Print the name and title of each signing officer under his or her signature.