| | OMB APPROVAL |
| | OMB Number: 3235-0570 Expires: July 31, 2022 Estimated average burden hours per response: 20.6 |
UNITED STATES
SECURITIES AND EXCHANGE COMMISSION
Washington, D.C. 20549
FORM N-CSR
CERTIFIED SHAREHOLDER REPORT OF REGISTERED
MANAGEMENT INVESTMENT COMPANY
| Investment Company Act file number | 811-22680 | |
| Ultimus Managers Trust |
| (Exact name of registrant as specified in charter) |
| 225 Pictoria Drive, Suite 450 Cincinnati, Ohio | 45246 |
| (Address of principal executive offices) | (Zip code) |
Khimmara Greer
| Ultimus Fund Solutions, LLC 225 Pictoria Drive, Suite 450 Cincinnati, Ohio 45246_ |
| (Name and address of agent for service) |
| Registrant's telephone number, including area code: | (513) 587-3400 | |
| Date of fiscal year end: | October 31 | |
| | | |
| Date of reporting period: | April 30, 2022 | |
Form N-CSR is to be used by management investment companies to file reports with the Commission not later than 10 days after the transmission to stockholders of any report that is required to be transmitted to stockholders under Rule 30e-1 under the Investment Company Act of 1940 (17 CFR 270.30e-1). The Commission may use the information provided on Form N-CSR in its regulatory, disclosure review, inspection, and policymaking roles.
A registrant is required to disclose the information specified by Form N-CSR, and the Commission will make this information public. A registrant is not required to respond to the collection of information contained in Form N-CSR unless the Form displays a currently valid Office of Management and Budget ("OMB") control number. Please direct comments concerning the accuracy of the information collection burden estimate and any suggestions for reducing the burden to the Secretary, Securities and Exchange Commission, 450 Fifth Street, NW, Washington, DC 20549-0609. The OMB has reviewed this collection of information under the clearance requirements of 44 U.S.C. § 3507.
| Item 1. | Reports to Stockholders. |

Westwood Quality Value Fund
Westwood Quality MidCap Fund
Westwood Quality SMidCap Fund
Westwood Quality SmallCap Fund
Westwood Quality AllCap Fund
Westwood Total Return Fund
Westwood Income Opportunity Fund
Westwood High Income Fund
Westwood Alternative Income Fund
Westwood SmallCap Growth Fund
| | |
| | |
| | |
| | |
| | |
| | |
| | |
| | |
| | |
| | |
| | |
| | |
| | |
| | |
| | |
| | |
| | |
| | |
| | Investment Adviser: |
| | Westwood Management Corp. |
| | |
| | |
| | |
| | |
| | |
| | |
| | |
| | |
| | |
| | |
WESTWOOD FUNDS
| Shareholder Letter | 1 |
| Schedules of Investments | |
| Westwood Quality Value Fund | 14 |
| Westwood Quality MidCap Fund | 16 |
| Westwood Quality SMIDCap Fund | 18 |
| Westwood Quality SmallCap Fund | 20 |
| Westwood Quality AllCap Fund | 22 |
| Westwood Total Return Fund | 24 |
| Westwood Income Opportunity Fund | 29 |
| Westwood High Income Fund | 35 |
| Westwood Alternative Income Fund | 40 |
| Westwood SmallCap Growth Fund | 48 |
| Statements of Assets and Liabilities | 50 |
| Statements of Operations | 53 |
| Statements of Changes in Net Assets | 56 |
| Financial Highlights | 64 |
| Notes to Financial Statements | 74 |
| About Your Funds’ Expenses | 97 |
| Disclosure Regarding Approval of Investment Advisory Agreement | 102 |
| Customer Privacy Notice | 105 |
The Trust files a complete listing of portfolio holdings for the Funds with the U.S. Securities and Exchange Commission (“SEC”) as of the end of the first and third quarters of each fiscal year as an exhibit to its report on Form N-PORT. The filings are available upon request, by calling 1-877-386-3944. Furthermore, you may obtain a copy of these filings on the SEC’s website at www.sec.gov.
A description of the policies and procedures that the Funds use to vote proxies relating to portfolio securities is available without charge upon request by calling toll-free 1-877-386-3944, or on the SEC’s website at www.sec.gov. Information regarding how the Funds voted proxies relating to portfolio securities during the period ended June 30, 2022 will be available on or about August 31, 2022 without charge upon request by calling 1-877-386-3944, or on the SEC’s website at www.sec.gov.
WESTWOOD FUNDS (Unaudited)
June 24, 2022
Dear Shareholders,
What a Difference Five Months Makes…
At the end of 2021, it was full steam ahead for risk assets. At the time, most of us knew the party had to end sooner or later, but the abruptness of the sentiment shifts certainly shocked more than just the casual investor. The change in momentum was further fueled by simultaneous events: Russia’s invasion of Ukraine, worsening global inflation and a Federal Reserve that enacted one of the most aggressive rate hike trajectories in history. As equities moved lower, high valuation growth stocks, largely tech names, took the worst of the blow, but all major stock indexes have sold off to or passed the widely accepted correction levels by 20% or more. That said, the broad indices don’t always paint a complete picture, and the sharp, broad selloff will uncover opportunities in securities that are deemed “guilty by association,” but have strong value or future growth potential as alibis.
It’s critical, however, that investors acknowledge the headwinds that America faces and with that adjust their approach to the markets with a different set of tactics that may have been applied over the last decade or so. There is no doubt that the current environment is certainly abnormal and, in many ways, unprecedented. When the pandemic hit, governments around the world acted swiftly, and perhaps in overabundance, to combat what seemed like another melt-down type event like what we experienced in 2009. Lawmakers launched tens of trillions of dollars in stimulus money directly to consumers and businesses alike. While their actions did stave off a potentially deep recession (the jury is still out on what would have happened), their actions have had unintended consequences, namely far-reaching inflation, and a hyper-demand rebound on a global supply chain that was crippled by lockdowns, travel and shipping restrictions, and a lack of workers. All of this, and the rate-hike remedies to combat sticky inflation, have resulted in massive financial penalties for consumers in the form of higher borrowing costs, high prices in nearly every consumable good and an obvious blow to sentiment.
We believe that relief is on the way for global supply and retailers, as supply chains either normalize or get re-routed. Some large retailers are already warning of excessive inventories as consumers start to pump the brakes on spending amid what’s already been a stressful couple of years. Now, more than ever, the Federal Reserve (Fed), and White House policy (mainly around energy and taxation), will likely be the deciding factors of whether a soft economic landing can actually be achieved.
Difficult Work for the Fed, and Consumers
At present, the Fed is dealing with record low unemployment and 40-year highs in inflation, setting the stage for their policy intervention. After keeping its benchmark interest rate anchored near zero since the beginning of the pandemic, the Federal Open Market Committee (FOMC) has begun raising interest rates at a break-neck pace, with many experts expecting another six rate hikes in 2022 alone. The trajectory is expected to push the effective federal funds rate somewhere between 2.75% and 3.25% by year end, which would be levels not seen since just before the housing meltdown and Great Recession. With these comparisons, it is obvious why the market is so skittish.
The reality is that a greater level of uncertainty prevails, and investors continue to scour data seeking, hard-to-find clues on where the economy and markets are headed from here. Broad expectations are for the Fed to deliver two more 50bps rate hikes by the time summer is over, but the question is how much tightening they signal thereafter; and obviously, what the effects of their actions will be.
And yes, these hikes have pushed the prime rate and mortgage rates higher, immediately increasing financing costs for many forms of consumer borrowing and credit. This has the potential to be a drag on corporate earnings into the back half of 2022. Currently, we see the risk of a recession in the United State growing; the Fed’s response to GDP contraction will predicate just how deep we go as they could certainly reverse course and cut rates if inflation rates cool during a contraction.
WESTWOOD FUNDS (Unaudited)
Eyes on Inflation
Central banks’ reaction to higher energy and food prices will prove difficult to predict, as the magnitude or speed of interest rate rises to combat inflation will have to be delicately balanced to support respective economies. The answer will depend on the extent to which higher energy prices dampen growth or alternatively fuel strong wage rises as workers try to protect their purchasing power amid a tight labor market. At the end of the day, the narrative the FOMC offers can either be solace or stress for both consumers and investors.
The Russia-Ukraine war is another wildcard that will complicate the task and effectiveness of the Fed’s monetary hawkishness. Its effects add to logistical troubles, corporate earnings (as many western companies have withdrawn from doing business in Russia) and food supply and costs. We believe that the conflict is likely to be drawn out, driving headline risk and continued disturbances, both temporary and permanent, in global trade and logistics.
While the risk of vaccine-resistant variants of COVID-19 remain, we continue to believe that the severity and spread of these variants will likely be controlled for most developed nations given the infrastructure and treatment options in place. This should allow for consumer spending, which has been strong, to persist into the second half of 2022.
Global Markets
Accommodative policies remain in effect for most developed nations, though some shifts in those policies may be underway given unique struggles faced. The Federal Reserve has signaled in the U.S. that the current level of monetary stimulus may no longer be warranted and plans to begin to taper their purchases of certain assets as a result. Conversely, in Europe, many of the same headwinds as seen in the U.S. are mounting, such as supply chain disruptions and rising prices from energy to food and more, putting pressure on the consumer. But unlike America, the European Central Bank seems to be in no hurry to reduce their monetary policy accommodations. China is also working hard to emerge from its worst economic slowdown since 2015, which many now believe will lead to additional stimulus through easier monetary policy. These factors, along with a relatively strong economy and rising rates, are pushing the U.S. Dollar higher, which in turn is creating additional earnings headwinds as roughly 40% of the earnings for the S&P 500 are derived outside of the U.S.; and those earnings will be worth less with a strong greenback.
Where Do Markets Head From Here?
The current market environment continues to produce dislocations with respect to valuation and increased levels of fundamental skepticism that play to our strength. Now, more than ever, highly tactical and surgical investment techniques, with properly hedged and balanced allocations, will be needed to reduce volatility and produce alpha. As it has for over 30 years, our investment process continues to seek out mispriced opportunities where fundamental analysis can uncover value being missed in the current market environment while maintaining a strong culture of risk management with a focus on mitigating potential downside risks.
Thank you for your trust.
Sincerely,
The Investment Team
The Westwood Funds
The information contained herein represents the views of the manager at a specific point in time and is based on information believed to be reliable. No representation or warranty is made concerning the accuracy or completeness of any data compiled herein. Any statements non-factual in nature constitute only current opinion, which is subject to change. Any statements concerning financial market trends are based on current market conditions, which will
WESTWOOD FUNDS (Unaudited)
fluctuate. Past performance is not indicative of future results. All information provided herein is for informational purposes only and is not intended to be, and should not be interpreted as, an offer, solicitation, or recommendation to buy or sell or otherwise invest in any of the securities/sectors/countries that may be mentioned. Investing involves risk, including possible loss of principal. A discussion of each fund’s performance during the semiannual period ending April 30, 2022, is presented below.
Westwood Quality Value Fund
The performance of the Westwood Quality Value Fund for the period ending April 30, 2022, was as follows:
| | | 2022 |
| | 6 Months | Year to Date |
| Westwood Quality Value Fund – I Shares (WHGLX) | -3.99% | -6.47% |
| Westwood Quality Value Fund – A Shares (WWLAX)* | -4.19% | -6.51% |
| Westwood Quality Value Fund – C Shares (WWLCX) | -4.51% | -6.77% |
| Russell 1000 Value Index | -3.94% | -6.34% |
The performance data quoted represents past performance. Past performance does not guarantee future results. The investment return and principal value of an investment will fluctuate so that an investor’s shares, when redeemed, may be worth more or less than their original cost and current performance may be lower or higher than the performance quoted. The Adviser has contractually agreed to waive fees and reimburse expenses until March 1, 2024. In the absence of current fee waivers, total return and yield would have been reduced.
Positive stock selection in Health Care, Commercial Services and Energy added to relative performance. Global crude supply shortages and increasing demand helped drive oil and fuel prices higher, and in turn generated alpha in our energy-related holdings such as ConocoPhillips, Valero Energy and EOG Resources. McKesson continued to benefit from strong health care demand and saw Q4 revenues for its U.S. Pharmaceutical and Specialty Solutions jump 14% year over year, and its fourth-quarter earnings results beat consensus estimates, rising 38% year over year. Despite slowing vaccine distribution, Johnson & Johnson moved higher early in the year as the consumer and pharmaceutical segments continued to show relative value. Investors also saw the consumer staple giant as a relative safe haven from increased volatility.
Negative stock selection in Financials and Technology weighed on relative performance. Vertiv Holdings, which is focused on IT/data infrastructure, experienced heavy selling after its fourth- quarter earnings report lagged consensus estimates, while Teradyne, Inc., failed to impress investors (despite fairly strong earnings) with its weaker than expected outlook. Goldman Sachs, Bank of America and Western Alliance Bancorp all experienced headwinds as investor concerns regarding potential credit losses rose as the risk of recession and consumer weakness increased due to inflation and rising interest rates. Shares of Alphabet also fell late in the quarter as investors shifted away from growth stocks as rate-hike trajectories sharpened.
WESTWOOD FUNDS (Unaudited)
Westwood Quality MidCap Fund
The performance of the Westwood SmallCap Growth Fund for the period ending April 30, 2022, was as follows:
| | | 2022 |
| | Since Inception | Year to Date |
| Westwood Quality MidCap Fund – I Shares (WWMCX) | -2.60% | -8.29% |
| Russell Midcap Value Index | -1.86% | -7.65% |
WWMCX Inception Date: 11/30/2021
The performance data quoted represents past performance. Past performance does not guarantee future results. The investment return and principal value of an investment will fluctuate so that an investor’s shares, when redeemed, may be worth more or less than their original cost and current performance may be lower or higher than the performance quoted. The Adviser has contractually agreed to waive fees and reimburse expenses until March 1, 2024.
Relative performance was aided by positive stock selection within the Health Care sector and positive allocation to the Energy sector. The top six contributors to return all were scattered throughout different segments of the energy sector. Holdings included Devon Energy, McKesson, Valero, Diamondback, DTE Energy and Freeport-McMoran. Global crude and natural gas supply shortages, along with increasing demand for refined fuel-oils and liquefied natural gas helped drive oil and fuel prices higher, and in turn, helped generate positive returns in our energy-related holdings. Profitability in downstream (delivery to retail customers) has also been, on average, increasing as refiners, marketers and resellers of distillates have seen consumer demand stable even as retail prices rise to record levels.
Unfavorable selection in Consumer Discretionary, as well as unfavorable selection and over-allocation to Materials, detracted from relative performance. Popular consumer delivery company 1-800-FLOWERS.COM saw its revenue drop 1% in its fiscal third quarter as consumers shifted spending in a post-COVID-19 era. Automated test equipment maker, Teradyne, Inc., failed to impress investors (despite fairly strong earnings) with its weaker than expected outlook. And General Motors, along with several of its peers, saw shares turn weaker as inventories rose and consumer demand slowed in the first half of 2022. Dana Corporation, which is a major drivetrain supplier for the automotive industry, also detracted from performance as its revenue is largely tied to the sale of new automobiles globally.
Westwood Quality SMidCap Fund
The performance of the Westwood Quality SMidCap Fund for the period ending April 30, 2022, was as follows:
| | | 2022 |
| | 6 Months | Year to Date |
| Westwood Quality SMidCap Fund – I Shares (WHGMX) | -10.21% | -10.92% |
| Westwood Quality SMidCap Fund – Ultra Shares (WWSMX) | -10.05% | -10.79% |
| Russell 2500 Value Index | -6.76% | -8.18% |
The performance data quoted represents past performance. Past performance does not guarantee future results. The investment return and principal value of an investment will fluctuate so that an investor’s shares, when redeemed, may be worth more or less than their original cost and current performance may be lower or higher than the performance quoted. The Adviser has contractually agreed to waive fees and reimburse expenses until March 1, 2024.
Positive stock selection in Health Care, Energy and Information Technology, along with allocation tailwinds, aided relative performance. As we’ve seen in the broad market, energy-related holdings in PDC and Magnolia Oil & Gas led to returns as energy prices rose due to global supply shortages and stable demand. First Horizon Corporation also contributed to performance as the regional bank remained isolated from many of the global risks that its larger peers
WESTWOOD FUNDS (Unaudited)
had to endure. The bank was able to focus on consumer lending and leverage rising rates to add to profitability. Despite a modest slowdown in new housing activity in aggregate, the nation’s largest supplier of structural building products, Builders FirstSource, was able to capture regional demand in Texas and other states. The company continues to aggressively capture additional market share and efficiencies through acquisitions.
Negative stock selection in Materials, Financials and Consumer Staples detracted from relative performance. Popular consumer delivery company 1-800-FLOWERS.COM saw its revenue drop 1% in its fiscal third quarter as consumers shifted spending in a post-COVID-19 era. Despite its second highest first quarter revenue reading in history, investment banking firm Perella Weinberg disappointed investors as a reduction in domestic mergers and acquisition activity added concerns about near-term future growth. Slowdowns in the U.S. housing market also had a bearish effect on Masonite International, while increasing costs negatively affected European frozen food company Nomad Foods.
Westwood Quality SmallCap Fund
The performance of the Westwood Quality SmallCap Fund for the period ending April 30, 2022, was as follows:
| | | 2022 |
| | 6 Months | Year to Date |
| Westwood Quality SmallCap Fund – I Shares (WHGSX) | -12.27% | -14.60% |
| Westwood Quality SmallCap Fund – A Shares (WHGAX)* | -12.30% | -14.66% |
| Westwood Quality SmallCap Fund – C Shares (WHGCX) | -12.66% | -14.85% |
| Westwood Quality SmallCap Fund – Ultra Shares (WWSYX) | -12.20% | -14.60% |
| Russell 2000 Value Index | -9.50% | -9.97% |
The performance data quoted represents past performance. Past performance does not guarantee future results. The investment return and principal value of an investment will fluctuate so that an investor’s shares, when redeemed, may be worth more or less than their original cost and current performance may be lower or higher than the performance quoted. The Adviser has contractually agreed to waive fees and reimburse expenses until March 1, 2024. In the absence of current fee waivers, total return and yield would have been reduced.
Positive stock selection in Health Care and Utilities added to relative performance. South Jersey Industries drew added attraction from investors who continued to move into the utility sector as a volatility shelter, while the company was also able to capture profits amid a rising energy cost landscape. Its acquisition by Infrastructure Investment Fund (IIF) remains on track. Holdings in PDC and Whiting Petroleum contributed to returns as energy prices rose due to global supply shortages, stable demand and improved margins. In the face of rising price pressure, Twinkie maker Hostess Brands was still able to best analyst estimates, fueled by demonstrable consumption momentum across its sweet baked goods and cookies portfolio, year over year pricing and favorable investor sentiment toward staples.
Industrials and Financials detracted from relative performance due to unfavorable stock selection. Masonite International experienced earnings pressure as the U.S. housing market, and subsequent demand for its doors decreased in the first half. Triumph Bancorp shares struggled despite a rising rate environment on concerns around consumer health. The company announced a strategic reorganization of its executive management team to better align with future growth priorities. REPAY shares underperformed during the period as future earnings growth and increasing competition came into question.
WESTWOOD FUNDS (Unaudited)
Westwood Quality AllCap Fund
The performance of the Westwood Quality AllCap Fund for the period ending April 30, 2022, was as follows:
| | | 2022 |
| | 6 Months | Year to Date |
| Westwood Quality AllCap Fund – I Shares (WQAIX) | -6.66% | -8.04% |
| Westwood Quality AllCap Fund – Ultra Shares (WQAUX) | -6.52% | -7.94% |
| Russell 3000 Value Index | -4.30% | -6.57% |
The performance data quoted represents past performance. Past performance does not guarantee future results. The investment return and principal value of an investment will fluctuate so that an investor’s shares, when redeemed, may be worth more or less than their original cost and current performance may be lower or higher than the performance quoted. The Adviser has contractually agreed to waive fees and reimburse expenses until March. 1, 2024. In the absence of current fee waivers, total return and yield would have been reduced.
Relative performance was aided by positive stock selection within the Health Care and Commercial Services sectors. Top individual contributors included McKesson, who continued to benefit from strong health care demand and saw Q4 revenues for its U.S. Pharmaceutical and Specialty Solutions jump 14% year over year, and its fourth-quarter earnings results beat consensus estimates, rising 38% year over year. Despite slowing vaccine distribution, another top contributor, Johnson & Johnson, moved higher early in the year as the consumer and pharmaceutical segments continued to show relative value. Investors also saw the consumer staple giant as a relative safe haven from increased volatility. Surging energy prices at the wholesale and retail levels helped fuel performance in Pioneer Natural Resources, Devon Energy and Freeport-McMoran.
Unfavorable selection and allocation in Industrials and Financials detracted from relative performance. Top individual detractors included Vertiv Holdings, which is focused on IT/data infrastructure and experienced heavy selling after its fourth-quarter earnings report lagged consensus estimates. Despite its second-highest, first-quarter revenue reading in history, investment banking firm Perella Weinberg disappointed investors as a reduction in domestic mergers and acquisition activity added concerns about near-term future growth. And as car inventories grew, and auto demand waned from pandemic highs, IAA Inc. failed to gather bullish momentum. Along those same lines, Aptiv PLC saw its shares come under pressure as investors grew concerned that the current auto cycle has peaked, especially in the face of $5 per gallon fuel in the U.S.
Westwood Total Return Fund
The performance of the Westwood Total Return Fund for the period ending April 30, 2022, was as follows:
| | | 2022 |
| | 6 Months | Year to Date |
| Westwood Total Return Fund – I Shares (WLVIX) | -8.96% | -9.61% |
| Westwood Total Return Fund – A Shares (WWTAX)* | -9.10% | -9.68% |
| Westwood Total Return Fund – C Shares (WTOCX) | -9.49% | -9.98% |
| 60% S&P 500 Index / 40% Bloomberg U.S. Aggregate Bond Index | -9.46% | -11.48% |
The performance data quoted represents past performance. Past performance does not guarantee future results. The investment return and principal value of an investment will fluctuate so that an investor’s shares, when redeemed, may be
WESTWOOD FUNDS (Unaudited)
worth more or less than their original cost and current performance may be lower or higher than the performance quoted. The Adviser has contractually agreed to waive fees and reimburse expenses until March 1, 2024. In the absence of current fee waivers, total return and yield would have been reduced.
The Westwood Total Return Fund was formerly known as Westwood Low Volatility Fund. Prior to Nov. 1, 2019, the Fund employed different investment strategies. Therefore, the past statistics and performance shown for periods prior to Nov. 1, 2019, may have differed had the Fund’s current investment strategy been in effect.
Market Commentary
Selling pressure in domestic and global markets shifted away from pandemic-related fears to growing inflation and rising interest rates now taking a toll on consumers. The consensus of economists now believes that an economic contraction is increasingly likely as the Federal Reserve may be unable to deliver a soft landing. With global supply chains already stressed, the Russia-Ukraine war not only added a highly volatile risk component to food and energy prices, it also created massive material changes in global trade routes and policies. This effect, along with dramatic shifts in the monetary policies of the world’s largest economies, leaves investors with an increasingly cloudy outlook. Ironically, 2019 had seen the largest easing in monetary policy by global central banks since the 2008 financial crisis, and 2022 may prove to be the largest tightening (at least domestically). Risk continues to be more “off,” with a flight to high- quality, value and/or dividend equities likely to remain for the foreseeable future. Given the broader breakdown of equity valuation, strategic investors can use market disconnections to uncover value and/or quasi-arbitrage opportunities while the masses revalue and reassess fair value and risk.
We remain tilted toward the lower duration range in bonds and are staying cautious in both equities and bonds, incrementally adding based on quality and fundamentals. The opportunity within credit is particularly encouraging, with certain quality tranches trading at spreads on the higher end of their historical ranges (i.e., they are relatively inexpensive).
Fund Performance
The Fund provided a positive return relative to its blended benchmark, driven in large part by asset allocation, with a slight tilt toward equities during the period.
Within the energy sector, shares of Devon Energy Corp. and Energy Transfer LP rose on the strength of higher natural gas and oil prices, and expectations of a colder-than-normal winter. Within Communication Services, our underweight position relative to the benchmark was a key factor, as the stocks in the index fell by more than 25%. Our positions in Consumer Discretionary were a net positive for the Fund, for somewhat unusual reasons. Equity holding amazon.com fell by more than 25% in the period, as investors began to price in the likelihood of slowing consumer spending. However, our underweight position in that stock, relative to the benchmark, was a net positive for the Fund. Finally, health care company Bristol Myers Squibb performed well in the period, rising after strong results for some experimental cancer treatments and acquisitions.
Our bond positions, generally, were a drag on performance during the period. As interest rates began to rise at the end of the period, investors reassessed their appetite for risk. In this type of environment, investment grade bonds tend to outperform high yield bonds, given the additional credit risk on high yield paper. Several short-term bonds held by the Fund, including those issued by Alarm.com Holdings, Expedia Group and MongoDB, Inc., were significant detractors to returns in the period.
Some equity positions were detrimental to total return as well. Positions in the Financials sector struggled as the Fed began to raise short-term interest rates, increasing the cost of capital for businesses and likely slowing down lending and other financial activity. Shares of banks like JP Morgan Chase, Citigroup and Truist Financial Corp. were among the laggards for the period.
WESTWOOD FUNDS (Unaudited)
Westwood Income Opportunity Fund
The performance of the Westwood Income Opportunity Fund for the period ending April 30, 2022, was as follows:
| | | 2022 |
| | 6 Months | Year to Date |
| Westwood Income Opportunity Fund – I Shares (WHGIX) | -8.84% | -9.39% |
| Westwood Income Opportunity Fund – A Shares (WWIAX)* | -8.97% | -9.53% |
| Westwood Income Opportunity Fund – C Shares (WWICX) | -9.26% | -9.73% |
| Bloomberg U.S. Aggregate Bond Index | -9.47% | -9.50% |
| S&P 500 Index | -9.65% | -12.92% |
| Blended Benchmark** | -10.78% | -11.88% |
| ** | 40% S&P 500 Index / 60% Bloomberg U.S. Aggregate Bond Index |
The performance data quoted represents past performance. Past performance does not guarantee future results. The investment return and principal value of an investment will fluctuate so that an investor’s shares, when redeemed, may be worth more or less than their original cost and current performance may be lower or higher than the performance quoted. The Adviser has contractually agreed to waive fees and reimburse expenses until March 1, 2024. In the absence of current fee waivers, total return and yield would have been reduced.
Market Commentary
Selling pressure in domestic and global markets shifted away from pandemic-related fears to growing inflation and rising interest rates now taking a toll on consumers. The consensus of economists now believes that an economic contraction is increasingly likely as the Federal Reserve may be unable to deliver a soft landing. With global supply chains already stressed, the Russia-Ukraine war not only added a highly volatile risk component to food and energy prices, it also created massive material changes in global trade routes and policies. This effect, along with dramatic shifts in the monetary policies of the world’s largest economies leaves investors with an increasingly cloudy outlook. Ironically, 2019 had seen the largest easing in monetary policy by global central banks since the 2008 financial crisis, and 2022 may prove to be the largest tightening (at least domestically). Risk continues to be more “off,” with a flight to high- quality, value and/or dividend equities likely to remain for the foreseeable future. Given the broader breakdown of equity valuation, strategic investors can use market disconnections to uncover value and/or quasi-arbitrage opportunities while the masses revalue and reassess fair value and risk.
We remain tilted toward the lower duration range in bonds and are staying cautious in both equities and bonds, incrementally adding based on quality and fundamentals. The opportunity within credit is particularly encouraging, with certain quality tranches trading at spreads on the higher end of their historical ranges (i.e., they are relatively inexpensive).
Fund Performance
The Fund declined by 8.84% in the period primarily due to higher levels of exposure in fixed income. This was offset by positive contributions from equity holdings across the Energy and Consumer Staples sectors. Equity exposure overall was reduced meaningfully during 2020, with proceeds redeployed into opportunities in dislocated markets, including convertible bonds, mortgage-backed securities, and corporate bond and rotations within equity allocation.
Energy stocks were one of the bright spots for the period, supported by higher oil and natural gas prices, leading to higher gasoline prices for consumers. Exxon Mobil, Energy Transfer LP and Baker Hughes Co. each handle a different
WESTWOOD FUNDS (Unaudited)
portion of the energy value chain — Exxon Mobil is an integrated oil company, Energy Transfer focuses on pipelines and Baker Hughes is involved in oilfield services — and all performed well during the period. Newmont Corp., a mining company that focuses on gold but also mines industrial material such as copper and lead, gained over 50% during the period, driven in large part by increased earnings from higher gold and copper prices.
As the equity market began to fall from its peak in early January, shares of financial companies were generally hit the hardest. Our position in shares of large banks Citigroup Inc. and JP Morgan Chase & Co. were detractors to performance, as investors began to price in slower future earnings and loan growth due to higher interest rates. Investment bank Moelis & Co. also struggled, given the likely impact of higher interest rates on their business, including mergers and acquisitions, initial public offerings and other activities. PayPal Holdings was another detractor during the period, as the stock fell significantly following their report of slowing transaction growth, reduced profitability and corporate restructuring to reduce headcount.
Westwood High Income Fund
The performance of the Westwood High Income Fund for the period ending April 30, 2022, was as follows:
| | | 2022 |
| | 6 Months | Year to Date |
| Westwood High Income Fund – I Shares (WHGHX) | -7.39% | -8.15% |
| Westwood High Income Fund – A Shares (WSDAX)* | -7.47% | -8.27% |
| Westwood High Income Fund – C Shares (WWHCX) | -7.85% | -8.48% |
| 80% Bloomberg U.S. Aggregate Bond Index / 20% S&P 500 Index | -9.43% | -10.14% |
The performance data quoted represents past performance. Past performance does not guarantee future results. The investment return and principal value of an investment will fluctuate so that an investor’s shares, when redeemed, may be worth more or less than their original cost and current performance may be lower or higher than the performance quoted. The Adviser has contractually agreed to waive fees and reimburse expenses until March 1, 2024.
The Westwood High Income Fund was formerly known as Westwood Short Duration High Yield. Prior to Nov. 1, 2019, the Fund employed different investment strategies. Therefore, the past statistics and performance shown for periods prior to Nov. 1, 2019, may have differed had the Fund’s current investment strategy been in effect.
Market Commentary
Selling pressure in domestic and global markets shifted away from pandemic-related fears to growing inflation and rising interest rates now taking a toll on consumers. The consensus of economists now believes that an economic contraction is increasingly likely as the Federal Reserve may be unable to deliver a soft landing. With global supply chains already stressed, the Russia-Ukraine war not only added a highly volatile risk component to food and energy prices, it also created massive material changes in global trade routes and policies. This effect, along with dramatic shifts in the monetary policies of the world’s largest economies leaves investors with an increasingly cloudy outlook. Ironically, 2019 had seen the largest easing in monetary policy by global central banks since the 2008 financial crisis, and 2022 may prove to be the largest tightening (at least domestically). Risk continues to be more “off,” with a flight to high- quality, value and/or dividend equities likely to remain for the foreseeable future. Given the broader breakdown of equity valuation, strategic investors can use market disconnections to uncover value and/or quasi-arbitrage opportunities while the masses revalue and reassess fair value and risk.
WESTWOOD FUNDS (Unaudited)
We remain tilted toward the lower duration range in bonds and are staying cautious in both equities and bonds, incrementally adding based on quality and fundamentals. The opportunity within credit is particularly encouraging, with certain quality tranches trading at spreads on the higher end of their historical ranges (i.e., they are relatively inexpensive).
Fund Performance
The Fund declined by -7.39% during the period, driven in large part by the allocation to fixed income, primarily the allocation to investment grade bonds. Our exposure to stocks was beneficial, as our stock portfolio produced a small gain on the period. On a relative basis, our stock exposure was responsible for substantially all of our outperformance compared to our blended benchmark.
Within the portfolio, our top contributors included a mining company, two health care companies, an energy firm and a consumer discretionary name. Newmont Corp., a mining company that focuses on gold but also mines industrial material such as copper and lead, gained over 50% during the period, driven in large part by increased earnings from higher gold and copper prices. Bristol Myers Squibb and Amgen, Inc. both advanced on largely company-specific news; Amgen continues to see positive results in their oncology drug pipeline, leading to strong earnings growth. EOG Resources, which develops, produces and markets oil and natural gas, has fared well amid rising oil and natural gas prices, expanding production and maintaining tight controls on costs. Last, Altria Corp. has fared well in an inflationary environment as it has been able to increase prices and pass on higher input costs to consumers.
The investment grade bond portion of the Fund was the primary detractor to returns in the period, though it was difficult to pin the problem on a single security. Our exposure to BBB-rated securities was hampered as interest rates began to rise: Investors fled longer-dated bonds and moved toward the short end of the yield curve, causing prices of bonds on the long end to decline. We typically pursue a barbell strategy, holding equal amounts on the long and short end of the curve, so that price increases on short-dated securities (less than five years to maturity) will balance out price declines on long-dated securities (10 or more years to maturity) over time. We shortened our duration during the period to reduce interest rate risk.
Westwood Alternative Income Fund
The performance of the Westwood Alternative Income Fund for the period ending April 30, 2022, was as follows:
| | | 2022 |
| | 6 Months | Year to Date |
| Westwood Alternative Income Fund – I Shares (WMNIX) | -2.33% | -2.00% |
| Westwood Alternative Income Fund – Ultra Shares (WMNUX) | -2.28% | -1.97% |
| Westwood Alternative Income Fund – A Shares (WMNAX)* | -2.35% | -2.05% |
| Westwood Alternative Income Fund – C Shares (WWACX) | -2.68% | -2.22% |
| FTSE 1-Month Treasury Bill | 0.04% | 0.02% |
The performance data quoted represents past performance. Past performance does not guarantee future results. The investment return and principal value of an investment will fluctuate so that an investor’s shares, when redeemed, may be worth more or less than their original cost and current performance may be lower or higher than the performance quoted. The Adviser has contractually agreed to waive fees and reimburse expenses until March 1, 2024.
Prior to Nov. 1, 2019, the Westwood Alternative Income Fund was formerly known as the Westwood Market Neutral Fund. As of Nov. 1, 2019, the Fund began following the Sensible FeesTM framework.
WESTWOOD FUNDS (Unaudited)
Over the past six months, the market’s appetite for risk has waned. The combination of global supply issues, rising energy costs, the war in Ukraine and the Federal Reserve’s penchant for staving off inflation in the United States has global investors confused about where best to put money to work. As a result, the S&P 500 Index has declined by over 9.5% and the U.S. 10-Year Note Yield has increased by 138 basis points leaving U.S. investors with few places to turn. Equity volatility, as measured by the CBOE VIX index, has doubled over this time period, demonstrating the concern for risk asset valuations as the zero-interest-rate policy has left the building. The Fed has admitted that they were wrong regarding inflationary pressures being transitory and are now playing catch-up. Some of the biggest questions that have the markets on edge is: How far will the Fed go to tamp down inflation? Will they succeed? Will they overshoot and push the U.S. economy into recession? Will the draining of liquidity be effective in fighting the cost-push inflation that we are experiencing? These are all questions that the market is dealing with in typical fashion — sell first and ask questions later.
We believe that we are well positioned in the Alternative Income Fund as the strategy seeks to profit from market swings and lack of conviction. The portfolio holds short- dated convertibles and fixed income securities that have limited sensitivity to rising rates and declining equities. At the same time, we are long equity volatility that has sprung to life.
Within the fixed income yield book, our holdings performed in line as both investment grade and high yield sold off. Credit spreads did widen as risk asset liquidity became scarce, but we were positioned in higher grade and low duration names.
The convertible arbitrage strategy held up well relative to other asset classes as the long volatility component offset the negative rate and liquidity pressures. Convertible valuations declined as the hunt for liquidity impacted all asset classes. Gamma trading opportunities added value as the equity markets have made several attempts to rebound, only to end lower. Activity in the primary market has come to a halt following the lead of the high yield market.
Macro tail hedges added value as both the equity markets were risk off and rates were higher across the curve. We continue to monitor and systematically adjust these positions for maximum Fund flexibility, and as a means of capital preservation during periods of market volatility.
Westwood SmallCap Growth Fund
The performance of the Westwood SmallCap Growth Fund for the period ending April 20, 2022, was as follows:
| | | 2022 |
| | 6 Months | Year to Date |
| Westwood SmallCap Growth Fund – I Shares (WSCIX) | -15.82% | -15.59% |
| Russell 2000 Growth Index | -26.77% | -23.35% |
The performance data quoted represents past performance. Past performance does not guarantee future results. The investment return and principal value of an investment will fluctuate so that an investor’s shares, when redeemed, may be worth more or less than their original cost and current performance may be lower or higher than the performance quoted. The Adviser has contractually agreed to waive fees and reimburse expenses until March 1, 2024. In the absence of current fee waivers, total return and yield would have been reduced.
Strong relative performance was aided by positive stock selection within Health Care and Financials. Top individual contributors included Krystal Biotech, as shares remained strong following the successful completion of GEM-3 pivotal trial. The company is also on track to file BLA for VYJUVEK™ for the treatment of dystrophic epidermolysis bullosa, with MAA filing anticipated in the back half of 2022. Wellhead and fracking company Cactus Inc. benefited from skyrocketing crude and natural gas prices, while health care company LHC Group delivered strong earnings
WESTWOOD FUNDS (Unaudited)
results that bested analysts’ estimates. HealthEquity Inc. shares also climbed in the period on strong sales and better-than-expected revenue forecasts as it is uniquely positioned in the HSA (Healthcare Savings Account) space.
Unfavorable selection in Utilities and slightly in Consumer Staples detracted from relative performance. Top individual detractors included NeoGenomics, Inc., which saw its CEO depart suddenly, likely under pressure after poor stock performance and guidance. Tactile Systems reported a wider-than-expected loss for the first quarter, prompting investors to sell. GrowGeneration also saw its net sales decline 9.2% as the industry as a whole softened. The CEO cited macro headwinds and growing competition. Rounding out the detractors was Power Integrations, which has seen its share price decline as its technology failed to impress the majority of investors who still see risks in the semiconductor sector.
To determine if a Fund is an appropriate investment for you, carefully consider the Fund’s investment objectives, risk factors, charges and expenses before investing. This and other information can be found in the Fund’s prospectus, which may be obtained by calling 1.877.386.3944. Read the prospectus carefully before investing or sending money.
Past performance is not predictive of future performance. Investment results and principal value will fluctuate so that shares, when redeemed, may be worth more or less than their original cost. Current performance may be higher or lower than the performance data quoted. Performance data current to the most recent month end are available by calling 1-877-386-3944.
An investor should consider the investment objectives, risks, charges and expenses of the fund carefully before investing. The fund’s prospectus contains this and other important information. To obtain a copy of the fund’s prospectus please visit the fund’s website at www.westwoodfunds.com or call 1-877-386-3944 and a copy will be sent to you free of charge. Please read the prospectus carefully before you invest. The fund is distributed by Ultimus Fund Distributors, LLC.
The Letter to Shareholders seeks to describe some of the Adviser’s current opinions and views of the financial markets. Although the Adviser believes it has a reasonable basis for any opinions or views expressed, actual results may differ, sometimes significantly so, from those expected or expressed. The securities held by the fund that are discussed in the Letter to Shareholders were held during the period covered by this Report. They do not comprise the entire investment portfolios of the fund, may be sold at any time, and may no longer be held by the Funds. For a complete list of securities held by the Funds as of April 30, 2022, please see the Schedules of Investments section of this Report. The opinions of the Fund’s adviser with respect to those securities may change at any time.
Statements in the Letter to Shareholders that reflect projections or expectations for future financial or economic performance of the Funds and the market in general and statements of the Funds’ plans and objectives for future operations are forward-looking statements. No assurance can be given that actual results or events will not differ materially from those projected, estimated, assumed, or anticipated in any such forward-looking statements. Important factors that could result in such differences, in addition to factors noted with such forward-looking statements include, without limitation, general economic conditions, such as inflation, recession, and interest rates. Past performance is not a guarantee of future results.
WESTWOOD FUNDS (Unaudited)
Definition of the Comparative Indices & Key Terms
Alpha is the measure of risk adjusted performance.
Bloomberg U.S. Aggregate Bond Index is a broad-based flagship benchmark that measures the investment grade, US dollar-denominated, fixed-rate taxable bond market.
Beta is a measure of the volatility, or systematic risk, of a security or a portfolio in comparison to the market as a whole. Beta is used in the capital asset pricing model (CAPM), which calculates the expected return of an asset based on its beta and expected market returns.
Delta is the ratio comparing the change in the price of the underlying asset to the corresponding change in the price of a derivative.
FTSE 1-Month Treasury Bill Index is a market value-weighted index of public obligations of the U.S. Treasury bills with maturities of one month. The Index reflects no deduction for fees, expenses or taxes.
Gamma is the rate of change for delta with respect to the underlying asset’s price. Gamma is an important measure of the convexity of a derivative’s value, in relation to the underlying assets.
Russell 1000 Index measures the performance of the large-cap segment of the U.S. equity universe. It is a subset of the Russell 3000 Index and includes approximately 1,000 of the largest securities based on a combination of their market cap and current index membership. The Russell 1000 represents approximately 92% of the Russell 3000 Index. The Russell 1000 Index is constructed to provide a comprehensive and unbiased barometer for the large-cap segment and is completely reconstituted annually to ensure new and growing equities are reflected.
Russell 1000 Value Index measures the performance of the large-cap value segment of the U.S. equity universe. It includes those Russell 1000 companies with lower price-to-book ratios and lower expected and historical growth rates.
Russell 2000 Value Index is a broadly diversified index predominantly made up of value stocks of small U.S. companies.
Russell 2500 Index measures the performance of the 2,500 smallest companies in the Russell 3000 Index, which represents approximately 16% of the total market capitalization of the Russell 3000 Index.
Russell 2500 Value Index measures the performance of the small to mid-cap value segment of the U.S. equity universe. It includes those Russell 2500 companies with lower price-to-book ratio and lower forecasted growth values
S&P 500 Index is an unmanaged capitalization-weighted index of 500 stocks designed to measure performance of the broad domestic stock market through changes in the aggregate market value of 500 stocks representing all major industries.
| WESTWOOD QUALITY VALUE FUND |
| APRIL 30, 2022 (Unaudited) |
| Sector Weightings (Unaudited)† |
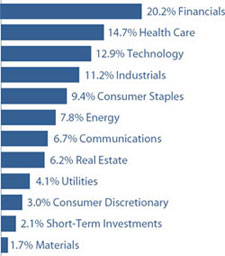
| † | Percentages are based on total investments. |
| SCHEDULE OF INVESTMENTS |
| COMMON STOCKS — 97.9% |
| | | Shares | | | Value | |
| Communications — 6.8% | | | | | | | | |
| Internet Media & Services — 2.2% | | | | | | | | |
| Alphabet, Inc. - Class A (a) | | | 2,546 | | | $ | 5,810,456 | |
| | | | | | | | | |
| Telecommunications — 4.6% | | | | | | | | |
| AT&T, Inc. | | | 290,987 | | | | 5,488,015 | |
| T-Mobile US, Inc. (a) | | | 55,487 | | | | 6,832,669 | |
| | | | | | | | 12,320,684 | |
| Consumer Discretionary — 3.0% | | | | | | | | |
| Retail - Discretionary — 3.0% | | | | | | | | |
| Home Depot, Inc. (The) | | | 19,249 | | | | 5,782,400 | |
| O’Reilly Automotive, Inc. (a) | | | 3,886 | | | | 2,357,053 | |
| | | | | | | | 8,139,453 | |
| Consumer Staples — 9.4% | | | | | | | | |
| Beverages — 2.2% | | | | | | | | |
| PepsiCo, Inc. | | | 33,946 | | | | 5,828,868 | |
| | | | | | | | | |
| Food — 2.1% | | | | | | | | |
| McCormick & Company, Inc. | | | 56,608 | | | | 5,693,067 | |
| | | | | | | | | |
| Retail - Consumer Staples — 5.1% | | | | | | | | |
| Dollar General Corporation | | | 23,027 | | | | 5,469,603 | |
| Walmart, Inc. | | | 54,575 | | | | 8,349,429 | |
| | | | | | | | 13,819,032 | |
| Energy — 7.8% | | | | | | | | |
| Oil & Gas Producers — 7.8% | | | | | | | | |
| Chevron Corporation | | | 24,343 | | | | 3,813,818 | |
| ConocoPhillips | | | 71,401 | | | | 6,820,223 | |
| EOG Resources, Inc. | | | 47,690 | | | | 5,568,284 | |
| COMMON STOCKS — continued |
| | | Shares | | | Value | |
| Energy — continued | | | | | | | | |
| Oil & Gas Producers — continued | | | | | | | | |
| Valero Energy Corporation | | | 42,724 | | | $ | 4,762,872 | |
| | | | | | | | 20,965,197 | |
| Financials — 20.3% | | | | | | | | |
| Asset Management — 3.3% | | | | | | | | |
| Blackstone, Inc. | | | 43,836 | | | | 4,452,423 | |
| Charles Schwab Corporation (The) | | | 66,065 | | | | 4,382,091 | |
| | | | | | | | 8,834,514 | |
| Banking — 6.1% | | | | | | | | |
| Bank of America Corporation | | | 207,628 | | | | 7,408,167 | |
| PNC Financial Services Group, Inc. (The) | | | 29,135 | | | | 4,839,324 | |
| Western Alliance Bancorp | | | 53,271 | | | | 4,054,456 | |
| | | | | | | | 16,301,947 | |
| Institutional Financial Services — 4.9% | | | | | | | | |
| Goldman Sachs Group, Inc. (The) | | | 26,221 | | | | 8,010,253 | |
| Intercontinental Exchange, Inc. | | | 43,905 | | | | 5,084,638 | |
| | | | | | | | 13,094,891 | |
| Insurance — 6.0% | | | | | | | | |
| American International Group, Inc. | | | 92,854 | | | | 5,432,887 | |
| Berkshire Hathaway, Inc. - Class B (a) | | | 16,587 | | | | 5,354,781 | |
| Progressive Corporation (The) | | | 50,446 | | | | 5,415,883 | |
| | | | | | | | 16,203,551 | |
| Health Care — 14.7% | | | | | | | | |
| Biotech & Pharma — 5.5% | | | | | | | | |
| Gilead Sciences, Inc. | | | 94,466 | | | | 5,605,612 | |
| Johnson & Johnson | | | 50,661 | | | | 9,142,284 | |
| | | | | | | | 14,747,896 | |
| Health Care Facilities & Services — 6.7% | | | | | | | | |
| CVS Health Corporation | | | 57,152 | | | | 5,494,022 | |
| McKesson Corporation | | | 8,699 | | | | 2,693,297 | |
| UnitedHealth Group, Inc. | | | 19,165 | | | | 9,746,361 | |
| | | | | | | | 17,933,680 | |
| Medical Equipment & Devices — 2.5% | | | | | | | | |
| Becton, Dickinson and Company | | | 27,588 | | | | 6,819,478 | |
| | | | | | | | | |
| Industrials — 11.0% | | | | | | | | |
| Aerospace & Defense — 1.9% | | | | | | | | |
| L3Harris Technologies, Inc. | | | 22,709 | | | | 5,274,392 | |
| | | | | | | | | |
| Diversified Industrials — 5.2% | | | | | | | | |
| Eaton Corporation plc | | | 56,588 | | | | 8,206,392 | |
| Honeywell International, Inc. | | | 29,616 | | | | 5,730,992 | |
| | | | | | | | 13,937,384 | |
| Electrical Equipment — 1.4% | | | | | | | | |
| Veritiv Holdings Company | | | 299,943 | | | | 3,758,286 | |
The accompanying notes are an integral part of the financial statements.
| WESTWOOD QUALITY VALUE FUND |
| APRIL 30, 2022 (Unaudited) |
| COMMON STOCKS — continued |
| | | Shares | | | Value | |
| Industrials — continued | | | | | | | | |
| Transportation & Logistics — 2.5% | | | | | | | | |
| Union Pacific Corporation | | | 28,251 | | | $ | 6,618,927 | |
| | | | | | | | | |
| Materials — 1.7% | | | | | | | | |
| Chemicals — 1.7% | | | | | | | | |
| Huntsman Corporation | | | 136,171 | | | | 4,612,112 | |
| | | | | | | | | |
| Real Estate — 6.2% | | | | | | | | |
| REITs — 6.2% | | | | | | | | |
| Alexandria Real Estate Equities, Inc. | | | 28,667 | | | | 5,221,980 | |
| Prologis, Inc. | | | 33,389 | | | | 5,351,923 | |
| VICI Properties, Inc. | | | 202,087 | | | | 6,024,214 | |
| | | | | | | | 16,598,117 | |
| Technology — 12.9% | | | | | | | | |
| Semiconductors — 4.2% | | | | | | | | |
| Microchip Technology, Inc. | | | 76,386 | | | | 4,980,367 | |
| Teradyne, Inc. | | | 60,524 | | | | 6,382,861 | |
| | | | | | | | 11,363,228 | |
| Software — 2.8% | | | | | | | | |
| Microsoft Corporation | | | 27,424 | | | | 7,610,708 | |
| | | | | | | | | |
| Technology Hardware — 2.0% | | | | | | | | |
| Cisco Systems, Inc. | | | 106,857 | | | | 5,233,856 | |
| | | | | | | | | |
| Technology Services — 3.9% | | | | | | | | |
| CACI International, Inc. - Class A (a) | | | 19,478 | | | | 5,167,514 | |
| Visa, Inc. - Class A | | | 25,179 | | | | 5,366,400 | |
| | | | | | | | 10,533,914 | |
| COMMON STOCKS — continued |
| | | Shares | | | Value | |
| Utilities — 4.1% | | | | | | | | |
| Electric Utilities — 4.1% | | | | | | | | |
| DTE Energy Company | | | 46,689 | | | $ | 6,118,127 | |
| NextEra Energy, Inc. | | | 67,660 | | | | 4,805,213 | |
| | | | | | | | 10,923,340 | |
| Total Common Stocks | | | | | | | | |
| (Cost $222,141,248) | | | | | | $ | 262,976,978 | |
| | | | | | | | | |
| MONEY MARKET FUNDS — 2.1% | | | | | | | | |
| SEI Daily Income Trust, Government Fund - Class F, 0.15% (b) (Cost $5,733,366) | | | 5,733,366 | | | $ | 5,733,366 | |
| | | | | | | | | |
| Investments at Value — 100.0% | | | | | | | | |
| (Cost $227,874,614) | | | | | | $ | 268,710,344 | |
| | | | | | | | | |
| Other Assets in Excess of Liabilities — 0.0% (c) | | | | | | | 108,840 | |
| | | | | | | | | |
| Net Assets — 100.0% | | | | | | $ | 268,819,184 | |
plc - Public Limited Company
| (a) | Non-income producing security. |
| (b) | The rate shown is the 7-day effective yield as of April 30, 2022. |
| (c) | Percentage rounds to less than 0.1%. |
The accompanying notes are an integral part of the financial statements.
| WESTWOOD QUALITY MIDCAP FUND |
| APRIL 30, 2022 (Unaudited) |
| Sector Weightings (Unaudited)† |
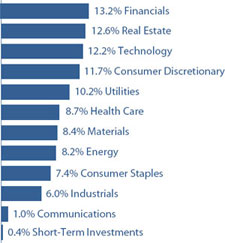
| † | Percentages are based on total investments. |
| SCHEDULE OF INVESTMENTS |
| COMMON STOCKS — 97.8% |
| | | Shares | | | Value | |
| Communications — 1.0% | | | | | | | | |
| Cable & Satellite — 1.0% | | | | | | | | |
| Cable One, Inc. | | | 4 | | | $ | 4,665 | |
| | | | | | | | | |
| Consumer Discretionary — 11.5% | | | | | | | | |
| Apparel & Textile Products — 0.9% | | | | | | | | |
| Skechers U.S.A., Inc. - Class A (a) | | | 111 | | | | 4,252 | |
| | | | | | | | | |
| Automotive — 1.4% | | | | | | | | |
| Dana, Inc. | | | 467 | | | | 6,916 | |
| | | | | | | | | |
| Home & Office Products — 1.0% | | | | | | | | |
| Scotts Miracle-Gro Company (The) | | | 46 | | | | 4,781 | |
| | | | | | | | | |
| Home Construction — 4.0% | | | | | | | | |
| Armstrong World Industries, Inc. | | | 84 | | | | 7,111 | |
| Masonite International Corporation (a) | | | 67 | | | | 5,194 | |
| PulteGroup, Inc. | | | 171 | | | | 7,141 | |
| | | | | | | | 19,446 | |
| Leisure Facilities & Services — 4.2% | | | | | | | | |
| Darden Restaurants, Inc. | | | 78 | | | | 10,275 | |
| Texas Roadhouse, Inc. | | | 125 | | | | 10,291 | |
| | | | | | | | 20,566 | |
| Consumer Staples — 7.3% | | | | | | | | |
| Beverages — 2.1% | | | | | | | | |
| Constellation Brands, Inc. - Class A | | | 41 | | | | 10,090 | |
| COMMON STOCKS — continued |
| | | Shares | | | Value | |
| Consumer Staples — continued | | | | | | | | |
| Food — 5.2% | | | | | | | | |
| Darling Ingredients, Inc. (a) | | | 74 | | | $ | 5,431 | |
| Hostess Brands, Inc. (a) | | | 376 | | | | 8,531 | |
| McCormick & Company, Inc. | | | 112 | | | | 11,264 | |
| | | | | | | | 25,226 | |
| Energy — 8.0% | | | | | | | | |
| Oil & Gas Producers — 8.0% | | | | | | | | |
| Devon Energy Corporation | | | 127 | | | | 7,388 | |
| Diamondback Energy, Inc. | | | 101 | | | | 12,749 | |
| PDC Energy, Inc. | | | 134 | | | | 9,345 | |
| Valero Energy Corporation | | | 87 | | | | 9,699 | |
| | | | | | | | 39,181 | |
| Financials — 12.9% | | | | | | | | |
| Asset Management — 3.5% | | | | | | | | |
| Blue Owl Capital, Inc. | | | 419 | | | | 4,998 | |
| LPL Financial Holdings, Inc. | | | 63 | | | | 11,836 | |
| | | | | | | | 16,834 | |
| Banking — 3.9% | | | | | | | | |
| Pinnacle Financial Partners, Inc. | | | 81 | | | | 6,282 | |
| Synovus Financial Corporation | | | 113 | | | | 4,694 | |
| Veritex Holdings, Inc. | | | 252 | | | | 8,278 | |
| | | | | | | | 19,254 | |
| Institutional Financial Services — 1.8% | | | | | | | | |
| Intercontinental Exchange, Inc. | | | 76 | | | | 8,802 | |
| | | | | | | | | |
| Insurance — 3.7% | | | | | | | | |
| Arch Capital Group Ltd. (a) | | | 184 | | | | 8,403 | |
| Ryan Specialty Group Holdings, Inc. - Class A (a) | | | 262 | | | | 9,692 | |
| | | | | | | | 18,095 | |
| Health Care — 8.6% | | | | | | | | |
| Health Care Facilities & Services — 4.8% | | | | | | | | |
| Centene Corporation (a) | | | 139 | | | | 11,197 | |
| McKesson Corporation | | | 40 | | | | 12,384 | |
| | | | | | | | 23,581 | |
| Medical Equipment & Devices — 3.8% | | | | | | | | |
| Cooper Companies, Inc. (The) | | | 24 | | | | 8,665 | |
| ICU Medical, Inc. (a) | | | 45 | | | | 9,629 | |
| | | | | | | | 18,294 | |
| Industrials — 5.9% | | | | | | | | |
| Electrical Equipment — 2.1% | | | | | | | | |
| Fortive Corporation | | | 177 | | | | 10,177 | |
| | | | | | | | | |
| Machinery — 3.8% | | | | | | | | |
| AGCO Corporation | | | 75 | | | | 9,555 | |
| Middleby Corporation (The) (a) | | | 58 | | | | 8,926 | |
| | | | | | | | 18,481 | |
The accompanying notes are an integral part of the financial statements.
| WESTWOOD QUALITY MIDCAP FUND |
| APRIL 30, 2022 (Unaudited) |
| COMMON STOCKS — continued |
| | | Shares | | | Value | |
| Materials — 8.2% | | | | | | | | |
| Chemicals — 2.9% | | | | | | | | |
| Albemarle Corporation | | | 40 | | | $ | 7,713 | |
| Huntsman Corporation | | | 194 | | | | 6,571 | |
| | | | | | | | 14,284 | |
| Construction Materials — 0.7% | | | | | | | | |
| Cemex S.A.B. de C.V. - ADR (a) | | | 804 | | | | 3,537 | |
| | | | | | | | | |
| Containers & Packaging — 2.3% | | | | | | | | |
| WestRock Company | | | 224 | | | | 11,095 | |
| | | | | | | | | |
| Forestry, Paper & Wood Products — 2.3% | | | | | | | | |
| UFP Industries, Inc. | | | 146 | | | | 11,296 | |
| | | | | | | | | |
| Real Estate — 12.4% | | | | | | | | |
| REITs — 12.4% | | | | | | | | |
| Alexandria Real Estate Equities, Inc. | | | 54 | | | | 9,837 | |
| Americold Realty Trust | | | 364 | | | | 9,602 | |
| National Retail Properties, Inc. | | | 223 | | | | 9,776 | |
| STAG Industrial, Inc. | | | 252 | | | | 9,405 | |
| Urban Edge Properties | | | 577 | | | | 10,784 | |
| VICI Properties, Inc. | | | 363 | | | | 10,821 | |
| | | | | | | | 60,225 | |
| Technology — 12.0% | | | | | | | | |
| Semiconductors — 5.8% | | | | | | | | |
| Microchip Technology, Inc. | | | 136 | | | | 8,867 | |
| Rambus, Inc. (a) | | | 394 | | | | 9,815 | |
| Teradyne, Inc. | | | 89 | | | | 9,386 | |
| | | | | | | | 28,068 | |
| Software — 1.9% | | | | | | | | |
| Tyler Technologies, Inc. (a) | | | 24 | | | | 9,473 | |
| | | | | | | | | |
| Technology Services — 4.3% | | | | | | | | |
| CACI International, Inc. - Class A (a) | | | 43 | | | | 11,408 | |
| Science Applications International Corporation | | | 113 | | | | 9,405 | |
| | | | | | | | 20,813 | |
| Utilities — 10.0% | | | | | | | | |
| Electric Utilities — 10.0% | | | | | | | | |
| Alliant Energy Corporation | | | 174 | | | | 10,233 | |
| CMS Energy Corporation | | | 192 | | | | 13,188 | |
| DTE Energy Company | | | 100 | | | | 13,104 | |
| Evergy, Inc. | | | 180 | | | | 12,213 | |
| | | | | | | | 48,738 | |
| Total Common Stocks | | | | | | | | |
| (Cost $489,761) | | | | | | | 476,170 | |
| MONEY MARKET FUNDS — 0.4% |
| | | Shares | | | Value | |
| First American Treasury Obligations Fund - Class X, 0.28% (b) (Cost $1,866) | | | 1,866 | | | $ | 1,866 | |
| | | | | | | | | |
| Investments at Value — 98.2% | | | | | | | | |
| (Cost $491,627) | | | | | | $ | 478,036 | |
| | | | | | | | | |
| Other Assets in Excess of Liabilities — 1.8% | | | | | | | 8,817 | |
| | | | | | | | | |
| Net Assets — 100.0% | | | | | | $ | 486,853 | |
ADR - American Depositary Receipt
S.A.B d e C.V. - Societe Anonima Bursatil de Capital Variable
| (a) | Non-income producing security. |
| (b) | The rate shown is the 7-day effective yield as of April 30, 2022. |
The accompanying notes are an integral part of the financial statements.
| WESTWOOD QUALITY SMIDCAP FUND |
| APRIL 30, 2022 (Unaudited) |
| Sector Weightings (Unaudited)† |
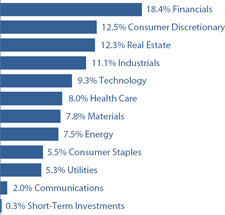
| † | Percentages are based on total investments. |
| SCHEDULE OF INVESTMENTS |
| COMMON STOCKS — 99.7% |
| | | Shares | | | Value | |
| Communications — 1.9% | | | | | | | | |
| Entertainment Content — 1.9% | | | | | | | | |
| Madison Square Garden | | | | | | | | |
| Entertainment Corporation (a) | | | 80,131 | | | $ | 5,869,596 | |
| | | | | | | | | |
| Consumer Discretionary — 12.5% | | | | | | | | |
| Automotive — 1.2% | | | | | | | | |
| Holley, Inc. (a) | | | 333,784 | | | | 3,518,084 | |
| | | | | | | | | |
| Home Construction — 1.9% | | | | | | | | |
| Armstrong World Industries, Inc. | | | 69,363 | | | | 5,872,272 | |
| | | | | | | | | |
| Leisure Facilities & Services — 3.1% | | | | | | | | |
| Jack in the Box, Inc. | | | 71,182 | | | | 5,891,022 | |
| Texas Roadhouse, Inc. | | | 40,139 | | | | 3,304,644 | |
| | | | | | | | 9,195,666 | |
| Leisure Products — 1.0% | | | | | | | | |
| Callaway Golf Company (a) | | | 137,914 | | | | 3,025,833 | |
| | | | | | | | | |
| Retail - Discretionary — 3.2% | | | | | | | | |
| Academy Sports & Outdoors, Inc. | | | 84,175 | | | | 3,144,778 | |
| Builders FirstSource, Inc. (a) | | | 103,818 | | | | 6,392,074 | |
| | | | | | | | 9,536,852 | |
| Wholesale - Discretionary — 2.1% | | | | | | | | |
| IAA, Inc. (a) | | | 176,457 | | | | 6,467,149 | |
| | | | | | | | | |
| Consumer Staples — 5.6% | | | | | | | | |
| Food — 5.6% | | | | | | | | |
| Hostess Brands, Inc. (a) | | | 280,857 | | | | 6,372,645 | |
| COMMON STOCKS — continued |
| | | Shares | | | Value | |
| Consumer Staples — continued | | | | | | | | |
| Food — continued | | | | | | | | |
| J & J Snack Foods Corporation | | | 41,582 | | | $ | 6,224,826 | |
| Nomad Foods Ltd. (a) | | | 220,772 | | | | 4,075,451 | |
| | | | | | | | 16,672,922 | |
| Energy — 7.5% | | | | | | | | |
| Oil & Gas Producers — 7.5% | | | | | | | | |
| Diamondback Energy, Inc. | | | 58,362 | | | | 7,367,035 | |
| Magnolia Oil & Gas Corporation - | | | | | | | | |
| Class A | | | 312,714 | | | | 7,267,473 | |
| PDC Energy, Inc. | | | 112,159 | | | | 7,821,969 | |
| | | | | | | | 22,456,477 | |
| Financials — 18.4% | | | | | | | | |
| Asset Management — 1.9% | | | | | | | | |
| LPL Financial Holdings, Inc. | | | 30,161 | | | | 5,666,347 | |
| | | | | | | | | |
| Banking — 10.1% | | | | | | | | |
| Pinnacle Financial Partners, Inc. | | | 75,005 | | | | 5,816,638 | |
| Simmons First National Corporation - Class A | | | 287,515 | | | | 6,862,983 | |
| Texas Capital Bancshares, Inc. (a) | | | 115,276 | | | | 5,920,575 | |
| Triumph Bancorp, Inc. (a) | | | 44,086 | | | | 3,061,332 | |
| Western Alliance Bancorp | | | 35,034 | | | | 2,666,438 | |
| Wintrust Financial Corporation | | | 69,534 | | | | 6,071,709 | |
| | | | | | | | 30,399,675 | |
| Institutional Financial Services — 1.4% | | | | | | | | |
| Perella Weinberg Partners | | | 547,262 | | | | 4,219,390 | |
| | | | | | | | | |
| Insurance — 3.1% | | | | | | | | |
| International General Insurance | | | | | | | | |
| Holdings Ltd. | | | 396,987 | | | | 3,005,191 | |
| Voya Financial, Inc. | | | 97,163 | | | | 6,134,872 | |
| | | | | | | | 9,140,063 | |
| Specialty Finance — 1.9% | | | | | | | | |
| MGIC Investment Corporation | | | 433,296 | | | | 5,658,846 | |
| | | | | | | | | |
| Health Care — 8.0% | | | | | | | | |
| Medical Equipment & Devices — 8.0% | | | | | | | | |
| Envista Holdings Corporation (a) | | | 76,102 | | | | 3,015,161 | |
| ICU Medical, Inc. (a) | | | 20,785 | | | | 4,447,782 | |
| Integer Holdings Corporation (a) | | | 59,501 | | | | 4,472,690 | |
| Integra LifeSciences Holdings Corporation (a) | | | 98,972 | | | | 6,053,128 | |
| Merit Medical Systems, Inc. (a) | | | 95,193 | | | | 5,902,918 | |
| | | | | | | | 23,891,679 | |
| Industrials — 11.1% | | | | | | | | |
| Aerospace & Defense — 1.9% | | | | | | | | |
| Moog, Inc. - Class A | | | 73,641 | | | | 5,881,707 | |
The accompanying notes are an integral part of the financial statements.
| WESTWOOD QUALITY SMIDCAP FUND |
| APRIL 30, 2022 (Unaudited) |
| COMMON STOCKS — continued |
| | | Shares | | | Value | |
| Industrials — continued | | | | | | | | |
| Electrical Equipment — 2.2% | | | | | | | | |
| Hubbell, Inc. | | | 33,406 | | | $ | 6,526,196 | |
| | | | | | | | | |
| Industrial Intermediate Products — 1.0% | | | | | | | | |
| AZZ, Inc. | | | 66,985 | | | | 3,057,195 | |
| | | | | | | | | |
| Machinery — 5.0% | | | | | | | | |
| AGCO Corporation | | | 45,286 | | | | 5,769,436 | |
| Albany International Corporation - Class A | | | 80,372 | | | | 6,286,698 | |
| Middleby Corporation (The) (a) | | | 18,437 | | | | 2,837,270 | |
| | | | | | | | 14,893,404 | |
| Transportation & Logistics — 1.0% | | | | | | | | |
| Alaska Air Group, Inc. (a) | | | 56,112 | | | | 3,051,932 | |
| | | | | | | | | |
| Materials — 7.8% | | | | | | | | |
| Chemicals — 2.4% | | | | | | | | |
| Ecovyst, Inc. | | | 708,066 | | | | 7,123,144 | |
| | | | | | | | | |
| Construction Materials — 2.1% | | | | | | | | |
| Eagle Materials, Inc. | | | 51,781 | | | | 6,385,633 | |
| | | | | | | | | |
| Containers & Packaging — 1.2% | | | | | | | | |
| WestRock Company | | | 74,173 | | | | 3,673,788 | |
| | | | | | | | | |
| Metals & Mining — 2.1% | | | | | | | | |
| Encore Wire Corporation | | | 28,760 | | | | 3,244,416 | |
| Livent Corporation (a) | | | 139,892 | | | | 2,988,093 | |
| | | | | | | | 6,232,509 | |
| Real Estate — 12.3% | | | | | | | | |
| Real Estate Owners & Developers — 2.0% | | | | | | | | |
| Radius Global Infrastructure, Inc. - Class A (a) | | | 479,856 | | | | 5,959,812 | |
| | | | | | | | | |
| REITs — 10.3% | | | | | | | | |
| Alexander & Baldwin, Inc. | | | 45,907 | | | | 973,229 | |
| American Assets Trust, Inc. | | | 170,564 | | | | 6,242,642 | |
| Americold Realty Trust | | | 233,806 | | | | 6,167,802 | |
| National Retail Properties, Inc. | | | 134,269 | | | | 5,886,353 | |
| STAG Industrial, Inc. | | | 155,612 | | | | 5,807,440 | |
| Urban Edge Properties | | | 312,419 | | | | 5,839,111 | |
| | | | | | | | 30,916,577 | |
| Technology — 9.3% | | | | | | | | |
| Semiconductors — 2.1% | | | | | | | | |
| Rambus, Inc. (a) | | | 246,641 | | | | 6,143,827 | |
| COMMON STOCKS — continued |
| | | Shares | | | Value | |
| Technology — continued | | | | | | | | |
| Technology Hardware — 2.8% | | | | | | | | |
| ADTRAN, Inc. | | | 239,263 | | | $ | 4,160,784 | |
| Viavi Solutions, Inc. (a) | | | 299,789 | | | | 4,298,974 | |
| | | | | | | | 8,459,758 | |
| Technology Services — 4.4% | | | | | | | | |
| CACI International, Inc. - Class A (a) | | | 26,841 | | | | 7,120,917 | |
| Science Applications International Corporation | | | 73,360 | | | | 6,105,753 | |
| | | | | | | | 13,226,670 | |
| Utilities — 5.3% | | | | | | | | |
| Electric Utilities — 5.3% | | | | | | | | |
| Alliant Energy Corporation | | | 104,288 | | | | 6,133,177 | |
| IDACORP, Inc. | | | 62,933 | | | | 6,619,293 | |
| NorthWestern Corporation | | | 55,549 | | | | 3,149,073 | |
| | | | | | | | 15,901,543 | |
| Total Common Stocks | | | | | | | | |
| (Cost $293,960,384) | | | | | | $ | 299,024,546 | |
| | | | | | | | | |
| MONEY MARKET FUNDS — 0.3% | | | | | | | | |
| SEI Daily Income Trust, Government Fund - Class F, 0.15% (b) (Cost $887,293) | | | 887,293 | | | $ | 887,293 | |
| | | | | | | | | |
| Investments at Value — 100.0% | | | | | | | | |
| (Cost $294,847,677) | | | | | | $ | 299,911,839 | |
| | | | | | | | | |
| Other Assets in Excess of Liabilities — 0.0% (c) | | | | | | | 58,565 | |
| | | | | | | | | |
| Net Assets — 100.0% | | | | | | $ | 299,970,404 | |
| (a) | Non-income producing security. |
| (b) | The rate shown is the 7-day effective yield as of April 30, 2022. |
| (c) | Percentage rounds to less than 0.1%. |
The accompanying notes are an integral part of the financial statements.
| WESTWOOD QUALITY SMALLCAP FUND |
| APRIL 30, 2022 (Unaudited) |
| Sector Weightings (Unaudited)† |
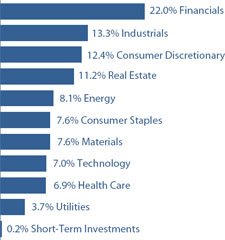
| † | Percentages are based on total investments. |
| SCHEDULE OF INVESTMENTS |
| COMMON STOCKS — 99.9% |
| | | Shares | | | Value | |
| Consumer Discretionary — 12.4% | | | | | | | | |
| Automotive — 1.2% | | | | | | | | |
| Methode Electronics, Inc. | | | 266,377 | | | $ | 11,883,078 | |
| | | | | | | | | |
| Home Construction — 4.0% | | | | | | | | |
| Century Communities, Inc. | | | 410,347 | | | | 21,633,494 | |
| Masonite International Corporation (a) | | | 241,428 | | | | 18,715,499 | |
| | | | | | | | 40,348,993 | |
| Leisure Facilities & Services — 3.8% | | | | | | | | |
| Chuy’s Holdings, Inc. (a) | | | 330,230 | | | | 8,259,052 | |
| Jack in the Box, Inc. | | | 232,683 | | | | 19,256,845 | |
| Papa John’s International, Inc. | | | 120,100 | | | | 10,935,105 | |
| | | | | | | | 38,451,002 | |
| Retail - Discretionary — 3.4% | | | | | | | | |
| Academy Sports & Outdoors, Inc. | | | 282,515 | | | | 10,554,760 | |
| Monro, Inc. | | | 523,846 | | | | 23,955,478 | |
| | | | | | | | 34,510,238 | |
| Consumer Staples — 7.6% | | | | | | | | |
| Beverages — 1.1% | | | | | | | | |
| Duckhorn Portfolio, Inc. (The) (a) | | | 553,415 | | | | 10,747,319 | |
| | | | | | | | | |
| Food — 4.3% | | | | | | | | |
| Hostess Brands, Inc. (a) | | | 1,007,195 | | | | 22,853,255 | |
| J & J Snack Foods Corporation | | | 137,797 | | | | 20,628,211 | |
| | | | | | | | 43,481,466 | |
| Household Products — 2.2% | | | | | | | | |
| Central Garden & Pet Company - Class A (a) | | | 535,623 | | | | 22,164,080 | |
| COMMON STOCKS — continued |
| | | Shares | | | Value | |
| Energy — 8.1% | | | | | | | | |
| Oil & Gas Producers — 8.1% | | | | | | | | |
| Brigham Minerals, Inc. - Class A | | | 724,921 | | | $ | 17,963,542 | |
| Northern Oil and Gas, Inc. | | | 867,841 | | | | 21,678,668 | |
| PDC Energy, Inc. | | | 304,893 | | | | 21,263,238 | |
| Whiting Petroleum Corporation | | | 288,413 | | | | 21,068,570 | |
| | | | | | | | 81,974,018 | |
| Financials — 22.0% | | | | | | | | |
| Banking — 15.6% | | | | | | | | |
| City Holding Company | | | 81,097 | | | | 6,275,286 | |
| Columbia Banking System, Inc. | | | 704,779 | | | | 19,790,194 | |
| Provident Financial Services, Inc. | | | 463,737 | | | | 10,262,500 | |
| Renasant Corporation | | | 639,952 | | | | 19,064,170 | |
| Sandy Spring Bancorp, Inc. | | | 497,849 | | | | 19,550,530 | |
| Seacoast Banking Corporation of Florida | | | 620,087 | | | | 20,152,827 | |
| Simmons First National Corporation - Class A | | | 785,311 | | | | 18,745,374 | |
| Triumph Bancorp, Inc. (a) | | | 248,798 | | | | 17,276,533 | |
| Trustmark Corporation | | | 230,379 | | | | 6,422,967 | |
| Veritex Holdings, Inc. | | | 589,857 | | | | 19,376,802 | |
| | | | | | | | 156,917,183 | |
| Institutional Financial Services — 4.3% | | | | | | | | |
| Moelis & Company - Class A | | | 439,924 | | | | 19,471,036 | |
| Perella Weinberg Partners | | | 599,353 | | | | 4,621,012 | |
| Piper Sandler Companies | | | 168,324 | | | | 19,353,893 | |
| | | | | | | | 43,445,941 | |
| Insurance — 2.1% | | | | | | | | |
| AMERISAFE, Inc. | | | 220,216 | | | | 10,207,012 | |
| Argo Group International Holdings Ltd. | | | 263,660 | | | | 11,284,648 | |
| | | | | | | | 21,491,660 | |
| Health Care — 6.9% | | | | | | | | |
| Health Care Facilities & Services — 1.9% | | | | | | | | |
| Patterson Companies, Inc. | | | 624,817 | | | | 19,225,619 | |
| | | | | | | | | |
| Medical Equipment & Devices — 5.0% | | | | | | | | |
| Avanos Medical, Inc. (a) | | | 359,671 | | | | 10,488,006 | |
| CONMED Corporation | | | 151,847 | | | | 20,189,577 | |
| Merit Medical Systems, Inc. (a) | | | 313,559 | | | | 19,443,794 | |
| | | | | | | | 50,121,377 | |
| Industrials — 13.3% | | | | | | | | |
| Aerospace & Defense — 1.9% | | | | | | | | |
| Moog, Inc. - Class A | | | 239,302 | | | | 19,113,051 | |
| | | | | | | | | |
| Engineering & Construction — 1.9% | | | | | | | | |
| Comfort Systems USA, Inc. | | | 234,372 | | | | 19,785,684 | |
The accompanying notes are an integral part of the financial statements.
| WESTWOOD QUALITY SMALLCAP FUND |
| APRIL 30, 2022 (Unaudited) |
| COMMON STOCKS — continued |
| | | Shares | | | Value | |
| Industrials — continued | | | | | | | | |
| Industrial Intermediate Products — 1.1% | | | | | | | | |
| AZZ, Inc. | | | 247,256 | | | $ | 11,284,764 | |
| | | | | | | | | |
| Machinery — 8.4% | | | | | | | | |
| Alamo Group, Inc. | | | 80,832 | | | | 10,220,398 | |
| Albany International Corporation - Class A | | | 138,076 | | | | 10,800,305 | |
| Altra Industrial Motion Corporation | | | 556,245 | | | | 21,693,555 | |
| Astec Industries, Inc. | | | 272,380 | | | | 10,650,058 | |
| Columbus McKinnon Corporation | | | 263,941 | | | | 9,356,708 | |
| Federal Signal Corporation | | | 634,991 | | | | 21,608,744 | |
| | | | | | | | 84,329,768 | |
| Materials — 7.6% | | | | | | | | |
| Chemicals — 4.4% | | | | | | | | |
| Ecovyst, Inc. | | | 1,072,642 | | | | 10,790,778 | |
| Innospec, Inc. | | | 121,601 | | | | 11,589,791 | |
| Stepan Company | | | 216,505 | | | | 22,107,326 | |
| | | | | | | | 44,487,895 | |
| Forestry, Paper & Wood Products — 1.0% | | | | | | | | |
| UFP Industries, Inc. | | | 129,709 | | | | 10,035,585 | |
| | | | | | | | | |
| Metals & Mining — 2.2% | | | | | | | | |
| Encore Wire Corporation | | | 94,733 | | | | 10,686,830 | |
| Livent Corporation (a) | | | 511,436 | | | | 10,924,273 | |
| | | | | | | | 21,611,103 | |
| Real Estate — 11.2% | | | | | | | | |
| Real Estate Owners & Developers — 1.9% | | | | | | | | |
| Radius Global Infrastructure, Inc. - Class A (a) | | | 1,562,105 | | | | 19,401,344 | |
| | | | | | | | | |
| REITs — 9.3% | | | | | | | | |
| Community Healthcare Trust, Inc. | | | 386,506 | | | | 14,231,151 | |
| Four Corners Property Trust, Inc. | | | 698,879 | | | | 19,191,217 | |
| Plymouth Industrial REIT, Inc. | | | 838,639 | | | | 20,227,973 | |
| PotlatchDeltic Corporation | | | 188,822 | | | | 10,458,851 | |
| Sunstone Hotel Investors, Inc. (a) | | | 967,606 | | | | 11,853,173 | |
| Urban Edge Properties | | | 945,486 | | | | 17,671,133 | |
| | | | | | | | 93,633,498 | |
| Technology — 7.0% | | | | | | | | |
| Semiconductors — 2.1% | | | | | | | | |
| Rambus, Inc. (a) | | | 837,223 | | | | 20,855,225 | |
| | | | | | | | | |
| Technology Hardware — 3.0% | | | | | | | | |
| ADTRAN, Inc. | | | 608,182 | | | | 10,576,285 | |
| Viavi Solutions, Inc. (a) | | | 1,354,063 | | | | 19,417,264 | |
| | | | | | | | 29,993,549 | |
| COMMON STOCKS — continued |
| | | Shares | | | Value | |
| Technology — continued | | | | | | | | |
| Technology Services — 1.9% | | | | | | | | |
| Repay Holdings Corporation (a) | | | 1,438,906 | | | $ | 19,252,562 | |
| | | | | | | | | |
| Utilities — 3.8% | | | | | | | | |
| Electric Utilities — 3.8% | | | | | | | | |
| Avista Corporation | | | 463,388 | | | | 18,799,651 | |
| NorthWestern Corporation | | | 335,475 | | | | 19,018,078 | |
| | | | | | | | 37,817,729 | |
| Total Common Stocks | | | | | | | | |
| (Cost $954,766,846) | | | | | | $ | 1,006,363,731 | |
| | | | | | | | | |
| MONEY MARKET FUNDS — 0.1% | | |
| SEI Daily Income Trust, Government Fund - Class F, 0.15% (b) (Cost $1,595,906) | | | 1,595,906 | | | $ | 1,595,906 | |
| | | | | | | | | |
| Investments at Value — 100.0% | | | | | | | | |
| (Cost $956,362,752) | | | | | | $ | 1,007,959,637 | |
| | | | | | | | | |
| Liabilities in Excess of Other Assets — (0.0%) (c) | | | | | | | (258,180 | ) |
| | | | | | | | | |
| Net Assets — 100.0% | | | | | | $ | 1,007,701,457 | |
| (a) | Non-income producing security. |
| (b) | The rate shown is the 7-day effective yield as of April 30, 2022. |
| (c) | Percentage rounds to less than 0.1%. |
The accompanying notes are an integral part of the financial statements.
| WESTWOOD QUALITY ALLCAP FUND |
| APRIL 30, 2022 (Unaudited) |
| Sector Weightings (Unaudited)† |
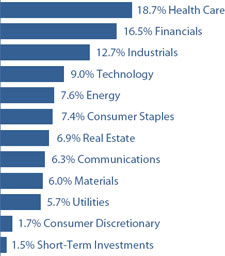
| † | Percentages are based on total investments. |
| SCHEDULE OF INVESTMENTS |
| COMMON STOCKS — 98.5% |
| | | Shares | | | Value | |
| Communications — 6.3% | | | | | | | | |
| Entertainment Content — 2.0% | | | | | | | | |
| Madison Square Garden Entertainment Corporation (a) | | | 5,905 | | | $ | 432,541 | |
| | | | | | | | | |
| Internet Media & Services — 1.7% | | | | | | | | |
| Alphabet, Inc. - Class A (a) | | | 165 | | | | 376,561 | |
| | | | | | | | | |
| Telecommunications — 2.6% | | | | | | | | |
| T-Mobile US, Inc. (a) | | | 4,468 | | | | 550,190 | |
| | | | | | | | | |
| Consumer Discretionary — 1.7% | | | | | | | | |
| Retail - Discretionary — 1.7% | | | | | | | | |
| O’Reilly Automotive, Inc. (a) | | | 613 | | | | 371,815 | |
| | | | | | | | | |
| Consumer Staples — 7.4% | | | | | | | | |
| Beverages — 3.2% | | | | | | | | |
| Duckhorn Portfolio, Inc. (The) (a) | | | 12,147 | | | | 235,895 | |
| PepsiCo, Inc. | | | 2,581 | | | | 443,183 | |
| | | | | | | | 679,078 | |
| Household Products — 2.0% | | | | | | | | |
| Church & Dwight Company, Inc. | | | 4,514 | | | | 440,386 | |
| | | | | | | | | |
| Retail - Consumer Staples — 2.2% | | | | | | | | |
| Walmart, Inc. | | | 3,156 | | | | 482,837 | |
| | | | | | | | | |
| Energy — 7.6% | | | | | | | | |
| Oil & Gas Producers — 7.6% | | | | | | | | |
| Devon Energy Corporation | | | 9,516 | | | | 553,546 | |
| COMMON STOCKS — continued |
| | | Shares | | | Value | |
| Energy — continued | | | | | | | | |
| Oil & Gas Producers — continued | | | | | | | | |
| PDC Energy, Inc. | | | 6,226 | | | $ | 434,201 | |
| Pioneer Natural Resources Company | | | 2,767 | | | | 643,244 | |
| | | | | | | | 1,630,991 | |
| Financials — 16.5% | | | | | | | | |
| Asset Management — 1.1% | | | | | | | | |
| Apollo Global Management, Inc. | | | 4,756 | | | | 236,658 | |
| | | | | | | | | |
| Banking — 7.9% | | | | | | | | |
| Bank of America Corporation | | | 14,651 | | | | 522,748 | |
| BOK Financial Corporation | | | 4,300 | | | | 356,599 | |
| Pinnacle Financial Partners, Inc. | | | 4,361 | | | | 338,195 | |
| PNC Financial Services Group, Inc. (The) | | | 2,871 | | | | 476,873 | |
| | | | | | | | 1,694,415 | |
| Institutional Financial Services — 1.5% | | | | | | | | |
| Perella Weinberg Partners | | | 40,539 | | | | 312,556 | |
| | | | | | | | | |
| Insurance — 6.0% | | | | | | | | |
| American International Group, Inc. | | | 5,466 | | | | 319,816 | |
| Chubb Ltd. | | | 2,251 | | | | 464,719 | |
| International General Insurance Holdings Ltd. | | | 26,170 | | | | 198,107 | |
| Progressive Corporation (The) | | | 2,995 | | | | 321,543 | |
| | | | | | | | 1,304,185 | |
| Health Care — 18.7% | | | | | | | | |
| Biotech & Pharma — 6.0% | | | | | | | | |
| Gilead Sciences, Inc. | | | 9,837 | | | | 583,727 | |
| Johnson & Johnson | | | 3,904 | | | | 704,516 | |
| | | | | | | | 1,288,243 | |
| Health Care Facilities & Services — 5.7% | | | | | | | | |
| CVS Health Corporation | | | 4,376 | | | | 420,665 | |
| McKesson Corporation | | | 1,446 | | | | 447,696 | |
| UnitedHealth Group, Inc. | | | 702 | | | | 357,002 | |
| | | | | | | | 1,225,363 | |
| Medical Equipment & Devices — 7.0% | | | | | | | | |
| Becton, Dickinson and Company | | | 2,566 | | | | 634,290 | |
| ICU Medical, Inc. (a) | | | 2,076 | | | | 444,243 | |
| Medtronic plc | | | 4,170 | | | | 435,181 | |
| | | | | | | | 1,513,714 | |
| Industrials — 12.7% | | | | | | | | |
| Aerospace & Defense — 2.3% | | | | | | | | |
| L3Harris Technologies, Inc. | | | 2,173 | | | | 504,701 | |
| | | | | | | | | |
| Electrical Equipment — 4.2% | | | | | | | | |
| Fortive Corporation | | | 7,790 | | | | 447,925 | |
The accompanying notes are an integral part of the financial statements.
| WESTWOOD QUALITY ALLCAP FUND |
| APRIL 30, 2022 (Unaudited) |
| COMMON STOCKS — continued |
| | | Shares | | | Value | |
| Industrials — continued | | | | | | | | |
| Electrical Equipment — continued | | | | | | | | |
| nLight, Inc. (a) | | | 15,140 | | | $ | 199,091 | |
| Veritiv Holdings Company | | | 19,694 | | | | 246,766 | |
| | | | | | | | 893,782 | |
| Machinery — 4.1% | | | | | | | | |
| AGCO Corporation | | | 4,335 | | | | 552,279 | |
| Albany International Corporation - Class A | | | 4,277 | | | | 334,547 | |
| | | | | | | | 886,826 | |
| Transportation & Logistics — 2.1% | | | | | | | | |
| Norfolk Southern Corporation | | | 1,782 | | | | 459,542 | |
| | | | | | | | | |
| Materials — 6.0% | | | | | | | | |
| Chemicals — 6.0% | | | | | | | | |
| Albemarle Corporation | | | 2,350 | | | | 453,150 | |
| Corteva, Inc. | | | 7,397 | | | | 426,733 | |
| Ecovyst, Inc. | | | 41,259 | | | | 415,066 | |
| | | | | | | | 1,294,949 | |
| Real Estate — 6.9% | | | | | | | | |
| Real Estate Owners & Developers — 1.8% | | | | | | | | |
| Radius Global Infrastructure, Inc. - Class A (a) | | | 31,048 | | | | 385,616 | |
| | | | | | | | | |
| REITs — 5.1% | | | | | | | | |
| Alexandria Real Estate Equities, Inc. | | | 2,205 | | | | 401,663 | |
| Americold Realty Trust | | | 10,500 | | | | 276,990 | |
| VICI Properties, Inc. | | | 13,953 | | | | 415,939 | |
| | | | | | | | 1,094,592 | |
| Technology — 9.0% | | | | | | | | |
| Semiconductors — 4.1% | | | | | | | | |
| Rambus, Inc. (a) | | | 17,763 | | | | 442,477 | |
| Teradyne, Inc. | | | 4,131 | | | | 435,655 | |
| | | | | | | | 878,132 | |
| Software — 1.5% | | | | | | | | |
| Microsoft Corporation | | | 1,146 | | | | 318,038 | |
| | | | | | | | | |
| Technology Hardware — 1.5% | | | | | | | | |
| Cisco Systems, Inc. | | | 6,611 | | | | 323,807 | |
| | | | | | | | | |
| Technology Services — 1.9% | | | | | | | | |
| CACI International, Inc. - Class A (a) | | | 1,564 | | | | 414,929 | |
| COMMON STOCKS — continued |
| | | Shares | | | Value | |
| Utilities — 5.7% | | | | | | | | |
| Electric Utilities — 5.7% | | | | | | | | |
| CMS Energy Corporation | | | 7,181 | | | $ | 493,263 | |
| DTE Energy Company | | | 2,939 | | | | 385,127 | |
| WEC Energy Group, Inc. | | | 3,569 | | | | 357,078 | |
| | | | | | | | 1,235,468 | |
| Total Common Stocks | | | | | | | | |
| (Cost $21,796,687) | | | | | | $ | 21,229,915 | |
| | | | | | | | | |
| MONEY MARKET FUNDS — 1.5% | | | | | | | | |
| First American Treasury Obligations Fund - Class X, 0.28% (b) (Cost $316,606) | | | 316,606 | | | $ | 316,606 | |
| | | | | | | | | |
| Investments at Value — 100.0% | | | | | | | | |
| (Cost $22,113,293) | | | | | | $ | 21,546,521 | |
| | | | | | | | | |
| Other Assets in Excess of Liabilities — 0.0% (c) | | | | | | | 11,700 | |
| | | | | | | | | |
| Net Assets — 100.0% | | | | | | $ | 21,558,221 | |
plc - Public Limited Company
| (a) | Non-income producing security. |
| (b) | The rate shown is the 7-day effective yield as of April 30, 2022. |
| (c) | Percentage rounds to less than 0.1%. |
The accompanying notes are an integral part of the financial statements.
| WESTWOOD TOTAL RETURN FUND |
| APRIL 30, 2022 (Unaudited) |
| Sector Weightings (Unaudited)† |
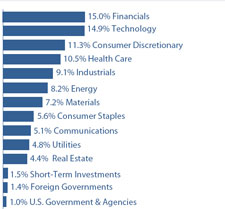
| † | Percentages are based on total investments. |
| SCHEDULE OF INVESTMENTS |
| U.S. GOVERNMENT & AGENCIES — 1.0% |
| | | Coupon | | Maturity | | Par Value | | | Value | |
| U.S. Treasury Bonds — 1.0% | | | | | | | | | | | | |
| U.S. Treasury Bonds (Costs $1,228,774) | | 1.875% | | 11/15/51 | | $ | 1,525,000 | | | $ | 1,201,414 | |
| | | | | | | | | | | | | |
| CONVERTIBLE BONDS — 7.9% | | | | | | | | | | | | |
| Communications — 0.9% | | | | | | | | | | | | |
| Snap, Inc. | | 0.125% | | 03/01/28 | | $ | 1,349,000 | | | $ | 1,182,398 | |
| | | | | | | | | | | | | |
| Consumer Staples — 0.8% | | | | | | | | | | | | |
| Tilray, Inc. | | 5.000% | | 10/01/23 | | | 1,000,000 | | | | 975,000 | |
| | | | | | | | | | | | | |
| Health Care — 1.6% | | | | | | | | | | | | |
| CONMED Corporation | | 2.625% | | 02/01/24 | | | 810,000 | | | | 1,268,472 | |
| Exact Sciences Corporation | | 0.375% | | 03/15/27 | | | 810,000 | | | | 689,715 | |
| | | | | | | | | | | | 1,958,187 | |
| Industrials — 0.8% | | | | | | | | | | | | |
| Southwest Airlines Company | | 1.250% | | 05/01/25 | | | 715,000 | | | | 976,333 | |
| | | | | | | | | | | | | |
| Real Estate — 1.1% | | | | | | | | | | | | |
| Radius Global Infrastructure, Inc., 144A | | 2.500% | | 09/15/26 | | | 1,500,000 | | | | 1,334,062 | |
| | | | | | | | | | | | | |
| Technology — 2.7% | | | | | | | | | | | | |
| Akamai Technologies, Inc. | | 0.125% | | 05/01/25 | | | 985,000 | | | | 1,233,220 | |
| Workday, Inc. | | 0.250% | | 10/01/22 | | | 645,000 | | | | 913,320 | |
| Ziff Davis, Inc., 144A | | 1.750% | | 11/01/26 | | | 1,182,000 | | | | 1,259,421 | |
| | | | | | | | | | | | 3,405,961 | |
| Total Convertible Bonds | | | | | | | | | | | | |
| (Cost $9,519,571) | | | | | | | | | | $ | 9,831,941 | |
The accompanying notes are an integral part of the financial statements.
| WESTWOOD TOTAL RETURN FUND |
| APRIL 30, 2022 (Unaudited) |
| | | Coupon | | Maturity | | Par Value | | | Value | |
| CORPORATE BONDS — 33.4% | | | | | | | | | | | | |
| Communications — 3.0% | | | | | | | | | | | | |
| América Móvil S.A.B. de C.V., 144A | | 5.375% | | 04/04/32 | | $ | 465,000 | | | $ | 423,062 | |
| DIRECTV Holdings, LLC, 144A | | 5.875% | | 08/15/27 | | | 1,225,000 | | | | 1,153,031 | |
| Expedia Group, Inc. | | 0.000% | | 02/15/26 | | | 345,000 | | | | 404,513 | |
| Magellanes, Inc., 144A | | 4.279% | | 03/15/32 | | | 742,000 | | | | 690,247 | |
| Netflix, Inc. | | 6.375% | | 05/15/29 | | | 665,000 | | | | 704,900 | |
| T-Mobile USA, Inc. | | 3.375% | | 04/15/29 | | | 325,000 | | | | 295,176 | |
| | | | | | | | | | | | 3,670,929 | |
| Consumer Discretionary — 5.8% | | | | | | | | | | | | |
| AMC Entertainment Holdings, Inc., 144A | | 7.500% | | 02/15/29 | | | 1,375,000 | | | | 1,258,125 | |
| Aptiv plc/Aptiv Corporation | | 3.250% | | 03/01/32 | | | 540,000 | | | | 476,972 | |
| At Home Group, Inc., 144A | | 4.875% | | 07/15/28 | | | 1,000,000 | | | | 826,250 | |
| Brunswick Corporation | | 2.400% | | 08/18/31 | | | 671,000 | | | | 528,502 | |
| Cinemark USA, Inc., 144A | | 5.875% | | 03/15/26 | | | 750,000 | | | | 699,375 | |
| Darden Restaurants, Inc. | | 4.550% | | 02/15/48 | | | 690,000 | | | | 614,102 | |
| Dick’s Sporting Goods, Inc. | | 4.100% | | 01/15/52 | | | 650,000 | | | | 476,759 | |
| Ford Motor Credit Company, LLC | | 4.271% | | 01/09/27 | | | 485,000 | | | | 460,047 | |
| Marriott International, Inc. | | 4.625% | | 06/15/30 | | | 167,000 | | | | 164,838 | |
| NCL Finance Ltd., 144A | | 6.125% | | 03/15/28 | | | 100,000 | | | | 90,000 | |
| Party City Holdings, Inc., 144A | | 8.750% | | 02/15/26 | | | 300,000 | | | | 274,875 | |
| Royal Caribbean Cruises Ltd., 144A | | 9.125% | | 06/15/23 | | | 1,225,000 | | | | 1,264,610 | |
| | | | | | | | | | | | 7,134,455 | |
| Consumer Staples — 1.6% | | | | | | | | | | | | |
| Rite Aid Corporation, 144A | | 7.500% | | 07/01/25 | | | 1,000,000 | | | | 856,150 | |
| Vector Group Ltd., 144A | | 5.750% | | 02/01/29 | | | 700,000 | | | | 614,250 | |
| Viterra Finance B.V., 144A | | 2.000% | | 04/21/26 | | | 627,000 | | | | 562,364 | |
| | | | | | | | | | | | 2,032,764 | |
| Energy — 2.3% | | | | | | | | | | | | |
| Diamondback Energy, Inc. | | 4.400% | | 03/24/51 | | | 900,000 | | | | 810,629 | |
| NGL Energy Operating, LLC, 144A | | 7.500% | | 02/01/26 | | | 825,000 | | | | 776,028 | |
| Petróleos Mexicanos | | 6.700% | | 02/16/32 | | | 1,345,000 | | | | 1,158,960 | |
| Range Resources Corporation | | 8.250% | | 01/15/29 | | | 50,000 | | | | 53,610 | |
| | | | | | | | | | | | 2,799,227 | |
| Financials — 6.3% | | | | | | | | | | | | |
| AerCap Ireland Capital Ltd. | | 3.300% | | 01/30/32 | | | 691,000 | | | | 575,178 | |
| AerCap Ireland Capital Ltd. | | 3.850% | | 10/29/41 | | | 646,000 | | | | 501,862 | |
| Aircastle Ltd., 144A | | 5.250% | | 08/11/25 | | | 510,000 | | | | 509,023 | |
| Aircastle Ltd., 144A | | 2.850% | | 01/26/28 | | | 1,500,000 | | | | 1,310,664 | |
| Apollo Management Holdings, L.P., 144A | | 4.872% | | 02/15/29 | | | 480,000 | | | | 489,830 | |
| Ares Capital Corporation, 144A | | 3.875% | | 01/15/26 | | | 1,625,000 | | | | 1,558,711 | |
| Bank of America Corporation (3MO LIBOR + 131) (a) | | 4.271% | | 07/23/29 | | | 470,000 | | | | 461,229 | |
| Compass Group Diversified Holdings, LLC, 144A | | 5.250% | | 04/15/29 | | | 1,121,000 | | | | 1,006,097 | |
| HSBC Holdings plc (SOFR + 253) (a) | | 4.762% | | 03/29/33 | | | 624,000 | | | | 590,927 | |
| UBS Group AG, 144A (Yield of U.S. T-Note 0.625% 07/26 + 85) (a) | | 1.494% | | 08/10/27 | | | 865,000 | | | | 768,043 | |
| | | | | | | | | | | | 7,771,564 | |
The accompanying notes are an integral part of the financial statements.
| WESTWOOD TOTAL RETURN FUND |
| APRIL 30, 2022 (Unaudited) |
| | | Coupon | | Maturity | | Par Value | | | Value | |
| CORPORATE BONDS — continued | | | | | | | | | | | | |
| Health Care — 2.3% | | | | | | | | | | | | |
| Community Health Systems, Inc., 144A | | 5.250% | | 05/15/30 | | $ | 1,400,000 | | | $ | 1,227,310 | |
| HCA, Inc. | | 3.500% | | 07/15/51 | | | 879,000 | | | | 654,042 | |
| Tenet Healthcare Corporation, 144A | | 6.250% | | 02/01/27 | | | 925,000 | | | | 918,063 | |
| | | | | | | | | | | | 2,799,415 | |
| Industrials — 3.8% | | | | | | | | | | | | |
| AAdvantage Loyalty IP Ltd., 144A | | 5.500% | | 04/20/26 | | | 250,000 | | | | 247,813 | |
| Alarm.com Holdings, Inc. | | 0.000% | | 01/15/26 | | | 575,000 | | | | 476,675 | |
| American Airlines Pass Through Trust, Series 2021-1B | | 3.950% | | 07/11/30 | | | 880,000 | | | | 794,690 | |
| AP Moller - Maersk A/S, 144A | | 4.500% | | 06/20/29 | | | 600,000 | | | | 605,861 | |
| Deluxe Corporation, 144A | | 8.000% | | 06/01/29 | | | 1,000,000 | | | | 948,750 | |
| Sempra Infrastructure, 144A | | 3.250% | | 01/15/32 | | | 853,000 | | | | 738,667 | |
| Triton Container International Ltd., 144A | | 0.800% | | 08/01/23 | | | 965,000 | | | | 929,149 | |
| | | | | | | | | | | | 4,741,605 | |
| Materials — 3.0% | | | | | | | | | | | | |
| Cabot Corporation | | 4.000% | | 07/01/29 | | | 395,000 | | | | 380,238 | |
| FMC Corporation | | 4.500% | | 10/01/49 | | | 366,000 | | | | 344,769 | |
| Glencore Funding, LLC, 144A | | 3.875% | | 04/27/51 | | | 202,000 | | | | 166,254 | |
| Livent Corporation | | 4.125% | | 07/15/25 | | | 460,000 | | | | 1,188,870 | |
| SSR Mining, Inc. | | 2.500% | | 04/01/39 | | | 1,155,000 | | | | 1,612,957 | |
| | | | | | | | | | | | 3,693,088 | |
| Real Estate — 1.4% | | | | | | | | | | | | |
| Iron Mountain, Inc., 144A | | 5.000% | | 07/15/28 | | | 730,000 | | | | 691,609 | |
| Service Properties Trust | | 5.000% | | 08/15/22 | | | 516,000 | | | | 513,868 | |
| Simon Property Group, L.P. | | 2.650% | | 02/01/32 | | | 668,000 | | | | 575,231 | |
| | | | | | | | | | | | 1,780,708 | |
| Technology — 3.3% | | | | | | | | | | | | |
| DXC Technology Company | | 1.800% | | 09/15/26 | | | 671,000 | | | | 600,178 | |
| Kyndryl Holdings, Inc., 144A | | 2.050% | | 10/15/26 | | | 336,000 | | | | 293,502 | |
| MongoDB, Inc. | | 0.250% | | 01/15/26 | | | 550,000 | | | | 984,500 | |
| MPH Acquisition Holdings, LLC, 144A | | 5.500% | | 09/01/28 | | | 1,100,000 | | | | 1,018,875 | |
| NICE Ltd. | | 0.000% | | 09/15/25 | | | 1,040,000 | | | | 1,059,500 | |
| Oracle Corporation | | 2.875% | | 03/25/31 | | | 116,000 | | | | 98,023 | |
| | | | | | | | | | | | 4,054,578 | |
| Utilities — 0.6% | | | | | | | | | | | | |
| Consolidated Edison Company of New York, Inc. | | 3.200% | | 12/01/51 | | | 1,000,000 | | | | 790,434 | |
| | | | | | | | | | | | | |
| Total Corporate Bonds | | | | | | | | | | | | |
| (Cost $44,160,795) | | | | | | | | | | $ | 41,268,767 | |
| | | | | | | | | | | | | |
| FOREIGN GOVERNMENTS — 1.4% | | | | | | | | | | | | |
| Chile Government International Bond | | 3.500% | | 01/31/34 | | $ | 1,000,000 | | | $ | 906,990 | |
| Republic of South Africa Government | | 5.875% | | 04/20/32 | | | 885,000 | | | | 841,458 | |
| Total Foreign Governments | | | | | | | | | | | | |
| (Cost $1,884,295) | | | | | | | | | | $ | 1,748,448 | |
The accompanying notes are an integral part of the financial statements.
| WESTWOOD TOTAL RETURN FUND |
| APRIL 30, 2022 (Unaudited) |
| | | Shares | | | Value | |
| Consumer Discretionary — 5.5% | | | | | | | | |
| Automotive — 1.8% | | | | | | | | |
| Toyota Motor Corporation - ADR | | | 12,727 | | | $ | 2,176,317 | |
| | | | | | | | | |
| E-Commerce Discretionary — 1.0% | | | | | | | | |
| Alibaba Group Holding Ltd. - ADR (b) | | | 4,885 | | | | 474,284 | |
| Amazon.com, Inc. (b) | | | 330 | | | | 820,258 | |
| | | | | | | | 1,294,542 | |
| Home Construction — 0.7% | | | | | | | | |
| Toll Brothers, Inc. | | | 19,000 | | | | 881,030 | |
| | | | | | | | | |
| Leisure Facilities & Services — 1.2% | | | | | | | | |
| McDonald’s Corporation | | | 5,744 | | | | 1,431,175 | |
| | | | | | | | | |
| Retail - Discretionary — 0.8% | | | | | | | | |
| Home Depot, Inc. (The) | | | 3,149 | | | | 945,960 | |
| | | | | | | | | |
| Consumer Staples — 3.1% | | | | | | | | |
| Household Products — 0.9% | | | | | | | | |
| Colgate-Palmolive Company | | | 14,191 | | | | 1,093,417 | |
| | | | | | | | | |
| Retail - Consumer Staples — 1.2% | | | | | | | | |
| Walmart, Inc. | | | 9,969 | | | | 1,525,157 | |
| | | | | | | | | |
| Tobacco & Cannabis — 1.0% | | | | | | | | |
| Altria Group, Inc. | | | 21,744 | | | | 1,208,314 | |
| | | | | | | | | |
| Energy — 5.9% | | | | | | | | |
| Oil & Gas Producers — 5.1% | | | | | | | | |
| Devon Energy Corporation | | | 54,935 | | | | 3,195,569 | |
| Energy Transfer, L.P. | | | 279,638 | | | | 3,098,389 | |
| | | | | | | | 6,293,958 | |
| Renewable Energy — 0.8% | | | | | | | | |
| Atlantica Sustainable Infrastructure plc | | | 32,315 | | | | 998,533 | |
| | | | | | | | | |
| Financials — 8.7% | | | | | | | | |
| Asset Management — 1.0% | | | | | | | | |
| Blackstone, Inc. | | | 12,290 | | | | 1,248,295 | |
| | | | | | | | | |
| Banking — 4.3% | | | | | | | | |
| Citigroup, Inc. | | | 17,755 | | | | 855,969 | |
| JPMorgan Chase & Company | | | 19,905 | | | | 2,375,861 | |
| Truist Financial Corporation | | | 24,489 | | | | 1,184,043 | |
| Wells Fargo & Company | | | 21,237 | | | | 926,570 | |
| | | | | | | | 5,342,443 | |
| COMMON STOCKS — continued |
| | | Shares | | | Value | |
| Financials —continued | | | | | | | | |
| Institutional Financial Services — 0.7% | | | | | | | | |
| Moelis & Company - Class A | | | 17,650 | | | $ | 781,189 | |
| | | | | | | | | |
| Insurance — 0.8% | | | | | | | | |
| Chubb Ltd. | | | 4,971 | | | | 1,026,263 | |
| | | | | | | | | |
| Specialty Finance — 1.9% | | | | | | | | |
| Annaly Capital Management, Inc. | | | 173,174 | | | | 1,111,777 | |
| MGIC Investment Corporation | | | 90,090 | | | | 1,176,576 | |
| | | | | | | | 2,288,353 | |
| Health Care — 5.4% | | | | | | | | |
| Biotech & Pharma — 4.7% | | | | | | | | |
| Amgen, Inc. | | | 6,873 | | | | 1,602,715 | |
| Bristol-Myers Squibb Company | | | 24,708 | | | | 1,859,771 | |
| Gilead Sciences, Inc. | | | 26,577 | | | | 1,577,079 | |
| Johnson & Johnson | | | 4,024 | | | | 726,171 | |
| | | | | | | | 5,765,736 | |
| Medical Equipment & Devices — 0.7% | | | | | | | | |
| Medtronic plc | | | 8,586 | | | | 896,035 | |
| | | | | | | | | |
| Industrials — 4.4% | | | | | | | | |
| Aerospace & Defense — 0.9% | | | | | | | | |
| Moog, Inc. - Class A | | | 13,978 | | | | 1,116,423 | |
| | | | | | | | | |
| Diversified Industrials — 0.8% | | | | | | | | |
| Honeywell International, Inc. | | | 5,172 | | | | 1,000,834 | |
| | | | | | | | | |
| Electrical Equipment — 0.7% | | | | | | | | |
| Amphenol Corporation - Class A | | | 12,043 | | | | 861,074 | |
| | | | | | | | | |
| Machinery — 1.0% | | | | | | | | |
| Deere & Company | | | 3,162 | | | | 1,193,813 | |
| | | | | | | | | |
| Transportation & Logistics — 1.0% | | | | | | | | |
| Union Pacific Corporation | | | 5,471 | | | | 1,281,801 | |
| | | | | | | | | |
| Materials — 4.2% | | | | | | | | |
| Chemicals — 0.9% | | | | | | | | |
| Dow, Inc. | | | 17,711 | | | | 1,177,782 | |
| | | | | | | | | |
| Metals & Mining — 3.3% | | | | | | | | |
| Barrick Gold Corporation | | | 52,015 | | | | 1,160,454 | |
| Freeport-McMoRan, Inc. | | | 46,925 | | | | 1,902,809 | |
| Glencore plc - ADR | | | 80,377 | | | | 985,181 | |
| | | | | | | | 4,048,444 | |
The accompanying notes are an integral part of the financial statements.
| WESTWOOD TOTAL RETURN FUND |
| APRIL 30, 2022 (Unaudited) |
| COMMON STOCKS — continued |
| | | Shares | | | Value | |
| Real Estate — 1.8% | | | | | | | | |
| REITs — 1.8% | | | | | | | | |
| Simon Property Group, Inc. | | | 12,915 | | | $ | 1,523,970 | |
| VICI Properties, Inc. | | | 24,441 | | | | 728,586 | |
| | | | | | | | 2,252,556 | |
| Technology — 7.7% | | | | | | | | |
| Semiconductors — 0.8% | | | | | | | | |
| Taiwan Semiconductor Manufacturing Company Ltd. - ADR | | | 10,127 | | | | 941,102 | |
| | | | | | | | | |
| Software — 2.1% | | | | | | | | |
| Microsoft Corporation | | | 9,176 | | | | 2,546,524 | |
| | | | | | | | | |
| Technology Hardware — 4.8% | | | | | | | | |
| Apple, Inc. | | | 30,877 | | | | 4,867,759 | |
| Cisco Systems, Inc. | | | 22,907 | | | | 1,121,985 | |
| | | | | | | | 5,989,744 | |
| Utilities — 2.4% | | | | | | | | |
| Electric Utilities — 2.4% | | | | | | | | |
| CMS Energy Corporation | | | 10,374 | | | | 712,590 | |
| NextEra Energy Partners, L.P. | | | 20,618 | | | | 1,374,396 | |
| WEC Energy Group, Inc. | | | 9,203 | | | | 920,760 | |
| | | | | | | | 3,007,746 | |
| Total Common Stocks | | | | | | | | |
| (Cost $54,565,849) | | | | | | $ | 60,614,560 | |
| | | | | | | | | |
| PREFERRED STOCKS — 5.3% | | | | | | | | |
| Communications — 1.2% | | | | | | | | |
| Telecommunications — 1.2% | | | | | | | | |
| 2020 Cash Mandatory Exchangeable Trust, 5.250%,144A | | | 1,350 | | | $ | 1,475,658 | |
| | | | | | | | | |
| Health Care — 1.2% | | | | | | | | |
| Medical Equipment & Devices — 1.2% | | | | | | | | |
| Boston Scientific Corporation, 5.500% - Series A | | | 13,425 | | | | 1,515,011 | |
| | | | | | | | | |
| Technology — 1.2% | | | | | | | | |
| Semiconductors — 1.2% | | | | | | | | |
| Broadcom, Inc., 8.000% | | | 812 | | | | 1,416,534 | |
| | | | | | | | | |
| Utilities — 1.7% | | | | | | | | |
| Electric Utilities — 1.7% | | | | | | | | |
| AES Corporation (The), 6.875% | | | 11,575 | | | | 1,002,395 | |
| PREFERRED STOCKS — continued |
| | | Shares | | | Value | |
| Utilities — continued | | | | | | | | |
| Electric Utilities — continued | | | | | | | | |
| American Electric Power Company, Inc., 6.125% | | | 20,275 | | | $ | 1,135,400 | |
| | | | | | | | 2,137,795 | |
| Total Preferred Stocks | | | | | | | | |
| (Cost $5,968,785) | | | | | | | 6,544,998 | |
| | | | | | | | | |
| MONEY MARKET FUNDS — 1.5% | |
| SEI Daily Income Trust, Government Fund - Class F, 0.15% (c) (Cost $1,855,936) | | | 1,855,936 | | | $ | 1,855,936 | |
| | | | | | | | | |
| Investments at Value — 99.6% | | | | | | | | |
| (Cost $119,184,005) | | | | | | $ | 123,066,064 | |
| | | | | | | | | |
| Other Assets in Excess of Liabilities — 0.4% | | | | | | | 475,479 | |
| | | | | | | | | |
| Net Assets — 100.0% | | | | | | $ | 123,541,543 | |
144A - Security was purchased in a transaction exempt from registration in compliance with Rule 144A of the Securities Act of 1933. This security may be resold in transactions exempt from registration, normally to qualified institutional buyers. The total value of such securities is $26,985,729 as of April 30, 2022, representing 21.8% of net assets.
A/S - Aktieselskab
ADR - American Depositary Receipt
AG - Aktiengesellschaft
B.V. - Besloten Vennootschap
LIBOR - London Interbank Offered Rate
plc - Public Limited Company
S.A.B de C.V. - Societe Anonima Bursatil de Capital Variable
SOFR - Secured Overnight Financing Rate
T-Note - U.S. Treasury Note
| (a) | Variable rate security. Interest rate resets periodically. The rate shown is the effective interest rate as of April 30, 2022. For securities based on a published reference rate and spread, the reference rate and spread (in basis points) are indicated parenthetically. Certain variable rate securities are not based on a published reference rate and spread but are determined by the issuer or agent and are based on current market conditions. These securities, therefore, do not indicate a reference rate and spread. |
| (b) | Non-income producing security. |
| (c) | The rate shown is the 7-day effective yield as of April 30, 2022. |
The accompanying notes are an integral part of the financial statements.
| WESTWOOD INCOME OPPORTUNITY FUND |
| APRIL 30, 2022 (Unaudited) |
| Sector Weightings (Unaudited)† |
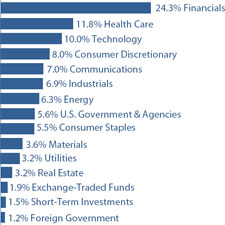
| † | Percentages are based on total investments. |
| SCHEDULE OF INVESTMENTS |
| U.S. GOVERNMENT & AGENCIES — 5.5% |
| | | Coupon | | Maturity | | Par Value | | | Value | |
| U.S. Treasury Bonds — 1.1% | | | | | | | | | | | | |
| U.S. Treasury Bonds | | 1.875% | | 11/15/51 | | $ | 10,658,000 | | | $ | 8,396,506 | |
| | | | | | | | | | | | | |
| U.S. Treasury Notes — 4.4% | | | | | | | | | | | | |
| U.S. Treasury Notes | | 2.250% | | 03/31/24 | | | 9,735,000 | | | | 9,656,283 | |
| U.S. Treasury Notes | | 1.250% | | 12/31/26 | | | 2,000,000 | | | | 1,854,141 | |
| U.S. Treasury Notes | | 2.500% | | 03/31/27 | | | 9,735,000 | | | | 9,548,666 | |
| U.S. Treasury Notes | | 1.625% | | 08/15/29 | | | 13,864,000 | | | | 12,702,348 | |
| | | | | | | | | | | | 33,761,438 | |
| Total U.S. Government & Agencies | | | | | | | | | | | | |
| (Cost $43,997,869) | | | | | | | | | | $ | 42,157,944 | |
| | | | | | | | | | | | | |
| CONVERTIBLE BONDS — 3.5% | | | | | | | | | | | | |
| Communications — 1.0% | | | | | | | | | | | | |
| Snap, Inc. | | 0.125% | | 03/01/28 | | $ | 8,192,000 | | | $ | 7,180,288 | |
| | | | | | | | | | | | | |
| Health Care — 0.7% | | | | | | | | | | | | |
| Exact Sciences Corporation | | 0.375% | | 03/15/27 | | | 6,523,000 | | | | 5,554,335 | |
| | | | | | | | | | | | | |
| Industrials — 0.9% | | | | | | | | | | | | |
| Southwest Airlines Company | | 1.250% | | 05/01/25 | | | 5,086,000 | | | | 6,944,933 | |
| | | | | | | | | | | | | |
| Technology — 0.9% | | | | | | | | | | | | |
| Akamai Technologies, Inc. | | 0.125% | | 05/01/25 | | | 5,733,000 | | | | 7,177,716 | |
| | | | | | | | | | | | | |
| Total Convertible Bonds | | | | | | | | | | | | |
| (Cost $26,612,786) | | | | | | | | | | $ | 26,857,272 | |
The accompanying notes are an integral part of the financial statements.
| WESTWOOD INCOME OPPORTUNITY FUND |
| APRIL 30, 2022 (Unaudited) |
| | | Coupon | | Maturity | | Par Value | | | Value | |
| Communications — 4.2% | | | | | | | | | | | | |
| América Móvil S.A.B. de C.V., 144A | | 5.375% | | 04/04/32 | | $ | 3,050,000 | | | $ | 2,774,921 | |
| Charter Communications Operating, LLC | | 3.700% | | 04/01/51 | | | 5,860,000 | | | | 4,146,026 | |
| Comcast Corporation | | 0.250% | | 05/20/27 | | | 3,000,000 | | | | 2,924,314 | |
| DISH DBS Corporation | | 5.875% | | 11/15/24 | | | 4,300,000 | | | | 4,171,000 | |
| Magellanes, Inc., 144A | | 4.279% | | 03/15/32 | | | 4,568,000 | | | | 4,249,393 | |
| Netflix, Inc. | | 6.375% | | 05/15/29 | | | 4,315,000 | | | | 4,573,900 | |
| Rogers Communications, Inc., 144A | | 4.550% | | 03/15/52 | | | 4,091,000 | | | | 3,641,624 | |
| Vodafone Group plc | | 4.875% | | 06/19/49 | | | 5,627,000 | | | | 5,396,122 | |
| | | | | | | | | | | | 31,877,300 | |
| Consumer Discretionary — 3.7% | | | | | | | | | | | | |
| Brunswick Corporation | | 2.400% | | 08/18/31 | | | 4,145,000 | | | | 3,264,741 | |
| Dick’s Sporting Goods, Inc. | | 4.100% | | 01/15/52 | | | 3,959,000 | | | | 2,903,831 | |
| Genuine Parts Company | | 1.875% | | 11/01/30 | | | 390,000 | | | | 317,937 | |
| Hyatt Hotels Corporation | | 1.800% | | 10/01/24 | | | 3,937,000 | | | | 3,744,481 | |
| Marriott International, Inc. | | 4.625% | | 06/15/30 | | | 1,581,000 | | | | 1,560,535 | |
| Ross Stores, Inc. | | 4.600% | | 04/15/25 | | | 6,085,000 | | | | 6,222,933 | |
| Royal Caribbean Cruises Ltd., 144A | | 9.125% | | 06/15/23 | | | 3,764,000 | | | | 3,885,709 | |
| Thor Industries, Inc., 144A | | 4.000% | | 10/15/29 | | | 2,760,000 | | | | 2,332,504 | |
| Whirlpool Corporation | | 4.750% | | 02/26/29 | | | 3,540,000 | | | | 3,589,935 | |
| | | | | | | | | | | | 27,822,606 | |
| Consumer Staples — 2.6% | | | | | | | | | | | | |
| 7-Eleven, Inc., 144A | | 0.950% | | 02/10/26 | | | 2,170,000 | | | | 1,942,206 | |
| Altria Group, Inc. | | 2.450% | | 02/04/32 | | | 2,077,000 | | | | 1,666,235 | |
| Conagra Brand, Inc. | | 5.400% | | 11/01/48 | | | 4,830,000 | | | | 4,833,897 | |
| Smithfield Foods, Inc., 144A | | 3.000% | | 10/15/30 | | | 2,799,000 | | | | 2,428,759 | |
| Vector Group Ltd., 144A | | 5.750% | | 02/01/29 | | | 3,727,000 | | | | 3,270,443 | |
| Viterra Finance B.V., 144A | | 2.000% | | 04/21/26 | | | 4,528,000 | | | | 4,061,216 | |
| Viterra Finance B.V., 144A | | 4.900% | | 04/21/27 | | | 1,869,000 | | | | 1,838,103 | |
| | | | | | | | | | | | 20,040,859 | |
| Energy — 2.3% | | | | | | | | | | | | |
| BP Capital Markets America, Inc. | | 3.543% | | 04/06/27 | | | 4,159,000 | | | | 4,096,361 | |
| BP Capital Markets America, Inc. | | 3.379% | | 02/08/61 | | | 1,521,000 | | | | 1,185,239 | |
| Diamondback Energy, Inc. | | 3.125% | | 03/24/31 | | | 1,159,000 | | | | 1,033,243 | |
| Grey Oak Pipeline, LLC, 144A | | 3.450% | | 10/15/27 | | | 420,000 | | | | 393,392 | |
| MPLX, L.P. | | 2.650% | | 08/15/30 | | | 728,000 | | | | 628,985 | |
| NGL Energy Operating, LLC, 144A | | 7.500% | | 02/01/26 | | | 3,313,000 | | | | 3,116,340 | |
| Petróleos Mexicanos | | 6.700% | | 02/16/32 | | | 6,515,000 | | | | 5,613,845 | |
| Schlumberger Finance Canada Ltd. | | 1.400% | | 09/17/25 | | | 1,001,000 | | | | 939,689 | |
| Transcontinental Gas Pipe Line Company, LLC | | 3.250% | | 05/15/30 | | | 892,000 | | | | 827,376 | |
| | | | | | | | | | | | 17,834,470 | |
| Financials — 15.9% | | | | | | | | | | | | |
| AerCap Ireland Capital Ltd. | | 6.500% | | 07/15/25 | | | 1,184,000 | | | | 1,227,911 | |
| AerCap Ireland Capital Ltd. | | 3.300% | | 01/30/32 | | | 3,939,000 | | | | 3,278,766 | |
| AerCap Ireland Capital Ltd. | | 3.850% | | 10/29/41 | | | 3,927,000 | | | | 3,050,791 | |
| Aircastle Ltd., 144A | | 5.250% | | 08/11/25 | | | 4,209,000 | | | | 4,200,940 | |
| Ally Financial, Inc. | | 1.450% | | 10/02/23 | | | 382,000 | | | | 371,441 | |
| Apollo Management Holdings, L.P., 144A | | 4.872% | | 02/15/29 | | | 4,325,000 | | | | 4,413,576 | |
The accompanying notes are an integral part of the financial statements.
| WESTWOOD INCOME OPPORTUNITY FUND |
| APRIL 30, 2022 (Unaudited) |
| CORPORATE BONDS — continued |
| | | Coupon | | Maturity | | Par Value | | | Value | |
| Financials — continued | | | | | | | | | | | | |
| Bank of America Corporation (a) | | 1.734% | | 07/22/27 | | $ | 4,280,000 | | | $ | 3,843,999 | |
| Bank of America Corporation, Series FF (b) | | 5.875% | | 12/31/49 | | | 6,940,000 | | | | 6,616,943 | |
| Barclays plc | | 4.375% | | 01/12/26 | | | 9,743,000 | | | | 9,715,903 | |
| Berkshire Hathaway Finance Corporation | | 2.850% | | 10/15/50 | | | 1,906,000 | | | | 1,450,865 | |
| BNP Paribas S.A., 144A (b) | | 4.625% | | 02/25/31 | | | 4,146,000 | | | | 3,492,798 | |
| Capital One Financial Corporation (Yield of U.S. T-Note 1.625% 02/31 + 112) (a) | | 2.359% | | 07/29/32 | | | 4,520,000 | | | | 3,642,609 | |
| Compass Group Diversified Holdings, LLC, 144A | | 5.250% | | 04/15/29 | | | 5,893,000 | | | | 5,288,967 | |
| Corebridge Financial, Inc., 144A | | 3.500% | | 04/04/25 | | | 2,259,000 | | | | 2,233,692 | |
| Goldman Sachs Group, Inc. (The) | | 3.615% | | 03/15/28 | | | 4,234,000 | | | | 4,066,990 | |
| Goldman Sachs Group, Inc. (The) (Yield of U.S. T-Note 1.625% 11/50 + 105) (a) | | 2.615% | | 04/22/32 | | | 822,000 | | | | 696,112 | |
| Hercules Capital, Inc. | | 2.625% | | 09/16/26 | | | 3,959,000 | | | | 3,566,451 | |
| HSBC Holdings plc (SOFR + 253) (a) | | 4.762% | | 03/29/33 | | | 3,983,000 | | | | 3,771,898 | |
| Intesa Sanpaolo S.p.A., 144A | | 4.198% | | 06/01/32 | | | 5,780,000 | | | | 4,792,953 | |
| JPMorgan Chase & Company | | 4.080% | | 04/26/26 | | | 3,170,000 | | | | 3,167,345 | |
| JPMorgan Chase & Company (a) | | 3.328% | | 04/22/52 | | | 7,410,000 | | | | 5,930,916 | |
| Mitsubishi UFJ Financial Group, Inc. (Yield of U.S. T-Note with a constant maturity of 1 year + 55) (a) | | 0.953% | | 07/19/25 | | | 5,075,000 | | | | 4,768,060 | |
| Morgan Stanley | | 1.512% | | 07/20/27 | | | 6,715,000 | | | | 5,982,732 | |
| Morgan Stanley (a) | | 5.297% | | 04/20/37 | | | 4,138,000 | | | | 4,142,681 | |
| Nomura Holdings, Inc. | | 2.679% | | 07/16/30 | | | 250,000 | | | | 215,303 | |
| Nomura Holdings, Inc. | | 2.999% | | 01/22/32 | | | 2,331,000 | | | | 2,017,693 | |
| Progressive Corporation | | 3.700% | | 03/15/52 | | | 4,417,000 | | | | 3,883,848 | |
| Royal Bank of Canada | | 1.600% | | 01/21/25 | | | 1,800,000 | | | | 1,709,688 | |
| UBS Group AG, 144A (Yield of U.S. T-Note 0.625% 07/26 + 85) (a) | | 1.494% | | 08/10/27 | | | 5,300,000 | | | | 4,705,925 | |
| Unum Group | | 4.125% | | 06/15/51 | | | 5,315,000 | | | | 4,180,500 | |
| Wells Fargo & Company (b) | | 5.900% | | 12/15/49 | | | 5,325,000 | | | | 5,205,187 | |
| Wells Fargo & Company (Yield of U.S. T-Note with a constant maturity of 5 years + 345.3) (a)(b) | | 3.900% | | 12/31/49 | | | 1,044,000 | | | | 952,598 | |
| Westpac Banking Corporation | | 3.133% | | 11/18/41 | | | 6,479,000 | | | | 5,036,848 | |
| | | | | | | | | | | | 121,622,929 | |
| Health Care — 3.4% | | | | | | | | | | | | |
| Amgen, Inc. | | 3.150% | | 02/21/40 | | | 8,387,000 | | | | 6,777,705 | |
| Bausch Health Companies, Inc., 144A | | 6.125% | | 02/01/27 | | | 4,177,000 | | | | 4,010,379 | |
| Community Health Systems, Inc., 144A | | 5.250% | | 05/15/30 | | | 5,575,000 | | | | 4,887,324 | |
| HCA, Inc., 144A | | 4.625% | | 03/15/52 | | | 5,571,000 | | | | 4,877,684 | |
| Royalty Pharma plc | | 3.550% | | 09/02/50 | | | 1,915,000 | | | | 1,413,450 | |
| Tenet Healthcare Corporation, 144A | | 6.250% | | 02/01/27 | | | 3,975,000 | | | | 3,945,188 | |
| | | | | | | | | | | | 25,911,730 | |
| Industrials — 0.9% | | | | | | | | | | | | |
| Delta Air Lines, Inc. | | 7.375% | | 01/15/26 | | | 557,000 | | | | 593,205 | |
| Flowserve Corporation | | 3.500% | | 10/01/30 | | | 1,867,000 | | | | 1,673,746 | |
| Sempra Infrastructure, 144A | | 3.250% | | 01/15/32 | | | 5,198,000 | | | | 4,501,281 | |
| | | | | | | | | | | | 6,768,232 | |
| Materials — 0.6% | | | | | | | | | | | | |
| FMC Corporation | | 4.500% | | 10/01/49 | | | 3,734,000 | | | | 3,517,402 | |
| Glencore Funding, LLC, 144A | | 3.875% | | 04/27/51 | | | 1,342,000 | | | | 1,104,517 | |
| | | | | | | | | | | | 4,621,919 | |
The accompanying notes are an integral part of the financial statements.
| WESTWOOD INCOME OPPORTUNITY FUND |
| APRIL 30, 2022 (Unaudited) |
| CORPORATE BONDS — continued |
| | | Coupon | | Maturity | | Par Value | | | Value | |
| Real Estate — 1.8% | | | | | | | | | | | | |
| Boston Properties, L.P. | | 2.450% | | 10/01/33 | | $ | 5,167,000 | | | $ | 4,200,849 | |
| Crown Castle International Corporation | | 2.900% | | 04/01/41 | | | 2,407,000 | | | | 1,798,941 | |
| Sabra Health Care, L.P. | | 3.200% | | 12/01/31 | | | 3,313,000 | | | | 2,783,551 | |
| Simon Property Group, L.P. | | 2.650% | | 02/01/32 | | | 4,104,000 | | | | 3,534,055 | |
| Vornado Realty, L.P. | | 3.400% | | 06/01/31 | | | 1,757,000 | | | | 1,547,549 | |
| | | | | | | | | | | | 13,864,945 | |
| Technology — 2.4% | | | | | | | | | | | | |
| Dell International, LLC | | 8.350% | | 07/15/46 | | | 3,980,000 | | | | 5,324,021 | |
| DXC Technology Company | | 1.800% | | 09/15/26 | | | 4,104,000 | | | | 3,670,834 | |
| Jabil, Inc. | | 1.700% | | 04/15/26 | | | 2,909,000 | | | | 2,626,277 | |
| Kyndryl Holdings, Inc., 144A | | 2.050% | | 10/15/26 | | | 2,124,000 | | | | 1,855,353 | |
| Microchip Technology, Inc. | | 2.670% | | 09/01/23 | | | 1,266,000 | | | | 1,254,244 | |
| Micron Technology, Inc. | | 2.703% | | 04/15/32 | | | 188,000 | | | | 156,575 | |
| Oracle Corporation | | 2.875% | | 03/25/31 | | | 779,000 | | | | 658,275 | |
| VMware, Inc. | | 4.700% | | 05/15/30 | | | 2,911,000 | | | | 2,937,995 | |
| | | | | | | | | | | | 18,483,574 | |
| Utilities — 0.7% | | | | | | | | | | | | |
| NextEra Energy Capital Holdings, Inc. | | 2.440% | | 01/15/32 | | | 1,313,000 | | | | 1,115,995 | |
| Pacific Gas and Electric Company | | 4.950% | | 07/01/50 | | | 4,895,000 | | | | 4,093,120 | |
| | | | | | | | | | | | 5,209,115 | |
| Total Corporate Bonds | | | | | | | | | | | | |
| (Cost $331,372,165) | | | | | | | | | | $ | 294,057,679 | |
| | | | | | | | | | | | | |
| FOREIGN GOVERNMENTS — 1.2% | | | | | | | | | | | | |
| Chile Government International Bond | | 2.750% | | 01/31/27 | | | 266,000 | | | $ | 252,027 | |
| Chile Government International Bond | | 4.340% | | 03/07/42 | | | 270,000 | | | | 246,394 | |
| Mexico Government International Bond | | 2.659% | | 05/24/31 | | | 890,000 | | | | 752,050 | |
| Mexico Government International Bond | | 3.500% | | 02/12/34 | | | 1,018,000 | | | | 861,513 | |
| Mexico Government International Bond | | 3.771% | | 05/24/61 | | | 835,000 | | | | 584,434 | |
| Panama Government International Bond | | 3.870% | | 07/23/60 | | | 508,000 | | | | 379,618 | |
| Peruvian Government International Bond | | 2.783% | | 01/23/31 | | | 735,000 | | | | 637,488 | |
| Peruvian Government International Bond | | 3.300% | | 03/11/41 | | | 749,000 | | | | 587,560 | |
| Saudi Government International Bond, 144A | | 2.250% | | 02/02/33 | | | 5,835,000 | | | | 5,059,610 | |
| Total Foreign Governments | | | | | | | | | | | | |
| (Cost $11,080,860) | | | | | | | | | | $ | 9,360,694 | |
The accompanying notes are an integral part of the financial statements.
| WESTWOOD INCOME OPPORTUNITY FUND |
| APRIL 30, 2022 (Unaudited) |
| | | Shares | | | Value | |
| Communications — 0.9% | | | | | | | | |
| Telecommunications — 0.9% | | | | | | | | |
| Verizon Communications, Inc. | | | 144,055 | | | $ | 6,669,746 | |
| | | | | | | | | |
| Consumer Discretionary — 4.3% | | | | | | | | |
| Automotive — 1.1% | | | | | | | | |
| Toyota Motor Corporation - ADR | | | 48,299 | | | | 8,259,129 | |
| | | | | | | | | |
| E-Commerce Discretionary — 0.7% | | | | | | | | |
| Alibaba Group Holding Ltd. - ADR (c) | | | 52,681 | | | | 5,114,798 | |
| | | | | | | | | |
| Home Construction — 1.1% | | | | | | | | |
| Toll Brothers, Inc. | | | 182,577 | | | | 8,466,095 | |
| | | | | | | | | |
| Retail - Discretionary — 1.4% | | | | | | | | |
| Home Depot, Inc. (The) | | | 36,747 | | | | 11,038,799 | |
| | | | | | | | | |
| Consumer Staples — 2.8% | | | | | | | | |
| Household Products — 1.0% | | | | | | | | |
| Colgate-Palmolive Company | | | 98,352 | | | | 7,578,022 | |
| | | | | | | | | |
| Retail - Consumer Staples — 1.2% | | | | | | | | |
| Walmart, Inc. | | | 58,683 | | | | 8,977,912 | |
| | | | | | | | | |
| Tobacco & Cannabis — 0.6% | | | | | | | | |
| Altria Group, Inc. | | | 87,786 | | | | 4,878,268 | |
| | | | | | | | | |
| Energy — 4.0% | | | | | | | | |
| Oil & Gas Producers — 2.5% | | | | | | | | |
| Enbridge, Inc. | | | 99,320 | | | | 4,334,325 | |
| Energy Transfer, L.P. | | | 1,331,858 | | | | 14,756,986 | |
| | | | | | | | 19,091,311 | |
| Oil & Gas Services & Equipment — 0.9% | | | | | | | | |
| Baker Hughes Company | | | 224,185 | | | | 6,954,219 | |
| | | | | | | | | |
| Renewable Energy — 0.6% | | | | | | | | |
| Atlantica Sustainable | | | | | | | | |
| Infrastructure plc | | | 142,244 | | | | 4,395,340 | |
| | | | | | | | | |
| Financials — 6.1% | | | | | | | | |
| Asset Management — 1.0% | | | | | | | | |
| Blackstone, Inc. | | | 71,715 | | | | 7,284,093 | |
| | | | | | | | | |
| Banking — 2.5% | | | | | | | | |
| Citigroup, Inc. | | | 119,241 | | | | 5,748,609 | |
| JPMorgan Chase & Company | | | 114,648 | | | | 13,684,385 | |
| | | | | | | | 19,432,994 | |
| COMMON STOCKS — continued |
| | | Shares | | | Value | |
| Financials — continued | | | | | | | | |
| Institutional Financial Services — 0.8% | | | | | | | | |
| Moelis & Company - Class A | | | 142,011 | | | $ | 6,285,407 | |
| | | | | | | | | |
| Specialty Finance — 1.8% | | | | | | | | |
| Annaly Capital Management, Inc. | | | 1,032,592 | | | | 6,629,240 | |
| MGIC Investment Corporation | | | 523,511 | | | | 6,837,054 | |
| | | | | | | | 13,466,294 | |
| Health Care — 6.3% | | | | | | | | |
| Biotech & Pharma — 4.4% | | | | | | | | |
| Amgen, Inc. | | | 42,423 | | | | 9,892,619 | |
| Bristol-Myers Squibb Company | | | 228,735 | | | | 17,216,884 | |
| Gilead Sciences, Inc. | | | 119,101 | | | | 7,067,453 | |
| | | | | | | | 34,176,956 | |
| Medical Equipment & Devices — 1.9% | | | | | | | | |
| Becton, Dickinson and Company | | | 25,130 | | | | 6,211,885 | |
| Medtronic plc | | | 77,714 | | | | 8,110,233 | |
| | | | | | | | 14,322,118 | |
| Industrials — 5.0% | | | | | | | | |
| Aerospace & Defense — 0.8% | | | | | | | | |
| Lockheed Martin Corporation | | | 13,613 | | | | 5,882,450 | |
| | | | | | | | | |
| Commercial Support Services — 1.1% | | | | | | | | |
| Republic Services, Inc. | | | 64,207 | | | | 8,621,074 | |
| | | | | | | | | |
| Diversified Industrials — 1.1% | | | | | | | | |
| Honeywell International, Inc. | | | 44,802 | | | | 8,669,635 | |
| | | | | | | | | |
| Machinery — 0.9% | | | | | | | | |
| Deere & Company | | | 17,661 | | | | 6,667,910 | |
| | | | | | | | | |
| Transportation & Logistics — 1.1% | | | | | | | | |
| Union Pacific Corporation | | | 36,724 | | | | 8,604,066 | |
| | | | | | | | | |
| Materials — 3.0% | | | | | | | | |
| Metals & Mining — 3.0% | | | | | | | | |
| Barrick Gold Corporation | | | 580,925 | | | | 12,960,437 | |
| Freeport-McMoRan, Inc. | | | 238,413 | | | | 9,667,647 | |
| | | | | | | | 22,628,084 | |
| Real Estate — 1.4% | | | | | | | | |
| REITs — 1.4% | | | | | | | | |
| Simon Property Group, Inc. | | | 55,007 | | | | 6,490,826 | |
| VICI Properties, Inc. | | | 139,831 | | | | 4,168,362 | |
| | | | | | | | 10,659,188 | |
| Technology — 5.8% | | | | | | | | |
| Software — 2.1% | | | | | | | | |
| Microsoft Corporation | | | 58,105 | | | | 16,125,299 | |
The accompanying notes are an integral part of the financial statements.
| WESTWOOD INCOME OPPORTUNITY FUND |
| APRIL 30, 2022 (Unaudited) |
| COMMON STOCKS — continued |
| | | Shares | | | Value | |
| Technology — continued | | | | | | | | |
| Technology Hardware — 2.6% | | | | | | | | |
| Apple, Inc. | | | 128,181 | | | $ | 20,207,735 | |
| | | | | | | | | |
| Technology Services — 1.1% | | | | | | | | |
| International Business Machines Corporation | | | 61,318 | | | | 8,106,853 | |
| | | | | | | | | |
| Total Common Stocks | | | | | | | | |
| (Cost $258,246,879) | | | | | | $ | 302,563,795 | |
| | | | | | | | | |
| EXCHANGE-TRADED FUNDS — 1.9% | | | | | | | | |
| Global X Nasdaq 100 Covered Call ETF (Cost $15,114,784) | | | 752,462 | | | $ | 14,560,140 | |
| | | | | | | | | |
| PREFERRED STOCKS — 7.6% | | | | | | | | |
| Communications — 0.9% | | | | | | | | |
| Telecommunications — 0.9% | | | | | | | | |
| 2020 Cash Mandatory Exchangeable Trust, 5.250%, 144A | | | 6,575 | | | | 7,187,001 | |
| | | | | | | | | |
| Financials — 2.2% | | | | | | | | |
| Asset Management — 0.9% | | | | | | | | |
| Charles Schwab Corporation (The), 5.375% | | | 805,000 | | | | 810,031 | |
| KKR & Company, Inc., 6.000% | | | 86,350 | | | | 5,661,106 | |
| | | | | | | | 6,471,137 | |
| Banking — 1.3% | | | | | | | | |
| Citigroup, Inc., 5.900% | | | 4,784,000 | | | | 4,863,749 | |
| Truist Financial Corporation, 5.500% | | | 5,483,000 | | | | 5,222,558 | |
| | | | | | | | 10,086,307 | |
| Health Care — 1.2% | | | | | | | | |
| Medical Equipment & Devices — 1.2% | | | | | | | | |
| Boston Scientific Corporation, 5.500% - Series A | | | 82,775 | | | | 9,341,159 | |
| | | | | | | | | |
| Technology — 0.8% | | | | | | | | |
| Semiconductors — 0.8% | | | | | | | | |
| Broadcom, Inc., 8.000% | | | 3,260 | | | | 5,687,070 | |
| | | | | | | | | |
| Utilities — 2.5% | | | | | | | | |
| Electric Utilities — 2.5% | | | | | | | | |
| AES Corporation (The), 6.875% | | | 60,310 | | | | 5,222,846 | |
| American Electric Power Company, Inc., 6.125% | | | 146,780 | | | | 8,219,680 | |
| PREFERRED STOCKS — continued |
| | | Shares | | | Value | |
| Utilities —continued | | | | | | | | |
| Electric Utilities — continued | | | | | | | | |
| Southern Company (The), 4.950% | | | 269,930 | | | $ | 5,700,921 | |
| | | | | | | | 19,143,447 | |
| Total Preferred Stocks | | | | | | | | |
| (Cost $57,027,906) | | | | | | | 57,916,121 | |
| | | | | | | | | |
| MONEY MARKET FUNDS — 1.5% | | | | | | | | |
| SEI Daily Income Trust, Government Fund - Class F, 0.15% (d) (Cost $11,254,269) | | | 11,254,269 | | | $ | 11,254,269 | |
| | | | | | | | | |
| Investments at Value — 99.3% | | | | | | | | |
| (Cost $754,707,518) | | | | | | $ | 758,727,914 | |
| | | | | | | | | |
| Other Assets in Excess of Liabilities — 0.7% | | | | | | | 5,428,473 | |
| | | | | | | | | |
| Net Assets — 100.0% | | | | | | $ | 764,156,387 | |
144A - Security was purchased in a transaction exempt from registration in compliance with Rule 144A of the Securities Act of 1933. This security may be resold in transactions exempt from registration, normally to qualified institutional buyers. The total value of such securities is $100,491,798 as of April 30, 2022, representing 13.2% of net assets.
ADR - American Depositary Receipt
AG - Aktiengesellshaft
B.V. - Besloten Vennootschap
plc - Public Limited Company
S.A.B de C.V. - Societe Anonima Bursatil de Capital Variable
S.p.A. - Societa per azioni
SOFR - Secured Overnight Financing Rate
T-Note - U.S. Treasury Note
| (a) | Variable rate security. Interest rate resets periodically. The rate shown is the effective interest rate as of April 30, 2022. For securities based on a published reference rate and spread, the reference rate and spread (in basis points) are indicated parenthetically. Certain variable rate securities are not based on a published reference rate and spread but are determined by the issuer or agent and are based on current market conditions. These securities, therefore, do not indicate a reference rate and spread. |
| (b) | Security has a perpetual maturity date. |
| (c) | Non-income producing security. |
| (d) | The rate shown is the 7-day effective yield as of April 30, 2022. |
The accompanying notes are an integral part of the financial statements.
| WESTWOOD HIGH INCOME FUND |
| APRIL 30, 2022 (Unaudited) |
| Sector Weightings (Unaudited)† |
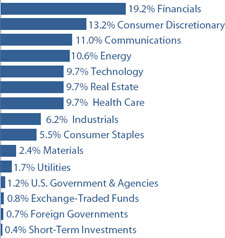
| † | Percentages are based on total investments. |
| SCHEDULE OF INVESTMENTS |
| U.S. GOVERNMENT & AGENCIES — 1.2% |
| | | Coupon | | Maturity | | Par Value | | | Value | |
| U.S. Treasury Bonds — 0.2% | | | | | | | | | | | | |
| U.S. Treasury Bonds | | 1.875% | | 11/15/51 | | $ | 250,000 | | | $ | 196,953 | |
| | | | | | | | | | | | | |
| U.S. Treasury Notes — 1.0% | | | | | | | | | | | | |
| U.S. Treasury Notes | | 2.125% | | 03/31/24 | | | 975,000 | | | | 964,907 | |
| | | | | | | | | | | | | |
| Total U.S. Government & Agencies | | | | | | | | | | | | |
| (Cost $1,205,228) | | | | | | | | | | $ | 1,161,860 | |
| | | | | | | | | | | | | |
| CONVERTIBLE BONDS — 1.4% | | | | | | | | | | | | |
| Consumer Staples — 0.5% | | | | | | | | | | | | |
| Tilray, Inc. | | 5.000% | | 10/01/23 | | $ | 500,000 | | | $ | 487,500 | |
| | | | | | | | | | | | | |
| Real Estate — 0.9% | | | | | | | | | | | | |
| Radius Global Infrastructure, Inc., 144A | | 2.500% | | 09/15/26 | | | 1,000,000 | | | | 889,375 | |
| | | | | | | | | | | | | |
| Total Convertible Bonds | | | | | | | | | | | | |
| (Cost $1,488,021) | | | | | | | | | | $ | 1,376,875 | |
| | | | | | | | | | | | | |
| CORPORATE BONDS — 70.9% | | | | | | | | | | | | |
| Communications — 8.8% | | | | | | | | | | | | |
| América Móvil S.A.B. de C.V., 144A | | 5.375% | | 04/04/32 | | $ | 360,000 | | | $ | 327,532 | |
| CSC Holdings, LLC, 144A | | 6.500% | | 02/01/29 | | | 1,000,000 | | | | 950,000 | |
| DIRECTV Holdings, LLC, 144A | | 5.875% | | 08/15/27 | | | 1,414,000 | | | | 1,330,927 | |
| DISH DBS Corporation | | 5.875% | | 11/15/24 | | | 1,250,000 | | | | 1,212,500 | |
| Liberty Media Corporation, 144A | | 2.750% | | 12/01/49 | | | 955,000 | | | | 915,845 | |
| Lumen Technologies, Inc., Series P | | 7.600% | | 09/15/39 | | | 625,000 | | | | 557,813 | |
| Magellanes, Inc., 144A | | 4.279% | | 03/15/32 | | | 600,000 | | | | 558,151 | |
| T-Mobile USA, Inc. | | 2.550% | | 02/15/31 | | | 1,250,000 | | | | 1,062,943 | |
The accompanying notes are an integral part of the financial statements.
| WESTWOOD HIGH INCOME FUND |
| APRIL 30, 2022 (Unaudited) |
| CORPORATE BONDS — continued |
| | | Coupon | | Maturity | | Par Value | | | Value | |
| Communications — continued | | | | | | | | | | | | |
| Vodafone Group plc | | 4.875% | | 06/19/49 | | $ | 500,000 | | | $ | 479,485 | |
| Zayo Group Holdings, Inc., 144A | | 4.000% | | 03/01/27 | | | 1,465,000 | | | | 1,274,550 | |
| | | | | | | | | | | | 8,669,746 | |
| Consumer Discretionary — 11.7% | | | | | | | | | | | | |
| AMC Entertainment Holdings, Inc., 144A | | 7.500% | | 02/15/29 | | | 1,125,000 | | | | 1,029,375 | |
| At Home Group, Inc., 144A | | 4.875% | | 07/15/28 | | | 1,250,000 | | | | 1,032,813 | |
| Brunswick Corporation | | 2.400% | | 08/18/31 | | | 414,000 | | | | 326,080 | |
| Cinemark USA, Inc., 144A | | 5.875% | | 03/15/26 | | | 1,000,000 | | | | 932,500 | |
| Darden Restaurants, Inc. | | 4.550% | | 02/15/48 | | | 790,000 | | | | 703,102 | |
| Dick’s Sporting Goods, Inc. | | 4.100% | | 01/15/52 | | | 501,000 | | | | 367,471 | |
| Ford Motor Credit Company, LLC | | 4.271% | | 01/09/27 | | | 1,000,000 | | | | 948,550 | |
| G-III Apparel Group Ltd., 144A | | 7.875% | | 08/15/25 | | | 1,250,000 | | | | 1,300,000 | |
| Guitar Center, Inc., 144A | | 8.500% | | 01/15/26 | | | 1,000,000 | | | | 1,002,200 | |
| Nordstrom, Inc. | | 2.300% | | 04/08/24 | | | 325,000 | | | | 311,188 | |
| Party City Holdings, Inc., 144A | | 8.750% | | 02/15/26 | | | 575,000 | | | | 526,844 | |
| Royal Caribbean Cruises Ltd., 144A | | 9.125% | | 06/15/23 | | | 1,225,000 | | | | 1,264,610 | |
| Scientific Games International, Inc., 144A | | 8.625% | | 07/01/25 | | | 850,000 | | | | 890,375 | |
| Thor Industries, Inc., 144A | | 4.000% | | 10/15/29 | | | 1,000,000 | | | | 845,110 | |
| | | | | | | | | | | | 11,480,218 | |
| Consumer Staples — 2.9% | | | | | | | | | | | | |
| Altria Group, Inc. | | 2.450% | | 02/04/32 | | | 900,000 | | | | 722,009 | |
| Rite Aid Corporation, 144A | | 7.500% | | 07/01/25 | | | 1,000,000 | | | | 856,150 | |
| Vector Group Ltd., 144A | | 5.750% | | 02/01/29 | | | 1,000,000 | | | | 877,500 | |
| Viterra Finance B.V., 144A | | 2.000% | | 04/21/26 | | | 428,000 | | | | 383,878 | |
| | | | | | | | | | | | 2,839,537 | |
| Energy — 7.0% | | | | | | | | | | | | |
| CNX Midstream Partners, L.P., 144A | | 4.750% | | 04/15/30 | | | 1,250,000 | | | | 1,150,000 | |
| Crestwood Midstream Partners, L.P., 144A | | 6.000% | | 02/01/29 | | | 1,000,000 | | | | 972,660 | |
| International Petroleum Corporation of Sweden | | 7.250% | | 02/01/27 | | | 700,000 | | | | 689,082 | |
| NGL Energy Operating, LLC, 144A | | 7.500% | | 02/01/26 | | | 1,100,000 | | | | 1,034,704 | |
| Nine Energy Service, Inc. | | 8.750% | | 11/01/23 | | | 1,000,000 | | | | 630,000 | |
| Northern Oil and Gas, Inc., 144A | | 8.125% | | 03/01/28 | | | 1,100,000 | | | | 1,094,500 | |
| Petróleos Mexicanos | | 6.700% | | 02/16/32 | | | 940,000 | | | | 809,979 | |
| Summit Midstream Holdings, LLC, 144A | | 8.500% | | 10/15/26 | | | 500,000 | | | | 466,815 | |
| | | | | | | | | | | | 6,847,740 | |
| Financials — 14.1% | | | | | | | | | | | | |
| AerCap Ireland Capital Ltd. | | 3.300% | | 01/30/32 | | | 650,000 | | | | 541,051 | |
| AerCap Ireland Capital Ltd. | | 3.850% | | 10/29/41 | | | 458,000 | | | | 355,809 | |
| Aircastle Ltd., 144A | | 5.250% | | 08/11/25 | | | 435,000 | | | | 434,167 | |
| Apollo Commercial Real Estate Finance, Inc. | | 5.375% | | 10/15/23 | | | 850,000 | | | | 829,281 | |
| Apollo Commercial Real Estate Finance, Inc., 144A | | 4.625% | | 06/15/29 | | | 1,000,000 | | | | 870,000 | |
| Ares Capital Corporation, 144A | | 3.875% | | 01/15/26 | | | 1,225,000 | | | | 1,175,028 | |
| Bank of America Corporation (3MO LIBOR + 131) (a) | | 4.271% | | 07/23/29 | | | 605,000 | | | | 593,709 | |
| Chubb INA Holdings, Inc. | | 2.850% | | 12/15/51 | | | 500,000 | | | | 382,488 | |
| Compass Group Diversified Holdings, LLC, 144A | | 5.250% | | 04/15/29 | | | 1,423,000 | | | | 1,277,142 | |
| Corebridge Financial, Inc., 144A | | 3.500% | | 04/04/25 | | | 287,000 | | | | 283,785 | |
| Hercules Capital, Inc. | | 2.625% | | 09/16/26 | | | 422,000 | | | | 380,157 | |
The accompanying notes are an integral part of the financial statements.
| WESTWOOD HIGH INCOME FUND |
| APRIL 30, 2022 (Unaudited) |
| CORPORATE BONDS — continued |
| | | Coupon | | Maturity | | Par Value | | | Value | |
| Financials — continued | | | | | | | | | | | | |
| HSBC Holdings plc (SOFR + 253) (a) | | 4.762% | | 03/29/33 | | $ | 484,000 | | | $ | 458,348 | |
| Icahn Enterprises, L.P./Icahn Enterprises Holdings, L.P. | | 5.250% | | 05/15/27 | | | 1,075,000 | | | | 1,004,233 | |
| Jackson Financial, Inc., 144A | | 4.000% | | 11/23/51 | | | 500,000 | | | | 392,445 | |
| Morgan Stanley (a) | | 5.297% | | 04/20/37 | | | 529,000 | | | | 529,598 | |
| Nomura Holdings, Inc. | | 2.329% | | 01/22/27 | | | 885,000 | | | | 805,018 | |
| Owl Rock Capital Corporation | | 3.400% | | 07/15/26 | | | 1,250,000 | | | | 1,153,733 | |
| Prospect Capital Corporation | | 3.364% | | 11/15/26 | | | 710,000 | | | | 636,088 | |
| UBS Group AG, 144A (Yield of U.S. T-Note 0.625% 07/26 + 85) (a) | | 1.494% | | 08/10/27 | | | 610,000 | | | | 541,625 | |
| Unum Group | | 4.125% | | 06/15/51 | | | 750,000 | | | | 589,911 | |
| Westpac Banking Corporation | | 3.133% | | 11/18/41 | | | 850,000 | | | | 660,800 | |
| | | | | | | | | | | | 13,894,416 | |
| Health Care — 4.8% | | | | | | | | | | | | |
| Amgen, Inc. | | 3.150% | | 02/21/40 | | | 823,000 | | | | 665,083 | |
| Bausch Health Companies, Inc., 144A | | 6.125% | | 02/01/27 | | | 1,112,000 | | | | 1,067,642 | |
| Community Health Systems, Inc., 144A | | 5.250% | | 05/15/30 | | | 600,000 | | | | 525,990 | |
| Emergent BioSolutions, Inc., 144A | | 3.875% | | 08/15/28 | | | 700,000 | | | | 594,125 | |
| HCA, Inc. | | 3.500% | | 07/15/51 | | | 552,000 | | | | 410,730 | |
| Par Pharmaceutical, Inc., 144A | | 7.500% | | 04/01/27 | | | 750,000 | | | | 684,285 | |
| Royalty Pharma plc | | 3.550% | | 09/02/50 | | | 1,000,000 | | | | 738,094 | |
| | | | | | | | | | | | 4,685,949 | |
| Industrials — 5.4% | | | | | | | | | | | | |
| American Airlines Pass Through Trust, Series 2021-1B | | 3.950% | | 07/11/30 | | | 595,000 | | | | 537,319 | |
| Boeing Company (The) | | 5.805% | | 05/01/50 | | | 1,000,000 | | | | 1,005,796 | |
| CoreCivic, Inc. | | 8.250% | | 04/15/26 | | | 1,000,000 | | | | 1,027,220 | |
| Deluxe Corporation, 144A | | 8.000% | | 06/01/29 | | | 1,000,000 | | | | 948,750 | |
| Sempra Infrastructure, 144A | | 3.250% | | 01/15/32 | | | 658,000 | | | | 569,804 | |
| Sotheby’s, 144A | | 7.375% | | 10/15/27 | | | 1,225,000 | | | | 1,206,625 | |
| | | | | | | | | | | | 5,295,514 | |
| Materials — 0.7% | | | | | | | | | | | | |
| Axalta Coating Systems, LLC, 144A | | 4.750% | | 06/15/27 | | | 700,000 | | | | 665,000 | |
| | | | | | | | | | | | | |
| Real Estate — 7.0% | | | | | | | | | | | | |
| Brixmor Operating Partnership, L.P. | | 4.050% | | 07/01/30 | | | 475,000 | | | | 449,106 | |
| Crown Castle International Corporation | | 2.900% | | 04/01/41 | | | 263,000 | | | | 196,560 | |
| GEO Group, Inc. (The), 144A | | 5.125% | | 04/01/23 | | | 1,000,000 | | | | 953,750 | |
| GLP Capital, L.P./GLP Financing II, Inc. | | 3.250% | | 01/15/32 | | | 1,000,000 | | | | 841,330 | |
| Host Hotels & Resorts, Inc. | | 3.500% | | 09/15/30 | | | 375,000 | | | | 337,253 | |
| Iron Mountain, Inc., 144A | | 5.000% | | 07/15/28 | | | 1,020,000 | | | | 966,358 | |
| New Residential Investment Corporation, 144A | | 6.250% | | 10/15/25 | | | 1,000,000 | | | | 952,500 | |
| Sabra Health Care, L.P. | | 3.200% | | 12/01/31 | | | 750,000 | | | | 630,143 | |
| Service Properties Trust | | 7.500% | | 09/15/25 | | | 1,000,000 | | | | 998,130 | |
| Simon Property Group, L.P. | | 2.650% | | 02/01/32 | | | 512,000 | | | | 440,896 | |
| Vornado Realty, L.P. | | 3.400% | | 06/01/31 | | | 181,000 | | | | 159,423 | |
| | | | | | | | | | | | 6,925,449 | |
The accompanying notes are an integral part of the financial statements.
| WESTWOOD HIGH INCOME FUND |
| APRIL 30, 2022 (Unaudited) |
| CORPORATE BONDS — continued |
| | | Coupon | | Maturity | | Par Value | | | Value | |
| Technology — 6.9% | | | | | | | | | | | | |
| Broadcom, Inc., 144A | | 3.500% | | 02/15/41 | | $ | 1,000,000 | | | $ | 779,380 | |
| CommScope Finance, LLC, 144A | | 6.000% | | 03/01/26 | | | 940,000 | | | | 886,608 | |
| Dell International, LLC | | 8.350% | | 07/15/46 | | | 800,000 | | | | 1,070,155 | |
| DXC Technology Company | | 1.800% | | 09/15/26 | | | 420,000 | | | | 375,670 | |
| MPH Acquisition Holdings, LLC, 144A | | 5.500% | | 09/01/28 | | | 900,000 | | | | 833,625 | |
| NXP B.V./NXP Funding, LLC, 144A | | 2.500% | | 05/11/31 | | | 1,000,000 | | | | 841,911 | |
| Oracle Corporation | | 2.950% | | 04/01/30 | | | 1,175,000 | | | | 1,014,773 | |
| VMware, Inc. | | 4.650% | | 05/15/27 | | | 957,000 | | | | 970,784 | |
| | | | | | | | | | | | 6,772,906 | |
| Utilities — 1.6% | | | | | | | | | | | | |
| Consolidated Edison Company of New York, Inc. | | 3.200% | | 12/01/51 | | | 1,000,000 | | | | 790,433 | |
| Pacific Gas and Electric Company | | 4.950% | | 07/01/50 | | | 1,000,000 | | | | 836,184 | |
| | | | | | | | | | | | 1,626,617 | |
| Total Corporate Bonds | | | | | | | | | | | | |
| (Cost $77,695,015) | | | | | | | | | | $ | 69,703,092 | |
| | | | | | | | | | | | | |
| FOREIGN GOVERNMENTS — 0.7% | | | | | | | | | | | | |
| Republic of South Africa Government (Cost $695,000) | | 5.875% | | 04/20/32 | | $ | 695,000 | | | $ | 660,806 | |
| | | Shares | | | Value | |
| Communications — 1.5% | | | | | | | | |
| Entertainment Content — 0.8% | | | | | | | | |
| Activision Blizzard, Inc. | | | 11,351 | | | $ | 858,136 | |
| | | | | | | | | |
| Telecommunications — 0.7% | | | | | | | | |
| Verizon Communications, Inc. | | | 14,401 | | | | 666,766 | |
| | | | | | | | | |
| Consumer Discretionary — 1.4% | | | | | | | | |
| Automotive — 0.8% | | | | | | | | |
| Toyota Motor Corporation - ADR | | | 4,355 | | | | 744,705 | |
| | | | | | | | | |
| Retail - Discretionary — 0.6% | | | | | | | | |
| TJX Companies, Inc. (The) | | | 10,119 | | | | 620,092 | |
| | | | | | | | | |
| Consumer Staples — 2.1% | | | | | | | | |
| Retail - Consumer Staples — 1.2% | | | | | | | | |
| Walmart, Inc. | | | 7,538 | | | | 1,153,238 | |
| | | | | | | | | |
| Tobacco & Cannabis — 0.9% | | | | | | | | |
| Altria Group, Inc. | | | 16,061 | | | | 892,510 | |
| COMMON STOCKS — continued |
| | | Shares | | | Value | |
| Energy — 3.6% | | | | | | | | |
| Oil & Gas Producers — 3.1% | | | | | | | | |
| Devon Energy Corporation | | | 10,200 | | | $ | 593,334 | |
| Enbridge, Inc. | | | 13,429 | | | | 586,042 | |
| Energy Transfer, L.P. | | | 45,268 | | | | 501,569 | |
| Enterprise Products Partners, L.P. | | | 26,743 | | | | 692,911 | |
| EOG Resources, Inc. | | | 5,691 | | | | 664,481 | |
| | | | | | | | 3,038,337 | |
| Renewable Energy — 0.5% | | | | | | | | |
| Atlantica Sustainable Infrastructure plc | | | 14,962 | | | | 462,326 | |
| | | | | | | | | |
| Financials — 4.9% | | | | | | | | |
| Asset Management — 1.0% | | | | | | | | |
| Blackstone, Inc. | | | 9,608 | | | | 975,884 | |
| | | | | | | | | |
| Banking — 2.2% | | | | | | | | |
| Citigroup, Inc. | | | 12,309 | | | | 593,417 | |
| Sumitomo Mitsui Financial Group, Inc. - ADR | | | 119,263 | | | | 714,386 | |
| Truist Financial Corporation | | | 18,698 | | | | 904,048 | |
| | | | | | | | 2,211,851 | |
| Institutional Financial Services — 0.7% | | | | | | | | |
| Moelis & Company - Class A | | | 15,397 | | | | 681,471 | |
The accompanying notes are an integral part of the financial statements.
| WESTWOOD HIGH INCOME FUND |
| APRIL 30, 2022 (Unaudited) |
| COMMON STOCKS — continued |
| | | Shares | | | Value | |
| Financials — continued | | | | | | | | |
| Specialty Finance — 1.0% | | | | | | | | |
| Annaly Capital Management, Inc. | | | 87,089 | | | $ | 559,111 | |
| MGIC Investment Corporation | | | 34,210 | | | | 446,783 | |
| | | | | | | | 1,005,894 | |
| Health Care — 2.9% | | | | | | | | |
| Biotech & Pharma — 2.9% | | | | | | | | |
| Amgen, Inc. | | | 4,148 | | | | 967,272 | |
| Bristol-Myers Squibb Company | | | 14,951 | | | | 1,125,362 | |
| Gilead Sciences, Inc. | | | 12,261 | | | | 727,568 | |
| | | | | | | | 2,820,202 | |
| Industrials — 0.8% | | | | | | | | |
| Aerospace & Defense — 0.8% | | | | | | | | |
| Moog, Inc. - Class A | | | 9,864 | | | | 787,838 | |
| | | | | | | | | |
| Materials — 1.7% | | | | | | | | |
| Containers & Packaging — 0.5% | | | | | | | | |
| WestRock Company | | | 10,207 | | | | 505,553 | |
| Metals & Mining — 1.2% | | | | | | | | |
| Barrick Gold Corporation | | | 30,400 | | | | 678,224 | |
| Freeport-McMoRan, Inc. | | | 11,794 | | | | 478,247 | |
| | | | | | | | 1,156,471 | |
| Real Estate — 1.6% | | | | | | | | |
| REITs — 1.6% | | | | | | | | |
| National Retail Properties, Inc. | | | 18,103 | | | | 793,636 | |
| VICI Properties, Inc. | | | 28,000 | | | | 834,680 | |
| | | | | | | | 1,628,316 | |
| Technology — 2.8% | | | | | | | | |
| Software — 0.8% | | | | | | | | |
| Microsoft Corporation | | | 2,710 | | | | 752,079 | |
| | | | | | | | | |
| Technology Hardware — 2.0% | | | | | | | | |
| Apple, Inc. | | | 8,719 | | | | 1,374,550 | |
| Cisco Systems, Inc. | | | 12,165 | | | | 595,842 | |
| | | | | | | | 1,970,392 | |
| Total Common Stocks | | | | | | | | |
| (Cost $21,939,651) | | | | | | $ | 22,932,061 | |
| | | | | | | | | |
| EXCHANGE-TRADED FUNDS — 0.8% | | | | | | | | |
| Global X Nasdaq 100 Covered Call ETF (Cost $828,549) | | | 40,847 | | | $ | 790,389 | |
| | | | | | | | | |
| PREFERRED STOCKS — 0.5% | | | | | | | | |
| Communications — 0.5% | | | | | | | | |
| Telecommunications — 0.5% | | | | | | | | |
| 2020 Cash Mandatory Exchangeable Trust, 5.250%,144A (Cost $533,411) | | | 465 | | | $ | 508,282 | |
| MONEY MARKET FUNDS — 0.4% |
| | | Shares | | | Value | |
| SEI Daily Income Trust, Government Fund - Class F, 0.01% (b) (Cost $419,581) | | | 419,581 | | | $ | 419,581 | |
| | | | | | | | | |
| Investments at Value — 99.2% | | | | | | | | |
| (Cost $104,804,456) | | | | | | $ | 97,552,946 | |
| | | | | | | | | |
| Other Assets in Excess of Liabilities — 0.8% | | | | | | | 743,659 | |
| | | | | | | | | |
| Net Assets — 100.0% | | | | | | $ | 98,296,605 | |
144A - Security was purchased in a transaction exempt from registration in compliance with Rule 144A of the Securities Act of 1933. This security may be resold in transactions exempt from registration, normally to qualified institutional buyers. The total value of such securities is $39,865,241 as of April 30, 2022, representing 40.6% of net assets.
ADR - American Depositary Receipt
AG - Aktiengesellschaft
B.V. - Besloten Vennootschap
LIBOR - London Interbank Offered Rate
plc - Public Limited Company
S.A.B de C.V. - Societe Anonima Bursatil de Capital Variable
SOFR - Secured Overnight Financing Rate
T-Note - U.S. Treasury Note
| (a) | Variable rate security. Interest rate resets periodically. The rate shown is the effective interest rate as of April 30, 2022. For securities based on a published reference rate and spread, the reference rate and spread (in basis points) are indicated parenthetically. Certain variable rate securities are not based on a published reference rate and spread but are determined by the issuer or agent and are based on current market conditions. These securities, therefore, do not indicate a reference rate and spread. |
| (b) | The rate shown is the 7-day effective yield as of April 30, 2022. |
The accompanying notes are an integral part of the financial statements.
| WESTWOOD ALTERNATIVE INCOME FUND |
| APRIL 30, 2022 (Unaudited) |
| Sector Weightings (Unaudited)† |
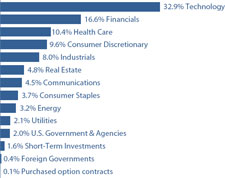
| † | Percentages are based on total investments. |
| SCHEDULE OF INVESTMENTS |
| U.S. GOVERNMENT & AGENCIES — 2.0% |
| | | Coupon | | Maturity | | Par Value | | | Value | |
| U.S. Treasury Notes — 2.0% | | | | | | | | | | | | |
| U.S. Treasury Notes (Cost $2,999,283) * | | 0.125% | | 10/31/22 | | $ | 3,000,000 | | | $ | 2,979,844 | |
| | | | | | | | | | | | | |
| CONVERTIBLE BONDS — 73.7% | | | | | | | | | | | | |
| Communications — 4.3% | | | | | | | | | | | | |
| Airbnb, Inc. * | | 0.000% | | 03/15/26 | | $ | 2,500,000 | | | $ | 2,291,250 | |
| Lyft, Inc. | | 1.500% | | 05/15/25 | | | 500,000 | | | | 560,750 | |
| Snap, Inc., 144A | | 0.000% | | 05/01/27 | | | 1,500,000 | | | | 1,190,250 | |
| Snap, Inc., 144A | | 0.125% | | 03/01/28 | | | 2,852,000 | | | | 2,499,778 | |
| | | | | | | | | | | | 6,542,028 | |
| Consumer Discretionary — 8.6% | | | | | | | | | | | | |
| Burlington Stores, Inc. | | 2.250% | | 04/15/25 | | | 1,000,000 | | | | 1,199,375 | |
| Chegg, Inc. | | 0.125% | | 03/15/25 | | | 3,000,000 | | | | 2,665,500 | |
| Etsy, Inc., 144A | | 0.250% | | 06/15/28 | | | 3,500,000 | | | | 2,782,500 | |
| Huazhu Group Ltd. | | 3.000% | | 05/01/26 | | | 785,000 | | | | 808,943 | |
| NCL Corporation Ltd. | | 6.000% | | 05/15/24 | | | 2,000,000 | | | | 3,306,999 | |
| Patrick Industries, Inc., 144A | | 1.750% | | 12/01/28 | | | 2,500,000 | | | | 2,248,438 | |
| | | | | | | | | | | | 13,011,755 | |
| Consumer Staples — 3.0% | | | | | | | | | | | | |
| Tilray, Inc.* | | 5.000% | | 10/01/23 | | | 4,650,000 | | | | 4,533,750 | |
| | | | | | | | | | | | | |
| Energy — 2.2% | | | | | | | | | | | | |
| Enphase Energy, Inc., 144A | | 0.000% | | 03/01/26 | | | 3,500,000 | | | | 3,293,500 | |
| | | | | | | | | | | | | |
| Financials — 11.2% | | | | | | | | | | | | |
| Apollo Commercial Real Estate Finance, Inc. * | | 4.750% | | 08/23/22 | | | 4,000,000 | | | | 3,997,501 | |
| Avolon Holdings Funding Ltd., 144A | | 4.250% | | 04/15/26 | | | 250,000 | | | | 239,902 | |
| Blackstone Mortgage Trust, Inc. | | 4.375% | | 05/05/22 | | | 3,500,000 | | | | 3,500,656 | |
| Granite Point Mortgage Trust, Inc., 144A * | | 5.625% | | 12/01/22 | | | 4,000,000 | | | | 3,935,000 | |
The accompanying notes are an integral part of the financial statements.
| WESTWOOD ALTERNATIVE INCOME FUND |
| APRIL 30, 2022 (Unaudited) |
| CONVERTIBLE BONDS — continued |
| | | Coupon | | Maturity | | Par Value | | | Value | |
| Financials — continued | | | | | | | | | | | | |
| KKR Group Finance Company X, LLC, 144A | | 3.250% | | 12/15/51 | | $ | 500,000 | | | $ | 376,275 | |
| KKR Real Estate Finance Trust, Inc. | | 6.125% | | 05/15/23 | | | 3,000,000 | | | | 3,009,375 | |
| MFA Financial, Inc. | | 6.250% | | 06/15/24 | | | 2,000,000 | | | | 1,970,000 | |
| | | | | | | | | | | | 17,028,709 | |
| Health Care — 8.6% | | | | | | | | | | | | |
| CONMED Corporation | | 2.625% | | 02/01/24 | | | 3,500,000 | | | | 5,481,050 | |
| Exact Sciences Corporation | | 0.375% | | 03/01/28 | | | 2,200,000 | | | | 1,768,800 | |
| Jazz Investments I Ltd. | | 2.000% | | 06/15/26 | | | 1,000,000 | | | | 1,220,625 | |
| Ligand Pharmaceuticals, Inc. * | | 0.750% | | 05/15/23 | | | 2,000,000 | | | | 1,923,750 | |
| NuVasive, Inc. | | 0.375% | | 03/15/25 | | | 3,000,000 | | | | 2,797,500 | |
| | | | | | | | | | | | 13,191,725 | |
| Industrials — 5.8% | | | | | | | | | | | | |
| Camtek Ltd., 144A | | 0.000% | | 12/01/26 | | | 400,000 | | | | 350,200 | |
| SFL Corporation Ltd. * | | 4.875% | | 05/01/23 | | | 4,338,000 | | | | 4,378,669 | |
| Southwest Airlines Company | | 1.250% | | 05/01/25 | | | 3,000,000 | | | | 4,096,500 | |
| | | | | | | | | | | | 8,825,369 | |
| Real Estate — 4.6% | | | | | | | | | | | | |
| DigitalBridge Group, Inc. | | 5.000% | | 04/15/23 | | | 3,709,000 | | | | 3,705,682 | |
| Integra LifeSciences Holdings Corporation | | 0.500% | | 08/15/25 | | | 1,000,000 | | | | 1,018,800 | |
| Radius Global Infrastructure, Inc., 144A | | 2.500% | | 09/15/26 | | | 2,500,000 | | | | 2,223,438 | |
| | | | | | | | | | | | 6,947,920 | |
| Technology — 25.4% | | | | | | | | | | | | |
| Akamai Technologies, Inc. | | 0.125% | | 05/01/25 | | | 2,000,000 | | | | 2,504,000 | |
| Avaya Holdings Corporation | | 2.250% | | 06/15/23 | | | 3,500,000 | | | | 3,372,276 | |
| Bentley Systems, Inc. | | 0.125% | | 01/15/26 | | | 1,400,000 | | | | 1,335,600 | |
| Bill.com Holding, Inc. | | 0.000% | | 12/01/25 | | | 3,058,000 | | | | 3,976,928 | |
| Cloudflare, Inc., 144A | | 0.000% | | 08/15/26 | | | 3,000,000 | | | | 2,617,500 | |
| Jamf Holding Corporation, 144A | | 0.125% | | 09/01/26 | | | 1,250,000 | | | | 1,154,688 | |
| Lumentum Holdings, Inc. * | | 2.000% | | 02/15/25 | | | 2,500,000 | | | | 2,995,000 | |
| Lumentum Holdings, Inc. | | 0.500% | | 12/15/26 | | | 3,000,000 | | | | 3,136,800 | |
| Mandiant, Inc. | | 0.875% | | 06/01/24 | | | 1,500,000 | | | | 1,640,625 | |
| MicroStrategy, Inc., 144A | | 0.000% | | 02/15/27 | | | 1,000,000 | | | | 633,500 | |
| Okta, Inc. | | 0.125% | | 09/01/25 | | | 1,500,000 | | | | 1,458,000 | |
| Perficient, Inc. | | 0.125% | | 11/15/26 | | | 2,000,000 | | | | 1,717,000 | |
| Silicon Laboratories, Inc. | | 0.625% | | 06/15/25 | | | 1,000,000 | | | | 1,268,800 | |
| Verint Systems, Inc., 144A | | 0.250% | | 04/15/26 | | | 3,460,000 | | | | 3,646,840 | |
| Vishay Intertechnology, Inc. | | 2.250% | | 06/15/25 | | | 3,280,000 | | | | 3,199,968 | |
| Workiva, Inc. | | 1.125% | | 08/15/26 | | | 1,000,000 | | | | 1,400,000 | |
| Ziff Davis, Inc., 144A * | | 1.750% | | 11/01/26 | | | 2,500,000 | | | | 2,663,750 | |
| | | | | | | | | | | | 38,721,275 | |
| | | | | | | | | | | | | |
| Total Convertible Bonds | | | | | | | | | | | | |
| (Cost $117,505,697) | | | | | | | | | | $ | 112,096,031 | |
The accompanying notes are an integral part of the financial statements.
| WESTWOOD ALTERNATIVE INCOME FUND |
| APRIL 30, 2022 (Unaudited) |
| | | Coupon | | Maturity | | Par Value | | | Value | |
| Consumer Discretionary — 0.7% | | | | | | | | | | | | |
| Royal Caribbean Cruises Ltd., 144A | | 9.125% | | 06/15/23 | | $ | 1,000,000 | | | $ | 1,032,335 | |
| | | | | | | | | | | | | |
| Consumer Staples — 0.6% | | | | | | | | | | | | |
| Vector Group Ltd., 144A * | | 5.750% | | 02/01/29 | | | 1,000,000 | | | | 877,500 | |
| | | | | | | | | | | | | |
| Energy — 0.9% | | | | | | | | | | | | |
| NGL Energy Operating, LLC, 144A | | 7.500% | | 02/01/26 | | | 925,000 | | | | 870,092 | |
| Phillips 66 * | | 0.900% | | 02/15/24 | | | 500,000 | | | | 480,281 | |
| | | | | | | | | | | | 1,350,373 | |
| Financials — 4.8% | | | | | | | | | | | | |
| Apollo Commercial Real Estate Finance, Inc. | | 5.375% | | 10/15/23 | | | 1,000,000 | | | | 975,625 | |
| Compass Group Diversified Holdings, LLC, 144A | | 5.250% | | 04/15/29 | | | 1,000,000 | | | | 897,500 | |
| Goldman Sachs Group, Inc. (Yield of U.S. T-Note 0.125% 10/22 + 53.8) * (a) | | 0.627% | | 11/17/23 | | | 1,000,000 | | | | 985,223 | |
| PennyMac Mortgage Investment Trust * | | 5.500% | | 11/01/24 | | | 3,500,000 | | | | 3,480,312 | |
| Royal Bank of Canada | | 1.600% | | 01/21/25 | | | 1,000,000 | | | | 949,827 | |
| | | | | | | | | | | | 7,288,487 | |
| Health Care — 1.3% | | | | | | | | | | | | |
| Ascendis Pharma A/S, 144A | | 2.250% | | 04/01/28 | | | 750,000 | | | | 690,750 | |
| CHS/Community Health Systems, Inc., 144A | | 5.250% | | 05/15/30 | | | 1,550,000 | | | | 1,358,808 | |
| | | | | | | | | | | | 2,049,558 | |
| Industrials — 1.9% | | | | | | | | | | | | |
| Alarm.com Holdings, Inc. | | 0.000% | | 01/15/26 | | | 3,500,000 | | | | 2,901,500 | |
| | | | | | | | | | | | | |
| Technology — 6.2% | | | | | | | | | | | | |
| John Bean Technologies Corporation, 144A | | 0.250% | | 05/15/26 | | | 4,000,000 | | | | 3,766,000 | |
| Micron Technology, Inc. | | 2.703% | | 04/15/32 | | | 60,000 | | | | 49,971 | |
| ON Semiconductor Corporation, 144A | | 0.000% | | 05/01/27 | | | 3,000,000 | | | | 3,562,500 | |
| Progress Software Corporation | | 1.000% | | 04/15/26 | | | 2,000,000 | | | | 2,009,000 | |
| | | | | | | | | | | | 9,387,471 | |
| Utilities — 2.0% | | | | | | | | | | | | |
| American Electric Power * | | 0.750% | | 11/01/23 | | | 2,750,000 | | | | 2,643,600 | |
| NextEra Energy Capital Holdings, Inc. | | 0.650% | | 03/01/23 | | | 400,000 | | | | 393,720 | |
| | | | | | | | | | | | 3,037,320 | |
| Total Corporate Bonds | | | | | | | | | | | | |
| (Cost $29,387,077) | | | | | | | | | | $ | 27,924,544 | |
| | | | | | | | | | | | | |
| FOREIGN GOVERNMENTS — 0.4% | | | | | | | | | | | | |
| Mexico Government International Bond | | 3.771% | | 05/24/61 | | $ | 235,000 | | | $ | 164,481 | |
| Peruvian Government International Bond | | 2.783% | | 01/23/31 | | | 235,000 | | | | 203,823 | |
| Peruvian Government International Bond | | 3.300% | | 03/11/41 | | | 240,000 | | | | 188,270 | |
| Total Foreign Governments | | | | | | | | | | | | |
| (Cost $702,487) | | | | | | | | | | $ | 556,574 | |
| | | | | | | | | | | | | |
| PURCHASED OPTION CONTRACTS — 0.1% | | | | | | | | | | | | |
| | | Strike Price | | Contracts | | Notional Value | | | Value | |
| Put Option Contracts — 0.1% ** | | | | | | | | | | | | |
| S&P 500 Index, 06/30/22 (Cost $127,330) | | $ 4,000.00 | | 10 | | $ | 4,131,930 | | | $ | 130,930 | |
The accompanying notes are an integral part of the financial statements.
| WESTWOOD ALTERNATIVE INCOME FUND |
| APRIL 30, 2022 (Unaudited) |
| MONEY MARKET FUNDS — 1.6% |
| | | Shares | | | Value | |
| SEI Daily Income Trust, Government Fund - Class F, 0.15% (b) (Cost $2,555,209) | | | 2,354,349 | | | $ | 2,354,349 | |
| | | | | | | | | |
| Investments at Value — 96.0% | | | | | | | | |
| (Cost $153,076,223) | | | | | | $ | 146,042,272 | |
| | | | | | | | | |
| Other Assets in Excess of Liabilities — 4.0% | | | | | | | 6,027,146 | |
| | | | | | | | | |
| Net Assets — 100.0% | | | | | | $ | 152,069,418 | |
| * | All or part of this security has been pledged as collateral for derivative instruments held by the Fund. |
| 144A - Security was purchased in a transaction exempt from registration in compliance with Rule 144A of the Securities Act of 1933. This security may be resold in transactions exempt from registration, normally to qualified institutional buyers. The total value of such securities is $42,911,044 as of April 30, 2022, representing 28.2% of net assets. |
A/S – Aktieselskab
plc – Public Limited Company
T-Note - U.S. Treasury Note
| (a) | Variable rate security. Interest rate resets periodically. The rate shown is the effective interest rate as of April 30, 2022. For securities based on a published reference rate and spread, the reference rate and spread (in basis points) are indicated parenthetically. Certain variable rate securities are not based on a published reference rate and spread but are determined by the issuer or agent and are based on current market conditions. These securities, therefore, do not indicate a reference rate and spread. |
| (b) | The rate shown is the 7-day effective yield as of April 30, 2022. |
| ** | The average monthly value of purchased options contracts sold during the six month period ended April 30, 2022 was $1,105,906. |
The accompanying notes are an integral part of the financial statements.
| WESTWOOD ALTERNATIVE INCOME FUND |
| APRIL 30, 2022 (Unaudited) |
A list of open OTC swap agreements as of April 30, 2022, is as follows:
| Total Return Swaps |
| | | | | | | | | | | | | | | | | | | | Net Unrealized | |
| | | Reference Entity / | | | | Fund | | Termination | | Notional | | | | | | Upfront | | | Appreciation / | |
| Counterparty | | Obligation (a) | | Fund Pays | | Receives | | Date | | Amount | | | Value | | | Payments | | | (Depreciation) | |
| BNP Paribas | | Airbnb, Inc. Effective Rate -0.03% | | BNP Paribas - Airbnb, Inc. - 009066101 | | Total Return Stock | | 12/16/2023 | | $ | 953,005 | | | $ | 72,048 | | | $ | — | | | $ | 72,048 | |
| BNP Paribas | | Airbnb, Inc. Effective Rate 1.42% | | BNP Paribas - Airbnb, Inc. - 009066AA9 | | Fix Nominal | | 3/15/2026 | | | (951,983 | ) | | | (35,483 | ) | | | — | | | | (35,483 | ) |
| BNP Paribas | | Akamai Technologies, Inc. Effective Rate -0.03% | | BNP Paribas - Akamai Technologies, Inc. - 00971T101 | | Total Return Stock | | 9/18/2023 | | | 4,013,184 | | | | 240,576 | | | | — | | | | 240,576 | |
| BNP Paribas | | Akamai Technologies, Inc. Effective Rate 1.42% | | BNP Paribas - Akamai Technologies, Inc. - 00971TAJ0 | | Fix Nominal | | 5/1/2025 | | | (2,632,759 | ) | | | (128,759 | ) | | | — | | | | (128,759 | ) |
| BNP Paribas | | Alarm.com Holdings, Inc. Effective Rate 0.09% | | BNP Paribas - Alarm. com Holdings, Inc. - 011642105 | | Total Return Stock | | 12/2/2023 | | | 556,700 | | | | (23,560 | ) | | | — | | | | (23,560 | ) |
| BNP Paribas | | Ascendis Pharma A/S Effective Rate -0.03% | | BNP Paribas - Ascendis Pharma A/S - 04351P101 | | Total Return Stock | | 3/29/2024 | | | 289,305 | | | | 42,876 | | | | — | | | | 42,876 | |
| BNP Paribas | | Avaya Holdings Corporation Effective Rate -0.03% | | BNP Paribas - Avaya Holdings Corporation - 05351X101 | | Total Return Stock | | 9/18/2023 | | | 88,084 | | | | 17,784 | | | | — | | | | 17,784 | |
| BNP Paribas | | Bentley Systems, Inc. Effective Rate -0.03% | | BNP Paribas - Bentley Systems, Inc. - 08265T208 | | Total Return Stock | | 11/17/2023 | | | 426,523 | | | | (1,616 | ) | | | — | | | | (1,616 | ) |
| BNP Paribas | | Bill.com Holdings, Inc. Effective Rate -0.03% | | BNP Paribas - Bill. com Holdings, Inc. - 090043100 | | Total Return Stock | | 1/27/2024 | | | 2,719,913 | | | | 304,366 | | | | — | | | | 304,366 | |
| BNP Paribas | | Burlington Stores, Inc. Effective Rate -0.03% | | BNP Paribas - Burlington Stores, Inc. - 122017106 | | Total Return Stock | | 1/22/2024 | | | 525,504 | | | | 36,960 | | | | — | | | | 36,960 | |
| BNP Paribas | | Camtek Ltd. Effective Rate -0.03% | | BNP Paribas - Camtek Ltd. - M20791105 | | Total Return Stock | | 11/23/2023 | | | 99,858 | | | | 1,848 | | | | — | | | | 1,848 | |
| BNP Paribas | | Chef’s Warehouse, Inc. (The) Effective Rate 1.42% | | BNP Paribas - Chef’s Warehouse, Inc. (The) - 163086AC5 | | Fix Nominal | | 12/1/2024 | | | (2,641,019 | ) | | | 106,482 | | | | — | | | | 106,482 | |
| BNP Paribas | | Chef’s Warehouse, Inc. (The) Effective Rate 0.00% | | BNP Paribas - Chef’s Warehouse, Inc. (The) - 163086101 | | Total Return Stock | | 9/18/2023 | | | 849,405 | | | | (83,895 | ) | | | — | | | | (83,895 | ) |
| BNP Paribas | | Chegg, Inc. Effective Rate -0.03% | | BNP Paribas - Chegg, Inc. - 163092109 | | Total Return Stock | | 3/24/2024 | | | 639,653 | | | | 137,431 | | | | — | | | | 137,431 | |
| BNP Paribas | | Cloudffare, Inc. Effective Rate -0.03% | | BNP Paribas - Cloudffare, Inc. - 18915M107 | | Total Return Stock | | 9/18/2023 | | | 962,535 | | | | 195,889 | | | | — | | | | 195,889 | |
| BNP Paribas | | CONMED Corporation Effective Rate -0.03% | | BNP Paribas - CONMED Corporation - 207410101 | | Total Return Stock | | 9/18/2023 | | | 4,838,547 | | | | 331,202 | | | | — | | | | 331,202 | |
| BNP Paribas | | Enphase Energy, Inc. Effective Rate -0.03% | | BNP Paribas - Enphase Energy, Inc. - 29355A107 | | Total Return Stock | | 9/18/2023 | | | 937,780 | | | | 113,026 | | | | — | | | | 113,026 | |
| BNP Paribas | | Etsy, Inc. Effective Rate -0.03% | | BNP Paribas - Etsy, Inc. - 29786A106 | | Total Return Stock | | 1/19/2023 | | | 861,666 | | | | 134,784 | | | | — | | | | 134,784 | |
The accompanying notes are an integral part of the financial statements.
| WESTWOOD ALTERNATIVE INCOME FUND |
| APRIL 30, 2022 (Unaudited) |
| Total Return Swaps |
| | | | | | | | | | | | | | | | | | | | Net Unrealized | |
| | | Reference Entity / | | | | Fund | | Termination | | Notional | | | | | | Upfront | | | Appreciation / | |
| Counterparty | | Obligation (a) | | Fund Pays | | Receives | | Date | | Amount | | | Value | | | Payments | | | (Depreciation) | |
| BNP Paribas | | Exact Sciences Corporation Effective Rate 1.42% | | BNP Paribas - Exact Sciences Corporation - 30063PAC9 | | Fix Nominal | | 3/1/2028 | | $ | (706,446 | ) | | $ | (63,246 | ) | | $ | — | | | $ | (63,246 | ) |
| BNP Paribas | | Exact Sciences Corporation Effective Rate -0.03% | | BNP Paribas - Exact Sciences Corporation - 30063P105 | | Total Return Stock | | 9/18/2023 | | | 997,044 | | | | 187,975 | | | | — | | | | 187,975 | |
| BNP Paribas | | FireEye, Inc. Effective Rate 1.42% | | BNP Paribas - FireEye, Inc. - 31816QAF8 | | Fix Nominal | | 6/1/2024 | | | (875,894 | ) | | | (11,832 | ) | | | — | | | | (11,832 | ) |
| BNP Paribas | | Huazhu Group Ltd. Effective Rate -0.03% | | BNP Paribas - Huazhu Group Ltd. - 44332N106 | | Total Return Stock | | 9/18/2023 | | | 298,065 | | | | 16,833 | | | | — | | | | 16,833 | |
| BNP Paribas | | Integra Lifesciences Holdings Corporation Effective Rate 1.42% | | BNP Paribas - Integra Lifesciences Holdings Corporation - 457985AM1 | | Fix Nominal | | 8/15/2025 | | | (2,059,778 | ) | | | (22,178 | ) | | | — | | | | (22,178 | ) |
| BNP Paribas | | Integra Lifesciences Holdings Corporation Effective Rate -0.03% | | BNP Paribas - Integra Lifesciences Holdings Corporation - 457985208 | | Total Return Stock | | 9/18/2023 | | | 1,136,640 | | | | 5,124 | | | | — | | | | 5,124 | |
| BNP Paribas | | Jamf Holding Corporation Effective Rate -0.03% | | BNP Paribas - Jamf Holding Corporation - 47074L105 | | Total Return Stock | | 9/18/2023 | | | 474,646 | | | | 24,966 | | | | — | | | | 24,966 | |
| BNP Paribas | | Jazz Pharmaceuticals plc Effective Rate 1.42% | | BNP Paribas - Jazz Pharmaceuticals plc - 472145AD3 | | Fix Nominal | | 8/15/2024 | | | (2,074,400 | ) | | | (40,650 | ) | | | — | | | | (40,650 | ) |
| BNP Paribas | | Jazz Pharmaceuticals plc Effective Rate -0.03% | | BNP Paribas - Jazz Pharmaceuticals plc - G50871105 | | Total Return Stock | | 9/18/2023 | | | 1,361,781 | | | | 31,955 | | | | — | | | | 31,955 | |
| BNP Paribas | | John Bean Technologies Corporation Effective Rate -0.03% | | BNP Paribas - John Bean Technologies Corporation - 477839104 | | Total Return Stock | | 10/21/2023 | | | 1,267,461 | | | | (88,908 | ) | | | — | | | | (88,908 | ) |
| BNP Paribas | | Ligand Pharmaceuticals, Inc. Effective Rate -0.03% | | BNP Paribas - Ligand Pharmaceuticals, Inc. - 53220K504 | | Total Return Stock | | 9/18/2023 | | | 60,420 | | | | 4,704 | | | | — | | | | 4,704 | |
| BNP Paribas | | Live Nation Entertainment, Inc. Effective Rate -0.03% | | BNP Paribas - Live Nation Entertainment, Inc. - 538034109 | | Total Return Stock | | 9/18/2023 | | | 1,813,384 | | | | 72,376 | | | | — | | | | 72,376 | |
| BNP Paribas | | Lumentum Holdings, Inc. Effective Rate 1.42% | | BNP Paribas - Lumentum Holdings, Inc. - 55024UAD1 | | Fix Nominal | | 12/15/2026 | | | (761,175 | ) | | | (29,255 | ) | | | — | | | | (29,255 | ) |
| BNP Paribas | | Lumentum Holdings, Inc. Effective Rate -0.03% | | BNP Paribas - Lumentum Holdings, Inc. - 55024U109 | | Total Return Stock | | 9/18/2023 | | | 2,077,650 | | | | 104,247 | | | | — | | | | 104,247 | |
| BNP Paribas | | Lyft, Inc. Effective Rate 1.42% | | BNP Paribas - Lyft, Inc. - 55087PAB0 | | Fix Nominal | | 5/15/2025 | | | (1,766,365 | ) | | | (84,115 | ) | | | — | | | | (84,115 | ) |
| BNP Paribas | | Lyft, Inc. Effective Rate -0.03% | | BNP Paribas - Lyft, Inc. - 55087P104 | | Total Return Stock | | 9/18/2023 | | | 1,225,194 | | | | 71,154 | | | | — | | | | 71,154 | |
| BNP Paribas | | Mandiant, Inc. Effective Rate -0.03% | | BNP Paribas - Mandiant, Inc. - 562662106 | | Total Return Stock | | 9/18/2023 | | | 766,057 | | | | 8,956 | | | | — | | | | 8,956 | |
The accompanying notes are an integral part of the financial statements.
| WESTWOOD ALTERNATIVE INCOME FUND |
| APRIL 30, 2022 (Unaudited) |
| Total Return Swaps |
| | | | | | | | | | | | | | | | | | | | Net Unrealized | |
| | | Reference Entity / | | | | Fund | | Termination | | Notional | | | | | | Upfront | | | Appreciation / | |
| Counterparty | | Obligation (a) | | Fund Pays | | Receives | | Date | | Amount | | | Value | | | Payments | | | (Depreciation) | |
| BNP Paribas | | MicroStrategy, Inc. Effective Rate -0.03% | | BNP Paribas - MicroStrategy, Inc. - 594972408 | | Total Return Stock | | 9/18/2023 | | $ | 200,651 | | | $ | 41,274 | | | $ | — | | | $ | 41,274 | |
| BNP Paribas | | Norwegian Cruise Line Holdings Ltd. Effective Rate -0.03% | | BNP Paribas - Norwegian Cruise Line Holdings Ltd. - G66721104 | | Total Return Stock | | 9/18/2023 | | | 2,653,371 | | | | 147,618 | | | | — | | | | 147,618 | |
| BNP Paribas | | NuVasive, Inc. Effective Rate -0.03% | | BNP Paribas - NuVasive, Inc. - 670704105 | | Total Return Stock | | 9/18/2023 | | | 540,672 | | | | 46,848 | | | | — | | | | 46,848 | |
| BNP Paribas | | Okta, Inc. Effective Rate -0.03% | | BNP Paribas - Okta, Inc. - 679295105 | | Total Return Stock | | 9/18/2023 | | | 1,327,245 | | | | 193,800 | | | | — | | | | 193,800 | |
| BNP Paribas | | Okta, Inc. Effective Rate 1.42% | | BNP Paribas - Okta, Inc. - 679295AD7 | | Fix Nominal | | 9/1/2025 | | | (1,557,477 | ) | | | (99,477 | ) | | | — | | | | (99,477 | ) |
| BNP Paribas | | ON Semiconductor Corporation Effective Rate -0.03% | | BNP Paribas - ON Semiconductor Corporation — 682189105 | | Total Return Stock | | 8/16/4048 | | | 2,279,481 | | | | 64,806 | | | | — | | | | 64,806 | |
| BNP Paribas | | Patrick Industries, Inc. Effective Rate -0.03% | | BNP Paribas - Patrick Industries, Inc. - 703343103 | | Total Return Stock | | 12/10/2023 | | | 792,990 | | | | (43,875 | ) | | | — | | | | (43,875 | ) |
| BNP Paribas | | PennyMac Mortgage Investment Trust Effective Rate -0.03% | | BNP Paribas - PennyMac Mortgage Investment Trust - 70931T103 | | Total Return Stock | | 9/18/2023 | | | 106,050 | | | | (1,330 | ) | | | — | | | | (1,330 | ) |
| BNP Paribas | | Perficient, Inc. Effective Rate -0.03% | | BNP Paribas - Perficient, Inc. - 71375U101 | | Total Return Stock | | 11/20/2023 | | | 546,720 | | | | 39,729 | | | | — | | | | 39,729 | |
| BNP Paribas | | Progress Software Corporation Effective Rate -0.03% | | BNP Paribas - Progress Software Corporation - 743312100 | | Total Return Stock | | 9/18/2023 | | | 940,996 | | | | 588 | | | | — | | | | 588 | |
| BNP Paribas | | Radius Global Infrastructure, Inc. Effective Rate -0.03% | | BNP Paribas - Radius Global Infrastructure, Inc. - 750481103 | | Total Return Stock | | 9/18/2023 | | | 658,646 | | | | 26,468 | | | | — | | | | 26,468 | |
| BNP Paribas | | SFL Corporation Ltd. Effective Rate 0.26% | | BNP Paribas - SFL Corporation Ltd. - G7738W106 | | Total Return Stock | | 3/14/2024 | | | 955,510 | | | | 69,654 | | | | — | | | | 69,654 | |
| BNP Paribas | | Silicon Laboratories, Inc. Effective Rate -0.03% | | BNP Paribas - Silicon Laboratories, Inc. - 826919102 | | Total Return Stock | | 1/21/2024 | | | 1,655,580 | | | | (3,813 | ) | | | — | | | | (3,813 | ) |
| BNP Paribas | | Silicon Laboratories, Inc. Effective Rate 1.42% | | BNP Paribas - Silicon Laboratories, Inc. - 826919AD4 | | Fix Nominal | | 6/15/2025 | | | (1,275,293 | ) | | | (6,493 | ) | | | — | | | | (6,493 | ) |
| BNP Paribas | | SNAP, Inc. - Class A Effective Rate -0.03% | | BNP Paribas - SNAP, Inc. - Class A - 83304A106 | | Total Return Stock | | 11/9/2023 | | | 1,224,000 | | | | 156,750 | | | | — | | | | 156,750 | |
| BNP Paribas | | Southwest Airlines Company Effective Rate -0.03% | | BNP Paribas - Southwest Airlines Company - 844741108 | | Total Return Stock | | 9/18/2023 | | | 2,551,239 | | | | (25,369 | ) | | | — | | | | (25,369 | ) |
| BNP Paribas | | Verint Systems, Inc. Effective Rate -0.03% | | BNP Paribas - Verint Systems, Inc. - 92343X100 | | Total Return Stock | | 9/18/2023 | | | 1,724,833 | | | | (15,631 | ) | | | — | | | | (15,631 | ) |
The accompanying notes are an integral part of the financial statements.
| WESTWOOD ALTERNATIVE INCOME FUND |
| APRIL 30, 2022 (Unaudited) |
| Total Return Swaps |
| | | | | | | | | | | | | | | | | | | | Net Unrealized | |
| | | Reference Entity / | | | | Fund | | Termination | | Notional | | | | | | Upfront | | | Appreciation / | |
| Counterparty | | Obligation (a) | | Fund Pays | | Receives | | Date | | Amount | | | Value | | | Payments | | | (Depreciation) | |
| BNP Paribas | | Vishay Intertechnology, Inc. Effective Rate -0.03% | | BNP Paribas - Vishay Intertechnology, Inc. - 928298108 | | Total Return
Stock | | 9/18/2023 | | $ | 481,290 | | | $ | (8,679 | ) | | $ | — | | | $ | (8,679 | ) |
| BNP Paribas | | Workiva, Inc. Effective Rate -0.03% | | BNP Paribas - Workiva, Inc. - 98139A105 | | Total Return
Stock | | 9/18/2023 | | | 1,066,600 | | | | 101,500 | | | | — | | | | 101,500 | |
| BNP Paribas | | Ziff Davis, Inc. Effective Rate -0.03% | | BNP Paribas - Ziff Davis, Inc. - 48123V102 | | Total Return
Stock | | 9/18/2023 | | | 1,542,240 | | | | 128,480 | | | | — | | | | 128,480 | |
| Total | | | | | | | | | | | | | | $ | 2,462,913 | | | $ | — | | | $ | 2,462,913 | |
| | | | | | | | | | | | | | | | | | | | | | | | | |
| | | | | | | | | Total swap agreements at value (assets) | | | $ | 3,281,077 | |
| | | | | | | | | Total swap agreements at value (liabilities) | | | | (818,164 | ) |
| | | | | | | | | Net swap agreements at value | | | $ | 2,462,913 | |
| (a) | Payment frequency is monthly. |
OTC - Over the Counter
The average monthly notional value for Swap Contracts -Receivable for the six month period ended April 30, 2022 was $60,622,177
The average monthly notional value for Swap Contracts-Payable for the six month period ended April 30, 2022 was $20,548,512
A list of the open futures contracts held by the Fund at April 30, 2022, is as follows:
| SCHEDULE OF FUTURES CONTRACTS SOLD SHORT |
| | | | | Expiration | | | | | Unrealized | |
| FUTURES CONTRACTS SOLD SHORT^ | | Contracts | | Date | | Notional Value | | | Appreciation | |
| Futures | | | | | | | | | | | | |
| 10-Year U.S. Treasury Note Future | | 2 | | 06/21/22 | | $ | (238,312 | ) | | $ | 16,063 | |
| 5-Year U.S. Treasury Note Future | | 2 | | 06/30/22 | | | (225,344 | ) | | | 10,875 | |
| U.S. Treasury Long Bond Future | | 4 | | 06/21/22 | | | (562,752 | ) | | | 62,373 | |
| Total Futures Contracts Sold Short | | | | | | $ | (1,026,408 | ) | | $ | 89,311 | |
| ^ | Cash has been pledged as collateral for futures contracts held by the Fund. |
The average monthly notional value of futures contracts sold short during the six month period ended April 30, 2022 was $1,105,906.
The accompanying notes are an integral part of the financial statements.
| WESTWOOD SMALLCAP GROWTH FUND |
| APRIL 30, 2022 (Unaudited) |
| Sector Weightings (Unaudited)† |
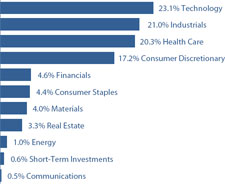
| † | Percentages are based on total investments. |
| SCHEDULE OF INVESTMENTS |
| COMMON STOCKS — 99.4% |
| | | Shares | | | Value | |
| Communications — 0.5% | | | | | | | | |
| Internet Media & Services — 0.5% | | | | | | | | |
| Yelp, Inc. (a) | | | 1,047 | | | $ | 34,059 | |
| | | | | | | | | |
| Consumer Discretionary — 17.2% | | | | | | | | |
| Automotive — 2.9% | | | | | | | | |
| Dana, Inc. | | | 2,420 | | | | 35,840 | |
| Dorman Products, Inc. (a) | | | 361 | | | | 35,638 | |
| Gentherm, Inc. (a) | | | 1,829 | | | | 123,311 | |
| | | | | | | | 194,789 | |
| Leisure Facilities & Services — 9.4% | | | | | | | | |
| First Watch Restaurant Group, Inc. (a) | | | 16,842 | | | | 218,946 | |
| Liberty Media Corporation - Liberty Braves - Series A (a) | | | 6,896 | | | | 181,158 | |
| Texas Roadhouse, Inc. | | | 2,933 | | | | 241,474 | |
| | | | | | | | 641,578 | |
| Leisure Products — 4.4% | | | | | | | | |
| Acushnet Holdings Corporation | | | 849 | | | | 34,588 | |
| Clarus Corporation | | | 10,373 | | | | 231,837 | |
| Marine Products Corporation | | | 2,765 | | | | 32,461 | |
| | | | | | | | 298,886 | |
| Retail - Discretionary — 0.5% | | | | | | | | |
| Monro, Inc. | | | 757 | | | | 34,618 | |
| | | | | | | | | |
| Consumer Staples — 4.4% | | | | | | | | |
| Food — 3.4% | | | | | | | | |
| Phibro Animal Health Corporation - Class A | | | 1,878 | | | | 33,785 | |
| Utz Brands, Inc. | | | 14,250 | | | | 201,210 | |
| | | | | | | | 234,995 | |
| COMMON STOCKS — continued |
| | | Shares | | | Value | |
| Consumer Staples — continued | | | | | | | | |
| Household Products — 1.0% | | | | | | | | |
| Central Garden & Pet Company (a). | | | 769 | | | $ | 33,675 | |
| Central Garden & Pet Company - Class A (a) | | | 819 | | | | 33,890 | |
| | | | | | | | 67,565 | |
| Energy — 1.0% | | | | | | | | |
| Oil & Gas Producers — 1.0% | | | | | | | | |
| Riley Exploration Permian, Inc. | | | 3,007 | | | | 69,853 | |
| | | | | | | | | |
| Financials — 4.6% | | | | | | | | |
| Asset Management — 2.8% | | | | | | | | |
| Columbia Financial, Inc. (a) | | | 9,951 | | | | 188,571 | |
| | | | | | | | | |
| Banking — 1.8% | | | | | | | | |
| Kearny Financial Corporation | | | 2,863 | | | | 33,955 | |
| Pacific Premier Bancorp, Inc. | | | 1,074 | | | | 33,681 | |
| Veritex Holdings, Inc. | | | 1,775 | | | | 58,309 | |
| | | | | | | | 125,945 | |
| Health Care — 20.3% | | | | | | | | |
| Biotech & Pharma — 2.1% | | | | | | | | |
| Corcept Therapeutics, Inc. (a) | | | 3,321 | | | | 71,434 | |
| Ligand Pharmaceuticals, Inc. (a) | | | 371 | | | | 34,451 | |
| REGENXBIO, Inc. (a) | | | 1,230 | | | | 34,145 | |
| | | | | | | | 140,030 | |
| Health Care Facilities & Services — 6.7% | | | | | | | | |
| Addus HomeCare Corporation (a) | | | 405 | | | | 34,133 | |
| Agiliti, Inc. (a) | | | 4,525 | | | | 89,324 | |
| Ensign Group, Inc. (The) | | | 423 | | | | 33,980 | |
| MEDNAX, Inc. (a) | | | 1,517 | | | | 28,095 | |
| Medpace Holdings, Inc. (a) | | | 1,799 | | | | 240,292 | |
| U.S. Physical Therapy, Inc. | | | 331 | | | | 34,348 | |
| | | | | | | | 460,172 | |
| Medical Equipment & Devices — 11.5% | | | | | | | | |
| Atrion Corporation | | | 53 | | | | 33,211 | |
| Glaukos Corporation (a) | | | 4,445 | | | | 210,204 | |
| LeMaitre Vascular, Inc. | | | 4,843 | | | | 209,266 | |
| Meridian Bioscience, Inc. (a) | | | 8,242 | | | | 210,913 | |
| Merit Medical Systems, Inc. (a) | | | 829 | | | | 51,406 | |
| Utah Medical Products, Inc. | | | 397 | | | | 33,582 | |
| Varex Imaging Corporation (a) | | | 1,748 | | | | 34,698 | |
| | | | | | | | 783,280 | |
| Industrials — 21.0% | | | | | | | | |
| Commercial Support Services — 1.0% | | | | | | | | |
| Hackett Group, Inc. (The) | | | 1,459 | | | | 34,272 | |
| National Research Corporation | | | 964 | | | | 33,065 | |
| | | | | | | | 67,337 | |
The accompanying notes are an integral part of the financial statements.
| WESTWOOD SMALLCAP GROWTH FUND |
| APRIL 30, 2022 (Unaudited) |
| COMMON STOCKS — continued |
| | | Shares | | | Value | |
| Industrials — continued | | | | | | | | |
| Electrical Equipment — 1.6% | | | | | | | | |
| Advanced Energy Industries, Inc. | | | 472 | | | $ | 36,117 | |
| Allied Motion Technologies, Inc. | | | 1,390 | | | | 33,833 | |
| OSI Systems, Inc. (a) | | | 451 | | | | 35,674 | |
| | | | | | | | 105,624 | |
| Engineering & Construction — 4.3% | | | | | | | | |
| Comfort Systems USA, Inc. | | | 2,664 | | | | 224,895 | |
| Installed Building Products, Inc. | | | 423 | | | | 34,039 | |
| Sterling Construction Company, Inc. (a) | | | 1,506 | | | | 34,472 | |
| | | | | | | | 293,406 | |
| Machinery — 13.1% | | | | | | | | |
| Alamo Group, Inc. | | | 270 | | | | 34,139 | |
| Albany International Corporation - Class A | | | 1,888 | | | | 147,679 | |
| Cactus, Inc. - Class A | | | 3,567 | | | | 178,100 | |
| ESCO Technologies, Inc. | | | 561 | | | | 35,035 | |
| Federal Signal Corporation | | | 1,012 | | | | 34,438 | |
| Helios Technologies, Inc. | | | 500 | | | | 33,590 | |
| Hillenbrand, Inc. | | | 5,512 | | | | 225,000 | |
| Luxfer Holdings plc | | | 12,601 | | | | 203,380 | |
| | | | | | | | 891,361 | |
| Transportation & Logistics — 1.0% | | | | | | | | |
| Dorian LPG Ltd. | | | 2,353 | | | | 34,636 | |
| Forward Air Corporation | | | 380 | | | | 36,849 | |
| | | | | | | | 71,485 | |
| Materials — 4.0% | | | | | | | | |
| Chemicals — 3.5% | | | | | | | | |
| Avient Corporation | | | 4,121 | | | | 202,918 | |
| Innospec, Inc. | | | 367 | | | | 34,979 | |
| | | | | | | | 237,897 | |
| Containers & Packaging — 0.5% | | | | | | | | |
| Myers Industries, Inc. | | | 1,627 | | | | 35,680 | |
| | | | | | | | | |
| Real Estate — 3.3% | | | | | | | | |
| Real Estate Owners & Developers — 0.5% | | | | | | | | |
| McGrath RentCorp | | | 412 | | | | 34,385 | |
| | | | | | | | | |
| REITs — 2.8% | | | | | | | | |
| Community Healthcare Trust, Inc. | | | 4,288 | | | | 157,884 | |
| Universal Health Realty Income Trust | | | 666 | | | | 33,427 | |
| | | | | | | | 191,311 | |
| Technology — 23.1% | | | | | | | | |
| Semiconductors — 5.2% | | | | | | | | |
| Axcelis Technologies, Inc. (a) | | | 4,065 | | | | 221,339 | |
| II-VI, Inc. (a) | | | 573 | | | | 35,073 | |
| COMMON STOCKS — continued |
| | | Shares | | | Value | |
| Technology — continued | | | | | | | | |
| Semiconductors — continued | | | | | | | | |
| Ultra Clean Holdings, Inc. (a) | | | 3,004 | | | $ | 93,635 | |
| | | | | | | | 350,047 | |
| Software — 11.4% | | | | | | | | |
| ACI Worldwide, Inc. (a) | | | 1,259 | | | | 34,774 | |
| Apollo Medical Holdings, Inc. (a) | | | 5,658 | | | | 206,404 | |
| Blackbaud, Inc. (a) | | | 625 | | | | 36,256 | |
| Cerence, Inc. (a) | | | 7,548 | | | | 222,666 | |
| CommVault Systems, Inc. (a) | | | 563 | | | | 34,343 | |
| Progress Software Corporation | | | 750 | | | | 35,985 | |
| Sapiens International Corporation N.V. (a) | | | 8,852 | | | | 205,720 | |
| | | | | | | | 776,148 | |
| Technology Hardware — 3.6% | | | | | | | | |
| InterDigital, Inc. | | | 4,347 | | | | 247,127 | |
| | | | | | | | | |
| Technology Services — 2.9% | | | | | | | | |
| CSG Systems International, Inc. | | | 565 | | | | 34,731 | |
| Marathon Digital Holdings, Inc. (a) | | | 6,100 | | | | 95,160 | |
| Maximus, Inc. | | | 467 | | | | 34,035 | |
| TTEC Holdings, Inc. | | | 456 | | | | 33,657 | |
| | | | | | | | 197,583 | |
| | | | | | | | | |
| Total Common Stocks | | | | | | | | |
| (Cost $7,027,042) | | | | | | $ | 6,773,732 | |
| | | | | | | | | |
| MONEY MARKET FUNDS — 0.6% | | | | | | | | |
| First American Treasury Obligations Fund - Class X, 0.01% (b) (Cost $40,681) | | | 40,681 | | | $ | 40,681 | |
| | | | | | | | | |
| Investments at Value — 100.0% | | | | | | | | |
| (Cost $7,067,723) | | | | | | $ | 6,814,413 | |
| | | | | | | | | |
| Other Assets in Excess of Liabilities — 0.0% (c) | | | | | | | 1,474 | |
| | | | | | | | | |
| Net Assets — 100.0% | | | | | | $ | 6,815,887 | |
N.V. - Naamloze Vennootschap
plc - Public Limited Company
| (a) | Non-income producing security. |
| (b) | The rate shown is the 7-day effective yield as of April 30, 2022. |
| (c) | Percentage rounds to less than 0.1%. |
The accompanying notes are an integral part of the financial statements.
| WESTWOOD FUNDS |
| APRIL 30, 2022 (Unaudited) |
| |
| STATEMENTS OF ASSETS AND LIABILITIES |
| | | | | | | | | Westwood | | | Westwood | |
| | | Westwood | | | Westwood | | | Quality | | | Quality | |
| | | Quality Value | | | Quality MidCap | | | SMidCap | | | SmallCap | |
| | | Fund | | | Fund | | | Fund | | | Fund | |
| ASSETS | | | | | | | | | | | | | | | | |
| Investments in securities | | | | | | | | | | | | | | | | |
| At cost | | $ | 227,874,614 | | | $ | 491,627 | | | $ | 294,847,677 | | | $ | 956,362,752 | |
| At value (Note 2) | | $ | 268,710,344 | | | $ | 478,036 | | | $ | 299,911,839 | | | $ | 1,007,959,637 | |
| Receivable for capital shares sold | | | 88,013 | | | | — | | | | 146,232 | | | | 419,247 | |
| Receivable for investment securities sold | | | — | | | | 3,449 | | | | 5,133,067 | | | | 4,944,778 | |
| Due from Adviser | | | — | | | | 13,256 | | | | — | | | | — | |
| Dividends receivable | | | 213,780 | | | | 309 | | | | 144,606 | | | | 219,082 | |
| Other assets | | | 33,972 | | | | 1,170 | | | | 26,897 | | | | 49,395 | |
| Total assets | | | 269,046,109 | | | | 496,220 | | | | 305,362,641 | | | | 1,013,592,139 | |
| LIABILITIES | | | | | | | | | | | | | | | | |
| Payable for capital shares redeemed | | | 117,303 | | | | — | | | | 305,272 | | | | 273,161 | |
| Payable for investment securities purchased | | | — | | | | — | | | | 4,869,300 | | | | 4,962,396 | |
| Payable to Adviser, net of waivers | | | 100,850 | | | | — | | | | 100,733 | | | | 601,315 | |
| Payable to Administrator | | | 6,444 | | | | 3,301 | | | | 6,503 | | | | 16,079 | |
| Accrued administrative servicing fees— Institutional Shares | | | 424 | | | | 106,162 | | | | 27,332 | | | | | |
| Payable for distribution fees — A Class Shares | | | 605 | | | | — | | | | — | | | | 613 | |
| Payable for distribution fees — C Class Shares | | | 171 | | | | — | | | | — | | | | 3,242 | |
| Other accrued expenses and liabilities | | | 1,552 | | | | 5,642 | | | | 4,267 | | | | 6,544 | |
| Total liabilities | | | 226,925 | | | | 9,367 | | | | 5,392,237 | | | | 5,890,682 | |
| NET ASSETS | | $ | 268,819,184 | | | $ | 486,853 | | | $ | 299,970,404 | | | $ | 1,007,701,457 | |
| NET ASSETS CONSIST OF | | | | | | | | | | | | | | | | |
| Paid-in capital | | $ | 223,464,664 | | | $ | 500,000 | | | $ | 281,887,780 | | | $ | 915,589,578 | |
| Accumulated earnings (deficit) | | | 45,354,520 | | | | (13,147 | ) | | | 18,082,624 | | | | 92,111,879 | |
| NET ASSETS | | $ | 268,819,184 | | | $ | 486,853 | | | $ | 299,970,404 | | | $ | 1,007,701,457 | |
| NET ASSET VALUE PER SHARE | | | | | | | | | | | | | | | | |
| INSTITUTIONAL SHARES | | | | | | | | | | | | | | | | |
| Net assets applicable to Institutional Shares | | $ | 267,597,946 | | | $ | 486,853 | | | $ | 208,163,658 | | | $ | 498,412,623 | |
| Institutional Shares of beneficial interest outstanding | | | 21,291,709 | | | | 50,000 | | | | 16,246,679 | | | | 27,061,504 | |
| Net asset value, offering price and redemption price per share (Note 1) | | $ | 12.57 | | | $ | 9.74 | | | $ | 12.81 | | | $ | 18.42 | |
| A CLASS SHARES | | | | | | | | | | | | | | | | |
| Net assets applicable to A Class Shares | | $ | 1,151,211 | | | | N/A | | | | N/A | | | $ | 1,433,243 | |
| A Class Shares of beneficial interest outstanding | | | 91,073 | | | | N/A | | | | N/A | | | | 77,954 | |
| Net asset value, offering price and redemption price per share (Note 1) | | $ | 12.64 | | | | N/A | | | | N/A | | | $ | 18.39 | |
| C CLASS SHARES | | | | | | | | | | | | | | | | |
| Net assets applicable to C Class Shares | | $ | 70,027 | | | | N/A | | | | N/A | | | $ | 752,819 | |
| C Class Shares of beneficial interest outstanding | | | 5,654 | | | | N/A | | | | N/A | | | | 41,281 | |
| Net asset value, offering price and redemption price per share (Note 1) | | $ | 12.39 | | | | N/A | | | | N/A | | | $ | 18.24 | |
| ULTRA SHARES | | | | | | | | | | | | | | | | |
| Net assets applicable to Ultra Shares | | | N/A | | | | N/A | | | $ | 91,806,746 | | | $ | 507,102,772 | |
| Ultra Shares of beneficial interest outstanding | | | N/A | | | | N/A | | | | 7,169,244 | | | | 27,518,509 | |
| Net asset value, offering price and redemption price per share (Note 1) | | | N/A | | | | N/A | | | | 12.81 | | | | 18.43 | |
| Maximum Offering Price Per Share (A Class Shares) | | $ | 13.03 | | | | N/A | | | | N/A | | | $ | 18.95 | |
| | | ($ | 12.64/97.00 | %) | | | N/A | | | | N/A | | | ($ | 18.39/97.00 | %) |
| | | | | | | | | | | | | | | | | |
Amounts designated as “—” are either $0 or have been rounded to $0.
N/A — Not Applicable.
The accompanying notes are an integral part of the financial statements.
| WESTWOOD FUNDS |
| APRIL 30, 2022 (Unaudited) |
| |
| STATEMENTS OF ASSETS AND LIABILITIES |
| | | | | | | | | Westwood | |
| | | Westwood | | | Westwood | | | Income | |
| | | Quality AllCap | | | Total Return | | | Opportunity | |
| | | Fund | | | Fund | | | Fund | |
| ASSETS | | | | | | | | | | | | |
| Investments in securities | | | | | | | | | | | | |
| At cost | | $ | 22,113,293 | | | $ | 119,184,005 | | | $ | 754,707,518 | |
| At value (Note 2) | | $ | 21,546,521 | | | $ | 123,066,064 | | | $ | 758,727,914 | |
| Receivable for capital shares sold | | | 67,000 | | | | 1,939,714 | | | | | |
| Receivable from Adviser (Note 4) | | | 698 | | | | — | | | | — | |
| Dividends and interest receivable | | | 6,715 | | | | 655,494 | | | | 4,308,088 | |
| Reclaim receivable | | | — | | | | 3,789 | | | | 49,023 | |
| Other assets | | | 8,154 | | | | 28,209 | | | | 35,923 | |
| Total assets | | | 21,562,088 | | | | 123,820,556 | | | | 765,060,662 | |
| LIABILITIES | | | | | | | | | | | | |
| Payable for capital shares redeemed | | | — | | | | 102,928 | | | | 431,995 | |
| Payable to Adviser, net of waiver | | | — | | | | 161,200 | | | | 341,873 | |
| Payable to administrator (Note 4) | | | 3,260 | | | | 3,205 | | | | 17,355 | |
| Accrued administrative services plan fees (Note 4) | | | 607 | | | | — | | | | — | |
| Payable for distribution fees — A Class Shares | | | — | | | | — | | | | 40,886 | |
| Payable for distribution fees — C Class Shares | | | — | | | | 635 | | | | 49,364 | |
| Other accrued expenses and liabilities | | | — | | | | 11,045 | | | | 22,802 | |
| Total liabilities | | | 3,867 | | | | 279,013 | | | | 904,275 | |
| NET ASSETS | | $ | 21,558,221 | | | $ | 123,541,543 | | | $ | 764,156,387 | |
| NET ASSETS CONSIST OF | | | | | | | | | | | | |
| Paid-in capital | | $ | 21,850,094 | | | $ | 115,654,647 | | | $ | 738,207,579 | |
| Accumulated earnings (deficit) | | | (291,873 | ) | | | 7,886,896 | | | | 25,948,808 | |
| NET ASSETS | | $ | 21,558,221 | | | $ | 123,541,543 | | | $ | 764,156,387 | |
| NET ASSET VALUE PER SHARE | | | | | | | | | | | | |
| INSTITUTIONAL SHARES | | | | | | | | | | | | |
| Net assets applicable to Institutional Shares | | $ | 494,422 | | | $ | 123,429,923 | | | $ | 690,502,174 | |
| Institutional Shares of beneficial interest outstanding | | | 50,225 | | | | 19,099,714 | | | | 60,014,895 | |
| Net asset value, offering price and redemption price per share (Note 1) | | $ | 9.84 | | | $ | 6.46 | | | $ | 11.51 | |
| A CLASS SHARES | | | | | | | | | | | | |
| Net assets applicable to A Class Shares | | | N/A | | | $ | 3,728 | | | $ | 60,396,947 | |
| A Class Shares of beneficial interest outstanding | | | N/A | | | | 578 | | | | 5,256,203 | |
| Net asset value, offering price and redemption price per share (Note 1) | | | N/A | | | $ | 6.45 | | | $ | 11.49 | |
| C CLASS SHARES | | | | | | | | | | | | |
| Net assets applicable to C Class Shares | | | N/A | | | $ | 107,892 | | | $ | 13,257,266 | |
| C Class Shares of beneficial interest outstanding | | | N/A | | | | 16,775 | | | | 1,159,273 | |
| Net asset value, offering price and redemption price per share (Note 1) | | | N/A | | | $ | 6.43 | | | $ | 11.44 | |
| ULTRA SHARES | | | | | | | | | | | | |
| Net assets applicable to Ultra Shares | | $ | 21,063,799 | | | | N/A | | | | N/A | |
| Ultra Shares of beneficial interest outstanding | | | 2,138,246 | | | | N/A | | | | N/A | |
| Net asset value, offering price and redemption price per share (Note 1) | | | 9.85 | | | | N/A | | | | N/A | |
| Maximum Offering Price Per Share (A Class Shares) | | | N/A | | | $ | 6.65 | | | $ | 11.85 | |
| | | | N/A | | | ($ | 6.45/97.00 | %) | | ($ | 11.49/97.00 | %) |
| | | | | | | | | | | | | |
Amounts designated as “—” are either $0 or have been rounded to $0.
N/A — Not Applicable.
The accompanying notes are an integral part of the financial statements.
| WESTWOOD FUNDS |
| APRIL 30, 2022 (Unaudited) |
| |
| STATEMENTS OF ASSETS AND LIABILITIES |
| | | Westwood | | | Westwood | | | Westwood | |
| | | High Income | | | Alternative | | | SmallCap | |
| | | Fund | | | Income Fund | | | Growth Fund | |
| ASSETS | | | | | | | | | | | | |
| Investments in securities: | | | | | | | | | | | | |
| At cost | | $ | 104,804,456 | | | $ | 153,076,223 | | | $ | 7,067,723 | |
| At value (Note 2) | | $ | 97,552,946 | | | $ | 146,042,272 | | | $ | 6,814,413 | |
| Swap contracts, at value (cost $0, $0 and $0, respectively) | | | — | | | | 3,281,077 | | | | — | |
| Receivable for capital shares sold | | | 89 | | | | 9,616 | | | | — | |
| Receivable for investment securities sold | | | — | | | | 1,503,119 | | | | — | |
| Receivable from Adviser (Note 4) | | | — | | | | — | | | | 8,888 | |
| Dividends and interest receivable | | | 1,103,381 | | | | 1,064,390 | | | | 756 | |
| Reclaim receivable | | | 3,975 | | | | — | | | | — | |
| Receivable due from Prime Broker | | | — | | | | 200,860 | | | | — | |
| Cash collateral on futures contracts | | | — | | | | 597,616 | | | | — | |
| Cash collateral on option contracts | | | — | | | | 274,699 | | | | — | |
| Variation Margin receivable on futures contracts | | | — | | | | 2,874 | | | | — | |
| Other assets | | | 34,008 | | | | 40,054 | | | | 9,257 | |
| Total assets | | | 98,694,399 | | | | 153,016,577 | | | | 6,833,314 | |
| LIABILITIES | | | | | | | | | | | | |
| Swap contracts, at value (premiums received $0, $0 and $0, respectively) | | | — | | | | 818,164 | | | | — | |
| Payable for capital shares redeemed | | | 54,859 | | | | 83,327 | | | | — | |
| Payable due to Adviser, net of waiver | | | 321,951 | | | | 5,676 | | | | — | |
| Payable to administrator (Note 4) | | | 2,660 | | | | 3,543 | | | | 3,311 | |
| Accrued administrative service plan fees (Note 4) | | | 13,004 | | | | 13,446 | | | | 5,758 | |
| Payable for distribution fees — A class shares | | | 1,617 | | | | 9 | | | | — | |
| Payable for distribution fees — C class shares | | | 992 | | | | — | | | | — | |
| Other accrued expenses and liabilities | | | 2,711 | | | | 22,994 | | | | 8,358 | |
| Total liabilities | | | 397,794 | | | | 947,159 | | | | 17,427 | |
| NET ASSETS | | $ | 98,296,605 | | | $ | 152,069,418 | | | $ | 6,815,887 | |
| NET ASSETS CONSIST OF | | | | | | | | | | | | |
| Paid-in capital | | $ | 113,753,474 | | | $ | 149,162,931 | | | $ | 7,852,540 | |
| Accumulated earnings (deficit) | | | (15,456,869 | ) | | | 2,906,487 | | | | (1,036,653 | ) |
| NET ASSETS | | $ | 98,296,605 | | | $ | 152,069,418 | | | $ | 6,815,887 | |
| NET ASSET VALUE PER SHARE | | | | | | | | | | | | |
| INSTITUTIONAL SHARES | | | | | | | | | | | | |
| Net assets applicable to Institutional Shares | | $ | 95,849,379 | | | $ | 57,180,062 | | | $ | 6,815,887 | |
| Institutional Shares of beneficial interest outstanding | | | 9,900,317 | | | | 5,411,441 | | | | 791,955 | |
| Net asset value, offering price and redemption price per share (Note 1) | | $ | 9.68 | | | $ | 10.57 | | | $ | 8.61 | |
| A CLASS SHARES | | | | | | | | | | | | |
| Net assets applicable to A Class Shares | | $ | 2,229,860 | | | $ | 32,928 | | | | N/A | |
| A Class Shares of beneficial interest outstanding | | | 229,092 | | | | 3,119 | | | | N/A | |
| Net asset value, offering price and redemption price per share (Note 1) | | $ | 9.73 | | | $ | 10.56 | | | | N/A | |
| C CLASS SHARES | | | | | | | | | | | | |
| Net assets applicable to C Class Shares | | $ | 217,366 | | | $ | 159 | | | | N/A | |
| C Class Shares of beneficial interest outstanding | | | 22,287 | | | | 15 | | | | N/A | |
| Net asset value, offering price and redemption price per share (Note 1) | | $ | 9.75 | | | $ | 10.59 | * | | | N/A | |
| ULTRA SHARES | | | | | | | | | | | | |
| Net assets applicable to Ultra Shares | | | N/A | | | $ | 94,856,269 | | | | N/A | |
| Ultra Shares of beneficial interest outstanding | | | N/A | | | | 8,973,515 | | | | N/A | |
| Net asset value, offering price and redemption price per share (Note 1) | | | N/A | | | | 10.57 | | | | N/A | |
| Maximum Offering Price Per Share (A Class Shares) | | $ | 10.03 | | | $ | 10.89 | | | | N/A | |
| | | ($ | 9.73/97.00 | %) | | ($ | 10.56/97.00 | %) | | | N/A | |
| | | | | | | | | | | | | |
Amounts designated as “—” are either $0 or have been rounded to $0.
N/A — Not Applicable.
| * | Net Assets divided by Shares do not calculate to the stated NAV because Net Assets are shown rounded. |
The accompanying notes are an integral part of the financial statements.
| WESTWOOD FUNDS |
| SIX MONTHS ENDED APRIL 30, 2022 (Unaudited) |
| |
| STATEMENTS OF OPERATIONS |
| | | | | | | | | Westwood | | | Westwood | |
| | | Westwood | | | Westwood | | | Quality | | | Quality | |
| | | Quality Value | | | Quality MidCap | | | SMidCap | | | SmallCap | |
| | | Fund | | | Fund (a) | | | Fund | | | Fund | |
| INVESTMENT INCOME | | | | | | | | | | | | | | | | |
| Dividends income (net of foreign tax withholding $1,708, $5, $0 and $0, respectively) | | $ | 2,403,372 | | | $ | 3,159 | | | $ | 2,417,167 | | | $ | 11,012,096 | |
| Total investment income | | | 2,403,372 | | | | 3,159 | | | | 2,417,167 | | | | 11,012,096 | |
| | | | | | | | | | | | | | | | | |
| EXPENSES | | | | | | | | | | | | | | | | |
| Investment management fees (Note 4) | | | 782,688 | | | | 1,230 | | | | 1,230,812 | | | | 4,605,514 | |
| Administrative service plan fees-Institutional Shares (Note 4) | | | — | | | | 424 | | | | 228,303 | | | | 277,321 | |
| Administration fees (Note 4) | | | 33,262 | | | | 12,500 | | | | 43,927 | | | | 143,228 | |
| Registration and filing fees | | | 33,153 | | | | 8,865 | | | | 61,405 | | | | 58,720 | |
| Trustees’ fees and expenses (Note 4) | | | 7,827 | | | | 92 | | | | 9,210 | | | | 30,023 | |
| Legal fees | | | 7,769 | | | | 14,125 | | | | 8,602 | | | | 28,763 | |
| Custody fees | | | 9,105 | | | | 651 | | | | 4,213 | | | | 10,412 | |
| Compliance fees (Note 4) | | | 2,423 | | | | 4 | | | | 3,039 | | | | 10,035 | |
| Audit fees and tax services fees | | | 8,320 | | | | 7,000 | | | | 8,461 | | | | 8,972 | |
| Distribution fees-C Class | | | 169 | | | | — | | | | — | | | | 4,136 | |
| Distribution fees-A Class | | | 1,257 | | | | — | | | | — | | | | 1,882 | |
| Transfer agent fees (Note 4) | | | 4,717 | | | | 4,139 | | | | 855 | | | | 4,540 | |
| Other expenses | | | 4,025 | | | | 2,248 | | | | 610 | | | | 9,367 | |
| Total expenses | | | 894,715 | | | | 51,278 | | | | 1,599,437 | | | | 5,192,913 | |
| Investment management fees reduced and expense reimbursements by Adviser (Note 4) | | | (45,379 | ) | | | (49,603 | ) | | | (255,207 | ) | | | (629,173 | ) |
| NET EXPENSES | | | 849,336 | | | | 1,675 | | | | 1,344,230 | | | | 4,563,740 | |
| | | | | | | | | | | | | | | | | |
| NET INVESTMENT INCOME | | | 1,554,036 | | | | 1,484 | | | | 1,072,937 | | | | 6,448,356 | |
| | | | | | | | | | | | | | | | | |
| REALIZED AND UNREALIZED GAINS (LOSSES) ON INVESTMENTS | | | | | | | | | | | | | | | | |
| Net realized gains (losses) from investments transactions | | | 5,092,306 | | | | (1,040 | ) | | | 14,191,184 | | | | 44,964,765 | |
| Change in unrealized appreciation (depreciation) on investments | | | (17,473,365 | ) | | | (13,591 | ) | | | (49,470,410 | ) | | | (190,300,047 | ) |
| NET REALIZED AND UNREALIZED LOSSES ON INVESTMENTS | | | (12,381,059 | ) | | | (14,631 | ) | | | (35,279,226 | ) | | | (145,335,282 | ) |
| | | | | | | | | | | | | | | | | |
| NET DECREASE IN NET ASSETS RESULTING FROM OPERATIONS | | $ | (10,827,023 | ) | | $ | (13,147 | ) | | $ | (34,206,289 | ) | | $ | (138,886,926 | ) |
| | | | | | | | | | | | | | | | | |
Amounts designated as “—” are either $0 or have been rounded to $0.
| (a) | Represents the period from the commencement of operations (November 30, 2021) through April 30, 2022. |
The accompanying notes are an integral part of the financial statements.
| WESTWOOD FUNDS |
| SIX MONTHS ENDED APRIL 30, 2022 (Unaudited) |
| |
| STATEMENTS OF OPERATIONS |
| | | | | | | | | Westwood | |
| | | Westwood | | | Westwood | | | Income | |
| | | Quality AllCap | | | Total Return | | | Opportunity | |
| | | Fund | | | Fund | | | Fund | |
| INVESTMENT INCOME | | | | | | | | | | | | |
| Dividend income (net of foreign withholding tax of $89, $9,348 and $50,444, respectively) | | $ | 187,421 | | | $ | 1,183,994 | | | $ | 7,314,419 | |
| Interest income (net of foreign withholdng tax of $0, $1,364 and $16,775, respectively) | | | — | | | | 1,036,913 | | | | 6,129,388 | |
| Total investment income | | | 187,421 | | | | 2,220,907 | | | | 13,443,807 | |
| | | | | | | | | | | | | |
| EXPENSES | | | | | | | | | | | | |
| Investment management fees (Note 4) | | | 50,204 | | | | 347,333 | | | | 3,154,607 | |
| Distribution fees-A Class | | | — | | | | 5 | | | | 76,479 | |
| Distribution fees-C Class | | | — | | | | 578 | | | | 66,726 | |
| Administration fees (Note 4) | | | 15,548 | | | | 19,606 | | | | 112,664 | |
| Registration and filing fees | | | 7,863 | | | | 32,354 | | | | 44,045 | |
| Trustees’ fees (Note 4) | | | 988 | | | | 3,958 | | | | 23,692 | |
| Legal fees | | | 4,030 | | | | 3,810 | | | | 21,738 | |
| Custody fees | | | 1,201 | | | | 4,526 | | | | 8,762 | |
| Audit fees and tax services fees | | | 7,000 | | | | 7,885 | | | | 8,658 | |
| Compliance fees (Note 4) | | | 206 | | | | 1,263 | | | | 7,784 | |
| Transfer agent fees (Note 4) | | | 5,026 | | | | 2,232 | | | | 6,329 | |
| Administrative service plan fees-Institutional Shares (Note 4) | | | 519 | | | | — | | | | — | |
| Other expenses | | | 3,950 | | | | 14,526 | | | | 18,749 | |
| Total expenses | | | 96,535 | | | | 438,076 | | | | 3,550,233 | |
| Investment management fees reduced and expense reimbursements by Adviser (Note 4) | | | (45,812 | ) | | | (56,038 | ) | | | — | |
| NET EXPENSES | | | 50,723 | | | | 382,038 | | | | 3,550,233 | |
| | | | | | | | | | | | | |
| NET INVESTMENT INCOME | | | 136,698 | | | | 1,838,869 | | | | 9,893,574 | |
| | | | | | | | | | | | | |
| REALIZED AND UNREALIZED GAINS (LOSSES) ON INVESTMENTS | | | | | | | | | | | | |
| Net realized gains from investment transactions | | | 196,873 | | | | 3,803,134 | | | | 20,224,688 | |
| Net realized losses from foreign currency transactions | | | — | | | | — | | | | (1,234 | ) |
| Change in unrealized appreciation (depreciation) on investment transactions | | | (1,741,820 | ) | | | (18,083,189 | ) | | | (105,630,998 | ) |
| Change in unrealized appreciation (depreciation) on foreign currency translations | | | — | | | | — | | | | (308,894 | ) |
| NET REALIZED AND UNREALIZED LOSSES ON INVESTMENTS | | | (1,544,947 | ) | | | (14,280,055 | ) | | | (85,716,438 | ) |
| | | | | | | | | | | | | |
| NET DECREASE IN NET ASSETS RESULTING FROM OPERATIONS | | $ | (1,408,249 | ) | | $ | (12,441,186 | ) | | $ | (75,822,864 | ) |
| | | | | | | | | | | | | |
Amounts designated as “—” are either $0 or have been rounded to $0.
The accompanying notes are an integral part of the financial statements.
| WESTWOOD FUNDS |
| SIX MONTHS ENDED APRIL 30, 2022 (Unaudited) |
| |
| STATEMENTS OF OPERATIONS |
| | | Westwood | | | Westwood | | | Westwood | |
| | | High Income | | | Alternative | | | SmallCap | |
| | | Fund | | | Income Fund | | | Growth Fund | |
| INVESTMENT INCOME | | | | | | | | | | | | |
| Dividend income (net of foreign withholding tax of $5,710, $0 and $0, respectively) | | $ | 496,349 | | | $ | — | | | $ | 23,235 | |
| Interest income (net of foreign withholding tax of $2,944, $2,819 and $0, respectively) | | | 2,119,677 | | | | 1,649,871 | | | | — | |
| Total investment income | | | 2,616,026 | | | | 1,649,871 | | | | 23,235 | |
| | | | | | | | | | | | | |
| EXPENSES | | | | | | | | | | | | |
| Investment management fees (Note 4) | | | 355,356 | | | | 175,275 | | | | 15,361 | |
| Registration and filing fees | | | 32,209 | | | | 42,374 | | | | 7,798 | |
| Administration fees (Note 4) | | | 13,739 | | | | 22,865 | | | | 15,548 | |
| Audit fees and tax services fees | | | 5,983 | | | | 8,808 | | | | 7,000 | |
| Distribution fees-A Class | | | 2,654 | | | | 50 | | | | — | |
| Distribution fees-C Class | | | 964 | | | | 163 | | | | — | |
| Trustees’ fees (Note 4) | | | 3,200 | | | | 4,301 | | | | 408 | |
| Legal fees | | | 3,049 | | | | 4,465 | | | | 2,632 | |
| Transfer agent fees (Note 4) | | | 2,756 | | | | 1,145 | | | | 5,010 | |
| Custody fees | | | 1,820 | | | | 5,173 | | | | 8,323 | |
| Compliance fees (Note 4) | | | 943 | | | | 1,524 | | | | 52 | |
| Administrative service plan fees-Institutional Shares (Note 4) | | | — | | | | 27,679 | | | | 5,586 | |
| Other expenses | | | 14,350 | | | | 7,497 | | | | 6,189 | |
| Total expenses | | | 437,023 | | | | 301,319 | | | | 73,907 | |
| Investment management fees reduced and expense reimbursements by Adviser (Note 4) | | | (27,168 | ) | | | (106,133 | ) | | | (52,961 | ) |
| NET EXPENSES | | | 409,855 | | | | 195,186 | | | | 20,946 | |
| | | | | | | | | | | | | |
| NET INVESTMENT INCOME | | | 2,206,171 | | | | 1,454,685 | | | | 2,289 | |
| | | | | | | | | | | | | |
| REALIZED AND UNREALIZED GAINS (LOSSES) ON INVESTMENTS | | | | | | | | | | | | |
| Net realized gains (losses) from investment transactions | | | 1,717,160 | | | | (3,919,767 | ) | | | (780,845 | ) |
| Net realized gains from foreign currency transactions | | | 110 | | | | 8 | | | | — | |
| Net realized gains from future transactions | | | — | | | | 54,237 | | | | — | |
| Net realized gains from swap transactions | | | — | | | | 11,961,781 | | | | — | |
| Change in unrealized appreciation (depreciation) on investment transactions | | | (12,045,331 | ) | | | (17,711,939 | ) | | | (269,558 | ) |
| Change in unrealized appreciation (depreciation) on foreign currency translations | | | (110 | ) | | | 393,721 | | | | — | |
| Change in unrealized appreciation on futures | | | — | | | | 66,402 | | | | — | |
| Change in unrealized appreciation (depreciation) on swaps | | | — | | | | 4,306,452 | | | | — | |
| NET REALIZED AND UNREALIZED LOSSES ON INVESTMENTS | | | (10,328,171 | ) | | | (4,849,105 | ) | | | (1,050,403 | ) |
| | | | | | | | | | | | | |
| NET DECREASE IN NET ASSETS RESULTING FROM OPERATIONS | | $ | (8,122,000 | ) | | $ | (3,394,420 | ) | | $ | (1,048,114 | ) |
| | | | | | | | | | | | | |
Amounts designated as “—” are either $0 or have been rounded to $0.
The accompanying notes are an integral part of the financial statements.
| WESTWOOD FUNDS |
| |
| STATEMENTS OF CHANGES IN NET ASSETS |
| | |
| | | | | | Westwood | | | | |
| | | Westwood Quality | | | Quality | | | Westwood Quality | |
| | | Value Fund | | | MidCap Fund | | | SMidCap Fund | |
| | | Six Months | | | | | | Period | | | Six Months | | | | |
| | | Ended | | | | | | Ended | | | Ended | | | | |
| | | April 30, | | | Year Ended | | | April 30, | | | April 30, | | | Year Ended | |
| | | 2022 | | | October 31, | | | 2022 (b) | | | 2022 | | | October 31, | |
| | | (Unaudited) | | | 2021 (a) | | | (Unaudited) | | | (Unaudited) | | | 2021 (c) | |
| FROM OPERATIONS | | | | | | | | | | | | | | | | | | | | |
| Net investment income | | $ | 1,554,036 | | | $ | 1,710,107 | | | $ | 1,484 | | | $ | 1,072,937 | | | $ | 2,806,105 | |
| Net realized gains (losses) on investments | | | 5,092,306 | | | | 40,037,123 | | | | (1,040 | ) | | | 14,191,184 | | | | 46,153,438 | |
| Net change in unrealized appreciation (depreciation) on investments | | | (17,473,365 | ) | | | 19,579,369 | | | | (13,591 | ) | | | (49,470,410 | ) | | | 33,763,426 | |
| Net increase (decrease) in net assets resulting from operations | | | (10,827,023 | ) | | | 61,326,599 | | | | (13,147 | ) | | | (34,206,289 | ) | | | 82,722,969 | |
| FROM DISTRIBUTIONS TO SHAREHOLDERS | | | | | | | | | | | | | | | | | | | | |
| Institutional Shares | | | (39,487,955 | ) | | | (11,086,837 | ) | | | — | | | | (33,934,718 | ) | | | (5,290,326 | ) |
| A Class Shares | | | (130,582 | ) | | | (131,278 | ) | | | — | | | | — | | | | — | |
| C Class Shares | | | (145 | ) | | | (10 | ) | | | — | | | | — | | | | — | |
| Ultra Shares | | | — | | | | — | | | | — | | | | (14,978,126 | ) | | | (219,880 | ) |
| Total distributions | | | (39,618,682 | ) | | | (11,218,125 | ) | | | — | | | | (48,912,844 | ) | | | (5,510,206 | ) |
| CAPITAL SHARE TRANSACTIONS | | | | | | | | | | | | | | | | | | | | |
| Institutional Shares: | | | | | | | | | | | | | | | | | | | | |
| Issued | | | 103,505,807 | | | | 26,813,884 | | | | 500,000 | | | | 16,151,508 | | | | 55,681,359 | |
| Reinvestment of dividends | | | 27,161,720 | | | | 9,127,074 | | | | — | | | | 33,838,985 | | | | 5,269,890 | |
| Redeemed | | | (19,527,877 | ) | | | (51,279,758 | ) | | | — | | | | (21,588,207 | ) | | | (50,919,571 | ) |
| Net increase (decrease) from Institutional | | | | | | | | | | | | | | | | | | | | |
| Shares capital share transactions | | | 111,139,650 | | | | (15,338,800 | ) | | | 500,000 | | | | 28,402,286 | | | | 10,031,678 | |
| A Class Shares: | | | | | | | | | | | | | | | | | | | | |
| Issued | | | 343,053 | | | | 192,311 | | | | N/A | | | | N/A | | | | N/A | |
| Reinvestment of dividends | | | 130,582 | | | | 131,278 | | | | N/A | | | | N/A | | | | N/A | |
| Redeemed | | | (10,163 | ) | | | (1,996,945 | ) | | | N/A | | | | N/A | | | | N/A | |
| Net increase (decrease) from A Class Shares capital share transactions | | | 463,472 | | | | (1,673,356 | ) | | | N/A | | | | N/A | | | | N/A | |
| C Class Shares: | | | | | | | | | | | | | | | | | | | | |
| Issued | | | 73,185 | | | | 2 | | | | N/A | | | | N/A | | | | N/A | |
| Reinvestment of dividends | | | 145 | | | | 10 | | | | N/A | | | | N/A | | | | N/A | |
| Redeemed | | | — | | | | — | | | | N/A | | | | N/A | | | | N/A | |
| Net increase from C Class Shares capital share transactions | | | 73,330 | | | | 12 | | | | N/A | | | | N/A | | | | N/A | |
| Ultra Shares: | | | | | | | | | | | | | | | | | | | | |
| Issued | | | N/A | | | | N/A | | | | N/A | | | | 6,939,768 | | | | 102,073,362 | |
| Reinvestment of dividends | | | N/A | | | | N/A | | | | N/A | | | | 14,978,126 | | | | 219,880 | |
| Redeemed | | | N/A | | | | N/A | | | | N/A | | | | (5,642,474 | ) | | | (17,547,586 | ) |
| Net increase from Ultra Shares capital share transactions | | | N/A | | | | N/A | | | | N/A | | | | 16,275,420 | | | | 84,745,656 | |
| Net increase (decrease) in net assets from capital share transactions | | | 111,676,452 | | | | (17,012,144 | ) | | | 500,000 | | | | 44,677,706 | | | | 94,777,334 | |
| TOTAL INCREASE (DECREASE) IN NET ASSETS | | | 61,230,747 | | | | 33,096,330 | | | | 486,853 | | | | (38,441,427 | ) | | | 171,990,097 | |
| NET ASSETS | | | | | | | | | | | | | | | | | | | | |
| Beginning of period | | | 207,588,437 | | | | 174,492,107 | | | | — | | | | 338,411,831 | | | | 166,421,734 | |
| End of period | | $ | 268,819,184 | | | $ | 207,588,437 | | | $ | 486,853 | | | $ | 299,970,404 | | | $ | 338,411,831 | |
| | | | | | | | | | | | | | | | | | | | | |
Amounts designated as “—” are $0 or rounded to $0.
N/A – Not applicable
| (a) | Effective March 1, 2021, Westwood LargeCap Fund was renamed as Westwood Quality Value Fund. |
| (b) | Represents the period from the commencement of operations (November 30, 2021) through April 30, 2022. |
| (c) | Effective March 1, 2021, Westwood SMIDCap Fund was renamed as Westwood Quality SMIDCap Fund. |
The accompanying notes are an integral part of the financial statements.
| WESTWOOD FUNDS |
| |
| STATEMENTS OF CHANGES IN NET ASSETS |
| | | | | | Westwood | | | | |
| | | Westwood Quality | | | Quality | | | Westwood Quality | |
| | | Value Fund | | | MidCap Fund | | | SMidCap Fund | |
| | | Six Months | | | | | | Period | | | Six Months | | | | |
| | | Ended | | | | | | Ended | | | Ended | | | | |
| | | April 30, | | | Year Ended | | | April 30, | | | April 30, | | | Year Ended | |
| | | 2022 | | | October 31, | | | 2022 (b) | | | 2022 | | | October 31, | |
| | | (Unaudited) | | | 2021 (a) | | | (Unaudited) | | | (Unaudited) | | | 2021 (c) | |
| CAPITAL SHARES ACTIVITY | | | | | | | | | | | | | | | | | | | | |
| Institutional Shares | | | | | | | | | | | | | | | | | | | | |
| Sold | | | 7,325,275 | | | | 1,895,497 | | | | 50,000 | | | | 1,119,292 | | | | 3,569,810 | |
| Issued in reinvestment of dividends to shareholders | | | 2,049,945 | | | | 713,906 | | | | — | | | | 2,351,737 | | | | 386,774 | |
| Redeemed | | | (1,452,461 | ) | | | (3,843,269 | ) | | | — | | | | (1,513,056 | ) | | | (3,402,481 | ) |
| Net increase (decrease) in shares outstanding | | | 7,922,759 | | | | (1,233,866 | ) | | | 50,000 | | | | 1,957,973 | | | | 554,103 | |
| Shares outstanding at beginning of period | | | 13,368,950 | | | | 14,602,816 | | | | — | | | | 14,288,706 | | | | 13,734,603 | |
| Shares outstanding at end of period | | | 21,291,709 | | | | 13,368,950 | | | | 50,000 | | | | 16,246,679 | | | | 14,288,706 | |
| | | | | | | | | | | | | | | | | | | | | |
| A Class Shares | | | | | | | | | | | | | | | | | | | | |
| Sold | | | 26,733 | | | | 13,323 | | | | N/A | | | | N/A | | | | N/A | |
| Issued in reinvestment of dividends to shareholders | | | 9,819 | | | | 10,233 | | | | N/A | | | | N/A | | | | N/A | |
| Redeemed | | | (753 | ) | | | (149,365 | ) | | | N/A | | | | N/A | | | | N/A | |
| Net increase (decrease) in shares outstanding | | | 35,799 | | | | (125,809 | ) | | | N/A | | | | N/A | | | | N/A | |
| Shares outstanding at beginning of period | | | 55,274 | | | | 181,083 | | | | N/A | | | | N/A | | | | N/A | |
| Shares outstanding at end of period | | | 91,073 | | | | 55,274 | | | | N/A | | | | N/A | | | | N/A | |
| | | | | | | | | | | | | | | | | | | | | |
| C Class Shares | | | | | | | | | | | | | | | | | | | | |
| Sold | | | 5,629 | | | | — | | | | N/A | | | | N/A | | | | N/A | |
| Issued in reinvestment of dividends to shareholders | | | 11 | | | | 1 | | | | N/A | | | | N/A | | | | N/A | |
| Redeemed | | | — | | | | — | | | | N/A | | | | N/A | | | | N/A | |
| Net increase in shares outstanding | | | 5,640 | | | | 1 | | | | N/A | | | | N/A | | | | N/A | |
| Shares outstanding at beginning of period | | | 14 | | | | 13 | | | | N/A | | | | N/A | | | | N/A | |
| Shares outstanding at end of period | | | 5,654 | | | | 14 | | | | N/A | | | | N/A | | | | N/A | |
| | | | | | | | | | | | | | | | | | | | | |
| Ultra Shares | | | | | | | | | | | | | | | | | | | | |
| Sold | | | N/A | | | | N/A | | | | N/A | | | | 449,440 | | | | 7,021,662 | |
| Issued in reinvestment of dividends to shareholders | | | N/A | | | | N/A | | | | N/A | | | | 1,040,385 | | | | 16,046 | |
| Redeemed | | | N/A | | | | N/A | | | | N/A | | | | (391,992 | ) | | | (1,139,429 | ) |
| Net increase in shares outstanding | | | N/A | | | | N/A | | | | N/A | | | | 1,097,833 | | | | 5,898,279 | |
| Shares outstanding at beginning of period | | | N/A | | | | N/A | | | | N/A | | | | 6,071,411 | | | | 173,132 | |
| Shares outstanding at end of period | | | N/A | | | | N/A | | | | N/A | | | | 7,169,244 | | | | 6,071,411 | |
| | | | | | | | | | | | | | | | | | | | | |
Amounts designated as “—” are $0 or rounded to $0.
N/A – Not applicable
| (a) | Effective March 1, 2021, Westwood LargeCap Fund was renamed as Westwood Quality Value Fund. |
| (b) | Represents the period from the commencement of operations (November 30, 2021) through April 30, 2022. |
| (c) | Effective March 1, 2021, Westwood SMIDCap Fund was renamed as Westwood Quality SMIDCap Fund. |
The accompanying notes are an integral part of the financial statements.
| WESTWOOD FUNDS |
| |
| STATEMENTS OF CHANGES IN NET ASSETS |
| | | Westwood Quality | | | Westwood Quality | | | Westwood Total | |
| | | SmallCap Fund | | | AllCap Fund | | | Return Fund | |
| | | Six Months | | | | | | Six Months | | | | | | Six Months | | | | |
| | | Ended | | | | | | Ended | | | | | | Ended | | | | |
| | | April 30, | | | Year Ended | | | April 30, | | | Period Ended | | | April 30, | | | Year Ended | |
| | | 2022 | | | October 31, | | | 2022 | | | October 31, | | | 2022 | | | October 31, | |
| | | (Unaudited) | | | 2021 (a) | | | (Unaudited) | | | 2021 (b) | | | (Unaudited) | | | 2021 | |
| FROM OPERATIONS | | | | | | | | | | | | | | | | | | | | | | | | |
| Net investment income | | $ | 6,448,356 | | | $ | 8,332,783 | | | $ | 136,698 | | | $ | 7,715 | | | $ | 1,838,869 | | | $ | 2,177,197 | |
| Net realized gains on investments | | | 44,964,765 | | | | 64,160,489 | | | | 196,873 | | | | 49,040 | | | | 3,803,134 | | | | 9,654,540 | |
| Net change in unrealized appreciation (depreciation) on investments | | | (190,300,047 | ) | | | 225,235,252 | | | | (1,741,820 | ) | | | 1,175,048 | | | | (18,083,189 | ) | | | 11,820,853 | |
| Net increase (decrease) in net assets resulting from operations | | | (138,886,926 | ) | | | 297,728,524 | | | | (1,408,249 | ) | | | 1,231,803 | | | | (12,441,186 | ) | | | 23,652,590 | |
| FROM DISTRIBUTIONS TO SHAREHOLDERS | | | | | | | | | | | | | | | | | | | | | | | | |
| Institutional Shares | | | (26,825,452 | ) | | | (2,987,544 | ) | | | (2,388 | ) | | | — | | | | (10,505,481 | ) | | | (4,734,312 | ) |
| A Class Shares | | | (69,757 | ) | | | (7,294 | ) | | | — | | | | — | | | | (295 | ) | | | (64 | ) |
| C Class Shares | | | (34,797 | ) | | | (227 | ) | | | — | | | | — | | | | (6,115 | ) | | | (152 | ) |
| Ultra Shares | | | (24,288,100 | ) | | | (1,597,937 | ) | | | (113,039 | ) | | | — | | | | — | | | | — | |
| Total Distributions | | | (51,218,106 | ) | | | (4,593,002 | ) | | | (115,427 | ) | | | — | | | | (10,511,891 | ) | | | (4,734,528 | ) |
| CAPITAL SHARE TRANSACTIONS | | | | | | | | | | | | | | | | | | | | | | | | |
| Institutional Shares: | | | | | | | | | | | | | | | | | | | | | | | | |
| Issued | | | 76,280,192 | | | | 250,276,944 | | | | — | | | | 500,000 | | | | 15,170,045 | | | | 53,807,851 | |
| Reinvestment of dividends | | | 25,833,286 | | | | 2,615,934 | | | | 2,388 | | | | — | | | | 10,478,884 | | | | 4,727,376 | |
| Redeemed | | | (93,569,704 | ) | | | (216,685,078 | ) | | | — | | | | — | | | | (22,995,350 | ) | | | (19,781,500 | ) |
| Net Increase from Institutional Shares capital share transactions | | | 8,543,774 | | | | 36,207,800 | | | | 2,388 | | | | 500,000 | | | | 2,653,579 | | | | 38,753,727 | |
| A Class Shares: | | | | | | | | | | | | | | | | | | | | | | | | |
| Issued | | | 279,633 | | | | 683,436 | | | | N/A | | | | N/A | | | | 8 | | | | 3,470 | |
| Reinvestment of dividends | | | 69,757 | | | | 6,782 | | | | N/A | | | | N/A | | | | 295 | | | | 63 | |
| Redeemed | | | (114,721 | ) | | | (589,763 | ) | | | N/A | | | | N/A | | | | — | | | | — | |
| Net increase from A Class Shares capital share transactions | | | 234,669 | | | | 100,455 | | | | N/A | | | | N/A | | | | 303 | | | | 3,533 | |
| C Class Shares: | | | | | | | | | | | | | | | | | | | | | | | | |
| Issued | | | 26,276 | | | | 591,709 | | | | N/A | | | | N/A | | | | 79,108 | | | | 71,650 | |
| Reinvestment of dividends | | | 31,748 | | | | 227 | | | | N/A | | | | N/A | | | | 6,114 | | | | 152 | |
| Redeemed | | | (9,810 | ) | | | (46,058 | ) | | | N/A | | | | N/A | | | | (31,959 | ) | | | — | |
| Net increase from C Class Shares capital share transactions | | | 48,214 | | | | 545,878 | | | | N/A | | | | N/A | | | | 53,263 | | | | 71,802 | |
| Ultra Shares: | | | | | | | | | | | | | | | | | | | | | | | | |
| Issued | | | 116,700,578 | | | | 304,226,286 | | | | 2,008,115 | | | | 20,512,529 | | | | N/A | | | | N/A | |
| Reinvestment of dividends | | | 22,576,807 | | | | 1,266,260 | | | | 113,039 | | | | — | | | | N/A | | | | N/A | |
| Redeemed | | | (45,495,622 | ) | | | (51,155,545 | ) | | | (1,285,977 | ) | | | — | | | | N/A | | | | N/A | |
| Net increase from Ultra Shares capital share transactions | | | 93,781,763 | | | | 254,337,001 | | | | 835,177 | | | | 20,512,529 | | | | N/A | | | | N/A | |
| Net increase in net assets from capital share transactions | | | 102,608,420 | | | | 291,191,134 | | | | 837,565 | | | | 21,012,529 | | | | 2,707,145 | | | | 38,829,062 | |
| TOTAL INCREASE (DECREASE) IN NET ASSETS | | | (87,496,612 | ) | | | 584,326,656 | | | | (686,111 | ) | | | 22,244,332 | | | | (20,245,932 | ) | | | 57,747,124 | |
| NET ASSETS | | | | | | | | | | | | | | | | | | | | | | | | |
| Beginning of period | | | 1,095,198,069 | | | | 510,871,413 | | | | 22,244,332 | | | | — | | | | 143,787,475 | | | | 86,040,351 | |
| End of period | | $ | 1,007,701,457 | | | $ | 1,095,198,069 | | | $ | 21,558,221 | | | $ | 22,244,332 | | | $ | 123,541,543 | | | $ | 143,787,475 | |
| | | | | | | | | | | | | | | | | | | | | | | | | |
Amounts designated as “—” are $0 or rounded to $0.
N/A — Not Applicable.
| (a) | Effective March 1, 2021, Westwood SmallCap Fund was renamed as Westwood Quality SmallCap Fund. |
| (b) | Represents the period from the commencement of operations (September 30, 2021) through October 31, 2021. |
The accompanying notes are an integral part of the financial statements.
| WESTWOOD FUNDS |
| |
| STATEMENTS OF CHANGES IN NET ASSETS |
| | | Westwood Quality | | | Westwood Quality | | | Westwood Total | |
| | | SmallCap Fund | | | AllCap Fund | | | Return Fund | |
| | | Six Months | | | | | | Six Months | | | | | | Six Months | | | | |
| | | Ended | | | | | | Ended | | | | | | Ended | | | | |
| | | April 30, | | | Year Ended | | | April 30, | | | Period Ended | | | April 30, | | | Year Ended | |
| | | 2022 | | | October 31, | | | 2022 | | | October 31, | | | 2022 | | | October 31, | |
| | | (Unaudited) | | | 2021 (a) | | | (Unaudited) | | | 2021 (b) | | | (Unaudited) | | | 2021 | |
| CAPITAL SHARES ACTIVITY | | | | | | | | | | | | | | | | | | | | | | | | |
| Institutional Shares: | | | | | | | | | | | | | | | | | | | | | | | | |
| Sold | | | 3,703,457 | | | | 12,662,660 | | | | — | | | | 50,000 | | | | 2,123,737 | | | | 7,458,941 | |
| Issued in reinvestment of dividends to shareholders | | | 1,201,430 | | | | 148,802 | | | | 225 | | | | — | | | | 1,460,835 | | | | 678,084 | |
| Redeemed | | | (4,516,499 | ) | | | (10,893,500 | ) | | | — | | | | — | | | | (3,261,552 | ) | | | (2,741,173 | ) |
| Net increase in shares outstanding | | | 388,388 | | | | 1,917,962 | | | | 225 | | | | 50,000 | | | | 323,020 | | | | 5,395,852 | |
| Shares outstanding at beginning of period | | | 26,673,116 | | | | 24,755,154 | | | | 50,000 | | | | — | | | | 18,776,694 | | | | 13,380,842 | |
| Shares outstanding at end of period | | | 27,061,504 | | | | 26,673,116 | | | | 50,225 | | | | 50,000 | | | | 19,099,714 | | | | 18,776,694 | |
| | | | | | | | | | | | | | | | | | | | | | | | | |
| A Class Shares: | | | | | | | | | | | | | | | | | | | | | | | | |
| Sold | | | 13,202 | | | | 33,869 | | | | N/A | | | | N/A | | | | 1 | | | | 502 | |
| Issued in reinvestment of dividends to shareholders | | | 3,251 | | | | 386 | | | | N/A | | | | N/A | | | | 41 | | | | 9 | |
| Redeemed | | | (5,506 | ) | | | (28,226 | ) | | | N/A | | | | N/A | | | | — | | | | — | |
| Net increase in shares outstanding | | | 10,947 | | | | 6,029 | | | | N/A | | | | N/A | | | | 42 | | | | 511 | |
| Shares outstanding at beginning of period | | | 67,007 | | | | 60,978 | | | | N/A | | | | N/A | | | | 536 | | | | 25 | |
| Shares outstanding at end of period | | | 77,954 | | | | 67,007 | | | | N/A | | | | N/A | | | | 578 | | | | 536 | |
| | | | | | | | | | | | | | | | | | | | | | | | | |
| C Class Shares: | | | | | | | | | | | | | | | | | | | | | | | | |
| Sold | | | 1,258 | | | | 28,559 | | | | N/A | | | | N/A | | | | 11,011 | | | | 9,567 | |
| Issued in reinvestment of dividends to shareholders | | | 1,494 | | | | 13 | | | | N/A | | | | N/A | | | | 856 | | | | 20 | |
| Redeemed | | | (496 | ) | | | (2,543 | ) | | | N/A | | | | N/A | | | | (4,705 | ) | | | — | |
| Net increase in shares outstanding | | | 2,256 | | | | 26,029 | | | | N/A | | | | N/A | | | | 7,162 | | | | 9,587 | |
| Shares outstanding at beginning of period | | | 39,025 | | | | 12,996 | | | | N/A | | | | N/A | | | | 9,613 | | | | 26 | |
| Shares outstanding at end of period | | | 41,281 | | | | 39,025 | | | | N/A | | | | N/A | | | | 16,775 | | | | 9,613 | |
| | | | | | | | | | | | | | | | | | | | | | | | | |
| Ultra Shares: | | | | | | | | | | | | | | | | | | | | | | | | |
| Sold | | | 5,756,734 | | | | 14,938,603 | | | | 198,042 | | | | 2,050,369 | | | | N/A | | | | N/A | |
| Issued in reinvestment of dividends to shareholders | | | 1,048,675 | | | | 72,028 | | | | 10,648 | | | | — | | | | N/A | | | | N/A | |
| Redeemed | | | (2,294,202 | ) | | | (2,499,316 | ) | | | (120,813 | ) | | | — | | | | N/A | | | | N/A | |
| Net increase in shares outstanding | | | 4,511,207 | | | | 12,511,315 | | | | 87,877 | | | | 2,050,369 | | | | N/A | | | | N/A | |
| Shares outstanding at beginning of period | | | 23,007,302 | | | | 10,495,987 | | | | 2,050,369 | | | | — | | | | N/A | | | | N/A | |
| Shares outstanding at end of period | | | 27,518,509 | | | | 23,007,302 | | | | 2,138,246 | | | | 2,050,369 | | | | N/A | | | | N/A | |
| | | | | | | | | | | | | | | | | | | | | | | | | |
Amounts designated as “—” are $0 or rounded to $0.
N/A — Not Applicable.
| (a) | Effective March 1, 2021, Westwood SmallCap Fund was renamed as Westwood Quality SmallCap Fund. |
| (b) | Represents the period from the commencement of operations (September 30, 2021) through October 31, 2021. |
The accompanying notes are an integral part of the financial statements.
| WESTWOOD FUNDS |
| |
| STATEMENTS OF CHANGES IN NET ASSETS |
| | | Westwood Income | | | Westwood High | |
| | | Opportunity Fund | | | Income Fund | |
| | | Six Months | | | | | | Six Months | | | | |
| | | Ended | | | | | | Ended | | | | |
| | | April 30, | | | Year Ended | | | April 30, | | | Year Ended | |
| | | 2022 | | | October 31, | | | 2022 | | | October 31, | |
| | | (Unaudited) | | | 2021 | | | (Unaudited) | | | 2021 | |
| FROM OPERATIONS | | | | | | | | | | | | | | | | |
| Net investment income | | $ | 9,893,574 | | | $ | 13,806,434 | | | $ | 2,206,171 | | | $ | 2,902,647 | |
| Net realized gains on investments and foreign currency transactions | | | 20,223,454 | | | | 80,730,191 | * | | | 1,717,270 | | | | 6,339,468 | |
| Net change in unrealized appreciation (depreciation) on investments and foreign currency translations | | | (105,939,892 | ) | | | 30,555,527 | | | | (12,045,441 | ) | | | 2,391,176 | |
| Net increase (decrease) in net assets resulting from operations | | | (75,822,864 | ) | | | 125,092,152 | | | | (8,122,000 | ) | | | 11,633,291 | |
| FROM DISTRIBUTIONS TO SHAREHOLDERS | | | | | | | | | | | | | | | | |
| Institutional Shares | | | (74,444,670 | ) | | | (56,562,024 | ) | | | (2,087,564 | ) | | | (2,977,937 | ) |
| A Class Shares | | | (5,763,910 | ) | | | (3,856,704 | ) | | | (41,792 | ) | | | (28,552 | ) |
| C Class Shares | | | (1,195,843 | ) | | | (402,304 | ) | | | (3,261 | ) | | | (586 | ) |
| Total Distributions | | | (81,404,423 | ) | | | (60,821,032 | ) | | | (2,132,617 | ) | | | (3,007,075 | ) |
| CAPITAL SHARE TRANSACTIONS | | | | | | | | | | | | | | | | |
| Institutional Shares: | | | | | | | | | | | | | | | | |
| Issued | | | 91,488,281 | | | | 223,537,176 | | | | 24,257,641 | | | | 30,838,485 | |
| Reinvestment of dividends | | | 70,129,952 | | | | 51,959,190 | | | | 2,068,944 | | | | 2,926,171 | |
| Redeemed | | | (142,566,585 | ) | | | (183,004,295 | ) | | | (14,821,217 | ) | | | (20,903,961 | ) |
| Net increase from Institutional Shares capital share transactions | | | 19,051,648 | | | | 92,492,071 | | | | 11,505,368 | | | | 12,860,695 | |
| A Class Shares: | | | | | | | | | | | | | | | | |
| Issued | | | 11,496,006 | | | | 23,359,106 | | | | 1,294,641 | | | | 1,497,333 | |
| Reinvestment of dividends | | | 4,947,663 | | | | 3,507,622 | | | | 31,755 | | | | 28,552 | |
| Redeemed | | | (7,131,213 | ) | | | (16,529,826 | ) | | | (503,062 | ) | | | (264,074 | ) |
| Net increase from A Class Shares capital share transactions | | | 9,312,456 | | | | 10,336,902 | | | | 823,334 | | | | 1,261,811 | |
| C Class Shares: | | | | | | | | | | | | | | | | |
| Issued | | | 2,331,311 | | | | 8,354,432 | | | | 135,011 | | | | 104,995 | |
| Reinvestment of dividends | | | 1,195,843 | | | | 396,871 | | | | 3,261 | | | | 586 | |
| Redeemed | | | (1,077,837 | ) | | | (396,921 | ) | | | (3,258 | ) | | | (581 | ) |
| Net increase from C Class Shares capital share transactions | | | 2,449,317 | | | | 8,354,382 | | | | 135,014 | | | | 105,000 | |
| Net increase in net assets from capital share transactions | | | 30,813,421 | | | | 111,183,355 | | | | 12,463,716 | | | | 14,227,506 | |
| TOTAL INCREASE (DECREASE) IN NET ASSETS | | | (126,413,866 | ) | | | 175,454,475 | | | | 2,209,099 | | | | 22,853,722 | |
| NET ASSETS | | | | | | | | | | | | | | | | |
| Beginning of period | | | 890,570,253 | | | | 715,115,778 | | | | 96,087,506 | | | | 73,233,784 | |
| End of period | | $ | 764,156,387 | | | $ | 890,570,253 | | | $ | 98,296,605 | | | $ | 96,087,506 | |
| | | | | | | | | | | | | | | | | |
Amounts designated as “—” are $0 or rounded to $0.
| * | Includes realized gains as a result of an in-kind redemption (see Note 8 in the Notes to the financial statements) |
The accompanying notes are an integral part of the financial statements.
| WESTWOOD FUNDS |
| |
| STATEMENTS OF CHANGES IN NET ASSETS |
| | | Westwood Income | | | Westwood High | |
| | | Opportunity Fund | | | Income Fund | |
| | | Six Months | | | | | | Six Months | | | | |
| | | Ended | | | | | | Ended | | | | |
| | | April 30, | | | Year Ended | | | April 30, | | | Year Ended | |
| | | 2022 | | | October 31, | | | 2022 | | | October 31, | |
| | | (Unaudited) | | | 2021 | | | (Unaudited) | | | 2021 | |
| CAPITAL SHARES ACTIVITY | | | | | | | | | | | | | | | | |
| Institutional Shares: | | | | | | | | | | | | | | | | |
| Sold | | | 7,217,601 | | | | 16,472,352 | | | | 2,282,541 | | | | 2,909,531 | |
| Issued in reinvestment of dividends to shareholders | | | 5,502,427 | | | | 3,918,464 | | | | 200,851 | | | | 277,550 | |
| Redeemed | | | (11,229,068 | ) | | | (13,468,901 | ) | | | (1,428,190 | ) | | | (1,977,856 | ) |
| Net increase in shares outstanding | | | 1,490,960 | | | | 6,921,915 | | | | 1,055,202 | | | | 1,209,225 | |
| Shares outstanding at beginning of period | | | 58,523,935 | | | | 51,602,020 | | | | 8,845,115 | | | | 7,635,890 | |
| Shares outstanding at end of period | | | 60,014,895 | | | | 58,523,935 | | | | 9,900,317 | | | | 8,845,115 | |
| | | | | | | | | | | | | | | | | |
| A Class Shares: | | | | | | | | | | | | | | | | |
| Sold | | | 921,906 | | | | 1,717,828 | | | | 122,017 | | | | 139,984 | |
| Issued in reinvestment of dividends to shareholders | | | 388,768 | | | | 265,073 | | | | 3,067 | | | | 2,674 | |
| Redeemed | | | (557,943 | ) | | | (1,225,243 | ) | | | (47,357 | ) | | | (24,561 | ) |
| Net increase in shares outstanding | | | 752,731 | | | | 757,658 | | | | 77,727 | | | | 118,097 | |
| Shares outstanding at beginning of period | | | 4,503,472 | | | | 3,745,814 | | | | 151,365 | | | | 33,268 | |
| Shares outstanding at end of period | | | 5,256,203 | | | | 4,503,472 | | | | 229,092 | | | | 151,365 | |
| | | | | | | | | | | | | | | | | |
| C Class Shares: | | | | | | | | | | | | | | | | |
| Sold | | | 188,627 | | | | 613,440 | | | | 12,566 | | | | 9,704 | |
| Issued in reinvestment of dividends to shareholders | | | 94,412 | | | | 30,069 | | | | 314 | | | | 54 | |
| Redeemed | | | (86,104 | ) | | | (29,240 | ) | | | (314 | ) | | | (54 | ) |
| Net increase in shares outstanding | | | 196,935 | | | | 614,269 | | | | 12,566 | | | | 9,704 | |
| Shares outstanding at beginning of period | | | 962,338 | | | | 348,069 | | | | 9,721 | | | | 17 | |
| Shares outstanding at end of period | | | 1,159,273 | | | | 962,338 | | | | 22,287 | | | | 9,721 | |
| | | | | | | | | | | | | | | | | |
Amounts designated as “—” are $0 or rounded to $0.
The accompanying notes are an integral part of the financial statements.
| WESTWOOD FUNDS |
| |
| STATEMENTS OF CHANGES IN NET ASSETS |
| | | Westwood Alternative | | | Westwood SmallCap | |
| | | Income Fund | | | Growth Fund | |
| | | Six Months | | | | | | Six Months | | | | |
| | | Ended | | | | | | Ended | | | | |
| | | April 30, | | | Year Ended | | | April 30, | | | Period Ended | |
| | | 2022 | | | October 31, | | | 2022 | | | October 31, | |
| | | (Unaudited) | | | 2021 | | | (Unaudited) | | | 2021 (a) | |
| FROM OPERATIONS | | | | | | | | | | | | | | | | |
| Net investment income | | $ | 1,454,685 | | | $ | 2,148,908 | | | $ | 2,289 | | | $ | 16 | |
| Net realized gains (losses) on investments, futures, purchased options, swap agreements and foreign currency transactions | | | 8,096,259 | | | | 4,511,310 | | | | (780,845 | ) | | | 9,912 | |
| Net change in unrealized appreciation (depreciation) on investments, futures, purchased options, swap agreements and foreign currency translations | | | (12,945,364 | ) | | | 821,294 | | | | (269,558 | ) | | | 16,248 | |
| Net increase (decrease) in net assets resulting from operations | | | (3,394,420 | ) | | | 7,481,512 | | | | (1,048,114 | ) | | | 26,176 | |
| FROM DISTRIBUTIONS TO SHAREHOLDERS | | | | | | | | | | | | | | | | |
| Institutional Shares | | | (1,089,917 | ) | | | (432,393 | ) | | | (14,715 | ) | | | — | |
| A Class Shares | | | (719 | ) | | | (847 | ) | | | — | | | | — | |
| C Class Shares | | | (541 | ) | | | (95 | ) | | | — | | | | — | |
| Ultra Shares | | | (2,459,062 | ) | | | (1,029,336 | ) | | | — | | | | — | |
| Total Distributions | | | (3,550,239 | ) | | | (1,462,671 | ) | | | (14,715 | ) | | | — | |
| CAPITAL SHARE TRANSACTIONS | | | | | | | | | | | | | | | | |
| Institutional Shares: | | | | | | | | | | | | | | | | |
| Issued | | | 17,017,448 | | | | 51,704,897 | | | | 6,843,533 | | | | 1,000,000 | |
| Reinvestment of dividends | | | 1,089,916 | | | | 430,754 | | | | 14,714 | | | | — | |
| Redeemed | | | (12,361,962 | ) | | | (22,321,581 | ) | | | (5,707 | ) | | | — | |
| Net increase from Institutional Shares capital share transactions | | | 5,745,402 | | | | 29,814,070 | | | | 6,852,540 | | | | 1,000,000 | |
| A Class Shares: | | | | | | | | | | | | | | | | |
| Issued | | | 11 | | | | 100,652 | | | | N/A | | | | N/A | |
| Reinvestment of dividends | | | 719 | | | | 847 | | | | N/A | | | | N/A | |
| Redeemed | | | (34,079 | ) | | | (64,339 | ) | | | N/A | | | | N/A | |
| Net increase (decrease) from A Class Shares capital share transactions | | | (33,349 | ) | | | 37,160 | | | | N/A | | | | N/A | |
| C Class Shares: | | | | | | | | | | | | | | | | |
| Issued | | | 11 | | | | 40,700 | | | | N/A | | | | N/A | |
| Reinvestment of dividends | | | 541 | | | | 95 | | | | N/A | | | | N/A | |
| Redeemed | | | (39,357 | ) | | | (155,945 | ) | | | N/A | | | | N/A | |
| Net decrease from C Class Shares capital share transactions | | | (38,805 | ) | | | (115,150 | ) | | | N/A | | | | N/A | |
| Ultra Shares: | | | | | | | | | | | | | | | | |
| Issued | | | 10,373,016 | | | | 56,461,535 | | | | N/A | | | | N/A | |
| Reinvestment of dividends | | | 2,459,062 | | | | 1,029,291 | | | | N/A | | | | N/A | |
| Redeemed | | | (41,662,079 | ) | | | (20,410,295 | ) | | | N/A | | | | N/A | |
| Net increase (decrease) from Ultra Shares capital share transactions | | | (28,830,001 | ) | | | 37,080,531 | | | | N/A | | | | N/A | |
| Net increase (decrease) in net assets from capital share transactions | | | (23,156,753 | ) | | | 66,816,611 | | | | 6,852,540 | | | | 1,000,000 | |
| TOTAL INCREASE (DECREASE) IN NET ASSETS | | | (30,101,412 | ) | | | 72,835,452 | | | | 5,789,711 | | | | 1,026,176 | |
| NET ASSETS | | | | | | | | | | | | | | | | |
| Beginning of period | | | 182,170,830 | | | | 109,335,378 | | | | 1,026,176 | | | | — | |
| End of period | | $ | 152,069,418 | | | $ | 182,170,830 | | | $ | 6,815,887 | | | $ | 1,026,176 | |
| | | | | | | | | | | | | | | | | |
Amounts designated as “—” are $0 or rounded to $0.
N/A — Not Applicable.
| (a) | Represents the period from the commencement of operations (September 30, 2021) through October 31, 2021. |
The accompanying notes are an integral part of the financial statements.
| WESTWOOD FUNDS |
| |
| STATEMENTS OF CHANGES IN NET ASSETS |
| | | Westwood Alternative | | | Westwood SmallCap | |
| | | Income Fund | | | Growth Fund | |
| | | Six Months | | | | | | Six Months | | | | |
| | | Ended | | | | | | Ended | | | | |
| | | April 30, | | | Year Ended | | | April 30, | | | Period Ended | |
| | | 2022 | | | October 31, | | | 2022 | | | October 31, | |
| | | (Unaudited) | | | 2021 | | | (Unaudited) | | | 2021 (a) | |
| CAPITAL SHARES ACTIVITY | | | | | | | | | | | | | | | | |
| Institutional Shares: | | | | | | | | | | | | | | | | |
| Sold | | | 1,580,821 | | | | 4,720,940 | | | | 691,071 | | | | 100,000 | |
| Issued in reinvestment of dividends to shareholders | | | 100,892 | | | | 39,419 | | | | 1,444 | | | | — | |
| Redeemed | | | (1,148,276 | ) | | | (2,058,234 | ) | | | (560 | ) | | | — | |
| Net increase in shares outstanding | | | 533,437 | | | | 2,702,125 | | | | 691,955 | | | | 100,000 | |
| Shares outstanding at beginning of period | | | 4,878,004 | | | | 2,175,879 | | | | 100,000 | | | | — | |
| Shares outstanding at end of period | | | 5,411,441 | | | | 4,878,004 | | | | 791,955 | | | | 100,000 | |
| | | | | | | | | | | | | | | | | |
| A Class Shares: | | | | | | | | | | | | | | | | |
| Sold | | | 1 | | | | 9,303 | | | | N/A | | | | N/A | |
| Issued in reinvestment of dividends to shareholders | | | 66 | | | | 78 | | | | N/A | | | | N/A | |
| Redeemed | | | (3,112 | ) | | | (5,880 | ) | | | N/A | | | | N/A | |
| Net increase (decrease) in shares outstanding | | | (3,045 | ) | | | 3,501 | | | | N/A | | | | N/A | |
| Shares outstanding at beginning of period | | | 6,164 | | | | 2,663 | | | | N/A | | | | N/A | |
| Shares outstanding at end of period | | | 3,119 | | | | 6,164 | | | | N/A | | | | N/A | |
| | | | | | | | | | | | | | | | | |
| C Class Shares: | | | | | | | | | | | | | | | | |
| Sold | | | 1 | | | | 3,726 | | | | N/A | | | | N/A | |
| Issued in reinvestment of dividends to shareholders | | | 50 | | | | 9 | | | | N/A | | | | N/A | |
| Redeemed | | | (3,688 | ) | | | (14,335 | ) | | | N/A | | | | N/A | |
| Net decrease in shares outstanding | | | (3,637 | ) | | | (10,600 | ) | | | N/A | | | | N/A | |
| Shares outstanding at beginning of period | | | 3,652 | | | | 14,252 | | | | N/A | | | | N/A | |
| Shares outstanding at end of period | | | 15 | | | | 3,652 | | | | N/A | | | | N/A | |
| | | | | | | | | | | | | | | | | |
| Ultra Shares: | | | | | | | | | | | | | | | | |
| Sold | | | 954,299 | | | | 5,166,470 | | | | N/A | | | | N/A | |
| Issued in reinvestment of dividends to shareholders | | | 227,286 | | | | 94,173 | | | | N/A | | | | N/A | |
| Redeemed | | | (3,853,520 | ) | | | (1,866,231 | ) | | | N/A | | | | N/A | |
| Net increase (decrease) in shares outstanding | | | (2,671,935 | ) | | | 3,394,412 | | | | N/A | | | | N/A | |
| Shares outstanding at beginning of period | | | 11,645,450 | | | | 8,251,038 | | | | N/A | | | | N/A | |
| Shares outstanding at end of period | | | 8,973,515 | | | | 11,645,450 | | | | N/A | | | | N/A | |
| | | | | | | | | | | | | | | | | |
Amounts designated as “—” are $0 or rounded to $0.
N/A — Not Applicable.
| (a) | Represents the period from the commencement of operations (September 30, 2021) through October 31, 2021. |
The accompanying notes are an integral part of the financial statements.
| | WESTWOOD FUNDS |
| | |
| FINANCIAL HIGHLIGHTS |
| | SELECTED PER SHARE DATA & RATIOS |
| | FOR A SHARE OUTSTANDING THROUGHOUT THE YEAR OR PERIOD |
| | | | | | | | | Net realized | | | | | | | | | | |
| | | Net asset value, | | | Net | | | and unrealized | | | Total from | | | Dividends from | | | Distributions | |
| | | beginning of | | | investment | | | gains (losses) on | | | investment | | | net investment | | | from net realized | |
| | | period | | | income (a) | | | investments | | | operations | | | income | | | capital gains | |
| Westwood Quality Value Fund (1) | | | | | | | | | | | | | | | | | | | | | | | | |
| Institutional Shares | | | | | | | | | | | | | | | | | | | | | | | | |
| For the six months ended April 30, 2022 (unaudited) | | $ | 15.46 | | | $ | 0.08 | | | $ | (0.59 | ) | | $ | (0.51 | ) | | $ | (0.10 | ) | | $ | (2.28 | ) |
| For the year ended October 31, 2021 | | | 11.80 | | | | 0.13 | | | | 4.28 | | | | 4.41 | | | | (0.17 | ) | | | (0.58 | ) |
| For the year ended October 31, 2020 | | | 13.16 | | | | 0.20 | | | | (0.95 | ) | | | (0.75 | ) | | | (0.21 | ) | | | (0.40 | ) |
| For the year ended October 31, 2019 | | | 13.07 | | | | 0.22 | | | | 1.21 | | | | 1.43 | | | | (0.19 | ) | | | (1.15 | ) |
| For the year ended October 31, 2018 | | | 13.10 | | | | 0.20 | | | | 0.62 | | | | 0.82 | | | | (0.15 | ) | | | (0.70 | ) |
| For the year ended October 31, 2017 | | | 11.06 | | | | 0.17 | | | | 2.21 | | | | 2.38 | | | | (0.13 | ) | | | (0.21 | ) |
| A Class Shares | | | | | | | | | | | | | | | | | | | | | | | | |
| For the six months ended April 30, 2022 (unaudited) | | | 15.53 | | | | 0.07 | | | | (0.61 | ) | | | (0.54 | ) | | | (0.07 | ) | | | (2.28 | ) |
| For the year ended October 31, 2021 | | | 11.84 | | | | 0.08 | | | | 4.31 | | | | 4.39 | | | | (0.12 | ) | | | (0.58 | ) |
| For the year ended October 31, 2020 | | | 13.20 | | | | 0.18 | | | | (0.96 | ) | | | (0.78 | ) | | | (0.18 | ) | | | (0.40 | ) |
| For the year ended October 31, 2019 | | | 13.12 | | | | 0.19 | | | | 1.21 | | | | 1.40 | | | | (0.17 | ) | | | (1.15 | ) |
| For the year ended October 31, 2018 | | | 13.15 | | | | 0.17 | | | | 0.62 | | | | 0.79 | | | | (0.12 | ) | | | (0.70 | ) |
| For the year ended October 31, 2017 | | | 11.09 | | | | 0.14 | | | | 2.23 | | | | 2.37 | | | | (0.10 | ) | | | (0.21 | ) |
| C Class Shares | | | | | | | | | | | | | | | | | | | | | | | | |
| For the six months ended April 30, 2022 (unaudited) | | | 15.33 | | | | 0.01 | | | | (0.58 | ) | | | (0.57 | ) | | | (0.09 | ) | | | (2.28 | ) |
| For the year ended October 31, 2021 | | | 11.80 | | | | 0.01 | | | | 4.27 | | | | 4.28 | | | | (0.17 | ) | | | (0.58 | ) |
| For the period ended October 31, 2020 (g) | | | 10.17 | | | | 0.16 | | | | 1.47 | | | | 1.63 | | | | — | | | | — | |
| Westwood Quality MidCap Fund | | | | | | | | | | | | | | | | | | | | | | | | |
| Institutional Shares | | | | | | | | | | | | | | | | | | | | | | | | |
| For the period ended April 30, 2022 (unaudited) (i) | | | 10.00 | | | | 0.03 | | | | (0.29 | ) | | | (0.26 | ) | | | — | | | | — | |
| Westwood Quality SMidCap Fund (2) | | | | | | | | | | | | | | | | | | | | | | | | |
| Institutional Shares | | | | | | | | | | | | | | | | | | | | | | | | |
| For the six months ended April 30, 2022 (unaudited) | | | 16.62 | | | | 0.04 | | | | (1.49 | ) | | | (1.45 | ) | | | (0.11 | ) | | | (2.25 | ) |
| For the year ended October 31, 2021 | | | 11.97 | | | | 0.15 | | | | 4.89 | | | | 5.04 | | | | (0.13 | ) | | | (0.26 | ) |
| For the year ended October 31, 2020 | | | 14.21 | | | | 0.11 | | | | (0.75 | ) | | | (0.64 | ) | | | (0.11 | ) | | | (1.49 | ) |
| For the year ended October 31, 2019 | | | 15.50 | | | | 0.10 | | | | 0.84 | | | | 0.94 | | | | (0.11 | ) | | | (2.12 | ) |
| For the year ended October 31, 2018 | | | 17.44 | | | | 0.08 | | | | (0.11 | ) | | | (0.03 | ) | | | (0.04 | ) | | | (1.87 | ) |
| For the year ended October 31, 2017 | | | 14.74 | | | | 0.07 | | | | 2.84 | | | | 2.91 | | | | (0.07 | ) | | | (0.14 | ) |
| Ultra Shares | | | | | | | | | | | | | | | | | | | | | | | | |
| For the six months ended April 30, 2022 (unaudited) | | | 16.62 | | | | 0.06 | | | | (1.48 | ) | | | (1.42 | ) | | | (0.14 | ) | | | (2.25 | ) |
| For the year ended October 31, 2021 | | | 11.96 | | | | 0.16 | | | | 4.91 | | | | 5.07 | | | | (0.15 | ) | | | (0.26 | ) |
| For the period ended October 31, 2020 (k) | | | 11.44 | | | | — | | | | 0.52 | | | | 0.52 | | | | — | | | | — | |
| | | | | | | | | | | | | | | | | | | | | | | | | |
Amounts designated as “—” are either $0.00 or have been rounded to $0.00.
| (a) | Per share net income has been determined on the basis of average number of shares outstanding during the period. |
| (b) | Total return is a measure of the change in value of an investment in the Fund over the period covered. The returns shown do not reflect the deduction of taxes a shareholder would pay on Fund distributions, if any or the redemption of Fund shares. The total returns would be lower if the Adviser had not reduced investment management fees and/or reimbursed expenses (Note 4). |
| (c) | Ratio was determined after investment management fee reductions and/or reimbursed expenses (Note 4). |
| (d) | Portfolio turnover rate is calculated on the basis of the Fund as a whole without distinguishing between classes of shares issued. |
| (g) | Represents the period from the commencement of operations (March 31, 2020) through October 31, 2020. |
| (h) | The ratio rounds to 0.00% due to the impact of the low level of average net assets. The share class is expected to run at the expense limit of 1.65% (1.73% excluding waivers) when assets are contributed. |
| (i) | Represents the period from the commencement of operations (November 30, 2021) through April 30, 2022. |
| (j) | Includes federal excise taxes of 0.01% of average net assets with respect to the period ending April 30, 2022. |
| (k) | Represents the period from the commencement of operations (July 31, 2020) through October 31, 2020. |
| (1) | Effective March 1, 2021, Westwood LargeCap Fund was renamed as Westwood Quality Value Fund. |
| (2) | Effective March 1, 2021, Westwood SMIDCap Fund was renamed as Westwood Quality SMIDCap Fund. |
The accompanying notes are an integral part of the financial statements.
| | WESTWOOD FUNDS |
| | |
| FINANCIAL HIGHLIGHTS |
| | SELECTED PER SHARE DATA & RATIOS |
| | FOR A SHARE OUTSTANDING THROUGHOUT THE YEAR OR PERIOD |
| | | | | | | | | | | | | | | | | | | Ratio of net | | | | |
| | | | | | | | | | | | | Ratio of total net | | | Ratio of total gross | | | investment income | | | | |
| Total | | | Net asset value, | | | | | | Net assets, | | | expenses to average | | | expenses to average | | | to average net | | | Portfolio | |
| distributions | | | end of period | | | Total return (b) | | | end of period (000’s) | | | net assets (c) | | | net assets | | | assets (c) | | | turnover rate (d) | |
| | | | | | | | | | | | | | | | | | | | | | | |
| $ | (2.38 | ) | | $ | 12.57 | | | | (3.99 | )%(e) | | $ | 267,598 | | | | 0.65 | %(f) | | | 0.68 | %(f) | | | 1.19 | %(f) | | | 39 | %(e) |
| | (0.75 | ) | | | 15.46 | | | | 38.80 | % | | | 206,730 | | | | 0.65 | % | | | 0.76 | % | | | 0.91 | % | | | 72 | % |
| | (0.61 | ) | | | 11.80 | | | | (6.11 | )% | | | 172,349 | | | | 0.65 | % | | | 0.77 | % | | | 1.66 | % | | | 52 | % |
| | (1.34 | ) | | | 13.16 | | | | 13.23 | % | | | 224,664 | | | | 0.65 | % | | | 0.73 | % | | | 1.80 | % | | | 36 | % |
| | (0.85 | ) | | | 13.07 | | | | 6.30 | % | | | 213,175 | | | | 0.65 | % | | | 0.72 | % | | | 1.50 | % | | | 49 | % |
| | (0.34 | ) | | | 13.10 | | | | 22.00 | % | | | 205,645 | | | | 0.75 | % | | | 0.83 | % | | | 1.40 | % | | | 44 | % |
| | | | | | | | | | | | | | | | | | | | | | | | | | | | | | | |
| | (2.35 | ) | | | 12.64 | | | | (4.19 | )%(e) | | | 1,151 | | | | 0.90 | %(f) | | | 0.93 | %(f) | | | 0.97 | %(f) | | | 39 | %(e) |
| | (0.70 | ) | | | 15.53 | | | | 38.46 | % | | | 858 | | | | 0.90 | % | | | 1.01 | % | | | 0.58 | % | | | 72 | % |
| | (0.58 | ) | | | 11.84 | | | | (6.32 | )% | | | 2,143 | | | | 0.90 | % | | | 1.00 | % | | | 1.43 | % | | | 52 | % |
| | (1.32 | ) | | | 13.20 | | | | 12.92 | % | | | 13,174 | | | | 0.90 | % | | | 0.98 | % | | | 1.54 | % | | | 36 | % |
| | (0.82 | ) | | | 13.12 | | | | 6.02 | % | | | 13,183 | | | | 0.90 | % | | | 0.97 | % | | | 1.25 | % | | | 49 | % |
| | (0.31 | ) | | | 13.15 | | | | 21.83 | % | | | 1,984 | | | | 1.00 | % | | | 1.08 | % | | | 1.14 | % | | | 44 | % |
| | | | | | | | | | | | | | | | | | | | | | | | | | | | | | | |
| | (2.37 | ) | | | 12.39 | | | | (4.51 | )%(e) | | | 70 | | | | 1.65 | %(f) | | | 1.68 | %(f) | | | 0.22 | %(f) | | | 39 | %(e) |
| | (0.75 | ) | | | 15.33 | | | | 37.62 | % | | | — | | | | 1.48 | % | | | 1.48 | % | | | 0.08 | % | | | 72 | % |
| | — | | | | 11.80 | | | | 16.03 | %(e) | | | — | | | | 0.00 | %(f)(h) | | | 0.00 | %(f)(h) | | | 2.29 | %(f) | | | 52 | %(e) |
| | | | | | | | | | | | | | | | | | | | | | | | | | | | | | | |
| | — | | | | 9.74 | | | | (2.60 | )%(e) | | | 487 | | | | 0.79 | %(f)(j) | | | 24.18 | %(f) | | | 0.70 | %(f) | | | 40 | %(e) |
| | | | | | | | | | | | | | | | | | | | | | | | | | | | | | | |
| | (2.36 | ) | | | 12.81 | | | | (10.21 | )%(e) | | | 208,164 | | | | 0.88 | %(f) | | | 1.04 | %(f) | | | 0.59 | %(f) | | | 61 | %(e) |
| | (0.39 | ) | | | 16.62 | | | | 42.85 | % | | | 237,479 | | | | 0.88 | % | | | 1.10 | % | | | 0.99 | % | | | 106 | % |
| | (1.60 | ) | | | 11.97 | | | | 5.39 | % | | | 164,350 | | | | 0.88 | % | | | 1.05 | % | | | 0.90 | % | | | 69 | % |
| | (2.23 | ) | | | 14.21 | | | | 9.46 | % | | | 187,341 | | | | 0.88 | % | | | 1.02 | % | | | 0.75 | % | | | 56 | % |
| | (1.91 | ) | | | 15.50 | | | | (0.33 | )% | | | 315,140 | | | | 0.88 | % | | | 1.03 | % | | | 0.50 | % | | | 58 | % |
| | (0.21 | ) | | | 17.44 | | | | 19.83 | % | | | 346,913 | | | | 0.97 | % | | | 0.97 | % | | | 0.40 | % | | | 55 | % |
| | | | | | | | | | | | | | | | | | | | | | | | | | | | | | | |
| | (2.39 | ) | | | 12.81 | | | | (10.05 | )%(e) | | | 91,807 | | | | 0.68 | %(f) | | | 0.84 | %(f) | | | 0.79 | %(f) | | | 61 | %(e) |
| | (0.41 | ) | | | 16.62 | | | | 43.19 | % | | | 100,933 | | | | 0.68 | % | | | 0.90 | % | | | 1.00 | % | | | 106 | % |
| | — | | | | 11.96 | | | | 4.55 | %(e) | | | 2,072 | | | | 0.70 | %(f) | | | 1.02 | %(f) | | | 0.08 | %(f) | | | 69 | %(e) |
The accompanying notes are an integral part of the financial statements.
| | WESTWOOD FUNDS |
| | |
| FINANCIAL HIGHLIGHTS |
| | SELECTED PER SHARE DATA & RATIOS |
| | FOR A SHARE OUTSTANDING THROUGHOUT THE YEAR OR PERIOD |
| | | | | | | | | Net realized | | | | | | | | | | |
| | | Net asset value, | | | Net | | | and unrealized | | | Total from | | | Dividends from | | | Distributions | |
| | | beginning of | | | investment | | | gains (losses) on | | | investment | | | net investment | | | from net realized | |
| | | period | | | income (loss) (a) | | | investments | | | operations | | | income | | | capital gains | |
| Westwood Quality SmallCap Fund (1) | | | | | | | | | | | | | | | | | | | | | | | | |
| Institutional Shares | | | | | | | | | | | | | | | | | | | | | | | | |
| For the six months ended April 30, 2022 (unaudited) | | $ | 21.99 | | | $ | 0.12 | | | $ | (2.68 | ) | | $ | (2.56 | ) | | $ | (0.20 | ) | | $ | (0.81 | ) |
| For the year ended October 31, 2021 | | | 14.46 | | | | 0.18 | | | | 7.47 | | | | 7.65 | | | | (0.12 | ) | | | — | |
| For the year ended October 31, 2020 | | | 16.97 | | | | 0.12 | | | | (2.45 | ) | | | (2.33 | ) | | | (0.12 | ) | | | (0.06 | ) |
| For the year ended October 31, 2019 | | | 16.76 | | | | 0.11 | | | | 1.10 | | | | 1.21 | | | | (0.12 | ) | | | (0.88 | ) |
| For the year ended October 31, 2018 | | | 18.39 | | | | 0.10 | | | | (0.47 | ) | | | (0.37 | ) | | | (0.07 | ) | | | (1.19 | ) |
| For the year ended October 31, 2017 | | | 14.39 | | | | 0.07 | | | | 4.18 | | | | 4.25 | | | | (0.09 | ) | | | (0.16 | ) |
| A Class Shares | | | | | | | | | | | | | | | | | | | | | | | | |
| For the six months ended April 30, 2022 (unaudited) | | | 21.94 | | | | 0.10 | | | | (2.66 | ) | | | (2.56 | ) | | | (0.18 | ) | | | (0.81 | ) |
| For the year ended October 31, 2021 | | | 14.44 | | | | 0.16 | | | | 7.45 | | | | 7.61 | | | | (0.11 | ) | | | — | |
| For the year ended October 31, 2020 | | | 16.99 | | | | 0.08 | | | | (2.43 | ) | | | (2.35 | ) | | | (0.14 | ) | | | (0.06 | ) |
| For the period ended October 31, 2019 (g) | | | 15.78 | | | | (0.02 | ) | | | 1.23 | | | | 1.21 | | | | — | | | | — | |
| C Class Shares | | | | | | | | | | | | | | | | | | | | | | | | |
| For the six months ended April 30, 2022 (unaudited) | | | 21.75 | | | | 0.03 | | | | (2.65 | ) | | | (2.62 | ) | | | (0.08 | ) | | | (0.81 | ) |
| For the year ended October 31, 2021 | | | 14.34 | | | | (0.01 | ) | | | 7.44 | | | | 7.43 | | | | (0.02 | ) | | | — | |
| For the year ended October 31, 2020 | | | 16.98 | | | | (0.01 | ) | | | (2.45 | ) | | | (2.46 | ) | | | (0.12 | ) | | | (0.06 | ) |
| For the period ended October 31, 2019 (g) | | | 15.78 | | | | (0.04 | ) | | | 1.24 | | | | 1.20 | | | | — | | | | — | |
| Ultra Shares | | | | | | | | | | | | | | | | | | | | | | | | |
| For the six months ended April 30, 2022 (unaudited) | | | 22.01 | | | | 0.13 | | | | (2.68 | ) | | | (2.55 | ) | | | (0.22 | ) | | | (0.81 | ) |
| For the year ended October 31, 2021 | | | 14.47 | | | | 0.20 | | | | 7.48 | | | | 7.68 | | | | (0.14 | ) | | | — | |
| For the period ended October 31, 2020 (h) | | | 11.72 | | | | 0.05 | | | | 2.70 | | | | 2.75 | | | | — | | | | — | |
| Westwood Quality AllCap Fund | | | | | | | | | | | | | | | | | | | | | | | | |
| Institutional Shares | | | | | | | | | | | | | | | | | | | | | | | | |
| For the six months ended April 30, 2022 (unaudited) | | | 10.59 | | | | 0.05 | | | | (0.75 | ) | | | (0.70 | ) | | | (0.03 | ) | | | (0.02 | ) |
| For the period ended October 31, 2021 (i) | | | 10.00 | | | | — | | | | 0.59 | | | | 0.59 | | | | — | | | | — | |
| Ultra Shares | | | | | | | | | | | | | | | | | | | | | | | | |
| For the six months ended April 30, 2022 (unaudited) | | | 10.59 | | | | 0.06 | | | | (0.75 | ) | | | (0.69 | ) | | | (0.03 | ) | | | (0.02 | ) |
| For the period ended October 31, 2021 (i) | | | 10.00 | | | | — | | | | 0.59 | | | | 0.59 | | | | — | | | | — | |
Amounts designated as “—” are either $0.00 or have been rounded to $0.00.
| (a) | Per share net income has been determined on the basis of average number of shares outstanding during the period. |
| (b) | Total return is a measure of the change in value of an investment in the Fund over the period covered. The returns shown do not reflect the deduction of taxes a shareholder would pay on Fund distributions, if any or the redemption of Fund shares. The total returns would be lower if the Adviser had not reduced investment management fees and/or reimbursed expenses (Note 4). |
| (c) | Ratio was determined after investment management fee reductions and/or reimbursed expenses (Note 4). |
| (d) | Portfolio turnover rate is calculated on the basis of the Fund as a whole without distinguishing between classes of shares issued. |
| (g) | Represents the period from the commencement of operations (September 3, 2019) through October 31, 2019. |
| (h) | Represents the period from the commencement of operations (March 31, 2020) through October 31, 2020. |
| (i) | Represents the period from the commencement of operations (September 30, 2021) through October 31, 2021. |
| (1) | Effective March 1, 2021, Westwood SmallCap Fund was renamed as Westwood Quality SmallCap Fund. |
The accompanying notes are an integral part of the financial statements.
| | WESTWOOD FUNDS |
| | |
| FINANCIAL HIGHLIGHTS |
| | SELECTED PER SHARE DATA & RATIOS |
| | FOR A SHARE OUTSTANDING THROUGHOUT THE YEAR OR PERIOD |
| | | | | | | | | | | | | | | | | | | Ratio of net | | | | |
| | | | | | | | | | | | | Ratio of total net | | | Ratio of total gross | | | investment income | | | | |
| Total | | | Net asset value, | | | | | | Net assets, | | | expenses to average | | | expenses to average | | | (loss) to average net | | | Portfolio | |
| distributions | | | end of period | | | Total return (b) | | | end of period (000’s) | | | net assets (c) | | | net assets | | | assets (c) | | | turnover rate (d) | |
| | | | | | | | | | | | | | | | | | | | | | | | | | | | | | | |
| $ | (1.01 | ) | | $ | 18.42 | | | | (12.27 | )%(e) | | $ | 498,413 | | | | 0.89 | %(f) | | | 1.01 | %(f) | | | 1.15 | %(f) | | | 31 | %(e) |
| | (0.12 | ) | | | 21.99 | | | | 53.07 | % | | | 586,435 | | | | 0.92 | % | | | 1.09 | % | | | 0.90 | % | | | 58 | % |
| | (0.18 | ) | | | 14.46 | | | | (13.90 | )% | | | 357,901 | | | | 0.99 | % | | | 1.16 | % | | | 0.81 | % | | | 67 | % |
| | (1.00 | ) | | | 16.97 | | | | 8.65 | % | | | 418,949 | | | | 0.99 | % | | | 1.11 | % | | | 0.66 | % | | | 64 | % |
| | (1.26 | ) | | | 16.76 | | | | (2.28 | )% | | | 341,713 | | | | 0.99 | % | | | 1.08 | % | | | 0.58 | % | | | 50 | % |
| | (0.25 | ) | | | 18.39 | | | | 29.71 | % | | | 234,321 | | | | 1.10 | % | | | 1.10 | % | | | 0.42 | % | | | 56 | % |
| | | | | | | | | | | | | | | | | | | | | | | | | | | | | | | |
| | (0.99 | ) | | | 18.39 | | | | (12.30 | )%(e) | | | 1,433 | | | | 1.04 | %(f) | | | 1.16 | %(f) | | | 0.98 | %(f) | | | 31 | %(e) |
| | (0.11 | ) | | | 21.94 | | | | 52.90 | % | | | 1,470 | | | | 1.04 | % | | | 1.22 | % | | | 0.77 | % | | | 58 | % |
| | (0.20 | ) | | | 14.44 | | | | (14.04 | )% | | | 881 | | | | 1.09 | % | | | 1.28 | % | | | 0.55 | % | | | 67 | % |
| | — | | | | 16.99 | | | | 7.67 | %(e) | | | 96 | | | | 1.08 | %(f) | | | 1.30 | %(f) | | | (0.90 | )%(f) | | | 64 | %(e) |
| | (0.89 | ) | | | 18.24 | | | | (12.66 | )%(e) | | | 753 | | | | 1.79 | %(f) | | | 1.91 | %(f) | | | 0.25 | %(f) | | | 31 | %(e) |
| | (0.02 | ) | | | 21.75 | | | | 51.81 | % | | | 849 | | | | 1.79 | % | | | 1.97 | % | | | (0.04 | )% | | | 58 | % |
| | (0.18 | ) | | | 14.34 | | | | (14.67 | )% | | | 186 | | | | 1.84 | % | | | 2.02 | % | | | (0.08 | )% | | | 67 | % |
| | — | | | | 16.98 | | | | 7.60 | %(e) | | | 51 | | | | 1.79 | %(f) | | | 2.05 | %(f) | | | (1.67 | )%(f) | | | 64 | %(e) |
| | (1.03 | ) | | | 18.43 | | | | (12.20 | )%(e) | | | 507,103 | | | | 0.79 | %(f) | | | 0.91 | %(f) | | | 1.24 | %(f) | | | 31 | %(e) |
| | (0.14 | ) | | | 22.01 | | | | 53.29 | % | | | 506,444 | | | | 0.79 | % | | | 0.97 | % | | | 0.95 | % | | | 58 | % |
| | — | | | | 14.47 | | | | 23.46 | %(e) | | | 151,903 | | | | 0.81 | %(f) | | | 1.10 | %(f) | | | 0.63 | %(f) | | | 67 | %(e) |
| | | | | | | | | | | | | | | | | | | | | | | | | | | | | | | |
| | (0.05 | ) | | | 9.84 | | | | (6.66 | )%(e) | | | 494 | | | | 0.65 | %(f) | | | 1.04 | %(f) | | | 1.05 | %(f) | | | 58 | %(e) |
| | — | | | | 10.59 | | | | 5.90 | %(e) | | | 529 | | | | 0.65 | %(f) | | | 2.25 | %(f) | | | 0.22 | %(f) | | | 4 | %(e) |
| | (0.05 | ) | | | 9.85 | | | | (6.52 | )%(e) | | | 21,064 | | | | 0.45 | %(f) | | | 0.86 | %(f) | | | 1.24 | %(f) | | | 58 | %(e) |
| | — | | | | 10.59 | | | | 5.90 | %(e) | | | 21,715 | | | | 0.45 | %(f) | | | 2.07 | %(f) | | | 0.44 | %(f) | | | 4 | %(e) |
The accompanying notes are an integral part of the financial statements.
| | WESTWOOD FUNDS |
| | |
| FINANCIAL HIGHLIGHTS |
| | SELECTED PER SHARE DATA & RATIOS |
| | FOR A SHARE OUTSTANDING THROUGHOUT THE YEAR OR PERIOD |
| | | | | | | | | Net realized | | | | | | | | | | |
| | | Net asset value, | | | Net | | | and unrealized | | | Total from | | | Dividends from | | | Distributions | |
| | | beginning of | | | investment | | | gains (losses) on | | | investment | | | net investment | | | from net realized | |
| | | period | | | income (a) | | | investments | | | operations | | | income | | | capital gains | |
| Westwood Total Return Fund (1) | | | | | | | | | | | | | | | | | | | | | | | | |
| Institutional Shares | | | | | | | | | | | | | | | | | | | | | | | | |
| For the six months ended April 30, 2022 (unaudited) | | $ | 7.65 | | | $ | 0.09 | | | $ | (0.72 | ) | | $ | (0.63 | ) | | $ | (0.09 | ) | | $ | (0.47 | ) |
| For the year ended October 31, 2021 | | | 6.43 | | | | 0.13 | | | | 1.41 | | | | 1.54 | | | | (0.13 | ) | | | (0.19 | ) |
| For the year ended October 31, 2020 | | | 6.64 | | | | 0.07 | | | | 0.92 | | | | 0.99 | | | | (0.06 | ) | | | (1.14 | ) |
| For the year ended October 31, 2019 | | | 10.46 | | | | 0.12 | | | | 0.53 | | | | 0.65 | | | | (0.36 | ) | | | (4.11 | ) |
| For the year ended October 31, 2018 | | | 11.94 | | | | 0.14 | | | | 0.15 | | | | 0.29 | | | | (0.12 | ) | | | (1.65 | ) |
| For the year ended October 31, 2017 | | | 10.73 | | | | 0.16 | | | | 1.35 | | | | 1.51 | | | | (0.14 | ) | | | (0.16 | ) |
| A Class Shares | | | | | | | | | | | | | | | | | | | | | | | | |
| For the six months ended April 30, 2022 (unaudited) | | | 7.64 | | | | 0.08 | | | | (0.72 | ) | | | (0.64 | ) | | | (0.08 | ) | | | (0.47 | ) |
| For the year ended October 31, 2021 | | | 6.43 | | | | 0.11 | | | | 1.40 | | | | 1.51 | | | | (0.11 | ) | | | (0.19 | ) |
| For the period ended October 31, 2020 (g) | | | 5.20 | | | | 0.03 | | | | 1.23 | | | | 1.26 | | | | (0.03 | ) | | | — | |
| C Class Shares | | | | | | | | | | | | | | | | | | | | | | | | |
| For the six months ended April 30, 2022 (unaudited) | | | 7.63 | | | | 0.06 | | | | (0.73 | ) | | | (0.67 | ) | | | (0.06 | ) | | | (0.47 | ) |
| For the year ended October 31, 2021 | | | 6.43 | | | | 0.02 | | | | 1.44 | | | | 1.46 | | | | (0.07 | ) | | | (0.19 | ) |
| For the period ended October 31, 2020 (g) | | | 5.20 | | | | 0.03 | | | | 1.23 | | | | 1.26 | | | | (0.03 | ) | | | — | |
| Westwood Income Opportunity Fund | | | | | | | | | | | | | | | | | | | | | | | | |
| Institutional Shares | | | | | | | | | | | | | | | | | | | | | | | | |
| For the six months ended April 30, 2022 (unaudited) | | | 13.92 | | | | 0.15 | | | | (1.26 | ) | | | (1.11 | ) | | | (0.14 | ) | | | (1.16 | ) |
| For the year ended October 31, 2021 | | | 12.84 | | | | 0.23 | | | | 1.90 | | | | 2.13 | | | | (0.50 | ) | | | (0.55 | ) |
| For the year ended October 31, 2020 | | | 15.89 | | | | 0.22 | | | | 0.34 | | | | 0.56 | | | | (0.20 | ) | | | (3.41 | ) |
| For the year ended October 31, 2019 | | | 15.31 | | | | 0.32 | | | | 1.25 | | | | 1.57 | | | | (0.36 | ) | | | (0.63 | ) |
| For the year ended October 31, 2018 | | | 15.72 | | | | 0.28 | | | | (0.11 | ) | | | 0.17 | | | | (0.28 | ) | | | (0.30 | ) |
| For the year ended October 31, 2017 | | | 14.58 | | | | 0.26 | | | | 1.18 | | | | 1.44 | | | | (0.23 | ) | | | (0.07 | ) |
| A Class Shares | | | | | | | | | | | | | | | | | | | | | | | | |
| For the six months ended April 30, 2022 (unaudited) | | | 13.90 | | | | 0.13 | | | | (1.26 | ) | | | (1.13 | ) | | | (0.12 | ) | | | (1.16 | ) |
| For the year ended October 31, 2021 | | | 12.83 | | | | 0.20 | | | | 1.88 | | | | 2.08 | | | | (0.46 | ) | | | (0.55 | ) |
| For the year ended October 31, 2020 | | | 15.88 | | | | 0.18 | | | | 0.34 | | | | 0.52 | | | | (0.16 | ) | | | (3.41 | ) |
| For the year ended October 31, 2019 | | | 15.30 | | | | 0.28 | | | | 1.25 | | | | 1.53 | | | | (0.32 | ) | | | (0.63 | ) |
| For the year ended October 31, 2018 | | | 15.71 | | | | 0.24 | | | | (0.11 | ) | | | 0.13 | | | | (0.24 | ) | | | (0.30 | ) |
| For the year ended October 31, 2017 | | | 14.57 | | | | 0.22 | | | | 1.18 | | | | 1.40 | | | | (0.19 | ) | | | (0.07 | ) |
| C Class Shares | | | | | | | | | | | | | | | | | | | | | | | | |
| For the six months ended April 30, 2022 (unaudited) | | | 13.84 | | | | 0.09 | | | | (1.26 | ) | | | (1.17 | ) | | | (0.07 | ) | | | (1.16 | ) |
| For the year ended October 31, 2021 | | | 12.79 | | | | 0.10 | | | | 1.88 | | | | 1.98 | | | | (0.38 | ) | | | (0.55 | ) |
| For the year ended October 31, 2020 | | | 15.88 | | | | 0.06 | | | | 0.36 | | | | 0.42 | | | | (0.10 | ) | | | (3.41 | ) |
| For the period ended October 31, 2019 (h) | | | 15.77 | | | | 0.03 | | | | 0.16 | | | | 0.19 | | | | (0.08 | ) | | | — | |
Amounts designated as “—” are either $0.00 or have been rounded to $0.00.
| (a) | Per share net income has been determined on the basis of average number of shares outstanding during the period. |
| (b) | Total return is a measure of the change in value of an investment in the Fund over the period covered. The returns shown do not reflect the deduction of taxes a shareholder would pay on Fund distributions, if any or the redemption of Fund shares. The total returns would be lower if the Adviser had not reduced investment management fees and/or reimbursed expenses (Note 4). |
| (c) | Ratio was determined after investment management fee reductions and/or reimbursed expenses (Note 4). |
| (d) | Portfolio turnover rate is calculated on the basis of the Fund as a whole without distinguishing between classes of shares issued. |
| (g) | Represents the period from the commencement of operations (March 31, 2020) through October 31, 2020. |
| (h) | Represents the period from the commencement of operations (September 3, 2019) through October 31, 2019. |
| (1) | Effective November 1, 2021, Westwood Low Volatility Equity Fund was renamed as Westwood Total Return Fund. |
The accompanying notes are an integral part of the financial statements.
| | WESTWOOD FUNDS |
| | |
| FINANCIAL HIGHLIGHTS |
| | SELECTED PER SHARE DATA & RATIOS |
| | FOR A SHARE OUTSTANDING THROUGHOUT THE YEAR OR PERIOD |
| | | | | | | | | | | | | | | | | | | Ratio of net | | | | |
| | | | | | | | | | | | | Ratio of total net | | | Ratio of total gross | | | investment income | | | | |
| Total | | | Net asset value, | | | | | | Net assets, | | | expenses to average | | | expenses to average | | | to average net | | | Portfolio | |
| distributions | | | end of period | | | Total return (b) | | | end of period (000’s) | | | net assets (c) | | | net assets | | | assets (c) | | | turnover rate (d) | |
| | | | | | | | | | | | | | | | | | | | | | | | | | | | | | | |
| $ | (0.56 | ) | | $ | 6.46 | | | | (8.96 | )%(e) | | $ | 123,430 | | | | 0.56 | %(f) | | | 0.64 | %(f) | | | 2.70 | %(f) | | | 30 | %(e) |
| | (0.32 | ) | | | 7.65 | | | | 24.46 | % | | | 143,710 | | | | 0.35 | % | | | 0.51 | % | | | 1.79 | % | | | 66 | % |
| | (1.20 | ) | | | 6.43 | | | | 17.59 | % | | | 86,040 | | | | 0.75 | % | | | 1.10 | % | | | 1.11 | % | | | 62 | % |
| | (4.47 | ) | | | 6.64 | | | | 16.55 | % | | | 4,722 | | | | 0.75 | % | | | 2.13 | % | | | 1.76 | % | | | 66 | % |
| | (1.77 | ) | | | 10.46 | | | | 2.35 | % | | | 7,803 | | | | 0.75 | % | | | 1.05 | % | | | 1.30 | % | | | 26 | % |
| | (0.30 | ) | | | 11.94 | | | | 14.24 | % | | | 44,778 | | | | 0.78 | % | | | 0.99 | % | | | 1.40 | % | | | 122 | % |
| | | | | | | | | | | | | | | | | | | | | | | | | | | | | | | |
| | (0.55 | ) | | | 6.45 | | | | (9.10 | )%(e) | | | 4 | | | | 0.85 | %(f) | | | 0.96 | %(f) | | | 2.41 | %(f) | | | 30 | %(e) |
| | (0.30 | ) | | | 7.64 | | | | 24.04 | % | | | 4 | | | | 0.64 | % | | | 0.78 | % | | | 1.47 | % | | | 66 | % |
| | (0.03 | ) | | | 6.43 | | | | 24.30 | %(e) | | | — | | | | 0.01 | %(f) | | | 0.01 | %(f) | | | 0.90 | %(f) | | | 62 | %(e) |
| | (0.53 | ) | | | 6.43 | | | | (9.49 | )%(e) | | | 108 | | | | 1.58 | %(f) | | | 1.66 | %(f) | | | 1.70 | %(f) | | | 30 | %(e) |
| | (0.26 | ) | | | 7.63 | | | | 23.13 | % | | | 73 | | | | 1.37 | % | | | 1.56 | % | | | 0.24 | % | | | 66 | % |
| | (0.03 | ) | | | 6.43 | | | | 24.30 | %(e) | | | — | | | | 0.01 | %(f) | | | 0.01 | %(f) | | | 0.88 | %(f) | | | 62 | %(g)(e) |
| | | | | | | | | | | | | | | | | | | | | | | | | | | | | | | |
| | (1.30 | ) | | | 11.51 | | | | (8.84 | )%(e) | | | 690,502 | | | | 0.81 | %(f) | | | 0.81 | %(f) | | | 2.39 | %(f) | | | 45 | %(e) |
| | (1.05 | ) | | | 13.92 | | | | 17.21 | % | | | 814,633 | | | | 0.85 | % | | | 0.86 | % | | | 1.68 | % | | | 82 | % |
| | (3.61 | ) | | | 12.84 | | | | 4.59 | % | | | 662,612 | | | | 0.89 | % | | | 0.89 | % | | | 1.69 | % | | | 111 | % |
| | (0.99 | ) | | | 15.89 | | | | 10.99 | % | | | 1,056,504 | | | | 0.85 | % | | | 0.85 | % | | | 2.08 | % | | | 66 | % |
| | (0.58 | ) | | | 15.31 | | | | 1.04 | % | | | 2,408,695 | | | | 0.83 | % | | | 0.83 | % | | | 1.80 | % | | | 42 | % |
| | (0.30 | ) | | | 15.72 | | | | 9.98 | % | | | 2,584,805 | | | | 0.83 | % | | | 0.83 | % | | | 1.72 | % | | | 34 | % |
| | | | | | | | | | | | | | | | | | | | | | | | | | | | | | | |
| | (1.28 | ) | | | 11.49 | | | | (8.97 | )%(e) | | | 60,397 | | | | 1.06 | %(f) | | | 1.06 | %(f) | | | 2.15 | %(f) | | | 45 | %(e) |
| | (1.01 | ) | | | 13.90 | | | | 16.86 | % | | | 62,614 | | | | 1.10 | % | | | 1.11 | % | | | 1.44 | % | | | 82 | % |
| | (3.57 | ) | | | 12.83 | | | | 4.34 | % | | | 48,051 | | | | 1.14 | % | | | 1.14 | % | | | 1.43 | % | | | 111 | % |
| | (0.95 | ) | | | 15.88 | | | | 10.71 | % | | | 64,450 | | | | 1.10 | % | | | 1.10 | % | | | 1.86 | % | | | 66 | % |
| | (0.54 | ) | | | 15.30 | | | | 0.78 | % | | | 74,510 | | | | 1.08 | % | | | 1.08 | % | | | 1.56 | % | | | 42 | % |
| | (0.26 | ) | | | 15.71 | | | | 9.71 | % | | | 98,976 | | | | 1.08 | % | | | 1.08 | % | | | 1.45 | % | | | 34 | % |
| | | | | | | | | | | | | | | | | | | | | | | | | | | | | | | |
| | (1.23 | ) | | | 11.44 | | | | (9.26 | )%(e) | | | 13,257 | | | | 1.81 | %(f) | | | 1.81 | %(f) | | | 1.40 | %(f) | | | 45 | %(e) |
| | (0.93 | ) | | | 13.84 | | | | 16.03 | % | | | 13,323 | | | | 1.85 | % | | | 1.86 | % | | | 0.70 | % | | | 82 | % |
| | (3.51 | ) | | | 12.79 | | | | 3.52 | % | | | 4,453 | | | | 1.90 | % | | | 1.90 | % | | | 0.48 | % | | | 111 | % |
| | (0.08 | ) | | | 15.88 | | | | 1.23 | %(e) | | | 273 | | | | 1.90 | %(f) | | | 1.90 | %(f) | | | 1.11 | %(f) | | | 66 | %(g)(e) |
The accompanying notes are an integral part of the financial statements.
| | WESTWOOD FUNDS |
| | |
| FINANCIAL HIGHLIGHTS |
| | SELECTED PER SHARE DATA & RATIOS |
| | FOR A SHARE OUTSTANDING THROUGHOUT THE YEAR OR PERIOD |
| | | | | | | | | Net realized | | | | | | | | | | | | | |
| | | Net asset value, | | | Net | | | and unrealized | | | Total from | | | Dividends from | | | Distributions | | | | |
| | | beginning of | | | investment | | | gains (losses) on | | | investment | | | net investment | | | from net realized | | | | |
| | | period | | | income (a) | | | investments | | | operations | | | income | | | capital gains | | | Return of capital | |
| Westwood High Income Fund (1) | | | | | | | | | | | | | | | | | | | | | | | | | | | | |
| Institutional Shares | | | | | | | | | | | | | | | | | | | | | | | | | | | | |
| For the six months ended April 30, 2022 (unaudited) | | $ | 10.67 | | | $ | 0.22 | | | $ | (1.00 | ) | | $ | (0.78 | ) | | $ | (0.21 | ) | | $ | — | | | $ | — | |
| For the year ended October 31, 2021 | | | 9.55 | | | | 0.35 | | | | 1.14 | | | | 1.49 | | | | (0.37 | ) | | | — | | | | — | |
| For the year ended October 31, 2020 | | | 9.25 | | | | 0.35 | | | | 0.29 | | | | 0.64 | | | | (0.34 | ) | | | — | | | | — | |
| For the year ended October 31, 2019 | | | 9.12 | | | | 0.41 | | | | 0.15 | | | | 0.56 | | | | (0.43 | ) | | | — | | | | — | |
| For the year ended October 31, 2018 | | | 9.37 | | | | 0.42 | | | | (0.24 | ) | | | 0.18 | | | | (0.43 | ) | | | — | | | | — | |
| For the year ended October 31, 2017 | | | 9.31 | | | | 0.42 | | | | 0.06 | | | | 0.48 | | | | (0.42 | ) | | | — | | | | — | |
| A Class Shares | | | | | | | | | | | | | | | | | | | | | | | | | | | | |
| For the six months ended April 30, 2022 (unaudited) | | | 10.72 | | | | 0.21 | | | | (1.00 | ) | | | (0.79 | ) | | | (0.20 | ) | | | — | | | | — | |
| For the year ended October 31, 2021 | | | 9.60 | | | | 0.33 | | | | 1.13 | | | | 1.46 | | | | (0.34 | ) | | | — | | | | — | |
| For the year ended October 31, 2020 | | | 9.29 | | | | 0.34 | | | | 0.29 | | | | 0.63 | | | | (0.32 | ) | | | — | | | | — | |
| For the year ended October 31, 2019 | | | 9.15 | | | | 0.39 | | | | 0.14 | | | | 0.53 | | | | (0.39 | ) | | | — | | | | — | |
| For the year ended October 31, 2018 | | | 9.37 | | | | 0.40 | | | | (0.23 | ) | | | 0.17 | | | | (0.39 | ) | | | — | | | | — | |
| For the year ended October 31, 2017 | | | 9.31 | | | | 0.40 | | | | 0.06 | | | | 0.46 | | | | (0.40 | ) | | | — | | | | — | |
| C Class Shares | | | | | | | | | | | | | | | | | | | | | | | | | | | | |
| For the six months ended April 30, 2022 (unaudited) | | | 10.75 | | | | 0.17 | | | | (1.00 | ) | | | (0.83 | ) | | | (0.17 | ) | | | — | | | | — | |
| For the year ended October 31, 2021 | | | 9.55 | | | | 0.22 | | | | 1.28 | | | | 1.50 | | | | (0.30 | ) | | | — | | | | — | |
| For the period ended October 31, 2020 (g) | | | 8.23 | | | | 0.24 | | | | 1.28 | | | | 1.52 | | | | (0.20 | ) | | | — | | | | — | |
Amounts designated as “—” are either $0.00 or have been rounded to $0.00.
| (a) | Per share net income has been determined on the basis of average number of shares outstanding during the period. |
| (b) | Total return is a measure of the change in value of an investment in the Fund over the period covered. The returns shown do not reflect the deduction of taxes a shareholder would pay on Fund distributions, if any or the redemption of Fund shares. The total returns would be lower if the Adviser had not reduced investment management fees and/or reimbursed expenses (Note 4). |
| (c) | Ratio was determined after investment management fee reductions and/or reimbursed expenses (Note 4). |
| (d) | Portfolio turnover rate is calculated on the basis of the Fund as a whole without distinguishing between classes of shares issued. |
| (g) | Represents the period from the commencement of operations (March 31, 2020) through October 31, 2020. |
| (1) | Effective November 1, 2019, Westwood Short Duration High Yield Fund was renamed as Westwood High Income Fund. |
The accompanying notes are an integral part of the financial statements.
| | WESTWOOD FUNDS |
| | |
| FINANCIAL HIGHLIGHTS |
| | SELECTED PER SHARE DATA & RATIOS |
| | FOR A SHARE OUTSTANDING THROUGHOUT THE YEAR OR PERIOD |
| | | | | | | | | | | | | | | | | | | Ratio of net | | | | |
| | | | | | | | | | | | | Ratio of total net | | | Ratio of total gross | | | investment income | | | | |
| Total | | | Net asset value, | | | | | | Net assets, | | | expenses to average | | | expenses to average | | | to average net | | | Portfolio | |
| distributions | | | end of period | | | Total return (b) | | | end of period (000’s) | | | net assets (c) | | | net assets | | | assets (c) | | | turnover rate (d) | |
| | | | | | | | | | | | | | | | | | | | | | | | | | | | | | | |
| $ | (0.21 | ) | | $ | 9.68 | | | | (7.39 | )%(e) | | $ | 95,849 | | | | 0.80 | %(f) | | | 0.85 | %(f) | | | 4.34 | %(f) | | | 37 | %(e) |
| | (0.37 | ) | | | 10.67 | | | | 15.69 | % | | | 94,360 | | | | 0.80 | % | | | 0.96 | % | | | 3.37 | % | | | 67 | % |
| | (0.34 | ) | | | 9.55 | | | | 7.14 | % | | | 72,914 | | | | 0.27 | % | | | 0.59 | % | | | 3.78 | % | | | 130 | % |
| | (0.43 | ) | | | 9.25 | | | | 6.25 | % | | | 65,168 | | | | 0.80 | % | | | 1.05 | % | | | 4.48 | % | | | 59 | % |
| | (0.43 | ) | | | 9.12 | | | | 1.92 | % | | | 64,926 | | | | 0.80 | % | | | 1.02 | % | | | 4.57 | % | | | 37 | % |
| | (0.42 | ) | | | 9.37 | | | | 5.27 | % | | | 77,595 | | | | 0.80 | % | | | 1.01 | % | | | 4.51 | % | | | 71 | % |
| | | | | | | | | | | | | | | | | | | | | | | | | | | | | | | |
| | (0.20 | ) | | | 9.73 | | | | (7.47 | )%(e) | | | 2,230 | | | | 1.05 | %(f) | | | 1.10 | %(f) | | | 4.13 | %(f) | | | 37 | %(e) |
| | (0.34 | ) | | | 10.72 | | | | 15.34 | % | | | 1,623 | | | | 1.05 | % | | | 1.21 | % | | | 3.05 | % | | | 67 | % |
| | (0.32 | ) | | | 9.60 | | | | 7.01 | % | | | 320 | | | | 0.48 | % | | | 0.82 | % | | | 3.61 | % | | | 130 | % |
| | (0.39 | ) | | | 9.29 | | | | 5.93 | % | | | 46 | | | | 1.05 | % | | | 1.34 | % | | | 4.20 | % | | | 59 | % |
| | (0.39 | ) | | | 9.15 | | | | 1.91 | % | | | 31 | | | | 1.05 | % | | | 1.26 | % | | | 4.26 | % | | | 37 | % |
| | (0.40 | ) | | | 9.37 | | | | 5.01 | % | | | 596 | | | | 1.05 | % | | | 1.26 | % | | | 4.25 | % | | | 71 | % |
| | | | | | | | | | | | | | | | | | | | | | | | | | | | | | | |
| | (0.17 | ) | | | 9.75 | | | | (7.85 | )%(e) | | | 217 | | | | 1.80 | %(f) | | | 1.94 | %(f) | | | 3.31 | %(f) | | | 37 | %(e) |
| | (0.30 | ) | | | 10.75 | | | | 15.77 | % | | | 104 | | | | 1.80 | % | | | 1.98 | % | | | 2.03 | % | | | 67 | % |
| | (0.20 | ) | | | 9.55 | | | | 18.51 | %(e) | | | — | | | | 0.02 | %(f) | | | 0.03 | %(f) | | | 4.46 | %(f) | | | 130 | %(e) |
The accompanying notes are an integral part of the financial statements.
| | WESTWOOD FUNDS |
| | |
| FINANCIAL HIGHLIGHTS |
| | SELECTED PER SHARE DATA & RATIOS |
| | FOR A SHARE OUTSTANDING THROUGHOUT THE YEAR OR PERIOD |
| | | | | | | | | Net realized | | | | | | | | | | | | | |
| | | Net asset value, | | | Net | | | and unrealized | | | Total from | | | Dividends from | | | Distributions | | | | |
| | | beginning of | | | investment | | | gains (losses) on | | | investment | | | net investment | | | from net realized | | | | |
| | | period | | | income (a) | | | investments | | | operations | | | income | | | capital gains | | | Return of capital | |
| Westwood Alternative Income Fund (1) | | | | | | | | | | | | | | | | | | | | | | | | | | | | |
| Institutional Shares | | | | | | | | | | | | | | | | | | | | | | | | | | | | |
| For the six months ended April 30, 2022 (unaudited) | | $ | 11.02 | | | $ | 0.09 | | | $ | (0.32 | ) | | $ | (0.23 | ) | | $ | (0.07 | ) | | $ | (0.15 | ) | | $ | — | |
| For the year ended October 31, 2021 | | | 10.47 | | | | 0.16 | | | | 0.49 | | | | 0.65 | | | | (0.10 | ) | | | — | | | | — | |
| For the year ended October 31, 2020 | | | 10.25 | | | | 0.18 | | | | 0.46 | | | | 0.64 | | | | (0.10 | ) | | | (0.32 | ) | | | — | |
| For the year ended October 31, 2019 | | | 9.82 | | | | 0.23 | | | | 0.41 | | | | 0.64 | | | | (0.21 | ) | | | — | | | | — | |
| For the year ended October 31, 2018 | | | 10.12 | | | | 0.18 | | | | (0.29 | ) | | | (0.11 | ) | | | (0.16 | ) | | | — | | | | (0.03 | ) |
| For the year ended October 31, 2017 | | | 10.01 | | | | 0.17 | | | | 0.05 | | | | 0.22 | | | | (0.09 | ) | | | (0.02 | ) | | | — | |
| A Class Shares | | | | | | | | | | | | | | | | | | | | | | | | | | | | |
| For the six months ended April 30, 2022 (unaudited) | | | 11.00 | | | | 0.08 | | | | (0.31 | ) | | | (0.23 | ) | | | (0.06 | ) | | | (0.15 | ) | | | — | |
| For the year ended October 31, 2021 | | | 10.46 | | | | 0.14 | | | | 0.48 | | | | 0.62 | | | | (0.08 | ) | | | — | | | | — | |
| For the period ended October 31, 2020 (g) | | | 9.78 | | | | 0.10 | | | | 0.62 | | | | 0.72 | | | | (0.04 | ) | | | — | | | | — | |
| C Class Shares | | | | | | | | | | | | | | | | | | | | | | | | | | | | |
| For the six months ended April 30, 2022 (unaudited) | | | 11.01 | | | | 0.04 | | | | (0.31 | ) | | | (0.27 | ) | | | — | | | | (0.15 | ) | | | — | |
| For the year ended October 31, 2021 | | | 10.46 | | | | 0.06 | | | | 0.50 | | | | 0.56 | | | | (0.01 | ) | | | — | | | | — | |
| For the period ended October 31, 2020 (g) | | | 9.78 | | | | 0.05 | | | | 0.65 | | | | 0.70 | | | | (0.02 | ) | | | — | | | | — | |
| Ultra Shares | | | | | | | | | | | | | | | | | | | | | | | | | | | | |
| For the six months ended April 30, 2022 (unaudited) | | | 11.02 | | | | 0.10 | | | | (0.32 | ) | | | (0.22 | ) | | | (0.08 | ) | | | (0.15 | ) | | | — | |
| For the year ended October 31, 2021 | | | 10.47 | | | | 0.17 | | | | 0.48 | | | | 0.65 | | | | (0.10 | ) | | | — | | | | — | |
| For the year ended October 31, 2020 | | | 10.25 | | | | 0.19 | | | | 0.46 | | | | 0.65 | | | | (0.11 | ) | | | (0.32 | ) | | | — | |
| For the year ended October 31, 2019 | | | 9.82 | | | | 0.24 | | | | 0.41 | | | | 0.65 | | | | (0.22 | ) | | | — | | | | — | |
| For the year ended October 31, 2018 | | | 10.13 | | | | 0.19 | | | | (0.29 | ) | | | (0.10 | ) | | | (0.18 | ) | | | — | | | | (0.03 | ) |
| For the year ended October 31, 2017 | | | 10.01 | | | | 0.19 | | | | 0.04 | | | | 0.23 | | | | (0.09 | ) | | | (0.02 | ) | | | — | |
| Westwood SmallCap Growth Fund | | | | | | | | | | | | | | | | | | | | | | | | | | | | |
| Institutional Shares | | | | | | | | | | | | | | | | | | | | | | | | | | | | |
| For the six months ended April 30, 2022 (unaudited) | | | 10.26 | | | | — | | | | (1.62 | ) | | | (1.62 | ) | | | (0.01 | ) | | | (0.02 | ) | | | — | |
| For the period ended October 31, 2021 (k) | | | 10.00 | | | | — | | | | 0.26 | | | | 0.26 | | | | — | | | | — | | | | — | |
Amounts designated as “—” are either $0.00 or have been rounded to $0.00.
| (a) | Per share net income has been determined on the basis of average number of shares outstanding during the period. |
| (b) | Total return is a measure of the change in value of an investment in the Fund over the period covered. The returns shown do not reflect the deduction of taxes a shareholder would pay on Fund distributions, if any or the redemption of Fund shares. The total returns would be lower if the Adviser had not reduced investment management fees and/or reimbursed expenses (Note 4). |
| (c) | Ratio was determined after investment management fee reductions and/or reimbursed expenses (Note 4). |
| (d) | Portfolio turnover rate is calculated on the basis of the Fund as a whole without distinguishing between classes of shares issued. |
| (g) | Represents the period from the commencement of operations (March 31, 2020) through October 31, 2020. |
| (h) | Excluding stock loan fees, and dividends on securities sold short, the ratio of expenses average net assets would have been 1.12% and 1.05% for Institutional Class and Ultra Class, respectively. |
| (i) | Excluding stock loan fees, and dividends on securities sold short, the ratio of expenses average net assets would have been 1.15% and 1.05% for Institutional Class and Ultra Class, respectively |
| (j) | Excluding stock loan fees, and dividends on securities sold short, the ratio of expenses average net assets would have been 1.18% and 1.05% for Institutional Class and Ultra Class, respectively |
| (k) | Represents the period from the commencement of operations (September 30, 2021) through October 31, 2021. |
| (1) | Effective November 1, 2019, Westwood Market Neutrual Income Fund was renamed as Westwood Alternative Income Fund. |
The accompanying notes are an integral part of the financial statements.
| | WESTWOOD FUNDS |
| | |
| FINANCIAL HIGHLIGHTS |
| | SELECTED PER SHARE DATA & RATIOS |
| | FOR A SHARE OUTSTANDING THROUGHOUT THE YEAR OR PERIOD |
| | | | | | | | | | | | | | | | | | | Ratio of net | | | | |
| | | | | | | | | | | | | Ratio of total net | | | Ratio of total gross | | | investment income | | | | |
| Total | | | Net asset value, | | | | | | Net assets, | | | expenses to average | | | expenses to average | | | to average net | | | Portfolio | |
| distributions | | | end of period | | | Total return (b) | | | end of period (000’s) | | | net assets (c) | | | net assets | | | assets (c) | | | turnover rate (d) | |
| | | | | | | | | | | | | | | | | | | | | | | | | | | | | | | |
| $ | (0.22 | ) | | $ | 10.57 | | | | (2.33 | )%(e) | | $ | 57,180 | | | | 0.30 | %(f) | | | 0.43 | %(f) | | | 1.72 | %(f) | | | 72 | %(e) |
| | (0.10 | ) | | | 11.02 | | | | 6.19 | % | | | 53,734 | | | | 0.96 | % | | | 1.21 | % | | | 1.45 | % | | | 125 | % |
| | (0.42 | ) | | | 10.47 | | | | 6.44 | % | | | 22,772 | | | | 0.90 | % | | | 1.40 | % | | | 1.79 | % | | | 137 | % |
| | (0.21 | ) | | | 10.25 | | | | 6.57 | % | | | 7,121 | | | | 1.15 | %(h) | | | 1.47 | % | | | 2.33 | % | | | 106 | % |
| | (0.19 | ) | | | 9.82 | | | | (1.09 | )% | | | 6,193 | | | | 1.22 | %(i) | | | 1.62 | % | | | 1.85 | % | | | 88 | % |
| | (0.11 | ) | | | 10.12 | | | | 2.16 | % | | | 7,490 | | | | 1.37 | %(j) | | | 2.15 | % | | | 1.69 | % | | | 80 | % |
| | | | | | | | | | | | | | | | | | | | | | | | | | | | | | | |
| | (0.21 | ) | | | 10.56 | | | | (2.35 | )%(e) | | | 33 | | | | 0.45 | %(f) | | | 0.59 | %(f) | | | 1.53 | %(f) | | | 72 | %(e) |
| | (0.08 | ) | | | 11.00 | | | | 5.97 | % | | | 68 | | | | 1.11 | % | | | 1.38 | % | | | 1.32 | % | | | 125 | % |
| | (0.04 | ) | | | 10.46 | | | | 7.35 | %(e) | | | 28 | | | | 1.15 | %(f) | | | 1.67 | %(f) | | | 1.61 | %(f) | | | 137 | %(e) |
| | | | | | | | | | | | | | | | | | | | | | | | | | | | | | | |
| | (0.15 | ) | | | 10.59 | | | | (2.68 | )%(e) | | | — | | | | 1.20 | %(f) | | | 1.33 | %(f) | | | 0.77 | %(f) | | | 72 | %(e) |
| | (0.01 | ) | | | 11.01 | | | | 5.39 | % | | | 40 | | | | 1.83 | % | | | 2.13 | % | | | 0.56 | % | | | 125 | % |
| | (0.02 | ) | | | 10.46 | | | | 7.21 | %(e) | | | 149 | | | | 2.10 | %(f) | | | 2.62 | %(f) | | | 0.85 | %(f) | | | 137 | %(e) |
| | (0.23 | ) | | | 10.57 | | | | (2.28 | )%(e) | | | 94,856 | | | | 0.20 | %(f) | | | 0.33 | %(f) | | | 1.79 | %(f) | | | 72 | %(e) |
| | (0.10 | ) | | | 11.02 | | | | 6.26 | % | | | 128,329 | | | | 0.85 | % | | | 1.12 | % | | | 1.53 | % | | | 125 | % |
| | (0.43 | ) | | | 10.47 | | | | 6.54 | % | | | 86,386 | | | | 0.87 | % | | | 1.40 | % | | | 1.86 | % | | | 137 | % |
| | (0.22 | ) | | | 10.25 | | | | 6.64 | % | | | 31,553 | | | | 1.08 | %(h) | | | 1.39 | % | | | 2.39 | % | | | 106 | % |
| | (0.21 | ) | | | 9.82 | | | | (1.02 | )% | | | 27,312 | | | | 1.12 | %(i) | | | 1.52 | % | | | 1.96 | % | | | 88 | % |
| | (0.11 | ) | | | 10.13 | | | | 2.31 | % | | | 23,465 | | | | 1.24 | %(j) | | | 1.96 | % | | | 1.87 | % | | | 80 | % |
| | | | | | | | | | | | | | | | | | | | | | | | | | | | | | | |
| | (0.03 | ) | | | 8.61 | | | | (15.82 | )%(e) | | | 6,816 | | | | 0.75 | %(f) | | | 2.63 | %(f) | | | 0.08 | %(f) | | | 410 | %(e) |
| | — | | | | 10.26 | | | | 2.60 | %(e) | | | 1,026 | | | | 27.56 | %(f) | | | 0.75 | %(f) | | | 0.02 | %(f) | | | 3 | %(h)(e) |
The accompanying notes are an integral part of the financial statements.
| NOTES TO FINANCIAL STATEMENTS (Unaudited) |
1. Organization
Westwood Quality Value Fund (“Value Fund”), Westwood Quality MidCap Fund (“MidCap Fund”), Westwood Quality SMidCap Fund (“SMidCap Fund”), Westwood Quality SmallCap Fund (“SmallCap Fund”), Westwood Quality AllCap Fund (“AllCap Fund”), Westwood Total Return Fund (“Total Return Fund”), Westwood Income Opportunity Fund (“Income Opportunity Fund”), Westwood High Income Fund (“High Income Fund”), Westwood Alternative Income Fund (“Alternative Income Fund”) and Westwood SmallCap Growth Fund (“SmallCap Growth Fund”), (individually, a “Fund” and collectively, the “Funds”) are each a series of Ultimus Managers Trust (the “Trust”), an open-end investment company established as an Ohio business trust under a Declaration of Trust dated February 28, 2012. The Trust is registered under the Investment Company Act of 1940, as amended, (the “1940 Act”).
The Value, SMidCap, SmallCap, Total Return, Income Opportunity, High Income and Alternative Income Funds (“Predecessor Funds”) were formerly part of The Advisors’ Inner Circle Fund and were acquired by, and reorganized into, the Trust on November 1, 2021, pursuant to an Agreement and Plan of Reorganization dated August 9, 2021. The AllCap and SmallCap Growth Funds commenced operations on September 30, 2021 and MidCap Fund commenced operations on November 30, 2021. Each Fund is classified as a diversified fund.
The investment objective of the Value, MidCap, SMidCap, SmallCap and AllCap Funds is to seek long-term capital appreciation.
The investment objective of Total Return Fund is to seek to provide total return, through a combination of current income and capital appreciation.
The investment objective of Income Opportunity Fund is to provide current income with a secondary investment objective to provide the opportunity for long-term capital appreciation.
The investment objective of High Income Fund is to seek to maximize total return through a high level of current income and capital appreciation.
The investment objective of Alternative Income Fund is to seek to provide absolute returns through a combination of current income and capital appreciation with low correlation to equity and fixed income markets.
The investment objective of SmallCap Growth Fund is to seek to achieve long-term capital growth.
All of the Funds offer Institutional Shares (sold without any sales loads, but subject to an administrative services plan fee of up to 0.20% of the average daily net assets attributable to Institutional Shares (for all Funds except Value, Total Return and Income Opportunity Funds), requiring a $100,000 minimum investment and offered exclusively to certain retirement plans established for the benefit of employees of the Westwood Management Corporation (the “Adviser”) or its affiliates; defined benefit retirement plans, endowments or foundations; banks and trust companies or law firms acting as trustee or manager for trust accounts; investors who purchase through asset-based fee programs available through financial intermediaries; and insurance companies).
The Value, SmallCap, Total Return, Income Opportunity, High Income and Alternative Income Funds offer A Class Shares (sold with a maximum sales charge of 3.00% (except for SmallCap Fund, which has a maximum sales charge of 4.00%) and a 12b-1 services plan fee up to 0.25% of the average daily net assets attributable to A Class Shares), requiring a $1,000 minimum investment. Class A Shares purchases of $250,000 or more may be subject to a contingent deferred sales charge (“CDSC”) of 1.00% if redeemed within 18 months of purchase (except for SmallCap Fund, in which purchases of $1,000,000 or more may be subject to a 1.00% CDSC fee if redeemed within 18 months of purchase.)
WESTWOOD FUNDS
The Value, SmallCap, Total Return, Income Opportunity, High Income and Alternative Income Funds offer C Class Shares (sold without any sales loads, but subject to a 12b-1 services plan fee of up to 1.00% of the average daily net assets attributable to C Class Shares for each Fund), requiring a $1,000 minimum investment. C Class Shares may be subject to a CDSC fee of 1.00% if redeemed within 12 months of purchase. C Class Shares automatically convert to A Class Shares after being held for 10 years.
The SMidCap, SmallCap, AllCap and Alternative Income Funds offer Ultra Shares (sold without any sales loads and distribution and/or administrative services fees, requiring a $20,000,000 initial investment and offered exclusively to employer retirement plans; health savings accounts under section 223 of the Internal Revenue Code of 1986, as amended, if such accounts are maintained by the Fund at an omnibus level; endowments and foundations and local, city and state agencies; unaffiliated registered investment companies; collective investment trusts; banks and trust companies or law firms acting as trustee or manager for trust accounts; and insurance companies).
Each share class represents an ownership interest in the same investment portfolio of the Fund.
2. Significant Accounting Policies
The following is a summary of the Funds’ significant accounting policies. The policies are in conformity with accounting principles generally accepted in the United States of America (“GAAP”). The Funds follow accounting and reporting guidance under Financial Accounting Standards Board (“FASB”) Accounting Standards Codification Topic 946, “Financial Services – Investment Companies.”
New accounting pronouncements – In March 2020, FASB issued Accounting Standards Update No. 2020-04 (“ASU 2020-04”), “Reference Rate Reform (Topic 848): Facilitation of the Effects of Reference Rate Reform on Financial Reporting.” ASU 2020-04 provides entities with optional guidance to ease potential accounting burden associated with transitioning away from the reference rates (e.g., LIBOR) that are expected to be discontinued. ASU 2020-04 allows, amount other things, certain contract modifications to be accounted as a continuation of the existing contract. This ASU was effective upon the issuance and its optional relief can be applied through December 31, 2022. The Funds will consider this optional guidance prospectively, if applicable. Management is also currently actively working with other financial institutions and counterparties to modify contracts as required by appliable regulation and within the regulatory deadlines.
In October 2020, the Securities and Exchange Commission (“SEC”) adopted new regulations governing the use of derivatives by registered investment companies (“Rule 18f-4”). The Funds will be required to comply with Rule 18f-4 by August 19, 2022. Once implemented, Rule 18f-4 will impose limits on the amount of derivatives a fund can enter into, eliminate the asset segregation framework currently used by funds to comply with Section 18 of the 1940 Act, treat derivatives as senior securities and require funds whose use of derivatives is more than a limited specified exposure amount to establish and maintain a comprehensive derivatives risk management program and appoint a derivatives risk manager. The Funds are currently evaluating the impact, if any, of this provision.
Securities valuation – Each Fund values its portfolio securities at market value as of the close of regular trading on the New York Stock Exchange (the “NYSE”) (normally 4:00 p.m. Eastern time) on each business day the NYSE is open for business. The Funds value its listed securities on the basis of the security’s last sale price on the security’s primary exchange, if available, otherwise at the exchange’s most recently quoted mean price. NASDAQ-listed securities are valued at the NASDAQ Official Closing Price. Investments representing shares of other open-end investment companies, other than exchange-traded funds (“ETFs”), if any, but including money market funds, are valued at their net asset value (“NAV”) as reported by such companies. Option contracts are valued at the closing price on the exchange on which they are primarily traded; if no closing price is available at the time of valuation, the option will be valued at the mean of the closing bid and ask prices for that day. Future contracts are valued at the final settlement price, or, if a settled price is not available, at the last sale price as of the close of regular trading on the primary exchange on which they are traded. When using a quoted price and when the market is considered active, these securities will be classified as Level
WESTWOOD FUNDS
1 within the fair value hierarchy (see below). Fixed income securities are generally valued using prices provided by an independent pricing service approved by the Board of Trustees of the Trust (the “Board”). The independent pricing service uses information with respect to transactions in bonds, quotations from bond dealers, market transactions in comparable securities, and various relationships between securities in determining these prices. Total return swaps are valued as the change in the value of the underlying security plus/minus the accrued income payment based on LIBOR or some other form of indices on the notional amount. In the event that market quotations are not readily available or are considered unreliable due to market or other events, the Funds value their securities and other assets at fair value pursuant to procedures established by the Board. Under these procedures, the securities will be classified as Level 2 or 3 within the fair value hierarchy, depending on the inputs used. Unavailable or unreliable market quotes may be due to the following factors: a substantial bid-ask spread; infrequent sales resulting in stale prices; insufficient trading volume; small trade sizes; a temporary lapse in any reliable pricing source; and actions of the securities or futures markets, such as the suspension or limitation of trading. As a result, the prices of securities used to calculate each Fund’s NAV may differ from quoted or published prices for the same securities. Securities traded on foreign exchanges, if any, are fair valued by an independent pricing service and translated from the local currency into U.S. dollars using currency exchange rates supplied by an independent pricing service.
GAAP establishes a single authoritative definition of fair value, sets out a framework for measuring fair value, and requires additional disclosures about fair value measurements.
Various inputs are used in determining the value of each Fund’s investments. These inputs are summarized in the three broad levels listed below:
| ● | Level 1 – quoted prices in active markets for identical securities |
| ● | Level 2 – other significant observable inputs |
| ● | Level 3 – significant unobservable inputs |
Fixed income securities held by the Funds are classified as Level 2 since values are based on prices provided by an independent pricing service that utilizes various “other significant observable inputs” including bid and ask quotations, prices of similar securities, and interest rates, among other factors.
The inputs or methods used for valuing securities are not necessarily an indication of the risks associated with investing in those securities. The inputs used to measure fair value may fall into different levels of the fair value hierarchy. In such cases, for disclosure purposes, the level in the fair value hierarchy within which the fair value measurement falls in its entirety is determined based on the lowest level input that is significant to the fair value measurement.
The following is a summary of each Fund’s investments and the inputs used to value the investments as of April 30, 2022:
| Westwood Quality Value Fund | | Level 1 | | | Level 2 | | | Level 3 | | | Total | |
| Common Stocks | | $ | 262,976,978 | | | $ | — | | | $ | — | | | $ | 262,976,978 | |
| Money Market Funds | | | 5,733,366 | | | | — | | | | — | | | | 5,733,366 | |
| Total Investment Securities | | $ | 268,710,344 | | | $ | — | | | $ | — | | | $ | 268,710,344 | |
| | | | | | | | | | | | | | | | | |
| Westwood Quality MidCap Fund | | | | | | | | | | | | |
| Common Stocks | | $ | 476,170 | | | $ | — | | | $ | — | | | $ | 476,170 | |
| Money Market Funds | | | 1,866 | | | | — | | | | — | | | | 1,866 | |
| Total Investment Securities | | $ | 478,036 | | | $ | — | | | $ | — | | | $ | 478,036 | |
WESTWOOD FUNDS
| Westwood Quality SMIDCap Fund | | Level 1 | | | Level 2 | | | Level 3 | | | Total | |
| Common Stocks | | $ | 299,024,546 | | | $ | — | | | $ | — | | | $ | 299,024,546 | |
| Money Market Funds | | | 887,293 | | | | — | | | | — | | | | 887,293 | |
| Total Investment Securities | | $ | 299,911,839 | | | $ | ��� | | | $ | — | | | $ | 299,911,839 | |
| | | | | | | | | | | | | | | | | |
| Westwood Quality SmallCap Fund | | | | | | | | | | | | | | | | |
| Common Stocks | | $ | 1,006,363,731 | | | $ | — | | | $ | — | | | $ | 1,006,363,731 | |
| Money Market Funds | | | 1,595,906 | | | | — | | | | — | | | | 1,595,906 | |
| Total Investment Securities | | $ | 1,007,959,637 | | | $ | — | | | $ | — | | | $ | 1,007,959,637 | |
| | | | | | | | | | | | | | | | | |
| Westwood Quality AllCap Fund | | | | | | | | | | | | | | | | |
| Common Stocks | | $ | 21,229,915 | | | $ | — | | | $ | — | | | $ | 21,229,915 | |
| Money Market Funds | | | 316,606 | | | | — | | | | — | | | | 316,606 | |
| Total Investment Securities | | $ | 21,546,521 | | | $ | — | | | $ | — | | | $ | 21,546,521 | |
| | | | | | | | | | | | | | | | | |
| Westwood Total Return Fund | | | | | | | | | | | | | | | | |
| U.S. Government & Agencies | | $ | — | | | $ | 1,201,414 | | | $ | — | | | $ | 1,201,414 | |
| Convertible Bonds | | | — | | | | 9,831,941 | | | | — | | | | 9,831,941 | |
| Corporate Bonds | | | — | | | | 41,268,767 | | | | — | | | | 41,268,767 | |
| Foreign Governments | | | — | | | | 1,748,448 | | | | — | | | | 1,748,448 | |
| Common Stocks | | | 60,614,560 | | | | — | | | | — | | | | 60,614,560 | |
| Preferred Stocks | | | 6,544,998 | | | | — | | | | — | | | | 6,544,998 | |
| Money Market Funds | | | 1,855,936 | | | | — | | | | — | | | | 1,855,936 | |
| Total Investment Securities | | $ | 69,015,494 | | | $ | 54,050,570 | | | $ | — | | | $ | 123,066,064 | |
| | | | | | | | | | | | | | | | | |
| Westwood Income Opportunity Fund | | | | | | | | | | | | | | | | |
| U.S. Government & Agencies | | $ | — | | | $ | 42,157,944 | | | $ | — | | | $ | 42,157,944 | |
| Convertible Bonds | | | — | | | | 26,857,272 | | | | — | | | | 26,857,272 | |
| Corporate Bonds | | | — | | | | 294,057,679 | | | | — | | | | 294,057,679 | |
| Foreign Governments | | | — | | | | 9,360,694 | | | | — | | | | 9,360,694 | |
| Common Stocks | | | 302,563,795 | | | | — | | | | — | | | | 302,563,795 | |
| Exchange-Traded Funds | | | 14,560,140 | | | | — | | | | — | | | | 14,560,140 | |
| Preferred Stocks | | | 47,019,784 | | | | 10,896,337 | | | | — | | | | 57,916,121 | |
| Money Market Funds | | | 11,254,269 | | | | — | | | | — | | | | 11,254,269 | |
| Total Investment Securities | | $ | 375,397,988 | | | $ | 383,329,926 | | | $ | — | | | $ | 758,727,914 | |
WESTWOOD FUNDS
| Westwood High Income Fund | | Level 1 | | | Level 2 | | | Level 3 | | | Total | |
| U.S. Government & Agencies | | $ | — | | | $ | 1,161,860 | | | $ | — | | | $ | 1,161,860 | |
| Convertible Bonds | | | — | | | | 1,376,875 | | | | — | | | | 1,376,875 | |
| Corporate Bonds | | | — | | | | 69,703,092 | | | | — | | | | 69,703,092 | |
| Foreign Governments | | | — | | | | 660,806 | | | | — | | | | 660,806 | |
| Common Stocks | | | 22,932,061 | | | | — | | | | — | | | | 22,932,061 | |
| Exchange-Traded Funds | | | 790,389 | | | | — | | | | — | | | | 790,389 | |
| Preferred Stocks | | | 508,282 | | | | — | | | | — | | | | 508,282 | |
| Money Market Funds | | | 419,581 | | | | — | | | | — | | | | 419,581 | |
| Total Investment Securities | | $ | 24,650,313 | | | $ | 72,902,633 | | | $ | — | | | $ | 97,552,946 | |
| | | | | | | | | | | | | | | | | |
| Westwood Alternative Income Fund | | | | | | | | | | | | | | | | |
| U.S. Government & Agencies | | $ | — | | | $ | 2,979,844 | | | $ | — | | | $ | 2,979,844 | |
| Convertible Bonds | | | — | | | | 112,096,031 | | | | — | | | | 112,096,031 | |
| Corporate Bonds | | | — | | | | 27,924,544 | | | | — | | | | 27,924,544 | |
| Foreign Governments | | | — | | | | 556,574 | | | | — | | | | 556,574 | |
| Purchased Option Contracts | | | 130,930 | | | | — | | | | — | | | | 130,930 | |
| Money Market Funds | | | 2,354,349 | | | | — | | | | — | | | | 2,354,349 | |
| Total Investment Securities | | $ | 2,485,279 | | | $ | 143,556,993 | | | $ | — | | | $ | 146,042,272 | |
| Other Financial Instruments** | | | | | | | | | | | | | | | | |
| Total Return Swaps at value (assets) | | $ | — | | | $ | 3,281,077 | | | $ | — | | | $ | 3,281,077 | |
| Total Return Swaps at value (liabilities) | | | — | | | | (818,164 | ) | | | — | | | | (818,164 | ) |
| Futures | | | 89,311 | | | | — | | | | — | | | | 89,311 | |
| Total Investments | | $ | 2,574,590 | | | $ | 146,019,906 | | | $ | — | | | $ | 148,594,496 | |
| | | | | | | | | | | | | | | | | |
| Westwood SmallCap Growth Fund | | | | | | | | | | | | | | | | |
| Common Stocks | | $ | 6,773,732 | | | $ | — | | | $ | — | | | $ | 6,773,732 | |
| Money Market Funds | | | 40,681 | | | | — | | | | — | | | | 40,681 | |
| Total Investment Securities | | $ | 6,814,413 | | | $ | — | | | $ | — | | | $ | 6,814,413 | |
Amounts designated as “-” are $0 or have been rounded to $0.
| ** | Other financial instruments are derivative instruments not reflected in the Schedule of Investments such as total return swap contracts and future contracts. These instruments are valued at the unrealized appreciation (depreciation) on the instrument. |
The Funds did not hold any derivative instruments or any assets or liabilities that were measured at fair value on a recurring basis using significant unobservable inputs (Level 3) as of or during the six months ended April 30, 2022.
Share valuation – The NAV per share of each class of each Fund is calculated daily by dividing the total value of the assets attributable to that class, less liabilities attributable to that class, by the number of shares outstanding of that
WESTWOOD FUNDS
class. The offering price and redemption price per share of each class of each Fund is equal to the NAV per share of such class.
Investment income – Dividend income is recorded on the ex-dividend date. Non-cash dividends included in dividend income, if any, are recorded at the fair value of the security received. Interest income is accrued as earned. Withholding taxes on foreign dividends, if any, have been recorded in accordance with the Funds’ understanding of the applicable country’s tax rules and rates. The Funds may invest in real estate investment trusts (“REITs”) that pay distributions to their shareholders based on available funds from operations. It is common for these distributions to exceed the REIT’s taxable earnings and profits resulting in the excess portion of such distribution to be designated as return of capital. Distributions received from REITs are generally recorded as dividend income and, if necessary, are reclassified annually in accordance with tax information provided by the underlying REITs. Discounts and premiums on fixed income securities, if any, are amortized using the interest method.
Investment transactions – Investment transactions are accounted for on the trade date. Realized gains and losses on investments sold are determined on a specific identification basis.
Allocation between Classes – Investment income earned, realized capital gains and losses, and unrealized appreciation and depreciation are allocated daily to each Class of a Fund based upon its proportionate share of total net assets of that Fund. Class-specific expenses are charged directly to the Class incurring the expense. Common expenses which are not attributable to a specific Class are allocated daily to each Class of shares of a Fund based upon its proportionate share of total net assets of that Fund.
Common expenses – Common expenses of the Trust are allocated among the Funds and the other series of the Trust based on the relative net assets of each series, the number of series in the Trust, or the nature of the services performed and the relative applicability to each series.
Futures contracts – A Fund may use futures contracts for tactical hedging purposes as well as to enhance a Fund’s returns. A futures contract represents a commitment for the future purchase or sale of an asset at a specified price on a specified date. When a Fund purchases or sells a futures contract, no price is paid to or received by a Fund. Instead, a Fund is required to deposit in a segregated asset account an amount of cash or qualifying securities. This is called the “initial margin deposit.” Subsequent payments, known as “variation margin,” are made or received by a Fund each day, depending on the daily fluctuations in the fair value of the underlying asset. A Fund recognizes an unrealized gain or loss equal to the daily valuation margin. If market conditions move unexpectedly, a Fund may not achieve the anticipated benefits of the futures contracts and may realize a loss. The margin deposits for futures contracts and the variation receivable/payable are reported on the Statements of Assets and Liabilities.
Options written/purchased – The Funds may utilize longer maturity options for stock replacement when and as price and volatility relationships become more favorable for options versus underlying stocks or for tax and liquidity management purposes. The Funds are authorized to write (sell) and purchase put and call options. The risk in writing a call option is that the Funds give up the opportunity to profit if the market price of the security increases. The risk in writing a put option is that the Funds may incur a loss if the market price of the security decreases and the option is exercised. The risk in purchasing an option is that the Funds pay a premium whether or not the option is exercised. The Funds also have the additional risk of being unable to enter into a closing transaction at an acceptable price if a liquid secondary market does not exist. Option contracts also involve the risk that they may not work as intended due to unanticipated developments in market conditions or other causes.
Swap contracts – The Funds are authorized to enter into swap contracts, including interest rate swap contracts, for the purposes of managing the Funds’ interest rate duration, yield curve exposure and yield spread sensitivity. Swaps are a two-party contract in which the seller (buyer) will pay to the buyer (seller) the difference between the current value of a security and its value at the time the contract was entered. Interest rate swaps involve the exchange by a Fund with another party of their respective commitment to pay or receive interest (e.g., an exchange of floating rate payments for fixed rate payments) with respect to a notional amount of principal. Swap contracts are privately
WESTWOOD FUNDS
negotiated in the over-the-counter market (“OTC Swaps”) or may be executed in a multilateral or other trade facility platform, such as a registered commodities exchange (“Centrally Cleared Swaps”).
Total return swaps allow an investor to benefit from the cash flow without ever actually owning the underlying security. The receiver must pay any decline in value to the payer at the end of the total return swaps. However, the investor does not need to make a payment if there is no decline in price. Payments can be made on various indices, bonds (i.e. mortgage backed securities, bank debt and corporate), loans or commodities. The value of a total return swap is equal to the change in value of the underlying asset versus the accrued income payment based on LIBOR or some other form of indices on the notional amount. Payments received or made are recorded as realized gains or loss. A Fund could be exposed to credit or market risk due to unfavorable changes in the fluctuation of interest rates or if the counterparty defaults on its obligation to perform. Risk of loss may exceed amounts recognized on the Statements of Assets and Liabilities. Interest rate and Total Return swap contracts outstanding at period end, if any, are listed after a Fund’s portfolio. In connection with swap agreements, securities may be set aside as collateral by a Fund’s custodian.
Periodic payments made or received are recorded as realized gains or losses. The Statements of Assets and Liabilities reflect, if any, unrealized appreciation or depreciation and accrued periodic payments for swap contracts the Funds may have open.
Entering into swap contracts involve, to varying degrees, elements of credit, interest rate and market risk in excess of the amounts recognized on the Statements of Assets and Liabilities. Such risks involve the possibility that there will be no liquid market for these contracts, that the counterparty to the contract may default on its obligation to perform and that there may be unfavorable changes in market conditions or fluctuations in interest rates. Swaps outstanding at year end, if any, are listed on the Schedules of Investments. In connection with swap contracts, cash or securities may be segregated as collateral by the Funds’ custodian. Refer to each Fund’s Schedule of Investments for details regarding open swap contracts, if applicable.
There is the risk that the counterparty refuses to continue to enter into swap agreements with the Funds in the future, or requires increased fees, which could impair the Funds’ ability to achieve their investment objective. A counterparty may also increase its collateral requirements, which may limit the Fund’s ability to use leverage and reduce investment returns. In addition, if the Funds cannot locate a counterparty willing to enter into transactions with the Funds, they will not be able to implement their investment strategy.
Foreign currency translation – Securities and other assets and liabilities denominated in or expected to settle in foreign currencies are translated into U.S. dollars based on exchange rates on the following basis:
| A. | The fair values of investment securities and other assets and liabilities are translated as of the close of the NYSE each day. |
| B. | Purchases and sales of investment securities and income and expenses are translated at the rate of exchange prevailing as of 4:00 p.m. Eastern Time on the respective date of such transactions. |
| C. | The Funds do not isolate that portion of the results of operations caused by changes in foreign exchange rates on investments from those caused by changes in market prices of securities held. Such fluctuations are included with the net realized and unrealized gains or losses on investments. |
Reported net realized foreign exchange gains or losses arise from 1) purchases and sales of foreign currencies, 2) currency gains or losses realized between the trade and settlement dates on securities transactions and 3) the difference between the amounts of dividends and foreign withholding taxes recorded on a Fund’s books and the U.S. dollar equivalent of the amounts actually received or paid. Reported net unrealized foreign exchange gains and losses arise from changes in the value of assets and liabilities that result from changes in exchange rates.
WESTWOOD FUNDS
The Funds may be subject to foreign taxes related to foreign income received, capital gain on the sale of securities and certain foreign currency transactions (a portion of which may be reclaimable). All foreign taxes are recorded in accordance with the applicable regulations and rates that exist in the foreign jurisdictions in which a Fund invests.
Forward foreign currency contracts – The Funds may enter into forward foreign currency contracts to offset the exposure to foreign currency. All foreign currency contracts are “marked- to-market” daily at the applicable translation rates, resulting in unrealized gains or losses. Realized and unrealized gains or losses from transactions in foreign contracts, if any, will be included on the Funds’ Statements of Operations. Risks associated with these contracts include the potential inability of counterparties to meet the terms of their contracts and unanticipated movements in the value of a foreign currency relative to the U.S. dollar.
Estimates – The preparation of financial statements in conformity with GAAP requires management to make estimates and assumptions that affect the reported amounts of assets and liabilities and disclosure of contingent assets and liabilities as of the date of the financial statements and the reported amounts of increase (decrease) in net assets from operations during the reporting period. Actual results could differ from those estimates.
Redemption fees – In an effort to discourage short-term trading and defray costs incurred by shareholders as a result of short-term trading, the Alternative Income Fund charges a 1.00% redemption fee on redemptions (including exchanges) of shares that have been held for less than 30 days. The redemption fee is deducted from the Fund’s sale proceeds and cannot be paid separately, and any proceeds of the fee are credited to the assets of the Fund from which the redemption was made. The fee does not apply to shares purchased with reinvested dividends or distributions.
Distributions to shareholders – Value, MidCap, SMidCap, SmallCap, AllCap and SmallCap Growth Funds distribute to shareholders any net investment income dividends and net realized capital gains distributions, if any, at least once each year. Total Return, Income Opportunity and Alternative Income Funds distribute to shareholders any net investment income dividends quarterly and net realized capital gains distributions, if any, at least once each year. High Income Fund distributes to shareholders any net investment income dividends monthly and net realized capital gains distributions, if any, at least once each year. The amount of such dividends and distributions are determined in accordance with federal income tax regulations, which may differ from GAAP. Dividends and distributions to shareholders are recorded on the ex-dividend date. The character of dividends paid to shareholders of the Funds for federal income tax purposes during the periods ended April 30, 2022 and October 31, 2021 was as follows:
| | | Ordinary | | | Long-Term | | | Total | |
| Period Ended | | Income | | | Capital Gains | | | Distributions | |
| Value Fund | | | | | | | | | | | | |
| April 30, 2022 | | $ | 8,370,856 | | | $ | 31,247,826 | | | $ | 39,618,682 | |
| October 31, 2021 | | $ | 2,548,171 | | | $ | 8,669,954 | | | $ | 11,218,125 | |
| MidCap Fund | | | | | | | | | | | | |
| April 30, 2022* | | $ | — | | | $ | — | | | $ | — | |
| SMidCap Fund | | | | | | | | | | | | |
| April 30, 2022 | | $ | 19,959,073 | | | $ | 28,953,771 | | | $ | 48,912,844 | |
| October 31, 2021 | | $ | 1,918,171 | | | $ | 3,592,035 | | | $ | 5,510,206 | |
| SmallCap Fund | | | | | | | | | | | | |
| April 30, 2022 | | $ | 36,264,335 | | | $ | 14,953,771 | | | $ | 51,218,106 | |
| October 31, 2021 | | $ | 4,593,002 | | | $ | — | | | $ | 4,593,002 | |
| AllCap Fund | | | | | | | | | | | | |
| April 30, 2022 | | $ | 115,427 | | | $ | — | | | $ | 115,427 | |
| October 31, 2021** | | $ | — | | | $ | — | | | $ | — | |
WESTWOOD FUNDS
| | | Ordinary | | | Long-Term | | | Total | |
| Period Ended | | Income | | | Capital Gains | | | Distributions | |
| Total Return Fund | | | | | | | | | | | | |
| April 30, 2022 | | $ | 6,017,089 | | | $ | 4,494,802 | | | $ | 10,511,891 | |
| October 31, 2021 | | $ | 4,414,961 | | | $ | 319,567 | | | $ | 4,734,528 | |
| Income Opportunity Fund | | | | | | | | | | | | |
| April 30, 2022 | | $ | 41,399,267 | | | $ | 40,005,156 | | | $ | 81,404,423 | |
| October 31, 2021 | | $ | 29,561,680 | | | $ | 31,259,352 | | | $ | 60,821,032 | |
| High Income Fund | | | | | | | | | | | | |
| April 30, 2022 | | $ | 2,132,617 | | | $ | — | | | $ | 2,132,617 | |
| October 31, 2021 | | $ | 3,007,075 | | | $ | — | | | $ | 3,007,075 | |
| Alternative Income Fund | | | | | | | | | | | | |
| April 30, 2022 | | $ | 3,075,840 | | | $ | 474,399 | | | $ | 3,550,239 | |
| October 31, 2021 | | $ | 1,462,671 | | | $ | — | | | $ | 1,462,671 | |
| SmallCap Growth Fund | | | | | | | | | | | | |
| April 30, 2022 | | $ | 14,715 | | | $ | — | | | $ | 14,715 | |
| October 31, 2021** | | $ | — | | | $ | — | | | $ | — | |
| * | Represents the period from the commencement of operations (November 30, 2021) through April 30, 2022. |
| ** | Represents the period from the commencement of operations (September 30, 2021) through October 31, 2021. |
Federal income tax – Each Fund has qualified and intends to, except MidCap Fund which opened during the current fiscal year and which intends to, continue to qualify as a regulated investment company under the Internal Revenue Code of 1986, as amended (the “Code”). Qualification generally will relieve the Funds of liability for federal income taxes to the extent 100% of their net investment income and net realized capital gains are distributed in accordance with the Code.
In order to avoid imposition of the excise tax applicable to regulated investment companies, it is also each Fund’s intention to declare as dividends in each calendar year at least 98% of its net investment income (earned during the calendar year) and 98.2% of its net realized capital gains (earned during the twelve months ended October 31) plus undistributed amounts from prior years.
WESTWOOD FUNDS
The following information is computed on a tax basis for each item as of October 31, 2021:
| | | Value | | | MidCap | | | SMidCap | | | SmallCap | | | AllCap | |
| | | Fund | | | Fund | | | Fund | | | Fund | | | Fund | |
| Federal income tax cost | | $ | 150,806,013 | | | | n/a | | | $ | 285,980,844 | | | $ | 863,742,232 | | | $ | 21,046,109 | |
| Gross unrealized appreciation | | $ | 59,076,453 | | | | n/a | | | $ | 59,357,403 | | | $ | 257,108,988 | | | $ | 1,370,814 | |
| Gross unrealized depreciation | | | (2,301,390 | ) | | | n/a | | | | (6,436,416 | ) | | | (21,873,306 | ) | | | (195,766 | ) |
| Net unrealized appreciation | | | 56,775,063 | | | | n/a | | | | 52,920,987 | | | | 235,235,682 | | | | 1,175,048 | |
| Undistributed ordinary income | | | 7,778,589 | | | | n/a | | | | 19,328,141 | | | | 32,029,451 | | | | 56,755 | |
| Undistributed long-term capital gains | | | 31,246,584 | | | | n/a | | | | 28,952,647 | | | | 14,951,567 | | | | — | |
| Other temporary differences | | | (11 | ) | | | n/a | | | | (18 | ) | | | 211 | | | | — | |
| Total distributable earnings | | $ | 95,800,225 | | | | n/a | | | $ | 101,201,757 | | | $ | 282,216,911 | | | $ | 1,231,803 | |
| | | | | | | | | | | | | | | | | | | | | |
| | | Total | | | Income | | | | | | Alternative | | | SmallCap | |
| | | Return | | | Opportunity | | | High | | | Income | | | Growth | |
| | | Fund | | | Fund | | | Income Fund | | | Fund | | | Fund | |
| Federal income tax cost | | $ | 122,352,495 | | | $ | 777,800,812 | | | $ | 92,027,908 | | | $ | 170,780,093 | | | $ | 981,823 | |
| Gross unrealized appreciation | | $ | 22,954,392 | | | $ | 116,874,504 | | | $ | 5,575,881 | | | $ | 13,256,427 | | | $ | 45,137 | |
| Gross unrealized depreciation | | | (1,098,218 | ) | | | (7,999,064 | ) | | | (800,536 | ) | | | (2,466,409 | ) | | | (28,889 | ) |
| Net unrealized appreciation | | | 21,856,174 | | | | 108,875,440 | | | | 4,775,345 | | | | 10,790,018 | | | | 16,248 | |
| Undistributed ordinary income | | | 4,485,760 | | | | 33,888,906 | | | | 3,073 | | | | 2,000,690 | | | | 9,928 | |
| Undistributed long-term capital gains | | | 4,493,666 | | | | 40,017,960 | | | | — | | | | 465,370 | | | | — | |
| Capital loss carryforwards | | | — | | | | — | | | | (9,980,660 | ) | | | — | | | | — | |
| Other temporary differences | | | 4,373 | | | | 393,789 | | | | (10 | ) | | | (3,404,932 | ) | | | — | |
| Total distributable earnings (accumulated deficit) | | $ | 30,839,973 | | | $ | 183,176,095 | | | $ | (5,202,252 | ) | | $ | 9,851,146 | | | $ | 26,176 | |
The difference between the federal income tax cost of portfolio investments and the financial statement cost of portfolio investments are due to certain timing differences in the recognition of capital gains or losses under income tax regulations and GAAP. These “book/tax” differences are temporary in nature and are primarily due to the tax deferral of losses on wash sales, constructive dividend income and partnership adjustments. Other temporary differences primarily consists of straddle loss deferral, contingent debt adjustment and perpetual bond.
WESTWOOD FUNDS
As of October 31, 2021, High Income Fund had long-term capital loss carryforwards of $9,980,660 for federal income tax purposes, which may be carried forward indefinitely. These capital loss carryforwards are available to offset net realized capital gains in the current and future years, thereby reducing future taxable gains distributions, if any.
The federal tax cost, unrealized appreciation (depreciation) as of April 30, 2022 is as follows:
| | | Value | | | MidCap | | | SMidCap | | | SmallCap | | | AllCap | |
| | | Fund | | | Fund | | | Fund | | | Fund | | | Fund | |
| Tax cost of portfolio investments | | $ | 229,408,647 | | | $ | 491,627 | | | $ | 296,461,263 | | | $ | 963,024,003 | | | $ | 22,113,293 | |
| Gross unrealized appreciation | | | 52,246,188 | | | | 28,701 | | | | 24,257,296 | | | | 125,823,598 | | | | 1,281,400.00 | |
| Gross unrealized depreciation | | | (12,944,491 | ) | | | (42,292 | ) | | | (20,806,720 | ) | | | (80,887,964 | ) | | | (1,848,172 | ) |
| Net unrealized appreciation (depreciation) on portfolio investments | | $ | 39,301,697 | | | $ | (13,591 | ) | | $ | 3,450,576 | | | $ | 44,935,634 | | | $ | (566,772 | ) |
| | | | | | | | | | | | | | | | | | | | | |
| | | Total | | | Income | | | High | | | Alternative | | | SmallCap | |
| | | Return | | | Opportunity | | | Income | | | Income | | | Growth | |
| | | Fund | | | Fund | | | Fund | | | Fund* | | | Fund | |
| Tax cost of portfolio investments | | $ | 119,293,080 | | | $ | 645,832,078 | | | $ | 100,026,111 | | | $ | 153,076,223 | | | $ | 7,067,723 | |
| Gross unrealized appreciation | | | 12,746,375 | | | | 178,511,560 | | | | 7,186,057 | | | | 2,140,231 | | | | 82,314.00 | |
| Gross unrealized depreciation | | | (8,973,391 | ) | | | (65,615,724 | ) | | | (9,659,222 | ) | | | (9,174,182 | ) | | | (335,624 | ) |
| Net unrealized appreciation (depreciation) on portfolio investments | | $ | 3,772,984 | | | $ | 112,895,836 | | | $ | (2,473,165 | ) | | $ | (7,033,951 | ) | | $ | (253,310 | ) |
| * | Swap agreement appreciation and futures contracts totals $ 68,133,991 and $89,311, respectively. Depreciation on swap agreements totaled $65,671,078. These amounts were not included in the above schedule. |
The Funds recognize the tax benefits or expenses of uncertain tax positions only when the position is “more likely than not” of being sustained assuming examination by tax authorities. Management has reviewed each Fund’s tax positions for the current tax year and has concluded that no provision for unrecognized tax benefits or expenses is required in these financial statements. The Funds identify their major tax jurisdiction as U.S. Federal.
WESTWOOD FUNDS
3. Investment Transactions
The cost of security purchases and proceeds from sales and maturities of securities (excluding short-term debt securities having maturities one year or less and U.S. Government securities) for the six months ended April 30, 2022 were as follows:
| | | Value | | | MidCap | | | SMidCap | | | SmallCap | | | AllCap | |
| | | Fund | | | Fund | | | Fund | | | Fund | | | Fund | |
| Purchases of investment securities | | $ | 170,761,944 | | | $ | 688,817 | | | $ | 197,872,328 | | | $ | 391,708,407 | | | $ | 13,401,832 | |
| Proceeds from sales of investment securities | | $ | 99,325,064 | | | $ | 198,016 | | | $ | 200,068,276 | | | $ | 331,578,082 | | | $ | 12,714,416 | |
| | | | | | | | | | | | | | | | | | | | | |
| | | Total | | | Income | | | High | | | Alternative | | | SmallCap | |
| | | Return | | | Opportunity | | | Income | | | Income | | | Growth | |
| | | Fund | | | Fund | | | Fund | | | Fund | | | Fund | |
| Purchases of investment securities | | $ | 38,567,058 | | | $ | 275,387,850 | | | $ | 38,352,081 | | | $ | 111,917,775 | | | $ | 29,029,639 | |
| Proceeds from sales and maturities of investment securities | | $ | 36,825,860 | | | $ | 262,427,444 | | | $ | 25,808,898 | | | $ | 120,833,264 | | | $ | 22,203,575 | |
The cost of security purchases and proceeds from sales and maturities of U.S. Government long-term securities for the six months ended April 30, 2022 were as follows:
| | | Value | | | MidCap | | | SMidCap | | | SmallCap | | | AllCap | |
| | | Fund | | | Fund | | | Fund | | | Fund | | | Fund | |
| Purchases of investment securities | | $ | — | | | $ | — | | | $ | — | | | $ | — | | | $ | — | |
| Proceeds from sales of investment securities | | $ | — | | | $ | — | | | $ | — | | | $ | — | | | $ | — | |
| | | | | | | | | | | | | | | | | | | | | |
| | | Total | | | Income | | | High | | | Alternative | | | SmallCap | |
| | | Return | | | Opportunity | | | Income | | | Income | | | Growth | |
| | | Fund | | | Fund | | | Fund | | | Fund | | | Fund | |
| Purchases of investment securities | | $ | 2,695,725 | | | $ | 97,724,194 | | | $ | 11,779,043 | | | $ | — | | | $ | — | |
| Proceeds from sales and maturities of investment securities | | $ | 11,769,047 | | | $ | 150,816,360 | | | $ | 11,315,918 | | | $ | — | | | $ | — | |
WESTWOOD FUNDS
4. Transactions with Related Parties
INVESTMENT MANAGEMENT AGREEMENT
The Funds’ investments are managed by the Adviser pursuant to the terms of an Investment Management Agreement. Each Fund pays the Adviser an investment management fee, based on the average net assets of each Fund, computed and accrued daily and paid monthly, at the annual rate shown in the table below. Pursuant to an Expense Limitation Agreement (“ELA”) between each Fund and the Adviser, the Adviser has contractually agreed, until March 1, 2024, to reduce investment management fees and reimburse other expenses to the extent necessary to limit total annual fund operating expenses of each Fund (exclusive of interest; taxes; brokerage commissions; Rule 12b-1 distribution fees (if any), administrative servicing fees (if any); borrowing expenses such as dividend and interest expenses on securities sold short; acquired fund fees and expenses; costs to organize the Funds; other expenditures which are capitalized in accordance with generally accepted accounting principle; and extraordinary expenses) to an amount not exceeding the following percentages of average daily net assets attributable to each respective class:
| | | | | Institutional | | A Class | | C Class | | Ultra Class |
| | | Management | | Class Expense | | Expense | | Expense | | Expense |
| Fund | | Fee | | Limitation | | Limitation | | Limitation | | Limitation |
| Value Fund | | 0.60% | | 0.65% | | 0.65% | | 0.65% | | n/a |
| MidCap Fund | | 0.58% | | 0.78% | | n/a | | n/a | | n/a |
| SMidCap Fund | | 0.75% | | 0.68% | | n/a | | n/a | | 0.68% |
| SmallCap Fund | | 0.85% | | 0.79% | | 0.79% | | 0.79% | | 0.79% |
| AllCap Fund | | 0.45% | | 0.45% | | n/a | | n/a | | 0.45% |
| Total Return Fund* | | 0.50% | (a) | 0.75% | | n/a | | n/a | | n/a |
| Income Opportunity Fund | | 0.75% | | 0.84% | | 0.84% | | 0.84% | | n/a |
| High Income | | 0.38% | (b) | n/a | | n/a | | n/a | | n/a |
| Alternative Income | | 0.53% | (c) | n/a | | n/a | | n/a | | n/a |
| SmallCap Growth Fund | | 0.55% | | 0.55% | | n/a | | n/a | | n/a |
The Adviser has contractually agreed to waive its management fee at an annual rate in the amount of 0.01% of the Alternative Income Fund’s average daily net assets. In addition, pursuant to a separate contractual agreement, the Adviser has contractually agreed to reduce its fees and reimburse expenses of the Total Return Fund, High Income Fund, and Alternative Income Fund in order to keep net operating expenses (excluding management fees, interest, taxes, brokerage commissions, Rule 12b-1 distribution fees (if any), administrative servicing fees (if any), acquired fund fees and expenses, other expenditures which are capitalized in accordance with generally accepted accounting principles, and extraordinary expenses (collectively, “excluded expenses”)) from exceeding the Funds’ average daily net assets as follows:
| | | Institutional | | A Class | | C Class | | Ultra Class |
| | | Class Expense | | Expense | | Expense | | Expense |
| Fund | | Limitation | | Limitation | | Limitation | | Limitation |
| Total Return Fund | | 0.05% | | 0.05% | | 0.05% | | n/a |
| High Income | | 0.10% | | 0.10% | | 0.10% | | n/a |
| Alternative Income | | 0.00% | | 0.00% | | 0.00% | | 0.00% |
| * | In connection with the Adviser’s Sensible Fees™ framework, for its services to each share class of Total Return, High Income and Alternative Income Funds, the Adviser is entitled to a management fee, which consists of a base fee (the “Base Fee”) and |
WESTWOOD FUNDS
a positive or negative performance adjustment (the “Performance Adjustment”) based on whether , and to what extent, the investment performance of each share class of each Fund exceeds, or is exceeded by, the performance of an index hurdle (the “Index Hurdle”) over the 12-month period from November 1 of each year though October 31 of the following year (the “Performance Period”). For each share class of each Fund, the Base Fee and Performance Adjustment are each calculated and accrued daily based on the average daily net assets of the share class during the Performance Period.
| (a) | The Base Fee is an annual rate of 0.50%. The Index Hurdle is the Blended 60/40 S&P 500® Index/Bloomberg U.S. Aggregate Bond Index plus 1.00%. The Performance Adjustment is calculated according to a schedule that adds or subtracts 0.0020% of the share class’s average daily net assets for each 0.01% by which the performance of the share class exceeds or lags the performance of the Index Hurdle over the Performance Period. The maximum Performance Adjustment (positive or negative) will not exceed an annual rate of +/- 0.20% of the share class’s average daily net assets during the Performance Period, which would occur when the performance of the share class exceeds, or is exceeded by, the performance of the Index Hurdle by 1.00% over the Performance Period. Accordingly, the management fee will range from a minimum annual rate of 0.30% to a maximum annual rate of 0.70%. |
| (b) | The Base Fee is an annual rate of 0.38%. The Index Hurdle is the Blended 80/20 Bloomberg U.S. Aggregate Bond Index/S&P 500® Index plus 1.00%. The Performance Adjustment is calculated according to a schedule that adds or subtracts 0.0032% of the share class’s average daily net assets for each 0.01% by which the performance of the share class exceeds or lags the performance of the Index Hurdle over the Performance Period. The maximum Performance Adjustment (positive or negative) will not exceed an annual rate of +/- 0.32% of the share class’s average daily net assets during the Performance Period, which would occur when the performance of the share class exceeds, or is exceeded by, the performance of the Index Hurdle by 1.00% over the Performance Period. Accordingly, the management fee will range from a minimum annual rate of 0.06% to a maximum annual rate of 0.70%. |
| (c) | The Base Fee is an annual rate of 0.53%. The Index Hurdle is the FTSE 1-Month U.S. Treasury Bill Index plus 2.00%. The Performance Adjustment is calculated according to a schedule that adds or subtracts 0.0016% of the share class’s average daily net assets for each 0.01% by which the performance of the share class exceeds or lags the performance of the Index Hurdle over the Performance Period. The maximum Performance Adjustment (positive or negative) will not exceed an annual rate of +/- 0.32% of the share class’s average daily net assets during the Performance Period, which would occur when the performance of the share class exceeds, or is exceeded by, the performance of the Index Hurdle by 2.00% over the Performance Period. Accordingly, the management fee will range from a minimum annual rate of 0.21% to a maximum annual rate of 0.85%. |
Under the terms of the ELA, investment management fee reductions and expense reimbursements by the Adviser are subject to repayment by the Funds for a period of three years after the date on which such fees and expenses were incurred or waived, provided that the repayments do not cause total annual fund operating expenses (exclusive of such reductions and reimbursements) to exceed (i) the expense limitation then in effect, if any, and (ii) the expense limitation in effect at the time the expenses to be repaid were incurred. Fee waivers/expense reimbursements for the Predecessor Funds prior to the Reorganization on November 1, 2021 are not subject to recoupment by the Adviser. As of April 30, 2022, the Adviser may seek repayment of investment management fee reductions and expense reimbursements no later than the dates below:
| | | Value | | | MidCap | | | SMidCap | | | SmallCap | | | AllCap | |
| | | Fund | | | Fund | | | Fund | | | Fund | | | Fund | |
| April 30, 2025 | | $ | 45,379 | | | $ | 49,603 | | | $ | 255,207 | | | $ | 629,173 | | | $ | 45,812 | |
| | | | | | | | | | | | | | | | | | | | | |
| | | Total | | | Income | | | High | | | Alternative | | | SmallCap | |
| | | Return | | | Opportunity | | | Income | | | Income | | | Growth | |
| | | Fund | | | Fund | | | Fund | | | Fund | | | Fund | |
| April 30, 2025 | | $ | 56,038 | | | $ | — | | | $ | 27,168 | | | $ | 106,133 | | | $ | 52,961 | |
WESTWOOD FUNDS
OTHER SERVICE PROVIDERS
Ultimus Fund Solutions, LLC (“Ultimus”) provides administration, fund accounting, compliance and transfer agency services to the Funds. The Funds pay Ultimus fees in accordance with the agreements for such services. In addition, the Funds pay out-of-pocket expenses including, but not limited to, postage, supplies, and certain costs related to the pricing of the Funds’ portfolio securities.
Under the terms of a Distribution Agreement with the Trust, Ultimus Fund Distributors, LLC (the “Distributor”) serves as the principal underwriter to the Funds. The Distributor is a wholly-owned subsidiary of Ultimus. The Distributor is compensated by the Adviser for acting as principal underwriter.
A Trustee and certain officers of the Trust are also officers of Ultimus.
ADMINISTRATIVE SERVICES PLAN
MidCap, SMidCap, SmallCap, AllCap, High Income, Alternative Income and SmallCap Growth Funds have adopted an administrative services plan (the “Plan”) that provides that the Institutional Shares class of each Fund may pay financial intermediaries for shareholder services in an amount not to exceed 0.20% based on the average daily net assets of each Fund’s Institutional Shares. During the period ended April 30, 2022, the Institutional Shares of the Funds incurred the following administrative services plan fees under the Plan:
| Administrative service plan fees | | | | |
| Institutional Shares | | | | |
| MidCap Fund | | $ | 424 | |
| SMIDCap Fund | | | 228,303 | |
| SmallCap Fund | | | 277,321 | |
| AllCap Fund | | | 519 | |
| High Income* | | | — | |
| Alternative Income Fund | | | 27,679 | |
| SmallCap Growth Fund | | | 5,586 | |
| * | During the six month period ended April 30, 2022, the prior year accrual was not completely depleted, so no additional expense was recognized. |
WESTWOOD FUNDS
DISTRIBUTION PLAN
Value, SmallCap, Total Return, Income Opportunity, High Income and Alternative Income Funds have adopted a distribution plan under Rule 12b-1 of the 1940 Act (the “Plan”) for A Class Shares and C Class Shares that allows the Funds to pay distribution and/or service fees for the sale and distribution of Fund shares, and for services provided to shareholders in an amount not to exceed 0.25% based on average daily net assets of each Fund’s A Class Shares and 1.00% based on the average daily net assets of each Fund’s C Class Shares. During the period ended April 30, 2022, the A Class Shares and C Class Shares of the Funds incurred the following administrative services plan fees under the Plan:
| Distribution fee | | | | |
| Value Fund | | | | |
| A Class Shares | | $ | 1,257 | |
| C Class Shares | | | 169 | |
| SmallCap Fund | | | | |
| A Class Shares | | | 1,882 | |
| C Class Shares | | | 4,136 | |
| Total Return Fund | | | | |
| A Class Shares | | | 5 | |
| C Class Shares | | | 578 | |
| Income Opportunity Fund | | | | |
| A Class Shares | | | 76,479 | |
| C Class Shares | | | 66,726 | |
| Distribution fee | | | | |
| High Income Fund | | | | |
| A Class Shares | | $ | 2,654 | |
| C Class Shares | | | 964 | |
| Alternative Income Fund | | | | |
| A Class Shares | | | 50 | |
| C Class Shares | | | 163 | |
TRUSTEE COMPENSATION
Each member of the Board (a “Trustee”) who is not an “interested person” (as defined by the 1940 Act, as amended) of the Trust (“Independent Trustee”) receives a $1,300 annual retainer from each Fund, paid quarterly, except for the Board Chairperson who receives a $1,700 annual retainer from each Fund, paid in quarterly installments. Each Independent Trustee also receives from each Fund a fee of $550 for each Board meeting attended plus reimbursement for travel and other meeting-related expenses.
PRINCIPAL HOLDERS OF FUND SHARES
As of April 30, 2022, the following shareholders owned of record 25% or more of the outstanding shares of the Funds:
| NAME OF RECORD OWNER | | % Ownership |
| Value Fund | | |
| Institutional Class | | |
| National Financial Services, LLC (for the benefit of its customers) | | 32% |
| SEI Private Trust Co. (for the benefit of its customers) | | 26% |
| A Class Shares | | |
| Pershing, LLC (for the benefit of its customers) | | 25% |
| C Class Shares | | |
| Raymond James (for the benefit of its customers) | | 100% |
WESTWOOD FUNDS
| NAME OF RECORD OWNER | | % Ownership |
| MidCap Fund | | |
| Institutional Shares | | |
| Westwood Management Corp. (for the benefit of its customers) | | 100% |
| SMIDCap Fund | | |
| Institutional Class | | |
| Northern Trust Co. (The) (for the benefit of its customers) | | 52% |
| Ultra Shares | | |
| National Financial Services, LLC (for the benefit of its customers) | | 91% |
| SmallCap Fund | | |
| Institutional Class | | |
| National Financial Services, LLC (for the benefit of its customers) | | 41% |
| A Class Shares | | |
| Charles Schwab & Co., Inc. (for the benefit of its customers) | | 44% |
| C Class Shares | | |
| Raymond James (for the benefit of its customers) | | 54% |
| Ultra Shares | | |
| National Financial Services, LLC (for the benefit of its customers) | | 45% |
| Quality AllCap Fund | | |
| Institutional Shares | | |
| Westwood Management Corp. (for the benefit of its customers) | | 100% |
| Ultra Shares | | |
| U.S. Bank San Diego transit Corp. | | 89% |
| Total Return Fund | | |
| Institutional Shares | | |
| National Financial Services, LLC (for the benefit of its customers) | | 88% |
| A Class Shares | | |
| Pershing, LLC (for the benefit of its customers) | | 95% |
| C Class Shares | | |
| LPL Financial (for the benefit of its customers) | | 100% |
| Income Opportunity Fund | | |
| A Class Shares | | |
| Wells Fargo Clearing Services (for the benefit of its customers) | | 38% |
| C Class Shares | | |
| Raymond James (for the benefit of its customers) | | 71% |
WESTWOOD FUNDS
| NAME OF RECORD OWNER | | % Ownership |
| High Income Fund | | |
| Institutional Shares | | |
| National Financial Services, LLC (for the benefit of its customers) | | 80% |
| A Class Shares | | |
| TD Ameritrade, Inc. (for the benefit of its customers) | | 43% |
| C Class Shares | | |
| Raymond James (for the benefit of its customers) | | 100% |
| Alternative Income Fund | | |
| Institutional Shares | | |
| LPL Financial (for the benefit of its customers) | | 43% |
| Charles Schwab & Co., Inc. (for the benefit of its customers) | | 30% |
| A Class Shares | | |
| Pershing, LLC (for the benefit of its customers) | | 58% |
| C Class Shares | | |
| SEI Investment Co. (for the benefit of its customers) | | 93% |
| Ultra Shares | | |
| National Financial Services, LLC (for the benefit of its customers) | | 100% |
| SmallCap Growth Fund | | |
| Institutional Shares | | |
| National Financial Services, LLC (for the benefit of its customers) | | 87% |
A beneficial owner of 25% or more of a Fund’s outstanding shares may be considered a controlling person of the Fund. That shareholder’s vote could have a more significant effect on matters presented at a shareholders’ meeting.
5. Derivative Transactions
The following is a summary of the fair value of derivative instruments for Alternative Income Fund held by the Fund as of April 30, 2022 presented on the Statements of Assets and Liabilities.
| | | Assets | |
| | | Investments, | | | Unrealized | | | | |
| | | at value for | | | appreciation | | | Swap | |
| | | purchased | | | on futures | | | agreements, | |
| | | options | | | contracts* | | | at value* | |
| Equity Risk Exposure | | $ | 130,930 | | | $ | — | | | $ | 3,174,595 | |
| Interest Rate Risk Exposure | | | — | | | | 89,311 | | | | — | |
| Credit Risk Exposure | | | — | | | | — | | | | 106,481 | |
WESTWOOD FUNDS
| | | Liabilities | |
| | | Investments, | | | Unrealized | | | | |
| | | at value for | | | depreciation | | | Swap | |
| | | purchased | | | on futures | | | agreements, | |
| | | options | | | contracts* | | | at value* | |
| Equity Risk Exposure | | $ | — | | | $ | — | | | $ | 296,676 | |
| Credit Risk Exposure | | | — | | | | — | | | | 521,487 | |
Amounts designated as “-” are $0 or have been rounded to $0.
| * | Total fair value is presented by Primary Risk Exposure. For futures contracts, the amounts represent their cumulative appreciation/depreciation, which includes movements of variation margin. |
The following summary of the effect of derivatives instruments for Alternative Income Fund on the Statements of Operations for the period ended April 30, 2022:
| | | Net realized | | | Net realized | | | Net realized | |
| | | gains from | | | gains from | | | gains (losses) | |
| | | purchased | | | futures | | | from swap | |
| | | options | | | contracts | | | transactions | |
| Equity Risk Exposure | | $ | 51,354 | | | $ | — | | | $ | 14,954,243 | |
| Interest Rate Risk Exposure | | | — | | | | 54,237 | | | | — | |
| Credit Risk Exposure | | | | | | | | | | | (2,992,462 | ) |
| Net Change in Unrealized Appreciation (Depreciation) on Derivatives |
| Recognized as a Result from Operations |
| | | Net unrealized | | | Net unrealized | | | Net unrealized | |
| | | gains from | | | gains from | | | gains (losses) | |
| | | purchased | | | futures | | | from swap | |
| | | options | | | contracts | | | transactions | |
| Equity Risk Exposure | | $ | 115,626 | | | $ | — | | | $ | 4,011,015 | |
| Interest Rate Risk Exposure | | | — | | | | 66,402 | | | | — | |
| Credit Risk Exposure | | | — | | | | — | | | | 295,437 | |
Amounts designated as “—” are $0 or have been rounded to $0.
Offsetting Assets and Liabilities:
Alternative Income Fund is required to disclose the impact of offsetting assets and liabilities represented in the Statements of Assets and Liabilities to enable users of the financial statements to evaluate the effect or potential effect of netting arrangements on its financial position for recognized assets and liabilities. These recognized assets and liabilities are financial instruments and derivative instruments that are either subject to an enforceable master netting arrangement or similar agreement or meet the following right of setoff criteria: the amounts owed by the Alternative Income Fund to another party are determinable, the Fund has the right to set off the amounts owed with the amounts owed by the other party, the Alternative Income Fund intends to set off, and the Fund’s right of setoff is enforceable at law.
WESTWOOD FUNDS
A Fund is subject to various netting arrangements with select counterparties (“Master Agreements”). Master Agreements govern the terms of certain transactions, and reduce the counterparty risk associated with relevant transactions by specifying credit protection mechanisms and providing standardization that improves legal certainty. Since different types of transactions have different mechanics and are sometimes traded out of different legal entities of a particular counterparty organization, each type of transaction may be covered by a different Master Agreement, resulting in the need for multiple agreements with a single counterparty. As the Master Agreements are specific to unique operations of different asset types, they allow a Fund to close out and net its total exposure to a specific counterparty entity in the event of a default with respect to all the transactions governed under a single agreement with a specific counterparty entity.
Master Agreements can also help limit counterparty risk by specifying collateral posting arrangements at pre-arranged exposure levels. Under the Master Agreements, collateral is routinely transferred if the total net exposure to certain transactions (net of existing collateral already in place) governed under the relevant Master Agreement with a counterparty in a given account exceeds a specified threshold, which typically ranges from zero to $250,000 depending on the counterparty and the type of Master Agreement. United States Treasury Securities and U.S. dollar cash are generally the preferred forms of collateral. Securities and cash pledged as collateral are reflected as assets in the Statements of Assets and Liabilities as either a component of investments at value (securities) or deposits due from counterparties (cash). Cash collateral received is not typically held in a segregated account and as such is reflected as a liability in the Statements of Assets and Liabilities as deposits due to counterparties. The market value of any securities received as collateral is not reflected as a component of net asset value. A Fund’s overall exposure to counterparty risk can change substantially within a short period, as it is affected by each transaction subject to the relevant Master Agreement.
Customer account agreements and related addendums govern cleared derivatives transactions such as futures, options on futures, and cleared Over The Counter (“OTC”) derivatives. Cleared derivative transactions require posting of initial margin as determined by each relevant clearing agency which is segregated at a broker account registered with the Commodities Futures Trading Commission (“CFTC”), or the applicable regulator. In the U.S., counterparty risk is believed to be reduced as creditors of the futures broker do not have claim to Fund assets in the segregated account. Additionally, portability of exposure in the event of default further reduces risk to the Funds. Variation margin, or changes in market value, are exchanged daily, but generally may not be netted between futures and cleared OTC derivatives.
International Swaps and Derivatives Association, Inc. Master Agreements and Credit Support Annexes (“ISDA Master Agreements”) govern OTC financial derivative transactions entered into by a Fund and select counterparties. ISDA Master Agreements maintain provisions for general obligations, representations, agreements, collateral and events of default or termination. Events of termination include conditions that may entitle counterparties to elect to terminate early and cause settlement of all outstanding transactions under the applicable ISDA Master Agreement. Any election to terminate early could be material to the financial statements. In limited circumstances, the ISDA Master Agreement may contain additional provisions that add additional counterparty protection beyond coverage of existing daily exposure if the counterparty has a decline in credit quality below a predefined level. These amounts, if any, may be segregated with a third party custodian.
WESTWOOD FUNDS
As of April 30, 2022, Alternative Income Fund’s derivative assets and liabilities by type are as follows:
| Description | | Assets | | | Liabilities | |
| Derivative Financial Instruments: | | | | | | | | |
| Options contract | | $ | 130,930 | | | $ | — | |
| Futures contracts | | | 89,311 | | | | — | |
| Swap agreements | | | 3,281,077 | | | | (818,164 | ) |
| Total derivative assets and liabilities in the Statements of Assets and Liabilities | | | 3,501,318 | | | | (818,164 | ) |
| Derivative not subject to a MNA or similar agreement | | | (220,241 | ) | | | — | |
| Total assets and liabilities subject to a MNA | | $ | 3,281,077 | | | $ | (818,164 | ) |
Amounts designated as “-” are $0 or have been rounded to $0.
| * | Includes options contracts purchased at value as reported in the Statements of Assets and Liabilities. |
The following table represents the Alternative Income Fund’s derivative assets by counterparty, net of amounts available for offset under an MNA and net of the related collateral received by the Fund as of April 30, 2022.
| | | | | | Derivative | | | | | | | | | | |
| | | Derivative | | | Liabilities | | | | | | | | | | |
| | | Assets Subject | | | Subject to | | | Net Amount | | | Non-cash | | | | |
| | | to a MNA by | | | a MNA by | | | of Derivative | | | Collateral | | | | |
| | | Counterparty | | | Counterparty | | | Assets | | | Received(a) | | | Net Exposure | |
| BNP Paribas | | $ | 3,281,077 | | | $ | (818,164 | ) | | $ | 2,462,913 | | | $ | (2,462,913 | ) | | $ | — | |
| (a) | The actual collateral received or pledged may be in excess of the amounts shown in the tables. The tables only reflect collateral amounts up to the amount of the financial instruments disclosed on the Statements of Assets and Liabilities. |
6. Certain Investments and Risks
Below are summaries of some, but not all, of the principal risks of investing in one or more of the Funds, each of which could adversely affect a Fund’s NAV, yield and total return. Each risk listed below does not necessarily apply to each Fund, and you should read each Fund’s prospectus carefully for a description of the principal risks associated with investing in a particular Fund.
RISKS ASSOCIATED WITH LOWER RATE DEBT SECURITIES
High Income Fund invests substantially all of its assets in high yield, or “junk,” bonds, and such investments represent highly speculative securities that are usually issued by smaller, less creditworthy and/or highly leveraged (indebted) companies. Compared with investment-grade bonds, high yield bonds are considered to carry a greater degree of risk and are considered to be less likely to make payments of interest and principal. In particular, lower-quality high yield bonds (rated CCC, CC, C, or unrated securities judged to be of comparable quality) are subject to a greater degree of credit risk than higher-quality high yield bonds and may be near default. High yield bonds rated D are in default. Market developments and the financial and business conditions of the corporation issuing these securities generally influence their price and liquidity more than changes in interest rates, when compared to investment-grade debt securities. In addition, insufficient liquidity in the non-investment grade bond market may make it more difficult to dispose of non-investment grade bonds and may cause the Fund to experience sudden and substantial price declines.
WESTWOOD FUNDS
RISKS ASSOCIATED WITH RULE 144A SECURITIES
Rule 144A securities are securities that are exempt from registration in compliance with the Securities Act of 1933, as amended, and the rules thereunder, and may have legal restrictions on resale. Under Rule 144A, these privately placed securities may be resold to qualified institutional buyers (“QIBS”), subject to certain conditions. An insufficient number of QIBs interested in purchasing Rule 144A securities at a particular time could adversely affect the marketability of the securities and a Fund might be unable to dispose of the securities promptly or at a reasonable price. As of April 30, 2022, High Income Fund had 40.6% of the value of its net assets invested in Rule 144A securities.
7. Change in Auditor
Prior to November 1, 2021, Ernst & Young, LLP (“EY”), One Commerce Square, 2005 Market Street, Suite 700, Philadelphia, PA, served as independent registered public accounting firm for the Predecessor Funds. The financial statements and notes thereto incorporated by reference for the Predecessor Westwood Quality Value Fund, the Predecessor Westwood Total Return Fund, the Predecessor Westwood Quality SMidCap Fund, the Predecessor Westwood Quality SmallCap Fund, the Predecessor Westwood Income Opportunity Fund, the Predecessor Westwood High Income Fund and the Predecessor Westwood Alternative Income Fund have been audited by EY, as indicated in their report with respect thereto, and are incorporated by reference in reliance on the authority of their report as experts in accounting and auditing. For the fiscal years ended October 31, 2021 and October 31, 2020, EY audit reports concerning the Funds contained no adverse opinion or disclaimer of opinion; nor were its reports qualified or modified as to uncertainty, audit scope, or accounting principles.
In connection with its audits for the fiscal years ended October 31, 2021 and October 31, 2020, there were no disagreements between Westwood and EY on any matter of accounting principles or practices, financial statement disclosure or auditing scope or procedure which, if not resolved to the satisfaction of EY, would have caused it to make reference to the disagreements in its report on the financial statements for such periods. In addition, there were no reportable events of the kind described in Item 304(a) (1) (v) of Regulation S-K under the Securities Exchange Act of 1934, as amended.
BBD, LLP (“BBD”), located at 1835 Market Street, 3rd Floor, Philadelphia, PA, 19103, serves as the independent registered public accounting firm for the Funds. During the Funds’ fiscal years ended October 31, 2021 and October 31, 2020, neither the Registrant nor anyone on its behalf consulted BBD concerning (i) the application of accounting principles to a specified transaction, either completed or proposed, or the type of audit opinion that might be rendered on the Registrant’s financial statements or (ii) the subject of a disagreement (as defined in paragraph (a) (1) (iv) of Item 304 of Regulation S-K) or reportable events (as described in paragraph (a) (1) (v) of said Item 304).
8. In-Kind Transactions
During the year ended October 31, 2021, the Value Fund issued shares of beneficial interest in exchange for securities and the Income Opportunity Fund redeemed shares of beneficial interest in exchange for securities. The securities were transferred at their current value on the date of the transaction.
| | | Transaction | | Shares Sold/ | | | Securities at | | | | | | | | | | |
| | | Date | | (Redeemed) | | | Value | | | Cash | | | Total | | | Realized Gain | |
| Value Fund | | 6/30/2021 | | $ | 1,175,620 | | | $ | 16,314,560 | | | $ | 778,960 | | | $ | 17,093,520 | | | $ | — | |
| Income Opportunity Fund | | 4/20/2021 | | | (1,578,769 | ) | | | 20,162,864 | | | | 1,403,118 | | | | 21,565,982 | | | | 2,878,054 | |
WESTWOOD FUNDS
9. Contingencies and Commitments
The Funds indemnify the Trust’s officers and Trustees for certain liabilities that might arise from their performance of their duties to the Funds. Additionally, in the normal course of business the Funds enter into contracts that contain a variety of representations and warranties and which provide general indemnifications. The Funds’ maximum exposure under these arrangements is unknown, as this would involve future claims that may be made against the Funds that have not yet occurred. However, based on experience, the Funds expect the risk of loss to be remote.
10. Subsequent Events
The Funds are required to recognize in the financial statements the effects of all subsequent events that provide additional evidence about conditions that existed as of the date of the Statements of Assets and Liabilities. For non-recognized subsequent events that must be disclosed to keep the financial statements from being misleading, the Funds are required to disclose the nature of the event as well as an estimate of its financial effect, or a statement that such an estimate cannot be made. Management has evaluated subsequent events through the issuance of these financial statements and has noted no such events.
WESTWOOD FUNDS
| ABOUT YOUR FUNDS’ EXPENSES (Unaudited) |
We believe it is important for you to understand the impact of costs on your investment. As a shareholder of the Funds, you incur two types of costs: (1) transaction costs, possibly including sales charges (loads) and redemption fees, and (2) ongoing costs, including management fees, class-specific expenses (such as administrative services fees and/or Rule 12b-1 fees) and other operating expenses. The following examples are intended to help you understand your ongoing costs (in dollars) of investing in the Funds and to compare these costs with the ongoing costs of investing in other mutual funds.
A mutual fund’s ongoing costs are expressed as a percentage of its average net assets. This figure is known as the expense ratio. The expenses in the table below are based on an investment of $1,000 made at the beginning of the most recent period (November 1, 2021) and held until the end of the period (April 30, 2022), except for MidCap Fund, for which the ongoing costs reflected in the table below are based on an investment of $1,000 made at the commencement of operations (November 30, 2021) and held until the end of the period (April 30, 2022).
The table below illustrates each Fund’s ongoing costs in two ways:
Actual fund return – This section helps you to estimate the actual expenses that you paid over the period. The “Ending Account Value” shown is derived from each Fund’s actual return, and the fourth column shows the dollar amount of operating expenses that would have been paid by an investor who started with $1,000 in the Funds. You may use the information here, together with the amount you invested, to estimate the expenses that you paid over the period.
To do so, simply divide your account value by $1,000 (for example, an $8,600 account value divided by $1,000 = 8.6), then multiply the result by the number given for the Funds under the heading “Expenses Paid During Period.”
Hypothetical 5% return – This section is intended to help you compare each Fund’s ongoing costs with those of other mutual funds. It assumes that the Funds had an annual return of 5% before expenses during the period shown, but that the expense ratio is unchanged. In this case, because the return used is not each Fund’s actual return, the results do not apply to your investment. The example is useful in making comparisons because the SEC requires all mutual funds to calculate expenses based on a 5% return. You can assess each Fund’s ongoing costs by comparing this hypothetical example with the hypothetical examples that appear in shareholder reports of other funds.
Note that expenses shown in the table are meant to highlight and help you compare ongoing costs only. The Funds do not charge transaction fees, such as purchase or redemption fees, nor do they carry a “sales load.”
The calculations assume no shares were bought or sold during the period. Your actual costs may have been higher or lower, depending on the amount of your investment and the timing of any purchases or redemptions.
More information about each Fund’s expenses can be found in this report. For additional information on operating expenses and other shareholder costs, please refer to each Fund’s prospectus.
WESTWOOD FUNDS
| | | Beginning | | | Ending | | | | | | |
| | | Account Value | | | Account Value | | | | | Expenses Paid | |
| | | November 1, | | | April 30, | | | Net Expense | | During | |
| | | 2021 | | | 2022 | | | Ratio (a) | | Period (b) | |
| Value Fund | | | | | | | | | | | | | | |
| Institutional Shares | | | | | | | | | | | | | | |
| Based on Actual Fund Return | | $ | 1,000.00 | | | $ | 960.10 | | | 0.65% | | $ | 3.16 | |
| Based on Hypothetical 5% Return (before expenses) | | $ | 1,000.00 | | | $ | 1,021.57 | | | 0.65% | | $ | 3.26 | |
| A Class Shares | | | | | | | | | | | | | | |
| Based on Actual Fund Return | | $ | 1,000.00 | | | $ | 958.10 | | | 0.90% | | $ | 4.37 | |
| Based on Hypothetical 5% Return (before expenses) | | $ | 1,000.00 | | | $ | 1,020.33 | | | 0.90% | | $ | 4.51 | |
| C Class Shares | | | | | | | | | | | | | | |
| Based on Actual Fund Return | | $ | 1,000.00 | | | $ | 954.90 | | | 1.65% | | $ | 7.90 | |
| Based on Hypothetical 5% Return (before expenses) | | $ | 1,000.00 | | | $ | 1,016.61 | | | 1.65% | | $ | 8.15 | |
| MidCap Fund (c) | | | | | | | | | | | | | | |
| Institutional Share Class | | | | | | | | | | | | | | |
| Based on Actual Fund Return | | $ | 1,000.00 | | | $ | 974.00 | | | 0.79% | | $ | 3.23 | |
| Based on Hypothetical 5% Return (before expenses) | | $ | 1,000.00 | | | $ | 1,020.88 | | | 0.79% | | $ | 3.96 | |
| SMidCap Fund | | | | | | | | | | | | | | |
| Institutional Share Class | | | | | | | | | | | | | | |
| Based on Actual Fund Return | | $ | 1,000.00 | | | $ | 897.90 | | | 0.88% | | $ | 4.14 | |
| Based on Hypothetical 5% Return (before expenses) | | $ | 1,000.00 | | | $ | 1,020.43 | | | 0.88% | | $ | 4.41 | |
| Ultra Shares | | | | | | | | | | | | | | |
| Based on Actual Fund Return | | $ | 1,000.00 | | | $ | 899.50 | | | 0.68% | | $ | 3.20 | |
| Based on Hypothetical 5% Return (before expenses) | | $ | 1,000.00 | | | $ | 1,021.42 | | | 0.68% | | $ | 3.41 | |
| SmallCap Fund | | | | | | | | | | | | | | |
| Institutional Share Class | | | | | | | | | | | | | | |
| Based on Actual Fund Return | | $ | 1,000.00 | | | $ | 877.30 | | | 0.89% | | $ | 4.14 | |
| Based on Hypothetical 5% Return (before expenses) | | $ | 1,000.00 | | | $ | 1,020.38 | | | 0.89% | | $ | 4.46 | |
| A Class Shares | | | | | | | | | | | | | | |
| Based on Actual Fund Return | | $ | 1,000.00 | | | $ | 877.00 | | | 1.04% | | $ | 4.84 | |
| Based on Hypothetical 5% Return (before expenses) | | $ | 1,000.00 | | | $ | 1,019.64 | | | 1.04% | | $ | 5.21 | |
WESTWOOD FUNDS
| | | Beginning | | | Ending | | | | | | |
| | | Account Value | | | Account Value | | | | | Expenses Paid | |
| | | November 1, | | | April 30, | | | Net Expense | | During | |
| | | 2021 | | | 2022 | | | Ratio (a) | | Period (b) | |
| SmallCap Fund (continued) | | | | | | | | | | | | | | |
| C Class Shares | | | | | | | | | | | | | | |
| Based on Actual Fund Return | | $ | 1,000.00 | | | $ | 873.40 | | | 1.79% | | $ | 8.31 | |
| Based on Hypothetical 5% Return (before expenses) | | $ | 1,000.00 | | | $ | 1,015.92 | | | 1.79% | | $ | 8.95 | |
| Ultra Shares | | | | | | | | | | | | | | |
| Based on Actual Fund Return | | $ | 1,000.00 | | | $ | 878.00 | | | 0.79% | | $ | 3.68 | |
| Based on Hypothetical 5% Return (before expenses) | | $ | 1,000.00 | | | $ | 1,020.88 | �� | | 0.79% | | $ | 3.96 | |
| AllCap Fund | | | | | | | | | | | | | | |
| Institutional Share Class | | | | | | | | | | | | | | |
| Based on Actual Fund Return | | $ | 1,000.00 | | | $ | 933.40 | | | 0.65% | | $ | 3.12 | |
| Based on Hypothetical 5% Return (before expenses) | | $ | 1,000.00 | | | $ | 1,021.57 | | | 0.65% | | $ | 3.26 | |
| Ultra Shares | | | | | | | | | | | | | | |
| Based on Actual Fund Return | | $ | 1,000.00 | | | $ | 934.80 | | | 0.45% | | $ | 2.16 | |
| Based on Hypothetical 5% Return (before expenses) | | $ | 1,000.00 | | | $ | 1,022.56 | | | 0.45% | | $ | 2.26 | |
| Total Return Fund | | | | | | | | | | | | | | |
| Institutional Shares | | | | | | | | | | | | | | |
| Based on Actual Fund Return | | $ | 1,000.00 | | | $ | 910.40 | | | 0.56% | | $ | 2.65 | |
| Based on Hypothetical 5% Return (before expenses) | | $ | 1,000.00 | | | $ | 1,022.02 | | | 0.56% | | $ | 2.81 | |
| A Class Shares | | | | | | | | | | | | | | |
| Based on Actual Fund Return | | $ | 1,000.00 | | | $ | 909.00 | | | 0.85% | | $ | 4.02 | |
| Based on Hypothetical 5% Return (before expenses) | | $ | 1,000.00 | | | $ | 1,020.58 | | | 0.85% | | $ | 4.26 | |
| C Class Shares | | | | | | | | | | | | | | |
| Based on Actual Fund Return | | $ | 1,000.00 | | | $ | 905.10 | | | 1.58% | | $ | 7.46 | |
| Based on Hypothetical 5% Return (before expenses) | | $ | 1,000.00 | | | $ | 1,016.96 | | | 1.58% | | $ | 7.90 | |
| Income Opportunity Fund | | | | | | | | | | | | | | |
| Institutional Shares | | | | | | | | | | | | | | |
| Based on Actual Fund Return | | $ | 1,000.00 | | | $ | 911.60 | | | 0.81% | | $ | 3.84 | |
| Based on Hypothetical 5% Return (before expenses) | | $ | 1,000.00 | | | $ | 1,020.78 | | | 0.81% | | $ | 4.06 | |
WESTWOOD FUNDS
| | | Beginning | | | Ending | | | | | | |
| | | Account Value | | | Account Value | | | | | Expenses Paid | |
| | | November 1, | | | April 30, | | | Net Expense | | During | |
| | | 2021 | | | 2022 | | | Ratio (a) | | Period (b) | |
| Income Opportunity Fund (continued) | | | | | | | | | | | | | | |
| A Class Shares | | | | | | | | | | | | | | |
| Based on Actual Fund Return | | $ | 1,000.00 | | | $ | 910.30 | | | 1.06% | | $ | 5.02 | |
| Based on Hypothetical 5% Return (before expenses) | | $ | 1,000.00 | | | $ | 1,019.54 | | | 1.06% | | $ | 5.31 | |
| C Class Shares | | | | | | | | | | | | | | |
| Based on Actual Fund Return | | $ | 1,000.00 | | | $ | 907.40 | | | 1.81% | | $ | 8.56 | |
| Based on Hypothetical 5% Return (before expenses) | | $ | 1,000.00 | | | $ | 1,015.82 | | | 1.81% | | $ | 9.05 | |
| High Income Fund | | | | | | | | | | | | | | |
| Institutional Shares | | | | | | | | | | | | | | |
| Based on Actual Fund Return | | $ | 1,000.00 | | | $ | 926.10 | | | 0.80% | | $ | 3.82 | |
| Based on Hypothetical 5% Return (before expenses) | | $ | 1,000.00 | | | $ | 1,020.83 | | | 0.80% | | $ | 4.01 | |
| A Class Shares | | | | | | | | | | | | | | |
| Based on Actual Fund Return | | $ | 1,000.00 | | | $ | 925.30 | | | 1.05% | | $ | 5.01 | |
| Based on Hypothetical 5% Return (before expenses) | | $ | 1,000.00 | | | $ | 1,019.59 | | | 1.05% | | $ | 5.26 | |
| C Class Shares | | | | | | | | | | | | | | |
| Based on Actual Fund Return | | $ | 1,000.00 | | | $ | 921.50 | | | 1.80% | | $ | 8.58 | |
| Based on Hypothetical 5% Return (before expenses) | | $ | 1,000.00 | | | $ | 1,015.87 | | | 1.80% | | $ | 9.00 | |
| Alternative Income Fund | | | | | | | | | | | | | | |
| Institutional Share Class | | | | | | | | | | | | | | |
| Based on Actual Fund Return | | $ | 1,000.00 | | | $ | 976.90 | | | 0.30% | | $ | 1.47 | |
| Based on Hypothetical 5% Return (before expenses) | | $ | 1,000.00 | | | $ | 1,023.31 | | | 0.30% | | $ | 1.51 | |
| A Class Shares | | | | | | | | | | | | | | |
| Based on Actual Fund Return | | $ | 1,000.00 | | | $ | 976.50 | | | 0.45% | | $ | 2.21 | |
| Based on Hypothetical 5% Return (before expenses) | | $ | 1,000.00 | | | $ | 1,022.56 | | | 0.45% | | $ | 2.26 | |
| C Class Shares | | | | | | | | | | | | | | |
| Based on Actual Fund Return | | $ | 1,000.00 | | | $ | 973.20 | | | 1.21% | | $ | 5.92 | |
| Based on Hypothetical 5% Return (before expenses) | | $ | 1,000.00 | | | $ | 1,018.79 | | | 1.21% | | $ | 6.06 | |
WESTWOOD FUNDS
| | | Beginning | | | Ending | | | | | | |
| | | Account Value | | | Account Value | | | | | Expenses Paid | |
| | | November 1, | | | April 30, | | | Net Expense | | During | |
| | | 2021 | | | 2022 | | | Ratio (a) | | Period (b) | |
| Alternative Income Fund (continued) | | | | | | | | | | | | | | |
| Ultra Shares | | | | | | | | | | | | | | |
| Based on Actual Fund Return | | $ | 1,000.00 | | | $ | 977.20 | | | 0.20% | | $ | 0.98 | |
| Based on Hypothetical 5% Return (before expenses) | | $ | 1,000.00 | | | $ | 1,023.80 | | | 0.20% | | $ | 1.00 | |
| SmallCap Growth Fund | | | | | | | | | | | | | | |
| Institutional Share Class | | | | | | | | | | | | | | |
| Based on Actual Fund Return | | $ | 1,000.00 | | | $ | 841.80 | | | 0.75% | | $ | 3.42 | |
| Based on Hypothetical 5% Return (before expenses) | | $ | 1,000.00 | | | $ | 1,021.08 | | | 0.75% | | $ | 3.76 | |
| (a) | Annualized, based on each Fund’s most recent one-half year expenses. |
| (b) | Expenses are equal to each Fund’s annualized net expense ratio multiplied by the average account value over the period, multiplied by 181/365 (to reflect the one-half year period), for Actual Fund Return and Hypothetical 5% Return information, respectively. |
| (c) | MidCap Fund, for which expenses are equal to the annualized net expense ratio multiplied by the average account value over the period, multiplied by 151/365 (to reflect the period since commencement of operations, November 30, 2021) and 181/365 (to reflect the one-half year period), for Actual Fund Return and Hypothetical 5% Return information, respectively. |
WESTWOOD HIGH INCOME FUND
WESTWOOD INCOME OPPORTUNITY FUND
WESTWOOD QUALITY VALUE FUND
WESTWOOD QUALITY SMALLCAP FUND
WESTWOOD ALTERNATIVE INCOME FUND
WESTWOOD QUALITY SMIDCAP FUND
WESTWOOD TOTAL RETURN FUND
WESTWOOD QUALITY MIDCAP FUND
| DISCLOSURE REGARDING APPROVAL OF INVESTMENT ADVISORY AGREEMENT (Unaudited) |
The Board of Trustees (the “Board”), including the Independent Trustees voting separately, has reviewed and approved the Investment Advisory Agreement (the “Agreement”) with Westwood Management Corp. (the “Adviser” or “Westwood”) with respect to the Westwood High Income Fund, the Westwood Income Opportunity Fund, the Westwood Quality Value Fund, the Westwood Quality SmallCap Fund, the Westwood Alternative Income Fund, the Westwood Quality SmidCap Fund and the Westwood Total Return Fund (individually a “Fund” and collectively, the “Funds”) for an initial term of two years. The Board approved the Agreement at a meeting held on April 19, 20 and 21, 2021 (the “Meeting”), at which all of the Trustees were present.
In deciding whether to approve the Agreement, the Board recalled its discussion with representatives of Westwood during the Meeting and its review of the various materials related to Westwood. The Board further considered those materials and discussions and numerous other factors, including:
The nature, extent, and quality of the services to be provided by the Adviser. In this regard, the Board considered the responsibilities Westwood would have under the Agreement for each of the Funds. The Board also considered the proposed services that Westwood would provide to each of the Funds including, without limitation, providing a continuous investment program for the Funds, adhering to each Fund’s investment restrictions, complying with the Trust’s policies and procedures, and voting proxies on behalf of each of the Funds. The Board considered the qualifications and experience of Westwood’s portfolio managers who are responsible for the day to day management of the Funds, as well as the qualifications and experience of the other individuals at Westwood who will provide services to the Funds. The Board also considered that the services to be provided under the Agreement would be substantially similar to those Westwood provided to the Funds’ predecessor funds (the “Predecessor Funds”) prior to their reorganization into the Trust. After reviewing the foregoing and further information provided to the Board (e.g., descriptions of Westwood’s business and Form ADV), the Board concluded that the quality, extent, and nature of the services to be provided by Westwood to the Funds were satisfactory and adequate.
The investment management capabilities and experience of the Adviser. In this regard, the Board considered the investment management experience of Westwood and its personnel. The Board considered its discussion with representatives of Westwood regarding the investment objective and strategies for each of the Funds and Westwood’s experience and plans for implementing such strategies. In particular, the Board considered the information from Westwood regarding prior experience managing the Predecessor Funds and with other accounts that had similar investment objectives and strategies as the Funds. After consideration of these and other factors, the Board determined that Westwood has the requisite knowledge and experience to serve as investment adviser for each of the Funds.
The investment performance of the Adviser and the Funds. The Board considered Westwood’s historical performance in management of the Predecessor Funds and with other accounts that had similar investment objectives and strategies as the Funds. The Board recalled the information provided by Westwood regarding the Predecessor Fund’s performance and explaining their expectations and strategies for the future. The Board determined that the Predecessor Funds’ historical performance was satisfactory, or, where the Predecessor Funds’ performance was materially below their benchmarks and/or peer groups, the Board was satisfied by the reasons for the underperformance and/or the steps taken by Westwood in an effort to improve the performance of the Funds.
The costs of the services to be provided and profits to be realized by the Adviser and its affiliates from the relationship with the Funds. In this regard, the Board considered Westwood’s methods of operation; its financial condition (and
WESTWOOD HIGH INCOME FUND
WESTWOOD INCOME OPPORTUNITY FUND
WESTWOOD QUALITY VALUE FUND
WESTWOOD QUALITY SMALLCAP FUND
WESTWOOD ALTERNATIVE INCOME FUND
WESTWOOD QUALITY SMIDCAP FUND
WESTWOOD TOTAL RETURN FUND
WESTWOOD QUALITY MIDCAP FUND
that of its parent company) and the projected asset levels of the Funds; and the overall expenses of each of the Funds, including the advisory fee. The Board reviewed the expense limitation agreement (the “ELA”) for the Funds and noted the benefit to the Funds from Westwood’s commitment to reduce its advisory fee and reimburse other operating expenses through at least November 1, 2023. The Board discussed Westwood’s financial condition, and that of Westwood’s parent company, and their ability to satisfy their financial commitments to the Funds. The Board also considered potential benefits for Westwood in managing the Funds, including promotion of Westwood’s name. The Board compared each Fund’s proposed advisory fee and overall expense ratio to the other funds in its custom peer group and Morningstar category, if applicable. The Board also reviewed the management fees charged by the Westwood to other clients with comparable mandates to the Funds. The Board considered any differences in management fees and took into account the respective demands, resources and complexity associated with each. The Board concluded, within the context of its full deliberations, that the proposed advisory fee and total expense limit for the Funds were within the range of what would have been negotiated at arms-length in light of all the surrounding circumstances.
The Board considered the potential profits to be realized by Westwood from its relationship with the Funds, including both direct benefits and indirect benefits, such as research and brokerage services received under soft dollar arrangements, that was anticipated to accrue to Westwood and its affiliates. The Board considered how Westwood’s anticipated profitability would be affected by factors such as its organizational structure and method for allocating expenses. The Trustees concluded that the advisory fee to be paid to Westwood by each of the Funds is reasonable in light of the nature and quality of the services provided by Westwood.
The extent to which the Funds and their investors would benefit from economies of scale. In this regard, the Board considered the Agreement and the ELA. The Board considered Westwood’s views relating to economies of scale in connection with the Funds as fund assets grow and the extent to which the benefits of any such economies of scale may be shared with the funds and fund shareholders. The Board recognized that economies of scale are difficult to identify and quantify and are rarely identifiable on a fund-by-fund basis. The Board noted that each Fund would benefit from the ELA and the Board can review the arrangement going forward if necessary. Based on this evaluation, the Board concluded that the proposed advisory fee for each Fund was reasonable in light of the information that was provided to the Board by Westwood with respect to economies of scale.
After further discussion of the factors noted above and in reliance of the information provided by Westwood and Trust management and taking into account the totality of all factors discussed and information presented at the Meeting, the Board indicated its desire to approve the Agreement. It was noted that in the Trustees’ deliberations regarding the approval of the Agreement, the Trustees did not identify any particular information or factor that was all-important or controlling, and that each individual Trustee may have attributed different weights to the various factors listed above. After full consideration of the above factors as well as other factors, the Board unanimously approved the Agreement for each of the Funds.
The Board, including the Independent Trustees voting separately, has reviewed and approved the Investment Advisory Agreement (the “Agreement”) with Westwood Management Corp. (the “Adviser” or “Westwood”) with respect to the Westwood Quality MidCap Fund (the “MidCap Fund”) for an initial term of two years. The Board approved the Agreement at a meeting held on July 19, 20 and 21, 2021 (the “Meeting”), at which all of the Trustees were present.
WESTWOOD HIGH INCOME FUND
WESTWOOD INCOME OPPORTUNITY FUND
WESTWOOD QUALITY VALUE FUND
WESTWOOD QUALITY SMALLCAP FUND
WESTWOOD ALTERNATIVE INCOME FUND
WESTWOOD QUALITY SMIDCAP FUND
WESTWOOD TOTAL RETURN FUND
WESTWOOD QUALITY MIDCAP FUND
In deciding whether to approve the Agreement, the Board recalled its discussion with representatives of Westwood during the Meeting and prior meetings and its review of the various materials related to Westwood. The Board further considered those materials and discussions and numerous other factors, including:
The nature, extent, and quality of the services to be provided by the Adviser. In this regard, the Board considered the responsibilities Westwood would have under the Agreement for the MidCap Fund. The Board also considered the proposed services that Westwood would provide to the MidCap Fund including, without limitation, providing a continuous investment program for the MidCap Fund, adhering to the Fund’s investment restrictions, complying with the Trust’s policies and procedures, and voting proxies on behalf of the MidCap Fund. The Board considered the qualifications and experience of the other individuals at Westwood who will provide services to the MidCap Fund. The Board concluded that the quality, extent, and nature of the services to be provided by Westwood to the MidCap Fund were satisfactory.
The investment management capabilities and experience of the Adviser. In this regard, the Board considered the investment management experience of Westwood and its personnel. The Board considered its discussion with representatives of Westwood regarding the investment objective and strategies for the MidCap Fund and Westwood’s experience and plans for implementing such strategies. In particular, the Board considered the information from Westwood regarding prior experience managing other accounts that had similar investment objectives and strategies as the MidCap Fund. After consideration of these and other factors, the Board determined that Westwood has the requisite knowledge and experience to serve as investment adviser for the MidCap Fund.
The costs of the services to be provided and profits to be realized by the Adviser and its affiliates from the relationship with the MidCap Fund. In this regard, the Board considered the proposed management fee for the MidCap Fund and proposed overall expense ratio, each as compared to the other funds in its custom peer group and Morningstar category and to the fees charged by the Westwood to other clients with comparable mandates to the MidCap Fund. The Board considered the anticipated profitability of Westwood from the MidCap Fund and the potential the indirect benefits that Westwood would receive from its management of the MidCap Fund. The Board concluded that the advisory fee to be paid to Westwood by the MidCap Fund is reasonable in light of the nature and quality of the services provided by Westwood.
The extent to which the MidCap Fund and its investors would benefit from economies of scale. In this regard, the Board considered the Agreement and the ELA. The Board considered economies of scale in connection with the MidCap Fund if fund assets grew and the extent to which the benefits of any such economies of scale may be shared with the funds and fund shareholders. The Board recognized that economies of scale are difficult to identify and quantify and are rarely identifiable on a fund-by-fund basis. The Board noted that the MidCap Fund would benefit from the ELA and the Board will continue going forward to review the arrangement. Based on this evaluation, the Board concluded that the proposed advisory fee for the MidCap Fund was reasonable in light of the information that was provided to the Board by Westwood with respect to economies of scale.
After further discussion of the factors noted above and in reliance of the information provided by Westwood and Trust Management and taking into account the totality of all factors discussed and information presented, the Board indicated its desire to approve the Agreement. It was noted that in the Trustees’ deliberations regarding the approval of the Agreement, the Trustees did not identify any particular information or factor that was all-important or controlling, and that each individual Trustee may have attributed different weights to the various factors listed above. After full consideration of the above factors as well as other factors, the Board unanimously approved the Agreement for the MidCap Fund.
WESTWOOD FUNDS
| FACTS | WHAT DOES THE WESTWOOD FUNDS® (the “Funds”) DO WITH YOUR PERSONAL INFORMATION? |
| Why? | Financial companies choose how they share your personal information. Federal law gives consumers the right to limit some but not all sharing. Federal law also requires us to tell you how we collect, share, and protect your personal information. Please read this notice carefully to understand what we do. |
| What? | The types of personal information we collect and share depend on the product or service you have with us. This information can include: ■ Social Security number ■ Assets ■ Retirement Assets ■ Transaction History ■ Checking Account Information ■ Purchase History ■ Account Balances ■ Account Transactions ■ Wire Transfer Instructions When you are no longer our customer, we continue to share your information as described in this notice. |
| How? | All financial companies need to share your personal information to run their everyday business. In the section below, we list the reasons financial companies can share their customers’ personal information; the reasons the Fund chooses to share; and whether you can limit this sharing. |
| Reasons we can share your personal information | Does the Fund share? | Can you limit this sharing? |
For our everyday business purposes – Such as to process your transactions, maintain your account(s), respond to court orders and legal investigations, or report to credit bureaus | Yes | No |
For our marketing purposes – to offer our products and services to you | No | We don’t share |
| For joint marketing with other financial companies | No | We don’t share |
For our affiliates’ everyday business purposes – information about your transactions and experiences | No | We don’t share |
For our affiliates’ everyday business purposes – information about your creditworthiness | No | We don’t share |
| For nonaffiliates to market to you | No | We don’t share |
| Questions? | Call 1-877-FUND-WHG |
WESTWOOD FUNDS
| Who we are |
| Who is providing this notice? | Westwood Funds® Ultimus Fund Distributors, LLC (Distributor) Ultimus Fund Solutions, LLC (Administrator) |
| What we do |
| How does the Fund protect my personal information? | To protect your personal information from unauthorized access and use, we use security measures that comply with federal law. These measures include computer safeguards and secured files and buildings. Our service providers are held accountable for adhering to strict policies and procedures to prevent any misuse of your nonpublic personal information. |
| How does the Fund collect my personal information? | We collect your personal information, for example, when you ■ Open an account ■ Provide account information ■ Give us your contact information ■ Make deposits or withdrawals from your account ■ Make a wire transfer ■ Tell us where to send the money ■ Tell us who receives the money ■ Show your government-issued ID ■ Show your driver’s license We also collect your personal information from other companies. |
| Why can’t I limit all sharing? | Federal law gives you the right to limit only ■ Sharing for affiliates’ everyday business purposes – information about your creditworthiness ■ Affiliates from using your information to market to you ■ Sharing for nonaffiliates to market to you State laws and individual companies may give you additional rights to limit sharing. |
| Definitions | |
| Affiliates | Companies related by common ownership or control. They can be financial and nonfinancial companies. ■ Westwood Management Corp., the investment adviser to the Fund, could be deemed to be an affiliate. |
| Nonaffiliates | Companies not related by common ownership or control. They can be financial and nonfinancial companies ■ The Fund does not share with nonaffiliates so they can market to you. |
| Joint marketing | A formal agreement between nonaffiliated financial companies that together market financial products or services to you. ■ The Fund does not jointly market. |
[This Page Intentionally Left Blank]
[This Page Intentionally Left Blank]
[This Page Intentionally Left Blank]
The Westwood Funds
P.O. Box 541150
Omaha, NE 68154
1-877-FUND-WHG
www.westwoodfunds.com
Adviser:
Westwood Management Corp.
200 Crescent Court, Suite 1200
Dallas, TX 75201
Distributor:
Ultimus Fund Distributors, LLC
225 Pictoria Drive
Suite 450
Cincinnati, OH 45246
Administrator:
Ultimus Fund Solutions, LLC
225 Pictoria Drive
Suite 450
Cincinnati, OH 45246
Legal Counsel:
Kilpatrick Townsend & Stockton LLP
4208 Six Forks Road
Suite 1400
Raleigh, NC 27609
Independent Registered Public Accounting Firm:
BBD, LLP
1835 Market Street, 3rd Floor
Philadelphia, PA 19103
This information must be preceded or accompanied by a current
prospectus for the Funds.
Westwood-SAR-22
Item 2. Code of Ethics.
Not required
Item 3. Audit Committee Financial Expert.
Not required
Item 4. Principal Accountant Fees and Services.
Not required
Item 5. Audit Committee of Listed Registrants.
Not applicable
Item 6. Schedule of Investments.
| (a) | Not applicable [schedule filed with Item 1] |
Item 7. Disclosure of Proxy Voting Policies and Procedures for Closed-End Management Investment Companies.
Not applicable
| Item 8. | Portfolio Managers of Closed-End Management Investment Companies. |
Not applicable
Item 9. Purchases of Equity Securities by Closed-End Management Investment Company and Affiliated Purchasers.
Not applicable
Item 10. Submission of Matters to a Vote of Security Holders.
The registrant’s Committee of Independent Trustees shall review shareholder recommendations for nominations to fill vacancies on the registrant’s board of trustees if such recommendations are submitted in writing and addressed to the Committee at the registrant’s offices. The Committee may adopt, by resolution, a policy regarding its procedures for considering candidates for the board of trustees, including any recommended by shareholders.
Item 11. Controls and Procedures.
(a) Based on their evaluation of the registrant’s disclosure controls and procedures (as defined in Rule 30a-3(c) under the Investment Company Act of 1940) as of a date within 90 days of the filing date of this report, the registrant’s principal executive officer and principal financial officer have concluded that such disclosure controls and procedures are reasonably designed and are operating effectively to ensure that material information relating to the registrant, including its consolidated subsidiaries, is made known to them by others within those entities, particularly during the period in which this report is being prepared, and that the information required in filings on Form N-CSR is recorded, processed, summarized, and reported on a timely basis.
(b) There were no changes in the registrant’s internal control over financial reporting (as defined in Rule 30a-3(d) under the Investment Company Act of 1940) that occurred during the period covered by this report that have materially affected, or are reasonably likely to materially affect, the registrant’s internal control over financial reporting.
Item 12. Disclosure of Securities Lending Activities for Closed-End Management Investment Companies.
Not applicable
File the exhibits listed below as part of this Form. Letter or number the exhibits in the sequence indicated.
(a)(1) Any code of ethics, or amendment thereto, that is the subject of the disclosure required by Item 2, to the extent that the registrant intends to satisfy the Item 2 requirements through filing of an exhibit: Not required
(a)(2) A separate certification for each principal executive officer and principal financial officer of the registrant as required by Rule 30a-2(a) under the Act (17 CFR 270.30a-2(a)): Attached hereto
(a)(3) Any written solicitation to purchase securities under Rule 23c-1 under the Act (17 CFR 270.23c-1) sent or given during the period covered by the report by or on behalf of the registrant to 10 or more persons: Not applicable
(a)(4) Change in the registrant’s independent public accountants: Attached hereto
(b) Certifications required by Rule 30a-2(b) under the Act (17 CFR 270.30a-2(b)): Attached hereto
Exhibit 99.CERT Certifications required by Rule 30a-2(a) under the Act
Exhibit 99.IND PUB ACCT Change in the registrant’s independent public accountant
Exhibit 99.906CERT Certifications required by Rule 30a-2(b) under the Act
SIGNATURES
Pursuant to the requirements of the Securities Exchange Act of 1934 and the Investment Company Act of 1940, the registrant has duly caused this report to be signed on its behalf by the undersigned, thereunto duly authorized.
| (Registrant) | Ultimus Managers Trust | | |
| | | | |
| By (Signature and Title)* | /s/ Khimmara Greer | |
| | | Khimmara Greer, Secretary | |
| | | | |
| Date | July 11, 2022 | | |
| | | | |
| Pursuant to the requirements of the Securities Exchange Act of 1934 and the Investment Company Act of 1940, this report has been signed below by the following persons on behalf of the registrant and in the capacities and on the dates indicated. | |
| | | | |
| By (Signature and Title)* | /s/ Todd E. Heim | |
| | | Todd E. Heim, Principal Executive Officer | |
| | | | |
| Date | July 11, 2022 | | |
| | | | |
| By (Signature and Title)* | /s/ Jennifer L. Leamer | | |
| | | Jennifer L. Leamer, Treasurer and Principal Financial Officer | | |
| | | | | |
| Date | July 11, 2022 | | | |
* Print the name and title of each signing officer under his or her signature.