| | Ng OMB APPROVAL |
| | OMB Number: 3235-0570 Expires: July 31, 2022 Estimated average burden hours per response: 20.6 |
UNITED STATES
SECURITIES AND EXCHANGE COMMISSION
Washington, D.C. 20549
FORM N-CSR
CERTIFIED SHAREHOLDER REPORT OF REGISTERED
MANAGEMENT INVESTMENT COMPANIES
| Investment Company Act file number | 811-22680 | |
| Ultimus Managers Trust |
| (Exact name of registrant as specified in charter) |
| 225 Pictoria Drive, Suite 450 Cincinnati, Ohio | 45246 |
| (Address of principal executive offices) | (Zip code) |
David K. James, esq.
| Ultimus Fund Solutions, LLC 225 Pictoria Drive, Suite 450 Cincinnati, Ohio 45246_ |
| (Name and address of agent for service) |
| Registrant's telephone number, including area code: | (513) 587-3400 | |
| Date of fiscal year end: | February 28 | |
| | | |
| Date of reporting period: | August 31, 2021 | |
Form N-CSR is to be used by management investment companies to file reports with the Commission not later than 10 days after the transmission to stockholders of any report that is required to be transmitted to stockholders under Rule 30e-1 under the Investment Company Act of 1940 (17 CFR 270.30e-1). The Commission may use the information provided on Form N-CSR in its regulatory, disclosure review, inspection, and policymaking roles.
A registrant is required to disclose the information specified by Form N-CSR, and the Commission will make this information public. A registrant is not required to respond to the collection of information contained in Form N-CSR unless the Form displays a currently valid Office of Management and Budget ("OMB") control number. Please direct comments concerning the accuracy of the information collection burden estimate and any suggestions for reducing the burden to the Secretary, Securities and Exchange Commission, 450 Fifth Street, NW, Washington, DC 20549-0609. The OMB has reviewed this collection of information under the clearance requirements of 44 U.S.C. § 3507.
| Item 1. | Reports to Stockholders. |
(a).

BLUEPRINT ADAPTIVE GROWTH
ALLOCATION FUND
Investor Class (BLUPX)
Institutional Class (BLUIX)
Semi-Annual Report
August 31, 2021
(Unaudited)
| BLUEPRINT ADAPTIVE GROWTH ALLOCATION FUND |
| LETTER TO SHAREHOLDERS | August 31, 2021 |
Dear Shareholders,
Since our last letter, the Fund has extended its run of positive performance to ten months while simultaneously outperforming the benchmark for the third consecutive quarter. Driven by U.S. equities, the Fund produced a return of 10.7% compared to 8.8% for the Fund’s benchmark, the Morningstar Global Allocation Index for the fiscal year beginning in March.
Among U.S. stocks, technology and real estate sectors produced the highest returns recently with value and industrial focused equities representing below average performance. Looking outside of equities, fixed income assets mostly held gains from the recent rebound from lows, but moved mostly sideways over the last 30-60 days. Of the major bond assets, only those indexed for inflation have managed to remain positive for 2021. Despite all the talk of inflation, metals such as gold remain unimpressive, finishing negative for August and still pacing to fall in value for the year.
As should be expected given the reliance on price trends, the Fund has reacted by remaining overweight in the U.S. specifically technology and real estate securities which have performed well within the portfolio. Industrials, fixed income, gold and hedges meant to dampen sudden volatility have unperformed but remain small and/or decreasing allocations within the portfolio. International equities have also dragged on the portfolio but have been decreasing with further plans to reduce should negative trends emerge and persist.
Looking ahead, there are plenty of data points and news items that could coincide with changes in market dynamics as we speed toward the end of the year. Domestically, supply and labor shortages along with the tapering chatter are ample stimulus for a drop in equity prices. However, as bull markets do, stocks have continued to shake off any semblance of negative news. Low volatility tends to beget low volatility in the short term which also usually associates with positive performance.
Internationally, the picture has been and seems poised to continue being less bright for equities. China’s more-heavy-handed-than-usual approach has had significant effects on global equity prices. In the more traditionally developed economies there are few noteworthy items appear set to drive performance dramatically higher and recent news of higher taxes in England could help start a trend to help pay for so much pandemic spending. On the fixed income front, prices have rebounded from lows but stagnated recently. With all the inflation news, it seems unlikely that anything will change on this front in the near future
We recently changed the Fund’s name to include the word adaptive because of our strong belief in what that means. The last eighteen months since the Fund’s inception have been a testament to adaptability. We are proud of the results generated thus far and excited that no matter what lies ahead, we can count on our systematic processes and relentless focus on market prices to keep us and our clients in the best position to meet their goals.
Thank you for your continued confidence and support.
Best,
 |  |
| Jon Robinson | Brandon Langley |
Blueprint Fund Management, LLC
www.blueprintmutualfunds.com
Past performance is not predictive of future performance. Investment results and principal value will fluctuate so that shares, when redeemed, may be worth more or less than their original cost. Current performance may be higher or lower than the performance data quoted. Performance data current to the most recent month-end are available by calling 1-866-983-4525.
An investor should consider the investment objectives, risks, charges, and expenses of the Fund carefully before investing. The Fund’s prospectus contains this and other important information. To obtain a copy of the Fund’s prospectus please visit the Fund’s website at www.blueprintmutualfunds.com or call 1-866-983-4525 and a copy will be sent to you free of charge. Please read the prospectus carefully before you invest. The Fund is distributed by Ultimus Fund Distributors, LLC.
The Letter to Shareholders seeks to describe some of the Adviser’s current opinions and views of the financial markets. Although the Adviser believes it has a reasonable basis for any opinions or views expressed, actual results may differ, sometimes significantly so, from those expected or expressed. The securities held by the Fund that are discussed in the Letter to Shareholders were held during the period covered by this Report. They do not comprise the entire investment portfolio of the Fund, may be sold at any time, and may no longer be held by the Fund. For a complete list of securities held by the Fund as of August 31, 2021, please see the Schedule of Investments section of the semi-annual report. The opinions of the Fund’s adviser with respect to those securities may change at any time.
BLUEPRINT ADAPTIVE GROWTH ALLOCATION FUND
PORTFOLIO INFORMATION
August 31, 2021 (Unaudited) |
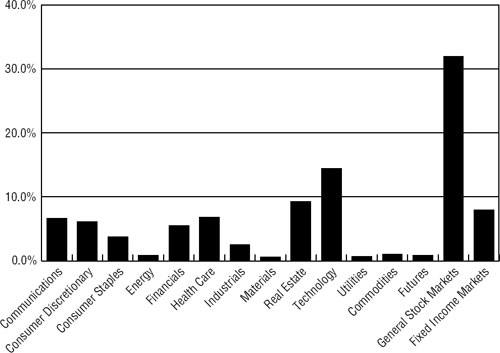
Sector Diversification (% of Net Assets)
Top 10 Equity Holdings
| | | % of | |
| | | Net Assets | |
| Vanguard FTSE Developed Markets ETF | | | 12.5 | % |
| iShares Core MSCI Emerging Markets ETF | | | 8.6 | % |
| iShares Core S&P Total U.S. Stock Market ETF | | | 6.7 | % |
| iShares TIPS Bond ETF | | | 3.9 | % |
| Microsoft Corporation | | | 3.8 | % |
| Apple, Inc. | | | 3.7 | % |
| Amazon.com, Inc. | | | 2.6 | % |
| Alphabet, Inc. - Classes A and C | | | 2.6 | % |
| iShares Core International Aggregate Bond ETF | | | 2.0 | % |
| SPDR® Portfolio Long Term Treasury ETF | | | 2.0 | % |
| BLUEPRINT ADAPTIVE GROWTH ALLOCATION FUND |
| SCHEDULE OF INVESTMENTS |
| August 31, 2021 (Unaudited) |
| COMMON STOCKS — 56.9% | | Shares | | | Value | |
| Communications — 6.6% | | | | | | |
| Cable & Satellite — 0.8% | | | | | | | | |
| Charter Communications, Inc. - Class A (a) | | | 158 | | | $ | 129,032 | |
| Comcast Corporation - Class A | | | 6,282 | | | | 381,192 | |
| | | | | | | | 510,224 | |
| Entertainment Content — 0.7% | | | | | | | | |
| Walt Disney Company (The) (a) | | | 2,775 | | | | 503,108 | |
| | | | | | | | | |
| Internet Media & Services — 4.8% | | | | | | | | |
| Alphabet, Inc. - Class A (a) | | | 311 | | | | 900,018 | |
| Alphabet, Inc. - Class C (a) | | | 297 | | | | 864,044 | |
| Booking Holdings, Inc. (a) | | | 31 | | | | 71,290 | |
| Facebook, Inc. - Class A (a) | | | 2,597 | | | | 985,250 | |
| Netflix, Inc. (a) | | | 604 | | | | 343,791 | |
| Shopify, Inc. - Class A (a) | | | 60 | | | | 91,487 | |
| | | | | | | | 3,255,880 | |
| Telecommunications — 0.3% | | | | | | | | |
| Deutsche Telekom AG - ADR | | | 4,299 | | | | 91,482 | |
| T-Mobile US, Inc. (a) | | | 689 | | | | 94,407 | |
| | | | | | | | 185,889 | |
| Consumer Discretionary — 6.1% | | | | | | | | |
| Apparel & Textile Products — 0.4% | | | | | | | | |
| LVMH Moet Hennessy Louis Vuitton S.A. - ADR | | | 460 | | | | 68,144 | |
| NIKE, Inc. - Class B | | | 1,434 | | | | 236,237 | |
| | | | | | | | 304,381 | |
| Automotive — 1.5% | | | | | | | | |
| Daimler AG - ADR | | | 2,225 | | | | 46,769 | |
| Ford Motor Company (a) | | | 5,050 | | | | 65,802 | |
| General Motors Company (a) | | | 1,353 | | | | 66,311 | |
| Tesla, Inc. (a) | | | 981 | | | | 721,741 | |
| Toyota Motor Corporation - ADR | | | 541 | | | | 94,258 | |
| | | | | | | | 994,881 | |
| E-Commerce Discretionary — 2.6% | | | | | | | | |
| Amazon.com, Inc. (a) | | | 510 | | | | 1,770,103 | |
| BLUEPRINT ADAPTIVE GROWTH ALLOCATION FUND |
| SCHEDULE OF INVESTMENTS (Continued) |
| COMMON STOCKS — 56.9% (Continued) | | Shares | | | Value | |
| Consumer Discretionary — 6.1% (Continued) | | | | | | | | |
| Leisure Facilities & Services — 0.6% | | | | | | | | |
| McDonald’s Corporation | | | 1,045 | | | $ | 248,146 | |
| Starbucks Corporation | | | 1,590 | | | | 186,809 | |
| | | | | | | | 434,955 | |
| Retail - Discretionary — 1.0% | | | | | | | | |
| Home Depot, Inc. (The) | | | 1,398 | | | | 456,000 | |
| Lowe’s Companies, Inc. | | | 1,036 | | | | 211,230 | |
| | | | | | | | 667,230 | |
| Consumer Staples — 3.7% | | | | | | | | |
| Beverages — 0.9% | | | | | | | | |
| Coca-Cola Company (The) | | | 5,264 | | | | 296,416 | |
| PepsiCo, Inc. | | | 1,816 | | | | 284,004 | |
| | | | | | | | 580,420 | |
| Food — 0.5% | | | | | | | | |
| Mondelēz International, Inc. - Class A | | | 1,952 | | | | 121,161 | |
| Nestlé S.A. - ADR | | | 1,865 | | | | 235,531 | |
| | | | | | | | 356,692 | |
| Household Products — 0.8% | | | | | | | | |
| L’Oreal S.A. - ADR | | | 999 | | | | 93,806 | |
| Procter & Gamble Company (The) | | | 3,310 | | | | 471,311 | |
| | | | | | | | 565,117 | |
| Retail - Consumer Staples — 1.0% | | | | | | | | |
| Costco Wholesale Corporation | | | 514 | | | | 234,122 | |
| Target Corporation | | | 562 | | | | 138,803 | |
| Walgreen Boots Alliance, Inc. | | | 548 | | | | 27,811 | |
| Walmart, Inc. | | | 1,906 | | | | 282,278 | |
| | | | | | | | 683,014 | |
| Tobacco & Cannabis — 0.5% | | | | | | | | |
| Altria Group, Inc. | | | 2,948 | | | | 148,078 | |
| Philip Morris International, Inc. | | | 1,947 | | | | 200,541 | |
| | | | | | | | 348,619 | |
| Energy — 0.8% | | | | | | | | |
| Oil & Gas Producers — 0.8% | | | | | | | | |
| Chevron Corporation | | | 1,492 | | | | 144,381 | |
| ConocoPhillips | | | 1,917 | | | | 106,451 | |
| Exxon Mobil Corporation | | | 3,246 | | | | 176,972 | |
| BLUEPRINT ADAPTIVE GROWTH ALLOCATION FUND |
| SCHEDULE OF INVESTMENTS (Continued) |
| COMMON STOCKS — 56.9% (Continued) | | Shares | | | Value | |
| Energy — 0.8% (Continued) | | | | | | | | |
| Oil & Gas Producers — 0.8% (Continued) | | | | | | | | |
| Royal Dutch Shell plc - Class B - ADR | | | 2,352 | | | $ | 92,598 | |
| | | | | | | | 520,402 | |
| Financials — 5.5% | | | | | | | | |
| Asset Management — 0.2% | | | | | | | | |
| BlackRock, Inc. | | | 167 | | | | 157,530 | |
| | | | | | | | | |
| Banking — 2.9% | | | | | | | | |
| Bank of America Corporation | | | 10,333 | | | | 431,403 | |
| Citigroup, Inc. | | | 3,151 | | | | 226,588 | |
| Commonwealth Bank of Australia - ADR | | | 1,271 | | | | 92,821 | |
| JPMorgan Chase & Company | | | 4,388 | | | | 701,861 | |
| Royal Bank of Canada | | | 896 | | | | 92,073 | |
| Toronto-Dominion Bank (The) | | | 710 | | | | 46,107 | |
| U.S. Bancorp | | | 2,022 | | | | 116,043 | |
| Wells Fargo & Company | | | 5,059 | | | | 231,196 | |
| | | | | | | | 1,938,092 | |
| Institutional Financial Services — 0.7% | | | | | | | | |
| Bank of New York Mellon Corporation (The) | | | 971 | | | | 53,619 | |
| Goldman Sachs Group, Inc. (The) | | | 387 | | | | 160,028 | |
| Hong Kong Exchanges and Clearing Ltd. - ADR | | | 856 | | | | 53,701 | |
| Morgan Stanley | | | 1,691 | | | | 176,591 | |
| | | | | | | | 443,939 | |
| Insurance — 1.4% | | | | | | | | |
| AIA Group Ltd. - ADR | | | 1,642 | | | | 78,537 | |
| Allianz SE - ADR | | | 2,005 | | | | 46,937 | |
| American International Group, Inc. | | | 1,101 | | | | 60,071 | |
| Berkshire Hathaway, Inc. - Class B (a) | | | 2,543 | | | | 726,713 | |
| MetLife, Inc. | | | 1,072 | | | | 66,464 | |
| | | | | | | | 978,722 | |
| Specialty Finance — 0.3% | | | | | | | | |
| American Express Company | | | 847 | | | | 140,568 | |
| Capital One Financial Corporation | | | 559 | | | | 92,777 | |
| | | | | | | | 233,345 | |
| BLUEPRINT ADAPTIVE GROWTH ALLOCATION FUND |
| SCHEDULE OF INVESTMENTS (Continued) |
| COMMON STOCKS — 56.9% (Continued) | | Shares | | | Value | |
| Health Care — 6.8% | | | | | | | | |
| Biotech & Pharma — 4.3% | | | | | | | | |
| AbbVie, Inc. | | | 2,323 | | | $ | 280,572 | |
| AstraZeneca plc - ADR | | | 1,596 | | | | 93,015 | |
| Biogen, Inc. (a) | | | 171 | | | | 57,954 | |
| Bristol-Myers Squibb Company | | | 3,182 | | | | 212,748 | |
| CSL Ltd. - ADR | | | 824 | | | | 93,928 | |
| Eli Lilly & Company | | | 841 | | | | 217,222 | |
| Gilead Sciences, Inc. | | | 1,575 | | | | 114,628 | |
| Johnson & Johnson | | | 3,514 | | | | 608,379 | |
| Novartis AG - ADR | | | 3,393 | | | | 313,479 | |
| Novo Nordisk A/S - ADR | | | 2,411 | | | | 241,028 | |
| Pfizer, Inc. | | | 6,396 | | | | 294,664 | |
| Roche Holding AG - ADR | | | 6,433 | | | | 323,065 | |
| Sanofi - ADR | | | 1,840 | | | | 95,275 | |
| | | | | | | | 2,945,957 | |
| Health Care Facilities & Services — 1.0% | | | | | | | | |
| CVS Health Corporation | | | 1,743 | | | | 150,578 | |
| UnitedHealth Group, Inc. | | | 1,262 | | | | 525,333 | |
| | | | | | | | 675,911 | |
| Medical Equipment & Devices — 1.5% | | | | | | | | |
| Abbott Laboratories | | | 2,553 | | | | 322,623 | |
| Danaher Corporation | | | 657 | | | | 212,973 | |
| Medtronic plc | | | 1,699 | | | | 226,782 | |
| Thermo Fisher Scientific, Inc. | | | 422 | | | | 234,189 | |
| | | | | | | | 996,567 | |
| Industrials — 2.5% | | | | | | | | |
| Aerospace & Defense — 0.6% | | | | | | | | |
| Airbus SE - ADR (a) | | | 2,768 | | | | 94,444 | |
| Boeing Company (The) (a) | | | 459 | | | | 100,751 | |
| General Dynamics Corporation | | | 301 | | | | 60,293 | |
| Raytheon Technologies Corporation | | | 1,961 | | | | 166,214 | |
| | | | | | | | 421,702 | |
| Diversified Industrials — 1.1% | | | | | | | | |
| 3M Company | | | 820 | | | | 159,687 | |
| Emerson Electric Company | | | 752 | | | | 79,336 | |
| General Electric Company | | | 1,605 | | | | 169,183 | |
| BLUEPRINT ADAPTIVE GROWTH ALLOCATION FUND |
| SCHEDULE OF INVESTMENTS (Continued) |
| COMMON STOCKS — 56.9% (Continued) | | Shares | | | Value | |
| Industrials — 2.5% (Continued) | | | | | | | | |
| Diversified Industrials — 1.1% (Continued) | | | | | | | | |
| Honeywell International, Inc. | | | 908 | | | $ | 210,574 | |
| Siemens AG - ADR | | | 1,120 | | | | 92,691 | |
| | | | | | | | 711,471 | |
| Electrical Equipment — 0.2% | | | | | | | | |
| ABB Ltd. - ADR | | | 3,356 | | | | 124,139 | |
| | | | | | | | | |
| Machinery — 0.1% | | | | | | | | |
| Caterpillar, Inc. | | | 408 | | | | 86,035 | |
| | | | | | | | | |
| Transportation & Logistics — 0.5% | | | | | | | | |
| FedEx Corporation | | | 174 | | | | 46,230 | |
| Union Pacific Corporation | | | 966 | | | | 209,467 | |
| United Parcel Service, Inc. - Class B | | | 447 | | | | 87,447 | |
| | | | | | | | 343,144 | |
| Materials — 0.6% | | | | | | | | |
| Chemicals — 0.5% | | | | | | | | |
| Dow, Inc. | | | 373 | | | | 23,462 | |
| DuPont de Nemours, Inc. | | | 316 | | | | 23,390 | |
| Linde plc | | | 960 | | | | 302,006 | |
| | | | | | | | 348,858 | |
| Metals & Mining — 0.1% | | | | | | | | |
| BHP Group Ltd. - ADR | | | 690 | | | | 45,637 | |
| Rio Tinto plc - ADR | | | 613 | | | | 46,018 | |
| | | | | | | | 91,655 | |
| Real Estate — 9.2% | | | | | | | | |
| REITs — 9.2% | | | | | | | | |
| Alexandria Real Estate Equities, Inc. | | | 886 | | | | 182,844 | |
| American Campus Communities, Inc. | | | 1,091 | | | | 55,477 | |
| American Tower Corporation | | | 2,176 | | | | 635,762 | |
| AvalonBay Communities, Inc. | | | 1,089 | | | | 250,013 | |
| Boston Properties, Inc. | | | 1,141 | | | | 128,922 | |
| Cousins Properties, Inc. | | | 1,133 | | | | 43,688 | |
| Crown Castle International Corporation | | | 2,551 | | | | 496,654 | |
| Digital Realty Trust, Inc. | | | 2,118 | | | | 347,161 | |
| Duke Realty Corporation | | | 2,733 | | | | 143,510 | |
| BLUEPRINT ADAPTIVE GROWTH ALLOCATION FUND |
| SCHEDULE OF INVESTMENTS (Continued) |
| COMMON STOCKS — 56.9% (Continued) | | Shares | | | Value | |
| Real Estate — 9.2% (Continued) | | | | | | | | |
| REITs — 9.2% (Continued) | | | | | | | | |
| Equinix, Inc. | | | 499 | | | $ | 420,882 | |
| Equity LifeStyle Properties, Inc. | | | 1,262 | | | | 107,358 | |
| Equity Residential | | | 2,655 | | | | 223,206 | |
| Essex Property Trust, Inc. | | | 503 | | | | 166,362 | |
| Extra Space Storage, Inc. | | | 908 | | | | 169,714 | |
| Federal Realty Investment Trust | | | 473 | | | | 57,597 | |
| Healthpeak Properties, Inc. | | | 4,189 | | | | 150,804 | |
| Host Hotels & Resorts, Inc. (a) | | | 2,020 | | | | 33,451 | |
| Invitation Homes, Inc. | | | 4,083 | | | | 168,138 | |
| Kilroy Realty Corporation | | | 412 | | | | 27,048 | |
| Prologis, Inc. | | | 3,589 | | | | 483,295 | |
| Public Storage | | | 1,005 | | | | 325,228 | |
| Realty Income Corporation | | | 2,803 | | | | 202,433 | |
| Regency Centers Corporation | | | 1,118 | | | | 76,717 | |
| SBA Communications Corporation | | | 797 | | | | 286,099 | |
| Simon Property Group, Inc. | | | 2,913 | | | | 391,653 | |
| Sun Communities, Inc. | | | 724 | | | | 145,879 | |
| UDR, Inc. | | | 2,338 | | | | 126,299 | |
| Ventas, Inc. | | | 1,583 | | | | 88,553 | |
| Welltower, Inc. | | | 3,231 | | | | 282,809 | |
| | | | | | | | 6,217,556 | |
| Technology — 14.4% | | | | | | | | |
| Semiconductors — 2.6% | | | | | | | | |
| ASML Holding N.V. | | | 624 | | | | 519,817 | |
| Broadcom, Inc. | | | 589 | | | | 292,856 | |
| NVIDIA Corporation | | | 2,242 | | | | 501,872 | |
| QUALCOMM, Inc. | | | 1,474 | | | | 216,221 | |
| Texas Instruments, Inc. | | | 1,365 | | | | 260,592 | |
| | | | | | | | 1,791,358 | |
| Software — 5.1% | | | | | | | | |
| Adobe, Inc. (a) | | | 503 | | | | 333,841 | |
| Microsoft Corporation | | | 8,487 | | | | 2,562,055 | |
| Oracle Corporation | | | 2,082 | | | | 185,569 | |
| salesforce.com, inc. (a) | | | 1,075 | | | | 285,165 | |
| BLUEPRINT ADAPTIVE GROWTH ALLOCATION FUND |
| SCHEDULE OF INVESTMENTS (Continued) |
| COMMON STOCKS — 56.9% (Continued) | | Shares | | | Value | |
| Technology — 14.4% (Continued) | | | | | | | | |
| Software — 5.1% (Continued) | | | | | | | | |
| SAP SE - ADR | | | 626 | | | $ | 93,988 | |
| | | | | | | | 3,460,618 | |
| Technology Hardware — 4.4% | | | | | | | | |
| Apple, Inc. | | | 16,710 | | | | 2,537,079 | |
| Cisco Systems, Inc. | | | 5,448 | | | | 321,541 | |
| Sony Group Corporation - ADR | | | 912 | | | | 94,356 | |
| | | | | | | | 2,952,976 | |
| Technology Services — 2.3% | | | | | | | | |
| Accenture plc - Class A | | | 791 | | | | 266,219 | |
| International Business Machines Corporation | | | 670 | | | | 94,028 | |
| Mastercard, Inc. - Class A | | | 680 | | | | 235,436 | |
| PayPal Holdings, Inc. (a) | | | 1,412 | | | | 407,588 | |
| Visa, Inc. - Class A | | | 2,340 | | | | 536,094 | |
| | | | | | | | 1,539,365 | |
| Utilities — 0.7% | | | | | | | | |
| Electric Utilities — 0.7% | | | | | | | | |
| Duke Energy Corporation | | | 1,021 | | | | 106,858 | |
| Exelon Corporation | | | 1,215 | | | | 59,559 | |
| NextEra Energy, Inc. | | | 2,550 | | | | 214,175 | |
| Southern Company (The) | | | 1,396 | | | | 91,759 | |
| | | | | | | | 472,351 | |
| | | | | | | | | |
| Total Common Stocks (Cost $32,051,656) | | | | | | $ | 38,612,206 | |
| BLUEPRINT ADAPTIVE GROWTH ALLOCATION FUND |
| SCHEDULE OF INVESTMENTS (Continued) |
| EXCHANGE-TRADED FUNDS — 41.5% | | Shares | | | Value | |
| iShares Core International Aggregate Bond ETF | | | 23,973 | | | $ | 1,336,495 | |
| iShares Core MSCI Emerging Markets ETF | | | 91,355 | | | | 5,854,942 | |
| iShares Core MSCI Total International Stock ETF | | | 10,593 | | | | 779,115 | |
| iShares Core S&P Total U.S. Stock Market ETF | | | 43,064 | | | | 4,453,248 | |
| iShares Core U.S. REIT ETF | | | 14,001 | | | | 871,702 | |
| iShares Gold Trust (a) | | | 19,393 | | | | 669,640 | |
| iShares TIPS Bond ETF | | | 20,574 | | | | 2,666,185 | |
| ProShares VIX Short-Term Futures ETF (a) | | | 24,719 | | | | 515,391 | |
| SPDR® Portfolio Long Term Treasury ETF | | | 31,282 | | | | 1,332,301 | |
| Vanguard FTSE Developed Markets ETF | | | 161,808 | | | | 8,488,448 | |
| Vanguard Small-Cap ETF | | | 5,336 | | | | 1,207,590 | |
| Total Exchange-Traded Funds (Cost $23,810,541) | | | | | | $ | 28,175,057 | |
| MONEY MARKET FUNDS — 1.8% | | Shares | | | Value | |
| First American Government Obligations Fund - Class X, 0.03% (b) (Cost $1,245,196) | | | 1,245,196 | | | $ | 1,245,196 | |
| | | | | | | | | |
| Investments at Value — 100.2% (Cost $57,107,393) | | | | | | $ | 68,032,459 | |
| Liabilities in Excess of Other Assets — (0.2%) | | | | | | | (173,759 | ) |
| Net Assets — 100.0% | | | | | | $ | 67,858,700 | |
ADR - American Depositary Receipt
| (a) | Non-income producing security. |
| (b) | The rate shown is the 7-day effective yield as of August 31, 2021. |
See accompanying notes to financial statements.
| BLUEPRINT ADAPTIVE GROWTH ALLOCATION FUND |
| STATEMENT OF ASSETS AND LIABILITIES |
| August 31, 2021 (Unaudited) |
| ASSETS | | | |
| Investments: | | | |
| At cost | | $ | 57,107,393 | |
| At value (Note 2) | | $ | 68,032,459 | |
| Receivable for capital shares sold | | | 593,354 | |
| Receivable for investment securities sold | | | 1,157,078 | |
| Dividends receivable | | | 50,646 | |
| Tax reclaims receivable | | | 175 | |
| Other assets | | | 35,751 | |
| Total assets | | | 69,869,463 | |
| | | | | |
| LIABILITIES | | | | |
| Payable for capital shares redeemed | | | 145,650 | |
| Payable for investment securities purchased | | | 1,800,543 | |
| Payable to the Adviser (Note 4) | | | 44,615 | |
| Payable to administrator (Note 4) | | | 12,240 | |
| Accrued distribution fees (Note 4) | | | 124 | |
| Other accrued expenses and liabilities | | | 7,591 | |
| Total liabilities | | | 2,010,763 | |
| | | | | |
| NET ASSETS | | $ | 67,858,700 | |
| | | | | |
| NET ASSETS CONSIST OF: | | | | |
| Paid-in capital | | $ | 58,336,182 | |
| Accumulated earnings | | | 9,522,518 | |
| NET ASSETS | | $ | 67,858,700 | |
| | | | | |
| NET ASSET VALUE PER SHARE: | | | | |
| INVESTOR CLASS | | | | |
| Net assets applicable to Investor Class | | $ | 440,042 | |
| Investor Class shares of beneficial interest outstanding (unlimited number of shares authorized, no par value) | | | 33,113 | |
| Net asset value, offering price and redemption price per share (Note 2) | | $ | 13.29 | |
| | | | | |
| INSTITUTIONAL CLASS | | | | |
| Net assets applicable to Institutional Class | | $ | 67,418,658 | |
| Institutional Class shares of beneficial interest outstanding (unlimited number of shares authorized, no par value) | | | 5,057,943 | |
| Net asset value, offering price and redemption price per share (Note 2) | | $ | 13.33 | |
See accompanying notes to financial statements.
| BLUEPRINT ADAPTIVE GROWTH ALLOCATION FUND |
| STATEMENT OF OPERATIONS |
| Six Months Ended August 31, 2021 (Unaudited) |
| INVESTMENT INCOME | | | |
| Dividend income (net of foreign withholding taxes of $5,212) | | $ | 532,856 | |
| | | | | |
| EXPENSES | | | | |
| Investment advisory fees (Note 4) | | | 286,976 | |
| Administration fees (Note 4) | | | 30,209 | |
| Registration and filing fees | | | 22,380 | |
| Fund accounting fees (Note 4) | | | 19,021 | |
| Transfer agent fees - Investor Class (Note 4) | | | 6,000 | |
| Transfer agent fees - Institutional Class (Note 4) | | | 9,000 | |
| Legal fees | | | 13,327 | |
| Offering costs (Note 2) | | | 9,900 | |
| Audit and tax services fees | | | 9,210 | |
| Trustees’ fees (Note 4) | | | 8,350 | |
| Compliance service fees (Note 4) | | | 6,000 | |
| Custodian and bank service fees | | | 5,204 | |
| Printing of shareholder reports | | | 5,062 | |
| Postage and supplies | | | 3,160 | |
| Insurance expense | | | 1,705 | |
| Distribution fees - Investor Class (Note 4) | | | 228 | |
| Other expenses | | | 9,498 | |
| Total expenses | | | 445,230 | |
| Fee reductions by the Adviser (Note 4) | | | (57,481 | ) |
| Net expenses | | | 387,749 | |
| | | | | |
| NET INVESTMENT INCOME | | | 145,107 | |
| | | | | |
| REALIZED AND UNREALIZED GAINS (LOSSES) ON INVESTMENTS | | | | |
| Net realized losses from investment transactions | | | (1,099,161 | ) |
| Net change in unrealized appreciation (depreciation) on investments | | | 6,980,051 | |
| NET REALIZED AND UNREALIZED GAINS ON INVESTMENTS | | | 5,880,890 | |
| | | | | |
| NET INCREASE IN NET ASSETS RESULTING FROM OPERATIONS | | $ | 6,025,997 | |
See accompanying notes to financial statements.
| BLUEPRINT ADAPTIVE GROWTH ALLOCATION FUND |
| STATEMENTS OF CHANGES IN NET ASSETS |
| | | Six Months Ended | | | Period Ended | |
| | | August 31, 2021 | | | February 28, | |
| | | (Unaudited) | | | 2021 (a) | |
| FROM OPERATIONS | | | | | | | | |
| Net investment income | | $ | 145,107 | | | $ | 41,476 | |
| Net realized losses from investment transactions | | | (1,099,161 | ) | | | (408,741 | ) |
| Net change in unrealized appreciation (depreciation) on investments | | | 6,980,051 | | | | 3,945,015 | |
| Net increase in net assets resulting from operations | | | 6,025,997 | | | | 3,577,750 | |
| | | | | | | | | |
| FROM DISTRIBUTIONS TO SHAREHOLDERS (Note 2) | | | | | | | | |
| Investor Class | | | — | | | | (63 | ) |
| Institutional Class | | | — | | | | (111,204 | ) |
| Decrease in net assets from distributions to shareholders | | | — | | | | (111,267 | ) |
| | | | | | | | | |
| CAPITAL SHARE TRANSACTIONS | | | | | | | | |
| Investor Class | | | | | | | | |
| Proceeds from shares sold | | | 373,861 | | | | 70,056 | |
| Net asset value of shares issued in reinvestment of distributions to shareholders | | | — | | | | 63 | |
| Payments for shares redeemed | | | (22,954 | ) | | | (64 | ) |
| Net increase in Investor Class net assets from capital share transactions | | | 350,907 | | | | 70,055 | |
| | | | | | | | | |
| Institutional Class | | | | | | | | |
| Proceeds from shares sold | | | 15,692,777 | | | | 54,668,532 | |
| Net asset value of shares issued in reinvestment of distributions to shareholders | | | — | | | | 110,988 | |
| Payments for shares redeemed | | | (7,556,479 | ) | | | (4,970,560 | ) |
| Net increase in Institutional Class net assets from capital share transactions | | | 8,136,298 | | | | 49,808,960 | |
| | | | | | | | | |
| TOTAL INCREASE IN NET ASSETS | | | 14,513,202 | | | | 53,345,498 | |
| | | | | | | | | |
| NET ASSETS | | | | | | | | |
| Beginning of period | | | 53,345,498 | | | | — | |
| End of period | | $ | 67,858,700 | | | $ | 53,345,498 | |
| BLUEPRINT ADAPTIVE GROWTH ALLOCATION FUND |
| STATEMENTS OF CHANGES IN NET ASSETS (Continued) |
| | | Six Months Ended | | | Period Ended | |
| | | August 31, 2021 | | | February 28, | |
| | | (Unaudited) | | | 2021 (a) | |
| CAPITAL SHARES ACTIVITY | | | | | | |
| Investor Class | | | | | | | | |
| Shares sold | | | 28,976 | | | | 6,015 | |
| Shares issued in reinvestment of distributions to shareholders | | | — | | | | 5 | |
| Shares redeemed | | | (1,877 | ) | | | (6 | ) |
| Net increase in shares outstanding | | | 27,099 | | | | 6,014 | |
| Shares outstanding at beginning of period | | | 6,014 | | | | — | |
| Shares outstanding at end of period | | | 33,113 | | | | 6,014 | |
| | | | | | | | | |
| Institutional Class | | | | | | | | |
| Shares sold | | | 1,227,395 | | | | 4,833,392 | |
| Shares issued in reinvestment of distributions to shareholders | | | — | | | | 9,319 | |
| Shares redeemed | | | (592,374 | ) | | | (419,789 | ) |
| Net increase in shares outstanding | | | 635,021 | | | | 4,422,922 | |
| Shares outstanding at beginning of period | | | 4,422,922 | | | | — | |
| Shares outstanding at end of period | | | 5,057,943 | | | | 4,422,922 | |
| (a) | Represents the period from the commencement of operations (March 31, 2020) through February 28, 2021. |
See accompanying notes to financial statements.
| BLUEPRINT ADAPTIVE GROWTH ALLOCATION FUND |
| INVESTOR CLASS |
| FINANCIAL HIGHLIGHTS |
Per Share Data for a Share Outstanding Throughout Each Period
| | | Six Months | | | | |
| | | Ended | | | | |
| | | August 31, | | | Period Ended | |
| | | 2021 | | | February 28, | |
| | | (Unaudited) | | | 2021 (a) | |
| Net asset value at beginning of period | | $ | 12.02 | | | $ | 10.00 | |
| Income (loss) from investment operations: | | | | | | | | |
| Net investment income (loss) (b) | | | 0.01 | | | | (0.02 | ) |
| Net realized and unrealized gains on investments | | | 1.26 | | | | 2.07 | |
| Total from investment operations | | | 1.27 | | | | 2.05 | |
| Less distributions from: | | | | | | | | |
| Net investment income | | | — | | | | (0.03 | ) |
| Net asset value at end of period | | $ | 13.29 | | | $ | 12.02 | |
| Total return (c) | | | 10.57 | % (d) | | | 20.48 | % (d) |
| Net assets at end of period | | $ | 440,042 | | | $ | 72,305 | |
| Ratios/supplementary data: | | | | | | | | |
| Ratio of total expenses to average net assets (e) | | | 15.50 | % (f) | | | 104.34 | % (f) |
| Ratio of net expenses to average net assets (e)(g) | | | 1.51 | % (f)(h) | | | 1.60 | % (f)(h) |
| Ratio of net investment income (loss) to average net assets (g) | | | 0.19 | % (f) | | | (0.16 | %) (f) |
| Portfolio turnover rate | | | 35 | % (d) | | | 95 | % (d) |
| (a) | Represents the period from the commencement of operations (March 31, 2020) through February 28, 2021. |
| (b) | Per share net investment income (loss) has been determined on the basis of average number of shares outstanding during the period. Recognition of net investment income (loss) by the Fund is affected by the timing of the declaration of the dividends by the underlying companies in which the Fund invests. |
| (c) | Total return is a measure of the change in value of an investment in the Fund over the periods covered. The returns shown do not reflect the deduction of taxes a shareholder would pay on Fund distributions, if any, or the redemption of Fund shares. The total returns would have been lower had the Adviser not reduced advisory fees and reimbursed expenses (Note 4). |
| (e) | Ratio does not include expenses of the investment companies in which the Fund invests. |
| (g) | Ratio was determined after advisory fees reductions and expense reimbursements (Note 4). |
| (h) | Includes costs to organize the Fund of 0.01% and 0.10% for the periods ended August 31, 2021 and February 28, 2021, respectively, which are excluded from the Expense Limitation Agreement (Note 4). |
See accompanying notes to financial statements.
| BLUEPRINT ADAPTIVE GROWTH ALLOCATION FUND |
| INSTITUTIONAL CLASS |
| FINANCIAL HIGHLIGHTS |
Per Share Data for a Share Outstanding Throughout Each Period
| | | Six Months | | | | |
| | | Ended | | | | |
| | | August 31, | | | Period Ended | |
| | | 2021 | | | February 28, | |
| | | (Unaudited) | | | 2021 (a) | |
| Net asset value at beginning of period | | $ | 12.04 | | | $ | 10.00 | |
| Income from investment operations: | | | | | | | | |
| Net investment income (b) | | | 0.03 | | | | 0.02 | |
| Net realized and unrealized gains on investments | | | 1.26 | | | | 2.06 | |
| Total from investment operations | | | 1.29 | | | | 2.08 | |
| Less distributions from: | | | | | | | | |
| Net investment income | | | — | | | | (0.04 | ) |
| Net asset value at end of period | | $ | 13.33 | | | $ | 12.04 | |
| Total return (c) | | | 10.71 | % (d) | | | 20.80 | % (d) |
| Net assets at end of period (000’s) | | $ | 67,419 | | | $ | 53,273 | |
| Ratios/supplementary data: | | | | | | | | |
| Ratio of total expenses to average net assets (e) | | | 1.43 | % (f) | | | 1.93 | % (f) |
| Ratio of net expenses to average net assets (e)(g) | | | 1.28 | % (f)(h) | | | 1.35 | % (f)(h) |
| Ratio of net investment income to average net assets (g) | | | 0.48 | % (f) | | | 0.20 | % (f) |
| Portfolio turnover rate | | | 35 | % (d) | | | 95 | % (d) |
| (a) | Represents the period from the commencement of operations (March 31, 2020) through February 28, 2021. |
| (b) | Per share net investment income has been determined on the basis of average number of shares outstanding during the period. Recognition of net investment income by the Fund is affected by the timing of the declaration of the dividends by the underlying companies in which the Fund invests. |
| (c) | Total return is a measure of the change in value of an investment in the Fund over the periods covered. The returns shown do not reflect the deduction of taxes a shareholder would pay on Fund distributions, if any, or the redemption of Fund shares. The total returns would have been lower had the Adviser not reduced advisory fees and reimbursed expenses (Note 4). |
| (e) | Ratio does not include expenses of the investment companies in which the Fund invests. |
| (g) | Ratio was determined after advisory fees reductions and expense reimbursements (Note 4). |
| (h) | Includes costs to organize the Fund of 0.03% and 0.10% for the periods ended August 31, 2021 and February 28, 2021, respectively, which are excluded from the Expense Limitation Agreement (Note 4). |
See accompanying notes to financial statements.
| BLUEPRINT ADAPTIVE GROWTH ALLOCATION FUND |
| NOTES TO FINANCIAL STATEMENTS |
| August 31, 2021 (Unaudited) |
Blueprint Adaptive Growth Allocation Fund (formerly Blueprint Growth Fund) (the “Fund”) is a diversified series of Ultimus Managers Trust (the “Trust”). The Trust is an open-end management investment company established as an Ohio business trust under a Declaration of Trust dated February 28,2012. Other series of the Trust are not incorporated in this report. The Fund commenced operations on March 31, 2020.
The investment objective of the Fund is to seek capital appreciation while managing risk.
The Fund currently offers two classes of shares: Investor Class shares (sold without any sales loads, but subject to a distribution and/or shareholder servicing fee of up to 0.25% of the average daily net assets attributable to Investor Class shares and requiring a $5,000 initial investment) and Institutional Class shares (sold without any sales loads and distribution and/or shareholder servicing fees and requiring a $15,000 initial investment). Each share class represents an ownership interest in the same investment portfolio.
| 2. | Significant Accounting Policies |
The following is a summary of the Fund’s significant accounting policies used in the preparation of its financial statements. These policies are in conformity with accounting principles generally accepted in the United States of America (“GAAP”). The Fund follows accounting and reporting guidance under Financial Accounting Standards Board Accounting Standards Codification Topic 946, “Financial Services – Investment Companies.”
Securities valuation – The Fund values its portfolio securities at fair value as of the close of regular trading on the New York Stock Exchange (the “NYSE”) (normally 4:00 p.m. Eastern time) on each business day the NYSE is open for business. The Fund values its listed securities, including common stocks and exchange-traded funds (“ETFs”), on the basis of the security’s last sale price on the security’s primary exchange, if available, otherwise at the exchange’s most recently quoted mean price. NASDAQ-listed securities are valued at the NASDAQ Official Closing Price. When using a quoted price and when the market for the security is considered active, the security will be classified as Level 1 within the fair value hierarchy (see below). In the event that market quotations are not readily available or are considered unreliable due to market or other events, the Fund values its securities and other assets at fair value in accordance with procedures established by and under the general supervision of the Board of Trustees of the Trust (the “Board”). Under these procedures, the securities will be classified as Level 2 or 3 within the fair value hierarchy, depending on the inputs used. Unavailable or unreliable market quotes may be due to the following factors: a substantial bid-ask spread; infrequent sales resulting in stale prices; insufficient trading volume; small trade sizes; a temporary lapse in any reliable pricing source; and actions of the securities or futures markets, such as the
| BLUEPRINT ADAPTIVE GROWTH ALLOCATION FUND |
| NOTES TO FINANCIAL STATEMENTS (Unaudited) (Continued) |
suspension or limitation of trading. As a result, the prices of securities used to calculate the Fund’s net asset value (“NAV”) may differ from quoted or published prices for the same securities.
GAAP establishes a single authoritative definition of fair value, sets out a framework for measuring fair value, and requires additional disclosures about fair value measurements.
Various inputs are used in determining the value of the Fund’s investments. These inputs are summarized in the three broad levels listed below:
| ● | Level 1 – quoted prices in active markets for identical securities |
| ● | Level 2 – other significant observable inputs |
| ● | Level 3 – significant unobservable inputs |
The inputs or methods used for valuing securities are not necessarily an indication of the risks associated with investing in those securities. The inputs used to measure fair value may fall into different levels of the fair value hierarchy. In such cases, for disclosure purposes, the level in the fair value hierarchy within which the fair value measurement falls in its entirety is determined based on the lowest level input that is significant to the fair value measurement.
The following is a summary of the Fund’s investments and the inputs used to value the investments as of August 31, 2021:
| | | Level 1 | | | Level 2 | | | Level 3 | | | Total | |
| Common Stocks | | $ | 38,612,206 | | | $ | — | | | $ | — | | | $ | 38,612,206 | |
| Exchange-Traded Funds | | | 28,175,057 | | | | — | | | | — | | | | 28,175,057 | |
| Money Market Funds | | | 1,245,196 | | | | — | | | | — | | | | 1,245,196 | |
| Total | | $ | 68,032,459 | | | $ | — | | | $ | — | | | $ | 68,032,459 | |
Refer to the Fund’s Schedule of Investments for a listing of the common stocks by sector and industry type. The Fund did not hold any derivative instruments or any assets or liabilities that were measured at fair value on a recurring basis using significant unobservable inputs (Level 3) as of or during the six months ended August 31, 2021.
Cash – The Fund’s cash, if any, is held in a bank account with balances which, at times, may exceed United States federally insured limits set by the Federal Deposit Insurance Corporation. The Fund maintains these balances with a high quality financial institution and may incur charges on cash overdrafts.
Share valuation – The NAV per share of each class of the Fund is calculated daily by dividing the total value of the assets attributable to that class, less liabilities attributable to that class, by the number of shares outstanding of that class. The offering price and redemption price per share of each class of the Fund is equal to the NAV per share of such class.
| BLUEPRINT ADAPTIVE GROWTH ALLOCATION FUND |
| NOTES TO FINANCIAL STATEMENTS (Unaudited) (Continued) |
Investment income – Dividend income is recorded on the ex-dividend date. Non-cash dividends included in dividend income, if any, are recorded at the fair market value of the security received. Interest income is accrued as earned. Withholding taxes on foreign dividends, if any, have been recorded in accordance with the Fund’s understanding of the applicable country’s rules and tax rates.
Investment transactions – Investment transactions are accounted for on the trade date. Realized gains and losses on investments sold are determined on a specific identification basis.
Offering costs – The Adviser advanced some of the Fund’s initial offering costs and was subsequently reimbursed by the Fund. Costs of $29,700 incurred in connection with the offering and initial registration had been deferred and were subsequently amortized on a straight-line basis over the first twelve months after commencement of operations. As of August 31, 2021, there was no unamortized offering costs remaining in the Fund.
Common expenses – Common expenses of the Trust are allocated among the Fund and the other series of the Trust based on the relative net assets of each series, the number of series in the Trust, or the nature of the services performed and the relative applicability to each series.
Allocation between Classes – Investment income earned, realized capital gains and losses, and unrealized appreciation and depreciation are allocated daily to each Class of the Fund based upon its proportionate share of total net assets of the Fund. Class-specific expenses are charged directly to the Class incurring the expense. Common expenses which are not attributable to a specific Class are allocated daily to the Class of shares of the Fund based upon its proportionate share of total net assets of the Fund.
Distributions to shareholders – The Fund distributes to shareholders any net investment income dividends and net realized capital gains on an annual basis. The amount of such dividends and distributions are determined in accordance with federal income tax regulations, which may differ from GAAP. Dividends and distributions to shareholders are recorded on the ex-dividend date. The tax character of distributions paid to shareholders by the Fund during the period ended February 28, 2021 was ordinary income. There were no distributions paid to shareholders by the Fund during the six months ended August 31, 2021.
Estimates – The preparation of financial statements in conformity with GAAP requires management to make estimates and assumptions that affect the reported amounts of assets and liabilities and disclosure of contingent assets and liabilities as of the date of the financial statements and the reported amounts of increase (decrease) in net assets from operations during the reporting period. Actual results could differ from those estimates.
| BLUEPRINT ADAPTIVE GROWTH ALLOCATION FUND |
| NOTES TO FINANCIAL STATEMENTS (Unaudited) (Continued) |
Federal income tax – The Fund intends to qualify as a regulated investment company under the Internal Revenue Code of 1986, as amended (the “Code”). Qualification generally will relieve the Fund of liability for federal income taxes to the extent 100% of its net investment income and net realized capital gains are distributed in accordance with the Code.
In order to avoid imposition of the excise tax applicable to regulated investment companies, it is also the Fund’s intention to declare as dividends in each calendar year equal to at least 98% of its net investment income (earned during the calendar year) and 98.2% of its net realized capital gains (earned during the twelve months ended October 31) plus undistributed amounts from prior years.
The following information is computed on a tax basis for each item as of August 31, 2021:
| Cost of portfolio investments | | $ | 57,298,126 | |
| Gross unrealized appreciation | | $ | 11,597,805 | |
| Gross unrealized depreciation | | | (863,472 | ) |
| Net unrealized appreciation | | | 10,734,333 | |
| Accumulated ordinary income | | | 106,488 | |
| Capital loss carryforwards | | | (217,612 | ) |
| Other losses | | | (1,100,691 | ) |
| Total accumulated earnings | | $ | 9,522,518 | |
The difference between the federal income tax cost of portfolio investments and the financial statement cost of portfolio investments is due to certain timing differences in the recognition of capital gains or losses under income tax regulations and GAAP. These “book/tax” differences are temporary in nature and are primarily due to the tax deferral of losses on wash sales.
As of February 28, 2021, the Fund had short-term capital loss carryforwards of $217,612 for federal income tax purposes. These capital loss carryforwards, which do not expire, may be utilized in the current and future years to offset net realized capital gains, if any.
For the six months ended August 31, 2021, the Fund reclassified $9,900 of accumulated earnings against paid-in capital on the Statement of Assets and Liabilities. Such reclassification, the result of permanent differences between the financial statement and income tax reporting requirements, had no effect on the Fund’s net assets or NAV per share.
The Fund recognizes the tax benefits or expenses of uncertain tax positions only when the position is “more likely than not” of being sustained assuming examination by tax authorities. Management has reviewed the Fund’s tax positions for the current and all open tax years and has concluded that no provision for unrecognized tax benefits or expenses is required in these financial statements. The Fund identifies its major tax
| BLUEPRINT ADAPTIVE GROWTH ALLOCATION FUND |
| NOTES TO FINANCIAL STATEMENTS (Unaudited) (Continued) |
jurisdiction as U.S. Federal. The Fund recognizes interest and penalties, if any, related to unrecognized tax benefits as income tax on the Statement of Operations. During the six months ended August 31, 2021, the Fund did not incur any interest of penalties.
| 3. | Investment Transactions |
During the six months ended August 31, 2021, cost of purchases and proceeds from sales of investment securities, other than short-term investments, amounted to $28,860,883 and $20,651,301, respectively.
| 4. | Transactions with Related Parties |
ADVISORY AND SUB-ADVISORY AGREEMENTS
Pursuant to the terms of the Advisory Agreement, Blueprint Fund Management, LLC (the “Adviser”) serves as the investment adviser to the Fund. The Adviser provides the Fund with the selection of a sub-investment advisor and the compliance and managerial oversight of that sub-adviser and its services to the Fund. The Fund pays the Adviser an investment advisory fee, computed and accrued daily and paid monthly, at the annual rate of 0.95% of average daily net assets.
Blueprint Investment Partners, LLC (the “Sub-Adviser”) serves as the Funds sub-adviser. Pursuant to the Sub-Advisory Agreement, the Sub-Adviser provides the Fund with a continuous program of investing the Fund’s assets and determining the composition of the Fund’s portfolio. For its services, the Adviser pays the Sub-Adviser an investment sub-advisory fee computed at the annual rate of 0.20% of the Fund’s average daily net assets. The Fund does not directly pay the sub-advisory fee.
Pursuant to an Expense Limitation Agreement (“ELA”) between the Fund and the Adviser, the Adviser has agreed contractually, until June 30, 2023, to reduce its advisory fees and reimburse other expenses to the extent necessary to limit total annual fund operating expenses (excluding brokerage costs, taxes, interest, borrowing costs such as interest and dividend expenses on securities sold short, acquired fund fees and expenses, costs to organize the Fund, extraordinary expenses such as litigation and merger or reorganization costs and other expenses not incurred in the ordinary course of the Fund’s business) to 1.50% and 1.25% of average daily net assets for Investor Class and Institutional Class shares, respectively. Accordingly, during the six months ended August 31, 2021, the Adviser reduced its investment advisory fees in the amount of $23,675, and, in addition, reimbursed other operating expenses of $33,806.
Advisory fee reductions and expense reimbursements by the Adviser are subject to repayment by the Fund for a period of three years after such fees and expenses were incurred, provided that the repayments do not cause total annual fund operating expenses (exclusive of such reductions and reimbursements) to exceed (i) the expense limitation then in effect, if any, and (ii) the expense limitation in effect at the time the expenses to be repaid were incurred. Prior to June 30, 2023, the agreement may not be modified or
| BLUEPRINT ADAPTIVE GROWTH ALLOCATION FUND |
| NOTES TO FINANCIAL STATEMENTS (Unaudited) (Continued) |
terminated without the approval of the Board. After June 30, 2023, the ELA may continue from year-to-year provided such continuance is approved by the Board. The ELA may be terminated by the Adviser, or the Board, without approval by the other party, at the end of the then current term upon not less than 90 days’ notice to the other parties as set forth in the ELA. As of August 31, 2021, the Adviser may seek repayment of expense reimbursements no later than the dates below:
| February 29, 2024 | | $ | 141,841 | |
| August 31, 2024 | | | 57,481 | |
| Total | | $ | 199,322 | |
OTHER SERVICE PROVIDERS
Ultimus Fund Solutions, LLC (“Ultimus”) provides administration, fund accounting, compliance and transfer agency services to the Fund. The Fund pays Ultimus fees in accordance with the agreements for such services. In addition, the Fund pays out-of-pocket expenses including, but not limited to, postage, supplies and certain costs related to the pricing of the Fund’s portfolio securities.
Under the terms of a Distribution Agreement with the Trust, Ultimus Fund Distributors, LLC (the “Distributor”) serves as principal underwriter to the Fund. The Distributor is a wholly-owned subsidiary of Ultimus. The Distributor is compensated partially by the Adviser and partially by the Investor Class shares of the Fund for acting as principal underwriter.
A Trustee and certain officers of the Trust are also officers of Ultimus.
DISTRIBUTION PLAN
The Fund has adopted a plan of distribution (the “Plan”), pursuant to Rule 12b-1 under the 1940 Act, which permits Investor Class shares of the Fund to make payments to securities dealers and other financial organizations (including payments directly to the Adviser and the Distributor) for expenses related to the distribution and servicing of the Fund’s Investor Class shares. The annual limitation for payment of expenses pursuant to the Plan is 0.25% of the Fund’s average daily net assets allocable to Investor Class shares. The Fund has not adopted a plan of distribution with respect to Institutional Class shares. During the six months ended August 31, 2021, Investor Class shares of the Fund incurred $228 of distribution fees under the Plan.
TRUSTEE COMPENSATION
Each Trustee who is not an “interested person” of the Trust (“Independent Trustee”) receives a $1,300 annual retainer from the Fund, paid quarterly, except for the Board Chairperson who receives a $1,500 annual retainer from the Fund, paid quarterly. Each Independent Trustee also receives from the Fund a fee of $500 for each Board meeting attended plus reimbursement for travel and other meeting-related expenses.
| BLUEPRINT ADAPTIVE GROWTH ALLOCATION FUND |
| NOTES TO FINANCIAL STATEMENTS (Unaudited) (Continued) |
PRINCIPAL HOLDERS OF FUND SHARES
As of August 31, 2021, the following shareholders owned of record 25% or more of the outstanding shares of the Fund:
| NAME OF RECORD OWNER | | % OWNERSHIP |
| National Financial Services, LLC (for the benefit of its customers) | | 54% |
| TD Ameritrade, Inc. (for the benefit of its customers) | | 32% |
A beneficial owner of 25% or more of the Fund’s outstanding shares may be considered a controlling person. That shareholder’s vote could have a more significant effect on matters presented at a shareholders’ meeting.
| 5. | Contingencies and Commitments |
The Fund indemnifies the Trust’s officers and Trustees for certain liabilities that might arise from their performance of their duties to the Fund. Additionally, in the normal course of business the Fund enters into contracts that contain a variety of representations and warranties and which provide general indemnifications. The Fund’s maximum exposure under these arrangements is unknown, as this would involve future claims that may be made against the Fund that have not yet occurred. However, based on experience, the Fund expects the risk of loss to be remote.
| 6. | Investment in Other Investment Companies |
The Fund may invest a significant portion of its assets in shares of one or more investment companies, including ETFs, open-end mutual funds and money market mutual funds. The Fund will incur additional indirect expenses (acquired fund fees and expenses) to the extent it invests in shares of other investment companies. As of August 31, 2021, the Fund had 41.5% of the value of its net assets invested in ETFs.
The Fund is required to recognize in the financial statements the effects of all subsequent events that provide additional evidence about conditions that existed as of the date of the Statement of Assets and Liabilities. For non-recognized subsequent events that must be disclosed to keep the financial statements from being misleading, the Fund is required to disclose the nature of the event as well as an estimate of its financial effect, or a statement that such an estimate cannot be made. Management has evaluated subsequent events through the issuance of these financial statements and has noted no such events.
| BLUEPRINT ADAPTIVE GROWTH ALLOCATION FUND |
| ABOUT YOUR FUND’S EXPENSES (Unaudited) |
We believe it is important for you to understand the impact of costs on your investment. As a shareholder of the Fund, you incur ongoing costs, including management fees, class-specific expenses (such as distribution fees) and other operating expenses. The following examples are intended to help you understand your ongoing costs (in dollars) of investing in the Fund and to compare these costs with the ongoing costs of investing in other mutual funds.
A mutual fund’s ongoing costs are expressed as a percentage of its average net assets. This figure is known as the expense ratio. The expenses in the table below are based on an investment of $1,000 made at the beginning of the most recent period (March 1, 2021) and held until the end of the period (August 31, 2021).
The table below illustrates the Fund’s ongoing costs in two ways:
Actual fund return – This section helps you to estimate the actual expenses that you paid over the period. The “Ending Account Value” shown is derived from the Fund’s actual return, and the fourth column shows the dollar amount of operating expenses that would have been paid by an investor who started with $1,000 in the Fund. You may use the information here, together with the amount you invested, to estimate the expenses that you paid over the period.
To do so, simply divide your account value by $1,000 (for example, an $8,600 account value divided by $1,000 = 8.6), then multiply the result by the number given for the Fund under the heading “Expenses Paid During Period.”
Hypothetical 5% return – This section is intended to help you compare the Fund’s ongoing costs with those of other mutual funds. It assumes that the Fund had an annual return of 5% before expenses during the period shown, but that the expense ratio is unchanged. In this case, because the return used is not the Fund’s actual return, the results do not apply to your investment. The example is useful in making comparisons because the U.S. Securities and Exchange Commission (the “SEC”) requires all mutual funds to calculate expenses based on a 5% return. You can assess the Fund’s ongoing costs by comparing this hypothetical example with the hypothetical examples that appear in shareholder reports of other funds.
Note that expenses shown in the table are meant to highlight and help you compare ongoing costs only. The Fund does not charge transaction fees, such as purchase or redemption fees, nor does it carry a “sales load.”
The calculations assume no shares were bought or sold during the period. Your actual costs may have been higher or lower, depending on the amount of your investment and the timing of any purchases or redemptions.
| BLUEPRINT ADAPTIVE GROWTH ALLOCATION FUND |
| ABOUT YOUR FUND’S EXPENSES (Unaudited) (Continued) |
More information about the Fund’s expenses can be found in this report. For additional information on operating expenses and other shareholder costs, please refer to the Fund’s prospectus.
| | | Beginning | | Ending | | | | |
| | | Account Value | | Account Value | | | | Expenses |
| | | March 1, | | August 31, | | Net Expense | | Paid During |
| | | 2021 | | 2021 | | Ratio (a) | | Period (b) |
| Investor Class | | | | | | | | |
| Based on Actual Fund Return | | $1,000.00 | | $1,105.70 | | 1.51% | | $8.01 |
| Based on Hypothetical 5% Return (before expenses) | | $1,000.00 | | $1,017.59 | | 1.51% | | $7.68 |
| Institutional Class | | | | | | | | |
| Based on Actual Fund Return | | $1,000.00 | | $1,107.10 | | 1.28% | | $6.80 |
| Based on Hypothetical 5% Return (before expenses) | | $1,000.00 | | $1,018.75 | | 1.28% | | $6.51 |
| (a) | Annualized, based on the Fund’s expenses during the period since the commencement of operations. |
| (b) | Expenses are equal to the Fund’s annualized net expense ratio multiplied by the average account value over the period, multiplied by 184/365 (to reflect the one-half year period). |
| BLUEPRINT ADAPTIVE GROWTH ALLOCATION FUND |
| OTHER INFORMATION (Unaudited) |
A description of the policies and procedures that the Fund uses to vote proxies relating to portfolio securities is available without charge upon request by calling toll-free 1-866-983-4525, or on the SEC’s website at www.sec.gov. Information regarding how the Fund voted proxies relating to portfolio securities during the most recent 12-month period ended June 30 is available without charge upon request by calling toll-free 1-866-983-4525, or on the SEC’s website at www.sec.gov.
The Trust files a complete listing of portfolio holdings for the Fund with the SEC as of the end of the first and third quarters of each fiscal year as an exhibit to Form N-PORT. These filings are available upon request by calling 1-866-983-4525. Furthermore, you may obtain a copy of the filings on the SEC’s website at www.sec.gov.
| CUSTOMER PRIVACY NOTICE |
| |
| FACTS | WHAT DOES THE BLUEPRINT ADAPTIVE GROWTH ALLOCATION FUND (the “Fund”) DO WITH YOUR PERSONAL INFORMATION? |
| |
| Why? | Financial companies choose how they share your personal information. Federal law gives consumers the right to limit some but not all sharing. Federal law also requires us to tell you how we collect, share, and protect your personal information. Please read this notice carefully to understand what we do. |
| |
| What? | The types of personal information we collect and share depend on the product or service you have with us. This information can include: ■ Social Security number ■ Assets ■ Retirement Assets ■ Transaction History ■ Checking Account Information ■ Purchase History ■ Account Balances ■ Account Transactions ■ Wire Transfer Instructions When you are no longer our customer, we continue to share your information as described in this notice. |
| |
| How? | All financial companies need to share your personal information to run their everyday business. In the section below, we list the reasons financial companies can share their customers’ personal information; the reasons the Fund chooses to share; and whether you can limit this sharing. |
| |
| Reasons we can share your personal information | Does the Fund
share? | Can you limit
this sharing? |
| For our everyday business purposes – Such as to process your transactions, maintain your account(s), respond to court orders and legal investigations, or report to credit bureaus | Yes | No |
| For our marketing purposes – to offer our products and services to you | No | We don’t share |
| For joint marketing with other financial companies | No | We don’t share |
| For our affiliates’ everyday business purposes – information about your transactions and experiences | No | We don’t share |
| For our affiliates’ everyday business purposes – information about your creditworthiness | No | We don’t share |
| For nonaffiliates to market to you | No | We don’t share |
| | | | |
| Questions? | Call 1-866-983-4525 |
| Who we are |
| Who is providing this notice? | Blueprint Adaptive Growth Allocation Fund Ultimus Fund Distributors, LLC (Distributor) Ultimus Fund Solutions, LLC (Administrator) |
| What we do |
| How does the Fund protect my personal information? | To protect your personal information from unauthorized access and use, we use security measures that comply with federal law. These measures include computer safeguards and secured files and buildings. Our service providers are held accountable for adhering to strict policies and procedures to prevent any misuse of your nonpublic personal information. |
| How does the Fund collect my personal information? | We collect your personal information, for example, when you ■ Open an account ■ Provide account information ■ Give us your contact information ■ Make deposits or withdrawals from your account ■ Make a wire transfer ■ Tell us where to send the money ■ Tell us who receives the money ■ Show your government-issued ID ■ Show your driver’s license We also collect your personal information from other companies. |
| Why can’t I limit all sharing? | Federal law gives you the right to limit only ■ Sharing for affiliates’ everyday business purposes – information about your creditworthiness ■ Affiliates from using your information to market to you ■ Sharing for nonaffiliates to market to you State laws and individual companies may give you additional rights to limit sharing. |
| |
| Definitions |
| Affiliates | Companies related by common ownership or control. They can be financial and nonfinancial companies. ■ Blueprint Fund Management, LLC, the investment adviser to the Fund, could be deemed to be an affiliate. ■ Blueprint Investment Partners, the investment sub-adviser to the Fund, could be deemed to be an affiliate. |
| Nonaffiliates | Companies not related by common ownership or control. They can be financial and nonfinancial companies ■ The Fund does not share with nonaffiliates so they can market to you. |
| Joint marketing | A formal agreement between nonaffiliated financial companies that together market financial products or services to you. ■ The Fund does not jointly market. |
Blueprint-SAR-21

HVIA EQUITY FUND
INSTITUTIONAL CLASS (HVEIX)
Managed by
Hudson Valley Investment Advisors, Inc.
SEMI-ANNUAL REPORT
August 31, 2021
(Unaudited)
| HVIA EQUITY FUND | September 1, 2021 | |
| LETTER TO SHAREHOLDERS | |
HVIA Fund for Period Ending August 31, 2021
The HVIA Equity Fund (“HVEIX” or the “Fund”) launched on October 6, 2016. The Fund’s focus is on using a G.A.R.P. investment framework to determine suitable investments. This acronym is “Growth at a Reasonable Price” which focuses on investing in equities that are at a discount to their expected growth rate. In our experience of using this investment philosophy, we’ve come to realize that the process does not fit neatly into months, quarters or years but is expected to outperform over the longer term.
Investment Environment
HVEIX recorded six month returns of +20.59% compared to +19.52% for the S&P 500. Stocks advanced based on higher expected earnings and the historically low interest rates. The returns for stocks had an upward bias as analysts raised their forecasts for the S&P 500 from $163 to $203 for stocks in the index over the period. The higher earnings were met with an end of period “head winds” from an outgrowth of COVID. Inflation and issues surrounding logistics became apparent as demand continued to increase while supply levels for almost all products in the U.S. were limited. Economies were in the process of opening supply chains which help to feed economic growth. As markets are a discounting mechanism it digested the possibility of peak revenues and margins.
The U.S. was early in addressing COVID with vaccines and quarantining to isolate the spread of the disease. This led to the reopening of the U.S. economy earlier versus others. Non U.S. countries trailed in the vaccination and immunity fight but are quickly catching up. At the end of the period this seems to have reversed as many non U.S. economies have seen improvement in combating COVID and have seen an uptick in GDP growth. A continuing problem for all economies it the lack of inventory and restricted labor. These limitations have slowed the potential worldwide GDP. Investors should not confuse slower sales with a lack of demand. Supplies have been influenced by choke points in distribution and have led to inflation concerns. We equate the experience to a hurricane that hits Florida and the demand for roofers and carpenters outpaces demand and after a period we go back to a “normalcy”.
The S&P 500 ended the quarter near a record, while interest rates continued in a trading range at the lower end of its recent trend. Risk which can be measured by Interest rate spreads, appears to remain at record tights which signals limited risk by markets. At the end of the period we expected a continuation of the upward earnings trend. This should help to move stock markets higher while interest rates should remain in a trading range. At the HVIA Fund, our biggest concern, and where we have focused, is policy mistakes by the Biden Administration. An example of what we believe to be such a mistake is pressure being exerted upon the Federal Reserve to drift from its historic dual mandate of limiting inflation and price stability. The Administration’s social push has put pressure on the Fed to be more focused on social areas that will not be well influenced by Federal Reserve policies and could cause a nontraditional response that could undermine financial stability.
Valuations are at the higher end of their historical range. Low interest rates and Government support has put forth a push and pull on the U.S. economy. Strong demand has been met by restricted supply. This may be further exacerbated as two bills currently in the House of Representatives may put forth further stimulative effects on an economy. This may increase the inflationary trends we are seeing and actually hurt spending by companies which may find it difficult to invest during a period of rising prices. One other result may be U.S. officials not being able to meet future crises as there would be less ability for the government intervention.
Over the period, the Fund was the beneficiary of a continuation of higher share prices. Productivity levels advanced and revenues continued to increase leading to higher expected EPS reports from Fund holdings. Margins are approaching record levels and demand is expected to remain robust. We think that we will transition into a “mid-cycle” economic environment as growth continues but moderates from the levels seen over the past 12 months. GDP growth in the U.S. should continue as the U.S. maintains both automotive and housing inventory that is significantly below historic levels. Demand should stay strong due to labor market strength and the record cash in the hands of consumers. This catch up should continue to power the economy into the future and maintain strong levels for an extended period.
HVIA continues to believe that more monies will be pushed into equities. Interest rates continue to be low, credit availability is significant and consumer confidence remains strong. Normally economists point to periods before a market downturn to see if interest rates move significantly higher. It appears that the Fed is being cautious on tapering which will limit fixed income appreciation making equities the choice for investment.
We expect that earnings will outpace expectations and help drive markets higher over the remainder of the year. We continue to believe that next year’s earnings estimates are also below potential and will see a continued earnings lift which will move markets higher.
Current Market and Economic Conditions
GDP is expected to be strong on a worldwide and domestic basis as the stimulative effects of central banks are continuing to be felt. Earnings expectations have improved as companies’ business conditions, pricing and margins outpaced analyst expectations. COVID and supply chains continue to be the main culprits for an earnings headwind as COVID has reduced workforce participation and limited manpower at all points of the supply chain. We believe that we have past the worst part of this COVID induced slowdown and that GDP expectations should improve as companies make adjustments to their businesses to meet demand. We also expect pent up demand to remain strong over the next few quarters as supply difficulties ease. We are expecting that labor will rebound as mandates are removed, schools reopen and family caregivers become available for work.
The economic picture is continuing to show improvement. Services such as travel and entertainment are seeing ever increasing demand based on TSA statistics and open table reservations that we monitor. Expectations are for these service areas to see continued growth as COVID becomes a thing of the past. In order to fulfill the expected future strength in demand, consideration still must be made for longer term labor supply and the need for
investment to enhance productivity. Keep in mind that services constitute 65% of U.S. GDP and helps to maintain a consistent level of the U.S. economy compared to other parts of the world that rely on construction or trade to maintain similar levels of GDP.
The Federal Government’s push to continue to stimulate the economy appears to be at an impasse as the recent political fallout from the withdrawal from Afghanistan, immigration and inflation has complicated the timing and amount that would be put into additional stimulus. We believe that some sort of stimulus will be added in the form of infrastructure helping to elongate the current advance but will be smaller than what was originally introduced by Democratic leaders.
We want our clients to be aware of the recent benefits the U.S. economy experienced via the lower regulation seen over the prior four years. The current Administration has and continues to increase the regulatory environment. HVIA is keeping a close eye on regulatory changes especially if it acts as an impediment to future economic growth. Our Washington contacts are indicating that the Biden Administration is getting slowed down and the political “goodwill” experienced during the early part of his administration is dissipating. We are cautiously optimistic that earnings will advance and additional regulatory changes will be limited as we move into 2022. No matter what happens, we expect valuation levels to remain on the higher end of historical valuations and growth in earnings will be a main driver in moving equity markets.
Investment Philosophy and Performance
We invest with an eye for the longer term, which means greater than 18 months. We focus on companies that are showing improving asset utilization, margin expansion and efficient capital allocation. The net effect is a portfolio of companies that tend to trend toward an improving Return on Equity (which is a measure of how well a company uses investments to generate earnings), but are trading at a discount to their expected growth or that of the industry group.
For the six-month period ended August 31, 2021, HVEIX was up +18.40% compared to +15.91% for the S&P 500 total return over the same period. The following three positions had the largest total return for the quarter:
Nvdia Corp. (NVDA) 61.84%
Danaher Corp. (DHR) 43.89%
Facebook Inc. (FB) 43.21%
Our top performer during the quarter was NVDA as the company’s earnings benefitted from strong demand for its product sets across all end markets. The company has expanded its total addressable markets which are showing accelerating growth. The company is also involved in areas such as electric vehicles and cloud computing servers along with other tech areas such as healthcare are propelling the top line of NVDA. and ultimately profitability. DHR was the second best performer which saw sales outpace analysts’ projections. The need for healthcare diagnostics and testing has helped to propel DHR’s business which has a “razor blade” business strategy. As a greater level of testing has led to the continued advance
in the stock. FB was the third best performer based on its continued growth in advertising. We are keeping an eye on the company based on the potential federal intervention due to the company’s quasi monopolistic impact on the market.
The following positions had the greatest negative total return for the quarter:
Southwest Airlines Co. (LUV) -14.26%
Cabot Oil and Gas Corp. (COG) -14.64%
Magna International Inc. (MGA) -14.88%
MGA was the fund’s worst performer during the six-month period under review. The company is positioned for expanding growth in the automotive industry. The contracting supply of computer chips that are part of most automobile production slowdown impacted the short term and revenue expectations. Since there is less than one week of supply and normally 45 days of inventory is normally kept by car companies, we believe this is a story of when not if in terms of improving top and bottom lines for MGA. COG was the second worst performer as Federal restrictions shut in some of its ability to expand its gas offering to other areas of the U.S. this will restrict its ability to market its total production. COG has made an acquisition for another gas player that should help the company diversify its geographic revenue stream. LUV was the third worst performer for the fund. Southwest has seen a downtick as the COVID Delta variant slashed demand for the company.
In closing, we believe that there are multiple crosscurrents to both the U.S. and World economies. We are past the worst of COVID, inflation may be peaking and the political aggressiveness may be somewhat dampened during the upcoming U.S. elections. Capital injected in markets around the world continues to be invested, inventories need rebuilding and pent up demand is strong. Overall, we are positive on the future and that of economies around the world.
Sincerely,
 |  |
| Gustave J. Scacco | Ron Mayfield |
| Portfolio Manager | Co-Portfolio Manager |
Past performance is not predictive of future performance. Investment results and principal value will fluctuate so that shares, when redeemed, may be worth more or less than their original cost. Current performance may be higher or lower than the performance data quoted. Performance data current to the most recent month-end is available by calling 1-888-209-8710.
An investor should consider the investment objectives, risks, charges, and expenses of the Fund carefully before investing. The Fund’s prospectus contains this and other important information. To obtain a copy of the Fund’s prospectus please visit the Fund’s website at
www.hviafunds.com or call 1-888-209-8710 and a copy will be sent to you free of charge. Please read the prospectus carefully before you invest. The Fund is distributed by Ultimus Fund Distributors, LLC.
The Letter to Shareholders seeks to describe some of the Adviser’s current opinions and views of the financial markets. Although the Adviser believes it has a reasonable basis for any opinions or views expressed, actual results may differ, sometimes significantly so, from those expected or expressed. The securities held by the Fund that are discussed in the Letter to Shareholders were held during the period covered by this Report. They do not comprise the entire investment portfolio of the Fund, may be sold at any time, and may no longer be held by the Fund. For a complete list of securities held by the Fund as of August 31, 2021, please see the Schedule of Investments section of the semi-annual report. The opinions of the Fund’s adviser with respect to those securities may change at any time.
HVIA EQUITY FUND
PORTFOLIO INFORMATION
August 31, 2021 (Unaudited)
Sector Diversification (% of Net Assets)
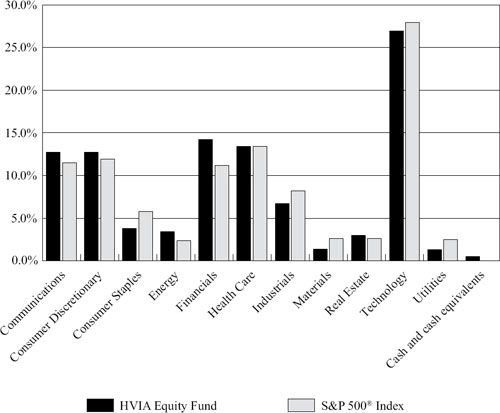
| Top 10 Equity Holdings |
| | % of |
| Security Description | Net Assets |
| NVIDIA Corporation | 5.5% |
| Microsoft Corporation | 4.3% |
| Apple, Inc. | 4.1% |
| Amazon.com, Inc. | 4.1% |
| Alphabet, Inc. - Class C | 4.1% |
| Facebook, Inc. - Class A | 3.8% |
| Bank of America Corporation | 3.5% |
| Adobe, Inc. | 3.3% |
| JPMorgan Chase & Company | 3.1% |
| Morgan Stanley | 3.1% |
| HVIA EQUITY FUND |
| SCHEDULE OF INVESTMENTS |
| August 31, 2021 (Unaudited) |
| COMMON STOCKS — 99.5% | | Shares | | | Value | |
| Communications — 12.7% | | | | | | | | |
| Cable & Satellite — 1.6% | | | | | | | | |
| Comcast Corporation - Class A | | | 10,000 | | | $ | 606,800 | |
| | | | | | | | | |
| Entertainment Content — 2.1% | | | | | | | | |
| Walt Disney Company (The) (a) | | | 4,500 | | | | 815,850 | |
| | | | | | | | | |
| Internet Media & Services — 7.9% | | | | | | | | |
| Alphabet, Inc. - Class C (a) | | | 535 | | | | 1,556,443 | |
| Facebook, Inc. - Class A (a) | | | 3,800 | | | | 1,441,644 | |
| | | | | | | | 2,998,087 | |
| Telecommunications — 1.1% | | | | | | | | |
| Verizon Communications, Inc. | | | 7,700 | | | | 423,500 | |
| | | | | | | | | |
| Consumer Discretionary — 12.7% | | | | | | | | |
| Apparel & Textile Products — 1.0% | | | | | | | | |
| NIKE, Inc. - Class B | | | 2,300 | | | | 378,902 | |
| | | | | | | | | |
| Automotive — 0.6% | | | | | | | | |
| Magna International, Inc. | | | 3,000 | | | | 236,730 | |
| | | | | | | | | |
| E-Commerce Discretionary — 4.1% | | | | | | | | |
| Amazon.com, Inc. (a) | | | 450 | | | | 1,561,855 | |
| | | | | | | | | |
| Home Construction — 0.2% | | | | | | | | |
| Lennar Corporation - Class A | | | 800 | | | | 85,848 | |
| | | | | | | | | |
| Leisure Facilities & Services — 4.6% | | | | | | | | |
| Chipotle Mexican Grill, Inc. (a) | | | 400 | | | | 761,332 | |
| Royal Caribbean Cruises Ltd. (a) | | | 3,835 | | | | 317,270 | |
| Starbucks Corporation | | | 5,800 | | | | 681,442 | |
| | | | | | | | 1,760,044 | |
| Retail - Discretionary — 2.2% | | | | | | | | |
| AutoZone, Inc. (a) | | | 265 | | | | 410,525 | |
| CarMax, Inc. (a) | | | 1,200 | | | | 150,252 | |
| Home Depot, Inc. (The) | | | 825 | | | | 269,098 | |
| | | | | | | | 829,875 | |
| Consumer Staples — 3.8% | | | | | | | | |
| Beverages — 0.8% | | | | | | | | |
| PepsiCo, Inc. | | | 1,900 | | | | 297,141 | |
| HVIA EQUITY FUND |
| SCHEDULE OF INVESTMENTS (Continued) |
| COMMON STOCKS — 99.5% (Continued) | | Shares | | | Value | |
| Consumer Staples — 3.8% (Continued) | | | | | | | | |
| Food — 0.7% | | | | | | | | |
| Mondelēz International, Inc. - Class A | | | 4,400 | | | $ | 273,108 | |
| | | | | | | | | |
| Household Products — 1.1% | | | | | | | | |
| Estée Lauder Companies, Inc. (The) - Class A | | | 1,300 | | | | 442,637 | |
| | | | | | | | | |
| Retail - Consumer Staples — 1.2% | | | | | | | | |
| Dollar General Corporation | | | 2,050 | | | | 456,966 | |
| | | | | | | | | |
| Energy — 3.4% | | | | | | | | |
| Oil & Gas Producers — 3.4% | | | | | | | | |
| Cabot Oil & Gas Corporation | | | 15,500 | | | | 246,295 | |
| Enbridge, Inc. | | | 3,306 | | | | 129,959 | |
| Exxon Mobil Corporation | | | 17,050 | | | | 929,566 | |
| | | | | | | | 1,305,820 | |
| Financials — 14.2% | | | | | | | | |
| Banking — 6.6% | | | | | | | | |
| Bank of America Corporation | | | 31,865 | | | | 1,330,364 | |
| JPMorgan Chase & Company | | | 7,450 | | | | 1,191,627 | |
| | | | | | | | 2,521,991 | |
| Institutional Financial Services — 3.1% | | | | | | | | |
| Morgan Stanley | | | 11,300 | | | | 1,180,059 | |
| | | | | | | | | |
| Insurance — 2.9% | | | | | | | | |
| Marsh & McLennan Companies, Inc. | | | 7,000 | | | | 1,100,400 | |
| | | | | | | | | |
| Specialty Finance — 1.6% | | | | | | | | |
| American Express Company | | | 3,800 | | | | 630,648 | |
| | | | | | | | | |
| Health Care — 13.4% | | | | | | | | |
| Biotech & Pharma — 2.3% | | | | | | | | |
| Eli Lilly & Company | | | 1,000 | | | | 258,290 | |
| Pfizer, Inc. | | | 13,500 | | | | 621,945 | |
| | | | | | | | 880,235 | |
| Health Care Facilities & Services — 1.7% | | | | | | | | |
| UnitedHealth Group, Inc. | | | 1,500 | | | | 624,405 | |
| | | | | | | | | |
| Medical Equipment & Devices — 9.4% | | | | | | | | |
| Danaher Corporation | | | 3,400 | | | | 1,102,144 | |
| Illumina, Inc. (a) | | | 1,750 | | | | 800,030 | |
| Medtronic plc | | | 5,000 | | | | 667,400 | |
| HVIA EQUITY FUND |
| SCHEDULE OF INVESTMENTS (Continued) |
| COMMON STOCKS — 99.5% (Continued) | | Shares | | | Value | |
| Health Care — 13.4% (Continued) | | | | | | | | |
| Medical Equipment & Devices — 9.4% (Continued) | | | | | | | | |
| PerkinElmer, Inc. | | | 3,350 | | | $ | 619,080 | |
| Thermo Fisher Scientific, Inc. | | | 750 | | | | 416,213 | |
| | | | | | | | 3,604,867 | |
| Industrials — 6.7% | | | | | | | | |
| Machinery — 1.4% | | | | | | | | |
| Lincoln Electric Holdings, Inc. | | | 2,350 | | | | 328,084 | |
| Oshkosh Corporation | | | 1,650 | | | | 189,057 | |
| | | | | | | | 517,141 | |
| Transportation & Logistics — 5.3% | | | | | | | | |
| CSX Corporation | | | 18,000 | | | | 585,540 | |
| FedEx Corporation | | | 4,350 | | | | 1,155,751 | |
| Southwest Airlines Company (a) | | | 6,150 | | | | 306,147 | |
| | | | | | | | 2,047,438 | |
| Materials — 1.4% | | | | | | | | |
| Chemicals — 1.4% | | | | | | | | |
| Sherwin-Williams Company (The) | | | 1,785 | | | | 542,051 | |
| | | | | | | | | |
| Real Estate — 3.0% | | | | | | | | |
| REITs — 3.0% | | | | | | | | |
| American Tower Corporation | | | 1,200 | | | | 350,604 | |
| Prologis, Inc. | | | 6,000 | | | | 807,960 | |
| | | | | | | | 1,158,564 | |
| Technology — 26.9% | | | | | | | | |
| Semiconductors — 7.5% | | | | | | | | |
| NVIDIA Corporation | | | 9,400 | | | | 2,104,190 | |
| Xilinx, Inc. | | | 5,000 | | | | 777,950 | |
| | | | | | | | 2,882,140 | |
| Software — 10.6% | | | | | | | | |
| Adobe, Inc. (a) | | | 1,930 | | | | 1,280,941 | |
| Microsoft Corporation | | | 5,400 | | | | 1,630,152 | |
| salesforce.com, inc. (a) | | | 4,300 | | | | 1,140,661 | |
| | | | | | | | 4,051,754 | |
| HVIA EQUITY FUND |
| SCHEDULE OF INVESTMENTS (Continued) |
| COMMON STOCKS — 99.5% (Continued) | | Shares | | | Value | |
| Technology — 26.9% (Continued) | | | | | | | | |
| Technology Hardware — 6.9% | | | | | | | | |
| Apple, Inc. | | | 10,300 | | | $ | 1,563,849 | |
| Ciena Corporation (a) | | | 18,550 | | | | 1,059,761 | |
| | | | | | | | 2,623,610 | |
| Technology Services — 1.9% | | | | | | | | |
| Visa, Inc. - Class A | | | 3,200 | | | | 733,120 | |
| | | | | | | | | |
| Utilities — 1.3% | | | | | | | | |
| Electric Utilities — 1.3% | | | | | | | | |
| AES Corporation (The) | | | 11,400 | | | | 272,118 | |
| Duke Energy Corporation | | | 2,180 | | | | 228,159 | |
| | | | | | | | 500,277 | |
| | | | | | | | | |
| Total Common Stocks (Cost $19,957,316) | | | | | | $ | 38,071,863 | |
| MONEY MARKET FUNDS — 0.4% | | Shares | | | Value | |
| First American Government Obligations Fund - Class X, 0.03% (b) (Cost $172,135) | | | 172,135 | | | $ | 172,135 | |
| | | | | | | | | |
| Investments at Value — 99.9% (Cost $20,129,451) | | | | | | $ | 38,243,998 | |
| | | | | | | | | |
| Other Assets in Excess of Liabilities — 0.1% | | | | | | | 22,711 | |
| | | | | | | | | |
| Net Assets — 100.0% | | | | | | $ | 38,266,709 | |
plc - Public Limited Company
| (a) | Non-income producing security. |
| (b) | The rate shown is the 7-day effective yield as of August 31, 2021. |
See accompanying notes to financial statements.
| HVIA EQUITY FUND |
| STATEMENT OF ASSETS AND LIABILITIES |
| August 31, 2021 (Unaudited) |
| ASSETS | | | |
| Investments in securities: | | | | |
| At cost | | $ | 20,129,451 | |
| At value (Note 2) | | $ | 38,243,998 | |
| Receivable for capital shares sold | | | 3,422 | |
| Dividends receivable | | | 29,653 | |
| Other assets | | | 19,091 | |
| TOTAL ASSETS | | | 38,296,164 | |
| | | | | |
| LIABILITIES | | | | |
| Payable to Adviser (Note 4) | | | 15,947 | |
| Payable to administrator (Note 4) | | | 8,649 | |
| Other accrued expenses | | | 4,859 | |
| TOTAL LIABILITIES | | | 29,455 | |
| | | | | |
| NET ASSETS | | $ | 38,266,709 | |
| | | | | |
| NET ASSETS CONSIST OF: | | | | |
| Paid-in capital | | $ | 19,185,209 | |
| Distributable earnings | | | 19,081,500 | |
| NET ASSETS | | $ | 38,266,709 | |
| | | | | |
| PRICING OF INSTITUTIONAL SHARES (NOTE 1) | | | | |
| Net assets applicable to Institutional Shares | | $ | 38,266,709 | |
| Shares of Institutional Shares outstanding (unlimited number of shares authorized, no par value) | | | 1,637,695 | |
| | | | | |
| Net asset value, offering price and redemption price per share (Note 2) | | $ | 23.37 | |
See accompanying notes to financial statements.
| HVIA EQUITY FUND |
| STATEMENT OF OPERATIONS |
| For the Six Months Ended August 31, 2021 (Unaudited) |
| INVESTMENT INCOME | | | |
| Dividends | | $ | 183,642 | |
| Foreign withholding taxes on dividends | | | (1,188 | ) |
| Interest | | | 203 | |
| TOTAL INVESTMENT INCOME | | | 182,657 | |
| | | | | |
| EXPENSES | | | | |
| Investment advisory fees (Note 4) | | | 129,831 | |
| Administration fees (Note 4) | | | 17,564 | |
| Fund accounting fees (Note 4) | | | 16,976 | |
| Legal fees | | | 14,087 | |
| Registration and filing fees | | | 11,874 | |
| Audit and tax services fees | | | 9,210 | |
| Transfer agent fees (Note 4) | | | 9,131 | |
| Trustees’ fees (Note 4) | | | 8,350 | |
| Compliance fees (Note 4) | | | 6,000 | |
| Custody and bank service fees | | | 3,210 | |
| Postage and supplies | | | 3,114 | |
| Printing of shareholder reports | | | 2,700 | |
| Insurance expense | | | 1,716 | |
| Other expenses | | | 7,105 | |
| TOTAL EXPENSES | | | 240,868 | |
| Less fee reductions by the Adviser (Note 4) | | | (67,175 | ) |
| NET EXPENSES | | | 173,693 | |
| | | | | |
| NET INVESTMENT INCOME | | | 8,964 | |
| | | | | |
| REALIZED AND UNREALIZED GAINS (LOSSES) ON INVESTMENTS AND FOREIGN CURRENCIES | | | | |
| Net realized gains from: | | | | |
| Investments | | | 574,175 | |
| Foreign currency transactions | | | 16 | |
| Net change in unrealized appreciation (depreciation) on: | | | | |
| Investments | | | 5,903,646 | |
| Foreign currency translations | | | (20 | ) |
| NET REALIZED AND UNREALIZED GAINS ON INVESTMENTS AND FOREIGN CURRENCIES | | | 6,477,817 | |
| | | | | |
| NET INCREASE IN NET ASSETS RESULTING FROM OPERATIONS | | $ | 6,486,781 | |
See accompanying notes to financial statements.
| HVIA EQUITY FUND |
| STATEMENTS OF CHANGES IN NET ASSETS |
| | | Six Months | | | | |
| | | Ended | | | Year | |
| | | August 31, | | | Ended | |
| | | 2021 | | | February 28, | |
| | | (Unaudited) | | | 2021 | |
| FROM OPERATIONS | | | | | | | | |
| Net investment income | | $ | 8,964 | | | $ | 32,974 | |
| Net realized gains (losses) from: | | | | | | | | |
| Investments | | | 574,175 | | | | 351,628 | |
| Foreign currency transactions | | | 16 | | | | (709 | ) |
| Net change in unrealized appreciation (depreciation) on: | | | | | | | | |
| Investments | | | 5,903,646 | | | | 8,023,634 | |
| Foreign currency translation | | | (20 | ) | | | 44 | |
| Net increase in net assets resulting from operations | | | 6,486,781 | | | | 8,407,571 | |
| | | | | | | | | |
| DISTRIBUTIONS TO SHAREHOLDERS (Note 2) | | | | | | | | |
| Institutional Shares | | | — | | | | (143,520 | ) |
| | | | | | | | | |
| CAPITAL SHARE TRANSACTIONS | | | | | | | | |
| Institutional Shares | | | | | | | | |
| Proceeds from shares sold | | | 3,150,775 | | | | 3,621,574 | |
| Net asset value of shares issued in reinvestment of distributions to shareholders | | | — | | | | 1,022 | |
| Payments for shares redeemed | | | (1,780,508 | ) | | | (1,705,703 | ) |
| Net increase in Institutional Shares net assets from capital share transactions | | | 1,370,267 | | | | 1,916,893 | |
| TOTAL INCREASE IN NET ASSETS | | | 7,857,048 | | | | 10,180,944 | |
| | | | | | | | | |
| NET ASSETS | | | | | | | | |
| Beginning of period | | | 30,409,661 | | | | 20,228,717 | |
| End of period | | $ | 38,266,709 | | | $ | 30,409,661 | |
| | | | | | | | | |
| CAPITAL SHARE ACTIVITY | | | | | | | | |
| Institutional Shares | | | | | | | | |
| Shares sold | | | 149,774 | | | | 229,701 | |
| Shares reinvested | | | — | | | | 54 | |
| Shares redeemed | | | (81,457 | ) | | | (105,450 | ) |
| Net increase in shares outstanding | | | 68,317 | | | | 124,305 | |
| Shares outstanding at beginning of period | | | 1,569,378 | | | | 1,445,073 | |
| Shares outstanding at end of period | | | 1,637,695 | | | | 1,569,378 | |
See accompanying notes to financial statements.
| HVIA EQUITY FUND |
| INSTITUTIONAL SHARES |
| FINANCIAL HIGHLIGHTS |
Per Share Data for a Share Outstanding Throughout Each Period
| | | Six Months | | | | | | | | | | | | | | | | |
| | | Ended | | | Year | | | Year | | | Year | | | Year | | | Period | |
| | | August 31, | | | Ended | | | Ended | | | Ended | | | Ended | | | Ended | |
| | | 2021 | | | Feb. 28, | | | Feb. 29, | | | Feb. 28, | | | Feb. 28, | | | Feb. 28, | |
| | | (Unaudited) | | | 2021 | | | 2020 | | | 2019 | | | 2018 | | | 2017(a) | |
| Net asset value at beginning of period | | $ | 19.38 | | | $ | 14.00 | | | $ | 13.28 | | | $ | 13.17 | | | $ | 11.39 | | | $ | 10.00 | |
| Income from investment operations: | | | | | | | | | | | | | | | | | | | | | | | | |
| Net investment income | | | 0.00 | (b) | | | 0.02 | | | | 0.06 | | | | 0.09 | | | | 0.06 | | | | 0.02 | |
| Net realized and unrealized gains on investments and foreign currencies | | | 3.99 | | | | 5.45 | | | | 0.76 | | | | 0.43 | | | | 1.81 | | | | 1.39 | |
| Total from investment operations | | | 3.99 | | | | 5.47 | | | | 0.82 | | | | 0.52 | | | | 1.87 | | | | 1.41 | |
| Less distributions from: | | | | | | | | | | | | | | | | | | | | | | | | |
| Net investment income | | | — | | | | (0.00 | ) (b) | | | (0.07 | ) | | | (0.08 | ) | | | (0.06 | ) | | | (0.02 | ) |
| Net realized gains | | | — | | | | (0.09 | ) | | | (0.03 | ) | | | (0.33 | ) | | | (0.03 | ) | | | — | |
| Total distributions | | | — | | | | (0.09 | ) | | | (0.10 | ) | | | (0.41 | ) | | | (0.09 | ) | | | (0.02 | ) |
| Net asset value at end of period | | $ | 23.37 | | | $ | 19.38 | | | $ | 14.00 | | | $ | 13.28 | | | $ | 13.17 | | | $ | 11.39 | |
| Total return (c) | | | 20.59 | % (d) | | | 39.10 | % | | | 6.11 | % | | | 4.34 | % | | | 16.45 | % | | | 14.06 | % (d) |
| Net assets at end of period (000’s) | | $ | 38,267 | | | $ | 30,410 | | | $ | 20,229 | | | $ | 17,929 | | | $ | 15,059 | | | $ | 11,381 | |
| Ratios/supplementary data: | | | | | | | | | | | | | | | | | | | | | | | | |
| Ratio of total expenses to average net assets | | | 1.37 | % (e) | | | 1.59 | % | | | 1.76 | % | | | 1.86 | % | | | 2.11 | % | | | 2.36 | % (e) |
| Ratio of net expenses to average net assets (f) | | | 0.99 | % (e) | | | 0.99 | % | | | 0.99 | % | | | 0.99 | % | | | 0.99 | % | | | 0.99 | % (e) |
| Ratio of net investment income to average net assets (f) | | | 0.05 | % (e) | | | 0.13 | % | | | 0.42 | % | | | 0.70 | % | | | 0.53 | % | | | 0.56 | % (e) |
| Portfolio turnover rate | | | 4 | % (d) | | | 11 | % | | | 16 | % | | | 29 | % | | | 4 | % | | | 2 | % (d) |
| (a) | Represents the period from the commencement of operations (October 3, 2016) through February 28, 2017. |
| (b) | Amount rounds to less than $0.01 per share. |
| (c) | Total return is a measure of the change in value of an investment in the Fund over the periods covered. The returns shown do not reflect the deduction of taxes a shareholders would pay on Fund distributions, if any, or the redemption of Fund shares. The total returns would be lower if the Adviser had not reduced advisory fees and reimbursed expenses. |
| (f) | Ratio was determined after advisory fee reductions and expense reimbursements (Note 4). |
See accompanying notes to financial statements.
| HVIA EQUITY FUND |
| NOTES TO FINANCIAL STATEMENTS |
| August 31, 2021 (Unaudited) |
HVIA Equity Fund (the “Fund”) is a diversified series of Ultimus Managers Trust (the “Trust”), an open-end investment company established as an Ohio business trust under a Declaration of Trust dated February 28, 2012. Other series of the Trust are not incorporated in this report.
The investment objective of the Fund is to seek growth at a reasonable price.
The Fund currently offers one class of shares: Institutional Class shares (sold without any sales loads or distribution fees and subject to a $25,000 initial investment requirement). As of August 31, 2021, the Investor Class shares (to be sold without any sales load, but subject to a distribution fee of up to 0.25% of the class’ average daily net assets and subject to a $2,500 initial investment requirement) are not currently offered. When both classes are offered, each share class will represent an ownership interest in the same investment portfolio.
| 2. | Significant Accounting Policies |
The following is a summary of the Fund’s significant accounting policies. The policies are in conformity with accounting principles generally accepted in the United States of America (“GAAP”). The Fund follows accounting and reporting guidance under Financial Accounting Standards Board Accounting Standards Codification Topic 946, “Financial Services – Investment Companies.”
Securities valuation – The Fund values its portfolio securities at fair value as of the close of regular trading on the New York Stock Exchange (the “NYSE”) (normally 4:00 p.m. Eastern time) on each business day the NYSE is open for business. The Fund values its common stocks on the basis of the security’s last sale price on the security’s primary exchange, if available, otherwise at the exchange’s most recently quoted mean price. NASDAQ-listed securities are valued at the NASDAQ Official Closing Price. Investments representing shares of other registered open-end investment companies that are not listed on an exchange, including money market funds, are valued at their net asset value (“NAV”) as reported by such companies. The Fund values securities traded in the over-the-counter market at the last sale price, if available, otherwise at the most recently quoted mean price. When using a quoted price and when the market is considered active, the security will be classified as Level 1 within the fair value hierarchy (see below). In the event that market quotations are not readily available or are considered unreliable due to market or other events, the Fund values its securities and other assets at fair value pursuant to procedures established by and under the direction of the Board of Trustees (the “Board”) of the Trust. Under these procedures, the securities will be classified as Level 2 or 3 within the fair value hierarchy, depending on the inputs used. Unavailable or unreliable market quotes may be due to the following factors: a substantial bid-ask spread; infrequent sales resulting in stale prices; insufficient trading volume; small trade sizes; a temporary lapse in any reliable pricing source; and actions of
| HVIA EQUITY FUND |
| NOTES TO FINANCIAL STATEMENTS (Continued) |
the securities or futures markets, such as the suspension or limitation of trading. As a result, the prices of securities used to calculate the Fund’s NAV may differ from quoted or published prices for the same securities.
GAAP establishes a single authoritative definition of fair value, sets out a framework for measuring fair value, and requires additional disclosures about fair value measurements.
Various inputs are used in determining the value of the Fund’s investments. These inputs are summarized in the three broad levels listed below:
| ● | Level 1 – quoted prices in active markets for identical securities |
| ● | Level 2 – other significant observable inputs |
| ● | Level 3 – significant unobservable inputs |
The inputs or methods used for valuing securities are not necessarily an indication of the risks associated with investing in those securities. The inputs used to measure fair value may fall into different levels of the fair value hierarchy. In such cases, for disclosure purposes, the level in the fair value hierarchy within which the fair value measurement falls in its entirety is determined based on the lowest level input that is significant to the fair value measurement.
The following is a summary of the Fund’s investments and the inputs used to value the investments as of August 31, 2021:
| | | Level 1 | | | Level 2 | | | Level 3 | | | Total | |
| Common Stocks | | $ | 38,071,863 | | | $ | — | | | $ | — | | | $ | 38,071,863 | |
| Money Market Funds | | | 172,135 | | | | — | | | | — | | | | 172,135 | |
| Total | | $ | 38,243,998 | | | $ | — | | | $ | — | | | $ | 38,243,998 | |
Refer to the Fund’s Schedule of Investments for a listing of the common stocks by sector and industry type. The Fund did not have any derivative instruments or any assets or liabilities that were measured at fair value on a recurring basis using significant unobservable inputs (Level 3) as of or during the six months ended August 31, 2021.
Foreign currency translation – Securities and other assets and liabilities denominated in or expected to settle in foreign currencies, if any, are translated into U.S. dollars based on exchange rates on the following basis:
| A. | The fair values of investment securities and other assets and liabilities are translated as of the close of the NYSE each day. |
| B. | Purchases and sales of investment securities and income and expenses are translated at the rate of exchange prevailing as of 4:00 p.m. Eastern Time on the respective date of such transactions. |
| HVIA EQUITY FUND |
| NOTES TO FINANCIAL STATEMENTS (Continued) |
| C. | The Fund does not isolate that portion of the results of operations caused by changes in foreign exchange rates on investments from those caused by changes in market prices of securities held. Such fluctuations are included with the net realized and unrealized gains or losses on investments. |
Reported net realized foreign exchange gains or losses arise from 1) purchases and sales of foreign currencies, 2) currency gains or losses realized between the trade and settlement dates on securities transactions, and 3) the difference between the amounts of dividends and foreign withholding taxes recorded on the Fund’s books and the U.S. dollar equivalent of the amounts actually received or paid. Reported net unrealized foreign exchange gains and losses arise from changes in the value of assets and liabilities that result from changes in exchange rates.
Cash – The Fund’s cash, if any, is held in a bank account with balances which, at times, may exceed United States federally insured limits set by the Federal Deposit Insurance Corporation. The Fund maintains these balances with a high-quality financial institution and may incur charges on cash overdrafts.
Share valuation – The NAV per share of each class of the Fund is calculated daily by dividing the total value of its assets attributable to that class, less liabilities attributable to that class, by the number of shares outstanding of that class. The offering price and redemption price per share of each class of the Fund is equal to the NAV per share of such class.
Investment income – Dividend income is recorded on the ex-dividend date. Non-cash dividends included in dividend income, if any, are recorded at the fair market value of the security received. Interest income is accrued as earned. Withholding taxes on foreign dividends have been recorded in accordance with the Fund’s understanding of the applicable country’s tax rules and rates.
Investment transactions – Investment transactions are accounted for on the trade date. Realized gains and losses on investments sold are determined on a specific identification basis.
Common expenses – Common expenses of the Trust are allocated among the Fund and the other series of the Trust based on the relative net assets of each series, the number of series in the Trust, or the nature of the services performed and the relative applicability to each series.
Distributions to shareholders – The Fund will distribute to shareholders any net investment income dividends and net realized capital gains distributions at least once each year. The amount of such dividends and distributions are determined in accordance with federal income
| HVIA EQUITY FUND |
| NOTES TO FINANCIAL STATEMENTS (Continued) |
tax regulations, which may differ from GAAP. Dividends and distributions to shareholders are recorded on the ex-dividend date. The tax character of the Fund’s distributions during the periods ended August 31, 2021 and February 28, 2021 was as follows:
| | | Ordinary | | | Long-Term | | | Total | |
| Period Ended | | Income | | | Capital Gains | | | Distributions | |
| August 31, 2021 | | $ | — | | | $ | — | | | $ | — | |
| February 28, 2021 | | $ | 4,185 | | | $ | 139,335 | | | $ | 143,520 | |
Estimates – The preparation of financial statements in conformity with GAAP requires management to make estimates and assumptions which affect the reported amounts of assets and liabilities and disclosure of contingent assets and liabilities as of the date of the financial statements and the reported amounts of increase (decrease) in net assets from operations during the reporting period. Actual results could differ from those estimates.
Federal income tax – The Fund has qualified and intends to continue to qualify as a regulated investment company under the Internal Revenue Code of 1986, as amended (the “Code”). Qualification generally will relieve the Fund of liability for federal income taxes to the extent 100% of its net investment income and net realized capital gains are distributed in accordance with the Code.
In order to avoid imposition of the excise tax applicable to regulated investment companies, it is also the Fund’s intention to declare as dividends in each calendar year at least 98% of its net investment income (earned during the calendar year) and 98.2% of its net realized capital gains (earned during the 12 months ended October 31) plus undistributed amounts from prior years.
The following information is computed on a tax basis for each item as of August 31, 2021:
| Tax cost of portfolio investments | | $ | 20,129,451 | |
| Gross unrealized appreciation | | $ | 18,370,238 | |
| Gross unrealized depreciation | | | (255,691 | ) |
| Net unrealized appreciation | | | 18,114,547 | |
| Net unrealized depreciation on foreign currency translation | | | (17 | ) |
| Undistributed ordinary income | | | 94,428 | |
| Undistributed long-term capital gains | | | 289,386 | |
| Other gains | | | 583,156 | |
| Accumulated earnings | | $ | 19,081,500 | |
| HVIA EQUITY FUND |
| NOTES TO FINANCIAL STATEMENTS (Continued) |
The Fund recognizes the tax benefits or expenses of uncertain tax positions only when the position is “more likely than not” of being sustained assuming examination by tax authorities. Management has reviewed the Fund’s tax positions for the current and all open tax periods (generally, three years) and has concluded that no provision for unrecognized tax benefits or expenses is required in these financial statements.
The Fund identifies its major tax jurisdiction as U.S. Federal. The Fund recognizes interest and penalties, if any, related to unrecognized tax benefits as income tax on the Statement of Operations. During the six months ended August 31, 2021, the Fund did not incur any interest of penalties.
| 3. | Investment Transactions |
During the six months ended August 31, 2021, cost of purchases and proceeds from sales of investment securities, other than short-term investments, amounted to $3,002,712 and $1,399,108, respectively.
| 4. | Transactions with Related Parties |
INVESTMENT ADVISORY AGREEMENT
The Fund’s investments are managed by Hudson Valley Investment Advisors, Inc. (the “Adviser”) pursuant to the terms of an Investment Advisory Agreement. Under the Investment Advisory Agreement, the Fund pays the Adviser an investment advisory fee, computed and accrued daily and paid monthly, at the annual rate of 0.74% of its average daily net assets.
Pursuant to an Expense Limitation Agreement (“ELA”), the Adviser has contractually agreed, until July 1, 2022, to reduce investment advisory fees and reimburse other expenses to the extent necessary to limit total annual operating expenses (exclusive of brokerage costs, taxes, interest, borrowing costs such as interest and dividend expense on securities sold short, costs to organize the Fund, acquired fund fees and expenses, extraordinary expenses such as litigation and merger or reorganization costs and other expenses not incurred in the ordinary course of the Fund’s business) to an amount not exceeding 0.99% of average daily net assets of the Institutional Class shares and 1.24% of the average daily net assets of the Investor class shares. Accordingly, the Adviser reduced its investment advisory fees in the amount of $67,175 during the six months ended August 31, 2021.
Under the terms of the ELA, investment advisory fee reductions and expense reimbursements by the Adviser are subject to repayment by the Fund for a period of three years after such fees and expenses were incurred, provided the repayments do not cause total annual operating expenses to exceed: (i) the expense limitation then in effect, if any, and (ii) the expense
| HVIA EQUITY FUND |
| NOTES TO FINANCIAL STATEMENTS (Continued) |
limitation in effect at the time the expenses to be repaid were incurred. As of August 31, 2021, the Adviser may seek repayment of investment advisory fee reductions and expense reimbursements in the amount of $449,666 no later than the dates listed below:
| February 28, 2022 | | $ | 73,283 | |
| February 28, 2023 | | | 154,552 | |
| February 29, 2024 | | | 154,656 | |
| August 31, 2024 | | | 67,175 | |
| Total | | $ | 449,666 | |
OTHER SERVICE PROVIDERS
Ultimus Fund Solutions, LLC (“Ultimus”) provides administration, fund accounting, compliance and transfer agency services to the Fund. The Fund pays Ultimus fees in accordance with the agreements for such services. In addition, the Fund pays out-of-pocket expenses including, but not limited to, postage, supplies, and certain costs related to the pricing of the Fund’s portfolio securities.
Under the terms of a Distribution Agreement with the Trust, Ultimus Fund Distributors, LLC (the “Distributor”) serves as the principal underwriter to the Fund. The Distributor is a wholly-owned subsidiary of Ultimus. The Distributor is currently compensated by the Adviser (not the Fund) for acting as principal underwriter.
Certain officers and a Trustee of the Trust are also officers of Ultimus.
TRUSTEE COMPENSATION
Each Trustee who is not an “interested person” of the Trust (“Independent Trustee”) receives a $1,300 annual retainer from the Fund, paid quarterly, except for the Board Chairperson who receives a $1,500 annual retainer from the Fund, paid quarterly. Each Independent Trustee also receives from the Fund a fee of $500 for each Board meeting attended plus reimbursement for travel and other meeting-related expenses.
PRINCIPAL HOLDER OF FUND SHARES
As of August 31, 2021, the following shareholder owned of record more than 25% of the outstanding shares of the Fund:
| NAME OF RECORD OWNER | | % Ownership |
| Pershing, LLC (for the benefit of its customers) | | 99.7% |
A beneficial owner of 25% or more of the Fund’s outstanding shares may be considered a controlling person. That shareholder’s vote could have a more significant effect on matters presented at a shareholders’ meeting.
| HVIA EQUITY FUND |
| NOTES TO FINANCIAL STATEMENTS (Continued) |
If a Fund has significant investments in the securities of issuers in industries within a particular business sector, any development affecting that sector will have a greater impact on the value of the net assets of the Fund than would be the case if the Fund did not have significant investments in that sector. In addition, this may increase the risk of loss of an investment in the Fund and increase the volatility of the Fund’s NAV per share. From time to time, circumstances may affect a particular sector and the companies within such sector. For instance, economic or market factors, regulation or deregulation, or other developments may negatively impact all companies in a particular sector and therefore the value of a Fund’s portfolio would be adversely affected. As of August 31, 2021, the Fund had 26.9% of the value of its net assets invested in common stocks within the Technology sector.
| 6. | Contingencies and Commitments |
The Fund indemnifies the Trust’s officers and Trustees for certain liabilities that might arise from the performance of their duties to the Fund. Additionally, in the normal course of business the Fund enters into contracts that contain a variety of representations and warranties and which provide general indemnifications. The Fund’s maximum exposure under these arrangements is unknown, as this would involve future claims that may be made against the Fund that have not yet occurred. However, based on experience, the Fund expects the risk of loss to be remote.
The Fund is required to recognize in the financial statements the effects of all subsequent events that provide additional evidence about conditions that existed as of the date of the Statement of Assets and Liabilities. For non-recognized subsequent events that must be disclosed to keep the financial statements from being misleading, the Fund is required to disclose the nature of the event as well as an estimate of its financial effect, or a statement that such an estimate cannot be made. Management has evaluated subsequent events through the issuance of these financial statements and has noted no such events.
| HVIA EQUITY FUND |
| ABOUT YOUR FUND’S EXPENSES (Unaudited) |
We believe it is important for you to understand the impact of costs on your investment. As a shareholder of the Fund, you incur ongoing costs, including management fees and other operating expenses. The following examples are intended to help you understand your ongoing costs (in dollars) of investing in the Fund and to compare these costs with the ongoing costs of investing in other mutual funds.
A mutual fund’s ongoing costs are expressed as a percentage of its average net assets. This figure is known as the expense ratio. The expenses in the table below are based on an investment of $1,000 made at the beginning of the most recent period (March 1, 2021) and held until the end of the period (August 31, 2021).
The table below illustrates the Fund’s ongoing costs in two ways:
Actual fund return – This section helps you to estimate the actual expenses that you paid over the period. The “Ending Account Value” shown is derived from the Fund’s actual return, and the fourth column shows the dollar amount of operating expenses that would have been paid by an investor who started with $1,000 in the Fund. You may use the information here, together with the amount you invested, to estimate the expenses that you paid over the period.
To do so, simply divide your account value by $1,000 (for example, an $8,600 account value divided by $1,000 = 8.6), then multiply the result by the number given for the Fund under the heading “Expenses Paid During Period.”
Hypothetical 5% return – This section is intended to help you compare the Fund’s ongoing costs with those of other mutual funds. It assumes that the Fund had an annual return of 5% before expenses during the period shown, but that the expense ratio is unchanged. In this case, because the return used is not the Fund’s actual return, the results do not apply to your investment. The example is useful in making comparisons because the U.S. Securities and Exchange Commission (the “SEC”) requires all mutual funds to calculate expenses based on a 5% return. You can assess the Fund’s ongoing costs by comparing this hypothetical example with the hypothetical examples that appear in shareholder reports of other funds.
Note that expenses shown in the table are meant to highlight and help you compare ongoing costs only. The Fund does not charge transaction fees, such as purchase or redemption fees, nor does it carry a “sales load.” The calculations assume no shares were bought or sold during the period. Your actual costs may have been higher or lower, depending on the amount of your investment and the timing of any purchases or redemptions.
More information about the Fund’s expenses can be found in this report. For additional information on operating expenses and other shareholder costs, please refer to the Fund’s prospectus.
| HVIA EQUITY FUND |
| ABOUT YOUR FUND’S EXPENSES (Unaudited) (Continued) |
| | | Beginning | | Ending | | | | |
| | | Account Value | | Account Value | | | | Expenses |
| | | March 1, | | August 31, | | Net Expense | | Paid During |
| Institutional Class | | 2021 | | 2021 | | Ratio (a) | | Period (b) |
| Based on Actual Fund Return | | $1,000.00 | | $1,205.90 | | 0.99% | | $5.50 |
| Based on Hypothetical 5% Return (before expenses) | | $1,000.00 | | $1,020.21 | | 0.99% | | $5.04 |
| (a) | Annualized, based on the Fund’s most recent one-half year expenses. |
| (b) | Expenses are equal to the Fund’s annualized net expense ratio multiplied by the average account value over the period, multiplied by 184/365 (to reflect the one-half year period). |
| HVIA EQUITY FUND |
| OTHER INFORMATION (Unaudited) |
A description of the policies and procedures that the Fund uses to vote proxies relating to portfolio securities is available without charge upon request by calling toll- free 1-888-209-8710, or on the SEC’s website at www.sec.gov. Information regarding how the Fund voted proxies relating to portfolio securities during the most recent 12-month period ended June 30 is available without charge upon request by calling toll-free 1-888-209-8710, or on the SEC’s website at www.sec.gov.
The Trust files a complete listing of portfolio holdings for the Fund with the SEC as of the end of the first and third quarters of each fiscal year as an exhibit to its reports on Form N-PORT. These filings are available upon request by calling 1-888-209-8710. Furthermore, you may obtain a copy of the filings on the SEC’s website at www.sec.gov.
| HVIA EQUITY FUND |
| DISCLOSURE REGARDING APPROVAL OF INVESTMENT ADVISORY AGREEMENT (Unaudited) |
The Board of Trustees (the “Board”), including the Independent Trustees voting separately, has reviewed and approved the continuance of the Fund’s Investment Advisory Agreement (the “Agreement”) with Hudson Valley Investment Advisors, Inc. (the “Adviser” or “HVIA”) for an additional one-year term. The Board approved the Agreement at a meeting held on April 19, 20 and 21, 2021 (“Meeting”), at which all of the Trustees were present.
In deciding whether to approve the continuation of the HVIA Advisory Agreement, the Board recalled its review of the materials related to the Fund and the Adviser throughout the preceding twelve months and its numerous discussions with Trust Management and the Adviser about the operations and performance of the Fund during that period. The Board further considered those materials and discussions and other numerous factors, including the following:
The nature, extent, and quality of the services provided by the Adviser. In this regard, the Board reviewed the services being provided by the Adviser to the Fund including, without limitation, providing a continuous investment program for the Fund, adhering to the Fund’s investment restrictions, complying with the Trust’s policies and procedures, and voting proxies on behalf of the Fund. The Board considered the qualifications and experience of HVIA’s portfolio managers who are responsible for the day to day management of the Fund, as well as the qualifications and experience of the other individuals at HVIA who provide services to the Fund. The Board concluded that the quality, extent, and nature of the services provided by HVIA to the Fund were satisfactory and adequate.
The investment performance of the Fund. In this regard, the Board compared the performance of the Fund with the performance of its benchmark index and custom peer group. The Board noted that the Fund had outperformed relative to its benchmark index and the average and median of the other funds in its custom peer group and Morningstar category (Large Blend) for the one-year, three-year and since inception time periods. The Board concluded that the investment performance of the Fund has been satisfactory.
The costs of the services provided and profits realized by the Adviser and its affiliates from their relationship with the Fund. In this regard, the Board considered HVIA’s staffing, methods of operating, its financial condition, the asset level of the Fund; the overall expenses of the Fund, including the advisory fee; and the differences in fees and services to HVIA’s other similar clients. The Board considered the current and anticipated profitability of the Fund to HVIA, if any. The Board considered its discussion with HVIA regarding the Fund’s expense limitation agreement (“ELA”), and considered HVIA’s past fee reductions and expense reimbursements for the Fund.
The Board also considered potential benefits for HVIA in managing the Fund, including promotion of HVIA’s name.
| HVIA EQUITY FUND |
| DISCLOSURE REGARDING APPROVAL OF INVESTMENT ADVISORY AGREEMENT (Unaudited) (Continued) |
The Board compared the Fund’s advisory fee and overall expense ratio to the average and median advisory fees and expense ratios for its custom peer group and fees charged to HVIA’s other client accounts. In considering the comparison in fees and expense ratios between the Fund and other comparable funds, the Board looked at the differences in types of funds being compared, the styles of investment management, the size of the Fund relative to the comparable funds, and the nature of the investment strategies. The Board also considered HVIA’s commitment to limit the Fund’s expenses under the ELA until at least July 1, 2022. The Board noted that the 0.74% advisory fee for the Fund was above the average and median for the other funds in the Fund’s custom peer group and Morningstar category (Large Blend), but was less than the highest advisory fee referenced for the other funds in its custom peer group and Morningstar category. The Board further noted that the overall expense ratio for the Fund of 0.99% was higher than the average and median expense ratio for the other funds in the Fund’s custom peer group and Morningstar category but lower than the highest expense ratio referenced for other funds in its custom peer group and Morningstar category. The Board also compared the fees paid by the Fund to the fees paid by other clients of HVIA, and considered the similarities and differences of services received by such other clients as compared to the services received by the Fund. The Board noted that the fee structures applicable to HVIA’s other clients were not indicative of any unreasonableness with respect to the advisory fees payable by the Fund. The Board concluded that the advisory fee to be paid to HVIA by the Fund is reasonable in light of the nature and quality of services provided by HVIA.
The extent to which economics of scale would be realized as the Fund grows and whether advisory fee levels reflect these economies of scale for the benefit of the Fund’s investors. In this regard, the Board considered that the Fund’s fee arrangements with HVIA involve both the advisory fee and the ELA. The Board determined that while the advisory fee rate remained the same as asset levels increased, the shareholders of the Fund have experienced in the past, and will experience in the future, benefits from the ELA. The Board concluded that the advisory fee was reasonable in light of the information that was provided to the Trustees by HVIA with respect to economies of scale.
After further discussion of the factors noted above and in reliance on the information provided by the Adviser and Trust Management, and taking into account the totality of all factors discussed and information presented at this Meeting and previous meetings, the Board indicated its agreement to approve the continuance of the Agreement. It was noted that in the Trustees’ deliberations regarding the approval of the continuance of the Agreement, the Trustees did not identify any particular information or factor that was all-important or controlling, and that each individual Trustee may have attributed different weights to various factors listed above. After full consideration of the above factors as well as other factors, the Board unanimously concluded that approval of the continuance of the Agreement was in the best interests of the Fund and its shareholders.
| CUSTOMER PRIVACY NOTICE |
| |
| FACTS | WHAT DOES THE HVIA EQUITY FUND (the “Fund”) DO WITH YOUR PERSONAL INFORMATION? |
| |
| Why? | Financial companies choose how they share your personal information. Federal law gives consumers the right to limit some but not all sharing. Federal law also requires us to tell you how we collect, share, and protect your personal information. Please read this notice carefully to understand what we do. |
| |
| What? | The types of personal information we collect and share depend on the product or service you have with us. This information can include: ■ Social Security number ■ Assets ■ Retirement Assets ■ Transaction History ■ Checking Account Information ■ Purchase History ■ Account Balances ■ Account Transactions ■ Wire Transfer Instructions When you are no longer our customer, we continue to share your information as described in this notice. |
| |
| How? | All financial companies need to share your personal information to run their everyday business. In the section below, we list the reasons financial companies can share their customers’ personal information; the reasons the Fund chooses to share; and whether you can limit this sharing. |
| |
| Reasons we can share your personal information | Does the
Fund share? | Can you limit
this sharing? |
For our everyday business purposes – Such as to process your transactions, maintain your account(s), respond to court orders and legal investigations, or report to credit bureaus | Yes | No |
For our marketing purposes – to offer our products and services to you | No | We don’t share |
| For joint marketing with other financial companies | No | We don’t share |
For our affiliates’ everyday business purposes – information about your transactions and experiences | No | We don’t share |
For our affiliates’ everyday business purposes – information about your creditworthiness | No | We don’t share |
| For nonaffiliates to market to you | No | We don’t share |
| | | | |
| Questions? | Call 1-888-209-8710 |
| Who we are |
| Who is providing this notice? | HVIA Equity Fund Ultimus Fund Distributors, LLC (Distributor) Ultimus Fund Solutions, LLC (Administrator) |
| What we do |
How does the Fund protect my personal information? | To protect your personal information from unauthorized access and use, we use security measures that comply with federal law. These measures include computer safeguards and secured files and buildings. Our service providers are held accountable for adhering to strict policies and procedures to prevent any misuse of your nonpublic personal information. |
How does the Fund collect my personal information? | We collect your personal information, for example, when you ■ Open an account ■ Provide account information ■ Give us your contact information ■ Make deposits or withdrawals from your account ■ Make a wire transfer ■ Tell us where to send the money ■ Tell us who receives the money ■ Show your government-issued ID ■ Show your driver’s license We also collect your personal information from other companies. |
Why can’t I limit all sharing? | Federal law gives you the right to limit only ■ Sharing for affiliates’ everyday business purposes – information about your creditworthiness ■ Affiliates from using your information to market to you ■ Sharing for nonaffiliates to market to you State laws and individual companies may give you additional rights to limit sharing. |
| |
| Definitions |
| Affiliates | Companies related by common ownership or control. They can be financial and nonfinancial companies. ■ Hudson Valley Investment Advisor, Inc., the investment adviser to the Fund, could be deemed to be an affiliate. |
| Nonaffiliates | Companies not related by common ownership or control. They can be financial and nonfinancial companies ■ The Fund does not share with nonaffiliates so they can market to you. |
| Joint marketing | A formal agreement between nonaffiliated financial companies that together market financial products or services to you. ■ The Fund does not jointly market. |
This page intentionally left blank.
HVIA-SAR-21
| |
| |
| |
| |
| |
| |
 |
| |
| |
| |
| |
| |
| |
| |
| |
| |
| SEMI-ANNUAL REPORT |
| |
| |
| August 31, 2021 |
| (Unaudited) |
| |
| |
| |
| |
| |
| |
| |
| |
| |
| |
| |
| |
| |
| |
| |
| |
| |
| |
| |
| |
| |
| |
| |
| LEFT BRAIN COMPOUND GROWTH FUND | |
| LETTER TO SHAREHOLDERS (Unaudited) | October 2021 |
| | |
Fund Objective:
The Left Brain Compound Growth Fund (LBCGX) (the “Fund”) seeks to achieve long-term capital appreciation. The fund strategy involves investing opportunistically in a combination of growth stocks (in an allocation of 50-80%) and high yield bonds (20-50% of Fund assets).
Investment Performance:
This report covers the period from the inception of the Fund (April 27, 2021) through August 31, 2021. The Fund started the period with a NAV of $25.00 and ended the quarter with a NAV of $26.83. This implies a return of 7.32% during the period. During the same period, the S&P 500® increased 8.03%, with the index trading higher from 4186.04 to 4522.68.
Investment Philosophy:
Our criteria for choosing stocks aligns with a relatively simple investment philosophy. For prospective equity investments, we usually consider whether a stock has the following characteristics:
| 1. | Revenue growth of at least 15-20% and preferably with an accelerating trajectory |
| 2. | Profitability on some metric (free cash flow, net income) or showing a predictable path toward positive net earnings within the next year |
| 3. | High quality management, preferably a founder/CEO with a historical pattern of success and significant amount of personal wealth invested in the business (for alignment of shareholder interest) |
| 4. | Company serves a market that is growing quickly and with competitive dynamics that are favorable to the target company |
| 5. | The company shows the potential to be a category-defining or category-killing business |
In terms of choosing high yield bonds, the criteria are slightly different. We are looking for companies that are showing improvement, both from the business and financials points of view. A few points we look for in our bond investments include:
| 1. | Improving business trajectory, either with respect to revenues or profits |
| 2. | A clear plan for deleveraging, whether it be through divestitures or free cash flow |
| 3. | Access to capital markets: has the company been able to complete a refinancing transaction in the previous 24 months and was the deal done at a favorable rate to the borrowing entity? |
| 4. | Recent history of improvement in financial metrics like leverage ratio and interest coverage |
For bond investments, it is important to consider the health of a company’s balance sheet, of course, but if the underlying business itself is deteriorating, we are likely to pass on investing in the credits underwritten by that business.
Fund Positioning:
The Fund spent the last four months working toward full investment. The Fund fully invested its stock allocation, but, because of the low interest rate environment, the process of selecting high yield bond investments has been more deliberately gradual. Within the next few months, we plan to complete our allocation to the fixed income side of the portfolio.
The Fund’s investments will primarily be in securities of large and medium companies with market capitalizations greater than $10 billion (“Large Cap”) and/or greater than $2 billion (“Mid-Cap”), and to a lesser extent, in securities of small companies with market capitalizations of less than $2 billion (“Small-Cap”) at the time of purchase. An analysis of positions currently held in the LBCGX portfolio, causes us to describe the current positioning as one indicative of a “mid-cap growth” skew, which reflects the fund manager’s view that stocks in this subset currently represent the best opportunities in the market and fit well with the Left Brain investment philosophy explained above.
Market & Economic Conditions:
During the period ended August 31, both stock and bond markets continued their upward momentum. Market strength was broad-based. Notable strength came from the following sectors: software (which we track using the ETF: IGV), Technology (XLK), Biotech (IBB) and Healthcare (RYH). The weakest sector ETFs under our coverage were Gold Miners (GDX), Transportation (IYT), Emerging Markets (EEM), and oil field services (XES).
Over the past six months, we have observed a number of cross currents in the economy and in the financial markets, most of which have received abundant coverage in the financial press. The first of these is the rise in interest rates. Ten-year US Treasury yields made a local bottom on July 31, at roughly 1.22%, have slowly risen since and now stand at roughly 1.53%. Though this seems like a small shift in rates, there has been a corresponding move down in long duration assets like growth stocks in the month of September.
Another clear theme over the past six months has been the threat of inflation in the overall economy, particularly in the energy sector. The COVID pandemic has created challenges in supply chains worldwide in an array of industries, including computer microchips, shipping containers, and automobiles, leading to rising prices throughout the global economy.
Many investors will remember that oil prices were briefly negative in May 2020, in the immediate wake of the pandemic. This caused many oil/gas companies to file for bankruptcy and others to decrease their capital expenditures in an effort to meet debt obligations, during a period of flagging revenue.
There is a raging debate among market participants as to whether these pricing pressures in the overall economy are temporary in nature, due to circumstances around the pandemic. We lean toward the view that the inflation we see will ultimately prove transitory in nature.
Interest rates have remained persistently low all year. At the time of writing, the 10-year treasury rate was trading at roughly 1.5%. The Fed appears to have taken a slightly more hawkish view for monetary policy in the face of growing inflationary pressures, with plans to taper down the post-pandemic bond buying program in November 2021 and to begin raising the US Federal Funds Rate at some point in 2022. These developments have weighed on markets throughout the month of September.
Outlook for Market:
As the coronavirus continues to dominate the headlines, the COVID-19 Delta variant is still having a significant economic impact, both in the US and abroad. Many companies have delayed their “return to the office” strategies and a large percentage of American schools have had to update their mask mandates for teachers and students. The Delta variant has also created confusion in the public regarding the need for booster shots, as conflicting data emerges with respect to the need for a third dose of the vaccine. The latest wave of the virus and the uncertainty accompanying it has led to a decrease in travel activity.
Should the Delta variant stick around longer, there could be a significant decrease in economic activity, which could potentially weigh on investor confidence. As of August 31, the S&P500® has increased by just over 20% on the year. A period of persistently low interest rates has allowed corporations to borrow cheaply and refinance their outstanding debts, saving them significant money on interest expense. Corporate balance sheets are generally very healthy and are a cause of underlying strength in the markets this year. Though markets are always unpredictable, the economic backdrop currently appears constructive for American corporations.
As long-term investors, we are keeping an eye on the path of interest rates in the short term, but we will not allow this single data point to dictate our investment positioning. We view the potential increase in interest rates as evidence that the economy is recovering well from the pandemic swoon. So long as interest rates do not spike quickly beyond the expectations of market participants, our view is that rising US interest rates will have limited impact on the business fundamentals of the companies we follow.
Impact to Portfolio of Future Market Conditions:
The Fund is underweight several sectors, such as Financials, Utilities, Consumer Staples, and Biotech. In the case that these sectors show notable strength versus the overall market, the fund could underperform its benchmark, until the markets rotate to bring our currently favored sectors (including Technology, Communications Services, Healthcare, and Retail) back into favor.
Note that with the rise in overall interest rates, financial stocks have been one of the strongest performing sectors in the markets for 2021. We are not particularly bullish on the financial sector going forward, but we have been looking for novel ways to add exposure to the industry through financial technology companies. The so-called “FinTech” companies offer exposure to the financial industry while still offering the type of revenue growth that is central to the Left Brain philosophy.
As stated above, we do think much of the inflation concern could be temporary. That being said, we have been working diligently to look for new investments in the energy sector to take advantage of a now prolonged period of high energy prices. In this regard, we prefer pipeline operators and natural gas producers for the coming six months.
Portfolio Performance:
Please note: despite the fact that the Fund launch date was April 27, the Fund did not begin making trades on the account until June 1. As such, portfolio performance data stated below will reflect the period from June 1-August 31 for this semi-annual report only.
The following securities were the top 3 performers in the fund during the period ended August 31:
| (1) | Atlassian (TEAM): +47% |
As we mentioned above, uncertainty regarding the return to office (particularly in the US) has created a catalyst for companies like these above. TEAM produces collaboration software, which enhances productivity of employees not working in a physical office. In the wake of Covid, cyber-attacks have been on the rise, which is constructive for NET (services to increase security and performance of websites) and ZS (cloud-based information security).
The following securities were the 3 worst performers in the fund during the period ended August 31:
| (3) | PBF Energy (PBF) bond: -14% |
ROKU and ZM were two of the strongest performing stocks in 2020 as both were among the most direct beneficiaries of stay-at-home orders related to the pandemic. As investors have broadened their allocations to sectors previously out of favor (ex.: financials, retail, energy), these two stocks have performed poorly in 2021 and particularly in the most recent quarter. We continue to be believers in the long-term stories behind both businesses.
PBF Energy bonds have been weak since reporting a mixed earnings report in the month of July, as revenues topped estimates, but earnings came in below the consensus expectation. As the oil market continues to stabilize, we remain optimistic about the company’s fortunes.
Sincerely,
| Noland Langford | Brian Dress |
| | |
| CEO/Portfolio Manager | Director of Research/Portfolio Manager |
| | |
Past performance is not predictive of future performance. Investment results and principal value will fluctuate so that shares, when redeemed, may be worth more or less than their original cost. Current performance may be higher or lower than the performance data quoted. Performance data current to the most recent month-end is available by calling 1-833-498-2238.
An investor should consider the investment objectives, risks, charges, and expenses of the Fund carefully before investing. The Fund’s prospectus contains this and other important information. To obtain a copy of the Fund’s prospectus please call 1-833-498-2238 and a copy will be sent to you free of charge. Please read the prospectus carefully before you invest. The Fund is distributed by Ultimus Fund Distributors, LLC.
The Letter to Shareholders seeks to describe some of the Adviser’s current opinions and views of the financial markets. Although the Adviser believes it has a reasonable basis for any opinions or views expressed, actual results may differ, sometimes significantly so, from those expected or expressed. The securities held by the Fund that are discussed in the Letter to Shareholders were held during the period covered by this Report. They do not comprise the entire investment portfolio of the Fund, may be sold at any time, and may no longer be held by the Fund. For a complete list of securities held by the Fund as of August 31, 2021, please see the Schedule of Investments section of the semi-annual report. The opinions of the Fund’s adviser with respect to those securities may change at any time.
| LEFT BRAIN COMPOUND GROWTH FUND |
| PORTFOLIO INFORMATION |
| August 31, 2021 (Unaudited) |
| Bond Portfolio (4.6% of Net Assets) | | | | |
| | | | | | | |
| | | % of Corporate | | | | % of |
| Sector Breakdown | | Bond Portfolio | | Ten Largest Equity Holdings | | Net Assets |
| Consumer Discretionary | | 19.8% | | Zscaler, Inc. | | 4.0% |
| Industrials | | 18.1% | | NVIDIA Corporation | | 3.4% |
| Energy | | 15.5% | | Cleveland-Cliffs, Inc. | | 3.2% |
| Communications | | 15.4% | | HubSpot, Inc. | | 3.0% |
| Financials | | 13.1% | | Etsy, Inc. | | 3.0% |
| Consumer Staples | | 13.0% | | Square, Inc. - Class A | | 2.7% |
| Materials | | 5.1% | | Twilio, Inc. - Class A | | 2.7% |
| | | | | Veeva Systems, Inc. - Class A | | 2.6% |
| | | | | DocuSign, Inc. | | 2.6% |
| | | | | InMode Ltd. | | 2.5% |
| Equity Sector Concentration vs. the S&P 500 Index (79.7% of Net Assets) |
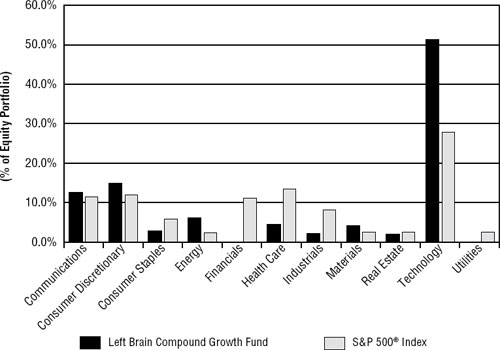
| LEFT BRAIN COMPOUND GROWTH FUND |
| SCHEDULE OF INVESTMENTS |
| August 31, 2021 (Unaudited) |
| CORPORATE BONDS — 4.6% | | Coupon | | Maturity | | Par Value | | | Value | |
| Communications — 0.7% | | | | | | | | | | | | |
| Liberty Media Corporation | | 8.500% | | 07/15/29 | | $ | 100,000 | | | $ | 114,000 | |
| | | | | | | | | | | | | |
| Consumer Discretionary — 0.9% | | | | | | | | | | | | |
| Bed Bath & Beyond, Inc. | | 4.915% | | 08/01/34 | | | 150,000 | | | | 146,437 | |
| | | | | | | | | | | | | |
| Consumer Staples — 0.6% | | | | | | | | | | | | |
| Rite Aid Corporation | | 7.700% | | 02/15/27 | | | 100,000 | | | | 96,000 | |
| | | | | | | | | | | | | |
| Energy — 0.7% | | | | | | | | | | | | |
| EnLink Midstream Partners, L.P. | | 5.600% | | 04/01/44 | | | 10,000 | | | | 9,500 | |
| PBF Holdings Company, LLC | | 7.250% | | 06/15/25 | | | 150,000 | | | | 105,000 | |
| | | | | | | | | | | | 114,500 | |
| Financials — 0.6% | | | | | | | | | | | | |
| Navient Corporation | | 5.625% | | 08/01/33 | | | 100,000 | | | | 96,875 | |
| | | | | | | | | | | | | |
| Industrials — 0.8% | | | | | | | | | | | | |
| American Airlines Group, Inc., 144A | | 3.750% | | 03/01/25 | | | 150,000 | | | | 133,515 | |
| | | | | | | | | | | | | |
| Materials — 0.3% | | | | | | | | | | | | |
| Cleveland-Cliffs, Inc. | | 6.250% | | 10/01/40 | | | 35,000 | | | | 38,238 | |
| | | | | | | | | | | | | |
| Total Corporate Bonds (Cost $753,475) | | | | | | | | | | $ | 739,565 | |
| COMMON STOCKS — 79.7% | | Shares | | | Value | |
| Communications — 10.0% | | | | | | | | |
| Advertising & Marketing — 2.1% | | | | | | | | |
| Trade Desk, Inc. (The) - Class A (a) | | | 4,150 | | | $ | 332,208 | |
| | | | | | | | | |
| Internet Media & Services — 7.9% | | | | | | | | |
| Airbnb, Inc. - Class A (a) | | | 2,250 | | | | 348,728 | |
| fuboTV, Inc. (a) | | | 10,000 | | | | 291,500 | |
| Roblox Corporation - Class A (a) | | | 2,800 | | | | 229,740 | |
| Roku, Inc. (a) | | | 1,100 | | | | 387,639 | |
| | | | | | | | 1,257,607 | |
| Consumer Discretionary — 11.8% | | | | | | | | |
| Consumer Services — 2.4% | | | | | | | | |
| Chegg, Inc. (a) | | | 4,500 | | | | 374,490 | |
| LEFT BRAIN COMPOUND GROWTH FUND |
| SCHEDULE OF INVESTMENTS (Continued) |
| COMMON STOCKS — 79.7% (Continued) | | Shares | | | Value | |
| Consumer Discretionary — 11.8% (Continued) | | | | | | | | |
| E-Commerce Discretionary — 3.0% | | | | | | | | |
| Etsy, Inc. (a) | | | 2,200 | | | $ | 475,772 | |
| | | | | | | | | |
| Leisure Facilities & Services — 2.2% | | | | | | | | |
| DraftKings, Inc. - Class A (a) | | | 6,000 | | | | 355,740 | |
| | | | | | | | | |
| Leisure Products — 2.3% | | | | | | | | |
| Axon Enterprise, Inc. (a) | | | 2,000 | | | | 363,740 | |
| | | | | | | | | |
| Retail - Discretionary — 1.9% | | | | | | | | |
| Cloudflare, Inc. - Class A (a) | | | 2,500 | | | | 301,850 | |
| | | | | | | | | |
| Consumer Staples — 2.2% | | | | | | | | |
| Beverages — 2.2% | | | | | | | | |
| Celsius Holdings, Inc. (a) | | | 4,200 | | | | 343,392 | |
| | | | | | | | | |
| Energy — 4.9% | | | | | | | | |
| Oil & Gas Producers — 2.7% | | | | | | | | |
| Energy Transfer, L.P. | | | 25,000 | | | | 232,500 | |
| Western Midstream Partners, L.P. | | | 10,000 | | | | 197,400 | |
| | | | | | | | 429,900 | |
| Renewable Energy — 2.2% | | | | | | | | |
| Enphase Energy, Inc. (a) | | | 2,000 | | | | 347,460 | |
| | | | | | | | | |
| Health Care — 3.6% | | | | | | | | |
| Health Care Facilities & Services — 1.1% | | | | | | | | |
| Teladoc Health, Inc. (a) | | | 1,200 | | | | 173,304 | |
| | | | | | | | | |
| Medical Equipment & Devices — 2.5% | | | | | | | | |
| InMode Ltd. (a) | | | 3,000 | | | | 392,640 | |
| | | | | | | | | |
| Industrials — 1.7% | | | | | | | | |
| Commercial Support Services — 1.7% | | | | | | | | |
| Avalara, Inc. (a) | | | 1,500 | | | | 269,550 | |
| | | | | | | | | |
| Materials — 3.2% | | | | | | | | |
| Metals & Mining — 3.2% | | | | | | | | |
| Cleveland-Cliffs, Inc. (a) | | | 22,000 | | | | 516,340 | |
| | | | | | | | | |
| Real Estate — 1.5% | | | | | | | | |
| REITs — 1.5% | | | | | | | | |
| Innovative Industrial Properties, Inc. | | | 1,000 | | | | 245,910 | |
| LEFT BRAIN COMPOUND GROWTH FUND |
| SCHEDULE OF INVESTMENTS (Continued) |
| COMMON STOCKS — 79.7% (Continued) | | Shares | | | Value | |
| Technology — 40.8% | | | | | | | | |
| Semiconductors — 5.1% | | | | | | | | |
| Advanced Micro Devices, Inc. (a) | | | 2,318 | | | $ | 256,649 | |
| NVIDIA Corporation | | | 2,400 | | | | 537,240 | |
| QUALCOMM, Inc. | | | 130 | | | | 19,070 | |
| | | | | | | | 812,959 | |
| Software — 28.7% | | | | | | | | |
| Atlassian Corporation plc - Class A (a) | | | 800 | | | | 293,648 | |
| CrowdStrike Holdings, Inc. - Class A (a) | | | 943 | | | | 264,983 | |
| DocuSign, Inc. (a) | | | 1,400 | | | | 414,736 | |
| HubSpot, Inc. (a) | | | 700 | | | | 479,129 | |
| MicroStrategy, Inc. - Class A (a) | | | 525 | | | | 364,508 | |
| Rapid7, Inc. (a) | | | 2,200 | | | | 267,344 | |
| Tenable Holdings, Inc. (a) | | | 5,400 | | | | 239,598 | |
| Twilio, Inc. - Class A (a) | | | 1,200 | | | | 428,352 | |
| Veeva Systems, Inc. - Class A (a) | | | 1,250 | | | | 414,975 | |
| Zendesk, Inc. (a) | | | 2,000 | | | | 247,200 | |
| Zoom Video Communications, Inc. - Class A (a) | | | 900 | | | | 260,550 | |
| ZoomInfo Technologies, Inc. - Class A (a) | | | 4,000 | | | | 260,760 | |
| Zscaler, Inc. (a) | | | 2,300 | | | | 640,181 | |
| | | | | | | | 4,575,964 | |
| Technology Hardware — 1.9% | | | | | | | | |
| Arista Networks, Inc. (a) | | | 800 | | | | 295,624 | |
| | | | | | | | | |
| Technology Services — 5.1% | | | | | | | | |
| Globant S.A. (a) | | | 1,200 | | | | 386,736 | |
| Square, Inc. - Class A (a) | | | 1,600 | | | | 428,912 | |
| | | | | | | | 815,648 | |
| | | | | | | | | |
| Total Common Stocks (Cost $11,921,643) | | | | | | $ | 12,680,098 | |
| LEFT BRAIN COMPOUND GROWTH FUND |
| SCHEDULE OF INVESTMENTS (Continued) |
| MONEY MARKET FUNDS — 15.5% | | Shares | | | Value | |
| Federated Hermes Government Obligations Fund - Institutional Class, 0.02% (b) (Cost $2,463,138) | | | 2,463,138 | | | $ | 2,463,138 | |
| | | | | | | | | |
| Investments at Value — 99.8% (Cost $15,138,256) | | | | | | $ | 15,882,801 | |
| | | | | | | | | |
| Other Assets in Excess of Liabilities — 0.2% | | | | | | | 31,260 | |
| | | | | | | | | |
| Net Assets — 100.0% | | | | | | $ | 15,914,061 | |
| (a) | Non-income producing security. |
| (b) | The rate shown is the 7-day effective yield as of August 31, 2021. |
144A - This security was purchased in a transaction exempt from registration in compliance with Rule 144A of the Securities Act of 1933. This security may be resold in transactions exempt from registration, normally to qualified institutional buyers. The total value of such securities is $133,515 as of August 31, 2021, representing 0.8% of net assets.
plc - Public Limited Company
S.A. - Societe Anonyme
See accompanying notes to financial statements.
| LEFT BRAIN COMPOUND GROWTH FUND |
| STATEMENT OF ASSETS AND LIABILITIES |
| August 31, 2021 (Unaudited) |
| ASSETS | | | |
| Investments in securities: | | | | |
| At cost | | $ | 15,138,256 | |
| At value (Note 2) | | $ | 15,882,801 | |
| Receivable for capital shares sold | | | 38,368 | |
| Dividends and interest receivable | | | 8,917 | |
| Other assets | | | 11,265 | |
| Total assets | | | 15,941,351 | |
| | | | | |
| LIABILITIES | | | | |
| Payable to Adviser (Note 4) | | | 316 | |
| Payable to administrator (Note 4) | | | 18,000 | |
| Other accrued expenses | | | 8,974 | |
| Total liabilities | | | 27,290 | |
| | | | | |
| NET ASSETS | | $ | 15,914,061 | |
| | | | | |
| NET ASSETS CONSIST OF: | | | | |
| Paid-in capital | | $ | 15,271,250 | |
| Accumulated earnings | | | 642,811 | |
| NET ASSETS | | $ | 15,914,061 | |
| | | | | |
| Shares of beneficial interest outstanding (unlimited number of shares authorized, no par value) | | | 593,080 | |
| | | | | |
| Net asset value, offering and redemption price per share (Note 2) | | $ | 26.83 | |
See accompanying notes to financial statements.
| LEFT BRAIN COMPOUND GROWTH FUND |
| STATEMENT OF OPERATIONS |
| For the Period Ended August 31, 2021(a) (Unaudited) |
| INVESTMENT INCOME | | | | |
| Dividends | | $ | 7,283 | |
| Interest | | | 8,615 | |
| Total investment income | | | 15,898 | |
| | | | | |
| EXPENSES | | | | |
| Management fees (Note 4) | | | 56,010 | |
| Legal fees | | | 24,610 | |
| Administration fees (Note 4) | | | 14,667 | |
| Registration and filing fees | | | 9,316 | |
| Trustees’ fees (Note 4) | | | 6,675 | |
| Transfer agent fees (Note 4) | | | 6,200 | |
| Compliance fees (Note 4) | | | 4,133 | |
| Custodian and bank service fees | | | 2,008 | |
| Printing of shareholder reports | | | 1,540 | |
| Postage and supplies | | | 1,369 | |
| Insurance expense | | | 576 | |
| Other expenses | | | 3,787 | |
| Total expenses | | | 130,891 | |
| Less fee reductions and expense reimbursements by the Adviser (Note 4) | | | (74,881 | ) |
| Net expenses | | | 56,010 | |
| | | | | |
| NET INVESTMENT LOSS | | | (40,112 | ) |
| | | | | |
| REALIZED AND UNREALIZED GAINS (LOSSES) ON INVESTMENTS | | | | |
| Net realized losses on investments transactions | | | (61,622 | ) |
| Net change in unrealized appreciation (depreciation) on investments | | | 744,545 | |
| NET REALIZED AND UNREALIZED GAINS ON INVESTMENTS | | | 682,923 | |
| | | | | |
| NET INCREASE IN NET ASSETS RESULTING FROM OPERATIONS | | $ | 642,811 | |
| (a) | Represents the period from the commencement of operations (April 27, 2021) through August 31, 2021. |
See accompanying notes to financial statements.
| LEFT BRAIN COMPOUND GROWTH FUND |
| STATEMENT OF CHANGES IN NET ASSETS |
| | | Period | |
| | | Ended | |
| | | August 31, | |
| | | 2021(a) | |
| | | (Unaudited) | |
| FROM OPERATIONS | | | | |
| Net investment loss | | $ | (40,112 | ) |
| Net realized losses from investment transactions | | | (61,622 | ) |
| Net change in unrealized appreciation (depreciation) on investments | | | 744,545 | |
| Net increase in net assets resulting from operations | | | 642,811 | |
| | | | | |
| FROM CAPITAL SHARE TRANSACTIONS | | | | |
| Proceeds from shares sold | | | 15,453,340 | |
| Payments for shares redeemed | | | (182,090 | ) |
| Net increase in net assets from capital share transactions | | | 15,271,250 | |
| | | | | |
| TOTAL INCREASE IN NET ASSETS | | | 15,914,061 | |
| | | | | |
| NET ASSETS | | | | |
| Beginning of period | | | — | |
| End of period | | $ | 15,914,061 | |
| | | | | |
| CAPITAL SHARES ACTIVITY | | | | |
| Shares sold | | | 600,108 | |
| Shares redeemed | | | (7,028 | ) |
| Net increase in shares outstanding | | | 593,080 | |
| Shares outstanding, beginning of period | | | — | |
| Shares outstanding, end of period | | | 593,080 | |
| (a) | Represents the period from the commencement of operations (April 27, 2021) through August 31, 2021. |
See accompanying notes to financial statements.
| LEFT BRAIN COMPOUND GROWTH FUND |
| FINANCIAL HIGHLIGHTS |
| |
| Per Share Data for a Share Outstanding Throughout the Period |
| | | Period | |
| | | Ended | |
| | | August 31, | |
| | | 2021(a) | |
| | | (Unaudited) | |
| Net asset value at beginning of period | | $ | 25.00 | |
| | | | | |
| Income (loss) from investment operations: | | | | |
| Net investment loss | | | (0.07 | ) |
| Net realized and unrealized gains on investments | | | 1.90 | |
| Total from investment operations | | | 1.83 | |
| | | | | |
| Net asset value at end of period | | $ | 26.83 | |
| | | | | |
| Total return (b) | | | 7.32 | % (c) |
| | | | | |
| Net assets at end of period (000’s) | | $ | 15,914 | |
| | | | | |
| Ratios/supplementary data: | | | | |
| Ratio of total expenses to average net assets | | | 4.67 | % (d) |
| Ratio of net expenses to average net assets (e) | | | 2.00 | % (d) |
| Ratio of net investment loss to average net assets (e) | | | (1.43 | %) (d) |
| Portfolio turnover rate | | | 16 | % (c) |
| (a) | Represents the period from the commencement of operations (April 27, 2021) through August 31, 2021. |
| (b) | Total return is a measure of the change in value of an investment in the Fund over the period covered. The return shown does not reflect the deduction of taxes a shareholder would pay on Fund distributions, if any, or the redemption of Fund shares. The total return would be lower if the Adviser had not reduced fees and reimbursed expenses (Note 4). |
| (e) | Ratio was determined after management fee reductions and expense reimbursements (Note 4). |
See accompanying notes to financial statements.
| LEFT BRAIN COMPOUND GROWTH FUND |
| NOTES TO FINANCIAL STATEMENTS |
| August 31, 2021 (Unaudited) |
| |
Left Brain Compound Growth Fund (the “Fund”) is a non-diversified series of Ultimus Managers Trust (the “Trust”). The Trust is an open-end management investment company established as an Ohio business trust under a Declaration of Trust dated February 28, 2012. Other series of the Trust are not incorporated in this report. The Fund commenced operations on April 27, 2021.
The investment objective of the Fund is to seek to achieve long-term capital appreciation.
| 2. | Significant Accounting Policies |
The Fund follows accounting and reporting guidance under Financial Accounting Standards Board Accounting Standards Codification Topic 946, “Financial Services – Investment Companies.” The following is a summary of the Fund’s significant accounting policies used in the preparation of its financial statements. These policies are in conformity with accounting principles generally accepted in the United States of America (“GAAP”).
Securities valuation – The Fund values its portfolio securities at market value as of the close of regular trading on the New York Stock Exchange (the “NYSE”) (normally 4:00 p.m. Eastern time) on each business day the NYSE is open for business. The Fund values its listed securities on the basis of the security’s last sale price on the security’s primary exchange, if available, otherwise at the exchange’s most recently quoted mean price. NASDAQ-listed securities are valued at the NASDAQ Official Closing Price. Investments representing shares of other registered open-end investment companies that are not listed on an exchange, including money market funds, are valued at their net asset value (“NAV”) as reported by such companies. When using a quoted price and when the market is considered active, the security will be classified as Level 1 within the fair value hierarchy (see below). The Fund’s fixed income securities are generally valued using prices provided by an independent pricing service approved by the Board of Trustees of the Trust (the “Board”). The independent pricing service uses information with respect to transactions in bonds, quotations from bond dealers, market transactions in comparable securities, and various relationships between securities in determining these prices. In the event that market quotations are not readily available or are considered unreliable due to market or other events, the Fund values its securities and other assets at fair value in accordance with procedures established by and under the general supervision of the Board. Under these procedures, the securities will be classified as Level 2 or 3 within the fair value hierarchy, depending on the inputs used. Unavailable or unreliable market quotes may be due to the following factors: a substantial bid-ask spread; infrequent sales resulting in stale prices; insufficient trading volume; small trade sizes; a temporary lapse in any reliable pricing source; and actions of the securities or futures markets, such as the suspension or limitation of trading. As a result, the prices of securities used to calculate the Fund’s NAV may differ from quoted or published prices for the same securities.
GAAP establishes a single authoritative definition of fair value, sets out a framework for measuring fair value, and requires additional disclosures about fair value measurements.
| LEFT BRAIN COMPOUND GROWTH FUND |
| NOTES TO FINANCIAL STATEMENTS (Continued) |
| |
Various inputs are used in determining the value of the Fund’s investments. These inputs are summarized in the three broad levels listed below:
| ● | Level 1 – quoted prices in active markets for identical securities |
| ● | Level 2 – other significant observable inputs |
| ● | Level 3 – significant unobservable inputs |
Fixed income securities held by the Fund are classified as Level 2 since values are based on prices provided by an independent pricing service that utilizes various “other significant observable inputs” including bid and ask quotations, prices of similar securities, and interest rates, among other factors.
The inputs or methods used for valuing securities are not necessarily an indication of the risks associated with investing in those securities. The inputs used to measure fair value may fall into different levels of the fair value hierarchy. In such cases, for disclosure purposes, the level in the fair value hierarchy within which the fair value measurement falls in its entirety is determined based on the lowest level input that is significant to the fair value measurement.
The following is a summary of the Fund’s investments based on the inputs used to value the investments as of August 31, 2021, by security type:
| | | Level 1 | | | Level 2 | | | Level 3 | | | Total | |
| Corporate Bonds | | $ | — | | | $ | 739,565 | | | $ | — | | | $ | 739,565 | |
| Common Stocks | | | 12,680,098 | | | | — | | | | — | | | | 12,680,098 | |
| Money Market Funds | | | 2,463,138 | | | | — | | | | — | | | | 2,463,138 | |
| Total | | $ | 15,143,236 | | | $ | 739,565 | | | $ | — | | | $ | 15,882,801 | |
| | | | | | | | | | | | | | | | | |
| | | | | | | | | | | | | | | | | |
Refer to the Fund’s Schedule of Investments for a listing of the corporate bonds and common stocks by sector and/or industry type. The Fund did not hold any derivative instruments or any assets or liabilities that were measured at fair value on a recurring basis using significant unobservable inputs (Level 3) as of or during the period ended August 31, 2021.
Share valuation – The NAV per share of the Fund is calculated daily by dividing the total value of the Fund’s assets, less liabilities, by the number of shares outstanding. The offering price and redemption price per share of the Fund is equal to the NAV per share.
Investment income – Dividend income is recorded on the ex-dividend date. Non-cash dividends included in dividend income, if any, are recorded at the fair market value of the security received. Interest income is accrued as earned. Withholding taxes on foreign dividends, if any, have been recorded in accordance with the Fund’s understanding of the applicable country’s tax rules and rates. Interest income is accrued as earned. Discounts and premiums on fixed income securities purchased are accreted or amortized using the effective interest method.
Investment transactions – Investment transactions are accounted for on the trade date. Realized gains and losses on investments sold are determined on a specific identification basis.
| LEFT BRAIN COMPOUND GROWTH FUND |
| NOTES TO FINANCIAL STATEMENTS (Continued) |
| |
Common expenses – Common expenses of the Trust are allocated among the Fund and the other series of the Trust based on the relative net assets of each series, the number of series in the Trust, or the nature of the services performed and the relative applicability to each series.
Distributions to shareholders – The Fund distributes to shareholders any net investment income dividends and net realized capital gains on an annual basis. The amount of such dividends and distributions are determined in accordance with federal income tax regulations, which may differ from GAAP. Dividends and distributions to shareholders are recorded on the ex-dividend date. There were no distributions paid to shareholders by the Fund during the period ended August 31, 2021.
Estimates – The preparation of financial statements in conformity with GAAP requires management to make estimates and assumptions that affect the reported amounts of assets and liabilities and disclosure of contingent assets and liabilities as of the date of the financial statements and the reported amounts of increase (decrease) in net assets from operations during the reporting period. Actual results could differ from those estimates.
Federal income tax – The Fund intends to qualify as a regulated investment company under the Internal Revenue Code of 1986, as amended (the “Code”). Qualification generally will relieve the Fund of liability for federal income taxes to the extent 100% of its net investment income and net realized capital gains are distributed in accordance with the Code.
In order to avoid imposition of the excise tax applicable to regulated investment companies, it is also the Fund’s intention to declare as dividends in each calendar year equal to at least 98% of its net investment income (earned during the calendar year) and 98.2% of its net realized capital gains (earned during the twelve months ended October 31) plus undistributed amounts from prior years.
The following information is computed on a tax basis for each item as of August 31, 2021:
| Tax cost of portfolio investments | | $ | 15,138,256 | |
| Gross unrealized appreciation | | $ | 1,119,059 | |
| Gross unrealized depreciation | | | (374,514 | ) |
| Net unrealized appreciation | | | 744,545 | |
| Accumulated ordinary loss | | | (40,112 | ) |
| Other losses | | | (61,622 | ) |
| Accumulated earnings | | $ | 642,811 | |
| | | | | |
| | | | | |
The Fund recognizes the tax benefits or expenses of uncertain tax positions only when the position is “more likely than not” of being sustained assuming examination by tax authorities. Management has reviewed the Fund’s tax positions for the current tax year and has concluded that no provision for unrecognized tax benefits or expenses is required in these financial statements. The Fund identifies its major tax jurisdiction as U.S. Federal.
The Fund recognizes interest and penalties, if any, related to unrecognized tax benefits as income tax on the Statement of Operations. During the period ended August 31, 2021, the Fund did not incur any interest or penalties.
| LEFT BRAIN COMPOUND GROWTH FUND |
| NOTES TO FINANCIAL STATEMENTS (Continued) |
| |
| 3. | Investment Transactions |
During the period ended August 31, 2021, cost of purchases and proceeds from sales of investment securities, other than short-term investments, amounted to $13,383,089 and $647,654, respectively.
| 4. | Transactions with Related Parties |
INVESTMENT ADVISORY AGREEMENT
The Fund’s investments are managed by Left Brain Wealth Management, LLC (the “Adviser”) pursuant to the terms of an Investment Advisory Agreement. The Fund pays the Adviser a management fee, computed and accrued daily and paid monthly, at the annual rate of 2.00% of average daily net assets.
Pursuant to an Expense Limitation Agreement (“ELA”) between the Fund and the Adviser, the Adviser has agreed contractually, until June 30, 2024, to reduce its management fees and reimburse other expenses to the extent necessary to limit total annual fund operating expenses (exclusive of brokerage costs, taxes, interest, borrowing costs such as interest and dividend expenses on securities sold short, costs to organize the Fund, acquired fund fees and expenses, extraordinary expenses such as litigation and merger or reorganization costs and other expenses not incurred in the ordinary course of the Fund’s business) to an amount not exceeding 2.00% of the Fund’s average daily net assets. Accordingly, during the period ended August 31, 2021, the Adviser did not collect any of its management fees and reimbursed other operating expenses totaling $18,871.
Under the terms of the ELA, management fee reductions and/or expense reimbursements by the Adviser are subject to repayment by the Fund for a period of three years after such date that fees and expenses were incurred, provided that the repayments do not cause total annual fund operating expenses to exceed (i) the expense limitation then in effect, if any, and (ii) the expense limitation in effect at the time the expenses to be repaid were incurred. Prior to June 30, 2024, this agreement may not be modified or terminated without the approval of the Fund’s Board. This agreement will terminate automatically if the Fund’s investment advisory agreement with the Adviser is terminated. As of August 31, 2021, the Adviser may seek repayment of management fee reductions in the amount of $74,881 no later than August 31, 2024.
OTHER SERVICE PROVIDERS
Ultimus Fund Solutions, LLC (“Ultimus”) provides administration, fund accounting, compliance and transfer agency services to the Fund. The Fund pays Ultimus fees in accordance with the agreements for such services. In addition, the Fund pays out-of-pocket expenses including, but not limited to, postage, supplies and certain costs related to the pricing of the Fund’s portfolio securities.
Under the terms of a Distribution Agreement with the Trust, Ultimus Fund Distributors, LLC (the “Distributor”) serves as principal underwriter to the Fund. The Distributor is a wholly-owned subsidiary of Ultimus. The Distributor is compensated by the Adviser (not the Fund) for acting as principal underwriter.
Certain officers and a Trustee of the Trust are also officers of Ultimus.
| LEFT BRAIN COMPOUND GROWTH FUND |
| NOTES TO FINANCIAL STATEMENTS (Continued) |
| |
TRUSTEE COMPENSATION
Each Trustee who is not an “interested person” of the Trust (“Independent Trustee”) receives a $1,300 annual retainer from the Fund, paid quarterly, except for the Board Chairperson who receives a $1,500 annual retainer from the Fund, paid quarterly. Each Independent Trustee also receives from the Fund a fee of $500 for each Board meeting attended plus reimbursement for travel and other meeting-related expenses.
PRINCIPAL HOLDER OF FUND SHARES
As of August 31, 2021, the following shareholder owned of record more than 25% of the outstanding shares of the Fund:
| Name of Record Owner | | % Ownership |
| TD Ameritrade, Inc. (for the benefit of its customers) | | 100% |
| | | |
A beneficial owner of 25% or more of the Fund’s outstanding shares may be considered a controlling person. That shareholder’s vote could have a more significant effect on matters presented at a shareholders’ meeting.
| 5. | Contingencies and Commitments |
The Fund indemnifies the Trust’s officers and Trustees for certain liabilities that might arise from their performance of their duties to the Fund. Additionally, in the normal course of business the Fund enters into contracts that contain a variety of representations and warranties and which provide general indemnifications. The Fund’s maximum exposure under these arrangements is unknown, as this would involve future claims that may be made against the Fund that have not yet occurred. However, based on experience, the Fund expects the risk of loss to be remote.
If a Fund has significant investments in the securities of issuers within a particular sector, any development affecting that sector will have a greater impact on the value of the net assets of the Fund than would be the case if the Fund did not have significant investments in that sector. In addition, this may increase the risk of loss in the Fund and increase the volatility of the Fund’s NAV per share. Occasionally, market conditions, regulatory changes or other developments may negatively impact a particular sector. As of August 31, 2021, the Fund had 40.8% of the value of its net assets invested in stocks within the Technology sector.
| LEFT BRAIN COMPOUND GROWTH FUND |
| NOTES TO FINANCIAL STATEMENTS (Continued) |
| |
| 7. | Non-Diversification Risk |
The Fund is a non-diversified Fund. As a result, the Fund’s holdings may be more concentrated in a limited number of securities and the value of its shares may be more sensitive than a diversified fund to any single economic, business, political, or regulatory occurrence.
The Fund is required to recognize in the financial statements the effects of all subsequent events that provide additional evidence about conditions that existed as of the date of the Statement of Assets and Liabilities. For non-recognized subsequent events that must be disclosed to keep the financial statements from being misleading, the Fund is required to disclose the nature of the event as well as an estimate of its financial effect, or a statement that such an estimate cannot be made. Management has evaluated subsequent events through the issuance of these financial statements and has noted no such events.
| LEFT BRAIN COMPOUND GROWTH FUND |
| ABOUT YOUR FUND’S EXPENSES (Unaudited) |
| |
We believe it is important for you to understand the impact of costs on your investment. As a shareholder of the Fund, you incur ongoing costs, including management fees, and other operating expenses. The following examples are intended to help you understand your ongoing costs (in dollars) of investing in the Fund and to compare these costs with the ongoing costs of investing in other mutual funds.
A mutual fund’s ongoing costs are expressed as a percentage of its average net assets. This figure is known as the expense ratio. The expenses in the table below are based on an investment of $1,000 made at the beginning of the most recent period (April 27, 2021) and held until the end of the period (August 31, 2021).
The table below illustrates the Fund’s ongoing costs in two ways:
Actual fund return – This section helps you to estimate the actual expenses that you paid over the period. The “Ending Account Value” shown is derived from the Fund’s actual return, and the fourth column shows the dollar amount of operating expenses that would have been paid by an investor who started with $1,000 in the Fund. You may use the information here, together with the amount you invested, to estimate the expenses that you paid over the period.
To do so, simply divide your account value by $1,000 (for example, an $8,600 account value divided by $1,000 = 8.6), then multiply the result by the number given for the Fund under the heading “Expenses Paid During Period.”
Hypothetical 5% return – This section is intended to help you compare the Fund’s ongoing costs with those of other mutual funds. It assumes that the Fund had an annual return of 5% before expenses during the period shown, but that the expense ratio is unchanged. In this case, because the return used is not the Fund’s actual return, the results do not apply to your investment. The example is useful in making comparisons because the U.S. Securities and Exchange Commission (the “SEC”) requires all mutual funds to calculate expenses based on a 5% return. You can assess the Fund’s ongoing costs by comparing this hypothetical example with the hypothetical examples that appear in shareholder reports of other funds.
Note that expenses shown in the table are meant to highlight and help you compare ongoing costs only. The Fund does not charge transaction fees, such as purchase or redemption fees, nor does it carry a “sales load.”
The calculations assume no shares were bought or sold during the period. Your actual costs may have been higher or lower, depending on the amount of your investment and the timing of any purchases or redemptions.
More information about the Fund’s expenses can be found in this report. For additional information on operating expenses and other shareholder costs, please refer to the Fund’s prospectus.
| LEFT BRAIN COMPOUND GROWTH FUND |
| ABOUT YOUR FUND’S EXPENSES (Unaudited) (Continued) |
| | Beginning | Ending | | |
| | Account Value | Account Value | Net | Expenses Paid |
| | March 1, | August 31, | Expense | During |
| | 2021 (a) | 2021 | Ratio (b) | Period (c) |
| Based on Actual Fund Return | $1,000.00 | $1,073.20 | 2.00% | $7.16 |
| Based on Hypothetical 5% Return (before expenses) | $1,000.00 | $1,015.12 | 2.00% | $10.16 |
| | | | | |
| (a) | Beginning Account Value is as of April 27, 2021 (date of commencement of operations) for the Actual Fund Return information. |
| (b) | Annualized, based on the Fund’s expenses during the period since the commencement of operations. |
| (c) | Expenses are equal to the Fund’s annualized net expense ratio multiplied by the average account value over the period, multiplied by 126/365 (to reflect the period since inception) and 184/365 (to reflect the one-half year period), for Actual Fund Return and Hypothetical 5% Return information, respectively. |
| OTHER INFORMATION (Unaudited) |
| |
A description of the policies and procedures that the Fund uses to vote proxies relating to portfolio securities is available without charge upon request by calling toll-free 1-833-498-2238, or on the SEC’s website at www.sec.gov. Information regarding how the Fund voted proxies relating to portfolio securities during the most recent period ended June 30 is available without charge upon request by calling toll-free 1-833-498-2238, or on the SEC’s website at www.sec.gov.
The Trust files a complete listing of portfolio holdings for the Fund with the SEC as of the end of the first and third quarters of each fiscal year as an exhibit to Form N-PORT. These filings are available upon request by calling 1-833-498-2238. Furthermore, you may obtain a copy of the filings on the SEC’s website at www.sec.gov.
| LEFT BRAIN COMPOUND GROWTH FUND |
| DISCLOSURE REGARDING APPROVAL OF |
| INVESTMENT ADVISORY AGREEMENT |
| (Unaudited) |
| |
The Board of Trustees (the “Board”), including the Independent Trustees voting separately, reviewed and approved the Fund’s Investment Advisory Agreement (the “Agreement”) with Left Brain Wealth Management, LLC (the “Adviser” or “Left Brain”) for an initial two-year term. The Board approved the Agreement at a meeting held on April 19, 20 and 21, 2021 (“Meeting”), at which all of the Trustees were present.
Legal counsel advised the Board during its deliberations. Additionally, the Board received and reviewed a substantial amount of information provided by the Adviser in response to requests of the Board and counsel. In considering whether to approve the Agreement and in reaching its conclusions with respect thereto, the Board reviewed and analyzed various factors that it determined were relevant to the Agreement, including the following factors.
The nature, extent, and quality of the services provided by the Adviser. In this regard, the Board considered the responsibilities Left Brain would have under the Agreement for the Fund. The Board also considered the proposed services that Left Brain would provide to the Fund including, without limitation, Left Brain’s procedures for formulating investment recommendations and assuring compliance with the Fund’s investment objective and limitations, and Left Brain compliance procedures and practices. The Board considered the qualifications and experience of Left Brain’s portfolio managers who are responsible for the day to day management of the Fund, as well as, the qualifications and experience of the other individuals at Left Brain who will provide services to the Fund. The Board concluded that the quality, extent, and nature of the services to be provided by Left Brain to the Fund were satisfactory and adequate.
The costs of the services provided and profits realized by the Adviser and its affiliates from their relationship with the Fund. In this regard, the Board considered Left Brain’s staffing for the Fund, methods of operation, the projected asset levels of the Fund, and the overall expenses of the Fund, including the advisory fee. The Board reviewed the Fund’s expense limitation agreement (the “ELA”) and noted the benefit to the Fund from Left Brain’s commitment to reduce its advisory fee and reimburse other operating expenses through June 30, 2024. The Board discussed Left Brain’s financial condition and its ability to satisfy its financial commitments to the Fund.
The Board also considered potential benefits for Left Brain in managing the Fund, including promotion of Left Brain’s name.
The Board compared the Fund’s proposed advisory fee and overall expense ratio to other funds in a custom peer group and considered the projected size of the Fund as compared to those other funds. The Board noted that the Fund’s proposed advisory fee of 2.00% is above the average and median of the advisory fee rates of the other funds in its custom peer group and its proposed overall annual expense ratio of 2.00% is above the average and median expense ratios of the funds for its custom peer group, but lower than the highest expense ratio referenced in the custom peer group. The Board also compared the proposed advisory fee for the Fund to the advisory fee paid by other clients of Left Brain and considered the similarities and differences of the services received by the other clients of Left Brain to the proposed services to be received by the Fund.
| LEFT BRAIN COMPOUND GROWTH FUND |
| DISCLOSURE REGARDING APPROVAL OF |
| INVESTMENT ADVISORY AGREEMENT |
| (Unaudited) (Continued) |
| |
The Board noted that the fee structure applicable to Left Brain’s other clients were not indicative of any unreasonableness with the respect to the advisory fee proposed for the Fund. Upon further consideration and discussion of the foregoing, the Board concluded that the proposed advisory fee and total expense limit for the Fund were reasonable in light of the nature and quality of services to be provided by Left Brain.
The extent to which the Left Brain Fund and its investors would benefit from economies of scale. In this regard, the Board considered the Agreement and the ELA. The Board determined that while the proposed advisory fee rate was flat and would stay the same as asset levels increased, the shareholders of the Fund would benefit from the ELA at all asset levels, since the advisory fee was equal to the expense cap. Following further discussion of the Fund’s projected asset levels, expectations for growth, and level of fees, the Board determined that the Fund’s fee arrangements with Left Brain would provide benefits to the Fund during the initial two year term, and the Board could review the arrangements going forward as necessary. After further discussion, the Board concluded that the advisory fee was reasonable in light of the information that was provided to the Trustees by the Left Brain with respect to economies of scale.
After further discussion of the factors noted above and in reliance of the information provided by the Adviser and Trust Management and taking into account the totality of all factors discussed and information presented, the Board indicated its desire to approve the Agreement. It was noted that in the Trustees’ deliberations regarding the approval of the Agreement, the Trustees did not identify any particular information or factor that was all-important or controlling, and that each individual Trustee may have attributed different weights to the various factors listed above. After full consideration of the above factors as well as other factors, the Board unanimously concluded that approval of the Agreement was in the best interests of the Fund and its shareholders.
| FACTS | WHAT DOES THE LEFT BRAIN COMPOUND GROWTH FUND (the “Fund”) DO WITH YOUR PERSONAL INFORMATION? |
| | |
| Why? | Financial companies choose how they share your personal information. Federal law gives consumers the right to limit some but not all sharing. Federal law also requires us to tell you how we collect, share, and protect your personal information. Please read this notice carefully to understand what we do. |
| | |
| What? | The types of personal information we collect and share depend on the product or service you have with us. This information can include: ■ Social Security number ■ Assets ■ Retirement Assets ■ Transaction History ■ Checking Account Information ■ Purchase History ■ Account Balances ■ Account Transactions ■ Wire Transfer Instructions When you are no longer our customer, we continue to share your information as described in this notice. |
| | |
| How? | All financial companies need to share your personal information to run their everyday business. In the section below, we list the reasons financial companies can share their customers’ personal information; the reasons the Fund chooses to share; and whether you can limit this sharing. |
| Reasons we can share your personal information | Does the
Fund share? | Can you limit
this sharing? |
For our everyday business purposes –
Such as to process your transactions, maintain your account(s), respond to court orders and legal investigations, or report to credit bureaus | Yes | No |
For our marketing purposes –
to offer our products and services to you | No | We don’t share |
| For joint marketing with other financial companies | No | We don’t share |
For our affiliates’ everyday business purposes –
information about your transactions and experiences | No | We don’t share |
For our affiliates’ everyday business purposes –
information about your creditworthiness | No | We don’t share |
| For nonaffiliates to market to you | No | We don’t share |
| Questions? | Call 833-498-2238 |
| Who we are |
| Who is providing this notice? | Left Brain Compound Growth Fund Ultimus Fund Distributors, LLC (Distributor) Ultimus Fund Solutions, LLC (Administrator) |
| What we do |
| How does the Fund protect my personal information? | To protect your personal information from unauthorized access and use, we use security measures that comply with federal law. These measures include computer safeguards and secured files and buildings. Our service providers are held accountable for adhering to strict policies and procedures to prevent any misuse of your nonpublic personal information. |
| How does the Fund collect my personal information? | We collect your personal information, for example, when you ■ Open an account ■ Provide account information ■ Give us your contact information ■ Make deposits or withdrawals from your account ■ Make a wire transfer ■ Tell us where to send the money ■ Tell us who receives the money ■ Show your government-issued ID ■ Show your driver’s license We also collect your personal information from other companies. |
| Why can’t I limit all sharing? | Federal law gives you the right to limit only ■ Sharing for affiliates’ everyday business purposes – information about your creditworthiness ■ Affiliates from using your information to market to you ■ Sharing for nonaffiliates to market to you State laws and individual companies may give you additional rights to limit sharing. |
| | |
| Definitions |
| Affiliates | Companies related by common ownership or control. They can be financial and nonfinancial companies. ■ Left Brain Wealth Management, LLC, the investment adviser to the Fund, could be deemed to be an affiliate. |
| Nonaffiliates | Companies not related by common ownership or control. They can be financial and nonfinancial companies ■ The Fund does not share with nonaffiliates so they can market to you. |
| Joint marketing | A formal agreement between nonaffiliated financial companies that together market financial products or services to you. ■ The Fund does not jointly market. |
(b). Not applicable
Item 2. Code of Ethics.
Not required
Item 3. Audit Committee Financial Expert.
Not required
Item 4. Principal Accountant Fees and Services.
Not required
Item 5. Audit Committee of Listed Registrants.
Not applicable
Item 6. Schedule of Investments.
| (a) | Not applicable [schedule filed with Item 1] |
Item 7. Disclosure of Proxy Voting Policies and Procedures for Closed-End Management Investment Companies.
Not applicable
| Item 8. | Portfolio Managers of Closed-End Management Investment Companies. |
Not applicable
Item 9. Purchases of Equity Securities by Closed-End Management Investment Company and Affiliated Purchasers.
Not applicable
Item 10. Submission of Matters to a Vote of Security Holders.
The registrant’s Committee of Independent Trustees shall review shareholder recommendations for nominations to fill vacancies on the registrant’s board of trustees if such recommendations are submitted in writing and addressed to the Committee at the registrant’s offices. The Committee may adopt, by resolution, a policy regarding its procedures for considering candidates for the board of trustees, including any recommended by shareholders.
Item 11. Controls and Procedures.
(a) Based on their evaluation of the registrant’s disclosure controls and procedures (as defined in Rule 30a-3(c) under the Investment Company Act of 1940) as of a date within 90 days of the filing date of this report, the registrant’s principal executive officer and principal financial officer have concluded that such disclosure controls and procedures are reasonably designed and are operating effectively to ensure that material information relating to the registrant, including its consolidated subsidiaries, is made known to them by others within those entities, particularly during the period in which this report is being prepared, and that the information required in filings on Form N-CSR is recorded, processed, summarized, and reported on a timely basis.
(b) There were no changes in the registrant’s internal control over financial reporting (as defined in Rule 30a-3(d) under the Investment Company Act of 1940) that occurred during the the period covered by this report that have materially affected, or are reasonably likely to materially affect, the registrant’s internal control over financial reporting.
Item 12. Disclosure of Securities Lending Activities for Closed-End Management Investment Companies.
Not applicable
File the exhibits listed below as part of this Form. Letter or number the exhibits in the sequence indicated.
(a)(1) Any code of ethics, or amendment thereto, that is the subject of the disclosure required by Item 2, to the extent that the registrant intends to satisfy the Item 2 requirements through filing of an exhibit: Not required
(a)(2) A separate certification for each principal executive officer and principal financial officer of the registrant as required by Rule 30a-2(a) under the Act (17 CFR 270.30a-2(a)): Attached hereto
(a)(3) Any written solicitation to purchase securities under Rule 23c-1 under the Act (17 CFR 270.23c-1) sent or given during the period covered by the report by or on behalf of the registrant to 10 or more persons: Not applicable
(a)(4) Change in the registrant’s independent public accountants: Not applicable
(b) Certifications required by Rule 30a-2(b) under the Act (17 CFR 270.30a-2(b)): Attached hereto
Exhibit 99.CERT Certifications required by Rule 30a-2(a) under the Act
Exhibit 99.906CERT Certifications required by Rule 30a-2(b) under the Act
SIGNATURES
Pursuant to the requirements of the Securities Exchange Act of 1934 and the Investment Company Act of 1940, the registrant has duly caused this report to be signed on its behalf by the undersigned, thereunto duly authorized.
| (Registrant) | Ultimus Managers Trust | | |
| | | | |
| By (Signature and Title)* | /s/ David K. James | |
| | | David K. James, Secretary | |
| | | | |
| Date | November 1, 2021 | | |
| | | | |
| Pursuant to the requirements of the Securities Exchange Act of 1934 and the Investment Company Act of 1940, this report has been signed below by the following persons on behalf of the registrant and in the capacities and on the dates indicated. |
| | | |
| By (Signature and Title)* | /s/ Todd E. Heim |
| | | Todd E. Heim, Principal Executive Officer |
| | | |
| Date | November 1, 2021 | |
| | | |
| By (Signature and Title)* | /s/ Jennifer L. Leamer |
| | | Jennifer L. Leamer, Treasurer and Principal Financial Officer |
| | | |
| Date | November 1, 2021 | |
* Print the name and title of each signing officer under his or her signature.