| OMB APPROVAL |
OMB Number: 3235-0570 Expires: July 31, 2022 Estimated average burden hours per response: 20.6 |
UNITED STATES
SECURITIES AND EXCHANGE COMMISSION
Washington, D.C. 20549
FORM N-CSR
CERTIFIED SHAREHOLDER REPORT OF REGISTERED
MANAGEMENT INVESTMENT COMPANY
| Investment Company Act file number | 811-22680 | |
| Ultimus Managers Trust |
| (Exact name of registrant as specified in charter) |
| 225 Pictoria Drive, Suite 450 Cincinnati, Ohio | 45246 |
| (Address of principal executive offices) | (Zip code) |
Matthew J. Beck, Esq.
| Ultimus Fund Solutions, LLC 225 Pictoria Drive, Suite 450 Cincinnati, Ohio 45246_ |
| (Name and address of agent for service) |
| Registrant's telephone number, including area code: | (513) 587-3400 | |
| Date of fiscal year end: | August 31 | |
| | | |
| Date of reporting period: | February 28, 2021 | |
Form N-CSR is to be used by management investment companies to file reports with the Commission not later than 10 days after the transmission to stockholders of any report that is required to be transmitted to stockholders under Rule 30e-1 under the Investment Company Act of 1940 (17 CFR 270.30e-1). The Commission may use the information provided on Form N-CSR in its regulatory, disclosure review, inspection, and policymaking roles.
A registrant is required to disclose the information specified by Form N-CSR, and the Commission will make this information public. A registrant is not required to respond to the collection of information contained in Form N-CSR unless the Form displays a currently valid Office of Management and Budget ("OMB") control number. Please direct comments concerning the accuracy of the information collection burden estimate and any suggestions for reducing the burden to the Secretary, Securities and Exchange Commission, 450 Fifth Street, NW, Washington, DC 20549-0609. The OMB has reviewed this collection of information under the clearance requirements of 44 U.S.C. § 3507.
| Item 1. | Reports to Stockholders. |
| |
| |
| |
| |
| |
| |
| |
| |
| |
| |
| |
| |
| |
 |
| |
| |
| |
| |
| |
| |
| |
| |
| |
| |
| BLUE CURRENT GLOBAL DIVIDEND FUND |
| |
| |
| INSTITUTIONAL CLASS (BCGDX) |
| |
| |
| |
| Semi-Annual Report |
| |
| February 28, 2021 |
| |
| (Unaudited) |
| |
| |
| |
| |
| |
| |
| |
| |
| |
| |
| |
| |
| |
| |
| |
| |
| |
| |
| |
| |
| |
| |
| |
BLUE CURRENT GLOBAL DIVIDEND FUND
LETTER TO SHAREHOLDERS | March 10, 2021 |
| | |
Dear Shareholders.
PERFORMANCE SUMMARY
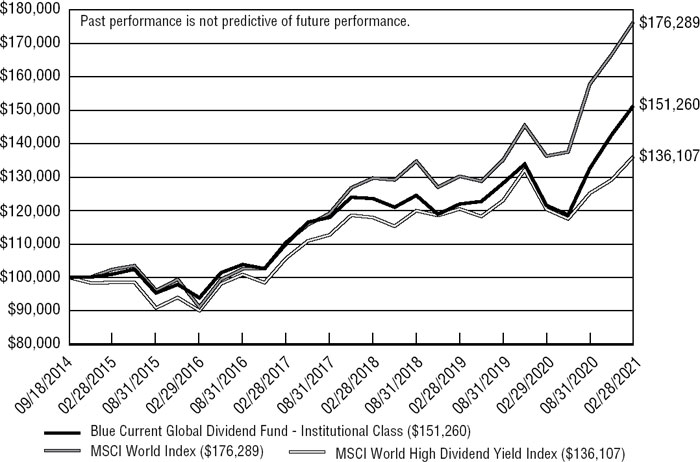
The Blue Current Global Dividend Fund (the “fund”) returned 14.08% over the six month period ending February 28, 2021. The fund’s benchmark, the MSCI World High Dividend Yield Index, returned 8.75% over the same period. The MSCI World High Dividend Yield Index most accurately reflects the fund’s investment objective to invest in high-quality, dividend paying stocks globally. Since its inception, the fund has produced a cumulative return of 51.26%, which compares to a 36.11% cumulative return for the MSCI World High Dividend Yield Index. It is important to remind our investors that we are not managing the fund to track or beat an index. We do not select securities to align with an index, or the underlying sector and country holdings, but rather aim to construct a portfolio of high quality companies that are committed to dividend growth and offer an attractive yield.
| | Total Returns for period ended February 28, 2021 |
| | |
| | | | Trailing 1 | Trailing 3 | Since |
| Fund Name | QTD (Since | YTD (Since | Year (Since | Year (Since | Inception |
| (Institutional Share Class) | 11/30/20) | 12/31/20) | 2/29/20) | 2/28/2018) | (9/18/14) |
| Blue Current Global Dividend | 6.11% | 2.07% | 24.46% | 22.40% | 51.26% |
| MSCI World High Div Yield Index | 3.18% | -0.04% | 13.09% | 15.42% | 36.11% |
| | | | | | |
Source: Bloomberg
Past performance is not predictive of future performance. Investment results and principal value will fluctuate so that shares, when redeemed, may be worth more or less than their original cost. Current performance may be higher or lower than the performance data quoted. Performance data current to the most recent month end is available by calling 1-800-514-3583.
The recent quarter-to-date period ending February 28, 2021, encapsulates the strength of the value rotation that was sparked by the announcement in early November of multiple vaccine treatments for COVID-19. Leading into that period, we had been active in repositioning the portfolio into more cyclical businesses that we expected to be undervalued whenever investment sentiment took a positive shift. These portfolio adjustments included adding to our consumer discretionary, industrial, and financial sector positions. We think our investment in Caterpillar (CAT) in mid-December embodies the portfolio’s transition to businesses exposed to the global economic recovery. It had been many years since we last invested in Caterpillar, but the economic recovery, combined with the pandemic-induced commodity supply disruptions, made a compelling case that demand would recover quickly. We also knew that Caterpillar’s dealer inventory was lean and that the sudden acceleration in demand would present a revenue tailwind for the company in 2021 and 2022. What also attracted us to CAT is knowing that despite the cyclicality of its end markets the company has increased its dividend for 27 straight years! Caterpillar has been one of the portfolio’s best performing stocks in 2021.
Somewhat surprisingly, given the recent rotation, many of the portfolio’s semiconductor investments were also top performers during the recent quarter and semiannual periods. One of the most systemically important manufacturing companies in the world, Taiwan Semiconductor, was a top contributor for both periods. It is estimated that Taiwan Semiconductor touches more than 50% of all electronic devices in the world. The recent supply shortfall of semiconductors has raised awareness of the importance of having a domestic champion in this increasingly critical industry. To improve its geographic flexibility, Taiwan Semiconductor has recently announced plans to expand its presence in the United States, a decision that has been matched by other global foundries including Samsung. As foundries decide to replicate their supply chains in critically important, customer-dense regions, the demand for semiconductor fabrication machinery also increases. We also made a small portfolio investment during the quarter in Tokyo Electron, a Japanese-based fabrication company that specializes in memory chips. Given the anemic dividend yields in Japan, this represents one of the few investments that we have made in that country. Tokyo Electron has also been a strong performer in 2021.
Looking below the sector level, the top three contributors to the Fund’s performance over the prior six-month period are JP Morgan, Taiwan Semiconductor, and Morgan Stanley, while the top three detractors are Anheuser Busch, Unilever, and Qualcomm.
The portfolio’s allocation to developed international equities was approximately 45% as of the end of the period, largely unchanged.
BLUE CURRENT PHILOSOPHY & OBJECTIVES
It is important to remind the Fund’s shareholders of our philosophy and objectives. In the current environment, investors need to make every penny work for them. With yield in short supply and safe income streams providing little return, quality companies with growing and sustainable cash flow from across the globe might be less risky than you think – and more fruitful.
The Fund utilizes the investment team’s expertise in growing cash flow through what we believe is a niche universe of high-quality, dividend-paying companies with sustainable business models and dividend policies. The primary objectives are to pay a stable and increasing dividend each quarter and deliver attractive long-term capital appreciation to investors.
The Blue Current investment team concentrates on a select portfolio of 25-50 companies across developed markets that meet our stringent qualities. We focus on companies that we believe have a strong history of rewarding shareholders and the financial ability to continue to increase their dividends over time. We also focus on the future earnings potential of each company and strive to purchase those businesses when they are trading at a discount to their true value.
OUTLOOK SUMMARY
After being humbled by the events of 2020, we find prognosticating especially challenging, but let us share a few observations that we believe make the case for investing in dividend-paying equities. After many years of modest economic growth, easy policy conditions, and
low interest rates favoring high-growth businesses, the market may be in the early stages of a secular shift to cyclical businesses. While it is still too early to determine the duration of this rotation, history would suggest that when capital rotations of this magnitude occur, they can persist for several years – sometimes as many as ten but potentially as few as five years. The duration is ultimately determined by macroeconomic factors such as economic strength, interest rates, inflation, and the cost of capital.
With $3 trillion of stimulus scheduled to occur in 2021, the ingredients are in place for robust economic growth and accelerating inflation, both of which can favor sectors of the market dominated by dividend payers. This would include businesses in the financial, industrial, and commodity sectors of the market. When economic growth accelerates, investors prefer cyclicality above growth and technology largely because the sectors are inexpensive and unloved by both the sell-side and buy-side in the early stages of recovery. Entering 2021, many high-growth technology companies were trading at market multiples in excess of 30x earnings, while old economy stocks possessed valuations in the mid-teens. A symptom of improving economic growth, higher interest rates also accelerate the shift away from long-dated cash flows to companies with current profits. If financial conditions tighten, investors opt for cash in hand and near-term clarity above speculation.
Another positive symptom of COVID-19 has been the acceleration of technology adoption by old economy stocks, which should manifest itself in higher margins over the coming years. Within our portfolio, there are many examples of businesses embracing technology resulting in the need for fewer workers, less real estate, and improved internal efficiencies. We would argue that away from the technology sector, many businesses still have embedded stranded cost structures that will be addressed through new efficiencies exacerbated by the events of 2020. It is likely that the culmination of these improvements will result in upside to earnings expectations and positive price response in the near term, especially for dividend-payers and cash flow rich businesses.
| Sincerely, | |
| | |
 |  |
| | |
| Henry “Harry” M. T. Jones | Dennis Sabo, CFA |
| Co-Portfolio Manager | Co-Portfolio Manager |
Disclosure and Risk Summary
The Letter to Shareholders seeks to describe some of the current opinions and views of the financial markets of Edge Capital Group, LLC (the “Adviser”). Although the Adviser believes it has a reasonable basis for any opinions or views expressed, actual results may differ, sometimes significantly so, from those expected or expressed. The securities held by the Fund that are discussed in the Letter to Shareholders were held during the period covered by this Report. They do not comprise the entire investment portfolio of the Fund, may be sold at any time and may no longer be held by the Fund. For a complete list of securities held in the Fund as of February 28, 2021, please see the Schedule of Investments section of the semi-annual report. The opinions of the Adviser with respect to those securities may change at any time.
The opinions expressed herein are those of the Adviser, and the report is not meant as legal, tax, or financial advice. You should consult your own professional advisors as to the legal, tax, financial, or other matters relevant to the suitability of investing. The external data presented in this report have been obtained from independent sources (as noted) and are believed to be accurate, but no independent verification has been made and accuracy is not guaranteed. The information contained in this report is not intended to address the needs of any particular investor.
The information contained in this document does not constitute an offer to sell any securities nor a solicitation to purchase any securities. Index returns reflect the reinvestment of dividends. An investor should consider the investment objectives, risks, charges and expenses of the Fund carefully before investing. The Fund’s prospectus contains this and other important information. To obtain a copy of the Fund’s prospectus please visit our website at www.bluecurrentfunds.com or call 1-800-514-3583 and a copy will be sent to you free of charge. Please read the prospectus carefully before you invest. The Blue Current Global Dividend Fund is distributed by Ultimus Fund Distributors, LLC.
PAST PERFORMANCE CANNOT BE CONSTRUED AS AN INDICATOR OF FUTURE RESULTS BECAUSE OF, AMONG OTHER THINGS, POSSIBLE DIFFERENCES IN MARKET CONDITIONS, INVESTMENT STRATEGY, AND REGULATORY CLIMATE. THERE IS NO ASSURANCE THAT THE FUND WILL ACHIEVE ITS INVESTMENT OBJECTIVE. INVESTMENT RESULTS AND PRINCIPAL VALUE WILL FLUCTUATE SO THAT SHARES, WHEN REDEEMED, MAY BE WORTH MORE OR LESS THAN THEIR ORIGINAL COST. CURRENT PERFORMANCE MAY BE HIGHER OR LOWER THAN THE PERFORMANCE DATA QUOTED. PERFORMANCE DATA CURRENT TO THE MOST RECENT MONTH END IS AVAILABLE BY CALLING 1-800-514-3583. THE FUND INVESTS PRIMARILY IN DIVIDEND PAYING COMPANIES AND IT IS POSSIBLE THESE COMPANIES MAY ELIMINATE OR REDUCE THEIR DIVIDEND PAYMENTS. INDEX INFORMATION (I) IS INCLUDED MERELY TO SHOW THE GENERAL TREND IN THE EQUITY MARKETS FOR THE PERIOD INDICATED AND IS NOT INTENDED TO IMPLY THAT THE FUND’S PORTFOLIO WILL BE SIMILAR TO THE INDICES EITHER IN COMPOSITION OR RISK AND (II) HAS BEEN OBTAINED FROM SOURCES BELIEVED TO BE ACCURATE.
| BLUE CURRENT GLOBAL DIVIDEND FUND |
| PERFORMANCE INFORMATION |
| February 28, 2021 (Unaudited) |
| |
Comparison of the Change in Value of a $100,000 Investment in
Blue Current Global Dividend Fund -
Institutional Class vs. the MSCI World Index
and the MSCI World High Dividend Yield Index
| Average Annual Total Returns |
| (for the periods ended February 28, 2021) |
| |
| | | | | | | | Since | |
| | 1 Year | | 3 Years | | 5 Years | | Inception(b) | |
| Blue Current Global Dividend Fund - Institutional Class(a) | 24.46% | | 6.97% | | 10.01% | | 6.63% | |
| MSCI World Index | 29.34% | | 10.77% | | 14.01% | | 9.19% | |
| MSCI World High Dividend Yield Index | 13.09% | | 4.90% | | 8.61% | | 4.90% | |
| | | | | | | | | |
| (a) | The Fund’s total returns do not reflect the deduction of taxes a shareholder would pay on Fund distributions or the redemption of Fund shares. |
| (b) | The Fund commenced operations on September 18, 2014. |
| BLUE CURRENT GLOBAL DIVIDEND FUND |
| PORTFOLIO INFORMATION |
| February 28, 2021 (Unaudited) |
| |
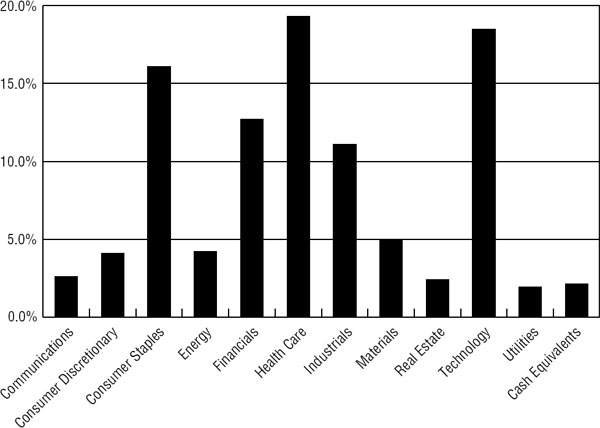
Sector Diversification
(% of Net Assets)
| Top Ten Equity Holdings |
| | | |
| Security Description | | % of Net Assets |
| JPMorgan Chase & Company | | 4.2% |
| Microsoft Corporation | | 4.0% |
| Medtronic plc | | 3.5% |
| Morgan Stanley | | 3.3% |
| QUALCOMM, Inc. | | 3.2% |
| Johnson & Johnson | | 3.2% |
| Coca-Cola Company (The) | | 2.9% |
| Caterpillar, Inc. | | 2.8% |
| EssilorLuxottica S.A. | | 2.8% |
| American Express Company | | 2.7% |
| BLUE CURRENT GLOBAL DIVIDEND FUND |
| SCHEDULE OF INVESTMENTS |
| February 28, 2021 (Unaudited) |
| COMMON STOCKS — 97.9% | | Shares | | | Value | |
| Communications — 2.6% | | | | | | | | |
| Entertainment Content — 2.6% | | | | | | | | |
| Vivendi SE (a) | | | 34,370 | | | $ | 1,190,353 | |
| | | | | | | | | |
| Consumer Discretionary — 4.1% | | | | | | | | |
| Apparel & Textile Products — 2.5% | | | | | | | | |
| LVMH Moet Hennessy Louis Vuitton SE (a) | | | 1,803 | | | | 1,143,117 | |
| | | | | | | | | |
| Retail - Discretionary — 1.6% | | | | | | | | |
| Home Depot, Inc. (The) | | | 2,870 | | | | 741,436 | |
| | | | | | | | | |
| Consumer Staples — 16.1% | | | | | | | | |
| Beverages — 10.4% | | | | | | | | |
| Anheuser-Busch InBev S.A./N.V. - ADR | | | 17,866 | | | | 1,031,404 | |
| Coca-Cola Company (The) | | | 27,825 | | | | 1,363,147 | |
| Coca-Cola European Partners plc | | | 23,650 | | | | 1,204,967 | |
| Diageo plc - ADR | | | 7,671 | | | | 1,210,024 | |
| | | | | | | | 4,809,542 | |
| Food — 2.5% | | | | | | | | |
| Nestlé S.A. - ADR | | | 11,050 | | | | 1,158,261 | |
| | | | | | | | | |
| Household Products — 1.9% | | | | | | | | |
| Unilever plc - ADR | | | 16,320 | | | | 849,619 | |
| | | | | | | | | |
| Wholesale - Consumer Staples — 1.3% | | | | | | | | |
| Bunge Ltd. | | | 8,075 | | | | 618,384 | |
| | | | | | | | | |
| Energy — 4.2% | | | | | | | | |
| Oil & Gas Producers — 4.2% | | | | | | | | |
| BP plc (a) | | | 300,000 | | | | 1,228,439 | |
| Kinder Morgan, Inc. | | | 48,315 | | | | 710,231 | |
| | | | | | | | 1,938,670 | |
| Financials — 12.7% | | | | | | | | |
| Banking — 4.2% | | | | | | | | |
| JPMorgan Chase & Company | | | 13,308 | | | | 1,958,538 | |
| | | | | | | | | |
| Institutional Financial Services — 3.3% | | | | | | | | |
| Morgan Stanley | | | 19,800 | | | | 1,522,026 | |
| | | | | | | | | |
| Insurance — 2.5% | | | | | | | | |
| Allianz SE (a) | | | 4,744 | | | | 1,145,712 | |
| | | | | | | | | |
See accompanying notes to financial statements.
| BLUE CURRENT GLOBAL DIVIDEND FUND |
| SCHEDULE OF INVESTMENTS (Continued) |
| COMMON STOCKS — 97.9% (Continued) | | Shares | | | Value | |
| Financials — 12.7% (Continued) | | | | | | | | |
| Specialty Finance — 2.7% | | | | | | | | |
| American Express Company | | | 9,345 | | | $ | 1,264,005 | |
| | | | | | | | | |
| Health Care — 19.3% | | | | | | | | |
| Biotech & Pharma — 8.7% | | | | | | | | |
| AstraZeneca plc - ADR | | | 13,200 | | | | 638,616 | |
| Johnson & Johnson | | | 9,222 | | | | 1,461,318 | |
| Novo Nordisk A/S - ADR | | | 11,500 | | | | 819,375 | |
| Sanofi - ADR | | | 23,980 | | | | 1,100,443 | |
| | | | | | | | 4,019,752 | |
| Medical Equipment & Devices — 10.6% | | | | | | | | |
| Abbott Laboratories | | | 8,240 | | | | 986,987 | |
| EssilorLuxottica S.A. (a) | | | 7,820 | | | | 1,276,487 | |
| Koninklijke Philips N.V. | | | 18,969 | | | | 1,031,913 | |
| Medtronic plc | | | 13,770 | | | | 1,610,677 | |
| | | | | | | | 4,906,064 | |
| Industrials — 11.1% | | | | | | | | |
| Aerospace & Defense — 2.1% | | | | | | | | |
| Raytheon Technologies Corporation | | | 13,300 | | | | 957,467 | |
| | | | | | | | | |
| Electrical Equipment — 1.5% | | | | | | | | |
| Carrier Global Corporation | | | 18,950 | | | | 692,243 | |
| | | | | | | | | |
| Machinery — 2.8% | | | | | | | | |
| Caterpillar, Inc. | | | 6,060 | | | | 1,308,233 | |
| | | | | | | | | |
| Transportation & Logistics — 4.7% | | | | | | | | |
| Deutsche Post AG (a) | | | 22,350 | | | | 1,110,754 | |
| Union Pacific Corporation | | | 5,300 | | | | 1,091,588 | |
| | | | | | | | 2,202,342 | |
| Materials — 5.0% | | | | | | | | |
| Chemicals — 5.0% | | | | | | | | |
| Air Liquide S.A. (a) | | | 5,487 | | | | 826,822 | |
| CF Industries Holdings, Inc. | | | 16,065 | | | | 727,423 | |
| Dow, Inc. | | | 12,715 | | | | 754,127 | |
| | | | | | | | 2,308,372 | |
| Real Estate — 2.4% | | | | | | | | |
| REITs — 2.4% | | | | | | | | |
| Crown Castle International Corporation | | | 7,065 | | | | 1,100,374 | |
| | | | | | | | | |
See accompanying notes to financial statements.
| BLUE CURRENT GLOBAL DIVIDEND FUND |
| SCHEDULE OF INVESTMENTS (Continued) |
| COMMON STOCKS — 97.9% (Continued) | | Shares | | | Value | |
| Technology — 18.5% | | | | | | | | |
| Semiconductors — 14.5% | | | | | | | | |
| Broadcom, Inc. | | | 2,295 | | | $ | 1,078,352 | |
| Intel Corporation | | | 12,000 | | | | 729,360 | |
| QUALCOMM, Inc. | | | 10,759 | | | | 1,465,268 | |
| Taiwan Semiconductor Manufacturing Company Ltd. - ADR | | | 9,230 | | | | 1,162,426 | |
| Texas Instruments, Inc. | | | 7,000 | | | | 1,205,890 | |
| Tokyo Electron Ltd. - ADR | | | 9,930 | | | | 1,042,650 | |
| | | | | | | | 6,683,946 | |
| Software — 4.0% | | | | | | | | |
| Microsoft Corporation | | | 8,000 | | | | 1,859,040 | |
| | | | | | | | | |
| Utilities — 1.9% | | | | | | | | |
| Electric Utilities — 1.9% | | | | | | | | |
| NextEra Energy, Inc. | | | 12,400 | | | | 911,152 | |
| | | | | | | | | |
| Total Common Stocks (Cost $33,424,723) | | | | | | $ | 45,288,648 | |
| MONEY MARKET FUNDS — 2.9% | | Shares | | | Value | |
| First American Government Obligations Fund - Class Z, 0.03% (b) (Cost $1,332,696) | | | 1,332,696 | | | $ | 1,332,696 | |
| | | | | | | | | |
| Investments at Value — 100.8% (Cost $34,757,419) | | | | | | $ | 46,621,344 | |
| | | | | | | | | |
| Liabilities in Excess of Other Assets — (0.8%) | | | | | | | (376,175 | ) |
| | | | | | | | | |
| Net Assets — 100.0% | | | | | | $ | 46,245,169 | |
| | | | | | | | | |
ADR – American Depositary Receipt.
| (a) | Level 2 security (Note 2). |
| (b) | The rate shown is the 7-day effective yield as of February 28, 2021. |
See accompanying notes to financial statements.
| BLUE CURRENT GLOBAL DIVIDEND FUND |
| SUMMARY OF COMMON STOCKS BY COUNTRY |
| February 28, 2021 (Unaudited) |
| | | | | | % of Net | |
| Country | | Value | | | Assets | |
| United States | | $ | 23,888,205 | | | | 51.7 | % |
| France | | | 5,537,222 | | | | 12.0 | % |
| United Kingdom | | | 5,131,665 | | | | 11.1 | % |
| Germany | | | 2,256,466 | | | | 4.9 | % |
| Ireland | | | 1,610,677 | | | | 3.5 | % |
| Taiwan Province of China | | | 1,162,426 | | | | 2.5 | % |
| Switzerland | | | 1,158,261 | | | | 2.5 | % |
| Japan | | | 1,042,650 | | | | 2.2 | % |
| Netherlands | | | 1,031,913 | | | | 2.2 | % |
| Belgium | | | 1,031,404 | | | | 2.2 | % |
| Denmark | | | 819,375 | | | | 1.8 | % |
| Bermuda | | | 618,384 | | | | 1.3 | % |
| | | $ | 45,288,648 | | | | 97.9 | % |
| | | | | | | | | |
See accompanying notes to financial statements.
| BLUE CURRENT GLOBAL DIVIDEND FUND |
| STATEMENT OF ASSETS AND LIABILITIES |
| February 28, 2021 (Unaudited) |
| ASSETS | | | | |
| Investments in securities: | | | | |
| At cost | | $ | 34,757,419 | |
| At value (Note 2) | | $ | 46,621,344 | |
| Receivable for capital shares sold | | | 156,000 | |
| Receivable for investment securities sold | | | 487,742 | |
| Dividends receivable | | | 85,567 | |
| Other assets | | | 17,281 | |
| Total assets | | | 47,367,934 | |
| | | | | |
| LIABILITIES | | | | |
| Payable for investment securities purchased | | | 1,085,688 | |
| Payable to Adviser (Note 4) | | | 23,783 | |
| Payable to administrator (Note 4) | | | 8,024 | |
| Other accrued expenses | | | 5,270 | |
| Total liabilities | | | 1,122,765 | |
| | | | | |
| NET ASSETS | | $ | 46,245,169 | |
| | | | | |
| NET ASSETS CONSIST OF: | | | | |
| Paid-in capital | | $ | 35,292,031 | |
| Accumulated earnings | | | 10,953,138 | |
| NET ASSETS | | $ | 46,245,169 | |
| | | | | |
| PRICING OF INSTITUTIONAL SHARES (Note 1) | | | | |
| Net assets applicable to Institutional Shares | | $ | 46,245,169 | |
| Shares of Institutional Shares outstanding (unlimited number of shares authorized, no par value) | | | 3,475,945 | |
| Net asset value, offering and redemption price per share (a) (Note 2) | | $ | 13.30 | |
| | | | | |
| (a) | Redemption fee of 2.00% may apply to redemptions of shares held for 7 days or less. |
See accompanying notes to financial statements.
| BLUE CURRENT GLOBAL DIVIDEND FUND |
| STATEMENT OF OPERATIONS |
| For the Six Months Ended February 28, 2021 (Unaudited) |
| INVESTMENT INCOME | | | | |
| Dividends | | $ | 449,610 | |
| Foreign withholding taxes on dividends | | | (9,800 | ) |
| Total investment income | | | 439,810 | |
| | | | | |
| EXPENSES | | | | |
| Investment advisory fees (Note 4) | | | 212,933 | |
| Administration fees (Note 4) | | | 18,330 | |
| Fund accounting fees (Note 4) | | | 17,097 | |
| Registration and filing fees | | | 11,780 | |
| Legal fees | | | 11,140 | |
| Audit and tax services fees | | | 8,750 | |
| Trustees’ fees and expenses (Note 4) | | | 8,400 | |
| Transfer agent fees (Note 4) | | | 7,650 | |
| Custodian and bank service fees | | | 6,640 | |
| Compliance fees (Note 4) | | | 5,100 | |
| Postage and supplies | | | 2,948 | |
| Insurance expense | | | 1,802 | |
| Printing of shareholder reports | | | 1,347 | |
| Pricing fees | | | 1,193 | |
| Other expenses | | | 9,238 | |
| Total expenses | | | 324,348 | |
| Fee reductions by the Adviser (Note 4) | | | (111,415 | ) |
| Net expenses | | | 212,933 | |
| | | | | |
| NET INVESTMENT INCOME | | | 226,877 | |
| | | | | |
| REALIZED AND UNREALIZED GAINS (LOSSES) ON INVESTMENTS AND FOREIGN CURRENCIES | | | | |
| Net realized gains (losses) from: | | | | |
| Investments | | | 2,496,185 | |
| Foreign currency transactions (Note 2) | | | (15,620 | ) |
| Net change in unrealized appreciation (depreciation) on: | | | | |
| Investments | | | 2,997,876 | |
| Foreign currency translation (Note 2) | | | (206 | ) |
| NET REALIZED AND UNREALIZED GAINS ON INVESTMENTS AND FOREIGN CURRENCIES | | | 5,478,235 | |
| | | | | |
| NET INCREASE IN NET ASSETS RESULTING FROM OPERATIONS | | $ | 5,705,112 | |
| | | | | |
See accompanying notes to financial statements.
| BLUE CURRENT GLOBAL DIVIDEND FUND |
| STATEMENTS OF CHANGES IN NET ASSETS |
| | | Six Months | | | | |
| | | Ended | | | Year | |
| | | February 28, | | | Ended | |
| | | 2021 | | | August 31, | |
| | | (Unaudited) | | | 2020 | |
| FROM OPERATIONS | | | | | | | | |
| Net investment income | | $ | 226,877 | | | $ | 1,055,393 | |
| Net realized gains (losses) from: | | | | | | | | |
| Investments | | | 2,496,185 | | | | (3,128,154 | ) |
| Foreign currency transactions | | | (15,620 | ) | | | (41,248 | ) |
| Net change in unrealized appreciation on: | | | | | | | | |
| Investments | | | 2,997,876 | | | | 237,237 | |
| Foreign currency translation | | | (206 | ) | | | 226 | |
| Net increase (decrease) in net assets from operations | | | 5,705,112 | | | | (1,876,546 | ) |
| | | | | | | | | |
| DISTRIBUTIONS TO SHAREHOLDERS (NOTE 2) | | | | | | | | |
| Institutional Shares | | | (296,022 | ) | | | (1,337,208 | ) |
| | | | | | | | | |
| FROM CAPITAL SHARE TRANSACTIONS | | | | | | | | |
| Institutional Shares | | | | | | | | |
| Proceeds from shares sold | | | 1,055,314 | | | | 6,191,262 | |
| Net asset value of shares issued in reinvestment of distributions to shareholders | | | 219,123 | | | | 988,219 | |
| Proceeds from redemption fees collected (Note 2) | | | — | | | | 2,496 | |
| Payments for shares redeemed | | | (2,477,785 | ) | | | (24,230,868 | ) |
| Net decrease in Institutional Shares net assets from capital share transactions | | | (1,203,348 | ) | | | (17,048,891 | ) |
| | | | | | | | | |
| TOTAL INCREASE (DECREASE) IN NET ASSETS | | | 4,205,742 | | | | (20,262,645 | ) |
| | | | | | | | | |
| NET ASSETS | | | | | | | | |
| Beginning of period | | | 42,039,427 | | | | 62,302,072 | |
| End of period | | $ | 46,245,169 | | | $ | 42,039,427 | |
| | | | | | | | | |
| CAPITAL SHARES ACTIVITY | | | | | | | | |
| Shares sold | | | 83,753 | | | | 552,621 | |
| Shares reinvested | | | 18,196 | | | | 85,252 | |
| Shares redeemed | | | (206,904 | ) | | | (2,417,199 | ) |
| Net decrease in shares outstanding | | | (104,955 | ) | | | (1,779,326 | ) |
| Shares outstanding, beginning of period | | | 3,580,900 | | | | 5,360,226 | |
| Shares outstanding, end of period | | | 3,475,945 | | | | 3,580,900 | |
| | | | | | | | | |
See accompanying notes to financial statements.
| BLUE CURRENT GLOBAL DIVIDEND FUND |
| INSTITUTIONAL SHARES |
| FINANCIAL HIGHLIGHTS |
| |
Per Share Data for a Share Outstanding Throughout Each Period
| | | Six Months | | | | | | | | | | | | | | | | |
| | | Ended | | | Year | | | Year | | | Year | | | Year | | | Year | |
| | | February 28, | | | Ended | | | Ended | | | Ended | | | Ended | | | Ended | |
| | | 2021 | | | August 31, | | | August 31, | | | August 31, | | | August 31, | | | August 31, | |
| | | (Unaudited) | | | 2020 | | | 2019 | | | 2018 | | | 2017 | | | 2016 | |
| Net asset value at beginning of period | | $ | 11.74 | | | $ | 11.62 | | | $ | 11.47 | | | $ | 11.20 | | | $ | 10.06 | | | $ | 9.42 | |
| | | | | | | | | | | | | | | | | | | | | | | | | |
| Income from investment operations: | | | | | | | | | | | | | | | | | | | | | | | | |
| Net investment income | | | 0.07 | | | | 0.24 | | | | 0.22 | | | | 0.23 | | | | 0.24 | | | | 0.22 | |
| Net realized and unrealized gains on investments and foreign currencies | | | 1.57 | | | | 0.16 | (a) | | | 0.11 | | | | 0.39 | | | | 1.11 | | | | 0.61 | |
| Total from investment operations | | | 1.64 | | | | 0.40 | | | | 0.33 | | | | 0.62 | | | | 1.35 | | | | 0.83 | |
| | | | | | | | | | | | | | | | | | | | | | | | | |
| Less distributions from: | | | | | | | | | | | | | | | | | | | | | | | | |
| Net investment income | | | (0.08 | ) | | | (0.20 | ) | | | (0.18 | ) | | | (0.14 | ) | | | (0.21 | ) | | | (0.19 | ) |
| Net realized gains | | | — | | | | (0.08 | ) | | | — | | | | (0.21 | ) | | | — | | | | — | |
| Total distributions | | | (0.08 | ) | | | (0.28 | ) | | | (0.18 | ) | | | (0.35 | ) | | | (0.21 | ) | | | (0.19 | ) |
| | | | | | | | | | | | | | | | | | | | | | | | | |
| Proceeds from redemption fees collected (Note 2) | | | — | | | | 0.00 | (b) | | | 0.00 | (b) | | | 0.00 | (b) | | | — | | | | — | |
| | | | | | | | | | | | | | | | | | | | | | | | | |
| Net asset value at end of period | | $ | 13.30 | | | $ | 11.74 | | | $ | 11.62 | | | $ | 11.47 | | | $ | 11.20 | | | $ | 10.06 | |
| | | | | | | | | | | | | | | | | | | | | | | | | |
| Total return (c) | | | 14.08 | % (d) | | | 3.46 | % | | | 2.91 | % | | | 5.58 | % | | | 13.57 | % | | | 8.92 | % |
| | | | | | | | | | | | | | | | | | | | | | | | | |
| Net assets at end of period (000’s) | | $ | 46,245 | | | $ | 42,039 | | | $ | 62,302 | | | $ | 65,543 | | | $ | 59,848 | | | $ | 39,632 | |
| | | | | | | | | | | | | | | | | | | | | | | | | |
| Ratios/supplementary data: | | | | | | | | | | | | | | | | | | | | | | | | |
| Ratio of total expenses to average net assets | | | 1.50 | % (e) | | | 1.48 | % | | | 1.43 | % | | | 1.39 | % | | | 1.45 | % | | | 1.55 | % |
| Ratio of net expenses to average net assets (f) | | | 0.99 | % (e) | | | 0.99 | % | | | 0.99 | % | | | 0.99 | % | | | 0.99 | % | | | 0.99 | % |
| Ratio of net investment income to average net assets (f) | | | 1.05 | % (e) | | | 1.94 | % | | | 1.87 | % | | | 2.06 | % | | | 2.47 | % | | | 2.37 | % |
| Portfolio turnover rate | | | 31 | % (d) | | | 66 | % | | | 46 | % | | | 50 | % | | | 61 | % | | | 58 | % |
| | | | | | | | | | | | | | | | | | | | | | | | | |
| (a) | Represents a balancing figure derived from other amounts in the financial highlights table that captures all other changes affecting net asset value per share. This per share amount does not correlate to the aggregate of the net realized and unrealized losses on the Statement of Operations for the same period. |
| (b) | Amount rounds to less than $0.01 per share. |
| (c) | Total return is a measure of the change in value of an investment in the Fund over periods covered, which assumes any dividends and capital gain distributions are reinvested in shares of the Fund. The returns shown do not reflect the deduction of taxes a shareholder would pay on Fund distributions or the redemption of Fund shares. The total returns would be lower if the Adviser had not reduced advisory fees (Note 4). |
| (f) | Ratio was determined after advisory fee reductions by the Adviser (Note 4). |
See accompanying notes to financial statements.
| BLUE CURRENT GLOBAL DIVIDEND FUND |
| NOTES TO FINANCIAL STATEMENTS |
| February 28, 2021 (Unaudited) |
Blue Current Global Dividend Fund (the “Fund”) is a diversified series of Ultimus Managers Trust (the “Trust”), an open-end investment company established as an Ohio business trust under a Declaration of Trust dated February 28, 2012. Other series of the Trust are not incorporated in this report.
The investment objective of the Fund is to seek current income and capital appreciation.
The Fund currently offers one class of shares: Institutional Class shares (sold without any sales loads or distribution fees and subject to a $100,000 initial investment requirement).
| 2. | Significant Accounting Policies |
The following is a summary of the Fund’s significant accounting policies. The policies are in conformity with accounting principles generally accepted in the United States of America (“GAAP”). The Fund follows accounting and reporting guidance under Financial Accounting Standards Board Accounting Standards Codification Topic 946, “Financial Services – Investment Companies.”
Securities valuation – The Fund values its portfolio securities including common stocks at fair value as of the close of regular trading on the New York Stock Exchange (the “NYSE”) (normally 4:00 p.m. Eastern Time) on each day the NYSE is open for business. The Fund generally values its listed securities on the basis of the security’s last sale price on the security’s primary exchange, if available, otherwise at the exchange’s most recently quoted mean price. NASDAQ-listed securities are valued at the NASDAQ Official Closing Price. Investments representing shares of other open-end investment companies, other than exchange-traded funds, if any, but including money market funds, are valued at their net asset value as reported by such companies. When using a quoted price and when the market is considered active, the security will be classified as Level 1 within the fair value hierarchy (see below). In the event that market quotations are not readily available or are considered unreliable due to market or other events, the Fund values its securities and other assets at fair value in accordance with procedures established by and under the general supervision of the Board of Trustees (the “Board”) of the Trust. Under these procedures, the securities will be classified as Level 2 or 3 within the fair value hierarchy, depending on the inputs used. Unavailable or unreliable market quotes may be due to the following factors: a substantial bid-ask spread; infrequent sales resulting in stale prices; insufficient trading volume; small trade sizes; a temporary lapse in any reliable pricing source; and actions of the securities or futures markets, such as the suspension or limitation of trading. As a result, the prices of securities used to calculate the Fund’s net asset value (“NAV”) may differ from quoted or published prices for the same securities. Securities traded on foreign exchanges are typically fair valued by an independent pricing service and translated from the local currency into U.S. dollars using currency exchange rates supplied by an independent pricing service.
| BLUE CURRENT GLOBAL DIVIDEND FUND |
| NOTES TO FINANCIAL STATEMENTS (Continued) |
GAAP establishes a single authoritative definition of fair value, sets out a framework for measuring fair value, and requires additional disclosures about fair value measurements.
Various inputs are used in determining the value of the Fund’s investments. These inputs are summarized in the three broad levels listed below:
| ● | Level 1 – quoted prices in active markets for identical securities |
| ● | Level 2 – other significant observable inputs |
| ● | Level 3 – significant unobservable inputs |
The inputs or methods used for valuing securities are not necessarily an indication of the risks associated with investing in those securities. The inputs used to measure fair value may fall into different levels of the fair value hierarchy. In such cases, for disclosure purposes, the level in the fair value hierarchy within which the fair value measurement falls in its entirety is determined based on the lowest level input that is significant to the fair value measurement.
The Fund’s foreign equity securities actively traded in foreign markets may be classified as Level 2 despite the availability of closing prices because such securities are typically fair valued by an independent pricing service. The Board has authorized the Fund to retain an independent pricing service to determine the fair value of its foreign securities because the value of such securities may be materially affected by events occurring before the Fund’s pricing time but after the close of the primary markets or exchanges on which such foreign securities are traded. These intervening events might be country-specific (e.g., natural disaster, economic or political developments, interest rate change); issuer specific (e.g., earnings report or merger announcement); or U.S. market-specific (such as a significant movement in the U.S. market that is deemed to affect the value of foreign securities). The pricing service uses an automated system that incorporates a model based on multiple parameters, including a security’s local closing price, relevant general and sector indices, currency fluctuations, trading in depositary receipts and futures, if applicable, and/or research valuations by its staff, in determining what it believes is the fair value of the securities.
The following is a summary of the Fund’s investments based on the inputs used to value the investments as of February 28, 2021:
| Investments in Securities | | Level 1 | | | Level 2 | | | Level 3 | | | Total | |
| Common Stocks | | $ | 37,366,964 | | | $ | 7,921,684 | | | $ | — | | | $ | 45,288,648 | |
| Money Market Funds | | | 1,332,696 | | | | — | | | | — | | | | 1,332,696 | |
| Total | | $ | 38,699,660 | | | $ | 7,921,684 | | | $ | — | | | $ | 46,621,344 | |
| | | | | | | | | | | | | | | | | |
| BLUE CURRENT GLOBAL DIVIDEND FUND |
| NOTES TO FINANCIAL STATEMENTS (Continued) |
Refer to the Fund’s Schedule of Investments for a listing of the common stocks by sector and industry type. The Fund did not have any assets or liabilities that were measured at fair value on a recurring basis using significant unobservable inputs (Level 3) as of or during the six months ended February 28, 2021.
Foreign currency translation – Securities and other assets and liabilities denominated in or expected to settle in foreign currencies are translated into U.S. dollars based on exchange rates on the following basis:
| A. | The fair values of investment securities and other assets and liabilities are translated as of the close of the NYSE each day. |
| B. | Purchases and sales of investment securities and income and expenses are translated at the rate of exchange prevailing as of 4:00 p.m. Eastern Time on the respective date of such transactions. |
| C. | The Fund does not isolate that portion of the results of operations caused by changes in foreign exchange rates on investments from those caused by changes in market prices of securities held. Such fluctuations are included with the net realized and unrealized gains or losses on investments. |
Reported net realized foreign exchange gains or losses arise from 1) purchases and sales of foreign currencies, 2) currency gains or losses realized between the trade and settlement dates on securities transactions and 3) the difference between the amounts of dividends and foreign withholding taxes recorded on the Fund’s books and the U.S. dollar equivalent of the amounts actually received or paid. Reported net unrealized foreign exchange gains and losses arise from changes in the value of assets and liabilities that result from changes in exchange rates.
The Fund may be subject to foreign taxes related to foreign income received, capital gain on the sale of securities and certain foreign currency transactions (a portion of which may be reclaimable). All foreign taxes are recorded in accordance with the applicable regulations and rates that exist in the foreign jurisdictions in which the Fund invests.
Forward foreign currency contracts – The Fund, at times, uses forward foreign currency contracts to offset the exposure to foreign currency. All foreign currency contracts are “marked-to-market” daily at the applicable translation rates, resulting in unrealized gains or losses. Realized and unrealized gains or losses from transactions in foreign contracts, if any, will be included on the Fund’s Statement of Operations. Risks associated with these contracts include the potential inability of counterparties to meet the terms of their contracts and unanticipated movements in the value of a foreign currency relative to the U.S. dollar. The Fund did not hold any forward foreign currency contracts during the six months ended February 28, 2021.
Share valuation – The NAV per share of the Fund is calculated daily by dividing the total value of the assets, less liabilities, by the number of shares outstanding. The offering price and redemption price per share of the Fund is equal to the NAV per share, except
| BLUE CURRENT GLOBAL DIVIDEND FUND |
| NOTES TO FINANCIAL STATEMENTS (Continued) |
that shareholders of the Fund are subject to a redemption fee equal to 2.00% of the value of Fund shares redeemed within 7 days of purchase, excluding involuntary redemptions of accounts that fall below the minimum investment amount or the redemption of Fund shares representing reinvested dividends, capital gain distributions, or capital appreciation. During the periods ended February 28, 2021 and August 31, 2020, proceeds from redemption fees, recorded in capital, totaled $0 and $2,496, respectively.
Investment income – Dividend income is recorded on the ex-dividend date. Non-cash dividends included in dividend income, if any, are recorded at the fair value of the security received. Interest income is accrued as earned. The Fund may invest in real estate investment trusts (“REITs”) that pay distributions to their shareholders based on available funds from operations. It is common for these distributions to exceed the REIT’s taxable earnings and profits resulting in the excess portion of such distribution to be designated as return of capital. Distributions received from REITs are generally recorded as dividend income and, if necessary, are reclassified annually in accordance with tax information provided by the underlying REITs. The Fund may also invest in master limited partnerships (“MLPs”) whose distributions generally are comprised of ordinary income, capital gains and return of capital from the MLP. For financial statement purposes, the Fund records all income received as ordinary income. This amount may be subsequently revised based on information received from the MLPs after their tax reporting periods are concluded, as the actual character of these distributions is not known until after the fiscal year end of the Fund. Withholding taxes on foreign dividends have been recorded for in accordance with the Fund’s understanding of the applicable country’s tax rules and rates.
Investment transactions – Investment transactions are accounted for on the trade date. Realized gains and losses on investments sold are determined on a specific identification basis.
Common expenses – Common expenses of the Trust are allocated among the Fund and the other series of the Trust based on the relative net assets of each series, the number of series in the Trust, or the nature of the services performed and the relative applicability to each series.
Distributions to shareholders – Distributions to shareholders arising from net investment income are declared and paid quarterly to shareholders. Net realized capital gains, if any, are distributed at least annually. The amount of distributions from net investment income and net realized capital gains are determined in accordance with federal income
| BLUE CURRENT GLOBAL DIVIDEND FUND |
| NOTES TO FINANCIAL STATEMENTS (Continued) |
tax regulations, which may differ from GAAP. Dividends and distributions to shareholders are recorded on the ex-dividend date. The tax character of distributions paid during the periods ended February 28, 2021 and August 31, 2020 was as follows:
| | | Ordinary | | | Long-Term | | | Total | |
| Periods Ended | | Income | | | Capital Gains | | | Distributions | |
| February 28, 2021 | | $ | 296,022 | | | $ | — | | | $ | 296,022 | |
| August 31, 2020 | | $ | 1,032,183 | | | $ | 305,025 | | | $ | 1,337,208 | |
| | | | | | | | | | | | | |
Estimates – The preparation of financial statements in conformity with GAAP requires management to make estimates and assumptions that affect the reported amounts of assets and liabilities and disclosure of contingent assets and liabilities, each as of the date of the financial statements, and the reported amounts of increase (decrease) in net assets from operations during the reporting period. Actual results could differ from those estimates.
Federal income tax – The Fund has qualified and intends to continue to qualify as a regulated investment company under the Internal Revenue Code of 1986, as amended (the “Code”). Qualification generally will relieve the Fund of liability for federal income taxes to the extent 100% of its net investment income and net realized capital gains are distributed in accordance with the Code.
In order to avoid imposition of the excise tax applicable to regulated investment companies, it is also the Fund’s intention to declare as dividends in each calendar year at least 98% of its net investment income (earned during the calendar year) and 98.2% of its net realized capital gains (earned during the 12 months ended October 31) plus undistributed amounts from prior years.
The following information is computed on a tax basis for each item as of February 28, 2021:
| | | | |
| Tax cost of portfolio investments | | $ | 34,998,343 | |
| Gross unrealized appreciation | | $ | 12,152,032 | |
| Gross unrealized depreciation | | | (529,031 | ) |
| Net unrealized appreciation on investments | | | 11,623,001 | |
| Net unrealized depreciation on foreign currency translation | | | (42 | ) |
| Accumulated ordinary income | | | 68,648 | |
| Other losses | | | (738,469 | ) |
| Accumulated earnings | | $ | 10,953,138 | |
| | | | | |
The difference between the federal income tax cost of portfolio investments and the financial statement cost is due to certain timing differences in the recognition of capital gains or losses under income tax regulations and GAAP. These “book/tax” differences
| BLUE CURRENT GLOBAL DIVIDEND FUND |
| NOTES TO FINANCIAL STATEMENTS (Continued) |
are temporary in nature and are primarily due to the tax deferral of losses on wash sales and the tax treatment of the cost of securities received as in-kind subscriptions at the inception of the Fund.
The Fund recognizes the tax benefits or expenses of uncertain tax positions only when the position is “more likely than not” to be sustained assuming examination by tax authorities. Management has reviewed the Fund’s tax positions for the current and all open tax years (generally, three years) and has concluded that no provision for unrecognized tax benefits or expenses is required in these financial statements. The Fund identifies its major tax jurisdiction as U.S. federal. The Fund recognizes interest and penalties, if any, related to unrecognized tax benefits as income tax on the Statement of Operations. During the six months ended February 28, 2021, the Fund did not incur any interest or penalties.
| 3. | Investment Transactions |
During the six months ended February 28, 2021, cost of purchases and proceeds from sales of investment securities, other than short-term investments, were $12,928,108 and $14,499,058, respectively.
| 4. | Transactions with Related Parties |
INVESTMENT ADVISORY AGREEMENT
The Fund’s investments are managed by Edge Capital Group, LLC (the “Adviser”) pursuant to the terms of an Investment Advisory Agreement. Under the Investment Advisory Agreement, the Fund pays the Adviser an investment advisory fee, computed and accrued daily and paid monthly, at the annual rate of 0.99% of its average daily net assets.
Pursuant to an Expense Limitation Agreement between the Fund and the Adviser (the “ELA”), the Adviser had agreed, until April 30, 2022, to reduce its investment advisory fees and reimburse other expenses to limit total annual operating expenses (exclusive of brokerage costs; taxes; interest; borrowing costs such as interest and dividends expenses on securities sold short; costs to organize the Fund; acquired fund fees and expenses; and extraordinary expenses such as litigation and merger or reorganization costs and other expenses not incurred in the ordinary course of the Fund’s business) to an amount not exceeding 0.99% of the average daily net assets of the Institutional Class shares. Accordingly, under the ELA, the Adviser reduced its investment advisory fees in the amount of $111,415 during the six months ended February 28, 2021.
Under the terms of the ELA, investment advisory fee reductions and expense reimbursements by the Adviser are subject to repayment by the Fund for a period of three years after such fees and expenses were incurred, provided that the repayments do not cause the Fund’s total annual operating expenses to exceed the lesser of (i) the expense limitation then in effect, if any, and (ii) the expense limitation in effect at the time
| BLUE CURRENT GLOBAL DIVIDEND FUND |
| NOTES TO FINANCIAL STATEMENTS (Continued) |
the expenses to be repaid were incurred. As of February 28, 2021, the Adviser may seek recoupment of investment advisory fee reductions in the amount of $769,092 no later than the dates stated below:
| | | | | |
| August 31, 2021 | | $ | 123,096 | |
| August 31, 2022 | | | 269,847 | |
| August 31, 2023 | | | 264,734 | |
| February 29, 2024 | | | 111,415 | |
| Total | | $ | 769,092 | |
| | | | | |
OTHER SERVICE PROVIDERS
Ultimus Fund Solutions, LLC (“Ultimus”) provides administration, fund accounting, compliance and transfer agency services to the Fund. The Fund pays Ultimus fees in accordance with the agreements for such services. In addition, the Fund pays out-of-pocket expenses including, but not limited to, postage, supplies, and certain costs related to the pricing of the Fund’s portfolio securities.
Under the terms of a Distribution Agreement with the Trust, Ultimus Fund Distributors, LLC (the “Distributor”) serves as principal underwriter to the Fund. The Distributor is a wholly-owned subsidiary of Ultimus. The Distributor is compensated by the Adviser (not the Fund) for acting as principal underwriter.
Certain officers and a Trustee of the Trust are also officers of Ultimus and are not paid by the Fund for serving in such capacities.
TRUSTEE COMPENSATION
Each Trustee who is not an “interested person” of the Trust (“Independent Trustee”) receives a $1,300 annual retainer from the Fund, paid quarterly, except for the Board Chairperson who receives a $1,500 annual retainer from the Fund, paid quarterly. Each Independent Trustee also receives from the Fund a fee of $500 for each Board meeting attended plus reimbursement for travel and other meeting-related expenses.
| 5. | Foreign Investment Risk |
Compared with investing in the U.S., investing in foreign markets involves a greater degree and variety of risk. Investors in foreign markets may face delayed settlements, currency controls, and adverse economic developments as well as higher overall transaction costs. In addition, fluctuations in the U.S. dollar’s value versus other currencies may erode or reverse gains or increase losses from investments denominated in foreign currencies. Foreign governments may expropriate assets, impose capital or currency controls, impose punitive taxes, impose limits on ownership or nationalize a company or industry. Any of these actions could have a severe effect on security prices and impair an investor’s ability to bring its capital or income back to the U.S. The value of foreign securities may be affected by incomplete, less frequent, or inaccurate financial information about
| BLUE CURRENT GLOBAL DIVIDEND FUND |
| NOTES TO FINANCIAL STATEMENTS (Continued) |
their issuers, social upheavals, or political actions ranging from tax code changes to government collapse. Foreign companies may also receive less coverage by market analysts than U.S. companies and may be subject to different reporting standards or regulatory requirements than those applicable to U.S. companies.
| 6. | Contingencies and Commitments |
The Fund indemnifies the Trust’s officers and Trustees for certain liabilities that might arise from their performance of their duties to the Fund. Additionally, in the normal course of business, the Fund enters into contracts that contain a variety of representations, warranties, and general indemnifications. The Fund’s maximum exposure under these arrangements is unknown, as this would involve future claims that may be made against the Fund that have not yet occurred. However, based on experience, the Fund expects the risk of loss to be remote.
The Fund is required to recognize in the financial statements the effects of all subsequent events that provide additional evidence about conditions that existed as of the date of the Statement of Assets and Liabilities. For non-recognized subsequent events that must be disclosed to keep the financial statements from being misleading, the Fund is required to disclose the nature of the event as well as an estimate of its financial effect, or a statement that such an estimate cannot be made. Management has evaluated subsequent events through the issuance of these financial statements and has noted no such events.
| BLUE CURRENT GLOBAL DIVIDEND FUND |
| ABOUT YOUR FUND’S EXPENSES (Unaudited) |
We believe it is important for you to understand the impact of costs on your investment. As a shareholder of the Fund, you incur ongoing costs, including management fees and other operating expenses. The following examples are intended to help you understand your ongoing costs (in dollars) of investing in the Fund and to compare these costs with the ongoing costs of investing in other mutual funds.
A mutual fund’s ongoing costs are expressed as a percentage of its average net assets. This figure is known as the expense ratio. The expenses in the table below are based on an investment of $1,000 made at the beginning of the most recent period (September 1, 2020) and held until the end of the period (February 28, 2021).
The table below illustrates the Fund’s ongoing costs in two ways:
Actual fund return – This section helps you to estimate the actual expenses that you paid over the period. The “Ending Account Value” shown is derived from the Fund’s actual return, and the fourth column shows the dollar amount of operating expenses that would have been paid by an investor who started with $1,000 in the Fund. You may use the information here, together with the amount you invested, to estimate the expenses that you paid over the period.
To do so, simply divide your account value by $1,000 (for example, an $8,600 account value divided by $1,000 = 8.6), then multiply the result by the number given for the Fund under the heading “Expenses Paid During Period.”
Hypothetical 5% return – This section is intended to help you compare the Fund’s ongoing costs with those of other mutual funds. It assumes that the Fund had an annual return of 5% before expenses during the period shown, but that the expense ratio is unchanged. In this case, because the return used is not the Fund’s actual return, the results do not apply to your investment. The example is useful in making comparisons because the U.S. Securities and Exchange Commission (the “SEC”) requires all mutual funds to calculate expenses based on a 5% return. You can assess the Fund’s ongoing costs by comparing this hypothetical example with the hypothetical examples that appear in shareholder reports of other funds.
Note that expenses shown in the table are meant to highlight and help you compare ongoing costs only. The Fund does not charge sales loads. However, a redemption fee of 2% is applied on the sale of shares held for less than 7 days.
The calculations assume no shares were bought or sold during the period. Your actual costs may have been higher or lower, depending on the amount of your investment and the timing of any purchases or redemptions.
More information about the Fund’s expenses can be found in this report. For additional information on operating expenses and other shareholder costs, please refer to the Fund’s prospectus.
| BLUE CURRENT GLOBAL DIVIDEND FUND |
| ABOUT YOUR FUND’S EXPENSES (Unaudited) (Continued) |
| | | Beginning | | Ending | | | | |
| | | Account Value | | Account Value | | | | Expenses |
| | | September 1, | | February 28, | | Net Expense | | Paid During |
| Institutional Class | | 2020 | | 2021 | | Ratio(a) | | Period(b) |
| | | | | | | | | |
| Based on Actual Fund Return | | $1,000.00 | | $1,140.80 | | 0.99% | | $5.25 |
| Based on Hypothetical 5%Return (before expenses) | | $1,000.00 | | $1,019.89 | | 0.99% | | $4.96 |
| | | | | | | | | |
| (a) | Annualized, based on the Fund’s most recent one-half year expenses. |
| (b) | Expenses are equal to the Fund’s annualized net expense ratio multiplied by the average account value over the period, multiplied by 181/365 (to reflect the one-half year period). |
| BLUE CURRENT GLOBAL DIVIDEND FUND |
| OTHER INFORMATION (Unaudited) |
A description of the policies and procedures that the Fund uses to vote proxies relating to portfolio securities is available without charge upon request by calling 1-800-514-3583, or on the SEC’s website at www.sec.gov. Information regarding how the Fund voted proxies relating to portfolio securities during the most recent 12-month period ended June 30 is also available without charge upon request by calling 1-800-514-3583, or on the SEC’s website at www.sec.gov.
The Trust files a complete listing of portfolio holdings for the Fund with the SEC as of the end of the first and third quarters of each fiscal year an exhibit to Form N-PORT. These filings are available upon request by calling 1-800-514-3583. Furthermore, you may obtain a copy of the filings on the SEC’s website at www.sec.gov.
| BLUE CURRENT GLOBAL DIVIDEND FUND |
| LIQUIDITY RISK MANAGEMENT PROGRAM (Unaudited) |
The Fund has adopted and implemented a written liquidity risk management program (the “Program”) as required by Rule 22e-4 (the “Liquidity Rule”) under the Investment Company Act of 1940, as amended. The Program is reasonably designed to assess and manage the Fund’s liquidity risk, taking into consideration, among other factors, the Fund’s investment strategy and the liquidity of its portfolio investments during normal and reasonably foreseeable stressed conditions; its short- and long-term cash flow projections; and its cash holdings and access to other funding sources. The Fund’s Board of Trustees (the “Board”) approved the appointment of the Liquidity Administrator Committee, comprising of the Fund’s Adviser and certain Trust officers, to be responsible for the Program’s administration and oversight and for reporting to the Board on at least an annual basis regarding the Program’s operation and effectiveness. The annual written report assessing the Program (the “Report”) was presented to the Board at the October 19-20, 2020 Board meeting and covered the period from June 1, 2019 to May 31, 2020 (the “Review Period”).
During the Review Period, the Fund did not experience unusual stress or disruption to its operations related to purchase and redemption activity. Also, during the Review Period, the Fund held adequate levels of cash and highly liquid investments to meet shareholder redemption activities in accordance with applicable requirements. The Report concluded that the Program is reasonably designed to prevent violation of the Liquidity Rule and the Program has been effectively implemented.
| CUSTOMER PRIVACY NOTICE |
| |
| FACTS | WHAT DOES THE BLUE CURRENT GLOBAL DIVIDEND FUND (the “Fund”) DO WITH YOUR PERSONAL INFORMATION? |
| |
| Why? | Financial companies choose how they share your personal information. Federal law gives consumers the right to limit some but not all sharing. Federal law also requires us to tell you how we collect, share, and protect your personal information. Please read this notice carefully to understand what we do. |
| |
| What? | The types of personal information we collect and share depend on the product or service you have with us. This information can include: ■ Social Security number ■ Assets ■ Retirement Assets ■ Transaction History ■ Checking Account Information ■ Purchase History ■ Account Balances ■ Account Transactions ■ Wire Transfer Instructions When you are no longer our customer, we continue to share your information as described in this notice. |
| |
| How? | All financial companies need to share your personal information to run their everyday business. In the section below, we list the reasons financial companies can share their customers’ personal information; the reasons the Fund chooses to share; and whether you can limit this sharing. |
| |
| | Does the | Can you limit |
| Reasons we can share your personal information | Fund share? | this sharing? |
For our everyday business purposes – Such as to process your transactions, maintain your account(s), respond to court orders and legal investigations, or report to credit bureaus | Yes | No |
For our marketing purposes – to offer our products and services to you | No | We don’t share |
| For joint marketing with other financial companies | No | We don’t share |
| For our affiliates’ everyday business purposes – information about your transactions and experiences | No | We don’t share |
| For our affiliates’ everyday business purposes – information about your creditworthiness | No | We don’t share |
| For nonaffiliates to market to you | No | We don’t share |
| | | | |
| Questions? | Call 1-800-514-3583 |
| Who we are |
| Who is providing this notice? | Blue Current Global Dividend Fund Ultimus Fund Distributors, LLC (Distributor) Ultimus Fund Solutions, LLC (Administrator) |
| What we do |
| How does the Fund protect my personal information? | To protect your personal information from unauthorized access and use, we use security measures that comply with federal law. These measures include computer safeguards and secured files and buildings. Our service providers are held accountable for adhering to strict policies and procedures to prevent any misuse of your nonpublic personal information. |
How does the Fund collect my personal information? | We collect your personal information, for example, when you ■ Open an account ■ Provide account information ■ Give us your contact information ■ Make deposits or withdrawals from your account ■ Make a wire transfer ■ Tell us where to send the money ■ Tell us who receives the money ■ Show your government-issued ID ■ Show your driver’s license We also collect your personal information from other companies. |
Why can’t I limit all sharing? | Federal law gives you the right to limit only ■ Sharing for affiliates’ everyday business purposes – information about your creditworthiness ■ Affiliates from using your information to market to you ■ Sharing for nonaffiliates to market to you State laws and individual companies may give you additional rights to limit sharing. |
| |
| Definitions |
| Affiliates | Companies related by common ownership or control. They can be financial and nonfinancial companies. ■ Edge Capital Group, LLC, the investment adviser to the Fund, could be deemed to be an affiliate. |
| Nonaffiliates | Companies not related by common ownership or control. They can be financial and nonfinancial companies ■ The Fund does not share with nonaffiliates so they can market to you. |
| Joint marketing | A formal agreement between nonaffiliated financial companies that together market financial products or services to you. ■ The Fund does not jointly market. |
This page intentionally left blank.
Blue-SAR-21

| Semi-Annual Report |
| February 28, 2021 |
| (Unaudited) |
| MARSHFIELD CONCENTRATED OPPORTUNITY FUND | |
| LETTER TO SHAREHOLDERS | March 18, 2021 |
From September 1, 2020 through February 28, 2021, the Marshfield Concentrated Opportunity Fund (the “Fund”) produced a cumulative total return of 9.28% compared to 9.74% for the S&P 500® Index.
Since the Fund’s inception in late 2015, we have used these letters to, among other things, reiterate the fact that we don’t pay much attention to the macroeconomic and political environment. We definitely refrain from predicting economic events and trends because we don’t think those are useful activities. However, we do pay some attention to current domestic and global developments because that allows us to understand something about how our companies perform in different environments, both in terms of their operating results and in terms of management’s approach to changes in such things as end market demand.
The pandemic and its effects on demand is a good example of such an opportunity for us and our companies. Companies’ reactions to the pandemic, both initial and over time, told us a lot about their resilience and ability to pivot when faced with both challenging conditions and the opportunities that emerged from those challenges. Fastenal, which we own, is a good example. The company can perhaps best be described as a hardware store for manufacturing and construction companies. Our initial thought early in the pandemic was that they would be reasonably adversely affected as their customers were forced to shut down or at least cut back their production. However, Fastenal’s sales and earnings actually increased, for several reasons: 1) to the extent we can tell, they were the first of our companies to take the pandemic seriously, starting planning in mid-February of 2020; 2) they quickly recognized the ramp up in demand for PPE and moved to access supply in China, where they have a sophisticated sourcing operation, and 3) through their many stores they reached out to existing and new customers to make it known that they could meet their PPE needs.i Thus they were able to profit from and build new client relationships from a very challenging and unanticipated event.
Even if we have views about broad industry trends, we always believe it is in the interest of the Fund and its shareholders to make our decisions on a bottom-up basis. Irrespective of the external climate, we ask ourselves if a stock is cheap enough to buy (or expensive enough to sell), if the company has a sufficient moat around its business which cannot easily be penetrated by competitors, and if the company’s corporate culture is appropriate to its business. As managers, we feel comfortable making a judgment about those aspects of a business, thereby making sure our investments can withstand shocks and not only survive, but thrive in any type of external environment. The pandemic has tested our ability to do this, but we believe we have passed that test.
| i | Per Fastenal’s earnings calls from April and June 2020, as well as comments from Fastenal management in a call with Marshfield Associates on April 29, 2020. |
As noted above, prices in the US equity market rose at a reasonably rapid pace during the six months ended February 28, 2021, notwithstanding the ongoing pandemic, and presumably anticipating a recovery. We don’t, however spend time thinking about the reasons for overall market movements. In fact, what the market does and what we think about the economy and how our companies are doing in it are often out of sync. We do spend most of our time analyzing what our companies are doing given the environment in which they operate.
We believe that the portfolio in general benefited from both the market’s apparent belief that the US economy would substantially recover in 2021, as well as our companies’ performance during the pandemic. Stocks in the portfolio which did particularly well and also materially affected performance include Deere (which returned 66.20 percent), Goldman Sachs (which returned 55.94 percent), and Ross Stores (which returned 28.06 percent). Deere and Goldman both had good earnings, in Deere’s case despite the downturn (the farm economy is doing well) and in Goldman’s case because of the downturn, which created both trading opportunities and demand for capital. Ross by contrast had a tough year but apparently better than investors had anticipated.
Several stocks in the portfolio declined in value during the six month period and underperformed the market. These included Strategic Education (which declined 11.36 percent), Moody’s (which declined 6.70 percent), and Fastenal (which declined 5.10 percent). Strategic Education’s enrollment statistics again disappointed investors. By contrast, our view is longer term and we remain confident in their model. The declines In Moody’s and Fastenal’s stock prices seem to us to be mere regression to the mean (by which we mean that the companies are doing well but that the stock prices had been ahead of themselves).
Our historical track record is one of limited turnover, and that was true again during this time period. We sold the rest of our Chipotle and substantially trimmed the size of our Deere position, in both cases due to price appreciation. We added to our existing position in Strategic Education due to its substantial decline in price. We also added slightly to our Arch Capital and Goldman positions on price weakness and, in Goldman’s case, before its substantial run-up.
Our approach in any environment (and particularly in the current, exuberant one) is to stick to our discipline. That means: 1) understanding what’s real and what’s fantasy; 2) acting with equanimity to exploit the misjudgments of the crowd; and 3) being patient and not pulling the trigger before our buy or sell price has been reached. These things won’t change. Process and discipline (enabled by patience) are why we believe investors choose to invest in the Fund, and we take our mandate to preserve capital and generate risk-adjusted returns very seriously.
We thank you for the opportunity to invest your money and for your confidence in our process, discipline, and patience.
| Sincerely, | |
| | |
| Elise J. Hoffmann | Christopher M. Niemczewski |
| Portfolio Manager | Portfolio Manager |
Past performance is not predictive of future performance. Investment results and principal value will fluctuate so that shares, when redeemed, may be worth more or less than their original cost. Current performance may be higher or lower than the performance data quoted. Performance data current to the most recent month-end are available by calling 1-855-691-5288.
An investor should consider the investment objectives, risks, charges and expenses of the Fund carefully before investing. The Fund’s prospectus contains this and other important information. To obtain a copy of the Fund’s prospectus please visit our website at www.MarshfieldFunds.com or call 1-855-691-5288 and a copy will be sent to you free of charge. Please read the prospectus carefully before you invest. The Fund is distributed by Ultimus Fund Distributors, LLC.
The Letter to Shareholders seeks to describe some of the Adviser’s current opinions and views of the financial markets. Although the Adviser believes it has a reasonable basis for any opinions or views expressed, actual results may differ, sometimes significantly so, from those expected or expressed. The securities held by the Fund that are discussed in the Letter to Shareholders were held during the period covered by this Report. They do not comprise the entire investment portfolio of the Fund, may be sold at any time, and may no longer be held by the Fund. For a complete list of securities held by the Fund as of February 28, 2021, please see the Schedule of Investments section of the semi-annual report. The opinions of the Fund’s adviser with respect to those securities may change at any time.
Statements in the Letter to Shareholders that reflect projections or expectations for future financial or economic performance of the Fund and the market in general and statements of the Fund’s plans and objectives for future operations are forward-looking statements. No assurance can be given that actual results or events will not differ materially from those projected, estimated, assumed, or anticipated in any such forward-looking statements. Important factors that could result in such differences, in addition to factors noted with such forward-looking statements, include, without limitation, general economic conditions, such as inflation, recession, and interest rates. Past performance is not a guarantee of future results
| MARSHFIELD CONCENTRATED OPPORTUNITY FUND |
| PORTFOLIO INFORMATION |
| February 28, 2021 (Unaudited) |
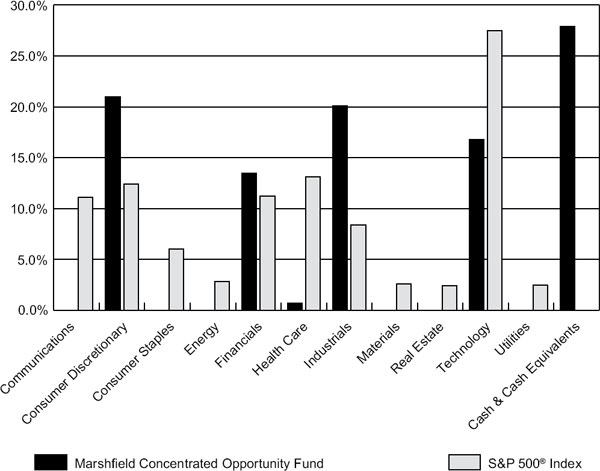
Portfolio Allocation (% of Net Assets)
| Security Description | | % of Net Assets |
| Cummins, Inc. | | 6.9% |
| Goldman Sachs Group, Inc. (The) | | 6.8% |
| Arch Capital Group Ltd. | | 6.7% |
| Moody’s Corporation | | 6.2% |
| AutoZone, Inc. | | 5.8% |
| Mastercard, Inc. - Class A | | 5.6% |
| Ross Stores, Inc. | | 5.2% |
| Visa, Inc. - Class A | | 5.0% |
| Expeditors International of Washington, Inc. | | 4.0% |
| O’Reilly Automotive, Inc. | | 4.0% |
| MARSHFIELD CONCENTRATED OPPORTUNITY FUND |
| SCHEDULE OF INVESTMENTS |
| February 28, 2021 (Unaudited) |
| COMMON STOCKS — 72.1% | | Shares | | | Value | |
| Consumer Discretionary — 21.0% | | | | | | | | |
| Consumer Services — 2.7% | | | | | | | | |
| Strategic Education, Inc. | | | 69,381 | | | $ | 6,308,120 | |
| | | | | | | | | |
| Home Construction — 2.4% | | | | | | | | |
| NVR, Inc. (a) | | | 1,294 | | | | 5,824,087 | |
| | | | | | | | | |
| Retail - Discretionary — 15.9% | | | | | | | | |
| AutoZone, Inc. (a) | | | 11,752 | | | | 13,631,380 | |
| O’Reilly Automotive, Inc. (a) | | | 21,015 | | | | 9,400,640 | |
| Ross Stores, Inc. | | | 105,192 | | | | 12,269,595 | |
| TJX Companies, Inc. (The) | | | 34,268 | | | | 2,261,345 | |
| | | | | | | | 37,562,960 | |
| Financials — 13.5% | | | | | | | | |
| Institutional Financial Services — 6.8% | | | | | | | | |
| Goldman Sachs Group, Inc. (The) | | | 50,204 | | | | 16,039,174 | |
| | | | | | | | | |
| Insurance — 6.7% | | | | | | | | |
| Arch Capital Group Ltd. (a) | | | 442,191 | | | | 15,839,282 | |
| | | | | | | | | |
| Health Care — 0.7% | | | | | | | | |
| Medical Equipment & Devices — 0.7% | | | | | | | | |
| Waters Corporation (a) | | | 5,892 | | | | 1,613,701 | |
| | | | | | | | | |
| Industrials — 20.1% | | | | | | | | |
| Industrial Support Services — 2.7% | | | | | | | | |
| Fastenal Company | | | 137,992 | | | | 6,398,689 | |
| | | | | | | | | |
| Machinery — 3.9% | | | | | | | | |
| Deere & Company | | | 26,610 | | | | 9,290,083 | |
| | | | | | | | | |
| Transportation & Logistics — 6.6% | | | | | | | | |
| Expeditors International of Washington, Inc. | | | 103,281 | | | | 9,485,327 | |
| Union Pacific Corporation | | | 29,827 | | | | 6,143,169 | |
| | | | | | | | 15,628,496 | |
| Transportation Equipment — 6.9% | | | | | | | | |
| Cummins, Inc. | | | 64,585 | | | | 16,352,922 | |
| MARSHFIELD CONCENTRATED OPPORTUNITY FUND |
| SCHEDULE OF INVESTMENTS (Continued) |
| COMMON STOCKS — 72.1% (Continued) | | Shares | | | Value | |
| Technology — 16.8% | | | | | | | | |
| Technology Services — 16.8% | | | | | | | | |
| Mastercard, Inc. - Class A | | | 37,342 | | | $ | 13,213,466 | |
| Moody’s Corporation | | | 53,545 | | | | 14,718,985 | |
| Visa, Inc. - Class A | | �� | 56,089 | | | | 11,912,743 | |
| | | | | | | | 39,845,194 | |
| | | | | | | | | |
| Total Common Stocks (Cost $129,916,030) | | | | | | $ | 170,702,708 | |
| | | | | | | | | |
| MONEY MARKET FUNDS — 27.0% | | Shares | | | Value | |
| Goldman Sachs Financial Square Funds - Treasury Instruments Fund - Institutional Shares, 0.006% (b) | | | 30,362,269 | | | $ | 30,362,269 | |
| Vanguard Treasury Money Market Fund, 0.02% (b) | | | 33,476,525 | | | | 33,476,525 | |
| Total Money Market Funds (Cost $63,838,794) | | | | | | $ | 63,838,794 | |
| | | | | | | | | |
| Investments at Value — 99.1% (Cost $193,754,824) | | | | | | $ | 234,541,502 | |
| | | | | | | | | |
| Other Assets in Excess of Liabilities — 0.9% | | | | | | | 2,250,072 | |
| | | | | | | | | |
| Net Assets — 100.0% | | | | | | $ | 236,791,574 | |
| (a) | Non-income producing security. |
| (b) | The rate shown is the 7-day effective yield as of February 28, 2021. |
See accompanying notes to financial statements.
| MARSHFIELD CONCENTRATED OPPORTUNITY FUND |
| STATEMENT OF ASSETS AND LIABILITIES |
| February 28, 2021 (Unaudited) |
| ASSETS | | | | |
| Investments in securities: | | | | |
| At cost | | $ | 193,754,824 | |
| At value (Note 2) | | $ | 234,541,502 | |
| Receivable for capital shares sold | | | 166,292 | |
| Receivable for investment securities sold | | | 2,095,198 | |
| Dividends receivable | | | 215,047 | |
| Other assets | | | 29,336 | |
| Total assets | | | 237,047,375 | |
| | | | | |
| LIABILITIES | | | | |
| Payable for capital shares redeemed | | | 48,169 | |
| Payable to Adviser (Note 4) | | | 144,202 | |
| Payable to administrator (Note 4) | | | 50,275 | |
| Other accrued expenses | | | 13,155 | |
| Total liabilities | | | 255,801 | |
| | | | | |
| NET ASSETS | | $ | 236,791,574 | |
| | | | | |
| NET ASSETS CONSIST OF: | | | | |
| Paid-in capital | | $ | 187,893,268 | |
| Accumulated earnings | | | 48,898,306 | |
| NET ASSETS | | $ | 236,791,574 | |
| | | | | |
| Shares of beneficial interest outstanding (unlimited number of shares authorized, no par value) | | | 11,075,383 | |
| | | | | |
| Net asset value, offering price and redemption price per share (Note 2) | | $ | 21.38 | |
See accompanying notes to financial statements.
| MARSHFIELD CONCENTRATED OPPORTUNITY FUND |
| STATEMENT OF OPERATIONS |
| For the Six Months Ended February 28, 2021 (Unaudited) |
| INVESTMENT INCOME | | | | |
| Dividend income | | $ | 748,212 | |
| | | | | |
| EXPENSES | | | | |
| Investment advisory fees (Note 4) | | | 1,012,277 | |
| Administration fees (Note 4) | | | 92,669 | |
| Fund accounting fees (Note 4) | | | 25,704 | |
| Registration and filing fees | | | 25,580 | |
| Transfer agent fees (Note 4) | | | 15,216 | |
| Custody and bank service fees | | | 13,552 | |
| Compliance fees (Note 4) | | | 11,742 | |
| Legal fees | | | 11,519 | |
| Postage and supplies | | | 8,443 | |
| Trustees’ fees and expenses (Note 4) | | | 8,400 | |
| Audit and tax services fees | | | 8,000 | |
| Printing of shareholder reports | | | 5,090 | |
| Insurance expense | | | 2,594 | |
| Other expenses | | | 7,296 | |
| Total expenses | | | 1,248,082 | |
| Less fee reductions by the Adviser (Note 4) | | | (137,631 | ) |
| Net expenses | | | 1,110,451 | |
| | | | | |
| NET INVESTMENT LOSS | | | (362,239 | ) |
| | | | | |
| REALIZED AND UNREALIZED GAINS ON INVESTMENTS | | | | |
| Net realized gains from investment transactions | | | 8,719,445 | |
| Net change in unrealized appreciation (depreciation) on investments | | | 11,419,498 | |
| NET REALIZED AND UNREALIZED GAINS ON INVESTMENTS | | | 20,138,943 | |
| | | | | |
| NET INCREASE IN NET ASSETS RESULTING FROM OPERATIONS | | $ | 19,776,704 | |
See accompanying notes to financial statements.
| MARSHFIELD CONCENTRATED OPPORTUNITY FUND |
| STATEMENTS OF CHANGES IN NET ASSETS |
| | | Six Months | | | | |
| | | Ended | | | Year | |
| | | February 28, | | | Ended | |
| | | 2021 | | | August 31, | |
| | | (Unaudited) | | | 2020 | |
| FROM OPERATIONS | | | | | | | | |
| Net investment loss | | $ | (362,239 | ) | | $ | (147,638 | ) |
| Net realized gains from investment transactions | | | 8,719,445 | | | | 5,889,111 | |
| Net change in unrealized appreciation (depreciation) on investments | | | 11,419,498 | | | | 18,359,707 | |
| Net increase in net assets resulting from operations | | | 19,776,704 | | | | 24,101,180 | |
| | | | | | | | | |
| DISTRIBUTIONS TO SHAREHOLDERS (Note 2) | | | (5,969,448 | ) | | | (1,819,672 | ) |
| | | | | | | | | |
| CAPITAL SHARE TRANSACTIONS | | | | | | | | |
| Proceeds from shares sold | | | 39,218,272 | | | | 113,298,747 | |
| Net asset value of shares issued in reinvestment of distributions to shareholders | | | 5,871,170 | | | | 1,779,367 | |
| Proceeds from redemption fees collected (Note 2) | | | 24,032 | | | | 59,200 | |
| Payments for shares redeemed | | | (24,510,500 | ) | | | (23,626,711 | ) |
| Net increase in net assets from capital share transactions | | | 20,602,974 | | | | 91,510,603 | |
| | | | | | | | | |
| TOTAL INCREASE IN NET ASSETS | | | 34,410,230 | | | | 113,792,111 | |
| | | | | | | | | |
| NET ASSETS | | | | | | | | |
| Beginning of period | | | 202,381,344 | | | | 88,589,233 | |
| End of period | | $ | 236,791,574 | | | $ | 202,381,344 | |
| | | | | | | | | |
| CAPITAL SHARES ACTIVITY | | | | | | | | |
| Shares sold | | | 1,914,861 | | | | 6,308,187 | |
| Shares reinvested | | | 285,147 | | | | 95,716 | |
| Shares redeemed | | | (1,193,113 | ) | | | (1,355,987 | ) |
| Net increase in shares outstanding | | | 1,006,895 | | | | 5,047,916 | |
| Shares outstanding at beginning of period | | | 10,068,488 | | | | 5,020,572 | |
| Shares outstanding at end of period | | | 11,075,383 | | | | 10,068,488 | |
See accompanying notes to financial statements.
| MARSHFIELD CONCENTRATED OPPORTUNITY FUND |
| FINANCIAL HIGHLIGHTS |
Per Share Data for a Share Outstanding Throughout Each Period
| | | Six Months | | | | | | | | | | | | | | | | |
| | | Ended | | | Year | | | Year | | | Year | | | Year | | | Period | |
| | | February 28, | | | Ended | | | Ended | | | Ended | | | Ended | | | Ended | |
| | | 2021 | | | August 31, | | | August 31, | | | August 31, | | | August 31, | | | August 31, | |
| | | (Unaudited) | | | 2020 | | | 2019 | | | 2018 | | | 2017 | | | 2016 (a) | |
| Net asset value at beginning of period | | $ | 20.10 | | | $ | 17.65 | | | $ | 15.37 | | | $ | 12.58 | | | $ | 10.61 | | | $ | 10.00 | |
| Income (loss) from investment operations: | | | | | | | | | | | | | | | | | | | | | | | | |
| Net investment income (loss) | | | (0.03 | ) | | | (0.02 | ) | | | 0.02 | | | | (0.00 | ) (b) | | | 0.00 | (b) | | | 0.02 | |
| Net realized and unrealized gains on investments | | | 1.87 | | | | 2.72 | | | | 2.53 | | | | 3.08 | | | | 2.04 | | | | 0.59 | |
| Total from investment operations | | | 1.84 | | | | 2.70 | | | | 2.55 | | | | 3.08 | | | | 2.04 | | | | 0.61 | |
| Less distributions from: | | | | | | | | | | | | | | | | | | | | | | | | |
| Net investment income | | | — | | | | (0.02 | ) | | | (0.00 | ) (b) | | | (0.01 | ) | | | (0.02 | ) | | | — | |
| Net realized gains | | | (0.56 | ) | | | (0.24 | ) | | | (0.27 | ) | | | (0.28 | ) | | | (0.05 | ) | | | — | |
| Total distributions | | | (0.56 | ) | | | (0.26 | ) | | | (0.27 | ) | | | (0.29 | ) | | | (0.07 | ) | | | — | |
| Proceeds from redemption fees collected (Note 2) | | | 0.00 | (b) | | | 0.01 | | | | 0.00 | (b) | | | 0.00 | (b) | | | — | | | | — | |
| Net asset value at end of period | | $ | 21.38 | | | $ | 20.10 | | | $ | 17.65 | | | $ | 15.37 | | | $ | 12.58 | | | $ | 10.61 | |
| Total return (c) | | | 9.28 | % (d) | | | 15.47 | % | | | 17.12 | % | | | 24.70 | % | | | 19.27 | % | | | 6.10 | % (d) |
| Net assets at end of period (000’s) | | $ | 236,792 | | | $ | 202,381 | | | $ | 88,589 | | | $ | 22,898 | | | $ | 12,834 | | | $ | 5,891 | |
| Ratios/supplementary data: | | | | | | | | | | | | | | | | | | | | | | | | |
| Ratio of total expenses to average net assets | | | 1.17 | % (e) | | | 1.23 | % | | | 1.48 | % | | | 2.09 | % | | | 2.87 | % | | | 3.80 | % (e) |
| Ratio of net expenses to average net assets (f) | | | 1.04 | % (e) | | | 1.10 | % | | | 1.10 | % | | | 1.10 | % | | | 1.10 | % | | | 1.22 | % (e) |
| Ratio of net investment income (loss) to average net assets (f) | | | (0.34 | %) (e) | | | (0.10 | %) | | | 0.22 | % | | | (0.01 | %) | | | 0.08 | % | | | 0.42 | % (e) |
| Portfolio turnover rate | | | 12 | % (d) | | | 14 | % | | | 14 | % | | | 10 | % | | | 11 | % | | | 18 | % (d) |
| (a) | Represents the period from the commencement of operations (December 29, 2015) through August 31, 2016. |
| (b) | Amount rounds to less than $0.01 per share. |
| (c) | Total return is a measure of the change in value of an investment in the Fund over the periods covered. The returns shown do not reflect the deduction of taxes a shareholders would pay on Fund distributions, if any, or the redemption of Fund shares. The total returns would be lower if the Adviser had not reduced advisory fees and reimbursed expenses (Note 4). |
| (f) | Ratio was determined after advisory fee reductions and expense reimbursements (Note 4). |
See accompanying notes to financial statements.
| MARSHFIELD CONCENTRATED OPPORTUNITY FUND |
| NOTES TO FINANCIAL STATEMENTS |
| February 28, 2021 (Unaudited) |
Marshfield Concentrated Opportunity Fund (the “Fund”) is a non-diversified series of Ultimus Managers Trust (the “Trust”), an open-end investment company established as an Ohio business trust under a Declaration of Trust dated February 28, 2012. Other series of the Trust are not incorporated in this report.
The investment objective of the Fund is to seek the dual goals of capital preservation and the long-term growth of principal, while targeting a pattern of performance at variance with that of the market.
| 2. | Significant Accounting Policies |
The Fund follows accounting and reporting guidance under Financial Accounting Standards Board Accounting Standards Codification Topic 946, “Financial Services – Investment Companies.” The following is a summary of the Fund’s significant accounting policies used in the preparation of its financial statements. These policies are in conformity with accounting principles generally accepted in the United States of America (“GAAP”).
Securities valuation – The Fund values its portfolio securities at fair value as of the close of regular trading on the New York Stock Exchange (the “NYSE”) (normally 4:00 p.m. Eastern time) on each business day the NYSE is open for business. The Fund values its listed securities, including common stocks, on the basis of the security’s last sale price on the security’s primary exchange, if available, otherwise at the exchange’s most recently quoted mean price. NASDAQ-listed securities are valued at the NASDAQ Official Closing Price. Investments representing shares of other registered open-end investment companies that are not listed on an exchange, including money market funds, are valued at their net asset value (“NAV”) as reported by such companies. When using a quoted price and when the market is considered active, the security will be classified as Level 1 within the fair value hierarchy (see below). Fixed income securities, if any, are generally valued using prices provided by an independent pricing service approved by the Board of Trustees of the Trust (the “Board”). The independent pricing service uses information with respect to transactions in bonds, quotations from bond dealers, market transactions in comparable securities, and various relationships between securities in determining these prices. In the event that market quotations are not readily available or are considered unreliable due to market or other events, the Fund values its securities and other assets at fair value in accordance with procedures established by and under the general supervision of the Board. Under these procedures, the securities will be classified as Level 2 or 3 within the fair value hierarchy, depending on the inputs used. Unavailable or unreliable market quotes may be due to the following factors: a substantial bid-ask spread; infrequent sales resulting in stale prices; insufficient trading volume; small trade sizes; a temporary lapse in any reliable pricing source; and actions of the securities or futures markets,
| MARSHFIELD CONCENTRATED OPPORTUNITY FUND |
| NOTES TO FINANCIAL STATEMENTS (Continued) |
such as the suspension or limitation of trading. As a result, the prices of securities used to calculate the Fund’s NAV may differ from quoted or published prices for the same securities.
GAAP establishes a single authoritative definition of fair value, sets out a framework for measuring fair value, and requires additional disclosures about fair value measurements.
Various inputs are used in determining the value of the Fund’s investments. These inputs are summarized in the three broad levels listed below:
| ● | Level 1 – quoted prices in active markets for identical securities |
| ● | Level 2 – other significant observable inputs |
| ● | Level 3 – significant unobservable inputs |
The inputs or methods used for valuing securities are not necessarily an indication of the risks associated with investing in those securities. The inputs used to measure fair value may fall into different levels of the fair value hierarchy. In such cases, for disclosure purposes, the level in the fair value hierarchy within which the fair value measurement falls in its entirety is determined based on the lowest level input that is significant to the fair value measurement.
The following is a summary of the Fund’s investments by the inputs used to value the investments as of February 28, 2021:
| | | Level 1 | | | Level 2 | | | Level 3 | | | Total | |
| Common Stocks | | $ | 170,702,708 | | | $ | — | | | $ | — | | | $ | 170,702,708 | |
| Money Market Funds | | | 63,838,794 | | | | — | | | | — | | | | 63,838,794 | |
| Total | | $ | 234,541,502 | | | $ | — | | | $ | — | | | $ | 234,541,502 | |
| | | | | | | | | | | | | | | | | |
Refer to the Fund’s Schedule of Investments for a listing of the common stocks by sector and industry type. The Fund did not hold derivative instruments or any assets or liabilities that were measured at fair value on a recurring basis using significant unobservable inputs (Level 3) as of or during the six months ended February 28, 2021.
Share valuation – The NAV per share of the Fund is calculated daily by dividing the total value of the Fund’s assets, less liabilities, by the number of shares outstanding. The offering price and redemption price per share of the Fund is equal to the NAV, except that shares of the Fund are subject to a redemption fee of 2% if redeemed within 90 days of the date of purchase. During the periods ended February 28, 2021 and August 31, 2020, proceeds from the redemption fees, recorded in capital, totaled $24,032 and $59,200, respectively.
| MARSHFIELD CONCENTRATED OPPORTUNITY FUND |
| NOTES TO FINANCIAL STATEMENTS (Continued) |
Investment income – Dividend income is recorded on the ex-dividend date. Non-cash dividends included in dividend income, if any, are recorded at the fair value of the security received. Interest income is accrued as earned.
Investment transactions – Investment transactions are accounted for on the trade date. Realized gains and losses on investments sold are determined on a specific identification basis.
Common expenses – Common expenses of the Trust are allocated among the Fund and the other series of the Trust based on the relative net assets of each series, the number of series in the Trust, or the nature of the services performed and the relative applicability to each series.
Distributions to shareholders – The Fund will distribute to shareholders any net investment income dividends and net realized capital gains distributions at least once each year. The amount of such dividends and distributions are determined in accordance with federal income tax regulations, which may differ from GAAP. Dividends and distributions are recorded on the ex-dividend date. The tax character of the Fund’s distributions paid to shareholders during the periods ended February 28, 2021 and August 31, 2020 was as follows:
| | | | | | Long-Term | | | | |
| Period | | Ordinary | | | Capital | | | Total | |
| Ended | | Income | | | Gains | | | Distributions | |
| 2/28/2021 | | $ | 28,598 | | | $ | 5,940,850 | | | $ | 5,969,448 | |
| 8/31/2020 | | $ | 296,128 | | | $ | 1,523,544 | | | $ | 1,819,672 | |
| | | | | | | | | | | | | |
Estimates – The preparation of financial statements in conformity with GAAP requires management to make estimates and assumptions that affect the reported amounts of assets and liabilities and disclosure of contingent assets and liabilities as of the date of the financial statements and the reported amounts of increase (decrease) in net assets from operations during the reporting period. Actual results could differ from those estimates.
Federal income tax – The Fund has qualified and intends to continue to qualify as a regulated investment company under the Internal Revenue Code of 1986, as amended (the “Code”). Qualification generally will relieve the Fund of liability for federal income taxes to the extent 100% of its net investment income and net realized capital gains are distributed in accordance with the Code.
The Fund recognizes interest and penalties, if any, related to unrecognized tax benefits as income tax on the Statement of Operations. During the six months ended February 28, 2021, the Fund did not incur any interest or penalties.
| MARSHFIELD CONCENTRATED OPPORTUNITY FUND |
| NOTES TO FINANCIAL STATEMENTS (Continued) |
In order to avoid imposition of the excise tax applicable to regulated investment companies, it is also the Fund’s intention to declare as dividends in each calendar year at least 98% of its net investment income (earned during the calendar year) and 98.2% of its net realized capital gains (earned during the 12 months ended October 31) plus undistributed amounts from prior years.
The following information is computed on a tax basis for each item as of February 28, 2021:
| | | | | |
| Tax cost of portfolio investments | | $ | 193,762,126 | |
| Gross unrealized appreciation | | $ | 43,089,917 | |
| Gross unrealized depreciation | | | (2,310,541 | ) |
| Net unrealized appreciation | | | 40,779,376 | |
| Accumulated ordinary loss | | | (362,239 | ) |
| Other gains | | | 8,481,169 | |
| Accumulated earnings | | $ | 48,898,306 | |
| | | | | |
The values of the federal income tax cost of portfolio investments and the financial statement cost of portfolio investments may be temporarily different (“book/tax differences”). These book/tax differences are due to the timing of the recognition of capital gains or losses under income tax regulations and GAAP, primarily due to the tax deferral of losses on wash sales.
The Fund recognizes the tax benefits or expenses of uncertain tax positions only when the position is “more likely than not” to be sustained assuming examination by tax authorities. Management has reviewed the Fund’s tax positions for the current and all open tax years (generally, three years) and has concluded that no provision for unrecognized tax benefits or expenses is required in these financial statements. The Fund identifies its major tax jurisdiction as U.S. Federal.
| 3. | Investment Transactions |
During the six months ended February 28, 2021, cost of purchases and proceeds from sales of investment securities, other than short-term investments, were $18,965,366 and $18,678,478, respectively.
| 4. | Transactions with Related Parties |
INVESTMENT ADVISORY AGREEMENT
The Fund’s investments are managed by Marshfield Associates, Inc. (the “Adviser”) pursuant to the terms of an Investment Advisory Agreement. Under the Investment Advisory Agreement, the Fund pays the Adviser an advisory fee, computed and accrued daily and paid monthly, at the annual rate of 0.95% of its average daily net assets.
| MARSHFIELD CONCENTRATED OPPORTUNITY FUND |
| NOTES TO FINANCIAL STATEMENTS (Continued) |
Effective December 1, 2020, pursuant to an Expense Limitation Agreement (“ELA”) between the Fund and the Adviser, the Adviser has contractually agreed, until January 1, 2022, to reduce its investment advisory fees and reimburse other expenses to limit total annual operating expenses (exclusive of brokerage costs; taxes; interest; borrowing costs such as interest and dividend expenses on securities sold short; costs to organize the Fund; acquired fund fees and expenses; extraordinary expenses such as litigation and merger or reorganization costs and other expenses not incurred in the ordinary course of the Fund’s business), to an amount not exceeding 0.99% of the Fund’s average daily net assets. Prior to December 1, 2020, the Adviser had contractually agreed to limit total annual operating expenses (exclusive of brokerage costs; taxes; interest; borrowing costs such as interest and dividend expenses on securities sold short; costs to organize the Fund; acquired fund fees and expenses; extraordinary expenses such as litigation and merger or reorganization costs and other expenses not incurred in the ordinary course of the Fund’s business), to an amount not exceeding 1.10% of the Fund’s average daily net assets. Accordingly, during the six months ended August 31, 2020, the Adviser reduced its investment advisory fees by $137,631.
Under the terms of the ELA, investment advisory fee reductions and expense reimbursements by the Adviser are subject to repayment by the Fund for a period of three years after such fees and expenses were incurred, provided the repayments do not cause total annual operating expenses to exceed the lesser of: (i) the expense limitation then in effect, if any, and (ii) the expense limitation in effect at the time the expenses to be repaid were incurred. As of February 28, 2021, the Adviser may seek repayment of investment advisory fee reductions and expense reimbursements in the amount of $581,128 no later than the dates as stated below:
| | | | |
| August 31, 2021 | | $ | 81,806 | |
| August 31, 2022 | | | 176,244 | |
| August 31, 2023 | | | 185,447 | |
| February 29, 2024 | | | 137,631 | |
| Total | | $ | 581,128 | |
| | | | | |
OTHER SERVICE PROVIDERS
Ultimus Fund Solutions, LLC (“Ultimus”) provides administration, fund accounting, compliance and transfer agency services to the Fund. The Fund pays Ultimus fees in accordance with the agreements for such services. In addition, the Fund pays out-of-pocket expenses including, but not limited to, postage, supplies, and certain costs related to the pricing of the Fund’s portfolio securities.
Under the terms of a Distribution Agreement with the Trust, Ultimus Fund Distributors, LLC (the “Distributor”) serves as principal underwriter to the Fund. The Distributor is a wholly -owned subsidiary of Ultimus. The Distributor is compensated by the Adviser (not the Fund) for acting as principal underwriter.
| MARSHFIELD CONCENTRATED OPPORTUNITY FUND |
| NOTES TO FINANCIAL STATEMENTS (Continued) |
Certain officers and a Trustee of the Trust are also officers of Ultimus.
TRUSTEE COMPENSATION
Each member of the Board (a “Trustee”) who is not an “interested person” of the Trust (“Independent Trustee”) receives a $1,300 annual retainer from the Fund, paid quarterly, except for the Board Chairperson who receives a $1,500 annual retainer from the Fund, paid quarterly. Each Independent Trustee also receives from the Fund a fee of $500 for each Board meeting attended plus reimbursement for travel and other meeting-related expenses.
PRINCIPAL HOLDER OF FUND SHARES
As of February 28, 2021, the following shareholder owned of record 25% or more of the outstanding shares of the Fund:
| Name of Record Owner | | % Ownership |
| | | |
| RBC Capital Markets, LLC (for the benefit of its customers) | | 60% |
| | | |
A beneficial owner of 25% or more of the Fund’s outstanding shares may be considered a controlling person. That shareholder’s vote could have a more significant effect on matters presented at a shareholders’ meeting.
| 5. | Contingencies and Commitments |
The Fund indemnifies the Trust’s officers and Trustees for certain liabilities that might arise from their performance of their duties to the Fund. Additionally, in the normal course of business the Fund enters into contracts that contain a variety of representations and warranties and which provide general indemnifications. The Fund’s maximum exposure under these arrangements is unknown, as this would involve future claims that may be made against the Fund that have not yet occurred. However, based on experience, the Fund expects the risk of loss to be remote.
| 6. | Investments in Money Market Funds |
In order to maintain sufficient liquidity to implement investment strategies, or for temporary defensive purposes, the Fund may at times invest a significant portion of its assets in shares of a money market fund. As of February 28, 2021, the Fund had 27.0% of the value of its net assets invested in shares of money market funds registered under the Investment Company Act of 1940, as amended (the “1940 Act”). An investment in a money market fund is not insured or guaranteed by the Federal Deposit Insurance Corporation or any other government agency, entity or person. While investor losses in money market funds have been rare, they are possible. The Fund incurs additional indirect expenses due to acquired fund fees and expenses to the extent it invests in shares of money market funds. The financial statements for the money market funds held can be found at www.sec.gov.
| MARSHFIELD CONCENTRATED OPPORTUNITY FUND |
| NOTES TO FINANCIAL STATEMENTS (Continued) |
The Fund is required to recognize in the financial statements the effects of all subsequent events that provide additional evidence about conditions that existed as of the date of the Statement of Assets and Liabilities. For non-recognized subsequent events that must be disclosed to keep the financial statements from being misleading, the Fund is required to disclose the nature of the event as well as an estimate of its financial effect, or a statement that such an estimate cannot be made. Management has evaluated subsequent events through the issuance of these financial statements and has noted no such events.
| MARSHFIELD CONCENTRATED OPPORTUNITY FUND |
| ABOUT YOUR FUND’S EXPENSES (Unaudited) |
We believe it is important for you to understand the impact of costs on your investment. As a shareholder of the Fund, you incur two types of cost: (1) transaction costs, including redemption fees; and (2) ongoing costs, including management fees and other operating expenses. The following examples are intended to help you understand your ongoing costs (in dollars) of investing in the Fund and to compare these costs with the ongoing costs of investing in other mutual funds.
A mutual fund’s ongoing costs are expressed as a percentage of its average net assets. This figure is known as the expense ratio. The expenses in the table below are based on an investment of $1,000 made at the beginning of the most recent period (September 1, 2020) and held until the end of the period (February 28, 2021).
The table below illustrates the Fund’s ongoing costs in two ways:
Actual fund return – This section helps you to estimate the actual expenses that you paid over the period. The “Ending Account Value” shown is derived from the Fund’s actual return, and the fourth column shows the dollar amount of operating expenses that would have been paid by an investor who started with $1,000 in the Fund. You may use the information here, together with the amount you invested, to estimate the expenses that you paid over the period.
To do so, simply divide your account value by $1,000 (for example, an $8,600 account value divided by $1,000 = 8.6), then multiply the result by the number given for the Fund under the heading “Expenses Paid During Period.”
Hypothetical 5% return – This section is intended to help you compare the Fund’s ongoing costs with those of other mutual funds. It assumes that the Fund had an annual return of 5% before expenses during the period shown, but that the expense ratio is unchanged. In this case, because the return used is not the Fund’s actual return, the results do not apply to your investment. The example is useful in making comparisons because the U.S. Securities and Exchange Commission (“SEC”) requires all mutual funds to calculate expenses based on a 5% return. You can assess the Fund’s ongoing costs by comparing this hypothetical example with the hypothetical examples that appear in shareholder reports of other funds.
Note that expenses shown in the table are meant to highlight and help you compare ongoing costs only. The Fund does not charge sales loads. However, a redemption fee of 2% is applied on the sale of shares held for less than 90 days.
The calculations assume no shares were bought or sold during the period. Your actual costs may have been higher or lower, depending on the amount of your investment and the timing of any purchases or redemptions.
More information about the Fund’s expenses can be found in this report. For additional information on operating expenses and other shareholder costs, please refer to the Fund’s prospectus.
| MARSHFIELD CONCENTRATED OPPORTUNITY FUND |
| ABOUT YOUR FUND’S EXPENSES (Unaudited) (Continued) |
| | | Beginning | | Ending | | | | |
| | | Account Value | | Account Value | | Net | | Expenses |
| | | September 1, | | February 28, | | Expense | | Paid During |
| | | 2020 | | 2021 | | Ratio (a) | | Period (b) |
| Based on Actual Fund Return | | $1,000.00 | | $1,092.80 | | 1.04% | | $5.40 |
| Based on Hypothetical 5% Return (before expenses) | | $1,000.00 | | $1,019.64 | | 1.04% | | $5.21 |
| | | | | | | | | |
| (a) | Annualized, based on the Fund’s most recent one-half year expenses. |
| (b) | Expenses are equal to the Fund’s annualized net expense ratio multiplied by the average account value over the period, multiplied by 181/365 (to reflect the one-half year period). |
| OTHER INFORMATION (Unaudited) |
A description of the policies and procedures that the Fund uses to vote proxies relating to portfolio securities is available without charge upon request by calling toll-free 1-855-691-5288, or on the SEC’s website at www.sec.gov. Information regarding how the Fund voted proxies relating to portfolio securities during the most recent 12-month period ended June 30 is available without charge upon request by calling toll-free 1-855-691-5288, or on the SEC’s website at www.sec.gov.
The Trust files a complete listing of portfolio holdings for the Fund with the SEC as of the end of the first and third quarters of each fiscal year as an exhibit to its reports on Form N-PORT. These filings are available upon request by calling 1-855-691-5288. Furthermore, you may obtain a copy of the filings on the SEC’s website at www.sec.gov.
| MARSHFIELD CONCENTRATED OPPORTUNITY FUND |
DISCLOSURE REGARDING APPROVAL OF INVESTMENT ADVISORY
AGREEMENT (Unaudited) |
The Board of Trustees (the “Board”), including the Independent Trustees voting separately, has reviewed and approved the continuation of the Fund’s Investment Advisory Agreement (the “Agreement”) with Marshfield Associates, Inc. (the “Adviser”) for an additional one-year term. The Board approved the Agreement at a meeting held on October 19-21, 2020, at which all of the Trustees were present.
Legal counsel advised the Board during its deliberations. Additionally, the Board received and reviewed a substantial amount of information provided by the Adviser in response to requests of the Board and counsel. In deciding whether to approve the Agreement, the Board recalled its discussion with the Adviser during the meeting and its review of various materials related to the Advisor and the Fund. The Board further considered those materials and discussions and numerous other factors, including:
The nature, extent, and quality of the services provided by the Adviser. In this regard, the Board reviewed the services being provided by Marshfield to the Marshfield Fund including, without limitation, its recent investment advisory services to the Marshfield Fund, its compliance policies and procedures, its efforts to promote the Marshfield Fund and assist in its distribution, and its compliance program. After reviewing the foregoing information and further information in the Marshfield Memorandum (e.g., descriptions of its business and Form ADV), the Board concluded that the quality, extent, and nature of the services provided by Marshfield were satisfactory and adequate.
The investment performance of the Marshfield Fund. In this regard, the Board compared the performance of the Marshfield Fund with the performance of its benchmark index, custom peer group and Morningstar category. The Board also considered the consistency of Marshfield’s management with the Marshfield Fund’s investment objective and policies. The Board noted that the Marshfield Fund had outperformed its primary benchmark, the Standard & Poor’s 500 Total Return Stock Index, for the three-year period and since inception period, and underperformed its benchmark for the year-to-date and one-year periods. The Board also noted that the Marshfield Fund had outperformed the median of its custom peer group for the one- and three-year periods and since inception period and outperformed the median of its Morningstar category (Large Growth) for the since inception period and underperformed the average and median performance of its Morningstar category for the one- and three-year periods. Following additional discussion of the investment performance of the Marshfield Fund; Marshfield’s experience in managing mutual funds and separate accounts; Marshfield’s historical investment performance; and other factors, the Board concluded that the investment performance of the Marshfield Fund has been satisfactory.
The costs of the services provided and profits realized by Marshfield and its affiliates from its relationship with the Marshfield Fund. In this regard, the Board considered Marshfield’s staffing, personnel, and methods of operations; the education and
| MARSHFIELD CONCENTRATED OPPORTUNITY FUND |
DISCLOSURE REGARDING APPROVAL OF INVESTMENT ADVISORY
AGREEMENT (Unaudited) (Continued) |
experience of its personnel; its compliance program, policies, and procedures; its financial condition and the level of commitment to the Marshfield Fund, and, generally, Marshfield’s advisory business; the asset level of the Marshfield Fund; and the overall expenses of the Marshfield Fund, including the advisory fee; and the difference in fees and services to Marshfield’s other similar clients. The Board considered its discussion with Marshfield regarding the Marshfield Expense Limitation Agreement (“Marshfield ELA”) and the proposed amendment thereto to lower the expense cap and considered Marshfield’s current and past fee reductions and expense reimbursements for the Marshfield Fund. The Board further took into account Marshfield’s commitment to continue the Marshfield ELA until at least January 1, 2022.
The Board also considered potential benefits for Marshfield in managing the Marshfield Fund, including promotion of Marshfield’s name. The Board compared the Marshfield Fund’s advisory fee and overall expense ratio to the average and median advisory fees and expense ratios for its custom peer group and Morningstar category (Large Growth) and fees charged to Marshfield’s other client accounts. In considering the comparison in fees and expense ratios between the Marshfield Fund and other comparable funds, the Board looked at the differences in types of funds being compared, the style of investment management, the size of the Marshfield Fund, and the nature of the investment strategy. The Board noted that the Marshfield Fund’s advisory fee of 0.95% was higher than the average and median advisory fee for the Marshfield Fund’s Morningstar category, and higher than the median advisory fee for its custom peer group, but less than the median advisory fee for its custom peer group and the highest advisory fee in the Marshfield Fund’s Morningstar category. The Board also considered Marshfield’s commitment to limit the Marshfield Fund’s expenses under the amended Marshfield ELA to 0.99%. The Board further noted that the overall expense ratio for the Marshfield Fund under the amended Marshfield ELA of 0.99% is higher than the average and median expense ratio for the other funds in the Marshfield Fund’s Morningstar category, but was lower than the average and median expense ratio in the Marshfield Fund’s custom peer group. The Board also compared the fees paid by the Marshfield Fund to the fees paid by other clients of Marshfield that may have similar investment strategies to the Marshfield Fund and considered the similarities and differences of services received by such other clients as compared to the services received by the Marshfield Fund. The Board noted that the fee structures applicable to Marshfield’s other clients were not indicative of any unreasonableness with respect to the advisory fees proposed payable by the Marshfield Fund. The Board further considered the investment strategy and style used by Marshfield in managing the portfolio of the Marshfield Fund. Following these comparisons and considerations and upon further consideration and discussion of the foregoing, the Board concluded that for the Marshfield Fund, the advisory fees to be paid to Marshfield by the Fund are fair and reasonable.
| MARSHFIELD CONCENTRATED OPPORTUNITY FUND |
DISCLOSURE REGARDING APPROVAL OF INVESTMENT ADVISORY
AGREEMENT (Unaudited) (Continued) |
The extent to which economies of scale would be realized as the Marshfield Fund grows and whether advisory fee levels reflect these economies of scale for the benefit of the Marshfield Fund’s investors. In this regard, the Board considered that the Marshfield Fund’s fee arrangements with Marshfield involve both the advisory fee and the Marshfield ELA. The Board determined that while the advisory fee rate remained the same as asset levels increased, the shareholders of the Marshfield Fund have experienced benefits from the Marshfield ELA and will continue to experience benefits from the Marshfield ELA until the Marshfield Fund assets grow to a level where its expenses otherwise fall below the expense limit. Following further discussion of the Marshfield Fund’s asset level, expectations for growth, and level of fees, the Board determined that the Marshfield Fund’s fee arrangements with Marshfield would continue to provide benefits. The Board also determined that the fee arrangements were fair and reasonable in relation to the nature and quality of services being provided by Marshfield, given the Marshfield Fund’s projected asset levels for the next year.
Brokerage and portfolio transactions. In this regard, the Board considered Marshfield’s trading policies, procedures, and performance in seeking best execution for its clients, including the Marshfield Fund. The Board also considered the historical portfolio turnover rate for the Marshfield Fund; the process by which evaluations are made of the overall reasonableness of commissions paid; the process by which Marshfield evaluates best execution; the method and basis for selecting and evaluating the broker-dealers used; and any anticipated allocation of portfolio business to persons affiliated with Marshfield. After further review and discussion, the Board determined that Marshfield’s practices regarding brokerage and portfolio transactions were satisfactory.
Possible conflicts of interest. In evaluating the possibility for conflicts of interest, the Board considered such matters as the experience and abilities of the advisory personnel assigned to the Marshfield Fund; Marshfield’s process for allocating trades among the Marshfield Fund and its other clients; and the substance and administration of Marshfield’s Code of Ethics. Following further consideration and discussion, the Board found for the Marshfield Fund that Marshfield’s standards and practices relating to the identification and mitigation of potential conflicts of interests were satisfactory.
After further discussion of the factors noted above and in reliance on the information provided by Marshfield and Trust Management, and taking into account the totality of all the factors discussed and information presented at this Meeting and previous Meetings, the Board indicated its agreement to approve the continuance of the Marshfield Advisory Agreement and to approve the continuance of the Marshfield ELA and the proposed Amended Schedule A to the Marshfield ELA. It was noted that in the Trustees’ deliberations regarding the approval of renewal the Marshfield Advisory Agreement, the Trustees did not identify any particular information or factor that was all-important or controlling, and that each individual Trustee may have attributed different weights to the various factors listed above.
| MARSHFIELD CONCENTRATED OPPORTUNITY FUND |
LIQUIDITY RISK MANAGEMENT PROGRAM
(Unaudited) |
The Fund has adopted and implemented a written liquidity risk management program (the “Program”) as required by Rule 22e-4 (the “Liquidity Rule”) under the Investment Company Act of 1940, as amended. The Program is reasonably designed to assess and manage the Fund’s liquidity risk, taking into consideration, among other factors, the Fund’s investment strategy and the liquidity of its portfolio investments during normal and reasonably foreseeable stressed conditions; its short- and long-term cash flow projections; and its cash holdings and access to other funding sources. The Fund’s Board of Trustees (the “Board”) approved the appointment of the Liquidity Administrator Committee, comprising of the Fund’s Adviser and certain Trust officers, to be responsible for the Program’s administration and oversight and for reporting to the Board on at least an annual basis regarding the Program’s operation and effectiveness. The annual written report assessing the Program (the “Report”) was presented to the Board at the October 19-20, 2020 Board meeting and covered the period from June 1, 2019 to May 31, 2020 (the “Review Period”).
During the Review Period, the Fund did not experience unusual stress or disruption to its operations related to purchase and redemption activity. Also, during the Review Period, the Fund held adequate levels of cash and highly liquid investments to meet shareholder redemption activities in accordance with applicable requirements. The Report concluded that the Program is reasonably designed to prevent violation of the Liquidity Rule and the Program has been effectively implemented.
| CUSTOMER PRIVACY NOTICE |
| |
| | WHAT DOES THE MARSHFIELD CONCENTRATED OPPORTUNITY FUND (the “Fund”) DO WITH YOUR PERSONAL INFORMATION? |
| |
| Why? | Financial companies choose how they share your personal information. Federal law gives consumers the right to limit some but not all sharing. Federal law also requires us to tell you how we collect, share, and protect your personal information. Please read this notice carefully to understand what we do. |
| |
| What? | The types of personal information we collect and share depend on the product or service you have with us. This information can include: ■ Social Security number ■ Assets ■ Retirement Assets ■ Transaction History ■ Checking Account Information ■ Purchase History ■ Account Balances ■ Account Transactions ■ Wire Transfer Instructions When you are no longer our customer, we continue to share your information as described in this notice. |
| |
| How? | All financial companies need to share your personal information to run their everyday business. In the section below, we list the reasons financial companies can share their customers’ personal information; the reasons the Fund chooses to share; and whether you can limit this sharing. |
| | | | |
| Reasons we can share your personal information | Does the
Fund share? | Can you limit
this sharing? |
For our everyday business purposes – Such as to process your transactions, maintain your account(s), respond to court orders and legal investigations, or report to credit bureaus | Yes | No |
For our marketing purposes – to offer our products and services to you | No | We don’t share |
| For joint marketing with other financial companies | No | We don’t share |
For our affiliates’ everyday business purposes – information about your transactions and experiences | No | We don’t share |
For our affiliates’ everyday business purposes – information about your creditworthiness | No | We don’t share |
| For nonaffiliates to market to you | No | We don’t share |
| | | |
| Questions? | Call 1-855-691-5288 |
| Who we are |
| Who is providing this notice? | Marshfield Concentrated Opportunity Fund Ultimus Fund Distributors, LLC (Distributor) Ultimus Fund Solutions, LLC (Administrator) |
| What we do |
How does the Fund protect my personal information? | To protect your personal information from unauthorized access and use, we use security measures that comply with federal law. These measures include computer safeguards and secured files and buildings. Our service providers are held accountable for adhering to strict policies and procedures to prevent any misuse of your nonpublic personal information. |
How does the Fund collect my personal information? | We collect your personal information, for example, when you ■ Open an account ■ Provide account information ■ Give us your contact information ■ Make deposits or withdrawals from your account ■ Make a wire transfer ■ Tell us where to send the money ■ Tell us who receives the money ■ Show your government-issued ID ■ Show your driver’s license We also collect your personal information from other companies. |
Why can’t I limit all sharing? | Federal law gives you the right to limit only ■ Sharing for affiliates’ everyday business purposes – information about your creditworthiness ■ Affiliates from using your information to market to you ■ Sharing for nonaffiliates to market to you State laws and individual companies may give you additional rights to limit sharing. |
| |
| Definitions |
| Affiliates | Companies related by common ownership or control. They can be financial and nonfinancial companies. ■ Marshfield Associates, Inc., the investment adviser to the Fund, could be deemed to be an affiliate. |
| Nonaffiliates | Companies not related by common ownership or control. They can be financial and nonfinancial companies ■ The Fund does not share with nonaffiliates so they can market to you. |
| Joint marketing | A formal agreement between nonaffiliated financial companies that together market financial products or services to you. ■ The Fund does not jointly market. |
Marshfield-SAR-21
| | | | | |
| | | | | |
| | | | | |
| | | | | |
| | | | | |
| | | | | |
| | | | | |
| | | | | |
| | | | | |
| | | | | |
| | | | | |
| | | | | |
| | | | | |
| | | | | |
| | | | | |
| | | | | |
| | | MEEHAN FOCUS FUND | | |
| | | | | |
| | | | | |
| | | SEMI-ANNUAL REPORT | | |
| | | | | |
| | | | | |
| | | | | |
| | | | | |
| | | February 28, 2021 | | |
| | | (Unaudited) | | |
| | | | | |
| | | | | |
| | | | | |
| | | | | |
| | | | | |
| | | | | |
| | | | | |
| | | | | |
| | | | | |
| | | | | |
| | | | | |
| | | | | |
| | | This report is for the information of the shareholders of Meehan Focus Fund. Its use in connection with any offering of the Fund’s shares is authorized only in a case of concurrent or prior delivery of the Fund’s current prospectus. Investors should refer to the Fund’s prospectus for a description of risk factors associated with investments in the Fund. | | |
| | | | | |
| | | | | |
| | | | | |
| | | | | |
| | | | | |
| | | | | |
| | | | | | |
| | | Meehan Focus Fund | Distributor: | | |
| | | A Series of Ultimus Managers Trust | Ultimus Fund Distributors, LLC | | |
| | | 7250 Woodmont Avenue, Suite 315 | 225 Pictoria Drive, Suite 450 | | |
| | | Bethesda, MD 20814 | Cincinnati, OH 45246 | | |
| | | (866) 884-5968 | (800) 933-8413 | | |
| | | | | | |
| | | | | | |
| | | | | | |
| | | | | | |
| | | | | | |
| | | | | | |
| | | | | | |
MEEHAN FOCUS FUND
LETTER TO SHAREHOLDERS | March 22, 2021 |
| | |
Dear Fellow Shareholders1:
The total return for the Meehan Focus Fund (“the Fund”) for the first six months of its 2021 fiscal year through February 28, 2021 was 12.22%2; the Fund’s net asset value (“NAV”) per share on February 28 was $36.41. The Fund’s performance over the past six months led the S&P 500, which gained 9.74%, but trailed the S&P 500 Value Index which gained 16.49% over the same time period. We are pleased to note that the Fund has now outperformed its benchmarks over the past year, three years, five years, and since inception.
Market and Economic Conditions
Stocks, with a couple of hiccups, remained in rally mode over the past six months as the S&P 500 established a series of new record highs, the most recent coming in mid-March. Stocks were buoyed by optimism surrounding vaccine approvals, expanding vaccination programs, two significant government relief bills, and better than expected corporate earnings.
Stocks’ strong performance over the past six months came despite a surge in COVID cases that began in November and continued into the winter months, bringing record rates of infections and deaths. While the impact of the COVID surge and coincident lockdowns was evident in employment and other economic data, stock investors remained firmly focused on a vision of a not too distant future featuring a widely vaccinated populace returning to more normal levels of economic activity. Fourth quarter corporate earnings growth of roughly 4% defied forecasts of an earnings decline and further bolstered investor optimism.3
The early winter dip in economic activity appears to be reversing as coronavirus cases have tailed off sharply since mid-January and vaccinations pick up speed. The U.S. economy now appears to be heating up – the February jobs report, which showed the economy adding 379,000 jobs (expectations were for 210,000), is the latest example.4 The unemployment rate ticked down to 6.2% in February, and January job gains were raised to 166,000 from 49,000.5 The manufacturing sector recorded its ninth consecutive month of growth, with the February Manufacturing PMI rising to 60.8%, its highest level in over two years.6
| 1 | The views expressed herein are not meant as investment advice. Although some of the described portfolio holdings were viewed favorably as of the date of this letter, there is no guarantee that the Fund will continue to hold these securities in the future. Please consider the investment objectives, risks, charges, and expenses of the Fund before investing. Contact the Fund at (866) 884-5968 for a prospectus, which contains this and other important information about the Fund. Read the prospectus carefully before investing. |
| 2 | Past performance does not guarantee future results. Performance data quoted above represents past performance, and the investment return and principal value of an investment will fluctuate so that an investor’s shares, when redeemed, may be worth more or less than their original cost. Current performance may be lower or higher than the performance data quoted. To obtain more current performance information, please call (866) 884-5968. |
| 3 | FactSet Earnings Insight, John Butters, February 26, 2021. |
| 4 | U.S. Labor Market Roars Back; Full Recovery Still Years Away, Lucia Mutikani, Reuters, March 5, 2021. |
| 5 | February Hiring Sets Up Stronger Spring Recovery, Eric Morath, Hannah Lang, Wall Street Journal, March 5, 2021. |
| 6 | February 2021 Manufacturing ISM, Report on Business, March 1, 2021; YCharts, US ISM Manufacturing PMI. |
While there is much good news, work remains to be done on the economic front. The United States has 9.5 million fewer jobs today than it did a year ago, and weekly unemployment claims, which have been stuck above 700,000, also remain stubbornly high. The service sector, which suffered greater pandemic losses and is more sensitive to lockdowns than manufacturing, saw growth decline in February.7
We are encouraged that Congress passed a third coronavirus relief bill. The $1.9 trillion rescue package signed by President Biden in early March, coming after a similar $900 billion package in December, provides needed relief for small businesses, families, the unemployed, and state and local governments as the economy continues to heal.
With an end to the pandemic in sight, investors’ attention has turned to other factors that could derail the stock rally. Most notable among them are rising interest rates and inflation. In February, a sharp move up in 10-year Treasury bond yields spooked stock investors and briefly sent the more growth-oriented NASDAQ index down more than 10% from its high. Although inflation expectations have risen this year, February reported inflation showed an increase of just 0.4% versus the year-ago period.8 The Federal Reserve, for its part, appears comfortable taking a wait and see approach to the recent rise in Treasury yields.
Outlook
We are optimistic about the prospects for stocks and the economy in 2021. The United States has now administered 100 million vaccine doses, and President Biden has upped the ante, promising that the United States will have enough doses to vaccinate all Americans by the end of May. Although Europe, Japan, and many other nations have been slower to roll out their vaccination programs, we believe the pace will pick up, allowing their economies to also get back on their feet.
Economic growth looks poised to accelerate as 2021 progresses, both in the United States and globally. The Organization for Economic Cooperation and Development recently lifted its global growth forecast to 5.6%, including U.S. GDP growth of 6.5%.9 While market valuations overall are a bit above their averages, we believe the still low interest rates and solid earnings growth this year will give stocks room to move higher.
Despite the good news, risks do remain. COVID is not yet under control and new variants springing up around the world could complicate the vaccination process and slow the resumption of economic activity. An unexpected rise in inflation or interest rates could also upset the market’s current trajectory, and we will be watching developments on this front closely.
Portfolio Review
The attached Schedule of Investments identifies the fund’s investments and their market value as of February 28, 2021. Over the past six months United Rentals, Applied Materials, and PNC were the largest contributors to the Fund’s positive performance.
| 7 | U.S. service sector slows as businesses face higher costs, Reuters, March 3, 2021. |
| 8 | U.S. Bureau of Labor Statistics, Consumer Price Index – February 2021, March 10, 2021. |
| 9 | Vaccine Rollout, U.S. Stimulus Boost Global Economic Outlook: OECD, Leigh Thomas, Reuters, March 9, 2021. |
United Rentals is the largest equipment rental company in the world, with a network of 1,100 rental locations spread throughout the United States and Canada. The company has seen its results significantly improve in recent quarters as economic activity has gained momentum. Fourth quarter earnings exceeded consensus forecasts by nearly 20%, and management noted that business volume trends showed steady improvement throughout the third and fourth quarters.10 Solid 2021 revenue guidance, which should include an increase in rental revenues as delayed work from 2020 moves forward, and growing optimism around economic reopening also underpinned the stock. In addition to improving economic conditions, we believe United Rentals will continue to benefit from the relative attractiveness of renting versus purchasing equipment as we emerge from the pandemic-induced recession.
Applied Materials is the world’s largest maker of wafer fabrication equipment for the semiconductor industry and the company’s tools and field service engineers play an important role in most of the world’s leading-edge chip manufacturing facilities. Applied Materials has benefitted over the past year from strong customer demand for equipment investments in emerging technologies such as AI, 5G, and cloud computing. In its most recent quarter Applied Materials posted revenue of $5.2 billion, a 25% year-over-year increase, and adjusted earnings per share of $1.39, which represented a year-over-year increase of 42% and handily exceeded estimates of $1.28 per share.11 Major customers, which include virtually all the world’s leading semi-conductor manufacturers, have indicated that they plan to increase their investments in plants and equipment to meet growing demand, news that bodes well for continued growth at Applied Materials.
PNC, the largest U.S. regional bank, saw its shares rise in recent months as earnings recovered, optimism surrounding 2021 economic growth rose, and the yield curve steepened. PNC followed up strong third quarter results with fourth quarter earnings per share of $3.26, a 9.8% year-over-year increase that exceeded estimates by a wide margin.12 The November 16 announcement that PNC would acquire the U.S. subsidiary of Spain’s Banco Bilbao for $11.6 billion was also well received by investors. We consider this deal a good use of the proceeds generated from PNC’s sale of its stake in BlackRock as it gives PNC a coast-to-coast presence and enhances its exposure to fast-growing Sunbelt states like Texas and Arizona.
These positive contributions were partially offset by weaker performances from several of the Fund’s technology holdings, including Apple, Alibaba, and Amazon. Their underperformance over the past six months came despite what we considered solid results from all three.
Apple’s December quarter numbers showed continued growth, with revenue climbing 21% year-over-year, and earnings per share rising to $1.68, well ahead of the consensus estimate of $1.41.13 Sales rose by 20% or more across multiple Apple product lines including iPad (41%), Mac (21%), services (24%), and wearables (30%).14 In addition, iPhone revenue grew
| 10 | United Rentals Earnings Tops Consensus on Stronger Rental Volume, Shweta Agarwal, Seeking Alpha, January 28, 2021; United Rentals Announces Fourth Quarter 2020 Results, United Rentals, January 27, 2021. |
| 11 | Applied Materials Announces First Quarter 2021 Results, Globe Newswire, February 18, 2021. |
| 12 | 4Q20 Earnings Press Release, PNC, January 15, 2021; MarketWatch. |
| 13 | Apple Reports First Quarter Results, Apple Press Release, January 27, 2021. |
| 14 | Apple’s Fantastic December Quarter Results Weren’t Enough, Chuck Jones, Forbes, January 31, 2021. |
17% despite a later than usual launch of new products, reflecting strong demand for its 5G phones. We believe Apple will be able to maintain the sales and earnings momentum it has built in recent quarters and that its shares will follow.
Alibaba’s recent financial and operational performance has been solid. In its most recent quarter revenue rose 37% year-over-year, led by 38% growth in its core commerce business and 50% growth in Alibaba Cloud, which also posted its first quarterly profit.15 Alibaba’s strong fundamentals, however, have been overshadowed by political issues. Late last year Alibaba found itself in the crosshairs of Chinese regulators who allege it has engaged in anticompetitive practices and forced the cancellation of a planned IPO of Ant Group, its division which operates the Alipay digital payments platform. While these actions are concerning and have caused Alibaba’s shares to decline, we do not believe it is in regulators’ long-term interests to cripple a popular company with 780 million users in China and one of the country’s flagship technology companies. We think Alibaba will find a solution to its current political issues that will allow its stock returns to better reflect its operational performance.
Amazon’s fourth quarter earnings per share of $14.09 nearly doubled consensus expectations of $7.03, as net sales rose 44% and exceeded $100 billion for the first time.16 Sales growth was driven by e-commerce (40%) and Amazon Web Services (28%). Strong 2021 sales and earnings guidance was also encouraging. We do not expect any disruptions from Jeff Bezos’ announcement that he will step down as CEO later this year, to be replaced by Andy Jassy, head of Amazon Web Services. Mr. Bezos will assume the role of Executive Chairman after the transition. We view Amazon’s recent underperformance as temporary and expect the shares to generate positive returns for the Fund as the year progresses.
Changes to the Fund’s portfolio over the past six months were modest. We trimmed the Fund’s positions in Visa, Apple, and Bank of America, realizing gains on the first two and a modest loss on the third. We also sold two of the Fund’s smaller positions, General Dynamics, and Kellogg, the former at a modest loss and the latter at essentially the same price at which it was purchased. A portion of the proceeds were used to increase the Fund’s position in Alibaba.
| 15 | Alibaba Group Announces December Quarter 2020 Results, Alibaba Press Release, February 2, 2021. |
| 16 | Amazon.com Announces Financial Results and CEO Transition, Amazon Press Release, February 2, 2021. |
Conclusion
We appreciate your confidence in our management of the Fund during this difficult time and look forward to continued success. You can check the Fund’s NAV online at any time by typing in the Fund’s ticker symbol (MEFOX) into most stock quotation services. Please do not hesitate to contact us if you have any questions regarding your investment in the Fund.
| | |
| Sincerely, | |
| | |
 |  |
| Thomas P. Meehan | Paul P. Meehan |
| | |
 | |
| R. Jordan Smyth, Jr. | |
| Portfolio Managers, Meehan Focus Fund | |
| | |
Past performance is not predictive of future performance. Investment results and principal value will fluctuate so that shares, when redeemed, may be worth more or less than their original cost. Current performance may be higher or lower than the performance data quoted. Performance data current to the most recent month end are available by calling 1-866-884-5968.
An investor should consider the investment objectives, risks, charges and expenses of the Fund carefully before investing. The Fund’s prospectus contains this and other important information. To obtain a copy of the Fund’s prospectus visit the Fund’s website at www.meehanmutualfunds.com or call 1-866-884-5968 and a copy will be sent to you free of charge. Please read the prospectus carefully before you invest. The Meehan Focus Fund is distributed by Ultimus Fund Distributors, LLC.
This Letter to Shareholders seeks to describe some of the Adviser’s current opinions and views of the financial markets. Although the Adviser believes it has a reasonable basis for any opinions or views expressed, actual results may differ, sometimes significantly so, from those expected or expressed. The securities held by the Fund that are discussed in the Letter to Shareholders were held during the period covered by this Report. They do not comprise the entire investment portfolio of the Fund, may be sold at any time and may no longer be held by the Fund. For a complete list of securities held by the Fund as of February 28, 2021, please see the Schedule of Investments section of the semi-annual report. The opinions of the Adviser with respect to those securities may change at any time.
Statements in the Letter to Shareholders that reflect projections or expectations for future financial or economic performance of the Fund and the market in general and statements of the Fund’s plans and objectives for future operations are forward-looking statements. No assurance can be given that actual results or events will not differ materially from those projected, estimated, assumed, or anticipated in any such forward-looking statements. Important factors that could result in such differences, in addition to factors noted with such forward-looking statements include, without limitation, general economic conditions, such as inflation, recession, and interest rates.
| MEEHAN FOCUS FUND |
| PERFORMANCE INFORMATION |
| February 28, 2021 (Unaudited) |
| |
Comparison of Change in Value of a $10,000 Investment in the
Meehan Focus Fund vs. the S&P 500® Total Return Index*
and the S&P 500® Value Index*
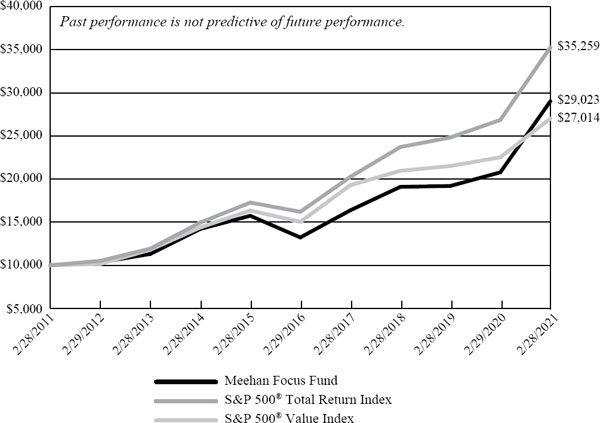
| Average Annual Total Returns |
| (For Periods Ended February 28, 2021) |
| | | | | | |
| | 1 Year | | 5 Years | | 10 Years |
| Meehan Focus Fund (a) | 39.68% | | 17.02% | | 11.24% |
| S&P 500® Total Return Index | 31.29% | | 16.82% | | 13.43% |
| S&P 500® Value Index | 19.93% | | 12.44% | | 10.45% |
| | | | | | |
| * | The above graph depicts the performance of the Fund versus the S&P 500® Total Return Index and the S&P 500® Value Index. It is important to note that the Fund is a professionally managed mutual fund; the S&P 500® Total Return Index by Standard & Poor’s Corp. is a capitalization-weighted index comprised of 500 issues listed on various exchanges, representing the performance of the stock market generally; and the S&P 500® Value Index measures value stocks using three factors: the ratios of book value, earnings, and sales to price. Constitutents are drawn from the S&P 500® Total Return Index. An index is not an investment product available for purchase. The Fund’s performance assumes the reinvestment of all dividends and all capital gains. Index returns assume reinvestment of dividends but, unlike the Fund’s returns, do not reflect any fees or expenses. |
| (a) | Performance presented represents historical data. The investment return and principal value of an investment will fluctuate so that an investor’s shares, when redeemed, may be worth more or less than their original cost. The Fund’s past performance is not indicative of future performance. The table and graph above do not reflect the deduction of taxes that a shareholder would pay on Fund distributions or the redemption of Fund shares. Current performance may be lower or higher than the performance data quoted. To obtain more current performance information, please contact (866) 884-5968. As disclosed in the Fund’s December 29, 2020 prospectus, the Fund’s total annual operating expenses are 1.01%. |
| MEEHAN FOCUS FUND |
| PORTFOLIO INFORMATION |
| February 28, 2021 (Unaudited) |
| |
Sector Diversification (% of Net Assets)
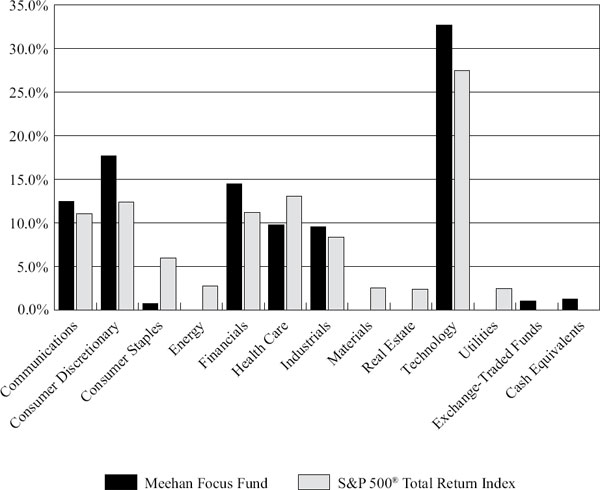
| Top 10 Equity Holdings |
| | % of |
| Security Description | Net Assets |
| Microsoft Corporation | 11.8% |
| Apple, Inc. | 10.1% |
| Lowe’s Companies, Inc. | 8.4% |
| Alphabet, Inc. - Classes A and C | 7.7% |
| Berkshire Hathaway, Inc. - Class B | 6.5% |
| United Rentals, Inc. | 6.2% |
| Applied Materials, Inc. | 4.7% |
| PNC Financial Services Group, Inc. (The) | 4.2% |
| Broadcom, Inc. | 3.5% |
| CVS Health Corporation | 3.4% |
| MEEHAN FOCUS FUND |
| SCHEDULE OF INVESTMENTS |
| February 28, 2021 (Unaudited) |
| COMMON STOCKS — 97.6% | | Shares | | | Value | |
| Communications — 12.5% | | | | | | | | |
| Entertainment Content — 2.6% | | | | | | | | |
| Walt Disney Company (The) (a) | | | 12,150 | | | $ | 2,296,836 | |
| | | | | | | | | |
| Internet Media & Services — 9.9% | | | | | | | | |
| Alphabet, Inc. - Class A (a) | | | 1,495 | | | | 3,022,755 | |
| Alphabet, Inc. - Class C (a) | | | 1,868 | | | | 3,804,855 | |
| Facebook, Inc. - Class A (a) | | | 7,790 | | | | 2,006,860 | |
| | | | | | | | 8,834,470 | |
| Consumer Discretionary — 17.7% | | | | | | | | |
| E-Commerce Discretionary — 4.8% | | | | | | | | |
| Alibaba Group Holding Ltd. - ADR (a) | | | 6,750 | | | | 1,604,880 | |
| Amazon.com, Inc. (a) | | | 855 | | | | 2,644,455 | |
| | | | | | | | 4,249,335 | |
| Home Construction — 3.0% | | | | | | | | |
| Lennar Corporation - Class A | | | 31,900 | | | | 2,646,743 | |
| | | | | | | | | |
| Retail - Discretionary — 9.9% | | | | | | | | |
| Lowe’s Companies, Inc. | | | 46,500 | | | | 7,428,375 | |
| Williams-Sonoma, Inc. | | | 10,730 | | | | 1,408,742 | |
| | | | | | | | 8,837,117 | |
| Consumer Staples — 0.8% | | | | | | | | |
| Food — 0.8% | | | | | | | | |
| Nestlé S.A. - ADR | | | 6,970 | | | | 730,595 | |
| | | | | | | | | |
| Financials — 14.5% | | | | | | | | |
| Asset Management — 2.0% | | | | | | | | |
| BlackRock, Inc. | | | 2,490 | | | | 1,729,305 | |
| | | | | | | | | |
| Banking — 6.0% | | | | | | | | |
| Bank of America Corporation | | | 46,000 | | | | 1,596,660 | |
| PNC Financial Services Group, Inc. (The) | | | 22,310 | | | | 3,756,112 | |
| | | | | | | | 5,352,772 | |
| Insurance — 6.5% | | | | | | | | |
| Berkshire Hathaway, Inc. - Class B (a) | | | 24,150 | | | | 5,808,316 | |
| MEEHAN FOCUS FUND |
| SCHEDULE OF INVESTMENTS (Continued) |
| COMMON STOCKS — 97.6% (Continued) | | Shares | | | Value | |
| Health Care — 9.8% | | | | | | | | |
| Biotech & Pharma — 4.0% | | | | | | | | |
| Bristol-Myers Squibb Company | | | 18,130 | | | $ | 1,111,913 | |
| Merck & Company, Inc. | | | 10,000 | | | | 726,200 | |
| Novartis AG - ADR | | | 20,420 | | | | 1,754,282 | |
| | | | | | | | 3,592,395 | |
| Health Care Facilities & Services — 3.4% | | | | | | | | |
| CVS Health Corporation | | | 44,000 | | | | 2,997,720 | |
| | | | | | | | | |
| Medical Equipment & Devices — 2.4% | | | | | | | | |
| Medtronic plc | | | 17,850 | | | | 2,087,914 | |
| | | | | | | | | |
| Industrials — 9.6% | | | | | | | | |
| Diversified Industrials — 1.5% | | | | | | | | |
| 3M Company | | | 7,470 | | | | 1,307,698 | |
| | | | | | | | | |
| Electrical Equipment — 1.9% | | | | | | | | |
| Johnson Controls International plc | | | 30,000 | | | | 1,673,700 | |
| | | | | | | | | |
| Industrial Support Services — 6.2% | | | | | | | | |
| United Rentals, Inc. (a) | | | 18,625 | | | | 5,538,703 | |
| | | | | | | | | |
| Technology — 32.7% | | | | | | | | |
| Semiconductors — 8.2% | | | | | | | | |
| Applied Materials, Inc. | | | 35,365 | | | | 4,179,790 | |
| Broadcom, Inc. | | | 6,575 | | | | 3,089,395 | |
| | | | | | | | 7,269,185 | |
| Software — 11.8% | | | | | | | | |
| Microsoft Corporation | | | 45,200 | | | | 10,503,576 | |
| | | | | | | | | |
| Technology Hardware — 10.1% | | | | | | | | |
| Apple, Inc. | | | 74,000 | | | | 8,973,240 | |
| | | | | | | | | |
| Technology Services — 2.6% | | | | | | | | |
| Visa, Inc. - Class A | | | 11,000 | | | | 2,336,290 | |
| | | | | | | | | |
| Total Common Stocks (Cost $30,725,998) | | | | | | $ | 86,765,910 | |
| MEEHAN FOCUS FUND |
| SCHEDULE OF INVESTMENTS (Continued) |
| EXCHANGE-TRADED FUNDS — 1.1% | | Shares | | | Value | |
| iShares Core MSCI Pacific ETF (Cost $788,521) | | | 14,690 | | | $ | 967,630 | |
| MONEY MARKET FUNDS — 1.3% | | Shares | | | Value | |
| Invesco Short-Term Investment Trust Government & Agency Portfolio - Institutional Class, 0.03% (b) (Cost $1,139,608) | | | 1,139,608 | | | $ | 1,139,608 | |
| | | | | | | | | |
| Investments at Value — 100.0% (Cost $32,654,127) | | | | | | $ | 88,873,148 | |
| | | | | | | | | |
| Liabilities in Excess of Other Assets — (0.0%) (c) | | | | | | | (26,422 | ) |
| | | | | | | | | |
| Net Assets — 100.0% | | | | | | $ | 88,846,726 | |
| | | | | | | | | |
ADR - American Depositary Receipt.
| (a) | Non-income producing security. |
| (b) | The rate shown is the 7-day effective yield as of February 28, 2021. |
| (c) | Percentage rounds to less than 0.1%. |
See accompanying notes to financial statements.
| MEEHAN FOCUS FUND |
| STATEMENT OF ASSETS AND LIABILITIES |
| February 28, 2021 (Unaudited) |
| ASSETS | | | | |
| Investments in securities: | | | | |
| At cost | | $ | 32,654,127 | |
| At value (Note 2) | | $ | 88,873,148 | |
| Dividends receivable | | | 47,694 | |
| Other assets | | | 13,659 | |
| TOTAL ASSETS | | | 88,934,501 | |
| | | | | |
| LIABILITIES | | | | |
| Payable for capital shares redeemed | | | 2,000 | |
| Payable to Adviser (Note 4) | | | 52,271 | |
| Payable to administrator (Note 4) | | | 25,788 | |
| Other accrued expenses | | | 7,716 | |
| TOTAL LIABILITIES | | | 87,775 | |
| | | | | |
| NET ASSETS | | $ | 88,846,726 | |
| | | | | |
| NET ASSETS CONSIST OF: | | | | |
| Paid-in capital | | $ | 32,605,501 | |
| Accumulated earnings | | | 56,241,225 | |
| NET ASSETS | | $ | 88,846,726 | |
| | | | | |
| Shares of beneficial interest outstanding (unlimited number of shares authorized, no par value) | | | 2,440,367 | |
| | | | | |
| Net asset value, offering price and redemption price per share (a) (Note 2) | | $ | 36.41 | |
| | | | | |
| (a) | Redemption price may differ from the net asset value per share depending upon the length of time held. |
See accompanying notes to financial statements.
| MEEHAN FOCUS FUND |
| STATEMENT OF OPERATIONS |
| For the Six Months Ended February 28, 2021 (Unaudited) |
| INVESTMENT INCOME | | | | |
| Dividend income | | $ | 463,102 | |
| | | | | |
| EXPENSES | | | | |
| Investment advisory fees (Note 4) | | | 326,477 | |
| Administration fees (Note 4) | | | 40,973 | |
| Fund accounting fees (Note 4) | | | 19,096 | |
| Legal fees | | | 10,939 | |
| Registration and filing fees | | | 9,745 | |
| Transfer agent fees (Note 4) | | | 9,000 | |
| Trustees’ fees and expenses (Note 4) | | | 8,400 | |
| Audit and tax services fees | | | 8,250 | |
| Compliance fees (Note 4) | | | 6,000 | |
| Custody and bank service fees | | | 4,371 | |
| Postage and supplies | | | 2,928 | |
| Insurance expense | | | 1,951 | |
| Printing of shareholder reports | | | 1,646 | |
| Other expenses | | | 4,257 | |
| TOTAL EXPENSES | | | 454,033 | |
| Less fee reductions by the Adviser (Note 4) | | | (45,936 | ) |
| NET EXPENSES | | | 408,097 | |
| | | | | |
| NET INVESTMENT INCOME | | | 55,005 | |
| | | | | |
| REALIZED AND UNREALIZED GAINS ON INVESTMENTS | | | | |
| Net realized gains from investments | | | 245,316 | |
| Net change in unrealized appreciation (depreciation) on investments | | | 9,340,408 | |
| NET REALIZED AND UNREALIZED GAINS ON INVESTMENTS | | | 9,585,724 | |
| | | | | |
| NET INCREASE IN NET ASSETS FROM OPERATIONS | | $ | 9,640,729 | |
| | | | | |
See accompanying notes to financial statements.
| MEEHAN FOCUS FUND |
| STATEMENTS OF CHANGES IN NET ASSETS |
| | | Six Months | | | | | | | |
| | | Ended | | | Ten Months | | | Year | |
| | | February 28, | | | Ended | | | Ended | |
| | | 2021 | | | August 31, | | | October 31, | |
| | | (Unaudited) | | | 2020(a) | | | 2019 | |
| FROM OPERATIONS | | | | | | | | | | | | |
| Net investment income | | $ | 55,005 | | | $ | 332,771 | | | $ | 488,712 | |
| Net realized gains (losses) from: | | | | | | | | | | | | |
| Investments | | | 245,316 | | | | 379,274 | | | | 2,006,403 | |
| Foreign currency transactions | | | — | | | | — | | | | (30 | ) |
| Net realized gains from in-kind redemptions (Note 2) | | | — | | | | — | | | | 2,033,739 | |
| Net change in unrealized appreciation (depreciation) on investments | | | 9,340,408 | | | | 13,541,956 | | | | 4,396,890 | |
| Net increase in net assets resulting from operations | | | 9,640,729 | | | | 14,254,001 | | | | 8,925,714 | |
| | | | | | | | | | | | | |
| DISTRIBUTIONS TO SHAREHOLDERS (Note 2) | | | (913,584 | ) | | | (2,495,082 | ) | | | (1,565,477 | ) |
| | | | | | | | | | | | | |
| CAPITAL SHARE TRANSACTIONS | | | | | | | | | | | | |
| Proceeds from shares sold | | | 321,338 | | | | 1,035,547 | | | | 665,329 | |
| Net asset value of shares issued in reinvestment of distributions to shareholders | | | 903,947 | | | | 2,473,247 | | | | 1,551,512 | |
| Payments for shares redeemed | | | (1,643,995 | ) | | | (2,295,828 | ) | | | (7,829,046 | ) |
| Net increase (decrease) in net assets from capital share transactions | | | (418,710 | ) | | | 1,212,966 | | | | (5,612,205 | ) |
| | | | | | | | | | | | | |
| TOTAL INCREASE IN NET ASSETS | | | 8,308,435 | | | | 12,971,885 | | | | 1,748,032 | |
| | | | | | | | | | | | | |
| NET ASSETS | | | | | | | | | | | | |
| Beginning of period | | | 80,538,291 | | | | 67,566,406 | | | | 65,818,374 | |
| End of period | | $ | 88,846,726 | | | $ | 80,538,291 | | | $ | 67,566,406 | |
| | | | | | | | | | | | | |
| CAPITAL SHARE ACTIVITY | | | | | | | | | | | | |
| Shares sold | | | 9,737 | | | | 40,626 | | | | 26,047 | |
| Shares reinvested | | | 26,028 | | | | 84,555 | | | | 68,864 | |
| Shares redeemed | | | (51,018 | ) | | | (84,647 | ) | | | (314,096 | ) |
| Net increase (decrease) in shares outstanding | | | (15,253 | ) | | | 40,534 | | | | (219,185 | ) |
| Shares outstanding at beginning of period | | | 2,455,620 | | | | 2,415,086 | | | | 2,634,271 | |
| Shares outstanding at end of period | | | 2,440,367 | | | | 2,455,620 | | | | 2,415,086 | |
| | | | | | | | | | | | | |
| (a) | Fund changed fiscal year to August 31. |
See accompanying notes to financial statements.
| MEEHAN FOCUS FUND |
| FINANCIAL HIGHLIGHTS |
| |
Per Share Data for a Share Outstanding Throughout Each Period
| | | Six Months | | | | | | | | | | | | | | | | | | | |
| | | Ended | | | Ten | | | | | | | | | | | | | | | | |
| | | February | | | Months | | | Year | | | Year | | | Year | | | Year | | | Year | |
| | | 28, | | | Ended | | | Ended | | | Ended | | | Ended | | | Ended | | | Ended | |
| | | 2021 | | | August 31, | | | Oct. 31, | | | Oct. 31, | | | Oct. 31, | | | Oct. 31, | | | Oct. 31, | |
| | | (Unaudited) | | | 2020(a) | | | 2019 | | | 2018 | | | 2017 | | | 2016 | | | 2015 | |
| Net asset value at beginning of period | | $ | 32.80 | | | $ | 27.98 | | | $ | 24.99 | | | $ | 24.13 | | | $ | 19.42 | | | $ | 21.07 | | | $ | 21.43 | |
| | | | | | | | | | | | | | | | | | | | | | | | | | | | | |
| Income (loss) from investment operations: | | | | | | | | | | | | | | | | | | | | | | | | | | | | |
| Net investment income | | | 0.02 | | | | 0.14 | | | | 0.21 | | | | 0.14 | | | | 0.15 | | | | 0.28 | | | | 0.17 | |
| Net realized and unrealized gains (losses) on investments and foreign currencies | | | 3.97 | | | | 5.71 | | | | 3.42 | | | | 0.86 | | | | 4.64 | | | | (1.30 | ) | | | (0.26 | ) |
| Total from investment operations | | | 3.99 | | | | 5.85 | | | | 3.63 | | | | 1.00 | | | | 4.79 | | | | (1.02 | ) | | | (0.09 | ) |
| | | | | | | | | | | | | | | | | | | | | | | | | | | | | |
| Less distributions from: | | | | | | | | | | | | | | | | | | | | | | | | | | | | |
| Net investment income | | | (0.12 | ) | | | (0.20 | ) | | | (0.15 | ) | | | (0.14 | ) | | | (0.06 | ) | | | (0.28 | ) | | | (0.18 | ) |
| Net realized gains from investment transactions | | | (0.26 | ) | | | (0.83 | ) | | | (0.49 | ) | | | — | | | | (0.02 | ) | | | (0.35 | ) | | | (0.09 | ) |
| Total distributions | | | (0.38 | ) | | | (1.03 | ) | | | (0.64 | ) | | | (0.14 | ) | | | (0.08 | ) | | | (0.63 | ) | | | (0.27 | ) |
| | | | | | | | | | | | | | | | | | | | | | | | | | | | | |
| Net asset value at end of period | | $ | 36.41 | | | $ | 32.80 | | | $ | 27.98 | | | $ | 24.99 | | | $ | 24.13 | | | $ | 19.42 | | | $ | 21.07 | |
| | | | | | | | | | | | | | | | | | | | | | | | | | | | | |
| Total return (b) | | | 12.22 | % (c) | | | 21.38 | % (c) | | | 15.16 | % | | | 4.15 | % | | | 24.72 | % | | | (4.86 | %) | | | (0.43 | %) |
| | | | | | | | | | | | | | | | | | | | | | | | | | | | | |
| Net assets at end of period (000’s) | | $ | 88,847 | | | $ | 80,538 | | | $ | 67,566 | | | $ | 65,818 | | | $ | 63,743 | | | $ | 52,654 | | | $ | 56,712 | |
| | | | | | | | | | | | | | | | | | | | | | | | | | | | | |
| Ratios/supplementary data: | | | | | | | | | | | | | | | | | | | | | | | | | | | | |
| Ratio of total expenses to average net assets (d) | | | 1.11 | % (e) | | | 1.16 | % (e) | | | 1.17 | % | | | 1.12 | % | | | 1.00 | % | | | 1.00 | % | | | 1.00 | % |
| Ratio of net expenses to average net assets (d) | | | 1.00 | % (e)(f) | | | 1.00 | % (e)(f) | | | 1.00 | % (f) | | | 1.00 | % (f) | | | 1.00 | % (f) | | | 1.00 | % | | | 1.00 | % |
| Ratio of net investment income to average net assets | | | 0.13 | % (e)(f) | | | 0.58 | % (e)(f) | | | 0.77 | % (f) | | | 0.54 | % (f) | | | 0.69 | % (f) | | | 1.44 | % | | | 0.81 | % |
| Portfolio turnover rate | | | 0 | % (c)(g) | | | 16 | % (c) | | | 20 | % | | | 20 | % | | | 10 | % | | | 44 | % | | | 23 | % |
| | | | | | | | | | | | | | | | | | | | | | | | | | | | | |
| (a) | Fund changed fiscal year to August 31. |
| (b) | Total return is a measure of the change in value of an investment in the Fund over the period covered. The returns shown do not reflect the deduction of taxes a shareholder would pay on Fund distributions, if any, or the redemption of Fund shares. Had the Adviser not reduced its fees, total returns would have been lower. |
| (d) | The ratio excludes the impact of expenses of the registered investment companies and exchange-traded funds in which the Fund may invest. |
| (f) | Ratio was determined after investment advisory fee reductions (Note 4). |
| (g) | Amount rounds to less than 1%. |
See accompanying notes to financial statements.
| MEEHAN FOCUS FUND |
| NOTES TO FINANCIAL STATEMENTS |
| February 28, 2021 (Unaudited) |
Meehan Focus Fund (the “Fund”) is a non-diversified series of Ultimus Managers Trust (the “Trust”). The Trust is an open-end management investment company registered under the Investment Company Act of 1940, as amended (the “1940 Act”). The Fund was reorganized into the Trust on October 23, 2017. It was formerly a series of Meehan Mutual Funds, Inc.
The Fund’s investment objective is to seek long-term growth of capital.
| 2. | Significant Accounting Policies |
The Fund follows accounting and reporting guidance under Financial Accounting Standards Board Accounting Standards Codification Topic 946, “Financial Services – Investment Companies.” The following is a summary of the Fund’s significant accounting policies used in the preparation of its financial statements. These policies are in conformity with accounting principals generally accepted in the United States of America (“GAAP”).
Securities valuation – The Fund’s portfolio securities are valued at fair value as of the close of regular trading on the New York Stock Exchange (the “NYSE”) (normally 4:00 p.m. Eastern Time) on each business day the NYSE is open. Securities, including common stocks and exchange-traded funds (“ETFs”), listed on the NYSE or other exchanges are valued on the basis of their last sale price on the exchanges on which they are primarily traded. If there are no sales on that day, the securities are valued at the closing mean price on the NYSE or other primary exchange for that day. NASDAQ listed securities are valued at the NASDAQ Official Closing Price. If there are no sales on that day, the securities are valued at the last mean price as reported by NASDAQ. Securities traded in the over-the-counter market are valued at the last reported sale price, if available, otherwise at the most recently quoted mean price. Investments representing shares of money market funds and other open-end investment companies, except for ETFs, are valued at their net asset value (“NAV”) as reported by such companies. When using a quoted price and when the market is considered active, the security will be classified as Level 1 within the fair value hierarchy (see below). In the event that market quotations are not readily available or are considered unreliable due to market or other events, the Fund values its securities and other assets at fair value in accordance with procedures established by and under the general supervision of the Board of Trustees of the Trust (the “Board”). Under these procedures, the securities will be classified as Level 2 or 3 within the fair value hierarchy, depending on the inputs used. Unavailable or unreliable market quotes may be due to the following factors: a substantial bid-ask spread; infrequent sales resulting in stale prices; insufficient trading volume; small trade sizes; a temporary lapse in any reliable pricing source; and actions of the securities or futures markets, such as suspension or limitation of trading. As a result, the prices of securities used to calculate the Fund’s NAV may differ from quoted or published prices for the same securities.
| MEEHAN FOCUS FUND |
| NOTES TO FINANCIAL STATEMENTS (Continued) |
GAAP establishes a single authoritative definition of fair value, sets out a framework for measuring fair value and requires additional disclosures about fair value measurements.
Various inputs are used in determining the value of the Fund’s investments. These inputs are summarized in the three broad levels listed below:
| ● | Level 1 – quoted prices in active markets for identical securities |
| ● | Level 2 – other significant observable inputs |
| ● | Level 3 – significant unobservable inputs |
The inputs or methodology used for valuing securities are not necessarily an indication of the risks associated with investing in those securities. The inputs used to measure fair value may fall into different levels of the fair value hierarchy. In such cases, for disclosure purposes, the level in the fair value hierarchy within which the fair value measurement falls in its entirety is determined based on the lowest level input that is significant to the fair value measurement.
The following is a summary of the Fund’s investments by the inputs used to value the investments as of February 28, 2021:
| | | Level 1 | | | Level 2 | | | Level 3 | | | Total | |
| Common Stocks | | $ | 86,765,910 | | | $ | — | | | $ | — | | | $ | 86,765,910 | |
| Exchange-Traded Funds | | | 967,630 | | | | — | | | | — | | | | 967,630 | |
| Money Market Funds | | | 1,139,608 | | | | — | | | | — | | | | 1,139,608 | |
| Total | | $ | 88,873,148 | | | $ | — | | | $ | — | | | $ | 88,873,148 | |
| | | | | | | | | | | | | | | | | |
Refer to the Fund’s Schedule of Investments for a listing of the common stocks by sector and industry type. The Fund did not hold derivative instruments or any assets or liabilities that were measured at fair value on a recurring basis using significant unobservable inputs (Level 3) as of or during the six months ended February 28, 2021.
Foreign currency translation – Securities and other assets and liabilities denominated in or expected to settle in foreign currencies, if any, are translated into U.S. dollars based on exchange rates on the following basis:
| A. | The fair values of investment securities and other assets and liabilities are translated as of the close of the NYSE each day. |
| B. | Purchases and sales of investment securities and income and expenses are translated at the rate of exchange prevailing as of 4:00 p.m. Eastern Time on the respective date of such transactions. |
| C. | The Fund does not isolate that portion of the results of operations caused by changes in foreign exchange rates on investments from those caused by changes in market prices of securities held. Such fluctuations are included with the net realized and unrealized gains or losses on investments. |
| MEEHAN FOCUS FUND |
| NOTES TO FINANCIAL STATEMENTS (Continued) |
Reported net realized foreign exchange gains or losses arise from 1) purchases and sales of foreign currencies and 2) the difference between the amounts of dividends and foreign withholding taxes recorded on the Fund’s books and the U.S. dollar equivalent of the amounts actually received or paid. Reported net unrealized foreign exchange gains and losses arise from changes in the value of assets and liabilities that result from changes in exchange rates.
Share valuation – The NAV per share of the Fund is calculated daily by dividing the total value of the Fund’s assets, less liabilities, by the number of shares outstanding. The offering price and redemption price per share of the Fund is equal to the NAV per share, except that shares of the Fund are subject to a redemption fee of 2% if redeemed within 7 calendar days of the date of purchase. No redemption fees were collected by the Fund during the periods ended February 28, 2021, August 31, 2020 and October 31, 2019.
Investment income – Dividend income is recorded on the ex-dividend date. Non-cash dividends included in dividend income, if any, are recorded at the fair value of the security received. Interest income is accrued as earned. Withholding taxes on foreign dividends have been recorded in accordance with the Fund’s understanding of the applicable country’s rules and tax rates.
Investment transactions – Investment transactions are accounted for on the trade date. Realized gains and losses on investments sold are determined on a specific identification basis.
Common expenses – Common expenses of the Trust are allocated among the Fund and the other series of the Trust based on the relative net assets of each series, the number of series in the Trust, or the nature of the services performed and the relative applicability to each series.
Distributions to shareholders – Distributions to shareholders arising from net investment income and net realized capital gains, if any, are distributed at least once each year. Distributions to shareholders are recorded on the ex-dividend date. The amount of distributions from net investment income and net realized capital gains are determined in accordance with federal income tax regulations, which may differ from GAAP. The tax character of distributions paid during the periods ended February 28, 2021, August 31, 2020 and October 31, 2019 was as follows:
| | | Ordinary | | | Long-Term | | | Total | |
| Period Ended | | Income | | | Capital Gains | | | Distributions | |
| | | | | | | | | | |
| February 28, 2021 | | $ | 289,072 | | | $ | 624,512 | | | $ | 913,584 | |
| August 31, 2020 | | $ | 488,556 | | | $ | 2,006,526 | | | $ | 2,495,082 | |
| October 31, 2019 | | $ | 367,617 | | | $ | 1,197,860 | | | $ | 1,565,477 | |
| | | | | | | | | | | | | |
| MEEHAN FOCUS FUND |
| NOTES TO FINANCIAL STATEMENTS (Continued) |
Estimates – The preparation of financial statements in conformity with GAAP requires management to make estimates and assumptions that affect the reported amounts of assets and liabilities and disclosure of contingent assets and liabilities as of the date of the financial statements and the reported amounts of increase (decrease) in net assets from operations during the reporting period. Actual results could differ from those estimates.
Federal income tax – The Fund has qualified and intends to continue to qualify each year as a “regulated investment company” under Subchapter M of the Internal Revenue Code of 1986, as amended (the “Code”). By so qualifying, the Fund will not be subject to federal income taxes to the extent that it distributes its net investment income and any net realized capital gains in accordance with the Code.
In order to avoid imposition of the excise tax applicable to regulated investment companies, it is also the Fund’s intention to declare as dividends in each calendar year at least 98% of its net investment income (earned during the calendar year) and 98.2% of its net realized capital gains (earned during the twelve months ended October 31) plus undistributed amounts from prior years.
The following information is computed on a tax basis for each item as of February 28, 2021:
| | | | |
| Tax cost of portfolio investments | | $ | 32,654,127 | |
| Gross unrealized appreciation. | | $ | 56,394,919 | |
| Gross unrealized depreciation | | | (175,898 | ) |
| Net unrealized appreciation | | | 56,219,021 | |
| Accumulated ordinary income | | | 22,331 | |
| Other losses | | | (127 | ) |
| Accumulated earnings | | $ | 56,241,225 | |
| | | | | |
During the year ended October 31, 2019, a principal of the Adviser and an affiliated trust took delivery of securities from the Fund, rather than cash, in exchange for the redemption of shares. The total fair value of these in-kind redemptions was $4,503,148 for 183,656 shares of the Fund. The Fund realized $2,033,739 of net capital gains resulting from the in-kind redemptions. The Fund recognizes a gain on in-kind redemptions to the extent that the value of the distributed securities on the date of redemption exceeds the cost of those securities and recognizes a loss to the extent that the cost of those securities exceeds the value of the distributed securities on the date of redemption. Such net gains are not taxable to the Fund and are not required to be distributed to shareholders. The Fund had reclassified this amount against paid-in capital on the Statement of Assets and Liabilities as of October 31, 2019. Such reclassification, the result of permanent differences between the financial statement and income tax reporting requirements, had no effect on the Fund’s net assets or NAV per share.
The Fund recognizes the tax benefits or expenses of uncertain tax positions only when the position is “more likely than not” to be sustained assuming examination by tax authorities. Management has reviewed the Fund’s tax positions taken on federal income tax returns for
| MEEHAN FOCUS FUND |
| NOTES TO FINANCIAL STATEMENTS (Continued) |
the current and all open tax years (generally, three years) and has concluded that no provision for unrecognized tax benefits or expenses is required in these financial statements and does not expect this to change over the next twelve months. The Fund identifies its major tax jurisdiction as U.S. Federal.
The Fund recognizes interest and penalties, if any, related to unrecognized tax benefits as income tax on the Statement of Operations. During the six months ended February 28, 2021, the Fund did not incur any interest or penalties.
| 3. | Investment Transactions |
During the six months ended February 28, 2021, cost of purchases and proceeds from sales of investment securities, other than short-term investments, were $308,553 and $1,867,617, respectively.
| 4. | Transactions with Related Parties |
INVESTMENT ADVISORY AGREEMENT
The Fund’s investments are managed by Edgemoor Investment Advisors, Inc. (the “Adviser”) pursuant to the terms of an Investment Advisory Agreement. Under the Investment Advisory Agreement, the Fund pays the Adviser an investment advisory fee, computed and accrued daily and paid monthly, at the annual rate of 0.80% of its average daily net assets.
Pursuant to an Expense Limitation Agreement (“ELA”), the Adviser has contractually agreed, until March 1, 2022, to reduce investment advisory fees and reimburse other expenses to the extent necessary to limit total annual operating expenses (exclusive of brokerage costs; taxes; interest; borrowing costs such as interest and dividend expenses on securities sold short; costs to organize the Fund; acquired fund fees and expenses; and extraordinary expenses, such as litigation and merger or reorganization costs and other expenses not incurred in the ordinary course of the Fund’s business) to an amount not exceeding 1.00% of the Fund’s average daily net assets. Accordingly, during the six months ended February 28, 2021, the Adviser reduced its advisory fees in the amount of $45,936.
Under the terms of the ELA, investment advisory fee reductions and expense reimbursements by the Adviser are subject to repayment by the Fund for a period of three years after such fees and expenses were incurred, provided the repayments do not cause total annual operating expenses to exceed the lesser of: (i) the expense limitation then in effect, if any, and (ii)
| MEEHAN FOCUS FUND |
| NOTES TO FINANCIAL STATEMENTS (Continued) |
the expense limitation in effect at the time the expenses to be repaid were incurred. As of February 28, 2021, the Adviser may seek recoupment of investment advisory fee reductions totaling $300,901 no later than the dates listed below:
| | | | | |
| October 31, 2021 | | $ | 55,440 | |
| October 31, 2022 | | | 105,329 | |
| August 31, 2023 | | | 94,196 | |
| February 29, 2024 | | | 45,936 | |
| Total | | $ | 300,901 | |
| | | | | |
OTHER SERVICE PROVIDERS
Ultimus Fund Solutions, LLC (“Ultimus”) provides administration, fund accounting, compliance and transfer agency services to the Fund. The Fund pays Ultimus fees in accordance with the agreements for such services. In addition, the Fund pays out-of-pocket expenses including, but not limited to, postage, supplies, and certain costs related to the pricing of the Fund’s portfolio securities.
Under the terms of a Distribution Agreement with the Trust, Ultimus Fund Distributors, LLC (the “Distributor”) serves as the principal underwriter to the Fund. The Distributor is a wholly-owned subsidiary of Ultimus. The Distributor is compensated by the Adviser (not the Fund) for acting as principal underwriter.
Certain officers and a Trustee of the Trust are also officers of Ultimus.
TRUSTEE COMPENSATION
Each member of the Board (a “Trustee”) who is not an “interested person” of the Trust (“Independent Trustee”) receives a $1,300 annual retainer from each Fund, paid quarterly, except for the Board Chairperson who receives a $1,500 annual retainer from each Fund, paid quarterly. Each Independent Trustee also receives from each Fund a fee of $500 for each Board meeting attended plus reimbursement for travel and other meeting-related expenses.
| 5. | Contingencies and Commitments |
The Fund indemnifies the Trust’s officers and Trustees for certain liabilities that might arise from their performance of their duties to the Fund. Additionally, in the normal course of business the Fund enters into contracts that contain a variety of representations and warranties and which provide general indemnifications. The Fund’s maximum exposure under these arrangements is unknown, as this would involve future claims that may be made against the Fund that have not yet occurred. However, based on experience, the Trust expects the risk of loss to be remote.
| MEEHAN FOCUS FUND |
| NOTES TO FINANCIAL STATEMENTS (Continued) |
| 6. | Non-Diversification Risk |
The Fund is a non-diversified Fund. As a result, the Fund’s holdings may be more concentrated in a limited number of securities and the value of its shares may be more sensitive than a diversified fund to any single economic, business, political, or regulatory occurrence.
If a Fund has significant investments in the securities of issuers within a particular sector, any development affecting that sector will have a greater impact on the value of the net assets of the Fund than would be the case if the Fund did not have significant investments in that sector. In addition, this may increase the risk of loss in the Fund and increase the volatility of the Fund’s NAV per share. Occasionally, market conditions, regulatory changes or other developments may negatively impact a particular sector. As of February 28, 2021, the Fund had 32.7% of the value of its net assets invested in stocks within the Technology sector.
The Fund is required to recognize in the financial statements the effects of all subsequent events that provide additional evidence about conditions that existed as of the date of the Statement of Assets and Liabilities. For non-recognized subsequent events that must be disclosed to keep the financial statements from being misleading, the Fund is required to disclose the nature of the event as well as an estimate of its financial effect, or a statement that such an estimate cannot be made. Management has evaluated subsequent events through the issuance of these financial statements and has noted no such events.
| MEEHAN FOCUS FUND |
| ABOUT YOUR FUND’S EXPENSES (Unaudited) |
We believe it is important for you to understand the impact of costs on your investment. As a shareholder of the Fund, you may incur two types of costs: (1) transaction costs, including redemption fees; and (2) ongoing costs, including management fees and other expenses. The following examples are intended to help you understand your ongoing costs (in dollars) of investing in the Fund and to compare these costs with the ongoing costs of investing in other mutual funds.
A mutual fund’s ongoing costs are expressed as a percentage of its average net assets. This figure is known as the expense ratio. The expenses in the table below are based on an investment of $1,000 made at the beginning of the most recent period (September 1, 2020) and held until the end of the period (February 28, 2021).
The table below illustrates the Fund’s ongoing costs in two ways:
Actual fund return – This section helps you to estimate the actual expenses that you paid over the period. The “Ending Account Value” shown is derived from the Fund’s actual return, and the third column shows the dollar amount of operating expenses that would have been paid by an investor who started with $1,000 in the Fund. You may use the information here, together with the amount you invested, to estimate the expenses that you paid over the period.
To do so, simply divide your account value by $1,000 (for example, an $8,600 account value divided by $1,000 = 8.6), then multiply the result by the number given for the Fund under the heading “Expenses Paid During Period.”
Hypothetical 5% return – This section is intended to help you compare the Fund’s ongoing costs with those of other mutual funds. It assumes that the Fund had an annual return of 5% before expenses during the period shown, but that the expense ratio is unchanged. In this case, because the return used is not the Fund’s actual return, the results do not apply to your investment. The example is useful in making comparisons because the U.S. Securities and Exchange Commission (the “SEC”) requires all mutual funds to calculate expenses based on a 5% return. You can assess the Fund’s ongoing costs by comparing this hypothetical example with the hypothetical examples that appear in shareholder reports of other funds.
Note that expenses shown in the table are meant to highlight and help you compare ongoing costs only. The Fund does not charge sales loads. However, a redemption fee of 2% is applied on the sale of shares of the Fund held for less than 7 calendar days.
The calculations assume no shares were bought or sold during the period. Your actual costs may have been higher or lower, depending on the amount of your investment and the timing of any purchases or redemptions.
More information about the Fund’s expenses, including historical annual expense ratios, can be found in this report. For additional information on operating expenses and other shareholder costs, please refer to the Fund’s prospectus.
| MEEHAN FOCUS FUND |
| ABOUT YOUR FUND’S EXPENSES (Unaudited) (Continued) |
| | | Beginning | | | Ending | | | | |
| | | Account Value | | | Account Value | | | Expenses | |
| | | September 1, | | | February 28, | | | Paid During | |
| | | 2020 | | | 2021 | | | Period * | |
| | | | | | | | | | |
| Based on Actual Fund Return | | $ | 1,000.00 | | | $ | 1,122.20 | | | $ | 5.26 | |
| Based on Hypothetical 5% Return (before expenses) | | $ | 1,000.00 | | | $ | 1,019.84 | | | $ | 5.01 | |
| | | | | | | | | | | | | |
| * | Expenses are equal to the Fund’s annualized net expense ratio of 1.00% for the period, multiplied by the average account value over the period, multiplied by 181/365 (to reflect the one-half year period). |
| MEEHAN FOCUS FUND |
| OTHER INFORMATION (Unaudited) |
A description of the policies and procedures that the Fund uses to vote proxies relating to portfolio securities is available without charge upon request by calling toll- free 1-866-884-5968, or on the SEC’s website at www.sec.gov. Information regarding how the Fund voted proxies relating to portfolio securities during the most recent 12-month period ended June 30 is available without charge upon request by calling toll-free 1-866-884-5968, or on the SEC’s website at www.sec.gov.
The Trust files a complete listing of portfolio holdings for the Fund with the SEC as of the end of the first and third quarters of each fiscal year as an exhibit to its reports on Form N-PORT. These filings are available upon request by calling 1-866-884-5968. Furthermore, you may obtain a copy of the filings on the SEC’s website at www.sec.gov.
| MEEHAN FOCUS FUND |
| DISCLOSURE REGARDING APPROVAL OF INVESTMENT ADVISORY AGREEMENT (Unaudited) |
The Board of Trustees (the “Board”), including the Independent Trustees voting separately, has reviewed and approved the continuance of the Fund’s Investment Advisory Agreement (the “Agreement”) with Edgemoor Investment Advisors, Inc. (the “Adviser”) for an additional one-year term. The Board approved the Agreement at a meeting held on October 19-21, 2020, at which all of the Trustees were present.
Legal counsel advised the Board during its deliberations. Additionally, the Board received and reviewed a substantial amount of information provided by the Adviser in response to requests of the Board and counsel. In deciding whether to approve the Agreement, the Board recalled its discussion with the Adviser during the meeting and its review of various materials related to the Advisor and the Fund. The Board further considered those materials and discussions and numerous other factors, including:
The nature, extent, and quality of the services provided by the Adviser. In this regard, the Board reviewed the services being provided by Edgemoor to the Meehan Fund including, without limitation, its recent investment advisory services to the Meehan Fund; Edgemoor’s compliance policies and procedures; Edgemoor’s efforts to promote the Meehan Fund and assist in its distribution; and Edgemoor’s compliance program. After reviewing the foregoing information and further information in the Edgemoor Memorandum (e.g., descriptions of its business and Form ADV), the Board concluded that the quality, extent, and nature of the services provided by Edgemoor were satisfactory and adequate for the Meehan Fund.
The investment performance of the Meehan Fund. In this regard, the Board compared the performance of the Meehan Fund with the performance of its benchmark index, custom peer group and Morningstar category. The Board noted that the Meehan Fund had outperformed its primary benchmark, the Standard & Poor’s 500 Total Return Stock Index, for the one- and three-year and since inception periods, and underperformed its benchmark for the five-year period. The Board also noted that the Meehan Fund had outperformed the median performance of its custom peer group and Morningstar category (Large Blend) for the one-, three-, and five-year and since inception periods. After further discussion, the Board determined that Edgemoor had satisfactorily explained its performance results for the Meehan Fund. The Board also considered the consistency of Edgemoor’s management with the Meehan Fund’s investment objective and policies. Following discussion of the investment performance of the Meehan Fund and its performance relative to its Morningstar category, Edgemoor’s experience in managing a mutual fund and separate accounts, its historical investment performance, and other factors, the Board concluded that the investment performance of the Meehan Fund has been satisfactory.
The costs of the services provided and profits realized by Edgemoor and its affiliates from its relationship with the Meehan Fund. In this regard, the Board considered Edgemoor’s staffing, personnel, and methods of operations; the education and experience of its personnel; compliance program, policies, and procedures; financial condition and the level of commitment to the Meehan Fund, and, generally, Edgemoor’s advisory business; the
| MEEHAN FOCUS FUND |
| DISCLOSURE REGARDING APPROVAL OF INVESTMENT ADVISORY AGREEMENT (Unaudited) (Continued) |
asset level of the Meehan Fund; and the overall expenses of the Meehan Fund, including the advisory fee. The Board considered the Meehan Expense Limitation Agreement (“Meehan ELA”) and considered Edgemoor’s current and past fee reductions and expense reimbursements for the Meehan Fund. The Board further took into account Edgemoor’s commitment to continue the Meehan ELA until at least March 1, 2022.
The Board also considered potential benefits for Edgemoor in managing the Meehan Fund, including promotion of Edgemoor’s name and the potential for it to receive research, statistical, or other services from the Meehan Fund’s trades. The Board compared the Meehan Fund’s advisory fee and overall expense ratio to the average advisory fees and average expense ratios for its custom peer group and Morningstar category (Large Blend). The Board noted that the 0.80% advisory fee for the Meehan Fund was lower than the average for the Meehan Fund’s custom peer group and higher than the median of the its custom peer group and the average and median of the Morningstar category. The Board further noted that the overall annual expense ratio of 1.00% for the Meehan Fund was lower than the average of the Meehan Fund’s custom peer group and higher than the median for its custom peer group and the average and median of the Morningstar category. The Board also considered the fee charged by Edgemoor to its other accounts that may have a substantially similar strategy as the Meehan Fund and considered the similarities and differences of services received by such other accounts as compared to the services received by the Meehan Fund. The Board noted that the fee structures applicable to Edgemoor’s other clients were not indicative of any unreasonableness with respect to the advisory fees payable to the Meehan Fund. The Board further considered the investment strategy and style used by Edgemoor in managing the portfolio of the Meehan Fund. Following these comparisons and upon further consideration and discussion of the foregoing, the Board concluded that the advisory fee paid to Edgemoor by the Meehan Fund is fair and reasonable.
The extent to which economies of scale would be realized as the Meehan Fund grows and whether advisory fee levels reflect these economies of scale for the benefit of the Meehan Fund’s investors. In this regard, the Board considered that the Meehan Fund’s fee arrangements with Edgemoor involve both the advisory fee and the Meehan ELA. The Board determined that while the advisory fee rate remained the same as asset levels increased, the shareholders of the Meehan Fund have experienced benefits from the Meehan ELA and will continue to experience benefits from the Meehan ELA until the Meehan Fund assets grow to a level where its expenses otherwise fall below the expense limit. Following further discussion of the Meehan Fund’s asset level, expectations for growth, and level of fees, the Board determined that the Meehan Fund’s fee arrangements with Edgemoor would continue to provide benefits. The Board also determined that the fee arrangements were fair and reasonable in relation to the nature and quality of services being provided by Edgemoor, given the Meehan Fund’s projected asset levels for the next year.
| MEEHAN FOCUS FUND |
| DISCLOSURE REGARDING APPROVAL OF INVESTMENT ADVISORY AGREEMENT (Unaudited) (Continued) |
Brokerage and portfolio transactions. In this regard, the Board considered Edgemoor’s trading policies, procedures, and performance in seeking best execution for its clients, including the Meehan Fund. The Board also considered the historical portfolio turnover rate for the Meehan Fund; the process by which evaluations are made of the overall reasonableness of commissions paid; the process by which Edgemoor evaluates best execution; the method and basis for selecting and evaluating the broker-dealers used; and any anticipated allocation of portfolio business to persons affiliated with Edgemoor. After further review and discussion, the Board determined that Edgemoor’s practices regarding brokerage and portfolio transactions were satisfactory.
Possible conflicts of interest. In evaluating the possibility for conflicts of interest, the Board considered such matters as the experience and abilities of the advisory personnel assigned to the Meehan Fund, Edgemoor’s process for allocating trades among the Meehan Fund and its other clients, and the substance and administration of Edgemoor’s Code of Ethics. Following further consideration and discussion, the Board found for the Meehan Fund that Edgemoor’s standards and practices relating to the identification and mitigation of potential conflicts of interests were satisfactory.
After further discussion of the factors noted above and in reliance on the information provided by Edgemoor and Trust Management, and taking into account the totality of all the factors discussed and information presented at this Meeting and previous Meetings, the Board indicated its agreement to approve the continuance of the Meehan Advisory Agreement and the Meehan ELA. It was noted that in the Trustees’ deliberations regarding the approval of renewal the Meehan Advisory Agreement, the Trustees did not identify any particular information or factor that was all-important or controlling, and that each individual Trustee may have attributed different weights to the various factors listed above.
| MEEHAN FOCUS FUND |
| LIQUIDITY RISK MANAGEMENT PROGRAM (Unaudited) |
The Fund has adopted and implemented a written liquidity risk management program (the “Program”) as required by Rule 22e-4 (the “Liquidity Rule”) under the Investment Company Act of 1940, as amended. The Program is reasonably designed to assess and manage the Fund’s liquidity risk, taking into consideration, among other factors, the Fund’s investment strategy and the liquidity of its portfolio investments during normal and reasonably foreseeable stressed conditions; its short- and long-term cash flow projections; and its cash holdings and access to other funding sources. The Fund’s Board of Trustees (the “Board”) approved the appointment of the Liquidity Administrator Committee, comprising of the Fund’s Adviser and certain Trust officers, to be responsible for the Program’s administration and oversight and for reporting to the Board on at least an annual basis regarding the Program’s operation and effectiveness. The annual written report assessing the Program (the “Report”) was presented to the Board at the October 19-20, 2020 Board meeting and covered the period from June 1, 2019 to May 31, 2020 (the “Review Period”).
During the Review Period, the Fund did not experience unusual stress or disruption to its operations related to purchase and redemption activity. Also, during the Review Period, the Fund held adequate levels of cash and highly liquid investments to meet shareholder redemption activities in accordance with applicable requirements. The Report concluded that the Program is reasonably designed to prevent violation of the Liquidity Rule and the Program has been effectively implemented.
| CUSTOMER PRIVACY NOTICE |
| |
| FACTS | WHAT DOES THE MEEHAN FOCUS FUND (the “Fund”) DO WITH YOUR PERSONAL INFORMATION? |
| |
| Why? | Financial companies choose how they share your personal information. Federal law gives consumers the right to limit some but not all sharing. Federal law also requires us to tell you how we collect, share, and protect your personal information. Please read this notice carefully to understand what we do. |
| |
| What? | The types of personal information we collect and share depend on the product or service you have with us. This information can include: ■ Social Security number ■ Assets ■ Retirement Assets ■ Transaction History ■ Checking Account Information ■ Purchase History ■ Account Balances ■ Account Transactions ■ Wire Transfer Instructions When you are no longer our customer, we continue to share your information as described in this notice. |
| |
| How? | All financial companies need to share your personal information to run their everyday business. In the section below, we list the reasons financial companies can share their customers’ personal information; the reasons the Fund chooses to share; and whether you can limit this sharing. |
| |
| Reasons we can share your personal information | Does the
Fund share? | Can you limit
this sharing? |
For our everyday business purposes – Such as to process your transactions, maintain your account(s), respond to court orders and legal investigations, or report to credit bureaus | Yes | No |
For our marketing purposes – to offer our products and services to you | No | We don’t share |
| For joint marketing with other financial companies | No | We don’t share |
For our affiliates’ everyday business purposes – information about your transactions and experiences | No | We don’t share |
For our affiliates’ everyday business purposes – information about your creditworthiness | No | We don’t share |
| For nonaffiliates to market to you | No | We don’t share |
| | | | |
| Questions? | Call 1-866-884-5968 |
| Who we are |
| Who is providing this notice? | Meehan Focus Fund Ultimus Fund Distributors, LLC (Distributor) Ultimus Fund Solutions, LLC (Administrator) |
| What we do |
| How does the Fund protect my personal information? | To protect your personal information from unauthorized access and use, we use security measures that comply with federal law. These measures include computer safeguards and secured files and buildings. Our service providers are held accountable for adhering to strict policies and procedures to prevent any misuse of your nonpublic personal information. |
| How does the Fund collect my personal information? | We collect your personal information, for example, when you ■ Open an account ■ Provide account information ■ Give us your contact information ■ Make deposits or withdrawals from your account ■ Make a wire transfer ■ Tell us where to send the money ■ Tell us who receives the money ■ Show your government-issued ID ■ Show your driver’s license We also collect your personal information from other companies. |
| Why can’t I limit all sharing? | Federal law gives you the right to limit only ■ Sharing for affiliates’ everyday business purposes – information about your creditworthiness ■ Affiliates from using your information to market to you ■ Sharing for nonaffiliates to market to you State laws and individual companies may give you additional rights to limit sharing. |
| |
| Definitions |
| Affiliates | Companies related by common ownership or control. They can be financial and nonfinancial companies. ■ Edgemoor Investment Advisors, Inc., the investment adviser to the Fund, could be deemed to be an affiliate. |
| Nonaffiliates | Companies not related by common ownership or control. They can be financial and nonfinancial companies ■ The Fund does not share with nonaffiliates so they can market to you. |
| Joint marketing | A formal agreement between nonaffiliated financial companies that together market financial products or services to you. ■ The Fund does not jointly market. |
This page intentionally left blank.
This page intentionally left blank.
This page intentionally left blank.
Meehan-SAR-21
Item 2. Code of Ethics.
Not required
Item 3. Audit Committee Financial Expert.
Not required
Item 4. Principal Accountant Fees and Services.
Not required
Item 5. Audit Committee of Listed Registrants.
Not applicable
Item 6. Schedule of Investments.
| (a) | Not applicable [schedule filed with Item 1] |
Item 7. Disclosure of Proxy Voting Policies and Procedures for Closed-End Management Investment Companies.
Not applicable
| Item 8. | Portfolio Managers of Closed-End Management Investment Companies. |
Not applicable
Item 9. Purchases of Equity Securities by Closed-End Management Investment Company and Affiliated Purchasers.
Not applicable
Item 10. Submission of Matters to a Vote of Security Holders.
The registrant’s Committee of Independent Trustees shall review shareholder recommendations for nominations to fill vacancies on the registrant’s board of trustees if such recommendations are submitted in writing and addressed to the Committee at the registrant’s offices. The Committee may adopt, by resolution, a policy regarding its procedures for considering candidates for the board of trustees, including any recommended by shareholders.
Item 11. Controls and Procedures.
(a) Based on their evaluation of the registrant’s disclosure controls and procedures (as defined in Rule 30a-3(c) under the Investment Company Act of 1940) as of a date within 90 days of the filing date of this report, the registrant’s principal executive officer and principal financial officer have concluded that such disclosure controls and procedures are reasonably designed and are operating effectively to ensure that material information relating to the registrant, including its consolidated subsidiaries, is made known to them by others within those entities, particularly during the period in which this report is being prepared, and that the information required in filings on Form N-CSR is recorded, processed, summarized, and reported on a timely basis.
(b) There were no changes in the registrant’s internal control over financial reporting (as defined in Rule 30a-3(d) under the Investment Company Act of 1940) that occurred during the period covered by this report that have materially affected, or are reasonably likely to materially affect, the registrant’s internal control over financial reporting.
Item 12. Disclosure of Securities Lending Activities for Closed-End Management Investment Companies.
Not applicable
File the exhibits listed below as part of this Form. Letter or number the exhibits in the sequence indicated.
(a)(1) Any code of ethics, or amendment thereto, that is the subject of the disclosure required by Item 2, to the extent that the registrant intends to satisfy the Item 2 requirements through filing of an exhibit: Not required
(a)(2) A separate certification for each principal executive officer and principal financial officer of the registrant as required by Rule 30a-2(a) under the Act (17 CFR 270.30a-2(a)): Attached hereto
(a)(3) Any written solicitation to purchase securities under Rule 23c-1 under the Act (17 CFR 270.23c-1) sent or given during the period covered by the report by or on behalf of the registrant to 10 or more persons: Not applicable
(a)(4) Change in the registrant’s independent public accountants: Not applicable
(b) Certifications required by Rule 30a-2(b) under the Act (17 CFR 270.30a-2(b)): Attached hereto
Exhibit 99.CERT Certifications required by Rule 30a-2(a) under the Act
Exhibit 99.906CERT Certifications required by Rule 30a-2(b) under the Act
SIGNATURES
Pursuant to the requirements of the Securities Exchange Act of 1934 and the Investment Company Act of 1940, the registrant has duly caused this report to be signed on its behalf by the undersigned, thereunto duly authorized.
| (Registrant) | Ultimus Managers Trust | | |
| | | | |
| By (Signature and Title)* | /s/ Matthew J. Beck | |
| | | Matthew J. Beck, Secretary | |
| | | | |
| Date | May 5, 2021 | | |
| | | | |
| Pursuant to the requirements of the Securities Exchange Act of 1934 and the Investment Company Act of 1940, this report has been signed below by the following persons on behalf of the registrant and in the capacities and on the dates indicated. | |
| | | | |
| By (Signature and Title)* | /s/ Todd E. Heim | |
| | | Todd E. Heim, Principal Executive Officer | |
| | | | |
| Date | May 5, 2021 | | |
| | | | |
| By (Signature and Title)* | /s/ Jennifer L. Leamer | | |
| | | Jennifer L. Leamer, Treasurer and Principal Financial Officer | | |
| | | | | |
| Date | May 5, 2021 | | | |
* Print the name and title of each signing officer under his or her signature.