| OMB APPROVAL |
OMB Number: 3235-0570 Expires: July 31, 2022 Estimated average burden hours per response: 20.6 |
UNITED STATES
SECURITIES AND EXCHANGE COMMISSION
Washington, D.C. 20549
FORM N-CSR
CERTIFIED SHAREHOLDER REPORT OF REGISTERED
MANAGEMENT INVESTMENT COMPANIES
| Investment Company Act file number | 811-22680 | |
| Ultimus Managers Trust |
| (Exact name of registrant as specified in charter) |
| 225 Pictoria Drive, Suite 450 Cincinnati, Ohio | 45246 |
| (Address of principal executive offices) | (Zip code) |
Matthew J. Beck
| Ultimus Fund Solutions, LLC 225 Pictoria Drive, Suite 450 Cincinnati, Ohio 45246_ |
| (Name and address of agent for service) |
| Registrant's telephone number, including area code: | (513) 587-3400 | |
| Date of fiscal year end: | May 31 | |
| | | |
| Date of reporting period: | November 30, 2020 | |
Form N-CSR is to be used by management investment companies to file reports with the Commission not later than 10 days after the transmission to stockholders of any report that is required to be transmitted to stockholders under Rule 30e-1 under the Investment Company Act of 1940 (17 CFR 270.30e-1). The Commission may use the information provided on Form N-CSR in its regulatory, disclosure review, inspection, and policymaking roles.
A registrant is required to disclose the information specified by Form N-CSR, and the Commission will make this information public. A registrant is not required to respond to the collection of information contained in Form N-CSR unless the Form displays a currently valid Office of Management and Budget ("OMB") control number. Please direct comments concerning the accuracy of the information collection burden estimate and any suggestions for reducing the burden to the Secretary, Securities and Exchange Commission, 450 Fifth Street, NW, Washington, DC 20549-0609. The OMB has reviewed this collection of information under the clearance requirements of 44 U.S.C. § 3507.
| Item 1. | Reports to Stockholders. |
| |
| |
| |
| |
| |
| |
| |
| |
| |
 |
| |
| |
| |
| Institutional Class (ADLVX) |
| |
SEMI-ANNUAL REPORT
November 30, 2020
(Unaudited) |
| |
| Managed by |
| Adler Asset Management, LLC |
| |
For information or assistance in opening an account,
please call toll-free 1-800-408-4682. |
| |
| |
| |
| |
| |
| |
| |
| |
| |
| |
| |
| |
| |
| |
| ADLER VALUE FUND | |
| LETTER TO SHAREHOLDERS (Unaudited) | December 31, 2020 |
| | |
Dear Shareholder,
In mid-August 2018, the Adler Value Fund (the “Fund”) commenced operations. Adler Asset Management, LLC (the “Adviser”) is the Fund’s investment adviser. For the semi-annual period ended November 30, 2020, the Fund’s total return was 24.02%. During the same period, the total return of the S&P 500 Value Index was 14.82%. During the semi-annual period, election and COVID-19 vaccine trial results altered the market environment and acted as a catalyst for investors to focus on value stocks.
Investment Approach
In selecting investments for the Fund, the Adviser uses a focused-value strategy to invest in companies that, in its opinion, appear to be undervalued by the equity market but where catalysts exist, in the opinion of the Adviser, to close these valuation gaps. The Adviser seeks to exploit perceived market misjudgments in pricing by buying equity securities that appear to be undervalued because of a temporary aversion to these out-of-favor issuers.
The Adviser maintains a watch list of companies and reviews each company’s financial condition and prospects, including: expected future earnings; cash flow; the ability and willingness to return capital to shareholders; competitive position; quality of the business franchise; and the reputation, experience, and competence of a company’s management and board of directors. The Adviser considers these factors both while the company is on the watch list and also at the time of purchase. Not all companies, at the time of purchase, are on the Adviser’s watch list, and a company may be added to the Fund’s portfolio following a precipitating event.
When added to the Fund’s portfolio, a company will generally be trading at a significant discount to its 52-week or all-time high. The Adviser’s contrarian approach, buying what it believes are fundamentally sound companies that are out-of-favor with the market, is industry, sector and market capitalization agnostic, and typically involves the securities of fewer than thirty issuers.
Portfolio Developments
Pfizer and Bayer are two Fund holdings:
| ● | Pfizer is a global biopharmaceutical company. In the Fund’s most recent semi-annual period, the Company had two noteworthy accomplishments. First, Pfizer, and its German partner, received regulatory approval for its COVID-19 vaccine. In addition, Pfizer completed the separation of its off-patent drug business by combining it with Mylan to create publicly-traded Viatris. The Fund continues to hold Viatris shares received in the transaction. The Adviser believes these achievements will act as catalysts for the market to re-evaluate Pfizer as a more focused company with prospects for sustainable organic growth. |
| ● | Bayer is a life sciences company focused on health care and nutrition. Bayer’s legal challenges with its Monsanto acquisition have been well-documented. Moreover, Bayer has struggled to implement a comprehensive Monsanto legal settlement. The Adviser |
| | purchased Bayer shares for the Fund after the Monsanto acquisition and the related legal exposure became known. The Adviser believes that Bayer will ultimately cobble together a solution to its Monsanto legal woes. |
In closing, I want to thank shareholders for their confidence in the Fund’s Adviser. The Adviser continues to assess companies that fit the Fund’s investment approach.
David Adler
Adler Asset Management, LLC
December 31, 2020
Past performance is not predictive of future performance. Investment results and principal value will fluctuate so that shares, when redeemed, may be worth more or less than their original cost. Current performance may be higher or lower than the performance data quoted. Performance data current to the most recent month-end are available by calling 1-800-408-4682.
An investor should consider the investment objectives, risks, charges and expenses of the Fund carefully before investing. The Fund’s prospectus contains this and other important information. To obtain a copy of the Fund’s prospectus please visit the Fund’s website at www.adlervaluefund.com or call 1-800-408-4682 and a copy will be sent to you free of charge. Please read the prospectus carefully before you invest. The Fund is distributed by Ultimus Fund Distributors, LLC.
The Letter to Shareholders seeks to describe some of the Adviser’s current opinions and views of the financial markets. Although the Adviser believes it has a reasonable basis for any opinions or views expressed, actual results may differ, sometimes significantly so, from those expected or expressed. The securities held by the Fund that are discussed in the Letter to Shareholders were held during the period covered by this Report. They do not comprise the entire investment portfolio of the Fund, may be sold at any time, and may no longer be held by the Fund. For a complete list of securities held by the Fund as of November 30, 2020, please see the Schedule of Investments section of the semi-annual report. The opinions of the Fund’s adviser with respect to those securities may change at any time.
Statements in the Letter to Shareholders that reflect projections or expectations for future financial or economic performance of the Fund and the market in general and statements of the Fund’s plans and objectives for future operations are forward-looking statements. No assurance can be given that actual results or events will not differ materially from those projected, estimated, assumed, or anticipated in any such forward-looking statements. Important factors that could result in such differences, in addition to factors noted with such forward-looking statements, include, without limitation, general economic conditions, such as inflation, recession, and interest rates. Past performance is not a guarantee of future results.
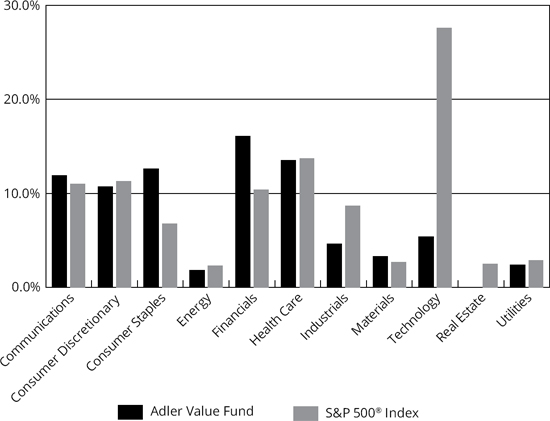
| ADLER VALUE FUND |
| PORTFOLIO INFORMATION |
| November 30, 2020 (Unaudited) |
| |
Sector Diversification
(% of Net Assets)
| Top 10 Equity Holdings |
| | | |
| | | % of Net |
| Security Description | | Assets |
| Veoneer, Inc. | | 5.6% |
| Meredith Corporation | | 5.1% |
| Charles Schwab Corporation (The) | | 4.5% |
| Big Lots, Inc. | | 4.3% |
| Equitable Holdings, Inc. | | 4.2% |
| Diageo plc - ADR | | 4.2% |
| Spectrum Brands Holdings, Inc. | | 4.1% |
| iHeartMedia, Inc. - Class A | | 4.0% |
| Citigroup, Inc. | | 3.8% |
| Cigna Corporation | | 3.6% |
| ADLER VALUE FUND |
| SCHEDULE OF INVESTMENTS |
| November 30, 2020 (Unaudited) |
| COMMON STOCKS — 82.3% | | Shares | | | Value | |
| Communications — 11.9% | | | | | | | | |
| Cable & Satellite — 2.8% | | | | | | | | |
| Altice USA, Inc. - Class A (a) | | | 1,300 | | | $ | 44,096 | |
| Comcast Corporation - Class A | | | 600 | | | | 30,144 | |
| | | | | | | | 74,240 | |
| Publishing & Broadcasting — 9.1% | | | | | | | | |
| iHeartMedia, Inc. - Class A (a) | | | 8,800 | | | | 105,204 | |
| Meredith Corporation | | | 6,500 | | | | 132,275 | |
| | | | | | | | 237,479 | |
| Consumer Discretionary — 10.7% | | | | | | | | |
| Automotive — 5.6% | | | | | | | | |
| Veoneer, Inc. (a) | | | 7,400 | | | | 147,482 | |
| | | | | | | | | |
| Leisure Facilities & Services — 5.1% | | | | | | | | |
| Jack in the Box, Inc. | | | 900 | | | | 82,791 | |
| Starbucks Corporation | | | 500 | | | | 49,010 | |
| | | | | | | | 131,801 | |
| Consumer Staples — 12.6% | | | | | | | | |
| Beverages — 4.2% | | | | | | | | |
| Diageo plc - ADR | | | 700 | | | | 108,465 | |
| | | | | | | | | |
| Household Products — 4.1% | | | | | | | | |
| Spectrum Brands Holdings, Inc. | | | 1,600 | | | | 106,928 | |
| | | | | | | | | |
| Retail - Consumer Staples — 4.3% | | | | | | | | |
| Big Lots, Inc. | | | 2,200 | | | | 113,674 | |
| | | | | | | | | |
| Energy — 1.8% | | | | | | | | |
| Oil & Gas Producers — 1.8% | | | | | | | | |
| Concho Resources, Inc. | | | 800 | | | | 45,984 | |
| | | | | | | | | |
| Financials — 16.1% | | | | | | | | |
| Asset Management — 4.5% | | | | | | | | |
| Charles Schwab Corporation (The) | | | 2,400 | | | | 117,072 | |
| | | | | | | | | |
| Banking — 4.6% | | | | | | | | |
| Citigroup, Inc. | | | 1,800 | | | | 99,126 | |
| U.S. Bancorp | | | 500 | | | | 21,605 | |
| | | | | | | | 120,731 | |
| Insurance — 7.0% | | | | | | | | |
| Aflac, Inc. | | | 1,700 | | | | 74,681 | |
| Equitable Holdings, Inc. | | | 4,300 | | | | 109,134 | |
| | | | | | | | 183,815 | |
| ADLER VALUE FUND |
| SCHEDULE OF INVESTMENTS (Unaudited) (Continued) |
| COMMON STOCKS — 82.3% (Continued) | | Shares | | | Value | |
| Health Care — 13.5% | | | | | | | | |
| Biotech & Pharma — 9.9% | | | | | | | | |
| Bayer AG - ADR | | | 6,200 | | | $ | 90,024 | |
| Bristol-Myers Squibb Company | | | 1,500 | | | | 93,600 | |
| Pfizer, Inc. | | | 1,900 | | | | 72,789 | |
| Viatris, Inc. (a) | | | 236 | | | | 3,966 | |
| | | | | | | | 260,379 | |
| Health Care Facilities & Services — 3.6% | | | | | | | | |
| Cigna Corporation | | | 450 | | | | 94,113 | |
| | | | | | | | | |
| Industrials — 4.6% | | | | | | | | |
| Aerospace & Defense — 1.4% | | | | | | | | |
| Raytheon Technologies Corporation | | | 500 | | | | 35,860 | |
| | | | | | | | | |
| Industrial Support Services — 3.2% | | | | | | | | |
| Grainger (W.W.), Inc. | | | 200 | | | | 83,660 | |
| | | | | | | | | |
| Materials — 3.3% | | | | | | | | |
| Chemicals — 3.3% | | | | | | | | |
| Valvoline, Inc. | | | 3,800 | | | | 86,602 | |
| | | | | | | | | |
| Technology — 5.4% | | | | | | | | |
| Technology Hardware — 3.1% | | | | | | | | |
| Diebold Nixdorf, Inc. (a) | | | 8,700 | | | | 82,389 | |
| | | | | | | | | |
| Technology Services — 2.3% | | | | | | | | |
| MultiPlan Corporation (a) | | | 8,500 | | | | 58,990 | |
| | | | | | | | | |
| Utilities — 2.4% | | | | | | | | |
| Electric Utilities — 2.4% | | | | | | | | |
| PG&E Corporation (a) | | | 5,000 | | | | 63,500 | |
| | | | | | | | | |
| Total Common Stocks (Cost $1,784,877) | | | | | | $ | 2,153,164 | |
| ADLER VALUE FUND |
| SCHEDULE OF INVESTMENTS (Unaudited) (Continued) |
| PURCHASED OPTION | | Strike | | | | | | Notional | | | | |
| CONTRACTS — 3.1% | | Price | | | Contracts | | | Value | | | Value | |
| Call Option Contracts — 3.1% | | | | | | | | | | | | | | | | |
| Aflac, Inc., 01/15/21 | | $ | 37.50 | | | | 10 | | | $ | 43,930 | | | $ | 6,850 | |
| Aflac, Inc., 01/15/21 | | | 52.50 | | | | 5 | | | | 21,965 | | | | 63 | |
| Big Lots, Inc., 01/15/21 | | | 22.50 | | | | 5 | | | | 25,835 | | | | 14,525 | |
| Big Lots, Inc., 01/15/21 | | | 25.00 | | | | 10 | | | | 51,670 | | | | 26,700 | |
| Meredith Corporation, 12/18/20 | | | 12.50 | | | | 5 | | | | 10,175 | | | | 3,725 | |
| Pfizer, Inc., 01/15/21 | | | 38.00 | | | | 20 | | | | 76,620 | | | | 6,800 | |
| Pfizer, Inc., 07/16/21 | | | 37.00 | | | | 10 | | | | 38,310 | | | | 5,000 | |
| Valvoline, Inc., 12/18/20 | | | 12.50 | | | | 10 | | | | 22,790 | | | | 10,400 | |
| Valvoline, Inc., 12/18/20 | | | 15.00 | | | | 10 | | | | 22,790 | | | | 7,950 | |
| Total Purchased Option Contracts (Cost $21,148) | | | $ | 314,085 | | | $ | 82,013 | |
| | | | | | | | | | | | | | | | | |
| MONEY MARKET FUNDS — 15.2% | | | | | | | | | | Shares | | | Value | |
| JPMorgan 100% U.S. Treasury Securities Money Market Fund - Institutional Class, 0.01% (b) (Cost $397,281) | | | | 397,281 | | | $ | 397,281 | |
| | | | | | | | | | | | | | | | | |
| Investments at Value — 100.6% (Cost $2,203,306) | | | | | | | $ | 2,632,458 | |
| | | | | | | | | | | | | | | | | |
| Liabilities in Excess of Other Assets — (0.6%) | | | | | | | | | | (15,712 | ) |
| | | | | | | | | | | | | | | | | |
| Net Assets — 100.0% | | | | | | | | | $ | 2,616,746 | |
| | | | | | | | | | | | | | | | | |
| (a) | Non-income producing security. |
| (b) | The rate shown is the 7-day effective yield as of November 30, 2020. |
See accompanying notes to financial statements.
| ADLER VALUE FUND |
| STATEMENT OF ASSETS AND LIABILITIES |
| November 30, 2020 (Unaudited) |
| ASSETS | | | | |
| Investments in securities: | | | | |
| At cost | | $ | 2,203,306 | |
| At value (Note 2) | | $ | 2,632,458 | |
| Receivable for capital shares sold | | | 750 | |
| Receivable from Adviser (Note 4) | | | 12,983 | |
| Dividends receivable | | | 3,783 | |
| Tax reclaims receivable | | | 341 | |
| Other assets | | | 13,966 | |
| Total assets | | | 2,664,281 | |
| | | | | |
| LIABILITIES | | | | |
| Payable for investment securities purchased | | | 17,627 | |
| Payable to administrator (Note 4) | | | 13,040 | |
| Other accrued expenses | | | 16,868 | |
| Total liabilities | | | 47,535 | |
| | | | | |
| NET ASSETS | | $ | 2,616,746 | |
| | | | | |
| NET ASSETS CONSIST OF: | | | | |
| Paid-in capital | | $ | 2,156,151 | |
| Accumulated earnings | | | 460,595 | |
| NET ASSETS | | $ | 2,616,746 | |
| | | | | |
| PRICING OF INSTITUTIONAL SHARES (Note 1) | | | | |
| Net assets applicable to Institutional Shares | | $ | 2,616,746 | |
| Shares of Institutional Shares outstanding (no par value, unlimited number of shares authorized) | | | 106,460 | |
| Net asset value, offering and redemption price per share (Note 2) | | $ | 24.58 | |
See accompanying notes to financial statements.
| ADLER VALUE FUND |
| STATEMENT OF OPERATIONS |
| For the Six Months Ended November 30, 2020 (Unaudited) |
| INVESTMENT INCOME | | | | |
| Dividends | | $ | 14,365 | |
| Foreign withholding tax on dividends | | | (4 | ) |
| Total investment income | | | 14,361 | |
| | | | | |
| EXPENSES | | | | |
| Fund accounting fees (Note 4) | | | 13,597 | |
| Administration fees (Note 4) | | | 13,500 | |
| Legal fees | | | 13,148 | |
| Investment advisory fees (Note 4) | | | 9,191 | |
| Audit and tax services fees | | | 8,950 | |
| Trustees’ fees (Note 4) | | | 8,350 | |
| Registration and filing fees | | | 7,855 | |
| Transfer agent fees (Note 4) | | | 6,000 | |
| Compliance fees (Note 4) | | | 6,000 | |
| Custodian and bank service fees | | | 5,296 | |
| Printing of shareholder reports | | | 2,390 | |
| Postage and supplies | | | 837 | |
| Other expenses | | | 6,157 | |
| Total expenses | | | 101,271 | |
| Less fee reductions and expense reimbursements by the Adviser (Note 4) | | | (89,783 | ) |
| Net expenses | | | 11,488 | |
| | | | | |
| NET INVESTMENT INCOME | | | 2,873 | |
| | | | | |
| REALIZED AND UNREALIZED GAINS (LOSSES) ON INVESTMENTS | | | | |
| Net realized losses on investments transactions | | | (1,273 | ) |
| Net change in unrealized appreciation (depreciation) on investments | | | 471,375 | |
| NET REALIZED AND UNREALIZED GAINS ON INVESTMENTS | | | 470,102 | |
| | | | | |
| NET INCREASE IN NET ASSETS RESULTING FROM OPERATIONS | | $ | 472,975 | |
See accompanying notes to financial statements.
| ADLER VALUE FUND |
| STATEMENTS OF CHANGES IN NET ASSETS |
| | | Six Months | | | | | | | |
| | | Ended | | | Ten Months | | | | |
| | | November 30, | | | Ended | | | Period Ended | |
| | | 2020 | | | May 31, | | | July 31, | |
| | | (Unaudited) | | | 2020(a) | | | 2019(b) | |
| FROM OPERATIONS | | | | | | | | | | | | |
| Net investment income | | $ | 2,873 | | | $ | 35,659 | | | $ | 10,351 | |
| Net realized losses from investment transactions | | | (1,273 | ) | | | (1,793 | ) | | | — | |
| Net change in unrealized appreciation (depreciation) on investments | | | 471,375 | | | | (61,173 | ) | | | 18,950 | |
| Net increase (decrease) in net assets resulting from operations | | | 472,975 | | | | (27,307 | ) | | | 29,301 | |
| | | | | | | | | | | | | |
| DISTRIBUTIONS TO SHAREHOLDERS (NOTE 2) | | | | | | | | | | | | |
| Institutional Shares | | | — | | | | (14,521 | ) | | | — | |
| | | | | | | | | | | | | |
| FROM CAPITAL SHARE TRANSACTIONS | | | | | | | | | | | | |
| Institutional Shares | | | | | | | | | | | | |
| Proceeds from shares sold | | | 685,403 | | | | 39,000 | | | | 1,417,374 | |
| Net asset value of shares issued in reinvestment of distributions to shareholders | | | — | | | | 14,521 | | | | — | |
| Net increase in Institutional Shares net assets from capital share transactions . | | | 685,403 | | | | 53,521 | | | | 1,417,374 | |
| | | | | | | | | | | | | |
| TOTAL INCREASE IN NET ASSETS | | | 1,158,378 | | | | 11,693 | | | | 1,446,675 | |
| | | | | | | | | | | | | |
| NET ASSETS | | | | | | | | | | | | |
| Beginning of period | | | 1,458,368 | | | | 1,446,675 | | | | — | |
| End of period | | $ | 2,616,746 | | | $ | 1,458,368 | | | $ | 1,446,675 | |
| | | | | | | | | | | | | |
| CAPITAL SHARES ACTIVITY | | | | | | | | | | | | |
| Shares sold | | | 32,895 | | | | 2,051 | | | | 70,866 | |
| Shares reinvested | | | — | | | | 648 | | | | — | |
| Net increase in shares outstanding | | | 32,895 | | | | 2,699 | | | | 70,866 | |
| Shares outstanding, beginning of period | | | 73,565 | | | | 70,866 | | | | — | |
| Shares outstanding, end of period | | | 106,460 | | | | 73,565 | | | | 70,866 | |
| (a) | Fund changed fiscal year to May 31. |
| (b) | Represents the period from the commencement of operations (August 16, 2018) through July 31, 2019. |
See accompanying notes to financial statements.
| ADLER VALUE FUND |
| INSTITUTIONAL SHARES |
| FINANCIAL HIGHLIGHTS |
| |
| Per Share Data for a Share Outstanding Throughout Each Period |
| | | Six Months | | | | | | | |
| | | Ended | | | Ten Months | | | | |
| | | November 30, | | | Ended | | | Period Ended | |
| | | 2020 | | | May 31, | | | July 31, | |
| | | (Unaudited) | | | 2020(a) | | | 2019(b) | |
| Net asset value at beginning of period | | $ | 19.82 | | | $ | 20.41 | | | $ | 20.00 | |
| | | | | | | | | | | | | |
| Income (loss) from investment operations: | | | | | | | | | | | | |
| Net investment income | | | 0.03 | (c) | | | 0.49 | (d) | | | 0.15 | |
| Net realized and unrealized gains (losses) on investments | | | 4.73 | | | | (0.88 | ) | | | 0.26 | |
| Total from investment operations | | | 4.76 | | | | (0.39 | ) | | | 0.41 | |
| | | | | | | | | | | | | |
| Less distributions from: | | | | | | | | | | | | |
| Net investment income | | | — | | | | (0.20 | ) | | | — | |
| | | | | | | | | | | | | |
| Net asset value at end of period | | $ | 24.58 | | | $ | 19.82 | | | $ | 20.41 | |
| | | | | | | | | | | | | |
| Total return (e) | | | 24.02 | % (f) | | | (2.01 | %) (f) | | | 2.05 | % (f) |
| | | | | | | | | | | | | |
| Net assets at end of period (000’s) | | $ | 2,617 | | | $ | 1,458 | | | $ | 1,447 | |
| | | | | | | | | | | | | |
| Ratios/supplementary data: | | | | | | | | | | | | |
| Ratio of total expenses to average net assets | | | 10.98 | % (g) | | | 13.01 | % (g) | | | 11.82 | % (g) |
| Ratio of net expenses to average net assets (h) | | | 1.25 | % (g) | | | 1.25 | % (g) | | | 1.26 | % (g)(i) |
| Ratio of net investment income to average net assets (h) | | | 0.31 | % (g) | | | 2.93 | % (d)(g) | | | 0.81 | % (g) |
| Portfolio turnover rate | | | 0 | % | | | 4 | % (f) | | | 0 | % |
| (a) | Fund changed fiscal year to May 31. |
| (b) | Represents the period from the commencement of operations (August 16, 2018) through July 31, 2019. |
| (c) | Per share net investment income has been determined on the basis of average number of shares outstanding during the period. |
| (d) | During the period ended May 31, 2020, the Fund received a large special dividend distribution from NortonLifeLock, Inc. Had the Fund not received this special dividend distribution, the net investment income per share and ratio of net investment income to average net assets would have been $0.33 and 1.97%(g) lower, respectively. |
| (e) | Total return is a measure of the change in value of an investment in the Fund over the periods covered. The returns shown does not reflect the deduction of taxes a shareholder would pay on Fund distributions, if any, or the redemption of Fund shares. The total returns would be lower if the Adviser had not reduced fees and reimbursed expenses (Note 4). |
| (h) | Ratio was determined after advisory fee reductions and expense reimbursements (Note 4). |
| (i) | Includes federal excise taxes of 0.01% of average net assets with respect to the period ended July 31, 2019. |
See accompanying notes to financial statements.
| ADLER VALUE FUND |
| NOTES TO FINANCIAL STATEMENTS |
| November 30, 2020 (Unaudited) |
Adler Value Fund (the “Fund”) is a non-diversified series of Ultimus Managers Trust (the “Trust”), an open-end investment company established as an Ohio business trust under a Declaration of Trust dated February 28, 2012. Other series of the Trust are not incorporated in this report. The Fund commenced operations on August 16, 2018.
The investment objective of the Fund is to seek to achieve long-term growth of capital.
The Fund currently offers one class of shares: Institutional Class shares (sold without any sales loads or distribution fees and subject to a $1,000,000 initial investment requirement). As of November 30, 2020, the Investor Class shares (to be sold without any sales loads, but subject to a distribution fee of up to 0.25% of Investor Class’ average daily net assets and subject to a $2,500 initial investment requirement) are not currently offered. When both classes are offered, each share class will represent an ownership interest in the same investment portfolio.
| 2. | Significant Accounting Policies |
The Fund follows accounting and reporting guidance under Financial Accounting Standards Board Accounting Standards Codification Topic 946, “Financial Services – Investment Companies.” The following is a summary of the Fund’s significant accounting policies used in preparation of its financial statements. These policies are in conformity with accounting principles generally accepted in the United States of America (“GAAP”).
Securities valuation – The Fund values its portfolio securities at market value as of the close of regular trading on the New York Stock Exchange (the “NYSE”) (normally 4:00 p.m. Eastern Time) on each day the NYSE is open for business. The Fund generally values its listed securities on the basis of the security’s last sale price on the security’s primary exchange, if available, otherwise at the exchange’s most recently quoted mean price. NASDAQ-listed securities are valued at the NASDAQ Official Closing Price. Option contracts are valued at the closing price on the exchanges on which they are primarily traded; if no closing price is available at the time of valuation, the option will be valued at the mean of the closing bid and ask prices for that day. Investments representing shares of money market funds and other open-end investment companies not traded on an exchange are valued at their net asset value (“NAV”) as reported by such companies. When using a quoted price and when the market is considered active, the security will be classified as Level 1 within the fair value hierarchy (see next page). In the event that market quotations are not readily available or are considered unreliable due to market or other events, the Fund values its securities and other assets at fair value in accordance with procedures established by and under the general supervision of the Board of Trustees of the Trust (the “Board”). Under these procedures, the securities will be classified as Level 2 or 3 within the fair value hierarchy, depending on the inputs used. Unavailable or unreliable market quotes may be due to the following factors: a substantial bid-ask spread; infrequent sales resulting in stale prices; insufficient trading volume; small trade sizes; a temporary lapse in any
| ADLER VALUE FUND |
| NOTES TO FINANCIAL STATEMENTS (Unaudited) (Continued) |
reliable pricing source; and actions of the securities or futures markets, such as the suspension or limitation of trading. As a result, the prices of securities used to calculate the Fund’s NAV may differ from quoted or published prices for the same securities.
GAAP establishes a single authoritative definition of fair value, sets out a framework for measuring fair value, and requires additional disclosures about fair value measurements.
Various inputs are used in determining the value of the Fund’s investments. These inputs are summarized in the three broad levels listed below:
| ● | Level 1 – quoted prices in active markets for identical securities |
| ● | Level 2 – other significant observable inputs |
| ● | Level 3 – significant unobservable inputs |
The inputs or methods used for valuing securities are not necessarily an indication of the risks associated with investing in those securities. The inputs used to measure fair value may fall into different levels of the fair value hierarchy. In such cases, for disclosure purposes, the level in the fair value hierarchy within which the fair value measurement falls in its entirety is determined based on the lowest level input that is significant to the fair value measurement.
The following is a summary of the Fund’s investments based on the inputs used to value the investments as of November 30, 2020:
| | | Level 1 | | | Level 2 | | | Level 3 | | | Total | |
| Common Stocks | | $ | 2,153,164 | | | $ | — | | | $ | — | | | $ | 2,153,164 | |
| Purchased Option Contracts | | | 11,800 | | | | 70,213 | | | | — | | | | 82,013 | |
| Money Market Funds | | | 397,281 | | | | — | | | | — | | | | 397,281 | |
| Total | | $ | 2,562,245 | | | $ | 70,213 | | | $ | — | | | $ | 2,632,458 | |
Refer to the Fund’s Schedule of Investments for a listing of the common stocks by sector and industry type. The Fund did not have any assets or liabilities that were measured at fair value on a recurring basis using significant unobservable inputs (Level 3) as of or during the six months ended November 30, 2020.
Share valuation – The NAV per share of each class of the Fund is calculated daily by dividing the total value of the assets attributable to that class, less liabilities attributable to that class, by the number of shares outstanding of that class. The offering price and redemption price per share of each class of the Fund is equal to the NAV per share of such class.
Investment income – Dividend income is recorded on the ex-dividend date. Non-cash dividends included in dividend income, if any, are recorded at the fair value of the security received. Interest income is accrued as earned. Withholding taxes on foreign dividends, if any, have been recorded in accordance with the Fund’s understanding of the applicable country’s tax rules and rates.
| ADLER VALUE FUND |
| NOTES TO FINANCIAL STATEMENTS (Unaudited) (Continued) |
Investment transactions – Investment transactions are accounted for on the trade date. Realized gains and losses on investments sold are determined on a specific identification basis.
Common expenses – Common expenses of the Trust are allocated among the Fund and the other series of the Trust based on the relative net assets of each series, the number of series in the Trust, or the nature of the services performed and the relative applicability to each series.
Distributions to shareholders – Distributions to shareholders arising from net investment income and realized capital gains, if any, are declared and paid annually to shareholders. The amount of distributions from net investment income and net realized capital gains are determined in accordance with federal income tax regulations, which may differ from GAAP. Dividends and distributions to shareholders are recorded on the ex-dividend date. For the ten months ended May 31, 2020, the tax character of distributions paid to shareholders was ordinary income. There were no distributions paid to shareholders during the periods ended November 30, 2020 and July 31, 2019.
On December 28, 2020, the Fund paid an ordinary income dividend of $0.3053 per share to shareholders of record on December 24, 2020.
Purchased option contracts – The Fund may use option contracts in any manner consistent with its investment objectives and as long as its use is consistent with relevant provisions of the Investment Company Act of 1940, as amended (the “1940 Act”). The Fund may use options for speculative purposes as well as for the purpose of seeking to reduce the overall investment risk that would otherwise be associated with the securities in which the Fund invests. When the Fund purchases a call or put option, an amount equal to the total premium (the premium plus the commission) paid by the Fund is recorded as an asset on the Fund’s Statement of Assets and Liabilities and is subsequently marked-to-market daily. Premiums paid in the purchase of options which expire are treated as realized losses. Premiums paid in the purchase of call options which are exercised increase the cost of the security purchased. Premiums paid in the purchase of put options which are exercised decrease the proceeds used to calculate the realized capital gain or loss on the sale of the security.
Estimates – The preparation of financial statements in conformity with GAAP requires management to make estimates and assumptions that affect the reported amounts of assets and liabilities and disclosure of contingent assets and liabilities as of the date of the financial statements and the reported amounts of increase (decrease) in net assets from operations during the reporting period. Actual results could differ from those estimates.
Federal income tax – The Fund has qualified and intends to continue to qualify as a regulated investment company under the Internal Revenue Code of 1986, as amended (the “Code”). Qualification generally will relieve the Fund of liability for federal income taxes to the extent 100% of its net investment income and net realized capital gains are distributed in accordance with the Code.
| ADLER VALUE FUND |
| NOTES TO FINANCIAL STATEMENTS (Unaudited) (Continued) |
In order to avoid imposition of the excise tax applicable to regulated investment companies, it is also the Fund’s intention to declare as dividends in each calendar year at least 98% of its net investment income (earned during the calendar year) and 98.2% of its net realized capital gains (earned during the 12 months ended October 31) plus undistributed amounts from prior years.
The following information is computed on a tax basis for each item as of November 30, 2020:
| Tax cost of portfolio investments | | $ | 2,203,306 | |
| Gross unrealized appreciation | | $ | 506,274 | |
| Gross unrealized depreciation | | | (77,122 | ) |
| Net unrealized appreciation | | | 429,152 | |
| Accumulated ordinary income | | | 34,509 | |
| Accumulated capital and other losses | | | (3,066 | ) |
| Accumulated earnings | | $ | 460,595 | |
As of May 31, 2020, the Fund had a long-term capital loss carryforward of $1,793 for federal income tax purposes, which may be carried forward indefinitely. This capital loss carryforward is available to offset net realized gains in the current and future years, thereby reducing future taxable gains.
The Fund recognizes the tax benefits or expenses of uncertain tax positions only when the position is “more likely than not” to be sustained assuming examination by tax authorities. Management has reviewed the Fund’s tax positions for the current open tax periods (generally, three years) and has concluded that no provision for unrecognized tax benefits or expenses is required in these financial statements. The Fund identifies its major tax jurisdiction as U.S. federal.
| 3. | Investment Transactions |
During the six months ended November 30, 2020, cost of purchases and proceeds from sales of investment securities, other than short-term investments, were $545,465 and $0, respectively.
| 4. | Transactions with Related Parties |
INVESTMENT ADVISORY AGREEMENT
The Fund’s investments are managed by Adler Asset Management, LLC (the “Adviser”) pursuant to the terms of an Investment Advisory Agreement. Under the Investment Advisory Agreement, the Fund pays the Adviser an investment advisory fee, computed and accrued daily and paid monthly, at the annual rate of 1.00% of its average daily net assets.
Pursuant to an Expense Limitation Agreement (“ELA”) between the Fund and the Adviser, the Adviser has agreed, until December 1, 2021, to reduce its investment advisory fees and reimburse other expenses to limit total annual operating expenses (exclusive of brokerage costs; taxes; interest; borrowing costs such as interest and dividends expenses on securities sold short; costs to organize the Fund; acquired fund fees and expenses; and extraordinary
| ADLER VALUE FUND |
| NOTES TO FINANCIAL STATEMENTS (Unaudited) (Continued) |
expenses such as litigation and merger or reorganization costs and other expenses not incurred in the ordinary course of the Fund’s business) to an amount not exceeding 1.25% of the Fund’s average daily net assets of the Institutional Class shares. Accordingly, during the six months ended November 30, 2020, the Adviser did not collect any of its investment advisory fees and reimbursed other operating expenses totaling $80,592.
Under the terms of the ELA, investment advisory fee reductions and expense reimbursements by the Adviser are subject to repayment by the Fund for a period of three years after such fees and expenses were incurred, provided that the repayments do not cause the Fund’s total annual operating expenses to exceed the lesser of (i) the expense limitation then in effect, if any, and (ii) the expense limitation in effect at the time the expenses to be repaid were incurred. As of November 30, 2020, the Adviser may seek recoupment of investment advisory fee reductions and expense reimbursements no later than the dates as stated below:
| July 31, 2022 | | $ | 134,855 | |
| May 31, 2023 | | | 142,930 | |
| November 30, 2023 | | | 89,783 | |
| Total | | $ | 367,568 | |
OTHER SERVICE PROVIDERS
Ultimus Fund Solutions, LLC (“Ultimus”) provides administration, fund accounting, compliance and transfer agency services to the Fund. The Fund pays Ultimus fees in accordance with the agreements for such services. In addition, the Fund pays out-of-pocket expenses including, but not limited to, postage, supplies, and certain costs related to the pricing of the Fund’s portfolio securities.
Under the terms of a Distribution Agreement with the Trust, Ultimus Fund Distributors, LLC (the “Distributor”) serves as principal underwriter to the Fund. The Distributor is a wholly-owned subsidiary of Ultimus. The Distributor is compensated by the Adviser (not the Fund) for acting as principal underwriter.
Certain officers and a Trustee of the Trust are also officers of Ultimus and the Distributor and are not paid by the Fund for serving in such capacities.
TRUSTEE COMPENSATION
Each member of the Board (a “Trustee”) who is not an “interested person” of the Trust (“Independent Trustee”) receives a $1,300 annual retainer from the Fund, paid quarterly, except for the Board Chairperson who receives a $1,500 annual retainer from the Fund, paid quarterly. Each Independent Trustee also receives from the Fund a fee of $500 for each Board meeting attended plus reimbursement for travel and other meeting-related expenses.
| ADLER VALUE FUND |
| NOTES TO FINANCIAL STATEMENTS (Unaudited) (Continued) |
PRINCIPAL HOLDER OF FUND SHARES
As of November 30, 2020, the following shareholder owned of record 25% or more of the outstanding shares of the Fund:
| NAME OF RECORD OWNER | | % Ownership |
| David R. Adler | | 71% |
A beneficial owner of 25% or more of the Fund’s outstanding shares may be considered a controlling person. That shareholder’s vote could have a more significant effect on matters presented at a shareholders’ meeting.
| 5. | Derivative Transactions |
The location on the Statement of Assets and Liabilities of the derivative positions of the Fund are as follows:
| | | | | | | | | | | | | | | Average | |
| | | | | | | | | Fair Value | | | Monthly | |
| | | | | | | | | | | | | | | Notional Value | |
| | | | | | | | | | | | | | | During the | |
| | | | | | | | | | | | | | | Six Months | |
| | | | | | | | | | | | | | | Ended | |
| Type of | | | | | | | | Asset | | | Liability | | | November 30, | |
| Derivative | | | Risk | | | Location | | | Derivatives | | | Derivatives | | | 2020* | |
| Equity call options purchased | | | Equity | | | Investments in securities at value | | | $ | 82,013 | | | $ | — | | | $ | 294,545 | |
| * | The average monthly notional value generally represents the Fund’s derivative activity throughout the six months. |
Realized and unrealized gains and losses associated with transactions in derivative instruments for the Fund during the six months ended November 30, 2020 are recorded in the following locations on the Statement of Operations:
| | | | | | | | | | | | Change in | |
| | | | | | | | | | | | Unrealized | |
| Type of | | | | | | Realized | | | | | Appreciation | |
| Derivative | | Risk | | Location | | Losses | | | Location | | (Depreciation) | |
| Equity call options purchased | | Equity | | Net realized losses on investment transactions | | $ | (1,270 | ) | | Net change in unrealized appreciation (depreciation) on investments | | $ | 28,160 | |
| ADLER VALUE FUND |
| NOTES TO FINANCIAL STATEMENTS (Unaudited) (Continued) |
| 6. | Contingencies and Commitments |
The Fund indemnifies the Trust’s officers and Trustees for certain liabilities that might arise from their performance of their duties to the Fund. Additionally, in the normal course of business, the Fund enters into contracts that contain a variety of representations, warranties, and general indemnifications. The Fund’s maximum exposure under these arrangements is unknown, as this would involve future claims that may be made against the Fund that have not yet occurred. However, based on experience, the Fund expects the risk of loss to be remote.
��
The Fund is required to recognize in the financial statements the effects of all subsequent events that provide additional evidence about conditions that existed as of the date of the Statement of Assets and Liabilities. For non-recognized subsequent events that must be disclosed to keep the financial statements from being misleading, the Fund is required to disclose the nature of the event as well as an estimate of its financial effect, or a statement that such an estimate cannot be made. Management has evaluated subsequent events through the issuance of these financial statements and has noted no such events other than the ordinary income dividend paid on December 28, 2020, as discussed in Note 2.
| ADLER VALUE FUND |
| LIQUIDITY RISK MANAGEMENT PROGRAM (Unaudited) |
The Fund has adopted and implemented a written liquidity risk management program (the “Program”) as required by Rule 22e-4 (the “Liquidity Rule”) under the Investment Company Act of 1940, as amended. The Program is reasonably designed to assess and manage the Fund’s liquidity risk, taking into consideration, among other factors, the Fund’s investment strategy and the liquidity of its portfolio investments during normal and reasonably foreseeable stressed conditions; its short- and long-term cash flow projections; and its cash holdings and access to other funding sources. The Fund’s Board of Trustees (the “Board”) approved the appointment of the Liquidity Administrator Committee, comprising of the Fund’s Adviser and certain Trust officers, to be responsible for the Program’s administration and oversight and for reporting to the Board on at least an annual basis regarding the Program’s operation and effectiveness. The annual written report assessing the Program (the “Report”) was presented to the Board at the October 19-20, 2020 Board meeting and covered the period from June 1, 2019 to May 31, 2020 (the “Review Period”).
During the Review Period, the Fund did not experience unusual stress or disruption to its operations related to purchase and redemption activity. Also, during the Review Period, the Fund held adequate levels of cash and highly liquid investments to meet shareholder redemption activities in accordance with applicable requirements. The Report concluded that the Program is reasonably designed to prevent violation of the Liquidity Rule and the Program has been effectively implemented.
| ADLER VALUE FUND |
| ABOUT YOUR FUND’S EXPENSES (Unaudited) |
We believe it is important for you to understand the impact of costs on your investment. As a shareholder of the Fund, you incur ongoing costs, including management fees and other operating expenses. The following examples are intended to help you understand your ongoing costs (in dollars) of investing in the Fund and to compare these costs with the ongoing costs of investing in other mutual funds.
A mutual fund’s ongoing costs are expressed as a percentage of its average net assets. This figure is known as the expense ratio. The expenses in the table below are based on an investment of $1,000 made at the beginning of the most recent period (June 1, 2020) and held until the end of the period (November 30, 2020).
The table below illustrates the Fund’s ongoing costs in two ways:
Actual fund return – This section helps you to estimate the actual expenses that you paid over the period. The “Ending Account Value” shown is derived from the Fund’s actual return, and the fourth column shows the dollar amount of operating expenses that would have been paid by an investor who started with $1,000 in the Fund. You may use the information here, together with the amount you invested, to estimate the expenses that you paid over the period.
To do so, simply divide your account value by $1,000 (for example, an $8,600 account value divided by $1,000 = 8.6), then multiply the result by the number given for the Fund under the heading “Expenses Paid During Period.”
Hypothetical 5% return – This section is intended to help you compare the Fund’s ongoing costs with those of other mutual funds. It assumes that the Fund had an annual return of 5% before expenses during the period shown, but that the expense ratio is unchanged. In this case, because the return used is not the Fund’s actual return, the results do not apply to your investment. The example is useful in making comparisons because the U.S. Securities and Exchange Commission (the “SEC”) requires all mutual funds to calculate expenses based on a 5% return. You can assess the Fund’s ongoing costs by comparing this hypothetical example with the hypothetical examples that appear in shareholder reports of other funds.
Note that expenses shown in the table are meant to highlight and help you compare ongoing costs only. The Fund does not charge sales loads.
The calculations assume no shares were bought or sold during the period. Your actual costs may have been higher or lower, depending on the amount of your investment and the timing of any purchases or redemptions.
More information about the Fund’s expenses can be found in this report. For additional information on operating expenses and other shareholder costs, please refer to the Fund’s prospectus.
| ADLER VALUE FUND |
| ABOUT YOUR FUND’S EXPENSES (Unaudited) (Continued) |
| | | Beginning | | Ending | | | | |
| | | Account Value | | Account Value | | | | Expenses |
| | | June 1, | | November 30, | | Net Expense | | Paid During |
| Institutional Class | | 2020 | | 2020 | | Ratio(a) | | Period(b) |
| Based on Actual Fund Return | | $1,000.00 | | $1,240.20 | | 1.25% | | $7.00 |
| Based on Hypothetical 5%Return (before expenses) | | $1,000.00 | | $1,018.75 | | 1.25% | | $6.31 |
| (a) | Annualized, based on the Fund’s most recent one-half year expenses. |
| (b) | Expenses are equal to the Fund’s annualized net expense ratio multiplied by the average account value over the period, multiplied by 183/366 (to reflect the one-half year period). |
| ADLER VALUE FUND |
| OTHER INFORMATION (Unaudited) |
A description of the policies and procedures that the Fund uses to vote proxies relating to portfolio securities is available without charge upon request by calling 1-800-408-4682, or on the SEC’s website at www.sec.gov. Information regarding how the Fund voted proxies relating to portfolio securities during the most recent 12-month period ended June 30 is also available without charge upon request by calling 1-800-408-4682, or on the SEC’s website at www.sec.gov.
The Trust files a complete listing of portfolio holdings for the Fund with the SEC as of the end of the first and third quarters of each fiscal year as an exhibit to its reports on Form N-PORT. These filings are available upon request by calling 1-800-408-4682. Furthermore, you may obtain a copy of the filings on the SEC’s website at www.sec.gov.
| ADLER VALUE FUND |
| CUSTOMER PRIVACY NOTICE |
| FACTS | WHAT DOES THE ADLER VALUE FUND (the “Fund”) DO WITH YOUR PERSONAL INFORMATION? |
| | |
| Why? | Financial companies choose how they share your personal information. Federal law gives consumers the right to limit some but not all sharing. Federal law also requires us to tell you how we collect, share, and protect your personal information. Please read this notice carefully to understand what we do. |
| | |
| What? | The types of personal information we collect and share depend on the product or service you have with us. This information can include: ■ Social Security number ■ Assets ■ Retirement Assets ■ Transaction History ■ Checking Account Information ■ Purchase History ■ Account Balances ■ Account Transactions ■ Wire Transfer Instructions When you are no longer our customer, we continue to share your information as described in this notice. |
| | |
| How? | All financial companies need to share your personal information to run their everyday business. In the section below, we list the reasons financial companies can share their customers’ personal information; the reasons the Fund chooses to share; and whether you can limit this sharing. |
| Reasons we can share your personal information | Does the
Fund share? | Can you limit
this sharing? |
For our everyday business purposes – Such as to process your transactions, maintain your account(s), respond to court orders and legal investigations, or report to credit bureaus | Yes | No |
For our marketing purposes – to offer our products and services to you | No | We don’t share |
| For joint marketing with other financial companies | No | We don’t share |
For our affiliates’ everyday business purposes – information about your transactions and experiences | No | We don’t share |
For our affiliates’ everyday business purposes – information about your creditworthiness | No | We don’t share |
| For nonaffiliates to market to you | No | We don’t share |
| | | | |
| Questions? | Call 1-800-408-4682 |
| ADLER VALUE FUND |
| CUSTOMER PRIVACY NOTICE (Continued) |
| Who we are |
| Who is providing this notice? | Adler Value Fund Ultimus Fund Distributors, LLC (Distributor) Ultimus Fund Solutions, LLC (Administrator) |
| What we do |
| How does the Fund protect my personal information? | To protect your personal information from unauthorized access and use, we use security measures that comply with federal law. These measures include computer safeguards and secured files and buildings. Our service providers are held accountable for adhering to strict policies and procedures to prevent any misuse of your nonpublic personal information. |
| How does the Fund collect my personal information? | We collect your personal information, for example, when you ■ Open an account ■ Provide account information ■ Give us your contact information ■ Make deposits or withdrawals from your account ■ Make a wire transfer ■ Tell us where to send the money ■ Tell us who receives the money ■ Show your government-issued ID ■ Show your driver’s license We also collect your personal information from other companies. |
| Why can’t I limit all sharing? | Federal law gives you the right to limit only ■ Sharing for affiliates’ everyday business purposes – information about your creditworthiness ■ Affiliates from using your information to market to you ■ Sharing for nonaffiliates to market to you State laws and individual companies may give you additional rights to limit sharing. |
| | |
| Definitions |
| Affiliates | Companies related by common ownership or control. They can be financial and nonfinancial companies. ■ Adler Asset Management, LLC, the investment adviser to the Fund, could be deemed to be an affiliate. |
| Nonaffiliates | Companies not related by common ownership or control. They can be financial and nonfinancial companies ■ The Fund does not share with nonaffiliates so they can market to you. |
| Joint marketing | A formal agreement between nonaffiliated financial companies that together market financial products or services to you. ■ The Fund does not jointly market. |
This page intentionally left blank.
ADLER-SAR-20
| |
| |
| |
| |
| |
| |
| |
| |
| |
| |
 |
| |
| |
| |
| |
| |
| EVOLUTIONARY TREE INNOVATORS FUND |
| |
| (INVNX) |
| |
| Semi-Annual Report |
| |
| November 30, 2020 |
| |
| (Unaudited) |
| |
| |
| |
| |
| |
| |
| |
| |
| |
| |
| |
| |
| |
| |
| |
| |
| |
| |
| |
| |
| |
| |
| |
| |
| |
| |
| |
| |
| |
| |
| EVOLUTIONARY TREE INNOVATORS FUND | |
| LETTER TO SHAREHOLDERS (Unaudited) | November 30, 2020 |
| | |
Dear Fellow Shareholders,
Given this is our first letter, we welcome you as a new shareholder to the Evolutionary Tree Innovators Fund (the “Fund”). We will touch on our investment approach, why we focus on innovation and not the markets, and conclude by providing a brief performance update. We are pleased that the Fund is off to a strong start in 2020.
How Our Approach Enables Investors to Benefit from the Power of Innovation
Everyone senses the power of innovation in their lives but struggles to find appropriate ways to invest in innovative businesses driving change. The Evolutionary Tree Innovators Fund was launched to provide an attractive pathway for investing in profound innovation and secular trends, or evolutionary shifts as we call them. The Fund and its adviser apply an innovation and evolution-focused framework to investing. We believe the development of innovation and its resultant pattern of evolutionary change is the primary engine of growth for companies, industries, and the economy—and, in turn, is the underlying driver of long-term wealth creation.
The Fund seeks to identify important innovations that are driving secular growth and evolutionary shifts for companies, industries, and the economy, and own the leading innovators at the forefront. The Fund defines evolutionary shift as when an industry shifts from an old generation (of a product, service, or business model) over to a “next generation” or new offering that provides advantages versus the “old way” of doing things. The Fund invests in a focused portfolio of 25-35 leading innovative businesses.
Innovations that drive these evolutionary shifts come in many forms and can be found in all industries and sectors across the economy. Examples of innovations that we believe contribute to sustainable growth include technological innovation, product innovation, service or experience innovation, process or cost innovation, and/or business model innovation. In addition to contributing to sustaining growth for leading innovative businesses, new innovations may also enable innovators to take market share, create competitive advantage, and/or enhance profitability over time. Taken together, we believe that innovation is a fundamental root cause and driver of sustainable growth and value creation over time.
Why We Focus on Innovation, Not on Short-term Movements in the Markets or the Economy
The Evolutionary Tree Innovators Fund is meant for investors that are seeking capital appreciation over the long term. We define long term as sticking with your investments for many years. In the context of this long-term investing mindset, we believe that trying to predict short-term movements in the economy or the markets is largely futile and often counter-productive. As such, we believe shifting the focus toward identifying specific innovations creating positive impact for users and sustaining growth is a more repeatable process for adding value. Focus on innovation and ignore the short-term market chatter.
Looking at investing from an innovation-focused vantage-point, we strongly believe the current economic environment is highly conducive to a steady stream of important and profound innovations across the economy, particularly with industry after industry becoming tech-enabled through digital transformation. We describe the current era we live in as the Age of Innovation. It is the Fund’s mission to own a high-quality collection of leading and emerging innovators that may benefit from these dynamics. Our increasingly intellectual capital-based economy is generating a growing number of innovative businesses in a variety of industries, most notably in technology, life sciences, fintech, and digital consumer spaces.
Investment Results and Contributors and Detractors to Performance
Evolutionary Tree Innovators Fund (INVNX) launched in early September 2020, so the investment results are very short term. The Fund is a long-term focused strategy with a time horizon that is measured in years (typically 3-7 years). As such, short-term performance is less meaningful than long-term results. However, we are pleased to report that the Fund is off to a good start, with strong absolute and relative investment results to date. The Fund was up +24.40% from the launch date through the end of November. This compares favorably to the benchmark S&P 500, which was up +6.95% over the same time period.
The top three contributors to performance in the period were HubSpot, Roku, and The Trade Desk. Contributors were generally companies providing cloud-based enterprise applications or digital consumer experiences and e-commerce services, which have benefited from the shifts to the cloud and e-commerce. The top three detractors were Revance, Ionis, and Dexcom. The primary detractors were life science companies, but we do not believe a change in administration will alter their long-term prospects. Both political parties tend to support healthcare innovation, especially for diseases with few or no alternatives, where we tend to focus our investments.
During 2020 and for the time period represented by these results, the investment environment has been quite positive for innovative businesses. We believe this dynamic is not a short-term one, but indicative of how the composition of the economy is changing—evolving—over long term. Many of the evolutionary shifts we identified and made prominent in the portfolio, including leading innovators in the fields of e-commerce, video streaming, cloud computing, and cybersecurity, among others, experienced acceleration due to the lockdowns throughout the year. However, we do not see these trends as temporary; rather, we believe these evolutionary shifts and associated changes in behavior are becoming permanent with years of growth runway ahead. We believe the portfolio is well positioned for the long term and owns a select group of leading and emerging innovators driving many of the most prominent secular changes in the economy.
Thanks for joining the growing community of investors embracing innovation investing and the Evolutionary Tree Innovators Fund. We wish you all the best in the New Year,
Thomas Ricketts, CFA
Portfolio Manager
Past performance is not predictive of future performance. Investment results and principal value will fluctuate so that shares, when redeemed, may be worth more or less than their original cost. Current performance may be higher or lower than performance data quoted. An investor should consider the investment objectives, risks, charges and expenses of the Fund carefully before investing. The Fund’s prospectus contains this and other important information. To obtain a copy of the Fund’s prospectus please call 1-833-517-1010 and a copy can be sent to you free of charge. Please read the prospectus carefully before you invest. The Fund is distributed by Ultimus Fund Distributors, LLC.
The Letter to Shareholders seeks to describe some of the Adviser’s current opinions and views of the financial markets and specific holdings. Although the Adviser believes it has a reasonable basis for any opinions or views expressed, actual results may differ, sometimes significantly so, from those expected or expressed. The securities held by the Fund that are discussed in the Letter to Shareholders were held during the period covered by this Report. They do not comprise the entire investment portfolio of the Fund, may be sold at any time, and may no longer be held by the Fund. For a complete list of securities held by the Fund as of November 30, 2020, please see the Schedule of Investments section of this Report. The opinions of the Fund’s Adviser with respect to those securities may change at any time.
Statements in the Letter to Shareholders that reflect projections or expectations for future financial or economic performance of the Fund and the market in general and statements of the Fund’s plans and objectives for future operations are forward-looking statements. No assurance can be given that actual results or events will not differ materially from those projected, estimated, assumed, or anticipated in any such forward- looking statements. Important factors that could result in such differences, in addition to factors noted with such forward-looking statements include, without limitation, general economic conditions, such as inflation, recession, and interest rates. Past performance is not a guarantee of future results.
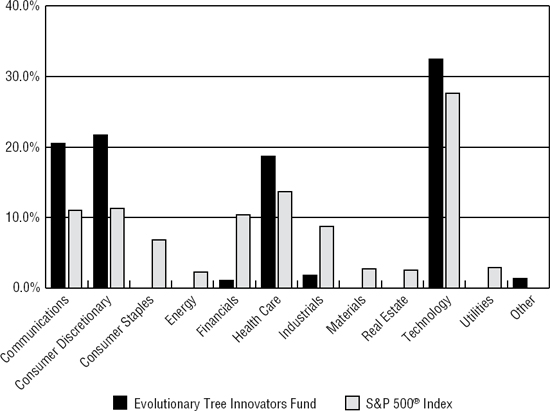
| EVOLUTIONARY TREE INNOVATORS FUND |
| PORTFOLIO INFORMATION |
| November 30, 2020 (Unaudited) |
| |
Sector Diversification (% of Net Assets)
| Top 10 Equity Holdings |
| | | % of |
| Security Description | | Net Assets |
| HubSpot, Inc. | | 7.7% |
| Zscaler, Inc. | | 6.0% |
| Sea Ltd. - ADR | | 5.8% |
| Amazon.com, Inc. | | 5.2% |
| Peloton Interactive, Inc. - Class A | | 4.6% |
| ServiceNow, Inc. | | 4.5% |
| Pinterest, Inc. - Class A | | 4.4% |
| Roku, Inc. | | 4.3% |
| Elastic N.V. | | 3.7% |
| DraftKings, Inc. - Class A | | 3.6% |
| EVOLUTIONARY TREE INNOVATORS FUND |
| SCHEDULE OF INVESTMENTS |
| November 30, 2020 (Unaudited) |
| COMMON STOCKS — 98.5% | | Shares | | | Value | |
| Communications — 20.5% | | | | | | | | |
| Communication Services — 2.9% | | | | | | | | |
| Twilio, Inc. - Class A (a) | | | 2,107 | | | $ | 674,430 | |
| | | | | | | | | |
| Digital Media — 10.1% | | | | | | | | |
| Facebook, Inc. - Class A (a) | | | 2,013 | | | | 557,541 | |
| Pinterest, Inc. - Class A (a) | | | 14,890 | | | | 1,042,598 | |
| Trade Desk, Inc. (The) - Class A (a) | | | 883 | | | | 795,645 | |
| | | | | | | | 2,395,784 | |
| Streaming Video — 7.5% | | | | | | | | |
| Netflix, Inc. (a) | | | 1,498 | | | | 735,068 | |
| Roku, Inc. (a) | | | 3,495 | | | | 1,026,027 | |
| | | | | | | | 1,761,095 | |
| Consumer Discretionary — 21.7% | | | | | | | | |
| Consumer Leisure — 4.6% | | | | | | | | |
| Peloton Interactive, Inc. - Class A (a) | | | 9,410 | | | | 1,094,854 | |
| | | | | | | | | |
| Digital Gaming — 3.6% | | | | | | | | |
| DraftKings, Inc. - Class A (a) | | | 16,047 | | | | 840,221 | |
| | | | | | | | | |
| E-Commerce — 13.5% | | | | | | | | |
| Amazon.com, Inc. (a) | | | 389 | | | | 1,232,367 | |
| Etsy, Inc. (a) | | | 3,608 | | | | 579,806 | |
| Sea Ltd. - ADR (a) | | | 7,596 | | | | 1,370,090 | |
| | | | | | | | 3,182,263 | |
| Financials — 3.3% | | | | | | | | |
| Financial Services — 3.3% | | | | | | | | |
| PayPal Holdings, Inc. (a) | | | 2,378 | | | | 509,178 | |
| Tradeweb Markets, Inc. - Class A | | | 4,456 | | | | 265,800 | |
| | | | | | | | 774,978 | |
| Health Care — 18.7% | | | | | | | | |
| Biotechnology — 14.4% | | | | | | | | |
| Alnylam Pharmaceuticals, Inc. (a) | | | 5,697 | | | | 740,097 | |
| argenx SE-ADR (a) | | | 1,773 | | | | 508,532 | |
| Arrowhead Pharmaceuticals, Inc. (a) | | | 9,989 | | | | 624,612 | |
| Dicerna Pharmaceuticals, Inc. (a) | | | 12,684 | | | | 320,525 | |
| Ionis Pharmaceuticals, Inc. (a) | | | 7,704 | | | | 389,283 | |
| Sarepta Therapeutics, Inc. (a) | | | 5,787 | | | | 815,157 | |
| | | | | | | | 3,398,206 | |
| EVOLUTIONARY TREE INNOVATORS FUND |
| SCHEDULE OF INVESTMENTS (Continued) |
| COMMON STOCKS — 98.5% (Continued) | | Shares | | | Value | |
| Health Care — 18.7% (Continued) | | | | | | | | |
| Medical Technology — 0.8% | | | | | | | | |
| DexCom, Inc. (a) | | | 603 | | | $ | 192,767 | |
| | | | | | | | | |
| Pharmaceuticals — 3.5% | | | | | | | | |
| Ascendis Pharma A/S - ADR (a) | | | 2,243 | | | | 378,461 | |
| Revance Therapeutics, Inc. (a) | | | 18,014 | | | | 434,858 | |
| | | | | | | | 813,319 | |
| Industrials — 1.8% | | | | | | | | |
| Transportation Services — 1.8% | | | | | | | | |
| Uber Technologies, Inc. (a) | | | 8,686 | | | | 431,347 | |
| | | | | | | | | |
| Technology — 32.5% | | | | | | | | |
| Application Software — 17.7% | | | | | | | | |
| Coupa Software, Inc. (a) | | | 2,500 | | | | 822,275 | |
| HubSpot, Inc. (a) | | | 4,620 | | | | 1,821,805 | |
| ServiceNow, Inc. (a) | | | 2,007 | | | | 1,072,842 | |
| Workday, Inc. - Class A (a) | | | 2,088 | | | | 469,361 | |
| | | | | | | | 4,186,283 | |
| Business Services — 1.3% | | | | | | | | |
| Avalara, Inc. (a) | | | 1,793 | | | | 307,948 | |
| | | | | | | | | |
| Data & Analytics — 5.7% | | | | | | | | |
| Elastic N.V. (a) | | | 6,983 | | | | 864,495 | |
| MongoDB, Inc. (a) | | | 1,702 | | | | 489,002 | |
| | | | | | | | 1,353,497 | |
| IT Security — 7.8% | | | | | | | | |
| CrowdStrike Holdings, Inc. - Class A (a) | | | 2,737 | | | | 419,527 | |
| Zscaler, Inc. (a) | | | 9,167 | | | | 1,427,760 | |
| | | | | | | | 1,847,287 | |
| | | | | | | | | |
| Total Common Stocks (Cost $20,468,626) | | | | | | $ | 23,254,279 | |
| EVOLUTIONARY TREE INNOVATORS FUND |
| SCHEDULE OF INVESTMENTS (Continued) |
| MONEY MARKET FUNDS — 1.4% | | Shares | | | Value | |
| First American Treasury Obligations Fund - Class X, 0.05% (b) (Cost $316,840) | | | 316,840 | | | $ | 316,840 | |
| | | | | | | | | |
| Investments at Value — 99.9% (Cost $20,785,466) | | | | | | $ | 23,571,119 | |
| | | | | | | | | |
| Other Assets in Excess of Liabilities — 0.1% | | | | | | | 29,955 | |
| | | | | | | | | |
| Net Assets — 100.0% | | | | | | $ | 23,601,074 | |
ADR - American Depositary Receipt.
| (a) | Non-income producing security. |
| (b) | The rate shown is the 7-day effective yield as of November 30, 2020. |
See accompanying notes to financial statements.
| EVOLUTIONARY TREE INNOVATORS FUND |
| STATEMENT OF ASSETS AND LIABILITIES |
| November 30, 2020 (Unaudited) |
| ASSETS | | | | |
| Investments in securities: | | | | |
| At cost | | $ | 20,785,466 | |
| At value (Note 2) | | $ | 23,571,119 | |
| Receivable for capital shares sold | | | 11,800 | |
| Receivable from Adviser (Note 4) | | | 6,811 | |
| Dividends receivable | | | 374 | |
| Other assets | | | 28,440 | |
| Total assets | | | 23,618,544 | |
| | | | | |
| LIABILITIES | | | | |
| Payable to administrator (Note 4) | | | 7,180 | |
| Other accrued expenses | | | 10,290 | |
| Total liabilities | | | 17,470 | |
| | | | | |
| NET ASSETS | | $ | 23,601,074 | |
| | | | | |
| NET ASSETS CONSIST OF: | | | | |
| Paid-in capital | | $ | 20,835,258 | |
| Accumulated earnings | | | 2,765,816 | |
| NET ASSETS | | $ | 23,601,074 | |
| | | | | |
| Shares of beneficial interest outstanding (unlimited number of shares authorized, no par value) | | | 948,461 | |
| Net asset value, offering and redemption price per share (Note 2) | | $ | 24.88 | |
See accompanying notes to financial statements.
| EVOLUTIONARY TREE INNOVATORS FUND |
| STATEMENT OF OPERATIONS |
| For the Period Ended November 30, 2020 (a) (Unaudited) |
| INVESTMENT INCOME | | | | |
| Dividends | | $ | 429 | |
| Foreign withholding tax on dividends | | | (1 | ) |
| Total investment income | | | 428 | |
| | | | | |
| EXPENSES | | | | |
| Management fees (Note 4) | | | 16,327 | |
| Legal fees | | | 8,993 | |
| Registration and filing fees | | | 8,509 | |
| Trustees’ fees (Note 4) | | | 6,675 | |
| Fund accounting fees (Note 4) | | | 5,679 | |
| Administration fees (Note 4) | | | 5,467 | |
| Compliance fees (Note 4) | | | 2,733 | |
| Transfer agent fees (Note 4) | | | 2,733 | |
| Custodian and bank service fees | | | 1,857 | |
| Printing of shareholder reports | | | 1,220 | |
| Postage and supplies | | | 356 | |
| Other expenses | | | 2,535 | |
| Total expenses | | | 63,084 | |
| Less fee reductions and expense reimbursements by the Adviser (Note 4) | | | (43,287 | ) |
| Net expenses | | | 19,797 | |
| | | | | |
| NET INVESTMENT LOSS | | | (19,369 | ) |
| | | | | |
| REALIZED AND UNREALIZED GAINS (LOSSES) ON INVESTMENTS | | | | |
| Net realized losses on investments transactions | | | (468 | ) |
| Net change in unrealized appreciation (depreciation) on investments | | | 2,785,653 | |
| NET REALIZED AND UNREALIZED GAINS ON INVESTMENTS | | | 2,785,185 | |
| | | | | |
| NET INCREASE IN NET ASSETS RESULTING FROM OPERATIONS | | $ | 2,765,816 | |
| (a) | Represents the period from the commencement of operations (September 9, 2020) through November 30, 2020. |
See accompanying notes to financial statements.
| EVOLUTIONARY TREE INNOVATORS FUND |
| STATEMENT OF CHANGES IN NET ASSETS |
| | | Period Ended | |
| | | November 30, | |
| | | 2020 (a) | |
| | | (Unaudited) | |
| FROM OPERATIONS | | | | |
| Net investment loss | | $ | (19,369 | ) |
| Net realized losses from investment transactions | | | (468 | ) |
| Net change in unrealized appreciation (depreciation) on investments | | | 2,785,653 | |
| Net increase in net assets resulting from operations | | | 2,765,816 | |
| | | | | |
| FROM CAPITAL SHARE TRANSACTIONS | | | | |
| Proceeds from shares sold | | | 20,859,227 | |
| Payments for shares redeemed | | | (23,969 | ) |
| Net increase in net assets from capital share transactions | | | 20,835,258 | |
| | | | | |
| TOTAL INCREASE IN NET ASSETS | | | 23,601,074 | |
| | | | | |
| NET ASSETS | | | | |
| Beginning of period | | | — | |
| End of period | | $ | 23,601,074 | |
| | | | | |
| CAPITAL SHARES ACTIVITY | | | | |
| Shares sold | | | 949,486 | |
| Shares redeemed | | | (1,025 | ) |
| Net increase in shares outstanding | | | 948,461 | |
| Shares outstanding, beginning of period | | | — | |
| Shares outstanding, end of period | | | 948,461 | |
| (a) | Represents the period from the commencement of operations (September 9, 2020) through November 30, 2020. |
See accompanying notes to financial statements.
| EVOLUTIONARY TREE INNOVATORS FUND |
| FINANCIAL HIGHLIGHTS |
| |
| Per Share Data for a Share Outstanding Throughout the Period |
| | | Period Ended | |
| | | November 30, | |
| | | 2020 (a) | |
| | | (Unaudited) | |
| Net asset value at beginning of period | | $ | 20.00 | |
| | | | | |
| Income (loss) from investment operations: | | | | |
| Net investment loss | | | (0.05 | ) |
| Net realized and unrealized gains on investments | | | 4.93 | |
| Total from investment operations | | | 4.88 | |
| | | | | |
| Net asset value at end of period | | $ | 24.88 | |
| | | | | |
| Total return (b) | | | 24.40 | % (c) |
| | | | | |
| Net assets at end of period (000’s) | | $ | 23,601 | |
| | | | | |
| Ratios/supplementary data: | | | | |
| Ratio of total expenses to average net assets | | | 3.09 | % (d) |
| Ratio of net expenses to average net assets (e) | | | 0.97 | % (d) |
| Ratio of net investment loss to average net assets (e) | | | (0.95 | )% (d) |
| Portfolio turnover rate | | | 1 | % (c) |
| (a) | Represents the period from the commencement of operations (September 9, 2020) through November 30, 2020. |
| (b) | Total return is a measure of the change in value of an investment in the Fund over the period covered. The return shown does not reflect the deduction of taxes a shareholder would pay on Fund distributions, if any, or the redemption of Fund shares. The total return would have been lower if the Adviser had not reduced fees and reimbursed expenses (Note 4). |
| (e) | Ratio was determined after advisory fee reductions and expense reimbursements (Note 4). |
See accompanying notes to financial statements.
| EVOLUTIONARY TREE INNOVATORS FUND |
| NOTES TO FINANCIAL STATEMENTS |
| November 30, 2020 (Unaudited) |
Evolutionary Tree Innovators Fund (the “Fund”) is a non-diversified series of Ultimus Managers Trust (the “Trust”). The Trust is an open-end management investment company established as an Ohio business trust under a Declaration of Trust dated February 28, 2012. Other series of the Trust are not incorporated in this report. The Fund commenced operations on September 9, 2020.
The investment objective of the Fund is to seek to achieve long-term growth of capital.
| 2. | Significant Accounting Policies |
The Fund follows accounting and reporting guidance under Financial Accounting Standards Board Accounting Standards Codification Topic 946, “Financial Services – Investment Companies.” The following is a summary of the Fund’s significant accounting policies used in the preparation of its financial statements. These policies are in conformity with accounting principles generally accepted in the United States of America (“GAAP”).
Securities valuation – The Fund values its portfolio securities at market value as of the close of regular trading on the New York Stock Exchange (the “NYSE”) (normally 4:00 p.m. Eastern time) on each business day the NYSE is open for business. The Fund values its listed securities on the basis of the security’s last sale price on the security’s primary exchange, if available, otherwise at the exchange’s most recently quoted mean price. NASDAQ-listed securities are valued at the NASDAQ Official Closing Price. When using a quoted price and when the market for the security is considered active, the security will be classified as Level 1 within the fair value hierarchy (see below). In the event that market quotations are not readily available or are considered unreliable due to market or other events, the Fund values its securities and other assets at fair value in accordance with procedures established by and under the general supervision of the Board of Trustees (the “Board”). Under these procedures, the securities will be classified as Level 2 or 3 within the fair value hierarchy, depending on the inputs used. Unavailable or unreliable market quotes may be due to the following factors: a substantial bid-ask spread; infrequent sales resulting in stale prices; insufficient trading volume; small trade sizes; a temporary lapse in any reliable pricing source; and actions of the securities or futures markets, such as the suspension or limitation of trading. As a result, the prices of securities used to calculate the Fund’s net asset value (“NAV”) may differ from quoted or published prices for the same securities.
GAAP establishes a single authoritative definition of fair value, sets out a framework for measuring fair value, and requires additional disclosures about fair value measurements.
Various inputs are used in determining the value of the Fund’s investments. These inputs are summarized in the three broad levels listed below:
| ● | Level 1 – quoted prices in active markets for identical securities |
| EVOLUTIONARY TREE INNOVATORS FUND |
| NOTES TO FINANCIAL STATEMENTS (Continued) |
| ● | Level 2 – other significant observable inputs |
| ● | Level 3 – significant unobservable inputs |
The inputs or methods used for valuing securities are not necessarily an indication of the risks associated with investing in those securities. The inputs used to measure fair value may fall into different levels of the fair value hierarchy. In such cases, for disclosure purposes, the level in the fair value hierarchy within which the fair value measurement falls in its entirety is determined based on the lowest level input that is significant to the fair value measurement.
The following is a summary of the Fund’s investments based on the inputs used to value the investments as of November 30, 2020, by security type:
| | | Level 1 | | | Level 2 | | | Level 3 | | | Total | |
| Common Stocks | | $ | 23,254,279 | | | $ | — | | | $ | — | | | $ | 23,254,279 | |
| Money Market Funds | | | 316,840 | | | | — | | | | — | | | | 316,840 | |
| Total | | $ | 23,571,119 | | | $ | — | | | $ | — | | | $ | 23,571,119 | |
Refer to the Fund’s Schedule of Investments for a listing of the common stocks by sector and industry type. The Fund did not hold any derivative instruments or any assets or liabilities that were measured at fair value on a recurring basis using significant unobservable inputs (Level 3) as of or during the period ended November 30, 2020.
Share valuation – The NAV per share of the Fund is calculated daily by dividing the total value of the Fund’s assets, less liabilities, by the number of shares outstanding. The offering price and redemption price per share of the Fund is equal to the NAV per share.
Investment income – Dividend income is recorded on the ex-dividend date. Non-cash dividends included in dividend income, if any, are recorded at the fair market value of the security received. Interest income is accrued as earned. Withholding taxes on foreign dividends have been recorded in accordance with the Fund’s understanding of the applicable country’s tax rules and rates.
Investment transactions – Investment transactions are accounted for on the trade date. Realized gains and losses on investments sold are determined on a specific identification basis.
Common expenses – Common expenses of the Trust are allocated among the Fund and the other series of the Trust based on the relative net assets of each series, the number of series in the Trust, or the nature of the services performed and the relative applicability to each series.
Distributions to shareholders – The Fund distributes to shareholders any net investment income dividends and net realized capital gains on an annual basis. The amount of such dividends and distributions are determined in accordance with federal income tax
| EVOLUTIONARY TREE INNOVATORS FUND |
| NOTES TO FINANCIAL STATEMENTS (Continued) |
regulations, which may differ from GAAP. Dividends and distributions to shareholders are recorded on the ex-dividend date. There were no distributions paid to shareholders by the Fund during the period ended November 30, 2020.
Estimates – The preparation of financial statements in conformity with GAAP requires management to make estimates and assumptions that affect the reported amounts of assets and liabilities and disclosure of contingent assets and liabilities as of the date of the financial statements and the reported amounts of increase (decrease) in net assets from operations during the reporting period. Actual results could differ from those estimates.
Federal income tax – The Fund intends to qualify as a regulated investment company under the Internal Revenue Code of 1986, as amended (the “Code”). Qualification generally will relieve the Fund of liability for federal income taxes to the extent 100% of its net investment income and net realized capital gains are distributed in accordance with the Code.
In order to avoid imposition of the excise tax applicable to regulated investment companies, it is also the Fund’s intention to declare as dividends in each calendar year equal to at least 98% of its net investment income (earned during the calendar year) and 98.2% of its net realized capital gains (earned during the twelve months ended October 31) plus undistributed amounts from prior years.
The following information is computed on a tax basis for each item as of November 30, 2020:
| Tax cost of portfolio investments | | $ | 20,785,739 | |
| Gross unrealized appreciation | | $ | 2,914,512 | |
| Gross unrealized depreciation | | | (129,132 | ) |
| Net unrealized appreciation | | | 2,785,380 | |
| Accumulated ordinary loss | | | (19,369 | ) |
| Other losses | | | (195 | ) |
| Accumulated earnings | | $ | 2,765,816 | |
The difference between the federal income tax cost of portfolio investments and the financial statement cost of portfolio investments is due to certain timing differences in the recognition of capital gains or losses under income tax regulations and GAAP. These “book/tax” differences are temporary in nature and are primarily due to the tax deferral of losses on wash sales.
The Fund recognizes the tax benefits or expenses of uncertain tax positions only when the position is “more likely than not” of being sustained assuming examination by tax authorities. Management has reviewed the Fund’s tax positions for the current tax year and has concluded that no provision for unrecognized tax benefits or expenses is required in these financial statements. The Fund identifies its major tax jurisdiction as U.S. Federal.
| EVOLUTIONARY TREE INNOVATORS FUND |
| NOTES TO FINANCIAL STATEMENTS (Continued) |
| 3. | Investment Transactions |
During the period ended November 30, 2020, cost of purchases and proceeds from sales of investment securities, other than short-term investments, amounted to $20,504,772 and $35,678, respectively.
| 4. | Transactions with Related Parties |
INVESTMENT ADVISORY AGREEMENT
The Fund’s investments are managed by Evolutionary Tree Capital Management, LLC (the “Adviser”) pursuant to the terms of an Investment Advisory Agreement. The Fund pays the Adviser a management fee, computed and accrued daily and paid monthly, at the annual rate of 0.80% of average daily net assets.
Pursuant to an Expense Limitation Agreement (“ELA”) between the Fund and the Adviser, the Adviser has agreed contractually, until October 31, 2023, to reduce its management fees and reimburse other expenses to the extent necessary to limit total annual fund operating expenses (exclusive brokerage costs, taxes, interest, borrowing costs such as interest and dividend expenses on securities sold short, costs to organize the Fund, acquired fund fees and expenses, extraordinary expenses such as litigation and merger or reorganization costs and other expenses not incurred in the ordinary course of the Fund’s business) to an amount not exceeding 0.97% of the Fund’s average daily net assets. Accordingly, the Adviser did not collect any of its management fees and, in addition, reimbursed other operating expenses totaling $26,960 during the period ended November 30, 2020.
Under the terms of the ELA, management fee reductions and/or expense reimbursements by the Adviser are subject to repayment by the Fund for a period of three years after such date that fees and expenses were incurred, provided that the repayments do not cause total annual fund operating expenses to exceed (i) the expense limitation then in effect, if any, and (ii) the expense limitation in effect at the time the expenses to be repaid were incurred. Prior to October 31, 2023, this agreement may not be modified or terminated without the approval of the Fund’s Board of Trustees. This agreement will terminate automatically if the Fund’s investment advisory agreement with the Adviser is terminated. As of November 30, 2020, the Adviser may seek repayment of management fee reductions and expense reimbursements in the amount of $43,287 no later than November 30, 2023.
OTHER SERVICE PROVIDERS
Ultimus Fund Solutions, LLC (“Ultimus”) provides administration, fund accounting, compliance and transfer agency services to the Fund. The Fund pays Ultimus fees in accordance with the agreements for such services. In addition, the Fund pays out-of-pocket expenses including, but not limited to, postage, supplies and certain costs related to the pricing of the Fund’s portfolio securities.
| EVOLUTIONARY TREE INNOVATORS FUND |
| NOTES TO FINANCIAL STATEMENTS (Continued) |
Under the terms of a Distribution Agreement with the Trust, Ultimus Fund Distributors, LLC (the “Distributor”) serves as principal underwriter to the Fund. The Distributor is a wholly-owned subsidiary of Ultimus. The Distributor is compensated by the Adviser (not the Fund) for acting as principal underwriter.
Certain officers and a Trustee of the Trust are also officers of Ultimus and the Distributor.
TRUSTEE COMPENSATION
Each Trustee who is not an “interested person” of the Trust (“Independent Trustee”) receives a $1,300 annual retainer from the Fund, paid quarterly, except for the Board Chairperson who receives a $1,500 annual retainer from the Fund, paid quarterly. Each Independent Trustee also receives from the Fund a fee of $500 for each Board meeting attended plus reimbursement for travel and other meeting-related expenses.
PRINCIPAL HOLDER OF FUND SHARES
As of November 30, 2020, the following shareholder owned of record more than 25% of the outstanding shares of the Fund:
| NAME OF RECORD OWNER | | % Ownership |
| Charles Schwab & Co. (for the benefit of its customers) | | 74% |
A beneficial owner of 25% or more of the Fund’s outstanding shares may be considered a controlling person. That shareholder’s vote could have a more significant effect on matters presented at a shareholders’ meeting.
| 5. | Contingencies and Commitments |
The Fund indemnifies the Trust’s officers and Trustees for certain liabilities that might arise from their performance of their duties to the Fund. Additionally, in the normal course of business the Fund enters into contracts that contain a variety of representations and warranties and which provide general indemnifications. The Fund’s maximum exposure under these arrangements is unknown, as this would involve future claims that may be made against the Fund that have not yet occurred. However, based on experience, the Fund expects the risk of loss to be remote.
| 6. | Non-Diversification Risk |
The Fund is a non-diversified Fund. As a result, the Fund’s holdings may be more concentrated in a limited number of securities and the value of its shares may be more sensitive than a diversified fund to any single economic, business, political, or regulatory occurrence.
| EVOLUTIONARY TREE INNOVATORS FUND |
| NOTES TO FINANCIAL STATEMENTS (Continued) |
If a Fund has significant investments in the securities of issuers within a particular sector, any development affecting that sector will have a greater impact on the value of the net assets of the Fund than would be the case if the Fund did not have significant investments in that sector. In addition, this may increase the risk of loss in the Fund and increase the volatility of the Fund’s NAV per share. Occasionally, market conditions, regulatory changes or other developments may negatively impact a particular sector. As of November 30, 2020, the Fund had 32.5% of the value of its net assets invested in stocks within the Technology sector.
The Fund is required to recognize in the financial statements the effects of all subsequent events that provide additional evidence about conditions that existed as of the date of the Statement of Assets and Liabilities. For non-recognized subsequent events that must be disclosed to keep the financial statements from being misleading, the Fund is required to disclose the nature of the event as well as an estimate of its financial effect, or a statement that such an estimate cannot be made. Management has evaluated subsequent events through the issuance of these financial statements and has noted no such events.
| EVOLUTIONARY TREE INNOVATORS FUND |
| ABOUT YOUR FUND’S EXPENSES (Unaudited) |
We believe it is important for you to understand the impact of costs on your investment. As a shareholder of the Fund, you incur ongoing costs, including management fees, and other operating expenses. The following examples are intended to help you understand your ongoing costs (in dollars) of investing in the Fund and to compare these costs with the ongoing costs of investing in other mutual funds.
A mutual fund’s ongoing costs are expressed as a percentage of its average net assets. This figure is known as the expense ratio. The expenses in the table below are based on an investment of $1,000 made at the beginning of the most recent period (September 9, 2020) and held until the end of the period (November 30, 2020).
The table below illustrates the Fund’s ongoing costs in two ways:
Actual fund return – This section helps you to estimate the actual expenses that you paid over the period. The “Ending Account Value” shown is derived from the Fund’s actual return, and the fourth column shows the dollar amount of operating expenses that would have been paid by an investor who started with $1,000 in the Fund. You may use the information here, together with the amount you invested, to estimate the expenses that you paid over the period.
To do so, simply divide your account value by $1,000 (for example, an $8,600 account value divided by $1,000 = 8.6), then multiply the result by the number given for the Fund under the heading “Expenses Paid During Period.”
Hypothetical 5% return – This section is intended to help you compare the Fund’s ongoing costs with those of other mutual funds. It assumes that the Fund had an annual return of 5% before expenses during the period shown, but that the expense ratio is unchanged. In this case, because the return used is not the Fund’s actual return, the results do not apply to your investment. The example is useful in making comparisons because the U.S. Securities and Exchange Commission (the “SEC”) requires all mutual funds to calculate expenses based on a 5% return. You can assess the Fund’s ongoing costs by comparing this hypothetical example with the hypothetical examples that appear in shareholder reports of other funds.
Note that expenses shown in the table are meant to highlight and help you compare ongoing costs only. The Fund does not charge transaction fees, such as purchase or redemption fees, nor does it carry a “sales load.”
The calculations assume no shares were bought or sold during the period. Your actual costs may have been higher or lower, depending on the amount of your investment and the timing of any purchases or redemptions.
| EVOLUTIONARY TREE INNOVATORS FUND |
| ABOUT YOUR FUND’S EXPENSES (Unaudited) (Continued) |
More information about the Fund’s expenses can be found in this report. For additional information on operating expenses and other shareholder costs, please refer to the Fund’s prospectus.
| | | Beginning | | Ending | | | | |
| | | Account Value | | Account Value | | | | Expenses |
| | | June 1, | | November 30, | | Net Expense | | Paid During |
| | | 2020 (a) | | 2020 | | Ratio (b) | | Period (c) |
| Based on Actual Fund Return | | $1,000.00 | | $1,244.00 | | 0.97% | | $2.47 |
| Based on Hypothetical 5% Return (before expenses) | | $1,000.00 | | $1,020.15 | | 0.97% | | $4.90 |
| (a) | Beginning Account Value is as of September 9, 2020 (date of commencement of operations) for the Actual Fund Return information. |
| (b) | Annualized, based on the Fund’s expenses during the period since the commencement of operations. |
| (c) | Expenses are equal to the Fund’s annualized net expense ratio multiplied by the average account value over the period, multiplied by 83/366 (to reflect the period since inceptions) and 183/366 (to reflect the one-half year period), for Actual Fund Return and Hypothetical 5% Return, respectively. |
| EVOLUTIONARY TREE INNOVATORS FUND |
| OTHER INFORMATION (Unaudited) |
A description of the policies and procedures that the Fund uses to vote proxies relating to portfolio securities is available without charge upon request by calling toll-free 1-833-517-1010, or on the SEC’s website at www.sec.gov. Information regarding how the Fund voted proxies relating to portfolio securities during the period ended June 30, 2021 will be available on or about August 31, 2021 without charge upon request by calling toll-free 1-833-517-1010, or on the SEC’s website at www.sec.gov.
The Trust files a complete listing of portfolio holdings for the Fund with the SEC as of the end of the first and third quarters of each fiscal year as an exhibit to Form N-PORT. These filings are available upon request by calling 1-833-517-1010. Furthermore, you may obtain a copy of the filings on the SEC’s website at www.sec.gov.
| EVOLUTIONARY TREE INNOVATORS FUND |
| DISCLOSURE REGARDING APPROVAL OF INVESTMENT |
| ADVISORY AGREEMENT (Unaudited) |
The Board of Trustees (the “Board”), including the Independent Trustees voting separately, has reviewed and approved the Fund’s Investment Advisory Agreement (the “Agreement”) with Evolutionary Tree Capital Management, LLC (the “Adviser”) for an initial two-year term. The Board approved the Agreement at a meeting held on April July 20-21, 2020, at which all of the Trustees were present.
Legal counsel advised the Board during its deliberations. Additionally, the Board received and reviewed a substantial amount of information provided by the Adviser in response to requests of the Board and counsel. In deciding whether to approve the Agreement, the Board recalled its discussion with the Adviser during the meeting and a prior meeting and its review of various materials related to the Advisor and the Fund. The Board further considered those materials and discussions and numerous other factors, including:
The nature, extent, and quality of the services to be provided by the Adviser. In this regard, the Board considered the responsibilities the Adviser would have under the Agreement for the Fund. The Board also considered the proposed services that the Adviser would provide to the Fund including, without limitation, the Adviser’s procedures for formulating investment recommendations and assuring compliance with the Fund’s investment objective and limitations, proposed initial marketing and distribution efforts, and the Adviser’s compliance procedures and practices. After reviewing the foregoing and further information provided in the board materials for the meeting regarding the Fund (e.g., descriptions of the Adviser’s business and Form ADV), the Board concluded that the quality, extent, and nature of the services to be provided by the Adviser to the Fund were satisfactory and adequate.
The investment management capabilities and experience of the Adviser. In this regard, the Board considered the investment management experience of the Adviser and its principal. The Board considered its discussion with the Adviser regarding the investment objective and strategies for the Fund and the Adviser’s experience and plans for implementing such strategies. In particular, the Board considered the information from the Adviser regarding prior experience in the financial industry by the Adviser and its principals. After consideration of these and other factors, the Board determined that the Adviser has the requisite knowledge and experience to serve as investment adviser for the Fund.
The costs of the services to be provided and profits to be realized by the Adviser and its affiliates from the relationship with the Fund. In this regard, the Board considered the Adviser’s methods of operation; the education and experience of the Adviser’s staff, including its principal; its compliance program, policies, and procedures; its financial condition and the level of commitment to the Fund; the projected asset levels of the Fund; and the overall expenses of the Fund, including the advisory fee. The Board reviewed the Fund’s expense limitation agreement (“ELA”) and noted the benefit to the Fund from the Adviser’s commitment to reduce its advisory fee and reimburse other operating expenses through October 31, 2023. The Board discussed the Adviser’s financial condition and its
| EVOLUTIONARY TREE INNOVATORS FUND |
| DISCLOSURE REGARDING APPROVAL OF INVESTMENT |
| ADVISORY AGREEMENT (Unaudited) (Continued) |
ability to satisfy its financial commitments to the Fund. The Board also considered potential benefits for the Adviser in managing the Fund, including promotion of the Adviser’s name. The Board compared the Fund’s proposed advisory fee and overall expense ratio to other comparable funds (in terms of the type of fund, the style of investment management, the projected size of the Fund, and the nature of the investment strategies).
The Board noted that the Fund’s advisory fee of 0.85% is above the average and the median for its custom peer group and its proposed overall annual expense ratio of 1.00% is above the average and equal to the median for its custom peer group. Upon further consideration and discussion of the foregoing, the Board concluded that the proposed advisory fee and total expense limit for the Fund were within the range of what would have been negotiated at arms-length in light of all the surrounding circumstances and were fair and reasonable.
The extent to which the Fund and its investors would benefit from economies of scale. In this regard, the Board considered the Fund’s ELA. The Board determined that while the proposed advisory fee rate was flat and would stay the same as asset levels increased, the shareholders of the Fund would benefit from the ELA until the Fund’s assets grew to a level where its expenses otherwise fall below the expense limit. Following further discussion of the Fund’s projected asset levels, expectations for growth, and level of fees, the Board determined that the Fund’s fee arrangements with the Adviser would provide benefits through the next three years, and the Board could review the arrangements going forward as necessary. After further discussion, the Board concluded the Fund’s arrangement with the Adviser was fair and reasonable in relation to the nature and quality of services to be provided by the Adviser and would benefit the Fund and its shareholders.
Brokerage and portfolio transactions. The Board considered the Adviser’s policies and procedures as they relate to seeking best execution for its clients. The Board also considered the anticipated portfolio turnover rate for the Fund; the method and basis for selecting and evaluating broker-dealers used to complete the Fund’s portfolio transactions; any anticipated allocation of portfolio business to persons affiliated with the Adviser; and the extent to which the Fund’s trades may be allocated to soft-dollar arrangements. After further review and discussion, the Board determined that the Adviser’s practices regarding brokerage and portfolio transactions for the Fund were satisfactory.
Possible conflicts of interest. In evaluating the possibility for conflicts of interest, the Board considered such matters as the experience and abilities of the advisory personnel to be assigned to the Fund and the Adviser’s process for allocating trades among the Fund and potential future clients with similar types of investment objectives and strategies. The Board also considered the substance and administration of the Adviser’s Code of Ethics. Following further consideration and discussion, the Board determined that the Adviser’s standards and practices relating to the identification and mitigation of potential conflicts of interests for the Fund were satisfactory.
| EVOLUTIONARY TREE INNOVATORS FUND |
| DISCLOSURE REGARDING APPROVAL OF INVESTMENT |
| ADVISORY AGREEMENT (Unaudited) (Continued) |
After further discussion of the factors noted above and in reliance on the information provided by the Adviser and Trust management, and taking into account the totality of all the factors discussed and information presented, the Board indicated its agreement to approve the Agreement. It was noted that in the Trustees’ deliberations regarding the approval of the Agreement, the Trustees did not identify any particular information or factor that was all-important or controlling, and that each individual Trustee may have attributed different weights to the various factors listed above. After full consideration of the above factors as well as other factors, the Board unanimously concluded that approval of the Agreement was in the best interests of the Fund and its shareholders.
| FACTS | WHAT DOES THE EVOLUTIONARY TREE INNOVATORS FUND (the “Fund”) DO WITH YOUR PERSONAL INFORMATION? |
| |
| Why? | Financial companies choose how they share your personal information. Federal law gives consumers the right to limit some but not all sharing. Federal law also requires us to tell you how we collect, share, and protect your personal information. Please read this notice carefully to understand what we do. |
| |
| What? | The types of personal information we collect and share depend on the product or service you have with us. This information can include: ■ Social Security number ■ Assets ■ Retirement Assets ■ Transaction History ■ Checking Account Information ■ Purchase History ■ Account Balances ■ Account Transactions ■ Wire Transfer Instructions When you are no longer our customer, we continue to share your information as described in this notice. |
| |
| How? | All financial companies need to share your personal information to run their everyday business. In the section below, we list the reasons financial companies can share their customers’ personal information; the reasons the Fund chooses to share; and whether you can limit this sharing. |
| |
| Reasons we can share your personal information | Does the Fund
share? | Can you limit
this sharing? |
For our everyday business purposes – Such as to process your transactions, maintain your account(s), respond to court orders and legal investigations, or report to credit bureaus | Yes | No |
For our marketing purposes – to offer our products and services to you | No | We don’t share |
| For joint marketing with other financial companies | No | We don’t share |
For our affiliates’ everyday business purposes – information about your transactions and experiences | No | We don’t share |
For our affiliates’ everyday business purposes – information about your creditworthiness | No | We don’t share |
| For nonaffiliates to market to you | No | We don’t share |
| | | |
| Questions? | Call 1-833-517-1010 |
| | | | |
| Who we are |
| Who is providing this notice? | Evolutionary Tree Innovators Fund Ultimus Fund Distributors, LLC (Distributor) Ultimus Fund Solutions, LLC (Administrator) |
| What we do |
| How does the Fund protect my personal information? | To protect your personal information from unauthorized access and use, we use security measures that comply with federal law. These measures include computer safeguards and secured files and buildings. Our service providers are held accountable for adhering to strict policies and procedures to prevent any misuse of your nonpublic personal information. |
| How does the Fund collect my personal information? | We collect your personal information, for example, when you ■ Open an account ■ Provide account information ■ Give us your contact information ■ Make deposits or withdrawals from your account ■ Make a wire transfer ■ Tell us where to send the money ■ Tell us who receives the money ■ Show your government-issued ID ■ Show your driver’s license We also collect your personal information from other companies. |
| Why can’t I limit all sharing? | Federal law gives you the right to limit only ■ Sharing for affiliates’ everyday business purposes – information about your creditworthiness ■ Affiliates from using your information to market to you ■ Sharing for nonaffiliates to market to you State laws and individual companies may give you additional rights to limit sharing. |
| |
| Definitions |
| Affiliates | Companies related by common ownership or control. They can be financial and nonfinancial companies. ■ Evolutionary Tree Capital Management, LLC, the investment adviser to the Fund, could be deemed to be an affiliate. |
| Nonaffiliates | Companies not related by common ownership or control. They can be financial and nonfinancial companies ■ The Fund does not share with nonaffiliates so they can market to you. |
| Joint marketing | A formal agreement between nonaffiliated financial companies that together market financial products or services to you. ■ The Fund does not jointly market. |
EVOLUTIONARY-SAR-20

KARNER BLUE BIODIVERSITY IMPACT FUND
Investor Class (KAIAX)
Institutional Class (KAIIX)
ButterflyTM Class (KAIBX)
Semi-Annual Report
November 30, 2020
(Unaudited)
Beginning on January 1, 2021, as permitted by regulations adopted by the U.S. Securities and Exchange Commission, paper copies of the Fund’s shareholder reports like this one will no longer be sent by mail, unless you specifically request paper copies of the reports from the Fund or from your financial intermediary, such as a broker-dealer or bank. Instead, the reports will be made available on a website, and you will be notified by mail each time a report is posted and provided with a website link to access the report.
If you already elected to receive shareholder reports electronically, you will not be affected by this change and you need not take any action. You may elect to receive shareholder reports and other communications from the Fund electronically by contacting the Fund at 1-855-KBANIML (855-522-6465) or, if you own these shares through a financial intermediary, by contacting your financial intermediary.
You may elect to receive all future reports in paper free of charge. You can inform the Fund that you wish to continue receiving paper copies of your shareholder reports by contacting the Fund at 1-855-KBANIML (855-522-6465). If you own shares through a financial intermediary, you may contact your financial intermediary or follow instructions included with this document to elect to continue to receive paper copies of your shareholder reports. Your election to receive reports in paper will apply to all Funds held with the Fund complex or at your financial intermediary.
| KARNER BLUE BIODIVERSITY IMPACT FUND | |
| LETTER TO SHAREHOLDERS (Unaudited) | January 6, 2021 |
Dear Shareholder,
In October 2010, almost 200 governments agreed upon a Strategic Plan for Biodiversity and the Aichi Biodiversity Targets for the 2011-2020 period, which was declared to be the United Nations Decade on Biodiversity. This plan provided an overarching framework on biodiversity, not only for the biodiversity-related conventions, but for the entire United Nations system and all other partners engaged in biodiversity management and policy development.1 The Aichi Targets are comprised of twenty specific targets structured around five biodiversity goals with the following overarching mission:
Take effective and urgent action to halt the loss of biodiversity in order to ensure that by 2020 ecosystems are resilient and continue to provide essential services, thereby securing the planet’s variety of life, and contributing to human well-being, and poverty eradication. To ensure this, pressures on biodiversity are reduced, ecosystems are restored, biological resources are sustainably used and benefits arising out of utilization of genetic resources are shared in a fair and equitable manner; adequate financial resources are provided, capacities are enhanced, biodiversity issues and values mainstreamed, appropriate policies are effectively implemented, and decision-making is based on sound science and the precautionary approach.2
Since our last report to you, the Global Biodiversity Outlook 5 (GBO-5) report prepared by the United Nations Convention on Biological Diversity concluded that the international community failed to meet fully any of the Aichi Targets and only six of the targets were even partly achieved. The report indicates that some progress was made with respect to the expansion of protected areas and the eradication of some invasive species. A number of nations have also initiated new measures to reduce deforestation and there is an overall increased awareness of the importance of biodiversity. According to the report, the “number of extinctions of birds and mammals would likely have been at least two to four times higher without [the] conservation actions over the past decade, [but species nevertheless] continue to move, on average, closer to extinction.”3 Especially troubling is the fact that, during the United Nations Decade on Biodiversity, annual funding available for projects to work toward the Aichi Targets fell far short of the amounts needed to actually achieve those targets and were but a small fraction of the funding for projects harmful to biodiversity. As a society, we are now called upon to take bold action at the upcoming COP15 Convention on Biological Diversity in China where the Post-2020 Global Biodiversity Framework will be adopted. This latest plan to save life on Earth “aims to galvanize urgent and transformative action by governments and all of society, including
| 1 | Secretariat of the Convention on Biological Diversity (2020, January 21). Strategic Plan for Diversity 2011-2020, including Aichi Biodiversity Targets. Montreal. Retrieved from https://www.cbd.int/doc/strategic-plan/2011-2020/Aichi-Targets-EN.pdf. |
| 2 | Secretariat of the Convention on Biological Diversity (n.d.). Strategic Plan for Diversity 2011-2020 and the Aichi Targets. Montreal. Retrieved from https://www.cbd.int/doc/strategic-plan/2011-2020/Aichi-Targets-EN.pdf. |
indigenous peoples and local communities, civil society and businesses [emphasis added]…to implement broad-based action to bring about a transformation in society’s relationship with biodiversity and to ensure that, by 2050, the shared vision of living in harmony with nature is fulfilled.”3
With approximately half of the world’s GDP being moderately or highly dependent upon ecosystem services, the mitigation and reversal of biodiversity loss and climate change will require visionary leadership from the business community.4 A recent study estimates that corporate capital expenditures totaling hundreds of billions of dollars annually over the next decade will be needed to transition companies operating in industries with high biodiversity impacts toward more sustainable business models that will preserve nature and its ecosystems.5 The realization of these new nature-oriented business models will require persistent imagination-inspired creative innovation to address the five key drivers of biodiversity loss, which are (i) irresponsible land and ocean use, (ii) exploitation and over-use of species, (iii) climate change, (iv) pollution and (v) invasive and introduced species. Fortunately, the business community has a long history of innovating in precisely this way and is therefore uniquely positioned to achieve the societal transformation that we need in the timeframe that we need it.
The focus on nature-based innovation is central to our management of the Fund. The Fund is grounded in the belief that innovative companies focused on problem-solving and best practices relating to biodiversity preservation, environmental protection, climate change mitigation and animal welfare can better position their businesses for growth and success in today’s marketplace. Utilizing a rigorous proprietary research process, KBC evaluates publicly-traded companies in almost every sector of the economy based on their biodiversity policies, practices, and performance. Our in-house academic research team develops and applies industry-specific frameworks to build an investable universe of forward-looking companies that integrate ecological protection, biodiversity preservation, and animal habitat conservation into their business operations and supply chains. Our investment team then applies bottom-up, fundamental financial analysis to assess companies in KBC’s investable universe on growth, profitability, valuation and balance sheet metrics to create a diversified portfolio of publicly-traded equity securities and American Depositary Receipts characterized by both robust sustainability practices and financial prospects. KBC believes that forward-looking companies that aggressively implement measures to address the planet’s biodiversity crisis have the potential to be more resilient while enabling investors to benefit from business transformations that form the foundation for a prosperous future.
| 3 | Secretariat of the Convention on Biological Diversity (2020). Global Biodiversity Outlook 5. Montreal. Retrieved from www.cbd.int/GBO5. |
| 4 | World Economic Forum (2020, January). Nature Risk Rising: Why the Crisis Engulfing Nature Matters for Business and the Economy. Retrieved from http://www3.weforum.org/docs/WEF_New_Nature_Economy_ Report_2020.pdf. |
| 5 | Deutz, A., Heal, G. M., Niu, R., Swanson, E., Townshend, T., Zhu, L., Delmar, A., Meghji, A., Sethi, S. A., and Tobin-de la Puente, J. 2020. Financing Nature: Closing the global biodiversity financing gap. The Paulson Institute, The Nature Conservancy, and the Cornell Atkinson Center for Sustainability. Retrieved from https://www.nature.org/en-us/what-we-do/our-insights/perspectives/closing-nature- funding-gap-global-biodiversity-finance/. |
PERFORMANCE
On a net basis, the ButterflyTM Class underperformed its benchmark, the Morningstar Developed Markets NR Index (the “Morningstar Index”), by 215 basis points during the six-month period ended November 30, 2020 and outperformed the Morningstar Index by 159 basis points on an annualized basis since inception.
| | Total Return | Total Return | Annualized |
| | Inception | 6/1/2020 | Total Return |
| | Through | Through | Since Inception |
| | 5/31/2020 | 11/30/2020 | (9/17/2019) |
| Karner Blue Biodiversity Impact Fund | | | |
| Investor Class | 1.26% | 18.97% | 16.75% |
| Institutional Class | 1.46% | 19.13% | 17.07% |
| ButterflyTM Class | 1.50% | 19.33% | 17.27% |
| Morningstar Developed Markets NR Index | -1.92% | 21.48% | 15.68% |
| S&P 500 Index | 2.70% | 19.98% | 18.95% |
Returns shown for periods greater than one year are annualized.
Past performance is not predictive of future performance. Investment results and principal value will fluctuate so that shares, when redeemed, may be worth less that their original cost. An investor should consider the investment objectives, risks, charges, and expenses of the Fund carefully before investing. The Fund’s prospectus contains this and other important information, and it should be read carefully before investing. Current performance may be lower or higher than the performance data quoted. For most recent month-end performance information or to obtain a prospectus, visit www.biodiversityimpactfund.com or call 1-855-KBANIML (855-522-6465).
The Fund’s stock selection during the six-month period ended November 30, 2020 (the “Reporting Period”) was slightly beneficial with Tesla, Inc., Fortescue Metals Group Ltd. ADR and NVIDIA Corp. again ranking among the Fund’s best performers. Our views with respect to these companies have not materially changed from the comments we shared in the Fund’s Annual Report for the period ended May 31, 2020. We maintain a constructive outlook on each company, but as a risk mitigation measure, we trimmed the Fund’s position in Tesla as share prices climbed.
Sector allocation was responsible for the Fund’s underperformance during the Reporting Period. In an environment dominated by heightened economic and financial uncertainty related to COVID-19, the Fund maintained a higher-than-normal cash allocation during most of the period, which weighed on performance in a rising market environment and accounted for more than one-third of the underperformance for the period. The remaining underperformance resulted from the Fund’s underweight allocations to the Consumer Cyclical and Technology sectors and overweight allocations to the Energy and Utility sectors. The Fund’s overweight allocation to the Consumer Defensive sector also significantly hurt performance, but that was offset by its overweight allocation to the Basic Materials sector.
Within the Basic Materials sector, Freeport-McMoRan, Inc. was a top performer during the Reporting Period. Freeport reported Q3 non-GAAP EPS of $0.32 and GAAP EPS of $0.51, which beat expectations by $0.01 and $0.19, respectively, with lighter-than-expected quarterly revenue of $2.37 billion. The company saw a 6.6% YOY surge in Q3 copper sales volumes, which significantly exceeded management’s forecast from the prior quarter. Freeport-McMoRan Inc. is also a top performer with respect to site reclamation and rehabilitation efforts using data collected prior to and during ore extraction to tailor revegetation specifically to local wildlife. For example, near one of Freeport’s two Colorado mines, the company created a wetland habitat for the boreal toad, and, in Arizona, Freeport worked with both Bat Conservation International to create a bat-compatible gate at a cave populated with Mexican free-tailed bats and with the Arizona Fish and Game Department to relocate the declining population of big-horn sheep to an area unaffected by its mines. Despite disturbing hundreds of hectares of land each year, since 2015 the company has rehabilitated land at an even faster pace such that its total land disturbed and not rehabilitated during the period from 2015 through 2018 decreased by nearly 2,000 hectares. Freeport has prepared a booklet entitled “Mining Reclamation in North America” that describes the company’s site reclamation efforts as part of its overall commitment to a sustainable future. The booklet explains the scope of the research that is needed to support site reclamation as follows:
By studying different forms of vegetation, we aim to better understand the response and establishment of vegetation on reclaimed land. This involves research to learn site-specific criteria for improving revegetation efforts on reclaimed land relative to species planted as well as the timing and method of planting. Currently, annual surveys are conducted at six different sites in Arizona. Surveys include collecting data on species present, species frequency, vegetation density, canopy cover and vegetation changes over time. In addition to studying vegetation dynamics on reclaimed land, native undisturbed comparable sites are also evaluated annually. By studying areas with similar soils, we seek to create seed mix that may enhance revegetation efforts.
As a member of the Wildlife Habitat Council (WHC) since 2006, Freeport engages in 15 WHC certification programs in the U.S., Chile, Peru and Indonesia, including 11 that have achieved Gold-Certified status which signifies excellence in conservation activities. One program is conducted at the company’s Unidad de Producción Cerro Verde mine located in the Atacama Desert in Peru, the world’s driest desert and home to a unique community of plants and animals adapted to the hyperarid conditions. Approximately 146,000 acres, or about 40 percent of the total land area of the mine, is reserved as habitat for biodiversity. The Weberbauer cactus, an important food source for many species in the region, is carefully managed and induced to flower to benefit Peruvian long-snouted bats which feed on the nectar and provide important pollination services. Site employees also relocate at-risk species, control non-native animals that compete for resources, enhance water and food sources, and collect data to inform future conservation activities as part of Freeport’s comprehensive effort to protect several lizard and avian species, including the tiger Pacific iguana, South American leaf-toed gecko, the black metaltail hummingbird, the cactus canastero and the white-throated earthcreeper. Another program is operated at Freeport’s Grasberg mine in Papua, Indonesia, which is the world’s second largest copper
and gold mine. Approximately 90 percent of the site is comprised of unimpacted natural ecosystems with high levels of biodiversity spanning a range of natural “carbon sinks” that include mangrove forest, freshwater swamp forest, lowland tropical rain forest, heath forest and montane forest. The site benefits from employee efforts to recolonize native species, plant mangrove seedlings and share expertise through extensive conservation education programs.
During the Reporting Period, the Fund also benefitted from gains in the renewable energy industry with key contributions from First Solar, Inc. and Orsted A/S ADR. After seeing revenues fall at the onset of the pandemic, First Solar posted two consecutive strong earnings results that beat expectations with Q3 revenue growing 70% YOY to $928M. The company develops solar farms and manufactures cadmium telluride solar modules, which use a thin-film technology that is less costly to manufacture, but also less efficient than the crystalline silicon technology used by its competitors. First Solar implements robust vegetation management standards in its solar farm development operations, including invasive species control, native plant revegetation and monitoring, and re-planting protected plants. The company also uses innovative soil preparation techniques to maintain native seeds in the soil that increase the likelihood of natural rehabilitation.
Orsted is a developer and operator of offshore and onshore wind farms as well as bioenergy plants and waste-to-energy solutions that are on the forefront of the energy transition toward a greener future. The company recently increased the green share of the company’s heat and power generation from 83% to 89% and completed its transformation into a global renewable energy company with the divestment of its Danish power distribution, residential customer and city light businesses. The company’s stock price gains this year have been powered by its strong balance sheet, which has enabled it to weather the COVID-19 crisis better than many of its leveraged rivals that have been forced to withdraw bids for some new renewable energy contracts. Orsted also recently announced a partnership with British Petroleum to develop a wind-powered technology that can produce hydrogen from water. The project is being developed at one of BP’s oldest refineries and will be powered by Orsted’s offshore wind farm in the North Sea. The industrial-scale 50MW electrolyser, which splits water molecules into hydrogen and oxygen gas, will generate one ton of renewable hydrogen per hour and avoid roughly 80,000 tons of CO2 equivalent emissions per year at full capacity. The green hydrogen market has high growth potential with sales estimated to be as high as $11.7 trillion by 2050 as emission-intensive industrial operations ramp up decarbonization efforts.
The Fund’s positions in the textile and apparel industry also benefitted performance during the Reporting Period with notable contributions from Levi Strauss & Co., Nike Inc. and VF Corp. Due to investments in their digital sales channels these companies were especially well-positioned to take advantage of the shift to online shopping following the shutdown of brick-and-mortar retailers at the start of the pandemic. Levi Strauss reported a Q2 sequential quarterly revenue decline of 67%, but the company exceeded even its own Q3 expectations with e-commerce sales that doubled as a share of total revenue, which powered sequential quarterly revenue growth of 114% and non-GAAP EPS of $0.08, trouncing expectations of a $0.22 loss. Cotton comprises 91 percent of the raw materials used by Levi Strauss and, in 2019, the company sourced 83 percent of its cotton from sustainable sources. The company also introduced its new and innovative Wellthread™ line
in 2019, which is described in the company’s sustainability report as “the first commercial realization of ‘cottonized hemp,’ rain-fed hemp fiber that requires less water and pesticides to cultivate compared to cotton and that is treated in a way that softens the coarse fiber to make it look and feel indistinguishable from cotton.” The company’s efforts to reduce its water footprint also prompted it to develop an innovative Water<LessTM production technique that can reduce water consumption during the denim finishing process by up to 96 percent. Levi Strauss further committed to reducing waste by promoting a circular economy through Cotton’s Blue Jeans Go GreenTM initiative, which collects used denim products to be recycled into building insulation. Levi Strauss supports the initiative by maintaining collection sites at its stores and rewarding participating customers with apparel discounts. The company’s popular Authorized Vintage collection featuring pre-worn, expertly repaired denim garments originally manufactured in the 1980s and 1990s is another example of a win-win that has produced an additional revenue stream while diverting waste and encouraging conscious consumption.
The key detractors during the Reporting Period were Intel Corp., Sprouts Farmers Market, Inc., and SAP SE ADR. Intel declined 22% from June 1, 2020 through November 16, 2020, when the Fund liquidated its entire position in the security following the company’s Q3 earnings report. Although the company reported sales and earnings in line with analyst estimates, it failed to adequately address the manufacturing challenges with its next generation 7-nanometer chip that first came to light during its Q2 earnings call. Intel’s diminished manufacturing prowess and chip delays gave credence to the view that Advanced Micro Devices, Inc. will be able to gain market share with its widely acclaimed 7 nanometer chip and secure a dominant position in the PC processor market.
Sprouts Farmers Market, Inc., a grocery store that focuses on providing natural, organic food products in the United States, also struggled during the Reporting Period and ultimately declined approximately 16 percent. The company reported Q3 non-GAAP EPS of $0.52 and GAAP EPS of $0.51, which beat expectations by $0.17 and $0.14, respectively, with quarterly revenue that grew 9.7% YOY to $1.58 billion. The company’s shares fared well during the initial market downturn as lockdown restrictions sent consumers flocking to grocery stores, but during the second half of the year growing investor confidence, fueled by positive vaccine news, shifted capital away from defensive securities into riskier assets. Sprouts Farmers Market is a steward in the food retail industry due to its environmentally-friendly product offerings and food waste diversion program, which donates all nutrient-rich and edible groceries that are otherwise unfit for sale to hunger relief agencies, to cattle ranches and dairy farms for use as animal feed, or for composting to produce nutrient-rich agricultural soil.
SAP SE was one of the Fund’s largest detractors during the Reporting Period, suffering a 23 percent swoon after the company reported its Q3 earnings results. Following the decline SAP Chairman and co-founder, Hasso Plattner, acquired $294 million of additional SAP shares bringing his total stake in the company to more than $8 billion. Although the company posted non-GAAP EPS of €1.70, beating estimates by €0.40, market sentiment turned bearish due to YOY sales declines and lowered guidance for its cloud-software business through 2025 due in part to “investment delays” in several industries impacted by the pandemic. The company is heavily exposed to the decline in business travel through its Concur expense-accounting and travel-booking platform. We
expect these business lines will recover as the pandemic ebbs and believe that SAP is otherwise well-positioned for a post-pandemic world in which digital transformation will likely be a key driver of IT spending. SAP’s entrenched client base, expanded partnership with NTT and significant investments in its S/4HANA enterprise resource planning (ERP) system should enable it to deliver value-added solutions that leverage artificial intelligence, allow for both private and hybrid cloud environments, and provide real-time processing, in-memory databases and advanced analytics. SAP’s technology has also been transformative with respect to elephant anti-poaching efforts and helps to minimize human/elephant conflict. Through the use of cloud integration and Big Data, coupled with unmanned aviation vehicles, SAP is able to monitor and track elephants, ensuring that the elephants stay inside reserve boundaries and away from human threat. SAP also works with non-profit tech start-up Rainforest Connection to combat illegal logging which is a significant contributor to deforestation and climate change. Rainforest Connection uses old cell phones to record and stream forest sounds to the cloud where they are evaluated in real time to determine if chainsaws or loggers are present. The non-profit even has the ability to predict deforestation before it occurs based on the animal sounds that it collects and analyzes. SAP’s technology also supports other groups, including Barcode of Life, LifeScanner, Northern Beaches Council and indigenous people of the Amazon, in their efforts to preserve Earth’s biodiversity.
OUTLOOK
We see the performance of the global economy and the performance of the financial markets moving along separate trajectories. Currently there is a profound dichotomy between those trajectories, with the Fund’s benchmark at a level that is approximately 11 percent higher than its pre-recession levels while the U.S. and Eurozone economies experienced estimated GDP declines of 3.5% and 7.8%, respectively, in 2020. While the reopening of national economies across the globe spurred a sharp economic rebound that resulted in a brief mid-2020 convergence, the development of efficacious vaccines later in the year caused the financial trajectory to again outpace the economic trajectory. Since the economic benefit of COVID-19 inoculations will take some time to materialize, we believe that further significant convergence will most likely not occur until the second half of 2021 and the pace of that convergence may slow as the long-term impacts of the 2020 recession become more readily apparent.
The financial market trajectory that took several major stock market indexes to all-time highs last year is supported by certain key expectations. These expectations include (i) an extended, years-long period of easy monetary policy both in the U.S. and Europe supported by the continued use of quantitative easing tools and the introduction of the Federal Reserve’s new average inflation targeting policy, (ii) further fiscal stimulus under the Biden Administration that will provide fuel for continued consumer spending, which accounted for approximately 70 percent of U.S. GDP prior to COVID-19; (iii) the widespread availability of effective COVID-19 vaccines that achieve herd immunity during the first half of 2021; (iv) the continuation of subdued consumer price inflation; and (v) a relatively stable U.S. Dollar exchange rate. As long as these expectations continue to be met, there exists a reasonable pathway that could enable the world to return to something resembling pre-COVID-19 normality while maintaining liquidity support for the financial markets, which we believe is a risk-on scenario that would provide continued support for
prevailing lofty P/E multiples. But there exist a number of potential roadblocks along that pathway. First, the Federal Reserve’s excessively loose monetary policy or a disorderly decline in the value of the U.S. Dollar could cause consumer price inflation to rise faster than anticipated and drive U.S. interest rates higher. Second, frothy stock market valuations and housing market prices, together with debt levels relative to GDP not seen since WWII, could spark investor concerns over excessive leverage and the potential for economic and financial retrenchment. Third, the recent spread of at least two more highly transmissible mutated variants of SARS-CoV-2 could cause healthcare systems to buckle under the burden of the pandemic and force politicians to reimpose widespread lockdowns such as the one recently implemented by Prime Minister Johnson in the United Kingdom. Fourth, the earlier-than-anticipated cessation of the Federal Reserve’s emergency lending programs for corporations, small businesses, cities and states could trigger unanticipated defaults or heightened liquidity concerns. Finally, a range of simmering international tensions could boil over and cause a flight to safety, including escalating trade tensions with China that prompts the sale of a significant portion of its U.S. Treasury holdings, Iranian retaliation in response to the assassination of its top nuclear scientist, and a further deterioration of U.S. relations with Russia stemming from its eight month long cyber-attack on the U.S. government and U.S. corporations.
Given the trauma that the world has suffered over the past year, it is somewhat surprising that the global economic outlook is arguably better at the start of 2021 than it was at the start of 2020. In 2019, global GDP expanded at the slowest annual rate since the 2008 financial crisis amid growing concerns for the year ahead. The U.S. economy completed its tenth consecutive year of economic expansion sustained by three Federal Reserve rate cuts during the second half of the year following a yield curve inversion that proved to be a harbinger of the ensuing recession. The European Central Bank also worked to boost economic activity by launching a quantitative easing program. Global trade tensions, especially between the U.S. and China, were high which weighed on trade volumes and industrial production as rising caution delayed purchases of equipment, machinery and durable goods. However, persistently strong consumer spending propped up a fairly tight labor market.
Although global GDP is estimated to have declined by about 4.2% in 2020, the consensus outlook for global GDP growth in 2021 is approximately 5.4% – much higher than the forecasted annual global GDP growth rate at the start of 2020. Significantly, the U.S. Purchasing Managers Index (PMI) and the Eurozone PMI stood at 57.5 and 53.8, respectively, in November 2020 compared to contractionary readings substantially below 50 at the end of 2019. While higher prevailing unemployment rates will likely dampen consumer spending in 2021, that impact should be mitigated by additional housing-related expenditures spurred by the red-hot housing market across the OECD. Pent-up demand for recreation, transportation and food service spending also has the potential to buttress the economy during the second half of 2021. The potential for substantial additional fiscal stimulus and a return to a more traditional international political landscape under the Biden Administration add further support for an overall upbeat economic outlook.
Ultimately, we are forced to try to reconcile the reality of our everyday experience with the apparent resilience of the global economy. On a daily basis we see people suffering tremendous pain as COVID-19 case counts skyrocket, deaths in the U.S. alone consistently
top 3,000 per day, hospital systems across the globe operate beyond capacity, and hunger, stress and economic hardship prevail. At the same time, it is becoming increasingly apparent that the worst-case pandemic-related economic outcomes are unlikely to materialize and the long-term structural damage to the global economy will likely be far less severe than originally feared. While there is much that could still go wrong, in the short- to medium-term, it appears as if the global economy and financial markets will successfully navigate this historically challenging period of human history.
CONCLUSION
On behalf of the entire Karner Blue Capital team we thank you for your investment in the Karner Blue Biodiversity Impact Fund and look forward to working together to realize a more sustainable and ethical future.
Sincerely,
| Vicki L. Benjamin | Andrew K. Niebler |
| President & Co-Founder | Executive Vice President & Co-Founder |
| Karner Blue Capital, LLC | Karner Blue Capital, LLC |
Past performance is not predictive of future performance. Investment results and principal value will fluctuate so that shares, when redeemed, may be worth more or less than their original cost. Current performance may be higher or lower than the performance data quoted. Performance data current to the most recent month end are available by calling 1-855-KBANIML (855-522-6465).
An investor should consider the investment objectives, risks, charges, and expenses of the Fund carefully before investing. The Fund’s prospectus contains this and other important information. To obtain a copy of the Fund’s prospectus please visit our website at www.biodiversityimpactfund.com or call 1-855-KBANIML (855-522-6465) and a copy will be sent to you free of charge. Please read the prospectus carefully before you invest. The Karner Blue Biodiversity Impact Fund is distributed by Ultimus Fund Distributors, LLC.
The Letter to Shareholders seeks to describe some of the Adviser’s current opinions and views of the financial markets. Although the Adviser believes it has a reasonable basis for any opinions or views expressed, actual results may differ, sometimes significantly so, from those expected or expressed. The securities held by the Fund that are discussed in the Letter to Shareholders were held during the period covered by this Report. They do not comprise the entire investment portfolio of the Fund, may be sold at any time and may no longer be held by the Fund. For a complete list of securities held by the Fund as of November 30, 2020, please see the Schedule of Investments section of the Semi-Annual Report. The opinions of the Adviser with respect to those securities may change at any time.
Statements in the Letter to Shareholders that reflect projections or expectations for future financial or economic performance of the Fund and the market in general and statements of the Fund’s plans and objectives for future operations are forward-looking statements. No assurance can be given that actual results or events will not differ materially from those projected, estimated, assumed, or anticipated in any such forward-looking statements. Important factors that could result in such differences, in addition to factors noted with such forward-looking statements include, without limitation, general economic conditions, such as inflation, recession, and interest rates. Past performance is not a guarantee of future results.
| KARNER BLUE BIODIVERSITY IMPACT FUND |
| PORTFOLIO INFORMATION |
| November 30, 2020 (Unaudited) |
Portfolio Allocation (% of Net Assets)
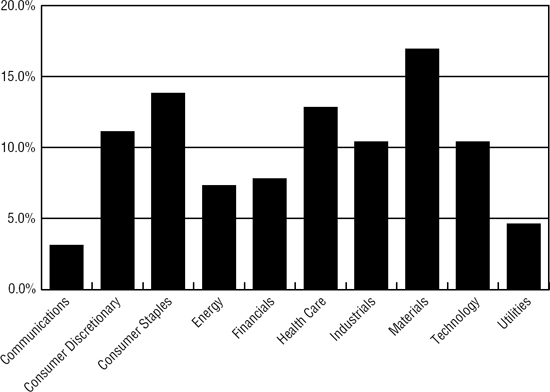
| Top 10 Equity Holdings |
| | % of |
| Security Description | Net Assets |
| Tesla, Inc. | 2.4% |
| Levi Strauss & Company - Class A | 2.1% |
| First Solar, Inc. | 1.9% |
| Orsted A/S - ADR | 1.9% |
| Microsoft Corporation | 1.9% |
| Fortescue Metals Group Ltd. - ADR | 1.8% |
| Newmont Corporation | 1.8% |
| Waste Management, Inc. | 1.8% |
| Alphabet, Inc. - Class A | 1.8% |
| NVIDIA Corporation | 1.8% |
| KARNER BLUE BIODIVERSITY IMPACT FUND |
| SCHEDULE OF INVESTMENTS |
| November 30, 2020 (Unaudited) |
| COMMON STOCKS — 98.2% | | Shares | | | Value | |
| Communications — 3.1% | | | | | | | | |
| Entertainment Content — 1.3% | | | | | | | | |
| Walt Disney Company (The) | | | 675 | | | $ | 99,907 | |
| | | | | | | | | |
| Internet Media & Services — 1.8% | | | | | | | | |
| Alphabet, Inc. - Class A (a) | | | 80 | | | | 140,352 | |
| | | | | | | | | |
| Consumer Discretionary — 11.2% | | | | | | | | |
| Apparel & Textile Products — 6.4% | | | | | | | | |
| adidas AG - ADR (a) | | | 556 | | | | 89,016 | |
| Levi Strauss & Company - Class A | | | 8,675 | | | | 159,533 | |
| NIKE, Inc. - Class B | | | 1,000 | | | | 134,700 | |
| VF Corporation | | | 1,345 | | | | 112,173 | |
| | | | | | | | 495,422 | |
| Automotive — 2.4% | | | | | | | | |
| Tesla, Inc. (a) | | | 335 | | | | 190,146 | |
| | | | | | | | | |
| Home & Office Products — 0.5% | | | | | | | | |
| Panasonic Corporation - ADR | | | 3,600 | | | | 38,556 | |
| | | | | | | | | |
| Leisure Facilities & Services — 0.9% | | | | | | | | |
| Cheesecake Factory, Inc. (The) | | | 1,805 | | | | 67,652 | |
| | | | | | | | | |
| Retail - Discretionary — 1.0% | | | | | | | | |
| Industria de Diseno Textil S.A. - ADR | | | 4,610 | | | | 77,079 | |
| | | | | | | | | |
| Consumer Staples — 13.8% | | | | | | | | |
| Food — 6.5% | | | | | | | | |
| Beyond Meat, Inc. (a) | | | 825 | | | | 115,417 | |
| Conagra Brands, Inc. | | | 2,570 | | | | 93,959 | |
| General Mills, Inc. | | | 1,040 | | | | 63,253 | |
| Hershey Company (The) | | | 455 | | | | 67,290 | |
| Ingredion, Inc. | | | 970 | | | | 74,836 | |
| Tattooed Chef, Inc. (a) | | | 4,200 | | | | 64,008 | |
| Vital Farms, Inc. (a) | | | 890 | | | | 26,380 | |
| | | | | | | | 505,143 | |
| KARNER BLUE BIODIVERSITY IMPACT FUND |
| SCHEDULE OF INVESTMENTS (Continued) |
| COMMON STOCKS — 98.2% (Continued) | | Shares | | | Value | |
| Consumer Staples — 13.8% (Continued) | | | | | | | | |
| Household Products — 3.9% | | | | | | | | |
| Estée Lauder Companies, Inc. (The) - Class A | | | 348 | | | $ | 85,371 | |
| L’Oreal S.A. - ADR | | | 1,015 | | | | 74,207 | |
| Procter & Gamble Company (The) | | | 535 | | | | 74,296 | |
| Unilever plc - ADR | | | 1,075 | | | | 65,639 | |
| | | | | | | | 299,513 | |
| Retail - Consumer Staples — 2.6% | | | | | | | | |
| Sprouts Farmers Market, Inc. (a) | | | 5,705 | | | | 120,775 | |
| Walmart, Inc. | | | 530 | | | | 80,978 | |
| | | | | | | | 201,753 | |
| Wholesale - Consumer Staples — 0.8% | | | | | | | | |
| Archer-Daniels-Midland Company | | | 1,260 | | | | 62,710 | |
| | | | | | | | | |
| Energy — 7.3% | | | | | | | | |
| Oil & Gas Producers — 5.4% | | | | | | | | |
| Equinor ASA - ADR | | | 7,549 | | | | 115,802 | |
| Repsol S.A. - ADR | | | 8,649 | | | | 82,252 | |
| Royal Dutch Shell plc - Class B - ADR | | | 2,605 | | | | 84,532 | |
| Total SE - ADR | | | 3,230 | | | | 136,112 | |
| | | | | | | | 418,698 | |
| Renewable Energy — 1.9% | | | | | | | | |
| First Solar, Inc. (a) | | | 1,589 | | | | 148,460 | |
| | | | | | | | | |
| Financials — 7.8% | | | | | | | | |
| Banking — 5.8% | | | | | | | | |
| Bank of Montreal | | | 1,175 | | | | 85,446 | |
| BNP Paribas S.A. - ADR (a) | | | 4,767 | | | | 121,177 | |
| Citigroup, Inc. | | | 1,470 | | | | 80,953 | |
| HSBC Holdings plc - ADR | | | 3,000 | | | | 77,670 | |
| ING Groep N.V. - ADR (a) | | | 8,528 | | | | 82,295 | |
| | | | | | | | 447,541 | |
| Institutional Financial Services — 2.0% | | | | | | | | |
| Credit Suisse Group AG - ADR | | | 6,500 | | | | 81,055 | |
| Goldman Sachs Group, Inc. (The) | | | 320 | | | | 73,785 | |
| | | | | | | | 154,840 | |
| KARNER BLUE BIODIVERSITY IMPACT FUND |
| SCHEDULE OF INVESTMENTS (Continued) |
| COMMON STOCKS — 98.2% (Continued) | | Shares | | | Value | |
| Health Care — 12.7% | | | | | | | | |
| Biotech & Pharma — 10.6% | | | | | | | | |
| AbbVie, Inc. | | | 1,080 | | | $ | 112,946 | |
| Amgen, Inc. | | | 292 | | | | 64,836 | |
| AstraZeneca plc - ADR | | | 1,720 | | | | 91,057 | |
| Bristol-Myers Squibb Company | | | 2,190 | | | | 136,656 | |
| Merck & Company, Inc. | | | 1,395 | | | | 112,144 | |
| Novo Nordisk A/S - ADR | | | 1,570 | | | | 105,394 | |
| Roche Holding AG - ADR | | | 2,684 | | | | 109,561 | |
| Sanofi - ADR | | | 1,885 | | | | 94,627 | |
| | | | | | | | 827,221 | |
| Medical Equipment & Devices — 2.1% | | | | | | | | |
| Abbott Laboratories | | | 675 | | | | 73,049 | |
| Medtronic plc | | | 780 | | | | 88,686 | |
| | | | | | | | 161,735 | |
| Industrials — 10.4% | | | | | | | | |
| Commercial Support Services — 3.5% | | | | | | | | |
| Republic Services, Inc. | | | 690 | | | | 66,737 | |
| ShotSpotter, Inc. (a) | | | 1,985 | | | | 65,842 | |
| Waste Management, Inc. | | | 1,182 | | | | 140,812 | |
| | | | | | | | 273,391 | |
| Diversified Industrials — 1.6% | | | | | | | | |
| 3M Company | | | 225 | | | | 38,864 | |
| Pentair plc | | | 1,625 | | | | 84,208 | |
| | | | | | | | 123,072 | |
| Electrical Equipment — 0.7% | | | | | | | | |
| Trimble, Inc. (a) | | | 925 | | | | 55,380 | |
| | | | | | | | | |
| Engineering & Construction — 0.9% | | | | | | | | |
| Stantec, Inc. | | | 2,315 | | | | 69,751 | |
| | | | | | | | | |
| Machinery — 1.1% | | | | | | | | |
| Xylem, Inc. | | | 915 | | | | 87,812 | |
| | | | | | | | | |
| Transportation & Logistics — 2.6% | | | | | | | | |
| A.P. Moller-Maersk A/S - B Shares - ADR | | | 8,050 | | | | 81,466 | |
| Deutsche Post AG - ADR | | | 2,466 | | | | 119,305 | |
| | | | | | | | 200,771 | |
| KARNER BLUE BIODIVERSITY IMPACT FUND |
| SCHEDULE OF INVESTMENTS (Continued) |
| COMMON STOCKS — 98.2% (Continued) | | Shares | | | Value | |
| Materials — 16.9% | | | | | | | | |
| Chemicals — 3.5% | | | | | | | | |
| Akzo Nobel N.V. - ADR | | | 3,145 | | | $ | 111,176 | |
| Avery Dennison Corporation | | | 520 | | | | 77,657 | |
| Koninklijke DSM N.V. - ADR | | | 1,945 | | | | 79,745 | |
| | | | | | | | 268,578 | |
| Construction Materials — 3.3% | | | | | | | | |
| CRH plc - ADR | | | 1,715 | | | | 67,314 | |
| LafargeHolcim Ltd. - ADR | | | 10,502 | | | | 109,116 | |
| Vulcan Materials Company | | | 550 | | | | 76,807 | |
| | | | | | | | 253,237 | |
| Forestry, Paper & Wood Products — 2.4% | | | | | | | | |
| Stora Enso Oyj - ADR | | | 4,631 | | | | 77,615 | |
| Trex Company, Inc. (a) | | | 730 | | | | 54,619 | |
| UPM-Kymmene Oyj - ADR | | | 1,775 | | | | 58,238 | |
| | | | | | | | 190,472 | |
| Metals & Mining — 7.7% | | | | | | | | |
| Barrick Gold Corporation | | | 5,331 | | | | 123,360 | |
| Fortescue Metals Group Ltd. - ADR | | | 5,355 | | | | 143,246 | |
| Freeport-McMoRan, Inc. | | | 5,246 | | | | 122,704 | |
| Kinross Gold Corporation | | | 9,381 | | | | 66,980 | |
| Newmont Corporation | | | 2,422 | | | | 142,462 | |
| | | | | | | | 598,752 | |
| Technology — 10.4% | | | | | | | | |
| Semiconductors — 1.8% | | | | | | | | |
| NVIDIA Corporation | | | 255 | | | | 136,695 | |
| | | | | | | | | |
| Software — 4.2% | | | | | | | | |
| Microsoft Corporation | | | 685 | | | | 146,638 | |
| Oracle Corporation | | | 745 | | | | 43,001 | |
| SAP SE - ADR | | | 670 | | | | 81,177 | |
| Simulations Plus, Inc. | | | 1,060 | | | | 59,328 | |
| | | | | | | | 330,144 | |
| Technology Hardware — 3.4% | | | | | | | | |
| Cisco Systems, Inc. | | | 2,645 | | | | 113,788 | |
| FUJIFILM Holdings Corporation - ADR | | | 1,400 | | | | 75,096 | |
| Sony Corporation - ADR | | | 830 | | | | 77,431 | |
| | | | | | | | 266,315 | |
| Technology Services — 1.0% | | | | | | | | |
| International Business Machines Corporation | | | 615 | | | | 75,965 | |
| KARNER BLUE BIODIVERSITY IMPACT FUND |
| SCHEDULE OF INVESTMENTS (Continued) |
| COMMON STOCKS — 98.2% (Continued) | | Shares | | | Value | |
| Utilities — 4.6% | | | | | | | | |
| Electric & Gas Marketing & Trading — 1.9% | | | | | | | | |
| Orsted A/S - ADR | | | 2,455 | | | $ | 147,239 | |
| | | | | | | | | |
| Electric Utilities — 2.7% | | | | | | | | |
| Exelon Corporation | | | 1,290 | | | | 52,980 | |
| Iberdrola S.A. - ADR | | | 1,410 | | | | 77,057 | |
| Red Electrica Corporation S.A. - ADR | | | 7,825 | | | | 79,971 | |
| | | | | | | | 210,008 | |
| | | | | | | | | |
| Investments at Value — 98.2% (Cost $6,444,938) | | | | | | $ | 7,624,310 | |
| | | | | | | | | |
| Other Assets in Excess of Liabilities — 1.8% | | | | | | | 137,362 | |
| | | | | | | | | |
| Net Assets — 100.0% | | | | | | $ | 7,761,672 | |
ADR - American Depositary Receipt.
| (a) | Non-income producing security. |
See accompanying notes to financial statements.
| KARNER BLUE BIODIVERSITY IMPACT FUND |
| STATEMENT OF ASSETS AND LIABILITIES |
| November 30, 2020 (Unaudited) |
| ASSETS | | | | |
| Investments in securities: | | | | |
| At cost | | $ | 6,444,938 | |
| At value (Note 2) | | $ | 7,624,310 | |
| Cash (Note 2) | | | 271,223 | |
| Cash denominated in foreign currency (Cost $718) | | | 721 | |
| Receivable for capital shares sold | | | 350 | |
| Receivable from Adviser (Note 4) | | | 27,694 | |
| Dividends and income receivable | | | 6,509 | |
| Tax reclaims receivable | | | 1,860 | |
| Other assets | | | 18,939 | |
| Total assets | | | 7,951,606 | |
| | | | | |
| LIABILITIES | | | | |
| Payable for investment securities purchased | | | 173,286 | |
| Payable to administrator (Note 4) | | | 6,562 | |
| Accrued distribution fees (Note 4) | | | 937 | |
| Accrued administrative services fees (Note 4) | | | 254 | |
| Other accrued expenses | | | 8,895 | |
| Total liabilities | | | 189,934 | |
| | | | | |
| NET ASSETS | | $ | 7,761,672 | |
| | | | | |
| NET ASSETS CONSIST OF: | | | | |
| Paid-in capital | | $ | 6,568,245 | |
| Accumulated earnings | | | 1,193,427 | |
| NET ASSETS | | $ | 7,761,672 | |
| | | | | |
| NET ASSET VALUE PER SHARE: | | | | |
| INVESTOR CLASS | | | | |
| Net assets applicable to Investor Class | | $ | 465,205 | |
| Investor Class shares of beneficial interest outstanding (unlimited number of shares authorized, no par value) | | | 38,629 | |
| Net asset value, offering price and redemption price per share (Note 2) | | $ | 12.04 | |
| | | | | |
| INSTITUTIONAL CLASS | | | | |
| Net assets applicable to Institutional Class | | $ | 337,632 | |
| Institutional Class shares of beneficial interest outstanding (unlimited number of shares authorized, no par value) | | | 27,954 | |
| Net asset value, offering price and redemption price per share (Note 2) | | $ | 12.08 | |
| | | | | |
| BUTTERFLY™ CLASS | | | | |
| Net assets applicable to Butterfly™ Class | | $ | 6,958,835 | |
| Butterfly™ Class shares of beneficial interest outstanding (unlimited number of shares authorized, no par value) | | | 575,282 | |
| Net asset value, offering price and redemption price per share (Note 2) | | $ | 12.10 | |
See accompanying notes to financial statements.
| KARNER BLUE BIODIVERSITY IMPACT FUND |
| STATEMENT OF OPERATIONS |
| For the Six Months Ended November 30, 2020 (Unaudited) |
| INVESTMENT INCOME | | | | |
| Dividend income | | $ | 77,351 | |
| Foreign withholding taxes on dividends | | | (6,473 | ) |
| Interest | | | 4 | |
| Total investment income | | | 70,882 | |
| | | | | |
| EXPENSES | | | | |
| Investment advisory fees (Note 4) | | | 28,103 | |
| Fund accounting fees (Note 4) | | | 18,853 | |
| Transfer agent fees (Note 4) | | | 18,000 | |
| Legal fees | | | 13,154 | |
| Administration fees (Note 4) | | | 12,500 | |
| Registration fees - Investor Class | | | 5,660 | |
| Registration fees - Institutional Class | | | 2,943 | |
| Registration fees - ButterflyTM Class | | | 3,132 | |
| Audit and tax services fees | | | 8,750 | |
| Trustees’ fees and expenses (Note 4) | | | 8,400 | |
| Compliance fees (Note 4) | | | 6,000 | |
| Filing fees | | | 5,086 | |
| Printing of shareholder reports | | | 4,328 | |
| Custody and bank service fees | | | 3,392 | |
| Postage and supplies | | | 1,857 | |
| Insurance expense | | | 1,614 | |
| Distribution fees - Investor Class (Note 4) | | | 566 | |
| Administrative services fees - Institutional Class (Note 4) | | | 156 | |
| Other expenses | | | 13,831 | |
| Total expenses | | | 156,325 | |
| Less fee reductions and expense reimbursements by Adviser (Note 4) | | | (104,925 | ) |
| Less fee waivers by the administrator (Note 4) | | | (20,400 | ) |
| Net expenses | | | 31,000 | |
| | | | | |
| NET INVESTMENT INCOME | | | 39,882 | |
| | | | | |
| REALIZED AND UNREALIZED GAINS ON INVESTMENTS AND FOREIGN CURRENCIES | | | | |
| Net realized gains from: | | | | |
| Investments | | | 94,675 | |
| Foreign currency transactions (Note 2) | | | 29 | |
| Net change in unrealized appreciation (depreciation) on: | | | | |
| Investments | | | 1,082,580 | |
| Foreign currency translation (Note 2) | | | 3 | |
| NET REALIZED AND UNREALIZED GAINS ON INVESTMENTS AND FOREIGN CURRENCIES | | | 1,177,287 | |
| | | | | |
| NET INCREASE IN NET ASSETS RESULTING FROM OPERATIONS | | $ | 1,217,169 | |
See accompanying notes to financial statements.
| KARNER BLUE BIODIVERSITY IMPACT FUND |
| STATEMENTS OF CHANGES IN NET ASSETS |
| | | Six Months Ended | | | | |
| | | November 30, | | | Period Ended | |
| | | 2020 | | | May 31, | |
| | | (Unaudited) | | | 2020 (a) | |
| FROM OPERATIONS | | | | | | | | |
| Net investment income | | $ | 39,882 | | | $ | 46,675 | |
| Net realized gains (losses) from investments and foreign currency translations | | | 94,704 | | | | (162,337 | ) |
| Net change in unrealized appreciation (depreciation) on investments and currency translation | | | 1,082,583 | | | | 96,792 | |
| Net increase (decrease) in net assets resulting from operations | | | 1,217,169 | | | | (18,870 | ) |
| | | | | | | | | |
| FROM DISTRIBUTIONS TO SHAREHOLDERS (Note 2) | | | | | | | | |
| Investor Class | | | — | | | | (173 | ) |
| Institutional Class | | | — | | | | (31 | ) |
| Butterfly™ Class | | | — | | | | (4,685 | ) |
| Decrease in net assets from distributions to shareholders | | | — | | | | (4,889 | ) |
| | | | | | | | | |
| CAPITAL SHARE TRANSACTIONS | | | | | | | | |
| Investor Class | | | | | | | | |
| Proceeds from shares sold | | | 11,203 | | | | 478,670 | |
| Net asset value of shares issued in reinvestment of distributions to shareholders | | | — | | | | 173 | |
| Payments for shares redeemed | | | (50,000 | ) | | | (50,030 | ) |
| Net increase (decrease) in Investor Class net assets from capital share transactions | | | (38,797 | ) | | | 428,813 | |
| | | | | | | | | |
| Institutional Class | | | | | | | | |
| Proceeds from shares sold | | | — | | | | 303,524 | |
| Net asset value of shares issued in reinvestment of distributions to shareholders | | | — | | | | 31 | |
| Payments for shares redeemed | | | (392 | ) | | | (189 | ) |
| Net increase (decrease) in Institutional Class net assets from capital share transactions | | | (392 | ) | | | 303,366 | |
| | | | | | | | | |
| Butterfly™ Class | | | | | | | | |
| Proceeds from shares sold | | | 360,933 | | | | 5,513,500 | |
| Net asset value of shares issued in reinvestment of distributions to shareholders | | | — | | | | 4,685 | |
| Payments for shares redeemed | | | — | | | | (3,846 | ) |
| Net increase in Butterfly™ Class net assets from capital share transactions | | | 360,933 | | | | 5,514,339 | |
| | | | | | | | | |
| TOTAL INCREASE IN NET ASSETS | | | 1,538,913 | | | | 6,222,759 | |
| | | | | | | | | |
| NET ASSETS | | | | | | | | |
| Beginning of period | | | 6,222,759 | | | | — | |
| End of period | | $ | 7,761,672 | | | $ | 6,222,759 | |
| (a) | Represents the period from the commencement of operations (September 17, 2019) through May 31, 2020. |
See accompanying notes to financial statements.
| KARNER BLUE BIODIVERSITY IMPACT FUND |
| STATEMENTS OF CHANGES IN NET ASSETS (Continued) |
| | | Six Months Ended | | | | |
| | | November 30, | | | Period Ended | |
| | | 2020 | | | May 31, | |
| | | (Unaudited) | | | 2020 (a) | |
| CAPITAL SHARE ACTIVITY | | | | | | | | |
| Investor Class | | | | | | | | |
| Shares sold | | | 1,048 | | | | 46,943 | |
| Shares reinvested | | | — | | | | 16 | |
| Shares redeemed | | | (4,390 | ) | | | (4,988 | ) |
| Net increase (decrease) in shares outstanding | | | (3,342 | ) | | | 41,971 | |
| Shares outstanding at beginning of period | | | 41,971 | | | | — | |
| Shares outstanding at end of period | | | 38,629 | | | | 41,971 | |
| | | | | | | | | |
| Institutional Class | | | | | | | | |
| Shares sold | | | — | | | | 28,006 | |
| Shares reinvested | | | — | | | | 3 | |
| Shares redeemed | | | (35 | ) | | | (20 | ) |
| Net increase (decrease) in shares outstanding | | | (35 | ) | | | 27,989 | |
| Shares outstanding at beginning of period | | | 27,989 | | | | — | |
| Shares outstanding at end of period | | | 27,954 | | | | 27,989 | |
| | | | | | | | | |
| Butterfly™ Class | | | | | | | | |
| Shares sold | | | 31,716 | | | | 543,487 | |
| Shares reinvested | | | — | | | | 438 | |
| Shares redeemed | | | — | | | | (359 | ) |
| Net increase in shares outstanding | | | 31,716 | | | | 543,566 | |
| Shares outstanding at beginning of period | | | 543,566 | | | | — | |
| Shares outstanding at end of period | | | 575,282 | | | | 543,566 | |
| (a) | Represents the period from the commencement of operations (September 17, 2019) through May 31, 2020. |
See accompanying notes to financial statements.
| KARNER BLUE BIODIVERSITY IMPACT FUND |
| INVESTOR CLASS |
| FINANCIAL HIGHLIGHTS |
Per Share Data for a Share Outstanding Throughout Each Period
| | | Six Months | | | | |
| | | Ended | | | | |
| | | November 30, | | | Period Ended | |
| | | 2020 | | | May 31, | |
| | | (Unaudited) | | | 2020 (a) | |
| Net asset value at beginning of period | | $ | 10.12 | | | $ | 10.00 | |
| Income from investment operations: | | | | | | | | |
| Net investment income (b) | | | 0.04 | | | | 0.08 | |
| Net realized and unrealized gains on investments and foreign currencies | | | 1.88 | | | | 0.05 | (c) |
| Total from investment operations | | | 1.92 | | | | 0.13 | |
| Less distributions from: | | | | | | | | |
| Net investment income | | | — | | | | (0.01 | ) |
| Net asset value at end of period | | $ | 12.04 | | | $ | 10.12 | |
| Total return (d) | | | 18.97 | % (e) | | | 1.26 | % (e) |
| Net assets at end of period (000’s) | | $ | 465 | | | $ | 425 | |
| Ratios/supplementary data: | | | | | | | | |
| Ratio of total expenses to average net assets | | | 6.84 | % (f) | | | 7.64 | % (f) |
| Ratio of net expenses to average net assets (g) | | | 1.25 | % (f) | | | 1.25 | % (f) |
| Ratio of net investment income to average net assets (g) | | | 0.81 | % (f) | | | 1.12 | % (f) |
| Portfolio turnover rate | | | 24 | % (e) | | | 61 | % (e) |
| (a) | Represents the period from the commencement of operations (September 17, 2019) through May 31, 2020. |
| (b) | Net investment income per share is based on average shares outstanding during the period. |
| (c) | Represents a balancing figure derived from other amounts in the financial highlights table that captures all other changes affecting net asset value per share. This per share amount does not correlate to the aggregate of the net realized and unrealized losses on the Statement of Operations for the same period. |
| (d) | Total return is a measure of the change in value of an investment in the Fund over the period covered. The returns shown do not reflect the deduction of taxes a shareholder would pay on Fund distributions, if any, or the redemption of Fund shares. The total returns would be lower if the Adviser had not reduced fees and reimbursed expenses (Note 4). |
| (g) | Ratio was determined after advisory fee reductions and expense reimbursements (Note 4). |
See accompanying notes to financial statements.
| KARNER BLUE BIODIVERSITY IMPACT FUND |
| INSTITUTIONAL CLASS |
| FINANCIAL HIGHLIGHTS |
Per Share Data for a Share Outstanding Throughout Each Period
| | | Six Months | | | | |
| | | Ended | | | | |
| | | November 30, | | | Period Ended | |
| | | 2020 | | | May 31, | |
| | | (Unaudited) | | | 2020 (a) | |
| Net asset value at beginning of period | | $ | 10.14 | | | $ | 10.00 | |
| Income from investment operations: | | | | | | | | |
| Net investment income (b) | | | 0.06 | | | | 0.12 | |
| Net realized and unrealized gains on investments and foreign currencies | | | 1.88 | | | | 0.03 | (c) |
| Total from investment operations | | | 1.94 | | | | 0.15 | |
| Less distributions from: | | | | | | | | |
| Net investment income | | | — | | | | (0.01 | ) |
| Net asset value at end of period | | $ | 12.08 | | | $ | 10.14 | |
| Total return (d) | | | 19.13 | % (e) | | | 1.46 | % (e) |
| Net assets at end of period (000’s) | | $ | 338 | | | $ | 284 | |
| Ratios/supplementary data: | | | | | | | | |
| Ratio of total expenses to average net assets | | | 6.08 | % (f) | | | 7.38 | % (f) |
| Ratio of net expenses to average net assets (g) | | | 1.00 | % (f) | | | 1.00 | % (f) |
| Ratio of net investment income to average net assets (g) | | | 1.03 | % (f) | | | 1.74 | % (f) |
| Portfolio turnover rate | | | 24 | % (e) | | | 61 | % (e) |
| (a) | Represents the period from the commencement of operations (September 17, 2019) through May 31, 2020. |
| (b) | Net investment income per share is based on average shares outstanding during the period. |
| (c) | Represents a balancing figure derived from other amounts in the financial highlights table that captures all other changes affecting net asset value per share. This per share amount does not correlate to the aggregate of the net realized and unrealized losses on the Statement of Operations for the same period. |
| (d) | Total return is a measure of the change in value of an investment in the Fund over the period covered. The returns shown do not reflect the deduction of taxes a shareholder would pay on Fund distributions, if any, or the redemption of Fund shares. The total returns would be lower if the Adviser had not reduced fees and reimbursed expenses (Note 4). |
| (g) | Ratio was determined after advisory fee reductions and expense reimbursements (Note 4). |
See accompanying notes to financial statements.
| KARNER BLUE BIODIVERSITY IMPACT FUND |
| BUTTERFLY™ CLASS |
| FINANCIAL HIGHLIGHTS |
Per Share Data for a Share Outstanding Throughout Each Period
| | | Six Months | | | | |
| | | Ended | | | | |
| | | November 30, | | | Period Ended | |
| | | 2020 | | | May 31, | |
| | | (Unaudited) | | | 2020 (a) | |
| Net asset value at beginning of period | | $ | 10.14 | | | $ | 10.00 | |
| Income from investment operations: | | | | | | | | |
| Net investment income (b) | | | 0.07 | | | | 0.10 | |
| Net realized and unrealized gains on investments and foreign currencies | | | 1.89 | | | | 0.05 | (c) |
| Total from investment operations | | | 1.96 | | | | 0.15 | |
| Less distributions from: | | | | | | | | |
| Net investment income | | | — | | | | (0.01 | ) |
| Net asset value at end of period | | $ | 12.10 | | | $ | 10.14 | |
| Total return (d) | | | 19.33 | % (e) | | | 1.50 | %(e) |
| Net assets at end of period (000’s) | | $ | 6,959 | | | $ | 5,514 | |
| Ratios/supplementary data: | | | | | | | | |
| Ratio of total expenses to average net assets | | | 4.19 | % (f) | | | 5.32 | % (f) |
| Ratio of net expenses to average net assets (g) | | | 0.85 | % (f) | | | 0.85 | % (f) |
| Ratio of net investment income to average net assets (g) | | | 1.16 | % (f) | | | 1.47 | % (f) |
| Portfolio turnover rate | | | 24 | %(e) | | | 61 | % (e) |
| (a) | Represents the period from the commencement of operations (September 17, 2019) through May 31, 2020. |
| (b) | Net investment income per share is based on average shares outstanding during the period. |
| (c) | Represents a balancing figure derived from other amounts in the financial highlights table that captures all other changes affecting net asset value per share. This per share amount does not correlate to the aggregate of the net realized and unrealized losses on the Statement of Operations for the same period. |
| (d) | Total return is a measure of the change in value of an investment in the Fund over the period covered. The returns shown do not reflect the deduction of taxes a shareholder would pay on Fund distributions, if any, or the redemption of Fund shares. The total returns would be lower if the Adviser had not reduced fees and reimbursed expenses (Note 4). |
| (g) | Ratio was determined after advisory fee reductions and expense reimbursements (Note 4). |
See accompanying notes to financial statements.
| KARNER BLUE BIODIVERSITY IMPACT FUND |
| NOTES TO FINANCIAL STATEMENTS |
| November 30, 2020 (Unaudited) |
Karner Blue Biodiversity Impact Fund (formerly Karner Blue Animal Impact Fund) (the “Fund”) is a diversified series of Ultimus Managers Trust (the “Trust”), an open-end investment company established as an Ohio business trust under a Declaration of Trust dated February 28, 2012. Other series of the Trust are not incorporated in this report.
The investment objective of the Fund is to seek to achieve long-term total returns by investing in companies that lead their industries in animal welfare performance.
The Fund offers three classes of shares: Investor Class shares (sold without any sales loads, but subject to a distribution and/or shareholder service fee of up to 0.25% of the average daily net assets attributable to Investor Class shares, and requiring a $2,000 initial investment), Institutional Class shares (sold without any sales loads and distribution and/ or shareholder service fees but subject to an administrative service fee of up to 0.10% of the average daily net assets attributable to Institutional Class shares, and requiring a $200,000 initial investment) and Butterfly™ Class shares (sold without any sales loads and distribution and/or shareholder service fees and requiring a $2,000,000 initial investment). Each share class represents an ownership interest in the same investment portfolio.
| 2. | Significant Accounting Policies |
The following is a summary of the Fund’s significant accounting policies. The policies are in conformity with accounting principles generally accepted in the United States of America (“GAAP”). The Fund follows accounting and reporting guidance under Financial Accounting Standards Board Accounting Standards Codification Topic 946, “Financial Services – Investment Companies.”
Securities valuation – The Fund values its portfolio securities at market value as of the close of regular trading on the New York Stock Exchange (the “NYSE”) (normally 4:00 p.m. Eastern time) on each business day the NYSE is open for business. The Fund values its listed securities on the basis of the security’s last sale price on the security’s primary exchange, if available, otherwise at the exchange’s most recently quoted mean price. NASDAQ-listed securities are valued at the NASDAQ Official Closing Price. When using a quoted price and when the market is considered active, the security will be classified as Level 1 within the fair value hierarchy (see below). In the event that market quotations are not readily available or are considered unreliable due to market or other events, the Fund values its securities and other assets at fair value in accordance with procedures established by and under the general supervision of the Board of Trustees (the “Board”). Under these procedures, the securities will be classified as Level 2 or 3 within the fair value hierarchy, depending on the inputs used. Unavailable or unreliable market quotes may be due to the following factors: a substantial bid-ask spread; infrequent sales
| KARNER BLUE BIODIVERSITY IMPACT FUND |
| NOTES TO FINANCIAL STATEMENTS (Continued) |
resulting in stale prices; insufficient trading volume; small trade sizes; a temporary lapse in any reliable pricing source; and actions of the securities or futures markets, such as the suspension or limitation of trading. As a result, the prices of securities used to calculate the Fund’s net asset value (“NAV”) may differ from quoted or published prices for the same securities.
GAAP establishes a single authoritative definition of fair value, sets out a framework for measuring fair value, and requires additional disclosures about fair value measurements.
Various inputs are used in determining the value of the Fund’s investments. These inputs are summarized in the three broad levels listed below:
| ● | Level 1 – quoted prices in active markets for identical securities |
| ● | Level 2 – other significant observable inputs |
| ● | Level 3 – significant unobservable inputs |
The inputs or methods used for valuing securities are not necessarily an indication of the risks associated with investing in those securities. The inputs used to measure fair value may fall into different levels of the fair value hierarchy. In such cases, for disclosure purposes, the level in the fair value hierarchy within which the fair value measurement falls in its entirety is determined based on the lowest level input that is significant to the fair value measurement.
The following is a summary of the Fund’s investments and the inputs used to value the investments as of November 30, 2020:
| | | Level 1 | | | Level 2 | | | Level 3 | | | Total | |
| Common Stocks | | $ | 7,624,310 | | | $ | — | | | $ | — | | | $ | 7,624,310 | |
| Total | | $ | 7,624,310 | | | $ | — | | | $ | — | | | $ | 7,624,310 | |
Refer to the Fund’s Schedule of Investments for a listing of securities by sector and industry type. The Fund did not hold any derivative instruments or any assets or liabilities that were measured at fair value on a recurring basis using significant unobservable inputs (Level 3) as of or during the six months ended November 30, 2020.
Cash account – The Fund’s cash is held in a bank account with balances which may exceed the amount covered by federal deposit insurance. As of November 30, 2020, the cash balance reflected on the Statement of Assets and Liabilities represents the amount held in a deposit sweep account.
Share valuation – The NAV per share of each class of the Fund is calculated daily by dividing the total value of the assets attributable to that class, less liabilities attributable to that class, by the number of shares outstanding of that class. The offering price and redemption price per share of each class of the Fund is equal to the NAV per share of such class.
| KARNER BLUE BIODIVERSITY IMPACT FUND |
| NOTES TO FINANCIAL STATEMENTS (Continued) |
Investment income – Dividend income is recorded on the ex-dividend date. Non-cash dividends included in dividend income, if any, are recorded at the fair market value of the security received. Interest income is accrued as earned. Withholding taxes on foreign dividends have been recorded in accordance with the Fund’s understanding of the applicable country’s rules and tax rates.
Investment transactions – Investment transactions are accounted for on the trade date. Realized gains and losses on investments sold are determined on a specific identification basis.
Foreign currency translation – Securities and other assets and liabilities denominated in or expected to settle in foreign currencies, if any, are translated into U.S. dollars based on exchange rates on the following basis:
| A. | The fair values of investment securities and other assets and liabilities are translated as of the close of the NYSE each day. |
| B. | Purchases and sales of investment securities and income and expenses are translated at the rate of exchange prevailing as of 4:00 p.m. Eastern time on the respective date of such transactions. |
| C. | The Fund does not isolate that portion of the results of operations caused by changes in foreign exchange rates on investments from those caused by changes in market prices of securities held. Such fluctuations are included with the net realized and unrealized gains or losses on investments. |
Reported net realized foreign exchange gains or losses arise from 1) purchases and sales of foreign currencies, 2) currency gains or losses realized between trade and settlement dates on securities transactions, and 3) the difference between the amounts of dividends and foreign withholding taxes recorded on the Fund’s books and the U.S. dollar equivalent of the amounts actually received or paid. Reported net unrealized foreign exchange gains and losses arise from changes in the value of assets and liabilities that result from changes in exchange rates.
Allocation between Classes – Investment income earned, realized capital gains and losses, and unrealized appreciation and depreciation are allocated daily to each Class of the Fund based upon its proportionate share of total net assets of the Fund. Class-specific expenses are charged directly to the Class incurring the expense. Common expenses which are not attributable to a specific Class are allocated daily to each Class of shares of the Fund based upon its proportionate share of total net assets of the Fund.
Common expenses – Common expenses of the Trust are allocated among the Fund and the other series of the Trust based on the relative net assets of each series, the number of series in the Trust, or the nature of the services performed and the relative applicability to each series.
| KARNER BLUE BIODIVERSITY IMPACT FUND |
| NOTES TO FINANCIAL STATEMENTS (Continued) |
Distributions to shareholders – The Fund distributes to shareholders any net investment income dividends and net realized capital gains distributions at least once each year. The amount of such dividends and distributions are determined in accordance with federal income tax regulations, which may differ from GAAP. Dividends and distributions to shareholders are recorded on the ex-dividend date. The distributions paid to shareholders during the period ended May 31, 2020 were ordinary income. There were no distributions paid to shareholders during the six months ended November 30, 2020.
Estimates – The preparation of financial statements in conformity with GAAP requires management to make estimates and assumptions that affect the reported amounts of assets and liabilities and disclosure of contingent assets and liabilities as of the date of the financial statements and the reported amounts of increase (decrease) in net assets from operations during the reporting period. Actual results could differ from those estimates.
Federal income tax – The Fund has qualified and intends to continue to qualify as a regulated investment company under the Internal Revenue Code of 1986, as amended (the “Code”). Qualification generally will relieve the Fund of liability for federal income taxes to the extent 100% of its net investment income and net realized capital gains are distributed in accordance with the Code.
In order to avoid imposition of the excise tax applicable to regulated investment companies, it is also the Fund’s intention to declare as dividends in each calendar year at least 98% of its net investment income (earned during the calendar year) and 98.2% of its net realized capital gains (earned during the twelve months ended October 31) plus undistributed amounts from prior years.
The following information is computed on a tax basis for each item as of November 30, 2020:
| Tax cost of portfolio investments | | $ | 6,454,704 | |
| Gross unrealized appreciation | | $ | 1,352,676 | |
| Gross unrealized depreciation | | | (183,070 | ) |
| Net unrealized appreciation | | | 1,169,606 | |
| Net unrealized appreciation on foreign currency translation | | | 3 | |
| Accumulated ordinary income | | | 81,716 | |
| Capital loss carryforwards | | | (153,539 | ) |
| Other gains | | | 95,641 | |
| Accumulated earnings | | $ | 1,193,427 | |
The difference between the federal income tax cost of portfolio investments and the financial statement cost of portfolio investments is due to certain timing differences in the recognition of capital gains or losses under income tax regulations and GAAP. These “book/tax” differences are temporary in nature and are primarily due to the tax deferral of losses on wash sales.
| KARNER BLUE BIODIVERSITY IMPACT FUND |
| NOTES TO FINANCIAL STATEMENTS (Continued) |
As of May 31, 2020, the Fund had a short-term capital loss carryforward of $153,539 for federal income tax purposes, which may be carried forward indefinitely. This capital loss carryforward is available to offset net realized gains in the current and future years, thereby reducing future taxable gains distributions.
The Fund recognizes the tax benefits or expenses of uncertain tax positions only when the position is “more likely than not” of being sustained assuming examination by tax authorities. Management has reviewed the Fund’s tax positions for the current and all open tax periods and has concluded that no provision for unrecognized tax benefits or expenses is required in these financial statements. The Fund identifies its major tax jurisdiction as U.S. Federal.
| 3. | Investment Transactions |
During the six months ended November 30, 2020, cost of purchases and proceeds from sales of investment securities, other than short-term investments, amounted to $2,077,506 and $1,591,815, respectively.
| 4. | Transactions with Related Parties |
INVESTMENT ADVISORY AGREEMENT
The Fund’s investments are managed by Karner Blue Capital, LLC (the “Adviser”) pursuant to the terms of an Investment Advisory Agreement. The Fund pays the Adviser an investment advisory fee, computed and accrued daily and paid monthly, at the annual rate of 0.80% of average daily net assets.
Pursuant to an Expense Limitation Agreement (“ELA”) between the Fund and the Adviser, the Adviser has contractually agreed, until September 30, 2021, to reduce investment advisory fees and reimburse other operating expenses to limit total annual operating expenses of the Fund (exclusive of brokerage costs; taxes; interest; borrowing costs such as interest and dividend expenses on securities sold short; costs to organize the Fund; acquired fund fees and expenses; extraordinary expenses such as litigation and merger or reorganization costs; and other expenses not incurred in the ordinary course of the Fund’s business) to an amount not exceeding the following percentages of average daily net assets attributable to each respective class:
| Investor Class | | Institutional Class | | Butterfly™ Class |
| 1.25% | | 1.00% | | 0.85% |
Accordingly, during the six months ended November 30, 2020, the Adviser did not collect any of its investment advisory fees and reimbursed other operating expenses of $76,822.
| KARNER BLUE BIODIVERSITY IMPACT FUND |
| NOTES TO FINANCIAL STATEMENTS (Continued) |
Under the terms of the ELA, investment advisory fee reductions and expense reimbursements by the Adviser are subject to repayment by the Fund for a period of three years after such fees and expenses were incurred, provided that the repayments do not cause total annual fund operating expenses to exceed the lesser of (i) the expense limitation then in effect, if any, and (ii) the expense limitation in effect at the time the expenses to be repaid were incurred. As of November 30, 2020, the Adviser may in the future seek repayment of investment advisory fee reductions and expense reimbursements in the amount of $249,707 no later than the dates listed below:
| May 31, 2023 | | $ | 144,782 | |
| November 30, 2023 | | | 104,925 | |
| Total | | $ | 249,707 | |
OTHER SERVICE PROVIDERS
Ultimus Fund Solutions, LLC (“Ultimus”) provides administration, fund accounting, compliance and transfer agency services to the Fund. The Fund pays Ultimus fees in accordance with the agreements for such services. In addition, the Fund pays out-of-pocket expenses including, but not limited to, postage, supplies and certain costs related to the pricing of its portfolio securities. During the six months ended November 30, 2020, Ultimus voluntarily waived fees in the amount of $20,400. These voluntary waivers are not subject to recoupment by Ultimus.
Under the terms of a Distribution Agreement with the Trust, Ultimus Fund Distributors, LLC (the “Distributor”) serves as the principal underwriter to the Fund. The Distributor is a wholly-owned subsidiary of Ultimus. The Distributor is compensated partially by the Adviser and partially by the Investor Class shares of the Fund for acting as principal underwriter.
A Trustee and certain officers of the Trust are also officers of Ultimus and/or the Distributor.
DISTRIBUTION PLAN
The Fund has adopted a plan of distribution (the “Plan”), pursuant to Rule 12b-1 under the Investment Company Act of 1940, as amended (the “1940 Act”), which permits Investor Class shares of the Fund to directly incur or reimburse the Fund’s principal underwriter for certain expenses related to the distribution of its shares. The annual limitation for payment of expenses pursuant to the Plan is 0.25% of the Fund’s average daily net assets allocable to Investor Class shares. The Fund has not adopted a plan of distribution with respect to the Institutional Class shares or the Butterfly™ Class shares. During the six months ended November 30, 2020, the Investor Class shares incurred $566 of distribution fees under the Plan.
| KARNER BLUE BIODIVERSITY IMPACT FUND |
| NOTES TO FINANCIAL STATEMENTS (Continued) |
ADMINISTRATIVE SERVICES PLAN
The Fund has adopted an Administrative Services Plan (the “Administrative Services Plan”), for the Institutional Class shares of the Fund. The Administrative Services Plan allows the Fund to use the net assets of the Institutional Class shares to pay financial intermediaries that provide services relating to Institutional Class shares. The Administrative Services Plan permits payments for the provision of certain administrative, recordkeeping and other non-distribution related services to Institutional Class shareholders. The Administrative Services Plan permits the Fund to make service fee payments at an annual rate of up to 0.10% of the Fund’s average daily net assets attributable to its Institutional Class shares. The Fund has not adopted an administrative services plan with respect to the Investor Class shares or the Butterfly™ Class shares. During the six months ended November 30, 2020, the Institutional Class shares incurred $156 of fees under the Administrative Services Plan.
TRUSTEE COMPENSATION
Each member of the Board (a “Trustee”) who is not an “interested person” of the Trust (“Independent Trustee”) receives a $1,300 annual retainer from the Fund, paid quarterly, except for the Board Chairperson who receives a $1,500 annual retainer from the Fund, paid in quarterly installments. Each Independent Trustee also receives from the Fund a fee of $500 for each Board meeting attended plus reimbursement for travel and other meeting-related expenses.
PRINCIPAL HOLDERS OF FUND SHARES
As of November 30, 2020, the following shareholders owned of record 25% or more of the outstanding shares of each class of the Fund:
| Name of Record Owners | | % Ownership |
| Investor Class | | |
| Muriel Vanhousen | | 25% |
| Institutional Class | | |
| Marion Look-Jameson | | 64% |
| Butterfly™ Class | | |
| SEI Private Trust Company (for the benefit of its customers) | | 64% |
A beneficial owner of 25% or more of the Fund’s outstanding shares may be considered a controlling person of the Fund. That shareholder’s vote could have a more significant effect on matters presented at a shareholders’ meeting.
| KARNER BLUE BIODIVERSITY IMPACT FUND |
| NOTES TO FINANCIAL STATEMENTS (Continued) |
| 5. | Foreign Securities Risk |
The Fund may invest in American Depositary Receipts (“ADRs”). Investments in ADRs provide exposure to foreign securities that may involve different risks than those of U.S. securities. Foreign securities are subject to individual country risk, less favorable reporting and disclosure risk, currency exchange risk and greater price volatility, and may have higher liquidity risk than U.S. registered securities. As of November 30, 2020, the Fund had 37.5% of its net assets invested in ADRs.
| 6. | Contingencies and Commitments |
The Fund indemnifies the Trust’s officers and Trustees for certain liabilities that might arise from their performance of their duties to the Fund. Additionally, in the normal course of business the Fund enters into contracts that contain a variety of representations and warranties and which provide general indemnifications. The Fund’s maximum exposure under these arrangements is unknown, as this would involve future claims that may be made against the Fund that have not yet occurred. However, based on experience, the Fund expects the risk of loss to be remote.
The Fund is required to recognize in the financial statements the effects of all subsequent events that provide additional evidence about conditions that existed as of the date of the Statement of Assets and Liabilities. For non-recognized subsequent events that must be disclosed to keep the financial statements from being misleading, the Fund is required to disclose the nature of the event as well as an estimate of its financial effect, or a statement that such an estimate cannot be made. Management has evaluated subsequent events through the issuance of these financial statements and has noted no such events except for the following:
The Fund paid the following distributions to shareholders subsequent to November 30, 2020:
| | | | | | | Per Share |
| | | Record | | | | Ordinary |
| | | Date | | Ex-Date | | Income |
| Investor Class | | 12/18/2020 | | 12/21/2020 | | $0.1025 |
| Institutional Class | | 12/18/2020 | | 12/21/2020 | | $0.1237 |
| Butterfly™ Class | | 12/18/2020 | | 12/21/2020 | | $0.1382 |
| KARNER BLUE BIODIVERSITY IMPACT FUND |
| ABOUT YOUR FUND’S EXPENSES (Unaudited) |
We believe it is important for you to understand the impact of costs on your investment. As a shareholder of the Fund, you incur ongoing costs, including management fees, class-specific expenses (such as distribution fees and administrative services fees) and other operating expenses. The following examples are intended to help you understand your ongoing costs (in dollars) of investing in the Fund and to compare these costs with the ongoing costs of investing in other mutual funds.
A mutual fund’s ongoing costs are expressed as a percentage of its average net assets. This figure is known as the expense ratio. The expenses in the table below are based on an investment of $1,000 made at the beginning of the most recent semi-annual period (June 1, 2020) and held until the end of the period (November 30, 2020).
The table below illustrates the Fund’s ongoing costs in two ways:
Actual fund return – This section helps you to estimate the actual expenses that you paid over the period. The “Ending Account Value” shown is derived from the Fund’s actual return, and the fourth column shows the dollar amount of operating expenses that would have been paid by an investor who started with $1,000 in the Fund. You may use the information here, together with the amount you invested, to estimate the expenses that you paid over the period.
To do so, simply divide your account value by $1,000 (for example, an $8,600 account value divided by $1,000 = 8.6), then multiply the result by the number given for the Fund under the heading “Expenses Paid During Period.”
Hypothetical 5% return – This section is intended to help you compare the Fund’s ongoing costs with those of other mutual funds. It assumes that the Fund had an annual return of 5% before expenses during the period shown, but that the expense ratio is unchanged. In this case, because the return used is not the Fund’s actual return, the results do not apply to your investment. The example is useful in making comparisons because the U.S. Securities and Exchange Commission (the “SEC”) requires all mutual funds to calculate expenses based on a 5% return. You can assess the Fund’s ongoing costs by comparing this hypothetical example with the hypothetical examples that appear in shareholder reports of other funds.
Note that expenses shown in the table are meant to highlight and help you compare ongoing costs only. The Fund does not charge transaction fees, such as purchase or redemption fees, nor does it carry a “sales load.”
The calculations assume no shares were bought or sold during the period. Your actual costs may have been higher or lower, depending on the amount of your investment and the timing of any purchases or redemptions.
| KARNER BLUE BIODIVERSITY IMPACT FUND |
| ABOUT YOUR FUND’S EXPENSES (Unaudited) (Continued) |
More information about the Fund’s expenses can be found in this report. For additional information on operating expenses and other shareholder costs, please refer to the Fund’s prospectus.
| | | | | Ending | | | | |
| | | Beginning | | Account Value | | Net | | Expenses |
| | | Account Value | | November 30, | | Expense | | Paid During |
| | | June 1, 2020 | | 2020 | | Ratio (a) | | Period (b) |
| Investor Class | | | | | | | | |
| Based on Actual Fund Return | | $1,000.00 | | $1,189.70 | | 1.25% | | $6.84 |
| Based on Hypothetical 5% Return (before expenses) | | $1,000.00 | | $1,018.75 | | 1.25% | | $6.31 |
| Institutional Class | | | | | | | | |
| Based on Actual Fund Return | | $1,000.00 | | $1,191.30 | | 1.00% | | $5.48 |
| Based on Hypothetical 5% Return (before expenses) | | $1,000.00 | | $1,020.00 | | 1.00% | | $5.05 |
| Butterfly™ Class | | | | | | | | |
| Based on Actual Fund Return | | $1,000.00 | | $1,193.30 | | 0.85% | | $4.66 |
| Based on Hypothetical 5% Return (before expenses) | | $1,000.00 | | $1,020.75 | | 0.85% | | $4.29 |
| (a) | Annualized, based on the most recent one-half year expenses. |
| (b) | Expenses are equal to the annualized expense ratio of each Class, multiplied by the average account value over the period, multiplied by 183/366 (to reflect the one-half year period). |
| OTHER INFORMATION (Unaudited) |
A description of the policies and procedures that the Fund uses to vote proxies relating to portfolio securities is available without charge upon request by calling toll-free 1-855-KBANIML (855-522-6465), or on the SEC’s website at www.sec.gov. Information regarding how the Fund voted proxies relating to portfolio securities during the most recent 12-month period ended June 30 is also available without charge upon request by calling toll-free 1-855-KBANIML (855-522-6465), or on the SEC’s website at www.sec.gov.
The Trust files a complete listing of portfolio holdings for the Fund with the SEC as of the end of the first and third quarters of each fiscal year as an exhibit to its reports on Form N-PORT. These filings are available upon request by calling 1-855-KBANIML (855-522-6465). Furthermore, you may obtain a copy of the filings on the SEC’s website at www.sec.gov.
| KARNER BLUE BIODIVERSITY IMPACT FUND |
| LIQUIDITY RISK MANAGEMENT PROGRAM (Unaudited) |
The Fund has adopted and implemented a written liquidity risk management program (the “Program”) as required by Rule 22e-4 (the “Liquidity Rule”) under the Investment Company Act of 1940, as amended. The Program is reasonably designed to assess and manage the Fund’s liquidity risk, taking into consideration, among other factors, the Fund’s investment strategy and the liquidity of its portfolio investments during normal and reasonably foreseeable stressed conditions; its short- and long-term cash flow projections; and its cash holdings and access to other funding sources. The Fund’s Board of Trustees (the “Board”) approved the appointment of the Liquidity Administrator Committee, comprising of the Fund’s Adviser and certain Trust officers, to be responsible for the Program’s administration and oversight and for reporting to the Board on at least an annual basis regarding the Program’s operation and effectiveness. The annual written report assessing the Program (the “Report”) was presented to the Board at the October 19-20, 2020 Board meeting and covered the period from September 17, 2019 to May 31, 2020 (the “Review Period”).
During the Review Period, the Fund did not experience unusual stress or disruption to its operations related to purchase and redemption activity. Also, during the Review Period, the Fund held adequate levels of cash and highly liquid investments to meet shareholder redemption activities in accordance with applicable requirements. The Report concluded that the Program is reasonably designed to prevent violation of the Liquidity Rule and the Program has been effectively implemented.
| FACTS | WHAT DOES THE KARNER BLUE BIODIVERSITY IMPACT FUND (the “Fund”) DO WITH YOUR PERSONAL INFORMATION? |
| |
| Why? | Financial companies choose how they share your personal information. Federal law gives consumers the right to limit some but not all sharing. Federal law also requires us to tell you how we collect, share, and protect your personal information. Please read this notice carefully to understand what we do. |
| |
| What? | The types of personal information we collect and share depend on the product or service you have with us. This information can include: ■ Social Security number ■ Assets ■ Retirement Assets ■ Transaction History ■ Checking Account Information ■ Purchase History ■ Account Balances ■ Account Transactions ■ Wire Transfer Instructions When you are no longer our customer, we continue to share your information as described in this notice. |
| |
| How? | All financial companies need to share your personal information to run their everyday business. In the section below, we list the reasons financial companies can share their customers’ personal information; the reasons the Fund chooses to share; and whether you can limit this sharing. |
| |
| Reasons we can share your personal information | Does the
Fund share? | Can you limit
this sharing? |
For our everyday business purposes – Such as to process your transactions, maintain your account(s), respond to court orders and legal investigations, or report to credit bureaus | Yes | No |
For our marketing purposes – to offer our products and services to you | No | We don’t share |
| For joint marketing with other financial companies | No | We don’t share |
For our affiliates’ everyday business purposes – information about your transactions and experiences | No | We don’t share |
For our affiliates’ everyday business purposes – information about your creditworthiness | No | We don’t share |
| For nonaffiliates to market to you | No | We don’t share |
| | | |
| Questions? | Call 1-855-KBANIML (855-522-6465) |
| | | | |
| Page 2 | |
| Who we are |
| Who is providing this notice? | Karner Blue Biodiversity Impact Fund Ultimus Fund Distributors, LLC (Distributor) Ultimus Fund Solutions, LLC (Administrator) |
| What we do |
| How does the Fund protect my personal information? | To protect your personal information from unauthorized access and use, we use security measures that comply with federal law. These measures include computer safeguards and secured files and buildings. Our service providers are held accountable for adhering to strict policies and procedures to prevent any misuse of your nonpublic personal information. |
| How does the Fund collect my personal information? | We collect your personal information, for example, when you ■ Open an account ■ Provide account information ■ Give us your contact information ■ Make deposits or withdrawals from your account ■ Make a wire transfer ■ Tell us where to send the money ■ Tell us who receives the money ■ Show your government-issued ID ■ Show your driver’s license We also collect your personal information from other companies. |
| Why can’t I limit all sharing? | Federal law gives you the right to limit only ■ Sharing for affiliates’ everyday business purposes – information about your creditworthiness ■ Affiliates from using your information to market to you ■ Sharing for nonaffiliates to market to you State laws and individual companies may give you additional rights to limit sharing. |
| |
| Definitions |
| Affiliates | Companies related by common ownership or control. They can be financial and nonfinancial companies. ■ Karner Blue Capital, LLC, the investment adviser to the Fund, could be deemed to be an affiliate. |
| Nonaffiliates | Companies not related by common ownership or control. They can be financial and nonfinancial companies ■ The Fund does not share with nonaffiliates so they can market to you. |
| Joint marketing | A formal agreement between nonaffiliated financial companies that together market financial products or services to you. ■ The Fund does not jointly market. |
This page intentionally left blank.
KARNER-SAR-20
| |
| |
| |
| |
| |
| |
| |
| |
| |
| KEMPNER MULTI-CAP DEEP VALUE FUND |
| |
| |
| Institutional Class (FIKDX) |
| |
| Investor Class (FAKDX) |
| |
| |
| |
| |
| |
| |
| Semi-Annual Report |
| |
| November 30, 2020 |
| |
| (Unaudited) |
| |
| |
| |
| |
| |
| |
| |
| |
| |
| |
| |
| |
| |
| |
| |
| |
| |
| |
| |
| |
| |
| |
| |
| |
| |
| |
| |
| |
| |
| |
| |
| |
| |
| |
| |
| |
| |
| KEMPNER MULTI-CAP DEEP VALUE FUND |
| LETTER TO SHAREHOLDERS (Unaudited) | December 2020 |
| | |
Fund Objective
The Kempner Multi-Cap Deep Value Fund seeks to generate a total pre-tax return, including capital growth and dividends, greater than the rate of inflation over a minimum three-to five-year period. For the 6-month period ended November 30, 2020, the Fund produced a cumulative return of 19.01% for the Institutional Class Shares and 18.88% for the Investor Class Shares, both net of fees. The Headline CPI inflation rate over the same six-month period was 1.97%. Comparatively, over the same time period, the Lipper Multi Cap Value Funds Classification Index returned 21.03% and the S&P 500 Value Index returned 14.82%.
U.S. Economic Commentary
The advent of several approved vaccines worldwide has now opened up the U.S. economy to quite positive possibilities in 2021. Indeed, even without the vaccine and despite some weak areas in the economy, there are already surprisingly broad numbers of economic indications of U.S. strength, even in the face of a pandemic surge this fall. Examples range from the November 2020 U.S. Purchasing Managers Employment Index at 56.8% - the highest in the last 10 years. For the week of December 22, 2020, the Evercore-ISI Trucking Survey, which is directly correlated with real GDP growth, reached the highest level in the past 5 years at 68.2%, and finally, the CRBE Raw Industrials Index for the month of November 2020 is at this year’s highest, up 22%.
All these areas of strength are there despite the existence of 11 million unemployed, a level, while down from the worst this year, that is as high as it was in the 2008-2009 great recession. We believe this group of unemployed can now be perceived as a positive. As vaccinations spread, many of these folks will be re-entering a rapidly opening economy, providing a boost throughout 2021. We expect the U.S. economy to grow at least 4% in 2021 and feel that that number will be higher if a COVID-19 relief bill is passed by Congress and the Administration.
Portfolio Strategy
Our investment approach continues to be one of investing in deeply undervalued companies and selling when the underlying value becomes realized by other market participants and reflected in the current price. The past year of rising markets has therefore resulted in a greater number of sale opportunities than purchase opportunities. We always consider cash as a buying reserve and in this case due to a spectacular market that we have seen and concerns about the coronavirus, which are relatively new, our accounts are more liquid than they have ever been in my lifetime. We, of course, will be gradually committing these reserves as long-term opportunities present themselves.
Over the past 6 months, we established and/or added to positions in Bristol-Myers Squibb Co. (BMY), Everest Re Group Ltd (RE), and Hewlett Packard Enterprises (HPE). During the same time frame, we added to the Fund’s positions in Citigroup Inc. (C) and DuPont de Nemours, Inc. (DD). We reduced the Fund’s positions in FedEx Corporation (FDX), Honda Motor Co. Ltd. (HMC), and Pfizer, Inc. (PFE). We sold entirely out of Accenture PLC
(ACN), Axis Capital Holdings Ltd. (AXS), Capital One Financial Corp. (COF), Nordstrom Inc. (JWN), Occidental Petroleum Corp. (OXY), Skyworks Solutions Inc. (SWKS) and United Parcel Services Inc. (UPS).
We continue to scour the equity universe to locate stocks which meet our investment criteria of: 1) a relatively low forecast P/E multiple, usually 15X or less, 2) a dividend yield is paid, or has declared a dividend, 3) public debt, if any, is investment grade, 4) a minimum of $500 million market capitalization, and 5) current stock price that is within 20% of the 52-week low price. In addition to meeting these criteria, stocks are quantitatively and qualitatively analyzed to determine company prospects and reasonableness of valuation.
The portfolio’s outperformance relative to the S&P 500 Value Index for the 6-month period ending November 30, 2020 was attributable in large part to a higher weighting of shares in the energy and financial sectors.
We maintain our long-term focus in the Kempner Multi-Cap Deep Value Fund on areas which we believe are overlooked by the market.
Harris L. Kempner, Jr. and M. Shawn Gault are the portfolio managers for the Kempner Multi-Cap Deep Value Fund.
Past performance is not predictive of future performance. Investment results and principal value will fluctuate so that shares, when redeemed, may be worth more or less than their original cost. Current performance may be higher or lower than the performance data quoted. Performance data current to the most recent month end are available by calling 1-800-665-9778.
An investor should consider the investment objectives, risks, charges and expenses of the Fund carefully before investing. The Fund’s prospectus contains this and other important information. To obtain a copy of the Fund’s prospectus please call 1-800-665-9778 and a copy will be sent to you free of charge. Please read the prospectus carefully before you invest. Kempner Multi-Cap Deep Value Fund is distributed by Ultimus Fund Distributors, LLC.
This Letter to Shareholders seeks to describe some of the Adviser’s current opinions and views of the financial markets. Although the Adviser believes it has a reasonable basis for any opinions or views expressed, actual results may differ, sometimes significantly so, from those expected or expressed. The securities held by the Fund that are discussed in the Letter to Shareholders were held during the period covered by this Report. They do not comprise the entire investment portfolio of the Fund, may be sold at any time and may no longer be held by the Fund. For a complete list of securities held by the Fund as of November 30, 2020, please see the Schedule of Investments section of the semi-annual report. The opinions of the Adviser with respect to those securities may change at any time.
Statements in the Letter to Shareholders that reflect projections or expectations for future financial or economic performance of the Fund and the market in general and statements of the Fund’s plans and objectives for future operations are forward-looking statements. No assurance can be given that actual results or events will not differ materially from those projected, estimated, assumed, or anticipated in any such forward-looking statements. Important factors that could result in such differences, in addition to factors noted with such forward-looking statements include, without limitation, general economic conditions, such as inflation, recession, and interest rates. Past performance is not a guarantee of future results.
| KEMPNER MULTI-CAP DEEP VALUE FUND |
| PORTFOLIO INFORMATION |
| November 30, 2020 (Unaudited) |
| |
Sector Diversification (% of Net Assets)
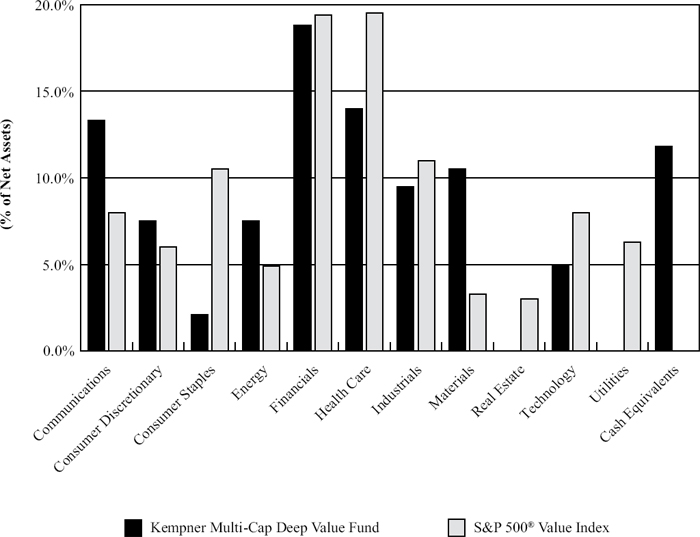
| Top 10 Equity Investments |
| |
| Security Description | | % of Net Assets |
| General Motors Company | | 5.9% |
| Lincoln National Corporation | | 5.1% |
| Bank of America Corporation | | 4.4% |
| Cardinal Health, Inc. | | 4.3% |
| Citigroup, Inc. | | 4.3% |
| ViacomCBS, Inc. - Class B | | 4.1% |
| Walt Disney Company (The) | | 3.9% |
| Acuity Brands, Inc. | | 3.6% |
| AT&T, Inc. | | 3.6% |
| Johnson Controls International plc | | 3.5% |
| KEMPNER MULTI-CAP DEEP VALUE FUND |
| SCHEDULE OF INVESTMENTS |
| November 30, 2020 (Unaudited) |
| COMMON STOCKS — 88.2% | | Shares | | | Value | |
| Communications — 13.3% | | | | | | | | |
| Entertainment Content — 8.0% | | | | | | | | |
| ViacomCBS, Inc. - Class B | | | 81,660 | | | $ | 2,880,965 | |
| Walt Disney Company (The) | | | 18,200 | | | | 2,693,782 | |
| | | | | | | | 5,574,747 | |
| Telecommunications — 5.3% | | | | | | | | |
| AT&T, Inc. | | | 86,692 | | | | 2,492,395 | |
| Verizon Communications, Inc. | | | 19,300 | | | | 1,165,913 | |
| | | | | | | | 3,658,308 | |
| Consumer Discretionary — 7.5% | | | | | | | | |
| Automotive — 7.5% | | | | | | | | |
| General Motors Company | | | 92,720 | | | | 4,064,845 | |
| Honda Motor Company Ltd. - ADR | | | 41,400 | | | | 1,147,608 | |
| | | | | | | | 5,212,453 | |
| Consumer Staples — 2.1% | | | | | | | | |
| Retail - Consumer Staples — 2.1% | | | | | | | | |
| Walgreen Boots Alliance, Inc. | | | 38,950 | | | | 1,480,489 | |
| | | | | | | | | |
| Energy — 7.5% | | | | | | | | |
| Oil & Gas Producers — 6.0% | | | | | | | | |
| BP plc - ADR | | | 89,120 | | | | 1,743,187 | |
| Royal Dutch Shell plc - Class A - ADR | | | 39,454 | | | | 1,335,124 | |
| Valero Energy Corporation | | | 20,400 | | | | 1,096,908 | |
| | | | | | | | 4,175,219 | |
| Oil & Gas Services & Equipment — 1.5% | | | | | | | | |
| Schlumberger Ltd. | | | 47,555 | | | | 988,668 | |
| | | | | | | | | |
| Financials — 18.8% | | | | | | | | |
| Banking — 9.8% | | | | | | | | |
| Bank of America Corporation | | | 108,970 | | | | 3,068,595 | |
| Citigroup, Inc. | | | 54,100 | | | | 2,979,287 | |
| Truist Financial Corporation | | | 15,300 | | | | 710,226 | |
| | | | | | | | 6,758,108 | |
| Insurance — 9.0% | | | | | | | | |
| Everest Re Group Ltd. | | | 6,200 | | | | 1,409,446 | |
| Hartford Financial Services Group, Inc. (The) | | | 29,250 | | | | 1,292,850 | |
| Lincoln National Corporation | | | 74,850 | | | | 3,534,417 | |
| | | | | | | | 6,236,713 | |
| KEMPNER MULTI-CAP DEEP VALUE FUND |
| SCHEDULE OF INVESTMENTS (Continued) |
| COMMON STOCKS — 88.2% (Continued) | | Shares | | | Value | |
| Health Care — 14.0% | | | | | | | | |
| Biotech & Pharma — 7.9% | | | | | | | | |
| Bristol-Myers Squibb Company | | | 22,850 | | | $ | 1,425,840 | |
| Merck & Company, Inc. | | | 17,430 | | | | 1,401,197 | |
| Pfizer, Inc. | | | 22,000 | | | | 842,820 | |
| Roche Holding AG - ADR | | | 43,000 | | | | 1,755,260 | |
| Viatris, Inc. (a) | | | 3,636 | | | | 61,160 | |
| | | | | | | | 5,486,277 | |
| Health Care Facilities & Services — 6.1% | | | | | | | | |
| Cardinal Health, Inc. | | | 54,965 | | | | 3,000,539 | |
| McKesson Corporation | | | 6,880 | | | | 1,237,781 | |
| | | | | | | | 4,238,320 | |
| Industrials — 9.5% | | | | | | | | |
| Electrical Equipment — 7.1% | | | | | | | | |
| Acuity Brands, Inc. | | | 21,050 | | | | 2,499,056 | |
| Johnson Controls International plc | | | 52,599 | | | | 2,421,658 | |
| | | | | | | | 4,920,714 | |
| Transportation & Logistics — 2.4% | | | | | | | | |
| FedEx Corporation | | | 5,700 | | | | 1,633,506 | |
| | | | | | | | | |
| Materials — 10.5% | | | | | | | | |
| Chemicals — 10.5% | | | | | | | | |
| Corteva, Inc. | | | 45,349 | | | | 1,737,774 | |
| Dow, Inc. | | | 28,899 | | | | 1,531,936 | |
| DuPont de Nemours, Inc. | | | 25,800 | | | | 1,636,752 | |
| Mosaic Company (The) | | | 108,150 | | | | 2,374,974 | |
| | | | | | | | 7,281,436 | |
| Technology — 5.0% | | | | | | | | |
| Semiconductors — 2.0% | | | | | | | | |
| Applied Materials, Inc. | | | 16,760 | | | | 1,382,365 | |
| | | | | | | | | |
| Technology Hardware — 3.0% | | | | | | | | |
| Cisco Systems, Inc. | | | 35,600 | | | | 1,531,512 | |
| Hewlett Packard Enterprise Company | | | 52,500 | | | | 579,600 | |
| | | | | | | | 2,111,112 | |
| | | | | | | | | |
| Total Common Stocks (Cost $58,523,646) | | | | | | $ | 61,138,435 | |
| KEMPNER MULTI-CAP DEEP VALUE FUND |
| SCHEDULE OF INVESTMENTS (Continued) |
| WARRANTS — 0.1% | | Shares | | | Value | |
| Energy — 0.1% | | | | | | | | |
| Oil & Gas Producers — 0.1% | | | | | | | | |
| Occidental Petroleum Corporation (Cost $0) | | | 4,600 | | | $ | 23,644 | |
| | | | | | | | | |
| MONEY MARKET FUNDS — 11.2% | | Shares | | | Value | |
| BlackRock Liquidity Funds Treasury Trust Fund - Institutional Shares, 0.01% (b) (Cost $7,773,449) | | | 7,773,449 | | | $ | 7,773,449 | |
| | | | | | | | | |
| Investments at Value — 99.5% (Cost $66,297,095) | | | | | | $ | 68,935,528 | |
| | | | | | | | | |
| Other Assets in Excess of Liabilities — 0.5% | | | | | | | 371,551 | |
| | | | | | | | | |
| Net Assets — 100.0% | | | | | | $ | 69,307,079 | |
ADR – American Depositary Receipt.
| (a) | Non-income producing security. |
| (b) | The rate shown is the 7-day effective yield as of November 30, 2020. |
See accompanying notes to financial statements.
| KEMPNER MULTI-CAP DEEP VALUE FUND |
| STATEMENT OF ASSETS AND LIABILITIES |
| November 30, 2020 (Unaudited) |
| ASSETS | | | | |
| Investments: | | | | |
| At cost | | $ | 66,297,095 | |
| At value (Note 2) | | $ | 68,935,528 | |
| Dividends receivable | | | 145,441 | |
| Receivable for investment securities sold | | | 276,372 | |
| Tax reclaims receivable | | | 9,898 | |
| Other assets | | | 6,116 | |
| Total assets | | | 69,373,355 | |
| | | | | |
| LIABILITIES | | | | |
| Payable to Adviser (Note 4) | | | 31,892 | |
| Payable to administrator (Note 4) | | | 12,230 | |
| Accrued distribution fees (Note 4) | | | 4,562 | |
| Other accrued expenses | | | 17,592 | |
| Total liabilities | | | 66,276 | |
| | | | | |
| NET ASSETS | | $ | 69,307,079 | |
| | | | | |
| NET ASSETS CONSIST OF: | | | | |
| Paid-in capital | | $ | 65,462,063 | |
| Accumulated earnings | | | 3,845,016 | |
| NET ASSETS | | $ | 69,307,079 | |
| | | | | |
| NET ASSET VALUE PER SHARE: | | | | |
| INSTITUTIONAL CLASS | | | | |
| Net assets applicable to Institutional Class | | $ | 54,871,000 | |
| Institutional Class shares of beneficial interest outstanding (unlimited number of shares authorized, no par value) | | | 5,304,951 | |
| Net asset value, offering price and redemption price per share (Note 2) | | $ | 10.34 | |
| | | | | |
| INVESTOR CLASS | | | | |
| Net assets applicable to Investor Class | | $ | 14,436,079 | |
| Investor Class shares of beneficial interest outstanding (unlimited number of shares authorized, no par value) | | | 1,397,214 | |
| Net asset value, offering price and redemption price per share (Note 2) | | $ | 10.33 | |
See accompanying notes to financial statements.
| KEMPNER MULTI-CAP DEEP VALUE FUND |
| STATEMENT OF OPERATIONS |
| For the Six Months Ended November 30, 2020 (Unaudited) |
| INVESTMENT INCOME | | | | |
| Dividend income | | $ | 824,257 | |
| Foreign withholding taxes on dividends | | | (8,198 | ) |
| Total investment income | | | 816,059 | |
| | | | | |
| EXPENSES | | | | |
| Investment advisory fees (Note 4) | | | 184,142 | |
| Administration fees (Note 4) | | | 31,349 | |
| Fund accounting fees (Note 4) | | | 21,127 | |
| Distribution fees - Investor Class (Note 4) | | | 16,175 | |
| Transfer agent fees (Note 4) | | | 14,253 | |
| Legal fees | | | 13,952 | |
| Registration and filing fees | | | 9,245 | |
| Audit and tax services fees | | | 9,000 | |
| Trustees’ fees and expenses (Note 4) | | | 8,400 | |
| Compliance service fees (Note 4) | | | 6,000 | |
| Custodian and bank service fees | | | 4,578 | |
| Printing of shareholder reports | | | 2,723 | |
| Insurance expense | | | 1,953 | |
| Postage and supplies | | | 552 | |
| Other expenses | | | 11,060 | |
| Total expenses | | | 334,509 | |
| | | | | |
| NET INVESTMENT INCOME | | | 481,550 | |
| | | | | |
| REALIZED AND UNREALIZED GAINS (LOSSES) ON INVESTMENTS | | | | |
| Net realized losses from investment transactions | | | (2,324,674 | ) |
| Net change in unrealized appreciation (depreciation) on investments | | | 12,972,062 | |
| NET REALIZED AND UNREALIZED GAINS ON INVESTMENTS | | | 10,647,388 | |
| | | | | |
| NET INCREASE IN NET ASSETS RESULTING FROM OPERATIONS | | $ | 11,128,938 | |
See accompanying notes to financial statements.
| KEMPNER MULTI-CAP DEEP VALUE FUND |
| STATEMENTS OF CHANGES IN NET ASSETS |
| | | Six Months | | | | | | | |
| | | Ended | | | Ten Months | | | Year | |
| | | November 30, | | | Ended | | | Ended | |
| | | 2020 | | | May 31, | | | July 31, | |
| | | (Unaudited) | | | 2020(a) | | | 2019 | |
| FROM OPERATIONS | | | | | | | | | | | | |
| Net investment income | | $ | 481,550 | | | $ | 1,324,666 | | | $ | 1,566,551 | |
| Net realized gains (losses) from investment transactions | | | (2,324,674 | ) | | | 4,544,600 | | | | 1,078,394 | |
| Net change in unrealized appreciation (depreciation) on investments | | | 12,972,062 | | | | (15,824,047 | ) | | | (2,710,254 | ) |
| Net increase (decrease) in net assets resulting from operations | | | 11,128,938 | | | | (9,954,781 | ) | | | (65,309 | ) |
| | | | | | | | | | | | | |
| FROM DISTRIBUTIONS TO SHAREHOLDERS (Note 2) | | | | | | | | | | | | |
| Institutional Class | | | (442,354 | ) | | | (2,778,216 | ) | | | (1,891,230 | ) |
| Investor Class | | | (99,243 | ) | | | (659,602 | ) | | | (405,918 | ) |
| Decrease in net assets from distributions to shareholders | | | (541,597 | ) | | | (3,437,818 | ) | | | (2,297,148 | ) |
| | | | | | | | | | | | | |
| CAPITAL SHARE TRANSACTIONS | | | | | | | | | | | | |
| Institutional Class | | | | | | | | | | | | |
| Proceeds from shares sold | | | 200,000 | | | | 1,361,548 | | | | 502,000 | |
| Net asset value of shares issued in reinvestment of distributions to shareholders | | | 22,940 | | | | 184,521 | | | | 488,647 | |
| Payments for shares redeemed | | | (2,305,005 | ) | | | (2,467,395 | ) | | | (6,515,014 | ) |
| Net decrease in Institutional Class net assets from capital share transactions | | | (2,082,065 | ) | | | (921,326 | ) | | | (5,524,367 | ) |
| | | | | | | | | | | | | |
| Investor Class | | | | | | | | | | | | |
| Proceeds from shares sold | | | 475,595 | | | | 58,348 | | | | 207,333 | |
| Net asset value of shares issued in reinvestment of distributions to shareholders | | | 97,633 | | | | 648,309 | | | | 394,858 | |
| Payments for shares redeemed | | | (529,211 | ) | | | (358,267 | ) | | | (520,339 | ) |
| Net increase in Investor Class net assets from capital share transactions | | | 44,017 | | | | 348,390 | | | | 81,852 | |
| | | | | | | | | | | | | |
| TOTAL INCREASE (DECREASE) IN NET ASSETS | | | 8,549,293 | | | | (13,965,535 | ) | | | (7,804,972 | ) |
| | | | | | | | | | | | | |
| NET ASSETS | | | | | | | | | | | | |
| Beginning of period | | | 60,757,786 | | | | 74,723,321 | | | | 82,528,293 | |
| End of period | | $ | 69,307,079 | | | $ | 60,757,786 | | | $ | 74,723,321 | |
| (a) | Fund changed fiscal year to May 31. |
See accompanying notes to financial statements.
| KEMPNER MULTI-CAP DEEP VALUE FUND |
| STATEMENTS OF CHANGES IN NET ASSETS (Continued) |
| | | Six Months | | | | | | | |
| | | Ended | | | Ten Months | | | Year | |
| | | November 30, | | | Ended | | | Ended | |
| | | 2020 | | | May 31, | | | July 31, | |
| | | (Unaudited) | | | 2020(a) | | | 2019 | |
| CAPITAL SHARES ACTIVITY | | | | | | | | | | | | |
| Institutional Class | | | | | | | | | | | | |
| Shares sold | | | 21,164 | | | | 124,841 | | | | 47,878 | |
| Shares issued in reinvestment of distributions to shareholders | | | 2,623 | | | | 17,685 | | | | 51,883 | |
| Shares redeemed | | | (252,718 | ) | | | (236,471 | ) | | | (621,448 | ) |
| Net decrease in shares outstanding | | | (228,931 | ) | | | (93,945 | ) | | | (521,687 | ) |
| Shares outstanding at beginning of period | | | 5,533,882 | | | | 5,627,827 | | | | 6,149,514 | |
| Shares outstanding at end of period | | | 5,304,951 | | | | 5,533,882 | | | | 5,627,827 | |
| | | | | | | | | | | | | |
| Investor Class | | | | | | | | | | | | |
| Shares sold | | | 50,826 | | | | 7,576 | | | | 19,363 | |
| Shares issued in reinvestment of distributions to shareholders | | | 11,171 | | | | 62,053 | | | | 40,136 | |
| Shares redeemed | | | (57,565 | ) | | | (32,739 | ) | | | (49,190 | ) |
| Net increase in shares outstanding | | | 4,432 | | | | 36,890 | | | | 10,309 | |
| Shares outstanding at beginning of period | | | 1,392,782 | | | | 1,355,892 | | | | 1,345,583 | |
| Shares outstanding at end of period | | | 1,397,214 | | | | 1,392,782 | | | | 1,355,892 | |
| (a) | Fund changed fiscal year to May 31. |
See accompanying notes to financial statements.
| KEMPNER MULTI-CAP DEEP VALUE FUND |
| INSTITUTIONAL CLASS |
| FINANCIAL HIGHLIGHTS |
| |
| Per Share Data for a Share Outstanding Throughout Each Period |
| | | Six | | | | | | | | | | | | | | | | | | | |
| | | Months | | | Ten | | | | | | | | | | | | | | | | |
| | | Ended | | | Months | | | Year | | | Year | | | Year | | | Year | | | Year | |
| | | Nov. 30, | | | Ended | | | Ended | | | Ended | | | Ended | | | Ended | | | Ended | |
| | | 2020 | | | May 31, | | | July 31, | | | July 31, | | | July 31, | | | July 31, | | | July 31, | |
| | | (Unaudited) | | | 2020(a) | | | 2019 | | | 2018 | | | 2017 | | | 2016 | | | 2015 | |
| Net asset value at beginning of period | | $ | 8.77 | | | $ | 10.70 | | | $ | 11.01 | | | $ | 10.47 | | | $ | 9.18 | | | $ | 10.42 | | | $ | 11.53 | |
| | | | | | | | | | | | | | | | | | | | | | | | | | | | | |
| Income (loss) from investment operations: | | | | | | | | | | | | | | | | | | | | | | | | | | | | |
| Net investment income | | | 0.07 | | | | 0.20 | | | | 0.21 | | | | 0.19 | | | | 0.19 | | | | 0.21 | | | | 0.18 | |
| Net realized and unrealized gains (losses) on investments | | | 1.58 | | | | (1.62 | ) | | | (0.19 | ) | | | 1.00 | | | | 1.29 | | | | (0.54 | ) | | | (0.29 | ) |
| Total from investment operations | | | 1.65 | | | | (1.42 | ) | | | 0.02 | | | | 1.19 | | | | 1.48 | | | | (0.33 | ) | | | (0.11 | ) |
| | | | | | | | | | | | | | | | | | | | | | | | | | | | | |
| Less distributions from: | | | | | | | | | | | | | | | | | | | | | | | | | | | | |
| Net investment income | | | (0.08 | ) | | | (0.17 | ) | | | (0.23 | ) | | | (0.17 | ) | | | (0.19 | ) | | | (0.21 | ) (b) | | | (0.19 | ) |
| Net realized gains | | | — | | | | (0.34 | ) | | | (0.10 | ) | | | (0.48 | ) | | | — | | | | (0.70 | ) | | | (0.81 | ) |
| Total distributions | | | (0.08 | ) | | | (0.51 | ) | | | (0.33 | ) | | | (0.65 | ) | | | (0.19 | ) | | | (0.91 | ) | | | (1.00 | ) |
| | | | | | | | | | | | | | | | | | | | | | | | | | | | | |
| Net asset value at end of period | | $ | 10.34 | | | $ | 8.77 | | | $ | 10.70 | | | $ | 11.01 | | | $ | 10.47 | | | $ | 9.18 | | | $ | 10.42 | |
| | | | | | | | | | | | | | | | | | | | | | | | | | | | | |
| Total return (c) | | | 19.01 | % (d) | | | (13.99 | )% (d) | | | 0.43 | % | | | 11.79 | % | | | 16.30 | % | | | (2.56 | )% | | | (1.16 | )% |
| | | | | | | | | | | | | | | | | | | | | | | | | | | | | |
| Net assets at end of period (000’s) | | $ | 54,871 | | | $ | 48,552 | | | $ | 60,228 | | | $ | 67,725 | | | $ | 67,863 | | | $ | 95,846 | | | $ | 130,791 | |
| | | | | | | | | | | | | | | | | | | | | | | | | | | | | |
| Ratios/supplementary data: | | | | | | | | | | | | | | | | | | | | | | | | | | | | |
| Ratio of total expenses to average net assets | | | 1.02 | % (e) | | | 0.99 | % (e) | | | 0.95 | % | | | 0.94 | % | | | 0.84 | % | | | 0.78 | % | | | 0.77 | % |
| Ratio of net investment income to average net assets | | | 1.59 | % (e) | | | 2.37 | % (e) | | | 2.13 | % | | | 1.74 | % | | | 1.98 | % | | | 2.30 | % | | | 1.66 | % |
| Portfolio turnover rate | | | 7 | % (d) | | | 27 | % (d) | | | 17 | % | | | 25 | % | | | 18 | % | | | 10 | % | | | 40 | % |
| (a) | Fund changed fiscal year to May 31. |
| (b) | Includes a return of capital of less than $0.01 per share. |
| (c) | Total return is a measure of the change in value of an investment in the Fund over the periods covered. The returns shown do not reflect the deduction of taxes a shareholder would pay on Fund distributions, if any, or the redemption of Fund shares. |
See accompanying notes to financial statements.
| KEMPNER MULTI-CAP DEEP VALUE FUND |
| INVESTOR CLASS |
| FINANCIAL HIGHLIGHTS |
| |
| Per Share Data for a Share Outstanding Throughout Each Period |
| | | Six | | | | | | | | | | | | | | | | | | | |
| | | Months | | | Ten | | | | | | | | | | | | | | | | |
| | | Ended | | | Months | | | Year | | | Year | | | Year | | | Year | | | Year | |
| | | Nov. 30, | | | Ended | | | Ended | | | Ended | | | Ended | | | Ended | | | Ended | |
| | | 2020 | | | May 31, | | | July 31, | | | July 31, | | | July 31, | | | July 31, | | | July 31, | |
| | | (Unaudited) | | | 2020(a) | | | 2019 | | | 2018 | | | 2017 | | | 2016 | | | 2015 | |
| Net asset value at beginning of period | | $ | 8.76 | | | $ | 10.69 | | | $ | 11.00 | | | $ | 10.46 | | | $ | 9.17 | | | $ | 10.40 | | | $ | 11.53 | |
| Income (loss) from investment operations: | | | | | | | | | | | | | | | | | | | | | | | | | | | | |
| Net investment income | | | 0.06 | | | | 0.18 | | | | 0.18 | | | | 0.17 | | | | 0.17 | | | | 0.19 | | | | 0.15 | |
| Net realized and unrealized gains (losses) on investments | | | 1.58 | | | | (1.62 | ) | | | (0.19 | ) | | | 1.00 | | | | 1.29 | | | | (0.53 | ) | | | (0.31 | ) |
| Total from investment operations | | | 1.64 | | | | (1.44 | ) | | | (0.01 | ) | | | 1.17 | | | | 1.46 | | | | (0.34 | ) | | | (0.16 | ) |
| | | | | | | | | | | | | | | | | | | | | | | | | | | | | |
| Less distributions from: | | | | | | | | | | | | | | | | | | | | | | | | | | | | |
| Net investment income | | | (0.07 | ) | | | (0.15 | ) | | | (0.20 | ) | | | (0.15 | ) | | | (0.17 | ) | | | (0.19 | ) (b) | | | (0.16 | ) |
| Net realized gains | | | — | | | | (0.34 | ) | | | (0.10 | ) | | | (0.48 | ) | | | — | | | | (0.70 | ) | | | (0.81 | ) |
| Total distributions | | | (0.07 | ) | | | (0.49 | ) | | | (0.30 | ) | | | (0.63 | ) | | | (0.17 | ) | | | (0.89 | ) | | | (0.97 | ) |
| | | | | | | | | | | | | | | | | | | | | | | | | | | | | |
| Net asset value at end of period | | $ | 10.33 | | | $ | 8.76 | | | $ | 10.69 | | | $ | 11.00 | | | $ | 10.46 | | | $ | 9.17 | | | $ | 10.40 | |
| | | | | | | | | | | | | | | | | | | | | | | | | | | | | |
| Total return (c) | | | 18.88 | % (d) | | | (14.18 | )% (d) | | | 0.18 | % | | | 11.55 | % | | | 16.06 | % | | | (2.70 | )% | | | (1.56 | )% |
| | | | | | | | | | | | | | | | | | | | | | | | | | | | | |
| Net assets at end of period (000’s) | | $ | 14,436 | | | $ | 12,206 | | | $ | 14,495 | | | $ | 14,803 | | | $ | 15,321 | | | $ | 14,880 | | | $ | 21,272 | |
| | | | | | | | | | | | | | | | | | | | | | | | | | | | | |
| Ratios/supplementary data: | | | | | | | | | | | | | | | | | | | | | | | | | | | | |
| Ratio of total expenses to average net assets | | | 1.27 | % (e) | | | 1.24 | % (e) | | | 1.20 | % | | | 1.19 | % | | | 1.09 | % | | | 1.03 | % | | | 1.02 | % |
| Ratio of net investment income to average net assets | | | 1.34 | % (e) | | | 2.12 | % (e) | | | 1.88 | % | | | 1.49 | % | | | 1.70 | % | | | 2.05 | % | | | 1.37 | % |
| Portfolio turnover rate | | | 7 | % (d) | | | 27 | % (d) | | | 17 | % | | | 25 | % | | | 18 | % | | | 10 | % | | | 40 | % |
| (a) | Fund changed fiscal year to May 31. |
| (b) | Includes a return of capital of less than $0.01 per share. |
| (c) | Total return is a measure of the change in value of an investment in the Fund over the periods covered. The returns shown do not reflect the deduction of taxes a shareholder would pay on Fund distributions, if any, or the redemption of Fund shares. |
See accompanying notes to financial statements.
| KEMPNER MULTI-CAP DEEP VALUE FUND |
| NOTES TO FINANCIAL STATEMENTS |
| November 30, 2020 (Unaudited) |
Kempner Multi-Cap Deep Value Fund (the “Fund”) is a diversified series of Ultimus Managers Trust (the “Trust”). The Trust is an open-end management investment company registered under the Investment Company Act of 1940, as amended (the “1940 Act”). The Fund was reorganized into the Trust on April 28, 2017.
The investment objective of the Fund is to seek to generate a total pre-tax return, including capital growth and dividends, that is greater than the rate of inflation over a three-to-five-year period.
The Fund currently offers two classes of shares: Institutional Class shares (sold without any sales loads and distribution and/or shareholder servicing fees and requiring a $500,000 initial investment) and Investor Class shares (sold without any sales loads, but subject to a distribution and/or shareholder servicing fee of up to 0.25% of the average daily net assets attributable to Investor Class shares, and requiring a $500 initial investment). Each share class represents an ownership interest in the same investment portfolio.
| 2. | Significant Accounting Policies |
The Fund follows accounting and reporting guidance under Financial Accounting Standards Board Accounting Standards Codification Topic 946, “Financial Services – Investment Companies.” The following is a summary of the Fund’s significant accounting policies used in the preparation of its financial statements. These policies are in conformity with accounting principles generally accepted in the United States of America (“GAAP”).
Securities valuation – The Fund values its portfolio securities at market value as of the close of regular trading on the New York Stock Exchange (the “NYSE”) (normally 4:00 p.m. Eastern time) on each business day the NYSE is open for business. The Fund values its listed securities on the basis of the security’s last sale price on the security’s primary exchange, if available, otherwise at the exchange’s most recently quoted mean price. NASDAQ-listed securities are valued at the NASDAQ Official Closing Price. Investments representing shares of money market funds and other open-end investment companies are valued at their net asset value (“NAV”) as reported by such companies. When using a quoted price and when the market for the security is considered active, the security will be classified as Level 1 within the fair value hierarchy (see below). In the event that market quotations are not readily available or are considered unreliable due to market or other events, the Fund values its securities and other assets at fair value in accordance with procedures established by and under the general supervision of the Board of Trustees (the “Board”). Under these procedures, the securities will be classified as Level 2 or 3 within the fair value hierarchy, depending on the inputs used. Unavailable or unreliable market quotes may be due to the following factors: a substantial bid-ask spread; infrequent sales resulting in stale prices; insufficient trading volume; small trade sizes; a temporary lapse in any reliable pricing source; and actions of the securities or futures markets, such as the suspension or limitation of trading. As a result, the prices of securities used to calculate the Fund’s NAV may differ from quoted or published prices for the same securities.
| KEMPNER MULTI-CAP DEEP VALUE FUND |
| NOTES TO FINANCIAL STATEMENTS (Continued) |
GAAP establishes a single authoritative definition of fair value, sets out a framework for measuring fair value, and requires additional disclosures about fair value measurements.
Various inputs are used in determining the value of the Fund’s investments. These inputs are summarized in the three broad levels listed below:
| ● | Level 1 – quoted prices in active markets for identical securities |
| ● | Level 2 – other significant observable inputs |
| ● | Level 3 – significant unobservable inputs |
The inputs or methods used for valuing securities are not necessarily an indication of the risks associated with investing in those securities. The inputs used to measure fair value may fall into different levels of the fair value hierarchy. In such cases, for disclosure purposes, the level in the fair value hierarchy within which the fair value measurement falls in its entirety is determined based on the lowest level input that is significant to the fair value measurement.
The following is a summary of the Fund’s investments based on the inputs used to value the investments as of November 30, 2020 by security type:
| | | Level 1 | | | Level 2 | | | Level 3 | | | Total | |
| Common Stocks | | $ | 61,138,435 | | | $ | — | | | $ | — | | | $ | 61,138,435 | |
| Warrants | | | 23,644 | | | | — | | | | — | | | | 23,644 | |
| Money Market Funds | | | 7,773,449 | | | | — | | | | — | | | | 7,773,449 | |
| Total | | $ | 68,935,528 | | | $ | — | | | $ | — | | | $ | 68,935,528 | |
Refer to the Fund’s Schedule of Investments for a listing of securities by sector and industry type. The Fund did not hold any derivative instruments or any assets or liabilities that were measured at fair value on a recurring basis using significant unobservable inputs (Level 3) as of or during the six months ended November 30, 2020.
Share valuation – The NAV per share of each class of the Fund is calculated daily by dividing the total value of the assets attributable to that class, less liabilities attributable to that class, by the number of shares outstanding of that class. The offering price and redemption price per share of each class of the Fund is equal to the NAV per share of such class.
Investment income – Dividend income is recorded on the ex-dividend date. Non-cash dividends included in dividend income, if any, are recorded at the fair market value of the security received. Interest income is accrued as earned. Withholding taxes on foreign dividends have been recorded in accordance with the Fund’s understanding of the applicable country’s rules and tax rates.
Investment transactions – Investment transactions are accounted for on the trade date. Realized gains and losses on investments sold are determined on a specific identification basis.
| KEMPNER MULTI-CAP DEEP VALUE FUND |
| NOTES TO FINANCIAL STATEMENTS (Continued) |
Allocation between Classes – Investment income earned, realized capital gains and losses, and unrealized appreciation and depreciation are allocated daily to each Class of the Fund based upon its proportionate share of total net assets of the Fund. Class-specific expenses are charged directly to the Class incurring the expense. Common expenses which are not attributable to a specific Class are allocated daily to each Class of shares of the Fund based upon its proportionate share of total net assets of the Fund.
Common expenses – Common expenses of the Trust are allocated among the Fund and the other series of the Trust based on the relative net assets of each series, the number of series in the Trust, or the nature of the services performed and the relative applicability to each series.
Distributions to shareholders – The Fund intends to declare and distribute net investment income dividends on a quarterly basis. In addition, the Fund will declare and distribute net realized capital gains, if any, on an annual basis. The amount of such dividends and distributions are determined in accordance with federal income tax regulations, which may differ from GAAP. Dividends and distributions to shareholders are recorded on the ex-dividend date. The tax character of distributions paid to shareholders by the Fund during the periods ended November 30, 2020, May 31, 2020 and July 31, 2019 were as follows:
| Period | | Ordinary | | | Long-Term | | | Total | |
| Ended | | Income | | | Capital Gains | | | Distributions | |
| 11/30/2020 | | $ | 541,597 | | | $ | — | | | $ | 541,597 | |
| 5/31/2020 | | $ | 2,234,371 | | | $ | 1,203,447 | | | $ | 3,437,818 | |
| 7/31/2019 | | $ | 2,075,676 | | | $ | 221,472 | | | $ | 2,297,148 | |
Estimates – The preparation of financial statements in conformity with GAAP requires management to make estimates and assumptions that affect the reported amounts of assets and liabilities and disclosure of contingent assets and liabilities as of the date of the financial statements and the reported amounts of increase (decrease) in net assets from operations during the reporting period. Actual results could differ from those estimates.
Federal income tax – The Fund has qualified and intends to continue to qualify as a regulated investment company under the Internal Revenue Code of 1986 (the “Code”). Qualification generally will relieve the Fund of liability for federal income taxes to the extent 100% of its net investment income and net realized capital gains are distributed in accordance with the Code.
In order to avoid imposition of the excise tax applicable to regulated investment companies, it is also the Fund’s intention to declare as dividends in each calendar year equal to at least 98% of its net investment income (earned during the calendar year) and 98.2% of its net realized capital gains (earned during the twelve months ended October 31) plus undistributed amounts from prior years.
| KEMPNER MULTI-CAP DEEP VALUE FUND |
| NOTES TO FINANCIAL STATEMENTS (Continued) |
The following information is computed on a tax basis for each item as of November 30, 2020:
| Tax cost of portfolio investments | | $ | 66,297,095 | |
| Gross unrealized appreciation | | $ | 10,930,168 | |
| Gross unrealized depreciation | | | (8,291,735 | ) |
| Net unrealized appreciation | | | 2,638,433 | |
| Accumulated ordinary income | | | 1,162,143 | |
| Undistributed long-term gains | | | 2,369,114 | |
| Other capital losses | | | (2,324,674 | ) |
| Accumulated deficit | | $ | 3,845,016 | |
The Fund recognizes the tax benefits or expenses of uncertain tax positions only when the position is “more likely than not” of being sustained assuming examination by tax authorities. Management has reviewed the Fund’s tax positions for the current and all open tax years (generally, three years) and has concluded that no provision for unrecognized tax benefits or expenses is required in these financial statements. The Fund identifies its major tax jurisdiction as U.S. Federal.
| 3. | Investment Transactions |
During the six months ended November 30, 2020, cost of purchases and proceeds from sales of investment securities, other than short-term investments, amounted to $3,855,916 and $8,727,498, respectively.
| 4. | Transactions with Related Parties |
INVESTMENT ADVISORY AGREEMENT
The Fund’s investments are managed by Kempner Capital Management, Inc. (the “Adviser”) pursuant to the terms of an Investment Advisory Agreement. The Fund pays the Adviser an investment advisory fee, computed and accrued daily and paid monthly, at the annual rate of 0.59% of average daily net assets.
The Adviser has agreed contractually, until at least December 1, 2021, to reduce its advisory fees and reimburse other expenses to the extent necessary to limit total annual fund operating expenses (exclusive of brokerage costs; taxes; interest; borrowing costs such as interest and dividend expenses on securities sold short; costs to organize the Fund; acquired fund fees and expenses; extraordinary expenses such as litigation and merger or reorganization costs and other expenses not incurred in the ordinary course of the Fund’s business) to an amount not exceeding 1.05% and 1.30% of average daily net assets for Institutional Class and Investor Class shares, respectively.
Advisory fee reductions and expense reimbursements by the Adviser are subject to repayment by the Fund for a period of three years after such fees and expenses were incurred, provided that the repayments do not cause the Fund’s total annual fund operating expenses to exceed the lesser of (i) the expense limitation then in effect, if any, and (ii) the expense limitation
| KEMPNER MULTI-CAP DEEP VALUE FUND |
| NOTES TO FINANCIAL STATEMENTS (Continued) |
in effect at the time the expenses to be repaid were incurred. This agreement will terminate automatically if the Investment Advisory Agreement is terminated. During the six months ended November 30, 2020, the Adviser did not reduce its advisory fees or reimburse other expenses of the Fund.
OTHER SERVICE PROVIDERS
Ultimus Fund Solutions, LLC (“Ultimus”) provides administration, fund accounting, compliance and transfer agency services to the Fund. The Fund pays Ultimus fees in accordance with the agreements for such services. In addition, the Fund pays out-of-pocket expenses including, but not limited to, postage, supplies and certain costs related to the pricing of the Fund’s portfolio securities.
Under the terms of a Distribution Agreement with the Trust, Ultimus Fund Distributors, LLC (the “Distributor”) serves as principal underwriter to the Fund. The Distributor is a wholly-owned subsidiary of Ultimus. The Distributor is compensated partially by the Adviser and partially by the Investor Class shares of the Fund for acting as principal underwriter.
A Trustee and certain officers of the Trust are also officers of Ultimus and/or the Distributor.
DISTRIBUTION PLAN
The Fund has adopted a plan of distribution (the “Plan”), pursuant to Rule 12b-1 under the 1940 Act, which permits Investor Class shares of the Fund to directly incur or reimburse the Fund’s principal underwriter for certain expenses related to the distribution of Investor Class shares. The annual limitation for payment of expenses pursuant to the Plan is 0.25% of the Fund’s average daily net assets allocable to Investor Class shares. The Fund has not adopted a plan of distribution with respect to Institutional Class shares. During the six months ended November 30, 2020, Investor Class shares of the Fund incurred $16,175 of distribution fees under the Plan.
TRUSTEE COMPENSATION
Each member of the Board (a “Trustee”) who is not an “interested person” of the Trust (“Independent Trustee”) receives a $1,300 annual retainer from the Fund, paid quarterly, except for the Board Chairperson who receives a $1,500 annual retainer from the Fund, paid quarterly. Each Independent Trustee also receives from the Fund a fee of $500 for each Board meeting attended plus reimbursement for travel and other meeting-related expenses.
| KEMPNER MULTI-CAP DEEP VALUE FUND |
| NOTES TO FINANCIAL STATEMENTS (Continued) |
PRINCIPAL HOLDERS OF FUND SHARES
As of November 30, 2020, the following shareholders owned of record 25% or more of the outstanding shares of each class of the Fund:
| NAME OF RECORD OWNERS | | % Ownership |
| Institutional Class | | |
| Muir & Company (for the benefit of its customers) | | 94% |
| Investor Class | | |
| Muir & Company (for the benefit of its customers) | | 32% |
| Morgan Stanley Smith Barney LLC (for the benefit of its customers) | | 42% |
A beneficial owner of 25% or more of the Fund’s outstanding shares may be considered a controlling person. That shareholder’s vote could have a more significant effect on matters presented at a shareholders’ meeting.
| 5. | Contingencies and Commitments |
The Fund indemnifies the Trust’s officers and Trustees for certain liabilities that might arise from their performance of their duties to the Fund. Additionally, in the normal course of business the Fund enters into contracts that contain a variety of representations and warranties and which provide general indemnifications. The Fund’s maximum exposure under these arrangements is unknown, as this would involve future claims that may be made against the Fund that have not yet occurred. However, based on experience, the Fund expects the risk of loss to be remote.
The Fund is required to recognize in the financial statements the effects of all subsequent events that provide additional evidence about conditions that existed as of the date of the Statement of Assets and Liabilities. For non-recognized subsequent events that must be disclosed to keep the financial statements from being misleading, the Fund is required to disclose the nature of the event as well as an estimate of its financial effect, or a statement that such an estimate cannot be made. Management has evaluated subsequent events through the issuance of these financial statements and has noted no such events except for the following:
The Fund paid the following distributions to shareholders subsequent to November 30, 2020:
| | | | | | | Per Share | |
| | | Record | | | | Ordinary | | | Short-Term | | | Long-Term | |
| | | Date | | Ex-Date | | Income | | | Capital Gain | | | Capital Gain | |
| Institutional Class | | 12/29/2020 | | 12/30/2020 | | $ | 0.0422 | | | $ | 0.1452 | | | $ | 0.3540 | |
| Investor Class | | 12/29/2020 | | 12/30/2020 | | $ | 0.0360 | | | $ | 0.1452 | | | $ | 0.3540 | |
| KEMPNER MULTI-CAP DEEP VALUE FUND |
| ABOUT YOUR FUND’S EXPENSES (Unaudited) |
We believe it is important for you to understand the impact of costs on your investment. As a shareholder of the Fund, you incur ongoing costs, including management fees, class-specific expenses (such as distribution fees) and other operating expenses. The following examples are intended to help you understand your ongoing costs (in dollars) of investing in the Fund and to compare these costs with the ongoing costs of investing in other mutual funds.
A mutual fund’s ongoing costs are expressed as a percentage of its average net assets. This figure is known as the expense ratio. The expenses in the table below are based on an investment of $1,000 made at the beginning of the most recent period (June 1, 2020) and held until the end of the period (November 30, 2020).
The table below illustrates the Fund’s ongoing costs in two ways:
Actual fund return – This section helps you to estimate the actual expenses that you paid over the period. The “Ending Account Value” shown is derived from the Fund’s actual return, and the fourth column shows the dollar amount of operating expenses that would have been paid by an investor who started with $1,000 in the Fund. You may use the information here, together with the amount you invested, to estimate the expenses that you paid over the period.
To do so, simply divide your account value by $1,000 (for example, an $8,600 account value divided by $1,000 = 8.6), then multiply the result by the number given for the Fund under the heading “Expenses Paid During Period.”
Hypothetical 5% return – This section is intended to help you compare the Fund’s ongoing costs with those of other mutual funds. It assumes that the Fund had an annual return of 5% before expenses during the period shown, but that the expense ratio is unchanged. In this case, because the return used is not the Fund’s actual return, the results do not apply to your investment. The example is useful in making comparisons because the SEC requires all mutual funds to calculate expenses based on a 5% return. You can assess the Fund’s ongoing costs by comparing this hypothetical example with the hypothetical examples that appear in shareholder reports of other funds.
Note that expenses shown in the table are meant to highlight and help you compare ongoing costs only. The Fund does not charge transaction fees, such as purchase or redemption fees, nor does it carry a “sales load.”
The calculations assume no shares were bought or sold during the period. Your actual costs may have been higher or lower, depending on the amount of your investment and the timing of any purchases or redemptions.
| KEMPNER MULTI-CAP DEEP VALUE FUND |
| ABOUT YOUR FUND’S EXPENSES (Unaudited) (Continued) |
More information about the Fund’s expenses can be found in this report. For additional information on operating expenses and other shareholder costs, please refer to the Fund’s prospectus.
| | | Beginning | | Ending | | Net | | Expenses |
| | | Account Value | | Account Value | | Expense | | Paid During |
| | | June 1, 2020 | | November 30, 2020 | | Ratio (a) | | Period (b) |
| Institutional Class | | | | | | | | |
| Based on Actual Fund Return | | $1,000.00 | | $1,190.10 | | 1.02% | | $5.58 |
| Based on Hypothetical 5% Return (before expenses) | | $1,000.00 | | $1,019.90 | | 1.02% | | $5.15 |
| Investor Class | | | | | | | | |
| Based on Actual Fund Return | | $1,000.00 | | $1,188.80 | | 1.27% | | $6.95 |
| Based on Hypothetical 5% Return (before expenses) | | $1,000.00 | | $1,018.65 | | 1.27% | | $6.41 |
| (a) | Annualized, based on the Fund’s most recent one-half year expenses. |
| (b) | Expenses are equal to the Fund’s annualized net expense ratio multiplied by the average account value over the period, multiplied by 183/366 (to reflect the one-half year period). |
| KEMPNER MULTI-CAP DEEP VALUE FUND |
| OTHER INFORMATION (Unaudited) |
A description of the policies and procedures that the Fund uses to vote proxies relating to portfolio securities is available without charge upon request by calling toll- free 1-800-665-9778, or on the SEC’s website at www.sec.gov. Information regarding how the Fund voted proxies relating to portfolio securities during the most recent 12-month period ended June 30 is available without charge upon request by calling toll-free 1-800-665-9778, or on the SEC’s website at www.sec.gov.
The Trust files a complete listing of portfolio holdings for the Fund with the SEC as of the end of the first and third quarters of each fiscal year as an exhibit to its reports on Form N-PORT. These filings are available upon request by calling 1-800-665-9778. Furthermore, you may obtain a copy of the filings on the SEC’s website at www.sec.gov.
| KEMPNER MULTI-CAP DEEP VALUE FUND |
| DISCLOSURE REGARDING APPROVAL OF INVESTMENT |
| ADVISORY AGREEMENT (Unaudited) |
The Board of Trustees (the “Board”), including the Independent Trustees voting separately, has reviewed and approved the Fund’s Investment Advisory Agreement (the “Agreement”) with Kempner Capital Management, Inc. (the “Adviser”) for an additional one-year term. The Board approved the Agreement at a meeting held on July 20-21, 2020, at which all of the Trustees were present.
Legal counsel advised the Board during its deliberations. Additionally, the Board received and reviewed a substantial amount of information provided by the Adviser in response to requests of the Board and counsel. In deciding whether to approve the continuation of the Agreement, the Board recalled its review of the materials related to the Fund and the Adviser throughout the preceding 12 months and its numerous discussions with Trust management and the Adviser about the operations and performance of the Fund during that period. The Board further considered those materials and discussions and numerous other factors, including:
The nature, extent, and quality of the services provided by the Adviser. In this regard, the Board reviewed the services being provided by the Adviser to the Fund including, without limitation, its recent investment advisory services to the Fund, the Adviser’s compliance policies and procedures, and its compliance program. After reviewing the foregoing information and further information in the Adviser’s memorandum (e.g., descriptions of its business and Form ADV), the Board concluded that the quality, extent, and nature of the services provided by the Adviser were satisfactory and adequate for the Fund.
The investment performance of the Fund. In this regard, the Board compared the performance of the Fund with the performance of its benchmark index, custom peer group and related Morningstar category. The Board noted that the Fund had outperformed the custom peer group’s average and median for the three-year period, underperformed the custom peer group’s median for the one-year period and the custom peer group’s average and median performance for the five-year, ten-year, and since inception periods, and matched the custom’s peer group average performance for the one-year period. The Board noted that the Fund underperformed its Morningstar category’s (Large Cap Value Category Under $100 million, True No-Load) average and median performance the one-year, three-year, five-year, ten-year, and since inception periods The Board further compared the performance of the Fund to the Consumer Price Index (the “CPI”) and noted that the Fund had underperformed for the three-year and five-year period and outperformed the CPI for the ten-year period. The Board also considered the consistency of the Adviser’s management with the Fund’s investment objective and policies. The Board indicated that the Adviser had satisfactorily explained its performance results for the Fund. Following discussion of the investment performance of the Fund and its performance relative to its Morningstar category, the Adviser’s experience in managing a mutual fund and separate accounts, its historical investment performance, and other factors, the Board concluded that the investment performance of the Fund has been satisfactory.
| KEMPNER MULTI-CAP DEEP VALUE FUND |
| DISCLOSURE REGARDING APPROVAL OF INVESTMENT |
| ADVISORY AGREEMENT (Unaudited) (Continued) |
The costs of the services provided and profits realized by the Adviser and its affiliates from its relationship with the Fund. In this regard, the Board considered the Adviser’s staffing, personnel, and methods of operations; the education and experience of its personnel; compliance program, policies, and procedures; financial condition and the level of commitment to the Fund, and, generally, the Adviser’s advisory business; the asset level of the Fund; and the overall expenses of the Fund, including the advisory fee. The Board considered the Fund’s expense limitation agreement (“ELA”) and considered the Adviser’s current and past fee reductions and expense reimbursements for the Fund. The Board further took into account the Adviser’s commitment to continue the ELA until at least December 1, 2021.
The Board also considered potential benefits for the Adviser in managing the Fund, including promotion of the Adviser’s name and the potential for it to receive research, statistical, or other services from the Fund’s trades. The Board compared the Fund’s advisory fee and overall expense ratio to the average advisory fees and average expense ratios for its custom peer group and Morningstar category. The Board noted that the 0.59% advisory fee for the Fund is above the average and below the median for the Fund’s custom peer group, and below the average and median of funds of similar size and structure in the Fund’s Morningstar category (Large Cap Value Category Under $100 million, True No-Load). The Board further noted that the overall annual expense ratio of 0.97% for the Fund is above the average and median for the Fund’s custom peer group and above the median and equal to the average of its Morningstar category. The Board also considered the fee charged by the Adviser to its other accounts that have a substantially similar strategy as the Fund and considered the similarities and differences of services received by such other accounts as compared to the services received by the Fund. The Board noted that the fee structures applicable to the Adviser’s other clients were not indicative of any unreasonableness with respect to the advisory fees payable to the Fund. The Board further considered the investment strategy and style used by the Adviser in managing the portfolio of the Fund. Following these comparisons and upon further consideration and discussion of the foregoing, the Board concluded that the advisory fee paid to the Adviser by the Fund is fair and reasonable.
The extent to which economies of scale would be realized as the Fund grows and whether advisory fee levels reflect these economies of scale for the benefit of the Fund’s investors. In this regard, the Board considered that the Fund’s fee arrangements with the Adviser involve both the advisory fee and the ELA. The Board determined that while the advisory fee rate remained the same as asset levels increased, the shareholders of the Fund have experienced benefits from the ELA in the past and could continue to experience benefits if assets fall to a level where expenses are higher than the ELA. Following further discussion of the Fund’s asset level, expectations for growth, and level of fees, the Board determined that the Fund’s fee arrangements with the Adviser would continue to provide benefits. The Board also determined that the fee arrangements were fair and reasonable in relation to the nature and quality of services being provided by the Adviser, given the Fund’s projected asset levels for the next year.
| KEMPNER MULTI-CAP DEEP VALUE FUND |
| DISCLOSURE REGARDING APPROVAL OF INVESTMENT |
| ADVISORY AGREEMENT (Unaudited) (Continued) |
Brokerage and portfolio transactions. In this regard, the Board considered the Adviser’s trading policies, procedures, and performance in seeking best execution for its clients, including the Fund. The Board also considered the historical portfolio turnover rate for the Fund; the process by which evaluations are made of the overall reasonableness of commissions paid; the process by which the Adviser evaluates best execution; the method and basis for selecting and evaluating the broker-dealers used; and any anticipated allocation of portfolio business to persons affiliated with the Adviser. After further review and discussion, the Board determined that the Adviser’s practices regarding brokerage and portfolio transactions were satisfactory.
Possible conflicts of interest. In evaluating the possibility for conflicts of interest, the Board considered such matters as the experience and abilities of the advisory personnel assigned to the Fund, the Adviser’s process for allocating trades among its different clients, and the substance and administration of the Adviser’s Code of Ethics. Following further consideration and discussion, the Board found for the Fund that the Adviser’s standards and practices relating to the identification and mitigation of potential conflicts of interests were satisfactory.
After further discussion of the factors noted above and in reliance on the information provided by the Adviser and Trust management, and taking into account the totality of all the factors discussed and information presented at this meeting and previous meetings, the Board indicated its agreement to approve the continuance of the Agreement. It was noted that in the Trustees’ deliberations regarding the approval of the continuance of the Agreement, the Trustees did not identify any particular information or factor that was all-important or controlling, and that each individual Trustee may have attributed different weights to the various factors listed above. After full consideration of the above factors as well as other factors, the Board unanimously concluded that approval of the Agreement was in the best interests of the Fund and its shareholders.
| KEMPNER MULTI-CAP DEEP VALUE FUND |
| LIQUIDITY RISK MANAGEMENT PROGRAM (Unaudited) |
The Fund has adopted and implemented a written liquidity risk management program (the “Program”) as required by Rule 22e-4 (the “Liquidity Rule”) under the Investment Company Act of 1940, as amended. The Program is reasonably designed to assess and manage the Fund’s liquidity risk, taking into consideration, among other factors, the Fund’s investment strategy and the liquidity of its portfolio investments during normal and reasonably foreseeable stressed conditions; its short- and long-term cash flow projections; and its cash holdings and access to other funding sources. The Fund’s Board of Trustees (the “Board”) approved the appointment of the Liquidity Administrator Committee, comprising of the Fund’s Adviser and certain Trust officers, to be responsible for the Program’s administration and oversight and for reporting to the Board on at least an annual basis regarding the Program’s operation and effectiveness. The annual written report assessing the Program (the “Report”) was presented to the Board at the October 19-20, 2020 Board meeting and covered the period from June 1, 2019 to May 31, 2020 (the “Review Period”).
During the Review Period, the Fund did not experience unusual stress or disruption to its operations related to purchase and redemption activity. Also, during the Review Period, the Fund held adequate levels of cash and highly liquid investments to meet shareholder redemption activities in accordance with applicable requirements. The Report concluded that the Program is reasonably designed to prevent violation of the Liquidity Rule and the Program has been effectively implemented.
This page intentionally left blank.
This page intentionally left blank.
| FACTS | WHAT DOES THE KEMPNER MULTI-CAP DEEP VALUE FUND (the “Fund”) DO WITH YOUR PERSONAL INFORMATION? |
| |
| Why? | Financial companies choose how they share your personal information. Federal law gives consumers the right to limit some but not all sharing. Federal law also requires us to tell you how we collect, share, and protect your personal information. Please read this notice carefully to understand what we do. |
| |
| What? | The types of personal information we collect and share depend on the product or service you have with us. This information can include: ■ Social Security number ■ Assets ■ Retirement Assets ■ Transaction History ■ Checking Account Information ■ Purchase History ■ Account Balances ■ Account Transactions ■ Wire Transfer Instructions When you are no longer our customer, we continue to share your information as described in this notice. |
| |
| How? | All financial companies need to share your personal information to run their everyday business. In the section below, we list the reasons financial companies can share their customers’ personal information; the reasons the Fund chooses to share; and whether you can limit this sharing. |
| |
| Reasons we can share your personal information | Does the
Fund share? | Can you limit
this sharing? |
| For our everyday business purposes – Such as to process your transactions, maintain your account(s), respond to court orders and legal investigations, or report to credit bureaus | Yes | No |
| For our marketing purposes – to offer our products and services to you | No | We don’t share |
| For joint marketing with other financial companies | No | We don’t share |
| For our affiliates’ everyday business purposes – information about your transactions and experiences | No | We don’t share |
| For our affiliates’ everyday business purposes – information about your creditworthiness | No | We don’t share |
| For nonaffiliates to market to you | No | We don’t share |
| | | | |
| Questions? | Call 1-800-665-9778 |
| Page 2 | |
| Who we are |
| Who is providing this notice? | Kempner Multi-Cap Deep Value Fund Ultimus Fund Distributors, LLC (Distributor) Ultimus Fund Solutions, LLC (Administrator) |
| What we do |
| How does the Fund protect my personal information? | To protect your personal information from unauthorized access and use, we use security measures that comply with federal law. These measures include computer safeguards and secured files and buildings. Our service providers are held accountable for adhering to strict policies and procedures to prevent any misuse of your nonpublic personal information. |
| How does the Fund collect my personal information? | We collect your personal information, for example, when you ■ Open an account ■ Provide account information ■ Give us your contact information ■ Make deposits or withdrawals from your account ■ Make a wire transfer ■ Tell us where to send the money ■ Tell us who receives the money ■ Show your government-issued ID ■ Show your driver’s license We also collect your personal information from other companies. |
| Why can’t I limit all sharing? | Federal law gives you the right to limit only ■ Sharing for affiliates’ everyday business purposes – information about your creditworthiness ■ Affiliates from using your information to market to you ■ Sharing for nonaffiliates to market to you State laws and individual companies may give you additional rights to limit sharing. |
| |
| Definitions |
| Affiliates | Companies related by common ownership or control. They can be financial and nonfinancial companies. ■ Kempner Capital Management, Inc., the investment adviser to the Fund, could be deemed to be an affiliate. |
| Nonaffiliates | Companies not related by common ownership or control. They can be financial and nonfinancial companies ■ The Fund does not share with nonaffiliates so they can market to you. |
| Joint marketing | A formal agreement between nonaffiliated financial companies that together market financial products or services to you. ■ The Fund does not jointly market. |
KEMPNER-SAR-20
| WAVELENGTH INTEREST RATE NEUTRAL FUND LETTER TO SHAREHOLDERS (Unaudited) January 15, 2021 |
Dear Fellow Shareholders:
Since our last shareholder letter, financial markets adapted to a deeply stressed set of conditions brought on by the worst public health crisis in over a century. The pandemic has changed the shape of our economy, as policy measures seeking to bridge a dangerous gap in output are producing new dynamics in an uneven recovery. Over the period, we actively managed downside risks and captured upside in line with our investment mandate while markets recalibrated to an economy in transition.
What follows is designed to provide a context for returns that fosters a deeper understanding of the investment process that supports them. By doing so we hope to build on the partnership your investment creates.
PERFORMANCE SUMMARY
For the six months ended November 30, 2020, the Wavelength Interest Rate Neutral Fund (the “Fund”) delivered a return of +6.49% versus a benchmark return of +0.06% for the S&P / BGCantor 0-3 Month US Treasury Bill Index (which seeks to represent the return from not taking risk in financial markets). These results were within targeted risk parameters and the Fund performed in line with investment objectives.
WAVELENGTH PHILOSOPHY
We believe that macroeconomic conditions drive asset prices and central banks use interest rates to manage macroeconomic conditions. Based on this fundamental logic, we seek to build a portfolio that is hedged to changes in interest rates by balancing investment exposure between instruments we expect to outperform in rising and falling macroeconomic conditions.
INVESTMENT ENVIRONMENT
As an extension of our investment philosophy we believe that changing expectations for the economy drive investment decisions, which in turn drive market prices. Since our last letter, economic conditions bounced off pandemic-driven lows with a series of upside surprises to both growth and inflation.
The period began with an uneven reopening of economies across the globe in the face of uncertainty around a persistently spreading virus and the varied effectiveness of preventative measures. Markets continued their rebound on the back of policy stimulus, and many existing trends accelerated as people adjusted to a new normal.
Coming off a record quarterly contraction in US gross domestic product, the summer months featured buoyant markets and better-than-expected earnings. Inflation expectations also began to rise from persistently low levels, as the Federal Reserve announced it would tolerate periods above its 2% target and concerns of rising prices began to manifest themselves in markets.
Heading into the fourth quarter, markets began to recognize political headwinds on the horizon in the form of gridlock around a new stimulus package and anxiety over the US election. Resurgent COVID-19 cases similarly tempered expectations for growth, and widespread business restrictions across Europe tipped the balance of risks to drive selling pressure into quarter-end.
In a challenging year on many fronts, November marked a turning point. The US election took place without upsetting markets, and positive testing developments for multiple vaccines eclipsed concerns over increasing rates of the virus’ spread. The period came to a close with a widespread reallocation of capital by investors as a clearer outlook for the trajectory of economic growth was established.
PERFORMANCE DISCUSSION
The Fund delivered strong positive performance over the period amidst substantial economic uncertainty. Market prices continued to move at increasing speed, and the portfolio’s balance was effective at insulating results from much of the day-to-day noise as we pursued assets offering the best risk-adjusted returns.
The serial dislocations from market moves driven by the onset of the pandemic created an excellent opportunity set for actively investing in fixed income. In this context, we monetized mispricings across the portfolio as markets adapted to new conditions moving into the third quarter. Through June and July, profits were driven by convertible bonds, inflation-linked bonds, and emerging market debt, in addition to municipal bonds which offered substantial opportunities as an asset class.
In August, inflation-linked bonds and emerging market debt continued to drive performance as the dollar weakened and the growing risk of an inflationary outcome was recognized by investors. The portfolio’s positive results were achieved amidst a sell-off for global bonds and rising political frictions over fiscal policy measures.
Heading into the autumn months, our investment process adjusted to increasing levels of risk in markets in the face of COVID-19’s resurgence and election anxiety in the US. In this context, we limited downside while positioning to capture upside as the US election and vaccine developments brought a clearer outlook for markets in November. To close out the period, the portfolio again benefited meaningfully from emerging market debt, convertible and inflation-linked bond exposures, and reflationary expectations took hold with investors adjusting to the new economic paradigm.
OUTLOOK
Markets are now in a delicate balance between the current reality of an intensifying pandemic and the promise of a vaccinated future. The gap between these conditions is marked by crucial risks for the economy, and the capacity for fiscal and monetary policy to provide a bridge will be tested in the coming months.
In this context, the portfolio is positioned with a balanced exposure to potential outcomes for growth and inflation, and we seek to systematically monetize opportunities in fixed income markets as they recalibrate to the changing shape of economic output.
Thank you for your trust and commitment through investment.
Sincerely,

Andrew Dassori
Founding Partner & Chief Investment Officer
Wavelength Capital Management
Past performance is not predictive of future performance. Investment results and principal value will fluctuate so that shares, when redeemed, may be worth more or less than their original cost. Current performance may be higher or lower than the performance data quoted. Performance data current to the most recent month end are available by calling 1-866-896-9292.
An investor should consider the investment objectives, risks, charges and expenses of the Fund carefully before investing. The Fund’s prospectus contains this and other important information. To obtain a copy of the Fund’s prospectus please visit our website at www.wavelengthfunds.com or call 1-866-896-9292 and a copy will be sent to you free of charge. Please read the prospectus carefully before you invest. The Wavelength Interest Rate Neutral Fund is distributed by Ultimus Fund Distributors, LLC.
The Letter to Shareholders seeks to describe some of the Adviser’s current opinions and views of the financial markets. Although the Adviser believes it has a reasonable basis for any opinions or views expressed, actual results may differ, sometimes significantly so, from those expected or expressed. The securities held by the Fund that are discussed in the Letter to Shareholders were held during the period covered by this Report. They do not comprise the entire investment portfolio of the Fund, may be sold at any time and may no longer be held by the Fund. For a complete list of securities held by the Fund as of November 30, 2020, please see the Schedule of Investments section of the Semi-Annual Report. The opinions of the Adviser with respect to those securities may change at any time.
Statements in the Letter to Shareholders that reflect projections or expectations for future financial or economic performance of the Fund and the market in general and statements of the Fund’s plans and objectives for future operations are forward-looking statements. No assurance can be given that actual results or events will not differ materially from those projected, estimated, assumed, or anticipated in any such forward-looking statements. Important factors that could result in such differences, in addition to factors noted with such forward-looking statements include, without limitation, general economic conditions, such as inflation, recession, and interest rates. Past performance is not a guarantee of future results.
| WAVELENGTH INTEREST RATE NEUTRAL FUND |
| PORTFOLIO INFORMATION |
| November 30, 2020 (Unaudited) |
| |
Portfolio Allocation (% of Net Assets)
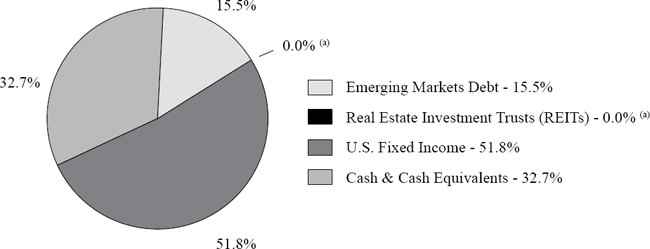
| (a) | Percentage rounds to less than 0.1% |
| Top 10 Equity Holdings |
| | | % of |
| Security Description | | Net Assets |
| iShares TIPS Bond ETF | | 14.7% |
| iShares National Muni Bond ETF | | 9.9% |
| Vanguard Emerging Markets Government Bond ETF | | 8.2% |
| Invesco Senior Loan ETF | | 6.1% |
| SPDR Bloomberg Barclays Convertible Securities ETF | | 5.9% |
| Vanguard Mortgage-Backed Securities ETF | | 4.2% |
| SPDR Bloomberg Barclays Short Term High Yield Bond ETF | | 4.2% |
| VanEck Vectors Emerging Markets High Yield Bond ETF | | 3.4% |
| iShares iBoxx $ High Yield Corporate Bond ETF | | 3.0% |
| Invesco Emerging Markets Sovereign Debt ETF | | 2.4% |
| WAVELENGTH INTEREST RATE NEUTRAL FUND |
| SCHEDULE OF INVESTMENTS |
| November 30, 2020 (Unaudited) |
| EXCHANGE-TRADED FUNDS — 67.3% | | Shares | | | Value | |
| Emerging Markets Debt — 15.5% | | | | | | | | |
| Invesco Emerging Markets Sovereign Debt ETF | | | 101,292 | | | $ | 2,855,422 | |
| iShares J.P. Morgan USD Emerging Markets Bond ETF | | | 14,653 | | | | 1,674,105 | |
| VanEck Vectors Emerging Markets High Yield Bond ETF | | | 170,321 | | | | 3,982,105 | |
| Vanguard Emerging Markets Government Bond ETF | | | 118,891 | | | | 9,648,005 | |
| | | | | | | | 18,159,637 | |
| Real Estate Investment Trusts (REITs) — 0.0% (a) | | | | | | | | |
| Vanguard Real Estate ETF | | | 400 | | | | 33,600 | |
| | | | | | | | | |
| U.S. Fixed Income — 51.8% | | | | | | | | |
| Invesco Senior Loan ETF (b) | | | 327,081 | | | | 7,199,053 | |
| iShares iBoxx $ High Yield Corporate Bond ETF (b) | | | 41,020 | | | | 3,540,846 | |
| iShares National Muni Bond ETF (b) | | | 99,800 | | | | 11,655,642 | |
| iShares TIPS Bond ETF | | | 136,061 | | | | 17,200,832 | |
| SPDR Bloomberg Barclays Convertible Securities ETF | | | 88,231 | | | | 6,906,723 | |
| SPDR Bloomberg Barclays High Yield Bond ETF | | | 18,777 | | | | 2,019,091 | |
| SPDR Bloomberg Barclays Short Term High Yield Bond ETF | | | 183,309 | | | | 4,883,352 | |
| Vanguard Mortgage-Backed Securities ETF (b) | | | 90,596 | | | | 4,903,055 | |
| Vanguard Short-Term Inflation-Protected Securities ETF | | | 46,957 | | | | 2,391,989 | |
| | | | | | | | 60,700,583 | |
| | | | | | | | | |
| Total Exchange-Traded Funds (Cost $73,794,108) | | | | | | $ | 78,893,820 | |
| WAVELENGTH INTEREST RATE NEUTRAL FUND |
| SCHEDULE OF INVESTMENTS (Continued) |
| MONEY MARKET FUNDS — 16.3% | | Shares | | | Value | |
| Fidelity Institutional Money Market Government Portfolio - Class I, 0.01% (c) | | | 9,546,318 | | | $ | 9,546,318 | |
| Invesco Short-Term Investments Trust - Institutional Class, 0.01% (c) | | | 9,546,318 | | | | 9,546,318 | |
| Total Money Market Funds (Cost $19,092,636) | | | | | | $ | 19,092,636 | |
| | | | | | | | | |
| COLLATERAL FOR SECURITIES LOANED — 22.4% | | Shares | | | Value | |
| Mount Vernon Liquid Assets Portfolio, LLC, 0.15% (Cost $26,237,359) (c)(d) | | | 26,237,359 | | | $ | 26,237,359 | |
| | | | | | | | | |
| Investments at Value — 106.0% (Cost $119,124,103) | | | | | | $ | 124,223,815 | |
| | | | | | | | | |
| Liabilities in Excess of Other Assets — (6.0%) | | | | | | | (7,043,250 | ) |
| | | | | | | | | |
| Net Assets — 100.0% | | | | | | $ | 117,180,565 | |
| (a) | Percentage rounds to less than 0.1% |
| (b) | All or a portion of the security is on loan. The total value of the securities on loan as of November 30, 2020 was $25,606,292 (Note 6). |
| (c) | The rate shown is the 7-day effective yield as of November 30, 2020. |
| (d) | This security was purchased with cash collateral held from securities on loan. The total value of such security as of November 30, 2020 was $26,237,359 (Note 6). |
See accompanying notes to financial statements.
| WAVELENGTH INTEREST RATE NEUTRAL FUND |
| SCHEDULE OF FUTURES CONTRACTS |
| November 30, 2020 (Unaudited) |
| | | | | | | | | | Value/Unrealized | |
| | | | | Expiration | | Notional | | | Appreciation | |
| FUTURES CONTRACTS | | Contracts | | Date | | Value | | | (Depreciation) | |
| Commodity Futures | | | | | | | | | | | | |
| E-Mini Gold Future | | 11 | | 1/27/2021 | | $ | 979,000 | | | $ | (14,180 | ) |
| | | | | | | | | | | | | |
| Index Futures | | | | | | | | | | | | |
| E-Mini Dow CBOT DJIA Future | | 10 | | 12/18/2020 | | | 1,478,850 | | | | 58,964 | |
| E-Mini Nasdaq 100 Future | | 13 | | 12/18/2020 | | | 3,198,975 | | | | 162,508 | |
| E-Mini S&P 500 Future | | 16 | | 12/18/2020 | | | 2,903,400 | | | | 117,641 | |
| Total Index Futures | | | | | | | 7,581,225 | | | | 339,113 | |
| | | | | | | | | | | | | |
| Treasury Futures | | | | | | | | | | | | |
| 10-Year U.S. Treasury Note Future | | 48 | | 3/31/2021 | | | 6,630,000 | | | | 8,297 | |
| 2-Year U.S. Treasury Note Future | | 54 | | 3/31/2021 | | | 11,925,984 | | | | 2,951 | |
| 5-Year U.S. Treasury Note Future | | 125 | | 3/31/2021 | | | 15,750,000 | | | | 11,896 | |
| U.S. Treasury Long Bond Future | | 29 | | 3/22/2021 | | | 5,066,844 | | | | 13,546 | |
| Total Treasury Futures | | | | | | | 39,372,828 | | | | 36,690 | |
| | | | | | | | | | | | | |
| Total Futures Contracts | | | | | | $ | 47,933,053 | | | $ | 361,623 | |
The average monthly notional value of futures contracts during the six months ended November 30, 2020 was $50,505,093.
See accompanying notes to financial statements.
| WAVELENGTH INTEREST RATE NEUTRAL FUND |
| STATEMENT OF ASSETS AND LIABILITIES |
| November 30, 2020 (Unaudited) |
| ASSETS | | | | |
| Investments in securities: | | | | |
| At cost | | $ | 119,124,103 | |
| At value* (Note 2) | | $ | 124,223,815 | |
| Cash (Note 2) | | | 16,425,769 | |
| Margin deposits for futures contracts (Note 2) | | | 2,759,544 | |
| Variation margin receivable (Notes 2 and 5) | | | 14,342 | |
| Receivable for capital shares sold | | | 498,211 | |
| Dividends and interest receivable | | | 22,008 | |
| Other assets | | | 26,555 | |
| Total assets | | | 143,970,244 | |
| | | | | |
| LIABILITIES | | | | |
| Variation margin payable (Notes 2 and 5) | | | 42,502 | |
| Payable for return of collateral received for securities on loan (Note 6) | | | 26,237,359 | |
| Payable for capital shares redeemed | | | 112,935 | |
| Payable for investment securities purchased | | | 309,486 | |
| Payable to Adviser (Note 4) | | | 57,607 | |
| Payable to administrator (Note 4) | | | 15,850 | |
| Other accrued expenses | | | 13,940 | |
| Total liabilities | | | 26,789,679 | |
| | | | | |
| NET ASSETS | | $ | 117,180,565 | |
| | | | | |
| NET ASSETS CONSIST OF: | | | | |
| Paid-in capital | | $ | 111,188,000 | |
| Accumulated earnings | | | 5,992,565 | |
| NET ASSETS | | $ | 117,180,565 | |
| | | | | |
| Shares of beneficial interest outstanding (unlimited number of shares authorized, no par value) | | | 10,668,255 | |
| | | | | |
| Net asset value, offering price and redemption price per share (Note 2) | | $ | 10.98 | |
| * | Includes value of securities on loan. |
See accompanying notes to financial statements.
| WAVELENGTH INTEREST RATE NEUTRAL FUND |
| STATEMENT OF OPERATIONS |
| For the Six Months Ended November 30, 2020 (Unaudited) |
| INVESTMENT INCOME | | | | |
| Dividends | | $ | 935,008 | |
| Securities lending income (Note 6) | | | 78,139 | |
| Total investment income | | | 1,013,147 | |
| | | | | |
| EXPENSES | | | | |
| Investment advisory fees (Note 4) | | | 489,308 | |
| Administration fees (Note 4) | | | 51,777 | |
| Registration and filing fees | | | 23,297 | |
| Fund accounting fees (Note 4) | | | 20,174 | |
| Legal fees | | | 11,852 | |
| Audit and tax services fees | | | 9,300 | |
| Transfer agent fees (Note 4) | | | 9,268 | |
| Trustees’ fees and expenses (Note 4) | | | 8,400 | |
| Custody and bank service fees | | | 8,257 | |
| Compliance fees (Note 4) | | | 6,335 | |
| Printing of shareholder reports | | | 4,776 | |
| Postage and supplies | | | 4,617 | |
| Insurance expense | | | 2,042 | |
| Other expenses | | | 14,429 | |
| Total expenses | | | 663,832 | |
| Less fee reductions by the Adviser (Note 4) | | | (153,921 | ) |
| Net expenses | | | 509,911 | |
| | | | | |
| NET INVESTMENT INCOME | | | 503,236 | |
| | | | | |
| REALIZED AND UNREALIZED GAINS ON INVESTMENTS AND FUTURES CONTRACTS | | | | |
| Net realized gains from: | | | | |
| Investments | | | 916,485 | |
| Futures contracts (Note 5) | | | 1,449,234 | |
| Net change in unrealized appreciation (depreciation) on: | | | | |
| Investments | | | 3,280,799 | |
| Futures contracts (Note 5) | | | 20,149 | |
| NET REALIZED AND UNREALIZED GAINS ON INVESTMENTS AND FUTURES CONTRACTS | | | 5,666,667 | |
| | | | | |
| NET INCREASE IN NET ASSETS RESULTING FROM OPERATIONS | | $ | 6,169,903 | |
See accompanying notes to financial statements.
| WAVELENGTH INTEREST RATE NEUTRAL FUND |
| STATEMENTS OF CHANGES IN NET ASSETS |
| | | Six Months | | | | |
| | | Ended | | | Year | |
| | | November 30, | | | Ended | |
| | | 2020 | | | May 31, | |
| | | (Unaudited) | | | 2020 | |
| FROM OPERATIONS | | | | | | | | |
| Net investment income | | $ | 503,236 | | | $ | 1,495,568 | |
| Net realized gains (losses) from: | | | | | | | | |
| Investments | | | 916,485 | | | | (3,214,366 | ) |
| Futures contracts (Note 5) | | | 1,449,234 | | | | 2,547,521 | |
| Long-term capital gain distributions from regulated investment companies | | | — | | | | 82 | |
| Net change in unrealized appreciation (depreciation) on: | | | | | | | | |
| Investments | | | 3,280,799 | | | | 1,717,300 | |
| Futures contracts (Note 5) | | | 20,149 | | | | 273,649 | |
| Net increase in net assets resulting from operations | | | 6,169,903 | | | | 2,819,754 | |
| | | | | | | | | |
| DISTRIBUTIONS TO SHAREHOLDERS (Note 2) | | | (368,311 | ) | | | (3,699,999 | ) |
| | | | | | | | | |
| CAPITAL SHARE TRANSACTIONS | | | | | | | | |
| Proceeds from shares sold | | | 46,199,361 | | | | 60,584,918 | |
| Net asset value of shares issued in reinvestment of distributions to shareholders | | | 255,609 | | | | 2,322,824 | |
| Payments for shares redeemed | | | (16,848,925 | ) | | | (33,522,882 | ) |
| Net increase in net assets from capital share transactions | | | 29,606,045 | | | | 29,384,860 | |
| | | | | | | | | |
| TOTAL INCREASE IN NET ASSETS | | | 35,407,637 | | | | 28,504,615 | |
| | | | | | | | | |
| NET ASSETS | | | | | | | | |
| Beginning of period | | | 81,772,928 | | | | 53,268,313 | |
| End of period | | $ | 117,180,565 | | | $ | 81,772,928 | |
| | | | | | | | | |
| CAPITAL SHARE ACTIVITY | | | | | | | | |
| Shares sold | | | 4,305,869 | | | | 5,832,350 | |
| Shares issued in reinvestment of distributions to shareholders | | | 24,117 | | | | 224,070 | |
| Shares redeemed | | | (1,559,746 | ) | | | (3,347,977 | ) |
| Net increase in shares outstanding | | | 2,770,240 | | | | 2,708,443 | |
| Shares outstanding at beginning of period | | | 7,898,015 | | | | 5,189,572 | |
| Shares outstanding at end of period | | | 10,668,255 | | | | 7,898,015 | |
See accompanying notes to financial statements.
| WAVELENGTH INTEREST RATE NEUTRAL FUND |
| FINANCIAL HIGHLIGHTS |
| |
| Per Share Data for a Share Outstanding Throughout Each Period |
| | | Six Months | | | | | | | | | | | | | | | | |
| | | Ended | | | Year | | | Year | | | Year | | | Year | | | Year | |
| | | Nov. 30, | | | Ended | | | Ended | | | Ended | | | Ended | | | Ended | |
| | | 2020 | | | May 31, | | | May 31, | | | May 31, | | | May 31, | | | May 31, | |
| | | (Unaudited) | | | 2020 | | 2019 | | | 2018 | | 2017 | | 2016 | |
| Net asset value at beginning of period | | $ | 10.35 | | | $ | 10.26 | | | $ | 9.97 | | | $ | 9.99 | | | $ | 9.54 | | | $ | 10.09 | |
| | | | | | | | | | | | | | | | | | | | | | | | | |
| Income (loss) from investment operations: | | | | | | | | | | | | | | | | | | | | | | | | |
| Net investment income | | | 0.05 | | | | 0.22 | | | | 0.27 | | | | 0.22 | | | | 0.20 | | | | 0.21 | |
| Net realized and unrealized gains (losses) on investments and futures contracts | | | 0.62 | | | | 0.38 | | | | 0.28 | | | | (0.03 | ) | | | 0.45 | | | | (0.56 | ) |
| Total from investment operations | | | 0.67 | | | | 0.60 | | | | 0.55 | | | | 0.19 | | | | 0.65 | | | | (0.35 | ) |
| | | | | | | | | | | | | | | | | | | | | | | | | |
| Less distributions from: | | | | | | | | | | | | | | | | | | | | | | | | |
| Net investment income | | | (0.04 | ) | | | (0.23 | ) | | | (0.26 | ) | | | (0.21 | ) | | | (0.20 | ) | | | (0.20 | ) |
| Net realized gains | | | — | | | | (0.28 | ) | | | — | | | | — | | | | — | | | | — | |
| Total distributions | | | (0.04 | ) | | | (0.51 | ) | | | (0.26 | ) | | | (0.21 | ) | | | (0.20 | ) | | | (0.20 | ) |
| | | | | | | | | | | | | | | | | | | | | | | | | |
| Net asset value at end of period | | $ | 10.98 | | | $ | 10.35 | | | $ | 10.26 | | | $ | 9.97 | | | $ | 9.99 | | | $ | 9.54 | |
| | | | | | | | | | | | | | | | | | | | | | | | | |
| Total return (a) | | | 6.49 | % (b) | | | 5.92 | % | | | 5.68 | % | | | 1.95 | % | | | 6.83 | % | | | (3.37 | )% |
| | | | | | | | | | | | | | | | | | | | | | | | | |
| Net assets at end of period (000’s) | | $ | 117,181 | | | $ | 81,773 | | | $ | 53,268 | | | $ | 48,434 | | | $ | 21,391 | | | $ | 16,761 | |
| | | | | | | | | | | | | | | | | | | | | | | | | |
| Ratios/supplementary data: | | | | | | | | | | | | | | | | | | | | | | | | |
| Ratio of total expenses to average net assets (c) | | | 1.29 | % (d) | | | 1.34 | % | | | 1.41 | % | | | 1.55 | % | | | 1.85 | % | | | 2.00 | % |
| Ratio of net expenses to average net assets (c)(e) | | | 0.99 | % (d) | | | 0.99 | % | | | 0.99 | % | | | 0.99 | % | | | 0.99 | % | | | 0.99 | % |
| Ratio of net investment income to average net assets (c)(e)(f) | | | 0.98 | % (d) | | | 2.07 | % | | | 2.65 | % | | | 2.17 | % | | | 2.01 | % | | | 2.16 | % |
| Portfolio turnover rate | | | 9 | % (b) | | | 52 | % | | | 20 | % | | | 9 | % | | | 53 | % | | | 103 | % |
| (a) | Total return is a measure of the change in value of an investment in the Fund over the periods covered. The returns shown do not reflect the deduction of taxes a shareholder would pay on Fund distributions, if any, or the redemption of Fund shares. The total returns would be lower if the Adviser had not reduced advisory fees and/or reimbursed expenses. |
| (c) | The ratios of expenses and net investment income to average net assets do not reflect the Fund’s proportionate share of expenses of the underlying investment companies in which the Fund invests. |
| (e) | Ratio was determined after advisory fee reductions and/or expense reimbursements (Note 4). |
| (f) | Recognition of net investment income by the Fund is affected by the timing of the declarations of dividends by the underlying investment companies in which the Fund invests. |
See accompanying notes to financial statements.
| WAVELENGTH INTEREST RATE NEUTRAL FUND |
| NOTES TO FINANCIAL STATEMENTS |
| November 30, 2020 (Unaudited) |
1. Organization
Wavelength Interest Rate Neutral Fund (the “Fund”) is a diversified series of Ultimus Managers Trust (the “Trust”), an open-end investment company established as an Ohio business trust under a Declaration of Trust dated February 28, 2012. Other series of the Trust are not incorporated in this report.
The investment objective of the Fund is to seek total return.
2. Significant Accounting Policies
The Fund follows accounting and reporting guidance under Financial Accounting Standards Board Accounting Standards Codification Topic 946, “Financial Services – Investment Companies.” The following is a summary of the Fund’s significant accounting policies used in the preparation of its financial statements. These policies are in conformity with accounting principles generally accepted in the United States of America (“GAAP”).
Securities and futures valuation – The Fund values its portfolio securities at market value as of the close of regular trading on the New York Stock Exchange (the “NYSE”) (normally 4:00 p.m. Eastern time) on each business day the NYSE is open. Exchange-traded funds (“ETFs”) are valued at the security’s last sale price on the security’s primary exchange, if available, otherwise at the exchange’s most recently quoted mean price. Investments representing shares of money market funds and other open-end investment companies, except for ETFs, are valued at their net asset value (“NAV”) as reported by such companies. NASDAQ-listed securities are valued at the NASDAQ Official Closing Price. The Fund values its exchange-traded futures contracts at their last sale price as of the close of regular trading on the NYSE. Prices for these futures contracts are monitored daily by Wavelength Capital Management, LLC (the “Adviser”) until the close of regular trading to determine if fair valuation is required.
When using a quoted price and when the market for the security is considered active, a security will be classified as Level 1 within the fair value hierarchy (see below). In the event that market quotations are not readily available or are considered unreliable due to market or other events, the Fund values its securities and other assets at fair value pursuant to the procedures adopted by and under the general supervision of the Trust’s Board of Trustees (the “Board”). Under these procedures, the securities will be classified as Level 2 or 3 within the fair value hierarchy, depending on the inputs used. Unavailable or unreliable market quotes may be due to the following factors: a substantial bid-ask spread; infrequent sales resulting in stale prices; insufficient trading volume; small trade sizes; a temporary lapse in any reliable pricing source; and actions of the securities or futures markets, such as the suspension or limitation of trading.
GAAP establishes a single authoritative definition of fair value, sets out a framework for measuring fair value, and requires additional disclosures about fair value measurements.
| WAVELENGTH INTEREST RATE NEUTRAL FUND |
| NOTES TO FINANCIAL STATEMENTS (Continued) |
Various inputs are used in determining the value of the Fund’s investments. These inputs are summarized in the three broad levels listed below:
| ● | Level 1 – quoted prices in active markets for identical securities |
| ● | Level 2 – other significant observable inputs |
| ● | Level 3 – significant unobservable inputs |
The inputs or methods used for valuing securities are not necessarily an indication of the risks associated with investing in those securities. The inputs used to measure fair value may fall into different levels of the fair value hierarchy. In such cases, for disclosure purposes, the level in the fair value hierarchy within which the fair value measurement falls in its entirety is determined based on the lowest level input that is significant to the fair value measurement.
The following is a summary of the Fund’s investments and other financial instruments and the inputs used to value the investments and other financial instruments as of November 30, 2020:
| | | Level 1 | | | Level 2 | | | Level 3 | | | Total | |
| Investments in Securities | | | | | | | | | | | | | | | | |
| Exchange-Traded Funds | | $ | 78,893,820 | | | $ | — | | | $ | — | | | $ | 78,893,820 | |
| Money Market Funds | | | 19,092,636 | | | | — | | | | — | | | | 19,092,636 | |
| Collateral for Securities Loaned * | | | — | | | | — | | | | — | | | | 26,237,359 | |
| Total | | $ | 97,986,456 | | | $ | — | | | $ | — | | | $ | 124,223,815 | |
| Other Financial Instruments | | | | | | | | | | | | | | | | |
| Futures Contracts | | $ | 361,623 | | | $ | — | | | $ | — | | | $ | 361,623 | |
| Total | | $ | 361,623 | | | $ | — | | | $ | — | | | $ | 361,623 | |
| | | | | | | | | | | | | | | | | |
| * | Certain investments that are measured at fair value using the NAV per share (or its equivalent) practical exedient have not been categorized in the fair value hierarchy. The fair value amounts presented in the table are intended to permit reconciliation of the fair value hierarchy to the amounts presented on the Statement of Assets and Liabilities. |
The Fund did not have any assets or liabilities that were measured at fair value on a recurring basis using significant unobservable inputs (Level 3) as of or during the six months ended November 30, 2020. Other Financial Instruments are future contracts which are valued at the unrealized appreciation (depreciation) as of November 30, 2020.
Cash account – The Fund’s cash is held in a bank account with balances which, at times, may exceed United States federally insured limits by the Federal Deposit Insurance Corporation. The Fund maintains these balances with a high-quality financial institution and may incur charges on cash overdrafts.
Share valuation – The NAV per share of the Fund is calculated daily by dividing the total value of the Fund’s assets, less liabilities, by the number of shares outstanding. The offering price and redemption price per share of the Fund is equal to the NAV per share.
| WAVELENGTH INTEREST RATE NEUTRAL FUND |
| NOTES TO FINANCIAL STATEMENTS (Continued) |
Investment income – Dividend income is recorded on the ex-dividend date. Interest income is accrued as earned. Non-cash dividends included in dividend income, if any, are recorded at the fair value of the security received.
Investment transactions – Investment transactions are accounted for on the trade date. Realized gains and losses on investments sold are determined on a specific identification basis.
Common expenses – Common expenses of the Trust are allocated among the Fund and the other series of the Trust based on the relative net assets of each series, the number of series in the Trust, or the nature of the services performed and the relative applicability to each series.
Distributions to shareholders – The Fund distributes to shareholders any net investment income on a quarterly basis and any net realized capital gains at least annually. The amount of such dividends and distributions are determined in accordance with federal income tax regulations, which may differ from GAAP. Dividends and distributions to shareholders are recorded on the ex-dividend date. The tax character of distributions paid during the periods ended November 30, 2020 and May 31, 2020 was as follows:
| Period | | Ordinary | | | Tax-Exempt | | | Long-Term | | | Total | |
| Ended | | Income | | | Distributions | | | Capital Gains | | | Distributions | |
| 11/30/2020 | | $ | 368,311 | | | $ | — | | | $ | — | | | $ | 368,311 | |
| 5/31/2020 | | $ | 2,317,659 | | | $ | 82,679 | | | $ | 1,299,661 | | | $ | 3,699,999 | |
Futures contracts – The Fund uses futures contracts to gain exposure to or to hedge against changes in the value of equities, real estate, interest rates or commodities. A futures contract represents a commitment for the future purchase or sale of an asset at a specified price on a specified date. When the Fund purchases or sells a futures contract, no price is paid to or received by the Fund. Instead, the Fund is required to deposit in a segregated asset account an amount of cash or qualifying securities currently ranging from 2% to 10% of the contract amount. This is called the “initial margin deposit.” Subsequent payments, known as “variation margin,” are made or received by the Fund each day, depending on the daily fluctuations in the fair value of the underlying asset. The Fund recognizes an unrealized gain or loss equal to the daily variation margin. If market conditions move unexpectedly, the Fund may not achieve the anticipated benefits of the futures contracts and may realize a loss. The margin deposits for futures contracts and the variation receivable/payable are reported on the Statement of Assets and Liabilities.
Estimates – The preparation of financial statements in conformity with GAAP requires management to make estimates and assumptions that affect the reported amounts of assets and liabilities and disclosure of contingent assets and liabilities as of the date of the financial statements and the reported amounts of increase (decrease) in net assets from operations during the reporting period. Actual results could differ from those estimates.
| WAVELENGTH INTEREST RATE NEUTRAL FUND |
| NOTES TO FINANCIAL STATEMENTS (Continued) |
Federal income tax – The Fund has qualified and intends to continue to qualify as a regulated investment company under the Internal Revenue Code of 1986, as amended (the “Code”). Qualification generally will relieve the Fund of liability for federal income taxes to the extent 100% of its net investment income and net realized capital gains are distributed in accordance with the Code.
In order to avoid imposition of the excise tax applicable to regulated investment companies, it is also the Fund’s intention to declare as dividends in each calendar year at least 98% of its net investment income (earned during the calendar year) and 98.2% of its net realized capital gains (earned during the twelve months ended October 31) plus undistributed amounts from prior years.
The following information is computed on a tax basis for each item as of November 30, 2020:
| | | | |
| Tax cost of portfolio investments | | $ | 120,876,864 | |
| Gross unrealized appreciation | | $ | 4,000,313 | |
| Gross unrealized depreciation | | | (653,362 | ) |
| Net unrealized appreciation | | | 3,346,951 | |
| Accumulated ordinary income | | | 279,144 | |
| Other gains | | | 2,366,470 | |
| Total accumulated earnings | | $ | 5,992,565 | |
| | | | | |
The value of the federal income tax cost of portfolio investments may temporarily differ from the financial statement cost. This book/tax difference is due to the recognition of capital gains or losses under income tax regulations and GAAP, primarily the tax deferral of losses on wash sales, the tax treatment of realized and unrealized gains and losses on futures contracts and adjustments to basis on publicly traded partnerships.
The Fund recognizes the tax benefits or expenses of uncertain tax positions only when the position is “more likely than not” to be sustained assuming examination by tax authorities. Management has reviewed the Fund’s tax positions for the current and all open tax years (generally, three years) and has concluded that no provision for unrecognized tax benefits or expenses is required in these financial statements. The Fund identifies its major tax jurisdiction as U.S. Federal.
3. Investment Transactions
During the six months ended November 30, 2020, cost of purchases and proceeds from sales of investment securities, other than short-term investments, were $29,565,326 and $6,077,364, respectively.
| WAVELENGTH INTEREST RATE NEUTRAL FUND |
| NOTES TO FINANCIAL STATEMENTS (Continued) |
4. Transactions with Related Parties
INVESTMENT ADVISORY AGREEMENT
The Fund’s investments are managed by the Adviser pursuant to the terms of the Investment Advisory Agreement. Under the Investment Advisory Agreement, the Fund pays the Adviser an investment advisory fee, computed and accrued daily and paid monthly, at the annual rate of 0.95% of its average daily net assets.
Pursuant to an Expense Limitation Agreement between the Fund and the Adviser (the “ELA”), the Adviser has agreed, until October 1, 2025, to reduce its investment advisory fees and reimburse other expenses to limit total annual operating expenses (exclusive of brokerage costs; taxes; interest; borrowing costs such as interest and dividends expenses on securities sold short; acquired fund fees and expenses; extraordinary expenses such as litigation and merger or reorganization costs and other expenses not incurred in the ordinary course of the Fund’s business) to an amount not exceeding 0.99% of the Fund’s average daily net assets. During the six months ended November 30, 2020, the Adviser reduced its investment advisory fees by $153,921.
Under the terms of the ELA, investment advisory fee reductions and expense reimbursements by the Adviser are subject to recoupment by the Adviser for a period of three years after such fees and expenses were incurred, provided that the recoupments do not cause total annual operating expenses of the Fund to exceed the lesser of (i) the expense limitation then in effect, if any, and (ii) the expense limitation in effect at the time the expenses to be repaid were incurred. As of November 30, 2020, the Adviser may seek recoupment of investment advisory fee reductions and expense reimbursements in the amount of $707,305 no later than the dates as stated below:
| May 31, 2021 | May 31, 2022 | May 31, 2023 | November 30, 2023 | Total |
| $90,953 | $211,390 | $251,041 | $153,921 | $707,305 |
OTHER SERVICE PROVIDERS
Ultimus Fund Solutions, LLC (“Ultimus”) provides administration, fund accounting, compliance and transfer agency services to the Fund. The Fund pays Ultimus fees in accordance with the agreements for such services. In addition, the Fund pays out-of-pocket expenses including, but not limited to, postage, supplies and certain costs related to the pricing of the Fund’s portfolio securities.
Under the terms of a Distribution Agreement with the Trust, Ultimus Fund Distributors, LLC (the “Distributor”) serves as the principal underwriter to the Fund. The Distributor is a wholly-owned subsidiary of Ultimus. The Distributor is compensated by the Adviser (not the Fund) for acting as principal underwriter.
Certain officers and a Trustee of the Trust are also officers of Ultimus and the Distributor.
| WAVELENGTH INTEREST RATE NEUTRAL FUND |
| NOTES TO FINANCIAL STATEMENTS (Continued) |
TRUSTEE COMPENSATION
Each member of the Board (a “Trustee”) who is not an “interested person” of the Trust (“Independent Trustee”) receives a $1,300 annual retainer from the Fund, paid quarterly, except for the Board Chairperson who receives a $1,500 annual retainer from the Fund, paid quarterly. Each Independent Trustee also receives from the Fund a fee of $500 for each Board meeting attended plus reimbursement for travel and other meeting-related expenses.
PRINCIPAL HOLDER OF FUND SHARES
As of November 30, 2020, the following shareholder owned of record 25% or more of the outstanding shares of the Fund:
| Name of Record Owner | % Ownership |
| National Financial Services, LLC (for the benefit of its customers) | 33% |
A shareholder owning of record or beneficially 25% or more of the Fund’s outstanding shares may be considered a controlling person. That shareholder’s vote could have a more significant effect on matters presented at a shareholders’ meeting.
5. Derivatives Transactions
The Fund’s positions in derivative instruments as of November 30, 2020 are recorded in the following location on the Statement of Assets and Liabilities:
| Derivative Investment Type | Location |
| Futures contracts | Variation margin receivable (payable) |
The following table sets forth the values of variation margin of the Fund as of November 30, 2020:
| | | Variation Margin | | | | |
| Type of Derivative and Risk | | Receivable | | | (Payable) | | | Total | |
| Asset Derivatives | | | | | | | | | | | | |
| Futures contracts | | | | | | | | | | | | |
| Commodity | | $ | — | | | $ | (4,339 | ) | | $ | (4,339 | ) |
| Index | | | 12,655 | | | | (26,100 | ) | | | (13,445 | ) |
| Treasury | | | 1,687 | | | | (12,063 | ) | | | (10,376 | ) |
| Total | | $ | 14,342 | | | $ | (42,502 | ) | | $ | (28,160 | ) |
| | | | | | | | | | | | | |
| WAVELENGTH INTEREST RATE NEUTRAL FUND |
| NOTES TO FINANCIAL STATEMENTS (Continued) |
The Fund’s transactions in derivative instruments during the six months ended November 30, 2020 are recorded in the following locations on the Statement of Operations:
| Derivative Investment Type | Location |
| Futures contracts | Net realized gains from futures contracts |
| | Net change in unrealized appreciation (depreciation) on futures contracts |
The following is a summary of the Fund’s net realized gains (losses) and net change in unrealized appreciation (depreciation) on derivative instruments recognized on the Statement of Operations during the six months ended November 30, 2020:
| | | | | | Net Change | |
| | | | | | in Unrealized | |
| | | Net Realized | | | Appreciation | |
| Type of Derivative and Risk | | Gains (Losses) | | | (Depreciation) | |
| Futures contracts | | | | | | | | |
| Commodity | | $ | 64,744 | | | $ | (24,349 | ) |
| Index | | | 1,543,266 | | | | 49,101 | |
| Treasury | | | (158,776 | ) | | | (4,603 | ) |
| Total | | $ | 1,449,234 | | | $ | 20,149 | |
| | | | | | | | | |
In the ordinary course of business, the Fund may enter into transactions subject to enforceable netting agreements or other similar arrangements (“netting agreements”). Generally, the right to offset in netting agreements allows the Fund to offset any exposure to a specific counterparty with any collateral received or delivered to that counterparty based on the terms of the agreements. Generally, the Fund manages its cash collateral securities and securities collateral on a counterparty basis.
| WAVELENGTH INTEREST RATE NEUTRAL FUND |
| NOTES TO FINANCIAL STATEMENTS (Continued) |
As of November 30, 2020, the offsetting of financial assets and derivative assets is as follows:
| | | Gross | | | Gross | | | | | | | | | | | | | |
| | | Amounts of | | | Amounts of | | | | | | | | | | | | | |
| | | Recognized | | | Recognized | | | | | | Net Amounts | | | | | | | |
| | | Assets not | | | Liabilities | | | | | | of Assets | | | | | | | |
| | | Offset on | | | not Offset on | | | | | | Presented on | | | | | | | |
| | | Statement of | | | Statement of | | | Derivatives | | | Statement of | | | | | | | |
| | | Assets and | | | Assets and | | | Available for | | | Assets and | | | Collateral | | | | |
| Description | | Liabilities | | | Liabilities | | | Offset | | | Liabilities | | | Pledged* | | | Net Amount | |
| Variation margin receivable - futures contracts | | $ | 14,342 | | | $ | — | | | $ | (14,342 | ) | | $ | — | | | $ | — | | | $ | — | |
| Variation margin payable - futures contracts | | | — | | | | (42,502 | ) | | | 14,342 | | | | (28,160 | ) | | | 28,160 | | | | — | |
| Total subject to a master netting or similar arrangement | | $ | 14,342 | | | $ | (42,502 | ) | | $ | — | | | $ | (28,160 | ) | | $ | 28,160 | | | $ | — | |
| | | | | | | | | | | | | | | | | | | | | | | | | |
| * | The amount is limited to the net amounts of financial assets and accordingly does not include excess collateral pledged. |
6. Securities Lending
Under the terms of the securities lending agreement with U.S. Bank National Association (“U.S. Bank”), U.S. Bank is authorized to loan securities on behalf of the Fund to approved borrowers. The contractual maturity of securities lending transactions are on an overnight and continuous basis. In exchange, the Fund receives cash collateral in the amount of at least 102% of the value of the securities loaned. Any collateral shortfalls due to changes in security market prices are adjusted the next business day. The cash collateral is invested in a short-term investment instrument as noted on the Fund’s Schedule of Investments. As of November 30, 2020, the Fund had 22.4% of its net assets invested in this short-term investment instrument for securities lending purposes. Although risk is mitigated by the collateral, the Fund could experience a delay in recovering its securities and possible loss of income or value if the borrower fails to return them. The agreement indemnifies the Fund from losses incurred in the event of a borrower’s material default of the terms and conditions of the borrower agreement. The agreement provides that after predetermined rebates to borrowers, the Fund retains a portion of its net securities lending income and pays U.S. Bank the remaining portion. The Fund manages credit exposure arising from these lending transactions by, in appropriate circumstances, entering into a Securities Lending Agreement with U.S. Bank that provides the Fund, in the event of default (such as bankruptcy or borrower’s failure to pay or perform), the right to net rights and obligations under such
| WAVELENGTH INTEREST RATE NEUTRAL FUND |
| NOTES TO FINANCIAL STATEMENTS (Continued) |
agreements and liquidate and set off collateral against the net amount owed to the Fund. As of November 30, 2020, the fair value of securities on loan and the collateral held were $25,606,292 and $26,237,359, respectively.
7. Certain Investments and Risks
The securities in which the Fund invests, as well as the risks associated with these securities, are described in the Fund’s prospectus. Among these risks are those associated with investments in shares of ETFs. ETFs issue their shares to authorized participants in return for a specific basket of securities. The authorized participants then sell the ETF’s shares on the secondary market. In other words, ETF shares are traded on a securities exchange based on their market value. Investments in ETFs are subject to the risk that the ETF’s shares may trade at a premium (creating the risk that the Fund pays more than NAV for an ETF when making a purchase) or discount (creating the risk that the Fund receives less than NAV when selling an ETF) to the ETF’s NAV. Investments in ETFs are also subject to index-tracking risk because the total return generated by the securities will be reduced by transaction costs and expenses not incurred by the indices. Certain securities comprising the index tracked by an ETF may, from time to time, temporarily be unavailable, which may further impede the ETF’s ability to track its applicable index or match the index’s performance. To the extent that the Fund invests in an ETF, the Fund incurs additional expenses because the Fund bears its pro-rata portion of such ETF’s advisory fees and operational expenses. Finally, ETF shares are also subject to the risks applicable to the underlying basket of securities. As of November 30, 2020, the Fund had 67.3% of the value of its net assets invested in ETFs.
8. Contingencies and Commitments
The Fund indemnifies the Trust’s officers and Trustees for certain liabilities that might arise from their performance of their duties to the Fund. Additionally, in the normal course of business, the Fund enters into contracts that contain a variety of representations and warranties and which provide general indemnifications. The Fund’s maximum exposure under these arrangements is unknown, as this would involve future claims that may be made against the Fund that have not yet occurred. However, based on experience, the Fund expects the risk of loss to be remote.
9. Subsequent Events
The Fund is required to recognize in the financial statements the effects of all subsequent events that provide additional evidence about conditions that existed as of the date of the Statement of Assets and Liabilities. For non-recognized subsequent events that must be disclosed to keep the financial statements from being misleading, the Fund is required to disclose the nature of the event as well as an estimate of its financial effect, or a statement that such an estimate cannot be made. Management has evaluated subsequent events through the issuance of these financial statements and has noted no such events except for the following:
On December 30, 2020, the Fund paid an ordinary income dividend, short-term and long-term capital gain distributions of $0.0532, $0.0860 and $0.0362 per share, respectively, to shareholders of record on December 29, 2020.
| WAVELENGTH INTEREST RATE NEUTRAL FUND |
| ABOUT YOUR FUND’S EXPENSES (Unaudited) |
We believe it is important for you to understand the impact of costs on your investment. As a shareholder of the Fund, you incur ongoing costs, including management fees and other operating expenses. The following examples are intended to help you understand your ongoing costs (in dollars) of investing in the Fund and to compare these costs with the ongoing costs of investing in other mutual funds.
A mutual fund’s ongoing costs are expressed as a percentage of its average net assets. This figure is known as the expense ratio. The expenses in the table below are based on an investment of $1,000 made at the beginning of the most recent period (June 1, 2020) and held until the end of the period (November 30, 2020).
The table below illustrates the Fund’s ongoing costs in two ways:
Actual fund return – This section helps you to estimate the actual expenses that you paid over the period. The “Ending Account Value” shown is derived from the Fund’s actual return, and the third column shows the dollar amount of operating expenses that would have been paid by an investor who started with $1,000 in the Fund. You may use the information here, together with the amount you invested, to estimate the expenses that you paid over the period.
To do so, simply divide your account value by $1,000 (for example, an $8,600 account value divided by $1,000 = 8.6), then multiply the result by the number given for the Fund under the heading “Expenses Paid During Period.”
Hypothetical 5% return – This section is intended to help you compare the Fund’s ongoing costs with those of other mutual funds. It assumes that the Fund had an annual return of 5% before expenses during the period shown, but that the expense ratio is unchanged. In this case, because the return used is not the Fund’s actual return, the results do not apply to your investment. The example is useful in making comparisons because the U.S. Securities and Exchange Commission (the “SEC”) requires all mutual funds to calculate expenses based on a 5% return. You can assess the Fund’s ongoing costs by comparing this hypothetical example with the hypothetical examples that appear in shareholder reports of other funds.
Note that expenses shown in the table are meant to highlight and help you compare ongoing costs only. The Fund does not charge transaction fees, such as purchase or redemption fees, nor does it carry a “sales load.”
The calculations assume no shares were bought or sold during the period. Your actual costs may have been higher or lower, depending on the amount of your investment and the timing of any purchases or redemptions.
| WAVELENGTH INTEREST RATE NEUTRAL FUND |
| ABOUT YOUR FUND’S EXPENSES (Unaudited) |
More information about the Fund’s expenses can be found in this report. For additional information on operating expenses and other shareholder costs, please refer to the Fund’s prospectus.
| | | Beginning | | Ending | | Expenses |
| | | Account Value | | Account Value | | Paid During |
| | | June 1, 2020 | | November 30, 2020 | | Period* |
| Based on Actual Fund Return | | $1,000.00 | | $1,064.90 | | $5.11 |
| Based on Hypothetical 5% Return (before expenses) | | $1,000.00 | | $1,020.05 | | $5.00 |
| * | Expenses are equal to the Fund’s annualized net expense ratio of 0.99% for the period, multiplied by the average account value over the period, multiplied by 183/366 (to reflect the one-half year period). |
| OTHER INFORMATION (Unaudited) |
A description of the policies and procedures that the Fund uses to vote proxies relating to portfolio securities is available without charge upon request by calling toll-free 1-866-896-9292, or on the SEC’s website at www.sec.gov. Information regarding how the Fund voted proxies relating to portfolio securities during the most recent 12-month period ended June 30 is available without charge upon request by calling toll-free 1-866-896-9292, or on the SEC’s website at www.sec.gov.
The Trust files a complete listing of portfolio holdings for the Fund with the SEC as of the end of the first and third quarters of each fiscal year as an exhibit to its reports on Form N-PORT. These filings are available upon request by calling 1-866-896-9292. Furthermore, you may obtain a copy of the filings on the SEC’s website at www.sec.gov.
| WAVELENGTH INTEREST RATE NEUTRAL FUND |
| DISCLOSURE REGARDING APPROVAL OF INVESTMENT ADVISORY AGREEMENT (Unaudited) |
The Board of Trustees (the “Board”), including the Independent Trustees voting separately, has reviewed and approved the Fund’s Investment Advisory Agreement (the “Agreement”) with Wavelength Capital Management, LLC (the “Adviser”) for an additional one-year term. The Board approved the Agreement at a meeting held on July 20-21, 2020, at which all of the Trustees were present.
Legal counsel advised the Board during its deliberations. Additionally, the Board received and reviewed a substantial amount of information provided by the Adviser in response to requests of the Board and counsel. In deciding whether to approve the continuation of the Agreement, the Board recalled its review of the materials related to the Fund and the Adviser throughout the preceding 12 months and its numerous discussions with Trust Management and the Adviser about the operations and performance of the Fund during that period. The Board further considered those materials and discussions and numerous other factors, including:
The nature, extent, and quality of the services provided by the Adviser. In this regard, the Board reviewed the services being provided by the Adviser to the Fund including, without limitation, its recent investment advisory services to the Fund; its compliance procedures and practices; its efforts to promote the Fund and assist in its distribution; and its compliance program. After reviewing the foregoing information and further information in the Adviser’s memorandum (e.g., description of its business and Form ADV), the Board concluded that the quality, extent, and nature of the services provided by the Adviser to the Fund were satisfactory and adequate.
The investment performance of the Fund. In this regard, the Board compared the performance of the Fund with the performance of its benchmark index, custom peer group, and Morningstar category. The Board also considered the consistency of the Adviser’s management with the Fund’s investment objective and policies. The Board noted that the Fund had outperformed relative to the average and median of its custom peer group and its Morningstar category (Nontraditional Bond Funds Under $250 Million, True No-Load) for the one-year, three-year, five-year and since inception periods. Following additional discussion of the investment performance of the Fund; the Adviser’s experience in managing mutual funds, private funds, and separate accounts; the Adviser’s historical investment performance; and other factors, the Board concluded that the investment performance of the Fund has been satisfactory.
The costs of the services provided and profits realized by the Adviser and its affiliates from their relationship with the Fund. In this regard, the Board considered the Adviser’s staffing; methods of operating; the education and experience of its personnel; its compliance program, policies and procedures; its financial condition and the level of commitment to the Fund and, generally, the Adviser’s advisory business; the asset level of the Fund; the overall expenses of the Fund, including the advisory fee; and the differences in fees and services to the Adviser’s other similar clients. The Board considered its discussion with the Adviser
| WAVELENGTH INTEREST RATE NEUTRAL FUND |
| DISCLOSURE REGARDING APPROVAL OF INVESTMENT ADVISORY AGREEMENT (Unaudited) |
regarding the expense limitation agreement (“ELA”), and considered the Adviser’s past fee reductions and expense reimbursements for the Fund. The Board further took into account the Adviser’s willingness to continue the ELA for the Fund until at least October 1, 2025.
The Board also considered potential benefits for the Adviser in managing the Fund, including promotion of the Adviser’s name. The Board compared the Fund’s advisory fee and overall expense ratio to the average and median advisory fees and expense ratios for its custom peer group and Morningstar categories. In considering the comparison in fees and expense ratios between the Fund and other comparable funds, the Board looked at the differences in types of funds being compared, the style of investment management, the size of the Fund, and the nature of the investment strategies. The Board also considered the Adviser’s commitment to limit the Fund’s expenses under the ELA. The Board noted that the 0.95% advisory fee for the Fund was above the average and the median for the Fund’s custom peer group and the Fund’s Morningstar category (Nontraditional Bond Funds Under $250 Million, True No-Load), but was less than the highest advisory fee in the Fund’s custom peer group and referenced for other funds in the Morningstar category. The Board further noted that the overall expense ratio for the Fund of 1.28% was lower than the average and higher than the median expense ratio for the other funds in the Adviser Fund’s custom peer group and higher than the average and higher than the median of the Morningstar category (Nontraditional Bond Funds Under $250 Million, True No-Load). The Board further considered the investment strategy and style used by the Adviser in managing the portfolio of the Fund. Following these comparisons and considerations and upon further consideration and discussion of the foregoing, the Board concluded that the advisory fee to be paid to the Adviser by the Fund is fair and reasonable.
The extent to which economics of scale would be realized as the Fund grows and whether advisory fee levels reflect these economies of scale for the benefit of the Fund’s investors. In this regard, the Board considered that the Fund’s fee arrangements with the Adviser involve both the advisory fee and the ELA. The Board determined that while the advisory fee rate remained the same as asset levels increased, the shareholders of the Fund have experienced in the past, and may again experience in the future, benefits from the ELA. Following further discussion of the Fund’s asset level, expectations for asset growth, and level of fees, the Board determined that the fee arrangements with the Adviser were fair and reasonable in relation to the nature and quality of services being provided by the Adviser.
Brokerage and portfolio transactions. In this regard, the Board considered the Adviser’s policies and procedures and performance in seeking best execution for its clients, including the Fund. The Board also considered the historical portfolio turnover rate for the Fund; the process by which evaluations are made of the overall reasonableness of commissions paid; the process by which the Adviser evaluates best execution; the method and basis for selecting and evaluating the broker-dealers used; and any anticipated allocation of portfolio business to persons affiliated with the Adviser. After further review and discussion, the Board determined that the Adviser’s practices regarding brokerage and portfolio transactions are satisfactory.
| WAVELENGTH INTEREST RATE NEUTRAL FUND |
| DISCLOSURE REGARDING APPROVAL OF INVESTMENT ADVISORY AGREEMENT (Unaudited) |
Possible conflicts of interest. In evaluating the possibility for conflicts of interest, the Board considered such matters as the experience and abilities of the advisory personnel assigned to the Fund; the Adviser’s process for allocating trades among the Fund and its other clients; and the substance and administration of the Adviser’s Code of Ethics. Following further consideration and discussion, the Board found for the Fund that the Adviser’s standards and practices relating to the identification and mitigation of potential conflicts of interests were satisfactory.
After further discussion of the factors noted above and in reliance on the information provided by the Adviser and Trust Management, and taking into account the totality of all the factors discussed and information presented at this meeting and previous meetings, the Board indicated its agreement to approve the continuance of the Agreement. It was noted that in the Trustees’ deliberations regarding the approval of the continuance of the Agreement, the Trustees did not identify any particular information or factor that was all-important or controlling, and that each individual Trustee may have attributed different weights to the various factors listed above. After full consideration of the above factors as well as other factors, the Board unanimously concluded that approval of the Agreement was in the best interests of the Fund and its shareholders.
| WAVELENGTH INTEREST RATE NEUTRAL FUND |
| LIQUIDITY RISK MANAGEMENT PROGRAM (Unaudited) |
The Fund has adopted and implemented a written liquidity risk management program (the “Program”) as required by Rule 22e-4 (the “Liquidity Rule”) under the Investment Company Act of 1940, as amended. The Program is reasonably designed to assess and manage the Fund’s liquidity risk, taking into consideration, among other factors, the Fund’s investment strategy and the liquidity of its portfolio investments during normal and reasonably foreseeable stressed conditions; its short- and long-term cash flow projections; and its cash holdings and access to other funding sources. The Fund’s Board of Trustees (the “Board”) approved the appointment of the Liquidity Administrator Committee, comprising of the Fund’s Adviser and certain Trust officers, to be responsible for the Program’s administration and oversight and for reporting to the Board on at least an annual basis regarding the Program’s operation and effectiveness. The annual written report assessing the Program (the “Report”) was presented to the Board at the October 19-20, 2020 Board meeting and covered the period from June 1, 2019 to May 31, 2020 (the “Review Period”).
During the Review Period, the Fund did not experience unusual stress or disruption to its operations related to purchase and redemption activity. Also, during the Review Period, the Fund held adequate levels of cash and highly liquid investments to meet shareholder redemption activities in accordance with applicable requirements. The Report concluded that the Program is reasonably designed to prevent violation of the Liquidity Rule and the Program has been effectively implemented.
| FACTS | WHAT DOES WAVELENGTH INTEREST RATE NEUTRAL FUND (the “Fund”) DO WITH YOUR PERSONAL INFORMATION? |
| |
| Why? | Financial companies choose how they share your personal information. Federal law gives consumers the right to limit some but not all sharing. Federal law also requires us to tell you how we collect, share, and protect your personal information. Please read this notice carefully to understand what we do. |
| |
| What? | The types of personal information we collect and share depend on the product or service you have with us. This information can include: ■ Social Security number ■ Assets ■ Retirement Assets ■ Transaction History ■ Checking Account Information ■ Purchase History ■ Account Balances ■ Account Transactions ■ Wire Transfer Instructions When you are no longer our customer, we continue to share your information as described in this notice. |
| |
| How? | All financial companies need to share your personal information to run their everyday business. In the section below, we list the reasons financial companies can share their customers’ personal information; the reasons the Fund chooses to share; and whether you can limit this sharing. |
| |
| Reasons we can share your personal information | Does the
Fund share? | Can you limit
this sharing? |
For our everyday business purposes – Such as to process your transactions, maintain your account(s), respond to court orders and legal investigations, or report to credit bureaus | Yes | No |
For our marketing purposes – to offer our products and services to you | No | We don’t share |
| For joint marketing with other financial companies | No | We don’t share |
For our affiliates’ everyday business purposes – information about your transactions and experiences | No | We don’t share |
For our affiliates’ everyday business purposes – information about your creditworthiness | No | We don’t share |
| For nonaffiliates to market to you | No | We don’t share |
| | | |
| Questions? | Call 1-866-896-9292 |
| | | | |
| Who we are |
| Who is providing this notice? | Wavelength Interest Rate Neutral Fund Ultimus Fund Distributors, LLC (Distributor) Ultimus Fund Solutions, LLC (Administrator) |
| What we do |
| How does the Fund protect my personal information? | To protect your personal information from unauthorized access and use, we use security measures that comply with federal law. These measures include computer safeguards and secured files and buildings. Our service providers are held accountable for adhering to strict policies and procedures to prevent any misuse of your nonpublic personal information. |
| How does the Fund collect my personal information? | We collect your personal information, for example, when you ■ Open an account ■ Provide account information ■ Give us your contact information ■ Make deposits or withdrawals from your account ■ Make a wire transfer ■ Tell us where to send the money ■ Tell us who receives the money ■ Show your government-issued ID ■ Show your driver’s license We also collect your personal information from other companies. |
| Why can’t I limit all sharing? | Federal law gives you the right to limit only ■ Sharing for affiliates’ everyday business purposes – information about your creditworthiness ■ Affiliates from using your information to market to you ■ Sharing for nonaffiliates to market to you State laws and individual companies may give you additional rights to limit sharing. |
| |
| Definitions |
| Affiliates | Companies related by common ownership or control. They can be financial and nonfinancial companies. ■ Wavelength Capital Management LLC, the investment adviser to the Fund, could be deemed to be an affiliate. |
| Nonaffiliates | Companies not related by common ownership or control. They can be financial and nonfinancial companies ■ The Fund does not share with nonaffiliates so they can market to you. |
| Joint marketing | A formal agreement between nonaffiliated financial companies that together market financial products or services to you. ■ The Fund does not jointly market. |
This page intentionally left blank.
WAVELENGTH-SAR-20
Item 2. Code of Ethics.
Not required
Item 3. Audit Committee Financial Expert.
Not required
Item 4. Principal Accountant Fees and Services.
Not required
Item 5. Audit Committee of Listed Registrants.
Not applicable
Item 6. Schedule of Investments.
| (a) | Not applicable [schedule filed with Item 1] |
Item 7. Disclosure of Proxy Voting Policies and Procedures for Closed-End Management Investment Companies.
Not applicable
| Item 8. | Portfolio Managers of Closed-End Management Investment Companies. |
Not applicable
Item 9. Purchases of Equity Securities by Closed-End Management Investment Company and Affiliated Purchasers.
Not applicable
Item 10. Submission of Matters to a Vote of Security Holders.
The registrant’s Committee of Independent Trustees shall review shareholder recommendations for nominations to fill vacancies on the registrant’s board of trustees if such recommendations are submitted in writing and addressed to the Committee at the registrant’s offices. The Committee may adopt, by resolution, a policy regarding its procedures for considering candidates for the board of trustees, including any recommended by shareholders.
Item 11. Controls and Procedures.
(a) Based on their evaluation of the registrant’s disclosure controls and procedures (as defined in Rule 30a-3(c) under the Investment Company Act of 1940) as of a date within 90 days of the filing date of this report, the registrant’s principal executive officer and principal financial officer have concluded that such disclosure controls and procedures are reasonably designed and are operating effectively to ensure that material information relating to the registrant, including its consolidated subsidiaries, is made known to them by others within those entities, particularly during the period in which this report is being prepared, and that the information required in filings on Form N-CSR is recorded, processed, summarized, and reported on a timely basis.
(b) There were no changes in the registrant’s internal control over financial reporting (as defined in Rule 30a-3(d) under the Investment Company Act of 1940) that occurred during the period covered by this report that have materially affected, or are reasonably likely to materially affect, the registrant’s internal control over financial reporting.
Item 12. Disclosure of Securities Lending Activities for Closed-End Management Investment Companies.
Not applicable
File the exhibits listed below as part of this Form. Letter or number the exhibits in the sequence indicated.
(a)(1) Any code of ethics, or amendment thereto, that is the subject of the disclosure required by Item 2, to the extent that the registrant intends to satisfy the Item 2 requirements through filing of an exhibit: Not required
(a)(2) A separate certification for each principal executive officer and principal financial officer of the registrant as required by Rule 30a-2(a) under the Act (17 CFR 270.30a-2(a)): Attached hereto
(a)(3) Any written solicitation to purchase securities under Rule 23c-1 under the Act (17 CFR 270.23c-1) sent or given during the period covered by the report by or on behalf of the registrant to 10 or more persons: Not applicable
(a)(4) Change in the registrant’s independent public accountants: Not applicable
(b) Certifications required by Rule 30a-2(b) under the Act (17 CFR 270.30a-2(b)): Attached hereto
Exhibit 99.CERT Certifications required by Rule 30a-2(a) under the Act
Exhibit 99.906CERT Certifications required by Rule 30a-2(b) under the Act
SIGNATURES
Pursuant to the requirements of the Securities Exchange Act of 1934 and the Investment Company Act of 1940, the registrant has duly caused this report to be signed on its behalf by the undersigned, thereunto duly authorized.
| (Registrant) | Ultimus Managers Trust | | |
| | | | |
| By (Signature and Title)* | /s/ Matthew J. Beck |
| | | Matthew J. Beck, Secretary |
| | | |
| Date | February 1, 2021 | |
| | | |
| Pursuant to the requirements of the Securities Exchange Act of 1934 and the Investment Company Act of 1940, this report has been signed below by the following persons on behalf of the registrant and in the capacities and on the dates indicated. |
| | | |
| By (Signature and Title)* | /s/ Todd E. Heim |
| | | Todd E. Heim, Principal Executive Officer |
| | | |
| Date | February 1, 2021 | |
| | | |
| By (Signature and Title)* | /s/ Jennifer L. Leamer |
| | | Jennifer L. Leamer, Treasurer and Principal Financial Officer |
| | | |
| Date | February 1, 2021 | |
* Print the name and title of each signing officer under his or her signature.