| | Ng OMB APPROVAL |
| | OMB Number: 3235-0570 Expires: July 31, 2022 Estimated average burden hours per response: 20.6 |
UNITED STATES
SECURITIES AND EXCHANGE COMMISSION
Washington, D.C. 20549
FORM N-CSR
CERTIFIED SHAREHOLDER REPORT OF REGISTERED
MANAGEMENT INVESTMENT COMPANIES
| Investment Company Act file number | 811-22680 | |
| Ultimus Managers Trust |
| (Exact name of registrant as specified in charter) |
| 225 Pictoria Drive, Suite 450 Cincinnati, Ohio | 45246 |
| (Address of principal executive offices) | (Zip code) |
Matthew J. Beck, esq.
| Ultimus Fund Solutions, LLC 225 Pictoria Drive, Suite 450 Cincinnati, Ohio 45246 |
| (Name and address of agent for service) |
| Registrant's telephone number, including area code: | (513) 587-3400 | |
| Date of fiscal year end: | November 30 | |
| | | |
| Date of reporting period: | May 31, 2020 | |
Form N-CSR is to be used by management investment companies to file reports with the Commission not later than 10 days after the transmission to stockholders of any report that is required to be transmitted to stockholders under Rule 30e-1 under the Investment Company Act of 1940 (17 CFR 270.30e-1). The Commission may use the information provided on Form N-CSR in its regulatory, disclosure review, inspection, and policymaking roles.
A registrant is required to disclose the information specified by Form N-CSR, and the Commission will make this information public. A registrant is not required to respond to the collection of information contained in Form N-CSR unless the Form displays a currently valid Office of Management and Budget ("OMB") control number. Please direct comments concerning the accuracy of the information collection burden estimate and any suggestions for reducing the burden to the Secretary, Securities and Exchange Commission, 450 Fifth Street, NW, Washington, DC 20549-0609. The OMB has reviewed this collection of information under the clearance requirements of 44 U.S.C. § 3507.
| Item 1. | Reports to Stockholders. |

LYRICAL U.S. VALUE EQUITY FUND
Institutional Class (LYRIX)
Investor Class (LYRBX)
LYRICAL INTERNATIONAL VALUE EQUITY FUND
Institutional Class (LYRWX)
Investor Class (LYRNX)
Semi-Annual Report
May 31, 2020
(Unaudited)
Beginning on January 1, 2021, as permitted by regulations adopted by the U.S. Securities and Exchange Commission, paper copies of the Funds’ shareholder reports like this one will no longer be sent by mail, unless you specifically request paper copies of the reports from the Funds or from your financial intermediary, such as a broker-dealer or bank. Instead, the reports will be made available on a website, and you will be notified by mail each time a report is posted and provided with a website link to access the report.
If you have already elected to receive shareholder reports electronically, you will not be affected by this change and you need not take any action. You may elect to receive shareholder reports and other communications from the Funds electronically by contacting the Funds at 1-888-884-8099 or, if you own these shares through a financial intermediary, by contacting your financial intermediary.
You may elect to receive all future reports in paper free of charge. You can inform the Funds that you wish to continue receiving paper copies of your shareholder reports by contacting the Funds at 1-888-884-8099. If you own shares through a financial intermediary, you may contact your financial intermediary or follow instructions included with this document to elect to continue to receive paper copies of your shareholder reports. Your election to receive reports in paper will apply to all funds held with the fund complex or at your financial intermediary.
LYRICAL FUNDS
LETTER TO SHAREHOLDERS | May 31, 2020 |
Dear Fellow Shareholders,
Enclosed is the Annual Report to shareholders of the Lyrical U.S. Value Equity Fund (the “Fund”) and Lyrical International Value Equity Fund (the “International Fund”) (collectively, the “Funds”). On behalf of the Funds and their investment adviser, Lyrical Asset Management LP, I would like to thank you for your investment.
The Funds’ value investing approach underperformed the broader stock market this past six months. Market environments in which value investing falls out of favor have tended to occur for a year or two every decade or so, and that is the kind of environment we observed for much of the past two and a half years.
This past six months was most notably affected by the COVID-19 pandemic. The market’s steep decline from mid-February through mid-March was notably unkind to the Funds’ holdings and to deep value stocks generally. Facing this adverse market action, we redoubled our underwriting of the resiliency of our portfolio companies, adjudging them, as a group, to be capable to endure the adverse business effects of the pandemic and to thrive thereafter. Earnings announcements of our portfolio companies to date have validated that view. We also sought to take advantage of market volatility, by selling seven positions and buying six new positions from February through May in the Fund and selling four positions and buying five new positions in the International Fund, with the view that each upgraded our portfolios. While the portfolio has seen strong advances since the March low, we believe it remains extraordinarily inexpensive and therefore attractive, whatever the remaining course of the pandemic.
Lyrical U.S. Value Equity
Since its launch on February 4, 2013 through May 31, 2020, the Fund’s Institutional Class has produced a cumulative total return of +66.04%, compared to the +136.79% cumulative total return for the S&P 500® Index (the “S&P 500”). For the six months ended May 31, 2020, the Fund’s Institutional Class produced a total return of -20.31% compared to the total return for the S&P 500 of -2.10%. For the six months ended May 31, 2020, the three positions that most positively impacted performance were Dell Technologies, Inc. Class C (DELL), Berry Global Group, Inc. (BERY), and Univar Solutions, Inc. (UNVR), with contributions of 140 basis points (bps) (up 25%), 102 bps (up 31%) and 91 bps (up 44%), respectively; conversely, the three positions that most negatively impacted performance were AerCap Holdings N.V. (AER), Suncor Energy, Inc. (SU), and Lincoln National Corporation (LNC), which detracted 277 bps (down 48%), 263 bps (down 44%) and 144 bps (down 35%), respectively. Please see the following for commentary on these stocks for the period:
Dell Technologies, Inc. Class C (DELL) up 25%: DELL is the world’s largest end-to-end provider of IT infrastructure, software, and services. We initiated our position in DELL in March of 2020, when many stocks were under pressure because of the COVID-19 pandemic. As with many of the deeply discounted names we own, DELL
1
began a recovery in price toward the end of March, which continued in April and May. On May 28, DELL beat consensus earnings by 42%, and the stock gained 9% on the day.
Berry Global Group, Inc. (BERY) up 31%: BERY is the largest global producer of plastic packaging and protective solutions. We initiated our position in BERY at the beginning of April, 2020, when many stocks were under pressure because of the COVID-19 pandemic. BERY is actually a beneficiary of demand from the pandemic as it makes the material for hospital gowns, surgical masks, and disinfectant wipes. On May 1, BERY beat consensus earnings by 11% and affirmed its 2020 free cash flow guidance. The stock rose 3% on the day.
Univar Solutions, Inc. (UNVR) up 44%: UNVR is a global chemical and ingredients distributor. The company is asset-light and highly resilient to changes in economic demand. We initiated our position in UNVR at the end of March, 2020, when many stocks were under pressure because of the COVID-19 pandemic. As with many of the deeply discounted names we own, UNVR began a recovery in price toward the end of March, which continued in April and May. On May 11, UNVR beat earnings by 11.5%, though the stock fell 5% on that day.
AerCap Holdings N.V. (AER) down 48%: AER is one of the largest global commercial aircraft leasing firms. When the COVID-19 pandemic caused global air travel to decline precipitously in February and March, AerCap’s stock fell sharply as well. However, AER is much less affected by demand for air travel than its airline customers and it has multiple layers of financial protection against declines in demand and even defaults at its customers. While we do not believe these protections have been adequately recognized by the market yet, the stock has recovered significantly from its maximum drawdown in March. As of May 31st, it was up 113% from its March lows.
Suncor Energy, Inc. (SU) down 44%: SU is the world’s largest oil sands energy production company, with a resource base that is estimated to last nearly 100 years. Suncor extracts oil from its oil sands at very low and predictable cash costs, reducing the company’s risk profile compared to other exploration and production oil companies. Suncor’s stock sold off in the early months of 2020, as global oil prices were impacted both by the COVID-19 pandemic and by a price war between Saudi Arabia and Russia. While such conditions can affect near-term earnings, Suncor’s intrinsic value is primarily determined by long-term cash flows, which we expect to normalize at much higher levels as supply and demand rebalance. In the meantime, Suncor has a fortress balance sheet that enables it to survive long periods of low oil prices and market dislocation. As with AER, Suncor has recovered significantly from its maximum drawdown in March. As of May 31st, SU was up 64% from its March lows.
Lincoln National Corporation (LNC) down 35%: LNC is a leading provider of life insurance, annuities, and group protection in the United States. The stock sold off sharply in February and March, as the COVID-19 pandemic swept the globe. We believe the market has misunderstood the resilience of Lincoln’s business structure. In recent years, the company has reduced its exposure to guaranteed annuities, has upgraded the quality of its investment portfolio, and has shown the ability to pass
2
on changes in interest rates in the pricing of its products. While the pandemic may reduce the rate of growth, we expect LNC to grow its earnings at or above normal market levels in each of the next several years. As with AER and SU, LNC has recovered significantly from its maximum drawdown in March. As of May 31st, LNC was up 122% from its March lows.
In analyzing the Fund portfolio’s performance attribution, we find it helpful to examine both the investment success rate and any skew in the distribution of returns. Over the life of the Fund, 68% of the Fund’s investments posted gains, and 28% outperformed the S&P 500. Skew has been a positive factor, as the Fund’s outperformers have outperformed by 17%, while our underperformers have underperformed by 16% over the life of the Fund. For the six month period ended May 31, 2020, 18% of the Fund’s investments posted gains, and 20% outperformed the S&P 500. For the six month period skew has been a negative factor as the Fund’s outperformers have outperformed by 16%, while our underperformers have underperformed by 23%.
During the life of the Fund we have sold thirty-nine positions, as eight companies announced they were being acquired, twenty approached our estimates of fair value, for four lost conviction in our thesis, for one the company announced or completed acquisitions which increased the complexity and decreased analyzability and for six the risk/reward became less compelling than other opportunities. We also added thirty-eight new positions from our pipeline of opportunities.
As of May 31, 2020, the valuation of our portfolio is 10.4 times the next twelve months consensus earnings. The S&P 500 has a valuation of 21.6 times earnings on this same basis, a premium of 108% over the Fund.
Lyrical International Value Equity
In March 2020, we launched the Lyrical International Value Equity Fund to employ our value strategy in the international space. Our portfolio is constructed to be balanced and diversified across approximately 25-40 positions at time of portfolio implementation, giving us exposure to as many different types of companies and situations as possible without sacrificing our strict investment standards. Our international portfolio weights match, at cost, the proportionate weights of the MSCI World Index by region, excluding the U.S., at cost: East (Asia, Australia, etc.) and West (Europe, Canada, etc). We divide the world in this way because countries in these regions have a high trading correlation.
Since its launch on March 2, 2020 through May 31, 2020, the Lyrical International Value Equity Fund – Institutional Class has produced a total return of -13.1%, compared to the -4.8% total return for the MSCI EAFE.
For the period since inception ended May 31, 2020, the three positions that most positively impacted performance were Kinden Corporation (1944-JP), Liberty Global plc (LBTYA), and Sony Corporation (6758-JP) with contributions of 45 basis points (bps) (up 11.8%), 44 bps (up 8.8%) and 38 bps (up 4.5%), respectively; conversely, the three positions that most negatively impacted performance were AerCap Holdings N.V. (AER), Suncor Energy, Inc. (SU), and Fairfax Financial Holdings Ltd. (FFH-CA) which detracted 191 bps (down 38.1%), 190 bps (down 37.1%) and 168 bps (down 35.8%), respectively.
3
Lyrical Asset Management’s Investment Philosophy and Portfolio Construction
For the new investors since our previous letter to the Funds’ shareholders, we’d like to briefly outline our investment philosophy and portfolio construction approach.
We believe our strategy and approach to investing differentiate us from other investment managers, even those that share a value approach to investing. We are deep value investors and by this we mean that we look to invest in companies trading significantly below intrinsic value. This separates us from other value managers who focus on relative value or core value approaches and whose portfolio characteristics have higher Price/Earnings, Price/Book and Price/Cash Flow multiples. We assess valuation based on current price relative to long-term normalized earnings, which contrasts us to those that rely on Price/Book or dividend yield. We only invest in what we consider to be quality businesses that we believe should earn good returns on invested capital and avoid volatile businesses and companies with excessive leverage. Other value investors may consider owning any business regardless of quality if they believe the price is low enough. Lastly, we only invest in businesses we can understand and avoid those that are excessively complex or require specialized technical knowledge, even though they may appear cheap from a high-level perspective.
We construct our portfolio purely bottom up and without regard to what is or is not contained in a benchmark. We are concerned with concentration risk and have strict limits on how much capital can be invested in any one position or any one industry. Our long portfolio is constructed to be balanced and diversified across approximately 33 positions, giving us exposure to many different types of companies and situations without sacrificing our strict investment standards.
Thank you for your continued trust and interest in Lyrical Asset Management.
Sincerely,
Andrew Wellington
Portfolio Manager
4
Past performance is not predictive of future performance. Investment results and principal value will fluctuate so that shares, when redeemed, may be worth more or less than their original cost. Current performance may be higher or lower than the performance data quoted. Performance data current to the most recent month end are available by calling 1-888-884-8099.
An investor should consider the investment objectives, risks, charges and expenses of the Funds carefully before investing. The Funds’ prospectus contains this and other important information. To obtain a copy of the Funds’ prospectus please visit the Funds’ website at www.lyricalvaluefunds.com or call 1-888-884-8099 and a copy will be sent to you free of charge. Please read the prospectus carefully before you invest. The Funds are distributed by Ultimus Fund Distributors, LLC.
The Letter to Shareholders seeks to describe some of the Adviser’s current opinions and views of the financial markets. Although the Adviser believes it has a reasonable basis for any opinions or views expressed, actual results may differ, sometimes significantly so, from those expected or expressed. The securities held by the Funds that are discussed in the Letter to Shareholders were held during the period covered by this Report. They do not comprise the entire investment portfolios of the Funds, may be sold at any time, and may no longer be held by the Funds. For a complete list of securities held by the Funds as of May 31, 2020, please see the Schedules of Investments section of this Report. The opinions of the Funds’ adviser with respect to those securities may change at any time.
Statements in the Letter to Shareholders that reflect projections or expectations for future financial or economic performance of the Funds and the market in general and statements of the Funds’ plans and objectives for future operations are forward-looking statements. No assurance can be given that actual results or events will not differ materially from those projected, estimated, assumed, or anticipated in any such forward-looking statements. Important factors that could result in such differences, in addition to factors noted with such forward-looking statements include, without limitation, general economic conditions, such as inflation, recession, and interest rates. Past performance is not a guarantee of future results.
5
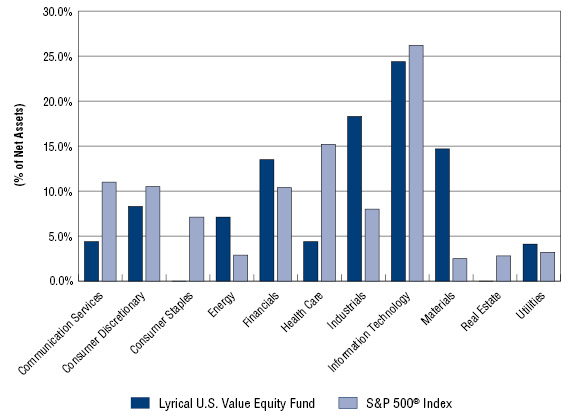
LYRICAL U.S. VALUE EQUITY FUND
PORTFOLIO INFORMATION
May 31, 2020 (Unaudited)
Lyrical U.S. Value Equity Fund vs. S&P 500® Index
Sector Diversification
Top Ten Equity Holdings
Security Description | % of
Net Assets |
Dell Technologies, Inc. - Class C | 4.9% |
Ameriprise Financial, Inc. | 4.7% |
Broadcom, Inc. | 4.7% |
Celanese Corporation | 4.7% |
United Rentals, Inc. | 4.6% |
XPO Logistics, Inc. | 4.6% |
HCA Healthcare, Inc. | 4.4% |
Liberty Global plc - Series C | 4.4% |
Western Digital Corporation | 4.3% |
Crown Holdings, Inc. | 4.2% |
6
LYRICAL INTERNATIONAL VALUE EQUITY FUND
PORTFOLIO INFORMATION
May 31, 2020 (Unaudited)
Lyrical International Value Equity Fund
Country Diversification

Top Ten Equity Holdings
Security Description | % of
Net Assets |
Ashtead Group plc | 5.4% |
Suzuki Motor Corporation | 4.9% |
Atos SE | 4.8% |
NXP Semiconductors N.V. | 4.6% |
Hitachi Ltd. | 4.5% |
Liberty Global plc - Series A | 4.4% |
Exor N.V. | 4.4% |
Sony Corporation | 4.2% |
ITOCHU Corporation | 4.1% |
SK Kaken Company Ltd. | 4.1% |
7
LYRICAL U.S. VALUE EQUITY FUND
SCHEDULE OF INVESTMENTS
May 31, 2020 (Unaudited) |
COMMON STOCKS — 99.2% | | Shares | | | Value | |
Communication Services — 4.4% | | | | | | | | |
Media — 4.4% | | | | | | | | |
Liberty Global plc - Series C (a) | | | 588,944 | | | $ | 12,149,915 | |
| | | | | | | | | |
Consumer Discretionary — 8.3% | | | | | | | | |
Auto Components — 0.6% | | | | | | | | |
Adient plc (a) | | | 105,470 | | | | 1,794,044 | |
| | | | | | | | | |
Household Durables — 4.0% | | | | | | | | |
Whirlpool Corporation | | | 89,801 | | | | 10,939,558 | |
| | | | | | | | | |
Internet & Direct Marketing Retail — 1.8% | | | | | | | | |
Qurate Retail, Inc. - Series A (a) | | | 613,101 | | | | 5,048,887 | |
| | | | | | | | | |
Textiles, Apparel & Luxury Goods — 1.9% | | | | | | | | |
Hanesbrands, Inc. | | | 523,685 | | | | 5,163,534 | |
| | | | | | | | | |
Energy — 7.1% | | | | | | | | |
Oil, Gas & Consumable Fuels — 7.1% | | | | | | | | |
EOG Resources, Inc. | | | 191,384 | | | | 9,754,842 | |
Suncor Energy, Inc. | | | 574,499 | | | | 9,835,423 | |
| | | | | | | | 19,590,265 | |
Financials — 13.5% | | | | | | | | |
Capital Markets — 6.5% | | | | | | | | |
Affiliated Managers Group, Inc. | | | 72,582 | | | | 4,835,413 | |
Ameriprise Financial, Inc. | | | 93,379 | | | | 13,079,596 | |
| | | | | | | | 17,915,009 | |
Insurance — 7.0% | | | | | | | | |
Assurant, Inc. | | | 85,174 | | | | 8,737,149 | |
Lincoln National Corporation | | | 284,077 | | | | 10,775,041 | |
| | | | | | | | 19,512,190 | |
Health Care — 4.4% | | | | | | | | |
Health Care Providers & Services — 4.4% | | | | | | | | |
HCA Healthcare, Inc. | | | 113,941 | | | | 12,180,293 | |
| | | | | | | | | |
Industrials — 18.3% | | | | | | | | |
Air Freight & Logistics — 4.6% | | | | | | | | |
XPO Logistics, Inc. (a) | | | 162,564 | | | | 12,811,669 | |
| | | | | | | | | |
Construction & Engineering — 2.7% | | | | | | | | |
Quanta Services, Inc. | | | 200,194 | | | | 7,393,164 | |
8
LYRICAL U.S. VALUE EQUITY FUND
SCHEDULE OF INVESTMENTS (Continued) |
COMMON STOCKS — 99.2% (Continued) | | Shares | | | Value | |
Industrials — 18.3% (Continued) | | | | | | | | |
Trading Companies & Distributors — 11.0% | | | | | | | | |
AerCap Holdings N.V. (a) | | | 249,013 | | | $ | 8,028,179 | |
Air Lease Corporation | | | 175,331 | | | | 5,279,217 | |
United Rentals, Inc. (a) | | | 92,393 | | | | 12,832,464 | |
Univar Solutions, Inc. (a) | | | 275,744 | | | | 4,263,002 | |
| | | | | | | | 30,402,862 | |
Information Technology — 24.4% | | | | | | | | |
Communications Equipment — 1.0% | | | | | | | | |
CommScope Holding Company, Inc. (a) | | | 249,856 | | | | 2,576,015 | |
| | | | | | | | | |
Electronic Equipment, Instruments & Components — 8.2% | | | | | | | | |
Arrow Electronics, Inc. (a) | | | 114,942 | | | | 7,940,193 | |
Flex Ltd. (a) | | | 719,647 | | | | 6,987,773 | |
SYNNEX Corporation | | | 73,440 | | | | 7,832,376 | |
| | | | | | | | 22,760,342 | |
IT Services — 1.3% | | | | | | | | |
Alliance Data Systems Corporation | | | 77,224 | | | | 3,577,788 | |
| | | | | | | | | |
Semiconductors & Semiconductor Equipment — 4.7% | | | | | | | | |
Broadcom, Inc. | | | 44,628 | | | | 12,998,797 | |
| | | | | | | | | |
Technology Hardware, Storage & Peripherals — 9.2% | | | | | | | | |
Dell Technologies, Inc. - Class C (a) | | | 273,722 | | | | 13,587,560 | |
Western Digital Corporation | | | 266,415 | | | | 11,820,834 | |
| | | | | | | | 25,408,394 | |
Materials — 14.7% | | | | | | | | |
Chemicals — 6.5% | | | | | | | | |
Celanese Corporation | | | 143,841 | | | | 12,932,744 | |
W.R. Grace & Company | | | 95,872 | | | | 5,004,519 | |
| | | | | | | | 17,937,263 | |
Containers & Packaging — 8.2% | | | | | | | | |
Berry Global Group, Inc. (a) | | | 203,666 | | | | 9,146,640 | |
Crown Holdings, Inc. (a) | | | 177,498 | | | | 11,613,694 | |
O-I Glass, Inc. | | | 249,431 | | | | 1,910,642 | |
| | | | | | | | 22,670,976 | |
Utilities — 4.1% | | | | | | | | |
Independent Power and Renewable Electricity Producers — 4.1% | | | | | | | | |
NRG Energy, Inc. | | | 316,399 | | | | 11,406,184 | |
| | | | | | | | | |
Total Common Stocks (Cost $257,976,544) | | | | | | $ | 274,237,149 | |
9
LYRICAL U.S. VALUE EQUITY FUND
SCHEDULE OF INVESTMENTS (Continued) |
MONEY MARKET FUNDS — 0.8% | | Shares | | | Value | |
Invesco Short-Term Investments Trust - Treasury Portfolio - Institutional Class, 0.07% (b) (Cost $2,308,714) | | | 2,308,714 | | | $ | 2,308,714 | |
| | | | | | | | | |
Investments at Value — 100.0% (Cost $260,285,258) | | | | | | $ | 276,545,863 | |
| | | | | | | | | |
Other Assets in Excess of Liabilities — 0.0% (c) | | | | | | | 57,642 | |
| | | | | | | | | |
Net Assets — 100.0% | | | | | | $ | 276,603,505 | |
(a) | Non-income producing security. |
(b) | The rate shown is the 7-day effective yield as of May 31, 2020. |
(c) | Percentage rounds to less than 0.1%. |
See accompanying notes to financial statements. |
10
LYRICAL INTERNATIONAL VALUE EQUITY FUND
SCHEDULE OF INVESTMENTS
May 31, 2020 (Unaudited) |
COMMON STOCKS — 98.9% | | Shares | | | Value | |
Canada — 15.8% | | | | | | | | |
Element Fleet Management Corporation | | | 4,939 | | | $ | 35,116 | |
Fairfax Financial Holdings Ltd. | | | 113 | | | | 31,388 | |
Linamar Corporation | | | 679 | | | | 18,857 | |
Suncor Energy, Inc. | | | 1,997 | | | | 34,328 | |
TFI International, Inc. | | | 902 | | | | 27,316 | |
| | | | | | | | 147,005 | |
Denmark — 3.3% | | | | | | | | |
ISS A/S (a) (b) | | | 1,853 | | | | 30,961 | |
| | | | | | | | | |
Finland — 2.1% | | | | | | | | |
Konecranes OYJ (a) (b) | | | 807 | | | | 19,398 | |
| | | | | | | | | |
France — 13.5% | | | | | | | | |
Atos SE (a) (b) | | | 594 | | | | 45,187 | |
Bollore S.A. (a) | | | 13,341 | | | | 38,290 | |
Elis S.A. (a) (b) | | | 1,402 | | | | 17,468 | |
SPIE S.A. (a) | | | 1,628 | | | | 25,461 | |
| | | | | | | | 126,406 | |
Hong Kong — 3.2% | | | | | | | | |
CK Hutchison Holdings Ltd. (a) | | | 4,800 | | | | 29,553 | |
| | | | | | | | | |
Japan — 30.6% | | | | | | | | |
Air Water, Inc. (a) | | | 1,900 | | | | 27,660 | |
Hitachi Ltd. (a) | | | 1,300 | | | | 41,990 | |
ITOCHU Corporation (a) | | | 1,800 | | | | 38,709 | |
Kinden Corporation (a) | | | 900 | | | | 15,078 | |
Kyudenko Corporation (a) | | | 600 | | | | 16,740 | |
NIPPO Corporation (a) | | | 900 | | | | 22,377 | |
SK Kaken Company Ltd. (a) | | | 100 | | | | 38,657 | |
Sony Corporation (a) | | | 600 | | | | 38,860 | |
Suzuki Motor Corporation (a) | | | 1,300 | | | | 45,319 | |
| | | | | | | | 285,390 | |
Netherlands — 12.6% | | | | | | | | |
AerCap Holdings N.V. (b) | | | 1,031 | | | | 33,240 | |
Exor N.V. (a) | | | 762 | | | | 41,088 | |
NXP Semiconductors N.V. | | | 451 | | | | 43,341 | |
| | | | | | | | 117,669 | |
Spain — 2.9% | | | | | | | | |
Grupo Catalana Occidente S.A. (a) | | | 1,214 | | | | 27,479 | |
11
LYRICAL INTERNATIONAL VALUE EQUITY FUND
SCHEDULE OF INVESTMENTS (Continued) |
COMMON STOCKS — 98.9% (Continued) | | Shares | | | Value | |
Sweden — 2.4% | | | | | | | | |
Intrum AB (a) | | | 1,351 | | | $ | 22,464 | |
| | | | | | | | | |
United Kingdom — 12.5% | | | | | | | | |
Ashtead Group plc (a) | | | 1,689 | | | | 50,426 | |
Babcock International Group plc (a) | | | 5,248 | | | | 24,892 | |
Liberty Global plc - Series A (b) | | | 1,949 | | | | 41,397 | |
| | | | | | | | 116,715 | |
| | | | | | | | | |
Total Common Stocks (Cost $1,010,462) | | | | | | $ | 923,040 | |
|
Money Market Funds — 0.4% | | Shares | | | Value | |
Invesco Short-Term Investments Trust - Treasury Portfolio - Institutional Class, 0.07% (c) (Cost $4,237) | | | 4237 | | | $ | 4,237 | |
| | | | | | | | | |
Investments at Value — 99.3% (Cost $1,014,699) | | | | | | $ | 927,277 | |
| | | | | | | | | |
Other Assets in Excess of Liabilities — 0.7% | | | | | | | 6,447 | |
| | | | | | | | | |
Net Assets — 100.0% | | | | | | $ | 933,724 | |
(a) | Level 2 security (Note 2). |
(b) | Non-income producing security. |
(c) | The rate shown is the 7-day effective yield as of May 31, 2020. |
See accompanying notes to financial statements. |
12
LYRICAL INTERNATIONAL VALUE EQUITY FUND
SCHEDULE OF INVESTMENTS (Continued) |
Common Stocks by Sector/Industry | | % of
Net Assets | |
Communication Services — 8.5% | | | | |
Entertainment | | | 4.1 | % |
Media | | | 4.4 | % |
| | | | | |
Consumer Discretionary — 11.0% | | | | |
Auto Components | | | 2.0 | % |
Automobiles | | | 4.8 | % |
Household Durables | | | 4.2 | % |
| | | | | |
Energy — 3.7% | | | | |
Oil, Gas & Consumable Fuels | | | 3.7 | % |
| | | | | |
Financials — 14.5% | | | | |
Diversified Financial Services | | | 8.2 | % |
Insurance | | | 6.3 | % |
| | | | | |
Industrials — 40.1% | | | | |
Commercial Services & Supplies | | | 14.6 | % |
Construction & Engineering | | | 4.2 | % |
Industrial Conglomerates | | | 3.2 | % |
Machinery | | | 2.1 | % |
Road & Rail | | | 2.9 | % |
Trading Companies & Distributors | | | 13.1 | % |
| | | | | |
Information Technology — 14.0% | | | | |
Electronic Equipment, Instruments & Components | | | 4.5 | % |
IT Services | | | 4.8 | % |
Semiconductors & Semiconductor Equipment | | | 4.7 | % |
| | | | | |
Materials — 7.1% | | | | |
Chemicals | | | 7.1 | % |
| | | | 98.9 | % |
See accompanying notes to financial statements. |
13
LYRICAL FUNDS
STATEMENTS OF ASSETS AND LIABILITIES
May 31, 2020 (Unaudited) |
| | Lyrical
U.S. Value
Equity Fund | | | Lyrical
International
Value Equity Fund | |
ASSETS | | | | | | | | |
Investments in securities: | | | | | | | | |
At cost | | $ | 260,285,258 | | | $ | 1,014,699 | |
At value (Note 2) | | $ | 276,545,863 | | | $ | 927,277 | |
Receivable for capital shares sold | | | 230,387 | | | | — | |
Receivable from Adviser (Note 4) | | | — | | | | 13,517 | |
Dividends receivable | | | 365,216 | | | | 4,249 | |
Tax reclaims receivable | | | — | | | | 185 | |
Other assets | | | 42,516 | | | | 4,094 | |
Total assets | | | 277,183,982 | | | | 949,322 | |
| | | | | | | | | |
LIABILITIES | | | | | | | | |
Payable for capital shares redeemed | | | 301,005 | | | | — | |
Payable to Adviser (Note 4) | | | 199,326 | | | | — | |
Payable to administrator (Note 4) | | | 37,652 | | | | 5,510 | |
Accrued distribution fees (Note 4) | | | 6,883 | | | | 263 | |
Other accrued expenses and liabilities | | | 35,611 | | | | 9,825 | |
Total liabilities | | | 580,477 | | | | 15,598 | |
| | | | | | | | | |
NET ASSETS | | $ | 276,603,505 | | | $ | 933,724 | |
| | | | | | | | | |
NET ASSETS CONSIST OF: | | | | | | | | |
Paid-in capital | | $ | 323,129,000 | | | $ | 1,056,800 | |
Accumulated deficit | | | (46,525,495 | ) | | | (123,076 | ) |
NET ASSETS | | $ | 276,603,505 | | | $ | 933,724 | |
| | | | | | | | | |
NET ASSET VALUE PER SHARE: | | | | | | | | |
INSTITUTIONAL CLASS | | | | | | | | |
Net assets applicable to Institutional Class | | $ | 271,070,459 | | | $ | 434,377 | |
Institutional Class shares of beneficial interest outstanding (unlimited number of shares authorized, no par value) | | | 21,443,004 | | | | 50,000 | |
Net asset value, offering price and redemption price per share (Note 2) | | $ | 12.64 | | | $ | 8.69 | |
INVESTOR CLASS | | | | | | | | |
Net assets applicable to Investor Class | | $ | 5,533,046 | | | $ | 499,347 | |
Investor Class shares of beneficial interest outstanding (unlimited number of shares authorized, no par value) | | | 440,296 | | | | 57,515 | |
Net asset value, offering price and redemption price per share (Note 2) | | $ | 12.57 | | | $ | 8.68 | |
See accompanying notes to financial statements. |
14
LYRICAL FUNDS
STATEMENTS OF OPERATIONS
Six Months Ended May 31, 2020 (Unaudited)(a) |
| | Lyrical
U.S. Value
Equity Fund | | | Lyrical
International
Value Equity Fund | |
INVESTMENT INCOME | | | | | | | | |
Dividend income | | $ | 3,888,989 | | | $ | 6,789 | |
Foreign witholding taxes on dividends | | | (89,906 | ) | | | (853 | ) |
Total investment income | | | 3,799,083 | | | | 5,936 | |
| | | | | | | | | |
EXPENSES | | | | | | | | |
Investment advisory fees (Note 4) | | | 2,693,782 | | | | 1,975 | |
Administration fees (Note 4) | | | 196,431 | | | | 6,000 | |
Fund accounting fees (Note 4) | | | 39,544 | | | | 7,523 | |
Transfer agent fees (Note 4) | | | 34,977 | | | | 6,000 | |
Postage and supplies | | | 35,783 | | | | 1,369 | |
Borrowing costs (Note 5) | | | 35,494 | | | | — | |
Registration and filing fees | | | 24,903 | | | | 2,973 | |
Compliance fees (Note 4) | | | 24,020 | | | | 3,000 | |
Custody and bank service fees | | | 20,956 | | | | 5,103 | |
Legal fees | | | 14,765 | | | | 5,841 | |
Trustees’ fees and expenses (Note 4) | | | 8,752 | | | | 6,675 | |
Networking fees | | | 13,670 | | | | 38 | |
Audit and tax services fees | | | 8,375 | | | | — | |
Distribution fees - Investor Class (Note 4) | | | 7,513 | | | | 264 | |
Printing of shareholder reports | | | 6,386 | | | | 300 | |
Insurance expense | | | 2,195 | | | | — | |
Other expenses | | | 30,549 | | | | 5,492 | |
Total expenses | | | 3,198,095 | | | | 52,553 | |
Less fees reduced and/or expenses reimbursed by Adviser (Note 4) | | | (30,352 | ) | | | (49,992 | ) |
Net expenses | | | 3,167,743 | | | | 2,561 | |
| | | | | | | | | |
NET INVESTMENT INCOME | | | 631,340 | | | | 3,375 | |
| | | | | | | | | |
REALIZED AND UNREALIZED LOSSES ON INVESTMENTS AND FOREIGN CURRENCIES | | | | | | | | |
Net realized losses from investment transactions | | | (27,979,679 | ) | | | (35,393 | ) |
Net realized losses from foreign currency transactions (Note 2) | | | (14,533 | ) | | | (3,634 | ) |
Net change in unrealized appreciation (depreciation) on investments | | | (100,626,159 | ) | | | (87,422 | ) |
Net change in unrealized appreciation (depreciation) on foreign currency translation | | | — | | | | (2 | ) |
NET REALIZED AND UNREALIZED LOSSES ON INVESTMENTS AND FOREIGN CURRENCIES | | | (128,620,371 | ) | | | (126,451 | ) |
| | | | | | | | | |
NET DECREASE IN NET ASSETS RESULTING FROM OPERATIONS | | $ | (127,989,031 | ) | | $ | (123,076 | ) |
(a) | Except for Lyrical International Value Equity Fund, which represents the period from the commencement of operations (March 2, 2020) through May 31, 2020. |
See accompanying notes to financial statements. |
15
LYRICAL U.S. VALUE EQUITY FUND
STATEMENTS OF CHANGES IN NET ASSETS |
| | Six Months
Ended
May 31, 2020
(Unaudited) | | | Year
Ended
November 30,
2019 | |
FROM OPERATIONS | | | | | | | | |
Net investment income | | $ | 631,340 | | | $ | 2,694,840 | |
Net realized gains (losses) from investment transactions | | | (27,979,679 | ) | | | 31,981,612 | |
Net realized losses from foreign currency transactions | | | (14,533 | ) | | | (1,948 | ) |
Net change in unrealized appreciation (depreciation) on investments | | | (100,626,159 | ) | | | (15,932,868 | ) |
Net increase (decrease) in net assets resulting from operations | | | (127,989,031 | ) | | | 18,741,636 | |
| | | | | | | | | |
FROM DISTRIBUTIONS TO SHAREHOLDERS (Note 2) | | | | | | | | |
Institutional Class | | | (1,934,332 | ) | | | (18,081,629 | ) |
Investor Class | | | — | | | | (167,631 | ) |
Decrease in net assets from distributions to shareholders | | | (1,934,332 | ) | | | (18,249,260 | ) |
| | | | | | | | | |
CAPITAL SHARE TRANSACTIONS | | | | | | | | |
Institutional Class | | | | | | | | |
Proceeds from shares sold | | | 130,500,660 | | | | 279,936,248 | |
Net asset value of shares issued in reinvestment of distributions to shareholders | | | 1,436,425 | | | | 14,799,306 | |
Payments for shares redeemed | | | (350,114,389 | ) | | | (585,459,118 | ) |
Net decrease in Institutional Class net assets from captial share transactions | | | (218,177,304 | ) | | | (290,723,564 | ) |
| | | | | | | | | |
Investor Class | | | | | | | | |
Proceeds from shares sold | | | 1,289,496 | | | | 1,562,229 | |
Net asset value of shares issued in reinvestment of distributions to shareholders | | | — | | | | 145,648 | |
Payments for shares redeemed | | | (953,839 | ) | | | (14,285,234 | ) |
Net increase (decrease) in Investor Class net assets from captial share transactions | | | 335,657 | | | | (12,577,357 | ) |
| | | | | | | | | |
TOTAL DECREASE IN NET ASSETS | | | (347,765,010 | ) | | | (302,808,545 | ) |
| | | | | | | | | |
NET ASSETS | | | | | | | | |
Beginning of period | | | 624,368,515 | | | | 927,177,060 | |
End of period | | $ | 276,603,505 | | | $ | 624,368,515 | |
See accompanying notes to financial statements. |
16
LYRICAL U.S. VALUE EQUITY FUND
STATEMENTS OF CHANGES IN NET ASSETS (Continued) |
| | Six Months
Ended
May 31, 2020
(Unaudited) | | | Year
Ended
November 30,
2019 | |
CAPITAL SHARE ACTIVITY | | | | | | | | |
Institutional Class | | | | | | | | |
Shares sold | | | 11,062,948 | | | | 18,953,610 | |
Shares issued in reinvestment of distributions to shareholders | | | 87,791 | | | | 952,538 | |
Shares redeemed | | | (28,531,725 | ) | | | (39,422,684 | ) |
Net decrease in shares outstanding | | | (17,380,986 | ) | | | (19,516,536 | ) |
Shares outstanding at beginning of period | | | 38,823,990 | | | | 58,340,526 | |
Shares outstanding at end of period | | | 21,443,004 | | | | 38,823,990 | |
| | | | | | | | | |
Investor Class | | | | | | | | |
Shares sold | | | 97,337 | | | | 102,409 | |
Shares issued in reinvestment of distributions to shareholders | | | — | | | | 9,230 | |
Shares redeemed | | | (80,367 | ) | | | (972,625 | ) |
Net increase (decrease) in shares outstanding | | | 16,970 | | | | (860,986 | ) |
Shares outstanding at beginning of period | | | 423,326 | | | | 1,284,312 | |
Shares outstanding at end of period | | | 440,296 | | | | 423,326 | |
See accompanying notes to financial statements. |
17
LYRICAL INTERNATIONAL VALUE EQUITY FUND
STATEMENT OF CHANGES IN NET ASSETS |
| | Period Ended
May 31, 2020
(Unaudited)(a) | |
FROM OPERATIONS | | | | |
Net investment income | | $ | 3,375 | |
Net realized losses from investment transactions | | | (35,393 | ) |
Net realized losses from foreign currency transactions | | | (3,634 | ) |
Net change in unrealized appreciation (depreciation) on investments | | | (87,422 | ) |
Net change in unrealized appreciation (depreciation) on foreign currency translation | | | (2 | ) |
Net decrease in net assets resulting from operations | | | (123,076 | ) |
| | | | | |
CAPITAL SHARE TRANSACTIONS | | | | |
Institutional Class | | | | |
Proceeds from shares sold | | | 500,000 | |
| | | | | |
Investor Class | | | | |
Proceeds from shares sold | | | 556,800 | |
| | | | | |
TOTAL INCREASE IN NET ASSETS | | | 933,724 | |
| | | | | |
NET ASSETS | | | | |
Beginning of period | | | — | |
End of period | | $ | 933,724 | |
| | | | | |
CAPITAL SHARE ACTIVITY | | | | |
Institutional Class | | | | |
Shares sold | | | 50,000 | |
Net increase in shares outstanding | | | 50,000 | |
Shares outstanding at beginning of period | | | — | |
Shares outstanding at end of period | | | 50,000 | |
| | | | | |
Investor Class | | | | |
Shares sold | | | 57,515 | |
Net increase in shares outstanding | | | 57,515 | |
Shares outstanding at beginning of period | | | — | |
Shares outstanding at end of period | | | 57,515 | |
(a) | Represents the period from the commencement of operations (March 2, 2020) through May 31, 2020. |
See accompanying notes to financial statements. |
18
LYRICAL U.S. VALUE EQUITY FUND
INSTITUTIONAL CLASS
FINANCIAL HIGHLIGHTS |
Per Share Data for a Share Outstanding Throughout Each Period: |
| | Six Months
Ended
May 31,
2020
(Unaudited) | | | Year
Ended
Nov. 30,
2019 | | | Year
Ended
Nov. 30,
2018 | | | Year
Ended
Nov. 30,
2017 | | | Year
Ended
Nov. 30,
2016 | | | Year
Ended
Nov. 30,
2015 | |
Net asset value at beginning of period | | $ | 15.91 | | | $ | 15.55 | | | $ | 18.62 | | | $ | 16.60 | | | $ | 15.63 | | | $ | 16.29 | |
| | | | | | | | | | | | | | | | | | | | | | | | | |
Income (loss) from investment operations: | | | | | | | | | | | | | | | | | | | | | | | | |
Net investment income | | | 0.02 | (a) | | | 0.05 | (a) | | | 0.03 | (a) | | | 0.01 | (a) | | | 0.24 | | | | 0.04 | |
Net realized and unrealized gains (losses) on investments and foreign currencies | | | (3.24 | ) | | | 0.76 | | | | (1.70 | ) | | | 3.54 | | | | 1.40 | | | | (0.35 | ) |
Total from investment operations | | | (3.22 | ) | | | 0.81 | | | | (1.67 | ) | | | 3.55 | | | | 1.64 | | | | (0.31 | ) |
| | | | | | | | | | | | | | | | | | | | | | | | | |
Less distributions: | | | | | | | | | | | | | | | | | | | | | | | | |
Dividends from net investment income | | | (0.05 | ) | | | (0.05 | ) | | | (0.01 | ) | | | (0.24 | ) | | | (0.04 | ) | | | (0.00 | )(b) |
Distributions from net realized gains | | | — | | | | (0.40 | ) | | | (1.39 | ) | | | (1.29 | ) | | | (0.63 | ) | | | (0.35 | ) |
Total distributions | | | (0.05 | ) | | | (0.45 | ) | | | (1.40 | ) | | | (1.53 | ) | | | (0.67 | ) | | | (0.35 | ) |
| | | | | | | | | | | | | | | | | | | | | | | | | |
Net asset value at end of period | | $ | 12.64 | | | $ | 15.91 | | | $ | 15.55 | | | $ | 18.62 | | | $ | 16.60 | | | $ | 15.63 | |
| | | | | | | | | | | | | | | | | | | | | | | | | |
Total return (c) | | | (20.31 | %)(d) | | | 5.03 | % | | | (9.02 | %) | | | 21.70 | % | | | 10.73 | % | | | (1.91 | %) |
| | | | | | | | | | | | | | | | | | | | | | | | | |
Net assets at end of period (000’s) | | $ | 271,070 | | | $ | 617,686 | | | $ | 907,366 | | | $ | 1,116,584 | | | $ | 993,904 | | | $ | 590,582 | |
| | | | | | | | | | | | | | | | | | | | | | | | | |
Ratios/supplementary data: | | | | | | | | | | | | | | | | | | | | | | | | |
Ratio of total expenses to average net assets | | | 1.38 | %(e) | | | 1.41 | % | | | 1.37 | % | | | 1.37 | % | | | 1.38 | % | | | 1.42 | % |
| | | | | | | | | | | | | | | | | | | | | | | | | |
Ratio of net expenses to average net assets | | | 1.37 | %(e)(f) | | | 1.41 | % | | | 1.37 | % | | | 1.37 | % | | | 1.38 | % | | | 142 | % |
| | | | | | | | | | | | | | | | | | | | | | | | | |
Ratio of net investment income to average net assets | | | 0.27 | %(e)(f) | | | 0.36 | % | | | 0.17 | % | | | 0.03 | % | | | 1.62 | % | | | 0.24 | % |
| | | | | | | | | | | | | | | | | | | | | | | | | |
Portfolio turnover rate | | | 22 | %(d) | | | 33 | % | | | 39 | % | | | 22 | % | | | 36 | % | | | 21 | % |
(a) | Per share net investment income has been determined on the basis of average number of shares outstanding during the period. |
(b) | Amount rounds to less than $0.01 per share. |
(c) | Total return is a measure of the change in value of an investment in the Fund over the periods covered. The returns shown do not reflect the deduction of taxes a shareholder would pay on Fund distributions, if any, or the redemption of Fund shares. The total return would have been lower if the Adviser had not reimbursed expense for the period ended May 31, 2020 (Note 4). |
(d) | Not annualized. |
(e) | Annualized. |
(f) | Ratio was determined after fee reductions and/or expense reimbursements (Note 4). |
See accompanying notes to financial statements. |
19
LYRICAL U.S. VALUE EQUITY FUND
INVESTOR CLASS
FINANCIAL HIGHLIGHTS |
Per Share Data for a Share Outstanding Throughout Each Period: |
| | Six Months
Ended
May 31,
2020
(Unaudited) | | | Year
Ended
Nov. 30,
2019 | | | Year
Ended
Nov. 30,
2018 | | | Year
Ended
Nov. 30,
2017 | | | Year
Ended
Nov. 30,
2016 | | | Year
Ended
Nov. 30,
2015 | |
Net asset value at beginning of period | | $ | 15.78 | | | $ | 15.43 | | | $ | 18.54 | | | $ | 16.52 | | | $ | 15.57 | | | $ | 16.27 | |
| | | | | | | | | | | | | | | | | | | | | | | | | |
Income (loss) from investment operations: | | | | | | | | | | | | | | | | | | | | | | | | |
Net investment income (loss) | | | 0.01 | (a) | | | 0.02 | (a) | | | (0.03 | )(a) | | | (0.05 | )(a) | | | 0.30 | | | | 0.01 | |
Net realized and unrealized gains (losses) on investments and foreign currencies | | | (3.22 | ) | | | 0.73 | | | | (1.69 | ) | | | 3.53 | | | | 1.28 | | | | (0.36 | ) |
Total from investment operations | | | (3.21 | ) | | | 0.75 | | | | (1.72 | ) | | | 3.48 | | | | 1.58 | | | | (0.35 | ) |
| | | | | | | | | | | | | | | | | | | | | | | | | |
Less distributions: | | | | | | | | | | | | | | | | | | | | | | | | |
Dividends from net investment income | | | — | | | | — | | | | — | | | | (0.17 | ) | | | (0.00 | )(b) | | | — | |
Distributions from net realized gains | | | — | | | | (0.40 | ) | | | (1.39 | ) | | | (1.29 | ) | | | (0.63 | ) | | | (0.35 | ) |
Total distributions | | | — | | | | (0.40 | ) | | | (1.39 | ) | | | (1.46 | ) | | | (0.63 | ) | | | (0.35 | ) |
| | | | | | | | | | | | | | | | | | | | | | | | | |
Net asset value at end of period | | $ | 12.57 | | | $ | 15.78 | | | $ | 15.43 | | | $ | 18.54 | | | $ | 16.52 | | | $ | 15.57 | |
| | | | | | | | | | | | | | | | | | | | | | | | | |
Total return (c) | | | (20.34 | %)(d) | | | 4.89 | % | | | (9.30 | %) | | | 21.32 | % | | | 10.36 | % | | | (2.19 | %) |
| | | | | | | | | | | | | | | | | | | | | | | | | |
Net assets at end of period (000’s) | | $ | 5,533 | | | $ | 6,682 | | | $ | 19,811 | | | $ | 36,777 | | | $ | 58,213 | | | $ | 61,375 | |
| | | | | | | | | | | | | | | | | | | | | | | | | |
Ratios/supplementary data: | | | | | | | | | | | | | | | | | | | | | | | | |
Ratio of total expenses to average net assets | | | 2.11 | %(e) | | | 2.03 | % | | | 1.72 | % | | | 1.70 | % | | | 1.70 | % | | | 1.72 | % |
| | | | | | | | | | | | | | | | | | | | | | | | | |
Ratio of net expenses to average net assets | | | 1.60 | %(e)(f) | | | 1.70 | %(f) | | | 1.70 | %(f) | | | 1.70 | % | | | 1.70 | % | | | 1.70 | %(f) |
| | | | | | | | | | | | | | | | | | | | | | | | | |
Ratio of net investment income (loss) to average net assets | | | 0.09 | %(e)(f) | | | 0.10 | %(f) | | | (0.18 | %)(f) | | | (0.32 | %) | | | 1.39 | % | | | 0.03 | %(f) |
| | | | | | | | | | | | | | | | | | | | | | | | | |
Portfolio turnover rate | | | 22 | %(d) | | | 33 | % | | | 39 | % | | | 22 | % | | | 36 | % | | | 21 | % |
(a) | Per share net investment income (loss) has been determined on the basis of average number of shares outstanding during the period. |
(b) | Amount rounds to less than $0.01 per share. |
(c) | Total return is a measure of the change in value of an investment in the Fund over the periods covered. The returns shown do not reflect the deduction of taxes a shareholder would pay on Fund distributions, if any, or the redemption of Fund shares. The total returns would be lower if the Adviser had not reimbursed expenses for the periods ended May 31, 2020, November 30, 2019, 2018 and 2015 (Note 4). |
(d) | Not annualized. |
(e) | Annualized. |
(f) | Ratio was determined after fee reductions and/or expense reimbursements (Note 4). |
See accompanying notes to financial statements. |
20
LYRICAL INTERNATIONAL VALUE EQUITY FUND
INSTITUTIONAL CLASS
FINANCIAL HIGHLIGHTS |
Per Share Data for a Share Outstanding Throughout the Period: |
| | Period
Ended
May 31,
2020
(Unaudited)(a) | |
Net asset value at beginning of period | | $ | 10.00 | |
| | | | | |
Income (loss) from investment operations: | | | | |
Net investment income (b) | | | 0.03 | |
Net realized and unrealized losses on investments and foreign currencies | | | (1.34 | ) |
Total from investment operations | | | (1.31 | ) |
| | | | | |
Net asset value at end of period | | $ | 8.69 | |
| | | | | |
Total return (c) | | | (13.10 | %)(d) |
| | | | | |
Net assets at end of period (000’s) | | $ | 434 | |
| | | | | |
Ratios/supplementary data: | | | | |
Ratio of total expenses to average net assets | | | 25.87 | %(e) |
| | | | | |
Ratio of net expenses to average net assets (f) | | | 1.13 | %(e) |
| | | | | |
Ratio of net investment income to average net assets (f) | | | 1.69 | %(e) |
| | | | | |
Portfolio turnover rate | | | 23 | %(d) |
(a) | Represents the period from the commencement of operations (March 2, 2020) through May 31, 2020. |
(b) | Per share net investment income has been determined on the basis of average number of shares outstanding during the period. |
(c) | Total return is a measure of the change in value of an investment in the Fund over the period covered. The return shown does not reflect the deduction of taxes a shareholder would pay on Fund distributions, if any, or the redemption of Fund shares. The total return would have been lower if the Adviser had not reduced fees and reimbursed expenses for the period ended May 31, 2020 (Note 4). |
(d) | Not annualized. |
(e) | Annualized. |
(f) | Ratio was determined after fee reductions and/or expense reimbursements (Note 4). |
See accompanying notes to financial statements. |
21
LYRICAL INTERNATIONAL VALUE EQUITY FUND
INVESTOR CLASS
FINANCIAL HIGHLIGHTS |
Per Share Data for a Share Outstanding Throughout the Period: |
| | Period
Ended
May 31,
2020
(Unaudited)(a) | |
Net asset value at beginning of period | | $ | 10.00 | |
| | | | | |
Income (loss) from investment operations: | | | | |
Net investment income (b) | | | 0.03 | |
Net realized and unrealized losses on investments and foreign currencies | | | (1.35 | ) |
Total from investment operations | | | (1.32 | ) |
| | | | | |
Net asset value at end of period | | $ | 8.68 | |
| | | | | |
Total return (c) | | | (13.20 | %)(d) |
| | | | | |
Net assets at end of period (000’s) | | $ | 499 | |
| | | | | |
Ratios/supplementary data: | | | | |
Ratio of total expenses to average net assets | | | 25.84 | %(e) |
| | | | | |
Ratio of net expenses to average net assets (f) | | | 1.38 | %(e) |
| | | | | |
Ratio of net investment income to average net assets (f) | | | 1.63 | %(e) |
| | | | | |
Portfolio turnover rate | | | 23 | %(d) |
(a) | Represents the period from the commencement of operations (March 2, 2020) through May 31, 2020. |
(b) | Per share net investment income has been determined on the basis of average number of shares outstanding during the period. |
(c) | Total return is a measure of the change in value of an investment in the Fund over the period covered. The return shown does not reflect the deduction of taxes a shareholder would pay on Fund distributions, if any, or the redemption of Fund shares. The total return would have been lower if the Adviser had not reduced fees and reimbursed expenses for the period ended May 31, 2020 (Note 4). |
(d) | Not annualized. |
(e) | Annualized. |
(f) | Ratio was determined after fee reductions and/or expense reimbursements (Note 4). |
See accompanying notes to financial statements. |
22
LYRICAL FUNDS
NOTES TO FINANCIAL STATEMENTS
May 31, 2020 (Unaudited)
1. Organization
Lyrical U.S. Value Equity Fund and Lyrical International Value Equity Fund (individually, a “Fund” and collectively, the “Funds”) are each a diversified series of Ultimus Managers Trust (the “Trust”), an open-end investment company established as an Ohio business trust under a Declaration of Trust dated February 28, 2012. Other series of the Trust are not incorporated in this report. Lyrical U.S. Value Equity Fund commenced operations on February 4, 2013. Lyrical International Value Equity Fund commenced operations on March 2, 2020.
The investment objective of each Fund is to seek to achieve long-term capital growth.
Each Fund offers two classes of shares: Institutional Class shares (sold without any sales loads and distribution and/or shareholder service fees and requiring a $100,000 initial investment) and Investor Class shares (sold without any sales loads, but subject to a distribution and/or shareholder service fee of up to 0.25% of the average daily net assets attributable to Investor Class shares, and requiring a $2,500 initial investment). Each share class represents an ownership interest in the same investment portfolio.
2. Significant Accounting Policies
The following is a summary of the Funds’ significant accounting policies. The policies are in conformity with accounting principles generally accepted in the United States of America (“GAAP”). The Funds follow accounting and reporting guidance under Financial Accounting Standards Board Accounting Standards Codification Topic 946, “Financial Services – Investment Companies.”
Securities valuation – Each Fund values its portfolio securities at market value as of the close of regular trading on the New York Stock Exchange (the “NYSE”) (normally 4:00 p.m. Eastern time) on each business day the NYSE is open for business. The Funds value their listed securities on the basis of the security’s last sale price on the security’s primary exchange, if available, otherwise at the exchange’s most recently quoted mean price. NASDAQ-listed securities are valued at the NASDAQ Official Closing Price. When using a quoted price and when the market is considered active, the security will be classified as Level 1 within the fair value hierarchy (see below). In the event that market quotations are not readily available or are considered unreliable due to market or other events, the Funds value their securities and other assets at fair value in accordance with procedures established by and under the general supervision of the Board of Trustees (the “Board”). Under these procedures, the securities will be classified as Level 2 or 3 within the fair value hierarchy, depending on the inputs used. Unavailable or unreliable market quotes may be due to the following factors: a substantial bid-ask spread; infrequent sales resulting in stale prices; insufficient trading volume; small trade sizes; a temporary lapse in any reliable pricing source; and actions of the securities or futures markets, such as the
23
LYRICAL FUNDS
NOTES TO FINANCIAL STATEMENTS (Continued) |
suspension or limitation of trading. As a result, the prices of securities used to calculate each Fund’s net asset value (“NAV”) may differ from quoted or published prices for the same securities.
GAAP establishes a single authoritative definition of fair value, sets out a framework for measuring fair value, and requires additional disclosures about fair value measurements.
Various inputs are used in determining the value of each Fund’s investments. These inputs are summarized in the three broad levels listed below:
● | Level 1 – quoted prices in active markets for identical securities |
● | Level 2 – other significant observable inputs |
● | Level 3 – significant unobservable inputs |
The inputs or methods used for valuing securities are not necessarily an indication of the risks associated with investing in those securities. The inputs used to measure fair value may fall into different levels of the fair value hierarchy. In such cases, for disclosure purposes, the level in the fair value hierarchy within which the fair value measurement falls in its entirety is determined based on the lowest level input that is significant to the fair value measurement.
Lyrical International Value Equity Fund’s foreign equity securities actively traded in foreign markets may be classified as Level 2 despite the availability of closing prices because such securities are typically fair valued by an independent pricing service. The Board has authorized the Fund to retain an independent pricing service to determine the fair value of its foreign securities because the value of such securities may be materially affected by events occurring before the Fund’s pricing time but after the close of the primary markets or exchanges on which such foreign securities are traded. These intervening events might be country-specific (e.g., natural disaster, economic or political developments, interest rate change); issuer specific (e.g., earnings report or merger announcement); or U.S. market-specific (such as a significant movement in the U.S. market that is deemed to affect the value of foreign securities). The pricing service uses an automated system that incorporates a model based on multiple parameters, including a security’s local closing price, relevant general and sector indices, currency fluctuations, trading in depositary receipts and futures, if applicable, and/or research valuations by its staff, in determining what it believes is the fair value of the securities.
The following is a summary of the inputs used to value each Fund’s investments as of May 31, 2020:
Lyrical U.S. Value Equity Fund | | Level 1 | | | Level 2 | | | Level 3 | | | Total | |
Common Stocks | | $ | 274,237,149 | | | $ | — | | | $ | — | | | $ | 274,237,149 | |
Money Market Funds | | | 2,308,714 | | | | — | | | | — | | | | 2,308,714 | |
Total | | $ | 276,545,863 | | | $ | — | | | $ | — | | | $ | 276,545,863 | |
24
LYRICAL FUNDS
NOTES TO FINANCIAL STATEMENTS (Continued) |
Lyrical International Value Equity
Fund | | Level 1 | | | Level 2 | | | Level 3 | | | Total | |
Common Stocks | | $ | 264,983 | | | $ | 658,057 | | | $ | — | | | $ | 923,040 | |
Money Market Funds | | | 4,237 | | | | — | | | | — | | | | 4,237 | |
Total | | $ | 269,220 | | | $ | 658,057 | | | $ | — | | | $ | 927,277 | |
Refer to each Fund’s Schedule of Investments for a listing of securities by sector and industry type or geographical region. The Funds did not hold any derivative instruments or any assets or liabilities that were measured at fair value on a recurring basis using significant unobservable inputs (Level 3) as of or during the period ended May 31, 2020.
Share valuation – The NAV per share of each class of each Fund is calculated daily by dividing the total value of the assets attributable to that class, less liabilities attributable to that class, by the number of shares outstanding of that class. The offering price and redemption price per share of each class of each Fund is equal to the NAV per share of such class.
Investment income – Dividend income is recorded on the ex-dividend date. Interest income is accrued as earned. Non-cash dividends included in dividend income, if any, are recorded at the fair value of the security received. Withholding taxes on foreign dividends have been recorded in accordance with the Funds’ understanding of the applicable country’s rules and tax rates.
Investment transactions – Investment transactions are accounted for on the trade date. Realized gains and losses on investments sold are determined on a specific identification basis.
Foreign currency translation – Securities and other assets and liabilities denominated in or expected to settle in foreign currencies, if any, are translated into U.S. dollars based on exchange rates on the following basis:
| | A. | The fair values of investment securities and other assets and liabilities are translated as of the close of the NYSE each day. |
| | B. | Purchases and sales of investment securities and income and expenses are translated at the rate of exchange prevailing as of 4:00 p.m. Eastern time on the respective date of such transactions. |
| | C. | The Funds do not isolate that portion of the results of operations caused by changes in foreign exchange rates on investments from those caused by changes in market prices of securities held. Such fluctuations are included with the net realized and unrealized gains or losses on investments. |
Reported net realized foreign exchange gains or losses arise from 1) purchases and sales of foreign currencies and 2) currency gains or losses realized between trade and settlement dates on securities transactions and 3) the difference between the amounts
25
LYRICAL FUNDS
NOTES TO FINANCIAL STATEMENTS (Continued) |
of dividends and foreign withholding taxes recorded on each Fund’s books and the U.S. dollar equivalent of the amounts actually received or paid. Reported net unrealized foreign exchange gains and losses arise from changes in the value of assets and liabilities that result from changes in exchange rates.
Allocation between Classes – Investment income earned, realized capital gains and losses, and unrealized appreciation and depreciation are allocated daily to each Class of a Fund based upon its proportionate share of total net assets of that Fund. Class-specific expenses are charged directly to the Class incurring the expense. Common expenses which are not attributable to a specific Class are allocated daily to each Class of shares of a Fund based upon its proportionate share of total net assets of that Fund.
Common expenses – Common expenses of the Trust are allocated among the Funds and the other series of the Trust based on the relative net assets of each series, the number of series in the Trust, or the nature of the services performed and the relative applicability to each series.
Distributions to shareholders – Each Fund distributes to shareholders any net investment income dividends and net realized capital gains distributions at least once each year. The amount of such dividends and distributions are determined in accordance with federal income tax regulations, which may differ from GAAP. Dividends and distributions to shareholders are recorded on the ex-dividend date. The Funds may utilize earnings and profits distributed to shareholders on redemption of shares as part of the dividends paid deduction for income tax purposes. The tax character of distributions paid to shareholders by Lyrical U.S. Value Equity Fund during the periods ended May 31, 2020 and November 30, 2019 was as follows:
| Period
Ended | | Ordinary
Income | | | Long-Term
Capital Gains | | | Total
Distributions | |
Institutional Class | 5/31/2020 | | $ | 1,934,332 | | | $ | — | | | $ | 1,934,332 | |
| | 11/30/2019 | | $ | 2,632,588 | | | $ | 15,449,041 | | | $ | 18,081,629 | |
Investor Class | 5/31/2020 | | $ | — | | | $ | — | | | $ | — | |
| | 11/30/2019 | | $ | — | | | $ | 167,631 | | | $ | 167,631 | |
Lyrical International Value Equity Fund made no distributions to shareholders during the period ended May 31, 2020.
Estimates – The preparation of financial statements in conformity with GAAP requires management to make estimates and assumptions that affect the reported amounts of assets and liabilities and disclosure of contingent assets and liabilities as of the date of the financial statements and the reported amounts of income and expenses during the reporting period. Actual results could differ from those estimates.
26
LYRICAL FUNDS
NOTES TO FINANCIAL STATEMENTS (Continued) |
Federal income tax – Each Fund has qualified and/or intends to qualify as a regulated investment company under the Internal Revenue Code of 1986, as amended (the “Code”). Qualification generally will relieve the Funds of liability for federal income taxes to the extent 100% of their net investment income and net realized capital gains are distributed in accordance with the Code.
In order to avoid imposition of the excise tax applicable to regulated investment companies, it is also each Fund’s intention to declare as dividends in each calendar year at least 98% of its net investment income (earned during the calendar year) and 98.2% of its net realized capital gains (earned during the twelve months ended October 31) plus undistributed amounts from prior years.
The following information is computed on a tax basis for each item as of May 31, 2020:
| | Lyrical
U.S. Value
Equity Fund | | | Lyrical
International Value
Equity Fund | |
Tax cost of portfolio investments | | $ | 288,864,480 | | | $ | 1,016,419 | |
Gross unrealized appreciation | | $ | 42,510,239 | | | $ | 40,089 | |
Gross unrealized depreciation | | | (54,828,856 | ) | | | (129,231 | ) |
Net unrealized depreciation | | | (12,318,617 | ) | | | (89,142 | ) |
Accumulated ordinary income | | | 614,080 | | | | — | |
Undistributed long-term gains | | | 5,235,470 | | | | — | |
Other losses | | | (40,056,428 | ) | | | (33,934 | ) |
Accumulated deficit | | $ | (46,525,495 | ) | | $ | (123,076 | ) |
The difference between the federal income tax cost of portfolio investments and the financial statement cost of portfolio investments for each Fund is due to certain timing differences in the recognition of capital gains or losses under income tax regulations and GAAP. These “book/tax” differences are temporary in nature and are primarily due to the tax deferral of losses on wash sales.
The Funds recognize the tax benefits or expenses of uncertain tax positions only when the position is “more likely than not” of being sustained assuming examination by tax authorities. Management has reviewed each Fund’s tax positions for the current and all open tax years (generally, three years) and has concluded that no provision for unrecognized tax benefits or expenses is required in these financial statements. The Funds identify their major tax jurisdiction as U.S. Federal.
27
LYRICAL FUNDS
NOTES TO FINANCIAL STATEMENTS (Continued) |
3. Investment Transactions
During the period ended May 31, 2020, cost of purchases and proceeds from sales of investment securities, other than short-term investments and short positions, amounted to $99,434,463 and $323,635,683, respectively, for Lyrical U.S. Value Equity Fund and $1,242,177 and $196,323, respectively, for Lyrical International Value Equity Fund.
4. Transactions with Related Parties
INVESTMENT ADVISORY AGREEMENT
The Funds’ investments are managed by Lyrical Asset Management L.P. (the “Adviser”) pursuant to the terms of an Investment Advisory Agreement. Effective April 1, 2020, the Funds pay the Adviser an investment advisory fee, computed and accrued daily and paid monthly, at the annual rate of 0.85% of average daily net assets. Prior to April 1, 2020, the Funds paid the Adviser an investment advisory fee, computed and accrued daily and paid monthly, at the annual rate of 1.25% of average daily net assets.
Effective April 1, 2020, pursuant to an Expense Limitation Agreement (“ELA”) between each Fund and the Adviser, the Adviser has contractually agreed, until April 1, 2021, to reduce investment advisory fees and reimburse other operating expenses to limit total annual operating expenses of each Fund (exclusive of brokerage costs; taxes; interest; borrowing costs such as interest and dividend expenses on securities sold short; costs to organize the Fund; acquired fund fees and expenses; extraordinary expenses such as litigation and merger or reorganization costs; and other expenses not incurred in the ordinary course of the Fund’s business) to an amount not exceeding the following percentages of average daily net assets attributable to each respective class:
Institutional Class | Investor Class |
0.99% | 1.24% |
Prior to April 1, 2020, these expense limitations were as follows for each respective class:
Institutional Class | Investor Class |
1.45% | 1.70% |
Accordingly, during the period ended May 31, 2020, the Adviser reduced its advisory fees by $8,882 and reimbursed other operating expenses of $21,470 of Lyrical U.S. Value Equity Fund and the Adviser did not collect any of its investment advisory fees from Lyrical International Value Equity Fund and reimbursed other operating expenses of $48,017.
Under the terms of the ELA, investment advisory fee reductions and expense reimbursements by the Adviser are subject to repayment by the Funds for a period of three years after such fees and expenses were incurred, provided that the repayments do not cause total annual
28
LYRICAL FUNDS
NOTES TO FINANCIAL STATEMENTS (Continued) |
fund operating expenses to exceed the lesser of (i) the expense limitation then in effect, if any, and (ii) the expense limitation in effect at the time the expenses to be repaid were incurred. As of May 31, 2020, the Adviser may seek repayment of advisory fee reductions and expense reimbursements no later than the dates below:
| | November 30,
2021 | | | November 30,
2022 | | | May 31,
2023 | | | Total | |
Lyrical U.S. Value Equity Fund | | $ | 6,222 | | | $ | 27,433 | | | $ | 30,352 | | | $ | 64,007 | |
Lyrical International Value Fund | | $ | — | | | $ | — | | | $ | 49,992 | | | $ | 49,992 | |
OTHER SERVICE PROVIDERS
Ultimus Fund Solutions, LLC (“Ultimus”) provides administration, fund accounting, compliance and transfer agency services to the Funds. The Funds pay Ultimus fees in accordance with the agreements for such services. In addition, the Funds pay out-of-pocket expenses including, but not limited to, postage, supplies, and certain costs related to the pricing of the Funds’ portfolio securities.
Under the terms of a Distribution Agreement with the Trust, Ultimus Fund Distributors, LLC (the “Distributor”) serves as the principal underwriter to the Funds. The Distributor is a wholly-owned subsidiary of Ultimus. The Distributor is compensated partially by the Adviser and partially by the Investor Class shares of each Fund for acting as principal underwriter.
A Trustee and certain officers of the Trust are also officers of Ultimus and/or the Distributor.
DISTRIBUTION PLAN
The Funds have adopted a plan of distribution (the “Plan”), pursuant to Rule 12b-1 under the Investment Company Act of 1940, as amended (the “1940 Act”), which permits Investor Class shares of each Fund to directly incur or reimburse the Funds’ principal underwriter for certain expenses related to the distribution of its shares. The annual limitation for payment of expenses pursuant to the Plan is 0.25% of each Fund’s average daily net assets allocable to Investor Class shares. The Funds have not adopted a plan of distribution with respect to the Institutional Class shares. During the period ended May 31, 2020, the Investor Class shares of Lyrical U.S. Value Equity Fund and Lyrical International Value Equity Fund incurred $7,513 and $264, respectively, of distribution fees under the Plan.
TRUSTEE COMPENSATION
Each member of the Board (a “Trustee”) who is not an “interested person” of the Trust (“Independent Trustee”) receives a $1,300 annual retainer from each Fund, paid quarterly, except for the Board Chairperson who receives a $1,500 annual retainer from each Fund,
29
LYRICAL FUNDS
NOTES TO FINANCIAL STATEMENTS (Continued) |
paid in quarterly installments. Each Independent Trustee also receives from each Fund a fee of $500 for each Board meeting attended plus reimbursement for travel and other meeting-related expenses.
PRINCIPAL HOLDERS OF FUND SHARES
As of May 31, 2020, the following shareholders owned of record 25% or more of the outstanding shares of the Funds:
NAME OF RECORD OWNERS | % Ownership |
Lyrical U.S. Value Equity Fund - Investor Class | |
Charles Schwab & Company, Inc. (for the benefit of its customers) | 25% |
Lyrical International Value Equity Fund - Institutional Class | |
Lyrical Asset Management L.P. | 100% |
Lyrical International Value Equity Fund - Investor Class | |
Lyrical Asset Management L.P. | 87% |
A beneficial owner of 25% or more of a Fund’s outstanding shares may be considered a controlling person of the Fund. That shareholder’s vote could have a more significant effect on matters presented at a shareholders’ meeting.
5. Borrowing Costs
From time to time, the Funds may have an overdrawn cash balance at the custodian due to redemptions or market movements. When this occurs, the Funds will incur borrowing costs charged by the custodian. Accordingly, during the six months ended May 31, 2020, the Lyrical U.S. Value Equity Fund incurred $35,494 of borrowing costs charged by the custodian.
6. Sector and Country Risks
If a Fund has significant investments in the securities of issuers within a particular sector, any development affecting that sector will have a greater impact on the value of the net assets of the Fund than would be the case if the Fund did not have significant investments in that sector. In addition, this may increase the risk of loss in the Fund and increase the volatility of the Fund’s NAV per share. For instance, economic or market factors, regulatory changes or other developments may negatively impact all companies in a particular sector, and therefore the value of the Fund’s portfolio will be adversely affected. As of May 31, 2020, Lyrical International Value Equity Fund had 40.1% of the value of its net assets invested in stocks within the Industrials sector.
30
LYRICAL FUNDS
NOTES TO FINANCIAL STATEMENTS (Continued) |
As of May 31, 2020, Lyrical International Value Equity Fund had 30.6% of the value of its stock portfolio invested in stocks of companies domiciled in Japan. At times, the Japanese economy has been negatively affected by government intervention and protectionism, an unstable financial services sector, a heavy reliance on international trade, and natural disasters. These factors, as well as other adverse political developments, increases in government debt, and changes to fiscal monetary or trade policies, may negatively affect Japanese markets and the prices of stocks of Japanese companies.
7. Contingencies and Commitments
The Funds indemnify the Trust’s officers and Trustees for certain liabilities that might arise from their performance of their duties to the Funds. Additionally, in the normal course of business the Funds enter into contracts that contain a variety of representations and warranties and which provide general indemnifications. The Funds’ maximum exposure under these arrangements is unknown, as this would involve future claims that may be made against the Funds that have not yet occurred. However, based on experience, the Funds expect the risk of loss to be remote.
8. Subsequent Events
The Funds are required to recognize in the financial statements the effects of all subsequent events that provide additional evidence about conditions that existed as of the date of the Statement of Assets and Liabilities. For non-recognized subsequent events that must be disclosed to keep the financial statements from being misleading, the Funds are required to disclose the nature of the event as well as an estimate of its financial effect, or a statement that such an estimate cannot be made. Management has evaluated subsequent events through the issuance of these financial statements and has noted no such events.
31
LYRICAL FUNDS
ABOUT YOUR FUND’S EXPENSES (Unaudited) |
We believe it is important for you to understand the impact of costs on your investment. As a shareholder of the Funds, you incur ongoing costs, including management fees, class-specific expenses (such as distribution fees) and other operating expenses. The following examples are intended to help you understand your ongoing costs (in dollars) of investing in the Funds and to compare these costs with the ongoing costs of investing in other mutual funds.
A mutual fund’s ongoing costs are expressed as a percentage of its average net assets. This figure is known as the expense ratio. The expenses in the table below are based on an investment of $1,000 made at the beginning of the most recent period (December 1, 2019 and March 2, 2020 for Lyrical U.S. Value Equity Fund and Lyrical International Value Equity Fund, respectively) and held until the end of the period (May 31, 2020).
The table below illustrates each Fund’s ongoing costs in two ways:
Actual fund return – This section helps you to estimate the actual expenses that you paid over the period. The “Ending Account Value” shown is derived from each Fund’s actual return, and the fourth column shows the dollar amount of operating expenses that would have been paid by an investor who started with $1,000 in the Funds. You may use the information here, together with the amount you invested, to estimate the expenses that you paid over the period.
To do so, simply divide your account value by $1,000 (for example, an $8,600 account value divided by $1,000 = 8.6), then multiply the result by the number given for the Funds under the heading “Expenses Paid During Period.”
Hypothetical 5% return – This section is intended to help you compare each Fund’s ongoing costs with those of other mutual funds. It assumes that the Funds had an annual return of 5% before expenses during the period shown, but that the expense ratio is unchanged. In this case, because the return used is not each Fund’s actual return, the results do not apply to your investment. The example is useful in making comparisons because the U.S. Securities and Exchange Commission (the “SEC”) requires all mutual funds to calculate expenses based on a 5% return. You can assess each Fund’s ongoing costs by comparing this hypothetical example with the hypothetical examples that appear in shareholder reports of other funds.
Note that expenses shown in the table are meant to highlight and help you compare ongoing costs only. The Funds do not charge transaction fees, such as purchase or redemption fees, nor do they carry a “sales load.”
The calculations assume no shares were bought or sold during the period. Your actual costs may have been higher or lower, depending on the amount of your investment and the timing of any purchases or redemptions.
32
LYRICAL FUNDS
ABOUT YOUR FUND’S EXPENSES (Unaudited) (Continued)
More information about each Fund’s expenses can be found in this report. For additional information on operating expenses and other shareholder costs, please refer to each Fund’s prospectus.
| Beginning
Account Value
December 1, 2019 | Ending
Account Value
May 31, 2020 | Net
Expense
Ratio(a) | Expenses
Paid During
Period(b) |
Lyrical U.S. Value Equity Fund |
Institutional Class | | | | |
Based on Actual Fund Return | $ 1,000.00 | $ 796.90 | 1.37% | $ 6.15 |
Based on Hypothetical 5% Return (before expenses) | $ 1,000.00 | $ 1,018.15 | 1.37% | $ 6.91 |
Investor Class | | | | |
Based on Actual Fund Return | $ 1,000.00 | $ 796.60 | 1.60% | $ 7.19 |
Based on Hypothetical 5% Return (before expenses) | $ 1,000.00 | $ 1,017.00 | 1.60% | $ 8.07 |
(a) | Annualized, based on the Fund’s most recent one-half year expenses. |
(b) | Expenses are equal to the Fund’s annualized net expense ratio multiplied by the average account value over the period, multiplied by 183/366 (to reflect the one-half year period). |
| Beginning
Account Value
December 1,
2019(a) | Ending
Account Value
May 31, 2020 | Net
Expense
Ratio(b) | Expenses
Paid During
Period(c) |
Lyrical International Value Equity Fund |
Institutional Class | | | | |
Based on Actual Fund Return | $ 1,000.00 | $ 869.00 | 1.13% | $ 2.60 |
Based on Hypothetical 5% Return (before expenses) | $ 1,000.00 | $ 1,019.35 | 1.13% | $ 5.70 |
Investor Class | | | | |
Based on Actual Fund Return | $ 1,000.00 | $ 868.00 | 1.38% | $ 3.17 |
Based on Hypothetical 5% Return (before expenses) | $ 1,000.00 | $ 1,018.10 | 1.38% | $ 6.96 |
(a) | Beginning Account Value is as of March 2, 2020 (date of commencement of operations for each class) for the Actual Fund Return information. |
(b) | Annualized, based on the Fund’s expenses during the period since the commencement of operations. |
(c) | Expenses are equal to the Fund��s annualized net expense ratio multiplied by the average account value over the period, multiplied by 91/366 (to reflect the period since inception) and 183/366 (to reflect the one-half year period), for Actual Fund Return and Hypothetical 5% Return information, respectively. |
33
LYRICAL FUNDS
OTHER INFORMATION (Unaudited)
A description of the policies and procedures that the Funds use to vote proxies relating to portfolio securities is available without charge upon request by calling toll-free 1-888-884-8099, or on the SEC’s website at www.sec.gov. Information regarding how the Funds voted proxies relating to portfolio securities during the most recent 12-month period ended June 30 is available without charge upon request by calling toll-free 1-888-884-8099, or on the SEC’s website at www.sec.gov.
The Trust files a complete listing of portfolio holdings for the Funds with the SEC as of the end of the first and third quarters of each fiscal year on Form N-PORT. These filings are available upon request by calling 1-888-884-8099. Furthermore, you may obtain a copy of the filings on the SEC’s website at www.sec.gov.
34
LYRICAL INTERNATIONAL VALUE EQUITY FUND
DISCLOSURE REGARDING APPROVAL OF INVESTMENT ADVISORY AGREEMENT (Unaudited)
The Board of Trustees (the “Board”), including the Independent Trustees voting separately, has reviewed and approved the Fund’s Investment Agreement with the Lyrical Asset Management LP (the “Adviser”) for an initial two-year term (the “Agreement”). The Board approved the Agreement at an in-person meeting held on January 21-22, 2020, at which all of the Trustees were present.
Legal counsel advised the Board during its deliberations. Additionally, the Board received and reviewed a substantial amount of information provided by the Adviser in response to requests of the Board and counsel. In deciding whether to approve the Agreement, the Board recalled its discussion with Mr. Jeffery M. Moses, Chief Operating Officer and Chief Compliance Officer of the Adviser and Mr. John Mullins, Associate Portfolio Manager of the Adviser, during the meeting and its review of various materials related to the Fund. The Board further considered those materials and discussions and numerous other factors, including:
The nature, extent, and quality of the services to be provided by the Adviser. In this regard, the Board considered the responsibilities the Adviser would have under the Advisory Agreement for the Fund. The Board also considered the proposed services that the Adviser would provide to the Fund including, without limitation, the Adviser’s procedures for formulating investment recommendations and assuring compliance with the Fund’s investment objective and limitations, proposed initial marketing and distribution efforts, and the Adviser’s compliance procedures and practices. After reviewing the foregoing and further information provided in the Board Materials (e.g., descriptions of the Adviser’s business and Form ADV), the Board concluded that the quality, extent, and nature of the services to be provided by the Adviser to the Fund were satisfactory and adequate.
The investment management capabilities and experience of the adviser. In this regard, the Board considered the investment management experience of the Adviser and its principals. The Board considered its discussion with Messrs. Moses and Mullins regarding the investment objective and strategies for the Fund and the Adviser’s experience and plans for implementing such strategies. In particular, the Board considered the information from the Adviser regarding prior experience in the financial industry by the Adviser and its principals. After consideration of these and other factors, the Board determined that the Adviser has the requisite knowledge and experience to serve as investment adviser for the Fund.
The costs of the services to be provided and profits to be realized by the Adviser and its affiliates from the relationship with the Fund. In this regard, the Board considered the Adviser’s methods of operation; the education and experience of Messrs. Moses and Mullins; its compliance program, policies, and procedures; its financial condition and the level of commitment to the Fund; the projected asset levels of the Fund; and the overall expenses of the Fund, including the advisory fee. The Board reviewed the Fund’s expense limitation agreement and noted the benefit to the Fund from the Adviser’s commitment to
35
LYRICAL INTERNATIONAL VALUE EQUITY FUND
DISCLOSURE REGARDING APPROVAL OF INVESTMENT ADVISORY AGREEMENT (Unaudited) (Continued)
reduce its advisory fee and reimburse other operating expenses through March 31, 2022. The Board discussed the Adviser’s financial condition and its ability to satisfy its financial commitments to the Fund. The Board also considered potential benefits for the Adviser in managing the Fund, including promotion of the Adviser’s name. The Board compared the Fund’s proposed advisory fee and overall expense ratio to other comparable funds (in terms of the type of fund, the style of investment management, the projected size of the Fund, and the nature of the investment strategies).
The Board noted that the Fund’s advisory fee (1.25%) is above the average and the median for its custom peer group. The Board discussed the explanation that Mr. Moses’ had provided for the factors the Adviser considered in determining the proposed advisory fee, and the analysis that it underwent in determining not to offer breakpoints on its fees at the present time. The Board also discussed the services that the Adviser proposes to provide to the Fund, in particular noting that that the Adviser was anticipated that the strategy and portfolio would result in a significant active share as compared to its competitors. The Board recalled that the Adviser believes that it delivers a unique strategy and unique value in its management, and that, to the extent that the fees were above those charged by certain other peer funds, the difference in fees was justified by the unique value that the Adviser was able to provide. Upon further consideration and discussion of the foregoing, the Board concluded that the proposed advisory fee and total expense limit for the Fund were within the range of what would have been negotiated at arms-length in light of all the surrounding circumstances and were fair and reasonable.
The extent to which the Fund and its investors would benefit from economies of scale. In this regard, the Board considered the Advisory Agreement and the Fund’s expense limitation agreement. The Board determined that while the proposed advisory fee was flat and would stay the same as asset levels increased, the shareholders of the Fund would benefit from the Fund’s expense limitation agreement until the Fund’s assets grew to a level where its expenses otherwise fall below the expense limit. Following further discussion of the Fund’s projected asset levels, expectations for growth, and level of fees, the Board determined that the Fund’s fee arrangements with the Adviser would provide benefits through the next three years, and the Board could review the arrangements going forward as necessary. After further discussion, the Board concluded the Fund’s arrangement with the Adviser was fair and reasonable in relation to the nature and quality of services to be provided by the Adviser and would benefit the Fund and its shareholders.
Brokerage and portfolio transactions. The Board considered the Adviser’s policies and procedures as they relate to seeking best execution for its clients. The Board also considered the anticipated portfolio turnover rate for the Fund; the method and basis for selecting and evaluating broker-dealers used to complete the Fund’s portfolio transactions; any anticipated allocation of portfolio business to persons affiliated with the Adviser; and
36
LYRICAL INTERNATIONAL VALUE EQUITY FUND
DISCLOSURE REGARDING APPROVAL OF INVESTMENT ADVISORY AGREEMENT (Unaudited) (Continued)
the extent to which the Fund’s trades may be allocated to soft-dollar arrangements. After further review and discussion, the Board determined that the Adviser’s practices regarding brokerage and portfolio transactions for the Fund were satisfactory.
Possible conflicts of interest. In evaluating the possibility for conflicts of interest, the Board considered such matters as the experience and abilities of the advisory personnel to be assigned to the Fund and the Adviser’s process for allocating trades among the Fund and potential future clients with similar types of investment objectives and strategies. The Board also considered the substance and administration of the Adviser’s Code of Ethics. Following further consideration and discussion, the Board determined that the Adviser’s standards and practices relating to the identification and mitigation of potential conflicts of interests for the Fund were satisfactory.
After further discussion of the factors noted above, as well as other factors, and in reliance on the information provided by the Adviser and Trust Management, and taking into account the totality of all the factors discussed and information presented at this meeting and previous meetings, the Board indicated its agreement to approve the Agreement. It was noted that in the Trustees’ deliberations regarding the approval of the Agreement, the Trustees did not identify any particular information or factor that was all-important or controlling, and that each individual Trustee may have attributed different weights to the various factors listed above. After full consideration of the above factors as well as other factors, the Board unanimously concluded that approval of the Agreement was in the best interests of the Fund and its shareholders.
37
FACTS | WHAT DO THE LYRICAL U.S. VALUE EQUITY FUND AND THE LYRICAL INTERNATIONAL VALUE EQUITY FUND (THE “FUNDS”) DO WITH YOUR PERSONAL INFORMATION? |
| | | | |
Why? | Financial companies choose how they share your personal information. Federal law gives consumers the right to limit some but not all sharing. Federal law also requires us to tell you how we collect, share, and protect your personal information. Please read this notice carefully to understand what we do. |
| | | | |
What? | ■ Social Security number ■ Assets ■ Retirement Assets ■ Transaction History ■ Checking Account Information ■ Purchase History ■ Account Balances ■ Account Transactions ■ Wire Transfer Instructions When you are no longer our customer, we continue to share your information as described in this notice. The types of personal information we collect and share depend on the product or service you have with us. This information can include: |
| | | | |
How? | All financial companies need to share your personal information to run their everyday business. In the section below, we list the reasons financial companies can share their customers’ personal information; the reasons the Funds chooses to share; and whether you can limit this sharing. |
| | | | |
Reasons we can share your personal information | Do the
Funds share? | Can you limit this sharing? |
For our everyday business purposes –
Such as to process your transactions, maintain your account(s), respond to court orders and legal investigations, or report to credit bureaus | Yes | No |
For our marketing purposes –
to offer our products and services to you | No | We don’t share |
For joint marketing with other financial companies | No | We don’t share |
For our affiliates’ everyday business purposes –
information about your transactions and experiences | No | We don’t share |
For our affiliates’ everyday business purposes –
information about your creditworthiness | No | We don’t share |
For nonaffiliates to market to you | No | We don’t share |
| | |
Questions? | Call 1-888-884-8099 |
38
Who we are |
Who is providing this notice? | Lyrical U.S. Value Equity Fund Lyrical International Value Equity Fund Ultimus Fund Distributors, LLC (Distributor) Ultimus Fund Solutions, LLC (Administrator) |
What we do |
How do the Funds protect my personal information? | To protect your personal information from unauthorized access and use, we use security measures that comply with federal law. These measures include computer safeguards and secured files and buildings. Our service providers are held accountable for adhering to strict policies and procedures to prevent any misuse of your nonpublic personal information. |
How do the Funds collect my personal information? | ■ Open an account ■ Provide account information ■ Give us your contact information ■ Make deposits or withdrawals from your account ■ Make a wire transfer ■ Tell us where to send the money ■ Tell us who receives the money ■ Show your government-issued ID ■ Show your driver’s license We also collect your personal information from other companies. We collect your personal information, for example, when you |
Why can’t I limit all sharing? | ■ Sharing for affiliates’ everyday business purposes – information about your creditworthiness ■ Affiliates from using your information to market to you ■ Sharing for nonaffiliates to market to you State laws and individual companies may give you additional rights to limit sharing. Federal law gives you the right to limit only |
| | |
Definitions |
Affiliates | Lyrical Asset Management LP, the investment adviser to the Funds, could be deemed to be an affiliate. Companies related by common ownership or control. They can be financial and nonfinancial companies. |
Nonaffiliates | The Funds do not share with nonaffiliates so they can market to you. Companies not related by common ownership or control. They can be financial and nonfinancial companies |
Joint marketing | The Funds do not jointly market. A formal agreement between nonaffiliated financial companies that together market financial products or services to you. |
39
This page intentionally left blank.
This page intentionally left blank.

Q3 All-Weather Sector Rotation Fund
Investor Class (QAWSX)
Institutional Class (QAISX)
Q3 All-Weather Tactical Fund
Investor Class (QAWTX)
Institutional Class (QAITX)
Semi-Annual Report
May 31, 2020
(Unaudited)
Beginning on January 1, 2021, as permitted by regulations adopted by the U.S. Securities and Exchange Commission, paper copies of the Funds’ shareholder reports will no longer be sent by mail, unless you specifically request paper copies of the reports from the Funds or from your financial intermediary, such as a broker-dealer or bank. Instead, the reports will be made available on a website, and you will be notified by mail each time a report is posted and provided with a website link to access the report.
If you have already elected to receive shareholder reports electronically, you will not be affected by this change and you need not take any action. You may elect to receive shareholder reports and other communications from the Funds electronically by contacting the Funds at 1-855-784-2399 or, if you own these shares through a financial intermediary, you may contact your financial intermediary.
You may elect to receive all future reports in paper free of charge. You can inform the Funds that you wish to continue receiving paper copies of your shareholder reports by contacting the Funds at 1-855-784-2399. If you own shares through a financial intermediary, you may contact your financial intermediary or follow instructions included with this disclosure to elect to continue to receive paper copies of your shareholder reports. Your election to receive reports in paper will apply to all funds held with the fund complex or at your financial intermediary.
Q3 ALL-WEATHER FUNDS |
LETTER TO SHAREHOLDERS | May 31, 2020 |
Dear Shareholders:
This Semi-Annual Report for the Q3 All-Weather Funds covers the period from December 30, 2019 – May 31, 2020. The All-Weather Funds are a series of Funds advised by Q3 Asset Management Corporation, which are actively managed using systematic, quantitative approaches to asset allocation in order to adjust to evolving market environments.
Q3 All-Weather Sector Rotation Fund (QAISX, QAWSX)
The Fund had returns of -13.80% for the period in the Investor class shares and -13.70% in the Institutional class shares, versus a return of -7.67% for the Morningstar Moderately Aggressive Target Risk Index during the same timeframe. The Fund’s investment objective is to seek long-term growth of capital.
The Fund began the period fully invested in equities with emphasis on the technology and health care sectors, as these were the leading areas of the equity markets for much of 2019. These holdings were largely unchanged for the first few months of the performance period as they continued to outperform the broader market. As the equity markets began to respond to COVID concerns in early March, the Fund became overweighted to fixed income holdings, primarily intermediate-term Treasury positions. Just prior to the move into bonds, the Fund experienced losses in excess of the index due to the concentrated holdings within the technology and health care sectors. The defensive stance lasted into May as the Fund then rotated completely out of fixed income and back into equities.
Q3 All-Weather Tactical Fund (QAITX, QAWTX)
The Fund returned 2.60% for the period for the Investor class shares and 2.70% for the Institutional class shares, versus a return of -4.15% for the Morningstar Moderate Target Risk Index for the period. The Fund’s investment objective seeks a positive rate of return over a calendar year regardless of market conditions. As the Fund begins to exhibit downside volatility, positions in Government Bonds may be taken.
The Fund began the period fully invested in the NASDAQ 100 Index. Beginning in late January the Fund due to increased downside volatility in the markets, responded by switching to 80% long exposure to the NASDAQ 100 Index initially and subsequently down to a 60% exposure. The remainder of the position was in Government Bonds. For the next few weeks, the Fund began to gradually shift away from equities and into Government Bonds and Short-term Bonds. In early to mid-March, as the COVID crisis began to affect the markets, the Fund continued to shift away from equities to the point where it was entirely out of the NASDAQ 100 position. As the markets began to stabilize the Fund gradually reentered equities throughout May and by the end of the period was back to a 100% invested position in NASDAQ.
1
The All-Weather Funds are created to work together in a portfolio to seek return and manage risk for an investor through changing market conditions. If you have any questions about the Funds, please visit us at our website www.Q3AllWeatherFunds.com or email info@Q3Tactical.com
Very truly yours,
Brad Giaimo | Bruce Greig | Adam Quiring |
Q3 Asset Management Corporation
Adviser to the All-Weather Funds
Past performance is not predictive of future performance. Investment results and principal value will fluctuate so that shares, when redeemed, may be worth more or less than their original cost. Current performance may be higher or lower than the performance data quoted. Performance data current to the most recent month end are available by calling 1-855-784-2399.
An investor should consider the investment objectives, risks, charges and expenses of the Funds carefully before investing. The Funds’ prospectus contains this and other important information. To obtain a copy of the Funds’ prospectus, please call 1-855-784-2399 and a copy will be sent to you free of charge. Please read the prospectus carefully before you invest. Q3 All-Weather Sector Rotation Fund and Q3 All-Weather Tactical Fund are distributed by Ultimus Fund Distributors, LLC.
The Letter to Shareholders seeks to describe some of the Adviser’s current opinions and views of the financial markets. Although the Adviser believes it has a reasonable basis for any opinions or views expressed, actual results may differ, sometimes significantly so, from those expected or expressed. The securities held by the Funds that are discussed in the Letter to Shareholders were held during the period covered by this Report. They do not comprise the entire investment portfolios of the Funds, may be sold at any time and may no longer be held by the Funds. The opinions of the Funds’ Adviser with respect to those securities may change at any time. For a complete list of securities held by the Funds as of May 31, 2020, please see the Schedules of Investments sections of the Semi-Annual Report.
Statements in the Letter to Shareholders that reflect projections or expectations for future financial or economic performance of the Funds and the market in general and statements of the Funds’ plans and objectives for future operations are forward-looking statements. No assurance can be given that actual results or events will not differ materially from those projected, estimated, assumed, or anticipated in any such forward-looking statements. Important factors that could result in such differences, in addition to factors noted with such forward-looking statements include, without limitation, general economic conditions, such as inflation, recession, and interest rates. Past performance is not a guarantee of future results.
2
Q3 ALL-WEATHER FUNDS
PORTFOLIO INFORMATION
May 31, 2020 (Unaudited)
Q3 ALL-WEATHER SECTOR ROTATION FUND
Sector Diversification (% of Net Assets)
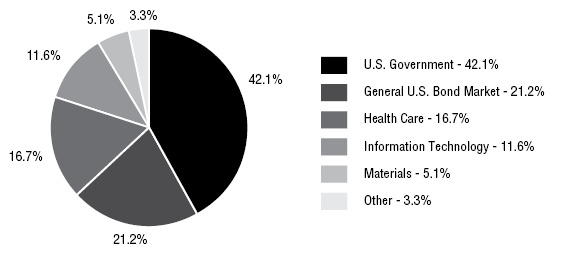
Q3 ALL-WEATHER TACTICAL FUND
Sector Diversification (% of Net Assets)
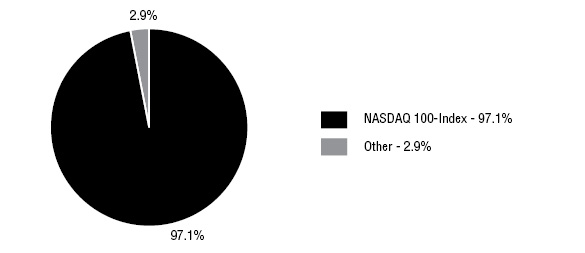
3
Q3 ALL-WEATHER SECTOR ROTATION FUND
SCHEDULE OF INVESTMENTS
May 31, 2020 (Unaudited) |
EXCHANGE-TRADED FUNDS — 96.7% | | Shares | | | Value | |
Fidelity MSCI Health Care Index ETF | | | 4,180 | | | $ | 212,219 | |
First Trust NYSE Arca Biotechnology Index Fund | | | 1,294 | | | | 214,041 | |
Invesco Dynamic Pharmaceuticals ETF | | | 3,242 | | | | 209,984 | |
iShares 3-7 Year Treasury Bond ETF | | | 6,004 | | | | 802,375 | |
iShares U.S. Treasury Bond ETF | | | 28,572 | | | | 799,587 | |
Technology Select Sector SPDR® Fund (The) | | | 2,288 | | | | 224,155 | |
VanEck Vectors Gold Miners ETF | | | 5,714 | | | | 196,104 | |
VanEck Vectors Semiconductor ETF | | | 1,532 | | | | 216,058 | |
Vanguard Total Bond Market ETF | | | 9,172 | | | | 806,402 | |
Total Exchange-Traded Funds (Cost $3,607,181) | | | | | | $ | 3,680,925 | |
|
MONEY MARKET FUNDS — 2.9% | | Shares | | | Value | |
First American Government Obligations Fund - Class X, 0.08% (a) (Cost $110,275) | | | 110,275 | | | $ | 110,275 | |
| | | | | | | | | |
Investments at Value — 99.6% (Cost $3,717,456) | | | | | | $ | 3,791,200 | |
| | | | | | | | | |
Other Assets in Excess of Liabilities — 0.4% | | | | | | | 13,743 | |
| | | | | | | | | |
Net Assets — 100.0% | | | | | | $ | 3,804,943 | |
(a) | The rate shown is the 7-day effective yield as of May 31, 2020. |
See accompanying notes to financial statements. |
4
Q3 ALL-WEATHER TACTICAL FUND
SCHEDULE OF INVESTMENTS
May 31, 2020 (Unaudited) |
EXCHANGE-TRADED FUNDS — 97.1% | | Shares | | | Value | |
Invesco QQQ Trust, Series 1 (Cost $34,736,404) | | | 153,770 | | | $ | 35,883,768 | |
|
MONEY MARKET FUNDS — 3.0% | | Shares | | | Value | |
First American Government Obligations Fund - Class X, 0.08% (a) (Cost $1,098,618) | | | 1,098,618 | | | $ | 1,098,618 | |
| | | | | | | | | |
Investments at Value — 100.1% (Cost $35,835,022) | | | | | | $ | 36,982,386 | |
| | | | | | | | | |
Liabilities in Excess of Other Assets — (0.1%) | | | | | | | (31,579 | ) |
| | | | | | | | | |
Net Assets — 100.0% | | | | | | $ | 36,950,807 | |
(a) | The rate shown is the 7-day effective yield as of May 31, 2020. |
See accompanying notes to financial statements. |
5
Q3 ALL-WEATHER FUNDS
STATEMENTS OF ASSETS AND LIABILITIES
May 31, 2020 (Unaudited) |
| | Q3 All-Weather
Sector Rotation
Fund | | | Q3 All-Weather
Tactical
Fund | |
ASSETS | | | | | | | | |
Investments in securities: | | | | | | | | |
At cost | | $ | 3,717,456 | | | $ | 35,835,022 | |
At value (Note 2) | | $ | 3,791,200 | | | $ | 36,982,386 | |
Receivable for capital shares sold | | | 56,912 | | | | 48,584 | |
Receivable for investment securities sold | | | — | | | | 34,309,876 | |
Receivable from Adviser (Note 4) | | | 7,487 | | | | — | |
Dividends receivable | | | 17 | | | | 65 | |
Other assets | | | 5,935 | | | | 11,506 | |
Total assets | | | 3,861,551 | | | | 71,352,417 | |
| | | | | | | | | |
LIABILITIES | | | | | | | | |
Payable for capital shares redeemed | | | 41,933 | | | | 61,247 | |
Payable for investment securities purchased | | | — | | | | 34,267,263 | |
Payable to Adviser (Note 4) | | | — | | | | 45,372 | |
Payable to administrator (Note 4) | | | 7,559 | | | | 9,741 | |
Accrued distribution fees (Note 4) | | | 59 | | | | 74 | |
Other accrued expenses and liabilities | | | 7,057 | | | | 17,913 | |
Total liabilities | | | 56,608 | | | | 34,401,610 | |
| | | | | | | | | |
NET ASSETS | | $ | 3,804,943 | | | $ | 36,950,807 | |
| | | | | | | | | |
NET ASSETS CONSIST OF: | | | | | | | | |
Paid-in capital | | $ | 4,430,244 | | | $ | 38,023,983 | |
Accumulated deficit | | | (625,301 | ) | | | (1,073,176 | ) |
NET ASSETS | | $ | 3,804,943 | | | $ | 36,950,807 | |
| | | | | | | | | |
NET ASSET VALUE PER SHARE: | | | | | | | | |
INVESTOR CLASS | | | | | | | | |
Net assets applicable to Investor Class | | $ | 55,779 | | | $ | 89,240 | |
Investor Class shares of beneficial interest outstanding (unlimited number of shares authorized, no par value) | | | 6,468 | | | | 8,700 | |
Net asset value, offering price and redemption price per share (Note 2) | | $ | 8.62 | | | $ | 10.26 | |
| | | | | | | | | |
INSTITUTIONAL CLASS | | | | | | | | |
Net assets applicable to Institutional Class | | $ | 3,749,164 | | | $ | 36,861,567 | |
Institutional Class shares of beneficial interest outstanding (unlimited number of shares authorized, no par value) | | | 434,242 | | | | 3,590,536 | |
Net asset value, offering price and redemption price per share (Note 2) | | $ | 8.63 | | | $ | 10.27 | |
See accompanying notes to financial statements. |
6
Q3 ALL-WEATHER FUNDS
STATEMENTS OF OPERATIONS
Period Ended May 31, 2020 (Unaudited) (a) |
| | Q3 All-Weather
Sector Rotation
Fund | | | Q3 All-Weather
Tactical
Fund | |
INVESTMENT INCOME | | | | | | | | |
Dividend income | | $ | 10,826 | | | $ | 125,338 | |
| | | | | | | | | |
EXPENSES | | | | | | | | |
Management fees (Note 4) | | | 10,649 | | | | 99,577 | |
Fund accounting fees (Note 4) | | | 12,637 | | | | 13,508 | |
Administration fees (Note 4) | | | 10,000 | | | | 13,923 | |
Trustees’ fees and expenses (Note 4) | | | 11,196 | | | | 11,196 | |
Transfer agent fees (Note 4) | | | 10,000 | | | | 10,500 | |
Legal fees | | | 9,571 | | | | 9,571 | |
Registration and filing fees | | | 5,347 | | | | 10,273 | |
Custody and bank service fees | | | 3,784 | | | | 6,793 | |
Compliance fees (Note 4) | | | 5,000 | | | | 5,000 | |
Postage and supplies | | | 2,854 | | | | 2,922 | |
Borrowing costs (Note 5) | | | 383 | | | | 2,987 | |
Printing of shareholder reports | | | 1,272 | | | | 1,272 | |
Distribution fees - Investor Class (Note 4) | | | 59 | | | | 74 | |
Other expenses | | | 4,864 | | | | 5,310 | |
Total expenses | | | 87,616 | | | | 192,906 | |
Management fees reduced and/or expense reimbursements by the Adviser (Note 4) | | | (66,515 | ) | | | (828 | ) |
Net expenses | | | 21,101 | | | | 192,078 | |
| | | | | | | | | |
NET INVESTMENT LOSS | | | (10,275 | ) | | | (66,740 | ) |
| | | | | | | | | |
REALIZED AND UNREALIZED GAINS (LOSSES) ON INVESTMENTS | | | | | | | | |
Net realized losses from investment transactions | | | (688,770 | ) | | | (2,153,800 | ) |
Net change in unrealized appreciation (depreciation) on investments | | | 73,744 | | | | 1,147,364 | |
NET REALIZED AND UNREALIZED LOSSES ON INVESTMENTS | | | (615,026 | ) | | | (1,006,436 | ) |
| | | | | | | | | |
NET DECREASE IN NET ASSETS RESULTING FROM OPERATIONS | | $ | (625,301 | ) | | $ | (1,073,176 | ) |
(a) | Represents the period from the commencement of operations (December 30, 2019) through May 31, 2020. |
See accompanying notes to financial statements. |
7
Q3 ALL-WEATHER SECTOR ROTATION FUND
STATEMENT OF CHANGES IN NET ASSETS |
| | Period Ended
May 31, 2020
(Unaudited) (a) | |
FROM OPERATIONS | | | | |
Net investment loss | | $ | (10,275 | ) |
Net realized losses from investment transactions | | | (688,770 | ) |
Net change in unrealized appreciation (depreciation) on investments | | | 73,744 | |
Net decrease in net assets resulting from operations | | | (625,301 | ) |
| | | | | |
CAPITAL SHARE TRANSACTIONS | | | | |
Investor Class | | | | |
Proceeds from shares sold | | | 63,976 | |
| | | | | |
Institutional Class | | | | |
Proceeds from shares sold | | | 4,757,368 | |
Payments for shares redeemed | | | (391,100 | ) |
Net increase in Institutional Class net assets from capital share transactions | | | 4,366,268 | |
| | | | | |
TOTAL INCREASE IN NET ASSETS | | | 3,804,943 | |
| | | | | |
NET ASSETS | | | | |
Beginning of period | | | — | |
End of period | | $ | 3,804,943 | |
| | | | | |
CAPITAL SHARE ACTIVITY | | | | |
Investor Class | | | | |
Shares sold | | | 6,468 | |
Net increase in shares outstanding | | | 6,468 | |
Shares outstanding at beginning of period | | | — | |
Shares outstanding at end of period | | | 6,468 | |
| | | | | |
Institutional Class | | | | |
Shares sold | | | 475,789 | |
Shares redeemed | | | (41,547 | ) |
Net increase in shares outstanding | | | 434,242 | |
Shares outstanding at beginning of period | | | — | |
Shares outstanding at end of period | | | 434,242 | |
(a) | Represents the period from the commencement of operations (December 30, 2019) through May 31, 2020. |
See accompanying notes to financial statements. |
8
Q3 ALL-WEATHER TACTICAL FUND
STATEMENT OF CHANGES IN NET ASSETS |
| | Period Ended
May 31, 2020
(Unaudited) (a) | |
FROM OPERATIONS | | | | |
Net investment loss | | $ | (66,740 | ) |
Net realized losses from investment transactions | | | (2,153,800 | ) |
Net change in unrealized appreciation (depreciation) on investments | | | 1,147,364 | |
Net decrease in net assets resulting from operations | | | (1,073,176 | ) |
| | | | | |
CAPITAL SHARE TRANSACTIONS | | | | |
Investor Class | | | | |
Proceeds from shares sold | | | 88,093 | |
| | | | | |
Institutional Class | | | | |
Proceeds from shares sold | | | 66,786,170 | |
Payments for shares redeemed | | | (28,850,280 | ) |
Net increase in Institutional Class net assets from captial share transactions | | | 37,935,890 | |
| | | | | |
TOTAL INCREASE IN NET ASSETS | | | 36,950,807 | |
| | | | | |
NET ASSETS | | | | |
Beginning of period | | | — | |
End of period | | $ | 36,950,807 | |
| | | | | |
CAPITAL SHARE ACTIVITY | | | | |
Investor Class | | | | |
Shares sold | | | 8,700 | |
Net increase in shares outstanding | | | 8,700 | |
Shares outstanding at beginning of period | | | — | |
Shares outstanding at end of period | | | 8,700 | |
| | | | | |
Institutional Class | | | | |
Shares sold | | | 6,379,384 | |
Shares redeemed | | | (2,788,848 | ) |
Net increase in shares outstanding | | | 3,590,536 | |
Shares outstanding at beginning of period | | | — | |
Shares outstanding at end of period | | | 3,590,536 | |
(a) | Represents the period from the commencement of operations (December 30, 2019) through May 31, 2020. |
See accompanying notes to financial statements. |
9
Q3 ALL-WEATHER SECTOR ROTATION FUND
INVESTOR CLASS
FINANCIAL HIGHLIGHTS |
Per Share Data for a Share Outstanding Throughout the Period: |
| | Period Ended
May 31, 2020
(Unaudited) (a) | |
Net asset value at beginning of period | | $ | 10.00 | |
| | | | | |
Loss from investment operations: | | | | |
Net investment loss (b) | | | (0.05 | ) |
Net realized and unrealized losses on investments | | | (1.33 | ) |
Total from investment operations | | | (1.38 | ) |
| | | | | |
Net asset value at end of period | | $ | 8.62 | |
| | | | | |
Total return (c) | | | (13.80 | %)(d) |
| | | | | |
Net assets at end of period (000’s) | | $ | 56 | |
| | | | | |
Ratios/supplementary data: | | | | |
Ratio of total expenses to average net assets (e) | | | 11.05 | %(f) |
| | | | | |
Ratio of net expenses to average net assets (e)(g) | | | 2.19 | %(f) |
| | | | | |
Ratio of net investment loss to average net assets (e)(g)(h) | | | (1.40 | %)(f) |
| | | | | |
Portfolio turnover rate | | | 351 | %(d) |
(a) | Represents the period from the commencement of operations (December 30, 2019) through May 31, 2020. |
(b) | Per share net investment loss has been determined on the basis of average number of shares outstanding during the period. |
(c) | Total return is a measure of the change in value of an investment in the Fund over the period covered. The return shown does not reflect the deduction of taxes a shareholder would pay on Fund distributions, if any, or the redemption of Fund shares. The total return would have been lower if the Adviser had not reduced fees and reimbursed expenses for the period ended May 31, 2020 (Note 4). |
(d) | Not annualized. |
(e) | The ratios of expenses and net investment loss to average net assets do not reflect the Fund’s proportionate share of expenses of the underlying investment companies in which the Fund invests. |
(f) | Annualized. |
(g) | Ratio was determined after management fee reductions and/or expense reimbursements (Note 4). |
(h) | Recognition of net investment loss by the Fund is affected by the timing of the declaration of dividends by the underlying companies in which the Fund invests. |
See accompanying notes to financial statements. |
10
Q3 ALL-WEATHER SECTOR ROTATION FUND
INSTITUTIONAL CLASS
FINANCIAL HIGHLIGHTS |
Per Share Data for a Share Outstanding Throughout the Period: |
| | Period Ended
May 31, 2020
(Unaudited) (a) | |
Net asset value at beginning of period | | $ | 10.00 | |
| | | | | |
Loss from investment operations: | | | | |
Net investment loss (b) | | | (0.04 | ) |
Net realized and unrealized losses on investments | | | (1.33 | ) |
Total from investment operations | | | (1.37 | ) |
| | | | | |
Net asset value at end of period | | $ | 8.63 | |
| | | | | |
Total return (c) | | | (13.70 | %)(d) |
| | | | | |
Net assets at end of period (000’s) | | $ | 3,749 | |
| | | | | |
Ratios/supplementary data: | | | | |
Ratio of total expenses to average net assets (e) | | | 8.08 | %(f) |
| | | | | |
Ratio of net expenses to average net assets (e)(g) | | | 1.94 | %(f) |
| | | | | |
Ratio of net investment loss to average net assets (e)(g)(h) | | | (0.95 | %)(f) |
| | | | | |
Portfolio turnover rate | | | 351 | %(d) |
(a) | Represents the period from the commencement of operations (December 30, 2019) through May 31, 2020. |
(b) | Per share net investment loss has been determined on the basis of average number of shares outstanding during the period. |
(c) | Total return is a measure of the change in value of an investment in the Fund over the period covered. The return shown does not reflect the deduction of taxes a shareholder would pay on Fund distributions, if any, or the redemption of Fund shares. The total return would have been lower if the Adviser had not reduced fees and reimbursed expenses for the period ended May 31, 2020 (Note 4). |
(d) | Not annualized. |
(e) | The ratios of expenses and net investment loss to average net assets do not reflect the Fund’s proportionate share of expenses of the underlying investment companies in which the Fund invests. |
(f) | Annualized. |
(g) | Ratio was determined after management fee reductions and/or expense reimbursements (Note 4). |
(h) | Recognition of net investment loss by the Fund is affected by the timing of the declaration of dividends by the underlying companies in which the Fund invests. |
See accompanying notes to financial statements. |
11
Q3 ALL-WEATHER TACTICAL FUND
INVESTOR CLASS
FINANCIAL HIGHLIGHTS |
Per Share Data for a Share Outstanding Throughout the Period: |
| | Period Ended
May 31, 2020
(Unaudited) (a) | |
Net asset value at beginning of period | | $ | 10.00 | |
| | | | | |
Income (loss) from investment operations: | | | | |
Net investment loss (b) | | | (0.06 | ) |
Net realized and unrealized gains on investments | | | 0.32 | |
Total from investment operations | | | 0.26 | |
| | | | | |
Net asset value at end of period | | $ | 10.26 | |
| | | | | |
Total return (c) | | | 2.60 | %(d) |
| | | | | |
Net assets at end of period (000’s) | | $ | 89 | |
| | | | | |
Ratios/supplementary data: | | | | |
Ratio of total expenses to average net assets (e) | | | 4.98 | %(f) |
| | | | | |
Ratio of net expenses to average net assets (e)(g) | | | 2.19 | %(f) |
| | | | | |
Ratio of net investment loss to average net assets (e)(g)(h) | | | (1.31 | %)(f) |
| | | | | |
Portfolio turnover rate | | | 1316 | %(d) |
(a) | Represents the period from the commencement of operations (December 30, 2019) through May 31, 2020. |
(b) | Per share net investment loss has been determined on the basis of average number of shares outstanding during the period. |
(c) | Total return is a measure of the change in value of an investment in the Fund over the period covered. The return shown does not reflect the deduction of taxes a shareholder would pay on Fund distributions, if any, or the redemption of Fund shares. The total return would have been lower if the Adviser had not reimbursed expense for the period ended May 31, 2020 (Note 4). |
(d) | Not annualized. |
(e) | The ratios of expenses and net investment loss to average net assets do not reflect the Fund’s proportionate share of expenses of the underlying investment companies in which the Fund invests. |
(f) | Annualized. |
(g) | Ratio was determined after management fee reductions and/or expense reimbursements (Note 4). |
(h) | Recognition of net investment loss by the Fund is affected by the timing of the declaration of dividends by the underlying companies in which the Fund invests. |
See accompanying notes to financial statements. |
12
Q3 ALL-WEATHER TACTICAL FUND
INSTITUTIONAL CLASS
FINANCIAL HIGHLIGHTS |
Per Share Data for a Share Outstanding Throughout the Period: |
| | Period Ended
May 31, 2020
(Unaudited) (a) | |
Net asset value at beginning of period | | $ | 10.00 | |
| | | | | |
Income (loss) from investment operations: | | | | |
Net investment loss (b) | | | (0.03 | ) |
Net realized and unrealized gains on investments | | | 0.30 | |
Total from investment operations | | | 0.27 | |
| | | | | |
Net asset value at end of period | | $ | 10.27 | |
| | | | | |
Total return (c) | | | 2.70 | %(d) |
| | | | | |
Net assets at end of period (000’s) | | $ | 36,862 | |
| | | | | |
Ratios/supplementary data: | | | | |
Ratio of total expenses to average net assets (e) | | | 1.91 | %(f) |
| | | | | |
Ratio of net investment loss to average net assets (e)(g) | | | (0.66 | %)(f) |
| | | | | |
Portfolio turnover rate | | | 1316 | %(d) |
(a) | Represents the period from the commencement of operations (December 30, 2019) through May 31, 2020. |
(b) | Per share net investment loss has been determined on the basis of average number of shares outstanding during the period. |
(c) | Total return is a measure of the change in value of an investment in the Fund over the period covered. The return shown does not reflect the deduction of taxes a shareholder would pay on Fund distributions, if any, or the redemption of Fund shares. |
(d) | Not annualized. |
(e) | The ratios of expenses and net investment loss to average net assets do not reflect the Fund’s proportionate share of expenses of the underlying investment companies in which the Fund invests. |
(f) | Annualized. |
(g) | Recognition of net investment loss by the Fund is affected by the timing of the declaration of dividends by the underlying companies in which the Fund invests. |
See accompanying notes to financial statements. |
13
Q3 ALL-WEATHER FUNDS
NOTES TO FINANCIAL STATEMENTS
May 31, 2020 (Unaudited)
1. Organization
Q3 All-Weather Sector Rotation Fund and Q3 All-Weather Tactical Fund (individually, a “Fund” and collectively, the “Funds”) are each a series of Ultimus Managers Trust (the “Trust”), an open-end investment company established as an Ohio business trust under a Declaration of Trust dated February 28, 2012. Other series of the Trust are not incorporated in this report. The Funds commenced operations on December 30, 2019.
Q3 All-Weather Sector Rotation Fund seeks to achieve long-term growth of capital.
Q3 All-Weather Tactical Fund seeks a positive rate of return over a calendar year regardless of market conditions.
Q3 All-Weather Sector Rotation Fund is classified as a diversified fund. Q3 All-Weather Tactical Fund is classified as a non-diversified fund.
Each Fund offers two classes of shares: Investor Class shares (sold without any sales loads, but subject to a distribution and/or shareholder service fee of up to 0.25% of the average daily net assets attributable to Investor Class shares and requiring no minimum initial investment) and Institutional Class shares (sold without any sales loads and distribution and/or shareholder service fees and requiring a $500,000 initial investment). Each share class represents an ownership interest in the same investment portfolio.
2. Significant Accounting Policies
The following is a summary of the Funds’ significant accounting policies. The policies are in conformity with accounting principles generally accepted in the United States of America (“GAAP”). The Funds follow accounting and reporting guidance under Financial Accounting Standards Board Accounting Standards Codification Topic 946, “Financial Services – Investment Companies.”
Securities valuation – Each Fund values its portfolio securities at market value as of the close of regular trading on the New York Stock Exchange (the “NYSE”) (normally 4:00 p.m. Eastern time) on each business day the NYSE is open for business. Exchange-traded funds (“ETFs”) are valued at the security’s last sale price on the primary exchange, if available, otherwise at the exchange’s most recently quoted mean price. Investments representing shares of other open-end investment companies, except ETFs but including money market funds, are valued at their net asset value (“NAV”) as reported by such companies. When using a quoted price and when the market is considered active, these securities will be classified as Level 1 with the fair value hierarchy (see below). In the event that market quotations are not readily available or are considered unreliable due to market or other events, the Funds value their securities and other assets at fair value pursuant to procedures established by and under the direction of the Board of Trustees of the Trust (the “Board”). Under these procedures, the securities will be classified as
14
Q3 ALL-WEATHER FUNDS
NOTES TO FINANCIAL STATEMENTS (Continued)
Level 2 or 3 within the fair value hierarchy, depending on the inputs used. Unavailable or unreliable market quotes may be due to the following factors: a substantial bid-ask spread; infrequent sales resulting in stale prices; insufficient trading volume; small trade sizes; a temporary lapse in any reliable pricing source; and actions of the securities or futures markets, such as the suspension or limitation of trading. As a result, the prices of securities used to calculate each Fund’s NAV may differ from quoted or published prices for the same securities.
GAAP establishes a single authoritative definition of fair value, sets out a framework for measuring fair value, and requires additional disclosures about fair value measurements.
Various inputs are used in determining the value of each Fund’s investments. These inputs are summarized in the three broad levels listed below:
● | Level 1 – quoted prices in active markets for identical securities |
● | Level 2 – other significant observable inputs |
● | Level 3 – significant unobservable inputs |
The inputs or methods used for valuing securities are not necessarily an indication of the risks associated with investing in those securities. The inputs used to measure fair value may fall into different levels of the fair value hierarchy. In such cases, for disclosure purposes, the level in the fair value hierarchy within which the fair value measurement falls in its entirety is determined based on the lowest level input that is significant to the fair value measurement.
The following is a summary of the inputs used to value each Fund’s investments as of May 31, 2020:
Q3 All-Weather Sector Rotation Fund | | Level 1 | | | Level 2 | | | Level 3 | | | Total | |
Exchange-Traded Funds | | $ | 3,680,925 | | | $ | — | | | $ | — | | | $ | 3,680,925 | |
Money Market Funds | | | 110,275 | | | | | | | | | | | | 110,275 | |
Total | | $ | 3,791,200 | | | $ | — | | | $ | — | | | $ | 3,791,200 | |
Q3 All-Weather Tactical Fund | | Level 1 | | | Level 2 | | | Level 3 | | | Total | |
Exchange-Traded Funds | | $ | 35,883,768 | | | $ | — | | | $ | — | | | $ | 35,883,768 | |
Money Market Funds | | | 1,098,618 | | | | | | | | | | | | 1,098,618 | |
Total | | $ | 36,982,386 | | | $ | — | | | $ | — | | | $ | 36,982,386 | |
Refer to each Fund’s Schedule of Investments for a listing of securities by asset type. The Funds did not hold any derivative instruments or any assets or liabilities that were measured at fair value on a recurring basis using significant unobservable inputs (Level 3) as of or during the period ended May 31, 2020.
15
Q3 ALL-WEATHER FUNDS
NOTES TO FINANCIAL STATEMENTS (Continued)
Share valuation – The NAV per share of each class of each Fund is calculated daily by dividing the total value of the assets attributable to that class, less liabilities attributable to that class, by the number of shares outstanding of that class. The offering price and redemption price per share of each class of each Fund is equal to the NAV per share of such class.
Investment income – Dividend income is recorded on the ex-dividend date. Interest income is accrued as earned. Non-cash dividends included in dividend income, if any, are recorded at the fair value of the security received. Withholding taxes on foreign dividends, if any, have been recorded in accordance with the Fund’s understanding of the applicable country’s rules and tax rates.
Investment transactions – Investment transactions are accounted for on the trade date. Realized gains and losses on investments sold are determined on a specific identification basis.
Allocation between Classes – Investment income earned, realized capital gains and losses, and unrealized appreciation and depreciation are allocated daily to each Class of a Fund based upon its proportionate share of total net assets of that Fund. Class-specific expenses are charged directly to the Class incurring the expense. Common expenses which are not attributable to a specific Class are allocated daily to each Class of shares of a Fund based upon its proportionate share of total net assets of that Fund.
Common expenses – Common expenses of the Trust are allocated among the Funds and the other series of the Trust based on the relative net assets of each series, the number of series in the Trust, or the nature of the services performed and the relative applicability to each series.
Distributions to shareholders – Each Fund distributes to shareholders any net investment income dividends and net realized capital gains distributions at least once each year. The amount of such dividends and distributions are determined in accordance with federal income tax regulations, which may differ from GAAP. Dividends and distributions to shareholders are recorded on the ex-dividend date. There were no distributions paid to shareholders by the Funds during the period ended May 31, 2020.
Estimates – The preparation of financial statements in conformity with GAAP requires management to make estimates and assumptions that affect the reported amounts of assets and liabilities and disclosure of contingent assets and liabilities as of the date of the financial statements and the reported amounts of income and expenses during the reporting period. Actual results could differ from those estimates.
Federal income tax – Each Fund intends to qualify as a regulated investment company under the Internal Revenue Code of 1986, as amended (the “Code”). Qualification generally will relieve the Funds of liability for federal income taxes to the extent 100% of their net investment income and net realized capital gains are distributed in accordance with the Code.
16
Q3 ALL-WEATHER FUNDS
NOTES TO FINANCIAL STATEMENTS (Continued)
In order to avoid imposition of the excise tax applicable to regulated investment companies, it is also each Fund’s intention to declare as dividends in each calendar year at least 98% of its net investment income (earned during the calendar year) and 98.2% of its net realized capital gains (earned during the twelve months ended October 31) plus undistributed amounts from prior years.
The following information is computed on a tax basis for each item as of May 31, 2020:
| | Q3 All-Weather
Sector
Rotation Fund | | | Q3 All-Weather
Tactical Fund | |
Tax cost of portfolio investments | | $ | 3,849,868 | | | $ | 35,845,958 | |
Gross unrealized appreciation | | $ | 40,801 | | | $ | 1,136,427 | |
Gross unrealized depreciation | | | (99,469 | ) | | | — | |
Net unrealized appreciation (depreciation) | | | (58,668 | ) | | | 1,136,427 | |
Accumulated ordinary loss | | | (10,275 | ) | | | (66,740 | ) |
Other losses | | | (556,358 | ) | | | (2,142,863 | ) |
Accumulated deficit | | $ | (625,301 | ) | | $ | (1,073,176 | ) |
The difference between the federal income tax cost of portfolio investments and the financial statement cost of portfolio investments is due to certain timing differences in the recognition of capital gains or losses under income tax regulations and GAAP. These “book/tax” differences are temporary in nature and are primarily due to the tax deferral of losses on wash sales.
The Funds recognize the tax benefits or expenses of uncertain tax positions only when the position is “more likely than not” of being sustained assuming examination by tax authorities. Management has reviewed each Fund’s tax positions for the current tax year and has concluded that no provision for unrecognized tax benefits or expenses is required in these financial statements. The Funds identify their major tax jurisdiction as U.S. Federal.
3. Investment Transactions
During the period ended May 31, 2020, cost of purchases and proceeds from sales of investment securities, other than short-term investments, amounted to $12,570,270 and $8,271,817, respectively, for Q3 All-Weather Sector Rotation Fund and $302,817,862 and $265,927,670, respectively, for Q3 All-Weather Tactical Fund.
4. Transactions with Related Parties
INVESTMENT MANAGEMENT AGREEMENT
The Funds’ investments are managed by Q3 Asset Management Corporation (the “Adviser”) pursuant to the terms of an Investment Management Agreement. Each Fund pay the Adviser an investment management fee, computed and accrued daily and paid monthly, at the annual rate of 1.00% of average daily net assets.
17
Q3 ALL-WEATHER FUNDS
NOTES TO FINANCIAL STATEMENTS (Continued)
Pursuant to an Expense Limitation Agreement (“ELA”) between each Fund and the Adviser, the Adviser has contractually agreed, until March 31, 2022, to reduce investment management fees and reimburse other expenses to the extent necessary to limit total annual fund operating expenses of each Fund (exclusive of brokerage costs; taxes; interest; borrowing costs such as interest and dividend expenses on securities sold short; costs to organize the Fund; acquired fund fees and expenses; extraordinary expenses such as litigation and merger or reorganization costs; and other expenses not incurred in the ordinary course of the Fund’s business) to an amount not exceeding the following percentages of average daily net assets attributable to each respective class:
Investor Class | Institutional Class |
2.19% | 1.94% |
Accordingly, during the period ended May 31, 2020, the Adviser did not collect any of its investment management fees and, in addition, reimbursed other operating expenses of $55,866 for Q3 All-Weather Sector Rotation Fund and reimbursed other operating expenses of $828 for Q3 All-Weather Tactical Fund.
Under the terms of the ELA, investment management fee reductions and expense reimbursements by the Adviser are subject to repayment by the Funds for a period of three years after the date on which such fees and expenses were incurred or waived, provided that the repayments do not cause total annual fund operating expenses (exclusive of such reductions and reimbursements) to exceed (i) the expense limitation then in effect, if any, and (ii) the expense limitation in effect at the time the expenses to be repaid were incurred. As of May 31, 2020, the Adviser may seek repayment of expense reimbursements no later than the dates below:
| | May 31, 2023 | | | Total | |
Q3 All-Weather Sector Rotation Fund | | $ | 66,515 | | | $ | 66,515 | |
Q3 All-Weather Tactical Fund | | $ | 828 | | | $ | 828 | |
OTHER SERVICE PROVIDERS
Ultimus Fund Solutions, LLC (“Ultimus”) provides administration, fund accounting, compliance and transfer agency services to the Funds. The Funds pay Ultimus fees in accordance with the agreements for such services. In addition, the Funds pay out-of-pocket expenses including, but not limited to, postage, supplies, and certain costs related to the pricing of the Funds’ portfolio securities.
Under the terms of a Distribution Agreement with the Trust, Ultimus Fund Distributors, LLC (the “Distributor”) serves as the principal underwriter to the Funds. The Distributor is a wholly-owned subsidiary of Ultimus. The Distributor is compensated partially by the Adviser and partially by the Investor Class shares of each Fund for acting as principal underwriter.
18
Q3 ALL-WEATHER FUNDS
NOTES TO FINANCIAL STATEMENTS (Continued)
A Trustee and certain officers of the Trust are also officers of Ultimus and/or the Distributor.
DISTRIBUTION PLAN
The Funds have adopted a plan of distribution (the “Plan”), pursuant to Rule 12b-1 under the Investment Company Act of 1940, as amended (the “1940 Act”), which permits Investor Class shares of each Fund to directly incur or reimburse the Funds’ principal underwriter for certain expenses related to the distribution of its shares. The annual limitation for payment of expenses pursuant to the Plan is 0.25% of each Fund’s average daily net assets allocable to Investor Class shares. The Funds have not adopted a plan of distribution with respect to the Institutional Class shares. During the period ended May 31, 2020, the Investor Class shares of Q3 All-Weather Sector Rotation Fund and Q3 All-Weather Tactical Fund incurred $59 and $74, respectively, of distribution fees under the Plan.
TRUSTEE COMPENSATION
Each member of the Board (a “Trustee”) who is not an “interested person” of the Trust (“Independent Trustee”) receives a $1,300 annual retainer from each Fund, paid quarterly, except for the Board Chairperson who receives a $1,500 annual retainer from each Fund, paid in quarterly installments. Each Independent Trustee also receives from each Fund a fee of $500 for each Board meeting attended plus reimbursement for travel and other meeting-related expenses.
PRINCIPAL HOLDERS OF FUND SHARES
As of May 31, 2020, the following shareholders owned of record 25% or more of the outstanding shares of the Funds:
NAME OF RECORD OWNERS | % Ownership |
Q3 All-Weather Sector Rotation Fund – Investor Class | |
Bradford Giaimo | 46% |
Adam Quiring | 46% |
Q3 All-Weather Sector Rotation Fund – Institutional Class | |
E*TRADE Savings Bank (for the benefit of its customers) | 74% |
Q3 All-Weather Tactical Fund – Investor Class | |
Bradford Giaimo | 34% |
Adam Quiring | 34% |
TD Ameritrade, Inc. (for the benefit of its customers) | 31% |
Q3 All-Weather Tactical Fund – Institutional Class | |
E*TRADE Savings Bank (for the benefit of its customers) | 47% |
TD Ameritrade, Inc. (for the benefit of its customers) | 30% |
A beneficial owner of 25% or more of a Fund’s outstanding shares may be considered a controlling person of the Fund. That shareholder’s vote could have a more significant effect on matters presented at a shareholders’ meeting.
19
Q3 ALL-WEATHER FUNDS
NOTES TO FINANCIAL STATEMENTS (Continued)
5. Borrowing Costs
From time to time, the Funds may have an overdrawn cash balance at the custodian due to redemptions or market movements. When this occurs, the Funds will incur borrowing costs charged by the custodian. Accordingly, during the period ended May 31, 2020, Q3 All-Weather Sector Rotation Fund and Q3 All-Weather Tactical Fund incurred $383 and $2,987, respectively, of borrowing costs charged by the custodian.
6. Investments in Other Investment Companies
Each Fund may invest a significant portion of its assets in shares of one or more investment companies, including ETFs, open-end mutual funds and money market mutual funds. Each Fund will incur additional indirect expenses (acquired fund fees and expenses) to the extent it invests in shares of other investment companies. As of May 31, 2020, Q3 All-Weather Sector Rotation Fund had 96.7% of the value of its net assets invested in ETFs. As of May 31, 2020, Q3 All-Weather Tactical Fund had 97.1% of the value of its net assets invested in Invesco QQQ Trust, Series 1 (“QQQ”), an ETF that tracks the Nasdaq 100 Index. The financial statements of QQQ can be found at www.sec.gov.
7. Contingencies and Commitments
The Funds indemnify the Trust’s officers and Trustees for certain liabilities that might arise from their performance of their duties to the Funds. Additionally, in the normal course of business the Funds enter into contracts that contain a variety of representations and warranties and which provide general indemnifications. The Funds’ maximum exposure under these arrangements is unknown, as this would involve future claims that may be made against the Funds that have not yet occurred. However, based on experience, the Funds expect the risk of loss to be remote.
8. Subsequent Events
The Funds are required to recognize in the financial statements the effects of all subsequent events that provide additional evidence about conditions that existed as of the date of the Statement of Assets and Liabilities. For non-recognized subsequent events that must be disclosed to keep the financial statements from being misleading, the Funds are required to disclose the nature of the event as well as an estimate of its financial effect, or a statement that such an estimate cannot be made. Management has evaluated subsequent events through the issuance of these financial statements and has noted no such events.
20
Q3 ALL-WEATHER FUNDS
ABOUT YOUR FUND’S EXPENSES (Unaudited)
We believe it is important for you to understand the impact of costs on your investment. As a shareholder of the Funds, you incur ongoing costs, including management fees, class-specific expenses (such as distribution fees) and other operating expenses. The following examples are intended to help you understand your ongoing costs (in dollars) of investing in the Funds and to compare these costs with the ongoing costs of investing in other mutual funds.
A mutual fund’s ongoing costs are expressed as a percentage of its average net assets. This figure is known as the expense ratio. The expenses in the table below are based on an investment of $1,000 made at the beginning of the most recent period (December 30, 2019) and held until the end of the period (May 31, 2020).
The table below illustrates each Fund’s ongoing costs in two ways:
Actual fund return – This section helps you to estimate the actual expenses that you paid over the period. The “Ending Account Value” shown is derived from each Fund’s actual return, and the fourth column shows the dollar amount of operating expenses that would have been paid by an investor who started with $1,000 in the Funds. You may use the information here, together with the amount you invested, to estimate the expenses that you paid over the period.
To do so, simply divide your account value by $1,000 (for example, an $8,600 account value divided by $1,000 = 8.6), then multiply the result by the number given for the Funds under the heading “Expenses Paid During Period.”
Hypothetical 5% return – This section is intended to help you compare each Fund’s ongoing costs with those of other mutual funds. It assumes that the Funds had an annual return of 5% before expenses during the period shown, but that the expense ratio is unchanged. In this case, because the return used is not each Fund’s actual return, the results do not apply to your investment. The example is useful in making comparisons because the U.S. Securities and Exchange Commission (the “SEC”) requires all mutual funds to calculate expenses based on a 5% return. You can assess each Fund’s ongoing costs by comparing this hypothetical example with the hypothetical examples that appear in shareholder reports of other funds.
Note that expenses shown in the table are meant to highlight and help you compare ongoing costs only. The Funds do not charge transaction fees, such as purchase or redemption fees, nor do they carry a “sales load.”
The calculations assume no shares were bought or sold during the period. Your actual costs may have been higher or lower, depending on the amount of your investment and the timing of any purchases or redemptions.
21
Q3 ALL-WEATHER FUNDS
ABOUT YOUR FUND’S EXPENSES (Unaudited) (Continued)
More information about each Fund’s expenses can be found in this report. For additional information on operating expenses and other shareholder costs, please refer to each Fund’s prospectus.
| Beginning
Account Value
December 1,
2019 (a) | Ending
Account Value
May 31,
2020 | Net
Expense
Ratio (b) | Expenses
Paid During
Period (c) |
Q3 All-Weather Sector Rotation Fund | | | | |
Investor Class | | | | |
Based on Actual Fund Return | $ 1,000.00 | $ 862.00 | 2.19% | $ 8.58 |
Based on Hypothetical 5% Return (before expenses) | $ 1,000.00 | $ 1,014.05 | 2.19% | $ 11.03 |
Institutional Class | | | | |
Based on Actual Fund Return | $ 1,000.00 | $ 863.00 | 1.94% | $ 7.60 |
Based on Hypothetical 5% Return (before expenses) | $ 1,000.00 | $ 1,015.30 | 1.94% | $ 9.77 |
Q3 All-Weather Tactical Fund | | | | |
Investor Class | | | | |
Based on Actual Fund Return | $ 1,000.00 | $ 1,026.00 | 2.19% | $ 5.46 |
Based on Hypothetical 5% Return (before expenses) | $ 1,000.00 | $ 1,011.82 | 2.19% | $ 9.27 |
Institutional Class | | | | |
Based on Actual Fund Return | $ 1,000.00 | $ 1,027.00 | 1.91% | $ 8.15 |
Based on Hypothetical 5% Return (before expenses) | $ 1,000.00 | $ 1,015.45 | 1.91% | $ 9.62 |
(a) | Beginning Account Value is as of December 30, 2019 (date of commencement of operations for each class) for the Actual Fund Return information. |
(b) | Annualized, based on the Fund’s expenses during the period since the commencement of operations. |
(c) | Expenses are equal to the Fund’s annualized net expense ratio multiplied by the average account value over the period, multiplied by 154/366 (to reflect the period since inception) and 183/366 (to reflect the one-half year period), for Actual Fund Return and Hypothetical 5% Return information, respectively. |
22
Q3 ALL-WEATHER FUNDS
OTHER INFORMATION (Unaudited)
A description of the policies and procedures that the Funds use to vote proxies relating to portfolio securities is available without charge upon request by calling toll-free 1-855-784-2399, or on the SEC’s website at www.sec.gov. Information regarding how the Funds voted proxies relating to portfolio securities during the period ended June 30, 2020 will be available on or about August 31, 2020 without charge upon request by calling toll-free 1-855-784-2399, or on the SEC’s website at www.sec.gov.
The Trust files a complete listing of portfolio holdings for the Funds with the SEC as of the end of the first and third quarters of each fiscal year on Form N-PORT. These filings are available upon request by calling 1-855-784-2399. Furthermore, you may obtain a copy of the filings on the SEC’s website at www.sec.gov.
23
Q3 ALL-WEATHER FUNDS
DISCLOSURE REGARDING APPROVAL OF INVESTMENT ADVISORY AGREEMENT (Unaudited)
The Board of Trustees (the “Board”), including the Independent Trustees voting separately, has reviewed and approved the Funds’ Investment Agreement with the Q3 Asset Management Corporation (the “Adviser”) for an initial two-year term (the “Agreement”). The Board approved the Agreement at an in-person meeting held on October 21-22, 2019, at which all of the Trustees were present.
Legal counsel advised the Board during its deliberations. Additionally, the Board received and reviewed a substantial amount of information provided by the Adviser in response to requests of the Board and counsel. In deciding whether to approve the Agreement, the Board recalled its discussion with Mr. Bruce Grieg, Director of Research of the Adviser, Mr. Adam Quiring, Principal Partner of the Adviser, and Mr. Brad Giaimo, Principal Partner of the Adviser, and management of the Trust during the meeting and its review of the various materials related to the Adviser and the Funds. The Board further considered those materials and discussions and numerous other factors, including:
The nature, extent, and quality of the services to be provided by the Adviser. In this regard, the Board considered the responsibilities the Adviser would have under the Agreement for the Funds. The Board also considered the proposed services that the Adviser would provide to each Fund including, without limitation, the Adviser’s procedures for formulating investment recommendations and assuring compliance with each Fund’s investment objective and limitations, proposed initial marketing and distribution efforts, and the Adviser’s compliance procedures and practices. After reviewing the foregoing and further information provided in the Funds Board Materials (e.g., descriptions of the Adviser’s business and Form ADV), the Board concluded that the quality, extent, and nature of the services to be provided by the Adviser to each Fund were satisfactory and adequate.
The investment management capabilities and experience of the adviser. In this regard, the Board considered the investment management experience of the Adviser and its principals. The Board considered its discussion Messrs. Grieg, Quiring, and Giaimo regarding the investment objective and strategies for each Fund and the Adviser’s experience and plans for implementing such strategies. In particular, the Board considered the information from the Adviser regarding prior experience in the financial industry by the Adviser and its principals. After consideration of these and other factors, the Board determined that the Adviser has the requisite knowledge and experience to serve as investment adviser for each Fund.
The costs of the services to be provided and profits to be realized by the Adviser and its affiliates from the relationship with the Funds. In this regard, the Board considered the Adviser’s methods of operation; the education and experience of Messrs. Grieg, Quiring, and Giaimo; its compliance program, policies, and procedures; its financial condition and the level of commitment to each Fund; the projected asset levels of each Fund; and the expected overall expenses of each Fund, including the advisory fee. The Board reviewed
24
Q3 ALL-WEATHER FUNDS
DISCLOSURE REGARDING APPROVAL OF INVESTMENT ADVISORY AGREEMENT (Unaudited) (Continued)
the Funds’ expense limitation agreement and noted the benefit to each Fund from the Adviser’s commitment to reduce its advisory fee and reimburse other operating expenses through March 31, 2022. The Board discussed the Adviser’s financial condition and its ability to satisfy its financial commitments to the Funds. The Board considered the support of the principals of the Adviser in assuring that the Adviser has adequate capital to meet its obligations. The Board also considered potential benefits for the Adviser in managing the Funds, including promotion of the Adviser’s name. The Board compared each Fund’s proposed advisory fee and overall expense ratio to other comparable funds (in terms of the type of fund, the style of investment management, the projected size of each Fund, and the nature of the investment strategies).
The Board noted that while the Q3 Sector Rotation Fund’s proposed advisory fee of 1.00% and its proposed overall annual expense ratio for the Investor Class of 2.59% were above the average and median for its custom peer group, the Adviser had satisfactorily explained how the fee and expense ratio were determined. The Board also considered the unique investment style and strategy of the Q3 Sector Rotation Fund versus its peer group. Upon further consideration and discussion of the foregoing, the Board concluded that the proposed advisory fee and total expense limit for the Q3 Sector Rotation Fund were within the range of what would have been negotiated at arms-length in light of all the surrounding circumstances and were fair and reasonable.
The Board noted that while the Q3 Tactical Fund’s proposed advisory fee of 1.00% is below the average and equal to the median for its custom peer group and its the proposed overall annual expense ratio of 2.27% for the Investor Class for the Q3 Tactical Fund is above the peer group’s average and median expense ratio, the Adviser had satisfactorily explained how the fee and expense ratio were determined. The Board also considered the unique investment style and strategy of the Q3 Tactical Fund versus its peer group. Upon further consideration and discussion of the foregoing, the Board concluded that the proposed advisory fee and total expense limit for the Q3 Tactical Fund were within the range of what would have been negotiated at arms-length in light of all the surrounding circumstances and were fair and reasonable.
The extent to which the Funds and its investors would benefit from economies of scale. In this regard, the Board considered the Agreement for the Funds and the Funds’ expense limitation agreement. The Board determined that while the proposed advisory fee was flat and would stay the same as asset levels increased, the shareholders of each Fund would benefit from the Funds’ expense limitation agreement until each Fund’s assets grew to a level where its expenses otherwise fall below the expense limit. Following further discussion of each Fund’s projected asset levels, expectations for growth, and level of fees, the Board determined that each Fund’s fee arrangements with the Adviser would provide benefits through the next three years, and the Board could review the arrangements going forward as necessary. After further discussion, the Board concluded
25
Q3 ALL-WEATHER FUNDS
DISCLOSURE REGARDING APPROVAL OF INVESTMENT ADVISORY AGREEMENT (Unaudited) (Continued)
each Fund’s arrangement with the Adviser was fair and reasonable in relation to the nature and quality of services to be provided by the Adviser and would benefit each Fund and its shareholders.
Brokerage and portfolio transactions. The Board considered the Adviser’s policies and procedures as they relate to seeking best execution for its clients. The Board also considered the anticipated portfolio turnover rate for each Fund; the method and basis for selecting and evaluating broker-dealers used to complete each Fund’s portfolio transactions; any anticipated allocation of portfolio business to persons affiliated with the Adviser; and the extent to which each Fund’s trades may be allocated to soft-dollar arrangements. After further review and discussion, the Board determined that the Adviser’s practices regarding brokerage and portfolio transactions for each Fund were satisfactory.
Possible conflicts of interest. In evaluating the possibility for conflicts of interest, the Board considered such matters as the experience and abilities of the advisory personnel to be assigned to each Fund and the Adviser’s process for allocating trades among each Fund and potential future clients with similar types of investment objectives and strategies. The Board also considered the substance and administration of the Adviser’s Code of Ethics. Following further consideration and discussion, the Board determined that the Adviser’s standards and practices relating to the identification and mitigation of potential conflicts of interests for the Funds were satisfactory.
After further discussion of the factors noted above, as well as other factors, and in reliance on the information provided by the Adviser and Trust Management, and taking into account the totality of all the factors discussed and information presented at this meeting and previous meetings, the Board indicated its agreement to approve the Agreement for each of the Funds. It was noted that in the Trustees’ deliberations regarding the approval of the Agreement for each of the Funds, the Trustees did not identify any particular information or factor that was all-important or controlling, and that each individual Trustee may have attributed different weights to the various factors listed above. After full consideration of the above factors as well as other factors, the Board unanimously concluded that approval of the Agreement for each of the Funds was in the best interests of the each of the Funds and its shareholders.
26
FACTS | WHAT DO THE Q3 ALL-WEATHER SECTOR ROTATION FUND AND THE Q3 ALL-WEATHER TACTICAL FUND (the “Funds”) DO WITH YOUR PERSONAL INFORMATION? |
| | | | |
Why? | Financial companies choose how they share your personal information. Federal law gives consumers the right to limit some but not all sharing. Federal law also requires us to tell you how we collect, share, and protect your personal information. Please read this notice carefully to understand what we do. |
| | | | |
What? | The types of personal information we collect and share depend on the product or service you have with us. This information can include: ■ Social Security number ■ Assets ■ Retirement Assets ■ Transaction History ■ Checking Account Information ■ Purchase History ■ Account Balances ■ Account Transactions ■ Wire Transfer Instructions When you are no longer our customer, we continue to share your information as described in this notice. |
| | | | |
How? | All financial companies need to share your personal information to run their everyday business. In the section below, we list the reasons financial companies can share their customers’ personal information; the reasons the Funds choose to share; and whether you can limit this sharing. |
| | | | |
Reasons we can share your personal information | Do the Funds share? | Can you limit this sharing? |
For our everyday business purposes –
Such as to process your transactions, maintain your account(s), respond to court orders and legal investigations, or report to credit bureaus | Yes | No |
For our marketing purposes –
to offer our products and services to you | No | We don’t share |
For joint marketing with other financial companies | No | We don’t share |
For our affiliates’ everyday business purposes –
information about your transactions and experiences | No | We don’t share |
For our affiliates’ everyday business purposes –
information about your creditworthiness | No | We don’t share |
For nonaffiliates to market to you | No | We don’t share |
| | |
Questions? | Call 1-855-784-2399 |
27
Page 2 | |
Who we are |
Who is providing this notice? | Q3 All-Weather Sector Rotation Fund Q3 All-Weather Tactical Fund Ultimus Fund Distributors, LLC (Distributor) Ultimus Fund Solutions, LLC (Administrator) |
What we do |
How do the Funds protect my personal information? | To protect your personal information from unauthorized access and use, we use security measures that comply with federal law. These measures include computer safeguards and secured files and buildings. Our service providers are held accountable for adhering to strict policies and procedures to prevent any misuse of your nonpublic personal information. |
How do the Funds collect my personal information? | We collect your personal information, for example, when you ■ Open an account ■ Provide account information ■ Give us your contact information ■ Make deposits or withdrawals from your account ■ Make a wire transfer ■ Tell us where to send the money ■ Tell us who receives the money ■ Show your government-issued ID ■ Show your driver’s license We also collect your personal information from other companies. |
Why can’t I limit all sharing? | Federal law gives you the right to limit only ■ Sharing for affiliates’ everyday business purposes – information about your creditworthiness ■ Affiliates from using your information to market to you ■ Sharing for nonaffiliates to market to you State laws and individual companies may give you additional rights to limit sharing. |
| | |
Definitions |
Affiliates | Companies related by common ownership or control. They can be financial and nonfinancial companies. ■ Q3 Asset Management Corporation, the investment adviser to the Funds, could be deemed to be an affiliate. |
Nonaffiliates | Companies not related by common ownership or control. They can be financial and nonfinancial companies ■ The Funds do not share with nonaffiliates so they can market to you. |
Joint marketing | A formal agreement between nonaffiliated financial companies that together market financial products or services to you. ■ The Funds do not jointly market. |
28
This page intentionally left blank.

RYAN LABS CORE BOND FUND
(RLCBX)
RYAN LABS LONG CREDIT FUND
(RLLCX)
Semi-Annual Report
May 31, 2020
(Unaudited)
Beginning on January 1, 2021, as permitted by regulations adopted by the U.S. Securities and Exchange Commission, paper copies of the Funds’ shareholder reports like this one will no longer be sent by mail, unless you specifically request paper copies of the reports from the Funds or from your financial intermediary, such as a broker-dealer or bank. Instead, the reports will be made available on a website, and you will be notified by mail each time a report is posted and provided with a website link to access the report.
If you already elected to receive shareholder reports electronically, you will not be affected by this change and you need not take any action. You may elect to receive shareholder reports and other communications from the Funds electronically by contacting the Funds at 1-866-561-3087 or, if you own these shares through a financial intermediary, by contacting your financial intermediary.
You may elect to receive all future reports in paper free of charge. You can inform the Funds that you wish to continue receiving paper copies of your shareholder reports by contacting the Funds at 1-866-561-3087. If you own shares through a financial intermediary, you may contact your financial intermediary or follow instructions included with this document to elect to continue to receive paper copies of your shareholder reports. Your election to receive reports in paper will apply to all Funds held with the Fund complex or at your financial intermediary.
RYAN LABS FUNDS
LETTER TO SHAREHOLDERS
(Unaudited) | May 31, 2020 |
Dear Shareholders,
Following is the Semi-Annual Report to shareholders of Ryan Labs Core Bond Fund and Ryan Labs Long Credit Fund (collectively, the “Funds”) for the six months ending May 31, 2020. On behalf of the investment manager, SLC Management, we would like to thank you for your continued investment.
MARKET RECAP
In the quarter ending May 31, 2020, fixed income markets along with all other asset classes saw one of the worst sell-offs on record. As the spread of COVID-19 across countries and the subsequent slowdown in global travel and supply chain disruptions started to flow, it led to severe dislocations across asset classes with equity and bond prices falling in tandem. The heart of the pandemic hit the markets in the last two weeks of March as an oil price war broke out in the middle of the virus-led shutdowns. The S&P 500 Index bounced wildly between limit down and limit up and the VIX Index reached its second highest reading on record. Liquidity seized up and bid/ask spreads widened as funds became forced sellers in order to meet margin calls and/or client redemptions and the market was flooded with new issuance. While no sector was safe, hospitality, travel, energy and retail names were hit especially hard. Credit curves became inverted with certain issuers’ front-end paper trading wide to their own longer maturities. Credit spreads as shown by the Bloomberg Barclays U.S. Agg Corporate Index, which ended February 2020 at +122 bps, traded as wide as +373 bps on March 23, 2020. Securitized credit also suffered as investors worried that the near-total shutdown of the U.S. economy would lead to surging delinquencies among consumer and corporate borrowers.
The Federal Reserve immediately stepped in and made an emergency cut to Fed funds interest rates by slashing them to 0-0.25%. In addition to its daily open market operations in the treasury and repo markets, the Fed announced new facilities aimed at commercial paper, money market funds, foreign exchange, certain investment grade & high yield corporate bonds and ETF’s, ABS, CMBS, CLO’s, and municipal bonds. The calming effect of all this stimulus spending was enough to bring the credit markets and the stock market back to normal operations through May. Re-opening in some parts of the country towards the end of May along with Fed’s intervention led to a strong month of spread tightening. Credit spreads ended May at +174bps, almost +200bps off its March wides. Securitized credit has lagged this market rally as a result of job losses, forbearance requests and delinquencies which have continued to see an uptick as a result of closure of nonessential businesses through most of the quarter. Year to date investment grade corporate issuance crossed $1 trillion (~90% of 2019’s total issuance) as the companies rushed to the new issue market to shore up liquidity.
1
RYAN LABS CORE BOND FUND (RLCBX)
INVESTMENT PHILOSOPHY
The overall investment objective of Ryan Labs Core Bond Fund (the “Fund”) is to seek total return consisting of current income and capital appreciation. The benchmark for this strategy is the Bloomberg Barclays U.S. Aggregate Bond Index (the “Benchmark”). The Core Bond Fund seeks this investment objective while providing protection against interest rate risk. We attempt to accomplish this investment objective by investing at least 80% of Core Bond Fund assets in U.S. dollar-denominated, investment-grade debt securities. There have been no changes to this philosophy. The inception date of the Long Credit Fund is December 29, 2014.
PERFORMANCE SUMMARY
For the trailing six-month period ending May 31, 2020, the Fund returned -0.55% compared to the Benchmark return of +1.65%, underperforming the Benchmark by 220 bps. For the six months ended May 31, 2020, the fund returned +3.30% compared to the benchmark return of +5.40%, underperforming by 210 bps. Underperformance for the past six months was primarily driven by the dislocation in the securitized markets. Allocation and security selection within Industrials and Utilities were positive contributors to the performance. The top outperformers CVS Health Corp, Kroger and Marathon Petroleum. Top underperformers included ABS and CMBS issuers.
RYAN LABS LONG CREDIT FUND
INVESTMENT PHILOSOPHY
The investment objective of Ryan Labs Long Credit Fund (the “Long Credit Fund”) is to seek total return consisting of current income and capital appreciation. The benchmark for this strategy is the Bloomberg Barclays U.S. Long Credit Index (the “Long Credit Benchmark”). We attempt to accomplish this investment objective by investing at least 80% of Long Credit Fund assets in U.S. dollar-denominated investment-grade debt securities. There have been no changes to this philosophy. The inception date of the Long Credit Fund is November 13, 2015.
PERFORMANCE SUMMARY
For the trailing six-month period ending May 31, 2020, the Fund returned +0.15% compared to the Benchmark return of -2.67%, outperforming the Benchmark by 282 bps. For the six months ended May 31, 2020, the fund returned +6.19% compared to the benchmark return of +3.39%, outperforming by 280 bps. Outperformance for the past six months was primarily driven by a higher Treasury weighting in the heart of the sell-off and issue selection within the sectors. Towards the end of the quarter, the treasury weight was down to 2% and we added corporate credit through new issues that were issued at the wides. Within corporate credit, the portfolio was underweight Industrials, overweight Utilities and Financials. Top performers included industrial credits like CVS Health Corp, Codelco, Apple. Underperformers included travel and energy related Air Lease, Boeing and Apache.
2
OUTLOOK
The Fed support, through its corporate ETF and secondary market bond purchases, has been bullish for credit spreads. With economies opening up and better than expected non-farm pay roll report for May, there seems to be light at the end of the tunnel. Companies have continued to tap the new issue market to shore up balance sheet liquidity as the fear of the second wave of the COVID-19 is still elevated. We believe this trend will continue as the demand for US corporate credit remains strong. As second quarter earnings start to flow in, we look forward to management guidance in terms of industry outlook and their approach to manage elevated balance sheet leverage.
Richard Familetti
President
Chief Investment Officer, U.S. Total Return Fixed Income
SLC Management
Past performance is not predictive of future performance. Investment results and principal value will fluctuate so that shares, when redeemed, may be worth more or less than their original cost. Current performance may be higher or lower than the performance data quoted. Performance data current to the most recent month end are available by calling 1-866-561-3087.
An investor should consider the investment objectives, risks, charges and expenses of the Funds carefully before investing. The Funds’ prospectus contains this and other important information. To obtain a copy of the Funds’ prospectus, please visit our website at www.ryanlabsfunds.com or call 1-866-561-3087 and a copy will be sent to you free of charge. Please read the prospectus carefully before you invest. Ryan Labs Core Bond Fund and Ryan Labs Long Credit Fund are distributed by Ultimus Fund Distributors, LLC.
The Letter to Shareholders seeks to describe some of the Adviser’s current opinions and views of the financial markets. Although the Adviser believes it has a reasonable basis for any opinions or views expressed, actual results may differ, sometimes significantly so, from those expected or expressed. The securities held by the Funds that are discussed in the Letter to Shareholders were held during the period covered by this Report. They do not comprise the entire investment portfolios of the Funds, may be sold at any time and may no longer be held by the Funds. The opinions of the Funds’ Adviser with respect to those securities may change at any time. For a complete list of securities held by the Funds as of May 31, 2020, please see the Schedules of Investments sections of the Semi-Annual Report.
Statements in the Letter to Shareholders that reflect projections or expectations for future financial or economic performance of the Funds and the market in general and statements of the Funds’ plans and objectives for future operations are forward-looking statements. No assurance can be given that actual results or events will not differ materially from those projected, estimated, assumed, or anticipated in any such forward-looking statements. Important factors that could result in such differences, in addition to factors noted with such forward-looking statements include, without limitation, general economic conditions, such as inflation, recession, and interest rates. Past performance is not a guarantee of future results.
3
RYAN LABS CORE BOND FUND
PORTFOLIO INFORMATION
May 31, 2020 (Unaudited)
Asset Allocation (% of Net Assets)
Security Allocation | % of
Net Assets |
Mortgage-Backed Securities | 41.6% |
Corporate Bonds | 32.9% |
Asset-Backed Securities | 14.3% |
U.S. Treasury Obligations | 9.5% |
International Bonds | 0.2% |
Cash Equivalents and Liabilities in Excess of Other Assets | 1.5% |
Total | 100.0% |
Top 10 Bond Holdings
Security Description | % of
Net Assets |
U.S. Treasury Bonds, 2.375%, due 11/15/2049 | 2.8% |
U.S. Treasury Bonds, 3.125%, due 05/15/2048 | 2.2% |
Federal Home Loan Mortgage Corporation, Pool #G08737, 3.000%, due 12/01/2046 | 2.1% |
Federal Home Loan Mortgage Corporation, Pool #FR SD8055, 2.500%, due 04/01/2050 | 1.7% |
U.S. Treasury Bonds, 2.000%, due 02/15/2050 | 1.4% |
Federal National Mortgage Association, Pool #AB5379, 3.500%, due 06/01/2042 | 1.4% |
U.S. Treasury Bonds, 3.000%, due 02/15/2049 | 1.3% |
Government National Mortgage Association, Pool #MA3937, 3.500%, due 09/20/2046 | 1.3% |
Towd Point Mortgage Trust, Series 2015-1, Class A5, 144A, 3.901%, due 10/25/2053 | 1.2% |
Towd Point Mortgage Trust, Series 2017-1, Class M2, 144A, 3.750%, due 10/25/2056 | 1.1% |
4
RYAN LABS LONG CREDIT FUND
PORTFOLIO INFORMATION
May 31, 2020 (Unaudited)
Asset Allocation (% of Net Assets)
Security Allocation | % of
Net Assets |
Corporate Bonds | 91.1% |
Municipal Bonds | 4.7% |
International Bonds | 2.6% |
U.S. Treasury Obligations | 0.3% |
Cash Equivalents and Other Assets in Excess of Liabilities | 1.3% |
Total | 100.0% |
Top 10 Bond Holdings
Security Description | % of
Net Assets |
AT&T, Inc., 4.650%, due 06/01/2044 | 2.6% |
Anheuser-Busch InBev Worldwide, Inc., 5.450%, due 01/23/2039 | 1.9% |
Verizon Communications, Inc., 4.862%, due 08/21/2046 | 1.7% |
California, Build America Bonds, General Obligation, 7.300%, due 10/01/2039 | 1.6% |
Comcast Corporation, 4.600%, due 10/15/2038 | 1.5% |
United Mexican States, 4.750%, due 03/08/2044 | 1.4% |
Markel Corporation, 5.000%, due 05/20/2049 | 1.4% |
Alabama Power Company, 4.300%, due 01/02/2046 | 1.3% |
Sempra Energy, 3.800%, due 02/01/2038 | 1.3% |
Wisconsin Electric Power Company, 4.300%, due 10/15/2048 | 1.3% |
5
RYAN LABS CORE BOND FUND
SCHEDULE OF INVESTMENTS
May 31, 2020 (Unaudited) |
U.S. TREASURY
OBLIGATIONS — 9.5% | | Coupon | | | Maturity | | | Par Value | | | Value | |
U.S. Treasury Notes — 0.0% (a) | | | | | | | | | | | | | | | | |
U.S. Treasury Notes | | | 0.625% | | | | 03/31/27 | | | $ | 15,000 | | | $ | 15,142 | |
| | | | | | | | | | | | | | | | | |
U.S. Treasury Bonds — 9.5% | | | | | | | | | | | | | | | | |
U.S. Treasury Bonds | | | 4.375% | | | | 02/15/38 | | | | 55,000 | | | | 85,574 | |
U.S. Treasury Bonds | | | 3.000% | | | | 02/15/47 | | | | 60,000 | | | | 81,762 | |
U.S. Treasury Bonds | | | 2.750% | | | | 08/15/47 | | | | 265,000 | | | | 346,260 | |
U.S. Treasury Bonds | | | 3.000% | | | | 02/15/48 | | | | 245,000 | | | | 335,516 | |
U.S. Treasury Bonds | | | 3.125% | | | | 05/15/48 | | | | 1,110,000 | | | | 1,555,864 | |
U.S. Treasury Bonds | | | 3.375% | | | | 11/15/48 | | | | 265,000 | | | | 389,447 | |
U.S. Treasury Bonds | | | 3.000% | | | | 02/15/49 | | | | 674,000 | | | | 930,225 | |
U.S. Treasury Bonds | | | 2.375% | | | | 11/15/49 | | | | 1,550,000 | | | | 1,915,824 | |
U.S. Treasury Bonds | | | 2.000% | | | | 02/15/50 | | | | 865,000 | | | | 991,371 | |
| | | | | | | | | | | | | | | | 6,631,843 | |
Total U.S. Treasury Obligations (Cost $5,709,676) | | | | | | | | | | | | | | $ | 6,646,985 | |
|
MORTGAGE-BACKED
SECURITIES — 41.6% | | Coupon | | | Maturity | | | Par Value | | | Value | |
Commercial — 22.2% | | | | | | | | | | | | | | | | |
Banc of America Merrill Lynch Mortgage Trust, Series 2014-FRR5, Class A-K37 (b) | | | 2.552% | | | | 01/27/47 | | | $ | 400,000 | | | $ | 329,245 | |
BankFinancial Corporation, Series 2020-BNK25, Class A-S (b) | | | 2.841% | | | | 01/18/63 | | | | 315,000 | | | | 323,479 | |
BBCMS Trust, Series 2017-C1, Class A-4 (b) | | | 3.674% | | | | 02/17/50 | | | | 125,000 | | | | 138,186 | |
Benchmark Mortgage Trust, Series 2019-B14, Class A-5 (b) | | | 3.049% | | | | 12/15/62 | | | | 275,000 | | | | 299,187 | |
Citigroup Commercial Mortgage Trust, Series 2014-GC21, Class D, 144A (b) | | | 5.110% | | | | 05/10/47 | | | | 720,000 | | | | 564,977 | |
Credit Suisse Mortgage Trust, Series 2013-IVR3, Class A1, 144A | | | 2.500% | | | | 05/25/43 | | | | 287,906 | | | | 292,769 | |
Finance of America Structured Securities Trust, Series 2019-JR2, Class A1, 144A | | | 2.000% | | | | 06/25/69 | | | | 427,028 | | | | 445,442 | |
FREMF Mortgage Trust, Series 2013-K35, Class C, 144A (b) | | | 4.073% | | | | 08/25/23 | | | | 389,000 | | | | 404,354 | |
6
RYAN LABS CORE BOND FUND
SCHEDULE OF INVESTMENTS (Continued) |
MORTGAGE-BACKED
SECURITIES — 41.6% (Continued) | | | Coupon | | | Maturity | | | Par Value | | | Value | |
| Commercial — 22.2% (Continued) | | | | | | | | | | | | | | | | |
FREMF Mortgage Trust, Series 2012-K22, Class B, 144A (b) | | | 3.812% | | | | 08/25/45 | | | $ | 170,000 | | | $ | 174,050 | |
FREMF Mortgage Trust, Series 2012-K22, Class C, 144A (b) | | | 3.812% | | | | 08/25/45 | | | | 240,000 | | | | 236,349 | |
FREMF Mortgage Trust, Series 2012-K23, Class B, 144A (b) | | | 3.782% | | | | 10/25/45 | | | | 465,000 | | | | 481,606 | |
FREMF Mortgage Trust, Series 2013-K24, Class B, 144A (b) | | | 3.622% | | | | 11/25/45 | | | | 250,000 | | | | 255,846 | |
FREMF Mortgage Trust, Series 2013-K28, Class C, 144A (b) | | | 3.609% | | | | 06/25/46 | | | | 240,000 | | | | 234,468 | |
FREMF Mortgage Trust, Series 2013-K31, Class C, 144A (b) | | | 3.744% | | | | 07/25/46 | | | | 323,000 | | | | 320,295 | |
FREMF Mortgage Trust, Series 2014-K40, Class B, 144A (b) | | | 4.209% | | | | 11/25/47 | | | | 275,000 | | | | 291,684 | |
FREMF Mortgage Trust, Series 2015-K44, Class B, 144A (b) | | | 3.807% | | | | 01/25/48 | | | | 65,000 | | | | 67,414 | |
FREMF Mortgage Trust, Series 2015-K44, Class C, 144A (b) | | | 3.807% | | | | 01/25/48 | | | | 620,000 | | | | 605,638 | |
FREMF Mortgage Trust, Series 2017-K726, Class B, 144A (b) | | | 4.109% | | | | 07/25/49 | | | | 235,000 | | | | 239,437 | |
FREMF Mortgage Trust, Series 2017-K729, Class C, 144A (b) | | | 3.800% | | | | 11/25/49 | | | | 215,000 | | | | 207,423 | |
FREMF Mortgage Trust, Series 20-K105, Class B, 144A (b) | | | 3.530% | | | | 03/25/53 | | | | 215,000 | | | | 204,750 | |
FREMF Mortgage Trust, Series 20-K105, Class C, 144A (b) | | | 3.530% | | | | 03/25/53 | | | | 290,000 | | | | 249,303 | |
| GM Financial Consumer Automobile Receivables Trust, Series 2019-4, Class A3 | | | 1.750% | | | | 07/16/24 | | | | 385,000 | | | | 392,042 | |
GoldenTree Loan Management US CLO1 Ltd., Series 2019-4A, Class C, 144A (3MO LIBOR + 270) (b) | | | 4.501% | | | | 04/24/31 | | | | 360,000 | | | | 355,935 | |
| Goldman Sachs Mortgage Securities Trust, Series 2011-GC3, Class E, 144A | | | 5.000% | | | | 03/10/44 | | | | 725,000 | | | | 676,291 | |
Goldman Sachs Mortgage Securities Trust, Series 2020-GC47, Class C (b) | | | 3.571% | | | | 05/12/53 | | | | 100,000 | | | | 92,950 | |
JPMBB Commercial Mortgage Securities Trust, Series 2015-C28, Class D, 144A (b) | | | 3.836% | | | | 10/15/48 | | | | 350,000 | | | | 244,719 | |
JPMCC Commercial Mortgage Securities Trust, Series 2016-NINE, Class A, 144A (b) | | | 2.949% | | | | 10/06/38 | | | | 70,000 | | | | 71,885 | |
7
RYAN LABS CORE BOND FUND
SCHEDULE OF INVESTMENTS (Continued) |
MORTGAGE-BACKED
SECURITIES — 41.6% (Continued) | | Coupon | | | Maturity | | | Par Value | | | Value | |
Commercial — 22.2% (Continued) | | | | | | | | | | | | | | | | |
JPMorgan Mortgage Trust, Series 2017-3, Class 1A3, 144A | | | 3.500% | | | | 08/25/47 | | | $ | 308,139 | | | $ | 316,970 | |
JPMorgan Mortgage Trust, Series 2018-3, Class A5, 144A | | | 3.500% | | | | 04/25/48 | | | | 115,546 | | | | 116,446 | |
JPMorgan Mortgage Trust, Series 2018-1, Class A3, 144A | | | 3.500% | | | | 06/25/48 | | | | 126,594 | | | | 129,925 | |
JPMorgan Mortgage Trust, Series 2018-1, Class A5, 144A | | | 3.500% | | | | 06/25/48 | | | | 122,650 | | | | 124,808 | |
JPMorgan Mortgage Trust, Series 2018-4, Class A15, 144A | | | 3.500% | | | | 10/25/48 | | | | 167,921 | | | | 169,109 | |
Kabbage Funding, LLC, Series 2019-1, Class B, 144A (b)(c) | | | 4.071% | | | | 03/15/24 | | | | 480,000 | | | | 81,600 | |
Madison Park Funding Ltd., Series 2019-37A, Class C, 144A (3MO LIBOR + 240) (b) | | | 3.619% | | | | 07/15/32 | | | | 620,000 | | | | 602,435 | |
Neuberger Berman CLO Ltd., Series 2019-32A, Class C, 144A (3MO LIBOR + 265) (b) | | | 3.785% | | | | 01/19/32 | | | | 460,000 | | | | 453,961 | |
Niagara Park CLO Ltd., Series 2019-1A, Class C, 144A (3MO LIBOR + 240) (b) | | | 3.535% | | | | 07/17/32 | | | | 420,000 | | | | 408,347 | |
SFAVE Commercial Mortgage Securities Trust, Series 2015-5AVE, Class A1, 144A | | | 3.872% | | | | 01/05/43 | | | | 689,000 | | | | 725,882 | |
Sutherland Commercial Mortgage Trust, Series 2018-SBC7, Class A, 144A | | | 4.720% | | | | 05/25/39 | | | | 249,887 | | | | 250,182 | |
Towd Point Mortgage Trust, Series 2015-1, Class A5, 144A (b) | | | 3.901% | | | | 10/25/53 | | | | 835,000 | | | | 849,536 | |
Towd Point Mortgage Trust, Series 2016-5, Class M2, 144A | | | 3.375% | | | | 10/25/56 | | | | 620,000 | | | | 602,549 | |
Towd Point Mortgage Trust, Series 2017-1, Class M2, 144A | | | 3.750% | | | | 10/25/56 | | | | 740,000 | | | | 758,482 | |
Towd Point Mortgage Trust, Series 2015-2, Class 1M2, 144A (b) | | | 3.748% | | | | 11/25/60 | | | | 445,000 | | | | 457,923 | |
Tralee CDO Ltd., Series 2013-1A, Class AR, 144A (3MO LIBOR + 132) (b) | | | 3.139% | | | | 07/20/29 | | | | 635,267 | | | | 624,899 | |
UBS-Citigroup Commercial Mortgage Trust, Series 2011-C1, Class E, 144A (b) | | | 6.252% | | | | 01/10/45 | | | | 255,000 | | | | 203,816 | |
Wind River CLO Ltd., Series 2014-1A, Class 1A, 144A (3MO LIBOR +105) (b) | | | 2.869% | | | | 07/18/31 | | | | 428,238 | | | | 413,614 | |
| | | | | | | | | | | | | | | | 15,490,208 | |
8
RYAN LABS CORE BOND FUND
SCHEDULE OF INVESTMENTS (Continued) |
MORTGAGE-BACKED
SECURITIES — 41.6% (Continued) | | Coupon | | | Maturity | | | Par Value | | | Value | |
Federal Home Loan Mortgage Corporation — 8.7% | | | | | | | | | | | | | | | | |
Federal Home Loan Mortgage Corporation, Pool #J19087 | | | 3.000% | | | | 05/01/27 | | | $ | 165,988 | | | $ | 175,348 | |
Federal Home Loan Mortgage Corporation, Pool #G18481 | | | 3.000% | | | | 09/01/28 | | | | 121,320 | | | | 128,162 | |
Federal Home Loan Mortgage Corporation, Pool #G18622 | | | 2.500% | | | | 12/01/31 | | | | 246,929 | | | | 258,953 | |
Federal Home Loan Mortgage Corporation, Pool #A93093 | | | 4.500% | | | | 07/01/40 | | | | 60,748 | | | | 68,159 | |
Federal Home Loan Mortgage Corporation, Pool #A94472 | | | 4.000% | | | | 10/01/40 | | | | 105,104 | | | | 115,478 | |
Federal Home Loan Mortgage Corporation, Series 4667, Class LA | | | 3.500% | | | | 01/15/43 | | | | 512,820 | | | | 524,257 | |
Federal Home Loan Mortgage Corporation, Series 2018-HRP1, Class M-2, 144A (b) | | | 2.597% | | | | 04/25/43 | | | | 97,078 | | | | 92,916 | |
Federal Home Loan Mortgage Corporation, Pool #Q19470 | | | 3.000% | | | | 06/01/43 | | | | 140,245 | | | | 150,182 | |
Federal Home Loan Mortgage Corporation, Pool #Q20576 | | | 3.000% | | | | 08/01/43 | | | | 265,108 | | | | 283,563 | |
Federal Home Loan Mortgage Corporation, Pool #G08572 | | | 3.500% | | | | 02/01/44 | | | | 83,424 | | | | 90,163 | |
Federal Home Loan Mortgage Corporation, Series 4791, Class L | | | 4.000% | | | | 05/15/44 | | | | 129,512 | | | | 132,257 | |
Federal Home Loan Mortgage Corporation, Pool #G08659 | | | 3.500% | | | | 08/01/45 | | | | 636,061 | | | | 682,716 | |
Federal Home Loan Mortgage Corporation, Pool #G08677 | | | 4.000% | | | | 11/01/45 | | | | 316,445 | | | | 343,533 | |
Federal Home Loan Mortgage Corporation, Pool #G08737 | | | 3.000% | | | | 12/01/46 | | | | 1,353,099 | | | | 1,428,223 | |
Federal Home Loan Mortgage Corporation, Pool #G08772 | | | 4.500% | | | | 06/01/47 | | | | 355,818 | | | | 384,646 | |
Federal Home Loan Mortgage Corporation, Pool #FR SD8055 | | | 2.500% | | | | 04/01/50 | | | | 1,136,502 | | | | 1,178,908 | |
| | | | | | | | | | | | | | | | 6,037,464 | |
Federal National Mortgage Association — 7.4% | | | | | | | | | | | | | | | | |
Federal National Mortgage Association, Pool #AJ7494 | | | 3.000% | | | | 12/01/26 | | | | 117,157 | | | | 124,300 | |
Federal National Mortgage Association, Pool #AB5490 | | | 3.000% | | | | 07/01/27 | | | | 38,860 | | | | 41,115 | |
Federal National Mortgage Association, Pool #AE0443 | | | 6.500% | | | | 10/01/39 | | | | 11,611 | | | | 13,838 | |
9
RYAN LABS CORE BOND FUND
SCHEDULE OF INVESTMENTS (Continued) |
MORTGAGE-BACKED
SECURITIES — 41.6% (Continued) | | Coupon | | | Maturity | | | Par Value | | | Value | |
Federal National Mortgage Association — 7.4% (Continued) | | | | | | | | | | | | | | | | |
Federal National Mortgage Association, Pool #AB5379 | | | 3.500% | | | | 06/01/42 | | | $ | 883,760 | | | $ | 959,250 | |
Federal National Mortgage Association, Pool #AB6670 | | | 3.000% | | | | 10/01/42 | | | | 125,476 | | | | 136,326 | |
Federal National Mortgage Association, Pool #AB9345 | | | 3.000% | | | | 05/01/43 | | | | 231,595 | | | | 247,862 | |
Federal National Mortgage Association, Pool #AB9350 | | | 3.000% | | | | 05/01/43 | | | | 99,304 | | | | 106,308 | |
Federal National Mortgage Association, Pool #AB9558 | | | 3.000% | | | | 06/01/43 | | | | 248,626 | | | | 266,074 | |
Federal National Mortgage Association, Pool #AT5860 | | | 3.500% | | | | 06/01/43 | | | | 476,514 | | | | 517,299 | |
Federal National Mortgage Association, Pool #AL4010 | | | 3.500% | | | | 07/01/43 | | | | 108,473 | | | | 119,517 | |
Federal National Mortgage Association, Pool #AL5625 | | | 3.500% | | | | 03/01/44 | | | | 65,896 | | | | 72,144 | |
Federal National Mortgage Association, Pool #AL5538 | | | 4.000% | | | | 07/01/44 | | | | 41,238 | | | | 45,767 | |
Federal National Mortgage Association, Pool #AS5165 | | | 3.000% | | | | 06/01/45 | | | | 142,629 | | | | 154,897 | |
Federal National Mortgage Association, Pool #AS7838 | | | 3.000% | | | | 08/01/46 | | | | 355,894 | | | | 380,880 | |
Federal National Mortgage Association, Pool #MA3088 | | | 4.000% | | | | 08/01/47 | | | | 298,378 | | | | 319,932 | |
Federal National Mortgage Association, Pool #MA3143 | | | 3.000% | | | | 09/01/47 | | | | 57,213 | | | | 60,343 | |
Federal National Mortgage Association, Pool #890813 | | | 3.500% | | | | 12/01/47 | | | | 393,335 | | | | 427,603 | |
Federal National Mortgage Association, Pool #MA3238 | | | 3.500% | | | | 01/01/48 | | | | 394,717 | | | | 417,708 | |
Federal National Mortgage Association, Pool #MA3240 | | | 4.500% | | | | 01/01/48 | | | | 695,190 | | | | 749,821 | |
| | | | | | | | | | | | | | | | 5,160,984 | |
Government National Mortgage Association — 3.3% | | | | | | | | | | | | | | | | |
Government National Mortgage Association, Pool #5175 | | | 4.500% | | | | 09/20/41 | | | | 52,942 | | | | 58,547 | |
Government National Mortgage Association, Pool #MA3521 | | | 3.500% | | | | 03/20/46 | | | | 385,169 | | | | 414,449 | |
Government National Mortgage Association, Pool #MA3937 | | | 3.500% | | | | 09/20/46 | | | | 837,352 | | | | 901,429 | |
10
RYAN LABS CORE BOND FUND
SCHEDULE OF INVESTMENTS (Continued) |
MORTGAGE-BACKED
SECURITIES — 41.6% (Continued) | | Coupon | | | Maturity | | | Par Value | | | Value | |
Government National Mortgage Association — 3.3% (Continued) | | | | | | | | | | | | | | | | |
Government National Mortgage Association, Pool #MA5076 | | | 3.000% | | | | 03/20/48 | | | $ | 362,620 | | | $ | 384,833 | |
Government National Mortgage Association, Series 2015-41, Class C (b) | | | 3.133% | | | | 01/16/57 | | | | 490,000 | | | | 527,829 | |
| | | | | | | | | | | | | | | | 2,287,087 | |
Total Mortgage-Backed Securities (Cost $29,026,354) | | | | | | | | | | | | | | $ | 28,975,743 | |
|
ASSET-BACKED
SECURITIES — 14.3% | | Coupon | | | Maturity | | | Par Value | | | Value | |
AmeriCredit Automobile Receivables Trust, Series 2017-3, Class D | | | 3.180% | | | | 07/18/23 | | | $ | 410,000 | | | $ | 414,764 | |
AmeriCredit Automobile Receivables Trust, Series 2018-1, Class D | | | 3.820% | | | | 03/18/24 | | | | 240,000 | | | | 246,397 | |
AmeriCredit Automobile Receivables Trust, Series 2018-3, Class D | | | 4.040% | | | | 11/18/24 | | | | 470,000 | | | | 483,750 | |
Carvana Auto Receivables Trust, Series 2019-2A, Class D, 144A (b) | | | 3.280% | | | | 01/15/25 | | | | 560,000 | | | | 545,970 | |
CIM Trust, Series 2018-R3, Class A2, 144A | | | 4.000% | | | | 09/25/57 | | | | 480,000 | | | | 459,003 | |
CommonBond Student Loan Trust, Series 2018-AGS, Class B, 144A | | | 3.580% | | | | 02/25/44 | | | | 209,800 | | | | 211,684 | |
CommonBond Student Loan Trust, Series 2018-BGS, Class B, 144A | | | 3.990% | | | | 09/25/45 | | | | 504,677 | | | | 504,408 | |
Domino’s Pizza Master Issuer, LLC, Series 2017-1A, Class A2II, 144A | | | 3.082% | | | | 07/25/47 | | | | 312,000 | | | | 312,584 | |
Drive Auto Receivables Trust, Series 2018-4, Class D | | | 4.090% | | | | 01/15/26 | | | | 700,000 | | | | 714,484 | |
Drive Auto Receivables Trust, Series 2018-5, Class D | | | 4.300% | | | | 04/15/26 | | | | 290,000 | | | | 293,765 | |
Drive Auto Receivables Trust, Series 2019-1, Class D | | | 4.090% | | | | 06/15/26 | | | | 410,000 | | | | 412,957 | |
Drive Auto Receivables Trust, Series 2019-2, Class D | | | 3.690% | | | | 08/17/26 | | | | 410,000 | | | | 410,505 | |
11
RYAN LABS CORE BOND FUND
SCHEDULE OF INVESTMENTS (Continued) |
ASSET-BACKED
SECURITIES — 14.3% (Continued) | | Coupon | | | Maturity | | | Par Value | | | Value | |
Drive Auto Receivables Trust, Series 2019-3, Class D | | | 3.180% | | | | 10/15/26 | | | $ | 310,000 | | | $ | 300,929 | |
Drive Auto Receivables Trust, Series 2020-1, Class D | | | 2.700% | | | | 05/17/27 | | | | 470,000 | | | | 440,512 | |
Exeter Automobile Receivables Trust, Series 2019-2A, Class D, 144A | | | 3.710% | | | | 03/17/25 | | | | 400,000 | | | | 389,454 | |
Harley Marine Financing, LLC, Series 2018-1A, Class A2, 144A (b) | | | 5.682% | | | | 05/15/43 | | | | 616,752 | | | | 559,987 | |
Hudson Yards, Series 2019-30HY, Class A, 144A | | | 3.228% | | | | 06/10/37 | | | | 310,000 | | | | 334,419 | |
Santander Drive Auto Receivables Trust, Series 2018-1, Class D | | | 3.320% | | | | 03/15/24 | | | | 280,000 | | | | 285,717 | |
Santander Drive Auto Receivables Trust, Series 2018-4, Class D | | | 3.980% | | | | 12/15/25 | | | | 360,000 | | | | 367,505 | |
Santander Drive Auto Receivables Trust, Series 2020-1, Class C | | | 4.110% | | | | 12/15/25 | | | | 280,000 | | | | 283,794 | |
Sierra Receivables Funding Company, LLC, Series 2016-3A, Class B, 144A | | | 2.630% | | | | 10/20/33 | | | | 81,112 | | | | 79,408 | |
SoFi Consumer Loan Program Trust, Series 2017-3, Class B, 144A (b) | | | 3.850% | | | | 05/25/26 | | | | 200,000 | | | | 187,958 | |
SoFi Consumer Loan Program Trust, Series 2017-5, Class B, 144A | | | 3.690% | | | | 09/25/26 | | | | 534,000 | | | | 500,634 | |
SoFi Consumer Loan Program Trust, Series 2018-4, Class D, 144A | | | 4.760% | | | | 11/26/27 | | | | 510,000 | | | | 470,456 | |
Toyota Auto Receivables Ownership Trust, Series 2019-D, Class Class A-3 | | | 1.920% | | | | 01/16/24 | | | | 385,000 | | | | 393,228 | |
Westlake Automobile Receivables Trust, Series 2020-1A, Class C, 144A | | | 2.520% | | | | 04/15/25 | | | | 380,000 | | | | 375,797 | |
Total Asset-Backed Securities (Cost $10,119,168) | | | | | | | | | | | | | | $ | 9,980,069 | |
|
CORPORATE BONDS — 32.9% | | Coupon | | | Maturity | | | Par Value | | | Value | |
Communication Services — 2.2% | | | | | | | | | | | | | | | | |
América Móvil S.A.B. de C.V. | | | 4.375% | | | | 04/22/49 | | | $ | 220,000 | | | $ | 260,040 | |
AT&T, Inc. | | | 4.350% | | | | 06/15/45 | | | | 185,000 | | | | 206,117 | |
Comcast Corporation | | | 1.950% | | | | 01/15/31 | | | | 50,000 | | | | 49,954 | |
Comcast Corporation | | | 3.450% | | | | 02/01/50 | | | | 130,000 | | | | 144,953 | |
Comcast Corporation | | | 2.800% | | | | 01/15/51 | | | | 25,000 | | | | 24,657 | |
Discovery Communications, LLC | | | 5.300% | | | | 05/15/49 | | | | 195,000 | | | | 221,480 | |
Sprint Spectrum Company, LP, 144A, Series 2016-1 | | | 3.360% | | | | 03/20/23 | | | | 367,500 | | | | 369,106 | |
12
RYAN LABS CORE BOND FUND
SCHEDULE OF INVESTMENTS (Continued) |
CORPORATE BONDS — 32.9%
(Continued) | | Coupon | | | Maturity | | | Par Value | | | Value | |
Communication Services — 2.2% (Continued) | | | | | | | | | | | | | | | | |
T-Mobile, Inc., 144A | | | 3.509% | | | | 04/15/25 | | | $ | 35,000 | | | $ | 37,429 | |
T-Mobile, Inc., 144A | | | 3.875% | | | | 04/15/30 | | | | 185,000 | | | | 200,212 | |
Verizon Communications, Inc. | | | 3.150% | | | | 03/22/30 | | | | 35,000 | | | | 38,819 | |
| | | | | | | | | | | | | | | | 1,552,767 | |
Consumer Discretionary — 0.3% | | | | | | | | | | | | | | | | |
Alibaba Group Holding Ltd. | | | 3.600% | | | | 11/28/24 | | | | 190,000 | | | | 206,454 | |
McDonald’s Corporation | | | 3.600% | | | | 07/01/30 | | | | 15,000 | | | | 16,984 | |
| | | | | | | | | | | | | | | | 223,438 | |
Consumer Staples — 1.5% | | | | | | | | | | | | | | | | |
Altria Group, Inc. | | | 5.800% | | | | 02/14/39 | | | | 230,000 | | | | 280,287 | |
Anheuser-Busch InBev Worldwide, Inc. | | | 5.450% | | | | 01/23/39 | | | | 145,000 | | | | 178,443 | |
B.A.T. Capital Corporation | | | 3.215% | | | | 09/06/26 | | | | 125,000 | | | | 130,127 | |
B.A.T. Capital Corporation | | | 4.700% | | | | 04/02/27 | | | | 45,000 | | | | 50,352 | |
B.A.T. Capital Corporation | | | 4.906% | | | | 04/02/30 | | | | 25,000 | | | | 28,593 | |
Kroger Company (The) | | | 4.450% | | | | 02/01/47 | | | | 340,000 | | | | 409,777 | |
| | | | | | | | | | | | | | | | 1,077,579 | |
Energy — 5.4% | | | | | | | | | | | | | | | | |
Boardwalk Pipelines, L.P. | | | 4.450% | | | | 07/15/27 | | | | 335,000 | | | | 320,612 | |
Chevron Corporation | | | 1.995% | | | | 05/11/27 | | | | 45,000 | | | | 46,917 | |
Chevron Corporation | | | 3.078% | | | | 05/11/50 | | | | 20,000 | | | | 21,652 | |
Enable Midstream Partners, L.P. | | | 4.400% | | | | 03/15/27 | | | | 505,000 | | | | 433,319 | |
Exxon Mobil Corporation | | | 2.610% | | | | 10/15/30 | | | | 120,000 | | | | 127,243 | |
Kinder Morgan Energy Partners, L.P. | | | 4.300% | | | | 05/01/24 | | | | 325,000 | | | | 353,724 | |
Marathon Petroleum Corporation, Series WI | | | 4.750% | | | | 12/15/23 | | | | 520,000 | | | | 561,287 | |
Marathon Petroleum Corporation | | | 4.700% | | | | 05/01/25 | | | | 30,000 | | | | 33,187 | |
Midwest Connector Capital Company, LLC, 144A | | | 3.900% | | | | 04/01/24 | | | | 480,000 | | | | 493,307 | |
Motiva Enterprises, LLC, 144A | | | 6.850% | | | | 01/15/40 | | | | 215,000 | | | | 202,893 | |
MPLX, L.P. | | | 5.500% | | | | 02/15/49 | | | | 220,000 | | | | 250,758 | |
TC Pipelines, L.P. | | | 4.375% | | | | 03/13/25 | | | | 290,000 | | | | 306,520 | |
Valero Energy Corporation | | | 2.700% | | | | 04/15/23 | | | | 60,000 | | | | 62,088 | |
Williams Companies, Inc. (The) | | | 3.350% | | | | 08/15/22 | | | | 505,000 | | | | 521,477 | |
| | | | | | | | | | | | | | | | 3,734,984 | |
Financials — 11.5% | | | | | | | | | | | | | | | | |
American International Group, Inc. | | | 2.500% | | | | 06/30/25 | | | | 40,000 | | | | 41,357 | |
Associated Bank, N.A. | | | 3.500% | | | | 08/13/21 | | | | 365,000 | | | | 372,388 | |
Aviation Capital Group, LLC, 144A | | | 4.125% | | | | 08/01/25 | | | | 470,000 | | | | 347,898 | |
Avolon Holdings Funding Ltd., 144A | | | 4.375% | | | | 05/01/26 | | | | 240,000 | | | | 195,490 | |
13
RYAN LABS CORE BOND FUND
SCHEDULE OF INVESTMENTS (Continued) |
CORPORATE BONDS — 32.9%
(Continued) | | Coupon | | | Maturity | | | Par Value | | | Value | |
Financials — 11.5% (Continued) | | | | | | | | | | | | | | | | |
Banco Santander S.A. | | | 3.848% | | | | 04/12/23 | | | $ | 345,000 | | | $ | 362,764 | |
Bank of America Corporation | | | 3.004% | | | | 12/20/23 | | | | 330,000 | | | | 344,515 | |
Bank of America Corporation | | | 3.705% | | | | 04/24/28 | | | | 240,000 | | | | 265,200 | |
BGC Partners, Inc. | | | 5.375% | | | | 07/24/23 | | | | 650,000 | | | | 654,051 | |
Boral Finance Properties Ltd., 144A | | | 3.000% | | | | 11/01/22 | | | | 380,000 | | | | 378,552 | |
Brighthouse Financial, Inc. | | | 4.700% | | | | 06/22/47 | | | | 355,000 | | | | 310,514 | |
Brookfield Finance, Inc. | | | 4.850% | | | | 03/29/29 | | | | 230,000 | | | | 257,396 | |
Cantor Fitzgerald, L.P., 144A | | | 4.875% | | | | 05/01/24 | | | | 200,000 | | | | 203,686 | |
Citigroup, Inc. | | | 2.666% | | | | 01/29/31 | | | | 220,000 | | | | 222,827 | |
Discover Bank | | | 2.700% | | | | 02/06/30 | | | | 40,000 | | | | 37,715 | |
General Motors Financial Company, Inc. | | | 3.250% | | | | 01/05/23 | | | | 140,000 | | | | 139,234 | |
Goldman Sachs Group, Inc. (The) | | | 3.850% | | | | 01/26/27 | | | | 189,000 | | | | 207,919 | |
Goldman Sachs Group, Inc. (The) | | | 4.017% | | | | 10/31/38 | | | | 315,000 | | | | 348,608 | |
Hyundai Capital America, 144A | | | 3.000% | | | | 06/20/22 | | | | 465,000 | | | | 467,660 | |
JPMorgan Chase & Company | | | 3.625% | | | | 12/01/27 | | | | 490,000 | | | | 535,214 | |
Mitsubishi UFJ Financial Group, Inc. | | | 3.535% | | | | 07/26/21 | | | | 470,000 | | | | 485,475 | |
Morgan Stanley | | | 3.950% | | | | 04/23/27 | | | | 205,000 | | | | 228,879 | |
Prudential Financial, Inc. | | | 1.500% | | | | 03/10/26 | | | | 15,000 | | | | 15,104 | |
SMBC Aviation Capital Finance Designated Activity, 144A | | | 2.650% | | | | 07/15/21 | | | | 325,000 | | | | 321,479 | |
Sumitomo Mitsui Financial Group, Inc. | | | 2.442% | | | | 10/19/21 | | | | 435,000 | | | | 445,916 | |
Sumitomo Mitsui Financial Group, Inc. | | | 2.784% | | | | 07/12/22 | | | | 290,000 | | | | 299,459 | |
Wells Fargo & Company | | | 2.164% | | | | 02/11/26 | | | | 145,000 | | | | 146,850 | |
Wells Fargo & Company | | | 2.188% | | | | 04/30/26 | | | | 90,000 | | | | 91,299 | |
Wells Fargo & Company | | | 3.068% | | | | 04/30/41 | | | | 95,000 | | | | 96,327 | |
Wells Fargo & Company | | | 5.013% | | | | 04/04/51 | | | | 115,000 | | | | 150,291 | |
| | | | | | | | | | | | | | | | 7,974,067 | |
Health Care — 2.2% | | | | | | | | | | | | | | | | |
AbbVie, Inc., 144A | | | 2.600% | | | | 11/21/24 | | | | 130,000 | | | | 136,840 | |
AbbVie, Inc. | | | 4.400% | | | | 11/06/42 | | | | 215,000 | | | | 247,609 | |
Amgen, Inc. | | | 2.450% | | | | 02/21/30 | | | | 45,000 | | | | 46,855 | |
Amgen, Inc. | | | 2.300% | | | | 02/25/31 | | | | 60,000 | | | | 61,934 | |
Amgen, Inc. | | | 3.375% | | | | 02/21/50 | | | | 170,000 | | | | 182,627 | |
Anthem, Inc. | | | 2.375% | | | | 01/15/25 | | | | 45,000 | | | | 47,311 | |
Bayer U.S. Finance II, LLC, 144A | | | 5.500% | | | | 08/15/25 | | | | 260,000 | | | | 305,639 | |
CVS Health Corporation | | | 5.050% | | | | 03/25/48 | | | | 350,000 | | | | 448,907 | |
UnitedHealth Group, Inc. | | | 3.500% | | | | 08/15/39 | | | | 45,000 | | | | 51,927 | |
| | | | | | | | | | | | | | | | 1,529,649 | |
Industrials — 0.5% | | | | | | | | | | | | | | | | |
Boeing Company (The) | | | 3.850% | | | | 11/01/48 | | | | 290,000 | | | | 249,089 | |
14
RYAN LABS CORE BOND FUND
SCHEDULE OF INVESTMENTS (Continued) |
CORPORATE BONDS — 32.9%
(Continued) | | Coupon | | | Maturity | | | Par Value | | | Value | |
Industrials — 0.5% (Continued) | | | | | | | | | | | | | | | | |
General Dynamics Corporation | | | 3.050% | | | | 04/15/30 | | | $ | 35,000 | | | $ | 39,078 | |
General Electric Company | | | 4.250% | | | | 05/01/40 | | | | 40,000 | | | | 38,904 | |
| | | | | | | | | | | | | | | | 327,071 | |
Information Technology — 4.4% | | | | | | | | | | | | | | | | |
Arrow Electronics, Inc. | | | 3.250% | | | | 09/08/24 | | | | 310,000 | | | | 325,054 | |
Arrow Electronics, Inc. | | | 3.875% | | | | 01/12/28 | | | | 440,000 | | | | 449,557 | |
Broadcom Corporation/Broadcom Cayman Finance Ltd. | | | 3.875% | | | | 01/15/27 | | | | 280,000 | | | | 294,877 | |
Broadcom, Inc., 144A | | | 3.150% | | | | 11/15/25 | | | | 45,000 | | | | 46,716 | |
Broadcom, Inc., 144A | | | 4.110% | | | | 09/15/28 | | | | 84,000 | | | | 87,955 | |
Broadcom, Inc., 144A | | | 4.150% | | | | 11/15/30 | | | | 45,000 | | | | 47,121 | |
Dell, Inc., 144A | | | 8.350% | | | | 07/15/46 | | | | 270,000 | | | | 342,089 | |
Intel Corporation | | | 4.750% | | | | 03/25/50 | | | | 40,000 | | | | 54,413 | |
International Business Machines Corporation | | | 1.700% | | | | 05/15/27 | | | | 50,000 | | | | 50,755 | |
International Business Machines Corporation | | | 2.950% | | | | 05/15/50 | | | | 25,000 | | | | 25,272 | |
KLA Corporation | | | 3.300% | | | | 03/01/50 | | | | 35,000 | | | | 35,248 | |
Lam Research Corporation | | | 1.900% | | | | 06/15/30 | | | | 25,000 | | | | 25,151 | |
Motorola Solutions, Inc. | | | 3.750% | | | | 05/15/22 | | | | 332,000 | | | | 346,867 | |
NVIDIA Corporation | | | 2.850% | | | | 04/01/30 | | | | 35,000 | | | | 38,359 | |
NVIDIA Corporation | | | 3.500% | | | | 04/01/50 | | | | 35,000 | | | | 39,884 | |
NXP BV/NXP Funding, LLC, 144A | | | 4.875% | | | | 03/01/24 | | | | 280,000 | | | | 309,566 | |
NXP BV/NXP Funding, LLC/NXP USA, Inc., 144A | | | 3.875% | | | | 06/18/26 | | | | 35,000 | | | | 37,727 | |
Oracle Corporation | | | 3.600% | | | | 04/01/40 | | | | 65,000 | | | | 71,963 | |
PayPal Holdings, Inc. | | | 2.650% | | | | 10/01/26 | | | | 105,000 | | | | 113,693 | |
Seagate HDD Cayman | | | 4.875% | | | | 03/01/24 | | | | 270,000 | | | | 286,988 | |
VMware, Inc. | | | 4.650% | | | | 05/15/27 | | | | 35,000 | | | | 37,821 | |
| | | | | | | | | | | | | | | | 3,067,076 | |
Materials — 0.9% | | | | | | | | | | | | | | | | |
DowDuPont, Inc. | | | 4.493% | | | | 11/15/25 | | | | 205,000 | | | | 232,521 | |
Glencore Funding, LLC, 144A | | | 4.875% | | | | 03/12/29 | | | | 345,000 | | | | 375,609 | |
| | | | | | | | | | | | | | | | 608,130 | |
Real Estate — 1.5% | | | | | | | | | | | | | | | | |
Alexandria Real Estate Equities, Inc. | | | 3.450% | | | | 04/30/25 | | | | 450,000 | | | | 495,450 | |
Crown Castle International Corporation | | | 3.200% | | | | 09/01/24 | | | | 400,000 | | | | 428,481 | |
Simon Property Group, L.P. | | | 3.250% | | | | 09/13/49 | | | | 100,000 | | | | 81,085 | |
Spirit Realty, L.P. | | | 3.400% | | | | 01/15/30 | | | | 35,000 | | | | 30,083 | |
| | | | | | | | | | | | | | | | 1,035,099 | |
15
RYAN LABS CORE BOND FUND
SCHEDULE OF INVESTMENTS (Continued) |
CORPORATE BONDS — 32.9%
(Continued) | | Coupon | | | Maturity | | | Par Value | | | Value | |
Utilities — 2.5% | | | | | | | | | | | | | | | | |
Cameron LNG, LLC, 144A | | | 3.701% | | | | 01/15/39 | | | $ | 210,000 | | | $ | 216,551 | |
Commonwealth Edison Company | | | 4.000% | | | | 03/01/48 | | | | 80,000 | | | | 95,863 | |
Électricité de France S.A., 144A | | | 5.000% | | | | 09/21/48 | | | | 250,000 | | | | 311,950 | |
Georgia Power Company | | | 2.200% | | | | 09/15/24 | | | | 105,000 | | | | 109,677 | |
PacifiCorp | | | 4.150% | | | | 02/15/50 | | | | 165,000 | | | | 204,513 | |
PECO Energy Company | | | 3.000% | | | | 09/15/49 | | | | 150,000 | | | | 159,935 | |
Sempra Energy | | | 4.050% | | | | 12/01/23 | | | | 265,000 | | | | 287,841 | |
Southern California Edison Company | | | 4.000% | | | | 04/01/47 | | | | 310,000 | | | | 342,334 | |
| | | | | | | | | | | | | | | | 1,728,664 | |
Total Corporate Bonds (Cost $22,061,505) | | | | | | | | | | | | | | $ | 22,858,524 | |
|
INTERNATIONAL BONDS — 0.2% | | Coupon | | | Maturity | | | Par Value | | | Value | |
United Mexican States (Cost $101,814) | | | 4.000% | | | | 10/02/23 | | | $ | 100,000 | | | $ | 105,950 | |
16
RYAN LABS CORE BOND FUND
SCHEDULE OF INVESTMENTS (Continued) |
MONEY MARKET FUNDS — 2.2% | | Shares | | | Value | |
Invesco Short-Term Investments Trust - Treasury Portfolio - Institutional Class, 0.08% (d) (Cost $1,523,907) | | | 1,523,907 | | | $ | 1,523,907 | |
| | | | | | | | | |
Investments at Value — 100.7% (Cost $68,542,424) | | | | | | $ | 70,091,178 | |
| | | | | | | | | |
Liabilities in Excess of Other Assets — (0.7%) | | | | | | | (499,964 | ) |
| | | | | | | | | |
Net Assets — 100.0% | | | | | | $ | 69,591,214 | |
144A - | This security was purchased in a transaction exempt from registration in compliance with Rule 144A of the Securities Act of 1933. This security may be resold in transactions exempt from registration, normally to qualified institutional buyers. The total value of such securities is $24,375,272 as of May 31, 2020, representing 35.0% of net assets (Note 6). |
LIBOR - | London interbank offered rate. |
(a) | Percentage rounds to less than 0.1%. |
(b) | Variable rate security. Interest rate resets periodically. The rate shown is the effective interest rate as of May 31, 2020. For securities based on a published reference rate and spread, the reference rate and spread (in basis points) are indicated parenthetically. Certain variable rate securities are not based on a published reference rate and spread but are determined by the issuer or agent and are based on current market conditions. These securities, therefore, do not indicate a reference rate and spread. |
(c) | Security value has been determined in good faith pursuant to procedures adopted by the Board of Trustees. The total value of such securities is $81,600 as of May 31, 2020, representing 0.1% of net assets (Note 2). |
(d) | The rate shown is the 7-day effective yield as of May 31, 2020. |
See accompanying notes to financial statements. |
17
RYAN LABS LONG CREDIT FUND
SCHEDULE OF INVESTMENTS
May 31, 2020 (Unaudited) |
U.S. TREASURY
OBLIGATIONS — 0.3% | | Coupon | | | Maturity | | | Par Value | | | Value | |
U.S. Treasury Bonds — 0.3% | | | | | | | | | | | | | | | | |
U.S. Treasury Bonds (Cost $253,936) | | | 2.000% | | | | 02/15/50 | | | $ | 225,000 | | | $ | 257,871 | |
|
MUNICIPAL BONDS — 4.7% | | Coupon | | | Maturity | | | Par Value | | | Value | |
Bay Area, California, Toll Authority Toll Bridge, Revenue | | | 6.263% | | | | 04/01/49 | | | $ | 200,000 | | | $ | 348,228 | |
Bay Area, California, Toll Authority Toll Bridge, Revenue | | | 6.907% | | | | 10/01/50 | | | | 140,000 | | | | 238,319 | |
California, Build America Bonds, General Obligation | | | 7.300% | | | | 10/01/39 | | | | 910,000 | | | | 1,480,670 | |
Dallas Independent School District, General Obligation | | | 6.450% | | | | 02/15/35 | | | | 90,000 | | | | 92,698 | |
Massachusetts State Taxable Consolidated Loan, General Obligation | | | 2.900% | | | | 09/01/49 | | | | 705,000 | | | | 745,432 | |
New York City Future Tax Secured, Revenue | | | 5.572% | | | | 11/01/38 | | | | 150,000 | | | | 203,380 | |
Port Authority New York & New Jersey Consolidated Bonds, Revenue | | | 4.458% | | | | 10/01/62 | | | | 320,000 | | | | 403,885 | |
San Diego Co., California, Build America Bonds, Revenue | | | 5.911% | | | | 04/01/48 | | | | 90,000 | | | | 142,091 | |
Texas State, General Obligation | | | 5.517% | | | | 04/01/39 | | | | 120,000 | | | | 175,306 | |
University of California, Revenue | | | 6.548% | | | | 05/15/48 | | | | 290,000 | | | | 443,517 | |
Total Municipal Bonds (Cost $4,030,037) | | | | | | | | | | | | | | $ | 4,273,526 | |
|
CORPORATE BONDS — 91.1% | | Coupon | | | Maturity | | | Par Value | | | Value | |
Communication Services — 14.5% | | | | | | | | | | | | | | | | |
AT&T, Inc. | | | 4.650% | | | | 06/01/44 | | | $ | 2,115,000 | | | $ | 2,350,792 | |
CBS Corporation | | | 4.850% | | | | 07/01/42 | | | | 535,000 | | | | 529,714 | |
Charter Communications Operating, LLC | | | 5.125% | | | | 07/01/49 | | | | 395,000 | | | | 459,209 | |
Charter Communications Operating, LLC | | | 4.800% | | | | 03/01/50 | | | | 430,000 | | | | 478,872 | |
Comcast Corporation | | | 4.600% | | | | 10/15/38 | | | | 1,120,000 | | | | 1,392,956 | |
Discovery Communications, LLC | | | 4.950% | | | | 05/15/42 | | | | 695,000 | | | | 744,463 | |
Rogers Communications, Inc. | | | 3.700% | | | | 11/15/49 | | | | 500,000 | | | | 555,866 | |
Telefónica Emisiones S.A.U. | | | 7.045% | | | | 06/20/36 | | | | 655,000 | | | | 940,522 | |
Tencent Holding Ltd., 144A | | | 3.925% | | | | 01/19/38 | | | | 960,000 | | | | 1,088,975 | |
Time Warner, Inc. | | | 6.750% | | | | 06/15/39 | | | | 210,000 | | | | 275,741 | |
18
RYAN LABS LONG CREDIT FUND
SCHEDULE OF INVESTMENTS (Continued) |
CORPORATE BONDS — 91.1%
(Continued) | | Coupon | | | Maturity | | | Par Value | | | Value | |
Communication Services — 14.5% (Continued) | | | | | | | | | | | | | | | | |
T-Mobile, Inc., 144A | | | 4.375% | | | | 04/15/40 | | | $ | 385,000 | | | $ | 425,203 | |
Verizon Communications, Inc. | | | 4.862% | | | | 08/21/46 | | | | 1,160,000 | | | | 1,556,410 | |
Vodafone Group plc | | | 5.000% | | | | 05/30/38 | | | | 755,000 | | | | 927,367 | |
Vodafone Group plc | | | 4.875% | | | | 06/19/49 | | | | 180,000 | | | | 223,764 | |
Walt Disney Company (The) | | | 6.200% | | | | 12/15/34 | | | | 720,000 | | | | 1,032,463 | |
Walt Disney Company (The) | | | 4.625% | | | | 03/23/40 | | | | 115,000 | | | | 143,290 | |
| | | | | | | | | | | | | | | | 13,125,607 | |
Consumer Discretionary — 3.9% | | | | | | | | | | | | | | | | |
General Motors Company, Inc. | | | 6.750% | | | | 04/01/46 | | | | 675,000 | | | | 735,231 | |
Hasbro, Inc. | | | 3.900% | | | | 11/19/29 | | | | 280,000 | | | | 280,658 | |
Hasbro, Inc. | | | 6.350% | | | | 03/15/40 | | | | 317,000 | | | | 361,894 | |
Home Depot, Inc. (The) | | | 3.125% | | | | 12/15/49 | | | | 585,000 | | | | 632,714 | |
Imperial Brands Finance plc, 144A | | | 3.875% | | | | 07/26/29 | | | | 460,000 | | | | 473,522 | |
Lowe’s Companies, Inc. | | | 5.000% | | | | 04/15/40 | | | | 740,000 | | | | 945,992 | |
Whirlpool Corporation | | | 4.600% | | | | 05/15/50 | | | | 95,000 | | | | 102,755 | |
| | | | | | | | | | | | | | | | 3,532,766 | |
Consumer Staples — 5.8% | | | | | | | | | | | | | | | | |
Altria Group, Inc. | | | 5.950% | | | | 02/14/49 | | | | 756,000 | | | | 978,992 | |
Anheuser-Busch InBev Worldwide, Inc. | | | 5.450% | | | | 01/23/39 | | | | 1,400,000 | | | | 1,722,902 | |
B.A.T. Capital Corporation | | | 4.540% | | | | 08/15/47 | | | | 420,000 | | | | 446,757 | |
B.A.T. Capital Corporation | | | 5.282% | | | | 04/02/50 | | | | 115,000 | | | | 134,798 | |
Coca-Cola Company (The) | | | 4.125% | | | | 03/25/40 | | | | 190,000 | | | | 238,237 | |
J.M. Smucker Company (The) | | | 3.550% | | | | 03/15/50 | | | | 350,000 | | | | 352,554 | |
Kroger Company (The) | | | 4.450% | | | | 02/01/47 | | | | 320,000 | | | | 385,672 | |
Walgreens Boots Alliance | | | 4.100% | | | | 04/15/50 | | | | 95,000 | | | | 92,312 | |
Walmart, Inc. | | | 3.625% | | | | 12/15/47 | | | | 720,000 | | | | 871,358 | |
| | | | | | | | | | | | | | | | 5,223,582 | |
Energy — 9.9% | | | | | | | | | | | | | | | | |
Apache Corporation | | | 5.350% | | | | 07/01/49 | | | | 295,000 | | | | 226,658 | |
Baker Hughes, a GE Company, LLC | | | 4.080% | | | | 12/15/47 | | | | 520,000 | | | | 522,794 | |
Boardwalk Pipelines, L.P. | | | 4.800% | | | | 05/03/29 | | | | 190,000 | | | | 184,783 | |
Enable Midstream Partners, L.P. | | | 4.400% | | | | 03/15/27 | | | | 350,000 | | | | 300,320 | |
Energy Transfer Partners, L.P. | | | 7.500% | | | | 07/01/38 | | | | 235,000 | | | | 276,484 | |
Energy Transfer Partners, L.P. | | | 6.500% | | | | 02/01/42 | | | | 830,000 | | | | 938,031 | |
Energy Transfer Partners, L.P. | | | 5.950% | | | | 10/01/43 | | | | 55,000 | | | | 56,331 | |
Enterprise Products Operating, LLC | | | 4.200% | | | | 01/31/50 | | | | 165,000 | | | | 177,983 | |
Enterprise Products Operating, LLC | | | 5.375% | | | | 02/15/78 | | | | 675,000 | | | | 605,077 | |
Exxon Mobil Corporation | | | 4.227% | | | | 03/19/40 | | | | 375,000 | | | | 456,418 | |
Kinder Morgan Energy Partners, L.P. | | | 6.500% | | | | 09/01/39 | | | | 883,000 | | | | 1,120,891 | |
19
RYAN LABS LONG CREDIT FUND
SCHEDULE OF INVESTMENTS (Continued) |
CORPORATE BONDS — 91.1%
(Continued) | | Coupon | | | Maturity | | | Par Value | | | Value | |
Energy — 9.9% (Continued) | | | | | | | | | | | | | | | | |
Magellan Midstream Partners, L.P. | | | 4.850% | | | | 02/01/49 | | | $ | 990,000 | | | $ | 1,111,966 | |
Marathon Petroleum Corporation | | | 5.850% | | | | 12/15/45 | | | | 560,000 | | | | 582,144 | |
National Oilwell Varco, Inc. | | | 3.600% | | | | 12/01/29 | | | | 640,000 | | | | 598,362 | |
ONEOK, Inc. | | | 7.150% | | | | 01/15/51 | | | | 475,000 | | | | 561,650 | |
Patterson-UTI Energy, Inc. | | | 3.950% | | | | 02/01/28 | | | | 235,000 | | | | 187,216 | |
Sabine Pass Liquefaction, LLC, 144A | | | 4.500% | | | | 05/15/30 | | | | 145,000 | | | | 159,023 | |
Shell International Finance B.V. | | | 3.750% | | | | 09/12/46 | | | | 610,000 | | | | 693,062 | |
Shell International Finance B.V. | | | 3.125% | | | | 11/07/49 | | | | 185,000 | | | | 191,491 | |
| | | | | | | | | | | | | | | | 8,950,684 | |
Financials — 13.0% | | | | | | | | | | | | | | | | |
American International Group, Inc. | | | 4.500% | | | | 07/16/44 | | | | 185,000 | | | | 206,931 | |
Banco Santander S.A. | | | 3.490% | | | | 05/28/30 | | | | 500,000 | | | | 510,693 | |
Berkshire Hathaway Finance Corporation | | | 4.300% | | | | 05/15/43 | | | | 540,000 | | | | 680,945 | |
Brookfield Finance, LLC | | | 3.450% | | | | 04/15/50 | | | | 1,300,000 | | | | 1,088,665 | |
Citigroup, Inc. | | | 2.976% | | | | 11/05/30 | | | | 920,000 | | | | 955,171 | |
GATX Corporation | | | 4.700% | | | | 04/01/29 | | | | 390,000 | | | | 425,298 | |
GE Capital International Funding Company | | | 4.418% | | | | 11/15/35 | | | | 1,000,000 | | | | 999,174 | |
Goldman Sachs Group, Inc. | | | 4.411% | | | | 04/23/39 | | | | 585,000 | | | | 673,945 | |
JPMorgan Chase & Company | | | 3.882% | | | | 07/24/38 | | | | 700,000 | | | | 801,006 | |
Manulife Financial Corporation | | | 4.061% | | | | 02/24/32 | | | | 1,005,000 | | | | 1,049,657 | |
Markel Corporation | | | 5.000% | | | | 05/20/49 | | | | 1,075,000 | | | | 1,242,603 | |
Morgan Stanley | | | 5.597% | | | | 03/24/51 | | | | 400,000 | | | | 575,470 | |
New York Life Insurance Company, 144A | | | 3.750% | | | | 05/15/50 | | | | 180,000 | | | | 202,540 | |
Prudential Financial, Inc. | | | 3.700% | | | | 03/13/51 | | | | 505,000 | | | | 533,433 | |
Synchrony Financial | | | 5.150% | | | | 03/19/29 | | | | 445,000 | | | | 455,542 | |
Unum Group | | | 5.750% | | | | 08/15/42 | | | | 95,000 | | | | 93,353 | |
Unum Group | | | 4.500% | | | | 12/15/49 | | | | 670,000 | | | | 577,165 | |
Wells Fargo & Company | | | 5.013% | | | | 04/04/51 | | | | 565,000 | | | | 738,385 | |
| | | | | | | | | | | | | | | | 11,809,976 | |
Health Care — 4.1% | | | | | | | | | | | | | | | | |
AbbVie, Inc. | | | 4.400% | | | | 11/06/42 | | | | 770,000 | | | | 886,786 | |
Amgen, Inc. | | | 3.150% | | | | 02/21/40 | | | | 335,000 | | | | 353,163 | |
Bayer U.S. Finance II, LLC, 144A | | | 4.875% | | | | 06/25/48 | | | | 500,000 | | | | 631,018 | |
Biogen, Inc. | | | 3.150% | | | | 05/01/50 | | | | 185,000 | | | | 180,611 | |
Cigna Corporation | | | 3.200% | | | | 03/15/40 | | | | 190,000 | | | | 199,394 | |
CVS Health Corporation | | | 5.050% | | | | 03/25/48 | | | | 415,000 | | | | 532,275 | |
HCA, Inc. | | | 5.125% | | | | 06/15/39 | | | | 275,000 | | | | 320,674 | |
20
RYAN LABS LONG CREDIT FUND
SCHEDULE OF INVESTMENTS (Continued) |
CORPORATE BONDS — 91.1%
(Continued) | | Coupon | | | Maturity | | | Par Value | | | Value | |
Health Care — 4.1% (Continued) | | | | | | | | | | | | | | | | |
Stanford Health Care | | | 3.310% | | | | 08/15/30 | | | $ | 455,000 | | | $ | 509,099 | |
Stryker Corporation | | | 2.900% | | | | 06/15/50 | | | | 145,000 | | | | 145,888 | |
| | | | | | | | | | | | | | | | 3,758,908 | |
Industrials — 9.1% | | | | | | | | | | | | | | | | |
Air Lease Corporation | | | 3.250% | | | | 10/01/29 | | | | 610,000 | | | | 510,920 | |
Boeing Company (The) | | | 3.750% | | | | 02/01/50 | | | | 655,000 | | | | 570,891 | |
Burlington Northern Santa Fe, LLC | | | 5.150% | | | | 09/01/43 | | | | 680,000 | | | | 909,622 | |
CSX Corporation | | | 4.500% | | | | 03/15/49 | | | | 80,000 | | | | 102,311 | |
Deere & Company | | | 2.875% | | | | 09/07/49 | | | | 405,000 | | | | 421,313 | |
FedEx Corporation | | | 4.950% | | | | 10/17/48 | | | | 1,000,000 | | | | 1,101,198 | |
General Dynamics Corporation | | | 4.250% | | | | 04/01/40 | | | | 280,000 | | | | 348,129 | |
General Electric Company | | | 3.625% | | | | 05/01/30 | | | | 95,000 | | | | 93,926 | |
General Electric Company | | | 4.350% | | | | 05/01/50 | | | | 190,000 | | | | 185,556 | |
Kansas City Southern | | | 2.875% | | | | 11/15/29 | | | | 175,000 | | | | 182,310 | |
Kansas City Southern | | | 3.500% | | | | 05/01/50 | | | | 475,000 | | | | 504,975 | |
Lockheed Martin Corporation | | | 3.800% | | | | 03/01/45 | | | | 880,000 | | | | 1,063,033 | |
Norfolk Southern Corporation | | | 3.050% | | | | 05/15/50 | | | | 375,000 | | | | 380,974 | |
Northrop Grumman Corporation | | | 5.150% | | | | 05/01/40 | | | | 575,000 | | | | 774,191 | |
Union Pacific Corporation | | | 3.550% | | | | 08/15/39 | | | | 660,000 | | | | 727,174 | |
United Parcel Service, Inc. | | | 3.750% | | | | 11/15/47 | | | | 300,000 | | | | 343,054 | |
| | | | | | | | | | | | | | | | 8,219,577 | |
Information Technology — 7.1% | | | | | | | | | | | | | | | | |
Apple, Inc. | | | 4.375% | | | | 05/13/45 | | | | 525,000 | | | | 685,995 | |
Broadcom, Inc., 144A | | | 5.000% | | | | 04/15/30 | | | | 635,000 | | | | 704,248 | |
Dell, Inc., 144A | | | 8.350% | | | | 07/15/46 | | | | 580,000 | | | | 734,858 | |
Intel Corporation | | | 4.600% | | | | 03/25/40 | | | | 225,000 | | | | 292,807 | |
Mastercard, Inc. | | | 3.650% | | | | 06/01/49 | | | | 715,000 | | | | 859,761 | |
Microsoft Corporation | | | 3.500% | | | | 11/15/42 | | | | 585,000 | | | | 705,600 | |
NVIDIA Corporation | | | 3.500% | | | | 04/01/40 | | | | 275,000 | | | | 312,607 | |
NXP BV/NXP Funding, LLC, 144A | | | 3.400% | | | | 05/01/30 | | | | 190,000 | | | | 195,877 | |
Oracle Corporation | | | 3.800% | | | | 11/15/37 | | | | 708,000 | | | | 806,509 | |
QUALCOMM, Inc. | | | 3.250% | | | | 05/20/50 | | | | 110,000 | | | | 119,369 | |
Visa, Inc. | | | 2.700% | | | | 04/15/40 | | | | 545,000 | | | | 578,493 | |
VMware, Inc. | | | 4.700% | | | | 05/15/30 | | | | 375,000 | | | | 409,647 | |
| | | | | | | | | | | | | | | | 6,405,771 | |
Materials — 4.0% | | | | | | | | | | | | | | | | |
Codelco, Inc., 144A | | | 4.375% | | | | 02/05/49 | | | | 885,000 | | | | 984,534 | |
Dow Chemical Company (The) | | | 4.800% | | | | 05/15/49 | | | | 435,000 | | | | 508,381 | |
Glencore Funding, LLC, 144A | | | 4.875% | | | | 03/12/29 | | | | 880,000 | | | | 958,074 | |
International Paper Company | | | 4.350% | | | | 08/15/48 | | | | 395,000 | | | | 449,203 | |
21
RYAN LABS LONG CREDIT FUND
SCHEDULE OF INVESTMENTS (Continued) |
CORPORATE BONDS — 91.1%
(Continued) | | Coupon | | | Maturity | | | Par Value | | | Value | |
Materials — 4.0% (Continued) | | | | | | | | | | | | | | | | |
Newcrest Finance Property Ltd., 144A | | | 3.250% | | | | 05/13/30 | | | $ | 100,000 | | | $ | 104,622 | |
Nucor Corporation | | | 4.400% | | | | 05/01/48 | | | | 590,000 | | | | 672,803 | |
| | | | | | | | | | | | | | | | 3,677,617 | |
Real Estate — 1.0% | | | | | | | | | | | | | | | | |
Highwoods Realty, L.P. | | | 3.050% | | | | 02/15/30 | | | | 950,000 | | | | 893,688 | |
| | | | | | | | | | | | | | | | | |
Utilities — 18.7% | | | | | | | | | | | | | | | | |
Alabama Power Company | | | 4.300% | | | | 01/02/46 | | | | 1,010,000 | | | | 1,219,277 | |
Cameron LNG, LLC, 144A | | | 2.902% | | | | 07/15/31 | | | | 625,000 | | | | 647,131 | |
Consolidated Edison Company | | | 4.200% | | | | 03/15/42 | | | | 735,000 | | | | 860,703 | |
Consolidated Edison Company | | | 3.800% | | | | 10/01/42 | | | | 350,000 | | | | 404,004 | |
Consumers Energy Company | | | 4.350% | | | | 04/15/49 | | | | 725,000 | | | | 966,752 | |
Dominion Energy, Inc., Series A | | | 4.600% | | | | 03/15/49 | | | | 630,000 | | | | 771,432 | |
DTE Electric Company | | | 2.950% | | | | 03/01/50 | | | | 600,000 | | | | 623,084 | |
Duke Energy Progress, LLC | | | 4.375% | | | | 03/30/44 | | | | 865,000 | | | | 1,075,917 | |
Duke Energy Progress, LLC | | | 3.600% | | | | 09/15/47 | | | | 40,000 | | | | 45,042 | |
Électricité de France S.A., 144A | | | 4.950% | | | | 10/13/45 | | | | 615,000 | | | | 749,887 | |
ENEL Finance International N.V., 144A | | | 4.750% | | | | 05/25/47 | | | | 330,000 | | | | 402,068 | |
Exelon Corporation | | | 4.700% | | | | 04/15/50 | | | | 230,000 | | | | 290,637 | |
Georgia Power Company | | | 4.300% | | | | 03/15/42 | | | | 580,000 | | | | 671,177 | |
MidAmerican Energy Company | | | 4.800% | | | | 09/15/43 | | | | 688,000 | | | | 895,709 | |
PacifiCorp | | | 6.250% | | | | 10/15/37 | | | | 308,000 | | | | 439,927 | |
Potomac Electric Power | | | 4.150% | | | | 03/15/43 | | | | 830,000 | | | | 987,680 | |
PPL Electric Utilities Corporation | | | 4.750% | | | | 07/15/43 | | | | 890,000 | | | | 1,135,477 | |
Public Service Electric and Gas Company | | | 3.850% | | | | 05/01/49 | | | | 260,000 | | | | 318,503 | |
Sempra Energy | | | 3.800% | | | | 02/01/38 | | | | 1,135,000 | | | | 1,208,613 | |
Southern California Edison Company | | | 4.650% | | | | 10/01/43 | | | | 404,000 | | | | 472,406 | |
Southern California Edison Company, Series B | | | 4.875% | | | | 03/01/49 | | | | 355,000 | | | | 438,723 | |
Southern California Edison Company | | | 3.650% | | | | 02/01/50 | | | | 105,000 | | | | 110,586 | |
Southwestern Public Service Company | | | 4.400% | | | | 11/15/48 | | | | 885,000 | | | | 1,090,753 | |
Wisconsin Electric Power Company | | | 4.300% | | | | 10/15/48 | | | | 965,000 | | | | 1,164,192 | |
| | | | | | | | | | | | | | | | 16,989,680 | |
Total Corporate Bonds (Cost $74,578,658) | | | | | | | | | | | | | | $ | 82,587,856 | |
22
RYAN LABS LONG CREDIT FUND
SCHEDULE OF INVESTMENTS (Continued) |
INTERNATIONAL BONDS — 2.6% | | Coupon | | | Maturity | | | Par Value | | | Value | |
Republic of Columbia | | | 5.200% | | | | 05/15/49 | | | $ | 295,000 | | | $ | 347,138 | |
Republic of Philippines | | | 3.700% | | | | 03/01/41 | | | | 640,000 | | | | 731,095 | |
United Mexican States | | | 4.750% | | | | 03/08/44 | | | | 1,250,000 | | | | 1,305,012 | |
Total International Bonds (Cost $2,304,855) | | | | | | | | | | | | | | $ | 2,383,245 | |
|
MONEY MARKET FUNDS — 0.3% | | Shares | | | Value | |
Invesco Short-Term Investments Trust - Treasury Portfolio - Institutional Class, 0.08% (a) (Cost $299,798) | | | 299,798 | | | $ | 299,798 | |
| | | | | | | | | |
Investments at Value — 99.0% (Cost $81,467,284) | | | | | | $ | 89,802,296 | |
| | | | | | | | | |
Other Assets in Excess of Liabilities — 1.0% | | | | | | | 866,898 | |
| | | | | | | | | |
Net Assets — 100.0% | | | | | | $ | 90,669,194 | |
144A - | This security was purchased in a transaction exempt from registration in compliance with Rule 144A of the Securities Act of 1933. This security may be resold in transactions exempt from registration, normally to qualified institutional buyers. The total value of such securities is $8,461,580 as of May 31, 2020, representing 9.3% of net assets (Note 6). |
(a) | The rate shown is the 7-day effective yield as of May 31, 2020. |
See accompanying notes to financial statements. |
23
RYAN LABS FUNDS
STATEMENTS OF ASSETS AND LIABILITIES
May 31, 2020 (Unaudited) |
| | Ryan Labs Core
Bond Fund | | | Ryan Labs Long
Credit Fund | |
ASSETS | | | | | | | | |
Investments in securities: | | | | | | | | |
At cost | | $ | 68,542,424 | | | $ | 81,467,284 | |
At value (Note 2) | | $ | 70,091,178 | | | $ | 89,802,296 | |
Receivable for securities sold | | | — | | | | 631,692 | |
Dividends and interest receivable | | | 346,509 | | | | 853,008 | |
TOTAL ASSETS | | | 70,437,687 | | | | 91,286,996 | |
| | | | | | | | | |
LIABILITIES | | | | | | | | |
Distributions payable | | | 115,331 | | | | 167,960 | |
Payable for capital shares redeemed | | | — | | | | 4,809 | |
Payable for securities purchased | | | 695,843 | | | | 399,823 | |
Payable to Adviser (Note 4) | | | 11,044 | | | | 19,797 | |
Payable to administrator (Note 4) | | | 10,950 | | | | 14,858 | |
Other accrued expenses | | | 13,305 | | | | 10,555 | |
TOTAL LIABILITIES | | | 846,473 | | | | 617,802 | |
| | | | | | | | | |
NET ASSETS | | $ | 69,591,214 | | | $ | 90,669,194 | |
| | | | | | | | | |
NET ASSETS CONSIST OF: | | | | | | | | |
Paid-in capital | | $ | 65,318,345 | | | $ | 77,065,342 | |
Accumulated earnings | | | 4,272,869 | | | | 13,603,852 | |
NET ASSETS | | $ | 69,591,214 | | | $ | 90,669,194 | |
| | | | | | | | | |
Shares of beneficial interest outstanding (unlimited number of shares authorized, no par value) | | | 6,696,668 | | | | 7,897,710 | |
| | | | | | | | | |
Net asset value, offering price and redemption price (Note 2) | | $ | 10.39 | | | $ | 11.48 | |
See accompanying notes to financial statements. |
24
RYAN LABS FUNDS
STATEMENTS OF OPERATIONS
For the Six Months Ended May 31, 2020 (Unaudited) |
| | Ryan Labs Core
Bond Fund | | | Ryan Labs Long
Credit Fund | |
INVESTMENT INCOME | | | | | | | | |
Interest | | $ | 1,350,136 | | | $ | 2,148,185 | |
Dividend | | | 8,542 | | | | 9,758 | |
TOTAL INVESTMENT INCOME | | | 1,358,678 | | | | 2,157,943 | |
| | | | | | | | | |
EXPENSES | | | | | | | | |
Investment advisory fees (Note 4) | | | 172,171 | | | | 292,306 | |
Administration fees (Note 4) | | | 43,071 | | | | 56,778 | |
Fund accounting fees (Note 4) | | | 19,363 | | | | 20,838 | |
Audit and tax services fees | | | 17,900 | | | | 17,900 | |
Pricing costs | | | 22,203 | | | | 10,825 | |
Legal fees | | | 11,534 | | | | 11,534 | |
Trustees’ fees and expenses (Note 4) | | | 11,252 | | | | 11,252 | |
Registration and filing fees | | | 8,482 | | | | 7,990 | |
Custody and bank service fees | | | 5,848 | | | | 8,482 | |
Compliance service fees (Note 4) | | | 6,000 | | | | 6,902 | |
Transfer agent fees (Note 4) | | | 6,000 | | | | 6,000 | |
Postage and supplies | | | 1,436 | | | | 1,572 | |
Printing of shareholder reports | | | 1,047 | | | | 897 | |
Other expenses | | | 6,991 | | | | 8,381 | |
TOTAL EXPENSES | | | 333,298 | | | | 461,657 | |
Less fee reductions by Adviser (Note 4) | | | (161,127 | ) | | | (169,351 | ) |
NET EXPENSES | | | 172,171 | | | | 292,306 | |
| | | | | | | | | |
NET INVESTMENT INCOME | | | 1,186,507 | | | | 1,865,637 | |
| | | | | | | | | |
REALIZED AND UNREALIZED GAINS (LOSSES) ON INVESTMENTS | | | | | | | | |
Net realized gains from investment transactions | | | 3,138,159 | | | | 5,619,768 | |
Net change in unrealized appreciation (depreciation) on investments | | | (1,695,916 | ) | | | (1,477,403 | ) |
NET REALIZED AND UNREALIZED GAINS ON INVESTMENTS | | | 1,442,243 | | | | 4,142,365 | |
| | | | | | | | | |
NET INCREASE IN NET ASSETS FROM OPERATIONS | | $ | 2,628,750 | | | $ | 6,008,002 | |
See accompanying notes to financial statements. |
25
RYAN LABS CORE BOND FUND
STATEMENTS OF CHANGES IN NET ASSETS |
| | Six Months
Ended
May 31, 2020
(Unaudited) | | | Year Ended
November 30,
2019 | |
FROM OPERATIONS | | | | | | | | |
Net investment income | | $ | 1,186,507 | | | $ | 2,859,712 | |
Net realized gains from investment transactions | | | 3,138,159 | | | | 722,145 | |
Net change in unrealized appreciation (depreciation) on investments | | | (1,695,916 | ) | | | 6,538,148 | |
Net increase in net assets resulting from operations | | | 2,628,750 | | | | 10,120,005 | |
| | | | | | | | | |
DISTRIBUTIONS TO SHAREHOLDERS (Note 2) | | | (1,241,968 | ) | | | (2,917,496 | ) |
| | | | | | | | | |
CAPITAL SHARE TRANSACTIONS | | | | | | | | |
Proceeds from shares sold | | | 500,000 | | | | 1,120,366 | |
Net asset value of shares issued in reinvestment of distributions to shareholders | | | 523,478 | | | | 1,483,306 | |
Payments for shares redeemed | | | (22,884,368 | ) | | | (12,990,230 | ) |
Net decrease from capital share transactions | | | (21,860,890 | ) | | | (10,386,558 | ) |
| | | | | | | | | |
TOTAL DECREASE IN NET ASSETS | | | (20,474,108 | ) | | | (3,184,049 | ) |
| | | | | | | | | |
NET ASSETS | | | | | | | | |
Beginning of period | | | 90,065,322 | | | | 93,249,371 | |
End of period | | $ | 69,591,214 | | | $ | 90,065,322 | |
| | | | | | | | | |
CAPITAL SHARES ACTIVITY | | | | | | | | |
Shares sold | | | 48,263 | | | | 116,519 | |
Shares reinvested | | | 50,862 | | | | 149,298 | |
Shares redeemed | | | (2,227,198 | ) | | | (1,300,295 | ) |
Net decrease in shares outstanding | | | (2,128,073 | ) | | | (1,034,478 | ) |
Shares outstanding at beginning of period | | | 8,824,741 | | | | 9,859,219 | |
Shares outstanding at end of period | | | 6,696,668 | | | | 8,824,741 | |
See accompanying notes to financial statements. |
26
RYAN LABS LONG CREDIT FUND
STATEMENTS OF CHANGES IN NET ASSETS |
| | Six Months
Ended
May 31, 2020
(Unaudited) | | | Year Ended
November 30,
2019 | |
FROM OPERATIONS | | | | | | | | |
Net investment income | | $ | 1,865,637 | | | $ | 4,013,820 | |
Net realized gains from investment transactions | | | 5,619,768 | | | | 5,138,858 | |
Net change in unrealized appreciation (depreciation) on investments | | | (1,477,403 | ) | | | 15,943,899 | |
Net increase in net assets resulting from operations | | | 6,008,002 | | | | 25,096,577 | |
| | | | | | | | | |
DISTRIBUTIONS TO SHAREHOLDERS (Note 2) | | | (5,442,522 | ) | | | (3,992,895 | ) |
| | | | | | | | | |
CAPITAL SHARE TRANSACTIONS | | | | | | | | |
Proceeds from shares sold | | | 750,000 | | | | 7,853,367 | |
Net asset value of shares issued in reinvestment of distributions to shareholders | | | 4,537,792 | | | | 2,143,196 | |
Payments for shares redeemed | | | (33,559,204 | ) | | | (4,397,268 | ) |
Net increase (decrease) from capital share transactions | | | (28,271,412 | ) | | | 5,599,295 | |
| | | | | | | | | |
TOTAL INCREASE (DECREASE) IN NET ASSETS | | | (27,705,932 | ) | | | 26,702,977 | |
| | | | | | | | | |
NET ASSETS | | | | | | | | |
Beginning of period | | | 118,375,126 | | | | 91,672,149 | |
End of period | | $ | 90,669,194 | | | $ | 118,375,126 | |
| | | | | | | | | |
CAPITAL SHARES ACTIVITY | | | | | | | | |
Shares sold | | | 66,313 | | | | 795,451 | |
Shares reinvested | | | 411,783 | | | | 204,008 | |
Shares redeemed | | | (3,031,896 | ) | | | (419,756 | ) |
Net increase (decrease) in shares outstanding | | | (2,553,800 | ) | | | 579,703 | |
Shares outstanding at beginning of period | | | 10,451,510 | | | | 9,871,807 | |
Shares outstanding at end of period | | | 7,897,710 | | | | 10,451,510 | |
See accompanying notes to financial statements. |
27
RYAN LABS CORE BOND FUND
FINANCIAL HIGHLIGHTS |
Per Share Data for a Share Outstanding Throughout Each Period: |
| | Six Months
Ended
May 31,
2020
(Unaudited) | | | Year Ended
Nov. 30,
2019 | | | Year Ended
Nov. 30,
2018 | | | Year Ended
Nov. 30,
2017 | | | Year Ended
Nov. 30,
2016 | | | Period
Ended
Nov. 30,
2015 (a) | |
Net asset value at beginning of period | | $ | 10.21 | | | $ | 9.46 | | | $ | 9.87 | | | $ | 9.89 | | | $ | 9.87 | | | $ | 10.00 | |
| | | | | | | | | | | | | | | | | | | | | | | | | |
Income (loss) from investment operations: | | | | | | | | | | | | | | | | | | | | | | | | |
Net investment income | | | 0.15 | | | | 0.30 | | | | 0.28 | | | | 0.25 | | | | 0.23 | | | | 0.21 | |
Net realized and unrealized gains (losses) on investments | | | 0.18 | | | | 0.76 | | | | (0.40 | ) | | | 0.12 | | | | 0.04 | | | | (0.13 | ) |
Total from investment operations | | | 0.33 | | | | 1.06 | | | | (0.12 | ) | | | 0.37 | | | | 0.27 | | | | 0.08 | |
| | | | | | | | | | | | | | | | | | | | | | | | | |
Less distributions from: | | | | | | | | | | | | | | | | | | | | | | | | |
Net investment income | | | (0.15 | ) | | | (0.31 | ) | | | (0.29 | ) | | | (0.26 | ) | | | (0.24 | ) | | | (0.21 | ) |
Net realized gains from investment transactions | | | — | | | | — | | | | — | | | | (0.13 | ) | | | (0.01 | ) | | | — | |
Total distributions | | | (0.15 | ) | | | (0.31 | ) | | | (0.29 | ) | | | (0.39 | ) | | | (0.25 | ) | | | (0.21 | ) |
| | | | | | | | | | | | | | | | | | | | | | | | | |
Net asset value at end of period | | $ | 10.39 | | | $ | 10.21 | | | $ | 9.46 | | | $ | 9.87 | | | $ | 9.89 | | | $ | 9.87 | |
| | | | | | | | | | | | | | | | | | | | | | | | | |
Total return (b) | | | 3.30 | %(c) | | | 11.32 | % | | | (1.21 | %) | | | 3.84 | % | | | 2.69 | % | | | 0.81 | %(c) |
| | | | | | | | | | | | | | | | | | | | | | | | | |
Net assets at end of period (000’s) | | $ | 69,591 | | | $ | 90,065 | | | $ | 93,249 | | | $ | 101,911 | | | $ | 100,236 | | | $ | 70,257 | |
| | | | | | | | | | | | | | | | | | | | | | | | | |
Ratios/supplementary data: | | | | | | | | | | | | | | | | | | | | | | | | |
Ratio of total expenses to average net assets | | | 0.78 | %(d) | | | 0.76 | % | | | 0.71 | % | | | 0.70 | % | | | 0.75 | % | | | 1.18 | %(d) |
Ratio of net expenses to average net assets (e) | | | 0.40 | %(d) | | | 0.40 | % | | | 0.40 | % | | | 0.40 | % | | | 0.40 | % | | | 0.40 | %(d) |
Ratio of net investment income to average net assets (e) | | | 2.76 | %(d) | | | 3.05 | % | | | 2.92 | % | | | 2.54 | % | | | 2.29 | % | | | 2.21 | %(d) |
Portfolio turnover rate | | | 25 | %(c) | | | 39 | % | | | 58 | % | | | 103 | % | | | 118 | % | | | 161 | %(c) |
(a) | Represents the period from the commencement of operations (December 29, 2014) through November 30, 2015. |
(b) | Total return is a measure of the change in value of an investment in the Fund over the periods covered, which assumes any dividends or capital gains distributions are reinvested in shares of the Fund. The returns shown do not reflect the deduction of taxes a shareholder would pay on Fund distributions or the redemption of Fund shares. The total returns would have been lower if the Adviser had not reduced advisory fees and/or reimbursed expenses (Note 4). |
(c) | Not annualized. |
(d) | Annualized. |
(e) | Ratio was determined after investment advisory fee reductions and/or expense reimbursements. (Note 4). |
See accompanying notes to financial statements. |
28
RYAN LABS LONG CREDIT FUND
FINANCIAL HIGHLIGHTS |
Per Share Data for a Share Outstanding Throughout Each Period: |
| | Six Months
Ended
May 31,
2020
(Unaudited) | | | Year Ended
Nov. 30,
2019 | | | Year Ended
Nov. 30,
2018 | | | Year Ended
Nov. 30,
2017 | | | Year Ended
Nov. 30,
2016 | | | Period
Ended
Nov. 30,
2015 (a) | |
Net asset value at beginning of period | | $ | 11.33 | | | $ | 9.29 | | | $ | 10.58 | | | $ | 10.33 | | | $ | 10.06 | | | $ | 10.00 | |
| | | | | | | | | | | | | | | | | | | | | | | | | |
Income (loss) from investment operations: | | | | | | | | | | | | | | | | | | | | | | | | |
Net investment income | | | 0.18 | | | | 0.39 | | | | 0.38 | | | | 0.37 | | | | 0.41 | | | | 0.01 | |
Net realized and unrealized gains (losses) on investments | | | 0.49 | | | | 2.03 | | | | (1.13 | ) | | | 0.64 | | | | 0.30 | | | | 0.06 | |
Total from investment operations | | | 0.67 | | | | 2.42 | | | | (0.75 | ) | | | 1.01 | | | | 0.71 | | | | 0.07 | |
| | | | | | | | | | | | | | | | | | | | | | | | | |
Less distributions from: | | | | | | | | | | | | | | | | | | | | | | | | |
Net investment income | | | (0.18 | ) | | | (0.38 | ) | | | (0.38 | ) | | | (0.37 | ) | | | (0.41 | ) | | | (0.01 | ) |
Net realized gains from investment transactions | | | (0.34 | ) | | | — | | | | (0.16 | ) | | | (0.39 | ) | | | (0.03 | ) | | | — | |
Total distributions | | | (0.52 | ) | | | (0.38 | ) | | | (0.54 | ) | | | (0.76 | ) | | | (0.44 | ) | | | (0.01 | ) |
| | | | | | | | | | | | | | | | | | | | | | | | | |
Net asset value at end of period | | $ | 11.48 | | | $ | 11.33 | | | $ | 9.29 | | | $ | 10.58 | | | $ | 10.33 | | | $ | 10.06 | |
| | | | | | | | | | | | | | | | | | | | | | | | | |
Total return (b) | | | 6.19 | %(c) | | | 26.49 | % | | | (7.38 | %) | | | 10.27 | % | | | 7.11 | % | | | 0.71 | %(c) |
| | | | | | | | | | | | | | | | | | | | | | | | | |
Net assets at end of period (000’s) | | $ | 90,669 | | | $ | 118,375 | | | $ | 91,672 | | | $ | 93,885 | | | $ | 53,640 | | | $ | 50,278 | |
| | | | | | | | | | | | | | | | | | | | | | | | | |
Ratios/supplementary data: | | | | | | | | | | | | | | | | | | | | | | | | |
Ratio of total expenses to average net assets | | | 0.79 | %(d) | | | 0.79 | % | | | 0.79 | % | | | 0.84 | % | | | 0.84 | % | | | 1.12 | %(d) |
Ratio of net expenses to average net assets (e) | | | 0.50 | %(d) | | | 0.50 | % | | | 0.50 | % | | | 0.50 | % | | | 0.50 | % | | | 0.50 | %(d) |
Ratio of net investment income to average net assets (e) | | | 3.20 | %(d) | | | 3.69 | % | | | 3.85 | % | | | 3.66 | % | | | 3.87 | % | | | 2.38 | %(d) |
Portfolio turnover rate | | | 80 | %(c) | | | 179 | % | | | 195 | % | | | 191 | % | | | 156 | % | | | 93 | %(c) |
(a) | Represents the period from the commencement of operations (November 13, 2015) through November 30, 2015. |
(b) | Total return is a measure of the change in value of an investment in the Fund over the periods covered, which assumes any dividends or capital gains distributions are reinvested in shares of the Fund. The returns shown do not reflect the deduction of taxes a shareholder would pay on Fund distributions or the redemption of Fund shares. The total returns would have been lower if the Adviser had not reduced advisory fees and/or reimbursed expenses (Note 4). |
(c) | Not annualized. |
(d) | Annualized. |
(e) | Ratio was determined after investment advisory fee reductions and/or expense reimbursements. (Note 4). |
See accompanying notes to financial statements. |
29
RYAN LABS FUNDS
NOTES TO FINANCIAL STATEMENTS
May 31, 2020 (Unaudited)
1. Organization
Ryan Labs Core Bond Fund and Ryan Labs Long Credit Fund (individually, a “Fund,” and collectively, the “Funds”) are each a diversified series of Ultimus Managers Trust (the “Trust”), an open-end investment company established as an Ohio business trust under a Declaration of Trust dated February 28, 2012. Other series of the Trust are not incorporated in this report.
Each Fund’s investment objective is to seek total return, consisting of current income and capital appreciation.
2. Significant Accounting Policies
The Funds follow accounting and reporting guidance under Financial Accounting Standards Board Accounting Standards Codification Topic 946, “Financial Services – Investment Companies.” These policies are in conformity with accounting principles generally accepted in the United States of America (“GAAP”).
Securities valuation – The Funds’ fixed income securities are generally valued using prices provided by an independent pricing service approved by the Trust’s Board of Trustees (the “Board”). The independent pricing service uses information with respect to transactions in bonds, quotations from bond dealers, market transactions in comparable securities, and various relationships between securities in determining these prices. The methods used by the independent pricing service and the quality of valuations so established are reviewed by Sun Life Capital Management (U.S.), LLC (d/b/a SLC Management) (the “Adviser”), under the general supervision of the Board. Exchange-traded funds (“ETFs”), if any, are valued at market value as of the close of regular trading on the New York Stock Exchange (the “NYSE”) (normally 4:00 p.m. Eastern time) on each business day the NYSE is open for business. ETFs are valued at the security’s last sale price on the primary exchange, if available, otherwise at the exchange’s most recently quoted mean price. Investments representing shares of money market funds and other open-end investment companies, except for ETFs, are valued at their net asset value (“NAV”) as reported by such companies. Securities for which market quotations are not readily available are valued at fair value as determined in good faith under procedures adopted by the Board.
GAAP establishes a single authoritative definition of fair value, sets out a framework for measuring fair value, and requires additional disclosures about fair value measurements.
Various inputs are used in determining the value of the Funds’ investments. These inputs are summarized in the three broad levels listed below:
| | ● | Level 1 – quoted prices in active markets for identical securities |
| | ● | Level 2 – other significant observable inputs |
| | ● | Level 3 – significant unobservable inputs |
30
RYAN LABS FUNDS
NOTES TO FINANCIAL STATEMENTS (Continued)
Fixed income securities held by the Funds are classified as Level 2 since values are based on prices provided by an independent pricing service that utilizes various “other significant observable inputs” including bid and ask quotations, prices of similar securities, and interest rates, among other factors.
The inputs or methods used for valuing securities are not necessarily an indication of the risks associated with investing in those securities. The inputs used to measure fair value may fall into different levels of the fair value hierarchy. In such cases, for disclosure purposes, the level in the fair value hierarchy within which the fair value measurement falls in its entirety is determined based on the lowest level input that is significant to the fair value measurement.
The following is a summary of the inputs used to value each Fund’s investments as of May 31, 2020:
Ryan Labs
Core Bond Fund | | Level 1 | | | Level 2 | | | Level 3 | | | Total | |
U.S. Treasury Obligations | | $ | — | | | $ | 6,646,985 | | | $ | — | | | $ | 6,646,985 | |
Mortgage-Backed Securities | | | — | | | | 28,975,743 | | | | — | | | | 28,975,743 | |
Asset-Backed Securities | | | — | | | | 9,980,069 | | | | — | | | | 9,980,069 | |
Corporate Bonds | | | — | | | | 22,858,524 | | | | — | | | | 22,858,524 | |
International Bonds | | | — | | | | 105,950 | | | | — | | | | 105,950 | |
Money Market Funds | | | 1,523,907 | | | | — | | | | — | | | | 1,523,907 | |
Total | | $ | 1.523,907 | | | $ | 68,567,271 | | | $ | — | | | $ | 70,091,178 | |
Ryan Labs
Long Credit Fund | | Level 1 | | | Level 2 | | | Level 3 | | | Total | |
U.S. Treasury Obligations | | $ | — | | | $ | 257,871 | | | $ | — | | | $ | 257,871 | |
Municipal Bonds | | | — | | | | 4,273,526 | | | | — | | | | 4,273,526 | |
Corporate Bonds | | | — | | | | 82,587,856 | | | | — | | | | 82,587,856 | |
International Bonds | | | — | | | | 2,383,245 | | | | — | | | | 2,383,245 | |
Money Market Funds | | | 299,798 | | | | — | | | | — | | | | 299,798 | |
Total | | $ | 299,798 | | | $ | 89,502,498 | | | $ | — | | | $ | 89,802,296 | |
The Funds did not hold derivative instruments or any assets or liabilities that were measured at fair value on a recurring basis using significant unobservable inputs (Level 3) as of or during the six months ended May 31, 2020.
Share valuation – The NAV per share of each Fund is calculated daily by dividing the total value of its assets, less liabilities, by the number of shares outstanding. The offering price and redemption price per share of each Fund is equal to the NAV per share.
31
RYAN LABS FUNDS
NOTES TO FINANCIAL STATEMENTS (Continued)
Investment income – Interest income is accrued as earned. Discounts and premiums on fixed income securities purchased are accreted or amortized using the effective interest method. Dividend income is recorded on the ex-dividend date. Non-cash dividends included in dividend income, if any, are recorded at the fair market value of the security received.
Investment transactions – Investment transactions are accounted for on the trade date. Realized gains and losses on investments sold are determined on a specific identification basis.
Common expenses – Common expenses of the Trust are allocated among the Funds and other series of the Trust based on the relative net assets of each series, the number of series in the Trust, or the nature of the services performed and the relative applicability to each series.
Distributions to shareholders – Dividends from net investment income are declared and paid monthly to shareholders. Net realized capital gains, if any, are distributed at least once each year. The amount of distributions from net investment income and net realized capital gains are determined in accordance with federal income tax regulations, which may differ from GAAP. Dividends and distributions to shareholders are recorded on the ex-dividend date.
The tax character of distributions paid by each Fund during the periods ended May 31, 2020 and November 30, 2019 was as follows:
Ryan Labs Core Bond Fund
Period Ended | | Ordinary Income | | | Total Distributions | |
May 31, 2020 | | $ | 1,241,968 | | | $ | 1,241,968 | |
November 30, 2019 | | $ | 2,917,496 | | | $ | 2,917,496 | |
Ryan Labs Long Credit Fund
Period Ended | | Ordinary Income | | | Total Distributions | |
May 31, 2020 | | $ | 5,442,522 | | | $ | 5,442,522 | |
November 30, 2019 | | $ | 3,992,895 | | | $ | 3,992,895 | |
Estimates – The preparation of financial statements in conformity with GAAP requires management to make estimates and assumptions that affect the reported amounts of assets and liabilities and disclosure of contingent assets and liabilities as of the date of the financial statements and the reported amounts of income and expenses during the reporting period. Actual results could differ from those estimates.
32
RYAN LABS FUNDS
NOTES TO FINANCIAL STATEMENTS (Continued)
Federal income tax – Each Fund has qualified and intends to continue to qualify as a regulated investment company under the Internal Revenue Code of 1986, as amended (the “Code”). Qualification generally will relieve each Fund of liability for federal income taxes to the extent 100% of its net investment income and net realized capital gains are distributed in accordance with the Code.
In order to avoid imposition of the excise tax applicable to regulated investment companies, it is each Fund’s intention to declare as dividends in each calendar year at least 98% of its net investment income (earned during the calendar year) and 98.2% of its net realized capital gains (earned during the twelve months ended October 31) plus undistributed amounts from prior years.
The following information is computed on a tax basis for each item as of May 31, 2020:
| | Ryan Labs
Core Bond Fund | | | Ryan Labs
Long Credit Fund | |
Tax cost of portfolio investments | | $ | 68,544,349 | | | $ | 81,610,427 | |
Gross unrealized appreciation | | $ | 3,132,903 | | | $ | 9,618,841 | |
Gross unrealized depreciation | | | (1,586,074 | ) | | | (1,426,972 | ) |
Net unrealized appreciation on investments | | | 1,546,829 | | | | 8,191,869 | |
Accumulated ordinary income | | | 130,840 | | | | 192,198 | |
Capital loss carryforwards | | | (360,307 | ) | | | — | |
Other gains | | | 3,070,838 | | | | 5,387,745 | |
Distributions payable | | | (115,331 | ) | | | (167,960 | ) |
Accumulated earnings | | $ | 4,272,869 | | | $ | 13,603,852 | |
The difference between the federal income tax cost of portfolio investments and the financial statement cost for each Fund is due to certain timing differences in the recognition of capital gains or losses under income tax regulations and GAAP. These “book/tax” differences are temporary in nature and are primarily due to the tax deferral of losses on wash sales.
As of November 30, 2019, Ryan Labs Core Bond Fund had short-term capital loss carry-forwards of $101,476 and long-term capital loss carryforwards of $258,831. These capital loss carryforwards, which do not expire, may be utilized in the current and future years to offset net realized capital gains, if any, prior to distributing such gains to sharholders.
The Funds recognize the tax benefits or expenses of uncertain tax positions only when the position is “more likely than not” to be sustained assuming examination by tax authorities. Management has reviewed each Fund’s tax positions for the current and all open tax years (generally, three years) and has concluded that no provision for unrecognized tax benefits or expenses is required in these financial statements. The Funds identify their major tax jurisdiction as U.S. Federal.
33
RYAN LABS FUNDS
NOTES TO FINANCIAL STATEMENTS (Continued)
3. Investment Transactions
During the six months ended May 31, 2020, cost of purchases and proceeds from sales and maturities of investment securities, other than U.S. Government securities and short-term investments, were as follows:
| | Ryan Labs
Core Bond Fund | | | Ryan Labs
Long Credit Fund | |
Purchase of investment securities | | $ | 9,077,373 | | | $ | 53,663,220 | |
Proceeds from sales and maturities of investment securities | | $ | 10,517,611 | | | $ | 74,296,653 | |
During the six months ended May 31, 2020, cost of purchases and proceeds from sales and maturities of long-term U.S. Government securities were as follows:
| | Ryan Labs
Core Bond Fund | | | Ryan Labs
Long Credit Fund | |
Purchase of U.S. Government securities | | $ | 12,018,075 | | | $ | 37,785,146 | |
Proceeds from sales and maturities of U.S. Government securities | | $ | 31,061,837 | | | $ | 47,049,692 | |
4. Transactions with Related Parties
INVESTMENT ADVISORY AGREEMENT
The Adviser is wholly-owned by Sun Life Financial (U.S.) Investments LLC and is an indirect wholly-owned subsidiary of Sun Life Financial Inc. Each Fund is managed by the Adviser pursuant to the terms of an Investment Advisory Agreement. Under the Investment Advisory Agreements, Ryan Labs Core Bond Fund and Ryan Labs Long Credit Fund pay the Adviser an advisory fee, computed and accrued daily and paid monthly, at the annual rate of 0.40% and 0.50%, respectively, of average daily net assets.
Pursuant to Expense Limitation Agreements (“ELAs”) between each Fund and the Adviser, the Adviser has agreed, until March 31, 2021, to reduce advisory fees and reimburse other expenses in order to limit total annual operating expenses (exclusive of brokerage costs; taxes; interest; borrowing costs such as interest and dividend expenses on securities sold short; costs to organize each Fund; acquired fund fees and expenses; extraordinary expenses such as litigation and merger or reorganization costs; and other expenses not incurred in the ordinary course of the Fund’s business) to an amount not exceeding 0.40% and 0.50% of the average daily net assets of Ryan Labs Core Bond Fund and Ryan Labs Long Credit Fund, respectively. Accordingly, during the six month ended May 31, 2020, the Adviser reduced its advisory fees in the amounts of $161,127 and $169,351 for Ryan Labs Core Bond Fund and Ryan Labs Long Credit Fund, respectively.
34
RYAN LABS FUNDS
NOTES TO FINANCIAL STATEMENTS (Continued)
Under the terms of the ELAs, investment advisory fee reductions and expense reimbursements by the Adviser are subject to recoupment by the Adviser for a period of three years after such fees and expenses were incurred, provided the recoupments do not cause total annual operating expenses to exceed the lesser of (i) the expense limitation then in effect, if any, or (ii) the expense limitation in effect at the time the expenses to be recouped were incurred. As of May 31, 2020, the Adviser may seek recoupment of investment advisory fee reductions and expense reimbursements no later than the dates as stated below:
| | Ryan Labs
Core Bond Fund | | | Ryan Labs
Long Credit Fund | |
November 30, 2020 | | $ | 147,407 | | | $ | 121,171 | |
November 30, 2021 | | | 299,646 | | | | 260,442 | |
November 30, 2022 | | | 336,025 | | | | 314,903 | |
May 31, 2023 | | | 161,127 | | | | 169,351 | |
Total | | $ | 944,205 | | | $ | 865,867 | |
OTHER SERVICE PROVIDERS
Ultimus Fund Solutions, LLC (“Ultimus”) provides administration, fund accounting, compliance and transfer agency services to the Funds. The Funds pay Ultimus fees in accordance with the agreements for such services. In addition, the Funds pay out-of-pocket expenses including, but not limited to, postage, supplies and certain costs related to the pricing of the Funds’ portfolio securities.
Under the terms of a Distribution Agreement with the Trust, Ultimus Fund Distributors, LLC (the “Distributor”) serves as principal underwriter to the Funds. The Distributor is a wholly-owned subsidiary of Ultimus. The Distributor is compensated by the Adviser (not the Funds) for acting as principal underwriter.
Certain officers and a Trustee of the Trust are also officers of Ultimus and the Distributor and are not paid by the Funds for serving in such capacities.
TRUSTEE COMPENSATION
Each member of the Board (a “Trustee”) who is not an “interested person” of the Trust (“Independent Trustee”) receives a $1,300 annual retainer from each Fund, paid quarterly, except for the Board Chairperson who receives a $1,500 annual retainer from each Fund, paid quarterly. Each Independent Trustee also receives from each Fund a fee of $500 for each Board meeting attended plus reimbursement for travel and other meeting-related expenses.
35
RYAN LABS FUNDS
NOTES TO FINANCIAL STATEMENTS (Continued)
PRINCIPAL HOLDERS OF FUND SHARES
As of May 31, 2020, the following shareholders owned of record 25% or more of the outstanding shares of each Fund:
NAME OF RECORD OWNERS | % Ownership |
Ryan Labs Core Bond Fund | |
Citibank, N.A. (for the benefit of its customers) | 69% |
U.S. Bank, N.A. (for the benefit of its customers) | 26% |
Ryan Labs Long Credit Fund | |
Citibank, N.A. (for the benefit of its customers) | 63% |
A beneficial owner of 25% or more of a Fund’s outstanding shares may be considered a controlling person of that Fund. That shareholder’s vote could have a more significant effect on matters presented at a shareholders’ meeting.
5. Risks Associated with Mortgage-Backed Securities
The Funds’ investments in mortgage-backed securities are subject to prepayment risk, especially when interest rates decline. Prepayment risk is the risk that the principal on mortgage-backed securities, other asset-backed securities or any fixed-income security with an embedded call option may be prepaid at any time, which could reduce yield and market value. This could reduce the effective maturity of a mortgage-backed security and cause the Funds to reinvest their assets at a lower prevailing interest rate. Mortgage-backed securities are also subject to extension risk, which is the risk that rising interest rates will increase the effective maturity of mortgage-backed securities due to the deceleration of prepayments. Mortgage-backed securities may also be subject to risks unique to the housing industry, including mortgage lending practices, defaults, foreclosures and changes in real estate values. The Funds’ investments in collateralized mortgage obligations are subject to default risk, prepayment and extension risk and market risk when interest rates rise. As of May 31, 2020, Ryan Labs Core Bond Fund had 41.6% of the value of its net assets invested in mortgage-backed securities.
6. Risks Associated with Rule 144A Securities
Rule 144A securities are securities that are exempt from registration under the Securities Act of 1933, as amended, and may have legal restriction on resale. Under Rule 144A, these privately placed securities may be resold to qualified institutional buyers (“QIBs”), subject to certain conditions. An insufficient number of QIBs interested in purchasing Rule 144A securities at a particular time could adversely affect the marketability of the securities and the Funds might be unable to dispose of the securities promptly or at a reasonable price. As of May 31, 2020, Ryan Labs Core Bond Fund and Ryan Labs Long Credit Fund had 35.0% and 9.3%, respectively, of the value of their net assets invested in Rule 144A securities.
36
RYAN LABS FUNDS
NOTES TO FINANCIAL STATEMENTS (Continued)
7. Contingencies and Commitments
The Funds indemnify the Trust’s officers and Trustees for certain liabilities that might arise from their performance of their duties to the Funds. Additionally, in the normal course of business the Funds enter into contracts that contain a variety of representations and warranties and which provide general indemnifications. The Funds’ maximum exposure under these arrangements is unknown, as this would involve future claims that may be made against the Funds that have not yet occurred. However, based on experience, the Funds expect the risk of loss to be remote.
8. Subsequent Events
The Funds are required to recognize in the financial statements the effects of all subsequent events that provide additional evidence about conditions that existed as of the date of the Statements of Assets and Liabilities. For non-recognized subsequent events that must be disclosed to keep the financial statements from being misleading, the Funds are required to disclose the nature of the event as well as an estimate of its financial effect, or a statement that such an estimate cannot be made. Management has evaluated subsequent events through the issuance of these financial statements and has noted no such events except for the following:
The following distributions were paid to shareholders subsequent to May 31, 2020:
| | | | | | | | | | | Per Share | |
| | Record
Date | | | Ex-Date | | | Ordinary
Income | |
Ryan Labs Core Bond Fund | | | 06/29/2020 | | | | 06/30/2020 | | | $ | 0.0256 | |
Ryan Labs Long Credit Fund | | | 06/29/2020 | | | | 06/30/2020 | | | $ | 0.0320 | |
37
RYAN LABS FUNDS
ABOUT YOUR FUNDS’ EXPENSES (Unaudited)
We believe it is important for you to understand the impact of costs on your investment. As a shareholder of the Funds, you incur ongoing costs, including management fees and other operating expenses. The following examples are intended to help you understand your ongoing costs (in dollars) of investing in the Funds and to compare these costs with the ongoing costs of investing in other mutual funds.
A mutual fund’s ongoing costs are expressed as a percentage of its average net assets. This figure is known as the expense ratio. The expenses in the table below are based on an investment of $1,000 made at the beginning of the most recent period (December 1, 2019) and held until the end of the period (May 31, 2020).
The table below illustrates each Fund’s ongoing costs in two ways:
Actual fund return – This section helps you to estimate the actual expenses that you paid over the period. The “Ending Account Value” shown is derived from each Fund’s actual return, and the fourth column shows the dollar amount of operating expenses that would have been paid by an investor who started with $1,000 in the Funds. You may use the information here, together with the amount you invested, to estimate the expenses that you paid over the period.
To do so, simply divide your account value by $1,000 (for example, an $8,600 account value divided by $1,000 = 8.6), then multiply the result by the number given for each Fund under the heading “Expenses Paid During Period.”
Hypothetical 5% return – This section is intended to help you compare each Fund’s ongoing costs with those of other mutual funds. It assumes that each Fund had an annual return of 5% before expenses during the period shown, but that the expense ratio is unchanged. In this case, because the return used is not each Fund’s actual return, the results do not apply to your investment. The example is useful in making comparisons because the U.S. Securities and Exchange Commission (the “SEC”) requires all mutual funds to calculate expenses based on a 5% return. You can assess each Fund’s ongoing costs by comparing this hypothetical example with the hypothetical examples that appear in shareholder reports of other funds.
Note that expenses shown in the table are meant to highlight and help you compare ongoing costs only. The Funds do not charge transaction fees, such as purchase or redemption fees, nor do they carry a “sales load.”
The calculations assume no shares were bought or sold during the period. Your actual costs may have been higher or lower, depending on the amount of your investment and the timing of any purchases or redemptions.
38
RYAN LABS FUNDS
ABOUT YOUR FUNDS’ EXPENSES (Unaudited) (Continued)
| Beginning
Account Value
December 1,
2019 | Ending
Account Value
May 31,
2020 | Net Expense
Ratio (a) | Expenses Paid
During
Period (b) |
Ryan Labs Core Bond Fund | | | | |
Based on Actual Fund Return | $1,000.00 | $1,033.00 | 0.40% | $2.03 |
Based on Hypothetical 5% Return (before expenses) | $1,000.00 | $1,023.00 | 0.40% | $2.02 |
| | | | | |
Ryan Labs Long Credit Fund | | | | |
Based on Actual Fund Return | $1,000.00 | $1,061.90 | 0.50% | $2.58 |
Based on Hypothetical 5% Return (before expenses) | $1,000.00 | $1,022.50 | 0.50% | $2.53 |
(a) | Annualized, based on each Fund’s most recent one-half year expenses. |
(b) | Expenses are equal to each Fund’s annualized net expense ratio multiplied by the average account value over the period, multiplied by 183/366 (to reflect the one-half year period). |
39
RYAN LABS FUNDS
OTHER INFORMATION (Unaudited)
A description of the policies and procedures that the Funds use to vote proxies relating to portfolio securities is available without charge upon request by calling toll-free 1-866-561-3087, or on the SEC’s website at www.sec.gov. Information regarding how the Funds voted proxies relating to portfolio securities during the most recent 12-month period ended June 30 is available without charge upon request by calling toll-free 1-866-561-3087, or on the SEC’s website at www.sec.gov.
The Trust files a complete listing of portfolio holdings for the Funds with the SEC as of the end of the first and third quarters of each fiscal year as an exhibit to its reports on Form N-PORT. These filings are available upon request by calling 1-866-561-3087. Furthermore, you may obtain a copy of the filings on the SEC’s website at www.sec.gov.
40
FACTS | WHAT DO THE RYAN LABS CORE BOND FUND AND THE RYAN LABS LONG CREDIT FUND (the “Funds”) DO WITH YOUR PERSONAL INFORMATION? |
| | | | |
Why? | Financial companies choose how they share your personal information. Federal law gives consumers the right to limit some but not all sharing. Federal law also requires us to tell you how we collect, share, and protect your personal information. Please read this notice carefully to understand what we do. |
| | | | |
What? | The types of personal information we collect and share depend on the product or service you have with us. This information can include: ■ Social Security number ■ Assets ■ Retirement Assets ■ Transaction History ■ Checking Account Information ■ Purchase History ■ Account Balances ■ Account Transactions ■ Wire Transfer Instructions When you are no longer our customer, we continue to share your information as described in this notice. |
| | | | |
How? | All financial companies need to share your personal information to run their everyday business. In the section below, we list the reasons financial companies can share their customers’ personal information; the reasons the Funds choose to share; and whether you can limit this sharing. |
| | | | |
Reasons we can share your personal information | Do the
Funds share? | Can you limit this sharing? |
For our everyday business purposes –
Such as to process your transactions, maintain your account(s), respond to court orders and legal investigations, or report to credit bureaus | Yes | No |
For our marketing purposes –
to offer our products and services to you | No | We don’t share |
For joint marketing with other financial companies | No | We don’t share |
For our affiliates’ everyday business purposes –
information about your transactions and experiences | No | We don’t share |
For our affiliates’ everyday business purposes –
information about your creditworthiness | No | We don’t share |
For nonaffiliates to market to you | No | We don’t share |
| | |
Questions? | Call 1-866-561-3087 |
41
Page 2 | |
| | |
Who we are |
Who is providing this notice? | Ryan Labs Core Bond Fund Ryan Labs Long Credit Fund Ultimus Fund Distributors, LLC (Distributor) Ultimus Fund Solutions, LLC (Administrator) |
What we do |
How do the Funds protect my personal information? | To protect your personal information from unauthorized access and use, we use security measures that comply with federal law. These measures include computer safeguards and secured files and buildings. Our service providers are held accountable for adhering to strict policies and procedures to prevent any misuse of your nonpublic personal information. |
How do the Funds collect my personal information? | We collect your personal information, for example, when you ■ Open an account ■ Provide account information ■ Give us your contact information ■ Make deposits or withdrawals from your account ■ Make a wire transfer ■ Tell us where to send the money ■ Tell us who receives the money ■ Show your government-issued ID ■ Show your driver’s license We also collect your personal information from other companies. |
Why can’t I limit all sharing? | Federal law gives you the right to limit only ■ Sharing for affiliates’ everyday business purposes – information about your creditworthiness ■ Affiliates from using your information to market to you ■ Sharing for nonaffiliates to market to you State laws and individual companies may give you additional rights to limit sharing. |
| | |
Definitions |
Affiliates | Companies related by common ownership or control. They can be financial and nonfinancial companies. ■ SLC Management, the investment adviser to the Funds, could be deemed to be an affiliate. |
Nonaffiliates | Companies not related by common ownership or control. They can be financial and nonfinancial companies. ■ The Funds do not share with nonaffiliates so they can market to you. |
Joint marketing | A formal agreement between nonaffiliated financial companies that together market financial products or services to you. ■ The Funds do not jointly market. |
42
This page intentionally left blank.
This page intentionally left blank.
This page intentionally left blank.
Not required
| Item 3. | Audit Committee Financial Expert. |
Not required
| Item 4. | Principal Accountant Fees and Services. |
Not required
| Item 5. | Audit Committee of Listed Registrants. |
Not applicable
| Item 6. | Schedule of Investments. |
| (a) | Not applicable [schedule filed with Item 1] |
| Item 7. | Disclosure of Proxy Voting Policies and Procedures for Closed-End Management Investment Companies. |
Not applicable
| Item 8. | Portfolio Managers of Closed-End Management Investment Companies. |
Not applicable
| Item 9. | Purchases of Equity Securities by Closed-End Management Investment Company and Affiliated Purchasers. |
Not applicable
| Item 10. | Submission of Matters to a Vote of Security Holders. |
The registrant’s Committee of Independent Trustees shall review shareholder recommendations for nominations to fill vacancies on the registrant’s board of trustees if such recommendations are submitted in writing and addressed to the Committee at the registrant’s offices. The Committee may adopt, by resolution, a policy regarding its procedures for considering candidates for the board of trustees, including any recommended by shareholders.
| Item 11. | Controls and Procedures. |
(a) Based on their evaluation of the registrant’s disclosure controls and procedures (as defined in Rule 30a-3(c) under the Investment Company Act of 1940) as of a date within 90 days of the filing date of this report, the registrant’s principal executive officer and principal financial officer have concluded that such disclosure controls and procedures are reasonably designed and are operating effectively to ensure that material information relating to the registrant, including its consolidated subsidiaries, is made known to them by others within those entities, particularly during the period in which this report is being prepared, and that the information required in filings on Form N-CSR is recorded, processed, summarized, and reported on a timely basis.
(b) There were no changes in the registrant’s internal control over financial reporting (as defined in Rule 30a-3(d) under the Investment Company Act of 1940) that occurred during the first and second fiscal quarter of the period covered by this report that have materially affected, or are reasonably likely to materially affect, the registrant’s internal control over financial reporting.
| Item 12. | Disclosure of Securities Lending Activities for Closed-End Management Investment Companies. |
Not applicable
File the exhibits listed below as part of this Form. Letter or number the exhibits in the sequence indicated.
(a)(1) Any code of ethics, or amendment thereto, that is the subject of the disclosure required by Item 2, to the extent that the registrant intends to satisfy the Item 2 requirements through filing of an exhibit: Not required
(a)(2) A separate certification for each principal executive officer and principal financial officer of the registrant as required by Rule 30a-2(a) under the Act (17 CFR 270.30a-2(a)): Attached hereto
(a)(3) Any written solicitation to purchase securities under Rule 23c-1 under the Act (17 CFR 270.23c-1) sent or given during the period covered by the report by or on behalf of the registrant to 10 or more persons: Not applicable
(a)(4) Change in the registrant’s independent public accountants: Not applicable
(b) Certifications required by Rule 30a-2(b) under the Act (17 CFR 270.30a-2(b)): Attached hereto
SIGNATURES
Pursuant to the requirements of the Securities Exchange Act of 1934 and the Investment Company Act of 1940, the registrant has duly caused this report to be signed on its behalf by the undersigned, thereunto duly authorized.
| (Registrant) | Ultimus Managers Trust | | |
| | | |
| By (Signature and Title)* | /s/ Matthew J. Beck | |
| | Matthew J. Beck, Secretary | |
| | | |
| Date | August 3, 2020 | | |
| | | |
| Pursuant to the requirements of the Securities Exchange Act of 1934 and the Investment Company Act of 1940, this report has been signed below by the following persons on behalf of the registrant and in the capacities and on the dates indicated. |
| | | | |
| By (Signature and Title)* | /s/ David R. Carson | |
| | | David R. Carson, Principal Executive Officer | |
| | | | |
| Date | August 3, 2020 | | |
| | | | |
| By (Signature and Title)* | /s/ Jennifer L. Leamer | |
| | | Jennifer L. Leamer, Treasurer and Principal Financial Officer | |
| | | | |
| Date | August 3, 2020 | | |
| * | Print the name and title of each signing officer under his or her signature. |