| OMB APPROVAL |
OMB Number: 3235-0570 Expires: August 31, 2020 Estimated average burden hours per response: 20.6 |
UNITED STATES
SECURITIES AND EXCHANGE COMMISSION
Washington, D.C. 20549
FORM N-CSR
CERTIFIED SHAREHOLDER REPORT OF REGISTERED
MANAGEMENT INVESTMENT COMPANIES
| Investment Company Act file number | 811-22680 | |
| Ultimus Managers Trust |
| (Exact name of registrant as specified in charter) |
| 225 Pictoria Drive, Suite 450 Cincinnati, Ohio | 45246 |
| (Address of principal executive offices) | (Zip code) |
Matthew J. Beck, esq.
| Ultimus Fund Solutions, LLC 225 Pictoria Drive, Suite 450 | Cincinnati, Ohio 45246 |
| (Name and address of agent for service) |
| Registrant's telephone number, including area code: | 513-587-3400 | |
| Date of fiscal year end: | October 31 | |
| | | |
| Date of reporting period: | April 30, 2020 | |
Form N-CSR is to be used by management investment companies to file reports with the Commission not later than 10 days after the transmission to stockholders of any report that is required to be transmitted to stockholders under Rule 30e-1 under the Investment Company Act of 1940 (17 CFR 270.30e-1). The Commission may use the information provided on Form N-CSR in its regulatory, disclosure review, inspection, and policymaking roles.
A registrant is required to disclose the information specified by Form N-CSR, and the Commission will make this information public. A registrant is not required to respond to the collection of information contained in Form N-CSR unless the Form displays a currently valid Office of Management and Budget ("OMB") control number. Please direct comments concerning the accuracy of the information collection burden estimate and any suggestions for reducing the burden to the Secretary, Securities and Exchange Commission, 450 Fifth Street, NW, Washington, DC 20549-0609. The OMB has reviewed this collection of information under the clearance requirements of 44 U.S.C. § 3507.
| Item 1. | Reports to Stockholders. |
Beginning on January 1, 2021, as permitted by regulations adopted by the U.S. Securities and Exchange Commission, paper copies of the Fund’s shareholder reports like this one will no longer be sent by mail, unless you specifically request paper copies of the reports from the Fund or from your financial intermediary, such as a broker-dealer or bank. Instead, the reports will be made available on a website, and you will be notified by mail each time a report is posted and provided with a website link to access the report.
If you already elected to receive shareholder reports electronically, you will not be affected by this change and you need not take any action. You may elect to receive shareholder reports and other communications from the Fund electronically by contacting the Fund at 1-866-822-9555 or, if you own these shares through a financial intermediary, by contacting your financial intermediary.
You may elect to receive all future reports in paper free of charge. You can inform the Fund that you wish to continue receiving paper copies of your shareholder reports by contacting the Fund at 1-866-822-9555. If you own shares through a financial intermediary, you may contact your financial intermediary or follow instructions included with this document to elect to continue to receive paper copies of your shareholder reports. Your election to receive reports in paper will apply to all Funds held with the Fund complex or at your financial intermediary.
STRALEM EQUITY FUND
LETTER TO SHAREHOLDERS
June 2020
Dear Shareholder,
During the first six months of its fiscal year, November 1, 2019 through April 30, 2020, Stralem Equity Fund’s (the “Fund’s”) performance was as follows:
Time Period | STEFX* | S&P 500** |
Nov 1, 2019 – April 30, 2020 | -5.10% | -3.16% |
Past performance does not guarantee future returns.
* | Net, after fees. |
** | Does not reflect deduction for fees, expenses or taxes |
Market Commentary
The market’s performance over this period, a relatively small pullback (-3.16%) in large-cap U.S. equities, belies the truly historic events bringing about the end of the 11-year bull market.
The close of calendar year 2019 was a mere stopping point along the road to a new all-time market high reached on February 19, 2020. The end of 2019 was filled with economic optimism as phase one of the U.S.-China trade deal was finally concluded, the U.S. reached a 50-year low in unemployment, and the Federal Reserve decided to reverse course and loosen monetary policy by cutting interest rates three times in 2019. These developments drove a strong year-end rally of 9% for the S&P 500 that capped a huge 31.5% return for the calendar year. While the Fund was able to participate in this outsized market gain, it predictably lagged the S&P 500 after fees largely because of ourParticipation with Protection portfolio structure that maintains an allocation to Down Market stocks in order to protect capital during market selloffs (of which there were none in 2019).
After reaching an all-time high of 3,393 on February 19, 2020, the S&P 500 collapsed as the novel coronavirus known as COVID-19, spread beyond China and reached the U.S. and Europe. Fears of a global pandemic, and the U.S.’s lack of preparation, quickly filtered into markets around the world, resulting in a sudden and severe investor reaction. Attempting to process the potential for millions of fatalities, a shuttered economy and Great Depression levels of unemployment caused investors to frantically and intensely sell wherever liquidity was available. Over the next 22 trading days, the S&P 500 lost 33.8%, the fastest 30% sell-off in stock market history! The uncertainty was unprecedented, and investors struggled to unload even safe securities like treasury and municipal bonds. The financial system has endured credit and liquidity challenges along with stock market crashes but never this much, this quickly.
1
Government response was swift and extraordinary. The Federal Reserve initially dropped interest rates 0.50%, and as the selling intensified, dropped rates another 1% (to 0.25% on Fed Funds) in mid-March while promising to do whatever was necessary to support the bond market by buying hundreds of billions of dollars of treasuries in order to reduce interest rates across the yield curve. In parallel with Fed actions, the dysfunctional and bitterly partisan Congress was able to quickly pass the largest fiscal stimulus bill (the $2T CARES Act) since World War II aimed at individuals, small businesses and corporations. The power and enormity of these actions provided investors with the comfort and assurance that however long this pandemic might last, and whatever economic damage may occur, government support would know no bounds.
The massive financial support quelled investor fears and the market catapulted back nearly as rapidly as it sold off. Led by the secular-growth advantaged technology companies (Facebook, Apple, Amazon, Microsoft, Google) which also happen to greatly benefit from shelter-in-place and work-from-home trends, the S&P 500 rebounded dramatically from its March low and traded up 30.4% into the end of April (27 trading days). This period included the best three days for the DJIA (+20.1%) since 1933! Despite the amazing rally off the bottom, from the peak to the month end, the S&P remained -13.7%.
As April ended, the market rally remained firmly in place, states around the country were beginning to open up, and despite unemployment reaching 17% (25 million) there was optimism about several vaccines in trials and hope that the summer weather would contain the spread of the virus.
Fund Performance
As expected, during the severe market sell-off Stralem Equity Fund initially went down with the market, but as the selling intensified, the Fund began to outperform. From peak-to-trough, the S&P 500 returned -33.8% and the Fund returned -31.7%, outperforming by 2.1%. This is typical of how the strategy performs during the first phase of a panic-driven market sell-off as all stocks are sold indiscriminately and independently of fundamentals or long-term outlooks. Investors simply want to reduce equity exposure through any means possible, and these periods are often referred to as having a “correlation of 1”—as all assets move dramatically and together. It is hard for active managers to outperform the market in these periods because the babies are thrown out with the bathwater, which is why the Fund outperformed, but by less than our historic downside capture. Far less common, however, is a near complete reversal so quickly after the sell-off. From the low on March 23rd to the April month end, the S&P 500 rose 30.4%, while the Fund was up 28.0%, underperforming by 2.3%.
The concept ofParticipation with Protection is built on the tenet that by going down less than the market when it falls means an investor doesn’t need to capture the full rebound to remain ahead over the entire period. Although this period’s volatility was absolutely unprecedented, the process performed as expected. The Fund went down 2.1 points less than the S&P 500 during the steep downfall, and then up 2.3 points less on the rebound, but the Fund’s total return across the market fall and rebound was -12.5% vs -13.7% for the S&P 500, or 1.2 points of outperformance. Typically, after such violent market swings, we will see a
2
series of smaller and shorter duration “after-shocks”, where the market exhibits increased volatility despite going sideways. It’s during these post-crash market moves that the Participation with Protection really shows its value by adding alpha through the turbulence. This is how we expect the remainder of 2020 to play out—lots of volatility.
Some investors were willing to declare March the bottom and dove back into equities simply based on the massive stimuli, optimism about COVID-19 vaccine development, and hope for a V-shaped economic recovery. However, we remained disciplined and slightly more cautious about the global macro coronavirus recovery. While the stock market has recovered much of its losses through April, we are now living through a historic time with uncertainty and severity of the COVID-19 pandemic and its far-reaching ramifications. We struggle to reconcile expectations for 2Q GDP declining by 30% with over 25 million unemployed, continued tensions on China trade, the absence of stock buybacks which heretofore provided significant support to the market, continued Coronavirus risks especially as attached to reopening and the outcome of a Presidential election in November with a stock market that seems to be grinding towards a new all-time high. Whereas the future is always uncertain, in our view, the uncertainty today is much greater than usual, the probability distribution of potential outcomes much wider and the tail risk much higher.
Portfolio Performance
From a portfolio perspective, the returns over the period truly need to be analyzed in two distinct segments, first, the 12.2% stock market rally from November 2019 to the all-time high on February 19th, 2020, and second, the sharp but intense (-13.7%) COVID-19 related sell-off and subsequent rebound into the April month end.
The stock market rally into the new high in February was driven by optimism of the U.S. China trade deal’s impact on global growth as well as the strength in the U.S. economy as evidenced by low interest rates and record employment. Every S&P 500 sector was positive during this bull market period except for Energy which was -1.7% as oil prices came under pressure from concerns about global demand, and the Saudis and Russians flooding the market to drive out the U.S. shale players. The market was led strongly by Technology (+23.3%) and Communication Services (+12.8%) which accounted for over 54% of the return of the S&P 500 until its peak. And within these sectors, the FAAMG stocks (Facebook, Apple, Amazon, Microsoft, Google), which represented 18.2% of the entire weight of the S&P 500 drove over 34% of the performance! These widely held and beloved companies continued their strong outperformance based on the strength of their business models, their secular growth, and the expectation that the companies would benefit from any economic disruption from the coronavirus that was spreading west from China. While 10% of the Fund is invested in Facebook, Microsoft, and Alphabet (Google), it was not enough to overcome their collective impact on the S&P 500, especially Apple which was +30.8%, and single-handedly cost the Fund 1.28% of relative performance!
3
In addition, the Fund suffered some stock specific issues as Tyson Foods and Dow Inc were -5.5% and -4.6%, respectively impacting the Fund negatively by 1.0% versus the benchmark. Both companies were impacted by China’s COVID-19 related shutdown before the virus even made it to the U.S. China is a large buyer of Tyson’s protein products (chicken, pork, beef) and the completed trade deal represented a major catalyst for Tyson’s export business. However, when China’s economy and the international trade it supports slowed due to COVID-19, so did Tyson’s business. We view this as a temporary hurdle and expect the company will be back to supplying China’s insatiable demand for imported protein shortly. Dow was also a victim of global economic weakness, especially as it deals with production shutdowns in Asia and the fall-off in commodity prices due to the global economic slowdown.
On the positive side, two of the Fund’s holdings, Adobe and D.R. Horton, were up over 30% in the market run-up to a new high. Adobe had a great Q4 earnings report and saw a reacceleration in subscriptions as the firm continues to flex its muscle with a near monopoly position in the online advertising tools space. D.R. Horton, one of the country’s largest homebuilders in high-growth markets also produced a very strong Q4 as mortgage rates remained very attractive, and the lull in home purchases earlier in the year proved to be temporary.
As the market fell dramatically, the Fund was certainly not immune from losses, but as expected, outperformed the benchmark in the intense sell-off, going down 31.7% vs the S&P 500 at 33.8%. Much of this outperformance was the result of not owning the large money-center banks (JP Morgan, Wells Fargo, Citibank and Bank of America) that lost 32% - 44% of their value in the sell-off on fears of loan losses and the lack of net interest margin on record low interest rates. At the same time, the Fund’s two financial firms, Progressive Insurance (+0.8%) and Intercontinental Exchange (-5.9%) outperformed as both expect to be beneficiaries of the new environment. Progressive, one of the country’s largest auto insurers, expects fewer insurance claims from the lack of driving and Intercontinental Exchange’s options and futures markets experience a dramatic increase in demand during the crisis when increased volatility leads investors to demand hedging products—especially in the Energy sector. The Fund also benefitted from strong stock performance from several Healthcare stocks, that have stable and defensive business models, and are not expected to see large decreases in revenue.
During the incredible 30% V-shaped market rebound, the Fund predictably lagged the S&P 500 slightly but still managed to produce a 28% return. The performance was broad-based and many of the stocks that went down the most during the downdraft, also recovered the most on the rebound. For example, UnitedHealth Group—which is considered a very stable business—dropped -35.9% during the market correction, only to rebound +50.1%, for a net loss of -3.8% — just incredible volatility for a healthcare insurer that should have stable results.
During the COVID-19 related sell-off, the Fund sold positions in EOG Resources and Boeing. EOG Resources is one of the largest U.S. shale exploration and production companies and their lifting costs are among the lowest in the country.
4
However, with OPEC and Russia deciding to flood the market with oil and driving the price down in the process, EOG’s ability to generate a strong profit on their Permian basin positions became questionable. We decided that it will take quite some time for supply and demand to return to balance, and thus exited the position. Boeing’s 737 Max production issues pre-date COVID-19 and are well documented. We were prepared to hold Boeing through its aircraft issues because we believed in the strength of their position as a global duopolist and the expectation that the 737 Max would begin production in the Spring/Summer. However, COVID-19 forced us to reconsider the health of the global airline industry and contemplate whether all airlines would survive. Rather than speculate on the outcome and timing, we decided to exit the position. The proceeds from the sales were redistributed to the other names in the portfolio, and the Fund holdings dropped to 33 names.
Given that the market achieved an all-time high in February followed by an historic sell-off in March that signaled the end of the 11-year bull market, only to rebound to -9.3% on a YTD basis, we believe investors are envisioning the possibility of a short but severe recession stemmed by some sort of virus therapeutic or vaccine rather than, what is in our view, the probability that the recovery will be much slower and the market may be way ahead of itself. We are in uncharted territory from a health and economic perspective. 25 million Americans are currently unemployed, but the $2T fiscal stimulus and the dramatic Federal Reserve actions may be just enough to provide a bridge to the struggling economy until the virus is defeated and the economy can fully recover. If 2020 was not volatile enough, the Trump Administration seems to be re-igniting its conflict with China as the country prepares for a Presidential election in the Fall. At Stralem, we are fond of saying that “we don’t predict the future, we merely prepare for it.” There is certainly much to consider and evaluate from a panoply of perspectives and for these reasons, we believe it continues to be prudent to maintain 35% of the portfolio in what we view as defensive positions with downside protection while allocating 65% to the Up Market Sector of higher growth stocks that participate with the market. We remain convinced that while the market may be behaving better over the past month, volatility will remain until we have more visibility into the duration of this global pandemic. It is our contention that a disciplined portfolio structure based on diligent research and stock selection driven by strong fundamentals will be increasingly rewarded. In our view, the portfolio is well-positioned to participate in continued upside momentum as well as to protect capital on the downside if necessary. We believe it is more imperative than ever to balance “participation with protection” in order to create, build and protect long term wealth.
Sincerely,
Stralem & Company Incorporated
5
Past performance is not predictive of future performance.Investment results and principal value will fluctuate so that shares, when redeemed, may be worth more or less than their original cost. Current performance may be higher or lower than the performance data quoted. Performance data current to the most recent month end are available by calling 1-866-822-9555.
An investor should consider the investment objectives, risks, charges and expenses of the Fund carefully before investing. The Fund’s prospectus contains this and other important information. To obtain a copy of the Fund’s prospectus please visit our website at www.stralemequityfund.com or call 1-866-822-9555 and a copy will be sent to you free of charge. Please read the prospectus carefully before you invest. Stralem Equity Fund is distributed by Ultimus Fund Distributors, LLC.
This Letter to Shareholders seeks to describe some of the Adviser’s current opinions and views of the financial markets. Although the Adviser believes it has a reasonable basis for any opinions or views expressed, actual results may differ, sometimes significantly so, from those expected or expressed. The securities held by the Fund that are discussed in the Letter to Shareholders were held during the period covered by this Report. They do not comprise the entire investment portfolio of the Fund, may be sold at any time and may no longer be held by the Fund. For a complete list of securities held by the Fund as of April 30, 2020, please see the Schedule of Investments section of the semi-annual report. The opinions of the Adviser with respect to those securities may change at any time.
Statements in the Letter to Shareholders that reflect projections or expectations for future financial or economic performance of the Fund and the market in general and statements of the Fund’s plans and objectives for future operations are forward-looking statements. No assurance can be given that actual results or events will not differ materially from those projected, estimated, assumed, or anticipated in any such forward-looking statements. Important factors that could result in such differences, in addition to factors noted with such forward-looking statements include, without limitation, general economic conditions, such as inflation, recession, and interest rates. Past performance is not a guarantee of future results.
6
STRALEM EQUITY FUND
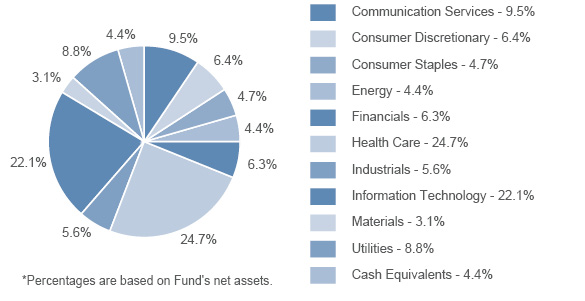
PORTFOLIO INFORMATION
April 30, 2020 (Unaudited)
| | | | As of October 31, 2019 | | | As of April 30, 2020 | |
| | | Value | | | % of Total
Investments | | | Value | | | % of Total
Investments | |
UP MARKET | NEW PRODUCTS | | $ | 10,956,610 | | | | 13.5 | % | | $ | 10,322,774 | | | | 14.4 | % |
| | NEW INDUSTRIES | | | 17,546,637 | | | | 21.5 | % | | | 16,634,990 | | | | 23.2 | % |
| | DOMINANT COMPANIES | | | 23,753,227 | | | | 29.1 | % | | | 20,579,440 | | | | 28.7 | % |
| | | | | | | | | | | | | | | | | | |
DOWN MARKET | LOW PRICE TO CASH FLOW | | | 9,843,020 | | | | 12.1 | % | | | 6,882,613 | | | | 9.6 | % |
| | HIGH YIELD | | | 17,189,239 | | | | 21.1 | % | | | 14,105,690 | | | | 19.7 | % |
| | | | | | | | | | | | | | | | | | |
MONEY MARKET | | | | 2,222,439 | | | | 2.7 | % | | | 3,171,315 | | | | 4.4 | % |
| | | | $ | 81,511,172 | | | | 100.0 | % | | $ | 71,696,822 | | | | 100.0 | % |
7
STRALEM EQUITY FUND
SCHEDULE OF INVESTMENTS
April 30, 2020 (Unaudited)
COMMON STOCKS — 95.6% | | Shares | | | Value | |
Communication Services — 9.5% | | | | | | | | |
Diversified Telecommunication Services — 2.5% | | | | | | | | |
AT&T, Inc. | | | 57,790 | | | $ | 1,760,861 | |
| | | | | | | | | |
Interactive Media & Services — 7.0% | | | | | | | | |
Alphabet, Inc. - Class A(a) | | | 1,800 | | | | 2,424,060 | |
Facebook, Inc. - Class A(a) | | | 12,800 | | | | 2,620,288 | |
| | | | | | | | 5,044,348 | |
Consumer Discretionary — 6.4% | | | | | | | | |
Auto Components — 3.4% | | | | | | | | |
Aptiv plc | | | 34,790 | | | | 2,419,644 | |
| | | | | | | | | |
Household Durables — 3.0% | | | | | | | | |
D.R. Horton, Inc. | | | 45,390 | | | | 2,143,316 | |
| | | | | | | | | |
Consumer Staples — 4.7% | | | | | | | | |
Beverages — 2.5% | | | | | | | | |
Coca-Cola Company (The) | | | 38,990 | | | | 1,789,251 | |
| | | | | | | | | |
Food Products — 2.2% | | | | | | | | |
Tyson Foods, Inc. - Class A | | | 24,860 | | | | 1,546,044 | |
| | | | | | | | | |
Energy — 4.4% | | | | | | | | |
Oil, Gas & Consumable Fuels — 4.4% | | | | | | | | |
Chevron Corporation | | | 18,470 | | | | 1,699,240 | |
Kinder Morgan, Inc. | | | 95,210 | | | | 1,450,048 | |
| | | | | | | | 3,149,288 | |
Financials — 6.3% | | | | | | | | |
Capital Markets — 3.2% | | | | | | | | |
Intercontinental Exchange, Inc. | | | 25,790 | | | | 2,306,915 | |
| | | | | | | | | |
Insurance — 3.1% | | | | | | | | |
Progressive Corporation (The) | | | 28,296 | | | | 2,187,281 | |
| | | | | | | | | |
Health Care — 24.7% | | | | | | | | |
Biotechnology — 4.7% | | | | | | | | |
AbbVie, Inc. | | | 19,600 | | | | 1,611,120 | |
Alexion Pharmaceuticals, Inc.(a) | | | 16,630 | | | | 1,787,226 | |
| | | | | | | | 3,398,346 | |
See accompanying notes to financial statements. |
8
STRALEM EQUITY FUND
SCHEDULE OF INVESTMENTS (Continued)
COMMON STOCKS — 95.6% (Continued) | | Shares | | | Value | |
Health Care — 24.7% (Continued) | | | | | | | | |
Health Care Equipment & Supplies — 6.1% | | | | | | | | |
Abbott Laboratories | | | 19,530 | | | $ | 1,798,518 | |
Danaher Corporation | | | 15,700 | | | | 2,566,322 | |
| | | | | | | | 4,364,840 | |
Health Care Providers & Services — 3.2% | | | | | | | | |
UnitedHealth Group, Inc. | | | 7,950 | | | | 2,325,137 | |
| | | | | | | | | |
Life Sciences Tools & Services — 2.4% | | | | | | | | |
Thermo Fisher Scientific, Inc. | | | 5,110 | | | | 1,710,215 | |
| | | | | | | | | |
Pharmaceuticals — 8.3% | | | | | | | | |
Johnson & Johnson | | | 11,530 | | | | 1,729,961 | |
Merck & Company, Inc. | | | 25,180 | | | | 1,997,781 | |
Pfizer, Inc. | | | 57,680 | | | | 2,212,605 | |
| | | | | | | | 5,940,347 | |
Industrials — 5.6% | | | | | | | | |
Aerospace & Defense — 2.7% | | | | | | | | |
Raytheon Technologies Corporation(a) | | | 29,885 | | | | 1,936,847 | |
| | | | | | | | | |
Air Freight & Logistics — 2.9% | | | | | | | | |
FedEx Corporation | | | 16,540 | | | | 2,096,776 | |
| | | | | | | | | |
Information Technology — 22.1% | | | | | | | | |
Communications Equipment — 2.8% | | | | | | | | |
Cisco Systems, Inc. | | | 47,700 | | | | 2,021,526 | |
| | | | | | | | | |
Electronic Equipment, Instruments & Components — 2.3% | | | | | | | | |
Keysight Technologies, Inc.(a) | | | 17,420 | | | | 1,685,734 | |
| | | | | | | | | |
IT Services — 3.6% | | | | | | | | |
Visa, Inc. - Class A | | | 14,250 | | | | 2,546,760 | |
| | | | | | | | | |
Semiconductors & Semiconductor Equipment — 3.0% | | | | | | | | |
Broadcom, Inc. | | | 7,820 | | | | 2,124,068 | |
| | | | | | | | | |
Software — 10.4% | | | | | | | | |
Adobe, Inc.(a) | | | 7,700 | | | | 2,723,028 | |
Microsoft Corporation | | | 13,530 | | | | 2,424,711 | |
Oracle Corporation | | | 43,370 | | | | 2,297,309 | |
| | | | | | | | 7,445,048 | |
See accompanying notes to financial statements. |
9
STRALEM EQUITY FUND
SCHEDULE OF INVESTMENTS (Continued)
COMMON STOCKS — 95.6% (Continued) | | Shares | | | Value | |
Materials — 3.1% | | | | | | | | |
Chemicals — 3.1% | | | | | | | | |
Dow, Inc. | | | 60,990 | | | $ | 2,237,723 | |
| | | | | | | | | |
Utilities — 8.8% | | | | | | | | |
Electric Utilities — 5.9% | | | | | | | | |
American Electric Power Company, Inc. | | | 24,350 | | | | 2,023,728 | |
Duke Energy Corporation | | | 26,000 | | | | 2,201,160 | |
| | | | | | | | 4,224,888 | |
Multi-Utilities — 2.9% | | | | | | | | |
Dominion Energy, Inc. | | | 27,490 | | | | 2,120,304 | |
| | | | | | | | | |
Total Common Stocks(Cost $51,788,923) | | | | | | $ | 68,525,507 | |
MONEY MARKET FUNDS — 4.4% | | Shares | | | Value | |
Dreyfus Government Cash Management - Participant Shares, 0.01%(b) (Cost $3,171,315) | | | 3,171,315 | | | $ | 3,171,315 | |
| | | | | | | | | |
Investments at Value — 100.0%(Cost $54,960,238) | | | | | | $ | 71,696,822 | |
| | | | | | | | | |
Other Assets in Excess of Liabilities — 0.0%(c) | | | | | | | 5,782 | |
| | | | | | | | | |
Net Assets — 100.0% | | | | | | $ | 71,702,604 | |
(a) | Non-income producing security. |
(b) | The rate shown is the 7-day effective yield as of April 30, 2020. |
(c) | Percentage rounds to less than 0.1%. |
See accompanying notes to financial statements. |
10
STRALEM EQUITY FUND
STATEMENT OF ASSETS AND LIABILITIES
April 30, 2020 (Unaudited)
ASSETS | | | | |
Investments in securities: | | | | |
At cost | | $ | 54,960,238 | |
At value (Note 2) | | $ | 71,696,822 | |
Dividends receivable | | | 60,210 | |
Other assets | | | 7,521 | |
Total Assets | | | 71,764,553 | |
| | | | | |
LIABILITIES | | | | |
Payable to Investment Adviser (Note 4) | | | 27,046 | |
Payable to administrator (Note 4) | | | 11,308 | |
Accrued expenses | | | 23,595 | |
Total Liabilities | | | 61,949 | |
| | | | | |
NET ASSETS | | $ | 71,702,604 | |
| | | | | |
NET ASSETS CONSIST OF: | | | | |
Paid-in capital | | $ | 52,709,068 | |
Accumulated earnings | | | 18,993,536 | |
Net Assets | | $ | 71,702,604 | |
| | | | | |
Shares of beneficial interest outstanding (unlimited number of shares authorized, no par value) | | | 10,468,822 | |
| | | | | |
Net asset value, offering price and redemption price per share | | $ | 6.85 | |
See accompanying notes to financial statements. |
11
STRALEM EQUITY FUND
STATEMENT OF OPERATIONS
For the Six Months Ended April 30, 2020 (Unaudited)
INVESTMENT INCOME | | | | |
Dividends | | $ | 832,165 | |
| | | | | |
EXPENSES | | | | |
Investment advisory fees (Note 4) | | | 435,481 | |
Administration fees (Note 4) | | | 37,772 | |
Fund accounting fees (Note 4) | | | 18,735 | |
Audit and tax services fees | | | 12,500 | |
Legal fees | | | 12,057 | |
Trustees’ fees and expenses (Note 4) | | | 11,641 | |
Registration and filing fees | | | 8,074 | |
Transfer agent fees (Note 4) | | | 7,500 | |
Compliance fees (Note 4) | | | 6,000 | |
Bank service fees | | | 3,682 | |
Printing | | | 3,054 | |
Postage and supplies | | | 2,087 | |
Insurance expense | | | 1,996 | |
Other | | | 9,584 | |
Total Expenses | | | 570,163 | |
Investment advisory fee reductions (Note 4) | | | (216,169 | ) |
Net Expenses | | | 353,994 | |
| | | | | |
NET INVESTMENT INCOME | | | 478,171 | |
| | | | | |
REALIZED AND UNREALIZED GAINS (LOSSES) ON INVESTMENTS | | | | |
Net realized gains from investment transactions | | | 2,293,192 | |
Net change in unrealized appreciation (depreciation) on investments | | | (7,091,894 | ) |
NET REALIZED AND UNREALIZED LOSSES ON INVESTMENTS | | | (4,798,702 | ) |
| | | | | |
NET DECREASE IN NET ASSETS RESULTING FROM OPERATIONS | | $ | (4,320,531 | ) |
See accompanying notes to financial statements. |
12
STRALEM EQUITY FUND
STATEMENTS OF CHANGES IN NET ASSETS
| | Six Months
Ended
April 30,
2020
(Unaudited) | | | Year
Ended
October 31,
2019 | |
OPERATIONS | | | | | | | | |
Net investment income | | $ | 478,171 | | | $ | 1,135,111 | |
Net realized gains from investment transactions | | | 2,293,192 | | | | 11,999,088 | |
Net change in unrealized appreciation (depreciation) on investments | | | (7,091,894 | ) | | | (2,562,424 | ) |
Net increase (decrease) in net assets resulting from operations | | | (4,320,531 | ) | | | 10,571,775 | |
| | | | | | | | | |
DISTRIBUTIONS TO SHAREHOLDERS (Note 2) | | | (13,259,786 | ) | | | (22,588,139 | ) |
| | | | | | | | | |
CAPITAL SHARE TRANSACTIONS | | | | | | | | |
Proceeds from shares sold | | | 15,099,017 | | | | 15,119,993 | |
Net asset value of shares issued in reinvestment of distributions | | | 12,237,004 | | | | 14,090,686 | |
Proceeds from redemption fees (Note 2) | | | — | | | | 133 | |
Payments for shares redeemed | | | (21,241,525 | ) | | | (31,554,090 | ) |
Net increase (decrease) in net assets from capital share transactions | | | 6,094,496 | | | | (2,343,278 | ) |
| | | | | | | | | |
TOTAL DECREASE IN NET ASSETS | | | (11,485,821 | ) | | | (14,359,642 | ) |
| | | | | | | | | |
NET ASSETS | | | | | | | | |
Beginning of period | | | 83,188,425 | | | | 97,548,067 | |
End of period | | $ | 71,702,604 | | | $ | 83,188,425 | |
| | | | | | | | | |
CAPITAL SHARE ACTIVITY | | | | | | | | |
Shares sold | | | 1,738,876 | | | | 1,925,627 | |
Shares reinvested | | | 1,612,254 | | | | 1,770,656 | |
Shares redeemed | | | (2,533,640 | ) | | | (3,814,517 | ) |
Net increase (decrease) in shares outstanding | | | 817,490 | | | | (118,234 | ) |
Shares outstanding, beginning of period | | | 9,651,332 | | | | 9,769,566 | |
Shares outstanding, end of period | | | 10,468,822 | | | | 9,651,332 | |
See accompanying notes to financial statements. |
13
STRALEM EQUITY FUND
FINANCIAL HIGHLIGHTS
(For a share outstanding throughout each period) |
| | | Six
Months
Ended
April 30,
2020 | | | Year Ended October 31, | |
| | (Unaudited) | | | 2019 | | | 2018 | | | 2017 | | | 2016 | | | 2015 | |
Net asset value, beginning of period | | $ | 8.62 | | | $ | 9.98 | | | $ | 10.53 | | | $ | 10.52 | | | $ | 15.53 | | | $ | 17.45 | |
| | | | | | | | | | | | | | | | | | | | | | | | | |
Income (loss) from investment operations: | | | | | | | | | | | | | | | | | | | | | | | | |
Net investment income | | | 0.06 | | | | 0.11 | | | | 0.13 | | | | 0.12 | | | | 0.22 | | | | 0.23 | |
Net realized and unrealized gains (losses) on investments | | | (0.36 | ) | | | 0.90 | | | | 0.00 | (a) | | | 1.49 | | | | 0.24 | | | | 0.34 | |
Total from investment operations | | | (0.30 | ) | | | 1.01 | | | | 0.13 | | | | 1.61 | | | | 0.46 | | | | 0.57 | |
| | | | | | | | | | | | | | | | | | | | | | | | | |
Less distributions: | | | | | | | | | | | | | | | | | | | | | | | | |
Dividends from net investment income | | | (0.12 | ) | | | (0.11 | ) | | | (0.11 | ) | | | (0.17 | ) | | | (0.25 | ) | | | (0.25 | ) |
Distributions from net realized gains | | | (1.35 | ) | | | (2.26 | ) | | | (0.57 | ) | | | (1.43 | ) | | | (5.22 | ) | | | (2.24 | ) |
Total distributions | | | (1.47 | ) | | | (2.37 | ) | | | (0.68 | ) | | | (1.60 | ) | | | (5.47 | ) | | | (2.49 | ) |
| | | | | | | | | | | | | | | | | | | | | | | | | |
Proceeds from redemption fees collected (Note 2) | | | | — | | | 0.00 | (a) | | | 0.00 | (a) | | | 0.00 | (a) | | | 0.00 | (a) | | | 0.00 | (a) |
| | | | | | | | | | | | | | | | | | | | | | | | | |
Net asset value, end of period | | $ | 6.85 | | | $ | 8.62 | | | $ | 9.98 | | | $ | 10.53 | | | $ | 10.52 | | | $ | 15.53 | |
| | | | | | | | | | | | | | | | | | | | | | | | | |
Total return(b) | | | (5.10 | %)(c) | | | 12.56 | % | | | 1.13 | % | | | 17.36 | % | | | 4.72 | % | | | 3.43 | % |
| | | | | | | | | | | | | | | | | | | | | | | | | |
Ratios/supplementary data: | | | | | | | | | | | | | | | | | | | | | | | | |
Net assets, end of period (000’s) | | $ | 71,703 | | | $ | 83,188 | | | $ | 97,548 | | | $ | 136,841 | | | $ | 142,965 | | | $ | 190,800 | |
Ratio of total expenses to average net assets | | | 1.53 | %(d) | | | 1.47 | % | | | 1.30 | % | | | 1.28 | % | | | 1.42 | % | | | 1.21 | % |
Ratio of net expenses to average net assets(e) | | | 0.95 | %(d) | | | 0.95 | % | | | 0.95 | % | | | 0.95 | % | | | 0.98 | % | | | 0.98 | % |
Ratio of net investment income to average net assets(e) | | | 1.28 | %(d) | | | 1.30 | % | | | 1.10 | % | | | 1.03 | % | | | 1.52 | % | | | 1.17 | % |
Portfolio turnover rate | | | 14 | %(c) | | | 28 | % | | | 32 | % | | | 7 | % | | | 8 | % | | | 33 | % |
(a) | Amount rounds to less than $0.01 per share. |
(b) | Total return is a measure of the change in value of an investment in the Fund over the periods covered, which assumes any dividends or capital gains distributions are reinvested in shares of the Fund. Returns shown do not reflect the deduction of taxes a shareholder would pay on Fund distributions or the redemption of Fund shares. The total returns would be lower if the Adviser had not reduced advisory fees and/or reimbursed expenses (Note 4). |
(c) | Not annualized. |
(d) | Annualized. |
(e) | Ratio was determined after fee reductions and/or expense reimbursements by the Adviser (Note 4). |
See accompanying notes to financial statements. |
14
STRALEM EQUITY FUND
NOTES TO FINANCIAL STATEMENTS
April 30, 2020 (Unaudited)
Stralem Equity Fund (the “Fund”) is a diversified series of Ultimus Managers Trust (the “Trust”). The Trust is an open-end management investment company registered under the Investment Company Act of 1940, as amended (the “1940 Act”). The Fund was reorganized into the Trust on October 17, 2016. It was formerly a series of Stralem Fund.
The Fund’s investment objective is to seek long-term capital appreciation.
2. | SIGNIFICANT ACCOUNTING POLICIES |
The Fund follows accounting and reporting guidance under Financial Accounting Standards Board Accounting Standards Codification Topic 946, “Financial Services – Investment Companies.” The following is a summary of the Fund’s significant accounting policies used in the preparation of its financial statements. These policies are in conformity with principles generally accepted in the United States of America (“GAAP”).
Investment valuation:
The Fund’s portfolio securities are valued as of the close of business of the regular session of trading on the New York Stock Exchange (“NYSE”) (normally 4:00 p.m., Eastern time) on each day the NYSE is open. Securities which are traded on stock exchanges are valued at the closing price on the day the securities are being valued, or, if not traded on a particular day, at the closing mean price. Securities quoted by NASDAQ are valued at the NASDAQ Official Closing Price. Securities traded in the over-the-counter market are valued at the last sale price, if available, otherwise, at the last quoted mean price. Investments in money market funds are valued at net asset value (“NAV”). When using a quoted price and when the market for the security is considered active, the security will be classified as Level 1 within the fair value hierarchy (see below). In the event that market quotations are not readily available or are considered unreliable due to market or other events, the Fund values its securities and other assets at fair value pursuant to procedures established by and under the direction of the Board of Trustees (the “Board”) of the Trust. Under these procedures, the securities will be classified as Level 2 or 3 within the fair value hierarchy, depending on the inputs used. Unavailable or unreliable market quotes may be due to the following factors: a substantial bid-ask spread; infrequent sales resulting in stale prices; insufficient trading volume; small trade sizes; a temporary lapse in any reliable pricing source; and actions of the securities or futures markets, such as the suspension or limitation of trading. As a result, the prices of securities used to calculate the Fund’s NAV may differ from quoted or published prices for the same securities.
15
STRALEM EQUITY FUND
NOTES TO FINANCIAL STATEMENTS (Continued)
GAAP establishes a single authoritative definition of fair value, sets out a framework for measuring fair value and requires additional disclosures about fair value measurements.
Various inputs are used in determining the value of the Fund’s investments. These inputs are summarized in the three broad levels listed below:
Level 1 – quoted prices in active markets for identical securities
Level 2 – other significant observable inputs
Level 3 – significant unobservable inputs
The inputs or methodology used for valuing securities are not necessarily an indication of the risks associated with investing in those securities. The inputs used to measure fair value may fall into different levels of the above fair value hierarchy. In such cases, for disclosure purposes, the level in the fair value hierarchy within which the fair value measurement falls is determined based on the lowest level input that is significant to the fair value measurement.
The following is a summary of the inputs used to value the Fund’s investments by security type as of April 30, 2020:
| | Level 1 | | | Level 2 | | | Level 3 | | | Total | |
Common Stocks | | $ | 68,525,507 | | | $ | — | | | $ | — | | | $ | 68,525,507 | |
Money Market Funds | | | 3,171,315 | | | | — | | | | — | | | | 3,171,315 | |
Total | | $ | 71,696,822 | | | $ | — | | | $ | — | | | $ | 71,696,822 | |
Refer to the Fund’s Schedule of Investments for a listing of the common stocks by sector and industry type. There were no Level 2 or Level 3 securities or derivative instruments held by the Fund as of or during the six months ended April 30, 2020.
Share valuation and redemption fees:
The NAV per share of the Fund is calculated daily by dividing the total value of the Fund’s assets, less liabilities, by the number of shares outstanding. The offering price and redemption price per share is equal to the NAV per share. Prior to November 1, 2019, Fund shares were subject to a redemption fee of 1% if shares were redeemed within 60 days of purchase. During the periods ended April 30, 2020 and October 31, 2019, proceeds from redemption fees totaled $0 and $133, respectively.
Investment transactions and income:
Investment transactions are accounted for on the trade date. Realized gains and losses on sales of investments are calculated on a specific identification basis. Dividend income is recorded on the ex-dividend date, and interest income is recognized on the accrual basis. Non-cash dividends included in dividend
16
STRALEM EQUITY FUND
NOTES TO FINANCIAL STATEMENTS (Continued)
income, if any, are recorded at the fair market value of the security received. Withholding taxes on foreign dividends, if any, have been recorded in accordance with the Fund’s understanding of the applicable country’s rules and tax rates.
Common expenses:
Common expenses of the Trust are allocated among the Fund and other series of the Trust based on the relative net assets of each series, the number of series in the Trust, or the nature of the services performed and the relative applicability to each series.
Distributions to shareholders:
Distributions arising from net investment income and net realized capital gains are declared and paid to shareholders annually. The amount of distributions from net investment income and net realized capital gains are determined in accordance with federal income tax regulations, which may differ from GAAP. The tax character of distributions paid to shareholders during the periods ended April 30, 2020 and October 31, 2019 was as follows:
Periods Ended | | Ordinary
Income | | | Long-Term
Capital Gains | | | Total
Distributions | |
April 30, 2020 | | $ | 1,083,092 | | | $ | 12,176,694 | | | $ | 13,259,786 | |
October 31, 2019 | | $ | 1,514,867 | | | $ | 21,073,272 | | | $ | 22,588,139 | |
Use of estimates:
The preparation of financial statements in conformity with GAAP requires management to make estimates and assumptions that affect the reported amounts of assets and liabilities and disclosure of contingent assets and liabilities as of the date of the financial statements and the reported amounts of income and expenses during the reporting period. Actual results could differ from those estimates.
Federal income tax:
The Fund has qualified and intends to continue to qualify as a regulated investment company under the Internal Revenue Code of 1986, as amended (the “Code”). Qualification generally will relieve the Fund of liability for federal income taxes to the extent its net investment income and net realized capital gains are distributed in accordance with the Code.
In order to avoid imposition of a federal excise tax applicable to regulated investment companies, the Fund must declare and pay as dividends in each calendar year at least 98% of its net investment income (earned during the calendar year) and 98.2% of its net realized capital gains (earned during the twelve months ended October 31) plus undistributed amounts from prior years.
17
STRALEM EQUITY FUND
NOTES TO FINANCIAL STATEMENTS (Continued)
The following information is computed on a tax basis for each item as of April 30, 2020:
Cost of portfolio investments | | $ | 55,287,724 | |
Gross unrealized appreciation | | $ | 20,336,393 | |
Gross unrealized depreciation | | | (3,927,295 | ) |
Net unrealized appreciation | | | 16,409,098 | |
Accumulated ordinary income | | | 317,682 | |
Other gains | | | 2,266,756 | |
Accumulated earnings | | $ | 18,993,536 | |
The difference between the federal income tax cost of portfolio investments and the financial statement cost of portfolio investments is due to certain timing differences in the recognition of capital gains or losses under income tax regulations and GAAP. These “book/tax” differences are temporary in nature and are due to the tax deferral of losses on wash sales.
3. | INVESTMENT TRANSACTIONS |
During the six months ended April 30, 2020, cost of purchases and proceeds from sales of investment securities, other than short-term investments, amounted to $9,709,193 and $15,644,706, respectively.
4. | TRANSACTIONS WITH RELATED PARTIES |
INVESTMENT ADVISORY AGREEMENT
Pursuant to an Investment Advisory Agreement with Stralem & Company Incorporated (the “Adviser”), the Fund pays the Adviser an advisory fee, payable quarterly, based on the average weekly net assets of the Fund, equal to 1.25% per annum of the first $50 million of such net assets; 1.00% per annum of the next $50 million of such net assets; and 0.75% per annum of such net assets in excess of $100 million.
The Adviser has agreed contractually, until at least March 1, 2021, to reduce its advisory fees and reimburse other expenses to the extent necessary to limit total annual operating expenses (excluding brokerage costs; taxes; interest; borrowing costs such as interest and dividend expenses on securities sold short; costs to organize the Fund; acquired fund fees and expenses; and extraordinary expenses, such as litigation and merger or reorganization costs and other expenses not incurred in the ordinary course of the Fund’s business) to an amount not exceeding 0.95% of the Fund’s average daily net assets. During the six months ended April 30, 2020, the Adviser reduced its advisory fees in the amount of $216,169.
18
STRALEM EQUITY FUND
NOTES TO FINANCIAL STATEMENTS (Continued)
Advisory fee reductions and expense reimbursements by the Adviser are subject to repayment by the Fund for a period of three years after such fees and expenses were incurred, provided that the repayments do not cause total annual operating expenses to exceed the lesser of (i) the expense limitation then in effect, if any, and (ii) the expense limitation in effect at the time the expenses to be repaid were incurred. Prior to March 1, 2021, this agreement may not be modified or terminated without the approval of the Board. This agreement will terminate automatically if the Investment Advisory Agreement is terminated. As of April 30, 2020, the amount of fee reductions and expense reimbursements available for recovery by the Adviser is $1,324,713, which must be recovered no later than the dates stated below:
October 31, 2020 | | $ | 206,325 | |
October 31, 2021 | | | 445,789 | |
October 31, 2022 | | | 456,430 | |
April 30, 2023 | | | 216,169 | |
| | | $ | 1,324,713 | |
OTHER SERVICE PROVIDERS
Ultimus Fund Solutions, LLC (“Ultimus”) provides administration, fund accounting, compliance, and transfer agent services for the Fund. The Fund pays Ultimus fees in accordance with the agreements for such services. In addition, the Fund pays out-of-pocket expenses including, but not limited to, postage, supplies and certain costs related to the pricing of the Fund’s portfolio securities.
Pursuant to a Distribution Agreement with Ultimus Fund Distributors, LLC (the “Distributor”), the Distributor provides distribution services and serves as principal underwriter for the Fund. The Distributor is a wholly owned subsidiary of Ultimus. The Distributor is compensated by the Adviser (not the Fund) for acting as principal underwriter.
Certain officers and a Trustee of the Trust are also officers of Ultimus and the Distributor.
TRUSTEE COMPENSATION
Each Trustee who is not an “interested person” of the Trust (“Independent Trustee”) receives a $1,300 annual retainer from the Fund, paid quarterly, except for the Board Chairperson who receives a $1,500 annual retainer from the Fund, paid quarterly. Each Independent Trustee also receives from the Fund a fee of $500 for each Board meeting attended plus reimbursement for travel and other meeting-related expenses.
19
STRALEM EQUITY FUND
NOTES TO FINANCIAL STATEMENTS (Continued)
PRINCIPAL HOLDER OF FUND SHARES
As of April 30, 2020, the following shareholder owned of record 25% or more of the outstanding shares of the Fund:
Name of Record Owner | % Ownership |
Pershing, LLC (for the benefit of its customers) | 82% |
A beneficial owner of 25% or more of the Fund’s outstanding shares may be considered a controlling person. That shareholder’s vote could have a more significant effect on matters presented at a shareholders’ meeting.
5. | CONTINGENCIES AND COMMITMENTS |
The Fund indemnifies the Trust’s officers and Trustees for certain liabilities that might arise from their performance of their duties to the Fund. Additionally, in the normal course of business the Fund enters into contracts that contain a variety of representations and warranties and which provide general indemnifications. The Fund’s maximum exposure under these arrangements is unknown, as this would involve future claims that may be made against the Fund that have not yet occurred. However, the Fund has not had any prior claims or losses pursuant to these arrangements.
The Fund is required to recognize in the financial statements the effects of all subsequent events that provide additional evidence about conditions that existed as of the date of the Statement of Assets and Liabilities. For non-recognized subsequent events that must be disclosed to keep the financial statements from being misleading, the Fund is required to disclose the nature of the event as well as an estimate of its financial effect, or a statement that such an estimate cannot be made. Management has evaluated subsequent events through the issuance of these financial statements and has noted no such events.
20
STRALEM EQUITY FUND
DISCLOSURE OF FUND EXPENSES (Unaudited)
As a shareholder of the Fund, you incur ongoing costs, including management fees and other Fund expenses, which are deducted from the Fund’s gross income. This Example is intended to help you understand your ongoing costs (in dollars) of investing in the Fund and to compare these costs with the ongoing costs of investing in other mutual funds.
The Example is based on an investment of $1,000 invested at the beginning of the period (November 1, 2019) and held until the end of the period (April 30, 2020).
Actual Expenses
The first line of the table below provides information about actual account values and actual expenses. You may use the information in this line, together with the amount you invested, to estimate the expenses that you paid over the period. Simply divide your account value by $1,000 (for example, an $8,600 account value divided by $1,000 = 8.6), then multiply the result by the number in the first line under the heading entitled “Expenses Paid During Period” to estimate the expenses you paid on your account during this period.
Hypothetical Example for Comparison Purposes
The second line of the table below provides information about hypothetical account values and hypothetical expenses based on the Fund’s actual expense ratio and an assumed rate of return of 5% per year before expenses, which is not the Fund’s actual return. The hypothetical account values and expenses may not be used to estimate the actual ending account balance or expenses you paid for the period. You may use this information to compare the ongoing costs of investing in the Fund and other mutual funds. To do so, compare this 5% hypothetical example with the 5% hypothetical examples that appear in the shareholder reports of other funds.
| Beginning
Account Value
November 1,
2019 | Ending
Account Value
April 30, 2020 | Expenses Paid
During Period* |
Based on Actual Fund Return | $ 1,000.00 | $ 949.00 | $ 4.60 |
Based on Hypothetical 5% Return | $ 1,000.00 | $ 1,020.14 | $ 4.77 |
* | Expenses are equal to the Fund’s annualized net expense ratio of 0.95% for the period, multiplied by the average account value over the period, multiplied by 182/366 (to reflect the one-half year period). |
21
STRALEM EQUITY FUND
ADDITIONAL INFORMATION (Unaudited)
PROXY VOTING POLICIES AND PROCEDURES
A description of the Fund’s proxy voting policies and procedures is available, without charge, upon request by calling toll free (866) 822-9555, or on the U.S. Securities and Exchange Commission (the “SEC”) website at www.sec.gov. Information regarding how the Fund voted proxies relating to portfolio securities during the most recent 12-month period ended June 30 is also available, without charge, upon request by calling toll free (866) 822-9555, or on the SEC website at www.sec.gov.
QUARTERLY PORTFOLIO HOLDINGS
The Fund’s complete schedule of portfolio holdings as of the end of the first and third quarters of each fiscal year are available on the SEC website at www.sec.gov or are available upon request, without charge, by calling toll free at (866) 822-9555.
HOUSEHOLDING
The Fund will generally send only one copy of the summary prospectus, proxy material, annual report and semi-annual report to shareholders residing at the same “household.” This reduces Fund expenses which benefits all shareholders, minimizes the volume of mail you receive and eliminates duplicates of the same information. If you need additional copies of these documents, a copy of the prospectus or do not want your mailings to be “householded,” please send us a written request or call us toll free at (866) 822-9555.
22
STRALEM EQUITY FUND
INVESTMENT ADVISER
Stralem & Company Incorporated
551 Madison Avenue, 10th Floor
New York, NY 10022
Telephone (212) 888-8123
Fax (212) 888-8152
This report is prepared for the information of the Fund’s shareholders. It is not authorized for distribution to prospective investors in the Fund unless it is preceded or accompanied by a current summary prospectus and/or prospectus which each describe the Fund’s objectives, risks, policies, expenses and other important information. Investors are advised to read the summary prospectus and/or prospectus carefully before investing. Past performance is not indicative of future results. Current performance may be lower or higher than the data contained herein. For performance information current through the most recent month end, please visit the Fund’s website at www.stralemequityfund.com or call toll-free(866) 822-9555. The Fund can suffer losses as well as gains.
23
Privacy Notice |
FACTS | WHAT DOES THE STRALEM EQUITY FUND (the “Fund”) DO WITH YOUR PERSONAL INFORMATION? |
| | |
Why? | Financial companies choose how they share your personal information. Federal law gives consumers the right to limit some but not all sharing. Federal law also requires us to tell you how we collect, share, and protect your personal information. Please read this notice carefully to understand what we do. |
| | |
What? | The types of personal information we collect and share depend on the product or service you have with us. This information can include: ■ Social Security number ■ Assets ■ Retirement Assets ■ Transaction History ■ Checking Account Information ■ Purchase History ■ Account Balances ■ Account Transactions ■ Wire Transfer Instructions When you areno longer our customer, we continue to share your information as described in this notice. |
| | |
How? | All financial companies need to share your personal information to run their everyday business. In the section below, we list the reasons financial companies can share their customers’ personal information; the reasons the Fund chooses to share; and whether you can limit this sharing. |
| | |
Reasons we can share your personal information | Does the
Fund share? | Can you limit this sharing? |
For our everyday business purposes — Such as to process your transactions, maintain your account(s), respond to court orders and legal investigations, or report to credit bureaus | Yes | No |
For our marketing purposes — to offer our products and services to you | No | We don’t share |
For joint marketing with other financial companies | No | We don’t share |
For our affiliates’ everyday business purposes —information about your transactions and experiences | No | We don’t share |
For our affiliates’ everyday business purposes — information about your creditworthiness | No | We don’t share |
For nonaffiliates to market to you | No | We don’t share |
| | |
Questions? | Call 1-866-822-9555 |
24
Who we are |
Who is providing this notice? | Stralem Equity Fund Ultimus Fund Distributors, LLC (Distributor) Ultimus Fund Solutions, LLC (Administrator) |
What we do |
How does the Fund protect my personal information? | To protect your personal information from unauthorized access and use, we use security measures that comply with federal law. These measures include computer safeguards and secured files and buildings. Our service providers are held accountable for adhering to strict policies and procedures to prevent any misuse of your nonpublic personal information. |
How does the Fund collect my personal information? | We collect your personal information, for example, when you ■ Open an account ■ Provide account information ■ Give us your contact information ■ Make deposits or withdrawals from your account ■ Make a wire transfer ■ Tell us where to send the money ■ Tell us who receives the money ■ Show your government-issued ID ■ Show your driver’s license We also collect your personal information from other companies. |
Why can’t I limit all sharing? | Federal law gives you the right to limit only ■ Sharing for affiliates’ everyday business purposes – information about your creditworthiness ■ Affiliates from using your information to market to you ■ Sharing for nonaffiliates to market to you State laws and individual companies may give you additional rights to limit sharing. |
| | |
Definitions |
Affiliates | Companies related by common ownership or control. They can be financial and nonfinancial companies. ■Stralem & Company Incorporated, the investment adviser to the Fund, could be deemed to be an affiliate. |
Nonaffiliates | Companies not related by common ownership or control. They can be financial and nonfinancial companies ■The Fund does not share with nonaffiliates so they can market to you. |
Joint marketing | A formal agreement between nonaffiliated financial companies that together market financial products or services to you. ■The Fund does not jointly market. |
25
MEEHAN FOCUS FUND
SEMI-ANNUAL REPORT
April 30, 2020
(Unaudited)
This report is for the information of the shareholders of Meehan Focus Fund. Its use in connection with any offering of the Fund’s shares is authorized only in a case of concurrent or prior delivery of the Fund’s current prospectus. Investors should refer to the Fund’s prospectus for a description of risk factors associated with investments in the Fund. |
Meehan Focus Fund
A Series of Ultimus Managers Trust
7250 Woodmont Avenue, Suite 315
Bethesda, MD 20814
(866) 884-5968 | Distributor:
Ultimus Fund Distributors, LLC
225 Pictoria Drive, Suite 450
Cincinnati, OH 45246
(800) 933-8413 |
Beginning on January 1, 2021, as permitted by regulations adopted by the U.S. Securities and Exchange Commission, paper copies of the Fund’s shareholder reports like this one will no longer be sent by mail, unless you specifically request paper copies of the reports from the Fund or from your financial intermediary, such as a broker-dealer or bank. Instead, the reports will be made available on a website, and you will be notified by mail each time a report is posted and provided with a website link to access the report. If you already elected to receive shareholder reports electronically, you will not be affected by this change and you need not take any action. You may elect to receive shareholder reports and other communications from the Fund electronically by contacting the Fund at 1-866-884-5968 or, if you own these shares through a financial intermediary, by contacting your financial intermediary. You may elect to receive all future reports in paper free of charge. You can inform the Fund that you wish to continue receiving paper copies of your shareholder reports by contacting the Fund at 1-866-884-5968. If you own shares through a financial intermediary, you may contact your financial intermediary or follow instructions included with this document to elect to continue to receive paper copies of your shareholder reports. Your election to receive reports in paper will apply to all Funds held with the Fund complex or at your financial intermediary. |
MEEHAN FOCUS FUND
LETTER TO SHAREHOLDERS | June 3, 2020 |
Dear Fellow Shareholders1:
The total return for the Meehan Focus Fund (“the Fund”) for the first six months of its 2020 fiscal year through April 30, 2020 was (5.23%)2; the Fund’s net asset value (“NAV”) per share at April 30 was $25.61.
Market and Economic Conditions
A great deal has changed, for the markets and the world at large, in a relatively short time. Six months ago the investing landscape featured a stock market in the midst of a rally that took the S&P 500 to its best annual return since 2013. And, as 2020 began, the U.S. economy was showing signs of emerging from a slowdown in the fall, led by continued strength in the labor market which added 273,000 jobs in February before impacts from the coronavirus began to be felt. The global economy also had some positive momentum, with the International Monetary Fund forecasting a rise in global growth from 2.9% in 2019 to 3.3% in 2020.3
The positive momentum that the market and the economy carried into 2020 was brought to an abrupt halt in February as the coronavirus and associated disease, COVID-19, began to show up outside of Wuhan, China, where it had been spreading since it was discovered in December 2019. After hitting an all-time high on February 19, the S&P 500 sold off sharply, losing 13% if its value by the end of the following week. Losses accelerated in March as the World Health Organization declared the coronavirus a pandemic, and an ill-timed dispute between Saudi Arabia and Russia over oil production caused oil prices to plummet, further rattling markets. After eleven years, the longest bull market in history came to an end.
Governments and central banks around the world have announced aggressive initiatives to mitigate the economic impact of the coronavirus pandemic, and more measures are being considered. In the United States, the Federal Reserve has cut interest rates to near zero and committed $2.3 trillion to an array of lending programs with the promise of more stimulus if needed. Congress has passed three stimulus packages since the start of the pandemic. The largest and most recent of these was the $2.2 trillion CARES Act which included direct payments to individuals, a Paycheck Protection Program for small businesses, expanded unemployment benefits, and other measures to boost the economy. The European Central Bank and other central banks and governments abroad have also acted to support their economies and markets.
1 | The views expressed herein are not meant as investment advice. Although some of the described portfolio holdings were viewed favorably as of the date of this letter, there is no guarantee that the Fund will continue to hold these securities in the future. Please consider the investment objectives, risks, charges, and expenses of the Fund before investing. Contact the Fund at (866) 884-5968 for a prospectus, which contains this and other important information about the Fund. Read the prospectus carefully before investing. |
2 | Past performance does not guarantee future results. Performance data quoted above represents past performance, and the investment return and principal value of an investment will fluctuate so that an investor’s shares, when redeemed, may be worth more or less than their original cost. Current performance may be lower or higher than the performance data quoted. To obtain more current performance information, please call (866) 884-5968. |
3 | World Economic Outlook Update, January 2020: Tentative Stabilization, Sluggish Recovery?, International Monetary Fund, January 9, 2020. |
1
Outlook
It is difficult to project with confidence the pandemic’s ultimate toll on the economy, but a recession, which seemed unlikely to most at the beginning of 2020, is now a virtual certainty in the United States and globally. All measures of economic activity in the United States have contracted sharply since the onset of the pandemic. In the first quarter, U.S. GDP decreased at an estimated annual rate of 5%, and second quarter numbers, which will capture more of the economic damage from coronavirus-related lockdowns, are projected to be considerably worse.4 By the end of May unemployment claims since the start of the pandemic had topped 40 million.5
Despite the dismal economic numbers, markets have rallied sharply. The S&P 500 closed April up 30% from its March 23 low, regaining much of the ground it had lost. With the rate of new infections and deaths related to COVID-19 showing signs of slowing in recent weeks, investors have shifted their focus to the eagerly anticipated reopening of the economy as lockdowns are lifted.
In our view, much will depend on the trajectory of the recovery. We believe the market’s recent performance reflects optimism that progress towards effective COVID-19 treatments and vaccines will yield results, and that the measures taken by the Fed and Congress will be enough to keep the economy afloat until a recovery can take hold. While we are pleased to see the market rally, we think the recovery could be a bit rockier than the market is currently anticipating and that we may see further pressure on stock prices in coming months.
Portfolio Review
The attached Schedule of Investments identifies the fund’s investments and their market value as of April 30, 2020. The Fund’s 5.23% decline over the past six months trailed the S&P 500, which lost 3.16%, but came in ahead of the Russell 1000 Value Index, which lost 13.66% over the same time period.
The Fund’s long-term holdings in technology giants Microsoft, Apple, and Alphabet all posted positive returns for the Fund over the past six months and, along with new addition Amazon, were the largest positive contributors to the Fund’s performance over that time. March quarter results showed the resilience of their businesses in the face of the pandemic.
4 | Gross Domestic Product, 1st Quarter 2020 (Second Estimate), U.S. Bureau of Economic Analysis, May 28, 2020; GDPNow, Federal Reserve Bank of Atlanta, June 1, 2020. |
5 | ‘Still Catching Up’: Jobless Numbers May Not Tell Full Story, Patricia Cohen, New York Times, May 28, 2020. |
2
Microsoft generated earnings per share and revenue growth of 23% and 15%, respectively, year over year.6 Its Azure cloud business again led the way with 59% year-over-year growth, and gaming and Microsoft 365 also posted strong numbers. Alphabet reported revenue growth of 13%, aided by 10% growth in advertising and 52% growth in its cloud business. Alphabet remains the leader in search, but its ability to produce solid revenue growth despite March’s sharp, pandemic-related decline in advertising highlighted the growing value of its non-search businesses such as YouTube and cloud.7 Apple’s overall March quarter numbers were mixed, with 16% growth in services and 24% growth in wearables the bright spots.8Shares were buoyed by the reopening of its Chinese stores in March and optimism about the phased reopening of stores in the United States and elsewhere.
We added e-commerce and web services giant Amazon to the Fund’s portfolio in late March, believing it was well positioned to benefit from increased demand for online retail services and cloud-based business operations spurred by the pandemic. Costs associated with expanding operations while also taking necessary measures to protect the health of its workers during the pandemic dented margins and earnings in the March quarter, but we believe Amazon will overcome these issues and emerge from the pandemic in a stronger position than it entered.
These positive contributions were more than offset by weaker performances from several Fund holdings in the financial sector, most notably PNC, and from two stocks that are no longer held by the Fund, Boeing and Booking Holdings.
PNC’s shares were hurt over the past several months by the sharp decline in interest rates, which reduces the interest rate margin it can earn on loans, and concerns about rising credit losses due to the economic impact of the coronavirus pandemic. First quarter earnings weakened, but PNC still managed a 5% revenue gain on higher commercial borrowing and better than expected net interest income.9 Low interest rates and rising loss reserves are likely to remain a drag on earnings, but PNC’s solid fee generating capacity and strong underwriting culture should help to cushion the blow. In addition, PNC’s recent decision to divest its ownership position in BlackRock should generate roughly $13 billion for the bank. This move will shore up PNC’s already strong balance sheet and may enable it to take advantage of depressed bank valuations to make a strategic acquisition, as it did with its 2008 acquisition of National City.
6 | Microsoft Corporation, Earnings Release FY20 Q3, April 29, 2020. |
7 | Alphabet beats Wall Street expectations with Q1 earnings but sees ‘significant’ slowdown in ad revenue, Hugh Langley, Business Insider, April 28, 2020. |
8 | Falling iPhone sales bring Apple’s Q2 revenue billions below initial expectations – but its bets on wearables and services are paying off, Lisa Eadicicco, Business Insider, April 30, 2020. |
9 | PNC Financial Services Group, First Quarter 2020 News Release, April 15, 2020. |
3
Boeing’s struggles began with the grounding of the 737 Max in March of 2019. The appointment of a new CEO in January of this year was a step in the right direction, but many regulatory issues related to the 737 Max remain unresolved, and Boeing’s existing troubles were compounded by the sharp slowdown in air travel due to the coronavirus-related shutdowns. We decided to sell the Fund’s position in early March. Although Boeing was one of the Fund’s weakest performers over the past six months, over the long term it generated a solid gain for the Fund.
A soft travel market in 2019 blunted revenue growth at online travel agent Booking Holdings before the emergence of the coronavirus. As the scope of the pandemic became evident in March, driving what we believe is likely to be a protracted downturn for travel-related companies, we decided to sell the Fund’s position in Booking at a modest loss.
In addition to the sales of Booking and Boeing, we also exited several other positions over the past six months. We sold the Fund’s positions in General Motors, General Dynamics, and two exchange traded funds (ETFs), the iShares MSCI EAFE Small Cap ETF and the iShares MSCI Eurozone ETF. The sale of General Motors generated a modest gain for the Fund, while the other three sales generated modest losses.
Proceeds from these sales were used to add new holdings Amazon and cereal and packaged foods maker Kellogg and to add to existing positions in several others including Facebook, Alibaba, CVS, Applied Materials, and Bristol Myers.
Administrative Matters
Effective in August 2020, the Fund’s fiscal year-end will change from October 31 to August 31. This change is being made to match the Fund’s fiscal quarters with those of the other series in the Ultimus Managers Trust which will help streamline reporting and audit processes. It will have no impact on Fund operations.
Conclusion
We appreciate your confidence in our management of the Fund during this difficult time and look forward to continued success. You can check the Fund’s NAV online at any time by typing in the Fund’s ticker symbol (MEFOX) into most stock quotation services. Best wishes for a relaxing, safe and healthy summer -- and please do not hesitate to contact us if you have any questions regarding your investment in the Fund.
Sincerely,

| 
|
Thomas P. Meehan | Paul P. Meehan |

| |
R. Jordan Smyth, Jr. | |
Portfolio Managers, Meehan Focus Fund | |
4
Past performance is not predictive of future performance.Investment results and principal value will fluctuate so that shares, when redeemed, may be worth more or less than their original cost. Current performance may be higher or lower than the performance data quoted. Performance data current to the most recent month end are available by calling 1-866-884-5968.
An investor should consider the investment objectives, risks, charges and expenses of the Fund carefully before investing. The Fund’s prospectus contains this and other important information. To obtain a copy of the Fund’s prospectus visit the Fund’s website at www.meehanmutualfunds.com or call 1-866-884-5968 and a copy will be sent to you free of charge. Please read the prospectus carefully before you invest. The Meehan Focus Fund is distributed by Ultimus Fund Distributors, LLC.
This Letter to Shareholders seeks to describe some of the Adviser’s current opinions and views of the financial markets. Although the Adviser believes it has a reasonable basis for any opinions or views expressed, actual results may differ, sometimes significantly so, from those expected or expressed. The securities held by the Fund that are discussed in the Letter to Shareholders were held during the period covered by this Report. They do not comprise the entire investment portfolio of the Fund, may be sold at any time and may no longer be held by the Fund. For a complete list of securities held by the Fund as of April 30, 2020, please see the Schedule of Investments section of the semi-annual report. The opinions of the Adviser with respect to those securities may change at any time.
Statements in the Letter to Shareholders that reflect projections or expectations for future financial or economic performance of the Fund and the market in general and statements of the Fund’s plans and objectives for future operations are forward-looking statements. No assurance can be given that actual results or events will not differ materially from those projected, estimated, assumed, or anticipated in any such forward-looking statements. Important factors that could result in such differences, in addition to factors noted with such forward-looking statements include, without limitation, general economic conditions, such as inflation, recession, and interest rates.
5
MEEHAN FOCUS FUND
PERFORMANCE INFORMATION
April 30, 2020 (Unaudited)
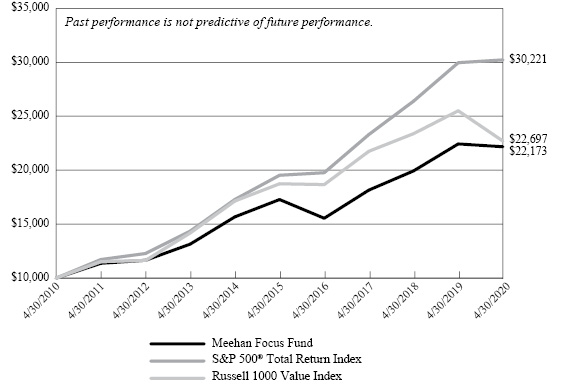
Comparison of Change in Value of a $10,000 Investment in the
Meehan Focus Fund vs. the S&P 500® Total Return Index*
and Russell 1000 Value Index*
Average Annual Total Returns
(For Periods Ended April 30, 2020) | |
| | 1 Year | 5 Years | 10 Years | |
Meehan Focus Fund(a) | (1.17%) | 5.11% | 8.29% | |
S&P 500® Total Return Index | 0.86% | 9.12% | 11.69% | |
Russell 1000 Value Index | (11.01%) | 3.90% | 8.54% | |
* | The above graph depicts the performance of the Fund versus the S&P 500® Total Return Index and the Russell 1000 Value Index. It is important to note that the Fund is a professionally managed mutual fund; the S&P 500® Total Return Index by Standard & Poor’s Corp. is a capitalization-weighted index comprised of 500 issues listed on various exchanges, representing the performance of the stock market generally; and the Russell 1000 Value Index measures the constituents that exhibit value characteristics within the largest 1,000 U.S. stocks by market cap of the U.S. equity investable universe. An index is not an investment product available for purchase. The Fund’s performance assumes the reinvestment of all dividends and all capital gains. Index returns assume reinvestment of dividends but, unlike the Fund’s returns, do not reflect any fees or expenses. |
(a) | Performance presented represents historical data. The investment return and principal value of an investment will fluctuate so that an investor’s shares, when redeemed, may be worth more or less than their original cost. The Fund’s past performance is not indicative of future performance. The table and graph above do not reflect the deduction of taxes that a shareholder would pay on Fund distributions or the redemption of Fund shares. Current performance may be lower or higher than the performance data quoted. To obtain more current performance information, please contact (866) 884-5968. As disclosed in the Fund’s February 28, 2020 prospectus, the Fund’s total annual operating expenses are 1.01%. |
6
MEEHAN FOCUS FUND
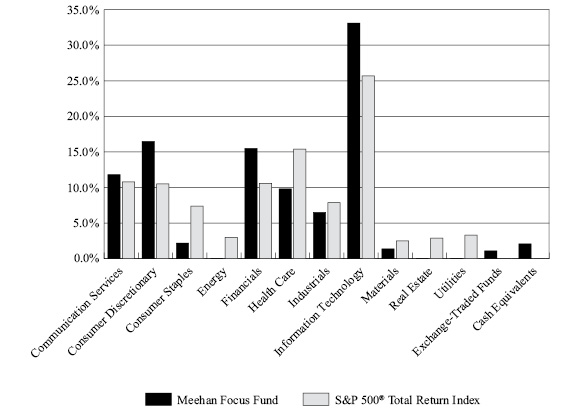
PORTFOLIO INFORMATION
April 30, 2020 (Unaudited)
Sector Diversification (% of Net Assets)
Top 10 Equity Holdings
Security Description | % of
Net Assets |
Microsoft Corporation | 14.2% |
Apple, Inc. | 9.9% |
Lowe’s Companies, Inc. | 7.7% |
Alphabet, Inc. - Classes A and C | 7.2% |
Berkshire Hathaway, Inc. - Class B | 7.1% |
United Rentals, Inc. | 3.8% |
PNC Financial Services Group, Inc. (The) | 3.8% |
Visa, Inc. - Class A | 3.4% |
Amazon.com, Inc. | 3.3% |
CVS Health Corporation | 2.9% |
7
MEEHAN FOCUS FUND
SCHEDULE OF INVESTMENTS
April 30, 2020 (Unaudited) |
COMMON STOCKS — 96.8% | | Shares | | | Value | |
Communication Services — 11.8% | | | | | | | | |
Entertainment — 2.1% | | | | | | | | |
Walt Disney Company (The) | | | 12,150 | | | $ | 1,314,023 | |
| | | | | | | | | |
Interactive Media & Services — 9.7% | | | | | | | | |
Alphabet, Inc. - Class A(a) | | | 1,495 | | | | 2,013,316 | |
Alphabet, Inc. - Class C(a) | | | 1,868 | | | | 2,519,297 | |
Facebook, Inc. - Class A(a) | | | 7,790 | | | | 1,594,691 | |
| | | | | | | | 6,127,304 | |
Consumer Discretionary — 16.5% | | | | | | | | |
Household Durables — 2.5% | | | | | | | | |
Lennar Corporation - Class A | | | 31,900 | | | | 1,597,233 | |
| | | | | | | | | |
Internet & Direct Marketing Retail — 5.2% | | | | | | | | |
Alibaba Group Holding Ltd. - ADR(a) | | | 5,750 | | | | 1,165,353 | |
Amazon.com, Inc.(a) | | | 855 | | | | 2,115,270 | |
| | | | | | | | 3,280,623 | |
Specialty Retail — 8.8% | | | | | | | | |
Lowe’s Companies, Inc. | | | 46,500 | | | | 4,870,875 | |
Williams-Sonoma, Inc. | | | 10,730 | | | | 663,543 | |
| | | | | | | | 5,534,418 | |
Consumer Staples — 2.2% | | | | | | | | |
Food Products — 2.2% | | | | | | | | |
Kellogg Company | | | 10,000 | | | | 655,000 | |
Nestlé S.A. - ADR | | | 6,970 | | | | 732,547 | |
| | | | | | | | 1,387,547 | |
Financials — 15.5% | | | | | | | | |
Banks — 6.4% | | | | | | | | |
Bank of America Corporation | | | 70,000 | | | | 1,683,500 | |
PNC Financial Services Group, Inc. (The) | | | 22,310 | | | | 2,379,808 | |
| | | | | | | | 4,063,308 | |
Capital Markets — 2.0% | | | | | | | | |
BlackRock, Inc. | | | 2,490 | | | | 1,250,079 | |
| | | | | | | | | |
Diversified Financial Services — 7.1% | | | | | | | | |
Berkshire Hathaway, Inc. - Class B(a) | | | 24,150 | | | | 4,524,744 | |
| | | | | | | | | |
Health Care — 9.8% | | | | | | | | |
Health Care Equipment & Supplies — 2.4% | | | | | | | | |
Medtronic plc | | | 15,850 | | | | 1,547,435 | |
8
MEEHAN FOCUS FUND
SCHEDULE OF INVESTMENTS (Continued) |
COMMON STOCKS — 96.8% (Continued) | | Shares | | | Value | |
Health Care — 9.8% (Continued) | | | | | | | | |
Health Care Providers & Services — 2.9% | | | | | | | | |
CVS Health Corporation | | | 30,000 | | | $ | 1,846,500 | |
| | | | | | | | | |
Pharmaceuticals — 4.5% | | | | | | | | |
Bristol-Myers Squibb Company | | | 18,130 | | | | 1,102,485 | |
Novartis AG - ADR | | | 20,420 | | | | 1,730,187 | |
| | | | | | | | 2,832,672 | |
Industrials — 6.5% | | | | | | | | |
Airlines — 0.9% | | | | | | | | |
Delta Air Lines, Inc. | | | 23,500 | | | | 608,885 | |
| | | | | | | | | |
Industrial Conglomerates — 1.8% | | | | | | | | |
3M Company | | | 7,470 | | | | 1,134,842 | |
| | | | | | | | | |
Trading Companies & Distributors — 3.8% | | | | | | | | |
United Rentals, Inc.(a) | | | 18,625 | | | | 2,393,313 | |
| | | | | | | | | |
Information Technology — 33.1% | | | | | | | | |
IT Services — 3.4% | | | | | | | | |
Visa, Inc. - Class A | | | 12,150 | | | | 2,171,448 | |
| | | | | | | | | |
Semiconductors & Semiconductor Equipment — 5.6% | | | | | | | | |
Applied Materials, Inc. | | | 35,365 | | | | 1,756,933 | |
Broadcom, Inc. | | | 6,575 | | | | 1,785,902 | |
| | | | | | | | 3,542,835 | |
Software — 14.2% | | | | | | | | |
Microsoft Corporation | | | 50,200 | | | | 8,996,342 | |
| | | | | | | | | |
Technology Hardware, Storage & Peripherals — 9.9% | | | | | | | | |
Apple, Inc. | | | 21,215 | | | | 6,232,967 | |
| | | | | | | | | |
Materials — 1.4% | | | | | | | | |
Chemicals — 1.4% | | | | | | | | |
Eastman Chemical Company | | | 14,940 | | | | 904,019 | |
| | | | | | | | | |
Total Common Stocks(Cost $31,365,912) | | | | | | $ | 61,290,537 | |
9
MEEHAN FOCUS FUND
SCHEDULE OF INVESTMENTS (Continued) |
EXCHANGE-TRADED FUNDS — 1.1% | | Shares | | | Value | |
iShares Core MSCI Pacific ETF (Cost $788,521) | | | 14,690 | | | $ | 722,601 | |
|
MONEY MARKET FUNDS — 2.0% | | Shares | | | Value | |
Invesco Short-Term Investment Trust Government & Agency Portfolio - Institutional Class, 0.20%(b) (Cost $1,255,682) | | | 1,255,682 | | | $ | 1,255,682 | |
| | | | | | | | | |
Investments at Value — 99.9%(Cost $33,410,115) | | | | | | $ | 63,268,820 | |
| | | | | | | | | |
Other Assets in Excess of Liabilities — 0.1% | | | | | | | 62,988 | |
| | | | | | | | |
Net Assets — 100.0% | | | | | | $ | 63,331,808 | |
ADR - American Depositary Receipt. |
(a) | Non-income producing security. |
(b) | The rate shown is the 7-day effective yield as of April 30, 2020. |
See accompanying notes to financial statements. |
10
MEEHAN FOCUS FUND
STATEMENT OF ASSETS AND LIABILITIES
April 30, 2020 (Unaudited) |
ASSETS | | | | |
Investments in securities: | | | | |
At cost | | $ | 33,410,115 | |
At value (Note 2) | | $ | 63,268,820 | |
Dividends receivable | | | 93,295 | |
Reclaims receivable | | | 3,844 | |
Other assets | | | 12,378 | |
TOTAL ASSETS | | | 63,378,337 | |
| | | | | |
LIABILITIES | | | | |
Payable for capital shares redeemed | | | 2,000 | |
Payable to Adviser (Note 4) | | | 25,674 | |
Payable to administrator (Note 4) | | | 10,272 | |
Other accrued expenses | | | 8,583 | |
TOTAL LIABILITIES | | | 46,529 | |
| | | | | |
NET ASSETS | | $ | 63,331,808 | |
| | | | | |
NET ASSETS CONSIST OF: | | | | |
Paid-in capital | | $ | 33,524,575 | |
Accumulated earnings | | | 29,807,233 | |
NET ASSETS | | $ | 63,331,808 | |
| | | | | |
Shares of beneficial interest outstanding (unlimited number of shares authorized, no par value ) | | | 2,473,182 | |
| | | | | |
Net asset value, offering price and redemption price per share(a) (Note 2) | | $ | 25.61 | |
(a) | Redemption price may differ from the net asset value per share depending upon the length of time held. |
See accompanying notes to financial statements. |
11
MEEHAN FOCUS FUND
STATEMENT OF OPERATIONS
For the Six Months Ended April 30, 2020 (Unaudited) |
INVESTMENT INCOME | | | | |
Dividend income | | $ | 611,525 | |
Foreign withholding taxes on dividends | | | (25,088 | ) |
TOTAL INVESTMENT INCOME | | | 586,437 | |
| | | | | |
EXPENSES | | | | |
Investment advisory fees (Note 4) | | | 268,521 | |
Administration fees (Note 4) | | | 33,554 | |
Fund accounting fees (Note 4) | | | 18,355 | |
Legal fees | | | 12,057 | |
Trustees’ fees and expenses (Note 4) | | | 11,378 | |
Audit and tax services fees | | | 9,000 | |
Transfer agent fees (Note 4) | | | 9,000 | |
Compliance fees (Note 4) | | | 6,000 | |
Registration and filing fees | | | 4,994 | |
Custody and bank service fees | | | 4,704 | |
Printing of shareholder reports | | | 4,599 | |
Postage and supplies | | | 2,434 | |
Insurance expense | | | 2,196 | |
Other expenses | | | 5,126 | |
TOTAL EXPENSES | | | 391,918 | |
Less fee reductions by the Adviser (Note 4) | | | (56,266 | ) |
NET EXPENSES | | | 335,652 | |
| | | | | |
NET INVESTMENT INCOME | | | 250,785 | |
| | | | | |
REALIZED AND UNREALIZED LOSSES ON INVESTMENTS | | | | |
Net realized losses from investment transactions | | | (225,679 | ) |
Net change in unrealized appreciation (depreciation) on investments | | | (3,477,952 | ) |
NET REALIZED AND UNREALIZED LOSSES ON INVESTMENTS | | | (3,703,631 | ) |
| | | | | |
NET DECREASE IN NET ASSETS FROM OPERATIONS | | $ | (3,452,846 | ) |
See accompanying notes to financial statements. |
12
MEEHAN FOCUS FUND
STATEMENTS OF CHANGES IN NET ASSETS |
| | Six Months
Ended
April 30,
2020
(Unaudited) | | | Year
Ended
October 31,
2019 | |
FROM OPERATIONS | | | | | | | | |
Net investment income | | $ | 250,785 | | | $ | 488,712 | |
Net realized gains (losses) from: | | | | | | | | |
Investments | | | (225,679 | ) | | | 2,006,403 | |
Foreign currency transactions | | | — | | | | (30 | ) |
Net realized gains from in-kind redemptions (Note 2) | | | — | | | | 2,033,739 | |
Net change in unrealized appreciation (depreciation) on investments | | | (3,477,952 | ) | | | 4,396,890 | |
Net increase (decrease) in net assets resulting from operations | | | (3,452,846 | ) | | | 8,925,714 | |
| | | | | | | | | |
DISTRIBUTIONS TO SHAREHOLDERS (Note 2) | | | (2,495,082 | ) | | | (1,565,477 | ) |
| | | | | | | | | |
CAPITAL SHARE TRANSACTIONS | | | | | | | | |
Proceeds from shares sold | | | 888,925 | | | | 665,329 | |
Net asset value of shares issued in reinvestment of distributions to shareholders | | | 2,473,247 | | | | 1,551,512 | |
Payments for shares redeemed | | | (1,648,842 | ) | | | (7,829,046 | ) |
Net increase (decrease) in net assets from capital share transactions | | | 1,713,330 | | | | (5,612,205 | ) |
| | | | | | | | | |
TOTAL INCREASE (DECREASE) IN NET ASSETS | | | (4,234,598 | ) | | | 1,748,032 | |
| | | | | | | | | |
NET ASSETS | | | | | | | | |
Beginning of period | | | 67,566,406 | | | | 65,818,374 | |
End of period | | $ | 63,331,808 | | | $ | 67,566,406 | |
| | | | | | | | | |
CAPITAL SHARE ACTIVITY | | | | | | | | |
Shares sold | | | 35,327 | | | | 26,047 | |
Shares reinvested | | | 84,555 | | | | 68,864 | |
Shares redeemed | | | (61,786 | ) | | | (314,096 | ) |
Net increase (decrease) in shares outstanding | | | 58,096 | | | | (219,185 | ) |
Shares outstanding at beginning of period | | | 2,415,086 | | | | 2,634,271 | |
Shares outstanding at end of period | | | 2,473,182 | | | | 2,415,086 | |
See accompanying notes to financial statements. |
13
MEEHAN FOCUS FUND
FINANCIAL HIGHLIGHTS |
Per Share Data for a Share Outstanding Throughout Each Period |
| | Six Months
Ended
Apr. 30,
2020
(Unaudited) | | | Year
Ended
Oct. 31,
2019 | | | Year
Ended
Oct. 31,
2018 | | | Year
Ended
Oct. 31,
2017 | | | Year
Ended
Oct. 31,
2016 | | | Year
Ended
Oct. 31,
2015 | |
Net asset value at beginning of period | | $ | 27.98 | | | $ | 24.99 | | | $ | 24.13 | | | $ | 19.42 | | | $ | 21.07 | | | $ | 21.43 | |
| | | | | | | | | | | | | | | | | | | | | | | | | |
Income (loss) from investment operations: | | | | | | | | | | | | | | | | | | | | | | | | |
Net investment income | | | 0.10 | | | | 0.21 | | | | 0.14 | | | | 0.15 | | | | 0.28 | | | | 0.17 | |
Net realized and unrealized gains (losses) on investments and foreign currencies | | | (1.44 | ) | | | 3.42 | | | | 0.86 | | | | 4.64 | | | | (1.30 | ) | | | (0.26 | ) |
Total from investment operations | | | (1.34 | ) | | | 3.63 | | | | 1.00 | | | | 4.79 | | | | (1.02 | ) | | | (0.09 | ) |
| | | | | | | | | | | | | | | | | | | | | | | | | |
Less distributions: | | | | | | | | | | | | | | | | | | | | | | | | |
From net investment income | | | (0.20 | ) | | | (0.15 | ) | | | (0.14 | ) | | | (0.06 | ) | | | (0.28 | ) | | | (0.18 | ) |
From net realized gains from investment transactions | | | (0.83 | ) | | | (0.49 | ) | | | — | | | | (0.02 | ) | | | (0.35 | ) | | | (0.09 | ) |
Total distributions | | | (1.03 | ) | | | (0.64 | ) | | | (0.14 | ) | | | (0.08 | ) | | | (0.63 | ) | | | (0.27 | ) |
| | | | | | | | | | | | | | | | | | | | | | | | | |
Net asset value at end of period | | $ | 25.61 | | | $ | 27.98 | | | $ | 24.99 | | | $ | 24.13 | | | $ | 19.42 | | | $ | 21.07 | |
| | | | | | | | | | | | | | | | | | | | | | | | | |
Total return(a) | | | (5.23 | %)(b) | | | 15.16 | % | | | 4.15 | % | | | 24.72 | % | | | (4.86 | %) | | | (0.43 | %) |
| | | | | | | | | | | | | | | | | | | | | | | | | |
Net assets at end of period (000’s) | | $ | 63,332 | | | $ | 67,566 | | | $ | 65,818 | | | $ | 63,743 | | | $ | 52,654 | | | $ | 56,712 | |
| | | | | | | | | | | | | | | | | | | | | | | | | |
Ratios/supplementary data: | | | | | | | | | | | | | | | | | | | | | | | | |
Ratio of total expenses to average net assets(c) | | | 1.17 | %(d) | | | 1.17 | % | | | 1.12 | % | | | 1.00 | % | | | 1.00 | % | | | 1.00 | % |
| | | | | | | | | | | | | | | | | | | | | | | | | |
Ratio of net expenses to average net assets(c) | | | 1.00 | %(d)(e) | | | 1.00 | %(e) | | | 1.00 | %(e) | | | 1.00 | %(e) | | | 1.00 | % | | | 1.00 | % |
| | | | | | | | | | | | | | | | | | | | | | | | | |
Ratio of net investment income to average net assets | | | 0.75 | %(d)(e) | | | 0.77 | %(e) | | | 0.54 | %(e) | | | 0.69 | %(e) | | | 1.44 | % | | | 0.81 | % |
| | | | | | | | | | | | | | | | | | | | | | | | | |
Portfolio turnover rate | | | 10 | %(b) | | | 20 | % | | | 20 | % | | | 10 | % | | | 44 | % | | | 23 | % |
(a) | Total return is a measure of the change in value of an investment in the Fund over the period covered. The returns shown do not reflect the deduction of taxes a shareholder would pay on Fund distributions, if any, or the redemption of Fund shares. Had the Adviser not reduced its fees, total returns would have been lower. |
(b) | Not annualized. |
(c) | The ratio excludes the impact of expenses of the registered investment companies and exchange-traded funds in which the Fund may invest. |
(d) | Annualized. |
(e) | Ratio was determined after investment advisory fee reductions (Note 4). |
See accompanying notes to financial statements. |
14
MEEHAN FOCUS FUND
NOTES TO FINANCIAL STATEMENTS
April 30, 2020 (Unaudited)
1. Organization
Meehan Focus Fund (the “Fund”) is a non-diversified series of Ultimus Managers Trust (the “Trust”). The Trust is an open-end management investment company registered under the Investment Company Act of 1940, as amended (the “1940 Act”). The Fund was reorganized into the Trust on October 23, 2017. It was formerly a series of Meehan Mutual Funds, Inc.
The Fund’s investment objective is to seek long-term growth of capital.
2. Significant Accounting Policies
The Fund follows accounting and reporting guidance under Financial Accounting Standards Board Accounting Standards Codification Topic 946, “Financial Services – Investment Companies.” The following is a summary of the Fund’s significant accounting policies used in the preparation of its financial statements. These policies are in conformity with accounting principals generally accepted in the United States of America (“GAAP”).
Securities valuation – The Fund’s portfolio securities are valued at market value as of the close of regular trading on the New York Stock Exchange (the “NYSE”) (normally 4:00 p.m. Eastern Time) on each business day the NYSE is open. Securities, including common stocks and exchange-traded funds (“ETFs”), listed on the NYSE or other exchanges are valued on the basis of their last sale price on the exchanges on which they are primarily traded. If there are no sales on that day, the securities are valued at the closing mean price on the NYSE or other primary exchange for that day. NASDAQ listed securities are valued at the NASDAQ Official Closing Price. If there are no sales on that day, the securities are valued at the last mean price as reported by NASDAQ. Securities traded in the over-the-counter market are valued at the last reported sale price, if available, otherwise at the most recently quoted mean price. Investments representing shares of money market funds and other open-end investment companies, except for ETFs, are valued at their net asset value (“NAV”) as reported by such companies. When using a quoted price and when the market is considered active, the security will be classified as Level 1 within the fair value hierarchy (see below). In the event that market quotations are not readily available or are considered unreliable due to market or other events, the Fund values its securities and other assets at fair value in accordance with procedures established by and under the general supervision of the Board of Trustees of the Trust (the “Board”). Under these procedures, the securities will be classified as Level 2 or 3 within the fair value hierarchy, depending on the inputs used. Unavailable or unreliable market quotes may be due to the following factors: a substantial bid-ask spread; infrequent sales resulting in stale prices; insufficient trading volume; small trade sizes; a temporary lapse in any reliable pricing source; and actions of the securities or futures markets, such as suspension or limitation of trading. As a result, the prices of securities used to calculate the Fund’s NAV may differ from quoted or published prices for the same securities.
15
MEEHAN FOCUS FUND
NOTES TO FINANCIAL STATEMENTS (Continued) |
GAAP establishes a single authoritative definition of fair value, sets out a framework for measuring fair value and requires additional disclosures about fair value measurements.
Various inputs are used in determining the value of the Fund’s investments. These inputs are summarized in the three broad levels listed below:
● | Level 1 – quoted prices in active markets for identical securities |
● | Level 2 – other significant observable inputs |
● | Level 3 – significant unobservable inputs |
The inputs or methodology used for valuing securities are not necessarily an indication of the risks associated with investing in those securities. The inputs used to measure fair value may fall into different levels of the fair value hierarchy. In such cases, for disclosure purposes, the level in the fair value hierarchy within which the fair value measurement falls in its entirety is determined based on the lowest level input that is significant to the fair value measurement.
The following is a summary of the inputs used to value the Fund’s investments as of April 30, 2020:
| | Level 1 | | | Level 2 | | | Level 3 | | | Total | |
Common Stocks | | $ | 61,290,537 | | | $ | — | | | $ | — | | | $ | 61,290,537 | |
Exhange-Traded Funds | | | 722,601 | | | | — | | | | — | | | | 722,601 | |
Money Market Funds | | | 1,255,682 | | | | — | | | | — | | | | 1,255,682 | |
Total | | $ | 63,268,820 | | | $ | — | | | $ | — | | | $ | 63,268,820 | |
Refer to the Fund’s Schedule of Investments for a listing of the common stocks by sector and industry type. The Fund did not hold derivative instruments or any assets or liabilities that were measured at fair value on a recurring basis using significant unobservable inputs (Level 3) as of or during the six months ended April 30, 2020.
Foreign currency translation – Securities and other assets and liabilities denominated in or expected to settle in foreign currencies, if any, are translated into U.S. dollars based on exchange rates on the following basis:
| | A. | The fair values of investment securities and other assets and liabilities are translated as of the close of the NYSE each day. |
| | B. | Purchases and sales of investment securities and income and expenses are translated at the rate of exchange prevailing as of 4:00 p.m. Eastern Time on the respective date of such transactions. |
| | C. | The Fund does not isolate that portion of the results of operations caused by changes in foreign exchange rates on investments from those caused by changes in market prices of securities held. Such fluctuations are included with the net realized and unrealized gains or losses on investments. |
16
MEEHAN FOCUS FUND
NOTES TO FINANCIAL STATEMENTS (Continued) |
Reported net realized foreign exchange gains or losses arise from 1) purchases and sales of foreign currencies and 2) the difference between the amounts of dividends and foreign withholding taxes recorded on the Fund’s books and the U.S. dollar equivalent of the amounts actually received or paid. Reported net unrealized foreign exchange gains and losses arise from changes in the value of assets and liabilities that result from changes in exchange rates.
Share valuation – The NAV per share of the Fund is calculated daily by dividing the total value of the Fund’s assets, less liabilities, by the number of shares outstanding. The offering price and redemption price per share of the Fund is equal to the NAV per share, except that shares of the Fund are subject to a redemption fee of 2% if redeemed within 7 calendar days of the date of purchase. No redemption fees were collected by the Fund during the periods ended April 30, 2020 and October 31, 2019.
Investment income – Dividend income is recorded on the ex-dividend date. Non-cash dividends included in dividend income, if any, are recorded at the fair market value of the security received. Interest income is accrued as earned. Withholding taxes on foreign dividends have been recorded in accordance with the Fund’s understanding of the applicable country’s rules and tax rates.
Investment transactions – Investment transactions are accounted for on the trade date. Realized gains and losses on investments sold are determined on a specific identification basis.
Common expenses – Common expenses of the Trust are allocated among the Fund and the other series of the Trust based on the relative net assets of each series, the number of series in the Trust, or the nature of the services performed and the relative applicability to each series.
Distributions to shareholders – Distributions to shareholders arising from net investment income and net realized capital gains, if any, are distributed at least once each year. Distributions to shareholders are recorded on the ex-dividend date. The amount of distributions from net investment income and net realized capital gains are determined in accordance with federal income tax regulations, which may differ from GAAP. The tax character of distributions paid during the periods ended April 30, 2020 and October 31, 2019 was as follows:
Period Ended | | Ordinary
Income | | | Long-Term
Capital Gains | | | Total
Distributions | |
April 30, 2020 | | $ | 488,556 | | | $ | 2,006,526 | | | $ | 2,495,082 | |
October 31, 2019 | | $ | 367,617 | | | $ | 1,197,860 | | | $ | 1,565,477 | |
17
MEEHAN FOCUS FUND
NOTES TO FINANCIAL STATEMENTS (Continued) |
Estimates– The preparation of financial statements in conformity with GAAP requires management to make estimates and assumptions that affect the reported amounts of assets and liabilities and disclosure of contingent assets and liabilities as of the date of the financial statements and the reported amounts of income and expenses during the reporting period. Actual results could differ from those estimates.
Federal income tax – The Fund has qualified and intends to continue to qualify each year as a “regulated investment company” under Subchapter M of the Internal Revenue Code of 1986, as amended (the “Code”). By so qualifying, the Fund will not be subject to federal income taxes to the extent that it distributes its net investment income and any net realized capital gains in accordance with the Code.
In order to avoid imposition of the excise tax applicable to regulated investment companies, it is also the Fund’s intention to declare as dividends in each calendar year at least 98% of its net investment income (earned during the calendar year) and 98.2% of its net realized capital gains (earned during the twelve months ended October 31) plus undistributed amounts from prior years.
The following information is computed on a tax basis for each item as of April 30, 2020:
Tax cost of portfolio investments | | $ | 33,410,115 | |
Gross unrealized appreciation | | $ | 30,746,558 | |
Gross unrealized depreciation | | | (887,853 | ) |
Net unrealized appreciation | | | 29,858,705 | |
Accumulated ordinary income | | | 174,412 | |
Other net losses | | | (225,884 | ) |
Accumulated earnings | | $ | 29,807,233 | |
During the year ended October 31, 2019, a principal of the Adviser and an affiliated trust took delivery of securities from the Fund, rather than cash, in exchange for the redemption of shares. The total fair value of these in-kind redemptions was $4,503,148 for 183,656 shares of the Fund. The Fund realized $2,033,739 of net capital gains resulting from the in-kind redemptions. The Fund recognizes a gain on in-kind redemptions to the extent that the value of the distributed securities on the date of redemption exceeds the cost of those securities and recognizes a loss to the extent that the cost of those securities exceeds the value of the distributed securities on the date of redemption. Such net gains are not taxable to the Fund and are not required to be distributed to shareholders. The Fund had reclassified this amount against paid-in capital on the Statement of Assets and Liabilities as of October 31, 2019. Such reclassification, the result of permanent differences between the financial statement and income tax reporting requirements, had no effect on the Fund’s net assets or NAV per share.
The Fund recognizes the tax benefits or expenses of uncertain tax positions only when the position is “more likely than not” to be sustained assuming examination by tax authorities. Management has reviewed the Fund’s tax positions taken on federal income tax returns for
18
MEEHAN FOCUS FUND
NOTES TO FINANCIAL STATEMENTS (Continued) |
the current and all open tax years (generally, three years) and has concluded that no provision for unrecognized tax benefits or expenses is required in these financial statements and does not expect this to change over the next twelve months. The Fund identifies its major tax jurisdiction as U.S. Federal.
3. Investment Transactions
During the six months ended April 30, 2020, cost of purchases and proceeds from sales of investment securities, other than short-term investments, were $7,331,444 and $6,615,525, respectively.
4. Transactions with Related Parties
INVESTMENT ADVISORY AGREEMENT
The Fund’s investments are managed by Edgemoor Investment Advisors, Inc. (the “Adviser”) pursuant to the terms of an Investment Advisory Agreement. Under the Investment Advisory Agreement, the Fund pays the Adviser an investment advisory fee, computed and accrued daily and paid monthly, at the annual rate of 0.80% of its average daily net assets.
Pursuant to an Expense Limitation Agreement (“ELA”), the Adviser has contractually agreed, until March 1, 2021, to reduce investment advisory fees and reimburse other expenses to the extent necessary to limit total annual operating expenses (exclusive of brokerage costs; taxes; interest; borrowing costs such as interest and dividend expenses on securities sold short; costs to organize the Fund; acquired fund fees and expenses; and extraordinary expenses, such as litigation and merger or reorganization costs and other expenses not incurred in the ordinary course of the Fund’s business) to an amount not exceeding 1.00% of the Fund’s average daily net assets. Accordingly, during the six months ended April 30, 2020, the Adviser reduced its advisory fees in the amount of $56,266.
Under the terms of the ELA, investment advisory fee reductions and expense reimbursements by the Adviser are subject to repayment by the Fund for a period of three years after such fees and expenses were incurred, provided the repayments do not cause total annual operating expenses to exceed the lesser of: (i) the expense limitation then in effect, if any, and (ii) the expense limitation in effect at the time the expenses to be repaid were incurred. As of April 30, 2020, the Adviser may seek recoupment of investment advisory fee reductions totaling $245,017 no later than the dates listed below:
October 31, 2020 | | $ | 957 | |
October 31, 2021 | | $ | 82,465 | |
October 31, 2022 | | $ | 105,329 | |
April 30, 2023 | | $ | 56,266 | |
19
MEEHAN FOCUS FUND
NOTES TO FINANCIAL STATEMENTS (Continued) |
OTHER SERVICE PROVIDERS
Ultimus Fund Solutions, LLC (“Ultimus”) provides administration, fund accounting, compliance and transfer agency services to the Fund. The Fund pays Ultimus fees in accordance with the agreements for such services. In addition, the Fund pays out-of-pocket expenses including, but not limited to, postage, supplies, and certain costs related to the pricing of the Fund’s portfolio securities.
Under the terms of a Distribution Agreement with the Trust, Ultimus Fund Distributors, LLC (the “Distributor”) serves as the principal underwriter to the Fund. The Distributor is a wholly-owned subsidiary of Ultimus. The Distributor is compensated by the Adviser (not the Fund) for acting as principal underwriter.
Certain officers and a Trustee of the Trust are also officers of Ultimus and the Distributor.
TRUSTEE COMPENSATION
Each Trustee who is not an “interested person” of the Trust (“Independent Trustee”) receives a $1,300 annual retainer from each Fund, paid quarterly, except for the Board Chairperson who receives a $1,500 annual retainer from each Fund, paid quarterly. Each Independent Trustee also receives from each Fund a fee of $500 for each Board meeting attended plus reimbursement for travel and other meeting-related expenses.
5. Contingencies and Commitments
The Fund indemnifies the Trust’s officers and Trustees for certain liabilities that might arise from their performance of their duties to the Fund. Additionally, in the normal course of business the Fund enters into contracts that contain a variety of representations and warranties and which provide general indemnifications. The Fund’s maximum exposure under these arrangements is unknown, as this would involve future claims that may be made against the Fund that have not yet occurred. However, based on experience, the Trust expects the risk of loss to be remote.
6. Non-Diversification Risk
The Fund is a non-diversified Fund. As a result, the Fund’s holdings may be more concentrated in a limited number of securities and the value of its shares may be more sensitive than a diversified fund to any single economic, business, political, or regulatory occurrence.
20
MEEHAN FOCUS FUND
NOTES TO FINANCIAL STATEMENTS (Continued) |
7. Sector Risk
If a Fund has significant investments in the securities of issuers within a particular sector, any development affecting that sector will have a greater impact on the value of the net assets of the Fund than would be the case if the Fund did not have significant investments in that sector. In addition, this may increase the risk of loss in the Fund and increase the volatility of the Fund’s NAV per share. Occasionally, market conditions, regulatory changes or other developments may negatively impact a particular sector. As of April 30, 2020, the Fund had 33.1% of the value of its net assets invested in stocks within the Information Technology sector.
8. Subsequent Events
The Fund is required to recognize in the financial statements the effects of all subsequent events that provide additional evidence about conditions that existed as of the date of the Statement of Assets and Liabilities. For non-recognized subsequent events that must be disclosed to keep the financial statements from being misleading, the Fund is required to disclose the nature of the event as well as an estimate of its financial effect, or a statement that such an estimate cannot be made. Management has evaluated subsequent events through the issuance of these financial statements and has noted no such events.
21
MEEHAN FOCUS FUND
ABOUT YOUR FUND’S EXPENSES (Unaudited) |
We believe it is important for you to understand the impact of costs on your investment. As a shareholder of the Fund, you may incur two types of costs: (1) transaction costs, including redemption fees; and (2) ongoing costs, including management fees and other expenses. The following examples are intended to help you understand your ongoing costs (in dollars) of investing in the Fund and to compare these costs with the ongoing costs of investing in other mutual funds.
A mutual fund’s ongoing costs are expressed as a percentage of its average net assets. This figure is known as the expense ratio. The expenses in the table below are based on an investment of $1,000 made at the beginning of the most recent period (November 1, 2019) and held until the end of the period (April 30, 2020).
The table below illustrates the Fund’s ongoing costs in two ways:
Actual fund return – This section helps you to estimate the actual expenses that you paid over the period. The “Ending Account Value” shown is derived from the Fund’s actual return, and the third column shows the dollar amount of operating expenses that would have been paid by an investor who started with $1,000 in the Fund. You may use the information here, together with the amount you invested, to estimate the expenses that you paid over the period.
To do so, simply divide your account value by $1,000 (for example, an $8,600 account value divided by $1,000 = 8.6), then multiply the result by the number given for the Fund under the heading “Expenses Paid During Period.”
Hypothetical 5% return – This section is intended to help you compare the Fund’s ongoing costs with those of other mutual funds. It assumes that the Fund had an annual return of 5% before expenses during the period shown, but that the expense ratio is unchanged. In this case, because the return used is not the Fund’s actual return, the results do not apply to your investment. The example is useful in making comparisons because the U.S. Securities and Exchange Commission (the “SEC”) requires all mutual funds to calculate expenses based on a 5% return. You can assess the Fund’s ongoing costs by comparing this hypothetical example with the hypothetical examples that appear in shareholder reports of other funds.
Note that expenses shown in the table are meant to highlight and help you compare ongoing costs only. The Fund does not charge sales loads. However, a redemption fee of 2% is applied on the sale of shares of the Fund held for less than 7 calendar days.
The calculations assume no shares were bought or sold during the period. Your actual costs may have been higher or lower, depending on the amount of your investment and the timing of any purchases or redemptions.
More information about the Fund’s expenses, including historical annual expense ratios, can be found in this report. For additional information on operating expenses and other shareholder costs, please refer to the Fund’s prospectus.
22
MEEHAN FOCUS FUND
ABOUT YOUR FUND’S EXPENSES (Unaudited) (Continued) |
| Beginning
Account Value
November 1,
2019 | Ending
Account Value
April 30,
2020 | Expenses
Paid During
Period* |
Based on Actual Fund Return | $ 1,000.00 | $ 947.40 | $ 4.84 |
Based on Hypothetical 5% Return (before expenses) | $ 1,000.00 | $ 1,019.89 | $ 5.02 |
* | Expenses are equal to the Fund’s annualized net expense ratio of 1.00% multiplied by the average account value over the period, multiplied 182/366 (to reflect the one-half year period). |
23
MEEHAN FOCUS FUND
OTHER INFORMATION (Unaudited) |
A description of the policies and procedures that the Fund uses to vote proxies relating to portfolio securities is available without charge upon request by calling toll-free 1-866-884-5968, or on the SEC’s website at www.sec.gov. Information regarding how the Fund voted proxies relating to portfolio securities during the most recent 12-month period ended June 30 is available without charge upon request by calling toll-free 1-866-884-5968, or on the SEC’s website at www.sec.gov.
The Trust files a complete listing of portfolio holdings for the Fund with the SEC as of the end of the first and third quarters of each fiscal year. These filings are available upon request by calling 1-866-884-5968. Furthermore, you may obtain a copy of the filings on the SEC’s website at www.sec.gov.
24
CUSTOMER PRIVACY NOTICE |
FACTS | WHAT DOES THE MEEHAN FOCUS FUND (the “Fund”) DO WITH YOUR PERSONAL INFORMATION? |
| | |
Why? | Financial companies choose how they share your personal information. Federal law gives consumers the right to limit some but not all sharing. Federal law also requires us to tell you how we collect, share, and protect your personal information. Please read this notice carefully to understand what we do. |
| | |
What? | The types of personal information we collect and share depend on the product or service you have with us. This information can include: ■ Social Security number ■ Assets ■ Retirement Assets ■ Transaction History ■ Checking Account Information ■ Purchase History ■ Account Balances ■ Account Transactions ■ Wire Transfer Instructions When you areno longer our customer, we continue to share your information as described in this notice. |
| | |
How? | All financial companies need to share your personal information to run their everyday business. In the section below, we list the reasons financial companies can share their customers’ personal information; the reasons the Fund chooses to share; and whether you can limit this sharing. |
| | |
Reasons we can share your personal information | Does the
Fund share? | Can you limit this sharing? |
For our everyday business purposes – Such as to process your transactions, maintain your account(s), respond to court orders and legal investigations, or report to credit bureaus | Yes | No |
For our marketing purposes – to offer our products and services to you | No | We don’t share |
For joint marketing with other financial companies | No | We don’t share |
For our affiliates’ everyday business purposes – information about your transactions and experiences | No | We don’t share |
For our affiliates’ everyday business purposes– information about your creditworthiness | No | We don’t share |
For nonaffiliates to market to you | No | We don’t share |
| | |
Questions? | Call 1-866-884-5968 |
25
Who we are |
Who is providing this notice? | Meehan Focus Fund Ultimus Fund Distributors, LLC (Distributor) Ultimus Fund Solutions, LLC (Administrator) |
What we do |
How does the Fund protect my personal information? | To protect your personal information from unauthorized access and use, we use security measures that comply with federal law. These measures include computer safeguards and secured files and buildings. Our service providers are held accountable for adhering to strict policies and procedures to prevent any misuse of your nonpublic personal information. |
How does the Fund collect my personal information? | We collect your personal information, for example, when you ■ Open an account ■ Provide account information ■ Give us your contact information ■ Make deposits or withdrawals from your account ■ Make a wire transfer ■ Tell us where to send the money ■ Tell us who receives the money ■ Show your government-issued ID ■ Show your driver’s license We also collect your personal information from other companies. |
Why can’t I limit all sharing? | Federal law gives you the right to limit only ■ Sharing for affiliates’ everyday business purposes – information about your creditworthiness ■ Affiliates from using your information to market to you ■ Sharing for nonaffiliates to market to you State laws and individual companies may give you additional rights to limit sharing. |
| | |
Definitions |
Affiliates | Companies related by common ownership or control. They can be financial and nonfinancial companies. ■Edgemoor Investment Advisors, Inc., the investment adviser to the Fund, could be deemed to be an affiliate. |
Nonaffiliates | Companies not related by common ownership or control. They can be financial and nonfinancial companies ■The Fund does not share with nonaffiliates so they can market to you. |
Joint marketing | A formal agreement between nonaffiliated financial companies that together market financial products or services to you. ■The Fund does not jointly market. |
26
This page intentionally left blank.
This page intentionally left blank.
This page intentionally left blank.
Not required
| Item 3. | Audit Committee Financial Expert. |
Not required
| Item 4. | Principal Accountant Fees and Services. |
Not required
| Item 5. | Audit Committee of Listed Registrants. |
Not applicable
| Item 5. | Audit Committee of Listed Registrants. |
Not applicable
| Item 6. | Schedule of Investments. |
(a) Not applicable [schedule filed with Item 1]
(b) Not applicable
| Item 7. | Disclosure of Proxy Voting Policies and Procedures for Closed-End Management Investment Companies. |
Not applicable
| Item 8. | Portfolio Managers of Closed-End Management Investment Companies. |
Not applicable
| Item 9. | Purchases of Equity Securities by Closed-End Management Investment Company and Affiliated Purchasers. |
Not applicable
| Item 10. | Submission of Matters to a Vote of Security Holders. |
The registrant’s Committee of Independent Trustees shall review shareholder recommendations for nominations to fill vacancies on the registrant’s board of trustees if such recommendations are submitted in writing and addressed to the Committee at the registrant’s offices. The Committee may adopt, by resolution, a policy regarding its procedures for considering candidates for the board of trustees, including any recommended by shareholders.
| Item 11. | Controls and Procedures. |
(a) Based on their evaluation of the registrant’s disclosure controls and procedures (as defined in Rule 30a-3(c) under the Investment Company Act of 1940) as of a date within 90 days of the filing date of this report, the registrant’s principal executive officer and principal financial officer have concluded that such disclosure controls and procedures are reasonably designed and are operating effectively to ensure that material information relating to the registrant, including its consolidated subsidiaries, is made known to them by others within those entities, particularly during the period in which this report is being prepared, and that the information required in filings on Form N-CSR is recorded, processed, summarized, and reported on a timely basis.
(b) There were no changes in the registrant’s internal control over financial reporting (as defined in Rule 30a-3(d) under the Investment Company Act of 1940) that occurred during the first and second fiscal quarter of the period covered by this report that have materially affected, or are reasonably likely to materially affect, the registrant’s internal control over financial reporting.
| Item 12. | Disclosure of Securities Lending Activities for Closed-End Management Investment Companies. |
Not applicable
File the exhibits listed below as part of this Form. Letter or number the exhibits in the sequence indicated.
(a)(1) Any code of ethics, or amendment thereto, that is the subject of the disclosure required by Item 2, to the extent that the registrant intends to satisfy the Item 2 requirements through filing of an exhibit: Not required
(a)(2) A separate certification for each principal executive officer and principal financial officer of the registrant as required by Rule 30a-2(a) under the Act (17 CFR 270.30a-2(a)): Attached hereto
(a)(3) Any written solicitation to purchase securities under Rule 23c-1 under the Act (17 CFR 270.23c-1) sent or given during the period covered by the report by or on behalf of the registrant to 10 or more persons: Not applicable
(a)(4) Change in the registrant’s independent public accountants: Not applicable
(b) Certifications required by Rule 30a-2(b) under the Act (17 CFR 270.30a-2(b)): Attached hereto
SIGNATURES
Pursuant to the requirements of the Securities Exchange Act of 1934 and the Investment Company Act of 1940, the registrant has duly caused this report to be signed on its behalf by the undersigned, thereunto duly authorized.
| (Registrant) | Ultimus Managers Trust | | |
| | | | |
| By (Signature and Title)* | /s/ Matthew J. Beck | |
| | | Matthew J. Beck, Secretary | |
| | | | |
| Date | June 23, 2020 | | |
| | | | |
| Pursuant to the requirements of the Securities Exchange Act of 1934 and the Investment Company Act of 1940, this report has been signed below by the following persons on behalf of the registrant and in the capacities and on the dates indicated. |
| | | | |
| By (Signature and Title)* | /s/ David R. Carson | |
| | | David R. Carson, Principal Executive Officer | |
| | | | |
| Date | June 23, 2020 | | |
| | | | |
| By (Signature and Title)* | /s/ Jennifer L. Leamer | |
| | | Jennifer L. Leamer, Treasurer and Principal Financial Officer | |
| | | | |
| Date | June 23, 2020 | | |
| * | Print the name and title of each signing officer under his or her signature. |