| | OMB APPROVAL |
| | OMB Number: 3235-0570 Expires: August 31, 2020 Estimated average burden hours per response: 20.6 |
UNITED STATES
SECURITIES AND EXCHANGE COMMISSION
Washington, D.C. 20549
FORM N-CSR
CERTIFIED SHAREHOLDER REPORT OF REGISTERED
MANAGEMENT INVESTMENT COMPANIES
| Investment Company Act file number | 811-22680 | |
| Ultimus Managers Trust |
| (Exact name of registrant as specified in charter) |
| 225 Pictoria Drive, Suite 450 Cincinnati, Ohio | 45246 |
| (Address of principal executive offices) | (Zip code) |
Matthew J. Beck
| Ultimus Fund Solutions, LLC 225 Pictoria Drive, Suite 450 Cincinnati, Ohio 45246 |
| (Name and address of agent for service) |
| Registrant's telephone number, including area code: | (513) 587-3400 | |
| Date of fiscal year end: | May 31 | |
| | | |
| Date of reporting period: | November 30, 2019 | |
Form N-CSR is to be used by management investment companies to file reports with the Commission not later than 10 days after the transmission to stockholders of any report that is required to be transmitted to stockholders under Rule 30e-1 under the Investment Company Act of 1940 (17 CFR 270.30e-1). The Commission may use the information provided on Form N-CSR in its regulatory, disclosure review, inspection, and policymaking roles.
A registrant is required to disclose the information specified by Form N-CSR, and the Commission will make this information public. A registrant is not required to respond to the collection of information contained in Form N-CSR unless the Form displays a currently valid Office of Management and Budget ("OMB") control number. Please direct comments concerning the accuracy of the information collection burden estimate and any suggestions for reducing the burden to the Secretary, Securities and Exchange Commission, 450 Fifth Street, NW, Washington, DC 20549-0609. The OMB has reviewed this collection of information under the clearance requirements of 44 U.S.C. § 3507.
| Item 1. | Reports to Stockholders. |
Beginning on January 1, 2021, as permitted by regulations adopted by the U.S. Securities and Exchange Commission, paper copies of the Fund’s shareholder reports like this one will no longer be sent by mail, unless you specifically request paper copies of the reports from the Fund or from your financial intermediary, such as a broker-dealer or bank. Instead, the reports will be made available on a website, and you will be notified by mail each time a report is posted and provided with a website link to access the report.
If you have already elected to receive shareholder reports electronically, you will not be affected by this change and you need not take any action. You may elect to receive shareholder reports and other communications from the Fund electronically by contacting the Fund at 1-866-896-9292 or, if you own these shares through a financial intermediary, by contacting your financial intermediary.
You may elect to receive all future reports in paper free of charge. You can inform the Fund that you wish to continue receiving paper copies of your shareholder reports by contacting the Fund at 1-866-896-9292. If you own shares through a financial intermediary, you may contact your financial intermediary or follow instructions included with this document to elect to continue to receive paper copies of your shareholder reports. Your election to receive reports in paper will apply to all Funds held with the Fund complex or at your financial intermediary.
WAVELENGTH INTEREST RATE NEUTRAL FUND |
LETTER TO SHAREHOLDERS (Unaudited) | January 16, 2020 |
Dear Fellow Shareholders:
Since our last shareholder letter, markets have cycled through a broad range of competing themes stemming from geopolitical tensions, monetary policy, and concerns over the economy’s trajectory after expanding for over a decade. Amidst rising levels of uncertainty throughout the period, we managed downside by design and captured upside systematically through the factors that we believe drive excess returns.
What follows is designed to provide a context for our results that fosters a deeper understanding of the investment process that supports them. By doing so we hope to build on the partnership your investment creates.
PERFORMANCE SUMMARY
For the six months ended November 30, 2019, the Wavelength Interest Rate Neutral Fund (the “Fund”) delivered a return of +4.68% versus a benchmark return of +1.05% for the S&P / BGCantor 0-3 Month US Treasury Bill Index (which seeks to represent the return from not taking risk in financial markets). These results were delivered amidst a transition for interest rates and unstable economic conditions where market dislocations were monetized in line with investment objectives.
WAVELENGTH PHILOSOPHY
We believe that macroeconomic conditions drive asset prices and central banks use interest rates to manage macroeconomic conditions. Based on this fundamental logic, we seek to build a portfolio that is hedged to changes in interest rates by balancing investment exposure between instruments we expect to outperform in rising and falling macroeconomic conditions.
INVESTMENT ENVIRONMENT
As an extension of our investment philosophy we believe that changing expectations for growth and inflation drive investment decisions, which in turn drive market prices. Since our last letter, negative surprises for the US economy turned positive while inflation remained subdued, producing heightened levels of late-cycle uncertainty in markets.
The six-month period began with increasing fear of an economic slowdown and mounting pressure for the Federal Reserve to respond through policy measures. Consistent with this, the FOMC cut the target for the federal funds rate at their July meeting. The change in approach ended a hiking cycle that was in place since 2015, and central banks across the globe followed suit with increasingly accommodative policy.
While asset prices tied to rising growth conditions were supported through June and July, this began to change in August as economic datapoints fell below market expectations. In this context, government bonds outperformed and futures on the federal funds rate priced in further interest rate cuts. Trade tensions also continued to drive price action, as tweets on additional tariffs negatively impacted the economic outlook. This dynamic led to rising levels of volatility in markets, making risk management increasingly critical.
1
The early days of Autumn were met by stronger-than-expected economic data and further monetary easing in the US and Europe. Stimulative policy decisions supported riskier assets, such as corporate credit, after a difficult summer for growth. Heading into October, markets welcomed the US and China moving closer to an agreement on trade and the UK edging back from the precipice of a no-deal Brexit.
The period came to a close with a rebound in expectations for the economy and declining fears of an oncoming recession in the US. Further market volatility was driven by tweets on trade negotiations, speculation around Brexit, and the impeachment inquiry. While these dynamics produced noisy conditions day-to-day, the economy maintained its connection to markets – consistent with our investment process – as the fundamental driver of asset prices over the long-term.
PERFORMANCE DISCUSSION
The portfolio benefited from a continued rotation between rising and falling growth assets over the period. This whipsaw of market swings proved difficult for many one-dimensional strategies and created conditions that highlight the strength of our investment process in an unpredictable environment.
Balanced profits were generated in June amidst a recalibration of expectations for interest rates and the recovery of assets tied to economic growth, such as convertible bonds and corporate credit. Outperformance continued into July, as the portfolio adapted to a new opportunity set with profits from convertible bonds and emerging market debt. These positive returns were achieved despite headwinds for US Treasuries and the broad-based underperformance of global bonds.
In the face of August’s stock market sell-off, the portfolio provided protection and delivered positive results. Many existing trends reversed, causing a rise in volatility across asset classes, and profits were generated in US Treasuries, as well as inflation-linked and municipal bonds. This upside was limited by convertible bond exposure which suffered as markets became increasingly stressed.
In September, portfolio exposure levels were reduced modestly as issues in overnight funding combined with Brexit-related uncertainty and the impeachment inquiry to drive choppy markets. Portfolio profits during the month were driven by convertible bonds, bank loans, and high yield corporate credit, and these were offset by negative contributions from positions across the US yield curve.
The portfolio rebounded positively in October and November, as both government bonds and growth-related assets benefited from central banks reiterating dovish stances. Holdings in more volatile markets were actively reduced, and factors helped monetize the changing shape of the US yield curve. Through this market action, the portfolio effectively recalibrated to a new set of expectations for the economy and its trajectory moving forward.
OUTLOOK
Late cycle economic conditions are leading to heightened uncertainty and a wider set of potential outcomes as central banks take action. We believe using factors to monetize the opportunity set offers a distinct advantage in this environment, and actively managing new
2
investment risks will be critical to returns. As a result, the portfolio is positioned targeting an equal exposure to potential outcomes for growth and inflation and seeks to be prepared for whatever comes next with the economy in transition.
Thank you for your trust and commitment through investment.
Sincerely,

Andrew Dassori
Founding Partner & Chief Investment Officer
Wavelength Capital Management
Past performance is not predictive of future performance. Investment results and principal value will fluctuate so that shares, when redeemed, may be worth more or less than their original cost. Current performance may be higher or lower than the performance data quoted. Performance data current to the most recent month end are available by calling 1-866-896-9292.
An investor should consider the investment objectives, risks, charges and expenses of the Fund carefully before investing. The Fund’s prospectus contains this and other important information. To obtain a copy of the Fund’s prospectus please visit our website at www.wavelengthfunds.com or call 1-866-896-9292 and a copy will be sent to you free of charge. Please read the prospectus carefully before you invest. The Wavelength Interest Rate Neutral Fund is distributed by Ultimus Fund Distributors, LLC.
The Letter to Shareholders seeks to describe some of the Adviser’s current opinions and views of the financial markets. Although the Adviser believes it has a reasonable basis for any opinions or views expressed, actual results may differ, sometimes significantly so, from those expected or expressed. The securities held by the Fund that are discussed in the Letter to Shareholders were held during the period covered by this Report. They do not comprise the entire investment portfolio of the Fund, may be sold at any time and may no longer be held by the Fund. For a complete list of securities held by the Fund as of November 30, 2019, please see the Schedule of Investments section of the Semi Annual Report. The opinions of the Adviser with respect to those securities may change at any time.
Statements in the Letter to Shareholders that reflect projections or expectations for future financial or economic performance of the Fund and the market in general and statements of the Fund’s plans and objectives for future operations are forward-looking statements. No assurance can be given that actual results or events will not differ materially from those projected, estimated, assumed, or anticipated in any such forward-looking statements. Important factors that could result in such differences, in addition to factors noted with such forward-looking statements include, without limitation, general economic conditions, such as inflation, recession, and interest rates. Past performance is not a guarantee of future results.
3
WAVELENGTH INTEREST RATE NEUTRAL FUND
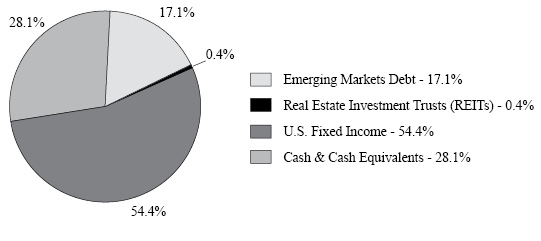
PORTFOLIO INFORMATION
November 30, 2019 (Unaudited)
Portfolio Allocation (% of Net Assets)
Top 10 Equity Holdings
Security Description | % of
Net Assets |
iShares TIPS Bond ETF | 17.0% |
Vanguard Emerging Markets Government Bond ETF | 9.5% |
SPDR Bloomberg Barclays Convertible Securities ETF | 7.4% |
iShares National Muni Bond ETF | 6.8% |
SPDR Bloomberg Barclays Short Term High Yield Bond ETF | 6.7% |
Invesco Senior Loan ETF | 6.3% |
VanEck Vectors Emerging Markets High Yield Bond ETF | 3.3% |
iShares J.P. Morgan USD Emerging Markets Bond ETF | 3.3% |
Vanguard Mortgage-Backed Securities ETF | 3.3% |
Vanguard Short-Term Inflation-Protected Securities ETF | 2.8% |
4
WAVELENGTH INTEREST RATE NEUTRAL FUND
SCHEDULE OF INVESTMENTS
November 30, 2019 (Unaudited) |
EXCHANGE-TRADED FUNDS — 71.9% | | Shares | | | Value | |
Emerging Markets Debt — 17.1% | | | | | | | | |
Invesco Emerging Markets Sovereign Debt ETF (a) | | | 25,892 | | | $ | 744,654 | |
iShares J.P. Morgan USD Emerging Markets Bond ETF | | | 24,103 | | | | 2,702,428 | |
VanEck Vectors Emerging Markets High Yield Bond ETF (a) | | | 115,249 | | | | 2,703,742 | |
Vanguard Emerging Markets Government Bond ETF | | | 95,545 | | | | 7,635,956 | |
| | | | | | | | 13,786,780 | |
Real Estate Investment Trusts (REITs) — 0.4% | | | | | | | | |
Vanguard Real Estate ETF (a) | | | 3,600 | | | | 335,052 | |
| | | | | | | | | |
U.S. Fixed Income — 54.4% | | | | | | | | |
Invesco Senior Loan ETF (a) | | | 227,239 | | | | 5,103,788 | |
iShares iBoxx $ High Yield Corporate Bond ETF (a) | | | 25,520 | | | | 2,218,709 | |
iShares National Muni Bond ETF | | | 48,200 | | | | 5,497,210 | |
iShares TIPS Bond ETF | | | 117,908 | | | | 13,722,133 | |
SPDR Bloomberg Barclays Convertible Securities ETF | | | 109,337 | | | | 5,980,734 | |
SPDR Bloomberg Barclays High Yield Bond ETF (a) | | | 10,277 | | | | 1,113,410 | |
SPDR Bloomberg Barclays Short Term High Yield Bond ETF (a) | | | 203,609 | | | | 5,434,324 | |
Vanguard Mortgage-Backed Securities ETF | | | 49,294 | | | | 2,625,399 | |
Vanguard Short-Term Inflation-Protected Securities ETF | | | 45,219 | | | | 2,224,323 | |
| | | | | | | | 43,920,030 | |
| | | | | | | | | |
Total Exchange-Traded Funds (Cost $57,228,953) | | | | | | $ | 58,041,862 | |
5
WAVELENGTH INTEREST RATE NEUTRAL FUND
SCHEDULE OF INVESTMENTS (Continued) |
MONEY MARKET FUNDS — 17.3% | | Shares | | | Value | |
Fidelity Institutional Money Market Government Portfolio - Class I, 1.53% (b) | | | 7,002,299 | | | $ | 7,002,299 | |
Invesco Short-Term Investments Trust - Treasury Portfolio - Institutional Class, 1.52% (b) | | | 7,002,299 | | | | 7,002,299 | |
Total Money Market Funds (Cost $14,004,598) | | | | | | $ | 14,004,598 | |
|
COLLATERAL FOR SECURITIES LOANED — 18.7% | | Shares | | | Value | |
Mount Vernon Liquid Assets Portfolio, LLC, 1.81% (b) (c) (Cost $15,128,346) | | | 15,128,346 | | | $ | 15,128,346 | |
| | | | | | | | | |
Investments at Value — 107.9% (Cost $86,361,897) | | | | | | $ | 87,174,806 | |
| | | | | | | | | |
Liabilities in Excess of Other Assets — (7.9%) | | | | | | | (6,393,884 | ) |
| | | | | | | | | |
Net Assets — 100.0% | | | | | | $ | 80,780,922 | |
(a) | All or a portion of the security is on loan. The total value of the securities on loan as of November 30, 2019 was $14,737,221 (Note 6). |
(b) | The rate shown is the 7-day effective yield as of November 30, 2019. |
(c) | This security was purchased with the cash collateral held from securities on loan. The total value of such securities as of November 30, 2019 was $15,128,346 (Note 6). |
See accompanying notes to financial statements. |
6
WAVELENGTH INTEREST RATE NEUTRAL FUND
SCHEDULE OF FUTURES CONTRACTS
November 30, 2019 (Unaudited) |
FUTURES CONTRACTS | | Contracts | | | Expiration
Date | | | Notional
Value | | | Value/Unrealized
Appreciation
(Depreciation) | |
Commodity Futures | | | | | | | | | | | | �� | | | | |
E-Mini Gold Future | | | 5 | | | | 1/29/2020 | | | $ | 367,563 | | | $ | 1,142 | |
E-Mini NYMEX Light Sweet Crude Oil Future | | | 2 | | | | 12/18/2019 | | | | 55,525 | | | | (2,467 | ) |
Total Commodity Futures | | | | | | | | | | | 423,088 | | | | (1,325 | ) |
| | | | | | | | | | | | | | | | | |
Index Futures | | | | | | | | | | | | | | | | |
E-Mini Dow CBOT DJIA Future | | | 13 | | | | 12/20/2019 | | | | 1,824,160 | | | | 42,698 | |
E-Mini NASDAQ 100 Future | | | 11 | | | | 12/20/2019 | | | | 1,851,135 | | | | 73,358 | |
E-Mini S&P 500 Future | | | 10 | | | | 12/20/2019 | | | | 1,571,625 | | | | 36,192 | |
Total Index Futures | | | | | | | | | | | 5,246,920 | | | | 152,248 | |
| | | | | | | | | | | | | | | | | |
Treasury Futures | | | | | | | | | | | | | | | | |
10-Year U.S. Treasury Note Future | | | 55 | | | | 3/20/2020 | | | | 7,112,187 | | | | (15,432 | ) |
2-Year U.S. Treasury Note Future | | | 44 | | | | 3/31/2020 | | | | 9,483,375 | | | | (4,237 | ) |
5-Year U.S. Treasury Note Future | | | 118 | | | | 3/31/2020 | | | | 14,032,781 | | | | (15,117 | ) |
U.S. Treasury Long Bond Future | | | 26 | | | | 3/20/2020 | | | | 4,130,750 | | | | (4,950 | ) |
Total Treasury Futures | | | | | | | | | | | 34,759,093 | | | | (39,736 | ) |
| | | | | | | | | | | | | | | | | |
Total Futures Contracts | | | | | | | | | | $ | 40,429,101 | | | $ | 111,187 | |
|
FUTURES CONTRACTS
SOLD SHORT | | Contracts | | | Expiration
Date | | | Notional
Value | | | Value/Unrealized
Depreciation | |
Commodity Futures | | | | | | | | | | | | | | | | |
E-Mini Silver Future | | | 2 | | | | 2/26/2020 | | | $ | (85,530 | ) | | $ | (127 | ) |
The average monthly notional value of futures contracts and futures contracts sold short during the six months ended November 30, 2019 was $37,078,893 and ($85,245), respectively.
See accompanying notes to financial statements. |
7
WAVELENGTH INTEREST RATE NEUTRAL FUND
STATEMENT OF ASSETS AND LIABILITIES
November 30, 2019 (Unaudited) |
ASSETS | | | | |
Investments in securities: | | | | |
At cost | | $ | 86,361,897 | |
At value* (Note 2) | | $ | 87,174,806 | |
Cash | | | 7,091,661 | |
Margin deposits for futures contracts (Note 2) | | | 1,685,888 | |
Variation margin receivable (Notes 2 and 5) | | | 3,403 | |
Receivable for capital shares sold | | | 590 | |
Receivable for investment securities sold | | | 56,019 | |
Dividends and interest receivable | | | 24,897 | |
Other assets | | | 22,730 | |
Total assets | | | 96,059,994 | |
| | | | | |
LIABILITIES | | | | |
Variation margin payable (Notes 2 and 5) | | | 54,293 | |
Payable for return of collateral received for securities on loan (Note 6) | | | 15,128,346 | |
Payable for investment securities purchased | | | 38,312 | |
Payable to Adviser (Note 4) | | | 35,907 | |
Payable to administrator (Note 4) | | | 12,090 | |
Other accrued expenses | | | 10,124 | |
Total liabilities | | | 15,279,072 | |
| | | | | |
NET ASSETS | | $ | 80,780,922 | |
| | | | | |
NET ASSETS CONSIST OF: | | | | |
Paid-in capital | | $ | 77,806,761 | |
Accumulated earnings | | | 2,974,161 | |
NET ASSETS | | $ | 80,780,922 | |
| | | | | |
Shares of beneficial interest outstanding (unlimited number of shares authorized, no par value) | | | 7,623,922 | |
| | | | | |
Net asset value, offering price and redemption price per share (Note 2) | | $ | 10.60 | |
* | Includes value of securities on loan. |
See accompanying notes to financial statements. |
8
WAVELENGTH INTEREST RATE NEUTRAL FUND
STATEMENT OF OPERATIONS
For the Six Months Ended November 30, 2019 (Unaudited) |
INVESTMENT INCOME | | | | |
Dividends | | $ | 1,081,591 | |
Interest | | | 4,080 | |
Securities lending income (Note 6) | | | 54,500 | |
Total investment income | | | 1,140,171 | |
| | | | | |
EXPENSES | | | | |
Investment advisory fees (Note 4) | | | 312,301 | |
Administration fees (Note 4) | | | 32,917 | |
Registration and filing fees | | | 18,612 | |
Fund accounting fees (Note 4) | | | 18,290 | |
Legal fees | | | 12,828 | |
Trustees’ fees and expenses (Note 4) | | | 11,157 | |
Transfer agent fees (Note 4) | | | 9,000 | |
Audit and tax service fees | | | 8,300 | |
Custody and bank service fees | | | 6,304 | |
Compliance fees and expenses (Note 4) | | | 6,000 | |
Printing of shareholder reports | | | 4,403 | |
Insurance expense | | | 2,094 | |
Postage and supplies | | | 1,817 | |
Other expenses | | | 8,444 | |
Total expenses | | | 452,467 | |
Less fee reductions by the Adviser (Note 4) | | | (127,017 | ) |
Net expenses | | | 325,450 | |
| | | | | |
NET INVESTMENT INCOME | | | 814,721 | |
| | | | | |
REALIZED AND UNREALIZED GAINS ON INVESTMENTS AND FUTURES CONTRACTS | | | | |
Net realized gains from: | | | | |
Investments | | | 46,534 | |
Futures contracts (Note 5) | | | 1,073,560 | |
Net change in unrealized appreciation (depreciation) on: | | | | |
Investments | | | 711,296 | |
Futures contracts (Note 5) | | | 43,235 | |
NET REALIZED AND UNREALIZED GAINS ON INVESTMENTS AND FUTURES CONTRACTS | | | 1,874,625 | |
| | | | | |
NET INCREASE IN NET ASSETS RESULTING FROM OPERATIONS | | $ | 2,689,346 | |
See accompanying notes to financial statements. |
9
WAVELENGTH INTEREST RATE NEUTRAL FUND
STATEMENTS OF CHANGES IN NET ASSETS |
| | Six Months
Ended
November 30,
2019
(Unaudited) | | | Year
Ended
May 31,
2019 | |
FROM OPERATIONS | | | | | | | | |
Net investment income | | $ | 814,721 | | | $ | 1,321,049 | |
Net realized gains (losses) from: | | | | | | | | |
Investments | | | 46,534 | | | | (151,065 | ) |
Futures contracts (Note 5) | | | 1,073,560 | | | | 1,249,961 | |
Net change in unrealized appreciation (depreciation) on: | | | | | | | | |
Investments | | | 711,296 | | | | 418,821 | |
Futures contracts (Note 5) | | | 43,235 | | | | (24,123 | ) |
Net increase in net assets resulting from operations | | | 2,689,346 | | | | 2,814,643 | |
| | | | | | | | | |
DISTRIBUTIONS TO SHAREHOLDERS (Note 2) | | | (786,403 | ) | | | (1,288,584 | ) |
| | | | | | | | | |
CAPITAL SHARE TRANSACTIONS | | | | | | | | |
Proceeds from shares sold | | | 30,785,152 | | | | 9,621,109 | |
Net asset value of shares issued in reinvestment of distributions to shareholders | | | 495,490 | | | | 859,862 | |
Payments for shares redeemed | | | (5,670,976 | ) | | | (7,172,521 | ) |
Net increase in net assets from capital share transactions | | | 25,609,666 | | | | 3,308,450 | |
| | | | | | | | | |
TOTAL INCREASE IN NET ASSETS | | | 27,512,609 | | | | 4,834,509 | |
| | | | | | | | | |
NET ASSETS | | | | | | | | |
Beginning of period | | | 53,268,313 | | | | 48,433,804 | |
End of period | | $ | 80,780,922 | | | $ | 53,268,313 | |
| | | | | | | | | |
CAPITAL SHARE ACTIVITY | | | | | | | | |
Shares sold | | | 2,924,409 | | | | 965,556 | |
Shares issued in reinvestment of distributions to shareholders | | | 47,172 | | | | 87,324 | |
Shares redeemed | | | (537,231 | ) | | | (723,313 | ) |
Net increase in shares outstanding | | | 2,434,350 | | | | 329,567 | |
Shares outstanding at beginning of period | | | 5,189,572 | | | | 4,860,005 | |
Shares outstanding at end of period | | | 7,623,922 | | | | 5,189,572 | |
See accompanying notes to financial statements. |
10
WAVELENGTH INTEREST RATE NEUTRAL FUND
FINANCIAL HIGHLIGHTS |
Per Share Data for a Share Outstanding Throughout Each Period |
| | Six Months
Ended
Nov. 30,
2019
(Unaudited) | | | Year
Ended
May 31,
2019 | | | Year
Ended
May 31,
2018 | | | Year
Ended
May 31,
2017 | | | Year
Ended
May 31,
2016 | | | Year
Ended
May 31,
2015 | |
Net asset value at beginning of period | | $ | 10.26 | | | $ | 9.97 | | | $ | 9.99 | | | $ | 9.54 | | | $ | 10.09 | | | $ | 10.38 | |
| | | | | | | | | | | | | | | | | | | | | | | | | |
Income (loss) from investment operations: | | | | | | | | | | | | | | | | | | | | | | | | |
Net investment income | | | 0.13 | | | | 0.27 | | | | 0.22 | | | | 0.20 | | | | 0.21 | | | | 0.23 | |
Net realized and unrealized gains (losses) on investments and futures contracts | | | 0.35 | | | | 0.28 | | | | (0.03 | ) | | | 0.45 | | | | (0.56 | ) | | | (0.25 | ) |
Total from investment operations | | | 0.48 | | | | 0.55 | | | | 0.19 | | | | 0.65 | | | | (0.35 | ) | | | (0.02 | ) |
| | | | | | | | | | | | | | | | | | | | | | | | | |
Less distributions: | | | | | | | | | | | | | | | | | | | | | | | | |
From net investment income | | | (0.14 | ) | | | (0.26 | ) | | | (0.21 | ) | | | (0.20 | ) | | | (0.20 | ) | | | (0.23 | ) |
From net realized gains | | | — | | | | — | | | | — | | | | — | | | | — | | | | (0.04 | ) |
Total distributions | | | (0.14 | ) | | | (0.26 | ) | | | (0.21 | ) | | | (0.20 | ) | | | (0.20 | ) | | | (0.27 | ) |
| | | | | | | | | | | | | | | | | | | | | | | | | |
Net asset value at end of period | | $ | 10.60 | | | $ | 10.26 | | | $ | 9.97 | | | $ | 9.99 | | | $ | 9.54 | | | $ | 10.09 | |
| | | | | | | | | | | | | | | | | | | | | | | | | |
Total return (a) | | | 4.68 | %(b) | | | 5.68 | % | | | 1.95 | % | | | 6.83 | % | | | (3.37 | %) | | | (0.17 | %) |
| | | | | | | | | | | | | | | | | | | | | | | | | |
Net assets at end of period (000’s) | | $ | 80,781 | | | $ | 53,268 | | | $ | 48,434 | | | $ | 21,391 | | | $ | 16,761 | | | $ | 17,815 | |
| | | | | | | | | | | | | | | | | | | | | | | | | |
Ratios/supplementary data: | | | | | | | | | | | | | | | | | | | | | | | | |
Ratio of total expenses to average net assets (c) | | | 1.37 | %(d) | | | 1.41 | % | | | 1.55 | % | | | 1.85 | % | | | 2.00 | % | | | 2.19 | % |
Ratio of net expenses to average net assets (c) (e) | | | 0.99 | %(d) | | | 0.99 | % | | | 0.99 | % | | | 0.99 | % | | | 0.99 | % | | | 0.99 | % |
Ratio of net investment income to average net assets (c) (e) (f) | | | 2.47 | %(d) | | | 2.65 | % | | | 2.17 | % | | | 2.01 | % | | | 2.16 | % | | | 2.52 | % |
Portfolio turnover rate | | | 3 | %(b) | | | 20 | % | | | 9 | % | | | 53 | % | | | 103 | % | | | 107 | % |
(a) | Total return is a measure of the change in value of an investment in the Fund over the years covered. The returns shown do not reflect the deduction of taxes a shareholder would pay on Fund distributions, if any, or the redemption of Fund shares. The total returns would be lower if the Adviser had not reduced advisory fees and/or reimbursed expenses. |
(b) | Not annualized. |
(c) | The ratios of expenses and net investment income to average net assets do not reflect the Fund’s proportionate share of expenses of the underlying investment companies in which the Fund invests. |
(d) | Annualized. |
(e) | Ratio was determined after advisory fee reductions and/or expense reimbursements (Note 4). |
(f) | Recognition of net investment income by the Fund is affected by the timing of the declarations of dividends by the underlying investment companies in which the Fund invests. |
See accompanying notes to financial statements. |
11
WAVELENGTH INTEREST RATE NEUTRAL FUND
NOTES TO FINANCIAL STATEMENTS
November 30, 2019 (Unaudited)
1. Organization
Wavelength Interest Rate Neutral Fund (the “Fund”) is a diversified series of Ultimus Managers Trust (the “Trust”), an open-end investment company established as an Ohio business trust under a Declaration of Trust dated February 28, 2012. Other series of the Trust are not incorporated in this report.
The investment objective of the Fund is to seek total return.
2. Significant Accounting Policies
The Fund follows accounting and reporting guidance under Financial Accounting Standards Board Accounting Standards Codification Topic 946, “Financial Services – Investment Companies.” The following is a summary of the Fund’s significant accounting policies used in the preparation of its financial statements. These policies are in conformity with accounting principles generally accepted in the United States of America (“GAAP”).
Securities and futures valuation – The Fund values its portfolio securities at market value as of the close of regular trading on the New York Stock Exchange (the “NYSE”) (normally 4:00 p.m. Eastern time) on each business day the NYSE is open. Exchange-traded funds (“ETFs”) are valued at the security’s last sale price on the security’s primary exchange, if available, otherwise at the exchange’s most recently quoted mean price. Investments representing shares of money market funds and other open-end investment companies, except for ETFs, are valued at their net asset value (“NAV”) as reported by such companies. NASDAQ-listed securities are valued at the NASDAQ Official Closing Price. The Fund values its exchange-traded futures contracts at their last sale price as of the close of regular trading on the NYSE. Prices for these futures contracts are monitored daily by Wavelength Capital Management, LLC (the “Adviser”) until the close of regular trading to determine if fair valuation is required.
When using a quoted price and when the market for the security is considered active, a security will be classified as Level 1 within the fair value hierarchy (see below). In the event that market quotations are not readily available or are considered unreliable due to market or other events, the Fund values its securities and other assets at fair value pursuant to the procedures adopted by and under the general supervision of the Trust’s Board of Trustees (the “Board”). Under these procedures, the securities will be classified as Level 2 or 3 within the fair value hierarchy, depending on the inputs used. Unavailable or unreliable market quotes may be due to the following factors: a substantial bid-ask spread; infrequent sales resulting in stale prices; insufficient trading volume; small trade sizes; a temporary lapse in any reliable pricing source; and actions of the securities or futures markets, such as the suspension or limitation of trading.
GAAP establishes a single authoritative definition of fair value, sets out a framework for measuring fair value, and requires additional disclosures about fair value measurements.
12
WAVELENGTH INTEREST RATE NEUTRAL FUND
NOTES TO FINANCIAL STATEMENTS (Continued)
Various inputs are used in determining the value of the Fund’s investments. These inputs are summarized in the three broad levels listed below:
● | Level 1 – quoted prices in active markets for identical securities |
● | Level 2 – other significant observable inputs |
● | Level 3 – significant unobservable inputs |
The inputs or methods used for valuing securities are not necessarily an indication of the risks associated with investing in those securities. The inputs used to measure fair value may fall into different levels of the fair value hierarchy. In such cases, for disclosure purposes, the level in the fair value hierarchy within which the fair value measurement falls in its entirety is determined based on the lowest level input that is significant to the fair value measurement.
The following is a summary of the inputs used to value the Fund’s investments and other financial instruments as of November 30, 2019:
| | Level 1 | | | Level 2 | | | Level 3 | | | Total | |
Investments in Securities | | | | | | | | | | | | | | | | |
Exchange-Traded Funds | | $ | 58,041,862 | | | $ | — | | | $ | — | | | $ | 58,041,862 | |
Money Market Funds | | | 14,004,598 | | | | — | | | | — | | | | 14,004,598 | |
Collateral for Securities Loaned * | | | — | | | | — | | | | — | | | | 15,128,346 | |
Total | | $ | 72,046,460 | | | $ | — | | | $ | — | | | $ | 87,174,806 | |
Other Financial Instruments | | | | | | | | | | | | | | | | |
Futures Contracts | | $ | 111,187 | | | $ | — | | | $ | — | | | $ | 111,187 | |
Futures Contracts Sold Short | | | (127 | ) | | | — | | | | — | | | | (127 | ) |
Total | | $ | 111,060 | | | $ | — | | | $ | — | | | $ | 111,060 | |
* | Certain investments that are measured at fair value using the NAV per share (or its equivalent) practical expedient have not been categorized in the fair value heirarchy. The fair value amounts presented in the table are intended to permit reconciliation of the fair value heirarchy to the amounts presented on the Statement of Assets and Liabilities. |
The Fund did not have any assets or liabilities that were measured at fair value on a recurring basis using significant unobservable inputs (Level 3) as of or during the six months ended November 30, 2019.
Share valuation – The NAV per share of the Fund is calculated daily by dividing the total value of the Fund’s assets, less liabilities, by the number of shares outstanding. The offering price and redemption price per share of the Fund is equal to the NAV per share.
Investment income – Dividend income is recorded on the ex-dividend date. Interest income is accrued as earned.
Investment transactions – Investment transactions are accounted for on the trade date. Realized gains and losses on investments sold are determined on a specific identification basis.
13
WAVELENGTH INTEREST RATE NEUTRAL FUND
NOTES TO FINANCIAL STATEMENTS (Continued)
Common expenses – Common expenses of the Trust are allocated among the Fund and the other series of the Trust based on the relative net assets of each series, the number of series in the Trust, or the nature of the services performed and the relative applicability to each series.
Distributions to shareholders – The Fund will distribute to shareholders any net investment income on a quarterly basis and any net realized capital gains at least annually. The amount of such dividends and distributions are determined in accordance with federal income tax regulations, which may differ from GAAP. Dividends and distributions to shareholders are recorded on the ex-dividend date. The tax character of distributions paid during theperiodsended November 30, 2019 and May 31, 2018 was ordinary income. On December 30, 2019, the Fund paid an ordinary income dividend and, short-term and long-term capital gain distributionsof $0.0676, $0.1125 and $0.1659 per share, respectively, to shareholders of record on December27, 2019.
Futures contracts – The Fund uses futures contracts to gain exposure to or to hedge against changes in the value of equities, real estate, interest rates or commodities. A futures contract represents a commitment for the future purchase or sale of an asset at a specified price on a specified date. When the Fund purchases or sells a futures contract, no price is paid to or received by the Fund. Instead, the Fund is required to deposit in a segregated asset account an amount of cash or qualifying securities currently ranging from 2% to 10% of the contract amount. This is called the “initial margin deposit.” Subsequent payments, known as “variation margin,” are made or received by the Fund each day, depending on the daily fluctuations in the fair value of the underlying asset. The Fund recognizes an unrealized gain or loss equal to the daily variation margin. If market conditions move unexpectedly, the Fund may not achieve the anticipated benefits of the futures contracts and may realize a loss. The margin deposits for futures contracts and the variation receivable/payable are reported on the Statement of Assets and Liabilities.
Estimates – The preparation of financial statements in conformity with GAAP requires management to make estimates and assumptions that affect the reported amounts of assets and liabilities and disclosure of contingent assets and liabilities as of the date of the financial statements and the reported amounts of income and expenses during the reporting period. Actual results could differ from those estimates.
Federal income tax – The Fund has qualified and intends to continue to qualify as a regulated investment company under the Internal Revenue Code of 1986, as amended (the “Code”). Qualification generally will relieve the Fund of liability for federal income taxes to the extent 100% of its net investment income and net realized capital gains are distributed in accordance with the Code.
In order to avoid imposition of the excise tax applicable to regulated investment companies, it is also the Fund’s intention to declare as dividends in each calendar year at least 98% of its net investment income (earned during the calendar year) and 98.2% of its net realized capital gains (earned during the twelve months ended October 31) plus undistributed amounts from prior years.
14
WAVELENGTH INTEREST RATE NEUTRAL FUND
NOTES TO FINANCIAL STATEMENTS (Continued)
The following information is computed on a tax basis for each item as of November 30, 2019:
Tax cost of portfolio investments | | $ | 86,573,852 | |
Gross unrealized appreciation | | $ | 1,168,795 | |
Gross unrealized depreciation | | | (567,841 | ) |
Net unrealized appreciation | | | 600,954 | |
Accumulated ordinary income | | | 217,878 | |
Undistributed long-term capital gains | | | 587,612 | |
Other gains | | | 1,567,717 | |
Total accumulated earnings | | $ | 2,974,161 | |
The value of the federal income tax cost of portfolio investments may temporarily differ from the financial statement cost. This book/tax difference is due to the recognition of capital gains or losses under income tax regulations and GAAP, primarily the tax deferral of losses on wash sales and the tax treatment of realized and unrealized gains and losses on futures contracts.
The Fund recognizes the tax benefits or expenses of uncertain tax positions only when the position is “more likely than not” to be sustained assuming examination by tax authorities. Management has reviewed the Fund’s tax positions for the current and all open tax years (generally, three years) and has concluded that no provision for unrecognized tax benefits or expenses is required in these financial statements. The Fund identifies its major tax jurisdiction as U.S. Federal.
3. Investment Transactions
During the six months ended November 30, 2019, cost of purchases and proceeds from sales of investment securities, other than short-term investments, were $14,169,025 and $1,595,635, respectively.
4. Transactions with Related Parties
INVESTMENT ADVISORY AGREEMENT
The Fund’s investments are managed by the Adviser pursuant to the terms of the Investment Advisory Agreement. Under the Investment Advisory Agreement, the Fund pays the Adviser an investment advisory fee, computed and accrued daily and paid monthly, at the annual rate of 0.95% of its average daily net assets.
Pursuant to an Expense Limitation Agreement between the Fund and the Adviser (the “ELA”), the Adviser has agreed, until October 1, 2025, to reduce its investment advisory fees and reimburse other expenses to limit total annual operating expenses (exclusive of brokerage costs; taxes; interest; borrowing costs such as interest and dividends expenses on securities sold short; acquired fund fees and expenses; extraordinary expenses such as litigation and merger or reorganization costs and other expenses not incurred in the ordinary
15
WAVELENGTH INTEREST RATE NEUTRAL FUND
NOTES TO FINANCIAL STATEMENTS (Continued)
course of the Fund’s business) to an amount not exceeding 0.99% of the Fund’s average daily net assets. During the six months ended November 30, 2019, the Adviser reduced its investment advisory fees by $127,017.
Under the terms of the ELA, investment advisory fee reductions and expense reimbursements by the Adviser are subject to recoupment by the Adviser for a period of three years after such fees and expenses were incurred, provided that the recoupments do not cause total annual operating expenses of the Fund to exceed the lesser of (i) the expense limitation then in effect, if any, and (ii) the expense limitation in effect at the time the expenses to be repaid were incurred. As of November 30, 2019, the Adviser may seek recoupment of investment advisory fee reductions and expense reimbursements in the amount of $593,215 no later than the dates as stated below:
May 31, 2020 | May 31, 2021 | May 31, 2022 | November 30, 2022 | Total |
$79,463 | $175,345 | $211,390 | $127,017 | $593,215 |
OTHER SERVICE PROVIDERS
Ultimus Fund Solutions, LLC (“Ultimus”) provides administration, fund accounting, compliance and transfer agency services to the Fund. The Fund pays Ultimus fees in accordance with the agreements for such services. In addition, the Fund pays out-of-pocket expenses including, but not limited to, postage, supplies and certain costs related to the pricing of the Fund’s portfolio securities.
Under the terms of a Distribution Agreement with the Trust, Ultimus Fund Distributors, LLC (the “Distributor”) serves as the principal underwriter to the Fund. The Distributor is a wholly-owned subsidiary of Ultimus. The Distributor is compensated by the Adviser (not the Fund) for acting as principal underwriter.
Certain officers and a Trustee of the Trust are also officers of Ultimus and the Distributor.
TRUSTEE COMPENSATION
Each Trustee who is not an “interested person” of the Trust (“Independent Trustee”) receives a $1,300 annual retainer from the Fund, paid quarterly, except for the Board Chairperson who receives a $1,500 annual retainer from the Fund, paid quarterly. Each Independent Trustee also receives from the Fund a fee of $500 for each Board meeting attended plus reimbursement for travel and other meeting-related expenses. Each Independent Trustee also received from the Fund a fee of $500 for each Board meeting attended plus reimbursement for travel and other meeting-related expenses.
16
WAVELENGTH INTEREST RATE NEUTRAL FUND
NOTES TO FINANCIAL STATEMENTS (Continued)
PRINCIPAL HOLDER OF FUND SHARES
As of November 30, 2019, the following shareholder owned of record 25% or more of the outstanding shares of the Fund:
Name of Record Owner | % Ownership |
National Financial Services, LLC (for the benefit of its customers) | 42% |
A shareholder owning of record or beneficially 25% or more of the Fund’s outstanding shares may be considered a controlling person. That shareholder’s vote could have a more significant effect on matters presented at a shareholders’ meeting.
5. Derivatives Transactions
The Fund’s positions in derivative instruments as of November 30, 2019 are recorded in the following location on the Statement of Assets and Liabilities:
Derivative Investment Type | Location |
Futures contracts | Variation margin receivable/payable |
The following table sets forth the values of variation margin of the Fund as of November 30, 2019:
| | | Variation Margin | | | | | |
Type of Derivative and Risk | | Receivable | | | (Payable) | | | Total | |
Asset Derivatives | | | | | | | | | | | | |
Futures contracts | | | | | | | | | | | | |
Commodity | | $ | 1,340 | | | $ | (2,585 | ) | | $ | (1,245 | ) |
Index | | | — | | | | (26,015 | ) | | | (26,015 | ) |
Treasury | | | 2,063 | | | | (25,438 | ) | | | (23,375 | ) |
Total Asset Derivatives | | $ | 3,403 | | | $ | (54,038 | ) | | $ | (50,635 | ) |
Liability Derivatives | | | | | | | | | | | | |
Futures contracts | | | | | | | | | | | | |
Commodity | | $ | — | | | $ | (255 | ) | | $ | (255 | ) |
Total Liability Derivatives | | $ | — | | | $ | (255 | ) | | $ | (255 | ) |
Total | | $ | 3,403 | | | $ | (54,293 | ) | | $ | (50,890 | ) |
17
WAVELENGTH INTEREST RATE NEUTRAL FUND
NOTES TO FINANCIAL STATEMENTS (Continued)
The Fund’s transactions in derivative instruments during the six months ended November 30, 2019 are recorded in the following locations on the Statement of Operations:
Derivative Investment Type | Location |
Futures contracts | Net realized gains from futures contracts |
| | Net change in unrealized appreciation (depreciation) on futures contracts |
The following is a summary of the Fund’s net realized gains and net change in unrealized appreciation (depreciation) on derivative instruments recognized on the Statement of Operations during the six months ended November 30, 2019:
Type of Derivative and Risk | | Net Realized
Gains | | | Net Change
in Unrealized
Appreciation
(Depreciation) | |
Futures contracts | | | | | | | | |
Commodity | | $ | 45,929 | | | $ | 2,323 | |
Index | | | 434,059 | | | | 279,476 | |
Treasury | | | 593,572 | | | | (238,564 | ) |
Total | | $ | 1,073,560 | | | $ | 43,235 | |
In the ordinary course of business, the Fund may enter into transactions subject to enforceable netting agreements or other similar arrangements (“netting agreements”). Generally, the right to offset in netting agreements allows the Fund to offset any exposure to a specific counterparty with any collateral received or delivered to that counterparty based on the terms of the agreements. Generally, the Fund manages its cash collateral securities and securities collateral on a counterparty basis.
18
WAVELENGTH INTEREST RATE NEUTRAL FUND
NOTES TO FINANCIAL STATEMENTS (Continued)
As of November 30, 2019, the offsetting of financial assets and derivative assets is as follows:
Description | | Gross
Amounts of
Recognized
Assets
not Offset on
Statement
of Assets and
Liabilities | | | Gross
Amounts of
Recognized
Liabilities
not Offset on
Statement
of Assets and
Liabilities | | | Derivatives
Available for
Offset | | | Net Amounts
of Assets
Presented on
Statement
of Assets and
Liabilities | | | Collateral
Pledged* | | | Net Amount | |
Variation margin receivable - | | | | | | | | | | | | | | | | | | | | | | | | |
futures contracts | | $ | 3,403 | | | $ | — | | | $ | (3,403 | ) | | $ | — | | | $ | — | | | $ | — | |
Variation margin payable - | | | | | | | | | | | | | | | | | | | | | | | | |
futures contracts | | | — | | | | (54,293 | ) | | | 3,403 | | | | (50,890 | ) | | | 50,890 | | | | — | |
Total subject to a master netting or similar arrangement | | $ | 3,403 | | | $ | (54,293 | ) | | $ | — | | | $ | (50,890 | ) | | $ | 50,890 | | | $ | — | |
* | The amount is limited to the net amounts of financial assets and accordingly does not include excess collateral pledged. |
6. Securities Lending
Under the terms of the securities lending agreement with U.S. Bank National Association (“U.S. Bank”), U.S. Bank is authorized to loan securities on behalf of the Fund to approved borrowers. The contractual maturity of securities lending transactions are on an overnight and continuous basis. In exchange, the Fund receives cash collateral in the amount of at least 102% of the value of the securities loaned. Any collateral shortfalls due to changes in security market prices are adjusted the next business day. The cash collateral is invested in a short-term investment instrument as noted on the Fund’s Schedule of Investments. As of November 30, 2019, the Fund had 18.7% of its net assets invested in this short-term investment instrument for securities lending purposes. Although risk is mitigated by the collateral, the Fund could experience a delay in recovering its securities and possible loss of income or value if the borrower fails to return them. The agreement indemnifies the Fund from losses incurred in the event of a borrower’s material default of the terms and conditions of the borrower agreement. The agreement provides that after predetermined rebates to borrowers, the Fund retains a portion of its net securities lending income and pays U.S. Bank the remaining portion. As of November 30, 2019, the fair value of securities on loan and the collateral held were $14,737,221 and $15,128,346, respectively.
19
WAVELENGTH INTEREST RATE NEUTRAL FUND
NOTES TO FINANCIAL STATEMENTS (Continued)
7. Certain Investments and Risks
The securities in which the Fund invests, as well as the risks associated with these securities, are described in the Fund’s prospectus. Among these risks are those associated with investments in shares of ETFs. ETFs issue their shares to authorized participants in return for a specific basket of securities. The authorized participants then sell the ETF’s shares on the secondary market. In other words, ETF shares are traded on a securities exchange based on their market value. Investments in ETFs are subject to the risk that the ETF’s shares may trade at a premium (creating the risk that the Fund pays more than NAV for an ETF when making a purchase) or discount (creating the risk that the Fund receives less than NAV when selling an ETF) to the ETF’s NAV. Investments in ETFs are also subject to index-tracking risk because the total return generated by the securities will be reduced by transaction costs and expenses not incurred by the indices. Certain securities comprising the index tracked by an ETF may, from time to time, temporarily be unavailable, which may further impede the ETF’s ability to track its applicable index or match the index’s performance. To the extent that the Fund invests in an ETF, the Fund incurs additional expenses because the Fund bears its pro-rata portion of such ETF’s advisory fees and operational expenses. Finally, ETF shares are also subject to the risks applicable to the underlying basket of securities. As of November 30, 2019, the Fund had 71.9% of the value of its net assets invested in ETFs.
8. Contingencies and Commitments
The Fund indemnifies the Trust’s officers and Trustees for certain liabilities that might arise from their performance of their duties to the Fund. Additionally, in the normal course of business, the Fund enters into contracts that contain a variety of representations and warranties and which provide general indemnifications. The Fund’s maximum exposure under these arrangements is unknown, as this would involve future claims that may be made against the Fund that have not yet occurred. However, based on experience, the Fund expects the risk of loss to be remote.
9. Subsequent Events
The Fund is required to recognize in the financial statements the effects of all subsequent events that provide additional evidence about conditions that existed as of the date of the Statement of Assets and Liabilities. For non-recognized subsequent events that must be disclosed to keep the financial statements from being misleading, the Fund is required to disclose the nature of the event as well as an estimate of its financial effect, or a statement that such an estimate cannot be made. Management has evaluated subsequent events through the issuance of these financial statements and has noted no such events other than the ordinary income dividend and long-term capital gain distribution paid on December 30, 2019, as discussed in Note 2.
20
WAVELENGTH INTEREST RATE NEUTRAL FUND
ABOUT YOUR FUND’S EXPENSES (Unaudited)
We believe it is important for you to understand the impact of costs on your investment. As a shareholder of the Fund, you incur ongoing costs, including management fees and other operating expenses. The following examples are intended to help you understand your ongoing costs (in dollars) of investing in the Fund and to compare these costs with the ongoing costs of investing in other mutual funds.
A mutual fund’s ongoing costs are expressed as a percentage of its average net assets. This figure is known as the expense ratio. The expenses in the table below are based on an investment of $1,000 made at the beginning of the most recent period (June 1, 2019) and held until the end of the period (November 30, 2019).
The table below illustrates the Fund’s ongoing costs in two ways:
Actual fund return – This section helps you to estimate the actual expenses that you paid over the period. The “Ending Account Value” shown is derived from the Fund’s actual return, and the third column shows the dollar amount of operating expenses that would have been paid by an investor who started with $1,000 in the Fund. You may use the information here, together with the amount you invested, to estimate the expenses that you paid over the period.
To do so, simply divide your account value by $1,000 (for example, an $8,600 account value divided by $1,000 = 8.6), then multiply the result by the number given for the Fund under the heading “Expenses Paid During Period.”
Hypothetical 5% return – This section is intended to help you compare the Fund’s ongoing costs with those of other mutual funds. It assumes that the Fund had an annual return of 5% before expenses during the period shown, but that the expense ratio is unchanged. In this case, because the return used is not the Fund’s actual return, the results do not apply to your investment. The example is useful in making comparisons because the U.S. Securities and Exchange Commission (the “SEC”) requires all mutual funds to calculate expenses based on a 5% return. You can assess the Fund’s ongoing costs by comparing this hypothetical example with the hypothetical examples that appear in shareholder reports of other funds.
Note that expenses shown in the table are meant to highlight and help you compare ongoing costs only. The Fund does not charge transaction fees, such as purchase or redemption fees, nor does it carry a “sales load.”
The calculations assume no shares were bought or sold during the period. Your actual costs may have been higher or lower, depending on the amount of your investment and the timing of any purchases or redemptions.
21
WAVELENGTH INTEREST RATE NEUTRAL FUND
ABOUT YOUR FUND’S EXPENSES (Unaudited)
More information about the Fund’s expenses can be found in this report. For additional information on operating expenses and other shareholder costs, please refer to the Fund’s prospectus.
| Beginning
Account Value
June 1, 2019 | Ending
Account Value
November 30, 2019 | Expenses
Paid During
Period* |
Based on Actual Fund Return | $1,000.00 | $1,046.80 | $5.08 |
Based on Hypothetical 5% Return (before expenses) | $1,000.00 | $1,020.10 | $5.01 |
* | Expenses are equal to the Fund’s annualized net expense ratio of 0.99% for the period, multiplied by the average account value over the period, multiplied by 183/365 (to reflect the one-half year period). |
OTHER INFORMATION (Unaudited)
A description of the policies and procedures that the Fund uses to vote proxies relating to portfolio securities is available without charge upon request by calling toll-free 1-866-896-9292, or on the SEC’s website at www.sec.gov. Information regarding how the Fund voted proxies relating to portfolio securities during the most recent 12-month period ended June 30 is available without charge upon request by calling toll-free 1-866-896-9292, or on the SEC’s website at www.sec.gov.
The Trust files a complete listing of portfolio holdings for the Fund with the SEC as of the end of the first and third quarters of each fiscal year. These filings are available upon request by calling 1-866-896-9292. Furthermore, you may obtain a copy of the filings on the SEC’s website at www.sec.gov.
22
CUSTOMER PRIVACY NOTICE |
FACTS | WHAT DOES WAVELENGTH INTEREST RATE NEUTRAL FUND (the “Fund”) DO WITH YOUR PERSONAL INFORMATION? |
| | | | |
Why? | Financial companies choose how they share your personal information. Federal law gives consumers the right to limit some but not all sharing. Federal law also requires us to tell you how we collect, share, and protect your personal information. Please read this notice carefully to understand what we do. |
| | | | |
What? | The types of personal information we collect and share depend on the product or service you have with us. This information can include: ■ Social Security number ■ Assets ■ Retirement Assets ■ Transaction History ■ Checking Account Information ■ Purchase History ■ Account Balances ■ Account Transactions ■ Wire Transfer Instructions When you are no longer our customer, we continue to share your information as described in this notice. |
| | | | |
How? | All financial companies need to share your personal information to run their everyday business. In the section below, we list the reasons financial companies can share their customers’ personal information; the reasons the Fund chooses to share; and whether you can limit this sharing. |
| | | | |
Reasons we can share your personal information | Does the
Fund share? | Can you limit this sharing? |
For our everyday business purposes –
Such as to process your transactions, maintain your account(s), respond to court orders and legal investigations, or report to credit bureaus | Yes | No |
For our marketing purposes –
to offer our products and services to you | No | We don’t share |
For joint marketing with other financial companies | No | We don’t share |
For our affiliates’ everyday business purposes –
information about your transactions and experiences | No | We don’t share |
For our affiliates’ everyday business purposes –
information about your creditworthiness | No | We don’t share |
For nonaffiliates to market to you | No | We don’t share |
| | |
Questions? | Call 1-866-896-9292 |
23
Who we are |
Who is providing this notice? | Wavelength Interest Rate Neutral Fund Ultimus Fund Distributors, LLC (Distributor) Ultimus Fund Solutions, LLC (Administrator) |
What we do |
How does the Fund protect my personal information? | To protect your personal information from unauthorized access and use, we use security measures that comply with federal law. These measures include computer safeguards and secured files and buildings. Our service providers are held accountable for adhering to strict policies and procedures to prevent any misuse of your nonpublic personal information. |
How does the Fund collect my personal information? | We collect your personal information, for example, when you ■ Open an account ■ Provide account information ■ Give us your contact information ■ Make deposits or withdrawals from your account ■ Make a wire transfer ■ Tell us where to send the money ■ Tell us who receives the money ■ Show your government-issued ID ■ Show your driver’s license We also collect your personal information from other companies. |
Why can’t I limit all sharing? | Federal law gives you the right to limit only ■ Sharing for affiliates’ everyday business purposes – information about your creditworthiness ■ Affiliates from using your information to market to you ■ Sharing for nonaffiliates to market to you State laws and individual companies may give you additional rights to limit sharing. |
| | |
Definitions |
Affiliates | Companies related by common ownership or control. They can be financial and nonfinancial companies. ■ Wavelength Capital Management LLC, the investment adviser to the Fund, could be deemed to be an affiliate. |
Nonaffiliates | Companies not related by common ownership or control. They can be financial and nonfinancial companies ■ The Fund does not share with nonaffiliates so they can market to you. |
Joint marketing | A formal agreement between nonaffiliated financial companies that together market financial products or services to you. ■ The Fund does not jointly market. |
24
This page intentionally left blank.

KARNER BLUE ANIMAL IMPACT FUND
Investor Class (KAIAX)
Institutional Class (KAIIX)
ButterflyTM Class (KAIBX)
Semi-Annual Report
November 30, 2019
(Unaudited)
Beginning on January 1, 2021, as permitted by regulations adopted by the U.S. Securities and Exchange Commission, paper copies of the Fund’s shareholder reports like this one will no longer be sent by mail, unless you specifically request paper copies of the reports from the Fund or from your financial intermediary, such as a broker-dealer or bank. Instead, the reports will be made available on a website, and you will be notified by mail each time a report is posted and provided with a website link to access the report.
If you already elected to receive shareholder reports electronically, you will not be affected by this change and you need not take any action. You may elect to receive shareholder reports and other communications from the Fund electronically by contacting the Fund at 1-855-KBANIML (855-522-6465) or, if you own these shares through a financial intermediary, by contacting your financial intermediary.
You may elect to receive all future reports in paper free of charge. You can inform the Fund that you wish to continue receiving paper copies of your shareholder reports by contacting the Fund at 1-855-KBANIML (855-522-6465). If you own shares through a financial intermediary, you may contact your financial intermediary or follow instructions included with this document to elect to continue to receive paper copies of your shareholder reports. Your election to receive reports in paper will apply to all Funds held with the Fund complex or at your financial intermediary.
KARNER BLUE ANIMAL IMPACT FUND |
LETTER TO SHAREHOLDERS | November 30, 2019 |
Dear Shareholder,
Thank you for your investment in the Karner Blue Animal Impact Fund (the ”Fund”). Through the application of socially responsible investing principles, the Fund is one of the first investment products centered around animals and their well-being. Prior to Karner Blue Capital’s formation, animal advocates focused their resources and energies on direct animal care and political and corporate advocacy. Now, however, they can use their investment dollars to seek financial returns while facilitating much needed change in the treatment of animals by corporations.
Corporations impact the lives of billions of animals daily. From pigs on farms, to rats in laboratories, to goats used for mohair – animals are utilized in the production of many items, including food, clothing, research and entertainment. They are also indirectly and negatively affected by company operations that encroach on their habitats, including the extractive industries like metals and mining, agriculture (which singularly is responsible for the clearing of millions of acres of the rainforest to render pasture for cattle ranching), and textiles and apparel. Generally, the animals affected by company operations are treated at best, with disregard; and at worst, cruelly and unethically.
Karner Blue Capital® believes that companies can reduce business risk and create shareholder value through the elimination of animal cruelty in corporate operations as well as supply and distribution chains. By lowering the cost of capital for these types of companies through investment (i.e., rewarding good performance) and engaging with those companies that lag behind, Karner Blue Capital is working collaboratively with the Fund’s shareholders to influence corporate animal policies and procedures, enhance standards and improve the welfare of animals globally.
Our Process
Karner Blue Capital utilizes an investment process that seeks to identify companies that are industry leaders with respect to animal welfare performance. The process combines a disciplined, research-based analysis of animal welfare policies and practices as well as a consideration of environmental, social and governance (“ESG”) factors to produce a portfolio that is then further analyzed for attractive quality, growth and valuation characteristics.
Intending to be a global portfolio, the process begins with a universe of approximately 5,000 companies that comprise the Fund’s benchmark, the Morningstar Developed Markets Index. Karner Blue Capital’s research analysts then eliminate companies that are primarily engaged in the production or distribution of tobacco, firearms, alcohol, coal, or fur. Understanding that not all industries affect animals with the same level of significance, we then focus on 14 industries that we believe have material animal, animal habitat, and/or biodiversity impacts. Only those companies that exceed the mean animal welfare performance for their industry, as determined using proprietary formulations by our analysts, are further analyzed. Companies that promote animal welfare outside of
1
their normal business operations are also considered. These companies, aptly named, “opportunity” companies find opportunities to deploy their products and services in innovative ways to help animals and provide for their health and wellbeing. Karner Blue Capital then uses fundamental security analysis, in combination with its animal welfare research, to determine the Fund’s final composition and allocations.
As of November 30, 2019, the Karner Blue Animal Impact Fund had 101 securities representing 42 industries across 17 countries.
Karner Blue research analysts engage with companies as a component of their research and benchmarking. Additionally, they also more formally engage with companies on important industry issues through advocacy campaigns, such as those intended to minimize and ultimately eliminate the use of confinement systems for pigs and laying hens, greyhound racing by gambling interests, animal testing by chemical and pesticide companies, and the use of kangaroo leather in the athletic shoe business. Corporate engagement is a key component of our investment philosophy and is the manner by which we and our investors can most impact the status quo surrounding animal treatment.
Fund Performance
For the period from Fund inception on September 17, 2019 to November 30, 2019, the Investor Class, Institutional Class and ButterflyTM Class had cumulative total returns of 3.30%, 3.30% and 3.40%, respectively. By comparison, during the same period the Fund’s primary benchmark, the Morningstar Developed Markets Index, returned 4.48% and the S&P 500 Index returned 4.90%.
The underperformance of the Fund during the period can be explained in considerable part by our investment in Beyond Meat, Inc., which fell approximately 50% during the holding period and cost the Fund 0.99%. The maker of substitute meat products exceeded analysts’ robust quarterly revenue and earnings expectations, yet sold off due to concerns over the company’s high valuation and the expiration of the initial public offering lock up. Beyond Meat is viewed favorably by our research analysts, and we remain optimistic about the company albeit at a slightly reduced position size. Another detractor from performance was First Solar, which fell about 15% during the period on an EPS miss and cost the Fund 0.29%. Like Beyond Meat, First Solar remains in the portfolio at a reduced position size.
On the positive side, Vanda Pharmaceuticals, a manufacturer of niche market drugs, rose roughly 23% during the period and contributed 0.41%. The company is growing nicely, has a solid balance sheet, and is reasonably valued. Accordingly, Vanda is one of our top ten holdings. Tesla, the manufacturer of battery-powered cars, surprised investors by turning a profit in the third quarter and contributed 0.40% to the Fund during the period.
We have found European companies to be a bit more progressive in the area of animal welfare, and as a result, the Fund currently has a greater exposure to that geographic region. Events that are specific to Europe, both positive and negative, e.g., the effects of Brexit, the stability of the EU, and certain foreign exchange rates, could have a significant effect on the Fund and its performance going forward.
2
Similarly, we have found that companies that have the most impacts on animals tend to be in industries more directly related to consumers. Relative to the Morningstar Developed Markets Index, the Fund is therefore overweight to both the consumer cyclical and consumer defensive sectors. Conversely, the Fund is significantly underweight to the financials sector, as the companies in this sector generally have minimal animal welfare effects. While some adjustment to our weightings can be implemented over time, in the short-to-intermediate-term our animal welfare investment strategy leads us to these over-and under-weightings, which could also have a material effect on the Fund’s performance.
Looking Forward
Climate change and its impact on the planet and its inhabitants, especially animals, requires changes in the behaviors of all stakeholders, especially corporations. We’re already seeing rapid and disruptive change in many industries, including fossil fuels and food and transportation, due to a growing understanding of the threats posed by a warming climate. The Karner Blue research analysts continually monitor their industries looking for leaders in climate change innovation and developments. We believe that these companies, such as Beyond Meat and Tesla, will continue to act as a vanguard, leading us forward and spurring other companies to mimic many of their policies. We look forward to sharing some corporate success stories in the next letter.
Growing consumer interest and passion for animal welfare is manifest; we continue to see important policy and regulatory reforms that are spurring change within many sectors of the animal-use industry, from gambling and greyhound racing, to circuses and wild animal acts, to fashion brands and retailers on the fur issue. Disruptive innovations are occurring in cell-cultured meats and dairy, cruelty-free cosmetics, and plant-based materials for athletic shoes. Driven by shifting consumer interests, companies are increasingly attentive to their environmental, animal and biodiversity impacts while embracing overall sustainability as a sound business strategy.
On behalf of the animals and the entire Karner Blue Capital team we thank you for your investment in the Karner Blue Animal Impact Fund and look forward to working together to realize a more compassionate future.
Sincerely,
Vicki L. Benjamin
President
Karner Blue Capital, LLC
Past performance is not predictive of future performance. Investment results and principal value will fluctuate so that shares, when redeemed, may be worth more or less than their original cost. Current performance may be higher or lower than the performance data quoted. Performance data current to the most recent month end are available by calling 1-855-KBANIML (855-522-6465) or by visiting our website at www.animalimpactfund.com.
3
An investor should consider the investment objectives, risks, charges and expenses of the Fund carefully before investing. The Fund’s prospectus contains this and other important information. To obtain a copy of the Fund’s prospectus please visit our website at www.animalimpactfund.com or call 1-855-KBANIML (855-522-6465) and a copy will be sent to you free of charge. Please read the prospectus carefully before you invest. The Karner Blue Animal Impact Fund is distributed by Ultimus Fund Distributors, LLC.
The Letter to Shareholders seeks to describe some of the Adviser’s current opinions and views of the financial markets. Although the Adviser believes it has a reasonable basis for any opinions or views expressed, actual results may differ, sometimes significantly so, from those expected or expressed. The securities held by the Fund that are discussed in the Letter to Shareholders were held during the period covered by this Report. They do not comprise the entire investment portfolio of the Fund, may be sold at any time and may no longer be held by the Fund. For a complete list of securities held by the Fund as of November 30, 2019, please see the Schedule of Investments section of the Semi-Annual Report. The opinions of the Adviser with respect to those securities may change at any time.
Statements in the Letter to Shareholders that reflect projections or expectations for future financial or economic performance of the Fund and the market in general and statements of the Fund’s plans and objectives for future operations are forward-looking statements. No assurance can be given that actual results or events will not differ materially from those projected, estimated, assumed, or anticipated in any such forward-looking statements. Important factors that could result in such differences, in addition to factors noted with such forward-looking statements include, without limitation, general economic conditions, such as inflation, recession, and interest rates. Past performance is not a guarantee of future results.
4
KARNER BLUE ANIMAL IMPACT FUND
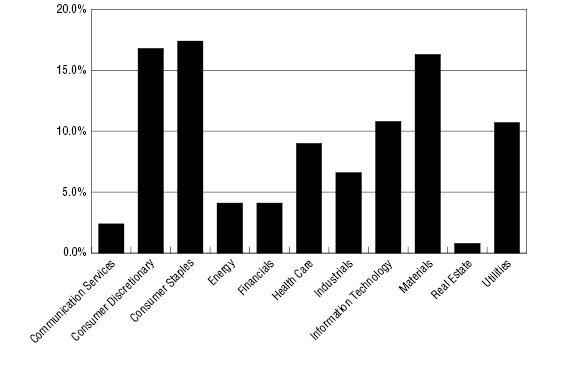
PORTFOLIO INFORMATION
November 30, 2019 (Unaudited)
Portfolio Allocation (% of Net Assets)
Top 10 Equity Holdings |
Security Description | % of
Net Assets |
Vanda Pharmaceuticals, Inc. | 2.5% |
Marks & Spencer Group plc - ADR | 2.3% |
First Solar, Inc. | 2.3% |
Veolia Environnement S.A. - ADR | 2.1% |
Newmont Mining Corporation | 1.7% |
Beyond Meat, Inc. | 1.6% |
Waste Management, Inc. | 1.6% |
Iberdrola S.A. - ADR | 1.6% |
Novo Nordisk A/S - ADR | 1.6% |
Ingredion, Inc. | 1.6% |
5
KARNER BLUE ANIMAL IMPACT FUND
SCHEDULE OF INVESTMENTS
November 30, 2019 (Unaudited) |
COMMON STOCKS — 99.0% | | Shares | | | Value | |
Communication Services — 2.4% | | | | | | | | |
Entertainment — 1.1% | | | | | | | | |
Walt Disney Company (The) | | | 355 | | | $ | 53,811 | |
| | | | | | | | | |
Interactive Media & Services — 1.3% | | | | | | | | |
Alphabet, Inc. - Class A (a) | | | 51 | | | | 66,508 | |
| | | | | | | | | |
Consumer Discretionary — 16.8% | | | | | | | | |
Auto Components — 0.6% | | | | | | | | |
Autoliv, Inc. | | | 360 | | | | 29,419 | |
| | | | | | | | | |
Automobiles — 2.5% | | | | | | | | |
Ford Motor Company | | | 4,092 | | | | 37,073 | |
Tesla, Inc. (a) | | | 181 | | | | 59,719 | |
Toyota Motor Corporation - ADR | | | 175 | | | | 24,537 | |
| | | | | | | | 121,329 | |
Hotels, Restaurants & Leisure — 3.4% | | | | | | | | |
Hilton Worldwide Holdings, Inc. | | | 710 | | | | 74,550 | |
Marriott International, Inc. - Class A | | | 500 | | | | 70,180 | |
TUI AG - ADR | | | 1,133 | | | | 7,761 | |
Whitbread plc - ADR | | | 946 | | | | 14,417 | |
| | | | | | | | 166,908 | |
Household Durables — 1.4% | | | | | | | | |
Roku, Inc. (a) | | | 201 | | | | 32,235 | |
Sony Corporation - ADR | | | 590 | | | | 37,453 | |
| | | | | | | | 69,688 | |
Internet & Direct Marketing Retail — 0.4% | | | | | | | | |
PetMed Express, Inc. | | | 950 | | | | 21,689 | |
| | | | | | | | | |
Multi-Line Retail — 2.3% | | | | | | | | |
Marks & Spencer Group plc - ADR | | | 22,476 | | | | 111,931 | |
| | | | | | | | | |
Specialty Retail — 2.4% | | | | | | | | |
Hennes & Mauritz AB - ADR | | | 16,560 | | | | 63,093 | |
Kingfisher plc - ADR | | | 10,286 | | | | 55,596 | |
| | | | | | | | 118,689 | |
Textiles, Apparel & Luxury Goods — 3.8% | | | | | | | | |
adidas AG - ADR | | | 461 | | | | 71,939 | |
NIKE, Inc. - Class B | | | 720 | | | | 67,313 | |
VF Corporation | | | 550 | | | | 48,697 | |
| | | | | | | | 187,949 | |
6
KARNER BLUE ANIMAL IMPACT FUND
SCHEDULE OF INVESTMENTS (Continued) |
COMMON STOCKS — 99.0% (Continued) | | Shares | | | Value | |
Consumer Staples — 17.4% | | | | | | | | |
Food & Staples Retailing — 2.7% | | | | | | | | |
J. Sainsbury plc - ADR | | | 3,079 | | | $ | 34,300 | |
Tesco plc - ADR | | | 6,543 | | | | 57,906 | |
Wm Morrison Supermarkets plc - ADR | | | 3,183 | | | | 40,934 | |
| | | | | | | | 133,140 | |
Food Products — 9.6% | | | | | | | | |
Beyond Meat, Inc. (a) | | | 980 | | | | 81,301 | |
Campbell Soup Company | | | 765 | | | | 35,626 | |
Danone S.A. - ADR | | | 4,615 | | | | 75,778 | |
General Mills, Inc. | | | 455 | | | | 24,261 | |
Hain Celestial Group, Inc. (The) (a) | | | 1,606 | | | | 39,700 | |
Ingredion, Inc. | | | 935 | | | | 77,764 | |
Kellogg Company | | | 905 | | | | 58,934 | |
Nestlé S.A. - ADR | | | 375 | | | | 38,977 | |
Orkla ASA - ADR | | | 4,237 | | | | 40,802 | |
| | | | | | | | 473,143 | |
Household Products — 1.8% | | | | | | | | |
Colgate-Palmolive Company | | | 355 | | | | 24,076 | |
Procter & Gamble Company (The) | | | 535 | | | | 65,302 | |
| | | | | | | | 89,378 | |
Personal Products — 3.3% | | | | | | | | |
Estée Lauder Companies, Inc. (The) - Class A | | | 253 | | | | 49,454 | |
L’Oréal S.A. - ADR | | | 1,285 | | | | 73,322 | |
Unilever plc - ADR | | | 665 | | | | 39,561 | |
| | | | | | | | 162,337 | |
Energy — 4.1% | | | | | | | | |
Oil, Gas & Consumable Fuels — 4.1% | | | | | | | | |
Eni S.p.A. - ADR | | | 1,500 | | | | 45,075 | |
Equinor ASA - ADR | | | 2,314 | | | | 42,879 | |
Repsol S.A. - ADR | | | 2,509 | | | | 39,291 | |
TOTAL S.A. - ADR | | | 1,380 | | | | 72,505 | |
| | | | | | | | 199,750 | |
Financials — 4.1% | | | | | | | | |
Banks — 2.5% | | | | | | | | |
BNP Paribas S.A. - ADR | | | 2,137 | | | | 59,889 | |
ING Groep N.V. - ADR | | | 5,353 | | | | 61,667 | |
| | | | | | | | 121,556 | |
Capital Markets — 1.2% | | | | | | | | |
Goldman Sachs Group, Inc. (The) | | | 280 | | | | 61,978 | |
7
KARNER BLUE ANIMAL IMPACT FUND
SCHEDULE OF INVESTMENTS (Continued) |
COMMON STOCKS — 99.0% (Continued) | | Shares | | | Value | |
Financials — 4.1% (Continued) | | | | | | | | |
Insurance — 0.4% | | | | | | | | |
Trupanion, Inc. (a) | | | 615 | | | $ | 20,959 | |
| | | | | | | | | |
Health Care — 9.0% | | | | | | | | |
Biotechnology — 3.8% | | | | | | | | |
AbbVie, Inc. | | | 745 | | | | 65,359 | |
Vanda Pharmaceuticals, Inc. (a) | | | 7,317 | | | | 122,413 | |
| | | | | | | | 187,772 | |
Pharmaceuticals — 5.2% | | | | | | | | |
AstraZeneca plc - ADR | | | 725 | | | | 35,148 | |
Merck KGaA - ADR | | | 805 | | | | 18,797 | |
Novo Nordisk A/S - ADR | | | 1,400 | | | | 78,610 | |
Roche Holding AG - ADR | | | 1,854 | | | | 71,509 | |
Sanofi - ADR | | | 1,100 | | | | 51,348 | |
| | | | | | | | 255,412 | |
Industrials — 6.6% | | | | | | | | |
Air Freight & Logistics — 0.7% | | | | | | | | |
Deutsche Post AG - ADR | | | 975 | | | | 36,308 | |
| | | | | | | | | |
Airlines — 0.8% | | | | | | | | |
Delta Air Lines, Inc. | | | 650 | | | | 37,251 | |
| | | | | | | | | |
Commercial Services & Supplies — 3.6% | | | | | | | | |
Herman Miller, Inc. | | | 850 | | | | 40,613 | |
Interface, Inc. | | | 1,848 | | | | 31,028 | |
Republic Services, Inc. | | | 280 | | | | 24,822 | |
Waste Management, Inc. | | | 717 | | | | 80,956 | |
| | | | | | | | 177,419 | |
Construction & Engineering — 1.0% | | | | | | | | |
Vinci S.A. - ADR | | | 1,747 | | | | 47,571 | |
| | | | | | | | | |
Machinery — 0.5% | | | | | | | | |
Xylem, Inc. | | | 325 | | | | 25,191 | |
| | | | | | | | | |
Information Technology — 10.8% | | | | | | | | |
Communications Equipment — 1.2% | | | | | | | | |
Cisco Systems, Inc. | | | 1,335 | | | | 60,489 | |
| | | | | | | | | |
IT Services — 1.2% | | | | | | | | |
International Business Machines Corporation | | | 455 | | | | 61,175 | |
8
KARNER BLUE ANIMAL IMPACT FUND
SCHEDULE OF INVESTMENTS (Continued) |
COMMON STOCKS — 99.0% (Continued) | | Shares | | | Value | |
Information Technology — 10.8% (Continued) | | | | | | | | |
Semiconductors & Semiconductor Equipment — 4.8% | | | | | | | | |
First Solar, Inc. (a) | | | 2,009 | | | $ | 110,977 | |
Intel Corporation | | | 1,050 | | | | 60,952 | |
NVIDIA Corporation | | | 290 | | | | 62,855 | |
| | | | | | | | 234,784 | |
Software — 2.8% | | | | | | | | |
Microsoft Corporation | | | 410 | | | | 62,066 | |
SAP SE - ADR | | | 265 | | | | 36,027 | |
ShotSpotter, Inc. (a) | | | 1,595 | | | | 39,109 | |
| | | | | | | | 137,202 | |
Technology Hardware, Storage & Peripherals — 0.8% | | | | | | | | |
Canon, Inc. - ADR | | | 1,330 | | | | 36,761 | |
| | | | | | | | | |
Materials — 16.3% | | | | | | | | |
Chemicals — 4.2% | | | | | | | | |
Akzo Nobel N.V. - ADR | | | 855 | | | | 27,334 | |
BASF SE - ADR | | | 2,888 | | | | 54,035 | |
Ecolab, Inc. | | | 270 | | | | 50,401 | |
Koninklijke DSM N.V. - ADR | | | 1,225 | | | | 39,270 | |
PPG Industries, Inc. | | | 275 | | | | 35,431 | |
| | | | | | | | 206,471 | |
Construction Materials — 0.5% | | | | | | | | |
LafargeHolcim Ltd. - ADR (a) | | | 2,346 | | | | 24,113 | |
| | | | | | | | | |
Containers & Packaging — 0.9% | | | | | | | | |
Avery Dennison Corporation | | | 190 | | | | 24,770 | |
Smurfit Kappa Group plc - ADR | | | 600 | | | | 21,354 | |
| | | | | | | | 46,124 | |
Metals & Mining — 8.8% | | | | | | | | |
AngloGold Ashanti Ltd. - ADR | | | 1,619 | | | | 30,826 | |
Barrick Gold Corporation | | | 2,302 | | | | 38,673 | |
Fortescue Metals Group Ltd. - ADR | | | 5,440 | | | | 70,769 | |
Freeport-McMoRan, Inc. | | | 3,161 | | | | 35,972 | |
Gold Fields Ltd. - ADR | | | 7,209 | | | | 38,568 | |
Kinross Gold Corporation (a) | | | 11,671 | | | | 50,535 | |
Newmont Mining Corporation | | | 2,167 | | | | 83,213 | |
Norsk Hydro ASA - ADR | | | 12,119 | | | | 42,647 | |
Rio Tinto plc - ADR | | | 755 | | | | 41,193 | |
| | | | | | | | 432,396 | |
Paper & Forest Products — 1.9% | | | | | | | | |
Mondi plc - ADR | | | 150 | | | | 6,656 | |
9
KARNER BLUE ANIMAL IMPACT FUND
SCHEDULE OF INVESTMENTS (Continued) |
COMMON STOCKS — 99.0% (Continued) | | Shares | | | Value | |
Materials — 16.3% (Continued) | | | | | | | | |
Paper & Forest Products — 1.9% (Continued) | | | | | | | | |
Stora Enso Oyj - ADR | | | 3,631 | | | $ | 48,873 | |
UPM-Kymmene Oyj - ADR (a) | | | 1,200 | | | | 39,987 | |
| | | | | | | | 95,516 | |
Real Estate — 0.8% | | | | | | | | |
Equity Real Estate Investment Trusts (REITs) — 0.8% | | | | | | | | |
Kilroy Realty Corporation | | | 455 | | | | 37,874 | |
| | | | | | | | | |
Utilities — 10.7% | | | | | | | | |
Electric Utilities — 2.8% | | | | | | | | |
Iberdrola S.A. - ADR | | | 2,015 | | | | 79,371 | |
SSE plc - ADR | | | 2,355 | | | | 39,604 | |
Terna Rete Elettrica Nazionale S.P.A. - ADR | | | 946 | | | | 18,097 | |
| | | | | | | | 137,072 | |
Gas Utilities — 1.2% | | | | | | | | |
Hong Kong and China Gas Company Ltd. - ADR | | | 32,575 | | | | 61,892 | |
| | | | | | | | | |
Independent Power and Renewable Electricity Producers — 1.6% | | | | | | | | |
Ormat Technologies, Inc. | | | 520 | | | | 39,962 | |
Pattern Energy Group, Inc. - Class A | | | 1,430 | | | | 39,354 | |
| | | | | | | | 79,316 | |
Multi-Utilities — 3.1% | | | | | | | | |
Engie S.A. - ADR | | | 2,495 | | | | 39,221 | |
Suez - ADR | | | 1,393 | | | | 10,239 | |
Veolia Environnement S.A. - ADR | | | 3,967 | | | | 101,555 | |
| | | | | | | | 151,015 | |
Water Utilities — 2.0% | | | | | | | | |
American Water Works Company, Inc. | | | 325 | | | | 39,335 | |
California Water Service Group | | | 775 | | | | 39,835 | |
United Utilities Group plc - ADR | | | 829 | | | | 18,379 | |
| | | | | | | | 97,549 | |
| | | | | | | | | |
Investments at Value — 99.0% (Cost $4,792,338) | | | | | | $ | 4,876,835 | |
| | | | | | | | | |
Other Assets in Excess of Liabilities — 1.0% | | | | | | | 51,550 | |
| | | | | | | | | |
Net Assets — 100.0% | | | | | | $ | 4,928,385 | |
ADR - American Depositary Receipt. |
(a) | Non-income producing security. |
See accompanying notes to financial statements. |
10
KARNER BLUE ANIMAL IMPACT FUND
STATEMENT OF ASSETS AND LIABILITIES
November 30, 2019 (Unaudited) |
ASSETS | | | | |
Investments in securities: | | | | |
At cost | | $ | 4,792,338 | |
At value (Note 2) | | $ | 4,876,835 | |
Cash | | | 48,408 | |
Receivable for capital shares sold | | | 350 | |
Receivable due from Adviser (Note 4) | | | 13,783 | |
Dividend and income receivable | | | 5,969 | |
Other assets | | | 3,520 | |
Total assets | | | 4,948,865 | |
| | | | | |
LIABILITIES | | | | |
Payable to administrator (Note 4) | | | 11,267 | |
Accrued distribution fees (Note 4) | | | 64 | |
Accrued administrative services fees (Note 4) | | | 10 | |
Other accrued expenses | | | 9,139 | |
Total liabilities | | | 20,480 | |
| | | | | |
NET ASSETS | | $ | 4,928,385 | |
| | | | | |
NET ASSETS CONSIST OF: | | | | |
Paid-in capital | | $ | 4,839,800 | |
Accumulated earnings | | | 88,585 | |
NET ASSETS | | $ | 4,928,385 | |
| | | | | |
NET ASSET VALUE PER SHARE: | | | | |
INVESTOR CLASS | | | | |
Net assets applicable to Investor Class | | $ | 174,854 | |
Investor Class shares of beneficial interest outstanding (unlimited number of shares authorized, no par value) | | | 16,931 | |
Net asset value, offering price and redemption price per share (Note 2) | | $ | 10.33 | |
| | | | | |
INSTITUTIONAL CLASS | | | | |
Net assets applicable to Institutional Class | | $ | 51,662 | |
Institutional Class shares of beneficial interest outstanding (unlimited number of shares authorized, no par value) | | | 5,000 | |
Net asset value, offering price and redemption price per share (Note 2) | | $ | 10.33 | |
| | | | | |
BUTTERFLY™ CLASS | | | | |
Net assets applicable to Butterfly™ Class | | $ | 4,701,869 | |
Butterfly™ Class shares of beneficial interest outstanding (unlimited number of shares authorized, no par value) | | | 454,847 | |
Net asset value, offering price and redemption price per share (Note 2) | | $ | 10.34 | |
See accompanying notes to financial statements. |
11
KARNER BLUE ANIMAL IMPACT FUND
STATEMENT OF OPERATIONS
Period Ended November 30, 2019 (a) (Unaudited) |
INVESTMENT INCOME | | | | |
Dividend income | | $ | 9,056 | |
Foreign witholding taxes on dividends | | | (1,465 | ) |
Interest | | | 234 | |
Total investment income | | | 7,825 | |
| | | | | |
EXPENSES | | | | |
Trustees’ fees and expenses (Note 4) | | | 8,505 | |
Fund accounting fees (Note 4) | | | 7,479 | |
Transfer agent fees (Note 4) | | | 7,399 | |
Legal fees | | | 6,094 | |
Administration fees (Note 4) | | | 4,933 | |
Investment advisory fees (Note 4) | | | 3,550 | |
Registration and filing fees | | | 2,615 | |
Compliance fees (Note 4) | | | 2,467 | |
Custody and bank service fees | | | 2,451 | |
Printing of shareholder reports | | | 1,360 | |
Insurance expense | | | 972 | |
Postage and supplies | | | 764 | |
Distribution fees - Investor Class (Note 4) | | | 64 | |
Administrative services fees - Institutional Class (Note 4) | | | 10 | |
Other expenses | | | 2,387 | |
Total expenses | | | 51,050 | |
Less fee reductions and expense reimbursements by Adviser (Note 4) | | | (47,160 | ) |
Net expenses | | | 3,890 | |
| | | | | |
NET INVESTMENT INCOME | | | 3,935 | |
| | | | | |
REALIZED AND UNREALIZED GAINS ON INVESTMENTS | | | | |
Net realized gains from investment transactions | | | 153 | |
Net change in unrealized appreciation (depreciation) on investments | | | 84,497 | |
NET REALIZED AND UNREALIZED GAINS ON INVESTMENTS | | | 84,650 | |
| | | | | |
NET INCREASE IN NET ASSETS RESULTING FROM OPERATIONS | | $ | 88,585 | |
(a) | Represents the period from the commencement of operations (September 17, 2019) through November 30, 2019. |
See accompanying notes to financial statements. |
12
KARNER BLUE ANIMAL IMPACT FUND
STATEMENT OF CHANGES IN NET ASSETS |
| | Period Ended
November 30,
2019 (a)
(Unaudited) | |
FROM OPERATIONS | | | | |
Net investment income | | $ | 3,935 | |
Net realized gains from investment transactions | | | 153 | |
Net change in unrealized appreciation (depreciation) on investments | | | 84,497 | |
Net increase in net assets resulting from operations | | | 88,585 | |
| | | | | |
CAPITAL SHARE TRANSACTIONS | | | | |
Investor Class | | | | |
Proceeds from shares sold | | | 170,500 | |
| | | | | |
Institutional Class | | | | |
Proceeds from shares sold | | | 50,000 | |
| | | | | |
Butterfly™ Class | | | | |
Proceeds from shares sold | | | 4,619,300 | |
| | | | | |
TOTAL INCREASE IN NET ASSETS | | | 4,928,385 | |
| | | | | |
NET ASSETS | | | | |
Beginning of period | | | — | |
End of period | | $ | 4,928,385 | |
| | | | | |
CAPITAL SHARE ACTIVITY | | | | |
Investor Class | | | | |
Shares sold | | | 16,931 | |
Shares outstanding at beginning of period | | | — | |
Shares outstanding at end of period | | | 16,931 | |
| | | | | |
Institutional Class | | | | |
Shares sold | | | 5,000 | |
Shares outstanding at beginning of period | | | — | |
Shares outstanding at end of period | | | 5,000 | |
| | | | | |
Butterfly™ Class | | | | |
Shares sold | | | 454,847 | |
Shares outstanding at beginning of period | | | — | |
Shares outstanding at end of period | | | 454,847 | |
(a) | Represents the period from the commencement of operations (September 17, 2019) through November 30, 2019. |
See accompanying notes to financial statements. |
13
KARNER BLUE ANIMAL IMPACT FUND
INVESTOR CLASS
FINANCIAL HIGHLIGHTS |
Per Share Data for a Share Outstanding Throughout the Period |
| | Period Ended
November 30,
2019 (a) | |
Net asset value at beginning of period | | $ | 10.00 | |
| | | | | |
Income from investment operations: | | | | |
Net investment income (b) | | | 0.01 | |
Net unrealized gains on investments | | | 0.32 | |
Total from investment operations | | | 0.33 | |
| | | | | |
Net asset value at end of period | | $ | 10.33 | |
| | | | | |
Total return (c) | | | 3.30 | %(d) |
| | | | | |
Net assets at end of period (000’s) | | $ | 175 | |
| | | | | |
Ratios/supplementary data: | | | | |
Ratio of total expenses to average net assets | | | 24.90 | %(e) |
| | | | | |
Ratio of net expenses to average net assets (f) | | | 1.25 | %(e) |
| | | | | |
Ratio of net investment income to average net assets (f) | | | 0.36 | %(e) |
| | | | | |
Portfolio turnover rate | | | 5 | %(d) |
(a) | Represents the period from the commencement of operations (September 17, 2019) through November 30, 2019. |
(b) | Net investment income per share is based on average shares outstanding during the period. |
(c) | Total return is a measure of the change in value of an investment in the Fund over the period covered. The return shown does not reflect the deduction of taxes a shareholder would pay on Fund distributions, if any, or the redemeption of Fund shares. The total return would be lower if the Adviser had not reduced fees and reimbursed expenses (Note 4). |
(d) | Not annualized. |
(e) | Annualized. |
(f) | Ratio was determined after advisory fee reductions and expense reimbursements (Note 4). |
See accompanying notes to financial statements. |
14
KARNER BLUE ANIMAL IMPACT FUND
INSTITUTIONAL CLASS
FINANCIAL HIGHLIGHTS |
Per Share Data for a Share Outstanding Throughout the Period |
| | Period Ended
November 30,
2019 (a) | |
Net asset value at beginning of period | | $ | 10.00 | |
| | | | | |
Income from investment operations: | | | | |
Net investment income (b) | | | 0.01 | |
Net unrealized gains on investments | | | 0.32 | |
Total from investment operations | | | 0.33 | |
| | | | | |
Net asset value at end of period | | $ | 10.33 | |
| | | | | |
Total return (c) | | | 3.30 | %(d) |
| | | | | |
Net assets at end of period (000’s) | | $ | 52 | |
| | | | | |
Ratios/supplementary data: | | | | |
Ratio of total expenses to average net assets | | | 39.78 | %(e) |
| | | | | |
Ratio of net expenses to average net assets (f) | | | 1.00 | %(e) |
| | | | | |
Ratio of net investment income to average net assets (f) | | | 0.59 | %(e) |
| | | | | |
Portfolio turnover rate | | | 5 | %(d) |
(a) | Represents the period from the commencement of operations (September 17, 2019) through November 30, 2019. |
(b) | Net investment income per share is based on average shares outstanding during the period. |
(c) | Total return is a measure of the change in value of an investment in the Fund over the period covered. The return shown does not reflect the deduction of taxes a shareholder would pay on Fund distributions, if any, or the redemeption of Fund shares. The total return would be lower if the Adviser had not reduced fees and reimbursed expenses (Note 4). |
(d) | Not annualized. |
(e) | Annualized. |
(f) | Ratio was determined after advisory fee reductions and expense reimbursements (Note 4). |
See accompanying notes to financial statements. |
15
KARNER BLUE ANIMAL IMPACT FUND
BUTTERFLY™ CLASS
FINANCIAL HIGHLIGHTS |
Per Share Data for a Share Outstanding Throughout the Period |
| | Period Ended
November 30,
2019 (a) | |
Net asset value at beginning of period | | $ | 10.00 | |
| | | | | |
Income from investment operations: | | | | |
Net investment income (b) | | | 0.02 | |
Net unrealized gains on investments | | | 0.32 | |
Total from investment operations | | | 0.34 | |
| | | | | |
Net asset value at end of period | | $ | 10.34 | |
| | | | | |
Total return (c) | | | 3.40 | %(d) |
| | | | | |
Net assets at end of period (000’s) | | $ | 4,702 | |
| | | | | |
Ratios/supplementary data: | | | | |
Ratio of total expenses to average net assets | | | 9.96 | %(e) |
| | | | | |
Ratio of net expenses to average net assets (f) | | | 0.85 | %(e) |
| | | | | |
Ratio of net investment income to average net assets (f) | | | 0.93 | %(e) |
| | | | | |
Portfolio turnover rate | | | 5 | %(d) |
(a) | Represents the period from the commencement of operations (September 17, 2019) through November 30, 2019. |
(b) | Net investment income per share is based on average shares outstanding during the period. |
(c) | Total return is a measure of the change in value of an investment in the Fund over the period covered. The return shown does not reflect the deduction of taxes a shareholder would pay on Fund distributions, if any, or the redemeption of Fund shares. The total return would be lower if the Adviser had not reduced fees and reimbursed expenses (Note 4). |
(d) | Not annualized. |
(e) | Annualized. |
(f) | Ratio was determined after advisory fee reductions and expense reimbursements (Note 4). |
See accompanying notes to financial statements. |
16
KARNER BLUE ANIMAL IMPACT FUND
NOTES TO FINANCIAL STATEMENTS
November 30, 2019 (Unaudited)
1. Organization
Karner Blue Animal Impact Fund (the “Fund”) is a diversified series of Ultimus Managers Trust (the “Trust”), an open-end investment company established as an Ohio business trust under a Declaration of Trust dated February 28, 2012. Other series of the Trust are not incorporated in this report.
The investment objective of the Fund is to seek to achieve long-term total returns by investing in companies that lead their industries in animal welfare performance.
The Fund offers three classes of shares: Investor Class shares (sold without any sales loads, but subject to a distribution and/or shareholder service fee of up to 0.25% of the average daily net assets attributable to Investor Class shares, and requiring a $2,000 initial investment), Institutional Class shares (sold without any sales loads and distribution and/or shareholder service fees and requiring a $200,000 initial investment) and Butterfly™ Class shares (sold without any sales loads and distribution and/or shareholder service fees and requiring a $2,000,000 initial investment). Each share class represents an ownership interest in the same investment portfolio.
2. Significant Accounting Policies
The following is a summary of the Fund’s significant accounting policies. The policies are in conformity with accounting principles generally accepted in the United States of America (“GAAP”). The Fund follows accounting and reporting guidance under Financial Accounting Standards Board Accounting Standards Codification Topic 946, “Financial Services – Investment Companies.”
Securities valuation – The Fund values its portfolio securities at market value as of the close of regular trading on the New York Stock Exchange (the “NYSE”) (normally 4:00 p.m. Eastern time) on each business day the NYSE is open for business. The Fund values its listed securities on the basis of the security’s last sale price on the security’s primary exchange, if available, otherwise at the exchange’s most recently quoted mean price. NASDAQ-listed securities are valued at the NASDAQ Official Closing Price. When using a quoted price and when the market is considered active, the security will be classified as Level 1 within the fair value hierarchy (see below). In the event that market quotations are not readily available or are considered unreliable due to market or other events, the Fund values its securities and other assets at fair value in accordance with procedures established by and under the general supervision of the Board of Trustees (the “Board”). Under these procedures, the securities will be classified as Level 2 or 3 within the fair value hierarchy, depending on the inputs used. Unavailable or unreliable market quotes may be due to the following factors: a substantial bid-ask spread; infrequent sales resulting in stale prices; insufficient trading volume; small trade sizes; a temporary lapse in any reliable pricing source; and actions of the securities or futures markets, such as the
17
KARNER BLUE ANIMAL IMPACT FUND
NOTES TO FINANCIAL STATEMENTS (Continued)
suspension or limitation of trading. As a result, the prices of securities used to calculate the Fund’s net asset value (“NAV”) may differ from quoted or published prices for the same securities.
GAAP establishes a single authoritative definition of fair value, sets out a framework for measuring fair value, and requires additional disclosures about fair value measurements.
Various inputs are used in determining the value of the Fund’s investments. These inputs are summarized in the three broad levels listed below:
| | ● | Level 1 – quoted prices in active markets for identical securities |
| | ● | Level 2 – other significant observable inputs |
| | ● | Level 3 – significant unobservable inputs |
The inputs or methods used for valuing securities are not necessarily an indication of the risks associated with investing in those securities. The inputs used to measure fair value may fall into different levels of the fair value hierarchy. In such cases, for disclosure purposes, the level in the fair value hierarchy within which the fair value measurement falls in its entirety is determined based on the lowest level input that is significant to the fair value measurement.
The following is a summary of the inputs used to value the Fund’s investments as of November 30, 2019:
| | Level 1 | | | Level 2 | | | Level 3 | | | Total | |
Common Stocks | | $ | 4,876,835 | | | $ | — | | | $ | — | | | $ | 4,876,835 | |
Total | | $ | 4,876,835 | | | $ | — | | | $ | — | | | $ | 4,876,835 | |
Refer to the Fund’s Schedule of Investments for a listing of securities by sector and industry type. The Fund did not hold any derivative instruments or any assets or liabilities that were measured at fair value on a recurring basis using significant unobservable inputs (Level 3) as of or during the period ended November 30, 2019.
Cash account – The Fund’s cash is held in a bank account with balances which may exceed the amount covered by federal deposit insurance. As of November 30, 2019, the cash balance reflected on the Statement of Assets and Liabilities represents the amount held in a deposit sweep account.
Share valuation – The NAV per share of each class of the Fund is calculated daily by dividing the total value of the assets attributable to that class, less liabilities attributable to that class, by the number of shares outstanding of that class. The offering price and redemption price per share of each class of the Fund is equal to the NAV per share of such class.
18
KARNER BLUE ANIMAL IMPACT FUND
NOTES TO FINANCIAL STATEMENTS (Continued)
Investment income – Dividend income is recorded on the ex-dividend date. Interest income is accrued as earned. Withholding taxes on foreign dividends have been recorded in accordance with the Fund’s understanding of the applicable country’s rules and tax rates.
Investment transactions – Investment transactions are accounted for on the trade date. Realized gains and losses on investments sold are determined on a specific identification basis.
Allocation between Classes – Investment income earned, realized capital gains and losses, and unrealized appreciation and depreciation are allocated daily to each Class of the Fund based upon its proportionate share of total net assets of the Fund. Class-specific expenses are charged directly to the Class incurring the expense. Common expenses which are not attributable to a specific Class are allocated daily to each Class of shares of the Fund based upon its proportionate share of total net assets of the Fund.
Common expenses – Common expenses of the Trust are allocated among the Fund and the other series of the Trust based on the relative net assets of each series, the number of series in the Trust, or the nature of the services performed and the relative applicability to each series.
Distributions to shareholders – The Fund distributes to shareholders any net investment income dividends and net realized capital gains distributions at least once each year. The amount of such dividends and distributions are determined in accordance with federal income tax regulations, which may differ from GAAP. Dividends and distributions to shareholders are recorded on the ex-dividend date. There were no distributions paid to shareholders during the period ended November 30, 2019.
Estimates – The preparation of financial statements in conformity with GAAP requires management to make estimates and assumptions that affect the reported amounts of assets and liabilities and disclosure of contingent assets and liabilities as of the date of the financial statements and the reported amounts of income and expenses during the reporting period. Actual results could differ from those estimates.
Federal income tax – The Fund has qualified and intends to continue to qualify as a regulated investment company under the Internal Revenue Code of 1986, as amended (the “Code”). Qualification generally will relieve the Fund of liability for federal income taxes to the extent 100% of its net investment income and net realized capital gains are distributed in accordance with the Code.
In order to avoid imposition of the excise tax applicable to regulated investment companies, it is also the Fund’s intention to declare as dividends in each calendar year at least 98% of its net investment income (earned during the calendar year) and 98.2% of its net realized capital gains (earned during the twelve months ended October 31) plus undistributed amounts from prior years.
19
KARNER BLUE ANIMAL IMPACT FUND
NOTES TO FINANCIAL STATEMENTS (Continued)
The following information is computed on a tax basis for each item as of November 30, 2019:
Tax cost of portfolio investments | | $ | 4,794,695 | |
Gross unrealized appreciation | | $ | 148,173 | |
Gross unrealized depreciation | | | (66,033 | ) |
Net unrealized appreciation | | | 82,140 | |
Accumulated ordinary income | | | 3,935 | |
Other gains | | | 2,510 | |
Accumulated earnings | | $ | 88,585 | |
The difference between the federal income tax cost of portfolio investments and the financial statement cost of portfolio investments is due to certain timing differences in the recognition of capital gains or losses under income tax regulations and GAAP. These “book/tax” differences are temporary in nature and are primarily due to the tax deferral of losses on wash sales.
The Fund recognizes the tax benefits or expenses of uncertain tax positions only when the position is “more likely than not” of being sustained assuming examination by tax authorities. Management has reviewed the Fund’s tax positions for the current period and has concluded that no provision for unrecognized tax benefits or expenses is required in these financial statements. The Fund identifies its major tax jurisdiction as U.S. Federal.
3. Investment Transactions
During the period ended November 30, 2019, cost of purchases and proceeds from sales of investment securities, other than short-term investments, amounted to $4,892,631 and $100,446, respectively.
4. Transactions with Related Parties
INVESTMENT ADVISORY AGREEMENT
The Fund’s investments are managed by Karner Blue Capital, LLC (the “Adviser”) pursuant to the terms of an Investment Advisory Agreement. The Fund pays the Adviser an investment advisory fee, computed and accrued daily and paid monthly, at the annual rate of 0.80% of average daily net assets.
Pursuant to an Expense Limitation Agreement (“ELA”) between the Fund and the Adviser, the Adviser has contractually agreed, until September 30, 2021, to reduce investment advisory fees and reimburse other operating expenses to limit total annual operating expenses of the Fund (exclusive of brokerage costs; taxes; interest; costs to organize the Fund; borrowing costs such as interest and dividend expenses on securities sold short; acquired fund fees and expenses; extraordinary expenses such as litigation and merger
20
KARNER BLUE ANIMAL IMPACT FUND
NOTES TO FINANCIAL STATEMENTS (Continued)
or reorganization costs; and other expenses not incurred in the ordinary course of the Fund’s business) to an amount not exceeding the following percentages of average daily net assets attributable to each respective class:
Investor Class | Institutional Class | Butterfly™ Class |
1.25% | 1.00% | 0.85% |
Accordingly, during the period ended November 30, 2019, the Adviser did not collect any of its investment advisory fees and reimbursed other operating expenses of $43,610.
Under the terms of the ELA, investment advisory fee reductions and expense reimbursements by the Adviser are subject to repayment by the Fund for a period of three years after such fees and expenses were incurred, provided that the repayments do not cause total annual fund operating expenses to exceed the lesser of (i) the expense limitation then in effect, if any, and (ii) the expense limitation in effect at the time the expenses to be repaid were incurred. As of November 30, 2019, the Adviser may in the future seek repayment of expense reimbursements of $47,160. The Adviser may recover this amount no later than November 30, 2022.
OTHER SERVICE PROVIDERS
Ultimus Fund Solutions, LLC (“Ultimus”) provides administration, fund accounting, compliance and transfer agency services to the Fund. The Fund pays Ultimus fees in accordance with the agreements for such services. In addition, the Fund pays out-of-pocket expenses including, but not limited to, postage, supplies and certain costs related to the pricing of its portfolio securities.
Under the terms of a Distribution Agreement with the Trust, Ultimus Fund Distributors, LLC (the “Distributor”) serves as the principal underwriter to the Fund. The Distributor is a wholly-owned subsidiary of Ultimus. The Distributor is compensated partially by the Adviser and partially by the Investor Class shares of the Fund for acting as principal underwriter.
A Trustee and certain officers of the Trust are also officers of Ultimus and/or the Distributor.
DISTRIBUTION PLAN
The Fund has adopted a plan of distribution (the “Plan”), pursuant to Rule 12b-1 under the Investment Company Act of 1940, as amended (the “1940 Act”), which permits Investor Class shares of the Fund to directly incur or reimburse the Fund’s principal underwriter for certain expenses related to the distribution of its shares. The annual limitation for payment of expenses pursuant to the Plan is 0.25% of the Fund’s average daily net assets allocable to Investor Class shares. The Fund has not adopted a plan of distribution with respect to the Institutional Class shares or the Butterfly™ Class shares. During the period ended November 30, 2019, the Investor Class shares incurred $64 of distribution fees under the Plan.
21
KARNER BLUE ANIMAL IMPACT FUND
NOTES TO FINANCIAL STATEMENTS (Continued)
ADMINISTRATIVE SERVICES PLAN
The Fund has adopted an Administrative Services Plan (the “Administrative Services Plan”), for the Institutional Class shares of the Fund. The Administrative Services Plan allows the Fund to use the net assets of the Institutional Class shares to pay financial intermediaries that provide services relating to Institutional Class shares. The Administrative Services Plan permits payments for the provision of certain administrative, recordkeeping and other non-distribution related services to Institutional Class shareholders. The Administrative Services Plan permits the Fund to make service fee payments at an annual rate of up to 0.10% of the Fund’s average daily net assets attributable to its Institutional Class shares. The Fund has not adopted an administrative services plan with respect to the Investor Class shares or the Butterfly™ Class shares. During the period ended November 30, 2019, the Institutional Class shares incurred $10 of fees under the Administrative Services Plan.
TRUSTEE COMPENSATION
Each Trustee who is not an “interested person” of the Trust (“Independent Trustee”) receives a $1,300 annual retainer from the Fund, paid quarterly, except for the Board Chairperson who receives a $1,500 annual retainer from the Fund, paid in quarterly installments. Each Independent Trustee also receives from the Fund a fee of $500 for each Board meeting attended plus reimbursement for travel and other meeting-related expenses.
PRINCIPAL HOLDERS OF FUND SHARES
As of November 30, 2019, the following shareholders owned of record 25% or more of the outstanding shares of the Fund:
Name of Record Owners | % Ownership |
Investor Class | |
Vicki L. Benjamin | 59% |
Institutional Class | |
Jacob Aaron Pincus Niebler | 50% |
Rachel Lauren Pincus Niebler | 50% |
Butterfly™ Class | |
SEI Private Trust Company (for the benefit of its customers) | 81% |
A beneficial owner of 25% or more of the Fund’s outstanding shares may be considered a controlling person of the Fund. That shareholder’s vote could have a more significant effect on matters presented at a shareholders’ meeting.
5. Foreign Securities Risk
The Fund may invest in American Depositary Receipts (“ADRs”). Investments in ADRs provide exposure to foreign securities that may involve different risks than those of U.S. securities. Foreign securities are subject to individual country risk, less favorable
22
KARNER BLUE ANIMAL IMPACT FUND
NOTES TO FINANCIAL STATEMENTS (Continued)
reporting and disclosure risk, currency exchange risk and greater price volatility, and may have higher liquidity risk than U.S. registered securities. As of November 30, 2019, the Fund had 48.2% of its net assets invested in ADRs.
6. Contingencies and Commitments
The Fund indemnifies the Trust’s officers and Trustees for certain liabilities that might arise from their performance of their duties to the Fund. Additionally, in the normal course of business the Fund enters into contracts that contain a variety of representations and warranties and which provide general indemnifications. The Fund’s maximum exposure under these arrangements is unknown, as this would involve future claims that may be made against the Fund that have not yet occurred. However, based on experience, the Fund expects the risk of loss to be remote.
7. Subsequent Events
The Fund is required to recognize in the financial statements the effects of all subsequent events that provide additional evidence about conditions that existed as of the date of the Statement of Assets and Liabilities. For non-recognized subsequent events that must be disclosed to keep the financial statements from being misleading, the Fund is required to disclose the nature of the event as well as an estimate of its financial effect, or a statement that such an estimate cannot be made. Management has evaluated subsequent events through the issuance of these financial statements and has noted no such events except for the following:
The Fund paid the following distributions to shareholders subsequent to November 30, 2019:
| | | | Per Share |
| Record
Date | Ex-Date | Ordinary
Income |
Investor Class | 12/19/2019 | 12/20/2019 | $0.0065 |
Institutional Class | 12/19/2019 | 12/20/2019 | $0.0062 |
Butterfly™ Class | 12/19/2019 | 12/20/2019 | $0.0103 |
23
KARNER BLUE ANIMAL IMPACT FUND
ABOUT YOUR FUND’S EXPENSES (Unaudited)
We believe it is important for you to understand the impact of costs on your investment. As a shareholder of the Fund, you incur ongoing costs, including management fees, class-specific expenses (such as distribution fees and administrative services fees) and other operating expenses. The following examples are intended to help you understand your ongoing costs (in dollars) of investing in the Fund and to compare these costs with the ongoing costs of investing in other mutual funds.
A mutual fund’s ongoing costs are expressed as a percentage of its average net assets. This figure is known as the expense ratio. The expenses in the table below are based on an investment of $1,000 made at the beginning of the most recent period (September 17, 2019) and held until the end of the period (November 30, 2019).
The table below illustrates the Fund’s ongoing costs in two ways:
Actual fund return – This section helps you to estimate the actual expenses that you paid over the period. The “Ending Account Value” shown is derived from the Fund’s actual return, and the fourth column shows the dollar amount of operating expenses that would have been paid by an investor who started with $1,000 in the Fund. You may use the information here, together with the amount you invested, to estimate the expenses that you paid over the period.
To do so, simply divide your account value by $1,000 (for example, an $8,600 account value divided by $1,000 = 8.6), then multiply the result by the number given for the Fund under the heading “Expenses Paid During Period.”
Hypothetical 5% return – This section is intended to help you compare the Fund’s ongoing costs with those of other mutual funds. It assumes that the Fund had an annual return of 5% before expenses during the period shown, but that the expense ratio is unchanged. In this case, because the return used is not the Fund’s actual return, the results do not apply to your investment. The example is useful in making comparisons because the U.S. Securities and Exchange Commission (the “SEC”) requires all mutual funds to calculate expenses based on a 5% return. You can assess the Fund’s ongoing costs by comparing this hypothetical example with the hypothetical examples that appear in shareholder reports of other funds.
Note that expenses shown in the table are meant to highlight and help you compare ongoing costs only. The Fund does not charge transaction fees, such as purchase or redemption fees, nor does it carry a “sales load.”
The calculations assume no shares were bought or sold during the period. Your actual costs may have been higher or lower, depending on the amount of your investment and the timing of any purchases or redemptions.
24
KARNER BLUE ANIMAL IMPACT FUND
ABOUT YOUR FUND’S EXPENSES (Unaudited) (Continued)
More information about the Fund’s expenses can be found in this report. For additional information on operating expenses and other shareholder costs, please refer to the Fund’s prospectus.
| Beginning
Account Value
June 1, 2019 (a) | Ending
Account Value
November 30,
2019 | Net
Expense
Ratio (b) | Expenses
Paid During
Period (c) |
Investor Class | | | | |
Based on Actual Fund Return | $1,000.00 | $1,033.00 | 1.25% | $2.58 |
Based on Hypothetical 5% Return (before expenses) | $1,000.00 | $1,018.80 | 1.25% | $6.33 |
Institutional Class | | | | |
Based on Actual Fund Return | $1,000.00 | $1,033.00 | 1.00% | $2.06 |
Based on Hypothetical 5% Return (before expenses) | $1,000.00 | $1,020.05 | 1.00% | $5.06 |
Butterfly™ Class | | | | |
Based on Actual Fund Return | $1,000.00 | $1,034.00 | 0.85% | $1.75 |
Based on Hypothetical 5% Return (before expenses) | $1,000.00 | $1,020.81 | 0.85% | $4.31 |
(a) | Beginning Account Value is as of September 17, 2019 (date of commencement of operations) for the Actual Fund Return information. |
(b) | Annualized, based on the Fund’s expenses during the period since commencement of operations. |
(c) | Expenses are equal to the Fund’s annualized net expense ratio multiplied by the average account value over the period, multiplied by 74/365 (to reflect the period since inception) and 183/365 (to reflect the one-half year period), for Actual Fund Return and Hypothectical 5% Return information, respectively. |
OTHER INFORMATION (Unaudited)
A description of the policies and procedures that the Fund uses to vote proxies relating to portfolio securities is available without charge upon request by calling toll-free 1-855-KBANIML (855-522-6465), or on the SEC’s website at www.sec.gov. Information regarding how the Fund voted proxies relating to portfolio securities during the period ended June 30, 2020 will be available on or before August 31, 2020 without charge upon request by calling toll-free 1-855-KBANIML (855-522-6465), or on the SEC’s website at www.sec.gov.
The Trust files a complete listing of portfolio holdings for the Fund with the SEC as of the end of the first and third quarters of each fiscal year on Form N-Q or as an exhibit to its reports on Form N-Q’s successor form, Form N-PORT. These filings are available upon request by calling 1-855-KBANIML (855-522-6465). Furthermore, you may obtain a copy of the filings on the SEC’s website at www.sec.gov.
25
KARNER BLUE ANIMAL IMPACT FUND
DISCLOSURE REGARDING APPROVAL OF INVESTMENT ADVISORY AGREEMENT (Unaudited)
The Board of Trustees (the “Board”), including the Independent Trustees voting separately, has reviewed and approved the Fund’s Investment Agreement with Karner Blue Capital, LLC (the “Adviser”) for an initial two-year term (the “Agreement”). The Board approved the Agreement at an in-person meeting held on July 22-23, 2019, at which all of the Trustees were present.
Legal counsel advised the Board during its deliberations. Additionally, the Board received and reviewed a substantial amount of information provided by the Adviser in response to requests of the Board and counsel. In deciding whether to approve the Agreement, the Board recalled its review of the materials related to the Fund and the Adviser delivered at or prior to the meeting and its numerous discussions with Trust management and the Adviser about the Fund. The board further considered those materials and discussions and numerous other factors, including:
The nature, extent, and quality of the services to be provided by the Adviser. In this regard, the Board considered the responsibilities the Adviser would have under the Karner Blue Advisory Agreement for the Fund. The Board also considered the proposed services that the Adviser would provide to the Fund including, without limitation, the Adviser’s procedures for formulating investment recommendations and assuring compliance with the Fund’s investment objective and limitations, proposed initial marketing and distribution efforts, and the Adviser’s compliance procedures and practices. After reviewing the foregoing and further information provided in the Fund Board Materials (e.g., descriptions of the Adviser’s business and Form ADV), the Board concluded that the quality, extent, and nature of the services to be provided by the Adviser to the Fund were satisfactory and adequate.
The investment management capabilities and experience of the adviser. In this regard, the Board considered the investment management experience of the Adviser and its principals. The Board considered its discussion with Ms. Benjamin and Mr. Niebler regarding the investment objective and strategies for the Fund and the Adviser’s experience and plans for implementing such strategies. In particular, the Board considered the information from the Adviser regarding prior experience in the financial industry by the Adviser and its principals. After consideration of these and other factors, the Board determined that the Adviser has the requisite knowledge and experience to serve as investment adviser for the Fund.
The costs of the services to be provided and profits to be realized by the Adviser and its affiliates from the relationship with the Fund. In this regard, the Board considered the Adviser’s methods of operation; the education and experience of Ms. Benjamin and Mr. Niebler; its compliance program, policies, and procedures; its financial condition and the level of commitment to the Fund; the projected asset levels of the Fund; and the overall expenses of the Fund, including the advisory fee. The Board reviewed the Karner Blue expense limitation agreement and noted the benefit to the Fund from the Adviser’s
26
KARNER BLUE ANIMAL IMPACT FUND
DISCLOSURE REGARDING APPROVAL OF INVESTMENT ADVISORY AGREEMENT (Unaudited) (Continued)
commitment to reduce its advisory fee and reimburse other operating expenses through September 30, 2021. The Board discussed the Adviser’s financial condition and its ability to satisfy its financial commitments to the Fund. The Board considered the support of the principals of the Adviser in assuring that the Adviser has adequate capital to meet its obligations. The Board also considered potential benefits for the Adviser in managing the Fund, including promotion of the Adviser’s name. The Board compared the Fund’s proposed advisory fee and overall expense ratio to other comparable funds (in terms of the type of fund, the style of investment management, the projected size of the Fund, and the nature of the investment strategies). The Board noted that the fund’s advisory fee (0.80%) is above the peer group’s average and median, but below the maximum in the category. The Board further noted that the proposed overall annual expense ratio (1.25% for the Investor Class) for the Fund is above the peer group’s average and median expense ratio, but below the maximum for the category. The Board also considered the unique investment style and strategy of the Fund versus its peer group. Upon further consideration and discussion of the foregoing, the Board concluded that the proposed advisory fee and total expense limit for the Fund were within the range of what would have been negotiated at arms-length in light of all the surrounding circumstances and were fair and reasonable.
The extent to which the Fund and its investors would benefit from economies of scale. In this regard, the Board considered the Karner Blue Advisory Agreement and the Karner Blue expense limitation agreement. The Board determined that while the proposed advisory fee was flat and would stay the same as asset levels increased, the shareholders of the Fund would benefit from the Karner Blue expense limitation agreement until the Fund’s assets grew to a level where its expenses otherwise fall below the expense limit. Following further discussion of the Fund’s projected asset levels, expectations for growth, and level of fees, the Board determined that the Fund’s fee arrangements with the Adviser would provide benefits through the next three years, and the Board could review the arrangements going forward as necessary. After further discussion, the Board concluded the Fund’s arrangement with the Adviser was fair and reasonable in relation to the nature and quality of services to be provided by the Adviser and would benefit the Fund and its shareholders.
Brokerage and portfolio transactions. The Board considered the Adviser’s policies and procedures as they relate to seeking best execution for its clients. The Board also considered the anticipated portfolio turnover rate for the Fund; the method and basis for selecting and evaluating broker-dealers used to complete the Fund’s portfolio transactions; any anticipated allocation of portfolio business to persons affiliated with the Adviser; and the extent to which the Fund’s trades may be allocated to soft-dollar arrangements. After further review and discussion, the Board determined that the Adviser’s practices regarding brokerage and portfolio transactions for the Fund were satisfactory.
27
KARNER BLUE ANIMAL IMPACT FUND
DISCLOSURE REGARDING APPROVAL OF INVESTMENT ADVISORY AGREEMENT (Unaudited) (Continued)
Possible conflicts of interest. In evaluating the possibility for conflicts of interest, the Board considered such matters as the experience and abilities of the advisory personnel to be assigned to the Fund and the Adviser’s process for allocating trades among the Fund and potential future clients with similar types of investment objectives and strategies. The Board also considered the substance and administration of the Adviser’s Code of Ethics. Following further consideration and discussion, the Board determined that the Adviser’s standards and practices relating to the identification and mitigation of potential conflicts of interests for the Fund were satisfactory.
After further discussion of the factors noted above, as well as other factors, and in reliance on the information provided by the Adviser and Trust Management, and taking into account the totality of all the factors discussed and information presented, the Board indicated its desire to approve the Agreement. It was noted that in the Trustees’ deliberations regarding the approval of the Agreement, the Trustees did not identify any particular information or factor that was all-important or controlling, and that each individual Trustee may have attributed different weights to the various factors listed above. After full consideration of the above factors as well as other factors, the Board unanimously concluded that approval of the Agreement was in the best interests of the Fund and its shareholders.
28
Customer Privacy Notice |
FACTS | WHAT DOES THE KARNER BLUE ANIMAL IMPACT FUND (the “Fund”) DO WITH YOUR PERSONAL INFORMATION? |
| | | | |
Why? | Financial companies choose how they share your personal information. Federal law gives consumers the right to limit some but not all sharing. Federal law also requires us to tell you how we collect, share, and protect your personal information. Please read this notice carefully to understand what we do. |
| | | | |
What? | The types of personal information we collect and share depend on the product or service you have with us. This information can include: ■ Social Security number ■ Assets ■ Retirement Assets ■ Transaction History ■ Checking Account Information ■ Purchase History ■ Account Balances ■ Account Transactions ■ Wire Transfer Instructions When you are no longer our customer, we continue to share your information as described in this notice. |
| | | | |
How? | All financial companies need to share your personal information to run their everyday business. In the section below, we list the reasons financial companies can share their customers’ personal information; the reasons the Fund chooses to share; and whether you can limit this sharing. |
| | | | |
Reasons we can share your personal information | Does the
Fund share? | Can you limit this sharing? |
For our everyday business purposes –
Such as to process your transactions, maintain your account(s), respond to court orders and legal investigations, or report to credit bureaus | Yes | No |
For our marketing purposes –
to offer our products and services to you | No | We don’t share |
For joint marketing with other financial companies | No | We don’t share |
For our affiliates’ everyday business purposes –
information about your transactions and experiences | No | We don’t share |
For our affiliates’ everyday business purposes –
information about your creditworthiness | No | We don’t share |
For nonaffiliates to market to you | No | We don’t share |
| | |
Questions? | Call 1-855-KBANIML (855-522-6465) |
29
Page 2 | |
Who we are |
Who is providing this notice? | Karner Blue Animal Impact Fund Ultimus Fund Distributors, LLC (Distributor) Ultimus Fund Solutions, LLC (Administrator) |
What we do |
How does the Fund protect my personal information? | To protect your personal information from unauthorized access and use, we use security measures that comply with federal law. These measures include computer safeguards and secured files and buildings. Our service providers are held accountable for adhering to strict policies and procedures to prevent any misuse of your nonpublic personal information. |
How does the Fund collect my personal information? | We collect your personal information, for example, when you ■ Open an account ■ Provide account information ■ Give us your contact information ■ Make deposits or withdrawals from your account ■ Make a wire transfer ■ Tell us where to send the money ■ Tell us who receives the money ■ Show your government-issued ID ■ Show your driver’s license We also collect your personal information from other companies. |
Why can’t I limit all sharing? | Federal law gives you the right to limit only ■ Sharing for affiliates’ everyday business purposes –
information about your creditworthiness ■ Affiliates from using your information to market to you ■ Sharing for nonaffiliates to market to you State laws and individual companies may give you additional rights to limit sharing. |
| | |
Definitions |
Affiliates | Companies related by common ownership or control. They can be financial and nonfinancial companies. ■ Karner Blue Capital, LLC, the investment adviser to the Fund, could be deemed to be an affiliate. |
Nonaffiliates | Companies not related by common ownership or control. They can be financial and nonfinancial companies ■ The Fund does not share with nonaffiliates so they can market to you. |
Joint marketing | A formal agreement between nonaffiliated financial companies that together market financial products or services to you. ■ The Fund does not jointly market. |
30
This page intentionally left blank.
This page intentionally left blank.
This page intentionally left blank.
Not required
| Item 3. | Audit Committee Financial Expert. |
Not required
| Item 4. | Principal Accountant Fees and Services. |
Not required
| Item 5. | Audit Committee of Listed Registrants. |
Not applicable
| Item 6. | Schedule of Investments. |
| (a) | Not applicable [schedule filed with Item 1] |
| Item 7. | Disclosure of Proxy Voting Policies and Procedures for Closed-End Management Investment Companies. |
Not applicable
| Item 8. | Portfolio Managers of Closed-End Management Investment Companies. |
Not applicable
| Item 9. | Purchases of Equity Securities by Closed-End Management Investment Company and Affiliated Purchasers. |
Not applicable
| Item 10. | Submission of Matters to a Vote of Security Holders. |
The registrant’s Committee of Independent Trustees shall review shareholder recommendations for nominations to fill vacancies on the registrant’s board of trustees if such recommendations are submitted in writing and addressed to the Committee at the registrant’s offices. The Committee may adopt, by resolution, a policy regarding its procedures for considering candidates for the board of trustees, including any recommended by shareholders.
| Item 11. | Controls and Procedures. |
(a) Based on their evaluation of the registrant’s disclosure controls and procedures (as defined in Rule 30a-3(c) under the Investment Company Act of 1940) as of a date within 90 days of the filing date of this report, the registrant’s principal executive officer and principal financial officer have concluded that such disclosure controls and procedures are reasonably designed and are operating effectively to ensure that material information relating to the registrant, including its consolidated subsidiaries, is made known to them by others within those entities, particularly during the period in which this report is being prepared, and that the information required in filings on Form N-CSR is recorded, processed, summarized, and reported on a timely basis.
(b) There were no changes in the registrant’s internal control over financial reporting (as defined in Rule 30a-3(d) under the Investment Company Act of 1940) that occurred during the second fiscal quarter of the period covered by this report that have materially affected, or are reasonably likely to materially affect, the registrant’s internal control over financial reporting.
| Item 12. | Disclosure of Securities Lending Activities for Closed-End Management Investment Companies. |
Not applicable
File the exhibits listed below as part of this Form. Letter or number the exhibits in the sequence indicated.
(a)(1) Any code of ethics, or amendment thereto, that is the subject of the disclosure required by Item 2, to the extent that the registrant intends to satisfy the Item 2 requirements through filing of an exhibit: Not required
(a)(2) A separate certification for each principal executive officer and principal financial officer of the registrant as required by Rule 30a-2(a) under the Act (17 CFR 270.30a-2(a)): Attached hereto
(a)(3) Any written solicitation to purchase securities under Rule 23c-1 under the Act (17 CFR 270.23c-1) sent or given during the period covered by the report by or on behalf of the registrant to 10 or more persons: Not applicable
(a)(4) Change in the registrant’s independent public accountants: Not applicable
(b) Certifications required by Rule 30a-2(b) under the Act (17 CFR 270.30a-2(b)): Attached hereto
| Exhibit 99.CERT | Certifications required by Rule 30a-2(a) under the Act |
| Exhibit 99.906CERT | Certifications required by Rule 30a-2(b) under the Act |
SIGNATURES
Pursuant to the requirements of the Securities Exchange Act of 1934 and the Investment Company Act of 1940, the registrant has duly caused this report to be signed on its behalf by the undersigned, thereunto duly authorized.
| (Registrant) | Ultimus Managers Trust | |
| | | |
| By (Signature and Title)* | /s/ Matthew J. Beck | |
| | | Matthew J. Beck, Secretary | |
| | | | |
| Date | January 31, 2020 | | |
| | | | |
| Pursuant to the requirements of the Securities Exchange Act of 1934 and the Investment Company Act of 1940, this report has been signed below by the following persons on behalf of the registrant and in the capacities and on the dates indicated. |
| | | | |
| By (Signature and Title)* | /s/ David R. Carson | |
| | | David R. Carson, Principal Executive Officer | |
| | | | |
| Date | January 31, 2020 | | |
| | | | |
| By (Signature and Title)* | /s/ Jennifer L. Leamer | |
| | | Jennifer L. Leamer, Treasurer and Principal Financial Officer | |
| | | | |
| Date | January 31, 2020 | | |
| * | Print the name and title of each signing officer under his or her signature. |