| OMB APPROVAL |
OMB Number: 3235-0570 Expires: August 31, 2020 Estimated average burden hours per response: 20.6 |
UNITED STATES
SECURITIES AND EXCHANGE COMMISSION
Washington, D.C. 20549
FORM N-CSR
CERTIFIED SHAREHOLDER REPORT OF REGISTERED
MANAGEMENT INVESTMENT COMPANIES
| Investment Company Act file number | 811-22680 | |
| Ultimus Managers Trust |
| (Exact name of registrant as specified in charter) |
| 225 Pictoria Drive, Suite 450 Cincinnati, Ohio | 45246 |
| (Address of principal executive offices) | (Zip code) |
Matthew J. Beck
| Ultimus Fund Solutions, LLC 225 Pictoria Drive, Suite 450 Cincinnati, Ohio 45246 |
| (Name and address of agent for service) |
| Registrant's telephone number, including area code: | (513) 587-3400 | |
| Date of fiscal year end: | November 30 | |
| | | |
| Date of reporting period: | May 31, 2019 | |
Form N-CSR is to be used by management investment companies to file reports with the Commission not later than 10 days after the transmission to stockholders of any report that is required to be transmitted to stockholders under Rule 30e-1 under the Investment Company Act of 1940 (17 CFR 270.30e-1). The Commission may use the information provided on Form N-CSR in its regulatory, disclosure review, inspection, and policymaking roles.
A registrant is required to disclose the information specified by Form N-CSR, and the Commission will make this information public. A registrant is not required to respond to the collection of information contained in Form N-CSR unless the Form displays a currently valid Office of Management and Budget ("OMB") control number. Please direct comments concerning the accuracy of the information collection burden estimate and any suggestions for reducing the burden to the Secretary, Securities and Exchange Commission, 450 Fifth Street, NW, Washington, DC 20549-0609. The OMB has reviewed this collection of information under the clearance requirements of 44 U.S.C. § 3507.
| Item 1. | Reports to Stockholders. |

LYRICAL U.S. VALUE EQUITY FUND
Institutional Class (LYRIX)
Investor Class (LYRBX)
Semi-Annual Report
May 31, 2019
(Unaudited)
Beginning on January 1, 2021, as permitted by regulations adopted by the U.S. Securities and Exchange Commission, paper copies of the Fund’s shareholder reports like this one will no longer be sent by mail, unless you specifically request paper copies of the reports from the Fund or from your financial intermediary, such as a broker-dealer or bank. Instead, the reports will be made available on a website, and you will be notified by mail each time a report is posted and provided with a website link to access the report.
If you have already elected to receive shareholder reports electronically, you will not be affected by this change and you need not take any action. You may elect to receive shareholder reports and other communications from the Fund electronically by contacting the Fund at 1-888-884-8099 or, if you own these shares through a financial intermediary, by contacting your financial intermediary.
You may elect to receive all future reports in paper free of charge. You can inform the Fund that you wish to continue receiving paper copies of your shareholder reports by contacting the Fund at 1-888-884-8099. If you own shares through a financial intermediary, you may contact your financial intermediary or follow instructions included with this document to elect to continue to receive paper copies of your shareholder reports. Your election to receive reports in paper will apply to all funds held with the fund complex or at your financial intermediary.
LYRICAL U.S. VALUE EQUITY FUND
LETTER TO SHAREHOLDERS | May 31, 2019 |
Dear Fellow Shareholders,
Enclosed is the Semi-Annual Report to shareholders of the Lyrical U.S. Value Equity Fund (the “Fund”). On behalf of the Fund and its investment adviser, Lyrical Asset Management LP, I would like to thank you for your investment.
A Generational Opportunity?
It is important to put recent performance in its historical context. To do so, we analyzed data going back to 1998, the start of the internet bubble (a very poor period for value stocks). We believe the lowest P/E stocks (we use the stocks that at the start of each year have bottom quintile forward P/E multiples among our 1,000 largest U.S. stock universe) are the best proxy for value investing.
Analyzing the data1 for the 21 years from 1998 through 2018, the lowest P/E stocks were the best performing P/E quintile, outperforming the S&P 500 by nearly 400 bp per annum. Over 10 years from 2009 through 2018, the lowest P/E stocks were again the best performers, outperforming the S&P 500 by over 200 bp per annum.
2018 was the rare year where performance was inversely related to P/E cheapness, with the higher P/E quintiles outperforming the lower ones. We need to go back 19 more years to 1999 to find another year as bad for low P/E stocks. After 1999 and until 2018, low P/E stocks outperformed 72% of the years, including 8 years (44% of the years) when low P/E stocks outperformed by over 1,000 bp. The preponderance of the historical evidence is that low P/E value stocks have worked quite well.
Looking back over the last two decades, we see long stretches where low P/E outperforms significantly and then short periods where it acutely underperforms. During the internet bubble, we had two years in 1998 and 1999 when low P/E stocks underperformed the market by 57 percentage points. Then the bubble burst, and low P/E stocks went on a glorious run for the next 14 years, outperforming the S&P 500 almost every year, and by an annualized average of over 1,000 bp per annum.
Much of the bad press value stocks have received is due to the unfortunate use of the Russell 1000 Value as the value stock proxy. That index has underperformed the S&P 500 over the last year, the last five years, the last ten years, and the last fifteen years. On the other hand, low P/E stocks have delivered hundreds of percentage points of outperformance. The value investing narrative based on the Russell index misses the whole story of value investing success, as shown by our low P/E analysis.
As a result of the recent poor performance in value stocks, we see today as the best opportunity for value in a generation. The absolute P/E ratios today are well below historical norms, and lower than where P/E ratios were in the internet bubble. Furthermore, the valuation spreads we see today are unusually wide and have only been like this twice before, at the end of the financial crisis and at the end of the internet bubble. Both of those periods proved to be extraordinary entry points for value stocks.
1
Recap
Since its launch on February 4, 2013 through May 31, 2019, the Fund’s Institutional Class has produced a cumulative total return of +77.15%, compared to the +109.85% cumulative total return for the S&P 500® Index (the “S&P 500”). For the six months ended May 31, 2019, the Fund’s Institutional Class produced a total return of -10.47% compared to the total return for the S&P 500 of +0.74%. For the six months ended May 31, 2019, the three positions that most positively impacted performance were Aflac Incorporated (AFL), Willis Towers Watson Public Limited Company (WLTW), and Ameriprise Financial, Inc. (AMP) with contributions of 39 basis points (bps) (up 8%), 34 bps (up 7%) and 33 bps (up 8%), respectively; conversely, the three positions that most negatively impacted performance were Qurate Retail, Inc. Class A (QRTEA), National Oilwell Varco, Inc. (NOV), and EOG Resources, Inc. (EOG) which detracted 145 bps (down 44%), 113 bps (down 35%) and 106 bps (down 20%), respectively.
In analyzing the Fund portfolio’s performance attribution, we find it helpful to examine both the investment success rate and any skew in the distribution of returns. Over the life of the Fund, 70% of the Fund’s investments posted gains, and 47% outperformed the S&P 500. Skew has been a positive factor, as the Fund’s outperformers have outperformed by 26%, while our underperformers have underperformed by 18% over the life of the Fund. For the six month period ended May 31, 2019, 31% of the Fund’s investments posted gains, and 23% outperformed the S&P 500. For the six month period skew has been a negative factor as the Fund’s outperformers have outperformed by 5%, while our underperformers have underperformed by 17%.
During the life of the Fund we have sold thirty positions, as seven companies announced they were being acquired, eighteen approached our estimates of fair value, for two we lost conviction in our thesis, for one the company announced or completed acquisitions which increased the complexity and decreased analyzability, and for two the risk/reward became less compelling than other opportunities. For each sale we added a new position from our pipeline of opportunities.
As of May 31, 2019, the valuation of our portfolio is 8.5 times the next twelve months consensus earnings. The S&P 500 has a valuation of 15.6 times earnings on this same basis, a premium of 84% over the Fund.
Lyrical Asset Management’s Investment Philosophy and Portfolio Construction
For the new investors since our previous letter to the Fund’s shareholders, we’d like to briefly outline our investment philosophy and portfolio construction approach.
We believe our strategy and approach to investing differentiate us from other investment managers, even those that share a value approach to investing. We are deep value investors and by this we mean that we look to invest in companies trading significantly below intrinsic value. This separates us from other value managers who focus on relative value or core value approaches and whose portfolio characteristics have higher Price/Earnings, Price/Book and Price/Cash Flow multiples. We assess valuation based on current price relative to long-term normalized earnings, which contrasts us to those that rely on Price/Book or dividend yield. We only invest in what we consider to be quality businesses that we believe should earn good returns on invested capital, and avoid volatile businesses and companies with excessive leverage. Other value investors may consider owning any business regardless of quality if they believe the price is low
2
enough. Lastly, we only invest in businesses we can understand and avoid those that are excessively complex or require specialized technical knowledge, even though they may appear cheap from a high-level perspective.
We construct our portfolio purely bottom up and without regard to what is or is not contained in a benchmark. We are concerned with concentration risk and have strict limits on how much capital can be invested in any one position or any one industry. Our long portfolio is constructed to be balanced and diversified across approximately 33 positions, giving us exposure to many different types of companies and situations without sacrificing our strict investment standards.
Thank you for your continued trust and interest in Lyrical Asset Management.
Sincerely,
Andrew Wellington
Portfolio Manager
Past performance is not predictive of future performance. Investment results and principal value will fluctuate so that shares, when redeemed, may be worth more or less than their original cost. Current performance may be higher or lower than the performance data quoted. Performance data current to the most recent month end are available by calling 1-888-884-8099.
An investor should consider the investment objectives, risks, charges and expenses of the Fund carefully before investing. The Fund’s prospectus contains this and other important information. To obtain a copy of the Fund’s prospectus please visit the Fund’s website at www.lyricalvaluefunds.com or call 1-888-884-8099 and a copy will be sent to you free of charge. Please read the prospectus carefully before you invest. The Fund is distributed by Ultimus Fund Distributors, LLC.
The Letter to Shareholders seeks to describe some of the Adviser’s current opinions and views of the financial markets. Although the Adviser believes it has a reasonable basis for any opinions or views expressed, actual results may differ, sometimes significantly so, from those expected or expressed. The securities held by the Fund that are discussed in the Letter to Shareholders were held during the period covered by this Report. They do not comprise the entire investment portfolios of the Fund, may be sold at any time, and may no longer be held by the Fund. For a complete list of securities held by the Funds as of November 30, 2018, please see the Schedules of Investments section of this Report. The opinions of the Fund’s adviser with respect to those securities may change at any time.
Statements in the Letter to Shareholders that reflect projections or expectations for future financial or economic performance of the Fund and the market in general and statements of the Fund’s plans and objectives for future operations are forward-looking statements. No assurance can be given that actual results or events will not differ materially from those projected, estimated, assumed, or anticipated in any such forward-looking statements. Important factors that could result in such differences, in addition to factors noted with such forward-looking statements include, without limitation, general economic conditions, such as inflation, recession, and interest rates. Past performance is not a guarantee of future results.
3
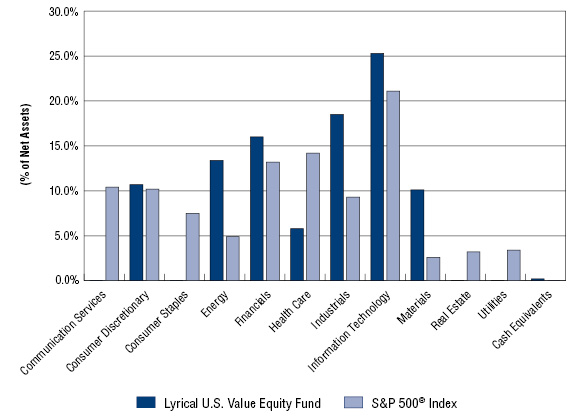
LYRICAL U.S. VALUE EQUITY FUND
PORTFOLIO INFORMATION
May 31, 2019 (Unaudited)
Lyrical U.S. Value Equity Fund vs S&P 500® Index
Sector Diversification
Top Ten Equity Holdings
Security Description | % of
Net Assets |
Microchip Technology, Inc. | 5.8% |
HCA Healthcare, Inc. | 5.8% |
Broadcom, Inc. | 5.7% |
Ameriprise Financial, Inc. | 5.7% |
Celanese Corporation | 5.7% |
Suncor Energy, Inc. | 5.6% |
Lincoln National Corporation | 5.4% |
EOG Resources, Inc. | 5.0% |
United Rentals, Inc. | 4.0% |
AerCap Holdings N.V. | 3.6% |
4
LYRICAL U.S. VALUE EQUITY FUND
SCHEDULE OF INVESTMENTS
May 31, 2019 (Unaudited) |
COMMON STOCKS — 99.8% | | Shares | | | Value | |
Consumer Discretionary — 10.7% | | | | | | | | |
Auto Components — 2.3% | | | | | | | | |
Adient plc | | | 245,514 | | | $ | 4,237,572 | |
Goodyear Tire & Rubber Company (The) | | | 808,974 | | | | 10,848,341 | |
Tenneco, Inc. - Class A | | | 190,890 | | | | 1,897,447 | |
| | | | | | | | 16,983,360 | |
Household Durables — 3.4% | | | | | | | | |
Whirlpool Corporation | | | 215,336 | | | | 24,737,800 | |
| | | | | | | | | |
Internet & Direct Marketing Retail — 2.6% | | | | | | | | |
Qurate Retail, Inc.(a) | | | 1,482,115 | | | | 18,570,901 | |
| | | | | | | | | |
Textiles, Apparel & Luxury Goods — 2.4% | | | | | | | | |
Hanesbrands, Inc. | | | 1,189,304 | | | | 17,661,164 | |
| | | | | | | | | |
Energy — 13.4% | | | | | | | | |
Energy Equipment & Services — 2.8% | | | | | | | | |
National Oilwell Varco, Inc. | | | 997,219 | | | | 20,792,016 | |
| | | | | | | | | |
Oil, Gas & Consumable Fuels — 10.6% | | | | | | | | |
EOG Resources, Inc. | | | 443,751 | | | | 36,334,332 | |
Suncor Energy, Inc. | | | 1,316,069 | | | | 40,534,925 | |
| | | | | | | | 76,869,257 | |
Financials — 16.0% | | | | | | | | |
Capital Markets — 7.7% | | | | | | | | |
Affiliated Managers Group, Inc. | | | 176,073 | | | | 14,758,439 | |
Ameriprise Financial, Inc. | | | 297,737 | | | | 41,156,186 | |
| | | | | | | | 55,914,625 | |
Insurance — 8.3% | | | | | | | | |
Assurant, Inc. | | | 205,010 | | | | 20,492,799 | |
Lincoln National Corporation | | | 663,575 | | | | 39,449,534 | |
| | | | | | | | 59,942,333 | |
Health Care — 5.8% | | | | | | | | |
Health Care Providers & Services — 5.8% | | | | | | | | |
HCA Healthcare, Inc. | | | 347,138 | | | | 41,989,812 | |
5
LYRICAL U.S. VALUE EQUITY FUND
SCHEDULE OF INVESTMENTS (Continued) |
COMMON STOCKS — 99.8% (Continued) | | Shares | | | Value | |
Industrials — 18.5% | | | | | | | | |
Air Freight & Logistics — 2.9% | | | | | | | | |
XPO Logistics, Inc.(a) | | | 401,871 | | | $ | 20,933,461 | |
| | | | | | | | | |
Construction & Engineering — 4.3% | | | | | | | | |
AECOM(a) | | | 452,353 | | | | 14,430,061 | |
Quanta Services, Inc. | | | 480,106 | | | | 16,688,484 | |
| | | | | | | | 31,118,545 | |
Road & Rail — 1.7% | | | | | | | | |
Avis Budget Group, Inc.(a) | | | 297,227 | | | | 8,429,358 | |
Hertz Global Holdings, Inc.(a) | | | 309,999 | | | | 4,361,686 | |
| | | | | | | | 12,791,044 | |
Trading Companies & Distributors — 9.6% | | | | | | | | |
AerCap Holdings N.V.(a) | | | 587,834 | | | | 26,346,720 | |
Air Lease Corporation | | | 395,673 | | | | 14,244,228 | |
United Rentals, Inc.(a) | | | 262,873 | | | | 28,942,317 | |
| | | | | | | | 69,533,265 | |
Information Technology — 25.3% | | | | | | | | |
Communications Equipment — 1.3% | | | | | | | | |
CommScope Holding Company, Inc.(a) | | | 590,613 | | | | 9,538,400 | |
| | | | | | | | | |
Electronic Equipment, Instruments & Components — 6.1% | | | | | | | | |
Arrow Electronics, Inc.(a) | | | 277,080 | | | | 17,361,833 | |
Flex Ltd.(a) | | | 1,725,733 | | | | 15,428,053 | |
Tech Data Corporation(a) | | | 121,640 | | | | 11,026,666 | |
| | | | | | | | 43,816,552 | |
IT Services — 3.2% | | | | | | | | |
Alliance Data Systems Corporation | | | 169,521 | | | | 23,309,137 | |
| | | | | | | | | |
Semiconductors & Semiconductor Equipment — 11.5% | | | | | | | | |
Broadcom, Inc. | | | 165,173 | | | | 41,564,134 | |
Microchip Technology, Inc. | | | 524,717 | | | | 41,993,101 | |
| | | | | | | | 83,557,235 | |
Technology Hardware, Storage & Peripherals — 3.2% | | | | | | | | |
Western Digital Corporation | | | 629,868 | | | | 23,443,687 | |
| | | | | | | | | |
Materials — 10.1% | | | | | | | | |
Chemicals — 5.7% | | | | | | | | |
Celanese Corporation | | | 432,910 | | | | 41,096,146 | |
6
LYRICAL U.S. VALUE EQUITY FUND
SCHEDULE OF INVESTMENTS (Continued) |
COMMON STOCKS — 99.8% (Continued) | | Shares | | | Value | |
Materials — 10.1% (Continued) | | | | | | | | |
Containers & Packaging — 4.4% | | | | | | | | |
Crown Holdings, Inc.(a) | | | 428,546 | | | $ | 23,754,305 | |
Owens-Illinois, Inc. | | | 518,454 | | | | 8,295,264 | |
| | | | | | | | 32,049,569 | |
| | | | | | | | | |
Investments at Value — 99.8% (Cost $726,316,012) | | | | | | $ | 724,648,309 | |
| | | | | | | | | |
Other Assets in Excess of Liabilities — 0.2% | | | | | | | 1,404,143 | |
| | | | | | | | | |
Net Assets — 100.0% | | | | | | $ | 726,052,452 | |
(a) | Non-income producing security. |
See accompanying notes to financial statements. |
7
LYRICAL U.S. VALUE EQUITY FUND
STATEMENT OF ASSETS AND LIABILITIES
May 31, 2019 (Unaudited) |
ASSETS | | | | |
Investments in securities: | | | | |
At cost | | $ | 726,316,012 | |
At value (Note 2) | | $ | 724,648,309 | |
Receivable for capital shares sold | | | 538,962 | |
Receivable for investment securities sold | | | 11,374,453 | |
Dividends receivable | | | 1,189,980 | |
Other assets | | | 52,970 | |
Total assets | | | 737,804,674 | |
| | | | | |
LIABILITIES | | | | |
Cash overdraft | | | 1,550,189 | |
Payable for capital shares redeemed | | | 9,246,580 | |
Payable to Adviser (Note 4) | | | 864,230 | |
Payable to administrator (Note 4) | | | 75,057 | |
Accrued distribution fees (Note 4) | | | 153 | |
Other accrued expenses | | | 16,013 | |
Total liabilities | | | 11,752,222 | |
| | | | | |
NET ASSETS | | $ | 726,052,452 | |
| | | | | |
NET ASSETS CONSIST OF: | | | | |
Paid-in capital | | $ | 738,109,678 | |
Accumulated deficit | | | (12,057,226 | ) |
NET ASSETS | | $ | 726,052,452 | |
| | | | | |
NET ASSET VALUE PER SHARE: | | | | |
INSTITUTIONAL CLASS | | | | |
Net assets applicable to Institutional Class | | $ | 719,108,905 | |
Institutional Class shares of beneficial interest outstanding (unlimited number of shares authorized, no par value) | | | 51,864,416 | |
Net asset value, offering price and redemption price per share (Note 2) | | $ | 13.87 | |
INVESTOR CLASS | | | | |
Net assets applicable to Investor Class | | $ | 6,943,547 | |
Investor Class shares of beneficial interest outstanding (unlimited number of shares authorized, no par value) | | | 503,975 | |
Net asset value, offering price and redemption price per share (Note 2) | | $ | 13.78 | |
See accompanying notes to financial statements. |
8
LYRICAL U.S. VALUE EQUITY FUND
STATEMENT OF OPERATIONS
Six Months Ended May 31, 2019 (Unaudited) |
INVESTMENT INCOME | | | | |
Dividend income | | $ | 7,858,536 | |
Foreign witholding taxes on dividends | | | (59,400 | ) |
Total investment income | | | 7,799,136 | |
| | | | | |
EXPENSES | | | | |
Investment advisory fees (Note 4) | | | 5,235,700 | |
Administration fees (Note 4) | | | 303,079 | |
Fund accounting fees (Note 4) | | | 51,401 | |
Transfer agent fees (Note 4) | | | 46,718 | |
Compliance fees (Note 4) | | | 42,884 | |
Registration and filing fees | | | 35,226 | |
Custody and bank service fees | | | 34,573 | |
Postage and supplies | | | 34,288 | |
Professional fees | | | 23,859 | |
Networking fees | | | 15,119 | |
Distribution fees - Investor Class (Note 4) | | | 13,178 | |
Insurance expense | | | 7,123 | |
Borrowing costs (Note 5) | | | 6,500 | |
Printing of shareholder reports | | | 6,463 | |
Trustees’ fees and expenses (Note 4) | | | 5,969 | |
Other expenses | | | 17,164 | |
Total expenses | | | 5,879,244 | |
Expense reimbursements by Adviser (Note 4) | | | (12,149 | ) |
Net expenses | | | 5,867,095 | |
| | | | | |
NET INVESTMENT INCOME | | | 1,932,041 | |
| | | | | |
REALIZED AND UNREALIZED GAINS (LOSSES) ON INVESTMENTS AND FOREIGN CURRENCIES | | | | |
Net realized gains from investment transactions | | | 39,236,366 | |
Net realized losses from foreign currency transactions (Note 2) | | | (11,202 | ) |
Net change in unrealized appreciation (depreciation) on investments | | | (134,487,335 | ) |
NET REALIZED AND UNREALIZED LOSSES ON INVESTMENTSAND FOREIGN CURRENCIES | | | (95,262,171 | ) |
| | | | | |
NET DECREASE IN NET ASSETS RESULTING FROM OPERATIONS | | $ | (93,330,130 | ) |
See accompanying notes to financial statements. |
9
LYRICAL U.S. VALUE EQUITY FUND
STATEMENTS OF CHANGES IN NET ASSETS |
| | Six Months
Ended
May 31, 2019
(Unaudited) | | | Year
Ended
November 30,
2018 | |
FROM OPERATIONS | | | | | | | | |
Net investment income | | $ | 1,932,041 | | | $ | 1,882,890 | |
Net realized gains from investment transactions | | | 39,236,366 | | | | 50,802,676 | |
Net realized losses from foreign currency transactions | | | (11,202 | ) | | | (4,989 | ) |
Net change in unrealized appreciation (depreciation) on investments | | | (134,487,335 | ) | | | (163,561,509 | ) |
Net decrease in net assets resulting from operations | | | (93,330,130 | ) | | | (110,880,932 | ) |
| | | | | | | | | |
FROM DISTRIBUTIONS TO SHAREHOLDERS (Note 2) | | | | | | | | |
Institutional Class | | | (2,632,588 | ) | | | (77,051,597 | ) |
Investor Class | | | — | | | | (1,717,444 | ) |
Decrease in net assets from distributions to shareholders | | | (2,632,588 | ) | | | (78,769,041 | ) |
| | | | | | | | | |
CAPITAL SHARE TRANSACTIONS | | | | | | | | |
Institutional Class | | | | | | | | |
Proceeds from shares sold | | | 224,256,886 | | | | 456,135,603 | |
Net asset value of shares issued in reinvestment of distributions to shareholders | | | 2,082,876 | | | | 61,458,585 | |
Payments for shares redeemed | | | (320,152,825 | ) | | | (542,065,326 | ) |
Net decrease in Institutional Class net assets from captial share transactions | | | (93,813,063 | ) | | | (24,471,138 | ) |
| | | | | | | | | |
Investor Class | | | | | | | | |
Proceeds from shares sold | | | 1,074,727 | | | | 4,889,814 | |
Net asset value of shares issued in reinvestment of distributions to shareholders | | | — | | | | 1,617,814 | |
Payments for shares redeemed | | | (12,423,554 | ) | | | (18,570,922 | ) |
Net decrease in Investor Class net assets from captial share transactions | | | (11,348,827 | ) | | | (12,063,294 | ) |
| | | | | | | | | |
TOTAL DECREASE IN NET ASSETS | | | (201,124,608 | ) | | | (226,184,405 | ) |
| | | | | | | | | |
NET ASSETS | | | | | | | | |
Beginning of period | | | 927,177,060 | | | | 1,153,361,465 | |
End of period | | $ | 726,052,452 | | | $ | 927,177,060 | |
See accompanying notes to financial statements. |
10
LYRICAL U.S. VALUE EQUITY FUND
STATEMENTS OF CHANGES IN NET ASSETS (Continued) |
| | Six Months
Ended
May 31, 2019
(Unaudited) | | | Year
Ended
November 30,
2018 | |
CAPITAL SHARE ACTIVITY | | | | | | | | |
Institutional Class | | | | | | | | |
Shares sold | | | 15,305,937 | | | | 25,680,359 | |
Shares issued in reinvestment of distributions to shareholders | | | 153,266 | | | | 3,949,556 | |
Shares redeemed | | | (21,935,313 | ) | | | (31,270,758 | ) |
Net decrease in shares outstanding | | | (6,476,110 | ) | | | (1,640,843 | ) |
Shares outstanding at beginning of period | | | 58,340,526 | | | | 59,981,369 | |
Shares outstanding at end of period | | | 51,864,416 | | | | 58,340,526 | |
| | | | | | | | | |
Investor Class | | | | | | | | |
Shares sold | | | 70,607 | | | | 268,775 | |
Shares issued in reinvestment of distributions to shareholders | | | — | | | | 104,804 | |
Shares redeemed | | | (850,944 | ) | | | (1,073,442 | ) |
Net decrease in shares outstanding | | | (780,337 | ) | | | (699,863 | ) |
Shares outstanding at beginning of period | | | 1,284,312 | | | | 1,984,175 | |
Shares outstanding at end of period | | | 503,975 | | | | 1,284,312 | |
See accompanying notes to financial statements. |
11
LYRICAL U.S. VALUE EQUITY FUND
INSTITUTIONAL CLASS
FINANCIAL HIGHLIGHTS |
Per Share Data for a Share Outstanding Throughout Each Period: |
| | Six Months
Ended
May 31,
2019
(Unaudited) | | | Year
Ended
Nov. 30,
2018 | | | Year
Ended
Nov. 30,
2017 | | | Year
Ended
Nov. 30,
2016 | | | Year
Ended
Nov. 30,
2015 | | | Year
Ended
Nov. 30,
2014 | |
Net asset value at beginning of period | | $ | 15.55 | | | $ | 18.62 | | | $ | 16.60 | | | $ | 15.63 | | | $ | 16.29 | | | $ | 13.78 | |
| | | | | | | | | | | | | | | | | | | | | | | | | |
Income (loss) from investment operations: | | | | | | | | | | | | | | | | | | | | | | | | |
Net investment income (loss) | | | 0.04 | (a) | | | 0.03 | (a) | | | 0.01 | (a) | | | 0.24 | | | | 0.04 | | | | (0.00 | )(b) |
Net realized and unrealized gains (losses) on investments and foreign currencies | | | (1.67 | ) | | | (1.70 | ) | | | 3.54 | | | | 1.40 | | | | (0.35 | ) | | | 2.66 | |
Total from investment operations | | | (1.63 | ) | | | (1.67 | ) | | | 3.55 | | | | 1.64 | | | | (0.31 | ) | | | 2.66 | |
| | | | | | | | | | | | | | | | | | | | | | | | | |
Less distributions: | | | | | | | | | | | | | | | | | | | | | | | | |
Dividends from net investment income | | | (0.05 | ) | | | (0.01 | ) | | | (0.24 | ) | | | (0.04 | ) | | | (0.00 | )(b) | | | (0.00 | )(b) |
Distributions from net realized gains | | | — | | | | (1.39 | ) | | | (1.29 | ) | | | (0.63 | ) | | | (0.35 | ) | | | (0.15 | ) |
Total distributions | | | (0.05 | ) | | | (1.40 | ) | | | (1.53 | ) | | | (0.67 | ) | | | (0.35 | ) | | | (0.15 | ) |
| | | | | | | | | | | | | | | | | | | | | | | | | |
Net asset value at end of period | | $ | 13.87 | | | $ | 15.55 | | | $ | 18.62 | | | $ | 16.60 | | | $ | 15.63 | | | $ | 16.29 | |
| | | | | | | | | | | | | | | | | | | | | | | | | |
Total return(c) | | | (10.47 | %)(d) | | | (9.02 | %) | | | 21.70 | % | | | 10.73 | % | | | (1.91 | %) | | | 19.41 | % |
| | | | | | | | | | | | | | | | | | | | | | | | | |
Net assets at end of period (000’s) | | $ | 719,109 | | | $ | 907,366 | | | $ | 1,116,584 | | | $ | 993,904 | | | $ | 590,582 | | | $ | 547,021 | |
| | | | | | | | | | | | | | | | | | | | | | | | | |
Ratios/supplementary data: | | | | | | | | | | | | | | | | | | | | | | | | |
Ratio of total expenses to average net assets | | | 1.40 | %(e) | | | 1.37 | % | | | 1.37 | % | | | 1.38 | % | | | 1.42 | % | | | 1.45 | % |
| | | | | | | | | | | | | | | | | | | | | | | | | |
Ratio of net expenses to average net assets | | | 1.40 | %(e) | | | 1.37 | % | | | 1.37 | % | | | 1.38 | % | | | 1.42 | % | | | 1.44 | %(f) |
| | | | | | | | | | | | | | | | | | | | | | | | | |
Ratio of net investment income (loss) to average net assets | | | 0.46 | %(e) | | | 0.17 | % | | | 0.03 | % | | | 1.62 | % | | | 0.24 | % | | | (0.00 | %)(f)(g) |
| | | | | | | | | | | | | | | | | | | | | | | | | |
Portfolio turnover rate | | | 25 | %(d) | | | 39 | % | | | 22 | % | | | 36 | % | | | 21 | % | | | 20 | % |
(a) | Per share net investment income has been determined on the basis of average number of shares outstanding during the period. |
(b) | Amount rounds to less than $0.01 per share. |
(c) | Total return is a measure of the change in value of an investment in the Fund over the periods covered. The returns shown do not reflect the deduction of taxes a shareholder would pay on Fund distributions, if any, or the redemption of Fund shares. The total return would have been lower if the Adviser had not reduced advisory fees and/or reimbursed expenses for the year ended November 30, 2014 (Note 4). |
(d) | Not annualized. |
(e) | Annualized. |
(f) | Ratio was determined after fee reductions and/or expense reimbursements (Note 4). |
(g) | Amount rounds to less than 0.01%. |
See accompanying notes to financial statements. |
12
LYRICAL U.S. VALUE EQUITY FUND
INVESTOR CLASS
FINANCIAL HIGHLIGHTS |
Per Share Data for a Share Outstanding Throughout Each Period: |
| | Six Months
Ended
May 31,
2019
(Unaudited) | | | Year
Ended
Nov. 30,
2018 | | | Year
Ended
Nov. 30,
2017 | | | Year
Ended
Nov. 30,
2016 | | | Year
Ended
Nov. 30,
2015 | | | Period
Ended
Nov. 30,
2014(a) | |
Net asset value at beginning of period | | $ | 15.43 | | | $ | 18.54 | | | $ | 16.52 | | | $ | 15.57 | | | $ | 16.27 | | | $ | 14.68 | |
| | | | | | | | | | | | | | | | | | | | | | | | | |
Income (loss) from investment operations: | | | | | | | | | | | | | | | | | | | | | | | | |
Net investment income (loss) | | | 0.01 | (b) | | | (0.03 | )(b) | | | (0.05 | )(b) | | | 0.30 | | | | 0.01 | | | | (0.01 | ) |
Net realized and unrealized gains (losses) on investments and foreign currencies | | | (1.66 | ) | | | (1.69 | ) | | | 3.53 | | | | 1.28 | | | | (0.36 | ) | | | 1.60 | |
Total from investment operations | | | (1.65 | ) | | | (1.72 | ) | | | 3.48 | | | | 1.58 | | | | (0.35 | ) | | | 1.59 | |
| | | | | | | | | | | | | | | | | | | | | | | | | |
Less distributions: | | | | | | | | | | | | | | | | | | | | | | | | |
Dividends from net investment income | | | — | | | | — | | | | (0.17 | ) | | | (0.00 | )(c) | | | — | | | | — | |
Distributions from net realized gains | | | — | | | | (1.39 | ) | | | (1.29 | ) | | | (0.63 | ) | | | (0.35 | ) | | | — | |
Total distributions | | | — | | | | (1.39 | ) | | | (1.46 | ) | | | (0.63 | ) | | | (0.35 | ) | | | — | |
| | | | | | | | | | | | | | | | | | | | | | | | | |
Net asset value at end of period | | $ | 13.78 | | | $ | 15.43 | | | $ | 18.54 | | | $ | 16.52 | | | $ | 15.57 | | | $ | 16.27 | |
| | | | | | | | | | | | | | | | | | | | | | | | | |
Total return(d) | | | (10.69 | %)(e) | | | (9.30 | %) | | | 21.32 | % | | | 10.36 | % | | | (2.19 | %) | | | 10.83 | %(e) |
| | | | | | | | | | | | | | | | | | | | | | | | | |
Net assets at end of period (000’s) | | $ | 6,944 | | | $ | 19,811 | | | $ | 36,777 | | | $ | 58,213 | | | $ | 61,375 | | | $ | 9,033 | |
| | | | | | | | | | | | | | | | | | | | | | | | | |
Ratios/supplementary data: | | | | | | | | | | | | | | | | | | | | | | | | |
Ratio of total expenses to average net assets | | | 1.93 | %(f) | | | 1.72 | % | | | 1.70 | % | | | 1.70 | % | | | 1.72 | % | | | 2.39 | %(f) |
| | | | | | | | | | | | | | | | | | | | | | | | | |
Ratio of net expenses to average net assets | | | 1.70 | %(f)(g) | | | 1.70 | %(g) | | | 1.70 | % | | | 1.70 | % | | | 1.70 | %(g) | | | 1.70 | %(f)(g) |
| | | | | | | | | | | | | | | | | | | | | | | | | |
Ratio of net investment income (loss) to average net assets | | | 0.16 | %(f)(g) | | | (0.18 | %)(g) | | | (0.32 | %) | | | 1.39 | % | | | 0.03 | %(g) | | | (0.18 | %)(f)(g) |
| | | | | | | | | | | | | | | | | | | | | | | | | |
Portfolio turnover rate | | | 25 | %(e) | | | 39 | % | | | 22 | % | | | 36 | % | | | 21 | % | | | 20 | %(e)(h) |
(a) | Represents the period from the commencement of operations (February 24, 2014) through November 30, 2014. |
(b) | Per share net investment income (loss) has been determined on the basis of average number of shares outstanding during the period. |
(c) | Amount rounds to less than $0.01 per share. |
(d) | Total return is a measure of the change in value of an investment in the Fund over the periods covered. The returns shown do not reflect the deduction of taxes a shareholder would pay on Fund distributions, if any, or the redemption of Fund shares. The total returns would be lower if the Adviser had not reduced advisory fees and/or reimbursed expenses for the periods ended May 31, 2019 and November 30, 2018, 2015 and 2014 (Note 4). |
(e) | Not annualized. |
(f) | Annualized. |
(g) | Ratio was determined after fee reductions and/or expense reimbursements (Note 4). |
(h) | Represents the year ended November 30, 2014. |
See accompanying notes to financial statements. |
13
LYRICAL U.S. VALUE EQUITY FUND
NOTES TO FINANCIAL STATEMENTS
May 31, 2019 (Unaudited)
1. Organization
Lyrical U.S. Value Equity Fund (the “Fund”) is a diversified series of Ultimus Managers Trust (the “Trust”), an open-end investment company established as an Ohio business trust under a Declaration of Trust dated February 28, 2012. Other series of the Trust are not incorporated in this report.
The investment objective of the Fund is to seek to achieve long-term capital growth.
The Fund offers two classes of shares: Institutional Class shares (sold without any sales loads and distribution and/or shareholder service fees and requiring a $100,000 initial investment) and Investor Class shares (sold without any sales loads, but subject to a distribution and/or shareholder service fee of up to 0.25% of the average daily net assets attributable to Investor Class shares, and requiring a $2,500 initial investment). Each share class represents an ownership interest in the same investment portfolio.
2. Significant Accounting Policies
The following is a summary of the Fund’s significant accounting policies. The policies are in conformity with accounting principles generally accepted in the United States of America (“GAAP”). The Fund follows accounting and reporting guidance under Financial Accounting Standards Board Accounting Standards Codification Topic 946, “Financial Services – Investment Companies.”
Securities valuation – The Fund values its portfolio securities at market value as of the close of regular trading on the New York Stock Exchange (the “NYSE”) (normally 4:00 p.m. Eastern time) on each business day the NYSE is open for business. The Fund values its listed securities on the basis of the security’s last sale price on the security’s primary exchange, if available, otherwise at the exchange’s most recently quoted mean price. NASDAQ-listed securities are valued at the NASDAQ Official Closing Price. When using a quoted price and when the market is considered active, the security will be classified as Level 1 within the fair value hierarchy (see below). In the event that market quotations are not readily available or are considered unreliable due to market or other events, the Fund values its securities and other assets at fair value in accordance with procedures established by and under the general supervision of the Board of Trustees (the “Board”). Under these procedures, the securities will be classified as Level 2 or 3 within the fair value hierarchy, depending on the inputs used. Unavailable or unreliable market quotes may be due to the following factors: a substantial bid-ask spread; infrequent sales resulting in stale prices; insufficient trading volume; small trade sizes; a temporary lapse in any reliable pricing source; and actions of the securities or futures markets, such as the suspension or limitation of trading. As a result, the prices of securities used to calculate the Fund’s net asset value (“NAV”) may differ from quoted or published prices for the same securities.
14
LYRICAL U.S. VALUE EQUITY FUND
NOTES TO FINANCIAL STATEMENTS (Continued) |
GAAP establishes a single authoritative definition of fair value, sets out a framework for measuring fair value, and requires additional disclosures about fair value measurements.
Various inputs are used in determining the value of the Fund’s investments. These inputs are summarized in the three broad levels listed below:
● | Level 1 – quoted prices in active markets for identical securities |
● | Level 2 – other significant observable inputs |
● | Level 3 – significant unobservable inputs |
The inputs or methods used for valuing securities are not necessarily an indication of the risks associated with investing in those securities. The inputs used to measure fair value may fall into different levels of the fair value hierarchy. In such cases, for disclosure purposes, the level in the fair value hierarchy within which the fair value measurement falls in its entirety is determined based on the lowest level input that is significant to the fair value measurement.
The following is a summary of the inputs used to value the Fund’s investments as of May 31, 2019:
Lyrical U.S. Value Equity Fund | | Level 1 | | | Level 2 | | | Level 3 | | | Total | |
Investments in Securities | | | | | | | | | | | | | | | | |
Common Stocks | | $ | 724,648,309 | | | $ | — | | | $ | — | | | $ | 724,648,309 | |
Total | | $ | 724,648,309 | | | $ | — | | | $ | — | | | $ | 724,648,309 | |
Refer to the Fund’s Schedule of Investments for a listing of securities by sector and industry type. The Fund did not hold any derivative instruments or any assets or liabilities that were measured at fair value on a recurring basis using significant unobservable inputs (Level 3) as of or during the six months ended May 31, 2019.
Share valuation – The NAV per share of each class of the Fund is calculated daily by dividing the total value of the assets attributable to that class, less liabilities attributable to that class, by the number of shares outstanding of that class. The offering price and redemption price per share of each class of the Fund is equal to the NAV per share of such class.
Investment income– Dividend income is recorded on the ex-dividend date. Interest income is accrued as earned. Withholding taxes on foreign dividends have been recorded in accordance with the Fund’s understanding of the applicable country’s rules and tax rates.
Investment transactions – Investment transactions are accounted for on the trade date. Realized gains and losses on investments sold are determined on a specific identification basis.
15
LYRICAL U.S. VALUE EQUITY FUND
NOTES TO FINANCIAL STATEMENTS (Continued) |
Foreign currency translation – Investment securities and other assets and liabilities denominated in or expected to settle in foreign currencies, if any, are translated into U.S. dollars based on exchange rates on the following basis:
| | A. | The fair values of investment securities and other assets and liabilities are translated as of the close of the NYSE each day. |
| | B. | Purchases and sales of investment securities and income and expenses are translated at the rate of exchange prevailing as of 4:00 p.m. Eastern time on the respective date of such transactions. |
| | C. | The Fund does not isolate that portion of the results of operations caused by changes in foreign exchange rates on investments from those caused by changes in market prices of securities held. Such fluctuations are included with the net realized and unrealized gains or losses on investments. |
Reported net realized foreign exchange gains or losses arise from 1) purchases and sales of foreign currencies and 2) the difference between the amounts of dividends and foreign withholding taxes recorded on the Fund’s books and the U.S. dollar equivalent of the amounts actually received or paid. Reported net unrealized foreign exchange gains and losses, if any, arise from changes in the value of assets and liabilities that result from changes in exchange rates.
Allocation between Classes – Investment income earned, realized capital gains and losses, and unrealized appreciation and depreciation are allocated daily to each Class of the Fund based upon its proportionate share of total net assets of the Fund. Class-specific expenses are charged directly to the Class incurring the expense. Common expenses which are not attributable to a specific Class are allocated daily to each Class of shares of the Fund based upon its proportionate share of total net assets of the Fund.
Common expenses – Common expenses of the Trust are allocated among the Fund and the other series of the Trust based on the relative net assets of each series, the number of series in the Trust, or the nature of the services performed and the relative applicability to each series.
16
LYRICAL U.S. VALUE EQUITY FUND
NOTES TO FINANCIAL STATEMENTS (Continued) |
Distributions to shareholders – The Fund distributes to shareholders any net investment income dividends and net realized capital gains distributions at least once each year. The amount of such dividends and distributions are determined in accordance with federal income tax regulations, which may differ from GAAP. Dividends and distributions to shareholders are recorded on the ex-dividend date. The tax character of distributions paid to shareholders by the Fund during the periods ended May 31, 2019 and November 30, 2018 was as follows:
| Period
Ended | | Ordinary
Income | | | Long-Term
Capital Gains | | | Total
Distributions | |
Institutional Class | 5/31/2019 | | $ | 2,632,588 | | | $ | — | | | $ | 2,632,588 | |
| | 11/30/2018 | | $ | 372,769 | | | $ | 76,678,828 | | | $ | 77,051,597 | |
Investor Class | 5/31/2019 | | $ | — | | | $ | — | | | $ | — | |
| | 11/30/2018 | | $ | 4,379 | | | $ | 1,713,065 | | | $ | 1,717,444 | |
Estimates – The preparation of financial statements in conformity with GAAP requires management to make estimates and assumptions that affect the reported amounts of assets and liabilities and disclosure of contingent assets and liabilities as of the date of the financial statements and the reported amounts of income and expenses during the reporting period. Actual results could differ from those estimates.
Federal income tax – The Fund has qualified and intends to continue to qualify as a regulated investment company under the Internal Revenue Code of 1986, as amended (the “Code”). Qualification generally will relieve the Fund of liability for federal income taxes to the extent 100% of its net investment income and net realized capital gains are distributed in accordance with the Code.
In order to avoid imposition of the excise tax applicable to regulated investment companies, it is also the Fund’s intention to declare as dividends in each calendar year at least 98% of its net investment income (earned during the calendar year) and 98.2% of its net realized capital gains (earned during the twelve months ended October 31) plus undistributed amounts from prior years.
The following information is computed on a tax basis for each item as of May 31, 2019:
Tax cost of portfolio investments | | $ | 785,725,297 | |
Gross unrealized appreciation | | $ | 98,566,874 | |
Gross unrealized depreciation | | | (159,643,862 | ) |
Net unrealized depreciation | | | (61,076,988 | ) |
Accumulated ordinary income | | | 1,159,552 | |
Undistributed long-term capital gains | | | 6,836,528 | |
Other gains | | | 41,023,682 | |
Accumulated deficit | | $ | (12,057,226 | ) |
17
LYRICAL U.S. VALUE EQUITY FUND
NOTES TO FINANCIAL STATEMENTS (Continued) |
The difference between the federal income tax cost of portfolio investments and the financial statement cost of portfolio investments is due to certain timing differences in the recognition of capital gains or losses under income tax regulations and GAAP. These “book/tax” differences are temporary in nature and are primarily due to the tax deferral of losses on wash sales.
The Fund recognizes the tax benefits or expenses of uncertain tax positions only when the position is “more likely than not” of being sustained assuming examination by tax authorities. Management has reviewed the Fund’s tax positions for the current and all open tax years (generally, three years) and has concluded that no provision for unrecognized tax benefits or expenses is required in these financial statements. The Fund identifies its major tax jurisdiction as U.S. Federal.
3. Investment Transactions
During the six months ended May 31, 2019, cost of purchases and proceeds from sales of investment securities, other than short-term investments, amounted to $209,364,830 and $325,936,681, respectively.
4. Transactions with Related Parties
INVESTMENT ADVISORY AGREEMENT
The Fund’s investments are managed by Lyrical Asset Management L.P. (the “Adviser”) pursuant to the terms of an Investment Advisory Agreement. The Fund pays the Adviser an investment advisory fee, computed and accrued daily and paid monthly, at the annual rate of 1.25% of average daily net assets.
Pursuant to an Expense Limitation Agreement (“ELA”) between the Fund and the Adviser, the Adviser has contractually agreed, until April 1, 2020, to reduce investment advisory fees and reimburse other operating expenses to limit total annual operating expenses of the Fund (exclusive of brokerage costs; taxes; interest; borrowing costs such as interest and dividend expenses on securities sold short; costs to organize the Fund; acquired fund fees and expenses; extraordinary expenses such as litigation and merger or reorganization costs; and other expenses not incurred in the ordinary course of the Fund’s business) to an amount not exceeding the following percentages of average daily net assets attributable to each respective class:
Institutional Class | Investor Class |
1.45% | 1.70% |
Accordingly, during the six months ended May 31, 2019, the Adviser reimbursed other operating expenses of $12,149 for Investor Class shares.
18
LYRICAL U.S. VALUE EQUITY FUND
NOTES TO FINANCIAL STATEMENTS (Continued) |
Under the terms of the ELA, investment advisory fee reductions and expense reimbursements by the Adviser are subject to repayment by the Fund for a period of three years after such fees and expenses were incurred, provided that the repayments do not cause total annual fund operating expenses to exceed the lesser of (i) the expense limitation then in effect, if any, and (ii) the expense limitation in effect at the time the expenses to be repaid were incurred. As of May 31, 2019, the Adviser may in the future seek repayment of expense reimbursements of $18,371. The Adviser may recover these amounts no later than the dates state below:
November 30, 2021 | | $ | 6,222 | |
May 31, 2022 | | | 12,149 | |
| | | $ | 18,371 | |
OTHER SERVICE PROVIDERS
Ultimus Fund Solutions, LLC (“Ultimus”) provides administration, fund accounting, compliance and transfer agency services to the Fund. The Fund pays Ultimus fees in accordance with the agreements for such services. In addition, the Fund pays out-of-pocket expenses including, but not limited to, postage, supplies and costs of pricing its portfolio securities.
Under the terms of a Distribution Agreement with the Trust, Ultimus Fund Distributors, LLC (the “Distributor”) serves as the principal underwriter to the Fund. The Distributor is a wholly-owned subsidiary of Ultimus. The Distributor is compensated partially by the Adviser and partially by the Investor Class shares of the Fund for acting as principal underwriter.
A Trustee and certain officers of the Trust are also officers of Ultimus and/or the Distributor.
DISTRIBUTION PLAN
The Fund has adopted a plan of distribution (the “Plan”), pursuant to Rule 12b-1 under the Investment Company Act of 1940, as amended (the “1940 Act”), which permits Investor Class shares of the Fund to directly incur or reimburse the Fund’s principal underwriter for certain expenses related to the distribution of its shares. The annual limitation for payment of expenses pursuant to the Plan is 0.25% of the Fund’s average daily net assets allocable to Investor Class shares. The Fund has not adopted a plan of distribution with respect to the Institutional Class shares. During the six months ended May 31, 2019, the Investor Class shares incurred $13,178 of distribution fees under the Plan.
TRUSTEE COMPENSATION
Each Trustee who is not an “interested person” of the Trust (“Independent Trustee”) receives a $1,300 annual retainer from the Fund, paid quarterly, except for the Board Chairperson who receives a $1,500 annual retainer from the Fund, paid in quarterly
19
LYRICAL U.S. VALUE EQUITY FUND
NOTES TO FINANCIAL STATEMENTS (Continued) |
installments. Each Independent Trustee also receives from the Fund a fee of $500 for each Board meeting attended plus reimbursement for travel and other meeting-related expenses.
PRINCIPAL HOLDER OF FUND SHARES
As of May 31, 2019, the following shareholder owned of record 25% or more of the outstanding shares of the Fund:
NAME OF RECORD OWNER | % Ownership |
Lyrical U.S. Value Equity Fund - Institutional Class | |
Charles Schwab & Company, Inc. (for the benefit of its customers) | 26% |
Lyrical U.S. Value Equity Fund - Investor Class | |
Charles Schwab & Company, Inc. (for the benefit of its customers) | 28% |
A beneficial owner of 25% or more of the Fund’s outstanding shares may be considered a controlling person of the Fund. That shareholder’s vote could have a more significant effect on matters presented at a shareholders’ meeting.
5. Borrowing Costs
From time to time, the Fund may have an overdrawn cash balance at the custodian due to redemptions or market movements. When this occurs, the Fund will incur borrowing costs charged by the custodian. Accordingly, during the six months ended May 31, 2019, the Fund incurred $6,500 of borrowing costs charged by the custodian.
6. Sector Risk
If the Fund has significant investments in the securities of issuers within a particular sector, any development affecting that sector will have a greater impact on the value of the net assets of the Fund than would be the case if the Fund did not have significant investments in that sector. In addition, this may increase the risk of loss in the Fund and increase the volatility of the Fund’s NAV per share. For instance, economic or market factors, regulatory changes or other developments may negatively impact all companies in a particular sector, and therefore the value of the Fund’s portfolio will be adversely affected. As of May 31, 2019, the Fund had 25.3% of the value of its net assets invested in stocks within the Information Technology sector.
20
LYRICAL U.S. VALUE EQUITY FUND
NOTES TO FINANCIAL STATEMENTS (Continued) |
7. Contingencies and Commitments
The Fund indemnifies the Trust’s officers and Trustees for certain liabilities that might arise from their performance of their duties to the Fund. Additionally, in the normal course of business the Fund enters into contracts that contain a variety of representations and warranties and which provide general indemnifications. The Fund’s maximum exposure under these arrangements is unknown, as this would involve future claims that may be made against the Fund that have not yet occurred. However, based on experience, the Fund expects the risk of loss to be remote.
8. Subsequent Events
The Fund is required to recognize in the financial statements the effects of all subsequent events that provide additional evidence about conditions that existed as of the date of the Statement of Assets and Liabilities. For non-recognized subsequent events that must be disclosed to keep the financial statements from being misleading, the Fund is required to disclose the nature of the event as well as an estimate of its financial effect, or a statement that such an estimate cannot be made. Management has evaluated subsequent events through the issuance of these financial statements and has noted no such events.
21
LYRICAL U.S. VALUE EQUITY FUND
ABOUT YOUR FUND’S EXPENSES (Unaudited) |
We believe it is important for you to understand the impact of costs on your investment. As a shareholder of the Fund, you incur ongoing costs, including management fees, class-specific expenses (such as distribution fees) and other operating expenses. The following examples are intended to help you understand your ongoing costs (in dollars) of investing in the Fund and to compare these costs with the ongoing costs of investing in other mutual funds.
A mutual fund’s ongoing costs are expressed as a percentage of its average net assets. This figure is known as the expense ratio. The expenses in the table below are based on an investment of $1,000 made at the beginning of the most recent period (December 1, 2018) and held until the end of the period (May 31, 2019).
The table below illustrates the Fund’s ongoing costs in two ways:
Actual fund return – This section helps you to estimate the actual expenses that you paid over the period. The “Ending Account Value” shown is derived from the Fund’s actual return, and the fourth column shows the dollar amount of operating expenses that would have been paid by an investor who started with $1,000 in the Fund. You may use the information here, together with the amount you invested, to estimate the expenses that you paid over the period.
To do so, simply divide your account value by $1,000 (for example, an $8,600 account value divided by $1,000 = 8.6), then multiply the result by the number given for the Fund under the heading “Expenses Paid During Period.”
Hypothetical 5% return – This section is intended to help you compare the Fund’s ongoing costs with those of other mutual funds. It assumes that the Fund had an annual return of 5% before expenses during the period shown, but that the expense ratio is unchanged. In this case, because the return used is not the Fund’s actual return, the results do not apply to your investment. The example is useful in making comparisons because the U.S. Securities and Exchange Commission (the “SEC”) requires all mutual funds to calculate expenses based on a 5% return. You can assess the Fund’s ongoing costs by comparing this hypothetical example with the hypothetical examples that appear in shareholder reports of other funds.
Note that expenses shown in the table are meant to highlight and help you compare ongoing costs only. The Fund does not charge transaction fees, such as purchase or redemption fees, nor does it carry a “sales load.”
The calculations assume no shares were bought or sold during the period. Your actual costs may have been higher or lower, depending on the amount of your investment and the timing of any purchases or redemptions.
22
LYRICAL U.S. VALUE EQUITY FUND
ABOUT YOUR FUND’S EXPENSES (Unaudited) (Continued)
More information about the Fund’s expenses can be found in this report. For additional information on operating expenses and other shareholder costs, please refer to the Fund’s prospectus.
| Beginning
Account Value
December 1, 2018 | Ending
Account Value
May 31, 2019 | Net
Expense
Ratio(a) | Expenses
Paid During
Period(b) |
Lyrical U.S. Value Equity Fund |
Institutional Class | | | | |
Based on Actual Fund Return | $ 1,000.00 | $ 895.30 | 1.40% | $ 6.62 |
Based on Hypothetical 5% Return (before expenses) | $ 1,000.00 | $ 1,017.95 | 1.40% | $ 7.04 |
Investor Class | | | | |
Based on Actual Fund Return | $ 1,000.00 | $ 893.10 | 1.70% | $ 8.02 |
Based on Hypothetical 5% Return (before expenses) | $ 1,000.00 | $ 1,016.45 | 1.70% | $ 8.55 |
(a) | Annualized, based on the Fund’s most recent one-half year expenses. |
(b) | Expenses are equal to the Fund’s annualized net expense ratio multiplied by the average account value over the period, multiplied by 182/365 (to reflect the one-half year period). |
23
LYRICAL U.S. VALUE EQUITY FUND
OTHER INFORMATION (Unaudited)
A description of the policies and procedures that the Fund uses to vote proxies relating to portfolio securities is available without charge upon request by calling toll-free 1-888-884-8099, or on the SEC’s website at www.sec.gov. Information regarding how the Fund voted proxies relating to portfolio securities during the most recent 12-month period ended June 30 is available without charge upon request by calling toll-free 1-888-884-8099, or on the SEC’s website at www.sec.gov.
The Trust files a complete listing of portfolio holdings for the Fund with the SEC as of the end of the first and third quarters of each fiscal year on Form N-Q or as an exhibit to its reports on Form N-Q’s successor form, Form N-PORT. These filings are available upon request by calling 1-888-884-8099. Furthermore, you may obtain a copy of the filings on the SEC’s website at www.sec.gov.
RESULTS OF SPECIAL MEETING OF SHAREHOLDERS
(Unaudited)
On June 18, 2018, a Special Meeting of Shareholders of the Trust was held for the purpose of considering the election of seven trustees for the Trust. The number of shares of the Trust present and voting at the Special Meeting represented 68.40% of the total shares entitled to vote at the meeting. Each of the seven nominees was elected by the shareholders of the Trust.
The results of the voting with respect to the election of the seven Trustees were as follows:
| | | Number of Shares | |
Nominee/Trustee | | Affirmative | | | Withhold | |
Robert G. Dorsey | | | 79,822,871 | | | | 11,178 | |
John J. Discepoli | | | 79,499,054 | | | | 334,995 | |
David M. Deptula | | | 79,499,054 | | | | 334,995 | |
Janine L. Cohen | | | 79,485,191 | | | | 348,858 | |
Jacqueline A. Williams | | | 79,757,455 | | | | 76,594 | |
Clifford N. Shireson | | | 79,771,318 | | | | 62,731 | |
Robert E. Morrison, Jr. | | | 79,771,349 | | | | 62,700 | |
24
CUSTOMER PRIVACY NOTICE |
FACTS | WHAT DOES THE LYRICAL U.S. VALUE EQUITY FUND (the “Fund”) DO WITH YOUR PERSONAL INFORMATION? |
| | | | |
Why? | Financial companies choose how they share your personal information. Federal law gives consumers the right to limit some but not all sharing. Federal law also requires us to tell you how we collect, share, and protect your personal information. Please read this notice carefully to understand what we do. |
| | | | |
What? | The types of personal information we collect and share depend on the product or service you have with us. This information can include: ■ Social Security number ■ Assets ■ Retirement Assets ■ Transaction History ■ Checking Account Information ■ Purchase History ■ Account Balances ■ Account Transactionss ■ Wire Transfer Instructions When you areno longer our customer, we continue to share your information as described in this notice. |
| | | | |
How? | All financial companies need to share your personal information to run their everyday business. In the section below, we list the reasons financial companies can share their customers’ personal information; the reasons Fund chooses to share; and whether you can limit this sharing. |
| | | | |
Reasons we can share your personal information | Does the
Fund share? | Can you limit this sharing? |
For our everyday business purposes –
Such as to process your transactions, maintain your account(s), respond to court orders and legal investigations, or report to credit bureaus | Yes | No |
For our marketing purposes –
to offer our products and services to you | No | We don’t share |
For joint marketing with other financial companies | No | We don’t share |
For our affiliates’ everyday business purposes –
information about your transactions and experiences | No | We don’t share |
For our affiliates’ everyday business purposes –
information about your creditworthiness | No | We don’t share |
For nonaffiliates to market to you | No | We don’t share |
| | |
Questions? | Call 1-888-884-8099 |
25
Who we are |
Who is providing this notice? | Lyrical U.S. Value Equity Fund Ultimus Fund Distributors, LLC (Distributor) Ultimus Fund Solutions, LLC (Administrator) |
What we do |
How does the Fund protect my personal information? | To protect your personal information from unauthorized access and use, we use security measures that comply with federal law. These measures include computer safeguards and secured files and buildings. Our service providers are held accountable for adhering to strict policies and procedures to prevent any misuse of your nonpublic personal information. |
How does the Fund collect my personal information? | We collect your personal information, for example, when you ■ Open an account ■ Provide account information ■ Give us your contact information ■ Make deposits or withdrawals from your account ■ Make a wire transfer ■ Tell us where to send the money ■ Tell us who receives the money ■ Show your government-issued ID ■ Show your driver’s license We also collect your personal information from other companies. |
Why can’t I limit all sharing? | Federal law gives you the right to limit only ■ Sharing for affiliates’ everyday business purposes –
information about your creditworthiness ■ Affiliates from using your information to market to you ■ Sharing for nonaffiliates to market to you State laws and individual companies may give you additional rights to limit sharing. |
| | |
Definitions |
Affiliates | Companies related by common ownership or control. They can be financial and nonfinancial companies. ■Lyrical Asset Management LP, the investment adviser to the Fund, could be deemed to be an affiliate. |
Nonaffiliates | Companies not related by common ownership or control. They can be financial and nonfinancial companies ■The Fund do not share with nonaffiliates so they can market to you. |
Joint marketing | A formal agreement between nonaffiliated financial companies that together market financial products or services to you. ■The Fund do not jointly market. |
26
This page intentionally left blank.
This page intentionally left blank.
This page intentionally left blank.

RYAN LABS CORE BOND FUND
(RLCBX)
RYAN LABS LONG CREDIT FUND
(RLLCX)
Semi-Annual Report
May 31, 2019
(Unaudited)
Beginning on January 1, 2021, as permitted by regulations adopted by the U.S. Securities and Exchange Commission, paper copies of the Funds’ shareholder reports like this one will no longer be sent by mail, unless you specifically request paper copies of the reports from the Funds or from your financial intermediary, such as a broker-dealer or bank. Instead, the reports will be made available on a website, and you will be notified by mail each time a report is posted and provided with a website link to access the report.
If you already elected to receive shareholder reports electronically, you will not be affected by this change and you need not take any action. You may elect to receive shareholder reports and other communications from the Funds electronically by contacting the Funds at 1-866-561-3087 or, if you own these shares through a financial intermediary, by contacting your financial intermediary.
You may elect to receive all future reports in paper free of charge. You can inform the Funds that you wish to continue receiving paper copies of your shareholder reports by contacting the Funds at 1-866-561-3087. If you own shares through a financial intermediary, you may contact your financial intermediary or follow instructions included with this document to elect to continue to receive paper copies of your shareholder reports. Your election to receive reports in paper will apply to all Funds held with the Fund complex or at your financial intermediary.
RYAN LABS FUNDS
LETTER TO SHAREHOLDERS | June 28, 2019 |
Dear Shareholders,
Following is the Semi-Annual Report to shareholders of Ryan Labs Core Bond Fund and Ryan Labs Long Credit Fund (collectively, the “Funds”) for the H1 2019. On behalf of the investment manager, Ryan Labs Asset Management, Inc., we would like to thank you for your continued investment.
MARKET RECAP
The past six months ending May 2019 started with December 2018’s market sell-off which was largely influenced by fears over a US-China tariff/trade war, unsettled Brexit terms, and an overly hawkish Fed hiking rates into near bear markets in equities. We viewed the credit market’s reaction between December and the end of the first calendar quarter as a pendulum. At the end of 2018, valuations seemed oversold too far and too fast from a technical perspective versus underlying fundamentals. Spreads rose to 153 bps at December end, as shown by the Bloomberg Barclays U.S. Corporate Credit Investment Grade index, from November’s 137 bps but progressed quickly down the following months, reaching 119 bps in March and finally 128 bps at May end. Although spreads expanded during December, corporate credit yields compressed given the US Treasury yield curve falling to lower levels. Regardless, over the past 6 months, corporate credit rallied with a return of +8.81%, outperforming against duration neutral Treasuries by 127 bps.
Most recently, markets continue to be influenced by the US Federal Reserve, which paused its interest rate normalization program after 9 rate hikes, along with the on-going China trade war. The Federal Open Market Committee did not move the 2.25% - 2.50% target federal funds rate range during its March 20 and May 1 meetings and pledged to be very patient on its next move. The pause eased the pressure from rising short-term rates and saw a reversal in direction: the 2-year Treasury fell to +1.95% at the end of May, from February’s 2.52% and November’s 2.80%. This rate compression happened across the curve with the 10-year yielding 2.14%, falling from February’s 2.71% and November’s 3.01%, and the 30-year falling to 2.71% from February’s 3.09% and November’s 3.30%. Given these moves, the 2s/10s yield curve flattened from November’s +21 bps March’s + 14 bps but jumped back to +19 bps at the end of May. Fed Chairman Powell had also stated that the latest policy revision was influenced by the slowing growth in U.S. consumer and business spending and the more pronounced slowdown in EU economies. The reduction of Treasury holdings would also cease by the end of September. Regardless, US economic data has come in positively, with the Q1 GDP growth of 3.2% showing a sign of resilience after the market swoon and government shutdown in January, job market showing strength with an unemployment rate of 3.6%, and U.S. consumer confidence levels rising as shown by the University of Michigan Consumer Sentiment index.
Treasury yields have also decreased as trade negotiations between the U.S. and China broke down in May which has placed an increased concern on the state of global economic growth. On May 8, the Trump administration raised the 10% tariff rate to 25% on $200B Chinese goods with a quick retaliation by China on $60B of their American imports. Other
1
influencing geopolitical events have included the ongoing Brexit debacle, where clarity on the process has become inexistent and heightened conflict between Britain and the EU, and the Trump administration threatening Mexico with a new tariff on imports if the number of immigrants into the U.S. would not come down.
RYAN LABS CORE BOND FUND (RLCBX)
INVESTMENT PHILOSOPHY
The investment objective of Ryan Labs Core Bond Fund (the “Core Bond Fund”) is to seek total return consisting of current income and capital appreciation. The benchmark for this strategy is the Bloomberg Barclays U.S. Aggregate Bond Index (the “Core Bond Benchmark”). The Core Bond Fund seeks this investment objective while providing protection against interest rate risk. We attempt to accomplish this investment objective by investing at least 80% of Core Bond Fund assets in U.S. dollar-denominated, investment-grade debt securities. The portfolio’s sensitivity to interest rate changes is intended to track the market for domestic, investment-grade fixed-income securities. The modified duration of the Core Bond Fund’s investment portfolio at the end of each calendar month will typically be within half a year of the Core Bond Benchmark. The primary strategies utilized for value-add are sector rotation, issue selection, and yield curve positioning.
PERFORMANCE SUMMARY
For the trailing six months ending May 31, 2019, the Fund returned +6.97% compared to the Benchmark return of +6.72%, outperforming the Benchmark by 25 bps. For the trailing year, the fund returned +6.45% compared to the benchmark return of +6.40%, outperforming by 5 bps. Outperformance for the past six months was primarily driven by an underweight to Treasuries and MBS Passthroughs, the overweight to ABS and CMBS allocations, slight overweight to financials, and issue selection across all corporate credit sectors, primarily in industrials. The top outperformers included CMBS positions, Cenovus Energy, Enel Finance International, Motiva Enterprises, and Celgene. Top underperformers included CVS Health Corp, Brighthouse Financial, Domtar, Kroger, and MPLX.
RYAN LABS LONG CREDIT FUND
INVESTMENT PHILOSOPHY
The investment objective of Ryan Labs Long Credit Fund (the “Long Credit Fund”) is to seek total return consisting of current income and capital appreciation. The benchmark for this strategy is the Bloomberg Barclays U.S. Long Credit Index (the “Long Credit Benchmark”). We attempt to accomplish this investment objective by investing at least 80% of Long Credit Fund’s net assets in U.S. dollar-denominated investment-grade debt securities. The portfolio’s sensitivity to interest rate changes is intended to track the market for domestic, investment-grade fixed-income securities. The modified duration of the Long Credit Fund’s investment portfolio at the end of each calendar month will typically be within half a year of the Long Credit Benchmark. The primary strategies utilized for value-add are sector rotation, issue selection, and yield curve positioning.
2
PERFORMANCE SUMMARY
For the trailing quarter ending May 31, 2019, the Fund returned +13.95% compared to the Benchmark return of +13.83%, outperforming the Benchmark by 12 bps. For the trailing year, the fund returned +9.19% compared to the benchmark return of +9.34%, underperforming by 16 bps. Outperformance for the past six months was primarily driven by issue selection within and across corporate credit. All major subsectors, industrials, utilities, and financials, outperformed. Issue selection within government related securities, particularly within agencies, also contributed positively to outperformance. Top performers included Electricite de France, Celgene, AT&T, Warner Media, and Enel Financial International. Underperformers included CVS Health Corp, Lowe’s, Brighthouse Financial, FedEx, and SC Johnson & Son.
OUTLOOK
With the change in the Fed stance, the market is pricing a rate cut in the coming months. Many of the US Corporations with international supply chains have lowered their earnings guidance or have put a pause on investment spending on concerns on the China-US tariff war along with other geo-political concerns. Despite good financial performance in the most recent earnings season and continued liquidity in the market, we see limited upside in the credit spreads. Non-financial BBB rated companies, that levered up due to M&A, have seen a slight improvement in their debt/EBITDA ratios as they paid down debt through liability management exercise and/or asset sales. Such actions are viewed favorably by rating agencies and in turn has supported performance in the BBB tier. We continue to add to corporate credit names, some of which have deleveraged their balance sheets and provide the best risk/reward profile and add through new issue concessions.
Richard Familetti
President, Ryan Labs Asset Management
Past performance is not predictive of future performance. Investment results and principal value will fluctuate so that shares, when redeemed, may be worth more or less than their original cost. Current performance may be higher or lower than the performance data quoted. Performance data current to the most recent month end are available by calling 1-866-561-3087.
An investor should consider the investment objectives, risks, charges and expenses of the Funds carefully before investing. The Funds’ prospectus contains this and other important information. To obtain a copy of the Funds’ prospectus, please visit our website at www.ryanlabsfunds.com or call 1-866-561-3087 and a copy will be sent to you free of charge. Please read the prospectus carefully before you invest. Ryan Labs Core Bond Fund and Ryan Labs Long Credit Fund are distributed by Ultimus Fund Distributors, LLC.
The Letter to Shareholders seeks to describe some of the Adviser’s current opinions and views of the financial markets. Although the Adviser believes it has a reasonable basis for any opinions or views expressed, actual results may differ, sometimes significantly so, from those expected or expressed. The securities held by the Funds that are discussed in the Letter
3
to Shareholders were held during the period covered by this Report. They do not comprise the entire investment portfolios of the Funds, may be sold at any time and may no longer be held by the Funds. The opinions of the Funds’ Adviser with respect to those securities may change at any time. For a complete list of securities held by the Funds as of May 31, 2019, please see the Schedules of Investments sections of the Semi-Annual Report.
Statements in the Letter to Shareholders that reflect projections or expectations for future financial or economic performance of the Funds and the market in general and statements of the Funds’ plans and objectives for future operations are forward-looking statements. No assurance can be given that actual results or events will not differ materially from those projected, estimated, assumed, or anticipated in any such forward-looking statements. Important factors that could result in such differences, in addition to factors noted with such forward-looking statements include, without limitation, general economic conditions, such as inflation, recession, and interest rates. Past performance is not a guarantee of future results.
4
RYAN LABS CORE BOND FUND
PORTFOLIO INFORMATION
May 31, 2019 (Unaudited)
Asset Allocation (% of Net Assets)
Security Allocation | Percentage of
Net Assets |
Mortgage-Backed Securities | 38.6% |
Corporate Bonds | 28.5% |
U.S. Treasury Obligations | 24.2% |
Asset-Backed Securities | 16.3% |
International Bonds | 0.1% |
Cash Equivalents and Liabilities in Excess of Other Assets | (7.7%) |
Total | 100.0% |
Top 10 Bond Holdings
Security Description | % of
Net Assets |
U.S. Treasury Notes, 1.375%, due 10/31/2020 | 4.2% |
Federal National Mortgage Association, Pool #MA3305, 3.500%, due 03/01/2048 | 2.1% |
U.S. Treasury Notes, 2.875%, due 08/15/2028 | 1.9% |
Federal Home Loan Mortgage Corporation, Pool #G08737, 3.000%, due 12/01/2046 | 1.8% |
U.S. Treasury Bonds, 4.500%, due 02/15/2036 | 1.8% |
Federal Home Loan Mortgage Corporation, Pool #G08707, 4.000%, due 05/01/2046 | 1.7% |
U.S. Treasury Notes, 3.125%, due 11/15/2028 | 1.6% |
U.S. Treasury Bonds, 3.125%, due 05/15/2048 | 1.6% |
U.S. Treasury Bonds, 3.000%, due 08/15/2048 | 1.5% |
U.S. Treasury Notes, 2.250%, due 11/15/2027 | 1.4% |
5
RYAN LABS LONG CREDIT FUND
PORTFOLIO INFORMATION
May 31, 2019 (Unaudited)
Asset Allocation (% of Net Assets)
Security Allocation | Percentage of
Net Assets |
Corporate Bonds | 90.1% |
U.S. Treasury Obligations | 7.1% |
International Bonds | 1.4% |
Municipal Bonds | 1.0% |
Mortgage-Backed Securities | 0.1% |
Cash Equivalents and Liabilities in Excess of Other Assets | 0.3% |
Total | 100.0% |
Top 10 Bond Holdings
Security Description | % of
Net Assets |
U.S. Treasury Bonds, 3.375%, due 11/15/2048 | 4.0% |
CVS Health Corporation, 5.050%, due 03/25/2048 | 1.9% |
U.S. Treasury Bonds, 3.000%, due 02/15/2049 | 1.8% |
Apple, Inc., 4.375%, due 05/13/2045 | 1.6% |
HSBC Bank USA, 5.875%, due 11/01/2034 | 1.6% |
Southwestern Public Service Company, 4.400%, due 11/15/2048 | 1.5% |
Anheuser-Busch Companies, LLC / Anheuser-Busch InBev Worldwide, Inc., 4.700%, due 02/01/2036 | 1.5% |
Consolidated Edison Company, 4.200%, due 03/15/2042 | 1.5% |
United Mexican States, 4.750%, due 03/08/2044 | 1.4% |
Mastercard, Inc., 3.650%, due 06/01/2049 | 1.4% |
6
RYAN LABS CORE BOND FUND
SCHEDULE OF INVESTMENTS
May 31, 2019 (Unaudited) |
U.S. TREASURY
OBLIGATIONS — 24.2% | | Coupon | | | Maturity | | | Par Value | | | Value | |
U.S. Treasury Notes — 12.8% | | | | | | | | | | | | | | |
U.S. Treasury Notes | | 1.375% | | | 08/31/20 | | | $ | 185,000 | | | $ | 183,280 | |
U.S. Treasury Notes | | 1.375% | | | 10/31/20 | | | | 3,785,000 | | | | 3,748,481 | |
U.S. Treasury Notes | | 2.875% | | | 10/31/20 | | | | 190,000 | | | | 192,056 | |
U.S. Treasury Notes | | 2.500% | | | 01/15/22 | | | | 210,000 | | | | 213,068 | |
U.S. Treasury Notes | | 2.000% | | | 11/30/22 | | | | 240,000 | | | | 240,675 | |
U.S. Treasury Notes | | 2.000% | | | 08/15/25 | | | | 730,000 | | | | 729,715 | |
U.S. Treasury Notes | | 2.250% | | | 03/31/26 | | | | 970,000 | | | | 983,679 | |
U.S. Treasury Notes | | 2.375% | | | 04/30/26 | | | | 240,000 | | | | 245,362 | |
U.S. Treasury Notes | | 2.250% | | | 11/15/27 | | | | 1,235,000 | | | | 1,248,797 | |
U.S. Treasury Notes | | 2.875% | | | 08/15/28 | | | | 1,610,000 | | | | 1,709,619 | |
U.S. Treasury Notes | | 3.125% | | | 11/15/28 | | | | 1,360,000 | | | | 1,474,431 | |
U.S. Treasury Notes | | 2.625% | | | 02/15/29 | | | | 280,000 | | | | 291,758 | |
U.S. Treasury Notes | | 2.375% | | | 05/15/29 | | | | 210,000 | | | | 214,331 | |
| | | | | | | | | | | | | | 11,475,252 | |
U.S. Treasury Bonds — 11.4% | | | | | | | | | | | | | | |
U.S. Treasury Bonds | | 5.375% | | | 02/15/31 | | | | 485,000 | | | | 644,254 | |
U.S. Treasury Bonds | | 4.500% | | | 02/15/36 | | | | 1,235,000 | | | | 1,610,180 | |
U.S. Treasury Bonds | | 5.000% | | | 05/15/37 | | | | 165,000 | | | | 229,872 | |
U.S. Treasury Bonds | | 4.375% | | | 02/15/38 | | | | 55,000 | | | | 71,833 | |
U.S. Treasury Bonds | | 4.500% | | | 05/15/38 | | | | 415,000 | | | | 550,896 | |
U.S. Treasury Bonds | | 4.250% | | | 05/15/39 | | | | 810,000 | | | | 1,047,305 | |
U.S. Treasury Bonds | | 3.000% | | | 05/15/42 | | | | 1,085,000 | | | | 1,174,936 | |
U.S. Treasury Bonds | | 2.875% | | | 11/15/46 | | | | 80,000 | | | | 84,747 | |
U.S. Treasury Bonds | | 3.000% | | | 02/15/47 | | | | 60,000 | | | | 65,114 | |
U.S. Treasury Bonds | | 2.750% | | | 08/15/47 | | | | 265,000 | | | | 273,695 | |
U.S. Treasury Bonds | | 2.750% | | | 11/15/47 | | | | 1,150,000 | | | | 1,187,465 | |
U.S. Treasury Bonds | | 3.000% | | | 02/15/48 | | | | 245,000 | | | | 265,394 | |
U.S. Treasury Bonds | | 3.125% | | | 05/15/48 | | | | 1,280,000 | | | | 1,420,200 | |
U.S. Treasury Bonds | | 3.000% | | | 08/15/48 | | | | 1,260,000 | | | | 1,366,411 | |
U.S. Treasury Bonds | | 3.375% | | | 11/15/48 | | | | 265,000 | | | | 308,580 | |
| | | | | | | | | | | | | | 10,300,882 | |
Total U.S. Treasury Obligations (Cost $20,749,877) | | | | | | | | | | | | $ | 21,776,134 | |
7
RYAN LABS CORE BOND FUND
SCHEDULE OF INVESTMENTS (Continued) |
MORTGAGE-BACKED
SECURITIES — 38.6% | | Coupon | | | Maturity | | | Par Value | | | Value | |
Commercial — 17.7% | | | | | | | | | | | | | | |
Banc of America Merrill Lynch
Mortgage Trust, Series 2014-FRR5, Class A-K37, 144A(a) | | 2.611% | | | 01/27/47 | | | $ | 400,000 | | | $ | 371,407 | |
Citigroup Comercial Mortgage Trust,
Series 2013-GC11, Class D, 144A(a) | | 4.567% | | | 04/10/46 | | | | 245,000 | | | | 249,754 | |
Citigroup Comercial Mortgage Trust,
Series 2014-GC21, Class D, 144A(a) | | 5.114% | | | 05/10/47 | | | | 720,000 | | | | 690,359 | |
Commercial Mortgage Trust,
Series 2012-CR5, Class E, 144A(a) | | 4.465% | | | 12/10/45 | | | | 410,000 | | | | 394,127 | |
Commercial Mortgage Trust,
Series 2013-CR7, Class D, 144A(a) | | 4.534% | | | 03/10/46 | | | | 410,000 | | | | 322,596 | |
Credit Suisse Mortgage Trust,
Series 2013-IVR3, Class A1, 144A | | 2.500% | | | 05/25/43 | | | | 382,930 | | | | 370,611 | |
FREMF Mortgage Trust,
Series 2013-K35, Class C, 144A(a) | | 4.074% | | | 08/25/23 | | | | 389,000 | | | | 402,357 | |
FREMF Mortgage Trust,
Series 2015-K44, Class B, 144A(a) | | 3.808% | | | 01/25/48 | | | | 190,000 | | | | 194,990 | |
FREMF Mortgage Trust,
Series 2015-K44, Class C, 144A(a) | | 3.808% | | | 01/25/48 | | | | 620,000 | | | | 616,733 | |
FREMF Mortgage Trust,
Series 2015-K46, Class B, 144A(a) | | 3.818% | | | 04/25/48 | | | | 390,000 | | | | 400,986 | |
FREMF Mortgage Trust,
Series 2015-K45, Class C, 144A(a) | | 3.713% | | | 04/25/48 | | | | 315,000 | | | | 313,117 | |
FREMF Mortgage Trust,
Series 2015-K46, Class C, 144A(a) | | 3.818% | | | 04/25/48 | | | | 250,000 | | | | 248,156 | |
FREMF Mortgage Trust,
Series 2015-K51, Class B, 144A(a) | | 4.088% | | | 10/25/48 | | | | 300,000 | | | | 310,479 | |
FREMF Mortgage Trust,
Series 2013-K31, Class C, 144A(a) | | 3.743% | | | 07/25/46 | | | | 323,000 | | | | 327,256 | |
GoldenTree Loan Management US CLO1 Ltd.,
Series 2019-4A, Class C, 144A
(3MO LIBOR + 270)(a) | | 5.308% | | | 04/24/31 | | | | 250,000 | | | | 250,802 | |
Goldman Sachs Mortgage Securities Trust,
Series 2011-GC3, Class E, 144A | | 5.000% | | | 03/10/44 | | | | 875,000 | | | | 889,219 | |
JPMBB Commercial Mortgage Securities Trust,
Series 2015-C28, Class D, 144A(a) | | 3.861% | | | 10/15/48 | | | | 350,000 | | | | 314,726 | |
JPMCC Commercial Mortgage Securities Trust,
Series 2016-NINE, Class A, 144A(a) | | 2.949% | | | 10/06/38 | | | | 70,000 | | | | 70,275 | |
JPMorgan Mortgage Trust, Series 2017-3, Class 1A3, 144A | | 3.500% | | | 08/25/47 | | | | 465,901 | | | | 469,638 | |
8
RYAN LABS CORE BOND FUND
SCHEDULE OF INVESTMENTS (Continued) |
MORTGAGE-BACKED
SECURITIES — 38.6% (Continued) | | Coupon | | | Maturity | | | Par Value | | | Value | |
Commercial — 17.7% (Continued) | | | | | | | | | | | | | | |
JPMorgan Mortgage Trust,
Series 2018-3, Class A5, 144A | | 3.500% | | | 04/25/48 | | | $ | 176,405 | | | $ | 178,218 | |
JPMorgan Mortgage Trust,
Series 2018-1, Class A3, 144A | | 3.500% | | | 06/25/48 | | | | 179,286 | | | | 180,616 | |
JPMorgan Mortgage Trust,
Series 2018-1, Class A5, 144A | | 3.500% | | | 06/25/48 | | | | 198,153 | | | | 200,189 | |
JPMorgan Mortgage Trust,
Series 2018-4, Class A15, 144A | | 3.500% | | | 10/25/48 | | | | 337,584 | | | | 340,681 | |
Kabbage Funding, LLC,
Series 2019-1, Class B, 144A(a) | | 4.071% | | | 03/15/24 | | | | 480,000 | | | | 487,727 | |
Madison Park Funding Ltd.,
Series 2019-37A, Class C, 144A (3MO LIBOR + 240)(a) | | 0.000% | | | 07/15/32 | | | | 500,000 | | | | 500,000 | |
Morgan Stanley BAML Trust,
Series 2014-C15, Class D, 144A(a) | | 5.075% | | | 04/15/47 | | | | 360,000 | | | | 373,641 | |
Neuberger Berman CLO Ltd.,
Series 2019-32A, Class C, 144A (3MO LIBOR + 265)(a) | | 5.217% | | | 01/19/32 | | | | 460,000 | | | | 460,229 | |
Niagara Park CLO Ltd.,
Series 2019-1A, Class C, 144A (3MO LIBOR + 240)(a) | | 0.000% | | | 07/17/32 | | | | 340,000 | | | | 340,000 | |
SFAVE Commercial Mortgage Securities Trust,
Series 2015-5AVE, Class A1, 144A | | 3.872% | | | 01/05/43 | | | | 624,000 | | | | 638,865 | |
Sutherland Commercial Mortgage Trust,
Series 2018-SBC7, Class A, 144A | | 4.720% | | | 05/25/39 | | | | 420,180 | | | | 425,139 | |
Towd Point Mortgage Trust,
Series 2015-1, Class A5, 144A(a) | | 3.935% | | | 10/25/53 | | | | 835,000 | | | | 865,227 | |
Towd Point Mortgage Trust,
Series 2016-5, Class M2, 144A | | 3.375% | | | 10/25/56 | | | | 620,000 | | | | 604,741 | |
Towd Point Mortgage Trust,
Series 2017-1, Class M2, 144A | | 3.750% | | | 10/25/56 | | | | 740,000 | | | | 745,437 | |
Towd Point Mortgage Trust,
Series 2015-2, Class 1M2, 144A(a) | | 3.791% | | | 11/25/60 | | | | 445,000 | | | | 456,624 | |
Tralee CDO Ltd.,
Series 2013-1A, Class AR, 144A (3MO LIBOR + 132)(a) | | 3.912% | | | 07/20/29 | | | | 640,000 | | | | 636,126 | |
UBS Commercial Mortgage Trust,
Series 2018-NYCHC, Class D, 144A (1MO LIBOR + 210)(a) | | 4.573% | | | 02/15/32 | | | | 450,000 | | | | 450,311 | |
UBS-Citigroup Commercial Mortgage Trust,
Series 2011-C1, Class E, 144A(a) | | 6.252% | | | 01/10/45 | | | | 405,000 | | | | 405,173 | |
Wind River CLO Ltd.,
Series 2014-1A, Class 1A, 144A (3MO LIBOR +105)(a) | | 3.651% | | | 07/18/31 | | | | 430,000 | | | | 426,463 | |
| | | | | | | | | | | | | | 15,922,995 | |
9
RYAN LABS CORE BOND FUND
SCHEDULE OF INVESTMENTS (Continued) |
MORTGAGE-BACKED
SECURITIES — 38.6% (Continued) | | Coupon | | | Maturity | | | Par Value | | | Value | |
Federal Home Loan Mortgage Corporation — 8.4% | | | | | | | | | | | | | | |
Federal Home Loan Mortgage Corporation, Pool #J19087 | | 3.000% | | | 05/01/27 | | | $ | 212,332 | | | $ | 216,312 | |
Federal Home Loan Mortgage Corporation, Pool #G18481 | | 3.000% | | | 09/01/28 | | | | 153,144 | | | | 155,687 | |
Federal Home Loan Mortgage Corporation, Pool #G18622 | | 2.500% | | | 12/01/31 | | | | 294,290 | | | | 294,600 | |
Federal Home Loan Mortgage Corporation, Pool #A93093 | | 4.500% | | | 07/01/40 | | | | 73,850 | | | | 79,014 | |
Federal Home Loan Mortgage Corporation, Pool #A94472 | | 4.000% | | | 10/01/40 | | | | 126,297 | | | | 131,505 | |
Federal Home Loan Mortgage Corporation, Series 4667, Class LA | | 3.500% | | | 01/15/43 | | | | 780,341 | | | | 804,591 | |
Federal Home Loan Mortgage Corporation, Series 2018-HRP1, Class M-2, 144A(a) | | 4.127% | | | 04/25/43 | | | | 173,532 | | | | 174,616 | |
Federal Home Loan Mortgage Corporation, Pool #Q19470 | | 3.000% | | | 06/01/43 | | | | 162,304 | | | | 163,867 | |
Federal Home Loan Mortgage Corporation, Pool #Q20576 | | 3.000% | | | 08/01/43 | | | | 298,780 | | | | 301,654 | |
Federal Home Loan Mortgage Corporation, Pool #G08572 | | 3.500% | | | 02/01/44 | | | | 104,135 | | | | 106,919 | |
Federal Home Loan Mortgage Corporation, Series 4791, Class L | | 4.000% | | | 05/15/44 | | | | 214,241 | | | | 220,456 | |
Federal Home Loan Mortgage Corporation, Pool #G08659 | | 3.500% | | | 08/01/45 | | | | 811,596 | | | | 831,225 | |
Federal Home Loan Mortgage Corporation, Pool #G08677 | | 4.000% | | | 11/01/45 | | | | 413,976 | | | | 429,619 | |
Federal Home Loan Mortgage Corporation, Pool #G08707 | | 4.000% | | | 05/01/46 | | | | 1,478,686 | | | | 1,534,321 | |
Federal Home Loan Mortgage Corporation, Pool #G08737 | | 3.000% | | | 12/01/46 | | | | 1,610,548 | | | | 1,623,225 | |
Federal Home Loan Mortgage Corporation, Pool #G08772 | | 4.500% | | | 06/01/47 | | | | 506,254 | | | | 531,592 | |
| | | | | | | | | | | | | | 7,599,203 | |
Federal National Mortgage Association — 8.8% | | | | | | | | | | | | | | |
Federal National Mortgage Association, Pool #AJ7494 | | 3.000% | | | 12/01/26 | | | | 143,027 | | | | 145,616 | |
Federal National Mortgage Association, Pool #AB5490 | | 3.000% | | | 07/01/27 | | | | 50,557 | | | | 51,474 | |
Federal National Mortgage Association, Pool #AE0443 | | 6.500% | | | 10/01/39 | | | | 14,156 | | | | 16,440 | |
Federal National Mortgage Association, Pool #AB5379 | | 3.500% | | | 06/01/42 | | | | 1,035,459 | | | | 1,063,952 | |
10
RYAN LABS CORE BOND FUND
SCHEDULE OF INVESTMENTS (Continued) |
MORTGAGE-BACKED
SECURITIES — 38.6% (Continued) | | Coupon | | | Maturity | | | Par Value | | | Value | |
Federal National Mortgage Association — 8.8% (Continued) | | | | | | | | | | | | | | |
Federal National Mortgage Association, Pool #AB6670 | | 3.000% | | | 10/01/42 | | | $ | 143,807 | | | $ | 145,235 | |
Federal National Mortgage Association, Pool #AB9345 | | 3.000% | | | 05/01/43 | | | | 279,099 | | | | 281,611 | |
Federal National Mortgage Association, Pool #AB9350 | | 3.000% | | | 05/01/43 | | | | 117,426 | | | | 118,479 | |
Federal National Mortgage Association, Pool #AB9558 | | 3.000% | | | 06/01/43 | | | | 293,295 | | | | 295,935 | |
Federal National Mortgage Association, Pool #AT5860 | | 3.500% | | | 06/01/43 | | | | 539,505 | | | | 554,252 | |
Federal National Mortgage Association, Pool #AL4010 | | 3.500% | | | 07/01/43 | | | | 126,117 | | | | 130,658 | |
Federal National Mortgage Association, Pool #AL5625 | | 3.500% | | | 03/01/44 | | | | 77,891 | | | | 80,412 | |
Federal National Mortgage Association, Pool #AL5538 | | 4.000% | | | 07/01/44 | | | | 49,538 | | | | 52,039 | |
Federal National Mortgage Association, Pool #AS5165 | | 3.000% | | | 06/01/45 | | | | 162,608 | | | | 164,939 | |
Federal National Mortgage Association, Pool #AS7838 | | 3.000% | | | 08/01/46 | | | | 408,002 | | | | 411,245 | |
Federal National Mortgage Association, Pool #MA3088 | | 4.000% | | | 08/01/47 | | | | 424,853 | | | | 440,510 | |
Federal National Mortgage Association, Pool #MA3143 | | 3.000% | | | 09/01/47 | | | | 68,739 | | | | 69,131 | |
Federal National Mortgage Association, Pool #890813 | | 3.500% | | | 12/01/47 | | | | 456,095 | | | | 470,051 | |
Federal National Mortgage Association, Pool #MA3238 | | 3.500% | | | 01/01/48 | | | | 507,356 | | | | 518,740 | |
Federal National Mortgage Association, Pool #MA3240 | | 4.500% | | | 01/01/48 | | | | 986,564 | | | | 1,035,266 | |
Federal National Mortgage Association, Pool #MA3305 | | 3.500% | | | 03/01/48 | | | | 1,803,151 | | | | 1,844,265 | |
| | | | | | | | | | | | | | 7,890,250 | |
Government National Mortgage Association — 3.7% | | | | | | | | | | | | | | |
Government National Mortgage Association, Pool #5175 | | 4.500% | | | 09/20/41 | | | | 64,031 | | | | 67,995 | |
Government National Mortgage Association, Pool #MA3521 | | 3.500% | | | 03/20/46 | | | | 501,186 | | | | 516,066 | |
Government National Mortgage Association, Pool #MA3937 | | 3.500% | | | 09/20/46 | | | | 1,087,006 | | | | 1,119,282 | |
Government National Mortgage Association, Pool #MA5076 | | 3.000% | | | 03/20/48 | | | | 457,286 | | | | 464,077 | |
11
RYAN LABS CORE BOND FUND
SCHEDULE OF INVESTMENTS (Continued) |
MORTGAGE-BACKED
SECURITIES — 38.6% (Continued) | | Coupon | | | Maturity | | | Par Value | | | Value | |
Government National Mortgage Association — 3.7%(Continued) | | | �� | | | | | | | | | | | |
Government National Mortgage Association, Series 2018-45, Class B | | 2.600% | | | 09/16/52 | | | $ | 680,000 | | | $ | 624,757 | |
Government National Mortgage Association, Series 2015-41, Class C(a) | | 3.141% | | | 01/16/57 | | | | 490,000 | | | | 488,652 | |
| | | | | | | | | | | | | | 3,280,829 | |
Total Mortgage-Backed Securities(Cost $34,271,871) | | | | | | | | | | | | $ | 34,693,277 | |
|
ASSET-BACKED
SECURITIES — 16.3% | | Coupon | | | Maturity | | | Par Value | | | Value | |
AmeriCredit Automobile Receivables Trust, Series 2017-3, Class D | | 3.180% | | | 07/18/23 | | | $ | 410,000 | | | $ | 414,509 | |
AmeriCredit Automobile Receivables Trust, Series 2018-1, Class D | | 3.820% | | | 03/18/24 | | | | 240,000 | | | | 246,927 | |
AmeriCredit Automobile Receivables Trust, Series 2018-3, Class D | | 4.040% | | | 11/18/24 | | | | 470,000 | | | | 489,461 | |
CIM Trust, Series 2018-R3, Class A2, 144A | | 4.000% | | | 09/25/57 | | | | 480,000 | | | | 477,545 | |
CommonBond Student Loan Trust, Series 2018-AGS, Class B, 144A | | 3.580% | | | 02/25/44 | | | | 225,000 | | | | 228,701 | |
CommonBond Student Loan Trust, Series 2018-BGS, Class B, 144A | | 3.990% | | | 09/25/45 | | | | 570,000 | | | | 586,719 | |
Domino’s Pizza Master Issuer, LLC, Series 2017-1A, Class A2II, 144A | | 3.082% | | | 07/25/47 | | | | 314,400 | | | | 314,051 | |
Drive Auto Receivables Trust, Series 2017-3, Class D, 144A | | 3.530% | | | 12/15/23 | | | | 1,000,000 | | | | 1,008,523 | |
Drive Auto Receivables Trust, Series 17-AA, Class D, 144A | | 4.160% | | | 05/15/24 | | | | 400,000 | | | | 406,498 | |
Drive Auto Receivables Trust, Series 2018-1, Class D | | 3.810% | | | 05/15/24 | | | | 620,000 | | | | 629,360 | |
Drive Auto Receivables Trust, Series 2018-2, Class D | | 4.140% | | | 08/15/24 | | | | 290,000 | | | | 297,011 | |
Drive Auto Receivables Trust, Series 2018-3, Class D | | 4.300% | | | 09/16/24 | | | | 330,000 | | | | 339,475 | |
Drive Auto Receivables Trust, Series 2018-4, Class D | | 4.090% | | | 01/15/26 | | | | 700,000 | | | | 720,406 | |
Drive Auto Receivables Trust, Series 2018-5, Class D | | 4.300% | | | 04/15/26 | | | | 290,000 | | | | 302,290 | |
12
RYAN LABS CORE BOND FUND
SCHEDULE OF INVESTMENTS (Continued) |
ASSET-BACKED
SECURITIES — 16.3% (Continued) | | Coupon | | | Maturity | | | Par Value | | | Value | |
Drive Auto Receivables Trust, Series 2019-1, Class D | | 4.090% | | | 06/15/26 | | | $ | 410,000 | | | $ | 421,968 | |
Drive Auto Receivables Trust, Series 2019-2, Class D | | 3.690% | | | 08/17/26 | | | | 410,000 | | | | 417,885 | |
Exeter Automobile Receivables Trust, Series 2019-2A, Class D, 144A | | 3.710% | | | 03/17/25 | | | | 400,000 | | | | 406,730 | |
Harley Marine Financing, LLC, Series 2018-1A, Class A2, 144A(a) | | 5.682% | | | 05/15/43 | | | | 640,200 | | | | 545,930 | |
Hertz Vehicle Financing, LLC, Series 2018-1A, Class B, 144A | | 3.600% | | | 02/25/24 | | | | 260,000 | | | | 262,904 | |
OneMain Direct Auto Receivables Trust, Series 2018-1A, Class D, 144A | | 4.400% | | | 01/14/28 | | | | 360,000 | | | | 370,979 | |
Santander Drive Auto Receivables Trust, Series 2016-2, Class E | | 4.380% | | | 09/15/23 | | | | 620,000 | | | | 629,493 | |
Santander Drive Auto Receivables Trust, Series 2016-3, Class E | | 4.290% | | | 02/15/24 | | | | 635,000 | | | | 645,722 | |
Santander Drive Auto Receivables Trust, Series 2018-1, Class D | | 3.320% | | | 03/15/24 | | | | 280,000 | | | | 283,257 | |
Santander Drive Auto Receivables Trust, Series 2018-4, Class D | | 3.980% | | | 12/15/25 | | | | 360,000 | | | | 370,335 | |
Shops at Crystals Trust, Series 2016-CSTL, Class D, 144A | | 3.731% | | | 07/05/36 | | | | 510,000 | | | | 473,704 | |
Sierra Receivables
Funding Company, LLC, Series 2016-3A, Class B, 144A | | 2.630% | | | 10/20/33 | | | | 119,774 | | | | 119,094 | |
SoFi Consumer Loan Program Trust, Series 2017-3, Class B, 144A(a) | | 3.850% | | | 05/25/26 | | | | 200,000 | | | | 204,740 | |
SoFi Consumer Loan Program Trust, Series 2017-5, Class B, 144A | | 3.690% | | | 09/25/26 | | | | 534,000 | | | | 545,127 | |
SoFi Consumer Loan Program Trust, Series 2018-1, Class B, 144A | | 3.650% | | | 02/25/27 | | | | 410,000 | | | | 419,045 | |
SoFi Consumer Loan Program Trust, Series 2018-2, Class C, 144A | | 4.250% | | | 04/26/27 | | | | 760,000 | | | | 777,969 | |
SoFi Consumer Loan Program Trust, Series 2018-3, Class C, 144A | | 4.670% | | | 08/25/27 | | | | 460,000 | | | | 476,192 | |
SoFi Consumer Loan Program Trust, Series 2018-4, Class D, 144A | | 4.760% | | | 11/26/27 | | | | 510,000 | | | | 531,241 | |
Westlake Automobile Receivables Trust, Series 2018-1A, Class D, 144A | | 3.410% | | | 05/15/23 | | | | 325,000 | | | | 327,922 | |
Total Asset-Backed Securities
(Cost $14,520,388) | | | | | | | | | | | | $ | 14,691,713 | |
13
RYAN LABS CORE BOND FUND
SCHEDULE OF INVESTMENTS (Continued) |
CORPORATE BONDS — 28.5% | | Coupon | | | Maturity | | | Par Value | | | Value | |
Communication Services — 1.1% | | | | | | | | | | | | | | |
América Móvil S.A.B. de C.V. | | 4.375% | | | 04/22/49 | | | $ | 270,000 | | | $ | 276,952 | |
Comcast Corporation | | 3.950% | | | 10/15/25 | | | | 100,000 | | | | 106,002 | |
Discovery Communications, LLC | | 5.300% | | | 05/15/49 | | | | 35,000 | | | | 35,318 | |
Sprint Spectrum Company, L.P., 144A, Series 2016-1 | | 3.360% | | | 03/20/23 | | | | 612,500 | | | | 610,969 | |
| | | | | | | | | | | | | | 1,029,241 | |
Consumer Discretionary — 0.6% | | | | | | | | | | | | | | |
Alibaba Group Holding Ltd. | | 2.500% | | | 11/28/19 | | | | 205,000 | | | | 204,969 | |
Alibaba Group Holding Ltd. | | 3.600% | | | 11/28/24 | | | | 345,000 | | | | 351,433 | |
| | | | | | | | | | | | | | 556,402 | |
Consumer Staples — 1.2% | | | | | | | | | | | | | | |
Altria Group, Inc. | | 5.800% | | | 02/14/39 | | | | 230,000 | | | | 249,117 | |
Anheuser-Busch InBev Worldwide, Inc. | | 4.750% | | | 01/23/29 | | | | 55,000 | | | | 59,760 | |
Kroger Company (The) | | 4.450% | | | 02/01/47 | | | | 515,000 | | | | 482,494 | |
Mars, Inc., 144A | | 3.875% | | | 04/01/39 | | | | 240,000 | | | | 245,340 | |
| | | | | | | | | | | | | | 1,036,711 | |
Energy — 5.9% | | | | | | | | | | | | | | |
Boardwalk Pipelines, L.P. | | 4.450% | | | 07/15/27 | | | | 500,000 | | | | 500,194 | |
Cenovus Energy, Inc. | | 6.750% | | | 11/15/39 | | | | 385,000 | | | | 429,861 | |
Enable Midstream Partners, L.P. | | 4.400% | | | 03/15/27 | | | | 505,000 | | | | 496,688 | |
Energy Transfer Operating, L.P. | | 7.500% | | | 10/15/20 | | | | 490,000 | | | | 520,019 | |
Kinder Morgan, Inc. | | 3.150% | | | 01/15/23 | | | | 438,000 | | | | 439,701 | |
Marathon Petroleum Corporation, Series WI | | 4.750% | | | 12/15/23 | | | | 520,000 | | | | 556,104 | |
Midwest Connector Capital Company, LLC, 144A | | 3.900% | | | 04/01/24 | | | | 480,000 | | | | 493,384 | |
Motiva Enterprises, LLC, 144A | | 6.850% | | | 01/15/40 | | | | 320,000 | | | | 381,173 | |
MPLX, L.P. | | 5.500% | | | 02/15/49 | | | | 440,000 | | | | 468,562 | |
Shell International Finance B.V. | | 1.875% | | | 05/10/21 | | | | 185,000 | | | | 183,294 | |
TC Pipelines, L.P. | | 4.375% | | | 03/13/25 | | | | 290,000 | | | | 301,320 | |
Williams Companies, Inc. (The) | | 3.350% | | | 08/15/22 | | | | 505,000 | | | | 512,626 | |
| | | | | | | | | | | | | | 5,282,926 | |
Financials — 10.8% | | | | | | | | | | | | | | |
American Financial Group, Inc. | | 4.500% | | | 06/15/47 | | | | 440,000 | | | | 440,028 | |
Associated Bank, N.A. | | 3.500% | | | 08/13/21 | | | | 365,000 | | | | 370,346 | |
Aviation Capital Group, LLC, 144A | | 4.125% | | | 08/01/25 | | | | 470,000 | | | | 480,412 | |
Avolon Holdings Funding Ltd., 144A | | 4.375% | | | 05/01/26 | | | | 240,000 | | | | 240,144 | |
Banco Santander S.A. | | 3.848% | | | 04/12/23 | | | | 150,000 | | | | 153,181 | |
Bank of America Corporation | | 3.004% | | | 12/20/23 | | | | 430,000 | | | | 431,630 | |
Bank of America Corporation | | 3.705% | | | 04/24/28 | | | | 340,000 | | | | 346,651 | |
Bank of Montreal | | 1.500% | | | 07/18/19 | | | | 200,000 | | | | 199,720 | |
Berkshire Hathaway, Inc. | | 2.100% | | | 08/14/19 | | | | 80,000 | | | | 79,930 | |
BGC Partners, Inc. | | 5.375% | | | 07/24/23 | | | | 650,000 | | | | 675,074 | |
14
RYAN LABS CORE BOND FUND
SCHEDULE OF INVESTMENTS (Continued) |
CORPORATE BONDS — 28.5%
(Continued) | | Coupon | | | Maturity | | | Par Value | | | Value | |
Financials — 10.8% (Continued) | | | | | | | | | | | | | | |
Boral Finance Properties Ltd., 144A | | 3.000% | | | 11/01/22 | | | $ | 380,000 | | | $ | 378,138 | |
Brighthouse Financial, Inc. | | 4.700% | | | 06/22/47 | | | | 515,000 | | | | 410,012 | |
Brookfield Finance, Inc. | | 4.850% | | | 03/29/29 | | | | 230,000 | | | | 245,132 | |
Cantor Fitzgerald, L.P., 144A | | 4.875% | | | 05/01/24 | | | | 170,000 | | | | 172,008 | |
Credit Suisse AG of New York | | 3.625% | | | 09/09/24 | | | | 586,000 | | | | 608,299 | |
GE Capital International Funding Company | | 2.342% | | | 11/15/20 | | | | 215,000 | | | | 212,842 | |
General Motors Financial Company, Inc. | | 3.250% | | | 01/05/23 | | | | 140,000 | | | | 138,569 | |
General Motors Financial Company, Inc. | | 4.350% | | | 01/17/27 | | | | 360,000 | | | | 355,993 | |
Goldman Sachs Group, Inc. (The) | | 3.850% | | | 01/26/27 | | | | 314,000 | | | | 320,695 | |
Goldman Sachs Group, Inc. (The) | | 4.017% | | | 10/31/38 | | | | 415,000 | | | | 409,725 | |
Hyundai Capital America, 144A | | 2.600% | | | 03/19/20 | | | | 235,000 | | | | 234,423 | |
JPMorgan Chase & Company | | 3.797% | | | 07/23/24 | | | | 450,000 | | | | 464,910 | |
JPMorgan Chase & Company | | 3.625% | | | 12/01/27 | | | | 490,000 | | | | 494,316 | |
Mitsubishi UFJ Financial Group, Inc. | | 3.535% | | | 07/26/21 | | | | 470,000 | | | | 478,987 | |
Morgan Stanley | | 3.950% | | | 04/23/27 | | | | 280,000 | | | | 285,589 | |
SMBC Aviation Capital Finance Designated Activity, 144A | | 2.650% | | | 07/15/21 | | | | 325,000 | | | | 322,513 | |
Sumitomo Mitsui Financial Group, Inc. | | 2.442% | | | 10/19/21 | | | | 435,000 | | | | 433,121 | |
Sumitomo Mitsui Financial Group, Inc. | | 2.784% | | | 07/12/22 | | | | 290,000 | | | | 291,571 | |
| | | | | | | | | | | | | | 9,673,959 | |
Health Care — 0.9% | | | | | | | | | | | | | | |
Bayer U.S. Finance II, LLC | | 5.500% | | | 08/15/25 | | | | 315,000 | | | | 331,159 | |
CVS Health Corporation | | 5.050% | | | 03/25/48 | | | | 510,000 | | | | 518,697 | |
| | | | | | | | | | | | | | 849,856 | |
Industrials — 0.4% | | | | | | | | | | | | | | |
Boeing Company (The) | | 3.850% | | | 11/01/48 | | | | 290,000 | | | | 290,882 | |
Domtar Corporation | | 4.500% | | | 03/21/49 | | | | 40,000 | | | | 41,722 | |
| | | | | | | | | | | | | | 332,604 | |
Information Technology — 3.4% | | | | | | | | | | | | | | |
Arrow Electronics, Inc. | | 3.250% | | | 09/08/24 | | | | 310,000 | | | | 304,666 | |
Arrow Electronics, Inc. | | 3.875% | | | 01/12/28 | | | | 505,000 | | | | 498,478 | |
Broadcom Corporation/Broadcom Cayman Finance Ltd. | | 3.875% | | | 01/15/27 | | | | 280,000 | | | | 266,269 | |
Broadcom, Inc., 144A | | 3.625% | | | 10/15/24 | | | | 80,000 | | | | 78,461 | |
Broadcom, Inc., 144A | | 4.750% | | | 04/15/29 | | | | 80,000 | | | | 78,911 | |
Dell, Inc., 144A | | 8.350% | | | 07/15/46 | | | | 370,000 | | | | 451,668 | |
Motorola Solutions, Inc. | | 3.750% | | | 05/15/22 | | | | 332,000 | | | | 341,180 | |
NXP BV / NXP Funding, LLC, 144A | | 4.875% | | | 03/01/24 | | | | 280,000 | | | | 295,184 | |
Seagate HDD Cayman | | 4.875% | | | 03/01/24 | | | | 270,000 | | | | 271,492 | |
Tech Data Corporation | | 4.950% | | | 02/15/27 | | | | 480,000 | | | | 494,967 | |
| | | | | | | | | | | | | | 3,081,276 | |
15
RYAN LABS CORE BOND FUND
SCHEDULE OF INVESTMENTS (Continued) |
CORPORATE BONDS — 28.5%
(Continued) | | Coupon | | | Maturity | | | Par Value | | | Value | |
Materials — 0.8% | | | | | | | | | | | | | | |
DowDuPont, Inc. | | 4.493% | | | 11/15/25 | | | $ | 265,000 | | | $ | 284,741 | |
Glencore Funding, LLC, 144A | | 4.000% | | | 03/27/27 | | | | 460,000 | | | | 448,704 | |
| | | | | | | | | | | | | | 733,445 | |
Real Estate — 1.7% | | | | | | | | | | | | | | |
Alexandria Real Estate Equities, Inc. | | 3.450% | | | 04/30/25 | | | | 450,000 | | | | 458,285 | |
Crown Castle International Corporation | | 3.200% | | | 09/01/24 | | | | 550,000 | | | | 550,787 | |
Crown Castle International Corporation | | 4.750% | | | 05/15/47 | | | | 130,000 | | | | 133,810 | |
EPR Properties | | 5.750% | | | 08/15/22 | | | | 385,000 | | | | 411,533 | |
| | | | | | | | | | | | | | 1,554,415 | |
Utilities — 1.7% | | | | | | | | | | | | | | |
Électricité de France S.A., 144A | | 5.000% | | | 09/21/48 | | | | 250,000 | | | | 268,507 | |
Entergy Louisiana, LLC | | 4.000% | | | 03/15/33 | | | | 255,000 | | | | 277,072 | |
NRG Energy, Inc., 144A | | 4.450% | | | 06/15/29 | | | | 75,000 | | | | 77,014 | |
PacifiCorp | | 4.150% | | | 02/15/50 | | | | 215,000 | | | | 231,583 | |
Sempra Energy | | 4.050% | | | 12/01/23 | | | | 265,000 | | | | 275,760 | |
Southern California Edison Company | | 4.000% | | | 04/01/47 | | | | 430,000 | | | | 414,458 | |
| | | | | | | | | | | | | | 1,544,394 | |
Total Corporate Bonds
(Cost $25,576,645) | | | | | | | | | | | | $ | 25,675,229 | |
|
INTERNATIONAL BONDS — 0.1% | | Coupon | | | Maturity | | | Par Value | | | Value | |
United Mexican States (Cost $102,320) | | 4.000% | | | 10/02/23 | | | $ | 100,000 | | | $ | 103,350 | |
16
RYAN LABS CORE BOND FUND
SCHEDULE OF INVESTMENTS (Continued) |
MONEY MARKET FUNDS— 2.6% | | Shares | | | Value | |
Invesco Short-Term Investments Trust - Treasury Portfolio - Institutional Class, 2.29%(b) (Cost $2,374,020) | | | 2,374,020 | | | $ | 2,374,020 | |
| | | | | | | | | |
Investments at Value — 110.3%
(Cost $97,595,121) | | | | | | $ | 99,313,723 | |
| | | | | | | | | |
Liabilities in Excess of Other Assets— (10.3%) | | | | | | | (9,317,168 | ) |
| | | | | | | | | |
Net Assets — 100.0% | | | | | | $ | 89,996,555 | |
144A - | This security was purchased in a transaction exempt from registration in compliance with Rule 144A of the Securities Act of 1933. This security may be resold in transactions exempt from registration, normally to qualified institutional buyers. The total value of such securities is $29,838,178 as of May 31, 2019, representing 33.2% of net assets (Note 6). |
LIBOR - | London interbank offered rate. |
(a) | Variable rate security. Interest rate resets periodically. The rate shown is the effective interest rate as of May 31, 2019. For securities based on a published reference rate and spread, the reference rate and spread (in basis points) are indicated parenthetically. Certain variable rate securities are not based on a published reference rate and spread but are determined by the issuer or agent and are based on current market conditions. These securities, therefore, do not indicate a reference rate and spread. |
(b) | The rate shown is the 7-day effective yield as of May 31, 2019. |
See accompanying notes to financial statements. |
17
RYAN LABS LONG CREDIT FUND
SCHEDULE OF INVESTMENTS
May 31, 2019 (Unaudited) |
U.S. TREASURY
OBLIGATIONS — 7.1% | | Coupon | | | Maturity | | | Par Value | | | Value | |
U.S. Treasury Notes — 1.3% | | | | | | | | | | | | | | |
U.S. Treasury Notes | | 2.625% | | | 02/15/29 | | | $ | 590,000 | | | $ | 614,776 | |
U.S. Treasury Notes | | 2.375% | | | 05/15/29 | | | | 815,000 | | | | 831,809 | |
| | | | | | | | | | | | | | 1,446,585 | |
U.S. Treasury Bonds — 5.8% | | | | | | | | | | | | | | |
U.S. Treasury Bonds | | 3.375% | | | 11/15/48 | | | | 3,705,000 | | | | 4,314,299 | |
U.S. Treasury Bonds | | 3.000% | | | 02/15/49 | | | | 1,795,000 | | | | 1,950,099 | |
| | | | | | | | | | | | | | 6,264,398 | |
Total U.S. Treasury Obligations(Cost $7,217,259) | | | | | | | | | | | | $ | 7,710,983 | |
|
MORTGAGE-BACKED
SECURITIES — 0.1% | | Coupon | | | Maturity | | | Par Value | | | Value | |
Commercial — 0.1% | | | | | | | | | | | | | | |
Commercial Mortgage Trust, Series 2013-CR7, Class D, 144A(a) (Cost $72,154) | | 4.534% | | | 03/10/46 | | | $ | 82,500 | | | $ | 64,913 | |
|
MUNICIPAL BONDS — 1.0% | | Coupon | | | Maturity | | | Par Value | | | Value | |
New York City Water & Sewer System, Build America Bonds, Rev., (Cost $952,036) | | 5.750% | | | 06/15/41 | | | $ | 765,000 | | | $ | 1,060,137 | |
|
CORPORATE BONDS — 90.1% | | Coupon | | | Maturity | | | Par Value | | | Value | |
Communication Services — 8.8% | | | | | | | | | | | | | | |
América Móvil S.A.B. de C.V. | | 4.375% | | | 04/22/49 | | | $ | 1,080,000 | | | $ | 1,107,810 | |
AT&T, Inc. | | 4.500% | | | 05/15/35 | | | | 690,000 | | | | 695,170 | |
AT&T, Inc. | | 4.350% | | | 06/15/45 | | | | 965,000 | | | | 917,735 | |
Comcast Corporation | | 4.250% | | | 01/15/33 | | | | 1,375,000 | | | | 1,483,099 | |
Comcast Corporation | | 4.600% | | | 10/15/38 | | | | 1,025,000 | | | | 1,119,774 | |
Discovery Communications, LLC | | 4.950% | | | 05/15/42 | | | | 820,000 | | | | 789,107 | |
Interpublic Group of Companies, Inc. (The) | | 5.400% | | | 10/01/48 | | | | 260,000 | | | | 276,845 | |
Telefonica Emisiones SAU | | 7.045% | | | 06/20/36 | | | | 885,000 | | | | 1,097,779 | |
Tencent Holding Ltd., 144A | | 3.925% | | | 01/19/38 | | | | 1,025,000 | | | | 1,001,419 | |
18
RYAN LABS LONG CREDIT FUND
SCHEDULE OF INVESTMENTS (Continued) |
CORPORATE BONDS — 90.1%
(Continued) | | Coupon | | | Maturity | | | Par Value | | | Value | |
Communication Services — 8.8% (Continued) | | | | | | | | | | | | | | |
Time Warner, Inc. | | 6.550% | | | 05/01/37 | | | $ | 285,000 | | | $ | 315,105 | |
Time Warner, Inc. | | 6.750% | | | 06/15/39 | | | | 160,000 | | | | 180,358 | |
Vodafone Group plc | | 5.000% | | | 05/30/38 | | | | 570,000 | | | | 584,704 | |
| | | | | | | | | | | | | | 9,568,905 | |
Consumer Discretionary — 6.1% | | | | | | | | | | | | | | |
CBS Corporation | | 4.850% | | | 07/01/42 | | | | 585,000 | | | | 585,653 | |
Ford Motor Company | | 4.750% | | | 01/15/43 | | | | 360,000 | | | | 297,540 | |
General Motors Company, Inc. | | 6.750% | | | 04/01/46 | | | | 945,000 | | | | 1,000,328 | |
Hasbro, Inc. | | 6.350% | | | 03/15/40 | | | | 262,000 | | | | 306,932 | |
Home Depot, Inc. (The) | | 4.500% | | | 12/06/48 | | | | 450,000 | | | | 504,025 | |
Johnson (S.C.) & Son, Inc., 144A | | 4.350% | | | 09/30/44 | | | | 690,000 | | | | 724,592 | |
Lowe’s Companies, Inc. | | 4.050% | | | 05/03/47 | | | | 675,000 | | | | 637,233 | |
Walt Disney Company (The), 144A | | 6.200% | | | 12/15/34 | | | | 840,000 | | | | 1,115,561 | |
Warner Media, LLC | | 4.650% | | | 06/01/44 | | | | 1,455,000 | | | | 1,433,515 | |
| | | | | | | | | | | | | | 6,605,379 | |
Consumer Staples — 5.2% | | | | | | | | | | | | | | |
Altria Group, Inc. | | 5.950% | | | 02/14/49 | | | | 525,000 | | | | 573,498 | |
Anheuser-Busch Companies, LLC / Anheuser-Busch InBev Worldwide, Inc. | | 4.700% | | | 02/01/36 | | | | 1,535,000 | | | | 1,583,654 | |
Anheuser-Busch InBev Worldwide, Inc. | | 5.450% | | | 01/23/39 | | | | 785,000 | | | | 875,721 | |
BAT Capital Corporation | | 4.540% | | | 08/15/47 | | | | 405,000 | | | | 363,784 | |
Conagra Brands, Inc. | | 5.400% | | | 11/01/48 | | | | 605,000 | | | | 635,888 | |
General Mills, Inc. | | 4.550% | | | 04/17/38 | | | | 355,000 | | | | 366,062 | |
Kroger Company (The) | | 4.450% | | | 02/01/47 | | | | 910,000 | | | | 852,562 | |
Target Corporation | | 3.375% | | | 04/15/29 | | | | 370,000 | | | | 381,288 | |
| | | | | | | | | | | | | | 5,632,457 | |
Energy — 10.3% | | | | | | | | | | | | | | |
Baker Hughes, a GE Company, LLC | | 4.080% | | | 12/15/47 | | | | 1,215,000 | | | | 1,109,064 | |
Boardwalk Pipelines, L.P. | | 4.450% | | | 07/15/27 | | | | 340,000 | | | | 340,132 | |
Boardwalk Pipelines, L.P. | | 4.800% | | | 05/03/29 | | | | 95,000 | | | | 97,026 | |
Buckeye Partners, L.P. | | 5.600% | | | 10/15/44 | | | | 295,000 | | | | 259,492 | |
Enable Midstream Partners, L.P. | | 4.400% | | | 03/15/27 | | | | 350,000 | | | | 344,239 | |
Energy Transfer Partners, L.P. | | 7.500% | | | 07/01/38 | | | | 165,000 | | | | 200,933 | |
Energy Transfer Partners, L.P. | | 6.500% | | | 02/01/42 | | | | 965,000 | | | | 1,085,996 | |
Energy Transfer Partners, L.P. | | 5.950% | | | 10/01/43 | | | | 345,000 | | | | 363,692 | |
Enterprise Products Operating, LLC | | 5.375% | | | 02/15/78 | | | | 1,145,000 | | | | 1,031,725 | |
EQT Corporation | | 3.900% | | | 10/01/27 | | | | 970,000 | | | | 924,676 | |
Kinder Morgan Energy Partners, L.P. | | 6.500% | | | 09/01/39 | | | | 1,063,000 | | | | 1,247,396 | |
Kinder Morgan, Inc. | | 5.200% | | | 03/01/48 | | | | 185,000 | | | | 194,022 | |
Magellan Midstream Partners, L.P. | | 4.850% | | | 02/01/49 | | | | 1,160,000 | | | | 1,252,910 | |
19
RYAN LABS LONG CREDIT FUND
SCHEDULE OF INVESTMENTS (Continued) |
CORPORATE BONDS — 90.1%
(Continued) | | Coupon | | | Maturity | | | Par Value | | | Value | |
Energy — 10.3% (Continued) | | | | | | | | | | | | | | |
Marathon Petroleum Corporation | | 5.850% | | | 12/15/45 | | | $ | 560,000 | | | $ | 617,146 | |
Patterson-UTI Energy, Inc. | | 3.950% | | | 02/01/28 | | | | 295,000 | | | | 286,562 | |
Petroleos Mexicanos | | 6.750% | | | 09/21/47 | | | | 772,000 | | | | 697,811 | |
Shell International Finance B.V. | | 3.750% | | | 09/12/46 | | | | 755,000 | | | | 765,400 | |
TransCanada Pipelines Ltd. | | 5.100% | | | 03/15/49 | | | | 375,000 | | | | 408,703 | |
| | | | | | | | | | | | | | 11,226,925 | |
Financials — 13.2% | | | | | | | | | | | | | | |
Allstate Corporation | | 4.200% | | | 12/15/46 | | | | 115,000 | | | | 123,158 | |
American International Group, Inc. | | 4.250% | | | 03/15/29 | | | | 360,000 | | | | 375,341 | |
American International Group, Inc. | | 4.500% | | | 07/16/44 | | | | 370,000 | | | | 373,264 | |
Bank of America Corporation | | 4.330% | | | 03/15/50 | | | | 635,000 | | | | 671,125 | |
Berkshire Hathaway Finance Corporation | | 4.300% | | | 05/15/43 | | | | 355,000 | | | | 384,117 | |
Brighthouse Financial, Inc. | | 4.700% | | | 06/22/47 | | �� | | 1,300,000 | | | | 1,034,982 | |
Crown Castle International Corporation | | 5.200% | | | 02/15/49 | | | | 880,000 | | | | 960,383 | |
GATX Corporation | | 4.700% | | | 04/01/29 | | | | 1,020,000 | | | | 1,088,297 | |
GE Capital International Funding Company | | 4.418% | | | 11/15/35 | | | | 755,000 | | | | 716,198 | |
Goldman Sachs Group, Inc. | | 4.411% | | | 04/23/39 | | | | 1,085,000 | | | | 1,120,579 | |
HSBC Bank USA | | 5.875% | | | 11/01/34 | | | | 1,390,000 | | | | 1,695,154 | |
Manulife Financial Corporation | | 4.061% | | | 02/24/32 | | | | 1,345,000 | | | | 1,351,049 | |
Markel Corporation | | 5.000% | | | 05/20/49 | | | | 745,000 | | | | 765,039 | |
National Rural Utilities Cooperative Corporation | | 4.400% | | | 11/01/48 | | | | 880,000 | | | | 984,251 | |
RenaissanceRe Holdings Ltd. | | 3.600% | | | 04/15/29 | | | | 645,000 | | | | 649,098 | |
Synchrony Financial | | 5.150% | | | 03/19/29 | | | | 465,000 | | | | 484,139 | |
Wells Fargo & Company | | 5.375% | | | 02/07/35 | | | | 1,245,000 | | | | 1,492,111 | |
| | | | | | | | | | | | | | 14,268,285 | |
Health Care — 7.7% | | | | | | | | | | | | | | |
AbbVie, Inc. | | 4.300% | | | 05/14/36 | | | | 1,275,000 | | | | 1,245,317 | |
Bayer U.S. Finance II, LLC, 144A | | 4.875% | | | 06/25/48 | | | | 580,000 | | | | 560,817 | |
CVS Health Corporation | | 5.050% | | | 03/25/48 | | | | 2,005,000 | | | | 2,039,191 | |
Eli Lilly and Company | | 3.875% | | | 03/15/39 | | | | 1,075,000 | | | | 1,132,839 | |
Merck & Company, Inc. | | 3.900% | | | 03/07/39 | | | | 1,000,000 | | | | 1,057,555 | |
Pfizer, Inc. | | 3.900% | | | 03/15/39 | | | | 1,090,000 | | | | 1,144,206 | |
Pfizer, Inc. | | 4.000% | | | 03/15/49 | | | | 175,000 | | | | 184,925 | |
UnitedHealth Group, Inc. | | 4.450% | | | 12/15/48 | | | | 890,000 | | | | 975,990 | |
| | | | | | | | | | | | | | 8,340,840 | |
Industrials — 5.1% | | | | | | | | | | | | | | |
Burlington Northern Santa Fe, LLC | | 5.150% | | | 09/01/43 | | | | 940,000 | | | | 1,122,406 | |
FedEx Corporation | | 4.950% | | | 10/17/48 | | | | 1,030,000 | | | | 1,070,994 | |
General Electric Company | | 4.500% | | | 03/11/44 | | | | 960,000 | | | | 900,178 | |
20
RYAN LABS LONG CREDIT FUND
SCHEDULE OF INVESTMENTS (Continued) |
CORPORATE BONDS — 90.1%
(Continued) | | Coupon | | | Maturity | | | Par Value | | | Value | |
Industrials — 5.1% (Continued) | | | | | | | | | | | | | | |
Norfolk Southern Corporation | | 4.450% | | | 06/15/45 | | | $ | 910,000 | | | $ | 977,955 | |
United Parcel Service, Inc. | | 3.750% | | | 11/15/47 | | | | 1,100,000 | | | | 1,065,723 | |
United Parcel Service, Inc., 144A | | 4.250% | | | 03/15/49 | | | | 185,000 | | | | 193,812 | |
WRKCo, Inc. | | 4.200% | | | 06/01/32 | | | | 185,000 | | | | 187,316 | |
| | | | | | | | | | | | | | 5,518,384 | |
Information Technology — 8.0% | | | | | | | | | | | | | | |
Apple, Inc. | | 4.375% | | | 05/13/45 | | | | 1,620,000 | | | | 1,774,195 | |
Arrow Electronics, Inc. | | 3.875% | | | 01/12/28 | | | | 555,000 | | | | 547,832 | |
Dell, Inc., 144A | | 8.350% | | | 07/15/46 | | | | 380,000 | | | | 463,875 | |
KLA-Tencor Corporation | | 5.000% | | | 03/15/49 | | | | 400,000 | | | | 426,798 | |
Mastercard, Inc. | | 3.650% | | | 06/01/49 | | | | 1,485,000 | | | | 1,508,580 | |
Microsoft Corporation | | 4.100% | | | 02/06/37 | | | | 971,000 | | | | 1,072,597 | |
Motorola Solutions, Inc. | | 4.600% | | | 05/23/29 | | | | 465,000 | | | | 475,089 | |
Oracle Corporation | | 3.800% | | | 11/15/37 | | | | 1,378,000 | | | | 1,384,473 | |
Oracle Corporation | | 6.500% | | | 04/15/38 | | | | 100,000 | | | | 135,234 | |
Tech Data Corporation | | 4.950% | | | 02/15/27 | | | | 450,000 | | | | 464,031 | |
Texas Instruments, Inc. | | 4.150% | | | 05/15/48 | | | | 415,000 | | | | 452,393 | |
| | | | | | | | | | | | | | 8,705,097 | |
Materials — 3.9% | | | | | | | | | | | | | | |
BHP Billiton Finance (USA) Ltd. | | 5.000% | | | 09/30/43 | | | | 480,000 | | | | 569,937 | |
Dow Chemical Company (The), 144A | | 4.800% | | | 05/15/49 | | | | 190,000 | | | | 190,520 | |
Glencore Funding, LLC, 144A | | 4.000% | | | 03/27/27 | | | | 1,050,000 | | | | 1,024,217 | |
Glencore Funding, LLC, 144A | | 4.875% | | | 03/12/29 | | | | 555,000 | | | | 564,833 | |
International Paper Company | | 4.350% | | | 08/15/48 | | | | 975,000 | | | | 901,841 | |
Nucor Corporation | | 4.400% | | | 05/01/48 | | | | 925,000 | | | | 975,762 | |
| | | | | | | | | | | | | | 4,227,110 | |
Real Estate — 1.1% | | | | | | | | | | | | | | |
AvalonBay Communities, Inc. | | 3.300% | | | 06/01/29 | | | | 95,000 | | | | 96,511 | |
Ventas Realty, L.P. | | 4.875% | | | 04/15/49 | | | | 1,005,000 | | | | 1,093,346 | |
| | | | | | | | | | | | | | 1,189,857 | |
Utilities — 20.7% | | | | | | | | | | | | | | |
Alabama Power Company | | 4.300% | | | 01/02/46 | | | | 935,000 | | | | 1,015,080 | |
Atmos Energy Corporation | | 4.300% | | | 10/01/48 | | | | 950,000 | | | | 1,032,891 | |
Commonwealth Edison Company | | 4.000% | | | 03/01/48 | | | | 690,000 | | | | 722,926 | |
Connecticut Light and Power Company (The) | | 4.000% | | | 04/01/48 | | | | 180,000 | | | | 191,997 | |
Consolidated Edison Company | | 4.200% | | | 03/15/42 | | | | 1,495,000 | | | | 1,578,577 | |
Consumers Energy Company | | 4.350% | | | 04/15/49 | | | | 795,000 | | | | 902,279 | |
Dominion Energy, Inc., Series A | | 4.600% | | | 03/15/49 | | | | 545,000 | | | | 584,232 | |
Duke Energy Progress, LLC | | 4.375% | | | 03/30/44 | | | | 865,000 | | | | 941,786 | |
Duke Energy Progress, LLC | | 3.600% | | | 09/15/47 | | | | 40,000 | | | | 38,712 | |
21
RYAN LABS LONG CREDIT FUND
SCHEDULE OF INVESTMENTS (Continued) |
CORPORATE BONDS — 90.1%
(Continued) | | Coupon | | | Maturity | | | Par Value | | | Value | |
Utilities — 20.7% (Continued) | | | | | | | | | | | | | | |
Électricité de France S.A., 144A | | 4.950% | | | 10/13/45 | | | $ | 1,305,000 | | | $ | 1,391,768 | |
ENEL Finance International N.V., 144A | | 4.750% | | | 05/25/47 | | | | 630,000 | | | | 614,815 | |
Entergy Louisiana, LLC | | 4.000% | | | 03/15/33 | | | | 790,000 | | | | 858,381 | |
Exelon Generation Company, LLC | | 5.600% | | | 06/15/42 | | | | 615,000 | | | | 665,704 | |
Florida Power & Light Company | | 3.990% | | | 03/01/49 | | | | 1,020,000 | | | | 1,087,037 | |
Georgia Power Company | | 4.300% | | | 03/15/42 | | | | 650,000 | | | | 672,217 | |
MidAmerican Energy Company | | 4.800% | | | 09/15/43 | | | | 953,000 | | | | 1,112,152 | |
PacifiCorp | | 4.125% | | | 01/15/49 | | | | 780,000 | | | | 833,794 | |
Potomac Electric Power | | 4.150% | | | 03/15/43 | | | | 965,000 | | | | 1,021,942 | |
PPL Electric Utilities Corporation | | 4.750% | | | 07/15/43 | | | | 1,050,000 | | | | 1,226,838 | |
Public Service Electric and Gas Company | | 3.850% | | | 05/01/49 | | | | 560,000 | | | | 579,719 | |
Sempra Energy | | 3.800% | | | 02/01/38 | | | | 1,255,000 | | | | 1,183,072 | |
Southern California Edison Company | | 4.650% | | | 10/01/43 | | | | 404,000 | | | | 416,883 | |
Southern California Edison Company, Series B | | 4.875% | | | 03/01/49 | | | | 215,000 | | | | 234,294 | |
Southwestern Public Service Company | | 4.400% | | | 11/15/48 | | | | 1,480,000 | | | | 1,638,097 | |
Union Electric Company | | 3.500% | | | 03/15/29 | | | | 705,000 | | | | 733,252 | |
Wisconsin Electric Power Company | | 4.300% | | | 10/15/48 | | | | 1,075,000 | | | | 1,160,472 | |
| | | | | | | | | | | | | | 22,438,917 | |
Total Corporate Bonds(Cost $93,591,951) | | | | | | | | | | | | $ | 97,722,156 | |
|
INTERNATIONAL BONDS — 1.4% | | Coupon | | | Maturity | | | Par Value | | | Value | |
United Mexican States (Cost $1,462,593) | | 4.750% | | | 03/08/44 | | | $ | 1,564,000 | | | $ | 1,546,796 | |
22
RYAN LABS LONG CREDIT FUND
SCHEDULE OF INVESTMENTS (Continued) |
MONEY MARKET FUNDS — 0.7% | | Shares | | | Value | |
Invesco Short-Term Investments Trust - Treasury Portfolio - Institutional Class, 2.29%(b) (Cost $812,471) | | | 812,471 | | | $ | 812,471 | |
| | | | | | | | | |
Investments at Value — 100.4%
(Cost $104,108,464) | | | | | | $ | 108,917,456 | |
| | | | | | | | | |
Liabilities in Excess of Other Assets — (0.4%) | | | | | | | (427,220 | ) |
| | | | | | | | | |
Net Assets — 100.0% | | | | | | $ | 108,490,236 | |
144A - | This security was purchased in a transaction exempt from registration in compliance with Rule 144A of the Securities Act of 1933. This security may be resold in transactions exempt from registration, normally to qualified institutional buyers. The total value of such securities is $7,911,142 as of May 31, 2019, representing 7.3% of net assets (Note 6). |
(a) | Variable rate security. Interest rate resets periodically. The rate shown is the effective interest rate as of May 31, 2019. These variable rate securities are not based on a published reference rate and spread but are determined by the issuer or agent and are based on current market conditions. These securities, therefore, do not indicate a reference rate and spread. |
(b) | The rate shown is the 7-day effective yield as of May 31, 2019. |
See accompanying notes to financial statements. |
23
RYAN LABS FUNDS
STATEMENTS OF ASSETS AND LIABILITIES
May 31, 2019 (Unaudited) |
| | Ryan Labs Core
Bond Fund | | | Ryan Labs Long
Credit Fund | |
ASSETS | | | | | | | | |
Investments in securities: | | | | | | | | |
At cost | | $ | 97,595,121 | | | $ | 104,108,464 | |
At value (Note 2) | | $ | 99,313,723 | | | $ | 108,917,456 | |
Receivable for securities sold | | | — | | | | 1,150,984 | |
Dividends and interest receivable | | | 498,769 | | | | 1,066,178 | |
Receivable from Adviser (Note 4) | | | 1,952 | | | | — | |
Other assets | | | 12,257 | | | | 11,805 | |
TOTAL ASSETS | | | 99,826,701 | | | | 111,146,423 | |
| | | | | | | | | |
LIABILITIES | | | | | | | | |
Distributions payable | | | 122,306 | | | | 160,487 | |
Payable for capital shares redeemed | | | 8,840,175 | | | | 1,531,734 | |
Payable for securities purchased | | | 840,000 | | | | 929,259 | |
Payable to Adviser (Note 4) | | | — | | | | 11,228 | |
Payable to administrator (Note 4) | | | 13,590 | | | | 14,704 | |
Other accrued expenses | | | 14,075 | | | | 8,775 | |
TOTAL LIABILITIES | | | 9,830,146 | | | | 2,656,187 | |
| | | | | | | | | |
NET ASSETS | | $ | 89,996,555 | | | $ | 108,490,236 | |
| | | | | | | | | |
NET ASSETS CONSIST OF: | | | | | | | | |
Paid-in capital | | $ | 89,359,807 | | | $ | 105,234,609 | |
Accumulated earnings | | | 636,748 | | | | 3,255,627 | |
NET ASSETS | | $ | 89,996,555 | | | $ | 108,490,236 | |
| | | | | | | | | |
Shares of beneficial interest outstanding (unlimited number of shares authorized, no par value) | | | 9,038,032 | | | | 10,446,859 | |
| | | | | | | | | |
Net asset value, offering price and redemption price (Note 2) | | $ | 9.96 | | | $ | 10.38 | |
See accompanying notes to financial statements. |
24
RYAN LABS FUNDS
STATEMENTS OF OPERATIONS
For the Six Months Ended May 31, 2019 (Unaudited) |
| | Ryan Labs Core
Bond Fund | | | Ryan Labs Long
Credit Fund | |
INVESTMENT INCOME | | | | | | | | |
Interest | | $ | 1,687,341 | | | $ | 2,279,240 | |
Dividend | | | 31,868 | | | | 11,823 | |
TOTAL INVESTMENT INCOME | | | 1,719,209 | | | | 2,291,063 | |
| | | | | | | | | |
EXPENSES | | | | | | | | |
Investment advisory fees (Note 4) | | | 192,020 | | | | 255,306 | |
Administration fees (Note 4) | | | 48,013 | | | | 50,890 | |
Pricing costs | | | 31,923 | | | | 11,272 | |
Professional fees | | | 21,565 | | | | 21,565 | |
Fund accounting fees (Note 4) | | | 19,737 | | | | 20,124 | |
Custody and bank service fees | | | 5,490 | | | | 8,187 | |
Compliance fees (Note 4) | | | 6,000 | | | | 6,175 | |
Registration and filing fees | | | 6,237 | | | | 5,777 | |
Transfer agent fees (Note 4) | | | 6,000 | | | | 6,000 | |
Trustees’ fees and expenses (Note 4) | | | 5,917 | | | | 5,917 | |
Postage and supplies | | | 1,989 | | | | 1,980 | |
Insurance expense | | | 1,775 | | | | 1,747 | |
Printing of shareholder reports | | | 2,005 | | | | 1,497 | |
Other expenses | | | 9,528 | | | | 9,964 | |
TOTAL EXPENSES | | | 358,199 | | | | 406,401 | |
Less fee reductions by Adviser (Note 4) | | | (166,178 | ) | | | (151,096 | ) |
NET EXPENSES | | | 192,021 | | | | 255,305 | |
| | | | | | | | | |
NET INVESTMENT INCOME | | | 1,527,188 | | | | 2,035,758 | |
| | | | | | | | | |
REALIZED AND UNREALIZED GAINS (LOSSES) ON INVESTMENTS | | | | | | | | |
Net realized gains (losses) from investment transactions | | | (46,411 | ) | | | 380,176 | |
Net change in unrealized appreciation (depreciation) on investments | | | 5,012,080 | | | | 10,940,476 | |
NET REALIZED AND UNREALIZED GAINS ON INVESTMENTS | | | 4,965,669 | | | | 11,320,652 | |
| | | | | | | | | |
NET INCREASE IN NET ASSETS FROM OPERATIONS | | $ | 6,492,857 | | | $ | 13,356,410 | |
See accompanying notes to financial statements. |
25
RYAN LABS CORE BOND FUND
STATEMENTS OF CHANGES IN NET ASSETS |
| | Six Months
Ended
May 31, 2019
(Unaudited) | | | Year Ended
November 30,
2018 | |
FROM OPERATIONS | | | | | | | | |
Net investment income | | $ | 1,527,188 | | | $ | 2,789,942 | |
Net realized losses from investment transactions | | | (46,411 | ) | | | (700,280 | ) |
Net change in unrealized appreciation (depreciation) on investments | | | 5,012,080 | | | | (3,264,995 | ) |
Net increase (decrease) in net assets resulting from operations | | | 6,492,857 | | | | (1,175,333 | ) |
| | | | | | | | | |
DISTRIBUTIONS TO SHAREHOLDERS (Note 2) | | | (1,539,687 | ) | | | (2,886,572 | ) |
| | | | | | | | | |
CAPITAL SHARE TRANSACTIONS | | | | | | | | |
Proceeds from shares sold | | | 1,076,366 | | | | 2,235,000 | |
Net asset value of shares issued in reinvestment of distributions to shareholders | | | 818,406 | | | | 1,527,719 | |
Payments for shares redeemed | | | (10,100,758 | ) | | | (8,362,805 | ) |
Net decrease from capital share transactions | | | (8,205,986 | ) | | | (4,600,086 | ) |
| | | | | | | | | |
TOTAL DECREASE IN NET ASSETS | | | (3,252,816 | ) | | | (8,661,991 | ) |
| | | | | | | | | |
NET ASSETS | | | | | | | | |
Beginning of period | | | 93,249,371 | | | | 101,911,362 | |
End of period | | $ | 89,996,555 | | | $ | 93,249,371 | |
| | | | | | | | | |
CAPITAL SHARES ACTIVITY | | | | | | | | |
Shares sold | | | 112,174 | | | | 228,627 | |
Shares reinvested | | | 84,006 | | | | 158,551 | |
Shares redeemed | | | (1,017,367 | ) | | | (852,192 | ) |
Net decrease in shares outstanding | | | (821,187 | ) | | | (465,014 | ) |
Shares outstanding at beginning of period | | | 9,859,219 | | | | 10,324,233 | |
Shares outstanding at end of period | | | 9,038,032 | | | | 9,859,219 | |
See accompanying notes to financial statements. |
26
RYAN LABS LONG CREDIT FUND
STATEMENTS OF CHANGES IN NET ASSETS |
| | Six Months
Ended
May 31, 2019
(Unaudited) | | | Year Ended
November 30,
2018 | |
FROM OPERATIONS | | | | | | | | |
Net investment income | | $ | 2,035,758 | | | $ | 3,458,754 | |
Net realized gains (losses) from investment transactions | | | 380,176 | | | | (1,938,185 | ) |
Net change in unrealized appreciation (depreciation) on investments | | | 10,940,476 | | | | (8,307,941 | ) |
Net increase (decrease) in net assets resulting from operations | | | 13,356,410 | | | | (6,787,372 | ) |
| | | | | | | | | |
DISTRIBUTIONS TO SHAREHOLDERS (Note 2) | | | (2,035,473 | ) | | | (4,806,244 | ) |
| | | | | | | | | |
CAPITAL SHARE TRANSACTIONS | | | | | | | | |
Proceeds from shares sold | | | 7,153,392 | | | | 11,972,010 | |
Net asset value of shares issued in reinvestment of distributions to shareholders | | | 1,094,237 | | | | 2,972,735 | |
Payments for shares redeemed | | | (2,750,479 | ) | | | (5,564,469 | ) |
Net increase from capital share transactions | | | 5,497,150 | | | | 9,380,276 | |
| | | | | | | | | |
TOTAL INCREASE (DECREASE) IN NET ASSETS | | | 16,818,087 | | | | (2,213,340 | ) |
| | | | | | | | | |
NET ASSETS | | | | | | | | |
Beginning of period | | | 91,672,149 | | | | 93,885,489 | |
End of period | | $ | 108,490,236 | | | $ | 91,672,149 | |
| | | | | | | | | |
CAPITAL SHARES ACTIVITY | | | | | | | | |
Shares sold | | | 733,121 | | | | 1,231,858 | |
Shares reinvested | | | 110,019 | | | | 291,619 | |
Shares redeemed | | | (268,088 | ) | | | (521,581 | ) |
Net increase in shares outstanding | | | 575,052 | | | | 1,001,896 | |
Shares outstanding at beginning of period | | | 9,871,807 | | | | 8,869,911 | |
Shares outstanding at end of period | | | 10,446,859 | | | | 9,871,807 | |
See accompanying notes to financial statements. |
27
RYAN LABS CORE BOND FUND
FINANCIAL HIGHLIGHTS |
Per Share Data for a Share Outstanding Throughout Each Period |
| | Six Months
Ended
May 31, 2019
(Unaudited) | | | Year Ended
November 30,
2018 | | | Year Ended
November 30,
2017 | | | Year Ended
November 30,
2016 | | | Period Ended
November 30,
2015(a) | |
Net asset value at beginning of period | | $ | 9.46 | | | $ | 9.87 | | | $ | 9.89 | | | $ | 9.87 | | | $ | 10.00 | |
| | | | | | | | | | | | | | | | | | | | | |
Income (loss) from investment operations: | | | | | | | | | | | | | | | | | | | | |
Net investment income | | | 0.15 | | | | 0.28 | | | | 0.25 | | | | 0.23 | | | | 0.21 | |
Net realized and unrealized gains (losses) on investments | | | 0.51 | | | | (0.40 | ) | | | 0.12 | | | | 0.04 | | | | (0.13 | ) |
Total from investment operations | | | 0.66 | | | | (0.12 | ) | | | 0.37 | | | | 0.27 | | | | 0.08 | |
| | | | | | | | | | | | | | | | | | | | | |
Less distributions from: | | | | | | | | | | | | | | | | | | | | |
Net investment income | | | (0.16 | ) | | | (0.29 | ) | | | (0.26 | ) | | | (0.24 | ) | | | (0.21 | ) |
Net realized gains from investment transactions | | | — | | | | — | | | | (0.13 | ) | | | (0.01 | ) | | | — | |
Total distributions | | | (0.16 | ) | | | (0.29 | ) | | | (0.39 | ) | | | (0.25 | ) | | | (0.21 | ) |
| | | | | | | | | | | | | | | | | | | | | |
Net asset value at end of period | | $ | 9.96 | | | $ | 9.46 | | | $ | 9.87 | | | $ | 9.89 | | | $ | 9.87 | |
| | | | | | | | | | | | | | | | | | | | | |
Total return(b) | | | 6.97 | %(c) | | | (1.21 | %) | | | 3.84 | % | | | 2.69 | % | | | 0.81 | %(c) |
| | | | | | | | | | | | | | | | | | | | | |
Net assets at end of period (000’s) | | $ | 89,997 | | | $ | 93,249 | | | $ | 101,911 | | | $ | 100,236 | | | $ | 70,257 | |
| | | | | | | | | | | | | | | | | | | | | |
Ratios/supplementary data: | | | | | | | | | | | | | | | | | | | | |
| | | | | | | | | | | | | | | | | | | | | |
Ratio of total expenses to average net assets | | | 0.75 | %(d) | | | 0.71 | % | | | 0.70 | % | | | 0.75 | % | | | 1.18 | %(d) |
| | | | | | | | | | | | | | | | | | | | | |
Ratio of net expenses to average net assets(e) | | | 0.40 | %(d) | | | 0.40 | % | | | 0.40 | % | | | 0.40 | % | | | 0.40 | %(d) |
| | | | | | | | | | | | | | | | | | | | | |
Ratio of net investment income to average net
assets(e) | | | 3.18 | %(d) | | | 2.92 | % | | | 2.54 | % | | | 2.29 | % | | | 2.21 | %(d) |
| | | | | | | | | | | | | | | | | | | | | |
Portfolio turnover rate | | | 21 | %(c) | | | 58 | % | | | 103 | % | | | 118 | % | | | 161 | %(c) |
(a) | Represents the period from the commencement of operations (December 29, 2014) through November 30, 2015. |
(b) | Total return is a measure of the change in value of an investment in the Fund over the periods covered, which assumes any dividends or capital gains distributions are reinvested in shares of the Fund. The returns shown do not reflect the deduction of taxes a shareholder would pay on Fund distributions or the redemption of Fund shares. The total returns would have been lower if the Adviser had not reduced advisory fees and/or reimbursed expenses (Note 4). |
(c) | Not annualized. |
(d) | Annualized. |
(e) | Ratio was determined after investment advisory fee reductions and/or expense reimbursements. (Note 4). |
See accompanying notes to financial statements. |
28
RYAN LABS LONG CREDIT FUND
FINANCIAL HIGHLIGHTS |
Per Share Data for a Share Outstanding Throughout Each Period |
| | Six Months
Ended
May 31, 2019
(Unaudited) | | | Year Ended
November 30,
2018 | | | Year Ended
November 30,
2017 | | | Year Ended
November 30,
2016 | | | Period Ended
November 30,
2015(a) | |
Net asset value at beginning of period | | $ | 9.29 | | | $ | 10.58 | | | $ | 10.33 | | | $ | 10.06 | | | $ | 10.00 | |
| | | | | | | | | | | | | | | | | | | | | |
Income (loss) from investment operations: | | | | | | | | | | | | | | | | | | | | |
Net investment income | | | 0.20 | | | | 0.38 | | | | 0.37 | | | | 0.41 | | | | 0.01 | |
Net realized and unrealized gains (losses) on investments | | | 1.09 | | | | (1.13 | ) | | | 0.64 | | | | 0.30 | | | | 0.06 | |
Total from investment operations | | | 1.29 | | | | (0.75 | ) | | | 1.01 | | | | 0.71 | | | | 0.07 | |
| | | | | | | | | | | | | | | | | | | | | |
Less distributions from: | | | | | | | | | | | | | | | | | | | | |
Net investment income | | | (0.20 | ) | | | (0.38 | ) | | | (0.37 | ) | | | (0.41 | ) | | | (0.01 | ) |
Net realized gains from investment transactions | | | — | | | | (0.16 | ) | | | (0.39 | ) | | | (0.03 | ) | | | — | |
Total distributions | | | (0.20 | ) | | | (0.54 | ) | | | (0.76 | ) | | | (0.44 | ) | | | (0.01 | ) |
| | | | | | | | | | | | | | | | | | | | | |
Net asset value at end of period | | $ | 10.38 | | | $ | 9.29 | | | $ | 10.58 | | | $ | 10.33 | | | $ | 10.06 | |
| | | | | | | | | | | | | | | | | | | | | |
Total return(b) | | | 13.95 | %(c) | | | (7.38 | %) | | | 10.27 | % | | | 7.11 | % | | | 0.71 | %(c) |
| | | | | | | | | | | | | | | | | | | | | |
Net assets at end of period (000’s) | | $ | 108,490 | | | $ | 91,672 | | | $ | 93,885 | | | $ | 53,640 | | | $ | 50,278 | |
| | | | | | | | | | | | | | | | | | | | | |
Ratios/supplementary data: | | | | | | | | | | | | | | | | | | | | |
| | | | | | | | | | | | | | | | | | | | | |
Ratio of total expenses to average net assets | | | 0.80 | %(d) | | | 0.79 | % | | | 0.84 | % | | | 0.84 | % | | | 1.12 | %(d) |
| | | | | | | | | | | | | | | | | | | | | |
Ratio of net expenses to average net assets(e) | | | 0.50 | %(d) | | | 0.50 | % | | | 0.50 | % | | | 0.50 | % | | | 0.50 | %(d) |
| | | | | | | | | | | | | | | | | | | | | |
Ratio of net investment income to average net
assets(e) | | | 3.98 | %(d) | | | 3.85 | % | | | 3.66 | % | | | 3.87 | % | | | 2.38 | %(d) |
| | | | | | | | | | | | | | | | | | | | | |
Portfolio turnover rate | | | 103 | %(c) | | | 195 | % | | | 191 | % | | | 156 | % | | | 93 | %(c) |
(a) | Represents the period from the commencement of operations (November 13, 2015) through November 30, 2015. |
(b) | Total return is a measure of the change in value of an investment in the Fund over the periods covered, which assumes any dividends or capital gains distributions are reinvested in shares of the Fund. The returns shown do not reflect the deduction of taxes a shareholder would pay on Fund distributions or the redemption of Fund shares. The total returns would have been lower if the Adviser had not reduced advisory fees and/or reimbursed expenses (Note 4). |
(c) | Not annualized. |
(d) | Annualized. |
(e) | Ratio was determined after investment advisory fee reductions and/or expense reimbursements. (Note 4). |
See accompanying notes to financial statements. |
29
RYAN LABS FUNDS
NOTES TO FINANCIAL STATEMENTS
May 31, 2019 (Unaudited)
1. Organization
Ryan Labs Core Bond Fund and Ryan Labs Long Credit Fund (individually, a “Fund,” and collectively, the “Funds”) are each a diversified series of Ultimus Managers Trust (the “Trust”), an open-end investment company established as an Ohio business trust under a Declaration of Trust dated February 28, 2012. Other series of the Trust are not incorporated in this report.
Each Fund’s investment objective is to seek total return, consisting of current income and capital appreciation.
2. Significant Accounting Policies
The Funds follow accounting and reporting guidance under Financial Accounting Standards Board (“FASB”) Accounting Standards Codification Topic 946, “Financial Services – Investment Companies.” These policies are in conformity with accounting principles generally accepted in the United States of America (“GAAP”).
New Accounting Pronouncement – In March 2017, FASB issued Accounting Standards Update No. 2017-08 (“ASU 2017-08”), “Receivables – Nonrefundable Fees and Other Costs (Subtopic 310-20): Premium Amortization on Purchased Callable Debt Securities.” ASU 2017-08 shortens the amortization period for certain callable debt securities, held at a premium, to be amortized to the earliest call date. ASU 2017-08 does not require an accounting change for securities held at a discount, which continue to accrete to maturity. ASU 2017-08 is effective for fiscal years and interim periods within those fiscal years beginning after December 15, 2018. Management is currently evaluating the impact, if any, of applying ASU 2017-08.
Securities valuation– The Funds’ fixed income securities are generally valued using prices provided by an independent pricing service approved by the Trust’s Board of Trustees (the “Board”). The independent pricing service uses information with respect to transactions in bonds, quotations from bond dealers, market transactions in comparable securities, and various relationships between securities in determining these prices. The methods used by the independent pricing service and the quality of valuations so established are reviewed by Ryan Labs, Inc. (the “Adviser”), under the general supervision of the Board. Exchange-traded funds (“ETFs”), if any, are valued at market value as of the close of regular trading on the New York Stock Exchange (the “NYSE”) (normally 4:00 p.m. Eastern time) on each business day the NYSE is open for business. ETFs are valued at the security’s last sale price on the primary exchange, if available, otherwise at the exchange’s most recently quoted mean price. Securities for which market quotations are not readily available are valued at fair value as determined in good faith under procedures adopted by the Board.
GAAP establishes a single authoritative definition of fair value, sets out a framework for measuring fair value, and requires additional disclosures about fair value measurements.
30
RYAN LABS FUNDS
NOTES TO FINANCIAL STATEMENTS (Continued)
Various inputs are used in determining the value of the Funds’ investments. These inputs are summarized in the three broad levels listed below:
| | ● | Level 1 – quoted prices in active markets for identical securities |
| | ● | Level 2 – other significant observable inputs |
| | ● | Level 3 – significant unobservable inputs |
Fixed income securities held by the Funds are classified as Level 2 since values are based on prices provided by an independent pricing service that utilizes various “other significant observable inputs” including bid and ask quotations, prices of similar securities, and interest rates, among other factors.
The inputs or methods used for valuing securities are not necessarily an indication of the risks associated with investing in those securities. The inputs used to measure fair value may fall into different levels of the fair value hierarchy. In such cases, for disclosure purposes, the level in the fair value hierarchy within which the fair value measurement falls in its entirety is determined based on the lowest level input that is significant to the fair value measurement.
The following is a summary of the inputs used to value each Fund’s investments as of May 31, 2019:
Ryan Labs
Core Bond Fund | | Level 1 | | | Level 2 | | | Level 3 | | | Total | |
U.S. Treasury Obligations | | $ | — | | | $ | 21,776,134 | | | $ | — | | | $ | 21,776,134 | |
Mortgage-Backed Securities | | | — | | | | 34,693,277 | | | | — | | | | 34,693,277 | |
Asset-Backed Securities | | | — | | | | 14,691,713 | | | | — | | | | 14,691,713 | |
Corporate Bonds | | | — | | | | 25,675,229 | | | | — | | | | 25,675,229 | |
International Bonds | | | — | | | | 103,350 | | | | — | | | | 103,350 | |
Money Market Funds | | | 2,374,020 | | | | — | | | | — | | | | 2,374,020 | |
Total | | $ | 2,374,020 | | | $ | 96,939,703 | | | $ | — | | | $ | 99,313,723 | |
Ryan Labs
Long Credit Fund | | Level 1 | | | Level 2 | | | Level 3 | | | Total | |
U.S. Treasury Obligations | | $ | — | | | $ | 7,710,983 | | | $ | — | | | $ | 7,710,983 | |
Mortgage-Backed Securities | | | — | | | | 64,913 | | | | — | | | | 64,913 | |
Municipal Bonds | | | — | | | | 1,060,137 | | | | — | | | | 1,060,137 | |
Corporate Bonds | | | — | | | | 97,722,156 | | | | — | | | | 97,722,156 | |
International Bonds | | | — | | | | 1,546,796 | | | | — | | | | 1,546,796 | |
Money Market Funds | | | 812,471 | | | | — | | | | — | | | | 812,471 | |
Total | | $ | 812,471 | | | $ | 108,104,985 | | | $ | — | | | $ | 108,917,456 | |
31
RYAN LABS FUNDS
NOTES TO FINANCIAL STATEMENTS (Continued)
The Funds did not hold derivative instruments or any assets or liabilities that were measured at fair value on a recurring basis using significant unobservable inputs (Level 3) as of or during the six months ended May 31, 2019.
Share valuation – The net asset value (“NAV”) per share of each Fund is calculated daily by dividing the total value of its assets, less liabilities, by the number of shares outstanding. The offering price and redemption price per share of each Fund is equal to the NAV per share.
Investment income – Interest income is accrued as earned. Discounts and premiums on fixed income securities purchased are accreted or amortized using the effective interest method. Dividend income is recorded on the ex-dividend date.
Investment transactions – Investment transactions are accounted for on the trade date. Realized gains and losses on investments sold are determined on a specific identification basis.
Common expenses – Common expenses of the Trust are allocated among the Funds and other series of the Trust based on the relative net assets of each series, the number of series in the Trust, or the nature of the services performed and the relative applicability to each series.
Distributions to shareholders – Dividends from net investment income are declared and paid monthly to shareholders. Net realized capital gains, if any, are distributed at least once each year. The amount of distributions from net investment income and net realized capital gains are determined in accordance with federal income tax regulations, which may differ from GAAP. Dividends and distributions to shareholders are recorded on the ex-dividend date.
The tax character of distributions paid by each Fund during the periods ended May 31, 2019 and November 30, 2018 was as follows:
Ryan Labs Core Bond Fund
Period Ended | | Ordinary Income | | | Total Distributions | |
May 31, 2019 | | $ | 1,539,687 | | | $ | 1,539,687 | |
November 30, 2018 | | $ | 2,886,572 | | | $ | 2,886,572 | |
Ryan Labs Long Credit Fund
Period Ended | | Ordinary Income | | | Long-Term
Capital Gains | | | Total Distributions | |
May 31, 2019 | | $ | 2,035,473 | | | $ | — | | | $ | 2,035,473 | |
November 30, 2018 | | $ | 3,982,634 | | | $ | 823,610 | | | $ | 4,806,244 | |
32
RYAN LABS FUNDS
NOTES TO FINANCIAL STATEMENTS (Continued)
On June 28, 2019, Ryan Labs Core Bond Fund and Ryan Labs Long Credit Fund paid net investment income dividends of $0.0243 and $0.0314 per share, respectively, to shareholders of record on June 27, 2019.
Estimates – The preparation of financial statements in conformity with GAAP requires management to make estimates and assumptions that affect the reported amounts of assets and liabilities and disclosure of contingent assets and liabilities as of the date of the financial statements and the reported amounts of income and expenses during the reporting period. Actual results could differ from those estimates.
Federal income tax– Each Fund has qualified and intends to continue to qualify as a regulated investment company under the Internal Revenue Code of 1986, as amended (the “Code”). Qualification generally will relieve each Fund of liability for federal income taxes to the extent 100% of its net investment income and net realized capital gains are distributed in accordance with the Code.
In order to avoid imposition of the excise tax applicable to regulated investment companies, it is each Fund’s intention to declare as dividends in each calendar year at least 98% of its net investment income (earned during the calendar year) and 98.2% of its net realized capital gains (earned during the twelve months ended October 31) plus undistributed amounts from prior years.
The following information is computed on a tax basis for each item as of May 31, 2019:
| | Ryan Labs
Core Bond Fund | | | Ryan Labs
Long Credit Fund | |
Tax cost of portfolio investments | | $ | 97,615,046 | | | $ | 104,440,156 | |
Gross unrealized appreciation | | $ | 2,309,571 | | | $ | 5,427,544 | |
Gross unrealized depreciation | | | (610,894 | ) | | | (950,244 | ) |
Net unrealized appreciation on investments | | | 1,698,677 | | | | 4,477,300 | |
Accumulated ordinary income | | | 138,310 | | | | 171,062 | |
Capital loss carryforwards | | | (1,003,336 | ) | | | (1,723,567 | ) |
Other gains (losses) | | | (74,597 | ) | | | 491,319 | |
Distributions payable | | | (122,306 | ) | | | (160,487 | ) |
Accumulated earnings | | $ | 636,748 | | | $ | 3,255,627 | |
The difference between the federal income tax cost of portfolio investments and the financial statement cost for each Fund is due to certain timing differences in the recognition of capital gains or losses under income tax regulations and GAAP. These “book/tax” differences are temporary in nature and are primarily due to the tax deferral of losses on wash sales.
33
RYAN LABS FUNDS
NOTES TO FINANCIAL STATEMENTS (Continued)
As of November 30, 2018, Ryan Labs Core Bond Fund had short-term capital loss carry- forwards of $622,535 and long-term capital loss carryforwards of $380,801; and Ryan Labs Long Credit Fund had short-term capital loss carryforwards of $1,723,567. These capital loss carryforwards, which do not expire, may be utilized in the current and future years to offset net realized capital gains, if any, prior to distributing such gains to sharholders.
The Funds recognize the tax benefits or expenses of uncertain tax positions only when the position is “more likely than not” to be sustained assuming examination by tax authorities. Management has reviewed each Fund’s tax positions for the current and all open tax years (generally, three years) and has concluded that no provision for unrecognized tax benefits or expenses is required in these financial statements. The Funds identify their major tax jurisdiction as U.S. Federal.
3. Investment Transactions
During the six months ended May 31, 2019, cost of purchases and proceeds from sales and maturities of investment securities, other than U.S. Government securities and short-term investments, were as follows:
| | Ryan Labs
Core Bond Fund | | | Ryan Labs
Long Credit Fund | |
Purchase of investment securities | | $ | 12,791,048 | | | $ | 64,629,109 | |
Proceeds from sales and maturities of investment securities | | $ | 14,750,524 | | | $ | 58,197,795 | |
During the six months ended May 31, 2019, cost of purchases and proceeds from sales and maturities of long-term U.S. Government securities were as follows:
| | Ryan Labs
Core Bond Fund | | | Ryan Labs
Long Credit Fund | |
Purchase of U.S. Government securities | | $ | 8,263,046 | | | $ | 45,094,099 | |
Proceeds from sales and maturities of U.S. Government securities | | $ | 2,641,882 | | | $ | 44,856,139 | |
4. Transactions with Related Parties
INVESTMENT ADVISORY AGREEMENT
The Adviser is a wholly-owned subsidiary of Sun Life Financial, Inc. Each Fund is managed by the Adviser pursuant to the terms of an Investment Advisory Agreement. Under the Investment Advisory Agreements, Ryan Labs Core Bond Fund and Ryan Labs Long Credit Fund pay the Adviser an advisory fee, computed and accrued daily and paid monthly, at the annual rate of 0.40% and 0.50%, respectively, of average daily net assets.
34
RYAN LABS FUNDS
NOTES TO FINANCIAL STATEMENTS (Continued)
Pursuant to Expense Limitation Agreements (“ELAs”) between each Fund and the Adviser, the Adviser has agreed, until March 31, 2020, to reduce advisory fees and reimburse other expenses in order to limit total annual operating expenses (exclusive of brokerage costs; taxes; interest; borrowing costs such as interest and dividend expenses on securities sold short; costs to organize each Fund; acquired fund fees and expenses; extraordinary expenses such as litigation and merger or reorganization costs; and other expenses not incurred in the ordinary course of business) to an amount not exceeding 0.40% and 0.50% of the average daily net assets of Ryan Labs Core Bond Fund and Ryan Labs Long Credit Fund, respectively. Accordingly, during the six months ended May 31, 2019, the Adviser reduced its advisory fees in the amounts of $166,178 and $151,096 for Ryan Labs Core Bond Fund and Ryan Labs Long Credit Fund, respectively.
Under the terms of the ELAs, investment advisory fee reductions and expense reimbursements by the Adviser are subject to recoupment by the Adviser for a period of three years after such fees and expenses were incurred, provided the recoupments do not cause total annual operating expenses to exceed the lesser of (i) the expense limitation then in effect, if any, or (ii) the expense limitation in effect at the time the expenses to be recouped were incurred. As of May 31, 2019, the Adviser may seek recoupment of investment advisory fee reductions and expense reimbursements no later than the dates as stated below:
| | Ryan Labs
Core Bond Fund | | | Ryan Labs
Long Credit Fund | |
November 30, 2019 | | $ | 125,721 | | | $ | 93,196 | |
November 30, 2020 | | | 298,798 | | | | 242,282 | |
November 30, 2021 | | | 299,646 | | | | 260,442 | |
May 31, 2022 | | | 166,178 | | | | 151,096 | |
Total | | $ | 890,343 | | | $ | 747,016 | |
OTHER SERVICE PROVIDERS
Ultimus Fund Solutions, LLC (“Ultimus”) provides administration, fund accounting, compliance and transfer agency services to the Funds. The Funds pay Ultimus fees in accordance with the agreements for such services. In addition, the Funds pay out-of-pocket expenses including, but not limited to, postage, supplies and costs of pricing the Funds’ portfolio securities.
Under the terms of a Distribution Agreement with the Trust, Ultimus Fund Distributors, LLC (the “Distributor”) serves as principal underwriter to the Funds. The Distributor is a wholly-owned subsidiary of Ultimus. The Distributor is compensated by the Adviser (not the Funds) for acting as principal underwriter.
Certain officers and a Trustee of the Trust are also officers of Ultimus and the Distributor and are not paid by the Funds for serving in such capacities.
35
RYAN LABS FUNDS
NOTES TO FINANCIAL STATEMENTS (Continued)
TRUSTEE COMPENSATION
Each Trustee who is not an “interested person” of the Trust (“Independent Trustee”) receives a $1,300 annual retainer from each Fund, paid quarterly, except for the Board Chairperson who receives a $1,500 annual retainer from each Fund, paid quarterly. Each Independent Trustee also receives from each Fund a fee of $500 for each Board meeting attended plus reimbursement for travel and other meeting-related expenses.
PRINCIPAL HOLDERS OF FUND SHARES
As of May 31, 2019, the following shareholders owned of record 25% or more of the outstanding shares of each Fund:
NAME OF RECORD OWNER | % Ownership |
Ryan Labs Core Bond Fund | |
Citibank, N.A. (for the benefit of its customers) | 51% |
Ryan Labs Long Credit Fund | |
Citibank, N.A. (for the benefit of its customers) | 46% |
Charles Schwab & Company (for the benefit of its customers) | 27% |
A beneficial owner of 25% or more of a Fund’s outstanding shares may be considered a controlling person of that Fund. That shareholder’s vote could have a more significant effect on matters presented at a shareholders’ meeting.
5. Risks Associated with Mortgage-Backed Securities
The Funds’ investments in mortgage-backed securities are subject to prepayment risk, especially when interest rates decline. Prepayment risk is the risk that the principal on mortgage-backed securities, other asset-backed securities or any fixed-income security with an embedded call option may be prepaid at any time, which could reduce yield and market value. This could reduce the effective maturity of a mortgage-backed security and cause the Funds to reinvest their assets at a lower prevailing interest rate. Mortgage-backed securities are also subject to extension risk, which is the risk that rising interest rates will increase the effective maturity of mortgage-backed securities due to the deceleration of prepayments. Mortgage-backed securities may also be subject to risks unique to the housing industry, including mortgage lending practices, defaults, foreclosures and changes in real estate values. The Funds’ investments in collateralized mortgage obligations are subject to default risk, prepayment and extension risk and market risk when interest rates rise. As of May 31, 2019, Ryan Labs Core Bond Fund had 38.6% of the value of its net assets invested in mortgage-backed securities.
36
RYAN LABS FUNDS
NOTES TO FINANCIAL STATEMENTS (Continued)
6. Risks Associated with Rule 144A Securities
Rule 144A securities are securities that are exempt from registration under the Securities Act of 1933, as amended, and may have legal restriction on resale. Under Rule 144A, these privately placed securities may be resold to qualified institutional buyers (“QIBs”), subject to certain conditions. An insufficient number of QIBs interested in purchasing Rule 144A securities at a particular time could adversely affect the marketability of the securities and the Funds might be unable to dispose of the securities promptly or at a reasonable price. As of May 31, 2019, Ryan Labs Core Bond Fund and Ryan Labs Long Credit Fund had 33.2% and 7.3%, respectively, of the value of their net assets invested in Rule 144A securities.
7. Contingencies and Commitments
The Funds indemnify the Trust’s officers and Trustees for certain liabilities that might arise from their performance of their duties to the Funds. Additionally, in the normal course of business the Funds enter into contracts that contain a variety of representations and warranties and which provide general indemnifications. The Funds’ maximum exposure under these arrangements is unknown, as this would involve future claims that may be made against the Funds that have not yet occurred. However, based on experience, the Funds expect the risk of loss to be remote.
8. Subsequent Events
The Funds are required to recognize in the financial statements the effects of all subsequent events that provide additional evidence about conditions that existed as of the date of the Statements of Assets and Liabilities. For non-recognized subsequent events that must be disclosed to keep the financial statements from being misleading, the Funds are required to disclose the nature of the event as well as an estimate of its financial effect, or a statement that such an estimate cannot be made. Management has evaluated subsequent events through the issuance of these financial statements and has noted no such events other than the payment of net investment income dividends on June 28, 2019, as discussed in Note 2.
37
RYAN LABS FUNDS
ABOUT YOUR FUNDS’ EXPENSES (Unaudited)
We believe it is important for you to understand the impact of costs on your investment. As a shareholder of the Funds, you incur ongoing costs, including management fees and other operating expenses. The following examples are intended to help you understand your ongoing costs (in dollars) of investing in the Funds and to compare these costs with the ongoing costs of investing in other mutual funds.
A mutual fund’s ongoing costs are expressed as a percentage of its average net assets. This figure is known as the expense ratio. The expenses in the table below are based on an investment of $1,000 made at the beginning of the most recent period (December 1, 2018) and held until the end of the period (May 31, 2019).
The table below illustrates each Fund’s ongoing costs in two ways:
Actual fund return – This section helps you to estimate the actual expenses that you paid over the period. The “Ending Account Value” shown is derived from each Fund’s actual return, and the fourth column shows the dollar amount of operating expenses that would have been paid by an investor who started with $1,000 in the Funds. You may use the information here, together with the amount you invested, to estimate the expenses that you paid over the period.
To do so, simply divide your account value by $1,000 (for example, an $8,600 account value divided by $1,000 = 8.6), then multiply the result by the number given for each Fund under the heading “Expenses Paid During Period.”
Hypothetical 5% return – This section is intended to help you compare each Fund’s ongoing costs with those of other mutual funds. It assumes that each Fund had an annual return of 5% before expenses during the period shown, but that the expense ratio is unchanged. In this case, because the return used is not each Fund’s actual return, the results do not apply to your investment. The example is useful in making comparisons because the U.S. Securities and Exchange Commission (the “SEC”) requires all mutual funds to calculate expenses based on a 5% return. You can assess each Fund’s ongoing costs by comparing this hypothetical example with the hypothetical examples that appear in shareholder reports of other funds.
Note that expenses shown in the table are meant to highlight and help you compare ongoing costs only. The Funds do not charge transaction fees, such as purchase or redemption fees, nor do they carry a “sales load.”
The calculations assume no shares were bought or sold during the period. Your actual costs may have been higher or lower, depending on the amount of your investment and the timing of any purchases or redemptions.
38
RYAN LABS FUNDS
ABOUT YOUR FUNDS’ EXPENSES (Unaudited) (Continued)
| Beginning
Account Value
December 1,
2018 | Ending
Account Value
May 31,
2019 | Net Expense
Ratio(a) | Expenses Paid
During
Period(b) |
Ryan Labs Core Bond Fund | | | | |
Based on Actual Fund Return | $1,000.00 | $1,069.70 | 0.40% | $2.06 |
Based on Hypothetical 5% Return (before expenses) | $1,000.00 | $1,022.94 | 0.40% | $2.02 |
| | | | | |
Ryan Labs Long Credit Fund | | | | |
Based on Actual Fund Return | $1,000.00 | $1,139.50 | 0.50% | $2.67 |
Based on Hypothetical 5% Return (before expenses) | $1,000.00 | $1,022.44 | 0.50% | $2.52 |
(a) | Annualized, based on each Fund’s most recent one-half year expenses. |
(b) | Expenses are equal to each Fund’s annualized net expense ratio multiplied by the average account value over the period, multiplied by 182/365 (to reflect the one-half year period). |
39
RYAN LABS FUNDS
OTHER INFORMATION (Unaudited)
A description of the policies and procedures that the Funds use to vote proxies relating to portfolio securities is available without charge upon request by calling toll-free 1-866-561-3087, or on the SEC’s website at www.sec.gov. Information regarding how the Funds voted proxies relating to portfolio securities during the most recent 12-month period ended June 30 is available without charge upon request by calling toll-free 1-866-561-3087, or on the SEC’s website at www.sec.gov.
The Trust files a complete listing of portfolio holdings for the Funds with the SEC as of the end of the first and third quarters of each fiscal year on Form N-Q. These filings are available upon request by calling 1-866-561-3087. Furthermore, you may obtain a copy of the filings on the SEC’s website at www.sec.gov.
40
RYAN LABS FUNDS
RESULTS OF SPECIAL MEETING OF SHAREHOLDERS
(Unaudited)
On June 18, 2018, a Special Meeting of Shareholders of the Trust was held for the purpose of considering the election of seven trustees for the Trust. The number of shares of the Trust present and voting at the Special Meeting represented 68.40% of the total shares entitled to vote at the meeting. Each of the seven nominees was elected by the shareholders of the Trust.
The results of the voting with respect to the election of the seven Trustees were as follows:
| | Number of Shares |
Nominee/Trustee | Affirmative | Withhold |
Robert G. Dorsey | 79,822,871 | 11,178 |
John J. Discepoli | 79,499,054 | 334,995 |
David M. Deptula | 79,499,054 | 334,995 |
Janine L. Cohen | 79,485,191 | 348,858 |
Jacqueline A. Williams | 79,757,455 | 76,594 |
Clifford N. Shireson | 79,771,318 | 62,731 |
Robert E. Morrison, Jr. | 79,771,349 | 62,700 |
41
RYAN LABS FUNDS
DISCLOSURE REGARDING APPROVAL OF INVESTMENT ADVISORY AGREEMENT
(Unaudited) |
The Board of Trustees (the “Board”), including the Independent Trustees voting separately, has reviewed and approved the Fund’s Investment Agreement with Ryan Labs Asset Management, Inc. (the “Adviser”) for an additional one-year term (the “Agreement”). The Board approved the Agreement at an in-person meeting held on January 22-23, 2019, at which all of the Trustees were present.
Legal counsel advised the Board during its deliberations. Additionally, the Board received and reviewed a substantial amount of information provided by the Adviser in response to requests of the Board and counsel. In considering whether to approve the Agreement and in reaching its conclusions with respect thereto, the Board reviewed and analyzed various factors that it determined were relevant to the Agreement, including the following factors.
The nature, extent, and quality of the services provided by the Adviser. In this regard, the Board reviewed the services being provided by the Adviser to the Funds including, without limitation, its investment advisory services since the Funds’ inception, the Adviser’s compliance policies and procedures, its efforts to promote the Funds and assist in its distribution, and its compliance program. After reviewing the foregoing information and further information in the Board materials (e.g., descriptions of its business and Form ADV), the Board concluded that the quality, extent, and nature of the services provided by the Adviser were satisfactory and adequate for the Funds.
The investment performance of the Funds. In this regard, the Board compared the performance of the Funds with the performance of their benchmark indices, custom peer groups and related Morningstar categories. For the Ryan Labs Core Bond Fund, the Board noted that: the fund had outperformed its benchmark for the one-year and since inception periods; the fund had outperformed its custom peer group average and median for the one-year period and its performance equaled the median for the three-year period, but underperformed its custom peer group average for the three-year period and average and median since inception; and the fund had outperformed its Morningstar category (Intermediate Term Bond Funds under $200 Million, True No-Load) average and median for the three-year period, but underperformed its Morningstar category average and median for the one-year and since inception periods. For the Ryan Labs Long Credit Fund, the Board noted that: the fund had outperformed its benchmark since inception but underperformed its benchmark for the one-year period; the fund outperformed its custom peer group average and median for the three year period, but underperformed its custom peer group average and median for the one-year and since inception periods; and outperformed its Morningstar category (Corporate Bond Funds under $200 Million, True No-Load) average and median for the three-year and since inception periods, but underperformed its Morningstar category average and median for the one-year period. The Board further noted that it had determined that the Adviser had satisfactorily explained its performance results for the Funds. The Board also considered the consistency of the Adviser’s management with the Funds’ investment objective and policies. Following
42
RYAN LABS FUNDS
DISCLOSURE REGARDING APPROVAL OF INVESTMENT ADVISORY AGREEMENT
(Unaudited) (Continued) |
additional discussion of the investment performance of the Funds and its performance relative to its Morningstar category, the Adviser’s experience in managing a mutual fund and separate accounts, its historical investment performance, and other factors, the Board concluded that the investment performance of the Funds has been satisfactory.
The costs of the services provided and profits realized by the Adviser and its affiliates from its relationship with the Funds. In this regard, the Board considered the Adviser’s staffing, personnel, and methods of operations; the education and experience of its personnel; compliance program, policies, and procedures; financial condition and the level of commitment to the Funds, and, generally, the Adviser’s advisory business; the asset level of the Funds; and the overall expenses of the Funds, including the advisory fee. The Board considered the expense limitation agreement and considered the Adviser’s current and past fee reductions and expense reimbursements for the Funds. The Board further took into account the Adviser’s commitment to continue the expense limitation agreement until at least March 31, 2020. The Board then noted that the expense cap set by the expense limitation agreement was equal to the investment advisory fee paid to the Adviser, and that therefore the Adviser would always be required to engage in fee reductions or expense reimbursements so long as the expense limitation agreement was in effect, regardless of the Funds’ asset levels.
The Board also considered potential benefits for the Adviser in managing the Funds, including promotion of the Adviser’s name and the potential for it to receive research, statistical, or other services from the Funds’ trades. The Board compared the Funds’ advisory fee and overall expense ratio to the average advisory fees and average expense ratios for its custom peer group and Morningstar category. The Board noted for the Ryan Labs Core Bond Fund that: the 0.40% advisory fee was lower than its custom peer group average and equal to its custom peer group median; the 0.40% advisory fee was higher than its Morningstar category (Intermediate Term Bond Funds under $200 Million, True No-Load) average and median, but lower than the highest advisory fee in its Morningstar category; the 0.40% annual expense ratio was lower than its custom peer group average and median; and the 0.40% annual expense ratio was lower than its Morningstar category average and median. The Board noted for the Ryan Labs Long Credit Fund that: the 0.50% advisory fee was equal to its custom peer group median, but higher than its custom peer group average; the 0.50% advisory fee was higher than its Morningstar category (Corporate Bond Funds under $200 Million, True No-Load) average and median, but less that the highest advisory fee in its Morningstar category; the 0.50% annual expense ratio was lower than its custom peer group average and equal to its peer group median; and the 0.50% annual expense ratio was lower than its Morningstar category average and median;
43
RYAN LABS FUNDS
DISCLOSURE REGARDING APPROVAL OF INVESTMENT ADVISORY AGREEMENT
(Unaudited) (Continued) |
The Board also considered the fee charged by the Adviser to its other accounts that may have a substantially similar strategy as the Funds and considered the similarities and differences of services received by such other accounts as compared to the services received by the Funds. The Board noted that the fee structures applicable to the Adviser’s other clients were not indicative of any unreasonableness with respect to the advisory fees payable to each of the Funds. The Board further considered the investment strategy and style used by the Adviser in managing the portfolio of each of the Funds. Following these comparisons and upon further consideration and discussion of the foregoing, the Board concluded that the advisory fee paid to the Adviser by each of the Funds is fair and reasonable.
The extent to which economies of scale would be realized as the Funds grows and whether advisory fee levels reflect these economies of scale for the benefit of the Funds’ investors.In this regard, the Board considered that for each of the Funds, the fee arrangements with the Adviser involve both the advisory fee and the expense limitation agreement. The Board determined that while the advisory fee remained the same as asset levels increased, the shareholders of the Funds have experienced benefits from the expense limitation agreement and will continue to experience benefits from the expense limitation agreement. Following further discussion of asset level of each of the Funds, expectations for growth, and level of fees, the Board determined that the fee arrangements for each of the Funds with the Adviser would continue to provide benefits given each of the Funds that the fee arrangements were fair and reasonable in relation to the nature and quality of services being provided by the Adviser.
Brokerage and portfolio transactions. In this regard, the Board considered the Adviser’s trading policies, procedures, and performance in seeking best execution for its clients, including the Funds. The Board also considered the historical portfolio turnover rate for the Funds; the process by which evaluations are made of the overall reasonableness of commissions paid; the process by which the Adviser evaluates best execution; the method and basis for selecting and evaluating the broker-dealers used; and any anticipated allocation of portfolio business to persons affiliated with the Adviser. After further review and discussion, the Board determined that the Adviser’s practices regarding brokerage and portfolio transactions were satisfactory.
Possible conflicts of interest. In evaluating the possibility for conflicts of interest, the Board considered such matters as the experience and abilities of the advisory personnel assigned to the Funds, the Adviser’s process for allocating trades among its different clients, and the substance and administration of the Adviser’s Code of Ethics. Following further consideration and discussion, the Board found for each of the Funds that the Adviser’s standards and practices relating to the identification and mitigation of potential conflicts of interests were satisfactory.
44
RYAN LABS FUNDS
DISCLOSURE REGARDING APPROVAL OF INVESTMENT ADVISORY AGREEMENT
(Unaudited) (Continued) |
After further discussion of the factors noted above and in reliance on the information provided by the Adviser and Trust Management and taking into account the totality of all the factors discussed and information presented at this meeting and previous meetings, the Board indicated its agreement to approve the continuance of each the Adviser’s Advisory Agreement and to approve the expense limitation agreement. It was noted that in the Trustees’ deliberations regarding the approval of the renewal of each the Adviser’s Advisory Agreement, the Trustees did not identify any particular information or factor that was all-important or controlling, and that each individual Trustee may have attributed different weights to the various factors listed above.
45
CUSTOMER PRIVACY NOTICE |
| |
FACTS | WHAT DO THE RYAN LABS CORE BOND FUND AND THE RYAN LABS LONG CREDIT FUND (the “Funds”) DO WITH YOUR PERSONAL INFORMATION? |
| | | | |
Why? | Financial companies choose how they share your personal information. Federal law gives consumers the right to limit some but not all sharing. Federal law also requires us to tell you how we collect, share, and protect your personal information. Please read this notice carefully to understand what we do. |
| | | | |
What? | The types of personal information we collect and share depend on the product or service you have with us. This information can include: ■ Social Security number ■ Assets ■ Retirement Assets ■ Transaction History ■ Checking Account Information ■ Purchase History ■ Account Balances ■ Account Transactions ■ Wire Transfer Instructions When you areno longer our customer, we continue to share your information as described in this notice. |
| | | | |
How? | All financial companies need to share your personal information to run their everyday business. In the section below, we list the reasons financial companies can share their customers’ personal information; the reasons the Funds choose to share; and whether you can limit this sharing. |
| | | | |
Reasons we can share your personal information | Do the
Funds share? | Can you limit this sharing? |
For our everyday business purposes –
Such as to process your transactions, maintain your account(s), respond to court orders and legal investigations, or report to credit bureaus | Yes | No |
For our marketing purposes –
to offer our products and services to you | No | We don’t share |
For joint marketing with other financial companies | No | We don’t share |
For our affiliates’ everyday business purposes –
information about your transactions and experiences | No | We don’t share |
For our affiliates’ everyday business purposes–
information about your creditworthiness | No | We don’t share |
For nonaffiliates to market to you | No | We don’t share |
| | |
Questions? | Call 1-866-561-3087 |
46
Page 2 | |
| | |
Who we are |
Who is providing this notice? | Ryan Labs Core Bond Fund Ryan Labs Long Credit Fund Ultimus Fund Distributors, LLC (Distributor) Ultimus Fund Solutions, LLC (Administrator) |
What we do |
How do the Funds protect my personal information? | To protect your personal information from unauthorized access and use, we use security measures that comply with federal law. These measures include computer safeguards and secured files and buildings. Our service providers are held accountable for adhering to strict policies and procedures to prevent any misuse of your nonpublic personal information. |
How do the Funds collect my personal information? | We collect your personal information, for example, when you ■ Open an account ■ Provide account information ■ Give us your contact information ■ Make deposits or withdrawals from your account ■ Make a wire transfer ■ Tell us where to send the money ■ Tell us who receives the money ■ Show your government-issued ID ■ Show your driver’s license We also collect your personal information from other companies. |
Why can’t I limit all sharing? | Federal law gives you the right to limit only ■ Sharing for affiliates’ everyday business purposes – information about your creditworthiness ■ Affiliates from using your information to market to you ■ Sharing for nonaffiliates to market to you State laws and individual companies may give you additional rights to limit sharing. |
| | |
Definitions |
Affiliates | Companies related by common ownership or control. They can be financial and nonfinancial companies. ■Ryan Labs Asset Management Inc., the investment adviser to the Funds, could be deemed to be an affiliate. |
Nonaffiliates | Companies not related by common ownership or control. They can be financial and nonfinancial companies. ■The Funds do not share with nonaffiliates so they can market to you. |
Joint marketing | A formal agreement between nonaffiliated financial companies that together market financial products or services to you. ■The Funds do not jointly market. |
47
This page intentionally left blank.
This page intentionally left blank.
Not required
| Item 3. | Audit Committee Financial Expert. |
Not required
| Item 4. | Principal Accountant Fees and Services. |
Not required
| Item 5. | Audit Committee of Listed Registrants. |
Not applicable
| Item 6. | Schedule of Investments. |
| (a) | Not applicable [schedule filed with Item 1] |
| Item 7. | Disclosure of Proxy Voting Policies and Procedures for Closed-End Management Investment Companies. |
Not applicable
| Item 8. | Portfolio Managers of Closed-End Management Investment Companies. |
Not applicable
| Item 9. | Purchases of Equity Securities by Closed-End Management Investment Company and Affiliated Purchasers. |
Not applicable
| Item 10. | Submission of Matters to a Vote of Security Holders. |
The registrant’s Committee of Independent Trustees shall review shareholder recommendations for nominations to fill vacancies on the registrant’s board of trustees if such recommendations are submitted in writing and addressed to the Committee at the registrant’s offices. The Committee may adopt, by resolution, a policy regarding its procedures for considering candidates for the board of trustees, including any recommended by shareholders.
| Item 11. | Controls and Procedures. |
(a) Based on their evaluation of the registrant’s disclosure controls and procedures (as defined in Rule 30a-3(c) under the Investment Company Act of 1940) as of a date within 90 days of the filing date of this report, the registrant’s principal executive officer and principal financial officer have concluded that such disclosure controls and procedures are reasonably designed and are operating effectively to ensure that material information relating to the registrant, including its consolidated subsidiaries, is made known to them by others within those entities, particularly during the period in which this report is being prepared, and that the information required in filings on Form N-CSR is recorded, processed, summarized, and reported on a timely basis.
(b) There were no changes in the registrant’s internal control over financial reporting (as defined in Rule 30a-3(d) under the Investment Company Act of 1940) that occurred during the second fiscal quarter of the period covered by this report that have materially affected, or are reasonably likely to materially affect, the registrant’s internal control over financial reporting.
| Item 12. | Disclosure of Securities Lending Activities for Closed-End Management Investment Companies. |
Not applicable
File the exhibits listed below as part of this Form. Letter or number the exhibits in the sequence indicated.
(a)(1) Any code of ethics, or amendment thereto, that is the subject of the disclosure required by Item 2, to the extent that the registrant intends to satisfy the Item 2 requirements through filing of an exhibit: Not required
(a)(2) A separate certification for each principal executive officer and principal financial officer of the registrant as required by Rule 30a-2(a) under the Act (17 CFR 270.30a-2(a)): Attached hereto
(a)(3) Any written solicitation to purchase securities under Rule 23c-1 under the Act (17 CFR 270.23c-1) sent or given during the period covered by the report by or on behalf of the registrant to 10 or more persons: Not applicable
(a)(4) Change in the registrant’s independent public accountants: Not applicable
(b) Certifications required by Rule 30a-2(b) under the Act (17 CFR 270.30a-2(b)): Attached hereto
| Exhibit 99.CERT | Certifications required by Rule 30a-2(a) under the Act |
| | |
| Exhibit 99.906CERT | Certifications required by Rule 30a-2(b) under the Act |
SIGNATURES
Pursuant to the requirements of the Securities Exchange Act of 1934 and the Investment Company Act of 1940, the registrant has duly caused this report to be signed on its behalf by the undersigned, thereunto duly authorized.
| (Registrant) | Ultimus Managers Trust | | |
| | | | |
| By (Signature and Title)* | /s/ Matthew J. Beck | |
| | | Matthew J. Beck, Secretary | |
| | | | |
| Date | July 31, 2019 | | |
Pursuant to the requirements of the Securities Exchange Act of 1934 and the Investment Company Act of 1940, this report has been signed below by the following persons on behalf of the registrant and in the capacities and on the dates indicated.
| By (Signature and Title)* | /s/ David R. Carson | |
| | | David R. Carson, Principal Executive Officer | |
| | | | |
| Date | July 31, 2019 | | |
| | | | |
| By (Signature and Title)* | /s/ Jennifer L. Leamer | |
| | | Jennifer L. Leamer, Treasurer and Principal Financial Officer |
| | | | |
| Date | July 31, 2019 | | |
| * | Print the name and title of each signing officer under his or her signature. |