| OMB APPROVAL |
OMB Number: 3235-0570 Expires: August 31, 2020 Estimated average burden hours per response: 20.6 |
UNITED STATES
SECURITIES AND EXCHANGE COMMISSION
Washington, D.C. 20549
FORM N-CSR
CERTIFIED SHAREHOLDER REPORT OF REGISTERED
MANAGEMENT INVESTMENT COMPANY
| Investment Company Act file number | 811-22680 | |
| Ultimus Managers Trust |
| (Exact name of registrant as specified in charter) |
| 225 Pictoria Drive, Suite 450 Cincinnati, Ohio | 45246 |
| (Address of principal executive offices) | (Zip code) |
Matthew J. Beck
| Ultimus Fund Solutions, LLC 225 Pictoria Drive, Suite 450 Cincinnati, Ohio 45246 |
| (Name and address of agent for service) |
| Registrant's telephone number, including area code: | (513) 587-3400 | |
| Date of fiscal year end: | August 31 | |
| | | |
| Date of reporting period: | February 28, 2019 | |
Form N-CSR is to be used by management investment companies to file reports with the Commission not later than 10 days after the transmission to stockholders of any report that is required to be transmitted to stockholders under Rule 30e-1 under the Investment Company Act of 1940 (17 CFR 270.30e-1). The Commission may use the information provided on Form N-CSR in its regulatory, disclosure review, inspection, and policymaking roles.
A registrant is required to disclose the information specified by Form N-CSR, and the Commission will make this information public. A registrant is not required to respond to the collection of information contained in Form N-CSR unless the Form displays a currently valid Office of Management and Budget ("OMB") control number. Please direct comments concerning the accuracy of the information collection burden estimate and any suggestions for reducing the burden to the Secretary, Securities and Exchange Commission, 450 Fifth Street, NW, Washington, DC 20549-0609. The OMB has reviewed this collection of information under the clearance requirements of 44 U.S.C. § 3507.
| Item 1. | Reports to Stockholders. |

Alambic Small Cap Value Plus Fund (ALAMX)
Alambic Small Cap Growth Plus Fund (ALGSX)
Alambic Mid Cap Value Plus Fund (ALMVX)
Alambic Mid Cap Growth Plus Fund (ALMGX)
Semi-Annual Report
February 28, 2019
(Unaudited)
Beginning on January 1, 2021, as permitted by regulations adopted by the U.S. Securities and Exchange Commission, paper copies of the Funds’ shareholder reports like this one will no longer be sent by mail, unless you specifically request paper copies of the reports from the Funds or from your financial intermediary, such as a broker-dealer or bank. Instead, the reports will be made available on a website, and you will be notified by mail each time a report is posted and provided with a website link to access the report.
If you already elected to receive shareholder reports electronically, you will not be affected by this change and you need not take any action. You may elect to receive shareholder reports and other communications from the Funds electronically by contacting the Funds at 1-888-890-8988 or, if you own these shares through a financial intermediary, by contacting your financial intermediary.
You may elect to receive all future reports in paper free of charge. You can inform the Funds that you wish to continue receiving paper copies of your shareholder reports by contacting the Funds at 1-888-890-8988. If you own shares through a financial intermediary, you may contact your financial intermediary or follow instructions included with this document to elect to continue to receive paper copies of your shareholder reports. Your election to receive reports in paper will apply to all Funds held with the Fund complex or at your financial intermediary.
ALAMBIC FUNDS
LETTER TO SHAREHOLDERS | March 2019 |
Dear Alambic Funds Shareholder:
We are pleased to present you with the Alambic Funds’ Semi-Annual Report for our fiscal 6 months ended February 28, 2019. Once again, this has been an interesting and volatile period in the markets, particularly for small cap equities. Fed policy shifts, trade issues, global economic trends and the usual geopolitical concerns have been the primary drivers. In addition to these factors, investors are beginning to consider the implications of the approaching end of the current economic cycle and the implications for earnings going forward. Despite the challenging environment the past few months, our Funds have weathered the resulting volatility well.
Following the equity markets’ very poor 4th calendar quarter last year and one of the worst Decembers on record, they have since recovered and are once again somewhat expensive relative to historical trends. Earnings growth and forward guidance in many cases justify current levels, but with shares priced with lower earnings expectations, many firms are still vulnerable to disappointing news, as was the case with our most recent earnings period. This, along with ongoing concerns relating to China trade negotiations, Fed policy, Brexit,etc., has resulted in market participants wondering which catalyst(s) would drive the markets going forward. This has generally been good for the Alambic Funds, as fundamental value and attention to valuation is coming back into favor, as investors become more defensive.
Performance Review
Alambic Small Cap Value Plus Fund (“ALAMX”)
For the past six months ended 2/28/2019, ALAMX delivered a return of -7.81%, compared to the -8.59% return for its benchmark, the Russel 2000 Value® Index. This fund is currently ranked in the 34th percentile of its peers according to Morningstar. The portfolio is managed with a focus on equities that are attractive from a fundamental value perspective and have a very low allocation to growth or momentum stocks. The portfolio also tends to have a bias towards smaller small cap stocks than our peer managers, and we tend to be underweight relative to our category in the financials sector as well. Portfolios continue to be built with a systematic, disciplined risk-controlled process, with the goal of delivering excess returns over time.
Small Cap stocks in general, and Small Cap Value stocks in particular, have rebounded nicely since the equity market lows in December. Although this momentum will be difficult to maintain, particularly with the possibility of an earnings recession, a trend favoring individual stock selection over investment in ETFs should continue to support this fund.
Alambic Small Cap Growth Plus Fund
For the past six months ended 2/28/2019, ALGSX has delivered a return of -8.09% compared to the -9.14% return for its benchmark, the Russell 2000 Growth® Index. This portfolio is managed with a focus on smaller market cap equities that score well on traditional growth factors, such as sales growth, cash flow growth and book value growth. Given the manager’s fundamental value bias, we also include value-oriented stocks with certain growth characteristics, which results in our characteristic “value tilt.” Thus, this portfolio is intended to outperform its benchmark during market cycles where value stocks outperform growth stocks.
1
During periods where the value and growth stocks’ relative performance is roughly equivalent, we would expect our performance to exceed our benchmark over time, but by a lesser amount. Since inception, this fund has delivered an annualized return of 12.24%, compared to the 12.05% return of its benchmark, the Russell 2000 Growth® Index.
Over the past six months, value stocks have been outperforming growth stocks although this trend reversed in February and March of this year. Our value bias in this fund relative to other small cap growth funds is reflected in its improving performance in the past six months relative to our benchmark and our peer group. As growth stocks are now very expensive relative to value, and with investors becoming more defensive, we expect the value bias to work in our favor going forward.
Alambic Mid Cap Value Plus Fund
For the past six months ended 2/28/2019, ALMVX has delivered a return of -5.11%, compared to the -3.98% return for its benchmark, the Russell Mid Cap Value® Index. We manage this portfolio without the traditional biases of our small cap funds relating to value factors and portfolio average market caps. Except for our usual underweight in financials, our sector weights are generally in line with the benchmark and our strong value bias has contributed to our performance during the past 6 months Since inception, this fund has delivered an annualized return of 5.44% compared to the 5.76% return of its benchmark, the Russell Mid Cap Value® Index.
As this fund was launched less than 2 years ago, its total assets are significantly lower than our small cap funds and, as a result, we carry fewer positions. This results in less diversification than the two small cap funds we manage, and sector weights and individual stocks can have a greater proportional impact on ALMVX’s performance than in those other funds.
Alambic Mid Cap Growth Plus Fund
For the past six months ended 2/28/2019, ALMGX has delivered a return of -5.03%, compared to the -1.27% return for its benchmark, the Russell Mid Cap Growth® Index. Consistent with our small cap growth fund, this portfolio has a significant position in mid cap growth stocks but also includes a significant number of value stocks that have certain growth characteristics. On a style basis, this fund is intentionally aligned more towards mid-cap core than mid cap growth. YTD, this fund has tracked the Russell Mid Cap® Index closely as a result and has underperformed the Russell Mid Cap Growth Index. We expect this fund’s value biased style to generate similar results in the future.
As with the mid cap growth fund, this fund also has relatively low total assets and, thus, a considerably smaller number of positions than the small cap funds we manage. As it is difficult to maintain similar sector and market segment weights in this fund relative to its benchmark because of its small size, sector and segment imbalances are amplified.
We now have over three-year track records for our two small cap funds and the mid cap funds will have their three-year track records by year end. Through this experience we have continued to learn how our models perform in different markets and have continued to tweak our models to lessen some of our portfolio biases and sector over/under weights. As always, we continue to work on building optimal portfolios that will provide attractive returns over time, relative to each fund’s benchmark and peers.
2
We are honored to have had your support as we continue to refine our portfolios and validate our belief that a long term view and disciplined systematic approach to fundamental investing will reward patient, value focused investors.
Sincerely
Albert Richards | Brian Thompson | Rob Slaymaker |
CEO | CRO | Partner |
Past performance is not predictive of future performance. Investment results and principal value will fluctuate so that shares, when redeemed, may be worth more or less than their original cost. Current performance may be higher or lower than the performance data quoted. Performance data current to the most recent month end are available by calling 1-888-890-8988.
An investor should consider the investment objectives, risks, charges and expenses of the Funds carefully before investing. The Funds’ prospectus contains this and other important information. To obtain a copy of the Funds’ prospectus, please visit our website at http://alambicfunds.com or call 1-888-890-8988 and a copy will be sent to you free of charge. Please read the prospectus carefully before you invest. The Alambic Funds are distributed by Ultimus Fund Distributors, LLC.
The Letter to Shareholders seeks to describe some of the Adviser’s current opinions and views of the financial markets. Although the Adviser believes it has a reasonable basis for any opinions or views expressed, actual results may differ, sometimes significantly so, from those expected or expressed. The securities held by the Funds that are discussed in the Letter to Shareholders were held during the period covered by this Report. They do not comprise the entire investment portfolio of the Funds, may be sold at any time and may no longer be held by the Funds. For a complete list of securities held by the Funds as of February 28, 2019, please see the Schedule of Investments sections of the Semi-Annual Report. The opinions of the Funds’ Adviser with respect to those securities may change at any time.
Statements in the Letter to Shareholders that reflect projections or expectations for future financial or economic performance of the Funds and the market in general and statements of the Funds’ plans and objectives for future operations are forward-looking statements. No assurance can be given that actual results or events will not differ materially from those projected, estimated, assumed, or anticipated in any such forward-looking statements. Important factors that could result in such differences, in addition to factors noted with such forward-looking statements include, without limitation, general economic conditions, such as inflation, recession, and interest rates. Past performance is not a guarantee of future results.
3
ALAMBIC SMALL CAP VALUE PLUS FUND
PORTFOLIO INFORMATION
February 28, 2019 (Unaudited)
Sector Diversification (% of Net Assets)

Top 10 Equity Holdings
Security Description | % of Net Assets |
Speedway Motorsports, Inc. | 2.7% |
GSI Technology, Inc. | 2.6% |
Builders FirstSource, Inc. | 2.3% |
Bassett Furniture Industries, Inc. | 2.2% |
Bridgepoint Education, Inc. | 2.1% |
Amkor Technology, Inc. | 2.1% |
L.B. Foster Company - Class A | 1.9% |
Lee Enterprises, Inc. | 1.9% |
Allscripts Healthcare Solutions, Inc. | 1.9% |
Commerical Vehicle Group, Inc. | 1.9% |
4
ALAMBIC SMALL CAP GROWTH PLUS FUND
PORTFOLIO INFORMATION
February 28, 2019 (Unaudited)
Sector Diversification (% of Net Assets)

Top 10 Equity Holdings
Security Description | % of Net Assets |
GSI Technology, Inc. | 2.7% |
Builders FirstSource, Inc. | 2.4% |
Navistar International Corporation | 2.3% |
Amkor Technology, Inc. | 2.1% |
Speedway Motorsports, Inc. | 2.0% |
Allscripts Healthcare Solutions, Inc. | 1.9% |
LifeVantage Corporation | 1.8% |
AGCO Corporation | 1.8% |
K12, Inc. | 1.7% |
Bridgepoint Education, Inc. | 1.7% |
5
ALAMBIC MID CAP VALUE PLUS FUND
PORTFOLIO INFORMATION
February 28, 2019 (Unaudited)
Sector Diversification (% of Net Assets)

Top 10 Equity Holdings
Security Description | % of Net Assets |
Bio-Rad Laboratories, Inc. - Class A | 2.9% |
AGCO Corporation | 2.8% |
Archer-Daniels-Midland Company | 2.6% |
Micron Technology, Inc. | 2.5% |
Allison Transmission Holdings, Inc. | 2.4% |
United States Cellular Corporation | 2.3% |
Apache Corporation | 2.2% |
JetBlue Airways Corporation | 2.1% |
Marathon Oil Corporation | 2.0% |
Alcoa Corporation | 1.8% |
6
ALAMBIC MID CAP GROWTH PLUS FUND
PORTFOLIO INFORMATION
February 28, 2019 (Unaudited)
Sector Diversification (% of Net Assets)

Top 10 Equity Holdings
Security Description | % of Net Assets |
Bio-Rad Laboratories, Inc. - Class A | 2.9% |
AGCO Corporation | 2.9% |
Allison Transmission Holdings, Inc. | 2.6% |
Micron Technology, Inc. | 2.5% |
Cadence Design Systems, Inc. | 2.1% |
Western Union Company (The) | 1.9% |
Mylan N.V. | 1.9% |
Spirit AeroSystems Holdings, Inc. - Class A | 1.8% |
McKesson Corporation | 1.8% |
JetBlue Airways Corporation | 1.8% |
7
ALAMBIC SMALL CAP VALUE PLUS FUND
SCHEDULE OF INVESTMENTS
February 28, 2019 (Unaudited) |
COMMON STOCKS — 95.5% | | Shares | | | Value | |
Communication Services — 7.2% | | | | | | | | |
Diversified Telecommunication Services — 1.8% | | | | | | | | |
IDT Corporation - Class B(a) | | | 4,325 | | | $ | 26,123 | |
Ooma, Inc.(a) | | | 1,800 | | | | 29,358 | |
| | | | | | | | 55,481 | |
Media — 3.1% | | | | | | | | |
Hemisphere Media Group, Inc.(a) | | | 1,187 | | | | 16,500 | |
Lee Enterprises, Inc.(a) | | | 19,065 | | | | 58,148 | |
Marchex, Inc. - Class B | | | 3,700 | | | | 16,021 | |
Tribune Publishing Company(a) | | | 320 | | | | 3,859 | |
| | | | | | | | 94,528 | |
Wireless Telecommunication Services — 2.3% | | | | | | | | |
Spok Holdings, Inc. | | | 2,435 | | | | 33,627 | |
United States Cellular Corporation(a) | | | 750 | | | | 35,018 | |
| | | | | | | | 68,645 | |
Consumer Discretionary — 12.5% | | | | | | | | |
Auto Components — 0.8% | | | | | | | | |
Tenneco, Inc. - Class A | | | 700 | | | | 24,220 | |
| | | | | | | | | |
Diversified Consumer Services — 2.9% | | | | | | | | |
Bridgepoint Education, Inc.(a) | | | 6,155 | | | | 63,458 | |
K12, Inc.(a) | | | 750 | | | | 24,030 | |
| | | | | | | | 87,488 | |
Hotels, Restaurants & Leisure — 2.9% | | | | | | | | |
Bluegreen Vacations Corporation | | | 105 | | | | 1,374 | |
Fiesta Restaurant Group, Inc.(a) | | | 300 | | | | 4,521 | |
Speedway Motorsports, Inc. | | | 4,631 | | | | 81,784 | |
| | | | | | | | 87,679 | |
Household Durables — 2.2% | | | | | | | | |
Bassett Furniture Industries, Inc. | | | 3,332 | | | | 65,807 | |
GoPro, Inc. - Class A(a) | | | 400 | | | | 2,332 | |
| | | | | | | | 68,139 | |
Internet & Direct Marketing Retail — 1.4% | | | | | | | | |
1-800-FLOWERS.COM, Inc. - Class A(a) | | | 1,600 | | | | 28,544 | |
Groupon, Inc.(a) | | | 4,900 | | | | 16,023 | |
| | | | | | | | 44,567 | |
Leisure Products — 1.5% | | | | | | | | |
Nautilus, Inc.(a) | | | 7,031 | | | | 45,912 | |
| | | | | | | | | |
Specialty Retail — 0.1% | | | | | | | | |
Ascena Retail Group, Inc.(a) | | | 1,300 | | | | 2,886 | |
See accompanying notes to financial statements.
8
ALAMBIC SMALL CAP VALUE PLUS FUND
SCHEDULE OF INVESTMENTS (Continued) |
COMMON STOCKS — 95.5% (Continued) | | Shares | | | Value | |
Consumer Discretionary — 12.5% (Continued) | | | | | | | | |
Textiles, Apparel & Luxury Goods — 0.7% | | | | | | | | |
Crocs, Inc.(a) | | | 200 | | | $ | 5,136 | |
Fossil Group, Inc.(a) | | | 1,000 | | | | 15,640 | |
| | | | | | | | 20,776 | |
Consumer Staples — 3.8% | | | | | | | | |
Food & Staples Retailing — 1.0% | | | | | | | | |
SpartanNash Company | | | 1,688 | | | | 32,038 | |
| | | | | | | | | |
Food Products — 0.4% | | | | | | | | |
Archer-Daniels-Midland Company | | | 250 | | | | 10,625 | |
| | | | | | | | | |
Household Products — 0.9% | | | | | | | | |
Oil-Dri Corporation of America | | | 958 | | | | 27,926 | |
| | | | | | | | | |
Personal Products — 1.5% | | | | | | | | |
LifeVantage Corporation(a) | | | 3,162 | | | | 46,070 | |
| | | | | | | | | |
Energy — 5.4% | | | | | | | | |
Energy Equipment & Services — 1.6% | | | | | | | | |
C&J Energy Services, Inc.(a) | | | 200 | | | | 3,454 | |
ION Geophysical Corporation(a) | | | 400 | | | | 5,264 | |
Mammoth Energy Services, Inc. | | | 1,400 | | | | 32,186 | |
ProPetro Holding Corporation(a) | | | 400 | | | | 7,944 | |
| | | | | | | | 48,848 | |
Oil, Gas & Consumable Fuels — 3.8% | | | | | | | | |
Bonanza Creek Energy, Inc.(a) | | | 260 | | | | 5,972 | |
Extraction Oil & Gas, Inc.(a) | | | 3,200 | | | | 13,440 | |
Gulfport Energy Corporation(a) | | | 3,700 | | | | 28,342 | |
Marathon Oil Corporation | | | 400 | | | | 6,640 | |
Midstates Petroleum Company, Inc.(a) | | | 586 | | | | 5,063 | |
QEP Resources, Inc.(a) | | | 284 | | | | 2,204 | |
Renewable Energy Group, Inc.(a) | | | 338 | | | | 8,981 | |
SandRidge Energy, Inc.(a) | | | 5,911 | | | | 45,928 | |
| | | | | | | | 116,570 | |
Financials — 19.1% | | | | | | | | |
Banks — 15.7% | | | | | | | | |
1st Source Corporation | | | 100 | | | | 4,755 | |
Associated Banc-Corporation | | | 100 | | | | 2,328 | |
Banc of California, Inc. | | | 400 | | | | 6,928 | |
BancFirst Corporation | | | 100 | | | | 5,638 | |
Carolina Financial Corporation | | | 100 | | | | 3,662 | |
Chemical Financial Corporation | | | 400 | | | | 18,332 | |
See accompanying notes to financial statements.
9
ALAMBIC SMALL CAP VALUE PLUS FUND
SCHEDULE OF INVESTMENTS (Continued) |
COMMON STOCKS — 95.5% (Continued) | | Shares | | | Value | |
Financials — 19.1% (Continued) | | | | | | | | |
Banks — 15.7% (Continued) | | | | | | | | |
City Holding Company | | | 150 | | | $ | 12,021 | |
Columbia Banking System, Inc. | | | 400 | | | | 15,152 | |
Community Bank System, Inc. | | | 350 | | | | 22,676 | |
First Bancorp | | | 200 | | | | 7,838 | |
First BanCorporation | | | 400 | | | | 4,604 | |
First Financial Bancorp | | | 400 | | | | 11,092 | |
First Financial Bankshares, Inc. | | | 200 | | | | 12,970 | |
First Horizon National Corporation | | | 200 | | | | 3,126 | |
First Merchants Corporation | | | 150 | | | | 6,059 | |
First Midwest Bancorp, Inc. | | | 100 | | | | 2,315 | |
FNB Corporation | | | 1,300 | | | | 15,912 | |
Fulton Financial Corporation | | | 300 | | | | 5,154 | |
Glacier Bancorp, Inc. | | | 200 | | | | 8,764 | |
Great Western Bancorp, Inc. | | | 200 | | | | 7,510 | |
Hancock Whitney Corporation | | | 200 | | | | 8,736 | |
Heartland Financial USA, Inc. | | | 150 | | | | 7,288 | |
Home BancShares, Inc. | | | 200 | | | | 3,896 | |
Hope Bancorp, Inc. | | | 200 | | | | 2,916 | |
IBERIABANK Corporation | | | 270 | | | | 21,122 | |
Independent Bank Group, Inc. | | | 200 | | | | 11,592 | |
Investors Bancorp, Inc. | | | 1,500 | | | | 18,855 | |
LegacyTexas Financial Group, Inc. | | | 100 | | | | 4,173 | |
National Bank Holdings Corporation - Class A | | | 200 | | | | 7,226 | |
NBT Bancorp, Inc. | | | 200 | | | | 7,726 | |
Old National Bancorp | | | 1,300 | | | | 23,114 | |
Pacific Premier Bancorp, Inc. | | | 500 | | | | 14,925 | |
PacWest Bancorp | | | 350 | | | | 14,357 | |
Renasant Corporation | | | 200 | | | | 7,656 | |
Republic Bancorp, Inc. - Class A | | | 50 | | | | 2,262 | |
S&T Bancorp, Inc. | | | 50 | | | | 2,069 | |
Seacoast Banking Corporation of Florida(a) | | | 100 | | | | 2,902 | |
Simmons First National Corporation - Class A | | | 600 | | | | 16,098 | |
South State Corporation | | | 60 | | | | 4,262 | |
Sterling Bancorp | | | 700 | | | | 14,231 | |
SVB Financial Group(a) | | | 10 | | | | 2,472 | |
Synovus Financial Corporation | | | 100 | | | | 3,968 | |
TCF Financial Corporation | | | 300 | | | | 6,870 | |
Texas Capital Bancshares, Inc.(a) | | | 150 | | | | 9,154 | |
Triumph Bancorp, Inc.(a) | | | 200 | | | | 6,774 | |
Trustmark Corporation | | | 300 | | | | 10,644 | |
UMB Financial Corporation | | | 180 | | | | 12,386 | |
See accompanying notes to financial statements.
10
ALAMBIC SMALL CAP VALUE PLUS FUND
SCHEDULE OF INVESTMENTS (Continued) |
COMMON STOCKS — 95.5% (Continued) | | Shares | | | Value | |
Financials — 19.1% (Continued) | | | | | | | | |
Banks — 15.7% (Continued) | | | | | | | | |
Umpqua Holdings Corporation | | | 400 | | | $ | 7,272 | |
United Bankshares, Inc. | | | 100 | | | | 3,839 | |
United Community Banks, Inc. | | | 100 | | | | 2,769 | |
Valley National Bancorp | | | 400 | | | | 4,224 | |
Webster Financial Corporation | | | 100 | | | | 5,742 | |
Western Alliance Bancorporation(a) | | | 400 | | | | 18,508 | |
Wintrust Financial Corporation | | | 180 | | | | 13,261 | |
| | | | | | | | 480,125 | |
Capital Markets — 0.1% | | | | | | | | |
Stifel Financial Corporation | | | 50 | | | | 2,722 | |
| | | | | | | | | |
Insurance — 1.1% | | | | | | | | |
Brighthouse Financial, Inc.(a) | | | 100 | | | | 3,872 | |
CNO Financial Group, Inc. | | | 600 | | | | 10,218 | |
Horace Mann Educators Corporation | | | 50 | | | | 1,960 | |
Mercury General Corporation | | | 50 | | | | 2,648 | |
MetLife, Inc. | | | 50 | | | | 2,259 | |
Primerica, Inc. | | | 20 | | | | 2,501 | |
RLI Corporation | | | 50 | | | | 3,526 | |
Selective Insurance Group, Inc. | | | 100 | | | | 6,596 | |
| | | | | | | | 33,580 | |
Thrifts & Mortgage Finance — 2.2% | | | | | | | | |
Axos Financial, Inc.(a) | | | 200 | | | | 6,456 | |
Capitol Federal Financial, Inc. | | | 100 | | | | 1,337 | |
Columbia Financial, Inc.(a) | | | 400 | | | | 6,412 | |
HomeStreet, Inc.(a) | | | 300 | | | | 8,370 | |
LendingTree, Inc.(a) | | | 30 | | | | 9,569 | |
MGIC Investment Corporation(a) | | | 500 | | | | 6,490 | |
Mr. Cooper Group, Inc.(a) | | | 300 | | | | 4,095 | |
New York Community Bancorp, Inc. | | | 100 | | | | 1,251 | |
Provident Financial Services, Inc. | | | 200 | | | | 5,490 | |
Radian Group, Inc. | | | 200 | | | | 4,072 | |
Washington Federal, Inc. | | | 500 | | | | 15,340 | |
| | | | | | | | 68,882 | |
Health Care — 9.3% | | | | | | | | |
Biotechnology — 0.9% | | | | | | | | |
SIGA Technologies, Inc.(a) | | | 4,091 | | | | 27,737 | |
| | | | | | | | | |
Health Care Equipment & Supplies — 3.4% | | | | | | | | |
Apyx Medical Corporation(a) | | | 3,019 | | | | 21,194 | |
Natus Medical, Inc.(a) | | | 600 | | | | 16,578 | |
See accompanying notes to financial statements.
11
ALAMBIC SMALL CAP VALUE PLUS FUND
SCHEDULE OF INVESTMENTS (Continued) |
COMMON STOCKS — 95.5% (Continued) | | Shares | | | Value | |
Health Care — 9.3% (Continued) | | | | | | | | |
Health Care Equipment & Supplies — 3.4% (Continued) | | | | | | | | |
OraSure Technologies, Inc.(a) | | | 3,300 | | | $ | 35,475 | |
Orthofix Medical, Inc.(a) | | | 350 | | | | 21,385 | |
RTI Surgical, Inc.(a) | | | 2,232 | | | | 11,115 | |
| | | | | | | | 105,747 | |
Health Care Technology — 1.9% | | | | | | | | |
Allscripts Healthcare Solutions, Inc.(a) | | | 5,400 | | | | 57,888 | |
| | | | | | | | | |
Life Sciences Tools & Services — 1.0% | | | | | | | | |
Bio-Rad Laboratories, Inc. - Class A(a) | | | 40 | | | | 10,836 | |
Luminex Corporation | | | 200 | | | | 5,096 | |
Medpace Holdings, Inc.(a) | | | 254 | | | | 13,957 | |
| | | | | | | | 29,889 | |
Pharmaceuticals — 2.1% | | | | | | | | |
Amphastar Pharmaceuticals, Inc.(a) | | | 741 | | | | 18,414 | |
Lannett Company, Inc.(a) | | | 4,800 | | | | 45,168 | |
| | | | | | | | 63,582 | |
Industrials — 17.1% | | | | | | | | |
Building Products — 2.3% | | | | | | | | |
Builders FirstSource, Inc.(a) | | | 5,039 | | | | 70,193 | |
| | | | | | | | | |
Commercial Services & Supplies — 2.0% | | | | | | | | |
ARC Document Solutions, Inc.(a) | | | 9,500 | | | | 22,515 | |
Brady Corporation - Class A | | | 71 | | | | 3,359 | |
Kimball International, Inc. - Class B | | | 238 | | | | 3,734 | |
R.R. Donnelley & Sons Company | | | 881 | | | | 4,740 | |
Steelcase, Inc. - Class A | | | 1,500 | | | | 26,265 | |
| | | | | | | | 60,613 | |
Construction & Engineering — 0.0%(b) | | | | | | | | |
Great Lakes Dredge & Dock Corporation(a) | | | 100 | | | | 890 | |
| | | | | | | | | |
Electrical Equipment — 0.1% | | | | | | | | |
Allied Motion Technologies, Inc. | | | 50 | | | | 2,083 | |
| | | | | | | | | |
Machinery — 8.5% | | | | | | | | |
AGCO Corporation | | | 700 | | | | 47,306 | |
Commercial Vehicle Group, Inc.(a) | | | 7,131 | | | | 57,048 | |
Global Brass & Copper Holdings, Inc. | | | 100 | | | | 3,375 | |
Hurco Companies, Inc. | | | 279 | | | | 11,963 | |
L.B. Foster Company - Class A(a) | | | 3,387 | | | | 58,629 | |
Miller Industries, Inc. | | | 1,212 | | | | 41,099 | |
Navistar International Corporation(a) | | | 1,043 | | | | 40,020 | |
| | | | | | | | 259,440 | |
See accompanying notes to financial statements.
12
ALAMBIC SMALL CAP VALUE PLUS FUND
SCHEDULE OF INVESTMENTS (Continued) |
COMMON STOCKS — 95.5% (Continued) | | Shares | | | Value | |
Industrials — 17.1% (Continued) | | | | | | | | |
Professional Services — 1.4% | | | | | | | | |
Acacia Research Corporation(a) | | | 7,500 | | | $ | 22,875 | |
Heidrick & Struggles International, Inc. | | | 350 | | | | 15,089 | |
ManpowerGroup, Inc. | | | 40 | | | | 3,370 | |
| | | | | | | | 41,334 | |
Road & Rail — 1.8% | | | | | | | | |
ArcBest Corporation | | | 850 | | | | 29,606 | |
PAM Transportation Services, Inc.(a) | | | 532 | | | | 26,951 | |
| | | | | | | | 56,557 | |
Trading Companies & Distributors — 1.0% | | | | | | | | |
BMC Stock Holdings, Inc.(a) | | | 1,328 | | | | 25,404 | |
Systemax, Inc. | | | 322 | | | | 6,524 | |
| | | | | | | | 31,928 | |
Information Technology — 14.0% | | | | | | | | |
Communications Equipment — 2.8% | | | | | | | | |
Digi International, Inc.(a) | | | 2,108 | | | | 27,826 | |
Extreme Networks, Inc.(a) | | | 1,200 | | | | 9,864 | |
Ribbon Communications, Inc.(a) | | | 9,600 | | | | 49,440 | |
| | | | | | | | 87,130 | |
Electronic Equipment, Instruments & Components — 1.7% | | | | | | | | |
Bel Fuse, Inc. - Class B | | | 710 | | | | 17,359 | |
Daktronics, Inc. | | | 1,764 | | | | 14,324 | |
PCM, Inc.(a) | | | 247 | | | | 8,297 | |
Tech Data Corporation(a) | | | 84 | | | | 8,586 | |
Vishay Intertechnology, Inc. | | | 100 | | | | 2,192 | |
| | | | | | | | 50,758 | |
IT Services — 1.3% | | | | | | | | |
Brightcove, Inc.(a) | | | 1,000 | | | | 8,870 | |
Conduent, Inc.(a) | | | 200 | | | | 2,924 | |
Presidio, Inc. | | | 1,600 | | | | 26,608 | |
| | | | | | | | 38,402 | |
Semiconductors & Semiconductor Equipment — 6.3% | | | | | | | | |
Amkor Technology, Inc.(a) | | | 7,200 | | | | 63,216 | |
Aquantia Corporation(a) | | | 500 | | | | 3,925 | |
Cirrus Logic, Inc.(a) | | | 78 | | | | 3,130 | |
DSP Group, Inc.(a) | | | 300 | | | | 4,119 | |
GSI Technology, Inc.(a) | | | 9,712 | | | | 78,668 | |
Micron Technology, Inc.(a) | | | 500 | | | | 20,440 | |
Photronics, Inc.(a) | | | 2,057 | | | | 20,179 | |
| | | | | | | | 193,677 | |
See accompanying notes to financial statements.
13
ALAMBIC SMALL CAP VALUE PLUS FUND
SCHEDULE OF INVESTMENTS (Continued) |
COMMON STOCKS — 95.5% (Continued) | | Shares | | | Value | |
Information Technology — 14.0% (Continued) | | | | | | | | |
Software — 1.4% | | | | | | | | |
3PEA International, Inc.(a) | | | 2,721 | | | $ | 20,027 | |
A10 Networks, Inc.(a) | | | 2,880 | | | | 20,102 | |
MobileIron, Inc.(a) | | | 500 | | | | 2,530 | |
| | | | | | | | 42,659 | |
Technology Hardware, Storage & Peripherals — 0.5% | | | | | | | | |
Stratasys Ltd.(a) | | | 594 | | | | 16,905 | |
| | | | | | | | | |
Materials — 5.9% | | | | | | | | |
Chemicals — 3.1% | | | | | | | | |
FutureFuel Corporation | | | 1,000 | | | | 18,440 | |
Huntsman Corporation | | | 600 | | | | 14,874 | |
OMNOVA Solutions, Inc.(a) | | | 535 | | | | 4,360 | |
Tredegar Corporation | | | 3,231 | | | | 56,284 | |
| | | | | | | | 93,958 | |
Metals & Mining — 2.7% | | | | | | | | |
Cleveland-Cliffs, Inc. | | | 300 | | | | 3,327 | |
Olympic Steel, Inc. | | | 1,400 | | | | 27,188 | |
Warrior Met Coal, Inc. | | | 1,800 | | | | 52,704 | |
| | | | | | | | 83,219 | |
Paper & Forest Products — 0.1% | | | | | | | | |
Verso Corporation - Class A(a) | | | 100 | | | | 1,965 | |
| | | | | | | | | |
Real Estate — 1.2% | | | | | | | | |
Equity Real Estate Investment Trusts (REITs) — 1.2% | | | | | | | | |
Colony Capital, Inc. | | | 800 | | | | 4,448 | |
First Industrial Realty Trust, Inc. | | | 400 | | | | 13,408 | |
GEO Group, Inc. (The) | | | 100 | | | | 2,272 | |
RLJ Lodging Trust | | | 100 | | | | 1,857 | |
Sabra Health Care REIT, Inc. | | | 400 | | | | 7,248 | |
Sunstone Hotel Investors, Inc. | | | 200 | | | | 3,010 | |
Xenia Hotel & Resorts, Inc. | | | 200 | | | | 3,906 | |
| | | | | | | | 36,149 | |
| | | | | | | | | |
Total Common Stocks (Cost $2,676,177) | | | | | | $ | 2,920,410 | |
See accompanying notes to financial statements.
14
ALAMBIC SMALL CAP VALUE PLUS FUND
SCHEDULE OF INVESTMENTS (Continued) |
RIGHTS — 0.0%(b) | | Shares | | | Value | |
Media General, Inc. - CVR(a)(c) (Cost $0) | | | 100 | | | $ | 5 | |
| | | | | | | | | |
Investments at Value — 95.5% (Cost $2,676,177) | | | | | | $ | 2,920,415 | |
| | | | | | | | | |
Other Assets in Excess of Liabilities — 4.5% | | | | | | | 138,624 | |
| | | | | | | | | |
Net Assets — 100.0% | | | | | | $ | 3,059,039 | |
CVR - Contingent Value Right. |
(a) | Non-income producing security. |
(b) | Percentage rounds to less than 0.1%. |
(c) | Illiquid security. Security value has been determined in good faith pursuant to procedures adopted by the Board of Trustees. The total value of such securities was $5 as of February 28, 2019, representing 0.0%(b) of net assets (Note 2). |
See accompanying notes to financial statements.
15
ALAMBIC SMALL CAP GROWTH PLUS FUND
SCHEDULE OF INVESTMENTS
February 28, 2019 (Unaudited) |
COMMON STOCKS — 97.9% | | Shares | | | Value | |
Communication Services — 4.7% | | | | | | | | |
Diversified Telecommunication Services — 1.3% | | | | | | | | |
IDT Corporation - Class B(a) | | | 1,421 | | | $ | 8,583 | |
Ooma, Inc.(a) | | | 1,816 | | | | 29,619 | |
| | | | | | | | 38,202 | |
Entertainment — 0.2% | | | | | | | | |
Glu Mobile, Inc.(a) | | | 500 | | | | 4,490 | |
| | | | | | | | | |
Interactive Media & Services — 0.0%(b) | | | | | | | | |
Meet Group, Inc. (The)(a) | | | 200 | | | | 1,200 | |
| | | | | | | | | |
Media — 2.2% | | | | | | | | |
Hemisphere Media Group, Inc.(a) | | | 146 | | | | 2,029 | |
Lee Enterprises, Inc.(a) | | | 8,918 | | | | 27,200 | |
Marchex, Inc. - Class B | | | 2,600 | | | | 11,258 | |
Sinclair Broadcast Group, Inc. - Class A | | | 400 | | | | 14,440 | |
Tribune Publishing Company(a) | | | 577 | | | | 6,959 | |
| | | | | | | | 61,886 | |
Wireless Telecommunication Services — 1.0% | | | | | | | | |
Spok Holdings, Inc. | | | 1,454 | | | | 20,080 | |
United States Cellular Corporation(a) | | | 200 | | | | 9,338 | |
| | | | | | | | 29,418 | |
Consumer Discretionary — 14.4% | | | | | | | | |
Auto Components — 1.0% | | | | | | | | |
Tenneco, Inc. - Class A | | | 800 | | | | 27,680 | |
| | | | | | | | | |
Automobiles — 0.2% | | | | | | | | |
General Motors Company | | | 150 | | | | 5,922 | |
| | | | | | | | | |
Diversified Consumer Services — 3.4% | | | | | | | | |
Bridgepoint Education, Inc.(a) | | | 4,720 | | | | 48,663 | |
K12, Inc.(a) | | | 1,575 | | | | 50,463 | |
| | | | | | | | 99,126 | |
Hotels, Restaurants & Leisure — 2.9% | | | | | | | | |
Fiesta Restaurant Group, Inc.(a) | | | 500 | | | | 7,535 | |
Norwegian Cruise Line Holdings Ltd.(a) | | | 300 | | | | 16,659 | |
Speedway Motorsports, Inc. | | | 3,273 | | | | 57,801 | |
| | | | | | | | 81,995 | |
Household Durables — 2.1% | | | | | | | | |
Bassett Furniture Industries, Inc. | | | 1,650 | | | | 32,588 | |
GoPro, Inc. - Class A(a) | | | 2,300 | | | | 13,409 | |
iRobot Corporation(a) | | | 100 | | | | 12,506 | |
See accompanying notes to financial statements.
16
ALAMBIC SMALL CAP GROWTH PLUS FUND
SCHEDULE OF INVESTMENTS (Continued) |
COMMON STOCKS — 97.9% (Continued) | | Shares | | | Value | |
Consumer Discretionary — 14.4% (Continued) | | | | | | | | |
Household Durables — 2.1% (Continued) | | | | | | | | |
PulteGroup, Inc. | | | 100 | | | $ | 2,700 | |
| | | | | | | | 61,203 | |
Internet & Direct Marketing Retail — 2.2% | | | | | | | | |
1-800-FLOWERS.COM, Inc. - Class A(a) | | | 1,900 | | | | 33,896 | |
Groupon, Inc.(a) | | | 9,000 | | | | 29,430 | |
| | | | | | | | 63,326 | |
Leisure Products — 1.0% | | | | | | | | |
Nautilus, Inc.(a) | | | 4,251 | | | | 27,759 | |
| | | | | | | | | |
Specialty Retail — 0.2% | | | | | | | | |
Office Depot, Inc. | | | 1,900 | | | | 6,593 | |
| | | | | | | | | |
Textiles, Apparel & Luxury Goods — 1.4% | | | | | | | | |
Crocs, Inc.(a) | | | 1,000 | | | | 25,680 | |
Fossil Group, Inc.(a) | | | 1,000 | | | | 15,640 | |
| | | | | | | | 41,320 | |
Consumer Staples — 3.8% | | | | | | | | |
Food & Staples Retailing — 1.4% | | | | | | | | |
Natural Grocers by Vitamin Cottage, Inc.(a) | | | 2,411 | | | | 34,236 | |
SpartanNash Company | | | 281 | | | | 5,333 | |
| | | | | | | | 39,569 | |
Food Products — 0.5% | | | | | | | | |
Archer-Daniels-Midland Company | | | 350 | | | | 14,875 | |
| | | | | | | | | |
Household Products — 0.1% | | | | | | | | |
Oil-Dri Corporation of America | | | 100 | | | | 2,915 | |
| | | | | | | | | |
Personal Products — 1.8% | | | | | | | | |
LifeVantage Corporation(a) | | | 3,540 | | | | 51,578 | |
| | | | | | | | | |
Energy — 4.0% | | | | | | | | |
Energy Equipment & Services — 1.6% | | | | | | | | |
C&J Energy Services, Inc.(a) | | | 100 | | | | 1,727 | |
Mammoth Energy Services, Inc. | | | 1,300 | | | | 29,887 | |
ProPetro Holding Corporation(a) | | | 700 | | | | 13,902 | |
| | | | | | | | 45,516 | |
Oil, Gas & Consumable Fuels — 2.4% | | | | | | | | |
Bonanza Creek Energy, Inc.(a) | | | 160 | | | | 3,675 | |
Gulfport Energy Corporation(a) | | | 1,900 | | | | 14,554 | |
Marathon Oil Corporation | | | 600 | | | | 9,960 | |
QEP Resources, Inc.(a) | | | 917 | | | | 7,116 | |
See accompanying notes to financial statements.
17
ALAMBIC SMALL CAP GROWTH PLUS FUND
SCHEDULE OF INVESTMENTS (Continued) |
COMMON STOCKS — 97.9% (Continued) | | Shares | | | Value | |
Energy — 4.0% (Continued) | | | | | | | | |
Oil, Gas & Consumable Fuels — 2.4% (Continued) | | | | | | | | |
SandRidge Energy, Inc.(a) | | | 3,192 | | | $ | 24,802 | |
W&T Offshore, Inc.(a) | | | 1,700 | | | | 8,857 | |
| | | | | | | | 68,964 | |
Financials — 0.7% | | | | | | | | |
Banks — 0.7% | | | | | | | | |
Smartsheet, Inc. - Class A(a) | | | 500 | | | | 19,120 | |
| | | | | | | | | |
Health Care — 25.3% | | | | | | | | |
Biotechnology — 5.5% | | | | | | | | |
ACADIA Pharmaceuticals, Inc.(a) | | | 400 | | | | 10,600 | |
Agenus, Inc.(a) | | | 1,200 | | | | 3,708 | |
Alexion Pharmaceuticals, Inc.(a) | | | 20 | | | | 2,706 | |
Amgen, Inc. | | | 30 | | | | 5,702 | |
Editas Medicine, Inc.(a) | | | 100 | | | | 2,063 | |
Emergent BioSolutions, Inc.(a) | | | 400 | | | | 23,340 | |
Genomic Health, Inc.(a) | | | 210 | | | | 15,954 | |
Invitae Corporation(a) | | | 300 | | | | 6,036 | |
KalVista Pharmaceuticals, Inc.(a) | | | 700 | | | | 15,876 | |
OPKO Health, Inc.(a) | | | 1,100 | | | | 2,805 | |
Seattle Genetics, Inc.(a) | | | 200 | | | | 14,856 | |
SIGA Technologies, Inc.(a) | | | 5,224 | | | | 35,419 | |
Ultragenyx Pharmaceutical, Inc.(a) | | | 200 | | | | 12,828 | |
Vanda Pharmaceuticals, Inc.(a) | | | 300 | | | | 6,072 | |
| | | | | | | | 157,965 | |
Health Care Equipment & Supplies — 7.2% | | | | | | | | |
Accuray, Inc.(a) | | | 4,900 | | | | 23,618 | |
Apyx Medical Corporation(a) | | | 3,400 | | | | 23,868 | |
Cardiovascular Systems, Inc.(a) | | | 600 | | | | 21,222 | |
Cerus Corporation(a) | | | 1,400 | | | | 9,114 | |
DexCom, Inc.(a) | | | 20 | | | | 2,787 | |
Integer Holdings Corporation(a) | | | 200 | | | | 18,192 | |
Lantheus Holdings, Inc.(a) | | | 400 | | | | 9,140 | |
Natus Medical, Inc.(a) | | | 1,000 | | | | 27,630 | |
OraSure Technologies, Inc.(a) | | | 200 | | | | 2,150 | |
Orthofix Medical, Inc.(a) | | | 250 | | | | 15,275 | |
RTI Surgical, Inc.(a) | | | 1,738 | | | | 8,655 | |
STAAR Surgical Company(a) | | | 500 | | | | 18,400 | |
Varex Imaging Corporation(a) | | | 900 | | | | 28,296 | |
| | | | | | | | 208,347 | |
See accompanying notes to financial statements.
18
ALAMBIC SMALL CAP GROWTH PLUS FUND
SCHEDULE OF INVESTMENTS (Continued) |
COMMON STOCKS — 97.9% (Continued) | | Shares | | | Value | |
Health Care — 25.3% (Continued) | | | | | | | | |
Health Care Providers & Services — 2.5% | | | | | | | | |
Amedisys, Inc.(a) | | | 300 | | | $ | 37,290 | |
BioTelemetry, Inc.(a) | | | 100 | | | | 7,472 | |
Cardinal Health, Inc. | | | 100 | | | | 5,434 | |
McKesson Corporation | | | 180 | | | | 22,889 | |
| | | | | | | | 73,085 | |
Health Care Technology — 2.9% | | | | | | | | |
Allscripts Healthcare Solutions, Inc.(a) | | | 5,100 | | | | 54,672 | |
Cerner Corporation(a) | | | 200 | | | | 11,190 | |
HealthStream, Inc. | | | 486 | | | | 13,511 | |
NextGen Healthcare, Inc.(a) | | | 300 | | | | 5,250 | |
| | | | | | | | 84,623 | |
Life Sciences Tools & Services — 3.2% | | | | | | | | |
Bio-Rad Laboratories, Inc. - Class A(a) | | | 130 | | | | 35,217 | |
Luminex Corporation | | | 932 | | | | 23,747 | |
Medpace Holdings, Inc.(a) | | | 500 | | | | 27,475 | |
NanoString Technologies, Inc.(a) | | | 200 | | | | 5,094 | |
| | | | | | | | 91,533 | |
Pharmaceuticals — 4.0% | | | | | | | | |
Amphastar Pharmaceuticals, Inc.(a) | | | 1,100 | | | | 27,335 | |
Corcept Therapeutics, Inc.(a) | | | 100 | | | | 1,247 | |
Lannett Company, Inc.(a) | | | 3,700 | | | | 34,817 | |
Merck & Company, Inc. | | | 250 | | | | 20,322 | |
Mylan N.V.(a) | | | 900 | | | | 23,751 | |
Supernus Pharmaceuticals, Inc.(a) | | | 165 | | | | 6,739 | |
| | | | | | | | 114,211 | |
Industrials — 20.9% | | | | | | | | |
Aerospace & Defense — 0.1% | | | | | | | | |
Arconic, Inc. | | | 200 | | | | 3,698 | |
| | | | | | | | | |
Building Products — 2.4% | | | | | | | | |
Builders FirstSource, Inc.(a) | | | 5,014 | | | | 69,845 | |
| | | | | | | | | |
Commercial Services & Supplies — 3.4% | | | | | | | | |
ARC Document Solutions, Inc.(a) | | | 7,000 | | | | 16,590 | |
Brady Corporation - Class A | | | 387 | | | | 18,309 | |
Clean Harbors, Inc.(a) | | | 50 | | | | 3,400 | |
Herman Miller, Inc. | | | 300 | | | | 11,004 | |
Kimball International, Inc. - Class B | | | 651 | | | | 10,214 | |
R.R. Donnelley & Sons Company | | | 1,264 | | | | 6,801 | |
Steelcase, Inc. - Class A | | | 1,800 | | | | 31,518 | |
| | | | | | | | 97,836 | |
See accompanying notes to financial statements.
19
ALAMBIC SMALL CAP GROWTH PLUS FUND
SCHEDULE OF INVESTMENTS (Continued) |
COMMON STOCKS — 97.9% (Continued) | | Shares | | | Value | |
Industrials — 20.9% (Continued) | | | | | | | | |
Construction & Engineering — 0.8% | | | | | | | | |
Fluor Corporation | | | 350 | | | $ | 13,160 | |
Great Lakes Dredge & Dock Corporation(a) | | | 800 | | | | 7,120 | |
Sterling Construction Company, Inc.(a) | | | 133 | | | | 1,943 | |
| | | | | | | | 22,223 | |
Electrical Equipment — 1.8% | | | | | | | | |
Allied Motion Technologies, Inc. | | | 50 | | | | 2,083 | |
Preformed Line Products Company | | | 750 | | | | 44,775 | |
Vicor Corporation(a) | | | 150 | | | | 4,767 | |
| | | | | | | | 51,625 | |
Machinery — 8.4% | | | | | | | | |
AGCO Corporation | | | 750 | | | | 50,685 | |
Allison Transmission Holdings, Inc. | | | 200 | | | | 9,940 | |
Caterpillar, Inc. | | | 40 | | | | 5,493 | |
Commercial Vehicle Group, Inc.(a) | | | 5,007 | | | | 40,056 | |
Hurco Companies, Inc. | | | 234 | | | | 10,034 | |
L.B. Foster Company - Class A(a) | | | 257 | | | | 4,449 | |
Miller Industries, Inc. | | | 1,012 | | | | 34,317 | |
Navistar International Corporation(a) | | | 1,700 | | | | 65,229 | |
Oshkosh Corporation | | | 272 | | | | 21,164 | |
| | | | | | | | 241,367 | |
Professional Services — 1.4% | | | | | | | | |
Acacia Research Corporation(a) | | | 3,200 | | | | 9,760 | |
Heidrick & Struggles International, Inc. | | | 527 | | | | 22,719 | |
Korn Ferry | | | 50 | | | | 2,439 | |
TriNet Group, Inc.(a) | | | 100 | | | | 6,129 | |
| | | | | | | | 41,047 | |
Road & Rail — 1.3% | | | | | | | | |
ArcBest Corporation | | | 837 | | | | 29,153 | |
PAM Transportation Services, Inc.(a) | | | 158 | | | | 8,004 | |
| | | | | | | | 37,157 | |
Trading Companies & Distributors — 1.3% | | | | | | | | |
BMC Stock Holdings, Inc.(a) | | | 1,212 | | | | 23,186 | |
Systemax, Inc. | | | 704 | | | | 14,263 | |
| | | | | | | | 37,449 | |
Information Technology — 19.2% | | | | | | | | |
Communications Equipment — 3.1% | | | | | | | | |
Digi International, Inc.(a) | | | 2,100 | | | | 27,720 | |
Extreme Networks, Inc.(a) | | | 3,100 | | | | 25,482 | |
Ribbon Communications, Inc.(a) | | | 6,800 | | | | 35,020 | |
| | | | | | | | 88,222 | |
See accompanying notes to financial statements.
20
ALAMBIC SMALL CAP GROWTH PLUS FUND
SCHEDULE OF INVESTMENTS (Continued) |
COMMON STOCKS — 97.9% (Continued) | | Shares | | | Value | |
Information Technology — 19.2% (Continued) | | | | | | | | |
Electronic Equipment, Instruments & Components — 2.9% | | | | | | | | |
Bel Fuse, Inc. - Class B | | | 1,056 | | | $ | 25,819 | |
Fitbit, Inc. - Class A(a) | | | 1,100 | | | | 6,512 | |
Knowles Corporation(a) | | | 200 | | | | 3,256 | |
PCM, Inc.(a) | | | 100 | | | | 3,359 | |
Tech Data Corporation(a) | | | 284 | | | | 29,031 | |
Vishay Intertechnology, Inc. | | | 600 | | | | 13,152 | |
Zebra Technologies Corporation - Class A(a) | | | 20 | | | | 4,010 | |
| | | | | | | | 85,139 | |
IT Services — 1.9% | | | | | | | | |
Conduent, Inc.(a) | | | 700 | | | | 10,234 | |
EVERTEC, Inc. | | | 115 | | | | 3,291 | |
Presidio, Inc. | | | 1,300 | | | | 21,619 | |
Sykes Enterprises, Inc.(a) | | | 400 | | | | 11,836 | |
TTEC Holdings, Inc. | | | 200 | | | | 6,852 | |
| | | | | | | | 53,832 | |
Semiconductors & Semiconductor Equipment — 6.7% | | | | | | | | |
Amkor Technology, Inc.(a) | | | 6,900 | | | | 60,582 | |
Aquantia Corporation(a) | | | 200 | | | | 1,570 | |
Cirrus Logic, Inc.(a) | | | 407 | | | | 16,333 | |
DSP Group, Inc.(a) | | | 100 | | | | 1,373 | |
GSI Technology, Inc.(a) | | | 9,449 | | | | 76,537 | |
Mellanox Technologies Ltd.(a) | | | 100 | | | | 10,744 | |
Micron Technology, Inc.(a) | | | 450 | | | | 18,396 | |
Photronics, Inc.(a) | | | 846 | | | | 8,299 | |
| | | | | | | | 193,834 | |
Software — 3.9% | | | | | | | | |
3PEA International, Inc.(a) | | | 2,321 | | | | 17,083 | |
A10 Networks, Inc.(a) | | | 5,915 | | | | 41,287 | |
ACI Worldwide, Inc.(a) | | | 300 | | | | 9,561 | |
Cadence Design Systems, Inc.(a) | | | 300 | | | | 17,175 | |
ChannelAdvisor Corporation(a) | | | 200 | | | | 2,586 | |
Cornerstone OnDemand, Inc.(a) | | | 150 | | | | 8,475 | |
Intelligent Systems Corporation(a) | | | 100 | | | | 1,867 | |
MobileIron, Inc.(a) | | | 2,100 | | | | 10,626 | |
Oracle Corporation | | | 50 | | | | 2,606 | |
| | | | | | | | 111,266 | |
Technology Hardware, Storage & Peripherals — 0.7% | | | | | | | | |
Stratasys Ltd.(a) | | | 700 | | | | 19,922 | |
See accompanying notes to financial statements.
21
ALAMBIC SMALL CAP GROWTH PLUS FUND
SCHEDULE OF INVESTMENTS (Continued) |
COMMON STOCKS — 97.9% (Continued) | | Shares | | | Value | |
Materials — 4.9% | | | | | | | | |
Chemicals — 1.4% | | | | | | | | |
FutureFuel Corporation | | | 800 | | | $ | 14,752 | |
Huntsman Corporation | | | 300 | | | | 7,437 | |
OMNOVA Solutions, Inc.(a) | | | 1,044 | | | | 8,509 | |
Tredegar Corporation | | | 649 | | | | 11,305 | |
| | | | | | | | 42,003 | |
Metals & Mining — 3.4% | | | | | | | | |
Alcoa Corporation(a) | | | 300 | | | | 8,850 | |
Cleveland-Cliffs, Inc. | | | 300 | | | | 3,327 | |
Nucor Corporation | | | 400 | | | | 24,228 | |
Olympic Steel, Inc. | | | 1,200 | | | | 23,304 | |
Warrior Met Coal, Inc. | | | 1,300 | | | | 38,064 | |
| | | | | | | | 97,773 | |
Paper & Forest Products — 0.1% | | | | | | | | |
Verso Corporation - Class A(a) | | | 100 | | | | 1,965 | |
| | | | | | | | | |
Investments at Value — 97.9% (Cost $2,505,189) | | | | | | $ | 2,818,624 | |
| | | | | | | | | |
Other Assets in Excess of Liabilities — 2.1% | | | | | | | 60,291 | |
| | | | | | | | | |
Net Assets — 100.0% | | | | | | $ | 2,878,915 | |
(a) | Non-income producing security. |
(b) | Percentage rounds to less than 0.1%. |
See accompanying notes to financial statements.
22
ALAMBIC MID CAP VALUE PLUS FUND
SCHEDULE OF INVESTMENTS
February 28, 2019 (Unaudited) |
COMMON STOCKS — 93.7% | | Shares | | | Value | |
Communication Services — 4.3% | | | | | | | | |
Entertainment — 1.5% | | | | | | | | |
Electronic Arts, Inc.(a) | | | 180 | | | $ | 17,240 | |
| | | | | | | | | |
Media — 0.5% | | | | | | | | |
AMC Networks, Inc. - Class A(a) | | | 80 | | | | 5,257 | |
| | | | | | | | | |
Wireless Telecommunication Services — 2.3% | | | | | | | | |
United States Cellular Corporation(a) | | | 540 | | | | 25,213 | |
| | | | | | | | | |
Consumer Discretionary — 9.4% | | | | | | | | |
Auto Components — 1.8% | | | | | | | | |
Gentex Corporation | | | 400 | | | | 8,136 | |
Goodyear Tire & Rubber Company (The) | | | 600 | | | | 11,868 | |
| | | | | | | | 20,004 | |
Automobiles — 0.7% | | | | | | | | |
General Motors Company | | | 190 | | | | 7,501 | |
| | | | | | | | | |
Hotels, Restaurants & Leisure — 0.9% | | | | | | | | |
MGM Resorts International | | | 100 | | | | 2,675 | |
Norwegian Cruise Line Holdings Ltd.(a) | | | 140 | | | | 7,774 | |
| | | | | | | | 10,449 | |
Household Durables — 4.2% | | | | | | | | |
NVR, Inc.(a) | | | 2 | | | | 5,240 | |
PulteGroup, Inc. | | | 650 | | | | 17,550 | |
Toll Brothers, Inc. | | | 480 | | | | 17,088 | |
Whirlpool Corporation | | | 50 | | | | 7,076 | |
| | | | | | | | 46,954 | |
Leisure Products — 0.3% | | | | | | | | |
Brunswick Corporation | | | 60 | | | | 3,164 | |
| | | | | | | | | |
Textiles, Apparel & Luxury Goods — 1.5% | | | | | | | | |
Columbia Sportswear Company | | | 20 | | | | 2,059 | |
Deckers Outdoor Corporation(a) | | | 20 | | | | 2,959 | |
Ralph Lauren Corporation | | | 100 | | | | 12,517 | |
| | | | | | | | 17,535 | |
Consumer Staples — 4.5% | | | | | | | | |
Beverages — 1.0% | | | | | | | | |
Molson Coors Brewing Company - Class B | | | 180 | | | | 11,099 | |
See accompanying notes to financial statements.
23
ALAMBIC MID CAP VALUE PLUS FUND
SCHEDULE OF INVESTMENTS (Continued) |
COMMON STOCKS — 93.7% (Continued) | | Shares | | | Value | |
Consumer Staples — 4.5% (Continued) | | | | | | | | |
Food Products — 3.5% | | | | | | | | |
Archer-Daniels-Midland Company | | | 680 | | | $ | 28,900 | |
J.M. Smucker Company (The) | | | 30 | | | | 3,177 | |
Seaboard Corporation | | | 2 | | | | 7,799 | |
| | | | | | | | 39,876 | |
Energy — 7.4% | | | | | | | | |
Oil, Gas & Consumable Fuels — 7.4% | | | | | | | | |
Apache Corporation | | | 750 | | | | 24,885 | |
Cimarex Energy Company | | | 40 | | | | 2,876 | |
Devon Energy Corporation | | | 450 | | | | 13,280 | |
EQT Corporation | | | 1,050 | | | | 19,026 | |
HollyFrontier Corporation | | | 20 | | | | 1,024 | |
Marathon Oil Corporation | | | 1,350 | | | | 22,410 | |
| | | | | | | | 83,501 | |
Financials — 10.8% | | | | | | | | |
Banks — 4.6% | | | | | | | | |
Citizens Financial Group, Inc. | | | 50 | | | | 1,847 | |
Comerica, Inc. | | | 40 | | | | 3,484 | |
Commerce Bancshares, Inc. | | | 63 | | | | 3,964 | |
Cullen/Frost Bankers, Inc. | | | 110 | | | | 11,405 | |
East West Bancorp, Inc. | | | 60 | | | | 3,277 | |
Fifth Third Bancorp | | | 50 | | | | 1,379 | |
First Citizens BancShares, Inc. - Class A | | | 4 | | | | 1,746 | |
Huntington Bancshares, Inc. | | | 200 | | | | 2,882 | |
KeyCorp | | | 250 | | | | 4,415 | |
M&T Bank Corporation | | | 10 | | | | 1,731 | |
Signature Bank | | | 20 | | | | 2,715 | |
SunTrust Banks, Inc. | | | 100 | | | | 6,487 | |
SVB Financial Group(a) | | | 5 | | | | 1,236 | |
Zions Bancorporation | | | 100 | | | | 5,110 | |
| | | | | | | | 51,678 | |
Capital Markets — 1.4% | | | | | | | | |
Affiliated Managers Group, Inc. | | | 20 | | | | 2,192 | |
Ameriprise Financial, Inc. | | | 20 | | | | 2,633 | |
FactSet Research Systems, Inc. | | | 20 | | | | 4,703 | |
Raymond James Financial, Inc. | | | 40 | | | | 3,303 | |
SEI Investments Company | | | 60 | | | | 3,165 | |
| | | | | | | | 15,996 | |
Consumer Finance — 0.2% | | | | | | | | |
Ally Financial, Inc. | | | 100 | | | | 2,709 | |
See accompanying notes to financial statements.
24
ALAMBIC MID CAP VALUE PLUS FUND
SCHEDULE OF INVESTMENTS (Continued) |
COMMON STOCKS — 93.7% (Continued) | | Shares | | | Value | |
Financials — 10.8% (Continued) | | | | | | | | |
Diversified Financial Services — 0.5% | | | | | | | | |
AXA Equitable Holdings, Inc. | | | 300 | | | $ | 5,736 | |
| | | | | | | | | |
Insurance — 4.1% | | | | | | | | |
American International Group, Inc. | | | 120 | | | | 5,184 | |
Arthur J. Gallagher & Company | | | 20 | | | | 1,606 | |
Assurant, Inc. | | | 40 | | | | 4,120 | |
Berkley (W.R.) Corporation | | | 20 | | | | 1,673 | |
Cincinnati Financial Corporation | | | 80 | | | | 6,946 | |
Erie Indemnity Company - Class A | | | 20 | | | | 3,564 | |
First American Financial Corporation | | | 60 | | | | 3,047 | |
Markel Corporation(a) | | | 1 | | | | 1,005 | |
Old Republic International Corporation | | | 250 | | | | 5,215 | |
Principal Financial Group, Inc. | | | 160 | | | | 8,422 | |
Prudential Financial, Inc. | | | 20 | | | | 1,917 | |
Reinsurance Group of America, Inc. | | | 20 | | | | 2,890 | |
| | | | | | | | 45,589 | |
Health Care — 12.0% | | | | | | | | |
Biotechnology — 0.2% | | | | | | | | |
Regeneron Pharmaceuticals, Inc.(a) | | | 5 | | | | 2,154 | |
| | | | | | | | | |
Health Care Equipment & Supplies — 1.6% | | | | | | | | |
Baxter International, Inc. | | | 40 | | | | 2,989 | |
DexCom, Inc.(a) | | | 30 | | | | 4,180 | |
Hill-Rom Holdings, Inc. | | | 20 | | | | 2,121 | |
Zimmer Biomet Holdings, Inc. | | | 70 | | | | 8,688 | |
| | | | | | | | 17,978 | |
Health Care Providers & Services — 2.4% | | | | | | | | |
Amedisys, Inc.(a) | | | 30 | | | | 3,729 | |
AmerisourceBergen Corporation | | | 20 | | | | 1,666 | |
Cardinal Health, Inc. | | | 60 | | | | 3,260 | |
McKesson Corporation | | | 140 | | | | 17,803 | |
| | | | | | | | 26,458 | |
Health Care Technology — 0.3% | | | | | | | | |
Cerner Corporation(a) | | | 60 | | | | 3,357 | |
| | | | | | | | | |
Life Sciences Tools & Services — 4.4% | | | | | | | | |
Agilent Technologies, Inc. | | | 180 | | | | 14,299 | |
Bio-Rad Laboratories, Inc. - Class A(a) | | | 120 | | | | 32,508 | |
Charles River Laboratories International, Inc.(a) | | | 20 | | | | 2,844 | |
| | | | | | | | 49,651 | |
See accompanying notes to financial statements.
25
ALAMBIC MID CAP VALUE PLUS FUND
SCHEDULE OF INVESTMENTS (Continued) |
COMMON STOCKS — 93.7% (Continued) | | Shares | | | Value | |
Health Care — 12.0% (Continued) | | | | | | | | |
Pharmaceuticals — 3.1% | | | | | | | | |
Merck & Company, Inc. | | | 220 | | | $ | 17,884 | |
Mylan N.V.(a) | | | 650 | | | | 17,153 | |
| | | | | | | | 35,037 | |
Industrials — 17.6% | | | | | | | | |
Aerospace & Defense — 2.4% | | | | | | | | |
Arconic, Inc. | | | 850 | | | | 15,716 | |
Spirit AeroSystems Holdings, Inc. - Class A | | | 120 | | | | 11,856 | |
| | | | | | | | 27,572 | |
Airlines — 2.7% | | | | | | | | |
JetBlue Airways Corporation(a) | | | 1,400 | | | | 23,380 | |
United Continental Holdings, Inc.(a) | | | 80 | | | | 7,025 | |
| | | | | | | | 30,405 | |
Building Products — 0.3% | | | | | | | | |
Owens Corning | | | 60 | | | | 2,996 | |
| | | | | | | | | |
Construction & Engineering — 1.3% | | | | | | | | |
Fluor Corporation | | | 380 | | | | 14,288 | |
| | | | | | | | | |
Industrial Conglomerates — 1.6% | | | | | | | | |
Carlisle Companies, Inc. | | | 150 | | | | 18,462 | |
| | | | | | | | | |
Machinery — 8.7% | | | | | | | | |
AGCO Corporation | | | 460 | | | | 31,087 | |
Allison Transmission Holdings, Inc. | | | 540 | | | | 26,838 | |
Caterpillar, Inc. | | | 20 | | | | 2,747 | |
Cummins, Inc. | | | 66 | | | | 10,170 | |
Navistar International Corporation(a) | | | 250 | | | | 9,592 | |
Oshkosh Corporation | | | 220 | | | | 17,118 | |
| | | | | | | | 97,552 | |
Professional Services — 0.6% | | | | | | | | |
ManpowerGroup, Inc. | | | 80 | | | | 6,740 | |
| | | | | | | | | |
Information Technology — 13.4% | | | | | | | | |
Communications Equipment — 0.3% | | | | | | | | |
EchoStar Corporation - Class A(a) | | | 80 | | | | 3,085 | |
| | | | | | | | | |
Electronic Equipment, Instruments & Components — 3.1% | | | | | | | | |
Arrow Electronics, Inc.(a) | | | 40 | | | | 3,188 | |
Avnet, Inc. | | | 140 | | | | 6,089 | |
Jabil, Inc. | | | 550 | | | | 15,620 | |
Zebra Technologies Corporation - Class A(a) | | | 50 | | | | 10,025 | |
| | | | | | | | 34,922 | |
See accompanying notes to financial statements.
26
ALAMBIC MID CAP VALUE PLUS FUND
SCHEDULE OF INVESTMENTS (Continued) |
COMMON STOCKS — 93.7% (Continued) | | Shares | | | Value | |
Information Technology — 13.4% (Continued) | | | | | | | | |
IT Services — 3.6% | | | | | | | | |
Cognizant Technology Solutions Corporation - Class A | | | 100 | | | $ | 7,098 | |
DXC Technology Company | | | 220 | | | | 14,489 | |
Western Union Company (The) | | | 1,100 | | | | 19,657 | |
| | | | | | | | 41,244 | |
Semiconductors & Semiconductor Equipment — 3.8% | | | | | | | | |
Mellanox Technologies Ltd.(a) | | | 50 | | | | 5,372 | |
Micron Technology, Inc.(a) | | | 700 | | | | 28,616 | |
ON Semiconductor Corporation(a) | | | 300 | | | | 6,444 | |
Teradyne, Inc. | | | 50 | | | | 2,042 | |
| | | | | | | | 42,474 | |
Software — 1.0% | | | | | | | | |
Cadence Design Systems, Inc.(a) | | | 200 | | | | 11,450 | |
| | | | | | | | | |
Technology Hardware, Storage & Peripherals — 1.6% | | | | | | | | |
Dell Technologies, Inc. - Class C(a) | | | 120 | | | | 6,698 | |
Hewlett Packard Enterprise Company | | | 200 | | | | 3,276 | |
Western Digital Corporation | | | 160 | | | | 8,048 | |
| | | | | | | | 18,022 | |
Materials — 7.8% | | | | | | | | |
Chemicals — 2.6% | | | | | | | | |
Chemours Company (The) | | | 50 | | | | 1,902 | |
Eastman Chemical Company | | | 80 | | | | 6,615 | |
Huntsman Corporation | | | 640 | | | | 15,866 | |
Mosaic Company (The) | | | 150 | | | | 4,690 | |
| | | | | | | | 29,073 | |
Containers & Packaging — 0.7% | | | | | | | | |
Packaging Corporation of America | | | 80 | | | | 7,647 | |
| | | | | | | | | |
Metals & Mining — 4.5% | | | | | | | | |
Alcoa Corporation(a) | | | 700 | | | | 20,650 | |
Nucor Corporation | | | 240 | | | | 14,537 | |
Reliance Steel & Aluminum Company | | | 80 | | | | 7,140 | |
Steel Dynamics, Inc. | | | 240 | | | | 8,957 | |
| | | | | | | | 51,284 | |
Real Estate — 6.2% | | | | | | | | |
Equity Real Estate Investment Trusts (REITs) — 6.2% | | | | | | | | |
Boston Properties, Inc. | | | 20 | | | | 2,654 | |
Brookfield Property REIT, Inc. - Class A | | | 100 | | | | 1,962 | |
CyrusOne, Inc. | | | 160 | | | | 7,974 | |
Digital Realty Trust, Inc. | | | 90 | | | | 10,181 | |
Duke Realty Corporation | | | 200 | | | | 5,914 | |
See accompanying notes to financial statements.
27
ALAMBIC MID CAP VALUE PLUS FUND
SCHEDULE OF INVESTMENTS (Continued) |
COMMON STOCKS — 93.7% (Continued) | | Shares | | | Value | |
Real Estate — 6.2% (Continued) | | | | | | | | |
Equity Real Estate Investment Trusts (REITs) — 6.2% (Continued) | | | | | | | | |
EPR Properties | | | 40 | | | $ | 2,939 | |
Host Hotels & Resorts, Inc. | | | 100 | | | | 1,961 | |
Iron Mountain, Inc. | | | 100 | | | | 3,542 | |
Kimco Realty Corporation | | | 200 | | | | 3,518 | |
Liberty Property Trust | | | 40 | | | | 1,893 | |
Medical Properties Trust, Inc. | | | 300 | | | | 5,469 | |
National Retail Properties, Inc. | | | 80 | | | | 4,168 | |
Omega Healthcare Investors, Inc. | | | 50 | | | | 1,795 | |
Park Hotels & Resorts, Inc. | | | 150 | | | | 4,686 | |
Realty Income Corporation | | | 60 | | | | 4,150 | |
Regency Centers Corporation | | | 20 | | | | 1,305 | |
SL Green Realty Corporation | | | 20 | | | | 1,814 | |
Ventas, Inc. | | | 20 | | | | 1,255 | |
VICI Properties, Inc. | | | 100 | | | | 2,131 | |
| | | | | | | | 69,311 | |
Utilities — 0.3% | | | | | | | | |
Multi-Utilities — 0.3% | | | | | | | | |
CMS Energy Corporation | | | 60 | | | | 3,264 | |
| | | | | | | | | |
Total Common Stocks (Cost $946,603) | | | | | | $ | 1,053,927 | |
|
RIGHTS — 0.0%(b) | | Shares | | | Value | |
Media General, Inc. - CVR(a)(c) (Cost $0) | | | 120 | | | $ | 6 | |
| | | | | | | | | |
Investments at Value — 93.7%(Cost $946,603) | | | | | | $ | 1,053,933 | |
| | | | | | | | | |
Other Assets in Excess of Liabilities — 6.3% | | | | | | | 71,082 | |
| | | | | | | | | |
Net Assets — 100.0% | | | | | | $ | 1,125,015 | |
CVR - Contingent Value Right. |
(a) | Non-income producing security. |
(b) | Percentage rounds to less than 0.1%. |
(c) | Illiquid security. Security value has been determined in good faith pursuant to procedures adopted by the Board of Trustees. The total value of such securities was $6 as of February 28, 2019, representing 0.0%(b) of net assets (Note 2). |
See accompanying notes to financial statements.
28
ALAMBIC MID CAP GROWTH PLUS FUND
SCHEDULE OF INVESTMENTS
February 28, 2019 (Unaudited) |
COMMON STOCKS — 96.0% | | Shares | | | Value | |
Communication Services — 2.6% | | | | | | | | |
Entertainment — 1.0% | | | | | | | | |
Electronic Arts, Inc.(a) | | | 120 | | | $ | 11,494 | |
| | | | | | | | | |
Media — 0.3% | | | | | | | | |
AMC Networks, Inc. - Class A(a) | | | 40 | | | | 2,628 | |
| | | | | | | | | |
Wireless Telecommunication Services — 1.3% | | | | | | | | |
United States Cellular Corporation(a) | | | 320 | | | | 14,941 | |
| | | | | | | | | |
Consumer Discretionary — 13.0% | | | | | | | | |
Auto Components — 1.4% | | | | | | | | |
BorgWarner, Inc. | | | 160 | | | | 6,497 | |
Goodyear Tire & Rubber Company (The) | | | 450 | | | | 8,901 | |
| | | | | | | | 15,398 | |
Hotels, Restaurants & Leisure — 2.7% | | | | | | | | |
Chipotle Mexican Grill, Inc.(a) | | | 4 | | | | 2,430 | |
Darden Restaurants, Inc. | | | 20 | | | | 2,242 | |
Dunkin' Brands Group, Inc. | | | 40 | | | | 2,858 | |
MGM Resorts International | | | 200 | | | | 5,350 | |
Norwegian Cruise Line Holdings Ltd.(a) | | | 320 | | | | 17,770 | |
| | | | | | | | 30,650 | |
Household Durables — 4.5% | | | | | | | | |
NVR, Inc.(a) | | | 3 | | | | 7,860 | |
PulteGroup, Inc. | | | 700 | | | | 18,900 | |
Toll Brothers, Inc. | | | 400 | | | | 14,240 | |
Whirlpool Corporation | | | 70 | | | | 9,906 | |
| | | | | | | | 50,906 | |
Internet & Direct Marketing Retail — 1.1% | | | | | | | | |
Etsy, Inc.(a) | | | 80 | | | | 5,702 | |
Expedia Group, Inc. | | | 60 | | | | 7,398 | |
| | | | | | | | 13,100 | |
Leisure Products — 0.4% | | | | | | | | |
Brunswick Corporation | | | 80 | | | | 4,219 | |
| | | | | | | | | |
Multi-Line Retail — 0.8% | | | | | | | | |
Dollar General Corporation | | | 80 | | | | 9,477 | |
| | | | | | | | | |
Specialty Retail — 0.5% | | | | | | | | |
Ross Stores, Inc. | | | 60 | | | | 5,690 | |
See accompanying notes to financial statements.
29
ALAMBIC MID CAP GROWTH PLUS FUND
SCHEDULE OF INVESTMENTS (Continued) |
COMMON STOCKS — 96.0% (Continued) | | Shares | | | Value | |
Consumer Discretionary — 13.0% (Continued) | | | | | | | | |
Textiles, Apparel & Luxury Goods — 1.6% | | | | | | | | |
Columbia Sportswear Company | | | 10 | | | $ | 1,030 | |
Deckers Outdoor Corporation(a) | | | 40 | | | | 5,918 | |
Ralph Lauren Corporation | | | 90 | | | | 11,265 | |
| | | | | | | | 18,213 | |
Consumer Staples — 3.3% | | | | | | | | |
Beverages — 1.1% | | | | | | | | |
Molson Coors Brewing Company - Class B | | | 140 | | | | 8,632 | |
Monster Beverage Corporation(a) | | | 60 | | | | 3,830 | |
| | | | | | | | 12,462 | |
Food Products — 2.2% | | | | | | | | |
Archer-Daniels-Midland Company | | | 400 | | | | 17,000 | |
Seaboard Corporation | | | 2 | | | | 7,799 | |
| | | | | | | | 24,799 | |
Energy — 5.0% | | | | | | | | |
Oil, Gas & Consumable Fuels — 5.0% | | | | | | | | |
Apache Corporation | | | 600 | | | | 19,908 | |
Devon Energy Corporation | | | 250 | | | | 7,377 | |
EQT Corporation | | | 700 | | | | 12,684 | |
Marathon Oil Corporation | | | 1,000 | | | | 16,600 | |
| | | | | | | | 56,569 | |
Financials — 0.5% | | | | | | | | |
Capital Markets — 0.5% | | | | | | | | |
Raymond James Financial, Inc. | | | 40 | | | | 3,303 | |
T. Rowe Price Group, Inc. | | | 20 | | | | 2,009 | |
| | | | | | | | 5,312 | |
Health Care — 16.0% | | | | | | | | |
Biotechnology — 2.0% | | | | | | | | |
Alexion Pharmaceuticals, Inc.(a) | | | 50 | | | | 6,766 | |
Incyte Corporation(a) | | | 120 | | | | 10,348 | |
Ionis Pharmaceuticals, Inc.(a) | | | 20 | | | | 1,420 | |
Seattle Genetics, Inc.(a) | | | 60 | | | | 4,457 | |
| | | �� | | | | | 22,991 | |
Health Care Equipment & Supplies — 2.8% | | | | | | | | |
Align Technology, Inc.(a) | | | 10 | | | | 2,590 | |
DexCom, Inc.(a) | | | 70 | | | | 9,753 | |
Edwards Lifesciences Corporation(a) | | | 20 | | | | 3,386 | |
Hill-Rom Holdings, Inc. | | | 100 | | | | 10,605 | |
Masimo Corporation(a) | | | 40 | | | | 5,251 | |
| | | | | | | | 31,585 | |
See accompanying notes to financial statements.
30
ALAMBIC MID CAP GROWTH PLUS FUND
SCHEDULE OF INVESTMENTS (Continued) |
COMMON STOCKS — 96.0% (Continued) | | Shares | | | Value | |
Health Care — 16.0% (Continued) | | | | | | | | |
Health Care Providers & Services — 4.1% | | | | | | | | |
Amedisys, Inc.(a) | | | 100 | | | $ | 12,430 | |
AmerisourceBergen Corporation | | | 80 | | | | 6,664 | |
Cardinal Health, Inc. | | | 60 | | | | 3,260 | |
McKesson Corporation | | | 160 | | | | 20,346 | |
Molina Healthcare, Inc.(a) | | | 26 | | | | 3,500 | |
| | | | | | | | 46,200 | |
Life Sciences Tools & Services — 5.2% | | | | | | | | |
Agilent Technologies, Inc. | | | 180 | | | | 14,299 | |
Bio-Rad Laboratories, Inc. - Class A(a) | | | 120 | | | | 32,508 | |
Bruker Corporation | | | 90 | | | | 3,439 | |
Charles River Laboratories International, Inc.(a) | | | 65 | | | | 9,241 | |
| | | | | | | | 59,487 | |
Pharmaceuticals — 1.9% | | | | | | | | |
Mylan N.V.(a) | | | 800 | | | | 21,112 | |
| | | | | | | | | |
Industrials — 19.3% | | | | | | | | |
Aerospace & Defense — 2.8% | | | | | | | | |
Arconic, Inc. | | | 600 | | | | 11,094 | |
Spirit AeroSystems Holdings, Inc. - Class A | | | 210 | | | | 20,748 | |
| | | | | | | | 31,842 | |
Airlines — 2.6% | | | | | | | | |
JetBlue Airways Corporation(a) | | | 1,200 | | | | 20,040 | |
Southwest Airlines Company | | | 160 | | | | 8,966 | |
| | | | | | | | 29,006 | |
Construction & Engineering — 1.7% | | | | | | | | |
Fluor Corporation | | | 460 | | | | 17,296 | |
Quanta Services, Inc. | | | 50 | | | | 1,782 | |
| | | | | | | | 19,078 | |
Electrical Equipment — 0.6% | | | | | | | | |
Acuity Brands, Inc. | | | 40 | | | | 5,205 | |
Rockwell Automation, Inc. | | | 10 | | | | 1,785 | |
| | | | | | | | 6,990 | |
Industrial Conglomerates — 0.6% | | | | | | | | |
Carlisle Companies, Inc. | | | 50 | | | | 6,154 | |
| | | | | | | | | |
Machinery — 9.5% | | | | | | | | |
AGCO Corporation | | | 480 | | | | 32,439 | |
Allison Transmission Holdings, Inc. | | | 600 | | | | 29,820 | |
Cummins, Inc. | | | 110 | | | | 16,950 | |
Navistar International Corporation(a) | | | 300 | | | | 11,511 | |
Oshkosh Corporation | | | 220 | | | | 17,118 | |
| | | | | | | | 107,838 | |
See accompanying notes to financial statements.
31
ALAMBIC MID CAP GROWTH PLUS FUND
SCHEDULE OF INVESTMENTS (Continued) |
COMMON STOCKS — 96.0% (Continued) | | Shares | | | Value | |
Industrials — 19.3% (Continued) | | | | | | | | |
Professional Services — 0.6% | | | | | | | | |
ManpowerGroup, Inc. | | | 80 | | | $ | 6,740 | |
| | | | | | | | | |
Road & Rail — 0.5% | | | | | | | | |
Old Dominion Freight Line, Inc. | | | 40 | | | | 6,031 | |
| | | | | | | | | |
Trading Companies & Distributors — 0.4% | | | | | | | | |
W.W. Grainger, Inc. | | | 15 | | | | 4,572 | |
| | | | | | | | | |
Information Technology — 29.4% | | | | | | | | |
Communications Equipment — 1.0% | | | | | | | | |
EchoStar Corporation - Class A(a) | | | 120 | | | | 4,627 | |
F5 Networks, Inc.(a) | | | 40 | | | | 6,726 | |
| | | | | | | | 11,353 | |
Electronic Equipment, Instruments & Components — 5.1% | | | | | | | | |
Arrow Electronics, Inc.(a) | | | 60 | | | | 4,782 | |
Avnet, Inc. | | | 339 | | | | 14,743 | |
Dolby Laboratories, Inc. - Class A | | | 160 | | | | 10,368 | |
Jabil, Inc. | | | 250 | | | | 7,100 | |
Keysight Technologies, Inc.(a) | | | 20 | | | | 1,688 | |
National Instruments Corporation | | | 180 | | | | 8,413 | |
Zebra Technologies Corporation - Class A(a) | | | 55 | | | | 11,028 | |
| | | | | | | | 58,122 | |
IT Services — 8.3% | | | | | | | | |
Booz Allen Hamilton Holding Corporation | | | 40 | | | | 2,114 | |
Cognizant Technology Solutions Corporation - Class A | | | 200 | | | | 14,196 | |
DXC Technology Company | | | 280 | | | | 18,441 | |
EPAM Systems, Inc.(a) | | | 80 | | | | 12,942 | |
Euronet Worldwide, Inc.(a) | | | 110 | | | | 14,775 | |
Sabre Corporation | | | 450 | | | | 10,094 | |
Western Union Company (The) | | | 1,200 | | | | 21,444 | |
| | | | | | | | 94,006 | |
Semiconductors & Semiconductor Equipment — 7.0% | | | | | | | | |
Lam Research Corporation | | | 75 | | | | 13,207 | |
Mellanox Technologies Ltd.(a) | | | 90 | | | | 9,669 | |
Micron Technology, Inc.(a) | | | 700 | | | | 28,616 | |
ON Semiconductor Corporation(a) | | | 800 | | | | 17,184 | |
Xilinx, Inc. | | | 80 | | | | 10,024 | |
| | | | | | | | 78,700 | |
Software — 5.5% | | | | | | | | |
Autodesk, Inc.(a) | | | 20 | | | | 3,260 | |
Cadence Design Systems, Inc.(a) | | | 420 | | | | 24,045 | |
See accompanying notes to financial statements.
32
ALAMBIC MID CAP GROWTH PLUS FUND
SCHEDULE OF INVESTMENTS (Continued) |
COMMON STOCKS — 96.0% (Continued) | | Shares | | | Value | |
Information Technology — 29.4% (Continued) | | | | | | | | |
Software — 5.5% (Continued) | | | | | | | | |
Citrix Systems, Inc. | | | 130 | | | $ | 13,715 | |
Dropbox, Inc. - Class A(a) | | | 100 | | | | 2,386 | |
Fortinet, Inc.(a) | | | 60 | | | | 5,208 | |
Tableau Software, Inc. - Class A(a) | | | 100 | | | | 13,190 | |
| | | | | | | | 61,804 | |
Technology Hardware, Storage & Peripherals — 2.5% | | | | | | | | |
Dell Technologies, Inc. - Class C(a) | | | 20 | | | | 1,116 | |
Hewlett Packard Enterprise Company | | | 350 | | | | 5,733 | |
HP, Inc. | | | 150 | | | | 2,960 | |
NetApp, Inc. | | | 100 | | | | 6,520 | |
Western Digital Corporation | | | 240 | | | | 12,072 | |
| | | | | | | | 28,401 | |
Materials — 6.9% | | | | | | | | |
Chemicals — 2.0% | | | | | | | | |
Chemours Company (The) | | | 450 | | | | 17,113 | |
Huntsman Corporation | | | 240 | | | | 5,950 | |
| | | | | | | | 23,063 | |
Containers & Packaging — 1.2% | | | | | | | | |
Packaging Corporation of America | | | 140 | | | | 13,383 | |
| | | | | | | | | |
Metals & Mining — 3.7% | | | | | | | | |
Alcoa Corporation(a) | | | 600 | | | | 17,700 | |
Nucor Corporation | | | 200 | | | | 12,114 | |
Reliance Steel & Aluminum Company | | | 20 | | | | 1,785 | |
Steel Dynamics, Inc. | | | 260 | | | | 9,703 | |
| | | | | | | | 41,302 | |
| | | | | | | | | |
Investments at Value — 96.0% (Cost $960,254) | | | | | | $ | 1,085,618 | |
| | | | | | | | | |
Other Assets in Excess of Liabilities — 4.0% | | | | | | | 44,990 | |
| | | | | | | | | |
Net Assets — 100.0% | | | | | | $ | 1,130,608 | |
(a) | Non-income producing security. |
See accompanying notes to financial statements.
33
ALAMBIC FUNDS
STATEMENTS OF ASSETS AND LIABILITIES
February 28, 2019 (Unaudited) |
| | Alambic Small
Cap Value Plus
Fund | | | Alambic Small
Cap Growth Plus
Fund | |
ASSETS | | | | | | | | |
Investments in securities: | | | | | | | | |
At cost | | $ | 2,676,177 | | | $ | 2,505,189 | |
At value (Note 2) | | $ | 2,920,415 | | | $ | 2,818,624 | |
Cash | | | 133,670 | | | | 46,275 | |
Receivable for investment securities sold | | | 75,877 | | | | 82,127 | |
Dividends receivable | | | 2,511 | | | | 1,419 | |
Receivable from Adviser (Note 4) | | | 26,143 | | | | 26,067 | |
Other assets | | | 9,412 | | | | 9,398 | |
Total assets | | | 3,168,028 | | | | 2,983,910 | |
| | | | | | | | | |
LIABILITIES | | | | | | | | |
Payable for investment securities purchased | | | 97,251 | | | | 93,258 | |
Payable to administrator (Note 4) | | | 7,023 | | | | 7,022 | |
Other accrued expenses | | | 4,715 | | | | 4,715 | |
Total liabilities | | | 108,989 | | | | 104,995 | |
| | | | | | | | | |
NET ASSETS | | $ | 3,059,039 | | | $ | 2,878,915 | |
| | | | | | | | | |
NET ASSETS CONSIST OF: | | | | | | | | |
Paid-in capital | | $ | 2,923,821 | | | $ | 2,692,711 | |
Accumulated earnings | | | 135,218 | | | | 186,204 | |
NET ASSETS | | $ | 3,059,039 | | | $ | 2,878,915 | |
| | | | | | | | | |
Shares of beneficial interest outstanding (unlimited number of shares authorized, no par value) | | | 288,233 | | | | 270,829 | |
| | | | | | | | | |
Net asset value, offering price and redemption price (Note 2) | | $ | 10.61 | | | $ | 10.63 | |
See accompanying notes to financial statements. |
34
ALAMBIC FUNDS
STATEMENTS OF ASSETS AND LIABILITIES
February 28, 2019 (Unaudited) (Continued) |
| | Alambic Mid
Cap Value Plus
Fund | | | Alambic Mid
Cap Growth Plus
Fund | |
ASSETS | | | | | | | | |
Investments in securities: | | | | | | | | |
At cost | | $ | 946,603 | | | $ | 960,254 | |
At value (Note 2) | | $ | 1,053,933 | | | $ | 1,085,618 | |
Cash | | | 42,076 | | | | 21,540 | |
Receivable for investment securities sold | | | 23,160 | | | | 18,276 | |
Dividends receivable | | | 1,077 | | | | 861 | |
Receivable from Adviser (Note 4) | | | 28,817 | | | | 28,384 | |
Other assets | | | 9,684 | | | | 9,378 | |
Total assets | | | 1,158,747 | | | | 1,164,057 | |
| | | | | | | | | |
LIABILITIES | | | | | | | | |
Payable for investment securities purchased | | | 22,158 | | | | 21,875 | |
Payable to administrator (Note 4) | | | 7,009 | | | | 7,009 | |
Other accrued expenses | | | 4,565 | | | | 4,565 | |
Total liabilities | | | 33,732 | | | | 33,449 | |
| | | | | | | | | |
NET ASSETS | | $ | 1,125,015 | | | $ | 1,130,608 | |
| | | | | | | | | |
NET ASSETS CONSIST OF: | | | | | | | | |
Paid-in capital | | $ | 1,060,583 | | | $ | 1,051,264 | |
Accumulated earnings | | | 64,432 | | | | 79,344 | |
NET ASSETS | | $ | 1,125,015 | | | $ | 1,130,608 | |
| | | | | | | | | |
Shares of beneficial interest outstanding (unlimited number of shares authorized, no par value) | | | 103,004 | | | | 103,248 | |
| | | | | | | | | |
Net asset value, offering price and redemption price (Note 2) | | $ | 10.92 | | | $ | 10.95 | |
See accompanying notes to financial statements. |
35
ALAMBIC FUNDS
STATEMENTS OF OPERATIONS
For the Six Months Ended February 28, 2019 (Unaudited) |
| | Alambic Small
Cap Value Plus
Fund | | | Alambic Small
Cap Growth Plus
Fund | |
INVESTMENT INCOME | | | | | | | | |
Dividend income | | $ | 20,959 | | | $ | 15,486 | |
| | | | | | | | | |
EXPENSES | | | | | | | | |
Professional fees | | | 20,459 | | | | 20,459 | |
Fund accounting fees (Note 4) | | | 15,146 | | | | 15,138 | |
Administration fees (Note 4) | | | 15,000 | | | | 15,000 | |
Investment advisory fees (Note 4) | | | 13,917 | | | | 13,106 | |
Compliance service fees (Note 4) | | | 6,000 | | | | 6,000 | |
Transfer agent fees (Note 4) | | | 6,000 | | | | 6,000 | |
Trustees' fees and expenses (Note 4) | | | 5,654 | | | | 5,654 | |
Registration and filing fees | | | 3,478 | | | | 3,471 | |
Custody and bank service fees | | | 2,729 | | | | 2,729 | |
Pricing costs | | | 1,871 | | | | 1,853 | |
Postage and supplies | | | 1,411 | | | | 1,401 | |
Insurance expense | | | 1,324 | | | | 1,337 | |
Printing of shareholder reports | | | 1,297 | | | | 1,297 | |
Other expenses | | | 3,894 | | | | 3,610 | |
Total expenses | | | 98,180 | | | | 97,055 | |
Less fee reductions and expense reimbursements by Adviser (Note 4) | | | (84,263 | ) | | | (83,948 | ) |
Net expenses | | | 13,917 | | | | 13,107 | |
| | | | | | | | | |
NET INVESTMENT INCOME | | | 7,042 | | | | 2,379 | |
| | | | | | | | | |
REALIZED AND UNREALIZED LOSSES ON INVESTMENTS | | | | | | | | |
Net realized losses from investment transactions | | | (112,128 | ) | | | (100,608 | ) |
Net change in unrealized appreciation (depreciation) on investments | | | (154,393 | ) | | | (155,807 | ) |
NET REALIZED AND UNREALIZED LOSSESON INVESTMENTS | | | (266,521 | ) | | | (256,415 | ) |
| | | | | | | | | |
NET DECREASE IN NET ASSETS RESULTINGFROM OPERATIONS | | $ | (259,479 | ) | | $ | (254,036 | ) |
See accompanying notes to financial statements. |
36
ALAMBIC FUNDS
STATEMENTS OF OPERATIONS
For the Six Months Ended February 28, 2019 (Unaudited) (Continued) |
| | Alambic Mid
Cap Value Plus
Fund | | | Alambic Mid
Cap Growth Plus
Fund | |
INVESTMENT INCOME | | | | | | | | |
Dividend income | | $ | 9,515 | | | $ | 5,843 | |
Foreign withholding taxes on dividends | | | (1 | ) | | | — | |
Total investment income | | | 9,514 | | | | 5,843 | |
| | | | | | | | | |
EXPENSES | | | | | | | | |
Professional fees | | | 20,459 | | | | 20,459 | |
Fund accounting fees (Note 4) | | | 14,054 | | | | 14,054 | |
Administration fees (Note 4) | | | 14,000 | | | | 14,000 | |
Compliance service fees (Note 4) | | | 6,000 | | | | 6,000 | |
Transfer agent fees (Note 4) | | | 6,000 | | | | 6,000 | |
Trustees' fees and expenses (Note 4) | | | 5,654 | | | | 5,654 | |
Investment advisory fees (Note 4) | | | 3,778 | | | | 3,780 | |
Registration and filing fees | | | 3,983 | | | | 3,432 | |
Custody and bank service fees | | | 2,729 | | | | 2,729 | |
Pricing costs | | | 1,508 | | | | 1,265 | |
Postage and supplies | | | 1,401 | | | | 1,326 | |
Insurance expense | | | 1,327 | | | | 1,327 | |
Printing of shareholder reports | | | 1,297 | | | | 1,297 | |
Other expenses | | | 3,722 | | | | 3,509 | |
Total expenses | | | 85,912 | | | | 84,832 | |
Less fee reductions and expense reimbursements by Adviser (Note 4) | | | (81,324 | ) | | | (80,242 | ) |
Net expenses | | | 4,588 | | | | 4,590 | |
| | | | | | | | | |
NET INVESTMENT INCOME | | | 4,926 | | | | 1,253 | |
| | | | | | | | | |
REALIZED AND UNREALIZED LOSSES ON INVESTMENTS | | | | | | | | |
Net realized losses from investment transactions | | | (47,812 | ) | | | (47,237 | ) |
Net change in unrealized appreciation (depreciation) on investments | | | (17,063 | ) | | | (13,994 | ) |
NET REALIZED AND UNREALIZED LOSSESON INVESTMENTS | | | (64,875 | ) | | | (61,231 | ) |
| | | | | | | | | |
NET DECREASE IN NET ASSETS RESULTINGFROM OPERATIONS | | $ | (59,949 | ) | | $ | (59,978 | ) |
See accompanying notes to financial statements. |
37
ALAMBIC SMALL CAP VALUE PLUS FUND
STATEMENTS OF CHANGES IN NET ASSETS |
| | Six Months
Ended
February 28,
2019
(Unaudited) | | | Year
Ended
August 31,
2018(a) | |
FROM OPERATIONS | | | | | | | | |
Net investment income | | $ | 7,042 | | | $ | 5,507 | |
Net realized gains (losses) from investment transactions | | | (112,128 | ) | | | 375,360 | |
Net change in unrealized appreciation (depreciation) on investments | | | (154,393 | ) | | | 162,454 | |
Net increase (decrease) in net assets resulting from operations | | | (259,479 | ) | | | 543,321 | |
| | | | | | | | | |
DISTRIBUTIONS TO SHAREHOLDERS (Note 2) | | | (332,068 | ) | | | (363,505 | ) |
| | | | | | | | | |
CAPITAL SHARE TRANSACTIONS | | | | | | | | |
Proceeds from shares sold | | | 25,000 | | | | 86,363 | |
Net asset value of shares issued in reinvestment of distributions to shareholders | | | 332,068 | | | | 363,505 | |
Payments for shares redeemed | | | (13,207 | ) | | | (69,662 | ) |
Net increase from capital share transactions | | | 343,861 | | | | 380,206 | |
| | | | | | | | | |
TOTAL INCREASE (DECREASE) IN NET ASSETS | | | (247,686 | ) | | | 560,022 | |
| | | | | | | | | |
NET ASSETS | | | | | | | | |
Beginning of period | | | 3,306,725 | | | | 2,746,703 | |
End of period | | $ | 3,059,039 | | | $ | 3,306,725 | |
| | | | | | | | | |
CAPITAL SHARES ACTIVITY | | | | | | | | |
Shares sold | | | 2,425 | | | | 6,593 | |
Shares issued in reinvestment of distributions to shareholders | | | 36,411 | | | | 29,943 | |
Shares redeemed | | | (1,448 | ) | | | (5,335 | ) |
Net increase in shares outstanding | | | 37,388 | | | | 31,201 | |
Shares outstanding at beginning of period | | | 250,845 | | | | 219,644 | |
Shares outstanding at end of period | | | 288,233 | | | | 250,845 | |
(a) | The presentation of Distributions to Shareholders has been updated to reflect the changes prescribed in amendments to Regulations S-X, effective November 5, 2018 (Note 2). For the year ended August 31, 2018, distributions to shareholders consisted of $4,978 and $358,527 from net investment income and from net realized gains, respectively. As of August 31, 2018, distributions in excess of net investment income was ($2,347). |
See accompanying notes to financial statements. |
38
ALAMBIC SMALL CAP GROWTH PLUS FUND
STATEMENTS OF CHANGES IN NET ASSETS |
| | Six Months
Ended
February 28,
2019
(Unaudited) | | | Year
Ended
August 31,
2018(a) | |
FROM OPERATIONS | | | | | | | | |
Net investment income (loss) | | $ | 2,379 | | | $ | (6,682 | ) |
Net realized gains (losses) from investment transactions | | | (100,608 | ) | | | 479,597 | |
Net change in unrealized appreciation (depreciation) on investments | | | (155,807 | ) | | | 81,190 | |
Net increase (decrease) in net assets resulting from operations | | | (254,036 | ) | | | 554,105 | |
| | | | | | | | | |
DISTRIBUTIONS TO SHAREHOLDERS (Note 2) | | | (387,087 | ) | | | (358,457 | ) |
| | | | | | | | | |
CAPITAL SHARE TRANSACTIONS | | | | | | | | |
Net asset value of shares issued in reinvestment of distributions to shareholders | | | 387,087 | | | | 358,457 | |
Payments for shares redeemed | | | (4,472 | ) | | | (35,512 | ) |
Net increase from capital share transactions | | | 382,615 | | | | 322,945 | |
| | | | | | | | | |
TOTAL INCREASE (DECREASE) IN NET ASSETS | | | (258,508 | ) | | | 518,593 | |
| | | | | | | | | |
NET ASSETS | | | | | | | | |
Beginning of period | | | 3,137,423 | | | | 2,618,830 | |
End of period | | $ | 2,878,915 | | | $ | 3,137,423 | |
| | | | | | | | | |
CAPITAL SHARES ACTIVITY | | | | | | | | |
Shares issued in reinvestment of distributions to shareholders | | | 42,351 | | | | 28,954 | |
Shares redeemed | | | (371 | ) | | | (2,675 | ) |
Net increase in shares outstanding | | | 41,980 | | | | 26,279 | |
Shares outstanding at beginning of period | | | 228,849 | | | | 202,570 | |
Shares outstanding at end of period | | | 270,829 | | | | 228,849 | |
(a) | The presentation of Distributions to Shareholders has been updated to reflect the changes prescribed in amendments to Regulations S-X, effective November 5, 2018 (Note 2). For the year ended August 31, 2018, distributions to shareholders consisted of $358,457 from net realized gains. As of August 31, 2018, accumulated net investment loss was ($6,623). |
See accompanying notes to financial statements. |
39
ALAMBIC MID CAP VALUE PLUS FUND
STATEMENTS OF CHANGES IN NET ASSETS | | | | |
| | Six Months
Ended
February 28,
2019
(Unaudited) | | | Year
Ended
August 31,
2018(a) | |
FROM OPERATIONS | | | | | | | | |
Net investment income | | $ | 4,926 | | | $ | 9,430 | |
Net realized gains (losses) from investment transactions | | | (47,812 | ) | | | 22,286 | |
Net change in unrealized appreciation (depreciation) on investments | | | (17,063 | ) | | | 91,463 | |
Net increase (decrease) in net assets resulting from operations | | | (59,949 | ) | | | 123,179 | |
| | | | | | | | | |
DISTRIBUTIONS TO SHAREHOLDERS (Note 2) | | | (17,902 | ) | | | (9,187 | ) |
| | | | | | | | | |
CAPITAL SHARE TRANSACTIONS | | | | | | | | |
Proceeds from shares sold | | | 9,975 | | | | 64,923 | |
Net asset value of shares issued in reinvestment of distributions to shareholders | | | 17,902 | | | | 9,187 | |
Net increase from capital share transactions | | | 27,877 | | | | 74,110 | |
| | | | | | | | | |
TOTAL INCREASE (DECREASE) IN NET ASSETS | | | (49,974 | ) | | | 188,102 | |
| | | | | | | | | |
NET ASSETS | | | | | | | | |
Beginning of period | | | 1,174,989 | | | | 986,887 | |
End of period | | $ | 1,125,015 | | | $ | 1,174,989 | |
| | | | | | | | | |
CAPITAL SHARES ACTIVITY | | | | | | | | |
Shares sold | | | 919 | | | | 5,507 | |
Shares issued in reinvestment of distributions to shareholders | | | 1,851 | | | | 795 | |
Net increase in shares outstanding | | | 2,770 | | | | 6,302 | |
Shares outstanding at beginning of period | | | 100,234 | | | | 93,932 | |
Shares outstanding at end of period | | | 103,004 | | | | 100,234 | |
(a) | The presentation of Distributions to Shareholders has been updated to reflect the changes prescribed in amendments to Regulations S-X, effective November 5, 2018 (Note 2). For the year ended August 31, 2018, distributions to shareholders consisted of $9,187 from net investment income. As of August 31, 2018, accumulated net investment income was $6,697. |
See accompanying notes to financial statements. |
40
ALAMBIC MID CAP GROWTH PLUS FUND
STATEMENTS OF CHANGES IN NET ASSETS | | | | |
| | Six Months
Ended
February 28,
2019
(Unaudited) | | | Year
Ended
August 31,
2018(a) | |
FROM OPERATIONS | | | | | | | | |
Net investment income | | $ | 1,253 | | | $ | 3,922 | |
Net realized gains (losses) from investment transactions | | | (47,237 | ) | | | 85,972 | |
Net change in unrealized appreciation (depreciation) on investments | | | (13,994 | ) | | | 70,519 | |
Net increase (decrease) in net assets resulting from operations | | | (59,978 | ) | | | 160,413 | |
| | | | | | | | | |
DISTRIBUTIONS TO SHAREHOLDERS (Note 2) | | | (88,810 | ) | | | (2,819 | ) |
| | | | | | | | | |
CAPITAL SHARE TRANSACTIONS | | | | | | | | |
Net asset value of shares issued in reinvestment of distributions to shareholders | | | 88,810 | | | | 2,819 | |
| | | | | | | | | |
TOTAL INCREASE (DECREASE) IN NET ASSETS | | | (59,978 | ) | | | 160,413 | |
| | | | | | | | | |
NET ASSETS | | | | | | | | |
Beginning of period | | | 1,190,586 | | | | 1,030,173 | |
End of period | | $ | 1,130,608 | | | $ | 1,190,586 | |
| | | | | | | | | |
CAPITAL SHARES ACTIVITY | | | | | | | | |
Shares issued in reinvestment of distributions to shareholders | | | 9,368 | | | | 234 | |
Net increase in shares outstanding | | | 9,368 | | | | 234 | |
Shares outstanding at beginning of period | | | 93,880 | | | | 93,646 | |
Shares outstanding at end of period | | | 103,248 | | | | 93,880 | |
(a) | The presentation of Distributions to Shareholders has been updated to reflect the changes prescribed in amendments to Regulations S-X, effective November 5, 2018 (Note 2). For the year ended August 31, 2018, distributions to shareholders consisted of $2,519 and $300 from net investment income and from net realized gains, respectively. As of August 31, 2018, accumulated net investment income was $3,057. |
See accompanying notes to financial statements. |
41
ALAMBIC SMALL CAP VALUE PLUS FUND
FINANCIAL HIGHLIGHTS |
Per Share Data for a Share Outstanding Throughout Each Period: |
| | Six Months
Ended
February 28,
2019
(Unaudited) | | | Year
Ended
August 31,
2018 | | | Year
Ended
August 31,
2017 | | | Period
Ended
August 31,
2016(a) | |
Net asset value at beginning of period | | $ | 13.18 | | | $ | 12.51 | | | $ | 11.60 | | | $ | 10.00 | |
| | | | | | | | | | | | | | | | | |
Income (loss) from investment operations: | | | | | | | | | | | | | | | | |
Net investment income | | | 0.03 | | | | 0.03 | | | | 0.01 | | | | 0.05 | |
Net realized and unrealized gains (losses) on investments | | | (1.28 | ) | | | 2.25 | | | | 0.94 | | | | 1.58 | |
Total from investment operations | | | (1.25 | ) | | | 2.28 | | | | 0.95 | | | | 1.63 | |
| | | | | | | | | | | | | | | | | |
Less distributions: | | | | | | | | | | | | | | | | |
From net investment income | | | — | | | | (0.02 | ) | | | (0.04 | ) | | | (0.03 | ) |
From net realized gains | | | (1.32 | ) | | | (1.59 | ) | | | — | | | | — | |
Total distributions | | | (1.32 | ) | | | (1.61 | ) | | | (0.04 | ) | | | (0.03 | ) |
| | | | | | | | | | | | | | | | | |
Net asset value at end of period | | $ | 10.61 | | | $ | 13.18 | | | $ | 12.51 | | | $ | 11.60 | |
| | | | | | | | | | | | | | | | | |
Total return(b) | | | (7.81 | %)(c) | | | 19.36 | % | | | 8.20 | % | | | 16.31 | %(c) |
| | | | | | | | | | | | | | | | | |
Net assets at end of period (000's) | | $ | 3,059 | | | $ | 3,307 | | | $ | 2,747 | | | $ | 2,567 | |
| | | | | | | | | | | | | | | | | |
Ratios/supplemental data: | | | | | | | | | | | | | | | | |
Ratio of total expenses to average net assets | | | 6.70 | %(d) | | | 5.80 | % | | | 6.65 | % | | | 7.24 | %(d) |
| | | | | | | | | | | | | | | | | |
Ratio of net expenses to average net assets(e) | | | 0.95 | %(d) | | | 0.95 | % | | | 1.18 | % | | | 1.20 | %(d) |
| | | | | | | | | | | | | | | | | |
Ratio of net investment income to average net assets(e) | | | 0.48 | %(d) | | | 0.18 | % | | | 0.04 | % | | | 0.53 | %(d) |
| | | | | | | | | | | | | | | | | |
Portfolio turnover rate | | | 236 | %(c) | | | 225 | % | | | 226 | % | | | 350 | %(c) |
(a) | Represents the period from the commencement of operations (September 1, 2015) through August 31, 2016. |
(b) | Total return is a measure of the change in value of an investment in the Fund over the periods covered. The returns shown do not reflect the deduction of taxes a shareholder would pay on Fund distributions, if any, or the redemption of Fund shares. The total returns would be lower if the Adviser had not reduced advisory fees and reimbursed expenses (Note 4). |
(c) | Not annualized. |
(d) | Annualized. |
(e) | Ratio was determined after advisory fees reductions and expense reimbursements (Note 4). |
See accompanying notes to financial statements. |
42
ALAMBIC SMALL CAP GROWTH PLUS FUND
FINANCIAL HIGHLIGHTS |
Per Share Data for a Share Outstanding Throughout Each Period: |
| | Six Months
Ended
February 28,
2019
(Unaudited) | | | Year
Ended
August 31,
2018 | | | Year
Ended
August 31,
2017 | | | Period
Ended
August 31,
2016 (a) | |
Net asset value at beginning of period | | $ | 13.71 | | | $ | 12.93 | | | $ | 11.14 | | | $ | 10.00 | |
| | | | | | | | | | | | | | | | | |
Income (loss) from investment operations: | | | | | | | | | | | | | | | | |
Net investment income (loss) | | | 0.01 | | | | (0.02 | ) | | | (0.06 | ) | | | (0.01 | ) |
Net realized and unrealized gains (losses) on investments | | | (1.40 | ) | | | 2.58 | | | | 1.85 | | | | 1.15 | |
Total from investment operations | | | (1.39 | ) | | | 2.56 | | | | 1.79 | | | | 1.14 | |
| | | | | | | | | | | | | | | | | |
Less distributions: | | | | | | | | | | | | | | | | |
From net realized gains | | | (1.69 | ) | | | (1.78 | ) | | | — | | | | — | |
| | | | | | | | | | | | | | | | | |
Net asset value at end of period | | $ | 10.63 | | | $ | 13.71 | | | $ | 12.93 | | | $ | 11.14 | |
| | | | | | | | | | | | | | | | | |
Total return(b) | | | (8.09 | %)(c) | | | 21.31 | % | | | 16.07 | % | | | 11.40 | %(c) |
| | | | | | | | | | | | | | | | | |
Net assets at end of period (000's) | | $ | 2,879 | | | $ | 3,137 | | | $ | 2,619 | | | $ | 2,246 | |
| | | | | | | | | | | | | | | | | |
Ratios/supplemental data: | | | | | | | | | | | | | | | | |
Ratio of total expenses to average net assets | | | 7.04 | %(d) | | | 6.09 | % | | | 7.22 | % | | | 8.89 | %(d) |
| | | | | | | | | | | | | | | | | |
Ratio of net expenses to average net assets(e) | | | 0.95 | %(d) | | | 0.95 | % | | | 1.18 | % | | | 1.20 | %(d) |
| | | | | | | | | | | | | | | | | |
Ratio of net investment income (loss) to average net assets(e) | | | 0.17 | %(d) | | | (0.23 | %) | | | (0.50 | %) | | | (0.16 | %)(d) |
| | | | | | | | | | | | | | | | | |
Portfolio turnover rate | | | 215 | %(c) | | | 220 | % | | | 199 | % | | | 309 | %(c) |
(a) | Represents the period from the commencement of operations (December 29, 2015) through August 31, 2016. |
(b) | Total return is a measure of the change in value of an investment in the Fund over the periods covered. The returns shown do not reflect the deduction of taxes a shareholder would pay on Fund distributions, if any, or the redemption of Fund shares. The total returns would be lower if the Adviser had not reduced advisory fees and reimbursed expenses (Note 4). |
(c) | Not annualized. |
(d) | Annualized. |
(e) | Ratio was determined after advisory fees reductions and expense reimbursements (Note 4). |
See accompanying notes to financial statements. |
43
ALAMBIC MID CAP VALUE PLUS FUND
FINANCIAL HIGHLIGHTS |
Per Share Data for a Share Outstanding Throughout Each Period: |
| | Six Months
Ended
February 28,
2019
(Unaudited) | | | Year
Ended
August 31,
2018 | | | Period
Ended
August 31,
2017 (a) | |
Net asset value at beginning of period | | $ | 11.72 | | | $ | 10.51 | | | $ | 10.00 | |
| | | | | | | | | | | | | |
Income (loss) from investment operations: | | | | | | | | | | | | |
Net investment income | | | 0.05 | | | | 0.10 | | | | 0.07 | |
Net realized and unrealized gains (losses) on investments | | | (0.67 | ) | | | 1.21 | | | | 0.44 | |
Total from investment operations | | | (0.62 | ) | | | 1.31 | | | | 0.51 | |
| | | | | | | | | | | | | |
Less distributions: | | | | | | | | | | | | |
From net investment income | | | (0.07 | ) | | | (0.10 | ) | | | — | |
From net realized gains | | | (0.11 | ) | | | — | | | | — | |
Total distributions | | | (0.18 | ) | | | (0.10 | ) | | | — | |
| | | | | | | | | | | | | |
Net asset value at end of period | | $ | 10.92 | | | $ | 11.72 | | | $ | 10.51 | |
| | | | | | | | | | | | | |
Total return(b) | | | (5.11 | %)(c) | | | 12.46 | % | | | 5.10 | %(c) |
| | | | | | | | | | | | | |
Net assets at end of period (000’s) | | $ | 1,125 | | | $ | 1,175 | | | $ | 987 | |
| | | | | | | | | | | | | |
Ratios/supplemental data: | | | | | | | | | | | | |
Ratio of total expenses to average net assets | | | 15.92 | %(d) | | | 13.87 | % | | | 17.03 | %(d) |
| | | | | | | | | | | | | |
Ratio of net expenses to average net assets(e) | | | 0.85 | %(d) | | | 0.85 | % | | | 0.85 | %(d) |
| | | | | | | | | | | | | |
Ratio of net investment income to average net assets(e) | | | 0.91 | %(d) | | | 0.85 | % | | | 1.22 | %(d) |
| | | | | | | | | | | | | |
Portfolio turnover rate | | | 167 | %(c) | | | 184 | % | | | 239 | %(c) |
(a) | Represents the period from the commencement of operations (December 29, 2016) through August 31, 2017. |
(b) | Total return is a measure of the change in value of an investment in the Fund over the periods covered. The returns shown do not reflect the deduction of taxes a shareholder would pay on Fund distributions, if any, or the redemption of Fund shares. The total returns would be lower if the Adviser had not reduced advisory fees and reimbursed expenses (Note 4). |
(c) | Not annualized. |
(d) | Annualized. |
(e) | Ratio was determined after advisory fees reductions and expense reimbursements (Note 4). |
See accompanying notes to financial statements. |
44
ALAMBIC MID CAP GROWTH PLUS FUND
FINANCIAL HIGHLIGHTS |
Per Share Data for a Share Outstanding Throughout Each Period: |
| | Six Months
Ended
February 28,
2019
(Unaudited) | | | Year
Ended
August 31,
2018 | | | Period
Ended
August 31,
2017 (a) | |
Net asset value at beginning of period | | $ | 12.68 | | | $ | 11.00 | | | $ | 10.00 | |
| | | | | | | | | | | | | |
Income (loss) from investment operations: | | | | | | | | | | | | |
Net investment income | | | 0.01 | | | | 0.04 | | | | 0.02 | |
Net realized and unrealized gains (losses) on investments | | | (0.79 | ) | | | 1.67 | | | | 0.98 | |
Total from investment operations | | | (0.78 | ) | | | 1.71 | | | | 1.00 | |
| | | | | | | | | | | | | |
Less distributions: | | | | | | | | | | | | |
From net investment income | | | (0.03 | ) | | | (0.03 | ) | | | — | |
From net realized gains | | | (0.92 | ) | | | (0.00 | )(b) | | | — | |
Total distributions | | | (0.95 | ) | | | (0.03 | ) | | | — | |
| | | | | | | | | | | | | |
Net asset value at end of period | | $ | 10.95 | | | $ | 12.68 | | | $ | 11.00 | |
| | | | | | | | | | | | | |
Total return(c) | | | (5.03 | %)(d) | | | 15.56 | % | | | 10.00 | %(d) |
| | | | | | | | | | | | | |
Net assets at end of period (000’s) | | $ | 1,131 | | | $ | 1,191 | | | $ | 1,030 | |
| | | | | | | | | | | | | |
Ratios/supplemental data: | | | | | | | | | | | | |
Ratio of total expenses to average net assets | | | 15.71 | %(e) | | | 13.60 | % | | | 16.22 | %(e) |
| | | | | | | | | | | | | |
Ratio of net expenses to average net assets(f) | | | 0.85 | %(e) | | | 0.85 | % | | | 0.85 | %(e) |
| | | | | | | | | | | | | |
Ratio of net investment income to average net assets(f) | | | 0.23 | %(e) | | | 0.35 | % | | | 0.30 | %(e) |
| | | | | | | | | | | | | |
Portfolio turnover rate | | | 169 | %(d) | | | 183 | % | | | 217 | %(d) |
(a) | Represents the period from the commencement of operations (December 29, 2016) through August 31, 2017. |
(b) | Amount rounds to less than $0.01 per share. |
(c) | Total return is a measure of the change in value of an investment in the Fund over the periods covered. The returns shown do not reflect the deduction of taxes a shareholder would pay on Fund distributions, if any, or the redemption of Fund shares. The total returns would be lower if the Adviser had not reduced advisory fees and reimbursed expenses (Note 4). |
(d) | Not annualized. |
(e) | Annualized. |
(f) | Ratio was determined after advisory fees reductions and expense reimbursements (Note 4). |
See accompanying notes to financial statements. |
45
ALAMBIC FUNDS
NOTES TO FINANCIAL STATEMENTS
February 28, 2019 (Unaudited)
1. Organization
Alambic Small Cap Value Plus Fund, Alambic Small Cap Growth Plus Fund, Alambic Mid Cap Value Plus Fund and Alambic Mid Cap Growth Plus Fund (individually, a “Fund” and collectively, the “Funds”) are each a diversified series of Ultimus Managers Trust (the “Trust”), an open-end investment company established as an Ohio business trust under a Declaration of Trust dated February 28, 2012. Other series of the Trust are not incorporated in this report.
The investment objective of each Fund is to seek long-term capital appreciation.
2. Significant Accounting Policies
In August 2018, the U.S. Securities and Exchange Commission (the “SEC”) adopted regulations that eliminated or amended disclosure requirements that were redundant or outdated in light of changes in SEC requirements, accounting principles generally accepted in the United States of America (“GAAP”), International Financial Reporting Standards or changes in technology or the business environment. These regulations were effective November 5, 2018, and the Funds are complying with them effective with these financial statements.
The Funds follow accounting and reporting guidance under Financial Accounting Standards Board (“FASB”) Accounting Standards Codification (“ASC”) Topic 946, “Financial Services – Investment Companies.” The following is a summary of significant accounting policies followed by the Funds. These policies are in conformity with GAAP.
Newaccountingpronouncement – In August 2018, FASB issued Accounting Standards Update No. 2018-13 (“ASU 2018-13”), “Disclosure Framework – Changes to the Disclosure Requirements for Fair Value Measurement,” which amends the fair value measurement disclosure requirements of ASC Topic 820 (“ASC 820”), “Fair Value Measurement.” ASU 2018-13 includes new, eliminated, and modified disclosure requirements for ASC 820. In addition, ASU 2018-13 clarifies that materiality is an appropriate consideration when evaluating disclosure requirements. ASU 2018-13 is effective for fiscal years beginning after December 15, 2019, including interim periods therein. Early adoption is permitted and the Funds have adopted ASU 2018-13 with these financial statements.
Securities valuation – Each Fund values its portfolio securities at market value as of the close of regular trading on the New York Stock Exchange (the “NYSE”) (normally 4:00 p.m. Eastern time) on each business day the NYSE is open for business. The Funds value their listed securities, including common stocks, on the basis of the security’s last sale price on the security’s primary exchange, if available, otherwise at the exchange’s most recently quoted mean price. NASDAQ-listed securities are valued at the NASDAQ Official Closing Price. The Funds value securities traded in the over-the-counter market at the last sale price, if available, otherwise at the most recently quoted mean price. When using a quoted price and when the market for the security is considered active, the security will be classified as Level 1 within the fair value hierarchy (see below). In the event that market quotations are not readily available or are considered unreliable due to market or other events, the Funds value their securities and other assets at fair value pursuant to procedures established by and under the direction
46
ALAMBIC FUNDS
NOTES TO FINANCIAL STATEMENTS (Continued) |
of the Board of Trustees (the “Board”) of the Trust. Under these procedures, the securities will be classified as Level 2 or 3 within the fair value hierarchy, depending on the inputs used. Unavailable or unreliable market quotes may be due to the following factors: a substantial bid-ask spread; infrequent sales resulting in stale prices; insufficient trading volume; small trade sizes; a temporary lapse in any reliable pricing source; and actions of the securities or futures markets, such as the suspension or limitation of trading. As a result, the prices of securities used to calculate each Fund’s net asset value (“NAV”) may differ from quoted or published prices for the same securities.
GAAP establishes a single authoritative definition of fair value, sets out a framework for measuring fair value, and requires additional disclosures about fair value measurements.
Various inputs are used in determining the value of each Fund’s investments. These inputs are summarized in the three broad levels listed below:
● | Level 1 – quoted prices in active markets for identical securities |
● | Level 2 – other significant observable inputs |
● | Level 3 – significant unobservable inputs |
The inputs or methods used for valuing securities are not necessarily an indication of the risks associated with investing in those securities. The inputs used to measure fair value may fall into different levels of the fair value hierarchy. In such cases, for disclosure purposes, the level in the fair value hierarchy within which the fair value measurement falls in its entirety is determined based on the lowest level input that is significant to the fair value measurement.
The following is a summary of the inputs used to value the Funds’ investments as of February 28, 2019:
Alambic Small Cap Value Plus Fund | | Level 1 | | | Level 2 | | | Level 3 | | | Total | |
Common Stocks | | $ | 2,920,410 | | | $ | — | | | $ | — | | | $ | 2,920,410 | |
Rights | | | — | | | | — | | | | 5 | | | | 5 | |
Total | | $ | 2,920,410 | | | $ | — | | | $ | 5 | | | $ | 2,920,415 | |
Alambic Small Cap Growth Plus Fund | | Level 1 | | | Level 2 | | | Level 3 | | | Total | |
Common Stocks | | $ | 2,818,624 | | | $ | — | | | $ | — | | | $ | 2,818,624 | |
Alambic Mid Cap Value Plus Fund | | Level 1 | | | Level 2 | | | Level 3 | | | Total | |
Common Stocks | | $ | 1,053,927 | | | $ | — | | | $ | — | | | $ | 1,053,927 | |
Rights | | | — | | | | — | | | | 6 | | | | 6 | |
Total | | $ | 1,053,927 | | | $ | — | | | $ | 6 | | | $ | 1,053,933 | |
47
ALAMBIC FUNDS
NOTES TO FINANCIAL STATEMENTS (Continued) |
Alambic Mid Cap Growth Plus Fund | | Level 1 | | | Level 2 | | | Level 3 | | | Total | |
Common Stocks | | $ | 1,085,618 | | | $ | — | | | $ | — | | | $ | 1,085,618 | |
Refer to the Funds’ Schedules of Investments for a listing of the common stocks by industry type. There were no Level 3 securities held by Alambic Small Cap Growth Plus Fund and Alambic Mid Cap Growth Plus Fund as of February 28, 2019.
The following is a reconciliation of Level 3 securities of Alambic Small Cap Value Plus Fund and Alambic Mid Cap Value Plus Fund for which significant unobservable inputs were used to determine fair value between August 31, 2018 and February 28, 2019.
| | Alambic Small
Cap Value Plus
Fund | | | Alambic Mid
Cap Value Plus
Fund | |
Balance as of August 31, 2018 | | $ | 5 | | | $ | 6 | |
Unrealized appreciation (depreciation) | | | — | | | | — | |
Balance as of February 28, 2019 | | $ | 5 | | | $ | 6 | |
The following table summarizes the valuation techniques used and unobservable inputs developed by the Board to determine the fair value of the Level 3 investments:
Alambic Small Cap Value Plus Fund |
| | Fair Value at
02/28/2019 | | Valuation
Technique | Unobservable
Input | | Range | | Impact to Valuation from an
Decrease in Input** |
Rights | | $ | 5 | | Discount on Future Cash Flows | Estimate of Future Cash Flows | | | 100 | % | Increase |
Alambic Mid Cap Value Plus Fund |
| | Fair Value at
02/28/2019 | | Valuation
Technique | Unobservable
Input | | Range | | Impact to Valuation from an
Decrease in Input** |
Rights | | $ | 6 | | Discount on Future Cash Flows | Estimate of Future Cash Flows | | | 100 | % | Increase |
** | This column represents the directional change in fair value of the Level 3 investments that would result in an increase from the corresponding input. A decrease to the unobservable input would have the opposite effect. Significant increases and decreases in these inputs in isolation could result in significantly higher or lower fair value measurements. |
48
ALAMBIC FUNDS
NOTES TO FINANCIAL STATEMENTS (Continued) |
Cash account – Each Fund’s cash is held in a bank account with balances which may exceed the amount covered by federal deposit insurance. As of February 28, 2019, the cash balances reflected on the Statements of Assets and Liabilities for each Fund represent the amount held in a deposit sweep account.
Share valuation – The NAV per share of each Fund is calculated daily by dividing the total value of its assets, less liabilities, by the number of shares outstanding. The offering price and redemption price per share of each Fund is equal to the NAV per share.
Investment income – Dividend income is recorded on the ex-dividend date. Interest income, if any, is accrued as earned. Withholding taxes on foreign dividends have been recorded for in accordance with the Funds’ understanding of the applicable country’s tax rules and rates.
Investments in REITs – With respect to each Fund, dividend income is recorded based on the income included in distributions received from its REIT investments using published REIT reclassifications. The actual amounts of income, return of capital, and capital gains are only determined by each REIT after its fiscal year end.
Investment transactions – Investment transactions are accounted for on the trade date. Realized gains and losses on investments sold are determined on a specific identification basis.
Common expenses – Common expenses of the Trust are allocated among the Funds and the other series of the Trust based on the relative net assets of each series, the number of series in the Trust, or the nature of the services performed and the relative applicability to each series.
Distributions to shareholders – The Funds distribute to shareholders any net investment income dividends and net realized capital gains distributions at least once each year. The amount of such dividends and distributions are determined in accordance with federal income tax regulations, which may differ from GAAP. Dividends and distributions to shareholders are recorded on the ex-dividend date. The tax character of distributions paid by each Fund to shareholders during the periods ended February 28, 2019 and August 31, 2018 was as follows:
| Period
Ended | | Ordinary
Income | | | Long-Term
Capital Gains | | | Total
Distributions | |
Alambic Small Cap Value Plus Fund | 2/28/2019 | | $ | — | | | $ | 332,068 | | | $ | 332,068 | |
| | 8/31/2018 | | $ | 4,978 | | | $ | 358,527 | | | $ | 363,505 | |
Alambic Small Cap Growth Plus Fund | 2/28/2019 | | $ | — | | | $ | 387,087 | | | $ | 387,087 | |
| | 8/31/2018 | | $ | — | | | $ | 358,457 | | | $ | 358,457 | |
Alambic Mid Cap Value Plus Fund | 2/28/2019 | | $ | 6,706 | | | $ | 11,196 | | | $ | 17,902 | |
| | 8/31/2018 | | $ | 9,187 | | | $ | — | | | $ | 9,187 | |
Alambic Mid Cap Growth Plus Fund | 2/28/2019 | | $ | 3,060 | | | $ | 85,750 | | | $ | 88,810 | |
| | 8/31/2018 | | $ | 2,819 | | | $ | — | | | $ | 2,819 | |
49
ALAMBIC FUNDS
NOTES TO FINANCIAL STATEMENTS (Continued) |
Estimates – The preparation of financial statements in conformity with GAAP requires management to make estimates and assumptions which affect the reported amounts of assets and liabilities and disclosure of contingent assets and liabilities as of the date of the financial statements and the reported amounts of income and expenses during the reporting period. Actual results could differ from those estimates.
Federal income tax – Each Fund has qualified and intends to continue to qualify as a regulated investment company under the Internal Revenue Code of 1986, as amended (the “Code”). Qualification generally will relieve each Fund of liability for federal income taxes to the extent 100% of its net investment income and net realized capital gains are distributed in accordance with the Code.
In order to avoid imposition of the excise tax applicable to regulated investment companies, it is also each Fund’s intention to declare as dividends in each calendar year at least 98% of its net investment income (earned during the calendar year) and 98.2% of its net realized capital gains (earned during the 12 months ended October 31) plus undistributed amounts from prior years.
The following information is computed on a tax basis for each item as of February 28, 2019:
| | Alambic Small
Cap Value Plus
Fund | | | Alambic Small
Cap Growth Plus
Fund | | | Alambic
Mid Cap Value
Plus Fund | | | Alambic
Mid Cap Growth
Plus Fund | |
Tax cost of portfolio investments | | $ | 2,677,185 | | | $ | 2,505,463 | | | $ | 946,603 | | | $ | 960,261 | |
Gross unrealized appreciation | | $ | 306,163 | | | $ | 364,537 | | | $ | 115,470 | | | $ | 133,088 | |
Gross unrealized depreciation | | | (62,933 | ) | | | (51,376 | ) | | | (8,140 | ) | | | (7,731 | ) |
Net unrealized appreciation | | | 243,230 | | | | 313,161 | | | | 107,330 | | | | 125,357 | |
Accumulated ordinary income (loss) | | | 4,695 | | | | (4,244 | ) | | | 4,917 | | | | 1,250 | |
Other losses | | | (112,707 | ) | | | (122,713 | ) | | | (47,815 | ) | | | (47,263 | ) |
Accumulated earnings | | $ | 135,218 | | | $ | 186,204 | | | $ | 64,432 | | | $ | 79,344 | |
The difference between the federal income tax cost of portfolio investments and the financial statement cost of portfolio investments for Alambic Small Cap Value Plus Fund, Alambic Small Cap Growth Plus Fund and Alambic Mid Cap Growth Plus Fund is due to certain timing differences in the recognition of capital gains or losses under income tax regulations and GAAP. These “book/tax” differences are temporary in nature and are due primarily to the tax deferral of losses on wash sales.
The Funds recognize the tax benefits or expenses of uncertain tax positions only when the position is “more likely than not” of being sustained assuming examination by tax authorities. Management has reviewed each Fund’s tax positions for the current and all open tax years (generally, three years) and has concluded that no provision for unrecognized tax benefits or expenses is required in these financial statements. The Funds identify their major tax jurisdiction as U.S. Federal.
50
ALAMBIC FUNDS
NOTES TO FINANCIAL STATEMENTS (Continued) |
3. Investment Transactions
During the six months ended February 28, 2019, costs of purchases and proceeds from sales of investment securities, other than short-term investments, were as follows:
| | Alambic Small
Cap Value Plus
Fund | | | Alambic Small
Cap Growth Plus
Fund | | | Alambic
Mid Cap Value
Plus Fund | | | Alambic
Mid Cap Growth
Plus Fund | |
Purchases of investment securities | | $ | 6,813,595 | | | $ | 5,964,684 | | | $ | 1,751,750 | | | $ | 1,800,256 | |
Proceeds from sales of investment securities | | $ | 6,779,089 | | | $ | 5,920,330 | | | $ | 1,721,291 | | | $ | 1,776,631 | |
4. Transactions with Related Parties
INVESTMENT ADVISORY AGREEMENT
Each Fund’s investments are managed by Alambic Investment Management, L.P. (the “Adviser”) pursuant to the terms of an Investment Advisory Agreement. Under the Investment Advisory Agreement, each Fund pays the Adviser an investment advisory fee, computed and accrued daily and paid monthly, at the annual rate of 0.95% of average daily net assets with respect to Alambic Small Cap Value Plus Fund and Alambic Small Cap Growth Plus Fund and at the annual rate of 0.70% of average daily net assets with respect to Alambic Mid Cap Value Plus Fund and Alambic Mid Cap Growth Plus Fund.
Pursuant to an Expense Limitation Agreement (the “ELA”) between each Fund and the Adviser, the Adviser has contractually agreed, until December 31, 2019, to reduce investment advisory fees and reimburse other expenses to the extent necessary to limit total annual operating expenses (exclusive of brokerage costs; taxes; interest; borrowing costs such as interest and dividend expense on securities sold short; costs to organize the Fund; acquired fund fees and expenses; extraordinary expenses such as litigation and merger or reorganization costs; and other expenses not incurred in the ordinary course of the Fund’s business) to 0.95% of average daily net assets with respect to Alambic Small Cap Value Plus Fund and Alambic Small Cap Growth Plus Fund and to 0.85% of average daily net assets with respect to Alambic Mid Cap Value Plus Fund and Alambic Mid Cap Growth Plus Fund.
Accordingly, during the six months ended February 28, 2019, the Adviser did not collect any of its investment advisory fees and reimbursed other operating expenses totaling $70,346, $70,842, $77,546 and $76,462 with respect to Alambic Small Cap Value Plus Fund, Alambic Small Cap Growth Plus Fund, Alambic Mid Cap Value Plus Fund and Alambic Mid Cap Growth Plus Fund, respectively.
Under the terms of the ELA, investment advisory fee reductions and expense reimbursements by the Adviser are subject to repayment by each Fund for a period of three years after such fees and expenses were incurred, provided the repayments do not cause total annual operating expenses to exceed the lesser of (i) the expense limitation then in effect, if any, and (ii) the
51
ALAMBIC FUNDS
NOTES TO FINANCIAL STATEMENTS (Continued) |
expense limitations in effect at the time the expenses to be repaid were incurred. As of February 28, 2019, the Adviser may seek repayment of investment advisory fee reductions and expense reimbursements totaling $451,370, $444,662, $312,030 and $309,732 with respect to Alambic Small Cap Value Plus Fund, Alambic Small Cap Growth Plus Fund, Alambic Mid Cap Value Plus Fund and Alambic Mid Cap Growth Plus Fund, respectively, no later than the dates as stated below:
| | Alambic Small
Cap Value Plus
Fund | | | Alambic Small
Cap Growth Plus
Fund | | | Alambic
Mid Cap Value
Plus Fund | | | Alambic
Mid Cap Growth
Plus Fund | |
August 31, 2019 | | $ | 63,294 | | | $ | 60,086 | | | $ | — | | | $ | — | |
August 31, 2020 | | | 151,500 | | | | 150,695 | | | | 85,992 | | | | 86,151 | |
August 31, 2021 | | | 152,313 | | | | 149,933 | | | | 144,714 | | | | 143,339 | |
February 28, 2022 | | | 84,263 | | | | 83,948 | | | | 81,324 | | | | 80,242 | |
| | | $ | 451,370 | | | $ | 444,662 | | | $ | 312,030 | | | $ | 309,732 | |
OTHER SERVICE PROVIDERS
Ultimus Fund Solutions, LLC (“Ultimus”) provides administration, fund accounting, compliance and transfer agency services to the Funds. Each Fund pays Ultimus fees in accordance with the agreements for such services. In addition, each Fund pays out-of-pocket expenses including, but not limited to, postage, supplies and costs of pricing its portfolio securities.
Under the terms of a Distribution Agreement with the Trust, Ultimus Fund Distributors, LLC (the “Distributor”) serves as the principal underwriter to each Fund. The Distributor is a wholly-owned subsidiary of Ultimus. The Distributor is compensated by the Adviser (not the Funds) for acting as principal underwriter.
Certain officers and a Trustee of the Trust are also officers of Ultimus and the Distributor and are not paid by the Funds for serving in such capacities.
TRUSTEE COMPENSATION
Each Trustee who is not an “interested person” of the Trust (“Independent Trustee”) receives a $1,300 annual retainer from each Fund, paid quarterly, except for the Board Chairperson who receives a $1,500 annual retainer from each Fund, paid quarterly. Each Independent Trustee also receives from each Fund a fee of $500 for each Board meeting attended plus reimbursement for travel and other meeting-related expenses.
52
ALAMBIC FUNDS
NOTES TO FINANCIAL STATEMENTS (Continued) |
PRINCIPAL HOLDERS OF FUND SHARES
As of February 28, 2019, the following shareholders owned of record 25% or more of the outstanding shares of each Fund:
Name of Record Owner | % Ownership |
Alambic Small Cap Value Plus Fund | |
Charles Schwab & Co. (for the benefit of its customers) | 54% |
Kawishiwi Partners Trust | 28% |
Alambic Small Cap Growth Plus Fund | |
Charles Schwab & Co. (for the benefit of its customers) | 43% |
Kawishiwi Partners Trust | 32% |
Alambic Mid Cap Value Plus Fund | |
Charles Schwab & Co. (for the benefit of its customers) | 56% |
Kawishiwi Partners Trust | 29% |
Alambic Mid Cap Growth Plus Fund | |
Charles Schwab & Co. (for the benefit of its customers) | 54% |
Kawishiwi Partners Trust | 30% |
A beneficial owner of 25% or more of a Fund’s outstanding shares may be considered a controlling person. That shareholder’s vote could have a more significant effect on matters presented at a shareholders’ meeting.
5. Sector Risk
If a Fund has significant investments in the securities of issuers within a particular sector, any development affecting that sector will have a greater impact on the value of the net assets of the Fund than would be the case if the Fund did not have significant investments in that sector. In addition, this may increase the risk of loss in the Fund and increase the volatility of the Fund’s NAV per share. For instance, economic or market factors, regulatory changes or other developments may negatively impact all companies in a particular sector, and therefore the value of the Fund’s portfolio will be adversely affected. As of February 28, 2019, Alambic Small Cap Growth Plus Fund had 25.3% of the value of its net assets invested in stocks within the Health Care sector and Alambic Mid Cap Growth Plus Fund had 29.4% of the value of its net assets invested in stocks within the Information Technology sector.
53
ALAMBIC FUNDS
NOTES TO FINANCIAL STATEMENTS (Continued) |
6. Contingencies and Commitments
The Funds indemnify the Trust’s officers and Trustees for certain liabilities that might arise from their performance of their duties to the Funds. Additionally, in the normal course of business the Funds enter into contracts that contain a variety of representations and warranties and which provide general indemnifications. The Funds’ maximum exposure under these arrangements is unknown, as this would involve future claims that may be made against the Funds that have not yet occurred. However, based on experience, the Funds expect the risk of loss to be remote.
7. Subsequent Events
The Funds are required to recognize in the financial statements the effects of all subsequent events that provide additional evidence about conditions that existed as of the date of the Statements of Assets and Liabilities. For non-recognized subsequent events that must be disclosed to keep the financial statements from being misleading, the Funds are required to disclose the nature of the event as well as an estimate of its financial effect, or a statement that such an estimate cannot be made. Management has evaluated subsequent events through the issuance of these financial statements and has noted no such events except those listed below:
On April 9, 2019, the Alambic Mid Cap Growth Plus Fund changed its name to the Alambic Mid Cap Plus Fund, and the broad-based securities market index to which it compares its performance was changed to the Russell Midcap Total Return Index.
On April 9, 2019, the Alambic Small Cap Growth Plus Fund changed its name to the Alambic Small Cap Plus Fund, and the broad-based securities market index to which it compares its performance was changed to the Russell 2000 Total Return Index.
54
ALAMBIC FUNDS
ABOUT YOUR FUNDS’ EXPENSES (Unaudited) |
We believe it is important for you to understand the impact of costs on your investment. As a shareholder of the Funds, you incur ongoing costs, including management fees and other operating expenses. The following examples are intended to help you understand your ongoing costs (in dollars) of investing in the Funds and to compare these costs with the ongoing costs of investing in other mutual funds.
A mutual fund’s ongoing costs are expressed as a percentage of its average net assets. This figure is known as the expense ratio. The expenses in the table below are based on an investment of $1,000 made at the beginning of the most recent period (September 1, 2018) and held until the end of the period (February 28, 2019).
The table below illustrates each Fund’s ongoing costs in two ways:
Actual fund return – This section helps you to estimate the actual expenses that you paid over the period. The “Ending Account Value” shown is derived from each Fund’s actual return, and the fourth column shows the dollar amount of operating expenses that would have been paid by an investor who started with $1,000 in the Funds. You may use the information here, together with the amount you invested, to estimate the expenses that you paid over the period.
To do so, simply divide your account value by $1,000 (for example, an $8,600 account value divided by $1,000 = 8.6), then multiply the result by the number given for the applicable Fund under the heading “Expenses Paid During Period.”
Hypothetical 5% return – This section is intended to help you compare each Fund’s ongoing costs with those of other mutual funds. It assumes that each Fund had an annual return of 5% before expenses during the period shown, but that the expense ratio is unchanged. In this case, because the return used is not the Funds’ actual return, the results do not apply to your investment. The example is useful in making comparisons because the SEC requires all mutual funds to calculate expenses based on a 5% return. You can assess each Fund’s ongoing costs by comparing this hypothetical example with the hypothetical examples that appear in shareholder reports of other funds. The hypothetical returns example does not reflect actual trading in any Fund, but is used for illustrative purposes only.
Note that expenses shown in the table are meant to highlight and help you compare ongoing costs only. The Funds do not charge transaction fees, such as purchase or redemption fees, nor do they carry a “sales load.”
The calculations assume no shares were bought or sold during the period. Your actual costs may have been higher or lower, depending on the amount of your investment and the timing of any purchases or redemptions.
More information about the Funds’ expenses can be found in this report. For additional information on operating expenses and other shareholder costs, please refer to each Fund’s prospectus.
55
ALAMBIC FUNDS
ABOUT YOUR FUNDS’ EXPENSES (Unaudited) (Continued) |
| Beginning
Account Value
September 1,
2018 | Ending
Account Value
February 28,
2019 | Net
Expense
Ratio(a) | Expenses
Paid During
Period(b) |
Alambic Small Cap Value Plus Fund |
Based on Actual Fund Return | $1,000.00 | $921.90 | 0.95% | $4.53 |
Based on Hypothetical 5% Return (before expenses) | $1,000.00 | $1,020.08 | 0.95% | $4.76 |
| | | | | |
Alambic Small Cap Growth Plus Fund |
Based on Actual Fund Return | $1,000.00 | $919.10 | 0.95% | $4.52 |
Based on Hypothetical 5% Return (before expenses) | $1,000.00 | $1,020.08 | 0.95% | $4.76 |
| | | | | |
Alambic Mid Cap Value Plus Fund |
Based on Actual Fund Return | $1,000.00 | $948.90 | 0.85% | $4.11 |
Based on Hypothetical 5% Return (before expenses) | $1,000.00 | $1,020.58 | 0.85% | $4.26 |
| | | | | |
Alambic Mid Cap Growth Plus Fund |
Based on Actual Fund Return | $1,000.00 | $949.70 | 0.85% | $4.11 |
Based on Hypothetical 5% Return (before expenses) | $1,000.00 | $1,020.58 | 0.85% | $4.26 |
(a) | Annualized, based on each Fund’s expenses for the previous six month period. |
(b) | Expenses are equal to each Fund’s annualized net expense ratio multiplied by the average account value over the period, multiplied by 181/365 (to reflect the one-half year period). |
56
ALAMBIC FUNDS
OTHER INFORMATION (Unaudited) |
A description of the policies and procedures that the Funds use to vote proxies relating to portfolio securities is available without charge upon request by calling toll-free 1-888-890-8988, or on the SEC website at http://www.sec.gov. Information regarding how the Funds voted proxies relating to portfolio securities during the most recent 12-month period ended June 30 is available without charge upon request by calling toll-free 1-888-890-8988, or on the SEC’s website at http://www.sec.gov.
The Trust files a complete listing of portfolio holdings for the Funds with the SEC as of the end of the first and third quarters of each fiscal year on Form N-Q. These filings are available upon request by calling 1-888-890-8988. Furthermore, you may obtain a copy of the filings on the SEC’s website at http://www.sec.gov.
57
ALAMBIC FUNDS
CUSTOMER PRIVACY NOTICE |
FACTS | WHAT DO THE ALAMBIC FUNDS DO WITH YOUR PERSONAL INFORMATION? |
Why? | Financial companies choose how they share your personal information. Federal law gives consumers the right to limit some but not all sharing. Federal law also requires us to tell you how we collect, share, and protect your personal information. Please read this notice carefully to understand what we do. |
What? | The types of personal information we collect and share depend on the product or service you have with us. This information can include: ■ Social Security number ■ Assets ■ Retirement Assets ■ Transaction History ■ Checking Account Information ■ Purchase History ■ Account Balances ■ Account Transactions ■ Wire Transfer Instructions When you areno longer our customer, we continue to share your information as described in this notice. |
How? | All financial companies need to share your personal information to run their everyday business. In the section below, we list the reasons financial companies can share their customers’ personal information; the reasons an Alambic Fund chooses to share; and whether you can limit this sharing. |
Reasons we can share your personal information | Do the Alambic Funds share? | Can you limit this sharing? |
For our everyday business purposes –
Such as to process your transactions, maintain your account(s), respond to court orders and legal investigations, or report to credit bureaus | Yes | No |
For our marketing purposes –
to offer our products and services to you | No | We don’t share |
For joint marketing with other financial companies | No | We don’t share |
For our affiliates’ everyday business purposes –
information about your transactions and experiences | No | We don’t share |
For our affiliates’ everyday business purposes –
information about your creditworthiness | No | We don’t share |
For nonaffiliates to market to you | No | We don’t share |
Questions? | Call 1-888-890-8988 |
58
Who we are |
Who is providing this notice? | Alambic Mid Cap Growth Plus Fund
Alambic Mid Cap Value Plus Fund
Alambic Small Cap Growth Plus Fund
Alambic Small Cap Value Plus Fund
Ultimus Fund Distributors, LLC (Distributor)
Ultimus Fund Solutions, LLC (Administrator) |
What we do |
How do the Alambic Funds protect my personal information? | To protect your personal information from unauthorized access and use, we use security measures that comply with federal law. These measures include computer safeguards and secured files and buildings. Our service providers are held accountable for adhering to strict policies and procedures to prevent any misuse of your nonpublic personal information. |
How do the Alambic Funds collect my personal information? | We collect your personal information, for example, when you ■ Open an account ■ Provide account information ■ Give us your contact information ■ Make deposits or withdrawals from your account ■ Make a wire transfer ■ Tell us where to send the money ■ Tell us who receives the money ■ Show your government-issued ID ■ Show your driver’s license We also collect your personal information from other companies. |
Why can’t I limit all sharing? | Federal law gives you the right to limit only ■ Sharing for affiliates’ everyday business purposes – information about your creditworthiness ■ Affiliates from using your information to market to you ■ Sharing for nonaffiliates to market to you State laws and individual companies may give you additional rights to limit sharing. |
Definitions |
Affiliates | Companies related by common ownership or control. They can be financial and nonfinancial companies. ■Alambic Investment Management, LP, the investment adviser to the Alambic Funds, could be deemed an affiliate. |
Nonaffiliates | Companies not related by common ownership or control. They can be financial and nonfinancial companies ■The Alambic Funds do not share with nonaffiliates so they can market to you. |
Joint marketing | A formal agreement between nonaffiliated financial companies that together market financial products or services to you. ■The Alambic Funds do not jointly market. |
59
This page intentionally left blank.
This page intentionally left blank.

BLUE CURRENT GLOBAL DIVIDEND FUND
INSTITUTIONAL CLASS (BCGDX)
Semi-Annual Report
February 28, 2019
(Unaudited)
Beginning on January 1, 2021, as permitted by regulations adopted by the U.S. Securities and Exchange Commission, paper copies of the Fund’s shareholder reports like this one will no longer be sent by mail, unless you specifically request paper copies of the reports from the Fund or from your financial intermediary, such as a broker-dealer or bank. Instead, the reports will be made available on a website, and you will be notified by mail each time a report is posted and provided with a website link to access the report.
If you already elected to receive shareholder reports electronically, you will not be affected by this change and you need not take any action. You may elect to receive shareholder reports and other communications from the Fund electronically by contacting the Fund at 1-800-514-3583 or, if you own these shares through a financial intermediary, by contacting your financial intermediary.
You may elect to receive all future reports in paper free of charge. You can inform the Fund that you wish to continue receiving paper copies of your shareholder reports by contacting the Fund at 1-800-514-3583. If you own shares through a financial intermediary, you may contact your financial intermediary or follow instructions included with this document to elect to continue to receive paper copies of your shareholder reports. Your election to receive reports in paper will apply to all Funds held with the Fund complex or at your financial intermediary.
BLUE CURRENT GLOBAL DIVIDEND FUND
LETTER TO SHAREHOLDERS | February 28, 2019 |
Dear Shareholders.
PERFORMANCE SUMMARY
The Blue Current Global Dividend Fund (the “fund”) returned -2.08% over the six month period ended February 28, 2019. The fund’s benchmark, the MSCI World High Dividend Yield Index, returned +0.43% over the same period. The MSCI World High Dividend Yield Index most accurately reflects the fund’s investment objective to invest in high-quality, dividend paying stocks globally. Since inception, the fund has produced a cumulative return of 21.94%, which compares to a 20.48% culumative return for the MSCI World High Dividend Yield Index. It is important to remind our investors that we are not managing the fund to track or beat an index. We do not select securities to align with an index, or the underlying sector and country holdings, but rather aim to construct a portfolio of high quality companies that are committed to dividend growth and offer an attractive yield.
| | Total Returns for period ended February 28, 2019 |
Fund Name
(Institutional Share Class) | QTD (since
11/30/18) | YTD (since
12/31/18) | Trailing 1
Year (since
2/28/18) | Trailing 3
Year (since
2/29/16) | Since
Inception
Annualized
(9/18/14) |
Blue Current Global Dividend | 2.58% | 11.16% | -1.33% | 29.88% | 4.56% |
MSCI World High Div Yield Index | 1.66% | 8.93% | 2.16% | 33.77% | 4.28% |
MSCI World Index | 2.58% | 11.02% | 0.43% | 42.92% | 6.12% |
Source: Bloomberg
Past performance is not predictive of future performance. Investment results and principal value will fluctuate so that shares, when redeemed, may be worth more or less than their original cost. Current performance may be higher or lower than the performance data quoted. Performance data current to the most recent month end are available by calling 1-800-514-3583.
Over the past twelve months the strategy has experienced numerous pressures, including investors’ lack of interest in dividend-paying companies in the face of rising global interest rates, increasing international political risk, and stock specific challenges, largely related to regulatory and legal pressures that arose last year.
For the second half of 2018, the portfolio’s international investments were material detractors to overall fund performance, especially relative to the fund’s US exposures which we have been generally pleased with. As a reminder, the fund’s mandate requires a minimum investment to companies domiciled within international developed markets of 40%, a commitment that we believe provides sufficient diversity, but at times can be frustrating given recent preferences for US equities. After a strong 2017, investor confidence in Europe and other regions eroded throughout 2018 for reasons that are not
1
without merit, including the continued Brexit saga that remains unresolved, labor riots in France, Italian budget issues, and the overall inability for eurozone fiscal and monetary policy to spur growth in the region. To make matters worse, several of our international positions weakened from specific issues related to regulatory or legal pressures, including Bayer, Deutsche Post, British Tobacco, and Vodafone. The combination of stock specific and macro-economic challenges made for a tough second half of 2018.
These pressures, however, are embraced by a process that is designed to identify mis-priced cash flow opportunities. We were able to reduce exposure to companies with increasing uncertainty (e.g. Bayer) and also invest in a few new companies that meet our stringent dividend yield and growth requirements. As a result of these changes, we were able to increase the portfolio yield, rebalance the international exposure, and remove several stock specific challenges that would likely add to future portfolio volatility.
Since the new year and through February 28th, ironically the recovery in fund performance has been led by the international investments, including several of the new positions that were implemented during the fourth quarter. At the time of this writing, it is too early to determine if the international outperformance experienced during the first two months of the year will carry through the challenging summer months given that economic uncertainty remains high across the UK, Japan, and eurozone. Even without clarity on these issues, the anticipated slowdown in US economic and earnings growth should rebase investor expectations to a level where growth is similar across most major regions of the world, creating a more balanced investing landscape in 2019 and 2020.
Over the trailing semi-annual period, information technology was the fund’s top performing sector, returning +2.4%. Returns were led by Cisco Systems and Corning. Unexpectedly, the consumer staples sector was also a strong performer during the six month period, returning +1.2%. Returns were led by Procter & Gamble, Diageo, and Nestle. It would be unusual for technology and consumer staples to be leading returns during a six month time period, but in this example, the technology sector performance was significant enough to offset overall market declines heading into the later months of the year, a period when staples performed well. It is worth noting that we exited Clorox in January due to valuation in favor of other compelling opportunities in the sector. Although the healthcare sector declined 1.3% during the period, it was still one of the fund’s top performing sectors.
Although a small sector weight in the portfolio (3.1%), the newly created communication services sector declined 15.5% during the period. Publicis and Vodafone led the decline. Also a detractor over the period, the materials sector declined 17.2% due to commodity price pressures and global growth concerns. DowDupont led the decline in this sector. Lastly, the industrials sector declined 4.9% during the period, also in response to global growth concerns.
The top five contributors over the last six months were led by Procter & Gamble, Prudential plc, Abbott Labs, Cisco, and Richemont. The top five detractors were British American Tobacco, DowDupont, PNC Financial, Deutsche Post, and Bayer.
2
BLUE CURRENT PHILOSOPHY & OBJECTIVES
It is important to remind the fund’s shareholders of our philosophy and objectives. In the current environment, investors need to make every penny work for them. With yield in short supply and safe income streams providing little return, quality companies with growing and sustainable cash flow from across the globe might be less risky than you think – and more fruitful. Over the long run, dividends matter, and dividend growth investors have outperformed.
The Adviser utilizes its investment expertise in growing cash flow through what we believe is a niche universe of high quality, dividend-paying companies with sustainable business models and dividend policies. The primary objectives are to pay a stable and increasing dividend each quarter and deliver attractive long term capital appreciation to investors.
The Blue Current investment team concentrates on a select portfolio of 25-50 companies across developed markets that meet our stringent qualities. We focus on companies that we believe have a strong history of rewarding shareholders and have the financial ability to continue to increase the dividend over time. We also focus on the future earnings potential of each company and strive to purchase those businesses when they are trading at a discount to their true value.
OUTLOOK SUMMARY
Starting 2019, we believed the portfolio’s quantitative qualities, namely dividend yield, valuation, and leverage, were as attractive as we had experienced in recent years, and would be sought by investors as the global economy enters its next act. While equity markets (and our portfolio) have rebounded in the year-to-date period, it is hard to determine at this stage whether investors are rotating to safer and more durable cash flow streams, or simply falling in love with risk assets again. The recovery appears to be largely driven by beta and cyclical businesses, the same businesses that led the decline only a few months earlier. This is not surprising given that easy monetary policy has been a tailwind for risk assets, the continuation of which should result in similar investor behavior as in recent years, e.g. a preference for growth businesses at the expense of value. We caution investors, however, to not lose sight of why the Federal Reserve has shifted its outlook and reconsidered the broader path of interest rate normalization. Slowing growth, domestically and abroad, will become a meaningful headwind to earnings growth over the next several years. A transition that historically has refocused investor preferences to businesses with recurring cash flow, strong balance sheets, and dividends. While we
3
are excited that the fund has participated in the recovery, we hope that over the next several years, investors will appreciate the same qualities that we are incorporating in the portfolio today.
Sincerely,

| 
|
Henry “Harry” M. T. Jones
Co-Portfolio Manager
Blue Current Global Dividend Fund | Dennis Sabo, CFA
Co-Portfolio Manager
Blue Current Global Dividend Fund |
Disclosure and Risk Summary
The Letter to Shareholders seeks to describe some of the current opinions and views of the financial markets of Edge Capital Group, LLC (the “Adviser”). Although the Adviser believes it has a reasonable basis for any opinions or views expressed, actual results may differ, sometimes significantly so, from those expected or expressed. The securities held by the Fund that are discussed in the Letter to Shareholders were held during the period covered by this Report. They do not comprise the entire investment portfolio of the Fund, may be sold at any time and may no longer be held by the Fund. For a complete list of securities held in the Fund as of February 28, 2019, please see the Schedule of Investments section of the Semi-Annual Report. The opinions of the Adviser with respect to those securities may change at any time.
The opinions expressed herein are those of the Adviser, and the report is not meant as legal, tax, or financial advice. You should consult your own professional advisors as to the legal, tax, financial, or other matters relevant to the suitability of investing. The external data presented in this report have been obtained from independent sources (as noted) and are believed to be accurate, but no independent verification has been made and accuracy is not guaranteed. The information contained in this report is not intended to address the needs of any particular investor.
The information contained in this document does not constitute an offer to sell any securities nor a solicitation to purchase any securities. Index returns reflect the reinvestment of dividends. An investor should consider the investment objectives, risks, charges and expenses of the Fund carefully before investing. The Fund’s prospectus contains this and other important information. To obtain a copy of the Fund’s prospectus
4
please visit our website at www.bluecurrentfunds.com or call 1-800-514-3583 and a copy will be sent to you free of charge. Please read the prospectus carefully before you invest. The Blue Current Global Dividend Fund is distributed by Ultimus Fund Distributors, LLC.
PAST PERFORMANCE CANNOT BE CONSTRUED AS AN INDICATOR OF FUTURE RESULTS BECAUSE OF, AMONG OTHER THINGS, POSSIBLE DIFFERENCES IN MARKET CONDITIONS, INVESTMENT STRATEGY, AND REGULATORY CLIMATE. THERE IS NO ASSURANCE THAT THE FUND WILL ACHIEVE ITS INVESTMENT OBJECTIVE. INVESTMENT RESULTS AND PRINCIPAL VALUE WILL FLUCTUATE SO THAT SHARES, WHEN REDEEMED, MAY BE WORTH MORE OR LESS THAN THEIR ORIGINAL COST. CURRENT PERFORMANCE MAY BE HIGHER OR LOWER THAN THE PERFORMANCE DATA QUOTED. PERFORMANCE DATA CURRENT TO THE MOST RECENT MONTH END IS AVAILABLE BY CALLING 1-800-514-3583. THE FUND INVESTS PRIMARILY IN DIVIDEND PAYING COMPANIES AND IT IS POSSIBLE THESE COMPANIES MAY ELIMINATE OR REDUCE THEIR DIVIDEND PAYMENTS. INDEX INFORMATION (I) IS INCLUDED MERELY TO SHOW THE GENERAL TREND IN THE EQUITY MARKETS FOR THE PERIOD INDICATED AND IS NOT INTENDED TO IMPLY THAT THE FUND’S PORTFOLIO WILL BE SIMILAR TO THE INDICES EITHER IN COMPOSITION OR RISK AND (II) HAS BEEN OBTAINED FROM SOURCES BELIEVED TO BE ACCURATE.
Statements in the Letter to Shareholders that reflect projections or expectations for future financial or economic performance of the Fund and the market in general and statements of the Fund’s plans and objectives for future operations are forward-looking statements. No assurance can be given that actual results or events will not differ materially from those projected, estimated, assumed, or anticipated in any such forward-looking statements. Important factors that could result in such differences, in addition to factors noted with such forward-looking statements, include, without limitation, general economic conditions, such as inflation, recession, and interest rates. Past performance is not a guarantee of future results.
5
BLUE CURRENT GLOBAL DIVIDEND FUND
PERFORMANCE INFORMATION
February 28, 2019 (Unaudited)
Comparison of the Change in Value of a $100,000 Investment in
Blue Current Global Dividend Fund -
Institutional Class vs. the MSCI World Index
and the MSCI World High Dividend Yield Index
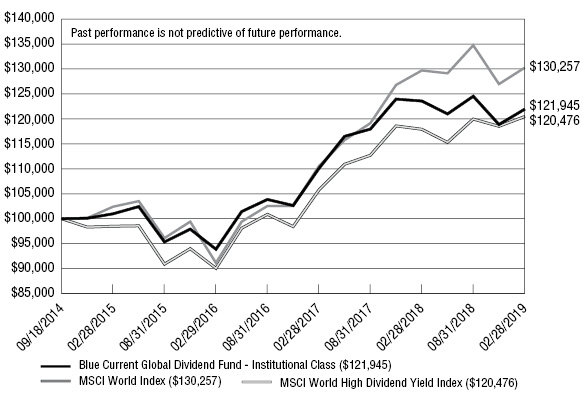
Average Annual Total Returns (for the periods ended February 28, 2019) |
| | 1 Year | 3 Years | Since
Inception(b) | |
Blue Current Global Dividend Fund - Institutional Class(a) | (1.33%) | 9.11% | 4.56% | |
MSCI World Index | 0.43% | 12.64% | 6.12% | |
MSCI World High Dividend Yield Index | 2.16% | 10.18% | 4.28% | |
(a) | The Fund’s total returns do not reflect the deduction of taxes a shareholder would pay on Fund distributions or the redemption of Fund shares. |
(b) | The Fund commenced operations on September 18, 2014. |
6
BLUE CURRENT GLOBAL DIVIDEND FUND
PORTFOLIO INFORMATION
February 28, 2019 (Unaudited)
Sector Diversification
(% of Net Assets)
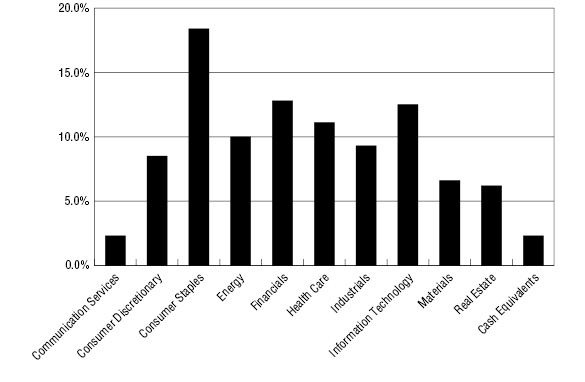
Top Ten Equity Holdings
Security Description | % of Net Assets |
Microsoft Corporation | 3.8% |
Cisco Systems, Inc. | 3.7% |
Johnson & Johnson | 3.3% |
Crown Castle International Corporation | 3.2% |
United Technologies Corporation | 3.1% |
Danone S.A. | 3.0% |
Unilever plc - ADR | 3.0% |
CoreSite Realty Corporation | 3.0% |
Allianz SE | 2.9% |
SunTrust Banks, Inc. | 2.9% |
7
BLUE CURRENT GLOBAL DIVIDEND FUND
SCHEDULE OF INVESTMENTS
February 28, 2019 (Unaudited) |
COMMON STOCKS — 97.7% | | Shares | | | Value | |
Communication Services — 2.3% | | | | | | | | |
Media — 2.3% | | | | | | | | |
Publicis Groupe S.A. (a) | | | 25,350 | | | $ | 1,402,999 | |
| | | | | | | | | |
Consumer Discretionary — 8.5% | | | | | | | | |
Household Durables — 2.2% | | | | | | | | |
Leggett & Platt, Inc. | | | 30,000 | | | | 1,362,600 | |
| | | | | | | | | |
Leisure Products — 1.9% | | | | | | | | |
Hasbro, Inc. | | | 13,900 | | | | 1,180,110 | |
| | | | | | | | | |
Textiles, Apparel & Luxury Goods — 4.4% | | | | | | | | |
Compagnie Financiere Richemont S.A. (a) | | | 12,300 | | | | 939,521 | |
LVMH Moet Hennessy Louis Vuitton SE (a) | | | 4,980 | | | | 1,708,808 | |
| | | | | | | | 2,648,329 | |
Consumer Staples — 18.4% | | | | | | | | |
Beverages — 7.4% | | | | | | | | |
Anheuser-Busch InBev S.A./N.V. - ADR | | | 21,000 | | | | 1,641,360 | |
Diageo plc - ADR | | | 10,897 | | | | 1,686,638 | |
PepsiCo, Inc. | | | 9,900 | | | | 1,144,836 | |
| | | | | | | | 4,472,834 | |
Food Products — 5.3% | | | | | | | | |
Danone S.A. (a) | | | 24,380 | | | | 1,841,111 | |
Nestlé S.A. - ADR | | | 15,115 | | | | 1,365,338 | |
| | | | | | | | 3,206,449 | |
Household Products — 2.7% | | | | | | | | |
Procter & Gamble Company (The) | | | 16,750 | | | | 1,650,713 | |
| | | | | | | | | |
Personal Products — 3.0% | | | | | | | | |
Unilever plc - ADR | | | 34,540 | | | | 1,838,564 | |
| | | | | | | | | |
Energy — 10.0% | | | | | | | | |
Oil, Gas & Consumable Fuels — 10.0% | | | | | | | | |
BP plc - ADR | | | 41,700 | | | | 1,778,505 | |
ConocoPhillips | | | 18,800 | | | | 1,275,580 | |
ONEOK, Inc. | | | 20,460 | | | | 1,314,760 | |
Royal Dutch Shell plc - Class B - ADR | | | 27,240 | | | | 1,732,736 | |
| | | | | | | | 6,101,581 | |
See accompanying notes to financial statements. |
8
BLUE CURRENT GLOBAL DIVIDEND FUND
SCHEDULE OF INVESTMENTS (Continued) |
COMMON STOCKS — 97.7% (Continued) | | Shares | | | Value | |
Financials — 12.8% | | | | | | | | |
Banks — 8.7% | | | | | | | | |
BB&T Corporation | | | 28,800 | | | $ | 1,467,936 | |
Citigroup, Inc. | | | 9,150 | | | | 585,417 | |
ING Groep N.V. - ADR | | | 111,500 | | | | 1,474,030 | |
SunTrust Banks, Inc. | | | 27,500 | | | | 1,783,925 | |
| | | | | | | | 5,311,308 | |
Insurance — 4.1% | | | | | | | | |
Allianz SE (a) | | | 8,040 | | | | 1,789,396 | |
Prudential plc - ADR | | | 16,500 | | | | 696,300 | |
| | | | | | | | 2,485,696 | |
Health Care — 11.1% | | | | | | | | |
Health Care Equipment & Supplies — 2.0% | | | | | | | | |
Abbott Laboratories | | | 16,000 | | | | 1,241,920 | |
| | | | | | | | | |
Pharmaceuticals — 9.1% | | | | | | | | |
Johnson & Johnson | | | 14,625 | | | | 1,998,360 | |
Novartis AG - ADR | | | 19,400 | | | | 1,769,862 | |
Sanofi - ADR | | | 42,115 | | | | 1,751,984 | |
| | | | | | | | 5,520,206 | |
Industrials — 9.3% | | | | | | | | |
Aerospace & Defense — 3.1% | | | | | | | | |
United Technologies Corporation | | | 14,900 | | | | 1,872,483 | |
| | | | | | | | | |
Air Freight & Logistics — 2.1% | | | | | | | | |
Deutsche Post AG (a) | | | 40,800 | | | | 1,265,217 | |
| | | | | | | | | |
Electrical Equipment — 2.1% | | | | | | | | |
Eaton Corporation plc | | | 16,139 | | | | 1,287,408 | |
| | | | | | | | | |
Machinery — 2.0% | | | | | | | | |
Cummins, Inc. | | | 7,780 | | | | 1,198,820 | |
| | | | | | | | | |
Information Technology — 12.5% | | | | | | | | |
Communications Equipment — 3.7% | | | | | | | | |
Cisco Systems, Inc. | | | 43,500 | | | | 2,251,995 | |
| | | | | | | | | |
Electronic Equipment, Instruments & Components — 2.7% | | | | | | | | |
Corning, Inc. | | | 46,500 | | | | 1,618,665 | |
See accompanying notes to financial statements. |
9
BLUE CURRENT GLOBAL DIVIDEND FUND
SCHEDULE OF INVESTMENTS (Continued) |
COMMON STOCKS — 97.7% (Continued) | | Shares | | | Value | |
Information Technology — 12.5% (Continued) | | | | | | | | |
Semiconductors & Semiconductor Equipment — 2.3% | | | | | | | | |
Taiwan Semiconductor Manufacturing Company Ltd. - ADR | | | 36,650 | | | $ | 1,431,183 | |
| | | | | | | | | |
Software — 3.8% | | | | | | | | |
Microsoft Corporation | | | 20,450 | | | | 2,291,013 | |
| | | | | | | | | |
Materials — 6.6% | | | | | | | | |
Chemicals — 4.0% | | | | | | | | |
Air Liquide S.A. (a) | | | 7,300 | | | | 909,797 | |
DowDuPont, Inc. | | | 29,040 | | | | 1,545,799 | |
| | | | | | | | 2,455,596 | |
Containers & Packaging — 2.6% | | | | | | | | |
International Paper Company | | | 34,300 | | | | 1,571,626 | |
| | | | | | | | | |
Real Estate — 6.2% | | | | | | | | |
Equity Real Estate Investment Trusts (REITs) — 6.2% | | | | | | | | |
CoreSite Realty Corporation | | | 17,700 | | | | 1,809,825 | |
Crown Castle International Corporation | | | 16,565 | | | | 1,967,094 | |
| | | | | | | | 3,776,919 | |
| | | | | | | | | |
Total Common Stocks (Cost $52,421,085) | | | | | | $ | 59,444,234 | |
|
MONEY MARKET FUNDS — 2.0% | | Shares | | | Value | |
First American Government Obligations Fund - Class Z, 2.29% (b) (Cost $1,198,979) | | | 1,198,979 | | | $ | 1,198,979 | |
| | | | | | | | | |
Investments at Value — 99.7% (Cost $53,620,064) | | | | | | $ | 60,643,213 | |
| | | | | | | | | |
Other Assets in Excess of Liabilities — 0.3% | | | | | | | 198,976 | |
| | | | | | | | | |
Net Assets — 100.0% | | | | | | $ | 60,842,189 | |
ADR – American Depositary Receipt. |
(a) | Level 2 security (Note 2). |
(b) | The rate shown is the 7-day effective yield as of February 28, 2019. |
| |
See accompanying notes to financial statements. |
10
BLUE CURRENT GLOBAL DIVIDEND FUND
SUMMARY OF COMMON STOCKS BY COUNTRY
February 28, 2019 (Unaudited) |
Country | | Value | | | % of Net
Assets | |
United States | | $ | 31,133,477 | | | | 51.2 | % |
United Kingdom | | | 7,732,743 | | | | 12.7 | % |
France | | | 7,614,699 | | | | 12.5 | % |
Switzerland | | | 4,074,721 | | | | 6.7 | % |
Germany | | | 3,054,613 | | | | 5.0 | % |
Belgium | | | 1,641,360 | | | | 2.7 | % |
Netherlands | | | 1,474,030 | | | | 2.5 | % |
Taiwan Province of China | | | 1,431,183 | | | | 2.3 | % |
Ireland | | | 1,287,408 | | | | 2.1 | % |
| | | $ | 59,444,234 | | | | 97.7 | % |
See accompanying notes to financial statements. |
11
BLUE CURRENT GLOBAL DIVIDEND FUND
STATEMENT OF ASSETS AND LIABILITIES
February 28, 2019 (Unaudited) |
ASSETS | |
Investments in securities: | | | | |
At cost | | $ | 53,620,064 | |
At value (Note 2) | | $ | 60,643,213 | |
Receivable for capital shares sold | | | 4,500 | |
Dividends receivable | | | 204,154 | |
Other assets | | | 19,118 | |
Total assets | | | 60,870,985 | |
| | | | | |
LIABILITIES | | | | |
Payable to Adviser (Note 4) | | | 10,746 | |
Payable to administrator (Note 4) | | | 10,590 | |
Other accrued expenses | | | 7,460 | |
Total liabilities | | | 28,796 | |
| | | | | |
NET ASSETS | | $ | 60,842,189 | |
| | | | |
NET ASSETS CONSIST OF: | | | | |
Paid-in capital | | $ | 54,637,406 | |
Accumulated earnings | | | 6,204,783 | |
NET ASSETS | | $ | 60,842,189 | |
| | | | | |
PRICING OF INSTITUTIONAL SHARES (Note 1) | | | | |
Net assets applicable to Institutional Shares | | $ | 60,842,189 | |
Shares of Institutional Shares outstanding (no par value, unlimited number of shares outstanding) | | | 5,453,836 | |
Net asset value, offering and redemption price per share (a) (Note 2) | | $ | 11.16 | |
(a) | Redemption fee may apply to redemptions of shares held for 7 days or less. |
| |
See accompanying notes to financial statements. |
12
BLUE CURRENT GLOBAL DIVIDEND FUND
STATEMENT OF OPERATIONS
For the Six Months Ended February 28, 2019 (Unaudited) |
INVESTMENT INCOME | | | | |
Dividends | | $ | 723,408 | |
Foreign withholding taxes on dividends | | | (8,266 | ) |
Total investment income | | | 715,142 | |
| | | | | |
EXPENSES | | | | |
Investment advisory fees (Note 4) | | | 298,020 | |
Administration fees (Note 4) | | | 30,091 | |
Professional fees | | | 25,374 | |
Fund accounting fees (Note 4) | | | 21,002 | |
Registration and filing fees | | | 10,189 | |
Custodian and bank service fees | | | 9,608 | |
Transfer agent fees (Note 4) | | | 9,000 | |
Compliance fees and expenses (Note 4) | | | 6,602 | |
Postage and supplies | | | 5,744 | |
Trustees’ fees and expenses (Note 4) | | | 5,654 | |
Printing of shareholder reports | | | 5,623 | |
Pricing fees | | | 1,799 | |
Insurance expense | | | 1,621 | |
Other expenses | | | 6,741 | |
Total expenses | | | 437,068 | |
Fee reductions by the Adviser (Note 4) | | | (139,048 | ) |
Net expenses | | | 298,020 | |
| | | | | |
NET INVESTMENT INCOME | | | 417,122 | |
| | | | | |
REALIZED AND UNREALIZED GAINS (LOSSES) ON INVESTMENTS, DERIVATIVES AND FOREIGN CURRENCY TRANSLATION | | | | |
Net realized gains (losses) from: | | | | |
Investments | | | (827,591 | ) |
Forward foreign currency contracts (Notes 2 and 5) | | | 160,657 | |
Foreign currency transactions (Note 2) | | | (23,085 | ) |
Net change in unrealized appreciation (depreciation) on: | | | | |
Investments | | | (1,340,596 | ) |
Forward foreign currency contracts (Notes 2 and 5) | | | (39,148 | ) |
NET REALIZED AND UNREALIZED LOSSES ON INVESTMENTS, DERIVATIVES AND FOREIGN CURRENCY TRANSLATION | | | (2,069,763 | ) |
| | | | | |
NET DECREASE IN NET ASSETS RESULTING FROM OPERATIONS | | $ | (1,652,641 | ) |
See accompanying notes to financial statements. |
13
BLUE CURRENT GLOBAL DIVIDEND FUND
STATEMENTS OF CHANGES IN NET ASSETS |
| | Six Months
Ended
February 28,
2019
(Unaudited) | | | Year
Ended
August 31,
2018(a) | |
FROM OPERATIONS | | | | | | | | |
Net investment income | �� | $ | 417,122 | | | $ | 1,316,452 | |
Net realized gains (losses) from: | | | | | | | | |
Investments | | | (827,591 | ) | | | 329,634 | |
Forward foreign currency contracts | | | 160,657 | | | | (472,454 | ) |
Foreign currency transactions | | | (23,085 | ) | | | (13,660 | ) |
Net change in unrealized appreciation (depreciation) on: | | | | | | | | |
Investments | | | (1,340,596 | ) | | | 2,001,653 | |
Forward foreign currency contracts | | | (39,148 | ) | | | 138,199 | |
Foreign currency translation | | | — | | | | (195 | ) |
Net increase (decrease) in net assets from operations | | | (1,652,641 | ) | | | 3,299,629 | |
| | | | | | | | | |
DISTRIBUTIONS TO SHAREHOLDERS (NOTE 2) | | | | | | | | |
Institutional Shares | | | (381,187 | ) | | | (1,941,711 | ) |
| | | | | | | | | |
FROM CAPITAL SHARE TRANSACTIONS | | | | | | | | |
Institutional Shares | | | | | | | | |
Proceeds from shares sold | | | 4,453,913 | | | | 8,580,932 | |
Net asset value of shares issued in reinvestment
of distributions | | | 288,003 | | | | 1,454,021 | |
Proceeds from redemption fees collected (Note 2) | | | — | | | | 764 | |
Payments for shares redeemed | | | (7,409,061 | ) | | | (5,698,681 | ) |
Net increase (decrease) in Institutional Shares net assets from capital share transactions | | | (2,667,145 | ) | | | 4,337,036 | |
| | | | | | | | | |
TOTAL INCREASE (DECREASE) IN NET ASSETS | | | (4,700,973 | ) | | | 5,694,954 | |
| | | | | | | | | |
NET ASSETS | | | | | | | | |
Beginning of period | | | 65,543,162 | | | | 59,848,208 | |
End of period | | $ | 60,842,189 | | | $ | 65,543,162 | |
| | | | | | | | | |
CAPITAL SHARE ACTIVITY | | | | | | | | |
Institutional Shares | | | | | | | | |
Shares sold | | | 408,520 | | | | 742,293 | |
Shares reinvested | | | 27,063 | | | | 127,013 | |
Shares redeemed | | | (698,262 | ) | | | (495,023 | ) |
Net increase (decrease) in shares outstanding | | | (262,679 | ) | | | 374,283 | |
Shares outstanding, beginning of period | | | 5,716,515 | | | | 5,342,232 | |
Shares outstanding, end of period | | | 5,453,836 | | | | 5,716,515 | |
(a) | The presentation of Distributions to Shareholders has been updated to reflect the changes prescribed in amendments to Regulation S-X, effective November 5, 2018 (Note 2). For the year ended August 31, 2018, distributions to shareholders consisted of $778,879 and $1,162,832 of net investment income and net realized capital gains, respectively, to Institutional Shares. Undistributed net investment income as of August 31, 2018 was $350,742. |
| |
See accompanying notes to financial statements. |
14
BLUE CURRENT GLOBAL DIVIDEND FUND
INSTITUTIONAL SHARES
FINANCIAL HIGHLIGHTS |
Per Share Data for a Share Outstanding Throughout Each Period |
| | Six Months
Ended
February 28,
2019
(Unaudited) | | | Year
Ended
August 31,
2018 | | | Year
Ended
August 31,
2017 | | | Year
Ended
August 31,
2016 | | | Period
Ended
August 31,
2015(a) | |
Net asset value at beginning of period | | $ | 11.47 | | | $ | 11.20 | | | $ | 10.06 | | | $ | 9.42 | | | $ | 10.00 | |
| | | | | | | | | | | | | | | | | | | | | |
Income (loss) from investment operations: | | | | | | | | | | | | | | | | | | | | |
Net investment income | | | 0.08 | | | | 0.23 | | | | 0.24 | | | | 0.22 | | | | 0.16 | |
Net realized and unrealized gains (losses) on investments and foreign currencies | | | (0.32 | ) | | | 0.39 | | | | 1.11 | | | | 0.61 | | | | (0.62 | ) |
Total from investment operations | | | (0.24 | ) | | | 0.62 | | | | 1.35 | | | | 0.83 | | | | (0.46 | ) |
| | | | | | | | | | | | | | | | | | | | | |
Less distributions: | | | | | | | | | | | | | | | | | | | | |
From net investment income | | | (0.07 | ) | | | (0.14 | ) | | | (0.21 | ) | | | (0.19 | ) | | | (0.12 | ) |
From net realized gains | | | — | | | | (0.21 | ) | | | — | | | | — | | | | — | |
Total distributions | | | (0.07 | ) | | | (0.35 | ) | | | (0.21 | ) | | | (0.19 | ) | | | (0.12 | ) |
| | | | | | | | | | | | | | | | | | | | | |
Proceeds from redemption fees collected (Note 2) | | | — | | | | 0.00 | (b) | | | — | | | | — | | | | — | |
| | | | | | | | | | | | | | | | | | | | | |
Net asset value at end of period | | $ | 11.16 | | | $ | 11.47 | | | $ | 11.20 | | | $ | 10.06 | | | $ | 9.42 | |
| | | | | | | | | | | | | | | | | | | | | |
Total return (c) | | | (2.08 | %)(d) | | | 5.58 | % | | | 13.57 | % | | | 8.92 | % | | | (4.65 | %)(d) |
| | | | | | | | | | | | | | | | | | | | | |
Net assets at end of period (000’s) | | $ | 60,842 | | | $ | 65,543 | | | $ | 59,848 | | | $ | 39,632 | | | $ | 30,098 | |
| | | | | | | | | | | | | | | | | | | | | |
Ratios/supplementary data: | | | | | | | | | | | | | | | | | | | | |
Ratio of total expenses to average net assets | | | 1.45 | %(e) | | | 1.39 | % | | | 1.45 | % | | | 1.55 | % | | | 1.68 | %(e) |
Ratio of net expenses to average net assets (f) | | | 0.99 | %(e) | | | 0.99 | % | | | 0.99 | % | | | 0.99 | % | | | 0.99 | %(e) |
Ratio of net investment income to average net assets (f) | | | 1.39 | %(e) | | | 2.06 | % | | | 2.47 | % | | | 2.37 | % | | | 2.04 | %(e) |
Portfolio turnover rate | | | 22 | %(d) | | | 50 | % | | | 61 | % | | | 58 | % | | | 72 | %(d) |
(a) | Represents the period from the commencement of operations (September 18, 2014) through August 31, 2015. |
(b) | Amount rounds to less than $0.01 per share. |
(c) | Total return is a measure of the change in value of an investment in the Fund over the periods covered, which assumes any dividends and capital gain distributions are reinvested in shares of the Fund. The returns shown do not reflect the deduction of taxes a shareholder would pay on Fund distributions or the redemption of Fund shares. The total returns would be lower if the Adviser had not reduced advisory fees (Note 4). |
(d) | Not annualized. |
(e) | Annualized. |
(f) | Ratio was determined after advisory fee reductions by the Adviser (Note 4). |
| |
See accompanying notes to financial statements. |
15
BLUE CURRENT GLOBAL DIVIDEND FUND
NOTES TO FINANCIAL STATEMENTS
February 28, 2019 (Unaudited)
1. Organization
Blue Current Global Dividend Fund (the “Fund”) is a diversified series of Ultimus Managers Trust (the “Trust”), an open-end investment company established as an Ohio business trust under a Declaration of Trust dated February 28, 2012. Other series of the Trust are not incorporated in this report.
The investment objective of the Fund is to seek current income and capital appreciation.
The Fund currently offers one class of shares: Institutional Class shares (sold without any sales loads or distribution fees and subject to a $100,000 initial investment requirement). As of February 28, 2019, the Investor Class shares (to be sold without any sales loads, but subject to a distribution fee of up to 0.25% of Investor Class’ average daily net assets and subject to a $2,500 initial investment requirement) are not currently offered. When both classes are offered, each share class will represent an ownership interest in the same investment portfolio.
2. Significant Accounting Policies
In August 2018, the U.S. Securities and Exchange Commission (the “SEC”) adopted regulations that eliminated or amended disclosure requirements that were redundant or outdated in light of changes in SEC requirements, accounting principles generally accepted in the United States of America (“GAAP”), International Financial Reporting Standards or changes in technology or the business environment. These regulations were effective November 5, 2018, and the Fund is complying with them effective with these financial statements.
The following is a summary of the Fund’s significant accounting policies. The policies are in conformity with GAAP. The Fund follows accounting and reporting guidance under Financial Accounting Standards Board (“FASB”) Accounting Standards Codification (“ASC”) Topic 946, “Financial Services – Investment Companies.”
New accounting pronouncement – In August 2018, FASB issued Accounting Standards Update No. 2018-13 (“ASU 2018-13”), “Disclosure Framework – Changes to the Disclosure Requirements for Fair Value Measurement,” which amends the fair value measurement disclosure requirements of ASC Topic 820 (“ASC 820”), “Fair Value Measurement.” ASU 2018-13 includes new, eliminated, and modified disclosure requirements for ASC 820. In addition, ASU 2018-13 clarifies that materiality is an appropriate consideration when evaluating disclosure requirements. ASU 2018-13 is effective for fiscal years beginning after December 15, 2019, including interim periods therein. Early adoption is permitted and the Fund has adopted ASU 2018-13 with these financial statements.
Securities valuation – The Fund values its portfolio securities at market value as of the close of regular trading on the New York Stock Exchange (the “NYSE”) (normally 4:00 p.m. Eastern Time) on each day the NYSE is open for business. The Fund generally values
16
BLUE CURRENT GLOBAL DIVIDEND FUND
NOTES TO FINANCIAL STATEMENTS (Continued)
its listed securities on the basis of the security’s last sale price on the security’s primary exchange, if available, otherwise at the exchange’s most recently quoted mean price. NASDAQ-listed securities are valued at the NASDAQ Official Closing Price. When using a quoted price and when the market is considered active, the security will be classified as Level 1 within the fair value hierarchy (see below). In the event that market quotations are not readily available or are considered unreliable due to market or other events, the Fund values its securities and other assets at fair value in accordance with procedures established by and under the general supervision of the Board of Trustees (the “Board”) of the Trust. Under these procedures, the securities will be classified as Level 2 or 3 within the fair value hierarchy, depending on the inputs used. Unavailable or unreliable market quotes may be due to the following factors: a substantial bid-ask spread; infrequent sales resulting in stale prices; insufficient trading volume; small trade sizes; a temporary lapse in any reliable pricing source; and actions of the securities or futures markets, such as the suspension or limitation of trading. As a result, the prices of securities used to calculate the Fund’s net asset value (“NAV”) may differ from quoted or published prices for the same securities. Securities traded on foreign exchanges are typically fair valued by an independent pricing service and translated from the local currency into U.S. dollars using currency exchange rates supplied by an independent pricing service.
GAAP establishes a single authoritative definition of fair value, sets out a framework for measuring fair value, and requires additional disclosures about fair value measurements.
Various inputs are used in determining the value of the Fund’s investments. These inputs are summarized in the three broad levels listed below:
● | Level 1 – quoted prices in active markets for identical securities |
● | Level 2 – other significant observable inputs |
● | Level 3 – significant unobservable inputs |
The inputs or methods used for valuing securities are not necessarily an indication of the risks associated with investing in those securities. The inputs used to measure fair value may fall into different levels of the fair value hierarchy. In such cases, for disclosure purposes, the level in the fair value hierarchy within which the fair value measurement falls in its entirety is determined based on the lowest level input that is significant to the fair value measurement.
The Fund’s foreign equity securities actively traded in foreign markets may be classified as Level 2 despite the availability of closing prices because such securities are typically fair valued by an independent pricing service. The Board has authorized the Fund to retain an independent pricing service to determine the fair value of its foreign securities because the value of such securities may be materially affected by events occurring before the Fund’s pricing time but after the close of the primary markets or exchanges on which such foreign securities are traded. These intervening events might be country-specific (e.g., natural disaster, economic or political developments, interest rate change); issuer
17
BLUE CURRENT GLOBAL DIVIDEND FUND
NOTES TO FINANCIAL STATEMENTS (Continued)
specific (e.g., earnings report or merger announcement); or U.S. market-specific (such as a significant movement in the U.S. market that is deemed to affect the value of foreign securities). The pricing service uses an automated system that incorporates a model based on multiple parameters, including a security’s local closing price, relevant general and sector indices, currency fluctuations, trading in depositary receipts and futures, if applicable, and/or research valuations by its staff, in determining what it believes is the fair value of the securities.
The following is a summary of the inputs used to value the Fund’s investments as of February 28, 2019:
Investments in Securities | | Level 1 | | | Level 2 | | | Level 3 | | | Total | |
Common Stocks | | $ | 49,587,385 | | | $ | 9,856,849 | | | $ | — | | | $ | 59,444,234 | |
Money Market Funds | | | 1,198,979 | | | | — | | | | — | | | | 1,198,979 | |
Total | | $ | 50,786,364 | | | $ | 9,856,849 | | | $ | — | | | $ | 60,643,213 | |
Refer to the Fund’s Schedule of Investments for a listing of the common stocks by industry type. As of February 28, 2019, the Fund did not have any assets or liabilities that were measured at fair value on a recurring basis using significant unobservable inputs (Level 3).
Foreign currency translation – Securities and other assets and liabilities denominated in or expected to settle in foreign currencies are translated into U.S. dollars based on exchange rates on the following basis:
| | A. | The fair values of investment securities and other assets and liabilities are translated as of the close of the NYSE each day. |
| | B. | Purchases and sales of investment securities and income and expenses are translated at the rate of exchange prevailing as of 4:00 p.m. Eastern Time on the respective date of such transactions. |
| | C. | The Fund does not isolate that portion of the results of operations caused by changes in foreign exchange rates on investments from those caused by changes in market prices of securities held. Such fluctuations are included with the net realized and unrealized gains or losses on investments. |
Reported net realized foreign exchange gains or losses arise from 1) purchases and sales of foreign currencies, 2) currency gains or losses realized between the trade and settlement dates on securities transactions and 3) the difference between the amounts of dividends and foreign withholding taxes recorded on the Fund’s books and the U.S. dollar equivalent of the amounts actually received or paid. Reported net unrealized foreign exchange gains and losses arise from changes in the value of assets and liabilities that result from changes in exchange rates.
18
BLUE CURRENT GLOBAL DIVIDEND FUND
NOTES TO FINANCIAL STATEMENTS (Continued)
Forward foreign currency contracts – The Fund, at times, uses forward foreign currency contracts to offset the exposure to foreign currency. All foreign currency contracts are “marked-to-market” daily at the applicable translation rates, resulting in unrealized gains or losses. Realized and unrealized gains or losses from transactions in foreign currency contracts will be included on the Fund’s Statement of Operations. Risks associated with these contracts include the potential inability of counterparties to meet the terms of their contracts and unanticipated movements in the value of a foreign currency relative to the U.S. dollar.
Share valuation – The NAV per share of each class of the Fund is calculated daily by dividing the total value of the assets attributable to that class, less liabilities attributable to that class, by the number of shares outstanding of that class. The offering price and redemption price per share of each class of the Fund is equal to the NAV per share of such class, except that shareholders of the Fund are subject to a redemption fee equal to 2.00% of the value of Fund shares redeemed within 7 days of purchase, excluding involuntary redemptions of accounts that fall below the minimum investment amount or the redemption of Fund shares representing reinvested dividends, capital gain distributions, or capital appreciation. During the periods ended February 28, 2019 and August 31, 2018, proceeds from redemption fees, recorded in capital, totaled $0 and $764, respectively.
Investment income – Dividend income is recorded on the ex-dividend date. Interest income is accrued as earned. The Fund may invest in real estate investment trusts (“REITs”) that pay distributions to their shareholders based on available funds from operations. It is common for these distributions to exceed the REIT’s taxable earnings and profits resulting in the excess portion of such distribution to be designated as return of capital. Distributions received from REITs are generally recorded as dividend income and, if necessary, are reclassified annually in accordance with tax information provided by the underlying REITs. The Fund may also invest in master limited partnerships (“MLPs”) whose distributions generally are comprised of ordinary income, capital gains and return of capital from the MLP. For financial statement purposes, the Fund records all income received as ordinary income. This amount may be subsequently revised based on information received from the MLPs after their tax reporting periods are concluded, as the actual character of these distributions is not known until after the fiscal year end of the Fund. Withholding taxes on foreign dividends have been recorded for in accordance with the Fund’s understanding of the applicable country’s tax rules and rates.
Investment transactions – Investment transactions are accounted for on the trade date. Realized gains and losses on investments sold are determined on a specific identification basis.
Common expenses – Common expenses of the Trust are allocated among the Fund and the other series of the Trust based on the relative net assets of each series, the number of series in the Trust, or the nature of the services performed and the relative applicability to each series.
19
BLUE CURRENT GLOBAL DIVIDEND FUND
NOTES TO FINANCIAL STATEMENTS (Continued)
Distributions to shareholders – Distributions to shareholders arising from net investment income are declared and paid quarterly to shareholders. Net realized capital gains, if any, are distributed at least annually. The amount of distributions from net investment income and net realized capital gains are determined in accordance with federal income tax regulations, which may differ from GAAP. Dividends and distributions to shareholders are recorded on the ex-dividend date. The tax character of distributions paid during the periods ended February 28, 2019 and August 31, 2018 was as follows:
Periods Ended | | Ordinary
Income | | | Long-Term
Capital Gains | | | Total
Distributions | |
02/28/19 | | $ | 381,187 | | | $ | — | | | $ | 381,187 | |
08/31/18 | | $ | 952,107 | | | $ | 989,604 | | | $ | 1,941,711 | |
On March 29, 2019, the Fund paid an ordinary income dividend of $0.0322 per share to shareholders of record on March 28, 2019.
Estimates – The preparation of financial statements in conformity with GAAP requires management to make estimates and assumptions that affect the reported amounts of assets and liabilities and disclosure of contingent assets and liabilities, each as of the date of the financial statements, and the reported amounts of income and expenses during the reporting period. Actual results could differ from those estimates.
Federal income tax – The Fund has qualified and intends to continue to qualify as a regulated investment company under the Internal Revenue Code of 1986, as amended (the “Code”). Qualification generally will relieve the Fund of liability for federal income taxes to the extent 100% of its net investment income and net realized capital gains are distributed in accordance with the Code.
In order to avoid imposition of the excise tax applicable to regulated investment companies, it is also the Fund’s intention to declare as dividends in each calendar year at least 98% of its net investment income (earned during the calendar year) and 98.2% of its net realized capital gains (earned during the 12 months ended October 31) plus undistributed amounts from prior years.
The following information is computed on a tax basis for each item as of February 28, 2019:
Tax cost of portfolio investments | | $ | 53,628,168 | |
Gross unrealized appreciation | | $ | 8,238,142 | |
Gross unrealized depreciation | | | (1,223,097 | ) |
Net unrealized appreciation on investments | | | 7,015,045 | |
Accumulated ordinary income | | | 388,387 | |
Other losses | | | (1,198,649 | ) |
Accumulated earnings | | $ | 6,204,783 | |
20
BLUE CURRENT GLOBAL DIVIDEND FUND
NOTES TO FINANCIAL STATEMENTS (Continued)
The difference between the federal income tax cost of portfolio investments and the financial statement cost is due to certain timing differences in the recognition of capital gains or losses under income tax regulations and GAAP. These “book/tax” differences are temporary in nature and are primarily due to the tax deferral of losses on wash sales and the tax treatment of the cost of securities received as in-kind subscriptions at the inception of the Fund.
The Fund recognizes the tax benefits or expenses of uncertain tax positions only when the position is “more likely than not” to be sustained assuming examination by tax authorities. Management has reviewed the Fund’s tax positions for the current and all open tax years (generally three years) and has concluded that no provision for unrecognized tax benefits or expenses is required in these financial statements. The Fund identifies its major tax jurisdiction as U.S. federal.
3. Investment Transactions
During the six months ended February 28, 2019, cost of purchases and proceeds from sales of investment securities, other than short-term investments, were $13,049,498 and $14,782,926, respectively.
4. Transactions with Related Parties
INVESTMENT ADVISORY AGREEMENT
The Fund’s investments are managed by Edge Capital Group, LLC (the “Adviser”) pursuant to the terms of an Investment Advisory Agreement. Under the Investment Advisory Agreement, the Fund pays the Adviser an investment advisory fee, computed and accrued daily and paid monthly, at the annual rate of 0.99% of its average daily net assets.
Pursuant to an Expense Limitation Agreement between the Fund and the Adviser (the “ELA”), the Adviser had agreed, until January 1, 2020, to reduce its investment advisory fees and reimburse other expenses to limit total annual operating expenses (exclusive of brokerage costs; taxes; interest; borrowing costs such as interest and dividends expenses on securities sold short; costs to organize the Fund; acquired fund fees and expenses; and extraordinary expenses such as litigation and merger or reorganization costs and other expenses not incurred in the ordinary course of the Fund’s business) to an amount not exceeding 1.24% of the average daily net assets of the Investor Class shares and 0.99% of the average daily net assets of the Institutional Class shares. Accordingly, under the ELA, the Adviser reduced its investment advisory fees in the amount of $139,048 during the six months ended February 28, 2019.
Under the terms of the ELA, investment advisory fee reductions and expense reimbursements by the Adviser are subject to repayment by the Fund for a period of three years after such fees and expenses were incurred, provided that the repayments do not cause the Fund’s total annual operating expenses to exceed the lesser of (i) the expense limitation then in effect, if any, and (ii) the expense limitation in effect at the time
21
BLUE CURRENT GLOBAL DIVIDEND FUND
NOTES TO FINANCIAL STATEMENTS (Continued)
the expenses to be repaid were incurred. As of February 28, 2019, the Adviser may seek recoupment of investment advisory fee reductions in the amount of $711,996 no later than the dates stated below:
August 31, 2019 | | $ | 90,390 | |
August 31, 2020 | | | 225,554 | |
August 31, 2021 | | | 257,004 | |
February 28, 2022 | | | 139,048 | |
Total | | $ | 711,996 | |
OTHER SERVICE PROVIDERS
Ultimus Fund Solutions, LLC (“Ultimus”) provides administration, fund accounting, compliance and transfer agency services to the Fund. The Fund pays Ultimus fees in accordance with the agreements for such services. In addition, the Fund pays out-of-pocket expenses including, but not limited to, postage, supplies, and costs of pricing the Fund’s portfolio securities.
Under the terms of a Distribution Agreement with the Trust, Ultimus Fund Distributors, LLC (the “Distributor”) serves as principal underwriter to the Fund. The Distributor is a wholly-owned subsidiary of Ultimus. The Distributor is compensated by the Adviser (not the Fund) for acting as principal underwriter.
Certain officers and a Trustee of the Trust are also officers of Ultimus and the Distributor and are not paid by the Fund for serving in such capacities.
TRUSTEE COMPENSATION
Each Trustee who is not an “interested person” of the Trust (“Independent Trustee”) receives a $1,300 annual retainer from the Fund, paid quarterly, except for the Board Chairperson who receives a $1,500 annual retainer from the Fund, paid quarterly. Each Independent Trustee also receives from the Fund a fee of $500 for each Board meeting attended plus reimbursement for travel and other meeting-related expenses.
PRINCIPAL HOLDER OF FUND SHARES
As of February 28, 2019, the following shareholder owned of record 25% or more of the outstanding shares of the Fund:
Name of Record Owner | % Ownership |
Pershing, LLC (for the benefit of multiple shareholders) | 79% |
A beneficial owner of 25% or more of the Fund’s outstanding shares may be considered a controlling person. That shareholder’s vote could have a more significant effect on matters presented at a shareholders’ meeting.
22
BLUE CURRENT GLOBAL DIVIDEND FUND
NOTES TO FINANCIAL STATEMENTS (Continued)
5. Derivative Transactions
There were no outstanding derivative positions held by the Fund as of February 28, 2019.
During the six months ended February 28, 2019, the effect of derivative contracts in the Fund’s Statement of Operations was as follows:
Risk | Derivative Type | | Net Realized
Gains | | | Net Change
in Unrealized
Appreciation
(Depreciation) | |
Currency | Forward foreign currency contracts | | $ | 160,657 | | | $ | (39,148 | ) |
In the ordinary course of business, the Fund may enter into transactions subject to enforceable netting agreements or other similar arrangements (“netting agreements”). Generally, the right to offset in netting agreements allows the Fund to offset the exposure it has on any transactions with a specific counterparty with any collateral it has received or delivered in connection with other transactions with that counterparty. Generally, the Fund manages its cash collateral and securities collateral, if any, on a counterparty basis.
The average net monthly notional value of forward foreign currency exchange contracts for the six months ended February 28, 2019 is $2,903,872.
6. Foreign Investment Risk
Compared with investing in the U.S., investing in foreign markets involves a greater degree and variety of risk. Investors in foreign markets may face delayed settlements, currency controls, and adverse economic developments as well as higher overall transaction costs. In addition, fluctuations in the U.S. dollar’s value versus other currencies may erode or reverse gains or increase losses from investments denominated in foreign currencies. Foreign governments may expropriate assets, impose capital or currency controls, impose punitive taxes, impose limits on ownership or nationalize a company or industry. Any of these actions could have a severe effect on security prices and impair an investor’s ability to bring its capital or income back to the U.S. The value of foreign securities may be affected by incomplete, less frequent, or inaccurate financial information about their issuers, social upheavals, or political actions ranging from tax code changes to government collapse. Foreign companies may also receive less coverage by market analysts than U.S. companies and may be subject to different reporting standards or regulatory requirements than those applicable to U.S. companies.
7. Contingencies and Commitments
The Fund indemnifies the Trust’s officers and Trustees for certain liabilities that might arise from their performance of their duties to the Fund. Additionally, in the normal course of business, the Fund enters into contracts that contain a variety of representations,
23
BLUE CURRENT GLOBAL DIVIDEND FUND
NOTES TO FINANCIAL STATEMENTS (Continued)
warranties, and general indemnifications. The Fund’s maximum exposure under these arrangements is unknown, as this would involve future claims that may be made against the Fund that have not yet occurred. However, based on experience, the Fund expects the risk of loss to be remote.
8. Subsequent Events
The Fund is required to recognize in the financial statements the effects of all subsequent events that provide additional evidence about conditions that existed as of the date of the Statement of Assets and Liabilities. For non-recognized subsequent events that must be disclosed to keep the financial statements from being misleading, the Fund is required to disclose the nature of the event as well as an estimate of its financial effect, or a statement that such an estimate cannot be made. Management has evaluated subsequent events through the issuance of these financial statements and has noted no such events other than the ordinary income dividend paid on March 29, 2019, as discussed in Note 2.
24
BLUE CURRENT GLOBAL DIVIDEND FUND
ABOUT YOUR FUND’S EXPENSES (Unaudited)
We believe it is important for you to understand the impact of costs on your investment. As a shareholder of the Fund, you incur ongoing costs, including management fees and other operating expenses. The following examples are intended to help you understand your ongoing costs (in dollars) of investing in the Fund and to compare these costs with the ongoing costs of investing in other mutual funds.
A mutual fund’s ongoing costs are expressed as a percentage of its average net assets. This figure is known as the expense ratio. The expenses in the table below are based on an investment of $1,000 made at the beginning of the most recent period (September 1, 2018) and held until the end of the period (February 28, 2019).
The table below illustrates the Fund’s ongoing costs in two ways:
Actual fund return – This section helps you to estimate the actual expenses that you paid over the period. The “Ending Account Value” shown is derived from the Fund’s actual return, and the fourth column shows the dollar amount of operating expenses that would have been paid by an investor who started with $1,000 in the Fund. You may use the information here, together with the amount you invested, to estimate the expenses that you paid over the period.
To do so, simply divide your account value by $1,000 (for example, an $8,600 account value divided by $1,000 = 8.6), then multiply the result by the number given for the Fund under the heading “Expenses Paid During Period.”
Hypothetical 5% return – This section is intended to help you compare the Fund’s ongoing costs with those of other mutual funds. It assumes that the Fund had an annual return of 5% before expenses during the period shown, but that the expense ratio is unchanged. In this case, because the return used is not the Fund’s actual return, the results do not apply to your investment. The example is useful in making comparisons because the SEC requires all mutual funds to calculate expenses based on a 5% return. You can assess the Fund’s ongoing costs by comparing this hypothetical example with the hypothetical examples that appear in shareholder reports of other funds.
Note that expenses shown in the table are meant to highlight and help you compare ongoing costs only. The Fund does not charge sales loads. However, a redemption fee of 2% is applied on the sale of shares held for less than 7 days.
The calculations assume no shares were bought or sold during the period. Your actual costs may have been higher or lower, depending on the amount of your investment and the timing of any purchases or redemptions.
More information about the Fund’s expenses can be found in this report. For additional information on operating expenses and other shareholder costs, please refer to the Fund’s prospectus.
25
BLUE CURRENT GLOBAL DIVIDEND FUND
ABOUT YOUR FUND’S EXPENSES (Unaudited) (Continued)
Institutional Class | Beginning
Account Value
September 1,
2018 | Ending
Account Value
February 28,
2019 | Net Expense
Ratio(a) | Expenses
Paid During
Period(b) |
Based on Actual Fund Return | $1,000.00 | $979.20 | 0.99% | $4.86 |
Based on Hypothetical 5% Return (before expenses) | $1,000.00 | $1,019.89 | 0.99% | $4.96 |
(a) | Annualized, based on the Fund’s most recent one-half year expenses. |
(b) | Expenses are equal to the Fund’s annualized net expense ratio multiplied by the average account value over the period, multiplied by 181/365 (to reflect the one-half year period). |
26
BLUE CURRENT GLOBAL DIVIDEND FUND
OTHER INFORMATION (Unaudited)
A description of the policies and procedures that the Fund uses to vote proxies relating to portfolio securities is available without charge upon request by calling 1-800-514-3583, or on the SEC’s website at http://www.sec.gov. Information regarding how the Fund voted proxies relating to portfolio securities during the most recent 12-month period ended June 30 is also available without charge upon request by calling 1-800-514-3583, or on the SEC’s website at http://www.sec.gov.
The Trust files a complete listing of portfolio holdings for the Fund with the SEC as of the end of the first and third quarters of each fiscal year on Form N-Q. These filings are available upon request by calling 1-800-514-3583. Furthermore, you may obtain a copy of the filings on the SEC’s website at http://www.sec.gov.
27
FACTS | WHAT DOES THE BLUE CURRENT GLOBAL DIVIDEND FUND (the “Fund”) DO WITH YOUR PERSONAL INFORMATION? |
Why? | Financial companies choose how they share your personal information. Federal law gives consumers the right to limit some but not all sharing. Federal law also requires us to tell you how we collect, share, and protect your personal information. Please read this notice carefully to understand what we do. |
What? | The types of personal information we collect and share depend on the product or service you have with us. This information can include: ■ Social Security number ■ Assets ■ Retirement Assets ■ Transaction History ■ Checking Account Information ■ Purchase History ■ Account Balances ■ Account Transactions ■ Wire Transfer Instructions When you are no longer our customer, we continue to share your information as described in this notice. |
How? | All financial companies need to share your personal information to run their everyday business. In the section below, we list the reasons financial companies can share their customers’ personal information; the reasons the Fund chooses to share; and whether you can limit this sharing. |
Reasons we can share your personal information | Does the
Fund share? | Can you limit this sharing? |
For our everyday business purposes –
Such as to process your transactions, maintain your account(s), respond to court orders and legal investigations, or report to credit bureaus | Yes | No |
For our marketing purposes –
to offer our products and services to you | No | We don’t share |
For joint marketing with other financial companies | No | We don’t share |
For our affiliates’ everyday business purposes –
information about your transactions and experiences | No | We don’t share |
For our affiliates’ everyday business purposes –
information about your creditworthiness | No | We don’t share |
For nonaffiliates to market to you | No | We don’t share |
Questions? | Call 1-800-514-3583 |
28
Who we are |
Who is providing this notice? | Blue Current Global Dividend Fund Ultimus Fund Distributors, LLC (Distributor) Ultimus Fund Solutions, LLC (Administrator) |
What we do |
How does the Fund protect my personal information? | To protect your personal information from unauthorized access and use, we use security measures that comply with federal law. These measures include computer safeguards and secured files and buildings. Our service providers are held accountable for adhering to strict policies and procedures to prevent any misuse of your nonpublic personal information. |
How does the Fund collect my personal information? | We collect your personal information, for example, when you ■ Open an account ■ Provide account information ■ Give us your contact information ■ Make deposits or withdrawals from your account ■ Make a wire transfer ■ Tell us where to send the money ■ Tell us who receives the money ■ Show your government-issued ID ■ Show your driver’s license We also collect your personal information from other companies. |
Why can’t I limit all sharing? | Federal law gives you the right to limit only ■ Sharing for affiliates’ everyday business purposes –
information about your creditworthiness ■ Affiliates from using your information to market to you ■ Sharing for nonaffiliates to market to you State laws and individual companies may give you additional rights to limit sharing. |
Definitions |
Affiliates | Companies related by common ownership or control. They can be financial and nonfinancial companies. ■ Edge Capital Group, LLC, the investment adviser to the Fund, could be deemed to be an affiliate. |
Nonaffiliates | Companies not related by common ownership or control. They can be financial and nonfinancial companies ■ The Fund does not share with nonaffiliates so they can market to you. |
Joint marketing | A formal agreement between nonaffiliated financial companies that together market financial products or services to you. ■ The Fund does not jointly market. |
29

Semi-Annual Report
February 28, 2019
(Unaudited)
Beginning on January 1, 2021, as permitted by regulations adopted by the U.S. Securities and Exchange Commission, paper copies of the Fund’s shareholder reports like this one will no longer be sent by mail, unless you specifically request paper copies of the reports from the Fund or from your financial intermediary, such as a broker-dealer or bank. Instead, the reports will be made available on a website, and you will be notified by mail each time a report is posted and provided with a website link to access the report.
If you already elected to receive shareholder reports electronically, you will not be affected by this change and you need not take any action. You may elect to receive shareholder reports and other communications from the Fund electronically by contacting the Fund at 1-855-691-5288 or, if you own these shares through a financial intermediary, by contacting your financial intermediary.
You may elect to receive all future reports in paper free of charge. You can inform the Fund that you wish to continue receiving paper copies of your shareholder reports by contacting the Fund at 1-855-691-5288. If you own shares through a financial intermediary, you may contact your financial intermediary or follow instructions included with this document to elect to continue to receive paper copies of your shareholder reports. Your election to receive reports in paper will apply to all Funds held with the Fund complex or at your financial intermediary.
MARSHFIELD CONCENTRATED OPPORTUNITY FUND |
LETTER TO SHAREHOLDERS | March 22, 2019 |
From September 1, 2018 through February 28, 2019, the Marshfield Concentrated Opportunity Fund (the “Fund”) produced a cumulative total return of 5.25% compared to -3.05% for the S&P 500® Index.
Since the Fund’s inception in late 2015, we have used these letters to, among other things, reiterate the fact that we don’t pay much attention to the macroeconomic and political environment. We definitely refrain from predicting economic events and trends because we don’t think those are useful activities. However, we do pay some attention to current domestic and global developments because that allows us to understand something about how our companies perform in different environments, both in terms of their operating results and in terms of management’s approach to changes in such things as end market demand. Even if we have views about broad industry trends, we always believe it is in the interest of the Fund and its shareholders to make our decisions on a bottom-up basis. Irrespective of the external climate, we ask ourselves if a stock is cheap enough to buy (or expensive enough to sell), if the company has a sufficient moat around its business which cannot be penetrated by competitors, and if the company’s corporate culture is appropriate to its business. As managers, we feel comfortable making a judgment about those aspects of a business, thereby making sure our investments can withstand shocks and not only survive, but thrive in any type of external environment.
As noted above, prices in the US equity market declined overall during the six months ended February 28, 2019, notwithstanding a moderately strengthening macro economy. We don’t spend time thinking about the reasons for overall market movements, even apparently paradoxical ones like that which just occurred. In fact, what the market does and what we think about the economy and how our companies are doing in it are often out of sync. Again, we spend most of our time analyzing what our companies are doing given the environment in which they operate. This half year saw positive macro trends that were reasonably stable and consistent despite the near-constant noise produced by the US political environment, which we do our best to tune out when making decisions about securities (unless, of course, specific political decisions, such as tariffs, directly or indirectly affect our companies). One particular event that did continue to have an impact on company earnings and valuations was the 2017 Tax Cut and Jobs Act, which reduced US corporate tax rates from 35% to 21%. This has boosted the value of the majority of the stocks in our portfolio, given the Fund’s strong position in companies with predominantly US-based earnings.
While we believe that the portfolio in general benefited from the improving US economy, many individual names ran their businesses exceptionally well, leading to strong stock market outperformance. Leaving asideWaters, which, although it did well, is our smallest position, stocks in the portfolio which did particularly well and also materially affected performance includeChipotle (which returned 31.7 percent),AutoZone (which returned 24.8 percent), andUnion Pacific (which returned 17.6 percent). From our point of view, none of these companies did
1
anything that we found particularly unexpected, but obviously their revenues and/or earnings (or anticipated revenues and/or earnings) considerably exceeded the expectations of the market.
Only two stocks in the portfolio declined in value during the six month period and only one underperformed the market, reminding us yet again that performance isn’t necessarily only driven by big outperformers, but can also be driven by a relative lack of underperformers. These includedGoldman Sachs (which lost 14.4 percent) andNVR (which was down 0.4 percent). Goldman undoubtedly was hurt by worries (some of them quite valid) about the effect of the 1MDB scandal, and NVR by worries about the effect of higher interest rates on new home purchases.
Our historical track record is one of limited turnover, and that was true again during this time period. We trimmed the size of two positions—Union Pacific andYum! Brands—due to price appreciation. We did not add any new names during the 6 month period but took advantage of reductions in share price to add slightly to our positions inArch Capital, Chipotle (which, while it ended the six month period strongly, was relatively inexpensive last fall), and Goldman. Each of the stocks to which we added is intended to be a long-term holding. While the stocks in this category experienced an increase in their share price from the time we added to them until the end of February, we buy stocks for their anticipated business and stock performance over the course of at least a business cycle, not just months or a single year.
Our approach in any environment is to stick to our discipline. That means: 1) understanding what’s real and what’s fantasy; 2) acting with equanimity to exploit the misjudgments of the crowd; and 3) being patient and not pulling the trigger before our buy or sell price has been reached. These things won’t change. Process and discipline (enabled by patience) are why we believe investors choose to invest in the Fund, and we take our mandate to preserve capital and generate risk-adjusted returns very seriously.
We thank you for the opportunity to invest your money and for your confidence in our process, discipline, and patience.
Sincerely,
Elise J. Hoffmann
Portfolio Manager | Christopher M. Niemczewski
Portfolio Manager |
Past performance is not predictive of future performance. Investment results and principal value will fluctuate so that shares, when redeemed, may be worth more or less than their original cost. Current performance may be higher or lower than the performance data quoted. Performance data current to the most recent month-end are available by calling 1-855-691-5288.
An investor should consider the investment objectives, risks, charges and expenses of the Fund carefully before investing. The Fund’s prospectus contains this and other important information. To obtain a copy of the Fund’s prospectus please visit our website at www.MarshfieldFunds.com or call 1-855-691-5288 and a copy will be sent to you free of charge. Please read the prospectus carefully before you invest. The Fund is distributed by Ultimus Fund Distributors, LLC.
2
The Letter to Shareholders seeks to describe some of the Adviser’s current opinions and views of the financial markets. Although the Adviser believes it has a reasonable basis for any opinions or views expressed, actual results may differ, sometimes significantly so, from those expected or expressed. The securities held by the Fund that are discussed in the Letter to Shareholders were held during the period covered by this Report. They do not comprise the entire investment portfolio of the Fund, may be sold at any time, and may no longer be held by the Fund. For a complete list of securities held by the Fund as of February 28, 2019, please see the Schedule of Investments section of the semi-annual report. The opinions of the Fund’s adviser with respect to those securities may change at any time.
Statements in the Letter to Shareholders that reflect projections or expectations for future financial or economic performance of the Fund and the market in general and statements of the Fund’s plans and objectives for future operations are forward-looking statements. No assurance can be given that actual results or events will not differ materially from those projected, estimated, assumed, or anticipated in any such forward-looking statements. Important factors that could result in such differences, in addition to factors noted with such forward-looking statements, include, without limitation, general economic conditions, such as inflation, recession, and interest rates. Past performance is not a guarantee of future results.
3
MARSHFIELD CONCENTRATED OPPORTUNITY FUND
PORTFOLIO INFORMATION
February 28, 2019 (Unaudited)
Portfolio Allocation (% of Net Assets)
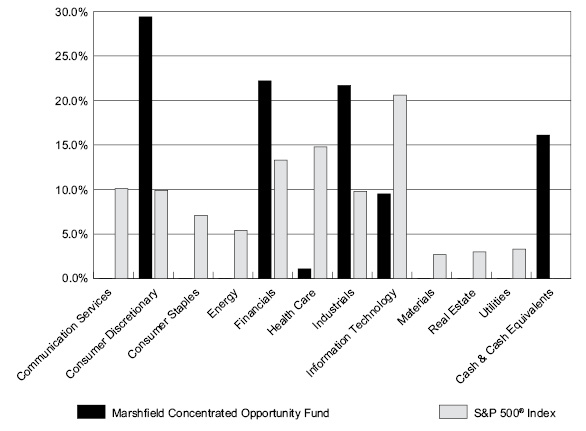
Top 10 Equity Holdings
Security Description | % of Net Assets |
Moody's Corporation | 9.8% |
Arch Capital Group Ltd. | 8.1% |
Chipotle Mexican Grill, Inc. | 7.3% |
AutoZone, Inc. | 6.1% |
Deere & Company | 5.7% |
Mastercard, Inc. - Class A | 5.0% |
Fastenal Company | 4.7% |
O'Reilly Automotive, Inc. | 4.6% |
Visa, Inc. - Class A | 4.5% |
Expeditors International of Washington, Inc. | 4.3% |
4
MARSHFIELD CONCENTRATED OPPORTUNITY FUND
SCHEDULE OF INVESTMENTS
February 28, 2019 (Unaudited) |
COMMON STOCKS — 83.9% | | Shares | | | Value | |
Consumer Discretionary — 29.4% | | | | | | | | |
Diversified Consumer Services — 3.3% | | | | | | | | |
Strategic Education, Inc. | | | 10,177 | | | $ | 1,330,948 | |
| | | | | | | | | |
Hotels, Restaurants & Leisure — 10.0% | | | | | | | | |
Chipotle Mexican Grill, Inc.(a) | | | 4,834 | | | | 2,936,800 | |
Yum! Brands, Inc. | | | 11,351 | | | | 1,072,669 | |
| | | | | | | | 4,009,469 | |
Household Durables — 1.9% | | | | | | | | |
NVR, Inc.(a) | | | 294 | | | | 770,280 | |
| | | | | | | | | |
Specialty Retail — 14.2% | | | | | | | | |
AutoZone, Inc.(a) | | | 2,633 | | | | 2,472,308 | |
O'Reilly Automotive, Inc.(a) | | | 4,976 | | | | 1,850,873 | |
Ross Stores, Inc. | | | 14,732 | | | | 1,397,036 | |
| | | | | | | | 5,720,217 | |
Financials — 22.2% | | | | | | | | |
Capital Markets — 14.1% | | | | | | | | |
Goldman Sachs Group, Inc. (The) | | | 8,580 | | | | 1,687,686 | |
Moody's Corporation | | | 22,878 | | | | 3,960,639 | |
| | | | | | | | 5,648,325 | |
Insurance — 8.1% | | | | | | | | |
Arch Capital Group Ltd.(a) | | | 99,633 | | | | 3,255,010 | |
| | | | | | | | | |
Health Care — 1.1% | | | | | | | | |
Life Sciences Tools & Services — 1.1% | | | | | | | | |
Waters Corporation(a) | | | 1,843 | | | | 446,411 | |
| | | | | | | | | |
Industrials — 21.7% | | | | | | | | |
Air Freight & Logistics — 4.3% | | | | | | | | |
Expeditors International of Washington, Inc. | | | 23,215 | | | | 1,739,965 | |
| | | | | | | | | |
Machinery — 9.9% | | | | | | | | |
Cummins, Inc. | | | 11,029 | | | | 1,699,459 | |
Deere & Company | | | 14,005 | | | | 2,297,380 | |
| | | | | | | | 3,996,839 | |
Road & Rail — 2.8% | | | | | | | | |
Union Pacific Corporation | | | 6,606 | | | | 1,107,826 | |
| | | | | | | | | |
Trading Companies & Distributors — 4.7% | | | | | | | | |
Fastenal Company | | | 29,863 | | | | 1,879,577 | |
5
MARSHFIELD CONCENTRATED OPPORTUNITY FUND
SCHEDULE OF INVESTMENTS (Continued) |
COMMON STOCKS — 83.9% (Continued) | | Shares | | | Value | |
Information Technology — 9.5% | | | | | | | | |
IT Services — 9.5% | | | | | | | | |
Mastercard, Inc. - Class A | | | 9,013 | | | $ | 2,025,852 | |
Visa, Inc. - Class A | | | 12,194 | | | | 1,806,175 | |
| | | | | | | | 3,832,027 | |
| | | | | | | | | |
Total Common Stocks (Cost $26,931,466) | | | | | | $ | 33,736,894 | |
|
MONEY MARKET FUNDS — 16.9% | | Shares | | | Value | |
Goldman Sachs Financial Square Funds - Treasury Instruments Fund - Institutional Shares, 2.25%(b) | | | 5,097,470 | | | $ | 5,097,470 | |
Vanguard Treasury Money Market Fund, 2.35%(b) | | | 1,711,947 | | | | 1,711,947 | |
Total Money Market Funds (Cost $6,809,417) | | | | | | $ | 6,809,417 | |
| | | | | | | | | |
Investments at Value — 100.8% (Cost $33,740,883) | | | | | | $ | 40,546,311 | |
| | | | | | | | | |
Liabilities in Excess of Other Assets - (0.8%) | | | | | | | (320,593 | ) |
| | | | | | | | | |
Net Assets — 100.0% | | | | | | $ | 40,225,718 | |
(a) | Non-income producing security. |
(b) | The rate shown is the 7-day effective yield as of February 28, 2019. |
See accompanying notes to financial statements. |
6
MARSHFIELD CONCENTRATED OPPORTUNITY FUND
STATEMENT OF ASSETS AND LIABILITIES
February 28, 2019 (Unaudited) |
ASSETS | | | | |
Investments in securities: | | | | |
At cost | | $ | 33,740,883 | |
At value (Note 2) | | $ | 40,546,311 | |
Receivable for capital shares sold | | | 245,197 | |
Receivable for investment securities sold | | | 18,900 | |
Dividends receivable | | | 51,954 | |
Other assets | | | 24,017 | |
Total assets | | | 40,886,379 | |
| | | | | |
LIABILITIES | | | | |
Payable for capital shares redeemed | | | 971 | |
Payable for investment securities purchased | | | 639,349 | |
Payable to Adviser (Note 4) | | | 5,184 | |
Payable to administrator (Note 4) | | | 7,890 | |
Other accrued expenses | | | 7,267 | |
Total liabilities | | | 660,661 | |
| | | | | |
NET ASSETS | | $ | 40,225,718 | |
| | | | | |
NET ASSETS CONSIST OF: | | | | |
Paid-in capital | | $ | 33,355,183 | |
Accumulated earnings | | | 6,870,535 | |
NET ASSETS | | $ | 40,225,718 | |
| | | | | |
Shares of beneficial interest outstanding (unlimited number of shares authorized, no par value) | | | 2,536,745 | |
| | | | | |
Net asset value, offering price and redemption price per share (Note 2) | | $ | 15.86 | |
See accompanying notes to financial statements. |
7
MARSHFIELD CONCENTRATED OPPORTUNITY FUND
STATEMENT OF OPERATIONS
For the Six Months Ended February 28, 2019 (Unaudited) |
INVESTMENT INCOME | | | | |
Dividend income | | $ | 169,972 | |
| | | | | |
EXPENSES | | | | |
Investment advisory fees (Note 4) | | | 126,224 | |
Professional fees | | | 22,352 | |
Fund accounting fees (Note 4) | | | 16,331 | |
Administration fees (Note 4) | | | 15,125 | |
Registration and filing fees | | | 12,921 | |
Transfer agent fees (Note 4) | | | 9,000 | |
Compliance fees (Note 4) | | | 6,000 | |
Trustees' fees and expenses (Note 4) | | | 5,654 | |
Custody and bank service fees | | | 5,442 | |
Printing of shareholder reports | | | 5,440 | |
Postage and supplies | | | 3,251 | |
Insurance expense | | | 1,452 | |
Pricing fees | | | 322 | |
Other expenses | | | 3,787 | |
Total expenses | | | 233,301 | |
Less fee reductions by the Adviser (Note 4) | | | (87,144 | ) |
Net expenses | | | 146,157 | |
| | | | | |
NET INVESTMENT INCOME | | | 23,815 | |
| | | | | |
REALIZED AND UNREALIZED GAINS ON INVESTMENTS | | | | |
Net realized gains from investment transactions | | | 194,060 | |
Net change in unrealized appreciation (depreciation) on investments | | | 1,821,065 | |
NET REALIZED AND UNREALIZED GAINS ON INVESTMENTS | | | 2,015,125 | |
| | | | | |
NET INCREASE IN NET ASSETS RESULTING FROM OPERATIONS | | $ | 2,038,940 | |
See accompanying notes to financial statements. |
8
MARSHFIELD CONCENTRATED OPPORTUNITY FUND
STATEMENTS OF CHANGES IN NET ASSETS |
| | Six Months
Ended
February 28,
2019
(Unaudited) | | | Year
Ended
August 31,
2018(a) | |
FROM OPERATIONS | | | | | | | | |
Net investment income (loss) | | $ | 23,815 | | | $ | (975 | ) |
Net realized gains from investment transactions | | | 194,060 | | | | 505,753 | |
Net change in unrealized appreciation (depreciation) on investments | | | 1,821,065 | | | | 3,106,123 | |
Net increase in net assets resulting from operations | | | 2,038,940 | | | | 3,610,901 | |
| | | | | | | | | |
DISTRIBUTIONS TO SHAREHOLDERS (Note 2) | | | (475,838 | ) | | | (312,300 | ) |
| | | | | | | | | |
CAPITAL SHARE TRANSACTIONS | | | | | | | | |
Proceeds from shares sold | | | 16,552,302 | | | | 7,384,990 | |
Net asset value of shares issued in reinvestment of distributions to shareholders | | | 457,005 | | | | 301,657 | |
Proceeds from redemption fees collected (Note 2) | | | 1,940 | | | | 690 | |
Payments for shares redeemed | | | (1,246,872 | ) | | | (921,553 | ) |
Net increase in net assets from captial share transactions | | | 15,764,375 | | | | 6,765,784 | |
| | | | | | | | | |
TOTAL INCREASE IN NET ASSETS | | | 17,327,477 | | | | 10,064,385 | |
| | | | | | | | | |
NET ASSETS | | | | | | | | |
Beginning of period | | | 22,898,241 | | | | 12,833,856 | |
End of period | | $ | 40,225,718 | | | $ | 22,898,241 | |
| | | | | | | | | |
CAPITAL SHARES ACTIVITY | | | | | | | | |
Shares sold | | | 1,098,194 | | | | 513,412 | |
Shares reinvested | | | 33,852 | | | | 21,796 | |
Shares redeemed | | | (85,134 | ) | | | (65,298 | ) |
Net increase in shares outstanding | | | 1,046,912 | | | | 469,910 | |
Shares outstanding at beginning of period | | | 1,489,833 | | | | 1,019,923 | |
Shares outstanding at end of period | | | 2,536,745 | | | | 1,489,833 | |
(a) | The presentation of Distributions to Shareholders has been updated to reflect the changes prescribed in amendments to Regulation S-X, effective November 5, 2018 (Note 2). For the year ended August 31, 2018, distributions to shareholders consisted of $8,517 from net investment income and $303,783 from net realized gains. As of August 31, 2018, undistributed net investment income was $0. |
See accompanying notes to financial statements. |
9
MARSHFIELD CONCENTRATED OPPORTUNITY FUND
FINANCIAL HIGHLIGHTS |
Per Share Data for a Share Outstanding Throughout Each Period |
| | Six Months
Ended
February 28,
2019
(Unaudited) | | | Year
Ended
August 31,
2018 | | | Year
Ended
August 31,
2017 | | | Period
Ended
August 31,
2016(a) | |
Net asset value at beginning of period | | $ | 15.37 | | | $ | 12.58 | | | $ | 10.61 | | | $ | 10.00 | |
| | | | | | | | | | | | | | | | | |
Income (loss) from investment operations: | | | | | | | | | | | | | | | | |
Net investment income (loss) | | | 0.01 | | | | (0.00 | )(b) | | | 0.00 | (b) | | | 0.02 | |
Net realized and unrealized gains on investments | | | 0.75 | | | | 3.08 | | | | 2.04 | | | | 0.59 | |
Total from investment operations | | | 0.76 | | | | 3.08 | | | | 2.04 | | | | 0.61 | |
| | | | | | | | | | | | | | | | | |
Less distributions: | | | | | | | | | | | | | | | | |
From net investment income | | | (0.00 | )(b) | | | (0.01 | ) | | | (0.02 | ) | | | — | |
From net realized gains | | | (0.27 | ) | | | (0.28 | ) | | | (0.05 | ) | | | — | |
Total distributions | | | (0.27 | ) | | | (0.29 | ) | | | (0.07 | ) | | | — | |
| | | | | | | | | | | | | | | | | |
Proceeds from redemption fees collected (Note 2) | | | 0.00 | (b) | | | 0.00 | (b) | | | — | | | | — | |
| | | | | | | | | | | | | | | | | |
Net asset value at end of period | | $ | 15.86 | | | $ | 15.37 | | | $ | 12.58 | | | $ | 10.61 | |
| | | | | | | | | | | | | | | | | |
Total return(c) | | | 5.25 | %(d) | | | 24.70 | % | | | 19.27 | % | | | 6.10 | %(d) |
| | | | | | | | | | | | | | | | | |
Net assets at end of period (000's) | | $ | 40,226 | | | $ | 22,898 | | | $ | 12,834 | | | $ | 5,891 | |
| | | | | | | | | | | | | | | | | |
Ratios/supplementary data: | | | | | | | | | | | | | | | | |
Ratio of total expenses to average net assets | | | 1.75 | %(e) | | | 2.09 | % | | | 2.87 | % | | | 3.80 | %(e) |
| | | | | | | | | | | | | | | | | |
Ratio of net expenses to average net assets(f) | | | 1.10 | %(e) | | | 1.10 | % | | | 1.10 | % | | | 1.22 | %(e) |
| | | | | | | | | | | | | | | | | |
Ratio of net investment income (loss) to average net assets(f) | | | 0.18 | %(e) | | | (0.01 | %) | | | 0.08 | % | | | 0.42 | %(e) |
| | | | | | | | | | | | | | | | | |
Portfolio turnover rate | | | 3 | %(d) | | | 10 | % | | | 11 | % | | | 18 | %(d) |
(a) | Represents the period from the commencement of operations (December 29, 2015) through August 31, 2016. |
(b) | Amount rounds to less than $0.01 per share. |
(c) | Total return is a measure of the change in value of an investment in the Fund over the period covered. The returns shown do not reflect the deduction of taxes a shareholders would pay on Fund distributions, if any, or the redemption of Fund shares. The total returns would be lower if the Adviser had not reduced advisory fees and reimbursed expenses (Note 4). |
(d) | Not annualized. |
(e) | Annualized. |
(f) | Ratio was determined after advisory fee reductions and expense reimbursements (Note 4). |
See accompanying notes to financial statements. |
10
MARSHFIELD CONCENTRATED OPPORTUNITY FUND
NOTES TO FINANCIAL STATEMENTS
February 28, 2019 (Unaudited)
1. Organization
Marshfield Concentrated Opportunity Fund (the “Fund”) is a non-diversified series of Ultimus Managers Trust (the “Trust”), an open-end investment company established as an Ohio business trust under a Declaration of Trust dated February 28, 2012. Other series of the Trust are not incorporated in this report.
The investment objective of the Fund is to seek the dual goals of capital preservation and the long-term growth of principal, while targeting a pattern of performance at variance with that of the market.
2. Significant Accounting Policies
In August 2018, the U.S. Securities and Exchange Commission (the “SEC”) adopted regulations that eliminated or amended disclosure requirements that were redundant or outdated in light of changes in SEC requirements, accounting principles generally accepted in the United States of America (“GAAP”), International Financial Reporting Standards or changes in technology or the business environment. These regulations were effective November 5, 2018, and the Fund is complying with them effective with these financial statements.
The Fund follows accounting and reporting guidance under Financial Accounting Standards Board (“FASB”) Accounting Standards Codification (“ASC”) Topic 946, “Financial Services – Investment Companies.” The following is a summary of the Fund’s significant accounting policies used in the preparation of its financial statements. These policies are in conformity with GAAP.
New accounting pronouncement – In August 2018, FASB issued Accounting Standards Update No. 2018-13 (“ASU 2018-13”), “Disclosure Framework – Changes to the Disclosure Requirements for Fair Value Measurement,” which amends the fair value measurement disclosure requirements of ASC Topic 820 (“ASC 820”), “Fair Value Measurement.” ASU 2018-13 includes new, eliminated, and modified disclosure requirements for ASC 820. In addition, ASU 2018-13 clarifies that materiality is an appropriate consideration when evaluating disclosure requirements. ASU 2018-13 is effective for fiscal years beginning after December 15, 2019, including interim periods therein. Early adoption is permitted and the Fund has adopted ASU 2018-13 with these financial statements.
Securities valuation – The Fund values its portfolio securities at market value as of the close of regular trading on the New York Stock Exchange (the “NYSE”) (normally 4:00 p.m. Eastern time) on each business day the NYSE is open for business. The Fund values its listed securities on the basis of the security’s last sale price on the security’s primary exchange, if available, otherwise at the exchange’s most recently quoted mean price. NASDAQ-listed securities are valued at the NASDAQ Official Closing Price. Investments representing shares of other open-end investment companies, including money market funds, are valued at their net asset value
11
MARSHFIELD CONCENTRATED OPPORTUNITY FUND
NOTES TO FINANCIAL STATEMENTS (Continued) |
(“NAV”) as reported by such companies. When using a quoted price and when the market is considered active, the security will be classified as Level 1 within the fair value hierarchy (see below). Fixed income securities, if any, are generally valued using prices provided by an independent pricing service approved by the Board of Trustees of the Trust (the “Board”). The independent pricing service uses information with respect to transactions in bonds, quotations from bond dealers, market transactions in comparable securities, and various relationships between securities in determining these prices. In the event that market quotations are not readily available or are considered unreliable due to market or other events, the Fund values its securities and other assets at fair value in accordance with procedures established by and under the general supervision of the Board. Under these procedures, the securities will be classified as Level 2 or 3 within the fair value hierarchy, depending on the inputs used. Unavailable or unreliable market quotes may be due to the following factors: a substantial bid-ask spread; infrequent sales resulting in stale prices; insufficient trading volume; small trade sizes; a temporary lapse in any reliable pricing source; and actions of the securities or futures markets, such as the suspension or limitation of trading. As a result, the prices of securities used to calculate the Fund’s NAV may differ from quoted or published prices for the same securities.
GAAP establishes a single authoritative definition of fair value, sets out a framework for measuring fair value, and requires additional disclosures about fair value measurements.
Various inputs are used in determining the value of the Fund’s investments. These inputs are summarized in the three broad levels listed below:
| | ● | Level 1 – quoted prices in active markets for identical securities |
| | ● | Level 2 – other significant observable inputs |
| | ● | Level 3 – significant unobservable inputs |
The inputs or methods used for valuing securities are not necessarily an indication of the risks associated with investing in those securities. The inputs used to measure fair value may fall into different levels of the fair value hierarchy. In such cases, for disclosure purposes, the level in the fair value hierarchy within which the fair value measurement falls in its entirety is determined based on the lowest level input that is significant to the fair value measurement.
The following is a summary of the inputs used to value the Fund’s investments as of February 28, 2019:
| | Level 1 | | | Level 2 | | | Level 3 | | | Total | |
Common Stocks | | $ | 33,736,894 | | | $ | — | | | $ | — | | | $ | 33,736,894 | |
Money Market Funds | | | 6,809,417 | | | | — | | | | — | | | | 6,809,417 | |
Total | | $ | 40,546,311 | | | $ | — | | | $ | — | | | $ | 40,546,311 | |
12
MARSHFIELD CONCENTRATED OPPORTUNITY FUND
NOTES TO FINANCIAL STATEMENTS (Continued) |
Refer to the Fund’s Schedule of Investments for a listing of the common stocks by industry type. As of February 28, 2019, the Fund did not hold derivative instruments or any assets or liabilities that were measured at fair value on a recurring basis using significant unobservable inputs (Level 3).
Share valuation – The NAV per share of the Fund is calculated daily by dividing the total value of the Fund’s assets, less liabilities, by the number of shares outstanding. The offering price and redemption price per share of the Fund is equal to the NAV, except that shares of the Fund are subject to a redemption fee of 2% if redeemed within 90 days of the date of purchase. During the periods ended February 28, 2019 and August 31, 2018, proceeds from the redemption fees, recorded in capital, totaled $1,940 and $690, respectively.
Investment income – Dividend income is recorded on the ex-dividend date. Interest income is accrued as earned.
Investment transactions – Investment transactions are accounted for on the trade date. Realized gains and losses on investments sold are determined on a specific identification basis.
Common expenses– Common expenses of the Trust are allocated among the Fund and the other series of the Trust based on the relative net assets of each series, the number of series in the Trust, or the nature of the services performed and the relative applicability to each series.
Distributions to shareholders – The Fund will distribute to shareholders any net investment income dividends and net realized capital gains distributions at least once each year. The amount of such dividends and distributions are determined in accordance with federal income tax regulations, which may differ from GAAP. Dividends and distributions are recorded on the ex-dividend date. The tax character of the Fund’s distributions paid to shareholders during the periods ended February 28, 2019 and August 31, 2018 was as follows:
Period
Ended | Ordinary
Income | Long-Term
Capital
Gains | Total
Distributions |
2/28/2019 | $ 24,384 | $ 451,454 | $ 475,838 |
8/31/2018 | $ 9,718 | $ 302,582 | $ 312,300 |
Estimates – The preparation of financial statements in conformity with GAAP requires management to make estimates and assumptions that affect the reported amounts of assets and liabilities and disclosure of contingent assets and liabilities as of the date of the financial statements and the reported amounts of income and expenses during the reporting period. Actual results could differ from those estimates.
13
MARSHFIELD CONCENTRATED OPPORTUNITY FUND
NOTES TO FINANCIAL STATEMENTS (Continued) |
Federal income tax– The Fund has qualified and intends to continue to qualify as a regulated investment company under the Internal Revenue Code of 1986, as amended (the “Code”). Qualification generally will relieve the Fund of liability for federal income taxes to the extent 100% of its net investment income and net realized capital gains are distributed in accordance with the Code.
In order to avoid imposition of the excise tax applicable to regulated investment companies, it is also the Fund’s intention to declare as dividends in each calendar year at least 98% of its net investment income (earned during the calendar year) and 98.2% of its net realized capital gains (earned during the 12 months ended October 31) plus undistributed amounts from prior years.
The following information is computed on a tax basis for each item as of February 28, 2019:
Tax cost of portfolio investments | | $ | 33,743,579 | |
Gross unrealized appreciation | | $ | 7,030,711 | |
Gross unrealized depreciation | | | (227,979 | ) |
Net unrealized appreciation | | | 6,802,732 | |
Accumulated ordinary income | | | 18,691 | |
Other gains | | | 49,112 | |
Accumulated earnings | | $ | 6,870,535 | |
The values of the federal income tax cost of portfolio investments and the financial statement cost of portfolio investments may be temporarily different (“book/tax differences”). These book/tax differences are due to the timing of the recognition of capital gains or losses under income tax regulations and GAAP, primarily due to the tax deferral of losses on wash sales.
The Fund recognizes the tax benefits or expenses of uncertain tax positions only when the position is “more likely than not” to be sustained assuming examination by tax authorities. Management has reviewed the Fund’s tax positions for the current and all open tax periods (generally, three years) and has concluded that no provision for unrecognized tax benefits or expenses is required in these financial statements. The Fund identifies its major tax jurisdiction as U.S. Federal.
3. Investment Transactions
During the six months ended February 28, 2019, cost of purchases and proceeds from sales of investment securities, other than short-term investments, were $12,940,734 and $706,205, respectively.
14
MARSHFIELD CONCENTRATED OPPORTUNITY FUND
NOTES TO FINANCIAL STATEMENTS (Continued) |
4. Transactions with Related Parties
INVESTMENT ADVISORY AGREEMENT
The Fund’s investments are managed by Marshfield Associates, Inc. (the “Adviser”) pursuant to the terms of an Investment Advisory Agreement. Under the Investment Advisory Agreement, the Fund pays the Adviser an advisory fee, computed and accrued daily and paid monthly, at the annual rate of 0.95% of its average daily net assets.
Pursuant to an Expense Limitation Agreement (“ELA”) between the Fund and the Adviser, the Adviser has contractually agreed, until January 1, 2020, to reduce its investment advisory fees and reimburse other expenses to limit total annual operating expenses (exclusive of brokerage costs; taxes; interest; borrowing costs such as interest and dividend expenses on securities sold short; costs to organize the Fund; acquired fund fees and expenses; extraordinary expenses such as litigation and merger or reorganization costs and other expenses not incurred in the ordinary course of the Fund’s business), to an amount not exceeding 1.10% of the Fund’s average daily net assets. Accordingly, during the six months ended February 28, 2019, the Adviser reduced its investment advisory fees by $87,144.
Under the terms of the ELA, investment advisory fee reductions and expense reimbursements by the Adviser are subject to repayment by the Fund for a period of three years after such fees and expenses were incurred, provided the repayments do not cause total annual operating expenses to exceed the lesser of: (i) the expense limitation then in effect, if any, and (ii) the expense limitation in effect at the time the expenses to be repaid were incurred. As of February 28, 2019, the Adviser may seek repayment of investment advisory fee reductions and expense reimbursements in the amount of $462,687 no later than the dates as stated below:
August 31, 2019 | | $ | 62,259 | |
August 31, 2020 | | | 149,506 | |
August 31, 2021 | | | 163,778 | |
February 28, 2022 | | | 87,144 | |
Total | | $ | 462,687 | |
OTHER SERVICE PROVIDERS
Ultimus Fund Solutions, LLC (“Ultimus”) provides administration, fund accounting, compliance and transfer agency services to the Fund. The Fund pays Ultimus fees in accordance with the agreements for such services. In addition, the Fund pays out-of-pocket expenses including, but not limited to, postage, supplies, and costs of pricing the Fund’s portfolio securities.
15
MARSHFIELD CONCENTRATED OPPORTUNITY FUND
NOTES TO FINANCIAL STATEMENTS (Continued) |
Under the terms of a Distribution Agreement with the Trust, Ultimus Fund Distributors, LLC (the “Distributor”) serves as principal underwriter to the Fund. The Distributor is a wholly-owned subsidiary of Ultimus. The Distributor is compensated by the Adviser (not the Fund) for acting as principal underwriter.
Certain officers and a Trustee of the Trust are also officers of Ultimus and the Distributor.
TRUSTEE COMPENSATION
Each Trustee who is not an “interested person” of the Trust (“Independent Trustee”) receives a $1,300 annual retainer from the Fund, paid quarterly, except for the Board Chairperson who receives a $1,500 annual retainer from the Fund, paid quarterly. Each Independent Trustee also receives from the Fund a fee of $500 for each Board meeting attended plus reimbursement for travel and other meeting-related expenses.
PRINCIPAL HOLDER OF FUND SHARES
As of February 28, 2019, the following shareholder owned of record 25% or more of the outstanding shares of the Fund:
Name of Record Owner | % Ownership |
RBC Capital Markets, LLC (for the benefit of its customers) | 39% |
A beneficial owner of 25% or more of the Fund’s outstanding shares may be considered a controlling person. That shareholder’s vote could have a more significant effect on matters presented at a shareholders’ meeting.
5. Sector Risk
If the Fund has significant investments in the securities of issuers within a particular sector, any development affecting that sector will have a greater impact on the value of the net assets of the Fund than would be the case if the Fund did not have significant investments in that sector. In addition, this may increase the risk of loss in the Fund and increase the volatility of the Fund’s NAV per share. Occasionally, market conditions, regulatory changes or other developments may negatively impact this sector, and therefore the value of the Fund’s portfolio will be adversely affected. As of February 28, 2019, the Fund had 29.4% of the value of its net assets invested in securities within the Consumer Discretionary sector.
6. Contingencies and Commitments
The Fund indemnifies the Trust’s officers and Trustees for certain liabilities that might arise from their performance of their duties to the Fund. Additionally, in the normal course of business the Fund enters into contracts that contain a variety of representations and warranties and which provide general indemnifications. The
16
MARSHFIELD CONCENTRATED OPPORTUNITY FUND
NOTES TO FINANCIAL STATEMENTS (Continued) |
Fund’s maximum exposure under these arrangements is unknown, as this would involve future claims that may be made against the Fund that have not yet occurred. However, based on experience, the Fund expects the risk of loss to be remote.
7. Subsequent Events
The Fund is required to recognize in the financial statements the effects of all subsequent events that provide additional evidence about conditions that existed as of the date of the Statement of Assets and Liabilities. For non-recognized subsequent events that must be disclosed to keep the financial statements from being misleading, the Fund is required to disclose the nature of the event as well as an estimate of its financial effect, or a statement that such an estimate cannot be made. Management has evaluated subsequent events through the issuance of these financial statements and has noted no such events.
17
MARSHFIELD CONCENTRATED OPPORTUNITY FUND
ABOUT YOUR FUND’S EXPENSES (Unaudited) |
We believe it is important for you to understand the impact of costs on your investment. As a shareholder of the Fund, you incur two types of cost: (1) transaction costs, including redemption fees; and (2) ongoing costs, including management fees and other operating expenses. The following examples are intended to help you understand your ongoing costs (in dollars) of investing in the Fund and to compare these costs with the ongoing costs of investing in other mutual funds.
A mutual fund’s ongoing costs are expressed as a percentage of its average net assets. This figure is known as the expense ratio. The expenses in the table below are based on an investment of $1,000 made at the beginning of the most recent period (September 1, 2018) and held until the end of the period (February 28, 2019).
The table below illustrates the Fund’s ongoing costs in two ways:
Actual fund return – This section helps you to estimate the actual expenses that you paid over the period. The “Ending Account Value” shown is derived from the Fund’s actual return, and the fourth column shows the dollar amount of operating expenses that would have been paid by an investor who started with $1,000 in the Fund. You may use the information here, together with the amount you invested, to estimate the expenses that you paid over the period.
To do so, simply divide your account value by $1,000 (for example, an $8,600 account value divided by $1,000 = 8.6), then multiply the result by the number given for the Fund under the heading “Expenses Paid During Period.”
Hypothetical 5% return – This section is intended to help you compare the Fund’s ongoing costs with those of other mutual funds. It assumes that the Fund had an annual return of 5% before expenses during the period shown, but that the expense ratio is unchanged. In this case, because the return used is not the Fund’s actual return, the results do not apply to your investment. The example is useful in making comparisons because the SEC requires all mutual funds to calculate expenses based on a 5% return. You can assess the Fund’s ongoing costs by comparing this hypothetical example with the hypothetical examples that appear in shareholder reports of other funds.
Note that expenses shown in the table are meant to highlight and help you compare ongoing costs only. The Fund does not charge sales loads. However, a redemption fee of 2% is applied on the sale of shares held for less than 90 days.
The calculations assume no shares were bought or sold during the period. Your actual costs may have been higher or lower, depending on the amount of your investment and the timing of any purchases or redemptions.
More information about the Fund’s expenses can be found in this report. For additional information on operating expenses and other shareholder costs, please refer to the Fund’s prospectus.
18
MARSHFIELD CONCENTRATED OPPORTUNITY FUND
ABOUT YOUR FUND’S EXPENSES (Unaudited) (Continued) |
| Beginning
Account Value
September 1,
2018 | Ending
Account Value
February 28,
2019 | Net
Expense
Ratio(a) | Expenses
Paid During
Period(b) |
Based on Actual Fund Return | $1,000.00 | $1,052.50 | 1.10% | $5.60 |
Based on Hypothetical 5% Return (before expenses) | $1,000.00 | $1,019.34 | 1.10% | $5.51 |
(a) | Annualized, based on the Fund’s most recent one-half year expenses. |
(b) | Expenses are equal to the Fund’s annualized net expense ratio multiplied by the average account value over the period, multiplied by 181/365 (to reflect the one-half year period). |
OTHER INFORMATION (Unaudited)
A description of the policies and procedures that the Fund uses to vote proxies relating to portfolio securities is available without charge upon request by calling toll-free 1-855-691-5288, or on the SEC’s website at http://www.sec.gov. Information regarding how the Fund voted proxies relating to portfolio securities during the most recent 12-month period ended June 30 is available without charge upon request by calling toll-free 1-855-691-5288, or on the SEC’s website at http://www.sec.gov.
The Trust files a complete listing of portfolio holdings for the Fund with the SEC as of the end of the first and third quarters of each fiscal year on Form N-Q. These filings are available upon request by calling 1-855-691-5288. Furthermore, you may obtain a copy of the filings on the SEC’s website at http://www.sec.gov.
19
MARSHFIELD CONCENTRATED OPPORTUNITY FUND
DISCLOSURE REGARDING APPROVAL OF INVESTMENT ADVISORY AGREEMENT (Unaudited) |
The Board of Trustees (the “Board”), including the Independent Trustees voting separately, has reviewed and approved the Fund’s Investment Agreement with Marshfield Associates, Inc. (the “Adviser”) for an additional one-year term (the “Agreement”). The Board approved the Agreement at an in-person meeting held on October 22-23, 2018, at which all of the Trustees were present.
Legal counsel advised the Board during its deliberations. Additionally, the Board received and reviewed a substantial amount of information provided by the Adviser in response to requests of the Board and counsel. In deciding whether to approve the renewal of the Investment Advisory Agreement, the Board recalled its review of the materials related to the Fund and the Adviser throughout the preceding 12 months and its numerous discussions with Trust management and the Adviser about the operations and performance of the Fund during that period. The Board further considered those materials and discussions and other numerous factors, including the following factors.
The nature, extent, and quality of the services provided by the Adviser. In this regard, the Board reviewed the services being provided by the Adviser to the Fund including, without limitation, its investment advisory services since the Fund’s inception; its compliance procedures and practices; its efforts to promote the Fund and assist in its distribution; and its compliance program. After reviewing the foregoing information and further information in the Adviser’s memorandum to the Board (e.g., description of its business and Form ADV), the Board concluded that the quality, extent, and nature of the services provided by the Adviser to the Fund were satisfactory and adequate.
The investment performance of the Fund. In this regard, the Board compared the performance of the Fund with the performance of its benchmark index, custom peer group, and Morningstar category. The Board also considered the consistency of the Adviser’s management with the Fund’s investment objective and policies. The Board noted that the Fund had outperformed relative to its benchmark index and custom peer group, and the median of its Morningstar category (Large Cap Growth Funds Under $50 Million, True No-Load), but underperformed the average of its Morningstar category for the one-year period ended August 31, 2018, and outperformed all of the aforementioned categories since inception. Following additional discussion of the investment performance of the Fund, the Adviser’s experience in managing mutual funds and separate accounts, the Adviser’s historical investment performance, and other factors, the Board concluded that the investment performance of the Fund has been satisfactory.
The costs of the services provided and profits realized by the Adviser and its affiliates from their relationship with the Fund. In this regard, the Board considered the Adviser’s staffing, personnel and methods of operating; the education and experience of its personnel; its compliance program, policies and procedures; its financial condition and the level of commitment to the Fund and, generally, the
20
MARSHFIELD CONCENTRATED OPPORTUNITY FUND
DISCLOSURE REGARDING APPROVAL OF INVESTMENT ADVISORY AGREEMENT (Unaudited) (Continued) |
Adviser’s advisory business; the asset level of the Fund; the overall expenses of the Fund, including the advisory fee; and the differences in fees and services to the Adviser’s other similar clients. The Board considered its discussion with the Adviser regarding the expense limitation agreement and considered the Adviser’s current and past fee reductions and expense reimbursements for the Fund. The Board further took into account the Adviser’s willingness to continue the expense limitation agreement for the Fund until at least January 1, 2020.
The Board also considered potential benefits for the Adviser in managing the Fund, including promotion of the Adviser’s name. The Board compared the Fund’s advisory fee and overall expense ratio to the average and median advisory fees and expense ratios for its custom peer group and Morningstar category (Large Cap Growth Funds Under $50 Million, True No-Load) and fees charged to the Adviser’s other client accounts. In considering the comparison in fees and expense ratios between the Fund and other comparable funds, the Board looked at the differences in types of funds being compared, the style of investment management, the size of the Fund, and the nature of the investment strategy. The Board noted that the Fund’s advisory fee of 0.95% was higher than the average and median advisory fee for the Fund’s custom peer group and Morningstar category, but less than the highest advisory fee in the Fund’s custom peer group and the Morningstar category. The Board also considered the Adviser’s commitment to limit the Fund’s expenses under the expense limitation agreement. The Board further noted that the overall expense ratio for the Fund of 1.10% was higher than the average and median expense ratio for the other funds in the Fund’s custom peer group and Morningstar category, but lower than the highest expense ratio in the Morningstar category. The Board also compared the fees paid by the Fund to the fees paid by other clients of the Adviser that may have similar investment strategies to the Fund and considered the similarities and differences of services received by such other clients as compared to the services received by the Fund. The Board noted that the fee structures applicable to the Adviser’s other clients were not indicative of any unreasonableness with respect to the advisory fees proposed payable by the Fund. The Board further considered the investment strategy and style used by the Adviser in managing the portfolio of the Fund. Following these comparisons and considerations and upon further consideration and discussion of the foregoing, the Board concluded that for the Fund, the advisory fees to be paid to the Adviser by the Fund are fair and reasonable.
The extent to which economies of scale would be realized as the Fund grows and whether advisory fee levels reflect these economies of scale for the benefit of the Fund’s investors. In this regard, the Board considered that for the Fund, the fee arrangements with the Adviser involve both the advisory fee and the expense limitation agreement. The Board determined that while the advisory fee remained the same as asset levels increased, the shareholders of the Fund will continue to experience benefits from the expense limitation agreement until the Fund’s assets grow to a level where its expenses otherwise fall below the expense limit. Following
21
MARSHFIELD CONCENTRATED OPPORTUNITY FUND
DISCLOSURE REGARDING APPROVAL OF INVESTMENT ADVISORY AGREEMENT (Unaudited) (Continued) |
further discussion of the asset levels for the Fund, expectations for asset growth, and level of fees, the Board determined that the fee arrangements with the Adviser will continue to provide benefits. The Board also determined that the Fund’s fee arrangements were fair and reasonable in relation to the nature and quality of services being provided by the Adviser, given the Fund’s projected asset levels for the next year.
Brokerage and portfolio transactions. In this regard, the Board considered the Adviser’s policies and procedures and performance in seeking best execution for its clients, including the Fund. The Board also considered the historical portfolio turnover rate for the Fund; the process by which evaluations are made of the overall reasonableness of commissions paid; the process by which the Adviser evaluates best execution; the method and basis for selecting and evaluating broker-dealers; and any anticipated allocation of portfolio business to persons affiliated with the Adviser. After further review and discussion, the Board determined for the Fund that the Adviser’s practices regarding brokerage and portfolio transactions are satisfactory.
Possible conflicts of interest. In evaluating the possibility for conflicts of interest, the Board considered such matters as the experience and abilities of the advisory personnel assigned to the Fund; the Adviser’s process for allocating trades among the Fund and its other clients; and the substance and administration of the Adviser’s Code of Ethics. Following further consideration and discussion, the Board found for the Fund that the Adviser’s standards and practices relating to the identification and mitigation of potential conflicts of interests were satisfactory.
After further discussion of the factors noted above, as well as other factors, and in reliance on the information provided by the Adviser and Trust Management, and taking into account the totality of all the factors discussed and information presented at this meeting and previous meetings, the Board indicated its agreement to approve the Agreement. It was noted that in the Trustees’ deliberations regarding the approval of the Agreement, the Trustees did not identify any particular information or factor that was all-important or controlling, and that each individual Trustee may have attributed different weights to the various factors listed above. After full consideration of the above factors as well as other factors, the Board unanimously concluded that approval of the Agreement was in the best interests of the Fund and its shareholders.
22
| | WHAT DOES THE MARSHFIELD CONCENTRATED OPPORTUNITY FUND (the “Fund”) DO WITH YOUR PERSONAL INFORMATION? |
Why? | Financial companies choose how they share your personal information. Federal law gives consumers the right to limit some but not all sharing. Federal law also requires us to tell you how we collect, share, and protect your personal information. Please read this notice carefully to understand what we do. |
What? | The types of personal information we collect and share depend on the product or service you have with us. This information can include: ■ Social Security number ■ Assets ■ Retirement Assets ■ Transaction History ■ Checking Account Information ■ Purchase History ■ Account Balances ■ Account Transactions ■ Wire Transfer Instructions When you areno longer our customer, we continue to share your information as described in this notice. |
How? | All financial companies need to share your personal information to run their everyday business. In the section below, we list the reasons financial companies can share their customers’ personal information; the reasons the Fund chooses to share; and whether you can limit this sharing. |
Reasons we can share your personal information | Does the
Fund share? | Can you limit this sharing? |
For our everyday business purposes –
Such as to process your transactions, maintain your account(s), respond to court orders and legal investigations, or report to credit bureaus | Yes | No |
For our marketing purposes –
to offer our products and services to you | No | We don’t share |
For joint marketing with other financial companies | No | We don’t share |
For our affiliates’ everyday business purposes –
information about your transactions and experiences | No | We don’t share |
For our affiliates’ everyday business purposes–
information about your creditworthiness | No | We don’t share |
For nonaffiliates to market to you | No | We don’t share |
Questions? | Call 1-855-691-5288 |
23
Who we are |
Who is providing this notice? | Marshfield Concentrated Opportunity Fund
Ultimus Fund Distributors, LLC (Distributor)
Ultimus Fund Solutions, LLC (Administrator) |
What we do |
How does the Fund protect my personal information? | To protect your personal information from unauthorized access and use, we use security measures that comply with federal law. These measures include computer safeguards and secured files and buildings. Our service providers are held accountable for adhering to strict policies and procedures to prevent any misuse of your nonpublic personal information. |
How does the Fund collect my personal information? | We collect your personal information, for example, when you ■ Open an account ■ Provide account information ■ Give us your contact information ■ Make deposits or withdrawals from your account ■ Make a wire transfer ■ Tell us where to send the money ■ Tell us who receives the money ■ Show your government-issued ID ■ Show your driver’s license We also collect your personal information from other companies. |
Why can’t I limit all sharing? | Federal law gives you the right to limit only ■ Sharing for affiliates’ everyday business purposes – information about your creditworthiness ■ Affiliates from using your information to market to you ■ Sharing for nonaffiliates to market to you State laws and individual companies may give you additional rights to limit sharing. |
Definitions |
Affiliates | Companies related by common ownership or control. They can be financial and nonfinancial companies. ■Marshfield Associates, Inc., the investment adviser to the Fund, could be deemed to be an affiliate. |
Nonaffiliates | Companies not related by common ownership or control. They can be financial and nonfinancial companies ■The Fund does not share with nonaffiliates so they can market to you. |
Joint marketing | A formal agreement between nonaffiliated financial companies that together market financial products or services to you. ■The Fund does not jointly market. |
24
This page intentionally left blank.
Not required
| Item 3. | Audit Committee Financial Expert. |
Not required
| Item 4. | Principal Accountant Fees and Services. |
Not required
| Item 5. | Audit Committee of Listed Registrants. |
Not applicable
| Item 6. | Schedule of Investments. |
| (a) | Not applicable [schedule filed with Item 1] |
| Item 7. | Disclosure of Proxy Voting Policies and Procedures for Closed-End Management Investment Companies. |
Not applicable
| Item 8. | Portfolio Managers of Closed-End Management Investment Companies. |
Not applicable
| Item 9. | Purchases of Equity Securities by Closed-End Management Investment Company and Affiliated Purchasers. |
Not applicable
| Item 10. | Submission of Matters to a Vote of Security Holders. |
The registrant’s Committee of Independent Trustees shall review shareholder recommendations for nominations to fill vacancies on the registrant’s board of trustees if such recommendations are submitted in writing and addressed to the Committee at the registrant’s offices. The Committee may adopt, by resolution, a policy regarding its procedures for considering candidates for the board of trustees, including any recommended by shareholders.
| Item 11. | Controls and Procedures. |
(a) Based on their evaluation of the registrant’s disclosure controls and procedures (as defined in Rule 30a-3(c) under the Investment Company Act of 1940) as of a date within 90 days of the filing date of this report, the registrant’s principal executive officer and principal financial officer have concluded that such disclosure controls and procedures are reasonably designed and are operating effectively to ensure that material information relating to the registrant, including its consolidated subsidiaries, is made known to them by others within those entities, particularly during the period in which this report is being prepared, and that the information required in filings on Form N-CSR is recorded, processed, summarized, and reported on a timely basis.
(b) There were no changes in the registrant’s internal control over financial reporting (as defined in Rule 30a-3(d) under the Investment Company Act of 1940) that occurred during the second fiscal quarter of the period covered by this report that have materially affected, or are reasonably likely to materially affect, the registrant’s internal control over financial reporting.
| Item 12. | Disclosure of Securities Lending Activities for Closed-End Management Investment Companies. |
Not applicable
File the exhibits listed below as part of this Form. Letter or number the exhibits in the sequence indicated.
(a)(1) Any code of ethics, or amendment thereto, that is the subject of the disclosure required by Item 2, to the extent that the registrant intends to satisfy the Item 2 requirements through filing of an exhibit: Not required
(a)(2) A separate certification for each principal executive officer and principal financial officer of the registrant as required by Rule 30a-2(a) under the Act (17 CFR 270.30a-2(a)): Attached hereto
(a)(3) Any written solicitation to purchase securities under Rule 23c-1 under the Act (17 CFR 270.23c-1) sent or given during the period covered by the report by or on behalf of the registrant to 10 or more persons: Not applicable
(a)(4) Change in the registrant’s independent public accountants: Not applicable
(b) Certifications required by Rule 30a-2(b) under the Act (17 CFR 270.30a-2(b)): Attached hereto
| Exhibit 99.CERT | Certifications required by Rule 30a-2(a) under the Act |
| Exhibit 99.906CERT | Certifications required by Rule 30a-2(b) under the Act |
SIGNATURES
Pursuant to the requirements of the Securities Exchange Act of 1934 and the Investment Company Act of 1940, the registrant has duly caused this report to be signed on its behalf by the undersigned, thereunto duly authorized.
| (Registrant) | Ultimus Managers Trust | | |
| | | | |
| By (Signature and Title)* | /s/ Matthew J. Beck | |
| | | Matthew J. Beck, Secretary | |
| | | | |
| Date | April 26, 2019 | | |
| | | | |
| Pursuant to the requirements of the Securities Exchange Act of 1934 and the Investment Company Act of 1940, this report has been signed below by the following persons on behalf of the registrant and in the capacities and on the dates indicated. |
| | | | |
| By (Signature and Title)* | /s/ David R. Carson | |
| | | David R. Carson, Principal Executive Officer | |
| | | | |
| Date | April 26, 2019 | | |
| | | | |
| By (Signature and Title)* | /s/ Jennifer L. Leamer | |
| | | Jennifer L. Leamer, Treasurer and Principal Financial Officer | |
| | | | |
| Date | April 26, 2019 | | |
| * | Print the name and title of each signing officer under his or her signature. |