| OMB APPROVAL |
OMB Number: 3235-0570 Expires: August 31, 2020 Estimated average burden hours per response: 20.6 |
UNITED STATES
SECURITIES AND EXCHANGE COMMISSION
Washington, D.C. 20549
FORM N-CSR
CERTIFIED SHAREHOLDER REPORT OF REGISTERED
MANAGEMENT INVESTMENT COMPANY
| Investment Company Act file number | 811-22680 | |
| Ultimus Managers Trust |
| (Exact name of registrant as specified in charter) |
| 225 Pictoria Drive, Suite 450 Cincinnati, Ohio | 45246 |
| (Address of principal executive offices) | (Zip code) |
Matthew J. Beck
| Ultimus Fund Solutions, LLC 225 Pictoria Drive, Suite 450 Cincinnati, Ohio 45246_ |
| (Name and address of agent for service) |
| Registrant's telephone number, including area code: | (513) 587-3400 | |
| Date of fiscal year end: | February 28 | |
| | | |
| Date of reporting period: | August 31, 2018 | |
Form N-CSR is to be used by management investment companies to file reports with the Commission not later than 10 days after the transmission to stockholders of any report that is required to be transmitted to stockholders under Rule 30e-1 under the Investment Company Act of 1940 (17 CFR 270.30e-1). The Commission may use the information provided on Form N-CSR in its regulatory, disclosure review, inspection, and policymaking roles.
A registrant is required to disclose the information specified by Form N-CSR, and the Commission will make this information public. A registrant is not required to respond to the collection of information contained in Form N-CSR unless the Form displays a currently valid Office of Management and Budget (“OMB”) control number. Please direct comments concerning the accuracy of the information collection burden estimate and any suggestions for reducing the burden to Secretary, Securities and Exchange Commission, 450 Fifth Street, NW, Washington, DC 20549-0609. The OMB has reviewed this collection of information under the clearance requirements of 44 U.S.C. § 3507.
| Item 1. | Reports to Stockholders. |

HVIA EQUITY FUND
INSTITUTIONAL CLASS (HVEIX)
Managed by
Hudson Valley Investment Advisors, Inc.
SEMI-ANNUAL REPORT
August 31, 2018
(Unaudited)
HVIA EQUITY FUND
LETTER TO SHAREHOLDERS | August 31, 2018 |
The HVIA Equity Fund (“HVEIX” or the “Fund”) launched on October 3, 2016. The Fund’s focus is on using a GARP investment framework to determine suitable investments. This acronym is “Growth at a Reasonable Price,” which focuses on investing in equities that are at a discount to their expected growth rate. In my experience of using this investment philosophy, I’ve come to realize that the process does not fit neatly into months, quarters or years but is expected to outperform over the longer term.
Investment Environment
The current U.S. markets, based on continuing revenue and earnings strength, would normally have seen increased equity prices but the influence of international and domestic political headwinds have raised the overall risk to the financial markets. Since the start of 2018 the global economic environment has moved from a synchronized upswing to one where the United States economy is the strongest while developing economies are slowing.
The Trump administration has put increasing pressure on major trading partners to lower tariffs and remove trade impediments in order to avert a more difficult economic environment. These moves have dialed up pressure on overseas economies, caused threats of retaliation and strengthened the U.S. Dollar. As a result, there has been a divergence between the positive returns seen in U.S. markets and the decline attributed to the majority of many overseas markets.
Relating to the current state of the U.S. equity markets, fundamentals are clearly driving a bullish tape. Strong economic drivers in the U.S. have shielded equities from an array of geopolitical risk. The growth story has been a well-documented catalyst for the relative outperformance of domestic equity markets. Investors have also focused on a flattening yield curve, unresolved trade wars, and the potential spillover from emerging markets concerns. Based on the evidence, current risks/rewards appear balanced and we suspect the market will continue to maintain an upward bias post the midterm election. Macroeconomic indicators show no signs of a recession as many leading economic indicators point to continued solid growth and a positive bias for equities.
The Fund focuses on changes to S&P 500 revenues and earnings as they are, in our opinion, the main driver of stock prices over the longer term. The equity markets have seen acceleration in both revenues and earnings after a multiyear period in which they were relatively flat and multiple expansions were the main driver of equity prices. We anticipate that trend to continue at least for the foreseeable future. HVIA is continuing to anticipate higher earnings growth and tougher comparisons in the back half of 2018. We also realize that the market is trading at a 16.8x forward multiple, which is approximately in line with the 5 year average, making it neither cheap nor expensive. This points to the fact that equities will continue to be more reliant on earnings, and multiples will not be a positive influence in an equity market advance.
1
Current Market and Economic Conditions
In spite of increasing trade and tariff policy uncertainty, the global economy continues to expand but slower than that seen in the start of the year. Overseas conditions have slowed in emerging markets and some of the developed economies are seeing a slight spillover effect. This slowdown has not impacted the U.S. markets as domestic markets are recording increasing growth with expectations of continued strength into the first half of 2019. Underscoring this is the U.S. unemployment rate, which has declined to historically low levels, while both consumer and business confidence hit cyclical highs. Future expectation derived from Institute for Supply Management (“ISM”) readings point to a continued strengthening of the economy.
Many investors are in a tug of war between still solid fundamentals, with economic growth continuing to improve relative to non-U.S. jurisdictions. Earnings growth of 25% is expected for the second quarter while sentiment has turned somewhat negative relative to earlier in the year. The world’s second largest economy, China, has seen slowing data while a strengthening dollar could impede U.S. companies with large overseas revenue exposures.
Higher inflation is expected as economic conditions remain strong, but should remain contained relative to prior inflationary periods. Energy price appreciation has influenced rising inflation but may see a reversion in the near future as we anniversary the increased oil prices seen in the earlier part of 2018. Labor has been held in check during this expansion which should also limit inflationary pressures. The Federal Open Market Committee (FOMC) (Federal Reserve May meeting) indicates it will tolerate an undefined interim higher level of inflation, while accelerating rates of inflation would cause the FOMC to be more aggressive.
The FOMC is expected to hike the federal funds rate two more times in 2018 (September and December) as part of its announced normalization policy. At least two additional 0.25% hikes are expected in 2019. This, accompanied by the risks in the markets, has created upward pressure on the dollar. Combined with higher oil prices, this is a serious problem for many emerging market economies.
In Washington, President Trump has presided over a divisive political agenda. Going into the midterm elections an administration with a solid economic backdrop would normally see strong voter approval. The current environment may see a greater exposure to elected Democrats, which could risk some of the initiatives put in place over the first two years of Trump’s administration, such as trade negotiations, social discourse and immigration, which has maintained a higher level of market risk.
Finally, we look to the yield curve maintaining a positive slope, which points to a continued expectation of economic improvement by fixed income markets. Commodity prices have reversed lower after strengthening earlier in the year. Economic strength should continue as PMI’s, employment and confidence measures are all indicating continued strength.
Investment Philosophy and Performance
We are investing with an eye for the longer term, which means over 18 months. Our focus is on stocks that are showing improving asset utilization, margin expansion and the efficient use of capital. This can be summed up in an improving Return on Equity (which is a measure of how well a company uses investments to generate earnings), but are trading at a discount to their historical growth or that of the industry group.
2
For the six months ended August 31st, 2018, HVEIX was up 6.30% versus 7.96% for the S&P 500 Index. The following three positions had the largest positive impact on the Fund’s performance during the period.
| | a) | Eli Lilly & Co. (LLY) (+39.83%) |
| | b) | ConocoPhillips (COP) (+37.40%) |
| | c) | CSX Corp. (CSX) (+36.88%) |
Since inception, the Fund has invested in stocks that are trading at a discount to their growth rate. We have seen that these are becoming tougher to find. We continue to see economic growth which benefitted the stocks listed above. Eli Lilly & Co. (LLY) announced better than expected earnings results and a plan to spin off its stake in an animal health business which was a slight drag on the business. We expect Eli Lilly to continue to have strong revenues but are keeping a close eye to the upcoming elections, which may change the discounting of drug prices. ConocoPhillips (COP) has transformed the company by selling underperforming assets and leveraging new technologies to get greater productivity from its asset portfolio. This, combined with the higher price of oil, has continued to allow COP to put up improved earnings. This was a top performer for the Fund and we continue to see upside. CSX is going through a change in the way that it operates and has provided a strong earnings and outlook due to the continued growth in the economic environment The transformation that enhances productivity is still in its infancy and we expect continued operating improvement over the next 12 months. We expect these three names to continue to perform as the economy remains buoyant.
The following positions had the greatest negative impact on the Fund’s performance over the six months ended August 31, 2018.
| | a) | The Goodyear Tire & Rubber Co. (GT) (-18.59%) |
| | b) | eBay, Inc. (EBAY) (-18.12%) |
| | c) | The J.M. Smucker Co. (SJM) (-17.36%) |
The investment in Goodyear Tire & Rubber Co. (GT) has been hurt by the increase in costs and the loss of a distribution point for its tire products. The company is a turnaround that is looking to benefit from the higher pricing and increased distribution into commercial markets. GT’s progress has not been as robust as first assumed. eBay was hurt when it announced earnings, as it trimmed its annual revenue forecast. The company was hurt by Amazon while brick and mortar retailing has seen a rebound in demand taking market share in the short term. J.M. Smucker Co. (SJM) has been impacted like most consumer staples companies on declines in retail shelf space and increased pricing pressure. SJM is also suffering from the revaluing of the staples space as the largest seller of coffee, and its expansion into pet food area has been met by a slowdown in both categories. The company is still well positioned but has been shunned like most stocks in the sector. We believe the company is still well positioned and will need to wait until operations are integrated and prices stabilize.
Sincerely,
Gustave J. Scacco
Portfolio Manager
3
Past performance is not predictive of future performance. Investment results and principal value will fluctuate so that shares, when redeemed, may be worth more or less than their original cost. Current performance may be higher or lower than the performance data quoted. Performance data current to the most recent month-end are available by calling 1-888-209-8710.
An investor should consider the investment objectives, risks, charges, and expenses of the Fund carefully before investing. The Fund’s prospectus contains this and other important information. To obtain a copy of the Fund’s prospectus please visit the Fund’s website at www.hviafunds.com or call 1-888-209-8710 and a copy will be sent to you free of charge. Please read the prospectus carefully before you invest. The Fund is distributed by Ultimus Fund Distributors, LLC.
The Letter to Shareholders seeks to describe some of the Adviser’s current opinions and views of the financial markets. Although the Adviser believes it has a reasonable basis for any opinions or views expressed, actual results may differ, sometimes significantly so, from those expected or expressed. The securities held by the Fund that are discussed in the Letter to Shareholders were held during the period covered by this Report. They do not comprise the entire investment portfolio of the Fund, may be sold at any time, and may no longer be held by the Fund. For a complete list of securities held by the Fund as of August 31, 2018, please see the Schedule of Investments section of the semi-annual report. The opinions of the Adviser with respect to those securities may change at any time.
Statements in the Letter to Shareholders that reflect projections or expectations for future financial or economic performance of the Fund and the market in general and statements of the Fund’s plans and objectives for future operations are forward-looking statements. No assurance can be given that actual results or events will not differ materially from those projected, estimated, assumed, or anticipated in any such forward-looking statements. Important factors that could result in such differences, in addition to factors noted with such forward-looking statements include, without limitation, general economic conditions, such as inflation, recession, and interest rates. Past performance is not a guarantee of future results.
4
HVIA EQUITY FUND
PORTFOLIO INFORMATION
August 31, 2018 (Unaudited)
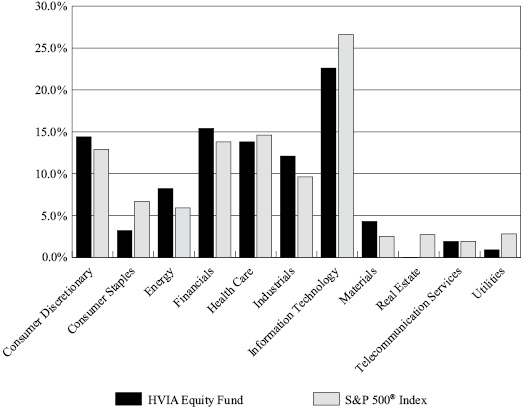
Sector Diversification (% of Net Assets)
Top 10 Equity Holdings
Security Description | % of
Net Assets |
Adobe Systems, Inc. | 3.9% |
Apple, Inc. | 3.9% |
CSX Coporation | 3.4% |
Alphabet, Inc. - Class C | 3.0% |
Red Hat, Inc. | 2.9% |
JPMorgan Chase & Company | 2.9% |
ConocoPhillips | 2.9% |
Microsoft Corporation | 2.8% |
Facebook, Inc. - Class A | 2.8% |
Bank of America Corporation | 2.8% |
5
HVIA EQUITY FUND
SCHEDULE OF INVESTMENTS
August 31, 2018 (Unaudited) |
COMMON STOCKS — 96.8% | | Shares | | | Value | |
Consumer Discretionary — 14.4% | | | | | | | | |
Auto Components — 0.6% | | | | | | | | |
Goodyear Tire & Rubber Company (The) | | | 4,950 | | | $ | 112,316 | |
| | | | | | | | | |
Hotels, Restaurants & Leisure — 3.0% | | | | | | | | |
Royal Caribbean Cruises Ltd. | | | 2,335 | | | | 286,224 | |
Starbucks Corporation | | | 4,500 | | | | 240,525 | |
| | | | | | | | 526,749 | |
Household Durables — 1.3% | | | | | | | | |
Lennar Corporation - Class A | | | 4,400 | | | | 227,348 | |
| | | | | | | | | |
Media — 0.9% | | | | | | | | |
Walt Disney Company (The) | | | 1,400 | | | | 156,828 | |
| | | | | | | | | |
Multi-Line Retail — 1.7% | | | | | | | | |
Dollar General Corporation | | | 2,725 | | | | 293,564 | |
| | | | | | | | | |
Specialty Retail — 4.8% | | | | | | | | |
AutoZone, Inc. (a) | | | 445 | | | | 341,261 | |
CarMax, Inc. (a) | | | 3,175 | | | | 247,809 | |
Home Depot, Inc. (The) | | | 1,275 | | | | 255,982 | |
| | | | | | | | 845,052 | |
Textiles, Apparel & Luxury Goods — 2.1% | | | | | | | | |
NIKE, Inc. - Class B | | | 4,500 | | | | 369,900 | |
| | | | | | | | | |
Consumer Staples — 3.2% | | | | | | | | |
Beverages — 0.9% | | | | | | | | |
Molson Coors Brewing Company - Class B | | | 1,000 | | | | 66,740 | |
PepsiCo, Inc. | | | 850 | | | | 95,208 | |
| | | | | | | | 161,948 | |
Food Products — 1.3% | | | | | | | | |
J.M. Smucker Company (The) | | | 1,500 | | | | 155,070 | |
Kraft Heinz Company (The) | | | 1,200 | | | | 69,924 | |
| | | | | | | | 224,994 | |
Personal Products — 1.0% | | | | | | | | |
Estée Lauder Companies, Inc. (The) - Class A | | | 1,300 | | | | 182,156 | |
| | | | | | | | | |
Energy — 8.2% | | | | | | | | |
Oil, Gas & Consumable Fuels — 8.2% | | | | | | | | |
ConocoPhillips | | | 6,900 | | | | 506,667 | |
6
HVIA EQUITY FUND
SCHEDULE OF INVESTMENTS (Continued) |
COMMON STOCKS — 96.8% (Continued) | | Shares | | | Value | |
Energy — 8.2% (Continued) | | | | | | | | |
Oil, Gas & Consumable Fuels — 8.2% (Continued) | | | | | | | | |
Enbridge, Inc. | | | 6,306 | | | $ | 215,476 | |
Exxon Mobil Corporation | | | 4,350 | | | | 348,740 | |
Williams Companies, Inc. (The) | | | 12,600 | | | | 372,834 | |
| | | | | | | | 1,443,717 | |
Financials — 15.5% | | | | | | | | |
Banks — 8.8% | | | | | | | | |
Bank of America Corporation | | | 15,800 | | | | 488,694 | |
BB&T Corporation | | | 4,300 | | | | 222,138 | |
JPMorgan Chase & Company | | | 4,450 | | | | 509,881 | |
SunTrust Banks, Inc. | | | 4,550 | | | | 334,698 | |
| | | | | | | | 1,555,411 | |
Capital Markets — 4.8% | | | | | | | | |
Bank of New York Mellon Corporation (The) | | | 4,400 | | | | 229,460 | |
Goldman Sachs Group, Inc. (The) | | | 1,200 | | | | 285,372 | |
Morgan Stanley | | | 7,000 | | | | 341,810 | |
| | | | | | | | 856,642 | |
Insurance — 1.9% | | | | | | | | |
Marsh & McLennan Companies, Inc. | | | 3,900 | | | | 330,057 | |
| | | | | | | | | |
Health Care — 13.8% | | | | | | | | |
Biotechnology — 1.8% | | | | | | | | |
Celgene Corporation (a) | | | 3,300 | | | | 311,685 | |
| | | | | | | | | |
Health Care Equipment & Supplies — 3.3% | | | | | | | | |
Danaher Corporation | | | 3,400 | | | | 352,036 | |
Medtronic plc | | | 2,400 | | | | 231,384 | |
| | | | | | | | 583,420 | |
Health Care Providers & Services — 2.0% | | | | | | | | |
UnitedHealth Group, Inc. | | | 1,350 | | | | 362,421 | |
| | | | | | | | | |
Life Sciences Tools & Services — 3.4% | | | | | | | | |
PerkinElmer, Inc. | | | 3,350 | | | | 309,641 | |
Thermo Fisher Scientific, Inc. | | | 1,200 | | | | 286,920 | |
| | | | | | | | 596,561 | |
Pharmaceuticals — 3.3% | | | | | | | | |
Eli Lilly & Company | | | 2,300 | | | | 242,995 | |
Pfizer, Inc. | | | 8,000 | | | | 332,160 | |
| | | | | | | | 575,155 | |
7
HVIA EQUITY FUND
SCHEDULE OF INVESTMENTS (Continued) |
COMMON STOCKS — 96.8% (Continued) | | Shares | | | Value | |
Industrials — 12.1% | | | | | | | | |
Aerospace & Defense — 2.1% | | | | | | | | |
Harris Corporation | | | 2,250 | | | $ | 365,648 | |
| | | | | | | | | |
Air Freight & Logistics — 2.5% | | | | | | | | �� |
FedEx Corporation | | | 1,800 | | | | 439,110 | |
| | | | | | | | | |
Building Products — 1.0% | | | | | | | | |
Masco Corporation | | | 4,750 | | | | 180,357 | |
| | | | | | | | | |
Machinery — 3.1% | | | | | | | | |
Lincoln Electric Holdings, Inc. | | | 3,850 | | | | 362,516 | |
Oshkosh Corporation | | | 2,750 | | | | 193,215 | |
| | | | | | | | 555,731 | |
Road & Rail — 3.4% | | | | | | | | |
CSX Corporation | | | 8,100 | | | | 600,696 | |
| | | | | | | | | |
Information Technology — 22.6% | | | | | | | | |
Internet Software & Services — 7.1% | | | | | | | | |
Alphabet, Inc. - Class C (a) | | | 435 | | | | 529,912 | |
eBay, Inc. (a) | | | 6,600 | | | | 228,426 | |
Facebook, Inc. - Class A (a) | | | 2,800 | | | | 492,044 | |
| | | | | | | | 1,250,382 | |
IT Services — 2.0% | | | | | | | | |
Visa, Inc. - Class A | | | 2,400 | | | | 352,536 | |
| | | | | | | | | |
Software — 9.6% | | | | | | | | |
Adobe Systems, Inc. (a) | | | 2,600 | | | | 685,126 | |
Microsoft Corporation | | | 4,400 | | | | 494,252 | |
Red Hat, Inc. (a) | | | 3,475 | | | | 513,362 | |
| | | | | | | | 1,692,740 | |
Technology Hardware, Storage & Peripherals — 3.9% | | | | | | | | |
Apple, Inc. | | | 3,000 | | | | 682,890 | |
| | | | | | | | | |
Materials — 4.2% | | | | | | | | |
Chemicals — 4.2% | | | | | | | | |
DowDuPont, Inc. | | | 2,850 | | | | 199,871 | |
LyondellBasell Industries N.V. - Class A | | | 2,475 | | | | 279,130 | |
Sherwin-Williams Company (The) | | | 595 | | | | 271,070 | |
| | | | | | | | 750,071 | |
8
HVIA EQUITY FUND
SCHEDULE OF INVESTMENTS (Continued) |
COMMON STOCKS — 96.8% (Continued) | | Shares | | | Value | |
Telecommunication Services — 1.9% | | | | | | | | |
Diversified Telecommunication Services — 1.9% | | | | | | | | |
Verizon Communications, Inc. | | | 6,200 | | | $ | 337,094 | |
| | | | | | | | | |
Utilities — 0.9% | | | | | | | | |
Electric Utilities — 0.6% | | | | | | | | |
Duke Energy Corporation | | | 1,200 | | | | 97,488 | |
| | | | | | | | | |
Independent Power and Renewable Electricity Producers — 0.3% | | | | | | | | |
AES Corporation | | | 4,000 | | | | 53,840 | |
| | | | | | | | | |
Total Investments at Value — 96.8% (Cost $12,932,519) | | | | | | $ | 17,074,507 | |
| | | | | | | | | |
Other Assets in Excess of Liabilities — 3.2% | | | | | | | 564,106 | |
| | | | | | | | | |
Net Assets — 100.0% | | | | | | $ | 17,638,613 | |
(a) | Non-income producing security. |
See accompanying notes to financial statements. |
9
HVIA EQUITY FUND
STATEMENT OF ASSETS AND LIABILITIES
August 31, 2018 (Unaudited) |
ASSETS | | | | |
Investments in securities: | | | | |
At cost | | $ | 12,932,519 | |
At value (Note 2) | | $ | 17,074,507 | |
Cash (Note 2) | | | 444,921 | |
Receivable for capital shares sold | | | 100,000 | |
Receivable from Adviser (Note 4) | | | 346 | |
Dividends and interest receivable | | | 30,160 | |
Other assets | | | 15,952 | |
TOTAL ASSETS | | | 17,665,886 | |
| | | | | |
LIABILITIES | | | | |
Payable for capital shares redeemed | | | 11,794 | |
Payable to administrator (Note 4) | | | 7,150 | |
Other accrued expenses | | | 8,329 | |
TOTAL LIABILITIES | | | 27,273 | |
| | | | | |
NET ASSETS | | $ | 17,638,613 | |
| | | | | |
NET ASSETS CONSIST OF: | | | | |
Paid-in capital | | $ | 13,368,726 | |
Accumulated net investment income | | | 60,366 | |
Accumulated net realized gains from investment transactions | | | 67,524 | |
Net unrealized appreciation (depreciation) on: | | | | |
Investments | | | 4,141,988 | |
Translation of assets and liabilities in foreign currencies | | | 9 | |
NET ASSETS | | $ | 17,638,613 | |
| | | | | |
PRICING OF INSTITUTIONAL SHARES (Note 1) | | | | |
Net assets applicable to Institutional Shares | | $ | 17,638,613 | |
Shares of Institutional Shares outstanding (unlimited number of shares authorized, no par value) | | | 1,259,899 | |
| | | | | |
Net asset value, offering price and redemption price per share (Note 2) | | $ | 14.00 | |
See accompanying notes to financial statements. |
10
HVIA EQUITY FUND
STATEMENT OF OPERATIONS
For the Six Months Ended August 31, 2018 (Unaudited) |
INVESTMENT INCOME | | | | |
Dividends | | $ | 130,726 | |
Interest | | | 2,791 | |
Foreign withholding taxes on dividends | | | (817 | ) |
TOTAL INVESTMENT INCOME | | | 132,700 | |
| | | | | |
EXPENSES | | | | |
Investment advisory fees (Note 4) | | | 60,744 | |
Professional fees | | | 22,777 | |
Fund accounting fees (Note 4) | | | 14,329 | |
Administration fees (Note 4) | | | 13,500 | |
Transfer agent fees (Note 4) | | | 9,000 | |
Registration and filing fees | | | 7,402 | |
Compliance fees (Note 4) | | | 6,000 | |
Custody and bank service fees | | | 5,110 | |
Trustees’ fees and expenses (Note 4) | | | 5,089 | |
Printing of shareholder reports | | | 2,783 | |
Postage and supplies | | | 1,943 | |
Insurance fees | | | 1,391 | |
Pricing fees | | | 742 | |
Other expenses | | | 3,481 | |
TOTAL EXPENSES | | | 154,291 | |
Less fee reductions and expense reimbursements by the Adviser (Note 4) | | | (73,025 | ) |
NET EXPENSES | | | 81,266 | |
| | | | | |
NET INVESTMENT INCOME | | | 51,434 | |
| | | | | |
REALIZED AND UNREALIZED GAINS (LOSSES) ON INVESTMENTS AND FOREIGN CURRENCIES (Note 2) | | | | |
Net realized gains (losses) from: | | | | |
Investments | | | 32,228 | |
Foreign currency transactions | | | (514 | ) |
Net change in unrealized appreciation (depreciation) on: | | | | |
Investments | | | 967,693 | |
Foreign currency translation | | | 48 | |
NET REALIZED AND UNREALIZED GAINS ON INVESTMENTS AND FOREIGN CURRENCIES | | | 999,455 | |
| | | | | |
NET INCREASE IN NET ASSETS FROM OPERATIONS | | $ | 1,050,889 | |
See accompanying notes to financial statements. |
11
HVIA EQUITY FUND
STATEMENTS OF CHANGES IN NET ASSETS |
| | Six Months
Ended
August 31,
2018
(Unaudited) | | | Year
Ended
February 28,
2018 | |
FROM OPERATIONS | | | | | | | | |
Net investment income | | $ | 51,434 | | | $ | 69,222 | |
Net realized gains (losses) from: | | | | | | | | |
Investments | | | 32,228 | | | | 57,478 | |
Foreign currency transactions | | | (514 | ) | | | (195 | ) |
Net change in unrealized appreciation (depreciation) on: | | | | | | | | |
Investments | | | 967,693 | | | | 1,844,138 | |
Foreign currency translation | | | 48 | | | | (39 | ) |
Net increase in net assets resulting from operations | | | 1,050,889 | | | | 1,970,604 | |
| | | | | | | | | |
DISTRIBUTIONS TO SHAREHOLDERS (Note 2) | | | | | | | | |
From net investment income, Institutional Shares | | | — | | | | (66,697 | ) |
From net realized gains on investments, Institutional Shares | | | — | | | | (35,109 | ) |
Decrease in net assets from distributions to shareholders | | | — | | | | (101,806 | ) |
| | | | | | | | | |
CAPITAL SHARE TRANSACTIONS | | | | | | | | |
Institutional Shares | | | | | | | | |
Proceeds from shares sold | | | 2,007,211 | | | | 2,701,090 | |
Net asset value of shares issued in reinvestment of distributions to shareholders | | | — | | | | 54 | |
Payments for shares redeemed | | | (478,029 | ) | | | (891,941 | ) |
Net increase in Institutional Shares net assets from capital share transactions | | | 1,529,182 | | | | 1,809,203 | |
| | | | | | | | | |
TOTAL INCREASE IN NET ASSETS | | | 2,580,071 | | | | 3,678,001 | |
| | | | | | | | | |
NET ASSETS | | | | | | | | |
Beginning of period | | | 15,058,542 | | | | 11,380,541 | |
End of period | | $ | 17,638,613 | | | $ | 15,058,542 | |
| | | | | | | | | |
ACCUMULATED NET INVESTMENT INCOME | | $ | 60,366 | | | $ | 9,446 | |
| | | | | | | | | |
CAPITAL SHARE ACTIVITY | | | | | | | | |
Institutional Shares | | | | | | | | |
Shares sold | | | 151,773 | | | | 215,889 | |
Shares reinvested | | | — | | | | 4 | |
Shares redeemed | | | (35,645 | ) | | | (71,246 | ) |
Net increase in shares outstanding | | | 116,128 | | | | 144,647 | |
Shares outstanding at beginning of period | | | 1,143,771 | | | | 999,124 | |
Shares outstanding at end of period | | | 1,259,899 | | | | 1,143,771 | |
12
HVIA EQUITY FUND
INSTITUTIONAL SHARES
FINANCIAL HIGHLIGHTS |
Per Share Data for a Share Outstanding Throughout Each Period |
| | Six Months
Ended
August 31,
2018
(Unaudited) | | | Year
Ended
February 28,
2018 | | | Period
Ended
February 28,
2017(a) | |
Net asset value at beginning of period | | $ | 13.17 | | | $ | 11.39 | | | $ | 10.00 | |
| | | | | | | | | | | | | |
Income from investment operations: | | | | | | | | | | | | |
Net investment income | | | 0.04 | | | | 0.06 | | | | 0.02 | |
Net realized and unrealized gains on investments and foreign currencies | | | 0.79 | | | | 1.81 | | | | 1.39 | |
Total from investment operations | | | 0.83 | | | | 1.87 | | | | 1.41 | |
| | | | | | | | | | | | | |
Less distributions: | | | | | | | | | | | | |
From net investment income | | | — | | | | (0.06 | ) | | | (0.02 | ) |
From net realized gains | | | — | | | | (0.03 | ) | | | — | |
Total distributions | | | — | | | | (0.09 | ) | | | (0.02 | ) |
| | | | | | | | | | | | | |
Net asset value at end of period | | $ | 14.00 | | | $ | 13.17 | | | $ | 11.39 | |
| | | | | | | | | | | | | |
Total return (b) | | | 6.30 | %(c) | | | 16.45 | % | | | 14.06 | %(c) |
| | | | | | | | | | | | | |
Net assets at end of period (000's) | | $ | 17,639 | | | $ | 15,059 | | | $ | 11,381 | |
| | | | | | | | | | | | | |
Ratios/supplementary data: | | | | | | | | | | | | |
Ratio of total expenses to average net assets | | | 1.88 | %(d) | | | 2.11 | % | | | 2.36 | %(d) |
| | | | | | | | | | | | | |
Ratio of net expenses to average net assets (e) | | | 0.99 | %(d) | | | 0.99 | % | | | 0.99 | %(d) |
| | | | | | | | | | | | | |
Ratio of net investment income to average net assets (e) | | | 0.63 | %(d) | | | 0.53 | % | | | 0.56 | %(d) |
| | | | | | | | | | | | | |
Portfolio turnover rate | | | 3 | %(c) | | | 4 | % | | | 2 | %(c) |
(a) | Represents the period from the commencement of operations (October 3, 2016) through February 28, 2017. |
(b) | Total return is a measure of the change in value of an investment in the Fund over the periods covered. The returns shown do not reflect the deduction of taxes a shareholder would pay on Fund distributions, if any, or the redemption of Fund shares. The total returns would be lower if the Adviser had not reduced advisory fees and reimbursed expenses. |
(c) | Not annualized. |
(d) | Annualized. |
(e) | Ratio was determined after advisory fee reductions and expense reimbursements (Note 4). |
See accompanying notes to financial statements. |
13
HVIA EQUITY FUND
NOTES TO FINANCIAL STATEMENTS
August 31, 2018 (Unaudited)
1. Organization
HVIA Equity Fund (the “Fund”) is a diversified series of Ultimus Managers Trust (the “Trust”), an open-end investment company established as an Ohio business trust under a Declaration of Trust dated February 28, 2012. Other series of the Trust are not incorporated in this report.
The investment objective of the Fund is to seek growth at a reasonable price.
The Fund currently offers one class of shares: Institutional Class shares (sold without any sales loads or distribution fees and subject to a $25,000 initial investment requirement). As of August 31, 2018, the Investor Class shares (to be sold without any sales load, but subject to a distribution fee of up to 0.25% of the class’ average daily net assets and subject to a $2,500 initial investment requirement) are not currently offered. When both classes are offered, each share class will represent an ownership interest in the same investment portfolio.
2. Significant Accounting Policies
The following is a summary of the Fund’s significant accounting policies. The policies are in conformity with accounting principles generally accepted in the United States of America (“GAAP”). The Fund follows accounting and reporting guidance under Financial Accounting Standards Board Accounting Standards Codification Topic 946, “Financial Services – Investment Companies.”
Securities valuation – The Fund values its portfolio securities at market value as of the close of regular trading on the New York Stock Exchange (the “NYSE”) (normally 4:00 p.m. Eastern time) on each business day the NYSE is open for business. The Fund values its common stocks on the basis of the security’s last sale price on the security’s primary exchange, if available, otherwise at the exchange’s most recently quoted mean price. NASDAQ-listed securities are valued at the NASDAQ Official Closing Price. The Fund values securities traded in the over-the-counter market at the last sale price, if available, otherwise at the most recently quoted mean price. When using a quoted price and when the market is considered active, the security will be classified as Level 1 within the fair value hierarchy (see below). In the event that market quotations are not readily available or are considered unreliable due to market or other events, the Fund values its securities and other assets at fair value pursuant to procedures established by and under the direction of the Board of Trustees (the “Board”) of the Trust. Under these procedures, the securities will be classified as Level 2 or 3 within the fair value hierarchy, depending on the inputs used. Unavailable or unreliable market quotes may be due to the following factors: a substantial bid-ask spread; infrequent sales resulting in stale prices; insufficient trading volume; small trade sizes; a temporary lapse in any reliable pricing source; and actions of the securities
14
HVIA EQUITY FUND
NOTES TO FINANCIAL STATEMENTS (Continued) |
or futures markets, such as the suspension or limitation of trading. As a result, the prices of securities used to calculate the Fund’s net asset value (“NAV”) may differ from quoted or published prices for the same securities.
GAAP establishes a single authoritative definition of fair value, sets out a framework for measuring fair value, and requires additional disclosures about fair value measurements.
Various inputs are used in determining the value of the Fund’s investments. These inputs are summarized in the three broad levels listed below:
● | Level 1 – quoted prices in active markets for identical securities |
● | Level 2 – other significant observable inputs |
● | Level 3 – significant unobservable inputs |
The inputs or methods used for valuing securities are not necessarily an indication of the risks associated with investing in those securities. The inputs used to measure fair value may fall into different levels of the fair value hierarchy. In such cases, for disclosure purposes, the level in the fair value hierarchy within which the fair value measurement falls in its entirety is determined based on the lowest level input that is significant to the fair value measurement.
The following is a summary of the inputs used to value the Fund’s investments as of August 31, 2018:
| | Level 1 | | | Level 2 | | | Level 3 | | | Total | |
Common Stocks | | $ | 17,074,507 | | | $ | — | | | $ | — | | | $ | 17,074,507 | |
Refer to the Fund’s Schedule of Investments for a listing of common stocks by industry type. As of August 31, 2018, the Fund did not have any transfers between Levels. In addition, the Fund did not have any derivative instruments or any assets or liabilities that were measured at fair value on a recurring basis using significant unobservable inputs (Level 3) as of August 31, 2018. It is the Fund’s policy to recognize transfers between Levels at the end of the reporting period.
Foreign currency translation – Securities and other assets and liabilities denominated in or expected to settle in foreign currencies, if any, are translated into U.S. dollars based on exchange rates on the following basis:
| | A. | The fair values of investment securities and other assets and liabilities are translated as of the close of the NYSE each day. |
| | B. | Purchases and sales of investment securities and income and expenses are translated at the rate of exchange prevailing as of 4:00 p.m. Eastern Time on the respective date of such transactions. |
15
HVIA EQUITY FUND
NOTES TO FINANCIAL STATEMENTS (Continued) |
| | C. | The Fund does not isolate that portion of the results of operations caused by changes in foreign exchange rates on investments from those caused by changes in market prices of securities held. Such fluctuations are included with the net realized and unrealized gains or losses on investments. |
Reported net realized foreign exchange gains or losses arise from 1) purchases and sales of foreign currencies, 2) currency gains or losses realized between the trade and settlement dates on securities transactions, and 3) the difference between the amounts of dividends and foreign withholding taxes recorded on the Fund’s books and the U.S. dollar equivalent of the amounts actually received or paid. Reported net unrealized foreign exchange gains and losses arise from changes in the value of assets and liabilities that result from changes in exchange rates.
Cash account – The Fund’s cash is held in a bank account with balances which may exceed the amount covered by federal deposit insurance. As of August 31, 2018, the cash balance reflected on the Statement of Assets and Liabilities represents the amount held in a deposit sweep account.
Share valuation – The NAV per share of each class of the Fund is calculated daily by dividing the total value of its assets attributable to that class, less liabilities attributable to that class, by the number of shares outstanding of that class. The offering price and redemption price per share of each class of the Fund is equal to the NAV per share of such class.
Investment income – Dividend income is recorded on the ex-dividend date. Interest income is accrued as earned. Withholding taxes on foreign dividends have been recorded in accordance with the Fund’s understanding of the applicable country’s tax rules and rates.
Investment transactions – Investment transactions are accounted for on the trade date. Realized gains and losses on investments sold are determined on a specific identification basis.
Common expenses – Common expenses of the Trust are allocated among the Fund and the other series of the Trust based on the relative net assets of each series or the nature of the services performed and the relative applicability to each series.
Distributions to shareholders – The Fund will distribute to shareholders any net investment income dividends and net realized capital gains distributions at least once each year. The amount of such dividends and distributions are determined in accordance with federal income tax regulations, which may differ from GAAP. Dividends and distributions to shareholders are recorded on the ex-dividend date. The tax character of distributions paid by the Fund to shareholders during the year ended February 28, 2018 was ordinary income. There were no distributions paid by the Fund to shareholders during the six months ended August 31, 2018.
Estimates – The preparation of financial statements in conformity with GAAP requires management to make estimates and assumptions which affect the reported amounts of assets and liabilities and disclosure of contingent assets and liabilities as of the date of the financial statements and the reported amounts of income and expenses during the reporting period. Actual results could differ from those estimates.
16
HVIA EQUITY FUND
NOTES TO FINANCIAL STATEMENTS (Continued) |
Federal income tax – The Fund has qualified and intends to continue to qualify as a regulated investment company under the Internal Revenue Code of 1986, as amended (the “Code”). Qualification generally will relieve the Fund of liability for federal income taxes to the extent 100% of its net investment income and net realized capital gains are distributed in accordance with the Code.
In order to avoid imposition of the excise tax applicable to regulated investment companies, it is also the Fund’s intention to declare as dividends in each calendar year at least 98% of its net investment income (earned during the calendar year) and 98.2% of its net realized capital gains (earned during the 12 months ended October 31) plus undistributed amounts from prior years.
The following information is computed on a tax basis for each item as of August 31, 2018:
Tax cost of portfolio investments and foreign currencies | | $ | 12,932,528 | |
Gross unrealized appreciation | | $ | 4,464,047 | |
Gross unrealized depreciation | | | (322,050 | ) |
Net unrealized appreciation | | | 4,141,997 | |
Undistributed ordinary income | | | 9,446 | |
Undistributed long-term capital gains | | | 35,296 | |
Other gains | | | 83,148 | |
Accumulated earnings | | $ | 4,269,887 | |
For the six months ended August 31, 2018, the Fund reclassified $514 of net realized losses on foreign currency transactions against accumulated net investment income on the Statement of Assets and Liabilities. This reclassification is the result of permanent differences between the financial statement and income tax reporting requirements. It had no effect on the Fund’s net assets or its NAV per share.
The Fund recognizes the tax benefits or expenses of uncertain tax positions only when the position is “more likely than not” of being sustained assuming examination by tax authorities. Management has reviewed the Fund’s tax positions for the current and all open tax periods (period ended February 28, 2017 and year ended February 28, 2018) and has concluded that no provision for unrecognized tax benefits or expenses is required in these financial statements. The Fund identifies its major tax jurisdiction as U.S. Federal.
3. Investment Transactions
During the six months ended August 31, 2018, cost of purchases and proceeds from sales of investment securities, other than short-term investments, amounted to $2,690,446 and $482,821, respectively.
17
HVIA EQUITY FUND
NOTES TO FINANCIAL STATEMENTS (Continued) |
4. Transactions with Related Parties
INVESTMENT ADVISORY AGREEMENT
The Fund’s investments are managed by Hudson Valley Investment Advisors, Inc. (the “Adviser”) pursuant to the terms of an Investment Advisory Agreement. Under the Investment Advisory Agreement, the Fund pays the Adviser an investment advisory fee, computed and accrued daily and paid monthly, at the annual rate of 0.74% of its average daily net assets.
Pursuant to an Expense Limitation Agreement (“ELA”), the Adviser has contractually agreed, until July 1, 2020, to reduce investment advisory fees and reimburse other expenses to the extent necessary to limit total annual operating expenses (exclusive of brokerage costs, taxes, interest, costs to organize the Fund, acquired fund fees and expenses, extraordinary expenses such as litigation and merger or reorganization costs and other expenses not incurred in the ordinary course of the Fund’s business) to an amount not exceeding 0.99% of average daily net assets. Accordingly, the Adviser did not collect any of its investment advisory fees and, in addition, reimbursed other operating expenses totaling $12,281 during the six months ended August 31, 2018.
Under the terms of the ELA, investment advisory fee reductions and expense reimbursements by the Adviser are subject to repayment by the Fund for a period of three years after such fees and expenses were incurred, provided the repayments do not cause total annual operating expenses to exceed: (i) the expense limitation then in effect, if any, and (ii) the expense limitation in effect at the time the expenses to be repaid were incurred. As of August 31, 2018, the Adviser may seek repayment of investment advisory fee reductions and expense reimbursements in the amount of $272,396 no later than the dates listed below:
February 29, 2020 | | $ | 53,835 | |
February 28, 2021 | | $ | 145,536 | |
August 31, 2021 | | $ | 73,025 | |
OTHER SERVICE PROVIDERS
Ultimus Fund Solutions, LLC (“Ultimus”) provides administration, fund accounting, compliance and transfer agency services to the Fund. The Fund pays Ultimus fees in accordance with the agreements for such services. In addition, the Fund pays out-of-pocket expenses including, but not limited to, postage, supplies, and costs of pricing the Fund’s portfolio securities.
Under the terms of a Distribution Agreement with the Trust, Ultimus Fund Distributors, LLC (the “Distributor”) serves as the principal underwriter to the Fund. The Distributor is a wholly-owned subsidiary of Ultimus. The Distributor is compensated by the Adviser (not the Fund) for acting as principal underwriter.
Certain officers and a Trustee of the Trust are also officers of Ultimus and the Distributor.
18
HVIA EQUITY FUND
NOTES TO FINANCIAL STATEMENTS (Continued) |
TRUSTEE COMPENSATION
Effective August 1, 2018, each Trustee who is not an “interested person” of the Trust (“Independent Trustee”) receives a $1,300 annual retainer from the Fund, paid quarterly, except for the Board Chairperson who receives a $1,500 annual retainer from the Fund, paid quarterly. Each Independent Trustee also receives from the Fund a fee of $500 for each Board meeting attended plus reimbursement for travel and other meeting-related expenses. Prior to August 1, 2018, each Independent Trustee received a $1,000 annual retainer from the Fund, paid quarterly, except for the Board Chairperson who received a $1,200 annual retainer from the Fund, paid quarterly. Each Independent Trustee also received from the Fund a fee of $500 for each Board meeting attended plus reimbursement for travel and other meeting-related expenses.
PRINCIPAL HOLDER OF FUND SHARES
As of August 31, 2018, the following shareholder owned of record more than 5% of the outstanding shares of the Fund:
NAME OF RECORD OWNER | % Ownership |
Pershing, LLC (for the benefit of its customers) | 99.7% |
A beneficial owner of 25% or more of the Fund’s outstanding shares may be considered a controlling person. That shareholder’s vote could have a more significant effect on matters presented at a shareholders’ meeting.
5. Contingencies and Commitments
The Fund indemnifies the Trust’s officers and Trustees for certain liabilities that might arise from the performance of their duties to the Fund. Additionally, in the normal course of business the Fund enters into contracts that contain a variety of representations and warranties and which provide general indemnifications. The Fund’s maximum exposure under these arrangements is unknown, as this would involve future claims that may be made against the Fund that have not yet occurred. However, based on experience, the Fund expects the risk of loss to be remote.
6. Subsequent Events
The Fund is required to recognize in the financial statements the effects of all subsequent events that provide additional evidence about conditions that existed as of the date of the Statement of Assets and Liabilities. For non-recognized subsequent events that must be disclosed to keep the financial statements from being misleading, the Fund is required to disclose the nature of the event as well as an estimate of its financial effect, or a statement that such an estimate cannot be made. Management has evaluated subsequent events through the issuance of these financial statements and has noted no such events.
19
HVIA EQUITY FUND
ABOUT YOUR FUND’S EXPENSES (Unaudited) |
We believe it is important for you to understand the impact of costs on your investment. As a shareholder of the Fund, you incur ongoing costs, including management fees and other operating expenses. The following examples are intended to help you understand your ongoing costs (in dollars) of investing in the Fund and to compare these costs with the ongoing costs of investing in other mutual funds.
A mutual fund’s ongoing costs are expressed as a percentage of its average net assets. This figure is known as the expense ratio. The expenses in the table below are based on an investment of $1,000 made at the beginning of the most recent period (March 1, 2018) and held until the end of the period (August 31, 2018).
The table below illustrates the Fund’s ongoing costs in two ways:
Actual fund return – This section helps you to estimate the actual expenses that you paid over the period. The “Ending Account Value” shown is derived from the Fund’s actual return, and the fourth column shows the dollar amount of operating expenses that would have been paid by an investor who started with $1,000 in the Fund. You may use the information here, together with the amount you invested, to estimate the expenses that you paid over the period.
To do so, simply divide your account value by $1,000 (for example, an $8,600 account value divided by $1,000 = 8.6), then multiply the result by the number given for the Fund under the heading “Expenses Paid During Period.”
Hypothetical 5% return – This section is intended to help you compare the Fund’s ongoing costs with those of other mutual funds. It assumes that the Fund had an annual return of 5% before expenses during the period shown, but that the expense ratio is unchanged. In this case, because the return used is not the Fund’s actual return, the results do not apply to your investment. The example is useful in making comparisons because the U.S. Securities and Exchange Commission (the “SEC”) requires all mutual funds to calculate expenses based on a 5% return. You can assess the Fund’s ongoing costs by comparing this hypothetical example with the hypothetical examples that appear in shareholder reports of other funds.
Note that expenses shown in the table are meant to highlight and help you compare ongoing costs only. The Fund does not charge transaction fees, such as purchase or redemption fees, nor does it carry a “sales load.” The calculations assume no shares were bought or sold during the period. Your actual costs may have been higher or lower, depending on the amount of your investment and the timing of any purchases or redemptions.
More information about the Fund’s expenses can be found in this report. For additional information on operating expenses and other shareholder costs, please refer to the Fund’s prospectus.
20
HVIA EQUITY FUND
ABOUT YOUR FUND’S EXPENSES (Unaudited) (Continued) |
Institutional Class | Beginning
Account Value
March 1,
2018 | Ending
Account Value
August 31,
2018 | Net Expense
Ratio (a) | Expenses
Paid During
Period (b) |
Based on Actual Fund Return | $ 1,000.00 | $ 1,063.00 | 0.99% | $ 5.15 |
Based on Hypothetical 5% Return (before expenses) | $ 1,000.00 | $ 1,020.21 | 0.99% | $ 5.04 |
(a) | Annualized, based on the Fund’s most recent one-half year expenses. |
(b) | Expenses are equal to the Fund’s annualized net expense ratio multiplied by the average account value over the period, multiplied 184/365 (to reflect the one-half year period). |
21
HVIA EQUITY FUND
OTHER INFORMATION (Unaudited) |
A description of the policies and procedures that the Fund uses to vote proxies relating to portfolio securities is available without charge upon request by calling toll-free 1-888-209-8710, or on the SEC’s website at http://www.sec.gov. Information regarding how the Fund voted proxies relating to portfolio securities during the most recent 12-month period ended June 30 is available without charge upon request by calling toll-free 1-888-209-8710, or on the SEC’s website at http://www.sec.gov.
The Trust files a complete listing of portfolio holdings for the Fund with the SEC as of the end of the first and third quarters of each fiscal year on Form N-Q. These filings are available upon request by calling 1-888-209-8710. Furthermore, you may obtain a copy of the filings on the SEC’s website at http://www.sec.gov. The Trust’s Forms N-Q may also be reviewed and copied at the SEC’s Public Reference Room in Washington, DC, and information on the operation of the Public Reference Room may be obtained by calling 1-800-SEC-0330.
22
HVIA EQUITY FUND
DISCLOSURE REGARDING APPROVAL OF INVESTMENT ADVISORY AGREEMENT (Unaudited) |
The Board of Trustees (the “Board”), including the Independent Trustees voting separately, has reviewed and approved the Fund’s Investment Advisory Agreement with Hudson Valley Investment Advisors, Inc. (the “Adviser”) for an additional one-year term (the “Agreement”). The Board approved the Agreement at an in-person meeting held on July 23-24, 2018, at which all of the Trustees were present.
Legal counsel advised the Board during its deliberations. Additionally, the Board received and reviewed a substantial amount of information provided by the Adviser in response to requests of the Board and counsel. In considering whether to approve the Agreement and in reaching its conclusions with respect thereto, the Board reviewed and analyzed various factors that it determined were relevant to the Agreement, including the following factors.
The nature, extent, and quality of the services provided by the Adviser. In this regard, the Board reviewed the services being provided by the Adviser to the Fund including, without limitation, its investment advisory services since the Fund’s inception, the Adviser’s compliance policies and procedures, its efforts to promote the Fund and assist in its distribution, and its compliance program. After reviewing the foregoing information and further information in the Adviser Memorandum (e.g., descriptions of its business and Form ADV), the Board concluded that the quality, extent, and nature of the services provided by the Adviser were satisfactory and adequate for the Fund.
The investment performance of the Fund. In this regard, the Board compared the performance of the Fund with the performance of its benchmark index, custom peer group and related Morningstar category. The Board noted that the Fund had underperformed its custom peer group’s average and median performance for the one year period and overperformed its custom peer group’s average and median performance since the Fund’s inception; while it underperformed its Morningstar category’s (Large Cap Growth Category Under $25 million, True No-Load) median and average performance for the one year period, and overperformed the median and average performance since the Fund’s inception. The Board also considered the consistency of the Adviser’s management with the Fund’s investment objective and policies. The Board indicated that the Adviser had satisfactorily explained its performance results for the Fund. Following discussion of the investment performance of the Fund and its performance relative to its Morningstar category, the Adviser’s experience in managing a mutual fund and separate accounts, its historical investment performance, and other factors, the Board concluded that the investment performance of the Fund has been satisfactory.
The costs of the services provided and profits realized by the Adviser and its affiliates from its relationship with the Fund. In this regard, the Board considered the Adviser’s staffing, personnel, and methods of operations; the education and experience of its personnel; compliance program, policies, and procedures; financial condition and the level of commitment to the Fund, and, generally, the Adviser’s advisory business; the asset level of the Fund; and the overall expenses of the Fund, including the advisory fee. The Board considered the Adviser’s expense limitation agreement, and considered the Adviser’s current
23
HVIA EQUITY FUND
DISCLOSURE REGARDING APPROVAL OF INVESTMENT ADVISORY AGREEMENT (Unaudited) (Continued) |
and past fee reductions and expense reimbursements for the Fund. The Board further took into account the Adviser’s commitment to continue the Adviser’s expense limitation agreement until at least January 1, 2020.
The Board also considered potential benefits for the Adviser in managing the Fund, including promotion of the Adviser’s name and the potential for it to receive research, statistical, or other services from the Fund’s trades. The Board compared the Fund’s advisory fee and overall expense ratio to the average advisory fees and average expense ratios for its custom peer group and Morningstar category. The Board noted that the 0.74% advisory fee for the Fund was above the average and the median for the Fund’s custom peer group, and above the average and median of funds of similar size and structure in the Fund’s Morningstar category (Large Cap Growth Category Under $25 million, True No-Load), but less than the highest advisor fee in its Morningstar category. The Board further noted that the overall annual expense ratio of 0.99% for the Fund is above the average and median for the Fund’s custom peer group, and above the median but below the average for its Morningstar category. The Board also considered the fee charged by the Adviser to its other accounts that have a substantially similar strategy as the Fund and considered the similarities and differences of services received by such other accounts as compared to the services received by the Fund. The Board noted that the fee structures applicable to the Adviser’s other clients were not indicative of any unreasonableness with respect to the advisory fees payable to the Fund. The Board further considered the investment strategy and style used by the Adviser in managing the portfolio of the Fund. Following these comparisons and upon further consideration and discussion of the foregoing, the Board concluded that the advisory fee paid to the Adviser by the Fund is fair and reasonable.
The extent to which economies of scale would be realized as the Fund grows and whether advisory fee levels reflect these economies of scale for the benefit of the Fund’s investors. In this regard, the Board considered that the Fund’s fee arrangements with the Adviser involve both the advisory fee and the Adviser’s expense limitation agreement. The Board determined that while the advisory fee remained the same as asset levels increased, the shareholders of the Fund have experienced benefits from the Adviser’s expense limitation agreement and will continue to experience benefits from the Adviser’s expense limitation agreement until the Fund assets grow to a level where its expenses otherwise fall below the expense limit. Following further discussion of the Fund’s asset level, expectations for growth, and level of fees, the Board determined that the Fund’s fee arrangements with the Adviser would continue to provide benefits. The Board also determined that the fee arrangements were fair and reasonable in relation to the nature and quality of services being provided by the Adviser, given the Fund’s projected asset levels for the next year.
Brokerage and portfolio transactions. In this regard, the Board considered the Adviser’s trading policies, procedures, and performance in seeking best execution for its clients, including the Fund. The Board also considered the historical portfolio turnover rate
24
HVIA EQUITY FUND
DISCLOSURE REGARDING APPROVAL OF INVESTMENT ADVISORY AGREEMENT (Unaudited) (Continued) |
for the Fund; the process by which evaluations are made of the overall reasonableness of commissions paid; the process by which the Adviser evaluates best execution; the method and basis for selecting and evaluating the broker-dealers used; and any anticipated allocation of portfolio business to persons affiliated with the Adviser. After further review and discussion, the Board determined that the Adviser’s practices regarding brokerage and portfolio transactions were satisfactory.
Possible conflicts of interest. In evaluating the possibility for conflicts of interest, the Board considered such matters as the experience and abilities of the advisory personnel assigned to the Fund, the Adviser’s process for allocating trades among its different clients, and the substance and administration of the Adviser’s Code of Ethics. Following further consideration and discussion, the Board found that the Adviser’s standards and practices relating to the identification and mitigation of potential conflicts of interests were satisfactory.
After full consideration of the above factors as well as other factors, the Board unanimously concluded that approval of the Agreement was in the best interests of the Fund and its shareholders.
25
CUSTOMER PRIVACY NOTICE
FACTS | WHAT DOES THE HVIA EQUITY FUND (the “Fund”) DO WITH YOUR PERSONAL INFORMATION? |
Why? | Financial companies choose how they share your personal information. Federal law gives consumers the right to limit some but not all sharing. Federal law also requires us to tell you how we collect, share, and protect your personal information. Please read this notice carefully to understand what we do. |
What? | The types of personal information we collect and share depend on the product or service you have with us. This information can include: ■ Social Security number ■ Assets ■ Retirement Assets ■ Transaction History ■ Checking Account Information ■ Purchase History ■ Account Balances ■ Account Transactions ■ Wire Transfer Instructions When you are no longer our customer, we continue to share your information as described in this notice. |
How? | All financial companies need to share your personal information to run their everyday business. In the section below, we list the reasons financial companies can share their customers’ personal information; the reasons the Fund chooses to share; and whether you can limit this sharing. |
Reasons we can share your personal information | Does the
Fund share? | Can you limit this sharing? |
For our everyday business purposes –
Such as to process your transactions, maintain your account(s), respond to court orders and legal investigations, or report to credit bureaus | Yes | No |
For our marketing purposes –
to offer our products and services to you | No | We don’t share |
For joint marketing with other financial companies | No | We don’t share |
For our affiliates’ everyday business purposes –
information about your transactions and experiences | No | We don’t share |
For our affiliates’ everyday business purposes –
information about your creditworthiness | No | We don’t share |
For nonaffiliates to market to you | No | We don’t share |
| Questions? | Call 1-888-209-8710 |
26
Who we are |
Who is providing this notice? | HVIA Equity Fund Ultimus Fund Distributors, LLC (Distributor) Ultimus Fund Solutions, LLC (Administrator) |
What we do |
How does the Fund protect my personal information? | To protect your personal information from unauthorized access and use, we use security measures that comply with federal law. These measures include computer safeguards and secured files and buildings. Our service providers are held accountable for adhering to strict policies and procedures to prevent any misuse of your nonpublic personal information. |
How does the Fund collect my personal information? | We collect your personal information, for example, when you ■ Open an account ■ Provide account information ■ Give us your contact information ■ Make deposits or withdrawals from your account ■ Make a wire transfer ■ Tell us where to send the money ■ Tell us who receives the money ■ Show your government-issued ID ■ Show your driver’s license We also collect your personal information from other companies. |
Why can’t I limit all sharing? | Federal law gives you the right to limit only ■ Sharing for affiliates’ everyday business purposes – information about your creditworthiness ■ Affiliates from using your information to market to you ■ Sharing for nonaffiliates to market to you State laws and individual companies may give you additional rights to limit sharing. |
Definitions |
Affiliates | Companies related by common ownership or control. They can be financial and nonfinancial companies. ■ Hudson Valley Investment Advisor, Inc., the investment adviser to the Fund, could be deemed to be an affiliate. |
Nonaffiliates | Companies not related by common ownership or control. They can be financial and nonfinancial companies ■ The Fund does not share with nonaffiliates so they can market to you. |
Joint marketing | A formal agreement between nonaffiliated financial companies that together market financial products or services to you. ■ The Fund does not jointly market. |
27
This page intentionally left blank.
This page intentionally left blank.

LADDER SELECT BOND FUND
INSTITUTIONAL CLASS (LSBIX)
Managed by
Ladder Capital Asset Management LLC
SEMI-ANNUAL REPORT
August 31, 2018
(Unaudited)
LADDER SELECT BOND FUND
LETTER TO SHAREHOLDERS | October 2018 |
Dear Ladder Select Bond Fund Shareholders,
For the six month period ended August 31, 2018, the Ladder Select Bond Fund (the “Fund”) returned 1.35%. For the same period, the Fund’s benchmark, the Bloomberg Barclays Intermediate Government/Credit Bond Index (the “Benchmark”), returned 0.99%, outperforming its Benchmark by 0.36%. For the quarter ended August 31, 2018, the Fund returned 0.68% compared to the Benchmark return of 0.55%, outperforming its benchmark by 0.13%.
The Fund seeks to capitalize on the sector-specific knowledge of commercial real estate (“CRE”) and commercial mortgage-backed securities (“CMBS”) of its adviser, Ladder Capital Asset Management (“LCAM”), to select investments that satisfy the Fund’s investment objective of a combination of current income and capital preservation.
Consistent with LCAM’s philosophy of seeking outperformance through deep sector expertise, the performance of the Fund was driven by two of the Funds larger holdings:
| | ■ | JPMCC 2016-WPT D – This investment is secured by a highly diverse portfolio of 108 office properties with 417 tenant leases. A significant proportion of the tenants are rated investment grade. The floating-rate investment grade security owned by the Fund is rated BBB by S&P and has a coupon of one-month dollar LIBOR +3.75%. This position was paid off at par during the previous quarter and refinanced as JPMCC 2018-WPT. The Fund reinvested a portion of the received proceeds in class DFL of the new JPMCC 2018-WPT securitization. |
| | ■ | COMM 2015-CR23 CMB and CMD – These investments are secured by a geographically diverse portfolio of 65 Courtyard by Marriott hotels located across 29 states. The sponsors are a joint venture between Clarion Partners, LLC and the State of Michigan Retirement Systems. Spreads on both positions have tightened year-to-date as the April 2020 maturity date approaches increasing the price of each position. In August 2017, 13 of the 65 properties were sold and the resulting proceeds were used to de-lever and partially defease the securitizations current loan. |
The Fund’s weighting in shorter duration and floating-rate investments along with open short positions in futures contributed to the Fund’s outperformance vs. the Benchmark. The Fund’s exposure to fixed-rate investments with durations longer than four years such as HILT 2016-SFP A and COMM 2031-LC13 AM partially offset the Fund’s overall positive performance.
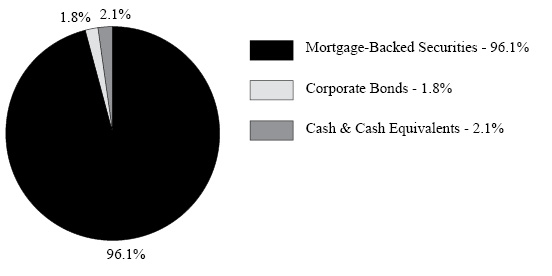
To minimize exposure to potential interest rate moves, the Fund portfolio’s general composition remained unchanged. Given market uncertainties and higher short-term interest rates, the Fund’s defensive portfolio posture continued to focus on investments with shorter durations and/or floating-rate coupons, with the prior six month period seeing an increase in short-term, fixed-rate investments as a number of floating-rate positions paid off due to assets being refinanced. The Fund ended the period with a portfolio comprised of 44% floating-rate securities indexed off 1-Month USD LIBOR, 52.7% fixed-rate securities, and 3.3% cash diversified amongst its 30 securities. To further mitigate the portfolio’s exposure
1
to interest rate movements, the Fund incorporates hedging strategies using Treasury futures. The Fund also continues to be conservatively positioned with respect to credit exposure with a current weighted-average rating of ‘AA/AA-‘. In addition, the Fund’s returns during the period benefited from assets indexed to LIBOR, with 1-Month USD LIBOR increasing from 188 basis points on March 31, 2018 to 211 basis points on August 31, 2018. Since the Fund’s inception on October 16, 2016, 1-Month USD LIBOR has increased by 158 basis points.
Market Environment:
The Treasury curve continued its flattening trend, with the 30-year Treasury virtually unchanged and the front-end of the curve responding to the Federal Reserve’s ongoing tightening of monetary policy. The relative moves across the Treasury curve during the period were the following: the 3-month Treasury bill yield was 39 basis points higher closing at 2.10%; the 2-year Treasury yield was 36 basis points higher closing at 2.63%; the 5-year Treasury yield increased by 18 basis points closing at 2.74%; the 10-year Treasury yield increased by 12 basis points higher closing at 2.86%; and the 30-year Treasury yield increased by 5 basis points closing at 3.02%. The Treasury curve continues to be influenced on the front-end by historically strong economic growth and the corresponding Federal Reserve’s tightening of monetary policy. The long end of the Treasury curve, in our opinion, has been well bid due to the significant spread difference between other developed market debt (i.e., German 10-year Bunds at 34 basis points on 8/31/18) along with a stronger U.S. dollar. The U.S. economy continues to be robust even with global uncertainty such as developing trade wars, Emerging Market/China growth, and potential market liquidity events. The most recent Q3 U.S. GDP estimate released by the Atlanta Federal Reserve Bank is 4.43% following a Q2 U.S. GDP of 4.2% which was the fastest rate of quarterly U.S. economic growth since Q3 of 2014.
The lack of CMBS issuance and a generally quiet summer on Wall Street allowed for spreads to tighten. Spreads on CMBS ‘on-the-run’ last cash flow AAA bonds were tighter by 12 basis points and spreads on CMBS ‘on-the-run’ BBB- bonds were tighter by 102 basis points over the previous twelve months. Spreads on 2013 last cash flow AAA bonds, which LCAM looks at as an example of intermediate-duration performance, ended the period at 45bps over Treasuries achieving their tightest spread to Treasuries on a one year look back. Supply in new-issue U.S. CMBS volume year-to-date for 2018 is unchanged from the prior year at 53.8mm. (Commercial Mortgage Alert – 9.7.18)
Outlook:
The following themes defined the period and we expect will also define the near term investment landscape: a flatter Treasury curve driven by Federal Open Market Committee rate increases and expectations of further increases through 2020, a significant spread difference between U.S. yields and other developing market debt, historically strong U.S. GDP during Q2 2018, continuing expectations for stronger than historical GDP for Q3 2018, lower than expected inflation, a flatter CMBS credit curve as BBBs continued to tighten along with the chase for incremental yield. While the Fund continues to be well-positioned for all of these market dynamics, during the period, the Fund took a slightly more defensive duration and credit stance by reinvesting proceeds in seasoned fixed-rate and AAA rated floating-rate positions. The Fund continues to be focused on absolute Treasury rates,
2
managing interest rate and spread duration, finding relative value along the credit curve and purchasing investments with potential value-add propositions similar to the COMM 2015-CR23 and the recently defeased AVMT 2013-AVM investments. Going into year-end and the 2019 new year, the Fund will be intensely focused on increasing tail risk (‘fatter’) and the slope of the credit curve (“flatter”) when analyzing new investments and surveilling the current portfolio.
Consistent with its capital preservation objective, the Fund will continue its strategy of investing in CRE debt exhibiting strong fundamental credit metrics while focusing on relative value within each respective transaction’s capital structure. The Fund will also continue to be cautious in these later stages of the current expansion in regards to the increasing risks of ‘fatter’ credit tails and a ‘flatter’ credit spread curve.
On behalf of everyone at Ladder Capital Asset Management, we thank you for investing with us. We look forward to the Fund’s continued success as we approach 2019.
Sincerely,
 |  |
| Brian Harris | Craig Sedmak |
| Principal Executive Officer and Portfolio Manager | Portfolio Manager |
Past performance is not predictive of future performance. Investment results and principal value will fluctuate so that shares, when redeemed, may be worth more or less than their original cost. Current performance may be higher or lower than the performance data quoted. Performance data current to the most recent month-end are available by calling 1-888-859-5867.
An investor should consider the investment objectives, risks, charges, and expenses of the Fund carefully before investing. The Fund’s prospectus contains this and other important information. To obtain a copy of the Fund’s prospectus please visit the Fund’s website at www.ladderfunds.com or call 1-888-859-5867 and a copy will be sent to you free of charge. Please read the prospectus carefully before you invest. The Fund is distributed by Ultimus Fund Distributors, LLC.
3
The Letter to Shareholders seeks to describe some of the Adviser’s current opinions and views of the financial markets. Although the Adviser believes it has a reasonable basis for any opinions or views expressed, actual results may differ, sometimes significantly so, from those expected or expressed. The securities held by the Fund that are discussed in the Letter to Shareholders were held during the period covered by this Report. They do not comprise the entire investment portfolio of the Fund, may be sold at any time, and may no longer be held by the Fund. For a complete list of securities held by the Fund as of August 31, 2018, please see the Schedule of Investments section of the semi-annual report. The opinions of the Fund’s adviser with respect to those securities may change at any time.
Statements in the Letter to Shareholders that reflect projections or expectations for future financial or economic performance of the Fund and the market in general and statements of the Fund’s plans and objectives for future operations are forward-looking statements. No assurance can be given that actual results or events will not differ materially from those projected, estimated, assumed, or anticipated in any such forward-looking statements. Important factors that could result in such differences, in addition to factors noted with such forward-looking statements, include, without limitation, general economic conditions, such as inflation, recession, and interest rates. Past performance is not a guarantee of future results.
4
LADDER SELECT BOND FUND
PORTFOLIO INFORMATION
August 31, 2018 (Unaudited)
Portfolio Allocation (% of Net Assets)
Top 10 Long-Term Holdings
| Security Description | % of
Net Assets |
Commercial Mortgage Trust, Series 2015-CR23,
Class CMD, 144A, 3.684%(a), due 05/10/2048 | 11.4% |
Hudsons Bay Simon JV Trust, Series 2015-HBFL,
Class AFL, 144A, 3.910% (a), due 08/05/2034 | 9.3% |
Commercial Mortgage Trust, Series 2015-CR23,
Class CMB, 144A, 3.684% (a), due 05/10/2048 | 7.8% |
Commercial Mortgage Trust, Series 2014-TWC,
Class B, 144A, 3.697% (a), due 02/13/2032 | 7.5% |
JPMorgan Chase Commercial Mortgage Securities, Series 2018-WPT,
Class DFL, 144A, 4.630% (a), due 07/05/2023 | 6.3% |
Commercial Mortgage Trust, Series 2012-LC4,
Class AM, 4.063%, due 12/10/2044 | 4.2% |
Progressive Residential Trust, Series 2016-SFR1,
Class A, 144A, 3.573% (a), due 09/17/2033 | 4.0% |
Wells Fargo Commercial Mortgage Trust, Series 2012-LC5,
Class B, 4.142%, due 10/15/2045 | 3.8% |
VNO Mortgage Trust, Series 2013-PENN,
Class B, 144A, 3.947% (a), due 12/13/2029 | 3.8% |
Ashford Hospitality Trust, Series 2018-KEYS,
Class A, 144A, 3.050% (a), due 05/15/2035 | 3.7% |
| (a) | Variable rate security. The rate shown is the effective interest rate as of August 31, 2018. |
5
LADDER SELECT BOND FUND
SCHEDULE OF INVESTMENTS
August 31, 2018 (Unaudited) |
MORTGAGE-BACKED
SECURITIES — 96.1% | | Coupon | | | Maturity | | | Par Value | | | Value | |
| Commercial — 96.1% | | | | | | | | | | | | | | | | |
| Ashford Hospitality Trust, Series 2018-KEYS, Class A, 144A (1MO LIBOR + 100) (a) | | | 3.050 | % | | | 05/15/35 | | | $ | 500,000 | | | $ | 500,781 | |
| Aventura Mall Trust, Series 2013-AVM, Class B, 144A (a) | | | 3.743 | % | | | 12/05/32 | | | | 250,000 | | | | 254,070 | |
| Aventura Mall Trust, Series 2013-AVM, Class E, 144A (a) | | | 3.743 | % | | | 12/05/32 | | | | 100,000 | | | | 101,628 | |
| Citigroup Commercial Mortgage Trust, Series 2016-SMPL, Class A, 144A | | | 2.228 | % | | | 09/10/31 | | | | 51,000 | | | | 50,964 | |
| Commercial Mortgage Asset Trust, IO, Series 1999-C2, Class X (a) | | | 2.036 | % | | | 11/17/32 | | | | 287,279 | | | | 183 | |
| Commercial Mortgage Trust, Series 2014-TWC, Class B, 144A (1MO LIBOR + 160) (a) | | | 3.697 | % | | | 02/13/32 | | | | 1,000,000 | | | | 1,001,255 | |
| Commercial Mortgage Trust, Series 2012-LC4, Class AM | | | 4.063 | % | | | 12/10/44 | | | | 550,000 | | | | 559,457 | |
| Commercial Mortgage Trust, Series 2013-LC6, Class AM | | | 3.282 | % | | | 01/10/46 | | | | 212,000 | | | | 209,186 | |
| Commercial Mortgage Trust, Series 2013-LC13, Class AM, 144A | | | 4.557 | % | | | 08/10/46 | | | | 346,000 | | | | 360,246 | |
| Commercial Mortgage Trust, Series 2015-CR23, Class CMB, 144A (a) | | | 3.684 | % | | | 05/10/48 | | | | 1,040,000 | | | | 1,043,110 | |
| Commercial Mortgage Trust, Series 2015-CR23, Class CMD, 144A (a) | | | 3.684 | % | | | 05/10/48 | | | | 1,531,000 | | | | 1,521,235 | |
| Goldman Sachs Mortgage Securities Trust, IO, Series 2005-ROCK, Class X1, 144A (a) | | | 0.207 | % | | | 05/03/32 | | | | 14,016,000 | | | | 229,158 | |
| Hilton USA Trust, Series 2016-SFP, Class A, 144A | | | 2.828 | % | | | 11/05/35 | | | | 500,000 | | | | 487,023 | |
| Home Partners of America Trust, Series 2017-1, Class B, 144A (1MO LIBOR + 135) (a) | | | 3.423 | % | | | 07/17/34 | | | | 300,000 | | | | 300,544 | |
| Hudsons Bay Simon JV Trust, Series 2015-HBFL, Class AFL, 144A (1MO LIBOR + 158) (a) | | | 3.910 | % | | | 08/05/34 | | | | 1,250,000 | | | | 1,251,959 | |
| JPMorgan Chase Commercial Mortgage Securities, Series 2018-WPT, Class DFL, 144A (a) | | | 4.630 | % | | | 07/05/23 | | | | 840,000 | | | | 837,910 | |
| Ladder Capital Commercial Mortgage Securities, LLC, Series 2014-PKMD, Class MRC, 144A (a) | | | 2.857 | % | | | 11/14/27 | | | | 22,000 | | | | 21,797 | |
6
LADDER SELECT BOND FUND
SCHEDULE OF INVESTMENTS (Continued) |
MORTGAGE-BACKED
SECURITIES — 96.1% (Continued) | | Coupon | | | Maturity | | | Par Value | | | Value | |
| Commercial — 96.1% (Continued) | | | | | | | | | | | | | | | | |
| LoanCore Capital Credit Advisor, LLC, Series 2018-CRE1, Class A, 144A (1MO LIBOR + 113) (a) | | | 3.202 | % | | | 05/15/28 | | | $ | 500,000 | | | $ | 500,500 | |
| Marathon CRE Issuer Ltd., Series 2018-FL1, Class A, 144A (1MO LIBOR + 115) (a) | | | 3.222 | % | | | 06/15/28 | | | | 500,000 | | | | 500,000 | |
| Morgan Stanley Capital Group Trust, Series 2016-SNR, Class A, 144A (a) | | | 3.348 | % | | | 11/15/34 | | | | 490,021 | | | | 478,067 | |
| Morgan Stanley Capital I Trust, IO, Series 2014-CPT, Class XA, 144A (a) | | | 0.089 | % | | | 07/13/29 | | | | 35,000,000 | | | | 110,128 | |
| Morgan Stanley Capital I Trust, IO, Series 2004-IQ8, Class X1, 144A (a) | | | 0.690 | % | | | 06/15/40 | | | | 3,617,806 | | | | 47,237 | |
| Progressive Residential Trust, Series 2016-SFR1, Class A, 144A (1MO LIBOR + 150) (a) | | | 3.573 | % | | | 09/17/33 | | | | 529,668 | | | | 530,127 | |
| Tharaldson Hotel Portfolio Trust, Series 2018-THL, Class D, 144A (1MO LIBOR + 200) (a) | | | 4.079 | % | | | 11/11/34 | | | | 432,791 | | | | 434,957 | |
| VNO Mortgage Trust, Series 2013-PENN, Class B, 144A (a) | | | 3.947 | % | | | 12/13/29 | | | | 500,000 | | | | 504,242 | |
| VNO Mortgage Trust, Series 2013-PENN, Class D, 144A (a) | | | 4.079 | % | | | 12/13/29 | | | | 200,000 | | | | 199,717 | |
| Wells Fargo Commercial Mortgage Trust, Series 2012-LC5, Class B | | | 4.142 | % | | | 10/15/45 | | | | 506,000 | | | | 512,783 | |
| WTC Depositor, LLC Trust, Series 2012-7WTC, Class A, 144A | | | 4.082 | % | | | 03/13/31 | | | | 2,346 | | | | 2,345 | |
| WTC Depositor, LLC Trust, Series 2012-7WTC, Class B, 144A | | | 5.965 | % | | | 03/13/31 | | | | 315,000 | | | | 316,471 | |
| Total Mortgage-Backed Securities (Cost $12,957,359) | | | | | | | | | | | | | | $ | 12,867,080 | |
| |
| CORPORATE BONDS — 1.8% | | Coupon | | | Maturity | | | Par Value | | | Value | |
| Financials — 1.8% | | | | | | | | | | | | | | | | |
| Starwood Property Trust, Inc., 144A (Cost $244,401) | | | 3.625 | % | | | 02/01/21 | | | $ | 250,000 | | | $ | 243,750 | |
7
LADDER SELECT BOND FUND
SCHEDULE OF INVESTMENTS (Continued) |
| MONEY MARKET FUNDS — 3.0% | | Shares | | | Value | |
| Fidelity Institutional Money Market Government Portfolio - Class I, 1.82% (b) (Cost $403,404) | | | 403,404 | | | $ | 403,404 | |
| | | | | | | | | |
| Total Investments at Value — 100.9% (Cost $13,605,164) | | | | | | $ | 13,514,234 | |
| | | | | | | | | |
| Liabilities in Excess of Other Assets — (0.9%) | | | | | | | (119,662 | ) |
| | | | | | | | | |
| Net Assets — 100.0% | | | | | | $ | 13,394,572 | |
| 144A - | This security was purchased in a transaction exempt from registration in compliance with Rule 144A of the Securities Act of 1933. This security may be resold in transactions exempt from registration, normally to qualified institutional buyers. The total value of such securities is $11,829,221 as of August 31, 2018, representing 88.3% of net assets (Note 8). |
| LIBOR - | London interbank offered rate. |
| IO - | Interest only strip. Par value shown is the notional value, not a true par value. |
| (a) | Variable rate security. Interest rate resets periodically. The rate shown is the effective interest rate as of August 31, 2018. For securities based on a published reference rate and spread, the reference rate and spread (in basis points) are indicated parenthetically. Certain variable rate securities are not based on a published reference rate and spread but are determined by the issuer or agent and are based on current market conditions. These securities, therefore, do not indicate a reference rate and spread. |
| (b) | The rate shown is the 7-day effective yield as of August 31, 2018. |
| See accompanying notes to financial statements. |
8
LADDER SELECT BOND FUND
SCHEDULE OF FUTURES CONTRACTS SOLD SHORT
August 31, 2018 (Unaudited) |
| FUTURES CONTRACTS SOLD SHORT | | Contracts | | | Expiration
Date | | | Notional
Value | | | Value/
Unrealized
Depreciation | |
| Swap Futures | | | | | | | | | | | | | | | | |
| Primary Fixed Rate 5-Year USD Deliverable Interest Rate Swap Future | | | 34 | | | | 09/17/2018 | | | $ | 3,297,469 | | | $ | (21,882 | ) |
| | | | | | | | | | | | | | | | | |
| Treasury Futures | | | | | | | | | | | | | | | | |
| 2-Year U.S. Treasury Note Future | | | 3 | | | | 12/31/2018 | | | | 634,031 | | | | (619 | ) |
| | | | | | | | | | | | | | | | | |
| Total Futures Contracts Sold Short | | | | | | | | | | $ | 3,931,500 | | | $ | (22,501 | ) |
| For the six months ended August 31, 2018, the average notional amount of futures contracts sold short was ($3,913,979) (Note 5). |
| See accompanying notes to financial statements. |
9
LADDER SELECT BOND FUND
STATEMENT OF ASSETS AND LIABILITIES
August 31, 2018 (Unaudited) |
| ASSETS | | | | |
| Investments in securities: | | | | |
| At cost | | $ | 13,605,164 | |
| At value (Note 2) | | $ | 13,514,234 | |
| Margin deposits for futures contracts (Note 2) | | | 36,645 | |
| Dividends and interest receivable | | | 41,753 | |
| Receivable from Adviser (Note 4) | | | 5,500 | |
| Other assets | | | 13,928 | |
| Total assets | | | 13,612,060 | |
| | | | | |
| LIABILITIES | | | | |
| Payable for investment securities purchased | | | 199,943 | |
| Payable to administrator (Note 4) | | | 6,600 | |
| Other accrued expenses | | | 10,945 | |
| Total liabilities | | | 217,488 | |
| | | | | |
| NET ASSETS | | $ | 13,394,572 | |
| | | | | |
| NET ASSETS CONSIST OF: | | | | |
| Paid-in capital | | $ | 13,413,692 | |
| Accumulated net investment income | | | 1,069 | |
| Accumulated net realized gains from investments and futures contracts | | | 93,242 | |
| Net unrealized depreciation on: | | | | |
| Investments | | | (90,930 | ) |
| Futures contracts | | | (22,501 | ) |
| NET ASSETS | | $ | 13,394,572 | |
| | | | | |
| PRICING OF INSTITUTIONAL SHARES (Note 1) | | | | |
| Net assets applicable to Institutional Shares | | $ | 13,394,572 | |
| Shares of Institutional Shares outstanding (unlimited number of shares authorized, no par value) | | | 1,341,172 | |
| Net asset value, offering price and redemption price per share (Note 2) | | $ | 9.99 | |
| See accompanying notes to financial statements. |
10
LADDER SELECT BOND FUND
STATEMENT OF OPERATIONS
For the Six Months Ended August 31, 2018 (Unaudited) |
| INVESTMENT INCOME | | | | |
| Interest | | $ | 245,205 | |
| Dividends | | | 4,697 | |
| Total investment income | | | 249,902 | |
| | | | | |
| EXPENSES | | | | |
| Investment advisory fees (Note 4) | | | 50,210 | |
| Professional fees | | | 23,959 | |
| Fund accounting fees (Note 4) | | | 14,164 | |
| Administration fees (Note 4) | | | 13,500 | |
| Pricing fees | | | 10,805 | |
| Compliance fees (Note 4) | | | 6,152 | |
| Transfer agent fees (Note 4) | | | 6,000 | |
| Trustees’ fees and expenses (Note 4) | | | 5,089 | |
| Registration and filing fees | | | 4,012 | |
| Custody and bank service fees | | | 3,474 | |
| Printing of shareholder reports | | | 2,840 | |
| Postage and supplies | | | 1,347 | |
| Insurance expense | | | 1,329 | |
| Other expenses | | | 3,377 | |
| Total expenses | | | 146,258 | |
| Less fee reductions and expense reimbursements by the Adviser (Note 4) | | | (82,658 | ) |
| Net expenses | | | 63,600 | |
| | | | | |
| NET INVESTMENT INCOME | | | 186,302 | |
| | | | | |
| REALIZED AND UNREALIZED GAINS (LOSSES) ON INVESTMENTS AND FUTURES CONTRACTS | | | | |
| Net realized gains from: | | | | |
| Investments | | | 3,241 | |
| Futures contracts (Note 5) | | | 85,777 | |
| Net change in unrealized appreciation (depreciation) on: | | | | |
| Investments | | | (18,125 | ) |
| Futures contracts (Note 5) | | | (81,343 | ) |
| NET REALIZED AND UNREALIZED LOSSES ON INVESTMENTS AND FUTURES CONTRACTS | | | (10,450 | ) |
| | | | | |
| NET INCREASE IN NET ASSETS RESULTING FROM OPERATIONS | | $ | 175,852 | |
| See accompanying notes to financial statements. |
11
LADDER SELECT BOND FUND
STATEMENTS OF CHANGES IN NET ASSETS |
| | | Six Months
Ended
August 31,
2018
(Unaudited) | | | Year Ended
February 28,
2018 | |
| FROM OPERATIONS | | | | | | | | |
| Net investment income | | $ | 186,302 | | | $ | 288,169 | |
| Net realized gains from: | | | | | | | | |
| Investments | | | 3,241 | | | | 26,679 | |
| Futures contracts (Note 5) | | | 85,777 | | | | 13,341 | |
| Net change in unrealized appreciation (depreciation) on: | | | | | | | | |
| Investments | | | (18,125 | ) | | | (104,279 | ) |
| Futures contracts (Note 5) | | | (81,343 | ) | | | 59,744 | |
| Net increase in net assets from operations | | | 175,852 | | | | 283,654 | |
| | | | | | | | | |
| DISTRIBUTIONS TO SHAREHOLDERS (Note 2) | | | | | | | | |
| From net investment income, Institutional Shares | | | (204,639 | ) | | | (296,787 | ) |
| From net realized gains, Institutional Shares | | | — | | | | (34,062 | ) |
| Decrease in net assets from distributions to shareholders | | | (204,639 | ) | | | (330,849 | ) |
| | | | | | | | | |
| FROM CAPITAL SHARE TRANSACTIONS | | | | | | | | |
| Institutional Shares | | | | | | | | |
| Proceeds from shares sold | | | 202,695 | | | | 1,268,844 | |
| Net asset value of shares issued in reinvestment of distributions to shareholders | | | 204,639 | | | | 326,022 | |
| Payments for shares redeemed | | | (7,857 | ) | | | (898,737 | ) |
| Net increase in Institutional Shares net assets from capital share transactions | | | 399,477 | | | | 696,129 | |
| | | | | | | | | |
| TOTAL INCREASE IN NET ASSETS | | | 370,690 | | | | 648,934 | |
| | | | | | | | | |
| NET ASSETS | | | | | | | | |
| Beginning of period | | | 13,023,882 | | | | 12,374,948 | |
| End of period | | $ | 13,394,572 | | | $ | 13,023,882 | |
| | | | | | | | | |
| ACCUMULATED NET INVESTMENT INCOME | | $ | 1,069 | | | $ | 1,861 | |
| | | | | | | | | |
| CAPITAL SHARE ACTIVITY | | | | | | | | |
| Institutional Shares | | | | | | | | |
| Shares sold | | | 20,247 | | | | 126,229 | |
| Shares reinvested | | | 20,471 | | | | 32,483 | |
| Shares redeemed | | | (786 | ) | | | (89,326 | ) |
| Net increase in shares outstanding | | | 39,932 | | | | 69,386 | |
| Shares outstanding at beginning of period | | | 1,301,240 | | | | 1,231,854 | |
| Shares outstanding at end of period | | | 1,341,172 | | | | 1,301,240 | |
| See accompanying notes to financial statements. |
12
LADDER SELECT BOND FUND
FINANCIAL HIGHLIGHTS |
| Per Share Data for a Share Outstanding Throughout Each Period |
| | | Six Months
Ended
August 31,
2018
(Unaudited) | | | Year Ended
February 28,
2018 | | | Period Ended
February 28,
2017 (a) | |
| Net asset value at beginning of period | | $ | 10.01 | | | $ | 10.05 | | | $ | 10.00 | |
| | | | | | | | | | | | | |
| Income (loss) from investment operations: | | | | | | | | | | | | |
| Net investment income | | | 0.14 | | | | 0.23 | | | | 0.03 | |
| Net realized and unrealized gains (losses) on investments and futures contracts (b) | | | (0.01 | ) | | | (0.00 | )(c) | | | 0.06 | |
| Total from investment operations | | | 0.13 | | | | 0.23 | | | | 0.09 | |
| | | | | | | | | | | | | |
| Less distributions: | | | | | | | | | | | | |
| From net investment income | | | (0.15 | ) | | | (0.24 | ) | | | (0.04 | ) |
| From net realized gains | | | — | | | | (0.03 | ) | | | — | |
| Total distributions | | | (0.15 | ) | | | (0.27 | ) | | | (0.04 | ) |
| | | | | | | | | | | | | |
| Net asset value at end of period | | $ | 9.99 | | | $ | 10.01 | | | $ | 10.05 | |
| | | | | | | | | | | | | |
| Total return (d) | | | 1.35 | %(e) | | | 2.30 | % | | | 0.85 | %(e) |
| | | | | | | | | | | | | |
| Net assets at end of period (000’s) | | $ | 13,395 | | | $ | 13,024 | | | $ | 12,375 | |
| | | | | | | | | | | | | |
| Ratios/supplementary data: | | | | | | | | | | | | |
| Ratio of total expenses to average net assets | | | 2.18 | %(f) | | | 2.17 | % | | | 2.26 | %(f) |
| | | | | | | | | | | | | |
| Ratio of net expenses to average net assets (g) | | | 0.95 | %(f) | | | 0.95 | % | | | 0.95 | %(f) |
| | | | | | | | | | | | | |
| Ratio of net investment income to average net assets (g) | | | 2.78 | %(f) | | | 2.32 | % | | | 0.96 | %(f) |
| | | | | | | | | | | | | |
| Portfolio turnover rate | | | 46 | %(e) | | | 85 | % | | | 91 | %(e) |
| (a) | Represents the period from the commencement of operations (October 18, 2016) through February 28, 2017. |
| (b) | Net realized and unrealized gains (losses) on investments and futures contracts per share are balancing amounts necessary to reconcile with the aggregate gains and losses in the Statement of Operations due to share transactions for the periods covered. |
| (c) | Amount rounds to less than $0.01 per share. |
| (d) | Total return is a measure of the change in value of an investment in the Fund over the periods covered. The returns shown do not reflect the deduction of taxes a shareholder would pay on Fund distributions, if any, or the redemption of Fund shares. The total returns would be lower if the Adviser had not reduced advisory fees and reimbursed expenses. |
| (e) | Not annualized. |
| (f) | Annualized. |
| (g) | Ratio was determined after advisory fee reductions and expense reimbursements (Note 4). |
| See accompanying notes to financial statements. |
13
LADDER SELECT BOND FUND
NOTES TO FINANCIAL STATEMENTS
August 31, 2018 (Unaudited)
1. Organization
Ladder Select Bond Fund (the “Fund”) is a non-diversified series of Ultimus Managers Trust (the “Trust”), an open-end investment company established as an Ohio business trust under a Declaration of Trust dated February 28, 2012. Other series of the Trust are not incorporated in this report.
The investment objective of the Fund is to seek a combination of current income and capital preservation.
The Fund currently offers one class of shares: Institutional Class shares (sold without any sales loads or distribution fees and subject to a $100,000 initial investment requirement). As of August 31, 2018, the Advisor Class shares (to be sold without any sales loads, but subject to a distribution fee of up to 0.25% of the average daily net assets allocable to the Advisor Class and subject to a $2,500 initial investment requirement) are not currently offered. When both classes are offered, each share class will represent an ownership interest in the same investment portfolio.
2. Significant Accounting Policies
The following is a summary of the Fund’s significant accounting policies. These policies are in conformity with accounting principles generally accepted in the United States of America (“GAAP”). The Fund follows accounting and reporting guidance under Financial Accounting Standards Board (“FASB”) Accounting Standards Codification Topic 946, “Financial Services – Investment Companies.”
New Accounting Pronouncement – In March, 2017, FASB issued Accounting Standards Update No. 2017-08 - Receivables – Nonrefundable Fees and Other Costs (Subtopic 310-20): Premium Amortization on Purchased Callable Debt Securities (the “ASU”). The ASU shortens the amortization period for certain callable debt securities, held at a premium, to be amortized to the earliest call date. The ASU does not require an accounting change for securities held at a discount, which continues to be amortized to maturity. The ASU is effective for fiscal years and interim periods within those fiscal years beginning after December 15, 2018. Management is currently evaluating the impact, if any, of applying the ASU.
Securities and futures valuation – The Fund’s fixed income securities, including mortgage-backed securities, are typically valued using evaluated bid prices provided by an independent pricing service approved by the Trust’s Board of Trustees (the “Board”). The independent pricing service uses information with respect to transactions in bonds, quotations from bond dealers, market transactions in comparable securities, and various relationships between securities in determining these prices. The methods used by the independent pricing service and the quality of valuations are reviewed by Ladder Capital Asset Management LLC (the “Adviser”), under the general supervision of the Board. The Fund values its futures contracts
14
LADDER SELECT BOND FUND
NOTES TO FINANCIAL STATEMENTS (Continued)
at their last sale price as of the close of regular trading on the New York Stock Exchange. Prices for these futures contracts are monitored daily by the Adviser until the close of regular trading to determine if fair valuation is required. Securities for which market quotations are not readily available are valued at fair value as determined in good faith under procedures adopted by the Board.
GAAP establishes a single authoritative definition of fair value, sets out a framework for measuring fair value, and requires additional disclosures about fair value measurements.
Various inputs are used in determining the value of the Fund’s investments. These inputs are summarized in the three broad levels listed below:
| ● | Level 1 – quoted prices in active markets for identical securities |
| ● | Level 2 – other significant observable inputs |
| ● | Level 3 – significant unobservable inputs |
Fixed income securities, including mortgage-backed securities and corporate bonds, held by the Fund are classified as Level 2 since values are based on prices provided by an independent pricing service that utilizes various “other significant observable inputs” including bid and ask quotations, prices of similar securities, and interest rates, among other factors. The inputs or methods used for valuing securities are not necessarily an indication of the risks associated with investing in those securities. The inputs used to measure fair value may fall into different levels of the fair value hierarchy. In such cases, for disclosure purposes, the level in the fair value hierarchy within which the fair value measurement falls in its entirety is determined based on the lowest level input that is significant to the fair value measurement.
The following is a summary of the inputs used to value the Fund’s investments and other financial instruments as of August 31, 2018:
| | | Level 1 | | | Level 2 | | | Level 3 | | | Total | |
| Investments in Securities | | | | | | | | | | | | | | | | |
| Mortgage-Backed Securities | | $ | — | | | $ | 12,867,080 | | | $ | — | | | $ | 12,867,080 | |
| Corporate Bonds | | | — | | | | 243,750 | | | | | | | | 243,750 | |
| Money Market Funds | | | 403,404 | | | | — | | | | — | | | | 403,404 | |
| Total | | $ | 403,404 | | | $ | 13,110,830 | | | $ | — | | | $ | 13,514,234 | |
| | | | | | | | | | | | | | | | | |
| Other Financial Instruments | | | | | | | | | | | | |
| Futures Contracts Sold Short | | $ | (22,501 | ) | | $ | — | | | $ | — | | | $ | (22,501 | ) |
15
LADDER SELECT BOND FUND
NOTES TO FINANCIAL STATEMENTS (Continued)
As of August 31, 2018, the Fund did not have any transfers between Levels. In addition, the Fund did not have any assets or liabilities that were measured at fair value on a recurring basis using significant unobservable inputs (Level 3) as of August 31, 2018. It is the Fund’s policy to recognize transfers between Levels at the end of the reporting period.
Share valuation – The net asset value (“NAV”) per share of each class of the Fund is calculated daily by dividing the total value of the assets attributable to that class, less liabilities attributable to that class, by the number of shares outstanding of that class. The offering price and redemption price per share of each class of the Fund is equal to the NAV per share of such class.
Investment income – Interest income is accrued as earned. Discounts and premiums on fixed income securities purchased are accreted or amortized using the effective interest method. Payments received from interest-only strips (“IOs”) are included in interest income on the Statement of Operations. Because no principal will be received at the maturing of an IO, adjustments are made to the cost of the security on a monthly basis until maturity. These adjustments are also included in interest income on the Statement of Operations. Realized gains and losses on paydowns of mortgage-backed securities are reflected in interest income on the Statement of Operations. Dividend income is recorded on the ex-dividend date.
Investment transactions – Investment transactions are accounted for on the trade date. Realized gains and losses on investments sold are determined on a specific identification basis.
Common expenses – Common expenses of the Trust are allocated among the Fund and other series of the Trust based on the relative net assets of each series or the nature of the services performed and the relative applicability to each series.
Distributions to shareholders – Dividends from net investment income are declared and paid monthly to shareholders. Net realized capital gains, if any, are distributed at least once each year. The amount of distributions from net investment income and net realized capital gains are determined in accordance with federal income tax regulations, which may differ from GAAP. Dividends and distributions to shareholders are recorded on the ex-dividend date. The tax character of the Fund’s distributions during the periods ended August 31, 2018 and February 28, 2018 was ordinary income. On September 28, 2018, the Fund paid an ordinary income dividend of $0.0220 per share to shareholders of record on September 27, 2018.
Futures contracts – The Fund uses futures contracts to gain exposure to or to hedge against changes in interest rates, credit spreads, and other risks. A futures contract represents a commitment for the future purchase or sale of an asset at a specified price on a specified date. When the Fund purchases or sells a futures contract, no price is paid to or received by the Fund. Instead, the Fund is required to deposit in a segregated asset account an amount of cash or qualifying securities currently ranging from 2% to 10% of the contract amount. This is called the “initial margin deposit.” Daily fluctuations in the fair value of the assets of the Fund are accumulated in an account each day. The total of this account is received or paid
16
LADDER SELECT BOND FUND
NOTES TO FINANCIAL STATEMENTS (Continued)
by the Fund when the position is closed. If market conditions move unexpectedly, the Fund may not achieve the anticipated benefits of the futures contracts and may realize a loss. For additional information, see Note 5.
Estimates – The preparation of financial statements in conformity with GAAP requires management to make estimates and assumptions that affect the reported amounts of assets and liabilities and disclosure of contingent assets and liabilities as of the date of the financial statements and the reported amounts of income and expenses during the reporting period. Actual results could differ from those estimates.
Federal income tax – The Fund has qualified and intends to continue to qualify as a regulated investment company under the Internal Revenue Code of 1986, as amended (the “Code”). Qualification generally will relieve the Fund of liability for federal income taxes to the extent 100% of its net investment income and net realized capital gains are distributed in accordance with the Code.
In order to avoid imposition of the excise tax applicable to regulated investment companies, it is also the Fund’s intention to declare as dividends in each calendar year at least 98% of its net investment income (earned during the calendar year) and 98.2% of its net realized capital gains (earned during the 12 months ended October 31) plus undistributed amounts from prior years.
The following information is computed on a tax basis for each item as of August 31, 2018:
| Tax cost of portfolio investments | | $ | 13,605,164 | |
| Gross unrealized appreciation | | $ | 27,023 | |
| Gross unrealized depreciation | | | (117,953 | ) |
| Net unrealized depreciation on investments | | | (90,930 | ) |
| Accumulated ordinary income | | | 1,069 | |
| Undistributed long-term capital gains | | | 42,775 | |
| Other gains | | | 27,966 | |
| Accumulated deficit | | $ | (19,120 | ) |
For the six months ended August 31, 2018, the following reclassification was made as a result of permanent differences between the financial statement and income tax reporting requirements due to the tax treatment of paydown adjustments:
| Accumulated net investment income | | $ | 17,545 | |
| Accumulated net realized gains from investments and futures contracts | | | (17,545 | ) |
Such reclassification had no effect on the Fund’s net assets or NAV per share.
17
LADDER SELECT BOND FUND
NOTES TO FINANCIAL STATEMENTS (Continued)
The Fund recognizes the tax benefits or expenses of uncertain tax positions only when the position is “more likely than not” to be sustained assuming examination by tax authorities. Management has reviewed the Fund’s tax positions for the current and all open tax periods (periods ended February 28, 2017 and February 28, 2018) and has concluded that no provision for unrecognized tax benefits or expenses is required in these financial statements. The Fund identifies its major tax jurisdiction as U.S. Federal.
3. Investment Transactions
During the six months ended August 31, 2018, cost of purchases and proceeds from sales of investment securities, other than short-term investments, were $6,509,318 and $5,968,947, respectively.
4. Transactions with Related Parties
INVESTMENT ADVISORY AGREEMENT
The Fund’s investments are managed by the Adviser pursuant to the terms of an Investment Advisory Agreement. Under the Investment Advisory Agreement, the Fund pays the Adviser an advisory fee, computed and accrued daily and paid monthly, at the annual rate of 0.75% of its average daily net assets.
Pursuant to an Expense Limitation Agreement (“ELA”) between the Fund and the Adviser, the Adviser has contractually agreed, until July 31, 2020, to reduce investment advisory fees and reimburse other operating expenses in order to limit total annual operating expenses (exclusive of portfolio transactions and other investment-related costs (including brokerage costs); taxes; interest; costs to organize the Fund; acquired fund fees and expenses; extraordinary expenses such as litigation and merger or reorganization costs and other expenses not incurred in the ordinary course of the Fund’s business to an amount not exceeding 0.95% of average daily net assets for the Institutional Class shares and 1.20% of average daily net assets for the Advisor Class shares. Accordingly, the Adviser did not collect any of its advisory fees and, in addition, reimbursed other operating expenses totaling $32,448 during the six months ended August 31, 2018.
Under the terms of the ELA, investment advisory fee reductions and expense reimbursements by the Adviser are subject to repayment by the Fund for a period of three years after such fees and expenses were incurred, provided that the repayments do not cause total annual operating expenses to exceed the lesser of: (i) the expense limitation then in effect, if any; and (ii)
18
LADDER SELECT BOND FUND
NOTES TO FINANCIAL STATEMENTS (Continued)
the expense limitation in effect at the time the expenses to be repaid were incurred. As of August 31, 2018, the Adviser may seek repayment of investment advisory fee reductions and expense reimbursements in the amount of $292,634 no later than the dates listed below:
| February 29, 2020 | | $ | 58,216 | |
| February 28, 2021 | | | 151,760 | |
| August 31, 2021 | | | 82,658 | |
| Total | | $ | 292,634 | |
OTHER SERVICE PROVIDERS
Ultimus Fund Solutions, LLC (“Ultimus”) provides administration, fund accounting, compliance and transfer agency services to the Fund. The Fund pays Ultimus fees in accordance with the agreements for such services. In addition, the Fund pays out-of-pocket expenses including, but not limited to, postage, supplies, and costs of pricing the Fund’s portfolio securities.
Under the terms of a Distribution Agreement with the Trust, Ultimus Fund Distributors, LLC (the “Distributor”) serves as principal underwriter to the Fund. The Distributor is a wholly-owned subsidiary of Ultimus. The Distributor is compensated by the Adviser (not the Fund) for acting as principal underwriter.
Certain officers and a Trustee of the Trust are also officers of Ultimus and the Distributor.
TRUSTEE COMPENSATION
Effective August 1, 2018, each Trustee who is not an “interested person” of the Trust (“Independent Trustee”) receives a $1,300 annual retainer from the Fund, paid quarterly, except for the Board Chairperson who receives a $1,500 annual retainer from the Fund, paid quarterly. Each Independent Trustee also receives from the Fund a fee of $500 for each Board meeting attended plus reimbursement for travel and other meeting-related expenses. Prior to August 1, 2018, each Independent Trustee received a $1,000 annual retainer from the Fund, paid quarterly, except for the Board Chairperson who received a $1,200 annual retainer from the Fund, paid quarterly. Each Independent Trustee also received from the Fund a fee of $500 for each Board meeting attended plus reimbursement for travel and other meeting-related expenses.
PRINCIPAL HOLDERS OF FUND SHARES
As of August 31, 2018, the following shareholders owned of record 5% or more of the outstanding shares of the Fund:
| Name of Record Owner | % Ownership |
| Ladder Capital Finance Portfolio II | 78% |
| TD Ameritrade, Inc. (for the benefit of its clients) | 8% |
19
LADDER SELECT BOND FUND
NOTES TO FINANCIAL STATEMENTS (Continued)
A beneficial owner of 25% or more of the Fund’s outstanding shares may be considered a controlling person. That shareholder’s vote could have a more significant effect on matters presented at a shareholders’ meeting.
5. Derivatives Transactions
The Fund’s positions in derivative instruments as of August 31, 2018 are recorded in the following location in the Statement of Assets and Liabilities:
| Derivative Investment Type | Risk | Location |
| Futures contracts sold short | Interest Rate | Net unrealized depreciation on futures contracts |
The Fund’s transactions in derivative instruments during the six months ended August 31, 2018 are recorded in the following location in the Statement of Operations:
| Derivative Investment Type | Risk | Location |
| Futures contracts sold short | Interest Rate | Net change in unrealized appreciation (depreciation) on futures contracts |
In the ordinary course of business, the Fund may enter into transactions subject to enforceable netting agreements or other similar arrangements (“netting agreements”). Generally, the right to offset in netting agreements allows the Fund to offset any exposure to a specific counterparty with any collateral received or delivered to that counterparty based on the terms of the agreements. Generally, the Fund manages its cash collateral on a counterparty basis.
As of August 31, 2018, the offsetting of financial liabilities is as follows:
| Description | | Gross
Amounts of
Recognized
Liabilities | | | Gross
Amounts
Offset in
Statement of
Assets and
Liabilities | | | Net Amounts
Presented in
Statement of
Assets and
Liabilities | | | Collateral
Pledged* | | | Net Amount | |
| Short futures contracts | | $ | (22,501 | ) | | $ | — | | | $ | (22,501 | ) | | $ | 22,501 | | | $ | — | |
| Total subject to a master netting or similar arrangement | | $ | (22,501 | ) | | $ | — | | | $ | (22,501 | ) | | $ | 22,501 | | | $ | — | |
| * | The amount is limited to the net amounts of financial liabilities and accordingly does not include excess collateral pledged. |
20
LADDER SELECT BOND FUND
NOTES TO FINANCIAL STATEMENTS (Continued)
6. Contingencies and Commitments
The Fund indemnifies the Trust’s officers and Trustees for certain liabilities that might arise from the performance of their duties to the Fund. Additionally, in the normal course of business, the Fund enters into contracts that contain a variety of representations and warranties and which provide general indemnifications. The Fund’s maximum exposure under these arrangements is unknown, as this would involve future claims that may be made against the Fund that have not yet occurred. However, based on experience, the Fund expects the risk of loss to be remote.
7. Risks Associated with Commercial Mortgage-Backed Securities (“CMBS”)
CMBS are securities that reflect an interest in, and are secured by, a pool of mortgage loans on commercial real property. The mortgage loan pool is transferred to a CMBS trust and distributed as various classes of CMBS (some of which are rated by nationally recognized statistical rating organizations). CMBS are a type of debt security and are subject to the risks generally associated with debt securities. CMBS are subject to credit risk, interest rate risk, prepayment risk, extension risk, and many of the risks of investing in the real estate that secures the underlying mortgage loans. The ability of borrowers to pay interest and repay principal on the mortgage loans held in a CMBS trust is not guaranteed and depends on the cash flows of the underlying commercial real estate property, which in turn depends on many factors, including the overall economic landscape, the refinancing markets for commercial mortgages, and sub-market and property specific characteristics. If one or more of the mortgages that are part of a CMBS trust defaults on its interest or principal obligations, securities held by the Fund may experience losses, the Fund’s current income may be reduced, and the Fund’s NAV may decline. The value of CMBS held by the Fund may also be affected by, among other things, changes or perceived changes in: interest rates; factors concerning the interests in and structure of the issuer or originator of the mortgages or other assets; the creditworthiness of the entities that provide any supporting letters of credit, surety bonds, or other credit enhancements; or the market’s assessment of the quality of underlying assets. CMBS may be deemed illiquid for a period due to a variety of reasons, such as current market conditions, the seniority in the CMBS trust’s capital structure, and trading conditions such as the number of market makers or trade volume. As a result, CMBS may exhibit greater price volatility than other types of mortgage- or asset-backed securities. CMBS are generally not guaranteed by the U.S. Government or any other entity and are subject to the risk of default on the underlying mortgages. CMBS react differently to changes in interest rates than other debt securities and the prices of CMBS may reflect adverse economic and market conditions. Some CMBS have experienced extraordinary weakness and volatility in recent years. As of August 31, 2018, the Fund had 96.1% of the value of its net assets invested in CMBS.
21
LADDER SELECT BOND FUND
NOTES TO FINANCIAL STATEMENTS (Continued)
8. Risks Associated with Rule 144A Securities
Rule 144A securities are securities that are exempt from registration under the Securities Act of 1933, as amended, and the rules thereunder, and may have legal restrictions on resale. Under Rule 144A, these privately placed securities may be resold to qualified institutional buyers (“QIBs”), subject to certain conditions. An insufficient number of QIBs interested in purchasing Rule 144A securities at a particular time could adversely affect the marketability of the securities and the Fund may be unable to dispose of the securities promptly or at a reasonable price. As of August 31, 2018, the Fund had 88.3% of the value of its net assets invested in Rule 144A securities.
9. Subsequent Events
The Fund is required to recognize in the financial statements the effects of all subsequent events that provide additional evidence about conditions that existed as of the date of the Statement of Assets and Liabilities. For non-recognized subsequent events that must be disclosed to keep the financial statements from being misleading, the Fund is required to disclose the nature of the event as well as an estimate of its financial effect, or a statement that such an estimate cannot be made. Management has evaluated subsequent events through the issuance of these financial statements and has noted no such events other than the ordinary income dividend paid on September 28, 2018, as noted in Note 2.
22
LADDER SELECT BOND FUND
ABOUT YOUR FUND’S EXPENSES (Unaudited)
We believe it is important for you to understand the impact of costs on your investment. As a shareholder of the Fund, you incur ongoing costs, including management fees and other operating expenses. The following examples are intended to help you understand your ongoing costs (in dollars) of investing in the Fund and to compare these costs with the ongoing costs of investing in other mutual funds.
A mutual fund’s ongoing costs are expressed as a percentage of its average net assets. This figure is known as the expense ratio. The expenses in the table below are based on an investment of $1,000 made at the beginning of the most recent period (March 1, 2018) and held until the end of the period (August 31, 2018).
The table below illustrates the Fund’s ongoing costs in two ways:
Actual fund return – This section helps you to estimate the actual expenses that you paid over the period. The “Ending Account Value” shown is derived from the Fund’s actual return, and the fourth column shows the dollar amount of operating expenses that would have been paid by an investor who started with $1,000 in the Fund. You may use the information here, together with the amount you invested, to estimate the expenses that you paid over the period.
To do so, simply divide your account value by $1,000 (for example, an $8,600 account value divided by $1,000 = 8.6), then multiply the result by the number given for the Fund under the heading “Expenses Paid During Period.”
Hypothetical 5% return – This section is intended to help you compare the Fund’s ongoing costs with those of other mutual funds. It assumes that the Fund had an annual return of 5% before expenses during the period shown, but that the expense ratio is unchanged. In this case, because the return used is not the Fund’s actual return, the results do not apply to your investment. The example is useful in making comparisons because the U.S Securities and Exchange Commission (the “SEC”) requires all mutual funds to calculate expenses based on a 5% return. You can assess the Fund’s ongoing costs by comparing this hypothetical example with the hypothetical examples that appear in shareholder reports of other funds.
Note that expenses shown in the table are meant to highlight and help you compare ongoing costs only. The Fund does not charge transaction fees, such as purchase or redemption fees, nor does it carry a “sales load.” The calculations assume no shares were bought or sold during the period. Your actual costs may have been higher or lower, depending on the amount of your investment and the timing of any purchases or redemptions.
23
LADDER SELECT BOND FUND
ABOUT YOUR FUND’S EXPENSES (Unaudited) (Continued)
More information about the Fund’s expenses can be found in this report. For additional information on operating expenses and other shareholder costs, please refer to the Fund’s prospectus.
| Institutional Class | Beginning
Account Value
March 1,
2018 | Ending
Account Value
August 31,
2018 | Net Expense
Ratio (a) | Expenses
Paid During
Period (b) |
| Based on Actual Fund Return | $ 1,000.00 | $ 1,013.50 | 0.95% | $ 4.82 |
| Based on Hypothetical 5% Return (before expenses) | $ 1,000.00 | $ 1,020.42 | 0.95% | $ 4.84 |
| (a) | Annualized, based on the Fund’s most recent one-half year expenses. |
| (b) | Expenses are equal to the Fund’s annualized net expense ratio multiplied by the average account value over the period, multiplied by 184/365 (to reflect the one-half year period). |
24
LADDER SELECT BOND FUND
OTHER INFORMATION (Unaudited)
A description of the policies and procedures that the Fund uses to vote proxies relating to portfolio securities is available without charge upon request by calling toll-free 1-888-859-5867, or on the SEC’s website at http://www.sec.gov. Information regarding how the Fund voted proxies relating to portfolio securities during the most recent 12-month period ended June 30 is also available without charge upon request by calling toll-free 1-888-859-5867, or on the SEC’s website at http://www.sec.gov.
The Trust files a complete listing of portfolio holdings for the Fund with the SEC as of the end of the first and third quarters of each fiscal year on Form N-Q. These filings are available upon request by calling 1-888-859-5867. Furthermore, you may obtain a copy of the filings on the SEC’s website at http://www.sec.gov. The Trust’s Forms N-Q may also be reviewed and copied at the SEC’s Public Reference Room in Washington, DC, and information on the operation of the Public Reference Room may be obtained by calling 1-800-SEC-0330.
25
LADDER SELECT BOND FUND
DISCLOSURE REGARDING APPROVAL OF INVESTMENT ADVISORY AGREEMENT (Unaudited)
The Board of Trustees (the “Board”), including the Independent Trustees voting separately, has reviewed and approved the Fund’s Investment Advisory Agreement with Ladder Capital Adviser LLC (the “Adviser”) for an additional one-year term (the “Agreement”). The Board approved the Agreement at an in-person meeting held on July 23-24, 2018, at which all of the Trustees were present.
Legal counsel advised the Board during its deliberations. Additionally, the Board received and reviewed a substantial amount of information provided by the Adviser in response to requests of the Board and counsel. In considering whether to approve the Agreement and in reaching its conclusions with respect thereto, the Board reviewed and analyzed various factors that it determined were relevant to the Agreement, including the following factors.
The nature, extent, and quality of the services provided by the Adviser. In this regard, the Board reviewed the services being provided by the Adviser to the Fund including, without limitation, its investment advisory services since the Fund’s inception, the Adviser’s compliance policies and procedures, its efforts to promote the Fund and assist in its distribution, and its compliance program. After reviewing the foregoing information and further information in the Adviser Memorandum (e.g., descriptions of its business and Form ADV), the Board concluded that the quality, extent, and nature of the services provided by the Adviser were satisfactory and adequate for the Fund.
The investment performance of the Fund. In this regard, the Board compared the performance of the Fund with the performance of its benchmark index, custom peer group and related Morningstar category. The Board noted that the Fund had underperformed its custom peer group’s average and median performance for the one year period and underperformed its custom peer group’s average and median performance since the Fund’s inception; while it had overperformed its Morningstar category’s (Intermediate Bond Funds Under $50 million, True No-Load) median and average performance for the one year period, and underperformed the median and overperformed the average performance since the Fund’s inception. The Board also considered the consistency of the Adviser’s management with the Fund’s investment objective and policies. The Board indicated that the Adviser had satisfactorily explained its performance results for the Fund. Following discussion of the investment performance of the Fund, the Adviser’s experience in managing a mutual fund and separate accounts, its historical investment performance, and other factors, the Board concluded that the investment performance of the Fund has been satisfactory.
The costs of the services provided and profits realized by the Adviser and its affiliates from its relationship with the Fund. In this regard, the Board considered the Adviser’s staffing, personnel, and methods of operations; the education and experience of its personnel; compliance program, policies, and procedures; financial condition and the level of commitment to the Fund, and, generally, the Adviser’s advisory business; the asset level of the Fund; and the overall expenses of the Fund, including the advisory fee. The Board considered the Adviser’s expense limitation agreement, and considered the Adviser’s current
26
LADDER SELECT BOND FUND
DISCLOSURE REGARDING APPROVAL OF INVESTMENT ADVISORY AGREEMENT (Unaudited) (Continued)
and past fee reductions and expense reimbursements for the Fund. The Board further took into account the Adviser’s commitment to continue the Adviser’s expense limitation agreement until at least July 31, 2020, and a letter of support provided by the Adviser.
The Board also considered potential benefits for the Adviser in managing the Fund, including promotion of the Adviser’s name and the potential for it to receive research, statistical, or other services from the Fund’s trades. The Board compared the Fund’s advisory fee and overall expense ratio to the average advisory fees and average expense ratios for its custom peer group and Morningstar category. The Board noted that the 0.75% advisory fee for the Fund was above the average and the median for the Fund’s custom peer group, and above the average and median of funds of similar size and structure in the Fund’s Morningstar category (Intermediate Bond Funds Under $50 million, True No-Load), but less than the highest advisory fee in its Morningstar category. The Board further noted that the overall annual expense ratio of 0.95% for the Fund is above the average and median for the Fund’s custom peer group, and above the average and median for its Morningstar category. The Board also considered the fee charged by the Adviser to its other accounts that have a substantially similar strategy as the Fund and considered the similarities and differences of services received by such other accounts as compared to the services received by the Fund. The Board noted that the fee structures applicable to the Adviser’s other clients were not indicative of any unreasonableness with respect to the advisory fees payable to the Fund. The Board further considered the investment strategy and style used by the Adviser in managing the portfolio of the Fund. Following these comparisons and upon further consideration and discussion of the foregoing, the Board concluded that the advisory fee paid to the Adviser by the Fund is fair and reasonable.
The extent to which economies of scale would be realized as the Fund grows and whether advisory fee levels reflect these economies of scale for the benefit of the Fund’s investors. In this regard, the Board considered that the Fund’s fee arrangements with the Adviser involve both the advisory fee and the Adviser’s expense limitation agreement. The Board determined that while the advisory fee remained the same as asset levels increased, the shareholders of the Fund have experienced benefits from the Adviser’s expense limitation agreement. Following further discussion of the Fund’s asset level, expectations for growth, and level of fees, the Board determined that the Fund’s fee arrangements with the Adviser would continue to provide benefits. The Board also determined that the fee arrangements were fair and reasonable in relation to the nature and quality of services being provided by the Adviser, given the Fund’s projected asset levels for the next year.
Brokerage and portfolio transactions. In this regard, the Board considered the Adviser’s trading policies, procedures, and performance in seeking best execution for its clients, including the Fund. The Board also considered the historical portfolio turnover rate for the Fund; the process by which evaluations are made of the overall reasonableness of commissions paid; the process by which the Adviser evaluates best execution; the
27
LADDER SELECT BOND FUND
DISCLOSURE REGARDING APPROVAL OF INVESTMENT ADVISORY AGREEMENT (Unaudited) (Continued)
method and basis for selecting and evaluating the broker-dealers used; and any anticipated allocation of portfolio business to persons affiliated with the Adviser. After further review and discussion, the Board determined that the Adviser’s practices regarding brokerage and portfolio transactions were satisfactory.
Possible conflicts of interest. In evaluating the possibility for conflicts of interest, the Board considered such matters as the experience and abilities of the advisory personnel assigned to the Fund, the Adviser’s process for allocating trades among its different clients, and the substance and administration of the Adviser’s Code of Ethics. Following further consideration and discussion, the Board found that the Adviser’s standards and practices relating to the identification and mitigation of potential conflicts of interests were satisfactory.
After full consideration of the above factors as well as other factors, the Board unanimously concluded that approval of the Agreement was in the best interests of the Fund and its shareholders.
28
CUSTOMER PRIVACY NOTICE
| FACTS | WHAT DOES THE LADDER SELECT BOND FUND (THE “FUND”) DO WITH YOUR PERSONAL INFORMATION? |
| Why? | Financial companies choose how they share your personal information. Federal law gives consumers the right to limit some but not all sharing. Federal law also requires us to tell you how we collect, share, and protect your personal information. Please read this notice carefully to understand what we do. |
| What? | The types of personal information we collect and share depend on the product or service you have with us. This information can include: ● Social Security number ● Assets ● Retirement Assets ● Transaction History ● Checking Account Information ● Purchase History ● Account Balances ● Account Transactions ● Wire Transfer Instructions When you are no longer our customer, we continue to share your information as described in this notice. |
| How? | All financial companies need to share your personal information to run their everyday business. In the section below, we list the reasons financial companies can share their customers’ personal information; the reasons the Fund chooses to share; and whether you can limit this sharing. |
| Reasons we can share your personal information | Does the
Fund share? | Can you limit this sharing? |
For our everyday business purposes –
Such as to process your transactions, maintain your account(s), respond to court orders and legal investigations, or report to credit bureaus | Yes | No |
For our marketing purposes –
to offer our products and services to you | No | We don’t share |
| For joint marketing with other financial companies | No | We don’t share |
For our affiliates’ everyday business purposes –
information about your transactions and experiences | No | We don’t share |
For our affiliates’ everyday business purposes –
information about your creditworthiness | No | We don’t share |
| For nonaffiliates to market to you | No | We don’t share |
| Questions? | Call 1-888-859-5867 |
29
| Who we are |
| Who is providing this notice? | Ladder Select Bond Fund Ultimus Fund Distributors, LLC (Distributor) Ultimus Fund Solutions, LLC (Administrator) |
| What we do |
| How does the Fund protect my personal information? | To protect your personal information from unauthorized access and use, we use security measures that comply with federal law. These measures include computer safeguards and secured files and buildings. Our service providers are held accountable for adhering to strict policies and procedures to prevent any misuse of your nonpublic personal information. |
| How does the Fund collect my personal information? | We collect your personal information, for example, when you ● Open an account ● Provide account information ● Give us your contact information ● Make deposits or withdrawals from your account ● Make a wire transfer ● Tell us where to send the money ● Tell us who receives the money ● Show your government-issued ID ● Show your driver’s license We also collect your personal information from other companies. |
| Why can’t I limit all sharing? | Federal law gives you the right to limit only ● Sharing for affiliates’ everyday business purposes – information about your creditworthiness ● Affiliates from using your information to market to you ● Sharing for nonaffiliates to market to you State laws and individual companies may give you additional rights to limit sharing. |
| Definitions |
| Affiliates | Companies related by common ownership or control. They can be financial and nonfinancial companies. ● Ladder Capital Asset Management LLC, the investment adviser to the Fund, could be deemed an affiliate. |
| Nonaffiliates | Companies not related by common ownership or control. They can be financial and nonfinancial companies ● The Fund does not share with nonaffiliates so they can market to you. |
| Joint marketing | A formal agreement between nonaffiliated financial companies that together market financial products or services to you. ● The Fund does not jointly market. |
30
This page intentionally left blank.
This page intentionally left blank.
This page intentionally left blank.

WAYCROSS LONG/SHORT EQUITY FUND
(WAYEX)
Semi-Annual Report
August 31, 2018
(Unaudited)
| WAYCROSS LONG/SHORT EQUITY FUND |
| LETTER TO SHAREHOLDERS | August 31, 2018 |
Dear Shareholders,
We are pleased to provide this update for the Waycross Long/Short Equity Fund (the “Fund”). The Fund seeks long-term capital appreciation with an emphasis on capital preservation, and its investment approach is based on bottom-up research that combines a thorough examination of a company’s fundamentals, valuation, and market sentiment. This comprehensive analysis allows us to construct a portfolio using both long and short positions, which provides growth potential while at the same time seeking to reduce volatility.
Performance Review
The Fund produced a +5.5% return for the six-month period ended August 31, 2018, while the benchmark, comprised of 50% S&P 500 and 50% 90-day Treasury Bills, rose 4.4%. Long positions were the primary driver to performance, while short exposure helped protect on the downside during the volatility at the start of the fiscal year.
The long exposure to the Consumer Discretionary sector was the largest contributor to the portfolio during the six months ending August 31, 2018. While the Fund experienced some negative performance from positions such as Norwegian Cruise Lines (NCLH), the laggards were more than offset by long positions in stocks such as Amazon.com (AMZN) and Ross Stores (ROST).
The Energy and Consumer Staples sectors proved to be challenging during the period. Both sectors were negative contributors to performance. In the Energy sector, Pioneer Natural Resources (PXD) detracted from performance. In the Consumer Staples sector, short exposure proved to be difficult as there were no long positions to offset the losses in the sector. Short holdings of Coca-Cola (KO) and Procter & Gamble (PG) were both up during the period.
The Fund remains actively managed, emphasizing long positions where company fundamentals are expected to support future earnings growth. A diversified book of short positions acts as a hedge across the portfolio and allows the Fund to maintain a lower volatility compared to the overall market.
1
Exposures Summary (as of 08/31/2018)
| Fund Exposures |
| Total Portfolio Exposures | Long/Short Exposure By Sector |

| 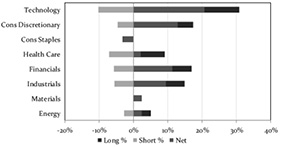
|
| Top Five Long Positions | | Top Five Short Positions |
| Security Name | Sector | % of
Net Assets | | Security Name | Sector | % of
Net Assets |
| AMAZON.COM, INC. | CONS DISC | 4.6% | | INTEL CORP. | INFO TECH | -2.2% |
| ALPHABET, INC. - CLASS A | INFO TECH | 4.4% | | EXXON MOBIL CORP. | ENERGY | -1.9% |
| MICROSOFT CORPORATION | INFO TECH | 3.8% | | ACCENTURE PLC
CLASS A | INFO TECH | -1.9% |
| MASTERCARD, INC. - CLASS A | INFO TECH | 3.7% | | JP MORGAN CHASE & Co. | FINANCIALS | -1.8% |
| ROSS STORES, INC. | CONS DISC | 3.7% | | HCA HEALTHCARE, INC. | HEALTH CARE | -1.7% |
The Fund seeks to provide superior risk-adjusted returns by maintaining a lower correlation to large cap equities. The Fund’s long exposure pulled back slightly during the first half of the fiscal year, and short exposure modestly decreased. This resulted in the Fund’s overall gross exposure (longs plus shorts) decreasing from 141% to 136%; however, the Fund’s overall net exposure remained mostly unchanged since the end of February 2018. In terms of sector positioning, the Fund’s gross long exposure to the Materials sector decreased, while its long exposure to the Energy sector increased. On the short side, the short exposure to Consumer Staples decreased slightly.
Market Outlook
The U.S. market remains strong, with economic data and earnings reports supporting the business activities of stocks domestically. While the current trade climate has been more favorable than expected to the United States, there is still the threat of continued trade pressure having a negative effect on domestic companies, multinational corporations, and the stock market as a whole.
During times of strength, the Fund remains well positioned to participate in upside gains. However, the Fund maintains its net exposure in order to seek to protect investor assets should there be increased market volatility. While the fundamentals of our long
2
positions remain strong in the long term, we do expect to see volatility in the short term. This volatility will allow increased returns from our short book, which is composed of companies that are less likely to perform under increased pressure.
On behalf of Waycross Partners, LLC, thank you for investing in the Fund.
Sincerely,
Benjamin H. Thomas, CFA
Managing Partner | Portfolio Manager
Past performance is not predictive of future performance. Investment results and principal value will fluctuate so that shares, when redeemed, may be worth more or less than their original cost. Current performance may be higher or lower than the performance data quoted. Performance data current to the most recent month-end are available by calling 1-866-267-4304.
An investor should consider the investment objectives, risks, charges and expenses of the Fund carefully before investing. The Fund’s prospectus contains this and other important information. To obtain a copy of the Fund’s prospectus please visit the Fund’s website at www.waycrossfunds.com or call 1-866-267-4304 and a copy will be sent to you free of charge. Please read the prospectus carefully before you invest. The Fund is distributed by Ultimus Fund Distributors, LLC.
The Letter to Shareholders seeks to describe some of the Adviser’s current opinions and views of the financial markets. Although the Adviser believes it has a reasonable basis for any opinions or views expressed, actual results may differ, sometimes significantly so, from those expected or expressed. The securities held by the Fund that are discussed in the Letter to Shareholders were held during the period covered by this Report. They do not comprise the entire investment portfolio of the Fund, may be sold at any time, and may no longer be held by the Fund. For a complete list of securities held by the Fund as of August 31, 2018, please see the Schedule of Investments section of the semi-annual report. The opinions of the Adviser with respect to those securities may change at any time.
Statements in the Letter to Shareholders that reflect projections or expectations for future financial or economic performance of the Fund and the market in general and statements of the Fund’s plans and objectives for future operations are forward-looking statements. No assurance can be given that actual results or events will not differ materially from those projected, estimated, assumed, or anticipated in any such forward-looking statements. Important factors that could result in such differences, in addition to factors noted with such forward-looking statements, include, without limitation, general economic conditions, such as inflation, recession, and interest rates. Past performance is not a guarantee of future results.
3
WAYCROSS LONG/SHORT EQUITY FUND
PORTFOLIO INFORMATION
August 31, 2018 (Unaudited)
Net Sector Exposure versus S&P 500® Index*
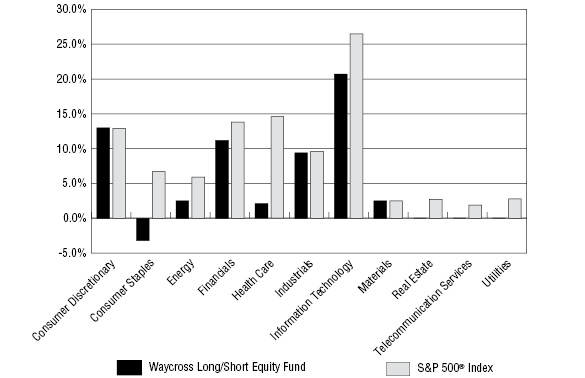
| * | The net percentages are computed by taking the net dollar exposure, including short positions, and dividing by the net assets of the Fund. Consequently, the percentages will not total to 100%. |
| Top 10 Long Equity Holdings | | Top 10 Short Equity Holdings |
| Security Description | % of
Net Assets | | Security Description | % of
Net Assets |
| Amazon.com, Inc. | 4.6% | | Intel Corporation | 2.2% |
| Alphabet, Inc. - Class A | 4.4% | | Exxon Mobil Corporation | 1.9% |
| Microsoft Corporation | 3.8% | | Accenture plc - Class A | 1.9% |
| Mastercard, Inc. - Class A | 3.7% | | JPMorgan Chase & Company | 1.8% |
| Ross Stores, Inc. | 3.7% | | HCA Healthcare, Inc. | 1.7% |
| Apple, Inc. | 3.7% | | UnitedHealth Group, Inc. | 1.7% |
| Visa, Inc. - Class A | 3.6% | | eBay, Inc. | 1.7% |
| Analog Devices, Inc. | 3.5% | | Texas Instruments, Inc. | 1.7% |
| Chipotle Mexican Grill, Inc. | 3.4% | | Coca-Cola Company (The) | 1.6% |
| Edwards Lifesciences Corporation | 3.3% | | Regions Financial Corporation | 1.6% |
4
WAYCROSS LONG/SHORT EQUITY FUND
SCHEDULE OF INVESTMENTS
August 31, 2018 (Unaudited) |
| COMMON STOCKS — 97.1% | | Shares | | | Value | |
| Consumer Discretionary — 17.5% | | | | | | | | |
| Hotels, Restaurants & Leisure — 6.1% | | | | | | | | |
| Chipotle Mexican Grill, Inc. (a) | | | 1,510 | | | $ | 717,522 | |
| Norwegian Cruise Line Holdings Ltd. (a) | | | 10,104 | | | | 541,675 | |
| | | | | | | | 1,259,197 | |
| Internet & Direct Marketing Retail — 4.6% | | | | | | | | |
| Amazon.com, Inc. (a)(b) | | | 475 | | | | 956,038 | |
| | | | | | | | | |
| Specialty Retail — 6.8% | | | | | | | | |
| Home Depot, Inc. (The) | | | 3,234 | | | | 649,290 | |
| Ross Stores, Inc. | | | 8,060 | | | | 771,987 | |
| | | | | | | | 1,421,277 | |
| Energy — 5.2% | | | | | | | | |
| Oil, Gas & Consumable Fuels — 5.2% | | | | | | | | |
| EOG Resources, Inc. | | | 5,290 | | | | 625,437 | |
| Pioneer Natural Resources Company | | | 2,570 | | | | 448,979 | |
| | | | | | | | 1,074,416 | |
| Financials — 16.9% | | | | | | | | |
| Banks — 9.1% | | | | | | | | |
| Bank of America Corporation (b) | | | 20,390 | | | | 630,663 | |
| Citigroup, Inc. | | | 8,882 | | | | 632,754 | |
| KeyCorp (b) | | | 30,619 | | | | 645,142 | |
| | | | | | | | 1,908,559 | |
| Capital Markets — 2.5% | | | | | | | | |
| Goldman Sachs Group, Inc. (The) (b) | | | 2,177 | | | | 517,712 | |
| | | | | | | | | |
| Insurance — 5.3% | | | | | | | | |
| American International Group, Inc. | | | 8,335 | | | | 443,172 | |
| Chubb Ltd. | | | 4,880 | | | | 659,971 | |
| | | | | | | | 1,103,143 | |
| Health Care — 9.2% | | | | | | | | |
| Biotechnology — 5.9% | | | | | | | | |
| Biogen, Inc. (a) | | | 1,690 | | | | 597,398 | |
| Celgene Corporation (a)(b) | | | 6,624 | | | | 625,637 | |
| | | | | | | | 1,223,035 | |
| Health Care Equipment & Supplies — 3.3% | | | | | | | | |
| Edwards Lifesciences Corporation (a) | | | 4,838 | | | | 697,833 | |
5
WAYCROSS LONG/SHORT EQUITY FUND
SCHEDULE OF INVESTMENTS (Continued) |
| COMMON STOCKS — 97.1% (Continued) | | Shares | | | Value | |
| Industrials — 14.9% | | | | | | | | |
| Air Freight & Logistics — 5.8% | | | | | | | | |
| FedEx Corporation | | | 2,400 | | | $ | 585,480 | |
| United Parcel Service, Inc. - Class B (b) | | | 5,000 | | | | 614,400 | |
| | | | | | | | 1,199,880 | |
| Airlines — 5.8% | | | | | | | | |
| Delta Air Lines, Inc. (b) | | | 10,410 | | | | 608,777 | |
| Southwest Airlines Company | | | 9,925 | | | | 608,402 | |
| | | | | | | | 1,217,179 | |
| Construction & Engineering — 3.3% | | | | | | | | |
| Fluor Corporation | | | 12,010 | | | | 689,494 | |
| | | | | | | | | |
| Information Technology — 30.9% | | | | | | | | |
| Internet Software & Services — 7.2% | | | | | | | | |
| Alphabet, Inc. - Class A (a)(b) | | | 750 | | | | 923,850 | |
| Facebook, Inc. - Class A (a)(b) | | | 3,290 | | | | 578,152 | |
| | | | | | | | 1,502,002 | |
| IT Services — 7.3% | | | | | | | | |
| Mastercard, Inc. - Class A (b) | | | 3,591 | | | | 774,076 | |
| Visa, Inc. - Class A | | | 5,149 | | | | 756,336 | |
| | | | | | | | 1,530,412 | |
| Semiconductors & Semiconductor Equipment — 6.6% | | | | | | | | |
| Analog Devices, Inc. (b) | | | 7,315 | | | | 723,088 | |
| Versum Materials, Inc. | | | 16,600 | | | | 660,514 | |
| | | | | | | | 1,383,602 | |
| Software — 6.1% | | | | | | | | |
| Electronic Arts, Inc. (a) | | | 4,050 | | | | 459,311 | |
| Microsoft Corporation (b) | | | 7,140 | | | | 802,036 | |
| | | | | | | | 1,261,347 | |
| Technology Hardware, Storage & Peripherals — 3.7% | | | | | | | | |
| Apple, Inc. | | | 3,338 | | | | 759,829 | |
| | | | | | | | | |
| Materials — 2.5% | | | | | | | | |
| Metals & Mining — 2.5% | | | | | | | | |
| Newmont Mining Corporation | | | 16,800 | | | | 521,304 | |
| | | | | | | | | |
| Total Common Stocks (Cost $15,704,137) | | | | | | $ | 20,226,259 | |
6
WAYCROSS LONG/SHORT EQUITY FUND
SCHEDULE OF INVESTMENTS (Continued) |
| MONEY MARKET FUNDS — 2.3% | | Shares | | | Value | |
| Fidelity Institutional Money Market Government Portfolio - Class I, 1.82% (c) (Cost $483,521) | | | 483,521 | | | $ | 483,521 | |
| | | | | | | | | |
| Total Investments at Value — 99.4% (Cost $16,187,658) | | | | | | $ | 20,709,780 | |
| | | | | | | | | |
| Other Assets in Excess of Liabilities — 0.6% | | | | | | | 134,156 | |
| | | | | | | | | |
| Net Assets — 100.0% | | | | | | $ | 20,843,936 | |
| (a) | Non-income producing security. |
| (b) | All or a portion of this security is pledged as collateral for open short positions. The total value of such securities as of August 31, 2018 was $7,150,170. |
| (c) | The rate shown is the 7-day effective yield as of August 31, 2018. |
| See accompanying notes to financial statements. |
7
WAYCROSS LONG/SHORT EQUITY FUND
SCHEDULE OF SECURITIES SOLD SHORT
August 31, 2018 (Unaudited) |
| COMMON STOCKS — 38.9% | | Shares | | | Value | |
| Consumer Discretionary — 4.5% | | | | | | | | |
| Hotels, Restaurants & Leisure — 1.9% | | | | | | | | |
| Jack in the Box, Inc. | | | 2,300 | | | $ | 208,472 | |
| Starbucks Corporation | | | 3,650 | | | | 195,093 | |
| | | | | | | | 403,565 | |
| Media — 1.4% | | | | | | | | |
| Walt Disney Company (The) | | | 2,620 | | | | 293,492 | |
| | | | | | | | | |
| Textiles, Apparel & Luxury Goods — 1.2% | | | | | | | | |
| NIKE, Inc. - Class B | | | 3,020 | | | | 248,244 | |
| | | | | | | | | |
| Consumer Staples — 3.2% | | | | | | | | |
| Beverages — 1.6% | | | | | | | | |
| Coca-Cola Company (The) | | | 7,510 | | | | 334,721 | |
| | | | | | | | | |
| Household Products — 1.6% | | | | | | | | |
| Procter & Gamble Company (The) | | | 3,904 | | | | 323,837 | |
| | | | | | | | | |
| Energy — 2.7% | | | | | | | | |
| Energy Equipment & Services — 0.8% | | | | | | | | |
| Helmerich & Payne, Inc. | | | 2,460 | | | | 161,302 | |
| | | | | | | | | |
| Oil, Gas & Consumable Fuels — 1.9% | | | | | | | | |
| Exxon Mobil Corporation | | | 5,120 | | | | 410,471 | |
| | | | | | | | | |
| Financials — 5.7% | | | | | | | | |
| Banks — 4.6% | | | | | | | | |
| JPMorgan Chase & Company | | | 3,270 | | | | 374,677 | |
| Regions Financial Corporation | | | 16,810 | | | | 327,122 | |
| Wells Fargo & Company | | | 4,300 | | | | 251,464 | |
| | | | | | | | 953,263 | |
| Insurance — 1.1% | | | | | | | | |
| MetLife, Inc. | | | 4,953 | | | | 227,293 | |
| | | | | | | | | |
| Health Care — 7.1% | | | | | | | | |
| Biotechnology — 1.5% | | | | | | | | |
| Amgen, Inc. | | | 1,610 | | | | 321,694 | |
| | | | | | | | | |
| Health Care Providers & Services — 4.6% | | | | | | | | |
| DaVita, Inc. | | | 3,520 | | | | 243,901 | |
| HCA Healthcare, Inc. | | | 2,670 | | | | 358,073 | |
8
WAYCROSS LONG/SHORT EQUITY FUND
SCHEDULE OF SECURITIES SOLD SHORT (Continued) |
| COMMON STOCKS — 38.9% (Continued) | | Shares | | | Value | |
| Health Care — 7.1% (Continued) | | | | | | | | |
| Health Care Providers & Services — 4.6% (Continued) | | | | | | | | |
| UnitedHealth Group, Inc. | | | 1,330 | | | $ | 357,052 | |
| | | | | | | | 959,026 | |
| Pharmaceuticals — 1.0% | | | | | | | | |
| Johnson & Johnson | | | 1,520 | | | | 204,729 | |
| | | | | | | | | |
| Industrials — 5.5% | | | | | | | | |
| Industrial Conglomerates — 2.0% | | | | | | | | |
| 3M Company | | | 993 | | | | 209,444 | |
| General Electric Company | | | 16,130 | | | | 208,722 | |
| | | | | | | | 418,166 | |
| Machinery — 1.0% | | | | | | | | |
| Ingersoll-Rand plc | | | 1,980 | | | | 200,554 | |
| | | | | | | | | |
| Road & Rail — 0.9% | | | | | | | | |
| Werner Enterprises, Inc. | | | 5,390 | | | | 199,699 | |
| | | | | | | | | |
| Trading Companies & Distributors — 1.6% | | | | | | | | |
| Fastenal Company | | | 3,410 | | | | 199,008 | |
| United Rentals, Inc. | | | 820 | | | | 127,813 | |
| | | | | | | | 326,821 | |
| Information Technology — 10.2% | | | | | | | | |
| Internet Software & Services — 1.7% | | | | | | | | |
| eBay, Inc. | | | 10,240 | | | | 354,406 | |
| | | | | | | | | |
| IT Services — 1.9% | | | | | | | | |
| Accenture plc - Class A | | | 2,383 | | | | 402,894 | |
| | | | | | | | | |
| Semiconductors & Semiconductor Equipment — 3.9% | | | | | | | | |
| Intel Corporation | | | 9,380 | | | | 454,273 | |
| Texas Instruments, Inc. | | | 3,150 | | | | 354,060 | |
| | | | | | | | 808,333 | |
| Software — 1.5% | | | | | | | | |
| Check Point Software Technologies Ltd. | | | 2,632 | | | | 305,812 | |
| | | | | | | | | |
| Technology Hardware, Storage & Peripherals — 1.2% | | | | | | | | |
| HP, Inc. | | | 10,030 | | | | 247,240 | |
| | | | | | | | | |
| Total Securities Sold Short — 38.9% (Proceeds $7,292,732) | | | | | | $ | 8,105,562 | |
| See accompanying notes to financial statements. |
9
WAYCROSS LONG/SHORT EQUITY FUND
STATEMENT OF ASSETS AND LIABILITIES
August 31, 2018 (Unaudited) |
| ASSETS | |
| Investments in securities: | | | | |
| At acquisition cost | | $ | 16,187,658 | |
| At value (Note 2) | | $ | 20,709,780 | |
| Cash deposits for securities sold short (Note 2) | | | 8,091,413 | |
| Receivable for capital shares sold | | | 153,100 | |
| Dividends and interest receivable | | | 26,444 | |
| Other assets | | | 13,135 | |
| Total assets | | | 28,993,872 | |
| | | | | |
| LIABILITIES | | | | |
| Securities sold short, at value (proceeds $7,292,732) (Note 2) | | | 8,105,562 | |
| Dividends payable on securities sold short (Note 2) | | | 16,173 | |
| Payable to Adviser (Note 4) | | | 14,046 | |
| Payable to administrator (Note 4) | | | 7,160 | |
| Other accrued expenses | | | 6,995 | |
| Total liabilities | | | 8,149,936 | |
| | | | | |
| NET ASSETS | | $ | 20,843,936 | |
| | | | | |
| NET ASSETS CONSIST OF: | | | | |
| Paid-in capital | | $ | 17,554,858 | |
| Accumulated net investment loss | | | (134,028 | ) |
| Accumulated net realized losses from investment transactions | | | (286,186 | ) |
| Net unrealized appreciation (depreciation) on: | | | | |
| Investments | | | 4,522,122 | |
| Short positions | | | (812,830 | ) |
| NET ASSETS | | $ | 20,843,936 | |
| | | | | |
| Shares of beneficial interest outstanding (unlimited number of shares authorized, no par value) | | | 1,811,875 | |
| | | | | |
| Net asset value, offering price and redemption price per share (Note 2) | | $ | 11.50 | |
| See accompanying notes to financial statements. |
10
WAYCROSS LONG/SHORT EQUITY FUND
STATEMENT OF OPERATIONS
For the Six Months Ended August 31, 2018 (Unaudited) |
| INVESTMENT INCOME | | | | |
| Dividend income | | $ | 123,201 | |
| Foreign withholding taxes on dividends | | | (6,710 | ) |
| Interest income | | | 47,982 | |
| | | | 164,473 | |
| EXPENSES | | | | |
| Investment advisory fees (Note 4) | | | 113,646 | |
| Dividend expense on securities sold short (Note 2) | | | 74,495 | |
| Professional fees | | | 26,339 | |
| Fund accounting fees (Note 4) | | | 16,154 | |
| Administration fees (Note 4) | | | 15,250 | |
| Compliance fees and expenses (Note 4) | | | 6,101 | |
| Transfer agent fees (Note 4) | | | 6,000 | |
| Registration and filing fees | | | 5,284 | |
| Trustees’ fees and expenses (Note 4) | | | 5,089 | |
| Custody and bank service fees | | | 3,863 | |
| Printing of shareholder reports | | | 2,534 | |
| Insurance expense | | | 1,392 | |
| Postage and supplies | | | 1,146 | |
| Other expenses | | | 5,267 | |
| Total expenses | | | 282,560 | |
| Less fee reductions by the Adviser (Note 4) | | | (25,640 | ) |
| Less fee waivers by the administrator (Note 4) | | | (1,500 | ) |
| Net expenses | | | 255,420 | |
| | | | | |
| NET INVESTMENT LOSS | | | (90,947 | ) |
| | | | | |
| REALIZED AND UNREALIZED GAINS (LOSSES) ON INVESTMENTS AND SECURITIES SOLD SHORT | | | | |
| Net realized losses from: | | | | |
| Investments | | | (3,211 | ) |
| Securities sold short | | | (136,794 | ) |
| Net change in unrealized appreciation (depreciation) on: | | | | |
| Investments | | | 1,425,014 | |
| Securities sold short | | | (182,663 | ) |
| NET REALIZED AND UNREALIZED GAINS ON INVESTMENTS AND SECURITIES SOLD SHORT | | | 1,102,346 | |
| | | | | |
| NET INCREASE IN NET ASSETS RESULTING FROM OPERATIONS | | $ | 1,011,399 | |
| See accompanying notes to financial statements. |
11
WAYCROSS LONG/SHORT EQUITY FUND
STATEMENTS OF CHANGES IN NET ASSETS |
| | | Six Months Ended
August 31, 2018
(Unaudited) | | | Year Ended
February 28,
2018 | |
| FROM OPERATIONS | | | | | | | | |
| Net investment loss | | $ | (90,947 | ) | | $ | (231,703 | ) |
| Net realized gains (losses) from: | | | | | | | | |
| Investments | | | (3,211 | ) | | | 520,031 | |
| Securities sold short | | | (136,794 | ) | | | (587,693 | ) |
| Net change in unrealized appreciation (depreciation) on: | | | | | | | | |
| Investments | | | 1,425,014 | | | | 2,325,998 | |
| Securities sold short | | | (182,663 | ) | | | (313,740 | ) |
| Net increase in net assets resulting from operations | | | 1,011,399 | | | | 1,712,893 | |
| | | | | | | | | |
| DISTRIBUTIONS TO SHAREHOLDERS | | | | | | | | |
| From net realized gains from investment transactions | | | — | | | | (174,058 | ) |
| | | | | | | | | |
| CAPITAL SHARE TRANSACTIONS | | | | | | | | |
| Proceeds from shares sold | | | 3,069,251 | | | | 3,803,161 | |
| Net asset value of shares issued in reinvestment of distributions | | | — | | | | 143,593 | |
| Payments for shares redeemed | | | (705,577 | ) | | | (607,940 | ) |
| Net increase in net assets from capital share transactions | | | 2,363,674 | | | | 3,338,814 | |
| | | | | | | | | |
| TOTAL INCREASE IN NET ASSETS | | | 3,375,073 | | | | 4,877,649 | |
| | | | | | | | | |
| NET ASSETS | | | | | | | | |
| Beginning of period | | | 17,468,863 | | | | 12,591,214 | |
| End of period | | $ | 20,843,936 | | | $ | 17,468,863 | |
| | | | | | | | | |
| ACCUMULATED NET INVESTMENT LOSS | | $ | (134,028 | ) | | $ | (43,081 | ) |
| | | | | | | | | |
| CAPITAL SHARE ACTIVITY | | | | | | | | |
| Shares sold | | | 272,049 | | | | 373,646 | |
| Shares reinvested | | | — | | | | 13,308 | |
| Shares redeemed | | | (63,382 | ) | | | (58,110 | ) |
| Net increase in shares outstanding | | | 208,667 | | | | 328,844 | |
| Shares outstanding at beginning of period | | | 1,603,208 | | | | 1,274,364 | |
| Shares outstanding at end of period | | | 1,811,875 | | | | 1,603,208 | |
| See accompanying notes to financial statements. |
12
WAYCROSS LONG/SHORT EQUITY FUND
FINANCIAL HIGHLIGHTS |
| Per Share Data for a Share Outstanding Throughout Each Period |
| | | Six Months
Ended
August 31,
2018
(Unaudited) | | | Year Ended
February 28,
2018 | | | Year Ended
February 28,
2017 | | | Period Ended
February 29,
2016 (a) | |
| Net asset value at beginning of period | | $ | 10.90 | | | $ | 9.88 | | | $ | 9.10 | | | $ | 10.00 | |
| | | | | | | | | | | | | | | | | |
| Income (loss) from investment operations: | | | | | | | | | | | | | | | | |
| Net investment loss | | | (0.05 | ) | | | (0.14 | ) | | | (0.11 | ) | | | (0.13 | ) |
| Net realized and unrealized gains (losses) on investments | | | 0.65 | | | | 1.27 | | | | 0.89 | | | | (0.77 | ) |
| Total from investment operations | | | 0.60 | | | | 1.13 | | | | 0.78 | | | | (0.90 | ) |
| | | | | | | | | | | | | | | | | |
| Less distributions: | | | | | | | | | | | | | | | | |
| Distributions from net realized gains | | | — | | | | (0.11 | ) | | | — | | | | — | |
| | | | | | | | | | | | | | | | | |
| Net asset value at end of period | | $ | 11.50 | | | $ | 10.90 | | | $ | 9.88 | | | $ | 9.10 | |
| | | | | | | | | | | | | | | | | |
| Total return (b) | | | 5.50 | %(c) | | | 11.44 | % | | | 8.57 | % | | | (9.00 | %)(c) |
| | | | | | | | | | | | | | | | | |
| Net assets at end of period (000's) | | $ | 20,844 | | | $ | 17,469 | | | $ | 12,591 | | | $ | 4,780 | |
| | | | | | | | | | | | | | | | | |
| Ratios/supplementary data: | | | | | | | | | | | | | | | | |
| Ratio of total expenses to average net assets | | | 3.10 | %(d) | | | 3.21 | % | | | 4.77 | % | | | 7.25 | %(d) |
| | | | | | | | | | | | | | | | | |
| Ratio of net expenses to average net assets (e) | | | 2.81 | %(d) | | | 2.90 | % | | | 2.99 | % | | | 3.30 | %(d) |
| | | | | | | | | | | | | | | | | |
| Ratio of net expenses to average net assets excluding dividend expense and brokerage expense on securities sold short (e) | | | 1.99 | %(d) | | | 1.99 | % | | | 2.13 | % | | | 2.15 | %(d) |
| | | | | | | | | | | | | | | | | |
| Ratio of net investment loss to average net assets (e) | | | (1.00 | %)(d) | | | (1.47 | %) | | | (1.96 | %) | | | (2.34 | %)(d) |
| | | | | | | | | | | | | | | | | |
| Portfolio turnover rate | | | 10 | %(c) | | | 35 | % | | | 192 | % | | | 134 | %(c) |
| (a) | Represents the period from the commencement of operations (April 29, 2015) through February 29, 2016. |
| (b) | Total return is a measure of the change in value of an investment in the Fund over the period covered. The returns shown do not reflect the deduction of taxes a shareholder would pay on Fund distributions, if any, or the redemption of Fund shares. The total returns would be lower if the Adviser and the administrator had not reduced fees and reimbursed expenses (Note 4). |
| (c) | Not annualized. |
| (d) | Annualized. |
| (e) | Ratio was determined after advisory fee reductions and/or expense reimbursements (Note 4). |
| See accompanying notes to financial statements. |
13
WAYCROSS LONG/SHORT EQUITY FUND
NOTES TO FINANCIAL STATEMENTS
August 31, 2018 (Unaudited)
1. Organization
Waycross Long/Short Equity Fund (the “Fund”) is a diversified series of Ultimus Managers Trust (the “Trust”), an open-end investment company established as an Ohio business trust under a Declaration of Trust dated February 28, 2012. Other series of the Trust are not incorporated in this report.
The investment objective of the Fund is to seek long-term capital appreciation with a secondary emphasis on capital preservation.
2. Significant Accounting Policies
The following is a summary of the Fund’s significant accounting policies used in the preparation of its financial statements. These policies are in conformity with accounting principles generally accepted in the United States of America (“GAAP”). The Fund follows accounting and reporting guidance under Financial Accounting Standards Board Accounting Standards Codification Topic 946, “Financial Services – Investment Companies.”
Securities valuation – The Fund values its portfolio securities at market value as of the close of regular trading on the New York Stock Exchange (the “NYSE”) (normally 4:00 p.m. Eastern time) on each day the NYSE is open for business. The Fund values its listed securities on the basis of the security’s last sale price on the security’s primary exchange, if available, otherwise at the exchange’s most recently quoted mean price. NASDAQ-listed securities are valued at the NASDAQ Official Closing Price. When using a quoted price and when the market is considered active, the security will be classified as Level 1 within the fair value hierarchy (see below). In the event that market quotations are not readily available or are considered unreliable due to market or other events, the Fund values its securities and other assets at fair value in accordance with procedures established by and under the general supervision of the Board of Trustees (the “Board”) of the Trust. Under these procedures, the securities will be classified as Level 2 or 3 within the fair value hierarchy, depending on the inputs used. Unavailable or unreliable market quotes may be due to the following factors: a substantial bid-ask spread; infrequent sales resulting in stale prices; insufficient trading volume; small trade sizes; a temporary lapse in any reliable pricing source; and actions of the securities or futures markets, such as the suspension or limitation of trading. As a result, the prices of securities used to calculate the Fund’s net asset value (“NAV”) may differ from quoted or published prices for the same securities.
GAAP establishes a single authoritative definition of fair value, sets out a framework for measuring fair value, and requires additional disclosures about fair value measurements.
14
WAYCROSS LONG/SHORT EQUITY FUND
NOTES TO FINANCIAL STATEMENTS (Continued)
Various inputs are used in determining the value of the Fund’s investments. These inputs are summarized in the three broad levels listed below:
| | ● | Level 1 – quoted prices in active markets for identical securities |
| | ● | Level 2 – other significant observable inputs |
| | ● | Level 3 – significant unobservable inputs |
The inputs or methods used for valuing securities are not necessarily an indication of the risks associated with investing in those securities. The inputs used to measure fair value may fall into different levels of the fair value hierarchy. In such cases, for disclosure purposes, the level in the fair value hierarchy within which the fair value measurement falls in its entirety is determined based on the lowest level input that is significant to the fair value measurement.
The following is a summary of the inputs used to value the Fund’s investments and other financial instruments as of August 31, 2018:
| | | Level 1 | | | Level 2 | | | Level 3 | | | Total | |
| Investments in Securities | | | | | | | | |
| Common Stocks | | $ | 20,226,259 | | | $ | — | | | $ | — | | | $ | 20,226,259 | |
| Money Market Funds | | | 483,521 | | | | — | | | | — | | | | 483,521 | |
| Total | | $ | 20,709,780 | | | $ | — | | | $ | — | | | $ | 20,709,780 | |
| Other Financial Instruments | | | | | | | | |
| Common Stocks - Sold Short | | $ | (8,105,562 | ) | | $ | — | | | $ | — | | | $ | (8,105,562 | ) |
Refer to the Fund’s Schedule of Investments and Schedule of Securities Sold Short for a listing of the common stocks by industry type. As of August 31, 2018, the Fund did not have any transfers between Levels. In addition, the Fund did not hold derivative instruments or have any assets or liabilities that were measured at fair value on a recurring basis using significant unobservable inputs (Level 3) as of August 31, 2018. It is the Fund’s policy to recognize transfers between Levels at the end of the reporting period.
Share valuation – The NAV per share of the Fund is calculated daily by dividing the total value of the Fund’s assets, less liabilities, by the number of shares outstanding. The offering price and redemption price per share of the Fund is equal to the NAV per share.
Investment income – Dividend income and expense is recorded on the ex-dividend date. Interest income is accrued as earned. Withholding taxes on foreign dividends have been recorded in accordance with the Fund’s understanding of the applicable country’s tax rules and rates.
Investment transactions – Investment transactions are accounted for on the trade date. Realized gains and losses on investments sold are determined on a specific identification basis.
15
WAYCROSS LONG/SHORT EQUITY FUND
NOTES TO FINANCIAL STATEMENTS (Continued)
Common expenses – Common expenses of the Trust are allocated among the Fund and the other series of the Trust based on the relative net assets of each series or the nature of the services performed and the relative applicability to each series.
Distributions to shareholders – Distributions to shareholders arising from net investment income, if any, are declared and paid annually to shareholders. Net realized capital gains, if any, are distributed at least annually. The amount of distributions from net investment income and net realized capital gains are determined in accordance with federal income tax regulations, which may differ from GAAP. Dividends and distributions to shareholders are recorded on the ex-dividend date. The tax character of distributions paid during the year ended February 28, 2018 was long-term capital gains. There were no distributions paid to shareholders during the six months ended August 31, 2018.
Short sales – The Fund sells securities short. When the Fund sells a security short, it must borrow the security sold short and deliver it to the broker-dealer through which it made the short sale. A gain, limited to the price at which the Fund sold the security short, or a loss, unlimited in size, will be recognized upon the termination of a short sale. The Fund is also subject to the risk that it may be unable to reacquire a security to terminate a short position except at a price substantially in excess of the last quoted price. The Fund is liable for any dividends payable on securities while those securities are in a short position and will also bear other costs, such as charges for the prime brokerage accounts, in connection with the short position. These costs are reported as dividend expense and brokerage expense on securities sold short, respectively, in the Statement of Operations. Net income earned on short sale proceeds held on deposit with the broker and/or margin interest earned, if any, are included in interest income in the Statement of Operations. As collateral for its short positions, the Fund is required under the Investment Company Act of 1940, as amended (the “1940 Act”), to maintain assets consisting of cash, cash equivalents, or other liquid securities equal to the market value of the securities sold short. The cash deposits with brokers or amounts due to prime brokers for securities sold short are reported on the Statement of Assets and Liabilities. These amounts are considered in conjunction with securities held in the Fund’s collateral account. The amount of collateral is required to be adjusted daily to reflect changes in the value of the securities sold short. To the extent the Fund invests the proceeds received from selling securities short, it is engaging in a form of leverage. The use of leverage by the Fund may make any change in the Fund’s NAV greater than it would be without the use of leverage. Short sales are speculative transactions and involve special risks, including greater reliance on the ability of Waycross Partners, LLC (the “Adviser���) to accurately anticipate the future value of a security.
Estimates – The preparation of financial statements in conformity with GAAP requires management to make estimates and assumptions that affect the reported amounts of assets and liabilities and disclosure of contingent assets and liabilities as of the date of the financial statements and the reported amounts of income and expenses during the reporting period. Actual results could differ from those estimates.
16
WAYCROSS LONG/SHORT EQUITY FUND
NOTES TO FINANCIAL STATEMENTS (Continued)
Federal income tax – The Fund has qualified and intends to continue to qualify as a regulated investment company under the Internal Revenue Code of 1986, as amended (the “Code”). Qualification generally will relieve the Fund of liability for federal income taxes to the extent 100% of its net investment income and net realized capital gains are distributed in accordance with the Code.
In order to avoid imposition of the excise tax applicable to regulated investment companies, it is also the Fund’s intention to declare as dividends in each calendar year at least 98% of its net investment income (earned during the calendar year) and 98.2% of its net realized capital gains (earned during the 12 months ended October 31) plus undistributed amounts from prior years.
The following information is computed on a tax basis for each item as of August 31, 2018:
| Tax cost of portfolio investments and securities sold short | | $ | 8,947,090 | |
| Gross unrealized appreciation | | $ | 4,996,507 | |
| Gross unrealized depreciation | | | (1,339,379 | ) |
| Net unrealized appreciation | | | 3,657,128 | |
| Accumulated capital and other losses | | | (368,050 | ) |
| Accumulated earnings | | $ | 3,289,078 | |
The federal income tax cost of portfolio investments and securities sold short and the tax components of accumulated earnings may temporarily differ from the financial statement cost of portfolio investments and components of net assets (“book/tax difference”). These book/tax differences are due to the recognition of capital gains or losses under income tax regulations and GAAP, primarily due to the tax deferral of losses on wash sales.
As of February 28, 2018, the Fund had a short-term capital loss carryforward of $7,252 for federal income tax purposes. This capital loss carryforward, which does not expire, may be utilized in the current and future years to offset net realized gains, if any, prior to distributing such gains to shareholders.
The Fund recognizes the tax benefits or expenses of uncertain tax positions only when the position is “more likely than not” to be sustained assuming examination by tax authorities. Management has reviewed the Fund’s tax positions for the current and all open tax years (tax years ended February 29, 2016 through February 28, 2018) and has concluded that no provision for unrecognized tax benefits or expenses is required in these financial statements. The Fund identifies its major tax jurisdiction as U.S. federal.
3. Investment Transactions
During the six months ended August 31, 2018, cost of purchases and proceeds from sales of investment securities, other than short-term investments and short positions, were $3,552,155 and $1,792,330, respectively.
17
WAYCROSS LONG/SHORT EQUITY FUND
NOTES TO FINANCIAL STATEMENTS (Continued)
4. Transactions with Related Parties
INVESTMENT ADVISORY AGREEMENT
The Fund’s investments are managed by the Adviser pursuant to the terms of an Investment Advisory Agreement. Under the Investment Advisory Agreement, the Fund pays the Adviser an advisory fee, computed and accrued daily and paid monthly, at the annual rate of 1.25% of its average daily net assets.
Pursuant to an Expense Limitation Agreement between the Fund and the Adviser (the “ELA”), the Adviser has contractually agreed, until June 30, 2019, to reduce investment advisory fees and reimburse other expenses to limit total annual operating expenses (exclusive of brokerage costs; taxes; interest; borrowing costs such as interest and dividend expenses on securities sold short; costs to organize the Fund; acquired fund fees and expenses; extraordinary expenses such as litigation and merger or reorganization costs and other expenses not incurred in the ordinary course of the Fund’s business; and amounts, if any, payable pursuant to a plan adopted in accordance with Rule 12b-1 under the 1940 Act) to an amount not exceeding 1.99% of the Fund’s average daily net assets. Accordingly, during the six months ended August 31, 2018, the Adviser reduced its advisory fees in the amount of $25,640.
Under the terms of the ELA, investment advisory fee reductions and expense reimbursements by the Adviser are subject to repayment by the Fund for a period of three years after such fees and expenses were incurred, provided that the repayments do not cause total annual operating expenses to exceed the lesser of (i) the expense limitation then in effect, if any, and (ii) the expense limitation in effect at the time the expenses to be repaid were incurred. As of August 31, 2018, the Adviser may seek repayment of investment advisory fee reductions and expense reimbursements totaling $276,548 no later than the dates listed below:
| February 28, 2019 | | $ | 60,359 | |
| February 29, 2020 | | | 147,839 | |
| February 28, 2021 | | | 42,710 | |
| August 31, 2021 | | | 25,640 | |
| Total | | $ | 276,548 | |
OTHER SERVICE PROVIDERS
Ultimus Fund Solutions, LLC (“Ultimus”) provides administration, fund accounting, compliance and transfer agency services to the Fund. The Fund pays Ultimus fees in accordance with the agreements for such services. In addition, the Fund pays out-of-pocket expenses including, but not limited to, postage, supplies and costs of pricing the Fund’s portfolio securities. During the six months ended August 31, 2018, Ultimus voluntarily waived fees in the amount of $1,500. These voluntary waivers are not subject to recoupment by Ultimus.
18
WAYCROSS LONG/SHORT EQUITY FUND
NOTES TO FINANCIAL STATEMENTS (Continued)
Under the terms of a Distribution Agreement with the Trust, Ultimus Fund Distributors, LLC (the “Distributor”) serves as principal underwriter to the Fund. The Distributor is a wholly-owned subsidiary of Ultimus. The Distributor is compensated by the Adviser (not the Fund) for acting as principal underwriter.
Certain officers and a Trustee of the Trust are also officers of Ultimus and the Distributor.
TRUSTEE COMPENSATION
Effective August 1, 2018, each Trustee who is not an “interested person” of the Trust (“Independent Trustee”) receives a $1,300 annual retainer from the Fund, paid quarterly, except for the Board Chairperson who receives a $1,500 annual retainer from the Fund, paid quarterly. Each Independent Trustee also receives from the Fund a fee of $500 for each Board meeting attended plus reimbursement for travel and other meeting-related expenses. Prior to August 1, 2018, each Independent Trustee received a $1,000 annual retainer form the Fund, paid quarterly, except for the Board Chairperson who received a $1,200 annual retainer from the Fund, paid quarterly. Each Independent Trustee also received from the Fund a fee of $500 for each Board meeting attended plus reimbursement for travel and other meeting-related expenses.
PRINCIPAL HOLDERS OF FUND SHARES
As of August 31, 2018, the following shareholders owned of record 5% or more of the outstanding shares of the Fund:
| Name of Record Owner | % Ownership |
| National Financial Services, LLC (for benefit of its customers) | 68% |
| Maril & Company (for benefit of its customers) | 26% |
A beneficial owner of 25% or more of the Fund’s outstanding shares may be considered a controlling person. That shareholder’s vote could have a more significant effect on matters presented at a shareholders’ meeting.
5. Contingencies and Commitments
The Fund indemnifies the Trust’s officers and Trustees for certain liabilities that might arise from their performance of their duties to the Fund. Additionally, in the normal course of business the Fund enters into contracts that contain a variety of representations and warranties and which provide general indemnifications. The Fund’s maximum exposure under these arrangements is unknown, as this would involve future claims that may be made against the Fund that have not yet occurred. However, based on experience, the Fund expects the risk of loss to be remote.
19
WAYCROSS LONG/SHORT EQUITY FUND
NOTES TO FINANCIAL STATEMENTS (Continued)
6. Sector Risk
If the Fund has significant investments in the securities of issuers within a particular sector, any development affecting that sector will have a greater impact on the value of the net assets of the Fund than would be the case if the Fund did not have significant investments in that sector. In addition, this may increase the risk of loss in the Fund and increase the volatility of the Fund’s NAV per share. Occasionally, market conditions, regulatory changes, or other developments may negatively impact a particular sector, and therefore the value of the Fund’s portfolio will be adversely affected.
As of August 31, 2018, the Fund had the following percentages of the value of its net assets invested or sold short in stocks within the Information Technology sector:
| Sector | Long Positions | Short Positions | Net Exposure |
| Information Technology | 30.9% | (10.2%) | 20.7% |
As shown above, although the Fund has greater than 25% of its net assets invested in long positions in the sector noted, the sector exposure is mitigated by short positions. As part of the Fund’s principal investment strategies, the Adviser monitors the Fund’s sector exposure to ensure the Fund’s portfolio is adequately diversified.
7. Subsequent Events
The Fund is required to recognize in the financial statements the effects of all subsequent events that provide additional evidence about conditions that existed as of the date of the Statement of Assets and Liabilities. For non-recognized subsequent events that must be disclosed to keep the financial statements from being misleading, the Fund is required to disclose the nature of the event as well as an estimate of its financial effect, or a statement that such an estimate cannot be made. Management has evaluated subsequent events through the issuance of these financial statements and has noted no such events.
20
WAYCROSS LONG/SHORT EQUITY FUND
ABOUT YOUR FUND’S EXPENSES (Unaudited)
We believe it is important for you to understand the impact of costs on your investment. As a shareholder of the Fund, you incur ongoing costs, including management fees and other operating expenses. The following examples are intended to help you understand your ongoing costs (in dollars) of investing in the Fund and to compare these costs with the ongoing costs of investing in other mutual funds.
A mutual fund’s ongoing costs are expressed as a percentage of its average net assets. This figure is known as the expense ratio. The expenses in the table below are based on an investment of $1,000 made at the beginning of the most recent period (March 1, 2018) and held until the end of the period (August 31, 2018).
The table below illustrates the Fund’s ongoing costs in two ways:
Actual fund return – This section helps you to estimate the actual expenses that you paid over the period. The “Ending Account Value” shown is derived from the Fund’s actual return, and the fourth column shows the dollar amount of operating expenses that would have been paid by an investor who started with $1,000 in the Fund. You may use the information here, together with the amount you invested, to estimate the expenses that you paid over the period.
To do so, simply divide your account value by $1,000 (for example, an $8,600 account value divided by $1,000 = 8.6), then multiply the result by the number given for the Fund under the heading “Expenses Paid During Period.”
Hypothetical 5% return – This section is intended to help you compare the Fund’s ongoing costs with those of other mutual funds. It assumes that the Fund had an annual return of 5% before expenses during the period shown, but that the expense ratio is unchanged. In this case, because the return used is not the Fund’s actual return, the results do not apply to your investment. The example is useful in making comparisons because the U.S. Securities and Exchange Commission (the “SEC”) requires all mutual funds to calculate expenses based on a 5% return. You can assess the Fund’s ongoing costs by comparing this hypothetical example with the hypothetical examples that appear in shareholder reports of other funds.
Note that expenses shown in the table are meant to highlight and help you compare ongoing costs only. The Fund does not charge transaction fees, such as purchase or redemption fees, nor does it carry a “sales load.”
The calculations assume no shares were bought or sold during the period. Your actual costs may have been higher or lower, depending on the amount of your investment and the timing of any purchases or redemptions.
21
WAYCROSS LONG/SHORT EQUITY FUND
ABOUT YOUR FUND’S EXPENSES (Unaudited) (Continued)
More information about the Fund’s expenses can be found in this report. For additional information on operating expenses and other shareholder costs, please refer to the Fund’s prospectus.
| | Beginning
Account Value
March 1,
2018 | Ending
Account Value
August 31,
2018 | Net
Expense
Ratio(a) | Expenses
Paid During
Period(b) |
| Based on Actual Fund Return | $1,000.00 | $1,055.00 | 2.81% | $14.56 |
| Based on Hypothetical 5% Return (before expenses) | $1,000.00 | $1,011.04 | 2.81% | $14.24 |
| (a) | Annualized, based on the Fund's most recent one-half year expenses. |
| (b) | Expenses are equal to the Fund’s annualized net expense ratio multiplied by the average account value over the period, multiplied by 184/365 (to reflect the one-half year period). |
OTHER INFORMATION (Unaudited)
A description of the policies and procedures that the Fund uses to vote proxies relating to portfolio securities is available without charge upon request by calling toll-free 1-866-267-4304, or on the SEC’s website at http://www.sec.gov. Information regarding how the Fund voted proxies relating to portfolio securities during the most recent 12-month period ended June 30 is available without charge upon request by calling toll-free 1-866-267-4304, or on the SEC’s website at http://www.sec.gov.
The Trust files a complete listing of the Fund’s portfolio holdings with the SEC as of the end of the first and third quarters of each fiscal year on Form N-Q. These filings are available upon request by calling 1-866-267-4304. Furthermore, you may obtain a copy of the filings on the SEC’s website at http://www.sec.gov. The Trust’s Forms N-Q may also be reviewed and copied at the SEC’s Public Reference Room in Washington, DC, and information on the operation of the Public Reference Room may be obtained by calling 1-800-SEC-0330.
22
CUSTOMER PRIVACY NOTICE
| FACTS | WHAT DOES THE WAYCROSS LONG/SHORT EQUITY FUND (the “Fund”) DO WITH YOUR PERSONAL INFORMATION? |
| Why? | Financial companies choose how they share your personal information. Federal law gives consumers the right to limit some but not all sharing. Federal law also requires us to tell you how we collect, share, and protect your personal information. Please read this notice carefully to understand what we do. |
| What? | The types of personal information we collect and share depend on the product or service you have with us. This information can include: ■ Social Security number ■ Assets ■ Retirement Assets ■ Transaction History ■ Checking Account Information ■ Purchase History ■ Account Balances ■ Account Transactions ■ Wire Transfer Instructions When you are no longer our customer, we continue to share your information as described in this notice. |
| How? | All financial companies need to share your personal information to run their everyday business. In the section below, we list the reasons financial companies can share their customers’ personal information; the reasons the Fund chooses to share; and whether you can limit this sharing. |
| Reasons we can share your personal information | Does the
Fund share? | Can you limit this sharing? |
For our everyday business purposes –
Such as to process your transactions, maintain your account(s), respond to court orders and legal investigations, or report to credit bureaus | Yes | No |
For our marketing purposes –
to offer our products and services to you | No | We don’t share |
| For joint marketing with other financial companies | No | We don’t share |
For our affiliates’ everyday business purposes –
information about your transactions and experiences | No | We don’t share |
For our affiliates’ everyday business purposes –
information about your creditworthiness | No | We don’t share |
| For nonaffiliates to market to you | No | We don’t share |
| Questions? | Call 1-866-267-4304 |
23
| Who we are |
| Who is providing this notice? | Waycross Long/Short Equity Fund Ultimus Fund Distributors, LLC (Distributor) Ultimus Fund Solutions, LLC (Administrator) |
| What we do |
| How does the Fund protect my personal information? | To protect your personal information from unauthorized access and use, we use security measures that comply with federal law. These measures include computer safeguards and secured files and buildings. Our service providers are held accountable for adhering to strict policies and procedures to prevent any misuse of your nonpublic personal information. |
| How does the Fund collect my personal information? | We collect your personal information, for example, when you ■ Open an account ■ Provide account information ■ Give us your contact information ■ Make deposits or withdrawals from your account ■ Make a wire transfer ■ Tell us where to send the money ■ Tell us who receives the money ■ Show your government-issued ID ■ Show your driver’s license We also collect your personal information from other companies. |
| Why can’t I limit all sharing? | Federal law gives you the right to limit only ■ Sharing for affiliates’ everyday business purposes – information about your creditworthiness ■ Affiliates from using your information to market to you ■ Sharing for nonaffiliates to market to you State laws and individual companies may give you additional rights to limit sharing. |
| Definitions |
| Affiliates | Companies related by common ownership or control. They can be financial and nonfinancial companies. ■ Waycross Partners, LLC, the investment adviser to the Fund, could be deemed to be an affiliate. |
| Nonaffiliates | Companies not related by common ownership or control. They can be financial and nonfinancial companies ■ The Fund does not share with nonaffiliates so they can market to you. |
| Joint marketing | A formal agreement between nonaffiliated financial companies that together market financial products or services to you. ■ The Fund does not jointly market. |
24
This page intentionally left blank.
Item 2. Code of Ethics.
Not required
Item 3. Audit Committee Financial Expert.
Not required
Item 4. Principal Accountant Fees and Services.
Not required
Item 5. Audit Committee of Listed Registrants.
Not applicable
Item 6. Schedule of Investments.
| (a) | Not applicable [schedule filed with Item 1] |
Item 7. Disclosure of Proxy Voting Policies and Procedures for Closed-End Management Investment Companies.
Not applicable
Item 8. Portfolio Managers of Closed-End Management Investment Companies.
Not applicable
Item 9. Purchases of Equity Securities by Closed-End Management Investment Company and Affiliated Purchasers.
Not applicable
Item 10. Submission of Matters to a Vote of Security Holders.
The registrant’s Committee of Independent Trustees shall review shareholder recommendations for nominations to fill vacancies on the registrant’s board of trustees if such recommendations are submitted in writing and addressed to the Committee at the registrant’s offices. The Committee may adopt, by resolution, a policy regarding its procedures for considering candidates for the board of trustees, including any recommended by shareholders.
Item 11. Controls and Procedures.
(a) Based on their evaluation of the registrant’s disclosure controls and procedures (as defined in Rule 30a-3(c) under the Investment Company Act of 1940) as of a date within 90 days of the filing date of this report, the registrant’s principal executive officer and principal financial officer have concluded that such disclosure controls and procedures are reasonably designed and are operating effectively to ensure that material information relating to the registrant, including its consolidated subsidiaries, is made known to them by others within those entities, particularly during the period in which this report is being prepared, and that the information required in filings on Form N-CSR is recorded, processed, summarized, and reported on a timely basis.
(b) There were no changes in the registrant’s internal control over financial reporting (as defined in Rule 30a-3(d) under the Investment Company Act of 1940) that occurred during the second fiscal quarter of the period covered by this report that have materially affected, or are reasonably likely to materially affect, the registrant’s internal control over financial reporting.
Item 12. Disclosure of Securities Lending Activities for Closed-End Management Investment Companies.
Not applicable
Item 13. Exhibits.
File the exhibits listed below as part of this Form. Letter or number the exhibits in the sequence indicated.
(a)(1) Any code of ethics, or amendment thereto, that is the subject of the disclosure required by Item 2, to the extent that the registrant intends to satisfy the Item 2 requirements through filing of an exhibit: Not required
(a)(2) A separate certification for each principal executive officer and principal financial officer of the registrant as required by Rule 30a-2(a) under the Act (17 CFR 270.30a-2(a)): Attached hereto
(a)(3) Any written solicitation to purchase securities under Rule 23c-1 under the Act (17 CFR 270.23c-1) sent or given during the period covered by the report by or on behalf of the registrant to 10 or more persons: Not applicable
(a)(4) Change in the registrant’s independent public accountants: Not applicable
(b) Certifications required by Rule 30a-2(b) under the Act (17 CFR 270.30a-2(b)): Attached hereto
| Exhibit 99.CERT | Certifications required by Rule 30a-2(a) under the Act |
| Exhibit 99.906CERT | Certifications required by Rule 30a-2(b) under the Act |
SIGNATURES
Pursuant to the requirements of the Securities Exchange Act of 1934 and the Investment Company Act of 1940, the registrant has duly caused this report to be signed on its behalf by the undersigned, thereunto duly authorized.
| (Registrant) | Ultimus Managers Trust | | |
| | | | |
| By (Signature and Title)* | /s/ Matthew J. Beck | |
| | | Matthew J. Beck, Secretary | |
| | | | |
| Date | November 6, 2018 | | |
| | | | |
| Pursuant to the requirements of the Securities Exchange Act of 1934 and the Investment Company Act of 1940, this report has been signed below by the following persons on behalf of the registrant and in the capacities and on the dates indicated. |
| | | | |
| By (Signature and Title)* | /s/ David R. Carson | |
| | | David R. Carson, Principal Executive Officer of HVIA Equity Fund, Ladder Select Bond Fund, and Waycross Long/Short Equity Fund | |
| | | | |
| Date | November 6, 2018 | | |
| | | | |
| By (Signature and Title)* | /s/ Jennifer L. Leamer | |
| | | Jennifer L. Leamer, Treasurer and Principal Financial Officer | |
| | | | |
| Date | November 6, 2018 | | |
| * | Print the name and title of each signing officer under his or her signature. |