| OMB APPROVAL |
OMB Number: 3235-0570 Expires: August 31, 2020 Estimated average burden hours per response: 20.6 |
UNITED STATES
SECURITIES AND EXCHANGE COMMISSION
Washington, D.C. 20549
FORM N-CSR
CERTIFIED SHAREHOLDER REPORT OF REGISTERED
MANAGEMENT INVESTMENT COMPANIES
| Investment Company Act file number | 811-22680 | |
| Ultimus Managers Trust |
| (Exact name of registrant as specified in charter) |
| 225 Pictoria Drive, Suite 450 Cincinnati, Ohio | 45246 |
| (Address of principal executive offices) | (Zip code) |
Natalie S. Anderson
| Ultimus Fund Solutions, LLC 225 Pictoria Drive, Suite 450 | Cincinnati, Ohio 45246 |
| (Name and address of agent for service) |
| Registrant's telephone number, including area code: | 513-587-3400 | |
| Date of fiscal year end: | October 31 | |
| | | |
| Date of reporting period: | April 30, 2018 | |
Form N-CSR is to be used by management investment companies to file reports with the Commission not later than 10 days after the transmission to stockholders of any report that is required to be transmitted to stockholders under Rule 30e-1 under the Investment Company Act of 1940 (17 CFR 270.30e-1). The Commission may use the information provided on Form N-CSR in its regulatory, disclosure review, inspection, and policymaking roles.
A registrant is required to disclose the information specified by Form N-CSR, and the Commission will make this information public. A registrant is not required to respond to the collection of information contained in Form N-CSR unless the Form displays a currently valid Office of Management and Budget ("OMB") control number. Please direct comments concerning the accuracy of the information collection burden estimate and any suggestions for reducing the burden to the Secretary, Securities and Exchange Commission, 450 Fifth Street, NW, Washington, DC 20549-0609. The OMB has reviewed this collection of information under the clearance requirements of 44 U.S.C. § 3507.
| Item 1. | Reports to Stockholders. |
STRALEM EQUITY FUND
LETTER TO SHAREHOLDERS
June 2018
Dear Shareholder,
During the first six months of its fiscal year, November 1, 2017 through April 30, 2018, Stralem Equity Fund’s (the “Fund’s”) performance was as follows:
Time Period | STEFX* | S&P 500** |
Nov 1, 2017 – April 30, 2018 | 0.01% | 3.82% |
| | Past performance does not guarantee future returns. |
* | Net, after fees. |
** | Does not reflect deduction for fees, expenses or taxes |
Stralem Equity Fund trailed the benchmark index over the first six months of the fiscal year by 3.81%, returning 0.01% vs. 3.82% for the S&P 500 Index (the “Index”). This was largely the result of our allocation to defensive, high-yielding, capital preservation stocks. These stocks rarely perform as strongly as stocks allocated to capital growth in a strong bull market such as we experienced during this time. They, however, fared worse than usual as a result of the Federal Reserve raising rates twice during this time frame. Underperformance was also a result of our under-allocation to what we view as exorbitantly expensive, popular growth stocks like Amazon and Netflix.
It is worth noting that the entirety of the market’s return during this period came in the last two months of 2017 during which time, the S&P 500 was +4.2% reaching an all-time high and closing the year without experiencing a single down month – the first time this has ever occurred. In contrast, the first four months of 2018 have essentially been flat (-0.38%) for the Index as investors digest a variety of new data points, some of which are at odds with each other.
We believe year-end 2017 investor enthusiasm was driven by the Trump Administration’s plan to cut corporate and individual taxes as well as enable companies to easily return their cash trapped overseas. This tax policy was viewed as not only giving consumers more discretionary income, but also allowing corporations to achieve record high profitability which was seen, in turn, as likely to drive capital investment and a wave of new buy backs and dividend increases – all of which are positive catalysts for stocks.
This fiscal stimulus was, however, offset by the Trump Administration’s trade proposals and the Federal Reserve’s strategy to tighten monetary policy. Trump’s plans to impose tariffs on China and perhaps even Canada and Mexico in an effort to get improved trade deals were seen as raising prices thus offsetting the additional discretionary income and profits. At the same time, the Federal Reserve continued to reverse its easy money policy by raising the Fed Funds rate for the third and fourth time in December of 2017 and March 2018. These
1
raises forced up short term interest rates and even drove the benchmark 10 year Treasury yield from 2.3% to over 3.0% in the period. Higher rates, while perhaps welcomed by those seeking some extra yield on their savings, would force up the cost of borrowing for consumers and corporations alike.
While the market initially chose to reward some of the more growth oriented and cyclical stocks in late 2017, it wasn’t until early 2018 when the geopolitical challenges facing the country began to affect stock prices. The Trump Administration, against the advice of many allies, threatened to withdraw from the Iran Nuclear Deal while also continuing to play cat and mouse with North Korea on a nuclear disarmament arrangement. Overall, the U.S.’s erratic behavior among our allies on trade and foreign policy has created genuine concern among investors, testing conviction levels ten years into a bull market. While we believe that many companies are navigating this environment quite well by pulling the levers required to grow and invest in a synchronized global growth environment, we have begun to see a change in the market. The S&P 500 didn’t have a negative return month in 2017 and then had only two down quarters in the past 5 years, but the first calendar quarter of 2018 was negative and correlations between stock returns have begun to decline; for the first time in a long time, the market began to differentiate between winners and losers. This results in a bumpier ride for investors, but it is a welcome development for active, fundamental managers who implement disciplined processes to distinguish among advantaged and disadvantaged stocks. The change in the market dynamic also ushered in the return of volatility and suggests a nervous market that perhaps lacks absolute certainty in the economic and market environment. One bout of extreme volatility played out in February when a number of levered investment funds that were shorting the VIX index blew up as volatility increased and they were forced to buy to cover when liquidity was low – sending the VIX from 13.5 on February 1st to 33.5 on February 8th! The VIX returned to 15.9 by the end of April, but is clearly off the single-digit levels (low of 8.6 in November 2017) that persisted through much of 2017.
The majority of the Fund’s underperformance (-3.81%) occurred as optimistic investors rotated away from the stable growing defensive sectors that Stralem owned — Consumer Staples (-4.2%) and Utilities (-4.8%) and into economically sensitive sectors like Consumer Discretionary (+13.5%), Technology (+4.8%), and Financials (+4.1%) where Stralem is underweight. Exuberance for Consumer Discretionary and Technology was driven by the view that there would be greater consumer income and growth. The move away from the defensive sectors was the result of higher interest rates, which benefit Financials, while negatively impacting the demand for Utilities and Staples, which investors often use as “yield substitutes”.
From a stock perspective, our three Utilities, PPL Corp (PPL), Dominion Energy (D), and Duke Energy (DUK) were down 20.5%, 16.3%, and 7.3% respectively and collectively hurt performance during the period by -1.57%. Likewise, owning stable dividend payers Philip Morris (PM) -20% and Mondelez (MDLZ) -3.7% hurt performance by 0.79%. Not owning Amazon (AMZN) +41.7% and Netflix (NFLX) +59.1%, two of the best performing stocks in the S&P 500, cost the portfolio 0.96% combined.
2
The portfolio achieved excellent stock performance from its Healthcare holdings, UnitedHealth Group (UNH) +13.2%, Danaher (DHR) +9.1%, Thermo Fisher (TMO) +8.7% and Merck (MRK) +8.7%. Other individual stocks that contributed strongly to performance in the period were Adobe Systems (ADBE) +26.5%, EOG Resources (EOG) +18.7%, Visa Inc (V) + 15.8%, Intercontinental Exchange (ICE) +10.3%, and FedEx (FDX) +9.9%.
During the period, five portfolio positions were sold [Amgen (AMGN), Walt Disney (DIS), Exxon Mobil (XOM), Johnson Controls (JCI) and Kraft Heinz (KHC)] and three new positions [Abbvie (ABBV), Alexion Pharmaceutical (ALZN) and Kinder Morgan (KMI)] were added reducing the total holdings to 33 securities.
Given that the market achieved all-time highs in 2017 despite the Federal Reserve’s policy reversal, impending trade wars, and geopolitical risks in both Asia and the Middle East, we believe it continues to be prudent to maintain 35% of the portfolio in what we view as defensive positions with downside protection while allocating 65% to the Up Market Sector of higher growth stocks that participate with the market. We remain convinced that the market environment really began to change as far back as Q42016 when the Fed started to pull back its loose monetary policy by curtailing quantitative easing and beginning the process of raising interest rates. Coupled with new highs in the stock market, an 9+ year rally without any significant pullback, and new political and geopolitical risks, additional uncertainty, volatility and caution have been reintroduced to the market. It is our contention that a disciplined portfolio structure based on diligent research and stock selection driven by strong fundamentals will be increasingly rewarded. In our view, the portfolio is well-positioned to participate in continued upside momentum as well as to protect capital on the downside if necessary. We believe it is more imperative than ever to balance “participation with protection” in order to create, build and protect long term wealth.
Sincerely,
Stralem & Company Incorporated
3
Past performance is not predictive of future performance. Investment results and principal value will fluctuate so that shares, when redeemed, may be worth more or less than their original cost. Current performance may be higher or lower than the performance data quoted. Performance data current to the most recent month end are available by calling 1-866-822-9555.
An investor should consider the investment objectives, risks, charges and expenses of the Fund carefully before investing. The Fund’s prospectus contains this and other important information. To obtain a copy of the Fund’s prospectus please visit our website at www.stralemequityfund.com or call 1-866-822-9555 and a copy will be sent to you free of charge. Please read the prospectus carefully before you invest. Stralem Equity Fund is distributed by Ultimus Fund Distributors, LLC.
This Letter to Shareholders seeks to describe some of the Adviser’s current opinions and views of the financial markets. Although the Adviser believes it has a reasonable basis for any opinions or views expressed, actual results may differ, sometimes significantly so, from those expected or expressed. The securities held by the Fund that are discussed in the Letter to Shareholders were held during the period covered by this Report. They do not comprise the entire investment portfolio of the Fund, may be sold at any time and may no longer be held by the Fund. For a complete list of securities held by the Fund as of April 30, 2018, please see the Schedule of Investments section of the semi-annual report. The opinions of the Adviser with respect to those securities may change at any time.
Statements in the Letter to Shareholders that reflect projections or expectations for future financial or economic performance of the Fund and the market in general and statements of the Fund’s plans and objectives for future operations are forward-looking statements. No assurance can be given that actual results or events will not differ materially from those projected, estimated, assumed, or anticipated in any such forward-looking statements. Important factors that could result in such differences, in addition to factors noted with such forward-looking statements include, without limitation, general economic conditions, such as inflation, recession, and interest rates. Past performance is not a guarantee of future results.
4
STRALEM EQUITY FUND
PORTFOLIO INFORMATION
April 30, 2018 (Unaudited)

| | | | | As of October 31, 2017 | | | As of April 30, 2018 | |
| | | | | Value | | | % of Total Investments | | | Value | | | % of Total Investments | |
| UP MARKET | | NEW PRODUCTS | | $ | 13,516,674 | | | | 9.9 | % | | $ | 16,512,432 | | | | 12.6 | % |
| | | NEW INDUSTRIES | | | 26,535,346 | | | | 19.4 | % | | | 24,506,130 | | | | 18.7 | % |
| | | DOMINANT COMPANIES | | | 50,299,002 | | | | 36.7 | % | | | 43,686,222 | | | | 33.3 | % |
| | | | | | | | | | | | | | | | | | | |
| DOWN MARKET | | LOW PRICE TO CASH FLOW | | | 11,756,714 | | | | 8.6 | % | | | 10,932,347 | | | | 8.3 | % |
| | | HIGH YIELD | | | 30,411,986 | | | | 22.2 | % | | | 30,358,664 | | | | 23.1 | % |
| | | | | | | | | | | | | | | | | | | |
| MONEY MARKET | | | | | 4,351,561 | | | | 3.2 | % | | | 5,302,203 | | | | 4.0 | % |
| | | | | $ | 136,871,283 | | | | 100.0 | % | | $ | 131,297,998 | | | | 100.0 | % |
5
STRALEM EQUITY FUND
SCHEDULE OF INVESTMENTS
April 30, 2018 (Unaudited)
| Shares | | | Common Stocks — 95.7% | | Value | |
| | | | Consumer Discretionary — 9.6% | | | |
| | | | Auto Components — 3.2% | | | |
| | 49,250 | | | Aptiv plc | | $ | 4,165,565 | |
| | | | | | | | | |
| | | | | Hotels, Restaurants & Leisure — 3.4% | | | | |
| | 77,400 | | | Starbucks Corporation | | | 4,455,918 | |
| | | | | | | | | |
| | | | | Specialty Retail — 3.0% | | | | |
| | 48,100 | | | Lowe's Companies, Inc. | | | 3,964,883 | |
| | | | | | | | | |
| | | | | Consumer Staples — 5.5% | | | | |
| | | | | Food Products — 3.1% | | | | |
| | 104,200 | | | Mondelēz International, Inc. - Class A | | | 4,115,900 | |
| | | | | | | | | |
| | | | | Tobacco — 2.4% | | | | |
| | 38,900 | | | Philip Morris International, Inc. | | | 3,189,800 | |
| | | | | | | | | |
| | | | | Energy — 6.4% | | | | |
| | | | | Oil, Gas & Consumable Fuels — 6.4% | | | | |
| | 23,800 | | | Chevron Corporation | | | 2,977,618 | |
| | 25,750 | | | EOG Resources, Inc. | | | 3,042,878 | |
| | 148,400 | | | Kinder Morgan, Inc. | | | 2,347,688 | |
| | | | | | | | 8,368,184 | |
| | | | | Financials — 5.4% | | | | |
| | | | | Diversified Financial Services — 3.4% | | | | |
| | 62,000 | | | Intercontinental Exchange, Inc. | | | 4,492,520 | |
| | | | | | | | | |
| | | | | Insurance — 2.0% | | | | |
| | 18,900 | | | Chubb Ltd. | | | 2,564,163 | |
| | | | | | | | | |
| | | | | Health Care — 29.4% | | | | |
| | | | | Biotechnology — 7.8% | | | | |
| | 41,700 | | | AbbVie, Inc. | | | 4,026,135 | |
| | 29,250 | | | Alexion Pharmaceuticals, Inc. (a) | | | 3,440,678 | |
| | 31,950 | | | Celgene Corporation (a) | | | 2,782,845 | |
| | | | | | | | 10,249,658 | |
| | | | | Health Care Equipment & Supplies — 6.1% | | | | |
| | 57,900 | | | Abbott Laboratories | | | 3,365,727 | |
| | 47,000 | | | Danaher Corporation | | | 4,715,040 | |
| | | | | | | | 8,080,767 | |
See notes to financial statements. |
6
STRALEM EQUITY FUND
SCHEDULE OF INVESTMENTS (Continued)
| Shares | | | Common Stocks — 95.7% (Continued) | | Value | |
| | | | Health Care — 29.4% (Continued) | | | |
| | | | Health Care Providers & Services — 3.5% | | | |
| | 19,400 | | | UnitedHealth Group, Inc. | | $ | 4,586,160 | |
| | | | | | | | | |
| | | | | Life Sciences Tools & Services — 2.9% | | | | |
| | 18,150 | | | Thermo Fisher Scientific, Inc. | | | 3,817,852 | |
| | | | | | | | | |
| | | | | Pharmaceuticals — 9.1% | | | | |
| | 24,550 | | | Johnson & Johnson | | | 3,105,329 | |
| | 75,600 | | | Merck & Company, Inc. | | | 4,450,572 | |
| | 119,400 | | | Pfizer, Inc. | | | 4,371,234 | |
| | | | | | | | 11,927,135 | |
| | | | | Industrials — 3.2% | | | | |
| | | | | Air Freight & Logistics — 3.2% | | | | |
| | 17,250 | | | FedEx Corporation | | | 4,264,200 | |
| | | | | | | | | |
| | | | | Information Technology — 22.3% | | | | |
| | | | | Internet Software & Services — 6.1% | | | | |
| | 4,000 | | | Alphabet, Inc. - Class A (a) | | | 4,074,320 | |
| | 23,200 | | | Facebook, Inc. - Class A (a) | | | 3,990,400 | |
| | | | | | | | 8,064,720 | |
| | | | | IT Services — 3.7% | | | | |
| | 38,800 | | | Visa, Inc. - Class A | | | 4,922,944 | |
| | | | | | | | | |
| | | | | Semiconductors & Semiconductor Equipment — 2.5% | | | | |
| | 14,500 | | | Broadcom, Inc. | | | 3,326,590 | |
| | | | | | | | | |
| | | | | Software — 10.0% | | | | |
| | 21,700 | | | Adobe Systems, Inc. (a) | | | 4,808,720 | |
| | 47,600 | | | Microsoft Corporation | | | 4,451,552 | |
| | 84,400 | | | Oracle Corporation | | | 3,854,548 | |
| | | | | | | | 13,114,820 | |
| | | | | Materials — 3.0% | | | | |
| | | | | Chemicals — 3.0% | | | | |
| | 63,300 | | | DowDuPont, Inc. | | | 4,003,092 | |
| | | | | | | | | |
| | | | | Telecommunication Services — 3.0% | | | | |
| | | | | Diversified Telecommunication Services — 3.0% | | | | |
| | 119,000 | | | AT&T, Inc. | | | 3,891,300 | |
See notes to financial statements. |
7
STRALEM EQUITY FUND
SCHEDULE OF INVESTMENTS (Continued)
| Shares | | | Common Stocks — 95.7% (Continued) | | Value | |
| | | | Utilities — 7.9% | | | |
| | | | Electric Utilities — 5.4% | | | |
| | 49,200 | | | Duke Energy Corporation | | $ | 3,943,872 | |
| | 109,200 | | | PPL Corporation | | | 3,177,720 | |
| | | | | | | | 7,121,592 | |
| | | | | Multi-Utilities — 2.5% | | | | |
| | 49,700 | | | Dominion Energy, Inc. | | | 3,308,032 | |
| | | | | | | | | |
| | | | | Total Common Stocks (Cost $85,123,584) | | $ | 125,995,795 | |
| Shares | | | Money Market Funds — 4.0% | | Value | |
| | 5,302,203 | | | Dreyfus Treasury Securities Cash Management Fund - Investor Shares, 1.29% (b) (Cost $5,302,203) | | $ | 5,302,203 | |
| | | | | | | | | |
| | | | | Total Investments at Value — 99.7% (Cost $90,425,787) | | $ | 131,297,998 | |
| | | | | | | | | |
| | | | | Other Assets in Excess of Liabilities — 0.3% | | | 401,606 | |
| | | | | | | | | |
| | | | | Net Assets — 100.0% | | $ | 131,699,604 | |
(a) | Non-income producing security. |
(b) | The rate shown is the 7-day effective yield as of April 30, 2018. |
See notes to financial statements. |
8
STRALEM EQUITY FUND
STATEMENT OF ASSETS AND LIABILITIES
April 30, 2018 (Unaudited)
| ASSETS | | | |
| Investments, at fair value (Notes 1 and 2) (Cost $90,425,787) | | $ | 131,297,998 | |
| Cash | | | 40,664 | |
| Receivable for capital shares sold | | | 317,800 | |
| Dividends receivable | | | 181,189 | |
| Other assets | | | 8,846 | |
| Total Assets | | | 131,846,497 | |
| | | | | |
| LIABILITIES | | | | |
| Payable for capital shares redeemed | | | 42,854 | |
| Payable to Investment Adviser (Note 3) | | | 69,128 | |
| Payable to administrator (Note 3) | | | 16,232 | |
| Accrued expenses | | | 18,679 | |
| Total Liabilities | | | 146,893 | |
| | | | | |
| NET ASSETS | | $ | 131,699,604 | |
| | | | | |
| NET ASSETS CONSIST OF: | | | | |
| Paid-in capital | | $ | 85,105,427 | |
| Accumulated net investment income | | | 434,946 | |
| Accumulated net realized gains from investment transactions | | | 5,287,020 | |
| Net unrealized appreciation on investments | | | 40,872,211 | |
| Net Assets | | $ | 131,699,604 | |
| | | | | |
| Shares of beneficial interest outstanding | | | 13,340,744 | |
| | | | | |
Net asset value, offering price and redemption price per share (a) | | $ | 9.87 | |
(a) | Redemption price varies based on length of time held (Note 1). |
See notes to financial statements. |
9
STRALEM EQUITY FUND
STATEMENT OF OPERATIONS
For the Six Months Ended April 30, 2018 (Unaudited)
| INVESTMENT INCOME | | | |
| Dividends | | $ | 1,479,477 | |
| | | | | |
| EXPENSES | | | | |
| Investment advisory fees (Note 3) | | | 693,206 | |
| Administration fees (Note 3) | | | 63,090 | |
| Professional fees | | | 30,823 | |
| Fund accounting fees (Note 3) | | | 21,759 | |
| Registration and filing fees | | | 9,451 | |
| Compliance fees (Note 3) | | | 7,864 | |
| Transfer agent fees (Note 3) | | | 7,500 | |
| Trustees’ fees and expenses (Note 3) | | | 7,195 | |
| Postage and supplies | | | 4,191 | |
| Bank service fees | | | 3,485 | |
| Printing | | | 2,565 | |
| Other | | | 11,645 | |
| Total Expenses | | | 862,774 | |
| Investment advisory fee reductions (Note 3): | | | (220,262 | ) |
| Net Expenses | | | 642,512 | |
| | | | | |
| NET INVESTMENT INCOME | | | 836,965 | |
| | | | | |
| REALIZED AND UNREALIZED GAINS (LOSSES) ON INVESTMENTS | | | | |
| Net realized gains from investment transactions | | | 5,428,870 | |
| Net change in unrealized appreciation (depreciation) on investments | | | (6,024,432 | ) |
| NET REALIZED AND UNREALIZED LOSSES ON INVESTMENTS | | | (595,562 | ) |
| | | | | |
| NET INCREASE IN NET ASSETS RESULTING FROM OPERATIONS | | $ | 241,403 | |
See notes to financial statements. |
10
STRALEM EQUITY FUND
STATEMENTS OF CHANGES IN NET ASSETS
| | | Six Months
Ended
April 30,
2018
(Unaudited) | | | Year
Ended
October 31,
2017 | |
| OPERATIONS | | | | | | |
| Net investment income | | $ | 836,965 | | | $ | 1,372,588 | |
| Net realized gains from investment transactions | | | 5,428,870 | | | | 7,346,411 | |
| Net change in unrealized appreciation (depreciation) on investments | | | (6,024,432 | ) | | | 12,604,924 | |
| Net increase in net assets resulting from operations | | | 241,403 | | | | 21,323,923 | |
| | | | | | | | | |
| DISTRIBUTIONS TO SHAREHOLDERS (Note 4) | | | | | | | | |
| From investment income | | | (1,377,392 | ) | | | (2,109,539 | ) |
| From realized gains | | | (7,346,089 | ) | | | (17,539,070 | ) |
| Decrease in net assets from distributions to shareholders | | | (8,723,481 | ) | | | (19,648,609 | ) |
| | | | | | | | | |
| CAPITAL SHARE TRANSACTIONS | | | | | | | | |
| Proceeds from shares sold | | | 2,782,346 | | | | 5,811,367 | |
| Net asset value of shares issued in reinvestment of distributions | | | 6,957,350 | | | | 16,004,485 | |
| Proceeds from redemption fees (Note 1) | | | 44 | | | | 5 | |
| Payments for shares redeemed | | | (6,399,087 | ) | | | (29,615,038 | ) |
| Net increase (decrease) in net assets from capital share transactions | | | 3,340,653 | | | | (7,799,181 | ) |
| | | | | | | | | |
| TOTAL DECREASE IN NET ASSETS | | | (5,141,425 | ) | | | (6,123,867 | ) |
| | | | | | | | | |
| NET ASSETS | | | | | | | | |
| Beginning of period | | | 136,841,029 | | | | 142,964,896 | |
| End of period | | $ | 131,699,604 | | | $ | 136,841,029 | |
| | | | | | | | | |
| ACCUMULATED NET INVESTMENT INCOME | | $ | 434,946 | | | $ | 975,373 | |
| | | | | | | | | |
| CAPITAL SHARE ACTIVITY | | | | | | | | |
| Shares sold | | | 274,579 | | | | 597,266 | |
| Shares reinvested | | | 690,898 | | | | 1,720,912 | |
| Shares redeemed | | | (624,788 | ) | | | (2,909,110 | ) |
| Net increase (decrease) in shares outstanding | | | 340,689 | | | | (590,932 | ) |
| Shares outstanding, beginning of period | | | 13,000,055 | | | | 13,590,987 | |
| Shares outstanding, end of period | | | 13,340,744 | | | | 13,000,055 | |
See notes to financial statements. |
11
STRALEM EQUITY FUND
FINANCIAL HIGHLIGHTS
| (For a share outstanding throughout each period) | | | |
| | | Six Months
Ended
April 30, 2018 | | | Year Ended October 31, | |
| | | (Unaudited) | | | 2017 | | | 2016 | | | 2015 | | | 2014 | | | 2013 (a) | |
| Net asset value, beginning of period | | $ | 10.53 | | | $ | 10.52 | | | $ | 15.53 | | | $ | 17.45 | | | $ | 16.77 | | | $ | 14.10 | |
| | | | | | | | | | | | | | | | | | | | | | | | | |
| Income (loss) from investment operations: | | | | | | | | | | | | | | | | | | | | | | | | |
| Net investment income | | | 0.06 | | | | 0.12 | | | | 0.22 | | | | 0.23 | | | | 0.24 | | | | 0.27 | |
| Net gain (loss) on investments | | | (0.04 | ) | | | 1.49 | | | | 0.24 | | | | 0.34 | | | | 1.70 | | | | 2.87 | |
| Total from investment operations | | | 0.02 | | | | 1.61 | | | | 0.46 | | | | 0.57 | | | | 1.94 | | | | 3.14 | |
| | | | | | | | | | | | | | | | | | | | | | | | | |
| Less distributions: | | | | | | | | | | | | | | | | | | | | | | | | |
| Dividends from net investment income | | | (0.11 | ) | | | (0.17 | ) | | | (0.25 | ) | | | (0.25 | ) | | | (0.26 | ) | | | (0.25 | ) |
| Distributions from net realized gains | | | (0.57 | ) | | | (1.43 | ) | | | (5.22 | ) | | | (2.24 | ) | | | (1.00 | ) | | | (0.22 | ) |
| Total distributions | | | (0.68 | ) | | | (1.60 | ) | | | (5.47 | ) | | | (2.49 | ) | | | (1.26 | ) | | | (0.47 | ) |
| | | | | | | | | | | | | | | | | | | | | | | | | |
| Proceeds from redemption fees collected (Note 1) | | | 0.00 | (b) | | | 0.00 | (b) | | | 0.00 | (b) | | | 0.00 | (b) | | | 0.00 | (b) | | | 0.00 | (b) |
| | | | | | | | | | | | | | | | | | | | | | | | | |
| Net asset value, end of period | | $ | 9.87 | | | $ | 10.53 | | | $ | 10.52 | | | $ | 15.53 | | | $ | 17.45 | | | $ | 16.77 | |
| | | | | | | | | | | | | | | | | | | | | | | | | |
Total return (c) | | | 0.01 | %(d) | | | 17.36 | % | | | 4.72 | % | | | 3.43 | % | | | 12.18 | % | | | 22.97 | % |
| | | | | | | | | | | | | | | | | | | | | | | | | |
| Ratios/supplemental data: | | | | | | | | | | | | | | | | | | | | | | | | |
| Net assets, end of period (000’s) | | $ | 131,700 | | | $ | 136,841 | | | $ | 142,965 | | | $ | 190,800 | | | $ | 318,237 | | | $ | 365,022 | |
| Ratio of total expenses to average net assets | | | 1.28 | %(e) | | | 1.28 | % | | | 1.42 | % | | | 1.21 | % | | | 1.12 | % | | | 1.09 | % |
Ratio of net expenses to average net assets (f) | | | 0.95 | %(e) | | | 0.95 | % | | | 0.98 | % | | | 0.98 | % | | | 0.98 | % | | | 0.98 | % |
Ratio of net investment income to average
net assets (f) | | | 1.24 | %(e) | | | 1.03 | % | | | 1.52 | % | | | 1.17 | % | | | 1.27 | % | | | 1.61 | % |
| Portfolio turnover rate | | | 14 | %(d) | | | 7 | % | | | 8 | % | | | 33 | % | | | 19 | % | | | 14 | % |
(a) | Per share amounts reflect the 10:1 stock split effective February 22, 2013 (Note 1). |
(b) | Amount rounds to less than $0.01 per share. |
(c) | Total return is the measure of the change in value of an investment in the Fund over the periods covered, which assumes any dividends or capital gains distributions are reinvested in shares of the Fund. Returns shown do not reflect the deduction of taxes a shareholder would pay on Fund distributions or the redemption of Fund shares. The total returns would be lower if the Adviser had not reduced advisory fees and/or reimbursed expenses (Note 3). |
(d) | Not annualized. |
(e) | Annualized. |
(f) | Ratio was determined after advisory fee reductions and/or expense reimbursements by the Investment Adviser (Note 3). |
See notes to financial statements. |
12
STRALEM EQUITY FUND
NOTES TO FINANCIAL STATEMENTS
April 30, 2018 (Unaudited)
1. | ORGANIZATION AND SUMMARY OF SIGNIFICANT ACCOUNTING POLICIES |
Stralem Equity Fund (the “Fund”) is a diversified series of Ultimus Managers Trust (the “Trust”). The Trust is an open-end management investment company registered under the Investment Company Act of 1940, as amended (the “1940 Act”). The Fund was reorganized into the Trust on October 17, 2016. It was formerly a series of Stralem Fund. The Fund’s investment objective is to seek long-term capital appreciation.
The Fund follows accounting and reporting guidance under Financial Accounting Standards Board Accounting Standards Codification Topic 946, “Financial Services – Investment Companies.” The following is a summary of the Fund’s significant accounting policies used in the preparation of its financial statements. These policies are in conformity with accounting principles generally accepted in the United States of America (“GAAP”).
Reorganization:
The Fund is the legal successor to Stralem Equity Fund (the “Predecessor Fund”), a series of Stralem Fund, an unaffiliated registered investment company. On October 17, 2016, the Fund (which had no prior activity or net assets) acquired all the net assets of the Predecessor Fund pursuant to a plan of reorganization (the “Reorganization”).
The Predecessor Fund commenced operations on January 18, 2000. The accounting and performance history of the Predecessor Fund were re-designated as that of the Fund.
Investment valuation:
GAAP establishes a single authoritative definition of fair value, sets out a framework for measuring fair value and requires additional disclosures about fair value measurements.
Various inputs are used in determining the value of the Fund’s investments. These inputs are summarized in the three broad levels listed below:
Level 1 – quoted prices in active markets for identical securities
Level 2 – other significant observable inputs
Level 3 – significant unobservable inputs
The inputs or methodology used for valuing securities are not necessarily an indication of the risks associated with investing in those securities. The inputs used to measure fair value may fall into different levels of the above fair value
13
STRALEM EQUITY FUND
NOTES TO FINANCIAL STATEMENTS (Continued)
hierarchy. In such cases, for disclosure purposes, the level in the fair value hierarchy within which the fair value measurement falls is determined based on the lowest level input that is significant to the fair value measurement.
The Fund’s portfolio securities are valued as of the close of business of the regular session of trading on the New York Stock Exchange (“NYSE”) (normally 4:00 p.m., Eastern time). Securities which are traded on stock exchanges are valued at the closing price on the day the securities are being valued, or, if not traded on a particular day, at the closing mean price. Securities quoted by NASDAQ are valued at the NASDAQ Official Closing Price. Securities traded in the over-the-counter market are valued at the last sale price, if available, otherwise, at the last quoted mean price. Investments in money market funds are valued at net asset value (“NAV”).
When using a quoted price and when the market for the security is considered active, the security will be classified as Level 1 within the fair value hierarchy (see above). In the event that market quotations are not readily available or are considered unreliable due to market or other events, the Fund values its securities and other assets at fair value pursuant to procedures established by and under the direction of the Board of Trustees (the “Board”) of the Trust. Under these procedures, the securities will be classified as Level 2 or 3 within the fair value hierarchy, depending on the inputs used. Unavailable or unreliable market quotes may be due to the following factors: a substantial bid-ask spread; infrequent sales resulting in stale prices; insufficient trading volume; small trade sizes; a temporary lapse in any reliable pricing source; and actions of the securities or futures markets, such as the suspension or limitation of trading. As a result, the prices of securities used to calculate the Fund’s NAV may differ from quoted or published prices for the same securities.
Investment transactions and income:
Investment transactions are accounted for on the trade date. Realized gains and losses on sales of investments are calculated on a specific identification basis. Dividend income is recorded on the ex-dividend date, and interest income is recognized on the accrual basis.
Common Expenses:
Common expenses of the Trust are allocated among the Fund and other series of the Trust based on the relative net assets of each series or the nature of the services performed and the relative applicability to each series.
Share valuation and redemption fees:
The NAV per share of the Fund is calculated as of the close of regular trading on the NYSE (normally 4:00 pm, Eastern time) on each day the NYSE is open for business by dividing the total value of the Fund’s assets, less liabilities, by the number of shares outstanding. The offering price and redemption price per share
14
STRALEM EQUITY FUND
NOTES TO FINANCIAL STATEMENTS (Continued)
is equal to the NAV per share, except that shares are subject to a redemption fee of 1% if shares are redeemed within 60 days of purchase. During the periods ended April 30, 2018 and October 31, 2017, proceeds from redemption fees totaled $44 and $5, respectively.
Stock split:
The Board of Trustees of Stralem Fund approved a ten-for-one stock split for the Predecessor Fund, effective February 22, 2013. All references to share and per share amounts in these financial statements have been retroactively adjusted to reflect the ten-for-one stock split for all periods presented.
Taxes:
The Fund has qualified and intends to continue to qualify as a regulated investment company under the Internal Revenue Code of 1986, as amended (the “Code”). Qualification generally will relieve the Fund of liability for federal income taxes to the extent its net investment income and net realized capital gains are distributed in accordance with the Code.
In order to avoid imposition of a federal excise tax applicable to regulated investment companies, the Fund must declare and pay as dividends in each calendar year at least 98% of its net investment income (earned during the calendar year) and 98.2% of its net realized capital gains (earned during the twelve months ended October 31) plus undistributed amounts from prior years.
The Fund recognizes the tax benefits or expenses of uncertain tax positions only when the position is “more likely than not” to be sustained assuming examination by tax authorities. Management has reviewed the Fund’s tax positions for the current and all open tax years (tax years ended October 31, 2014 through October 31, 2017) and has concluded that no provision for unrecognized tax benefits or expenses is required in these financial statements.
Use of estimates:
The preparation of financial statements in conformity with GAAP requires management to make estimates and assumptions that affect the reported amounts of assets and liabilities and disclosure of contingent assets and liabilities as of the date of the financial statements and the reported amounts of income and expenses during the reporting period. Actual results could differ from those estimates.
15
STRALEM EQUITY FUND
NOTES TO FINANCIAL STATEMENTS (Continued)
The following is a summary of the inputs used to value the Fund’s investments by security type as of April 30, 2018:
| | | Level 1 | | | Level 2 | | | Level 3 | | | Total | |
| Common Stocks | | $ | 125,995,795 | | | $ | — | | | $ | — | | | $ | 125,995,795 | |
| Money Market Funds | | | 5,302,203 | | | | — | | | | — | | | | 5,302,203 | |
| Total | | $ | 131,297,998 | | | $ | — | | | $ | — | | | $ | 131,297,998 | |
Refer to the Fund’s Schedule of Investments for a listing of the common stocks by industry type. As of April 30, 2018, the Fund did not have any transfers between Levels. There were no Level 2 or Level 3 securities or derivative instruments held by the Fund as of April 30, 2018. It is the Fund’s policy to recognize transfers between Levels at the end of the reporting period.
3. | RELATED PARTY TRANSACTIONS |
Pursuant to an Investment Advisory Agreement with Stralem & Company Incorporated (the “Adviser”), the Fund pays the Adviser an advisory fee, payable quarterly, based on the average weekly net assets of the Fund, equal to 1.25% per annum of the first $50 million of such net assets; 1.00% per annum of the next $50 million of such net assets; and 0.75% per annum of such net assets in excess of $100 million.
The Adviser has agreed contractually, until at least March 1, 2019, to reduce its advisory fees and reimburse other expenses to the extent necessary to limit total annual fund operating expenses (excluding brokerage costs; taxes; interest; costs to organize the Fund; acquired fund fees and expenses; extraordinary expenses such as litigation and merger or reorganization costs and other expenses not incurred in the ordinary course of the Fund’s business; and amounts, if any, payable pursuant to a plan adopted in accordance with Rule 12b-1 under the 1940 Act) to an amount not exceeding 0.95% of the Fund’s average daily net assets. During the six months ended April 30, 2018, the Adviser reduced its advisory fees in the amount of $220,262.
Advisory fee reductions and expense reimbursements by the Adviser are subject to repayment by the Fund for a period of three years after such fees and expenses were incurred, provided that the repayments do not cause total annual fund operating expenses to exceed the lesser of (i) the expense limitation then in effect, if any, and (ii) the expense limitation in effect at the time the expenses to be repaid were incurred. Prior to March 1, 2019, this agreement may not be modified or terminated without the approval of the Board. This agreement will terminate automatically if the Investment Advisory Agreement is terminated. As
16
STRALEM EQUITY FUND
NOTES TO FINANCIAL STATEMENTS (Continued)
of April 30, 2018, the amount of fee reductions and expense reimbursements available for recovery by the Adviser is $652,114, which must be recovered no later than the dates stated below:
October 31, 2020 | | | $ | 431,852 | |
April 30, 2021 | | | | 220,262 | |
| | | | $ | 652,114 | |
Ultimus Fund Solutions, LLC (“Ultimus”) provides administration, fund accounting, compliance, and transfer agent services for the Fund. The Fund pays Ultimus fees in accordance with the agreements for such services. In addition, the Fund pays out-of-pocket expenses including, but not limited to, postage, supplies and costs of pricing the Fund’s portfolio securities.
Pursuant to a Distribution Agreement with Ultimus Fund Distributors, LLC (the “Distributor”), the Distributor provides distribution services and serves as principal underwriter for the Fund. The Distributor is a wholly owned subsidiary of Ultimus. The Distributor does not receive a fee from the Fund or the Adviser for its distribution services.
Certain officers and a Trustee of the Trust are also officers of Ultimus and the Distributor.
Each Trustee who is not an “interested person” of the Trust (“Independent Trustee”) receives a $1,000 annual retainer from the Fund, except for the Board Chairman who receives a $1,200 annual retainer from the Fund. Each Independent Trustee also receives from the Fund a fee of $500 for each Board meeting attended plus reimbursement of travel and other meeting-related expenses.
4. | DISTRIBUTIONS TO SHAREHOLDERS |
Distributions arising from net investment income and net realized capital gains, if any, are declared and paid to shareholders annually. The amount of distributions from net investment income and net realized capital gains are determined in accordance with the Code, which may differ from GAAP. The tax character of distributions paid to shareholders during the periods ended April 30, 2018 and October 31, 2017 was as follows:
| Periods Ended | | | Ordinary
Income | | | Long-Term
Capital Gains | | | Total
Distributions | |
April 30, 2018 | | | $ | 1,508,018 | | | $ | 7,215,463 | | | $ | 8,723,481 | |
October 31, 2017 | | | $ | 2,489,305 | | | $ | 17,159,304 | | | $ | 19,648,609 | |
17
STRALEM EQUITY FUND
NOTES TO FINANCIAL STATEMENTS (Continued)
The following information is computed on a tax basis for each item as of April 30, 2018:
| Cost of portfolio investments | | $ | 90,567,252 | |
| Gross unrealized appreciation | | $ | 42,638,161 | |
| Gross unrealized depreciation | | | (1,907,415 | ) |
| Net unrealized appreciation | | | 40,730,746 | |
| Accumulated ordinary income | | | 434,946 | |
| Other gains | | | 5,428,485 | |
| Accumulated earnings | | $ | 46,594,177 | |
The difference between the federal income tax cost of portfolio investments and the financial statement cost and the difference between the book-basis and tax-basis net unrealized appreciation is due to certain timing differences in the recognition of capital gains or losses under income tax regulations and GAAP. These “book/tax” differences are temporary in nature and are due to the tax deferral of losses on wash sales.
6. | INVESTMENT TRANSACTIONS |
During the six months ended April 30, 2018, cost of purchases and proceeds from sales of investment securities, other than short-term investments, amounted to $18,216,521 and $24,144,886, respectively.
7. | PRINCIPAL HOLDERS OF FUND SHARES |
As of April 30, 2018, the following shareholders owned of record 5% or more of the outstanding shares of the Fund:
Name of Record Owner | % Ownership |
Pershing LLC (for the benefit of its customers) | 60% |
Lindercourse & Co. (for the benefit of its customers) | 8% |
Saxon & Co. (for the benefit of its customers) | 8% |
National Financial Services LLC (for the benefit of its customers) | 6% |
The Catholic Foundation | 5% |
Strafe & Co. (for the benefit of its customers) | 5% |
A beneficial owner of 25% or more of the Fund’s outstanding shares may be considered a controlling person. That shareholder’s vote could have a more significant effect on matters presented at a shareholder’s meeting.
18
STRALEM EQUITY FUND
NOTES TO FINANCIAL STATEMENTS (Continued)
If the Fund has significant investments in the securities of issuers within a particular sector, any development affecting that sector will have a greater impact on the value of the net assets of the Fund than would be the case if the Fund did not have significant investments in that sector. In addition, this may increase the risk of loss in the Fund and increase the volatility of the Fund’s NAV per share. Occasionally, market conditions, regulatory changes or other developments may negatively impact this sector, and therefore the value of the Fund’s portfolio will be adversely affected. As of April 30, 2018, the Fund had 29.4% of the value of its net assets invested in securities within the Health Care sector.
9. | CONTINGENCIES AND COMMITMENTS |
The Fund indemnifies the Trust’s officers and Trustees for certain liabilities that might arise from their performance of their duties to the Fund. Additionally, in the normal course of business the Fund enters into contracts that contain a variety of representations and warranties and which provide general indemnifications. The Fund’s maximum exposure under these arrangements is unknown, as this would involve future claims that may be made against the Fund that have not yet occurred. However, the Fund has not had any prior claims or losses pursuant to these arrangements.
The Fund is required to recognize in the financial statements the effects of all subsequent events that provide additional evidence about conditions that existed as of the date of the Statement of Assets and Liabilities. For non-recognized subsequent events that must be disclosed to keep the financial statements from being misleading, the Fund is required to disclose the nature of the event as well as an estimate of its financial effect, or a statement that such an estimate cannot be made. Management has evaluated subsequent events through the issuance of these financial statements and has noted no such events.
19
STRALEM EQUITY FUND
DISCLOSURE OF FUND EXPENSES (Unaudited)
As a shareholder of the Fund, you incur ongoing costs, including management fees and other Fund expenses, which are deducted from the Fund’s gross income. This Example is intended to help you understand your ongoing costs (in dollars) of investing in the Fund and to compare these costs with the ongoing costs of investing in other mutual funds.
The Example is based on an investment of $1,000 invested at the beginning of the period (November 1, 2017) and held until the end of the period (April 30, 2018).
Actual Expenses
The first line of the table below provides information about actual account values and actual expenses. You may use the information in this line, together with the amount you invested, to estimate the expenses that you paid over the period. Simply divide your account value by $1,000 (for example, an $8,600 account value divided by $1,000 = 8.6), then multiply the result by the number in the first line under the heading entitled “Expenses Paid During Period” to estimate the expenses you paid on your account during this period.
Hypothetical Example for Comparison Purposes
The second line of the table below provides information about hypothetical account values and hypothetical expenses based on the Fund’s actual expense ratio and an assumed rate of return of 5% per year before expenses, which is not the Fund’s actual return. The hypothetical account values and expenses may not be used to estimate the actual ending account balance or expenses you paid for the period. You may use this information to compare the ongoing costs of investing in the Fund and other mutual funds. To do so, compare this 5% hypothetical example with the 5% hypothetical examples that appear in the shareholder reports of other funds.
| | | Beginning
Account Value
November 1, 2017 | | | Ending
Account Value
April 30, 2018 | | | Expenses Paid
During Period* | |
| Based on Actual Fund Return | | $ | 1,000.00 | | | $ | 1,000.10 | | | $ | 4.71 | |
| Based on Hypothetical 5% Return | | $ | 1,000.00 | | | $ | 1,020.08 | | | $ | 4.76 | |
* | Expenses are equal to the Fund’s annualized net expense ratio of 0.95% for the period, multiplied by the average account value over the period, multiplied by 181/365 (to reflect the one-half year period). |
20
STRALEM EQUITY FUND
ADDITIONAL INFORMATION (Unaudited)
PROXY VOTING POLICIES AND PROCEDURES
A description of the Fund’s proxy voting policies and procedures is available, without charge, upon request by calling toll free (866) 822-9555, or on the U.S. Securities and Exchange Commission’s (the “SEC”) website at http://www.sec.gov. The Fund’s proxy voting record for the most recent 12-month period ended June 30th is also available from the SEC’s website at http://www.sec.gov or upon request by calling the Fund at (866) 822-9555.
QUARTERLY PORTFOLIO HOLDINGS
The Fund’s Forms N-Q containing a complete schedule of portfolio holdings as of the end of the first and third quarters of each fiscal year are available on the SEC’s website at http://www.sec.gov or are available upon request, without charge, by calling toll free at (866) 822-9555. The Fund’s Forms N-Q may also be reviewed and copied at the SEC’s Public Reference Room in Washington, DC, and information on the operation of the Public Reference Room may be obtained by calling 1-(800) SEC-0338.
HOUSEHOLDING
The Fund will generally send only one copy of the summary prospectus, proxy material, annual report and semi-annual report to shareholders residing at the same “household.” This reduces Fund expenses which benefits all shareholders, minimizes the volume of mail you receive and eliminates duplicates of the same information. If you need additional copies of these documents, a copy of the prospectus or do not want your mailings to be “householded,” please send us a written request or call us toll free at (866) 822-9555.
21
STRALEM EQUITY FUND
INVESTMENT ADVISER
Stralem & Company Incorporated
551 Madison Avenue, 10th Floor
New York, NY 10022
Telephone (212) 888-8123
Fax (212) 888-8152
This report is prepared for the information of the Fund’s shareholders. It is not authorized for distribution to prospective investors in the Fund unless it is preceded or accompanied by a current summary prospectus and/or prospectus which each describe the Fund’s objectives, risks, policies, expenses and other important information. Investors are advised to read the summary prospectus and/or prospectus carefully before investing. Past performance is not indicative of future results. Current performance may be lower or higher than the data contained herein. For performance information current through the most recent month end, please visit the Fund’s website at www.stralemequityfund.com or call toll-free (866) 822-9555. The Fund can suffer losses as well as gains.
22
FACTS | WHAT DOES THE STRALEM EQUITY FUND (the “Fund”) DO WITH YOUR PERSONAL INFORMATION? |
Why? | Financial companies choose how they share your personal information. Federal law gives consumers the right to limit some but not all sharing. Federal law also requires us to tell you how we collect, share, and protect your personal information. Please read this notice carefully to understand what we do. |
What? | The types of personal information we collect and share depend on the product or service you have with us. This information can include: ■ Social Security number ■ Assets ■ Retirement Assets ■ Transaction History ■ Checking Account Information ■ Purchase History ■ Account Balances ■ Account Transactions ■ Wire Transfer Instructions When you are no longer our customer, we continue to share your information as described in this notice. |
How? | All financial companies need to share your personal information to run their everyday business. In the section below, we list the reasons financial companies can share their customers’ personal information; the reasons the Fund chooses to share; and whether you can limit this sharing. |
Reasons we can share your personal information | Does the
Fund share? | Can you limit
this sharing? |
For our everyday business purposes — Such as to process your transactions, maintain your account(s), respond to court orders and legal investigations, or report to credit bureaus | Yes | No |
For our marketing purposes — to offer our products and services to you | No | We don’t share |
For joint marketing with other financial companies | No | We don’t share |
For our affiliates’ everyday business purposes — information about your transactions and experiences | No | We don’t share |
For our affiliates’ everyday business purposes — information about your creditworthiness | No | We don’t share |
For nonaffiliates to market to you | No | We don’t share |
Questions? | Call 1-866-822-9555 |
23
Who we are |
Who is providing this notice? | Stralem Equity Fund Ultimus Fund Distributors, LLC (Distributor) Ultimus Fund Solutions, LLC (Administrator) |
What we do |
How does the Fund protect my personal information? | To protect your personal information from unauthorized access and use, we use security measures that comply with federal law. These measures include computer safeguards and secured files and buildings. Our service providers are held accountable for adhering to strict policies and procedures to prevent any misuse of your nonpublic personal information. |
How does the Fund collect my personal information? | We collect your personal information, for example, when you ■ Open an account ■ Provide account information ■ Give us your contact information ■ Make deposits or withdrawals from your account ■ Make a wire transfer ■ Tell us where to send the money ■ Tell us who receives the money ■ Show your government-issued ID ■ Show your driver’s license We also collect your personal information from other companies. |
Why can’t I limit all sharing? | Federal law gives you the right to limit only ■ Sharing for affiliates’ everyday business purposes – information about your creditworthiness ■ Affiliates from using your information to market to you ■ Sharing for nonaffiliates to market to you State laws and individual companies may give you additional rights to limit sharing. |
Definitions |
Affiliates | Companies related by common ownership or control. They can be financial and nonfinancial companies. ■ Stralem & Company Incorporated, the investment adviser to the Fund, could be deemed to be an affiliate. |
Nonaffiliates | Companies not related by common ownership or control. They can be financial and nonfinancial companies ■ The Fund does not share with nonaffiliates so they can market to you. |
Joint marketing | A formal agreement between nonaffiliated financial companies that together market financial products or services to you. ■ The Fund does not jointly market. |
24
[This page intentionally left blank]

| MEEHAN FOCUS FUND SEMI-ANNUAL REPORT April 30, 2018 (Unaudited) |
This report is for the information of the shareholders of Meehan Focus Fund. Its use in connection with any offering of the Fund’s shares is authorized only in a case of concurrent or prior delivery of the Fund’s current prospectus. Investors should refer to the Fund’s prospectus for a description of risk factors associated with investments in the Fund. The information in this report has not been audited. |
Meehan Focus Fund
A Series of Ultimus Managers Trust
7250 Woodmont Avenue, Suite 315
Bethesda, MD 20814
(866) 884-5968 | Distributor:
Ultimus Fund Distributors, LLC
225 Pictoria Drive, Suite 450
Cincinnati, OH 45246
(800) 933-8413 |
MEEHAN FOCUS FUND
LETTER TO SHAREHOLDERS | June 6, 2018 |
Dear Fellow Shareholders1:
The total return for the Meehan Focus Fund (“the Fund”) for the first six months of its 2018 fiscal year through April 30, 2018 was 2.19%2; the Fund’s net asset value (“NAV”) at April 30, 2018 was $24.52.
Market and Economic Conditions
After months of steady climbing, including a strong start to 2018 as the market celebrated December’s tax bill, stocks hit a rough patch in late January and early February, experiencing their first correction (a drop of 10%-20% from the previous high) since early 2016. Volatility rose sharply and stocks declined as data showed January wage growth accelerated at a more rapid rate than anticipated, stoking fears that a pickup in growth and inflation would cause the Federal Reserve (the Fed) to raise rates more quickly than expected.3 Adding to investor concerns, the Trump administration announced its intention to impose tariffs on steel and aluminum imports, drawing criticism from trading partners and raising fears that affected countries would retaliate.
Volatility remained a theme through March and April. Stocks largely recovered from their early February swoon, but then the technology sector came under pressure in March, dragging the major indexes down with it. The threat of increased regulation was the major issue, and the revelation of a large data breach at Facebook was the primary culprit. While stocks regained some of the ground lost in the correction by the end of April, they remain below their late-January high.
Investors remain concerned about volatility, the trajectory of interest rates and inflation, and the specter of protectionism. However, strong corporate earnings, reasonable valuations, and steady economic growth have supported stocks. First quarter earnings for S&P 500 companies rose 26%, the highest since the fourth quarter of 2010, while revenues grew 8.3%, the strongest since the third quarter of 2011.4
1 | The views expressed herein are not meant as investment advice. Although some of the described portfolio holdings were viewed favorably as of the date of this letter, there is no guarantee that the Fund will continue to hold these securities in the future. Please consider the investment objectives, risks, charges, and expenses of the Fund before investing. Contact the Fund at (866) 884-5968 for a prospectus, which contains this and other important information about the Fund. Read the prospectus carefully before investing. |
2 | Past performance does not guarantee future results. Performance data quoted above represents past performance, and the investment return and principal value of an investment will fluctuate so that an investor’s shares, when redeemed, may be worth more or less than their original cost. Current performance may be lower or higher than the performance data quoted. To obtain more current performance information, please call (866) 884-5968. |
3 | Derby, Michael S. “After Market Turmoil, Fed Officials Stand Firm on Rate-Increase Course.” The Wall Street Journal, February 7, 2018. |
4 | Thomson Reuters S&P 500 2018Q1 Earnings Dashboard, June 1, 2018; S&P Dow Jones Indices. |
1
U.S. GDP grew at an estimated 2.2% rate in the first quarter, a deceleration from 2017’s fourth quarter, but expectations are that growth in coming quarters will be more robust. Elsewhere in the world, economic expansion also continued in the first quarter. Though there are some signs of slowing growth in Europe, the synchronized global expansion that began last year is expected to continue in 2018 with the International Monetary Fund projecting global growth to reach 3.9%, the best since the Great Recession.1
After boosting rates three times in 2017, the Fed announced its first increase of 2018 at its March 21 meeting, the first led by incoming Chairman Powell. Current expectations are for the Fed to raise rates a total of three to four times in 2018; in our view any additional increases would not be welcomed by the markets.
Our outlook for the remainder of 2018 is cautiously optimistic. Already-strong corporate earnings growth received a boost from tax reform and should provide support for further increases in stocks. In addition, we believe the U.S. economy can continue its steady expansion even as the Fed removes some of the monetary stimulus it has provided since the Great Recession. Solid global economic growth should support equity markets outside the United States and also boost revenues for U.S. multinationals, which garner 38% of their earnings from abroad.
The primary risks to this scenario, in our view, are rising interest rates and further protectionist measures disrupting global trade; we expect stock prices at the end of 2018 to be higher than today.
Portfolio Review
The attached Schedule of Investments identifies the Fund’s investments and their market value as of April 30, 2018. The Fund’s top 10 holdings, which represented 54.1% of the Fund’s portfolio on April 30, 2018, were as follows:
Company | % of Fund |
1. | Berkshire Hathaway, Inc. – Class B | 8.0 |
2. | Microsoft Corporation | 7.9 |
3. | Lowe's Companies, Inc. | 6.3 |
4. | Apple, Inc. | 5.8 |
5. | Alphabet Inc. – Classes A and C | 5.6 |
6. | PNC Financial Services Group, Inc. (The) | 5.6 |
7. | United Rentals, Inc. | 4.6 |
8. | Boeing Company (The) | 3.7 |
9. | iShares MSCI Eurozone ETF | 3.4 |
10. | Affiliated Managers Group, Inc. | 3.2 |
| | | 54.1 |
As of April 30, 2018, all of the Fund’s top 10 holdings showed gains since the Fund purchased them. The Fund’s largest gains, in dollar terms, were in Microsoft Corp. (“Microsoft”), Berkshire Hathaway, Inc., and Lowe’s Companies, Inc.
1 | International Monetary Fund, World Economic Outlook (April 2018). |
2
The Fund’s performance over the past six months was driven by solid returns from Microsoft, Boeing, and Express Scripts, counterbalanced by declines in General Motors Company (“GM”) and 3M Company (“3M”).
Several positive factors drove Boeing’s results over the past several months, including an increase in projected 2018 aircraft deliveries, a prospering airline industry which is steadily adding new orders, expanding margins, and an expected earnings boost from tax reform.
Microsoft shares continued to benefit from the trends that made the stock one of the Fund’s best performing holdings in 2017: the company’s successful shift from a personal computer-based business strategy to one focused on a mobile, cloud-based computing platform and the network effect created by its massive enterprise footprint across a multitude of products and services. Earnings for the quarter ended March 31 rose 16%, and both earnings and revenues exceeded estimates. The performance was led by 93% revenue growth in its Azure cloud platform and solid results across all its business segments.
Shares of Express Scripts were buffeted in 2017 by news that its largest customer would be leaving when its contract expires in 2019 and negative press coverage of the role pharmacy benefit managers like Express Scripts play in the health care system. Despite these headwinds, Express Scripts continued to post solid results and maintained a strong competitive position due to the cost-saving and efficiency services it offers to its customers, and in March managed-care company Cigna offered to acquire Express Scripts at a substantial premium. While the merger is subject to regulatory review, we are optimistic that it will be approved and close in the second half of 2018, rewarding Express Scripts shareholders.
GM beat its first quarter earnings estimates handily, but concerns about slowing auto sales have weighed on the shares. Unlike the past, GM today has a healthy North American unit with a competitive lineup in all vehicle segments and just four brands to market, as compared to eight before its restructuring. We believe the slimmed-down, post-bankruptcy GM is well positioned to prosper even if 2018 vehicle sales decline from 2017 totals. Since April 30, shares of GM have rallied significantly, largely due to the announcement that Japan’s SoftBank Vision Fund would invest $2.25 billion in GM’s autonomous vehicle subsidiary GM Cruise, a strong endorsement of GM’s position in this emerging technology. This announcement was welcome but unexpected and serves to reinforce our view that the market has underestimated the value of today’s GM.
3M’s first quarter earnings exceeded estimates, but management lowered the high end of its full-year earnings and cash flow guidance, and the market punished its shares. We view this news as a temporary setback for this diversified industrial powerhouse that holds a leading position in many of its sectors. Revenues, earnings, and margins all increased in the first quarter, and 3M is well positioned to benefit from continued global growth. 3M is well managed and has consistently grown on the strength of its commitment to innovation and new product development, and we believe that improved revenue and earnings momentum in coming quarters will push its shares higher.
Over the past six months we made several changes to the Fund’s portfolio. We sold the Fund’s position in managed care company Anthem, Inc. at a substantial gain after it reached our estimate of its full value. We also reduced the Fund’s positions in pharmaceutical company Merck & Company, Inc. and industrial company Johnson Controls International plc, realizing a modest gain on the Merck sale and a loss on the sale of Johnson Controls. We added three new stocks to the Fund’s portfolio: homebuilder Lennar Corporation, medical device manufacturer Medtronic plc, and social media company Facebook, Inc. Finally, we increased several existing holdings.
3
Conclusion
We appreciate your confidence in our management of the Fund and look forward to continued success. You can check the Fund’s NAV online at any time by typing in the Fund’s ticker symbol (MEFOX) into most stock quotation services. Best wishes for a relaxing and restful summer — and please do not hesitate to contact us if you have any questions regarding your investment in the Fund.
Sincerely,

| 
|
Thomas P. Meehan | Paul P. Meehan |
| | |

| |
R. Jordan Smyth, Jr. | |
Portfolio Managers, Meehan Focus Fund | |
Past performance is not predictive of future performance. Investment results and principal value will fluctuate so that shares, when redeemed, may be worth more or less than their original cost. Current performance may be higher or lower than the performance data quoted. Performance data current to the most recent month end are available by calling 1-866-884-5968.
An investor should consider the investment objectives, risks, charges and expenses of the Fund carefully before investing. The Fund’s prospectus contains this and other important information. To obtain a copy of the Fund’s prospectus, please visit the Fund’s website at www.meehanmutualfunds.com or call 1-866-884-5968 and a copy will be sent to you free of charge. Please read the prospectus carefully before you invest. The Meehan Focus Fund is distributed by Ultimus Fund Distributors, LLC.
This Letter to Shareholders seeks to describe some of the Adviser’s current opinions and views of the financial markets. Although the Adviser believes it has a reasonable basis for any opinions or views expressed, actual results may differ, sometimes significantly so, from those expected or expressed. The securities held by the Fund that are discussed in the Letter to Shareholders were held during the period covered by this Report. They do not comprise the entire investment portfolio of the Fund, may be sold at any time and may no longer be held by the Fund. For a complete list of securities held by the Fund as of April 30, 2018, please see the Schedule of Investments section of the semi-annual report. The opinions of the Adviser with respect to those securities may change at any time.
Statements in the Letter to Shareholders that reflect projections or expectations for future financial or economic performance of the Fund and the market in general and statements of the Fund’s plans and objectives for future operations are forward-looking statements. No assurance can be given that actual results or events will not differ materially from those projected, estimated, assumed, or anticipated in any such forward-looking statements. Important factors that could result in such differences, in addition to factors noted with such forward-looking statements include, without limitation, general economic conditions, such as inflation, recession, and interest rates.
4
MEEHAN FOCUS FUND
PERFORMANCE INFORMATION
April 30, 2018 (Unaudited)
Comparison of Change in Value of a $10,000 Investment in the
Meehan Focus Fund vs. the S&P 500® Total Return Index and
the NASDAQ Composite Index*
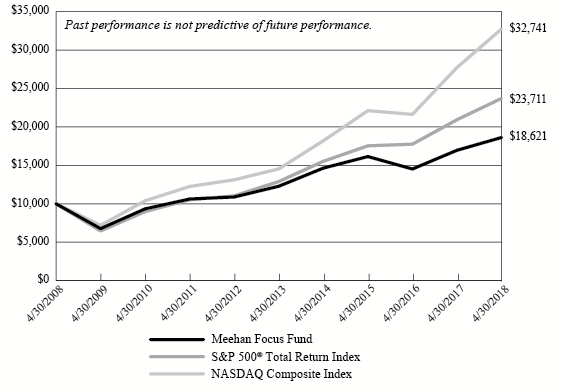
Average Annual Total Returns
(For Periods Ended April 30, 2018) |
| | 1 Year | 5 Years | 10 Years |
Meehan Focus Fund (a) | 9.79% | 8.68% | 6.41% |
S&P 500® Total Return | 13.27% | 12.96% | 9.02% |
NASDAQ Composite Index | 18.09% | 17.64% | 12.59% |
* | The above graph depicts the performance of the Fund versus the S&P 500® Total Return Index and the NASDAQ Composite Index. It is important to note that the Fund is a professionally managed mutual fund; the S&P 500® Total Return Index by Standard & Poor’s Corp. is a capitalization weighted index comprised of 500 issues listed on various exchanges, representing the performance of the stock market generally; and the NASDAQ Composite Index measures all NASDAQ domestic and non-U.S. based common stocks listed on the NASDAQ Stock Market. An index is not an investment product available for purchase. The Fund’s performance assumes the reinvestment of all dividends and all capital gains. Index returns assume reinvestment of dividends but, unlike the Fund’s returns, do not reflect any fees or expenses. |
(a) | Performance presented represents historical data. The investment return and principal value of an investment will fluctuate so that an investor’s shares, when redeemed, may be worth more or less than their original cost. The Fund’s past performance is not indicative of future performance. The table and graph above do not reflect the deduction of taxes that a shareholder would pay on Fund distributions or the redemption of Fund shares. Current performance may be lower or higher than the performance data quoted. To obtain more current performance information, please contact (866) 884-5968. As disclosed in the Fund’s current prospectus, the Fund’s total annual operating expenses are 1.02%. |
5
MEEHAN FOCUS FUND
PORTFOLIO INFORMATION
April 30, 2018 (Unaudited)
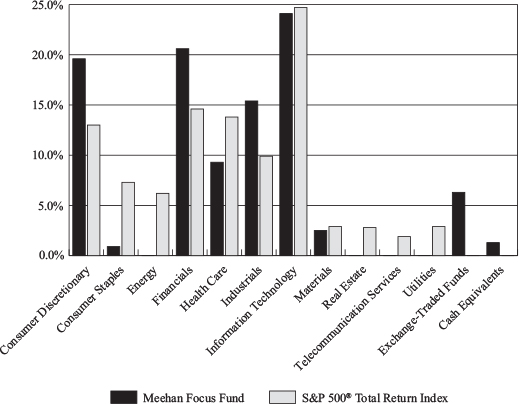
Sector Diversification (% of Net Assets)
Top 10 Equity Holdings
Security Description | % of
Net Assets |
Berkshire Hathaway, Inc. - Class B | 8.0% |
Microsoft Corporation | 7.9% |
Lowe's Companies, Inc. | 6.3% |
Apple, Inc. | 5.8% |
Alphabet, Inc. - Classes A and C | 5.6% |
PNC Financial Services Group, Inc. (The) | 5.6% |
United Rentals, Inc. | 4.6% |
Boeing Company (The) | 3.7% |
iShares MSCI Eurozone ETF | 3.4% |
Affiliated Managers Group, Inc. | 3.2% |
6
MEEHAN FOCUS FUND
SCHEDULE OF INVESTMENTS
April 30, 2018 (Unaudited) | | |
| COMMON STOCKS — 92.4% | | Shares | | | Value | |
| Consumer Discretionary — 19.6% | | | | | | |
| Auto Components — 0.4% | | | | | | |
| Adient plc | | | 4,429 | | | $ | 271,453 | |
| | | | | | | | | |
| Automobiles — 2.8% | | | | | | | | |
| General Motors Company | | | 50,000 | | | | 1,837,000 | |
| | | | | | | | | |
| Household Durables — 1.4% | | | | | | | | |
| Lennar Corporation - Class A | | | 17,000 | | | | 899,130 | |
| | | | | | | | | |
| Internet & Direct Marketing Retail — 2.9% | | | | | | | | |
Booking Holdings, Inc. (a) | | | 875 | | | | 1,905,750 | |
| | | | | | | | | |
| Media — 4.4% | | | | | | | | |
| Time Warner, Inc. | | | 16,000 | | | | 1,516,800 | |
| Walt Disney Company (The) | | | 13,000 | | | | 1,304,290 | |
| | | | | | | | 2,821,090 | |
| Specialty Retail — 7.7% | | | | | | | | |
| Lowe's Companies, Inc. | | | 50,000 | | | | 4,121,500 | |
| Williams-Sonoma, Inc. | | | 19,000 | | | | 908,200 | |
| | | | | | | | 5,029,700 | |
| Consumer Staples — 0.9% | | | | | | | | |
| Food Products — 0.9% | | | | | | | | |
| Nestlé S.A. - ADR | | | 7,500 | | | | 580,200 | |
| | | | | | | | | |
| Financials — 20.6% | | | | | | | | |
| Banks — 5.6% | | | | | | | | |
| PNC Financial Services Group, Inc. (The) | | | 25,000 | | | | 3,640,250 | |
| | | | | | | | | |
| Capital Markets — 5.9% | | | | | | | | |
| Affiliated Managers Group, Inc. | | | 12,800 | | | | 2,110,208 | |
| BlackRock, Inc. | | | 3,250 | | | | 1,694,875 | |
| | | | | | | | 3,805,083 | |
| Consumer Finance — 1.1% | | | | | | | | |
| Capital One Financial Corporation | | | 8,150 | | | | 738,553 | |
| | | | | | | | | |
| Diversified Financial Services — 8.0% | | | | | | | | |
Berkshire Hathaway, Inc. - Class B (a) | | | 27,000 | | | | 5,230,710 | |
7
MEEHAN FOCUS FUND
SCHEDULE OF INVESTMENTS (Continued) | | |
| COMMON STOCKS — 92.4% (Continued) | | Shares | | | Value | |
| Health Care — 9.3% | | | | | | |
| Health Care Equipment & Supplies — 1.8% | | | | | | |
| Medtronic plc | | | 15,000 | | | $ | 1,201,950 | |
| | | | | | | | | |
| Health Care Providers & Services — 2.6% | | | | | | | | |
Express Scripts Holding Company (a) | | | 22,000 | | | | 1,665,400 | |
| | | | | | | | | |
| Pharmaceuticals — 4.9% | | | | | | | | |
| Johnson & Johnson | | | 7,000 | | | | 885,430 | |
| Merck & Company, Inc. | | | 10,000 | | | | 588,700 | |
| Novartis AG - ADR | | | 22,000 | | | | 1,687,180 | |
| | | | | | | | 3,161,310 | |
| Industrials — 15.4% | | | | | | | | |
| Aerospace & Defense — 3.7% | | | | | | | | |
| Boeing Company (The) | | | 7,250 | | | | 2,418,310 | |
| | | | | | | | | |
| Air Freight & Logistics — 1.6% | | | | | | | | |
| United Parcel Service, Inc. - Class B | | | 9,000 | | | | 1,021,500 | |
| | | | | | | | | |
| Airlines — 2.0% | | | | | | | | |
| Southwest Airlines Company | | | 25,000 | | | | 1,320,750 | |
| | | | | | | | | |
| Building Products — 1.1% | | | | | | | | |
| Johnson Controls International plc | | | 22,000 | | | | 745,140 | |
| | | | | | | | | |
| Industrial Conglomerates — 2.4% | | | | | | | | |
| 3M Company | | | 8,000 | | | | 1,555,120 | |
| | | | | | | | | |
| Trading Companies & Distributors — 4.6% | | | | | | | | |
United Rentals, Inc. (a) | | | 20,000 | | | | 3,000,000 | |
| | | | | | | | | |
| Information Technology — 24.1% | | | | | | | | |
| Internet Software & Services — 6.5% | | | | | | | | |
Alphabet, Inc. - Class A (a) | | | 1,600 | | | | 1,629,728 | |
Alphabet, Inc. - Class C (a) | | | 2,003 | | | | 2,037,712 | |
Facebook, Inc. - Class A (a) | | | 3,250 | | | | 559,000 | |
| | | | | | | | 4,226,440 | |
| IT Services — 3.9% | | | | | | | | |
First Data Corporation - Class A (a) | | | 52,000 | | | | 941,200 | |
| Visa, Inc. - Class A | | | 13,000 | | | | 1,649,440 | |
| | | | | | | | 2,590,640 | |
8
MEEHAN FOCUS FUND
SCHEDULE OF INVESTMENTS (Continued)
| COMMON STOCKS — 92.4% (Continued) | | Shares | | | Value | |
| Information Technology — 24.1% (Continued) | | | | | | |
| Software — 7.9% | | | | | | |
| Microsoft Corporation | | | 55,000 | | | $ | 5,143,600 | |
| | | | | | | | | |
| Technology Hardware, Storage & Peripherals — 5.8% | | | | | | | | |
| Apple, Inc. | | | 22,800 | | | | 3,767,928 | |
| | | | | | | | | |
| Materials — 2.5% | | | | | | | | |
| Chemicals — 2.5% | | | | | | | | |
| Eastman Chemical Company | | | 16,000 | | | | 1,633,280 | |
| | | | | | | | | |
Total Common Stocks (Cost $33,433,402) | | | | | | $ | 60,210,287 | |
| |
| EXCHANGE-TRADED FUNDS — 6.3% | | | Shares | | | | Value | |
| iShares Core MSCI Emerging Markets ETF | | | 33,000 | | | $ | 1,876,050 | |
| iShares MSCI Eurozone ETF | | | 50,000 | | | | 2,216,500 | |
Total Exchange-Traded Funds (Cost $3,517,934) | | | | | | $ | 4,092,550 | |
| |
| MONEY MARKET FUNDS — 1.3% | | | Shares | | | | Value | |
Invesco STIT Government & Agency Portfolio - Institutional Class, 1.61% (b) (Cost $821,527) | | | 821,527 | | | $ | 821,527 | |
| | | | | | | | | |
Total Investments at Value — 100.0% (Cost $37,772,863) | | | | | | $ | 65,124,364 | |
| | | | | | | | | |
Other Assets in Excess of Liabilities — 0.0% (c) | | | | | | | 31,474 | |
| | | | | | | | | |
| Net Assets — 100.0% | | | | | | $ | 65,155,838 | |
ADR - American Depositary Receipt. |
(a) | Non-income producing security. |
(b) | The rate shown is the 7-day effective yield as of April 30, 2018. |
(c) | Percentage rounds to less than 0.1%. |
See accompanying notes to financial statements. |
9
MEEHAN FOCUS FUND
STATEMENT OF ASSETS AND LIABILITIES
April 30, 2018 (Unaudited) | |
| | | | |
| ASSETS | | | |
| Investments in securities: | | | |
| At acquisition cost | | $ | 37,772,863 | |
| At value (Note 2) | | $ | 65,124,364 | |
| Receivable for capital shares sold | | | 500 | |
| Dividends receivable | | | 69,227 | |
| Tax reclaims receivable | | | 3,643 | |
| Other assets | | | 10,962 | |
| TOTAL ASSETS | | | 65,208,696 | |
| | | | | |
| LIABILITIES | | | | |
| Payable to Adviser (Note 4) | | | 37,214 | |
| Other accrued expenses | | | 15,644 | |
| TOTAL LIABILITIES | | | 52,858 | |
| | | | | |
| NET ASSETS | | $ | 65,155,838 | |
| | | | | |
| NET ASSETS CONSIST OF: | | | | |
| Paid-in capital | | $ | 35,967,932 | |
| Accumulated net investment income | | | 123,866 | |
| Accumulated net realized gains from investment transactions | | | 1,712,539 | |
| Net unrealized appreciation on investments | | | 27,351,501 | |
| NET ASSETS | | $ | 65,155,838 | |
| | | | | |
| Shares of beneficial interest outstanding | | | 2,656,907 | |
| | | | | |
Net asset value, offering price and redemption price per share (a) (Note 2) | | $ | 24.52 | |
(a) | Redemption price may differ from the net asset value per share depending upon the length of time held. |
See accompanying notes to financial statements. |
10
MEEHAN FOCUS FUND
STATEMENT OF OPERATIONS
For the Six Months Ended April 30, 2018 (Unaudited) | |
| | | | |
| INVESTMENT INCOME | | | |
| Dividends (net of foreign withholding taxes of $12,861) | | $ | 533,559 | |
| | | | | |
| EXPENSES | | | | |
| Investment advisory fees (Note 4) | | | 266,858 | |
| Administration fees (Note 4) | | | 33,376 | |
| Professional fees | | | 20,574 | |
| Fund accounting fees (Note 4) | | | 18,337 | |
| Transfer agent fees (Note 4) | | | 9,000 | |
| Trustees’ fees and expenses (Note 4) | | | 6,274 | |
| Compliance fees (Note 4) | | | 6,229 | |
| Registration and filing fees | | | 3,655 | |
| Custody and bank service fees | | | 3,631 | |
| Printing of shareholder reports | | | 3,093 | |
| Postage and supplies | | | 2,724 | |
| Other expenses | | | 2,272 | |
| TOTAL EXPENSES | | | 376,023 | |
| Less fee reductions by the Adviser (Note 4) | | | (42,450 | ) |
| NET EXPENSES | | | 333,573 | |
| | | | | |
| NET INVESTMENT INCOME | | | 199,986 | |
| | | | | |
| REALIZED AND UNREALIZED GAINS (LOSSES) ON INVESTMENTS | | | | |
| Net realized gains from investments | | | 1,748,042 | |
| Net change in unrealized appreciation (depreciation) on investments | | | (549,565 | ) |
| NET REALIZED AND UNREALIZED GAINS ON INVESTMENTS | | | 1,198,477 | |
| | | | | |
| NET INCREASE IN NET ASSETS FROM OPERATIONS | | $ | 1,398,463 | |
See accompanying notes to financial statements. |
11
MEEHAN FOCUS FUND
STATEMENTS OF CHANGES IN NET ASSETS | | |
| | | Six Months
Ended
April 30,
2018
(Unaudited) | | | Year
Ended
October 31,
2017 | |
| FROM OPERATIONS | | | | | | |
| Net investment income | | $ | 199,986 | | | $ | 405,950 | |
| Net realized gains (losses) from investment transactions | | | 1,748,042 | | | | (35,503 | ) |
| Net change in unrealized appreciation (depreciation) on investments | | | (549,565 | ) | | | 12,441,786 | |
| Net increase in net assets from operations | | | 1,398,463 | | | | 12,812,233 | |
| | | | | | | | | |
| DISTRIBUTIONS TO SHAREHOLDERS (Note 2) | | | | | | | | |
| From net investment income | | | (377,677 | ) | | | (169,399 | ) |
| From net realized gains from investment transactions | | | — | | | | (39,732 | ) |
| Decrease in net assets from distributions | | | (377,677 | ) | | | (209,131 | ) |
| | | | | | | | | |
| CAPITAL SHARE TRANSACTIONS | | | | | | | | |
| Proceeds from shares sold | | | 892,050 | | | | 1,110,023 | |
| Net asset value of shares issued in reinvestment of distributions to shareholders | | | 372,854 | | | | 207,767 | |
| Payments for shares redeemed | | | (872,404 | ) | | | (2,832,042 | ) |
| Net increase (decrease) in net assets from capital share transactions | | | 392,500 | | | | (1,514,252 | ) |
| | | | | | | | | |
| TOTAL INCREASE IN NET ASSETS | | | 1,413,286 | | | | 11,088,850 | |
| | | | | | | | | |
| NET ASSETS | | | | | | | | |
| Beginning of period | | | 63,742,552 | | | | 52,653,702 | |
| End of period | | $ | 65,155,838 | | | $ | 63,742,552 | |
| | | | | | | | | |
| ACCUMULATED NET INVESTMENT INCOME | | $ | 123,866 | | | $ | 301,557 | |
| | | | | | | | | |
| CAPITAL SHARE ACTIVITY | | | | | | | | |
| Shares sold | | | 34,916 | | | | 50,394 | |
| Shares reinvested | | | 14,767 | | | | 9,941 | |
| Shares redeemed | | | (34,681 | ) | | | (129,810 | ) |
| Net increase (decrease) in shares outstanding | | | 15,002 | | | | (69,475 | ) |
| Shares outstanding at beginning of period | | | 2,641,905 | | | | 2,711,380 | |
| Shares outstanding at end of period | | | 2,656,907 | | | | 2,641,905 | |
See accompanying notes to financial statements. |
12
MEEHAN FOCUS FUND
FINANCIAL HIGHLIGHTS | | | | | | |
| | | | | | | |
Per Share Data for a Share Outstanding Throughout Each Period
| | | Six Months
Ended
April 30,
2018 (Unaudited) | | | Year
Ended
Oct. 31,
2017 | | | Year
Ended
Oct. 31,
2016 | | | Year
Ended
Oct. 31,
2015 | | | Year
Ended
Oct. 31,
2014 | | | Year
Ended
Oct. 31,
2013 | |
| Net asset value at beginning of period | | $ | 24.13 | | | $ | 19.42 | | | $ | 21.07 | | | $ | 21.43 | | | $ | 20.42 | | | $ | 16.41 | |
| | | | | | | | | | | | | | | | | | | | | | | | | |
| Income (loss) from investment operations: | | | | | | | | | | | | | | | | | | | | | | | | |
| Net investment income | | | 0.08 | | | | 0.15 | | | | 0.28 | | | | 0.17 | | | | 0.18 | | | | 0.21 | |
| Net realized and unrealized gains (losses) on investments | | | 0.45 | | | | 4.64 | | | | (1.30 | ) | | | (0.26 | ) | | | 1.96 | | | | 4.52 | |
| Total from investment operations | | | 0.53 | | | | 4.79 | | | | (1.02 | ) | | | (0.09 | ) | | | 2.14 | | | | 4.73 | |
| | | | | | | | | | | | | | | | | | | | | | | | | |
| Less distributions: | | | | | | | | | | | | | | | | | | | | | | | | |
| From net investment income | | | (0.14 | ) | | | (0.06 | ) | | | (0.28 | ) | | | (0.18 | ) | | | (0.19 | ) | | | (0.22 | ) |
| From net realized gains from investment transactions | | | — | | | | (0.02 | ) | | | (0.35 | ) | | | (0.09 | ) | | | (0.94 | ) | | | (0.50 | ) |
| Total distributions | | | (0.14 | ) | | | (0.08 | ) | | | (0.63 | ) | | | (0.27 | ) | | | (1.13 | ) | | | (0.72 | ) |
| | | | | | | | | | | | | | | | | | | | | | | | | |
| Net asset value at end of period | | $ | 24.52 | | | $ | 24.13 | | | $ | 19.42 | | | $ | 21.07 | | | $ | 21.43 | | | $ | 20.42 | |
| | | | | | | | | | | | | | | | | | | | | | | | | |
Total return (a) | | | 2.19 | %(b) | | | 24.72 | % | | | (4.86 | %) | | | (0.43 | %) | | | 10.50 | % | | | 29.01 | % |
| | | | | | | | | | | | | | | | | | | | | | | | | |
| Net assets at end of period (000's) | | $ | 65,156 | | | $ | 63,743 | | | $ | 52,654 | | | $ | 56,712 | | | $ | 57,179 | | | $ | 51,006 | |
| | | | | | | | | | | | | | | | | | | | | | | | | |
| Ratios/supplementary data: | | | | | | | | | | | | | | | | | | | | | | | | |
Ratio of total expenses to average net assets (c) | | | 1.13 | %(d) | | | 1.00 | % | | | 1.00 | % | | | 1.00 | % | | | 1.00 | % | | | 1.00 | % |
| | | | | | | | | | | | | | | | | | | | | | | | | |
Ratio of net expenses to average net assets (c) | | | 1.00 | %(d)(e) | | | 1.00 | %(e) | | | 1.00 | % | | | 1.00 | % | | | 1.00 | % | | | 1.00 | % |
| | | | | | | | | | | | | | | | | | | | | | | | | |
| Ratio of net investment income to average net assets | | | 0.60 | %(d)(e) | | | 0.69 | %(e) | | | 1.44 | % | | | 0.81 | % | | | 0.89 | % | | | 1.17 | % |
| | | | | | | | | | | | | | | | | | | | | | | | | |
| Portfolio turnover rate | | | 6 | %(b) | | | 10 | % | | | 44 | % | | | 23 | % | | | 23 | % | | | 17 | % |
(a) | Total return is a measure of the change in value of an investment in the Fund over the period covered. The returns shown do not reflect the deduction of taxes a shareholder would pay on Fund distributions, if any, or the redemption of Fund shares. Had the Adviser not reduced its fees and reimbursed expenses, total returns would have been lower. |
(b) | Not annualized. |
(c) | These ratios exclude the impact of expenses of the registered investment companies and exchange traded funds in which the Fund may invest. |
(d) | Annualized. |
(e) | Ratio was determined after advisory fee reductions (Note 4). |
See accompanying notes to financial statements. |
13
MEEHAN FOCUS FUND
NOTES TO FINANCIAL STATEMENTS
April 30, 2018 (Unaudited)
1. Organization
Meehan Focus Fund (the “Fund”) is a non-diversified series of Ultimus Managers Trust (the “Trust”). The Trust is an open-end management investment company registered under the Investment Company Act of 1940, as amended (the “1940 Act”). The Fund was reorganized into the Trust on October 23, 2017. It was formerly a series of Meehan Mutual Funds, Inc.
The Fund’s investment objective is to seek long-term growth of capital.
2. Significant Accounting Policies
The Fund follows accounting and reporting guidance under Financial Accounting Standards Board Accounting Standards Codification Topic 946, “Financial Services – Investment Companies.” The following is a summary of the Fund’s significant accounting policies used in the preparation of its financial statements. These policies are in conformity with accounting principles generally accepted in the United States of America (“GAAP”).
Securities valuation – The Fund’s portfolio securities are valued at market value as of the close of regular trading on the New York Stock Exchange (the “NYSE”) (normally 4:00 p.m. Eastern time) on each business day the NYSE is open. Securities listed on the NYSE or other exchanges are valued on the basis of their last sale price on the exchanges on which they are primarily traded. If there are no sales on that day, the securities are valued at the closing mean price on the NYSE or other primary exchange for that day. NASDAQ listed securities are valued at the NASDAQ Official Closing Price. If there are no sales on that day, the securities are valued at the last mean price as reported by NASDAQ. Securities traded in the over-the-counter market are valued at the last reported sale price, if available, otherwise at the most recently quoted mean price. Investments representing shares of other open-end investment companies, including money market funds, are valued at their net asset value (“NAV”) as reported by such companies. When using a quoted price and when the market is considered active, the security will be classified as Level 1 within the fair value hierarchy (see below). In the event that market quotations are not readily available or are considered unreliable due to market or other events, the Fund values its securities and other assets at fair value in accordance with procedures established by and under the general supervision of the Board of Trustees of the Trust (the “Board”). Under these procedures, the securities will be classified as Level 2 or 3 within the fair value hierarchy, depending on the inputs used. Unavailable or unreliable market quotes may be due to the following factors: a substantial bid-ask spread; infrequent sales resulting in stale prices; insufficient trading volume; small trade sizes; a temporary lapse in any reliable pricing source; and actions of the securities or futures markets, such as suspension or limitation of trading. As a result, the prices of securities used to calculate the Fund’s NAV may differ from quoted or published prices for the same securities.
GAAP establishes a single authoritative definition of fair value, sets out a framework for measuring fair value and requires additional disclosures about fair value measurements.
14
MEEHAN FOCUS FUND
NOTES TO FINANCIAL STATEMENTS (Continued) |
Various inputs are used in determining the value of the Fund’s investments. These inputs are summarized in the three broad levels listed below:
● | Level 1 – quoted prices in active markets for identical securities |
● | Level 2 – other significant observable inputs |
● | Level 3 – significant unobservable inputs |
The inputs or methodology used for valuing securities are not necessarily an indication of the risks associated with investing in those securities. The inputs used to measure fair value may fall into different levels of the fair value hierarchy. In such cases, for disclosure purposes, the level in the fair value hierarchy within which the fair value measurement falls in its entirety is determined based on the lowest level input that is significant to the fair value measurement.
The following is a summary of the inputs used to value the Fund’s investments as of April 30, 2018:
| | | Level 1 | | | Level 2 | | | Level 3 | | | Total | |
| Common Stocks | | $ | 60,210,287 | | | $ | — | | | $ | — | | | $ | 60,210,287 | |
| Exhange-Traded Funds | | | 4,092,550 | | | | — | | | | — | | | | 4,092,550 | |
| Money Market Funds | | | 821,527 | | | | — | | | | — | | | | 821,527 | |
| Total | | $ | 65,124,364 | | | $ | — | | | $ | — | | | $ | 65,124,364 | |
Refer to the Fund’s Schedule of Investments for a listing of the common stocks by industry type. As of April 30, 2018, the Fund did not have any transfers between Levels. In addition, the Fund did not hold derivative instruments or any assets or liabilities that were measured at fair value on a recurring basis using significant unobservable inputs (Level 3) as of April 30, 2018. It is the Fund’s policy to recognize transfers between Levels at the end of the reporting period.
Share valuation – The NAV per share of the Fund is calculated daily by dividing the total value of the Fund’s assets, less liabilities, by the number of shares outstanding. The offering price and redemption price per share of the Fund is equal to the NAV per share, except that shares of the Fund are subject to a redemption fee of 2% if redeemed within 7 calendar days of the date of purchase. No redemption fees were collected by the Fund during the periods ended April 30, 2018 and October 31, 2017.
Investment income – Dividend income is recorded on the ex-dividend date. Interest income is accrued as earned.
Investment transactions – Investment transactions are accounted for on the trade date. Realized gains and losses on investments sold are determined on a specific identification basis.
15
MEEHAN FOCUS FUND
NOTES TO FINANCIAL STATEMENTS (Continued) |
Common expenses – Common expenses of the Trust are allocated among the Fund and the other series of the Trust based on the relative net assets of each series or the nature of the services performed and the relative applicability to each series.
Distributions to shareholders – Distributions to shareholders arising from net investment income and net realized capital gains, if any, are distributed at least once each year. The amount of distributions from net investment income and net realized capital gains are determined in accordance with federal income tax regulations, which may differ from GAAP. The tax character of distributions paid during the periods ended April 30, 2018 and October 31, 2017 was as follows:
| Period Ended | | | Ordinary
Income | | | Long-Term
Capital Gains | | | Total
Distributions | |
April 30, 2018 | | | $ | 377,677 | | | $ | — | | | $ | 377,677 | |
October 31, 2017 | | | $ | 169,618 | | | $ | 39,513 | | | $ | 209,131 | |
Estimates – The preparation of financial statements in conformity with GAAP requires management to make estimates and assumptions that affect the reported amounts of assets and liabilities and disclosure of contingent assets and liabilities as of the date of the financial statements and the reported amounts of income and expenses during the reporting period. Actual results could differ from those estimates.
Federal income tax – The Fund has qualified and intends to continue to qualify each year as a “regulated investment company” under Subchapter M of the Internal Revenue Code of 1986, as amended (the “Code”). By so qualifying, the Fund will not be subject to federal income taxes to the extent that it distributes its net investment income and any net realized capital gains in accordance with the Code.
In order to avoid imposition of the excise tax applicable to regulated investment companies, it is also the Fund’s intention to declare as dividends in each calendar year at least 98% of its net investment income (earned during the calendar year) and 98.2% of its net realized capital gains (earned during the twelve months ended October 31) plus undistributed amounts from prior years.
16
MEEHAN FOCUS FUND
NOTES TO FINANCIAL STATEMENTS (Continued) |
The following information is computed on a tax basis for each item as of April 30, 2018:
| Tax cost of portfolio investments | | $ | 37,772,863 | |
| Gross unrealized appreciation | | $ | 27,785,862 | |
| Gross unrealized depreciation | | | (434,361 | ) |
| Net unrealized appreciation | | | 27,351,501 | |
| Accumulated ordinary income | | | 123,866 | |
| Capital loss carryforwards | | | (35,503 | ) |
| Other net gains | | | 1,748,042 | |
| Accumulated earnings | | $ | 29,187,906 | |
As of October 31, 2017, the Fund had short-term capital loss carryforwards of $35,503. These capital loss carryforwards, which do not expire, may be utilized in the current and future years to offset net realized capital gains, if any, prior to distributing such gains to shareholders.
The Fund recognizes the tax benefits or expenses of uncertain tax positions only when the position is “more likely than not” to be sustained assuming examination by tax authorities. Management has reviewed the Fund’s tax positions taken on federal income tax returns for the current and all open tax years (October 31, 2014 through October 31, 2017) and has concluded that no provision for unrecognized tax benefits or expenses is required in these financial statements and does not expect this to change over the next twelve months. The Fund identifies its major tax jurisdiction as U.S. Federal.
3. Investment Transactions
During the six months ended April 30, 2018, cost of purchases and proceeds from sales of investment securities, other than short-term investments, were $5,038,759 and $3,895,817, respectively.
4. Transactions with Related Parties
INVESTMENT ADVISORY AGREEMENT
The Fund’s investments are managed by Edgemoor Investment Advisors, Inc. (the “Adviser”) pursuant to the terms of an Investment Advisory Agreement. Under the Investment Advisory Agreement, the Fund pays the Adviser an investment advisory fee, computed and accrued daily and paid monthly, at the annual rate of 0.80% of its average daily net assets.
Pursuant to an Expense Limitation Agreement (“ELA”), the Adviser has contractually agreed, until March 1, 2019, to reduce investment advisory fees and reimburse other expenses to the extent necessary to limit total annual operating expenses (exclusive of brokerage costs; taxes; interest; borrowing costs such as interest and dividend expenses on securities sold short; costs to organize the Fund; acquired fund fees and expenses; extraordinary expenses such as litigation and merger or reorganization costs; other expenses not incurred in the ordinary
17
MEEHAN FOCUS FUND
NOTES TO FINANCIAL STATEMENTS (Continued) |
course of the Fund’s business; and amounts, if any, payable pursuant to a plan adopted in accordance with Rule 12b-1 under the 1940 Act) to an amount not exceeding 1.00% of the Fund’s average daily net assets. Accordingly, during the six months ended April 30, 2018, the Adviser reduced its advisory fees in the amount of $42,450.
Under the terms of the ELA, investment advisory fee reductions and expense reimbursements by the Adviser are subject to repayment by the Fund for a period of three years after such fees and expenses were incurred, provided the repayments do not cause total annual operating expenses to exceed (i) the expense limitation then in effect, if any, and (ii) the expense limitation in effect at the time the expenses to be repaid were incurred. As of April 30, 2018, the Adviser may seek recoupment of investment advisory fee reductions totaling $43,407 no later than the dates listed below:
October 31, 2020 | | | $ | 957 |
April 30, 2021 | | | $ | 42,450 |
OTHER SERVICE PROVIDERS
Ultimus Fund Solutions, LLC (“Ultimus”) provides administration, fund accounting, compliance and transfer agency services to the Fund. The Fund pays Ultimus fees in accordance with the agreements for such services. In addition, the Fund pays out-of-pocket expenses including, but not limited to, postage, supplies, and costs of pricing the Fund’s portfolio securities.
Under the terms of a Distribution Agreement with the Trust, Ultimus Fund Distributors, LLC (the “Distributor”) serves as the principal underwriter to the Fund. The Distributor is a wholly-owned subsidiary of Ultimus. The Distributor is compensated by the Adviser (not the Fund) for acting as principal underwriter.
Certain officers and a Trustee of the Trust are also officers of Ultimus and the Distributor.
TRUSTEE COMPENSATION
Each Trustee who is not an “interested person” of the Trust (“Independent Trustee”) receives a $1,000 annual retainer from the Fund, paid quarterly, except for the Board Chairperson who receives a $1,200 annual retainer from the Fund, paid quarterly. Each Independent Trustee also receives from the Fund a fee of $500 for each Board meeting attended plus reimbursement for travel and other meeting-related expenses.
18
MEEHAN FOCUS FUND
NOTES TO FINANCIAL STATEMENTS (Continued) |
PRINCIPAL HOLDERS OF FUND SHARES
As of April 30, 2018, the following shareholders owned of record 5% or more of the outstanding shares of the Fund:
Name of Record Owner | % Ownership |
Thomas P. Meehan and Marren W. Meehan | 16% |
Wachovia National Bank (for the benefit of its customers) | 8% |
CLRDS Employees 401k Plan | 6% |
Timothy C. Coughlin Revocable Trust | 5% |
5. Contingencies and Commitments
The Fund indemnifies the Trust’s officers and Trustees for certain liabilities that might arise from their performance of their duties to the Fund. Additionally, in the normal course of business the Fund enters into contracts that contain a variety of representations and warranties and which provide general indemnifications. The Fund’s maximum exposure under these arrangements is unknown, as this would involve future claims that may be made against the Fund that have not yet occurred. However, based on experience, the Fund expects the risk of loss to be remote.
6. Non-Diversification Risk
The Fund is a non-diversified Fund. As a result, the Fund’s holdings may be more concentrated in a limited number of securities and the value of its shares may be more sensitive than a diversified fund to any single economic, business, political, or regulatory occurrence.
7. Subsequent Events
The Fund is required to recognize in the financial statements the effects of all subsequent events that provide additional evidence about conditions that existed as of the date of the Statement of Assets and Liabilities. For non-recognized subsequent events that must be disclosed to keep the financial statements from being misleading, the Fund is required to disclose the nature of the event as well as an estimate of its financial effect, or a statement that such an estimate cannot be made. Management has evaluated subsequent events through the issuance of these financial statements and has noted no such events.
19
MEEHAN FOCUS FUND
ABOUT YOUR FUND’S EXPENSES (Unaudited) |
We believe it is important for you to understand the impact of costs on your investment. As a shareholder of the Fund, you may incur two types of costs: (1) transaction costs, including redemption fees; and (2) ongoing costs, including management fees and other expenses. The following examples are intended to help you understand your ongoing costs (in dollars) of investing in the Fund and to compare these costs with the ongoing costs of investing in other mutual funds.
A mutual fund’s ongoing costs are expressed as a percentage of its average net assets. This figure is known as the expense ratio. The expenses in the table below are based on an investment of $1,000 made at the beginning of the most recent period (November 1, 2017) and held until the end of the period (April 30, 2018).
The table below illustrates the Fund’s ongoing costs in two ways:
Actual fund return – This section helps you to estimate the actual expenses that you paid over the period. The “Ending Account Value” shown is derived from the Fund’s actual return, and the third column shows the dollar amount of operating expenses that would have been paid by an investor who started with $1,000 in the Fund. You may use the information here, together with the amount you invested, to estimate the expenses that you paid over the period.
To do so, simply divide your account value by $1,000 (for example, an $8,600 account value divided by $1,000 = 8.6), then multiply the result by the number given for the Fund under the heading “Expenses Paid During Period.”
Hypothetical 5% return – This section is intended to help you compare the Fund’s ongoing costs with those of other mutual funds. It assumes that the Fund had an annual return of 5% before expenses during the period shown, but that the expense ratio is unchanged. In this case, because the return used is not the Fund’s actual return, the results do not apply to your investment. The example is useful in making comparisons because the U.S. Securities and Exchange Commission (the “SEC”) requires all mutual funds to calculate expenses based on a 5% return. You can assess the Fund’s ongoing costs by comparing this hypothetical example with the hypothetical examples that appear in shareholder reports of other funds.
Note that expenses shown in the table are meant to highlight and help you compare ongoing costs only. The Fund does not charge sales loads. However, a redemption fee of 2% is applied on the sale of shares of the Fund held for less than 7 calendar days.
The calculations assume no shares were bought or sold during the period. Your actual costs may have been higher or lower, depending on the amount of your investment and the timing of any purchases or redemptions.
More information about the Fund’s expenses, including historical annual expense ratios, can be found in this report. For additional information on operating expenses and other shareholder costs, please refer to the Fund’s prospectus.
20
MEEHAN FOCUS FUND
ABOUT YOUR FUND’S EXPENSES (Unaudited) (Continued) |
| | | Beginning
Acount Value
November 1, 2017 | | | Ending
Account Value
April 30, 2018 | | | Expenses
Paid During
Period* | |
| Based on Actual Fund Return | | $ | 1,000.00 | | | $ | 1,021.90 | | | $ | 5.01 | |
| Based on Hypothetical 5% Return (before expenses) | | $ | 1,000.00 | | | $ | 1,019.84 | | | $ | 5.01 | |
* | Expenses are equal to the Fund’s annualized net expense ratio of 1.00% for the period, multiplied by the average account value over the period, multiplied by 181/365 (to reflect the one-half year period). |
21
MEEHAN FOCUS FUND
OTHER INFORMATION (Unaudited) |
A description of the policies and procedures that the Fund uses to vote proxies relating to portfolio securities is available without charge upon request by calling toll-free 1-866-884-5968, or on the SEC’s website at http://www.sec.gov. Information regarding how the Fund voted proxies relating to portfolio securities during the most recent 12-month period ended June 30 is available without charge upon request by calling toll-free 1-866-884-5968, or on the SEC’s website at http://www.sec.gov.
The Trust files a complete listing of portfolio holdings for the Fund with the SEC as of the end of the first and third quarters of each fiscal year on Form N-Q. These filings are available upon request by calling 1-866-884-5968. Furthermore, you may obtain a copy of the filings on the SEC’s website at http://www.sec.gov. The Trust’s Forms N-Q may also be reviewed and copied at the SEC’s Public Reference Room in Washington, DC, and information on the operation of the Public Reference Room may be obtained by calling 1-800-SEC-0330.
22
FACTS | WHAT DOES THE MEEHAN FOCUS FUND (the “Fund”) DO WITH YOUR PERSONAL INFORMATION? |
Why? | Financial companies choose how they share your personal information. Federal law gives consumers the right to limit some but not all sharing. Federal law also requires us to tell you how we collect, share, and protect your personal information. Please read this notice carefully to understand what we do. |
What? | The types of personal information we collect and share depend on the product or service you have with us. This information can include: ■ Social Security number ■ Assets ■ Retirement Assets ■ Transaction History ■ Checking Account Information ■ Purchase History ■ Account Balances ■ Account Transactions ■ Wire Transfer Instructions When you are no longer our customer, we continue to share your information as described in this notice. |
How? | All financial companies need to share your personal information to run their everyday business. In the section below, we list the reasons financial companies can share their customers’ personal information; the reasons the Fund chooses to share; and whether you can limit this sharing. |
Reasons we can share your personal information | Does the
Fund share? | Can you limit this sharing? |
For our everyday business purposes – Such as to process your transactions, maintain your account(s), respond to court orders and legal investigations, or report to credit bureaus | Yes | No |
For our marketing purposes – to offer our products and services to you | No | We don’t share |
For joint marketing with other financial companies | No | We don’t share |
For our affiliates’ everyday business purposes – information about your transactions and experiences | No | We don’t share |
For our affiliates’ everyday business purposes – information about your creditworthiness | No | We don’t share |
For nonaffiliates to market to you | No | We don’t share |
Questions? | Call 1-866-884-5968 |
23
Who we are |
Who is providing this notice? | Meehan Focus Fund Ultimus Fund Distributors, LLC (Distributor) Ultimus Fund Solutions, LLC (Administrator) |
What we do |
How does the Fund protect my personal information? | To protect your personal information from unauthorized access and use, we use security measures that comply with federal law. These measures include computer safeguards and secured files and buildings. Our service providers are held accountable for adhering to strict policies and procedures to prevent any misuse of your nonpublic personal information. |
How does the Fund collect my personal information? | We collect your personal information, for example, when you ■ Open an account ■ Provide account information ■ Give us your contact information ■ Make deposits or withdrawals from your account ■ Make a wire transfer ■ Tell us where to send the money ■ Tell us who receives the money ■ Show your government-issued ID ■ Show your driver’s license We also collect your personal information from other companies. |
Why can’t I limit all sharing? | Federal law gives you the right to limit only ■ Sharing for affiliates’ everyday business purposes – information about your creditworthiness ■ Affiliates from using your information to market to you ■ Sharing for nonaffiliates to market to you State laws and individual companies may give you additional rights to limit sharing. |
Definitions |
Affiliates | Companies related by common ownership or control. They can be financial and nonfinancial companies. ■ Edgemoor Investment Advisors, Inc., the investment adviser to the Fund, could be deemed to be an affiliate. |
Nonaffiliates | Companies not related by common ownership or control. They can be financial and nonfinancial companies ■ The Fund does not share with nonaffiliates so they can market to you. |
Joint marketing | A formal agreement between nonaffiliated financial companies that together market financial products or services to you. ■ The Fund does not jointly market. |
24
This page intentionally left blank.
Not required
| Item 3. | Audit Committee Financial Expert. |
Not required
| Item 4. | Principal Accountant Fees and Services. |
Not required
| Item 5. | Audit Committee of Listed Registrants. |
Not applicable
| Item 5. | Audit Committee of Listed Registrants. |
Not applicable
| Item 6. | Schedule of Investments. |
(a) Not applicable [schedule filed with Item 1]
(b) Not applicable
| Item 7. | Disclosure of Proxy Voting Policies and Procedures for Closed-End Management Investment Companies. |
Not applicable
| Item 8. | Portfolio Managers of Closed-End Management Investment Companies. |
Not applicable
| Item 9. | Purchases of Equity Securities by Closed-End Management Investment Company and Affiliated Purchasers. |
Not applicable
| Item 10. | Submission of Matters to a Vote of Security Holders. |
The registrant’s Committee of Independent Trustees shall review shareholder recommendations for nominations to fill vacancies on the registrant’s board of trustees if such recommendations are submitted in writing and addressed to the Committee at the registrant’s offices. The Committee may adopt, by resolution, a policy regarding its procedures for considering candidates for the board of trustees, including any recommended by shareholders.
| Item 11. | Controls and Procedures. |
(a) Based on their evaluation of the registrant’s disclosure controls and procedures (as defined in Rule 30a-3(c) under the Investment Company Act of 1940) as of a date within 90 days of the filing date of this report, the registrant’s principal executive officer and principal financial officer have concluded that such disclosure controls and procedures are reasonably designed and are operating effectively to ensure that material information relating to the registrant, including its consolidated subsidiaries, is made known to them by others within those entities, particularly during the period in which this report is being prepared, and that the information required in filings on Form N-CSR is recorded, processed, summarized, and reported on a timely basis.
(b) There were no changes in the registrant’s internal control over financial reporting (as defined in Rule 30a-3(d) under the Investment Company Act of 1940) that occurred during the second fiscal quarter of the period covered by this report that have materially affected, or are reasonably likely to materially affect, the registrant’s internal control over financial reporting.
| Item 12. | Disclosure of Securities Lending Activities for Closed-End Management Investment Companies. |
Not applicable
File the exhibits listed below as part of this Form. Letter or number the exhibits in the sequence indicated.
(a)(1) Any code of ethics, or amendment thereto, that is the subject of the disclosure required by Item 2, to the extent that the registrant intends to satisfy the Item 2 requirements through filing of an exhibit: Not required
(a)(2) A separate certification for each principal executive officer and principal financial officer of the registrant as required by Rule 30a-2(a) under the Act (17 CFR 270.30a-2(a)): Attached hereto
(a)(3) Any written solicitation to purchase securities under Rule 23c-1 under the Act (17 CFR 270.23c-1) sent or given during the period covered by the report by or on behalf of the registrant to 10 or more persons: Not applicable
(a)(4) Change in the registrant’s independent public accountants: Not applicable
(b) Certifications required by Rule 30a-2(b) under the Act (17 CFR 270.30a-2(b)): Attached hereto
| Exhibit 99.CERT | Certifications required by Rule 30a-2(a) under the Act |
| | |
| Exhibit 99.906CERT | Certifications required by Rule 30a-2(b) under the Act |
SIGNATURES
Pursuant to the requirements of the Securities Exchange Act of 1934 and the Investment Company Act of 1940, the registrant has duly caused this report to be signed on its behalf by the undersigned, thereunto duly authorized.
| (Registrant) | Ultimus Managers Trust | | |
| | | | |
| By (Signature and Title)* | /s/ Natalie S. Anderson | |
| | | Natalie S. Anderson, Assistant Secretary | |
| | | | |
| Date | July 9, 2018 | | |
| | | | |
| Pursuant to the requirements of the Securities Exchange Act of 1934 and the Investment Company Act of 1940, this report has been signed below by the following persons on behalf of the registrant and in the capacities and on the dates indicated. |
| | | | |
| By (Signature and Title)* | /s/ David R. Carson | |
| | | David R. Carson, Principal Executive Officer of Meehan Focus Fund and Stralem Equity Fund | |
| | | | |
| Date | July 9, 2018 | | |
| | | | |
| By (Signature and Title)* | /s/ Jennifer L. Leamer | |
| | | Jennifer L. Leamer, Treasurer and Principal Accounting Officer | |
| | | | |
| Date | July 9, 2018 | | |
| * | Print the name and title of each signing officer under his or her signature. |