| | OMB APPROVAL |
| | OMB Number: 3235-0570 Expires: August 31, 2022 Estimated average burden hours per response: 20.6 |
UNITED STATES
SECURITIES AND EXCHANGE COMMISSION
Washington, D.C. 20549
FORM N-CSR
CERTIFIED SHAREHOLDER REPORT OF REGISTERED
MANAGEMENT INVESTMENT COMPANIES
| Investment Company Act file number | 811-22680 | |
| Ultimus Managers Trust |
| (Exact name of registrant as specified in charter) |
| 225 Pictoria Drive, Suite 450 Cincinnati, Ohio | 45246 |
| (Address of principal executive offices) | (Zip code) |
Khimmara Greer, Esq.
| Ultimus Fund Solutions, LLC 225 Pictoria Drive, Suite 450 Cincinnati, Ohio 45246_ |
| (Name and address of agent for service) |
| Registrant's telephone number, including area code: | (513) 587-3400 | |
| Date of fiscal year end: | May 31 | |
| | | |
| Date of reporting period: | November 30, 2021 | |
Form N-CSR is to be used by management investment companies to file reports with the Commission not later than 10 days after the transmission to stockholders of any report that is required to be transmitted to stockholders under Rule 30e-1 under the Investment Company Act of 1940 (17 CFR 270.30e-1). The Commission may use the information provided on Form N-CSR in its regulatory, disclosure review, inspection, and policymaking roles.
A registrant is required to disclose the information specified by Form N-CSR, and the Commission will make this information public. A registrant is not required to respond to the collection of information contained in Form N-CSR unless the Form displays a currently valid Office of Management and Budget ("OMB") control number. Please direct comments concerning the accuracy of the information collection burden estimate and any suggestions for reducing the burden to the Secretary, Securities and Exchange Commission, 450 Fifth Street, NW, Washington, DC 20549-0609. The OMB has reviewed this collection of information under the clearance requirements of 44 U.S.C. § 3507.
| Item 1. | Reports to Stockholders. |
Institutional Class (ADLVX)
SEMI-ANNUAL REPORT
November 30, 2021
(Unaudited)
Managed by
Adler Asset Management, LLC
For information or assistance in opening an account,
please call toll-free 1-800-408-4682.
| ADLER VALUE FUND | |
| LETTER TO SHAREHOLDERS (Unaudited) | December 31, 2021 |
Dear Shareholder,
In mid-August 2018, the Adler Value Fund (the “Fund”) commenced operations. Adler Asset Management, LLC (the “Adviser”) is the Fund’s investment adviser. For the semi-annual period ended November 30, 2021, the Fund’s total return was -2.98%. During the same period, the total return of the S&P 500 Value Index was -0.85%.
Value stocks were subdued during the semi-annual period, reflecting ultra-low interest rates. As the market grappled with persistent inflation, the Chairman of the Federal Reserve suggested retiring the term “transitory” to explain the current rate of inflation. However, U.S. real interest rates remain negative. The Fund modestly underperformed the S&P 500 Value Index during the semi-annual period against this backdrop with financial stocks as the Fund’s largest industry sector. As the period ended, public equity markets appear to be re-assessing the premium valuations afforded “long duration” growth stocks.
Investment Approach
In selecting investments for the Fund, the Adviser uses a focused-value strategy to invest in companies that, in its opinion, appear to be undervalued by the equity market but where catalysts exist, in the opinion of the Adviser, to close these valuation gaps. The Adviser seeks to exploit perceived market misjudgments in pricing by buying equity securities that appear to be undervalued because of a temporary aversion to these out-of-favor issuers.
The Adviser maintains a watch list of companies and reviews each company’s financial condition and prospects, including factors such as (but not limited to): expected future earnings, cash flow, the ability and willingness to return capital to shareholders, competitive position, quality of the business franchise, and the reputation, experience, and competence of a company’s management and board of directors. The Adviser considers these factors both while the company is on the watch list and at the time of purchase. Not all companies, at the time of purchase, are on the Adviser’s watch list, and a company may be added to the Fund’s portfolio following a precipitating event.
When added to the Fund’s portfolio, a company will generally be trading at a significant discount to its 52-week or all-time high. The Adviser’s contrarian approach, buying what it believes are fundamentally sound companies that are out-of-favor with the market, is industry, sector and market capitalization agnostic, and typically will result in a portfolio containing the securities of fewer than thirty issuers
Portfolio Developments
Following is a discussion of recent developments concerning two fund holdings.
| ● | Veoneer (VNE) is an automotive technology company that designs, develops and manufactures software, hardware and systems for advanced-driving assistance systems as well as collaborative and automated driving. In October 2021, VNE publicly confirmed a definitive agreement for its sale at $37.00 per share for a transaction expected to close in 2022. |
| ● | Bayer (BAYRY) is a life sciences company focused on health care and nutrition. Bayer’s legal challenges with its Monsanto acquisition have been well-documented. The Adviser purchased Bayer ADRs for the Fund after the Monsanto acquisition and the related legal exposure became known. Bayer continues to face setbacks with this glyphosate litigation. It trades below the Fund’s average cost. The Adviser believes the resolution of this litigation is a key catalyst for Bayer’s re-valuation. |
In closing, I want to thank shareholders for their confidence in the Fund’s Adviser. The Adviser continues to assess companies that fit the Fund’s investment approach.
David Adler
Adler Asset Management, LLC
December 31, 2021
Past performance is not predictive of future performance. Investment results and principal value will fluctuate so that shares, when redeemed, may be worth more or less than their original cost. Current performance may be higher or lower than the performance data quoted. Performance data current to the most recent month-end are available by calling 1-800-408-4682.
An investor should consider the investment objectives, risks, charges and expenses of the Fund carefully before investing. The Fund’s prospectus contains this and other important information. To obtain a copy of the Fund’s prospectus please visit the Fund’s website at www.adlervaluefund.com or call 1-800-408-4682 and a copy will be sent to you free of charge. Please read the prospectus carefully before you invest. The Fund is distributed by Ultimus Fund Distributors, LLC.
The Letter to Shareholders seeks to describe some of the Adviser’s current opinions and views of the financial markets. Although the Adviser believes it has a reasonable basis for any opinions or views expressed, actual results may differ, sometimes significantly so, from those expected or expressed. The securities held by the Fund that are discussed in the Letter to Shareholders were held during the period covered by this Report. They do not comprise the entire investment portfolio of the Fund, may be sold at any time, and may no longer be held by the Fund. For a complete list of securities held by the Fund as of November 30, 2021, please see the Schedule of Investments section of the semi-annual report. The opinions of the Fund’s adviser with respect to those securities may change at any time.
Statements in the Letter to Shareholders that reflect projections or expectations for future financial or economic performance of the Fund and the market in general and statements of the Fund’s plans and objectives for future operations are forward-looking statements. No assurance can be given that actual results or events will not differ materially from those projected, estimated, assumed, or anticipated in any such forward-looking statements. Important factors that could result in such differences, in addition to factors noted with such forward-looking statements, include, without limitation, general economic conditions, such as inflation, recession, and interest rates. Past performance is not a guarantee of future results.
| ADLER VALUE FUND |
| PORTFOLIO INFORMATION |
| November 30, 2021 (Unaudited) |
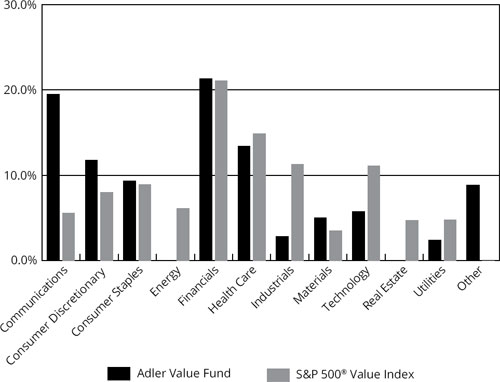
Sector Diversification
(% of Net Assets)
| Top 10 Equity Holdings |
| | | |
| | | % of Net |
| Security Description | | Assets |
| Veoneer, Inc. | | 11.0% |
| Meredith Corporation | | 10.5% |
| Valvoline, Inc. | | 5.0% |
| Charles Schwab Corporation (The) | | 4.9% |
| iHeartMedia, Inc. - Class A | | 4.5% |
| Big Lots, Inc. | | 4.2% |
| Spectrum Brands Holdings, Inc. | | 3.8% |
| Equitable Holdings, Inc. | | 3.8% |
| Aflac, Inc. | | 3.7% |
| Pfizer, Inc. | | 3.1% |
| ADLER VALUE FUND |
| SCHEDULE OF INVESTMENTS |
| November 30, 2021 (Unaudited) |
| COMMON STOCKS — 89.6% | | Shares | | | Value | |
| Communications — 19.5% | | | | | | | | |
| Cable & Satellite — 1.6% | | | | | | | | |
| Altice USA, Inc. - Class A (a) | | | 1,900 | | | $ | 30,096 | |
| Comcast Corporation - Class A | | | 600 | | | | 29,988 | |
| | | | | | | | 60,084 | |
| Entertainment Content — 2.9% | | | | | | | | |
| ViacomCBS, Inc. - Class B | | | 3,700 | | | | 114,515 | |
| | | | | | | | | |
| Publishing & Broadcasting — 15.0% | | | | | | | | |
| iHeartMedia, Inc. - Class A (a) | | | 9,000 | | | | 176,490 | |
| Meredith Corporation (a) | | | 7,000 | | | | 413,000 | |
| | | | | | | | 589,490 | |
| Consumer Discretionary — 11.8% | | | | | | | | |
| Automotive — 11.0% | | | | | | | | |
| Veoneer, Inc. (a) | | | 12,100 | | | | 430,760 | |
| | | | | | | | | |
| Leisure Facilities & Services — 0.8% | | | | | | | | |
| Starbucks Corporation | | | 300 | | | | 32,892 | |
| | | | | | | | | |
| Consumer Staples — 9.3% | | | | | | | | |
| Beverages — 1.3% | | | | | | | | |
| Diageo plc - ADR | | | 250 | | | | 50,792 | |
| | | | | | | | | |
| Household Products — 3.8% | | | | | | | | |
| Spectrum Brands Holdings, Inc. | | | 1,500 | | | | 150,150 | |
| | | | | | | | | |
| Retail - Consumer Staples — 4.2% | | | | | | | | |
| Big Lots, Inc. | | | 3,800 | | | | 164,844 | |
| | | | | | | | | |
| Financials — 19.7% | | | | | | | | |
| Asset Management — 6.3% | | | | | | | | |
| Charles Schwab Corporation (The) | | | 2,500 | | | | 193,475 | |
| XP, Inc. - Class A (a) | | | 1,795 | | | | 51,481 | |
| | | | | | | | 244,956 | |
| Banking — 3.1% | | | | | | | | |
| Citigroup, Inc. | | | 1,900 | | | | 121,030 | |
| | | | | | | | | |
| Insurance — 10.3% | | | | | | | | |
| Aflac, Inc. | | | 2,700 | | | | 146,178 | |
| Equitable Holdings, Inc. | | | 4,700 | | | | 147,862 | |
| Jackson Financial, Inc. - Class A | | | 3,500 | | | | 110,810 | |
| | | | | | | | 404,850 | |
| ADLER VALUE FUND |
| SCHEDULE OF INVESTMENTS (Continued) |
| COMMON STOCKS — 89.6% (Continued) | | Shares | | | Value | |
| Health Care — 13.4% | | | | | | | | |
| Biotech & Pharma — 10.5% | | | | | | | | |
| Bayer AG - ADR | | | 7,800 | | | $ | 98,436 | |
| Bristol-Myers Squibb Company | | | 1,500 | | | | 80,445 | |
| Pfizer, Inc. | | | 2,300 | | | | 123,579 | |
| Viatris, Inc. | | | 8,835 | | | | 108,759 | |
| | | | | | | | 411,219 | |
| Health Care Facilities & Services — 2.9% | | | | | | | | |
| Cigna Corporation | | | 600 | | | | 115,140 | |
| | | | | | | | | |
| Industrials — 2.8% | | | | | | | | |
| Aerospace & Defense — 0.3% | | | | | | | | |
| Raytheon Technologies Corporation | | | 150 | | | | 12,138 | |
| | | | | | | | | |
| Industrial Support Services — 2.5% | | | | | | | | |
| Grainger (W.W.), Inc. | | | 200 | | | | 96,282 | |
| | | | | | | | | |
| Materials — 5.0% | | | | | | | | |
| Chemicals — 5.0% | | | | | | | | |
| Valvoline, Inc. | | | 5,800 | | | | 197,606 | |
| | | | | | | | | |
| Technology — 5.7% | | | | | | | | |
| Technology Hardware — 3.2% | | | | | | | | |
| Corning, Inc. | | | 900 | | | | 33,381 | |
| Diebold Nixdorf, Inc. (a) | | | 11,400 | | | | 92,454 | |
| | | | | | | | 125,835 | |
| Technology Services — 2.5% | | | | | | | | |
| MultiPlan Corporation (a) | | | 24,000 | | | | 96,960 | |
| | | | | | | | | |
| Utilities — 2.4% | | | | | | | | |
| Electric Utilities — 2.4% | | | | | | | | |
| PG&E Corporation (a) | | | 8,000 | | | | 95,040 | |
| | | | | | | | | |
| Total Common Stocks (Cost $2,537,554) | | | | | | $ | 3,514,583 | |
| ADLER VALUE FUND |
| SCHEDULE OF INVESTMENTS (Continued) |
| PREFERRED STOCKS — 1.6% | | Shares | | | Value | |
| Financials — 1.6% | | | | | | | | |
| Banking — 1.6% | | | | | | | | |
| Itau Unibanco Holding S.A. - ADR (Cost $76,260) | | | 15,800 | | | $ | 61,936 | |
| PURCHASED OPTION | | Strike | | | | | | Notional | | | | |
| CONTRACTS — 4.7% | | Price | | | Contracts | | | Value | | | Value | |
| Call Option Contracts — 4.7% | | | | | | | | | | | | | | | | |
| Altice USA, Inc. - Class A, 06/20/22 | | $ | 18.00 | | | | 20 | | | $ | 31,680 | | | $ | 3,700 | |
| Altice USA, Inc. - Class A, 06/20/22 | | | 25.00 | | | | 10 | | | | 15,840 | | | | 550 | |
| Bristol-Myers Squibb Company, 01/24/22 | | | 62.50 | | | | 25 | | | | 134,075 | | | | 650 | |
| Bristol-Myers Squibb Company, 06/20/22 | | | 57.50 | | | | 20 | | | | 107,260 | | | | 4,980 | |
| Bristol-Myers Squibb Company, 06/20/22 | | | 65.00 | | | | 15 | | | | 80,445 | | | | 1,305 | |
| Diebold Nixdorf, Inc., 01/24/22 | | | 12.50 | | | | 50 | | | | 40,550 | | | | 500 | |
| Diebold Nixdorf, Inc., 02/22/22 | | | 10.00 | | | | 10 | | | | 8,110 | | | | 480 | |
| Diebold Nixdorf, Inc., 05/23/22 | | | 10.00 | | | | 20 | | | | 16,220 | | | | 2,000 | |
| Equitable Holdings, Inc., 01/24/22 | | | 30.00 | | | | 50 | | | | 157,300 | | | | 13,125 | |
| iHeartMedia, Inc. - Class A, 01/24/22 | | | 22.50 | | | | 30 | | | | 58,830 | | | | 1,650 | |
| iHeartMedia, Inc. - Class A, 01/24/22 | | | 25.00 | | | | 20 | | | | 39,220 | | | | 800 | |
| iHeartMedia, Inc. - Class A, 04/18/22 | | | 20.00 | | | | 40 | | | | 78,440 | | | | 9,300 | |
| iHeartMedia, Inc. - Class A, 04/18/22 | | | 22.50 | | | | 30 | | | | 58,830 | | | | 4,125 | |
| Itau Unibanco Holding S.A. - ADR, 01/23/23 | | | 4.50 | | | | 10 | | | | 3,920 | | | | 1,063 | |
| Itau Unibanco Holding S.A. - ADR, 01/23/23 | | | 5.00 | | | | 20 | | | | 7,840 | | | | 1,520 | |
| Jackson Financial, Inc. - Class A, 06/20/22 | | | 30.00 | | | | 10 | | | | 31,660 | | | | 4,700 | |
| MultiPlan Corporation, 01/24/22 | | | 7.50 | | | | 20 | | | | 8,080 | | | | 100 | |
| MultiPlan Corporation, 01/23/23 | | | 5.00 | | | | 90 | | | | 36,360 | | | | 9,225 | |
| MultiPlan Corporation, 01/23/23 | | | 7.50 | | | | 10 | | | | 4,040 | | | | 600 | |
| ADLER VALUE FUND |
| SCHEDULE OF INVESTMENTS (Continued) |
| PURCHASED OPTION | | | | | | | | | | | | |
| CONTRACTS — 4.7% | | Strike | | | | | | Notional | | | | |
| (Continued) | | Price | | | Contracts | | | Value | | | Value | |
| Call Option Contracts — 4.7% | | | | | | | | | | | | | | | | |
| (Continued) | | | | | | | | | | | | | | | | |
| Pfizer, Inc., 01/24/22 | | $ | 37.00 | | | | 20 | | | $ | 107,460 | | | $ | 34,760 | |
| PG&E Corporation, 01/24/22 | | | 10.00 | | | | 10 | | | | 11,880 | | | | 2,130 | |
| PG&E Corporation, 01/24/22 | | | 12.00 | | | | 10 | | | | 11,880 | | | | 710 | |
| PG&E Corporation, 01/23/23 | | | 10.00 | | | | 10 | | | | 11,880 | | | | 3,110 | |
| Veoneer, Inc., 02/22/22 | | | 21.00 | | | | 10 | | | | 35,600 | | | | 14,900 | |
| Veoneer, Inc., 02/22/22 | | | 22.00 | | | | 10 | | | | 35,600 | | | | 14,000 | |
| Veoneer, Inc., 02/22/22 | | | 23.00 | | | | 20 | | | | 71,200 | | | | 25,600 | |
| ViacomCBS, Inc. - Class B, 01/24/22 | | | 40.00 | | | | 30 | | | | 92,850 | | | | 630 | |
| ViacomCBS, Inc. - Class B, 06/20/22 | | | 37.50 | | | | 10 | | | | 30,950 | | | | 1,480 | |
| Viatris, Inc., 01/24/22 | | | 12.50 | | | | 10 | | | | 12,310 | | | | 650 | |
| Viatris, Inc., 01/24/22 | | | 15.00 | | | | 55 | | | | 67,705 | | | | 715 | |
| Viatris, Inc., 01/24/22 | | | 20.00 | | | | 20 | | | | 24,620 | | | | 100 | |
| Viatris, Inc., 01/23/23 | | | 12.50 | | | | 10 | | | | 12,310 | | | | 2,000 | |
| Viatris, Inc., 01/23/23 | | | 15.00 | | | | 150 | | | | 184,650 | | | | 18,000 | |
| XP, Inc. - Class A, 05/23/22 | | | 30.00 | | | | 10 | | | | 28,680 | | | | 4,350 | |
| Total Purchased Option Contracts (Cost $202,693) | | $ | 1,658,275 | | | $ | 183,508 | |
| MONEY MARKET FUNDS — 4.2% | | Shares | | | Value | |
| Federated Hermes Treasury Obligations Fund, 0.01% (b) (Cost $167,286) | | | 167,286 | | | $ | 167,286 | |
| | | | | | | | | |
| Investments at Value — 100.1% (Cost $2,983,793) | | | | | | $ | 3,927,313 | |
| | | | | | | | | |
| Liabilities in Excess of Other Assets — (0.1%) | | | | | | | (3,970 | ) |
| | | | | | | | | |
| Net Assets — 100.0% | | | | | | $ | 3,923,343 | |
| (a) | Non-income producing security. |
| (b) | The rate shown is the 7-day effective yield as of November 30, 2021. |
See accompanying notes to financial statements.
| ADLER VALUE FUND |
| STATEMENT OF ASSETS AND LIABILITIES |
| November 30, 2021 (Unaudited) |
| ASSETS | | | | |
| Investments in securities: | | | | |
| At cost | | $ | 2,983,793 | |
| At value (Note 2) | | $ | 3,927,313 | |
| Receivable for capital shares sold | | | 250 | |
| Receivable from Adviser (Note 4) | | | 21,632 | |
| Dividends receivable | | | 7,758 | |
| Tax reclaims receivable | | | 341 | |
| Other assets | | | 12,587 | |
| Total assets | | | 3,969,881 | |
| | | | | |
| LIABILITIES | | | | |
| Payable for investment securities purchased | | | 32,828 | |
| Payable to administrator (Note 4) | | | 7,030 | |
| Other accrued expenses | | | 6,680 | |
| Total liabilities | | | 46,538 | |
| | | | | |
| NET ASSETS | | $ | 3,923,343 | |
| | | | | |
| NET ASSETS CONSIST OF: | | | | |
| Paid-in capital | | $ | 2,899,727 | |
| Accumulated earnings | | | 1,023,616 | |
| NET ASSETS | | $ | 3,923,343 | |
| | | | | |
| PRICING OF INSTITUTIONAL SHARES (Note 2) | | | | |
| Net assets applicable to Institutional Shares | | $ | 3,923,343 | |
| Shares of Institutional Shares outstanding (no par value, unlimited number of shares authorized) | | | 132,609 | |
| Net asset value, offering and redemption price per share (Note 2) | | $ | 29.59 | |
See accompanying notes to financial statements.
| ADLER VALUE FUND |
| STATEMENT OF OPERATIONS |
| For the Six Months Ended November 30, 2021 (Unaudited) |
| INVESTMENT INCOME | | | | |
| Dividends | | $ | 38,513 | |
| Foreign withholding tax on dividends | | | (123 | ) |
| Total investment income | | | 38,390 | |
| | | | | |
| EXPENSES | | | | |
| Investment advisory fees (Note 4) | | | 19,866 | |
| Fund accounting fees (Note 4) | | | 15,197 | |
| Administration fees (Note 4) | | | 15,000 | |
| Legal fees | | | 13,727 | |
| Audit and tax services fees | | | 8,910 | |
| Trustees’ fees and expenses (Note 4) | | | 8,658 | |
| Registration and filing fees | | | 8,156 | |
| Transfer agent fees (Note 4) | | | 6,000 | |
| Compliance fees (Note 4) | | | 6,000 | |
| Custodian and bank service fees | | | 4,959 | |
| Postage and supplies | | | 1,798 | |
| Insurance expense | | | 1,658 | |
| Printing of shareholder reports | | | 1,080 | |
| Other expenses | | | 3,776 | |
| Total expenses | | | 114,785 | |
| Less fee reductions and expense reimbursements by the Adviser (Note 4) | | | (89,953 | ) |
| Net expenses | | | 24,832 | |
| | | | | |
| NET INVESTMENT INCOME | | | 13,558 | |
| | | | | |
| REALIZED AND UNREALIZED GAINS (LOSSES) ON INVESTMENTS | | | | |
| Net realized gains on investments transactions | | | 67,602 | |
| Net change in unrealized appreciation (depreciation) on investments | | | (204,676 | ) |
| NET REALIZED AND UNREALIZED LOSSES ON INVESTMENTS | | | (137,074 | ) |
| | | | | |
| NET DECREASE IN NET ASSETS RESULTING FROM OPERATIONS | | $ | (123,516 | ) |
See accompanying notes to financial statements.
| ADLER VALUE FUND |
| STATEMENTS OF CHANGES IN NET ASSETS |
| | | Six Months | | | | |
| | | Ended | | | | |
| | | November 30, | | | Year Ended | |
| | | 2021 | | | May 31, | |
| | | (Unaudited) | | | 2021 | |
| FROM OPERATIONS | | | | | | | | |
| Net investment income | | $ | 13,558 | | | $ | 6,671 | |
| Net realized gains (losses) from investment transactions | | | 67,602 | | | | (3,828 | ) |
| Net change in unrealized appreciation (depreciation) on investments | | | (204,676 | ) | | | 1,190,419 | |
| Net increase (decrease) in net assets resulting from operations | | | (123,516 | ) | | | 1,193,262 | |
| | | | | | | | | |
| DISTRIBUTIONS TO SHAREHOLDERS (NOTE 2) | | | | | | | | |
| Institutional Shares | | | — | | | | (33,750 | ) |
| | | | | | | | | |
| FROM CAPITAL SHARE TRANSACTIONS | | | | | | | | |
| Institutional Shares | | | | | | | | |
| Proceeds from shares sold | | | 252,169 | | | | 1,143,090 | |
| Net asset value of shares issued in reinvestment of distributions to shareholders | | | — | | | | 33,750 | |
| Payments for shares redeemed | | | — | | | | (30 | ) |
| Net increase in Institutional Shares net assets from capital share transactions | | | 252,169 | | | | 1,176,810 | |
| | | | | | | | | |
| TOTAL INCREASE IN NET ASSETS | | | 128,653 | | | | 2,336,322 | |
| | | | | | | | | |
| NET ASSETS | | | | | | | | |
| Beginning of period | | | 3,794,690 | | | | 1,458,368 | |
| End of period | | $ | 3,923,343 | | | $ | 3,794,690 | |
| | | | | | | | | |
| CAPITAL SHARES ACTIVITY | | | | | | | | |
| Institutional Shares | | | | | | | | |
| Shares sold | | | 8,195 | | | | 49,491 | |
| Shares reinvested | | | — | | | | 1,359 | |
| Shares redeemed | | | — | | | | (1 | ) |
| Net increase in shares outstanding | | | 8,195 | | | | 50,849 | |
| Shares outstanding, beginning of period | | | 124,414 | | | | 73,565 | |
| Shares outstanding, end of period | | | 132,609 | | | | 124,414 | |
See accompanying notes to financial statements.
| ADLER VALUE FUND |
| INSTITUTIONAL SHARES |
| FINANCIAL HIGHLIGHTS |
Per Share Data for a Share Outstanding Throughout Each Period
| | | Six Months | | | | | | | | | | |
| | | Ended | | | | | | | | | | |
| | | November 30, | | | Year Ended | | | Period Ended | | | Period Ended | |
| | | 2021 | | | May 31, | | | May 31, | | | July 31, | |
| | | (Unaudited) | | | 2021 | | | 2020(a) | | | 2019(b) | |
| Net asset value at beginning of period | | $ | 30.50 | | | $ | 19.82 | | | $ | 20.41 | | | $ | 20.00 | |
| Income (loss) from investment operations: | | | | | | | | | | | | | | | | |
| Net investment income | | | 0.10 | | | | 0.07 | (c) | | | 0.49 | (d) | | | 0.15 | |
| Net realized and unrealized gains (losses) on investments | | | (1.01 | ) | | | 10.92 | | | | (0.88 | ) | | | 0.26 | |
| Total from investment operations | | | (0.91 | ) | | | 10.99 | | | | (0.39 | ) | | | 0.41 | |
| Less distributions from: | | | | | | | | | | | | | | | | |
| Net investment income | | | — | | | | (0.31 | ) | | | (0.20 | ) | | | — | |
| Net asset value at end of period | | $ | 29.59 | | | $ | 30.50 | | | $ | 19.82 | | | $ | 20.41 | |
| Total return (e) | | | (2.98 | %) (f) | | | 55.78 | % | | | (2.01 | %) (f) | | | 2.05 | % (f) |
| Net assets at end of period (000’s) | | $ | 3,923 | | | $ | 3,795 | | | $ | 1,458 | | | $ | 1,447 | |
| Ratios/supplementary data: | | | | | | | | | | | | | | | | |
| Ratio of total expenses to average net assets | | | 5.78 | % (g) | | | 8.42 | % | | | 13.01 | % (g) | | | 11.82 | % (g) |
| Ratio of net expenses to average net assets (h) | | | 1.25 | % (g) | | | 1.25 | % | | | 1.25 | % (g) | | | 1.26 | % (g)(i) |
| Ratio of net investment income to average net assets (h) | | | 0.68 | % (g) | | | 0.27 | % | | | 2.93 | % (d)(g) | | | 0.81 | % (g) |
| Portfolio turnover rate | | | 10 | % (f) | | | 0 | % (j) | | | 4 | % (f) | | | 0 | % |
| (a) | Fund changed fiscal year to May 31. |
| (b) | Represents the period from the commencement of operations (August 16, 2018) through July 31, 2019. |
| (c) | Per share net investment income has been determined on the basis of average number of shares outstanding during the period. |
| (d) | During the period ended May 31, 2020, the Fund received a large special dividend distribution from NortonLifeLock, Inc. Had the Fund not received this special dividend distribution, the net investment income per share and ratio of net investment income to average net assets would have been $0.33 and 1.97%(g) lower, respectively. |
| (e) | Total return is a measure of the change in value of an investment in the Fund over the periods covered. The returns shown do not reflect the deduction of taxes a shareholder would pay on Fund distributions, if any, or the redemption of Fund shares. The total returns would be lower if the Adviser had not reduced fees and reimbursed expenses (Note 4). |
| (h) | Ratio was determined after advisory fee reductions and expense reimbursements (Note 4). |
| (i) | Includes federal excise taxes of 0.01% of average net assets with respect to the period ended July 31, 2019. |
| (j) | Percentage rounds to less than 1%. |
See accompanying notes to financial statements.
| ADLER VALUE FUND |
| NOTES TO FINANCIAL STATEMENTS |
| November 30, 2021 (Unaudited) |
Adler Value Fund (the “Fund”) is a non-diversified series of Ultimus Managers Trust (the “Trust”), an open-end investment company established as an Ohio business trust under a Declaration of Trust dated February 28, 2012. Other series of the Trust are not incorporated in this report.
The investment objective of the Fund is to seek to achieve long-term growth of capital.
The Fund currently offers one class of shares: Institutional Class shares (sold without any sales loads or distribution fees and subject to a $1,000,000 initial investment requirement).
| 2. | Significant Accounting Policies |
The Fund follows accounting and reporting guidance under Financial Accounting Standards Board Accounting Standards Codification Topic 946, “Financial Services – Investment Companies.” The following is a summary of the Fund’s significant accounting policies used in preparation of its financial statements. These policies are in conformity with accounting principles generally accepted in the United States of America (“GAAP”).
Securities valuation – The Fund values its portfolio securities at market value as of the close of regular trading on the New York Stock Exchange (the “NYSE”) (normally 4:00 p.m. Eastern Time) on each day the NYSE is open for business. The Fund generally values its listed securities on the basis of the security’s last sale price on the security’s primary exchange, if available, otherwise at the exchange’s most recently quoted mean price. NASDAQ-listed securities are valued at the NASDAQ Official Closing Price. Option contracts are valued at the closing price on the exchanges on which they are primarily traded; if no closing price is available at the time of valuation, the option will be valued at the mean of the closing bid and ask prices for that day. Investments representing shares of money market funds and other open-end investment companies not traded on an exchange are valued at their net asset value (“NAV”) as reported by such companies. When using a quoted price and when the market is considered active, the security will be classified as Level 1 within the fair value hierarchy (see next page). In the event that market quotations are not readily available or are considered unreliable due to market or other events, the Fund values its securities and other assets at fair value in accordance with procedures established by and under the general supervision of the Board of Trustees of the Trust (the “Board”). Under these procedures, the securities will be classified as Level 2 or 3 within the fair value hierarchy, depending on the inputs used. Unavailable or unreliable market quotes may be due to the following factors: a substantial bid-ask spread; infrequent sales resulting in stale prices; insufficient trading volume; small trade sizes; a temporary lapse in any reliable pricing source; and actions of the securities or futures markets, such as the suspension or limitation of trading. As a result, the prices of securities used to calculate the Fund’s NAV may differ from quoted or published prices for the same securities.
GAAP establishes a single authoritative definition of fair value, sets out a framework for measuring fair value, and requires additional disclosures about fair value measurements.
| ADLER VALUE FUND |
| NOTES TO FINANCIAL STATEMENTS (Unaudited) (Continued) |
Various inputs are used in determining the value of the Fund’s investments. These inputs are summarized in the three broad levels listed below:
| ● | Level 1 – quoted prices in active markets for identical securities |
| ● | Level 2 – other significant observable inputs |
| ● | Level 3 – significant unobservable inputs |
The inputs or methods used for valuing securities are not necessarily an indication of the risks associated with investing in those securities. The inputs used to measure fair value may fall into different levels of the fair value hierarchy. In such cases, for disclosure purposes, the level in the fair value hierarchy within which the fair value measurement falls in its entirety is determined based on the lowest level input that is significant to the fair value measurement.
The following is a summary of the Fund’s investments based on the inputs used to value the investments as of November 30, 2021:
| | | Level 1 | | | Level 2 | | | Level 3 | | | Total | |
| Common Stocks | | $ | 3,514,583 | | | $ | — | | | $ | — | | | $ | 3,514,583 | |
| Preferred Stocks | | | 61,936 | | | | — | | | | — | | | | 61,936 | |
| Purchased Option Contracts | | | 77,200 | | | | 106,308 | | | | — | | | | 183,508 | |
| Money Market Funds | | | 167,286 | | | | — | | | | — | | | | 167,286 | |
| Total | | $ | 3,821,005 | | | $ | 106,308 | | | $ | — | | | $ | 3,927,313 | |
| | | | | | | | | | | | | | | | | |
Refer to the Fund’s Schedule of Investments for a listing of the common and preferred stocks by sector and industry type. The Fund did not have any assets or liabilities that were measured at fair value on a recurring basis using significant unobservable inputs (Level 3) as of or during the six months ended November 30, 2021.
Share valuation – The NAV per share of each class of the Fund is calculated daily by dividing the total value of the assets attributable to that class, less liabilities attributable to that class, by the number of shares outstanding of that class. The offering price and redemption price per share of each class of the Fund is equal to the NAV per share of such class.
Investment income – Dividend income is recorded on the ex-dividend date. Non-cash dividends included in dividend income, if any, are recorded at the fair value of the security received. Interest income is accrued as earned. Withholding taxes on foreign dividends, if any, have been recorded in accordance with the Fund’s understanding of the applicable country’s tax rules and rates.
Investment transactions – Investment transactions are accounted for on the trade date. Realized gains and losses on investments sold are determined on a specific identification basis.
Common expenses – Common expenses of the Trust are allocated among the Fund and the other series of the Trust based on the relative net assets of each series, the number of series in the Trust, or the nature of the services performed and the relative applicability to each series.
| ADLER VALUE FUND |
| NOTES TO FINANCIAL STATEMENTS (Unaudited) (Continued) |
Distributions to shareholders – Distributions to shareholders arising from net investment income and realized capital gains, if any, are declared and paid annually to shareholders. The amount of distributions from net investment income and net realized capital gains are determined in accordance with federal income tax regulations, which may differ from GAAP. Dividends and distributions to shareholders are recorded on the ex-dividend date. For the year ended May 31, 2021, the tax character of distributions paid to shareholders was ordinary income. There were no distributions paid to shareholders during the six months ended November 30, 2021.
Purchased option contracts – The Fund may use option contracts in any manner consistent with its investment objectives and as long as its use is consistent with relevant provisions of the Investment Company Act of 1940, as amended (the “1940 Act”). The Fund may use options for speculative purposes as well as for the purpose of seeking to reduce the overall investment risk that would otherwise be associated with the securities in which the Fund invests. When the Fund purchases a call or put option, an amount equal to the total premium (the premium plus the commission) paid by the Fund is recorded as an asset on the Fund’s Statement of Assets and Liabilities and is subsequently marked-to-market daily. Premiums paid in the purchase of options which expire are treated as realized losses. Premiums paid in the purchase of call options which are exercised increase the cost of the security purchased. Premiums paid in the purchase of put options which are exercised decrease the proceeds used to calculate the realized capital gain or loss on the sale of the security.
Estimates – The preparation of financial statements in conformity with GAAP requires management to make estimates and assumptions that affect the reported amounts of assets and liabilities and disclosure of contingent assets and liabilities as of the date of the financial statements and the reported amounts of increase (decrease) in net assets from operations during the reporting period. Actual results could differ from those estimates.
Federal income tax – The Fund has qualified and intends to continue to qualify as a regulated investment company under the Internal Revenue Code of 1986, as amended (the “Code”). Qualification generally will relieve the Fund of liability for federal income taxes to the extent 100% of its net investment income and net realized capital gains are distributed in accordance with the Code.
In order to avoid imposition of the excise tax applicable to regulated investment companies, it is also the Fund’s intention to declare as dividends in each calendar year amounts equal to at least 98% of its net investment income (earned during the calendar year) and 98.2% of its net realized capital gains (earned during the 12 months ended October 31) plus undistributed amounts from prior years.
| ADLER VALUE FUND |
| NOTES TO FINANCIAL STATEMENTS (Unaudited) (Continued) |
The following information is computed on a tax basis for each item as of November 30, 2021:
| Tax cost of portfolio investments | | $ | 2,983,793 | |
| Gross unrealized appreciation | | $ | 1,219,875 | |
| Gross unrealized depreciation | | | (276,355 | ) |
| Net unrealized appreciation | | | 943,520 | |
| Undistributed ordinary income | | | 4,557 | |
| Capital loss carryforward | | | (5,621 | ) |
| Other gains | | | 81,160 | |
| Accumulated earnings | | $ | 1,023,616 | |
| | | | | |
As of May 31, 2021, the Fund had a long-term capital loss carryforward of $5,621 for federal income tax purposes, which may be carried forward indefinitely. This capital loss carryforward is available to offset net realized gains in the current and future years, thereby reducing future taxable gains.
The Fund recognizes the tax benefits or expenses of uncertain tax positions only when the position is “more likely than not” to be sustained assuming examination by tax authorities. Management has reviewed the Fund’s tax positions for the current and all open tax periods (generally, three years) and has concluded that no provision for unrecognized tax benefits or expenses is required in these financial statements. The Fund identifies its major tax jurisdiction as U.S. federal.
| 3. | Investment Transactions |
During the six months ended November 30, 2021, cost of purchases and proceeds from sales of investment securities, other than short-term investments, were $578,665 and $353,513, respectively.
| 4. | Transactions with Related Parties |
INVESTMENT ADVISORY AGREEMENT
The Fund’s investments are managed by Adler Asset Management, LLC (the “Adviser”) pursuant to the terms of an Investment Advisory Agreement. Under the Investment Advisory Agreement, the Fund pays the Adviser an investment advisory fee, computed and accrued daily and paid monthly, at the annual rate of 1.00% of its average daily net assets.
Pursuant to an Expense Limitation Agreement (“ELA”) between the Fund and the Adviser, the Adviser has agreed, until December 1, 2022, to reduce its investment advisory fees and reimburse other expenses to limit total annual operating expenses (exclusive of brokerage costs; taxes; interest; borrowing costs such as interest and dividends expenses on securities sold short; costs to organize the Fund; acquired fund fees and expenses; and extraordinary expenses such as litigation and merger or reorganization costs and other expenses not incurred in the ordinary course of the Fund’s business) to an amount not exceeding 1.25% of
| ADLER VALUE FUND |
| NOTES TO FINANCIAL STATEMENTS (Unaudited) (Continued) |
the Fund’s average daily net assets of the Institutional Class shares. Accordingly, during the six months ended November 30, 2021, the Adviser did not collect any of its investment advisory fees and reimbursed other operating expenses totaling $70,087.
Under the terms of the ELA, investment advisory fee reductions and expense reimbursements by the Adviser are subject to repayment by the Fund for a period of three years after such fees and expenses were incurred, provided that the repayments do not cause the Fund’s total annual operating expenses to exceed the lesser of (i) the expense limitation then in effect, if any, and (ii) the expense limitation in effect at the time the expenses to be repaid were incurred. As of November 30, 2021, the Adviser may seek recoupment of investment advisory fee reductions and expense reimbursements no later than the dates as stated below:
| July 31, 2022 | | $ | 94,665 | |
| May 31, 2023 | | | 142,930 | |
| May 31, 2024 | | | 179,743 | |
| November 30, 2024 | | | 89,953 | |
| Total | | $ | 507,291 | |
| | | | | |
OTHER SERVICE PROVIDERS
Ultimus Fund Solutions, LLC (“Ultimus”) provides administration, fund accounting, compliance and transfer agency services to the Fund. The Fund pays Ultimus fees in accordance with the agreements for such services. In addition, the Fund pays out-of-pocket expenses including, but not limited to, postage, supplies, and certain costs related to the pricing of the Fund’s portfolio securities.
Under the terms of a Distribution Agreement with the Trust, Ultimus Fund Distributors, LLC (the “Distributor”) serves as principal underwriter to the Fund. The Distributor is a wholly-owned subsidiary of Ultimus. The Distributor is compensated by the Adviser (not the Fund) for acting as principal underwriter.
Certain officers and a Trustee of the Trust are also officers of Ultimus and are not paid by the Fund for serving in such capacities.
TRUSTEE COMPENSATION
Effective October 19, 2021, each member of the Board (a “Trustee”) who is not an “interested person” (as defined by the 1940 Act, as amended) of the Trust (“Independent Trustee”) receives a $1,300 annual retainer from the Fund, paid quarterly, except for the Board Chairperson who receives a $1,700 annual retainer from the Fund, paid in quarterly installments. Each Independent Trustee also receives from the Fund a fee of $550 for each Board meeting attended plus reimbursement for travel and other meeting-related expenses. Prior to October 19, 2021, each Independent Trustee received a $1,300 annual retainer from the Fund, paid quarterly, except for the Board Chairperson who received a $1,500 annual retainer from the Fund, paid in quarterly installments. Each Independent Trustee also received from the Fund a fee of $500 for each Board meeting attended plus reimbursement for travel and other meeting-related expenses.
| ADLER VALUE FUND |
| NOTES TO FINANCIAL STATEMENTS (Unaudited) (Continued) |
PRINCIPAL HOLDER OF FUND SHARES
As of November 30, 2021, the following shareholder owned of record 25% or more of the outstanding shares of the Fund:
| NAME OF RECORD OWNER | % Ownership |
| David R. Adler | 65% |
A beneficial owner of 25% or more of the Fund’s outstanding shares may be considered a controlling person. That shareholder’s vote could have a more significant effect on matters presented at a shareholders’ meeting.
| 5. | Derivative Transactions |
The location on the Statement of Assets and Liabilities of the derivative positions of the Fund are as follows:
| | | | | | | Fair Value | | | Average
Monthly | |
Type of
Derivative | | Risk | | Location | | Asset
Derivatives | | | Liability
Derivatives | | | Notional Value
During the
Six Months
Ended
November 30,
2021* | |
| Equity call options purchased | | Equity | | Investments in securities at value | | $ | 183,508 | | | $ | — | | | $ | 1,506,571 | |
| * | The average monthly notional value generally represents the Fund’s derivative activity throughout the period. |
Realized and unrealized gains and losses associated with transactions in derivative instruments for the Fund during the six months ended November 30, 2021 are recorded in the following locations on the Statement of Operations:
Type of
Derivative | | Risk | | Location | | Realized
Losses | | | Location | | Change in
Unrealized
Appreciation
(Depreciation) | |
| Equity call options purchased | | Equity | | Net realized gains (losses) on investment transactions | | $ | (27,660 | ) | | Net change in unrealized appreciation (depreciation) on investments | | $ | (25,446 | ) |
| ADLER VALUE FUND |
| NOTES TO FINANCIAL STATEMENTS (Unaudited) (Continued) |
| 6. | Contingencies and Commitments |
The Fund indemnifies the Trust’s officers and Trustees for certain liabilities that might arise from their performance of their duties to the Fund. Additionally, in the normal course of business, the Fund enters into contracts that contain a variety of representations, warranties, and general indemnifications. The Fund’s maximum exposure under these arrangements is unknown, as this would involve future claims that may be made against the Fund that have not yet occurred. However, based on experience, the Fund expects the risk of loss to be remote.
The Fund is required to recognize in the financial statements the effects of all subsequent events that provide additional evidence about conditions that existed as of the date of the Statement of Assets and Liabilities. For non-recognized subsequent events that must be disclosed to keep the financial statements from being misleading, the Fund is required to disclose the nature of the event as well as an estimate of its financial effect, or a statement that such an estimate cannot be made. Management has evaluated subsequent events through the issuance of these financial statements and has noted no such events except for the following:
On December 28, 2021, the Fund paid an income distribution and a long-term capital gain distribution of $2.3003 and $0.0978 per share, respectively, to shareholders of record on December 27, 2021.
| ADLER VALUE FUND |
| LIQUIDITY RISK MANAGEMENT PROGRAM (Unaudited) |
The Fund has adopted and implemented a written liquidity risk management program (the “Program”) as required by Rule 22e-4 (the “Liquidity Rule”) under the Investment Company Act of 1940, as amended. The Program is reasonably designed to assess and manage the Fund’s liquidity risk, taking into consideration, among other factors, the Fund’s investment strategy and the liquidity of its portfolio investments during normal and reasonably foreseeable stressed conditions; its short- and long-term cash flow projections; and its cash holdings and access to other funding sources. The Fund’s Board of Trustees (the “Board”) approved the appointment of the Liquidity Administrator Committee, comprising of the Fund’s Adviser and certain Trust officers, to be responsible for the Program’s administration and oversight and for reporting to the Board on at least an annual basis regarding the Program’s operation and effectiveness. The annual written report assessing the Program (the “Report”) was presented to the Board at the October 18 - 19, 2021 Board meeting and covered the period from June 1, 2020 to May 31, 2021 (the “Review Period”).
During the Review Period, the Fund did not experience unusual stress or disruption to its operations related to purchase and redemption activity. Also, during the Review Period, the Fund held adequate levels of cash and highly liquid investments to meet shareholder redemption activities in accordance with applicable requirements. The Report concluded that the Program is reasonably designed to prevent violation of the Liquidity Rule and the Program has been effectively implemented.
| ADLER VALUE FUND |
| ABOUT YOUR FUND’S EXPENSES (Unaudited) |
We believe it is important for you to understand the impact of costs on your investment. As a shareholder of the Fund, you incur ongoing costs, including management fees and other operating expenses. The following examples are intended to help you understand your ongoing costs (in dollars) of investing in the Fund and to compare these costs with the ongoing costs of investing in other mutual funds.
A mutual fund’s ongoing costs are expressed as a percentage of its average net assets. This figure is known as the expense ratio. The expenses in the table below are based on an investment of $1,000 made at the beginning of the most recent period (June 1, 2021) and held until the end of the period (November 30, 2021).
The table below illustrates the Fund’s ongoing costs in two ways:
Actual fund return – This section helps you to estimate the actual expenses that you paid over the period. The “Ending Account Value” shown is derived from the Fund’s actual return, and the fourth column shows the dollar amount of operating expenses that would have been paid by an investor who started with $1,000 in the Fund. You may use the information here, together with the amount you invested, to estimate the expenses that you paid over the period.
To do so, simply divide your account value by $1,000 (for example, an $8,600 account value divided by $1,000 = 8.6), then multiply the result by the number given for the Fund under the heading “Expenses Paid During Period.”
Hypothetical 5% return – This section is intended to help you compare the Fund’s ongoing costs with those of other mutual funds. It assumes that the Fund had an annual return of 5% before expenses during the period shown, but that the expense ratio is unchanged. In this case, because the return used is not the Fund’s actual return, the results do not apply to your investment. The example is useful in making comparisons because the U.S. Securities and Exchange Commission (the “SEC”) requires all mutual funds to calculate expenses based on a 5% return. You can assess the Fund’s ongoing costs by comparing this hypothetical example with the hypothetical examples that appear in shareholder reports of other funds.
Note that expenses shown in the table are meant to highlight and help you compare ongoing costs only. The Fund does not charge sales loads.
The calculations assume no shares were bought or sold during the period. Your actual costs may have been higher or lower, depending on the amount of your investment and the timing of any purchases or redemptions.
| ADLER VALUE FUND |
| ABOUT YOUR FUND’S EXPENSES (Unaudited) (Continued) |
More information about the Fund’s expenses can be found in this report. For additional information on operating expenses and other shareholder costs, please refer to the Fund’s prospectus.
| | Beginning | Ending | | |
| | Account Value | Account Value | | Expenses |
| | June 1, | November 30, | Net Expense | Paid During |
| Institutional Class | 2021 | 2021 | Ratio(a) | Period(b) |
| Based on Actual Fund Return | $1,000.00 | $ 970.20 | 1.25% | $6.17 |
Based on Hypothetical 5%
Return (before expenses) | $1,000.00 | $ 1,018.80 | 1.25% | $6.33 |
| (a) | Annualized, based on the Fund’s most recent one-half year expenses. |
| (b) | Expenses are equal to the Fund’s annualized net expense ratio multiplied by the average account value over the period, multiplied by 183/365 (to reflect the one-half year period). |
| ADLER VALUE FUND |
| OTHER INFORMATION (Unaudited) |
A description of the policies and procedures that the Fund uses to vote proxies relating to portfolio securities is available without charge upon request by calling 1-800-408-4682, or on the SEC’s website at www.sec.gov. Information regarding how the Fund voted proxies relating to portfolio securities during the most recent 12-month period ended June 30 is also available without charge upon request by calling 1-800-408-4682, or on the SEC’s website at www.sec.gov.
The Trust files a complete listing of portfolio holdings for the Fund with the SEC as of the end of the first and third quarters of each fiscal year as an exhibit to its reports on Form N-PORT. These filings are available upon request by calling 1-800-408-4682. Furthermore, you may obtain a copy of the filings on the SEC’s website at www.sec.gov.
| ADLER VALUE FUND |
| CUSTOMER PRIVACY NOTICE |
| FACTS | WHAT DOES THE ADLER VALUE FUND (the “Fund”) DO WITH YOUR PERSONAL INFORMATION? |
| Why? | Financial companies choose how they share your personal information. Federal law gives consumers the right to limit some but not all sharing. Federal law also requires us to tell you how we collect, share, and protect your personal information. Please read this notice carefully to understand what we do. |
| What? | The types of personal information we collect and share depend on the product or service you have with us. This information can include: |
| | |
| | ■ Social Security number |
| | |
| | ■ Assets |
| | |
| | ■ Retirement Assets |
| | |
| | ■ Transaction History |
| | |
| | ■ Checking Account Information |
| | |
| | ■ Purchase History |
| | |
| | ■ Account Balances |
| | |
| | ■ Account Transactions |
| | |
| | ■ Wire Transfer Instructions |
| | |
| | When you are no longer our customer, we continue to share your information as described in this notice. |
| How? | All financial companies need to share your personal information to run their everyday business. In the section below, we list the reasons financial companies can share their customers’ personal information; the reasons the Fund chooses to share; and whether you can limit this sharing. |
| | Does the | Can you limit |
| Reasons we can share your personal information | Fund share? | this sharing? |
| For our everyday business purposes – | | |
| Such as to process your transactions, maintain your account(s), respond to court orders and legal investigations, or report to credit bureaus | Yes | No |
| For our marketing purposes – | | |
| to offer our products and services to you | No | We don’t share |
| For joint marketing with other financial companies | No | We don’t share |
| For our affiliates’ everyday business purposes – | | |
| information about your transactions and experiences | No | We don’t share |
| For our affiliates’ everyday business purposes – | | |
| information about your creditworthiness | No | We don’t share |
| For nonaffiliates to market to you | No | We don’t share |
| Questions? | Call 1-800-408-4682 |
| ADLER VALUE FUND |
| CUSTOMER PRIVACY NOTICE (Continued) |
| Who we are |
Who is providing this
notice? | Adler Value Fund Ultimus Fund Distributors, LLC (Distributor) Ultimus Fund Solutions, LLC (Administrator) |
| What we do |
How does the Fund
protect my personal
information? | To protect your personal information from unauthorized access and use, we use security measures that comply with federal law. These measures include computer safeguards and secured files and buildings. Our service providers are held accountable for adhering to strict policies and procedures to prevent any misuse of your nonpublic personal information. |
How does the Fund
collect my personal
information? | We collect your personal information, for example, when you ■ Open an account ■ Provide account information ■ Give us your contact information ■ Make deposits or withdrawals from your account ■ Make a wire transfer ■ Tell us where to send the money ■ Tell us who receives the money ■ Show your government-issued ID ■ Show your driver’s license We also collect your personal information from other companies. |
Why can’t I limit all
sharing? | Federal law gives you the right to limit only ■ Sharing for affiliates’ everyday business purposes – information about your creditworthiness ■ Affiliates from using your information to market to you ■ Sharing for nonaffiliates to market to you State laws and individual companies may give you additional rights to limit sharing. |
| Definitions |
| Affiliates | Companies related by common ownership or control. They can be financial and nonfinancial companies. |
| | ■ Adler Asset Management, LLC, the investment adviser to the Fund, could be deemed to be an affiliate. |
| Nonaffiliates | Companies not related by common ownership or control. They can be financial and nonfinancial companies |
| | ■ The Fund does not share with nonaffiliates so they can market to you. |
| Joint marketing | A formal agreement between nonaffiliated financial companies that together market financial products or services to you. |
| | ■ The Fund does not jointly market. |
ADLER-SAR-21
| |
| |
| |
| |
| |
| |
| |
 |
| |
| |
| |
| |
| |
| EVOLUTIONARY TREE INNOVATORS FUND |
| |
| (INVNX) |
| |
| Semi-Annual Report |
| |
| November 30, 2021 |
| |
| (Unaudited) |
| |
| |
| |
| |
| |
| |
| |
| |
| |
| |
| |
| |
| |
| |
| |
| |
| |
| |
| |
| EVOLUTIONARY TREE INNOVATORS FUND | |
| LETTER TO SHAREHOLDERS (Unaudited) | November 30, 2021 |
| | |
Dear Fellow Shareholders,
We know it has been a volatile period in the markets over the past six and twelve months, particularly for innovation-focused strategies. Given this backdrop, we felt compelled to provide our perspective and share why we have confidence in the portfolio and its long-term potential for adding value.
For newer investors to the Evolutionary Tree Innovators Fund, we provide below a brief overview of our investment approach and why we focus on long-term drivers such as innovation versus short-term movements in the market or economy. For investors that are more familiar with our innovation-focused strategy, please jump to the sections on our perspective on near-term volatility and why we believe the underlying companies owned in the Fund are well positioned, as a group, to drive sustainable growth.
How Our Approach Enables Investors to Benefit from the Power of Innovation
The Evolutionary Tree Innovators Fund was launched to provide an attractive pathway for investing in important innovations and secular trends, or evolutionary shifts as we call them. The Fund and its adviser apply an innovation and evolution-focused framework to investing. We believe the development of innovation and its resultant pattern of evolutionary change is the primary engine of growth for companies, industries, and the economy—and, in turn, is the underlying driver of long-term wealth creation.
The Fund seeks to identify important innovations that are driving secular growth and evolutionary shifts for companies, industries, and the economy, and own the leading innovators at the forefront. The Fund defines an evolutionary shift as when an industry shifts from an old generation (of a product, service, or business model) over to a “next generation” or new offering that provides advantages versus the “old way” of doing things. The Fund invests in a focused portfolio of 25-35 quality innovative businesses.
Examples of innovations that we believe contribute to sustainable growth include technological innovation, product innovation, service or experience innovation, process or cost innovation, and/or business model innovation. In addition to contributing to sustaining growth for leading innovative businesses, new innovations may also enable innovators to take market share, create competitive advantage, and/or enhance profitability over time. Innovation is the root cause of value creation.
Why We Focus on Innovation, Not on Short-term Movements in the Markets or the Economy
The Evolutionary Tree Innovators Fund is meant for investors that are seeking capital appreciation over the long term. We define long term as sticking with your investments for many years. In the context of this long-term investing mindset, we believe that trying to predict short-term movements in the economy or the markets is largely futile and often counter-productive. As such, we believe shifting the focus toward identifying specific innovations creating positive impact for users and sustaining growth is a more repeatable process for adding value. Focus on innovation and ignore the short-term market chatter.
Looking at investing from an innovation-focused vantage-point, we strongly believe the current economic environment is highly conducive to a steady stream of important and profound innovations across the economy, particularly with industry after industry becoming tech-enabled through digital transformation. We describe the current era we live in as the Age of Innovation. It is the Fund’s mission to own a high-quality and focused collection of leading and emerging innovators that may benefit from these dynamics. Our increasingly intellectual capital-based economy is generating a growing number of innovative businesses in a variety of industries, most notably in technology, life sciences, fintech, and digital consumer spaces.
Perspective on Near-Term Economic Impacts to Innovation and Growth Stocks
The Evolutionary Tree Innovators Fund tended to lean into the digital-based business models, which served the Fund well during the lockdown period in 2020 and early 2021, but from an investment return point of view turned into a short-term headwind later in 2021. Despite this, we believe the shift to digital-based business models will continue even as the economy re-opens. Many of the behaviors, such as using e-commerce or embracing cloud computing, shaped during COVID are becoming more permanent and we are not going back to less efficient ways of doing things. As such, we continue to maintain ownership of quality innovative businesses, including digital innovators.
The equity markets are currently hyper-focused on near-term inflation and any risk that this pushes up interest rates, which is perceived as negative for equities and growth stocks in particular. Interest rates have been too low for too long, and we believe it’s a healthy dynamic for rates to move to more normalized levels. While we acknowledge that inflation is running hot in the near term (with the re-opening and supply chain issues), we see more limited impact on businesses held in the portfolio. The reason is that innovative businesses with differentiated products or services and competitive advantages tend to have pricing power. This means that any increase in component or input costs can typically be passed on to the consumer, limiting any impact on margins. In addition, while inflation is elevated coming out of COVID and may remain elevated for an intermediate-term period (as supply chains catch up), the impact on interest rates has been pretty modest to date, with the 10-Yr Treasury Note yielding about 1.5-1.7%. While this level is up from COVID lows of around 0.50%, the current yield is toward the low end of the past 10 years, where it has typically ranged from 1.5-3.0%. This historical period is one where growth stocks did well, demonstrating that the current interest rate environment is still conducive to growth stocks over the long term. There is risk that interest rates could trend higher, but there is still room for expansion while potentially allowing growth stocks to deliver positive returns over the long term.
All that said, investor fears about inflation, interest rates, new COVID variants (omicron at this moment), and geopolitical events (Russia, China), has led to a “risk-off” environment that has penalized growth and innovation stocks in the near term. As we touch on below, we believe this environment is temporary and investors will likely re-embrace secular growth companies over time.
Investment Results and Contributors and Detractors to Performance
Evolutionary Tree Innovators Fund (INVNX) launched in early September 2020, so the investment results are very short term. The Fund is a long-term focused strategy with a time horizon that is measured in years (typically 3-7 years). As such, short-term performance is less meaningful than long-term results. We would counsel evaluating the strategy on rolling 3 and 5-year investments results, which will be determined over the next few years.
While the Fund delivered strong results initially, the recent pullback in technology and innovation-oriented companies has led to recent under-performance in the near term. In particular, companies that benefited from COVID are seeing “tougher comparisons” with elevated growth they delivered during 2020, leading to some companies experiencing deceleration in growth. However, the long-term secular trends are still intact, in our opinion, and the companies are likely to see improving trends next year. We are also witnessing the markets scrutinize valuations. We believe this is a healthy process and we did take some proactive steps to reduce weights in certain holdings (or outright sales) where we believed the valuations/prices were extended, such as a substantial weight reduction in Zscaler and the sale of both CrowdStrike and MongoDB. We believe we have reduced this risk in the portfolio, and we also built up cash on the margin as a buffer. We believe we are being prudent on risk management and valuation discipline. As the markets have continued to penalize innovative growth companies, we are now seeing valuations over-correct for many companies and reach highly attractive levels, in our opinion. We are currently looking for opportunities to invest our higher-than-normal cash in existing holdings that we believe are currently undervalued or in newer holdings that meet our investment criteria.
While the Fund delivered strong results during 2020, 2021 experienced a number of headwinds for innovation and growth-oriented stocks, as we described above. We believe these headwinds are temporary and the underlying businesses, in aggregate, continue sustaining strong growth, which we believe will lead to improved investment results over time.
For the semi-annual period ended November 30, the Evolutionary Tree Innovator Fund experienced a 3.97% return versus the S&P 500 Index, which saw a return of 9.38%. Since inception of the Fund in early September 2020, the Fund has delivered a cumulative return of 32.35% versus 36.81% for the S&P 500 Index. Given that the Fund’s stated benchmark, the S&P 500 Index, includes both growth and value-oriented stocks, it has delivered somewhat stronger results from the time of the Fund’s launch, as cyclicals and “re-opening trades” have recently served as tailwinds to that index and headwinds to the growth style. So-called re-opening trades are those stocks that investors believe may potentially benefit from the re-opening of the economy as the population gets vaccinated. We believe the benefits of the re-opening trade will be short lived, while secular growers and innovators—which we focus on—can sustain growth for longer.
The top three contributors to performance in the period were Zscaler, HubSpot, and ServiceNow. Contributors were generally companies providing cloud-based enterprise applications or cybersecurity-related offerings. We continue to see companies of all sizes globally shift away from legacy on-premise software/IT to cloud-based and software-
as-a-service platforms as they continue on the journey toward digital transformation. The top three detractors were Peloton, Pinterest, and Roku. The dominant theme of the detractors is that a few of them are experiencing “tough comparisons” against robust growth during 2020/COVID. However, for most of these businesses, underlying growth is still quite robust. Both Pinterest and Roku have reported revenue growth of over 40% in recent periods. Peloton reported strong growth in connected fitness subscribers (+87% year-over-year), but lowered guidance for the year on incrementally slower demand and the recent price cut on its bike product. We believe the company is still the leader with a strong loyal customer base and will be able to address execution issues (re-launch of the Tread product after recall) while benefiting from new products and geographic expansion (currently only in 5 countries; new Tread product launch is at the beginning of its product lifecycle). That said, for any business that experiences a setback we will undergo a rigorous review process to determine if the underlying issue is fixable or structural in nature. If the issue is fixable and short-term in nature, we are likely to stick with the investment, otherwise we will sell the business and reallocate to higher-conviction holdings. During our analysis of a company issue we identify specific milestones we expect the company to meet, and monitor and evaluate the progress relative to those milestones over time.
What Gives Us Confidence in the Portfolio and Long-Term Prospects to Add Value for Shareholders
Despite the recent volatility, we continue to stay focused on the long-term growth prospects of our leading innovator holdings. We believe owning quality innovators—companies pioneering long-term trends with highly innovative products or services, with competitive advantages, and strong balance sheets—provides a strong foundation for confidence in the long-term potential of the Innovators Fund. The companies in the portfolio are actually in great shape, in our assessment, with strong growth and improving profitability across the Fund, along with solid balance sheets. We are pleased to report that the businesses held in the Fund have, on average, delivered exceptionally strong revenue and earnings growth during 2020 (approximately 53% revenue growth on a weighted-average basis), and are estimated to grow revenues approximately 45-50% on a weighted-average basis during 2021, with well-above-average growth projected over the longer term (next five years).
We believe this robust growth validates our view that a stronger economic recovery is positive for secular growers as well as cyclical industries. Now that cyclicals have seen much of their rebound, investors are likely to re-embrace secular growers. Recent events—such as higher inflation, omicron, and geopolitical events—have led to a temporary risk-off environment and volatility, but investors will re-embrace quality innovators as they continue delivering strong growth over time. We counsel patience and focusing on the underlying growth of the businesses, which provides a foundation for improving investment results over time.
Staying True to Our Long-Term Innovation-Focused Approach
While investors are focused on the topics du jour of inflation and the “re-opening trade,” we remain focused on longer-term opportunities represented in the Fund, which are multi-year in nature and driven by the adoption of innovations and secular trends. These are the types of opportunities that will not only benefit from a strengthening economy but can also grow for years beyond that.
As we mentioned in our Year-End Report, which still reflects our current thinking in this environment:
Rather than relying on the typical short-term trading approach of shifting from one group of stocks to another group—say from “COVID stocks” to “re-opening stocks” for example–we remain consistent in staying focused on our long-term approach of owning companies that meet our eight criteria and are positioned to grow over a multi-year period. The eight criteria we use to identify and evaluate quality innovators includes the following characteristics: 1) Benefits from evolutionary shift driven by secular trends and innovation, 2) Large market opportunity with room for growth, 3) Attractive industry structure and dynamics, 4) Industry leader with strong innovation pipeline, 5) Multiple layers of competitive advantage, 6) Strong business model and financial position, 7) Exceptional talent with a unique culture, and 8) Logical valuation based on long-term drivers and economics.
We believe quality innovators are best able to drive value creation when you stick with them over many years, as their innovations gain adoption over time. Innovation is not going to stop, and important secular trends represent the future.
Thanks for joining the growing community of investors embracing innovation investing and the Evolutionary Tree Innovators Fund. We wish you all the best in the New Year.
Thomas Ricketts, CFA
Portfolio Manager
Past performance is not predictive of future performance. Investment results and principal value will fluctuate so that shares, when redeemed, may be worth more or less than their original cost. Current performance may be higher or lower than performance data quoted. An investor should consider the investment objectives, risks, charges and expenses of the Fund carefully before investing. The Fund’s prospectus contains this and other important information. To obtain a copy of the Fund’s prospectus please call 1-833-517-1010 and a copy can be sent to you free of charge. Please read the prospectus carefully before you invest. The Fund is distributed by Ultimus Fund Distributors, LLC.
The Letter to Shareholders seeks to describe some of the Adviser’s current opinions and views of the financial markets and specific holdings. Although the Adviser believes it has a reasonable basis for any opinions or views expressed, actual results may differ, sometimes significantly so, from those expected or expressed. The securities held by the Fund that are discussed in the Letter to Shareholders were held during the period covered by this Report. They do not comprise the entire investment portfolio of the Fund, may be sold at any time, and may no longer be held by the Fund. For a complete list of securities held by the Fund as of November 30, 2021, please see the Schedule of Investments section of this Report. The opinions of the Fund’s Adviser with respect to those securities may change at any time.
Statements in the Letter to Shareholders that reflect projections or expectations for future financial or economic performance of the Fund and the market in general and statements of the Fund’s plans and objectives for future operations are forward-looking statements. No assurance can be given that actual results or events will not differ materially from those projected, estimated, assumed, or anticipated in any such forward- looking statements. Important factors that could result in such differences, in addition to factors noted with such forward-looking statements include, without limitation, general economic conditions, such as inflation, recession, and interest rates. Past performance is not a guarantee of future results.
| EVOLUTIONARY TREE INNOVATORS FUND |
| PORTFOLIO INFORMATION |
| November 30, 2021 (Unaudited) |
| |
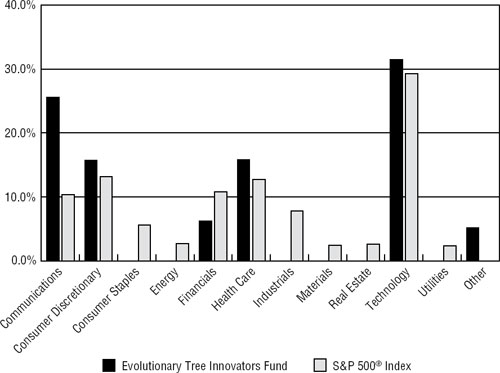
Sector Diversification (% of Net Assets)
| Top 10 Equity Holdings |
| | % of |
| Security Description | Net Assets |
| HubSpot, Inc. | 7.0% |
| Sea Ltd. - ADR | 5.2% |
| ServiceNow, Inc. | 4.9% |
| Netflix, Inc. | 4.3% |
| Twilio, Inc. - Class A | 3.9% |
| Amazon.com, Inc. | 3.8% |
| nCino, Inc. | 3.8% |
| Pinterest, Inc. - Class A | 3.7% |
| Nextdoor Holdings, Inc. | 3.4% |
| PayPal Holdings, Inc. | 3.4% |
| EVOLUTIONARY TREE INNOVATORS FUND |
| SCHEDULE OF INVESTMENTS |
| November 30, 2021 (Unaudited) |
| COMMON STOCKS — 94.8% | | Shares | | | Value | |
| Communications — 25.5% | | | | | | | | |
| Communication Services — 13.8% | | | | | | | | |
| Bumble, Inc. - Class A (a) | | | 38,035 | | | $ | 1,303,079 | |
| Nextdoor Holdings, Inc. (a) | | | 146,065 | | | | 1,657,838 | |
| Snap, Inc. - Class A (a) | | | 20,681 | | | | 984,622 | |
| Twilio, Inc. - Class A (a) | | | 6,602 | | | | 1,889,162 | |
| Zoom Video Communications, Inc. - Class A (a) | | | 4,045 | | | | 855,153 | |
| | | | | | | | 6,689,854 | |
| Digital Media — 5.2% | | | | | | | | |
| Pinterest, Inc. - Class A (a) | | | 45,065 | | | | 1,805,304 | |
| Unity Software, Inc. (a) | | | 4,115 | | | | 709,385 | |
| | | | | | | | 2,514,689 | |
| Streaming Video — 6.5% | | | | | | | | |
| Netflix, Inc. (a) | | | 3,218 | | | | 2,065,634 | |
| Roku, Inc. (a) | | | 4,875 | | | | 1,109,599 | |
| | | | | | | | 3,175,233 | |
| Consumer Discretionary — 15.8% | | | | | | | | |
| Consumer Leisure — 2.2% | | | | | | | | |
| Peloton Interactive, Inc. - Class A (a) | | | 23,760 | | | | 1,045,440 | |
| | | | | | | | | |
| Digital Gaming — 2.4% | | | | | | | | |
| DraftKings, Inc. - Class A (a) | | | 33,123 | | | | 1,144,400 | |
| | | | | | | | | |
| E-Commerce — 11.2% | | | | | | | | |
| Amazon.com, Inc. (a) | | | 530 | | | | 1,858,747 | |
| Farfetch Ltd. - Class A (a) | | | 30,975 | | | | 1,065,850 | |
| Sea Ltd. - ADR (a) | | | 8,761 | | | | 2,523,781 | |
| | | | | | | | 5,448,378 | |
| Financials — 6.2% | | | | | | | | |
| Financial Services — 6.2% | | | | | | | | |
| PayPal Holdings, Inc. (a) | | | 8,863 | | | | 1,638,680 | |
| Square, Inc. - Class A (a) | | | 6,635 | | | | 1,382,270 | |
| | | | | | | | 3,020,950 | |
| Health Care — 15.8% | | | | | | | | |
| Biotechnology — 9.8% | | | | | | | | |
| argenx SE - ADR (a) | | | 4,189 | | | | 1,169,611 | |
| Arrowhead Pharmaceuticals, Inc. (a) | | | 20,989 | | | | 1,470,279 | |
| Beam Therapeutics, Inc. (a) | | | 9,870 | | | | 781,211 | |
| Sarepta Therapeutics, Inc. (a) | | | 16,482 | | | | 1,331,910 | |
| | | | | | | | 4,753,011 | |
| EVOLUTIONARY TREE INNOVATORS FUND |
| SCHEDULE OF INVESTMENTS (Continued) |
| COMMON STOCKS — 94.8% (Continued) | | Shares | | | Value | |
| Health Care — 15.8% (Continued) | | | | | | | | |
| Medical Technology — 2.8% | | | | | | | | |
| DermTech, Inc. (a) | | | 21,828 | | | $ | 438,306 | |
| DexCom, Inc. (a) | | | 1,643 | | | | 924,336 | |
| | | | | | | | 1,362,642 | |
| Pharmaceuticals — 3.2% | | | | | | | | |
| Ascendis Pharma A/S - ADR (a) | | | 7,318 | | | | 1,002,712 | |
| Revance Therapeutics, Inc. (a) | | | 39,111 | | | | 535,039 | |
| | | | | | | | 1,537,751 | |
| Technology — 31.5% | | | | | | | | |
| Application Software — 19.6% | | | | | | | | |
| Coupa Software, Inc. (a) | | | 4,320 | | | | 849,571 | |
| DocuSign, Inc. (a) | | | 4,200 | | | | 1,034,712 | |
| HubSpot, Inc. (a) | | | 4,213 | | | | 3,399,512 | |
| nCino, Inc. (a) | | | 29,365 | | | | 1,824,154 | |
| ServiceNow, Inc. (a) | | | 3,702 | | | | 2,397,785 | |
| | | | | | | | 9,505,734 | |
| Business Services — 2.3% | | | | | | | | |
| Avalara, Inc. (a) | | | 7,898 | | | | 1,103,193 | |
| | | | | | | | | |
| Data & Analytics — 4.6% | | | | | | | | |
| Confluent, Inc. - Class A (a) | | | 13,875 | | | | 1,082,528 | |
| Elastic N.V. (a) | | | 7,481 | | | | 1,162,996 | |
| | | | | | | | 2,245,524 | |
| IT Security — 3.0% | | | | | | | | |
| Zscaler, Inc. (a) | | | 4,230 | | | | 1,467,683 | |
| | | | | | | | | |
| IT Services — 2.0% | | | | | | | | |
| DigitalOcean Holdings, Inc. (a) | | | 9,600 | | | | 967,776 | |
| | | | | | | | | |
| Total Common Stocks (Cost $46,791,198) | | | | | | $ | 45,982,258 | |
| EVOLUTIONARY TREE INNOVATORS FUND |
| SCHEDULE OF INVESTMENTS (Continued) |
| MONEY MARKET FUNDS — 2.2% | | Shares | | | Value | |
First American Treasury Obligations Fund - Class X, 0.01% (b)
(Cost $1,062,745) | | | 1,062,745 | | | $ | 1,062,745 | |
| | | | | | | | | |
| Investments at Value — 97.0% (Cost $47,853,943) | | | | | | $ | 47,045,003 | |
| | | | | | | | | |
| Other Assets in Excess of Liabilities — 3.0% | | | | | | | 1,451,276 | |
| | | | | | | | | |
| Net Assets — 100.0% | | | | | | $ | 48,496,279 | |
ADR - American Depositary Receipt
| (a) | Non-income producing security. |
| (b) | The rate shown is the 7-day effective yield as of November 30, 2021. |
See accompanying notes to financial statements.
| EVOLUTIONARY TREE INNOVATORS FUND |
| STATEMENT OF ASSETS AND LIABILITIES |
| November 30, 2021 (Unaudited) |
| ASSETS | | | | |
| Investments in securities: | | | | |
| At cost | | $ | 47,853,943 | |
| At value (Note 2) | | $ | 47,045,003 | |
| Receivable for capital shares sold | | | 853,319 | |
| Receivable for investment securities sold | | | 618,386 | |
| Dividends receivable | | | 30 | |
| Other assets | | | 26,269 | |
| Total assets | | | 48,543,007 | |
| | | | | |
| LIABILITIES | | | | |
| Payable for capital shares redeemed | | | 4,991 | |
| Payable to Adviser (Note 4) | | | 24,539 | |
| Payable to administrator (Note 4) | | | 7,758 | |
| Other accrued expenses | | | 9,440 | |
| Total liabilities | | | 46,728 | |
| | | | | |
| NET ASSETS | | $ | 48,496,279 | |
| | | | | |
| NET ASSETS CONSIST OF: | | | | |
| Paid-in capital | | $ | 45,915,148 | |
| Accumulated earnings | | | 2,581,131 | |
| NET ASSETS | | $ | 48,496,279 | |
| | | | | |
| Shares of beneficial interest outstanding (unlimited number of shares authorized, no par value) | | | 1,831,949 | |
| Net asset value, offering and redemption price per share (Note 2) | | $ | 26.47 | |
| | | | | |
See accompanying notes to financial statements.
| EVOLUTIONARY TREE INNOVATORS FUND |
| STATEMENT OF OPERATIONS |
| For the Six Months Ended November 30, 2021 (Unaudited) |
| INVESTMENT INCOME | | | | |
| Dividends | | $ | 87 | |
| | | | | |
| EXPENSES | | | | |
| Management fees (Note 4) | | | 170,199 | |
| Registration and filing fees | | | 25,810 | |
| Fund accounting fees (Note 4) | | | 14,623 | |
| Administration fees (Note 4) | | | 14,091 | |
| Legal fees | | | 11,870 | |
| Audit and tax service fees | | | 8,710 | |
| Trustees’ fees and expenses (Note 4) | | | 8,658 | |
| Transfer agent fees (Note 4) | | | 7,666 | |
| Compliance fees (Note 4) | | | 6,000 | |
| Custodian and bank service fees | | | 4,639 | |
| Postage and supplies | | | 2,651 | |
| Printing of shareholder reports | | | 2,114 | |
| Insurance expense | | | 1,517 | |
| Other expenses | | | 9,217 | |
| Total expenses | | | 287,765 | |
| Less fee reductions and expense reimbursements by the Adviser (Note 4) | | | (81,399 | ) |
| Net expenses | | | 206,366 | |
| | | | | |
| NET INVESTMENT LOSS | | | (206,279 | ) |
| | | | | |
| REALIZED AND UNREALIZED GAINS (LOSSES) ON INVESTMENTS | | | | |
| Net realized gains on Investments | | | 2,512,912 | |
| Net change in unrealized appreciation (depreciation) on Investments | | | (2,707,382 | ) |
| NET REALIZED AND UNREALIZED LOSSES ON INVESTMENTS | | | (194,470 | ) |
| | | | | |
| NET DECREASE IN NET ASSETS RESULTING FROM OPERATIONS | | $ | (400,749 | ) |
| | | | | |
See accompanying notes to financial statements.
| EVOLUTIONARY TREE INNOVATORS FUND |
| STATEMENTS OF CHANGES IN NET ASSETS |
| | | Six Months Ended | | | | |
| | | November 30, | | | Period Ended | |
| | | 2021 | | | May 31, | |
| | | (Unaudited) | | | 2021 (a) | |
| FROM OPERATIONS | | | | | | | | |
| Net investment loss | | $ | (206,279 | ) | | $ | (154,033 | ) |
| Net realized gains from investment transactions | | | 2,512,912 | | | | 1,237,471 | |
| Net change in unrealized appreciation (depreciation) on investments | | | (2,707,382 | ) | | | 1,898,442 | |
| Net increase (decrease) in net assets resulting from operations | | | (400,749 | ) | | | 2,981,880 | |
| | | | | | | | | |
| FROM CAPITAL SHARE TRANSACTIONS | | | | | | | | |
| Proceeds from shares sold | | | 22,369,815 | | | | 27,224,801 | |
| Payments for shares redeemed | | | (1,395,550 | ) | | | (2,283,918 | ) |
| Net increase in net assets from capital share transactions | | | 20,974,265 | | | | 24,940,883 | |
| | | | | | | | | |
| TOTAL INCREASE IN NET ASSETS | | | 20,573,516 | | | | 27,922,763 | |
| | | | | | | | | |
| NET ASSETS | | | | | | | | |
| Beginning of period | | | 27,922,763 | | | | — | |
| End of period | | $ | 48,496,279 | | | $ | 27,922,763 | |
| | | | | | | | | |
| CAPITAL SHARES ACTIVITY | | | | | | | | |
| Shares sold | | | 785,459 | | | | 1,181,048 | |
| Shares redeemed | | | (50,125 | ) | | | (84,433 | ) |
| Net increase in shares outstanding | | | 735,334 | | | | 1,096,615 | |
| Shares outstanding, beginning of period | | | 1,096,615 | | | | — | |
| Shares outstanding, end of period | | | 1,831,949 | | | | 1,096,615 | |
| | | | | | | | | |
| (a) | Represents the period from commencement of operations (September 9, 2020) through May 31, 2021. |
See accompanying notes to financial statements.
| EVOLUTIONARY TREE INNOVATORS FUND |
| FINANCIAL HIGHLIGHTS |
| |
| Per Share Data for a Share Outstanding Throughout Each Period |
| | | Six Months | | | | |
| | | Ended | | | | |
| | | November 30, | | | Year Ended | |
| | | 2021 | | | May 31, | |
| | | (Unaudited) | | | 2021 (a) | |
| Net asset value at beginning of period | | $ | 25.46 | | | $ | 20.00 | |
| | | | | | | | | |
| Income (loss) from investment operations: | | | | | | | | |
| Net investment loss | | | (0.11 | ) | | | (0.18 | ) (b) |
| Net realized and unrealized gain on investments | | | 1.12 | (c) | | | 5.64 | |
| Total from investment operations | | | 1.01 | | | | 5.46 | |
| | | | | | | | | |
| Net asset value at end of period | | $ | 26.47 | | | $ | 25.46 | |
| | | | | | | | | |
| Total return (d) | | | 3.97 | % (e) | | | 27.30 | % (e) |
| | | | | | | | | |
| Net assets at end of period (000’s) | | $ | 48,496 | | | $ | 27,923 | |
| | | | | | | | | |
| Ratios/supplementary data: | | | | | | | | |
| Ratio of total expenses to average net assets | | | 1.35 | % (f) | | | 1.65 | % (f) |
| Ratio of net expenses to average net assets (g) | | | 0.97 | % (f) | | | 0.97 | % (f) |
| Ratio of net investment loss to average net assets (g) | | | (0.97 | %) (f) | | | (0.97 | %) (f) |
| Portfolio turnover rate | | | 31 | % (e) | | | 33 | % (e) |
| | | | | | | | | |
| (a) | Represents the period from the commencement of operations (September 9, 2020) through May 31, 2021. |
| (b) | Per share net investment loss has been determined on the basis of average number of shares outstanding during the period. |
| (c) | Represents a balancing figure derived from other amounts in the financial highlights table that captures all other changes affecting net asset value per share. This per share amount does not correlate to the aggregate of the net realized and unrealized losses on the Statement of Operations for the same period. |
| (d) | Total return is a measure of the change in value of an investment in the Fund over the period covered. The returns shown do not reflect the deduction of taxes a shareholder would pay on Fund distributions, if any, or the redemption of Fund shares. The total returns would be lower if the Adviser had not reduced fees (Note 4). |
| (g) | Ratio was determined after management fee reductions by the Adviser (Note 4). |
See accompanying notes to financial statements.
| EVOLUTIONARY TREE INNOVATORS FUND |
| NOTES TO FINANCIAL STATEMENTS |
| November 30, 2021 (Unaudited) |
| |
Evolutionary Tree Innovators Fund (the “Fund”) is a non-diversified series of Ultimus Managers Trust (the “Trust”). The Trust is an open-end management investment company established as an Ohio business trust under a Declaration of Trust dated February 28, 2012. Other series of the Trust are not incorporated in this report.
The investment objective of the Fund is to seek to achieve long-term growth of capital.
| 2. | Significant Accounting Policies |
The Fund follows accounting and reporting guidance under Financial Accounting Standards Board Accounting Standards Codification Topic 946, “Financial Services – Investment Companies.” The following is a summary of the Fund’s significant accounting policies used in the preparation of its financial statements. These policies are in conformity with accounting principles generally accepted in the United States of America (“GAAP”).
Securities valuation – The Fund values its portfolio securities at market value as of the close of regular trading on the New York Stock Exchange (the “NYSE”) (normally 4:00 p.m. Eastern time) on each business day the NYSE is open for business. The Fund values its listed securities on the basis of the security’s last sale price on the security’s primary exchange, if available, otherwise at the exchange’s most recently quoted mean price. NASDAQ-listed securities are valued at the NASDAQ Official Closing Price. When using a quoted price and when the market for the security is considered active, the security will be classified as Level 1 within the fair value hierarchy (see below). In the event that market quotations are not readily available or are considered unreliable due to market or other events, the Fund values its securities and other assets at fair value in accordance with procedures established by and under the general supervision of the Board of Trustees (the “Board”). Under these procedures, the securities will be classified as Level 2 or 3 within the fair value hierarchy, depending on the inputs used. Unavailable or unreliable market quotes may be due to the following factors: a substantial bid-ask spread; infrequent sales resulting in stale prices; insufficient trading volume; small trade sizes; a temporary lapse in any reliable pricing source; and actions of the securities or futures markets, such as the suspension or limitation of trading. As a result, the prices of securities used to calculate the Fund’s net asset value (“NAV”) may differ from quoted or published prices for the same securities.
GAAP establishes a single authoritative definition of fair value, sets out a framework for measuring fair value, and requires additional disclosures about fair value measurements.
| EVOLUTIONARY TREE INNOVATORS FUND |
| NOTES TO FINANCIAL STATEMENTS (Continued) |
| |
Various inputs are used in determining the value of the Fund’s investments. These inputs are summarized in the three broad levels listed below:
| ● | Level 1 – quoted prices in active markets for identical securities |
| ● | Level 2 – other significant observable inputs |
| ● | Level 3 – significant unobservable inputs |
The inputs or methods used for valuing securities are not necessarily an indication of the risks associated with investing in those securities. The inputs used to measure fair value may fall into different levels of the fair value hierarchy. In such cases, for disclosure purposes, the level in the fair value hierarchy within which the fair value measurement falls in its entirety is determined based on the lowest level input that is significant to the fair value measurement.
The following is a summary of the Fund’s investments based on the inputs used to value the investments as of November 30, 2021, by security type:
| | | Level 1 | | | Level 2 | | | Level 3 | | | Total | |
| Common Stocks | | $ | 45,982,258 | | | $ | — | | | $ | — | | | $ | 45,982,258 | |
| Money Market Funds | | | 1,062,745 | | | | — | | | | — | | | | 1,062,745 | |
| Total | | $ | 47,045,003 | | | $ | — | | | $ | — | | | $ | 47,045,003 | |
| | | | | | | | | | | | | | | | | |
| | | | | | | | | | | | | | | | | |
Refer to the Fund’s Schedule of Investments for a listing of the common stocks by sector and industry type. The Fund did not hold any derivative instruments or any assets or liabilities that were measured at fair value on a recurring basis using significant unobservable inputs (Level 3) as of or during the six months ended November 30, 2021.
Share valuation – The NAV per share of the Fund is calculated daily by dividing the total value of the Fund’s assets, less liabilities, by the number of shares outstanding. The offering price and redemption price per share of the Fund is equal to the NAV per share.
Investment income – Dividend income is recorded on the ex-dividend date. Non-cash dividends included in dividend income, if any, are recorded at the fair market value of the security received. Interest income is accrued as earned. Withholding taxes on foreign dividends have been recorded in accordance with the Fund’s understanding of the applicable country’s tax rules and rates.
Investment transactions – Investment transactions are accounted for on the trade date. Realized gains and losses on investments sold are determined on a specific identification basis.
Common expenses – Common expenses of the Trust are allocated among the Fund and the other series of the Trust based on the relative net assets of each series, the number of series in the Trust, or the nature of the services performed and the relative applicability to each series.
Distributions to shareholders – The Fund distributes to shareholders any net investment income dividends and net realized capital gains on an annual basis. The amount of such dividends and distributions are determined in accordance with federal income tax
| EVOLUTIONARY TREE INNOVATORS FUND |
| NOTES TO FINANCIAL STATEMENTS (Continued) |
| |
regulations, which may differ from GAAP. Dividends and distributions to shareholders are recorded on the ex-dividend date. There were no distributions paid to shareholders by the Fund during the six months ended November 30, 2021 and the period ended May 31, 2021.
Estimates – The preparation of financial statements in conformity with GAAP requires management to make estimates and assumptions that affect the reported amounts of assets and liabilities and disclosure of contingent assets and liabilities as of the date of the financial statements and the reported amounts of increase (decrease) in net assets from operations during the reporting period. Actual results could differ from those estimates.
Federal income tax – The Fund has qualified and intends to continue to qualify as a regulated investment company under the Internal Revenue Code of 1986, as amended (the “Code”). Qualification generally will relieve the Fund of liability for federal income taxes to the extent 100% of its net investment income and net realized capital gains are distributed in accordance with the Code.
In order to avoid imposition of the excise tax applicable to regulated investment companies, it is also the Fund’s intention to declare as dividends in each calendar year amounts equal to at least 98% of its net investment income (earned during the calendar year) and 98.2% of its net realized capital gains (earned during the twelve months ended October 31) plus undistributed amounts from prior years, if any.
The following information is computed on a tax basis for each item as of November 30, 2021:
| Tax cost of portfolio investments | | $ | 48,141,091 | |
| Gross unrealized appreciation | | $ | 6,326,815 | |
| Gross unrealized depreciation | | | (7,422,903 | ) |
| Net unrealized depreciation | | | (1,096,088 | ) |
| Undistributed ordinary income | | | 1,105,045 | |
| Other net gains | | | 2,572,174 | |
| Accumulated earnings | | $ | 2,581,131 | |
| | | | | |
| | | | | |
The difference between the federal income tax cost of portfolio investments and the financial statement cost of portfolio investments is due to certain timing differences in the recognition of capital gains or losses under income tax regulations and GAAP. These “book/tax” differences are temporary in nature and are primarily due to the tax deferral of losses on wash sales.
The Fund recognizes the tax benefits or expenses of uncertain tax positions only when the position is “more likely than not” of being sustained assuming examination by tax authorities. Management has reviewed the Fund’s tax positions for the current and all
| EVOLUTIONARY TREE INNOVATORS FUND |
| NOTES TO FINANCIAL STATEMENTS (Continued) |
| |
open tax years (open tax years since inception) and has concluded that no provision for unrecognized tax benefits or expenses is required in these financial statements. The Fund identifies its major tax jurisdiction as U.S. Federal.
| 3. | Investment Transactions |
During the six months ended November 30, 2021, cost of purchases and proceeds from sales of investment securities, other than short-term investments, amounted to $31,383,541 and $12,527,260, respectively.
| 4. | Transactions with Related Parties |
INVESTMENT ADVISORY AGREEMENT
The Fund’s investments are managed by Evolutionary Tree Capital Management, LLC (the “Adviser”) pursuant to the terms of an Investment Advisory Agreement. The Fund pays the Adviser a management fee, computed and accrued daily and paid monthly, at the annual rate of 0.80% of average daily net assets.
Pursuant to an Expense Limitation Agreement (“ELA”) between the Fund and the Adviser, the Adviser has agreed contractually, until October 31, 2023, to reduce its management fees and reimburse other expenses to the extent necessary to limit total annual fund operating expenses (exclusive of brokerage costs, taxes, interest, borrowing costs such as interest and dividend expenses on securities sold short, costs to organize the Fund, acquired fund fees and expenses, extraordinary expenses such as litigation and merger or reorganization costs and other expenses not incurred in the ordinary course of the Fund’s business) to an amount not exceeding 0.97% of the Fund’s average daily net assets. Accordingly, during the six months ended November 30, 2021, the Adviser reduced its management fees in the amount of $81,399.
Under the terms of the ELA, management fee reductions and/or expense reimbursements by the Adviser are subject to repayment by the Fund for a period of three years after such date that fees and expenses were incurred, provided that the repayments do not cause total annual fund operating expenses to exceed (i) the expense limitation then in effect, if any, and (ii) the expense limitation in effect at the time the expenses to be repaid were incurred. Prior to October 31, 2023, this agreement may not be modified or terminated without the approval of the Fund’s Board of Trustees. This agreement will terminate automatically if the Fund’s investment advisory agreement with the Adviser is terminated. As of November 30, 2021, the Adviser may seek repayment of management fee reductions no later than the dates as stated below:
| May 31, 2024 | | $ | 108,771 | |
| November 30, 2024 | | | 81,399 | |
| Total | | $ | 190,170 | |
| | | | | |
| EVOLUTIONARY TREE INNOVATORS FUND |
| NOTES TO FINANCIAL STATEMENTS (Continued) |
| |
OTHER SERVICE PROVIDERS
Ultimus Fund Solutions, LLC (“Ultimus”) provides administration, fund accounting, compliance and transfer agency services to the Fund. The Fund pays Ultimus fees in accordance with the agreements for such services. In addition, the Fund pays out-of-pocket expenses including, but not limited to, postage, supplies and certain costs related to the pricing of the Fund’s portfolio securities.
Under the terms of a Distribution Agreement with the Trust, Ultimus Fund Distributors, LLC (the “Distributor”) serves as principal underwriter to the Fund. The Distributor is a wholly-owned subsidiary of Ultimus. The Distributor is compensated by the Adviser (not the Fund) for acting as principal underwriter.
Certain officers and a Trustee of the Trust are also officers of Ultimus.
TRUSTEE COMPENSATION
Effective October 20, 2021, each member of the Board (a “Trustee”) who is not an “interested person” (as defined by the 1940 Act, as amended) of the Trust (“Independent Trustee”) receives a $1,300 annual retainer from the Fund, paid quarterly, except for the Board Chairperson who receives a $1,700 annual retainer from the Fund, paid in quarterly installments. Each Independent Trustee also receives from the Fund a fee of $550 for each Board meeting attended plus reimbursement for travel and other meeting-related expenses. Prior to October 20, 2021, each Independent Trustee received a $1,300 annual retainer from the Fund, paid quarterly, except for the Board Chairperson who received a $1,500 annual retainer from the Fund, paid in quarterly installments. Each Independent Trustee also received from the Fund a fee of $500 for each Board meeting attended plus reimbursement for travel and other meeting-related expenses.
PRINCIPAL HOLDER OF FUND SHARES
As of November 30, 2021, the following shareholder owned of record more than 25% of the outstanding shares of the Fund:
| NAME OF RECORD OWNER | % Ownership |
| Charles Schwab & Co. (for the benefit of its customers) | 73% |
| | |
A beneficial owner of 25% or more of the Fund’s outstanding shares may be considered a controlling person. That shareholder’s vote could have a more significant effect on matters presented at a shareholders’ meeting.
| 5. | Contingencies and Commitments |
The Fund indemnifies the Trust’s officers and Trustees for certain liabilities that might arise from their performance of their duties to the Fund. Additionally, in the normal course of business the Fund enters into contracts that contain a variety of representations and warranties and which provide general indemnifications. The Fund’s maximum exposure
| EVOLUTIONARY TREE INNOVATORS FUND |
| NOTES TO FINANCIAL STATEMENTS (Continued) |
| |
under these arrangements is unknown, as this would involve future claims that may be made against the Fund that have not yet occurred. However, based on experience, the Fund expects the risk of loss to be remote.
| 6. | Non-Diversification Risk |
The Fund is a non-diversified Fund. As a result, the Fund’s holdings may be more concentrated in a limited number of securities and the value of its shares may be more sensitive than a diversified fund to any single economic, business, political, or regulatory occurrence.
If a Fund has significant investments in the securities of issuers within a particular sector, any development affecting that sector will have a greater impact on the value of the net assets of the Fund than would be the case if the Fund did not have significant investments in that sector. In addition, this may increase the risk of loss in the Fund and increase the volatility of the Fund’s NAV per share. Occasionally, market conditions, regulatory changes or other developments may negatively impact a particular sector. As of November 30, 2021, the Fund had 31.5% and 25.5% of the value of its net assets invested in stocks within the Technology and Communications sectors, respectively.
The Fund is required to recognize in the financial statements the effects of all subsequent events that provide additional evidence about conditions that existed as of the date of the Statement of Assets and Liabilities. For non-recognized subsequent events that must be disclosed to keep the financial statements from being misleading, the Fund is required to disclose the nature of the event as well as an estimate of its financial effect, or a statement that such an estimate cannot be made. Management has evaluated subsequent events through the issuance of these financial statements and has noted no such events except for the following:
On December 17, 2021, the Fund paid a short-term capital gain distribution of $0.7182 per share to shareholders of record on December 16, 2021.
| EVOLUTIONARY TREE INNOVATORS FUND |
| ABOUT YOUR FUND’S EXPENSES (Unaudited) |
| |
We believe it is important for you to understand the impact of costs on your investment. As a shareholder of the Fund, you incur ongoing costs, including management fees, and other operating expenses. The following examples are intended to help you understand your ongoing costs (in dollars) of investing in the Fund and to compare these costs with the ongoing costs of investing in other mutual funds.
A mutual fund’s ongoing costs are expressed as a percentage of its average net assets. This figure is known as the expense ratio. The expenses in the table below are based on an investment of $1,000 made at the beginning of the most recent period (June 1, 2021) and held until the end of the period (November 30, 2021).
The table below illustrates the Fund’s ongoing costs in two ways:
Actual fund return – This section helps you to estimate the actual expenses that you paid over the period. The “Ending Account Value” shown is derived from the Fund’s actual return, and the fourth column shows the dollar amount of operating expenses that would have been paid by an investor who started with $1,000 in the Fund. You may use the information here, together with the amount you invested, to estimate the expenses that you paid over the period.
To do so, simply divide your account value by $1,000 (for example, an $8,600 account value divided by $1,000 = 8.6), then multiply the result by the number given for the Fund under the heading “Expenses Paid During Period.”
Hypothetical 5% return – This section is intended to help you compare the Fund’s ongoing costs with those of other mutual funds. It assumes that the Fund had an annual return of 5% before expenses during the period shown, but that the expense ratio is unchanged. In this case, because the return used is not the Fund’s actual return, the results do not apply to your investment. The example is useful in making comparisons because the U.S. Securities and Exchange Commission (the “SEC”) requires all mutual funds to calculate expenses based on a 5% return. You can assess the Fund’s ongoing costs by comparing this hypothetical example with the hypothetical examples that appear in shareholder reports of other funds.
Note that expenses shown in the table are meant to highlight and help you compare ongoing costs only. The Fund does not charge transaction fees, such as purchase or redemption fees, nor does it carry a “sales load.”
The calculations assume no shares were bought or sold during the period. Your actual costs may have been higher or lower, depending on the amount of your investment and the timing of any purchases or redemptions.
| EVOLUTIONARY TREE INNOVATORS FUND |
| ABOUT YOUR FUND’S EXPENSES (Unaudited) (Continued) |
| |
More information about the Fund’s expenses can be found in this report. For additional information on operating expenses and other shareholder costs, please refer to the Fund’s prospectus.
| | Beginning | Ending | | |
| | Account Value | Account Value | | Expenses |
| | June 1, | November 30, | Net Expense | Paid During |
| | 2021 | 2021 | Ratio (a) | Period (b) |
| Based on Actual Fund Return | $1,000.00 | $1,039.70 | 0.97% | $4.96 |
| Based on Hypothetical 5% Return (before expenses) | $1,000.00 | $1,020.21 | 0.97% | $4.91 |
| | | | | |
| (a) | Annualized, based on the Fund’s expenses during the period since the commencement of operations. |
| (b) | Expenses are equal to the Fund’s annualized net expense ratio multiplied by the average account value over the period, multiplied by 183/365 (to reflect the one-half year period). |
| EVOLUTIONARY TREE INNOVATORS FUND |
| OTHER INFORMATION (Unaudited) |
| |
A description of the policies and procedures that the Fund uses to vote proxies relating to portfolio securities is available without charge upon request by calling toll-free 1-833-517-1010, or on the SEC’s website at www.sec.gov. Information regarding how the Fund voted proxies relating to portfolio securities during the period ended June 30, 2021 will be available on or about August 31, 2021 without charge upon request by calling toll-free 1-833-517-1010, or on the SEC’s website at www.sec.gov.
The Trust files a complete listing of portfolio holdings for the Fund with the SEC as of the end of the first and third quarters of each fiscal year as an exhibit to Form N-PORT. These filings are available upon request by calling 1-833-517-1010. Furthermore, you may obtain a copy of the filings on the SEC’s website at www.sec.gov.
| LIQUIDITY RISK MANAGEMENT PROGRAM (Unaudited) |
| |
The Fund has adopted and implemented a written liquidity risk management program (the “Program”) as required by Rule 22e-4 (the “Liquidity Rule”) under the Investment Company Act of 1940, as amended. The Program is reasonably designed to assess and manage the Fund’s liquidity risk, taking into consideration, among other factors, the Fund’s investment strategy and the liquidity of its portfolio investments during normal and reasonably foreseeable stressed conditions; its short- and long-term cash flow projections; and its cash holdings and access to other funding sources. The Fund’s Board of Trustees (the “Board”) approved the appointment of the Liquidity Administrator Committee, comprising of the Fund’s Adviser and certain Trust officers, to be responsible for the Program’s administration and oversight and for reporting to the Board on at least an annual basis regarding the Program’s operation and effectiveness. The annual written report assessing the Program (the “Report”) was presented to the Board at the October 18 - 19, 2021 Board meeting and covered the period from June 1, 2020 to May 31, 2021 (the “Review Period”).
During the Review Period, the Fund did not experience unusual stress or disruption to its operations related to purchase and redemption activity. Also, during the Review Period, the Fund held adequate levels of cash and highly liquid investments to meet shareholder redemption activities in accordance with applicable requirements. The Report concluded that the Program is reasonably designed to prevent violation of the Liquidity Rule and the Program has been effectively implemented.
| FACTS | WHAT DOES THE EVOLUTIONARY TREE INNOVATORS FUND (the “Fund”) DO WITH YOUR PERSONAL INFORMATION? |
| |
| Why? | Financial companies choose how they share your personal information. Federal law gives consumers the right to limit some but not all sharing. Federal law also requires us to tell you how we collect, share, and protect your personal information. Please read this notice carefully to understand what we do. |
| |
| What? | The types of personal information we collect and share depend on the product or service you have with us. This information can include: ■ Social Security number ■ Assets ■ Retirement Assets ■ Transaction History ■ Checking Account Information ■ Purchase History ■ Account Balances ■ Account Transactions ■ Wire Transfer Instructions When you are no longerour customer, we continue to share your information as described in this notice. |
| |
| How? | All financial companies need to share your personal information to run their everyday business. In the section below, we list the reasons financial companies can share their customers’ personal information; the reasons the Fund chooses to share; and whether you can limit this sharing. |
| |
| Reasons we can share your personal information | Does the Fund
share? | Can you limit
this sharing? |
For our everyday business purposes – Such as to process your transactions, maintain your account(s), respond to court orders and legal investigations, or report to credit bureaus | Yes | No |
For our marketing purposes – to offer our products and services to you | No | We don’t share |
| For joint marketing with other financial companies | No | We don’t share |
For our affiliates’ everyday business purposes – information about your transactions and experiences | No | We don’t share |
For our affiliates’ everyday business purposes – information about your creditworthiness | No | We don’t share |
| For nonaffiliates to market to you | No | We don’t share |
| | | |
| Questions? | Call 1-833-517-1010 |
| | | | |
| Who we are |
| Who is providing this notice? | Evolutionary Tree Innovators Fund Ultimus Fund Distributors, LLC (Distributor) Ultimus Fund Solutions, LLC (Administrator) |
| What we do |
| How does the Fund protect my personal information? | To protect your personal information from unauthorized access and use, we use security measures that comply with federal law. These measures include computer safeguards and secured files and buildings. Our service providers are held accountable for adhering to strict policies and procedures to prevent any misuse of your nonpublic personal information. |
| How does the Fund collect my personal information? | We collect your personal information, for example, when you ■ Open an account ■ Provide account information ■ Give us your contact information ■ Make deposits or withdrawals from your account ■ Make a wire transfer ■ Tell us where to send the money ■ Tell us who receives the money ■ Show your government-issued ID ■ Show your driver’s license We also collect your personal information from other companies. |
| Why can’t I limit all sharing? | Federal law gives you the right to limit only ■ Sharing for affiliates’ everyday business purposes – information about your creditworthiness ■ Affiliates from using your information to market to you ■ Sharing for nonaffiliates to market to you State laws and individual companies may give you additional rights to limit sharing. |
| |
| Definitions |
| Affiliates | Companies related by common ownership or control. They can be financial and nonfinancial companies. ■ Evolutionary Tree Capital Management, LLC, the investment adviser to the Fund, could be deemed to be an affiliate. |
| Nonaffiliates | Companies not related by common ownership or control. They can be financial and nonfinancial companies ■ The Fund does not share with nonaffiliates so they can market to you. |
| Joint marketing | A formal agreement between nonaffiliated financial companies that together market financial products or services to you. ■ The Fund does not jointly market. |
EVOLUTIONARY-SAR-21

KARNER BLUE BIODIVERSITY IMPACT FUND
ButterflyTM Class (KAIBX)
Semi-Annual Report
November 30, 2021
(Unaudited)
| KARNER BLUE BIODIVERSITY IMPACT FUND | |
| LETTER TO SHAREHOLDERS (Unaudited) | January 3, 2022 |
Dear Shareholder,
Over half of global GDP is moderately or highly dependent on nature. Nevertheless most human economic activity undercuts the sustainability of nature by altering how land and oceans are used and by exacerbating climate change, pollution, animal exploitation, and the spread of invasive non-native species. Since the dawn of civilization, scientists estimate that humanity has eradicated 83 percent of wild mammals, 80 percent of marine animals, 50 percent of plants and 15 percent of fish.1 In fact, the combined biomass of humans and livestock now far outstrips that of wild mammals and our planet is facing an unprecedented crisis of biodiversity loss. Since these impacts on nature are largely byproducts of the human progress and business innovation that were spawned by the Agricultural Revolution and Industrial Revolution, it therefore stands to reason that we will need to look to the business community to identify and implement solutions to reverse the planet’s biodiversity loss. At the same time, the recent COP26 meeting in Glasgow, Scotland highlighted the limits of large-scale global governmental collective action when the parochial interests of governments conflict with the need to address a global concern, even one as urgent as climate change. While governments can help establish legislative and regulatory regimes to protect nature, and civil society and philanthropy can encourage investment in promising, cutting-edge, nature-forward technologies, ultimately the business community must be at the vanguard of an all-hands-on-deck effort if we are to succeed in addressing the existential threat to our planet posed by biodiversity loss.
Businesses directly impact biodiversity through their operations and supply chains. According to the World Economic Forum, three socio -economic production and consumption systems — food, infrastructure, and energy — are responsible for the largest pressures on biodiversity.2 In fact, approximately 80% of threatened and near-threatened species are currently endangered by these three systems with the impacts from food, land, and ocean use posing by far the greatest biodiversity threat.3 Accordingly, those companies that recognize the biodiversity-related risks to their companies and our planet, and actively work to transform their business models to support the regeneration of nature, can provide compelling investment opportunities for capital market participants. Through investment in solution-oriented companies operating in these three socio-economic systems, investors can help transform individual industries, build a more robust global economy and, ultimately, ensure the vitality of our planet.
| 1 | Global Agriculture, Agriculture at a Crossroads: Findings and Recommendations for Future Farming, Humans Have Destroyed 83% of Wild Mammals, Biomass Census Shows, May 23, 2018. Accessed at https://www.globalagriculture.org/whats-new/news/en/33211.html. |
| 2 | World Economic Forum, New Nature Economy Report II – The Future of Nature and Business, pp. 9, 15-16, 21, 2020. Accessed at https://www3.weforum.org/docs/WEF_The_Future_Of_Nature_And_Business_2020.pdf. |
This type of investment approach requires investors to integrate biodiversity impacts and dependencies into their investment decision-making by accurately assessing the related risks, evaluating the efforts companies are making to manage those risks, and identifying new nature-forward business opportunities. The size and scope of the business operations of publicly-traded companies make them a ripe target for this type of analysis and the finance industry is well-equipped to quickly reallocate needed capital when there is a potential to realize disruptive, transformational change. Even seemingly small improvements to the business models of large companies can significantly move the biodiversity preservation needle and enhance the outlook for the sustainability of the planet. This is especially true since public equity is the biggest asset class in the sustainable investment universe, representing 51% of assets under management, compared to annual impact investments in biodiversity conservation, which make up less than 0.5% of the total private equity impact investment market.4 By seeking to identify publicly-traded companies that are leading their industries with respect to nature-positive policies and practices, Karner Blue Capital is working to harness the power of the capital markets to foster biodiversity and lay the foundation for a more sustainable and resilient society.
PERFORMANCE
The Fund seeks to achieve long-term total returns by investing in companies that lead their industries in animal welfare performance. KBC’s strategy to achieve the Fund’s investment objective involves peer-relative evaluations of companies that operate in 16 industries with significant exposure to the five key drivers of biodiversity loss, which are (i) irresponsible land and ocean use, (ii) exploitation and over-use of species, (iii) climate change, (iv) pollution and (v) invasive and introduced species. The Fund’s holdings of companies operating in these industries together comprise at least 65 percent of the Fund’s assets. KBC also assesses companies that operate in other industries and that, in KBC’s opinion, have made significant contributions to the advancement of biodiversity and animal welfare outside of their normal business operations. The companies in this group are referred to as Opportunity Companies and may comprise up to 35 percent of the Fund’s holdings at the time of purchase.
On a net basis, the ButterflyTM Class underperformed its benchmark, the Morningstar Developed Markets (NR) Index (the “Morningstar Index”), by 107 basis points during the six-month period ended November 30, 2021 (the “Reporting Period”) and outperformed the Morningstar Index by 90 basis points on an annualized basis since inception.
| 4 | Tobin-de la Puente, J. and Mitchell, A.W. (eds.), 2021. The Little Book of Investing in Nature, Global Canopy: Oxford, p. 69. |
Performance: Total Return % as of 11.30.21
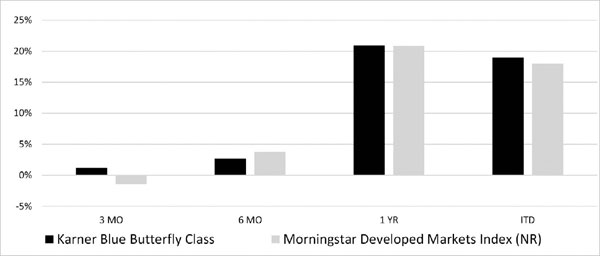
| | | | | ITD |
| Total Return Percentage as of 11.30.2021 | 3 MO | 6 MO | 1 YR | 9.17.19^ |
| Karner Blue Biodiversity Impact Fund ButterflyTM Class | 1.19 | 2.70 | 20.91 | 18.91 |
| Morningstar Developed Markets Index (NR) | -1.47 | 3.77 | 20.87 | 18.01 |
Returns for periods over one year are annualized.
^ ITD is the inception-to-date return from 9.17.2019 through 11.30.2021.
Source: Ultimus Fund Solutions, LLC
The Fund’s performance during the Reporting Period was characterized by strong stock selection and weak sector allocation. Stock selection was particularly strong in the Technology and Industrials sectors, but that was partially offset by notably weak stock selection in the Consumer Cyclical sector. Virtually all of the sector allocation drag was attributable to the Fund’s overweight allocation to the Basic Materials sector, as global prices slumped across a wide array of commodities amid a sharp slowdown in China’s economy relative to the rapid pace of growth during the first half of 2021. From a global perspective, strong stock selection in the United States and the Fund’s underweight allocation to Japan benefitted the Fund’s relative performance, but that was more than offset by weak stock selection in Switzerland and Canada and the Fund’s overweight allocation to France.
The three stocks that most positively impacted Fund performance during the Reporting Period were as follows:
| | Contribution |
| | to the Fund’s |
| | Return During |
| | the Reporting |
| Holding | Period |
| NVIDIA Corp. | 1.74% |
| Enphase Energy Inc. | 1.30% |
| First Solar Inc. | 0.77% |
The three stocks that most negatively impacted Fund performance during the Reporting Period were as follows:
| | Contribution |
| | to the Fund’s |
| | Return During |
| | the Reporting |
| Holding | Period |
| Newmont Corp. | -0.51% |
| Kinross Gold Corp. | -0.39% |
| Lightning eMotors Inc. | -0.36% |
Enphase Energy, Inc. ranked among the best performers during the Reporting Period. Our view with respect to Enphase has not materially changed from the comments we shared in the Fund’s Annual Report for the period ended May 31, 2021 and we maintain a constructive outlook on the company. Kinross Gold Corp. ranked among the worst performers during the Reporting Period. We liquidated this position following a decision to lighten the Fund’s overall allocation to gold stocks in favor of other positions, such as Real Estate Investment Trusts, to hedge inflation risk in the portfolio. The other four companies listed in the charts above are discussed in more detail below, as are Plug Power, Inc. and The Walt Disney Company, which ranked in the top 10 contributors and detractors, respectively.
NVIDIA was the top contributor during the Reporting Period. In November, the company reported Q3 adjusted EPS of $1.17 on record quarterly revenue of $7.10 billion, beating consensus expectations by $0.06 and $280 million, respectively. Sales during the quarter grew 50 percent YOY, fueled by the gaming and data center segments, enabling NVIDIA to post its tenth consecutive quarterly earnings report where it beat on both EPS and revenue. The data center segment benefited from sales of high-performance networking technologies through its Mellanox subsidiary and the continued adoption of NVIDIA’s A100 graphics processing units (GPUs) by cloud customers such as Microsoft, Amazon, and Google. Gross margins during the quarter grew 40 basis points sequentially to 65.2%, and NVIDIA guided Q4 gross margins and revenue higher above consensus expectations. NVIDIA’s GPUs, which process thousands of calculations simultaneously rather than sequentially, were originally designed to bring movie-like graphics to the gaming industry. However, in the early 2000s, researchers realized that the parallel processing capabilities of the GPUs worked exceptionally well to train neural networks and today approximately 90 percent of machine learning is performed using NVIDIA GPUs. Due to their ability to rapidly process massive amounts of data, NVIDIA’s GPUs enable researchers to gain insights and accelerate research at unprecedented speed and scale and can dramatically advance human understanding of, and the identification of potential solutions for, biodiversity loss and climate change. To that end, in 2021 the University of Waikato in New Zealand installed the world’s most advanced system for powering universal AI networks, a NVIDIA DGX A100 supercomputer with eight A100 GPUs capable of processing up to five quadrillion basic arithmetic operations per second. As one of its first projects, the supercomputer was used to train computer models capable of learning and classifying New Zealand’s plants and animals based on a publicly available
database comprised of more than one million photos. Students and researchers using more traditional computing methods could take months, or even years, to process the data needed to create comparable models, but the power of this computer reduces that to a matter of days.5
The third-largest contributor during the Reporting Period was First Solar, Inc., which exceeded market expectations in July with a very solid earnings report but then disappointed in November as supply chain challenges weighed on results. For the third quarter, the company reported adjusted EPS of $0.42 on revenue of $584 million, missing expectations by $0.17 and $101 million, respectively. First Solar designs, manufactures and sells cadmium telluride solar modules and is the only large-scale thin film supplier in a global market dominated by crystalline silicon solar modules produced in Asia. Since First Solar does not use silicon in its solar modules, it does not have exposure to the recently reported human rights abuses of Uighurs in China’s polysilicon manufacturing industry. In 2021, the company completed its exit from the North American solar farm development, operations and maintenance business to enable a sharper focus on its core manufacturing competency and solar module innovation. The company shipped nearly 8 gigawatts of products in 2021 and it expects to double its capacity to 16 gigawatts by 2024 with the addition of two state-of-the-art factories in Ohio and India. First Solar has also implemented its Responsible Solar operating model that places sustainability at the center of its business operations. To that end, the Series 6 solar module manufacturing process has achieved efficiency improvements with respect to greenhouse gas (GHG) emissions intensity, energy use, and water use, which has resulted in an Electronic Product Environmental Assessment Tool (EPEAT) Silver rating, making it the first photovoltaic product to be included in the EPEAT registry for sustainable electronics. Furthermore, First Solar has committed to powering its global operations with 100% renewable energy by 2028 and has set science-based targets to reduce its absolute GHG emissions by 20 percent relative to a 2020 baseline by 2028 and to achieve Net Zero emissions by 2050.
Plug Power, Inc. was another significant contributor, accounting for 52 basis points of the Fund’s returns during the Reporting Period. In November, Plug Power reported a Q3 loss of $0.19 per share on quarterly revenue of $144 million. Although the company met revenue expectations, it fell short of consensus EPS expectations by $0.11. At the same time, management affirmed the company’s high growth trajectory by raising guidance for 2022 revenues nearly 9 percent from $838 million to $913 million. Plug Power’s innovative technology uses hydrogen fuel cells to power electric motors for clients in the power, energy, and transportation industries while actively addressing one of the key drivers of biodiversity loss through the reduction of GHG emissions. In an effort to further reduce its GHG emissions, by 2024 Plug Power is committed to using 50 percent green hydrogen, which is hydrogen produced using renewable energy sources. To that end, Plug Power recently entered into a long-term supply and logistics agreement with
| 5 | The University of Waikato, University of Waikato Installs the World’s Most Advanced AI System, April 19, 2021. Accessed at https://www.waikato.ac.nz/news-opinion/media/2021/university-of-waikato-installs-the-worlds-most-advanced-ai-system |
Certarus (USA), Ltd. to facilitate the distribution of 10 tons of green hydrogen daily to their end customers. The company delivers a significant value proposition to end customers, such as Amazon, BMW, The Southern Company, Carrefour, and Walmart, by vertically integrating all elements necessary to power, fuel, and service its hydrogen-based mobility solutions while providing meaningful environmental benefits, efficiency gains, fast fueling, and lower operational costs. Compared to battery-powered mobility solutions, hydrogen also allows for longer run times and frees up additional cargo space. Plug Power is working to leverage its technological know-how, modular product architecture and existing customer base to rapidly expand into other key markets including zero-emission on-road vehicles, robotics, and data centers. The company recently acquired Netherlands-based Frames Group for €115 million to expand its engineering, process, and systems integration expertise and enable the company to more effectively scale the delivery of green hydrogen solutions. It is expected that the addition of 300 new employees in the Netherlands, India, the United Arab Emirates, Malaysia and Brazil will enhance Plug Power’s capabilities to deliver a range of turnkey electrolyzer solutions from one megawatt (MW) containerized systems to 1,000 MW standalone plants.
Newmont led all detractors during the Reporting Period. The company exceeded market expectations with its Q2 earnings report but then disappointed in Q3 as operational issues at several mines and rising costs cut into the company’s profits. In October, Newmont reported Q3 adjusted EPS of $0.60 on quarterly revenue of $2.9 billion, which fell short of expectations by $0.11 and $213 million. Newmont indicated that it experienced rising costs for materials, energy and labor, while low vaccination rates in most South American countries disrupted operations at some of its mines. The company also reported production-related issues at other mines, including Nevada Gold Mines and Boddington, which lowered output. As a sustainable and responsible leader in the extractives industry, Newmont requires all of its operating sites to conduct biodiversity risk assessments. The assessments are used to develop biodiversity action plans that provide strategic direction for conservation activities to help avoid or offset impact and minimize or restore disturbances. Newmont has committed not to explore or mine in World Heritage Sites and utilizes the Global Reporting Initiative guidelines to annually report on, and obtain third-party assurance for, its sustainable development performance. Newmont has also implemented its commitment to achieve no net biodiversity loss at its mining sites through a three-year collaborative agreement with the International Union for Conservation of Nature (IUCN). Pursuant to the terms of the agreement, Nevada Gold Mines and Boddington were assessed by subject matter experts and representatives of IUCN member organizations using the IUCN Biodiversity Net Gain Review Protocol, which provides a step-by-step guide to assist companies interested in transforming their operations to meet widely accepted global goals for biodiversity and sustainable development. Furthermore, Newmont has taken a number of steps to implement the Global Industry Standard on Tailings Management (GISTM), including (i) the implementation of a new Tailings Management Governance Framework Guideline, (ii) updated technical and governance standards, policies and procedures to achieve zero harm to people and the environment from tailings management, and (iii) employee training sessions and educational workshops. Newmont has pledged to implement the
GISTM for its active operations and its Tailings Storage Facilities (TSFs) that have GISTM Consequence Classifications of “Extreme” or “Very High” by August 2023 and for all of the company’s other TSFs by August 2025.
Lightning eMotors, Inc. (“Lightning”) was the third largest detractor during the Reporting Period. Lightning designs, engineers, customizes and manufactures zero emission all-electric medium- and heavy-duty vehicles, including delivery trucks, shuttle buses, passenger vans, chassis-cab models, and city transit buses. These vehicles reduce pollution and GHG emissions, thereby addressing two of the five drivers of biodiversity loss. Lightning also supports a wide array of fleet customer needs with a full suite of control software, telematics, analytics, and charging solutions to simplify the buying and ownership experience, maximize uptime and energy efficiency, and manage operating costs and safety. The company actively seeks out opportunities to apply its products and services to used vehicles, which it refers to as a “repower”. Repowering used vehicles enables Lightning to extend the life of vehicles that would otherwise enter the waste stream while avoiding the negative environmental impacts of manufacturing a new vehicle. In November, Lightning reported record Q3 earnings and losses as supply chain challenges issues hampered the company’s ability to scale its operations and improve its gross margins. We anticipate that the company will be able to address these issues in 2022.
The Walt Disney Co. was another significant detractor during the Reporting Period, reducing the Fund’s performance by 29 bps. As a diversified global entertainment company, Disney operates in two primary business segments: (i) Disney Media and Entertainment Distribution and (ii) Disney Parks, Experiences and Products. The timely launch of Disney’s online streaming service, Disney+, in November 2019 enabled the company to skillfully navigate the 2020 Covid-related shutdowns that affected large parts of its business, but its efforts to restore those businesses to full operating capacity in 2021 were undermined by the emergence of the delta and omicron variants. In November Disney reported Q4/2021 EPS of $0.37 on revenue of $18.53 billion versus expectations of $0.49 and $18.78 billion, respectively, as increased consumer mobility slowed new Disney+ subscriptions and Covid-related disruptions continued to adversely impact its theme parks, resorts, cruise ship sailings, guided tours, theatrical releases, stage plays and content production and availability. Over the past decade, the company has worked diligently to hone its image as an environmental champion by prioritizing renewable energy use, fuel conservation, sustainable building design, waste and single-use plastic reduction, responsible water use, eco-friendly show production, and nature-based solutions. Disney has regularly set ambitious GHG emissions goals and has succeeded in meeting them predominantly through the purchase of carbon credits, with approximately half of those carbon credits being generated by investments in the Alto Mayo Protection Forest in Peru through Conservation International. When Disney began funding the Alto Mayo in 2009, it was considered to be one of the most threatened tropical and subtropical rain forests in Peru with more than 1,500 acres per year being deforested due to logging and farming activities. According to Conservation International, the carbon credit investments by Disney and other companies are estimated to have slowed deforestation in the Alto Mayo by half, which exceeds the gains that have been made in surrounding forests.
REVIEW & OUTLOOK
The Reporting Period was dominated by 3 i’s – imbalances, inflation and infrastructure (both physical and social).
At the start of the Reporting Period global supply chain constraints and container shipping bottlenecks emerged as significant imbalances with the greatest potential to impact the short- to medium-term growth and inflation outlook. Investors learned that the global supply chain, when functioning properly, operates like a fine-tuned machine. Its precision and complexity means that it cannot be turned on and off with the flip of a switch, but rather requires careful recalibration to be properly restarted. Moreover, the supply chain issues were not limited to the movement of goods, but also involved significant manufacturing disruptions of key components, especially in countries with low vaccination rates. Countries in Southeast Asia struggled mightily to keep factories operating during delta-driven labor shortages and in many cases were forced to temporarily shut. In an interconnected world, the failure of developed nations to make available adequate vaccine supplies to poorer countries creates an opportunity for further virus mutations and poses an ongoing risk to the growth trajectories of emerging economies and developed nations alike. For these reasons, economists began to reflect the growing gap between global demand and supply for manufactured goods by deferring some of the then-remaining anticipated 2021 growth into 2022 and raising end-of-year inflation estimates.
The sharp shift in consumer spending patterns in favor of durable goods purchases and away from services spurred by the stay-at-home economy also created a wide array of sector-specific imbalances. In August, Federal Reserve Chairman Powell addressed this shift in consumer preferences, and the challenges it raises for monetary policy management, as follows:
The unevenness of the recovery can further be seen through the lens of the sectoral shift of spending into goods—particularly durable goods such as appliances, furniture, and cars—and away from services, particularly in-person services in areas such as travel and leisure. As the pandemic struck, restaurant meals fell 45 percent, air travel 95 percent, and dentist visits 65 percent. Even today, with overall gross domestic product and consumption spending more than fully recovered, services spending remains about 7 percent below trend. Total employment is now 6 million below its February 2020 level, and 5 million of that shortfall is in the still-depressed service sector. In contrast, spending on durable goods has boomed since the start of the recovery and is now running about 20 percent above the pre-pandemic level. With demand outstripping pandemic-afflicted supply, rising durables prices are a principal factor lifting inflation well above our 2 percent objective…Durable goods alone contributed about 1 percentage point to the latest 12-month measures of headline and core inflation. Energy prices, which rebounded with the strong recovery, added another 0.8 percentage point to headline inflation, and from long experience we expect the inflation effects of these increases to be transitory.6
| 6 | Chairman Jerome H. Powell. Monetary Policy in the Time of COVID, at the “Macroeconomic Policy in an Uneven Economy” economic policy symposium sponsored by the Federal Reserve Bank of Kansas City, Jackson Hole, Wyoming. Accessed at https://www.federalreserve.gov/newsevents/speech/powell20210827a.htm. |
Notwithstanding the Federal Reserve’s “dual mandate” to achieve maximum employment and stable prices, during the Reporting Period senior Federal Reserve officials persisted in describing inflation as “transitory” even as November’s U.S. consumer price index (CPI) saw the largest increase in 39 years and the producer price index (PPI) that same month rose at the fastest rate on record. As Christmas demand for consumer goods picked up, the manufacturing and shipping sectors struggled to keep pace due to input and labor shortages, which contributed to headline CPI and headline PPI rates of 6.8% YOY and 9.6% YOY, respectively, while the cost of energy, which includes gasoline and electricity, soared 33% YOY. Similarly, inflation across the 19-member Eurozone reached 4.9% YOY in November, its highest rate since records began in 1997. During most of the Reporting Period, equity market participants displayed some cognitive dissonance as they toggled back and forth between concerns that the Fed’s easy monetary policy would fuel further inflationary pressures and the possibility that the Federal Reserve might actually do something to slow the liquidity spigot ever so slightly. Bond market participants, on the other hand, demonstrated greater equanimity, seemingly confident in the notion that the Federal Reserve pendulum would swing back in favor of the stable prices mandate in due course. The 10-year bond yield traded mostly sideways during the Reporting Period and ended 14 bps lower than where it began. Tight labor markets drove initial jobless claims at the end of November to the lowest level since 1969, and the Great Resignation posed especially significant challenges for businesses in need of skilled labor while employees in lower-paying, frontline positions in the leisure, hospitality, restaurant, hotel and retail industries quit in droves. Faced with all of this historic data, Federal Reserve officials finally acknowledged that the U.S. economic recovery may have achieved maximum employment triggering a somewhat more hawkish tone amid growing expectations that interest rates could rise significantly faster than previously anticipated to combat historic inflationary pressures. The official recognition that these pressures are not transitory, coupled with an accelerated bond purchase tapering plan and the potential for as many as three interest rate hikes in 2022, helped to inject confidence into the equity markets that the Fed will act appropriately to counter the inflationary threat. We anticipate that these accelerated interest rate hikes will result in an enhanced market focus on valuations, but precisely how that concern manifests itself will depend importantly on shifting expectations around the specific timing of the hikes relative to then-prevailing inflation data and the overall shape of the yield curve.
Those expectations will also be significantly influenced by the fact that consumers dramatically increased their savings during the pandemic. According to Deloitte, in 2020 alone, U.S. households saved about $1.6 trillion more than was forecasted prior to the onset of the pandemic.7 While some of that savings was invested, much of it remains undeployed. Whether consumers choose to stash the cash in an abundance of caution or unleash that capital in a frenetic release of pent-up demand – especially for travel, leisure, entertainment, dining and other similar services and experiences – will significantly impact the 2022 growth trajectory and inflation outlook. It is also unclear whether the newly observed consumer behaviors will persist or if spending on consumer
| 7 | Bachman, Daniel. United States Economic Forecast 3rd Quarter 2021. Accessed at https://www2.deloitte.com/xe/en/insights/economy/us-economic-forecast/2021-q3.html |
durables has been pulled forward potentially resulting in more subdued consumer durable spending over the medium-term. All of these uncertainties present significant challenges for the Federal Reserve and European Central Bank in their efforts to establish appropriate monetary policies, including the timing and trajectory of bond purchase tapering.
On the fiscal policy side, following much hand wringing over the fate of the U.S. infrastructure bill, Congress passed the $1.2 trillion measure in an unusual display of bipartisanship. The bill, which represents the most significant investment in the country’s aging physical infrastructure in more than a decade, renewed several expiring infrastructure programs and added approximately $550 billion in new spending. This additional fiscal stimulus may also provide somewhat greater flexibility for the Federal Reserve to transition away from excessively loose monetary policy while avoiding undue market volatility. At the same time, significant uncertainty remains surrounding the passage of President Biden’s Build Back Better social infrastructure agenda. Democrats are seeking to authorize approximately $1.75 trillion of spending over the next 10-years on a wide array of social and climate initiatives, but Senator Manchin has continued to express reservations about the wisdom of this amount of spending and the additional debt that will be required to fully fund all of the programs. After Senator Manchin appeared to kill the bill, economists shaved approximately one-half percentage point off of the estimated U.S. GDP growth rate for 2022. The uncertainty surrounding this spending package therefore presents yet another variable that complicates the Federal Reserve’s efforts to control inflation by normalizing monetary policy.
Globally, there continues to be a sharp recovery imbalance between developed economies, many of which have now surpassed their late-2019 output levels, and developing economies where low vaccination rates continue to present a major obstacle to economic growth. However, the development of effective anti-viral pills by both Pfizer and Merck have the potential to close this gap. When coupled with at home diagnostic tests, these anti-viral therapies could enable most people who contract Covid to fully recuperate at home and reduce the tremendous stress on hospital systems across the globe. Both companies have also licensed their technologies to the United Nation’s Medicines Patent Pool thereby enabling drugmakers in 96 other countries, representing more than half of the world’s population, to manufacture these pills. That decision will be vital to saving lives in low- and middle-income countries where Covid vaccination rates have lagged. Ultimately, these pills may represent the final tools needed for the world to gain the upper hand in the battle against Covid.
China, which buttressed global economic growth during much of the pandemic, also started experiencing significant economic imbalances during the Reporting Period that caused the Chinese economy to slow significantly, with Q3 growth falling to 4.9% YOY down from the blistering Q1 pace of 18.3% YOY. China’s zero-tolerance Covid policies have forced the closure of some ports and factories while mandatory lockdowns in some areas have limited mobility and cut into retail sales. Stringent pollution control and de-carbonization regulations in the lead up to the Winter Olympics also reduced steel and cement output and curbed commodity demand. The property and construction sectors, key engines of the country’s economic growth, contracted in Q3 after Beijing introduced measures to rein in a speculative real estate bubble that made it nearly impossible for some heavily indebted property developers to refinance outstanding loans and continue
normal operations. These measures are part of a broader effort to deleverage the economy by reducing the amount of non-financial sector debt, i.e., debt incurred by governments, corporations and households, which reached record levels in 2020 and declined only slightly as of Q3/2021 to 265% of GDP. China’s energy industry is also in a state of disarray as global coal and natural gas prices have spiked but state-controlled electricity prices have remained low, leading to electricity rationing across more than half of China’s provinces and the temporary shuttering of many factories. Looking forward to 2022, economists now expect China’s economy to grow at a relatively anemic annual rate of about 5.2%. While the ramifications of China’s slower pace of growth on the rest of the world are hard to predict, one important silver lining will likely be that central banks, at the margin, will find it somewhat easier to beat back the global inflation threat.
CONCLUSION
On behalf of the entire Karner Blue Capital team we thank you for your investment in the Karner Blue Biodiversity Impact Fund and look forward to working together to realize a more sustainable and ethical future.
Sincerely,
| Vicki L. Benjamin | Andrew K. Niebler |
| President & Co-Founder | Executive Vice President & Co-Founder |
| Karner Blue Capital, LLC | Karner Blue Capital, LLC |
Past performance is not predictive of future performance. Investment results and principal value will fluctuate so that shares, when redeemed, may be worth more or less than their original cost. Current performance may be higher or lower than the performance data quoted. Performance data current to the most recent month end are available by calling 1-855-KBANIML (855-522-6465).
An investor should consider the investment objectives, risks, charges, and expenses of the Fund carefully before investing. The Fund’s prospectus contains this and other important information. To obtain a copy of the Fund’s prospectus please visit our website at www.biodiversityimpactfund.com or call 1-855-KBANIML (855-522-6465) and a copy will be sent to you free of charge. Please read the prospectus carefully before you invest. The Karner Blue Biodiversity Impact Fund is distributed by Ultimus Fund Distributors, LLC.
The Letter to Shareholders seeks to describe some of the Adviser’s current opinions and views of the financial markets. Although the Adviser believes it has a reasonable basis for any opinions or views expressed, actual results may differ, sometimes significantly so, from those expected or expressed. The securities held by the Fund that are discussed in the Letter to Shareholders were held during the period covered by this Report. They do not comprise the entire investment portfolio of the Fund, may be sold at any time and may no longer be held by the Fund. For a complete list of securities held by the Fund as of November 30, 2021, please see the Schedule of Investments section of the Semi-Annual Report. The opinions of the Adviser with respect to those securities may change at any time.
Statements in the Letter to Shareholders that reflect projections or expectations for future financial or economic performance of the Fund and the market in general and statements of the Fund’s plans and objectives for future operations are forward-looking statements. No assurance can be given that actual results or events will not differ materially from those projected, estimated, assumed, or anticipated in any such forward- looking statements. Important factors that could result in such differences, in addition to factors noted with such forward-looking statements include, without limitation, general economic conditions, such as inflation, recession, and interest rates. Past performance is not a guarantee of future results.
KARNER BLUE BIODIVERSITY IMPACT FUND
PORTFOLIO INFORMATION
November 30, 2021 (Unaudited)
Portfolio Allocation (% of Net Assets)
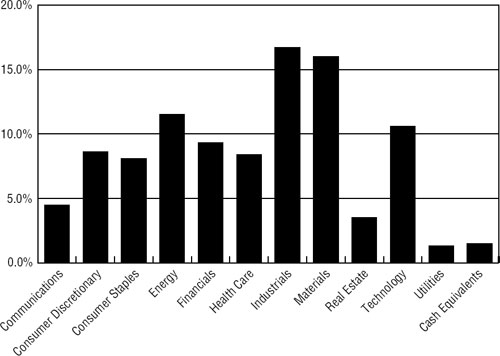
| Top 10 Equity Holdings |
| | % of |
| Security Description | Net Assets |
| NVIDIA Corporation | 3.1% |
| Enphase Energy, Inc. | 2.6% |
| Microsoft Corporation | 2.3% |
| First Solar, Inc. | 2.3% |
| Deere & Company | 2.1% |
| BNP Paribas S.A. - ADR | 2.0% |
| Alphabet, Inc. - Class A | 1.9% |
| CNH Industrial N.V. | 1.8% |
| ChargePoint Holdings, Inc. | 1.8% |
| Plug Power, Inc. | 1.8% |
| KARNER BLUE BIODIVERSITY IMPACT FUND |
| SCHEDULE OF INVESTMENTS |
| November 30, 2021 (Unaudited) |
| COMMON STOCKS — 98.5% | | Shares | | | Value | |
| Communications — 4.5% | | | | | | |
| Entertainment Content — 1.2% | | | | | | | | |
| Walt Disney Company (The) (a) | | | 935 | | | $ | 135,482 | |
| | | | | | | | | |
| Internet Media & Services — 1.9% | | | | | | | | |
| Alphabet, Inc. - Class A (a) | | | 73 | | | | 207,170 | |
| | | | | | | | | |
| Telecommunications — 1.4% | | | | | | | | |
| Iridium Communications, Inc. (a) | | | 4,031 | | | | 154,992 | |
| | | | | | | | | |
| Consumer Discretionary — 8.6% | | | | | | | | |
| Apparel & Textile Products — 3.2% | | | | | | | | |
| adidas AG - ADR | | | 731 | | | | 105,703 | |
| Allbirds, Inc. - Class A (a) | | | 5,600 | | | | 107,744 | |
| Levi Strauss & Company - Class A | | | 5,725 | | | | 146,388 | |
| | | | | | | | 359,835 | |
| Automotive — 3.4% | | | | | | | | |
| Cie Generale des Etablissements Michelin - ADR | | | 3,830 | | | | 113,061 | |
| Lightning eMotors, Inc. (a) | | | 21,466 | | | | 156,058 | |
| NIO, Inc. - ADR (a) | | | 2,805 | | | | 109,760 | |
| | | | | | | | 378,879 | |
| Home & Office Products — 1.5% | | | | | | | | |
| Panasonic Corporation - ADR | | | 15,255 | | | | 166,279 | |
| | | | | | | | | |
| Leisure Facilities & Services — 0.5% | | | | | | | | |
| Cheesecake Factory, Inc. (The) (a) | | | 1,275 | | | | 48,858 | |
| | | | | | | | | |
| Consumer Staples — 8.1% | | | | | | | | |
| Food — 2.9% | | | | | | | | |
| Hershey Company (The) | | | 915 | | | | 162,403 | |
| McCormick & Company, Inc. | | | 1,840 | | | | 157,909 | |
| | | | | | | | 320,312 | |
| Household Products — 2.7% | | | | | | | | |
| Clorox Company (The) | | | 685 | | | | 111,552 | |
| Procter & Gamble Company (The) | | | 1,260 | | | | 182,171 | |
| | | | | | | | 293,723 | |
| KARNER BLUE BIODIVERSITY IMPACT FUND |
| SCHEDULE OF INVESTMENTS (Continued) |
| COMMON STOCKS — 98.5% (Continued) | | Shares | | | Value | |
| Consumer Staples — 8.1% (Continued) | | | | | | | | |
| Retail - Consumer Staples — 2.5% | | | | | | | | |
| Sprouts Farmers Market, Inc. (a) | | | 6,285 | | | $ | 166,301 | |
| Target Corporation | | | 475 | | | | 115,824 | |
| | | | | | | | 282,125 | |
| Energy — 11.5% | | | | | | | | |
| Renewable Energy — 11.5% | | | | | | | | |
| Canadian Solar, Inc. (a) | | | 4,665 | | | | 176,990 | |
| Enphase Energy, Inc. (a) | | | 1,135 | | | | 283,750 | |
| First Solar, Inc. (a) | | | 2,490 | | | | 257,964 | |
| JinkoSolar Holding Company Ltd. - ADR (a) | | | 1,475 | | | | 77,113 | |
| Plug Power, Inc. (a) | | | 4,950 | | | | 197,257 | |
| Shoals Technologies Group, Inc. - Class A (a) | | | 4,975 | | | | 139,798 | |
| SolarEdge Technologies, Inc. (a) | | | 295 | | | | 96,689 | |
| Stem, Inc. (a) | | | 2,250 | | | | 47,745 | |
| | | | | | | | 1,277,306 | |
| Financials — 9.3% | | | | | | | | |
| Banking — 6.0% | | | | | | | | |
| Bank of Montreal | | | 1,630 | | | | 169,634 | |
| BNP Paribas S.A. - ADR | | | 7,267 | | | | 226,694 | |
| Citigroup, Inc. | | | 1,550 | | | | 98,735 | |
| ING Groep N.V. - ADR | | | 12,528 | | | | 172,510 | |
| | | | | | | | 667,573 | |
| Institutional Financial Services — 3.3% | | | | | | | | |
| Credit Suisse Group AG - ADR (a) | | | 19,150 | | | | 184,032 | |
| Goldman Sachs Group, Inc. (The) | | | 465 | | | | 177,160 | |
| | | | | | | | 361,192 | |
| Health Care — 8.4% | | | | | | | | |
| Biotech & Pharma — 8.4% | | | | | | | | |
| AbbVie, Inc. | | | 715 | | | | 82,425 | |
| AstraZeneca plc - ADR | | | 2,395 | | | | 131,318 | |
| Merck & Company, Inc. | | | 1,865 | | | | 139,707 | |
| Novo Nordisk A/S - ADR | | | 1,265 | | | | 135,140 | |
| Pfizer, Inc. | | | 2,440 | | | | 131,101 | |
| Roche Holding AG - ADR | | | 3,299 | | | | 160,925 | |
| Sanofi - ADR | | | 3,190 | | | | 151,749 | |
| | | | | | | | 932,365 | |
| Industrials — 16.7% | | | | | | | | |
| Commercial Support Services — 1.5% | | | | | | | | |
| Waste Management, Inc. | | | 1,047 | | | | 168,221 | |
| KARNER BLUE BIODIVERSITY IMPACT FUND |
| SCHEDULE OF INVESTMENTS (Continued) |
| COMMON STOCKS — 98.5% (Continued) | | Shares | | | Value | |
| Industrials — 16.7% (Continued) | | | | | | | | |
| Electrical Equipment — 3.4% | | | | | | | | |
| ChargePoint Holdings, Inc. (a) | | | 7,960 | | | $ | 203,139 | |
| Nuvve Holding Corporation (a) | | | 2,550 | | | | 40,265 | |
| Trimble, Inc. (a) | | | 1,570 | | | | 134,816 | |
| | | | | | | | 378,220 | |
| Engineering & Construction — 1.8% | | | | | | | | |
| NV5 Global, Inc. (a) | | | 500 | | | | 65,750 | |
| Stantec, Inc. | | | 2,525 | | | | 136,502 | |
| | | | | | | | 202,252 | |
| Machinery — 5.3% | | | | | | | | |
| CNH Industrial N.V. | | | 12,505 | | | | 204,582 | |
| Deere & Company | | | 690 | | | | 238,422 | |
| GrafTech International Ltd. | | | 12,275 | | | | 143,004 | |
| | | | | | | | 586,008 | |
| Transportation & Logistics — 3.4% | | | | | | | | |
| A.P. Moller-Maersk A/S - B Shares - ADR | | | 11,670 | | | | 175,867 | |
| Deutsche Post AG - ADR | | | 2,516 | | | | 149,450 | |
| Kuehne & Nagel International AG - ADR | | | 900 | | | | 51,534 | |
| | | | | | | | 376,851 | |
| Transportation Equipment — 1.3% | | | | | | | | |
| Blue Bird Corporation (a) | | | 4,867 | | | | 98,508 | |
| Lion Electric Company (The) (a) | | | 4,553 | | | | 49,628 | |
| | | | | | | | 148,136 | |
| Materials — 16.0% | | | | | | | | |
| Chemicals — 2.5% | | | | | | | | |
| Air Products & Chemicals, Inc. | | | 562 | | | | 161,541 | |
| Amyris, Inc. (a) | | | 850 | | | | 5,831 | |
| Koninklijke DSM N.V. - ADR | | | 2,045 | | | | 110,451 | |
| | | | | | | | 277,823 | |
| Construction Materials — 4.5% | | | | | | | | |
| CRH plc - ADR | | | 2,065 | | | | 100,524 | |
| Holcim Ltd. - ADR (a) | | | 13,552 | | | | 130,642 | |
| Owens Corning | | | 1,725 | | | | 146,349 | |
| Vulcan Materials Company | | | 630 | | | | 120,733 | |
| | | | | | | | 498,248 | |
| Forestry, Paper & Wood Products — 1.1% | | | | | | | | |
| Trex Company, Inc. (a) | | | 989 | | | | 131,309 | |
| KARNER BLUE BIODIVERSITY IMPACT FUND |
| SCHEDULE OF INVESTMENTS (Continued) |
| COMMON STOCKS — 98.5% (Continued) | | Shares | | | Value | |
| Materials — 16.0% (Continued) | | | | | | | | |
| Metals & Mining — 6.3% | | | | | | | | |
| Fortescue Metals Group Ltd. - ADR | | | 7,280 | | | $ | 177,341 | |
| Freeport-McMoRan, Inc. | | | 4,821 | | | | 178,763 | |
| Livent Corporation (a) | | | 5,925 | | | | 179,468 | |
| Newmont Corporation | | | 3,012 | | | | 165,419 | |
| | | | | | | | 700,991 | |
| Steel — 1.6% | | | | | | | | |
| Commercial Metals Company | | | 5,690 | | | | 175,821 | |
| | | | | | | | | |
| Real Estate — 3.5% | | | | | | | | |
| REITs — 3.5% | | | | | | | | |
| Hannon Armstrong Sustainable Infrastructure Capital, Inc. | | | 1,295 | | | | 73,660 | |
| Prologis, Inc. | | | 1,055 | | | | 159,041 | |
| Weyerhaeuser Company | | | 4,100 | | | | 154,201 | |
| | | | | | | | 386,902 | |
| Technology — 10.6% | | | | | | | | |
| Semiconductors — 5.4% | | | | | | | | |
| Intel Corporation | | | 2,010 | | | | 98,892 | |
| NVIDIA Corporation | | | 1,070 | | | | 349,633 | |
| Semtech Corporation (a) | | | 1,840 | | | | 157,633 | |
| | | | | | | | 606,158 | |
| Software — 4.3% | | | | | | | | |
| Microsoft Corporation | | | 785 | | | | 259,513 | |
| SAP SE - ADR | | | 805 | | | | 103,394 | |
| Synopsys, Inc. (a) | | | 325 | | | | 110,825 | |
| | | | | | | | 473,732 | |
| Technology Hardware — 0.9% | | | | | | | | |
| Sony Group Corporation - ADR | | | 810 | | | | 98,699 | |
| | | | | | | | | |
| Utilities — 1.3% | | | | | | | | |
| Electric & Gas Marketing & Trading — 1.3% | | | | | | | | |
| Orsted A/S - ADR | | | 3,425 | | | | 146,556 | |
| | | | | | | | | |
| Total Common Stocks (Cost $9,142,360) | | | | | | $ | 10,942,018 | |
| KARNER BLUE BIODIVERSITY IMPACT FUND |
| SCHEDULE OF INVESTMENTS (Continued) |
| MONEY MARKET FUNDS — 0.8% | | Shares | | | Value | |
| First American Government Obligations Fund - Class X, 0.03% (b) (Cost $90,613) | | | 90,613 | | | $ | 90,613 | |
| | | | | | | | | |
| Investments at Value — 99.3% (Cost $9,232,973) | | | | | | $ | 11,032,631 | |
| | | | | | | | | |
| Other Assets in Excess of Liabilities — 0.7% | | | | | | | 79,237 | |
| | | | | | | | | |
| Net Assets — 100.0% | | | | | | $ | 11,111,868 | |
| ADR | - American Depositary Receipt |
| N.V. | - Naamloze Vennootschap |
| plc | - Public Limited Company |
| (a) | Non-income producing security. |
| (b) | The rate shown is the 7-day effective yield as of November 30, 2021. |
See accompanying notes to financial statements.
| KARNER BLUE BIODIVERSITY IMPACT FUND |
| STATEMENT OF ASSETS AND LIABILITIES |
| November 30, 2021 (Unaudited) |
| ASSETS | | | |
| Investments in securities: | | | | |
| At cost | | $ | 9,232,973 | |
| At value (Note 2) | | $ | 11,032,631 | |
| Receivable for capital shares sold | | | 50,350 | |
| Receivable for investment securities sold | | | 59,304 | |
| Receivable from Adviser (Note 4) | | | 5,372 | |
| Dividend and income receivable | | | 3,882 | |
| Other assets | | | 16,101 | |
| Total assets | | | 11,167,640 | |
| | | | | |
| LIABILITIES | | | | |
| Payable for investment securities purchased | | | 22,356 | |
| Payable to administrator (Note 4) | | | 15,184 | |
| Accrued administrative services fee (Note 4) | | | 7,557 | |
| Other accrued expenses | | | 10,675 | |
| Total liabilities | | | 55,772 | |
| | | | | |
| NET ASSETS | | $ | 11,111,868 | |
| | | | | |
| NET ASSETS CONSIST OF: | | | | |
| Paid-in capital | | $ | 8,229,305 | |
| Accumulated earnings | | | 2,882,563 | |
| NET ASSETS | | $ | 11,111,868 | |
| | | | | |
| NET ASSET VALUE PER SHARE: | | | | |
| BUTTERFLY™ CLASS | | | | |
| Net assets applicable to Butterfly™ Class | | $ | 11,111,868 | |
| Butterfly™ Class shares of beneficial interest outstanding (unlimited number of shares authorized, no par value) | | | 768,040 | |
| Net asset value, offering price and redemption price per share (Note 2) | | $ | 14.47 | |
See accompanying notes to financial statements.
| KARNER BLUE BIODIVERSITY IMPACT FUND |
| STATEMENT OF OPERATIONS |
| Six Months Ended November 30, 2021 (Unaudited) |
| INVESTMENT INCOME | | | |
| Dividend income | | $ | 88,006 | |
| Foreign witholding taxes on dividends | | | (8,420 | ) |
| Total investment income | | | 79,586 | |
| | | | | |
| EXPENSES | | | | |
| Investment advisory fees (Note 4) | | | 43,754 | |
| Fund accounting fees (Note 4) | | | 14,795 | |
| Administration fees (Note 4) | | | 14,250 | |
| Legal fees | | | 11,897 | |
| Registration and filing fees | | | 10,399 | |
| Transfer agent fees (Note 4) | | | 9,000 | |
| Audit and tax services fees | | | 8,710 | |
| Trustees’ fees and expenses (Note 4) | | | 8,658 | |
| Compliance fees (Note 4) | | | 6,000 | |
| Administrative service fees (Note 4) | | | 5,469 | |
| Custody and bank service fees | | | 4,168 | |
| Postage and supplies | | | 3,251 | |
| Printing of shareholder reports | | | 2,447 | |
| Insurance expense | | | 1,689 | |
| Other expenses | | | 7,080 | |
| Total expenses | | | 151,567 | |
| Less fee reductions and expense reimbursements by Adviser (Note 4) | | | (101,140 | ) |
| Net expenses | | | 50,427 | |
| | | | | |
| NET INVESTMENT INCOME | | | 29,159 | |
| | | | | |
| REALIZED AND UNREALIZED GAINS (LOSSES) ON INVESTMENTS AND FOREIGN CURRENCIES | | | | |
| Net realized gains (losses) from: | | | | |
| Investments | | | 473,165 | |
| Foreign currency transactions (Note 2) | | | (178 | ) |
| Net change in unrealized appreciation (depreciation) on investments | | | (205,679 | ) |
| NET REALIZED AND UNREALIZED GAINS ON INVESTMENTS AND FOREIGN CURRENCIES | | | 267,308 | |
| | | | | |
| NET INCREASE IN NET ASSETS RESULTING FROM OPERATIONS | | $ | 296,467 | |
See accompanying notes to financial statements.
| KARNER BLUE BIODIVERSITY IMPACT FUND |
| STATEMENTS OF CHANGES IN NET ASSETS |
| | | Six Months Ended | | | | |
| | | November 30, | | | Year Ended | |
| | | 2021 | | | May 31, | |
| | | (Unaudited) | | | 2021 | |
| FROM OPERATIONS | | | | | | | | |
| Net investment income | | $ | 29,159 | | | $ | 93,473 | |
| Net realized gains from investments and foreign currency translations | | | 472,987 | | | | 695,563 | |
| Net change in unrealized appreciation (depreciation) on investments | | | (205,679 | ) | | | 1,908,545 | |
| Net increase in net assets resulting from operations | | | 296,467 | | | | 2,697,581 | |
| | | | | | | | | |
| FROM DISTRIBUTIONS TO SHAREHOLDERS (Note 2) | | | | | | | | |
| Investor Class | | | — | | | | (4,791 | ) |
| Institutional Class | | | — | | | | (3,457 | ) |
| Butterfly™ Class | | | — | | | | (79,509 | ) |
| Decrease in net assets from distributions to shareholders | | | — | | | | (87,757 | ) |
| | | | | | | | | |
| CAPITAL SHARE TRANSACTIONS | | | | | | | | |
| Investor Class | | | | | | | �� | |
| Proceeds from shares sold | | | — | | | | 233,552 | |
| Net asset value of shares issued in reinvestment of distributions to shareholders | | | — | | | | 4,791 | |
| Payments for shares redeemed | | | — | | | | (50,325 | ) |
| Shares exchanged for Butterfly™ Class (Note 1) | | | — | | | | (746,207 | ) |
| Net decrease in Investor Class net assets from capital share transactions | | | — | | | | (558,189 | ) |
| | | | | | | | | |
| Institutional Class | | | | | | | | |
| Net asset value of shares issued in reinvestment of distributions to shareholders | | | — | | | | 3,457 | |
| Payments for shares redeemed | | | — | | | | (685 | ) |
| Shares exchanged for Butterfly™ Class (Note 1) | | | — | | | | (374,058 | ) |
| Net decrease in Institutional Class net assets from capital share transactions | | | — | | | | (371,286 | ) |
| | | | | | | | | |
| Butterfly™ Class | | | | | | | | |
| Proceeds from shares sold | | | 100,240 | | | | 1,750,844 | |
| Shares exchanged from Investor Class (Note 1) | | | — | | | | 746,207 | |
| Shares exchanged from Institutional Class (Note 1) | | | — | | | | 374,058 | |
| Net asset value of shares issued in reinvestment of distributions to shareholders | | | — | | | | 28,650 | |
| Payments for shares redeemed | | | (87,489 | ) | | | (217 | ) |
| Net increase in Butterfly Class™ net assets from capital share transactions | | | 12,751 | | | | 2,899,542 | |
| | | | | | | | | |
| TOTAL INCREASE IN NET ASSETS | | | 309,218 | | | | 4,579,891 | |
See accompanying notes to financial statements.
| KARNER BLUE BIODIVERSITY IMPACT FUND |
| STATEMENTS OF CHANGES IN NET ASSETS (Continued) |
| | | Six Months Ended | | | | |
| | | November 30, | | | Year Ended | |
| | | 2021 | | | May 31, | |
| | | (Unaudited) | | | 2021 | |
| NET ASSETS | | | | | | | | |
| Beginning of period | | $ | 10,802,650 | | | $ | 6,222,759 | |
| End of period | | $ | 11,111,868 | | | $ | 10,802,650 | |
| | | | | | | | | |
| CAPITAL SHARE ACTIVITY | | | | | | | | |
| Investor Class | | | | | | | | |
| Shares sold | | | — | | | | 18,449 | |
| Shares reinvested | | | — | | | | 384 | |
| Shares redeemed | | | — | | | | (4,416 | ) |
| Shares exchanged for Butterfly™ Class (Note 1) | | | — | | | | (56,388 | ) |
| Net decrease in shares outstanding | | | — | | | | (41,971 | ) |
| Shares outstanding at beginning of period | | | — | | | | 41,971 | |
| Shares outstanding at end of period | | | — | | | | — | |
| | | | | | | | | |
| Institutional Class | | | | | | | | |
| Shares reinvested | | | — | | | | 277 | |
| Shares redeemed | | | — | | | | (59 | ) |
| Shares exchanged for Butterfly™ Class (Note 1) | | | — | | | | (28,207 | ) |
| Net decrease in shares outstanding | | | — | | | | (27,989 | ) |
| Shares outstanding at beginning of period | | | — | | | | 27,989 | |
| Shares outstanding at end of period | | | — | | | | — | |
| | | | | | | | | |
| Butterfly™ Class | | | | | | | | |
| Shares sold | | | 7,037 | | | | 136,601 | |
| Shares issued in connection with exchange of Investor Class shares (Note 1) | | | — | | | | 56,224 | |
| Shares issued in connection with exchange of Institutional Class shares (Note 1) | | | — | | | | 28,184 | |
| Shares reinvested | | | — | | | | 2,290 | |
| Shares redeemed | | | (5,846 | ) | | | (16 | ) |
| Net increase in shares outstanding | | | 1,191 | | | | 223,283 | |
| Shares outstanding at beginning of period | | | 766,849 | | | | 543,566 | |
| Shares outstanding at end of period | | | 768,040 | | | | 766,849 | |
See accompanying notes to financial statements.
| KARNER BLUE BIODIVERSITY IMPACT FUND |
| BUTTERFLY™ CLASS |
| FINANCIAL HIGHLIGHTS |
Per Share Data for a Share Outstanding Throughout Each Period
| | | Six Months | | | | | | | |
| | | Ended | | | | | | | |
| | | November 30, | | | Year Ended | | | Period Ended | |
| | | 2021 | | | May 31, | | | May 31, | |
| | | (Unaudited) | | | 2021 | | | 2020 (a) | |
| Net asset value at beginning of period | | $ | 14.09 | | | $ | 10.14 | | | $ | 10.00 | |
| Income from investment operations: | | | | | | | | | | | | |
| Net investment income | | | 0.04 | | | | 0.15 | (b) | | | 0.10 | (b) |
| Net realized and unrealized gains on investments and foreign currencies | | | 0.34 | | | | 3.94 | | | | 0.05 | (c) |
| Total from investment operations | | | 0.38 | | | | 4.09 | | | | 0.15 | |
| Less distributions from: | | | | | | | | | | | | |
| Net investment income | | | — | | | | (0.14 | ) | | | (0.01 | ) |
| Net asset value at end of period | | $ | 14.47 | | | $ | 14.09 | | | $ | 10.14 | |
| Total return (d) | | | 2.70 | % (e) | | | 40.49 | % | | | 1.50 | % (e) |
| Net assets at end of period (000’s) | | $ | 11,112 | | | $ | 10,803 | | | $ | 5,514 | |
| Ratios/supplementary data: | | | | | | | | | | | | |
| Ratio of total expenses to average net assets | | | 2.73 | % (f) | | | 3.62 | % | | | 5.32 | % (f) |
| Ratio of net expenses to average net assets (g) | | | 0.88 | % (f) | | | 0.85 | % | | | 0.85 | % (f) |
| Ratio of net investment income to average net assets (g) | | | 0.57 | % (f) | | | 1.20 | % | | | 1.47 | % (f) |
| Portfolio turnover rate | | | 48 | % (e) | | | 55 | % | | | 61 | % (e) |
| (a) | Represents the period from the commencement of operations (September 17, 2019) through May 31, 2020. |
| (b) | Net investment income per share has been determined on the basis of average number of shares outstanding during the period. |
| (c) | Represents a balancing figure derived from other amounts in the financial highlights table that captures all other changes affecting net asset value per share. This per share amount does not correlate to the aggregate of the net realized and unrealized losses on the Statement of Operations for the same period. |
| (d) | Total return is a measure of the change in value of an investment in the Fund over the periods covered. The returns shown do not reflect the deduction of taxes a shareholder would pay on Fund distributions, if any, or the redemption of Fund shares. The total returns would be lower if the Adviser had not reduced advisory fees and reimbursed expenses (Note 4). |
| (g) | Ratio was determined after fee reductions and expense reimbursements (Note 4). |
See accompanying notes to financial statements.
| KARNER BLUE BIODIVERSITY IMPACT FUND |
| NOTES TO FINANCIAL STATEMENTS |
| November 30, 2021 (Unaudited) |
Karner Blue Biodiversity Impact Fund (the “Fund”) is a diversified series of Ultimus Managers Trust (the “Trust”), an open-end investment company established as an Ohio business trust under a Declaration of Trust dated February 28, 2012. Other series of the Trust are not incorporated in this report.
The investment objective of the Fund is to seek to achieve long-term total returns by investing in companies that lead their industries in animal welfare performance.
The Fund currently offers one class of shares: Butterfly™ Class shares (sold without any sales loads and distribution and/or shareholder service fees but subject to an administrative service fee of up to 0.10% of the average net assets, and requiring a $2,000 initial investment). Prior to March 19, 2021, the Fund offered three classes of shares, including Investor Class shares (sold without any sales loads, but subject to a distribution and/or shareholder service fee of up to 0.25% of the average daily net assets attributable to Investor Class shares, and requiring a $2,000 initial investment), Institutional Class shares (sold without any sales loads and distribution and/or shareholder service fees but subject to an administrative service fee of up to 0.10% of the average daily net assets attributable to Institutional Class shares, and requiring a $200,000 initial investment) and ButterflyTM Class shares (sold without any sales loads and distribution and/or shareholder service fees and requiring a $2,000,000 initial investment). On March 19, 2021, all existing Investor Class and Institutional Class shares were converted into Butterfly™ Class shares at the Butterfly™ Class net asset value per share as of March 18, 2021, which was $13.27. After March 19, 2021, Investor Class shares and Institutional Class shares were no longer offered by the Fund.
| 2. | Significant Accounting Policies |
The following is a summary of the Fund’s significant accounting policies. The policies are in conformity with accounting principles generally accepted in the United States of America (“GAAP”). The Fund follows accounting and reporting guidance under Financial Accounting Standards Board Accounting Standards Codification Topic 946, “Financial Services – Investment Companies.”
Securities valuation – The Fund values its portfolio securities at market value as of the close of regular trading on the New York Stock Exchange (the “NYSE”) (normally 4:00 p.m. Eastern time) on each business day the NYSE is open for business. The Fund values its listed securities on the basis of the security’s last sale price on the security’s primary exchange, if available, otherwise at the exchange’s most recently quoted mean price. NASDAQ-listed securities are valued at the NASDAQ Official Closing Price. When using a quoted price and when the market is considered active, the security will be classified as Level 1 within the fair value hierarchy (see below). In the event that market quotations
| KARNER BLUE BIODIVERSITY IMPACT FUND |
| NOTES TO FINANCIAL STATEMENTS (Continued) |
are not readily available or are considered unreliable due to market or other events, the Fund values its securities and other assets at fair value in accordance with procedures established by and under the general supervision of the Board of Trustees (the “Board”). Under these procedures, the securities will be classified as Level 2 or 3 within the fair value hierarchy, depending on the inputs used. Unavailable or unreliable market quotes may be due to the following factors: a substantial bid-ask spread; infrequent sales resulting in stale prices; insufficient trading volume; small trade sizes; a temporary lapse in any reliable pricing source; and actions of the securities or futures markets, such as the suspension or limitation of trading. As a result, the prices of securities used to calculate the Fund’s net asset value (“NAV”) may differ from quoted or published prices for the same securities.
GAAP establishes a single authoritative definition of fair value, sets out a framework for measuring fair value, and requires additional disclosures about fair value measurements.
Various inputs are used in determining the value of the Fund’s investments. These inputs are summarized in the three broad levels listed below:
| ● | Level 1 – quoted prices in active markets for identical securities |
| ● | Level 2 – other significant observable inputs |
| ● | Level 3 – significant unobservable inputs |
The inputs or methods used for valuing securities are not necessarily an indication of the risks associated with investing in those securities. The inputs used to measure fair value may fall into different levels of the fair value hierarchy. In such cases, for disclosure purposes, the level in the fair value hierarchy within which the fair value measurement falls in its entirety is determined based on the lowest level input that is significant to the fair value measurement.
The following is a summary of the Fund’s investments and the inputs used to value the investments as of November 30, 2021:
| | | Level 1 | | | Level 2 | | | Level 3 | | | Total | |
| Common Stocks | | $ | 10,942,018 | | | $ | — | | | $ | — | | | $ | 10,942,018 | |
| Money Market Funds | | | 90,613 | | | | — | | | | — | | | | 90,613 | |
| Total | | $ | 11,032,631 | | | $ | — | | | $ | — | | | $ | 11,032,631 | |
Refer to the Fund’s Schedule of Investments for a listing of securities by sector and industry type. The Fund did not hold any derivative instruments or any assets or liabilities that were measured at fair value on a recurring basis using significant unobservable inputs (Level 3) as of or during the six months ended November 30, 2021.
| KARNER BLUE BIODIVERSITY IMPACT FUND |
| NOTES TO FINANCIAL STATEMENTS (Continued) |
Share valuation – The NAV per share of the Fund is calculated daily by dividing the total value of the assets, less liabilities, by the number of shares outstanding. The offering price and redemption price per share of the Fund is equal to the NAV per share of the Fund.
Investment income – Dividend income is recorded on the ex-dividend date. Non-cash dividends included in dividend income, if any, are recorded at the fair market value of the security received. Interest income is accrued as earned. Withholding taxes on foreign dividends have been recorded in accordance with the Fund’s understanding of the applicable country’s rules and tax rates.
Investment transactions – Investment transactions are accounted for on the trade date. Realized gains and losses on investments sold are determined on a specific identification basis.
Foreign currency translation – Securities and other assets and liabilities denominated in or expected to settle in foreign currencies, if any, are translated into U.S. dollars based on exchange rates on the following basis:
| A. | The fair values of investment securities and other assets and liabilities are translated as of the close of the NYSE each day. |
| B. | Purchases and sales of investment securities and income and expenses are translated at the rate of exchange prevailing as of 4:00 p.m. Eastern time on the respective date of such transactions. |
| C. | The Fund does not isolate that portion of the results of operations caused by changes in foreign exchange rates on investments from those caused by changes in market prices of securities held. Such fluctuations are included with the net realized and unrealized gains or losses on investments. |
Reported net realized foreign exchange gains or losses arise from 1) purchases and sales of foreign currencies, 2) currency gains or losses realized between trade and settlement dates on securities transactions, and 3) the difference between the amounts of dividends and foreign withholding taxes recorded on the Fund’s books and the U.S. dollar equivalent of the amounts actually received or paid. Reported net unrealized foreign exchange gains and losses arise from changes in the value of assets and liabilities, other than investments in securities, that result from changes in exchange rates.
Allocation between Classes – Investment income earned, realized capital gains and losses, and unrealized appreciation and depreciation were allocated daily to each Class of the Fund based upon its proportionate share of total net assets of the Fund. Class-specific expenses were charged directly to the Class incurring the expense. Common expenses which were not attributable to a specific Class were allocated daily to each Class of shares of the Fund based upon its proportionate share of total net assets of the Fund. Effective March 19, 2021, the allocation between classes no longer applies to the Fund.
| KARNER BLUE BIODIVERSITY IMPACT FUND |
| NOTES TO FINANCIAL STATEMENTS (Continued) |
Common expenses – Common expenses of the Trust are allocated among the Fund and the other series of the Trust based on the relative net assets of each series, the number of series in the Trust, or the nature of the services performed and the relative applicability to each series.
Distributions to shareholders – The Fund distributes to shareholders any net investment income dividends and net realized capital gains distributions at least once each year. The amount of such dividends and distributions are determined in accordance with federal income tax regulations, which may differ from GAAP. Dividends and distributions to shareholders are recorded on the ex-dividend date. The distributions paid to shareholders during the year ended May 31, 2021 were from ordinary income. There were no distributions paid to shareholders during the six months ended November 30, 2021.
Estimates – The preparation of financial statements in conformity with GAAP requires management to make estimates and assumptions that affect the reported amounts of assets and liabilities and disclosure of contingent assets and liabilities as of the date of the financial statements and the reported amounts of increase (decrease) in net assets from operations during the reporting period. Actual results could differ from those estimates.
Federal income tax – The Fund has qualified and intends to continue to qualify as a regulated investment company under the Internal Revenue Code of 1986, as amended (the “Code”). Qualification generally will relieve the Fund of liability for federal income taxes to the extent 100% of its net investment income and net realized capital gains are distributed in accordance with the Code.
In order to avoid imposition of the excise tax applicable to regulated investment companies, it is also the Fund’s intention to declare as dividends in each calendar year at least 98% of its net investment income (earned during the calendar year) and 98.2% of its net realized capital gains (earned during the twelve months ended October 31) plus undistributed amounts from prior years.
The following information is computed on a tax basis for each item as of November 30, 2021:
| Tax cost of portfolio investments | | $ | 9,262,792 | |
| Gross unrealized appreciation | | $ | 2,181,334 | |
| Gross unrealized depreciation | | | (411,495 | ) |
| Net unrealized appreciation | | | 1,769,839 | |
| Undistributed ordinary income | | | 108,845 | |
| Undistributed long-term capital gains | | | 477,178 | |
| Other gains | | | 526,701 | |
| Accumulated earnings | | $ | 2,882,563 | |
| KARNER BLUE BIODIVERSITY IMPACT FUND |
| NOTES TO FINANCIAL STATEMENTS (Continued) |
The difference between the federal income tax cost of portfolio investments and the financial statement cost of portfolio investments is due to certain timing differences in the recognition of capital gains or losses under income tax regulations and GAAP. These “book/tax” differences are temporary in nature and are primarily due to the tax deferral of losses on wash sales.
The Fund recognizes the tax benefits or expenses of uncertain tax positions only when the position is “more likely than not” of being sustained assuming examination by tax authorities. Management has reviewed the Fund’s tax positions for the current and all open tax periods (generally, three years) and has concluded that no provision for unrecognized tax benefits or expenses is required in these financial statements. The Fund identifies its major tax jurisdiction as U.S. Federal.
| 3. | Investment Transactions |
During the six months ended November 30, 2021, cost of purchases and proceeds from sales of investment securities, other than short-term investments, amounted to $5,172,325 and $5,209,357, respectively.
| 4. | Transactions with Related Parties |
INVESTMENT ADVISORY AGREEMENT
The Fund’s investments are managed by Karner Blue Capital, LLC (the “Adviser”) pursuant to the terms of an Investment Advisory Agreement. The Fund pays the Adviser an investment advisory fee, computed and accrued daily and paid monthly, at the annual rate of 0.80% of average daily net assets.
Effective October 1, 2021, pursuant to an Expense Limitation Agreement (“ELA”) between the Fund and the Adviser, the Adviser has contractually agreed, until September 30, 2022, to reduce investment advisory fees and reimburse other operating expenses to limit total annual operating expenses of the Fund (exclusive of brokerage costs; taxes; interest; borrowing costs such as interest and dividend expenses on securities sold short; costs to organize the Fund; acquired fund fees and expenses; extraordinary expenses such as litigation and merger or reorganization costs; and other expenses not incurred in the ordinary course of the Fund’s business) to an amount not exceeding 0.95% of its average daily net assets. Prior to October 1, 2021, the Adviser had contractually agreed to limit total annual operating expenses of the Fund (exclusive of brokerage costs; taxes; interest; borrowing costs such as interest and dividend expenses on securities sold short; costs to organize the Fund; acquired fund fees and expenses; extraordinary expenses such as litigation and merger or reorganization costs; and other expenses not incurred in the ordinary course of the Fund’s business) to an amount not exceeding 0.85% of its average daily net assets.
Accordingly, during the six months ended November 30, 2021, the Adviser did not collect any of its investment advisory fees and reimbursed other operating expenses of $57,386.
| KARNER BLUE BIODIVERSITY IMPACT FUND |
| NOTES TO FINANCIAL STATEMENTS (Continued) |
Under the terms of the ELA, investment advisory fee reductions and expense reimbursements by the Adviser are subject to repayment by the Fund for a period of three years after such fees and expenses were incurred, provided that the repayments do not cause total annual fund operating expenses to exceed the lesser of (i) the expense limitation then in effect, if any, and (ii) the expense limitation in effect at the time the expenses to be repaid were incurred. As of November 30, 2021, the Adviser may in the future seek repayment of investment advisory fee reductions and expense reimbursements in the amount of $463,868 no later than the dates listed below:
| May 31, 2023 | | $ | 144,782 | |
| May 31, 2024 | | | 217,946 | |
| November 30, 2024 | | | 101,140 | |
| Total | | $ | 463,868 | |
OTHER SERVICE PROVIDERS
Ultimus Fund Solutions, LLC (“Ultimus”) provides administration, fund accounting, compliance and transfer agency services to the Fund. The Fund pays Ultimus fees in accordance with the agreements for such services. In addition, the Fund pays out-of-pocket expenses including, but not limited to, postage, supplies and certain costs related to the pricing of its portfolio securities.
Under the terms of a Distribution Agreement with the Trust, Ultimus Fund Distributors, LLC (the “Distributor”) serves as the principal underwriter to the Fund. The Distributor is a wholly-owned subsidiary of Ultimus. The Distributor is compensated by the Adviser, not the Fund.
Certain officers and a Trustee of the Trust are also officers of Ultimus and are not paid by the Fund for serving in such capacities.
ADMINISTRATIVE SERVICES PLAN
The Fund has adopted an Administrative Services Plan (the “Administrative Services Plan”), for the Butterfly™ Class shares of the Fund. The Administrative Services Plan allows the Fund to use the net assets of the Butterfly™ Class shares to pay financial intermediaries that provide services relating to Butterfly™ Class shares. The Administrative Services Plan permits payments for the provision of certain administrative, recordkeeping and other non-distribution related services to Butterfly™ Class shareholders. The Administrative Services Plan permits the Fund to make service fee payments at an annual rate of up to 0.10% of the Fund’s average daily net assets attributable to its Butterfly™ Class shares. During the six months ended November 30, 2021, the Fund incurred $5,469 of fees under the Administrative Services Plan.
| KARNER BLUE BIODIVERSITY IMPACT FUND |
| NOTES TO FINANCIAL STATEMENTS (Continued) |
TRUSTEE COMPENSATION
Effective October 20, 2021, each member of the Board (a “Trustee”) who is not an “interested person” (as defined by the 1940 Act, as amended) of the Trust (“Independent Trustee”) receives a $1,300 annual retainer from the Fund, paid quarterly, except for the Board Chairperson who receives a $1,700 annual retainer from the Fund, paid in quarterly installments. Each Independent Trustee also receives from the Fund a fee of $550 for each Board meeting attended plus reimbursement for travel and other meeting-related expenses. Prior to October 20, 2021, each Independent Trustee received a $1,300 annual retainer from the Fund, paid quarterly, except for the Board Chairperson who received a $1,500 annual retainer from the Fund, paid in quarterly installments. Each Independent Trustee also received from the Fund a fee of $500 for each Board meeting attended plus reimbursement for travel and other meeting-related expenses.
PRINCIPAL HOLDERS OF FUND SHARES
As of November 30, 2021, the following shareholders owned of record 25% or more of the outstanding shares of the Fund:
| Name of Record Owners | | % Ownership |
| Butterfly™ Class | | |
| SEI Private Trust Company (for the benefit of its customers) | | 59% |
A beneficial owner of 25% or more of the Fund’s outstanding shares may be considered a controlling person of the Fund. That shareholder’s vote could have a more significant effect on matters presented at a shareholders’ meeting.
| 5. | Foreign Securities Risk |
The Fund may invest in American Depositary Receipts (“ADRs”). Investments in ADRs provide exposure to foreign securities that may involve different risks than those of U.S. securities. Foreign securities are subject to individual country risk, less favorable reporting and disclosure risk, currency exchange risk and greater price volatility, and may have higher liquidity risk than U.S. registered securities. As of November 30, 2021, the Fund had 26.8% of its net assets invested in ADRs.
| 6. | Contingencies and Commitments |
The Fund indemnifies the Trust’s officers and Trustees for certain liabilities that might arise from their performance of their duties to the Fund. Additionally, in the normal course of business the Fund enters into contracts that contain a variety of representations and warranties and which provide general indemnifications. The Fund’s maximum exposure under these arrangements is unknown, as this would involve future claims that may be made against the Fund that have not yet occurred. However, based on experience, the Fund expects the risk of loss to be remote.
| KARNER BLUE BIODIVERSITY IMPACT FUND |
| NOTES TO FINANCIAL STATEMENTS (Continued) |
The Fund is required to recognize in the financial statements the effects of all subsequent events that provide additional evidence about conditions that existed as of the date of the Statement of Assets and Liabilities. For non-recognized subsequent events that must be disclosed to keep the financial statements from being misleading, the Fund is required to disclose the nature of the event as well as an estimate of its financial effect, or a statement that such an estimate cannot be made. Management has evaluated subsequent events through the issuance of these financial statements and has noted no such events except for the following:
On December 21, 2021, the Fund paid an ordinary income dividend and short-term and long-term capital gain distributions of $0.1035, $0.1372 and $1.1569 per share, respectively, to shareholders of record on December 20, 2021.
| KARNER BLUE BIODIVERSITY IMPACT FUND |
| ABOUT YOUR FUND’S EXPENSES (Unaudited) |
We believe it is important for you to understand the impact of costs on your investment. As a shareholder of the Fund, you incur ongoing costs, including management fees, class-specific expenses (such as distribution fees and administrative services fees) and other operating expenses. The following examples are intended to help you understand your ongoing costs (in dollars) of investing in the Fund and to compare these costs with the ongoing costs of investing in other mutual funds.
A mutual fund’s ongoing costs are expressed as a percentage of its average net assets. This figure is known as the expense ratio. The expenses in the table below are based on an investment of $1,000 made at the beginning of the most recent semi-annual period (June 1, 2021) and held until the end of the period (November 30, 2021).
The table below illustrates the Fund’s ongoing costs in two ways:
Actual fund return – This section helps you to estimate the actual expenses that you paid over the period. The “Ending Account Value” shown is derived from the Fund’s actual return, and the fourth column shows the dollar amount of operating expenses that would have been paid by an investor who started with $1,000 in the Fund. You may use the information here, together with the amount you invested, to estimate the expenses that you paid over the period.
To do so, simply divide your account value by $1,000 (for example, an $8,600 account value divided by $1,000 = 8.6), then multiply the result by the number given for the Fund under the heading “Expenses Paid During Period.”
Hypothetical 5% return – This section is intended to help you compare the Fund’s ongoing costs with those of other mutual funds. It assumes that the Fund had an annual return of 5% before expenses during the period shown, but that the expense ratio is unchanged. In this case, because the return used is not the Fund’s actual return, the results do not apply to your investment. The example is useful in making comparisons because the U.S. Securities and Exchange Commission (the “SEC”) requires all mutual funds to calculate expenses based on a 5% return. You can assess the Fund’s ongoing costs by comparing this hypothetical example with the hypothetical examples that appear in shareholder reports of other funds.
Note that expenses shown in the table are meant to highlight and help you compare ongoing costs only. The Fund does not charge transaction fees, such as purchase or redemption fees, nor does it carry a “sales load.”
The calculations assume no shares were bought or sold during the period. Your actual costs may have been higher or lower, depending on the amount of your investment and the timing of any purchases or redemptions.
| KARNER BLUE BIODIVERSITY IMPACT FUND |
| ABOUT YOUR FUND’S EXPENSES (Unaudited) (Continued) |
More information about the Fund’s expenses can be found in this report. For additional information on operating expenses and other shareholder costs, please refer to the Fund’s prospectus.
| | | | | Ending | | | | |
| | | Beginning | | Account Value | | Net | | Expenses |
| | | Account Value | | November 30, | | Expense | | Paid During |
| | | June 1, 2021 | | 2021 | | Ratio (a) | | Period (b) |
| Butterfly™ Class | | | | | | | | |
| Based on Actual Fund Return | | $1,000.00 | | $1,027.00 | | 0.88% | | $4.47 |
| Based on Hypothetical 5% Return (before expenses). | | $1,000.00 | | $1,020.66 | | 0.88% | | $4.46 |
| (a) | Annualized, based on the most recent one-half year expenses. |
| (b) | Expenses are equal to the annualized expense ratio, multiplied by the average account value over the period, multiplied by 183/365 (to reflect the one-half year period). |
| OTHER INFORMATION (Unaudited) |
A description of the policies and procedures that the Fund uses to vote proxies relating to portfolio securities is available without charge upon request by calling toll-free 1-855-KBANIML (855-522-6465), or on the SEC’s website at www.sec.gov. Information regarding how the Fund voted proxies relating to portfolio securities during the most recent 12-month period ended June 30 is also available without charge upon request by calling toll-free 1-855-KBANIML (855-522-6465), or on the SEC’s website at www.sec.gov.
The Trust files a complete listing of portfolio holdings for the Fund with the SEC as of the end of the first and third quarters of each fiscal year as an exhibit to its reports on Form N-PORT. These filings are available upon request by calling 1-855-KBANIML (855-522-6465). Furthermore, you may obtain a copy of the filings on the SEC’s website at www.sec.gov.
| KARNER BLUE BIODIVERSITY IMPACT FUND |
| DISCLOSURE REGARDING APPROVAL OF INVESTMENT |
| ADVISORY AGREEMENT (Unaudited) |
The Board of Trustees (the “Board”), including the Independent Trustees voting separately, has reviewed and approved the Fund’s Investment Advisory Agreement with Karner Blue Capital, LLC (the “Adviser” or “Karner Blue”) for an additional one-year term (the “Agreement”). The Board approved the Agreement at a meeting held on July 19, 20 and 21, 2021, at which all of the Trustees were present.
In deciding whether to approve the continuation of the Agreement, the Board recalled its review of the materials related to the Fund and Karner Blue throughout the preceding two years and its numerous discussions with Trust management and Karner Blue about the operations and performance of the Fund during that period. The Board further considered those materials and discussions and other numerous factors, including the following:
The nature, extent, and quality of the services provided by the Adviser. In this regard, the Board reviewed the services being provided by Karner Blue to the Fund including, without limitation, its providing a continuous investment program for the Fund, adhering to the Fund’s investment restrictions, complying with the Trust’s policies and procedures and voting proxies on behalf of the Fund. The Board considered the qualifications and experience of Karner Blue’s portfolio managers who are responsible for the day-to day management of the Fund’s portfolio, as well as the qualifications of other individuals at Karner Blue who provide services to the Fund. The Board concluded that the quality, extent, and nature of the services provided by Karner Blue to the Fund were satisfactory.
The investment performance of the Fund. In this regard, the Board compared the performance of the Fund with the performance of its benchmark index, custom peer group, and Morningstar category. The Board concluded that the investment performance of the Fund had been satisfactory.
The costs of the services provided and profits realized by the Adviser and its affiliates from their relationship with the Fund. In this regard, the Board considered the Fund’s management fee proposed to be charged to the Fund and the Fund’s expense ratio, each as compared to the Fund’s peer group and to the fees charged by Karner Blue to other similar clients. The Board considered the revenue earned by Karner Blue from the Fund and the current and anticipated profitability of the Fund to Karner Blue, if any. The Board considered Karner Blue’s past fee reductions and expense reimbursements for the Fund and the indirect benefits that Karner Blue received from its management of the Fund. The Board concluded that the advisory fee to be paid to Karner Blue by the Fund is reasonable in light of the nature and quality of services provided by Karner Blue.
The extent to which economics of scale would be realized as the Fund grows and whether advisory fee levels reflect these economies of scale for the benefit of the Fund’s investors. In this regard, the Board considered that the Fund’s fee arrangements with Karner Blue involve both the advisory fee and the expense limitation agreement (the “ELA”). The Board determined that while the advisory fee rate remained the same as asset levels increased, the shareholders of the Fund have experienced benefits from the ELA and will continue
| KARNER BLUE BIODIVERSITY IMPACT FUND |
| DISCLOSURE REGARDING APPROVAL OF INVESTMENT |
| ADVISORY AGREEMENT (Unaudited)(Continued) |
to experience benefits from the ELA. The Board concluded that the advisory fee was reasonable in light of the information that was provided to the Trustees by Karner Blue with respect to economies of scale.
After further discussion of the factors noted above, as well as other factors, and in reliance on the information provided by the Adviser and Trust management, and taking into account the totality of all factors discussed and information presented at the meeting and previous meetings, the Board indicated its agreement to approve the continuance of the Agreement and the Fund’s ELA. It was noted that in the Trustees’ deliberations regarding the approval of the continuance of the Agreement, the Trustees did not identify any particular information or factor that was all-important or controlling, and that each individual Trustee may have attributed different weights to various factors listed above. After full consideration of the above factors as well as other factors, the Board unanimously concluded that approval of the continuance of the Agreement was in the best interests of the Fund and its shareholders.
| KARNER BLUE BIODIVERSITY IMPACT FUND |
| LIQUIDITY RISK MANAGEMENT PROGRAM (Unaudited) |
The Fund has adopted and implemented a written liquidity risk management program (the “Program”) as required by Rule 22e-4 (the “Liquidity Rule”) under the Investment Company Act of 1940, as amended. The Program is reasonably designed to assess and manage the Fund’s liquidity risk, taking into consideration, among other factors, the Fund’s investment strategy and the liquidity of its portfolio investments during normal and reasonably foreseeable stressed conditions; its short- and long-term cash flow projections; and its cash holdings and access to other funding sources. The Fund’s Board of Trustees (the “Board”) approved the appointment of the Liquidity Administrator Committee, comprising of the Fund’s Adviser and certain Trust officers, to be responsible for the Program’s administration and oversight and for reporting to the Board on at least an annual basis regarding the Program’s operation and effectiveness. The annual written report assessing the Program (the “Report”) was presented to the Board at the October 18-19, 2021 Board meeting and covered the period from June 1, 2020 to May 31, 2021 (the “Review Period”).
During the Review Period, the Fund did not experience unusual stress or disruption to its operations related to purchase and redemption activity. Also, during the Review Period, the Fund held adequate levels of cash and highly liquid investments to meet shareholder redemption activities in accordance with applicable requirements. The Report concluded that the Program is reasonably designed to prevent violation of the Liquidity Rule and the Program has been effectively implemented.
| FACTS | WHAT DOES THE KARNER BLUE BIODIVERSITY IMPACT FUND (the “Fund”) DO WITH YOUR PERSONAL INFORMATION? |
| |
| Why? | Financial companies choose how they share your personal information. Federal law gives consumers the right to limit some but not all sharing. Federal law also requires us to tell you how we collect, share, and protect your personal information. Please read this notice carefully to understand what we do. |
| |
| What? | The types of personal information we collect and share depend on the product or service you have with us. This information can include: ■ Social Security number ■ Assets ■ Retirement Assets ■ Transaction History ■ Checking Account Information ■ Purchase History ■ Account Balances ■ Account Transactions ■ Wire Transfer Instructions When you are no longer our customer, we continue to share your information as described in this notice. |
| |
| How? | All financial companies need to share your personal information to run their everyday business. In the section below, we list the reasons financial companies can share their customers’ personal information; the reasons the Fund chooses to share; and whether you can limit this sharing. |
| |
| Reasons we can share your personal information | Does the
Fund share? | Can you limit
this sharing? |
For our everyday business purposes – Such as to process your transactions, maintain your account(s), respond to court orders and legal investigations, or report to credit bureaus | Yes | No |
For our marketing purposes – to offer our products and services to you | No | We don’t share |
| For joint marketing with other financial companies | No | We don’t share |
For our affiliates’ everyday business purposes – information about your transactions and experiences | No | We don’t share |
For our affiliates’ everyday business purposes – information about your creditworthiness | No | We don’t share |
| For nonaffiliates to market to you | No | We don’t share |
| | | |
| Questions? | Call 1-855-KBANIML (855-522-6465) |
| | | | |
| Page 2 | |
| Who we are |
| Who is providing this notice? | Karner Blue Biodiversity Impact Fund Ultimus Fund Distributors, LLC (Distributor) Ultimus Fund Solutions, LLC (Administrator) |
| What we do |
| How does the Fund protect my personal information? | To protect your personal information from unauthorized access and use, we use security measures that comply with federal law. These measures include computer safeguards and secured files and buildings. Our service providers are held accountable for adhering to strict policies and procedures to prevent any misuse of your nonpublic personal information. |
| How does the Fund collect my personal information? | We collect your personal information, for example, when you ■ Open an account ■ Provide account information ■ Give us your contact information ■ Make deposits or withdrawals from your account ■ Make a wire transfer ■ Tell us where to send the money ■ Tell us who receives the money ■ Show your government-issued ID ■ Show your driver’s license We also collect your personal information from other companies. |
| Why can’t I limit all sharing? | Federal law gives you the right to limit only ■ Sharing for affiliates’ everyday business purposes – information about your creditworthiness ■ Affiliates from using your information to market to you ■ Sharing for nonaffiliates to market to you State laws and individual companies may give you additional rights to limit sharing. |
| |
| Definitions |
| Affiliates | Companies related by common ownership or control. They can be financial and nonfinancial companies. ■ Karner Blue Capital, LLC, the investment adviser to the Fund, could be deemed to be an affiliate. |
| Nonaffiliates | Companies not related by common ownership or control. They can be financial and nonfinancial companies ■ The Fund does not share with nonaffiliates so they can market to you. |
| Joint marketing | A formal agreement between nonaffiliated financial companies that together market financial products or services to you. ■ The Fund does not jointly market. |
This page intentionally left blank.
This page intentionally left blank.
This page intentionally left blank.
KARNER-SAR-21
KEMPNER MULTI-CAP DEEP VALUE FUND
Institutional Class (FIKDX)
Investor Class (FAKDX)
Semi-Annual Report
November 30, 2021
(Unaudited)
| KEMPNER MULTI-CAP DEEP VALUE FUND | |
| LETTER TO SHAREHOLDERS (Unaudited) | January 2022 |
Fund Objective
The Kempner Multi-Cap Deep Value Fund seeks to generate a total pre-tax return, including capital growth and dividends, greater than the rate of inflation over a minimum three-to five-year period. For the 6-month period ended November 30, 2021, the Fund produced a cumulative return of -5.33% for the Institutional Class Shares and -5.46% for the Investor Class Shares, both net of fees. The Headline CPI inflation rate over the same six-month period was 3.85%. Comparatively, over the same time period, the Lipper Multi Cap Value Funds Classification Index returned -1.07% and the S&P 500 Value Index returned -0.85%.
U.S. Economic Commentary
We, in the U.S., have just completed an exceptionally strong economic year in 2021. We had nominal GDP growth of greater than 10%, which compares to an average of 3% per year during the last 20 years. This strong recovery from Covid-19 was due to multiple factors: less Covid influence, higher inflation, an easy money policy, fiscal stimulus, increased demand for labor, a steadily decreasing unemployment rate, and very strong consumer income and spending. In 2022, we expect all of these to continue at lower rates, although very little of 2022 will be influenced by further government fiscal spending.
We’re calling for a nominal GDP of 6 ½ - 7 ½% in 2022. Of this, we expect real GDP to be about 4%, and the range is dependent upon how inflation rates might develop. This is slower than the double-digit nominal growth in 2021, but still very strong when compared to recent experience over the last decades.
Portfolio Strategy
Our investment approach continues to be one of investing in deeply undervalued companies and selling when the underlying value becomes realized by other market participants and reflected in the current price. The past year of rising markets has therefore resulted in a greater number of sale opportunities than purchase opportunities. We always consider cash as a buying reserve and in this case due to a spectacular market that we have seen and concerns about the coronavirus, which are relatively new, our accounts are more liquid than they have ever been. We, of course, will be gradually committing these reserves as long-term opportunities present themselves.
Over the past 6 months, we established and/or added to positions in Amgen Inc. (AMGN), Caterpillar Inc. (CAT), Crane Company (CR), Equitable Holding (EQH), Fidelity National Info Services (FIS), LyondellBasell Industries (LYB), and Newmont Mining Corp (NEM). During the same time frame, we added to the Fund’s positions in Continental AG (CTTAY), Leidos Holdings (LDOS), Lockheed Martin Corp. (LMT), Organon & Co. (OGN), Viacom CBS Inc. Class B (VIAC) and Viatris, Inc. (VTRS). We reduced the Fund’s positions in Acuity Brands Inc. (AYI), Cisco Systems Inc. (CSCO), Dupont de Nemours (DD), Johnson Controls Intl. (JCI), Roche Holdings Ltd. (RHHBY) and AT&T Inc. (T). We sold entirely out of Credit Suisse Group (CS), Honda Motor Co. (HMC), Newmont Mining Corp (NEM), Pfizer Inc. (PFE) and AT&T Inc. (T).
We continue to scour the equity universe to locate stocks which meet our investment criteria of: 1) a relatively low forecast P/E multiple, usually 15X or less, 2) a dividend yield is paid, or has declared a dividend, 3) public debt, if any, is investment grade, 4) a minimum of $500 million market capitalization, and 5) current stock price that is within 20% of the 52-week low price. In addition to meeting these criteria, stocks are quantitatively and qualitatively analyzed to determine company prospects and reasonableness of valuation.
The portfolio’s underperformance relative to the S&P 500 Value Index for the 6-month period ending November 30, 2021 was attributable to a reversal of the cyclical share outperformance in the beginning of the year. The Delta variant of Covid-19 led to a risk-off market reaction.
We maintain our long-term focus in the Kempner Multi-Cap Deep Value Fund on areas which we believe are overlooked by the market.
Harris L. Kempner, Jr. and M. Shawn Gault are the portfolio managers for the Kempner Multi-Cap Deep Value Fund.
Past performance is not predictive of future performance. Investment results and principal value will fluctuate so that shares, when redeemed, may be worth more or less than their original cost. Current performance may be higher or lower than the performance data quoted. Performance data current to the most recent month end are available by calling 1-800-665-9778.
An investor should consider the investment objectives, risks, charges and expenses of the Fund carefully before investing. The Fund’s prospectus contains this and other important information. To obtain a copy of the Fund’s prospectus please call 1-800-665-9778 and a copy will be sent to you free of charge. Please read the prospectus carefully before you invest. Kempner Multi-Cap Deep Value Fund is distributed by Ultimus Fund Distributors, LLC.
This Letter to Shareholders seeks to describe some of the Adviser’s current opinions and views of the financial markets. Although the Adviser believes it has a reasonable basis for any opinions or views expressed, actual results may differ, sometimes significantly so, from those expected or expressed. The securities held by the Fund that are discussed in the Letter to Shareholders were held during the period covered by this Report. They do not comprise the entire investment portfolio of the Fund, may be sold at any time and may no longer be held by the Fund. For a complete list of securities held by the Fund as of November 30, 2021, please see the Schedule of Investments section of the semi-annual report. The opinions of the Adviser with respect to those securities may change at any time.
Statements in the Letter to Shareholders that reflect projections or expectations for future financial or economic performance of the Fund and the market in general and statements of the Fund’s plans and objectives for future operations are forward-looking statements. No assurance can be given that actual results or events will not differ materially from those projected, estimated, assumed, or anticipated in any such forward-looking statements. Important factors that could result in such differences, in addition to factors noted with such forward-looking statements include, without limitation, general economic conditions, such as inflation, recession, and interest rates. Past performance is not a guarantee of future results.
KEMPNER MULTI-CAP DEEP VALUE FUND
PORTFOLIO INFORMATION
November 30, 2021 (Unaudited) |
Sector Diversification (% of Net Assets)
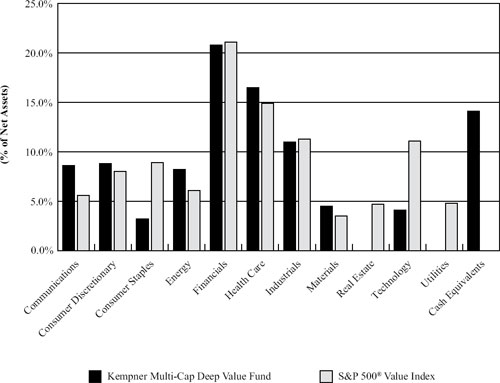
Top 10 Equity Investments
| Security Description | | % of Net Assets |
| General Motors Company | 6.5% |
| Lincoln National Corporation | 6.0% |
| Bank of America Corporation | 4.4% |
| Citigroup, Inc. | 4.2% |
| Walt Disney Company (The) | 3.2% |
| Cardinal Health, Inc. | 3.1% |
| Viatris, Inc. | 2.9% |
| Johnson Controls International plc | 2.8% |
| BP plc - ADR | 2.8% |
| Organon & Company | 2.7% |
| KEMPNER MULTI-CAP DEEP VALUE FUND |
| SCHEDULE OF INVESTMENTS |
| November 30, 2021 (Unaudited) |
| COMMON STOCKS — 84.8% | | Shares | | | Value | |
| Communications — 7.8% | | | | | | |
| Entertainment Content — 5.5% | | | | | | | | |
| ViacomCBS, Inc. - Class B | | | 60,710 | | | $ | 1,878,974 | |
| Walt Disney Company (The) (a) | | | 18,200 | | | | 2,637,180 | |
| | | | | | | | 4,516,154 | |
| Telecommunications — 2.3% | | | | | | | | |
| Deutsche Telekom AG - ADR | | | 55,289 | | | | 980,827 | |
| Verizon Communications, Inc. | | | 19,300 | | | | 970,211 | |
| | | | | | | | 1,951,038 | |
| Consumer Discretionary — 8.8% | | | | | | | | |
| Automotive — 8.8% | | | | | | | | |
| Continental AG - ADR (a) | | | 172,300 | | | | 1,853,948 | |
| General Motors Company (a) | | | 92,720 | | | | 5,365,707 | |
| Vitesco Technologies Group AG - ADR (a) | | | 10,090 | | | | 87,379 | |
| | | | | | | | 7,307,034 | |
| Consumer Staples — 3.2% | | | | | | | | |
| Food — 1.1% | | | | | | | | |
| Ingredion, Inc. | | | 9,800 | | | | 912,674 | |
| | | | | | | | | |
| Retail - Consumer Staples — 2.1% | | | | | | | | |
| Walgreen Boots Alliance, Inc. | | | 38,950 | | | | 1,744,960 | |
| | | | | | | | | |
| Energy — 8.1% | | | | | | | | |
| Oil & Gas Producers — 6.4% | | | | | | | | |
| BP plc - ADR | | | 89,120 | | | | 2,313,555 | |
| Royal Dutch Shell plc - Class A - ADR | | | 39,454 | | | | 1,658,646 | |
| Valero Energy Corporation | | | 20,400 | | | | 1,365,576 | |
| | | | | | | | 5,337,777 | |
| Oil & Gas Services & Equipment — 1.7% | | | | | | | | |
| Schlumberger Ltd. | | | 47,555 | | | | 1,363,878 | |
| | | | | | | | | |
| Financials — 20.8% | | | | | | | | |
| Banking — 9.7% | | | | | | | | |
| Bank of America Corporation | | | 81,720 | | | | 3,634,088 | |
| Citigroup, Inc. | | | 54,100 | | | | 3,446,170 | |
| Truist Financial Corporation | | | 15,300 | | | | 907,443 | |
| | | | | | | | 7,987,701 | |
| Insurance — 11.1% | | | | | | | | |
| Equitable Holdings, Inc. | | | 60,150 | | | | 1,892,319 | |
| Everest Re Group Ltd. | | | 6,200 | | | | 1,589,556 | |
| Hartford Financial Services Group, Inc. (The) | | | 11,650 | | | | 770,065 | |
| Lincoln National Corporation | | | 74,850 | | | | 4,964,801 | |
| | | | | | | | 9,216,741 | |
| KEMPNER MULTI-CAP DEEP VALUE FUND |
| SCHEDULE OF INVESTMENTS (Continued) |
| COMMON STOCKS — 84.8% (Continued) | | Shares | | | Value | |
| Health Care — 16.5% | | | | | | | | |
| Biotech & Pharma — 11.6% | | | | | | | | |
| Amgen, Inc. | | | 4,300 | | | $ | 855,184 | |
| Bristol-Myers Squibb Company | | | 22,850 | | | | 1,225,446 | |
| Merck & Company, Inc. | | | 17,430 | | | | 1,305,681 | |
| Organon & Company | | | 77,343 | | | | 2,260,736 | |
| Roche Holding AG - ADR | | | 32,250 | | | | 1,573,155 | |
| Viatris, Inc. | | | 193,485 | | | | 2,381,800 | |
| | | | | | | | 9,602,002 | |
| Health Care Facilities & Services — 4.9% | | | | | | | | |
| Cardinal Health, Inc. | | | 54,965 | | | | 2,541,032 | |
| McKesson Corporation | | | 6,880 | | | | 1,491,309 | |
| | | | | | | | 4,032,341 | |
| Industrials — 11.0% | | | | | | | | |
| Aerospace & Defense — 1.7% | | | | | | | | |
| Lockheed Martin Corporation | | | 4,300 | | | | 1,433,276 | |
| | | | | | | | | |
| Electrical Equipment — 5.6% | | | | | | | | |
| Acuity Brands, Inc. | | | 11,085 | | | | 2,231,965 | |
| Johnson Controls International plc | | | 31,549 | | | | 2,358,603 | |
| | | | | | | | 4,590,568 | |
| Machinery — 2.1% | | | | | | | | |
| Caterpillar, Inc. | | | 4,350 | | | | 841,072 | |
| Crane Company | | | 9,600 | | | | 926,784 | |
| | | | | | | | 1,767,856 | |
| Transportation & Logistics — 1.6% | | | | | | | | |
| FedEx Corporation | | | 5,700 | | | | 1,313,109 | |
| | | | | | | | | |
| Materials — 4.5% | | | | | | | | |
| Chemicals — 4.5% | | | | | | | | |
| Corteva, Inc. | | | 25,499 | | | | 1,147,455 | |
| Dow, Inc. | | | 14,449 | | | | 793,683 | |
| DuPont de Nemours, Inc. | | | 9,700 | | | | 717,412 | |
| LyondellBasell Industries N.V. - Class A | | | 12,500 | | | | 1,089,125 | |
| | | | | | | | 3,747,675 | |
| Technology — 4.1% | | | | | | | | |
| Technology Hardware — 1.6% | | | | | | | | |
| Cisco Systems, Inc. | | | 24,920 | | | | 1,366,613 | |
| | | | | | | | | |
| Technology Services — 2.5% | | | | | | | | |
| Fidelity National Information Services, Inc. | | | 6,200 | | | | 647,900 | |
| Leidos Holdings, Inc. | | | 16,200 | | | | 1,424,142 | |
| | | | | | | | 2,072,042 | |
| | | | | | | | | |
| Total Common Stocks (Cost $60,889,696) | | | | | | $ | 70,263,439 | |
| KEMPNER MULTI-CAP DEEP VALUE FUND |
| SCHEDULE OF INVESTMENTS (Continued) |
| PREFERRED STOCKS — 0.8% | | Shares | | | Value | |
| Communications — 0.8% | | | | | | |
| Entertainment Content — 0.8% | | | | | | | | |
| ViacomCBS, Inc., Series A, 5.75% (Cost $860,830) | | | 13,500 | | | $ | 697,410 | |
| WARRANTS — 0.1% | | Shares | | | Value | |
| Energy — 0.1% | | | | | | |
| Oil & Gas Producers — 0.1% | | | | | | | | |
| Occidental Petroleum Corporation, expires 08/03/2027 (a) (Cost $0) | | | 4,600 | | | $ | 57,500 | |
| MONEY MARKET FUNDS — 14.1% | | Shares | | | Value | |
| First American Treasury Obligations Fund - Class X, 0.01% (b) (Cost $11,686,727) | | | 11,686,727 | | | $ | 11,686,727 | |
| | | | | | | | | |
| Investments at Value — 99.8% (Cost $73,437,253) | | | | | | $ | 82,705,076 | |
| | | | | | | | | |
| Other Assets in Excess of Liabilities — 0.2% | | | | | | | 135,724 | |
| | | | | | | | | |
| Net Assets — 100.0% | | | | | | $ | 82,840,800 | |
ADR – American Depositary Receipt
AG – Aktiengesellschaft
N.V. – Naamloze Vennootschap
plc – Public Limited Company
| (a) | Non-income producing security. |
| (b) | The rate shown is the 7-day effective yield as of November 30, 2021. |
See accompanying notes to financial statements.
| KEMPNER MULTI-CAP DEEP VALUE FUND |
| STATEMENT OF ASSETS AND LIABILITIES |
| November 30, 2021 (Unaudited) |
| ASSETS | | | |
| Investments: | | | |
| At cost | | $ | 73,437,253 | |
| At value (Note 2) | | $ | 82,705,076 | |
| Receivable for investment securities sold | | | 654,425 | |
| Dividends receivable | | | 226,534 | |
| Tax reclaims receivable | | | 24,428 | |
| Other assets | | | 6,471 | |
| Total assets | | | 83,616,934 | |
| | | | | |
| LIABILITIES | | | | |
| Payable for investment securities purchased | | | 684,418 | |
| Payable to Adviser (Note 4) | | | 42,493 | |
| Payable to administrator (Note 4) | | | 14,340 | |
| Accrued distribution fees (Note 4) | | | 18,233 | |
| Other accrued expenses | | | 16,650 | |
| Total liabilities | | | 776,134 | |
| | | | | |
| NET ASSETS | | $ | 82,840,800 | |
| | | | | |
| NET ASSETS CONSIST OF: | | | | |
| Paid-in capital | | $ | 67,265,348 | |
| Accumulated earnings | | | 15,575,452 | |
| NET ASSETS | | $ | 82,840,800 | |
| | | | | |
| NET ASSET VALUE PER SHARE: | | | | |
| INSTITUTIONAL CLASS | | | | |
| Net assets applicable to Institutional Class | | $ | 65,289,070 | |
| Institutional Class shares of beneficial interest outstanding (unlimited number of shares authorized, no par value) | | | 5,424,787 | |
| Net asset value, offering price and redemption price per share (Note 2) | | $ | 12.04 | |
| | | | | |
| INVESTOR CLASS | | | | |
| Net assets applicable to Investor Class | | $ | 17,551,730 | |
| Investor Class shares of beneficial interest outstanding (unlimited number of shares authorized, no par value) | | | 1,459,713 | |
| Net asset value, offering price and redemption price per share (Note 2) | | $ | 12.02 | |
See accompanying notes to financial statements.
| KEMPNER MULTI-CAP DEEP VALUE FUND |
| STATEMENT OF OPERATIONS |
| For the Six Months Ended November 30, 2021 (Unaudited) |
| INVESTMENT INCOME | | | |
| Dividend income | | $ | 946,789 | |
| Foreign withholding taxes on dividends | | | (17,190 | ) |
| Total investment income | | | 929,599 | |
| | | | | |
| EXPENSES | | | | |
| Investment advisory fees (Note 4) | | | 255,915 | |
| Administration fees (Note 4) | | | 43,393 | |
| Fund accounting fees (Note 4) | | | 22,859 | |
| Distribution fees - Investor Class (Note 4) | | | 23,155 | |
| Legal fees | | | 14,087 | |
| Transfer agent fees (Note 4) | | | 13,887 | |
| Registration and filing fees | | | 8,978 | |
| Audit and tax services fees | | | 8,960 | |
| Trustees’ fees and expenses (Note 4) | | | 8,658 | |
| Compliance service fees (Note 4) | | | 6,000 | |
| Custodian and bank service fees | | | 5,455 | |
| Insurance expense | | | 1,905 | |
| Printing of shareholder reports | | | 1,836 | |
| Postage and supplies | | | 2,351 | |
| Other expenses | | | 7,387 | |
| Total expenses | | | 424,826 | |
| | | | | |
| NET INVESTMENT INCOME | | | 504,773 | |
| | | | | |
| REALIZED AND UNREALIZED GAINS (LOSSES) ON INVESTMENTS | | | | |
| Net realized gains from investment transactions | | | 502,343 | |
| Net change in unrealized appreciation (depreciation) on investments | | | (5,708,089 | ) |
| NET REALIZED AND UNREALIZED LOSSES ON INVESTMENTS | | | (5,205,746 | ) |
| | | | | |
| NET DECREASE IN NET ASSETS RESULTING FROM OPERATIONS | | $ | (4,700,973 | ) |
See accompanying notes to financial statements.
| KEMPNER MULTI-CAP DEEP VALUE FUND |
| STATEMENTS OF CHANGES IN NET ASSETS |
| | | Six Months | | | | |
| | | Ended | | | Year | |
| | | November 30, | | | Ended | |
| | | 2021 | | | May 31, | |
| | | (Unaudited) | | | 2021 | |
| FROM OPERATIONS | | | | | | | | |
| Net investment income | | $ | 504,773 | | | $ | 1,000,156 | |
| Net realized gains from investment transactions | | | 502,343 | | | | 5,555,621 | |
| Net change in unrealized appreciation (depreciation) on investments | | | (5,708,089 | ) | | | 25,309,541 | |
| Net increase (decrease) in net assets resulting from operations | | | (4,700,973 | ) | | | 31,865,318 | |
| | | | | | | | | |
| FROM DISTRIBUTIONS TO SHAREHOLDERS (Note 2) | | | | | | | | |
| Institutional Class | | | (382,421 | ) | | | (3,496,009 | ) |
| Investor Class | | | (80,327 | ) | | | (887,811 | ) |
| Decrease in net assets from distributions to shareholders | | | (462,748 | ) | | | (4,383,820 | ) |
| | | | | | | | | |
| CAPITAL SHARE TRANSACTIONS | | | | | | | | |
| Institutional Class | | | | | | | | |
| Proceeds from shares sold | | | 325,000 | | | | 1,250,001 | |
| Net asset value of shares issued in reinvestment of distributions to shareholders | | | 21,757 | | | | 186,356 | |
| Payments for shares redeemed | | | (135,424 | ) | | | (2,484,949 | ) |
| Net increase (decrease) in Institutional Class net assets from capital share transactions | | | 211,333 | | | | (1,048,592 | ) |
| | | | | | | | | |
| Investor Class | | | | | | | | |
| Proceeds from shares sold | | | 217,896 | | | | 983,556 | |
| Net asset value of shares issued in reinvestment of distributions to shareholders | | | 66,407 | | | | 877,593 | |
| Payments for shares redeemed | | | (759,401 | ) | | | (783,555 | ) |
| Net increase (decrease) in Investor Class net assets from capital share transactions | | | (475,098 | ) | | | 1,077,594 | |
| | | | | | | | | |
| TOTAL INCREASE (DECREASE) IN NET ASSETS | | | (5,427,486 | ) | | | 27,510,500 | |
| | | | | | | | | |
| NET ASSETS | | | | | | | | |
| Beginning of period | | | 88,268,286 | | | | 60,757,786 | |
| End of period | | $ | 82,840,800 | | | $ | 88,268,286 | |
See accompanying notes to financial statements.
| KEMPNER MULTI-CAP DEEP VALUE FUND |
| STATEMENTS OF CHANGES IN NET ASSETS (Continued) |
| | | Six Months | | | | |
| | | Ended | | | Year | |
| | | November 30, | | | Ended | |
| | | 2021 | | | May 31, | |
| | | (Unaudited) | | | 2021 | |
| CAPITAL SHARES ACTIVITY | | | | | | |
| Institutional Class | | | | | | | | |
| Shares sold | | | 26,442 | | | | 123,603 | |
| Shares issued in reinvestment of distributions to shareholders | | | 1,745 | | | | 18,589 | |
| Shares redeemed | | | (10,807 | ) | | | (268,667 | ) |
| Net increase (decrease) in shares outstanding | | | 17,380 | | | | (126,475 | ) |
| Shares outstanding at beginning of period | | | 5,407,407 | | | | 5,533,882 | |
| Shares outstanding at end of period | | | 5,424,787 | | | | 5,407,407 | |
| | | | | | | | | |
| Investor Class | | | | | | | | |
| Shares sold | | | 17,741 | | | | 94,988 | |
| Shares issued in reinvestment of distributions to shareholders | | | 5,331 | | | | 87,550 | |
| Shares redeemed | | | (60,503 | ) | | | (78,176 | ) |
| Net increase (decrease) in shares outstanding | | | (37,431 | ) | | | 104,362 | |
| Shares outstanding at beginning of period | | | 1,497,144 | | | | 1,392,782 | |
| Shares outstanding at end of period | | | 1,459,713 | | | | 1,497,144 | |
See accompanying notes to financial statements.
| KEMPNER MULTI-CAP DEEP VALUE FUND |
| INSTITUTIONAL CLASS |
| FINANCIAL HIGHLIGHTS |
Per Share Data for a Share Outstanding Throughout Each Period
| | | Six Months | | | | | | Ten | | | | | | | | | | | | | |
| | | Ended | | | Year | | | Months | | | Year | | | Year | | | Year | | | Year | |
| | | Nov. 30, | | | Ended | | | Ended | | | Ended | | | Ended | | | Ended | | | Ended | |
| | | 2021 | | | May 31, | | | May 31, | | | July 31, | | | July 31, | | | July 31, | | | July 31, | |
| | | (Unaudited) | | | 2021 | | | 2020(a) | | | 2019 | | | 2018 | | | 2017 | | | 2016 | |
| Net asset value at beginning of period | | $ | 12.79 | | | $ | 8.77 | | | $ | 10.70 | | | $ | 11.01 | | | $ | 10.47 | | | $ | 9.18 | | | $ | 10.42 | |
| Income (loss) from investment operations: | | | | | | | | | | | | | | | | | | | | | | | | | | | | |
| Net investment income | | | 0.08 | | | | 0.15 | | | | 0.20 | | | | 0.21 | | | | 0.19 | | | | 0.19 | | | | 0.21 | |
| Net realized and unrealized gains (losses) on investments | | | (0.76 | ) | | | 4.53 | | | | (1.62 | ) | | | (0.19 | ) | | | 1.00 | | | | 1.29 | | | | (0.54 | ) |
| Total from investment operations | | | (0.68 | ) | | | 4.68 | | | | (1.42 | ) | | | 0.02 | | | | 1.19 | | | | 1.48 | | | | (0.33 | ) |
| Less distributions from: | | | | | | | | | | | | | | | | | | | | | | | | | | | | |
| Net investment income | | | (0.07 | ) | | | (0.16 | ) | | | (0.17 | ) | | | (0.23 | ) | | | (0.17 | ) | | | (0.19 | ) | | | (0.21 | ) (b) |
| Net realized gains | | | — | | | | (0.50 | ) | | | (0.34 | ) | | | (0.10 | ) | | | (0.48 | ) | | | — | | | | (0.70 | ) |
| Total distributions | | | (0.07 | ) | | | (0.66 | ) | | | (0.51 | ) | | | (0.33 | ) | | | (0.65 | ) | | | (0.19 | ) | | | (0.91 | ) |
| Net asset value at end of period | | $ | 12.04 | | | $ | 12.79 | | | $ | 8.77 | | | $ | 10.70 | | | $ | 11.01 | | | $ | 10.47 | | | $ | 9.18 | |
| Total return (c) | | | (5.33 | %) (d) | | | 55.52 | % | | | (13.99 | %) (d) | | | 0.43 | % | | | 11.79 | % | | | 16.30 | % | | | (2.56 | %) |
| Net assets at end of period (000’s) | | $ | 65,289 | | | $ | 69,143 | | | $ | 48,552 | | | $ | 60,228 | | | $ | 67,725 | | | $ | 67,863 | | | $ | 95,846 | |
| Ratios/supplementary data: | | | | | | | | | | | | | | | | | | | | | | | | | | | | |
| Ratio of total expenses to average net assets | | | 0.93 | % (e) | | | 0.97 | % | | | 0.99 | % (e) | | | 0.95 | % | | | 0.94 | % | | | 0.84 | % | | | 0.78 | % |
| Ratio of net investment income to average net assets | | | 1.22 | % (e) | | | 1.46 | % | | | 2.37 | % (e) | | | 2.13 | % | | | 1.74 | % | | | 1.98 | % | | | 2.30 | % |
| Portfolio turnover rate | | | 13 | % (d) | | | 21 | % | | | 27 | % (d) | | | 17 | % | | | 25 | % | | | 18 | % | | | 10 | % |
| (a) | Fund changed fiscal year to May 31. |
| (b) | Includes a return of capital of less than $0.01 per share. |
| (c) | Total return is a measure of the change in value of an investment in the Fund over the periods covered. The returns shown do not reflect the deduction of taxes a shareholder would pay on Fund distributions, if any, or the redemption of Fund shares. |
See accompanying notes to financial statements.
| KEMPNER MULTI-CAP DEEP VALUE FUND |
| INVESTOR CLASS |
| FINANCIAL HIGHLIGHTS |
Per Share Data for a Share Outstanding Throughout Each Period
| | | Six Months | | | | | | Ten | | | | | | | | | | | | | |
| | | Ended | | | Year | | | Months | | | Year | | | Year | | | Year | | | Year | |
| | | Nov. 30, | | | Ended | | | Ended | | | Ended | | | Ended | | | Ended | | | Ended | |
| | | 2021 | | | May 31, | | | May 31, | | | July 31, | | | July 31, | | | July 31, | | | July 31, | |
| | | (Unaudited) | | | 2021 | | | 2020(a) | | | 2019 | | | 2018 | | | 2017 | | | 2016 | |
| Net asset value at beginning of period | | $ | 12.77 | | | $ | 8.76 | | | $ | 10.69 | | | $ | 11.00 | | | $ | 10.46 | | | $ | 9.17 | | | $ | 10.40 | |
| Income (loss) from investment operations: | | | | | | | | | | | | | | | | | | | | | | | | | | | | |
| Net investment income | | | 0.06 | | | | 0.13 | | | | 0.18 | | | | 0.18 | | | | 0.17 | | | | 0.17 | | | | 0.19 | |
| Net realized and unrealized gains (losses) on investments | | | (0.76 | ) | | | 4.51 | | | | (1.62 | ) | | | (0.19 | ) | | | 1.00 | | | | 1.29 | | | | (0.53 | ) |
| Total from investment operations | | | (0.70 | ) | | | 4.64 | | | | (1.44 | ) | | | (0.01 | ) | | | 1.17 | | | | 1.46 | | | | (0.34 | ) |
| Less distributions from: | | | | | | | | | | | | | | | | | | | | | | | | | | | | |
| Net investment income | | | (0.05 | ) | | | (0.13 | ) | | | (0.15 | ) | | | (0.20 | ) | | | (0.15 | ) | | | (0.17 | ) | | | (0.19 | ) (b) |
| Net realized gains | | | — | | | | (0.50 | ) | | | (0.34 | ) | | | (0.10 | ) | | | (0.48 | ) | | | — | | | | (0.70 | ) |
| Total distributions | | | (0.05 | ) | | | (0.63 | ) | | | (0.49 | ) | | | (0.30 | ) | | | (0.63 | ) | | | (0.17 | ) | | | (0.89 | ) |
| Net asset value at end of period | | $ | 12.02 | | | $ | 12.77 | | | $ | 8.76 | | | $ | 10.69 | | | $ | 11.00 | | | $ | 10.46 | | | $ | 9.17 | |
| Total return (c) | | | (5.46 | %) (d) | | | 55.09 | % | | | (14.18 | %) (d) | | | 0.18 | % | | | 11.55 | % | | | 16.06 | % | | | (2.70 | %) |
| Net assets at end of period (000’s) | | $ | 17,552 | | | $ | 19,125 | | | $ | 12,206 | | | $ | 14,495 | | | $ | 14,803 | | | $ | 15,321 | | | $ | 14,880 | |
| Ratios/supplementary data: | | | | | | | | | | | | | | | | | | | | | | | | | | | | |
| Ratio of total expenses to average net assets | | | 1.18 | % (e) | | | 1.22 | % | | | 1.24 | % (e) | | | 1.20 | % | | | 1.19 | % | | | 1.09 | % | | | 1.03 | % |
| Ratio of net investment income to average net assets | | | 0.97 | % (e) | | | 1.21 | % | | | 2.12 | % (e) | | | 1.88 | % | | | 1.49 | % | | | 1.70 | % | | | 2.05 | % |
| Portfolio turnover rate | | | 13 | % (d) | | | 21 | % | | | 27 | % (d) | | | 17 | % | | | 25 | % | | | 18 | % | | | 10 | % |
| (a) | Fund changed fiscal year to May 31. |
| (b) | Includes a return of capital of less than $0.01 per share. |
| (c) | Total return is a measure of the change in value of an investment in the Fund over the periods covered. The returns shown do not reflect the deduction of taxes a shareholder would pay on Fund distributions, if any, or the redemption of Fund shares. |
See accompanying notes to financial statements.
| KEMPNER MULTI-CAP DEEP VALUE FUND |
| NOTES TO FINANCIAL STATEMENTS |
| November 30, 2021 (Unaudited) |
Kempner Multi-Cap Deep Value Fund (the “Fund”) is a diversified series of Ultimus Managers Trust (the “Trust”). The Trust is an open-end management investment company registered under the Investment Company Act of 1940, as amended (the “1940 Act”). The Fund was reorganized into the Trust on April 28, 2017.
The investment objective of the Fund is to seek to generate a total pre-tax return, including capital growth and dividends, that is greater than the rate of inflation over a three-to-five-year period.
The Fund currently offers two classes of shares: Institutional Class shares (sold without any sales loads and distribution and/or shareholder servicing fees and requiring a $500,000 initial investment) and Investor Class shares (sold without any sales loads, but subject to a distribution and/or shareholder servicing fee of up to 0.25% of the average daily net assets attributable to Investor Class shares and requiring a $500 initial investment). Each share class represents an ownership interest in the same investment portfolio.
| 2. | Significant Accounting Policies |
The Fund follows accounting and reporting guidance under Financial Accounting Standards Board Accounting Standards Codification Topic 946, “Financial Services – Investment Companies.” The following is a summary of the Fund’s significant accounting policies used in the preparation of its financial statements. These policies are in conformity with accounting principles generally accepted in the United States of America (“GAAP”).
Securities valuation – The Fund values its portfolio securities at market value as of the close of regular trading on the New York Stock Exchange (the “NYSE”) (normally 4:00 p.m. Eastern time) on each business day the NYSE is open for business. The Fund values its listed securities on the basis of the security’s last sale price on the security’s primary exchange, if available, otherwise at the exchange’s most recently quoted mean price. NASDAQ-listed securities are valued at the NASDAQ Official Closing Price. Investments representing shares of money market funds and other open-end investment companies are valued at their net asset value (“NAV”) as reported by such companies. When using a quoted price and when the market for the security is considered active, the security will be classified as Level 1 within the fair value hierarchy (see below). In the event that market quotations are not readily available or are considered unreliable due to market or other events, the Fund values its securities and other assets at fair value in accordance with procedures established by and under the general supervision of the Board of Trustees (the “Board”). Under these procedures, the securities will be classified as Level 2 or 3 within the fair value hierarchy, depending on the inputs used. Unavailable or unreliable market quotes may be due to the following factors: a substantial bid-ask spread; infrequent sales resulting in stale prices; insufficient trading volume; small trade sizes; a temporary lapse in any reliable pricing source; and actions of the securities or futures markets, such as the suspension or limitation of trading. As a result, the prices of securities used to calculate the Fund’s NAV may differ from quoted or published prices for the same securities.
| KEMPNER MULTI-CAP DEEP VALUE FUND |
| NOTES TO FINANCIAL STATEMENTS (Continued) |
GAAP establishes a single authoritative definition of fair value, sets out a framework for measuring fair value, and requires additional disclosures about fair value measurements.
Various inputs are used in determining the value of the Fund’s investments. These inputs are summarized in the three broad levels listed below:
| ● | Level 1 – quoted prices in active markets for identical securities |
| ● | Level 2 – other significant observable inputs |
| ● | Level 3 – significant unobservable inputs |
The inputs or methods used for valuing securities are not necessarily an indication of the risks associated with investing in those securities. The inputs used to measure fair value may fall into different levels of the fair value hierarchy. In such cases, for disclosure purposes, the level in the fair value hierarchy within which the fair value measurement falls in its entirety is determined based on the lowest level input that is significant to the fair value measurement.
The following is a summary of the Fund’s investments based on the inputs used to value the investments as of November 30, 2021 by security type:
| | | Level 1 | | | Level 2 | | | Level 3 | | | Total | |
| Common Stocks | | $ | 70,263,439 | | | $ | — | | | $ | — | | | $ | 70,263,439 | |
| Preferred Stocks | | | 697,410 | | | | — | | | | — | | | | 697,410 | |
| Warrants | | | 57,500 | | | | — | | | | — | | | | 57,500 | |
| Money Market Funds | | | 11,686,727 | | | | — | | | | — | | | | 11,686,727 | |
| Total | | $ | 82,705,076 | | | $ | — | | | $ | — | | | $ | 82,705,076 | |
Refer to the Fund’s Schedule of Investments for a listing of securities by sector and industry type. The Fund did not hold any derivative instruments or any assets or liabilities that were measured at fair value on a recurring basis using significant unobservable inputs (Level 3) as of or during six months ended November 30, 2021.
Share valuation – The NAV per share of each class of the Fund is calculated daily by dividing the total value of the assets attributable to that class, less liabilities attributable to that class, by the number of shares outstanding of that class. The offering price and redemption price per share of each class of the Fund is equal to the NAV per share of such class.
Investment income – Dividend income is recorded on the ex-dividend date. Non-cash dividends included in dividend income, if any, are recorded at the fair market value of the security received. Interest income is accrued as earned. Withholding taxes on foreign dividends have been recorded in accordance with the Fund’s understanding of the applicable country’s rules and tax rates.
Investment transactions – Investment transactions are accounted for on the trade date. Realized gains and losses on investments sold are determined on a specific identification basis.
| KEMPNER MULTI-CAP DEEP VALUE FUND |
| NOTES TO FINANCIAL STATEMENTS (Continued) |
Allocation between Classes – Investment income earned, realized capital gains and losses, and unrealized appreciation and depreciation are allocated daily to each Class of the Fund based upon its proportionate share of total net assets of the Fund. Class-specific expenses are charged directly to the Class incurring the expense. Common expenses which are not attributable to a specific Class are allocated daily to each Class of shares of the Fund based upon its proportionate share of total net assets of the Fund.
Common expenses – Common expenses of the Trust are allocated among the Fund and the other series of the Trust based on the relative net assets of each series, the number of series in the Trust, or the nature of the services performed and the relative applicability to each series.
Distributions to shareholders – The Fund intends to declare and distribute net investment income dividends on a quarterly basis. In addition, the Fund will declare and distribute net realized capital gains, if any, on an annual basis. The amount of such dividends and distributions are determined in accordance with federal income tax regulations, which may differ from GAAP. Dividends and distributions to shareholders are recorded on the ex-dividend date. The tax character of distributions paid to shareholders by the Fund during the periods ended November 30, 2021 and May 31, 2021 were as follows:
| Period | | Ordinary | | | Long-Term | | | Total | |
| Ended | | Income | | | Capital Gains | | | Distributions | |
| 11/30/2021 | | $ | 462,748 | | | $ | — | | | $ | 462,748 | |
| 5/31/2021 | | $ | 2,014,446 | | | $ | 2,369,374 | | | $ | 4,383,820 | |
Estimates – The preparation of financial statements in conformity with GAAP requires management to make estimates and assumptions that affect the reported amounts of assets and liabilities and disclosure of contingent assets and liabilities as of the date of the financial statements and the reported amounts of increase (decrease) in net assets from operations during the reporting period. Actual results could differ from those estimates.
Federal income tax – The Fund has qualified and intends to continue to qualify as a regulated investment company under the Internal Revenue Code of 1986 (the “Code”). Qualification generally will relieve the Fund of liability for federal income taxes to the extent 100% of its net investment income and net realized capital gains are distributed in accordance with the Code.
In order to avoid imposition of the excise tax applicable to regulated investment companies, it is also the Fund’s intention to declare as dividends in each calendar year amounts equal to at least 98% of its net investment income (earned during the calendar year) and 98.2% of its net realized capital gains (earned during the twelve months ended October 31) plus undistributed amounts from prior years.
| KEMPNER MULTI-CAP DEEP VALUE FUND |
| NOTES TO FINANCIAL STATEMENTS (Continued) |
The following information is computed on a tax basis for each item as of November 30, 2021:
| Tax cost of portfolio investments | | $ | 73,437,262 | |
| Gross unrealized appreciation | | $ | 16,181,288 | |
| Gross unrealized depreciation | | | (6,913,474 | ) |
| Net unrealized appreciation | | | 9,267,814 | |
| Undistributed ordinary income | | | 1,964,682 | |
| Undistributed long-term gains | | | 3,798,588 | |
| Other gains | | | 544,368 | |
| Accumulated earnings | | $ | 15,575,452 | |
The value of the federal income tax cost of portfolio investments may temporarily differ from the financial statement cost. This book/tax difference is due to the recognition of capital gains or losses under income tax regulations and GAAP, primarily due to the tax deferral of losses on wash sales.
The Fund recognizes the tax benefits or expenses of uncertain tax positions only when the position is “more likely than not” of being sustained assuming examination by tax authorities. Management has reviewed the Fund’s tax positions for the current and all open tax years (generally, three years) and has concluded that no provision for unrecognized tax benefits or expenses is required in these financial statements. The Fund identifies its major tax jurisdiction as U.S. Federal.
| 3. | Investment Transactions |
During six months ended November 30, 2021, cost of purchases and proceeds from sales of investment securities, other than short-term investments, amounted to $13,252,870 and $9,683,719, respectively.
| 4. | Transactions with Related Parties |
INVESTMENT ADVISORY AGREEMENT
The Fund’s investments are managed by Kempner Capital Management, Inc. (the “Adviser”) pursuant to the terms of an Investment Advisory Agreement. The Fund pays the Adviser an investment advisory fee, computed and accrued daily and paid monthly, at the annual rate of 0.59% of average daily net assets.
The Adviser has agreed contractually, until at least December 1, 2022, to reduce its advisory fees and reimburse other expenses to the extent necessary to limit total annual fund operating expenses (exclusive of brokerage costs; taxes; interest; borrowing costs such as interest and dividend expenses on securities sold short; costs to organize the Fund; acquired fund fees and expenses; extraordinary expenses such as litigation and merger or reorganization costs and other expenses not incurred in the ordinary course of the Fund’s business) to an amount not exceeding 1.05% and 1.30% of average daily net assets for Institutional Class and Investor Class shares, respectively.
| KEMPNER MULTI-CAP DEEP VALUE FUND |
| NOTES TO FINANCIAL STATEMENTS (Continued) |
Advisory fee reductions and expense reimbursements by the Adviser are subject to repayment by the Fund for a period of three years after such fees and expenses were incurred, provided that the repayments do not cause the Fund’s total annual fund operating expenses to exceed the lesser of (i) the expense limitation then in effect, if any, and (ii) the expense limitation in effect at the time the expenses to be repaid were incurred. This agreement will terminate automatically if the Investment Advisory Agreement is terminated. During the six months ended November 30, 2021, the Adviser did not reduce its advisory fees or reimburse other expenses of the Fund.
OTHER SERVICE PROVIDERS
Ultimus Fund Solutions, LLC (“Ultimus”) provides administration, fund accounting, compliance and transfer agency services to the Fund. The Fund pays Ultimus fees in accordance with the agreements for such services. In addition, the Fund pays out-of-pocket expenses including, but not limited to, postage, supplies and certain costs related to the pricing of the Fund’s portfolio securities.
Under the terms of a Distribution Agreement with the Trust, Ultimus Fund Distributors, LLC (the “Distributor”) serves as principal underwriter to the Fund. The Distributor is a wholly-owned subsidiary of Ultimus. The Distributor is compensated partially by the Adviser and partially by the Investor Class shares of the Fund for acting as principal underwriter.
A Trustee and certain officers of the Trust are also officers of Ultimus.
DISTRIBUTION PLAN
The Fund has adopted a plan of distribution (the “Plan”), pursuant to Rule 12b-1 under the 1940 Act, which permits Investor Class shares of the Fund to directly incur or reimburse the Fund’s principal underwriter for certain expenses related to the distribution of Investor Class shares. The annual limitation for payment of expenses pursuant to the Plan is 0.25% of the Fund’s average daily net assets allocable to Investor Class shares. The Fund has not adopted a plan of distribution with respect to Institutional Class shares. During the six months ended November 30, 2021, Investor Class shares of the Fund incurred $23,155 of distribution fees under the Plan.
TRUSTEE COMPENSATION
Effective October 20, 2021, each member of the Board (a “Trustee”) who is not an “interested person” (as defined by the 1940 Act, as amended) of the Trust (“Independent Trustee”) receives a $1,300 annual retainer from the Fund, paid quarterly, except for the Board Chairperson who receives a $1,700 annual retainer from the Fund, paid in quarterly installments. Each Independent Trustee also receives from the Fund a fee of $550 for each Board meeting attended plus reimbursement for travel and other meeting-related expenses. Prior to October 20, 2021, each Independent Trustee received a $1,300 annual retainer from the Fund, paid quarterly, except for the Board Chairperson who received a $1,500 annual retainer from the Fund, paid in quarterly installments. Each Independent Trustee also received from the Fund a fee of $500 for each Board meeting attended plus reimbursement for travel and other meeting-related expenses.
| KEMPNER MULTI-CAP DEEP VALUE FUND |
| NOTES TO FINANCIAL STATEMENTS (Continued) |
PRINCIPAL HOLDERS OF FUND SHARES
As of November 30, 2021, the following shareholders owned of record 25% or more of the outstanding shares of each class of the Fund:
| NAME OF RECORD OWNERS | | % Ownership |
| Institutional Class | | |
| Muir & Company (for the benefit of its customers) | | 98% |
| Investor Class | | |
| Morgan Stanley Smith Barney LLC (for the benefit of its customers) | | 42% |
| Muir & Company (for the benefit of its customers) | | 32% |
A beneficial owner of 25% or more of the Fund’s outstanding shares may be considered a controlling person. That shareholder’s vote could have a more significant effect on matters presented at a shareholders’ meeting.
| 5. | Contingencies and Commitments |
The Fund indemnifies the Trust’s officers and Trustees for certain liabilities that might arise from their performance of their duties to the Fund. Additionally, in the normal course of business the Fund enters into contracts that contain a variety of representations and warranties and which provide general indemnifications. The Fund’s maximum exposure under these arrangements is unknown, as this would involve future claims that may be made against the Fund that have not yet occurred. However, based on experience, the Fund expects the risk of loss to be remote.
The Fund is required to recognize in the financial statements the effects of all subsequent events that provide additional evidence about conditions that existed as of the date of the Statement of Assets and Liabilities. For non-recognized subsequent events that must be disclosed to keep the financial statements from being misleading, the Fund is required to disclose the nature of the event as well as an estimate of its financial effect, or a statement that such an estimate cannot be made. Management has evaluated subsequent events through the issuance of these financial statements and has noted no such events except for the following:
The Fund paid the following distributions to shareholders subsequent to November 30, 2021:
| | | | | | | Per Share | |
| | | Record | | | | Ordinary | | | Short-Term | | | Long-Term | |
| | | Date | | Ex-Date | | Income | | | Capital Gain | | | Capital Gain | |
| Institutional Class | | 12/29/2021 | | 12/30/2021 | | $ | 0.0464 | | | $ | 0.2562 | | | $ | 0.5814 | |
| Investor Class | | 12/29/2021 | | 12/30/2021 | | $ | 0.0384 | | | $ | 0.2562 | | | $ | 0.5814 | |
| KEMPNER MULTI-CAP DEEP VALUE FUND |
| ABOUT YOUR FUND’S EXPENSES (Unaudited) |
We believe it is important for you to understand the impact of costs on your investment. As a shareholder of the Fund, you incur ongoing costs, including management fees, class-specific expenses (such as distribution fees) and other operating expenses. The following examples are intended to help you understand your ongoing costs (in dollars) of investing in the Fund and to compare these costs with the ongoing costs of investing in other mutual funds.
A mutual fund’s ongoing costs are expressed as a percentage of its average net assets. This figure is known as the expense ratio. The expenses in the table below are based on an investment of $1,000 made at the beginning of the most recent period (June 1, 2021) and held until the end of the period (November 30, 2021).
The table below illustrates the Fund’s ongoing costs in two ways:
Actual fund return – This section helps you to estimate the actual expenses that you paid over the period. The “Ending Account Value” shown is derived from the Fund’s actual return, and the fourth column shows the dollar amount of operating expenses that would have been paid by an investor who started with $1,000 in the Fund. You may use the information here, together with the amount you invested, to estimate the expenses that you paid over the period.
To do so, simply divide your account value by $1,000 (for example, an $8,600 account value divided by $1,000 = 8.6), then multiply the result by the number given for the Fund under the heading “Expenses Paid During Period.”
Hypothetical 5% return – This section is intended to help you compare the Fund’s ongoing costs with those of other mutual funds. It assumes that the Fund had an annual return of 5% before expenses during the period shown, but that the expense ratio is unchanged. In this case, because the return used is not the Fund’s actual return, the results do not apply to your investment. The example is useful in making comparisons because the SEC requires all mutual funds to calculate expenses based on a 5% return. You can assess the Fund’s ongoing costs by comparing this hypothetical example with the hypothetical examples that appear in shareholder reports of other funds.
Note that expenses shown in the table are meant to highlight and help you compare ongoing costs only. The Fund does not charge transaction fees, such as purchase or redemption fees, nor does it carry a “sales load.”
The calculations assume no shares were bought or sold during the period. Your actual costs may have been higher or lower, depending on the amount of your investment and the timing of any purchases or redemptions.
| KEMPNER MULTI-CAP DEEP VALUE FUND |
| ABOUT YOUR FUND’S EXPENSES (Unaudited) (Continued) |
More information about the Fund’s expenses can be found in this report. For additional information on operating expenses and other shareholder costs, please refer to the Fund’s prospectus.
| | | Beginning | | Ending | | Net | | Expenses |
| | | Account Value | | Account Value | | Expense | | Paid During |
| | | June 1, 2021 | | November 30, 2021 | | Ratio(a) | | Period(b) |
| Institutional Class | | | | | | | | |
| Base on Actual Fund Return | | $1,000.00 | | $946.70 | | 0.93% | | $4.54 |
| Based on Hypothetical 5%Return (before expenses) | | $1,000.00 | | $1,020.41 | | 0.93% | | $4.71 |
| Investor Class | | | | | | | | |
| Base on Actual Fund Return | | $1,000.00 | | $945.40 | | 1.18% | | $5.75 |
| Based on Hypothetical 5%Return (before expenses) | | $1,000.00 | | $1,019.15 | | 1.18% | | $5.97 |
| (a) | Annualized, based on the Fund’s most recent one-half year expenses. |
| (b) | Expenses are equal to the Fund’s annualized net expense ratio multiplied by the average account value over the period, multiplied by 183/365 (to reflect the one-half year period). |
| KEMPNER MULTI-CAP DEEP VALUE FUND |
| OTHER INFORMATION (Unaudited) |
A description of the policies and procedures that the Fund uses to vote proxies relating to portfolio securities is available without charge upon request by calling toll- free 1-800-665-9778, or on the SEC’s website at www.sec.gov. Information regarding how the Fund voted proxies relating to portfolio securities during the most recent 12-month period ended June 30 is available without charge upon request by calling toll-free 1-800-665-9778, or on the SEC’s website at www.sec.gov.
The Trust files a complete listing of portfolio holdings for the Fund with the SEC as of the end of the first and third quarters of each fiscal year as an exhibit to its reports on Form N-PORT. These filings are available upon request by calling 1-800-665-9778. Furthermore, you may obtain a copy of the filings on the SEC’s website at www.sec.gov.
| KEMPNER MULTI-CAP DEEP VALUE FUND |
| DISCLOSURE REGARDING APPROVAL OF INVESTMENT |
| ADVISORY AGREEMENT (Unaudited) |
The Board of Trustees (the “Board”), including the Independent Trustees voting separately, has reviewed and approved the Fund’s Investment Advisory Agreement with Kempner Capital Management, Inc. (the “Adviser” or “Kempner”) for an additional one-year term (the “Agreement”). The Board approved the Agreement at a meeting held on July 19, 20 and 21, 2021, at which all of the Trustees were present.
In deciding whether to approve the continuation of the Agreement, the Board recalled its review of the materials related to the Fund and Kempner throughout the preceding twelve months and its numerous discussions with Trust management and Kempner about the operations and performance of the Fund during that period. The Board further considered those materials and discussions and other numerous factors, including the following:
The nature, extent, and quality of the services provided by the Adviser. In this regard, the Board reviewed the services being provided by Kempner to the Fund including, without limitation, its providing a continuous investment program for the Fund, adhering to the Fund’s investment restrictions, complying with the Trust’s policies and procedures and voting proxies on behalf of the Fund. The Board considered the qualifications and experience of Kempner’s portfolio managers who are responsible for the day-to day management of the Fund’s portfolio, as well as the qualifications of other individuals at Kempner who provide services to the Fund. The Board concluded that the quality, extent, and nature of the services provided by Kempner to the Fund were satisfactory.
The investment performance of the Fund. In this regard, the Board compared the performance of the Fund with the performance of its benchmark index, custom peer group, and Morningstar category. The Board concluded that the investment performance of the Fund has been satisfactory.
The costs of the services provided and profits realized by the Adviser and its affiliates from their relationship with the Fund. In this regard, the Board considered the management fee proposed to be charged to the Fund and the Fund’s expense ratio, each as compared to the Fund’s peer group and to the fees charged by Kempner to other similar clients. The Board considered the revenue earned by Kempner from the Fund and the current and anticipated profitability of the Fund to Kempner, if any. The Board also considered Kempner’s past fee reductions and expense reimbursements for the Fund. The Board concluded that the advisory fee to be paid to Kempner by the Fund is reasonable in light of the nature and quality of services provided by Kempner.
The extent to which economics of scale would be realized as the Fund grows and whether advisory fee levels reflect these economies of scale for the benefit of the Fund’s investors. In this regard, the Board considered that the Fund’s fee arrangements with Kempner involve both the advisory fee and the expense limitation agreement (the “ELA”). The Board determined that while the advisory fee rate remained the same as asset levels increased, the shareholders of the Fund have experienced benefits from the ELA in the past. The Board concluded that the advisory fee was reasonable in light of the information that was provided to the Trustees by Kempner with respect to economies of scale.
| KEMPNER MULTI-CAP DEEP VALUE FUND |
| DISCLOSURE REGARDING APPROVAL OF INVESTMENT |
| ADVISORY AGREEMENT (Unaudited) (Continued) |
After further discussion of the factors noted above, as well as other factors, and in reliance on the information provided by the Adviser and Trust management, and taking into account the totality of all factors discussed and information presented at the meeting and previous meetings, the Board indicated its agreement to approve the continuance of the Agreement and the Fund’s ELA. It was noted that in the Trustees’ deliberations regarding the approval of the continuance of the Agreement, the Trustees did not identify any particular information or factor that was all-important or controlling, and that each individual Trustee may have attributed different weights to various factors listed above. After full consideration of the above factors as well as other factors, the Board unanimously concluded that approval of the continuance of the Agreement was in the best interests of the Fund and its shareholders.
| KEMPNER MULTI-CAP DEEP VALUE FUND |
| LIQUIDITY RISK MANAGEMENT PROGRAM (Unaudited) |
The Fund has adopted and implemented a written liquidity risk management program (the “Program”) as required by Rule 22e-4 (the “Liquidity Rule”) under the Investment Company Act of 1940, as amended. The Program is reasonably designed to assess and manage the Fund’s liquidity risk, taking into consideration, among other factors, the Fund’s investment strategy and the liquidity of its portfolio investments during normal and reasonably foreseeable stressed conditions; its short- and long-term cash flow projections; and its cash holdings and access to other funding sources. The Fund’s Board of Trustees (the “Board”) approved the appointment of the Liquidity Administrator Committee, comprising of the Fund’s Adviser and certain Trust officers, to be responsible for the Program’s administration and oversight and for reporting to the Board on at least an annual basis regarding the Program’s operation and effectiveness. The annual written report assessing the Program (the “Report”) was presented to the Board at the October 18 - 19, 2021 Board meeting and covered the period from June 1, 2020 to May 31, 2021 (the “Review Period”).
During the Review Period, the Fund did not experience unusual stress or disruption to its operations related to purchase and redemption activity. Also, during the Review Period, the Fund held adequate levels of cash and highly liquid investments to meet shareholder redemption activities in accordance with applicable requirements. The Report concluded that the Program is reasonably designed to prevent violation of the Liquidity Rule and the Program has been effectively implemented.
This page intentionally left blank.
This page intentionally left blank.
This page intentionally left blank.
| FACTS | WHAT DOES THE KEMPNER MULTI-CAP DEEP VALUE FUND (the “Fund”) DO WITH YOUR PERSONAL INFORMATION? |
| |
| Why? | Financial companies choose how they share your personal information. Federal law gives consumers the right to limit some but not all sharing. Federal law also requires us to tell you how we collect, share, and protect your personal information. Please read this notice carefully to understand what we do. |
| |
| What? | The types of personal information we collect and share depend on the product or service you have with us. This information can include: ■ Social Security number ■ Assets ■ Retirement Assets ■ Transaction History ■ Checking Account Information ■ Purchase History ■ Account Balances ■ Account Transactions ■ Wire Transfer Instructions When you are no longer our customer, we continue to share your information as described in this notice. |
| |
| How? | All financial companies need to share your personal information to run their everyday business. In the section below, we list the reasons financial companies can share their customers’ personal information; the reasons the Fund chooses to share; and whether you can limit this sharing. |
| |
| Reasons we can share your personal information | Does the
Fund share? | Can you limit
this sharing? |
| For our everyday business purposes – Such as to process your transactions, maintain your account(s), respond to court orders and legal investigations, or report to credit bureaus | Yes | No |
| For our marketing purposes – to offer our products and services to you | No | We don’t share |
| For joint marketing with other financial companies | No | We don’t share |
| For our affiliates’ everyday business purposes – information about your transactions and experiences | No | We don’t share |
| For our affiliates’ everyday business purposes – information about your creditworthiness | No | We don’t share |
| For nonaffiliates to market to you | No | We don’t share |
| | | | |
| Questions? | Call 1-800-665-9778 |
| Page 2 | |
| Who we are |
| Who is providing this notice? | Kempner Multi-Cap Deep Value Fund Ultimus Fund Distributors, LLC (Distributor) Ultimus Fund Solutions, LLC (Administrator) |
| What we do |
| How does the Fund protect my personal information? | To protect your personal information from unauthorized access and use, we use security measures that comply with federal law. These measures include computer safeguards and secured files and buildings. Our service providers are held accountable for adhering to strict policies and procedures to prevent any misuse of your nonpublic personal information. |
| How does the Fund collect my personal information? | We collect your personal information, for example, when you ■ Open an account ■ Provide account information ■ Give us your contact information ■ Make deposits or withdrawals from your account ■ Make a wire transfer ■ Tell us where to send the money ■ Tell us who receives the money ■ Show your government-issued ID ■ Show your driver’s license We also collect your personal information from other companies. |
| Why can’t I limit all sharing? | Federal law gives you the right to limit only ■ Sharing for affiliates’ everyday business purposes – information about your creditworthiness ■ Affiliates from using your information to market to you ■ Sharing for nonaffiliates to market to you State laws and individual companies may give you additional rights to limit sharing. |
| |
| Definitions |
| Affiliates | Companies related by common ownership or control. They can be financial and nonfinancial companies. ■ Kempner Capital Management, Inc., the investment adviser to the Fund, could be deemed to be an affiliate. |
| Nonaffiliates | Companies not related by common ownership or control. They can be financial and nonfinancial companies ■ The Fund does not share with nonaffiliates so they can market to you. |
| Joint marketing | A formal agreement between nonaffiliated financial companies that together market financial products or services to you. ■ The Fund does not jointly market. |
KEMPNER-SAR-21
WAVELENGTH INTEREST RATE NEUTRAL FUND
LETTER TO SHAREHOLDERS (Unaudited) January 10, 2022
Dear Fellow Shareholders:
Since our last shareholder letter, the global economic reawakening accelerated with a swift revival of demand in dormant sectors leading to supply bottlenecks and inflationary pressures. As these dynamics took hold, successive waves of COVID-19 variants increased levels of uncertainty for investors, and the shifting policy backdrop expanded the set of both potential risks and opportunities. Our portfolio adapted to these conditions actively and profitably by monetizing the serial dislocations across markets over the period.
What follows is designed to provide a context for returns that fosters a deeper understanding of the investment process that supports them. By doing so we hope to build on the partnership your investment creates.
PERFORMANCE SUMMARY
For the six months ended November 30, 2021, the Wavelength Interest Rate Neutral Fund (the “Fund”) delivered a return of +0.62% versus a benchmark return of +0.02% for the S&P / BGCantor 0-3 Month US Treasury Bill Index (which seeks to represent the return from not taking risk in financial markets). These results were within targeted risk parameters and the Fund performed in line with investment objectives.
WAVELENGTH PHILOSOPHY
We believe that macroeconomic conditions drive asset prices and central banks use interest rates to manage macroeconomic conditions. Based on this fundamental logic, we seek to build a portfolio that is hedged to changes in interest rates by balancing investment exposure between instruments we expect to outperform in rising and falling macroeconomic conditions.
INVESTMENT ENVIRONMENT
As an extension of our investment philosophy, we believe that changing expectations for the economy drive investment decisions, which in turn drive market prices. Since our last letter, economic growth maintained its upward trajectory while inflation consistently exceeded the market’s consensus expectations and became more than a transitory issue for the Federal Reserve. This situation reflected a fast-moving economy in transition where many traditional strategies that rely on specific forecasts were under pressure.
Towards the end of the second quarter, concerns over rising prices grew meaningfully among market participants, though the Federal Reserve continued to describe these pressures as a transitory part of the reopening process. Enthusiasm around the US economy ultimately overshadowed concerns from COVID variants elsewhere, and corporate assets benefited further from this dynamic despite stretched valuations.
Heading into the summer months, economies across the globe prepared for takeoff despite considerable risks emerging on the horizon. The uptick in breakthrough infections, labor shortages, and persistent inflation pressures were among the key impediments to business activity and the recalibration of supply and demand. Central banks endeavored to manage this uneven economic liftoff by setting the groundwork for an eventual tapering as new frictions emerged through the policies they enacted.
Autumn featured an acceleration of both growth and inflation with business momentum building despite escalating concerns over COVID-19’s variants. In this environment, central banks faced new challenges to their policies designed to suppress interest rates, and the prospect of policy tightening started to disrupt markets and the forward path of interest rates.
The period came to a close with unresolved supply and demand imbalances, and persistent inflation pressures brought about a widespread pivot by central banks. This shifting policy backdrop led to an uptick in volatility that underscored the importance of risk management and expanded the opportunity set for actively investing across fixed income.
PERFORMANCE DISCUSSION
The Fund delivered on its mandate with positive results for the period, monetizing opportunities from dislocations created in a swiftly changing investment landscape. Understanding the fundamental linkages between markets and the economy proved critical in this environment and played a key role in generating returns.
As the second quarter came to a close, the portfolio benefited from rising growth conditions that supported convertible bonds and emerging market debt. US Treasury exposures also contributed positively to performance in June, as a flattening dynamic benefited positions along the yield curve.
The Fund continued to generate returns into the third quarter amidst growing inflation pressures and concerns over how they would be addressed. Profits in July were driven by government and inflation-linked bond exposures, in addition to emerging market debt positions which continued to outperform. Positive performance was maintained through the August wave of COVID-19’s Delta variant, due to contributions from growth-related corporate assets, including convertible bonds, bank loans, and high yield credit. Profits were offset by a widespread selling of assets in September amidst increased anxiety over the Federal Reserve’s prospective tapering, financial troubles at Chinese property giant Evergrande, and continued bottlenecks for supply chains across the globe.
Upside for the portfolio was limited in November as the Federal Reserve’s policy pivot combined with rising uncertainty around COVID’s Omicron variant to increase volatility in markets. Profits from inflation-linked bonds and long-dated US Treasuries were offset by positions in emerging market debt, high yield credit and convertible bonds which came under pressure as growth expectations were pared back.
OUTLOOK
The global economy is entering an uneven period of transition with central banks reconsidering their approaches alongside the evolving landscape for public health. Facing markets that offer low yields and stretched valuations, we believe investors will increasingly look beyond traditional approaches to generate returns. With a shifting policy backdrop, there are new risks on the horizon, but strategies focused on the impact of these policies stand to benefit from
an expanded opportunity set. In this environment, our portfolio is positioned for a widening set of potential outcomes as we seek to monetize opportunities resulting from the disruptive economic forces at play across fixed income markets.
Thank you for your trust and commitment through investment.
Sincerely,

Andrew Dassori
Founding Partner & Chief Investment Officer
Wavelength Capital Management
Past performance is not predictive of future performance. Investment results and principal value will fluctuate so that shares, when redeemed, may be worth more or less than their original cost. Current performance may be higher or lower than the performance data quoted. Performance data current to the most recent month end are available by calling 1-866-896-9292.
An investor should consider the investment objectives, risks, charges and expenses of the Fund carefully before investing. The Fund’s prospectus contains this and other important information. To obtain a copy of the Fund’s prospectus please visit our website at www.wavelengthfunds.com or call 1-866-896-9292 and a copy will be sent to you free of charge. Please read the prospectus carefully before you invest. The Wavelength Interest Rate Neutral Fund is distributed by Ultimus Fund Distributors, LLC.
The Letter to Shareholders seeks to describe some of the Adviser’s current opinions and views of the financial markets. Although the Adviser believes it has a reasonable basis for any opinions or views expressed, actual results may differ, sometimes significantly so, from those expected or expressed. The securities held by the Fund that are discussed in the Letter to Shareholders were held during the period covered by this Report. They do not comprise the entire investment portfolio of the Fund, may be sold at any time and may no longer be held by the Fund. For a complete list of securities held by the Fund as of November 30, 2021, please see the Schedule of Investments section of the Semi-Annual Report. The opinions of the Adviser with respect to those securities may change at any time.
Statements in the Letter to Shareholders that reflect projections or expectations for future financial or economic performance of the Fund and the market in general and statements of the Fund’s plans and objectives for future operations are forward-looking statements. No assurance can be given that actual results or events will not differ materially from those projected, estimated, assumed, or anticipated in any such forward-looking statements. Important factors that could result in such differences, in addition to factors noted with such forward-looking statements include, without limitation, general economic conditions, such as inflation, recession, and interest rates. Past performance is not a guarantee of future results.
WAVELENGTH INTEREST RATE NEUTRAL FUND
PORTFOLIO INFORMATION
November 30, 2021 (Unaudited)
Portfolio Allocation (% of Net Assets)
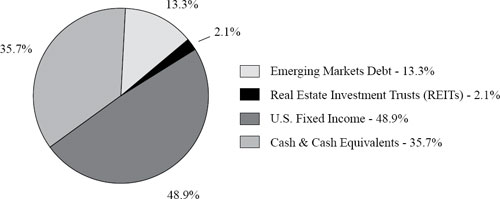
| Top 10 Equity Holdings |
| | | | | |
| | | | % of Net | |
| | Security Description | | Assets | |
| | iShares TIPS Bond ETF | | 11.5% | |
| | Invesco Senior Loan ETF | | 8.9% | |
| | iShares National Muni Bond ETF | | 7.0% | |
| | Vanguard Emerging Markets Government Bond ETF | | 5.9% | |
| | SPDR Bloomberg Convertible Securities ETF | | 5.5% | |
| | Vanguard Short-Term Inflation-Protected Securities ETF | | 4.7% | |
| | Vanguard Mortgage-Backed Securities ETF | | 4.6% | |
| | SPDR Bloomberg Short Term High Yield Bond ETF | | 3.6% | |
| | VanEck Emerging Markets High Yield Bond ETF | | 3.3% | |
| | iShares J.P. Morgan USD Emerging Markets Bond ETF | | 2.5% | |
| WAVELENGTH INTEREST RATE NEUTRAL FUND |
| SCHEDULE OF INVESTMENTS |
| November 30, 2021 (Unaudited) |
| EXCHANGE-TRADED FUNDS — 64.3% | | Shares | | | Value | |
| Emerging Markets Debt — 13.3% | | | | | | | | |
| Invesco Emerging Markets Sovereign Debt ETF (a) | | | 121,947 | | | $ | 3,153,549 | |
| iShares J.P. Morgan USD Emerging Markets Bond ETF (a) | | | 44,135 | | | | 4,743,188 | |
| VanEck Emerging Markets High Yield Bond ETF (a) | | | 278,313 | | | | 6,189,681 | |
| Vanguard Emerging Markets Government Bond ETF | | | 147,794 | | | | 11,310,675 | |
| | | | | | | | 25,397,093 | |
| Real Estate Investment Trusts (REITs) — 2.1% | | | | | | | | |
| Vanguard Real Estate ETF (a) | | | 36,800 | | | | 3,928,032 | |
| | | | | | | | | |
| U.S. Fixed Income — 48.9% | | | | | | | | |
| Invesco Senior Loan ETF (a) | | | 780,112 | | | | 17,006,442 | |
| iShares iBoxx $High Yield Corporate Bond ETF (a) | | | 41,620 | | | | 3,564,337 | |
| iShares National Muni Bond ETF (a) | | | 114,295 | | | | 13,329,083 | |
| iShares TIPS Bond ETF | | | 168,861 | | | | 21,894,517 | |
| SPDR Bloomberg Convertible Securities ETF (a) | | | 123,881 | | | | 10,399,810 | |
| SPDR Bloomberg High Yield Bond ETF (a) | | | 20,277 | | | | 2,166,192 | |
| SPDR Bloomberg Short Term High Yield Bond ETF (a) | | | 256,276 | | | | 6,904,075 | |
| Vanguard Mortgage-Backed Securities ETF (a) | | | 166,168 | | | | 8,813,551 | |
| Vanguard Short-Term Inflation-Protected Securities ETF | | | 170,660 | | | | 8,894,799 | |
| | | | | | | | 92,972,806 | |
| | | | | | | | | |
| Total Exchange-Traded Funds (Cost $118,482,806) | | | | | | $ | 122,297,931 | |
| WAVELENGTH INTEREST RATE NEUTRAL FUND |
| SCHEDULE OF INVESTMENTS (Continued) |
| MONEY MARKET FUNDS — 16.1% | | Shares | | | Value | |
| Fidelity Institutional Money Market Government Portfolio - Class I, 0.01% (b) | | | 15,360,576 | | | $ | 15,360,576 | |
| Invesco Short-Term Investments Trust - Institutional Class, 0.01% (b) | | | 15,360,576 | | | | 15,360,576 | |
| Total Money Market Funds (Cost $30,721,152) | | | | | | $ | 30,721,152 | |
| | | | | | | | | |
| COLLATERAL FOR SECURITIES LOANED — 33.1% | | Value | | | Value | |
| Mount Vernon Liquid Assets Portfolio, LLC, 0.10% (Cost $62,873,605) (b)(c) | | | 62,873,605 | | | $ | 62,873,605 | |
| | | | | | | | | |
| Investments at Value — 113.5% (Cost $212,077,563) | | | | | | $ | 215,892,688 | |
| | | | | | | | | |
| Liabilities in Excess of Other Assets — (13.5%) | | | | | | | (25,644,508 | ) |
| | | | | | | | | |
| Net Assets — 100.0% | | | | | | $ | 190,248,180 | |
| (a) | All or a portion of the security is on loan. The total value of the securities on loan as of November 30, 2021 was $61,178,918 (Note 6). |
| (b) | The rate shown is the 7-day effective yield as of November 30, 2021. |
| (c) | This security was purchased with cash collateral held from securities on loan (Note 6). |
See accompanying notes to financial statements.
| WAVELENGTH INTEREST RATE NEUTRAL FUND |
| SCHEDULE OF FUTURES CONTRACTS |
| November 30, 2021 (Unaudited) |
| | | | | | | | | | | | Value/Unrealized | |
| | | | | | Expiration | | | Notional | | | Appreciation | |
| FUTURES CONTRACTS | | Contracts | | | Date | | | Value | | | (Depreciation) | |
| Commodities Futures | | | | | | | | | | | | | | | | |
| E-Mini Gold Future | | | 36 | | | | 1/27/2022 | | | $ | 3,197,700 | | | $ | (26,696 | ) |
| | | | | | | | | | | | | | | | | |
| Index Futures | | | | | | | | | | | | | | | | |
| E-Mini Dow CBOT DJIA Future | | | 20 | | | | 12/17/2021 | | | | 3,445,700 | | | | (1,517 | ) |
| E-Mini Nasdaq 100 Future | | | 11 | | | | 12/17/2021 | | | | 3,553,110 | | | | 212,357 | |
| E-Mini S&P 500 Future | | | 17 | | | | 12/17/2021 | | | | 3,881,313 | | | | 97,652 | |
| Total Index Futures | | | | | | | | | | | 10,880,123 | | | | 308,492 | |
| | | | | | | | | | | | | | | | | |
| Treasury Futures | | | | | | | | | | | | | | | | |
| 10-Year U.S. Treasury Note Future | | | 80 | | | | 3/31/2022 | | | | 10,465,000 | | | | 35,308 | |
| 2-Year U.S. Treasury Note Future | | | 34 | | | | 3/31/2022 | | | | 7,436,969 | | | | 15,521 | |
| 5-Year U.S. Treasury Note Future | | | 136 | | | | 3/31/2022 | | | | 16,510,187 | | | | 136,230 | |
| U.S. Treasury Long Bond Future | | | 40 | | | | 3/22/2022 | | | | 6,485,000 | | | | 137,433 | |
| Total Treasury Futures | | | | | | | | | | | 40,897,156 | | | | 324,492 | |
| | | | | | | | | | | | | | | | | |
| Total Futures Contracts | | | | | | | | | | $ | 54,974,979 | | | $ | 606,288 | |
The average monthly notional value of futures contracts during the six months ended November 30, 2021 was $52,762,670.
See accompanying notes to financial statements.
| WAVELENGTH INTEREST RATE NEUTRAL FUND |
| STATEMENT OF ASSETS AND LIABILITIES |
| November 30, 2021 (Unaudited) |
| ASSETS | | | |
| Investments in securities: | | | | |
| At cost | | $ | 212,077,563 | |
| At value* (Note 2) | | $ | 215,892,688 | |
| Cash (Note 2) | | | 34,145,534 | |
| Margin deposits for futures contracts (Note 2) | | | 3,988,115 | |
| Variation margin receivable (Notes 2 and 5) | | | 127,056 | |
| Receivable for capital shares sold | | | 161,722 | |
| Dividends and interest receivable | | | 30,009 | |
| Other assets | | | 28,392 | |
| Total assets | | | 254,373,516 | |
| | | | | |
| LIABILITIES | | | | |
| Variation margin payable (Notes 2 and 5) | | | 219,316 | |
| Payable for return of collateral received for securities on loan (Note 6) | | | 62,873,605 | |
| Payable for capital shares redeemed | | | 38,761 | |
| Payable for investment securities purchased | | | 559,092 | |
| Payable to Adviser (Note 4) | | | 396,505 | |
| Payable to administrator (Note 4) | | | 23,315 | |
| Other accrued expenses | | | 14,742 | |
| Total liabilities | | | 64,125,336 | |
| | | | | |
| NET ASSETS | | $ | 190,248,180 | |
| | | | | |
| NET ASSETS CONSIST OF: | | | | |
| Paid-in capital | | $ | 184,668,323 | |
| Accumulated earnings | | | 5,579,857 | |
| NET ASSETS | | $ | 190,248,180 | |
| | | | | |
| Shares of beneficial interest outstanding (unlimited number of shares authorized, no par value) | | | 17,332,079 | |
| | | | | |
| Net asset value, offering price and redemption price per share (Note 2) | | $ | 10.98 | |
| * | Includes value of securities on loan (Note 6). |
See accompanying notes to financial statements.
| WAVELENGTH INTEREST RATE NEUTRAL FUND |
| STATEMENT OF OPERATIONS |
| For the Six Months Ended November 30, 2021 (Unaudited) |
| INVESTMENT INCOME | | | |
| Dividends | | $ | 2,002,307 | |
| Securities lending income (Note 6) | | | 142,603 | |
| Total investment income | | | 2,144,910 | |
| | | | | |
| EXPENSES | | | | |
| Investment advisory fees (Note 4) | | | 831,871 | |
| Administration fees (Note 4) | | | 87,077 | |
| Fund accounting fees (Note 4) | | | 24,144 | |
| Registration and filing fees | | | 22,419 | |
| Legal fees | | | 20,837 | |
| Postage and supplies | | | 17,956 | |
| Transfer agent fees (Note 4) | | | 13,030 | |
| Networking fees | | | 12,219 | |
| Compliance fees (Note 4) | | | 9,698 | |
| Audit and tax services fees | | | 9,260 | |
| Trustees’ fees and expenses (Note 4) | | | 8,658 | |
| Custody and bank service fees | | | 8,004 | |
| Insurance expense | | | 1,932 | |
| Other expenses | | | 6,390 | |
| Total expenses | | | 1,073,495 | |
| Less fee reductions by the Adviser (Note 4) | | | (206,588 | ) |
| Net expenses | | | 866,907 | |
| | | | | |
| NET INVESTMENT INCOME | | | 1,278,003 | |
| | | | | |
| REALIZED AND UNREALIZED GAINS (LOSSES) ON INVESTMENTS AND FUTURES CONTRACTS | | | | |
| Net realized gains from: | | | | |
| Investments | | | 65,123 | |
| Futures contracts (Note 5) | | | 743,517 | |
| Net change in unrealized appreciation (depreciation) on: | | | | |
| Investments | | | (1,632,317 | ) |
| Futures contracts (Note 5) | | | 328,200 | |
| NET REALIZED AND UNREALIZED LOSSES ON INVESTMENTS AND FUTURES CONTRACTS | | | (495,477 | ) |
| | | | | |
| NET INCREASE IN NET ASSETS RESULTING FROM OPERATIONS | | $ | 782,526 | |
See accompanying notes to financial statements.
| WAVELENGTH INTEREST RATE NEUTRAL FUND |
| STATEMENTS OF CHANGES IN NET ASSETS |
| | | Six Months | | | | |
| | | Ended | | | Year | |
| | | November 30, | | | Ended | |
| | | 2021 | | | May 31, | |
| | | (Unaudited) | | | 2021 | |
| FROM OPERATIONS | | | | | | | | |
| Net investment income | | $ | 1,278,003 | | | $ | 1,247,639 | |
| Net realized gains from: | | | | | | | | |
| Investments | | | 65,123 | | | | 1,548,518 | |
| Futures contracts (Note 5) | | | 743,517 | | | | 2,092,167 | |
| Net change in unrealized appreciation (depreciation) on: | | | | | | | | |
| Investments | | | (1,632,317 | ) | | | 3,628,529 | |
| Futures contracts (Note 5) | | | 328,200 | | | | (63,386 | ) |
| Net increase in net assets resulting from operations | | | 782,526 | | | | 8,453,467 | |
| | | | | | | | | |
| DISTRIBUTIONS TO SHAREHOLDERS (Note 2) | | | (1,212,906 | ) | | | (2,499,049 | ) |
| | | | | | | | | |
| CAPITAL SHARE TRANSACTIONS | | | | | | | | |
| Proceeds from shares sold | | | 51,733,274 | | | | 102,097,480 | |
| Net asset value of shares issued in reinvestment of distributions to shareholders | | | 918,471 | | | | 1,871,694 | |
| Payments for shares redeemed | | | (17,834,988 | ) | | | (35,834,717 | ) |
| Net increase in net assets from capital share transactions | | | 34,816,757 | | | | 68,134,457 | |
| | | | | | | | | |
| TOTAL INCREASE IN NET ASSETS | | | 34,386,377 | | | | 74,088,875 | |
| | | | | | | | | |
| NET ASSETS | | | | | | | | |
| Beginning of period | | | 155,861,803 | | | | 81,772,928 | |
| End of period | | $ | 190,248,180 | | | $ | 155,861,803 | |
| | | | | | | | | |
| CAPITAL SHARE ACTIVITY | | | | | | | | |
| Shares sold | | | 4,677,653 | | | | 9,408,498 | |
| Shares issued in reinvestment of distributions to shareholders | | | 83,604 | | | | 171,595 | |
| Shares redeemed | | | (1,612,072 | ) | | | (3,295,214 | ) |
| Net increase in shares outstanding | | | 3,149,185 | | | | 6,284,879 | |
| Shares outstanding at beginning of period | | | 14,182,894 | | | | 7,898,015 | |
| Shares outstanding at end of period | | | 17,332,079 | | | | 14,182,894 | |
See accompanying notes to financial statements.
| WAVELENGTH INTEREST RATE NEUTRAL FUND |
| FINANCIAL HIGHLIGHTS |
Per Share Data for a Share Outstanding Throughout Each Period
| | | Six Months | | | | | | | | | | | | | | | | |
| | | Ended | | | Year | | | Year | | | Year | | | Year | | | Year | |
| | | Nov. 30, | | | Ended | | | Ended | | | Ended | | | Ended | | | Ended | |
| | | 2021 | | | May 31, | | | May 31, | | | May 31, | | | May 31, | | | May 31, | |
| | | (Unaudited) | | | 2021 | | | 2020 | | | 2019 | | | 2018 | | | 2017 | |
| Net asset value at beginning of period | | $ | 10.99 | | | $ | 10.35 | | | $ | 10.26 | | | $ | 9.97 | | | $ | 9.99 | | | $ | 9.54 | |
| Income (loss) from investment operations: | | | | | | | | | | | | | | | | | | | | | | | | |
| Net investment income (a) | | | 0.08 | | | | 0.11 | | | | 0.22 | | | | 0.27 | | | | 0.22 | | | | 0.20 | |
| Net realized and unrealized gains (losses) on investments and futures contracts | | | (0.01 | ) | | | 0.75 | | | | 0.38 | | | | 0.28 | | | | (0.03 | ) | | | 0.45 | |
| Total from investment operations | | | 0.07 | | | | 0.86 | | | | 0.60 | | | | 0.55 | | | | 0.19 | | | | 0.65 | |
| Less distributions from: | | | | | | | | | | | | | | | | | | | | | | | | |
| Net investment income | | | (0.08 | ) | | | (0.10 | ) | | | (0.23 | ) | | | (0.26 | ) | | | (0.21 | ) | | | (0.20 | ) |
| Net realized gains | | | — | | | | (0.12 | ) | | | (0.28 | ) | | | — | | | | — | | | | — | |
| Total distributions | | | (0.08 | ) | | | (0.22 | ) | | | (0.51 | ) | | | (0.26 | ) | | | (0.21 | ) | | | (0.20 | ) |
| Net asset value at end of period | | $ | 10.98 | | | $ | 10.99 | | | $ | 10.35 | | | $ | 10.26 | | | $ | 9.97 | | | $ | 9.99 | |
| Total return (b) | | | 0.62 | % (c) | | | 8.39 | % | | | 5.92 | % | | | 5.68 | % | | | 1.95 | % | | | 6.83 | % |
| Net assets at end of period (000’s) | | $ | 190,248 | | | $ | 155,862 | | | $ | 81,773 | | | $ | 53,268 | | | $ | 48,434 | | | $ | 21,391 | |
| Ratios/supplementary data: | | | | | | | | | | | | | | | | | | | | | | | | |
| Ratio of total expenses to average net assets (d) | | | 1.22 | % (e) | | | 1.25 | % | | | 1.34 | % | | | 1.41 | % | | | 1.55 | % | | | 1.85 | % |
| Ratio of net expenses to average net assets (d)(f) | | | 0.99 | % (e) | | | 0.99 | % | | | 0.99 | % | | | 0.99 | % | | | 0.99 | % | | | 0.99 | % |
| Ratio of net investment income to average net assets (a)(d)(f) | | | 1.46 | % (e) | | | 1.02 | % | | | 2.07 | % | | | 2.65 | % | | | 2.17 | % | | | 2.01 | % |
| Portfolio turnover rate | | | 1 | % (c) | | | 12 | % | | | 52 | % | | | 20 | % | | | 9 | % | | | 53 | % |
| (a) | Recognition of net investment income by the Fund is affected by the timing of the declarations of dividends by the underlying investment companies in which the Fund invests. |
| (b) | Total return is a measure of the change in value of an investment in the Fund over the periods covered. The returns shown do not reflect the deduction of taxes a shareholder would pay on Fund distributions, if any, or the redemption of Fund shares. The total returns would be lower if the Adviser had not reduced advisory fees and/or reimbursed expenses. |
| (d) | The ratios of expenses and net investment income to average net assets do not reflect the Fund’s proportionate share of expenses of the underlying investment companies in which the Fund invests. |
| (f) | Ratio was determined after advisory fee reductions and/or expense reimbursements (Note 4). |
See accompanying notes to financial statements.
| WAVELENGTH INTEREST RATE NEUTRAL FUND |
| NOTES TO FINANCIAL STATEMENTS |
| November 30, 2021 (Unaudited) |
Wavelength Interest Rate Neutral Fund (the “Fund”) is a diversified series of Ultimus Managers Trust (the “Trust”), an open-end investment company established as an Ohio business trust under a Declaration of Trust dated February 28, 2012. Other series of the Trust are not incorporated in this report.
The investment objective of the Fund is to seek total return.
| 2. | Significant Accounting Policies |
The Fund follows accounting and reporting guidance under Financial Accounting Standards Board Accounting Standards Codification Topic 946, “Financial Services – Investment Companies.” The following is a summary of the Fund’s significant accounting policies used in the preparation of its financial statements. These policies are in conformity with accounting principles generally accepted in the United States of America (“GAAP”).
Securities and futures valuation – The Fund values its portfolio securities at market value as of the close of regular trading on the New York Stock Exchange (the “NYSE”) (normally 4:00 p.m. Eastern time) on each business day the NYSE is open. Exchange-traded funds (“ETFs”) are valued at the security’s last sale price on the security’s primary exchange, if available, otherwise at the exchange’s most recently quoted mean price. Investments representing shares of money market funds and other open-end investment companies, except for ETFs, are valued at their net asset value (“NAV”) as reported by such companies. NASDAQ-listed securities are valued at the NASDAQ Official Closing Price. The Fund values its exchange-traded futures contracts at their last sale price as of the close of regular trading on the NYSE. Prices for these futures contracts are monitored daily by Wavelength Capital Management, LLC (the “Adviser”) until the close of regular trading to determine if fair valuation is required.
When using a quoted price and when the market for the security is considered active, a security will be classified as Level 1 within the fair value hierarchy (see below). In the event that market quotations are not readily available or are considered unreliable due to market or other events, the Fund values its securities and other assets at fair value pursuant to the procedures adopted by and under the general supervision of the Trust’s Board of Trustees (the “Board”). Under these procedures, the securities will be classified as Level 2 or 3 within the fair value hierarchy, depending on the inputs used. Unavailable or unreliable market quotes may be due to the following factors: a substantial bid-ask spread; infrequent sales resulting in stale prices; insufficient trading volume; small trade sizes; a temporary lapse in any reliable pricing source; and actions of the securities or futures markets, such as the suspension or limitation of trading.
GAAP establishes a single authoritative definition of fair value, sets out a framework for measuring fair value, and requires additional disclosures about fair value measurements.
| WAVELENGTH INTEREST RATE NEUTRAL FUND |
| NOTES TO FINANCIAL STATEMENTS (Continued) |
Various inputs are used in determining the value of the Fund’s investments. These inputs are summarized in the three broad levels listed below:
| ● | Level 1 – quoted prices in active markets for identical securities |
| ● | Level 2 – other significant observable inputs |
| ● | Level 3 – significant unobservable inputs |
The inputs or methods used for valuing securities are not necessarily an indication of the risks associated with investing in those securities. The inputs used to measure fair value may fall into different levels of the fair value hierarchy. In such cases, for disclosure purposes, the level in the fair value hierarchy within which the fair value measurement falls in its entirety is determined based on the lowest level input that is significant to the fair value measurement.
The following is a summary of the Fund’s investments and other financial instruments and the inputs used to value the investments and other financial instruments as of November 30, 2021:
| | | Level 1 | | | Level 2 | | | Level 3 | | | Total | |
| Investments in Securities | | | | | | | | | | | | | | | | |
| Exchange-Traded Funds | | $ | 122,297,931 | | | $ | — | | | $ | — | | | $ | 122,297,931 | |
| Money Market Funds | | | 30,721,152 | | | | — | | | | — | | | | 30,721,152 | |
| Collateral for Securities Loaned * | | | — | | | | — | | | | — | | | | 62,873,605 | |
| Total | | $ | 153,019,083 | | | $ | — | | | $ | — | | | $ | 215,892,688 | |
| | | | | | | | | | | | | | | | | |
| Other Financial Instruments | | | | | | | | | | | | | | | | |
| Futures Contracts | | $ | 606,288 | | | $ | — | | | $ | — | | | $ | 606,288 | |
| Total | | $ | 606,288 | | | $ | — | | | $ | — | | | $ | 606,288 | |
| * | Certain investments that are measured at fair value using the NAV per share (or its equivalent) practical expedient have not been categorized in the fair value hierarchy. The fair value amounts presented in the table are intended to permit reconciliation of the fair value hierarchy to the amounts presented on the Statement of Assets and Liabilities. |
The Fund did not have any assets or liabilities that were measured at fair value on a recurring basis using significant unobservable inputs (Level 3) as of or during the six months ended November 30, 2021. Other Financial Instruments are future contracts which are valued at the unrealized appreciation (depreciation) as of November 30, 2021.
Cash account – The Fund’s cash is held in a bank account with balances which, at times, may exceed United States federally insured limits by the Federal Deposit Insurance Corporation. The Fund maintains these balances with a high-quality financial institution and may incur charges on cash overdrafts.
Share valuation – The NAV per share of the Fund is calculated daily by dividing the total value of the Fund’s assets, less liabilities, by the number of shares outstanding. The offering price and redemption price per share of the Fund is equal to the NAV per share.
| WAVELENGTH INTEREST RATE NEUTRAL FUND |
| NOTES TO FINANCIAL STATEMENTS (Continued) |
Investment income – Dividend income is recorded on the ex-dividend date. Interest income, if any, is accrued as earned. Non-cash dividends included in dividend income, if any, are recorded at the fair value of the security received.
Investment transactions – Investment transactions are accounted for on the trade date. Realized gains and losses on investments sold are determined on a specific identification basis.
Common expenses – Common expenses of the Trust are allocated among the Fund and the other series of the Trust based on the relative net assets of each series, the number of series in the Trust, or the nature of the services performed and the relative applicability to each series.
Distributions to shareholders – The Fund distributes to shareholders any net investment income on a quarterly basis and any net realized capital gains at least annually. The amount of such dividends and distributions are determined in accordance with federal income tax regulations, which may differ from GAAP. Dividends and distributions to shareholders are recorded on the ex-dividend date. The tax character of distributions paid during the periods ended November 30, 2021 and May 31, 2021 was as follows:
| Period | | Ordinary | | | Tax-Exempt | | | Long-Term | | | Total | |
| Ended | | Income | | | Distributions | | | Capital Gains | | | Distributions | |
| 11/30/2021 | | $ | 1,212,906 | | | $ | — | | | $ | — | | | $ | 1,212,906 | |
| 5/31/2021 | | $ | 1,980,645 | | | $ | 108,171 | | | $ | 410,233 | | | $ | 2,499,049 | |
Futures contracts – The Fund uses futures contracts to gain exposure to or to hedge against changes in the value of equities, real estate, interest rates or commodities. A futures contract represents a commitment for the future purchase or sale of an asset at a specified price on a specified date. When the Fund purchases or sells a futures contract, no price is paid to or received by the Fund. Instead, the Fund is required to deposit in a segregated asset account an amount of cash or qualifying securities currently ranging from 2% to 10% of the contract amount. This is called the “initial margin deposit.” Subsequent payments, known as “variation margin,” are made or received by the Fund each day, depending on the daily fluctuations in the fair value of the underlying asset. The Fund recognizes an unrealized gain or loss equal to the daily variation margin. If market conditions move unexpectedly, the Fund may not achieve the anticipated benefits of the futures contracts and may realize a loss. The margin deposits for futures contracts and the variation receivable/payable are reported on the Statement of Assets and Liabilities.
Estimates – The preparation of financial statements in conformity with GAAP requires management to make estimates and assumptions that affect the reported amounts of assets and liabilities and disclosure of contingent assets and liabilities as of the date of the financial statements and the reported amounts of increase (decrease) in net assets from operations during the reporting period. Actual results could differ from those estimates.
| WAVELENGTH INTEREST RATE NEUTRAL FUND |
| NOTES TO FINANCIAL STATEMENTS (Continued) |
Federal income tax – The Fund has qualified and intends to continue to qualify as a regulated investment company under the Internal Revenue Code of 1986, as amended (the “Code”). Qualification generally will relieve the Fund of liability for federal income taxes to the extent 100% of its net investment income and net realized capital gains are distributed in accordance with the Code.
In order to avoid imposition of the excise tax applicable to regulated investment companies, it is also the Fund’s intention to declare as dividends in each calendar year amounts equal to at least 98% of its net investment income (earned during the calendar year) and 98.2% of its net realized capital gains (earned during the twelve months ended October 31) plus undistributed amounts from prior years.
The following information is computed on a tax basis for each item as of November 30, 2021:
| Tax cost of portfolio investments | | $ | 213,679,505 | |
| Gross unrealized appreciation | | $ | 4,379,896 | |
| Gross unrealized depreciation | | | (2,166,713 | ) |
| Net unrealized appreciation | | | 2,213,183 | |
| Accumulated ordinary income | | | 379,377 | |
| Undistributed long-term capital gains | | | 1,343,721 | |
| Other gains | | | 1,643,576 | |
| Total accumulated earnings | | $ | 5,579,857 | |
The value of the federal income tax cost of portfolio investments may temporarily differ from the financial statement cost. This book/tax difference is due to the recognition of capital gains or losses under income tax regulations and GAAP, primarily the tax deferral of losses on wash sales, the tax treatment of realized and unrealized gains and losses on futures contracts and adjustments to basis on publicly traded partnerships.
The Fund recognizes the tax benefits or expenses of uncertain tax positions only when the position is “more likely than not” to be sustained assuming examination by tax authorities. Management has reviewed the Fund’s tax positions for the current and all open tax years (generally, three years) and has concluded that no provision for unrecognized tax benefits or expenses is required in these financial statements. The Fund identifies its major tax jurisdiction as U.S. Federal.
| 3. | Investment Transactions |
During the six months ended November 30, 2021, cost of purchases and proceeds from sales of investment securities, other than short-term investments, were $23,686,605 and $663,261, respectively.
| WAVELENGTH INTEREST RATE NEUTRAL FUND |
| NOTES TO FINANCIAL STATEMENTS (Continued) |
| 4. | Transactions with Related Parties |
Wavelength Capital Management, LLC (the “Adviser”), which has served as the investment adviser to the Fund since the Fund’s inception, redeemed MANG Investments LLC’s (“MANG”) ownership interest in the Adviser in a transaction that closed on August 13, 2021 (the “Transaction”).
The closing of the Transaction was considered an “assignment” under the Investment Company Act of 1940, as amended (the “1940 Act”), of the Fund’s then existing investment advisory agreement (the “Previous Advisory Agreement”) and resulted in its automatic termination. At a meeting held prior to the closing of the Transaction on August 13, 2021, the Board of Trustees (the “Board”) reviewed and approved the Fund’s interim investment advisory agreement (the “Interim Advisory Agreement”) and a new investment advisory agreement (the “Current Advisory Agreement”), each with the Adviser and each with substantially the same terms as the Previous Advisory Agreement, except for the start and end date of the agreement and, in the case of the Interim Advisory Agreement, various terms related to compliance with Rule 15a-4 of the 1940 Act. The New Advisory Agreement became effective upon approval by the Fund’s shareholders on December 8, 2021.
PREVIOUS INVESTMENT ADVISORY AGREEMENT
Prior to August 13, 2021, the Fund’s investments were managed by the Adviser pursuant to the terms of the Previous Advisory Agreement. Under the Previous Advisory Agreement, the Fund paid the Adviser an investment advisory fee, computed and accrued daily and paid monthly, at the annual rate of 0.95% of its average daily net assets.
Pursuant to an Expense Limitation Agreement between the Fund and the Adviser (the “Previous ELA”), the Adviser agreed, until October 1, 2025, to reduce its investment advisory fees and reimburse other expenses to limit total annual operating expenses (exclusive of brokerage costs; taxes; interest; borrowing costs such as interest and dividends expenses on securities sold short; acquired fund fees and expenses; extraordinary expenses such as litigation and merger or reorganization costs and other expenses not incurred in the ordinary course of the Fund’s business) to an amount not exceeding 0.99% of the Fund’s average daily net assets.
INTERIM INVESTMENT ADVISORY AGREEMENT
From August 13, 2021 through December 8, 2021, the Fund’s investments were managed by the Adviser pursuant to the terms of the Interim Advisory Agreement. Under the Interim Advisory Agreement, the Fund paid the Adviser an investment advisory fee, computed and accrued daily and paid monthly, at the annual rate of 0.95% of its average daily net assets.
Pursuant to an interim Expense Limitation Agreement between the Fund and the Adviser (the “Interim ELA”), the Adviser agreed, until October 1, 2025, to reduce its investment advisory fees and reimburse other expenses to limit total annual operating expenses (exclusive of brokerage costs; taxes; interest; borrowing costs such as interest and dividends expenses on securities sold short; acquired fund fees and expenses; extraordinary expenses such as
| WAVELENGTH INTEREST RATE NEUTRAL FUND |
| NOTES TO FINANCIAL STATEMENTS (Continued) |
litigation and merger or reorganization costs and other expenses not incurred in the ordinary course of the Fund’s business) to an amount not exceeding 0.99% of the Fund’s average daily net assets.
CURRENT INVESTMENT ADVISORY AGREEMENT
Since December 8, 2021, the Fund’s investments are managed by the Adviser pursuant to the terms of the Current Advisory Agreement. Under the Current Advisory Agreement, the Fund pays the Adviser an investment advisory fee, computed and accrued daily and paid monthly, at the annual rate of 0.95% of its average daily net assets.
Pursuant to a new Expense Limitation Agreement between the Fund and the Adviser (the “Current ELA”), the Adviser has agreed, until October 1, 2025, to reduce its investment advisory fees and reimburse other expenses to limit total annual operating expenses (exclusive of brokerage costs; taxes; interest; borrowing costs such as interest and dividends expenses on securities sold short; acquired fund fees and expenses; extraordinary expenses such as litigation and merger or reorganization costs and other expenses not incurred in the ordinary course of the Fund’s business) to an amount not exceeding 0.99% of the Fund’s average daily net assets.
Accordingly, under each of the Previous ELA, the Interim ELA, and the Current ELA, the Adviser, reduced its investment advisory fees in the aggregate amount of $206,588 during the six months period ended November 30, 2021.
Under the terms of the Previous ELA, the Interim ELA, and the Current ELA, investment advisory fee reductions and expense reimbursements by the Adviser are subject to recoupment by the Adviser for a period of three years after such fees and expenses were incurred, provided that the recoupments do not cause total annual operating expenses of the Fund to exceed the lesser of (i) the expense limitation then in effect, if any, and (ii) the expense limitation in effect at the time the expenses to be repaid were incurred. As of November 30, 2021, the Adviser may seek recoupment of investment advisory fee reductions and expense reimbursements in the amount of $889,655 no later than the dates as stated below:
| May 31, 2022 | | | May 31, 2023 | | | May 31, 2024 | | | November 30, 2024 | | | Total | |
| $ | 110,525 | | | $ | 251,041 | | | $ | 321,501 | | | $ | 206,588 | | | $ | 889,655 | |
OTHER SERVICE PROVIDERS
Ultimus Fund Solutions, LLC (“Ultimus”) provides administration, fund accounting, compliance and transfer agency services to the Fund. The Fund pays Ultimus fees in accordance with the agreements for such services. In addition, the Fund pays out-of-pocket expenses including, but not limited to, postage, supplies and certain costs related to the pricing of the Fund’s portfolio securities.
| WAVELENGTH INTEREST RATE NEUTRAL FUND |
| NOTES TO FINANCIAL STATEMENTS (Continued) |
Under the terms of a Distribution Agreement with the Trust, Ultimus Fund Distributors, LLC (the “Distributor”) serves as the principal underwriter to the Fund. The Distributor is a wholly-owned subsidiary of Ultimus. The Distributor is compensated by the Adviser (not the Fund) for acting as principal underwriter.
Certain officers and a Trustee of the Trust are also officers of Ultimus.
TRUSTEE COMPENSATION
Effective October 20, 2021, each member of the Board (a “Trustee”) who is not an “interested person” (as defined by the 1940 Act, as amended) of the Trust (“Independent Trustee”) receives a $1,300 annual retainer from the Fund, paid quarterly, except for the Board Chairperson who receives a $1,700 annual retainer from the Fund, paid in quarterly installments. Each Independent Trustee also receives from the Fund a fee of $550 for each Board meeting attended plus reimbursement for travel and other meeting-related expenses. Prior to October 20, 2021, each Independent Trustee received a $1,300 annual retainer from the Fund, paid quarterly, except for the Board Chairperson who received a $1,500 annual retainer from the Fund, paid in quarterly installments. Each Independent Trustee also received from the Fund a fee of $500 for each Board meeting attended plus reimbursement for travel and other meeting-related expenses.
PRINCIPAL HOLDER OF FUND SHARES
As of November 30, 2021, the following shareholder owned of record 25% or more of the outstanding shares of the Fund:
| Name of Record Owner | % Ownership |
| National Financial Services, LLC (for the benefit of its customers) | 36% |
A shareholder owning of record or beneficially 25% or more of the Fund’s outstanding shares may be considered a controlling person. That shareholder’s vote could have a more significant effect on matters presented at a shareholders’ meeting.
| 5. | Derivatives Transactions |
The Fund’s positions in derivative instruments as of November 30, 2021 are recorded in the following location on the Statement of Assets and Liabilities:
| Derivative Investment Type | | Location |
| Futures contracts | | Variation margin receivable (payable) |
| WAVELENGTH INTEREST RATE NEUTRAL FUND |
| NOTES TO FINANCIAL STATEMENTS (Continued) |
The following table sets forth the values of variation margin of the Fund as of November 30, 2021:
| | | Variation Margin | | | | |
| Type of Derivative and Risk | | Receivable | | | (Payable) | | | Total | |
| Asset Derivatives | | | | | | | | | | | | |
| Futures contracts | | | | | | | | | | | | |
| Commodity | | $ | — | | | $ | (15,127 | ) | | $ | (15,127 | ) |
| Index | | | 12 | | | | (201,458 | ) | | | (201,446 | ) |
| Treasury | | | 127,044 | | | | (2,731 | ) | | | 124,313 | |
| Total | | $ | 127,056 | | | $ | (219,316 | ) | | $ | (92,260 | ) |
The Fund’s transactions in derivative instruments during the six months ended November 30, 2021 are recorded in the following locations on the Statement of Operations:
| Derivative Investment Type | Location |
| Futures contracts | Net realized gains from futures contracts |
| | Net change in unrealized appreciation (depreciation) on futures contracts |
The following is a summary of the Fund’s net realized gains (losses) and net change in unrealized appreciation (depreciation) on derivative instruments recognized on the Statement of Operations during the six months ended November 30, 2021:
| | | | | | Net Change | |
| | | | | | in Unrealized | |
| | | Net Realized | | | Appreciation | |
| Type of Derivative and Risk | | Gains (Losses) | | | (Depreciation) | |
| Futures contracts | | | | | | | | |
| Commodity | | $ | (146,667 | ) | | $ | (41,286 | ) |
| Index | | | 1,227,487 | | | | 22,830 | |
| Treasury | | | (337,303 | ) | | | 346,656 | |
| Total | | $ | 743,517 | | | $ | 328,200 | |
In the ordinary course of business, the Fund may enter into transactions subject to enforceable netting agreements or other similar arrangements (“netting agreements”). Generally, the right to offset in netting agreements allows the Fund to offset any exposure to a specific counterparty with any collateral received or delivered to that counterparty based on the terms of the agreements. Generally, the Fund manages its cash collateral securities and securities collateral on a counterparty basis.
| WAVELENGTH INTEREST RATE NEUTRAL FUND |
| NOTES TO FINANCIAL STATEMENTS (Continued) |
As of November 30, 2021, the offsetting of financial assets and derivative assets is as follows:
| | | Gross | | | Gross | | | | | | | | | | | | | |
| | | Amounts of | | | Amounts of | | | | | | | | | | | | | |
| | | Recognized | | | Recognized | | | | | | Net Amounts | | | | | | | |
| | | Assets not | | | Liabilities | | | | | | of Assets | | | | | | | |
| | | Offset on | | | not Offset on | | | | | | Presented on | | | | | | | |
| | | Statement of | | | Statement of | | | Derivatives | | | Statement of | | | | | | | |
| | | Assets and | | | Assets and | | | Available for | | | Assets and | | | Collateral | | | | |
| Description | | Liabilities | | | Liabilities | | | Offset | | | Liabilities | | | Pledged* | | | Net Amount | |
| Variation margin receivable -futures contracts | | $ | 127,056 | | | $ | — | | | $ | (127,056 | ) | | $ | — | | | $ | — | | | $ | — | |
| Variation margin payable -futures contracts | | | — | | | | (219,316 | ) | | | 127,056 | | | | (92,260 | ) | | | 92,260 | | | | — | |
| Total subject to a master netting or similar arrangement | | $ | 127,056 | | | $ | (219,316 | ) | | $ | — | | | $ | (92,260 | ) | | $ | 92,260 | | | $ | — | |
| * | The amount is limited to the net amounts of financial assets and accordingly does not include excess collateral pledged. |
Under the terms of the securities lending agreement with U.S. Bank National Association (“U.S. Bank”), U.S. Bank is authorized to loan securities on behalf of the Fund to approved borrowers. The contractual maturity of securities lending transactions are on an overnight and continuous basis. In exchange, the Fund receives cash collateral in the amount of at least 102% of the value of the securities loaned. Any collateral shortfalls due to changes in security market prices are adjusted the next business day. The cash collateral is invested in a short-term investment instrument as noted on the Fund’s Schedule of Investments. As of November 30, 2021, the Fund had 33.1% of its net assets invested in this short-term investment instrument for securities lending purposes. Although risk is mitigated by the collateral, the Fund could experience a delay in recovering its securities and possible loss of income or value if the borrower fails to return them. The agreement provides that after predetermined rebates to borrowers, the Fund retains a portion of its net securities lending income and pays U.S. Bank the remaining portion. The Fund manages credit exposure arising from these lending transactions by, in appropriate circumstances, entering into a Securities Lending Agreement with U.S. Bank that provides the Fund, in the event of default (such as bankruptcy or borrower’s failure to pay or perform), the right to net rights and obligations under such agreements and liquidate and set off collateral against the net amount owed to the Fund. As of November 30, 2021, the fair value of securities on loan and the collateral held were $61,178,918 and $62,873,605, respectively.
| WAVELENGTH INTEREST RATE NEUTRAL FUND |
| NOTES TO FINANCIAL STATEMENTS (Continued) |
| 7. | Certain Investments and Risks |
The securities in which the Fund invests, as well as the risks associated with these securities, are described in the Fund’s prospectus. Among these risks are those associated with investments in shares of ETFs. ETFs issue their shares to authorized participants in return for a specific basket of securities. The authorized participants then sell the ETF’s shares on the secondary market. In other words, ETF shares are traded on a securities exchange based on their market value. Investments in ETFs are subject to the risk that the ETF’s shares may trade at a premium (creating the risk that the Fund pays more than NAV for an ETF when making a purchase) or discount (creating the risk that the Fund receives less than NAV when selling an ETF) to the ETF’s NAV. Investments in ETFs are also subject to index-tracking risk because the total return generated by the securities will be reduced by transaction costs and expenses not incurred by the indices. Certain securities comprising the index tracked by an ETF may, from time to time, temporarily be unavailable, which may further impede the ETF’s ability to track its applicable index or match the index’s performance. To the extent that the Fund invests in an ETF, the Fund incurs additional expenses because the Fund bears its pro-rata portion of such ETF’s advisory fees and operational expenses. Finally, ETF shares are also subject to the risks applicable to the underlying basket of securities. As of November 30, 2021, the Fund had 64.3% of the value of its net assets invested in ETFs.
| 8. | Contingencies and Commitments |
The Fund indemnifies the Trust’s officers and Trustees for certain liabilities that might arise from their performance of their duties to the Fund. Additionally, in the normal course of business, the Fund enters into contracts that contain a variety of representations and warranties and which provide general indemnifications. The Fund’s maximum exposure under these arrangements is unknown, as this would involve future claims that may be made against the Fund that have not yet occurred. However, based on experience, the Fund expects the risk of loss to be remote.
The Fund is required to recognize in the financial statements the effects of all subsequent events that provide additional evidence about conditions that existed as of the date of the Statement of Assets and Liabilities. For non-recognized subsequent events that must be disclosed to keep the financial statements from being misleading, the Fund is required to disclose the nature of the event as well as an estimate of its financial effect, or a statement that such an estimate cannot be made. Management has evaluated subsequent events through the issuance of these financial statements and has noted no such events except for the following:
On December 30, 2021, the Fund paid an ordinary income dividend and short-term and long-term capital gain distributions of $0.0598, $0.0538 and $0.1055 per share, respectively, to shareholders of record on December 29, 2021.
| WAVELENGTH INTEREST RATE NEUTRAL FUND |
| ABOUT YOUR FUND’S EXPENSES (Unaudited) |
We believe it is important for you to understand the impact of costs on your investment. As a shareholder of the Fund, you incur ongoing costs, including management fees and other operating expenses. The following examples are intended to help you understand your ongoing costs (in dollars) of investing in the Fund and to compare these costs with the ongoing costs of investing in other mutual funds.
A mutual fund’s ongoing costs are expressed as a percentage of its average net assets. This figure is known as the expense ratio. The expenses in the table below are based on an investment of $1,000 made at the beginning of the most recent period (June 1, 2021) and held until the end of the period (November 30, 2021).
The table below illustrates the Fund’s ongoing costs in two ways:
Actual fund return – This section helps you to estimate the actual expenses that you paid over the period. The “Ending Account Value” shown is derived from the Fund’s actual return, and the third column shows the dollar amount of operating expenses that would have been paid by an investor who started with $1,000 in the Fund. You may use the information here, together with the amount you invested, to estimate the expenses that you paid over the period.
To do so, simply divide your account value by $1,000 (for example, an $8,600 account value divided by $1,000 = 8.6), then multiply the result by the number given for the Fund under the heading “Expenses Paid During Period.”
Hypothetical 5% return – This section is intended to help you compare the Fund’s ongoing costs with those of other mutual funds. It assumes that the Fund had an annual return of 5% before expenses during the period shown, but that the expense ratio is unchanged. In this case, because the return used is not the Fund’s actual return, the results do not apply to your investment. The example is useful in making comparisons because the U.S. Securities and Exchange Commission (the “SEC”) requires all mutual funds to calculate expenses based on a 5% return. You can assess the Fund’s ongoing costs by comparing this hypothetical example with the hypothetical examples that appear in shareholder reports of other funds.
Note that expenses shown in the table are meant to highlight and help you compare ongoing costs only. The Fund does not charge transaction fees, such as purchase or redemption fees, nor does it carry a “sales load.”
The calculations assume no shares were bought or sold during the period. Your actual costs may have been higher or lower, depending on the amount of your investment and the timing of any purchases or redemptions.
| WAVELENGTH INTEREST RATE NEUTRAL FUND |
| ABOUT YOUR FUND’S EXPENSES (Unaudited) |
More information about the Fund’s expenses can be found in this report. For additional information on operating expenses and other shareholder costs, please refer to the Fund’s prospectus.
| | | Beginning | | Ending | | Expenses |
| | | Account Value | | Account Value | | Paid During |
| | | June 1, 2021 | | November 30, 2021 | | Period* |
| Based on Actual Fund Return | | $1,000.00 | | $1,006.20 | | $4.98 |
| Based on Hypothetical 5% Return (before expenses) | | $1,000.00 | | $1,020.10 | | $5.01 |
| * | Expenses are equal to the Fund’s annualized net expense ratio of 0.99% for the period, multiplied by the average account value over the period, multiplied by 183/365 (to reflect the one-half year period). |
| OTHER INFORMATION (Unaudited) |
A description of the policies and procedures that the Fund uses to vote proxies relating to portfolio securities is available without charge upon request by calling toll- free 1-866-896-9292, or on the SEC’s website at www.sec.gov. Information regarding how the Fund voted proxies relating to portfolio securities during the most recent 12-month period ended June 30 is available without charge upon request by calling toll-free 1-866-896-9292, or on the SEC’s website at www.sec.gov. The Trust files a complete listing of portfolio holdings for the Fund with the SEC as of the end of the first and third quarters of each fiscal year as an exhibit to its reports on Form N-PORT. These filings are available upon request by calling 1-866-896-9292. Furthermore, you may obtain a copy of the filings on the SEC’s website at www.sec.gov.
| WAVELENGTH INTEREST RATE NEUTRAL FUND |
| DISCLOSURE REGARDING APPROVAL OF PREVIOUS |
| INVESTMENT ADVISORY AGREEMENT (Unaudited) |
The Board of Trustees (the “Board”), including the Independent Trustees voting separately, has reviewed and approved the Fund’s Investment Advisory Agreement with Wavelength Capital Management, LLC (the “Adviser” or “Wavelength”) for an additional one-year term (the “Agreement”). The Board approved the Agreement at a meeting held on July 19, 20 and 21, 2021, at which all of the Trustees were present.
In deciding whether to approve the continuation of the Agreement, the Board recalled its review of the materials related to the Fund and Wavelength throughout the preceding twelve months and its numerous discussions with Trust management and Wavelength about the operations and performance of the Fund during that period. The Board further considered those materials and discussions and other numerous factors, including the following:
The nature, extent, and quality of the services provided by the Adviser. In this regard, the Board reviewed the services being provided by Wavelength to the Fund including, without limitation, its providing a continuous investment program for the Fund, adhering to the Fund’s investment restrictions, complying with the Trust’s policies and procedures and voting proxies on behalf of the Fund. The Board considered the qualifications and experience of Wavelength’s portfolio managers who are responsible for the day-to day management of the Fund’s portfolio, as well as the qualifications of other individuals at Wavelength who provide services to the Fund. The Board concluded that the quality, extent, and nature of the services provided by Wavelength to the Fund were satisfactory.
The investment performance of the Fund. In this regard, the Board compared the performance of the Fund with the performance of its benchmark index, custom peer group, and Morningstar category. The Board concluded that the investment performance of the Fund has been satisfactory.
The costs of the services provided and profits realized by the Adviser and its affiliates from their relationship with the Fund. In this regard, the Board considered the Fund’s management fee proposed to be charged to the Fund and the Fund’s expense ratio, each as compared to the Fund’s peer group. The Board considered the revenue earned from the Fund and the current and anticipated profitability of the Fund to Wavelength, if any. The Board also considered Wavelength’s past fee reductions and expense reimbursements for the Fund and the indirect benefits that Wavelength received from its management of the Fund. The Board concluded that the advisory fee to be paid to Wavelength by the Fund is reasonable in light of the nature and quality of services provided by Wavelength.
The extent to which economics of scale would be realized as the Fund grows and whether advisory fee levels reflect these economies of scale for the benefit of the Fund’s investors. In this regard, the Board considered that the Fund’s fee arrangements with Wavelength involve both the advisory fee and the expense limitation agreement (the “ELA”). The Board determined that while the advisory fee rate remained the same as asset levels increased, the shareholders of the Fund have experienced benefits from the ELA and will continue to
| WAVELENGTH INTEREST RATE NEUTRAL FUND |
| DISCLOSURE REGARDING APPROVAL OF PREVIOUS |
| INVESTMENT ADVISORY AGREEMENT (Unaudited) |
experience benefits from the ELA. The Board concluded that the advisory fee was reasonable in light of the information that was provided to the Trustees by Wavelength with respect to economies of scale.
After further discussion of the factors noted above, as well as other factors, and in reliance on the information provided by the Adviser and Trust management, and taking into account the totality of all factors discussed and information presented at the meeting and previous meetings, the Board indicated its agreement to approve the continuance of the Agreement and the Fund’s ELA. It was noted that in the Trustees’ deliberations regarding the approval of the continuance of the Agreement, the Trustees did not identify any particular information or factor that was all-important or controlling, and that each individual Trustee may have attributed different weights to various factors listed above. After full consideration of the above factors as well as other factors, the Board unanimously concluded that approval of the continuance of the Agreement was in the best interests of the Fund and its shareholders.
| WAVELENGTH INTEREST RATE NEUTRAL FUND |
| DISCLOSURE REGARDING APPROVAL OF INTERIM AND |
| NEW INVESTMENT ADVISORY AGREEMENTS (Unaudited) |
The Board of Trustees (the “Board”), including the Independent Trustees voting separately, has reviewed and approved the Fund’s Interim Investment Advisory Agreement (the “Interim Advisory Agreement”) for a period not to exceed 150 days from the effective date of the Interim Advisory Agreement and a new Investment Advisory Agreement (the “New Advisory Agreement” and together with the Interim Advisory Agreement, the “Advisory Agreements”) for an initial term of two years, each with Wavelength Capital Management, LLC (the “Adviser” or “Wavelength”). The Board approved the Agreement at a meeting held on August 13, 2021, at which all of the Trustees were present, prior to the termination of the then existing Investment Advisory Agreement (the “Previous Advisory Agreement”). The Previous Investment Advisory Agreement terminated when the Adviser bought back MANG Investments LLC remaining interest in the Adviser (the “Transaction”). The New Advisory Agreement became effective upon approval by the Fund’s shareholders on December 8, 2021.
In determining whether to approve the Advisory Agreements, the Board recalled its review of the materials presented at prior Board meetings, materials related to the Fund and Wavelength throughout the last several months and its various discussions with Trust management and Wavelength about the operations and performance of the Fund during that period. The Board also considered (i) that Wavelength represented that the Transaction between Wavelength and MANG Investments, LLC should not materially affect the Fund’s operation or the level or quality of advisory services provided to the Fund; (ii) that Wavelength represented that the same portfolio manager who currently provides services to the Fund is anticipated to continue to do so upon the closing of the Transaction; and (iii) Wavelength’s agreement to pay for the Fund’s costs and expenses incurred in connection with the Transaction, including without limitation, the costs and expenses of preparing a proxy statement. The Board further considered numerous factors, including, among other things:
The nature, extent, and quality of the services provided by the Adviser. In this regard, the Board reviewed the services being provided by Wavelength to the Fund including, without limitation, providing a continuous investment program for the Fund, adhering to the Fund’s investment restrictions, complying with the Trust’s policies and procedures, and voting proxies on behalf of the Fund. The Board considered that there were no anticipated changes in the portfolio manager for the Fund as a result of the Transaction and there would be no anticipated reduction in services. The Board reviewed the Wavelength’s financial statements and considered Wavelength’s financial condition in light of the Transaction. The Board concluded that the quality, extent, and nature of the services provided by Wavelength to the Fund were satisfactory.
The investment performance of the Fund. In this regard, the Board reviewed the Fund’s performance, including comparisons to peer funds and various benchmarks. The Board concluded that the investment performance of the Fund has been satisfactory.
The costs of the services provided and profits realized by the Adviser and its affiliates from their relationship with the Fund. In this regard, the Board considered the management fees proposed to be charged to the Fund, and the Fund’s total expense ratios, as compared to
| WAVELENGTH INTEREST RATE NEUTRAL FUND |
| DISCLOSURE REGARDING APPROVAL OF INTERIM AND |
| NEW INVESTMENT ADVISORY AGREEMENTS (Unaudited) |
the Fund’s peer group. The Board considered the terms and conditions of each of the New Advisory Agreement and Interim Advisory Agreement, including the management fee and the services to be provided by Wavelength thereunder, and considered that these were the same as under the Previous Investment Advisory Agreement. The Board considered the current and anticipated profitability of the Fund to Wavelength, if any, and the indirect benefits that Wavelength receives, including promotion of Wavelength’s name. The Board concluded that the advisory fee to be paid to Wavelength by the Fund is reasonable in light of the nature and quality of services provided by Wavelength.
The extent to which economics of scale would be realized as the Fund grows and whether advisory fee levels reflect these economies of scale for the benefit of the Fund’s investors. In this regard, the Board considered that the Fund’s fee arrangements with Wavelength will continue to involve both the advisory fee and the expense limitation agreement. The Board determined that while the advisory fee rate remained the same as asset levels increased, the shareholders of the Fund have experienced in the past, and will experience in the future, benefits from the expense limitation agreement. The Board considered Wavelength’s willingness to agree to keep the term of the new expense limitation agreement for a period of at least two years from the closing of the Transaction. The Board also considered that Wavelength had indicated a willingness to consider implementing breakpoints in its management fee in the future. The Board concluded that the advisory fee was reasonable in light of the information that was provided to the Board by Wavelength with respect to economies of scale.
After further discussion of the factors noted above and in reliance on the information provided by Wavelength and Trust Management, and taking into account the totality of all factors discussed and information presented at the meeting and previous meetings, the Board indicated its agreement to approve the Advisory Agreements. It was noted that in the Board’s deliberations regarding the approval of the Advisory Agreements, the Board did not identify any particular information or factor that was all-important or controlling, and that each individual Trustee may have attributed different weights to various factors listed above. After full consideration of the above factors as well as other factors, the Board unanimously concluded that approval of the Advisory Agreements were in the best interests of the Fund and its shareholders.
| WAVELENGTH INTEREST RATE NEUTRAL FUND |
| LIQUIDITY RISK MANAGEMENT PROGRAM (Unaudited) |
The Fund has adopted and implemented a written liquidity risk management program (the “Program”) as required by Rule 22e-4 (the “Liquidity Rule”) under the Investment Company Act of 1940, as amended. The Program is reasonably designed to assess and manage the Fund’s liquidity risk, taking into consideration, among other factors, the Fund’s investment strategy and the liquidity of its portfolio investments during normal and reasonably foreseeable stressed conditions; its short- and long-term cash flow projections; and its cash holdings and access to other funding sources. The Fund’s Board of Trustees (the “Board”) approved the appointment of the Liquidity Administrator Committee, comprising of the Fund’s Adviser and certain Trust officers, to be responsible for the Program’s administration and oversight and for reporting to the Board on at least an annual basis regarding the Program’s operation and effectiveness. The annual written report assessing the Program (the “Report”) was presented to the Board at the October 18 - 19, 2021 Board meeting and covered the period from June 1, 2020 to May 31, 2021 (the “Review Period”).
During the Review Period, the Fund did not experience unusual stress or disruption to its operations related to purchase and redemption activity. Also, during the Review Period, the Fund held adequate levels of cash and highly liquid investments to meet shareholder redemption activities in accordance with applicable requirements. The Report concluded that the Program is reasonably designed to prevent violation of the Liquidity Rule and the Program has been effectively implemented.
| FACTS | WHAT DOES WAVELENGTH INTEREST RATE NEUTRAL FUND (the “Fund”) DO WITH YOUR PERSONAL INFORMATION? |
| |
| Why? | Financial companies choose how they share your personal information. Federal law gives consumers the right to limit some but not all sharing. Federal law also requires us to tell you how we collect, share, and protect your personal information. Please read this notice carefully to understand what we do. |
| |
| What? | The types of personal information we collect and share depend on the product or service you have with us. This information can include: ■ Social Security number ■ Assets ■ Retirement Assets ■ Transaction History ■ Checking Account Information ■ Purchase History ■ Account Balances ■ Account Transactions ■ Wire Transfer Instructions When you are no longer our customer, we continue to share your information as described in this notice. |
| |
| How? | All financial companies need to share your personal information to run their everyday business. In the section below, we list the reasons financial companies can share their customers’ personal information; the reasons the Fund chooses to share; and whether you can limit this sharing. |
| |
| Reasons we can share your personal information | Does the
Fund share? | Can you limit
this sharing? |
For our everyday business purposes – Such as to process your transactions, maintain your account(s), respond to court orders and legal investigations, or report to credit bureaus | Yes | No |
For our marketing purposes – to offer our products and services to you | No | We don’t share |
| For joint marketing with other financial companies | No | We don’t share |
For our affiliates’ everyday business purposes – information about your transactions and experiences | No | We don’t share |
For our affiliates’ everyday business purposes – information about your creditworthiness | No | We don’t share |
| For nonaffiliates to market to you | No | We don’t share |
| | | |
| Questions? | Call 1-866-896-9292 |
| | | | |
| Who we are |
| Who is providing this notice? | Wavelength Interest Rate Neutral Fund Ultimus Fund Distributors, LLC (Distributor) Ultimus Fund Solutions, LLC (Administrator) |
| What we do |
| How does the Fund protect my personal information? | To protect your personal information from unauthorized access and use, we use security measures that comply with federal law. These measures include computer safeguards and secured files and buildings. Our service providers are held accountable for adhering to strict policies and procedures to prevent any misuse of your nonpublic personal information. |
| How does the Fund collect my personal information? | We collect your personal information, for example, when you ■ Open an account ■ Provide account information ■ Give us your contact information ■ Make deposits or withdrawals from your account ■ Make a wire transfer ■ Tell us where to send the money ■ Tell us who receives the money ■ Show your government-issued ID ■ Show your driver’s license We also collect your personal information from other companies. |
| Why can’t I limit all sharing? | Federal law gives you the right to limit only ■ Sharing for affiliates’ everyday business purposes – information about your creditworthiness ■ Affiliates from using your information to market to you ■ Sharing for nonaffiliates to market to you State laws and individual companies may give you additional rights to limit sharing. |
| |
| Definitions |
| Affiliates | Companies related by common ownership or control. They can be financial and nonfinancial companies. ■ Wavelength Capital Management LLC, the investment adviser to the Fund, could be deemed to be an affiliate. |
| Nonaffiliates | Companies not related by common ownership or control. They can be financial and nonfinancial companies ■ The Fund does not share with nonaffiliates so they can market to you. |
| Joint marketing | A formal agreement between nonaffiliated financial companies that together market financial products or services to you. ■ The Fund does not jointly market. |
This page intentionally left blank.
This page intentionally left blank.
This page intentionally left blank.
WAVELENGTH-SAR-21
Item 2. Code of Ethics.
Not required
Item 3. Audit Committee Financial Expert.
Not required
Item 4. Principal Accountant Fees and Services.
Not required
Item 5. Audit Committee of Listed Registrants.
Not applicable
Item 6. Schedule of Investments.
| (a) | Not applicable [schedule filed with Item 1] |
Item 7. Disclosure of Proxy Voting Policies and Procedures for Closed-End Management Investment Companies.
Not applicable
| Item 8. | Portfolio Managers of Closed-End Management Investment Companies. |
Not applicable
Item 9. Purchases of Equity Securities by Closed-End Management Investment Company and Affiliated Purchasers.
Not applicable
Item 10. Submission of Matters to a Vote of Security Holders.
The registrant’s Committee of Independent Trustees shall review shareholder recommendations for nominations to fill vacancies on the registrant’s board of trustees if such recommendations are submitted in writing and addressed to the Committee at the registrant’s offices. The Committee may adopt, by resolution, a policy regarding its procedures for considering candidates for the board of trustees, including any recommended by shareholders.
Item 11. Controls and Procedures.
(a) Based on their evaluation of the registrant’s disclosure controls and procedures (as defined in Rule 30a-3(c) under the Investment Company Act of 1940) as of a date within 90 days of the filing date of this report, the registrant’s principal executive officer and principal financial officer have concluded that such disclosure controls and procedures are reasonably designed and are operating effectively to ensure that material information relating to the registrant, including its consolidated subsidiaries, is made known to them by others within those entities, particularly during the period in which this report is being prepared, and that the information required in filings on Form N-CSR is recorded, processed, summarized, and reported on a timely basis.
(b) There were no changes in the registrant’s internal control over financial reporting (as defined in Rule 30a-3(d) under the Investment Company Act of 1940) that occurred during the period covered by this report that have materially affected, or are reasonably likely to materially affect, the registrant’s internal control over financial reporting.
Item 12. Disclosure of Securities Lending Activities for Closed-End Management Investment Companies.
Not applicable
File the exhibits listed below as part of this Form. Letter or number the exhibits in the sequence indicated.
(a)(1) Any code of ethics, or amendment thereto, that is the subject of the disclosure required by Item 2, to the extent that the registrant intends to satisfy the Item 2 requirements through filing of an exhibit: Not required
(a)(2) A separate certification for each principal executive officer and principal financial officer of the registrant as required by Rule 30a-2(a) under the Act (17 CFR 270.30a-2(a)): Attached hereto
(a)(3) Any written solicitation to purchase securities under Rule 23c-1 under the Act (17 CFR 270.23c-1) sent or given during the period covered by the report by or on behalf of the registrant to 10 or more persons: Not applicable
(a)(4) Change in the registrant’s independent public accountants: Not applicable
(b) Certifications required by Rule 30a-2(b) under the Act (17 CFR 270.30a-2(b)): Attached hereto
Exhibit 99.CERT Certifications required by Rule 30a-2(a) under the Act
Exhibit 99.906CERT Certifications required by Rule 30a-2(b) under the Act
SIGNATURES
Pursuant to the requirements of the Securities Exchange Act of 1934 and the Investment Company Act of 1940, the registrant has duly caused this report to be signed on its behalf by the undersigned, thereunto duly authorized.
| (Registrant) | Ultimus Managers Trust | | |
| | | | |
| By (Signature and Title)* | /s/ Khimmara Greer |
| | | Khimmara Greer, Secretary |
| | | |
| Date | February 2, 2022 | |
| | | |
| Pursuant to the requirements of the Securities Exchange Act of 1934 and the Investment Company Act of 1940, this report has been signed below by the following persons on behalf of the registrant and in the capacities and on the dates indicated. |
| | | |
| By (Signature and Title)* | /s/ Todd E. Heim |
| | | Todd E. Heim, Principal Executive Officer |
| | | |
| Date | February 2, 2022 | |
| | | |
| By (Signature and Title)* | /s/ Jennifer L. Leamer |
| | | Jennifer L. Leamer, Treasurer and Principal Financial Officer |
| | | |
| Date | February 2, 2022 | |
* Print the name and title of each signing officer under his or her signature.