UNITED STATES
SECURITIES AND EXCHANGE COMMISSION
Washington, D.C. 20549
FORM N-CSR
CERTIFIED SHAREHOLDER REPORT OF REGISTERED MANAGEMENT
INVESTMENT COMPANIES
| Investment Company Act file number | 811-22691 | |
F/m Funds Trust
(Exact name of registrant as specified in charter)
| 225 Pictoria Drive, Suite 450, Cincinnati, Ohio 45246 |
| (Address of principal executive offices) (Zip code) |
Jesse D. Hallee
c/o Ultimus Fund Solutions, LLC, 225 Pictoria Drive, Suite 450 Cincinnati, Ohio 45246
Name and address of agent for service)
| Registrant's telephone number, including area code: | (513) 587-3400 |
| | |
| Date of fiscal year end: | August 31 |
| | |
| Date of reporting period: | August 31, 2022 |
Form N-CSR is to be used by management investment companies to file reports with the Commission not later than 10 days after the transmission to stockholders of any report that is required to be transmitted to stockholders under Rule 30e-1 under the Investment Company Act of 1940 (17 CFR 270.30e-1). The Commission may use the information provided on Form N-CSR in its regulatory, disclosure review, inspection, and policymaking roles.
A registrant is required to disclose the information specified by Form N-CSR, and the Commission will make this information public. A registrant is not required to respond to the collection of information contained in Form N-CSR unless the Form displays a currently valid Office of Management and Budget (“OMB”) control number. Please direct comments concerning the accuracy of the information collection burden estimate and any suggestions for reducing the burden to Secretary, Securities and Exchange Commission, 450 Fifth Street, NW, Washington, DC 20549-0609. The OMB has reviewed this collection of information under the clearance requirements of 44 U.S.C. § 3507.
| Item 1. | Reports to Stockholders. |
(a)
| | | | |
| | | | |
| | | | |
| | | | |
| | | | |
| | | | |
| | | | |
| | | | |
| | | | |
| |  | |
| | | | |
| | | | |
| | | | |
| | | | |
| | | | |
| | Oakhurst Fixed Income Fund | |
| | | | |
| | Oakhurst Short Duration Bond Fund | |
| | | | |
| | Oakhurst Short Duration | |
| | High Yield Credit Fund | |
| | | | |
| | | | |
| | | | |
| | | | |
| | | | |
| | | | |
| | | | |
| | | | |
| | | | |
| | | | |
| | | | |
| | | | |
| | | | |
| | ANNUAL REPORT | |
| | August 31, 2022 | |
| | | | |
| | | | |
| | | | |
| | | | |
| | | | |
| | | | |
| | | | |
| | | | |
| | | | |
| | | | |
| | | | |
| | | | |
| | | | |
| | | | |
| | | | |
| F/m FUNDS |
| Letter to Shareholders |
| August 31, 2022 (Unaudited) |
| |
“Same As It Ever Was”
Released in 1981, the Talking Heads single “Once in a Lifetime,” a comment on unchecked consumerism and existential crisis, was climbing the charts. As singer David Byrne questions his possessions and life, he asks the question, “How did I get here?” At around the same time that the song could be heard on various radio stations, Federal Reserve (the “Fed”) Chairman Paul Volcker was waging war against rampant inflation, causing financial markets to sag under the pressure of severely tighter monetary policy. Now, four decades later, Fed Chairman Jerome Powell has embarked on a similar journey, attempting to quash inflation that has spread across the U.S. and impacted global financial markets. As we revisit how we got here, we must inquire, like the song posits, if this will be the “same as it ever was.”
The quick review of history will note the excessive monetary and fiscal policy responses to the Covid shutdown. Understanding the need for immediate relief as the soaring ranks of the unemployed and nearly significant (and often absolute) reduction in some business revenues, the massive stimulus was largely applauded. Few were eager to allow the markets and economy to free fall, and even the loudest proponents of free market capitalism refrained from criticism, at least at first. As the government largesse continued, both in frequency and magnitude, there was a growing contingent that began raising concerns. Inflationary pressures resulting from such easy policies was often cited, but most dismissed these fears and enjoyed the impressive rebound in the markets. Central bankers, too, expressed little regard since the Fed had just recently discussed that inflation had remained stubbornly low and below its 2% target.
Therefore, as had been the strategy since the Great Financial Crisis, the Fed and its peer central bankers continued with zero interest rate policies (ZIRP) and sizeable bond purchases (QE). The powerful combination of easy monetary policies created an ideal environment for most risky assets, generating handsome returns. Though fixed income investors decried the paltry yields, many abandoned such conservative
pursuits and opted for higher risk alternatives. Even for some that lost their jobs during early Covid, unemployment benefits and fiscal stimulus checks often went into the markets, notably cryptocurrencies and meme stocks. Economists point to the impact of the government programs and the handsome financial gains as a major influence on those that left the workforce more permanently during the Great Resignation. Even as inflation began its upward ascent, the Fed developed its “transitory narrative,” claiming that the increase in prices was due to supply chain disruptions and the reopening efforts would quickly resolve these issues, returning inflation back to its 2% target. Unfortunately, there was ample evidence to contradict this thesis, with wages, housing, commodities, and numerous industries already realizing that inflation was surging and becoming engrained in the economy.
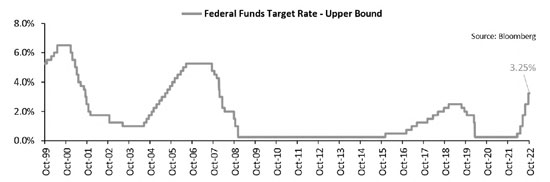
By the time the Fed and other central banks finally realized the severity of the inflationary problem, it was too late. Rather than having the ability to slowly remove accommodation and improve the odds of a soft landing, the Fed was forced to quickly ratchet up short-term rates and attempt to rebuild its inflation-fighting credibility. To date, the 300 basis point increase in the fed funds rate over six months has been difficult to digest for financial markets. Equity indices have fallen into bear market territory and bonds are on pace for their worst year ever. Reducing the Fed’s balance sheet (QT), the other significant tool at the central bank’s disposal, which has only recently begun in earnest, may worsen liquidity and cause further instability.

Earlier in the year, market participants had expected that peak inflation had passed, only to be disappointed by higher prints for CPI and core PCE price indices. After reaching 6.5% in March, core CPI fell to 5.9% in June and July only to surprise markets and move back up to 6.3% in August. This disappointing news sparked stronger Fed rhetoric and increased expectations for the terminal funds rate. Finally, though, numerous signs of weakness in the U.S. and globally indicate that further increases in the year-over-year price levels are unlikely. Companies have announced hiring freezes and layoffs, with more expected to reduce payrolls over the next few months. Though the strength in the employment sector has been mentioned as one of the lone remaining signals that we are not yet in a recession, the lagging nature of this statistic will become more evident shortly. The unemployment rate ticked up to 3.7% in August from 3.5% a month prior, yet companies continue to produce net job gains, though at a slower pace than earlier in the year. The other statistic often
used to support employment health has been the JOLTS report on job openings. Having peaked at nearly 12 million, the JOLTS job openings data was drifting lower and then fell by more than 1 million in August to its current 10 million openings. Over the next several months, the unemployment rate is likely to move above 4% as companies pare back on full-time workers. Therefore, as employment wanes and the economy weakens, inflation will come down from its lofty levels, but the lagging nature of some price inputs, such as shelter, and the stickiness of wages, will make it difficult to reach the Fed’s target any time soon.

The adoption of a much more hawkish stance, with many Fed voting members stating that tight policy is necessary until 2% inflation is reached, increases the likelihood of a hard landing. Initially late to the party, the Fed may end up being the guests that won’t leave. Compounding one policy mistake with another may be evidence that this could be the “same as it ever was.” Since monetary policy also works with a lag, the Fed could certainly raise rates well after it is warranted and worsen a recession. Some investors have predicted an early end to the tightening cycle due to weakening economic conditions and financial instability. Many point to the recent intervention by the Bank of England to shore up its sovereign debt market following wrong way bets on rates by UK pension plans. U.S. dollar strength and the negative impact on G-7 nations and emerging market currencies have also been discussed as rationale to slow or pause the Fed’s policies. However, as has been repeatedly made clear by Powell and team, the Fed intends to break the back of inflation and, thus, a pause or pivot is not on the table.
However, despite the apparent Fed resolve, many investors and strategists aren’t buying what the Fed is selling. They strongly believe that the Fed, as it has in the past, will come to the rescue should economic or market conditions warrant. Rather than anticipating tighter conditions for a longer period, they have simply pushed out the expected rate cuts by a few months, with the initial rate reduction predicted to be in late 2023 rather than in the first half. The phenomenon of bad economic news being welcomed by the markets, with the thought that the Fed will be forced to
prematurely end rate hikes and balance sheet reduction, has also returned. Careful what you wish for, though, since a deteriorating economy is actually bad for the corporate, household, and government sectors.
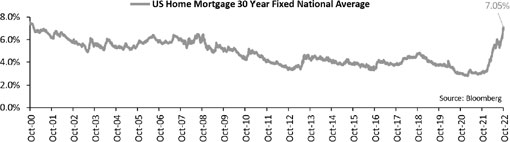
The pressure on central banks to curtail tight policy is sure to intensify through winter. The housing sector, recently a driving force for the bullish environment, will become a drag as 7% mortgage rates force shelter prices downward. Dollar strength will crimp corporate earnings and force global central banks to sell U.S. Treasury reserves to defend their currencies. A negative wealth effect should not be overlooked as dwindling retirement savings may force reduced spending and prompt recent retirees to re-enter the workforce. Escalating prices and shortages in both food and energy could cause civil unrest and further buoy populism. As economic challenges worsen, political changes in Sweden and Italy could be harbingers of what to expect in numerous regions.
The potential fallout resulting from the reversal of economic and market fortunes will further test the resolve of central banks. Due to a reduction of political independence for monetary policymakers over the past decade, many are convinced that easy monetary policy, engrained in the DNA of current central bankers, will win out. Gone are the likes of Paul Volcker, who remain undeterred in his fight against inflation, despite numerous protests and calls from Congress to loosen monetary conditions. As today’s talking heads speculate on the future of monetary policy, many feel strongly that central banks will revert to the “same as it ever was” and expect an early end to this tightening cycle.
Barry P. Julien, CFA®
Chief Investment Officer & Portfolio Manager
The Oakhurst Fixed Income Fund (OHFIX)
Attempting to digest 225 basis points of rate hikes over five months, financial markets and the real economy are certainly feeling the strain of tighter monetary policy. The Fed also remains under pressure from both sides, with some advocating that inflation is becoming engrained and more needs to be done, while others are arguing that additional rate hikes and quantitative tightening will deepen the recession. Although unemployment remains low at 3.7%, with job openings falling and layoffs taking hold, the prognosis has weakened. Housing, the other area of prior strength, has witnessed a dramatic slowdown as soaring mortgage rates have reduced buyer demand. The manufacturing and service sectors have slowed, and stubbornly elevated inflation has impacted corporate and household budgets.
The bond market adjusted again to tougher Fed rhetoric as the message of “higher rates for longer” took hold. As such, the two-year US Treasury yield rose to 3.50%, up from a mere 0.21% a year ago, while the ten-year Treasury yield increased, too, but to a lesser degree. Expectations for a soft landing were further damaged by the deeper inversion of the yield curve. The difficult environment proved challenging for most fixed income sectors, though corporate bond spreads only widened modestly following an earlier rally. As rates approach fair value, we have been slowly increasing the allocation to US Treasuries and lengthening maturities. Heightened volatility negatively impacted the rate-sensitive mortgage-backed securities, as the embedded option value detracted from valuations. Fortunately, the shorter duration profile continued to lessen the impact of higher rates, leading to outperformance for the year ended August 31, 2022. For the year, the Fund generated a net return of -10.59%, ahead of the -11.52% loss for the Bloomberg U.S. Aggregate Bond Index. Modest inflows offset some of the negative performance, with the Fund ending at $119.4 million, slightly below the $126.2 million at the beginning of the year.
The Oakhurst Short Duration Bond Fund (OHSDX)
The sizeable and rapid adjustment in short-term rates has greatly altered the risk-reward trade off for short duration strategies. With the expected terminal Fed funds rate approaching 4.0%, the two-year Treasury yield of nearly 3.5% has begun to factor in more future rate hikes. Now, however, even if rates increased by 200 basis points from these levels, short duration investors should still be able to generate positive returns. The improved bond math has sparked interest in short strategies, from safer government securities to higher-yielding corporate bonds. The Fund continued to focus on adding value through higher income, overweighting corporate bonds, mortgage-backed securities, and asset-backed securities. While a risk-off sentiment led to wider spreads, the income advantage helped to offset some of the negative impact from higher rates. However, since the Fund’s duration remained slightly longer than that of the index, the considerable move in rates could not be overcome and the Fund underperformed. During the past twelve months ended August 31, 2022, the Fund had a net loss of - 4.65% versus a decrease of -4.04% for the ICE BofA U.S. Corporate & Government Index. Despite the attractive yield, the Fund has experienced significant outflows over the past twelve months, ending the year at $57.8 million, well below the beginning value of $131.1 million.
The Oakhurst Short Duration High Yield Credit Fund (OHSHX)
Following a difficult first half of 2022, the high yield market began to reverse course in the third quarter. Although investors continued to withdraw money from high yield mutual funds, and the new issue market grinded to a halt, the sector held up quite well. Hopes that the Fed might pivot produced a significant high yield rally in July. However, as the Fed rhetoric intensified, risk-off sentiment returned and investors shed risky assets for safe-haven securities. With the Fed intent upon slowing down economic growth, credit metrics began to deteriorate and high yield issuers struggled. Consumer Cyclicals and Technology sectors detracted from performance, as did the Fund’s overweight in Financials and underweight in the Energy sector. Across credit ratings, despite the higher interest rate sensitivity of BB-rated issues, the Fund’s overweight to single B- rated bonds negatively impacted performance as higher-quality names held up best. Partially due to its yield advantage and lower duration, shorter duration high yield outperformed the broader market over the past year. For the year period ended August 31, 2022, the Fund generated a net return of -8.11%, trailing the decrease of -5.55% for the ICE BofA 1-5 Year U.S. Cash Pay High Yield Constrained Index. During the year, the Fund’s assets shrank from $101.4 million to $66.5 million.
| OAKHURST FIXED INCOME FUND |
| Performance Information |
| August 31, 2022 (Unaudited) |
| |
Comparison of the Change in Value of a $100,000 Investment
in Oakhurst Fixed Income Fund - Institutional Shares versus the
Bloomberg U.S. Aggregate Bond Index
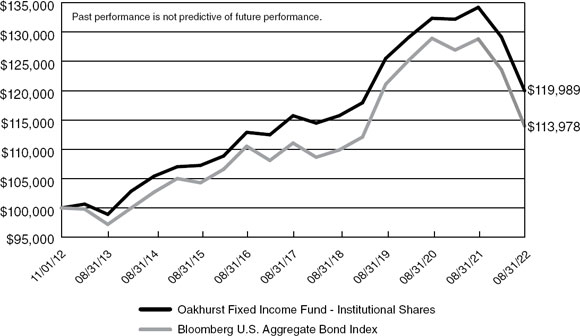
Average Annual Total Returns
(for periods ended August 31, 2022) |
| | | | Since | |
| | 1 Year | 5 Years | Inception (b) | |
| | | | | |
| Oakhurst Fixed Income Fund - Institutional Shares (a) | -10.59% | 0.73% | 1.87% | |
| Bloomberg U.S. Aggregate Bond Index (c) | -11.52% | 0.52% | 1.34% | |
| (a) | The returns shown do not reflect the deduction of taxes a shareholder would pay on Fund distributions or the redemption of Fund shares. |
| (b) | Represents the period from the commencement of operations (November 1, 2012) through August 31, 2022. |
| (c) | The Bloomberg U.S. Aggregate Bond Index covers the U.S. investment grade fixed rate bond market, with index components for U.S. government, agency and corporate securities. The Fund does not invest solely in securities included in the Bloomberg U.S. Aggregate Bond Index and may invest in other types of securities. |
| OAKHURST SHORT DURATION BOND FUND |
| Performance Information |
| August 31, 2022 (Unaudited) |
| |
Comparison of the Change in Value of a $100,000 Investment
in Oakhurst Short Duration Bond Fund - Institutional Shares
versus the ICE BofA U.S. Corp./Govt. 1-3 Years Bond Index

Average Annual Total Returns
(for periods ended August 31, 2022) |
| | | | Since | |
| | 1 Year | 5 Years | Inception (b) | |
| Oakhurst Short Duration Bond Fund - Institutional Shares (a) | -4.65% | 1.07% | 1.54% | |
| ICE BofA U.S. Corp./Govt. 1-3 Years Bond Index (c) | -4.03% | 0.94% | 0.96% | |
| (a) | The returns shown do not reflect the deduction of taxes a shareholder would pay on Fund distributions or the redemption of Fund shares. |
| (b) | Represents the period from the commencement of operations (April 26, 2013) through August 31, 2022. |
| (c) | The ICE BofA U.S. Corp./Govt. 1-3 Years Bond Index covers the U.S. investment grade debt publicly issued in the U.S. domestic market, including U.S. Treasury, U.S. agency, foreign government, supranational and corporate securities, with a remaining term to final maturity less than 3 years. The Fund does not invest solely in securities included in the ICE BofA U.S. Corp./Govt. 1-3 Years Bond Index and may invest in other types of securities. |
| OAKHURST SHORT DURATION |
| HIGH YIELD CREDIT FUND |
| Performance Information |
| August 31, 2022 (Unaudited) |
| |
Comparison of the Change in Value of a $100,000 Investment
in Oakhurst Short Duration High Yield Credit Fund - Institutional Shares
versus the ICE BofA 1-5 Year U.S. Cash Pay High Yield Constrained Index

Average Annual Total Returns
(for periods ended August 31, 2022) |
| | | | Since | |
| | 1 Year | 5 Years | Inception (b) | |
| Oakhurst Short Duration High Yield Credit Fund - Institutional Shares (a) | -8.11% | 2.14% | 3.55% | |
| ICE BofA 1-5 Year U.S. Cash Pay High Yield Constrained Index (c) | -5.55% | 2.74% | 4.72% | |
| (a) | The returns shown do not reflect the deduction of taxes a shareholder would pay on Fund distributions or the redemption of Fund shares. |
| (b) | Represents the period of the commencement of operations (October 1, 2015) through August 31, 2022. |
| (c) | The ICE BofA 1-5 Year U.S. Cash Pay High Yield Constrained Index covers the performance of U.S. dollar denominated below investment grade corporate debt, currently in a coupon paying period, with a remaining term to final maturity less than 5 years but caps issuer exposure at 2%. The Fund does not invest solely in securities included in the ICE BofA 1-5 Year U.S. Cash Pay High Yield Constrained Index and may invest in other types of securities. |
| OAKHURST FIXED INCOME FUND |
| Portfolio Information |
| August 31, 2022 (Unaudited) |
| |
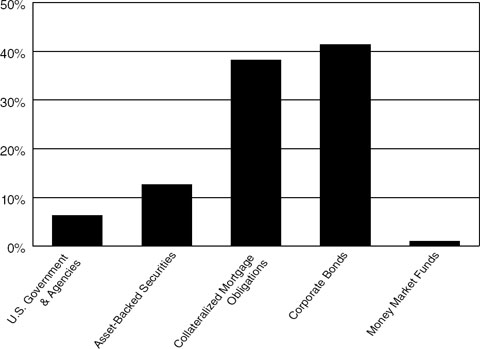
Portfolio Allocation (% of Net Assets)
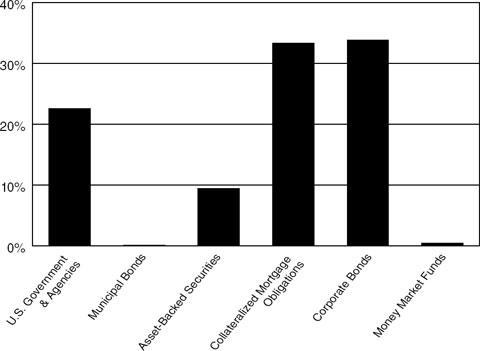
Top 10 Long-Term Holdings
| | | % of |
| Security Description | | Net Assets |
| U.S. Treasury Bonds, 3.000%, due 05/15/42 | | 3.4% |
| U.S. Treasury Notes, 2.750%, due 05/31/29 | | 3.2% |
| U.S. Treasury Notes, 2.375%, due 05/15/29 | | 3.2% |
| U.S. Treasury Bonds, 2.500%, due 02/15/45 | | 2.5% |
| U.S. Treasury Bonds, 5.250%, due 02/15/29 | | 2.1% |
| U.S. Treasury Notes, 2.875%, due 05/15/32 | | 1.6% |
| Federal Farm Credit Bank, 1.150%, due 08/12/30 | | 1.4% |
| U.S. Treasury Notes, 1.875%, due 02/15/32 | | 1.2% |
| FNMA, Series 2017-105-N, 3.000%, due 01/25/48 | | 1.2% |
| Rocket Mortgage, LLC, 144A, Series 2022-1-A-5, 2.500%, due 01/25/52 | | 1.2% |
| OAKHURST SHORT DURATION BOND FUND |
| Portfolio Information |
| August 31, 2022 (Unaudited) |
| |
Portfolio Allocation (% of Net Assets)
| Top 10 Long-Term Holdings |
| | | % of |
| Security Description | | Net Assets |
| U.S. Treasury Notes, 2.500%, due 05/31/24 | | 1.7% |
| U.S. Treasury Notes, 2.250%, due 04/30/24 | | 1.7% |
| U.S. Treasury Notes, 2.500%, due 01/31/25 | | 1.7% |
| Sequoia Mortgage Trust, Series 2003-5-A-1, 2.678%(a), due 09/20/33 | | 1.6% |
| Sequoia Mortgage Trust, 144A, Series 2009-2-A1, 4.000%, due 06/25/49 | | 1.6% |
| FNMA, Pool #MA1237, 3.000%, due 11/01/32 | | 1.6% |
| Rocket Mortgage, LLC, 144A, Series 2022-1-A-5, 2.500%, due 01/25/52 | | 1.5% |
| Structured Asset Mortgage Investments, Inc., Series 2004-AR3-I-A-1, 2.720%(a), due 07/19/34 | | 1.4% |
| FHLMC, Series 4710-PA, 3.000%, due 04/15/45 | | 1.4% |
| FNMA, Series 2010-109-NB, 3.000%, due 10/25/40 | | 1.3% |
| | | |
| (a) | Variable rate security. |
| OAKHURST SHORT DURATION |
| HIGH YIELD CREDIT FUND |
| Portfolio Information |
| August 31, 2022 (Unaudited) |
| |
Portfolio Allocation (% of Net Assets)

| Top 10 Long-Term Holdings |
| | | % of |
| Security Description | | Net Assets |
| American Airlines Group Pass-Through Certificates, Series 2014-1-B, 4.375%, due 04/01/24 | | 1.8% |
| New Fortress Energy, Inc., 144A, 6.500%, due 09/30/26 | | 1.7% |
| U.S. Acute Care Solutions, LLC, 144A, 6.375%, due 03/01/26 | | 1.6% |
| NCL Corporation Ltd., 144A, 3.625%, due 12/15/24 | | 1.6% |
| HOA Funding, LLC, 144A, Series 2021-1-B, 7.432%, due 08/20/51 | | 1.6% |
| Tilray, Inc., 5.000%, due 10/01/23 | | 1.5% |
| Washington Multifamily Acquisition I, 144A, 5.750%, due 04/15/26 | | 1.5% |
| PennyMac Mortgage Investment Trust, 5.500%, due 11/01/24 | | 1.5% |
| Prime Security Services Borrower, LLC, 144A, 5.750%, due 04/15/26 | | 1.5% |
| Hughes Satellite Systems Corporation, 6.625%, due 08/01/26 | | 1.5% |
| OAKHURST FIXED INCOME FUND |
| Schedule of Investments |
| August 31, 2022 |
U.S. GOVERNMENT &
AGENCIES — 22.6% | | Coupon | | Maturity | | Par Value | | Value |
| Federal Farm Credit Bank — 1.4% | | | | | | | | | | | | |
| Federal Farm Credit Bank | | 1.150% | | 08/12/30 | | $ | 2,000,000 | | | $ | 1,653,256 | |
| | | | | | | | | | | | | |
| Federal Home Loan Bank — 1.0% | | | | | | | | | | | | |
| Federal Home Loan Bank | | 3.250% | | 05/20/27 | | | 1,250,000 | | | | 1,211,633 | |
| | | | | | | | | | | | | |
| Small Business Administration — 0.0% (a) | | | | | | | | | | | | |
| SBA | | 5.720% | | 01/01/29 | | | 30,104 | | | | 30,285 | |
| | | | | | | | | | | | | |
| Tennessee Valley Authority — 1.0% | | | | | | | | | | | | |
| Tennessee Valley Authority | | 4.650% | | 06/15/35 | | | 1,100,000 | | | | 1,175,926 | |
| | | | | | | | | | | | | |
| U.S. Treasury Bonds — 8.0% | | | | | | | | | | | | |
| U.S. Treasury Bonds | | 5.250% | | 02/15/29 | | | 2,272,000 | | | | 2,528,310 | |
| U.S. Treasury Bonds | | 3.000% | | 05/15/42 | | | 4,370,000 | | | | 4,031,667 | |
| U.S. Treasury Bonds | | 2.500% | | 02/15/45 | | | 3,608,000 | | | | 2,996,049 | |
| | | | | | | | | | | | 9,556,026 | |
| U.S. Treasury Notes — 11.2% | | | | | | | | | | | | |
| U.S. Treasury Notes | | 3.250% | | 06/30/27 | | | 1,170,000 | | | | 1,166,344 | |
| U.S. Treasury Notes | | 2.375% | | 05/15/29 | | | 3,987,000 | | | | 3,768,805 | |
| U.S. Treasury Notes | | 2.750% | | 05/31/29 | | | 4,000,000 | | | | 3,868,906 | |
| U.S. Treasury Notes | | 1.625% | | 05/15/31 | | | 1,340,000 | | | | 1,187,052 | |
| U.S. Treasury Notes | | 1.875% | | 02/15/32 | | | 1,585,000 | | | | 1,421,052 | |
| U.S. Treasury Notes | | 2.875% | | 05/15/32 | | | 2,000,000 | | | | 1,954,687 | |
| | | | | | | | | | | | 13,366,846 | |
| | | | | | | | | | | | | |
| Total U.S. Government & Agencies (Cost $29,439,853) | | | | | | | | | | $ | 26,993,972 | |
| MUNICIPAL BONDS — 0.2% | | Coupon | | Maturity | | Par Value | | Value |
| California State Health Facilities Financing Authority, Revenue Bond,Series 2019, (Cost $260,000) | | 2.704% | | 06/01/30 | | $ | 260,000 | | | $ | 232,878 | |
| OAKHURST FIXED INCOME FUND |
| Schedule of Investments (Continued) |
ASSET-BACKED
SECURITIES — 9.5% | | Coupon | | Maturity | | Par Value | | Value |
| Coinstar Funding, LLC, 144A, Series 2017-1-A-2 | | 5.216% | | 04/25/47 | | $ | 1,402,300 | | | $ | 1,355,886 | |
| Countrywide Asset-Backed Certificates, Series 2004-6-2-A-3 (1*1MO LIBOR + 120) (b) | | 3.644% | | 11/25/34 | | | 148,892 | | | | 143,143 | |
| DB Master Finance, LLC, 144A, Series 2021-1-A-2-II | | 2.493% | | 11/20/51 | | | 1,466,915 | | | | 1,256,747 | |
| Domino’s Pizza Master Issuer, LLC, 144A, Series 2015-1-A-2-II | | 4.474% | | 10/25/45 | | | 1,234,675 | | | | 1,198,734 | |
| Exeter Automobile Receivables Trust, Series 2021-2A-C | | 0.980% | | 06/15/26 | | | 1,000,000 | | | | 962,695 | |
| Fat Brands GFG Royalty, LLC, 144A, Series 2021-1-A-2 | | 6.000% | | 07/25/51 | | | 1,000,000 | | | | 950,683 | |
| Flagship Credit Auto Trust, 144A, Series 2020-4-D | | 2.180% | | 02/16/27 | | | 735,000 | | | | 702,920 | |
| Focus Brands Funding, LLC, 144A, Series 2018-1-A-2 | | 5.184% | | 10/30/48 | | | 741,125 | | | | 700,297 | |
| GLS Auto Receivables Issuer Trust, 144A, Series 2020-1-C | | 2.720% | | 11/17/25 | | | 1,250,000 | | | | 1,229,275 | |
| HOA Funding, LLC, 144A, Series 2021-1-B | | 7.432% | | 08/20/51 | | | 700,000 | | | | 576,188 | |
| Jack in the Box Funding, LLC, 144A, Series 2022-1-A-2-I | | 3.445% | | 02/26/52 | | | 881,100 | | | | 799,284 | |
| Long Beach Mortgage Loan Trust, Series 2004-4-I-A1 (1*1MO LIBOR + 56) (b) | | 3.004% | | 10/25/34 | | | 726,683 | | | | 689,771 | |
| Santander Drive Auto Receivables Trust, Series 2021-4-B | | 0.880% | | 06/15/26 | | | 796,000 | | | | 773,913 | |
| | | | | | | | | | | | | |
| Total Asset-Backed Securities (Cost $11,869,652) | | | | | | | | | | $ | 11,339,536 | |
COLLATERALIZED MORTGAGE
OBLIGATIONS — 33.3% | | Coupon | | Maturity | | Par Value | | Value |
| Federal Home Loan Mortgage Corporation — 6.6% | | | | | | | | | | | | |
| FHLMC, Series 2515-UP | | 5.500% | | 10/15/22 | | $ | 467 | | | $ | 467 | |
| FHLMC, Series 3827-HA | | 3.500% | | 11/15/25 | | | 89,369 | | | | 89,012 | |
| FHLMC, Series 4011-ML | | 3.000% | | 03/15/27 | | | 500,000 | | | | 482,369 | |
| FHLMC, Series 2569-LD | | 5.500% | | 02/15/33 | | | 34,747 | | | | 36,022 | |
| FHLMC, Series 3793-UA | | 4.000% | | 06/15/33 | | | 38,005 | | | | 37,935 | |
| OAKHURST FIXED INCOME FUND |
| Schedule of Investments (Continued) |
COLLATERALIZED MORTGAGE
OBLIGATIONS — 33.3% (Continued) | | Coupon | | Maturity | | Par Value | | Value |
| Federal Home Loan Mortgage Corporation — 6.6% (Continued) | | | | | | | | | | | | |
| FHLMC, Series 5206-DV | | 3.500% | | 06/25/33 | | $ | 1,163,254 | | | $ | 1,149,071 | |
| FHLMC, Pool #C9-1859 | | 3.500% | | 12/01/35 | | | 255,401 | | | | 253,096 | |
| FHLMC, Series 3622-WA | | 5.500% | | 09/15/39 | | | 174,856 | | | | 179,601 | |
| FHLMC, Series 3843-JA | | 4.000% | | 04/15/40 | | | 13,681 | | | | 13,711 | |
| FHLMC, Series 3940-PD | | 2.500% | | 02/15/41 | | | 146,258 | | | | 142,314 | |
| FHLMC, Series 4226-AN | | 4.000% | | 04/15/41 | | | 25,209 | | | | 25,224 | |
| FHLMC, Series 4077-AP | | 4.000% | | 01/15/42 | | | 47,078 | | | | 46,536 | |
| FHLMC, Series 4183-PA | | 3.500% | | 01/15/43 | | | 54,342 | | | | 54,094 | |
| FHLMC, Series 4566-CA | | 3.000% | | 01/15/43 | | | 148,241 | | | | 146,933 | |
| FHLMC, Series 5245-CB | | 4.000% | | 12/25/46 | | | 1,167,225 | | | | 1,161,272 | |
| FHLMC, Series 5227-JQ | | 4.000% | | 04/25/47 | | | 1,216,509 | | | | 1,207,926 | |
| FHLMC, Series 4753-JA | | 3.000% | | 12/15/47 | | | 114,799 | | | | 108,197 | |
| FHLMC, Series 4760-A | | 3.000% | | 02/15/48 | | | 806,531 | | | | 774,084 | |
| FHLMC, Series 4960-PD | | 2.000% | | 10/25/49 | | | 874,314 | | | | 779,865 | |
| FHLMC, Series 5252-BA | | 4.000% | | 02/25/50 | | | 1,250,000 | | | | 1,236,523 | |
| | | | | | | | | | | | 7,924,252 | |
| Federal National Mortgage Association — 5.7% | | | | | | | | | | | | |
| FNMA, Series 2005-80-BA | | 5.000% | | 04/25/29 | | | 24,818 | | | | 25,311 | |
| FNMA, Series 2009-96-DB | | 4.000% | | 11/25/29 | | | 96,150 | | | | 95,972 | |
| FNMA, Pool #FM5329 | | 2.000% | | 01/01/31 | | | 645,211 | | | | 609,021 | |
| FNMA, Pool #MA1201 | | 3.500% | | 10/01/32 | | | 109,224 | | | | 108,409 | |
| FNMA, Series 2022-22-EV | | 4.000% | | 07/25/33 | | | 1,192,820 | | | | 1,193,856 | |
| FNMA, Series 2004-W3-A-7 | | 5.500% | | 05/25/34 | | | 601,170 | | | | 618,148 | |
| FNMA, Pool #FS0862 | | 2.500% | | 12/01/36 | | | 1,117,490 | | | | 1,065,399 | |
| FNMA, Pool #MA0584 | | 4.500% | | 10/01/40 | | | 9,961 | | | | 9,793 | |
| FNMA, Series 2013-13-MA | | 4.000% | | 01/25/43 | | | 257,797 | | | | 259,336 | |
| FNMA, Series 2016-49-LA | | 3.500% | | 01/25/43 | | | 174,346 | | | | 172,242 | |
| FNMA, Series 2014-80-KA | | 2.000% | | 03/25/44 | | | 289,870 | | | | 239,598 | |
| FNMA, Series 2016-24-HA | | 3.000% | | 04/25/44 | | | 82,719 | | | | 81,398 | |
| FNMA, Series 2017-22-EC | | 3.000% | | 06/25/44 | | | 186,345 | | | | 183,062 | |
| FNMA, Series 2016-89-CG | | 3.000% | | 04/25/46 | | | 145,801 | | | | 140,310 | |
| FNMA, Series 2017-105-N | | 3.000% | | 01/25/48 | | | 1,483,207 | | | | 1,411,886 | |
| FNMA, Series 2019-33-N | | 3.000% | | 03/25/48 | | | 340,740 | | | | 331,477 | |
| FNMA, Series 2018-45-AB | | 3.000% | | 06/25/48 | | | 244,560 | | | | 232,804 | |
| | | | | | | | | | | | 6,778,022 | |
| Government National Mortgage Association — 9.2% | | | | | | | | | | | | |
| GNMA, Series 2020-078-CB | | 5.000% | | 09/20/34 | | | 276,140 | | | | 280,969 | |
| OAKHURST FIXED INCOME FUND |
| Schedule of Investments (Continued) |
COLLATERALIZED MORTGAGE
OBLIGATIONS — 33.3% (Continued) | | Coupon | | Maturity | | Par Value | | Value |
| Government National Mortgage Association — 9.2% (Continued) | | | | | | | | | | | | |
| GNMA, Series 2009-104-KA | | 4.500% | | 08/16/39 | | $ | 24,050 | | | $ | 24,065 | |
| GNMA, Series 2017-084-JD | | 3.000% | | 05/20/47 | | | 42,555 | | | | 41,035 | |
| GNMA, Series 2018-006-JA | | 2.750% | | 01/20/48 | | | 236,960 | | | | 223,701 | |
| GNMA, Series 2019-061-KU | | 3.500% | | 05/20/49 | | | 902,782 | | | | 862,454 | |
| GNMA, Series 2019-099-JC | | 3.000% | | 08/20/49 | | | 84,240 | | | | 80,378 | |
| GNMA, Series 2019-152-HA | | 3.500% | | 08/20/49 | | | 195,415 | | | | 189,822 | |
| GNMA, Series 2020-05-NA | | 3.500% | | 12/20/49 | | | 269,061 | | | | 257,507 | |
| GNMA, Series 2020-133-A (b) | | 5.935% | | 05/01/50 | | | 282,572 | | | | 300,721 | |
| GNMA, Series 2020-084-WA | | 3.500% | | 06/20/50 | | | 199,548 | | | | 189,806 | |
| GNMA, Series 2020-095-NB | | 4.500% | | 07/20/50 | | | 28,588 | | | | 27,247 | |
| GNMA, Series 2020-122-DP | | 2.500% | | 07/20/50 | | | 1,343,006 | | | | 1,253,366 | |
| GNMA, Series 2022-078-LA | | 4.500% | | 07/20/50 | | | 1,185,299 | | | | 1,199,166 | |
| GNMA, Series 2020-123-PB | | 2.250% | | 08/20/50 | | | 647,776 | | | | 592,658 | |
| GNMA, Series 2020-133-HA | | 3.500% | | 09/20/50 | | | 337,968 | | | | 319,217 | |
| GNMA, Series 2020-134-NP | | 2.500% | | 09/20/50 | | | 1,031,756 | | | | 961,830 | |
| GNMA, Series 2020-183-AY | | 2.000% | | 11/20/50 | | | 999,295 | | | | 894,508 | |
| GNMA, Series 2022-075-PA | | 4.000% | | 04/20/51 | | | 1,234,427 | | | | 1,229,559 | |
| GNMA, Series 2022-20-KA | | 2.500% | | 01/20/52 | | | 1,199,033 | | | | 1,121,623 | |
| GNMA, Series 2022-024-BC | | 4.000% | | 02/20/52 | | | 892,646 | | | | 879,503 | |
| | | | | | | | | | | | 10,929,135 | |
| Non-Agency — 11.8% | | | | | | | | | | | | |
| ABN AMRO Mortgage Corporation, Series 2003-12-1A | | 5.000% | | 12/25/33 | | | 100,532 | | | | 95,719 | |
| Bank of America Funding Corporation, Series 2003-J-2-A-1 (b) | | 2.564% | | 11/25/33 | | | 273,905 | | | | 251,827 | |
| Bank of America Funding Corporation, Series 2004-A-3-A-1 (b) | | 2.361% | | 02/25/34 | | | 65,315 | | | | 64,816 | |
| Bear Stearns ALT-A Trust, Series 2003-6-II-A-1 (b) | | 3.254% | | 01/25/34 | | | 189,468 | | | | 185,751 | |
| Countrywide Home Loans, Inc., Series 2003-49-A-9 (b) | | 2.579% | | 12/19/33 | | | 40,381 | | | | 37,761 | |
| Credit Suisse First Boston Mortgage Securities Company, Series 2002-AR31-IV-A-2 (b) | | 2.245% | | 11/25/32 | | | 41,210 | | | | 41,011 | |
| Credit Suisse First Boston Mortgage Securities Company, Series 2003-11-I-A-31 | | 5.500% | | 06/25/33 | | | 24,307 | | | | 23,411 | |
| CSMC Mortgage Trust, 144A, Series 2013-IVR1-A-2 | | 3.000% | | 03/25/43 | | | 390,398 | | | | 358,262 | |
| GS Mortgage-Backed Securities, 144A, Series 2021-PJ1-A-4 (b) | | 2.500% | | 06/25/51 | | | 668,363 | | | | 555,944 | |
| OAKHURST FIXED INCOME FUND |
| Schedule of Investments (Continued) |
COLLATERALIZED MORTGAGE
OBLIGATIONS — 33.3% (Continued) | | Coupon | | Maturity | | Par Value | | Value |
| Non-Agency — 11.8% (Continued) | | | | | | | | | | | | |
| HarborView Mortgage Loan Trust, Series 2003-1-A (b) | | 2.260% | | 05/19/33 | | $ | 45,951 | | | $ | 41,211 | |
| HarborView Mortgage Loan Trust, Series 2004-4-2-A (1*1MO LIBOR + 56) (b) | | 2.646% | | 06/19/34 | | | 56,215 | | | | 51,516 | |
| Impac CMB Trust, Series 2004-10-4-A-2 (1*1MO LIBOR + 94) (b) | | 3.384% | | 03/25/35 | | | 50,281 | | | | 47,375 | |
| Impac CMB Trust, Series 2005-4-2-A-1 (1*1MO LIBOR + 30) (b) | | 2.744% | | 05/25/35 | | | 331,772 | | | | 298,497 | |
| Impac CMB Trust, 144A, Series 2007-A-A (1*1MO LIBOR + 50) (b) | | 2.944% | | 05/25/37 | | | 306,344 | | | | 293,153 | |
| Impac CMB Trust, 144A, Series 2007-A-M-1 (1*1MO LIBOR + 80) (b) | | 3.244% | | 05/25/37 | | | 304,705 | | | | 290,153 | |
| Impac Secured Assets Corporation, Series 2003-3-A-1 (b) | | 5.200% | | 08/25/33 | | | 28,209 | | | | 26,900 | |
| Impac Secured Assets Corporation, Series 2006-1-2-A-1 (1*1MO LIBOR + 70) (b) | | 3.144% | | 05/25/36 | | | 94,310 | | | | 86,800 | |
| JPMorgan Alternative Loan Trust, Series 2005-A2-1-A-1 (1*1MO LIBOR + 52) (b) | | 2.704% | | 01/25/36 | | | 16,468 | | | | 16,435 | |
| JPMorgan Mortgage Trust, Series 2003-A1-1-A-1 (b) | | 2.032% | | 10/25/33 | | | 111,731 | | | | 104,223 | |
| JPMorgan Mortgage Trust, Series 2004-A1-4-A-1 (b) | | 2.027% | | 02/25/34 | | | 80,905 | | | | 75,487 | |
| JPMorgan Mortgage Trust, Series 2004-A3-S-F-3 (b) | | 2.274% | | 06/25/34 | | | 94,474 | | | | 89,896 | |
| JPMorgan Mortgage Trust, Series 2004-A4-2-A-2 (b) | | 2.768% | | 09/25/34 | | | 626,549 | | | | 594,753 | |
| JPMorgan Mortgage Trust, Series 2004-A5-2-A-1 (b) | | 2.259% | | 12/25/34 | | | 28,957 | | | | 29,482 | |
| JPMorgan Mortgage Trust, 144A, Series 2013-3-A-3 (b) | | 3.355% | | 07/25/43 | | | 58,232 | | | | 55,191 | |
| JPMorgan Mortgage Trust, 144A, Series 2017-A-A-3 (b) | | 3.500% | | 05/25/47 | | | 123,217 | | | | 112,953 | |
| JPMorgan Mortgage Trust, 144A, Series 2018-1-A-7 (b) | | 3.500% | | 06/25/48 | | | 475,196 | | | | 446,526 | |
| Master Adjustable Rate Mortgage Trust, Series 2003-3-2-A-1 (b) | | 1.823% | | 09/25/33 | | | 52,470 | | | | 47,013 | |
| OAKHURST FIXED INCOME FUND |
| Schedule of Investments (Continued) |
COLLATERALIZED MORTGAGE
OBLIGATIONS — 33.3% (Continued) | | Coupon | | Maturity | | Par Value | | Value |
| Non-Agency — 11.8% (Continued) | | | | | | | | | | | | |
| Master Asset Securitization Trust, Series 2004-1-3-A-7 | | 5.250% | | 01/25/34 | | $ | 43,351 | | | $ | 40,721 | |
| Merrill Lynch Mortgage Investors Trust, Series 2004-A3-I-A (b) | | 2.855% | | 05/25/34 | | | 120,591 | | | | 112,109 | |
| Merrill Lynch Mortgage Investors Trust, Series 2004-1-A-2 (1*1MO LIBOR + 90) (b) | | 3.344% | | 11/25/34 | | | 865,439 | | | | 829,956 | |
| Merrill Lynch Mortgage Investors Trust, Series 2005-A1-I-A (b) | | 2.866% | | 12/25/34 | | | 242,867 | | | | 244,133 | |
| Nationstar Mortgage Loan Trust, 144A, Series 2013-A-A (b) | | 3.750% | | 12/25/52 | | | 43,478 | | | | 40,817 | |
| New Residential Mortgage Loan Trust, 144A, Series 2015-2-A-2 (b) | | 3.750% | | 08/25/55 | | | 220,633 | | | | 209,325 | |
| New Residential Mortgage Loan Trust, 144A, Series 2017-3-A-1 (b) | | 4.000% | | 04/25/57 | | | 245,561 | | | | 236,728 | |
| Opteum Mortgage Acceptance Corporation, Series 2005-5-IIA1D2 (b) | | 5.850% | | 12/25/35 | | | 27,804 | | | | 27,544 | |
| Rocket Mortgage, LLC, 144A, Series 2022-1-A-5 | | 2.500% | | 01/25/52 | | | 1,529,810 | | | | 1,374,857 | |
| SBA Tower Trust, 144A, Series 2020-1-2-1C | | 1.884% | | 07/15/50 | | | 300,000 | | | | 270,337 | |
| SBA Tower Trust, 144A, Series 2020-1-2-2C | | 2.328% | | 07/15/52 | | | 10,000 | | | | 8,722 | |
| Sequoia Mortgage Trust, Series 2003-8-A-1 (1*1MO LIBOR + 64) (b) | | 2.766% | | 01/20/34 | | | 296,742 | | | | 285,524 | |
| Sequoia Mortgage Trust, Series 2004-6-A-2 (1*1MO LIBOR + 56) (b) | | 2.686% | | 07/20/34 | | | 114,122 | | | | 102,509 | |
| Sequoia Mortgage Trust, 144A, Series 2013-5-A-1 (b) | | 2.500% | | 05/25/43 | | | 184,621 | | | | 164,086 | |
| Sequoia Mortgage Trust, Series 2013-6-A-2 (b) | | 3.000% | | 05/25/43 | | | 231,501 | | | | 213,094 | |
| Sequoia Mortgage Trust, 144A, Series 2019-4-A-1 | | 3.500% | | 11/25/49 | | | 598,130 | | | | 550,670 | |
| Structured Adjustable Rate Mortgage Loan Trust, Series 2004-1-4-A4 (b) | | 2.543% | | 02/25/34 | | | 91,095 | | | | 87,819 | |
| Structured Asset Mortgage Investments II Trust, Series 2004-AR6-A-1A (1*1MO LIBOR + 70) (b) | | 2.716% | | 02/19/35 | | | 1,078,482 | | | | 1,036,557 | |
| OAKHURST FIXED INCOME FUND |
| Schedule of Investments (Continued) |
COLLATERALIZED MORTGAGE
OBLIGATIONS — 33.3% (Continued) | | Coupon | | Maturity | | Par Value | | Value |
| Non-Agency — 11.8% (Continued) | | | | | | | | | | | | |
| Structured Asset Mortgage Investments, Inc., Series 2003-AR4-A-1 (1*1MO LIBOR + 70) (b) | | 2.820% | | 01/19/34 | | $ | 32,060 | | | $ | 30,862 | |
| Structured Asset Mortgage Investments, Inc., Series 2004-AR4-IA1 (1*1MO LIBOR + 70) (b) | | 2.820% | | 12/19/34 | | | 72,265 | | | | 67,629 | |
| Structured Asset Securities Corporation, Series 2003-9A-2-A1 (b) | | 2.340% | | 03/25/33 | | | 109,336 | | | | 108,196 | |
| Structured Asset Securities Corporation, Series 2003-34A-5-A4 (b) | | 2.683% | | 11/25/33 | | | 136,370 | | | | 129,074 | |
| Terwin Mortgage Trust, 144A, Series 2004-1HE-M-1 | | 3.194% | | 02/25/34 | | | 303,840 | | | | 291,549 | |
| Wa-Mu Mortgage Pass-Through Certificates, Series 2003-S3-III-A1 | | 5.500% | | 05/25/33 | | | 26,513 | | | | 25,712 | |
| Wa-Mu Mortgage Pass-Through Certificates, Series 2003-AR7-A-7 (b) | | 2.467% | | 08/25/33 | | | 508,891 | | | | 479,169 | |
| Wa-Mu Mortgage Pass-Through Certificates, Series 2003-AR8-A (b) | | 2.765% | | 08/25/33 | | | 192,925 | | | | 189,012 | |
| Wa-Mu Mortgage Pass-Through Certificates, Series 2002-AR2-A (1*COF 11 + 125) (b) | | 1.912% | | 02/27/34 | | | 109,413 | | | | 103,920 | |
| Wa-Mu Mortgage Pass-Through Certificates, Series 2005-AR2-1-A-1A (1*1MO LIBOR + 66) (b) | | 3.104% | | 01/25/45 | | | 1,057,968 | | | | 1,003,540 | |
| Wa-Mu Mortgage Pass-Through Certificates, Series 2005-AR13-A-1A3 (1*1MO LIBOR + 156) (b) | | 4.004% | | 10/25/45 | | | 165,451 | | | | 160,470 | |
| Wells Fargo Alternative Loan Trust, Series 2002-1-I-A-1 | | 6.250% | | 08/25/32 | | | 247,022 | | | | 236,300 | |
| Wells Fargo Mortgage-Backed Securities, 144A, Series 2021-RR1-A-3 | | 2.500% | | 12/25/50 | | | 1,186,285 | | | | 1,069,993 | |
| | | | | | | | | | | | 14,053,000 | |
| | | | | | | | | | | | | |
| Total Collateralized Mortgage Obligations (Cost $41,865,925) | | | | | | | | | | $ | 39,684,409 | |
| | | | | | | | | | | | | |
| OAKHURST FIXED INCOME FUND |
| Schedule of Investments (Continued) |
| CORPORATE BONDS — 33.8% | | Coupon | | Maturity | | Par Value | | Value |
| Communications — 2.3% | | | | | | | | |
| CBS Corporation | | 7.875% | | 07/30/30 | | $ | 765,000 | | | $ | 866,283 | |
| Magallanes, Inc., 144A | | 4.054% | | 03/15/29 | | | 1,010,000 | | | | 921,888 | |
| T-Mobile USA, Inc. | | 2.050% | | 02/15/28 | | | 1,073,000 | | | | 932,927 | |
| | | | | | | | | | | | 2,721,098 | |
| Consumer Discretionary — 0.7% | | | | | | | | | | | | |
| Genting NY, LLC, 144A | | 3.300% | | 02/15/26 | | | 1,025,000 | | | | 909,613 | |
| | | | | | | | | | | | | |
| Consumer Staples — 1.5% | | | | | | | | | | | | |
| Clorox Company | | 1.800% | | 05/15/30 | | | 989,000 | | | | 807,574 | |
| Flowers Foods, Inc. | | 2.400% | | 03/15/31 | | | 1,128,000 | | | | 941,074 | |
| | | | | | | | | | | | 1,748,648 | |
| Energy — 1.9% | | | | | | | | | | | | |
| Enbridge, Inc. | | 3.125% | | 11/15/29 | | | 1,059,000 | | | | 959,126 | |
| Grey Oak Pipeline, LLC, 144A | | 3.450% | | 10/15/27 | | | 1,013,000 | | | | 928,893 | |
| Phillips 66 Partners, L.P. | | 3.550% | | 10/01/26 | | | 399,000 | | | | 368,624 | |
| | | | | | | | | | | | 2,256,643 | |
| Financials — 13.1% | | | | | | | | | | | | |
| AerCap Ireland Capital D.A.C. | | 1.750% | | 01/30/26 | | | 980,000 | | | | 864,789 | |
| Antares Holdings, L.P. | | 3.950% | | 07/15/26 | | | 1,070,000 | | | | 948,478 | |
| Aviation Capital Group, LLC, 144A | | 1.950% | | 01/30/26 | | | 1,102,000 | | | | 952,192 | |
| Bank of America Corporation (1*3MO LIBOR + 104) (b) | | 3.419% | | 12/20/28 | | | 984,000 | | | | 913,004 | |
| Barings BDC, Inc., 144A | | 3.300% | | 11/23/26 | | | 1,040,000 | | | | 901,620 | |
| Blackstone Private Credit Fund | | 3.250% | | 03/15/27 | | | 1,050,000 | | | | 902,179 | |
| Drawbridge Special Opportunities Fund, L.P., 144A | | 3.875% | | 02/15/26 | | | 937,000 | | | | 859,999 | |
| Fairfax Financial Holdings Ltd. | | 4.850% | | 04/17/28 | | | 938,000 | | | | 910,560 | |
| Fidelity National Financial, Inc. | | 3.400% | | 06/15/30 | | | 899,000 | | | | 779,879 | |
| First American Financial Corporation | | 4.000% | | 05/15/30 | | | 1,017,000 | | | | 912,525 | |
| FS KKR Capital Corporation | | 3.400% | | 01/15/26 | | | 983,000 | | | | 895,650 | |
| Goldman Sachs Group, Inc. | | 3.800% | | 03/15/30 | | | 987,000 | | | | 912,105 | |
| Icahn Enterprises, L.P. | | 4.375% | | 02/01/29 | | | 750,000 | | | | 637,897 | |
| Jackson Financial, Inc., 144A | | 3.125% | | 11/23/31 | | | 1,100,000 | | | | 883,559 | |
| M.D.C. Holdings, Inc. | | 3.850% | | 01/15/30 | | | 779,000 | | | | 638,824 | |
| Owl Rock Capital Corporation | | 2.625% | | 01/15/27 | | | 1,072,000 | | | | 905,482 | |
| PennyMac Mortgage Investment Trust | | 5.500% | | 11/01/24 | | | 1,000,000 | | | | 962,500 | |
| Prospect Capital Corporation | | 3.437% | | 10/15/28 | | | 1,131,000 | | | | 877,624 | |
| | | | | | | | | | | | 15,658,866 | |
| OAKHURST FIXED INCOME FUND |
| Schedule of Investments (Continued) |
CORPORATE BONDS — 33.8%
(Continued) | | Coupon | | Maturity | | Par Value | | Value |
| Health Care — 1.9% | | | | | | | | | | | | |
| Bristol-Myers Squibb Company | | 5.875% | | 11/15/36 | | $ | 485,000 | | | $ | 522,927 | |
| CVS Pass-Through Trust, 144A, Series 2013 | | 4.704% | | 01/10/36 | | | 217,705 | | | | 208,950 | |
| CVS Pass-Through Trust, 144A, Series 2014 | | 4.163% | | 08/11/36 | | | 700,109 | | | | 643,426 | |
| Mylan, Inc. | | 4.550% | | 04/15/28 | | | 963,000 | | | | 905,624 | |
| | | | | | | | | | | | 2,280,927 | |
| Industrials — 4.6% | | | | | | | | | | | | |
| Air Canada Pass-Through Certificates, 144A, Series 2013-1-A | | 4.125% | | 11/15/26 | | | 487,570 | | | | 437,267 | |
| Air Canada Pass-Through Certificates, 144A, Series 2015-1-A | | 3.600% | | 09/15/28 | | | 941,554 | | | | 868,178 | |
| American Airlines Group Pass-Through Certificates, Series 2019-1-AA | | 3.150% | | 08/15/33 | | | 1,104,740 | | | | 975,251 | |
| MasTec, Inc., 144A | | 4.500% | | 08/15/28 | | | 975,000 | | | | 896,451 | |
| Roper Technologies, Inc. | | 2.950% | | 09/15/29 | | | 1,035,000 | | | | 913,642 | |
| U.S. Airways Pass-Through Trust, Series 2011-1-A | | 7.125% | | 04/22/25 | | | 371,034 | | | | 370,523 | |
| United Airlines Pass-Through Certificates, Series 2020-1-A | | 5.875% | | 04/15/29 | | | 1,068,289 | | | | 1,069,579 | |
| | | | | | | | | | | | 5,530,891 | |
| Materials — 0.8% | | | | | | | | | | | | |
| Georgia-Pacific, LLC | | 7.750% | | 11/15/29 | | | 780,000 | | | | 934,880 | |
| | | | | | | | | | | | | |
| Real Estate — 1.6% | | | | | | | | | | | | |
| American Homes 4 Rent | | 2.375% | | 07/15/31 | | | 1,128,000 | | | | 907,604 | |
| Crown Castle International Corporation | | 4.000% | | 03/01/27 | | | 875,000 | | | | 850,574 | |
| Public Storage | | 2.250% | | 11/09/31 | | | 130,000 | | | | 109,238 | |
| | | | | | | | | | | | 1,867,416 | |
| Technology — 3.8% | | | | | | | | | | | | |
| Hewlett Packard Enterprise Company | | 6.200% | | 10/15/35 | | | 857,000 | | | | 906,114 | |
| Leidos, Inc. | | 4.375% | | 05/15/30 | | | 1,000,000 | | | | 925,180 | |
| NXP B.V./NXP Funding, LLC | | 2.500% | | 05/11/31 | | | 1,167,000 | | | | 939,788 | |
| PayPal Holdings, Inc. | | 2.850% | | 10/01/29 | | | 1,021,000 | | | | 925,685 | |
| TD SYNNEX Corporation | | 2.375% | | 08/09/28 | | | 1,089,000 | | | | 916,405 | |
| | | | | | | | | | | | 4,613,172 | |
| OAKHURST FIXED INCOME FUND |
| Schedule of Investments (Continued) |
CORPORATE BONDS — 33.8%
(Continued) | | Coupon | | Maturity | | Par Value | | Value |
| Utilities — 1.6% | | | | | | | | |
| Elwood Energy, LLC | | 8.159% | | 07/05/26 | | $ | 529,615 | | | $ | 529,615 | |
| Entergy New Orleans, LLC | | 4.000% | | 06/01/26 | | | 700,000 | | | | 681,672 | |
| NSG Holdings, LLC, 144A | | 7.750% | | 12/15/25 | | | 678,945 | | | | 656,879 | |
| | | | | | | | | | | | 1,868,166 | |
| | | | | | | | | | | | | |
| Total Corporate Bonds (Cost $46,008,170) | | | | | | | | | | $ | 40,390,320 | |
| MONEY MARKET FUNDS — 0.5% | | Shares | | | Value | |
| Invesco Short-Term Investments Trust - Treasury Portfolio - Institutional Class, 2.17% (c) (Cost $609,987) | | | 609,987 | | | $ | 609,987 | |
| | | | | | | | | |
| Total Investments at Value — 99.9% (Cost $130,053,587) | | | | | | $ | 119,251,102 | |
| | | | | | | | | |
| Other Assets in Excess of Liabilities — 0.1% | | | | | | | 158,798 | |
| | | | | | | | | |
| Net Assets — 100.0% | | | | | | $ | 119,409,900 | |
144A - Security was purchased in a transaction exempt from registration in compliance with Rule 144A of the Securities Act of 1933. This security may be resold in transactions exempt from registration, normally to qualified institutional buyers. These securities have been deemed liquid under procedures approved by the Board of Trustees. The total value of such securities is $25,168,195 as of August 31, 2022, representing 21.1% of net assets.
COF 11 - Cost of funds for the 11th District of San Francisco.
LIBOR - London Interbank Offered Rate.
| (a) | Percentage rounds to less than 0.1%. |
| (b) | Variable rate security. Interest rate resets periodically. The rate shown is the effective interest rate as of August 31, 2022. For securities based on a published reference rate and spread, the reference rate and spread (in basis points) are indicated parenthetically. Certain variable rate securities are not based on a published reference rate and spread but are determined by the issuer or agent and are based on current market conditions. These securities, therefore, do not indicate a reference rate and spread. |
| (c) | The rate shown is the 7-day effective yield as of August 31, 2022. |
See accompanying notes to financial statements.
| OAKHURST SHORT DURATION BOND FUND |
| Schedule of Investments |
| August 31, 2022 |
U.S. GOVERNMENT &
AGENCIES — 6.3% | | Coupon | | Maturity | | Par Value | | Value |
| Federal Home Loan Bank — 1.2% | | | | | | | | | | | | |
| Federal Home Loan Banks | | 3.000% | | 02/23/24 | | $ | 700,000 | | | $ | 691,552 | |
| | | | | | | | | | | | | |
| Small Business Administration — 0.0% (a) | | | | | | | | | | | | |
| SBA | | 5.080% | | 11/01/22 | | | 3,901 | | | | 3,905 | |
| SBA | | 5.510% | | 11/01/27 | | | 28,078 | | | | 28,273 | |
| | | | | | | | | | | | 32,178 | |
| U.S. Treasury Notes — 5.1% | | | | | | | | | | | | |
| U.S. Treasury Notes | | 2.250% | | 04/30/24 | | | 1,000,000 | | | | 980,820 | |
| U.S. Treasury Notes | | 2.500% | | 05/31/24 | | | 1,000,000 | | | | 983,867 | |
| U.S. Treasury Notes | | 2.500% | | 01/31/25 | | | 1,000,000 | | | | 977,774 | |
| | | | | | | | | | | | 2,942,461 | |
| | | | | | | | | | | | | |
| Total U.S. Government & Agencies (Cost $3,722,857) | | | | | | | | | | $ | 3,666,191 | |
ASSET-BACKED
SECURITIES — 12.6% | | Coupon | | Maturity | | Par Value | | Value |
| Accredited Mortgage Loan Trust, Series 2004-3-2A2 (1*1MO LIBOR + 120) (b) | | 3.644% | | 10/25/34 | | $ | 82,594 | | | $ | 81,196 | |
| ACE Securities Corporation, Series 2003-NC1-A-2A (1*1MO LIBOR + 84) (b) | | 2.864% | | 07/25/33 | | | 234,621 | | | | 214,042 | |
| Argent Securities, Inc., Series 2004-W10-A-2 (1*1MO LIBOR + 78) (b) | | 3.224% | | 10/25/34 | | | 295,955 | | | | 287,906 | |
| Coinstar Funding, LLC, 144A, Series 2017-1-A-2 | | 5.216% | | 04/25/47 | | | 611,138 | | | | 590,910 | |
| Countrywide Asset-Backed Certificates, Series 2004-6-2-A-3 (1*1MO LIBOR + 120) (b) | | 3.644% | | 11/25/34 | | | 152,019 | | | | 146,149 | |
| Countrywide Home Loans, Inc., Series 2004-6-2-A-5 (1*1MO LIBOR + 78) (b) | | 3.224% | | 11/25/34 | | | 579,813 | | | | 545,469 | |
| DB Master Finance, LLC, 144A, Series 2021-1-A-2-I | | 2.045% | | 11/20/51 | | | 679,863 | | | | 586,590 | |
| Domino’s Pizza Master Issuer, LLC, 144A, Series 2015-1-A-2-II | | 4.474% | | 10/25/45 | | | 612,625 | | | | 594,792 | |
| OAKHURST SHORT DURATION BOND FUND |
| Schedule of Investments (Continued) |
ASSET-BACKED
SECURITIES — 12.6% (Continued) | | Coupon | | Maturity | | Par Value | | Value |
| Drive Auto Receivables Trust, Series 2020-2-D | | 3.050% | | 05/15/28 | | $ | 670,000 | | | $ | 658,462 | |
| Drive Auto Receivables Trust, Series 2021-1-C | | 1.020% | | 06/15/27 | | | 556,000 | | | | 543,035 | |
| Fat Brands GFG Royalty, LLC, 144A, Series 2021-1-A-2 | | 6.000% | | 07/25/51 | | | 700,000 | | | | 665,478 | |
| Flagship Credit Auto Trust, 144A, Series 2020-4-C | | 1.280% | | 02/16/27 | | | 610,000 | | | | 586,179 | |
| HOA Funding, LLC, 144A, Series 2021-1-B | | 7.432% | | 08/20/51 | | | 865,000 | | | | 712,004 | |
| Mortgage IT Trust, Series 2005-5-A-1 (1*1MO LIBOR + 52) (b) | | 2.704% | | 12/25/35 | | | 413,811 | | | | 396,823 | |
| Soundview Home Equity Loan Trust, Series 2003-2-A-2 (1*1MO LIBOR + 130) (b) | | 3.744% | | 11/25/33 | | | 245,319 | | | | 241,757 | |
| Thornburg Mortgage Trust, Series 2003-4-A-1 (1*1MO LIBOR + 64) (b) | | 2.764% | | 09/25/43 | | | 454,970 | | | | 439,015 | |
| Total Asset-Backed Securities (Cost $7,759,491) | | | | | | | | | | $ | 7,289,807 | |
COLLATERALIZED MORTGAGE
OBLIGATIONS — 38.3% | | Coupon | | Maturity | | Par Value | | Value |
| Federal Home Loan Mortgage Corporation — 6.2% | | | | | | | | | | | | |
| FHLMC, Pool #J1-2630 | | 4.000% | | 07/01/25 | | $ | 204,740 | | | $ | 204,602 | |
| FHLMC, Series 2580-PY | | 4.000% | | 03/15/33 | | | 10,518 | | | | 10,408 | |
| FHLMC, Series 3664-DA | | 4.000% | | 11/15/37 | | | 370,968 | | | | 372,344 | |
| FHLMC, Series 4348-ME | | 2.500% | | 06/15/39 | | | 8,308 | | | | 8,295 | |
| FHLMC, Series 3597-LH | | 4.500% | | 07/15/39 | | | 184,374 | | | | 184,545 | |
| FHLMC, Series 4444-CH | | 3.000% | | 01/15/41 | | | 184,920 | | | | 184,497 | |
| FHLMC, Series 4312-GA | | 2.500% | | 12/15/41 | | | 68,914 | | | | 67,051 | |
| FHLMC, Series 4768-E | | 3.500% | | 09/15/42 | | | 467,005 | | | | 465,069 | |
| FHLMC, Series 4319-PM | | 3.000% | | 03/15/43 | | | 659,176 | | | | 647,464 | |
| FHLMC, Series 4710-PA | | 3.000% | | 04/15/45 | | | 801,154 | | | | 777,265 | |
| FHLMC, Series 4938-BL | | 2.250% | | 07/25/49 | | | 459,841 | | | | 424,747 | |
| FHLMC, Series 4960-PD | | 2.000% | | 10/25/49 | | | 291,438 | | | | 259,955 | |
| | | | | | | | | | | | 3,606,242 | |
| OAKHURST SHORT DURATION BOND FUND |
| Schedule of Investments (Continued) |
COLLATERALIZED MORTGAGE
OBLIGATIONS — 38.3% (Continued) | | Coupon | | Maturity | | Par Value | | Value |
| Federal National Mortgage Association — 8.9% | | | | | | | | | | | | |
| FNMA, Series 2003-48-TC | | 5.000% | | 06/25/23 | | $ | 5,805 | | | $ | 5,802 | |
| FNMA, Series 2010-112-CY | | 4.000% | | 10/25/25 | | | 90,815 | | | | 90,789 | |
| FNMA, Pool #AL0300 | | 4.500% | | 06/01/26 | | | 112,820 | | | | 114,449 | |
| FNMA, Series 2012-41-BA | | 2.500% | | 04/25/27 | | | 342,642 | | | | 334,005 | |
| FNMA, Pool #AL4309 | | 4.000% | | 10/01/28 | | | 209,354 | | | | 209,749 | |
| FNMA, Series 2005-80-BA | | 5.000% | | 04/25/29 | | | 86,864 | | | | 88,590 | |
| FNMA, Pool #MA1237 | | 3.000% | | 11/01/32 | | | 942,217 | | | | 908,195 | |
| FNMA, Series 2005-109-PC | | 6.000% | | 12/25/35 | | | 57,873 | | | | 59,934 | |
| FNMA, Series 2008-17-PA | | 4.500% | | 10/25/37 | | | 132,853 | | | | 131,963 | |
| FNMA, Series 2008-49-PA | | 5.000% | | 04/25/38 | | | 104,496 | | | | 105,358 | |
| FNMA, Series 2010-152-DA | | 3.000% | | 05/25/39 | | | 126,922 | | | | 126,038 | |
| FNMA, Series 2009-94-DA | | 4.500% | | 10/25/39 | | | 234,428 | | | | 232,095 | |
| FNMA, Series 2010-109-NB | | 3.000% | | 10/25/40 | | | 788,887 | | | | 758,206 | |
| FNMA, Series 2012-102-PA | | 4.500% | | 03/25/41 | | | 16,577 | | | | 16,903 | |
| FNMA, Series 2012-136-PD | | 2.500% | | 11/25/42 | | | 286,905 | | | | 279,410 | |
| FNMA, Series 2013-82-BP | | 2.750% | | 12/25/42 | | | 375,240 | | | | 362,057 | |
| FNMA, Series 2014-80-KA | | 2.000% | | 03/25/44 | | | 89,882 | | | | 74,294 | |
| FNMA, Series 2016-72-AP | | 4.000% | | 07/25/44 | | | 108,636 | | | | 106,177 | |
| FNMA, Series 2018-14-PA | | 3.500% | | 04/25/47 | | | 408,778 | | | | 400,918 | |
| FNMA, Series 2019-25-PA | | 3.000% | | 05/25/48 | | | 782,520 | | | | 756,486 | |
| | | | | | | | | | | | 5,161,418 | |
| Government National Mortgage Association — 1.6% | | | | | | | | | | | | |
| GNMA, Pool #615735X | | 5.000% | | 07/15/23 | | | 9,103 | | | | 9,416 | |
| GNMA, Series 2011-26-PA | | 4.000% | | 07/20/40 | | | 63,556 | | | | 63,546 | |
| GNMA, Series 2012-10-LD | | 3.000% | | 07/20/40 | | | 62,920 | | | | 62,767 | |
| GNMA, Series 2018-131-PG | | 3.000% | | 09/20/48 | | | 102,607 | | | | 98,814 | |
| GNMA, Series 2019-024-PE | | 3.250% | | 02/20/49 | | | 224,682 | | | | 216,179 | |
| GNMA, Series 2019-065-EB | | 3.000% | | 05/20/49 | | | 200,169 | | | | 189,239 | |
| GNMA, Series 2019-152-HA | | 3.500% | | 08/20/49 | | | 193,217 | | | | 187,686 | |
| GNMA, Series 2020-095-NB | | 4.500% | | 07/20/50 | | | 80,154 | | | | 76,392 | |
| | | | | | | | | | | | 904,039 | |
| Non-Agency — 21.6% | | | | | | | | | | | | |
| Adjustable Rate Mortgage Trust, Series 2004-5-4-A-1 (b) | | 2.885% | | 04/25/35 | | | 116,252 | | | | 116,046 | |
| American Credit Acceptance Receivables Trust, 144A, Series 2020-4-D | | 1.770% | | 12/14/26 | | | 515,000 | | | | 493,120 | |
| OAKHURST SHORT DURATION BOND FUND |
| Schedule of Investments (Continued) |
COLLATERALIZED MORTGAGE
OBLIGATIONS — 38.3% (Continued) | | Coupon | | Maturity | | Par Value | | Value |
| Non-Agency — 21.6% (Continued) | | | | | | | | | | | | |
| American General Mortgage Loan Trust, 144A, Series 2006-1-A-5 (b) | | 5.750% | | 12/25/35 | | $ | 2,065 | | | $ | 2,162 | |
| American Home Mortgage Investment Trust, Series 2004-3-IV-A (1*6MO LIBOR + 150) (b) | | 2.876% | | 10/25/34 | | | 565,167 | | | | 563,699 | |
| American Home Mortgage Investment Trust, Series 2004-3-VI-A1 (c) | | 4.820% | | 10/25/34 | | | 15,032 | | | | 14,777 | |
| Citigroup Mortgage Loan Trust, Inc., Series 2005-6-A-1 (1*H15T1Y + 210) (b) | | 2.190% | | 09/25/35 | | | 103,792 | | | | 103,360 | |
| Credit Suisse First Boston Mortgage Securitization, Series 2004-6-II-A-1 (d) | | 0.000% | | 09/25/22 | | | 12,056 | | | | 2 | |
| Credit Suisse First Boston Mortgage Securitization, Series 2004-AR2-II-A-1 (b) | | 2.273% | | 03/25/34 | | | 34,396 | | | | 33,629 | |
| Goldman Sachs Mortgage Loan Trust, Series 2003-13-1A1 (b) | | 2.633% | | 10/25/33 | | | 83,579 | | | | 84,413 | |
| Goldman Sachs Mortgage Loan Trust, Series 2004-10F-7A-1 | | 5.500% | | 09/25/34 | | | 23,374 | | | | 22,932 | |
| Goldman Sachs Mortgage Loan Trust, Series 2005-5F-8A-2 (1*1MO LIBOR + 50) (b) | | 2.944% | | 06/25/35 | | | 48,578 | | | | 46,763 | |
| GSR Mortgage Loan Trust, Series 2003-7F-IA-4 | | 5.250% | | 06/25/33 | | | 175,694 | | | | 173,483 | |
| GSR Mortgage Loan Trust, Series 2005-AR6-1A-1 (b) | | 2.933% | | 09/25/35 | | | 12,743 | | | | 12,561 | |
| HarborView Mortgage Loan Trust, Series 2004-4-2-A (1*1MO LIBOR + 56) (b) | | 2.646% | | 06/19/34 | | | 32,123 | | | | 29,438 | |
| Impac CMB Trust, Series 2005-4-2-A-1 (1*1MO LIBOR + 30) (b) | | 2.744% | | 05/25/35 | | | 198,666 | | | | 178,741 | |
| Impac CMB Trust, 144A, Series 2007-A-A (1*1MO LIBOR + 50) (b) | | 2.944% | | 05/25/37 | | | 141,394 | | | | 135,306 | |
| OAKHURST SHORT DURATION BOND FUND |
| Schedule of Investments (Continued) |
COLLATERALIZED MORTGAGE
OBLIGATIONS — 38.3% (Continued) | | Coupon | | Maturity | | Par Value | | Value |
| Non-Agency — 21.6% (Continued) | | | | | | | | | | | | |
| JPMorgan Alternative Loan Trust, Series 2005-A2-1-A-1 (1*1MO LIBOR + 52) (b) | | 2.704% | | 01/25/36 | | $ | 57,203 | | | $ | 57,087 | |
| JPMorgan Mortgage Trust, Series 2003-A1-4-A-5 (b) | | 1.984% | | 10/25/33 | | | 73,679 | | | | 71,225 | |
| JPMorgan Mortgage Trust, 144A, Series 2018-1-A-7 (b) | | 3.500% | | 06/25/48 | | | 601,915 | | | | 565,600 | |
| JPMorgan Mortgage Trust, 144A, Series 2018-8-A-3 (b) | | 4.000% | | 01/25/49 | | | 116,538 | | | | 112,525 | |
| Master Adjustable Rate Mortgages Trust, Series 2004-13-2-A-1 (b) | | 2.678% | | 04/21/34 | | | 113,431 | | | | 109,601 | |
| Master Adjustable Rate Mortgages Trust, Series 2004-6-4-A-6 (b) | | 3.244% | | 07/25/34 | | | 238,017 | | | | 236,621 | |
| Master Seasoned Securitization Trust, Series 2005-1-1-A-1 (b) | | 5.975% | | 09/25/32 | | | 368,602 | | | | 362,501 | |
| MASTR Asset Alternative Loans Trust, Series 2003-1-2-A-1 | | 6.500% | | 01/25/33 | | | 345,261 | | | | 333,332 | |
| MASTR Asset Securitization Trust, Series 2003-12-1-A-1 | | 5.250% | | 12/25/24 | | | 31,789 | | | | 31,313 | |
| MASTR Asset Securitization Trust, Series 2003-11-7-A-5 | | 5.250% | | 12/25/33 | | | 268,766 | | | | 258,676 | |
| Mellon Residential Funding Corporation, Series 2000-TBC2-A-1 (1*1MO LIBOR + 48) (b) | | 2.871% | | 06/15/30 | | | 666,686 | | | | 634,912 | |
| MLCC Mortgage Investors, Inc., Series MLCC 2003-B-A-1 (1*1MO LIBOR + 68) (b) | | 2.784% | | 04/25/28 | | | 33,127 | | | | 31,687 | |
| MLCC Mortgage Investors, Inc., Series 2003-E-A-2 (1*6MO LIBOR + 66) (b) | | 3.896% | | 10/25/28 | | | 455,278 | | | | 438,949 | |
| Mortgage IT Trust, Series 2004-2-M-1 (1*1MO LIBOR + 82.5) (b) | | 2.994% | | 12/25/34 | | | 536,043 | | | | 506,301 | |
| Nationstar Mortgage Loan Trust, 144A, Series 2013-A-A (b) Provident Funding Mortgage Trust, 144A, Series 2019-2-A-2 (b) | | 3.000% | | 12/25/49 | | | 677,485 | | | | 602,350 | |
| Rocket Mortgage, LLC, 144A, Series 2022-1-A-5 | | 2.500% | | 01/25/52 | | | 956,131 | | | | 859,286 | |
| OAKHURST SHORT DURATION BOND FUND |
| Schedule of Investments (Continued) |
COLLATERALIZED MORTGAGE
OBLIGATIONS — 38.3% (Continued) | | Coupon | | Maturity | | Par Value | | Value |
| Non-Agency — 21.6% (Continued) | | | | | | | | | | | | |
| Sequoia Mortgage Trust, Series 2003-5-A-1 (1*1MO LIBOR + 62) (b) | | 2.678% | | 09/20/33 | | $ | 955,203 | | | $ | 922,269 | |
| Sequoia Mortgage Trust, 144A, Series 2019-2-A1 | | 4.000% | | 06/25/49 | | | 928,612 | | | | 910,046 | |
| Sequoia Mortgage Trust, 144A, Series 2019-5-A | | 3.500% | | 12/25/49 | | | 756,667 | | | | 702,209 | |
| Structured Adjustable Rate Mortgage Loan Trust, Series 2004-12-3-A3 (b) | | 2.716% | | 09/25/34 | | | 33,113 | | | | 32,481 | |
| Structured Asset Mortgage Investments II Trust, Series 2004-AR6-A-1A (1*1MO LIBOR + 70) (b) | | 2.716% | | 02/19/35 | | | 371,003 | | | | 356,581 | |
| Structured Asset Mortgage Investments, Inc., Series 2004-AR3-I-A-1 (1*1MO LIBOR + 60) (b) | | 2.720% | | 07/19/34 | | | 844,297 | | | | 782,136 | |
| Structured Asset Securities Corporation, Series 2003-34A-3-A4 (b) | | 3.033% | | 11/25/33 | | | 59,778 | | | | 59,233 | |
| Wa-Mu Mortgage Pass-Through Certificates, Series 2003-AR7-A-7 (b) | | 2.467% | | 08/25/33 | | | 120,015 | | | | 113,005 | |
| Wa-Mu Mortgage Pass-Through Certificates, Series 2003-AR8-A (b) | | 2.765% | | 08/25/33 | | | 84,829 | | | | 83,108 | |
| Wa-Mu Mortgage Pass-Through Certificates, Series 2002-AR2-A (1*COF 11 + 125) (b) | | 1.912% | | 02/27/34 | | | 19,893 | | | | 18,895 | |
| Wells Fargo Mortgage-Backed Securities, Series 2004-K-II-A12 (b) | | 3.493% | | 07/25/34 | | | 11,284 | | | | 11,242 | |
| Wells Fargo Mortgage-Backed Securities, Series 2004-K-II-A-6 (b) | | 3.493% | | 07/25/34 | | | 271,928 | | | | 270,919 | |
| Wells Fargo Mortgage-Backed Securities, 144A, Series 2020-1-A-1 (b) | | 3.000% | | 12/25/49 | | | 820,717 | | | | 723,787 | |
| | | | | | | | | | | | 12,473,621 | |
| | | | | | | | | | | | | |
| Total Collateralized Mortgage Obligations (Cost $23,246,188) | | | | | | | | | | $ | 22,145,320 | |
| OAKHURST SHORT DURATION BOND FUND |
| Schedule of Investments (Continued) |
| CORPORATE BONDS — 41.4% | | Coupon | | Maturity | | Par Value | | Value |
| Communications — 1.5% | | | | | | | | |
| Magallanes, Inc., 144A | | 3.428% | | 03/15/24 | | $ | 420,000 | | | $ | 410,719 | |
| TFCF America, Inc. | | 3.700% | | 09/15/24 | | | 450,000 | | | | 446,345 | |
| | | | | | | | | | | | 857,064 | |
| Consumer Discretionary — 2.3% | | | | | | | | | | | | |
| AutoNation, Inc. | | 3.500% | | 11/15/24 | | | 550,000 | | | | 539,552 | |
| AutoNation, Inc. | | 4.500% | | 10/01/25 | | | 650,000 | | | | 647,139 | |
| Genuine Parts Company | | 1.750% | | 02/01/25 | | | 174,000 | | | | 163,644 | |
| | | | | | | | | | | | 1,350,335 | |
| Consumer Staples — 1.2% | | | | | | | | | | | | |
| Whole Foods Markets, Inc. | | 5.200% | | 12/03/25 | | | 650,000 | | | | 676,152 | |
| | | | | | | | | | | | | |
| Energy — 4.0% | | | | | | | | | | | | |
| Devon Energy Corporation | | 5.250% | | 09/15/24 | | | 550,000 | | | | 558,570 | |
| El Paso Natural Gas Company, LLC | | 7.500% | | 11/15/26 | | | 603,000 | | | | 663,820 | |
| Grey Oak Pipeline, LLC, 144A | | 2.000% | | 09/15/23 | | | 550,000 | | | | 535,988 | |
| Phillips 66 Partners LP | | 3.605% | | 02/15/25 | | | 589,000 | | | | 558,990 | |
| | | | | | | | | | | | 2,317,368 | |
| Financials — 19.1% | | | | | | | | | | | | |
| AerCap Ireland Capital D.A.C. | | 4.500% | | 09/15/23 | | | 550,000 | | | | 547,276 | |
| Ally Financial, Inc. | | 3.875% | | 05/21/24 | | | 550,000 | | | | 545,546 | |
| Antares Holdings L.P., 144A | | 8.500% | | 05/18/25 | | | 525,000 | | | | 549,143 | |
| Ares Capital Corporation | | 4.250% | | 03/01/25 | | | 550,000 | | | | 535,475 | |
| Aspen Insurance Holdings Ltd. | | 4.650% | | 11/15/23 | | | 550,000 | | | | 550,552 | |
| Athene Global Funding, 144A | | 2.750% | | 06/25/24 | | | 550,000 | | | | 528,106 | |
| Aviation Capital Group, LLC, 144A | | 4.125% | | 08/01/25 | | | 575,000 | | | | 539,873 | |
| Blackstone Private Credit Fund | | 2.350% | | 11/22/24 | | | 650,000 | | | | 604,123 | |
| Fairfax Financial Holdings Ltd., 144A | | 4.875% | | 08/13/24 | | | 600,000 | | | | 594,967 | |
| Fidelity & Guaranty Life Holdings, Inc., 144A | | 5.500% | | 05/01/25 | | | 550,000 | | | | 554,220 | |
| First Horizon National Corporation | | 4.000% | | 05/26/25 | | | 550,000 | | | | 540,438 | |
| FS KKR Capital Corporation | | 4.625% | | 07/15/24 | | | 575,000 | | | | 572,155 | |
| Goldman Sachs BDC, Inc. | | 3.750% | | 02/10/25 | | | 550,000 | | | | 539,746 | |
| Goldman Sachs Group, Inc. | | 3.500% | | 01/23/25 | | | 550,000 | | | | 539,398 | |
| Icahn Enterprises, L.P. | | 4.750% | | 09/15/24 | | | 400,000 | | | | 380,512 | |
| JP Morgan Chase & Company | | 3.875% | | 09/10/24 | | | 565,000 | | | | 562,798 | |
| Morgan Stanley | | 4.000% | | 07/23/25 | | | 550,000 | | | | 547,066 | |
| Owl Rock Capital Corporation | | 5.250% | | 04/15/24 | | | 550,000 | | | | 549,658 | |
| PennyMac Mortgage Investment Trust | | 5.500% | | 11/01/24 | | | 650,000 | | | | 625,625 | |
| Wells Fargo & Company | | 3.908% | | 04/25/26 | | | 650,000 | | | | 637,236 | |
| | | | | | | | | | | | 11,043,913 | |
| OAKHURST SHORT DURATION BOND FUND |
| Schedule of Investments (Continued) |
CORPORATE BONDS — 41.4%
(Continued) | | Coupon | | Maturity | | Par Value | | Value |
| Industrials — 4.0% | | | | | | | | | | | | |
| Air Canada Pass-Through Certificates, 144A, Series 2013-1-A | | 4.125% | | 11/15/26 | | | 759,896 | | | | 681,496 | |
| American Airlines Group Pass-Through Certificates, Series 2013-1-A | | 4.000% | | 01/15/27 | | | 436,485 | | | | 378,756 | |
| Delta Air Lines Pass-Through Certificates, Series 2019-1-A | | 3.404% | | 10/25/25 | | | 146,000 | | | | 138,867 | |
| Ryder System, Inc., Series MTN | | 4.625% | | 06/01/25 | | | 550,000 | | | | 549,556 | |
| Southwest Airlines Company | | 5.250% | | 05/04/25 | | | 550,000 | | | | 565,096 | |
| | | | | | | | | | | | 2,313,771 | |
| Real Estate — 0.9% | | | | | | | | | | | | |
| American Tower Corporation | | 4.000% | | 06/01/25 | | | 550,000 | | | | 540,652 | |
| Technology — 5.6% | | | | | | | | | | | | |
| Dell International, LLC | | 5.850% | | 07/15/25 | | | 550,000 | | | | 569,825 | |
| KLA Corporation | | 4.650% | | 11/01/24 | | | 189,000 | | | | 192,117 | |
| Leidos, Inc. | | 3.625% | | 05/15/25 | | | 610,000 | | | | 596,324 | |
| Microchip Technology, Inc. | | 4.250% | | 09/01/25 | | | 663,000 | | | | 656,573 | |
| Oracle Corporation | | 2.950% | | 05/15/25 | | | 600,000 | | | | 575,454 | |
| TD SYNNEX Corporation | | 1.250% | | 08/09/24 | | | 659,000 | | | | 612,381 | |
| | | | | | | | | | | | 3,202,674 | |
| Utilities — 2.8% | | | | | | | | | | | | |
| Elwood Energy, LLC | | 8.159% | | 07/05/26 | | | 481,104 | | | | 481,104 | |
| Entergy New Orleans, LLC | | 4.000% | | 06/01/26 | | | 625,000 | | | | 608,635 | |
| NSG Holdings, LLC, 144A | | 7.750% | | 12/15/25 | | | 526,258 | | | | 509,155 | |
| | | | | | | | | | | | 1,598,894 | |
| | | | | | | | | | | | | |
| Total Corporate Bonds (Cost $25,079,021) | | | | | | | | | | $ | 23,900,823 | |
| OAKHURST SHORT DURATION BOND FUND |
| Schedule of Investments (Continued) |
| MONEY MARKET FUNDS — 1.0% | | Shares | | Value |
| Invesco Short-Term Investments Trust - Treasury Portfolio - Institutional Class, 2.17% (e) (Cost $581,708) | | | 581,708 | | | $ | 581,708 | |
| | | | | | | | | |
| Total Investments at Value — 99.6% (Cost $60,389,265) | | | | | | $ | 57,583,849 | |
| | | | | | | | | |
| Other Assets in Excess of Liabilities — 0.4% | | | | | | | 204,378 | |
| | | | | | | | | |
| Net Assets — 100.0% | | | | | | $ | 57,788,227 | |
144A - Security was purchased in a transaction exempt from registration in compliance with Rule 144A of the Securities Act of 1933. This security may be resold in transactions exempt from registration, normally to qualified institutional buyers. These securities have been deemed liquid under procedures approved by the Board of Trustees. The total value of such securities is $14,011,323 as of August 31, 2022, representing 24.2% of net assets.
COF 11 - Cost of funds for the 11th District of San Francisco.
H15T1Y - U.S. Treasury yield curve rate for U.S. Treasury note with a constant maturity of 1 year.
LIBOR - London Interbank Offered Rate.
| (a) | Percentage rounds to less than 0.1%. |
| (b) | Variable rate security. Interest rate resets periodically. The rate shown is the effective interest rate as of August 31, 2022. For securities based on a published reference rate and spread, the reference rate and spread (in basis points) are indicated parenthetically. Certain variable rate securities are not based on a published reference rate and spread but are determined by the issuer or agent and are based on current market conditions. These securities, therefore, do not indicate a reference rate and spread. |
| (c) | Step Coupon. Rate shown is the coupon in effect as of August 31, 2022. |
| (d) | Illiquid security. Total value of illiquid securities held as of August 31, 2022 was $2, representing 0.0% (a) of net assets. |
| (e) | The rate shown is the 7-day effective yield as of August 31, 2022. |
See accompanying notes to financial statements.
| OAKHURST SHORT DURATION HIGH YIELD CREDIT FUND |
| Schedule of Investments |
| August 31, 2022 |
ASSET-BACKED
SECURITIES — 7.0% | | Coupon | | Maturity | | Par Value | | Value |
| Coinstar Funding, LLC, 144A, Series 2017-1-A-2 | | 5.216% | | 04/25/47 | | $ | 544,813 | | | $ | 526,780 | |
| Fat Brands GFG Royalty, LLC, 144A, Series 2021-1-A-2 | | 6.000% | | 07/25/51 | | | 1,000,000 | | | | 950,683 | |
| Fat Brands Twin Peaks, LLC, 144A, Series 2021-1-B-2 | | 9.000% | | 07/25/51 | | | 1,000,000 | | | | 955,797 | |
| Focus Brands Funding, LLC, 144A, Series 2018-1-A-2 | | 5.184% | | 10/30/48 | | | 481,250 | | | | 454,738 | |
| HOA Funding, LLC, 144A, Series 2021-1-B | | 7.432% | | 08/20/51 | | | 1,250,000 | | | | 1,028,908 | |
| NPR Finance Ltd., 144A, Series 2019-2-C-1 | | 6.441% | | 11/19/49 | | | 774,107 | | | | 699,798 | |
| | | | | | | | | | | | | |
| Total Asset-Backed Securities (Cost $4,960,692) | | | | | | | | | | $ | 4,616,704 | |
| CORPORATE BONDS — 87.9% | | Coupon | | Maturity | | Par Value | | Value |
| Communications — 12.4% | | | | | | | | | | | | |
| Centerfield Media Parent, Inc., 144A | | 6.625% | | 08/01/26 | | $ | 1,000,000 | | | $ | 811,547 | |
| Connect Finco SARL/ U.S. Finco, LLC, 144A | | 6.750% | | 10/01/26 | | | 1,000,000 | | | | 915,737 | |
| GrubHub Holdings, Inc., 144A | | 5.500% | | 07/01/27 | | | 1,200,000 | | | | 936,000 | |
| Hughes Satellite Systems Corporation | | 6.625% | | 08/01/26 | | | 1,015,000 | | | | 960,444 | |
| iHeartCommunications, Inc. | | 8.375% | | 05/01/27 | | | 1,000,000 | | | | 877,560 | |
| Scripps Escrow, Inc., 144A | | 5.875% | | 07/15/27 | | | 750,000 | | | | 684,375 | |
| Summer (BC) BidCo B, LLC, 144A | | 5.500% | | 10/31/26 | | | 950,000 | | | | 825,892 | |
| Terrier Media Buyer, Inc, 144A | | 8.875% | | 12/15/27 | | | 1,000,000 | | | | 860,035 | |
| Uber Technologies, Inc., 144A | | 6.250% | | 01/15/28 | | | 750,000 | | | | 716,250 | |
| Zayo Group Holdings, Inc., 144A | | 4.000% | | 03/01/27 | | | 750,000 | | | | 639,375 | |
| | | | | | | | | | | | 8,227,215 | |
| Consumer Discretionary — 10.2% | | | | | | | | | | | | |
| Arrow BidCo, LLC, 144A | | 9.500% | | 03/15/24 | | | 750,000 | | | | 748,148 | |
| Carnival Corporation 144A | | 7.625% | | 03/01/26 | | | 500,000 | | | | 425,000 | |
| Carvana Company, 144A | | 5.625% | | 10/01/25 | | | 1,000,000 | | | | 749,219 | |
| Jaguar Land Rover Automotive plc, 144A | | 4.500% | | 10/01/27 | | | 250,000 | | | | 183,623 | |
| Lucid Group, Inc. | | 1.250% | | 12/15/26 | | | 1,430,000 | | | | 904,501 | |
| Merlin Entertainments plc, 144A | | 5.750% | | 06/15/26 | | | 968,000 | | | | 917,501 | |
| OAKHURST SHORT DURATION HIGH YIELD CREDIT FUND |
| Schedule of Investments (Continued) |
CORPORATE BONDS — 87.9%
(Continued) | | Coupon | | Maturity | | Par Value | | Value |
| Consumer Discretionary — 10.2% (Continued) | | | | | | | | | | | | |
| NCL Corporation Ltd., 144A | | 3.625% | | 12/15/24 | | $ | 1,200,000 | | | $ | 1,039,885 | |
| Washington Multifamily Acquisition I, 144A | | 5.750% | | 04/15/26 | | | 1,000,000 | | | | 963,970 | |
| White Cap Parent, LLC, 144A (a) | | 8.250% | | 03/15/26 | | | 1,000,000 | | | | 869,904 | |
| | | | | | | | | | | | 6,801,751 | |
| Consumer Staples — 6.2% | | | | | | | | | | | | |
| Beyond Meat, Inc., CV | | 0.000% | | 03/15/27 | | | 1,535,000 | | | | 532,645 | |
| Chobani, LLC, 144A | | 7.500% | | 04/15/25 | | | 752,000 | | | | 714,167 | |
| Coty, Inc., 144A | | 6.500% | | 04/15/26 | | | 1,000,000 | | | | 953,750 | |
| Energizer Holdings, Inc., 144A | | 6.500% | | 12/31/27 | | | 1,000,000 | | | | 930,278 | |
| Tilray, Inc. | | 5.000% | | 10/01/23 | | | 1,000,000 | | | | 971,353 | |
| | | | | | | | | | | | 4,102,193 | |
| Energy — 7.6% | | | | | | | | | | | | |
| Antero Midstream Partners, L.P., 144A | | 5.750% | | 03/01/27 | | | 500,000 | | | | 473,750 | |
| Ascent Resources Utica Holdings, LLC, 144A | | 7.000% | | 11/01/26 | | | 950,000 | | | | 923,875 | |
| Crestwood Midstream Partners, L.P., 144A | | 5.625% | | 05/01/27 | | | 1,000,000 | | | | 932,500 | |
| Howard Midstream Energy Partners, 144A | | 6.750% | | 01/15/27 | | | 1,000,000 | | | | 904,764 | |
| New Fortress Energy, Inc., 144A | | 6.500% | | 09/30/26 | | | 1,200,000 | | | | 1,130,478 | |
| Sunnova Energy Corporation, 144A | | 5.875% | | 09/01/26 | | | 750,000 | | | | 692,355 | |
| | | | | | | | | | | | 5,057,722 | |
| Financials — 13.2% | | | | | | | | | | | | |
| Acrisure, LLC, 144A | | 7.000% | | 11/15/25 | | | 944,000 | | | | 889,541 | |
| AG TTMT Escrow Issuer, LLC, 144A | | 8.625% | | 09/30/27 | | | 750,000 | | | | 750,300 | |
| Castlelake Aviation Finance Company, 144A | | 5.000% | | 04/15/27 | | | 750,000 | | | | 646,751 | |
| Enova International, Inc., 144A | | 8.500% | | 09/15/25 | | | 525,000 | | | | 489,751 | |
| Finance of America Funding, LLC, 144A | | 7.875% | | 11/15/25 | | | 500,000 | | | | 322,500 | |
| Fly Leasing Ltd., 144A | | 7.000% | | 10/15/24 | | | 1,000,000 | | | | 550,000 | |
| Icahn Enterprises, L.P. | | 6.250% | | 05/15/26 | | | 800,000 | | | | 766,908 | |
| INTL FCStone, Inc., 144A | | 8.625% | | 06/15/25 | | | 600,000 | | | | 610,500 | |
| Jefferson Capital Holdings, LLC, 144A | | 6.000% | | 08/15/26 | | | 750,000 | | | | 660,000 | |
| MBIA, Inc. | | 7.000% | | 12/15/25 | | | 500,000 | | | | 493,125 | |
| Navient Corporation | | 6.750% | | 06/15/26 | | | 500,000 | | | | 474,170 | |
| OAKHURST SHORT DURATION HIGH YIELD CREDIT FUND |
| Schedule of Investments (Continued) |
CORPORATE BONDS — 87.9%
(Continued) | | Coupon | | Maturity | | Par Value | | Value |
| Financials — 13.2% (Continued) | | | | | | | | | | | | |
| PennyMac Mortgage Investment Trust | | 5.500% | | 11/01/24 | | $ | 1,000,000 | | | $ | 962,500 | |
| United Shore Financial Services, LLC, 144A | | 5.500% | | 11/15/25 | | | 750,000 | | | | 654,972 | |
| World Acceptance Corporation, 144A | | 7.000% | | 11/01/26 | | | 750,000 | | | | 521,491 | |
| | | | | | | | | | | | 8,792,509 | |
| Health Care — 9.2% | | | | | | | | | | | | |
| Akumin, Inc., 144A | | 7.000% | | 11/01/25 | | | 850,000 | | | | 720,747 | |
| Global Medical Response, Inc., 144A | | 6.500% | | 10/01/25 | | | 987,000 | | | | 880,897 | |
| Heartland Dental, LLC, 144A | | 8.500% | | 05/01/26 | | | 1,003,000 | | | | 955,357 | |
| Prime Healthcare Services, Inc., 144A | | 7.250% | | 11/01/25 | | | 1,000,000 | | | | 885,000 | |
| RP Escrow Issuer, LLC, 144A | | 5.250% | | 12/15/25 | | | 750,000 | | | | 669,196 | |
| Surgery Center Holdings, Inc., 144A | | 6.750% | | 07/01/25 | | | 991,000 | | | | 956,001 | |
| U.S. Acute Care Solutions, LLC, 144A | | 6.375% | | 03/01/26 | | | 1,210,000 | | | | 1,081,032 | |
| | | | | | | | | | | | 6,148,230 | |
| Industrials — 16.7% | | | | | | | | | | | | |
| Air Canada Pass-Through Certificates, 144A, Series 2015-1-B | | 3.875% | | 09/15/24 | | | 63,606 | | | | 62,316 | |
| Air Canada Pass-Through Certificates, 144A, Series 2017-1-B | | 3.700% | | 01/15/26 | | | 839,074 | | | | 751,174 | |
| Alta Equipment Group, Inc., 144A | | 5.625% | | 04/15/26 | | | 1,000,000 | | | | 867,320 | |
| American Airlines Group Pass-Through Certificates, Series 2014-1-B | | 4.375% | | 04/01/24 | | | 1,216,793 | | | | 1,215,206 | |
| American Airlines Group Pass-Through Certificates, Series 2017-1B-B | | 4.950% | | 08/15/26 | | | 824,800 | | | | 760,582 | |
| Brundage-Bone Concrete Pumping, 144A | | 6.000% | | 02/01/26 | | | 750,000 | | | | 688,751 | |
| Doric Nimrod Air Finance Alpha Ltd., 144A, Series 2012-1 | | 5.125% | | 11/30/24 | | | 397,818 | | | | 390,896 | |
| GardaWorld Security Corporation, 144A | | 4.625% | | 02/15/27 | | | 750,000 | | | | 659,175 | |
| OAKHURST SHORT DURATION HIGH YIELD CREDIT FUND |
| Schedule of Investments (Continued) |
CORPORATE BONDS — 87.9%
(Continued) | | Coupon | | Maturity | | Par Value | | Value |
| Industrials — 16.7% (Continued) | | | | | | | | | | | | |
| JPW Industries Holding Corporation, 144A | | 9.000% | | 10/01/24 | | $ | 1,000,000 | | | $ | 895,010 | |
| PowerTeam Services, LLC, 144A | | 9.033% | | 12/04/25 | | | 925,000 | | | | 758,500 | |
| Prime Security Services Borrower, LLC, 144A | | 5.750% | | 04/15/26 | | | 1,000,000 | | | | 962,455 | |
| Promontoria Holding 264 B.V., 144A | | 7.875% | | 03/01/27 | | | 1,000,000 | | | | 857,500 | |
| Sotheby’s, 144A | | 4.875% | | 12/15/25 | | | 6,000 | | | | 5,805 | |
| Tutor Perini Corporation, 144A | | 6.875% | | 05/01/25 | | | 750,000 | | | | 613,125 | |
| United Airlines, Inc., Series 2016-1B | | 3.650% | | 07/07/27 | | | 829,687 | | | | 741,141 | |
| Waste Pro USA, Inc., 144A | | 5.500% | | 02/15/26 | | | 1,000,000 | | | | 896,250 | |
| | | | | | | | | | | | 11,125,206 | |
| Materials — 2.4% | | | | | | | | | | | | |
| Fortress Transportation & Infrastructure Investors, LLC, 144A | | 9.750% | | 08/01/27 | | | 750,000 | | | | 752,664 | |
| Neon Holdings, Inc., 144A | | 10.125% | | 04/01/26 | | | 900,000 | | | | 837,002 | |
| | | | | | | | | | | | 1,589,666 | |
| Real Estate — 4.4% | | | | | | | | | | | | |
| Brookfield Property Partners, L.P., 144A | | 5.750% | | 05/15/26 | | | 1,000,000 | | | | 932,626 | |
| New Residential Investment Corporation, 144A | | 6.250% | | 10/15/25 | | | 700,000 | | | | 620,942 | |
| Service Properties Trust | | 5.250% | | 02/15/26 | | | 750,000 | | | | 645,475 | |
| WeWork Companies, Inc., 144A | | 7.875% | | 05/01/25 | | | 1,000,000 | | | | 746,050 | |
| | | | | | | | | | | | 2,945,093 | |
| Technology — 3.5% | | | | | | | | | | | | |
| CPI Cg, Inc., 144A | | 8.625% | | 03/15/26 | | | 934,000 | | | | 897,682 | |
| LogMeIn, Inc., 144A | | 5.500% | | 09/01/27 | | | 1,000,000 | | | | 726,615 | |
| MicroStrategy, Inc., CV | | 0.000% | | 02/15/27 | | | 1,500,000 | | | | 700,143 | |
| | | | | | | | | | | | 2,324,440 | |
| Utilities — 2.1% | | | | | | | | | | | | |
| Elwood Energy, LLC | | 8.159% | | 07/05/26 | | | 601,380 | | | | 601,380 | |
| NSG Holdings, LLC, 144A | | 7.750% | | 12/15/25 | | | 794,181 | | | | 768,370 | |
| | | | | | | | | | | | 1,369,750 | |
| | | | | | | | | | | | | |
| Total Corporate Bonds (Cost $66,867,391) | | | | | | | | | | $ | 58,483,775 | |
| OAKHURST SHORT DURATION HIGH YIELD CREDIT FUND |
| Schedule of Investments (Continued) |
| MONEY MARKET FUNDS — 3.6% | | Shares | | Value |
| Invesco Short-Term Investments Trust - Treasury Portfolio - Institutional Class, 2.17% (b) (Cost $2,427,519) | | | 2,427,519 | | | $ | 2,427,519 | |
| | | | | | | | | |
| Total Investments at Value — 98.5% (Cost $74,255,602) | | | | | | $ | 65,527,998 | |
| | | | | | | | | |
| Other Assets in Excess of Liabilities — 1.5% | | | | | | | 985,910 | |
| | | | | | | | | |
| Net Assets — 100.0% | | | | | | $ | 66,513,908 | |
144A - Security was purchased in a transaction exempt from registration in compliance with Rule 144A of the Securities Act of 1933. This security may be resold in transactions exempt from registration, normally to qualified institutional buyers. These securities have been deemed liquid under procedures approved by the Board of Trustees. The total value of such securities is $51,493,346 as of August 31, 2022, representing 77.4% of net assets.
CV - Convertible security.
| (a) | Payment-in-kind bond. The rate shown is the coupon rate of 8.25%. The payment-in-kind rate is 0.75%. |
| (b) | The rate shown is the 7-day effective yield as of August 31, 2022. |
See accompanying notes to financial statements.
| F/m FUNDS TRUST |
| Statements of Assets and Liabilities |
| August 31, 2022 |
| | | | | | | | | Oakhurst Short | |
| | | | | | Oakhurst Short | | | Duration High | |
| | | Oakhurst Fixed | | | Duration Bond | | | Yield Credit | |
| | | Income Fund | | | Fund | | | Fund | |
| ASSETS | | | | | | | | | | | | |
| Investments in securities: | | | | | | | | | | | | |
| At cost | | $ | 130,053,587 | | | $ | 60,389,265 | | | $ | 74,255,602 | |
| At value (Note 2) | | $ | 119,251,102 | | | $ | 57,583,849 | | | $ | 65,527,998 | |
| Receivable for capital shares sold | | | 86,473 | | | | — | | | | 5,920 | |
| Dividends and interest receivable | | | 727,053 | | | | 389,755 | | | | 1,285,428 | |
| Other assets | | | 15,906 | | | | 15,440 | | | | 10,075 | |
| TOTAL ASSETS | | | 120,080,534 | | | | 57,989,044 | | | | 66,829,421 | |
| | | | | | | | | | | | | |
| LIABILITIES | | | | | | | | | | | | |
| Dividends payable | | | 261,707 | | | | 116,939 | | | | 244,536 | |
| Payable for capital shares redeemed | | | 330,200 | | | | 51,692 | | | | 16,445 | |
| Payable for investment securities purchased | | | 15,920 | | | | — | | | | — | |
| Payable to Adviser (Note 4) | | | 34,142 | | | | 10,401 | | | | 35,167 | |
| Payable to administrator (Note 4) | | | 12,890 | | | | 8,010 | | | | 8,750 | |
| Other accrued expenses | | | 15,775 | | | | 13,775 | | | | 10,615 | |
| TOTAL LIABILITIES | | | 670,634 | | | | 200,817 | | | | 315,513 | |
| | | | | | | | | | | | | |
| NET ASSETS | | $ | 119,409,900 | | | $ | 57,788,227 | | | $ | 66,513,908 | |
| | | | | | | | | | | | | |
| Net assets consist of: | | | | | | | | | | | | |
| Paid-in capital | | $ | 131,940,333 | | | $ | 62,967,422 | | | $ | 78,159,216 | |
| Accumulated deficit | | | (12,530,433 | ) | | | (5,179,195 | ) | | | (11,645,308 | ) |
| NET ASSETS | | $ | 119,409,900 | | | $ | 57,788,227 | | | $ | 66,513,908 | |
| | | | | | | | | | | | | |
| PRICING OF INSTITUTIONAL SHARES (NOTE 1) | | | | | | | | | | | | |
| Net assets applicable to | | | | | | | | | | | | |
| Institutional Shares | | $ | 119,409,900 | | | $ | 57,788,227 | | | $ | 66,513,908 | |
| Shares of Institutional Shares outstanding (unlimited number of shares authorized, no par value) | | | 13,423,461 | | | | 6,204,867 | | | | 7,562,738 | |
| Net asset value, offering and redemption price per share (Note 2) | | $ | 8.90 | | | $ | 9.31 | | | $ | 8.79 | |
See accompanying notes to financial statements.
| F/m FUNDS TRUST |
| Statements of Operations |
| For the Year Ended August 31, 2022 |
| | | | | | | | | Oakhurst Short | |
| | | | | | Oakhurst Short | | | Duration High | |
| | | Oakhurst Fixed | | | Duration Bond | | | Yield Credit | |
| | | Income Fund | | | Fund | | | Fund | |
| INVESTMENT INCOME | | | | | | | | | | | | |
| Interest | | $ | 2,940,707 | | | $ | 1,822,943 | | | $ | 4,887,723 | |
| Dividends | | | 8,530 | | | | 7,923 | | | | 13,355 | |
| TOTAL INCOME | | | 2,949,237 | | | | 1,830,866 | | | | 4,901,078 | |
| | | | | | | | | | | | | |
| EXPENSES | | | | | | | | | | | | |
| Investment advisory fees (Note 4) | | | 573,921 | | | | 294,537 | | | | 635,767 | |
| Administration fees (Note 4) | | | 88,844 | | | | 65,902 | | | | 67,728 | |
| Registration and filing fees | | | 45,106 | | | | 46,752 | | | | 30,409 | |
| Fund accounting fees (Note 4) | | | 41,472 | | | | 38,389 | | | | 38,461 | |
| Trustees’ fees and expenses (Note 4) | | | 37,103 | | | | 37,103 | | | | 37,103 | |
| Pricing costs | | | 41,580 | | | | 37,366 | | | | 18,783 | |
| Insurance expense | | | 29,800 | | | | 31,851 | | | | 20,330 | |
| Legal fees | | | 21,585 | | | | 21,585 | | | | 21,585 | |
| Audit and tax services fees | | | 17,808 | | | | 17,808 | | | | 17,808 | |
| Transfer agent fees (Note 4) | | | 18,000 | | | | 12,000 | | | | 12,000 | |
| Compliance service fees and expenses (Note 4) | | | 12,626 | | | | 12,626 | | | | 12,626 | |
| Custodian and bank service fees | | | 13,804 | | | | 11,745 | | | | 8,258 | |
| Shareholder reporting expenses | | | 8,093 | | | | 5,898 | | | | 5,948 | |
| Other expenses | | | 11,376 | | | | 11,108 | | | | 12,186 | |
| TOTAL EXPENSES | | | 961,118 | | | | 644,670 | | | | 938,992 | |
| Less fee reductions by the Adviser (Note 4) | | | (272,412 | ) | | | (139,749 | ) | | | (133,686 | ) |
| NET EXPENSES | | | 688,706 | | | | 504,921 | | | | 805,306 | |
| | | | | | | | | | | | | |
| NET INVESTMENT INCOME | | | 2,260,531 | | | | 1,325,945 | | | | 4,095,772 | |
| | | | | | | | | | | | | |
| REALIZED AND UNREALIZED LOSSES ON INVESTMENTS | | | | | | | | | | | | |
| Net realized losses from investment transactions | | | (1,225,877 | ) | | | (643,602 | ) | | | (888,591 | ) |
| Net change in unrealized appreciation (depreciation) on investments | | | (13,290,452 | ) | | | (4,210,869 | ) | | | (10,427,059 | ) |
| NET REALIZED AND UNREALIZED LOSSES ON INVESTMENTS | | | (14,516,329 | ) | | | (4,854,471 | ) | | | (11,315,650 | ) |
| | | | | | | | | | | | | |
| NET DECREASE IN NET ASSETS FROM OPERATIONS | | $ | (12,255,798 | ) | | $ | (3,528,526 | ) | | $ | (7,219,878 | ) |
See accompanying notes to financial statements.
| OAKHURST FIXED INCOME FUND |
| Statements of Changes in Net Assets |
| | | Year Ended | | | Year Ended | |
| | | August 31, | | | August 31, | |
| | | 2022 | | | 2021 | |
| FROM OPERATIONS | | | | | | | | |
| Net investment income | | $ | 2,260,531 | | | $ | 1,910,644 | |
| Net realized gains (losses) from investment transactions | | | (1,225,877 | ) | | | 1,619,096 | |
| Net change in unrealized appreciation (depreciation) on investments | | | (13,290,452 | ) | | | (1,963,767 | ) |
| Net increase (decrease) in net assets from operations | | | (12,255,798 | ) | | | 1,565,973 | |
| | | | | | | | | |
| DISTRIBUTIONS TO SHAREHOLDERS (Note 2) | | | | | | | | |
| Institutional Shares | | | (3,681,583 | ) | | | (3,462,407 | ) |
| | | | | | | | | |
| FROM CAPITAL SHARE TRANSACTIONS | | | | | | | | |
| Institutional Shares | | | | | | | | |
| Proceeds from shares sold | | | 64,441,849 | | | | 78,011,415 | |
| Reinvestments of distributions to shareholders | | | 738,322 | | | | 918,130 | |
| Payments for shares redeemed | | | (56,042,754 | ) | | | (47,251,409 | ) |
| Net increase in net assets from capital share transactions | | | 9,137,417 | | | | 31,678,136 | |
| | | | | | | | | |
| TOTAL INCREASE (DECREASE) IN NET ASSETS | | | (6,799,964 | ) | | | 29,781,702 | |
| | | | | | | | | |
| NET ASSETS | | | | | | | | |
| Beginning of year | | | 126,209,864 | | | | 96,428,162 | |
| End of year | | $ | 119,409,900 | | | $ | 126,209,864 | |
| | | | | | | | | |
| CAPITAL SHARE ACTIVITY | | | | | | | | |
| Institutional Shares | | | | | | | | |
| Shares sold | | | 6,881,074 | | | | 7,521,975 | |
| Shares issued in reinvestment of distributions to shareholders | | | 75,845 | | | | 89,271 | |
| Shares redeemed | | | (5,809,167 | ) | | | (4,604,183 | ) |
| Net increase in shares outstanding | | | 1,147,752 | | | | 3,007,063 | |
| Shares outstanding, beginning of year | | | 12,275,709 | | | | 9,268,646 | |
| Shares outstanding, end of year | | | 13,423,461 | | | | 12,275,709 | |
See accompanying notes to financial statements.
| OAKHURST SHORT DURATION BOND FUND |
| Statements of Changes in Net Assets |
| | | Year Ended | | | Year Ended | |
| | | August 31, | | | August 31, | |
| | | 2022 | | | 2021 | |
| FROM OPERATIONS | | | | | | | | |
| Net investment income | | $ | 1,325,945 | | | $ | 2,058,628 | |
| Net realized gains (losses) from investment transactions | | | (643,602 | ) | | | 1,486,440 | |
| Net change in unrealized appreciation (depreciation) on investments | | | (4,210,869 | ) | | | (383,467 | ) |
| Net increase (decrease) in net assets from operations | | | (3,528,526 | ) | | | 3,161,601 | |
| | | | | | | | | |
| DISTRIBUTIONS TO SHAREHOLDERS (Note 2) | | | | | | | | |
| Institutional Shares | | | (1,804,631 | ) | | | (2,894,249 | ) |
| | | | | | | | | |
| FROM CAPITAL SHARE TRANSACTIONS | | | | | | | | |
| Institutional Shares | | | | | | | | |
| Proceeds from shares sold | | | 35,269,520 | | | | 88,126,252 | |
| Reinvestments of distributions to shareholders | | | 768,186 | | | | 874,879 | |
| Payments for shares redeemed | | | (104,061,592 | ) | | | (83,946,474 | ) |
| Net increase (decrease) in net assets from capital share transactions | | | (68,023,886 | ) | | | 5,054,657 | |
| | | | | | | | | |
| TOTAL INCREASE (DECREASE) IN NET ASSETS | | | (73,357,043 | ) | | | 5,322,009 | |
| | | | | | | | | |
| NET ASSETS | | | | | | | | |
| Beginning of year | | | 131,145,270 | | | | 125,823,261 | |
| End of year | | $ | 57,788,227 | | | $ | 131,145,270 | |
| | | | | | | | | |
| CAPITAL SHARE ACTIVITY | | | | | | | | |
| Institutional Shares | | | | | | | | |
| Shares sold | | | 3,667,532 | | | | 8,804,787 | |
| Shares issued in reinvestment of distributions to shareholders | | | 78,435 | | | | 87,455 | |
| Shares redeemed | | | (10,663,975 | ) | | | (8,381,617 | ) |
| Net increase (decrease) in shares outstanding | | | (6,918,008 | ) | | | 510,625 | |
| Shares outstanding, beginning of year | | | 13,122,875 | | | | 12,612,250 | |
| Shares outstanding, end of year | | | 6,204,867 | | | | 13,122,875 | |
See accompanying notes to financial statements.
| OAKHURST SHORT DURATION |
| HIGH YIELD CREDIT FUND |
| Statements of Changes in Net Assets |
| | | Year Ended | | | Year Ended | |
| | | August 31, | | | August 31, | |
| | | 2022 | | | 2021 | |
| FROM OPERATIONS | | | | | | | | |
| Net investment income | | $ | 4,095,772 | | | $ | 3,000,859 | |
| Net realized gains (losses) from investment transactions | | | (888,591 | ) | | | 972,261 | |
| Net change in unrealized appreciation (depreciation) on investments | | | (10,427,059 | ) | | | 1,047,774 | |
| Net increase (decrease) in net assets from operations | | | (7,219,878 | ) | | | 5,020,894 | |
| | | | | | | | | |
| DISTRIBUTIONS TO SHAREHOLDERS (Note 2) | | | | | | | | |
| Institutional Shares | | | (4,142,799 | ) | | | (3,025,838 | ) |
| | | | | | | | | |
| FROM CAPITAL SHARE TRANSACTIONS | | | | | | | | |
| Institutional Shares | | | | | | | | |
| Proceeds from shares sold | | | 29,873,353 | | | | 62,909,027 | |
| Reinvestments of distributions to shareholders | | | 779,803 | | | | 313,077 | |
| Payments for shares redeemed | | | (54,209,366 | ) | | | (5,677,934 | ) |
| Net increase (decrease) in net assets from capital share transactions | | | (23,556,210 | ) | | | 57,544,170 | |
| | | | | | | | | |
| TOTAL INCREASE (DECREASE) IN NET ASSETS | | | (34,918,887 | ) | | | 59,539,226 | |
| | | | | | | | | |
| NET ASSETS | | | | | | | | |
| Beginning of year | | | 101,432,795 | | | | 41,893,569 | |
| End of year | | | 66,513,908 | | | | 101,432,795 | |
| | | | | | | | | |
| CAPITAL SHARE ACTIVITY | | | | | | | | |
| Institutional Shares | | | | | | | | |
| Shares sold | | | 3,077,434 | | | | 6,274,844 | |
| Shares issued in reinvestment of distributions to shareholders | | | 83,932 | | | | 31,499 | |
| Shares redeemed | | | (5,680,701 | ) | | | (570,682 | ) |
| Net increase (decrease) in shares outstanding | | | (2,519,335 | ) | | | 5,735,661 | |
| Shares outstanding, beginning of year | | | 10,082,073 | | | | 4,346,412 | |
| Shares outstanding, end of year | | | 7,562,738 | | | | 10,082,073 | |
See accompanying notes to financial statements.
| OAKHURST FIXED INCOME FUND |
| INSTITUTIONAL SHARES |
| Financial Highlights |
Per share data for a share outstanding throughout each year:
| | | Year | | | Year | | | Year | | | Year | | | Year | |
| | | Ended | | | Ended | | | Ended | | | Ended | | | Ended | |
| | | Aug. 31, | | | Aug. 31, | | | Aug. 31, | | | Aug. 31, | | | Aug. 31, | |
| | | 2022 | | | 2021 | | | 2020 | | | 2019 | | | 2018 | |
| Net asset value at beginning of year | | $ | 10.28 | | | $ | 10.40 | | | $ | 10.10 | | | $ | 9.60 | | | $ | 9.91 | |
| Income (loss) from investment operations: | | | | | | | | | | | | | | | | | | | | |
| Net investment income | | | 0.19 | | | | 0.15 | | | | 0.22 | | | | 0.28 | | | | 0.27 | |
| Net realized and unrealized gains (losses) on investments | | | (1.26 | ) | | | (0.00 | ) (a) | | | 0.32 | | | | 0.51 | | | | (0.27 | ) |
| Total from investment operations | | | (1.07 | ) | | | 0.15 | | | | 0.54 | | | | 0.79 | | | | (0.00 | ) (a) |
| Less distributions from: | | | | | | | | | | | | | | | | | | | | |
| Net investment income | | | (0.22 | ) | | | (0.21 | ) | | | (0.24 | ) | | | (0.29 | ) | | | (0.29 | ) |
| Net realized gains on investments | | | (0.09 | ) | | | (0.06 | ) | | | — | | | | — | | | | (0.02 | ) |
| Total distributions | | | (0.31 | ) | | | (0.27 | ) | | | (0.24 | ) | | | (0.29 | ) | | | (0.31 | ) |
| Net asset value at end of year | | $ | 8.90 | | | $ | 10.28 | | | $ | 10.40 | | | $ | 10.10 | | | $ | 9.60 | |
| Total return (b) | | | (10.59 | %) | | | 1.42 | % | | | 5.45 | % | | | 8.42 | % | | | 0.01 | % |
| Net assets at end of year (000’s) | | $ | 119,410 | | | $ | 126,210 | | | $ | 96,428 | | | $ | 76,637 | | | $ | 60,020 | |
| Ratio of total expenses to average net assets (c) | | | 0.84 | % | | | 0.80 | % | | | 0.87 | % | | | 0.94 | % | | | 0.95 | % |
| Ratio of net expenses to average net assets | | | 0.60 | % | | | 0.60 | % | | | 0.60 | % | | | 0.60 | % | | | 0.60 | % |
| Ratio of net investment income to average net assets (c) | | | 1.97 | % | | | 1.45 | % | | | 2.20 | % | | | 2.92 | % | | | 2.77 | % |
| Portfolio turnover rate | | | 48 | % | | | 52 | % | | | 43 | % | | | 36 | % | | | 46 | % |
| (a) | Rounds to less than $0.01 per share. |
| (b) | Total return is a measure of the change in value of an investment in the Fund over the periods covered, which assumes any dividends or capital gains distributions are reinvested in shares of the Fund. The returns shown do not reflect the deduction of taxes a shareholder would pay on Fund distributions or the redemption of Fund shares. Had the Adviser not reduced/waived its fees, the total returns would have been lower. |
| (c) | Ratios were determined based on expenses prior to any fee reductions/waivers by the Adviser (Note 4). |
See accompanying notes to financial statements.
| OAKHURST SHORT DURATION BOND FUND |
| INSTITUTIONAL SHARES |
| Financial Highlights |
Per share data for a share outstanding throughout each year:
| | | Year | | | Year | | | Year | | | Year | | | Year | |
| | | Ended | | | Ended | | | Ended | | | Ended | | | Ended | |
| | | Aug. 31, | | | Aug. 31, | | | Aug. 31, | | | Aug. 31, | | | Aug. 31, | |
| | | 2022 | | | 2021 | | | 2020 | | | 2019 | | | 2018 | |
| Net asset value at beginning of year | | $ | 9.99 | | | $ | 9.98 | | | $ | 9.94 | | | $ | 9.80 | | | $ | 9.97 | |
| Income (loss) from investment operations: | | | | | | | | | | | | | | | | | | | | |
| Net investment income | | | 0.14 | | | | 0.15 | | | | 0.22 | | | | 0.24 | | | | 0.21 | |
| Net realized and unrealized gains (losses) on investments | | | (0.60 | ) | | | 0.07 | | | | 0.07 | | | | 0.18 | | | | (0.14 | ) |
| Total from investment operations | | | (0.46 | ) | | | 0.22 | | | | 0.29 | | | | 0.42 | | | | 0.07 | |
| Less distributions from: | | | | | | | | | | | | | | | | | | | | |
| Net investment income | | | (0.22 | ) | | | (0.21 | ) | | | (0.25 | ) | | | (0.28 | ) | | | (0.24 | ) |
| Net asset value at end of year | | $ | 9.31 | | | $ | 9.99 | | | $ | 9.98 | | | $ | 9.94 | | | $ | 9.80 | |
| Total return (a) | | | (4.65 | %) | | | 2.26 | % | | | 2.95 | % | | | 4.31 | % | | | 0.73 | % |
| Net assets at end of year (000’s) | | $ | 57,788 | | | $ | 131,145 | | | $ | 125,823 | | | $ | 112,976 | | | $ | 128,254 | |
| Ratio of total expenses to average net assets (b) | | | 0.77 | % | | | 0.65 | % | | | 0.68 | % | | | 0.63 | % | | | 0.65 | % |
| Ratio of net expenses to average net assets | | | 0.60 | % | | | 0.60 | % | | | 0.60 | % | | | 0.60 | % | | | 0.60 | % |
| Ratio of net investment income to average net assets (b) | | | 1.58 | % | | | 1.51 | % | | | 2.13 | % | | | 2.48 | % | | | 2.09 | % |
| Portfolio turnover rate | | | 70 | % | | | 102 | % | | | 70 | % | | | 47 | % | | | 51 | % |
| (a) | Total return is a measure of the change in value of an investment in the Fund over the periods covered, which assumes any dividends or capital gains distributions are reinvested in shares of the Fund. The returns shown do not reflect the deduction of taxes a shareholder would pay on Fund distributions or the redemption of Fund shares. Had the Adviser not reduced/waived its fees, the total returns would have been lower. |
| (b) | Ratios were determined based on expenses prior to any fee reductions/waivers by the Adviser (Note 4). |
See accompanying notes to financial statements.
| OAKHURST SHORT DURATION |
| HIGH YIELD CREDIT FUND |
| INSTITUTIONAL SHARES |
| Financial Highlights |
Per share data for a share outstanding throughout each year:
| | | Year | | | Year | | | Year | | | Year | | | Year | |
| | | Ended | | | Ended | | | Ended | | | Ended | | | Ended | |
| | | Aug. 31, | | | Aug. 31, | | | Aug. 31, | | | Aug. 31, | | | Aug. 31, | |
| | | 2022 | | | 2021 | | | 2020 | | | 2019 | | | 2018 | |
| Net asset value at beginning of year | | $ | 10.06 | | | $ | 9.64 | | | $ | 9.95 | | | $ | 10.00 | | | $ | 10.28 | |
| Income (loss) from investment operations: | | | | | | | | | | | | | | | | | | | | |
| Net investment income | | | 0.47 | | | | 0.47 | | | | 0.52 | | | | 0.52 | | | | 0.52 | |
| Net realized and unrealized gains (losses) on investments | | | (1.26 | ) | | | 0.42 | | | | (0.31 | ) | | | (0.05 | ) | | | (0.21 | ) |
| Total from investment operations | | | (0.79 | ) | | | 0.89 | | | | 0.21 | | | | 0.47 | | | | 0.31 | |
| Less distributions from: | | | | | | | | | | | | | | | | | | | | |
| Net investment income | | | (0.48 | ) | | | (0.47 | ) | | | (0.52 | ) | | | (0.52 | ) | | | (0.52 | ) |
| Net realized gains on investments | | | — | | | | — | | | | — | | | | — | | | | (0.07 | ) |
| Total distributions | | | (0.48 | ) | | | (0.47 | ) | | | (0.52 | ) | | | (0.52 | ) | | | (0.59 | ) |
| Net asset value at end of year | | $ | 8.79 | | | $ | 10.06 | | | $ | 9.64 | | | $ | 9.95 | | | $ | 10.00 | |
| Total return (a) | | | (8.11 | %) | | | 9.45 | % | | | 2.27 | % | | | 4.87 | % | | | 3.08 | % |
| Net assets at end of year (000’s) | | $ | 66,514 | | | $ | 101,433 | | | $ | 41,894 | | | $ | 45,830 | | | $ | 41,730 | |
| Ratio of total expenses to average net assets (b) | | | 1.11 | % | | | 1.18 | % | | | 1.29 | % | | | 1.25 | % | | | 1.25 | % |
| Ratio of net expenses to average net assets | | | 0.95 | % | | | 0.95 | % | | | 0.95 | % | | | 0.95 | % | | | 0.95 | % |
| Ratio of net investment income to average net assets (b) | | | 4.84 | % | | | 4.72 | % | | | 5.38 | % | | | 5.29 | % | | | 5.08 | % |
| Portfolio turnover rate | | | 53 | % | | | 60 | % | | | 113 | % | | | 86 | % | | | 78 | % |
| (a) | Total return is a measure of the change in value of an investment in the Fund over the periods covered, which assumes any dividends or capital gains distributions are reinvested in shares of the Fund. The returns shown do not reflect the deduction of taxes a shareholder would pay on Fund distributions or the redemption of Fund shares. Had the Adviser not reduced/waived its fees, the total returns would have been lower. |
| (b) | Ratios were determined based on expenses prior to any fee reductions/waivers by the Adviser (Note 4). |
See accompanying notes to financial statements.
| F/m FUNDS TRUST |
| Notes to Financial Statements |
| August 31, 2022 |
Oakhurst Fixed Income Fund (formerly First Western Fixed Income Fund), Oakhurst Short Duration Bond Fund (formerly First Western Short Duration Bond Fund) and Oakhurst Short Duration High Yield Credit Fund (formerly First Western Short Duration High Yield Credit Fund) (individually, a “Fund,” and, collectively, the “Funds”) are each a diversified series of the F/m Funds Trust (formerly First Western Funds Trust) (the “Trust”), an open-end management investment company established as an Ohio business trust under a Declaration of Trust dated April 2, 2012. Other series of the Trust are not incorporated in this report.
The investment objective of Oakhurst Fixed Income Fund is total return.
The investment objective of Oakhurst Short Duration Bond Fund is to seek a high level of income consistent with preservation of capital and liquidity.
The investment objective of Oakhurst Short Duration High Yield Credit Fund is to seek a high level of income and capital appreciation.
Each Fund has registered two classes of shares, Institutional shares and Retail shares. As of the date of this report, Retail shares of each Fund are not currently offered. When both classes of each Fund are offered, each share class will represent an ownership interest in the corresponding Fund’s investment portfolio.
| 2. | Significant Accounting Policies |
The following is a summary of the Funds’ significant accounting policies used in the preparation of their financial statements. These policies are in conformity with accounting principles generally accepted in the United States of America (“GAAP”). The Funds follow accounting and reporting guidance under Financial Accounting Standards Board (“FASB”) Accounting Standards Codification Topic 946, “Financial Services – Investment Companies.”
Accounting Pronouncement – In March 2020, FASB issued Accounting Standards Update 2020-04, Reference Rate Reform: Facilitation of the Effects of Reference Rate Reform on Financial Reporting (“ASU 2020-04”) and in January 2021, the FASB issued Accounting Standards Update 2021-01, Reference Rate Reform (Topic 848): Scope (“ASU 2021-01”), which provides optional, temporary relief with respect to the financial reporting of contracts subject to certain types of modifications due to the planned discontinuation of the London Interbank Offered Rate (“LIBOR”) and other interbank offered rates as of the end of 2021. The temporary relief provided by ASU 2020-04 and ASU 2021-01 is effective for certain reference rate-related contract modifications that occur during the period from March 12, 2020 through December 31, 2022. The Funds will consider this optional
| F/m FUNDS TRUST |
| Notes to Financial Statements (Continued) |
guidance prospectively, if applicable. Management is currently actively working with other financial institutions and counterparties to modify contracts as required by applicable regulation and within the regulatory deadlines.
Securities valuation – Securities are generally valued at fair value using prices provided by an independent pricing service approved by the Trust’s Board of Trustees (the “Board”). The independent pricing service uses information with respect to transactions in bonds, quotations from bond dealers, market transactions in comparable securities and various relationships between securities in determining these prices. The methods used by the independent pricing service and the quality of valuations so established are reviewed by Oakhurst Capital Management, LLC (the “Adviser”) under the general supervision of the Board.
In the event that market prices are not readily available or are considered unreliable due to market or other events, the Funds value their securities and other assets at fair value using procedures approved by the Board.
Investments in registered investment companies, including money market funds, are reported at their respective net asset values (“NAVs”) as reported by those companies.
GAAP establishes a single authoritative definition of fair value, sets out a framework for measuring fair value and requires additional disclosures about fair value measurements.
Various inputs are used in determining the value of each Fund’s investments. These inputs are summarized in the three broad levels listed below:
| ● | Level 1 – unadjusted quoted prices in active markets for identical securities |
| ● | Level 2 – other significant observable inputs |
| ● | Level 3 – significant unobservable inputs |
Fixed income securities held by the Funds are typically classified as Level 2 since values are typically provided by an independent pricing service that utilizes various “other significant observable inputs,” including benchmark yields, reported trades, broker dealer quotes, issuer spreads, benchmark securities, bids, offers, reference data and industry and market events. The inputs or methodology used are not necessarily an indication of the risks associated with investing in those securities. The inputs used to measure fair value may fall into different levels of the fair value hierarchy. In such cases, for disclosure purposes, the level in the fair value hierarchy within which the fair value measurement falls in its entirety is based on the lowest level input that is significant to the fair value measurement.
| F/m FUNDS TRUST |
| Notes to Financial Statements (Continued) |
The following is a summary of each Fund’s investments based on inputs used to value the investments as of August 31, 2022:
Oakhurst Fixed Income Fund
| | | Level 1 | | | Level 2 | | | Level 3 | | | Total | |
| U.S. Government & Agencies | | $ | — | | | $ | 26,993,972 | | | $ | — | | | $ | 26,993,972 | |
| Municipal Bonds | | | — | | | | 232,878 | | | | — | | | | 232,878 | |
| Asset-Backed Securities | | | — | | | | 11,339,536 | | | | — | | | | 11,339,536 | |
| Collateralized Mortgage Obligations | | | — | | | | 39,684,409 | | | | — | | | | 39,684,409 | |
| Corporate Bonds | | | — | | | | 40,390,320 | | | | — | | | | 40,390,320 | |
| Money Market Funds | | | 609,987 | | | | — | | | | — | | | | 609,987 | |
| Total | | $ | 609,987 | | | $ | 118,641,115 | | | $ | — | | | $ | 119,251,102 | |
| | | | | | | | | | | | | | | | | |
Oakhurst Short Duration Bond Fund
| | | Level 1 | | | Level 2 | | | Level 3 | | | Total | |
| U.S. Government & Agencies | | $ | — | | | $ | 3,666,191 | | | $ | — | | | $ | 3,666,191 | |
| Asset-Backed Securities | | | — | | | | 7,289,807 | | | | — | | | | 7,289,807 | |
| Collateralized Mortgage Obligations | | | — | | | | 22,145,320 | | | | — | | | | 22,145,320 | |
| Corporate Bonds | | | — | | | | 23,900,823 | | | | — | | | | 23,900,823 | |
| Money Market Funds | | | 581,708 | | | | — | | | | — | | | | 581,708 | |
| Total | | $ | 581,708 | | | $ | 57,002,141 | | | $ | — | | | $ | 57,583,849 | |
| | | | | | | | | | | | | | | | | |
Oakhurst Short Duration High Yield Credit Fund
| | | Level 1 | | | Level 2 | | | Level 3 | | | Total | |
| Asset-Backed Securities | | $ | — | | | $ | 4,616,704 | | | $ | — | | | $ | 4,616,704 | |
| Corporate Bonds | | | — | | | | 58,483,775 | | | | — | | | | 58,483,775 | |
| Money Market Funds | | | 2,427,519 | | | | — | | | | — | | | | 2,427,519 | |
| Total | | $ | 2,427,519 | | | $ | 63,100,479 | | | $ | — | | | $ | 65,527,998 | |
| | | | | | | | | | | | | | | | | |
The Funds did not hold any derivative instruments or assets or liabilities that were measured at fair value on a recurring basis using significant unobservable inputs (Level 3) as of or during the year ended August 31, 2022.
Share valuation – The NAV per share of each class of each Fund is calculated daily by dividing the total value of the assets attributable to that class, less liabilities attributable to that class, by the number of shares outstanding of that class. The offering price and redemption price per share of each class of each Fund is equal to the NAV per share of such class.
| F/m FUNDS TRUST |
| Notes to Financial Statements (Continued) |
Common expenses – Common expenses of the Trust are allocated among the Funds based on relative net assets of each Fund or the nature of the services performed and the relative applicability to each Fund.
Investment income – Interest income is accrued as earned. Discounts and premiums on fixed income securities purchased are accreted or amortized using the effective interest method and recognized within interest income. Dividend income is recorded on the ex-dividend date. Non-cash dividends included in dividend income, if any, are recorded at the fair market value of the security received.
Investment transactions – Investment transactions are accounted for on the trade date. Realized gains and losses on investments sold are determined on a specific identification basis.
Distributions to shareholders – Dividends from net investment income are declared and paid monthly to shareholders. Net realized capital gains, if any, are distributed at least once each year. The amount of distributions from net investment income and net realized capital gains are determined in accordance with federal income tax regulations, which may differ from GAAP. Dividends and distributions to shareholders are recorded on the ex-dividend date. The tax character of distributions paid to shareholders during the years ended August 31, 2022 and 2021 was as follows:
| | | Ordinary | | | Long-Term | | | Total | |
| Year Ended | | Income | | | Capital Gains | | | Distributions | |
| Oakhurst Fixed Income Fund: | | | | | | | | | | | | |
| August 31, 2022 | | $ | 2,572,576 | | | $ | 1,012,132 | | | $ | 3,584,708 | |
| August 31, 2021 | | $ | 2,790,322 | | | $ | 664,970 | | | $ | 3,455,292 | |
| | | | | | | | | | | | | |
| Oakhurst Short Duration Bond Fund: | | | | | | | | | | | | |
| August 31, 2022 | | $ | 1,784,854 | | | $ | — | | | $ | 1,784,854 | |
| August 31, 2021 | | $ | 3,004,318 | | | $ | — | | | $ | 3,004,318 | |
| | | | | | | | | | | | | |
| Oakhurst Short Duration High Yield Credit Fund: | | | | | | | | | | | | |
| August 31, 2022 | | $ | 4,244,150 | | | $ | — | | | $ | 4,244,150 | |
| August 31, 2021 | | $ | 2,850,592 | | | $ | — | | | $ | 2,850,592 | |
Estimates – The preparation of financial statements in conformity with GAAP requires management to make estimates and assumptions that affect the reported amounts of assets and liabilities and disclosure of contingent assets and liabilities as of the date of the financial statements and the reported amounts of increase (decrease) in net assets from operations during the reporting period. Actual results could differ from those estimates.
| F/m FUNDS TRUST |
| Notes to Financial Statements (Continued) |
Federal income tax – Each Fund has qualified and intends to continue to qualify as a regulated investment company under the Internal Revenue Code of 1986, as amended (the “Code”). Accordingly, the Funds intend to distribute their taxable income and net realized gains, if any, to shareholders in accordance with timing requirements imposed by the Code. Therefore, no federal income tax provision is provided in the Funds’ financial statements.
In order to avoid imposition of the excise tax applicable to regulated investment companies, it is also each Fund’s intention to declare as dividends in each calendar year at least 98% of its net investment income (earned during the calendar year) and 98.2% of its net realized capital gains (earned during the twelve months ended October 31) plus undistributed amounts from prior years.
The following information is computed on a tax basis for each item as of August 31, 2022:
| | | | | | Oakhurst Short | | | Oakhurst Short | |
| | | Oakhurst Fixed | | | Duration Bond | | | Duration High | |
| | | Income Fund | | | Fund | | | Yield Credit Fund | |
| | | | | | | | | | |
| | | | | | | | | | |
| Tax cost of investments | | $ | 130,455,623 | | | $ | 60,389,265 | | | $ | 74,255,602 | |
| Gross unrealized appreciation | | $ | 102,750 | | | $ | 26,151 | | | $ | 175,590 | |
| Gross unrealized depreciation | | | (11,307,271 | ) | | | (2,831,567 | ) | | | (8,903,194 | ) |
| Net unrealized depreciation on investments | | | (11,204,521 | ) | | | (2,805,416 | ) | | | (8,727,604 | ) |
| Undistributed ordinary income | | | 278,975 | | | | 126,088 | | | | 265,506 | |
| Accumulated capital and other losses | | | (1,343,180 | ) | | | (2,382,928 | ) | | | (2,938,674 | ) |
| Distributions payable | | | (261,707 | ) | | | (116,939 | ) | | | (244,536 | ) |
| Accumulated deficit | | $ | (12,530,433 | ) | | $ | (5,179,195 | ) | | $ | (11,645,308 | ) |
| | | | | | | | | | | | | |
The difference between the federal income tax cost of investments and the financial statement cost of investments for Oakhurst Fixed Income Fund is due to certain timing differences in the recognition of capital gains and losses under income tax regulations and GAAP. These timing differences are temporary in nature and are due to the tax deferral of losses on wash sales.
Post-October losses represent losses incurred after October 31, 2021. These losses are deemed to arise on the first day of a Fund’s next taxable year. For the year ended August 31, 2022, Oakhurst Fixed Income Fund deferred until September 1, 2022 post-October losses of $1,343,180 for federal income tax purposes.
During the year ended August 31, 2022, Oakhurst Short Duration High Yield Credit Fund utilized $94,763 of long-term capital loss carryforwards (“CLCFs”).
| F/m FUNDS TRUST |
| Notes to Financial Statements (Continued) |
As of August 31, 2022, the Funds had the following CLCFs for federal income tax purposes:
| | | | | | Oakhurst Short | | | Oakhurst Short | |
| | | Oakhurst Fixed | | | Duration Bond | | | Duration High | |
| | | Income Fund | | | Fund | | | Yield Credit Fund | |
| | | | | | | | | | |
| | | | | | | | | | |
| Short-term loss carryforwards | | $ | — | | | $ | 1,388,941 | | | $ | 2,191,580 | |
| Long-term loss carryforwards | | | — | | | | 993,987 | | | | 747,094 | |
| Total | | $ | — | | | $ | 2,382,928 | | | $ | 2,938,674 | |
| | | | | | | | | | | | | |
These CLCFs may be carried forward indefinitely and are available to offset net realized capital gains in future years, thereby reducing future taxable capital gain distributions.
The Funds recognize the tax benefits or expenses of uncertain tax positions only when the position is “more likely than not” to be sustained assuming examination by tax authorities. Management has reviewed each Fund’s tax positions taken on Federal income tax returns for all open tax years (generally, three years) and has concluded that no provision for unrecognized tax benefits or expenses is required in these financial statements and does not expect this to change over the next year. Each Fund identifies its major tax jurisdiction as U.S. Federal.
| 3. | Investment Transactions |
During the year ended August 31, 2022, cost of purchases and proceeds from sales and maturities of investment securities, other than short-term investments and U.S. government securities, were as follows:
| | | | | | Oakhurst Short | | | Oakhurst Short | |
| | | Oakhurst Fixed | | | Duration Bond | | | Duration High | |
| | | Income Fund | | | Fund | | | Yield Credit Fund | |
| | | | | | | | | | |
| | | | | | | | | | |
| Purchases of investment securities | | $ | 38,325,157 | | | $ | 35,963,986 | | | $ | 43,463,402 | |
| Proceeds from sales and maturities of investment securities | | $ | 36,554,095 | | | $ | 88,072,131 | | | $ | 66,780,125 | |
| | | | | | | | | | | | | |
| F/m FUNDS TRUST |
| Notes to Financial Statements (Continued) |
During the year ended August 31, 2022, cost of purchases and proceeds from sales and maturities of U.S. government long-term securities were as follows:
| | | | | | Oakhurst Short | | | Oakhurst Short | |
| | | Oakhurst Fixed | | | Duration Bond | | | Duration High | |
| | | Income Fund | | | Fund | | | Yield Credit Fund | |
| | | | | | | | | | |
| | | | | | | | | | |
| Purchases of U.S. government long-term securities | | $ | 25,764,406 | | | $ | 17,940,195 | | | $ | — | |
| Proceeds from sales and maturities of U.S. government securities | | $ | 18,370,192 | | | $ | 25,165,256 | | | $ | — | |
| | | | | | | | | | | | | |
| 4. | Transactions with Related Parties |
Oakhurst Capital Management, LLC (the “Adviser”) is the investment adviser for the Funds. The Adviser is jointly owned by Lido Advisors, LLC and F/m Acceleration, LLC.
INVESTMENT ADVISORY AGREEMENTS
Under the terms of the investment advisory agreement between the Trust, on behalf of each Fund, and the Adviser, Oakhurst Fixed Income Fund pays the Adviser a fee, which is computed and accrued daily and paid monthly, at the annual rate of 0.50% of its average daily net assets; Oakhurst Short Duration Bond Fund pays the Adviser a fee, which is computed and accrued daily and paid monthly, at the annual rate of 0.35% of its average daily net assets and Oakhurst Short Duration High Yield Credit Fund pays the Adviser a fee, which is computed and accrued daily and paid monthly, at the annual rate of 0.75% of its average daily net assets.
The Adviser has contractually agreed until December 29, 2022 to reduce its investment advisory fees and to pay other operating expenses to the extent necessary to limit annual ordinary operating expenses (excluding brokerage costs, taxes, borrowing costs, interest, acquired fund fees and expenses and extraordinary expenses) to 0.60% of the average daily net assets allocable to Institutional Shares of each of Oakhurst Fixed Income Fund and Oakhurst Short Duration Bond Fund and to 0.95% of the average daily net assets allocable to Institutional Shares of Oakhurst Short Duration High Yield Credit Fund. During the year ended August 31, 2022, the Adviser reduced its advisory fees by $272,412, $139,749, and $133,686 for Oakhurst Fixed Income Fund, Oakhurst Short Duration Bond Fund and Oakhurst Short Duration High Yield Credit Fund, respectively.
Advisory fee reductions and expense reimbursements by the Adviser are subject to repayment by the Funds for a period of three years after such fees and expenses were incurred, provided that the repayments do not cause a Fund’s ordinary operating expenses (excluding brokerage costs, taxes, borrowing costs, interest, acquired fund fees and expenses and extraordinary expenses) to exceed the agreed
| F/m FUNDS TRUST |
| Notes to Financial Statements (Continued) |
upon expense limitations. As of August 31, 2022, the Adviser may in the future recover advisory fee reductions and expense reimbursements totaling $450,295, $193,573, and $220,863 for Oakhurst Fixed Income Fund, Oakhurst Short Duration Bond Fund, and Oakhurst Short Duration High Yield Credit Fund, respectively. The Adviser may recover these amounts no later than the date stated below:
| | | | | | Oakhurst Short | | | Oakhurst Short | |
| | | Oakhurst Fixed | | | Duration Bond | | | Duration High | |
| | | Income Fund | | | Fund | | | Yield Credit Fund | |
| | | | | | | | | | |
| | | | | | | | | | |
| August 31, 2024 | | $ | 177,883 | | | $ | 53,824 | | | $ | 87,177 | |
| August 31, 2025 | | | 272,412 | | | | 139,749 | | | | 133,686 | |
| Total | | $ | 450,295 | | | $ | 193,573 | | | $ | 220,863 | |
| | | | | | | | | | | | | |
F/m Investments, LLC, d/b/a Oakhurst Capital Advisors is the sub-adviser to the Trust’s Funds. The Sub-Adviser is paid a fee equal to the annual rate of 0.025% of each Fund’s average daily net assets. Compensation of the Sub-Adviser is paid by the Adviser (not the Funds) at the annual rate of the average value of each Fund’s daily net assets. The Sub-Adviser’s fee is reduced on a pro-rata basis to the extent that the Adviser reduces its advisory fees or reimburses expenses of the Funds.
OTHER SERVICE PROVIDERS
Ultimus Fund Solutions, LLC (“Ultimus”) provides administration, fund accounting, and transfer agency services to the Funds. The Funds pay Ultimus fees in accordance with the agreements for such services. In addition, the Funds pay out-of-pocket expenses including, but not limited to, postage, supplies and certain costs related to the pricing of the Funds’ portfolio securities.
Pursuant to the terms of a Distribution Agreement with the Trust, Ultimus Fund Distributors, LLC (“UFD”) serves as principal underwriter and exclusive agent for the distribution of shares of the Funds. UFD is a wholly-owned subsidiary of Ultimus. UFD is compensated by the Adviser (not the Funds) for its services to the Trust.
Certain officers of the Trust are also officers of Ultimus.
Pursuant to a Compliance Consulting Agreement with Key Bridge Compliance, LLC (“Key Bridge”), Key Bridge provides the Chief Compliance Officer and compliance services to the Trust.
TRUSTEES’ COMPENSATION
Effective January 14, 2022, each Trustee who is not an “interested person” of the Trust (“Independent Trustee”) receives from the Trust an annual fee of $46,000, payable quarterly (except that amount is $47,000 for the Chair of the Committee of
| F/m FUNDS TRUST |
| Notes to Financial Statements (Continued) |
Independent Trustees) and reimbursement of travel and other expenses incurred in attending meetings. Prior to January 14, 2022, each Independent Trustee received from the Trust an annual fee of $34,500, that was payable quarterly (except that the amount was $35,500 for the Chair of the Committee of Independent Trustees) and reimbursement of travel and other expenses incurred in attending meetings.
Trustees who are affiliated with the Adviser do not receive compensation from the Trust. Each Fund pays its proportionate share of the Independent Trustees’ fees and expenses.
PRINCIPAL HOLDERS OF FUND SHARES
As of August 31, 2022, the following shareholders owned of record 25% or more of the outstanding shares of each Fund:
| NAME OF RECORD OWNERS | % Ownership |
| Oakhurst Fixed Income Fund | |
| Maril & Company (for the benefit of its customers) | 47% |
| National Financial Services, LLC (for the benefit of its customers) | 42% |
| | |
| Oakhurst Short Duration Bond Fund | |
| Maril & Company (for the benefit of its customers) | 82% |
| | |
| Oakhurst Short Duration High Yield Credit Fund | |
| National Financial Services, LLC (for the benefit of its customers) | 80% |
A beneficial owner of 25% or more of a Fund’s outstanding shares may be considered a controlling person. That shareholder’s vote could have a more significant effect on matters presented at a shareholders’ meeting.
| 5. | Contingencies and Commitments |
The Funds indemnify the Trust’s officers and Trustees for certain liabilities that might arise from the performance of their duties to the Funds. Additionally, in the normal course of business, the Funds enter into contracts that contain a variety of representations and warranties and which provide general indemnifications. The Funds’ maximum exposure under these arrangements is unknown, as this would involve future claims that may be made against the Funds that have not yet occurred. However, based on experience, the Funds expect the risk of loss to be remote.
| F/m FUNDS TRUST |
| Notes to Financial Statements (Continued) |
Oakhurst Fixed Income Fund has an uncommitted senior secured line of credit up to $6,000,000 with its custodian bank which expires on December 16, 2022. Oakhurst Short Duration Bond Fund has an uncommitted senior secured line of credit up to $5,500,000 with its custodian bank which expires on December 16, 2022. Oakhurst Short Duration High Yield Credit Fund has an uncommitted senior secured line of credit up to $4,500,000 with its custodian bank which expires on December 16, 2022. All portfolio securities held by each Fund are pledged as collateral for its line of credit. Borrowings under the lines of credit bear interest at a rate per annum equal to the bank’s Prime Rate at the time of borrowing. As of August 31, 2022, the Prime Rate was 5.50%. During the year ended August 31, 2022, none of the Funds borrowed under their respective lines of credit.
| 7. | Risks Associated with Collateralized Mortgage Obligations |
Oakhurst Fixed Income Fund and Oakhurst Short Duration Bond Fund have each adopted a fundamental policy to concentrate its investments in collateralized mortgage obligations (“CMOs”). This means each Fund will invest at least 25% of its total assets in agency and non-agency CMOs. The Funds’ investments in CMOs are subject to prepayment risk, especially when interest rates decline. Prepayment risk is the risk that the principal on CMOs, other asset-backed securities or any fixed-income security with an embedded call option may be prepaid at any time, which could reduce yield and market value. This could reduce the effective maturity of a CMO and cause the Funds to reinvest their assets at a lower prevailing interest rate. CMOs are also subject to extension risk, which is the risk that rising interest rates will increase the effective maturity of CMOs due to the deceleration of prepayments. CMOs may also be subject to risks unique to the housing industry, including mortgage lending practices, defaults, foreclosures and changes in real estate values. The Funds’ investments in CMOs are subject to default risk, prepayment and extension risk and market risk when interest rates rise. As a result of each Fund’s policy to concentrate in CMOs, the Funds will be subject to the risks associated with these securities to a greater degree than a fund that does not concentrate in CMOs. As of August 31, 2022, Oakhurst Fixed Income Fund and Oakhurst Short Duration Bond Fund had 33.3% and 38.3%, respectively, of the value of their net assets invested in CMOs.
| 8. | Risks Associated with Lower Rated Debt Securities |
Oakhurst Short Duration High Yield Credit Fund invests primarily in lower-rated debt securities (commonly called “junk” bonds). These securities are often considered to be speculative and involve greater risk of default or price changes than higher-rated securities due to changes in the issuer’s creditworthiness. Prices of lower-rated
| F/m FUNDS TRUST |
| Notes to Financial Statements (Continued) |
securities have been found to be less sensitive to interest rate changes and more sensitive to adverse economic changes and individual corporate developments than more highly rated investments. An economic downturn tends to disrupt the market for lower-rated securities and may adversely affect their values. Such an economic downturn may be expected to result in increased defaults by the issuers of such securities. Securities rated below Baa by Moody’s Investors Service, Inc. or
BBB by Standards & Poor’s or Fitch Ratings are generally considered to be “junk” bonds.
| 9. | Risks Associated with Rule 144A Securities |
Rule 144A securities are securities that are exempt from registration in compliance with the Securities Act of 1933, as amended, and the rules thereunder, and may have legal restrictions on resale. Under Rule 144A, these privately placed securities may be resold to qualified institutional buyers (“QIBs”), subject to certain conditions. An insufficient number of QIBs interested in purchasing Rule 144A securities at a particular time could adversely affect the marketability of the securities and a Fund might be unable to dispose of the securities promptly or at a reasonable price. As of August 31, 2022, Oakhurst Fixed Income Fund, Oakhurst Short Duration Bond Fund and Oakhurst Short Duration High Yield Credit Fund had 21.1%, 24.2% and 77.4%, respectively, of the value of their net assets invested in Rule 144A securities.
The Funds are required to recognize in the financial statements the effects of all subsequent events that provide additional evidence about conditions that existed as of the date of the Statements of Assets and Liabilities. For non-recognized subsequent events that must be disclosed to keep the financial statements from being misleading, the Funds are required to disclose the nature of the event as well as an estimate of its financial effect, or a statement that such an estimate cannot be made. Management has evaluated subsequent events through the issuance of these financial statements and has noted no such events other than the following:
On September 30, 2022, Oakhurst Fixed Income Fund, Oakhurst Short Duration Bond Fund and Oakhurst Short Duration High Yield Credit Fund paid net investment income dividends of $0.0203, $0.0224, and $0.0406 per share, respectively, to shareholders of record on September 29, 2022.
| F/m FUNDS TRUST |
| Report of Independent Registered Public |
| Accounting Firm |
To the Shareholders and Board of Trustees of
F/m Funds Trust
Opinion on the Financial Statements
We have audited the accompanying statements of assets and liabilities, including the schedules of investments, of F/m Funds Trust, comprising Oakhurst Fixed Income Fund, Oakhurst Short Duration Bond Fund, and Oakhurst Short Duration High Yield Credit Fund (the “Funds”) as of August 31, 2022, the related statements of operations for the year then ended, the statements of changes in net assets for each of the two years in the period then ended, the related notes, and the financial highlights for each of the five years in the period then ended (collectively referred to as the “financial statements”). In our opinion, the financial statements present fairly, in all material respects, the financial position of each of the Funds as of August 31, 2022, the results of their operations for the year then ended, the changes in net assets for each of the two years in the period then ended, and the financial highlights for each of the five years in the period then ended, in conformity with accounting principles generally accepted in the United States of America.
Basis for Opinion
These financial statements are the responsibility of the Funds’ management. Our responsibility is to express an opinion on the Funds’ financial statements based on our audits. We are a public accounting firm registered with the Public Company Accounting Oversight Board (United States) (“PCAOB”) and are required to be independent with respect to the Funds in accordance with the U.S. federal securities laws and the applicable rules and regulations of the Securities and Exchange Commission and the PCAOB.
We conducted our audits in accordance with the standards of the PCAOB. Those standards require that we plan and perform the audit to obtain reasonable assurance about whether the financial statements are free of material misstatement whether due to error or fraud.
Our audits included performing procedures to assess the risks of material misstatement of the financial statements, whether due to error or fraud, and performing procedures that respond to those risks. Such procedures included examining, on a test basis, evidence regarding the amounts and disclosures in the financial statements. Our procedures included confirmation of securities owned as of August 31, 2022, by correspondence with the custodian and brokers. Our audits also included evaluating the accounting principles used and significant estimates made by management, as well as evaluating the overall presentation of the financial statements. We believe that our audits provide a reasonable basis for our opinion.
| F/m FUNDS TRUST |
| Report of Independent Registered Public |
| Accounting Firm (Continued) |
We have served as the Funds’ auditor since 2017.
COHEN & COMPANY, LTD.
Milwaukee, Wisconsin
October 28, 2022
| F/m FUNDS TRUST |
| About Your Funds’ Expenses (Unaudited) |
We believe it is important for you to understand the impact of costs on your investment. As a shareholder of the Funds, you incur ongoing costs, including management fees and other operating expenses. The following examples are intended to help you understand your ongoing costs (in dollars) of investing in the Funds and to compare these costs with the ongoing costs of investing in other mutual funds.
A mutual fund’s ongoing costs are expressed as a percentage of its average net assets. This figure is known as the expense ratio. The expenses in the table below are based on an investment of $1,000 made at the beginning of the most recent period (March 1, 2022) and held until the end of the period (August 31, 2022).
The table below illustrates each Fund’s ongoing costs in two ways:
Actual fund return – This section helps you to estimate the actual expenses that you paid over the period. The “Ending Account Value” shown is derived from each Fund’s actual return, and the fourth column shows the dollar amount of operating expenses that would have been paid by an investor who started with $1,000 in the Funds. You may use the information here, together with the amount you invested, to estimate the expenses that you paid over the period.
To do so, simply divide your account value by $1,000 (for example, an $8,600 account value divided by $1,000 = 8.6), then multiply the result by the number given for the Funds under the heading “Expenses Paid During Period.”
Hypothetical 5% return – This section is intended to help you compare the Funds’ ongoing costs with those of other mutual funds. It assumes that each Fund had an annual return of 5% before expenses during the period shown, but that the expense ratio is unchanged. In this case, because the return used is not the Funds’ actual return, the results do not apply to your investment. The example is useful in making comparisons because the U.S. Securities and Exchange Commission (the “SEC”) requires all mutual funds to calculate expenses based on a 5% return. You can assess each Fund’s ongoing costs by comparing this hypothetical example with the hypothetical examples that appear in shareholder reports of other funds.
Note that expenses shown in the table are meant to highlight and help you compare ongoing costs only. The Funds do not charge transaction fees, such as purchase or redemption fees, nor do they carry a “sales load.” The calculations assume no shares were bought or sold during the period. Your actual costs may have been higher or lower, depending on the amount of your investment and the timing of any purchases or redemptions.
More information about the Funds’ expenses can be found in this report. For additional information on operating expenses and other shareholder costs, please refer to each Fund’s prospectus.
| F/m FUNDS TRUST |
| About Your Funds’ Expenses (Unaudited) (Continued) |
| | | Beginning | | | Ending | | | | | | |
| | | Account | | | Account | | | | | Expenses | |
| | | Value | | | Value | | | Net | | Paid | |
| | | March 1, | | | August 31, | | | Expense | | During | |
| | | 2022 | | | 2022 | | | Ratio(a) | | Period(b) | |
| | | | | | | | | | | | |
| | | | | | | | | | | | |
| Oakhurst Fixed Income Fund | | | | | | | | | | | | | | |
| Based on Actual Fund Return | | $ | 1,000.00 | | | $ | 929.20 | | | 0.60% | | $ | 2.92 | |
| Based on Hypothetical 5%Return (before expenses) | | $ | 1,000.00 | | | $ | 1,022.18 | | | 0.60% | | $ | 3.06 | |
| | | | | | | | | | | | | | | |
| Oakhurst Short Duration Bond Fund | | | | | | | | | | | | | | |
| Based on Actual Fund Return | | $ | 1,000.00 | | | $ | 968.10 | | | 0.60% | | $ | 2.98 | |
| Based on Hypothetical 5%Return (before expenses) | | $ | 1,000.00 | | | $ | 1,022.18 | | | 0.60% | | $ | 3.06 | |
| | | | | | | | | | | | | | | |
| Oakhurst Short Duration High Yield Credit Fund | | | | | | | | | | | | | | |
| Based on Actual Fund Return | | $ | 1,000.00 | | | $ | 930.90 | | | 0.95% | | $ | 4.62 | |
| Based on Hypothetical 5%Return (before expenses) | | $ | 1,000.00 | | | $ | 1,020.42 | | | 0.95% | | $ | 4.84 | |
| | | | | | | | | | | | | | | |
| (a) | Annualized, based on each Fund’s most recent one-half year expenses. |
| (b) | Expenses are equal to each Fund’s annualized net expense ratio multiplied by the average account value over the period, multiplied by 184/365 (to reflect the one-half year period). |
| F/m FUNDS TRUST |
| Other Information (Unaudited) |
A description of the policies and procedures that the Funds use to vote proxies relating to portfolio securities is available without charge upon request by calling toll-free 1-800-292-6775, or on the SEC’s website at www.sec.gov. Information regarding how the Funds voted proxies relating to portfolio securities during the most recent 12-month period ended June 30 is also available without charge upon request by calling toll-free 1-800-292-6775, or on the SEC’s website at www.sec.gov.
The Trust files a complete listing of portfolio holdings for the Funds with the SEC as of the end of the first and third quarters of each fiscal year as an exhibit on Form N-PORT. These filings are available upon request by calling 1-800-292-6775. Furthermore, you may obtain a copy of the filings on the SEC’s website at www.sec.gov and the Funds’ website www.fm-funds.com.
| Federal Tax Information (Unaudited) |
For the fiscal year ended August 31, 2022, Oakhurst Fixed Income Fund designated $1,012,132 as long-term capital gain distributions.
| F/m FUNDS TRUST |
| Trustees and Officers of the Trust |
| (Unaudited) |
Overall responsibility for management of the Trust rests with its Trustees. The Trustees serve for terms of indefinite duration until death, resignation, retirement or removal from office. The Trustees, in turn, elect the officers of the Trust to actively supervise the Trust’s day-to-day operations. The officers are elected annually.
The Trustees and executive officers of the Trust, their addresses and their principal occupations during the past five years are as follows:
Name, Address
and Year of Birth | Length
of Time
Served | Position(s)
Held with
Trust | Principal Occupation(s) During Past
5 Years and Directorships of Public
Companies Within the Past 5 Years | Number of
Portfolios
in Fund
Complex
Overseen
by Trustee |
| Interested Trustee: |
Alexander Morris*
c/o 3050 K Street NW,
Ste. 201
Washington, D.C. 20007
Year of birth: 1984 | Since December 2020 | Trustee | President and Chief Investment Officer of F/m Acceleration and F/m Investments since March 2019. Director of Key Bridge Compliance, LLC since January 2019. Founder of Rowhouse Capital Partners LLC, the predecessor of F/m Investments in 2014. President of the Trust from December 2020 until April 2022. | 4 |
| Independent Trustees: |
Debra Lee
McGinty-Poteet**
c/o 3050 K Street NW,
Ste. 201
Washington, D.C. 20007
Year of birth: 1956 | Since May 2015 | Trustee | Retired since 2012. Board Member and Audit Committee Chair of Series Portfolios Trust, a registered investment company (2015 to present). Currently serves on the Board for a number of non-profit organizations. | 4 |
E. Keith Wirtz
c/o 3050 K Street NW,
Ste. 201
Washington, D.C. 20007
Year of birth: 1960 | Since October 2016 | Trustee | Vice President and Chief Investment Officer of Union Savings Bank of Connecticut since July 2019. Principal of Walrus Partners, LLC, a registered investment adviser from 2013 until 2019. Currently serves on the Board or Committee for a number of non-profit organizations. | 4 |
John R. Hildebrand
c/o 3050 K Street NW,
Ste. 201
Washington, D.C. 20007
Year of birth: 1956 | Since October 2019 | Trustee | Retired since 2016. Partner in the Financial Services/Investment Management Practice of PricewaterhouseCoopers from 1994 until 2016. | 4 |
| * | Alexander Morris is considered an “interested person” of the Trust within the meaning of Section 2(a) (19) under the 1940 Act due to his affiliations with the Adviser and the Sub-Adviser. |
| ** | Debra McGinty-Poteet is a member of the Board of Trustees and Audit Committee Chair of Series Portfolios Trust, a series trust that includes the Oakhurst Strategic Defined Risk Fund, which is managed by an affiliate of the Adviser. |
| F/m FUNDS TRUST |
| Trustees and Officers of the Trust |
| (Unaudited) (Continued) |
Name, Address
and Year of Birth | Length
of Time
Served | Position(s)
Held with
Trust | Principal Occupation(s) During Past 5 Years |
| Executive Officers: |
Matthew Swendiman
c/o 3050 K Street NW,
Ste. 201
Washington, D.C. 20007
Year of birth: 1973 | Since April 2022 | President | Chairman and Chief Compliance Officer of the Adviser since March 2019. Chairman of F/m Acceleration, LLC (investment adviser) since March 2019. Director of Key Bridge Compliance, LLC and its predecessor firm since November 2018. President and CEO of JCM Financial Services Consulting, LLC from November 2018 to present. Of Counsel for Graydon law firm from September 2012 until November 2018. Chief Compliance Officer of the Trust from April 2021 until April 2022. |
Dennis Mason
c/o 3050 K Street NW,
Ste. 201
Washington, D.C. 20007
Year of Birth: 1976 | Since April 2022 | Chief Compliance Officer | Senior Compliance Officer, Key Bridge Compliance, LLC since April 2021. Fund Compliance Officer, Apex Fund Services, July 2013 until April 2021. |
Jesse D. Hallee
225 Pictoria Drive
Suite 450
Cincinnati, OH 45240
Year of Birth: 1976 | Since October 2022 | Interim Secretary | Vice President and Senior Managing Counsel, Ultimus Fund Solutions, LLC since 2019; Vice President and Senior Counsel, State Street Bank and Trust Company, 2013 until 2019. |
Angela A. Simmons
225 Pictoria Drive
Suite 450
Cincinnati, OH 45240
Year of Birth: 1975 | Since March 2022 | Treasurer | Vice President – Financial Administration of Ultimus Fund Solutions, LLC. She has worked at Ultimus since 2007 in a number of roles, including Assistant Vice President – Financial Administration and Assistant Mutual Fund Controller-Fund Accounting Manager. |
Additional Information about members of the Board of Trustees and executive officers is available in the Statement of Additional Information (“SAI”). To obtain a free copy of the SAI, please call toll-free 1-800-292-6775.
| F/m FUNDS TRUST |
| Liquidity Risk Management Disclosure (Unaudited) |
The Funds have adopted and implemented a written liquidity risk management program as required by Rule 22e-4 (the “Liquidity Rule”) under the Investment Company Act of 1940. The program is reasonably designed to assess, manage, and periodically review each Fund’s liquidity risk, taking into consideration, among other factors, the Fund’s investment strategies and the liquidity of its portfolio investments during normal and reasonably foreseeable stressed conditions; its short and long-term cash flow projections; and its cash holdings and access to other funding sources. The Board of Trustees approved the appointment of a Liquidity Risk Management Program Administrator (the “Liquidity Administrator”), which includes representatives from the Funds’ investment adviser. The Liquidity Administrator is responsible for the administration of the program and its policies and procedures and for reporting to the Board on an annual basis regarding the program’s operation, adequacy and effectiveness, as well as any material changes to the program. The Liquidity Administrator assessed each Fund’s liquidity risk profile and the adequacy and effectiveness of the liquidity risk management program’s operations during the period from October 1, 2020 through September 30, 2021 (the “Review Period”) in order to prepare a written report for the Board of Trustees (the “Report”) for consideration at its meeting held on October 28, 2021. During the Review Period, none of the Funds experienced unusual stress or disruption to its operations from any purchase and redemption activity. Also, during the Review Period the Funds held adequate levels of cash and highly liquid investments to meet shareholder redemption activities in accordance with applicable requirements. The Report concluded that (i) the Funds’ liquidity risk management program is reasonably designed to prevent violations of the Liquidity Rule and (ii) the Funds’ liquidity risk management program has been effectively implemented during the Review Period.
This page intentionally left blank.
| | | | | | | |
| | | | | | | |
| | | | | | | |
| | | | | | | |
| | | | | | | |
| | | | | | | |
| | | | F/m FUNDS TRUST | | | |
| | | | | | | |
| | | | | | | |
| | | | | | | |
| | | | Investment Adviser Oakhurst Capital
Management, LLC
1875 Century Park E,
Suite 950,
Los Angeles, CA 90067 Sub-Adviser F/m Investments, LLC
d/b/a Oakhurst Capital Advisors
3050 K Street, NW,
Suite 201
Washington, D.C. 20007 Administrator Ultimus Fund Solutions, LLC
P.O. Box 46707
Cincinnati, Ohio 45246-0707
1-800-292-6775 Legal Counsel Sullivan & Worcester LLP
1666 K Street, NW
Washington, D.C. 20006 | Custodian U.S. Bank, N.A.
425 Walnut Street
Cincinnati, OH 45202 Board of Trustees Alexander Morris
Debra L. McGinty-Poteet
E. Keith Wirtz
John R. Hildebrand Executive Officers Matthew Swendiman, President
Angela A. Simmons, Treasurer
Jesse D. Hallee, Interim Secretary
Dennis Mason, Chief Compliance Officer Distributor Ultimus Fund Distributors, LLC
225 Pictoria Drive, Suite 450
Cincinnati, OH 45246 | | | |
| | | | | | | | |
| | | | | | | | |
| | | | | | | | |
| | | | | | | | |
| | | |  | | | |
 | | | | |
| | | | | | | | |
| | | | | | | | |
| | | | | | | | |
| | | | | | | | |
| | | | | Oakhurst-AR-22 | | | |
| | | | | | | | |
| | | | | | | | |
| | | | | | | | |
| | | | | | | | |
As of the end of the period covered by this report, the registrant has adopted a code of ethics that applies to the registrant’s principal executive officer, principal financial officer, principal accounting officer or controller, or persons performing similar functions, regardless of whether these individuals are employed by the registrant or a third party. Pursuant to Item 13(a)(1), a copy of registrant’s code of ethics is filed as an exhibit to this Form N-CSR. During the period covered by this report, the code of ethics has not been amended, and the registrant has not granted any waivers, including implicit waivers, from the provisions of the code of ethics.
| Item 3. | Audit Committee Financial Expert. |
The registrant’s board of trustees has determined that the registrant has three audit committee financial experts serving on its audit committee. The names of the audit committee financial experts are Keith Wirtz, Debra McGinty-Poteet and John R. Hildebrand. Messrs. Wirtz and Hildebrand and Ms. McGinty-Poteet are “independent” for purposes of this Item.
| Item 4. | Principal Accountant Fees and Services. |
| (a) | Audit Fees. The aggregate fees billed for professional services rendered by the principal accountant for the audit of the registrant’s annual financial statements or for services that are normally provided by the accountant in connection with statutory and regulatory filings or engagements were $42,300 and $42,300 with respect to the registrant’s fiscal years ended August 31, 2022 and 2021, respectively. |
| (b) | Audit-Related Fees. No fees were billed in either of the last two fiscal years for assurance and related services by the principal accountant that are reasonably related to the performance of the audit of the registrant’s financial statements and are not reported under paragraph (a) of this Item. |
| (c) | Tax Fees. The aggregate fees billed for professional services rendered by the principal accountant for tax compliance, tax advice, and tax planning were $11,100 and $11,100 with respect to the registrant’s fiscal years ended August 31, 2022 and 2021, respectively. The services comprising these fees are the preparation of the registrant’s federal income and excise tax returns. |
| (d) | All Other Fees. No fees were billed in either of the last two fiscal years for products and services provided by the principal accountant, other than the services reported in paragraphs (a) through (c) of this Item. |
(e)(1) The audit committee has not adopted pre-approval policies and procedures described in paragraph (c)(7) of Rule 2-01 of Regulation S-X.
(e)(2) None of the services described in paragraph (b) through (d) of this Item were approved by the audit committee pursuant to paragraph (c)(7)(i)(C) of Rule 2-01 of Regulation S-X.
| (f) | Less than 50% of hours expended on the principal accountant’s engagement to audit the registrant’s financial statements for the most recent fiscal year were attributed to work performed by persons other than the principal accountant’s full-time, permanent employees. |
| (g) | With respect to the fiscal years ended August 31, 2022 and 2021, aggregate non-audit fees of $11,100 and $11,100, respectively, were billed by the registrant’s principal accountant for services rendered to the registrant. No non-audit fees were billed in either of the last two fiscal years by the registrant’s principal accountant for services rendered to the registrant’s investment adviser (not including any sub-adviser whose role is primarily portfolio management and is subcontracted with or overseen by another investment adviser), and any entity controlling, controlled by, or under common control with the adviser that provides ongoing services to the registrant. |
| (h) | The principal accountant has not provided any non-audit services to the registrant’s investment adviser (not including any sub-adviser whose role is primarily portfolio management and is subcontracted with or overseen by another investment adviser), and any entity controlling, controlled by, or under common control with the investment adviser that provides ongoing services to the registrant. |
| Item 5. | Audit Committee of Listed Registrants. |
Not applicable
| Item 6. | Schedule of Investments. |
| (a) | Not applicable [schedule filed with Item 1] |
| Item 7. | Disclosure of Proxy Voting Policies and Procedures for Closed-End Management Investment Companies. |
Not applicable
| Item 8. | Portfolio Managers of Closed-End Management Investment Companies. |
Not applicable
| Item 9. | Purchases of Equity Securities by Closed-End Management Investment Company and Affiliated Purchasers. |
Not applicable
| Item 10. | Submission of Matters to a Vote of Security Holders. |
The registrant’s Committee of Independent Trustees shall review shareholder recommendations for nominations to fill vacancies on the registrant’s board of trustees if such recommendations are submitted in writing and addressed to the Committee at the registrant’s offices. The Committee may adopt, by resolution, a policy regarding its procedures for considering candidates for the board of trustees, including any recommended by shareholders.
| Item 11. | Controls and Procedures. |
(a) Based on their evaluation of the registrant’s disclosure controls and procedures (as defined in Rule 30a-3(c) under the Investment Company Act of 1940) as of a date within 90 days of the filing date of this report, the registrant’s principal executive officer and principal financial officer have concluded that such disclosure controls and procedures are reasonably designed and are operating effectively to ensure that material information relating to the registrant, including its consolidated subsidiaries, is made known to them by others within those entities, particularly during the period in which this report is being prepared, and that the information required in filings on Form N-CSR is recorded, processed, summarized, and reported on a timely basis.
(b) There were no changes in the registrant’s internal control over financial reporting (as defined in Rule 30a-3(d) under the Investment Company Act of 1940) that occurred during the period covered by this report that have materially affected, or are reasonably likely to materially affect, the registrant’s internal control over financial reporting.
Item 12. Disclosure of Securities Lending Activities for Closed-End Management Investment Companies.
Not applicable
File the exhibits listed below as part of this Form. Letter or number the exhibits in the sequence indicated.
(a)(1) Any code of ethics, or amendment thereto, that is the subject of the disclosure required by Item 2, to the extent that the registrant intends to satisfy the Item 2 requirements through filing of an exhibit: Attached hereto
(a)(2) A separate certification for each principal executive officer and principal financial officer of the registrant as required by Rule 30a-2(a) under the Act (17 CFR 270.30a-2(a)): Attached hereto
(a)(3) Any written solicitation to purchase securities under Rule 23c-1 under the Act (17 CFR 270.23c-1) sent or given during the period covered by the report by or on behalf of the registrant to 10 or more persons: Not applicable
(a)(4) Change in the registrant’s independent public accountants: Not applicable
(b) Certifications required by Rule 30a-2(b) under the Act (17 CFR 270.30a-2(b)): Attached hereto
SIGNATURES
Pursuant to the requirements of the Securities Exchange Act of 1934 and the Investment Company Act of 1940, the registrant has duly caused this report to be signed on its behalf by the undersigned, thereunto duly authorized.
| (Registrant) | F/m Funds Trust | | |
| | | | |
| By (Signature and Title)* | /s/ Matthew Swendiman | |
| | | | |
| | | Matthew Swendiman, President and Principal Executive Officer | |
| | | | |
| Date | November 3, 2022 | | |
| | | | |
| Pursuant to the requirements of the Securities Exchange Act of 1934 and the Investment Company Act of 1940, this report has been signed below by the following persons on behalf of the registrant and in the capacities and on the dates indicated. |
| | | | |
| By (Signature and Title)* | /s/ Matthew Swendiman | |
| | | | |
| | | Matthew Sendiman, President and Principal Executive Officer | |
| | | | |
| Date | November 3, 2022 | | |
| | | | |
| By (Signature and Title)* | | /s/ Angela A. Simmons | |
| | | | |
| | | Angela A. Simmons, Treasurer and Principal Accounting Officer | |
| | | | |
| Date | November 3, 2022 | | |
* Print the name and title of each signing officer under his or her signature.