UNITED STATES
SECURITIES AND EXCHANGE COMMISSION
Washington, D.C. 20549
FORM N-CSR
Certified Shareholder Report of
Registered Management Investment Companies
Investment Company Act File Number: 811-22692
American Funds College Target Date Series
(Exact Name of Registrant as Specified in Charter)
6455 Irvine Center Drive
Irvine, California 92618
(Address of Principal Executive Offices)
Registrant's telephone number, including area code: (949) 975-5000
Date of fiscal year end: October 31
Date of reporting period: April 30, 2014
Steven I. Koszalka
American Funds College Target Date Series
6455 Irvine Center Drive
Irvine, California 92618
(Name and Address of Agent for Service)
Copies to:
Michael Glazer
Bingham McCutchen LLP
355 South Grand Avenue, Suite 4400
Los Angeles, California 90071
(Counsel for the Registrant)
ITEM 1 – Reports to Stockholders

 | American Funds College
Target Date Series® Semi-annual report
for the six months ended
April 30, 2014 |
American Funds College Target Date Series seeks to help investors saving for higher education. Each fund in the series is an age-appropriate portfolio of actively managed stock and bond funds, the mix of which becomes increasingly focused on preservation as the enrollment date approaches.
American Funds, from Capital Group, is one of the nation’s largest mutual fund families. For more than 80 years, Capital has invested with a long-term focus based on thorough research and attention to risk.
Fund results shown in this report, unless otherwise indicated, are for Class 529-A shares at net asset value. If a sales charge had been deducted, the results would have been lower. Results are for past periods and are not predictive of results for future periods. Current and future results may be lower or higher than those shown. Share prices and returns will vary, so investors may lose money. Investing for short periods makes losses more likely. Investments are not FDIC-insured, nor are they deposits of or guaranteed by a bank or any other entity, so they may lose value. For current information and month-end results, visit americanfunds.com.
Here are the average annual total returns on a $1,000 investment with all distributions reinvested for periods ended March 31, 2014 (the most recent calendar quarter-end). Also shown are the gross and net expense ratios as of the series prospectus dated January 1, 2014.
| | | | | | Lifetime | | Gross | | Net |
| Class 529-A shares | | 1 year | | (since 9/14/12) | | expense ratio | | expense ratio |
| | | | | | | | | |
| Reflecting 4.25% maximum initial sales charge: | | | | | | | | | | | | |
| American Funds College 2030 Fund® | | 13.30 | % | | 13.41 | % | | 0.90 | % | | 0.80 | % |
| American Funds College 2027 Fund® | | 10.84 | | | 11.14 | | | 0.92 | | | 0.82 | |
| American Funds College 2024 Fund® | | 8.12 | | | 8.59 | | | 0.91 | | | 0.81 | |
| American Funds College 2021 Fund® | | 4.82 | | | 6.03 | | | 0.92 | | | 0.81 | |
| American Funds College 2018 Fund® | | 1.34 | | | 3.24 | | | 0.86 | | | 0.76 | |
| American Funds College 2015 Fund® | | -3.37 | | | -1.54 | | | 0.86 | | | 0.76 | |
| | | | | | | | | | | | | |
| Reflecting 2.50% maximum initial sales charge: | | | | | | | | | | | | |
| American Funds College Enrollment FundSM | | -3.03 | | | -1.95 | | | 0.93 | | | 0.82 | |
Investment results assume all distributions are reinvested and reflect applicable fees and expenses.
The college target date funds invest in Class R-6 shares of the underlying funds. The series’ investment adviser is currently waiving its management fee of 0.10% and reimbursing certain expenses in all share classes of American Funds College Enrollment Fund. In addition, the investment adviser has in the past reimbursed certain expenses for all funds. Investment results and net expense ratios shown reflect the waiver and/or reimbursements, without which the results would have been lower and the expenses would have been higher. Expense ratios are as of each fund’s prospectus available at the time of publication and include the weighted average expenses of the underlying funds. The waiver and reimbursement will remain in effect at least through December 31, 2014. After that time, the investment adviser may elect at its discretion to extend, modify or terminate the reimbursement. The waiver may only be modified or terminated with the approval of the series’ board.
The funds’ allocation strategy does not guarantee that investors’ education savings goals will be met. Investors and their advisers should periodically evaluate their investment to determine whether it continues to meet their needs. Investment allocations may not achieve fund objectives. There are expenses associated with the underlying funds in addition to fund of funds expenses. The funds’ risks are directly related to the risks of the underlying funds. Refer to the series prospectus and the Risk Factors section of this report for more information on these and other risks associated with investing in the series.

Fellow investors:
Sustained strength in equities with unusually low volatility, continuing accommodative monetary policy and some stabilization in bonds boosted returns for most of the funds in the American Funds College Target Date Series during the six months ended April 30, 2014.
Four of the seven funds — College 2030, College 2027, College 2024 and College 2021 — beat their benchmarks (see the table on page 3). These longer dated funds show that in order to benefit from positive periods in the stock market, a long term investor is best advised to have the equity exposure these funds provide.
The funds that trailed their benchmarks, College 2018, College 2015 and American Funds College Enrollment Fund, had lower returns due to the muted returns of their bond holdings. It’s important to remember that the nearer dated funds hold assets for investors whose beneficiaries are at or approaching enrollment, and these funds have met their primary objective, which is preservation of capital.
The stock market
The U.S. stock market touched new highs during the period, although its pace moderated compared to the prior period. Despite a wobble in the second half of January, and another hiccup in early April when many stocks that had done well in 2013 sold off sharply, the stock market rebounded both times and, in general, is in quite sound shape. The balance sheets and fundamentals of many companies are sound, which are signs of a healthy stock market.
The U.S. unemployment rate has decreased and economic activity has gradually improved. However, there are still indicators of weakness in the U.S. economy. Gross domestic product growth slowed to an annualized rate of –1.0% in the first quarter of 2014. Most of this slowdown was related to severe winter weather, which shut down parts of the country and hurt production. Housing has recovered in recent years since the U.S. housing crisis that began in 2008, but activity weakened over the last year in part because both mortgage rates and home prices rose.
The Federal Reserve continued to trim its purchases of long-term securities. The series’ portfolio managers anticipated that tapering would not be that detrimental to equity returns because most of the impact on stocks was already “priced in” in 2013. The Fed has also reaffirmed its commitment to keeping interest rates at historically low levels.
| American Funds College Target Date Series | 1 |
The distant-dated funds participated well in the stock market rally while the near-dated funds achieved their primary goal: preservation of capital.
The recession in the European Union also appears to be waning as major euro zone economies have stabilized and central bank monetary policy has remained supportive, though the potential for market volatility remains. Emerging markets remain generally disappointing. The series’ modest exposure to emerging markets decreases over time as the beneficiary gets closer to enrollment.
The bond market
Bonds fared well during the period, led by long-dated Treasuries and high-grade corporate bonds as companies continue to take advantage of low borrowing costs and issue attractively priced bonds. Short duration Treasuries and mortgage-backed securities were comparatively weak.
Corporate pension plans have benefited the bond market by rebalancing into bonds, in accordance with their target allocations to equities and bonds. As stock values go up, they rebalance portfolios by selling riskier assets and buying high-quality bonds.
Our outlook
Equities have risen appreciably in the past five-plus years so a stock market correction would not be surprising. While it makes sense to remain invested to capture further appreciation, future returns may be more moderate. As the Fed winds down its stimulus program, there is a chance the bond market could sell off and bond yields could go higher.
As the structural and institutional reforms in the euro area continue, this might decrease the chance of another recession in Europe. China’s economic growth has slowed, but it is unclear how much more of an adjustment there will be, and what impact the reform process will have. Our investment professionals closely monitor geopolitical events such as in Ukraine and Thailand and we will continue to do so.
The series
The distant-dated funds have participated very well in the rally. They experienced bumpiness in April; however, that’s the kind of risk a long-term investor can take. The nearer dated funds missed out on the equity rally, but have delivered steady returns. Their capital preservation objective has not been severely tested since the series’ inception, but they should provide more stability if the stock market becomes volatile.
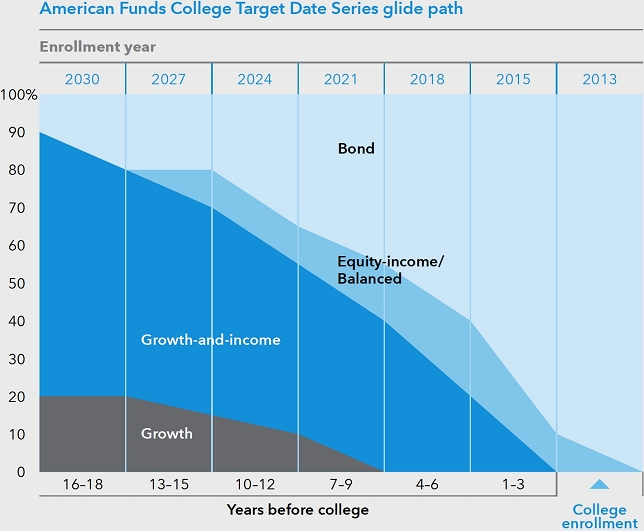
We remind investors that the series’ glide path is more growth-oriented in the early years, becoming more preservation-oriented as beneficiaries approach college.
Thank you for your investment in American Funds College Target Date Series and for your continued faith in our long-term investment approach.
Cordially,

Bradley J. Vogt
Vice Chairman of the Board

Walter R. Burkley
President
June 17, 2014
For current information about the series, visit americanfunds.com.
| 2 | American Funds College Target Date Series |
Results at a glance
For periods ended April 30, 2014, with all distributions reinvested for Class 529-A shares
| | | Cumulative
total returns | | Average annual
total returns |
| | | | | | | | | | |
| | | 6 months | | 1 year | | Lifetime
(since 9/14/12) |
| | | | | | | | | | |
| American Funds College 2030 Fund | | 5.91 | % | | 15.68 | % | | 16.23 | % |
| S&P Target Date To 2030 Index¹ | | 4.53 | | | 10.26 | | | 11.32 | |
| | | | | | | | | | |
| American Funds College 2027 Fund | | 5.43 | | | 13.63 | | | 14.04 | |
| S&P Target Date To 2025 Index¹ | | 4.21 | | | 9.00 | | | 10.07 | |
| | | | | | | | | | |
| American Funds College 2024 Fund | | 5.09 | | | 11.19 | | | 11.63 | |
| S&P Target Date To 2025 Index¹ | | 4.21 | | | 9.00 | | | 10.07 | |
| | | | | | | | | | |
| American Funds College 2021 Fund | | 4.31 | | | 8.25 | | | 9.21 | |
| S&P Target Date To 2020 Index¹ | | 3.85 | | | 7.68 | | | 8.77 | |
| | | | | | | | | | |
| American Funds College 2018 Fund | | 3.15 | | | 5.02 | | | 6.33 | |
| S&P Target Date To 2015 Index¹ | | 3.47 | | | 6.27 | | | 7.37 | |
| | | | | | | | | | |
| American Funds College 2015 Fund | | 1.36 | | | 0.86 | | | 1.55 | |
| Barclays U.S. Aggregate Index² | | 1.74 | | | -0.26 | | | 1.01 | |
| | | | | | | | | | |
| American Funds College Enrollment Fund | | 0.50 | | | -0.30 | | | -0.04 | |
| Barclays Intermediate U. S. Aggregate Index³ | | 1.07 | | | 0.06 | | | 0.86 | |
| 1 | The S&P Target Date Style Index series (“To” variant), a subset of the S&P Target Date Index series, comprises a set of multi-asset class indexes based on funds with glide paths that aim to emphasize market risk sensitivity around the target date. Each index is fully investable with varying levels of exposure to the asset classes determined during an annual survey process of target date funds’ holdings. The current universe of eligible asset classes includes U.S. Large-Cap, U.S. Mid-Cap, U.S. Small-Cap, International Equities, Emerging Markets, U.S. REITs, Core Fixed Income, Cash Equivalents, TIPS and High-Yield Corporate Bonds. Each asset class is represented in the indexes via a different exchange traded fund. |
| 2 | Barclays U.S. Aggregate Index represents the U.S. investment-grade fixed-rate bond market. |
| 3 | Barclays Intermediate U.S. Aggregate Index represents securities in the intermediate maturity range (1–10 years) of the U.S. investment-grade fixed-rate bond market. |
| American Funds College Target Date Series | 3 |
Investment strategies for American Funds College Target Date Series
About the series
Launched in September 2012, the American Funds College Target Date Series was designed to provide an off-the-shelf, low maintenance investment option for parents who want to use a 529 savings plan to save for college.
An investor simply needs to select the Target Date Series fund that corresponds to the projected enrollment year of the student. American Funds takes care of the asset allocation and the fund selection and adjusts these over time as the enrollment date approaches. The only thing investors need to worry about is making contributions.
For dates far from enrollment, the respective funds-of-funds have an emphasis on long-term growth of capital. For dates close to enrollment, the funds-of-funds have an emphasis on near-term preservation of capital.
The funds in the series have a conservative tilt, with a preference toward funds holding equities that pay dividends. The automatic rebalancing is disciplined and frequent to ensure that the funds are consistent with their stated investment objective.
The fund’s portfolio managers don’t attempt to be tactical asset allocators — that is, buy or sell based on market changes. They work out the rebalancing schedule, or “glide path,” that would make sense through the cycle, and they stick to it.
| 4 | American Funds College Target Date Series |
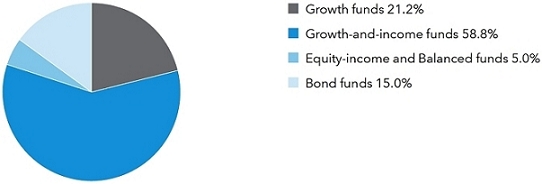
| American Funds College 2030 Fund | unaudited |
Investment portfolio, April 30, 2014
| Fund investments | | Shares | | | Value
(000) | | | Percent of
net assets | |
| Growth funds 21.2% | | | | | | | | | | | | |
| EuroPacific Growth Fund, Class R-6 | | | 412,353 | | | $ | 20,325 | | | | 8.1 | % |
| The Growth Fund of America, Class R-6 | | | 544,982 | | | | 32,661 | | | | 13.1 | |
| | | | | | | | 52,986 | | | | 21.2 | |
| | | | | | | | | | | | | |
| Growth-and-income funds 58.8% | | | | | | | | | | | | |
| Capital World Growth and Income Fund, Class R-6 | | | 951,020 | | | | 44,137 | | | | 17.6 | |
| Fundamental Investors, Class R-6 | | | 846,746 | | | | 43,751 | | | | 17.5 | |
| International Growth and Income Fund, Class R-6 | | | 909,275 | | | | 23,429 | | | | 9.4 | |
| The Investment Company of America, Class R-6 | | | 945,056 | | | | 35,714 | | | | 14.3 | |
| | | | | | | | 147,031 | | | | 58.8 | |
| | | | | | | | | | | | | |
| Equity-income and Balanced funds 5.0% | | | | | | | | | | | | |
| American Funds Global Balanced Fund, Class R-6 | | | 400,161 | | | | 12,501 | | | | 5.0 | |
| | | | | | | | | | | | | |
| Bond funds 15.0% | | | | | | | | | | | | |
| Capital World Bond Fund, Class R-6 | | | 599,858 | | | | 12,501 | | | | 5.0 | |
| U.S. Government Securities Fund, Class R-6 | | | 1,810,433 | | | | 25,002 | | | | 10.0 | |
| | | | | | | | 37,503 | | | | 15.0 | |
| | | | | | | | | | | | | |
| Total investment securities (cost: $230,566,000) | | | | | | | 250,021 | | | | 100.0 | |
| Other assets less liabilities | | | | | | | (87 | ) | | | — | |
| | | | | | | | | | | | | |
| Net assets | | | | | | $ | 249,934 | | | | 100.0 | % |
See Notes to Financial Statements
| American Funds College Target Date Series | 5 |
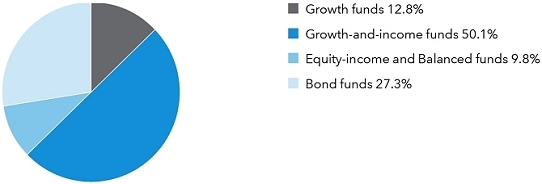
| American Funds College 2027 Fund | unaudited |
Investment portfolio, April 30, 2014
| Fund investments | | Shares | | | Value
(000) | | | Percent of
net assets | |
| Growth funds 12.8% | | | | | | | | | | | | |
| EuroPacific Growth Fund, Class R-6 | | | 202,777 | | | $ | 9,995 | | | | 3.9 | % |
| The Growth Fund of America, Class R-6 | | | 529,301 | | | | 22,755 | | | | 8.9 | |
| | | | | | | | 32,750 | | | | 12.8 | |
| | | | | | | | | | | | | |
| Growth-and-income funds 50.1% | | | | | | | | | | | | |
| Capital World Growth and Income Fund, Class R-6 | | | 703,346 | | | | 32,642 | | | | 12.8 | |
| Fundamental Investors, Class R-6 | | | 581,341 | | | | 30,038 | | | | 11.8 | |
| International Growth and Income Fund, Class R-6 | | | 661,207 | | | | 23,751 | | | | 9.4 | |
| The Investment Company of America, Class R-6 | | | 943,301 | | | | 35,647 | | | | 14.0 | |
| Washington Mutual Investors Fund, Class R-6 | | | 131,473 | | | | 5,314 | | | | 2.1 | |
| | | | | | | | 127,392 | | | | 50.1 | |
| | | | | | | | | | | | | |
| Equity-income and Balanced funds 9.8% | | | | | | | | | | | | |
| American Funds Global Balanced Fund, Class R-6 | | | 797,102 | | | | 24,901 | | | | 9.8 | |
| | | | | | | | | | | | | |
| Bond funds 27.3% | | | | | | | | | | | | |
| The Bond Fund of America, Class R-6 | | | 1,492,995 | | | | 18,901 | | | | 7.4 | |
| Capital World Bond Fund, Class R-6 | | | 601,674 | | | | 12,539 | | | | 4.9 | |
| U.S. Government Securities Fund, Class R-6 | | | 2,750,656 | | | | 37,987 | | | | 15.0 | |
| | | | | | | | 69,427 | | | | 27.3 | |
| | | | | | | | | | | | | |
| Total investment securities (cost: $234,563,000) | | | | | | | 254,470 | | | | 100.0 | |
| Other assets less liabilities | | | | | | | (106 | ) | | | — | |
| | | | | | | | | | | | | |
| Net assets | | | | | | $ | 254,364 | | | | 100.0 | % |
See Notes to Financial Statements
| 6 | American Funds College Target Date Series |
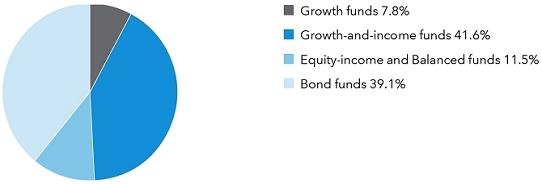
| American Funds College 2024 Fund | unaudited |
Investment portfolio, April 30, 2014
| Fund investments | | Shares | | | Value
(000) | | | Percent of
net assets | |
| Growth funds 7.8% | | | | | | | | | | | | |
| The Growth Fund of America, Class R-6 | | | 619,259 | | | $ | 26,622 | | | | 7.8 | % |
| | | | | | | | | | | | | |
| Growth-and-income funds 41.6% | | | | | | | | | | | | |
| American Mutual Fund, Class R-6 | | | 264,121 | | | | 9,395 | | | | 2.8 | |
| Capital World Growth and Income Fund, Class R-6 | | | 590,406 | | | | 27,401 | | | | 8.0 | |
| International Growth and Income Fund, Class R-6 | | | 829,784 | | | | 29,806 | | | | 8.8 | |
| The Investment Company of America, Class R-6 | | | 1,093,852 | | | | 41,336 | | | | 12.1 | |
| Washington Mutual Investors Fund, Class R-6 | | | 830,385 | | | | 33,564 | | | | 9.9 | |
| | | | | | | | 141,502 | | | | 41.6 | |
| | | | | | | | | | | | | |
| Equity-income and Balanced funds 11.5% | | | | | | | | | | | | |
| American Funds Global Balanced Fund, Class R-6 | | | 1,260,104 | | | | 39,366 | | | | 11.5 | |
| | | | | | | | | | | | | |
| Bond funds 39.1% | | | | | | | | | | | | |
| American Funds Mortgage Fund, Class R-6 | | | 1,224,670 | | | | 12,320 | | | | 3.6 | |
| The Bond Fund of America, Class R-6 | | | 5,007,630 | | | | 63,397 | | | | 18.6 | |
| Capital World Bond Fund, Class R-6 | | | 665,419 | | | | 13,867 | | | | 4.1 | |
| U.S. Government Securities Fund, Class R-6 | | | 3,143,085 | | | | 43,406 | | | | 12.8 | |
| | | | | | | | 132,990 | | | | 39.1 | |
| | | | | | | | | | | | | |
| Total investment securities (cost: $318,104,000) | | | | | | | 340,480 | | | | 100.0 | |
| Other assets less liabilities | | | | | | | (169 | ) | | | — | |
| | | | | | | | | | | | | |
| Net assets | | | | | | $ | 340,311 | | | | 100.0 | % |
See Notes to Financial Statements
| American Funds College Target Date Series | 7 |
| American Funds College 2021 Fund | unaudited |
Investment portfolio, April 30, 2014

| Fund investments | | Shares | | | Value
(000) | | | Percent of
net assets | |
| Growth-and-income fund 33.6% | | | | | | | | | | | | |
| American Mutual Fund, Class R-6 | | | 1,470,162 | | | $ | 52,294 | | | | 13.2 | % |
| International Growth and Income Fund, Class R-6 | | | 910,174 | | | | 32,693 | | | | 8.2 | |
| Washington Mutual Investors Fund, Class R-6 | | | 1,203,103 | | | | 48,629 | | | | 12.2 | |
| | | | | | | | 133,616 | | | | 33.6 | |
| | | | | | | | | | | | | |
| Equity-income and Balanced funds 15.7% | | | | | | | | | | | | |
| American Funds Global Balanced Fund, Class R-6 | | | 1,564,980 | | | | 48,890 | | | | 12.3 | |
| The Income Fund of America, Class R-6 | | | 643,415 | | | | 13,769 | | | | 3.4 | |
| | | | | | | | 62,659 | | | | 15.7 | |
| | | | | | | | | | | | | |
| Bond funds 50.7% | | | | | | | | | | | | |
| American Funds Mortgage Fund, Class R-6* | | | 5,282,581 | | | | 53,143 | | | | 13.3 | |
| The Bond Fund of America, Class R-6 | | | 7,374,421 | | | | 93,360 | | | | 23.5 | |
| Intermediate Bond Fund of America, Class R-6 | | | 1,721,176 | | | | 23,270 | | | | 5.8 | |
| U.S. Government Securities Fund, Class R-6 | | | 2,338,554 | | | | 32,296 | | | | 8.1 | |
| | | | | | | | 202,069 | | | | 50.7 | |
| | | | | | | | | | | | | |
| Total investment securities (cost: $376,127,000) | | | | | | | 398,344 | | | | 100.0 | |
| Other assets less liabilities | | | | | | | (209 | ) | | | — | |
| | | | | | | | | | | | | |
| Net assets | | | | | | $ | 398,135 | | | | 100.0 | % |
| * | This holding is an affiliate of the fund under the Investment Company Act of 1940 since the fund holds 5% or more of its outstanding voting shares. Further details on this holding and related transactions during the six months ended April 30, 2014, appear below. |
| | | Beginning
shares | | Additions | | Reductions | | Ending
shares | | Dividend
income
(000) | | Value of
affiliate at
4/30/2014
(000) | |
| American Funds Mortgage Fund, Class R-6 | | 2,765,728 | | 2,516,853 | | — | | | 5,282,581 | | $ | 341 | | $ | 53,143 | |
See Notes to Financial Statements
| 8 | American Funds College Target Date Series |
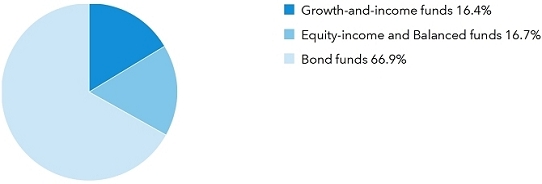
| American Funds College 2018 Fund | unaudited |
Investment portfolio, April 30, 2014
| Fund investments | | Shares | | | Value
(000) | | | Percent of
net assets | |
| Growth-and-income funds 16.4% | | | | | | | | | | | | |
| American Mutual Fund, Class R-6 | | | 1,876,407 | | | $ | 66,744 | | | | 16.4 | % |
| | | | | | | | | | | | | |
| Equity-income and Balanced funds 16.7% | | | | | | | | | | | | |
| The Income Fund of America, Class R-6 | | | 3,172,625 | | | | 67,894 | | | | 16.7 | |
| | | | | | | | | | | | | |
| Bond funds 66.9% | | | | | | | | | | | | |
| American Funds Mortgage Fund, Class R-6* | | | 8,585,265 | | | | 86,368 | | | | 21.3 | |
| The Bond Fund of America, Class R-6 | | | 7,000,272 | | | | 88,623 | | | | 21.8 | |
| Intermediate Bond Fund of America, Class R-6 | | | 7,140,137 | | | | 96,535 | | | | 23.8 | |
| | | | | | | | 271,526 | | | | 66.9 | |
| | | | | | | | | | | | | |
| Total investment securities (cost: $390,034,000) | | | | | | | 406,164 | | | | 100.0 | |
| Other assets less liabilities | | | | | | | (244 | ) | | | — | |
| | | | | | | | | | | | | |
| Net assets | | | | | | $ | 405,920 | | | | 100.0 | % |
| * | This holding is an affiliate of the fund under the Investment Company Act of 1940 since the fund holds 5% or more of its outstanding voting shares. Further details on this holding and related transactions during the six months ended April 30, 2014, appear below. |
| | | Beginning
shares | | Additions | | Reductions | | Ending
shares | | Dividend
income
(000) | | Value of
affiliate at
4/30/2014
(000) | |
| American Funds Mortgage Fund, Class R-6 | | 5,810,634 | | 2,774,631 | | — | | | 8,585,265 | | $ | 646 | | $ | 86,368 | |
See Notes to Financial Statements
| American Funds College Target Date Series | 9 |
| American Funds College 2015 Fund | unaudited |
Investment portfolio, April 30, 2014

| Fund investments | | Shares | | | Value
(000) | | | Percent of
net assets | |
| Equity-income and Balanced funds 8.4% | | | | | | | | | | | | |
| The Income Fund of America, Class R-6 | | | 951,748 | | | $ | 20,368 | | | | 8.4 | % |
| | | | | | | | | | | | | |
| Bond funds 91.6% | | | | | | | | | | | | |
| American Funds Mortgage Fund, Class R-6* | | | 6,582,949 | | | | 66,225 | | | | 27.5 | |
| The Bond Fund of America, Class R-6 | | | 3,351,924 | | | | 42,435 | | | | 17.6 | |
| Intermediate Bond Fund of America, Class R-6 | | | 6,375,680 | | | | 86,199 | | | | 35.7 | |
| Short-Term Bond Fund of America, Class R-6 | | | 2,601,220 | | | | 26,012 | | | | 10.8 | |
| | | | | | | | 220,871 | | | | 91.6 | |
| | | | | | | | | | | | | |
| Total investment securities (cost: $240,871,000) | | | | | | | 241,239 | | | | 100.0 | |
| Other assets less liabilities | | | | | | | (163 | ) | | | — | |
| | | | | | | | | | | | | |
| Net assets | | | | | | $ | 241,076 | | | | 100.0 | % |
| * | This holding is an affiliate of the fund under the Investment Company Act of 1940 since the fund holds 5% or more of its outstanding voting shares. Further details on this holding and related transactions during the six months ended April 30, 2014, appear below. |
| | | Beginning shares | | Additions | | Reductions | | Ending
shares | | Dividend income
(000) | | Value of
affiliate at
4/30/2014
(000) | |
| American Funds Mortgage Fund, Class R-6 | | 5,834,638 | | 850,392 | | 102,081 | | | 6,582,949 | | $ | 573 | | $ | 66,225 | |
See Notes to Financial Statements
| 10 | American Funds College Target Date Series |
| American Funds College Enrollment Fund | unaudited |
Investment portfolio, April 30, 2014

| Fund investments | | Shares | | | Value
(000) | | | Percent of
net assets | |
| Bond funds 100.0% | | | | | | | | | | | | |
| American Funds Mortgage Fund, Class R-6 | | | 2,083,333 | | | $ | 20,958 | | | | 30.0 | % |
| Intermediate Bond Fund of America, Class R-6 | | | 1,807,551 | | | | 24,438 | | | | 35.0 | |
| Short-Term Bond Fund of America, Class R-6 | | | 2,440,602 | | | | 24,406 | | | | 35.0 | |
| | | | | | | | | | | | | |
| Total investment securities (cost: $70,563,000) | | | | | | | 69,802 | | | | 100.0 | |
| Other assets less liabilities | | | | | | | (48 | ) | | | — | |
| | | | | | | | | | | | | |
| Net assets | | | | | | $ | 69,754 | | | | 100.0 | % |
See Notes to Financial Statements
| American Funds College Target Date Series | 11 |
Financial statements
Statements of assets and liabilities
at April 30, 2014
| | | | | College 2030 Fund | | | College 2027 Fund | |
| Assets: | | | | | | | | |
| Investment securities, at value: | | | | | | | | |
| Unaffiliated issuers | | $ | 250,021 | | | $ | 254,470 | |
| Affiliated issuer | | | — | | | | — | |
| Receivables for: | | | | | | | | |
| Sales of fund’s shares | | | 487 | | | | 507 | |
| Dividends | | | 27 | | | | 75 | |
| Total assets | | | 250,535 | | | | 255,052 | |
| | | | | | | | | |
| Liabilities: | | | | | | | | |
| Payables for: | | | | | | | | |
| Purchases of investments | | | 447 | | | | 541 | |
| Repurchases of fund’s shares | | | 60 | | | | 31 | |
| Services provided by related parties | | | 76 | | | | 98 | |
| Trustees’ deferred compensation | | | — | * | | | — | * |
| Other | | | 18 | | | | 18 | |
| Total liabilities | | | 601 | | | | 688 | |
| Net assets at April 30, 2014 | | $ | 249,934 | | | $ | 254,364 | |
| | | | | | | | | |
| Net assets consist of: | | | | | | | | |
| Capital paid in on shares of beneficial interest | | $ | 225,073 | | | $ | 228,667 | |
| Undistributed net investment income | | | 661 | | | | 729 | |
| Undistributed net realized gain | | | 4,745 | | | | 5,061 | |
| Net unrealized appreciation (depreciation) | | | 19,455 | | | | 19,907 | |
| Net assets at April 30, 2014 | | $ | 249,934 | | | $ | 254,364 | |
| | | | | | | | | |
| Investment securities, at cost: | | | | | | | | |
| Unaffiliated issuers | | $ | 230,566 | | | $ | 234,563 | |
| Affiliated issuer | | | — | | | | — | |
| | | | | | | | | |
| Shares of beneficial interest issued and outstanding (no stated par value) — unlimited shares authorized | | | | | | | | |
| Class 529-A: | | Net assets | | $ | 191,260 | | | $ | 188,662 | |
| | | Shares outstanding | | | 15,278 | | | | 15,556 | |
| | | Net asset value per share | | $ | 12.52 | | | $ | 12.13 | |
| Class 529-B: | | Net assets | | $ | 145 | | | $ | 1,108 | |
| | | Shares outstanding | | | 12 | | | | 92 | |
| | | Net asset value per share | | $ | 12.46 | | | $ | 12.06 | |
| Class 529-C: | | Net assets | | $ | 39,770 | | | $ | 45,776 | |
| | | Shares outstanding | | | 3,201 | | | | 3,800 | |
| | | Net asset value per share | | $ | 12.42 | | | $ | 12.05 | |
| Class 529-E: | | Net assets | | $ | 6,332 | | | $ | 6,817 | |
| | | Shares outstanding | | | 507 | | | | 564 | |
| | | Net asset value per share | | $ | 12.48 | | | $ | 12.09 | |
| Class 529-F-1: | | Net assets | | $ | 12,427 | | | $ | 12,001 | |
| | | Shares outstanding | | | 991 | | | | 987 | |
| | | Net asset value per share | | $ | 12.54 | | | $ | 12.16 | |
*Amount less than one thousand.
See Notes to Financial Statements
| 12 | American Funds College Target Date Series |
unaudited
(dollars and shares in thousands, except per-share amounts)
| College 2024 Fund | | | College 2021 Fund | | | College 2018 Fund | | | College 2015 Fund | | | College Enrollment Fund | |
| | | | | | | | | | | | | | | | | | | |
| $ | 340,480 | | | $ | 345,201 | | | $ | 319,796 | | | $ | 175,014 | | | $ | 69,802 | |
| | — | | | | 53,143 | | | | 86,368 | | | | 66,225 | | | | — | |
| | 1,190 | | | | 1,081 | | | | 827 | | | | 321 | | | | 43 | |
| | 189 | | | | 322 | | | | 410 | | | | 298 | | | | 70 | |
| | 341,859 | | | | 399,747 | | | | 407,401 | | | | 241,858 | | | | 69,915 | |
| | | | | | | | | | | | | | | | | | | |
| | 1,374 | | | | 1,380 | | | | 1,198 | | | | 573 | | | | 96 | |
| | 6 | | | | 23 | | | | 40 | | | | 47 | | | | 17 | |
| | 144 | | | | 181 | | | | 214 | | | | 145 | | | | 42 | |
| | — | * | | | — | * | | | — | * | | | — | * | | | — | * |
| | 24 | | | | 28 | | | | 29 | | | | 17 | | | | 5 | |
| | 1,548 | | | | 1,612 | | | | 1,481 | | | | 782 | | | | 160 | |
| $ | 340,311 | | | $ | 398,135 | | | $ | 405,920 | | | $ | 241,076 | | | $ | 69,755 | |
| | | | | | | | | | | | | | | | | | | |
| $ | 310,323 | | | $ | 369,976 | | | $ | 386,733 | | | $ | 239,538 | | | $ | 70,373 | |
| | 1,275 | | | | 1,878 | | | | 1,756 | | | | 922 | | | | 138 | |
| | 6,337 | | | | 4,064 | | | | 1,301 | | | | 248 | | | | 5 | |
| | 22,376 | | | | 22,217 | | | | 16,130 | | | | 368 | | | | (761 | ) |
| $ | 340,311 | | | $ | 398,135 | | | $ | 405,920 | | | $ | 241,076 | | | $ | 69,755 | |
| | | | | | | | | | | | | | | | | | | |
| $ | 318,104 | | | $ | 323,038 | | | $ | 303,539 | | | $ | 174,147 | | | $ | 70,563 | |
| | — | | | | 53,089 | | | | 86,495 | | | | 66,724 | | | | — | |
| | | | | | | | | | | | | | | | | | | |
| $ | 247,171 | | | $ | 281,396 | | | $ | 264,396 | | | $ | 142,173 | | | $ | 39,972 | |
| | 21,100 | | | | 24,891 | | | | 24,405 | | | | 14,101 | | | | 4,042 | |
| $ | 11.71 | | | $ | 11.31 | | | $ | 10.83 | | | $ | 10.08 | | | $ | 9.89 | |
| $ | 3,659 | | | $ | 3,317 | | | $ | 3,444 | | | $ | 2,369 | | | $ | 461 | |
| | 314 | | | | 295 | | | | 319 | | | | 236 | | | | 47 | |
| $ | 11.65 | | | $ | 11.25 | | | $ | 10.78 | | | $ | 10.04 | | | $ | 9.85 | |
| $ | 60,372 | | | $ | 79,679 | | | $ | 102,078 | | | $ | 68,346 | | | $ | 20,032 | |
| | 5,188 | | | | 7,093 | | | | 9,482 | | | | 6,815 | | | | 2,035 | |
| $ | 11.64 | | | $ | 11.23 | | | $ | 10.77 | | | $ | 10.03 | | | $ | 9.85 | |
| $ | 12,427 | | | $ | 13,941 | | | $ | 14,453 | | | $ | 10,828 | | | $ | 3,056 | |
| | 1,063 | | | | 1,236 | | | | 1,337 | | | | 1,076 | | | | 309 | |
| $ | 11.69 | | | $ | 11.28 | | | $ | 10.81 | | | $ | 10.06 | | | $ | 9.88 | |
| $ | 16,682 | | | $ | 19,802 | | | $ | 21,549 | | | $ | 17,360 | | | $ | 6,234 | |
| | 1,422 | | | | 1,749 | | | | 1,986 | | | | 1,719 | | | | 629 | |
| $ | 11.74 | | | $ | 11.32 | | | $ | 10.85 | | | $ | 10.10 | | | $ | 9.91 | |
| American Funds College Target Date Series | 13 |
Statements of operations
for the six months ended April 30, 2014
| | | College 2030 Fund | | | College 2027 Fund | |
| Investment income: | | | | | | | | |
| Income: | | | | | | | | |
| Dividends: | | | | | | | | |
| Unaffiliated issuers | | $ | 2,183 | | | $ | 2,252 | |
| Affiliated issuer | | | — | | | | — | |
| | | | 2,183 | | | | 2,252 | |
| | | | | | | | | |
| Fees and expenses*: | | | | | | | | |
| Investment advisory services | | | 97 | | | | 104 | |
| Distribution services | | | 275 | | | | 325 | |
| Transfer agent services | | | 126 | | | | 135 | |
| 529 plan services | | | 93 | | | | 99 | |
| Reports to shareholders | | | 4 | | | | 5 | |
| Registration statement and prospectus | | | 30 | | | | 32 | |
| Trustees’ compensation | | | — | † | | | — | † |
| Auditing and legal | | | 1 | | | | 1 | |
| Custodian | | | 3 | | | | 3 | |
| Other | | | 2 | | | | 3 | |
| Total fees and expenses before reimbursements/waivers | | | 631 | | | | 707 | |
| Less reimbursements/waivers of fees and expenses: | | | | | | | | |
| Investment advisory services | | | 97 | | | | 104 | |
| Other | | | — | | | | — | |
| Total fees and expenses after reimbursements/waivers | | | 534 | | | | 603 | |
| Net investment income | | | 1,649 | | | | 1,649 | |
| | | | | | | | | |
| Net realized gain and unrealized appreciation on investments: | | | | | | | | |
| Net realized gain on sale of investments: | | | | | | | | |
| Unaffiliated issuers | | | — | | | | — | |
| Affiliated issuer | | | — | | | | — | |
| Capital gain distributions received | | | 4,742 | | | | 5,060 | |
| Net realized gain | | | 4,742 | | | | 5,060 | |
| Net unrealized appreciation on investments | | | 4,802 | | | | 4,357 | |
| Net realized gain and unrealized appreciation on investments | | | 9,544 | | | | 9,417 | |
| Net increase in net assets resulting from operations | | $ | 11,193 | | | $ | 11,066 | |
| * | Additional information related to class-specific fees and expenses is included in the Notes to Financial Statements. |
| † | Amount less than one thousand. |
See Notes to Financial Statements
| 14 | American Funds College Target Date Series |
unaudited
(dollars in thousands)
| College 2024 Fund | | | College 2021 Fund | | | College 2018 Fund | | | College 2015 Fund | | | College Enrollment Fund | |
| | | | | | | | | | | | | | | | | | | |
| $ | 3,296 | | | $ | 3,803 | | | $ | 3,532 | | | $ | 1,651 | | | $ | 453 | |
| | — | | | | 341 | | | | 646 | | | | 573 | | | | — | |
| | 3,296 | | | | 4,144 | | | | 4,178 | | | | 2,224 | | | | 453 | |
| | | | | | | | | | | | | | | | | | | |
| | 140 | | | | 165 | | | | 170 | | | | 107 | | | | 33 | |
| | 457 | | | | 576 | | | | 683 | | | | 477 | | | | 152 | |
| | 181 | | | | 214 | | | | 219 | | | | 137 | | | | 43 | |
| | 134 | | | | 158 | | | | 163 | | | | 102 | | | | 32 | |
| | 6 | | | | 6 | | | | 7 | | | | 4 | | | | 2 | |
| | 40 | | | | 47 | | | | 49 | | | | 36 | | | | 21 | |
| | 1 | | | | 1 | | | | 1 | | | | 1 | | | | — | † |
| | 1 | | | | 1 | | | | 1 | | | | 1 | | | | — | † |
| | 3 | | | | 3 | | | | 3 | | | | 3 | | | | 3 | |
| | 4 | | | | 4 | | | | 5 | | | | 3 | | | | 1 | |
| | 967 | | | | 1,175 | | | | 1,301 | | | | 871 | | | | 287 | |
| | | | | | | | | | | | | | | | | | | |
| | 140 | | | | 165 | | | | 170 | | | | 107 | | | | 33 | |
| | — | | | | — | | | | — | | | | — | | | | 7 | |
| | 827 | | | | 1,010 | | | | 1,131 | | | | 764 | | | | 247 | |
| | 2,469 | | | | 3,134 | | | | 3,047 | | | | 1,460 | | | | 206 | |
| | | | | | | | | | | | | | | | | | | |
| | — | | | | — | | | | — | | | | 236 | | | | 5 | |
| | — | | | | — | | | | — | | | | 11 | | | | — | |
| | 6,327 | | | | 4,064 | | | | 1,285 | | | | — | | | | — | |
| | 6,327 | | | | 4,064 | | | | 1,285 | | | | 247 | | | | 5 | |
| | 5,498 | | | | 7,252 | | | | 6,774 | | | | 1,223 | | | | 9 | |
| | 11,825 | | | | 11,316 | | | | 8,059 | | | | 1,470 | | | | 14 | |
| $ | 14,294 | | | $ | 14,450 | | | $ | 11,106 | | | $ | 2,930 | | | $ | 220 | |
| American Funds College Target Date Series | 15 |
Statements of changes in net assets
| | | College 2030 Fund | | | College 2027 Fund | |
| | | Six months
ended
April 30,
2014* | | | Year ended
October 31,
2013 | | | Six months
ended
April 30,
2014* | | | Year ended
October 31,
2013 | |
| Operations: | | | | | | | | | | | | | | | | |
| Net investment income | | $ | 1,649 | | | $ | 1,084 | | | $ | 1,649 | | | $ | 1,281 | |
| Net realized gain | | | 4,742 | | | | 99 | | | | 5,060 | | | | 236 | |
| Net unrealized appreciation (depreciation) on investments | | | 4,802 | | | | 14,701 | | | | 4,357 | | | | 15,640 | |
| Net increase (decrease) in net assets resulting from operations | | | 11,193 | | | | 15,884 | | | | 11,066 | | | | 17,157 | |
| | | | | | | | | | | | | | | | | |
| Dividends and distributions paid to shareholders: | | | | | | | | | | | | | | | | |
| Dividends from net investment income: | | | | | | | | | | | | | | | | |
| Class 529-A | | | (1,532 | ) | | | (172 | ) | | | (1,561 | ) | | | (263 | ) |
| Class 529-B | | | (1 | ) | | | — | † | | | (4 | ) | | | (2 | ) |
| Class 529-C | | | (185 | ) | | | (36 | ) | | | (207 | ) | | | (57 | ) |
| Class 529-E | | | (46 | ) | | | (5 | ) | | | (52 | ) | | | (6 | ) |
| Class 529-F-1 | | | (99 | ) | | | (16 | ) | | | (110 | ) | | | (15 | ) |
| Total dividends from net investment income | | | (1,863 | ) | | | (229 | ) | | | (1,934 | ) | | | (343 | ) |
| Distributions from net realized gain: | | | | | | | | | | | | | | | | |
| Short-term net realized gains: | | | | | | | | | | | | | | | | |
| Class 529-A | | | — | | | | — | | | | — | | | | — | |
| Class 529-B | | | — | | | | — | | | | — | | | | — | |
| Class 529-C | | | — | | | | — | | | | — | | | | — | |
| Class 529-E | | | — | | | | — | | | | — | | | | — | |
| Class 529-F-1 | | | — | | | | — | | | | — | | | | — | |
| Long-term net realized gains: | | | | | | | | | | | | | | | | |
| Class 529-A | | | (55 | ) | | | — | | | | (108 | ) | | | — | |
| Class 529-B | | | — | † | | | — | | | | (1 | ) | | | — | |
| Class 529-C | | | (12 | ) | | | — | | | | (27 | ) | | | — | |
| Class 529-E | | | (2 | ) | | | — | | | | (4 | ) | | | — | |
| Class 529-F-1 | | | (3 | ) | | | — | | | | (7 | ) | | | — | |
| Total distributions from net realized gain | | | (72 | ) | | | — | | | | (147 | ) | | | — | |
| Total dividends and distributions paid to shareholders | | | (1,935 | ) | | | (229 | ) | | | (2,081 | ) | | | (343 | ) |
| | | | | | | | | | | | | | | | | |
| Net capital share transactions | | | 96,838 | | | | 121,530 | | | | 77,647 | | | | 136,867 | |
| | | | | | | | | | | | | | | | | |
| Total increase in net assets | | | 106,096 | | | | 137,185 | | | | 86,632 | | | | 153,681 | |
| | | | | | | | | | | | | | | | | |
| Net assets: | | | | | | | | | | | | | | | | |
| Beginning of period | | | 143,838 | | | | 6,653 | | | | 167,732 | | | | 14,051 | |
| End of period | | $ | 249,934 | | | $ | 143,838 | | | $ | 254,364 | | | $ | 167,732 | |
| Undistributed net investment income | | $ | 661 | | | $ | 875 | | | $ | 729 | | | $ | 1,014 | |
| * | Unaudited. |
| † | Amount less than one thousand. |
See Notes to Financial Statements
| 16 | American Funds College Target Date Series |
(dollars in thousands)
| College 2024 Fund | | | College 2021 Fund | | | College 2018 Fund | | | College 2015 Fund | | | College Enrollment Fund | |
Six months
ended
April 30,
2014* | | | Year ended
October 31,
2013 | | | Six months
ended
April 30,
2014* | | | Year ended
October 31,
2013 | | | Six months
ended
April 30, 2014* | | | Year ended
October 31,
2013 | | | Six months
ended
April 30,
2014* | | | Year ended
October 31,
2013 | | | Six months
ended
April 30,
2014* | | | Year ended
October 31,
2013 | |
| | | | | | | | | | | | | | | | | | | | | | | | | | | | | | | | | | | | | | | |
| $ | 2,469 | | | $ | 2,088 | | | $ | 3,134 | | | $ | 2,790 | | | $ | 3,047 | | | $ | 3,091 | | | $ | 1,460 | | | $ | 1,621 | | | $ | 206 | | | $ | 241 | |
| | 6,327 | | | | 342 | | | | 4,064 | | | | 268 | | | | 1,285 | | | | 199 | | | | 247 | | | | 331 | | | | 5 | | | | 110 | |
| | 5,498 | | | | 17,000 | | | | 7,252 | | | | 15,082 | | | | 6,774 | | | | 9,430 | | | | 1,223 | | | | (836 | ) | | | 9 | | | | (765 | ) |
| | 14,294 | | | | 19,430 | | | | 14,450 | | | | 18,140 | | | | 11,106 | | | | 12,720 | | | | 2,930 | | | | 1,116 | | | | 220 | | | | (414 | ) |
| | | | | | | | | | | | | | | | | | | | | | | | | | | | | | | | | | | | | | | |
| | (2,348 | ) | | | (324 | ) | | | (2,892 | ) | | | (349 | ) | | | (2,938 | ) | | | (312 | ) | | | (1,396 | ) | | | (214 | ) | | | (230 | ) | | | (51 | ) |
| | (20 | ) | | | (6 | ) | | | (20 | ) | | | (5 | ) | | | (26 | ) | | | (4 | ) | | | (12 | ) | | | (3 | ) | | | — | † | | | (1 | ) |
| | (323 | ) | | | (66 | ) | | | (479 | ) | | | (77 | ) | | | (701 | ) | | | (86 | ) | | | (327 | ) | | | (71 | ) | | | — | | | | (19 | ) |
| | (98 | ) | | | (16 | ) | | | (123 | ) | | | (15 | ) | | | (133 | ) | | | (17 | ) | | | (96 | ) | | | (9 | ) | | | (14 | ) | | | (2 | ) |
| | (172 | ) | | | (29 | ) | | | (228 | ) | | | (19 | ) | | | (270 | ) | | | (22 | ) | | | (194 | ) | | | (15 | ) | | | (49 | ) | | | (9 | ) |
| | (2,961 | ) | | | (441 | ) | | | (3,742 | ) | | | (465 | ) | | | (4,068 | ) | | | (441 | ) | | | (2,025 | ) | | | (312 | ) | | | (293 | ) | | | (82 | ) |
| | | | | | | | | | | | | | | | | | | | | | | | | | | | | | | | | | | | | | | |
| | — | | | | — | | | | — | | | | — | | | | — | | | | — | | | | (36 | ) | | | — | | | | (4 | ) | | | — | |
| | — | | | | — | | | | — | | | | — | | | | — | | | | — | | | | (1 | ) | | | — | | | | — | † | | | — | |
| | — | | | | — | | | | — | | | | — | | | | — | | | | — | | | | (18 | ) | | | — | | | | (2 | ) | | | — | |
| | — | | | | — | | | | — | | | | — | | | | — | | | | — | | | | (3 | ) | | | — | | | | — | † | | | — | |
| | — | | | | — | | | | — | | | | — | | | | — | | | | — | | | | (4 | ) | | | — | | | | (1 | ) | | | — | |
| | (150 | ) | | | — | | | | (79 | ) | | | — | | | | (39 | ) | | | — | | | | (60 | ) | | | — | | | | (22 | ) | | | — | |
| | (3 | ) | | | — | | | | (1 | ) | | | — | | | | (1 | ) | | | — | | | | (1 | ) | | | — | | | | — | † | | | — | |
| | (36 | ) | | | — | | | | (22 | ) | | | — | | | | (15 | ) | | | — | | | | (29 | ) | | | — | | | | (12 | ) | | | — | |
| | (7 | ) | | | — | | | | (4 | ) | | | — | | | | (2 | ) | | | — | | | | (5 | ) | | | — | | | | (2 | ) | | | — | |
| | (10 | ) | | | — | | | | (6 | ) | | | — | | | | (3 | ) | | | — | | | | (7 | ) | | | — | | | | (4 | ) | | | — | |
| | (206 | ) | | | — | | | | (112 | ) | | | — | | | | (60 | ) | | | — | | | | (164 | ) | | | — | | | | (47 | ) | | | — | |
| | (3,167 | ) | | | (441 | ) | | | (3,854 | ) | | | (465 | ) | | | (4,128 | ) | | | (441 | ) | | | (2,189 | ) | | | (312 | ) | | | (340 | ) | | | (82 | ) |
| | | | | | | | | | | | | | | | | | | | | | | | | | | | | | | | | | | | | | | |
| | 99,161 | | | | 190,448 | | | | 109,993 | | | | 231,185 | | | | 107,402 | | | | 247,050 | | | | 45,094 | | | | 166,750 | | | | 2,922 | | | | 55,809 | |
| | | | | | | | | | | | | | | | | | | | | | | | | | | | | | | | | | | | | | | |
| | 110,288 | | | | 209,437 | | | | 120,589 | | | | 248,860 | | | | 114,380 | | | | 259,329 | | | | 45,835 | | | | 167,554 | | | | 2,802 | | | | 55,313 | |
| | | | | | | | | | | | | | | | | | | | | | | | | | | | | | | | | | | | | | | |
| | 230,023 | | | | 20,586 | | | | 277,546 | | | | 28,686 | | | | 291,540 | | | | 32,211 | | | | 195,241 | | | | 27,687 | | | | 66,953 | | | | 11,640 | |
| $ | 340,311 | | | $ | 230,023 | | | $ | 398,135 | | | $ | 277,546 | | | $ | 405,920 | | | $ | 291,540 | | | $ | 241,076 | | | $ | 195,241 | | | $ | 69,755 | | | $ | 66,953 | |
| $ | 1,275 | | | $ | 1,767 | | | $ | 1,878 | | | $ | 2,486 | | | $ | 1,756 | | | $ | 2,777 | | | $ | 922 | | | $ | 1,487 | | | $ | 138 | | | $ | 225 | |
| American Funds College Target Date Series | 17 |
| Notes to financial statements | unaudited |
1. Organization
American Funds College Target Date Series (the “series”) is registered under the Investment Company Act of 1940 as an open-end, diversified management investment company. The series consists of seven funds (the “funds”) — American Funds College 2030 Fund (“College 2030 Fund”), American Funds College 2027 Fund (“College 2027 Fund”), American Funds College 2024 Fund (“College 2024 Fund”), American Funds College 2021 Fund (“College 2021 Fund”), American Funds College 2018 Fund (“College 2018 Fund”), American Funds College 2015 Fund (“College 2015 Fund”) and American Funds College Enrollment Fund (“College Enrollment Fund”).
Each fund in the series is designed for investors who plan to attend college in, or close to, the year designated in the fund’s name. Depending on its proximity to its target date, each fund will seek to achieve the following objectives to varying degrees: growth, income and conservation of capital. As each fund approaches its target date, it will increasingly emphasize income and conservation of capital by investing a greater portion of its assets in equity-income, balanced and bond funds. When each fund reaches its target date, it will principally invest in bond funds and may merge into the Enrollment Fund, which will also principally invest in bond funds. Each fund will attempt to achieve its investment objectives by investing in a mix of American Funds (the “underlying funds”) in different combinations and weightings. Capital Research and Management Company (“CRMC”), the series’ investment adviser, is also the investment adviser to the underlying funds.
Each fund in the series has five 529 college savings plan share classes (Classes 529-A, 529-B, 529-C, 529-E and 529-F-1). The funds’ share classes are described further in the following table:
| Share class | | Initial sales
charge | | Contingent deferred sales
charge upon redemption | | Conversion feature |
| Class 529-A | | Up to 2.50% for College Enrollment Fund; up to 4.25% for all other funds | | None (except 1% for certain redemptions within one year of purchase without an initial sales charge) | | None |
| Class 529-B* | | None | | Declines from 5% to 0% for redemptions within six years of purchase | | Class 529-B converts to Class 529-A after eight years |
| Class 529-C | | None | | 1% for redemptions within one year of purchase | | None |
| Class 529-E | | None | | None | | None |
| Class 529-F-1 | | None | | None | | None |
*Class 529-B shares of the fund are not available for purchase.
Holders of all share classes of each fund have equal pro rata rights to the assets, dividends and liquidation proceeds of each fund held. Each share class of each fund has identical voting rights, except for the exclusive right to vote on matters affecting only its class. Share classes have different fees and expenses (“class-specific fees and expenses”), primarily due to different arrangements for distribution, administrative and shareholder services. Differences in class-specific fees and expenses will result in differences in net investment income and, therefore, the payment of different per-share dividends by each share class of each fund.
2. Significant accounting policies
Each fund’s financial statements have been prepared to comply with accounting principles generally accepted in the United States of America. These principles require management to make estimates and assumptions that affect reported amounts and disclosures. Actual results could differ from those estimates. The funds follow the significant accounting policies described below, as well as the valuation policies described in the next section on valuation.
Security transactions and related investment income — Security transactions are recorded by the funds as of the date the trades are executed. Realized gains and losses from security transactions are determined based on the specific identified cost of the securities. Dividend income is recognized on the ex-dividend date and interest income is recognized on an accrual basis.
Fees and expenses — The fees and expenses of the underlying funds are not included in the fees and expenses reported for each of the funds; however, they are indirectly reflected in the valuation of each of the underlying funds. These fees are included in the net effective expense ratios that are provided as supplementary information in the Financial Highlights tables on pages 29 to 32.
| 18 | American Funds College Target Date Series |
Class allocations — Income, fees and expenses (other than class-specific fees and expenses) and realized and unrealized gains and losses are allocated daily among the various share classes of each fund based on their relative net assets. Class-specific fees and expenses, such as distribution, administrative and shareholder services, are charged directly to the respective share class of each fund.
Dividends and distributions to shareholders — Dividends and distributions to shareholders are recorded on each fund’s ex-dividend date.
3. Valuation
Security valuation — The net asset value of each share class of each fund is calculated based on the reported net asset values of the underlying funds in which each fund invests. The net asset value of each underlying fund is calculated based on the policies and procedures of the underlying fund contained in each underlying fund’s statement of additional information. Generally, the funds and the underlying funds determine the net asset value of each share class as of approximately 4:00 p.m. New York time each day the New York Stock Exchange is open.
Processes and structure — The series’ board of trustees has delegated authority to the funds’ investment adviser to make fair value determinations, subject to board oversight. The investment adviser has established a Joint Fair Valuation Committee (the “Fair Valuation Committee”) to administer, implement and oversee the fair valuation process, and to make fair value decisions. The Fair Valuation Committee regularly reviews its own fair value decisions, as well as decisions made under its standing instructions to the investment adviser’s valuation teams. The Fair Valuation Committee reviews changes in fair value measurements from period to period and may, as deemed appropriate, update the fair valuation guidelines to better reflect the results of back testing and address new or evolving issues. The Fair Valuation Committee reports any changes to the fair valuation guidelines to the board of trustees with supplemental information to support the changes. The series’ board and audit committee also regularly review reports that describe fair value determinations and methods. Pricing decisions, processes and controls over security valuation are also subject to additional internal reviews, including an annual control self-evaluation program facilitated by the investment adviser’s compliance group.
Classifications — The series’ investment adviser classifies each fund’s assets and liabilities into three levels based on the method used to value the assets or liabilities. Level 1 values are based on quoted prices in active markets for identical securities. Level 2 values are based on significant observable market inputs, such as quoted prices for similar securities and quoted prices in inactive markets. Level 3 values are based on significant unobservable inputs that reflect the investment adviser’s determination of assumptions that market participants might reasonably use in valuing the securities. The valuation levels are not necessarily an indication of the risk or liquidity associated with the underlying investment. At April 30, 2014, all of the investment securities held by for each fund were classified as Level 1.
4. Risk factors
Investing in the funds may involve certain risks including, but not limited to, those described below.
Allocation risk — Investments in the funds are subject to risks related to the investment adviser’s allocation choices. The selection of the underlying funds and the allocation of the fund’s assets could cause the fund to lose value or its results to lag relevant benchmarks or other funds with similar objectives.
Fund structure — The funds invest in underlying funds and incur expenses related to the underlying funds. In addition, investors in the funds will incur fees to pay for certain expenses related to the operations of the funds. An investor holding the underlying funds directly and in the same proportions as the funds would incur lower overall expenses but would not receive the benefit of the portfolio management and other services provided by the funds.
Because the funds’ investments consist of underlying funds, the funds’ risks are directly related to the risks of the underlying funds. For this reason, it is important to understand the risks associated with investing in the underlying funds.
Market conditions — The prices of, and the income generated by, the common stocks, bonds and other securities held by the underlying funds may decline due to market conditions and other factors, including those directly involving the issuers of securities held by the underlying funds.
| American Funds College Target Date Series | 19 |
Investing in stocks — Investing in stocks may involve larger price swings and greater potential for loss than other types of investments. As a result, the value of the underlying funds may be subject to sharp, short-term declines in value. Income provided by an underlying fund may be reduced by changes in the dividend policies of, and the capital resources available at, the companies in which the underlying fund invests. These risks will be more significant for the fund in the years preceding its target date because a greater proportion of the fund’s assets will consist of underlying funds that primarily invest in stocks.
Investing in bonds — Rising interest rates will generally cause the prices of bonds and other debt securities to fall. Longer maturity debt securities may be subject to greater price fluctuations than shorter maturity debt securities. In addition, falling interest rates may cause an issuer to redeem, call or refinance a debt security before its stated maturity, which may result in the underlying fund having to reinvest the proceeds in lower yielding securities.
Bonds and other debt securities are subject to credit risk, which is the possibility that the credit strength of an issuer will weaken and/or an issuer of a debt security will fail to make timely payments of principal or interest and the security will go into default. Credit risk is gauged, in part, by the credit ratings of the debt securities in which the underlying fund invests. However, ratings are only the opinions of the rating agencies issuing them and are not guarantees as to credit quality or an evaluation of market risk. The fund’s investment adviser relies on its own credit analysts to research issuers and issues in seeking to mitigate various credit and default risks. These risks will be more significant as the fund approaches its target date because a greater proportion of the fund’s assets will consist of underlying funds that primarily invest in bonds.
Investing in lower rated bonds — Lower rated bonds and other lower rated debt securities generally have higher rates of interest and involve greater risk of default or price declines due to changes in the issuer’s creditworthiness than those of higher quality debt securities. The market prices of these securities may fluctuate more than the prices of higher quality debt securities and may decline significantly in periods of general economic difficulty. These risks may be increased with respect to investments in bonds rated Ba1 or BB+ or below by Nationally Recognized Statistical Rating Organizations or unrated but determined by the underlying fund’s investment adviser to be of equivalent quality. Such securities are considered speculative and are sometimes referred to as “junk bonds.”
Investing in small companies — Investing in smaller companies may pose additional risks. For example, it is often more difficult to value or dispose of small company stocks and more difficult to obtain information about smaller companies than about larger companies. In addition, the prices of these stocks may be more volatile than stocks of larger, more established companies.
Investing outside the U.S. — Securities of issuers domiciled outside the U.S., or with significant operations outside the U.S., may lose value because of adverse political, social, economic or market developments in the countries or regions in which the issuers operate. These securities may also lose value due to changes in foreign currency exchange rates against the U.S. dollar and/or currencies of other countries. Securities markets in certain countries may be more volatile and/or less liquid than those in the U.S. Investments outside the U.S. may also be subject to different settlement and accounting practices and different regulatory, legal and reporting standards, and may be more difficult to value, than those in the U.S. The risks of investing outside the U.S. may be heightened in connection with investments in emerging markets.
Investing in emerging markets — Investing in emerging markets may involve risks in addition to and greater than those generally associated with investing in the securities markets of developed countries. For instance, developing countries may have less developed legal and accounting systems than those in developed countries. The governments of these countries may be less stable and more likely to impose capital controls, nationalize a company or industry, place restrictions on foreign ownership and on withdrawing sale proceeds of securities from the country, and/or impose punitive taxes that could adversely affect the prices of securities. In addition, the economies of these countries may be dependent on relatively few industries that are more susceptible to local and global changes. Securities markets in these countries can also be relatively small and have substantially lower trading volumes. As a result, securities issued in these countries may be more volatile and less liquid, and may be more difficult to value, than securities issued in countries with more developed economies and/or markets. Additionally, there may be increased settlement risks for transactions in local securities.
Investing in mortgage-backed and asset-backed securities — Many types of bonds and other debt securities, including mortgage-backed/related securities, are subject to prepayment risk as well as the risks associated with investing in debt securities in general. If interest rates fall and the loans underlying these securities are prepaid faster than expected, the underlying fund may have to reinvest the prepaid principal in lower yielding securities, thus reducing the funds’ income. Conversely, if interest rates increase and the loans underlying the securities are prepaid slower than expected, the time in which the securities are paid off could be extended. This may reduce the funds’ cash for potential reinvestment in higher yielding securities.
| 20 | American Funds College Target Date Series |
Investing in U.S. government securities — Securities backed by the U.S. Treasury or the full faith and credit of the U.S. government are guaranteed only as to the timely payment of interest and principal when held to maturity. Accordingly, the current market values for these securities will fluctuate with changes in interest rates. Securities issued by government-sponsored entities and federal agencies and instrumentalities that are not backed by the full faith and credit of the U.S. government are neither issued nor guaranteed by the U.S. government.
Investing in future delivery contracts — Contracts for future delivery of mortgage-related securities, such as to be announced contracts and mortgage dollar rolls, involve the funds selling mortgage-related securities and simultaneously contracting to repurchase similar securities for delivery at a future date at a predetermined price. This can increase the underlying fund’s market exposure, and the market price of the securities the funds contract to repurchase could drop below their purchase price. While the funds can preserve and generate capital through the use of such contracts by, for example, realizing the difference between the sale price and the future purchase price, the income generated by the funds may be reduced by engaging in such transactions. In addition, these transactions may increase the turnover rate of the funds.
Management — The investment adviser to the funds and to the underlying funds actively manages each underlying fund’s investments. Consequently, the underlying funds are subject to the risk that the methods and analyses employed by the investment adviser in this process may not produce the desired results. This could cause an underlying fund to lose value or its investment results to lag relevant benchmarks or other funds with similar objectives.
5. Taxation and distributions
Federal income taxation — Each fund complies with the requirements under Subchapter M of the Internal Revenue Code applicable to mutual funds and each intends to distribute substantially all of its net taxable income and net capital gains each year. The funds are not subject to income taxes to the extent such distributions are made. Therefore, no federal income tax provision is required.
As of and during the period ended April 30, 2014, none of the funds had a liability for any unrecognized tax benefits. Each fund recognizes interest and penalties, if any, related to unrecognized tax benefits as income tax expense in the statements of operations. During the period, none of the funds incurred any significant interest or penalties.
The series is not subject to examination by U.S. federal and state tax authorities for tax years before 2012, the year the series commenced operations.
Distributions — Distributions paid to shareholders are based on net investment income and net realized gains determined on a tax basis, which may differ from net investment income and net realized gains for financial reporting purposes. These differences are due primarily to different treatment for items such as short-term capital gains and losses and deferred expenses. The fiscal year in which amounts are distributed may differ from the year in which the net investment income and net realized gains are recorded by the funds for financial reporting purposes.
Dividends from net investment income and distributions from short-term net realized gains shown in the funds’ statements of changes in net assets are considered ordinary income distributions for tax purposes. Distributions from long-term net realized gains in the funds’ statements of changes in net assets are considered long-term capital gain distributions for tax purposes.
The components of distributable earnings on a tax basis are reported as of the funds’ most recent year-end. As of October 31, 2013, the components of distributable earnings on a tax basis for each fund were as follows (dollars in thousands):
| | | College
2030 Fund | | College
2027 Fund | | College
2024 Fund | | College
2021 Fund | | College
2018 Fund | | College
2015 Fund | | College
Enrollment Fund |
| Undistributed ordinary income | | $ | 875 | | | $ | 1,014 | | | $ | 1,767 | | | $ | 2,486 | | | $ | 2,777 | | | $ | 1,549 | | | $ | 233 | |
| Undistributed long-term capital gain | | | 75 | | | | 148 | | | | 216 | | | | 112 | | | | 76 | | | | 102 | | | | 39 | |
| American Funds College Target Date Series | 21 |
As of April 30, 2014, the tax basis unrealized appreciation (depreciation) and cost of investment securities for each fund were as follows (dollars in thousands):
| | | College
2030 Fund | | College
2027 Fund | | College
2024 Fund | | College
2021 Fund | | College
2018 Fund | | College
2015 Fund | | College
Enrollment Fund |
| Gross unrealized appreciation on investment securities | | $ | 19,455 | | | $ | 20,350 | | | $ | 23,134 | | | $ | 23,326 | | | $ | 17,257 | | | $ | 2,464 | | | $ | — | |
| Gross unrealized depreciation on investment securities | | | — | | | | (443 | ) | | | (758 | ) | | | (1,109 | ) | | | (1,127 | ) | | | (2,096 | ) | | | (761 | ) |
| Net unrealized appreciation (depreciation) on investment securities | | | 19,455 | | | | 19,907 | | | | 22,376 | | | | 22,217 | | | | 16,130 | | | | 368 | | | | (761 | ) |
| Cost of investment securities | | | 230,566 | | | | 234,563 | | | | 318,104 | | | | 376,127 | | | | 390,034 | | | | 240,871 | | | | 70,563 | |
6. Fees and transactions with related parties
CRMC, the series’ investment adviser, is the parent company of American Funds Distributors®, Inc. (“AFD”), the principal underwriter of the series’ shares, and American Funds Service Company® (“AFS”), the series’ transfer agent. CRMC, AFD and AFS are considered related parties to the series.
Investment advisory services — The series has an investment advisory and service agreement with CRMC that provides for monthly fees, accrued daily. These fees are based on an annual rate of 0.10% of daily net assets. CRMC is currently waiving these fees. This waiver can only be modified or terminated with the approval of the series’ board of trustees. Investment advisory services fees are presented in the statements of operations gross of the waiver from CRMC. CRMC receives fees from the underlying funds for investment advisory services. These fees are included in the net effective expense ratios that are provided as supplementary information in the Financial Highlights tables on pages 29 to 32.
Other reimbursements — CRMC has agreed to reimburse a portion of the fees and expenses of the funds during their startup period. At its discretion, the adviser may elect to extend, modify, or terminate the reimbursements. Fees and expenses in the statements of operations are presented gross of the reimbursement from CRMC. The amounts reimbursed by CRMC are reflected as other reimbursements.
Class-specific fees and expenses — Expenses that are specific to individual share classes are accrued directly to the respective share class. The principal class-specific fees and expenses are further described below:
Distribution services — The series has plans of distribution for all share classes. Under the plans, the board of trustees approves certain categories of expenses that are used to finance activities primarily intended to sell fund shares and service existing accounts. The plans provide for payments, based on an annualized percentage of average daily net assets, ranging from 0.50% to 1.00% as noted in this section. In some cases, the board of trustees has limited the amounts that may be paid to less than the maximum allowed by the plans. All share classes may use up to 0.25% of average daily net assets to pay service fees, or to compensate AFD for paying service fees, to firms that have entered into agreements with AFD to provide certain shareholder services. The remaining amounts available to be paid under each plan are paid to dealers to compensate them for their sales activities.
| Share class | | Currently approved limits | | Plan limits | |
| Class 529-A | | | 0.30 | % | | | 0.50 | % | |
| Class 529-B | | | 1.00 | | | | 1.00 | | |
| Class 529-C | | | 1.00 | | | | 1.00 | | |
| Class 529-E | | | 0.50 | | | | 0.75 | | |
| Class 529-F-1 | | | 0.25 | | | | 0.50 | | |
For Class 529-A shares, distribution-related expenses include the reimbursement of dealer and wholesaler commissions paid by AFD for certain shares sold without a sales charge. This share class reimburses AFD for amounts billed within the prior 15 months but only to the extent that the overall annual expense limit of 0.30% is not exceeded. As of April 30, 2014, there were no unreimbursed expenses subject to reimbursement for the funds’ Class 529-A shares.
| 22 | American Funds College Target Date Series |
Transfer agent services — The series has a shareholder services agreement with AFS under which the funds compensate AFS for providing transfer agent services to all of the funds’ share classes. These services include recordkeeping, shareholder communications and transaction processing. In addition, the funds reimburse AFS for amounts paid to third parties for performing transfer agent services on behalf of fund shareholders.
Administrative services — The series has an administrative services agreement with CRMC for providing administrative services to all of the funds’ share classes. These services include, but are not limited to, coordinating, monitoring, assisting and overseeing third parties that provide services to fund shareholders. CRMC receives administrative services fees of 0.05% of average daily net assets from the Class R-6 shares of the underlying funds for administrative services provided to the series.
529 plan services — Each 529 share class is subject to service fees to compensate the Commonwealth of Virginia for the maintenance of the 529 college savings plan. During the period November 1, 2013, to March 31, 2014, the quarterly fee was based on a series of decreasing annual rates beginning with 0.10% on the first $30 billion of the net assets invested in Class 529 shares of the American Funds and decreasing to 0.06% on such assets between $120 billion and $150 billion. Effective April 1, 2014, the quarterly fee was amended to provide for reduced annual rates of 0.07%, 0.06% and 0.05% over $30 billion, $50 billion and $70 billion, respectively, of the net assets invested in Class 529 shares of the American Funds. The fee for any given calendar quarter is accrued and calculated on the basis of the average net assets of Class 529 shares of the American Funds for the last month of the prior calendar quarter. The Commonwealth of Virginia is not considered a related party to the series.
Class-specific expenses under the agreements described in this section for the six months ended April 30, 2014, were as follows (dollars in thousands):
| | | Distribution
services | | Transfer agent
services | | 529 plan
services | |
| College 2030 Fund | | | | | | | | | | |
| Class 529-A | | | $107 | | | $98 | | | $71 | |
| Class 529-B | | | 1 | | | — | * | | — | * |
| Class 529-C | | | 155 | | | 19 | | | 15 | |
| Class 529-E | | | 12 | | | 3 | | | 2 | |
| Class 529-F-1 | | | — | | | 6 | | | 5 | |
| Total | | | $275 | | | $126 | | | $93 | |
| | | | | | | | | | | |
| College 2027 Fund | | | | | | | | | | |
| Class 529-A | | | $118 | | | $102 | | | $73 | |
| Class 529-B | | | 5 | | | 1 | | | — | * |
| Class 529-C | | | 188 | | | 23 | | | 18 | |
| Class 529-E | | | 14 | | | 3 | | | 3 | |
| Class 529-F-1 | | | — | | | 6 | | | 5 | |
| Total | | | $325 | | | $135 | | | $99 | |
| | | | | | | | | | | |
| College 2024 Fund | | | | | | | | | | |
| Class 529-A | | | $171 | | | $136 | | | $97 | |
| Class 529-B | | | 16 | | | 2 | | | 2 | |
| Class 529-C | | | 245 | | | 30 | | | 23 | |
| Class 529-E | | | 25 | | | 5 | | | 5 | |
| Class 529-F-1 | | | — | | | 8 | | | 7 | |
| Total | | | $457 | | | $181 | | | $134 | |
| | | | | | | | | | | |
| College 2021 Fund | | | | | | | | | | |
| Class 529-A | | | $208 | | | $156 | | | $112 | |
| Class 529-B | | | 15 | | | 2 | | | 2 | |
| Class 529-C | | | 325 | | | 40 | | | 31 | |
| Class 529-E | | | 28 | | | 5 | | | 5 | |
| Class 529-F-1 | | | — | | | 11 | | | 8 | |
| Total | | | $576 | | | $214 | | | $158 | |
| | | | | | | | | | | |
| College 2018 Fund | | | | | | | | | | |
| Class 529-A | | | $213 | | | $148 | | | $106 | |
| Class 529-B | | | 16 | | | 2 | | | 1 | |
| Class 529-C | | | 425 | | | 52 | | | 41 | |
| Class 529-E | | | 29 | | | 5 | | | 6 | |
| Class 529-F-1 | | | — | | | 12 | | | 9 | |
| Total | | | $683 | | | $219 | | | $163 | |
| | | | | | | | | | | |
| College 2015 Fund | | | | | | | | | | |
| Class 529-A | | | $136 | | | $84 | | | $60 | |
| Class 529-B | | | 11 | | | 1 | | | 1 | |
| Class 529-C | | | 306 | | | 38 | | | 29 | |
| Class 529-E | | | 24 | | | 5 | | | 5 | |
| Class 529-F-1 | | | — | | | 9 | | | 7 | |
| Total | | | $477 | | | $137 | | | $102 | |
| | | | | | | | | | | |
| College Enrollment Fund | | | | | | | | | | |
| Class 529-A | | | $46 | | | $25 | | | $18 | |
| Class 529-B | | | 2 | | | — | * | | — | * |
| Class 529-C | | | 97 | | | 12 | | | 9 | |
| Class 529-E | | | 7 | | | 2 | | | 2 | |
| Class 529-F-1 | | | — | | | 4 | | | 3 | |
| Total | | | $152 | | | $43 | | | $32 | |
*Amount less than one thousand.
| American Funds College Target Date Series | 23 |
Trustees’ deferred compensation — Trustees who are unaffiliated with CRMC may elect to defer the cash payment of part or all of their compensation. These deferred amounts, which remain as liabilities of the funds, are treated as if invested in shares of the American Funds. These amounts represent general, unsecured liabilities of the funds and vary according to the total returns of the selected American Funds. Trustees’ compensation in the funds’ statements of operations includes current fees (either paid in cash or deferred) and a net increase in the value of the deferred amounts as follows:
| | | Current fees | | Increase in value of
deferred amounts | | Total trustees’
compensation |
| College 2030 Fund | | $ | 457 | | | $ | 3 | | | $ | 460 | |
| College 2027 Fund | | | 493 | | | | 4 | | | | 497 | |
| College 2024 Fund | | | 666 | | | | 6 | | | | 672 | |
| College 2021 Fund | | | 786 | | | | 8 | | | | 794 | |
| College 2018 Fund | | | 811 | | | | 8 | | | | 819 | |
| College 2015 Fund | | | 511 | | | | 6 | | | | 517 | |
| College Enrollment Fund | | | 161 | | | | 2 | | | | 163 | |
Affiliated officers and trustees — Officers and certain trustees of the series are or may be considered to be affiliated with CRMC, AFD and AFS. No affiliated officers or trustees received any compensation directly from any of the funds in the series.
7. Investment transactions
The funds made purchases and sales of investment securities during the six months ended April 30, 2014, as follows (dollars in thousands):
| | | Purchases | | | Sales | |
| College 2030 Fund | | | $101,328 | | | $ | — | |
| College 2027 Fund | | | 82,306 | | | | — | |
| College 2024 Fund | | | 104,852 | | | | — | |
| College 2021 Fund | | | 113,413 | | | | — | |
| College 2018 Fund | | | 107,695 | | | | — | |
| College 2015 Fund | | | 49,320 | | | | 4,907 | |
| College Enrollment Fund | | | 8,263 | | | | 5,473 | |
| 24 | American Funds College Target Date Series |
8. Capital share transactions
Capital share transactions in the funds for the six months ended April 30, 2014, were as follows (dollars and shares in thousands):
| | | College | | | College | | | College | | | College | |
| | | 2030 Fund | | | 2027 Fund | | | 2024 Fund | | | 2021 Fund | |
| Share class | | Amount | | | Shares | | | Amount | | | Shares | | | Amount | | | Shares | | | Amount | | | Shares | |
| | | | | | | | | | | | | | | | | | | | | | | | | | | | | | | | | |
| Class 529-A | | | | | | | | | | | | | | | | | | | | | | | | | | | | | | | | |
| Sales* | | $ | 75,490 | | | | 6,189 | | | $ | 59,012 | | | | 4,983 | | | $ | 72,924 | | | | 6,377 | | | $ | 80,715 | | | | 7,299 | |
| Reinvestments of dividends and distributions | | | 1,587 | | | | 130 | | | | 1,669 | | | | 141 | | | | 2,498 | | | | 219 | | | | 2,970 | | | | 270 | |
| Repurchases* | | | (2,675 | ) | | | (219 | ) | | | (2,898 | ) | | | (244 | ) | | | (4,318 | ) | | | (377 | ) | | | (7,845 | ) | | | (711 | ) |
| Total Class 529-A transactions | | | 74,402 | | | | 6,100 | | | | 57,783 | | | | 4,880 | | | | 71,104 | | | | 6,219 | | | | 75,840 | | | | 6,858 | |
| Class 529-B | | | | | | | | | | | | | | | | | | | | | | | | | | | | | | | | |
| Sales* | | | 35 | | | | 3 | | | | 277 | | | | 24 | | | | 1,056 | | | | 93 | | | | 950 | | | | 87 | |
| Reinvestments of dividends and distributions | | | 1 | | | | — | † | | | 5 | | | | — | † | | | 22 | | | | 2 | | | | 21 | | | | 2 | |
| Repurchases* | | | (21 | ) | | | (2 | ) | | | (38 | ) | | | (3 | ) | | | (380 | ) | | | (34 | ) | | | (527 | ) | | | (48 | ) |
| Total Class 529-B transactions | | | 15 | | | | 1 | | | | 244 | | | | 21 | | | | 698 | | | | 61 | | | | 444 | | | | 41 | |
| Class 529-C | | | | | | | | | | | | | | | | | | | | | | | | | | | | | | | | |
| Sales* | | | 16,668 | | | | 1,376 | | | | 15,517 | | | | 1,321 | | | | 20,225 | | | | 1,779 | | | | 25,981 | | | | 2,363 | |
| Reinvestments of dividends and distributions | | | 197 | | | | 16 | | | | 233 | | | | 20 | | | | 359 | | | | 31 | | | | 501 | | | | 46 | |
| Repurchases* | | | (1,266 | ) | | | (104 | ) | | | (1,123 | ) | | | (96 | ) | | | (1,176 | ) | | | (103 | ) | | | (2,163 | ) | | | (197 | ) |
| Total Class 529-C transactions | | | 15,599 | | | | 1,288 | | | | 14,627 | | | | 1,245 | | | | 19,408 | | | | 1,707 | | | | 24,319 | | | | 2,212 | |
| Class 529-E | | | | | | | | | | | | | | | | | | | | | | | | | | | | | | | | |
| Sales* | | | 2,505 | | | | 206 | | | | 2,297 | | | | 195 | | | | 3,869 | | | | 339 | | | | 4,339 | | | | 392 | |
| Reinvestments of dividends and distributions | | | 48 | | | | 4 | | | | 56 | | | | 5 | | | | 105 | | | | 9 | | | | 127 | | | | 12 | |
| Repurchases* | | | (143 | ) | | | (12 | ) | | | (81 | ) | | | (7 | ) | | | (204 | ) | | | (17 | ) | | | (251 | ) | | | (23 | ) |
| Total Class 529-E transactions | | | 2,410 | | | | 198 | | | | 2,272 | | | | 193 | | | | 3,770 | | | | 331 | | | | 4,215 | | | | 381 | |
| Class 529-F-1 | | | | | | | | | | | | | | | | | | | | | | | | | | | | | | | | |
| Sales* | | | 4,406 | | | | 361 | | | | 2,988 | | | | 250 | | | | 4,403 | | | | 385 | | | | 5,690 | | | | 514 | |
| Reinvestments of dividends and distributions | | | 102 | | | | 8 | | | | 117 | | | | 10 | | | | 182 | | | | 16 | | | | 234 | | | | 21 | |
| Repurchases* | | | (96 | ) | | | (7 | ) | | | (384 | ) | | | (32 | ) | | | (404 | ) | | | (35 | ) | | | (749 | ) | | | (67 | ) |
| Total Class 529-F-1 transactions | | | 4,412 | | | | 362 | | | | 2,721 | | | | 228 | | | | 4,181 | | | | 366 | | | | 5,175 | | | | 468 | |
| Total net increase | | $ | 96,838 | | | | 7,949 | | | $ | 77,647 | | | | 6,567 | | | $ | 99,161 | | | | 8,684 | | | $ | 109,993 | | | | 9,960 | |
See page 28 for footnotes.
| American Funds College Target Date Series | 25 |
| | | College | | | College | | | College | |
| | | 2018 Fund | | | 2015 Fund | | | Enrollment Fund | |
| Share class | | Amount | | | Shares | | | Amount | | | Shares | | | Amount | | | Shares | |
| | | | | | | | | | | | | | | | | | | | | | | | | |
| Class 529-A | | | | | | | | | | | | | | | | | | | | | | | | |
| Sales* | | $ | 73,424 | | | | 6,890 | | | $ | 39,490 | | | | 3,950 | | | $ | 9,640 | | | | 979 | |
| Reinvestments of dividends and distributions | | | 2,977 | | | | 282 | | | | 1,491 | | | | 151 | | | | 256 | | | | 26 | |
| Repurchases* | | | (8,167 | ) | | | (769 | ) | | | (14,726 | ) | | | (1,475 | ) | | | (7,665 | ) | | | (778 | ) |
| Total Class 529-A transactions | | | 68,234 | | | | 6,403 | | | | 26,255 | | | | 2,626 | | | | 2,231 | | | | 227 | |
| Class 529-B | | | | | | | | | | | | | | | | | | | | | | | | |
| Sales* | | | 927 | | | | 88 | | | | 703 | | | | 71 | | | | 249 | | | | 26 | |
| Reinvestments of dividends and distributions | | | 27 | | | | 2 | | | | 14 | | | | 1 | | | | — | † | | | — | † |
| Repurchases* | | | (535 | ) | | | (51 | ) | | | (782 | ) | | | (79 | ) | | | (295 | ) | | | (30 | ) |
| Total Class 529-B transactions | | | 419 | | | | 39 | | | | (65 | ) | | | (7 | ) | | | (46 | ) | | | (4 | ) |
| Class 529-C | | | | | | | | | | | | | | | | | | | | | | | | |
| Sales* | | | 31,979 | | | | 3,019 | | | | 18,126 | | | | 1,824 | | | | 4,537 | | | | 462 | |
| Reinvestments of dividends and distributions | | | 716 | | | | 68 | | | | 374 | | | | 38 | | | | 14 | | | | 2 | |
| Repurchases* | | | (4,339 | ) | | | (410 | ) | | | (6,777 | ) | | | (682 | ) | | | (4,585 | ) | | | (468 | ) |
| Total Class 529-C transactions | | | 28,356 | | | | 2,677 | | | | 11,723 | | | | 1,180 | | | | (34 | ) | | | (4 | ) |
| Class 529-E | | | | | | | | | | | | | | | | | | | | | | | | |
| Sales* | | | 5,725 | | | | 538 | | | | 3,077 | | | | 308 | | | | 786 | | | | 80 | |
| Reinvestments of dividends and distributions | | | 135 | | | | 13 | | | | 103 | | | | 11 | | | | 16 | | | | 1 | |
| Repurchases* | | | (662 | ) | | | (62 | ) | | | (587 | ) | | | (59 | ) | | | (444 | ) | | | (45 | ) |
| Total Class 529-E transactions | | | 5,198 | | | | 489 | | | | 2,593 | | | | 260 | | | | 358 | | | | 36 | |
| Class 529-F-1 | | | | | | | | | | | | | | | | | | | | | | | | |
| Sales* | | | 5,383 | | | | 505 | | | | 5,481 | | | | 548 | | | | 1,565 | | | | 158 | |
| Reinvestments of dividends and distributions | | | 273 | | | | 26 | | | | 205 | | | | 20 | | | | 54 | | | | 5 | |
| Repurchases* | | | (461 | ) | | | (43 | ) | | | (1,098 | ) | | | (110 | ) | | | (1,206 | ) | | | (122 | ) |
| Total Class 529-F-1 transactions | | | 5,195 | | | | 488 | | | | 4,588 | | | | 458 | | | | 413 | | | | 41 | |
| Total net increase | | $ | 107,402 | | | | 10,096 | | | $ | 45,094 | | | | 4,517 | | | $ | 2,922 | | | | 296 | |
| 26 | American Funds College Target Date Series |
Capital share transactions in the funds for the year ended October 31, 2013, were as follows (dollars and shares in thousands):
| | | College | | | College | | | College | | | College | |
| | | 2030 Fund | | | 2027 Fund | | | 2024 Fund | | | 2021 Fund | |
| Share class | | Amount | | | Shares | | | Amount | | | Shares | | | Amount | | | Shares | | | Amount | | | Shares | |
| | | | | | | | | | | | | | | | | | | | | | | | | | | | | | | | | |
| Class 529-A | | | | | | | | | | | | | | | | | | | | | | | | | | | | | | | | |
| Sales* | | $ | 94,967 | | | | 8,871 | | | $ | 103,167 | | | | 9,787 | | | $ | 142,467 | | | | 13,676 | | | $ | 168,775 | | | | 16,348 | |
| Reinvestments of dividends | | | 172 | | | | 17 | | | | 263 | | | | 27 | | | | 324 | | | | 33 | | | | 349 | | | | 35 | |
| Repurchases* | | | (2,522 | ) | | | (230 | ) | | | (2,650 | ) | | | (248 | ) | | | (4,370 | ) | | | (413 | ) | | | (5,110 | ) | | | (486 | ) |
| Total Class 529-A transactions | | | 92,617 | | | | 8,658 | | | | 100,780 | | | | 9,566 | | | | 138,421 | | | | 13,296 | | | | 164,014 | | | | 15,897 | |
| Class 529-B | | | | | | | | | | | | | | | | | | | | | | | | | | | | | | | | |
| Sales* | | | 111 | | | | 10 | | | | 733 | | | | 71 | | | | 2,713 | | | | 263 | | | | 2,776 | | | | 270 | |
| Reinvestments of dividends | | | — | † | | | — | † | | | 2 | | | | — | † | | | 6 | | | | 1 | | | | 5 | | | | 1 | |
| Repurchases* | | | (27 | ) | | | (2 | ) | | | (101 | ) | | | (9 | ) | | | (442 | ) | | | (42 | ) | | | (671 | ) | | | (65 | ) |
| Total Class 529-B transactions | | | 84 | | | | 8 | | | | 634 | | | | 62 | | | | 2,277 | | | | 222 | | | | 2,110 | | | | 206 | |
| Class 529-C | | | | | | | | | | | | | | | | | | | | | | | | | | | | | | | | |
| Sales* | | | 19,365 | | | | 1,814 | | | | 25,182 | | | | 2,397 | | | | 34,243 | | | | 3,297 | | | | 48,392 | | | | 4,697 | |
| Reinvestments of dividends | | | 36 | | | | 4 | | | | 57 | | | | 6 | | | | 66 | | | | 7 | | | | 77 | | | | 7 | |
| Repurchases* | | | (463 | ) | | | (42 | ) | | | (1,355 | ) | | | (125 | ) | | | (2,078 | ) | | | (192 | ) | | | (4,264 | ) | | | (405 | ) |
| Total Class 529-C transactions | | | 18,938 | | | | 1,776 | | | | 23,884 | | | | 2,278 | | | | 32,231 | | | | 3,112 | | | | 44,205 | | | | 4,299 | |
| Class 529-E | | | | | | | | | | | | | | | | | | | | | | | | | | | | | | | | |
| Sales* | | | 3,185 | | | | 295 | | | | 3,804 | | | | 359 | | | | 7,396 | | | | 710 | | | | 8,011 | | | | 777 | |
| Reinvestments of dividends | | | 5 | | | | 1 | | | | 6 | | | | 1 | | | | 16 | | | | 1 | | | | 15 | | | | 2 | |
| Repurchases* | | | (19 | ) | | | (2 | ) | | | (101 | ) | | | (9 | ) | | | (394 | ) | | | (36 | ) | | | (109 | ) | | | (11 | ) |
| Total Class 529-E transactions | | | 3,171 | | | | 294 | | | | 3,709 | | | | 351 | | | | 7,018 | | | | 675 | | | | 7,917 | | | | 768 | |
| Class 529-F-1 | | | | | | | | | | | | | | | | | | | | | | | | | | | | | | | | |
| Sales* | | | 6,750 | | | | 628 | | | | 8,051 | | | | 761 | | | | 11,235 | | | | 1,083 | | | | 13,072 | | | | 1,259 | |
| Reinvestments of dividends | | | 16 | | | | 1 | | | | 15 | | | | 2 | | | | 29 | | | | 3 | | | | 19 | | | | 2 | |
| Repurchases* | | | (46 | ) | | | (4 | ) | | | (206 | ) | | | (18 | ) | | | (763 | ) | | | (73 | ) | | | (152 | ) | | | (15 | ) |
| Total Class 529-F-1 transactions | | | 6,720 | | | | 625 | | | | 7,860 | | | | 745 | | | | 10,501 | | | | 1,013 | | | | 12,939 | | | | 1,246 | |
| Total net increase | | $ | 121,530 | | | | 11,361 | | | $ | 136,867 | | | | 13,002 | | | $ | 190,448 | | | | 18,318 | | | $ | 231,185 | | | | 22,416 | |
See page 28 for footnotes.
| American Funds College Target Date Series | 27 |
| | | College | | | College | | | College | |
| | | 2018 Fund | | | 2015 Fund | | | Enrollment Fund | |
| Share class | | Amount | | | Shares | | | Amount | | | Shares | | | Amount | | | Shares | |
| | | | | | | | | | | | | | | | | | | | | | | | | |
| Class 529-A | | | | | | | | | | | | | | | | | | | | | | | | |
| Sales* | | $ | 168,031 | | | | 16,441 | | | $ | 108,046 | | | | 10,794 | | | $ | 40,872 | | | | 4,110 | |
| Reinvestments of dividends | | | 312 | | | | 31 | | | | 214 | | | | 21 | | | | 51 | | | | 5 | |
| Repurchases* | | | (7,537 | ) | | | (728 | ) | | | (11,598 | ) | | | (1,164 | ) | | | (9,250 | ) | | | (936 | ) |
| Total Class 529-A transactions | | | 160,806 | | | | 15,744 | | | | 96,662 | | | | 9,651 | | | | 31,673 | | | | 3,179 | |
| Class 529-B | | | | | | | | | | | | | | | | | | | | | | | | |
| Sales* | | | 2,970 | | | | 291 | | | | 2,794 | | | | 280 | | | | 709 | | | | 71 | |
| Reinvestments of dividends | | | 4 | | | | 1 | | | | 3 | | | | 1 | | | | — | † | | | — | † |
| Repurchases* | | | (654 | ) | | | (64 | ) | | | (746 | ) | | | (75 | ) | | | (314 | ) | | | (32 | ) |
| Total Class 529-B transactions | | | 2,320 | | | | 228 | | | | 2,051 | | | | 206 | | | | 395 | | | | 39 | |
| Class 529-C | | | | | | | | | | | | | | | | | | | | | | | | |
| Sales* | | | 67,162 | | | | 6,589 | | | | 56,000 | | | | 5,613 | | | | 21,957 | | | | 2,214 | |
| Reinvestments of dividends | | | 86 | | | | 9 | | | | 71 | | | | 7 | | | | 19 | | | | 2 | |
| Repurchases* | | | (4,202 | ) | | | (407 | ) | | | (6,606 | ) | | | (667 | ) | | | (5,332 | ) | | | (543 | ) |
| Total Class 529-C transactions | | | 63,046 | | | | 6,191 | | | | 49,465 | | | | 4,953 | | | | 16,644 | | | | 1,673 | |
| Class 529-E | | | | | | | | | | | | | | | | | | | | | | | | |
| Sales* | | | 7,099 | | | | 697 | | | | 7,737 | | | | 774 | | | | 2,666 | | | | 268 | |
| Reinvestments of dividends | | | 17 | | | | 2 | | | | 9 | | | | 1 | | | | 2 | | | | — | † |
| Repurchases* | | | (253 | ) | | | (24 | ) | | | (619 | ) | | | (63 | ) | | | (584 | ) | | | (59 | ) |
| Total Class 529-E transactions | | | 6,863 | | | | 675 | | | | 7,127 | | | | 712 | | | | 2,084 | | | | 209 | |
| Class 529-F-1 | | | | | | | | | | | | | | | | | | | | | | | | |
| Sales* | | | 14,200 | | | | 1,385 | | | | 11,837 | | | | 1,183 | | | | 6,110 | | | | 614 | |
| Reinvestments of dividends | | | 22 | | | | 2 | | | | 15 | | | | 1 | | | | 9 | | | | 1 | |
| Repurchases* | | | (207 | ) | | | (20 | ) | | | (407 | ) | | | (40 | ) | | | (1,106 | ) | | | (112 | ) |
| Total Class 529-F-1 transactions | | | 14,015 | | | | 1,367 | | | | 11,445 | | | | 1,144 | | | | 5,013 | | | | 503 | |
| Total net increase | | $ | 247,050 | | | | 24,205 | | | $ | 166,750 | | | | 16,666 | | | $ | 55,809 | | | | 5,603 | |
| * | Includes exchanges between share classes of the fund. |
| † | Amount less than one thousand. |
| 28 | American Funds College Target Date Series |
Financial highlights
| | | | | Income (loss) from investment operations1 | | | Dividends and distributions | | | | | | | | | | | | | | |
| Period ended | | Net asset
value,
beginning
of period | | Net
investment
income (loss) | | Net gains
(losses) on
securities
(both
realized and
unrealized) | | | Total from
investment
operations | | | Dividends
(from net
investment
income) | | Distributions
(from capital
gains) | | Total
dividends
and
distributions | | Net asset
value, end
of period | | Total
return2,3 | | Net assets,
end of period
(in thousands) | | Ratio of
expenses to
average net
assets before
reimbursements/
waivers4 | | Ratio of
expenses to
average net
assets after
reimbursements/
waivers3,4 | | Net
effective
expense
ratio5 | | Ratio of
net income
(loss) to
average
net assets3 |
| American Funds College 2030 Fund | | | | | | | | | | |
| Class 529-A: | | | | | | | | | | | | | | | | | | | | | | | | | | | | | | | | | | | | | | | | | | | | | | | | | | | | | | | | |
| 4/30/146,7 | | $ | 11.96 | | | $ | .11 | | | $ | .60 | | | $ | .71 | | | $ | (.14 | ) | | $ | (.01 | ) | | $ | (.15 | ) | | $ | 12.52 | | | | 5.91 | % | | $ | 191,260 | | | | .51 | %8 | | | .41 | %8 | | | .81 | %8 | | | 1.84 | %8 |
| 10/31/13 | | | 9.79 | | | | .18 | | | | 2.07 | | | | 2.25 | | | | (.08 | ) | | | — | | | | (.08 | ) | | | 11.96 | | | | 23.14 | | | | 109,785 | | | | .49 | | | | .39 | | | | .80 | | | | 1.59 | |
| 10/31/126,9 | | | 10.00 | | | | — | 10 | | | (.21 | ) | | | (.21 | ) | | | — | | | | — | | | | — | | | | 9.79 | | | | (2.10 | ) | | | 5,096 | | | | .19 | | | | .08 | | | | .49 | | | | (.02 | ) |
| Class 529-B: | | | | | | | | | | | | | | | | | | | | | | | | | | | | | | | | | | | | | | | | | | | | | | | | | | | | | | | | |
| 4/30/146,7 | | | 11.89 | | | | .06 | | | | .59 | | | | .65 | | | | (.07 | ) | | | (.01 | ) | | | (.08 | ) | | | 12.46 | | | | 5.40 | | | | 145 | | | | 1.35 | 8 | | | 1.25 | 8 | | | 1.65 | 8 | | | 1.06 | 8 |
| 10/31/13 | | | 9.79 | | | | .09 | | | | 2.07 | | | | 2.16 | | | | (.06 | ) | | | — | | | | (.06 | ) | | | 11.89 | | | | 22.26 | | | | 124 | | | | 1.34 | | | | 1.24 | | | | 1.65 | | | | .80 | |
| 10/31/126,9 | | | 10.00 | | | | (.01 | ) | | | (.20 | ) | | | (.21 | ) | | | — | | | | — | | | | — | | | | 9.79 | | | | (2.10 | ) | | | 26 | | | | .28 | | | | .19 | | | | .60 | | | | (.13 | ) |
| Class 529-C: | | | | | | | | | | | | | | | | | | | | | | | | | | | | | | | | | | | | | | | | | | | | | | | | | | | | | | | | |
| 4/30/146,7 | | | 11.87 | | | | .06 | | | | .58 | | | | .64 | | | | (.08 | ) | | | (.01 | ) | | | (.09 | ) | | | 12.42 | | | | 5.37 | | | | 39,770 | | | | 1.36 | 8 | | | 1.26 | 8 | | | 1.66 | 8 | | | 1.00 | 8 |
| 10/31/13 | | | 9.79 | | | | .08 | | | | 2.07 | | | | 2.15 | | | | (.07 | ) | | | — | | | | (.07 | ) | | | 11.87 | | | | 22.24 | | | | 22,702 | | | | 1.35 | | | | 1.25 | | | | 1.66 | | | | .75 | |
| 10/31/126,9 | | | 10.00 | | | | (.01 | ) | | | (.20 | ) | | | (.21 | ) | | | — | | | | — | | | | — | | | | 9.79 | | | | (2.10 | ) | | | 1,340 | | | | .26 | | | | .17 | | | | .58 | | | | (.13 | ) |
| Class 529-E: | | | | | | | | | | | | | | | | | | | | | | | | | | | | | | | | | | | | | | | | | | | | | | | | | | | | | | | | |
| 4/30/146,7 | | | 11.93 | | | | .09 | | | | .59 | | | | .68 | | | | (.12 | ) | | | (.01 | ) | | | (.13 | ) | | | 12.48 | | | | 5.69 | | | | 6,332 | | | | .83 | 8 | | | .73 | 8 | | | 1.13 | 8 | | | 1.51 | 8 |
| 10/31/13 | | | 9.79 | | | | .14 | | | | 2.08 | | | | 2.22 | | | | (.08 | ) | | | — | | | | (.08 | ) | | | 11.93 | | | | 22.78 | | | | 3,686 | | | | .82 | | | | .72 | | | | 1.13 | | | | 1.25 | |
| 10/31/126,9 | | | 10.00 | | | | (.01 | ) | | | (.20 | ) | | | (.21 | ) | | | — | | | | — | | | | — | | | | 9.79 | | | | (2.10 | ) | | | 152 | | | | .21 | | | | .10 | | | | .51 | | | | (.07 | ) |
| Class 529-F-1: | | | | | | | | | | | | | | | | | | | | | | | | | | | | | | | | | | | | | | | | | | | | | | | | | | | | | | | | |
| 4/30/146,7 | | | 11.98 | | | | .12 | | | | .60 | | | | .72 | | | | (.15 | ) | | | (.01 | ) | | | (.16 | ) | | | 12.54 | | | | 5.98 | | | | 12,427 | | | | .36 | 8 | | | .26 | 8 | | | .66 | 8 | | | 1.97 | 8 |
| 10/31/13 | | | 9.79 | | | | .20 | | | | 2.07 | | | | 2.27 | | | | (.08 | ) | | | — | | | | (.08 | ) | | | 11.98 | | | | 23.39 | | | | 7,541 | | | | .35 | | | | .25 | | | | .66 | | | | 1.80 | |
| 10/31/126,9 | | | 10.00 | | | | — | 10 | | | (.21 | ) | | | (.21 | ) | | | — | | | | — | | | | — | | | | 9.79 | | | | (2.10 | ) | | | 39 | | | | .17 | | | | .06 | | | | .47 | | | | .01 | |
| American Funds College 2027 Fund | | | | | | | | | | | | | | | | | | | | | | | | | | | | | | | | | | | | |
| Class 529-A: | | | | | | | | | | | | | | | | | | | | | | | | | | | | | | | | | | | | | | | | | | | | | | | | | | | | | | | | |
| 4/30/146,7 | | $ | 11.64 | | | $ | .10 | | | $ | .53 | | | $ | .63 | | | $ | (.13 | ) | | $ | (.01 | ) | | $ | (.14 | ) | | $ | 12.13 | | | | 5.43 | % | | $ | 188,662 | | | | .53 | %8 | | | .43 | %8 | | | .82 | %8 | | | 1.74 | %8 |
| 10/31/13 | | | 9.82 | | | | .16 | | | | 1.75 | | | | 1.91 | | | | (.09 | ) | | | — | | | | (.09 | ) | | | 11.64 | | | | 19.58 | | | | 124,245 | | | | .52 | | | | .42 | | | | .82 | | | | 1.51 | |
| 10/31/126,9 | | | 10.00 | | | | — | 10 | | | (.18 | ) | | | (.18 | ) | | | — | | | | — | | | | — | | | | 9.82 | | | | (1.80 | ) | | | 10,910 | | | | .14 | | | | .08 | | | | .49 | | | | .01 | |
| Class 529-B: | | | | | | | | | | | | | | | | | | | | | | | | | | | | | | | | | | | | | | | | | | | | | | | | | | | | | | | | |
| 4/30/146,7 | | | 11.55 | | | | .06 | | | | .52 | | | | .58 | | | | (.06 | ) | | | (.01 | ) | | | (.07 | ) | | | 12.06 | | | | 4.99 | | | | 1,108 | | | | 1.35 | 8 | | | 1.25 | 8 | | | 1.64 | 8 | | | .96 | 8 |
| 10/31/13 | | | 9.82 | | | | .08 | | | | 1.72 | | | | 1.80 | | | | (.07 | ) | | | — | | | | (.07 | ) | | | 11.55 | | | | 18.59 | | | | 820 | | | | 1.35 | | | | 1.24 | | | | 1.64 | | | | .73 | |
| 10/31/126,9 | | | 10.00 | | | | — | 10 | | | (.18 | ) | | | (.18 | ) | | | — | | | | — | | | | — | | | | 9.82 | | | | (1.80 | ) | | | 86 | | | | .23 | | | | .17 | | | | .58 | | | | (.04 | ) |
| Class 529-C: | | | | | | | | | | | | | | | | | | | | | | | | | | | | | | | | | | | | | | | | | | | | | | | | | | | | | | | | |
| 4/30/146,7 | | | 11.55 | | | | .05 | | | | .53 | | | | .58 | | | | (.07 | ) | | | (.01 | ) | | | (.08 | ) | | | 12.05 | | | | 5.03 | | | | 45,776 | | | | 1.36 | 8 | | | 1.26 | 8 | | | 1.65 | 8 | | | .91 | 8 |
| 10/31/13 | | | 9.82 | | | | .07 | | | | 1.74 | | | | 1.81 | | | | (.08 | ) | | | — | | | | (.08 | ) | | | 11.55 | | | | 18.53 | | | | 29,510 | | | | 1.35 | | | | 1.25 | | | | 1.65 | | | | .69 | |
| 10/31/126,9 | | | 10.00 | | | | (.01 | ) | | | (.17 | ) | | | (.18 | ) | | | — | | | | — | | | | — | | | | 9.82 | | | | (1.80 | ) | | | 2,721 | | | | .23 | | | | .17 | | | | .58 | | | | (.09 | ) |
| Class 529-E: | | | | | | | | | | | | | | | | | | | | | | | | | | | | | | | | | | | | | | | | | | | | | | | | | | | | | | | | |
| 4/30/146,7 | | | 11.61 | | | | .08 | | | | .53 | | | | .61 | | | | (.12 | ) | | | (.01 | ) | | | (.13 | ) | | | 12.09 | | | | 5.30 | | | | 6,817 | | | | .83 | 8 | | | .73 | 8 | | | 1.12 | 8 | | | 1.43 | 8 |
| 10/31/13 | | | 9.82 | | | | .13 | | | | 1.74 | | | | 1.87 | | | | (.08 | ) | | | — | | | | (.08 | ) | | | 11.61 | | | | 19.24 | | | | 4,311 | | | | .82 | | | | .72 | | | | 1.12 | | | | 1.15 | |
| 10/31/126,9 | | | 10.00 | | | | — | 10 | | | (.18 | ) | | | (.18 | ) | | | — | | | | — | | | | — | | | | 9.82 | | | | (1.80 | ) | | | 198 | | | | .19 | | | | .10 | | | | .51 | | | | (.02 | ) |
| Class 529-F-1: | | | | | | | | | | | | | | | | | | | | | | | | | | | | | | | | | | | | | | | | | | | | | | | | | | | | | | | | |
| 4/30/146,7 | | | 11.66 | | | | .11 | | | | .53 | | | | .64 | | | | (.13 | ) | | | (.01 | ) | | | (.14 | ) | | | 12.16 | | | | 5.55 | | | | 12,001 | | | | .36 | 8 | | | .26 | 8 | | | .65 | 8 | | | 1.89 | 8 |
| 10/31/13 | | | 9.83 | | | | .18 | | | | 1.74 | | | | 1.92 | | | | (.09 | ) | | | — | | | | (.09 | ) | | | 11.66 | | | | 19.70 | | | | 8,846 | | | | .35 | | | | .25 | | | | .65 | | | | 1.66 | |
| 10/31/126,9 | | | 10.00 | | | | — | 10 | | | (.17 | ) | | | (.17 | ) | | | — | | | | — | | | | — | | | | 9.83 | | | | (1.70 | ) | | | 136 | | | | .11 | | | | .05 | | | | .46 | | | | .01 | |
See page 32 for footnotes.
| American Funds College Target Date Series | 29 |
Financial highlights (continued)
| | | | | Income (loss) from investment operations1 | | | Dividends and distributions | | | | | | | | | | | | | | |
| Period ended | | Net asset
value,
beginning
of period | | Net
investment
income (loss) | | Net gains
(losses) on
securities
(both
realized and
unrealized) | | Total from
investment
operations | | Dividends
(from net
investment
income) | | Distributions
(from capital
gains) | | Total
dividends
and
distributions | | Net asset
value, end
of period | | Total
return2,3 | | Net assets,
end of period
(in thousands) | | Ratio of
expenses to
average net
assets before
reimbursements/
waivers4 | | Ratio of
expenses to
average net
assets after
reimbursements/
waivers3,4 | | Net
effective
expense
ratio5 | | Ratio of
net income
(loss) to
average
net assets3 |
| American Funds College 2024 Fund | | | | | | | | | | | | | | | | | | | | | | | | | | | | | | | | | | | | |
| Class 529-A: | | | | | | | | | | | | | | | | | | | | | | | | | | | | | | | | | | | | | | | | | | | | | | | | | | | | | | | | |
| 4/30/146,7 | | $ | 11.29 | | | $ | .11 | | | $ | .46 | | | $ | .57 | | | $ | (.14 | ) | | $ | (.01 | ) | | $ | (.15 | ) | | $ | 11.71 | | | | 5.09 | % | | $ | 247,171 | | | | .54 | %8 | | | .44 | %8 | | | .81 | %8 | | | 1.92 | %8 |
| 10/31/13 | | | 9.88 | | | | .18 | | | | 1.31 | | | | 1.49 | | | | (.08 | ) | | | — | | | | (.08 | ) | | | 11.29 | | | | 15.28 | | | | 168,000 | | | | .53 | | | | .43 | | | | .81 | | | | 1.72 | |
| 10/31/126,9 | | | 10.00 | | | | .01 | | | | (.13 | ) | | | (.12 | ) | | | — | | | | — | | | | — | | | | 9.88 | | | | (1.20 | ) | | | 15,653 | | | | .13 | | | | .08 | | | | .46 | | | | .07 | |
| Class 529-B: | | | | | | | | | | | | | | | | | | | | | | | | | | | | | | | | | | | | | | | | | | | | | | | | | | | | | | | | |
| 4/30/146,7 | | | 11.20 | | | | .06 | | | | .47 | | | | .53 | | | | (.07 | ) | | | (.01 | ) | | | (.08 | ) | | | 11.65 | | | | 4.76 | | | | 3,659 | | | | 1.35 | 8 | | | 1.25 | 8 | | | 1.62 | 8 | | | 1.09 | 8 |
| 10/31/13 | | | 9.87 | | | | .10 | | | | 1.30 | | | | 1.40 | | | | (.07 | ) | | | — | | | | (.07 | ) | | | 11.20 | | | | 14.34 | | | | 2,834 | | | | 1.34 | | | | 1.24 | | | | 1.62 | | | | .92 | |
| 10/31/126,9 | | | 10.00 | | | | — | 10 | | | (.13 | ) | | | (.13 | ) | | | — | | | | — | | | | — | | | | 9.87 | | | | (1.30 | ) | | | 306 | | | | .23 | | | | .18 | | | | .56 | | | | (.04 | ) |
| Class 529-C: | | | | | | | | | | | | | | | | | | | | | | | | | | | | | | | | | | | | | | | | | | | | | | | | | | | | | | | | |
| 4/30/146,7 | | | 11.20 | | | | .06 | | | | .47 | | | | .53 | | | | (.08 | ) | | | (.01 | ) | | | (.09 | ) | | | 11.64 | | | | 4.76 | | | | 60,372 | | | | 1.36 | 8 | | | 1.26 | 8 | | | 1.63 | 8 | | | 1.10 | 8 |
| 10/31/13 | | | 9.87 | | | | .09 | | | | 1.31 | | | | 1.40 | | | | (.07 | ) | | | — | | | | (.07 | ) | | | 11.20 | | | | 14.25 | | | | 38,991 | | | | 1.35 | | | | 1.24 | | | | 1.62 | | | | .89 | |
| 10/31/126,9 | | | 10.00 | | | | — | 10 | | | (.13 | ) | | | (.13 | ) | | | — | | | | — | | | | — | | | | 9.87 | | | | (1.30 | ) | | | 3,645 | | | | .22 | | | | .17 | | | | .55 | | | | (.02 | ) |
| Class 529-E: | | | | | | | | | | | | | | | | | | | | | | | | | | | | | | | | | | | | | | | | | | | | | | | | | | | | | | | | |
| 4/30/146,7 | | | 11.26 | | | | .09 | | | | .47 | | | | .56 | | | | (.12 | ) | | | (.01 | ) | | | (.13 | ) | | | 11.69 | | | | 4.99 | | | | 12,427 | | | | .83 | 8 | | | .73 | 8 | | | 1.10 | 8 | | | 1.63 | 8 |
| 10/31/13 | | | 9.87 | | | | .15 | | | | 1.31 | | | | 1.46 | | | | (.07 | ) | | | — | | | | (.07 | ) | | | 11.26 | | | | 14.94 | | | | 8,248 | | | | .82 | | | | .72 | | | | 1.10 | | | | 1.42 | |
| 10/31/126,9 | | | 10.00 | | | | — | 10 | | | (.13 | ) | | | (.13 | ) | | | — | | | | — | | | | — | | | | 9.87 | | | | (1.30 | ) | | | 557 | | | | .15 | | | | .10 | | | | .48 | | | | .03 | |
| Class 529-F-1: | | | | | | | | | | | | | | | | | | | | | | | | | | | | | | | | | | | | | | | | | | | | | | | | | | | | | | | | |
| 4/30/146,7 | | | 11.31 | | | | .12 | | | | .47 | | | | .59 | | | | (.15 | ) | | | (.01 | ) | | | (.16 | ) | | | 11.74 | | | | 5.28 | | | | 16,682 | | | | .36 | 8 | | | .26 | 8 | | | .63 | 8 | | | 2.09 | 8 |
| 10/31/13 | | | 9.88 | | | | .20 | | | | 1.31 | | | | 1.51 | | | | (.08 | ) | | | — | | | | (.08 | ) | | | 11.31 | | | | 15.41 | | | | 11,950 | | | | .35 | | | | .25 | | | | .63 | | | | 1.91 | |
| 10/31/126,9 | | | 10.00 | | | | .01 | | | | (.13 | ) | | | (.12 | ) | | | — | | | | — | | | | — | | | | 9.88 | | | | (1.20 | ) | | | 425 | | | | .11 | | | | .05 | | | | .43 | | | | .06 | |
| American Funds College 2021 Fund | | | | | | | | | | | | | | | | | | | | | | | | | | | | | | | | | | | | |
| Class 529-A: | | | | | | | | | | | | | | | | | | | | | | | | | | | | | | | | | | | | | | | | | | | | | | | | | | | | | | | | |
| 4/30/146,7 | | $ | 10.99 | | | $ | .11 | | | $ | .36 | | | $ | .47 | | | $ | (.15 | ) | | $ | — | 10 | | $ | (.15 | ) | | $ | 11.31 | | | | 4.31 | % | | $ | 281,396 | | | | .54 | %8 | | | .44 | %8 | | | .77 | %8 | | | 2.06 | %8 |
| 10/31/13 | | | 9.93 | | | | .19 | | | | .93 | | | | 1.12 | | | | (.06 | ) | | | — | | | | (.06 | ) | | | 10.99 | | | | 11.40 | | | | 198,086 | | | | .56 | | | | .45 | | | | .81 | | | | 1.83 | |
| 10/31/126,9 | | | 10.00 | | | | .01 | | | | (.08 | ) | | | (.07 | ) | | | — | | | | — | | | | — | | | | 9.93 | | | | (.70 | ) | | | 21,221 | | | | .12 | | | | .08 | | | | .46 | | | | .12 | |
| Class 529-B: | | | | | | | | | | | | | | | | | | | | | | | | | | | | | | | | | | | | | | | | | | | | | | | | | | | | | | | | |
| 4/30/146,7 | | | 10.91 | | | | .07 | | | | .34 | | | | .41 | | | | (.07 | ) | | | — | 10 | | | (.07 | ) | | | 11.25 | | | | 3.86 | | | | 3,317 | | | | 1.35 | 8 | | | 1.25 | 8 | | | 1.58 | 8 | | | 1.26 | 8 |
| 10/31/13 | | | 9.92 | | | | .11 | | | | .93 | | | | 1.04 | | | | (.05 | ) | | | — | | | | (.05 | ) | | | 10.91 | | | | 10.53 | | | | 2,773 | | | | 1.34 | | | | 1.24 | | | | 1.60 | | | | 1.04 | |
| 10/31/126,9 | | | 10.00 | | | | — | 10 | | | (.08 | ) | | | (.08 | ) | | | — | | | | — | | | | — | | | | 9.92 | | | | (.80 | ) | | | 480 | | | | .22 | | | | .18 | | | | .56 | | | | .02 | |
| Class 529-C: | | | | | | | | | | | | | | | | | | | | | | | | | | | | | | | | | | | | | | | | | | | | | | | | | | | | | | | | |
| 4/30/146,7 | | | 10.90 | | | | .07 | | | | .35 | | | | .42 | | | | (.09 | ) | | | — | 10 | | | (.09 | ) | | | 11.23 | | | | 3.89 | | | | 79,679 | | | | 1.36 | 8 | | | 1.26 | 8 | | | 1.59 | 8 | | | 1.26 | 8 |
| 10/31/13 | | | 9.93 | | | | .11 | | | | .91 | | | | 1.02 | | | | (.05 | ) | | | — | | | | (.05 | ) | | | 10.90 | | | | 10.37 | | | | 53,217 | | | | 1.35 | | | | 1.24 | | | | 1.60 | | | | 1.04 | |
| 10/31/126,9 | | | 10.00 | | | | — | 10 | | | (.07 | ) | | | (.07 | ) | | | — | | | | — | | | | — | | | | 9.93 | | | | (.70 | ) | | | 5,774 | | | | .21 | | | | .17 | | | | .55 | | | | .03 | |
| Class 529-E: | | | | | | | | | | | | | | | | | | | | | | | | | | | | | | | | | | | | | | | | | | | | | | | | | | | | | | | | |
| 4/30/146,7 | | | 10.96 | | | | .10 | | | | .35 | | | | .45 | | | | (.13 | ) | | | — | 10 | | | (.13 | ) | | | 11.28 | | | | 4.15 | | | | 13,941 | | | | .83 | 8 | | | .73 | 8 | | | 1.06 | 8 | | | 1.79 | 8 |
| 10/31/13 | | | 9.93 | | | | .16 | | | | .93 | | | | 1.09 | | | | (.06 | ) | | | — | | | | (.06 | ) | | | 10.96 | | | | 11.06 | | | | 9,364 | | | | .82 | | | | .71 | | | | 1.07 | | | | 1.56 | |
| 10/31/126,9 | | | 10.00 | | | | .01 | | | | (.08 | ) | | | (.07 | ) | | | — | | | | — | | | | — | | | | 9.93 | | | | (.70 | ) | | | 862 | | | | .15 | | | | .10 | | | | .48 | | | | .10 | |
| Class 529-F-1: | | | | | | | | | | | | | | | | | | | | | | | | | | | | | | | | | | | | | | | | | | | | | | | | | | | | | | | | |
| 4/30/146,7 | | | 11.01 | | | | .12 | | | | .35 | | | | .47 | | | | (.16 | ) | | | — | 10 | | | (.16 | ) | | | 11.32 | | | | 4.37 | | | | 19,802 | | | | .36 | 8 | | | .26 | 8 | | | .59 | 8 | | | 2.23 | 8 |
| 10/31/13 | | | 9.94 | | | | .22 | | | | .92 | | | | 1.14 | | | | (.07 | ) | | | — | | | | (.07 | ) | | | 11.01 | | | | 11.53 | | | | 14,106 | | | | .35 | | | | .24 | | | | .60 | | | | 2.05 | |
| 10/31/126,9 | | | 10.00 | | | | .01 | | | | (.07 | ) | | | (.06 | ) | | | — | | | | — | | | | — | | | | 9.94 | | | | (.60 | ) | | | 349 | | | | .10 | | | | .05 | | | | .43 | | | | .11 | |
| 30 | American Funds College Target Date Series |
| | | | | Income (loss) from investment operations1 | | | Dividends and distributions | | | | | | | | | | | | | | |
| Period ended | | Net asset
value,
beginning
of period | | Net
investment
income | | Net gains
(losses) on
securities
(both
realized and
unrealized) | | Total from
investment
operations | | Dividends
(from net
investment
income) | | Distributions
(from capital
gains) | | Total
dividends
and
distributions | | Net asset
value, end
of period | | Total
return2,3 | | Net assets,
end of period
(in thousands) | | Ratio of
expenses to
average net
assets before
reimbursements/
waivers4 | | Ratio of
expenses to
average net
assets after
reimbursements/
waivers3,4 | | Net
effective
expense
ratio5 | | Ratio of
net income
to average
net assets3 |
| American Funds College 2018 Fund | | | | | | | | | | | | | | | | | | | | | | | | | | | | | | | | | | | | |
| Class 529-A: | | | | | | | | | | | | | | | | | | | | | | | | | | | | | | | | | | | | | | | | | | | | | | | | | | | | | | | | |
| 4/30/146,7 | | $ | 10.65 | | | $ | .11 | | | $ | .22 | | | $ | .33 | | | $ | (.15 | ) | | $ | — | 10 | | $ | (.15 | ) | | $ | 10.83 | | | | 3.15 | % | | $ | 264,396 | | | | .56 | %8 | | | .46 | %8 | | | .75 | %8 | | | 1.99 | %8 |
| 10/31/13 | | | 9.98 | | | | .20 | | | | .53 | | | | .73 | | | | (.06 | ) | | | — | | | | (.06 | ) | | | 10.65 | | | | 7.33 | | | | 191,677 | | | | .57 | | | | .47 | | | | .76 | | | | 1.91 | |
| 10/31/126,9 | | | 10.00 | | | | .01 | | | | (.03 | ) | | | (.02 | ) | | | — | | | | — | | | | — | | | | 9.98 | | | | (.20 | ) | | | 22,528 | | | | .13 | | | | .08 | | | | .38 | | | | .10 | |
| Class 529-B: | | | | | | | | | | | | | | | | | | | | | | | | | | | | | | | | | | | | | | | | | | | | | | | | | | | | | | | | |
| 4/30/146,7 | | | 10.57 | | | | .06 | | | | .24 | | | | .30 | | | | (.09 | ) | | | — | 10 | | | (.09 | ) | | | 10.78 | | | | 2.85 | | | | 3,444 | | | | 1.35 | 8 | | | 1.25 | 8 | | | 1.54 | 8 | | | 1.20 | 8 |
| 10/31/13 | | | 9.97 | | | | .12 | | | | .52 | | | | .64 | | | | (.04 | ) | | | — | | | | (.04 | ) | | | 10.57 | | | | 6.46 | | | | 2,959 | | | | 1.34 | | | | 1.24 | | | | 1.53 | | | | 1.13 | |
| 10/31/126,9 | | | 10.00 | | | | — | 10 | | | (.03 | ) | | | (.03 | ) | | | — | | | | — | | | | — | | | | 9.97 | | | | (.30 | ) | | | 523 | | | | .22 | | | | .18 | | | | .48 | | | | .02 | |
| Class 529-C: | | | | | | | | | | | | | | | | | | | | | | | | | | | | | | | | | | | | | | | | | | | | | | | | | | | | | | | | |
| 4/30/146,7 | | | 10.57 | | | | .06 | | | | .23 | | | | .29 | | | | (.09 | ) | | | — | 10 | | | (.09 | ) | | | 10.77 | | | | 2.82 | | | | 102,078 | | | | 1.36 | 8 | | | 1.26 | 8 | | | 1.55 | 8 | | | 1.19 | 8 |
| 10/31/13 | | | 9.97 | | | | .12 | | | | .53 | | | | .65 | | | | (.05 | ) | | | — | | | | (.05 | ) | | | 10.57 | | | | 6.53 | | | | 71,910 | | | | 1.35 | | | | 1.24 | | | | 1.53 | | | | 1.14 | |
| 10/31/126,9 | | | 10.00 | | | | — | 10 | | | (.03 | ) | | | (.03 | ) | | | — | | | | — | | | | — | | | | 9.97 | | | | (.30 | ) | | | 6,126 | | | | .22 | | | | .17 | | | | .47 | | | | — | 11 |
| Class 529-E: | | | | | | | | | | | | | | | | | | | | | | | | | | | | | | | | | | | | | | | | | | | | | | | | | | | | | | | | |
| 4/30/146,7 | | | 10.62 | | | | .09 | | | | .23 | | | | .32 | | | | (.13 | ) | | | — | 10 | | | (.13 | ) | | | 10.81 | | | | 3.08 | | | | 14,453 | | | | .83 | 8 | | | .73 | 8 | | | 1.02 | 8 | | | 1.73 | 8 |
| 10/31/13 | | | 9.98 | | | | .17 | | | | .52 | | | | .69 | | | | (.05 | ) | | | — | | | | (.05 | ) | | | 10.62 | | | | 6.98 | | | | 9,003 | | | | .82 | | | | .72 | | | | 1.01 | | | | 1.62 | |
| 10/31/126,9 | | | 10.00 | | | | .01 | | | | (.03 | ) | | | (.02 | ) | | | — | | | | — | | | | — | | | | 9.98 | | | | (.20 | ) | | | 1,723 | | | | .14 | | | | .10 | | | | .40 | | | | .05 | |
| Class 529-F-1: | | | | | | | | | | | | | | | | | | | | | | | | | | | | | | | | | | | | | | | | | | | | | | | | | | | | | | | | |
| 4/30/146,7 | | | 10.67 | | | | .12 | | | | .23 | | | | .35 | | | | (.17 | ) | | | — | 10 | | | (.17 | ) | | | 10.85 | | | | 3.31 | | | | 21,549 | | | | .36 | 8 | | | .26 | 8 | | | .55 | 8 | | | 2.20 | 8 |
| 10/31/13 | | | 9.98 | | | | .22 | | | | .53 | | | | .75 | | | | (.06 | ) | | | — | | | | (.06 | ) | | | 10.67 | | | | 7.56 | | | | 15,991 | | | | .35 | | | | .24 | | | | .53 | | | | 2.15 | |
| 10/31/126,9 | | | 10.00 | | | | .01 | | | | (.03 | ) | | | (.02 | ) | | | — | | | | — | | | | — | | | | 9.98 | | | | (.20 | ) | | | 1,311 | | | | .10 | | | | .05 | | | | .35 | | | | .10 | |
| American Funds College 2015 Fund | | | | | | | | | | | | | | | | | | | | | | | | | | | | | | | | | | | | |
| Class 529-A: | | | | | | | | | | | | | | | | | | | | | | | | | | | | | | | | | | | | | | | | | | | | | | | | | | | | | | | | |
| 4/30/146,7 | | $ | 10.07 | | | $ | .08 | | | $ | .06 | | | $ | .14 | | | $ | (.12 | ) | | $ | (.01 | ) | | $ | (.13 | ) | | $ | 10.08 | | | | 1.36 | % | | $ | 142,173 | | | | .59 | %8 | | | .49 | %8 | | | .80 | %8 | | | 1.59 | %8 |
| 10/31/13 | | | 10.02 | | | | .14 | | | | (.04 | ) | | | .10 | | | | (.05 | ) | | | — | | | | (.05 | ) | | | 10.07 | | | | .96 | | | | 115,560 | | | | .58 | | | | .48 | | | | .76 | | | | 1.43 | |
| 10/31/126,9 | | | 10.00 | | | | .01 | | | | .01 | | | | .02 | | | | — | | | | — | | | | — | | | | 10.02 | | | | .20 | | | | 18,273 | | | | .13 | | | | .08 | | | | .38 | | | | .12 | |
| Class 529-B: | | | | | | | | | | | | | | | | | | | | | | | | | | | | | | | | | | | | | | | | | | | | | | | | | | | | | | | | |
| 4/30/146,7 | | | 10.00 | | | | .04 | | | | .06 | | | | .10 | | | | (.05 | ) | | | (.01 | ) | | | (.06 | ) | | | 10.04 | | | | 1.00 | | | | 2,369 | | | | 1.36 | 8 | | | 1.26 | 8 | | | 1.57 | 8 | | | .83 | 8 |
| 10/31/13 | | | 10.01 | | | | .06 | | | | (.04 | ) | | | .02 | | | | (.03 | ) | | | — | | | | (.03 | ) | | | 10.00 | | | | .24 | | | | 2,426 | | | | 1.35 | | | | 1.24 | | | | 1.52 | | | | .65 | |
| 10/31/126,9 | | | 10.00 | | | | — | 10 | | | .01 | | | | .01 | | | | — | | | | — | | | | — | | | | 10.01 | | | | .10 | | | | 375 | | | | .22 | | | | .18 | | | | .48 | | | | .03 | |
| Class 529-C: | | | | | | | | | | | | | | | | | | | | | | | | | | | | | | | | | | | | | | | | | | | | | | | | | | | | | | | | |
| 4/30/146,7 | | | 10.00 | | | | .04 | | | | .06 | | | | .10 | | | | (.06 | ) | | | (.01 | ) | | | (.07 | ) | | | 10.03 | | | | .95 | | | | 68,346 | | | | 1.36 | 8 | | | 1.26 | 8 | | | 1.57 | 8 | | | .82 | 8 |
| 10/31/13 | | | 10.01 | | | | .06 | | | | (.03 | ) | | | .03 | | | | (.04 | ) | | | — | | | | (.04 | ) | | | 10.00 | | | | .26 | | | | 56,327 | | | | 1.35 | | | | 1.25 | | | | 1.53 | | | | .65 | |
| 10/31/126,9 | | | 10.00 | | | | — | 10 | | | .01 | | | | .01 | | | | — | | | | — | | | | — | | | | 10.01 | | | | .10 | | | | 6,828 | | | | .21 | | | | .17 | | | | .47 | | | | .03 | |
| Class 529-E: | | | | | | | | | | | | | | | | | | | | | | | | | | | | | | | | | | | | | | | | | | | | | | | | | | | | | | | | |
| 4/30/146,7 | | | 10.05 | | | | .07 | | | | .05 | | | | .12 | | | | (.10 | ) | | | (.01 | ) | | | (.11 | ) | | | 10.06 | | | | 1.23 | | | | 10,828 | | | | .84 | 8 | | | .74 | 8 | | | 1.05 | 8 | | | 1.35 | 8 |
| 10/31/13 | | | 10.02 | | | | .12 | | | | (.05 | ) | | | .07 | | | | (.04 | ) | | | — | | | | (.04 | ) | | | 10.05 | | | | .82 | | | | 8,203 | | | | .82 | | | | .72 | | | | 1.00 | | | | 1.19 | |
| 10/31/126,9 | | | 10.00 | | | | .01 | | | | .01 | | | | .02 | | | | — | | | | — | | | | — | | | | 10.02 | | | | .20 | | | | 1,037 | | | | .14 | | | | .10 | | | | .40 | | | | .10 | |
| Class 529-F-1: | | | | | | | | | | | | | | | | | | | | | | | | | | | | | | | | | | | | | | | | | | | | | | | | | | | | | | | | |
| 4/30/146,7 | | | 10.09 | | | | .09 | | | | .07 | | | | .16 | | | | (.14 | ) | | | (.01 | ) | | | (.15 | ) | | | 10.10 | | | | 1.57 | | | | 17,360 | | | | .37 | 8 | | | .27 | 8 | | | .58 | 8 | | | 1.81 | 8 |
| 10/31/13 | | | 10.02 | | | | .17 | | | | (.05 | ) | | | .12 | | | | (.05 | ) | | | — | | | | (.05 | ) | | | 10.09 | | | | 1.19 | | | | 12,725 | | | | .35 | | | | .25 | | | | .53 | | | | 1.66 | |
| 10/31/126,9 | | | 10.00 | | | | .01 | | | | .01 | | | | .02 | | | | — | | | | — | | | | — | | | | 10.02 | | | | .20 | | | | 1,174 | | | | .11 | | | | .05 | | | | .35 | | | | .15 | |
See page 32 for footnotes.
| American Funds College Target Date Series | 31 |
Financial highlights (continued)
| | | | | Income (loss) from investment operations1 | | | Dividends and distributions | | | | | | | | | | | | | | |
| Period ended | | Net asset
value,
beginning
of period | | Net
investment
income (loss) | | Net gains
(losses) on
securities
(both
realized and
unrealized) | | Total from
investment
operations | | Dividends
(from net
investment
income) | | Distributions
(from capital
gains) | | Total
dividends
and
distributions | | Net asset
value, end
of period | | Total
return2,3 | | Net assets,
end of period
(in thousands) | | Ratio of
expenses to
average net
assets before
reimbursements/
waivers4 | | Ratio of
expenses to
average net
assets after
reimbursements/
waivers3,4 | | Net
effective
expense
ratio5 | | Ratio of
net income
(loss) to
average
net assets3 |
| American Funds College Enrollment Fund | | | | | | �� | | | | | | | | | | | | | | | | | | | | | | | | | | | | | | |
| Class 529-A: | | | | | | | | | | | | | | | | | | | | | | | | | | | | | | | | | | | | | | | | | | | | | | | | | | | | | | | | |
| 4/30/146,7 | | $ | 9.91 | | | $ | .04 | | | $ | .01 | | | $ | .05 | | | $ | (.06 | ) | | $ | (.01 | ) | | $ | (.07 | ) | | $ | 9.89 | | | | .50 | % | | $ | 39,972 | | | | .65 | %8 | | | .53 | %8 | | | .86 | %8 | | | .83 | %8 |
| 10/31/13 | | | 10.01 | | | | .07 | | | | (.14 | ) | | | (.07 | ) | | | (.03 | ) | | | — | | | | (.03 | ) | | | 9.91 | | | | (.67 | ) | | | 37,830 | | | | .62 | | | | .51 | | | | .82 | | | | .70 | |
| 10/31/126,9 | | | 10.00 | | | | .01 | | | | — | 10 | | | .01 | | | | — | | | | — | | | | — | | | | 10.01 | | | | .10 | | | | 6,373 | | | | .15 | | | | .08 | | | | .41 | | | | .09 | |
| Class 529-B: | | | | | | | | | | | | | | | | | | | | | | | | | | | | | | | | | | | | | | | | | | | | | | | | | | | | | | | | |
| 4/30/146,7 | | | 9.85 | | | | — | 10 | | | .01 | | | | .01 | | | | — | 10 | | | (.01 | ) | | | (.01 | ) | | | 9.85 | | | | .08 | | | | 461 | | | | 1.39 | 8 | | | 1.27 | 8 | | | 1.60 | 8 | | | .10 | 8 |
| 10/31/13 | | | 10.00 | | | | — | 10 | | | (.13 | ) | | | (.13 | ) | | | (.02 | ) | | | — | | | | (.02 | ) | | | 9.85 | | | | (1.32 | ) | | | 508 | | | | 1.37 | | | | 1.26 | | | | 1.57 | | | | (.04 | ) |
| 10/31/126,9 | | | 10.00 | | | | — | 10 | | | — | 10 | | | — | 10 | | | — | | | | — | | | | — | | | | 10.00 | | | | — | 11 | | | 118 | | | | .26 | | | | .18 | | | | .51 | | | | (.02 | ) |
| Class 529-C: | | | | | | | | | | | | | | | | | | | | | | | | | | | | | | | | | | | | | | | | | | | | | | | | | | | | | | | | |
| 4/30/146,7 | | | 9.85 | | | | — | 10 | | | .01 | | | | .01 | | | | — | | | | (.01 | ) | | | (.01 | ) | | | 9.85 | | | | .07 | | | | 20,032 | | | | 1.40 | 8 | | | 1.28 | 8 | | | 1.61 | 8 | | | .09 | 8 |
| 10/31/13 | | | 10.00 | | | | — | 10 | | | (.13 | ) | | | (.13 | ) | | | (.02 | ) | | | — | | | | (.02 | ) | | | 9.85 | | | | (1.28 | ) | | | 20,070 | | | | 1.37 | | | | 1.26 | | | | 1.57 | | | | (.04 | ) |
| 10/31/126,9 | | | 10.00 | | | | — | 10 | | | — | 10 | | | — | 10 | | | — | | | | — | | | | — | | | | 10.00 | | | | — | 11 | | | 3,661 | | | | .23 | | | | .17 | | | | .50 | | | | — | 11 |
| Class 529-E: | | | | | | | | | | | | | | | | | | | | | | | | | | | | | | | | | | | | | | | | | | | | | | | | | | | | | | | | |
| 4/30/146,7 | | | 9.90 | | | | .03 | | | | .01 | | | | .04 | | | | (.05 | ) | | | (.01 | ) | | | (.06 | ) | | | 9.88 | | | | .35 | | | | 3,056 | | | | .87 | 8 | | | .75 | 8 | | | 1.08 | 8 | | | .62 | 8 |
| 10/31/13 | | | 10.01 | | | | .05 | | | | (.13 | ) | | | (.08 | ) | | | (.03 | ) | | | — | | | | (.03 | ) | | | 9.90 | | | | (.74 | ) | | | 2,704 | | | | .84 | | | | .73 | | | | 1.04 | | | | .48 | |
| 10/31/126,9 | | | 10.00 | | | | .01 | | | | — | 10 | | | .01 | | | | — | | | | — | | | | — | | | | 10.01 | | | | .10 | | | | 639 | | | | .16 | | | | .10 | | | | .43 | | | | .07 | |
| Class 529-F-1: | | | | | | | | | | | | | | | | | | | | | | | | | | | | | | | | | | | | | | | | | | | | | | | | | | | | | | | | |
| 4/30/146,7 | | | 9.94 | | | | .05 | | | | .01 | | | | .06 | | | | (.08 | ) | | | (.01 | ) | | | (.09 | ) | | | 9.91 | | | | .63 | | | | 6,234 | | | | .40 | 8 | | | .28 | 8 | | | .61 | 8 | | | 1.08 | 8 |
| 10/31/13 | | | 10.01 | | | | .09 | | | | (.12 | ) | | | (.03 | ) | | | (.04 | ) | | | — | | | | (.04 | ) | | | 9.94 | | | | (.34 | ) | | | 5,841 | | | | .37 | | | | .27 | | | | .58 | | | | .95 | |
| 10/31/126,9 | | | 10.00 | | | | .01 | | | | — | 10 | | | .01 | | | | — | | | | — | | | | — | | | | 10.01 | | | | .10 | | | | 849 | | | | .12 | | | | .05 | | | | .38 | | | | .12 | |
| | | Six months ended | | Period ended October 31 |
| Portfolio turnover rate for all share classes | | April 30, 20146,7 | | 2013 | | 20126,9 |
| College 2030 Fund | | | — | %12 | | | — | %12 | | | — | %12 |
| College 2027 Fund | | | — | 12 | | | — | 12 | | | — | 12 |
| College 2024 Fund | | | — | 12 | | | — | 12 | | | — | 12 |
| College 2021 Fund | | | — | 12 | | | — | 12 | | | — | 12 |
| College 2018 Fund | | | — | 12 | | | — | 12 | | | — | 12 |
| College 2015 Fund | | | 2 | | | | 1 | | | | — | 12 |
| College Enrollment Fund | | | 8 | | | | 8 | | | | — | 12 |
| 1 | Based on average shares outstanding. |
| 2 | Total returns exclude any applicable sales charges. |
| 3 | This column reflects the impact,if any,of certain reimbursements/waivers from CRMC. During the periods shown,CRMC reduced fees for investment advisory services. During some of the periods shown, CRMC reimbursed other fees and expenses. |
| 4 | This column does not include expenses of the underlying funds in which each fund invests. |
| 5 | This column reflects the net effective expense ratios for each fund and class,which are unaudited. These ratios include each class’s expense ratio combined with the weighted average net expense ratio of the underlying funds for the periods presented. See pages 33 to 35 for further information regarding fees and expenses. |
| 6 | Based on operations for the period shown and, accordingly, is not representative of a full year. |
| 7 | Unaudited for the six months ended April 30, 2014. |
| 8 | Annualized. |
| 9 | For the period September 14, 2012, commencement of operations, through October 31, 2012. |
| 10 | Amount less than $.01. |
| 11 | Amount less than .01%. |
| 12 | Amount is either less than 1% or there is no turnover. |
See Notes to Financial Statements
| 32 | American Funds College Target Date Series |
As a fund shareholder, you incur two types of costs: (1) transaction costs, such as initial sales charges on purchase payments (loads), and (2) ongoing costs, including management fees, distribution and service (12b-1) fees, and other expenses. This example is intended to help you understand your ongoing costs (in dollars) of investing in the funds so you can compare these costs with the ongoing costs of investing in other mutual funds. The examples are based on an investment of $1,000 invested at the beginning of the period and held for the entire six-month period (November 1, 2013, through April 30, 2014).
Actual expenses:
The first line of each share class in the tables on the following pages provides information about actual account values and actual expenses. You may use the information in this line, together with the amount you invested, to estimate the expenses that you paid over the period. Simply divide your account value by $1,000 (for example, an $8,600 account value divided by $1,000 = 8.6), then multiply the result by the number in the first line under the heading entitled “Expenses paid during period” to estimate the expenses you paid on your account during this period.
Hypothetical example for comparison purposes:
The second line of each share class in the tables on the following pages provides information about hypothetical account values and hypothetical expenses based on the actual expense ratio for the share class and an assumed rate of return of 5.00% per year before expenses, which is not the actual return of the share class. The hypothetical account values and expenses may not be used to estimate the actual ending account balance or expenses you paid for the period. You may use this information to compare the ongoing costs of investing in the funds and other funds. To do so, compare this 5.00% hypothetical example with the 5.00% hypothetical examples that appear in the shareholder reports of the other funds.
Notes:
There are some account fees that are charged to certain types of accounts, such as individual retirement accounts (generally, a $10 fee is charged to set up the account and an additional $10 fee is charged to the account annually), that would increase the amount of expenses paid on your account. In addition, retirement plan participants may be subject to certain fees charged by the plan sponsor. You can estimate the impact of these fees by adding the amount of the fees to the total estimated expenses you paid on your account during the period as calculated above. In addition, your ending account value would also be lower by the amount of these fees.
Note that the expenses shown in the tables on the following pages are meant to highlight your ongoing costs only and do not reflect any transactional costs,such as sales charges (loads). Therefore, the second line of each share class in the tables is useful in comparing ongoing costs only, and will not help you determine the relative total costs of owning different funds. In addition, if these transactional costs were included, your costs would have been higher.
| American Funds College Target Date Series | 33 |
| | | Beginning
account value
11/1/2013 | | Ending
account value
4/30/2014 | | Expenses paid
during period1,2 | | Annualized
expense ratio2 | | | Effective
expenses
paid during
period3 | | Effective
annualized
expense
ratio4 | |
| | | | | | | | | | | | | | | | | | | | | |
| American Funds College 2030 Fund | | | | | | | | | | | | | | | | | | | | |
| Class 529-A — actual return | | $ | 1,000.00 | | $ | 1,059.13 | | $ | 2.09 | | | .41 | % | | $ | 4.14 | | | .81 | % |
| Class 529-A — assumed 5% return | | | 1,000.00 | | | 1,022.76 | | | 2.06 | | | .41 | | | | 4.06 | | | .81 | |
| Class 529-B — actual return | | | 1,000.00 | | | 1,053.95 | | | 6.37 | | | 1.25 | | | | 8.40 | | | 1.65 | |
| Class 529-B — assumed 5% return | | | 1,000.00 | | | 1,018.60 | | | 6.26 | | | 1.25 | | | | 8.25 | | | 1.65 | |
| Class 529-C — actual return | | | 1,000.00 | | | 1,053.66 | | | 6.42 | | | 1.26 | | | | 8.45 | | | 1.66 | |
| Class 529-C — assumed 5% return | | | 1,000.00 | | | 1,018.55 | | | 6.31 | | | 1.26 | | | | 8.30 | | | 1.66 | |
| Class 529-E — actual return | | | 1,000.00 | | | 1,056.86 | | | 3.72 | | | .73 | | | | 5.76 | | | 1.13 | |
| Class 529-E — assumed 5% return | | | 1,000.00 | | | 1,021.17 | | | 3.66 | | | .73 | | | | 5.66 | | | 1.13 | |
| Class 529-F-1 — actual return | | | 1,000.00 | | | 1,059.78 | | | 1.33 | | | .26 | | | | 3.37 | | | .66 | |
| Class 529-F-1 — assumed 5% return | | | 1,000.00 | | | 1,023.51 | | | 1.30 | | | .26 | | | | 3.31 | | | .66 | |
| | | | | | | | | | | | | | | | | | | | | |
| American Funds College 2027 Fund | | | | | | | | | | | | | | | | | | | | |
| Class 529-A — actual return | | $ | 1,000.00 | | $ | 1,054.29 | | $ | 2.19 | | | .43 | % | | $ | 4.18 | | | .82 | % |
| Class 529-A — assumed 5% return | | | 1,000.00 | | | 1,022.66 | | | 2.16 | | | .43 | | | | 4.11 | | | .82 | |
| Class 529-B — actual return | | | 1,000.00 | | | 1,049.90 | | | 6.35 | | | 1.25 | | | | 8.34 | | | 1.64 | |
| Class 529-B — assumed 5% return | | | 1,000.00 | | | 1,018.60 | | | 6.26 | | | 1.25 | | | | 8.20 | | | 1.64 | |
| Class 529-C — actual return | | | 1,000.00 | | | 1,050.27 | | | 6.41 | | | 1.26 | | | | 8.39 | | | 1.65 | |
| Class 529-C — assumed 5% return | | | 1,000.00 | | | 1,018.55 | | | 6.31 | | | 1.26 | | | | 8.25 | | | 1.65 | |
| Class 529-E — actual return | | | 1,000.00 | | | 1,053.00 | | | 3.72 | | | .73 | | | | 5.70 | | | 1.12 | |
| Class 529-E — assumed 5% return | | | 1,000.00 | | | 1,021.17 | | | 3.66 | | | .73 | | | | 5.61 | | | 1.12 | |
| Class 529-F-1 — actual return | | | 1,000.00 | | | 1,055.52 | | | 1.33 | | | .26 | | | | 3.31 | | | .65 | |
| Class 529-F-1 — assumed 5% return | | | 1,000.00 | | | 1,023.51 | | | 1.30 | | | .26 | | | | 3.26 | | | .65 | |
| | | | | | | | | | | | | | | | | | | | | |
| American Funds College 2024 Fund | | | | | | | | | | | | | | | | | | | | |
| Class 529-A — actual return | | $ | 1,000.00 | | $ | 1,050.87 | | $ | 2.24 | | | .44 | % | | $ | 4.12 | | | .81 | % |
| Class 529-A — assumed 5% return | | | 1,000.00 | | | 1,022.61 | | | 2.21 | | | .44 | | | | 4.06 | | | .81 | |
| Class 529-B — actual return | | | 1,000.00 | | | 1,047.65 | | | 6.35 | | | 1.25 | | | | 8.22 | | | 1.62 | |
| Class 529-B — assumed 5% return | | | 1,000.00 | | | 1,018.60 | | | 6.26 | | | 1.25 | | | | 8.10 | | | 1.62 | |
| Class 529-C — actual return | | | 1,000.00 | | | 1,047.55 | | | 6.40 | | | 1.26 | | | | 8.28 | | | 1.63 | |
| Class 529-C — assumed 5% return | | | 1,000.00 | | | 1,018.55 | | | 6.31 | | | 1.26 | | | | 8.15 | | | 1.63 | |
| Class 529-E — actual return | | | 1,000.00 | | | 1,049.91 | | | 3.71 | | | .73 | | | | 5.59 | | | 1.10 | |
| Class 529-E — assumed 5% return | | | 1,000.00 | | | 1,021.17 | | | 3.66 | | | .73 | | | | 5.51 | | | 1.10 | |
| Class 529-F-1 — actual return | | | 1,000.00 | | | 1,052.78 | | | 1.32 | | | .26 | | | | 3.21 | | | .63 | |
| Class 529-F-1 — assumed 5% return | | | 1,000.00 | | | 1,023.51 | | | 1.30 | | | .26 | | | | 3.16 | | | .63 | |
| | | | | | | | | | | | | | | | | | | | | |
| American Funds College 2021 Fund | | | | | | | | | | | | | | | | | | | | |
| Class 529-A — actual return | | $ | 1,000.00 | | $ | 1,043.12 | | $ | 2.23 | | | .44 | % | | $ | 3.90 | | | .77 | % |
| Class 529-A — assumed 5% return | | | 1,000.00 | | | 1,022.61 | | | 2.21 | | | .44 | | | | 3.86 | | | .77 | |
| Class 529-B — actual return | | | 1,000.00 | | | 1,038.58 | | | 6.32 | | | 1.25 | | | | 7.99 | | | 1.58 | |
| Class 529-B — assumed 5% return | | | 1,000.00 | | | 1,018.60 | | | 6.26 | | | 1.25 | | | | 7.90 | | | 1.58 | |
| Class 529-C — actual return | | | 1,000.00 | | | 1,038.86 | | | 6.37 | | | 1.26 | | | | 8.04 | | | 1.59 | |
| Class 529-C — assumed 5% return | | | 1,000.00 | | | 1,018.55 | | | 6.31 | | | 1.26 | | | | 7.95 | | | 1.59 | |
| Class 529-E — actual return | | | 1,000.00 | | | 1,041.50 | | | 3.70 | | | .73 | | | | 5.37 | | | 1.06 | |
| Class 529-E — assumed 5% return | | | 1,000.00 | | | 1,021.17 | | | 3.66 | | | .73 | | | | 5.31 | | | 1.06 | |
| Class 529-F-1 — actual return | | | 1,000.00 | | | 1,043.68 | | | 1.32 | | | .26 | | | | 2.99 | | | .59 | |
| Class 529-F-1 — assumed 5% return | | | 1,000.00 | | | 1,023.51 | | | 1.30 | | | .26 | | | | 2.96 | | | .59 | |
| 34 | American Funds College Target Date Series |
| | | Beginning
account value
11/1/2013 | | Ending
account value
4/30/2014 | | Expenses paid
during period1,2 | | Annualized
expense ratio2 | | | Effective
expenses
paid during
period3 | | Effective
annualized
expense
ratio4 | |
| | | | | | | | | | | | | | | | | | | | | |
| American Funds College 2018 Fund | | | | | | | | | | | | | | | | | | | | |
| Class 529-A — actual return | | $ | 1,000.00 | | $ | 1,031.49 | | $ | 2.32 | | | .46 | % | | $ | 3.78 | | | .75 | % |
| Class 529-A — assumed 5% return | | | 1,000.00 | | | 1,022.51 | | | 2.31 | | | .46 | | | | 3.76 | | | .75 | |
| Class 529-B — actual return | | | 1,000.00 | | | 1,028.52 | | | 6.29 | | | 1.25 | | | | 7.75 | | | 1.54 | |
| Class 529-B — assumed 5% return | | | 1,000.00 | | | 1,018.60 | | | 6.26 | | | 1.25 | | | | 7.70 | | | 1.54 | |
| Class 529-C — actual return | | | 1,000.00 | | | 1,028.21 | | | 6.34 | | | 1.26 | | | | 7.79 | | | 1.55 | |
| Class 529-C — assumed 5% return | | | 1,000.00 | | | 1,018.55 | | | 6.31 | | | 1.26 | | | | 7.75 | | | 1.55 | |
| Class 529-E — actual return | | | 1,000.00 | | | 1,030.77 | | | 3.68 | | | .73 | | | | 5.14 | | | 1.02 | |
| Class 529-E — assumed 5% return | | | 1,000.00 | | | 1,021.17 | | | 3.66 | | | .73 | | | | 5.11 | | | 1.02 | |
| Class 529-F-1 — actual return | | | 1,000.00 | | | 1,033.07 | | | 1.31 | | | .26 | | | | 2.77 | | | .55 | |
| Class 529-F-1 — assumed 5% return | | | 1,000.00 | | | 1,023.51 | | | 1.30 | | | .26 | | | | 2.76 | | | .55 | |
| | | | | | | | | | | | | | | | | | | | | |
| American Funds College 2015 Fund | | | | | | | | | | | | | | | | | | | | |
| Class 529-A — actual return | | $ | 1,000.00 | | $ | 1,013.57 | | $ | 2.45 | | | .49 | % | | $ | 3.99 | | | .80 | % |
| Class 529-A — assumed 5% return | | | 1,000.00 | | | 1,022.36 | | | 2.46 | | | .49 | | | | 4.01 | | | .80 | |
| Class 529-B — actual return | | | 1,000.00 | | | 1,010.01 | | | 6.28 | | | 1.26 | | | | 7.82 | | | 1.57 | |
| Class 529-B — assumed 5% return | | | 1,000.00 | | | 1,018.55 | | | 6.31 | | | 1.26 | | | | 7.85 | | | 1.57 | |
| Class 529-C — actual return | | | 1,000.00 | | | 1,009.46 | | | 6.28 | | | 1.26 | | | | 7.82 | | | 1.57 | |
| Class 529-C — assumed 5% return | | | 1,000.00 | | | 1,018.55 | | | 6.31 | | | 1.26 | | | | 7.85 | | | 1.57 | |
| Class 529-E — actual return | | | 1,000.00 | | | 1,012.34 | | | 3.69 | | | .74 | | | | 5.24 | | | 1.05 | |
| Class 529-E — assumed 5% return | | | 1,000.00 | | | 1,021.12 | | | 3.71 | | | .74 | | | | 5.26 | | | 1.05 | |
| Class 529-F-1 — actual return | | | 1,000.00 | | | 1,015.67 | | | 1.35 | | | .27 | | | | 2.90 | | | .58 | |
| Class 529-F-1 — assumed 5% return | | | 1,000.00 | | | 1,023.46 | | | 1.35 | | | .27 | | | | 2.91 | | | .58 | |
| | | | | | | | | | | | | | | | | | | | | |
| American Funds College Enrollment Fund | | | | | | | | | | | | | | | | | | | | |
| Class 529-A — actual return | | $ | 1,000.00 | | $ | 1,005.04 | | $ | 2.63 | | | .53 | % | | $ | 4.28 | | | .86 | % |
| Class 529-A — assumed 5% return | | | 1,000.00 | | | 1,022.17 | | | 2.66 | | | .53 | | | | 4.31 | | | .86 | |
| Class 529-B — actual return | | | 1,000.00 | | | 1,000.82 | | | 6.30 | | | 1.27 | | | | 7.94 | | | 1.60 | |
| Class 529-B — assumed 5% return | | | 1,000.00 | | | 1,018.50 | | | 6.36 | | | 1.27 | | | | 8.00 | | | 1.60 | |
| Class 529-C — actual return | | | 1,000.00 | | | 1,000.72 | | | 6.35 | | | 1.28 | | | | 7.99 | | | 1.61 | |
| Class 529-C — assumed 5% return | | | 1,000.00 | | | 1,018.45 | | | 6.41 | | | 1.28 | | | | 8.05 | | | 1.61 | |
| Class 529-E — actual return | | | 1,000.00 | | | 1,003.53 | | | 3.73 | | | .75 | | | | 5.37 | | | 1.08 | |
| Class 529-E — assumed 5% return | | | 1,000.00 | | | 1,021.08 | | | 3.76 | | | .75 | | | | 5.41 | | | 1.08 | |
| Class 529-F-1 — actual return | | | 1,000.00 | | | 1,006.27 | | | 1.39 | | | .28 | | | | 3.03 | | | .61 | |
| Class 529-F-1 — assumed 5% return | | | 1,000.00 | | | 1,023.41 | | | 1.40 | | | .28 | | | | 3.06 | | | .61 | |
| 1 | The “expenses paid during period” are equal to the “annualized expense ratio,” multiplied by the average account value over the period, multiplied by the number of days in the period, and divided by 365 (to reflect the one-half year period). |
| 2 | The “expenses paid during period” and “annualized expense ratio” do not include the expenses of the underlying funds in which each fund invests. |
| 3 | The “effective expenses paid during period” are equal to the “effective annualized expense ratio,” multiplied by the average account value over the period, multiplied by the number of days in the period, and divided by 365 (to reflect the one-half year period). |
| 4 | The “effective annualized expense ratio” reflects the net annualized expense ratio of the class plus the class’s pro-rata share of the weighted average expense ratio of the underlying funds in which it invests. The annualized weighted average expense ratio of the underlying funds for the period reflects the net actual expense ratio of each underlying fund for the period, annualized and weighted for the fund’s relative average investment therein during the period. |
| American Funds College Target Date Series | 35 |
Approval of Investment Advisory and Service Agreement
The American Funds College Target Date Series’ board has approved the series’ Investment Advisory and Service Agreement (the “agreement”) with Capital Research and Management Company (“CRMC”) for an additional one-year term through December 31, 2014. The board approved the agreement following the recommendation of the series’ Contracts Committee (the “committee”), which is composed of all of the series’ independent board members. The board and the committee determined that each fund’s advisory fee structure was fair and reasonable in relation to the services provided and that approving the agreement was in the best interests of each fund and its shareholders.
In reaching this decision, the board and the committee took into account information furnished to them throughout the year and otherwise provided to them, as well as information prepared specifically in connection with their review of the agreement, and were advised by their independent counsel. They considered the following factors, among others, but did not identify any single issue or particular piece of information that, in isolation, was the controlling factor, and each board and committee member did not necessarily attribute the same weight to each factor.
1. Nature, extent and quality of services
The board and the committee considered the depth and quality of CRMC’s investment management process, including its global research capabilities; the experience, capability and integrity of its senior management and other personnel; the low turnover rates of its key personnel; the overall financial strength and stability of its organization; and the ongoing evolution of CRMC’s organizational structure designed to maintain and strengthen these qualities. The board and the committee also considered the nature, extent and quality of administrative, compliance and shareholder services provided by CRMC to the funds under the agreement and other agreements, as well as the benefits to each fund’s shareholders from investing in a fund that is part of a large family of funds. The board and the committee concluded that the nature, extent and quality of the services provided by CRMC have benefited and should continue to benefit each fund and its shareholders.
2. Investment results
The board and the committee considered the investment results of each fund in light of its objectives. In that connection, they recognized that each fund, except the College Enrollment Fund, seeks to achieve the following objectives to varying degrees: growth, income and preservation of capital, depending on the proximity to its target date. They noted that the target date is meant to roughly correspond to the year in which the fund beneficiary will start to withdraw funds to meet higher education expenses; that the fund will increasingly emphasize income and preservation of capital by investing a greater portion of its assets in bond, equity-income and balanced funds as it approaches and passes its target date; and that in this way, the fund seeks to achieve an appropriate balance of total return and stability during different time periods. They further noted that the College Enrollment Fund seeks to provide current income, consistent with preservation of capital.
The board and the committee compared each fund’s investment results with those of other relevant funds (including funds that form the basis of the Lipper index for the category in which the fund is included), and data such as relevant market and fund indexes, over various periods through June 30, 2013. This report, including the letter to shareholders and related disclosures, contains certain information about each fund’s investment results.
American Funds College 2030 Fund — The board and the committee reviewed the fund’s investment results measured against the investment results of (i) the Lipper Mixed-Asset Target Date Funds Average 2030 (the Lipper category that includes the fund) and (ii) the S&P Target Date To 2030 Index. They noted that the fund’s investment results were above each measurement for the three- and six-month periods. The board and the committee further noted that over the lifetime of the fund since September 14, 2012, the fund’s investment results also were higher than both the Lipper average and the S&P index.
| 36 | American Funds College Target Date Series |
American Funds College 2027 Fund — The board and the committee reviewed the fund’s investment results measured against the investment results of (i) the Lipper Mixed-Asset Target Date Funds Average 2030 (the Lipper category that includes the fund) and (ii) the S&P Target Date To 2025 Index. They noted that the fund’s investment results were above each measurement for the three- and six-month periods. The board and the committee further noted that over the lifetime of the fund since September 14, 2012, the fund’s investment results also were higher than both the Lipper average and the S&P index.
American Funds College 2024 Fund — The board and the committee reviewed the fund’s investment results measured against the investment results of (i) the Lipper Mixed-Asset Target Date Funds Average 2025 (the Lipper category that includes the fund) and (ii) the S&P Target Date To 2025 Index. They noted that the fund’s investment results were above each measurement for the three- and six-month periods. The board and the committee further noted that over the lifetime of the fund since September 14, 2012, the fund’s investment results also were higher than both the Lipper average and the S&P index.
American Funds College 2021 Fund — The board and the committee reviewed the fund’s investment results measured against the investment results of (i) the Lipper Mixed-Asset Target Date Funds Average 2025 (the Lipper category that includes the fund) and (ii) the S&P Target Date To 2020 Index. They noted that the fund’s investment results were above each measurement for the three-month period, but above the S&P index and below the Lipper average for the six-month period. The board and the committee further noted that over the lifetime of the fund since September 14, 2012, the fund’s investment results were higher than the S&P index, but below the Lipper average.
American Funds College 2018 Fund — The board and the committee reviewed the fund’s investment results measured against the investment results of (i) the Lipper Mixed-Asset Target Date Funds Average 2020 (the Lipper category that includes the fund) and (ii) the S&P Target Date To 2015 Index. They noted that the fund’s investment results were above each measurement for the three-month period, but above the S&P index and below the Lipper average for the six-month period. The board and the committee further noted that over the lifetime of the fund since September 14, 2012, the fund’s investment results were below both the Lipper average and the S&P index.
American Funds College 2015 Fund — The board and the committee reviewed the fund’s investment results measured against the investment results of (i) the Lipper Mixed-Asset Target Date Funds Average 2015 (the Lipper category that includes the fund) and (ii) the Barclays U.S. Aggregate Index. They noted that the fund’s investment results were above each measurement for the three-month period, and above the Barclays index, but substantially below the Lipper average for the six-month period as well as over the lifetime of the fund since September 14, 2012.
| American Funds College Target Date Series | 37 |
American Funds College Enrollment Fund — The board and the committee reviewed the fund’s investment results measured against the investment results of (i) the Lipper Short-Intermediate Investment Grade Debt Funds Average (the Lipper category that includes the fund) and (ii) the Barclays Intermediate U.S. Aggregate Index. They noted that the fund’s investment results were above the Barclays index but below the Lipper average for the three- and six-month periods. The board and the committee further noted that over the lifetime of the fund since September 14, 2012, the fund’s investment results were below the Barclays index and substantially below the Lipper average.
The board and the committee concluded that each fund’s investment results have been satisfactory and that CRMC’s record in managing the funds indicated that its continued management should benefit each fund and its shareholders.
3. Advisory fees and total expenses
The board and the committee compared the total expense levels of each fund to those of other relevant funds. They observed that each fund’s expenses were less than the median and average of fees and expenses of those of the other funds included in its Lipper category described above.
The board and the committee also reviewed the advisory fee schedule of the funds (including the fees and expenses of the underlying American Funds in which the funds invest) compared to those of other relevant funds. The board and the committee noted CRMC’s waiver of the entire advisory fee payable by the funds under the agreement and CRMC’s commitment not to remove the waiver without board approval. In addition, they reviewed information regarding the effective advisory fees charged to other clients by CRMC and its affiliates. They noted that,to the extent there were differences between the advisory fees paid by the fund and the advisory fees paid by those clients, the differences appropriately reflected the investment,operational and regulatory differences between advising the fund and the other clients. The board and the committee concluded that each fund’s cost structure was fair and reasonable in relation to the services provided, and that each fund’s shareholders receive reasonable value in return for the advisory fees and other amounts paid to CRMC by the fund.
4. Ancillary benefits
The board and the committee considered a variety of other benefits that CRMC and its affiliates receive as a result of CRMC’s relationship with each fund and the other American Funds, including fees for administrative services provided to certain share classes; fees paid to CRMC’s affiliated transfer agent; sales charges and distribution fees received and retained by the funds’ principal underwriter,an affiliate of CRMC; and possible ancillary benefits to CRMC and its institutional management affiliates in managing other investment vehicles. The board and the committee reviewed CRMC’s portfolio trading practices,noting that while CRMC receives the benefit of research provided by broker-dealers executing portfolio transactions on behalf of each fund, it does not obtain third-party research or other services in return for allocating brokerage to such broker-dealers. The board and the committee took these ancillary benefits into account in evaluating the reasonableness of the advisory fees and other amounts paid to CRMC by the funds.
| 38 | American Funds College Target Date Series |
5. Adviser financial information
The board and the committee reviewed information regarding CRMC’s costs of providing services to the American Funds, including personnel, systems and resources of investment, compliance, trading, accounting and other administrative operations. They considered CRMC’s costs and willingness to invest in technology, infrastructure and staff to maintain and expand services and capabilities, respond to industry and regulatory developments,and attract and retain qualified personnel. They noted information regarding the compensation structure for CRMC’s investment professionals. The board and the committee also compared CRMC’s profitability and compensation data to the reported results and data of several large, publicly held investment management companies. The board and the committee noted the competitiveness and cyclicality of both the mutual fund industry and the capital markets, and the importance in that environment of CRMC’s long-term profitability for maintaining its independence, company culture and management continuity. The board and the committee concluded that each fund’s advisory fee structure reflected a reasonable sharing of benefits between CRMC and the funds’ shareholders.
| American Funds College Target Date Series | 39 |
Office of the series
6455 Irvine Center Drive
Irvine, CA 92618-4518
Investment adviser
Capital Research and Management Company
333 South Hope Street
Los Angeles, CA 90071-1406
Transfer agent for shareholder accounts
American Funds Service Company
(Write to the address near you.)
P.O. Box 6007
Indianapolis, IN 46206-6007
P.O. Box 2280
Norfolk, VA 23501-2280
Custodian of assets
JPMorgan Chase Bank
270 Park Avenue
New York, NY 10017-2070
Counsel
Bingham McCutchen LLP
355 South Grand Avenue, Suite 4400
Los Angeles, CA 90071-3106
Independent registered public accounting firm
Deloitte & Touche LLP
695 Town Center Drive
Suite 1200
Costa Mesa, CA 92626-7188
Principal underwriter
American Funds Distributors, Inc.
333 South Hope Street
Los Angeles, CA 90071-1406
Investors should carefully consider investment objectives, risks, charges and expenses. This and other important information is contained in the series prospectus, which can be obtained from your financial professional and should be read carefully before investing. You may also call American Funds Service Company (AFS) at (800) 421-4225 or visit the American Funds website at americanfunds.com.
“Proxy Voting Guidelines for American Funds College Target Date Series” — which describes how we vote proxies relating to the underlying funds held in the portfolios — is available on the American Funds website or upon request by calling AFS. The series files its proxy voting record with the U.S. Securities and Exchange Commission (SEC) for the 12 months ended June 30 by August 31. The proxy voting record is available free of charge on the SEC website at sec.gov and on the American Funds website.
American Funds College Target Date Series files a complete list of its portfolio holdings with the SEC for the first and third quarters of each fiscal year on Form N-Q. This filing is available free of charge on the SEC website. You may also review or, for a fee, copy this filing at the SEC’s Public Reference Room in Washington, D.C. Additional information regarding the operation of the Public Reference Room may be obtained by calling the SEC’s Office of Investor Education and Advocacy at (800) SEC-0330. Additionally, the list of portfolio holdings is available by calling AFS.
This report is for the information of shareholders of American Funds College Target Date Series, but it also may be used as sales literature when preceded or accompanied by the current prospectus, which gives details about charges, expenses, investment objectives and operating policies of the series. If used as sales material after June 30, 2014, this report must be accompanied by an American Funds statistical update for the most recently completed calendar quarter.
| 40 | American Funds College Target Date Series |
The American Funds Advantage
Since 1931, American Funds, part of Capital Group, has helped investors pursue long-term investment success. Our consistent approach — in combination with The Capital SystemSM — has resulted in a superior long-term track record.
| | Aligned with investor success |
| | We base our decisions on a long-term perspective, which we believe aligns our goals with the interests of our clients. Our portfolio managers average 26 years of investment experience, including 21 years at our company, reflecting a career commitment to our long-term approach.1 |
| | |
| | The Capital SystemSM |
| | Our investment process, The Capital System, combines individual accountability with teamwork. Each fund is divided into portions that are managed independently by investment professionals with diverse backgrounds, ages and investment approaches. An extensive global research effort is the backbone of our system. |
| | |
| | Superior long-term track record |
| | Our equity funds have beaten their Lipper peer indexes in 90% of 10-year periods and 96% of 20-year periods. Our fixed-income funds have beaten their Lipper indexes in 56% of 10-year periods and 57% of 20-year periods.2 Our fund management fees have been among the lowest in the industry.3 |
| | 1 | Portfolio manager experience as of December 31, 2013. |
| | 2 | Based on Class A share results for rolling periods through December 31, 2013. Periods covered are the shorter of the fund’s lifetime or since the comparable Lipper index inception date (except SMALLCAP World Fund, for which the Lipper average was used). |
| | 3 | Based on management fees for the 20-year period ended December 31, 2013, versus comparable Lipper categories, excluding funds of funds. |
 | | Printed on paper containing 10% post-consumer waste Printed with inks containing soy and/or vegetable oil |
| Lit No. MFGESRX-800-0614P Litho in USA CGD/UNL/10240-S38907 |
ITEM 2 – Code of Ethics
Not applicable for filing of semi-annual reports to shareholders.
ITEM 3 – Audit Committee Financial Expert
Not applicable for filing of semi-annual reports to shareholders.
ITEM 4 – Principal Accountant Fees and Services
Not applicable for filing of semi-annual reports to shareholders.
ITEM 5 – Audit Committee of Listed Registrants
Not applicable to this Registrant, insofar as the Registrant is not a listed issuer as defined in Rule 10A-3 under the Securities Exchange Act of 1934.
ITEM 6 – Schedule of Investments
Not applicable, insofar as the schedule is included as part of the report to shareholders filed under Item 1 of this Form.
ITEM 7 – Disclosure of Proxy Voting Policies and Procedures for Closed-End Management Investment Companies
Not applicable to this Registrant, insofar as the Registrant is not a closed-end management investment company.
ITEM 8 – Portfolio Managers of Closed-End Management Investment Companies
Not applicable to this Registrant, insofar as the Registrant is not a closed-end management investment company.
ITEM 9 – Purchases of Equity Securities by Closed-End Management Investment Company and Affiliated Purchasers
Not applicable to this Registrant, insofar as the Registrant is not a closed-end management investment company.
ITEM 10 – Submission of Matters to a Vote of Security Holders
There have been no material changes to the procedures by which shareholders may recommend nominees to the Registrant’s board of trustees since the Registrant last submitted a proxy statement to its shareholders. The procedures are as follows. The Registrant has a nominating and governance committee comprised solely of persons who are not considered ‘‘interested persons’’ of the Registrant within the meaning of the Investment Company Act of 1940, as amended. The committee periodically reviews such issues as the board’s composition, responsibilities, committees, compensation and other relevant issues, and recommends any appropriate changes to the full board of trustees. While the committee normally is able to identify from its own resources an ample number of qualified candidates, it will consider shareholder suggestions of persons to be considered as nominees to fill future vacancies on the board. Such suggestions must be sent in writing to the nominating and governance committee of the Registrant, c/o the Registrant’s Secretary, and must be accompanied by complete biographical and occupational data on the prospective nominee, along with a written consent of the prospective nominee for consideration of his or her name by the nominating and governance committee.
ITEM 11 – Controls and Procedures
| (a) | The Registrant’s Principal Executive Officer and Principal Financial Officer have concluded, based on their evaluation of the Registrant’s disclosure controls and procedures (as such term is defined in Rule 30a-3 under the Investment Company Act of 1940), that such controls and procedures are adequate and reasonably designed to achieve the purposes described in paragraph (c) of such rule. |
| | |
| (b) | There were no changes in the Registrant’s internal controls over financial reporting (as defined in Rule 30a-3(d) under the Investment Company Act of 1940) that occurred during the Registrant’s second fiscal quarter of the period covered by this report that has materially affected, or is reasonably likely to materially affect, the Registrant’s internal control over financial reporting. |
ITEM 12 – Exhibits
| (a)(1) | Not applicable for filing of semi-annual reports to shareholders. |
| | |
| (a)(2) | The certifications required by Rule 30a-2 of the Investment Company Act of 1940 and Sections 302 and 906 of the Sarbanes-Oxley Act of 2002 are attached as exhibits hereto. |
SIGNATURES
Pursuant to the requirements of the Securities Exchange Act of 1934 and the Investment Company Act of 1940, the Registrant has duly caused this report to be signed on its behalf by the undersigned, thereunto duly authorized.
| | AMERICAN FUNDS COLLEGE TARGET DATE SERIES |
| | |
| | By /s/ Walter R. Burkley |
| | Walter R. Burkley, President and Principal Executive Officer |
| | |
| | Date: June 30, 2014 |
Pursuant to the requirements of the Securities Exchange Act of 1934 and the Investment Company Act of 1940, this report has been signed below by the following persons on behalf of the Registrant and in the capacities and on the dates indicated.
| By /s/ Walter R. Burkley |
Walter R. Burkley, President and Principal Executive Officer |
| |
| Date: June 30, 2014 |
| By /s/ Gregory F. Niland |
Gregory F. Niland, Treasurer and Principal Financial Officer |
| |
| Date: June 30, 2014 |