UNITED STATES
SECURITIES AND EXCHANGE COMMISSION
Washington, D.C. 20549
FORM N-CSR
Certified Shareholder Report of
Registered Management Investment Companies
Investment Company Act File Number: 811-22692
American Funds College Target Date Series
(Exact Name of Registrant as Specified in Charter)
6455 Irvine Center Drive
Irvine, California 92618
(Address of Principal Executive Offices)
Registrant's telephone number, including area code: (949) 975-5000
Date of fiscal year end: October 31
Date of reporting period: April 30, 2020
Gregory F. Niland
American Funds College Target Date Series
5300 Robin Hood Road
Norfolk, Virginia 23513
(Name and Address of Agent for Service)
ITEM 1 – Reports to Stockholders
American Funds College
Target Date Series® |  |
Semi-annual report
for the six months ended
April 30, 2020 |

A balanced approach
that seeks to build
and preserve wealth
for higher education
Beginning January 1, 2021, as permitted by regulations adopted by the U.S. Securities and Exchange Commission, we intend to no longer mail paper copies of the series’ shareholder reports, unless specifically requested from American Funds or your financial intermediary, such as a broker-dealer or bank. Instead, the reports will be made available on the Capital Group website (capitalgroup.com); you will be notified by mail and provided with a website link to access the report each time a report is posted. If you have already elected to receive shareholder reports electronically, you will not be affected by this change and do not need to take any action. If you prefer to receive shareholder reports and other communications electronically, you may update your mailing preferences with your financial intermediary, or enroll in e-delivery at capitalgroup.com (for accounts held directly with the series).
You may elect to receive paper copies of all future reports free of charge. If you invest through a financial intermediary, you may contact your financial intermediary to request that you continue to receive paper copies of your shareholder reports. If you invest directly with the series, you may inform American Funds that you wish to continue receiving paper copies of your shareholder reports by contacting us at (800) 421-4225. Your election to receive paper reports will apply to all funds held with American Funds or through your financial intermediary.
American Funds College 2036 FundSM, American Funds College 2033 Fund®, American Funds College 2030 Fund®, American Funds College 2027 Fund®, American Funds College 2024 Fund®, American Funds College 2021 Fund®: Each fund will seek to achieve the following objectives to varying degrees: growth, income and preservation of capital, depending on the proximity to its target date. The target date is meant to roughly correspond to the year in which the fund beneficiary will start to withdraw funds to meet higher education expenses. Each fund will increasingly emphasize income and preservation of capital by investing a greater portion of its assets in bond, equity-income and balanced funds as it approaches and passes its target date. In this way, each fund seeks to achieve an appropriate balance of total return and stability during different time periods.
American Funds College Enrollment Fund®: The fund’s investment objective is to provide current income, consistent with preservation of capital.
American Funds, by Capital Group, is one of the nation’s largest mutual fund families. For nearly 90 years, Capital Group has invested with a long-term focus based on thorough research and attention to risk.
Fund results shown in this report, unless otherwise indicated, are for Class 529-A shares at net asset value. If a sales charge had been deducted, the results would have been lower. Results are for past periods and are not predictive of results for future periods. Current and future results may be lower or higher than those shown. Prices and returns will vary, so investors may lose money. Investing for short periods makes losses more likely. For current information and month-end results, visit capitalgroup.com.
Here are the average annual total returns on a $1,000 investment with all distributions reinvested for periods ended March 31, 2020 (the most recent calendar quarter-end). Also shown are the expense ratios as of the series prospectus dated January 1, 2020. The expense ratios are restated to reflect current fees.
| | | Cumulative total returns | | Average annual total returns | | |
| Class 529-A shares | | 1 year | | 5 years | | Lifetime* | | Expense ratio |
| |
| Reflecting 4.25% maximum initial sales charge: | | | | | | | | | | | | | | | | |
| American Funds College 2036 Fund | | | –10.33 | % | | | — | | | | –3.62 | % | | | 0.88 | % |
| American Funds College 2033 Fund | | | –7.30 | | | | 3.30 | % | | | 3.25 | | | | 0.80 | |
| American Funds College 2030 Fund | | | –5.38 | | | | 3.25 | | | | 6.14 | | | | 0.77 | |
| American Funds College 2027 Fund | | | –3.28 | | | | 3.01 | | | | 5.54 | | | | 0.72 | |
| American Funds College 2024 Fund | | | –1.09 | | | | 2.72 | | | | 4.84 | | | | 0.69 | |
| American Funds College 2021 Fund | | | 0.85 | | | | 1.95 | | | | 3.74 | | | | 0.70 | |
| Reflecting 2.50% maximum initial sales charge: | | | | | | | | | | | | | | | | |
| American Funds College Enrollment Fund | | | 3.11 | | | | 1.45 | | | | 1.20 | | | | 0.70 | |
| * | Since September 14, 2012, for all funds except College 2036 Fund, which commenced operations on February 9, 2018, and College 2033 Fund, which commenced operations on March 27, 2015. |
The college target date funds invest in Class R-6 shares of the underlying funds. Investment results assume all distributions are reinvested and reflect applicable fees and expenses. When applicable, investment results reflect fee waivers and/or expense reimbursements, without which results would have been lower. Refer to the fund’s most recent prospectus for details. For more information on fee waivers and expense reimbursements, visit capitalgroup.com.
The funds’ allocation strategy does not guarantee that investors’ education savings goals will be met. Investors and their advisors should periodically evaluate their investment to determine whether it continues to meet their needs. Investment allocations may not achieve fund objectives. There are expenses associated with the underlying funds in addition to fund of funds expenses. The funds’ risks are directly related to the risks of the underlying funds. Refer to the series prospectus and the Risk Factors section of this report for more information on these and other risks associated with investing in the series.
Investments are not FDIC-insured, nor are they deposits of or guaranteed by a bank or any other entity, so they may lose value.
Fellow investors:
Shown in the table below are the semi-annual returns for American Funds College Target Date Series for the six months ended April 30, 2020. Also shown are the results of its primary benchmarks.
For additional information about the series, its results, holdings and the Target Date Solutions Committee, visit capitalgroup.com/individual/investments. You can also access information about Capital Group’s American Funds and read our insights about the markets, retirement, saving for college, investing fundamentals and more atcapitalgroup.com.
Contents
Results at a glance
For periods ended April 30, 2020, with all distributions reinvested for Class 529-A shares
| | | Cumulative total returns | | Average annual total returns |
| | | 6 months | | 1 year | | 5 years | | Lifetime1 |
| | | | | | | | | |
| American Funds College 2036 Fund2 | | | –3.06 | % | | | –0.93 | % | | | — | | | | 2.13 | % |
| Standard & Poor’s 500 Composite Index3,4 | | | –3.16 | | | | 0.86 | | | | — | | | | 6.99 | |
| Bloomberg Barclays U.S. Aggregate Index4,5 | | | 4.86 | | | | 10.84 | | | | — | | | | 7.07 | |
| | | | | | | | | | | | | | | | | |
| American Funds College 2033 Fund | | | –0.74 | | | | 1.71 | | | | 5.24 | % | | | 5.55 | |
| Standard & Poor’s 500 Composite Index3,4 | | | –3.16 | | | | 0.86 | | | | 9.12 | | | | 9.23 | |
| Bloomberg Barclays U.S. Aggregate Index4,5 | | | 4.86 | | | | 10.84 | | | | 3.80 | | | | 3.68 | |
| | | | | | | | | | | | | | | | | |
| American Funds College 2030 Fund | | | –0.21 | | | | 2.91 | | | | 4.97 | | | | 7.48 | |
| American Funds College 2027 Fund | | | 0.57 | | | | 4.16 | | | | 4.52 | | | | 6.67 | |
| American Funds College 2024 Fund | | | 2.07 | | | | 5.56 | | | | 4.03 | | | | 5.78 | |
| American Funds College 2021 Fund | | | 3.34 | | | | 6.20 | | | | 2.99 | | | | 4.45 | |
| Standard & Poor’s 500 Composite Index3,4 | | | –3.16 | | | | 0.86 | | | | 9.12 | | | | 11.71 | |
| Bloomberg Barclays U.S. Aggregate Index4,5 | | | 4.86 | | | | 10.84 | | | | 3.80 | | | | 3.28 | |
| | | | | | | | | | | | | | | | | |
|
| American Funds College Enrollment Fund | | | 4.02 | | | | 6.34 | | | | 2.12 | | | | 1.63 | |
| Bloomberg Barclays U.S. Aggregate 1–5 Years Index4,6 | | | 3.36 | | | | 6.50 | | | | 2.50 | | | | 2.06 | |
| 1 | Since September 14, 2012, for all funds except College 2036 Fund, which commenced operations on February 9, 2018, and College 2033 Fund, which commenced operations on March 27, 2015. |
| 2 | Five-year returns for College 2036 Fund are unavailable since the fund commenced operations on February 9, 2018. |
| 3 | Standard & Poor’s 500 Composite Index is a market capitalization-weighted index based on the results of approximately 500 widely held common stocks. Source: S&P Dow Jones Indices LLC. |
| 4 | The market indexes are unmanaged and, therefore, have no expenses. Investors cannot invest directly in an index. There have been periods when the fund has lagged the index. |
| 5 | Bloomberg Barclays U.S. Aggregate Index represents the U.S. investment-grade (bonds rated BBB/Baa and above) fixed-rate bond market. Source: Bloomberg Index Services Ltd. |
| 6 | Bloomberg Barclays U.S. Aggregate 1–5 Years Index represents securities in the one- to five-year maturity range of the U.S. investment-grade (bonds rated BBB/Baa and above) fixed-rate bond market. Source: Bloomberg Index Services Ltd. |
| American Funds College Target Date Series | 1 |
Investment approach for
American Funds College Target Date Series
About the series
Launched in September 2012, American Funds College Target Date Series was designed to provide a low-maintenance investment option for parents who want to use a 529 savings plan to save for college.
An investor simply needs to select the College Target Date Series fund that most closely corresponds to the projected enrollment year of the student. American Funds takes care of the fund selection and the asset allocation and adjusts these over time as the enrollment date approaches. The only thing investors should need to worry about is making contributions.
For dates far from enrollment, the respective funds of funds have an emphasis on long-term growth of capital. For dates close to enrollment, the funds of funds have an emphasis on near-term preservation of capital.
The funds in the series have a conservative tilt, with a preference toward funds holding equities that pay dividends. The automatic rebalancing is disciplined and frequent to ensure that the funds are consistent with their stated investment objective.
The investment professionals of the Target Date Solutions Committee don’t attempt to be tactical asset allocators — that is, buy or sell based on market changes. They work out the rebalancing schedule, or “glide path,” that would make sense through the cycle, and they stick to it.

The allocations shown are as of January 1, 2020, and are subject to the Target Date Solutions Committee’s discretion. The investment adviser anticipates that the funds will invest their assets within a range that deviates no more than 10% above or below these allocations. Underlying funds may be added or removed during the year. Changes in the equity allocation within the underlying equity-income and balanced funds may affect the overall equity exposure in the target date funds. For quarterly updates of fund allocations, visit capitalgroup.com.
| 2 | American Funds College Target Date Series |
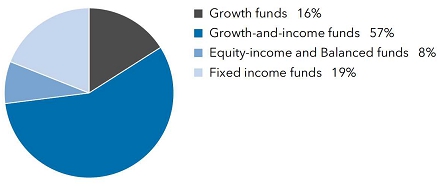
| American Funds College 2036 Fund | unaudited |
| Investment portfolio April 30, 2020 | |
| | | | | | | | Value | |
| Growth funds 16% | | | Shares | | | | (000) | |
| The Growth Fund of America, Class R-6 | | | 994,176 | | | $ | 49,381 | |
| EuroPacific Growth Fund, Class R-6 | | | 610,464 | | | | 28,679 | |
| | | | | | | | 78,060 | |
| |
| Growth-and-income funds 57% | | | | | | | | |
| Fundamental Investors, Class R-6 | | | 1,422,050 | | | | 77,672 | |
| Capital World Growth and Income Fund, Class R-6 | | | 1,682,056 | | | | 76,315 | |
| The Investment Company of America, Class R-6 | | | 2,039,408 | | | | 72,685 | |
| International Growth and Income Fund, Class R-6 | | | 1,820,067 | | | | 51,945 | |
| | | | | | | | 278,617 | |
| |
| Equity-income and Balanced funds 8% | | | | | | | | |
| American Funds Global Balanced Fund, Class R-6 | | | 1,298,944 | | | | 40,995 | |
| |
| Fixed income funds 19% | | | | | | | | |
| U.S. Government Securities Fund, Class R-6 | | | 4,401,886 | | | | 65,588 | |
| Capital World Bond Fund, Class R-6 | | | 1,209,573 | | | | 24,155 | |
| | | | | | | | 89,743 | |
| | | | | | | | | |
| Total investment securities 100%(cost: $508,120,000) | | | | | | | 487,415 | |
| Other assets less liabilities 0% | | | | | | | (134 | ) |
| | | | | | | | | |
| Net assets 100% | | | | | | $ | 487,281 | |
See notes to financial statements.
| American Funds College Target Date Series | 3 |
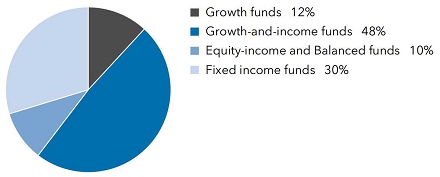
| American Funds College 2033 Fund | unaudited |
| Investment portfolio April 30, 2020 | |
| | | | | | | | Value | |
| Growth funds 12% | | | Shares | | | | (000) | |
| The Growth Fund of America, Class R-6 | | | 2,787,720 | | | $ | 138,466 | |
| EuroPacific Growth Fund, Class R-6 | | | 311,347 | | | | 14,627 | |
| | | | | | | | 153,093 | |
| |
| Growth-and-income funds 48% | | | | | | | | |
| The Investment Company of America, Class R-6 | | | 5,708,614 | | | | 203,455 | |
| Capital World Growth and Income Fund, Class R-6 | | | 3,250,045 | | | | 147,455 | |
| International Growth and Income Fund, Class R-6 | | | 4,499,663 | | | | 128,420 | |
| Washington Mutual Investors Fund, Class R-6 | | | 2,486,979 | | | | 104,354 | |
| Fundamental Investors, Class R-6 | | | 832,340 | | | | 45,462 | |
| | | | | | | | 629,146 | |
| |
| Equity-income and Balanced funds 10% | | | | | | | | |
| American Funds Global Balanced Fund, Class R-6 | | | 4,065,107 | | | | 128,295 | |
| |
| Fixed income funds 30% | | | | | | | | |
| U.S. Government Securities Fund, Class R-6 | | | 12,355,865 | | | | 184,102 | |
| The Bond Fund of America, Class R-6 | | | 11,238,679 | | | | 154,757 | |
| Capital World Bond Fund, Class R-6 | | | 3,021,922 | | | | 60,348 | |
| | | | | | | | 399,207 | |
| | | | | | | | | |
| Total investment securities 100%(cost: $1,307,941,000) | | | | | | | 1,309,741 | |
| Other assets less liabilities 0% | | | | | | | (345 | ) |
| | | | | | | | | |
| Net assets 100% | | | | | | $ | 1,309,396 | |
See notes to financial statements.
| 4 | American Funds College Target Date Series |
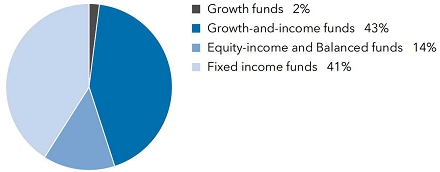
| American Funds College 2030 Fund | unaudited |
| Investment portfolio April 30, 2020 | |
| | | | | | Value | |
| Growth funds 2% | | Shares | | | (000) | |
| The Growth Fund of America, Class R-6 | | | 1,001,637 | | | $ | 49,751 | |
| |
| Growth-and-income funds 43% | | | | | | | | |
| Washington Mutual Investors Fund, Class R-6 | | | 7,139,376 | | | | 299,568 | |
| American Mutual Fund, Class R-6 | | | 6,372,253 | | | | 245,969 | |
| International Growth and Income Fund, Class R-6 | | | 7,217,608 | | | | 205,991 | |
| The Investment Company of America, Class R-6 | | | 2,060,653 | | | | 73,442 | |
| Capital World Growth and Income Fund, Class R-6 | | | 1,053,877 | | | | 47,814 | |
| | | | | | | | 872,784 | |
| |
| Equity-income and Balanced funds 14% | | | | | | | | |
| American Funds Global Balanced Fund, Class R-6 | | | 9,136,743 | | | | 288,356 | |
| |
| Fixed income funds 41% | | | | | | | | |
| The Bond Fund of America, Class R-6 | | | 33,270,722 | | | | 458,137 | |
| U.S. Government Securities Fund, Class R-6 | | | 14,393,233 | | | | 214,459 | |
| American Funds Mortgage Fund, Class R-6 | | | 14,401,114 | | | | 151,500 | |
| Capital World Bond Fund, Class R-6 | | | 1,085,787 | | | | 21,683 | |
| | | | | | | | 845,779 | |
| | | | | | | | | |
| Total investment securities 100%(cost: $2,050,303,000) | | | | | | | 2,056,670 | |
| Other assets less liabilities 0% | | | | | | | (625 | ) |
| | | | | | | | | |
| Net assets 100% | | | | | | $ | 2,056,045 | |
See notes to financial statements.
| American Funds College Target Date Series | 5 |
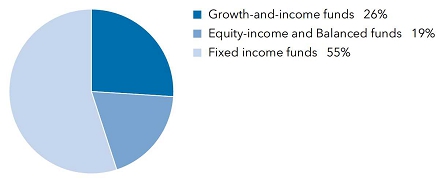
| American Funds College 2027 Fund | unaudited |
| Investment portfolio April 30, 2020 | |
| | | | | | Value | |
| Growth-and-income funds 26% | | Shares | | | (000) | |
| American Mutual Fund, Class R-6 | | | 9,563,777 | | | $ | 369,162 | |
| Washington Mutual Investors Fund, Class R-6 | | | 1,592,857 | | | | 66,836 | |
| International Growth and Income Fund, Class R-6 | | | 1,501,632 | | | | 42,857 | |
| | | | | | | | 478,855 | |
| |
| Equity-income and Balanced funds 19% | | | | | | | | |
| The Income Fund of America, Class R-6 | | | 14,333,170 | | | | 294,833 | |
| American Funds Global Balanced Fund, Class R-6 | | | 2,037,932 | | | | 64,317 | |
| | | | | | | | 359,150 | |
| |
| Fixed income funds 55% | | | | | | | | |
| The Bond Fund of America, Class R-6 | | | 32,936,725 | | | | 453,539 | |
| American Funds Mortgage Fund, Class R-6 | | | 30,759,832 | | | | 323,593 | |
| Intermediate Bond Fund of America, Class R-6 | | | 15,436,742 | | | | 215,960 | |
| U.S. Government Securities Fund, Class R-6 | | | 2,688,993 | | | | 40,066 | |
| | | | | | | | 1,033,158 | |
| | | | | | | | | |
| Total investment securities 100%(cost: $1,857,519,000) | | | | | | | 1,871,163 | |
| Other assets less liabilities 0% | | | | | | | (597 | ) |
| | | | | | | | | |
| Net assets 100% | | | | | | $ | 1,870,566 | |
See notes to financial statements.
| 6 | American Funds College Target Date Series |
| American Funds College 2024 Fund | unaudited |
| Investment portfolio April 30, 2020 | |
| | | | | | Value | |
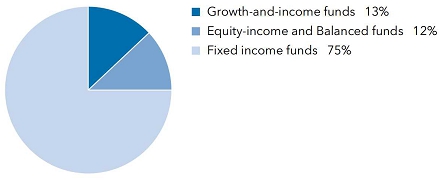
| Growth-and-income funds 13% | | Shares | | | (000) | |
| American Mutual Fund, Class R-6 | | | 7,705,588 | | | $ | 297,436 | |
| |
| Equity-income and Balanced funds 12% | | | | | | | | |
| The Income Fund of America, Class R-6 | | | 14,095,458 | | | | 289,944 | |
| |
| Fixed income funds 75% | | | | | | | | |
| Intermediate Bond Fund of America, Class R-6 | | | 51,609,942 | | | | 722,023 | |
| American Funds Mortgage Fund, Class R-6 | | | 52,250,290 | | | | 549,673 | |
| The Bond Fund of America, Class R-6 | | | 35,285,070 | | | | 485,875 | |
| | | | | | | | 1,757,571 | |
| | | | | | | | | |
| Total investment securities 100%(cost: $2,275,063,000) | | | | | | | 2,344,951 | |
| Other assets less liabilities 0% | | | | | | | (784 | ) |
| | | | | | | | | |
| Net assets 100% | | | | | | $ | 2,344,167 | |
Investments in affiliates
This holding is an affiliate of the fund under the Investment Company Act of 1940 since the fund holds 5% or more of the underlying fund’s outstanding voting shares. Further details on this holding and related transactions during the six months ended April 30, 2020, appear below.
| | | | | | | | | | | | | | | Net | | | Net | | | | | | Value of | |
| | | | | | | | | | | | | | | realized | | | unrealized | | | Dividend | | | affiliate at | |
| | | Beginning | | | | | | | | | Ending | | | gain | | | appreciation | | | income | | | 4/30/2020 | |
| | | shares | | | Additions | | | Reductions | | | shares | | | (000) | | | (000) | | | (000) | | | (000) | |
| Fixed income funds 23% |
| American Funds Mortgage Fund, Class R-6 | | | 45,835,857 | | | | 6,618,654 | | | | 204,221 | | | | 52,250,290 | | | $ | 140 | | | $ | 17,748 | | | $ | 5,571 | | | $ | 549,673 | |
See notes to financial statements.
| American Funds College Target Date Series | 7 |
| American Funds College 2021 Fund | unaudited |
| Investment portfolio April 30, 2020 | |
| | | | | | Value | |
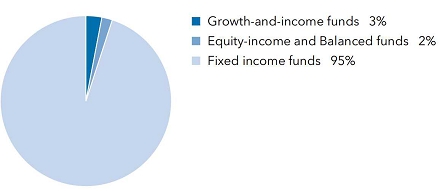
| Growth-and-income funds 3% | | Shares | | | (000) | |
| American Mutual Fund, Class R-6 | | | 1,356,979 | | | $ | 52,380 | |
| |
| Equity-income and Balanced funds 2% | | | | | | | | |
| The Income Fund of America, Class R-6 | | | 2,531,565 | | | | 52,074 | |
| |
| Fixed income funds 95% | | | | | | | | |
| Intermediate Bond Fund of America, Class R-6 | | | 54,885,096 | | | | 767,842 | |
| American Funds Mortgage Fund, Class R-6 | | | 59,790,525 | | | | 628,996 | |
| Short-Term Bond Fund of America, Class R-6 | | | 59,552,349 | | | | 602,670 | |
| The Bond Fund of America, Class R-6 | | | 7,246,814 | | | | 99,789 | |
| | | | | | | | 2,099,297 | |
| | | | | | | | | |
| Total investment securities 100%(cost: $2,145,238,000) | | | | | | | 2,203,751 | |
| Other assets less liabilities 0% | | | | | | | (789 | ) |
| | | | | | | | | |
| Net assets 100% | | | | | | $ | 2,202,962 | |
Investments in affiliates
These holdings are affiliates of the fund under the Investment Company Act of 1940 since the fund holds 5% or more of each underlying fund’s outstanding voting shares. Further details on these holdings and related transactions during the six months ended April 30, 2020, appear below.
| | | | | | | | | | | | | | | Net | | | Net | | | | | | Value of | |
| | | | | | | | | | | | | | | realized | | | unrealized | | | Dividend | | | affiliates at | |
| | | Beginning | | | | | | | | | Ending | | | gain | | | appreciation | | | income | | | 4/30/2020 | |
| | | shares | | | Additions | | | Reductions | | | shares | | | (000) | | | (000) | | | (000) | | | (000) | |
| Fixed income funds 56% |
| American Funds Mortgage Fund, Class R-6 | | | 55,345,802 | | | | 4,444,723 | | | | — | | | | 59,790,525 | | | $ | — | | | $ | 19,684 | | | $ | 6,356 | | | $ | 628,996 | |
| Short-Term Bond Fund of America, Class R-6 | | | 46,554,477 | | | | 12,997,872 | | | | — | | | | 59,552,349 | | | | — | | | | 8,706 | | | | 5,603 | | | | 602,670 | |
| Total 56% | | | | | | | | | | | | | | | | | | $ | — | | | $ | 28,390 | | | $ | 11,959 | | | $ | 1,231,666 | |
See notes to financial statements.
| 8 | American Funds College Target Date Series |
| American Funds College Enrollment Fund | unaudited |
| Investment portfolio April 30, 2020 | |

| | | | | | Value | |
| Fixed income funds 100% | | Shares | | | (000) | |
| Intermediate Bond Fund of America, Class R-6 | | | 27,677,320 | | | $ | 387,206 | |
| Short-Term Bond Fund of America, Class R-6 | | | 38,155,270 | | | | 386,131 | |
| American Funds Mortgage Fund, Class R-6 | | | 31,452,445 | | | | 330,880 | |
| | | | | | | | 1,104,217 | |
| |
| Total investment securities 100%(cost: $1,080,807,000) | | | | | | | 1,104,217 | |
| Other assets less liabilities 0% | | | | | | | (488 | ) |
| | | | | | | | | |
| Net assets 100% | | | | | | $ | 1,103,729 | |
Investments in affiliates
These holdings are affiliates of the fund under the Investment Company Act of 1940 since the fund holds 5% or more of each underlying fund’s outstanding voting shares. Further details on these holdings and related transactions during the six months ended April 30, 2020, appear below.
| | | | | | | | | | | | | | | Net | | | Net | | | | | | Value of | |
| | | | | | | | | | | | | | | realized | | | unrealized | | | Dividend | | | affiliates at | |
| | | Beginning | | | | | | | | | Ending | | | (loss) gain | | | appreciation | | | income | | | 4/30/2020 | |
| | | shares | | | Additions | | | Reductions | | | shares | | | (000) | | | (000) | | | (000) | | | (000) | |
| Fixed income funds 0% |
| Short-Term Bond Fund of America, Class R-6* | | | 40,121,563 | | | | 1,464,196 | | | | 3,430,489 | | | | 38,155,270 | | | $ | (3 | ) | | $ | 5,928 | | | $ | 4,069 | | | $ | — | |
| American Funds Mortgage Fund, Class R-6* | | | 33,680,235 | | | | 1,005,449 | | | | 3,233,239 | | | | 31,452,445 | | | | 74 | | | | 10,485 | | | | 3,567 | | | | — | |
| Total 0% | | | | | | | | | | | | | | | | | | $ | 71 | | | $ | 16,413 | | | $ | 7,636 | | | $ | — | |
| * | Unaffiliated issuer at 4/30/2020. |
See notes to financial statements.
| American Funds College Target Date Series | 9 |
Financial statements
Statements of assets and liabilities
at April 30, 2020
| | | | | College 2036 Fund | | | College 2033 Fund | |
| | | | | | | | | | | |
| Assets: | | | | | | | | | | |
| Investment securities, at value: | | | | | | | | |
| Unaffiliated issuers | | $ | 487,415 | | | $ | 1,309,741 | |
| Affiliated issuers | | | — | | | | — | |
| Receivables for: | | | | | | | | |
| Sales of fund’s shares | | | 774 | | | | 888 | |
| Dividends | | | | | 130 | | | | 813 | |
| Total assets | | | | | 488,319 | | | | 1,311,442 | |
| | | | | | | | | | | |
| Liabilities: | | | | | | | | | | |
| Payables for: | | | | | | | | | | |
| Purchases of investments | | | 852 | | | | 1,340 | |
| Repurchases of fund’s shares | | | 51 | | | | 361 | |
| Services provided by related parties | | | 111 | | | | 278 | |
| Trustees’ deferred compensation | | | — | * | | | 3 | |
| Other | | | | | 24 | | | | 64 | |
| Total liabilities | | | | | 1,038 | | | | 2,046 | |
| Net assets at April 30, 2020 | | $ | 487,281 | | | $ | 1,309,396 | |
| | | | | | | | | | | |
| Net assets consist of: | | | | | | | | |
| Capital paid in on shares of beneficial interest | | $ | 496,492 | | | $ | 1,276,304 | |
| Total (accumulated loss) distributable earnings | | | (9,211 | ) | | | 33,092 | |
| Net assets at April 30, 2020 | | $ | 487,281 | | | $ | 1,309,396 | |
| | | | | | | | | | | |
| Investment securities, at cost: | | | | | | | | |
| Unaffiliated issuers | | $ | 508,120 | | | $ | 1,307,941 | |
| Affiliated issuers | | | — | | | | — | |
| | | | | | | | | | | |
Shares of beneficial interest issued and outstanding
(no stated par value) — unlimited shares authorized | | | | | | | | |
| | | | | | | | | | | |
| Class 529-A: | | Net assets | | $ | 402,991 | | | $ | 1,067,240 | |
| | | Shares outstanding | | | 39,946 | | | | 93,559 | |
| | | Net asset value per share | | $ | 10.09 | | | $ | 11.41 | |
| Class 529-C: | | Net assets | | $ | 26,640 | | | $ | 101,239 | |
| | | Shares outstanding | | | 2,660 | | | | 8,968 | |
| | | Net asset value per share | | $ | 10.01 | | | $ | 11.29 | |
| Class 529-E: | | Net assets | | $ | 11,708 | | | $ | 35,305 | |
| | | Shares outstanding | | | 1,162 | | | | 3,109 | |
| | | Net asset value per share | | $ | 10.08 | | | $ | 11.36 | |
| Class 529-T: | | Net assets | | $ | 11 | | | $ | 12 | |
| | | Shares outstanding | | | 1 | | | | 1 | |
| | | Net asset value per share | | $ | 10.14 | | | $ | 11.43 | |
| Class 529-F-1: | | Net assets | | $ | 45,931 | | | $ | 105,600 | |
| | | Shares outstanding | | | 4,538 | | | | 9,220 | |
| | | Net asset value per share | | $ | 10.12 | | | $ | 11.45 | |
| | |
| * | Amount less than one thousand. |
See notes to financial statements.
| 10 | American Funds College Target Date Series |
unaudited
(dollars and shares in thousands, except per-share amounts)
| College 2030 Fund | | | College 2027 Fund | | | College 2024 Fund | | | College 2021 Fund | | | College Enrollment Fund | |
| | | | | | | | | | | | | | | | | | | |
| $ | 2,056,670 | | | $ | 1,871,163 | | | $ | 1,795,278 | | | $ | 972,085 | | | $ | 1,104,217 | |
| | — | | | | — | | | | 549,673 | | | | 1,231,666 | | | | — | |
| | 1,988 | | | | 1,047 | | | | 1,400 | | | | 1,895 | | | | 483 | |
| | 2,016 | | | | 2,343 | | | | 3,684 | | | | 4,245 | | | | 2,224 | |
| | 2,060,674 | | | | 1,874,553 | | | | 2,350,035 | | | | 2,209,891 | | | | 1,106,924 | |
| | | | | | | | | | | | | | | | | | | |
| | 3,234 | | | | 3,179 | | | | 4,625 | | | | 5,738 | | | | 2,329 | |
| | 769 | | | | 211 | | | | 452 | | | | 388 | | | | 378 | |
| | 517 | | | | 498 | | | | 666 | | | | 683 | | | | 425 | |
| | 6 | | | | 5 | | | | 6 | | | | 7 | | | | 6 | |
| | 103 | | | | 94 | | | | 119 | | | | 113 | | | | 57 | |
| | 4,629 | | | | 3,987 | | | | 5,868 | | | | 6,929 | | | | 3,195 | |
| $ | 2,056,045 | | | $ | 1,870,566 | | | $ | 2,344,167 | | | $ | 2,202,962 | | | $ | 1,103,729 | |
| | | | | | | | | | | | | | | | | | | |
| $ | 1,991,065 | | | $ | 1,807,004 | | | $ | 2,235,776 | | | $ | 2,123,411 | | | $ | 1,074,001 | |
| | 64,980 | | | | 63,562 | | | | 108,391 | | | | 79,551 | | | | 29,728 | |
| $ | 2,056,045 | | | $ | 1,870,566 | | | $ | 2,344,167 | | | $ | 2,202,962 | | | $ | 1,103,729 | |
| | | | | | | | | | | | | | | | | | | |
| $ | 2,050,303 | | | $ | 1,857,519 | | | $ | 1,747,857 | | | $ | 948,972 | | | $ | 1,080,807 | |
| | — | | | | — | | | | 527,206 | | | | 1,196,266 | | | | — | |
| | | | | | | | | | | | | | | | | | | |
| $ | 1,607,868 | | | $ | 1,428,179 | | | $ | 1,713,347 | | | $ | 1,535,442 | | | $ | 754,617 | |
| | 121,566 | | | | 113,086 | | | | 140,120 | | | | 133,294 | | | | 73,529 | |
| $ | 13.23 | | | $ | 12.63 | | | $ | 12.23 | | | $ | 11.52 | | | $ | 10.26 | |
| $ | 226,065 | | | $ | 216,747 | | | $ | 339,591 | | | $ | 374,703 | | | $ | 186,671 | |
| | 17,357 | | | | 17,398 | | | | 28,155 | | | | 32,919 | | | | 18,221 | |
| $ | 13.02 | | | $ | 12.46 | | | $ | 12.06 | | | $ | 11.38 | | | $ | 10.25 | |
| $ | 57,188 | | | $ | 52,216 | | | $ | 78,219 | | | $ | 84,231 | | | $ | 39,757 | |
| | 4,352 | | | | 4,165 | | | | 6,426 | | | | 7,347 | | | | 3,883 | |
| $ | 13.14 | | | $ | 12.54 | | | $ | 12.17 | | | $ | 11.46 | | | $ | 10.24 | |
| $ | 12 | | | $ | 12 | | | $ | 12 | | | $ | 11 | | | $ | 11 | |
| | 1 | | | | 1 | | | | 1 | | | | 1 | | | | 1 | |
| $ | 13.24 | | | $ | 12.65 | | | $ | 12.24 | | | $ | 11.53 | | | $ | 10.26 | |
| $ | 164,912 | | | $ | 173,412 | | | $ | 212,998 | | | $ | 208,575 | | | $ | 122,673 | |
| | 12,418 | | | | 13,667 | | | | 17,352 | | | | 18,052 | | | | 11,921 | |
| $ | 13.28 | | | $ | 12.69 | | | $ | 12.27 | | | $ | 11.55 | | | $ | 10.29 | |
| | |
| American Funds College Target Date Series | 11 |
Statements of operations
for the six months ended April 30, 2020
| | | | College 2036 Fund | | | | College 2033 Fund | |
| | | | | | | | | |
| Investment income: | | | | | | | | |
| Income: | | | | | | | | |
| Dividends: | | | | | | | | |
| Unaffiliated issuers | | $ | 4,631 | | | $ | 14,282 | |
| Affiliated issuers | | | — | | | | — | |
| | | | 4,631 | | | | 14,282 | |
| | | | | | | | | |
| Fees and expenses*: | | | | | | | | |
| Distribution services | | | 655 | | | | 1,810 | |
| Transfer agent services | | | 210 | | | | 656 | |
| 529 plan services | | | 130 | | | | 393 | |
| Reports to shareholders | | | 9 | | | | 28 | |
| Registration statement and prospectus | | | 46 | | | | 48 | |
| Trustees’ compensation | | | 1 | | | | 2 | |
| Auditing and legal | | | 8 | | | | 8 | |
| Custodian | | | 3 | | | | 3 | |
| Other | | | 1 | | | | 3 | |
| Total fees and expenses | | | 1,063 | | | | 2,951 | |
| Net investment income | | | 3,568 | | | | 11,331 | |
| | | | | | | | | |
| Net realized gain and unrealized (depreciation) appreciation: | | | | | | | | |
| Net realized gain (loss) on sale of investments: | | | | | | | | |
| Unaffiliated issuers | | | 1,142 | | | | 1,845 | |
| Affiliated issuers | | | — | | | | — | |
| Capital gain distributions received | | | 9,306 | | | | 26,419 | |
| | | | 10,448 | | | | 28,264 | |
| | | | | | | | | |
| Net unrealized (depreciation) appreciation on investments: | | | | | | | | |
| Unaffiliated issuers | | | (30,383 | ) | | | (51,970 | ) |
| Affiliated issuers | | | — | | | | — | |
| | | | (30,383 | ) | | | (51,970 | ) |
| Net realized gain and unrealized (depreciation) appreciation | | | (19,935 | ) | | | (23,706 | ) |
| | | | | | | | | |
| Net (decrease) increase in net assets resulting from operations | | $ | (16,367 | ) | | $ | (12,375 | ) |
| | |
| * | Additional information related to class-specific fees and expenses is included in the notes to financial statements. |
See notes to financial statements.
| 12 | American Funds College Target Date Series |
unaudited
(dollars in thousands)
| College 2030 Fund | | | College 2027 Fund | | | College 2024 Fund | | | College 2021 Fund | | | College Enrollment Fund | |
| | | | | | | | | | | | | | | | | | | |
| $ | 23,567 | | | $ | 23,321 | | | $ | 23,185 | | | $ | 11,992 | | | $ | 11,637 | |
| | — | | | | — | | | | 5,571 | | | | 11,959 | | | | — | |
| | 23,567 | | | | 23,321 | | | | 28,756 | | | | 23,951 | | | | 11,637 | |
| | | | | | | | | | | | | | | | | | | |
| | 3,128 | | | | 2,851 | | | | 3,755 | | | | 3,746 | | | | 1,911 | |
| | 1,044 | | | | 941 | | | | 1,150 | | | | 1,087 | | | | 572 | |
| | 626 | | | | 566 | | | | 698 | | | | 661 | | | | 342 | |
| | 45 | | | | 40 | | | | 49 | | | | 46 | | | | 25 | |
| | 59 | | | | 55 | | | | 65 | | | | 49 | | | | 9 | |
| | 2 | | | | 2 | | | | 3 | | | | 2 | | | | 2 | |
| | 9 | | | | 9 | | | | 9 | | | | 9 | | | | 8 | |
| | 3 | | | | 3 | | | | 3 | | | | 3 | | | | 3 | |
| | 5 | | | | 4 | | | | 5 | | | | 5 | | | | 2 | |
| | 4,921 | | | | 4,471 | | | | 5,737 | | | | 5,608 | | | | 2,874 | |
| | 18,646 | | | | 18,850 | | | | 23,019 | | | | 18,343 | | | | 8,763 | |
| | | | | | | | | | | | | | | | | | | |
| | 20,359 | | | | 17,479 | | | | 77 | | | | (2,885 | ) | | | 180 | |
| | — | | | | — | | | | 140 | | | | — | | | | — | |
| | 33,009 | | | | 26,603 | | | | 31,132 | | | | 17,286 | | | | 6,325 | |
| | 53,368 | | | | 44,082 | | | | 31,349 | | | | 14,401 | | | | 6,505 | |
| | | | | | | | | | | | | | | | | | | |
| | (79,545 | ) | | | (55,995 | ) | | | (29,222 | ) | | | 8,380 | | | | 26,915 | |
| | — | | | | — | | | | 17,748 | | | | 28,390 | | | | — | |
| | (79,545 | ) | | | (55,995 | ) | | | (11,474 | ) | | | 36,770 | | | | 26,915 | |
| | (26,177 | ) | | | (11,913 | ) | | | 19,875 | | | | 51,171 | | | | 33,420 | |
| $ | (7,531 | ) | | $ | 6,937 | | | $ | 42,894 | | | $ | 69,514 | | | $ | 42,183 | |
| | |
| American Funds College Target Date Series | 13 |
Statements of changes in net assets
| | | College 2036 Fund | | | College 2033 Fund | |
| | | | | | | |
| | | Six months
ended
April 30,
2020* | | | Year ended
October 31,
2019 | | | Six months
ended
April 30,
2020* | | | Year ended
October 31,
2019 | |
| Operations: | | | | | | | | | | | | | | | | |
| Net investment income | | $ | 3,568 | | | $ | 3,112 | | | $ | 11,331 | | | $ | 17,043 | |
| Net realized gain (loss) | | | 10,448 | | | | 5,330 | | | | 28,264 | | | | 36,846 | |
| Net unrealized (depreciation) appreciation | | | (30,383 | ) | | | 15,156 | | | | (51,970 | ) | | | 50,342 | |
| Net (decrease) increase in net assets resulting from operations | | | (16,367 | ) | | | 23,598 | | | | (12,375 | ) | | | 104,231 | |
| | | | | | | | | | | | | | | | | |
| Distributions paid to shareholders | | | (10,189 | ) | | | (1,349 | ) | | | (57,191 | ) | | | (34,348 | ) |
| | | | | | | | | | | | | | | | | |
| Net capital share transactions | | | 180,780 | | | | 222,307 | | | | 210,203 | | | | 288,600 | |
| | | | | | | | | | | | | | | | | |
| Total increase (decrease) in net assets | | | 154,224 | | | | 244,556 | | | | 140,637 | | | | 358,483 | |
| | | | | | | | | | | | | | | | | |
| Net assets: | | | | | | | | | | | | | | | | |
| Beginning of period | | | 333,057 | | | | 88,501 | | | | 1,168,759 | | | | 810,276 | |
| End of period | | $ | 487,281 | | | $ | 333,057 | | | $ | 1,309,396 | | | $ | 1,168,759 | |
See notes to financial statements.
| 14 | American Funds College Target Date Series |
(dollars in thousands)
| College 2030 Fund | | | College 2027 Fund | | | College 2024 Fund | | | College 2021 Fund | | | College Enrollment Fund | |
| | | | | | | | | | | | | | |
Six months
ended
April 30,
2020* | | | Year ended
October 31,
2019 | | | Six months
ended
April 30,
2020* | | | Year ended
October 31,
2019 | | | Six months
ended
April 30,
2020* | | | Year ended
October 31,
2019 | | | Six months
ended
April 30,
2020* | | | Year ended
October 31,
2019 | | | Six months
ended
April 30,
2020* | | | Year ended
October 31,
2019 | |
| | | | | | | | | | | | | | | | | | | | | | | | | | | | | |
| $ | 18,646 | | | $ | 31,564 | | | $ | 18,850 | | | $ | 31,093 | | | $ | 23,019 | | | $ | 39,285 | | | $ | 18,343 | | | $ | 36,122 | | | $ | 8,763 | | | $ | 21,171 | |
| | 53,368 | | | | 49,315 | | | | 44,082 | | | | 30,370 | | | | 31,349 | | | | 21,615 | | | | 14,401 | | | | 16,275 | | | | 6,505 | | | | (1,292 | ) |
| | (79,545 | ) | | | 91,409 | | | | (55,995 | ) | | | 83,091 | | | | (11,474 | ) | | | 92,509 | | | | 36,770 | | | | 70,438 | | | | 26,915 | | | | 43,069 | |
| | (7,531 | ) | | | 172,288 | | | | 6,937 | | | | 144,554 | | | | 42,894 | | | | 153,409 | | | | 69,514 | | | | 122,835 | | | | 42,183 | | | | 62,948 | |
| | | | | | | | | | | | | | | | | | | | | | | | | | | | | | | | | | | | | | | |
| | (86,891 | ) | | | (88,393 | ) | | | (68,341 | ) | | | (59,378 | ) | | | (69,056 | ) | | | (54,751 | ) | | | (57,822 | ) | | | (39,681 | ) | | | (23,087 | ) | | | (15,488 | ) |
| | 249,951 | | | | 354,880 | | | | 218,497 | | | | 335,389 | | | | 260,710 | | | | 410,445 | | | | 147,975 | | | | 293,568 | | | | (57,018 | ) | | | (152,446 | ) |
| | | | | | | | | | | | | | | | | | | | | | | | | | | | | | | | | | | | | | | |
| | 155,529 | | | | 438,775 | | | | 157,093 | | | | 420,565 | | | | 234,548 | | | | 509,103 | | | | 159,667 | | | | 376,722 | | | | (37,922 | ) | | | (104,986 | ) |
| | | | | | | | | | | | | | | | | | | | | | | | | | | | | | | | | | | | | | | |
| | 1,900,516 | | | | 1,461,741 | | | | 1,713,473 | | | | 1,292,908 | | | | 2,109,619 | | | | 1,600,516 | | | | 2,043,295 | | | | 1,666,573 | | | | 1,141,651 | | | | 1,246,637 | |
| $ | 2,056,045 | | | $ | 1,900,516 | | | $ | 1,870,566 | | | $ | 1,713,473 | | | $ | 2,344,167 | | | $ | 2,109,619 | | | $ | 2,202,962 | | | $ | 2,043,295 | | | $ | 1,103,729 | | | $ | 1,141,651 | |
| | |
| American Funds College Target Date Series | 15 |
| Notes to financial statements | unaudited |
1. Organization
American Funds College Target Date Series (the “series”) is registered under the Investment Company Act of 1940 as an open-end, diversified management investment company. The series consists of seven funds (the “funds”) — American Funds College 2036 Fund (“College 2036 Fund”), American Funds College 2033 Fund (“College 2033 Fund”), American Funds College 2030 Fund (“College 2030 Fund”), American Funds College 2027 Fund (“College 2027 Fund”), American Funds College 2024 Fund (“College 2024 Fund”), American Funds College 2021 Fund (“College 2021 Fund”) and American Funds College Enrollment Fund (“College Enrollment Fund”). The assets of each fund are segregated, with each fund accounted for separately.
Each fund in the series is designed for investors who plan to attend college in, or close to, the year designated in the fund’s name. Depending on its proximity to its target date, each fund will seek to achieve the following objectives to varying degrees: growth, income and preservation of capital. As each fund approaches its target date, it will increasingly emphasize income and preservation of capital by investing a greater portion of its assets in fixed income, equity-income and balanced funds. When each fund reaches its target date, it will primarily invest in fixed income funds and may merge into the College Enrollment Fund, which principally invests in fixed income funds. Each fund will attempt to achieve its investment objectives by investing in a mix of American Funds (the “underlying funds”) in different combinations and weightings. Capital Research and Management Company (“CRMC”), the series’ investment adviser, is also the investment adviser of the underlying funds.
Each fund in the series has five 529 college savings plan share classes (Classes 529-A, 529-C, 529-E, 529-T and 529-F-1). The funds’ share classes are described further in the following table:
| Share class | | Initial sales charge | | Contingent deferred sales
charge upon redemption | | Conversion feature |
| Class 529-A | | Up to 2.50% for College Enrollment Fund; up to 4.25% for all other funds | | None (except 1% for certain redemptions within 18 months of purchase without an initial sales charge) | | None |
| Class 529-C | | None | | 1% for redemptions within one year of purchase | | Class 529-C converts to Class 529-A after 10 years |
| Class 529-E | | None | | None | | None |
| Class 529-T* | | Up to 2.50% | | None | | None |
| Class 529-F-1 | | None | | None | | None |
| * | Class 529-T shares are not available for purchase. |
Holders of all share classes of each fund have equal pro rata rights to the assets, dividends and liquidation proceeds of each fund held. Each share class of each fund has identical voting rights, except for the exclusive right to vote on matters affecting only its class. Share classes have different fees and expenses (“class-specific fees and expenses”), primarily due to different arrangements for distribution and transfer agent services. Differences in class-specific fees and expenses will result in differences in net investment income and, therefore, the payment of different per-share dividends by each share class of each fund.
2. Significant accounting policies
Each fund in the series is an investment company that applies the accounting and reporting guidance issued in Topic 946 by the U.S. Financial Accounting Standards Board. Each fund’s financial statements have been prepared to comply with U.S. generally accepted accounting principles (“U.S. GAAP”). These principles require the series’ investment adviser to make estimates and assumptions that affect reported amounts and disclosures. Actual results could differ from those estimates. Subsequent events, if any, have been evaluated through the date of issuance in the preparation of the financial statements. The funds follow the significant accounting policies in this section, as well as the valuation policies described in the next section on valuation.
Security transactions and related investment income — Security transactions are recorded by the funds as of the date the trades are executed. Realized gains and losses from security transactions are determined based on the specific identified cost of the securities. Dividend income is recognized on the ex-dividend date.
Fees and expenses — The fees and expenses of the underlying funds are not included in the fees and expenses reported for each of the funds; however, they are indirectly reflected in the valuation of each of the underlying funds. These fees are included in the net effective expense ratios that are provided as supplementary information in the financial highlights tables.
| 16 | American Funds College Target Date Series |
Class allocations — Income, fees and expenses (other than class-specific fees and expenses), realized gains and losses and unrealized appreciation and depreciation are allocated daily among the various share classes of each fund based on their relative net assets. Class-specific fees and expenses, such as distribution and transfer agent services, are charged directly to the respective share class of each fund.
Distributions paid to shareholders — Income dividends and capital gain distributions are recorded on each fund’s ex-dividend date.
3. Valuation
Security valuation — The net asset value of each share class of each fund is calculated based on the reported net asset values of the underlying funds in which each fund invests. The net asset value of each underlying fund is calculated based on the policies and procedures of the underlying fund contained in each underlying fund’s statement of additional information. Generally, the funds and the underlying funds determine the net asset value of each share class as of approximately 4:00 p.m. New York time each day the New York Stock Exchange is open.
Processes and structure — The series’ board of trustees has delegated authority to the series’ investment adviser to make fair value determinations, subject to board oversight. The investment adviser has established a Joint Fair Valuation Committee (the “Fair Valuation Committee”) to administer, implement and oversee the fair valuation process, and to make fair value decisions. The Fair Valuation Committee regularly reviews its own fair value decisions, as well as decisions made under its standing instructions to the investment adviser’s valuation teams. The Fair Valuation Committee reviews changes in fair value measurements from period to period and may, as deemed appropriate, update the fair valuation guidelines to better reflect the results of back testing and address new or evolving issues. The Fair Valuation Committee reports any changes to the fair valuation guidelines to the board of trustees. The series’ board and audit committee also regularly review reports that describe fair value determinations and methods. Pricing decisions, processes and controls over security valuation are also subject to additional internal reviews, including an annual control self-evaluation program facilitated by the investment adviser’s compliance group.
Classifications — The series’ investment adviser classifies each fund’s assets and liabilities into three levels based on the method used to value the assets or liabilities. Level 1 values are based on quoted prices in active markets for identical securities. Level 2 values are based on significant observable market inputs, such as quoted prices for similar securities and quoted prices in inactive markets. Level 3 values are based on significant unobservable inputs that reflect the investment adviser’s determination of assumptions that market participants might reasonably use in valuing the securities. The valuation levels are not necessarily an indication of the risk or liquidity associated with the underlying investment. At April 30, 2020, all of the investment securities held by each fund were classified as Level 1.
4. Risk factors
Investing in the funds may involve certain risks including, but not limited to, those described below.
Allocation risk — Investments in each fund are subject to risks related to the investment adviser’s allocation choices. The selection of the underlying funds and the allocation of each fund’s assets could cause the funds to lose value or their results to lag relevant benchmarks or other funds with similar objectives.
Fund structure — Each fund invests in underlying funds and incurs expenses related to the underlying funds. In addition, investors in each fund will incur fees to pay for certain expenses related to the operations of the fund. An investor holding the underlying funds directly and in the same proportions as each fund would incur lower overall expenses but would not receive the benefit of the portfolio management and other services provided by each fund. Additionally, in accordance with an exemption under the Investment Company Act of 1940, as amended, the investment adviser considers only proprietary funds when selecting underlying investment options and allocations. This means that the funds’ investment adviser did not, nor does it expect to, consider any unaffiliated funds as underlying investment options for each fund. This strategy could raise certain conflicts of interest when choosing underlying investments for each fund, including the selection of funds that result in greater compensation to the adviser or funds with relatively lower historical investment results. The investment adviser has policies and procedures designed to mitigate material conflicts of interest that may arise in connection with its management of each fund.
Underlying fund risks — Because each fund’s investments consist of underlying funds, each fund’s risks are directly related to the risks of the underlying funds. For this reason, it is important to understand the risks associated with investing in the underlying funds, as described below.
| American Funds College Target Date Series | 17 |
Market conditions — The prices of, and the income generated by, the common stocks, bonds and other securities held by the underlying funds may decline — sometimes rapidly or unpredictably — due to various factors, including events or conditions affecting the general economy or particular industries; overall market changes; local, regional or global political, social or economic instability; governmental, governmental agency or central bank responses to economic conditions; and currency exchange rate, interest rate and commodity price fluctuations.
Issuer risks — The prices of, and the income generated by, securities held by the underlying funds may decline in response to various factors directly related to the issuers of such securities, including reduced demand for an issuer’s goods or services, poor management performance, major litigation related to the issuer, changes in government regulations affecting the issuer or its competitive environment and strategic initiatives such as mergers, acquisitions or dispositions and the market response to any such initiatives.
Investing in stocks — Investing in stocks may involve larger price swings and greater potential for loss than other types of investments. As a result, the value of the underlying funds may be subject to sharp, short-term declines in value. Income provided by an underlying fund may be reduced by changes in the dividend policies of, and the capital resources available at, the companies in which the underlying fund invests. These risks may be even greater in the case of smaller capitalization stocks. As the fund nears its target date, a decreasing proportion of the fund’s assets will be invested in underlying funds that invest primarily in stocks. Accordingly, these risks are expected to be more significant the further the fund is removed from its target date and are expected to lessen as the fund approaches its target date.
Investing outside the U.S. — Securities of issuers domiciled outside the U.S., or with significant operations or revenues outside the U.S., may lose value because of adverse political, social, economic or market developments (including social instability, regional conflicts, terrorism and war) in the countries or regions in which the issuers operate or generate revenue. These securities may also lose value due to changes in foreign currency exchange rates against the U.S. dollar and/or currencies of other countries. Issuers of these securities may be more susceptible to actions of foreign governments, such as nationalization, currency blockage or the imposition of price controls or punitive taxes, each of which could adversely impact the value of these securities. Securities markets in certain countries may be more volatile and/or less liquid than those in the U.S. Investments outside the U.S. may also be subject to different accounting practices and different regulatory, legal and reporting standards and practices, and may be more difficult to value, than those in the U.S. In addition, the value of investments outside the U.S. may be reduced by foreign taxes, including foreign withholding taxes on interest and dividends. Further, there may be increased risks of delayed settlement of securities purchased or sold by an underlying fund. The risks of investing outside the U.S. may be heightened in connection with investments in emerging markets.
Investing in debt instruments — The prices of, and the income generated by, bonds and other debt securities held by an underlying fund may be affected by changing interest rates and by changes in the effective maturities and credit ratings of these securities.
Rising interest rates will generally cause the prices of bonds and other debt securities to fall. A general rise in interest rates may cause investors to sell debt securities on a large scale, which could also adversely affect the price and liquidity of debt securities and could also result in increased redemptions from the fund. Falling interest rates may cause an issuer to redeem, call or refinance a debt security before its stated maturity, which may result in the fund failing to recoup the full amount of its initial investment and having to reinvest the proceeds in lower yielding securities. Longer maturity debt securities generally have greater sensitivity to changes in interest rates and may be subject to greater price fluctuations than shorter maturity debt securities.
Bonds and other debt securities are also subject to credit risk, which is the possibility that the credit strength of an issuer or guarantor will weaken or be perceived to be weaker, and/or an issuer of a debt security will fail to make timely payments of principal or interest and the security will go into default. A downgrade or default affecting any of the underlying funds’ securities could cause the value of the underlying funds’ shares to decrease. Credit risk is gauged, in part, by the credit ratings of the debt securities in which the underlying fund invests. However, ratings are only the opinions of the rating agencies issuing them and are not guarantees as to credit quality or an evaluation of market risk. The underlying funds’ investment adviser relies on its own credit analysts to research issuers and issues in seeking to assess credit and default risks. These risks will be more significant as the fund approaches its target date because a greater proportion of the fund’s assets will consist of underlying funds that primarily invest in bonds.
Investing in mortgage-related and other asset-backed securities — Mortgage-related securities, such as mortgage-backed securities, and other asset-backed securities, include debt obligations that represent interests in pools of mortgages or other income-bearing assets, such as consumer loans or receivables. Such securities often involve risks that are different from or more acute than the risks associated with investing in other types of debt securities. Mortgage-backed and other asset-backed securities are subject to changes in the payment patterns of borrowers of the underlying debt, potentially increasing the volatility of the securities and an
| 18 | American Funds College Target Date Series |
underlying fund’s net asset value. When interest rates fall, borrowers are more likely to refinance or prepay their debt before its stated maturity. This may result in an underlying fund having to reinvest the proceeds in lower yielding securities, effectively reducing the underlying fund’s income. Conversely, if interest rates rise and borrowers repay their debt more slowly than expected, the time in which the mortgage-backed and other asset-backed securities are paid off could be extended, reducing an underlying fund’s cash available for reinvestment in higher yielding securities. Mortgage-backed securities are also subject to the risk that underlying borrowers will be unable to meet their obligations and the value of property that secures the mortgages may decline in value and be insufficient, upon foreclosure, to repay the associated loans. Investments in asset-backed securities are subject to similar risks.
Investing in securities backed by the U.S. government— Securities backed by the U.S. Treasury or the full faith and credit of the U.S. government are guaranteed only as to the timely payment of interest and principal when held to maturity. Accordingly, the current market values for these securities will fluctuate with changes in interest rates and the credit rating of the U.S. government. Securities issued by government-sponsored entities and federal agencies and instrumentalities that are not backed by the full faith and credit of the U.S. government are neither issued nor guaranteed by the U.S. government.
Investing in derivatives — The use of derivatives involves a variety of risks, which may be different from, or greater than, the risks associated with investing in traditional securities, such as stocks and bonds. Changes in the value of a derivative may not correlate perfectly with, and may be more sensitive to market events than, the underlying asset, rate or index, and a derivative instrument may expose the underlying fund to losses in excess of its initial investment. Derivatives may be difficult to value, difficult for the underlying fund to buy or sell at an opportune time or price and difficult, or even impossible, to terminate or otherwise offset. The underlying fund’s use of derivatives may result in losses to the underlying fund, and investing in derivatives may reduce the underlying fund’s returns and increase the underlying fund’s price volatility. The underlying fund’s counterparty to a derivative transaction (including, if applicable, the underlying fund’s clearing broker, the derivatives exchange or the clearinghouse) may be unable or unwilling to honor its financial obligations in respect of the transaction. In certain cases, the underlying fund may be hindered or delayed in exercising remedies against or closing out derivative instruments with a counterparty, which may result in additional losses.
Management — The investment adviser to each fund and to the underlying funds actively manages each underlying fund’s investments. Consequently, the underlying funds are subject to the risk that the methods and analyses, including models, tools and data, employed by the investment adviser in this process may be flawed or incorrect and may not produce the desired results. This could cause an underlying fund to lose value or its investment results to lag relevant benchmarks or other funds with similar objectives.
5. Taxation and distributions
Federal income taxation — Each fund complies with the requirements under Subchapter M of the Internal Revenue Code applicable to mutual funds and intends to distribute substantially all of its net taxable income and net capital gains each year. The funds are not subject to income taxes to the extent such distributions are made. Therefore, no federal income tax provision is required.
As of and during the period ended April 30, 2020, none of the funds had a liability for any unrecognized tax benefits. Each fund recognizes interest and penalties, if any, related to unrecognized tax benefits as income tax expense in their respective statements of operations. During the period, none of the funds incurred any significant interest or penalties.
Each fund’s tax returns are not subject to examination by federal, state and, if applicable, non-U.S. tax authorities after the expiration of each jurisdiction’s statute of limitations, which is generally three years after the date of filing but can be extended in certain jurisdictions.
Distributions — Distributions paid to shareholders are based on each fund’s net investment income and net realized gains determined on a tax basis, which may differ from net investment income and net realized gains for financial reporting purposes. These differences are due primarily to different treatment for items such as short-term capital gains and losses; net capital losses; capital losses related to sales of certain securities within 30 days of purchase and deferred expenses. The fiscal year in which amounts are distributed may differ from the year in which the net investment income and net realized gains are recorded by the funds for financial reporting purposes.
Dividends from net investment income and distributions from short-term net realized gains shown in the funds’ statements of changes in net assets are considered ordinary income distributions for tax purposes. Distributions from long-term net realized gains in the funds’ statements of changes in net assets are considered long-term capital gain distributions for tax purposes.
| American Funds College Target Date Series | 19 |
Additional tax basis disclosures for each fund are as follows (dollars in thousands):
| | | College | | | College | | | College | | | College | | | College | | | College | | | College | |
| | | 2036 Fund | | | 2033 Fund | | | 2030 Fund | | | 2027 Fund | | | 2024 Fund | | | 2021 Fund | | | Enrollment Fund | |
| As of October 31, 2019 | | | | | | | | | | | | | | | | | | | | | | | | | | | | |
| Undistributed ordinary income | | $ | 2,337 | | | $ | 13,535 | | | $ | 28,859 | | | $ | 25,804 | | | $ | 31,595 | | | $ | 31,194 | | | $ | 17,824 | |
| Undistributed long-term capital gains | | | 5,330 | | | | 35,356 | | | | 44,637 | | | | 29,529 | | | | 21,602 | | | | 15,138 | | | | — | |
| Capital loss carryforward* | | | — | | | | — | | | | — | | | | — | | | | — | | | | — | | | | (3,475 | ) |
| As of April 30, 2020 | | | | | | | | | | | | | | | | | | | | | | | | | | | | |
| Gross unrealized appreciation on investments | | | 4,027 | | | | 31,455 | | | | 51,164 | | | | 53,065 | | | | 88,601 | | | | 67,843 | | | | 23,206 | |
| Gross unrealized depreciation on investments | | | (24,732 | ) | | | (29,655 | ) | | | (44,798 | ) | | | (39,421 | ) | | | (18,713 | ) | | | (9,539 | ) | | | — | |
| Net unrealized (depreciation) appreciation on investments | | | (20,705 | ) | | | 1,800 | | | | 6,366 | | | | 13,644 | | | | 69,888 | | | | 58,304 | | | | 23,206 | |
| Cost of investments | | | 508,120 | | | | 1,307,941 | | | | 2,050,304 | | | | 1,857,519 | | | | 2,275,063 | | | | 2,145,447 | | | | 1,081,011 | |
| * | Capital loss carryforwards will be used to offset any capital gains realized by the funds in the current year or in subsequent years. The funds will not make distributions from capital gains while a capital loss carryforward remains. |
Distributions paid by each fund were characterized for tax purposes as follows (dollars in thousands):
College 2036 Fund
| | | Six months ended April 30, 2020 | | | Year ended October 31, 2019 | |
| | | | | | | | | Total | | | | | | | | | Total | |
| | | Ordinary | | | Long-term | | | distributions | | | Ordinary | | | Long-term | | | distributions | |
| Share class | | income | | | capital gains | | | paid | | | income | | | capital gains | | | paid | |
| Class 529-A | | $ | 4,030 | | | $ | 4,402 | | | $ | 8,432 | | | $ | 937 | | | $ | 183 | | | $ | 1,120 | |
| Class 529-C | | | 182 | | | | 302 | | | | 484 | | | | 44 | | | | 13 | | | | 57 | |
| Class 529-E | | | 104 | | | | 123 | | | | 227 | | | | 23 | | | | 5 | | | | 28 | |
| Class 529-T | | | — | † | | | — | † | | | — | † | | | — | † | | | — | † | | | — | † |
| Class 529-F-1 | | | 540 | | | | 506 | | | | 1,046 | | | | 123 | | | | 21 | | | | 144 | |
| Total | | $ | 4,856 | | | $ | 5,333 | | | $ | 10,189 | | | $ | 1,127 | | | $ | 222 | | | $ | 1,349 | |
| | | | | | | | | | | | | | | | | | | | | | | | | |
| College 2033 Fund | | | | | | | | | | | | | | | | | |
| | | | | | | | | | | | | | | | | | | | | | | | | |
| | | | Six months ended April 30, 2020 | | | | Year ended October 31, 2019 | |
| | | | | | | | | | | Total | | | | | | | | | | | Total | |
| | | Ordinary | | | Long-term | | | distributions | | | Ordinary | | | Long-term | | | distributions | |
| Share class | | income | | | capital gains | | | paid | | | income | | | capital gains | | | paid | |
| Class 529-A | | $ | 18,174 | | | $ | 28,776 | | | $ | 46,950 | | | $ | 10,451 | | | $ | 17,654 | | | $ | 28,105 | |
| Class 529-C | | | 1,144 | | | | 2,856 | | | | 4,000 | | | | 596 | | | | 1,951 | | | | 2,547 | |
| Class 529-E | | | 543 | | | | 950 | | | | 1,493 | | | | 301 | | | | 579 | | | | 880 | |
| Class 529-T | | | — | † | | | — | † | | | — | † | | | — | † | | | — | † | | | — | † |
| Class 529-F-1 | | | 1,971 | | | | 2,777 | | | | 4,748 | | | | 1,147 | | | | 1,669 | | | | 2,816 | |
| Total | | $ | 21,832 | | | $ | 35,359 | | | $ | 57,191 | | | $ | 12,495 | | | $ | 21,853 | | | $ | 34,348 | |
| | | | | | | | | | | | | | | | | | | | | | | | | |
| College 2030 Fund | | | | | | | | | | | | | | | | | |
| | | | | | | | | | | | | | | | | | | | | | | | | |
| | | Six months ended April 30, 2020 | | | Year ended October 31, 2019 | |
| | | | | | | | | | | Total | | | | | | | | | | | Total | |
| | | Ordinary | | | Long-term | | | distributions | | | Ordinary | | | Long-term | | | distributions | |
| Share class | | income | | | capital gains | | | paid | | | income | | | capital gains | | | paid | |
| Class 529-A | | $ | 33,902 | | | $ | 34,774 | | | $ | 68,676 | | | $ | 19,406 | | | $ | 49,987 | | | $ | 69,393 | |
| Class 529-C | | | 3,462 | | | | 5,139 | | | | 8,601 | | | | 1,724 | | | | 8,146 | | | | 9,870 | |
| Class 529-E | | | 1,116 | | | | 1,250 | | | | 2,366 | | | | 619 | | | | 1,820 | | | | 2,439 | |
| Class 529-T | | | — | † | | | — | † | | | — | † | | | — | † | | | — | † | | | — | † |
| Class 529-F-1 | | | 3,759 | | | | 3,489 | | | | 7,248 | | | | 2,067 | | | | 4,624 | | | | 6,691 | |
| Total | | $ | 42,239 | | | $ | 44,652 | | | $ | 86,891 | | | $ | 23,816 | | | $ | 64,577 | | | $ | 88,393 | |
| 20 | American Funds College Target Date Series |
College 2027 Fund
| | | Six months ended April 30, 2020 | | | Year ended October 31, 2019 | |
| | | | | | | | | Total | | | | | | | | | Total | |
| | | Ordinary | | | Long-term | | | distributions | | | Ordinary | | | Long-term | | | distributions | |
| Share class | | income | | | capital gains | | | paid | | | income | | | capital gains | | | paid | |
| Class 529-A | | $ | 30,403 | | | $ | 22,456 | | | $ | 52,859 | | | $ | 18,659 | | | $ | 26,684 | | | $ | 45,343 | |
| Class 529-C | | | 3,325 | | | | 3,544 | | | | 6,869 | | | | 2,040 | | | | 4,831 | | | | 6,871 | |
| Class 529-E | | | 1,020 | | | | 818 | | | | 1,838 | | | | 609 | | | | 969 | | | | 1,578 | |
| Class 529-T | | | — | † | | | — | † | | | — | † | | | — | † | | | — | † | | | — | † |
| Class 529-F-1 | | | 4,055 | | | | 2,720 | | | | 6,775 | | | | 2,470 | | | | 3,116 | | | | 5,586 | |
| Total | | $ | 38,803 | | | $ | 29,538 | | | $ | 68,341 | | | $ | 23,778 | | | $ | 35,600 | | | $ | 59,378 | |
| |
| College 2024 Fund | | | | | | | | | | | | | |
| |
| | | Six months ended April 30, 2020 | | | Year ended October 31, 2019 | |
| | | | | | | | | | | Total | | | | | | | | | | | Total | |
| | | Ordinary | | | Long-term | | | distributions | | | Ordinary | | | Long-term | | | distributions | |
| Share class | | income | | | capital gains | | | paid | | | income | | | capital gains | | | paid | |
| Class 529-A | | $ | 35,944 | | | $ | 15,779 | | | $ | 51,723 | | | $ | 22,910 | | | $ | 18,062 | | | $ | 40,972 | |
| Class 529-C | | | 5,179 | | | | 3,191 | | | | 8,370 | | | | 3,087 | | | | 3,825 | | | | 6,912 | |
| Class 529-E | | | 1,497 | | | | 719 | | | | 2,216 | | | | 952 | | | | 836 | | | | 1,788 | |
| Class 529-T | | | — | † | | | — | † | | | — | † | | | — | † | | | — | † | | | — | † |
| Class 529-F-1 | | | 4,821 | | | | 1,926 | | | | 6,747 | | | | 2,987 | | | | 2,092 | | | | 5,079 | |
| Total | | $ | 47,441 | | | $ | 21,615 | | | $ | 69,056 | | | $ | 29,936 | | | $ | 24,815 | | | $ | 54,751 | |
| |
| College 2021 Fund | | | | | | | | | | | | | |
| | | | | | | | | | | | | | | | | | | | | | | | | |
| | | Six months ended April 30, 2020 | | | Year ended October 31, 2019 | |
| | | | | | | | | | | Total | | | | | | | | | | | Total | |
| | | Ordinary | | | Long-term | | | distributions | | | Ordinary | | | Long-term | | | distributions | |
| Share class | | income | | | capital gains | | | paid | | | income | | | capital gains | | | paid | |
| Class 529-A | | $ | 31,231 | | | $ | 10,527 | | | $ | 41,758 | | | $ | 20,929 | | | $ | 7,584 | | | $ | 28,513 | |
| Class 529-C | | | 5,323 | | | | 2,661 | | | | 7,984 | | | | 3,511 | | | | 2,102 | | | | 5,613 | |
| Class 529-E | | | 1,542 | | | | 573 | | | | 2,115 | | | | 1,032 | | | | 419 | | | | 1,451 | |
| Class 529-T | | | — | † | | | — | † | | | — | † | | | — | † | | | — | † | | | — | † |
| Class 529-F-1 | | | 4,572 | | | | 1,393 | | | | 5,965 | | | | 3,113 | | | | 991 | | | | 4,104 | |
| Total | | $ | 42,668 | | | $ | 15,154 | | | $ | 57,822 | | | $ | 28,585 | | | $ | 11,096 | | | $ | 39,681 | |
| |
| College Enrollment Fund | | | | | | | | | |
| | | | | | | | | | | | | | | | | | | | | | | | | |
| | | Six months ended April 30, 2020 | | | Year ended October 31, 2019 | |
| | | | | | | | | | | Total | | | | | | | | | | | Total | |
| | | Ordinary | | | Long-term | | | distributions | | | Ordinary | | | Long-term | | | distributions | |
| Share class | | income | | | capital gains | | | paid | | | income | | | capital gains | | | paid | |
| Class 529-A | | $ | 16,655 | | | $ | — | | | $ | 16,655 | | | $ | 11,086 | | | $ | — | | | $ | 11,086 | |
| Class 529-C | | | 2,636 | | | | — | | | | 2,636 | | | | 1,819 | | | | — | | | | 1,819 | |
| Class 529-E | | | 800 | | | | — | | | | 800 | | | | 567 | | | | — | | | | 567 | |
| Class 529-T | | | — | † | | | — | | | | — | † | | | — | † | | | — | | | | — | † |
| Class 529-F-1 | | | 2,996 | | | | — | | | | 2,996 | | | | 2,016 | | | | — | | | | 2,016 | |
| Total | | $ | 23,087 | | | $ | — | | | $ | 23,087 | | | $ | 15,488 | | | $ | — | | | $ | 15,488 | |
| † | Amount less than one thousand. |
| American Funds College Target Date Series | 21 |
6. Fees and transactions with related parties
CRMC, the series’ investment adviser, is the parent company of American Funds Distributors®, Inc. (“AFD”), the principal underwriter of the series’ shares, and American Funds Service Company® (“AFS”), the series’ transfer agent. CRMC, AFD and AFS are considered related parties to the series.
Investment advisory services — The series has an investment advisory and service agreement with CRMC. CRMC receives fees from the underlying funds for investment advisory services. These fees are included in the net effective expense ratios that are provided as supplementary information in the financial highlights tables.
Class-specific fees and expenses — Expenses that are specific to individual share classes are accrued directly to the respective share class. The principal class-specific fees and expenses are further described below:
Distribution services — The series has plans of distribution for all share classes of each fund. Under the plans, the board of trustees approves certain categories of expenses that are used to finance activities primarily intended to sell fund shares and service existing accounts. The plans provide for payments, based on an annualized percentage of average daily net assets, ranging from 0.50% to 1.00% as noted in this section. In some cases, the board of trustees has limited the amounts that may be paid to less than the maximum allowed by the plans. Each share class may use up to 0.25% of average daily net assets to pay service fees, or to compensate AFD for paying service fees, to firms that have entered into agreements with AFD to provide certain shareholder services. The remaining amounts available to be paid under each plan are paid to dealers to compensate them for their sales activities.
| Share class | | Currently approved limits | | Plan limits |
| Class 529-A | | 0.30 | % | | 0.50 | % |
| Class 529-C | | 1.00 | | | 1.00 | |
| Class 529-E | | 0.50 | | | 0.75 | |
| Classes 529-T and 529-F-1 | | 0.25 | | | 0.50 | |
For Class 529-A shares, distribution-related expenses include the reimbursement of dealer and wholesaler commissions paid by AFD for certain shares sold without a sales charge. This share class reimburses AFD for amounts billed within the prior 15 months but only to the extent that the overall annual expense limit is not exceeded. As of April 30, 2020, unreimbursed expenses subject to reimbursement for the funds’ Class 529-A shares were as follows (dollars in thousands):
| Fund | | Class 529-A | |
| College 2036 Fund | | $ | 15 | |
| College 2033 Fund | | | — | |
| College 2030 Fund | | | — | |
| College 2027 Fund | | | — | |
| College 2024 Fund | | | — | |
| College 2021 Fund | | | — | |
| College Enrollment Fund | | | — | |
Transfer agent services — The series has a shareholder services agreement with AFS under which the funds compensate AFS for providing transfer agent services to all of the funds’ share classes. These services include recordkeeping, shareholder communications and transaction processing. In addition, the funds reimburse AFS for amounts paid to third parties for performing transfer agent services on behalf of fund shareholders.
Administrative services — The series has an administrative services agreement with CRMC under which each fund compensates CRMC for providing administrative services to the series. Administrative services are provided by CRMC and its affiliates to help assist third parties providing non-distribution services to fund shareholders. These services include providing in-depth information on the series and market developments that impact underlying fund investments. Administrative services also include, but are not limited to, coordinating, monitoring and overseeing third parties that provide services to fund shareholders. The agreement provides each underlying fund the ability to charge an administrative services fee at the annual rate of 0.05% of the daily net assets for Class R-6 shares. CRMC receives administrative services fees at the annual rate of 0.03% of the daily net assets of the Class R-6 shares of each underlying fund for CRMC’s provision of administrative services. These fees are included in the net effective expense ratios that are provided as supplementary information in the financial highlights tables.
| 22 | American Funds College Target Date Series |
529 plan services — Each 529 share class is subject to service fees to compensate the Virginia College Savings Plan (“Virginia529”) for its oversight and administration of the CollegeAmerica 529 college savings plan. The fee is based on the combined net assets invested in Class 529 and ABLE shares of the American Funds. Class ABLE shares are offered on other American Funds by Virginia529 through ABLEAmerica®, a tax-advantaged savings program for individuals with disabilities. Prior to January 1, 2020, the quarterly fee was based on a series of decreasing annual rates beginning with 0.10% on the first $20 billion of the combined net assets invested in the American Funds and decreasing to 0.03% on such assets in excess of $100 billion. Effective January 1, 2020, the quarterly fee was amended to a series of decreasing annual rates beginning with 0.09% on the first $20 billion of the combined net assets invested in the American Funds and decreasing to 0.03% on such assets in excess of $100 billion. The fee for any given calendar quarter is accrued and calculated on the basis of the average net assets of Class 529 and ABLE shares of the American Funds for the last month of the prior calendar quarter. Virginia529 is not considered a related party to the fund.
Class-specific expenses under the agreements described in this section for the six months ended April 30, 2020, were as follows (dollars in thousands):
| College 2036 Fund | | | | | | | | | |
| | | | | | | | | | |
| | | Distribution | | | Transfer agent | | | 529 plan | |
| Share class | | services | | | services | | | services | |
| Class 529-A | | $ | 515 | | | $ | 177 | | | $ | 108 | |
| Class 529-C | | | 116 | | | | 11 | | | | 7 | |
| Class 529-E | | | 24 | | | | 3 | | | | 3 | |
| Class 529-T | | | — | | | | — | * | | | — | * |
| Class 529-F-1 | | | — | | | | 19 | | | | 12 | |
| Total class-specific expenses | | $ | 655 | | | $ | 210 | | | $ | 130 | |
| | | | | | | | | | |
| College 2033 Fund | | | | | | | | | |
| | | Distribution | | | Transfer agent | | | 529 plan | |
| Share class | | services | | | services | | | services | |
| Class 529-A | | $ | 1,236 | | | $ | 547 | | | $ | 320 | |
| Class 529-C | | | 491 | | | | 47 | | | | 31 | |
| Class 529-E | | | 83 | | | | 11 | | | | 11 | |
| Class 529-T | | | — | | | | — | * | | | — | * |
| Class 529-F-1 | | | — | | | | 51 | | | | 31 | |
| Total class-specific expenses | | $ | 1,810 | | | $ | 656 | | | $ | 393 | |
| |
| College 2030 Fund | | | | | | | | | | | | |
| | | Distribution | | | Transfer agent | | | 529 plan | |
| Share class | | services | | | services | | | services | |
| Class 529-A | | $ | 1,883 | | | $ | 838 | | | $ | 489 | |
| Class 529-C | | | 1,107 | | | | 106 | | | | 70 | |
| Class 529-E | | | 138 | | | | 19 | | | | 18 | |
| Class 529-T | | | — | | | | — | * | | | — | * |
| Class 529-F-1 | | | — | | | | 81 | | | | 49 | |
| Total class-specific expenses | | $ | 3,128 | | | $ | 1,044 | | | $ | 626 | |
| | | | | | | | | | | | | |
| College 2027 Fund | | | | | | | | | | | | |
| | | Distribution | | | Transfer agent | | | 529 plan | |
| Share class | | services | | | services | | | services | |
| Class 529-A | | $ | 1,681 | | | $ | 737 | | | $ | 431 | |
| Class 529-C | | | 1,047 | | | | 101 | | | | 67 | |
| Class 529-E | | | 123 | | | | 17 | | | | 16 | |
| Class 529-T | | | — | | | | — | * | | | — | * |
| Class 529-F-1 | | | — | | | | 86 | | | | 52 | |
| Total class-specific expenses | | $ | 2,851 | | | $ | 941 | | | $ | 566 | |
| |
| College 2024 Fund | | | | | | | | | | | | |
| | | Distribution | | | Transfer agent | | | 529 plan | |
| Share class | | services | | | services | | | services | |
| Class 529-A | | $ | 1,972 | | | $ | 870 | | | $ | 511 | |
| Class 529-C | | | 1,599 | | | | 152 | | | | 101 | |
| Class 529-E | | | 184 | | | | 26 | | | | 23 | |
| Class 529-T | | | — | | | | — | * | | | — | * |
| Class 529-F-1 | | | — | | | | 102 | | | | 63 | |
| Total class-specific expenses | | $ | 3,755 | | | $ | 1,150 | | | $ | 698 | |
| | | | | | | | | | | | | |
| College 2021 Fund | | | | | | | | | | | | |
| | | Distribution | | | Transfer agent | | | 529 plan | |
| Share class | | services | | | services | | | services | |
| Class 529-A | | $ | 1,755 | | | $ | 787 | | | $ | 460 | |
| Class 529-C | | | 1,792 | | | | 172 | | | | 114 | |
| Class 529-E | | | 199 | | | | 28 | | | | 25 | |
| Class 529-T | | | — | | | | — | * | | | — | * |
| Class 529-F-1 | | | — | | | | 100 | | | | 62 | |
| Total class-specific expenses | | $ | 3,746 | | | $ | 1,087 | | | $ | 661 | |
| |
| College Enrollment Fund | | | | | | | | | | | | |
| | | Distribution | | | Transfer agent | | | 529 plan | |
| Share class | | services | | | services | | | services | |
| Class 529-A | | $ | 878 | | | $ | 403 | | | $ | 232 | |
| Class 529-C | | | 937 | | | | 92 | | | | 60 | |
| Class 529-E | | | 96 | | | | 14 | | | | 12 | |
| Class 529-T | | | — | | | | — | * | | | — | * |
| Class 529-F-1 | | | — | | | | 63 | | | | 38 | |
| Total class-specific expenses | | $ | 1,911 | | | $ | 572 | | | $ | 342 | |
| * | Amount less than one thousand. |
| American Funds College Target Date Series | 23 |
Trustees’ deferred compensation — Trustees who are unaffiliated with CRMC may elect to defer the cash payment of part or all of their compensation. These deferred amounts, which remain as liabilities of the funds, are treated as if invested in shares of the American Funds. These amounts represent general, unsecured liabilities of the funds and vary according to the total returns of the selected American Funds. Trustees’ compensation shown on the accompanying financial statements reflects current fees (either paid in cash or deferred) and a net increase in the value of the deferred amounts as follows (dollars in thousands):
| | | | | | Decrease in value of | | | Total trustees’ | |
| | | Current fees | | | deferred amounts | | | compensation | |
| College 2036 Fund | | $ | 1 | | | $ | — | * | | $ | 1 | |
| College 2033 Fund | | | 2 | | | | — | * | | | 2 | |
| College 2030 Fund | | | 3 | | | | (1 | ) | | | 2 | |
| College 2027 Fund | | | 3 | | | | (1 | ) | | | 2 | |
| College 2024 Fund | | | 4 | | | | (1 | ) | | | 3 | |
| College 2021 Fund | | | 3 | | | | (1 | ) | | | 2 | |
| College Enrollment Fund | | | 2 | | | | — | * | | | 2 | |
| * | Amount less than one thousand. |
Affiliated officers and trustees — Officers and certain trustees of the series are or may be considered to be affiliated with CRMC, AFD and AFS. No affiliated officers or trustees received any compensation directly from any of the funds in the series.
7. Investment transactions
The funds made purchases and sales of investment securities during the six months ended April 30, 2020, as follows (dollars in thousands):
| | | Purchases | | | Sales | |
| College 2036 Fund | | $ | 196,058 | | | $ | 12,542 | |
| College 2033 Fund | | | 289,842 | | | | 99,169 | |
| College 2030 Fund | | | 470,237 | | | | 255,678 | |
| College 2027 Fund | | | 413,079 | | | | 217,567 | |
| College 2024 Fund | | | 249,674 | | | | 3,980 | |
| College 2021 Fund | | | 229,489 | | | | 103,857 | |
| College Enrollment Fund | | | 37,943 | | | | 103,098 | |
| 24 | American Funds College Target Date Series |
8. Capital share transactions
Capital share transactions in the funds were as follows (dollars and shares in thousands):
College 2036 Fund
| | | Sales* | | | Reinvestments of
distributions | | | Repurchases* | | | Net increase | |
| Share class | | Amount | | | Shares | | | Amount | | | Shares | | | Amount | | | Shares | | | Amount | | | Shares | |
| |
| Six months ended April 30, 2020 | | | | | | | | | | | | | |
| | | | | | | | | | | | | | | | | | | | | | | | | | | | | | | | | |
| Class 529-A | | $ | 151,540 | | | | 14,387 | | | $ | 8,433 | | | | 766 | | | $ | (10,208 | ) | | | (979 | ) | | $ | 149,765 | | | | 14,174 | |
| Class 529-C | | | 10,961 | | | | 1,045 | | | | 483 | | | | 44 | | | | (1,682 | ) | | | (163 | ) | | | 9,762 | | | | 926 | |
| Class 529-E | | | 4,964 | | | | 474 | | | | 226 | | | | 21 | | | | (264 | ) | | | (27 | ) | | | 4,926 | | | | 468 | |
| Class 529-T | | | — | | | | — | | | | — | † | | | — | † | | | — | | | | — | | | | — | † | | | — | † |
| Class 529-F-1 | | | 17,132 | | | | 1,638 | | | | 1,046 | | | | 95 | | | | (1,851 | ) | | | (184 | ) | | | 16,327 | | | | 1,549 | |
| Total net increase (decrease) | | $ | 184,597 | | | | 17,544 | | | $ | 10,188 | | | | 926 | | | $ | (14,005 | ) | | | (1,353 | ) | | $ | 180,780 | | | | 17,117 | |
| |
| Year ended October 31, 2019 | | | | | | | | | | | | | |
| | | | | | | | | | | | | | | | | | | | | | | | | | | | | | | | | |
| Class 529-A | | $ | 192,596 | | | | 19,096 | | | $ | 1,120 | | | | 123 | | | $ | (9,928 | ) | | | (974 | ) | | $ | 183,788 | | | | 18,245 | |
| Class 529-C | | | 12,681 | | | | 1,263 | | | | 57 | | | | 6 | | | | (1,383 | ) | | | (138 | ) | | | 11,355 | | | | 1,131 | |
| Class 529-E | | | 5,015 | | | | 496 | | | | 28 | | | | 3 | | | | (368 | ) | | | (36 | ) | | | 4,675 | | | | 463 | |
| Class 529-T | | | — | | | | — | | | | — | † | | | — | † | | | — | | | | — | | | | — | † | | | — | † |
| Class 529-F-1 | | | 24,002 | | | | 2,380 | | | | 144 | | | | 16 | | | | (1,657 | ) | | | (162 | ) | | | 22,489 | | | | 2,234 | |
| Total net increase (decrease) | | $ | 234,294 | | | | 23,235 | | | $ | 1,349 | | | | 148 | | | $ | (13,336 | ) | | | (1,310 | ) | | $ | 222,307 | | | | 22,073 | |
| |
| College 2033 Fund | | | | | | | | | | | | | | | | | |
| | | | | | | | | | | | | | | | | | | | | | | | | | | | | | | | | |
| | | Sales* | | | Reinvestments of
distributions | | | Repurchases* | | | Net increase | |
| Share class | | Amount | | | Shares | | | Amount | | | Shares | | | Amount | | | Shares | | | Amount | | | Shares | |
| |
| Six months ended April 30, 2020 | | | | | | | | | | | | | |
| | | | | | | | | | | | | | | | | | | | | | | | | | | | | | | | | |
| Class 529-A | | $ | 158,070 | | | | 13,393 | | | $ | 46,946 | | | | 3,902 | | | $ | (32,463 | ) | | | (2,802 | ) | | $ | 172,553 | | | | 14,493 | |
| Class 529-C | | | 13,547 | | | | 1,168 | | | | 3,998 | | | | 335 | | | | (5,246 | ) | | | (452 | ) | | | 12,299 | | | | 1,051 | |
| Class 529-E | | | 5,622 | | | | 480 | | | | 1,494 | | | | 125 | | | | (1,090 | ) | | | (94 | ) | | | 6,026 | | | | 511 | |
| Class 529-T | | | — | | | | — | | | | 1 | | | | — | † | | | — | | | | — | | | | 1 | | | | — | † |
| Class 529-F-1 | | | 17,414 | | | | 1,487 | | | | 4,747 | | | | 393 | | | | (2,837 | ) | | | (246 | ) | | | 19,324 | | | | 1,634 | |
| Total net increase (decrease) | | $ | 194,653 | | | | 16,528 | | | $ | 57,186 | | | | 4,755 | | | $ | (41,636 | ) | | | (3,594 | ) | | $ | 210,203 | | | | 17,689 | |
| |
| Year ended October 31, 2019 | | | | | | | | | | | | | | | | | |
| | | | | | | | | | | | | | | | | | | | | | | | | | | | | | | | | |
| Class 529-A | | $ | 255,818 | | | | 22,376 | | | $ | 28,100 | | | | 2,694 | | | $ | (44,128 | ) | | | (3,834 | ) | | $ | 239,790 | | | | 21,236 | |
| Class 529-C | | | 21,577 | | | | 1,905 | | | | 2,546 | | | | 246 | | | | (8,756 | ) | | | (774 | ) | | | 15,367 | | | | 1,377 | |
| Class 529-E | | | 9,516 | | | | 838 | | | | 881 | | | | 85 | | | | (2,445 | ) | | | (213 | ) | | | 7,952 | | | | 710 | |
| Class 529-T | | | — | | | | — | | | | 1 | | | | — | † | | | — | | | | — | | | | 1 | | | | — | † |
| Class 529-F-1 | | | 29,560 | | | | 2,576 | | | | 2,813 | | | | 269 | | | | (6,883 | ) | | | (595 | ) | | | 25,490 | | | | 2,250 | |
| Total net increase (decrease) | | $ | 316,471 | | | | 27,695 | | | $ | 34,341 | | | | 3,294 | | | $ | (62,212 | ) | | | (5,416 | ) | | $ | 288,600 | | | | 25,573 | |
See end of tables for footnotes.
| American Funds College Target Date Series | 25 |
College 2030 Fund
| | | Sales* | | | Reinvestments of
distributions | | | Repurchases* | | | Net increase | |
| Share class | | Amount | | | Shares | | | Amount | | | Shares | | | Amount | | | Shares | | | Amount | | | Shares | |
| |
| Six months ended April 30, 2020 | | | | | | | | | | | | | | | | | |
| | | | | | | | | | | | | | | | | | | | | | | | | | | | | | | | | |
| Class 529-A | | $ | 180,675 | | | | 13,320 | | | $ | 68,672 | | | | 5,001 | | | $ | (49,347 | ) | | | (3,688 | ) | | $ | 200,000 | | | | 14,633 | |
| Class 529-C | | | 23,554 | | | | 1,763 | | | | 8,600 | | | | 635 | | | | (13,762 | ) | | | (1,036 | ) | | | 18,392 | | | | 1,362 | |
| Class 529-E | | | 6,881 | | | | 512 | | | | 2,366 | | | | 173 | | | | (2,217 | ) | | | (171 | ) | | | 7,030 | | | | 514 | |
| Class 529-T | | | — | | | | — | | | | 1 | | | | — | † | | | — | | | | — | | | | 1 | | | | — | † |
| Class 529-F-1 | | | 23,340 | | | | 1,726 | | | | 7,248 | | | | 527 | | | | (6,060 | ) | | | (458 | ) | | | 24,528 | | | | 1,795 | |
| Total net increase (decrease) | | $ | 234,450 | | | | 17,321 | | | $ | 86,887 | | | | 6,336 | | | $ | (71,386 | ) | | | (5,353 | ) | | $ | 249,951 | | | | 18,304 | |
| |
| Year ended October 31, 2019 | | | | | | | | | | | | | | | | | | | | | | | | | |
| | | | | | | | | | | | | | | | | | | | | | | | | | | | | | | | | |
| Class 529-A | | $ | 289,254 | | | | 21,827 | | | $ | 69,379 | | | | 5,701 | | | $ | (74,800 | ) | | | (5,626 | ) | | $ | 283,833 | | | | 21,902 | |
| Class 529-C | | | 33,730 | | | | 2,580 | | | | 9,871 | | | | 821 | | | | (20,128 | ) | | | (1,539 | ) | | | 23,473 | | | | 1,862 | |
| Class 529-E | | | 10,785 | | | | 819 | | | | 2,439 | | | | 201 | | | | (3,528 | ) | | | (266 | ) | | | 9,696 | | | | 754 | |
| Class 529-T | | | — | | | | — | | | | 1 | | | | — | † | | | — | | | | — | | | | 1 | | | | — | † |
| Class 529-F-1 | | | 39,969 | | | | 3,003 | | | | 6,690 | | | | 548 | | | | (8,782 | ) | | | (656 | ) | | | 37,877 | | | | 2,895 | |
| Total net increase (decrease) | | $ | 373,738 | | | | 28,229 | | | $ | 88,380 | | | | 7,271 | | | $ | (107,238 | ) | | | (8,087 | ) | | $ | 354,880 | | | | 27,413 | |
| |
| College 2027 Fund | | | | | | | | | | | | | | | | | | | | | |
| | | | | | | | | | | | | | | | | | | | | | | | | | | | | | | | | |
| | | Sales* | | | Reinvestments of
distributions | | | Repurchases* | | | Net increase | |
| Share class | | Amount | | | Shares | | | Amount | | | Shares | | | Amount | | | Shares | | | Amount | | | Shares | |
| |
| Six months ended April 30, 2020 | | | | | | | | | | | | | | | | | | | | | |
| | | | | | | | | | | | | | | | | | | | | | | | | | | | | | | | | |
| Class 529-A | | $ | 174,045 | | | | 13,559 | | | $ | 52,833 | | | | 4,112 | | | $ | (55,007 | ) | | | (4,364 | ) | | $ | 171,871 | | | | 13,307 | |
| Class 529-C | | | 26,743 | | | | 2,115 | | | | 6,869 | | | | 540 | | | | (16,187 | ) | | | (1,291 | ) | | | 17,425 | | | | 1,364 | |
| Class 529-E | | | 6,637 | | | | 521 | | | | 1,838 | | | | 144 | | | | (1,823 | ) | | | (144 | ) | | | 6,652 | | | | 521 | |
| Class 529-T | | | — | | | | — | | | | — | † | | | — | † | | | — | | | | — | | | | — | † | | | — | † |
| Class 529-F-1 | | | 24,826 | | | | 1,928 | | | | 6,773 | | | | 525 | | | | (9,050 | ) | | | (718 | ) | | | 22,549 | | | | 1,735 | |
| Total net increase (decrease) | | $ | 232,251 | | | | 18,123 | | | $ | 68,313 | | | | 5,321 | | | $ | (82,067 | ) | | | (6,517 | ) | | $ | 218,497 | | | | 16,927 | |
| |
| Year ended October 31, 2019 | | | | | | | | | | | | | | | | | | | | | |
| | | | | | | | | | | | | | | | | | | | | | | | | | | | | | | | | |
| Class 529-A | | $ | 296,971 | | | | 23,675 | | | $ | 45,329 | | | | 3,884 | | | $ | (72,967 | ) | | | (5,803 | ) | | $ | 269,333 | | | | 21,756 | |
| Class 529-C | | | 39,565 | | | | 3,195 | | | | 6,871 | | | | 595 | | | | (27,478 | ) | | | (2,218 | ) | | | 18,958 | | | | 1,572 | |
| Class 529-E | | | 11,881 | | | | 953 | | | | 1,578 | | | | 136 | | | | (3,133 | ) | | | (251 | ) | | | 10,326 | | | | 838 | |
| Class 529-T | | | — | | | | — | | | | 1 | | | | — | † | | | — | | | | — | | | | 1 | | | | — | † |
| Class 529-F-1 | | | 43,063 | | | | 3,413 | | | | 5,586 | | | | 477 | | | | (11,878 | ) | | | (936 | ) | | | 36,771 | | | | 2,954 | |
| Total net increase (decrease) | | $ | 391,480 | | | | 31,236 | | | $ | 59,365 | | | | 5,092 | | | $ | (115,456 | ) | | | (9,208 | ) | | $ | 335,389 | | | | 27,120 | |
| 26 | American Funds College Target Date Series |
College 2024 Fund
| | | Sales* | | | Reinvestments of
distributions | | | Repurchases* | | | Net increase | |
| Share class | | Amount | | | Shares | | | Amount | | | Shares | | | Amount | | | Shares | | | Amount | | | Shares | |
| |
| Six months ended April 30, 2020 | | | | | | | | | | | | | | | | | | | | | |
| | | | | | | | | | | | | | | | | | | | | | | | | | | | | | | | | |
| Class 529-A | | $ | 210,995 | | | | 17,258 | | | $ | 51,708 | | | | 4,259 | | | $ | (73,524 | ) | | | (6,069 | ) | | $ | 189,179 | | | | 15,448 | |
| Class 529-C | | | 50,318 | | | | 4,171 | | | | 8,369 | | | | 698 | | | | (23,913 | ) | | | (1,988 | ) | | | 34,774 | | | | 2,881 | |
| Class 529-E | | | 9,495 | | | | 780 | | | | 2,215 | | | | 183 | | | | (2,882 | ) | | | (239 | ) | | | 8,828 | | | | 724 | |
| Class 529-T | | | — | | | | — | | | | — | † | | | — | † | | | — | | | | — | | | | — | † | | | — | † |
| Class 529-F-1 | | | 32,522 | | | | 2,652 | | | | 6,747 | | | | 554 | | | | (11,340 | ) | | | (934 | ) | | | 27,929 | | | | 2,272 | |
| Total net increase (decrease) | | $ | 303,330 | | | | 24,861 | | | $ | 69,039 | | | | 5,694 | | | $ | (111,659 | ) | | | (9,230 | ) | | $ | 260,710 | | | | 21,325 | |
| |
| Year ended October 31, 2019 | | | | | | | | | | | | | | | | | | | | | |
| | | | | | | | | | | | | | | | | | | | | | | | | | | | | | | | | |
| Class 529-A | | $ | 360,131 | | | | 30,098 | | | $ | 40,962 | | | | 3,622 | | | $ | (98,034 | ) | | | (8,193 | ) | | $ | 303,059 | | | | 25,527 | |
| Class 529-C | | | 86,704 | | | | 7,339 | | | | 6,909 | | | | 617 | | | | (44,039 | ) | | | (3,735 | ) | | | 49,574 | | | | 4,221 | |
| Class 529-E | | | 16,981 | | | | 1,429 | | | | 1,787 | | | | 158 | | | | (5,323 | ) | | | (447 | ) | | | 13,445 | | | | 1,140 | |
| Class 529-T | | | — | | | | — | | | | — | † | | | — | † | | | — | | | | — | | | | — | † | | | — | † |
| Class 529-F-1 | | | 53,846 | | | | 4,475 | | | | 5,079 | | | | 448 | | | | (14,558 | ) | | | (1,209 | ) | | | 44,367 | | | | 3,714 | |
| Total net increase (decrease) | | $ | 517,662 | | | | 43,341 | | | $ | 54,737 | | | | 4,845 | | | $ | (161,954 | ) | | | (13,584 | ) | | $ | 410,445 | | | | 34,602 | |
| |
| College 2021 Fund | | | | | | | | | | | | | | | | | | | | | |
| | | | | | | | | | | | | | | | | | | | | | | | | | | | | | | | | |
| | | Sales* | | | Reinvestments of
distributions | | | Repurchases* | | | Net increase | |
| Share class | | Amount | | | Shares | | | Amount | | | Shares | | | Amount | | | Shares | | | Amount | | | Shares | |
| |
| Six months ended April 30, 2020 | | | | | | | | | | | | | | | | | | | | | |
| | | | | | | | | | | | | | | | | | | | | | | | | | | | | | | | | |
| Class 529-A | | $ | 174,894 | | | | 15,403 | | | $ | 41,755 | | | | 3,739 | | | $ | (109,729 | ) | | | (9,676 | ) | | $ | 106,920 | | | | 9,466 | |
| Class 529-C | | | 47,436 | | | | 4,227 | | | | 7,983 | | | | 721 | | | | (40,279 | ) | | | (3,593 | ) | | | 15,140 | | | | 1,355 | |
| Class 529-E | | | 9,571 | | | | 848 | | | | 2,116 | | | | 190 | | | | (5,727 | ) | | | (507 | ) | | | 5,960 | | | | 531 | |
| Class 529-T | | | — | | | | — | | | | — | † | | | — | † | | | — | | | | — | | | | — | † | | | — | † |
| Class 529-F-1 | | | 28,646 | | | | 2,515 | | | | 5,964 | | | | 532 | | | | (14,655 | ) | | | (1,289 | ) | | | 19,955 | | | | 1,758 | |
| Total net increase (decrease) | | $ | 260,547 | | | | 22,993 | | | $ | 57,818 | | | | 5,182 | | | $ | (170,390 | ) | | | (15,065 | ) | | $ | 147,975 | | | | 13,110 | |
| |
| Year ended October 31, 2019 | | | | | | | | | | | | | | | | | | | | | |
| | | | | | | | | | | | | | | | | | | | | | |
| Class 529-A | | $ | 349,249 | | | | 31,199 | | | $ | 28,503 | | | | 2,646 | | | $ | (156,672 | ) | | | (13,965 | ) | | $ | 221,080 | | | | 19,880 | |
| Class 529-C | | | 93,113 | | | | 8,432 | | | | 5,611 | | | | 526 | | | | (70,576 | ) | | | (6,384 | ) | | | 28,148 | | | | 2,574 | |
| Class 529-E | | | 20,260 | | | | 1,818 | | | | 1,451 | | | | 135 | | | | (9,556 | ) | | | (857 | ) | | | 12,155 | | | | 1,096 | |
| Class 529-T | | | — | | | | — | | | | — | † | | | — | † | | | — | | | | — | | | | — | † | | | — | † |
| Class 529-F-1 | | | 48,459 | | | | 4,313 | | | | 4,104 | | | | 381 | | | | (20,378 | ) | | | (1,813 | ) | | | 32,185 | | | | 2,881 | |
| Total net increase (decrease) | | $ | 511,081 | | | | 45,762 | | | $ | 39,669 | | | | 3,688 | | | $ | (257,182 | ) | | | (23,019 | ) | | $ | 293,568 | | | | 26,431 | |
See end of tables for footnotes.
| American Funds College Target Date Series | 27 |
College Enrollment Fund
| | | Sales* | | | Reinvestments of
distributions | | | Repurchases* | | | Net decrease | |
| Share class | | Amount | | | Shares | | | Amount | | | Shares | | | Amount | | | Shares | | | Amount | | | Shares | |
| |
| Six months ended April 30, 2020 | | | | | | | | | | | | | | | | | |
| | | | | | | | | | | | | | | | | | | | | | | | | | | | | | | | | |
| Class 529-A | | $ | 93,046 | | | | 9,267 | | | $ | 16,650 | | | | 1,689 | | | $ | (136,148 | ) | | | (13,602 | ) | | $ | (26,452 | ) | | | (2,646 | ) |
| Class 529-C | | | 21,354 | | | | 2,134 | | | | 2,634 | | | | 268 | | | | (47,223 | ) | | | (4,731 | ) | | | (23,235 | ) | | | (2,329 | ) |
| Class 529-E | | | 5,558 | | | | 555 | | | | 799 | | | | 81 | | | | (9,753 | ) | | | (977 | ) | | | (3,396 | ) | | | (341 | ) |
| Class 529-T | | | — | | | | — | | | | — | † | | | — | † | | | — | | | | — | | | | — | † | | | — | † |
| Class 529-F-1 | | | 16,436 | | | | 1,633 | | | | 2,996 | | | | 303 | | | | (23,367 | ) | | | (2,328 | ) | | | (3,935 | ) | | | (392 | ) |
| Total net increase (decrease) | | $ | 136,394 | | | | 13,589 | | | $ | 23,079 | | | | 2,341 | | | $ | (216,491 | ) | | | (21,638 | ) | | $ | (57,018 | ) | | | (5,708 | ) |
| |
| Year ended October 31, 2019 | | | | | | | | | | | | | |
| | | | | | | | | | | | | | | | | | | | | | | | | | | | | | | | | |
| Class 529-A | | $ | 193,004 | | | | 19,491 | | | $ | 11,080 | | | | 1,146 | | | $ | (285,047 | ) | | | (28,815 | ) | | $ | (80,963 | ) | | | (8,178 | ) |
| Class 529-C | | | 50,794 | | | | 5,153 | | | | 1,817 | | | | 188 | | | | (107,572 | ) | | | (10,926 | ) | | | (54,961 | ) | | | (5,585 | ) |
| Class 529-E | | | 9,938 | | | | 1,005 | | | | 567 | | | | 59 | | | | (18,536 | ) | | | (1,881 | ) | | | (8,031 | ) | | | (817 | ) |
| Class 529-T | | | — | | | | — | | | | — | † | | | — | † | | | — | | | | — | | | | — | † | | | — | † |
| Class 529-F-1 | | | 35,190 | | | | 3,543 | | | | 2,014 | | | | 208 | | | | (45,695 | ) | | | (4,607 | ) | | | (8,491 | ) | | | (856 | ) |
| Total net increase (decrease) | | $ | 288,926 | | | | 29,192 | | | $ | 15,478 | | | | 1,601 | | | $ | (456,850 | ) | | | (46,229 | ) | | $ | (152,446 | ) | | | (15,436 | ) |
| * | Includes exchanges between share classes of the fund. |
| † | Amount less than one thousand. |
| 28 | American Funds College Target Date Series |
Financial highlights
College 2036 Fund
| | | | | | (Loss) income from
investment operations1 | | | Dividends and distributions | | | | | | | | | | | | Ratio of | | | Ratio of | | | | | | | |
| Period ended | | Net asset
value,
beginning
of period | | | Net
investment
income | | | Net (losses)
gains on
securities
(both
realized and
unrealized) | | | Total from
investment
operations | | | Dividends
(from net
investment
income) | | | Distributions
(from capital
gains) | | | Total
dividends
and
distributions | | | Net asset
value,
end
of period | | | Total return2,3 | | | Net assets,
end of period
(in millions) | | | expenses to
average net
assets before
waivers/
reimburse-
ments4 | | | expenses to
average net
assets after
waivers/
reimburse-
ments3,4 | | | Net
effective
expense
ratio3,5 | | | Ratio of
net income
to average
net assets3 | |
| Class 529-A: | | | | | | | | | | | | | | | | | | | | | | | | | | | | | | | | | | | | | | | | | | | | | | |
| 4/30/20206,7 | | $ | 10.68 | | | $ | .09 | | | $ | (.39 | ) | | $ | (.30 | ) | | $ | (.14 | ) | | $ | (.15 | ) | | $ | (.29 | ) | | $ | 10.09 | | | | (3.06 | )%8 | | $ | 403 | | | | .50 | %9 | | | .50 | %9 | | | .87 | %9 | | | 1.73 | %9 |
| 10/31/2019 | | | 9.71 | | | | .15 | | | | .93 | | | | 1.08 | | | | (.09 | ) | | | (.02 | ) | | | (.11 | ) | | | 10.68 | | | | 11.33 | | | | 275 | | | | .51 | | | | .51 | | | | .89 | | | | 1.51 | |
| 10/31/20186,10 | | | 10.00 | | | | .09 | | | | (.38 | ) | | | (.29 | ) | | | — | | | | — | | | | — | | | | 9.71 | | | | (2.90 | )8 | | | 73 | | | | .56 | 9 | | | .50 | 9 | | | .89 | 9 | | | 1.27 | 9 |
| Class 529-C: | | | | | | | | | | | | | | | | | | | | | | | | | | | | | | | | | | | | | | | | | | | | | | | | | | | | | | | | |
| 4/30/20206,7 | | | 10.59 | | | | .05 | | | | (.39 | ) | | | (.34 | ) | | | (.09 | ) | | | (.15 | ) | | | (.24 | ) | | | 10.01 | | | | (3.40 | )8 | | | 26 | | | | 1.19 | 9 | | | 1.19 | 9 | | | 1.56 | 9 | | | 1.05 | 9 |
| 10/31/2019 | | | 9.67 | | | | .08 | | | | .92 | | | | 1.00 | | | | (.06 | ) | | | (.02 | ) | | | (.08 | ) | | | 10.59 | | | | 10.48 | | | | 18 | | | | 1.20 | | | | 1.20 | | | | 1.58 | | | | .83 | |
| 10/31/20186,10 | | | 10.00 | | | | .05 | | | | (.38 | ) | | | (.33 | ) | | | — | | | | — | | | | — | | | | 9.67 | | | | (3.30 | )8 | | | 6 | | | | 1.25 | 9 | | | 1.19 | 9 | | | 1.58 | 9 | | | .66 | 9 |
| Class 529-E: | | | | | | | | | | | | | | | | | | | | | | | | | | | | | | | | | | | | | | | | | | | | | | | | | | | | | | | | |
| 4/30/20206,7 | | | 10.67 | | | | .08 | | | | (.39 | ) | | | (.31 | ) | | | (.13 | ) | | | (.15 | ) | | | (.28 | ) | | | 10.08 | | | | (3.16 | )8 | | | 12 | | | | .66 | 9 | | | .66 | 9 | | | 1.03 | 9 | | | 1.57 | 9 |
| 10/31/2019 | | | 9.70 | | | | .14 | | | | .93 | | | | 1.07 | | | | (.08 | ) | | | (.02 | ) | | | (.10 | ) | | | 10.67 | | | | 11.19 | | | | 8 | | | | .67 | | | | .67 | | | | 1.05 | | | | 1.36 | |
| 10/31/20186,10 | | | 10.00 | | | | .09 | | | | (.39 | ) | | | (.30 | ) | | | — | | | | — | | | | — | | | | 9.70 | | | | (3.00 | )8 | | | 2 | | | | .86 | 9 | | | .68 | 9 | | | 1.07 | 9 | | | 1.23 | 9 |
| Class 529-T: | | | | | | | | | | | | | | | | | | | | | | | | | | | | | | | | | | | | | | | | | | | | | | |
| 4/30/20206,7 | | | 10.73 | | | | .11 | | | | (.40 | ) | | | (.29 | ) | | | (.15 | ) | | | (.15 | ) | | | (.30 | ) | | | 10.14 | | | | (2.95 | )8,11 | | | — | 12 | | | .23 | 9,11 | | | .23 | 9,11 | | | .60 | 9,11 | | | 2.04 | 9,11 |
| 10/31/2019 | | | 9.72 | | | | .19 | | | | .93 | | | | 1.12 | | | | (.09 | ) | | | (.02 | ) | | | (.11 | ) | | | 10.73 | | | | 11.66 | 11 | | | — | 12 | | | .26 | 11 | | | .26 | 11 | | | .64 | 11 | | | 1.89 | 11 |
| 10/31/20186,10 | | | 10.00 | | | | .11 | | | | (.39 | ) | | | (.28 | ) | | | — | | | | — | | | | — | | | | 9.72 | | | | (2.80 | )8,11 | | | — | 12 | | | .71 | 9,11 | | | .31 | 9,11 | | | .70 | 9,11 | | | 1.49 | 9,11 |
| Class 529-F-1: |
| 4/30/20206,7 | | | 10.72 | | | | .11 | | | | (.40 | ) | | | (.29 | ) | | | (.16 | ) | | | (.15 | ) | | | (.31 | ) | | | 10.12 | | | | (2.95 | )8 | | | 46 | | | | .19 | 9 | | | .19 | 9 | | | .56 | 9 | | | 2.03 | 9 |
| 10/31/2019 | | | 9.73 | | | | .18 | | | | .94 | | | | 1.12 | | | | (.11 | ) | | | (.02 | ) | | | (.13 | ) | | | 10.72 | | | | 11.67 | | | | 32 | | | | .20 | | | | .20 | | | | .58 | | | | 1.80 | |
| 10/31/20186,10 | | | 10.00 | | | | .12 | | | | (.39 | ) | | | (.27 | ) | | | — | | | | — | | | | — | | | | 9.73 | | | | (2.70 | )8 | | | 8 | | | | .26 | 9 | | | .19 | 9 | | | .58 | 9 | | | 1.55 | 9 |
See end of tables for footnotes.
| American Funds College Target Date Series | 29 |
Financial highlights(continued)
College 2033 Fund
| | | | | | (Loss) income from
investment operations1 | | | Dividends and distributions | | | | | | | | | | | | Ratio of | | | Ratio of | | | | | | | |
| Period ended | | Net asset
value,
beginning
of period | | | Net
investment
income | | | Net (losses)
gains on
securities
(both
realized and
unrealized) | | | Total from
investment
operations | | | Dividends
(from net
investment
income) | | | Distributions
(from capital
gains) | | | Total
dividends
and
distributions | | | Net asset
value,
end
of period | | | Total return2 | | | Net assets,
end of period
(in millions) | | | expenses to
average net
assets before
waivers/
reimburse-
ments4 | | | expenses to
average net
assets after
waivers/
reimburse-
ments3,4 | | | Net
effective
expense
ratio3,5 | | | Ratio of
net income
to average
net assets3 | |
| Class 529-A: | | | | | | | | | | | | | | | | | | | | | | | | | | | | | | | | | | | | | | | | | | | | | | | | | | | | | | | | |
| 4/30/20206,7 | | $ | 12.04 | | | $ | .11 | | | $ | (.17 | ) | | $ | (.06 | ) | | $ | (.21 | ) | | $ | (.36 | ) | | $ | (.57 | ) | | $ | 11.41 | | | | (.74 | )%8 | | $ | 1,067 | | | | .43 | %9 | | | .43 | %9 | | | .77 | %9 | | | 1.86 | %9 |
| 10/31/2019 | | | 11.33 | | | | .20 | | | | .97 | | | | 1.17 | | | | (.17 | ) | | | (.29 | ) | | | (.46 | ) | | | 12.04 | | | | 10.95 | | | | 952 | | | | .45 | | | | .45 | | | | .81 | | | | 1.76 | |
| 10/31/2018 | | | 11.67 | | | | .18 | | | | (.27 | ) | | | (.09 | ) | | | (.13 | ) | | | (.12 | ) | | | (.25 | ) | | | 11.33 | | | | (.78 | ) | | | 655 | | | | .43 | | | | .43 | | | | .81 | | | | 1.49 | |
| 10/31/2017 | | | 10.10 | | | | .17 | | | | 1.63 | | | | 1.80 | | | | (.14 | ) | | | (.09 | ) | | | (.23 | ) | | | 11.67 | | | | 18.15 | | | | 428 | | | | .34 | | | | .34 | | | | .73 | | | | 1.53 | |
| 10/31/2016 | | | 9.89 | | | | .15 | | | | .16 | | | | .31 | | | | (.10 | ) | | | — | | | | (.10 | ) | | | 10.10 | | | | 3.13 | | | | 166 | | | | .41 | | | | .39 | | | | .79 | | | | 1.54 | |
| 10/31/20156,13 | | | 10.00 | | | | .08 | | | | (.19 | ) | | | (.11 | ) | | | — | | | | — | | | | — | | | | 9.89 | | | | (1.10 | )8 | | | 40 | | | | .62 | 9 | | | .48 | 9 | | | .89 | 9 | | | 1.33 | 9 |
| Class 529-C: | | | | | | | | | | | | | | | | | | | | | | | | | | | | | | | | | | | | | | | | | | | | | | | | | | | | | | | | |
| 4/30/20206,7 | | | 11.88 | | | | .06 | | | | (.16 | ) | | | (.10 | ) | | | (.13 | ) | | | (.36 | ) | | | (.49 | ) | | | 11.29 | | | | (1.06 | )8 | | | 101 | | | | 1.17 | 9 | | | 1.17 | 9 | | | 1.51 | 9 | | | 1.12 | 9 |
| 10/31/2019 | | | 11.18 | | | | .12 | | | | .96 | | | | 1.08 | | | | (.09 | ) | | | (.29 | ) | | | (.38 | ) | | | 11.88 | | | | 10.13 | | | | 94 | | | | 1.18 | | | | 1.18 | | | | 1.54 | | | | 1.03 | |
| 10/31/2018 | | | 11.53 | | | | .09 | | | | (.27 | ) | | | (.18 | ) | | | (.05 | ) | | | (.12 | ) | | | (.17 | ) | | | 11.18 | | | | (1.58 | ) | | | 73 | | | | 1.20 | | | | 1.20 | | | | 1.58 | | | | .72 | |
| 10/31/2017 | | | 10.00 | | | | .07 | | | | 1.63 | | | | 1.70 | | | | (.08 | ) | | | (.09 | ) | | | (.17 | ) | | | 11.53 | | | | 17.23 | | | | 58 | | | | 1.20 | | | | 1.20 | | | | 1.59 | | | | .70 | |
| 10/31/2016 | | | 9.85 | | | | .07 | | | | .15 | | | | .22 | | | | (.07 | ) | | | — | | | | (.07 | ) | | | 10.00 | | | | 2.21 | | | | 29 | | | | 1.24 | | | | 1.22 | | | | 1.62 | | | | .72 | |
| 10/31/20156,13 | | | 10.00 | | | | .04 | | | | (.19 | ) | | | (.15 | ) | | | — | | | | — | | | | — | | | | 9.85 | | | | (1.50 | )8 | | | 9 | | | | 1.36 | 9 | | | 1.21 | 9 | | | 1.62 | 9 | | | .66 | 9 |
| Class 529-E: | | | | | | | | | | | | | | | | | | | | | | | | | | | | | | | | | | | | | | | | | | | | | | | | | | | | | | | | |
| 4/30/20206,7 | | | 11.98 | | | | .10 | | | | (.18 | ) | | | (.08 | ) | | | (.18 | ) | | | (.36 | ) | | | (.54 | ) | | | 11.36 | | | | (.83 | )8 | | | 35 | | | | .65 | 9 | | | .65 | 9 | | | .99 | 9 | | | 1.64 | 9 |
| 10/31/2019 | | | 11.28 | | | | .18 | | | | .96 | | | | 1.14 | | | | (.15 | ) | | | (.29 | ) | | | (.44 | ) | | | 11.98 | | | | 10.69 | | | | 31 | | | | .66 | | | | .66 | | | | 1.02 | | | | 1.55 | |
| 10/31/2018 | | | 11.62 | | | | .15 | | | | (.26 | ) | | | (.11 | ) | | | (.11 | ) | | | (.12 | ) | | | (.23 | ) | | | 11.28 | | | | (1.01 | ) | | | 21 | | | | .67 | | | | .67 | | | | 1.05 | | | | 1.26 | |
| 10/31/2017 | | | 10.06 | | | | .13 | | | | 1.64 | | | | 1.77 | | | | (.12 | ) | | | (.09 | ) | | | (.21 | ) | | | 11.62 | | | | 17.87 | | | | 13 | | | | .67 | | | | .67 | | | | 1.06 | | | | 1.19 | |
| 10/31/2016 | | | 9.88 | | | | .13 | | | | .14 | | | | .27 | | | | (.09 | ) | | | — | | | | (.09 | ) | | | 10.06 | | | | 2.78 | | | | 5 | | | | .71 | | | | .69 | | | | 1.09 | | | | 1.29 | |
| 10/31/20156,13 | | | 10.00 | | | | .06 | | | | (.18 | ) | | | (.12 | ) | | | — | | | | — | | | | — | | | | 9.88 | | | | (1.20 | )8 | | | 1 | | | | .80 | 9 | | | .68 | 9 | | | 1.09 | 9 | | | .95 | 9 |
| Class 529-T: | | | | | | | | | | | | | | | | | | | | | | | | | | | | | | | | | | | | | | | | | | | | | | | | | | | | | | | | |
| 4/30/20206,7 | | | 12.07 | | | | .12 | | | | (.17 | ) | | | (.05 | ) | | | (.23 | ) | | | (.36 | ) | | | (.59 | ) | | | 11.43 | | | | (.67 | )8,11 | | | — | 12 | | | .22 | 9,11 | | | .22 | 9,11 | | | .56 | 9,11 | | | 2.08 | 9,11 |
| 10/31/2019 | | | 11.35 | | | | .23 | | | | .97 | | | | 1.20 | | | | (.19 | ) | | | (.29 | ) | | | (.48 | ) | | | 12.07 | | | | 11.19 | 11 | | | — | 12 | | | .24 | 11 | | | .24 | 11 | | | .60 | 11 | | | 1.99 | 11 |
| 10/31/2018 | | | 11.67 | | | | .20 | | | | (.26 | ) | | | (.06 | ) | | | (.14 | ) | | | (.12 | ) | | | (.26 | ) | | | 11.35 | | | | (.52 | )11 | | | — | 12 | | | .25 | 11 | | | .25 | 11 | | | .63 | 11 | | | 1.68 | 11 |
| 10/31/20176,14 | | | 10.61 | | | | .08 | | | | .98 | | | | 1.06 | | | | — | | | | — | | | | — | | | | 11.67 | | | | 9.99 | 8,11 | | | — | 12 | | | .23 | 9,11 | | | .23 | 9,11 | | | .62 | 9,11 | | | 1.34 | 9,11 |
| Class 529-F-1: | | | | | | | | | | | | | | | | | | | | | | | | | | | | | | | | | | | | | | | | | | | | | | | | | | | | | | | | |
| 4/30/20206,7 | | | 12.10 | | | | .12 | | | | (.18 | ) | | | (.06 | ) | | | (.23 | ) | | | (.36 | ) | | | (.59 | ) | | | 11.45 | | | | (.69 | )8 | | | 106 | | | | .18 | 9 | | | .18 | 9 | | | .52 | 9 | | | 2.11 | 9 |
| 10/31/2019 | | | 11.38 | | | | .23 | | | | .98 | | | | 1.21 | | | | (.20 | ) | | | (.29 | ) | | | (.49 | ) | | | 12.10 | | | | 11.29 | | | | 92 | | | | .19 | | | | .19 | | | | .55 | | | | 2.02 | |
| 10/31/2018 | | | 11.71 | | | | .20 | | | | (.26 | ) | | | (.06 | ) | | | (.15 | ) | | | (.12 | ) | | | (.27 | ) | | | 11.38 | | | | (.59 | ) | | | 61 | | | | .20 | | | | .20 | | | | .58 | | | | 1.72 | |
| 10/31/2017 | | | 10.12 | | | | .18 | | | | 1.65 | | | | 1.83 | | | | (.15 | ) | | | (.09 | ) | | | (.24 | ) | | | 11.71 | | | | 18.42 | | | | 33 | | | | .20 | | | | .20 | | | | .59 | | | | 1.67 | |
| 10/31/2016 | | | 9.91 | | | | .17 | | | | .14 | | | | .31 | | | | (.10 | ) | | | — | | | | (.10 | ) | | | 10.12 | | | | 3.21 | | | | 13 | | | | .24 | | | | .22 | | | | .62 | | | | 1.77 | |
| 10/31/20156,13 | | | 10.00 | | | | .09 | | | | (.18 | ) | | | (.09 | ) | | | — | | | | — | | | | — | | | | 9.91 | | | | (.90 | )8 | | | 4 | | | | .38 | 9 | | | .22 | 9 | | | .63 | 9 | | | 1.55 | 9 |
| 30 | American Funds College Target Date Series |
College 2030 Fund
| | | | | | (Loss) income from
investment operations1 | | | Dividends and distributions | | | | | | | | | | | | Ratio of | | | Ratio of | | | | | | | |
| Period ended | | Net asset
value,
beginning
of period | | | Net
investment
income | | | Net (losses)
gains on
securities
(both
realized and
unrealized) | | | Total from
investment
operations | | | Dividends
(from net
investment
income) | | | Distributions
(from capital
gains) | | | Total
dividends
and
distributions | | | Net asset
value,
end
of period | | | Total return2 | | | Net assets,
end of period
(in millions) | | | expenses to
average net
assets before
waivers/
reimburse-
ments4 | | | expenses to
average net
assets after
waivers/
reimburse-
ments3,4 | | | Net
effective
expense
ratio3,5 | | | Ratio of
net income
to average
net assets3 | |
| Class 529-A: | | | | | | | | | | | | | | | | | | | | | | | | | | | | | | | | | | | | | | | | | | | | | | | | | | | | | | | | |
| 4/30/20206,7 | | $ | 13.86 | | | $ | .13 | | | $ | (.14 | ) | | $ | (.01 | ) | | $ | (.27 | ) | | $ | (.35 | ) | | $ | (.62 | ) | | $ | 13.23 | | | | (.21 | )%8 | | $ | 1,608 | | | | .43 | %9 | | | .43 | %9 | | | .75 | %9 | | | 1.94 | %9 |
| 10/31/2019 | | | 13.32 | | | | .26 | | | | 1.07 | | | | 1.33 | | | | (.22 | ) | | | (.57 | ) | | | (.79 | ) | | | 13.86 | | | | 10.81 | | | | 1,482 | | | | .44 | | | | .44 | | | | .78 | | | | 1.95 | |
| 10/31/2018 | | | 13.83 | | | | .23 | | | | (.23 | ) | | | — | 15 | | | (.18 | ) | | | (.33 | ) | | | (.51 | ) | | | 13.32 | | | | (.07 | ) | | | 1,133 | | | | .43 | | | | .43 | | | | .79 | | | | 1.65 | |
| 10/31/2017 | | | 12.63 | | | | .20 | | | | 1.52 | | | | 1.72 | | | | (.20 | ) | | | (.32 | ) | | | (.52 | ) | | | 13.83 | | | | 14.16 | | | | 931 | | | | .41 | | | | .41 | | | | .78 | | | | 1.55 | |
| 10/31/2016 | | | 12.70 | | | | .19 | | | | .22 | | | | .41 | | | | (.18 | ) | | | (.30 | ) | | | (.48 | ) | | | 12.63 | | | | 3.42 | | | | 643 | | | | .42 | | | | .41 | | | | .79 | | | | 1.57 | |
| 10/31/2015 | | | 12.94 | | | | .20 | | | | (.12 | ) | | | .08 | | | | (.17 | ) | | | (.15 | ) | | | (.32 | ) | | | 12.70 | | | | .68 | | | | 454 | | | | .50 | | | | .40 | | | | .79 | | | | 1.55 | |
| Class 529-C: | | | | | | | | | | | | | | | | | | | | | | | | | | | | | | | | | | | | | | | | | | | | | | | | | | | | | | | | |
| 4/30/20206,7 | | | 13.61 | | | | .08 | | | | (.14 | ) | | | (.06 | ) | | | (.18 | ) | | | (.35 | ) | | | (.53 | ) | | | 13.02 | | | | (.60 | )8 | | | 226 | | | | 1.16 | 9 | | | 1.16 | 9 | | | 1.48 | 9 | | | 1.20 | 9 |
| 10/31/2019 | | | 13.09 | | | | .16 | | | | 1.05 | | | | 1.21 | | | | (.12 | ) | | | (.57 | ) | | | (.69 | ) | | | 13.61 | | | | 9.94 | | | | 218 | | | | 1.18 | | | | 1.18 | | | | 1.52 | | | | 1.21 | |
| 10/31/2018 | | | 13.60 | | | | .12 | | | | (.22 | ) | | | (.10 | ) | | | (.08 | ) | | | (.33 | ) | | | (.41 | ) | | | 13.09 | | | | (.82 | ) | | | 185 | | | | 1.19 | | | | 1.19 | | | | 1.55 | | | | .87 | |
| 10/31/2017 | | | 12.44 | | | | .10 | | | | 1.49 | | | | 1.59 | | | | (.11 | ) | | | (.32 | ) | | | (.43 | ) | | | 13.60 | | | | 13.23 | | | | 174 | | | | 1.20 | | | | 1.20 | | | | 1.57 | | | | .77 | |
| 10/31/2016 | | | 12.53 | | | | .09 | | | | .22 | | | | .31 | | | | (.10 | ) | | | (.30 | ) | | | (.40 | ) | | | 12.44 | | | | 2.56 | | | | 132 | | | | 1.23 | | | | 1.22 | | | | 1.60 | | | | .77 | |
| 10/31/2015 | | | 12.79 | | | | .09 | | | | (.10 | ) | | | (.01 | ) | | | (.10 | ) | | | (.15 | ) | | | (.25 | ) | | | 12.53 | | | | (.08 | ) | | | 97 | | | | 1.32 | | | | 1.22 | | | | 1.61 | | | | .71 | |
| Class 529-E: | | | | | | | | | | | | | | | | | | | | | | | | | | | | | | | | | | | | | | | | | | | | | | | | | | | | | | | | |
| 4/30/20206,7 | | | 13.76 | | | | .12 | | | | (.14 | ) | | | (.02 | ) | | | (.25 | ) | | | (.35 | ) | | | (.60 | ) | | | 13.14 | | | | (.33 | )8 | | | 57 | | | | .64 | 9 | | | .64 | 9 | | | .96 | 9 | | | 1.73 | 9 |
| 10/31/2019 | | | 13.23 | | | | .23 | | | | 1.06 | | | | 1.29 | | | | (.19 | ) | | | (.57 | ) | | | (.76 | ) | | | 13.76 | | | | 10.56 | | | | 53 | | | | .65 | | | | .65 | | | | .99 | | | | 1.74 | |
| 10/31/2018 | | | 13.75 | | | | .19 | | | | (.23 | ) | | | (.04 | ) | | | (.15 | ) | | | (.33 | ) | | | (.48 | ) | | | 13.23 | | | | (.35 | ) | | | 41 | | | | .66 | | | | .66 | | | | 1.02 | | | | 1.41 | |
| 10/31/2017 | | | 12.56 | | | | .17 | | | | 1.51 | | | | 1.68 | | | | (.17 | ) | | | (.32 | ) | | | (.49 | ) | | | 13.75 | | | | 13.89 | | | | 33 | | | | .66 | | | | .66 | | | | 1.03 | | | | 1.30 | |
| 10/31/2016 | | | 12.64 | | | | .16 | | | | .22 | | | | .38 | | | | (.16 | ) | | | (.30 | ) | | | (.46 | ) | | | 12.56 | | | | 3.13 | | | | 22 | | | | .70 | | | | .68 | | | | 1.06 | | | | 1.29 | |
| 10/31/2015 | | | 12.89 | | | | .16 | | | | (.12 | ) | | | .04 | | | | (.14 | ) | | | (.15 | ) | | | (.29 | ) | | | 12.64 | | | | .36 | | | | 15 | | | | .79 | | | | .69 | | | | 1.08 | | | | 1.25 | |
| Class 529-T: | | | | | | | | | | | | | | | | | | | | | | | | | | | | | | | | | | | | | | | | | | | | | | | | | | | | | | | | |
| 4/30/20206,7 | | | 13.88 | | | | .14 | | | | (.13 | ) | | | .01 | | | | (.30 | ) | | | (.35 | ) | | | (.65 | ) | | | 13.24 | | | | (.11 | )8,11 | | | — | 12 | | | .22 | 9,11 | | | .22 | 9,11 | | | .54 | 9,11 | | | 2.15 | 9,11 |
| 10/31/2019 | | | 13.33 | | | | .29 | | | | 1.07 | | | | 1.36 | | | | (.24 | ) | | | (.57 | ) | | | (.81 | ) | | | 13.88 | | | | 11.07 | 11 | | | — | 12 | | | .24 | 11 | | | .24 | 11 | | | .58 | 11 | | | 2.16 | 11 |
| 10/31/2018 | | | 13.85 | | | | .25 | | | | (.23 | ) | | | .02 | | | | (.21 | ) | | | (.33 | ) | | | (.54 | ) | | | 13.33 | | | | .05 | 11 | | | — | 12 | | | .24 | 11 | | | .24 | 11 | | | .60 | 11 | | | 1.82 | 11 |
| 10/31/20176,14 | | | 12.82 | | | | .11 | | | | .92 | | | | 1.03 | | | | — | | | | — | | | | — | | | | 13.85 | | | | 8.03 | 8,11 | | | — | 12 | | | .23 | 9,11 | | | .23 | 9,11 | | | .60 | 9,11 | | | 1.48 | 9,11 |
| Class 529-F-1: | | | | | | | | | | | | | | | | | | | | | | | | | | | | | | | | | | | | | | | | | | | | | | | | | | | | | | | | |
| 4/30/20206,7 | | | 13.93 | | | | .15 | | | | (.14 | ) | | | .01 | | | | (.31 | ) | | | (.35 | ) | | | (.66 | ) | | | 13.28 | | | | (.13 | )8 | | | 165 | | | | .18 | 9 | | | .18 | 9 | | | .50 | 9 | | | 2.19 | 9 |
| 10/31/2019 | | | 13.38 | | | | .29 | | | | 1.08 | | | | 1.37 | | | | (.25 | ) | | | (.57 | ) | | | (.82 | ) | | | 13.93 | | | | 11.14 | | | | 148 | | | | .19 | | | | .19 | | | | .53 | | | | 2.20 | |
| 10/31/2018 | | | 13.89 | | | | .26 | | | | (.23 | ) | | | .03 | | | | (.21 | ) | | | (.33 | ) | | | (.54 | ) | | | 13.38 | | | | .13 | | | | 103 | | | | .19 | | | | .19 | | | | .55 | | | | 1.87 | |
| 10/31/2017 | | | 12.68 | | | | .23 | | | | 1.52 | | | | 1.75 | | | | (.22 | ) | | | (.32 | ) | | | (.54 | ) | | | 13.89 | | | | 14.39 | | | | 72 | | | | .20 | | | | .20 | | | | .57 | | | | 1.76 | |
| 10/31/2016 | | | 12.75 | | | | .22 | | | | .21 | | | | .43 | | | | (.20 | ) | | | (.30 | ) | | | (.50 | ) | | | 12.68 | | | | 3.55 | | | | 42 | | | | .23 | | | | .21 | | | | .59 | | | | 1.76 | |
| 10/31/2015 | | | 12.98 | | | | .22 | | | | (.11 | ) | | | .11 | | | | (.19 | ) | | | (.15 | ) | | | (.34 | ) | | | 12.75 | | | | .87 | | | | 28 | | | | .32 | | | | .22 | | | | .61 | | | | 1.72 | |
See end of tables for footnotes.
| American Funds College Target Date Series | 31 |
Financial highlights(continued)
College 2027 Fund
| | | | | | Income (loss) from
investment operations1 | | | Dividends and distributions | | | | | | | | | | | | Ratio of | | | Ratio of | | | | | | | |
| Period ended | | Net asset
value,
beginning
of period | | | Net
investment
income | | | Net (losses)
gains on
securities
(both
realized and
unrealized) | | | Total from
investment
operations | | | Dividends
(from net
investment
income) | | | Distributions
(from capital
gains) | | | Total
dividends
and
distributions | | | Net asset
value,
end
of period | | | Total return2 | | | Net assets,
end of period
(in millions) | | | expenses to
average net
assets before
waivers/
reimburse-
ments4 | | | expenses to
average net
assets after
waivers/
reimburse-
ments3,4 | | | Net
effective
expense
ratio3,5 | | | Ratio of
net income
to average
net assets3 | |
| Class 529-A: | | | | | | | | | | | | | | | | | | | | | | | | | | | | | | | | | | | | | | | | | | | | | | | | | | | | | | | | |
| 4/30/20206,7 | | $ | 13.06 | | | $ | .14 | | | $ | (.06 | ) | | $ | .08 | | | $ | (.29 | ) | | $ | (.22 | ) | | $ | (.51 | ) | | $ | 12.63 | | | | .57 | %8 | | $ | 1,428 | | | | .43 | %9 | | | .43 | %9 | | | .69 | %9 | | | 2.17 | %9 |
| 10/31/2019 | | | 12.42 | | | | .27 | | | | .93 | | | | 1.20 | | | | (.23 | ) | | | (.33 | ) | | | (.56 | ) | | | 13.06 | | | | 10.23 | | | | 1,303 | | | | .44 | | | | .44 | | | | .73 | | | | 2.15 | |
| 10/31/2018 | | | 12.92 | | | | .24 | | | | (.24 | ) | | | — | | | | (.19 | ) | | | (.31 | ) | | | (.50 | ) | | | 12.42 | | | | (.11 | ) | | | 969 | | | | .43 | | | | .43 | | | | .75 | | | | 1.91 | |
| 10/31/2017 | | | 12.17 | | | | .20 | | | | 1.06 | | | | 1.26 | | | | (.19 | ) | | | (.32 | ) | | | (.51 | ) | | | 12.92 | | | | 10.76 | | | | 777 | | | | .41 | | | | .41 | | | | .76 | | | | 1.65 | |
| 10/31/2016 | | | 12.26 | | | | .20 | | | | .23 | | | | .43 | | | | (.19 | ) | | | (.33 | ) | | | (.52 | ) | | | 12.17 | | | | 3.70 | | | | 537 | | | | .44 | | | | .42 | | | | .78 | | | | 1.64 | |
| 10/31/2015 | | | 12.54 | | | | .20 | | | | (.14 | ) | | | .06 | | | | (.17 | ) | | | (.17 | ) | | | (.34 | ) | | | 12.26 | | | | .53 | | | | 379 | | | | .52 | | | | .42 | | | | .78 | | | | 1.65 | |
| Class 529-C: | | | | | | | | | | | | | | | | | | | | | | | | | | | | | | | | | | | | | | | | | | | | | | | | | | | | | | | | |
| 4/30/20206,7 | | | 12.85 | | | | .09 | | | | (.06 | ) | | | .03 | | | | (.20 | ) | | | (.22 | ) | | | (.42 | ) | | | 12.46 | | | | .19 | 8 | | | 217 | | | | 1.16 | 9 | | | 1.16 | 9 | | | 1.42 | 9 | | | 1.43 | 9 |
| 10/31/2019 | | | 12.22 | | | | .18 | | | | .92 | | | | 1.10 | | | | (.14 | ) | | | (.33 | ) | | | (.47 | ) | | | 12.85 | | | | 9.46 | | | | 206 | | | | 1.18 | | | | 1.18 | | | | 1.47 | | | | 1.41 | |
| 10/31/2018 | | | 12.72 | | | | .14 | | | | (.24 | ) | | | (.10 | ) | | | (.09 | ) | | | (.31 | ) | | | (.40 | ) | | | 12.22 | | | | (.89 | ) | | | 177 | | | | 1.19 | | | | 1.19 | | | | 1.51 | | | | 1.14 | |
| 10/31/2017 | | | 11.99 | | | | .11 | | | | 1.05 | | | | 1.16 | | | | (.11 | ) | | | (.32 | ) | | | (.43 | ) | | | 12.72 | | | | 9.97 | | | | 167 | | | | 1.19 | | | | 1.19 | | | | 1.54 | | | | .87 | |
| 10/31/2016 | | | 12.10 | | | | .10 | | | | .23 | | | | .33 | | | | (.11 | ) | | | (.33 | ) | | | (.44 | ) | | | 11.99 | | | | 2.86 | | | | 128 | | | | 1.23 | | | | 1.22 | | | | 1.58 | | | | .85 | |
| 10/31/2015 | | | 12.40 | | | | .10 | | | | (.14 | ) | | | (.04 | ) | | | (.09 | ) | | | (.17 | ) | | | (.26 | ) | | | 12.10 | | | | (.26 | ) | | | 96 | | | | 1.32 | | | | 1.22 | | | | 1.58 | | | | .85 | |
| Class 529-E: | | | | | | | | | | | | | | | | | | | | | | | | | | | | | | | | | | | | | | | | | | | | | | | | | | | | | | | | |
| 4/30/20206,7 | | | 12.96 | | | | .12 | | | | (.05 | ) | | | .07 | | | | (.27 | ) | | | (.22 | ) | | | (.49 | ) | | | 12.54 | | | | .47 | 8 | | | 52 | | | | .64 | 9 | | | .64 | 9 | | | .90 | 9 | | | 1.96 | 9 |
| 10/31/2019 | | | 12.33 | | | | .24 | | | | .93 | | | | 1.17 | | | | (.21 | ) | | | (.33 | ) | | | (.54 | ) | | | 12.96 | | | | 10.01 | | | | 47 | | | | .65 | | | | .65 | | | | .94 | | | | 1.94 | |
| 10/31/2018 | | | 12.83 | | | | .21 | | | | (.24 | ) | | | (.03 | ) | | | (.16 | ) | | | (.31 | ) | | | (.47 | ) | | | 12.33 | | | | (.35 | ) | | | 35 | | | | .66 | | | | .66 | | | | .98 | | | | 1.69 | |
| 10/31/2017 | | | 12.09 | | | | .17 | | | | 1.05 | | | | 1.22 | | | | (.16 | ) | | | (.32 | ) | | | (.48 | ) | | | 12.83 | | | | 10.51 | | | | 27 | | | | .66 | | | | .66 | | | | 1.01 | | | | 1.40 | |
| 10/31/2016 | | | 12.19 | | | | .16 | | | | .23 | | | | .39 | | | | (.16 | ) | | | (.33 | ) | | | (.49 | ) | | | 12.09 | | | | 3.44 | | | | 20 | | | | .70 | | | | .68 | | | | 1.04 | | | | 1.39 | |
| 10/31/2015 | | | 12.48 | | | | .17 | | | | (.15 | ) | | | .02 | | | | (.14 | ) | | | (.17 | ) | | | (.31 | ) | | | 12.19 | | | | .23 | | | | 14 | | | | .79 | | | | .69 | | | | 1.05 | | | | 1.39 | |
| Class 529-T: | | | | | | | | | | | | | | | | | | | | | | | | | | | | | | | | | | | | | | | | | | | | | | | | | | | | | | | | |
| 4/30/20206,7 | | | 13.09 | | | | .15 | | | | (.06 | ) | | | .09 | | | | (.31 | ) | | | (.22 | ) | | | (.53 | ) | | | 12.65 | | | | .66 | 8,11 | | | — | 12 | | | .22 | 9,11 | | | .22 | 9,11 | | | .48 | 9,11 | | | 2.37 | 9,11 |
| 10/31/2019 | | | 12.44 | | | | .30 | | | | .93 | | | | 1.23 | | | | (.25 | ) | | | (.33 | ) | | | (.58 | ) | | | 13.09 | | | | 10.49 | 11 | | | — | 12 | | | .23 | 11 | | | .23 | 11 | | | .52 | 11 | | | 2.36 | 11 |
| 10/31/2018 | | | 12.94 | | | | .27 | | | | (.25 | ) | | | .02 | | | | (.21 | ) | | | (.31 | ) | | | (.52 | ) | | | 12.44 | | | | .08 | 11 | | | — | 12 | | | .24 | 11 | | | .24 | 11 | | | .56 | 11 | | | 2.09 | 11 |
| 10/31/20176,14 | | | 12.18 | | | | .12 | | | | .64 | | | | .76 | | | | — | | | | — | | | | — | | | | 12.94 | | | | 6.24 | 8,11 | | | — | 12 | | | .23 | 9,11 | | | .23 | 9,11 | | | .58 | 9,11 | | | 1.67 | 9,11 |
| Class 529-F-1: | | | | | | | | | | | | | | | | | | | | | | | | | | | | | | | | | | | | | | | | | | | | | | | | | | | | | | | | |
| 4/30/20206,7 | | | 13.14 | | | | .15 | | | | (.06 | ) | | | .09 | | | | (.32 | ) | | | (.22 | ) | | | (.54 | ) | | | 12.69 | | | | .64 | 8 | | | 174 | | | | .18 | 9 | | | .18 | 9 | | | .44 | 9 | | | 2.41 | 9 |
| 10/31/2019 | | | 12.49 | | | | .30 | | | | .94 | | | | 1.24 | | | | (.26 | ) | | | (.33 | ) | | | (.59 | ) | | | 13.14 | | | | 10.55 | | | | 157 | | | | .19 | | | | .19 | | | | .48 | | | | 2.40 | |
| 10/31/2018 | | | 12.98 | | | | .27 | | | | (.24 | ) | | | .03 | | | | (.21 | ) | | | (.31 | ) | | | (.52 | ) | | | 12.49 | | | | .17 | | | | 112 | | | | .19 | | | | .19 | | | | .51 | | | | 2.15 | |
| 10/31/2017 | | | 12.22 | | | | .23 | | | | 1.06 | | | | 1.29 | | | | (.21 | ) | | | (.32 | ) | | | (.53 | ) | | | 12.98 | | | | 11.02 | | | | 75 | | | | .20 | | | | .20 | | | | .55 | | | | 1.86 | |
| 10/31/2016 | | | 12.31 | | | | .22 | | | | .23 | | | | .45 | | | | (.21 | ) | | | (.33 | ) | | | (.54 | ) | | | 12.22 | | | | 3.87 | | | | 43 | | | | .23 | | | | .21 | | | | .57 | | | | 1.86 | |
| 10/31/2015 | | | 12.58 | | | | .23 | | | | (.14 | ) | | | .09 | | | | (.19 | ) | | | (.17 | ) | | | (.36 | ) | | | 12.31 | | | | .76 | | | | 28 | | | | .32 | | | | .22 | | | | .58 | | | | 1.85 | |
| 32 | American Funds College Target Date Series |
College 2024 Fund
| | | | | | Income (loss) from
investment operations1 | | | Dividends and distributions | | | | | | | | | | | | Ratio of | | | Ratio of | | | | | | | |
| Period ended | | Net asset
value,
beginning
of period | | | Net
investment
income | | | Net gains
(losses) on
securities
(both
realized and
unrealized) | | | Total from
investment
operations | | | Dividends
(from net
investment
income) | | | Distributions
(from capital
gains) | | | Total
dividends
and
distributions | | | Net asset
value,
end
of period | | | Total return2 | | | Net assets,
end of period
(in millions) | | | expenses to
average net
assets before
waivers/
reimburse-
ments4 | | | expenses to
average net
assets after
waivers/
reimburse-
ments3,4 | | | Net
effective
expense
ratio3,5 | | | Ratio of
net income
to average
net assets3 | |
| Class 529-A: | | | | | | | | | | | | | | | | | | | | | | | | | | | | | | | | | | | | | | | | | | | | | | | | | | | | | | | | |
| 4/30/20206,7 | | $ | 12.38 | | | $ | .13 | | | $ | .12 | | | $ | .25 | | | $ | (.28 | ) | | $ | (.12 | ) | | $ | (.40 | ) | | $ | 12.23 | | | | 2.07 | %8 | | $ | 1,713 | | | | .42 | %9 | | | .42 | %9 | | | .67 | %9 | | | 2.17 | %9 |
| 10/31/2019 | | | 11.78 | | | | .27 | | | | .74 | | | | 1.01 | | | | (.23 | ) | | | (.18 | ) | | | (.41 | ) | | | 12.38 | | | | 8.85 | | | | 1,544 | | | | .43 | | | | .43 | | | | .70 | | | | 2.23 | |
| 10/31/2018 | | | 12.09 | | | | .23 | | | | (.22 | ) | | | .01 | | | | (.19 | ) | | | (.13 | ) | | | (.32 | ) | | | 11.78 | | | | .02 | | | | 1,168 | | | | .43 | | | | .43 | | | | .71 | | | | 1.96 | |
| 10/31/2017 | | | 11.65 | | | | .21 | | | | .62 | | | | .83 | | | | (.20 | ) | | | (.19 | ) | | | (.39 | ) | | | 12.09 | | | | 7.36 | | | | 935 | | | | .42 | | | | .42 | | | | .70 | | | | 1.75 | |
| 10/31/2016 | | | 11.81 | | | | .20 | | | | .22 | | | | .42 | | | | (.20 | ) | | | (.38 | ) | | | (.58 | ) | | | 11.65 | | | | 3.79 | | | | 681 | | | | .44 | | | | .43 | | | | .73 | | | | 1.77 | |
| 10/31/2015 | | | 12.11 | | | | .21 | | | | (.18 | ) | | | .03 | | | | (.17 | ) | | | (.16 | ) | | | (.33 | ) | | | 11.81 | | | | .25 | | | | 484 | | | | .53 | | | | .43 | | | | .76 | | | | 1.76 | |
| Class 529-C: | | | | | | | | | | | | | | | | | | | | | | | | | | | | | | | | | | | | | | | | | | | | | | | | | | | | | | | | |
| 4/30/20206,7 | | | 12.18 | | | | .09 | | | | .11 | | | | .20 | | | | (.20 | ) | | | (.12 | ) | | | (.32 | ) | | | 12.06 | | | | 1.68 | 8 | | | 340 | | | | 1.16 | 9 | | | 1.16 | 9 | | | 1.41 | 9 | | | 1.43 | 9 |
| 10/31/2019 | | | 11.60 | | | | .18 | | | | .72 | | | | .90 | | | | (.14 | ) | | | (.18 | ) | | | (.32 | ) | | | 12.18 | | | | 8.02 | | | | 308 | | | | 1.17 | | | | 1.17 | | | | 1.44 | | | | 1.49 | |
| 10/31/2018 | | | 11.90 | | | | .14 | | | | (.22 | ) | | | (.08 | ) | | | (.09 | ) | | | (.13 | ) | | | (.22 | ) | | | 11.60 | | | | (.71 | ) | | | 244 | | | | 1.18 | | | | 1.18 | | | | 1.46 | | | | 1.18 | |
| 10/31/2017 | | | 11.48 | | | | .11 | | | | .62 | | | | .73 | | | | (.12 | ) | | | (.19 | ) | | | (.31 | ) | | | 11.90 | | | | 6.56 | | | | 236 | | | | 1.19 | | | | 1.19 | | | | 1.47 | | | | .98 | |
| 10/31/2016 | | | 11.66 | | | | .11 | | | | .22 | | | | .33 | | | | (.13 | ) | | | (.38 | ) | | | (.51 | ) | | | 11.48 | | | | 2.94 | | | | 176 | | | | 1.23 | | | | 1.21 | | | | 1.51 | | | | .99 | |
| 10/31/2015 | | | 11.98 | | | | .11 | | | | (.17 | ) | | | (.06 | ) | | | (.10 | ) | | | (.16 | ) | | | (.26 | ) | | | 11.66 | | | | (.54 | ) | | | 126 | | | | 1.32 | | | | 1.22 | | | | 1.55 | | | | .97 | |
| Class 529-E: | | | | | | | | | | | | | | | | | | | | | | | | | | | | | | | | | | | | | | | | | | | | | | | | | | | | | | | | |
| 4/30/20206,7 | | | 12.32 | | | | .12 | | | | .11 | | | | .23 | | | | (.26 | ) | | | (.12 | ) | | | (.38 | ) | | | 12.17 | | | | 1.88 | 8 | | | 78 | | | | .64 | 9 | | | .64 | 9 | | | .89 | 9 | | | 1.95 | 9 |
| 10/31/2019 | | | 11.72 | | | | .24 | | | | .74 | | | | .98 | | | | (.20 | ) | | | (.18 | ) | | | (.38 | ) | | | 12.32 | | | | 8.67 | | | | 70 | | | | .65 | | | | .65 | | | | .92 | | | | 2.01 | |
| 10/31/2018 | | | 12.04 | | | | .20 | | | | (.23 | ) | | | (.03 | ) | | | (.16 | ) | | | (.13 | ) | | | (.29 | ) | | | 11.72 | | | | (.27 | ) | | | 54 | | | | .66 | | | | .66 | | | | .94 | | | | 1.73 | |
| 10/31/2017 | | | 11.60 | | | | .18 | | | | .63 | | | | .81 | | | | (.18 | ) | | | (.19 | ) | | | (.37 | ) | | | 12.04 | | | | 7.17 | | | | 43 | | | | .66 | | | | .66 | | | | .94 | | | | 1.50 | |
| 10/31/2016 | | | 11.76 | | | | .17 | | | | .23 | | | | .40 | | | | (.18 | ) | | | (.38 | ) | | | (.56 | ) | | | 11.60 | | | | 3.54 | | | | 32 | | | | .70 | | | | .68 | | | | .98 | | | | 1.51 | |
| 10/31/2015 | | | 12.07 | | | | .18 | | | | (.19 | ) | | | (.01 | ) | | | (.14 | ) | | | (.16 | ) | | | (.30 | ) | | | 11.76 | | | | (.08 | ) | | | 22 | | | | .79 | | | | .69 | | | | 1.02 | | | | 1.50 | |
| Class 529-T: | | | | | | | | | | | | | | | | | | | | | | | | | | | | | | | | | | | | | | | | | | | | | | | | | | | | | | | | |
| 4/30/20206,7 | | | 12.40 | | | | .14 | | | | .12 | | | | .26 | | | | (.30 | ) | | | (.12 | ) | | | (.42 | ) | | | 12.24 | | | | 2.15 | 8,11 | | | — | 12 | | | .20 | 9,11 | | | .20 | 9,11 | | | .45 | 9,11 | | | 2.39 | 9,11 |
| 10/31/2019 | | | 11.80 | | | | .29 | | | | .73 | | | | 1.02 | | | | (.24 | ) | | | (.18 | ) | | | (.42 | ) | | | 12.40 | | | | 9.02 | 11 | | | — | 12 | | | .23 | 11 | | | .23 | 11 | | | .50 | 11 | | | 2.43 | 11 |
| 10/31/2018 | | | 12.11 | | | | .25 | | | | (.22 | ) | | | .03 | | | | (.21 | ) | | | (.13 | ) | | | (.34 | ) | | | 11.80 | | | | .22 | 11 | | | — | 12 | | | .24 | 11 | | | .24 | 11 | | | .52 | 11 | | | 2.14 | 11 |
| 10/31/20176,14 | | | 11.62 | | | | .12 | | | | .37 | | | | .49 | | | | — | | | | — | | | | — | | | | 12.11 | | | | 4.22 | 8,11 | | | — | 12 | | | .23 | 9,11 | | | .23 | 9,11 | | | .51 | 9,11 | | | 1.77 | 9,11 |
| Class 529-F-1: | | | | | | | | | | | | | | | | | | | | | | | | | | | | | | | | | | | | | | | | | | | | | | | | | | | | | | | | |
| 4/30/20206,7 | | | 12.44 | | | | .15 | | | | .11 | | | | .26 | | | | (.31 | ) | | | (.12 | ) | | | (.43 | ) | | | 12.27 | | | | 2.12 | 8 | | | 213 | | | | .18 | 9 | | | .18 | 9 | | | .43 | 9 | | | 2.41 | 9 |
| 10/31/2019 | | | 11.84 | | | | .30 | | | | .74 | | | | 1.04 | | | | (.26 | ) | | | (.18 | ) | | | (.44 | ) | | | 12.44 | | | | 9.09 | | | | 188 | | | | .19 | | | | .19 | | | | .46 | | | | 2.47 | |
| 10/31/2018 | | | 12.14 | | | | .26 | | | | (.22 | ) | | | .04 | | | | (.21 | ) | | | (.13 | ) | | | (.34 | ) | | | 11.84 | | | | .30 | | | | 135 | | | | .19 | | | | .19 | | | | .47 | | | | 2.19 | |
| 10/31/2017 | | | 11.69 | | | | .23 | | | | .63 | | | | .86 | | | | (.22 | ) | | | (.19 | ) | | | (.41 | ) | | | 12.14 | | | | 7.63 | | | | 92 | | | | .19 | | | | .19 | | | | .47 | | | | 1.97 | |
| 10/31/2016 | | | 11.85 | | | | .23 | | | | .21 | | | | .44 | | | | (.22 | ) | | | (.38 | ) | | | (.60 | ) | | | 11.69 | | | | 3.97 | | | | 57 | | | | .23 | | | | .21 | | | | .51 | | | | 1.99 | |
| 10/31/2015 | | | 12.15 | | | | .23 | | | | (.18 | ) | | | .05 | | | | (.19 | ) | | | (.16 | ) | | | (.35 | ) | | | 11.85 | | | | .41 | | | | 36 | | | | .32 | | | | .22 | | | | .55 | | | | 1.97 | |
See end of tables for footnotes.
| American Funds College Target Date Series | 33 |
Financial highlights(continued)
College 2021 Fund
| | | | | | Income (loss) from
investment operations1 | | | Dividends and distributions | | | | | | | | | | | | Ratio of | | | Ratio of | | | | | | | |
| Period ended | | Net asset
value,
beginning
of period | | | Net
investment
income | | | Net gains
(losses) on
securities
(both
realized and
unrealized) | | | Total from
investment
operations | | | Dividends
(from net
investment
income) | | | Distributions
(from capital
gains) | | | Total
dividends
and
distributions | | | Net asset
value,
end
of period | | | Total return2 | | | Net assets,
end of period
(in millions) | | | expenses to
average net
assets before
waivers/
reimburse-
ments4 | | | expenses to
average net
assets after
waivers/
reimburse-
ments3,4 | | | Net
effective
expense
ratio3,5 | | | Ratio of
net income
to average
net assets3 | |
| Class 529-A: | | | | | | | | | | | | | | | | | | | | | | | | | | | | | | | | | | | | | | | | | | | | | | | | | | | | | | | | |
| 4/30/20206,7 | | $ | 11.48 | | | $ | .11 | | | $ | .26 | | | $ | .37 | | | $ | (.24 | ) | | $ | (.09 | ) | | $ | (.33 | ) | | $ | 11.52 | | | | 3.34 | %8 | | $ | 1,535 | | | | .42 | %9 | | | .42 | %9 | | | .69 | %9 | | | 1.86 | %9 |
| 10/31/2019 | | | 10.99 | | | | .23 | | | | .53 | | | | .76 | | | | (.19 | ) | | | (.08 | ) | | | (.27 | ) | | | 11.48 | | | | 7.08 | | | | 1,421 | | | | .43 | | | | .43 | | | | .72 | | | | 2.07 | |
| 10/31/2018 | | | 11.38 | | | | .19 | | | | (.33 | ) | | | (.14 | ) | | | (.15 | ) | | | (.10 | ) | | | (.25 | ) | | | 10.99 | | | | (1.27 | ) | | | 1,142 | | | | .43 | | | | .43 | | | | .72 | | | | 1.76 | |
| 10/31/2017 | | | 11.39 | | | | .17 | | | | .16 | | | | .33 | | | | (.19 | ) | | | (.15 | ) | | | (.34 | ) | | | 11.38 | | | | 3.07 | | | | 961 | | | | .43 | | | | .43 | | | | .71 | | | | 1.52 | |
| 10/31/2016 | | | 11.44 | | | | .19 | | | | .20 | | | | .39 | | | | (.20 | ) | | | (.24 | ) | | | (.44 | ) | | | 11.39 | | | | 3.62 | | | | 745 | | | | .45 | | | | .44 | | | | .72 | | | | 1.69 | |
| 10/31/2015 | | | 11.61 | | | | .21 | | | | (.11 | ) | | | .10 | | | | (.19 | ) | | | (.08 | ) | | | (.27 | ) | | | 11.44 | | | | .87 | | | | 531 | | | | .53 | | | | .43 | | | | .71 | | | | 1.80 | |
| Class 529-C: | | | | | | | | | | | | | | | | | | | | | | | | | | | | | | | | | | | | | | | | | | | | | | | | | | | | | | | | |
| 4/30/20206,7 | | | 11.30 | | | | .06 | | | | .27 | | | | .33 | | | | (.16 | ) | | | (.09 | ) | | | (.25 | ) | | | 11.38 | | | | 2.99 | 8 | | | 375 | | | | 1.16 | 9 | | | 1.16 | 9 | | | 1.43 | 9 | | | 1.12 | 9 |
| 10/31/2019 | | | 10.83 | | | | .15 | | | | .52 | | | | .67 | | | | (.12 | ) | | | (.08 | ) | | | (.20 | ) | | | 11.30 | | | | 6.22 | | | | 357 | | | | 1.17 | | | | 1.17 | | | | 1.46 | | | | 1.33 | |
| 10/31/2018 | | | 11.21 | | | | .11 | | | | (.33 | ) | | | (.22 | ) | | | (.06 | ) | | | (.10 | ) | | | (.16 | ) | | | 10.83 | | | | (2.04 | ) | | | 314 | | | | 1.18 | | | | 1.18 | | | | 1.47 | | | | .99 | |
| 10/31/2017 | | | 11.23 | | | | .08 | | | | .17 | | | | .25 | | | | (.12 | ) | | | (.15 | ) | | | (.27 | ) | | | 11.21 | | | | 2.33 | | | | 325 | | | | 1.19 | | | | 1.19 | | | | 1.47 | | | | .76 | |
| 10/31/2016 | | | 11.30 | | | | .10 | | | | .20 | | | | .30 | | | | (.13 | ) | | | (.24 | ) | | | (.37 | ) | | | 11.23 | | | | 2.81 | | | | 246 | | | | 1.22 | | | | 1.21 | | | | 1.49 | | | | .92 | |
| 10/31/2015 | | | 11.49 | | | | .12 | | | | (.11 | ) | | | .01 | | | | (.12 | ) | | | (.08 | ) | | | (.20 | ) | | | 11.30 | | | | .09 | | | | 167 | | | | 1.32 | | | | 1.22 | | | | 1.50 | | | | 1.02 | |
| Class 529-E: | | | | | | | | | | | | | | | | | | | | | | | | | | | | | | | | | | | | | | | | | | | | | | | | | | | | | | | | |
| 4/30/20206,7 | | | 11.41 | | | | .09 | | | | .27 | | | | .36 | | | | (.22 | ) | | | (.09 | ) | | | (.31 | ) | | | 11.46 | | | | 3.23 | 8 | | | 84 | | | | .64 | 9 | | | .64 | 9 | | | .91 | 9 | | | 1.64 | 9 |
| 10/31/2019 | | | 10.93 | | | | .21 | | | | .52 | | | | .73 | | | | (.17 | ) | | | (.08 | ) | | | (.25 | ) | | | 11.41 | | | | 6.81 | | | | 78 | | | | .65 | | | | .65 | | | | .94 | | | | 1.85 | |
| 10/31/2018 | | | 11.33 | | | | .17 | | | | (.34 | ) | | | (.17 | ) | | | (.13 | ) | | | (.10 | ) | | | (.23 | ) | | | 10.93 | | | | (1.56 | ) | | | 63 | | | | .66 | | | | .66 | | | | .95 | | | | 1.53 | |
| 10/31/2017 | | | 11.34 | | | | .14 | | | | .17 | | | | .31 | | | | (.17 | ) | | | (.15 | ) | | | (.32 | ) | | | 11.33 | | | | 2.87 | | | | 52 | | | | .66 | | | | .66 | | | | .94 | | | | 1.28 | |
| 10/31/2016 | | | 11.39 | | | | .16 | | | | .21 | | | | .37 | | | | (.18 | ) | | | (.24 | ) | | | (.42 | ) | | | 11.34 | | | | 3.41 | | | | 38 | | | | .70 | | | | .68 | | | | .96 | | | | 1.45 | |
| 10/31/2015 | | | 11.57 | | | | .18 | | | | (.12 | ) | | | .06 | | | | (.16 | ) | | | (.08 | ) | | | (.24 | ) | | | 11.39 | | | | .55 | | | | 26 | | | | .79 | | | | .69 | | | | .97 | | | | 1.55 | |
| Class 529-T: | | | | | | | | | | | | | | | | | | | | | | | | | | | | | | | | | | | | | | | | | | | | | | | | | | | | | | | | |
| 4/30/20206,7 | | | 11.49 | | | | .12 | | | | .27 | | | | .39 | | | | (.26 | ) | | | (.09 | ) | | | (.35 | ) | | | 11.53 | | | | 3.52 | 8,11 | | | — | 12 | | | .21 | 9,11 | | | .21 | 9,11 | | | .48 | 9,11 | | | 2.07 | 9,11 |
| 10/31/2019 | | | 11.00 | | | | .25 | | | | .53 | | | | .78 | | | | (.21 | ) | | | (.08 | ) | | | (.29 | ) | | | 11.49 | | | | 7.26 | 11 | | | — | 12 | | | .23 | 11 | | | .23 | 11 | | | .52 | 11 | | | 2.27 | 11 |
| 10/31/2018 | | | 11.40 | | | | .21 | | | | (.33 | ) | | | (.12 | ) | | | (.18 | ) | | | (.10 | ) | | | (.28 | ) | | | 11.00 | | | | (1.15 | )11 | | | — | 12 | | | .24 | 11 | | | .24 | 11 | | | .53 | 11 | | | 1.94 | 11 |
| 10/31/20176,14 | | | 11.16 | | | | .10 | | | | .14 | | | | .24 | | | | — | | | | — | | | | — | | | | 11.40 | | | | 2.15 | 8,11 | | | — | 12 | | | .23 | 9,11 | | | .23 | 9,11 | | | .51 | 9,11 | | | 1.57 | 9,11 |
| Class 529-F-1: | | | | | | | | | | | | | | | | | | | | | | | | | | | | | | | | | | | | | | | | | | | | | | |
| 4/30/20206,7 | | | 11.52 | | | | .12 | | | | .27 | | | | .39 | | | | (.27 | ) | | | (.09 | ) | | | (.36 | ) | | | 11.55 | | | | 3.47 | 8 | | | 209 | | | | .18 | 9 | | | .18 | 9 | | | .45 | 9 | | | 2.11 | 9 |
| 10/31/2019 | | | 11.03 | | | | .26 | | | | .53 | | | | .79 | | | | (.22 | ) | | | (.08 | ) | | | (.30 | ) | | | 11.52 | | | | 7.32 | | | | 187 | | | | .19 | | | | .19 | | | | .48 | | | | 2.31 | |
| 10/31/2018 | | | 11.43 | | | | .22 | | | | (.34 | ) | | | (.12 | ) | | | (.18 | ) | | | (.10 | ) | | | (.28 | ) | | | 11.03 | | | | (1.15 | ) | | | 148 | | | | .19 | | | | .19 | | | | .48 | | | | 2.00 | |
| 10/31/2017 | | | 11.43 | | | | .20 | | | | .17 | | | | .37 | | | | (.22 | ) | | | (.15 | ) | | | (.37 | ) | | | 11.43 | | | | 3.37 | | | | 111 | | | | .20 | | | | .20 | | | | .48 | | | | 1.75 | |
| 10/31/2016 | | | 11.47 | | | | .22 | | | | .21 | | | | .43 | | | | (.23 | ) | | | (.24 | ) | | | (.47 | ) | | | 11.43 | | | | 3.92 | | | | 78 | | | | .23 | | | | .21 | | | | .49 | | | | 1.92 | |
| 10/31/2015 | | | 11.64 | | | | .23 | | | | (.11 | ) | | | .12 | | | | (.21 | ) | | | (.08 | ) | | | (.29 | ) | | | 11.47 | | | | 1.05 | | | | 50 | | | | .32 | | | | .22 | | | | .50 | | | | 2.01 | |
| 34 | American Funds College Target Date Series |
College Enrollment Fund
| | | | | | Income (loss) from
investment operations1 | | | Dividends and distributions | | | | | | | | | | | | Ratio of | | | Ratio of | | | | | | | |
| Period ended | | Net asset
value,
beginning
of period | | | Net
investment
income | | | Net gains
(losses) on
securities
(both
realized and
unrealized) | | | Total from
investment
operations | | | Dividends
(from net
investment
income) | | | Distributions
(from capital
gains) | | | Total
dividends
and
distributions | | | Net asset
value,
end
of period | | | Total return2 | | | Net assets,
end of period
(in millions) | | | expenses to
average net
assets before
waivers/
reimburse-
ments4 | | | expenses to
average net
assets after
waivers/
reimburse-
ments3,4 | | | Net
effective
expense
ratio3,5 | | | Ratio of
net income
to average
net assets3 | |
| Class 529-A: | | | | | | | | | | | | | | | | | | | | | | | | | | | | | | | | | | | | | | | | | | | | | | | | | | | | | | | | |
| 4/30/20206,7 | | $ | 10.09 | | | $ | .09 | | | $ | .31 | | | $ | .40 | | | $ | (.23 | ) | | $ | — | | | $ | (.23 | ) | | $ | 10.26 | | | | 4.02 | %8 | | $ | 754 | | | | .42 | %9 | | | .42 | %9 | | | .70 | %9 | | | 1.73 | %9 |
| 10/31/2019 | | | 9.70 | | | | .19 | | | | .34 | | | | .53 | | | | (.14 | ) | | | — | | | | (.14 | ) | | | 10.09 | | | | 5.49 | | | | 769 | | | | .42 | | | | .42 | | | | .71 | | | | 1.91 | |
| 10/31/2018 | | | 9.95 | | | | .16 | | | | (.27 | ) | | | (.11 | ) | | | (.12 | ) | | | (.02 | ) | | | (.14 | ) | | | 9.70 | | | | (1.11 | ) | | | 818 | | | | .44 | | | | .44 | | | | .75 | | | | 1.61 | |
| 10/31/2017 | | | 10.08 | | | | .11 | | | | (.08 | ) | | | .03 | | | | (.14 | ) | | | (.02 | ) | | | (.16 | ) | | | 9.95 | | | | .30 | | | | 213 | | | | .44 | | | | .44 | | | | .75 | | | | 1.07 | |
| 10/31/2016 | | | 10.02 | | | | .10 | | | | .07 | | | | .17 | | | | (.10 | ) | | | (.01 | ) | | | (.11 | ) | | | 10.08 | | | | 1.72 | | | | 246 | | | | .48 | | | | .47 | | | | .78 | | | | 1.00 | |
| 10/31/2015 | | | 9.99 | | | | .10 | | | | .03 | | | | .13 | | | | (.09 | ) | | | (.01 | ) | | | (.10 | ) | | | 10.02 | | | | 1.24 | | | | 246 | | | | .57 | | | | .47 | | | | .78 | | | | 1.02 | |
| Class 529-C: | | | | | | | | | | | | | | | | | | | | | | | | | | | | | | | | | | | | | | | | | | | | | | | | | | | | | | | | |
| 4/30/20206,7 | | | 10.02 | | | | .05 | | | | .32 | | | | .37 | | | | (.14 | ) | | | — | | | | (.14 | ) | | | 10.25 | | | | 3.72 | 8 | | | 187 | | | | 1.16 | 9 | | | 1.16 | 9 | | | 1.44 | 9 | | | .98 | 9 |
| 10/31/2019 | | | 9.64 | | | | .11 | | | | .34 | | | | .45 | | | | (.07 | ) | | | — | | | | (.07 | ) | | | 10.02 | | | | 4.73 | | | | 206 | | | | 1.18 | | | | 1.18 | | | | 1.47 | | | | 1.16 | |
| 10/31/2018 | | | 9.84 | | | | .08 | | | | (.26 | ) | | | (.18 | ) | | | — | | | | (.02 | ) | | | (.02 | ) | | | 9.64 | | | | (1.87 | ) | | | 252 | | | | 1.18 | | | | 1.18 | | | | 1.49 | | | | .87 | |
| 10/31/2017 | | | 9.97 | | | | .03 | | | | (.08 | ) | | | (.05 | ) | | | (.06 | ) | | | (.02 | ) | | | (.08 | ) | | | 9.84 | | | | (.50 | ) | | | 96 | | | | 1.19 | | | | 1.19 | | | | 1.50 | | | | .32 | |
| 10/31/2016 | | | 9.94 | | | | .03 | | | | .06 | | | | .09 | | | | (.05 | ) | | | (.01 | ) | | | (.06 | ) | | | 9.97 | | | | .96 | | | | 117 | | | | 1.24 | | | | 1.22 | | | | 1.53 | | | | .25 | |
| 10/31/2015 | | | 9.91 | | | | .03 | | | | .02 | | | | .05 | | | | (.01 | ) | | | (.01 | ) | | | (.02 | ) | | | 9.94 | | | | .48 | | | | 117 | | | | 1.32 | | | | 1.22 | | | | 1.53 | | | | .27 | |
| Class 529-E: | | | | | | | | | | | | | | | | | | | | | | | | | | | | | | | | | | | | | | | | | | | | | | | | | | | | | | | | |
| 4/30/20206,7 | | | 10.05 | | | | .08 | | | | .31 | | | | .39 | | | | (.20 | ) | | | — | | | | (.20 | ) | | | 10.24 | | | | 3.97 | 8 | | | 40 | | | | .63 | 9 | | | .63 | 9 | | | .91 | 9 | | | 1.51 | 9 |
| 10/31/2019 | | | 9.66 | | | | .17 | | | | .34 | | | | .51 | | | | (.12 | ) | | | — | | | | (.12 | ) | | | 10.05 | | | | 5.31 | | | | 42 | | | | .64 | | | | .64 | | | | .93 | | | | 1.69 | |
| 10/31/2018 | | | 9.92 | | | | .13 | | | | (.27 | ) | | | (.14 | ) | | | (.10 | ) | | | (.02 | ) | | | (.12 | ) | | | 9.66 | | | | (1.45 | ) | | | 49 | | | | .65 | | | | .65 | | | | .96 | | | | 1.39 | |
| 10/31/2017 | | | 10.04 | | | | .09 | | | | (.07 | ) | | | .02 | | | | (.12 | ) | | | (.02 | ) | | | (.14 | ) | | | 9.92 | | | | .18 | | | | 17 | | | | .64 | | | | .64 | | | | .95 | | | | .87 | |
| 10/31/2016 | | | 9.99 | | | | .08 | | | | .07 | | | | .15 | | | | (.09 | ) | | | (.01 | ) | | | (.10 | ) | | | 10.04 | | | | 1.49 | | | | 18 | | | | .71 | | | | .69 | | | | 1.00 | | | | .78 | |
| 10/31/2015 | | | 9.96 | | | | .08 | | | | .03 | | | | .11 | | | | (.07 | ) | | | (.01 | ) | | | (.08 | ) | | | 9.99 | | | | 1.04 | | | | 17 | | | | .79 | | | | .69 | | | | 1.00 | | | | .79 | |
| Class 529-T: | | | | | | | | | | | | | | | | | | | | | | | | | | | | | | | | | | | | | | | | | | | | | | | | | | | | | | | | |
| 4/30/20206,7 | | | 10.10 | | | | .10 | | | | .31 | | | | .41 | | | | (.25 | ) | | | — | | | | (.25 | ) | | | 10.26 | | | | 4.15 | 8,11 | | | — | 12 | | | .21 | 9,11 | | | .21 | 9,11 | | | .49 | 9,11 | | | 1.93 | 9,11 |
| 10/31/2019 | | | 9.70 | | | | .21 | | | | .34 | | | | .55 | | | | (.15 | ) | | | — | | | | (.15 | ) | | | 10.10 | | | | 5.71 | 11 | | | — | 12 | | | .23 | 11 | | | .23 | 11 | | | .52 | 11 | | | 2.10 | 11 |
| 10/31/2018 | | | 9.96 | | | | .16 | | | | (.25 | ) | | | (.09 | ) | | | (.15 | ) | | | (.02 | ) | | | (.17 | ) | | | 9.70 | | | | (.96 | )11 | | | — | 12 | | | .25 | 11 | | | .25 | 11 | | | .56 | 11 | | | 1.69 | 11 |
| 10/31/20176,14 | | | 9.88 | | | | .07 | | | | .01 | | | | .08 | | | | — | | | | — | | | | — | | | | 9.96 | | | | .81 | 8,11 | | | — | 12 | | | .24 | 9,11 | | | .24 | 9,11 | | | .55 | 9,11 | | | 1.26 | 9,11 |
| Class 529-F-1: | | | | | | | | | | | | | | | | | | | | | | | | | | | | | | | | | | | | | | | | | | | | | | |
| 4/30/20206,7 | | | 10.13 | | | | .10 | | | | .31 | | | | .41 | | | | (.25 | ) | | | — | | | | (.25 | ) | | | 10.29 | | | | 4.17 | 8 | | | 123 | | | | .18 | 9 | | | .18 | 9 | | | .46 | 9 | | | 1.97 | 9 |
| 10/31/2019 | | | 9.73 | | | | .21 | | | | .35 | | | | .56 | | | | (.16 | ) | | | — | | | | (.16 | ) | | | 10.13 | | | | 5.81 | | | | 125 | | | | .19 | | | | .19 | | | | .48 | | | | 2.15 | |
| 10/31/2018 | | | 9.99 | | | | .18 | | | | (.27 | ) | | | (.09 | ) | | | (.15 | ) | | | (.02 | ) | | | (.17 | ) | | | 9.73 | | | | (.99 | ) | | | 128 | | | | .18 | | | | .18 | | | | .49 | | | | 1.85 | |
| 10/31/2017 | | | 10.11 | | | | .13 | | | | (.07 | ) | | | .06 | | | | (.16 | ) | | | (.02 | ) | | | (.18 | ) | | | 9.99 | | | | .66 | | | | 43 | | | | .20 | | | | .20 | | | | .51 | | | | 1.31 | |
| 10/31/2016 | | | 10.05 | | | | .13 | | | | .06 | | | | .19 | | | | (.12 | ) | | | (.01 | ) | | | (.13 | ) | | | 10.11 | | | | 1.89 | | | | 46 | | | | .23 | | | | .22 | | | | .53 | | | | 1.26 | |
| 10/31/2015 | | | 10.02 | | | | .13 | | | | .02 | | | | .15 | | | | (.11 | ) | | | (.01 | ) | | | (.12 | ) | | | 10.05 | | | | 1.47 | | | | 39 | | | | .32 | | | | .22 | | | | .53 | | | | 1.25 | |
See end of tables for footnotes.
| American Funds College Target Date Series | 35 |
Financial highlights(continued)
| | | Six months ended | | Year ended October 31, |
| Portfolio turnover rate for all share classes | | April 30, 20206,7,8 | | 2019 | | 2018 | | 2017 | | 2016 | | 2015 |
| College 2036 Fund | | | 3 | % | | | — | %16 | | | — | %6,8,10,16 | | | | | | | | | | | | |
| College 2033 Fund | | | 8 | | | | 4 | | | | — | 16 | | | — | %16 | | | — | %16 | | | — | %6,8,13,16 |
| College 2030 Fund | | | 13 | | | | 7 | | | | 8 | | | | 6 | | | | 4 | | | | — | 16 |
| College 2027 Fund | | | 12 | | | | 9 | | | | 10 | | | | 11 | | | | 9 | | | | 10 | |
| College 2024 Fund | | | — | 16 | | | — | 16 | | | 6 | | | | 13 | | | | 10 | | | | 20 | |
| College 2021 Fund | | | 5 | | | | 11 | | | | 14 | | | | 7 | | | | 5 | | | | 25 | |
| College Enrollment Fund | | | 3 | | | | 5 | | | | 4 | | | | 7 | | | | 12 | | | | 15 | |
| 1 | Based on average shares outstanding. |
| 2 | Total returns exclude any applicable sales charges. |
| 3 | This column reflects the impact, if any, of certain waivers/reimbursements from CRMC. During some of the periods shown, CRMC reduced fees for investment advisory services and reimbursed a portion of miscellaneous fees and expenses. |
| 4 | This column does not include expenses of the underlying funds in which each fund invests. |
| 5 | This column reflects the net effective expense ratios for each fund and class, which are unaudited. These ratios include each class’s expense ratio combined with the weighted average net expense ratio of the underlying funds for the periods presented. See expense example for further information regarding fees and expenses. |
| 6 | Based on operations for a period that is less than a full year. |
| 7 | Unaudited. |
| 8 | Not annualized. |
| 9 | Annualized. |
| 10 | For the period February 9, 2018, commencement of operations, through October 31, 2018. |
| 11 | All or a significant portion of assets in this class consisted of seed capital invested by CRMC and/or its affiliates. Fees for distribution services are not charged or accrued on these seed capital assets. If such fees were paid by the fund on seed capital assets, fund expenses would have been higher and net income and total return would have been lower. |
| 12 | Amount less than $1 million. |
| 13 | For the period March 27, 2015, commencement of investment operations, through October 31, 2015. |
| 14 | Class 529-T shares began investment operations on April 7, 2017. |
| 15 | Amount less than $.01. |
| 16 | Amount is either less than 1% or there is no turnover. |
See notes to financial statements.
| 36 | American Funds College Target Date Series |
As a shareholder of the funds, you incur two types of costs: (1) transaction costs, such as initial sales charges on purchase payments (loads), and (2) ongoing costs, including distribution and service (12b-1) fees and other expenses. This example is intended to help you understand your ongoing costs (in dollars) of investing in the funds so you can compare these costs with the ongoing costs of investing in other mutual funds. The example is based on an investment of $1,000 invested at the beginning of the period and held for the entire six-month period (November 1, 2019, through April 30, 2020).
Actual expenses:
The first line of each share class in the tables on the following pages provides information about actual account values and actual expenses. You may use the information in this line, together with the amount you invested, to estimate the expenses that you paid over the period. Simply divide your account value by $1,000 (for example, an $8,600 account value divided by $1,000 = 8.6), then multiply the result by the number in the first line under the heading titled “Expenses paid during period” to estimate the expenses you paid on your account during this period.
Hypothetical example for comparison purposes:
The second line of each share class in the tables on the following pages provides information about hypothetical account values and hypothetical expenses based on the actual expense ratio for the share class and an assumed rate of return of 5.00% per year before expenses, which is not the actual return of the share class. The hypothetical account values and expenses may not be used to estimate the actual ending account balance or expenses you paid for the period. You may use this information to compare the ongoing costs of investing in the funds and other funds. To do so, compare this 5.00% hypothetical example with the 5.00% hypothetical examples that appear in the shareholder reports of the other funds.
Note:
Note that the expenses shown in the tables on the following pages are meant to highlight your ongoing costs only and do not reflect any transactional costs, such as sales charges (loads). Therefore, the second line of each share class in the tables is useful in comparing ongoing costs only and will not help you determine the relative total costs of owning different funds. In addition, if these transactional costs were included, your costs would have been higher.
| American Funds College Target Date Series | 37 |
College 2036 Fund
| | | Beginning
account value
11/1/2019 | | | Ending
account value
4/30/2020 | | | Expenses
paid during
period1,2 | | | Annualized
expense ratio2 | | | Effective
expenses paid
during period3 | | | Effective
annualized
expense ratio4 | |
| Class 529-A – actual return | | $ | 1,000.00 | | | $ | 969.40 | | | $ | 2.45 | | | | .50 | % | | $ | 4.26 | | | | .87 | % |
| Class 529-A – assumed 5% return | | | 1,000.00 | | | | 1,022.38 | | | | 2.51 | | | | .50 | | | | 4.37 | | | | .87 | |
| Class 529-C – actual return | | | 1,000.00 | | | | 965.97 | | | | 5.82 | | | | 1.19 | | | | 7.63 | | | | 1.56 | |
| Class 529-C – assumed 5% return | | | 1,000.00 | | | | 1,018.95 | | | | 5.97 | | | | 1.19 | | | | 7.82 | | | | 1.56 | |
| Class 529-E – actual return | | | 1,000.00 | | | | 968.44 | | | | 3.23 | | | | .66 | | | | 5.04 | | | | 1.03 | |
| Class 529-E – assumed 5% return | | | 1,000.00 | | | | 1,021.58 | | | | 3.32 | | | | .66 | | | | 5.17 | | | | 1.03 | |
| Class 529-T – actual return | | | 1,000.00 | | | | 970.53 | | | | 1.13 | | | | .23 | | | | 2.94 | | | | .60 | |
| Class 529-T – assumed 5% return | | | 1,000.00 | | | | 1,023.72 | | | | 1.16 | | | | .23 | | | | 3.02 | | | | .60 | |
| Class 529-F-1 – actual return | | | 1,000.00 | | | | 970.48 | | | | .93 | | | | .19 | | | | 2.74 | | | | .56 | |
| Class 529-F-1 – assumed 5% return | | | 1,000.00 | | | | 1,023.92 | | | | .96 | | | | .19 | | | | 2.82 | | | | .56 | |
College 2033 Fund
| | | Beginning
account value
11/1/2019 | | | Ending
account value
4/30/2020 | | | Expenses
paid during
period1,2 | | | Annualized
expense ratio2 | | | Effective
expenses paid
during period3 | | | Effective
annualized
expense ratio4 | |
| Class 529-A – actual return | | $ | 1,000.00 | | | $ | 992.61 | | | $ | 2.13 | | | | .43 | % | | $ | 3.81 | | | | .77 | % |
| Class 529-A – assumed 5% return | | | 1,000.00 | | | | 1,022.73 | | | | 2.16 | | | | .43 | | | | 3.87 | | | | .77 | |
| Class 529-C – actual return | | | 1,000.00 | | | | 989.39 | | | | 5.79 | | | | 1.17 | | | | 7.47 | | | | 1.51 | |
| Class 529-C – assumed 5% return | | | 1,000.00 | | | | 1,019.05 | | | | 5.87 | | | | 1.17 | | | | 7.57 | | | | 1.51 | |
| Class 529-E – actual return | | | 1,000.00 | | | | 991.68 | | | | 3.22 | | | | .65 | | | | 4.90 | | | | .99 | |
| Class 529-E – assumed 5% return | | | 1,000.00 | | | | 1,021.63 | | | | 3.27 | | | | .65 | | | | 4.97 | | | | .99 | |
| Class 529-T – actual return | | | 1,000.00 | | | | 993.35 | | | | 1.09 | | | | .22 | | | | 2.78 | | | | .56 | |
| Class 529-T – assumed 5% return | | | 1,000.00 | | | | 1,023.77 | | | | 1.11 | | | | .22 | | | | 2.82 | | | | .56 | |
| Class 529-F-1 – actual return | | | 1,000.00 | | | | 993.14 | | | | .89 | | | | .18 | | | | 2.58 | | | | .52 | |
| Class 529-F-1 – assumed 5% return | | | 1,000.00 | | | | 1,023.97 | | | | .91 | | | | .18 | | | | 2.61 | | | | .52 | |
College 2030 Fund
| | | Beginning
account value
11/1/2019 | | | Ending
account value
4/30/2020 | | | Expenses
paid during
period1,2 | | | Annualized
expense ratio2 | | | Effective
expenses paid
during period3 | | | Effective
annualized
expense ratio4 | |
| Class 529-A – actual return | | $ | 1,000.00 | | | $ | 997.93 | | | $ | 2.14 | | | | .43 | % | | $ | 3.73 | | | | .75 | % |
| Class 529-A – assumed 5% return | | | 1,000.00 | | | | 1,022.73 | | | | 2.16 | | | | .43 | | | | 3.77 | | | | .75 | |
| Class 529-C – actual return | | | 1,000.00 | | | | 993.97 | | | | 5.75 | | | | 1.16 | | | | 7.34 | | | | 1.48 | |
| Class 529-C – assumed 5% return | | | 1,000.00 | | | | 1,019.10 | | | | 5.82 | | | | 1.16 | | | | 7.42 | | | | 1.48 | |
| Class 529-E – actual return | | | 1,000.00 | | | | 996.75 | | | | 3.18 | | | | .64 | | | | 4.77 | | | | .96 | |
| Class 529-E – assumed 5% return | | | 1,000.00 | | | | 1,021.68 | | | | 3.22 | | | | .64 | | | | 4.82 | | | | .96 | |
| Class 529-T – actual return | | | 1,000.00 | | | | 998.87 | | | | 1.09 | | | | .22 | | | | 2.68 | | | | .54 | |
| Class 529-T – assumed 5% return | | | 1,000.00 | | | | 1,023.77 | | | | 1.11 | | | | .22 | | | | 2.72 | | | | .54 | |
| Class 529-F-1 – actual return | | | 1,000.00 | | | | 998.74 | | | | .89 | | | | .18 | | | | 2.48 | | | | .50 | |
| Class 529-F-1 – assumed 5% return | | | 1,000.00 | | | | 1,023.97 | | | | .91 | | | | .18 | | | | 2.51 | | | | .50 | |
| 38 | American Funds College Target Date Series |
College 2027 Fund
| | | Beginning
account value
11/1/2019 | | | Ending
account value
4/30/2020 | | | Expenses
paid during
period1,2 | | | Annualized
expense ratio2 | | | Effective
expenses paid
during period3 | | | Effective
annualized
expense ratio4 | |
| Class 529-A – actual return | | $ | 1,000.00 | | | $ | 1,005.71 | | | $ | 2.14 | | | | .43 | % | | $ | 3.44 | | | | .69 | % |
| Class 529-A – assumed 5% return | | | 1,000.00 | | | | 1,022.73 | | | | 2.16 | | | | .43 | | | | 3.47 | | | | .69 | |
| Class 529-C – actual return | | | 1,000.00 | | | | 1,001.90 | | | | 5.77 | | | | 1.16 | | | | 7.07 | | | | 1.42 | |
| Class 529-C – assumed 5% return | | | 1,000.00 | | | | 1,019.10 | | | | 5.82 | | | | 1.16 | | | | 7.12 | | | | 1.42 | |
| Class 529-E – actual return | | | 1,000.00 | | | | 1,004.73 | | | | 3.19 | | | | .64 | | | | 4.49 | | | | .90 | |
| Class 529-E – assumed 5% return | | | 1,000.00 | | | | 1,021.68 | | | | 3.22 | | | | .64 | | | | 4.52 | | | | .90 | |
| Class 529-T – actual return | | | 1,000.00 | | | | 1,006.61 | | | | 1.10 | | | | .22 | | | | 2.39 | | | | .48 | |
| Class 529-T – assumed 5% return | | | 1,000.00 | | | | 1,023.77 | | | | 1.11 | | | | .22 | | | | 2.41 | | | | .48 | |
| Class 529-F-1 – actual return | | | 1,000.00 | | | | 1,006.39 | | | | .90 | | | | .18 | | | | 2.19 | | | | .44 | |
| Class 529-F-1 – assumed 5% return | | | 1,000.00 | | | | 1,023.97 | | | | .91 | | | | .18 | | | | 2.21 | | | | .44 | |
College 2024 Fund
| | | Beginning
account value
11/1/2019 | | | Ending
account value
4/30/2020 | | | Expenses
paid during
period1,2 | | | Annualized
expense ratio2 | | | Effective
expenses paid
during period3 | | | Effective
annualized
expense ratio4 | |
| Class 529-A – actual return | | $ | 1,000.00 | | | $ | 1,020.68 | | | $ | 2.11 | | | | .42 | % | | $ | 3.37 | | | | .67 | % |
| Class 529-A – assumed 5% return | | | 1,000.00 | | | | 1,022.77 | | | | 2.11 | | | | .42 | | | | 3.37 | | | | .67 | |
| Class 529-C – actual return | | | 1,000.00 | | | | 1,016.77 | | | | 5.82 | | | | 1.16 | | | | 7.07 | | | | 1.41 | |
| Class 529-C – assumed 5% return | | | 1,000.00 | | | | 1,019.10 | | | | 5.82 | | | | 1.16 | | | | 7.07 | | | | 1.41 | |
| Class 529-E – actual return | | | 1,000.00 | | | | 1,018.80 | | | | 3.21 | | | | .64 | | | | 4.47 | | | | .89 | |
| Class 529-E – assumed 5% return | | | 1,000.00 | | | | 1,021.68 | | | | 3.22 | | | | .64 | | | | 4.47 | | | | .89 | |
| Class 529-T – actual return | | | 1,000.00 | | | | 1,021.53 | | | | 1.01 | | | | .20 | | | | 2.26 | | | | .45 | |
| Class 529-T – assumed 5% return | | | 1,000.00 | | | | 1,023.87 | | | | 1.01 | | | | .20 | | | | 2.26 | | | | .45 | |
| Class 529-F-1 – actual return | | | 1,000.00 | | | | 1,021.24 | | | | .90 | | | | .18 | | | | 2.16 | | | | .43 | |
| Class 529-F-1 – assumed 5% return | | | 1,000.00 | | | | 1,023.97 | | | | .91 | | | | .18 | | | | 2.16 | | | | .43 | |
College 2021 Fund
| | | Beginning
account value
11/1/2019 | | | Ending
account value
4/30/2020 | | | Expenses
paid during
period1,2 | | | Annualized
expense ratio2 | | | Effective
expenses paid
during period3 | | | Effective
annualized
expense ratio4 | |
| Class 529-A – actual return | | $ | 1,000.00 | | | $ | 1,033.36 | | | $ | 2.12 | | | | .42 | % | | $ | 3.49 | | | | .69 | % |
| Class 529-A – assumed 5% return | | | 1,000.00 | | | | 1,022.77 | | | | 2.11 | | | | .42 | | | | 3.47 | | | | .69 | |
| Class 529-C – actual return | | | 1,000.00 | | | | 1,029.95 | | | | 5.85 | | | | 1.16 | | | | 7.22 | | | | 1.43 | |
| Class 529-C – assumed 5% return | | | 1,000.00 | | | | 1,019.10 | | | | 5.82 | | | | 1.16 | | | | 7.17 | | | | 1.43 | |
| Class 529-E – actual return | | | 1,000.00 | | | | 1,032.28 | | | | 3.23 | | | | .64 | | | | 4.60 | | | | .91 | |
| Class 529-E – assumed 5% return | | | 1,000.00 | | | | 1,021.68 | | | | 3.22 | | | | .64 | | | | 4.57 | | | | .91 | |
| Class 529-T – actual return | | | 1,000.00 | | | | 1,035.19 | | | | 1.06 | | | | .21 | | | | 2.43 | | | | .48 | |
| Class 529-T – assumed 5% return | | | 1,000.00 | | | | 1,023.82 | | | | 1.06 | | | | .21 | | | | 2.41 | | | | .48 | |
| Class 529-F-1 – actual return | | | 1,000.00 | | | | 1,034.71 | | | | .91 | | | | .18 | | | | 2.28 | | | | .45 | |
| Class 529-F-1 – assumed 5% return | | | 1,000.00 | | | | 1,023.97 | | | | .91 | | | | .18 | | | | 2.26 | | | | .45 | |
See end of tables for footnotes.
| American Funds College Target Date Series | 39 |
College Enrollment Fund
| | | Beginning
account value
11/1/2019 | | | Ending
account value
4/30/2020 | | | Expenses
paid during
period1,2 | | | Annualized
expense ratio2 | | | Effective
expenses paid
during period3 | | | Effective
annualized
expense ratio4 | |
| Class 529-A – actual return | | $ | 1,000.00 | | | $ | 1,040.21 | | | $ | 2.13 | | | | .42 | % | | $ | 3.55 | | | | .70 | % |
| Class 529-A – assumed 5% return | | | 1,000.00 | | | | 1,022.77 | | | | 2.11 | | | | .42 | | | | 3.52 | | | | .70 | |
| Class 529-C – actual return | | | 1,000.00 | | | | 1,037.21 | | | | 5.88 | | | | 1.16 | | | | 7.29 | | | | 1.44 | |
| Class 529-C – assumed 5% return | | | 1,000.00 | | | | 1,019.10 | | | | 5.82 | | | | 1.16 | | | | 7.22 | | | | 1.44 | |
| Class 529-E – actual return | | | 1,000.00 | | | | 1,039.75 | | | | 3.20 | | | | .63 | | | | 4.62 | | | | .91 | |
| Class 529-E – assumed 5% return | | | 1,000.00 | | | | 1,021.73 | | | | 3.17 | | | | .63 | | | | 4.57 | | | | .91 | |
| Class 529-T – actual return | | | 1,000.00 | | | | 1,041.52 | | | | 1.07 | | | | .21 | | | | 2.49 | | | | .49 | |
| Class 529-T – assumed 5% return | | | 1,000.00 | | | | 1,023.82 | | | | 1.06 | | | | .21 | | | | 2.46 | | | | .49 | |
| Class 529-F-1 – actual return | | | 1,000.00 | | | | 1,041.72 | | | | .91 | | | | .18 | | | | 2.34 | | | | .46 | |
| Class 529-F-1 – assumed 5% return | | | 1,000.00 | | | | 1,023.97 | | | | .91 | | | | .18 | | | | 2.31 | | | | .46 | |
| 1 | The “expenses paid during period” are equal to the “annualized expense ratio,” multiplied by the average account value over the period, multiplied by the number of days in the period, and divided by 366 (to reflect the one-half year period). |
| 2 | The “expenses paid during period” and “annualized expense ratio” do not include the expenses of the underlying funds in which each fund invests. |
| 3 | The “effective expenses paid during period” are equal to the “effective annualized expense ratio,” multiplied by the average account value over the period, multiplied by the number of days in the period, and divided by 366 (to reflect the one-half year period). |
| 4 | The “effective annualized expense ratio” reflects the net annualized expense ratio of the class plus the class’s pro-rata share of the weighted average expense ratio of the underlying funds in which it invests. The annualized weighted average expense ratio of the underlying funds for the period reflects the net actual expense ratio of each underlying fund for the period, annualized and weighted for the fund’s relative average investment therein during the period. |
| 40 | American Funds College Target Date Series |
Approval of Investment Advisory and Service Agreement
The series’ board has approved the continuation of the series’ Investment Advisory and Service Agreement (the “agreement”) with Capital Research and Management Company (“CRMC”) for an additional one-year term through April 30, 2021. The board approved the agreement following the recommendation of the series’ Contracts Committee (the “committee”), which is composed of all the series’ independent board members. The board and the committee determined in the exercise of their business judgment that the advisory fee structure for each fund within the series was fair and reasonable in relation to the services provided, and that approving the agreement was in the best interests of each fund and its shareholders.
In reaching this decision, the board and the committee took into account their interaction with CRMC as well as information furnished to them throughout the year and otherwise provided to them, as well as information prepared specifically in connection with their review of the agreement, and were advised by their independent counsel with respect to the matters considered. They considered the following factors, among others, but did not identify any single issue or particular piece of information that, in isolation, was the controlling factor, and each board and committee member did not necessarily attribute the same weight to each factor.
1. Nature, extent and quality of services
The board and the committee considered the depth and quality of CRMC’s investment management process, including its global research capabilities; the experience, capability and integrity of its senior management and other personnel; the low turnover rates of its key personnel; the overall financial strength and stability of CRMC and the Capital Group organization; the resources and systems CRMC devotes to investment management (the manner in which each fund’s assets are managed, including liquidity management), financial, investment operations, compliance, trading, proxy voting, shareholder communications, and other services; and the ongoing evolution of CRMC’s organizational structure designed to maintain and strengthen these qualities. The board and the committee also considered the nature, extent and quality of administrative and shareholder services provided by CRMC to the funds under the agreement and other agreements, as well as the benefits to each fund’s shareholders from investing in a fund that is part of a large family of funds. The board considered the risks assumed by CRMC in providing services to the funds, including operational, business, financial, reputational, regulatory and litigation risks. The board and the committee concluded that the nature, extent and quality of the services provided by CRMC have benefited and should continue to benefit each fund and its shareholders.
2. Investment results
The board and the committee considered the investment results of each fund in light of its objectives. They compared each fund’s investment results with those of other funds (including funds that currently form the basis of the Lipper index for the category in which the fund is included), and data such as relevant market and fund indexes over various periods (including each fund’s lifetime) through September 30, 2019, while recognizing the American Funds College 2036 Fund’s short operational history. They generally placed greater emphasis on longer term periods. On the basis of this evaluation and the board’s and the committee’s ongoing review of investment results, and considering the relative market conditions during certain of the reporting periods, the board and the committee concluded that each fund’s investment results have been satisfactory for renewal of the agreement, and that CRMC’s record in managing the funds indicated that its continued management should benefit each fund and its shareholders.
3. Advisory fees and total expenses
The board and the committee compared the total expense levels of each fund to those of other relevant funds. They observed that each fund’s total expenses are competitive with those of other similar funds included in the comparable Lipper category.
The board and the committee also reviewed the fee schedule of the funds (including the fees and total expenses of the underlying American Funds in which the funds invest) to those of other relevant funds. The board and the committee noted CRMC’s prior elimination of the entire advisory fee payable by the funds under the agreement. The board and committee also considered the breakpoint discounts in each underlying fund’s advisory fee structure that reduce the level of fees charged by CRMC to the underlying fund as fund assets increase. In addition, they reviewed information regarding the effective
| American Funds College Target Date Series | 41 |
advisory fees charged to non-mutual fund clients by CRMC and its affiliates. They noted that, to the extent there were differences between the advisory fees paid by the underlying American Funds and the advisory fees paid by those clients, the differences appropriately reflected the investment, operational, regulatory and market differences between advising the underlying funds and the other clients. The board and the committee concluded that each fund’s cost structure was fair and reasonable in relation to the services provided, as well as the risks assumed by the adviser, and that each fund’s shareholders receive reasonable value in return for the other amounts paid by the funds.
4. Ancillary benefits
The board and the committee considered a variety of other benefits that CRMC and its affiliates receive as a result of CRMC’s relationship with each fund and the underlying American Funds, including fees for administrative services provided to certain share classes; fees paid to CRMC’s affiliated transfer agent; sales charges and distribution fees received and retained by the funds’ principal underwriter, an affiliate of CRMC; and possible ancillary benefits to CRMC and its institutional management affiliates in managing other investment vehicles. The board and the committee reviewed CRMC’s portfolio trading practices, noting that through December 31, 2018, CRMC benefited from research obtained with commissions from portfolio transactions made on behalf of the underlying American Funds, and since that time has undertaken to bear the cost of obtaining such research. The board and the committee took these ancillary benefits into account in evaluating the reasonableness of the other amounts paid by each fund.
5. Adviser financial information
The board and the committee reviewed information regarding CRMC’s costs of providing services to the American Funds, including personnel, systems and resources of investment, compliance, trading, accounting and other administrative operations. They considered CRMC’s costs and related cost allocation methodology as well as its track record of investing in technology, infrastructure and staff to maintain and expand services and capabilities, respond to industry and regulatory developments, and attract and retain qualified personnel. They noted information regarding the compensation structure for CRMC’s investment professionals. They reviewed information on the profitability of the investment adviser and its affiliates. The board and the committee also compared CRMC’s profitability and compensation data to the reported results and data of several large, publicly held investment management companies. The board and the committee noted the competitiveness and cyclicality of both the mutual fund industry and the capital markets, and the importance in that environment of CRMC’s long-term profitability for maintaining its independence, company culture and management continuity. They further considered the breakpoint discounts in the underlying funds’ advisory fee structure and CRMC’s sharing of potential economies of scale, or efficiencies, through breakpoints and other fee reductions and costs voluntarily absorbed. The board and the committee concluded that each fund’s expense structure reflected a reasonable sharing of benefits between CRMC and the funds’ shareholders.
| 42 | American Funds College Target Date Series |
Liquidity Risk Management Program
The series has adopted a liquidity risk management program (the “program”). The series’ board has designated Capital Research and Management Company (“CRMC”) as the administrator of the program. Personnel of CRMC or its affiliates conduct the day-to-day operation of the program pursuant to policies and procedures administered by the Capital Group Liquidity Risk Management Committee.
Under the program, CRMC manages each fund’s liquidity risk, which is the risk that the fund could not meet shareholder redemption requests without significant dilution of remaining shareholders’ interests in the fund. This risk is managed by monitoring the degree of liquidity of each fund’s investments, limiting the amount of each fund’s illiquid investments, and utilizing various risk management tools and facilities available to each fund for meeting shareholder redemptions, among other means. CRMC’s process of determining the degree of liquidity of each fund’s investments is supported by one or more third-party liquidity assessment vendors.
The series’ board reviewed a report prepared by CRMC regarding the operation and effectiveness of the program for the period December 1, 2018, through September 30, 2019. No significant liquidity events impacting any of the funds were noted in the report. In addition, CRMC provided its assessment that the program had been effective in managing each fund’s liquidity risk.
| American Funds College Target Date Series | 43 |
Office of the series
6455 Irvine Center Drive
Irvine, CA 92618-4518
Investment adviser
Capital Research and Management Company
333 South Hope Street
Los Angeles, CA 90071-1406
Transfer agent for shareholder accounts
American Funds Service Company
(Write to the address near you.)
P.O. Box 6007
Indianapolis, IN 46206-6007
P.O. Box 2280
Norfolk, VA 23501-2280
Custodian of assets
State Street Bank and Trust Company
One Lincoln Street
Boston, MA 02111
Counsel
Morgan, Lewis & Bockius LLP
One Federal Street
Boston, MA 02110-1726
Independent registered public accounting firm
Deloitte & Touche LLP
695 Town Center Drive
Suite 1000
Costa Mesa, CA 92626-7188
Principal underwriter
American Funds Distributors, Inc.
333 South Hope Street
Los Angeles, CA 90071-1406
| 44 | American Funds College Target Date Series |
Investors should carefully consider investment objectives, risks, charges and expenses. This and other important information is contained in the series prospectus, summary prospectuses and CollegeAmerica Program Description, which can be obtained from your financial professional and should be read carefully before investing. You may also call American Funds Service Company (AFS) at (800) 421-4225 or visit the Capital Group website at capitalgroup.com. CollegeAmerica is distributed by American Funds Distributors. Interests in CollegeAmerica are sold through unaffiliated intermediaries.
“Proxy Voting Guidelines for American Funds College Target Date Series” — which describes how we vote proxies relating to the underlying funds held in the portfolios — is available on our website or upon request by calling AFS. The series files its proxy voting record with the U.S. Securities and Exchange Commission (SEC) for the 12 months ended June 30 by August 31. The proxy voting record is available free of charge on the SEC website at sec.gov and on our website.
Visit the Capital Group website for more information on the securities held by the underlying funds in the American Funds College Target Date Series’ portfolios.
American Funds College Target Date Series files a complete list of its portfolio holdings with the SEC for the first and third quarters of each fiscal year on Form NPORT-P. This filing is available free of charge on the SEC website. Additionally, the list of portfolio holdings is available by calling AFS.
This report is for the information of shareholders of American Funds College Target Date Series, but it also may be used as sales literature when preceded or accompanied by the current prospectus, which gives details about charges, expenses, investment objectives and operating policies of the series. If used as sales material after June 30, 2020, this report must be accompanied by an American Funds statistical update for the most recently completed calendar quarter.
The Standard & Poor’s 500 Composite Index (“Index”) is a product of S&P Dow Jones Indices LLC and/or its affiliates and has been licensed for use by Capital Group. Copyright © 2020 S&P Dow Jones Indices LLC, a division of S&P Global, and/or its affiliates. All rights reserved. Redistribution or reproduction in whole or in part are prohibited without written permission of S&P Dow Jones Indices LLC.
Bloomberg® is a trademark of Bloomberg Finance L.P. (collectively with its affiliates, “Bloomberg”). Barclays® is a trademark of Barclays Bank Plc (collectively with its affiliates, “Barclays”), used under license. Neither Bloomberg nor Barclays approves or endorses this material, guarantees the accuracy or completeness of any information herein and, to the maximum extent allowed by law, neither shall have any liability or responsibility for injury or damages arising in connection therewith.
American Funds Distributors, Inc., member FINRA.
Depending on your state of residence, there may be an in-state plan that provides state tax and other state benefits, such as financial aid, scholarship funds and protection from creditors, not available through CollegeAmerica. Before investing in any state’s 529 plan, investors should consult a tax advisor.

The Capital Advantage®
Since 1931, Capital Group, home of American Funds, has helped investors pursue long-term investment success. Our consistent approach — in combination with The Capital SystemSM— has resulted in superior outcomes.
Aligned with investor success
We base our decisions on a long-term perspective, which we believe aligns our goals with the interests of our clients. Our portfolio managers average 28 years of investment experience, including 22 years at our company, reflecting a career commitment to our long-term approach.1
The Capital System
The Capital System combines individual accountability with teamwork. Funds using The Capital System are divided into portions that are managed independently by investment professionals with diverse backgrounds, ages and investment approaches. An extensive global research effort is the backbone of our system.
American Funds’ superior outcomes
Equity funds have beaten their Lipper peer indexes in 92% of 10-year periods and 99% of 20-year periods.2Fixed income funds have helped investors achieve diversification through attention to correlation between bonds and equities.3Fund management fees have been among the lowest in the industry.4
| | 1 | Portfolio manager experience as of December 31, 2019. |
| | 2 | Based on Class F-2 share results for rolling periods through December 31, 2019. Periods covered are the shorter of the fund’s lifetime or since the comparable Lipper index inception date (except Capital Income Builder and SMALLCAP World Fund, for which the Lipper average was used). Expenses differ for each share class, so results will vary. Visitcapitalgroup.comfor more information on specific expense adjustments and the actual dates of first sale. |
| | 3 | Based on Class F-2 share results as of December 31, 2019. Fifteen of the 17 fixed income American Funds that have been in existence for the three-year period showed a three-year correlation below 0.2. Standard & Poor’s 500 Composite Index was used as an equity market proxy. Correlation based on monthly total returns. Correlation is a statistical measure of how two securities move in relation to each other. A correlation ranges from –1 to 1. A positive correlation close to 1 implies that as one security moves, either up or down, the other security will move in “lockstep,” in the same direction. A negative correlation close to –1 indicates that the securities have moved in the opposite direction. |
| | 4 | On average, our management fees were in the lowest quintile 65% of the time, based on the 20-year period ended December 31, 2019, versus comparable Lipper categories, excluding funds of funds. |
| | | |
| Class F-2 shares were first offered on August 1, 2008. Class F-2 share results prior to the date of first sale are hypothetical based on the results of the original share class of the fund without a sales charge, adjusted for typical estimated expenses. Results for certain funds with an inception date after August 1, 2008, also include hypothetical returns because those funds’ Class F-2 shares sold after the funds’ date of first offering. Visitcapitalgroup.com for more information on specific expense adjustments and the actual dates of first sale. |
All Capital Group trademarks mentioned are owned by The Capital Group Companies, Inc., an affiliated company or fund. All other company and product names mentioned are the property of their respective companies.

ITEM 2 – Code of Ethics
Not applicable for filing of semi-annual reports to shareholders.
ITEM 3 – Audit Committee Financial Expert
Not applicable for filing of semi-annual reports to shareholders.
ITEM 4 – Principal Accountant Fees and Services
Not applicable for filing of semi-annual reports to shareholders.
ITEM 5 – Audit Committee of Listed Registrants
Not applicable to this Registrant, insofar as the Registrant is not a listed issuer as defined in Rule 10A-3 under the Securities Exchange Act of 1934.
ITEM 6 – Schedule of Investments
Not applicable, insofar as the schedule is included as part of the report to shareholders filed under Item 1 of this Form.
ITEM 7 – Disclosure of Proxy Voting Policies and Procedures for Closed-End Management Investment
Companies
Not applicable to this Registrant, insofar as the Registrant is not a closed-end management investment company.
ITEM 8 – Portfolio Managers of Closed-End Management Investment Companies
Not applicable to this Registrant, insofar as the Registrant is not a closed-end management investment company.
ITEM 9 – Purchases of Equity Securities by Closed-End Management Investment Company and Affiliated Purchasers
Not applicable to this Registrant, insofar as the Registrant is not a closed-end management investment company.
ITEM 10 – Submission of Matters to a Vote of Security Holders
There have been no material changes to the procedures by which shareholders may recommend nominees to the Registrant’s boardof trustees since the Registrant last submitted a proxy statement to its shareholders. The procedures are as follows. The Registrant has a nominating and governance committee comprised solely of persons who are not considered ‘‘interested persons’’ of the Registrant within the meaning of the Investment Company Act of 1940, as amended. The committee periodically reviews such issues as the board’s composition, responsibilities, committees, compensation and other relevant issues, and recommends any appropriate changes to the full board of trustees. While the committee normally is able to identify from its own resources an ample number of qualified candidates, it will consider shareholder suggestions of persons to be considered as nominees to fill future vacancies on the board. Such suggestions must be sent in writing to the nominating and governance committee of the Registrant, c/o the Registrant’s Secretary, and must be accompanied by complete biographical and occupational data on the prospective nominee, along with a written consent of the prospective nominee for consideration of his or her name by the nominating and governance committee.
ITEM 11 – Controls and Procedures
| (a) | The Registrant’s Principal Executive Officer and Principal Financial Officer have concluded, based on their evaluation of the Registrant’s disclosure controls and procedures (as such term is defined in Rule 30a-3 under the Investment Company Act of 1940), that such controls and procedures are adequate and reasonably designed to achieve the purposes described in paragraph (c) of such rule. |
| | |
| (b) | There were no changes in the Registrant’s internal controls over financial reporting (as defined in Rule 30a-3(d) under the Investment Company Act of 1940) that occurred during the Registrant’s semi-annual period covered by this report that has materially affected, or is reasonably likely to materially affect, the Registrant’s internal control over financial reporting. |
ITEM 12 – Exhibits
| (a)(1) | Not applicable for filing of semi-annual reports to shareholders. |
| | |
| (a)(2) | The certifications required by Rule 30a-2 of the Investment Company Act of 1940 and Sections302 and906 of the Sarbanes-Oxley Act of 2002 are attached as exhibits hereto. |
SIGNATURES
Pursuant to the requirements of the Securities Exchange Act of 1934 and the Investment Company Act of 1940, the Registrant has duly caused this report to be signed on its behalf by the undersigned, thereunto duly authorized.
| | AMERICAN FUNDS COLLEGE TARGET DATE SERIES |
| | |
| | By__/s/ Walter R. Burkley____________________ |
| | Walter R. Burkley, Executive Vice President and Principal Executive Officer |
| | |
| | Date: June 30, 2020 |
Pursuant to the requirements of the Securities Exchange Act of 1934 and the Investment Company Act of 1940, this report has been signed below by the following persons on behalf of the Registrant and in the capacities and on the dates indicated.
| By__/s/ Walter R. Burkley_________________ |
Walter R. Burkley, Executive Vice President and Principal Executive Officer |
| |
| Date: June 30, 2020 |
| By ___/s/ Gregory F. Niland __________ |
Gregory F. Niland, Treasurer and Principal Financial Officer |
| |
| Date: June 30, 2020 |