UNITED STATES
SECURITIES AND EXCHANGE COMMISSION
Washington, D.C. 20549
FORM N-CSRS
CERTIFIED SHAREHOLDER REPORT OF REGISTERED MANAGEMENT
INVESTMENT COMPANIES
Investment Company Act File Number 811-22698
KraneShares Trust
(Exact name of registrant as specified in charter)
1270 Avenue of the Americas
22nd Floor
New York, New York, 10020
(Address of principal executive offices) (Zip code)
Jonathan Krane
KraneShares Trust
1270 Avenue of the Americas
22nd Floor
New York, New York, 10020
(Name and address of agent for service)
Copy to:
Stacy L. Fuller
K&L Gates LLP
1601 K Street NW
Washington, DC 20006-1600
Registrant’s telephone number, including area code: (855) 857-2638
Date of fiscal year end: March 31, 2019
Date of reporting period: September 30, 2018
Item 1. Reports to Stockholders.
A copy of the report transmitted to stockholders pursuant to Rule 30e-1 under the Investment Company Act, as amended ( [17 CFR § 270.30e-1], are attached hereto.

|
|
Semi-Annual Report
KraneShares Bosera MSCI China A Share ETF KraneShares Zacks New China ETF (Now known as, KraneShares CICC China Leaders 100 Index ETF) KraneShares CSI China Internet ETF KraneShares E Fund China Commercial Paper ETF KraneShares MSCI All China Index ETF (Formerly, KraneShares FTSE Emerging Market Plus ETF) KraneShares MSCI One Belt One Road Index ETF KraneShares Emerging Markets Consumer Technology Index ETF KraneShares MSCI China Environment Index ETF KraneShares Electric Vehicles and Future Mobility Index ETF KraneShares MSCI All China Health Care Index ETF KraneShares CCBS China Corporate High Yield Bond USD Index ETF KraneShares Emerging Markets Healthcare Index ETF
September 30, 2018
|
Table of Contents
Schedules of Investments |
|
|
| 1 | |
| 8 | |
| 12 | |
| 15 | |
| 18 | |
| 27 | |
| 33 | |
| 38 | |
| 41 | |
| 45 | |
| 47 | |
| 50 | |
Statements of Assets and Liabilities |
| 54 |
Statements of Operations |
| 58 |
Statements of Changes in Net Assets |
| 62 |
Financial Highlights |
| 74 |
Notes to Financial Statements |
| 78 |
Approval of Investment Advisory Agreement |
| 100 |
Disclosure of Fund Expenses |
| 103 |
Supplemental Information |
| 105 |
The Funds file their complete schedules of Fund holdings with the Securities and Exchange Commission (the “Commission”) for the first and third quarters of each fiscal year on Form N-Q within sixty days after the end of the period. After April 1, 2019, the Funds will file their complete schedules of Fund holdings on Form N-PORT, pursuant to the Investment Company Reporting Modernization rules adopted under the Investment Company Act of 1940, as amended. The Funds’ Forms N-Q are available on the Commission’s website at http://www.sec.gov, and may be reviewed and copied at the Commission’s Public Reference Room in Washington, DC. Information on the operation of the Public Reference Room may be obtained by calling 1-800-SEC-0330.
A description of the policies and procedures that KraneShares Trust uses to determine how to vote proxies relating to Fund securities, as well as information relating to how the Funds voted proxies relating to Fund securities during the most recent 12-month period ended June 30, are available (i) without charge, upon request, by calling 1-855-8KRANE8; and (ii) on the Commission’s website at http://www.sec.gov.
Fund shares may only be purchased or redeemed from a Fund in large Creation Unit aggregations. Investors who cannot transact in Creation Units of a Fund’s shares must buy or sell Fund shares in the secondary market at their market price, which may be at a premium or discount to a Fund’s net asset value, with the assistance of a broker. In doing so, the investor may incur brokerage commissions and may pay more than net asset value when buying Fund shares and receive less than net asset value when selling Fund shares.
Schedule of Investments (Unaudited) September 30, 2018
KraneShares Bosera MSCI China A Share ETF
|
| Shares |
| Value | |
COMMON STOCK – 99.6%‡ |
|
|
|
|
|
CHINA – 99.6% |
|
|
|
|
|
Communication Services – 2.0% |
|
|
|
|
|
| 142,500 |
| $ | 270,685 | |
| 126,021 |
|
| 221,067 | |
| 4,382,133 |
|
| 3,547,435 | |
| 312,085 |
|
| 494,848 | |
| 171,897 |
|
| 96,683 | |
| 320,658 |
|
| 488,868 | |
| 120,053 |
|
| 332,581 | |
| 60,196 |
|
| 211,368 | |
| 375,874 |
|
| 550,651 | |
| 65,400 |
|
| 299,787 | |
| 110,000 |
|
| 172,180 | |
|
|
|
|
| 6,686,153 |
Consumer Discretionary – 9.3% |
|
|
|
|
|
| 212,721 |
|
| 1,517,979 | |
| 510,817 |
|
| 479,591 | |
| 280,548 |
|
| 2,773,432 | |
| 171,000 |
|
| 575,832 | |
| 328,822 |
|
| 347,909 | |
| 322,137 |
|
| 1,191,522 | |
| 435,927 |
|
| 2,546,910 | |
| 155,191 |
|
| 249,231 | |
| 67,838 |
|
| 230,905 | |
| 432,933 |
|
| 647,455 | |
| 483,514 |
|
| 1,581,121 | |
| 305,001 |
|
| 613,052 | |
| 897,086 |
|
| 5,676,703 | |
| 727,676 |
|
| 1,747,116 | |
| 1,081,270 |
|
| 5,229,873 | |
| 46,300 |
|
| 105,646 | |
| 1,315,481 |
|
| 1,204,478 | |
The accompanying notes are an integral part of the financial statements.
1
Schedule of Investments (Unaudited) September 30, 2018
KraneShares Bosera MSCI China A Share ETF (continued)
|
| Shares |
| Value | |
COMMON STOCK (continued) |
|
|
|
|
|
Consumer Discretionary (continued) |
|
|
|
|
|
| 1,345,578 |
| $ | 2,636,165 | |
| 1,313,100 |
|
| 536,263 | |
| 134,807 |
|
| 116,771 | |
| 183,250 |
|
| 520,673 | |
| 295,800 |
|
| 1,257,470 | |
|
|
|
|
| 31,786,097 |
Consumer Staples – 12.0% |
|
|
|
|
|
| 190,400 |
|
| 101,833 | |
| 281,912 |
|
| 3,244,983 | |
| 419,400 |
|
| 1,593,946 | |
| 754,840 |
|
| 2,817,238 | |
| 211,561 |
|
| 3,935,675 | |
| 165,384 |
|
| 17,546,482 | |
| 224,547 |
|
| 1,550,479 | |
| 175,758 |
|
| 636,046 | |
| 789,387 |
|
| 703,273 | |
| 144,800 |
|
| 995,203 | |
| 725,400 |
|
| 703,198 | |
| 53,500 |
|
| 270,353 | |
| 537,676 |
|
| 5,309,869 | |
| 1,101,986 |
|
| 1,305,291 | |
|
|
|
|
| 40,713,869 |
Energy – 2.9% |
|
|
|
|
|
| 3,590,594 |
|
| 3,715,524 | |
| 516,028 |
|
| 1,529,200 | |
| 386,200 |
|
| 379,431 | |
| 2,003,688 |
|
| 2,670,380 | |
| 834,847 |
|
| 1,055,601 | |
| 222,700 |
|
| 260,225 | |
| 206,946 |
|
| 200,010 | |
|
|
|
|
| 9,810,371 |
Financials – 33.8% |
|
|
|
|
|
| 9,845,707 |
|
| 5,566,346 | |
| 461,760 |
|
| 347,632 | |
| 1,492,100 |
|
| 1,012,718 | |
| 2,584,884 |
|
| 2,295,387 | |
| 6,928,000 |
|
| 3,745,627 | |
| 5,467,680 |
|
| 4,640,765 | |
| 420,754 |
|
| 747,874 | |
| 863,013 |
|
| 980,839 | |
| 1,321,400 |
|
| 1,240,625 | |
| 1,313,545 |
|
| 1,460,428 | |
| 596,770 |
|
| 1,540,364 | |
| 1,571,176 |
|
| 2,785,854 | |
| 465,728 |
|
| 345,204 | |
| 985,634 |
|
| 868,084 | |
| 1,083,500 |
|
| 1,140,095 | |
| 5,659,584 |
|
| 3,216,140 | |
| 431,600 |
|
| 1,422,650 | |
The accompanying notes are an integral part of the financial statements.
2
Schedule of Investments (Unaudited) September 30, 2018
KraneShares Bosera MSCI China A Share ETF (continued)
|
| Shares |
| Value | |
COMMON STOCK (continued) |
|
|
|
|
|
Financials (continued) |
|
|
|
|
|
| 2,748,036 |
| $ | 12,257,249 | |
| 654,606 |
|
| 1,249,161 | |
| 4,946,178 |
|
| 4,557,563 | |
| 876,811 |
|
| 4,525,122 | |
| 1,394,329 |
|
| 3,382,169 | |
| 440,400 |
|
| 656,702 | |
| 373,663 |
|
| 515,914 | |
| 203,900 |
|
| 154,986 | |
| 844,900 |
|
| 677,825 | |
| 688,039 |
|
| 1,384,957 | |
| 380,188 |
|
| 466,353 | |
| 908,847 |
|
| 1,980,004 | |
| 648,731 |
|
| 649,618 | |
| 924,349 |
|
| 1,203,699 | |
| 210,900 |
|
| 154,790 | |
| 960,645 |
|
| 2,198,959 | |
| 1,537,005 |
|
| 1,825,035 | |
| 769,290 |
|
| 705,494 | |
| 6,939,598 |
|
| 5,819,475 | |
| 2,855,634 |
|
| 6,619,679 | |
| 587,223 |
|
| 387,465 | |
| 305,464 |
|
| 2,241,058 | |
| 639,691 |
|
| 830,224 | |
| 2,157,804 |
|
| 3,465,357 | |
| 1,463,433 |
|
| 14,569,247 | |
| 429,047 |
|
| 520,049 | |
| 3,776,768 |
|
| 5,829,329 | |
| 303,200 |
|
| 274,971 | |
| 2,196,762 |
|
| 1,436,711 | |
| 600,200 |
|
| 612,360 | |
| 182,217 |
|
| 169,225 | |
| 295,255 |
|
| 347,152 | |
|
|
|
|
| 115,024,534 |
Health Care – 5.7% |
|
|
|
|
|
| 138,580 |
|
| 639,467 | |
| 185,260 |
|
| 685,779 | |
| 57,489 |
|
| 396,623 | |
| 225,945 |
|
| 1,201,870 | |
| 161,046 |
|
| 982,576 | |
| 468,420 |
|
| 4,322,976 | |
| 159,003 |
|
| 350,330 | |
| 597,145 |
|
| 1,898,894 | |
| 335,140 |
|
| 839,238 | |
| 168,860 |
|
| 713,911 | |
| 221,900 |
|
| 1,017,491 | |
| 324,940 |
|
| 968,124 | |
| 165,848 |
|
| 681,171 | |
| 245,100 |
|
| 950,036 | |
| 262,685 |
|
| 873,505 | |
The accompanying notes are an integral part of the financial statements.
3
Schedule of Investments (Unaudited) September 30, 2018
KraneShares Bosera MSCI China A Share ETF (continued)
|
| Shares |
| Value | |
COMMON STOCK (continued) |
|
|
|
|
|
Health Care (continued) |
|
|
|
|
|
| 238,693 |
| $ | 629,289 | |
| 119,034 |
|
| 1,284,175 | |
| 66,550 |
|
| 979,399 | |
|
|
|
|
| 19,414,854 |
Industrials – 12.1% |
|
|
|
|
|
| 348,231 |
|
| 1,217,690 | |
| 451,100 |
|
| 534,324 | |
| 282,800 |
|
| 652,685 | |
| 159,823 |
|
| 884,989 | |
| 100,800 |
|
| 211,837 | |
| 252,700 |
|
| 469,364 | |
| 843,246 |
|
| 686,303 | |
| 805,221 |
|
| 853,132 | |
| 49,704 |
|
| 85,530 | |
| 865,085 |
|
| 838,607 | |
| 55,006 |
|
| 61,956 | |
| 1,658,500 |
|
| 2,687,597 | |
| 732,036 |
|
| 719,205 | |
| 84,610 |
|
| 228,108 | |
| 5,850,136 |
|
| 4,667,797 | |
| 468,901 |
|
| 162,874 | |
| 671,237 |
|
| 398,025 | |
| 2,538,705 |
|
| 3,187,863 | |
| 2,151,703 |
|
| 2,573,688 | |
| 299,669 |
|
| 975,146 | |
| 1,138,175 |
|
| 597,159 | |
| 109,723 |
|
| 675,662 | |
| 214,184 |
|
| 115,488 | |
| 460,690 |
|
| 1,032,445 | |
| 2,508,419 |
|
| 1,301,494 | |
| 531,238 |
|
| 1,362,723 | |
| 706,100 |
|
| 420,749 | |
| 1,099,390 |
|
| 854,829 | |
| 1,182,299 |
|
| 1,525,858 | |
| 781,000 |
|
| 598,185 | |
| 104,494 |
|
| 892,526 | |
| 665,789 |
|
| 523,489 | |
| 646,127 |
|
| 573,763 | |
| 141,629 |
|
| 739,370 | |
| 506,210 |
|
| 661,399 | |
| 688,773 |
|
| 717,743 | |
| 288,651 |
|
| 566,344 | |
| 969,052 |
|
| 1,204,167 | |
| 1,392,900 |
|
| 799,633 | |
| 547,900 |
|
| 645,797 | |
| 502,688 |
|
| 877,435 | |
| 346,833 |
|
| 1,161,386 | |
| 198,373 |
|
| 422,948 | |
| 1,224,220 |
|
| 665,433 | |
|
|
|
|
| 41,032,745 |
The accompanying notes are an integral part of the financial statements.
4
Schedule of Investments (Unaudited) September 30, 2018
KraneShares Bosera MSCI China A Share ETF (continued)
|
| Shares |
| Value | |
COMMON STOCK (continued) |
|
|
|
|
|
Information Technology – 6.7% |
|
|
|
|
|
| 297,131 |
| $ | 1,201,807 | |
| 79,502 |
|
| 390,080 | |
| 23,600 |
|
| 45,550 | |
| 4,077,300 |
|
| 1,866,624 | |
| 266,000 |
|
| 347,935 | |
| 985,945 |
|
| 776,651 | |
| 1,461,612 |
|
| 1,807,738 | |
| 270,063 |
|
| 325,774 | |
| 462,982 |
|
| 592,135 | |
| 1,276,956 |
|
| 5,333,795 | |
| 196,033 |
|
| 680,642 | |
| 107,400 |
|
| 861,779 | |
| 229,550 |
|
| 953,150 | |
| 270,307 |
|
| 557,852 | |
| 148,600 |
|
| 558,065 | |
| 463,005 |
|
| 907,761 | |
| 457,565 |
|
| 1,087,952 | |
| 906,734 |
|
| 566,659 | |
| 387,133 |
|
| 683,613 | |
| 58,360 |
|
| 357,339 | |
| 305,330 |
|
| 1,234,526 | |
| 293,650 |
|
| 630,354 | |
| 384,600 |
|
| 1,022,902 | |
|
|
|
|
| 22,790,683 |
Materials – 6.1% |
|
|
|
|
|
| 768,366 |
|
| 685,662 | |
| 570,678 |
|
| 3,051,368 | |
| 2,295,844 |
|
| 2,619,303 | |
| 1,482,643 |
|
| 799,437 | |
| 394,594 |
|
| 341,798 | |
| 1,240,891 |
|
| 822,379 | |
| 344,700 |
|
| 512,496 | |
| 206,310 |
|
| 480,948 | |
| 975,600 |
|
| 462,235 | |
| 4,076,780 |
|
| 983,556 | |
| 306,479 |
|
| 644,530 | |
| 106,265 |
|
| 501,780 | |
| 579,400 |
|
| 532,193 | |
| 1,139,100 |
|
| 678,765 | |
| 219,449 |
|
| 289,596 | |
| 268,693 |
|
| 437,369 | |
| 189,500 |
|
| 651,900 | |
| 780,350 |
|
| 519,432 | |
| 887,004 |
|
| 755,435 | |
| 116,506 |
|
| 643,945 | |
| 2,041,400 |
|
| 649,750 | |
| 136,080 |
|
| 1,053,935 | |
| 575,800 |
|
| 816,762 | |
| 257,247 |
|
| 253,860 | |
| 2,690,100 |
|
| 1,395,758 | |
|
|
|
|
| 20,584,192 |
The accompanying notes are an integral part of the financial statements.
5
Schedule of Investments (Unaudited) September 30, 2018
KraneShares Bosera MSCI China A Share ETF (continued)
|
| Shares |
| Value | |
COMMON STOCK (continued) |
|
|
|
|
|
Real Estate – 5.2% |
|
|
|
|
|
| 448,955 |
| $ | 1,652,767 | |
| 803,490 |
|
| 2,182,547 | |
| 1,239,142 |
|
| 4,376,239 | |
| 202,251 |
|
| 206,937 | |
| 353,459 |
|
| 1,345,390 | |
| 754,800 |
|
| 994,976 | |
| 1,297,341 |
|
| 1,206,723 | |
| 974,000 |
|
| 730,436 | |
| 1,556,400 |
|
| 2,752,869 | |
| 751,100 |
|
| 871,113 | |
| 68,100 |
|
| 98,974 | |
| 1,588,668 |
|
| 718,071 | |
| 288,001 |
|
| 310,160 | |
| 386,001 |
|
| 228,326 | |
| 151,500 |
|
| 107,450 | |
|
|
|
|
| 17,782,978 |
Utilities – 3.8% |
|
|
|
|
|
| 280,025 |
|
| 154,244 | |
| 1,497,040 |
|
| 1,307,620 | |
| 1,867,960 |
|
| 4,446,878 | |
| 2,071,600 |
|
| 767,750 | |
| 1,420,844 |
|
| 867,300 | |
| 679,587 |
|
| 761,506 | |
| 922,900 |
|
| 540,547 | |
| 1,088,822 |
|
| 1,215,323 | |
| 869,516 |
|
| 664,718 | |
| 695,927 |
|
| 549,209 | |
| 417,400 |
|
| 508,358 | |
| 1,489,142 |
|
| 1,099,444 | |
|
|
|
|
| 12,882,897 |
TOTAL COMMON STOCK |
|
|
|
|
|
|
|
|
| 338,509,373 | |
TOTAL INVESTMENTS – 99.6% |
|
|
|
|
|
|
|
|
| 338,509,373 | |
OTHER ASSETS LESS LIABILITIES – 0.4% |
|
|
|
| 1,244,233 |
NET ASSETS – 100% |
|
|
| $ | 339,753,606 |
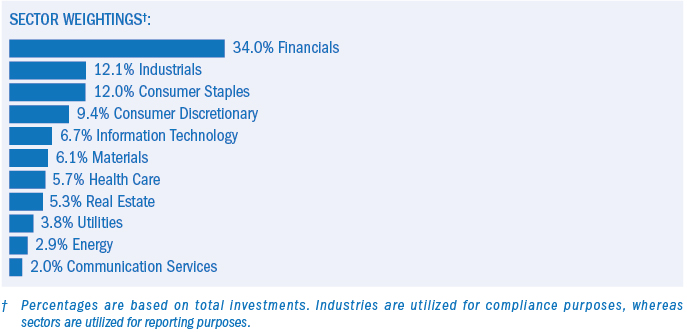
‡ Industries are utilized for compliance purposes, whereas sectors are utilized for reporting.
* Non-income producing security.
(A) Security is fair valued using methods determined in good faith by the Fair Value Committee appointed by the Board of Trustees. The total value of such securities as of September 30, 2018 was $9,345,514 and represents 2.8% of Net Assets.
(B) Level 3 security in accordance with fair value hierarchy.
(C) Security considered illiquid. The total value of such securities as of September 30, 2018 was $9,345,514 and represents 2.8% of Net Assets.
Cl — Class
The accompanying notes are an integral part of the financial statements.
6
Schedule of Investments (Unaudited) September 30, 2018
KraneShares Bosera MSCI China A Share ETF (concluded)
The following summarizes the market value of the Fund’s investments, as of September 30, 2018, based on the inputs used to value them:
|
| Level 1 |
| Level 2 |
| Level 3 |
| Total | ||||
Investments in Securities |
|
|
|
|
|
|
|
|
|
|
|
|
|
|
|
|
|
|
|
|
|
|
|
| |
|
|
|
|
|
|
|
|
|
|
|
| |
| $ | 6,053,785 |
| $ | — |
| $ | 632,368 |
| $ | 6,686,153 | |
|
| 24,851,924 |
|
| — |
|
| 6,934,173 |
|
| 31,786,097 | |
|
| 40,713,869 |
|
| — |
|
| — |
|
| 40,713,869 | |
|
| 9,810,371 |
|
| — |
|
| — |
|
| 9,810,371 | |
|
| 115,024,534 |
|
| — |
|
| — |
|
| 115,024,534 | |
|
| 18,130,679 |
|
| — |
|
| 1,284,175 |
|
| 19,414,854 | |
|
| 41,032,745 |
|
| — |
|
| — |
|
| 41,032,745 | |
|
| 22,745,133 |
|
| — |
|
| 45,550 |
|
| 22,790,683 | |
|
| 20,242,394 |
|
| — |
|
| 341,798 |
|
| 20,584,192 | |
|
| 17,675,528 |
|
| — |
|
| 107,450 |
|
| 17,782,978 | |
|
| 12,882,897 |
|
| — |
|
| — |
|
| 12,882,897 | |
|
| 329,163,859 |
|
| — |
|
| 9,345,514 |
|
| 338,509,373 | |
Total Investments in Securities |
| $ | 329,163,859 |
| $ | — |
| $ | 9,345,514 |
| $ | 338,509,373 |
The following is a reconciliation of the beginning and ending balances, of the period ended September 30, 2018, of investments in which significant unobservable inputs (Level 3) were used in determining value:
|
| Common Stock | |
Beginning balance as of March 29, 2018 |
| $ | 6,103,566 |
|
| — | |
|
| 478,249 | |
|
| (556,052) | |
|
| 47,553 | |
|
| (5,283,756) | |
|
| 8,892,728 | |
|
| (336,774) | |
Ending balance as of September 30, 2018 |
| $ | 9,345,514 |
(1) Realized gain/(loss) from the sale of Level 3 securities is included on the Statement of Operations in Net Realized Gain (Loss) on Investments
(2) Change in unrealized appreciation/(depreciation) is included on the Statement of Operations in Net Change in Unrealized Appreciation (Depreciation) on Investments
For the period ended September 30, 2018, there have been no transfers between Level 1 and Level 2 investments.
For the period ended September 30, 2018, there have been no transfers between Level 2 and Level 3 investments.
For the period ended September 30, 2018, the transfers in and out of Level 3 occurred due to a halt in trading of these securities. Transfers between levels are recognized at period end.
Amounts designated as “–” are $0 or have been rounded to $0.
The accompanying notes are an integral part of the financial statements.
7
Schedule of Investments (Unaudited) September 30, 2018
KraneShares Zacks New China ETF
|
| Shares |
| Value | |
COMMON STOCK – 99.2%‡ |
|
|
|
|
|
CHINA – 71.3% |
|
|
|
|
|
Communication Services – 14.4% |
|
|
|
|
|
| 1,650 |
| $ | 121,440 | |
| 605 |
|
| 138,352 | |
| 2,542 |
|
| 104,995 | |
| 45,000 |
|
| 27,834 | |
| 762 |
|
| 57,089 | |
|
|
|
|
| 449,710 |
Consumer Discretionary – 13.4% |
|
|
|
|
|
| 5,400 |
|
| 41,093 | |
| 15,300 |
|
| 151,252 | |
| 9,400 |
|
| 28,580 | |
| 35,300 |
|
| 115,433 | |
| 15,600 |
|
| 59,856 | |
| 26,000 |
|
| 22,960 | |
|
|
|
|
| 419,174 |
Consumer Staples – 6.0% |
|
|
|
|
|
| 35,400 |
|
| 37,352 | |
| 13,120 |
|
| 151,019 | |
|
|
|
|
| 188,371 |
Health Care – 3.3% |
|
|
|
|
|
| 4,000 |
|
| – | |
| 65,500 |
|
| 103,964 | |
|
|
|
|
| 103,964 |
Industrials – 9.1% |
|
|
|
|
|
| 54,200 |
|
| 75,385 | |
| 46,000 |
|
| 47,970 | |
| 30,000 |
|
| 66,787 | |
| 76,736 |
|
| 95,124 | |
|
|
|
|
| 285,266 |
Information Technology – 3.8% |
|
|
|
|
|
| 65,064 |
|
| 83 | |
| 26,000 |
|
| 49,575 | |
| 27,000 |
|
| 70,218 | |
|
|
|
|
| 119,876 |
The accompanying notes are an integral part of the financial statements.
8
Schedule of Investments (Unaudited) September 30, 2018
KraneShares Zacks New China ETF (continued)
|
| Shares |
| Value | |
COMMON STOCK (continued) |
|
|
|
|
|
Materials – 0.0% |
|
|
|
|
|
| 28,720 |
| $ | — | |
| 10,672 |
|
| 14 | |
| 40,000 |
|
| — | |
|
|
|
|
| 14 |
Utilities – 21.3% |
|
|
|
|
|
| 48,787 |
|
| 116,143 | |
| 292,000 |
|
| 73,887 | |
| 92,800 |
|
| 82,137 | |
| 142,900 |
|
| 87,228 | |
| 3,172 |
|
| 82,155 | |
| 75,500 |
|
| 84,271 | |
| 30,500 |
|
| 33,246 | |
| 146,000 |
|
| 107,793 | |
|
|
|
|
| 666,860 |
TOTAL CHINA |
|
|
|
| 2,233,235 |
|
|
|
|
|
|
HONG KONG – 22.4% |
|
|
|
|
|
Consumer Discretionary – 5.8% |
|
|
|
|
|
| 47,000 |
|
| 36,700 | |
| 21,200 |
|
| 77,080 | |
| 25,000 |
|
| 67,892 | |
|
|
|
|
| 181,672 |
Consumer Staples – 3.1% |
|
|
|
|
|
| 75,000 |
|
| 97,573 | |
|
|
|
|
|
|
Financials – 3.7% |
|
|
|
|
|
| 256,000 |
|
| 115,161 | |
|
|
|
|
|
|
Health Care – 1.6% |
|
|
|
|
|
| 24,000 |
|
| 48,399 | |
|
|
|
|
|
|
Information Technology – 5.5% |
|
|
|
|
|
| 5,900 |
|
| 60,094 | |
| 19,000 |
|
| 62,039 | |
| 57,000 |
|
| 50,554 | |
|
|
|
|
| 172,687 |
Utilities – 2.7% |
|
|
|
|
|
| 48,000 |
|
| 84,898 | |
TOTAL HONG KONG |
|
|
|
| 700,390 |
|
|
|
|
|
|
SINGAPORE – 1.1% |
|
|
|
|
|
Industrials – 1.1% |
|
|
|
|
|
| 2,010 |
|
| 34,712 | |
TOTAL SINGAPORE |
|
|
|
| 34,712 |
The accompanying notes are an integral part of the financial statements.
9
Schedule of Investments (Unaudited) September 30, 2018
KraneShares Zacks New China ETF (continued)
|
| Shares |
| Value | |
COMMON STOCK (continued) |
|
|
|
|
|
UNITED STATES – 4.4% |
|
|
|
|
|
Information Technology – 4.4% |
|
|
|
|
|
| 560 |
| $ | 138,169 | |
|
|
|
|
|
|
TOTAL UNITED STATES |
|
|
|
| 138,169 |
TOTAL COMMON STOCK |
|
|
|
|
|
|
|
|
| 3,106,506 | |
TOTAL INVESTMENTS – 99.2% |
|
|
|
|
|
|
|
|
| 3,106,506 | |
OTHER ASSETS LESS LIABILITIES – 0.8% |
|
|
|
| 23,793 |
NET ASSETS – 100% |
|
|
| $ | 3,130,299 |
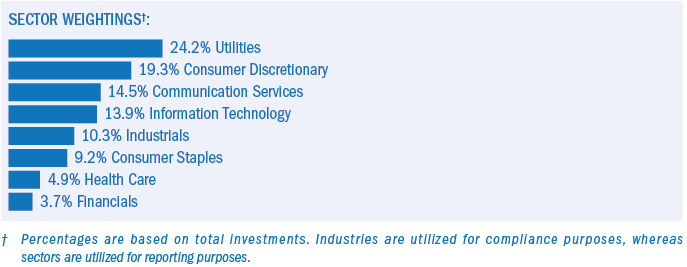
‡ Industries are utilized for compliance purposes, whereas sectors are utilized for reporting.
* Non-income producing security.
(A) Level 3 security in accordance with fair value hierarchy.
(B) Security is fair valued using methods determined in good faith by the Fair Value Committee appointed by the Board of Trustees. The total value of such securities as of September 30, 2018 was $97 and represents 0.0% of Net Assets.
(C) Security considered illiquid. The total value of such securities as of September 30, 2018 was $97 and represents 0.0% of Net Assets.
ADR — American Depositary Receipt
Cl — Class
The accompanying notes are an integral part of the financial statements.
10
Schedule of Investments (Unaudited) September 30, 2018
KraneShares Zacks New China ETF (concluded)
The following summarizes the market value of the Fund’s investments, as of September 30, 2018, based on the inputs used to value them:
|
| Level 1 |
| Level 2 |
| Level 3^ |
| Total | ||||
Investments in Securities |
|
|
|
|
|
|
|
|
|
|
|
|
|
|
|
|
|
|
|
|
|
|
|
| |
|
|
|
|
|
|
|
|
|
|
|
| |
| $ | 449,710 |
| $ | — |
| $ | — |
| $ | 449,710 | |
|
| 419,174 |
|
| — |
|
| — |
|
| 419,174 | |
|
| 188,371 |
|
| — |
|
| — |
|
| 188,371 | |
|
| 103,964 |
|
| — |
|
| — |
|
| 103,964 | |
|
| 285,266 |
|
| — |
|
| — |
|
| 285,266 | |
|
| 119,793 |
|
| — |
|
| 83 |
|
| 119,876 | |
|
| — |
|
| — |
|
| 14 |
|
| 14 | |
|
| 666,860 |
|
| — |
|
| — |
|
| 666,860 | |
|
| 700,390 |
|
| — |
|
| — |
|
| 700,390 | |
|
| 34,712 |
|
| — |
|
| — |
|
| 34,712 | |
|
| 138,169 |
|
| — |
|
| — |
|
| 138,169 | |
|
| 3,106,409 |
|
| — |
|
| 97 |
|
| 3,106,506 | |
Total Investments in Securities |
| $ | 3,106,409 |
| $ | — |
| $ | 97 |
| $ | 3,106,506 |
^ A reconciliation of Level 3 investments, including certain disclosures related to significant inputs used in valuing Level 3 investments is only presented when the Fund has over 1% of Level 3 investments at the beginning and/or end of the period in relation to net assets.
For the period ended September 30, 2018, there have been no transfers between Level 1 and Level 2 investments.
For the period ended September 30, 2018, there have been no transfers between Level 2 and Level 3 investments.
For the period ended September 30, 2018, the transfers in and out of Level 3 occurred due to a halt in trading of these securities. Transfers between levels are recognized at period end.
Amounts designated as “—” are $0 or have been rounded to $0.
The accompanying notes are an integral part of the financial statements.
11
Schedule of Investments (Unaudited) September 30, 2018
KraneShares CSI China Internet ETF

|
| Shares |
| Value | |
COMMON STOCK – 99.8%‡ |
|
|
|
|
|
CHINA – 93.8% |
|
|
|
|
|
Communication Services – 57.6% |
|
|
|
|
|
| 932,463 |
| $ | 68,629,277 | |
| 662,702 |
|
| 51,299,762 | |
| 596,029 |
|
| 136,299,912 | |
| 505,914 |
|
| 11,636,022 | |
| 98,278 |
|
| 1,297,270 | |
| 2,685,352 |
|
| 6,955,062 | |
| 2,616,598 |
|
| 70,831,308 | |
| 1,547,947 |
|
| 67,800,079 | |
| 563,946 |
|
| 128,720,674 | |
| 820,913 |
|
| 57,037,035 | |
| 981,831 |
|
| 7,295,004 | |
| 510,277 |
|
| 10,144,307 | |
| 3,625,875 |
|
| 149,763,294 | |
| 12,754,000 |
|
| 7,888,837 | |
| 511,654 |
|
| 37,417,257 | |
| 548,484 |
|
| 41,092,421 | |
|
|
|
|
| 854,107,521 |
Consumer Discretionary – 26.9% |
|
|
|
|
|
| 52,350 |
|
| 578,991 | |
| 837,218 |
|
| 137,940,038 | |
| 511,048 |
|
| 24,826,712 | |
| 8,209,818 |
|
| 3,084,623 | |
| 1,641,710 |
|
| 61,022,361 | |
| 3,036,018 |
|
| 79,209,709 | |
| 362,039 |
|
| 4,597,895 | |
| 1,742,815 |
|
| 44,807,774 | |
| 1,035,695 |
|
| 7,436,290 | |
| 5,646,613 |
|
| 35,234,865 | |
|
|
|
|
| 398,739,258 |
Financials – 4.2% |
|
|
|
|
|
| 632,995 |
|
| 17,103,525 | |
| 205,773 |
|
| 1,621,491 | |
| 269,573 |
|
| 1,318,212 | |
| 461,492 |
|
| 4,582,615 | |
| 1,108,728 |
|
| 5,776,473 | |
The accompanying notes are an integral part of the financial statements.
12
Schedule of Investments (Unaudited) September 30, 2018
KraneShares CSI China Internet ETF (continued)
|
| Shares |
| Value | ||
COMMON STOCK (continued) |
|
|
|
|
|
|
Financials (continued) |
|
|
|
|
|
|
| 587,462 |
| $ | 10,809,301 |
| |
| 5,328,800 |
|
| 21,758,126 |
| |
|
|
|
|
| 62,969,743 |
|
Industrials – 2.3% |
|
|
|
|
|
|
| 449,839 |
|
| 34,633,105 |
| |
Information Technology – 2.8% |
|
|
|
|
|
|
| 775,598 |
|
| 7,833,540 |
| |
| 172,945 |
|
| 1,700,049 |
| |
| 14,553,000 |
|
| 27,748,694 |
| |
| 605,577 |
|
| 4,396,489 |
| |
|
|
|
|
| 41,678,772 |
|
TOTAL CHINA |
|
|
|
| 1,392,128,399 |
|
|
|
|
|
|
|
|
HONG KONG – 6.0% |
|
|
|
|
|
|
Communication Services – 4.7% |
|
|
|
|
|
|
| 216,584,000 |
|
| 29,616,337 |
| |
| 5,040,600 |
|
| 31,693,379 |
| |
| 3,805,752 |
|
| 7,966,647 |
| |
|
|
|
|
| 69,276,363 |
|
Financials – 0.9% |
|
|
|
|
|
|
| 43,249,000 |
|
| 14,204,646 |
| |
|
|
|
|
|
|
|
Industrials – 0.4% |
|
|
|
|
|
|
| 7,976,900 |
|
| 5,555,867 |
| |
TOTAL HONG KONG |
|
|
|
| 89,036,876 |
|
TOTAL COMMON STOCK |
|
|
|
|
|
|
|
|
|
| 1,481,165,275 |
| |
|
|
|
|
|
|
|
SHORT-TERM INVESTMENT(B)(C) – 11.20% |
|
|
|
|
|
|
| 165,631,848 |
|
| 165,631,848 |
| |
TOTAL SHORT-TERM INVESTMENT |
|
|
|
|
|
|
|
|
|
| 165,631,848 |
| |
TOTAL INVESTMENTS – 111.0% |
|
|
|
|
|
|
|
|
|
| 1,646,797,123 |
| |
OTHER ASSETS LESS LIABILITIES – (11.0)% |
|
|
|
| (162,989,909 | ) |
NET ASSETS – 100% |
|
|
| $ | 1,483,807,214 |
|
‡ Industries are utilized for compliance purposes, whereas sectors are utilized for reporting.
* Non-income producing security.
(A) This security or a partial position of this security is on loan at September 30, 2018. The total value of securities on loan at September 30, 2018 was $160,221,941.
(B) The rate shown is the 7-day effective yield as of September 30, 2018.
(C) This security was purchased with cash collateral held from securities on loan. The total value of such security as of September 30, 2018 was $165,631,848.
ADR — American Depositary Receipt
Cl — Class
The accompanying notes are an integral part of the financial statements.
13
Schedule of Investments (Unaudited) September 30, 2018
KraneShares CSI China Internet ETF (concluded)
As of September 30, 2018, all of the Fund’s investments were considered Level 1 of the fair value hierarchy, in accordance with the authoritative guidance under U.S. GAAP.
For the period ended September 30, 2018, there have been no transfers between Level 1, Level 2 and Level 3 investments. Transfers between levels are recognized at period end.
The accompanying notes are an integral part of the financial statements.
14
Schedule of Investments (Unaudited) September 30, 2018
KraneShares E Fund China Commercial Paper ETF
|
| Face |
| Value | |
COMMERCIAL PAPER – 97.6% |
|
|
|
|
|
CHINA – 97.6% |
|
|
|
|
|
Energy – 6.1% |
|
|
|
|
|
| 5,000,000 |
| $ | 728,016 | |
|
|
|
|
|
|
Financials – 34.2% |
|
|
|
|
|
| 5,000,000 |
|
| 729,017 | |
| 4,000,000 |
|
| 582,577 | |
| 4,000,000 |
|
| 583,981 | |
| 3,000,000 |
|
| 436,673 | |
| 3,000,000 |
|
| 437,278 | |
| 3,000,000 |
|
| 436,695 | |
| 3,000,000 |
|
| 437,689 | |
| 3,000,000 |
|
| 436,390 | |
|
|
|
|
| 4,080,300 |
Industrials – 25.7% |
|
|
|
|
|
| 3,000,000 |
|
| 437,490 | |
| 2,000,000 |
|
| 291,376 | |
| 5,000,000 |
|
| 730,365 | |
| 4,000,000 |
|
| 582,441 | |
| 5,000,000 |
|
| 728,046 | |
| 2,000,000 |
|
| 294,816 | |
|
|
|
|
| 3,064,534 |
The accompanying notes are an integral part of the financial statements.
15
Schedule of Investments (Unaudited) September 30, 2018
KraneShares E Fund China Commercial Paper ETF (continued)
|
| Face |
| Value | |
COMMERCIAL PAPER (continued) |
|
|
|
|
|
Materials – 17.0% |
|
|
|
|
|
| 7,000,000 |
| $ | 1,019,222 | |
| 4,000,000 |
|
| 580,817 | |
| 3,000,000 |
|
| 437,277 | |
|
|
|
|
| 2,037,316 |
Utilities – 14.6% |
|
|
|
|
|
| 3,000,000 |
|
| 435,954 | |
| 6,000,000 |
|
| 874,447 | |
| 3,000,000 |
|
| 435,727 | |
|
|
|
|
| 1,746,128 |
TOTAL COMMERCIAL PAPER |
|
|
|
|
|
|
|
|
| 11,656,294 | |
|
|
|
|
|
|
SHORT-TERM INVESTMENTS(B) – 2.1% |
|
|
|
|
|
| 381 |
|
| 55 | |
| 1,561,853 |
|
| 227,114 | |
| 159,214 |
|
| 23,155 | |
| 3,459 |
|
| 503 | |
TOTAL SHORT-TERM INVESTMENTS |
|
|
|
|
|
|
|
|
| 250,827 | |
|
|
|
|
|
|
TOTAL INVESTMENTS – 99.7% |
|
|
|
|
|
|
|
|
| 11,907,121 | |
OTHER ASSETS LESS LIABILITIES – 0.3% |
|
|
|
| 31,841 |
NET ASSETS – 100% |
|
|
| $ | 11,938,962 |
* Affiliated investment is a Chinese investment company which is managed by E Fund Management (Hong Kong) Co., Limited (the “Sub-Adviser”) or an affiliate of the Sub-Adviser or which is distributed by an affiliate of the Fund’s distributor. Transactions with affiliated companies during the period ended September 30, 2018 are as follows:
|
| Value |
| Purchases |
| Proceeds |
| Change in |
| Realized |
| Value |
| Number of |
| Dividend Income |
E Fund Money Market Fund | ||||||||||||||||
|
| $23,71 |
| $296,65 |
| $(77,022) |
| $(29,102) |
| $12,86 |
| $227,11 |
| 1,561,85 |
| $ — |
(A) In CNY unless otherwise indicated.
(B) Class not available.
(C) The rate shown is the 7-day effective yield as of September 30, 2018.
CNY — Chinese Yuan
Ltd. — Limited
The accompanying notes are an integral part of the financial statements.
16
Schedule of Investments (Unaudited) September 30, 2018
KraneShares E Fund China Commercial Paper ETF (concluded)
The following summarizes the market value of the Fund’s investments, as of September 30, 2018, based on the inputs used to value them:
|
| Level 1 |
| Level 2 |
| Level 3 |
| Total | ||||
Investments in Securities |
|
|
|
|
|
|
|
|
|
|
|
|
| $ | — |
| $ | 11,656,294 |
| $ | — |
| $ | 11,656,294 | |
|
| 250,827 |
|
| — |
|
| — |
|
| 250,827 | |
Total Investments in Securities |
| $ | 250,827 |
| $ | 11,656,294 |
| $ | — |
| $ | 11,907,121 |
For the period ended September 30, 2018, there have been no transfers between Level 1 and Level 2 investments.
For the period ended September 30, 2018, there have been no transfers between Level 2 and Level 3 investments.
For the period ended September 30, 2018, there were no Level 3 investments
The accompanying notes are an integral part of the financial statements.
17
Schedule of Investments (Unaudited) September 30, 2018
KraneShares MSCI All China Index ETF
|
| Shares |
| Value | |
COMMON STOCK – 97.9%‡ |
|
|
|
|
|
CHINA – 87.7% |
|
|
|
| |
Communication Services – 12.3% |
|
|
|
| |
| 96 |
| $ | 7,066 | |
| 58 |
| 4,490 | ||
| 248 |
| 56,713 | ||
| 131 |
| 5,738 | ||
| 70 |
| 15,977 | ||
| 2,340 |
| 3,428 | ||
| 80 |
| 5,558 | ||
| 4,558 |
| 188,264 | ||
| 56 |
| 4,095 | ||
| 51 |
| 3,821 | ||
|
|
|
| 295,150 | |
Consumer Discretionary – 15.2% |
|
|
|
|
|
| 918 |
|
| 151,249 | |
| 2,000 |
|
| 9,597 | |
| 3,500 |
|
| 2,805 | |
| 6,000 |
|
| 9,707 | |
| 700 |
|
| 4,995 | |
| 1,000 |
|
| 7,182 | |
| 3,400 |
|
| 3,192 | |
| 600 |
|
| 5,931 | |
| 5,300 |
|
| 5,608 | |
| 300 |
|
| 11,151 | |
| 6,000 |
|
| 6,180 | |
| 2,200 |
|
| 8,137 | |
| 5,000 |
|
| 9,968 | |
| 6,500 |
|
| 4,145 | |
| 1,000 |
|
| 5,843 | |
| 8,000 |
|
| 8,864 | |
| 1,300 |
|
| 4,251 | |
| 131 |
|
| 4,231 | |
The accompanying notes are an integral part of the financial statements.
18
Schedule of Investments (Unaudited) September 30, 2018
KraneShares MSCI All China Index ETF (continued)
|
| Shares |
| Value | |
COMMON STOCK (continued) |
|
|
|
|
|
Consumer Discretionary (continued) |
|
|
|
|
|
| 500 |
| $ | 13,045 | |
| 1,800 |
|
| 11,390 | |
| 1,200 |
|
| 3,200 | |
| 128 |
|
| 9,473 | |
| 2,300 |
|
| 5,522 | |
| 1,957 |
|
| 9,466 | |
| 4,800 |
|
| 4,395 | |
| 1,000 |
|
| 12,831 | |
| 3,500 |
|
| 6,857 | |
| 900 |
|
| 2,858 | |
| 312 |
|
| 8,022 | |
| 503 |
|
| 3,139 | |
| 316 |
|
| 11,095 | |
|
|
|
|
| 364,329 |
Consumer Staples – 5.8% |
|
|
|
|
|
| 800 |
|
| 3,429 | |
| 300 |
|
| 3,629 | |
| 3,000 |
|
| 9,987 | |
| 2,000 |
|
| 8,038 | |
| 700 |
|
| 8,057 | |
| 1,300 |
|
| 4,108 | |
| 1,300 |
|
| 4,941 | |
| 1,060 |
|
| 9,781 | |
| 2,000 |
|
| 7,465 | |
| 400 |
|
| 7,441 | |
| 400 |
|
| 42,438 | |
| 600 |
|
| 4,143 | |
| 1,000 |
|
| 3,619 | |
| 5,700 |
|
| 5,078 | |
| 300 |
|
| 2,062 | |
| 2,000 |
|
| 3,675 | |
| 6,000 |
|
| 5,053 | |
| 4,200 |
|
| 4,975 | |
|
|
|
|
| 137,919 |
Energy – 4.1% |
|
|
|
|
|
| 4,000 |
|
| 4,340 | |
| 7,400 |
|
| 7,657 | |
| 18,500 |
|
| 18,536 | |
| 3,000 |
|
| 6,855 | |
| 13,826 |
|
| 27,387 | |
| 5,100 |
|
| 5,011 | |
| 3,900 |
|
| 5,198 | |
| 19,984 |
|
| 16,192 | |
| 3,200 |
|
| 4,046 | |
| 2,000 |
|
| 2,337 | |
|
|
|
|
| 97,559 |
Financials – 18.3% |
|
|
|
|
|
| 7,000 |
|
| 3,958 | |
| 34,397 |
|
| 16,880 | |
The accompanying notes are an integral part of the financial statements.
19
Schedule of Investments (Unaudited) September 30, 2018
KraneShares MSCI All China Index ETF (continued)
|
| Shares |
| Value | |
COMMON STOCK (continued) |
|
|
|
|
|
Financials (continued) |
|
|
|
|
|
| 3,200 |
| $ | 2,409 | |
| 6,100 |
|
| 4,140 | |
| 7,800 |
|
| 6,926 | |
| 8,300 |
|
| 4,487 | |
| 59,396 |
|
| 26,415 | |
| 12,000 |
|
| 10,185 | |
| 1,000 |
|
| 750 | |
| 3,900 |
|
| 4,432 | |
| 6,300 |
|
| 5,915 | |
| 4,100 |
|
| 4,559 | |
| 1,900 |
|
| 4,904 | |
| 4,100 |
|
| 7,270 | |
| 5,900 |
|
| 4,373 | |
| 14,000 |
|
| 8,964 | |
| 11,000 |
|
| 11,575 | |
| 56,000 |
|
| 48,951 | |
| 15,000 |
|
| 8,524 | |
| 8,483 |
|
| 19,275 | |
| 4,000 |
|
| 17,842 | |
| 2,600 |
|
| 4,962 | |
| 7,600 |
|
| 7,003 | |
| 1,500 |
|
| 7,741 | |
| 3,000 |
|
| 7,277 | |
| 2,800 |
|
| 3,866 | |
| 4,800 |
|
| 3,851 | |
| 1,500 |
|
| 3,019 | |
| 3,200 |
|
| 3,925 | |
| 4,000 |
|
| 8,714 | |
| 8,000 |
|
| 10,418 | |
| 1,700 |
|
| 3,891 | |
| 5,300 |
|
| 6,293 | |
| 14,000 |
|
| 11,740 | |
| 5,500 |
|
| 12,750 | |
| 7,400 |
|
| 4,883 | |
| 600 |
|
| 4,402 | |
| 1,300 |
|
| 6,239 | |
| 51 |
|
| 2,149 | |
| 3,800 |
|
| 4,932 | |
| 7,510 |
|
| 8,868 | |
| 5,700 |
|
| 9,154 | |
| 2,400 |
|
| 23,893 | |
| 3,500 |
|
| 35,560 | |
| 8,000 |
|
| 12,348 | |
| 9,100 |
|
| 5,952 | |
|
|
|
|
| 436,564 |
Health Care – 5.3% |
|
|
|
|
|
| 2,000 |
|
| 3,364 | |
| 6,000 |
|
| 5,881 | |
| 1,100 |
|
| 5,076 | |
The accompanying notes are an integral part of the financial statements.
20
Schedule of Investments (Unaudited) September 30, 2018
KraneShares MSCI All China Index ETF (continued)
|
| Shares |
| Value | |
COMMON STOCK (continued) |
|
|
|
|
|
Health Care (continued) |
|
|
|
|
|
| 100 |
| $ | 3,445 | |
| 3,000 |
|
| 4,171 | |
| 6,000 |
|
| 4,079 | |
| 4,000 |
|
| 8,496 | |
| 800 |
|
| 5,519 | |
| 700 |
|
| 3,724 | |
| 700 |
|
| 4,271 | |
| 800 |
|
| 4,406 | |
| 3,500 |
|
| 3,210 | |
| 1,000 |
|
| 9,229 | |
| 1,900 |
|
| 6,042 | |
| 1,600 |
|
| 4,007 | |
| 1,100 |
|
| 5,044 | |
| 500 |
|
| 1,971 | |
| 2,000 |
|
| 5,959 | |
| 700 |
|
| 2,713 | |
| 1,600 |
|
| 7,831 | |
| 1,000 |
|
| 3,325 | |
| 3,000 |
|
| 4,394 | |
| 1,400 |
|
| 3,691 | |
| 500 |
|
| 5,058 | |
| 400 |
|
| 4,315 | |
| 400 |
|
| 5,887 | |
| 1,200 |
|
| 2,715 | |
|
|
|
|
| 127,823 |
Industrials – 9.2% |
|
|
|
|
|
| 33 |
|
| 2,541 | |
| 1,100 |
|
| 3,846 | |
| 1,512 |
|
| 918 | |
| 1,500 |
|
| 3,462 | |
| 2,000 |
|
| 2,442 | |
| 700 |
|
| 3,876 | |
| 4,000 |
|
| 4,861 | |
| 8,000 |
|
| 8,179 | |
| 2,000 |
|
| 6,978 | |
| 6,900 |
|
| 5,616 | |
| 4,323 |
|
| 3,735 | |
| 2,900 |
|
| 3,073 | |
| 4,000 |
|
| 7,658 | |
| 2,900 |
|
| 4,699 | |
| 3,500 |
|
| 4,723 | |
| 6,000 |
|
| 5,950 | |
| 6,600 |
|
| 6,484 | |
| 11,000 |
|
| 8,777 | |
| 4,000 |
|
| 4,228 | |
| 4,780 |
|
| 7,123 | |
| 16,400 |
|
| 5,697 | |
| 7,600 |
|
| 4,506 | |
| 5,600 |
|
| 7,032 | |
The accompanying notes are an integral part of the financial statements.
21
Schedule of Investments (Unaudited) September 30, 2018
KraneShares MSCI All China Index ETF (continued)
|
| Shares |
| Value | |
COMMON STOCK (continued) |
|
|
|
|
|
Industrials (continued) |
|
|
|
|
|
| 5,000 |
| $ | 4,569 | |
| 4,700 |
|
| 5,622 | |
| 3,000 |
|
| 5,291 | |
| 2,000 |
|
| 3,712 | |
| 700 |
|
| 4,311 | |
| 4,000 |
|
| 5,132 | |
| 1,900 |
|
| 4,258 | |
| 11,400 |
|
| 5,915 | |
| 6,500 |
|
| 3,873 | |
| 5,300 |
|
| 4,121 | |
| 3,600 |
|
| 4,646 | |
| 24,000 |
|
| 8,557 | |
| 400 |
|
| 3,416 | |
| 3,600 |
|
| 2,831 | |
| 2,300 |
|
| 3,005 | |
| 7,000 |
|
| 8,698 | |
| 2,500 |
|
| 4,364 | |
| 1,000 |
|
| 3,349 | |
| 1,600 |
|
| 3,097 | |
| 1,900 |
|
| 4,051 | |
| 800 |
|
| 4,570 | |
| 10,200 |
|
| 5,544 | |
|
|
|
|
| 219,336 |
Information Technology – 4.4% |
|
|
|
|
|
| 1,000 |
|
| 10,390 | |
| 1,100 |
|
| 4,449 | |
| 13,100 |
|
| 5,997 | |
| 2,700 |
|
| 3,532 | |
| 3,900 |
|
| 4,824 | |
| 73 |
|
| 2,565 | |
| 4,364 |
|
| 5 | |
| 2,800 |
|
| 11,695 | |
| 1,100 |
|
| 3,819 | |
| 900 |
|
| 3,737 | |
| 4,000 |
|
| 4,355 | |
| 2,000 |
|
| 3,814 | |
| 12,000 |
|
| 8,772 | |
| 1,500 |
|
| 3,096 | |
| 1,800 |
|
| 3,529 | |
| 2,200 |
|
| 5,231 | |
| 700 |
|
| 8,078 | |
| 2,000 |
|
| 3,532 | |
| 2,000 |
|
| 5,201 | |
| 500 |
|
| 2,740 | |
| 900 |
|
| 3,639 | |
| 1,400 |
|
| 3,005 | |
|
|
|
|
| 106,005 |
The accompanying notes are an integral part of the financial statements.
22
Schedule of Investments (Unaudited) September 30, 2018
KraneShares MSCI All China Index ETF (continued)
|
| Shares |
| Value | |
COMMON STOCK (continued) |
|
|
|
|
|
Materials – 4.0% |
|
|
|
|
|
| 5,000 |
| $ | 4,462 | |
| 1,000 |
|
| 5,347 | |
| 1,000 |
|
| 6,038 | |
| 5,100 |
|
| 5,818 | |
| 7,800 |
|
| 4,206 | |
| 15,000 |
|
| 6,288 | |
| 6,000 |
|
| 5,329 | |
| 2,900 |
|
| 4,312 | |
| 8,800 |
|
| 4,169 | |
| 17,700 |
|
| 4,270 | |
| 6,000 |
|
| 7,001 | |
| 600 |
|
| 2,833 | |
| 2,100 |
|
| 3,418 | |
| 1,400 |
|
| 4,816 | |
| 1,200 |
|
| 3,002 | |
| 9,100 |
|
| 7,750 | |
| 600 |
|
| 3,316 | |
| 300 |
|
| 2,323 | |
| 3,000 |
|
| 4,256 | |
| 15,000 |
|
| 7,783 | |
|
|
|
|
| 96,737 |
Real Estate – 3.5% |
|
|
|
|
|
| 1,200 |
|
| 4,418 | |
| 2,400 |
|
| 6,519 | |
| 4,839 |
|
| 15,151 | |
| 4,214 |
|
| 14,756 | |
| 2,400 |
|
| 8,476 | |
| 1,300 |
|
| 4,303 | |
| 800 |
|
| 3,045 | |
| 2,800 |
|
| 3,691 | |
| 4,800 |
|
| 4,465 | |
| 6,400 |
|
| 3,786 | |
| 3,500 |
|
| 6,190 | |
| 8,500 |
|
| 3,842 | |
| 8,400 |
|
| 4,969 | |
|
|
|
|
| 83,611 |
Telecommunication Services – 2.6% |
|
|
|
|
|
| 4,972 |
|
| 49,022 | |
| 12,000 |
|
| 5,965 | |
| 6,000 |
|
| 7,070 | |
|
|
|
|
| 62,057 |
Utilities – 3.0% |
|
|
|
|
|
| 8,000 |
|
| 4,263 | |
| 4,000 |
|
| 3,364 | |
| 6,500 |
|
| 5,678 | |
| 3,200 |
|
| 7,618 | |
| 1,882 |
|
| 16,355 | |
| 4,000 |
|
| 7,106 | |
| 6,800 |
|
| 4,151 | |
The accompanying notes are an integral part of the financial statements.
23
Schedule of Investments (Unaudited) September 30, 2018
KraneShares MSCI All China Index ETF (continued)
|
| Shares |
| Value | |
COMMON STOCK (continued) |
|
|
|
|
|
Utilities (continued) |
|
|
|
|
|
| 11,077 |
| $ | 7,290 | |
| 7,100 |
|
| 4,158 | |
| 3,600 |
|
| 4,018 | |
| 3,700 |
|
| 4,506 | |
| 5,000 |
|
| 3,692 | |
|
|
|
|
| 72,199 |
TOTAL CHINA |
|
|
|
| 2,099,289 |
|
|
|
|
|
|
HONG KONG – 10.2% |
|
|
|
|
|
Communication Services – 0.2% |
|
|
|
|
|
| 40,000 |
|
| 5,470 | |
|
|
|
|
|
|
Consumer Discretionary – 0.4% |
|
|
|
|
|
| 6,000 |
|
| 3,220 | |
| 2,000 |
|
| 5,431 | |
|
|
|
|
| 8,651 |
Consumer Staples – 0.2% |
|
|
|
|
|
| 3,000 |
|
| 3,903 | |
|
|
|
|
|
|
Energy – 0.2% |
|
|
|
|
|
| 4,000 |
|
| 4,636 | |
|
|
|
|
|
|
Financials – 4.6% |
|
|
|
|
|
| 504 |
|
| 128 | |
| 10,500 |
|
| 4,898 | |
| 17,000 |
|
| 3,128 | |
| 2,000 |
|
| 3,696 | |
| 3,500 |
|
| 14,224 | |
| 9,500 |
|
| 7,054 | |
| 3,000 |
|
| 11,578 | |
| 1,800 |
|
| 6,315 | |
| 2,000 |
|
| 3,558 | |
| 3,000 |
|
| 2,856 | |
| 4,000 |
|
| 5,132 | |
| 2,800 |
|
| 4,015 | |
| 49,441 |
|
| 36,141 | |
| 7,452 |
|
| 3,352 | |
| 1,500 |
|
| 3,742 | |
|
|
|
|
| 109,817 |
Health Care – 0.4% |
|
|
|
|
|
| 2,000 |
|
| 3,379 | |
| 6,000 |
|
| 5,597 | |
|
|
|
|
| 8,976 |
Industrials – 0.4% |
|
|
|
|
|
| 10,000 |
|
| 4,805 | |
| 2,500 |
|
| 5,163 | |
|
|
|
|
| 9,968 |
Information Technology – 0.6% |
|
|
|
|
|
| 1,500 |
|
| 4,898 | |
| 5,000 |
|
| 3,502 | |
| 5,000 |
|
| 5,393 | |
|
|
|
|
| 13,793 |
The accompanying notes are an integral part of the financial statements.
24
Schedule of Investments (Unaudited) September 30, 2018
KraneShares MSCI All China Index ETF (continued)
|
| Shares |
| Value | |
COMMON STOCK (continued) |
|
|
|
|
|
Materials – 0.6% |
|
|
|
|
|
| 4,000 |
| $ | 4,657 | |
| 4,000 |
|
| 4,325 | |
| 7,000 |
|
| 5,421 | |
|
|
|
|
| 14,403 |
Real Estate – 1.7% |
|
|
|
|
|
| 2,000 |
|
| 5,610 | |
| 8,000 |
|
| 3,640 | |
| 8,000 |
|
| 3,681 | |
| 9,000 |
|
| 11,352 | |
| 2,000 |
|
| 3,675 | |
| 2,500 |
|
| 2,288 | |
| 2,000 |
|
| 5,163 | |
| 2,000 |
|
| 6,160 | |
|
|
|
|
| 41,569 |
Utilities – 0.9% |
|
|
|
|
|
| 1,800 |
|
| 5,095 | |
| 2,000 |
|
| 8,141 | |
| 4,000 |
|
| 7,075 | |
|
|
|
|
| 20,311 |
TOTAL HONG KONG |
|
|
|
| 241,497 |
TOTAL COMMON STOCK |
|
|
|
|
|
|
|
|
| 2,340,786 | |
TOTAL INVESTMENTS – 97.9% |
|
|
|
|
|
|
|
|
| 2,340,786 | |
OTHER ASSETS LESS LIABILITIES – 2.1% |
|
|
|
| 49,406 |
NET ASSETS – 100% |
|
|
| $ | 2,390,192 |
Affiliated investment is a registered investment company which is managed by Krane Funds Advisors, LLC (the “Adviser”). Transactions with affiliated companies during the period ended September 30, 2018 are as follows:
|
| Value Held as |
| Purchases |
| Proceeds |
| Change in Unrealized Appreciation (Depreciation) |
| Realized |
| Value |
| Number of Shares Held as |
| Dividend Income |
KraneShares Bosera MSCI China A Share ETF | ||||||||||||||||
|
| $360,832 |
| $— |
| $(306,928) |
| $19,757 |
| $(73,661) |
| $— |
| — |
| $— |
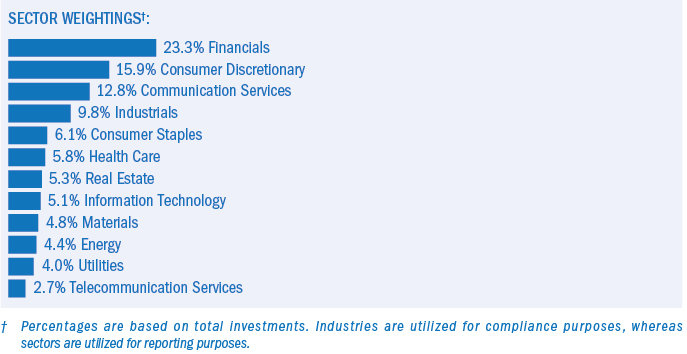
‡ Industries are utilized for compliance purposes, whereas sectors are utilized for reporting.
* Non-income producing security.
(A) Level 3 security in accordance with fair value hierarchy.
(B) Security considered illiquid. The total value of such securities as of September 30, 2018 was $5 and represents 0.0% of Net Assets.
(C) Security is fair valued using methods determined in good faith by the Fair Value Committee appointed by the Board of Trustees. The total value of such securities as of September 30, 2018 was $5 and represents 0.0% of Net Assets.
ADR — American Depositary Receipt
Cl — Class
ETF — Exchange Traded Fund
The accompanying notes are an integral part of the financial statements.
25
Schedule of Investments (Unaudited) September 30, 2018
KraneShares MSCI All China Index ETF (concluded)
The following summarizes the market value of the Fund’s investments, as of September 30, 2018, based on the inputs used to value them:
Investments in Securities |
| Level 1 |
| Level 2 |
| Level 3^ |
| Total | ||||
Common Stock |
|
|
|
|
|
|
|
|
|
|
|
|
|
|
|
|
|
|
|
|
|
|
|
| |
| $ | 295,150 |
| $ | — |
| $ | — |
| $ | 295,150 | |
|
| 364,329 |
|
| — |
|
| — |
|
| 364,329 | |
|
| 137,919 |
|
| — |
|
| — |
|
| 137,919 | |
|
| 97,559 |
|
| — |
|
| — |
|
| 97,559 | |
|
| 436,564 |
|
| — |
|
| — |
|
| 436,564 | |
|
| 127,823 |
|
| — |
|
| — |
|
| 127,823 | |
|
| 219,336 |
|
| — |
|
| — |
|
| 219,336 | |
|
| 106,000 |
|
| — |
|
| 5 |
|
| 106,005 | |
|
| 96,737 |
|
| — |
|
| — |
|
| 96,737 | |
|
| 83,611 |
|
| — |
|
| — |
|
| 83,611 | |
|
| 62,057 |
|
| — |
|
| — |
|
| 62,057 | |
|
| 72,199 |
|
| — |
|
| — |
|
| 72,199 | |
|
| 241,497 |
|
| — |
|
| — |
|
| 241,497 | |
|
| 2,340,781 |
|
| — |
|
| 5 |
|
| 2,340,786 | |
Total Investments in Securities |
| $ | 2,340,781 |
| $ | — |
| $ | 5 |
| $ | 2,340,786 |
^ A reconciliation of Level 3 investments, including certain disclosures related to significant inputs used in valuing Level 3 investments is only presented when the Fund has over 1% of Level 3 investments at the beginning and/or end of the period in relation to net assets.
For the period ended September 30, 2018, there have been no transfers between Level 1 and Level 2 investments.
For the period ended September 30, 2018, there have been no transfers between Level 2 and Level 3 investments.
For the period ended September 30, 2018, there have been no transfers between Level 1 and Level 3 investments. Transfers between levels are recognized at period end.
Amounts designated as “—” are $0 or have been rounded to $0.
The accompanying notes are an integral part of the financial statements.
26
Schedule of Investments (Unaudited) September 30, 2018
KraneShares MSCI One Belt One Road Index ETF

|
| Shares |
| Value | |
COMMON STOCK – 99.5%‡ |
|
|
|
|
|
|
|
|
|
| |
CHINA – 36.5% |
|
|
|
| |
Financials – 3.6% |
|
|
|
| |
| 54,005 |
| $ | 95,992 | |
| 121,400 |
| 137,975 | ||
| 271,355 |
| 254,767 | ||
| 199,391 |
| 221,687 | ||
| 119,045 |
| 307,275 | ||
| 197,425 |
| 107,986 | ||
|
|
|
| 1,125,682 | |
Industrials – 17.1% |
|
|
|
| |
| 42,108 |
| 101,528 | ||
| 30,900 |
| 33,772 | ||
| 133,500 |
| 465,763 | ||
| 108,450 |
| 114,903 | ||
| 66,000 |
| 42,206 | ||
| 154,500 |
| 208,504 | ||
| 297,500 |
| 295,032 | ||
| 52,176 |
| 77,954 | ||
| 1,005,479 |
| 802,267 | ||
| 324,850 |
| 296,832 | ||
| 181,680 |
| 52,281 | ||
| 350,332 |
| 419,038 | ||
| 132,900 |
| 69,727 | ||
| 26,745 |
| 53,213 | ||
| 25,100 |
| 154,563 | ||
| 40,500 |
| 81,464 | ||
| 96,000 |
| 123,176 | ||
| 87,400 |
| 78,501 | ||
| 72,049 |
| 89,949 | ||
| 419,600 |
| 217,710 | ||
| 145,001 |
| 86,403 | ||
| 210,700 |
| 94,929 | ||
| 210,000 |
| 74,876 | ||
| 164,010 |
| 128,956 | ||
| 73,800 |
| 65,535 | ||
The accompanying notes are an integral part of the financial statements.
27
Schedule of Investments (Unaudited) September 30, 2018
KraneShares MSCI One Belt One Road Index ETF (continued)
|
| Shares |
| Value | |
COMMON STOCK (continued) |
|
|
|
| |
Industrials (continued) |
|
|
|
| |
| 62,119 |
| $ | 81,162 | |
| 139,546 |
| 50,906 | ||
| 87,375 |
| 91,050 | ||
| 192,948 |
| 110,767 | ||
| 48,200 |
| 51,804 | ||
| 150,600 |
| 136,674 | ||
| 112,000 |
| 93,179 | ||
| 52,097 |
| 111,075 | ||
| 44,500 |
| 254,208 | ||
| 150,457 |
| 81,782 | ||
|
|
|
| 5,291,689 | |
Materials – 5.2% |
|
|
|
| |
| 100,500 |
| 606,861 | ||
| 183,280 |
| 62,773 | ||
| 35,424 |
| 74,806 | ||
| 303,000 |
| 269,121 | ||
| 85,424 |
| 127,008 | ||
| 89,700 |
| 68,442 | ||
| 26,000 |
| 122,771 | ||
| 52,710 |
| 73,849 | ||
| 46,220 |
| 54,411 | ||
| 120,459 |
| 81,408 | ||
| 39,400 |
| 60,183 | ||
|
|
|
| 1,601,633 | |
Utilities – 10.6% |
|
|
|
| |
| 39,500 |
| 221,607 | ||
| 830,875 |
| 197,501 | ||
| 249,000 |
| 209,385 | ||
| 305,242 |
| 266,620 | ||
| 345,543 |
| 822,602 | ||
| 242,000 |
| 61,235 | ||
| 60,200 |
| 523,150 | ||
| 191,442 |
| 116,858 | ||
| 333,000 |
| 219,166 | ||
| 374,860 |
| 111,621 | ||
| 159,906 |
| 178,484 | ||
| 107,019 |
| 81,813 | ||
| 103,484 |
| 126,035 | ||
| 213,441 |
| 157,586 | ||
|
|
|
| 3,293,663 | |
TOTAL CHINA |
|
|
| 11,312,667 | |
|
|
|
|
| |
HONG KONG – 4.6% |
|
|
|
| |
Industrials – 0.5% |
|
|
|
| |
| 76,663 |
| 158,325 | ||
Materials – 0.8% |
|
|
|
| |
| 208,000 |
| 242,160 | ||
The accompanying notes are an integral part of the financial statements.
28
Schedule of Investments (Unaudited) September 30, 2018
KraneShares MSCI One Belt One Road Index ETF (continued)
|
| Shares |
| Value | |
COMMON STOCK (continued) |
|
|
|
| |
Utilities – 3.3% |
|
|
|
| |
| 136,600 |
| $ | 386,675 | |
| 346,000 |
| 76,939 | ||
| 71,500 |
| 291,029 | ||
| 152,635 |
| 269,967 | ||
|
|
|
| 1,024,610 | |
TOTAL HONG KONG |
|
|
| 1,425,095 | |
|
|
|
|
| |
INDIA – 3.9% |
|
|
|
| |
Industrials – 0.7% |
|
|
|
| |
| 8,808 |
| 216,050 | ||
Materials – 3.2% |
|
|
|
| |
| 271,710 |
| 860,784 | ||
| 12,843 |
| 126,127 | ||
|
|
|
| 986,911 | |
TOTAL INDIA |
|
|
| 1,202,961 | |
|
|
|
|
| |
INDONESIA – 5.6% |
|
|
|
| |
Energy – 2.8% |
|
|
|
| |
| 3,428,300 |
| 422,167 | ||
| 13,471,900 |
| 195,278 | ||
| 79,000 |
| 137,043 | ||
| 1,647,600 |
| 110,566 | ||
|
|
|
| 865,054 | |
Materials – 2.8% |
|
|
|
| |
| 1,954,700 |
| 110,843 | ||
| 657,500 |
| 765,535 | ||
|
|
|
| 876,378 | |
TOTAL INDONESIA |
|
|
| 1,741,432 | |
|
|
|
|
| |
ISRAEL – 6.2% |
|
|
|
| |
Materials – 6.2% |
|
|
|
| |
| 8,992 |
| 931,051 | ||
| 163,569 |
| 998,634 | ||
TOTAL ISRAEL |
|
|
| 1,929,685 | |
|
|
|
|
| |
KAZAKHSTAN – 1.0% |
|
|
|
| |
Energy – 1.0% |
|
|
|
| |
| 27,720 |
| 293,832 | ||
TOTAL KAZAKHSTAN |
|
|
| 293,832 | |
|
|
|
|
| |
KUWAIT – 1.8% |
|
|
|
| |
Industrials – 1.8% |
|
|
|
| |
| 203,689 |
| 564,982 | ||
TOTAL KUWAIT |
|
|
| 564,982 | |
The accompanying notes are an integral part of the financial statements.
29
Schedule of Investments (Unaudited) September 30, 2018
KraneShares MSCI One Belt One Road Index ETF (continued)
|
| Shares |
| Value | |
COMMON STOCK (continued) |
|
|
|
| |
MALAYSIA – 6.9% |
|
|
|
| |
Energy – 0.5% |
|
|
|
| |
| 614,500 |
| $ | 78,696 | |
| 835,300 |
| 82,753 | ||
|
|
|
| 161,449 | |
Industrials – 1.1% |
|
|
|
| |
| 553,500 |
| 349,072 | ||
Materials – 5.3% |
|
|
|
| |
| 567,800 |
| 1,284,187 | ||
| 308,500 |
| 362,284 | ||
|
|
|
| 1,646,471 | |
TOTAL MALAYSIA |
|
|
| 2,156,992 | |
|
|
|
|
| |
PHILIPPINES – 3.4% |
|
|
|
| |
Industrials – 3.4% |
|
|
|
| |
| 927,000 |
| 195,248 | ||
| 109,980 |
| 191,544 | ||
| 666,850 |
| 665,863 | ||
TOTAL PHILIPPINES |
|
|
| 1,052,655 | |
|
|
|
|
| |
POLAND – 2.6% |
|
|
|
| |
Materials – 2.6% |
|
|
|
| |
| 32,620 |
| 788,487 | ||
TOTAL POLAND |
|
|
| 788,487 | |
|
|
|
|
| |
RUSSIA – 7.2% |
|
|
|
| |
Energy – 7.2% |
|
|
|
| |
| 260,930 |
| 1,964,095 | ||
| 99 |
| 250,542 | ||
TOTAL RUSSIA |
|
|
| 2,214,637 | |
|
|
|
|
| |
SINGAPORE – 9.0% |
|
|
|
| |
Financials – 5.5% |
|
|
|
| |
| 203,000 |
| 1,699,652 | ||
Industrials – 3.5% |
|
|
|
| |
| 336,900 |
| 84,225 | ||
| 93,700 |
| 477,295 | ||
| 34,900 |
| 248,784 | ||
| 100,800 |
| 262,633 | ||
|
|
|
| 1,072,937 | |
TOTAL SINGAPORE |
|
|
|
| 2,772,589 |
|
|
|
|
|
|
SOUTH AFRICA – 3.4% |
|
|
|
|
|
Materials – 3.4% |
|
|
|
|
|
| 12,569 |
|
| 410,344 | |
| 162,139 |
|
| 315,083 | |
| 15,051 |
|
| 341,367 | |
TOTAL SOUTH AFRICA |
|
|
|
| 1,066,794 |
The accompanying notes are an integral part of the financial statements.
30
Schedule of Investments (Unaudited) September 30, 2018
KraneShares MSCI One Belt One Road Index ETF (continued)
|
| Shares |
| Value | |
COMMON STOCK (continued) |
|
|
|
|
|
THAILAND – 6.0% |
|
|
|
|
|
Energy – 1.6% |
|
|
|
|
|
| 2,407,400 |
| $ | 506,194 | |
|
|
|
|
| 506,194 |
Materials – 4.4% |
|
|
|
|
|
| 536,300 |
|
| 1,347,383 | |
TOTAL THAILAND |
|
|
|
| 1,853,577 |
|
|
|
|
|
|
TURKEY – 1.4% |
|
|
|
|
|
Industrials – 1.4% |
|
|
|
|
|
| 134,972 |
|
| 428,914 | |
TOTAL TURKEY |
|
|
|
| 428,914 |
TOTAL COMMON STOCK |
|
|
|
|
|
|
|
|
| 30,805,299 | |
TOTAL INVESTMENTS – 99.5% |
|
|
|
|
|
|
|
|
| 30,805,299 | |
OTHER ASSETS LESS LIABILITIES – 0.5% |
|
|
|
| 167,358 |
NET ASSETS – 100% |
|
|
| $ | 30,972,657 |
‡ Industries are utilized for compliance purposes, whereas sectors are utilized for reporting.
* Non-income producing security.
(A) Security considered illiquid. The total value of such securities as of September 30, 2018 was $42,206 and represents 0.1% of Net Assets.
(B) Level 3 security in accordance with fair value hierarchy.
Cl — Class
ETF — Exchange Traded Fund
GDR — Global Depositary Receipt
The accompanying notes are an integral part of the financial statements.
31
Schedule of Investments (Unaudited) September 30, 2018
KraneShares MSCI One Belt One Road Index ETF (concluded)
The following summarizes the market value of the Fund’s investments, as of September 30, 2018, based on the inputs used to value them:
Investments in Securities |
| Level 1 |
| Level 2 |
| Level 3^ |
| Total | ||||
|
|
|
|
|
|
|
|
|
|
|
| |
| $ | 11,312,667 |
| $ | — |
| $ | — |
| $ | 11,312,667 | |
|
| 1,425,095 |
|
| — |
|
| — |
|
| 1,425,095 | |
|
| 1,202,961 |
|
| — |
|
| — |
|
| 1,202,961 | |
|
| 1,741,432 |
|
| — |
|
| — |
|
| 1,741,432 | |
|
| 1,929,685 |
|
| — |
|
| — |
|
| 1,929,685 | |
|
| — |
|
| — |
|
| 293,832 |
|
| 293,832 | |
|
| 564,982 |
|
| — |
|
| — |
|
| 564,982 | |
|
| 2,156,992 |
|
| — |
|
| — |
|
| 2,156,992 | |
|
| 1,052,655 |
|
| — |
|
| — |
|
| 1,052,655 | |
|
| 788,487 |
|
| — |
|
| — |
|
| 788,487 | |
|
| 2,214,637 |
|
| — |
|
| — |
|
| 2,214,637 | |
|
| 2,772,589 |
|
| — |
|
| — |
|
| 2,772,589 | |
|
| 1,066,794 |
|
| — |
|
| — |
|
| 1,066,794 | |
|
| 1,853,577 |
|
| — |
|
| — |
|
| 1,853,577 | |
|
| 428,914 |
|
| — |
|
| — |
|
| 428,914 | |
|
| 30,511,467 |
|
| — |
|
| 293,832 |
|
| 30,805,299 | |
Total Investments in Securities |
| $ | 30,511,467 |
| $ | — |
| $ | 293,832 |
| $ | 30,805,299 |
^ A reconciliation of Level 3 investments, including certain disclosures related to significant inputs used in valuing Level 3 investments is only presented when the Fund has over 1% of Level 3 investments at the beginning and/or end of the period in relation to net assets.
For the period ended September 30, 2018, there have been no transfers between Level 1 and Level 2 investments.
For the period ended September 30, 2018, there have been no transfers between Level 2 and Level 3 investments.
For the period ended September 30, 2018, the transfers in and out of Level 3 occurred due to a halt in trading of these securities. Transfers between levels are recognized at period end.
The accompanying notes are an integral part of the financial statements.
32
Schedule of Investments (Unaudited) September 30, 2018
KraneShares Emerging Markets Consumer Technology Index ETF
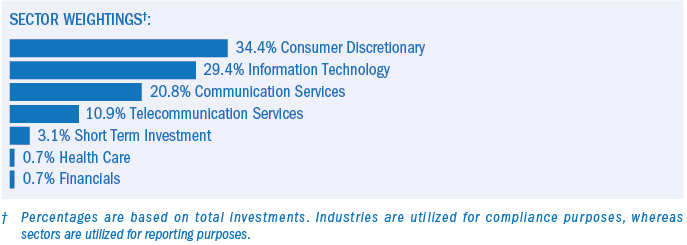
|
| Shares |
| Value | |
COMMON STOCK – 99.1%‡ |
|
|
|
|
|
ARGENTINA – 3.6% |
|
|
|
|
|
Information Technology – 3.6% |
|
|
|
|
|
| 3,352 |
| $ | 1,141,255 | |
TOTAL ARGENTINA |
|
|
|
| 1,141,255 |
|
|
|
|
|
|
BRAZIL – 3.8% |
|
|
|
|
|
Consumer Discretionary – 1.7% |
|
|
|
|
|
| 38,270 |
|
| 263,627 | |
| 24,726 |
|
| 265,615 | |
|
|
|
|
| 529,242 |
Information Technology – 2.1% |
|
|
|
|
|
| 221,080 |
|
| 675,383 | |
TOTAL BRAZIL |
|
|
|
| 1,204,625 |
|
|
|
|
|
|
CHINA – 39.8% |
|
|
|
|
|
Communication Services – 21.3% |
|
|
|
|
|
| 11,325 |
|
| 833,520 | |
| 10,514 |
|
| 813,889 | |
| 4,944 |
|
| 1,130,594 | |
| 27,103 |
|
| 733,678 | |
| 5,658 |
|
| 1,291,438 | |
| 27,375 |
|
| 1,130,698 | |
| 11,105 |
|
| 812,109 | |
|
|
|
|
| 6,745,926 |
Consumer Discretionary – 18.5% |
|
|
|
|
|
| 6,785 |
|
| 1,117,897 | |
| 28,882 |
|
| 1,073,544 | |
| 39,439 |
|
| 1,028,963 | |
| 14,886 |
|
| 1,101,713 | |
| 28,591 |
|
| 735,074 | |
| 130,228 |
|
| 812,623 | |
|
|
|
|
| 5,869,814 |
TOTAL CHINA |
|
|
|
| 12,615,740 |
The accompanying notes are an integral part of the financial statements.
33
Schedule of Investments (Unaudited) September 30, 2018
KraneShares Emerging Markets Consumer Technology Index ETF (continued)
|
| Shares |
| Value | |
COMMON STOCK (continued) |
|
|
|
|
|
EGYPT – 0.6% |
|
|
|
|
|
Telecommunication Services – 0.6% |
|
|
|
|
|
| 303,391 |
| $ | 197,238 | |
TOTAL EGYPT |
|
|
|
| 197,238 |
|
|
|
|
|
|
GREECE – 4.8% |
|
|
|
|
|
Consumer Discretionary – 2.4% |
|
|
|
|
|
| 72,899 |
|
| 765,433 | |
Telecommunication Services – 2.4% |
|
|
|
|
|
| 61,339 |
|
| 753,058 | |
TOTAL GREECE |
|
|
|
| 1,518,491 |
|
|
|
|
|
|
INDIA – 0.9% |
|
|
|
|
|
Consumer Discretionary – 0.9% |
|
|
|
|
|
| 73,787 |
|
| 59,496 | |
| 7,895 |
|
| 216,718 | |
TOTAL INDIA |
|
|
|
| 276,214 |
|
|
|
|
|
|
MALAYSIA – 2.4% |
|
|
|
|
|
Telecommunication Services – 2.4% |
|
|
|
|
|
| 991,800 |
|
| 771,680 | |
TOTAL MALAYSIA |
|
|
|
| 771,680 |
|
|
|
|
|
|
MEXICO – 2.4% |
|
|
|
|
|
Consumer Discretionary – 2.4% |
|
|
|
|
|
| 215,100 |
|
| 764,959 | |
TOTAL MEXICO |
|
|
|
| 764,959 |
|
|
|
|
|
|
POLAND – 3.2% |
|
|
|
|
|
Consumer Discretionary – 2.5% |
|
|
|
|
|
| 128,655 |
|
| 776,237 | |
Telecommunication Services – 0.7% |
|
|
|
|
|
| 186,620 |
|
| 224,788 | |
TOTAL POLAND |
|
|
|
| 1,001,025 |
|
|
|
|
|
|
PUERTO RICO – 0.7% |
|
|
|
|
|
Information Technology – 0.7% |
|
|
|
|
|
| 9,763 |
|
| 235,288 | |
TOTAL PUERTO RICO |
|
|
|
| 235,288 |
|
|
|
|
|
|
RUSSIA – 2.6% |
|
|
|
|
|
Information Technology – 2.6% |
|
|
|
|
|
| 31,022 |
|
| 838,214 | |
TOTAL RUSSIA |
|
|
|
| 838,214 |
|
|
|
|
|
|
SOUTH AFRICA – 3.5% |
|
|
|
|
|
Consumer Discretionary – 3.5% |
|
|
|
|
|
| 5,209 |
|
| 1,123,292 | |
TOTAL SOUTH AFRICA |
|
|
|
| 1,123,292 |
The accompanying notes are an integral part of the financial statements.
34
Schedule of Investments (Unaudited) September 30, 2018
KraneShares Emerging Markets Consumer Technology Index ETF (continued)
|
| Shares |
| Value | |
COMMON STOCK (continued) |
|
|
|
|
|
SOUTH KOREA – 23.1% |
|
|
|
|
|
Consumer Discretionary – 2.6% |
|
|
|
|
|
| 3,608 |
| $ | 806,657 | |
Financials – 0.7% |
|
|
|
|
|
| 11,566 |
|
| 233,562 | |
Health Care – 0.7% |
|
|
|
|
|
| 3,224 |
|
| 232,517 | |
Information Technology – 16.5% |
|
|
|
|
|
| 1,677 |
|
| 221,634 | |
| 3,881 |
|
| 241,414 | |
| 4,361 |
|
| 240,214 | |
| 11,077 |
|
| 1,188,337 | |
| 1,653 |
|
| 1,066,981 | |
| 2,017 |
|
| 804,618 | |
| 7,624 |
|
| 790,408 | |
| 4,261 |
|
| 235,090 | |
| 1,043 |
|
| 201,031 | |
| 13,230 |
|
| 237,347 | |
|
|
|
|
| 5,227,074 |
Telecommunication Services – 2.6% |
|
|
|
|
|
| 54,966 |
|
| 816,245 | |
TOTAL SOUTH KOREA |
|
|
|
| 7,316,055 |
|
|
|
|
|
|
TAIWAN – 2.0% |
|
|
|
|
|
Information Technology – 2.0% |
|
|
|
|
|
| 75,000 |
|
| 208,791 | |
| 47,000 |
|
| 210,886 | |
| 173,880 |
|
| 215,834 | |
TOTAL TAIWAN |
|
|
|
| 635,511 |
|
|
|
|
|
|
THAILAND – 2.4% |
|
|
|
|
|
Telecommunication Services – 2.4% |
|
|
|
|
|
| 457,037 |
|
| 763,142 | |
TOTAL THAILAND |
|
|
|
| 763,142 |
|
|
|
|
|
|
UNITED STATES – 3.3% |
|
|
|
|
|
Consumer Discretionary – 0.8% |
|
|
|
|
|
| 14,807 |
|
| 249,794 | |
Information Technology – 2.5% |
|
|
|
|
|
| 28,917 |
|
| 800,134 | |
TOTAL UNITED STATES |
|
|
|
| 1,049,928 |
TOTAL COMMON STOCK |
|
|
|
|
|
|
|
|
| 31,452,657 | |
The accompanying notes are an integral part of the financial statements.
35
Schedule of Investments (Unaudited) September 30, 2018
KraneShares Emerging Markets Consumer Technology Index ETF (continued)
|
| Shares |
| Value | ||
COMMON STOCK (continued) |
|
|
|
|
|
|
SHORT-TERM INVESTMENT(E)(F) – 3.2% |
|
|
|
|
|
|
| 1,004,958 |
| $ | 1,004,958 |
| |
TOTAL SHORT-TERM INVESTMENT |
|
|
|
|
|
|
|
|
|
| 1,004,958 |
| |
TOTAL INVESTMENTS – 102.3% |
|
|
|
|
|
|
|
|
|
| 32,457,615 |
| |
OTHER ASSETS LESS LIABILITIES – (2.3)% |
|
|
|
| (722,502 | ) |
NET ASSETS - 100% |
|
|
| $ | 31,735,113 |
|
‡ Industries are utilized for compliance purposes, whereas sectors are utilized for reporting.
* Non-income producing security.
(A) Security is fair valued using methods determined in good faith by the Fair Value Committee appointed by the Board of Trustees. The total value of such securities as of September 30, 2018 was $215,834 and represents 0.7% of Net Assets.
(B) Level 3 security in accordance with fair value hierarchy.
(C) Security considered illiquid. The total value of such securities as of September 30, 2018 was $215,834 and represents 0.7% of Net Assets.
(D) Certain securities or partial positions of certain securities are on loan at September 30, 2018. The total market value of securities on loan at September 30, 2018 was $978,722.
(E) This security was purchased with cash collateral held from securities on loan. The total value of such security as of September 30, 2018 was $1,004,958
(F) The rate shown is the 7-day effective yield as of September 30, 2018.
ADR — American Depositary Receipt
Cl — Class
GDR — Global Depositary Receipt
The accompanying notes are an integral part of the financial statements.
36
Schedule of Investments (Unaudited) September 30, 2018
KraneShares Emerging Markets Consumer Technology Index ETF (concluded)
The following summarizes the market value of the Fund’s investments, as of September 30, 2018, based on the inputs used to value them:
Investments in Securities |
| Level 1 |
| Level 2 |
| Level 3^ |
| Total | ||||
|
|
|
|
|
|
|
|
|
|
|
| |
| $ | 1,141,255 |
| $ | — |
| $ | — |
| $ | 1,141,255 | |
|
| 1,204,625 |
|
| — |
|
| — |
|
| 1,204,625 | |
|
| 12,615,740 |
|
| — |
|
| — |
|
| 12,615,740 | |
|
| 197,238 |
|
| — |
|
| — |
|
| 197,238 | |
|
| 1,518,491 |
|
| — |
|
| — |
|
| 1,518,491 | |
|
| 276,214 |
|
| — |
|
| — |
|
| 276,214 | |
|
| 771,680 |
|
| — |
|
| — |
|
| 771,680 | |
|
| 764,959 |
|
| — |
|
| — |
|
| 764,959 | |
|
| 1,001,025 |
|
| — |
|
| — |
|
| 1,001,025 | |
|
| 235,288 |
|
| — |
|
| — |
|
| 235,288 | |
|
| 838,214 |
|
| — |
|
| — |
|
| 838,214 | |
|
| 1,123,292 |
|
| — |
|
| — |
|
| 1,123,292 | |
|
| 7,316,055 |
|
| — |
|
| — |
|
| 7,316,055 | |
|
| 419,677 |
|
| — |
|
| 215,834 |
|
| 635,511 | |
|
| 763,142 |
|
| — |
|
| — |
|
| 763,142 | |
|
| 1,049,928 |
|
| — |
|
| — |
|
| 1,049,928 | |
|
| 31,236,823 |
|
| — |
|
| 215,834 |
|
| 31,452,657 | |
|
| 1,004,958 |
|
| — |
|
| — |
|
| 1,004,958 | |
Total Investments in Securities |
| $ | 32,241,781 |
| $ | — |
| $ | 215,834 |
| $ | 32,457,615 |
^ A reconciliation of Level 3 investments, including certain disclosures related to significant inputs used in valuing Level 3 investments is only presented when the Fund has over 1% of Level 3 investments at the beginning and/or end of the period in relation to net assets.
For the period ended September 30, 2018, there have been no transfers between Level 1 and Level 2 investments.
For the period ended September 30, 2018, there have been no transfers between Level 2 and Level 3 investments.
For the period ended September 30, 2018, the transfers in and out of Level 3 occurred due to a halt in trading of these securities. Transfers between levels are recognized at period end.
The accompanying notes are an integral part of the financial statements.
37
Schedule of Investments (Unaudited) September 30, 2018
KraneShares MSCI China Environment Index ETF

|
| Shares |
| Value | |
COMMON STOCK — 97.6%‡ |
|
|
|
|
|
CHINA — 76.9% |
|
|
|
|
|
Consumer Discretionary — 17.2% |
|
|
|
|
|
| 3,300 |
| $ | 23,549 | |
| 78,000 |
|
| 560,212 | |
| 168,000 |
|
| 73,857 | |
| 193,000 |
|
| 91,753 | |
| 185,885 |
|
| 164,151 | |
| 288,694 |
|
| 99,983 | |
|
|
|
|
| 1,013,505 |
Consumer Staples — 0.5% |
|
|
|
|
|
| 395,000 |
|
| 28,773 | |
|
|
|
|
|
|
Industrials — 17.0% |
|
|
|
|
|
| 80,000 |
|
| 33,023 | |
| 1,380,000 |
|
| 35,096 | |
| 732,216 |
|
| 632,568 | |
| 126,000 |
|
| 43,637 | |
| 100,000 |
|
| 39,617 | |
| 5,900 |
|
| 11,576 | |
| 12,000 |
|
| 20,946 | |
| 170,400 |
|
| 183,141 | |
|
|
|
|
| 999,604 |
Information Technology — 6.9% |
|
|
|
|
|
| 8,025 |
|
| 86,429 | |
| 11,500 |
|
| 23,734 | |
| 16,800 |
|
| 39,945 | |
| 820,000 |
|
| 252,553 | |
|
|
|
|
| 402,661 |
Real Estate — 12.6% |
|
|
|
|
|
| 15,900 |
|
| 56,154 | |
| 136,500 |
|
| 451,808 | |
| 1,001,000 |
|
| 232,823 | |
|
|
|
|
| 740,785 |
The accompanying notes are an integral part of the financial statements.
38
Schedule of Investments (Unaudited) September 30, 2018
KraneShares MSCI China Environment Index ETF (continued)
|
| Shares |
| Value | |
COMMON STOCK (continued) |
|
|
|
|
|
Utilities — 22.6% |
|
|
|
|
|
| 1,026,500 |
| $ | 547,036 | |
| 655,000 |
|
| 94,589 | |
| 126,027 |
|
| 32,744 | |
| 312,800 |
|
| 263,035 | |
| 114,500 |
|
| 41,557 | |
| 609,000 |
|
| 70,824 | |
| 780,000 |
|
| 232,259 | |
| 170,000 |
|
| 22,812 | |
| 90,000 |
|
| 25,649 | |
|
|
|
|
| 1,330,505 |
TOTAL CHINA |
|
|
|
| 4,515,833 |
|
|
|
|
|
|
HONG KONG — 20.7% |
|
|
|
|
|
Industrials — 4.7% |
|
|
|
|
|
| 135,000 |
|
| 155,273 | |
| 1,550,000 |
|
| 62,397 | |
| 4,637,000 |
|
| 57,482 | |
|
|
|
|
| 275,152 |
Information Technology — 11.2% |
|
|
|
|
|
| 2,140,000 |
|
| 123,069 | |
| 363,000 |
|
| 257,002 | |
| 2,924,000 |
|
| 205,523 | |
| 139,000 |
|
| 70,345 | |
|
|
|
|
| 655,939 |
Utilities — 4.9% |
|
|
|
|
|
| 203,000 |
|
| 105,587 | |
| 308,000 |
|
| 53,138 | |
| 1,500,000 |
|
| 53,675 | |
| 1,637,000 |
|
| 27,406 | |
| 1,052,000 |
|
| 46,383 | |
|
|
|
|
| 286,189 |
TOTAL HONG KONG |
|
|
|
| 1,217,280 |
TOTAL COMMON STOCK |
|
|
|
|
|
|
|
|
| 5,733,113 | |
TOTAL INVESTMENTS — 97.6% |
|
|
|
|
|
|
|
|
| 5,733,113 | |
OTHER ASSETS LESS LIABILITIES — 2.4% |
|
|
|
| 143,915 |
NET ASSETS — 100% |
|
|
| $ | 5,877,028 |
‡ Narrow industries are utilized for compliance purposes, whereas sectors are utilized for reporting.
* Non-income producing security.
ADR — American Depositary Receipt
Cl — Class
The accompanying notes are an integral part of the financial statements.
39
Schedule of Investments (Unaudited) September 30, 2018
KraneShares MSCI China Environment Index ETF (concluded)
As of September 30, 2018, all of the Fund’s investments were considered Level 1 of the fair value hierarchy, in accordance with the authoritative guidance under U.S. GAAP.
For the period ended September 30, 2018, there have been no transfers between Level 1 and Level 2 investments.
For the period ended September 30, 2018, there have been no transfers between Level 2 and Level 3 investments.
The accompanying notes are an integral part of the financial statements.
40
Schedule of Investments (Unaudited) September 30, 2018
KraneShares Electric Vehicles and Future Mobility Index
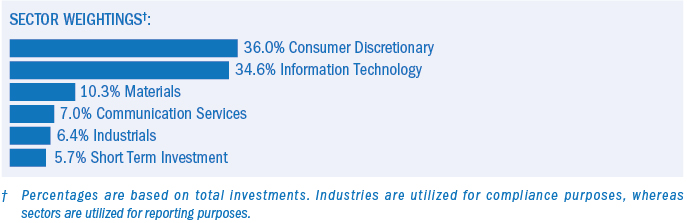
|
| Shares |
| Value | |
COMMON STOCK — 96.1%‡ |
|
|
|
|
|
AUSTRALIA — 1.1% |
|
|
|
|
|
Materials — 1.1% |
|
|
|
|
|
| 204,138 |
| $ | 367,784 | |
TOTAL AUSTRALIA |
|
|
|
| 367,784 |
|
|
|
|
|
|
AUSTRIA — 1.3% |
|
|
|
|
|
Information Technology — 1.3% |
|
|
|
|
|
| 7,699 |
|
| 432,399 | |
TOTAL AUSTRIA |
|
|
|
| 432,399 |
|
|
|
|
|
|
CANADA — 1.5% |
|
|
|
|
|
Materials — 1.5% |
|
|
|
|
|
| 44,716 |
|
| 508,875 | |
TOTAL CANADA |
|
|
|
| 508,875 |
|
|
|
|
|
|
CHILE — 3.1% |
|
|
|
|
|
Materials — 3.1% |
|
|
|
|
|
| 49,956 |
|
| 556,992 | |
| 10,858 |
|
| 496,428 | |
TOTAL CHILE |
|
|
|
| 1,053,420 |
|
|
|
|
|
|
CHINA — 20.1% |
|
|
|
|
|
Communication Services — 3.7% |
|
|
|
|
|
| 5,476 |
|
| 1,252,252 | |
Consumer Discretionary — 10.9% |
|
|
|
|
|
| 236,100 |
|
| 358,923 | |
| 516,500 |
|
| 413,865 | |
| 59,500 |
|
| 427,342 | |
| 53,036 |
|
| 403,593 | |
| 154,946 |
|
| 521,772 | |
| 360,000 |
|
| 370,816 | |
| 631,500 |
|
| 402,712 | |
| 291,482 |
|
| 379,995 | |
| 107,656 |
|
| 387,246 | |
|
|
|
|
| 3,666,264 |
The accompanying notes are an integral part of the financial statements.
41
Schedule of Investments (Unaudited) September 30, 2018
KraneShares Electric Vehicles and Future Mobility Index (continued)
|
| Shares |
| Value | |
COMMON STOCK (continued) |
|
|
|
|
|
Industrials — 3.3% |
|
|
|
|
|
| 182,210 |
| $ | 362,535 | |
| 1,220,400 |
|
| 370,700 | |
| 205,400 |
|
| 369,866 | |
|
|
|
|
| 1,103,101 |
Information Technology — 2.2% |
|
|
|
|
|
| 304,828 |
|
| 367,711 | |
| 265,300 |
|
| 377,865 | |
|
|
|
|
| 745,576 |
TOTAL CHINA |
|
|
|
| 6,767,193 |
|
|
|
|
|
|
FRANCE — 0.4% |
|
|
|
|
|
Information Technology — 0.4% |
|
|
|
|
|
| 8,000 |
|
| 145,605 | |
TOTAL FRANCE |
|
|
|
| 145,605 |
|
|
|
|
|
|
GERMANY — 10.2% |
|
|
|
|
|
Consumer Discretionary — 8.2% |
|
|
|
|
|
| 12,359 |
|
| 1,115,520 | |
| 18,409 |
|
| 1,162,109 | |
| 8,839 |
|
| 493,200 | |
|
|
|
|
| 2,770,829 |
Information Technology — 2.0% |
|
|
|
|
|
| 29,793 |
|
| 677,208 | |
TOTAL GERMANY |
|
|
|
| 3,448,037 |
|
|
|
|
|
|
JAPAN — 1.1% |
|
|
|
|
|
Industrials — 1.1% |
|
|
|
|
|
| 15,200 |
|
| 374,296 | |
TOTAL JAPAN |
|
|
|
| 374,296 |
|
|
|
|
|
|
NETHERLANDS — 1.9% |
|
|
|
|
|
Information Technology — 1.9% |
|
|
|
|
|
| 7,556 |
|
| 646,038 | |
TOTAL NETHERLANDS |
|
|
|
| 646,038 |
|
|
|
|
|
|
PERU — 2.1% |
|
|
|
|
|
Materials — 2.1% |
|
|
|
|
|
| 16,573 |
|
| 714,959 | |
TOTAL PERU |
|
|
|
| 714,959 |
|
|
|
|
|
|
SOUTH KOREA — 4.3% |
|
|
|
|
|
Consumer Discretionary — 2.1% |
|
|
|
|
|
| 22,531 |
|
| 712,948 | |
Information Technology — 2.2% |
|
|
|
|
|
| 3,113 |
|
| 725,455 | |
TOTAL SOUTH KOREA |
|
|
|
| 1,438,403 |
The accompanying notes are an integral part of the financial statements.
42
Schedule of Investments (Unaudited) September 30, 2018
KraneShares Electric Vehicles and Future Mobility Index (continued)
|
| Shares |
| Value | |
COMMON STOCK (continued) |
|
|
|
|
|
SWEDEN — 1.5% |
|
|
|
|
|
Consumer Discretionary — 1.5% |
|
|
|
|
|
| 5,837 |
| $ | 505,951 | |
TOTAL SWEDEN |
|
|
|
| 505,951 |
|
|
|
|
|
|
SWITZERLAND — 1.6% |
|
|
|
|
|
Information Technology — 1.6% |
|
|
|
|
|
| 28,826 |
|
| 524,818 | |
TOTAL SWITZERLAND |
|
|
|
| 524,818 |
|
|
|
|
|
|
TAIWAN — 2.1% |
|
|
|
|
|
Consumer Discretionary — 1.1% |
|
|
|
|
|
| 47,497 |
|
| 353,898 | |
Information Technology — 1.0% |
|
|
|
|
|
| 24,000 |
|
| 365,506 | |
TOTAL TAIWAN |
|
|
|
| 719,404 |
|
|
|
|
|
|
UNITED KINGDOM — 1.1% |
|
|
|
|
|
Information Technology — 1.1% |
|
|
|
|
|
| 16,080 |
|
| 351,404 | |
TOTAL UNITED KINGDOM |
|
|
|
| 351,404 |
|
|
|
|
|
|
UNITED STATES — 42.8% |
|
|
|
|
|
Communication Services — 3.7% |
|
|
|
|
|
| 1,028 |
|
| 1,240,878 | |
Consumer Discretionary — 10.6% |
|
|
|
|
|
| 7,971 |
|
| 668,766 | |
| 124,816 |
|
| 1,154,549 | |
| 7,626 |
|
| 346,602 | |
| 4,042 |
|
| 1,070,200 | |
| 3,544 |
|
| 329,238 | |
|
|
|
|
| 3,569,355 |
Industrials — 2.4% |
|
|
|
|
|
| 12,582 |
|
| 428,794 | |
| 4,343 |
|
| 378,406 | |
|
|
|
|
| 807,200 |
Information Technology — 23.0% |
|
|
|
|
|
| 21,004 |
|
| 648,814 | |
| 10,099 |
|
| 390,629 | |
| 13,054 |
|
| 1,206,973 | |
| 9,381 |
|
| 362,107 | |
| 10,873 |
|
| 511,140 | |
| 22,849 |
|
| 379,750 | |
| 11,896 |
|
| 670,815 | |
| 19,555 |
|
| 388,753 | |
| 4,352 |
|
| 1,222,999 | |
| 7,900 |
|
| 716,609 | |
| 11,494 |
|
| 1,233,192 | |
|
|
|
|
| 7,731,781 |
The accompanying notes are an integral part of the financial statements.
43
Schedule of Investments (Unaudited) September 30, 2018
KraneShares Electric Vehicles and Future Mobility Index (concluded)
|
| Shares |
| Value | ||
COMMON STOCK (continued) |
|
|
|
|
|
|
Materials — 3.0% |
|
|
|
|
|
|
| 4,987 |
| $ | 497,603 |
| |
| 5,925 |
|
| 516,541 |
| |
|
|
|
|
| 1,014,144 |
|
TOTAL UNITED STATES |
|
|
|
| 14,363,358 |
|
TOTAL COMMON STOCK |
|
|
|
|
|
|
|
|
|
| 32,361,944 |
| |
|
|
|
|
|
|
|
PREFERRED STOCK — 3.7% |
|
|
|
|
|
|
GERMANY — 3.7% |
|
|
|
|
|
|
Consumer Discretionary — 3.7% |
|
|
|
|
|
|
|
|
|
|
|
| |
| 7,060 |
|
| 1,243,143 |
| |
TOTAL PREFERRED STOCK |
|
|
|
|
|
|
|
|
|
| 1,243,143 |
| |
|
|
|
|
|
|
|
SHORT-TERM INVESTMENT(B)(C) — 6.1% |
|
|
|
|
|
|
| 2,037,770 |
|
| 2,037,770 |
| |
TOTAL SHORT-TERM INVESTMENT |
|
|
|
|
|
|
|
|
|
| 2,037,770 |
| |
TOTAL INVESTMENTS — 105.9% |
|
|
|
|
|
|
|
|
|
| 35,642,857 |
| |
OTHER ASSETS LESS LIABILITIES — (5.9)% |
|
|
|
| (1,980,319 | ) |
NET ASSETS — 100% |
|
|
| $ | 33,662,538 |
|
‡ Industries are utilized for compliance purposes, whereas sectors are utilized for reporting.
* Non-income producing security.
(A) Certain securities or partial positions of certain securities are on loan at September 30, 2018. The total market value of securities on loan at September 30, 2018 was $1,972,377.
(B) This security was purchased with cash collateral held from securities on loan. The total value of such security as of September 30, 2018 was $2,037,770.
(C) The rate shown is the 7-day effective yield as of September 30, 2018.
ADR — American Depositary Receipt
Cl — Class
As of September 30, 2018, all of the Fund’s investments were considered Level 1 of the fair value hierarchy, in accordance with the authoritative guidance under U.S. GAAP.
For the period ended September 30, 2018, there have been no transfers between Level 1, Level 2 and Level 3 investments. Transfers between levels are recognized at period end
The accompanying notes are an integral part of the financial statements.
44
Schedule of Investments (Unaudited) September 30, 2018
KraneShares MSCI All China Health Care Index
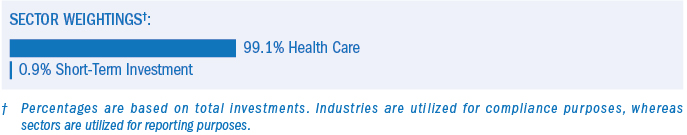
|
| Shares |
| Value | |
COMMON STOCK — 99.7%‡ |
|
|
|
|
|
CHINA — 91.7% |
|
|
|
|
|
Health Care — 91.7% |
|
|
|
|
|
| 370,500 |
| $ | 623,112 | |
| 1,000,000 |
|
| 980,204 | |
| 61,200 |
|
| 286,049 | |
| 77,455 |
|
| 217,148 | |
| 123,268 |
|
| 568,811 | |
| 15,100 |
|
| 520,115 | |
| 393,000 |
|
| 546,440 | |
| 33,332 |
|
| 221,193 | |
| 67,955 |
|
| 259,352 | |
| 92,207 |
|
| 210,664 | |
| 451,000 |
|
| 715,846 | |
| 86,109 |
|
| 318,751 | |
| 652,000 |
|
| 443,282 | |
| 1,410,000 |
|
| 2,994,824 | |
| 57,614 |
|
| 397,485 | |
| 291,700 |
|
| 122,944 | |
| 124,046 |
|
| 659,838 | |
| 127,800 |
|
| 171,252 | |
| 130,683 |
|
| 797,325 | |
| 83,276 |
|
| 458,704 | |
| 61,706 |
|
| 353,254 | |
| 121,070 |
|
| 228,394 | |
| 333,106 |
|
| 3,074,184 | |
| 89,145 |
|
| 240,852 | |
| 104,409 |
|
| 249,164 | |
| 103,408 |
|
| 255,792 | |
| 140,200 |
|
| 188,275 | |
| 167,850 |
|
| 369,823 | |
| 439,295 |
|
| 1,396,938 | |
| 42,380 |
|
| 208,679 | |
| 342,500 |
|
| 307,269 | |
| 280,852 |
|
| 703,293 | |
| 132,771 |
|
| 192,771 | |
| 78,530 |
|
| 332,011 | |
| 600,000 |
|
| 592,723 | |
| 184,159 |
|
| 844,435 | |
| 92,928 |
|
| 259,311 | |
| 165,500 |
|
| 652,491 | |
| 172,994 |
|
| 515,417 | |
| 261,000 |
|
| 652,425 | |
The accompanying notes are an integral part of the financial statements.
45
Schedule of Investments (Unaudited) September 30, 2018
KraneShares MSCI All China Health Care Index (concluded)
|
| Shares |
| Value | ||
COMMON STOCK (continued) |
|
|
|
|
|
|
Health Care (continued) |
|
|
|
|
|
|
| 78,743 |
| $ | 323,413 |
| |
| 109,025 |
|
| 194,580 |
| |
| 131,800 |
|
| 510,872 |
| |
| 267,080 |
|
| 197,575 |
| |
| 1,122,000 |
|
| 229,421 |
| |
| 356,800 |
|
| 1,746,405 |
| |
| 132,676 |
|
| 441,186 |
| |
| 166,000 |
|
| 243,116 |
| |
| 182,591 |
|
| 481,383 |
| |
| 143,000 |
|
| 1,446,466 |
| |
| 111,039 |
|
| 190,267 |
| |
| 88,765 |
|
| 957,624 |
| |
| 54,023 |
|
| 795,042 |
| |
| 115,354 |
|
| 366,988 |
| |
| 193,011 |
|
| 436,762 |
| |
TOTAL CHINA |
|
|
|
| 31,691,940 |
|
|
|
|
|
|
|
|
HONG KONG — 8.0% |
|
|
|
|
|
|
Health Care — 8.0% |
|
|
|
|
|
|
| 214,000 |
|
| 361,548 |
| |
| 2,099,500 |
|
| 1,958,665 |
| |
| 438,000 |
|
| 423,172 |
| |
TOTAL HONG KONG |
|
|
|
| 2,743,385 |
|
TOTAL COMMON STOCK |
|
|
|
|
|
|
|
|
|
| 34,435,325 |
| |
|
|
|
|
|
|
|
SHORT-TERM INVESTMENT(B)(C) — 0.9% |
|
|
|
|
|
|
| 323,782 |
|
| 323,782 |
| |
TOTAL SHORT-TERM INVESTMENT |
|
|
|
|
|
|
|
|
|
| 323,782 |
| |
TOTAL INVESTMENTS — 100.5% |
|
|
|
|
|
|
|
|
|
| 34,759,107 |
| |
OTHER ASSETS LESS LIABILITIES — (0.6)% |
|
|
|
| (199,462 | ) |
NET ASSETS — 100% |
|
|
| $ | 34,559,645 |
|
‡ Industries are utilized for compliance purposes, whereas sectors are utilized for reporting.
* Non-income producing security.
(A) This security or a partial position of this security is on loan at September 30, 2018. The total value of securities on loan at September 30, 2018 was $307,757.
(B) This security was purchased with cash collateral held from securities on loan. The total value of such security as of September 30, 2018 was $323,782
(C) The rate shown is the 7-day effective yield as of September 30, 2018.
Cl — Class
As of September 30, 2018, all of the Fund’s investments were considered Level 1 of the fair value hierarchy, in accordance with the authoritative guidance under U.S. GAAP.
For the period ended September 30, 2018, there have been no transfers between Level 1, Level 2 and Level 3 investments. Transfers between levels are recognized at period end.
The accompanying notes are an integral part of the financial statements.
46
Schedule of Investments (Unaudited) September 30, 2018
KraneShares CCBS China Corporate High Yield Bond USD Index Fund
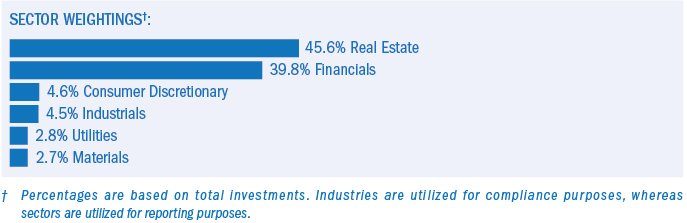
|
| Face |
| Value | ||
CORPORATE OBLIGATIONS — 86.5% |
|
|
|
|
|
|
CHINA — 65.6% |
|
|
|
|
|
|
| $ | 200,000 |
| $ | 209,069 | |
|
| 600,000 |
|
| 599,250 | |
|
| 200,000 |
|
| 190,002 | |
|
| 300,000 |
|
| 280,164 | |
|
| 200,000 |
|
| 203,054 | |
|
| 200,000 |
|
| 202,504 | |
|
| 200,000 |
|
| 187,754 | |
|
| 600,000 |
|
| 595,980 | |
|
| 300,000 |
|
| 297,170 | |
|
| 400,000 |
|
| 379,150 | |
|
| 200,000 |
|
| 207,740 | |
|
| 250,000 |
|
| 240,662 | |
|
| 300,000 |
|
| 304,901 | |
|
| 200,000 |
|
| 202,274 | |
|
| 200,000 |
|
| 158,026 | |
The accompanying notes are an integral part of the financial statements.
47
Schedule of Investments (Unaudited) September 30, 2018
KraneShares CCBS China Corporate High Yield Bond USD Index Fund (continued)
|
| Face |
| Value | ||
CORPORATE OBLIGATIONS (continued) |
|
|
|
|
|
|
CHINA (continued) |
|
|
|
|
|
|
| $ | 200,000 |
| $ | 196,493 | |
|
| 200,000 |
|
| 182,600 | |
|
| 200,000 |
|
| 188,504 | |
|
| 200,000 |
|
| 195,968 | |
|
| 200,000 |
|
| 194,281 | |
|
| 200,000 |
|
| 183,017 | |
|
| 200,000 |
|
| 174,309 | |
|
| 200,000 |
|
| 189,224 | |
|
| 200,000 |
|
| 191,004 | |
|
| 200,000 |
|
| 190,903 | |
|
| 200,000 |
|
| 195,744 | |
|
| 200,000 |
|
| 186,015 | |
TOTAL CHINA |
|
|
|
|
| 6,525,762 |
|
|
|
|
|
|
|
HONG KONG — 20.9% |
|
|
|
|
|
|
|
| 250,000 |
|
| 261,525 | |
|
| 200,000 |
|
| 198,164 | |
|
| 200,000 |
|
| 203,965 | |
|
| 300,000 |
|
| 283,183 | |
|
| 350,000 |
|
| 326,028 | |
|
| 250,000 |
|
| 243,250 | |
The accompanying notes are an integral part of the financial statements.
48
Schedule of Investments (Unaudited) September 30, 2018
KraneShares CCBS China Corporate High Yield Bond USD Index Fund (concluded)
|
| Face |
| Value | ||
CORPORATE OBLIGATIONS (continued) |
|
|
|
|
|
|
HONG KONG (continued) |
|
|
|
|
|
|
| $ | 350,000 |
| $ | 367,063 | |
|
| 200,000 |
|
| 199,549 | |
TOTAL HONG KONG |
|
|
|
|
| 2,082,727 |
TOTAL CORPORATE OBLIGATIONS |
|
|
|
|
|
|
|
|
|
|
| 8,608,489 | |
TOTAL INVESTMENTS — 86.5% |
|
|
|
|
|
|
|
|
|
|
| 8,608,489 | |
OTHER ASSETS LESS LIABILITIES — 13.5% |
|
|
|
|
| 1,339,747 |
NET ASSETS — 100% |
|
|
|
| $ | 9,948,236 |
ICE — Intercontinental Exchange
LIBOR — London Interbank Offered Rate
USD — United States Dollar
VAR — Variable Rate
As of September 30, 2018, all of the Fund’s investments were considered Level 2 of the fair value hierarchy, in accordance with the authoritative guidance under U.S. GAAP.
For the period ended September 30, 2018, there have been no transfers between Level 1, Level 2 and Level 3 investments. Transfers between levels are recognized at period end.
The accompanying notes are an integral part of the financial statements.
49
Schedule of Investments (Unaudited) September 30, 2018
KraneShares Emerging Markets Healthcare Index ETF

|
| Shares |
| Value | |
COMMON STOCK — 98.6%‡ |
|
|
|
|
|
BRAZIL — 1.3% |
|
|
|
|
|
Health Care — 1.3% |
|
|
|
|
|
| 2,200 |
| $ | 11,822 | |
| 3,800 |
|
| 12,180 | |
| 1,800 |
|
| 7,311 | |
TOTAL BRAZIL |
|
|
|
| 31,313 |
|
|
|
|
|
|
CHINA — 34.9% |
|
|
|
|
|
Health Care — 34.9% |
|
|
|
|
|
| 11,000 |
|
| 18,500 | |
| 10,200 |
|
| 47,808 | |
| 232 |
|
| 39,955 | |
| 5,800 |
|
| 26,764 | |
| 700 |
|
| 24,111 | |
| 3,000 |
|
| 17,401 | |
| 10,000 |
|
| 13,904 | |
| 3,000 |
|
| 4,102 | |
| 7,000 |
|
| 49,810 | |
| 2,800 |
|
| 19,317 | |
| 6,400 |
|
| 39,048 | |
| 3,400 |
|
| 19,464 | |
| 294 |
|
| 5,321 | |
| 11,600 |
|
| 107,055 | |
| 21,800 |
|
| 69,323 | |
| 7,800 |
|
| 34,405 | |
| 13,000 |
|
| 11,663 | |
| 3,800 |
|
| 16,066 | |
| 8,000 |
|
| 7,903 | |
| 2,000 |
|
| 7,885 | |
| 3,800 |
|
| 9,499 | |
| 4,600 |
|
| 18,893 | |
| 6,200 |
|
| 24,032 | |
| 40,000 |
|
| 8,179 | |
| 6,600 |
|
| 21,947 | |
| 2,000 |
|
| 2,929 | |
| 9,200 |
|
| 24,255 | |
| 6,600 |
|
| 20,911 | |
| 5,000 |
|
| 50,576 | |
| 4,400 |
|
| 47,469 | |
The accompanying notes are an integral part of the financial statements.
50
Schedule of Investments (Unaudited) September 30, 2018
KraneShares Emerging Markets Healthcare Index ETF (continued)
|
| Shares |
| Value | |
COMMON STOCK (continued) |
|
|
|
|
|
Health Care (continued) |
|
|
|
|
|
| 2,600 |
| $ | 38,263 | |
| 5,400 |
|
| 17,180 | |
TOTAL CHINA |
|
|
|
| 863,938 |
|
|
|
|
|
|
HONG KONG — 1.3% |
|
|
|
|
|
Health Care — 1.3% |
|
|
|
|
|
| 5,000 |
|
| 4,550 | |
| 6,000 |
|
| 10,137 | |
| 16,000 |
|
| 3,946 | |
| 1,000 |
|
| 3,437 | |
| 6,000 |
|
| 7,944 | |
| 800 |
|
| 3,328 | |
TOTAL HONG KONG |
|
|
|
| 33,342 |
|
|
|
|
|
|
HUNGARY — 1.0% |
|
|
|
|
|
Health Care — 1.0% |
|
|
|
|
|
| 1,344 |
|
| 25,145 | |
TOTAL HUNGARY |
|
|
|
| 25,145 |
|
|
|
|
|
|
INDIA — 15.3% |
|
|
|
|
|
Health Care — 15.3% |
|
|
|
|
|
| 4,394 |
|
| 41,906 | |
| 5,918 |
|
| 53,396 | |
| 1,224 |
|
| 42,350 | |
| 3,806 |
|
| 7,086 | |
| 3,352 |
|
| 41,661 | |
| 1,402 |
|
| 44,471 | |
| 16,477 |
|
| 141,665 | |
| 800 |
|
| 5,979 | |
TOTAL INDIA |
|
|
|
| 378,514 |
|
|
|
|
|
|
INDONESIA — 1.2% |
|
|
|
|
|
Health Care — 1.2% |
|
|
|
|
|
| 337,000 |
|
| 31,209 | |
TOTAL INDONESIA |
|
|
|
| 31,209 |
|
|
|
|
|
|
MALAYSIA — 5.7% |
|
|
|
|
|
Health Care — 5.7% |
|
|
|
|
|
| 25,000 |
|
| 39,990 | |
| 61,000 |
|
| 76,793 | |
| 9,200 |
|
| 23,698 | |
TOTAL MALAYSIA |
|
|
|
| 140,481 |
The accompanying notes are an integral part of the financial statements.
51
Schedule of Investments (Unaudited) September 30, 2018
KraneShares Emerging Markets Healthcare Index ETF (continued)
|
| Shares |
| Value | |
COMMON STOCK (continued) |
|
|
|
|
|
SOUTH AFRICA — 3.1% |
|
|
|
|
|
Health Care — 3.1% |
|
|
|
|
|
| 3,348 |
| $ | 40,073 | |
| 10,712 |
|
| 18,591 | |
| 10,874 |
|
| 18,603 | |
TOTAL SOUTH AFRICA |
|
|
|
| 77,267 |
|
|
|
|
|
|
SOUTH KOREA — 28.7% |
|
|
|
|
|
Consumer Discretionary — 1.1% |
|
|
|
|
|
| 266 |
|
| 28,800 | |
Health Care — 27.6% |
|
|
|
|
|
| 344 |
|
| 8,559 | |
| 496 |
|
| 132,803 | |
| 1,020 |
|
| 84,782 | |
| 70 |
|
| 7,446 | |
| 414 |
|
| 6,718 | |
| 82 |
|
| 14,341 | |
| 146 |
|
| 13,689 | |
| 84 |
|
| 13,252 | |
| 338 |
|
| 8,791 | |
| 374 |
|
| 10,992 | |
| 83 |
|
| 37,413 | |
| 450 |
|
| 35,619 | |
| 30 |
|
| 11,570 | |
| 406 |
|
| 9,535 | |
| 41 |
|
| 22,879 | |
| 412 |
|
| 6,147 | |
| 327 |
|
| 157,420 | |
| 512 |
|
| 47,265 | |
| 114 |
|
| 24,748 | |
| 86 |
|
| 18,801 | |
| 1,328 |
|
| 10,092 | |
|
|
|
|
| 682,862 |
TOTAL SOUTH KOREA |
|
|
|
| 711,662 |
|
|
|
|
|
|
THAILAND — 5.6% |
|
|
|
|
|
Health Care — 5.6% |
|
|
|
|
|
| 18,600 |
|
| 11,963 | |
| 113,600 |
|
| 89,574 | |
| 5,200 |
|
| 29,907 | |
| 6,200 |
|
| 7,141 | |
|
|
|
|
| 138,585 |
TOTAL THAILAND |
|
|
|
| 138,585 |
The accompanying notes are an integral part of the financial statements.
52
Schedule of Investments (Unaudited) September 30, 2018
KraneShares Emerging Markets Healthcare Index ETF (concluded)
|
| Shares |
| Value | |
COMMON STOCK (continued) |
|
|
|
|
|
UNITED STATES — 0.5% |
|
|
|
|
|
Health Care — 0.5% |
|
|
|
|
|
| 144 |
| $ | 11,520 | |
TOTAL UNITED STATES |
|
|
|
| 11,520 |
TOTAL COMMON STOCK |
|
|
|
|
|
|
|
|
| 2,442,976 | |
TOTAL INVESTMENTS — 98.6% |
|
|
|
|
|
|
|
|
| 2,442,976 | |
OTHER ASSETS LESS LIABILITIES — 1.4% |
|
|
|
| 34,429 |
NET ASSETS — 100% |
|
|
| $ | 2,477,405 |
‡ Industries are utilized for compliance purposes, whereas sectors are utilized for reporting.
* Non-income producing security.
ADR — American Depository Receipt
Cl — Class
As of September 30, 2018, all of the Fund’s investments were considered Level 1 of the fair value hierarchy, in accordance with the authoritative guidance under U.S. GAAP.
For the period ended September 30, 2018, here have been no transfers between Level 1, Level 2 and Level 3 investments. Transfers between levels are recognized at period end.
The accompanying notes are an integral part of the financial statements.
53
Statements of Assets and Liabilities (Unaudited)
September 30, 2018
|
| KraneShares |
| KraneShares |
| KraneShares | ||||||
Assets: |
|
|
|
|
|
|
|
|
|
|
|
|
| $ | 338,509,373 |
|
| $ | 3,106,506 |
|
| $ | 1,646,797,123 | * | |
|
| — |
|
|
| 23,348 |
|
|
| 16,731,320 |
| |
|
| 1,869,725 |
|
|
| 228 |
|
|
| 479 |
| |
|
| 5,769,925 |
|
|
| — |
|
|
| — |
| |
|
| — |
|
|
| 1,822 |
|
|
| 429,421 |
| |
|
| 3,800 |
|
|
| 55 |
|
|
| 17,179 |
| |
|
| 346,152,823 |
|
|
| 3,131,959 |
|
|
| 1,663,975,522 |
| |
|
|
|
|
|
|
|
|
|
|
|
|
|
Liabilities: |
|
|
|
|
|
|
|
|
|
|
|
|
|
| 5,603,872 |
|
|
| — |
|
|
| 13,761,900 |
| |
|
| — |
|
|
| — |
|
|
| 165,631,848 |
| |
|
| 639,724 |
|
|
| — |
|
|
| — |
| |
|
| 154,541 |
|
|
| 1,603 |
|
|
| 693,564 |
| |
|
| 871 |
|
|
| 57 |
|
|
| 21,693 |
| |
|
| 209 |
|
|
| — |
|
|
| 20,444 |
| |
|
| — |
|
|
| — |
|
|
| 38,859 |
| |
|
| 6,399,217 |
|
|
| 1,660 |
|
|
| 180,168,308 |
| |
| $ | 339,753,606 |
|
| $ | 3,130,299 |
|
| $ | 1,483,807,214 |
| |
|
|
|
|
|
|
|
|
|
|
|
|
|
Net Assets Consist of: |
|
|
|
|
|
|
|
|
|
|
|
|
| $ | 403,761,932 |
|
| $ | 2,913,115 |
|
| $ | 1,646,491,756 |
| |
|
| 8,629,893 |
|
|
| 67,750 |
|
|
| (8,843,330 | ) | |
|
| (19,571,903 | ) |
|
| 403,860 |
|
|
| 91,276,741 |
| |
|
| (53,066,107 | ) |
|
| (254,430 | ) |
|
| (245,117,363 | ) | |
|
| (209 | ) |
|
| 4 |
|
|
| (590 | ) | |
| $ | 339,753,606 |
|
| $ | 3,130,299 |
|
| $ | 1,483,807,214 |
| |
|
| 11,800,000 |
|
|
| 100,000 |
|
|
| 30,350,000 |
| |
| $ | 28.79 |
|
| $ | 31.30 |
|
| $ | 48.89 |
| |
| $ | 391,575,480 |
|
| $ | 3,360,936 |
|
| $ | 1,891,914,486 |
| |
|
| 1,869,725 |
|
|
| 228 |
|
|
| 480 |
| |
|
| — |
|
|
| — |
|
|
| 160,221,941 |
| |
Amounts designated as “—” are $0 or have been rounded to $0.
The accompanying notes are an integral part of the financial statements.
54
Statements of Assets and Liabilities (Unaudited) (continued)
September 30, 2018
|
| KraneShares |
| KraneShares |
| KraneShares | ||||||
Assets: |
|
|
|
|
|
|
|
|
|
|
|
|
| $ | 11,680,007 |
|
| $ | 2,340,786 |
|
| $ | 30,805,299 |
| |
|
| 227,114 |
|
|
| — |
|
|
| — |
| |
|
| — |
|
|
| 23,531 |
|
|
| 84,509 |
| |
|
| 45,218 |
|
|
| 23,176 |
|
|
| 59,285 |
| |
|
| 275,317 |
|
|
| 3,387 |
|
|
| 41,966 |
| |
|
| — |
|
|
| 408 |
|
|
| 1,167 |
| |
|
| — |
|
|
| 1 |
|
|
| 3 |
| |
|
| 133 |
|
|
| 270 |
|
|
| 271 |
| |
|
| 12,227,789 |
|
|
| 2,391,559 |
|
|
| 30,992,500 |
| |
|
|
|
|
|
|
|
|
|
|
|
|
|
Liabilities: |
|
|
|
|
|
|
|
|
|
|
|
|
|
| 282,705 |
|
|
| — |
|
|
| — |
| |
|
| 5,302 |
|
|
| 1,331 |
|
|
| 19,386 |
| |
|
| 642 |
|
|
| — |
|
|
| — |
| |
|
| 178 |
|
|
| 36 |
|
|
| 457 |
| |
|
| 288,827 |
|
|
| 1,367 |
|
|
| 19,843 |
| |
| $ | 11,938,962 |
|
| $ | 2,390,192 |
|
| $ | 30,972,657 |
| |
|
|
|
|
|
|
|
|
|
|
|
|
|
Net Assets Consist of: |
|
|
|
|
|
|
|
|
|
|
|
|
| $ | 12,240,899 |
|
| $ | 2,483,561 |
|
| $ | 34,447,668 |
| |
|
| 326,047 |
|
|
| 44,789 |
|
|
| 521,011 |
| |
|
| 89,310 |
|
|
| (136,370 | ) |
|
| (1,122,416 | ) | |
|
| (704,087 | ) |
|
| (1,817 | ) |
|
| (2,873,670 | ) | |
|
| (642 | ) |
|
| — |
|
|
| — |
| |
|
| (12,565 | ) |
|
| 29 |
|
|
| 64 |
| |
| $ | 11,938,962 |
|
| $ | 2,390,192 |
|
| $ | 30,972,657 |
| |
|
| 350,000 |
|
|
| 100,000 |
|
|
| 1,300,002 |
| |
| $ | 34.11 |
|
| $ | 23.90 |
|
| $ | 23.83 |
| |
| $ | 12,369,432 |
|
| $ | 2,342,603 |
|
| $ | 33,678,969 |
| |
|
| 241,776 |
|
|
| — |
|
|
| — |
| |
|
| 45,218 |
|
|
| 23,077 |
|
|
| 59,512 |
| |
Amounts designated as “—” are $0 or have been rounded to $0.
The accompanying notes are an integral part of the financial statements.
55
Statements of Assets and Liabilities (Unaudited) (continued)
September 30, 2018
|
| KraneShares |
| KraneShares |
| KraneShares | ||||||
Assets: |
|
|
|
|
|
|
|
|
|
|
|
|
| $ | 32,457,615 | * |
| $ | 5,733,113 |
|
| $ | 35,642,857 | * | |
|
| 41,771 |
|
|
| 119,893 |
|
|
| 44,166 |
| |
|
| 255,390 |
|
|
| 4,734 |
|
|
| 1,074 |
| |
|
| 7,536 |
|
|
| 22,959 |
|
|
| 17,008 |
| |
|
| 83 |
|
|
| — |
|
|
| 14,121 |
| |
|
| 29 |
|
|
| 68 |
|
|
| 23 |
| |
|
| — |
|
|
| 5 |
|
|
| — |
| |
|
| 32,762,424 |
|
|
| 5,880,772 |
|
|
| 35,719,249 |
| |
|
|
|
|
|
|
|
|
|
|
|
|
|
Liabilities: |
|
|
|
|
|
|
|
|
|
|
|
|
|
| 1,004,958 |
|
|
| — |
|
|
| 2,037,770 |
| |
|
| 21,661 |
|
|
| 3,593 |
|
|
| 18,199 |
| |
|
| 491 |
|
|
| 151 |
|
|
| 439 |
| |
|
| 118 |
|
|
| — |
|
|
| — |
| |
|
| 83 |
|
|
| — |
|
|
| 303 |
| |
|
| 1,027,311 |
|
|
| 3,744 |
|
|
| 2,056,711 |
| |
| $ | 31,735,113 |
|
| $ | 5,877,028 |
|
| $ | 33,662,538 |
| |
|
|
|
|
|
|
|
|
|
|
|
|
|
Net Assets Consist of: |
|
|
|
|
|
|
|
|
|
|
|
|
| $ | 39,078,165 |
|
| $ | 7,558,481 |
|
| $ | 37,267,795 |
| |
|
| (7,402 | ) |
|
| 123,421 |
|
|
| 229,650 |
| |
|
| (2,229,844 | ) |
|
| (1,202,591 | ) |
|
| (1,513,398 | ) | |
|
| (5,105,814 | ) |
|
| (602,310 | ) |
|
| (2,321,020 | ) | |
|
| 8 |
|
|
| 27 |
|
|
| (489 | ) | |
| $ | 31,735,113 |
|
| $ | 5,877,028 |
|
| $ | 33,662,538 |
| |
|
| 1,450,002 |
|
|
| 300,002 |
|
|
| 1,550,002 |
| |
| $ | 21.89 |
|
| $ | 19.59 |
|
| $ | 21.72 |
| |
| $ | 37,563,429 |
|
| $ | 6,335,423 |
|
| $ | 37,963,877 |
| |
|
| 255,355 |
|
|
| 4,723 |
|
|
| 1,088 |
| |
|
| 978,722 |
|
|
| — |
|
|
| 1,972,377 |
| |
Amounts designated as “—” are $0 or have been rounded to $0.
The accompanying notes are an integral part of the financial statements.
56
Statements of Assets and Liabilities (Unaudited) (concluded)
September 30, 2018
|
| KraneShares |
| KraneShares |
| KraneShares Emerging Markets | ||||||
Assets: |
|
|
|
|
|
|
|
|
|
|
|
|
| $ | 34,759,107 | * |
| $ | 8,608,489 |
|
| $ | 2,442,976 |
| |
|
| 221,597 |
|
|
| 1,205,670 |
|
|
| 40,101 |
| |
|
| 4,564 |
|
|
| — |
|
|
| 854 |
| |
|
| 4,477 |
|
|
| 139,682 |
|
|
| 597 |
| |
|
| 1,114,947 |
|
|
| — |
|
|
| — |
| |
|
| — |
|
|
| — |
|
|
| 1 |
| |
|
| — |
|
|
| — |
|
|
| 1 |
| |
|
| 22 |
|
|
| — |
|
|
| — |
| |
|
| 36,104,714 |
|
|
| 9,953,841 |
|
|
| 2,484,530 |
| |
|
|
|
|
|
|
|
|
|
|
|
|
|
Liabilities: |
|
|
|
|
|
|
|
|
|
|
|
|
|
| 1,199,494 |
|
|
| — |
|
|
| 5,496 |
| |
|
| 323,782 |
|
|
| — |
|
|
| — |
| |
|
| 20,834 |
|
|
| 5,536 |
|
|
| 1,580 |
| |
|
| 285 |
|
|
| 69 |
|
|
| 38 |
| |
|
| — |
|
|
| — |
|
|
| 11 |
| |
|
| 674 |
|
|
| — |
|
|
| — |
| |
|
| 1,545,069 |
|
|
| 5,605 |
|
|
| 7,125 |
| |
| $ | 34,559,645 |
|
| $ | 9,948,236 |
|
| $ | 2,477,405 |
| |
|
|
|
|
|
|
|
|
|
|
|
|
|
Net Assets Consist of: |
|
|
|
|
|
|
|
|
|
|
|
|
| $ | 40,717,625 |
|
| $ | 10,000,040 |
|
| $ | 2,500,025 |
| |
|
| 134,061 |
|
|
| 5,393 |
|
|
| (237 | ) | |
|
| (1,052,239 | ) |
|
| — |
|
|
| 5,362 |
| |
|
| (5,239,142 | ) |
|
| (57,197 | ) |
|
| (27,729 | ) | |
|
| (660 | ) |
|
| — |
|
|
| (16 | ) | |
| $ | 34,559,645 |
|
| $ | 9,948,236 |
|
| $ | 2,477,405 |
| |
|
| 1,550,002 |
|
|
| 250,001 |
|
|
| 100,001 |
| |
| $ | 22.30 |
|
| $ | 39.79 |
|
| $ | 24.77 |
| |
| $ | 39,998,249 |
|
| $ | 8,665,686 |
|
| $ | 2,470,705 |
| |
|
| 4,564 |
|
|
| — |
|
|
| 854 |
| |
|
| 307,757 |
|
|
| — |
|
|
| — |
| |
Amounts designated as “—” are $0 or have been rounded to $0.
The accompanying notes are an integral part of the financial statements.
57
Statements of Operations (Unaudited)
For the Period Ended September 30, 2018
|
| KraneShares |
| KraneShares |
| KraneShares | ||||||
Investment Income: |
|
|
|
|
|
|
|
|
|
|
|
|
| $ | 10,925,935 |
|
| $ | 93,252 |
|
| $ | 4,735,171 |
| |
|
| 36,176 |
|
|
| 1,059 |
|
|
| 35,163 |
| |
|
| — |
|
|
| — |
|
|
| 3,252,945 |
| |
|
| (1,093,708 | ) |
|
| (5,517 | ) |
|
| (3,803 | ) | |
|
| 9,868,403 |
|
|
| 88,794 |
|
|
| 8,019,476 |
| |
|
|
|
|
|
|
|
|
|
|
|
|
|
Expenses: |
|
|
|
|
|
|
|
|
|
|
|
|
|
| 1,619,097 |
|
|
| 13,852 |
|
|
| 4,967,547 |
| |
|
| 27,798 |
|
|
| 279 |
|
|
| 82,284 |
| |
|
| — |
|
|
| — |
|
|
| 322,258 |
| |
|
| — |
|
|
| — |
|
|
| 17,255 |
| |
|
| 1,646,895 |
|
|
| 14,131 |
|
|
| 5,389,344 |
| |
|
| (415,156 | ) |
|
| — |
|
|
| — |
| |
|
| — |
|
|
| (41 | ) |
|
| (14,468 | ) | |
|
| 1,231,739 |
|
|
| 14,090 |
|
|
| 5,374,876 |
| |
|
| 8,636,664 |
|
|
| 74,704 |
|
|
| 2,644,600 |
| |
|
|
|
|
|
|
|
|
|
|
|
|
|
Net Realized Gain (Loss) on: |
|
|
|
|
|
|
|
|
|
|
|
|
|
| (21,367,229 | ) |
|
| 295,528 |
|
|
| 64,685,812 |
| |
|
| (2,160,978 | ) |
|
| (1,455 | ) |
|
| (3,042 | ) | |
|
| (23,528,207 | ) |
|
| 294,073 |
|
|
| 64,682,770 |
| |
|
|
|
|
|
|
|
|
|
|
|
|
|
Net Change in Unrealized Appreciation (Depreciation) on: |
|
|
|
|
|
|
|
|
|
|
|
|
|
| (85,149,896 | ) |
|
| (567,157 | ) |
|
| (362,785,309 | ) | |
|
| (7,926 | ) |
|
| 4 |
|
|
| (616 | ) | |
|
|
|
|
|
|
|
|
|
|
|
|
|
|
| (85,157,822 | ) |
|
| (567,153 | ) |
|
| (362,785,925 | ) | |
|
|
|
|
|
|
|
|
|
|
|
|
|
|
| (108,686,029 | ) |
|
| (273,080 | ) |
|
| (298,103,155 | ) | |
|
|
|
|
|
|
|
|
|
|
|
|
|
| $ | (100,049,365 | ) |
| $ | (198,376 | ) |
| $ | (295,458,555 | ) | |
† See Note 3 in Notes to Financial Statements.
(1) Includes realized gains (losses) as a result of in-kind redemptions. (See Note 4 in Notes to Financial Statements.)
Amounts designated as “—” are $0 or have been rounded to $0.
The accompanying notes are an integral part of the financial statements.
58
Statements of Operations (Unaudited) (continued)
For the Period Ended September 30, 2018
|
| KraneShares |
| KraneShares |
| KraneShares | ||||||
Investment Income: |
|
|
|
|
|
|
|
|
|
|
|
|
| $ | — |
|
| $ | 44,990 |
|
| $ | 676,808 |
| |
|
| 292,863 |
|
|
| 392 |
|
|
| — |
| |
|
| — |
|
|
| (4,867 | ) |
|
| (51,900 | ) | |
|
| 292,863 |
|
|
| 40,515 |
|
|
| 624,908 |
| |
|
|
|
|
|
|
|
|
|
|
|
|
|
Expenses: |
|
|
|
|
|
|
|
|
|
|
|
|
|
| 43,078 |
|
|
| 8,552 |
|
|
| 127,645 |
| |
|
| 694 |
|
|
| 413 |
|
|
| 2,071 |
| |
|
| 135 |
|
|
| — |
|
|
| — |
| |
|
| 43,907 |
|
|
| 8,965 |
|
|
| 129,716 |
| |
|
| (7,602 | ) |
|
| (685 | ) |
|
| — |
| |
|
| (117 | ) |
|
| (23 | ) |
|
| (299 | ) | |
|
| 36,188 |
|
|
| 8,257 |
|
|
| 129,417 |
| |
|
| 256,675 |
|
|
| 32,258 |
|
|
| 495,491 |
| |
|
|
|
|
|
|
|
|
|
|
|
|
|
Net Realized Gain (Loss) on: |
|
|
|
|
|
|
|
|
|
|
|
|
|
| 47 |
|
|
| 128,363 |
|
|
| (1,102,671 | ) | |
|
| 12,865 |
|
|
| (73,661 | ) |
|
| — |
| |
|
| 118,059 |
|
|
| 651 |
|
|
| (22,824 | ) | |
|
| 130,971 |
|
|
| 55,353 |
|
|
| (1,125,495 | ) | |
|
|
|
|
|
|
|
|
|
|
|
|
|
Net Change in Unrealized Appreciation (Depreciation) on: |
|
|
|
|
|
|
|
|
|
|
|
|
|
| (1,174,318 | ) |
|
| (413,664 | ) |
|
| (1,811,843 | ) | |
|
| (29,102 | ) |
|
| 19,757 |
|
|
| — |
| |
|
| (642 | ) |
|
| — |
|
|
| — |
| |
|
| (19,441 | ) |
|
| 19 |
|
|
| (197 | ) | |
|
|
|
|
|
|
|
|
|
|
|
|
|
|
| (1,223,503 | ) |
|
| (393,888 | ) |
|
| (1,812,040 | ) | |
|
|
|
|
|
|
|
|
|
|
|
|
|
|
| (1,092,532 | ) |
|
| (338,535 | ) |
|
| (2,937,535 | ) | |
|
|
|
|
|
|
|
|
|
|
|
|
|
| $ | (835,857 | ) |
| $ | (306,277 | ) |
| $ | (2,442,044 | ) | |
† See Note 3 in Notes to Financial Statements.
(1) Includes realized gains (losses) as a result of in-kind redemptions. (See Note 4 in Notes to Financial Statements.)
Amounts designated as “—” are $0 or have been rounded to $0.
The accompanying notes are an integral part of the financial statements.
59
Statements of Operations (Unaudited) (continued)
For the Period Ended September 30, 2018
|
| KraneShares Emerging Markets Consumer Technology Index ETF |
| KraneShares |
| KraneShares Electric Vehicles and Future | ||||||
Investment Income: |
|
|
|
|
|
|
|
|
|
|
|
|
| $ | 170,306 |
|
| $ | 167,213 |
|
| $ | 362,974 |
| |
|
| 203 |
|
|
| — |
|
|
| — |
| |
|
| 2,317 |
|
|
| — |
|
|
| 5,803 |
| |
|
| (18,328 | ) |
|
| (4,354 | ) |
|
| (32,147 | ) | |
|
| 154,498 |
|
|
| 162,859 |
|
|
| 336,630 |
| |
|
|
|
|
|
|
|
|
|
|
|
|
|
Expenses: |
|
|
|
|
|
|
|
|
|
|
|
|
|
| 155,266 |
|
|
| 25,874 |
|
|
| 106,984 |
| |
|
| 2,192 |
|
|
| 481 |
|
|
| 1,715 |
| |
|
| 226 |
|
|
| — |
|
|
| 596 |
| |
|
| — |
|
|
| — |
|
|
| 783 |
| |
|
| 157,684 |
|
|
| 26,355 |
|
|
| 110,078 |
| |
|
| (350 | ) |
|
| (93 | ) |
|
| — |
| |
|
| 157,334 |
|
|
| 26,262 |
|
|
| 110,078 |
| |
|
| (2,836 | ) |
|
| 136,597 |
|
|
| 226,552 |
| |
|
|
|
|
|
|
|
|
|
|
|
|
|
Net Realized Gain (Loss) on: |
|
|
|
|
|
|
|
|
|
|
|
|
|
| (2,212,192 | ) |
|
| (989,235 | ) |
|
| (1,441,383 | ) | |
|
| (17,326 | ) |
|
| 473 |
|
|
| (4,124 | ) | |
|
| (2,229,518 | ) |
|
| (988,762 | ) |
|
| (1,445,507 | ) | |
|
|
|
|
|
|
|
|
|
|
|
|
|
Net Change in Unrealized Appreciation (Depreciation) on: |
|
|
|
|
|
|
|
|
|
|
|
|
|
| (5,041,515 | ) |
|
| (443,246 | ) |
|
| (1,104,734 | ) | |
|
| 1,821 |
|
|
| 48 |
|
|
| (351 | ) | |
|
|
|
|
|
|
|
|
|
|
|
|
|
|
| (5,039,694 | ) |
|
| (443,198 | ) |
|
| (1,105,085 | ) | |
|
|
|
|
|
|
|
|
|
|
|
|
|
|
| (7,269,212 | ) |
|
| (1,431,960 | ) |
|
| (2,550,592 | ) | |
|
|
|
|
|
|
|
|
|
|
|
|
|
| $ | (7,272,048 | ) |
| $ | (1,295,363 | ) |
| $ | (2,324,040 | ) | |
† See Note 3 in Notes to Financial Statements.
(1) Includes realized gains (losses) as a result of in-kind redemptions. (See Note 4 in Notes to Financial Statements.)
Amounts designated as “—” are $0 or have been rounded to $0.
The accompanying notes are an integral part of the financial statements.
60
Statements of Operations (Unaudited) (concluded)
For the Period Ended September 30, 2018
|
| KraneShares |
| KraneShares |
| KraneShares Emerging Markets Healthcare Index ETF(3) | ||||||
|
|
|
|
|
|
|
|
|
|
|
|
|
Investment Income: |
|
|
|
|
|
|
|
|
|
|
|
|
| $ | 264,176 |
|
| $ | — |
|
| $ | 1,385 |
| |
|
| — |
|
|
| 144,760 |
|
|
| — |
| |
|
| 133 |
|
|
| — |
|
|
| 114 |
| |
|
| (21,131 | ) |
|
| (2,069 | ) |
|
| (53 | ) | |
|
| 243,178 |
|
|
| 142,691 |
|
|
| 1,446 |
| |
|
|
|
|
|
|
|
|
|
|
|
|
|
Expenses: |
|
|
|
|
|
|
|
|
|
|
|
|
|
| 99,129 |
|
|
| 17,558 |
|
|
| 1,634 |
| |
|
| 1,288 |
|
|
| 308 |
|
|
| 37 |
| |
|
| 13 |
|
|
| — |
|
|
| — |
| |
|
| 4,044 |
|
|
| — |
|
|
| — |
| |
|
| — |
|
|
| — |
|
|
| 12 |
| |
|
| 104,474 |
|
|
| 17,866 |
|
|
| 1,683 |
| |
|
| — |
|
|
| — |
|
|
| — |
| |
|
| 104,474 |
|
|
| 17,866 |
|
|
| 1,683 |
| |
|
| 138,704 |
|
|
| 124,825 |
|
|
| (237 | ) | |
|
|
|
|
|
|
|
|
|
|
|
|
|
Net Realized Gain (Loss) on: |
|
|
|
|
|
|
|
|
|
|
|
|
|
| (1,045,402 | ) |
|
| — |
|
|
| — |
| |
|
| (7,366 | ) |
|
| — |
|
|
| 5,362 |
| |
|
| (1,052,768 | ) |
|
| — |
|
|
| 5,362 |
| |
|
|
|
|
|
|
|
|
|
|
|
|
|
Net Change in Unrealized Appreciation (Depreciation) on: |
|
|
|
|
|
|
|
|
|
|
|
|
|
| (5,408,772 | ) |
|
| (57,197 | ) |
|
| (27,729 | ) | |
|
| (660 | ) |
|
| — |
|
|
| (16 | ) | |
|
|
|
|
|
|
|
|
|
|
|
|
|
|
| (5,409,432 | ) |
|
| (57,197 | ) |
|
| (27,745 | ) | |
|
|
|
|
|
|
|
|
|
|
|
|
|
|
| (6,462,200 | ) |
|
| (57,197 | ) |
|
| (22,383 | ) | |
|
|
|
|
|
|
|
|
|
|
|
|
|
| $ | (6,323,496 | ) |
| $ | 67,628 |
|
| $ | (22,620 | ) | |
† See Note 3 in Notes to Financial Statements.
(1) Commenced operations on January 31, 2018.
(2) Commenced operations on June 26, 2018.
(3) Commenced operations on August 29, 2018.
Amounts designated as “—” are $0 or have been rounded to $0.
The accompanying notes are an integral part of the financial statements.
61
Statements of Changes in Net Assets
|
| KraneShares | ||||||
|
| Period Ended September 30, |
| Year Ended | ||||
Operations: |
|
|
|
|
|
|
|
|
| $ | 8,636,664 |
|
| $ | 1,479,820 |
| |
|
| (23,528,207 | ) |
|
| 6,492,291 |
| |
|
| (85,157,822 | ) |
|
| 32,248,698 |
| |
|
| (100,049,365 | ) |
|
| 40,220,809 |
| |
|
|
|
|
|
|
|
|
|
Dividends and Distributions from: |
|
|
|
|
|
|
|
|
|
| — |
|
|
| (1,563,342 | ) | |
|
| — |
|
|
| (1,383,104 | ) | |
|
| — |
|
|
| (2,946,446 | ) | |
|
|
|
|
|
|
|
|
|
Capital Share Transactions:(1) |
|
|
|
|
|
|
|
|
|
| 316,224,770 |
|
|
| 273,881,297 |
| |
|
| (229,745,386 | ) |
|
| (10,325,858 | ) | |
|
| 86,479,384 |
|
|
| 263,555,439 |
| |
|
| (13,569,981 | ) |
|
| 300,829,802 |
| |
|
|
|
|
|
|
|
|
|
Net Assets: |
|
|
|
|
|
|
|
|
|
| 353,323,587 |
|
|
| 52,493,785 |
| |
| $ | 339,753,606 |
|
| $ | 353,323,587 |
| |
| $ | 8,629,893 |
|
| $ | (6,771 | ) | |
|
|
|
|
|
|
|
|
|
Share Transactions: |
|
|
|
|
|
|
|
|
|
| 9,400,000 |
|
|
| 8,700,000 |
| |
|
| (7,850,000 | ) |
|
| (300,000 | ) | |
|
| 1,550,000 |
|
|
| 8,400,000 |
| |
^ March 29, 2018 represents the last business day of the Fund’s reporting period. See Note 2 of the accompanying Notes to Financial Statements.
(1) Includes transaction costs related to creations and redemptions.
Amounts designated as “—” are $0 or have been rounded to $0.
The accompanying notes are an integral part of the financial statements.
62
Statements of Changes in Net Assets (continued)
|
| KraneShares | ||||||
|
| Period Ended September 30, |
| Year Ended | ||||
Operations: |
|
|
|
|
|
|
|
|
| $ | 74,704 |
|
| $ | 32,511 |
| |
|
| 294,073 |
|
|
| 1,236,546 |
| |
|
| (567,153 | ) |
|
| (457,296 | ) | |
|
| (198,376 | ) |
|
| 811,761 |
| |
|
|
|
|
|
|
|
|
|
Dividends and Distributions from: |
|
|
|
|
|
|
|
|
|
| — |
|
|
| (44,526 | ) | |
|
| — |
|
|
| (1,101,598 | ) | |
|
| — |
|
|
| (1,146,124 | ) | |
|
|
|
|
|
|
|
|
|
Capital Share Transactions:(1) |
|
|
|
|
|
|
|
|
|
| — |
|
|
| 2,010,914 |
| |
|
| (1,753,543 | ) |
|
| — |
| |
|
| (1,753,543 | ) |
|
| 2,010,914 |
| |
|
| (1,951,919 | ) |
|
| 1,676,551 |
| |
|
|
|
|
|
|
|
|
|
Net Assets: |
|
|
|
|
|
|
|
|
|
| 5,082,218 |
|
|
| 3,405,667 |
| |
| $ | 3,130,299 |
|
| $ | 5,082,218 |
| |
| $ | 67,750 |
|
| $ | (6,954 | ) | |
|
|
|
|
|
|
|
|
|
Share Transactions: |
|
|
|
|
|
|
|
|
|
| — |
|
|
| 50,000 |
| |
|
| (50,000 | ) |
|
| — |
| |
|
| (50,000 | ) |
|
| 50,000 |
| |
^ March 29, 2018 represents the last business day of the Fund’s reporting period. See Note 2 of the accompanying Notes to Financial Statements.
(1) Includes transaction costs related to creations and redemptions.
Amounts designated as “—” are $0 or have been rounded to $0.
The accompanying notes are an integral part of the financial statements.
63
Statements of Changes in Net Assets (continued)
|
| KraneShares | ||||||
|
| Period Ended September 30, |
| Year Ended | ||||
Operations: |
|
|
|
|
|
|
|
|
| $ | 2,644,600 |
|
| $ | (3,282,143 | ) | |
|
| 64,682,770 |
|
|
| 116,670,014 |
| |
|
| (362,785,925 | ) |
|
| 103,487,002 |
| |
|
| (295,458,555 | ) |
|
| 216,874,873 |
| |
|
|
|
|
|
|
|
|
|
Dividends and Distributions from: |
|
|
|
|
|
|
|
|
|
| — |
|
|
| (7,001,175 | ) | |
|
| — |
|
|
| (7,001,175 | ) | |
|
|
|
|
|
|
|
|
|
Capital Share Transactions:(1) |
|
|
|
|
|
|
|
|
|
| 540,526,049 |
|
|
| 1,335,264,104 |
| |
|
| (389,882,519 | ) |
|
| (207,772,539 | ) | |
|
| 150,643,530 |
|
|
| 1,127,491,565 |
| |
|
| (144,815,025 | ) |
|
| 1,337,365,263 |
| |
|
|
|
|
|
|
|
|
|
Net Assets: |
|
|
|
|
|
|
|
|
|
| 1,628,622,239 |
|
|
| 291,256,976 |
| |
| $ | 1,483,807,214 |
|
| $ | 1,628,622,239 |
| |
| $ | (8,843,330 | ) |
| $ | (11,487,930 | ) | |
|
|
|
|
|
|
|
|
|
Share Transactions: |
|
|
|
|
|
|
|
|
|
| 10,300,000 |
|
|
| 23,350,000 |
| |
|
| (6,600,000 | ) |
|
| (3,600,000 | ) | |
|
| 3,700,000 |
|
|
| 19,750,000 |
| |
^ March 29, 2018 represents the last business day of the Fund’s reporting period. See Note 2 of the accompanying Notes to Financial Statements.
(1) Includes transaction costs related to creations and redemptions.
Amounts designated as “—” are $0 or have been rounded to $0.
The accompanying notes are an integral part of the financial statements.
64
Statements of Changes in Net Assets (continued)
|
| KraneShares | |||||
|
| Period Ended September 30, |
| Year Ended | |||
Operations: |
|
|
|
|
|
|
|
| $ | 256,675 |
|
| $ | 355,255 | |
|
| 130,971 |
|
|
| 466,850 | |
|
| (1,223,503 | ) |
|
| 652,690 | |
|
| (835,857 | ) |
|
| 1,474,795 | |
|
|
|
|
|
|
|
|
Dividends and Distributions from: |
|
|
|
|
|
|
|
|
| (255,464 | ) |
|
| — | |
|
| (255,464 | ) |
|
| — | |
|
|
|
|
|
|
|
|
Capital Share Transactions:(1) |
|
|
|
|
|
|
|
|
| — |
|
|
| 1,710,233 | |
|
| — |
|
|
| 1,710,233 | |
|
| (1,091,321 | ) |
|
| 3,185,028 | |
|
|
|
|
|
|
|
|
Net Assets: |
|
|
|
|
|
|
|
|
| 13,030,283 |
|
|
| 9,845,255 | |
| $ | 11,938,962 |
|
| $ | 13,030,283 | |
| $ | 326,047 |
|
| $ | 324,836 | |
|
|
|
|
|
|
|
|
Share Transactions: |
|
|
|
|
|
|
|
|
| — |
|
|
| 50,000 | |
|
| — |
|
|
| 50,000 | |
^ March 29, 2018 represents the last business day of the Fund’s reporting period. See Note 2 of the accompanying Notes to Financial Statements.
(1) Includes transaction costs related to creations and redemptions.
Amounts designated as “—” are $0 or have been rounded to $0.
The accompanying notes are an integral part of the financial statements.
65
Statements of Changes in Net Assets (continued)
|
| KraneShares | ||||||
|
| Period Ended September 30, 2018 |
| Year Ended | ||||
Operations: |
|
|
|
|
|
|
|
|
| $ | 32,258 |
|
| $ | 44,815 |
| |
|
| 55,353 |
|
|
| (9,600 | ) | |
|
| (393,888 | ) |
|
| 437,556 |
| |
|
| (306,277 | ) |
|
| 472,771 |
| |
|
|
|
|
|
|
|
|
|
Dividends and Distributions from: |
|
|
|
|
|
|
|
|
|
| — |
|
|
| (32,628 | ) | |
|
| — |
|
|
| (32,628 | ) | |
|
| (306,277 | ) |
|
| 440,143 |
| |
|
|
|
|
|
|
|
|
|
Net Assets: |
|
|
|
|
|
|
|
|
|
| 2,696,469 |
|
|
| 2,256,326 |
| |
| $ | 2,390,192 |
|
| $ | 2,696,469 |
| |
| $ | 44,789 |
|
| $ | 12,531 |
| |
^ March 29, 2018 represents the last business day of the Fund’s reporting period. See Note 2 of the accompanying Notes to Financial Statements.
Amounts designated as “—” are $0 or have been rounded to $0.
The accompanying notes are an integral part of the financial statements.
66
Statements of Changes in Net Assets (continued)
|
| KraneShares | ||||||
|
| Period Ended September 30, 2018 |
| Period Ended March 29, | ||||
Operations: |
|
|
|
|
|
|
|
|
| $ | 495,491 |
|
| $ | 40,387 |
| |
|
| (1,125,495 | ) |
|
| (5,101 | ) | |
|
| (1,812,040 | ) |
|
| (1,061,566 | ) | |
|
| (2,442,044 | ) |
|
| (1,026,280 | ) | |
|
|
|
|
|
|
|
|
|
Dividends and Distributions from: |
|
|
|
|
|
|
|
|
|
| — |
|
|
| (6,687 | ) | |
|
| — |
|
|
| (6,687 | ) | |
|
|
|
|
|
|
|
|
|
Capital Share Transactions:(2) |
|
|
|
|
|
|
|
|
|
| 2,522,827 |
|
|
| 33,080,732 |
| |
|
| (1,155,891 | ) |
|
| — |
| |
|
| 1,366,936 |
|
|
| 33,080,732 |
| |
|
| (1,075,108 | ) |
|
| 32,047,765 |
| |
|
|
|
|
|
|
|
|
|
Net Assets: |
|
|
|
|
|
|
|
|
|
| 32,047,765 |
|
|
| — |
| |
| $ | 30,972,657 |
|
| $ | 32,047,765 |
| |
| $ | 521,011 |
|
| $ | 25,520 |
| |
|
|
|
|
|
|
|
|
|
Share Transactions: |
|
|
|
|
|
|
|
|
|
| 100,000 |
|
|
| 1,250,002 |
| |
|
| (50,000 | ) |
|
| — |
| |
|
| 50,000 |
|
|
| 1,250,002 |
| |
^ March 29, 2018 represents the last business day of the Fund’s reporting period. See Note 2 of the accompanying Notes to Financial Statements.
(1) Commenced operations on September 7, 2017.
(2) Includes transaction costs related to creations and redemptions.
Amounts designated as “—” are $0 or have been rounded to $0.
The accompanying notes are an integral part of the financial statements.
67
Statements of Changes in Net Assets (continued)
|
| KraneShares Emerging Markets | ||||||
|
| Period Ended September 30, |
| Period Ended | ||||
Operations: |
|
|
|
|
|
|
|
|
| $ | (2,836 | ) |
| $ | (7,348 | ) | |
|
| (2,229,518 | ) |
|
| 2,456 |
| |
|
| (5,039,694 | ) |
|
| (66,112 | ) | |
|
| (7,272,048 | ) |
|
| (71,004 | ) | |
|
|
|
|
|
|
|
|
|
Capital Share Transactions:(2) |
|
|
|
|
|
|
|
|
|
| 30,158,197 |
|
|
| 23,899,284 |
| |
|
| (14,979,316 | ) |
|
| — |
| |
|
| 15,178,881 |
|
|
| 23,899,284 |
| |
|
| 7,906,833 |
|
|
| 23,828,280 |
| |
|
|
|
|
|
|
|
|
|
Net Assets: |
|
|
|
|
|
|
|
|
|
| 23,828,280 |
|
|
| — |
| |
| $ | 31,735,113 |
|
| $ | 23,828,280 |
| |
| $ | (7,402 | ) |
| $ | (4,566 | ) | |
|
|
|
|
|
|
|
|
|
Share Transactions: |
|
|
|
|
|
|
|
|
|
| 1,200,000 |
|
|
| 900,002 |
| |
|
| (650,000 | ) |
|
| — |
| |
|
| 550,000 |
|
|
| 900,002 |
| |
^ March 29, 2018 represents the last business day of the Fund’s reporting period. See Note 2 of the accompanying Notes to Financial Statements.
(1) Commenced operations on October 11, 2017.
(2) Includes transaction costs related to creations and redemptions.
Amounts designated as “—” are $0 or have been rounded to $0.
The accompanying notes are an integral part of the financial statements.
68
Statements of Changes in Net Assets (continued)
|
| KraneShares | ||||||
|
| Period Ended |
| Period Ended | ||||
Operations: |
|
|
|
|
|
|
|
|
| $ | 136,597 |
|
| $ | (20,699 | ) | |
|
| (988,762 | ) |
|
| (214,154 | ) | |
|
| (443,198 | ) |
|
| (159,085 | ) | |
|
| (1,295,363 | ) |
|
| (393,938 | ) | |
|
|
|
|
|
|
|
|
|
Capital Share Transactions:(2) |
|
|
|
|
|
|
|
|
|
| 2,259,339 |
|
|
| 8,730,662 |
| |
|
| (2,245,301 | ) |
|
| (1,178,371 | ) | |
|
| 14,038 |
|
|
| 7,552,291 |
| |
|
| (1,281,325 | ) |
|
| 7,158,353 |
| |
|
|
|
|
|
|
|
|
|
Net Assets: |
|
|
|
|
|
|
|
|
|
| 7,158,353 |
|
|
| — |
| |
| $ | 5,877,028 |
|
| $ | 7,158,353 |
| |
| $ | 123,421 |
|
| $ | (13,176 | ) | |
|
|
|
|
|
|
|
|
|
Share Transactions: |
|
|
|
|
|
|
|
|
|
| 100,000 |
|
|
| 350,002 |
| |
|
| (100,000 | ) |
|
| (50,000 | ) | |
|
| — |
|
|
| 300,002 |
| |
^ March 29, 2018 represents the last business day of the Fund’s reporting period. See Note 2 of the accompanying Notes to Financial Statements.
(1) Commenced operations on October 12, 2017.
(2) Includes transaction costs related to creations and redemptions.
Amounts designated as “—” are $0 or have been rounded to $0.
The accompanying notes are an integral part of the financial statements.
69
Statements of Changes in Net Assets (continued)
|
| KraneShares Electric Vehicles and Future Mobility Index ETF | ||||||
|
| Period Ended September 30, 2018 |
| Period Ended March 29, | ||||
Operations: |
|
|
|
|
|
|
|
|
| $ | 226,552 |
|
| $ | 15,786 |
| |
|
| (1,445,507 | ) |
|
| (80,579 | ) | |
|
| (1,105,085 | ) |
|
| (1,216,424 | ) | |
|
| (2,324,040 | ) |
|
| (1,281,217 | ) | |
|
|
|
|
|
|
|
|
|
Capital Share Transactions:(2) |
|
|
|
|
|
|
|
|
|
| 9,188,949 |
|
|
| 28,078,846 |
| |
|
| 9,188,949 |
|
|
| 28,078,846 |
| |
|
| 6,864,909 |
|
|
| 26,797,629 |
| |
|
|
|
|
|
|
|
|
|
Net Assets: |
|
|
|
|
|
|
|
|
|
| 26,797,629 |
|
|
| — |
| |
| $ | 33,662,538 |
|
| $ | 26,797,629 |
| |
| $ | 229,650 |
|
| $ | 3,098 |
| |
|
|
|
|
|
|
|
|
|
Share Transactions: |
|
|
|
|
|
|
|
|
|
| 400,000 |
|
|
| 1,150,002 |
| |
|
| 400,000 |
|
|
| 1,150,002 |
| |
^ March 29, 2018 represents the last business day of the Fund’s reporting period. See Note 2 of the accompanying Notes to Financial Statements.
(1) Commenced operations on January 18, 2018.
(2) Includes transaction costs related to creations and redemptions.
Amounts designated as “—” are $0 or have been rounded to $0.
The accompanying notes are an integral part of the financial statements.
70
Statements of Changes in Net Assets (continued)
|
| Kraneshares | ||||||
|
| Period Ended September 30, 2018 |
| Period Ended March 29, | ||||
Operations: |
|
|
|
|
|
|
|
|
| $ | 138,704 |
|
| $ | (3,585 | ) | |
|
| (1,052,768 | ) |
|
| (529 | ) | |
|
| (5,409,432 | ) |
|
| 169,630 |
| |
|
| (6,323,496 | ) |
|
| 165,516 |
| |
|
|
|
|
|
|
|
|
|
Capital Share Transactions:(2) |
|
|
|
|
|
|
|
|
|
| 36,885,130 |
|
|
| 3,832,495 |
| |
|
| 36,885,130 |
|
|
| 3,832,495 |
| |
|
| 30,561,634 |
|
|
| 3,998,011 |
| |
|
|
|
|
|
|
|
|
|
Net Assets: |
|
|
|
|
|
|
|
|
|
| 3,998,011 |
|
|
| — |
| |
| $ | 34,559,645 |
|
| $ | 3,998,011 |
| |
| $ | 134,061 |
|
| $ | (4,114 | ) | |
|
|
|
|
|
|
|
|
|
Share Transactions: |
|
|
|
|
|
|
|
|
|
| 1,400,000 |
|
|
| 150,002 |
| |
|
| 1,400,000 |
|
|
| 150,002 |
| |
^ March 29, 2018 represents the last business day of the Fund’s reporting period. See Note 2 of the accompanying Notes to Financial Statements.
(1) Commenced operations on January 31, 2018.
(2) Includes transaction costs related to creations and redemptions.
Amounts designated as “—” are $0 or have been rounded to $0.
The accompanying notes are an integral part of the financial statements.
71
Statements of Changes in Net Assets (concluded)
|
| KraneShares CCBS China Corporate High Yield Bond USD Index ETF |
| KraneShares Emerging Markets Healthcare | ||||
|
| Period Ended |
| Period Ended | ||||
Operations: |
|
|
|
|
|
|
|
|
| $ | 124,825 |
|
| $ | (237 | ) | |
|
| — |
|
|
| 5,362 |
| |
|
| (57,197 | ) |
|
| (27,745 | ) | |
|
| 67,628 |
|
|
| (22,620 | ) | |
|
|
|
|
|
|
|
|
|
Dividends and Distributions from: |
|
|
|
|
|
|
|
|
|
| (119,432 | ) |
|
| — |
| |
|
| (119,432 | ) |
|
| — |
| |
|
|
|
|
|
|
|
|
|
Capital Share Transactions:(2) |
|
|
|
|
|
|
|
|
|
| 10,000,040 |
|
|
| 2,500,025 |
| |
|
| 10,000,040 |
|
|
| 2,500,025 |
| |
|
| 9,948,236 |
|
|
| 2,477,405 |
| |
|
|
|
|
|
|
|
|
|
Net Assets: |
|
|
|
|
|
|
|
|
|
| — |
|
|
| — |
| |
| $ | 9,948,236 |
|
| $ | 2,477,405 |
| |
| $ | 5,393 |
|
| $ | (237 | ) | |
|
|
|
|
|
|
|
|
|
Share Transactions: |
|
|
|
|
|
|
|
|
|
| 250,001 |
|
|
| 100,001 |
| |
|
| 250,001 |
|
|
| 100,001 |
| |
(1) Commenced operations on June 26, 2018.
(2) Commenced operations on August 29, 2018.
The accompanying notes are an integral part of the fi nancial statements.
72
(This page intentionally left blank.)
73
Financial Highlights
Selected Per Share Data & Ratios
For the Periods Ended September 30, 2018 (Unaudited)
and the Years/Periods Ended March 31 (unless otherwise indicated)
For a Share Outstanding Throughout Each Period
|
| Net Asset Value, Beginning of Period |
| Net Investment Income |
| Net Realized and Unrealized Gain (Loss) on Investments ($) |
| Total from Operations ($) |
| Distribution from Net Investment Income |
| Distribution from Capital Gains |
| Return | ||||||
KraneShares Bosera MSCI China A Share ETF | ||||||||||||||||||||
2018*** |
| 34.47 |
| 0.65 |
|
| (6.33 | ) |
| (5.68 | ) |
| — |
|
| — |
|
| — |
|
2018(1) |
| 28.38 |
| 0.21 |
|
| 6.22 |
|
| 6.43 |
|
| (0.18 | ) |
| (0.16 | ) |
| — |
|
2017 |
| 30.37 |
| (0.01 | ) |
| (0.67 | ) |
| (0.68 | ) |
| — |
|
| (0.85 | ) |
| (0.46 | ) |
2016 |
| 53.55 |
| 0.62 |
|
| (13.67 | ) |
| (13.05 | ) |
| (0.41 | ) |
| (9.72 | ) |
| — |
|
2015 |
| 28.92 |
| (0.22 | ) |
| 24.90 |
|
| 24.68 |
|
| (0.05 | ) |
| — |
|
| — |
|
2014(2) |
| 30.00 |
| (0.02 | ) |
| (1.06 | ) |
| (1.08 | ) |
| — |
|
| — |
|
| — |
|
KraneShares Zacks New China ETF(6)# | ||||||||||||||||||||
2018*** |
| 33.88 |
| 0.61 |
|
| (3.19 | ) |
| (2.58 | ) |
| — |
|
| — |
|
| — |
|
2018(1) |
| 34.06 |
| 0.24 |
|
| 7.22 |
|
| 7.46 |
|
| (0.30 | ) |
| (7.34 | ) |
| — |
|
2017 |
| 28.02 |
| 0.21 |
|
| 6.54 |
|
| 6.75 |
|
| (0.33 | ) |
| — |
|
| (0.38 | ) |
2016 |
| 34.20 |
| 0.18 |
|
| (3.21 | ) |
| (3.03 | ) |
| (0.25 | ) |
| (2.89 | ) |
| (0.01 | ) |
2015 |
| 31.42 |
| 0.12 |
|
| 2.97 |
|
| 3.09 |
|
| (0.31 | ) |
| — |
|
| — |
|
2014(3) |
| 25.00 |
| (0.03 | ) |
| 6.45 |
|
| 6.42 |
|
| — |
|
| — |
|
| — |
|
KraneShares CSI China Internet ETF | ||||||||||||||||||||
2018*** |
| 61.11 |
| 0.10 |
|
| (12.32 | ) |
| (12.22 | ) |
| — |
|
| — |
|
| — |
|
2018(1) |
| 42.21 |
| (0.19 | ) |
| 19.43 |
|
| 19.24 |
|
| (0.34 | ) |
| — |
|
| — |
|
2017 |
| 35.76 |
| (0.27 | ) |
| 7.13 |
|
| 6.86 |
|
| (0.30 | ) |
| — |
|
| (0.11 | ) |
2016 |
| 34.18 |
| (0.20 | ) |
| 1.84 |
|
| 1.64 |
|
| (0.06 | ) |
| — |
|
| — | (7) |
2015 |
| 35.93 |
| (0.14 | ) |
| (1.32 | ) |
| (1.46 | ) |
| (0.29 | ) |
| — |
|
| — |
|
2014(4) |
| 25.00 |
| (0.02 | ) |
| 11.05 |
|
| 11.03 |
|
| (0.06 | ) |
| (0.04 | ) |
| — |
|
KraneShares E Fund China Commercial Paper ETF | ||||||||||||||||||||
2018*** |
| 37.23 |
| 0.73 |
|
| (3.12 | ) |
| (2.39 | ) |
| (0.73 | ) |
| — |
|
| — |
|
2018(1) |
| 32.82 |
| 1.07 |
|
| 3.34 |
|
| 4.41 |
|
| — |
|
| — |
|
| — |
|
2017 |
| 34.18 |
| 0.61 |
|
| (1.96 | ) |
| (1.35 | ) |
| — |
|
| — |
|
| (0.01 | ) |
2016 |
| 34.81 |
| 1.01 |
|
| (1.39 | ) |
| (0.38 | ) |
| (0.21 | ) |
| (0.01 | ) |
| (0.03 | ) |
2015(5) |
| 35.00 |
| 0.39 |
|
| (0.35 | ) |
| 0.04 |
|
| (0.23 | ) |
| — |
|
| — |
|
(1) March 29, 2018 represents the last business day of the Fund’s reporting period. See Note 2 of the accompanying Notes to Financial Statements.
(2) The Fund commenced operations on March 4, 2014.
(3) The Fund commenced operations on July 22, 2013.
(4) The Fund commenced operations on July 31, 2013.
(5) The Fund commenced operations on December 2, 2014.
(6) Effective August 1, 2014, the KraneShares CSI China Five Year Plan ETF changed its name to KraneShares CSI New China ETF. Effective June 1, 2016, the KraneShares CSI New China ETF changed its name to KraneShares Zacks New China ETF.
(7) Amount was less than $0.01 per share.
(8) Pursuant to an Investment Advisory Agreement between the Trust and the Adviser, the Fund paid the Adviser a fee, calculated daily and paid monthly, at an annual rate of 0.78% of the average daily net assets of the Fund (prior to March 24, 2016, the Fund paid the Adviser at an annual rate of 1.10% of the average daily net assets of the Fund). Effective March 24, 2016, pursuant to the terms of an Expense Limitation Agreement, the Adviser had contractually agreed to reduce its management fee to 0.68% of the Fund’s average daily net assets until July 31, 2017.
(9) As of February 17, 2017, pursuant to the terms of an Expense Limitation Agreement, the Adviser had contractually agreed to waive its management fee by 0.20% of the Fund’s average daily net assets. The contractual fee waiver will remain in effect until October 4, 2019.
(10) As of July 28, 2017, pursuant to the terms of an Expense Limitation Agreement, the Adviser has contractually agreed to reduce its management fee and/or reimburse the Fund in an amount equal to the fees paid by the Fund to counsel to the Independent Trustees of the Trust until July 31, 2018.
The accompanying notes are an integral part of the financial statements.
74
| Total from Distributions ($) | Net Asset Value, End of Period ($) | Total Return (%)** | Net Assets End of Period ($)(000) | Ratio of Expenses to Average Net Assets (%) | Ratio of Expenses to Average Net Assets (Excluding Waivers) (%) | Ratio of Net Investment Income (Loss) to Average Net Assets (%) | Portfolio Turnover (%) | ||||||||||||
| — | 28.79 | (16.48 | ) | 339,754 | 0.59 | † | 0.79 | † | 4.16 | † | 75 | †† | |||||||
| (0.34 | ) | 34.47 | 22.68 | 353,324 | 0.60 | (9) | 0.80 | (9) | 0.61 | 52 | |||||||||
| (1.31 | ) | 28.38 | (2.04 | ) | 52,494 | 0.72 | (9) | 0.84 | (9) | (0.04 | ) | 95 | |||||||
| (10.13 | ) | 30.37 | (27.18 | ) | 4,555 | 0.93 | (8) | 1.18 | (8) | 1.18 | 116 | ||||||||
| (0.05 | ) | 53.55 | 85.37 | 26,774 | 1.31 | 1.51 | (0.55 | ) | 110 | ||||||||||
| — | 28.92 | (3.60 | ) | 11,566 | 1.10 | † | 1.10 | † | (0.84 | )† | — | †† | |||||||
| — | 31.30 | (7.62 | ) | 3,130 | 0.69 | † | 0.69 | † | 3.67 | † | 63 | †† | |||||||
| (7.64 | ) | 33.88 | 22.57 | 5,082 | 0.71 | (10) | 0.71 | (10) | 0.64 | 105 | |||||||||
| (0.71 | ) | 34.06 | 24.54 | 3,406 | 0.84 | 0.84 | 0.55 | 86 | |||||||||||
| (3.15 | ) | 28.02 | (9.71 | ) | 2,803 | 0.73 | 0.73 | 0.60 | 575 | ||||||||||
| (0.31 | ) | 34.20 | 9.92 | 3,421 | 0.71 | 0.71 | 0.37 | 36 | |||||||||||
| — | 31.42 | 25.70 | 3,143 | 0.68 | † | 0.68 | † | (0.15 | )† | 7 | †† | ||||||||
| — | 48.89 | (20.00 | ) | 1,483,807 | 0.74 | † | 0.74 | † | 0.36 | † | 31 | †† | |||||||
| (0.34 | ) | 61.11 | 45.62 | 1,628,622 | 0.70 | (10) | 0.70 | (10) | (0.33 | ) | 29 | ||||||||
| (0.41 | ) | 42.21 | 19.44 | 291,257 | 0.81 | 0.81 | (0.72 | ) | 35 | ||||||||||
| (0.06 | ) | 35.76 | 4.77 | 194,869 | 0.72 | 0.72 | (0.56 | ) | 27 | ||||||||||
| (0.29 | ) | 34.18 | (4.09 | ) | 131,612 | 0.71 | 0.71 | (0.39 | ) | 43 | |||||||||
| (0.10 | ) | 35.93 | 44.18 | 77,243 | 0.68 | † | 0.68 | † | (0.90 | )† | 8 | †† | |||||||
| (0.73 | ) | 34.11 | (6.50 | ) | 11,939 | 0.58 | † | 0.71 | † | 4.10 | † | — | †† | ||||||
| — | 37.23 | 13.44 | 13,030 | 0.77 | ^(10)(12) | 0.89 | ^(10)(12) | 3.10 | ^ | — | |||||||||
| (0.01 | ) | 32.82 | (3.95 | )(11) | 9,845 | 0.95 | ^ | 1.07 | ^ | 1.84 | ^ | — | |||||||
| (0.25 | ) | 34.18 | (1.11 | ) | 18,799 | 0.57 | ^ | 0.69 | ^ | 2.92 | ^ | 717 | |||||||
| (0.23 | ) | 34.81 | 0.13 | 8,702 | 0.60 | †^ | 0.72 | †^ | 3.46 | †^ | — | †† | |||||||
(11) Fund received reimbursement from third-party for dilution to shareholders for an accounting error. Absent the reimbursement, total return would have been (4.44)%.
(12) The expenses during the year include a one-time, non-recurring expense. Had this expense not been included, the net and gross expense ratios for the period would have been 0.59% and 0.71%, respectively.
* Per share data calculated using average shares method.
** Total return is based on the change in net asset value of a share during the year or period and assumes reinvestment of dividends and distributions at net asset value. Total return is for the period indicated and periods of less than one year have not been annualized. The return shown does not reflect the deduction of taxes that a shareholder would pay on Fund distributions or the redemption of Fund shares. Excludes effects of standard creation and redemption transaction fees associated with creation units.
*** For the six-month period ended September 30, 2018. All ratios for the period have been annualized, except for the Total Return.
† Annualized.
†† Portfolio turnover rate is for the period indicated and periods of less than one year have not been annualized. Excludes effect of in-kind transfers.
^ The ratios of expenses and net investment income/(loss) to Average Net Assets reflect the expenses and net investment income/(loss), respectively, for the year/period as reported in the Statements of Operations and do not reflect the Fund’s proportionate share of the income and expenses of the money market funds.
# After the close of the markets on September 13, 2016, the Fund effected a 2 for 1 share split (see Note 7). Per share data has been adjusted to reflect the share split.
Amounts designated as “—” are $0 or have been rounded to $0.
The accompanying notes are an integral part of the financial statements.
75
Financial Highlights
Selected Per Share Data & Ratios
For the Periods Ended September 30, 2018 (Unaudited)
and the Years/Periods Ended March 31 (unless otherwise indicated)
For a Share Outstanding Throughout Each Period
| Net Asset Value, Beginning of Period ($) | Net Investment Income (Loss) ($)* | Net Realized and Unrealized Gain (Loss) on Investments ($) | Total from Operations ($) | Distribution from Net Investment Income ($) | Distribution from Capital Gains ($) | Return of Capital ($) | ||||||||||||||
| KraneShares MSCI All China Index ETF | ||||||||||||||||||||
| 2018*** | 26.96 | 0.32 | (3.38 | ) | (3.06 | ) | — | — | — | |||||||||||
| 2018(1) | 22.56 | 0.45 | 4.28 | 4.73 | (0.33 | ) | — | — | ||||||||||||
| 2017 | 21.66 | 0.37 | 1.88 | 2.25 | (0.70 | ) | (0.47 | ) | (0.18 | ) | ||||||||||
| 2016 | 25.63 | 0.29 | (3.86 | ) | (3.57 | ) | (0.35 | ) | (0.05 | ) | — | |||||||||
| 2015(2) | 25.00 | — | 0.63 | 0.63 | — | — | — | |||||||||||||
| KraneShares MSCI One Belt One Road Index ETF | ||||||||||||||||||||
| 2018*** | 25.64 | 0.37 | (2.18 | ) | (1.81 | ) | — | — | — | |||||||||||
| 2018(1)(3) | 25.00 | 0.08 | 0.59 | ^ | 0.67 | (0.03 | ) | — | — | |||||||||||
| KraneShares Emerging Markets Consumer Technology Index ETF | ||||||||||||||||||||
| 2018*** | 26.48 | (0.00 | ) | (4.59 | ) | (4.59 | ) | — | — | — | ||||||||||
| 2018(1)(4) | 25.00 | (0.03 | ) | 1.51 | ^ | 1.48 | — | — | — | |||||||||||
| KraneShares MSCI China Environment Index ETF | ||||||||||||||||||||
| 2018*** | 23.86 | 0.46 | (4.73 | ) | (4.27 | ) | — | — | — | |||||||||||
| 2018(1)(5) | 25.00 | (0.09 | ) | (1.05 | ) | (1.14 | ) | — | — | — | ||||||||||
| KraneShares Electric Vehicles and Future Mobility Index ETF | ||||||||||||||||||||
| 2018*** | 23.30 | 0.16 | (1.74 | ) | (1.58 | ) | — | — | — | |||||||||||
| 2018(1)(6) | 25.00 | 0.02 | (1.72 | ) | (1.70 | ) | — | — | — | |||||||||||
| KraneShares MSCI All China Health Care Index ETF | ||||||||||||||||||||
| 2018*** | 26.65 | 0.14 | (4.49 | ) | (4.35 | ) | — | — | — | |||||||||||
| 2018(1)(7) | 25.00 | (0.03 | ) | 1.68 | 1.65 | — | — | — | ||||||||||||
| KraneShares CCBS China Corporate High Yield Bond USD Index ETF | ||||||||||||||||||||
| 2018***(8) | 40.00 | 0.53 | (0.26 | ) | 0.27 | (0.48 | ) | — | — | |||||||||||
| KraneShares Emerging Markets Healthcare Index ETF | ||||||||||||||||||||
| 2018***(9) | 25.00 | 0.00 | (0.23 | ) | (0.23 | ) | — | — | — | |||||||||||
(1) March 29, 2018 represents the last business day of the Fund’s reporting period. See Note 2 of the accompanying Notes to Financial Statements.
(2) The Fund commenced operations on February 12, 2015.
(3) The Fund commenced operations on September 7, 2017.
(4) The Fund commenced operations on October 11, 2017.
(5) The Fund commenced operations on October 12, 2017.
(6) The Fund commenced operations on January 18, 2018.
(7) The Fund commenced operations on January 31, 2018.
(8) The Fund commenced operations on June 26, 2018.
(9) The Fund commenced operations on August 29, 2018.
(10) As of July 28, 2017, pursuant to the terms of an Expense Limitation Agreement, the Adviser has contractually agreed to reduce its management fee and/or reimburse the Fund in an amount equal to the fees paid by the Fund to counsel to the Independent Trustees of the Trust until July 31, 2018.
(11) The expense ratio includes interest expense. Had this expense been excluded, the ratios would have been 0.78%, 0.79% and 0.53%, respectively.
(12) The expense ratio includes interest expense. Had this expense been excluded, the ratios would have been 0.78%, 0.78% and (0.22)%, respectively.
(13) The expense ratio includes interest expense. Had this expense been excluded, the ratios would have been 0.78%, 0.79% and (0.78)%, respectively.
(14) The expense ratio includes interest expense. Had this expense been excluded, the ratios would have been 0.69%, 0.69% and 1.44%, respectively.
(15) The expense ratio includes interest expense. Had this expense been excluded, the ratios would have been 0.69%, 0.69% and 0.44%, respectively.
(16) The expense ratio includes interest expense. Had this expense been excluded, the ratios would have been 0.79%, 0.79% and 1.12%, respectively.
The accompanying notes are an integral part of the financial statements.
76
| Total from Distributions ($) | Net Asset Value, End of Period ($) | Total Return (%)** | Net Assets End of Period ($)(000) | Ratio of Expenses to Average Net Assets (%) | Ratio of Expenses to Average Net Assets (Excluding Waivers) (%) | Ratio of Net Investment Income (Loss) to Average Net Assets (%) | Portfolio Turnover (%) | ||||||||||||
| — | 23.90 | (11.35 | ) | 2,390 | 0.66 | † | 0.71 | † | 2.56 | † | 75 | †† | |||||||
| (0.33 | ) | 26.96 | 20.99 | 2,696 | 0.63 | ‡‡(10) | 0.72 | ‡‡(10) | 1.75 | ‡‡ | 3 | ||||||||
| (1.35 | ) | 22.56 | 11.24 | 2,256 | 0.37 | ‡‡ | 0.73 | ‡‡ | 1.70 | ‡‡ | 25 | ||||||||
| (0.40 | ) | 21.66 | (14.00 | ) | 2,166 | 0.91 | ‡ | 1.12 | ‡ | 1.27 | ‡ | 1 | |||||||
| — | 25.63 | 2.52 | 2,563 | 0.88 | †‡ | 0.88 | †‡ | (0.07 | )† ‡ | 8 | †† | ||||||||
| — | 23.83 | (7.06 | ) | 30,973 | 0.79 | † | 0.79 | † | 3.03 | † | 41 | †† | |||||||
| (0.03 | ) | 25.64 | 2.67 | 32,048 | 0.79 | †‡‡(10)(11) | 0.80 | †‡‡(10)(11) | 0.52 | †(11) | 1 | †† | |||||||
| — | 21.89 | (17.33 | ) | 31,735 | 0.80 | † | 0.80 | † | (0.01 | ) † | 82 | †† | |||||||
| — | 26.48 | 5.92 | 23,828 | 0.79 | †(10)(12) | 0.79 | †(10)(12) | (0.23 | ) †(12) | — | †† | ||||||||
| — | 19.59 | (17.90 | ) | 5,877 | 0.79 | † | 0.79 | † | 4.12 | † | 83 | †† | |||||||
| — | 23.86 | (4.56 | ) | 7,158 | 0.78 | †(10)(13) | 0.79 | †(10)(13) | (0.78 | )†(13) | 36 | †† | |||||||
| — | 21.72 | (6.78 | ) | 33,663 | 0.70 | †(14) | 0.70 | †(14) | 1.44 | †(14) | 39 | †† | |||||||
| — | 23.30 | (6.80 | ) | 26,798 | 0.70 | †(15) | 0.70 | †(15) | 0.43 | †(15) | 18 | †† | |||||||
| — | 22.30 | (16.32 | ) | 34,560 | 0.82 | †(16) | 0.82 | †(16) | 1.09 | †(16) | 33 | †† | |||||||
| — | 26.65 | 6.60 | 3,998 | 0.82 | †(17) | 0.82 | †(17) | (0.82 | )†(17) | — | †† | ||||||||
| (0.48 | ) | 39.79 | 0.65 | 9,948 | 0.72 | † | 0.72 | † | 5.05 | † | 102 | †† | |||||||
| — | 24.77 | (0.92 | ) | 2,477 | 0.78 | † | 0.78 | † | (0.11 | )† | 101 | †† | |||||||
(17) The expense ratio includes interest expense. Had this expense been excluded, the ratios would have been 0.79%, 0.79% and (0.79)%, respectively.
* Per share data calculated using average shares method.
** Total return is based on the change in net asset value of a share during the year or period and assumes reinvestment of dividends and distributions at net asset value. Total return is for the period indicated and periods of less than one year have not been annualized. The return shown does not reflect the deduction of taxes that a shareholder would pay on Fund distributions or the redemption of Fund shares. Excludes effects of standard creation and redemption transaction fees associated with creation units.
*** For the six-month period ended September 30, 2018. All ratios for the period have been annualized, except for the Total Return.
^ Realized and unrealized gains and losses per share are balancing amounts necessary to reconcile the change in net asset value per share for the period, and may not reconcile with the aggregate gains and losses in the Statement of Operations due to share transactions for the period.
† Annualized.
†† Portfolio turnover rate is for the period indicated and periods of less than one year have not been annualized. Excludes effect of in-kind transfers.
‡ The ratios of expenses and net investment income/(loss) to Average Net Assets reflect the expenses and net investment income/(loss), respectively, for the year/period as reported in the Statements of Operations and do not reflect the Fund’s proportionate share of the income and expenses from investments in other investment companies, except for investments in the KraneShares Bosera MSCI China A Share ETF.
‡‡ The ratios of expenses and net investment income/(loss) to Average Net Assets reflect the expenses and net investment income/(loss), respectively, for the year/period as reported in the Statements of Operations and do not reflect the Fund’s proportionate share of the income and expenses from investments in other investment companies.
Amounts designated as “—” are $0 or have been rounded to $0
The accompanying notes are an integral part of the financial statements.
77
Notes to Financial Statements (Unaudited)
1. ORGANIZATION
KraneShares Trust (the “Trust”) is a Delaware Statutory Trust formed on February 3, 2012. The Trust is registered under the Investment Company Act of 1940, as amended, as an open-end management investment company. As of September 30, 2018, the Trust had twelve operational series. The financial statements herein and the related notes pertain to the KraneShares Bosera MSCI China A Share ETF, KraneShares Zacks New China ETF, KraneShares CSI China Internet ETF, KraneShares E Fund China Commercial Paper ETF, KraneShares MSCI All China Index ETF(formerly, KraneShares FTSE Emerging Markets Plus ETF), KraneShares MSCI One Belt One Road Index ETF, KraneShares Emerging Markets Consumer Technology Index ETF, KraneShares MSCI China Environment Index ETF, KraneShares Electric Vehicles and Future Mobility Index ETF, KraneShares MSCI All China Health Care Index ETF, KraneShares CCBS China Corporate High Yield Bond USD Index ETF and KraneShares Emerging Markets Healthcare Index ETF (each, a “Fund” and collectively, the “Funds”). KraneShares Bosera MSCI China A Share ETF and KraneShares MSCI All China Index ETF are diversified Funds, as defined under Section 5(b)(1) of the Investment Company Act of 1940; while the KraneShares Zacks New China ETF, KraneShares CSI China Internet ETF, KraneShares E Fund China Commercial Paper ETF, KraneShares MSCI One Belt One Road Index ETF, KraneShares Emerging Markets Consumer Technology Index ETF, KraneShares MSCI China Environment Index ETF, KraneShares Electric Vehicles and Future Mobility Index ETF, KraneShares MSCI All China Health Care Index ETF, KraneShares CCBS China Corporate High Yield Bond USD Index ETF and KraneShares Emerging Markets Healthcare Index ETF are non-diversified Funds. Krane Funds Advisors, LLC (“Krane” or the ‘‘Adviser’’), a Delaware limited liability company, serves as the investment adviser for the Funds and is subject to the supervision of the Board of Trustees (the ‘‘Board’’). The Adviser is responsible for managing the investment activities of the Funds, the Funds’ business affairs and other administrative matters. The Adviser may use sub-advisers (each, a “Sub-Adviser” or collectively, the “Sub-Advisers”) to perform the day-to-day management of the Funds.
China International Capital Corporation (USA) Holdings Inc., a wholly-owned, indirect subsidiary of China International Capital Corporation Limited owns a majority stake in Krane. Central Huijin Investment Limited, a mainland Chinese-domiciled entity, currently holds approximately 55.7% of the shares of China International Capital Corporation Limited. Central Huijin Investment Limited is a wholly-owned subsidiary of China Investment Corporation, which is a mainland Chinese sovereign wealth fund. KFA One Holdings, LLC, located at 1270 Avenue of the Americas, 22nd Floor, New York, NY 10020, holds the remaining equity interests in Krane and Jonathan Krane, through his equity interests in KFA One Holdings, LLC, beneficially owns more than 10% of the equity interests in Krane.
Shares of KraneShares Bosera MSCI China A Share ETF, KraneShares Zacks New China ETF, KraneShares CSI China Internet ETF, KraneShares E Fund China Commercial Paper ETF, KraneShares MSCI One Belt One Road Index ETF, KraneShares Emerging Markets Consumer Technology Index ETF, KraneShares MSCI China Environment Index ETF, KraneShares Electric Vehicles and Future Mobility Index ETF, KraneShares MSCI All China Health Care Index ETF, KraneShares MSCI All China Index ETF, KraneShares CCBS China Corporate High Yield Bond USD Index ETF and KraneShares Emerging Markets Healthcare Index ETF are listed and traded on the NYSE Arca, Inc. (“NYSE Arca”), (the “Exchange”). Market prices for Fund shares (“Shares”) may be different from their net asset value (“NAV”). The Funds issue and redeem Shares on a continuous basis at NAV only in large blocks of Shares, typically 50,000 Shares or multiples thereof, called “Creation Units”. This does not mean, however, that individual investors will be able to redeem and purchase Shares directly with the series
78
Notes to Financial Statements (Unaudited) (continued)
of the Trust. Only Authorized Participants can redeem and purchase Creation Units of Shares directly. Each Fund will issue and redeem Shares for a basket of securities and/or a balancing cash amount. Individual shares trade in the secondary market at market prices that change throughout the day.
The investment objective of each Fund is to seek investment results that generally correspond (before fees and expenses) to its respective index listed below (each, an “Underlying Index”):
Fund |
| Index |
KraneShares Bosera MSCI China A Share ETF |
| MSCI China A Inclusion Index |
KraneShares Zacks New China ETF |
| Zacks New China Index |
KraneShares CSI China Internet ETF |
| CSI Overseas China Internet Index |
KraneShares E Fund China Commercial Paper ETF |
| CSI Diversified High Grade Commercial Paper Index |
KraneShares MSCI All China Index ETF |
| KraneShares MSCI All China Index |
KraneShares MSCI One Belt One Road Index ETF |
| MSCI Global China Infrastructure Exposure Index |
KraneShares Emerging Markets Consumer Technology |
| Solactive Emerging Market Consumer Technology |
KraneShares MSCI China Environment Index ETF |
| MSCI China IMI Environment 10/40 Index |
KraneShares Electric Vehicles and Future Mobility |
| Solactive Electric Vehicles and Future Mobility |
KraneShares MSCI All China Health Care Index ETF |
| MSCI China All Shares Health Care 10/40 Index |
KraneShares CCBS China Corporate High Yield Bond |
| Solactive USD China Corporate High Yield Bond |
Kraneshares Emerging Markets Healthcare Index ETF |
| Solactive Emerging Markets Healthcare Index |
2. SIGNIFICANT ACCOUNTING POLICIES
The following is a summary of the significant accounting policies followed by the Funds. The Funds are investment companies that apply the accounting and reporting guidance issued in Topic 946 by the U.S. Financial Accounting Standards Board (FASB”).
USE OF ESTIMATES — The preparation of financial statements in conformity with U.S. generally accepted accounting principles (“U.S. GAAP”) requires management to make estimates and assumptions that affect the reported amounts of assets and liabilities and disclosure of contingent assets and liabilities at the date of the financial statements and the reported amounts of increases and decreases in net assets from operations during the reporting period. Actual results could differ from those estimates, and could have a material impact to the Funds.
REPORTING PERIOD END DATE — The Funds’ fiscal year end is March 31. The last day of the Funds’ reporting period, however, is the last day the Exchange was open for trading during the fiscal period. The Funds’ financial statements have been presented through that date to maintain consistency with the Funds’ net asset value calculations used for shareholder transactions.
SECURITY VALUATION — Each Fund normally calculates NAV as of the regularly scheduled close of normal trading on each day that the NYSE is scheduled to be open for business (a ‘‘Business Day’’) (normally, 4:00 p.m., Eastern time). Any assets or liabilities denominated in currencies other than the U.S. dollar are converted into U.S. dollars at the current market rates on the date of valuation as quoted by one or more sources.
In calculating the values of each Fund’s portfolio securities, securities listed on a securities exchange, market or automated quotation system for which quotations are readily available (except for securities traded on NASDAQ), including securities traded over the counter, are valued at the last reported sale price on the primary exchange or market (foreign or domestic) on which they are traded (or at the
79
Notes to Financial Statements (Unaudited) (continued)
time as of which the Fund’s NAV is calculated if a security’s exchange is normally open at that time). If there is no such reported sale, such securities are valued at the most recently reported bid price. For securities traded on NASDAQ, the NASDAQ Official Closing Price will be used. If available, debt securities are priced based upon valuations provided by independent, third-party pricing agents. Such values generally reflect the last reported sales price if the security is actively traded. The third-party pricing agents may also value debt securities at an evaluated bid price by employing methodologies that utilize actual market transactions, broker-supplied valuations, or other methodologies designed to identify the market value for such securities. Debt obligations with remaining maturities of sixty days or less may be valued at their amortized cost, which approximates market value. The prices for foreign securities are reported in local currency and converted to U.S. dollars using currency exchange rates. The value of a swap contract is equal to the obligation (or rights) under the swap contract, which will generally be equal to the net amounts to be paid or received under the contract based upon the relative values of the positions held by each party to the contract as determined by the applicable independent, third party pricing agent. Exchange-traded options are valued at the last reported sales price on the exchange on which they are listed. If there is no such reported sale on the valuation date, long positions are valued at the most recent bid price, and short positions are valued at the most recent ask price. Futures are valued at the settlement price established by the board of trade on which they are traded. Foreign currency forward contracts are valued at the current day’s interpolated foreign exchange rate, as calculated using the current day’s spot rate and the 30-, 60-, 90- and 180-day forward rates provided by an Independent Pricing Agent. The exchange rates used for valuation are captured as of the close of the London Stock Exchange each day normally at 4:00 p.m. Greenwich Mean Time. Prices for most securities held by a Fund are provided daily by independent pricing agents. If a security price cannot be obtained from an independent, third-party pricing agent, the Fund seeks to obtain bid and ask prices from two broker-dealers who make a market in the portfolio instrument and determines the average of the two.
Investments in open-end investment companies that do not trade on an exchange are valued at the end of day NAV per share. Investments in open-end investment companies that trade on an exchange are valued at the last reported sale price or official closing price as of the close of the customary trading session on the exchange where the security is principally traded. If there is no such reported sale, such securities are valued at the most recently reported bid price.
Securities for which market prices are not ‘‘readily available,’’ or are not deemed to reflect current market values, or are debt securities where no evaluated price is available from the Trust’s third-party pricing agents pursuant to established methodologies, are fair valued in accordance with the Trust’s valuation policies and procedures approved by the Board of Trustees. Some of the more common reasons that may necessitate that a security be valued using ‘‘fair value’’ pricing may include, but are not limited to: the security’s trading has been halted or suspended; the security’s primary trading market is temporarily closed; or the security has not been traded for an extended period of time. A Fund may fair value certain of the foreign securities held by the Fund each day the Fund calculates its NAV.
In addition, a Fund may fair value its securities if an event that may materially affect the value of the Fund’s securities that trade outside of the United States (a ‘‘Significant Event’’) has occurred between the time of the security’s last close and the time that the Fund calculates its NAV. A Significant Event may relate to a single issuer or to an entire market sector, country or region. Events that may be Significant Events may include: government actions, natural disasters, armed conflict, acts of
80
Notes to Financial Statements (Unaudited) (continued)
terrorism and significant market fluctuations. If Krane becomes aware of a Significant Event that has occurred with respect to a portfolio instrument or group of portfolio instruments after the closing of the exchange or market on which the portfolio instrument or portfolio instruments principally trade, but before the time at which a Fund calculates its NAV, it will notify the Administrator and may request that an ad hoc meeting of the Fair Valuation Committee be called.
With respect to trade-halted securities, the Trust typically will fair value a trade-halted security by adjusting the security’s last market close price by the security’s sector performance, as measured by a predetermined index, unless Krane recommends and the Trust’s Fair Valuation Committee determines to make additional adjustments. Certain foreign securities exchanges have mechanisms in place that confine one day’s price movement in an individual security to a pre-determined price range based on that day’s opening price (‘‘Collared Securities’’). Fair value determinations for Collared Securities will generally be capped by Krane based on any applicable pre-determined ‘‘limit down’’ or ‘‘limit up’’ prices established by the relevant foreign securities exchange. As an example, China A-Shares can only be plus or minus ten percent in one day of trading in the relevant mainland China equity market. As a result, the fair value price determination on a given day will generally be capped plus or minus ten percent.
Fair value pricing involves subjective judgments and it is possible that a fair value determination for a security is materially different than the value that could actually be realized upon the sale of the security or that another fund that uses market quotations or its own fair value procedures to price the same securities. In addition, fair value pricing could result in a difference between the prices used to calculate a Fund’s NAV and the prices used by the Underlying Index. This may adversely affect a Fund’s ability to track the Underlying Index.
Trading in securities on many foreign exchanges is normally completed before the close of business on each Business Day. In addition, securities trading in a particular country or countries may not take place on each Business Day or may take place on days that are not Business Days. Changes in valuations on certain securities may occur at times or on days on which a Fund’s NAV is not calculated and on which Fund shares do not trade and sales and redemptions of shares do not occur.As a result, the value of a Fund’s portfolio securities and the net asset value of its shares may change on days when you will not be able to purchase or sell your shares.
As of September 30, 2018, the total market value of securities valued in accordance with Fair Value Procedures is as follows:
| Fair Valued Amount | % of Net Assets | |||||||
| KraneShares Bosera MSCI China A Share ETF | $9,345,514 | 2.8 | % | |||||
| KraneShares Zacks New China ETF | 97 | 0.0 | % | |||||
| KraneShares MSCI All China Index ETF | 5 | 0.0 | % | |||||
| KraneShares MSCI One Belt One Road Index ETF | 293,832 | 0.9 | % | |||||
| KraneShares Emerging Markets Consumer Technology Index ETF | 215,834 | 0.7 | % | |||||
In accordance with the authoritative guidance on fair value measurements and disclosure under U.S. GAAP, the Funds disclose the fair value of their investments in a hierarchy that prioritizes the inputs to valuation techniques used to measure the fair value. The objective of a fair value measurement is to determine the price that would be received to sell an asset or paid to transfer a liability in an orderly transaction between market participants at the measurement date (an exit price). Accordingly, the fair value hierarchy gives the highest priority to quoted prices (unadjusted)
81
Notes to Financial Statements (Unaudited) (continued)
in active markets for identical assets or liabilities (Level 1) and the lowest priority to unobservable inputs (Level 3). The three levels of the fair value hierarchy are described below:
Level 1 — Unadjusted quoted prices in active markets for identical, unrestricted assets or liabilities that the Funds have the ability to access at the measurement date.
Level 2 — Other significant observable inputs (including quoted prices in non-active markets, quoted prices for similar investments, fair value of investments for which the Funds have the ability to fully redeem tranches at net asset value as of the measurement date or within the near term, and short-term investments valued at amortized cost).
Level 3 — Significant unobservable inputs (including the Funds’ own assumptions in determining the fair value of investments, broker quotes, fair value of investments for which the Funds do not have the ability to fully redeem tranches at net asset value as of the measurement date or within the near term).
Investments are classified within the level of the lowest significant input considered in determining fair value. Investments classified within Level 3 whose fair value measurement considers several inputs may include Level 1 or Level 2 inputs as components of the overall fair value measurement. For details of the investment classification, refer to each Fund’s Schedule of Investments.
For the period ended September 30, 2018, there have been no significant changes to the Funds’ fair valuation methodologies.
The following table summarizes the quantitative inputs and assumptions used for items categorized as material Level 3 investments as of September 30, 2018. The disclosures below also include qualitative information on the sensitivity of the fair value measurements to changes in the significant unobservable inputs.
KraneShares Bosera MSCI China A Share ETF
Quantitative information about Level 3 fair value measurements | |||||||||
Assets |
| Fair Value at 9/30/18 |
| Valuation Technique(s) |
| Unobservable Input |
| Fair Value | |
Common Stock |
| $9,345,514 |
| Sector Movement |
| Sector Performance |
| +/-10% | |
* Certain foreign securities exchanges have mechanisms in place that confine one day’s price movement in an individual security to a pre-determined price range, based on that day’s opening price (‘‘Collared Securities’’). Fair value determinations for Collared Securities will generally be capped by the Adviser based on any applicable pre-determined ‘‘limit down’’ or ‘‘limit up’’ prices established by a foreign securities exchange. As a result, the fair value price determination on a given day generally is capped plus or minus ten percent.
The unobservable input used to determine fair value of the Level 3 asset may have similar or diverging impacts on valuation. Significant increases and decreases in this input could result in significantly higher or lower fair value measurement.
FEDERAL INCOME TAXES — It is each Fund’s intention to qualify or continue to qualify as a regulated investment company for federal income tax purposes by complying with the appropriate provisions of Subchapter M of the Internal Revenue Code of 1986, as amended, and to distribute annually all or substantially all of its taxable income and gains to shareholders. Accordingly, no provisions for federal income taxes have been made in the financial statements.
82
Notes to Financial Statements (Unaudited) (continued)
The Funds evaluate tax positions taken or expected to be taken in the course of preparing the Funds’ tax returns to determine whether it is “more-likely-than-not” (i.e., greater than 50 percent) that each tax position will be sustained upon examination by a taxing authority based on the technical merits of the position. Tax positions not deemed to meet the more-likely-than-not threshold are recorded as a tax benefit or expense in the current year. The Funds did not record any tax provisions in the current period. However, management’s conclusions regarding tax positions may be subject to review and adjustment at a later date based on factors including, but not limited to, examination by tax authorities (i.e., the last three tax year ends, as applicable), on-going analysis of and changes to tax laws, regulations and interpretations thereof.
As of September 30, 2018, management of the Funds has reviewed all open tax years since inception and concluded that there is no tax liability resulting from unrecognized tax benefits relating to uncertain income tax positions taken or expected to be taken in future tax returns. The Funds are also not aware of any tax positions for which it is reasonably possible that the total amounts of unrecognized tax benefits will significantly change in the next 12 months.
SECURITY TRANSACTIONS AND INVESTMENT INCOME — Security transactions are accounted for on the trade date for financial reporting purposes. Costs used in determining realized gains and losses on the sale of investment securities are based on specific identification. Dividend income is recorded, net of any applicable withholding tax, on the ex-dividend date, or for certain foreign securities, when the information becomes available to the Funds. Interest income is recognized on the accrual basis from the settlement date.
Dividend income received from affiliated funds is recognized on the ex-dividend date and is recorded as income distributions in the Statement of Operations. Capital gain distributions received from affiliated funds are recognized on ex-dividend date and are recorded on the Statement of Operations as such. Costs used in determining realized gains and losses on the sales of affiliated funds are on the basis of specific identification. See details on the Statements of Operations.
FOREIGN CURRENCY — The books and records of the Funds are maintained in U.S. dollars. Investment securities and other assets and liabilities denominated in a foreign currency are translated into U.S. dollars on the date of valuation. Purchases and sales of investment securities, income and expenses are translated into U.S. dollars at the relevant rates of exchange prevailing on the respective dates of such transactions. The Funds do not isolate that portion of realized or unrealized gains and losses resulting from changes in the foreign exchange rate from fluctuations arising from changes in the market prices of the securities. These gains and losses are included in net realized and unrealized gains and losses on foreign currency translations on the Statements of Operations. Net realized and unrealized gains and losses on foreign currency transactions and translations represent net foreign exchange gains or losses from foreign currency exchange contracts, disposition of foreign currencies, currency gains or losses realized between trade and settlement dates on securities transactions and the difference between the amount of the investment income and foreign withholding taxes recorded on the Funds’ books and the U.S. dollar equivalent amounts actually received or paid.
DIVIDENDS AND DISTRIBUTIONS TO SHAREHOLDERS — The Funds distribute their net investment income at least annually. Any net realized capital gains are distributed annually. All distributions are recorded on the ex-dividend date.
83
Notes to Financial Statements (Unaudited) (continued)
CASH OVERDRAFT CHARGES — Per the terms of an agreement with BBH, if a Fund has a cash overdraft on a given day, it will be assessed an overdraft charge of LIBOR plus 2.00%. Cash overdraft charges are included in “Interest Expense” on the Statements of Operations.
SECURITIES LENDING — The Funds may lend securities from their portfolios to brokers, dealers and other financial institutions. In connection with such loans, a Fund remains the beneficial owner of the loaned securities and continues to receive payments in amounts approximately equal to the interest, dividends or other distributions payable on the loaned securities. A Fund also has the right to terminate a loan at any time. A Fund does not have the right to vote on securities while they are on loan. Loans of portfolio securities will not exceed 33 1/3% of the value of a Fund’s total assets (including the value of all assets received as collateral for the loan). A Fund will receive collateral consisting of cash in the form of U.S. dollars, foreign currency, or securities issued or fully guaranteed by the U.S. Government which will be maintained at all times in an amount equal to at least 102% of the current market value of the loaned securities. If the collateral consists of cash, a Fund will reinvest the cash and pay the borrower a pre-negotiated fee or “rebate” from any return earned on the investment. Should the borrower of the securities fail financially, a Fund may experience delays in recovering the loaned securities or exercising its rights in the collateral. In a loan transaction, a Fund will also bear the risk of any decline in value of securities acquired with cash collateral. Krane and a sub-adviser are subject to potential conflicts of interest because the compensation paid to them increases in connection with any net income received by a Fund from a securities lending program. Each Fund pays Krane 10% of any net monthly income received from the investment of cash collateral and loan fees received from borrowers in respect of each securities loan (net of any amounts paid to the custodian and/or securities lending agent or rebated to borrowers). (See Note 3).
The following table discloses the Funds with securities on loan and the value of securities on loan as of September 30, 2018:
| Market Value of Securities on Loan | Cash Collateral for Securities on Loan | |||||||
| KraneShares CSI China Internet ETF | $160,221,941 | $165,631,848 | ||||||
| KraneShares Emerging Markets Consumer Technology Index ETF | 978,722 | 1,004,958 | ||||||
| KraneShares Electric Vehicles and Future Mobility Index ETF | 1,972,377 | 2,037,770 | ||||||
| KraneShares MSCI All China Health Care Index ETF | 307,757 | 323,782 | ||||||
CREATION UNITS — The Funds issue and redeem Shares at NAV and only in large blocks of Shares (each block of Shares for a Fund is a Creation Unit of 50,000 Shares, or multiples thereof).
The standard creation and redemption fees for each Fund are listed below. These fees are subject to adjustment from time to time by the Adviser.
84
Notes to Financial Statements (Unaudited) (continued)
| Fund | Standard Transaction Fee | Maximum Variable Transaction Fee | ||||||
| KraneShares Bosera MSCI China A Share ETF | $ 5,800 | 2.00% | ||||||
| KraneShares Zacks New China ETF | 800 | 2.00% | ||||||
| KraneShares CSI China Internet ETF | 500 | 2.00% | ||||||
| KraneShares E Fund China Commercial Paper ETF | 1,000 | 2.00% | ||||||
| KraneShares MSCI All China Index ETF | 8,500 | 2.00% | ||||||
| KraneShares MSCI One Belt One Road Index ETF | 3,900 | 2.00% | ||||||
| KraneShares Emerging Markets Consumer Technology Index ETF | 1,500 | 2.00% | ||||||
| KraneShares MSCI China Environment Index ETF | 750 | 2.00% | ||||||
| KraneShares Electric Vehicles and Future Mobility Index ETF | 1,100 | 2.00% | ||||||
| KraneShares MSCI All China Health Care Index ETF | 1,320 | 2.00% | ||||||
| Kraneshares CCBS China Corporate High Yield Bond USD Index Fund | 1,000 | 2.00% | ||||||
| Kraneshares Emerging Markets Healthcare Index ETF | 2,800 | 2.00% | ||||||
Except when aggregated in Creation Units, Shares are not redeemable securities of a Fund. Shares of a Fund may only be purchased or redeemed by certain Authorized Participants. An Authorized Participant is either (i) a broker-dealer or other participant in the clearing process through the Continuous Net Settlement System of the National Securities Clearing Corporation or (ii) a Depository Trust Company (‘‘DTC’’) participant and, in each case, must have executed a Participant Agreement with the Distributor. Most retail investors will not qualify as Authorized Participants or have the resources to buy and sell whole Creation Units. Therefore, they will be unable to purchase or redeem the Shares directly from a Fund. Rather, most retail investors will purchase Shares in the secondary market with the assistance of a broker and will be subject to customary brokerage commissions or fees when buying or selling Shares. If a Creation Unit is purchased or redeemed for cash, a higher transaction fee will be charged.
The following table discloses Creation Unit breakdown for the period ended September 30, 2018:
| Creation Unit Shares | Standard Transaction Fee – Subscriptions | Value | Standard Transaction Fee – Redemptions | |||||||||||||
| KraneShares Bosera MSCI China A Share ETF | 1,550,000 | $ 155,400 | $ 86,479,384 | $ 121,800 | ||||||||||||
| KraneShares Zacks New China ETF | (50,000 | ) | — | (1,753,543 | ) | 800 | ||||||||||
| KraneShares CSI China Internet ETF | 3,700,000 | 25,000 | 150,643,530 | 14,000 | ||||||||||||
| KraneShares MSCI One Belt One Road Index ETF | 50,000 | 750 | 1,366,936 | 3,900 | ||||||||||||
| KraneShares Emerging Markets Consumer Technology Index ETF | 550,000 | 7,500 | 15,178,881 | 7,500 | ||||||||||||
| KraneShares MSCI China Environment Index ETF | — | 15,000 | 14,038 | — | ||||||||||||
| KraneShares Electric Vehicles and Future Mobility Index ETF | 400,000 | 8,800 | 9,188,949 | — | ||||||||||||
| KraneShares MSCI All China Health Care Index ETF | 1,400,000 | 18,480 | 36,885,130 | — | ||||||||||||
| KraneShares CCBS China Corporate High Yield Bond USD Index Fund | 250,001 | 1,000 | 10,000,040 | — | ||||||||||||
| KraneShares Emerging Markets Healthcare Index ETF | 100,001 | 2,800 | 2,500,025 | — | ||||||||||||
85
Notes to Financial Statements (Unaudited) (continued)
CASH AND CASH EQUIVALENTS — Idle cash and currency balances may be swept into various overnight sweep accounts and are classified as cash equivalents on the Statement of Assets and Liabilities. These amounts, at times, may exceed United States federally insured limits. Amounts swept are available on the next business day.
3. RELATED PARTY TRANSACTIONS
INVESTMENT ADVISORY AGREEMENT — The Adviser serves as investment adviser to each Fund pursuant to an Investment Advisory Agreement between the Trust on behalf of each Fund and the Adviser (the “Agreement”). Under the Agreement, Krane is responsible for reviewing, supervising and administering each Fund’s investment program and the general management and administration of the Trust. In addition to these services, to the extent a Fund engages in securities lending, Krane will: (i) assist the securities lending agent of the Fund (the “Agent”) to determine which securities are available for loan, (ii) monitor the Agent’s activities to ensure that securities loans are effected in accordance with Krane’s instructions and in accordance with applicable procedures and guidelines adopted by the Board, (iii) make recommendations to the Board regarding the Fund’s participation in securities lending; (iv) prepare appropriate periodic reports for, and seek appropriate periodic approvals from, the Board with respect to securities lending activities, (v) respond to Agent inquiries concerning the Agent’s activities, and (vi) such other related duties as Krane deems necessary or appropriate (this provision became effective with respect to the Funds on the later of October 5, 2017, or the date the Fund commenced operations). The Board of Trustees of the Trust supervises Krane and establishes policies that Krane must follow in its management activities.
The Agreement requires require the Adviser to pay all operating expenses of the Funds, except: (a) interest and taxes (including, but not limited to, income, excise, transaction, transfer and withholding taxes); (b) expenses of the Funds incurred with respect to the acquisition and disposition of portfolio securities and the execution of portfolio transactions, including brokerage commissions and short sale dividend or interest expense; (c) expenses incurred in connection with any distribution plan adopted by the Trust in compliance with Rule 12b-1 under the Investment Company Act, including distribution fees; (d) “Acquired Fund Fees and Expenses” (as defined by Form N-1A under the 1940 Act); (e) litigation expenses; (f) the compensation payable to the Adviser under the Agreement; (g) compensation and expenses of the Independent Trustees (including any fees of independent legal counsel to the Independent Trustees); and (h) any expenses determined to be extraordinary expenses by the Board. In addition, effective on the later of October 5, 2017, or the date the Fund commenced operations, under the Agreement, while the fees and expenses related to the Funds’ securities lending-related activities reduce the gross revenues and income of the Funds from such activities, they are not fees and expenses for which Krane is responsible.
Each Agreement provides that each Fund pays a unitary (or unified) fee to the Adviser for advisory and management services provided to the Fund, subject to the exceptions noted herein. In this context, there exists a risk that a Trust service provider will seek recourse against the Trust if is not timely paid by Krane for the fees and expenses for which it is responsible, which could materially adversely affect the Funds. Pursuant to the Agreement between the Trust and the Adviser, the Funds below pay the Adviser a fee, which is calculated daily and paid monthly, at the following annual rates, based on a percentage of the average daily net assets of each Fund. In addition, as compensation for the services provided by the Adviser in connection with any securities lending-related activities, each Fund pays the Adviser 10% of the monthly investment income received from the investment
86
Notes to Financial Statements (Unaudited) (continued)
of cash collateral and loan fees received from borrowers in respect to securities loans (net of any amounts paid to the custodian and/or securities lending agent or rebated to borrowers), included on the Statements of Operations as “Security Lending Fees”.
| Management Fee | ||||
| KraneShares Bosera MSCI China A Share ETF | 0.78 | % | ||
| KraneShares Zacks New China ETF | 0.68 | % | ||
| KraneShares CSI China Internet ETF | 0.68 | % | ||
| KraneShares E Fund China Commercial Paper ETF | 0.68 | % | ||
| KraneShares MSCI All China Index ETF | 0.68 | % | ||
| KraneShares MSCI One Belt One Road Index ETF | 0.78 | % | ||
| KraneShares Emerging Markets Consumer Technology Index ETF | 0.78 | % | ||
| KraneShares MSCI China Environment Index ETF | 0.78 | % | ||
| KraneShares Electric Vehicles and Future Mobility Index ETF | 0.68 | % | ||
| KraneShares MSCI All China Health Care Index ETF | 0.78 | % | ||
| Kraneshares CCBS China Corporate High Yield Bond USD Index Fund | 0.68 | % | ||
| Kraneshares Emerging Markets Healthcare Index ETF | 0.78 | % | ||
Effective July 28, 2017, pursuant to the terms of an Expense Limitation Agreement, the Adviser has contractually agreed to reduce its management fee and/or reimburse the Funds, except for KraneShares Bosera MSCI China A Share ETF, KraneShares Electric Vehicles and Future Mobility Index ETF, KraneShares MSCI All China Health Care Index ETF, KraneShares CCBS China Corporate High Yield Bond USD Index ETF and KraneShares Emerging Markets Healthcare Index ETF, in an amount equal to the fees paid by the Funds to counsel to the independent Trustees of the Trust until July 31, 2018. The Expense Limitation Agreement may only be terminated prior to July 31, 2018 by the Board.
Pursuant to the terms of an Expense Limitation Agreement, the Adviser has contractually agreed to waive its management fee for the KraneShares Bosera MSCI China A Share ETF by 0.20% of the Fund’s average daily net assets. This contractual fee waiver will continue until October 4, 2019, and may only be terminated prior thereto by the Board.
Pursuant to the terms of an Expense Limitation Agreement, the Adviser has contractually agreed to reduce its management fee for the KraneShares E Fund China Commercial Paper ETF by 0.12% of the Fund’s average daily net assets until October 4, 2019. The Expense Limitation Agreement may only be terminated prior thereto by the Board.
Pursuant to the terms of an Expense Limitation Agreement, Krane has contractually agreed to reduce its management fee for theKraneShares MSCI All China Index ETF (formerly, KraneShares FTSE Emerging Markets Plus ETF) in an amount equal to any Acquired Fund Fees and Expenses incurred by the Fund from its investments in the KraneShares Bosera MSCI China A Share ETF. This Expense Limitation Agreement will continue until October 4, 2019. The Expense Limitation Agreement may only be terminated by the Board.
The Adviser and each Sub-Adviser bear all of their own costs associated with providing these advisory services. As part of its agreement with the Trust, the Adviser has contractually agreed to pay all operating expenses of the Funds, including the cost of index licensing fees, transfer agency, custody, fund administration, legal, audit and other services, except as set forth above and as otherwise indicated in those agreements.
87
Notes to Financial Statements (Unaudited) (continued)
SUB-ADVISORY AGREEMENT — Bosera Asset Management (International) Co., Ltd. (“Bosera”), operating out of Hong Kong, serves as the Sub-Adviser to the KraneShares Bosera MSCI China A Share ETF and is responsible for the day-to-day management of the Fund, subject to the supervision by the Adviser and the Board. For the services Bosera provides to KraneShares Bosera MSCI China A Share ETF, the Adviser pays Bosera a fee equal to 50% of the net revenue the Adviser receives from the Fund.
CCB Securities Ltd. (“CCBS”), located at 18/F CCB Centre, 18 Wang Chiu Road, Kowloon Bay, Kowloon, Hong Kong, serves as the sub-adviser of KraneShares CCBS China Corporate High Yield Bond USD Index ETF. CCBS is responsible for the day-to-day investment management of the Fund, subject to the supervision of Krane and the Board. The Adviser has entered into a Sub-Advisory Agreement with CCBS pursuant to which the Adviser has agreed to pay CCBS a fee equal to 50% of net revenue earned by the Adviser from the Fund. For these purposes, net revenue is defined as gross revenue less gross fund-related expenses (including any waiver by the Adviser of its compensation under the investment advisory agreement and any payments or reimbursements by Krane of the Fund’s expenses).
E Fund Management (Hong Kong) Co., Limited (‘‘E Fund”), operating out of Hong Kong, serves as the Sub-Adviser to the KraneShares E Fund China Commercial Paper ETF and is responsible for the day-to-day management of the Fund, subject to the supervision by the Adviser and the Board. For the services E Fund provides to KraneShares E Fund China Commercial Paper ETF, the Adviser pays E Fund a fee equal to 50% of the net revenue the Adviser receives from the Fund.
DISTRIBUTION AGREEMENT — SEI Investments Distribution Co. (the “Distributor”), a wholly-owned subsidiary of SEI Investments Company, and an affiliate of the administrator, serves as the Funds’ distributor of Creation Units pursuant to a Distribution Agreement. The Distributor does not maintain any secondary market in Fund shares.
The Trust has adopted a Distribution and Service Plan (“Plan”) pursuant to Rule 12b-1 under the 1940 Act. In accordance with its Plan, each Fund is authorized to pay an amount up to 0.25% of its average daily net assets each year for certain distribution-related activities. For the period ended September 30, 2018 no fees were charged under the Plan. Fees would only be charged under the Plan upon approval by the Board.
ADMINISTRATOR, CUSTODIAN AND TRANSFER AGENT — SEI Investments Global Funds Services (the “Administrator”) serves as the Funds’ Administrator pursuant to an Administration Agreement. Brown Brothers Harriman & Co. serves as the Funds’ Custodian and Transfer Agent pursuant to a Custodian and Transfer Agent Agreement.
88
Notes to Financial Statements (Unaudited) (continued)
4. INVESTMENT TRANSACTIONS
For the period ended September 30, 2018, the purchases and sales of investments in securities excluding in-kind transactions, long-term U.S. Government and short-term securities were:
| Purchases | Sales and | |||||||
| KraneShares Bosera MSCI China A Share ETF | $ | 394,958,350 | $ | 299,943,259 | ||||
| KraneShares Zacks New China ETF | 2,500,992 | 3,796,435 | ||||||
| KraneShares CSI China Internet ETF | 493,633,778 | 461,592,720 | ||||||
| KraneShares MSCI All China Index ETF | 1,871,955 | 1,849,792 | ||||||
| KraneShares MSCI One Belt One Road Index ETF | 16,036,643 | 12,956,503 | ||||||
| KraneShares Emerging Markets Consumer Technology Index ETF | 37,547,242 | 29,558,240 | ||||||
| KraneShares MSCI China Environment Index ETF | 5,603,856 | 5,294,557 | ||||||
| KraneShares Electric Vehicles and Future Mobility Index ETF | 15,274,300 | 12,011,815 | ||||||
| KraneShares MSCI All China Health Care Index ETF | 44,911,547 | 7,933,334 | ||||||
| Kraneshares CCBS China Corporate High Yield Bond USD Index Fund | 7,555,045 | 7,403,799 | ||||||
| Kraneshares Emerging Markets Healthcare Index ETF | 2,470,705 | — | ||||||
For the period ended September 30, 2018, in-kind transactions associated with creations and redemptions were:
| Purchases | Sales and Maturities | Realized Gain (Loss) | ||||||||||
| KraneShares Zacks New China ETF | $ | — | $ | 301,926 | $ | 28,170 | ||||||
| KraneShares CSI China Internet ETF | 433,080,592 | 311,259,770 | 68,912,623 | |||||||||
| KraneShares MSCI One Belt One Road Index ETF | 1,088,468 | 507,934 | 6,827 | |||||||||
| KraneShares Emerging Markets Consumer Technology Index ETF | 18,501,134 | 10,391,632 | 328,964 | |||||||||
| KraneShares MSCI China Environment Index ETF | 104,436 | 93,911 | (10,680 | ) | ||||||||
| KraneShares Electric Vehicles and Future Mobility Index ETF | 6,906,824 | — | — | |||||||||
During the period ended September 30, 2018, there were no purchases or sales of long-term U.S. government securities for the Funds.
5. TAX INFORMATION
The amount and character of income and capital gain distributions to be paid, if any, are determined in accordance with Federal income tax regulations, which may differ from U.S. GAAP. As a result, net investment income (loss) and net realized gain (loss) on investment transactions for a reporting period may differ significantly from distributions during such period. These book/tax differences may be temporary or permanent. To the extent these differences are permanent in nature, they are charged or credited to undistributed net investment income (loss), accumulated net realized gain (loss) or paid-in capital, as appropriate, in the period that the differences arise.
89
Notes to Financial Statements (Unaudited) (continued)
The tax character of dividends and distributions paid during the years ended March 29, 2018 and March 31, 2017 were as follows:
| KraneShares Funds | Ordinary Income | Long-Term Capital Gain | Return of Capital | Totals | ||||||||||||
KraneShares Bosera MSCI China A Share ETF | ||||||||||||||||
| 2018 | $ | 2,946,446 | $ | — | $ | — | $ | 2,946,446 | ||||||||
| 2017 | — | 127,486 | 437,353 | 564,839 | ||||||||||||
KraneShares Zacks New China ETF | ||||||||||||||||
| 2018 | $ | 44,526 | $ | 1,101,598 | $ | — | $ | 1,146,124 | ||||||||
| 2017 | 32,656 | — | 38,008 | 70,664 | ||||||||||||
KraneShares CSI China Internet ETF | ||||||||||||||||
| 2018 | $ | 7,001,175 | $ | — | $ | — | $ | 7,001,175 | ||||||||
| 2017 | 1,721,413 | — | 656,632 | 2,378,045 | ||||||||||||
KraneShares E Fund China Commercial Paper ETF | ||||||||||||||||
| 2018 | $ | — | $ | — | $ | — | $ | — | ||||||||
| 2017 | — | — | 6,584 | 6,584 | ||||||||||||
KraneShares MSCI All China Index ETF | ||||||||||||||||
| 2018 | $ | 32,628 | $ | — | $ | — | $ | 32,628 | ||||||||
| 2017 | 70,606 | 46,996 | 17,872 | 135,474 | ||||||||||||
KraneShares MSCI One Belt One Road Index ETF | ||||||||||||||||
| 2018 | $ | 6,687 | $ | — | $ | — | $ | 6,687 | ||||||||
KraneShares Emerging Markets Consumer Technology Index ETF | ||||||||||||||||
| 2018 | $ | — | $ | — | $ | — | $ | — | ||||||||
KraneShares MSCI China Environment Index ETF | ||||||||||||||||
| 2018 | $ | — | $ | — | $ | — | $ | — | ||||||||
KraneShares Electric Vehicles and Future Mobility Index ETF | ||||||||||||||||
| 2018 | $ | — | $ | — | $ | — | $ | — | ||||||||
KraneShares MSCI All China Health Care Index ETF | ||||||||||||||||
| 2018 | $ | — | $ | — | $ | — | $ | — | ||||||||
As of March 29, 2018, the components of tax basis distributable earnings (accumulated losses) were as follows:
| KraneShares Bosera MSCI China A Share ETF | KraneShares Zacks New China ETF | KraneShares CSI China Internet ETF | KraneShares E Fund China Commercial Paper ETF | KraneShares MSCI All China Index | ||||||||||||||||
| Undistributed Ordinary Income | $ | 4,041,554 | $ | 21,899 | $ | — | $ | 324,836 | $ | 13,639 | ||||||||||
| Undistributed Long-Term Capital Gain | 712,126 | 87,888 | 44,976,086 | — | — | |||||||||||||||
| Capital Loss Carryforwards | — | — | — | (41,317 | ) | (195,033 | ) | |||||||||||||
| Qualified Late-Year Loss Deferrals | — | (6,954 | ) | (6,042,559 | ) | — | — | |||||||||||||
| Unrealized Appreciation (Depreciation) on Investments and Foreign Currency | 31,287,363 | 312,727 | 93,840,479 | 505,868 | 394,302 | |||||||||||||||
| Other Temporary Differences | (4 | ) | — | 7 | (3 | ) | — | |||||||||||||
| Total Distributable Earnings (Accumulated Losses) | $ | 36,041,039 | $ | 415,560 | $ | 132,774,013 | $ | 789,384 | $ | 212,908 | ||||||||||
90
Notes to Financial Statements (Unaudited) (continued)
| KraneShares MSCI One Belt One Road Index ETF | KraneShares Emerging Markets Consumer Technology Index ETF | KraneShares MSCI China Environment Index ETF | KraneShares Electric Vehicles and Future Mobility Index ETF | KraneShares MSCI All China Health Care Index ETF | ||||||||||||||||
| Undistributed Ordinary Income | $ | 73,891 | $ | — | $ | — | $ | 34,872 | $ | — | ||||||||||
| Undistributed Long-Term Capital Gain | — | — | — | — | — | |||||||||||||||
| Capital Loss Carryforwards | — | (325 | ) | (10,254 | ) | (1,967 | ) | — | ||||||||||||
| Qualified Late-Year Loss Deferrals | — | (3,209 | ) | (13,176 | ) | — | (4,114 | ) | ||||||||||||
| Unrealized Appreciation (Depreciation) on Investments and Foreign Currency | (1,106,858 | ) | (67,469 | ) | (362,660 | ) | (1,314,122 | ) | 169,630 | |||||||||||
| Other Temporary Differences | — | (1 | ) | — | — | — | ||||||||||||||
| Total Distributable Earnings (Accumulated Losses) | $ | (1,032,967 | ) | $ | (71,004 | ) | $ | (386,090 | ) | $ | (1,281,217 | ) | $ | 165,516 | ||||||
The Kraneshares CCBS China Corporate High Yield Bond USD Index Fund and Kraneshares Emerging Markets Healthcare Index ETF did not commence operations prior to March 31, 2018.
Qualified late year ordinary and Post-October capital losses (including currency and specified gain/loss items) represent losses realized from Jan. 1, 2018 through March 29, 2018 and November 1, 2017 through March 29, 2018, respectively, that in accordance with federal income tax regulations, the Funds have elected to defer and treat as having arisen in the following fiscal year.
Under the Regulated Investment Company Modernization Act of 2010, the Funds are permitted to carry forward capital losses incurred in taxable years beginning after December 22, 2010 for an unlimited period. Post-enactment capital losses that are carried forward will retain their character as either short-term or long-term capital losses rather than being considered all short-term as under previous law. Losses carried forward under these new provisions are as follows:
| KraneShares Funds | Short-Term Loss | Long-Term Loss | Total | |||||||||
| KraneShares E Fund China Commercial Paper ETF | $ | 41,317 | $ | — | $ | 41,317 | ||||||
| KraneShares MSCI All China Index ETF | 3,107 | 191,926 | 195,033 | |||||||||
| KraneShares Emerging Markets Consumer Technology Index ETF | 325 | — | 325 | |||||||||
| KraneShares MSCI China Environment Index ETF | 10,254 | — | 10,254 | |||||||||
| KraneShares Electric Vehicles and Future Mobility Index ETF | 1,967 | — | 1,967 | |||||||||
The Kraneshares CCBS China Corporate High Yield Bond USD Index Fund and Kraneshares Emerging Markets Healthcare Index ETF did not commence operations prior to March 31, 2018.
During the period ended September 30, 2018, KraneShares Bosera MSCI China A Share ETF, KraneShares Zacks New China ETF, KraneShares CSI China Internet ETF and KraneShares E Fund
91
Notes to Financial Statements (Unaudited) (continued)
China Commercial Paper ETF utilized $511,878, $1,116, $9,490,738 and $17,034 of capital loss carryforwards, respectively, to offset capital gains.
The differences between book and tax-basis unrealized appreciation and depreciation are attributable primarily to the tax deferral of losses on wash sales and investments in passive foreign investment companies. The federal tax cost and aggregate gross unrealized appreciation and depreciation on investments held by the Funds at September 30, 2018 were as follows:
| KraneShares Funds | Federal Tax Cost | Aggregated Gross Unrealized Appreciation | Aggregated Gross Unrealized Depreciation | Net Unrealized Appreciation/ Depreciation | ||||||||||||
| KraneShares Bosera MSCI China A Share ETF | 392,371,906 | 2,516,921 | (56,379,454 | ) | (53,862,533 | ) | ||||||||||
| KraneShares Zacks New China ETF | 27,040,192 | 186,498 | (24,120,184 | ) | (23,933,686 | ) | ||||||||||
| KraneShares CSI China Internet ETF | 1,915,593,741 | 49,668,701 | (318,465,319 | ) | (268,796,618 | ) | ||||||||||
| KraneShares E Fund China Commercial Paper ETF | 12,611,552 | 14,703 | (719,134 | ) | (704,431 | ) | ||||||||||
| KraneShares MSCI All China Index ETF | 2,340,401 | 155,538 | (155,153 | ) | 385 | |||||||||||
| KraneShares MSCI One Belt One Road Index ETF | 33,724,261 | 1,522,896 | (4,441,858 | ) | (2,918,962 | ) | ||||||||||
| KraneShares Emerging Markets Consumer Technology Index ETF | 37,564,786 | 543,206 | (5,650,377 | ) | (5,107,171 | ) | ||||||||||
| KraneShares MSCI China Environment Index ETF | 6,538,998 | 164,588 | (970,473 | ) | (805,885 | ) | ||||||||||
| KraneShares Electric Vehicles and Future Mobility Index ETF | 38,061,575 | 1,391,838 | (3,810,556 | ) | (2,418,718 | ) | ||||||||||
| Kraneshares MSCI All China Health Care Index ETF | 39,998,249 | 723,999 | (5,963,141 | (5,239,142 | ) | |||||||||||
| KraneShares CCBS China Corporate High Yield Bond USD Index ETF | 8,665,686 | 18,901 | (76,098 | ) | (57,197 | ) | ||||||||||
| KraneShares Emerging Markets Healthcare Index ETF | 2,470,705 | 95,046 | (122,775 | ) | (27,729 | ) | ||||||||||
Uncertainties in the Chinese tax rules governing the taxation of income distributions and capital gains from investments in A Shares could result in unexpected tax liabilities for the Funds. China generally imposes withholding tax at a rate of 10% on dividends and interest derived by non-Chinese resident investors (including, for example, Qualified Foreign Institutional Investors (QFII)) from Chinese companies and those companies which are not Chinese tax residents, but which are deemed to be Chinese tax residents (e.g., under Notice 7). China also imposes withholding tax at a rate of 10% on capital gains derived by non-residents from investment in actual and constructive Chinese resident companies. The Chinese withholding taxes applied to dividends, interest and capital gains may, in principle, be subject to a reduced rate under an applicable Chinese tax treaty, but the application of such treaties in the case of a non-resident (e.g., in the case of a QFII acting on behalf of non-resident investors, such as the Funds) is also uncertain. The imposition of such taxes could have a material adverse effect on the Funds’ returns. The People’s Republic of China (the “PRC”) rules regarding the taxation of non-resident investors are quickly evolving and certain of the tax regulations to be issued by the PRC State Administration of Taxation and/or the PRC Ministry of Finance to clarify matters may apply retrospectively. Such retroactively applied rules may be adverse to the Funds and their shareholders. KraneShares E Fund China Commercial Paper ETF does not currently accrue or
92
Notes to Financial Statements (Unaudited) (continued)
withhold taxes. The fund has adopted this general administrative practice due to the lack of clarity for application and remittance of the taxes. It is also unclear how China’s value added tax (“VAT”) may be affected by tax treaty provisions. If such a tax is collected, the expenses will be passed on and borne by the Funds. The imposition of such taxes, as well as future changes in applicable PRC tax law, may adversely affect the Funds. If the Funds expect VAT to be imposed, they reserve the right to establish a reserve for such tax. If the Funds establish such a reserve but are not ultimately subject to the tax, shareholders who redeemed or sold their shares while the reserve was in place will effectively bear the tax and may not benefit from the later release, if any, of the reserve. Conversely, if the Funds do not establish such a reserve but ultimately are subject to the tax, shareholders who redeemed or sold their shares prior to the tax being withheld, reserved or paid will have effectively avoided the tax, even if they benefited from investments in a Fund. Effective November 17, 2014, QFIIs, RQFIIs (i.e., QFIIs investing in Yuan, rather than foreign currency) and non-Chinese resident investors investing through the Hong Kong-Shanghai Stock Connect are exempted temporarily from the 10% capital gains tax that normally applies to sales of A Shares on a public Chinese exchange (such as the Shanghai Stock Exchange). However, such investors are still required to pay capital gains tax for gains realized on trades executed before November 17, 2014. The Funds have recorded capital gains tax for gains realized prior to November 17, 2014, and have reflected such taxes in the Statement of Assets and Liabilities.
6. CONCENTRATION OF RISKS
As with all ETFs, shareholders of the Funds are subject to the risk that their investment could lose money. Each Fund is subject to certain of the principal risks noted below, any of which may adversely affect a Fund’s NAV, trading price, yield, total return and ability to meet its investment objective. A more complete description of principal risks is included in each Fund’s prospectus under the heading “Principal Risks.”
Cash and Cash Equivalents Risk — The Fund may hold cash or cash equivalents. Generally, such positions offer less potential for gain than other investments. Holding cash or cash equivalents, even strategically, may lead to missed investment opportunities. This is particularly true when the market for other investments in which the Fund may invest is rapidly rising. If the Fund holds cash uninvested it will be subject to the credit risk of the depositing institution holding the cash.
CHINA RISK — The Chinese economy is generally considered an emerging market and can be significantly affected by economic and political conditions in China and surrounding Asian countries. In addition, the Chinese economy is export-driven and highly reliant on trade. A downturn in the economies of China’s primary trading partners could slow or eliminate the growth of the Chinese economy and adversely impact the Fund’s investments. The Chinese government strictly regulates the payment of foreign currency denominated obligations and sets monetary policy. The Chinese government may introduce new laws and regulations that could have an adverse effect on the Fund. Although China has begun the process of privatizing certain sectors of its economy, privatized entities may lose money and/or be re-nationalized.
In the Chinese securities markets, a small number of issuers may represent a large portion of the entire market. The Chinese securities markets are subject to more frequent trading halts, low trading volume and price volatility. Further, the Chinese economy is heavily dependent upon trading with key partners. Recent developments in relations between the United States and China have heightened concerns of increased tariffs and restrictions on trade between the two countries. An increase in
93
Notes to Financial Statements (Unaudited) (continued)
tariffs or trade restrictions, or even the threat of such developments, could lead to a significant reduction in international trade, which could have a negative impact on China’s export industry and a commensurately negative impact on the Fund.
The RMB Bond market is volatile with a risk of trading suspensions in particular securities and government interventions. Trading in RMB Bonds may be suspended without warning and for lengthy periods. Information on such trading suspensions, including as to their expected length, may be unavailable. Securities affected by trading suspensions may be or become illiquid. In recent years, Chinese entities have incurred significant levels of debt and Chinese financial institutions currently hold relatively large amounts of non-performing debt. Thus, there exists a possibility that widespread defaults could occur, which could trigger a financial crisis, freeze Chinese debt and finance markets and make certain Chinese securities illiquid.
CHINESE CREDIT RATINGS RISK — The debt securities included in Underlying Index securities, and therefore the securities held by the KraneShares E Fund China Commercial Paper ETF Fund, will generally be rated by Chinese ratings agencies (and not by U.S. nationally recognized statistical ratings organizations (“NRSROs”)). The rating criteria and methodology used by Chinese rating agencies may be different from those adopted by NRSROs and international credit rating agencies. Therefore, such rating systems may not provide an equivalent standard for comparison with securities rated by NRSROs or other international credit rating agencies.
Concentration Risk — Because the Fund’s assets are expected to be concentrated in an industry or group of industries to the extent that the Underlying Index concentrates in a particular industry or group of industries, the Fund is subject to loss due to adverse occurrences that may affect that industry or group of industries or sector. Market conditions, interest rates, and economic, regulatory, or financial developments could significantly affect a single industry or a group of related industries, and the securities of companies in that industry or group of industries could react similarly to these or other developments. As of the date of this prospectus, the Underlying Index was concentrated in Chinese government/Chinese government-related debt.
Currency Risk — The Fund’s NAV is determined on the basis of the U.S. dollar, therefore, the Fund may lose value if a security denominated in another currency depreciates against the U.S. dollar, even if the local currency value of the Fund’s holdings goes up. Currency exchange rates can be very volatile and can change quickly and unpredictably, which may adversely affect the Fund. The Fund may also be subject to delays in converting or transferring U.S. dollars to foreign currencies for the purpose of purchasing portfolio investments. This may hinder the Fund’s performance, including because any delay could result in the Fund missing an investment opportunity and purchasing securities at a higher price than originally intended, or incurring cash drag.
Depositary Receipts Risk — The Fund may hold the securities of Chinese and other non-U.S. companies in the form of depositary receipts, including American Depositary Receipts and Global Depositary Receipts. Investing in depositary receipts entails the risks associated with foreign investments. The underlying securities of the depositary receipts in the Fund’s portfolio are subject to fluctuations in foreign currency exchange rates that may affect the value of the Fund’s portfolio. In addition, the value of the securities underlying the depositary receipts may change materially when the U.S. markets are not open for trading, which will affect the value of the depositary receipts. Like direct investments in foreign securities, investments in depositary receipts involve political and economic risks distinct from those associated with investing in the securities of U.S. issuers.
94
Notes to Financial Statements (Unaudited) (continued)
Emerging Markets Risk — The Fund’s investments in emerging markets are subject to greater risk of loss than investments in developed markets. This is due to, among other things, greater market volatility, greater risk of asset seizures and capital controls, lower trading volume, political and economic instability, greater risk of market shutdown and more governmental limitations on foreign investments than typically found in developed markets. The economies of emerging markets, and China in particular, may be heavily reliant upon international trade and may suffer disproportionately if international trading declines or is disrupted.
ETF Risk. As an ETF, the Fund is subject to the following risks:
Authorized Participants Concentration Risk. The Fund has a limited number of financial institutions that may act as Authorized Participants. To the extent they cannot or are otherwise unwilling to engage in creation and redemption transactions with the Fund and no other Authorized Participant steps in, shares of the Fund may trade like closed-end fund shares at a significant discount to net asset value (“NAV”) and may face delisting from the Exchange.
Cash Transactions Risk. Like other ETFs, the Fund sells and redeems its shares only in large blocks called Creation Units and only to “Authorized Participants.” Unlike many other ETFs, however, the Fund expects to effect part or all of its creations and redemptions for cash, rather than in-kind securities. Thus, an investment in the Fund may be less tax-efficient than an investment in other ETFs as the Fund may recognize a capital gain that it could avoid by making redemptions in-kind. As a result, the Fund may pay out higher annual capital gains distributions than ETFs that redeem in-kind. Further, paying redemption proceeds in cash rather than through in-kind delivery of portfolio securities may require the Fund to dispose of or sell portfolio investments to obtain the cash needed to distribute redemption proceeds at an inopportune time.
International Closed Market Trading Risk. Because substantially all of the Fund’s investments trade in markets that are closed when the Fund and Exchange are open, there are likely to be deviations between current pricing of an underlying security and stale pricing, resulting in the Fund trading at a discount or premium to NAV greater than those incurred by other ETFs.
New Fund Risk. The Fund is new and does not yet have shares outstanding. If the Fund does not grow in size, it will be at greater risk than larger funds of wider bid-ask spreads for its shares, trading at a greater premium or discount to NAV, liquidation and/or a stop to trading.
Premium/Discount Risk. There may be times when the market price of the Fund’s shares is more than the NAV intra-day (at a premium) or less than the NAV intra-day (at a discount). As a result, shareholders of the Fund may pay more than NAV when purchasing shares and receive less than NAV when selling Fund shares. This risk is heightened in times of market volatility or periods of steep market declines. In such market conditions, market or stop loss orders to sell Fund shares may be executed at prices well below NAV.
Equity Securities Risk — The values of equity securities are subject to factors such as market fluctuations, changes in interest rates and perceived trends in stock prices. Equity securities are subject to volatile changes in value and their values may be more volatile than other asset classes. In the event of liquidation, equity securities are generally subordinate in rank to debt and other securities of the same issuer.
FIXED INCOME SECURITIES RISK — Fixed income securities are subject to credit risk and interest rate risk. Credit risk refers to the possibility that the issuer of a security will not make timely interest
95
Notes to Financial Statements (Unaudited) (continued)
payments or repay the principal of the debt issued (i.e., it defaults on its obligations). Interest rate risk refers to fluctuations in the value of a debt resulting from changes in the level of interest rates. When interest rates go up, the prices of most debt instruments go down; and when interest rates go down, the prices of most debt instruments go up. Debt instruments with longer durations tend to be more sensitive to interest rate changes, typically making them more volatile. The current low-interest-rate environment heightens the risks associated with rising interest rates.
FOREIGN SECURITIES RISK — Investments in securities of non-U.S. issuers may be less liquid than investments in U.S. issuers as foreign trading markets are not typically as active as U.S. markets and may have less governmental regulation and oversight. For example, non-U.S. issuers may be subject to different accounting, auditing, financial reporting and investor protection standards than U.S. issuers. As a result, there may be less information publicly available about non-U.S. issuers. Investments in non-U.S. securities also involve risk of loss due to foreign currency fluctuations and political or economic instability. Foreign markets also may have clearance and settlement procedures that make it difficult for the Funds to buy and sell securities. These factors could result in a loss to the Funds by causing the Funds to be unable to dispose of an investment or to miss an attractive investment opportunity, or by causing the Funds’ assets to be uninvested for some period of time.
Frontier Markets Risk — Frontier market countries generally have smaller economies and less developed capital markets or legal, regulatory and political systems than traditional emerging market countries. As a result, the risks of investing in emerging market countries are magnified in frontier market countries.
GEOGRAPHIC FOCUS RISK — The Funds’ investments will be focused in a particular country, countries, or region and therefore a Fund may be susceptible to adverse market, political, regulatory, and geographic events affecting that country, countries or region. Such geographic focus also may subject the Fund to a higher degree of volatility than a more geographically diversified fund.
High Portfolio Turnover Risk — The Fund may incur high turnover rates, which may increase the Fund’s brokerage commission costs and negatively impact the Fund’s performance. Such portfolio turnover also may generate net short-term capital gains.
INDUSTRY CONCENTRATION RISK — In following its methodology, each Fund’s Underlying Index from time to time may be concentrated to a significant degree in securities of issuers located in a single industry or group of industries. To the extent that an Underlying Index concentrates in the securities of issuers in a particular industry or group of industries, each Fund also is expected to concentrate its investments to approximately the same extent. If a Fund concentrates its investments in an industry, the Fund may face more risks than if it were diversified broadly over industries. In addition, at times, an industry or sector may be out of favor and underperforms other industries or the market as a whole. Any factors detrimental to the performance of such industry or sector may disproportionately impact a Fund’s NAV.
KraneShares E Fund China Commercial Paper ETF utilizes a cash sweep program (the “Cash Sweep Program”). In the Cash Sweep Program, at least a portion of the Fund’s uninvested cash balance is used to purchase shares of funds that are registered in China, but not in the U.S., and that provide daily liquidity, including the E Fund Money Market Fund. The Fund may also invest in other similar investment companies that are registered in China and provide daily liquidity (collectively, the “PRC Investment Companies”). The Fund’s investments in the PRC Investment Companies are, in conjunction with other investments in investment companies (other than U.S. money market funds),
96
Notes to Financial Statements (Unaudited) (continued)
subject to the limitations imposed by Section 12(d)(1) and the rules thereunder. The PRC Investment Companies are intended to provide liquidity, increased diversity of holdings, and a return on investment that is similar to the return on investments in underlying index constituents. Investments in the PRC Investment Companies are subject to the risks faced by them, which include credit risk, interest rate risk, currency risk, foreign investment risk, and custody risk. The PRC Investment Companies are PRC-domiciled funds and the Fund, therefore, will not enjoy the protections of the United States securities laws, including the 1940 Act, with respect to its investments in the PRC Investment Companies. In addition, E Fund is subject to conflicts of interest in allocating Fund assets to PRC Investment Companies that are sponsored by E Fund or its affiliates.
Investment in Investment Companies Risk — The Fund may invest in other investment companies, including those advised, sponsored or otherwise serviced by the Adviser, the Sub-Adviser and/or their affiliates. The Fund will indirectly be exposed to the risks of investments by such funds. Moreover, the Fund will incur its pro rata share of the underlying fund’s expenses. the Adviser and the Sub-Adviser are subject to conflicts of interest in allocating Fund assets to investment companies that are advised, sponsored or otherwise serviced by the Adviser and the Sub-Adviser and/or their affiliates. To the extent that the Fund invests in investment companies or other pooled investment vehicles that are not registered pursuant to the 1940 Act, including foreign investment companies, it will not enjoy the protections of the 1940 Act.
Large Capitalization Company Risk — Investments in large capitalization companies may go in and out of favor based on market and economic conditions and may underperform other market segments. Some large capitalization companies may be unable to respond quickly to new competitive challenges and attain the high growth rate of successful smaller companies, especially during extended periods of economic expansion. As such, returns on investments in stocks of large capitalization companies could trail the returns on investments in stocks of small and mid-capitalization companies.
LIQUIDITY RISK — Certain of the Funds’ investments may be or become difficult to purchase or sell at a reasonable time or price. If a transaction is particularly large or if the relevant market is or becomes illiquid, it may not be possible to initiate a transaction or liquidate a position at an advantageous time or price, which may cause the Funds to suffer significant losses and difficulties in meeting redemptions. If a number of securities held by the Funds halt trading, it may have a cascading effect and cause the Funds to halt trading. Volatility in market prices will increase the risk of the Funds being subject to a trading halt.
Management Risk — Because the Fund may not fully replicate the Underlying Index and may hold less than the total number of securities in the Underlying Index, the Fund is subject to management risk. This is the risk that E Fund’s security selection process, which is subject to a number of constraints, may not produce the intended results.
MARKET RISK — The values of the Funds’ holdings could decline generally or could underperform other investments. In addition, there is a risk that policy changes by the U.S. Government, Federal Reserve, and/or other government actors, such as continuing to raise interest rates, could cause increased volatility in global financial markets and higher levels of Fund redemptions, which could have a negative impact on the Funds. Further, the Funds are susceptible to the risk that certain investments may be difficult or impossible to sell at a favorable time or price. Market developments may cause the Funds’ investments to become less liquid and subject to erratic price movements. Such market developments may also cause the Funds to encounter difficulties in timely honoring redemptions, especially if market events cause an increased incidence of shareholder redemptions.
97
Notes to Financial Statements (Unaudited) (continued)
Non-Diversified Fund Risk — Because the Fund is non-diversified and may invest a greater portion of its assets in fewer issuers than a diversified fund, changes in the market value of a single portfolio holding could cause greater fluctuations in the Fund’s share price than would occur in a diversified fund. This may increase the Fund’s volatility and cause the performance of a single portfolio holding or a relatively small number of portfolio holdings to have a greater impact on the Fund’s performance.
Passive Investment Risk — The Fund is not actively managed, does not seek to “beat” the Underlying Index and does not take temporary defensive positions when markets decline. Therefore, the Fund may not sell a security due to current or projected underperformance of a security, industry or sector. There is no guarantee that the Underlying Index will create the desired exposure. The Underlying Index may not contain an appropriate mix of securities, but the Fund’s investment objective and principal investment strategies impose limits on the Fund’s ability to invest in securities not included in the Underlying Index.
SECURITIES LENDING RISK — To the extent a Fund lends its securities, it may be subject to the following risks: (1) borrowers of the Funds’ securities typically provide collateral in the form of cash that is reinvested in securities; (2) the securities in which the collateral is invested may not perform sufficiently to cover the return collateral payments owed to borrowers; (3) delays may occur in the recovery of securities from borrowers, which could interfere with the Funds’ ability to vote proxies or to settle transactions; and (4) there is the risk of possible loss of rights in the collateral should the borrower fail financially.
Small and Mid-Capitalization Company Risk — Investing in the securities of small and medium capitalization companies involves greater risk and the possibility of greater price volatility than investing in larger capitalization companies and more established companies. Since small and medium-sized companies may have limited operating histories, product lines and financial resources, the securities of these companies may lack sufficient market liquidity and can be sensitive to expected changes in interest rates, borrowing costs and earnings.
Tax Risk — In order to qualify for the favorable tax treatment generally available to regulated investment companies, the Fund must satisfy certain income, asset diversification and distribution requirements each year. If the Fund were to fail to qualify as a regulated investment company, it would be taxed in the same manner as an ordinary corporation, and distributions to its shareholders would not be deductible by the Fund in computing its taxable income, which would adversely affect the Fund’s performance.
Tracking Error Risk — The Fund’s return may not match or achieve a high degree of correlation with the return of the Underlying Index. This may be due to, among other factors, the Fund holding cash under certain circumstances in lieu of Underlying Index securities, such as when the Fund is subject to delays converting U.S. dollars into a foreign currency to purchase foreign securities. The Fund may not be able to invest in certain components of the Underlying Index due to legal restrictions imposed by foreign governments or other regulatory reasons. In addition, securities included in the Underlying Index may be suspended from trading. To the extent that the Fund employs a representative sampling strategy or calculates its NAV based on fair value prices and the value of the Underlying Index is based on securities’ closing prices on local foreign markets, the Fund’s ability to track the Underlying Index may be adversely affected. Changes in currency exchange rates or delays in converting currencies may also cause tracking error.
VALUATION RISK — Independent market quotations for the non-U.S. securities held by the Funds may not be readily available and such securities may be fair valued. Fair valuation is subjective and
98
Notes to Financial Statements (Unaudited) (concluded)
different market participants may assign different prices to the same security. As a result, there is a risk that the Funds may not be able to sell a security at the price assigned to the security by the Fund. In addition, the securities in which the Funds invest may trade on days that the Funds do not price their shares; as a result, the value of Fund shares may change on days when investors cannot purchase or sell their holdings.
Non-Diversified Fund Risk — Because the Fund is non-diversified and may invest a greater portion of its assets in fewer issuers than a diversified fund, changes in the market value of a single portfolio holding could cause greater fluctuations in the Fund’s share price than would occur in a diversified fund. This may increase the Fund’s volatility and cause the performance of a single portfolio holding or a relatively small number of portfolio holdings to have a greater impact on the Fund’s performance.
7. OTHER
At September 30, 2018, the records of the Trust reflect all Shares outstanding created by Authorized Participants are in the form of Creation Units. However, the individual shares comprising such Creation Units are listed and traded on the NYSE Arca Exchange, and a portion thereof have been purchased and sold by persons other than Authorized Participants. Each Authorized Participant has entered into an agreement with the Funds’ Distributor.
After the close of the markets on September 13, 2016, the KraneShares Zacks New China ETF effected a split of its issued and outstanding shares for shareholders of record on September 12, 2016. The effect of this transaction was to increase the number of outstanding shares of the Fund by a ratio of two-to-one, resulting in a corresponding decrease in the net asset value per share. The capital share activity presented in the Statements of Changes in Net Assets for the period ended March 31, 2017, and per share data in the financial highlights for the periods presented through March 31, 2017, have been given retroactive effect to reflect these share splits. There were no changes in net assets, results of operations or total return as a result of these transactions.
8. INDEMNIFICATIONS
In the normal course of business, the Funds enter into contracts that provide general indemnifications. The Funds’ maximum exposure under these arrangements is dependent on future claims that may be made against the Funds and, therefore, cannot be established; however, based on experience, the risk of loss from such claims is considered remote.
9. NEW ACCOUNTING PRONOUNCEMENTS
In August 2018, the FASB issued Accounting Standards Update 2018-13, Fair Value Measurement (Topic 820). The new guidance includes additions and modifications to disclosures requirements for fair value measurements. For public entities, the amendments are effective for financial statements issued for fiscal years beginning after December 15, 2019, and interim periods within those fiscal years. At this time, management is currently evaluating the impact of this new guidance on the financial statements and disclosures.
10. SUBSEQUENT EVENTS
Effective November 1, 2018, the KraneShares Zacks New China ETF is renamed the KraneShares CICC China Leaders 100 Index ETF (the “Fund”) and the Fund’s underlying index is changed from the Zacks New China Index to the CSI CICC Select 100 Index. Additionally, the “Creation Transaction Fees” and “Redemption Transaction Fees” for the Fund are changed to $2,500.
99
Approval of New Fund Advisory Agreements & Board Considerations (Unaudited)
At an in-person meeting on November 15, 2017, the Board of Trustees (“Board”) of the KraneShares Trust (“Trust”), including a majority of the Trustees who are not “interested persons” of the Trust, approved the advisory agreement between Krane Funds Advisors, LLC (“Krane”) and the Trust with respect to the KraneShares CCBS China Corporate High Yield Bond USD Index ETF (“KCCB”), KraneShares MSCI All China Health Care Index ETF, KraneShares Future Vehicle Index ETF and KraneShares Emerging Markets Healthcare Index ETF (collectively, the “New Funds”) (the “Advisory Agreement”) and the portfolio management agreement between Krane and CCB Securities Ltd. (“CCBS”) with respect to KCCB (“Subadvisory Agreement” and, together with the Advisory Agreement, the “Agreements”). In advance of the meeting, the Board received and considered information relating to the Agreements, and was given the opportunity to ask questions and request additional information. In reviewing the Agreements, the Board considered that the evaluation process with respect to Krane and CCBS is an ongoing one and, in this regard, noted that it considers information at each regularly scheduled meeting regarding, among other matters, the services provided by Krane to the operational series of the Trust and would continue to consider similar information regarding Krane and CCBS at future meetings of the Board. The Board also considered information provided outside of the Board meetings.
In evaluating the Agreements, the Board considered, among other matters: (1) the nature, extent and quality of the services to be provided by Krane and CCBS, as applicable; (2) the proposed advisory and sub-advisory fees and estimated total expense ratios of the New Funds; (3) the estimated costs of the services to be provided by Krane and Krane’s profitability expectations with respect to its relationship with the New Funds; (4) the extent to which economies of scale would be realized as the New Funds grow and whether the Advisory Agreement would enable investors to share in the benefits of economies of scale; and (5) other benefits Krane and CCBS anticipated they may receive from their relationship with the New Funds.
Nature, Extent and Quality of Services. Based on the written and oral reports received by the Board prior to and at the November 15, 2017 meeting and a presentation from senior representatives of Krane at the November 15, 2017 meeting, the Board considered the nature, quality and extent of the overall services to be provided by Krane under the Advisory Agreement and CCBS under the Sub-Advisory Agreement. In this connection, the Board considered the responsibilities of Krane and CCBS under such Agreements. The Board discussed Krane’s and CCBS’s resources available to the management of the New Funds. It recognized that Krane had invested significant time and effort in structuring the Trust and the New Funds, obtaining the necessary exemptive relief from the Securities and Exchange Commission, assessing the market appeal of each New Fund’s investment strategy and arranging service providers. It also considered the financial conditions of Krane and CCBS.
The Board observed that Krane had agreed to bear many of the New Funds’ expenses under a unitary fee arrangement. The Board considered that Krane would be responsible for establishing and monitoring each New Fund’s investment program and carrying out directives of the Board and that Krane and CCBS, as applicable, would be responsible for the day-to-day investment activities of the New Funds. Further, the Board considered the securities-lending services that Krane may provide to the New Funds under the Advisory Agreement.
In considering the Agreements, the Board evaluated its experience with and the information previously provided by Krane. The Board also considered Krane’s analysis and recommendation of CCBS to serve as the sub-adviser for KCCB. Based on its review and other considerations, the Board
100
Approval of New Fund Advisory Agreements & Board Considerations (Unaudited) (continued)
determined, in the exercise of its reasonable business judgment, that the nature, quality and extent of the services to be provided by Krane and CCBS are appropriate for the New Funds.
Investment Performance. The Board noted that, because the New Funds had not yet commenced investment operations, they had no investment performance. The Board considered that, once the New Funds commence operations, it will receive regular reports regarding the performance of each New Fund and the tracking error of each New Fund compared to its peer funds. The Board also considered its experience with Krane’s management of the operational series of the Trust that pursue different investment strategies and Krane’s and CCBS’s representations regarding CCBS’s experience in the investment management industry.
Based on the information provided to it, the Board determined, in its reasonable business judgment, that engaging Krane and CCBS could benefit the New Funds and their shareholders.
Fees and Expenses. The Board reviewed and considered the compensation to be received by Krane and CCBS under the Agreements in light of the nature, quality and extent of the services to be provided by each of them. The Board received written and oral presentations from Krane prior to and at the November 15, 2017 meeting and had the opportunity to ask questions of senior representatives of Krane at the November 15, 2017 meeting. In this regard, the Board noted Krane’s representation that each New Fund would offer unique investment exposure for shareholders. The Board considered that Krane had agreed to enter into a unitary advisory fee arrangement with respect to the New Funds, under which Krane, and not the New Funds, will be responsible for paying many of the New Funds’ expenses, including those of the New Funds’ principal service providers and CCBS.
The Board considered Krane’s representations regarding the competitive marketplace for the New Funds, including Krane’s evaluation of its fees compared to other market participants. The Board also considered the compensation paid and to be paid to Krane by the operational series of the Trust, which currently are Krane’s only advisory clients, as compared to the New Funds. The Board recognized that Krane may receive additional compensation under the Advisory Agreement resulting from any securities lending-related services it provides to the New Funds. With respect to CCBS, the Board considered that CCBS does not currently manage any accounts comparable to KCCB.
In light of their experience with Krane’s management of the operational series of the Trust, the Board evaluated the impact of the proposed “unitary” advisory fee arrangement on the New Funds’ anticipated total expense ratios. They noted that historically Krane has carefully monitored the level of expenses borne by the series of the Trust and that the Board routinely receives reports detailing the expense ratios of the operational series of the Trust and that similar routine reports will be provided for the New Funds.
Based on these and other considerations, the Board, in the exercise of its reasonable business judgment, determined that the compensation to be received by Krane and CCBS under the Agreements and the estimated expenses of the New Funds were reasonable.
Costs and Profitability. The Board considered the estimated cost of services and profitability of Krane with respect to the New Funds. The Board noted that, because the New Funds had not yet launched, it was difficult to estimate how profitable they would be to Krane. The Board, however, received information from Krane regarding the range of assets each New Fund was expected to gather, Krane’s anticipated profitability within those ranges and at what level of assets Krane expected its services to the New Funds to become profitable. The Board also considered the information
101
Approval of New Fund Advisory Agreements & Board Considerations (Unaudited) (concluded)
previously provided to it by Krane regarding the cost of its services and profitability with respect to the operational series of the Trust and the similarities and differences between those series and the New Funds. The Board noted Krane’s commitment to the New Funds and its proposal of a unitary fee structure under which it bears many of the New Funds’ expenses.
The Board did not consider information regarding the anticipated costs of services provided or profits to be realized by CCBS from its relationship with KCCB, noting instead the arm’s-length nature of the relationship between Krane and CCBS with respect to the negotiation of the sub-advisory fee rate with respect to KCCB and that Krane, and not KCCB, was responsible for paying CCBS’s compensation under the Subadvisory Agreement.
Under the totality of the circumstances, the Board concluded in the exercise of its reasonable business judgment, that Krane’s anticipated profitability with respect to the New Funds was reasonable.
Other Benefits. The Board considered the extent to which Krane and CCBS would derive ancillary benefits from the New Funds’ operations, including potential benefits to Krane as a result of its ability to use New Fund assets to engage in soft dollar transactions. In considering such matters, the Board considered Krane’s representation that the nature of the ancillary benefits Krane expected to receive from its relationship with the New Funds was expected to be similar as those it received with respect to the operational series of the Trust. In addition, the Board considered that Krane could potentially benefit from any New Fund trades conducted in the future through a broker-dealer affiliated with the majority owner of Krane.
Based on the materials provided to the Board, the Board determined that any other benefits realized by Krane and CCBS from their relationship with the New Funds were not a material factor to be considered in connection with the approval of the Agreements.
Economies of Scale. The Board considered whether Krane would realize economies of scale with respect to its services to the New Funds as they grow larger, including the extent to which this would be reflected in the level of fees to be paid by the New Funds to Krane. The Board noted that the proposed advisory fees for the New Funds do not include breakpoints, but that it was not possible — before the commencement of investment operations — to accurately evaluate potential economies of scale. Based on these and other considerations, including that the New Funds were newly organized, the Board generally concluded that it would monitor for potential economies of scale with respect to Krane’s services to the New Funds under the Advisory Agreement in the future. The Board did not consider whether CCBS would realize economies of scale with respect to its services to KCCB given the arm’s-length nature of the relationship between Krane and CCBS and that Krane, and not KCCB, would pay CCBS’s compensation under the Subadvisory Agreement.
The Board thus determined to continue monitoring for potential economies of scale, and concluded that, at present, they were not a material factor for the Board to consider.
Conclusion. The Board did not identify any single factor as being of paramount importance, and different Trustees may have given different weight to different factors. The Board reviewed a memorandum from Trustee counsel discussing the legal standards applicable to its consideration of the Agreements. The Board noted that, once the New Funds become operational, it would continue to monitor the New Funds at its regular meetings and outside of the Board meetings. Based on its review, including consideration of each of the factors referenced above, the Board determined, in the exercise of its reasonable business judgment, that the advisory and sub-advisory arrangements, as outlined in the Agreements, were reasonable in light of the factors considered by the Board.
102
Disclosure of Fund Expenses (Unaudited)
As a shareholder of a Fund, you incur two types of costs: (1) transaction costs, including brokerage expenses; and (2) ongoing costs. All Exchange Traded Funds (“ETFs”) have operating expenses. As a shareholder of an ETF, your investment is affected by these ongoing costs, which include (among others) costs for ETF management, administrative services, commissions, and shareholder reports like this one. It is important for you to understand the impact of these costs on your investment returns. In addition, a shareholder is responsible for brokerage fees as a result of their investment in the Fund.
Operating expenses such as these are deducted from an ETF’s gross income and directly reduce its final investment return. These expenses are expressed as a percentage of the ETF’s average net assets; this percentage is known as the ETF’s expense ratio.
The following examples use the expense ratio and are intended to help you understand the ongoing costs (in dollars) of investing in your Fund and to compare these costs with those of other funds. The examples are based on an investment of $1,000 made at the beginning of the period shown and held for the entire period (April 1, 2018 to September 30, 2018).
The table on the next page illustrates your Fund’s costs in two ways:
Actual Fund Return. This section helps you to estimate the actual expenses that your Fund incurred over the period. The “Expenses Paid During Period” column shows the actual dollar expense cost incurred by a $1,000 investment in the Fund, and the “Ending Account Value” number is derived from deducting that expense cost from the Fund’s gross investment return.
You can use this information, together with the actual amount you invested in the Fund, to estimate the expenses you paid over that period. Simply divide your actual account value by $1,000 to arrive at a ratio (for example, an $8,600 account value divided by $1,000 = 8.6), then multiply that ratio by the number shown for your Fund under “Expenses Paid During Period.”
Hypothetical 5% Return. This section helps you compare your Fund’s costs with those of other funds. It assumes that the Fund had an annual 5% return before expenses during the year, but that the expense ratio (Column 3) for the period is unchanged. This example is useful in making comparisons because the Securities and Exchange Commission requires all funds to make this 5% calculation. You can assess your Fund’s comparative cost by comparing the hypothetical result for your Fund in the “Expenses Paid During Period” column with those that appear in the same charts in the shareholder reports for other funds.
NOTE: Because the return is set at 5% for comparison purposes — NOT your Fund’s actual return — the account values shown may not apply to your specific investment.
Please note that the expenses shown in the table are meant to highlight your ongoing costs only and do not reflect any transactional costs, including brokerage commissions on the purchases and sale of Fund shares. Therefore, the expense examples are useful in comparing ongoing costs only, and will not help you determine the relative total costs of owning different funds. If these transactional costs had been included, your costs would have been higher.
103
Disclosure of Fund Expenses (Unaudited) (concluded)
| Beginning Account Value 4/1/2018 | Ending Account Value 9/30/2018 | Annualized Expense Ratios | Expenses | |||||||||||||
| KraneShares Bosera MSCI China A Share ETF | ||||||||||||||||
| Actual Fund Return | $ | 1,000.00 | $ | 835.20 | 0.59 | % | $ | 2.71 | ||||||||
| Hypothetical 5% Return | 1,000.00 | 1,022.11 | 0.59 | 2.99 | ||||||||||||
| KraneShares Zacks New China ETF | ||||||||||||||||
| Actual Fund Return | $ | 1,000.00 | $ | 923.80 | 0.69 | % | $ | 3.33 | ||||||||
| Hypothetical 5% Return | 1,000.00 | 1,021.61 | 0.69 | 3.50 | ||||||||||||
| KraneShares CSI China Internet ETF | ||||||||||||||||
| Actual Fund Return | $ | 1,000.00 | $ | 800.00 | 0.74 | % | $ | 3.34 | ||||||||
| Hypothetical 5% Return | 1,000.00 | 1,021.36 | 0.74 | 3.75 | ||||||||||||
| KraneShares E Fund China Commercial Paper ETF | ||||||||||||||||
| Actual Fund Return | $ | 1,000.00 | $ | 935.00 | 0.58 | % | $ | 2.81 | ||||||||
| Hypothetical 5% Return | 1,000.00 | 1,022.16 | 0.58 | 2.94 | ||||||||||||
| KraneShares MSCI All China Index ETF | ||||||||||||||||
| Actual Fund Return | $ | 1,000.00 | $ | 886.50 | 0.66 | % | $ | 3.12 | ||||||||
| Hypothetical 5% Return | 1,000.00 | 1,021.76 | 0.66 | 3.35 | ||||||||||||
| KraneShares MSCI One Belt One Road Index ETF | ||||||||||||||||
| Actual Fund Return | $ | 1,000.00 | $ | 929.40 | 0.79 | % | $ | 3.82 | ||||||||
| Hypothetical 5% Return | 1,000.00 | 1,021.11 | 0.79 | 4.00 | ||||||||||||
| KraneShares Emerging Markets Consumer Technology Index ETF | ||||||||||||||||
| Actual Fund Return | $ | 1,000.00 | $ | 826.70 | 0.80 | % | $ | 3.66 | ||||||||
| Hypothetical 5% Return | 1,000.00 | 1,021.06 | 0.80 | 4.05 | ||||||||||||
| KraneShares MSCI China Environment Index ETF | ||||||||||||||||
| Actual Fund Return | $ | 1,000.00 | $ | 821.00 | 0.79 | % | $ | 3.61 | ||||||||
| Hypothetical 5% Return | 1,000.00 | 1,021.11 | 0.79 | 4.00 | ||||||||||||
| KraneShares Electric Vehicles and Future Mobility Index ETF | ||||||||||||||||
| Actual Fund Return | $ | 1,000.00 | $ | 932.20 | 0.70 | % | $ | 3.39 | ||||||||
| Hypothetical 5% Return | 1,000.00 | 1,021.56 | 0.70 | 3.55 | ||||||||||||
| Kraneshares MSCI All China Health Care Index ETF | ||||||||||||||||
| Actual Fund Return | $ | 1,000.00 | $ | 836.80 | 0.82 | % | $ | 3.78 | ||||||||
| Hypothetical 5% Return | 1,000.00 | 1,020.96 | 0.82 | 4.15 | ||||||||||||
KraneShares CCBS China Corporate High Yield Bond USD Index ETF(2) | ||||||||||||||||
| Actual Fund Return | $ | 1,000.00 | $ | 1,006.50 | 0.72 | % | $ | 1.92 | ||||||||
| Hypothetical 5% Return | 1,000.00 | 1,011.37 | 0.72 | 1.92 | ||||||||||||
KraneShares Emerging Markets Healthcare Index ETF(3) | ||||||||||||||||
| Actual Fund Return | $ | 1,000.00 | $ | 990.80 | 0.78 | % | $ | 0.70 | ||||||||
| Hypothetical 5% Return | 1,000.00 | 1,003.82 | 0.78 | 0.71 | ||||||||||||
(1) Expenses are equal to the Fund’s annualized expense ratio multiplied by the average account value over the period, multiplied by 183/365 (to reflect the one-half year period from 04/01/18-09/30/18).
(2) Expenses are equal to the Fund’s annualized expense ratio multiplied by the average account value over the period, multiplied by 97/365 (to reflect the one-half year period from 06/26/18-09/30/18).
(3) Expenses are equal to the Fund’s annualized expense ratio multiplied by the average account value over the period, multiplied by 33/365 (to reflect the one-half year period from 08/29/18-09/30/18).
104
Supplemental Information (Unaudited)
Net asset value, or “NAV”, is the price per Share at which the Funds issue and redeem Shares to Authorized Participants. It is calculated in accordance with the policies described in Note 2 in Notes to Financial Statements.) The “Market Price” of the Funds generally is determined using the midpoint between the highest bid and the lowest offer on the stock exchange on which the Shares of the Funds are listed for trading, as of the time that the Funds’ NAV is calculated. The Funds’ Market Price may be at, above or below their NAV. The NAV of the Funds will fluctuate with changes in the market value of their holdings. The Market Price of the Funds will fluctuate in accordance with changes in their NAV, as well as market supply and demand of Fund Shares.
Premiums or discounts are the differences (expressed as a percentage) between the NAV and Market Price of the Funds on a given day, generally at the time NAV is calculated. A premium is the amount that the Funds are trading above the reported NAV, expressed as a percentage of the NAV. A discount is the amount that the Funds are trading below the reported NAV, expressed as a percentage of the NAV. Shareholders may pay more than NAV when they buy Fund Shares and receive less than NAV when they sell those Shares, because Shares are bought and sold at Market Price.
Further information regarding premiums and discounts is available on the Funds’ website at http://kraneshares.com. The premium and discount information contained on the website represents past performance and cannot be used to predict future results.
105
(This page intentionally left blank.)
106
KraneShares Trust:
1270 Avenue of the Americas, 22nd Floor
New York, New York 10020
1-855-857-2638
http://kraneshares.com/
Investment Adviser:
Krane Funds Advisors, LLC
1270 Avenue of the Americas, 22nd Floor
New York, New York 10020
Distributor:
SEI Investments Distribution Co.
One Freedom Valley Drive
Oaks, PA 19456
Administrator:
SEI Investments Global Funds Services
One Freedom Valley Drive
Oaks, PA 19456
This information must be preceded or accompanied by a current prospectus for the Funds described.
KraneShares Trust:
1270 Avenue of the Americas, 22nd Floor
New York, New York 10020
KRS-SA-001-0600
KRS-SA-001-0600
Item 2. Code of Ethics.
Not applicable for semi-annual report.
Item 3. Audit Committee Financial Expert.
Not applicable for semi-annual report.
Item 4. Principal Accountant Fees and Services.
Not applicable for semi-annual report.
Item 5. Audit Committee of Listed Registrants.
Not applicable for semi-annual report.
Item 6. Schedule of Investments.
Schedule of Investments is included as part of the Report to Shareholders filed under Item 1 of this form.
Item 7. Disclosure of Proxy Voting Policies and Procedures for Closed-End Management Investment Companies.
Not applicable to open-end management investment companies.
Item 8. Portfolio Managers of Closed-End Management Investment Companies.
Not applicable to open-end management investment companies.
Item 9. Purchases of Equity Securities by Closed-End Management Company and Affiliated Purchasers.
Not applicable to open-end management investment companies.
Item 10. Submission of Matters to a Vote of Security Holders.
There have been no changes to the procedures by which shareholders may recommend nominees to the Registrant’s Board of Trustees during the period covered by this report.
Item 11. Controls and Procedures.
(a) The Registrant’s principal executive and principal financial officers, or persons performing similar functions, have concluded that the Registrant’s disclosure controls and procedures (as defined in Rule 30a-3(c) under the Investment Company Act (17 CFR § 270.30a-3(c)) as of a date within 90 days of the filing date of the report, are effective based on the evaluation of these controls and procedures required by Rule 30a-3(b) under the Investment Company Act (17 CFR § 270.30a-3(b)) and Rules 13a-15(b) or 15d-15(b) under the Securities Exchange Act of 1934 (17 CFR § 240.13a-15(b) or § 240.15d-15(b)).
(b) There has been no change in the Registrant’s internal control over financial reporting (as defined in Rule 30a-3(d) under the 1940 Act (17 CFR § 270.30a-3(d)) that occurred during the second fiscal quarter of the period covered by this report that has materially affected, or is reasonably likely to materially affect, the Registrant’s internal control over financial reporting.
Item 12. Disclosure of Securities Lending Activities for Closed-End Management Investment Companies.
Not applicable to open-end management investment companies.
Items 13. Exhibits.
(a)(1) Not applicable for semi-annual report.
(a)(2) A certification for the principal executive officer and the principal financial officer of the Registrant as required by Rule 30a-2(a) under the 1940 Act, as amended (17 CFR 270.30a-2(a)), is filed herewith.
(b) Officer certification as required by Rule 30a-2(b) under the 1940 Act, as amended (17 CFR 270.30a-2(b)) also accompany this filing as an exhibit.
SIGNATURES
Pursuant to the requirements of the Securities Exchange Act of 1934 and the Investment Company Act of 1940, the Registrant has duly caused this report to be signed on its behalf by the undersigned, thereunto duly authorized.
| (Registrant) | KraneShares Trust |
| By (Signature and Title) | /s/ Jonathan Krane |
| Jonathan Krane | |
| Principal Executive Officer |
Date: December 6, 2018
Pursuant to the requirements of the Securities Exchange Act of 1934 and the Investment Company Act of 1940, this report has been signed below by the following persons on behalf of the Registrant and in the capacities and on the dates indicated.
| By (Signature and Title) | /s/ Jonathan Krane |
| Jonathan Krane | |
| Principal Executive Officer | |
| Date: December 6, 2018 | |
| By (Signature and Title) | /s/ Jonathan Krane |
| Jonathan Krane | |
| Principal Financial Officer |
Date: December 6, 2018