UNITED STATES
SECURITIES AND EXCHANGE COMMISSION
Washington, D.C. 20549
FORM N-CSRS
CERTIFIED SHAREHOLDER REPORT OF REGISTERED MANAGEMENT
INVESTMENT COMPANIES
Investment Company Act File Number 811-22698
KraneShares Trust
(Exact name of registrant as specified in charter)
280 Park Avenue
32nd Floor
New York, New York 10017
(Address of principal executive offices) (Zip code)
Jonathan Krane
KraneShares Trust
280 Park Avenue
32nd Floor
New York, New York 10017
(Name and address of agent for service)
Copy to:
Stacy L. Fuller
K&L Gates LLP
1601 K Street NW
Washington, DC 20006-1600
Registrant’s telephone number, including area code: (855) 857-2638
Date of fiscal year end: March 31, 2020
Date of reporting period: September 30, 2019
Item 1. Reports to Stockholders.
A copy of the report transmitted to stockholders pursuant to Rule 30e-1 under the Investment Company Act, as amended [17 CFR § 270.30e-1], are attached hereto.
![]()
Semi-Annual Report KraneShares CICC China Leaders 100 Index ETF KraneShares CSI China Internet ETF KraneShares Bosera MSCI China A Share ETF KraneShares E Fund China Commercial Paper ETF KraneShares MSCI All China Index ETF KraneShares MSCI One Belt One Road Index ETF KraneShares Emerging Markets Consumer Technology Index ETF KraneShares MSCI China Environment Index ETF KraneShares Electric Vehicles and Future Mobility Index ETF KraneShares MSCI All China Health Care Index ETF KraneShares CCBS China Corporate High Yield Bond USD Index ETF KraneShares Emerging Markets Healthcare Index ETF KraneShares MSCI Emerging Markets ex China Index ETF Beginning on January1, 2021, as permitted by regulations adopted by the Securities and Exchange Commission, paper copies of the Fund’s shareholder reports will no longer be sent by mail, unless you specifically request paper copies of the reports from the Fund (if you hold your Fund shares directly with the Fund) or from your financial intermediary, such as a broker-dealer or bank (if you hold your Fund shares through a financial intermediary). Instead, the reports will be made available on a website, and you will be notified by mail each time a report is posted and provided with a website link to access the report. If you already elected to receive shareholder reports electronically, you will not be affected by this change and you need not take any action. If you hold your Fund shares directly with the Fund, you may elect to receive shareholder reports and other communications electronically from the Fund by contacting the Fund at 855-857-2638 or, if you hold your Fund shares through a financial intermediary, contacting your financial intermediary. You may elect to receive all future reports in paper free of charge. If you hold your Fund shares directly with the Fund, you can inform the Fund that you wish to continue receiving paper copies of your shareholder reports at 855-857-2638 or, if you hold your Fund shares through a financial intermediary, contacting your financial intermediary. Your election to receive reports in paper will apply to all of the KraneShares Funds you hold directly with series of the Trust or through your financial intermediary, as applicable. September30, 2019 |
Table of Contents
Schedules of Investments | ||
1 | ||
5 | ||
7 | ||
18 | ||
22 | ||
31 | ||
37 | ||
41 | ||
44 | ||
48 | ||
KraneShares CCBS China Corporate High Yield Bond USD Index ETF | 50 | |
54 | ||
57 | ||
70 | ||
74 | ||
78 | ||
92 | ||
96 | ||
120 | ||
127 | ||
129 |
The Funds file their complete schedules of Fund holdings with the Securities and Exchange Commission (the “Commission”) for the first and third quarters of each fiscal year as an exhibit to its reports on Form N-PORT within sixty days after the end of the period. The Funds’ Form N-PORT reports are available on the Commission’s website at http://www.sec.gov, and may be reviewed and copied at the Commission’s Public Reference Room in Washington, DC. Information on the operation of the Public Reference Room may be obtained by calling 1-800-SEC-0330.
A description of the policies and procedures that KraneShares Trust uses to determine how to vote proxies relating to Fund securities, as well as information relating to how the Funds voted proxies relating to Fund securities during the most recent 12-month year ended June30, are available (i) without charge, upon request, by calling 855-857-2638; and (ii) on the Commission’s website at http://www.sec.gov.
Fund shares may only be purchased or redeemed from a Fund in large Creation Unit aggregations. Investors who cannot transact in Creation Units of a Fund’s shares must buy or sell Fund shares in the secondary market at their market price, which may be at a premium or discount to a Fund’s net asset value, with the assistance of a broker. In doing so, the investor may incur brokerage commissions and may pay more than net asset value when buying Fund shares and receive less than net asset value when selling Fund shares.
Shares | Value | ||||
COMMON STOCK — 99.4%‡ |
| ||||
CHINA — 99.4% |
| ||||
Communication Services — 0.7% |
| ||||
China South Publishing & Media Group, Cl A | 5,400 | $ | 9,150 | ||
Shanghai Oriental Pearl Group, Cl A | 15,800 |
| 20,244 | ||
| 29,394 | ||||
Consumer Discretionary — 9.3% |
| ||||
Dashang, Cl A | 1,400 |
| 5,085 | ||
Fuyao Glass Industry Group, Cl A | 11,000 |
| 33,087 | ||
Hisense Home Appliances Group, Cl A | 3,000 |
| 4,558 | ||
HLA, Cl A | 13,900 |
| 15,805 | ||
Joyoung, Cl A | 2,300 |
| 7,047 | ||
KingClean Electric, Cl A | 600 |
| 1,841 | ||
Lao Feng Xiang, Cl A | 1,000 |
| 6,863 | ||
Midea Group, Cl A | 30,500 |
| 218,248 | ||
Rainbow Department Store, Cl A | 3,800 |
| 6,375 | ||
Shanghai Jinjiang International Hotels Development, Cl A | 1,300 |
| 4,214 | ||
TCL, Cl A | 80,500 |
| 40,130 | ||
Wuchan Zhongda Group, Cl A | 13,100 |
| 10,053 | ||
Zhejiang Hangmin, Cl A | 4,060 |
| 3,451 | ||
Zhejiang Meida Industrial, Cl A | 1,800 |
| 3,244 | ||
Zhejiang Semir Garment, Cl A | 4,000 |
| 6,923 | ||
| 366,924 | ||||
Consumer Staples — 17.3% |
| ||||
By-health, Cl A | 7,000 |
| 18,154 | ||
Chacha Food, Cl A | 1,900 |
| 6,782 | ||
Henan Shuanghui Investment & Development, Cl A | 8,300 |
| 28,708 | ||
Inner Mongolia Yili Industrial Group, Cl A | 46,700 |
| 186,507 | ||
Jiangsu Yanghe Brewery Joint-Stock, Cl A | 4,700 |
| 68,448 | ||
Luzhou Laojiao, Cl A | 5,700 |
| 68,021 | ||
Wuliangye Yibin, Cl A | 14,300 |
| 259,920 | ||
The accompanying notes are an integral part of the financial statements.
1
Schedule of Investments (Unaudited)September 30, 2019
KraneShares CICC China Leaders 100 Index ETF (continued)
Shares | Value | ||||
COMMON STOCK (continued) |
| ||||
Consumer Staples (continued) |
| ||||
Yixintang Pharmaceutical Group, Cl A | 1,500 | $ | 4,707 | ||
Yonghui Superstores, Cl A | 28,200 |
| 35,106 | ||
| 676,353 | ||||
Energy — 1.5% |
| ||||
China Shenhua Energy, Cl A | 19,400 |
| 51,018 | ||
Huolinhe Opencut Coal Industry of Inner Mongolia, Cl A | 5,100 |
| 5,835 | ||
| 56,853 | ||||
Financials — 44.0% |
| ||||
Agricultural Bank of China, Cl A | 296,800 |
| 143,804 | ||
Bank of China, Cl A | 163,600 |
| 82,015 | ||
Bank of Communications, Cl A | 213,800 |
| 163,167 | ||
Bohai Leasing, Cl A* | 14,200 |
| 7,119 | ||
China Construction Bank, Cl A | 52,200 |
| 51,095 | ||
China Life Insurance, Cl A | 13,800 |
| 53,104 | ||
China Merchants Bank, Cl A | 43,500 |
| 211,676 | ||
China Merchants Securities, Cl A | 22,000 |
| 50,678 | ||
CITIC Securities, Cl A | 60,000 |
| 188,876 | ||
GF Securities, Cl A* | 20,000 |
| 38,005 | ||
Guotai Junan Securities, Cl A | 34,900 |
| 85,867 | ||
Huatai Securities, Cl A | 24,800 |
| 66,296 | ||
Industrial & Commercial Bank of China, Cl A | 167,900 |
| 130,018 | ||
Industrial Bank, Cl A | 80,200 |
| 196,873 | ||
Ping An Insurance Group of China, Cl A | 18,200 |
| 221,829 | ||
Shenwan Hongyuan Group, Cl A | 49,000 |
| 32,798 | ||
| 1,723,220 | ||||
Health Care — 2.9% |
| ||||
China Animal Healthcare*(A)(B)(C) | 4,000 |
| — | ||
China Resources Sanjiu Medical & Pharmaceutical, Cl A | 3,000 |
| 12,237 | ||
Huadong Medicine, Cl A | 6,000 |
| 22,013 | ||
Jilin Aodong Pharmaceutical Group, Cl A | 5,000 |
| 10,783 | ||
KPC Pharmaceuticals, Cl A | 4,200 |
| 6,258 | ||
Livzon Pharmaceutical Group, Cl A | 2,480 |
| 9,217 | ||
Shandong Buchang Pharmaceuticals, Cl A | 4,810 |
| 12,845 | ||
Shanghai Pharmaceuticals Holding, Cl A | 8,900 |
| 22,683 | ||
Sunflower Pharmaceutical Group, Cl A | 2,100 |
| 4,246 | ||
Tasly Pharmaceutical Group, Cl A | 7,000 |
| 15,272 | ||
| 115,554 | ||||
Industrials — 9.6% |
| ||||
China State Construction Engineering, Cl A | 164,800 |
| 125,310 | ||
CNHTC Jinan Truck, Cl A | 2,000 |
| 4,103 | ||
CRRC, Cl A | 75,200 |
| 77,083 | ||
Henan Zhongyuan Expressway, Cl A | 7,100 |
| 4,067 | ||
Shanghai Construction Group, Cl A | 33,600 |
| 15,950 | ||
Shanghai International Port Group, Cl A | 23,300 |
| 18,565 | ||
Shanghai Tunnel Engineering, Cl A | 14,200 |
| 11,712 | ||
Sichuan Road & Bridge, Cl A | 16,200 |
| 7,328 | ||
Sieyuan Electric, Cl A | 3,600 |
| 5,586 | ||
TangShan Port Group, Cl A | 22,400 |
| 7,716 | ||
Weichai Power, Cl A | 35,000 |
| 54,990 | ||
The accompanying notes are an integral part of the financial statements.
2
Schedule of Investments (Unaudited)September 30, 2019
KraneShares CICC China Leaders 100 Index ETF (continued)
Shares | Value | ||||
COMMON STOCK (continued) |
| ||||
Industrials (continued) |
| ||||
Wolong Electric Group, Cl A | 4,900 | $ | 5,702 | ||
Xiamen ITG Group, Cl A | 10,200 |
| 10,484 | ||
Zhejiang Yankon Group, Cl A | 6,800 |
| 4,142 | ||
Zhengzhou Yutong Bus, Cl A | 10,200 |
| 19,854 | ||
| 372,592 | ||||
Information Technology — 0.9% |
| ||||
Aisino, Cl A | 8,400 |
| 24,643 | ||
Hanergy Thin Film Power Group*(A)(B)(C) | 65,064 |
| — | ||
Hangzhou First Applied Material, Cl A | 800 |
| 5,086 | ||
Shenzhen Everwin Precision Technology, Cl A | 4,100 |
| 8,147 | ||
| 37,876 | ||||
Materials — 4.0% |
| ||||
Anhui Conch Cement, Cl A | 15,600 |
| 90,307 | ||
China Lumena New Materials*(A)(B)(C) | 28,720 |
| — | ||
Guangdong Tapai Group, Cl A | 2,800 |
| 3,772 | ||
ORG Technology, Cl A* | 8,000 |
| 5,276 | ||
Shenzhen Jinjia Group, Cl A | 6,800 |
| 9,151 | ||
Tianhe Chemicals Group*(A)(B)(C) | 40,000 |
| — | ||
Xinyangfeng Agricultural Technology, Cl A | 4,000 |
| 5,769 | ||
Zhejiang Longsheng Group, Cl A | 20,400 |
| 40,165 | ||
| 154,440 | ||||
Real Estate — 6.8% |
| ||||
Beijing Capital Development, Cl A | 9,400 |
| 10,688 | ||
Beijing Urban Construction Investment & Development, Cl A | 9,240 |
| 9,083 | ||
China Fortune Land Development, Cl A | 13,600 |
| 51,363 | ||
Financial Street Holdings, Cl A | 8,000 |
| 8,626 | ||
Gemdale, Cl A | 17,300 |
| 27,981 | ||
Oceanwide Holdings, Cl A | 11,700 |
| 7,078 | ||
Poly Developments and Holdings Group, Cl A | 55,000 |
| 110,136 | ||
RiseSun Real Estate Development, Cl A | 13,500 |
| 15,653 | ||
Shanghai Lujiazui Finance & Trade Zone Development, Cl A | 6,420 |
| 12,280 | ||
Zhongtian Financial Group, Cl A | 30,000 |
| 14,157 | ||
| 267,045 | ||||
Utilities — 2.4% |
| ||||
SDIC Power Holdings, Cl A | 32,000 |
| 40,374 | ||
Shanghai Dazhong Public Utilities Group, Cl A | 14,600 |
| 9,977 | ||
Shanghai Electric Power, Cl A | 7,900 |
| 8,728 | ||
Shenergy, Cl A | 21,600 |
| 16,787 | ||
Zhejiang Zheneng Electric Power, Cl A | 31,300 |
| 17,094 | ||
| 92,960 | ||||
TOTAL COMMON STOCK |
| 3,893,211 | |||
| |||||
TOTAL INVESTMENTS — 99.4% |
| 3,893,211 | |||
OTHER ASSETS LESS LIABILITIES — 0.6% |
| 24,879 | |||
NET ASSETS — 100% | $ | 3,918,090 | |||
The accompanying notes are an integral part of the financial statements.
3
Schedule of Investments (Unaudited)September 30, 2019
KraneShares CICC China Leaders 100 Index ETF(concluded)
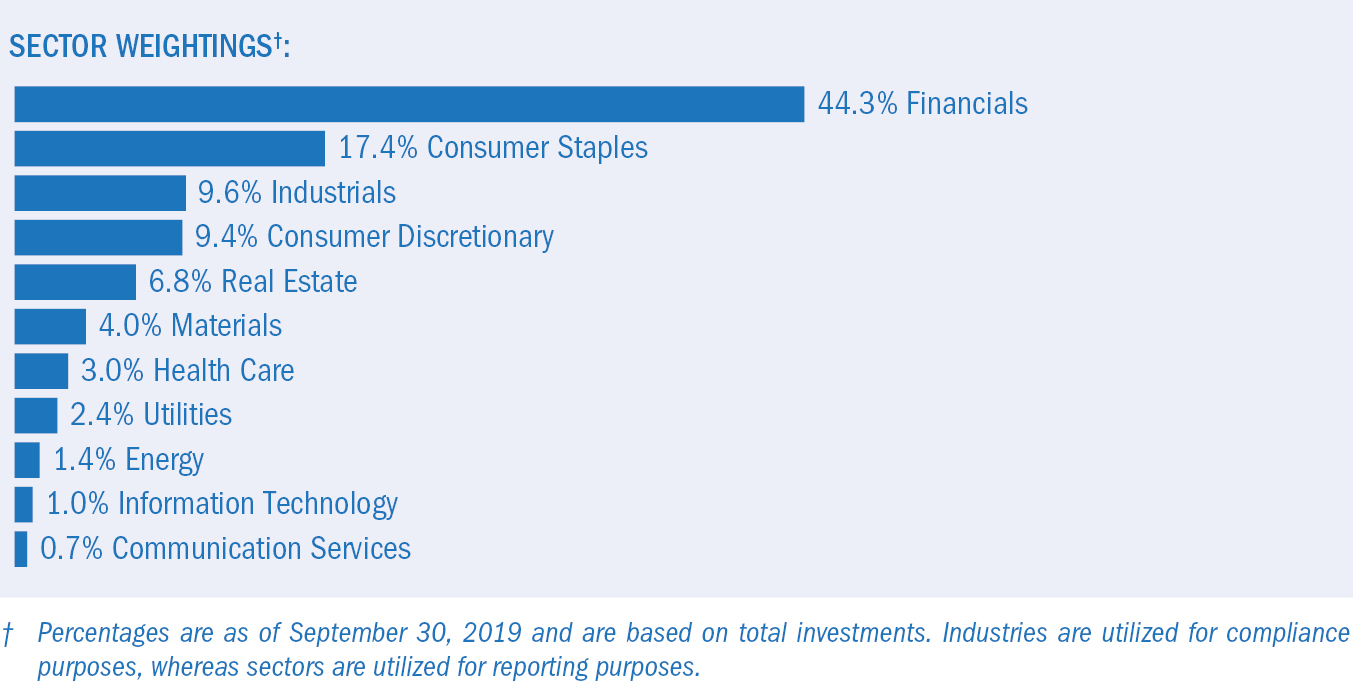
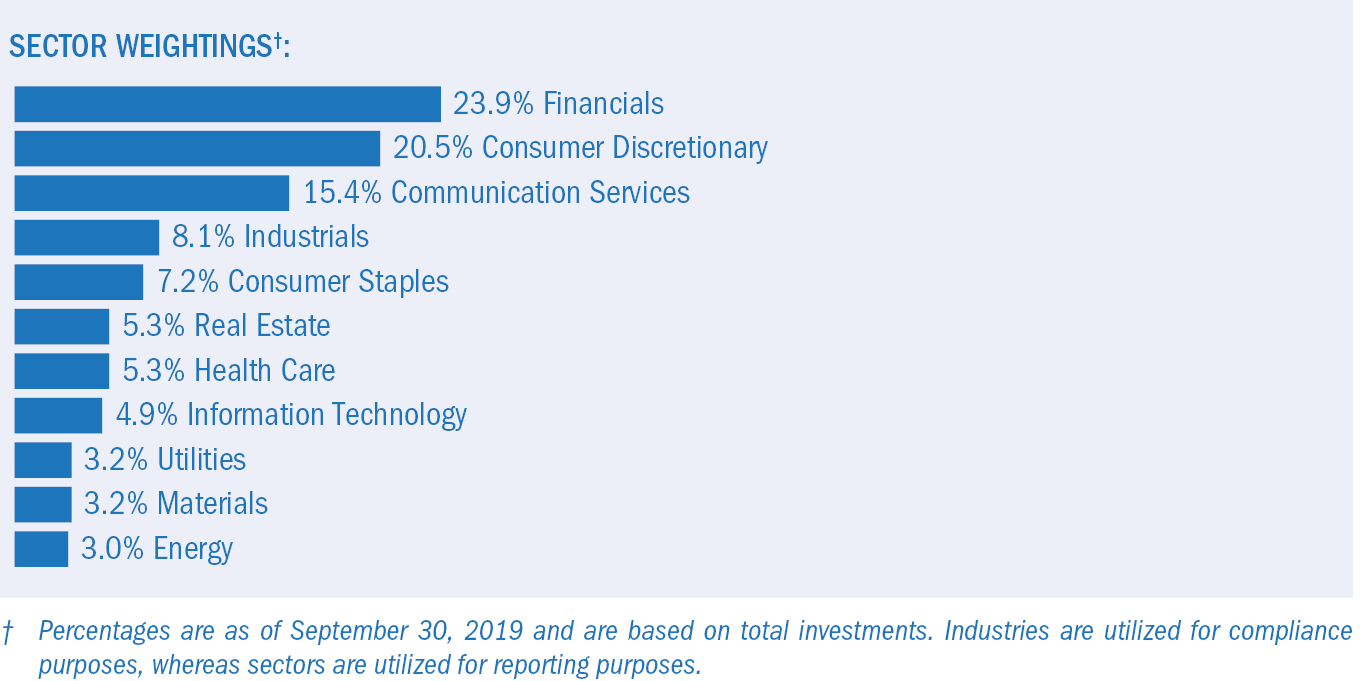
‡ Industries are utilized for compliance purposes, whereas sectors are utilized for reporting.
* Non-income producing security.
(A) Security is fair valued using methods determined in good faith by the Fair Value Committee of the Board of Trustees. The total value of such securities as of September 30, 2019 was $0 and represents 0.0% of Net Assets.
(B) Level 3 security in accordance with fair value hierarchy.
(C) Security considered illiquid. The total value of such securities as of September 30, 2019 was $0 and represents 0.0% of Net Assets.
Cl — Class
The following summarizes the market value of the Fund’s investments used as of September30, 2019, based on the inputs used to value them:
Investments in Securities | Level 1 | Level 2 | Level 3^ | Total | ||||||||
Common Stock |
|
|
|
| ||||||||
China |
|
|
|
| ||||||||
Communication Services | $ | 29,394 | $ | — | $ | — | $ | 29,394 | ||||
Consumer Discretionary |
| 366,924 |
| — |
| — |
| 366,924 | ||||
Consumer Staples |
| 676,353 |
| — |
| — |
| 676,353 | ||||
Energy |
| 56,853 |
| — |
| — |
| 56,853 | ||||
Financials |
| 1,723,220 |
| — |
| — |
| 1,723,220 | ||||
Health Care |
| 115,554 |
| — |
| — |
| 115,554 | ||||
Industrials |
| 372,592 |
| — |
| — |
| 372,592 | ||||
Information Technology |
| 37,876 |
| — |
| — |
| 37,876 | ||||
Materials |
| 154,440 |
| — |
| — |
| 154,440 | ||||
Real Estate |
| 267,045 |
| — |
| — |
| 267,045 | ||||
Utilities |
| 92,960 |
| — |
| — |
| 92,960 | ||||
Total Common Stock |
| 3,893,211 |
| — |
| — |
| 3,893,211 | ||||
Total Investments in Securities | $ | 3,893,211 | $ | — | $ | — | $ | 3,893,211 | ||||
^ A reconciliation of Level 3 investments, including certain disclosures related to significant inputs used in valuing Level 3 investments is only presented when the Fund has over 1% of Level 3 investments at the beginning and/or end of the period in relation to net assets
For the period ended September30, 2019, there have been no transfers between Level 1 and Level 2 investments.
For the period ended September30, 2019, there have been no transfers between Level 2 and Level 3 investments.
For the period ended September30, 2019, the transfers in and out of Level 3 occurred due to a halt in trading of these securities. Transfers between levels are recognized at period end.
Amounts designated as “—” are $0 or have been rounded to $0.
The accompanying notes are an integral part of the financial statements.
4
Shares | Value | ||||
COMMON STOCK — 102.4%‡ |
| ||||
CHINA — 87.4% |
| ||||
Communication Services — 47.2% |
| ||||
58.com ADR* | 966,170 | $ | 47,641,843 | ||
Autohome ADR* | 557,979 |
| 46,384,794 | ||
Baidu ADR* | 1,100,903 |
| 113,128,792 | ||
Bilibili ADR* | 1,822,830 |
| 25,738,360 | ||
Bitauto Holdings ADR* | 345,998 |
| 5,179,590 | ||
HUYA ADR* | 597,347 |
| 14,121,283 | ||
iQIYI ADR*(A) | 2,700,713 |
| 43,562,501 | ||
Momo ADR | 1,510,648 |
| 46,799,875 | ||
NetEase ADR | 233,612 |
| 62,182,842 | ||
Qutoutiao ADR(A) | 1,380,877 |
| 5,109,245 | ||
SINA* | 642,900 |
| 25,195,251 | ||
Sogou ADR*(A) | 708,297 |
| 3,498,987 | ||
Tencent Holdings | 3,578,575 |
| 150,731,620 | ||
Tencent Music Entertainment Group ADR* | 4,365,782 |
| 55,751,036 | ||
Weibo ADR*(A) | 631,793 |
| 28,272,737 | ||
YY ADR* | 616,139 |
| 34,645,496 | ||
| 707,944,252 | ||||
Consumer Discretionary — 34.4% |
| ||||
Alibaba Group Holding ADR* | 879,155 |
| 147,021,091 | ||
Baozun ADR*(A) | 379,147 |
| 16,189,577 | ||
Ctrip.com International ADR* | 1,815,235 |
| 53,168,233 | ||
JD.com ADR* | 3,473,687 |
| 97,992,710 | ||
Pinduoduo ADR* | 3,092,357 |
| 99,635,742 | ||
TAL Education Group ADR* | 1,719,274 |
| 58,867,942 | ||
Uxin ADR(A) | 1,657,093 |
| 4,059,878 | ||
Vipshop Holdings ADR* | 4,435,403 |
| 39,563,795 | ||
| 516,498,968 | ||||
Financials — 3.2% |
| ||||
360 Finance ADR(A) | 162,392 |
| 1,445,289 | ||
Fanhua ADR(A) | 451,122 |
| 12,013,379 | ||
LexinFintech Holdings ADR*(A) | 751,329 |
| 7,535,830 | ||
PPDAI Group ADR | 1,756,208 |
| 5,093,003 | ||
Qudian ADR* | 1,915,255 |
| 13,196,107 | ||
Yirendai ADR*(A) | 117,304 |
| 823,474 | ||
ZhongAn Online P&C Insurance, Cl H*(A) | 3,398,700 |
| 8,020,505 | ||
| 48,127,587 | ||||
The accompanying notes are an integral part of the financial statements.
5
Schedule of Investments (Unaudited)September 30, 2019
KraneShares CSI China Internet ETF(concluded)
Shares | Value | |||||
COMMON STOCK (continued) |
|
| ||||
Industrials — 1.4% |
|
| ||||
51job ADR* | 290,287 | $ | 21,481,238 |
| ||
Information Technology — 1.2% |
|
| ||||
Kingsoft | 8,133,000 |
| 17,263,199 |
| ||
TOTAL CHINA |
| 1,311,315,244 |
| |||
HONG KONG — 15.0% |
|
| ||||
Communication Services — 3.0% |
|
| ||||
Alibaba Pictures Group* | 139,544,000 |
| 22,606,434 |
| ||
China Literature*(A) | 3,510,600 |
| 11,934,267 |
| ||
iDreamSky Technology Holdings*(A) | 4,196,800 |
| 2,259,165 |
| ||
NetDragon Websoft Holdings | 2,400,815 |
| 5,585,997 |
| ||
Wise Talent Information Technology* | 1,310,800 |
| 3,086,635 |
| ||
| 45,472,498 |
| ||||
Consumer Discretionary — 11.2% |
|
| ||||
Meituan Dianping, Cl B* | 13,592,300 |
| 138,880,938 |
| ||
Tongcheng-Elong Holdings* | 19,038,800 |
| 29,240,395 |
| ||
| 168,121,333 |
| ||||
Financials — 0.4% |
|
| ||||
Yixin Group* | 23,398,500 |
| 5,462,058 |
| ||
Information Technology — 0.4% |
|
| ||||
Weimob* | 14,375,000 |
| 6,454,576 |
| ||
TOTAL HONG KONG |
| 225,510,465 |
| |||
TOTAL COMMON STOCK |
| 1,536,825,709 |
| |||
SHORT-TERM INVESTMENT(B)(C) — 6.9% |
|
| ||||
Invesco Government & Agency Portfolio, Cl Institutional, 2.270% | 104,328,298 |
| 104,328,298 |
| ||
TOTAL SHORT-TERM INVESTMENT |
| 104,328,298 |
| |||
|
| |||||
TOTAL INVESTMENTS — 109.3% |
| 1,641,154,007 |
| |||
OTHER ASSETS LESS LIABILITIES — (9.3)% |
| (139,650,975 | ) | |||
NET ASSETS — 100% | $ | 1,501,503,032 |
| |||
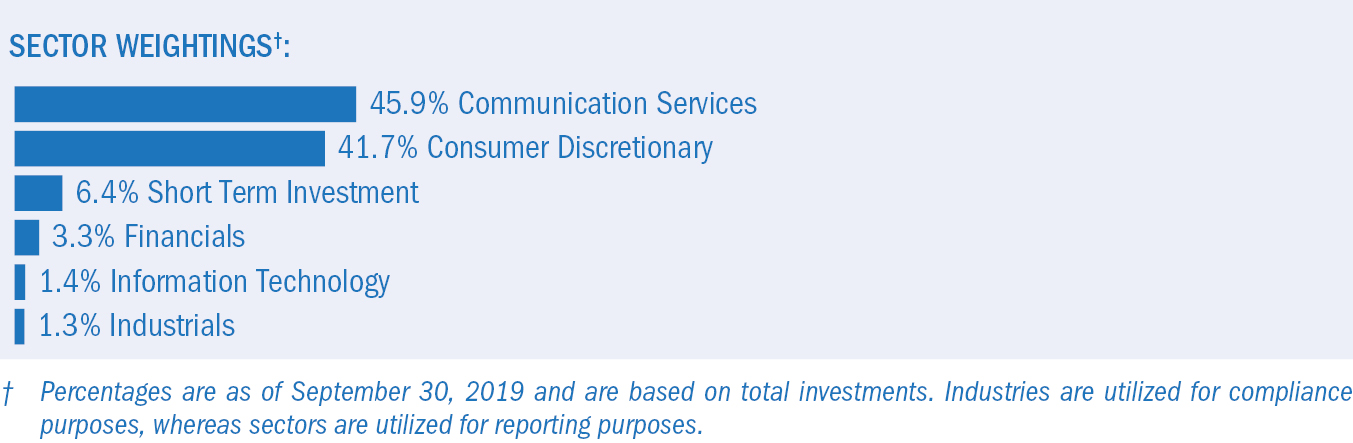
‡ Industries are utilized for compliance purposes, whereas sectors are utilized for reporting.
* Non-income producing security.
(A) This security or a partial position of this security is on loan at September 30, 2019. The total market value of securities on loan at September 30, 2019 was $101,348,781.
(B) The rate shown is the 7-day effective yield as of September 30, 2019.
(C) This security was purchased with cash collateral held from securities on loan. The total value of such security as of September 30, 2019 was $104,328,298.
ADR — American Depositary Receipt
Cl — Class
As of September30, 2019, all of the Fund’s investments were considered Level 1 of the fair value hierarchy, in accordance with the authoritative guidance under U.S. GAAP.
For the period ended September30, 2019, there have been no transfers between Level1, Level 2 or Level 3 investments. Transfers between levels are recognized at period end.
The accompanying notes are an integral part of the financial statements.
6
Shares | Value | ||||
COMMON STOCK — 99.9%‡ |
| ||||
CHINA — 99.9% |
| ||||
Communication Services — 1.8% |
| ||||
Beijing Enlight Media, Cl A | 448,660 | $ | 588,060 | ||
China Film, Cl A | 237,921 |
| 514,742 | ||
China South Publishing & Media Group, Cl A | 274,648 |
| 465,362 | ||
China United Network Communications, Cl A | 4,747,220 |
| 3,995,238 | ||
Chinese Universe Publishing and Media Group, Cl A | 210,736 |
| 385,399 | ||
CITIC Guoan Information Industry, Cl A | 599,497 |
| 303,056 | ||
Giant Network Group, Cl A | 206,380 |
| 546,208 | ||
Mango Excellent Media, Cl A | 106,785 |
| 684,266 | ||
Perfect World, Cl A | 134,049 |
| 519,963 | ||
Shanghai Oriental Pearl Group, Cl A | 525,006 |
| 672,689 | ||
Wuhu Sanqi Interactive Entertainment Network Technology Group, Cl A | 325,004 |
| 820,565 | ||
Youzu Interactive, Cl A | 135,927 |
| 302,644 | ||
| 9,798,192 | ||||
Consumer Discretionary — 7.2% |
| ||||
Anhui Zhongding Sealing Parts, Cl A | 186,700 |
| 226,408 | ||
BTG Hotels Group, Cl A | 149,675 |
| 351,908 | ||
BYD, Cl A | 277,258 |
| 1,893,890 | ||
Changzhou Xingyu Automotive Lighting Systems, Cl A | 42,201 |
| 455,919 | ||
China Grand Automotive Services Group, Cl A | 1,251,587 |
| 674,762 | ||
China International Travel Service, Cl A | 298,607 |
| 3,891,274 | ||
China Shipbuilding Industry Group Power, Cl A | 262,490 |
| 840,268 | ||
Chongqing Changan Automobile, Cl A | 596,520 |
| 618,973 | ||
Fuyao Glass Industry Group, Cl A | 306,335 |
| 921,424 | ||
Global Top E-Commerce, Cl A | 238,300 |
| 253,276 | ||
Gree Electric Appliances of Zhuhai, Cl A | 459,968 |
| 3,690,720 | ||
Guangzhou Automobile Group, Cl A | 363,696 |
| 624,902 | ||
Haier Smart Home, Cl A | 932,468 |
| 1,997,810 | ||
Hangzhou Robam Appliances, Cl A | 145,141 |
| 534,533 | ||
HLA, Cl A | 458,092 |
| 520,880 | ||
The accompanying notes are an integral part of the financial statements.
7
Schedule of Investments (Unaudited)September 30, 2019
KraneShares Bosera MSCI China A Share ETF(continued)
Shares | Value | ||||
COMMON STOCK (continued) |
| ||||
Consumer Discretionary (continued) |
| ||||
Huayu Automotive Systems, Cl A | 482,179 | $ | 1,586,737 | ||
Liaoning Cheng Da, Cl A* | 233,938 |
| 433,401 | ||
Midea Group, Cl A | 527,002 |
| 3,771,047 | ||
NanJi E-Commerce, Cl A* | 375,400 |
| 541,978 | ||
NavInfo, Cl A | 300,235 |
| 684,454 | ||
Ningbo Joyson Electronic, Cl A* | 203,275 |
| 493,585 | ||
Oppein Home Group, Cl A | 42,791 |
| 667,883 | ||
SAIC Motor, Cl A | 1,191,166 |
| 3,966,550 | ||
Shandong Linglong Tyre, Cl A | 183,519 |
| 523,738 | ||
Shanghai Jinjiang International Hotels Development, Cl A | 81,800 |
| 265,175 | ||
Shanghai Yuyuan Tourist Mart Group, Cl A | 494,669 |
| 564,548 | ||
Shenzhen Overseas Chinese Town, Cl A | 1,254,675 |
| 1,235,138 | ||
Songcheng Performance Development, Cl A | 222,136 |
| 869,109 | ||
Suning.com, Cl A | 1,423,783 |
| 2,065,534 | ||
Suofeiya Home Collection, Cl A | 141,184 |
| 338,468 | ||
TCL, Cl A | 2,072,200 |
| 1,033,024 | ||
Visual China Group, Cl A | 107,100 |
| 306,849 | ||
Wanxiang Qianchao, Cl A | 421,033 |
| 305,404 | ||
Weifu High-Technology Group, Cl A | 127,974 |
| 293,538 | ||
Wuchan Zhongda Group, Cl A | 658,630 |
| 505,418 | ||
Zhejiang Semir Garment, Cl A | 275,300 |
| 476,490 | ||
Zhejiang Supor, Cl A | 83,694 |
| 840,667 | ||
Zhejiang Wanfeng Auto Wheel, Cl A | 334,466 |
| 330,195 | ||
| 39,595,877 | ||||
Consumer Staples — 14.9% |
| ||||
Angel Yeast, Cl A | 125,981 |
| 477,201 | ||
Anhui Gujing Distillery, Cl A | 58,703 |
| 945,338 | ||
Anhui Kouzi Distillery, Cl A | 91,800 |
| 717,051 | ||
Beijing Dabeinong Technology Group, Cl A | 648,900 |
| 415,263 | ||
Beijing Shunxin Agriculture, Cl A | 113,410 |
| 828,357 | ||
Beijing Yanjing Brewery, Cl A | 431,100 |
| 350,738 | ||
Chongqing Fuling Zhacai Group, Cl A | 120,700 |
| 377,420 | ||
Foshan Haitian Flavouring & Food, Cl A | 344,158 |
| 5,296,926 | ||
Fujian Sunner Development, Cl A | 158,011 |
| 545,644 | ||
Guangdong Haid Group, Cl A | 241,821 |
| 1,059,905 | ||
Heilongjiang Agriculture, Cl A | 271,900 |
| 368,945 | ||
Henan Shuanghui Investment & Development, Cl A | 420,509 |
| 1,454,458 | ||
Inner Mongolia Yili Industrial Group, Cl A | 932,419 |
| 3,723,826 | ||
Jiangsu King’s Luck Brewery JSC, Cl A | 191,807 |
| 868,090 | ||
Jiangsu Yanghe Brewery Joint-Stock, Cl A | 230,508 |
| 3,356,975 | ||
Jiangxi Zhengbang Technology, Cl A | 362,700 |
| 767,434 | ||
Jonjee Hi-Tech Industrial And Commercial Holding, Cl A | 121,851 |
| 723,987 | ||
Kweichow Moutai, Cl A | 192,148 |
| 30,943,007 | ||
Laobaixing Pharmacy Chain JSC, Cl A | 43,829 |
| 464,792 | ||
Luzhou Laojiao, Cl A | 223,975 |
| 2,672,821 | ||
Muyuan Foodstuff, Cl A | 265,708 |
| 2,623,146 | ||
New Hope Liuhe, Cl A | 644,792 |
| 1,550,311 | ||
Shanghai Jahwa United, Cl A | 102,700 |
| 493,999 | ||
Shanxi Xinghuacun Fen Wine Factory, Cl A | 133,326 |
| 1,443,375 | ||
The accompanying notes are an integral part of the financial statements.
8
Schedule of Investments (Unaudited)September 30, 2019
KraneShares Bosera MSCI China A Share ETF(continued)
Shares | Value | ||||
COMMON STOCK (continued) |
| ||||
Consumer Staples(continued) |
| ||||
Sichuan Swellfun, Cl A | 74,722 | $ | 474,206 | ||
Tech-Bank Food, Cl A | 177,350 |
| 286,096 | ||
Tongwei, Cl A | 593,780 |
| 1,059,312 | ||
Tsingtao Brewery, Cl A | 106,424 |
| 722,787 | ||
Wens Foodstuffs Group | 812,529 |
| 4,230,357 | ||
Wuliangye Yibin, Cl A | 593,668 |
| 10,790,638 | ||
Yonghui Superstores, Cl A | 1,463,671 |
| 1,822,107 | ||
Yuan Longping High-tech Agriculture, Cl A | 201,388 |
| 353,639 | ||
| 82,208,151 | ||||
Energy — 2.3% |
| ||||
China Merchants Energy Shipping, Cl A | 927,800 |
| 619,729 | ||
China Petroleum & Chemical, Cl A | 3,897,084 |
| 2,739,506 | ||
China Shenhua Energy, Cl A | 672,576 |
| 1,768,747 | ||
Guanghui Energy, Cl A | 1,039,005 |
| 483,042 | ||
Jizhong Energy Resources, Cl A | 540,400 |
| 264,857 | ||
Offshore Oil Engineering, Cl A | 676,187 |
| 510,369 | ||
PetroChina, Cl A | 2,476,355 |
| 2,146,507 | ||
Shaanxi Coal Industry, Cl A | 1,274,469 |
| 1,558,018 | ||
Shandong Xinchao Energy, Cl A* | 1,040,000 |
| 292,724 | ||
Shanxi Lu’an Environmental Energy Development, Cl A | 457,462 |
| 463,791 | ||
Shanxi Xishan Coal & Electricity Power, Cl A | 481,946 |
| 396,830 | ||
Yang Quan Coal Industry Group, Cl A | 367,800 |
| 265,760 | ||
Yantai Jereh Oilfield Services Group, Cl A | 146,506 |
| 554,126 | ||
Yanzhou Coal Mining, Cl A | 377,200 |
| 562,536 | ||
| 12,626,542 | ||||
Financials — 27.2% |
| ||||
Agricultural Bank of China, Cl A | 11,392,207 |
| 5,519,666 | ||
Anxin Trust, Cl A | 836,431 |
| 551,671 | ||
Avic Capital, Cl A | 1,372,800 |
| 897,745 | ||
Bank of Beijing, Cl A | 3,233,552 |
| 2,427,020 | ||
Bank of Chengdu, Cl A | 552,400 |
| 629,661 | ||
Bank of China, Cl A | 5,372,200 |
| 2,693,171 | ||
Bank of Communications, Cl A | 6,002,814 |
| 4,581,210 | ||
Bank of Guiyang, Cl A | 492,127 |
| 586,456 | ||
Bank of Hangzhou, Cl A | 784,591 |
| 928,387 | ||
Bank of Jiangsu, Cl A | 1,765,564 |
| 1,658,956 | ||
Bank of Nanjing, Cl A | 1,297,209 |
| 1,560,386 | ||
Bank of Ningbo, Cl A | 796,616 |
| 2,812,229 | ||
Bank of Shanghai, Cl A | 2,172,649 |
| 2,844,657 | ||
Caitong Securities, Cl A | 548,909 |
| 765,576 | ||
Changjiang Securities, Cl A | 845,705 |
| 828,983 | ||
China CITIC Bank, Cl A | 867,934 |
| 685,480 | ||
China Construction Bank, Cl A | 1,467,226 |
| 1,436,161 | ||
China Everbright Bank, Cl A | 6,088,384 |
| 3,359,132 | ||
China Life Insurance, Cl A | 424,639 |
| 1,634,050 | ||
China Merchants Bank, Cl A | 3,154,929 |
| 15,352,291 | ||
China Merchants Securities, Cl A | 874,590 |
| 2,014,648 | ||
China Minsheng Banking, Cl A | 5,423,410 |
| 4,571,911 | ||
China Pacific Insurance Group, Cl A | 961,486 |
| 4,694,871 | ||
The accompanying notes are an integral part of the financial statements.
9
Schedule of Investments (Unaudited)September 30, 2019
KraneShares Bosera MSCI China A Share ETF(continued)
Shares | Value | ||||
COMMON STOCK (continued) |
| ||||
Financials (continued) |
| ||||
CITIC Securities, Cl A | 1,504,643 | $ | 4,736,511 | ||
Dongxing Securities, Cl A | 421,780 |
| 646,739 | ||
East Money Information, Cl A | 1,027,020 |
| 2,125,603 | ||
Everbright Securities, Cl A | 597,433 |
| 947,868 | ||
First Capital Securities, Cl A | 535,637 |
| 477,042 | ||
Founder Securities, Cl A | 1,259,006 |
| 1,214,719 | ||
GF Securities, Cl A* | 905,228 |
| 1,720,151 | ||
Guosen Securities, Cl A | 627,041 |
| 1,078,259 | ||
Guotai Junan Securities, Cl A | 1,149,481 |
| 2,828,150 | ||
Guoyuan Securities, Cl A | 514,668 |
| 615,480 | ||
Haitong Securities, Cl A | 1,237,587 |
| 2,478,224 | ||
Hithink RoyalFlush Information Network, Cl A | 82,200 |
| 1,141,859 | ||
Huaan Securities, Cl A | 553,754 |
| 477,668 | ||
Huatai Securities, Cl A | 998,995 |
| 2,670,534 | ||
Huaxi Securities, Cl A | 401,431 |
| 552,016 | ||
Huaxia Bank, Cl A | 1,961,027 |
| 2,026,603 | ||
Hubei Biocause Pharmaceutical, Cl A | 755,641 |
| 745,991 | ||
Industrial & Commercial Bank of China, Cl A | 8,246,626 |
| 6,386,019 | ||
Industrial Bank, Cl A | 3,177,062 |
| 7,798,955 | ||
Industrial Securities, Cl A | 1,024,144 |
| 892,032 | ||
New China Life Insurance, Cl A | 318,966 |
| 2,173,875 | ||
Northeast Securities, Cl A | 357,900 |
| 407,456 | ||
Orient Securities, Cl A | 912,535 |
| 1,303,402 | ||
Pacific Securities, Cl A | 1,042,500 |
| 499,265 | ||
Ping An Bank, Cl A | 2,625,948 |
| 5,732,724 | ||
Ping An Insurance Group of China, Cl A | 1,656,681 |
| 20,192,337 | ||
SDIC Capital, Cl A | 538,765 |
| 940,040 | ||
Sealand Securities, Cl A | 644,712 |
| 445,986 | ||
Shanghai AJ Group, Cl A | 248,000 |
| 301,439 | ||
Shanghai Pudong Development Bank, Cl A | 4,488,971 |
| 7,442,645 | ||
Shanxi Securities, Cl A | 432,646 |
| 475,588 | ||
Shenwan Hongyuan Group, Cl A | 3,446,581 |
| 2,306,987 | ||
Sinolink Securities, Cl A | 462,500 |
| 564,103 | ||
SooChow Securities, Cl A | 458,787 |
| 594,267 | ||
Southwest Securities, Cl A | 863,300 |
| 545,214 | ||
Western Securities, Cl A | 535,589 |
| 668,249 | ||
Xishui Strong Year Inner Mongolia, Cl A | 167,142 |
| 204,328 | ||
Zheshang Securities, Cl A | 424,800 |
| 514,552 | ||
| 149,907,198 | ||||
Health Care — 8.2% |
| ||||
Aier Eye Hospital Group, Cl A | 473,896 |
| 2,353,819 | ||
Beijing SL Pharmaceutical, Cl A | 157,150 |
| 274,636 | ||
Beijing Tiantan Biological Products, Cl A | 159,828 |
| 635,400 | ||
Beijing Tongrentang, Cl A | 209,736 |
| 790,049 | ||
BGI Genomics, Cl A | 61,220 |
| 548,487 | ||
Changchun High & New Technology Industry Group, Cl A | 25,981 |
| 1,434,754 | ||
Chengdu Kanghong Pharmaceutical Group, Cl A | 89,239 |
| 416,254 | ||
China National Accord Medicines, Cl A | 57,111 |
| 347,807 | ||
China National Medicines, Cl A | 116,900 |
| 446,077 | ||
China Reform Health Management and Services Group, Cl A* | 137,500 |
| 337,723 | ||
The accompanying notes are an integral part of the financial statements.
10
Schedule of Investments (Unaudited)September 30, 2019
KraneShares Bosera MSCI China A Share ETF(continued)
Shares | Value | ||||
COMMON STOCK (continued) |
| ||||
Health Care (continued) |
| ||||
China Resources Double Crane Pharmaceutical, Cl A | 159,566 | $ | 272,602 | ||
China Resources Sanjiu Medical & Pharmaceutical, Cl A | 149,685 |
| 610,587 | ||
Chongqing Zhifei Biological Products, Cl A | 203,926 |
| 1,354,995 | ||
Dong-E-E-Jiao, Cl E | 100,037 |
| 426,977 | ||
Guangzhou Baiyunshan Pharmaceutical Holdings, Cl A | 215,039 |
| 1,044,902 | ||
Guizhou Bailing Group Pharmaceutical, Cl A | 215,789 |
| 313,355 | ||
Hangzhou Tigermed Consulting, Cl A | 114,750 |
| 997,065 | ||
Huadong Medicine, Cl A | 267,641 |
| 981,935 | ||
Hualan Biological Engineering, Cl A | 214,550 |
| 1,030,508 | ||
Hubei Jumpcan Pharmaceutical, Cl A | 124,580 |
| 494,049 | ||
Jafron Biomedical, Cl A | 63,952 |
| 679,712 | ||
Jiangsu Hengrui Medicine, Cl A | 676,368 |
| 7,641,485 | ||
Jiangsu Yuyue Medical Equipment & Supply, Cl A | 153,317 |
| 463,738 | ||
Jilin Aodong Pharmaceutical Group, Cl A | 177,845 |
| 383,523 | ||
Jinyu Bio-Technology, Cl A | 177,400 |
| 468,764 | ||
Joincare Pharmaceutical Group Industry, Cl A | 296,416 |
| 407,192 | ||
Jointown Pharmaceutical Group, Cl A | 287,177 |
| 573,855 | ||
Lepu Medical Technology Beijing, Cl A | 272,511 |
| 956,299 | ||
Livzon Pharmaceutical Group, Cl A | 94,058 |
| 349,563 | ||
Meinian Onehealth Healthcare Holdings, Cl A | 572,828 |
| 975,409 | ||
Shandong Buchang Pharmaceuticals, Cl A | 176,260 |
| 470,688 | ||
Shanghai Fosun Pharmaceutical Group, Cl A | 307,579 |
| 1,088,405 | ||
Shanghai Pharmaceuticals Holding, Cl A | 294,135 |
| 749,630 | ||
Shenzhen Hepalink Pharmaceutical Group, Cl A | 159,000 |
| 414,132 | ||
Shenzhen Kangtai Biological Products, Cl A | 98,708 |
| 1,026,170 | ||
Shenzhen Mindray Bio-Medical Electronics, Cl A | 61,948 |
| 1,600,141 | ||
Shenzhen Salubris Pharmaceuticals, Cl A | 133,326 |
| 349,128 | ||
Shijiazhuang Yiling Pharmaceutical, Cl A | 184,469 |
| 278,724 | ||
Sichuan Kelun Pharmaceutical, Cl A | 220,169 |
| 797,285 | ||
Tasly Pharmaceutical Group, Cl A | 231,358 |
| 504,755 | ||
Tonghua Dongbao Pharmaceutical, Cl A | 311,071 |
| 762,301 | ||
Walvax Biotechnology, Cl A | 235,153 |
| 888,755 | ||
Winning Health Technology Group, Cl A | 248,100 |
| 551,704 | ||
WuXi AppTec, Cl A | 224,479 |
| 2,725,358 | ||
Yifan Pharmaceutical, Cl A | 184,621 |
| 346,688 | ||
Yunnan Baiyao Group, Cl A | 159,230 |
| 1,695,715 | ||
Zhangzhou Pientzehuang Pharmaceutical, Cl A | 92,250 |
| 1,316,086 | ||
Zhejiang Conba Pharmaceutical, Cl A | 407,900 |
| 361,565 | ||
Zhejiang Huahai Pharmaceutical, Cl A | 202,211 |
| 418,512 | ||
Zhejiang NHU, Cl A | 328,617 |
| 984,305 | ||
| 45,341,568 | ||||
Industrials — 12.6% |
| ||||
AECC Aero-Engine Control, Cl A | 175,200 |
| 334,394 | ||
AECC Aviation Power, Cl A | 344,044 |
| 1,053,638 | ||
Air China, Cl A | 609,436 |
| 682,727 | ||
AVIC Aircraft, Cl A | 423,427 |
| 922,015 | ||
AVIC Electromechanical Systems, Cl A | 551,890 |
| 503,109 | ||
AVIC Shenyang Aircraft, Cl A* | 142,738 |
| 619,627 | ||
AVICOPTER, Cl A | 90,200 |
| 567,381 | ||
Beijing New Building Materials, Cl A | 258,416 |
| 651,359 | ||
The accompanying notes are an integral part of the financial statements.
11
Schedule of Investments (Unaudited)September 30, 2019
KraneShares Bosera MSCI China A Share ETF(continued)
Shares | Value | ||||
COMMON STOCK (continued) |
| ||||
Industrials (continued) |
| ||||
Beijing Originwater Technology, Cl A | 481,792 | $ | 452,701 | ||
China Aerospace Times Electronics, Cl A* | 415,900 |
| 351,184 | ||
China Avionics Systems, Cl A | 224,239 |
| 445,891 | ||
China Communications Construction, Cl A | 419,224 |
| 593,507 | ||
China Eastern Airlines, Cl A | 1,427,700 |
| 1,035,608 | ||
China Gezhouba Group, Cl A | 704,264 |
| 574,954 | ||
China International Marine Containers Group, Cl A | 232,820 |
| 331,892 | ||
China Meheco, Cl A | 163,400 |
| 295,855 | ||
China National Chemical Engineering, Cl A | 754,439 |
| 612,747 | ||
China Railway Construction, Cl A | 1,759,242 |
| 2,330,481 | ||
China Railway Group, Cl A | 2,850,200 |
| 2,394,724 | ||
China Railway Hi-tech Industry, Cl A | 339,800 |
| 488,202 | ||
China Shipbuilding Industry, Cl A | 3,499,099 |
| 2,699,831 | ||
China Southern Airlines, Cl A | 1,315,402 |
| 1,221,239 | ||
China Spacesat, Cl A | 180,831 |
| 548,733 | ||
China State Construction Engineering, Cl A | 6,420,406 |
| 4,881,925 | ||
CMST Development, Cl A | 336,400 |
| 233,179 | ||
Contemporary Amperex Technology, Cl A | 111,899 |
| 1,120,369 | ||
COSCO SHIPPING Development, Cl A | 1,213,078 |
| 426,374 | ||
COSCO SHIPPING Energy Transportation, Cl A | 418,400 |
| 393,722 | ||
COSCO SHIPPING Holdings, Cl A* | 986,864 |
| 657,799 | ||
CRRC, Cl A | 3,720,556 |
| 3,813,711 | ||
Dalian Port PDA, Cl A | 1,183,100 |
| 334,658 | ||
Daqin Railway, Cl A | 2,273,610 |
| 2,416,499 | ||
Dongfang Electric, Cl A | 420,726 |
| 542,610 | ||
Eve Energy, Cl A | 148,400 |
| 631,529 | ||
Fangda Carbon New Material, Cl A* | 411,880 |
| 670,202 | ||
Guangdong LY Intelligent Manufacturing, Cl A* | 695,900 |
| 912,119 | ||
Guangshen Railway, Cl A | 864,391 |
| 372,812 | ||
Guangzhou Baiyun International Airport, Cl A | 316,509 |
| 995,019 | ||
Guoxuan High-Tech, Cl A | 173,800 |
| 304,464 | ||
Hongfa Technology, Cl A | 113,900 |
| 403,368 | ||
Inner Mongolia First Machinery Group, Cl A | 258,400 |
| 381,022 | ||
Jiangsu Hengli Hydraulic, Cl A | 134,937 |
| 727,479 | ||
Jiangsu Zhongtian Technology, Cl A | 468,900 |
| 567,313 | ||
Juneyao Airlines, Cl A* | 250,620 |
| 479,748 | ||
Metallurgical Corp of China, Cl A | 2,730,321 |
| 1,066,711 | ||
NARI Technology, Cl A | 706,834 |
| 2,024,135 | ||
Ningbo Zhoushan Port, Cl A | 1,343,100 |
| 701,530 | ||
Power Construction Corp of China, Cl A | 1,949,846 |
| 1,264,183 | ||
Sany Heavy Industry, Cl A | 1,280,853 |
| 2,561,276 | ||
SF Holding, Cl A | 180,184 |
| 994,630 | ||
Shanghai Construction Group, Cl A | 1,361,811 |
| 646,465 | ||
Shanghai Electric Group, Cl A | 1,228,160 |
| 863,351 | ||
Shanghai International Airport, Cl A | 147,389 |
| 1,646,599 | ||
Shanghai International Port Group, Cl A | 1,299,500 |
| 1,035,422 | ||
Shanghai M&G Stationery, Cl A | 140,739 |
| 878,190 | ||
Shanghai Mechanical and Electrical Industry, Cl A | 123,337 |
| 287,220 | ||
Shanghai Tunnel Engineering, Cl A | 480,850 |
| 396,601 | ||
Shanghai Waigaoqiao Free Trade Zone Group, Cl A | 119,132 |
| 297,280 | ||
The accompanying notes are an integral part of the financial statements.
12
Schedule of Investments (Unaudited)September 30, 2019
KraneShares Bosera MSCI China A Share ETF(continued)
Shares | Value | ||||
COMMON STOCK (continued) |
| ||||
Industrials (continued) |
| ||||
Shenzhen Inovance Technology, Cl A | 254,215 | $ | 866,108 | ||
Siasun Robot & Automation, Cl A | 238,583 |
| 482,097 | ||
Sinochem International, Cl A | 414,136 |
| 287,063 | ||
Sinotrans, Cl A | 669,800 |
| 398,624 | ||
Spring Airlines, Cl A | 140,239 |
| 835,598 | ||
Suzhou Gold Mantis Construction Decoration, Cl A | 409,341 |
| 519,902 | ||
TangShan Port Group, Cl A | 906,300 |
| 312,202 | ||
TBEA, Cl A | 568,050 |
| 517,046 | ||
Tian Di Science & Technology, Cl A | 632,900 |
| 290,695 | ||
Tianjin Port, Cl A | 307,345 |
| 265,116 | ||
Tus Environmental Science And Technology Development, Cl A | 218,782 |
| 289,209 | ||
Weichai Power, Cl A | 916,222 |
| 1,439,535 | ||
XCMG Construction Machinery, Cl A | 1,198,087 |
| 743,226 | ||
Xiamen C & D, Cl A | 433,618 |
| 528,269 | ||
Xinjiang Goldwind Science & Technology, Cl A | 527,805 |
| 925,351 | ||
Yunda Holding, Cl A | 227,009 |
| 1,093,529 | ||
Zhejiang Chint Electrics, Cl A | 329,051 |
| 1,005,879 | ||
Zhejiang Sanhua Intelligent Controls, Cl A | 422,995 |
| 779,507 | ||
Zhejiang Weixing New Building Materials, Cl A | 240,586 |
| 535,669 | ||
Zhengzhou Yutong Bus, Cl A | 338,549 |
| 658,969 | ||
Zoomlion Heavy Industry Science and Technology, Cl A | 983,541 |
| 785,048 | ||
| 69,199,955 | ||||
Information Technology — 10.5% |
| ||||
360 Security Technology, Cl A | 206,934 |
| 680,391 | ||
Aisino, Cl A | 284,803 |
| 835,521 | ||
AVIC Jonhon Optronic Technology, Cl A | 157,206 |
| 906,534 | ||
Beijing Shiji Information Technology, Cl A | 136,018 |
| 751,402 | ||
Beijing Sinnet Technology, Cl A | 235,700 |
| 613,245 | ||
BOE Technology Group, Cl A | 5,178,780 |
| 2,719,490 | ||
Chaozhou Three-Circle Group, Cl A | 266,603 |
| 746,662 | ||
China Greatwall Technology Group, Cl A | 449,000 |
| 811,082 | ||
China National Software & Service, Cl A | 75,642 |
| 760,318 | ||
China TransInfo Technology, Cl A | 227,400 |
| 561,717 | ||
Dawning Information Industry, Cl A | 137,637 |
| 661,665 | ||
DHC Software, Cl A | 476,430 |
| 449,664 | ||
Fiberhome Telecommunication Technologies, Cl A | 178,779 |
| 684,954 | ||
Focus Media Information Technology, Cl A | 2,244,729 |
| 1,650,259 | ||
Foxconn Industrial Internet, Cl A | 607,012 |
| 1,224,020 | ||
GCL System Integration Technology, Cl A* | 774,600 |
| 727,828 | ||
Gigadevice Semiconductor Beijing, Cl A | 43,567 |
| 886,934 | ||
Glodon, Cl A | 172,308 |
| 856,328 | ||
GoerTek, Cl A | 496,314 |
| 1,221,812 | ||
GRG Banking Equipment, Cl A | 368,399 |
| 444,687 | ||
Guangzhou Haige Communications Group, Cl A | 352,765 |
| 484,106 | ||
Hangzhou Hikvision Digital Technology, Cl A | 1,429,751 |
| 6,466,834 | ||
Hangzhou Silan Microelectronics, Cl A | 200,700 |
| 425,783 | ||
Hengtong Optic-electric, Cl A | 291,175 |
| 634,443 | ||
Holitech Technology, Cl A | 476,610 |
| 387,097 | ||
Hubei Kaile Science & Technology, Cl A | 153,000 |
| 321,374 | ||
Hundsun Technologies, Cl A | 122,784 |
| 1,271,134 | ||
The accompanying notes are an integral part of the financial statements.
13
Schedule of Investments (Unaudited)September 30, 2019
KraneShares Bosera MSCI China A Share ETF(continued)
Shares | Value | ||||
COMMON STOCK (continued) |
| ||||
Information Technology (continued) |
| ||||
Hytera Communications, Cl A | 281,000 | $ | 403,722 | ||
Iflytek, Cl A | 336,559 |
| 1,501,536 | ||
Inspur Electronic Information Industry, Cl A | 197,200 |
| 709,690 | ||
Jiangsu Changjiang Electronics Technology, Cl A | 245,183 |
| 590,881 | ||
Lens Technology, Cl A | 500,423 |
| 721,777 | ||
Leyard Optoelectronic, Cl A | 388,850 |
| 378,983 | ||
LONGi Green Energy Technology, Cl A | 554,264 |
| 2,035,841 | ||
Luxshare Precision Industry, Cl A | 818,083 |
| 3,065,577 | ||
MLS, Cl A | 162,810 |
| 260,133 | ||
NAURA Technology Group, Cl A | 70,024 |
| 643,054 | ||
Newland Digital Technology, Cl A | 159,647 |
| 366,187 | ||
Ninestar, Cl A | 162,600 |
| 676,703 | ||
OFILM Group, Cl A | 414,865 |
| 691,326 | ||
Sanan Optoelectronics, Cl A | 623,731 |
| 1,229,784 | ||
Shanghai 2345 Network Holding Group, Cl A | 882,524 |
| 409,057 | ||
Shanghai Baosight Software, Cl A | 128,918 |
| 645,565 | ||
Shengyi Technology, Cl A | 323,816 |
| 1,130,898 | ||
Shennan Circuits, Cl A | 51,945 |
| 1,098,372 | ||
Shenzhen Kingdom Sci-Tech, Cl A | 130,500 |
| 381,932 | ||
Shenzhen Sunway Communication, Cl A | 149,245 |
| 748,189 | ||
Suzhou Dongshan Precision Manufacturing, Cl A | 245,692 |
| 677,776 | ||
Tianjin Zhonghuan Semiconductor, Cl A | 425,900 |
| 722,238 | ||
Tianma Microelectronics, Cl A | 313,211 |
| 606,141 | ||
Tunghsu Optoelectronic Technology, Cl A | 838,145 |
| 666,648 | ||
Unigroup Guoxin Microelectronics, Cl A | 92,759 |
| 663,622 | ||
Unisplendour, Cl A | 145,842 |
| 642,904 | ||
Venustech Group, Cl A | 137,108 |
| 614,002 | ||
Wangsu Science & Technology, Cl A | 372,099 |
| 521,060 | ||
Westone Information Industry, Cl A | 128,200 |
| 500,686 | ||
Wuxi Lead Intelligent Equipment, Cl A | 134,805 |
| 636,158 | ||
Yealink Network Technology, Cl A | 76,400 |
| 649,291 | ||
Yonyou Network Technology, Cl A | 380,211 |
| 1,644,642 | ||
Zhejiang Dahua Technology, Cl A | 458,477 |
| 1,108,763 | ||
ZTE, Cl A* | 525,694 |
| 2,356,392 | ||
| 57,884,814 | ||||
Materials — 7.7% |
| ||||
Aluminum Corp of China, Cl A* | 2,000,200 |
| 985,927 | ||
Angang Steel, Cl A | 815,011 |
| 352,656 | ||
Anhui Conch Cement, Cl A | 611,646 |
| 3,540,784 | ||
Baoshan Iron & Steel, Cl A | 2,839,000 |
| 2,349,534 | ||
BBMG, Cl A | 1,275,308 |
| 592,901 | ||
Beijing Oriental Yuhong Waterproof Technology, Cl A | 228,219 |
| 671,759 | ||
Beijing Sanju Environmental Protection and New Material, Cl A | 359,515 |
| 313,642 | ||
Chengzhi, Cl A | 127,800 |
| 262,179 | ||
China Jushi, Cl A | 535,662 |
| 609,082 | ||
China Molybdenum, Cl A | 2,701,691 |
| 1,377,101 | ||
China Northern Rare Earth Group High-Tech, Cl A | 555,600 |
| 845,708 | ||
Elion Clean Energy, Cl A | 418,900 |
| 251,063 | ||
Ganfeng Lithium, Cl A | 170,465 |
| 538,522 | ||
The accompanying notes are an integral part of the financial statements.
14
Schedule of Investments (Unaudited)September 30, 2019
KraneShares Bosera MSCI China A Share ETF(continued)
Shares | Value | ||||
COMMON STOCK (continued) |
| ||||
Materials (continued) |
| ||||
GEM, Cl A | 634,800 | $ | 395,572 | ||
Guangdong HEC Technology Holding, Cl A | 460,900 |
| 471,149 | ||
Hengli Petrochemical, Cl A | 901,502 |
| 1,884,757 | ||
Hengyi Petrochemical, Cl A | 434,551 |
| 791,675 | ||
Hesteel, Cl A | 1,623,959 |
| 573,066 | ||
Huaxin Cement, Cl A | 208,260 |
| 549,725 | ||
Hunan Valin Steel, Cl A* | 645,650 |
| 368,881 | ||
Inner Mongolia BaoTou Steel Union, Cl A | 6,971,600 |
| 1,425,326 | ||
Inner Mongolia Junzheng Energy & Chemical Industry Group, Cl A | 1,290,445 |
| 543,920 | ||
Jiangsu Yangnong Chemical, Cl A | 47,400 |
| 330,549 | ||
Jiangxi Copper, Cl A | 317,371 |
| 638,635 | ||
Jinduicheng Molybdenum, Cl A | 411,179 |
| 434,717 | ||
Lomon Billions Group, Cl A | 310,782 |
| 552,263 | ||
Luxi Chemical Group, Cl A | 224,000 |
| 308,968 | ||
Maanshan Iron & Steel, Cl A | 912,700 |
| 343,803 | ||
Nanjing Iron & Steel, Cl A | 676,700 |
| 290,913 | ||
Ningbo Shanshan, Cl A | 171,674 |
| 257,468 | ||
Rongsheng Petro Chemical, Cl A | 641,397 |
| 983,490 | ||
Sansteel Minguang Fujian, Cl A | 374,950 |
| 422,142 | ||
Shandong Gold Mining, Cl A | 397,631 |
| 1,887,038 | ||
Shandong Hualu Hengsheng Chemical, Cl A | 248,757 |
| 572,324 | ||
Shandong Nanshan Aluminum, Cl A | 1,827,600 |
| 542,557 | ||
Shandong Sun Paper Industry JSC, Cl A | 396,300 |
| 440,074 | ||
Shanying International Holding, Cl A | 701,100 |
| 302,385 | ||
Shenghe Resources Holding, Cl A | 268,395 |
| 342,766 | ||
Shenzhen Zhongjin Lingnan Nonfemet, Cl A | 545,893 |
| 308,829 | ||
Sichuan Hebang Biotechnology | 1,350,600 |
| 293,148 | ||
Sinopec Shanghai Petrochemical, Cl A | 934,004 |
| 545,398 | ||
Tangshan Jidong Cement, Cl A | 206,119 |
| 442,475 | ||
Tangshan Sanyou Chemical Industries, Cl A | 315,700 |
| 228,115 | ||
Tianqi Lithium, Cl A | 174,707 |
| 665,439 | ||
Tongkun Group, Cl A | 278,679 |
| 495,606 | ||
Tongling Nonferrous Metals Group, Cl A | 1,609,900 |
| 489,201 | ||
Transfar Zhilian, Cl A | 498,279 |
| 542,851 | ||
Wanhua Chemical Group, Cl A | 480,165 |
| 2,968,588 | ||
Western Mining, Cl A | 364,401 |
| 282,695 | ||
Xiamen Tungsten, Cl A | 216,170 |
| 405,932 | ||
Xinjiang Zhongtai Chemical, Cl A | 328,300 |
| 320,889 | ||
Xinxing Ductile Iron Pipes, Cl A | 610,300 |
| 333,301 | ||
Xinyu Iron & Steel, Cl A | 487,700 |
| 303,908 | ||
Yintai Resources, Cl A | 313,472 |
| 572,407 | ||
Yunnan Energy New Material | 102,637 |
| 479,323 | ||
Yunnan Tin, Cl A* | 255,205 |
| 362,730 | ||
Zhejiang Huayou Cobalt, Cl A | 164,959 |
| 621,611 | ||
Zhejiang Jiahua Energy Chemical Industry, Cl A | 219,073 |
| 324,566 | ||
Zhejiang Juhua, Cl A | 419,800 |
| 415,614 | ||
Zhejiang Longsheng Group, Cl A | 497,571 |
| 979,646 | ||
Zhongjin Gold, Cl A | 527,837 |
| 641,576 | ||
Zijin Mining Group, Cl A | 2,644,902 |
| 1,211,117 | ||
| 42,579,986 | ||||
The accompanying notes are an integral part of the financial statements.
15
Schedule of Investments (Unaudited)September 30, 2019
KraneShares Bosera MSCI China A Share ETF(continued)
Shares | Value | ||||
COMMON STOCK (continued) |
| ||||
Real Estate — 4.4% |
| ||||
Beijing Capital Development, Cl A | 394,526 | $ | 448,601 | ||
China Enterprise | 621,538 |
| 394,271 | ||
China Fortune Land Development, Cl A | 459,190 |
| 1,734,212 | ||
China Merchants Shekou Industrial Zone Holdings, Cl A | 1,007,377 |
| 2,678,834 | ||
China Vanke, Cl A | 1,487,172 |
| 5,393,737 | ||
Financial Street Holdings, Cl A | 457,159 |
| 492,932 | ||
Gemdale, Cl A | 690,407 |
| 1,116,647 | ||
Grandjoy Holdings Group, Cl A | 500,383 |
| 474,373 | ||
Greenland Holdings, Cl A | 1,240,641 |
| 1,226,534 | ||
Jiangsu Zhongnan Construction Group, Cl A | 567,400 |
| 616,566 | ||
Jinke Properties Group, Cl A | 816,641 |
| 750,177 | ||
Oceanwide Holdings, Cl A | 529,763 |
| 320,475 | ||
Poly Developments and Holdings Group, Cl A | 1,819,190 |
| 3,642,864 | ||
RiseSun Real Estate Development, Cl A | 664,993 |
| 771,039 | ||
Seazen Holdings, Cl A | 345,165 |
| 1,371,728 | ||
Shanghai Zhangjiang High-Tech Park Development, Cl A | 236,807 |
| 513,990 | ||
Sichuan Languang Development, Cl A | 456,408 |
| 384,111 | ||
Tahoe Group, Cl A | 380,680 |
| 320,379 | ||
Xinhu Zhongbao, Cl A | 1,315,168 |
| 532,240 | ||
Yango Group, Cl A | 619,380 |
| 511,727 | ||
Zhejiang China Commodities City Group, Cl A | 832,456 |
| 440,638 | ||
| 24,136,075 | ||||
Utilities — 3.1% |
| ||||
Chengdu Xingrong Environment, Cl A | 456,733 |
| 306,356 | ||
China National Nuclear Power, Cl A | 1,983,766 |
| 1,469,518 | ||
China Yangtze Power, Cl A | 3,364,567 |
| 8,589,041 | ||
GD Power Development, Cl A | 3,005,200 |
| 1,005,773 | ||
Huadian Power International, Cl A | 1,038,185 |
| 520,459 | ||
Huaneng Power International, Cl A | 728,810 |
| 591,931 | ||
Hubei Energy Group, Cl A | 663,500 |
| 378,150 | ||
Inner Mongolia MengDian HuaNeng Thermal Power, Cl A | 888,200 |
| 370,643 | ||
SDIC Power Holdings, Cl A | 1,037,869 |
| 1,309,472 | ||
Shanghai Electric Power, Cl A | 400,300 |
| 442,274 | ||
Shenergy, Cl A | 751,194 |
| 583,813 | ||
Shenzhen Energy Group, Cl A | 505,264 |
| 408,955 | ||
Sichuan Chuantou Energy, Cl A | 673,225 |
| 940,848 | ||
| 16,917,233 | ||||
TOTAL COMMON STOCK |
| 550,195,591 | |||
| |||||
TOTAL INVESTMENTS — 99.9% |
| 550,195,591 | |||
OTHER ASSETS LESS LIABILITIES — 0.1% |
| 550,539 | |||
NET ASSETS — 100% | $ | 550,746,130 | |||
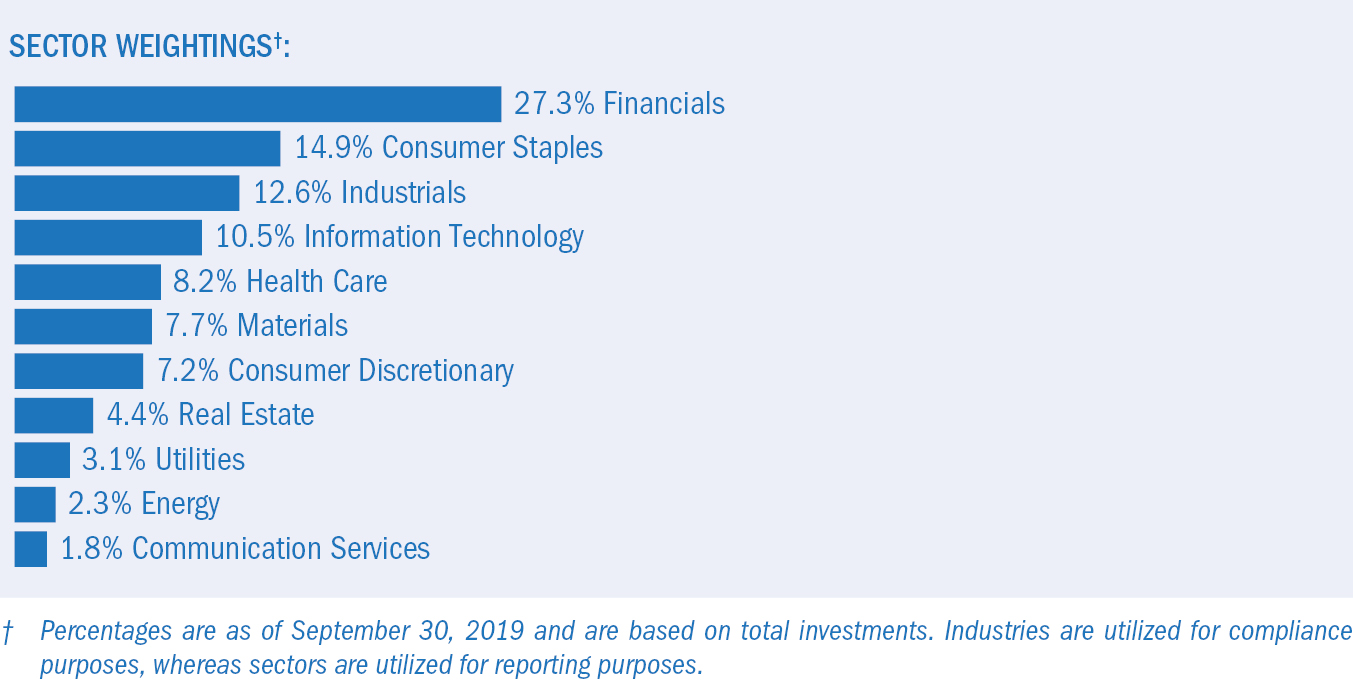
‡ Industries are utilized for compliance purposes, whereas sectors are utilized for reporting.
* Non-income producing security.
Cl — Class
The accompanying notes are an integral part of the financial statements.
16
Schedule of Investments (Unaudited)September 30, 2019
KraneShares Bosera MSCI China A Share ETF(concluded)
As of September30, 2019, all of the Fund’s investments were considered Level 1 of the fair value hierarchy, in accordance with the authoritative guidance under U.S. GAAP.
For the period ended September30, 2019, there have been no transfers between Level1, Level 2 or Level 3 investments. Transfers between levels are recognized at period end.
The accompanying notes are an integral part of the financial statements.
17
Face | Value | ||||
COMMERCIAL PAPER — 79.5%‡ |
| ||||
CHINA — 79.5% |
| ||||
Consumer Discretionary — 3.2% |
| ||||
Beijing Tourism Group | 4,000,000 | $ | 560,246 | ||
Consumer Staples — 3.9% |
| ||||
China National Cereals, Oils and Foodstuffs Corporation | 5,000,000 |
| 699,904 | ||
Energy — 21.4% |
| ||||
China Energy Conservation & Environmental Protection Group | 4,000,000 |
| 560,101 | ||
Chongqing Water Asset Management | 3,000,000 |
| 420,108 | ||
GD Power Development | 3,000,000 |
| 420,583 | ||
Guangdong Energy Group | 5,000,000 |
| 699,913 | ||
Nanjing Railway Construction Investment | 3,000,000 |
| 420,307 | ||
Shaanxi Coal and Chemical Industry Group | 6,000,000 |
| 840,321 | ||
Yanchang Petroleum Group | 3,000,000 |
| 420,007 | ||
| 3,781,340 | ||||
The accompanying notes are an integral part of the financial statements.
18
Schedule of Investments (Unaudited)September 30, 2019
KraneShares E Fund China Commercial Paper ETF(continued)
Face | Value | ||||
COMMERCIAL PAPER (continued) |
| ||||
Financials — 4.0% |
| ||||
Beijing State-Owned Assets Management First Harbor Engineering | 5,000,000 | $ | 700,051 | ||
Health Care — 4.0% |
| ||||
SinoPharm Group | 5,000,000 |
| 700,174 | ||
Industrials — 28.6% |
| ||||
Anhui Transportation Holding Group | 4,000,000 |
| 559,830 | ||
China Southern Airlines | 5,000,000 |
| 699,927 | ||
Chinese Universe Publish | 4,000,000 |
| 560,023 | ||
Guangzhou Development | 6,000,000 |
| 839,619 | ||
Shaanxi Non-ferrous Metals Holding Group | 5,000,000 |
| 699,481 | ||
Tianjin Infrastructure Construction & Investment Group | 5,000,000 |
| 700,235 | ||
Xiamen ITG Group | 5,000,000 |
| 700,054 | ||
Zhejiang Geely Holding Group | 2,000,000 |
| 280,036 | ||
| 5,039,205 | ||||
Materials — 14.4% |
| ||||
China National Chemical | 5,000,000 |
| 700,048 | ||
Jiangsu Shagang Group | 5,000,000 |
| 700,198 | ||
Shougang Group | 5,000,000 |
| 700,244 | ||
Wangfujing Group | 3,000,000 |
| 419,883 | ||
| 2,520,373 | ||||
TOTAL COMMERCIAL PAPER |
| 14,001,293 | |||
The accompanying notes are an integral part of the financial statements.
19
Schedule of Investments (Unaudited)September 30, 2019
KraneShares E Fund China Commercial Paper ETF(continued)
Face | Value | ||||
CORPORATE OBLIGATIONS — 13.5% |
| ||||
CHINA — 13.5% |
| ||||
Industrials — 13.5% |
| ||||
Anhui Publishing Group | 10,000,000 | $ | 1,402,103 | ||
Qingdao City Construction Investment Group | 3,000,000 |
| 419,623 | ||
Sinochem Fertilizer | 4,000,000 |
| 560,029 | ||
TOTAL CORPORATE OBLIGATIONS |
| 2,381,755 | |||
SHORT-TERM INVESTMENTS(B)(C) — 0.2% |
| ||||
China Universal Express Income Money Market Fund, 2.247% | 388 |
| 54 | ||
E Fund Money Market Fund, 2.432%* | 106,097 |
| 14,866 | ||
Fortune SGAM Xianjin Tianyi Money Market Fund, 2.342% | 162,898 |
| 22,825 | ||
Xianjinbao Real-Time Redemption Money Market Fund, 1.989% | 3,525 |
| 494 | ||
TOTAL SHORT-TERM INVESTMENTS |
| 38,239 | |||
TOTAL INVESTMENTS — 93.2% |
| 16,421,287 | |||
OTHER ASSETS LESS LIABILITIES — 6.8% |
| 1,206,078 | |||
NET ASSETS — 100% | $ | 17,627,365 | |||
* Affiliated investment is a Chinese investment company which is managed by E Fund Management (Hong Kong) Co., Limited (the “Sub-Adviser”) or an affiliate of the Sub-Adviser or which is distributed by an affiliate of the Fund’s distributor. Transactions with affiliated companies during the period ended September 30, 2019 are as follows:
Value of | Purchases | Proceeds | Unrealized | Realized | Value of | Number | Dividend | Capital Gains | ||||||||
E Fund Money Market Fund | ||||||||||||||||
$384,215 | $574,216 | $(932,142) | $ 6,618 | $(18,041) | $ 14,866 | 106,097 | $3,318 | $ — | ||||||||
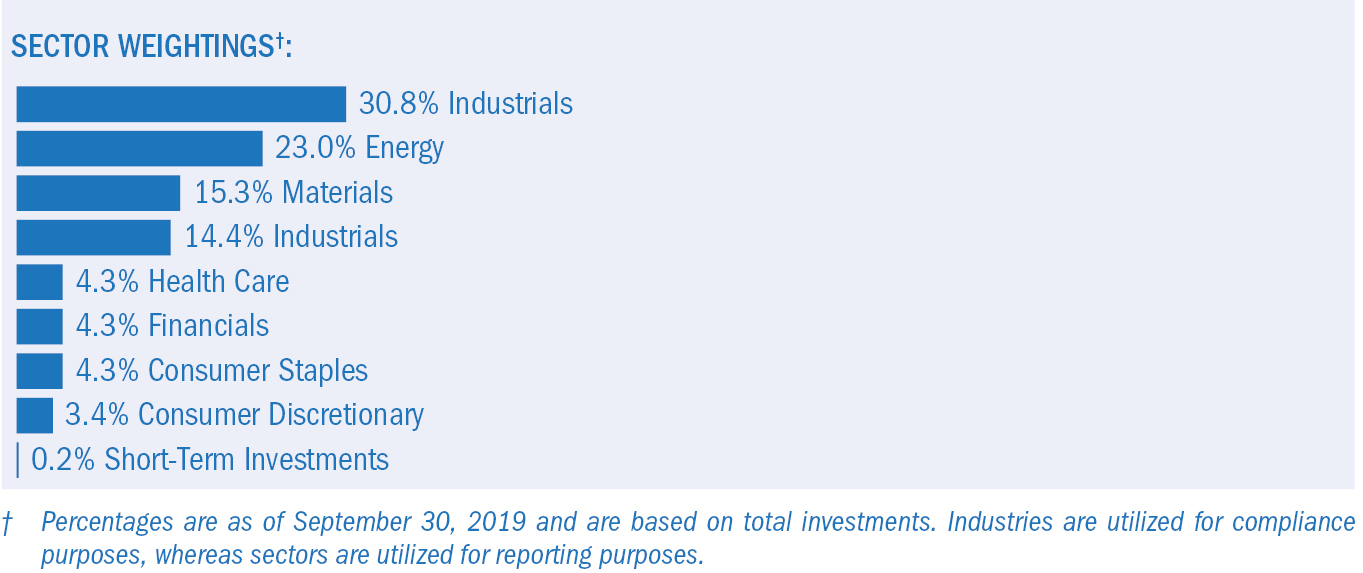
‡ Narrow industries are utilized for compliance purposes, whereas broad sectors are utilized for reporting.
(A) In CNY unless otherwise indicated.
(B) The rate shown is the 7-day effective yield as of September 30, 2019.
(C) Class not available
CNY — Chinese Yuan
The accompanying notes are an integral part of the financial statements.
20
Schedule of Investments (Unaudited)September 30, 2019
KraneShares E Fund China Commercial Paper ETF(concluded)
The following summarizes the market value of the Fund’s investments used as of September30, 2019, based on the inputs used to value them:
Investments in Securities | Level 1 | Level 2 | Level 3 | Total | ||||||||
Commercial Paper | $ | — | $ | 14,001,293 | $ | — | $ | 14,001,293 | ||||
Corporate Obligations |
| — |
| 2,381,755 |
| — |
| 2,381,755 | ||||
Short-Term Investments |
| 38,239 |
| — |
| — |
| 38,239 | ||||
Total Investments in Securities | $ | 38,239 | $ | 16,383,048 | $ | — | $ | 16,421,287 | ||||
For the period ended September30, 2019, there have been no transfers between Level1, Level 2 or Level 3 investments. Transfers between levels are recognized at period end.
Amounts designated as “—” are $0 or have been rounded to $0
The accompanying notes are an integral part of the financial statements.
21
Shares | Value | ||||
COMMON STOCK — 99.7%‡ |
| ||||
CHINA — 90.3% |
| ||||
Communication Services — 15.1% |
| ||||
58.com ADR* | 296 | $ | 14,596 | ||
Autohome ADR* | 178 | �� |
| 14,797 | |
Baidu ADR* | 720 |
| 73,987 | ||
China Mobile | 15,972 |
| 132,125 | ||
China Telecom, Cl H | 36,000 |
| 16,394 | ||
China Unicom Hong Kong | 14,000 |
| 14,858 | ||
Momo ADR | 280 |
| 8,674 | ||
NetEase ADR | 284 |
| 75,595 | ||
Shanghai Oriental Pearl Group, Cl A | 6,740 |
| 8,636 | ||
SINA* | 240 |
| 9,406 | ||
Tencent Holdings | 16,058 |
| 676,372 | ||
Tencent Music Entertainment Group ADR* | 1 |
| 13 | ||
Weibo ADR* | 176 |
| 7,876 | ||
YY ADR* | 171 |
| 9,615 | ||
| 1,062,944 | ||||
Consumer Discretionary — 20.1% |
| ||||
Alibaba Group Holding ADR* | 3,983 |
| 666,077 | ||
ANTA Sports Products | 6,000 |
| 49,634 | ||
BAIC Motor, Cl H | 9,500 |
| 5,865 | ||
Brilliance China Automotive Holdings | 14,000 |
| 15,037 | ||
BYD, Cl A | 1,900 |
| 12,979 | ||
BYD, Cl H | 3,000 |
| 14,982 | ||
China Grand Automotive Services Group, Cl A | 10,200 |
| 5,499 | ||
China International Travel Service, Cl A | 1,800 |
| 23,457 | ||
Chongqing Changan Automobile, Cl A | 15,700 |
| 16,291 | ||
Ctrip.com International ADR* | 1,565 |
| 45,839 | ||
Dongfeng Motor Group, Cl H | 12,000 |
| 11,404 | ||
Fuyao Glass Industry Group, Cl A | 6,600 |
| 19,852 | ||
Geely Automobile Holdings | 13,000 |
| 22,055 | ||
The accompanying notes are an integral part of the financial statements.
22
Schedule of Investments(Unaudited)September 30, 2019
KraneShares MSCI All China Index ETF(continued)
Shares | Value | ||||
COMMON STOCK (continued) |
| ||||
Consumer Discretionary (continued) |
| ||||
Great Wall Motor, Cl H | 18,500 | $ | 12,389 | ||
Gree Electric Appliances of Zhuhai, Cl A | 3,000 |
| 24,072 | ||
Guangzhou Automobile Group, Cl H | 14,000 |
| 13,394 | ||
Haier Smart Home, Cl A | 6,700 |
| 14,355 | ||
Huayu Automotive Systems, Cl A | 3,700 |
| 12,176 | ||
Huazhu Group ADR | 411 |
| 13,571 | ||
JD.com ADR* | 4,684 |
| 132,136 | ||
Midea Group, Cl A | 5,400 |
| 38,641 | ||
NavInfo, Cl A | 5,400 |
| 12,310 | ||
New Oriental Education & Technology Group ADR* | 481 |
| 53,276 | ||
SAIC Motor, Cl A | 5,557 |
| 18,505 | ||
Shenzhen Overseas Chinese Town, Cl A | 14,400 |
| 14,176 | ||
Shenzhou International Group Holdings | 3,000 |
| 39,187 | ||
Suning.com, Cl A | 10,300 |
| 14,943 | ||
Suofeiya Home Collection, Cl A | 2,500 |
| 5,993 | ||
TAL Education Group ADR* | 952 |
| 32,596 | ||
Vipshop Holdings ADR* | 1,543 |
| 13,763 | ||
Yum China Holdings | 889 |
| 40,387 | ||
| 1,414,841 | ||||
Consumer Staples — 7.0% |
| ||||
Anhui Gujing Distillery, Cl A | 700 |
| 11,273 | ||
China Mengniu Dairy | 7,000 |
| 26,207 | ||
China Resources Beer Holdings | 10,000 |
| 53,002 | ||
Foshan Haitian Flavouring & Food, Cl A | 1,900 |
| 29,243 | ||
Guangdong Haid Group, Cl A | 3,700 |
| 16,217 | ||
Henan Shuanghui Investment & Development, Cl A | 3,700 |
| 12,798 | ||
Inner Mongolia Yili Industrial Group, Cl A | 6,000 |
| 23,962 | ||
Jiangsu Yanghe Brewery Joint-Stock, Cl A | 1,200 |
| 17,476 | ||
Kweichow Moutai, Cl A | 1,000 |
| 161,037 | ||
Luzhou Laojiao, Cl A | 1,800 |
| 21,480 | ||
Muyuan Foodstuff, Cl A | 2,900 |
| 28,630 | ||
New Hope Liuhe, Cl A | 16,900 |
| 40,634 | ||
Shanxi Xinghuacun Fen Wine Factory, Cl A | 700 |
| 7,578 | ||
Tingyi Cayman Islands Holding | 10,000 |
| 14,083 | ||
Want Want China Holdings | 18,000 |
| 14,396 | ||
Yonghui Superstores, Cl A | 12,600 |
| 15,686 | ||
| 493,702 | ||||
Energy — 2.9% |
| ||||
China Oilfield Services, Cl H | 12,000 |
| 14,343 | ||
China Petroleum & Chemical, Cl A | 22,200 |
| 15,606 | ||
China Petroleum & Chemical, Cl H | 50,500 |
| 30,019 | ||
China Shenhua Energy, Cl H | 9,000 |
| 18,070 | ||
CNOOC | 37,826 |
| 57,708 | ||
Offshore Oil Engineering, Cl A | 15,100 |
| 11,397 | ||
PetroChina, Cl A | 11,500 |
| 9,968 | ||
PetroChina, Cl H | 51,984 |
| 26,724 | ||
The accompanying notes are an integral part of the financial statements.
23
Schedule of Investments(Unaudited)September 30, 2019
KraneShares MSCI All China Index ETF(continued)
Shares | Value | ||||
COMMON STOCK (continued) |
| ||||
Energy (continued) |
| ||||
Shaanxi Coal Industry, Cl A | 9,600 | $ | 11,736 | ||
Shanxi Lu’an Environmental Energy Development, Cl A | 6,000 |
| 6,083 | ||
| 201,654 | ||||
Financials — 19.5% |
| ||||
Agricultural Bank of China, Cl A | 21,000 |
| 10,175 | ||
Agricultural Bank of China, Cl H | 84,397 |
| 33,051 | ||
Anxin Trust, Cl A | 9,567 |
| 6,310 | ||
Avic Capital, Cl A | 18,100 |
| 11,837 | ||
Bank of Beijing, Cl A | 23,400 |
| 17,563 | ||
Bank of China, Cl A | 24,700 |
| 12,382 | ||
Bank of China, Cl H | 175,396 |
| 68,911 | ||
Bank of Communications, Cl A | 36,000 |
| 27,474 | ||
Bank of Communications, Cl H | 5,000 |
| 3,266 | ||
Bank of Hangzhou, Cl A | 11,500 |
| 13,608 | ||
Bank of Jiangsu, Cl A | 18,700 |
| 17,571 | ||
Bank of Nanjing, Cl A | 12,100 |
| 14,555 | ||
Bank of Ningbo, Cl A | 5,500 |
| 19,416 | ||
Bank of Shanghai, Cl A | 15,704 |
| 20,561 | ||
Changjiang Securities, Cl A | 17,500 |
| 17,154 | ||
China CITIC Bank, Cl H | 25,000 |
| 13,330 | ||
China Construction Bank, Cl A | 10,300 |
| 10,082 | ||
China Construction Bank, Cl H | 257,000 |
| 196,043 | ||
China Everbright Bank, Cl A | 45,000 |
| 24,828 | ||
China Life Insurance, Cl H | 18,483 |
| 42,816 | ||
China Merchants Bank, Cl A | 12,000 |
| 58,393 | ||
China Merchants Securities, Cl A | 7,800 |
| 17,968 | ||
China Minsheng Banking, Cl A | 22,800 |
| 19,220 | ||
China Pacific Insurance Group, Cl A | 4,300 |
| 20,996 | ||
CITIC Securities, Cl A | 9,000 |
| 28,331 | ||
Everbright Securities, Cl A | 8,400 |
| 13,327 | ||
Founder Securities, Cl A | 14,400 |
| 13,894 | ||
GF Securities, Cl A* | 4,300 |
| 8,171 | ||
Guosen Securities, Cl A | 9,600 |
| 16,508 | ||
Guotai Junan Securities, Cl A | 6,600 |
| 16,238 | ||
Haitong Securities, Cl A | 10,200 |
| 20,425 | ||
Huatai Securities, Cl A | 4,900 |
| 13,099 | ||
Huaxia Bank, Cl A | 15,700 |
| 16,225 | ||
Hubei Biocause Pharmaceutical, Cl A | 10,300 |
| 10,168 | ||
Industrial & Commercial Bank of China, Cl A | 42,000 |
| 32,524 | ||
Industrial Bank, Cl A | 16,300 |
| 40,013 | ||
Industrial Securities, Cl A | 22,169 |
| 19,309 | ||
New China Life Insurance, Cl A | 1,800 |
| 12,268 | ||
New China Life Insurance, Cl H | 3,700 |
| 14,631 | ||
Noah Holdings ADR* | 171 |
| 4,993 | ||
Orient Securities, Cl A | 11,400 |
| 16,283 | ||
PICC Property & Casualty, Cl H | 15,510 |
| 18,103 | ||
Ping An Bank, Cl A | 16,891 |
| 36,875 | ||
Ping An Insurance Group of China, Cl A | 7,200 |
| 87,757 | ||
The accompanying notes are an integral part of the financial statements.
24
Schedule of Investments(Unaudited)September 30, 2019
KraneShares MSCI All China Index ETF(continued)
Shares | Value | ||||
COMMON STOCK (continued) |
| ||||
Financials (continued) |
| ||||
Ping An Insurance Group of China, Cl H | 15,000 | $ | 172,303 | ||
Shanghai Pudong Development Bank, Cl A | 24,000 |
| 39,792 | ||
Shenwan Hongyuan Group, Cl A | 27,100 |
| 18,140 | ||
| 1,366,887 | ||||
Health Care — 5.3% |
| ||||
3SBio* | 6,000 |
| 9,950 | ||
Alibaba Health Information Technology* | 14,000 |
| 12,233 | ||
Beijing Tongrentang, Cl A | 3,044 |
| 11,466 | ||
Changchun High & New Technology Industry Group, Cl A | 500 |
| 27,612 | ||
China Medical System Holdings | 7,000 |
| 8,322 | ||
China Traditional Chinese Medicine Holdings | 14,000 |
| 6,429 | ||
CSPC Pharmaceutical Group | 12,000 |
| 24,094 | ||
Dong-E-E-Jiao, Cl E | 2,400 |
| 10,244 | ||
Genscript Biotech* | 10,000 |
| 19,160 | ||
Guangzhou Baiyunshan Pharmaceutical Holdings, Cl A | 1,900 |
| 9,232 | ||
Huadong Medicine, Cl A | 2,280 |
| 8,365 | ||
Hualan Biological Engineering, Cl A | 3,600 |
| 17,291 | ||
Jiangsu Hengrui Medicine, Cl A | 3,600 |
| 40,672 | ||
Meinian Onehealth Healthcare Holdings, Cl A | 5,760 |
| 9,808 | ||
Shanghai Fosun Pharmaceutical Group, Cl A | 3,100 |
| 10,970 | ||
Shanghai Fosun Pharmaceutical Group, Cl H | 2,500 |
| 6,713 | ||
Shanghai Pharmaceuticals Holding, Cl A | 6,000 |
| 15,291 | ||
Sichuan Kelun Pharmaceutical, Cl A | 1,900 |
| 6,880 | ||
Sino Biopharmaceutical | 18,000 |
| 22,869 | ||
Sinopharm Group, Cl H | 4,800 |
| 15,032 | ||
Tasly Pharmaceutical Group, Cl A | 3,000 |
| 6,545 | ||
Tong Ren Tang Technologies, Cl H | 7,000 |
| 6,367 | ||
Tonghua Dongbao Pharmaceutical, Cl A | 4,200 |
| 10,292 | ||
Wuxi Biologics Cayman* | 2,500 |
| 25,512 | ||
Yunnan Baiyao Group, Cl A | 1,200 |
| 12,779 | ||
Zhangzhou Pientzehuang Pharmaceutical, Cl A | 600 |
| 8,560 | ||
Zhejiang NHU, Cl A | 3,600 |
| 10,783 | ||
| 373,471 | ||||
Industrials — 7.9% |
| ||||
51job ADR* | 113 |
| 8,362 | ||
AECC Aviation Power, Cl A | 3,100 |
| 9,494 | ||
AVIC Aircraft, Cl A | 4,300 |
| 9,363 | ||
AVIC Electromechanical Systems, Cl A | 6,000 |
| 5,470 | ||
AVIC Shenyang Aircraft, Cl A* | 1,900 |
| 8,248 | ||
Beijing Capital International Airport, Cl H | 10,000 |
| 8,534 | ||
China Communications Construction, Cl H | 24,000 |
| 18,767 | ||
China Conch Venture Holdings | 6,000 |
| 22,196 | ||
China Eastern Airlines, Cl A | 20,500 |
| 14,870 | ||
China Everbright International | 12,323 |
| 9,494 | ||
China Gezhouba Group, Cl A | 8,500 |
| 6,939 | ||
China Merchants Port Holdings | 10,552 |
| 15,883 | ||
China Railway Construction, Cl A | 8,500 |
| 11,260 | ||
China Railway Construction, Cl H | 9,500 |
| 10,385 | ||
China Railway Group, Cl H | 18,000 |
| 10,929 | ||
The accompanying notes are an integral part of the financial statements.
25
Schedule of Investments(Unaudited)September 30, 2019
KraneShares MSCI All China Index ETF(continued)
Shares | Value | ||||
COMMON STOCK (continued) |
| ||||
Industrials (continued) |
| ||||
China Southern Airlines, Cl A | 7,900 | $ | 7,335 | ||
China State Construction Engineering, Cl A | 33,000 |
| 25,092 | ||
China State Construction International Holdings | 12,000 |
| 11,282 | ||
CITIC | 12,780 |
| 16,139 | ||
COSCO SHIPPING Development, Cl A | 49,200 |
| 17,293 | ||
COSCO SHIPPING Holdings, Cl A* | 22,800 |
| 15,197 | ||
CRRC, Cl A | 16,800 |
| 17,221 | ||
CRRC, Cl H | 13,000 |
| 9,071 | ||
Daqin Railway, Cl A | 13,900 |
| 14,774 | ||
Fosun International | 9,000 |
| 11,136 | ||
Guangzhou Baiyun International Airport, Cl A | 6,000 |
| 18,863 | ||
Jiangsu Expressway, Cl H | 12,000 |
| 15,246 | ||
Metallurgical Corp of China, Cl A | 34,200 |
| 13,362 | ||
Ningbo Zhoushan Port, Cl A | 6,500 |
| 3,395 | ||
Power Construction Corp of China, Cl A | 15,700 |
| 10,179 | ||
Sany Heavy Industry, Cl A | 10,800 |
| 21,596 | ||
Shanghai Electric Group, Cl H | 38,000 |
| 12,264 | ||
Shanghai International Airport, Cl A | 1,200 |
| 13,406 | ||
Shanghai International Port Group, Cl A | 10,800 |
| 8,605 | ||
Suzhou Gold Mantis Construction Decoration, Cl A | 6,700 |
| 8,510 | ||
Weichai Power, Cl A | 20,988 |
| 32,976 | ||
Xinjiang Goldwind Science & Technology, Cl A | 8,449 |
| 14,813 | ||
Zhejiang Chint Electrics, Cl A | 3,000 |
| 9,171 | ||
Zhejiang Sanhua Intelligent Controls, Cl A | 6,240 |
| 11,499 | ||
Zhengzhou Yutong Bus, Cl A | 5,444 |
| 10,596 | ||
Zhuzhou CRRC Times Electric, Cl H | 2,400 |
| 9,934 | ||
Zoomlion Heavy Industry Science and Technology, Cl A | 30,600 |
| 24,424 | ||
| 553,573 | ||||
Information Technology — 4.3% |
| ||||
AAC Technologies Holdings | 3,000 |
| 15,881 | ||
Aisino, Cl A | 3,100 |
| 9,094 | ||
BOE Technology Group, Cl A | 39,100 |
| 20,532 | ||
DHC Software, Cl A | 7,900 |
| 7,456 | ||
Focus Media Information Technology, Cl A | 11,500 |
| 8,454 | ||
GDS Holdings ADR* | 233 |
| 9,339 | ||
Hanergy Thin Film Power Group*(A)(B)(C) | 4,364 |
| — | ||
Hangzhou Hikvision Digital Technology, Cl A | 8,309 |
| 37,582 | ||
Hengtong Optic-electric, Cl A | 3,100 |
| 6,755 | ||
Iflytek, Cl A | 2,500 |
| 11,154 | ||
Kingdee International Software Group | 12,000 |
| 12,644 | ||
Kingsoft | 6,000 |
| 12,736 | ||
Lenovo Group | 14,000 |
| 9,340 | ||
LONGi Green Energy Technology, Cl A | 4,680 |
| 17,190 | ||
Luxshare Precision Industry, Cl A | 7,150 |
| 26,793 | ||
OFILM Group, Cl A | 5,382 |
| 8,968 | ||
Sanan Optoelectronics, Cl A | 6,600 |
| 13,013 | ||
Sunny Optical Technology Group | 1,900 |
| 27,921 | ||
Tianma Microelectronics, Cl A | 6,000 |
| 11,612 | ||
TravelSky Technology, Cl H | 5,000 |
| 10,383 | ||
Unigroup Guoxin Microelectronics, Cl A | 1,300 |
| 9,301 | ||
The accompanying notes are an integral part of the financial statements.
26
Schedule of Investments(Unaudited)September 30, 2019
KraneShares MSCI All China Index ETF(continued)
Shares | Value | ||||
COMMON STOCK (continued) |
| ||||
Information Technology (continued) |
| ||||
Yonyou Network Technology, Cl A | 3,250 | $ | 14,058 | ||
Zhejiang Dahua Technology, Cl A | 4,200 |
| 10,157 | ||
| 310,363 | ||||
Materials — 2.8% |
| ||||
Angang Steel, Cl A | 19,470 |
| 8,425 | ||
Anhui Conch Cement, Cl A | 3,000 |
| 17,367 | ||
Anhui Conch Cement, Cl H | 3,000 |
| 17,814 | ||
Baoshan Iron & Steel, Cl A | 15,100 |
| 12,497 | ||
BBMG, Cl A | 23,400 |
| 10,879 | ||
China Molybdenum, Cl H | 39,000 |
| 12,935 | ||
China National Building Material, Cl H | 14,000 |
| 12,572 | ||
China Northern Rare Earth Group High-Tech, Cl A | 8,500 |
| 12,938 | ||
Ganfeng Lithium, Cl A | 1,800 |
| 5,687 | ||
Hesteel, Cl A | 26,400 |
| 9,316 | ||
Inner Mongolia BaoTou Steel Union, Cl A | 52,900 |
| 10,815 | ||
Rongsheng Petro Chemical, Cl A | 6,100 |
| 9,353 | ||
Shandong Hualu Hengsheng Chemical, Cl A | 3,600 |
| 8,282 | ||
Sinopec Shanghai Petrochemical, Cl A | 27,100 |
| 15,825 | ||
Tianqi Lithium, Cl A | 1,800 |
| 6,856 | ||
Zhejiang Huayou Cobalt, Cl A | 780 |
| 2,939 | ||
Zhejiang Longsheng Group, Cl A | 9,000 |
| 17,720 | ||
Zijin Mining Group, Cl A | 15,100 |
| 6,914 | ||
| 199,134 | ||||
Real Estate — 3.3% |
| ||||
China Fortune Land Development, Cl A | 3,600 |
| 13,596 | ||
China Merchants Shekou Industrial Zone Holdings, Cl A | 7,200 |
| 19,146 | ||
China Overseas Land & Investment | 12,839 |
| 40,371 | ||
China Resources Land | 12,214 |
| 51,181 | ||
China Vanke, Cl A | 7,143 |
| 25,907 | ||
China Vanke, Cl H | 3,700 |
| 12,885 | ||
Gemdale, Cl A | 8,400 |
| 13,586 | ||
Greenland Holdings, Cl A | 14,400 |
| 14,236 | ||
Poly Developments and Holdings Group, Cl A | 10,300 |
| 20,625 | ||
Seazen Holdings, Cl A | 2,400 |
| 9,538 | ||
Xinhu Zhongbao, Cl A | 25,300 |
| 10,239 | ||
| 231,310 | ||||
Utilities — 2.1% |
| ||||
Beijing Enterprises Water Group | 24,000 |
| 12,277 | ||
China Longyuan Power Group, Cl H | 12,000 |
| 6,735 | ||
China National Nuclear Power, Cl A | 19,300 |
| 14,297 | ||
China Yangtze Power, Cl A | 9,600 |
| 24,507 | ||
ENN Energy Holdings | 482 |
| 4,986 | ||
Guangdong Investment | 12,000 |
| 23,481 | ||
Huadian Power International, Cl A | 20,400 |
| 10,227 | ||
Huaneng Power International, Cl H | 13,077 |
| 6,289 | ||
Hubei Energy Group, Cl A | 21,100 |
| 12,025 | ||
SDIC Power Holdings, Cl A | 10,800 |
| 13,626 | ||
Sichuan Chuantou Energy, Cl A | 10,900 |
| 15,233 | ||
| 143,683 | ||||
TOTAL CHINA |
| 6,351,562 | |||
The accompanying notes are an integral part of the financial statements.
27
Schedule of Investments(Unaudited)September 30, 2019
KraneShares MSCI All China Index ETF(continued)
Shares | Value | ||||
COMMON STOCK (continued) |
| ||||
HONG KONG — 9.4% |
| ||||
Communication Services — 0.3% |
| ||||
Alibaba Pictures Group* | 120,000 | $ | 19,440 | ||
| |||||
Consumer Discretionary — 0.3% |
| ||||
China First Capital Group* | 14,000 |
| 4,090 | ||
Haier Electronics Group | 6,000 |
| 15,652 | ||
| 19,742 | ||||
Consumer Staples — 0.1% |
| ||||
Sun Art Retail Group | 9,000 |
| 9,138 | ||
| |||||
Energy — 0.2% |
| ||||
Yanzhou Coal Mining, Cl H | 12,000 |
| 12,185 | ||
| |||||
Financials — 4.3% |
| ||||
China Cinda Asset Management, Cl H | 4,504 |
| 885 | ||
China Galaxy Securities, Cl H | 30,500 |
| 16,224 | ||
China Huarong Asset Management, Cl H | 49,000 |
| 7,376 | ||
China International Capital, Cl H | 5,200 |
| 10,082 | ||
China Merchants Bank, Cl H | 9,500 |
| 45,201 | ||
China Minsheng Banking, Cl H | 27,500 |
| 18,697 | ||
China Pacific Insurance Group, Cl H | 8,600 |
| 31,594 | ||
China Taiping Insurance Holdings | 5,000 |
| 11,162 | ||
CITIC Securities, Cl H | 6,000 |
| 11,235 | ||
Far East Horizon | 7,000 |
| 6,501 | ||
GF Securities, Cl H | 12,000 |
| 12,567 | ||
Huatai Securities, Cl H | 7,400 |
| 11,082 | ||
Industrial & Commercial Bank of China, Cl H | 171,441 |
| 114,813 | ||
People’s Insurance Group of China, Cl H | 19,452 |
| 7,791 | ||
| 305,210 | ||||
Health Care — 0.0% |
| ||||
Shanghai Henlius Biotech, Cl H* | 23 |
| — | ||
| |||||
Industrials — 0.2% |
| ||||
Fullshare Holdings | 30,000 |
| 976 | ||
Shenzhen International Holdings | 7,016 |
| 13,478 | ||
| 14,454 | ||||
Information Technology — 0.5% |
| ||||
Kingboard Holdings | 3,500 |
| 9,264 | ||
Meitu* | 15,000 |
| 3,444 | ||
Semiconductor Manufacturing International* | 15,000 |
| 18,751 | ||
| 31,459 | ||||
Materials — 0.3% |
| ||||
China Resources Cement Holdings | 12,000 |
| 12,032 | ||
Nine Dragons Paper Holdings | 12,000 |
| 10,103 | ||
| 22,135 | ||||
Real Estate — 2.0% |
| ||||
China Evergrande Group | 6,000 |
| 12,782 | ||
China Jinmao Holdings Group | 24,000 |
| 13,746 | ||
CIFI Holdings Group | 25,195 |
| 14,720 | ||
Country Garden Holdings | 25,000 |
| 31,667 | ||
Guangzhou R&F Properties | 5,200 |
| 7,867 | ||
KWG Group Holdings | 6,773 |
| 5,935 | ||
The accompanying notes are an integral part of the financial statements.
28
Schedule of Investments(Unaudited)September 30, 2019
KraneShares MSCI All China Index ETF(continued)
Shares | Value | ||||
COMMON STOCK (continued) |
| ||||
Real Estate (continued) |
| ||||
Longfor Group Holdings | 6,000 | $ | 22,425 | ||
Shimao Property Holdings | 3,500 |
| 10,224 | ||
Sunac China Holdings | 6,000 |
| 24,109 | ||
| 143,475 | ||||
Utilities — 1.2% |
| ||||
China Gas Holdings | 5,000 |
| 19,325 | ||
China Resources Gas Group | 10,000 |
| 49,430 | ||
China Resources Power Holdings | 10,000 |
| 12,131 | ||
| 80,886 | ||||
TOTAL HONG KONG |
| 658,124 | |||
TOTAL COMMON STOCK |
| 7,009,686 | |||
| |||||
TOTAL INVESTMENTS — 99.7% |
| 7,009,686 | |||
OTHER ASSETS LESS LIABILITIES — 0.3% |
| 19,471 | |||
NET ASSETS — 100% | $ | 7,029,157 | |||
‡ Industries are utilized for compliance purposes, whereas sectors are utilized for reporting.
* Non-income producing security.
(A) Security is fair valued using methods determined in good faith by the Fair Value Committee of the Board of Trustees. The total value of such securities as of September 30, 2019 was $0 and represents 0.0% of Net Assets.
(B) Level 3 security in accordance with fair value hierarchy.
(C) Security considered illiquid. The total value of such securities as of September 30, 2019 was $0 and represents 0.0% of Net Assets.
ADR —American Depositary Receipt
Cl —Class
The following summarizes the market value of the Fund’s investments used as of September30, 2019, based on the inputs used to value them:
Investments in Securities | Level 1 | Level 2 | Level 3^ | Total | ||||||||
Common Stock |
|
|
|
| ||||||||
China |
|
|
|
| ||||||||
Communication Services | $ | 1,062,944 | $ | — | $ | — | $ | 1,062,944 | ||||
Consumer Discretionary |
| 1,414,841 |
| — |
| — |
| 1,414,841 | ||||
Consumer Staples |
| 493,702 |
| — |
| — |
| 493,702 | ||||
Energy |
| 201,654 |
| — |
| — |
| 201,654 | ||||
Financials |
| 1,366,887 |
| — |
| — |
| 1,366,887 | ||||
Health Care |
| 373,471 |
| — |
| — |
| 373,471 | ||||
Industrials |
| 553,573 |
| — |
| — |
| 553,573 | ||||
Information Technology |
| 310,363 |
| — |
| — |
| 310,363 | ||||
Materials |
| 199,134 |
| — |
| — |
| 199,134 | ||||
Real Estate |
| 231,310 |
| — |
| — |
| 231,310 | ||||
Utilities |
| 143,683 |
| — |
| — |
| 143,683 | ||||
Hong Kong |
| 658,124 |
| — |
| — |
| 658,124 | ||||
Total Common Stock |
| 7,009,686 |
| — |
| — |
| 7,009,686 | ||||
Total Investments in Securities | $ | 7,009,686 | $ | — | $ | — | $ | 7,009,686 | ||||
^ A reconciliation of Level 3 investments, including certain disclosures related to significant inputs used in valuing Level 3 investments is only presented when the Fund has over 1% of Level 3 investments at the beginning and/or end of the period in relation to net assets.
The accompanying notes are an integral part of the financial statements.
29
Schedule of Investments(Unaudited)September 30, 2019
KraneShares MSCI All China Index ETF(concluded)
For the period endedSeptember30, 2019, there have been no transfers between Level 1 and Level 2 investments.
For the period endedSeptember30, 2019, there have been no transfers between Level 2 and Level 3 investments.
For the period ended September30, 2019, the transfers in and out of Level 3 occurred due to a halt in trading of these securities. Transfers between levels are recognized at period end.
Amounts designated as “—” are $0 or have been rounded to $0.
The accompanying notes are an integral part of the financial statements.
30
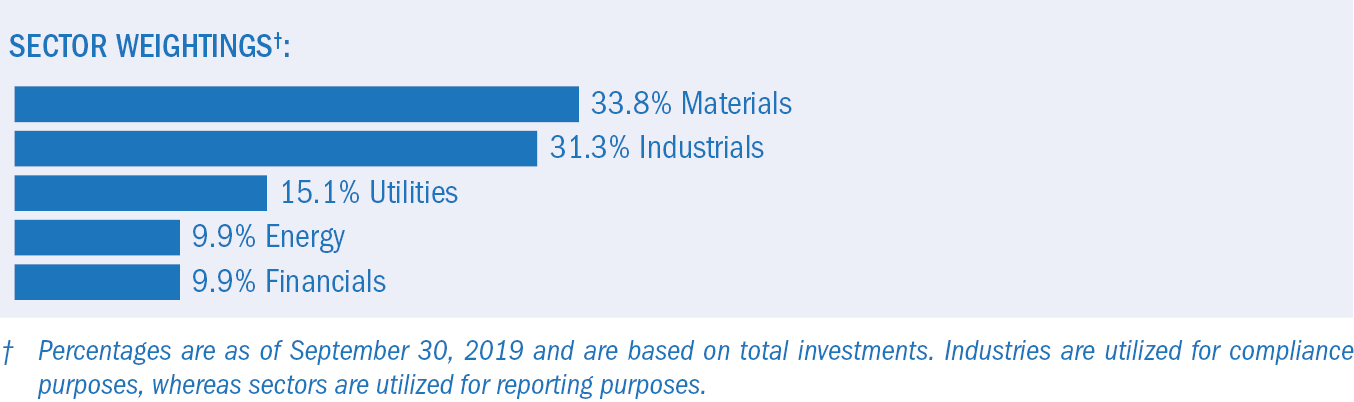
Shares | Value | ||||
COMMON STOCK — 98.7%‡ |
| ||||
CHINA — 38.3% |
| ||||
Energy — 0.2% |
| ||||
Guanghui Energy, Cl A | 87,900 | $ | 40,865 | ||
| |||||
Financials — 4.1% |
| ||||
Bank of Chengdu, Cl A | 46,400 |
| 52,890 | ||
Bank of Guiyang, Cl A | 41,527 |
| 49,486 | ||
Bank of Hangzhou, Cl A | 66,100 |
| 78,214 | ||
Bank of Jiangsu, Cl A | 148,555 |
| 139,585 | ||
Bank of Nanjing, Cl A | 109,391 |
| 131,584 | ||
Bank of Ningbo, Cl A | 68,146 |
| 240,571 | ||
Chongqing Rural Commercial Bank, Cl H | 103,425 |
| 55,015 | ||
| 747,345 | ||||
Industrials — 18.6% |
| ||||
Beijing New Building Materials, Cl A | 21,608 |
| 54,465 | ||
China Communications Construction, Cl H | 192,000 |
| 150,134 | ||
China Conch Venture Holdings | 69,500 |
| 257,099 | ||
China Gezhouba Group, Cl A | 59,650 |
| 48,698 | ||
China Railway Construction, Cl H | 86,000 |
| 94,015 | ||
China Railway Group, Cl H | 166,500 |
| 101,097 | ||
China Railway Hi-tech Industry, Cl A | 28,676 |
| 41,200 | ||
China Shipbuilding Industry, Cl A | 295,200 |
| 227,770 | ||
China State Construction Engineering, Cl A | 546,979 |
| 415,910 | ||
Contemporary Amperex Technology, Cl A | 9,400 |
| 94,116 | ||
CRRC, Cl H | 196,850 |
| 137,353 | ||
Daqin Railway, Cl A | 192,032 |
| 204,101 | ||
Dongfang Electric, Cl A | 36,100 |
| 46,558 | ||
Guangdong LY Intelligent Manufacturing, Cl A* | 60,300 |
| 79,036 | ||
Inner Mongolia First Machinery Group, Cl A | 21,500 |
| 31,703 | ||
Jiangsu Expressway, Cl H | 52,000 |
| 66,066 | ||
Jiangsu Zhongtian Technology, Cl A | 40,049 |
| 48,455 | ||
Metallurgical Corp of China, Cl A | 232,200 |
| 90,718 | ||
NARI Technology, Cl A | 59,600 |
| 170,674 | ||
Ningbo Zhoushan Port, Cl A | 112,701 |
| 58,866 | ||
Shanghai Construction Group, Cl A | 116,000 |
| 55,066 | ||
Shanghai Electric Group, Cl H | 114,000 |
| 36,791 | ||
Shanghai International Port Group, Cl A | 111,510 |
| 88,850 | ||
Shanghai Tunnel Engineering, Cl A | 40,700 |
| 33,569 | ||
Shenzhen Inovance Technology, Cl A | 21,400 |
| 72,909 | ||
Siasun Robot & Automation, Cl A | 20,400 |
| 41,222 | ||
The accompanying notes are an integral part of the financial statements.
31
Schedule of Investments(Unaudited)September 30, 2019
KraneShares MSCI One Belt One Road Index ETF(continued)
Shares | Value | ||||
COMMON STOCK (continued) |
| ||||
Industrials (continued) |
| ||||
Suzhou Gold Mantis Construction Decoration, Cl A | 35,119 | $ | 44,604 | ||
TBEA, Cl A | 48,075 |
| 43,758 | ||
XCMG Construction Machinery, Cl A | 103,048 |
| 63,925 | ||
Xinjiang Goldwind Science & Technology, Cl A | 44,344 |
| 77,744 | ||
Yangzijiang Shipbuilding Holdings | 87,500 |
| 60,742 | ||
Zhejiang Expressway, Cl H | 62,000 |
| 53,621 | ||
Zhejiang Weixing New Building Materials, Cl A | 20,840 |
| 46,401 | ||
Zhengzhou Yutong Bus, Cl A | 28,497 |
| 55,468 | ||
Zhuzhou CRRC Times Electric, Cl H | 26,500 |
| 109,693 | ||
Zoomlion Heavy Industry Science and Technology, Cl A | 84,957 |
| 67,812 | ||
| 3,370,209 | ||||
Materials — 4.0% |
| ||||
Anhui Conch Cement, Cl H | 52,500 |
| 311,743 | ||
BBMG, Cl A | 108,100 |
| 50,256 | ||
Beijing Oriental Yuhong Waterproof Technology, Cl A | 19,424 |
| 57,174 | ||
China National Building Material, Cl H | 167,000 |
| 149,971 | ||
China Northern Rare Earth Group High-Tech, Cl A | 46,124 |
| 70,208 | ||
Huaxin Cement, Cl A | 17,700 |
| 46,721 | ||
Yunnan Chihong Zinc & Germanium, Cl A | 65,759 |
| 40,701 | ||
| 726,774 | ||||
Utilities — 11.4% |
| ||||
Beijing Enterprises Holdings | 22,000 |
| 101,169 | ||
CGN Power, Cl H | 461,875 |
| 116,656 | ||
China Longyuan Power Group, Cl H | 135,000 |
| 75,771 | ||
China National Nuclear Power, Cl A | 168,642 |
| 124,925 | ||
China Yangtze Power, Cl A | 281,643 |
| 718,976 | ||
ENN Energy Holdings | 35,000 |
| 362,081 | ||
GD Power Development, Cl A | 253,100 |
| 84,707 | ||
Huadian Power International, Cl A | 87,742 |
| 43,986 | ||
Huaneng Power International, Cl H | 163,000 |
| 78,387 | ||
Huaneng Renewables, Cl H(A)(B)(C) | 200,860 |
| 69,773 | ||
SDIC Power Holdings, Cl A | 83,806 |
| 105,738 | ||
Shenergy, Cl A | 63,119 |
| 49,055 | ||
Sichuan Chuantou Energy, Cl A | 56,384 |
| 78,798 | ||
Zhejiang Zheneng Electric Power, Cl A | 117,041 |
| 63,919 | ||
| 2,073,941 | ||||
TOTAL CHINA |
| 6,959,134 | |||
| |||||
HONG KONG — 5.2% |
| ||||
Industrials — 1.0% |
| ||||
China Communications Services, Cl H | 104,000 |
| 58,902 | ||
Shenzhen International Holdings | 40,810 |
| 78,399 | ||
Sinotruk Hong Kong | 29,500 |
| 43,727 | ||
| 181,028 | ||||
Materials — 0.6% |
| ||||
China Resources Cement Holdings | 104,000 |
| 104,273 | ||
| |||||
Utilities — 3.6% |
| ||||
China Gas Holdings | 81,400 |
| 314,618 | ||
China Power International Development | 197,000 |
| 40,961 | ||
The accompanying notes are an integral part of the financial statements.
32
Schedule of Investments(Unaudited)September 30, 2019
KraneShares MSCI One Belt One Road Index ETF(continued)
Shares | Value | ||||
COMMON STOCK (continued) |
| ||||
Utilities (continued) |
| ||||
China Resources Gas Group | 39,500 | $ | 195,248 | ||
China Resources Power Holdings | 82,635 |
| 100,245 | ||
| 651,072 | ||||
TOTAL HONG KONG |
| 936,373 | |||
| |||||
INDIA — 3.3% |
| ||||
Industrials — 0.6% |
| ||||
AIA Engineering | 4,506 |
| 113,434 | ||
| |||||
Materials — 2.7% |
| ||||
Hindalco Industries | 137,895 |
| 372,325 | ||
PI Industries | 6,420 |
| 118,405 | ||
| 490,730 | ||||
TOTAL INDIA |
| 604,164 | |||
| |||||
INDONESIA — 3.9% |
| ||||
Energy — 1.1% |
| ||||
Adaro Energy | 1,632,700 |
| 148,375 | ||
Bukit Asam | 348,400 |
| 55,469 | ||
| 203,844 | ||||
Materials — 2.8% |
| ||||
Barito Pacific | 3,124,800 |
| 217,933 | ||
Indah Kiat Pulp & Paper | 332,300 |
| 151,577 | ||
Pabrik Kertas Tjiwi Kimia | 174,500 |
| 129,692 | ||
| 499,202 | ||||
TOTAL INDONESIA |
| 703,046 | |||
| |||||
ISRAEL — 2.4% |
| ||||
Materials — 2.4% |
| ||||
Israel Chemicals | 86,716 |
| 430,611 | ||
TOTAL ISRAEL |
| 430,611 | |||
| |||||
JORDAN — 0.4% |
| ||||
Financials — 0.4% |
| ||||
Arab Bank | 9,738 |
| 78,426 | ||
TOTAL JORDAN |
| 78,426 | |||
| |||||
KAZAKHSTAN — 1.6% |
| ||||
Energy — 1.6% |
| ||||
KazMunaiGas Exploration Production GDR*(A)(B)(C) | 27,720 |
| 293,832 | ||
TOTAL KAZAKHSTAN |
| 293,832 | |||
| |||||
KUWAIT — 1.5% |
| ||||
Industrials — 1.5% |
| ||||
Agility Public Warehousing KSC | 114,408 |
| 270,279 | ||
TOTAL KUWAIT |
| 270,279 | |||
| |||||
MALAYSIA — 5.3% |
| ||||
Energy — 0.3% |
| ||||
Sapura Energy | 874,000 |
| 58,448 | ||
| |||||
Industrials — 1.0% |
| ||||
Sime Darby | 326,200 |
| 175,293 | ||
The accompanying notes are an integral part of the financial statements.
33
Schedule of Investments(Unaudited)September 30, 2019
KraneShares MSCI One Belt One Road Index ETF(continued)
Shares | Value | ||||
COMMON STOCK (continued) |
| ||||
Materials — 4.0% |
| ||||
Petronas Chemicals Group | 293,700 | $ | 528,898 | ||
Press Metal Aluminium Holdings | 168,700 |
| 191,787 | ||
| 720,685 | ||||
TOTAL MALAYSIA |
| 954,426 | |||
| |||||
PHILIPPINES — 4.5% |
| ||||
Industrials — 4.5% |
| ||||
DMCI Holdings | 466,600 |
| 74,811 | ||
International Container Terminal Services | 117,920 |
| 273,926 | ||
JG Summit Holdings | 335,560 |
| 469,382 | ||
TOTAL PHILIPPINES |
| 818,119 | |||
| |||||
POLAND — 1.8% |
| ||||
Materials — 1.8% |
| ||||
KGHM Polska Miedz | 16,793 |
| 335,094 | ||
TOTAL POLAND |
| 335,094 | |||
| |||||
RUSSIA — 11.7% |
| ||||
Energy — 4.7% |
| ||||
Rosneft | 131,520 |
| 849,941 | ||
| |||||
Materials — 7.0% |
| ||||
MMC Norilsk Nickel PJSC | 4,964 |
| 1,276,605 | ||
TOTAL RUSSIA |
| 2,126,546 | |||
| |||||
SINGAPORE — 8.4% |
| ||||
Financials — 5.3% |
| ||||
Oversea-Chinese Banking | 122,024 |
| 958,262 | ||
| |||||
Industrials — 3.1% |
| ||||
Hutchison Port Holdings Trust, Cl U | 210,100 |
| 32,776 | ||
Keppel | 55,700 |
| 238,847 | ||
Singapore Airlines | 20,600 |
| 136,151 | ||
Singapore Technologies Engineering | 60,100 |
| 166,884 | ||
| 574,658 | ||||
TOTAL SINGAPORE |
| 1,532,920 | |||
| |||||
SOUTH AFRICA — 5.8% |
| ||||
Materials — 5.8% |
| ||||
Anglo American Platinum | 6,175 |
| 371,836 | ||
Impala Platinum Holdings* | 77,649 |
| 487,940 | ||
Kumba Iron Ore | 7,658 |
| 189,131 | ||
TOTAL SOUTH AFRICA |
| 1,048,907 | |||
| |||||
THAILAND — 3.5% |
| ||||
Energy — 0.9% |
| ||||
IRPC | 1,380,300 |
| 166,078 | ||
| |||||
Materials — 2.6% |
| ||||
PTT Global Chemical | 263,600 |
| 463,250 | ||
TOTAL THAILAND |
| 629,328 | |||
The accompanying notes are an integral part of the financial statements.
34
Schedule of Investments(Unaudited)September 30, 2019
KraneShares MSCI One Belt One Road Index ETF(continued)
Shares | Value | ||||
COMMON STOCK (continued) |
| ||||
TURKEY — 0.8% |
| ||||
Industrials — 0.8% |
| ||||
Turk Hava Yollari AO* | 63,187 | $ | 138,538 | ||
TOTAL TURKEY |
| 138,538 | |||
| |||||
UNITED KINGDOM — 0.3% |
| ||||
Energy — 0.3% |
| ||||
NAC Kazatomprom JSC GDR | 4,547 |
| 60,020 | ||
TOTAL UNITED KINGDOM |
| 60,020 | |||
TOTAL COMMON STOCK |
| 17,919,763 | |||
| |||||
PREFERRED STOCK — 0.7% |
| ||||
RUSSIA— 0.7% |
| ||||
Energy — 0.7% |
| ||||
Transneft(D) | 52 |
| 120,057 | ||
TOTAL PREFERRED STOCK |
| 120,057 | |||
| |||||
TOTAL INVESTMENTS — 99.4% |
| 18,039,820 | |||
OTHER ASSETS LESS LIABILITIES — 0.6% |
| 114,814 | |||
NET ASSETS — 100% | $ | 18,154,634 | |||
‡ Industries are utilized for compliance purposes, whereas sectors are utilized for reporting.
* Non-income producing security.
(A) Security is fair valued using methods determined in good faith by the Fair Value Committee of the Board of Trustees. The total value of such securities as of September 30, 2019 was $363,605 and represents 2.0% of Net Assets.
(B) Level 3 security in accordance with fair value hierarchy.
(C) Security considered illiquid. The total value of such securities as of September 30, 2019 was $363,605 and represents 2.0% of Net Assets.
(D) Currently, no stated interest rate.
CL — Class
GDR — Global Depositary Receipt
PJSC — Public Joint Stock Company
The following summarizes the market value of the Fund’s investments used as of September30, 2019, based on the inputs used to value them:
Investments in Securities | Level 1 | Level 2 | Level 3 | Total | ||||||||
Common Stock |
|
|
|
| ||||||||
China |
|
|
|
| ||||||||
Energy | $ | 40,865 | $ | — | $ | — | $ | 40,865 | ||||
Financials |
| 747,345 |
| — |
| — |
| 747,345 | ||||
Industrials |
| 3,370,209 |
| — |
| — |
| 3,370,209 | ||||
Materials |
| 726,774 |
| — |
| — |
| 726,774 | ||||
Utilities |
| 2,004,168 |
| — |
| 69,773 |
| 2,073,941 | ||||
Hong Kong |
| 936,373 |
| — |
| — |
| 936,373 | ||||
India |
| 604,164 |
| — |
| — |
| 604,164 | ||||
Indonesia |
| 703,046 |
| — |
| — |
| 703,046 | ||||
Israel |
| 430,611 |
| — |
| — |
| 430,611 | ||||
Jordan |
| 78,426 |
| — |
| — |
| 78,426 | ||||
The accompanying notes are an integral part of the financial statements.
35
Schedule of Investments(Unaudited)September 30, 2019
KraneShares MSCI One Belt One Road Index ETF(concluded)
Investments in Securities | Level 1 | Level 2 | Level 3 | Total | ||||||||
Kazakhstan |
|
|
|
| ||||||||
Energy | $ | — | $ | — | $ | 293,832 | $ | 293,832 | ||||
Kuwait |
| 270,279 |
| — |
| — |
| 270,279 | ||||
Malaysia |
| 954,426 |
| — |
| — |
| 954,426 | ||||
Philippines |
| 818,119 |
| — |
| — |
| 818,119 | ||||
Poland |
| 335,094 |
| — |
| — |
| 335,094 | ||||
Russia |
| 2,126,546 |
| — |
| — |
| 2,126,546 | ||||
Singapore |
| 1,532,920 |
| — |
| — |
| 1,532,920 | ||||
South Africa |
| 1,048,907 |
| — |
| — |
| 1,048,907 | ||||
Thailand |
| 629,328 |
| — |
| — |
| 629,328 | ||||
Turkey |
| 138,538 |
| — |
| — |
| 138,538 | ||||
United Kingdom |
| 60,020 |
| — |
| — |
| 60,020 | ||||
Total Common Stock |
| 17,556,158 |
| — |
| 363,605 |
| 17,919,763 | ||||
Preferred Stock |
| — |
| 120,057 |
| — |
| 120,057 | ||||
Total Investments in Securities | $ | 17,556,158 | $ | 120,057 | $ | 363,605 | $ | 18,039,820 | ||||
|
|
|
| |||||||||
The following is a reconciliation of the investments in which significant unobservable inputs (Level 3) were used in determining value:
Common Stock | |||
Beginning balance as of March 31, 2019 | $ | 293,832 | |
Accrued discounts/premiums |
| — | |
Realized gain/(loss)(1) |
| — | |
Change in unrealized appreciation/(depreciation)(2) |
| — | |
Purchases |
| — | |
Sales |
| — | |
Transfer into Level 3 |
| 69,773 | |
Transfer out of Level 3 |
| — | |
Ending balance as of September 30, 2019 | $ | 363,605 | |
(1) Realized gain/(loss) from the sale of Level 3 securities is included on the Statement of Operations in Net Realized Gain (Loss) on Investments
(2) Change in unrealized appreciation/(depreciation) is included on the Statement of Operations in Net Change in Unrealized Appreciation (Depreciation) on Investments
For the period endedSeptember30, 2019, there have been no transfers between Level 1 and Level 2 investments.
For the period endedSeptember30, 2019, there have been no transfers between Level 2 and Level 3 investments.
Amounts designated as “—” are $0 or have been rounded to $0.
The accompanying notes are an integral part of the financial statements.
36
Schedule of Investments (Unaudited)September 30, 2019
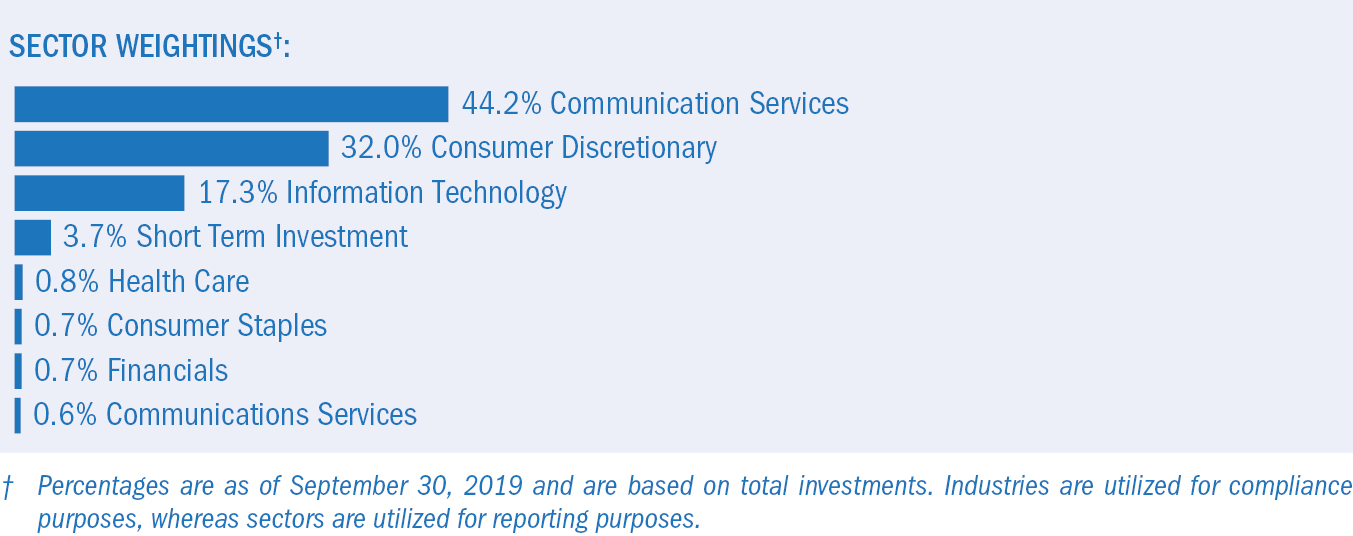
Shares | Value | ||||
COMMON STOCK — 100.2%‡ |
| ||||
ARGENTINA — 3.7% |
| ||||
Consumer Discretionary — 3.7% |
| ||||
MercadoLibre* | 1,446 | $ | 797,079 | ||
TOTAL ARGENTINA |
| 797,079 | |||
| |||||
BRAZIL — 7.2% |
| ||||
Communication Services — 0.8% |
| ||||
Smiles Fidelidade | 18,400 |
| 166,711 | ||
| |||||
Consumer Discretionary — 3.7% |
| ||||
B2W Cia Digital* | 55,170 |
| 634,295 | ||
CVC Brasil Operadora e Agencia de Viagens | 13,426 |
| 180,629 | ||
| 814,924 | ||||
Information Technology — 2.7% |
| ||||
Cielo | 306,280 |
| 588,236 | ||
TOTAL BRAZIL |
| 1,569,871 | |||
| |||||
CHINA — 38.6% |
| ||||
Communication Services — 22.1% |
| ||||
58.com ADR* | 10,108 |
| 498,426 | ||
Autohome ADR* | 6,079 |
| 505,347 | ||
Baidu ADR* | 7,071 |
| 726,616 | ||
China Telecom, Cl H | 1,162,000 |
| 529,166 | ||
iQIYI ADR*(A) | 31,596 |
| 509,644 | ||
NetEase ADR | 2,862 |
| 761,807 | ||
Tencent Holdings | 17,975 |
| 757,117 | ||
Weibo ADR* | 11,707 |
| 523,888 | ||
| 4,812,011 | ||||
Consumer Discretionary — 16.5% |
| ||||
Alibaba Group Holding ADR* | 4,712 |
| 787,987 | ||
Ctrip.com International ADR* | 22,848 |
| 669,218 | ||
JD.com ADR* | 26,042 |
| 734,645 | ||
New Oriental Education & Technology Group ADR* | 7,370 |
| 816,301 | ||
TAL Education Group ADR* | 16,845 |
| 576,773 | ||
| 3,584,924 | ||||
TOTAL CHINA |
| 8,396,935 | |||
The accompanying notes are an integral part of the financial statements.
37
Schedule of Investments(Unaudited)September 30, 2019
KraneShares Emerging Markets Consumer Technology Index ETF(continued)
Shares | Value | ||||
COMMON STOCK(continued) |
| ||||
GREECE — 5.0% |
| ||||
Communication Services — 2.6% |
| ||||
Hellenic Telecommunications Organization | 41,233 | $ | 568,198 | ||
| |||||
Consumer Discretionary — 2.4% |
| ||||
OPAP | 51,542 |
| 530,164 | ||
TOTAL GREECE |
| 1,098,362 | |||
| |||||
INDIA — 0.8% |
| ||||
Consumer Discretionary — 0.8% |
| ||||
MakeMyTrip* | 7,618 |
| 172,852 | ||
TOTAL INDIA |
| 172,852 | |||
| |||||
MALAYSIA — 3.5% |
| ||||
Communication Services — 2.7% |
| ||||
Telekom Malaysia | 685,400 |
| 589,310 | ||
| |||||
Information Technology — 0.8% |
| ||||
My EG Services | 490,800 |
| 164,108 | ||
TOTAL MALAYSIA |
| 753,418 | |||
| |||||
MEXICO — 2.7% |
| ||||
Communication Services — 2.7% |
| ||||
Grupo Televisa | 298,700 |
| 585,025 | ||
TOTAL MEXICO |
| 585,025 | |||
| |||||
NETHERLANDS — 1.1% |
| ||||
Consumer Discretionary — 1.1% |
| ||||
Prosus* | 3,217 |
| 236,209 | ||
TOTAL NETHERLANDS |
| 236,209 | |||
| |||||
POLAND — 3.0% |
| ||||
Communication Services — 0.7% |
| ||||
Orange Polska | 110,778 |
| 152,663 | ||
| |||||
Consumer Discretionary — 2.3% |
| ||||
Cyfrowy Polsat | 76,445 |
| 503,767 | ||
TOTAL POLAND |
| 656,430 | |||
| |||||
PUERTO RICO — 0.8% |
| ||||
Information Technology — 0.8% |
| ||||
EVERTEC | 5,534 |
| 172,772 | ||
TOTAL PUERTO RICO |
| 172,772 | |||
| |||||
RUSSIA — 3.1% |
| ||||
Information Technology — 3.1% |
| ||||
Mail.Ru Group GDR* | 24,567 |
| 514,924 | ||
QIWI ADR | 7,190 |
| 157,821 | ||
TOTAL RUSSIA |
| 672,745 | |||
| |||||
SOUTH AFRICA — 2.3% |
| ||||
Consumer Discretionary — 2.3% |
| ||||
Naspers, Cl N | 3,246 |
| 491,326 | ||
TOTAL SOUTH AFRICA |
| 491,326 | |||
The accompanying notes are an integral part of the financial statements.
38
Schedule of Investments (Unaudited)September 30, 2019
KraneShares Emerging Markets Consumer Technology Index ETF(continued)
Shares | Value | ||||
COMMON STOCK(continued) |
| ||||
SOUTH KOREA — 20.8% |
| ||||
Communication Services — 12.1% |
| ||||
Kakao | 4,905 | $ | 555,639 | ||
KT ADR | 50,675 |
| 573,134 | ||
NAVER | 6,182 |
| 811,415 | ||
NCSoft | 1,207 |
| 525,726 | ||
Studio Dragon* | 2,901 |
| 165,647 | ||
| 2,631,561 | ||||
Consumer Discretionary — 0.7% |
| ||||
DoubleUGames | 3,461 |
| 159,718 | ||
| |||||
Consumer Staples — 0.8% |
| ||||
Orion Holdings | 12,421 |
| 165,108 | ||
| |||||
Financials — 0.7% |
| ||||
Daou Technology | 9,821 |
| 163,389 | ||
| |||||
Health Care — 0.8% |
| ||||
Celltrion Pharm* | 6,014 |
| 176,224 | ||
| |||||
Information Technology — 5.7% |
| ||||
Com2uSCorp | 2,109 |
| 164,503 | ||
Douzone Bizon | 3,268 |
| 178,679 | ||
Netmarble(A) | 6,936 |
| 547,968 | ||
NHN* | 3,262 |
| 169,897 | ||
Pearl Abyss* | 1,014 |
| 167,849 | ||
| 1,228,896 | ||||
TOTAL SOUTH KOREA |
| 4,524,896 | |||
| |||||
TAIWAN — 2.3% |
| ||||
Information Technology — 2.3% |
| ||||
Wistron NeWeb | 65,000 |
| 170,962 | ||
WPG Holdings | 131,880 |
| 162,382 | ||
WT Microelectronics | 133,000 |
| 166,118 | ||
TOTAL TAIWAN |
| 499,462 | |||
| |||||
THAILAND — 2.5% |
| ||||
Communication Services — 2.5% |
| ||||
Intouch Holdings | 258,837 |
| 554,318 | ||
TOTAL THAILAND |
| 554,318 | |||
| |||||
UNITED STATES — 2.8% |
| ||||
Information Technology — 2.8% |
| ||||
Pagseguro Digital, Cl A* | 13,068 |
| 605,179 | ||
TOTAL UNITED STATES |
| 605,179 | |||
TOTAL COMMON STOCK |
| 21,786,879 | |||
| |||||
PREFERRED STOCK — 0.7% |
| ||||
BRAZIL— 0.7% |
| ||||
Communication Services — 0.7% |
| ||||
Oi(B)* | 414,800 |
| 144,394 | ||
TOTAL PREFERRED STOCK |
| 144,394 | |||
The accompanying notes are an integral part of the financial statements.
39
Schedule of Investments(Unaudited)September 30, 2019
KraneShares Emerging Markets Consumer Technology Index ETF(concluded)
Shares | Value | |||||
SHORT-TERM INVESTMENT(C)(D) — 3.9% |
|
| ||||
Invesco Government & Agency Portfolio, Cl Institutional, 2.270% | 851,781 | $ | 851,781 |
| ||
TOTAL SHORT-TERM INVESTMENT |
| 851,781 |
| |||
|
| |||||
TOTAL INVESTMENTS — 104.8% |
| 22,783,054 |
| |||
OTHER ASSETS LESS LIABILITIES — (4.8)% |
| (1,053,288 | ) | |||
NET ASSETS — 100% | $ | 21,729,766 |
| |||
‡ Industries are utilized for compliance purposes, whereas sectors are utilized for reporting.
* Non-income producing security.
(A) This security or a partial position of this security is on loan at September 30, 2019. The total market value of securities on loan at September 30, 2019 was $823,981.
(B) Currently, no stated interest rate.
(C) The rate shown is the 7-day effective yield as of September 30, 2019.
(D) This security was purchased with cash collateral held from securities on loan. The total value of such security as of September 30, 2019 was $851,781.
ADR— American Depositary Receipt
Cl — Class
GDR — Global Depositary Receipt
As of September30, 2019, all of the Fund’s investments were considered Level 1 of the fair value hierarchy, in accordance with the authoritative guidance under U.S. GAAP.
For the period endedSeptember30, 2019, there have been no transfers between Level1, Level 2 or Level 3 investments. Transfers between levels are recognized at period end.
The accompanying notes are an integral part of the financial statements.
40
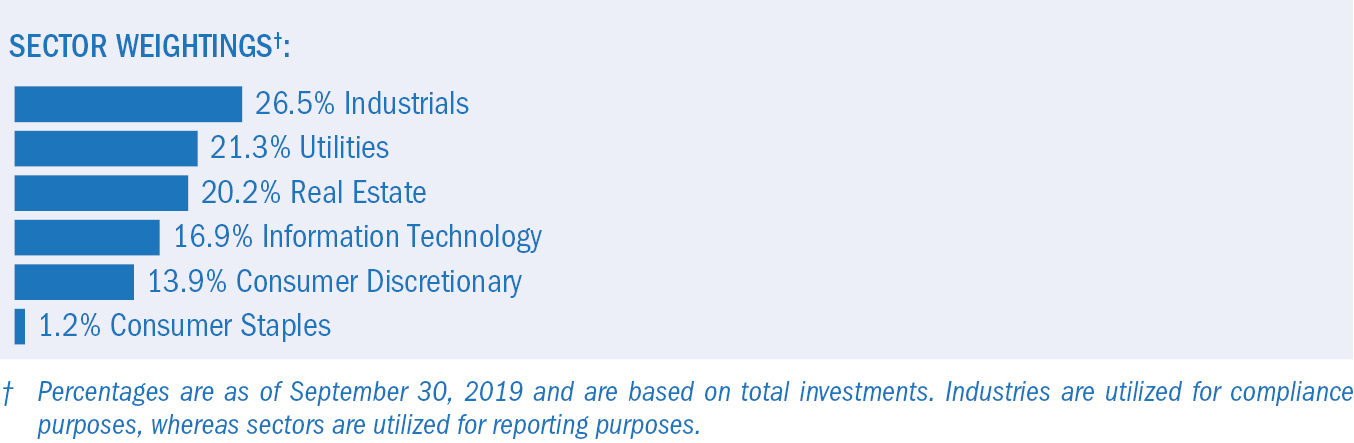
Shares | Value | ||||
COMMON STOCK — 98.4%‡ |
| ||||
CHINA — 75.0% |
| ||||
Consumer Discretionary — 13.7% |
| ||||
BYD, Cl A | 6,600 | $ | 45,083 | ||
BYD, Cl H | 51,500 |
| 257,191 | ||
NIO ADR* | 53,000 |
| 82,680 | ||
Tianneng Power International | 87,885 |
| 61,883 | ||
Yadea Group Holdings | 136,694 |
| 29,643 | ||
| 476,480 | ||||
Consumer Staples — 1.2% |
| ||||
NVC Lighting Holding | 315,000 |
| 41,387 | ||
| |||||
Industrials — 24.1% |
| ||||
Capital Environment Holdings* | 640,000 |
| 15,267 | ||
China Conch Venture Holdings | 91,000 |
| 336,633 | ||
China Everbright International | 336,216 |
| 259,043 | ||
Contemporary Amperex Technology, Cl A | 4,200 |
| 42,052 | ||
CT Environmental Group*(A)(B)(C) | 329,000 |
| 1,049 | ||
Dynagreen Environmental Protection Group, Cl H | 48,000 |
| 19,226 | ||
Tus Environmental Science And Technology Development, Cl A | 8,500 |
| 11,236 | ||
Xinjiang Goldwind Science & Technology, Cl A | 19,835 |
| 34,775 | ||
Xinjiang Goldwind Science & Technology, Cl H | 99,004 |
| 117,197 | ||
| 836,478 | ||||
Information Technology — 10.5% |
| ||||
JinkoSolar Holding ADR* | 4,060 |
| 64,757 | ||
LONGi Green Energy Technology, Cl A | 21,330 |
| 78,346 | ||
Sanan Optoelectronics, Cl A | 24,400 |
| 48,108 | ||
Wuxi Lead Intelligent Equipment, Cl A | 5,400 |
| 25,483 | ||
Xinyi Solar Holdings | 251,704 |
| 150,906 | ||
| 367,600 | ||||
Real Estate — 8.6% |
| ||||
China Vanke, Cl A | 19,300 |
| 69,998 | ||
China Vanke, Cl H | 65,900 |
| 229,491 | ||
| 299,489 | ||||
Utilities — 16.9% |
| ||||
Beijing Enterprises Water Group | 302,500 |
| 154,735 | ||
China Datang Renewable Power, Cl H | 305,000 |
| 29,569 | ||
China Everbright Water | 73,614 |
| 16,768 | ||
The accompanying notes are an integral part of the financial statements.
41
Schedule of Investments(Unaudited)September 30, 2019
KraneShares MSCI China Environment Index ETF(continued)
Shares | Value | ||||
COMMON STOCK (continued) |
| ||||
Utilities(continued) |
| ||||
China Longyuan Power Group, Cl H | 289,800 | $ | 162,655 | ||
Huaneng Renewables, Cl H(A)(B)(C) | 582,000 |
| 223,425 | ||
| 587,152 | ||||
TOTAL CHINA |
| 2,608,586 | |||
| |||||
HONG KONG — 23.4% |
| ||||
Industrials — 2.0% |
| ||||
China High Speed Transmission Equipment Group | 52,000 |
| 31,905 | ||
Fullshare Holdings | 1,152,500 |
| 37,489 | ||
| 69,394 | ||||
Information Technology — 6.0% |
| ||||
China Railway Signal & Communication, Cl H | 191,000 |
| 118,166 | ||
GCL-Poly Energy Holdings* | 1,675,000 |
| 67,304 | ||
Wasion Holdings | 65,000 |
| 24,626 | ||
| 210,096 | ||||
Real Estate — 11.3% |
| ||||
China Merchants Land | 158,000 |
| 21,767 | ||
Shimao Property Holdings | 57,000 |
| 166,505 | ||
SOHO China | 268,500 |
| 76,720 | ||
Yuexiu Real Estate Investment Trust† | 200,000 |
| 128,071 | ||
| 393,063 | ||||
Utilities — 4.1% |
| ||||
Canvest Environmental Protection Group | 82,000 |
| 35,773 | ||
China Everbright Greentech | 47,000 |
| 27,339 | ||
Concord New Energy Group | 770,000 |
| 37,816 | ||
GCL New Energy Holdings* | 752,000 |
| 26,859 | ||
Panda Green Energy Group* | 502,000 |
| 14,728 | ||
| 142,515 | ||||
TOTAL HONG KONG |
| 815,068 | |||
TOTAL COMMON STOCK |
| 3,423,654 | |||
| |||||
TOTAL INVESTMENTS — 98.4% |
| 3,423,654 | |||
OTHER ASSETS LESS LIABILITIES — 1.6% |
| 55,733 | |||
NET ASSETS — 100% | $ | 3,479,387 | |||
‡ Industries are utilized for compliance purposes, whereas sectors are utilized for reporting.
* Non-income producing security.
† Real Estate Investment Trust
(A) Security is fair valued using methods determined in good faith by the Fair Value Committee of the Board of Trustees. The total value of such securities as of September 30, 2019 was $224,474 and represents 6.5% of Net Assets.
(B) Level 3 security in accordance with fair value hierarchy.
(C) Security considered illiquid. The total value of such securities as of September 30, 2019 was $224,474 and represents 6.5% of Net Assets.
ADR — American Depositary Receipt
Cl — Class
The accompanying notes are an integral part of the financial statements.
42
Schedule of Investments(Unaudited)September 30, 2019
KraneShares MSCI China Environment Index ETF(concluded)
The following summarizes the market value of the Fund’s investments used as of September30, 2019, based on the inputs used to value them:
Investments in Securities | Level 1 | Level 2 | Level 3 | Total | ||||||||
Common Stock |
|
|
|
| ||||||||
China |
|
|
|
| ||||||||
Consumer Discretionary | $ | 476,480 | $ | — | $ | — | $ | 476,480 | ||||
Consumer Staples |
| 41,387 |
| — |
| — |
| 41,387 | ||||
Industrials |
| 835,429 |
| — |
| 1,049 |
| 836,478 | ||||
Information Technology |
| 367,600 |
| — |
| — |
| 367,600 | ||||
Real Estate |
| 299,489 |
| — |
| — |
| 299,489 | ||||
Utilities |
| 363,727 |
| — |
| 223,425 |
| 587,152 | ||||
Hong Kong |
| 815,068 |
| — |
| — |
| 815,068 | ||||
Total Common Stock |
| 3,199,180 |
| — |
| 224,474 |
| 3,423,654 | ||||
Total Investments in Securities | $ | 3,199,180 | $ | — | $ | 224,474 | $ | 3,423,654 | ||||
The following is a reconciliation of the investments in which significant unobservable inputs (Level 3) were used in determining value:
Common Stock | |||
Beginning balance as of March 31, 2019 | $ | — | |
Accrued discounts/premiums |
| — | |
Realized gain/(loss)(1) |
| — | |
Change in unrealized appreciation/(depreciation)(2) |
| — | |
Purchases |
| — | |
Sales |
| — | |
Transfer into Level 3 |
| 224,474 | |
Transfer out of Level 3 |
| — | |
Ending balance as of September 30, 2019 | $ | 224,474 | |
(1) Realized gain/(loss) from the sale of Level 3 securities is included on the Statement of Operations in Net Realized Gain (Loss) on Investments
(2) Change in unrealized appreciation/(depreciation) is included on the Statement of Operations in Net Change in Unrealized Appreciation (Depreciation) on Investments
For the period endedSeptember30, 2019, there have been no transfers between Level 1 and Level 2 investments.
For the period endedSeptember30, 2019, there have been no transfers between Level 2 and Level 3 investments.
For the period endedSeptember30, 2019, the transfer in and out of level 3 occurred due to a halt in trading of these securities. Transfers between levels are recognized at period end.
Amounts designated as “—” are $0 or have been rounded to $0.
The accompanying notes are an integral part of the financial statements.
43
Schedule of Investments (Unaudited)September 30, 2019
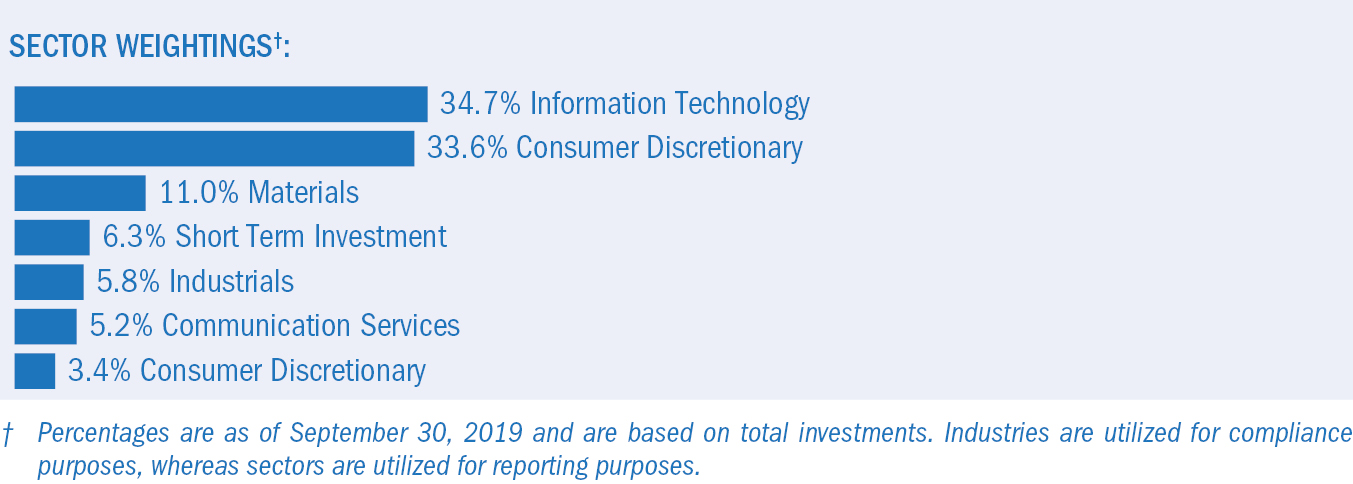
Shares | Value | ||||
COMMON STOCK — 96.1%‡ |
| ||||
AUSTRIA — 1.3% |
| ||||
Information Technology — 1.3% |
| ||||
ams | 7,079 | $ | 314,993 | ||
TOTAL AUSTRIA |
| 314,993 | |||
| |||||
CANADA — 1.6% |
| ||||
Materials — 1.6% |
| ||||
First Quantum Minerals | 48,514 |
| 407,825 | ||
TOTAL CANADA |
| 407,825 | |||
| |||||
CHILE — 2.8% |
| ||||
Materials — 2.8% |
| ||||
Antofagasta | 32,693 |
| 362,186 | ||
Sociedad Quimica y Minera de Chile ADR(A) | 11,952 |
| 332,146 | ||
TOTAL CHILE |
| 694,332 | |||
| |||||
CHINA — 22.3% |
| ||||
Communication Services — 1.9% |
| ||||
Baidu ADR* | 4,630 |
| 475,779 | ||
Consumer Discretionary — 12.6% |
| ||||
Brilliance China Automotive Holdings | 320,000 |
| 343,700 | ||
BYD, Cl H(A) | 71,500 |
| 357,070 | ||
China Shipbuilding Industry Group Power, Cl A | 108,646 |
| 347,791 | ||
Great Wall Motor, Cl H | 462,000 |
| 309,399 | ||
Guangdong Dongfang Precision Science & Technology, Cl A | 502,800 |
| 329,511 | ||
Huizhou Desay Sv Automotive, Cl A | 88,300 |
| 291,193 | ||
Kuang-Chi Technologies, Cl A | 241,092 |
| 302,496 | ||
Ningbo Joyson Electronic, Cl A* | 140,700 |
| 341,643 | ||
NIO ADR*(A) | 119,000 |
| 185,640 | ||
Zotye Automobile, Cl A* | 611,900 |
| 298,187 | ||
| 3,106,630 | ||||
Industrials — 4.8% |
| ||||
Camel Group, Cl A | 230,105 |
| 292,900 | ||
Guoxuan High-Tech, Cl A | 160,789 |
| 281,671 | ||
Jiangxi Special Electric Motor, Cl A* | 535,806 |
| 299,371 | ||
Zhejiang Narada Power Source, Cl A* | 198,000 |
| 324,121 | ||
| 1,198,063 | ||||
The accompanying notes are an integral part of the financial statements.
44
Schedule of Investments(Unaudited)September 30, 2019
KraneShares Electric Vehicles and Future Mobility Index ETF(continued)
Shares | Value | ||||
COMMON STOCK (continued) |
| ||||
Information Technology — 3.0% |
| ||||
GoerTek, Cl A | 180,828 | $ | 445,157 | ||
Shanghai Belling, Cl A | 137,300 |
| 290,320 | ||
| 735,477 | ||||
TOTAL CHINA |
| 5,515,949 | |||
| |||||
FRANCE — 2.0% |
| ||||
Consumer Discretionary — 1.5% |
| ||||
Valeo | 11,314 |
| 366,953 | ||
Information Technology — 0.5% |
| ||||
STMicroelectronics | 6,168 |
| 119,223 | ||
TOTAL FRANCE |
| 486,176 | |||
| |||||
GERMANY — 10.2% |
| ||||
Consumer Discretionary — 8.4% |
| ||||
Bayerische Motoren Werke | 12,558 |
| 884,288 | ||
Daimler | 17,011 |
| 846,043 | ||
Hella GmbH & KGaA | 7,831 |
| 350,203 | ||
| 2,080,534 | ||||
Information Technology — 1.8% |
| ||||
Infineon Technologies | 25,228 |
| 454,140 | ||
TOTAL GERMANY |
| 2,534,674 | |||
| |||||
JAPAN — 1.6% |
| ||||
Materials — 1.6% |
| ||||
Hitachi Chemical | 12,300 |
| 401,180 | ||
TOTAL JAPAN |
| 401,180 | |||
| |||||
NETHERLANDS — 2.1% |
| ||||
Information Technology — 2.1% |
| ||||
NXP Semiconductors | 4,778 |
| 521,375 | ||
TOTAL NETHERLANDS |
| 521,375 | |||
| |||||
PERU — 2.0% |
| ||||
Materials — 2.0% |
| ||||
Southern Copper | 14,624 |
| 499,117 | ||
TOTAL PERU |
| 499,117 | |||
| |||||
SOUTH KOREA — 2.0% |
| ||||
Information Technology — 2.0% |
| ||||
Samsung SDI | 2,609 |
| 486,400 | ||
TOTAL SOUTH KOREA |
| 486,400 | |||
| |||||
SWITZERLAND — 1.5% |
| ||||
Information Technology — 1.5% |
| ||||
STMicroelectronics | 19,706 |
| 381,226 | ||
TOTAL SWITZERLAND |
| 381,226 | |||
| |||||
TAIWAN — 2.6% |
| ||||
Consumer Discretionary — 1.3% |
| ||||
Cub Elecparts | 40,000 |
| 320,392 | ||
Information Technology — 1.3% |
| ||||
Parade Technologies | 18,000 |
| 313,301 | ||
TOTAL TAIWAN |
| 633,693 | |||
The accompanying notes are an integral part of the financial statements.
45
Schedule of Investments(Unaudited)September 30, 2019
KraneShares Electric Vehicles and Future Mobility Index ETF(continued)
Shares | Value | |||||
COMMON STOCK (continued) |
|
| ||||
UNITED KINGDOM — 1.4% |
|
| ||||
Information Technology — 1.4% |
|
| ||||
Dialog Semiconductor* | 7,201 | $ | 340,950 |
| ||
TOTAL UNITED KINGDOM |
| 340,950 |
| |||
|
| |||||
UNITED STATES — 42.7% |
|
| ||||
Communication Services — 3.6% |
|
| ||||
Alphabet, Cl A* | 731 |
| 892,653 |
| ||
|
| |||||
Consumer Discretionary — 12.0% |
|
| ||||
Aptiv | 5,737 |
| 501,528 |
| ||
General Motors | 24,168 |
| 905,817 |
| ||
Gentherm* | 7,940 |
| 326,215 |
| ||
Tesla*(A) | 3,704 |
| 892,182 |
| ||
Visteon* | 4,164 |
| 343,697 |
| ||
| 2,969,439 |
| ||||
Industrials — 1.3% |
|
| ||||
EnerSys | 5,056 |
| 333,393 |
| ||
Information Technology — 22.2% |
|
| ||||
Advanced Micro Devices* | 29,169 |
| 845,609 |
| ||
Ambarella* | 5,182 |
| 325,611 |
| ||
Analog Devices | 7,803 |
| 871,829 |
| ||
Cirrus Logic* | 6,015 |
| 322,284 |
| ||
Maxim Integrated Products | 8,710 |
| 504,396 |
| ||
MaxLinear, Cl A* | 14,622 |
| 327,240 |
| ||
NVIDIA | 4,991 |
| 868,783 |
| ||
Skyworks Solutions | 6,270 |
| 496,898 |
| ||
Texas Instruments | 7,007 |
| 905,585 |
| ||
| 5,468,235 |
| ||||
Materials — 3.6% |
|
| ||||
Albemarle | 5,599 |
| 389,242 |
| ||
FMC | 5,642 |
| 494,691 |
| ||
| 883,933 |
| ||||
TOTAL UNITED STATES |
| 10,547,653 |
| |||
TOTAL COMMON STOCK |
| 23,765,543 |
| |||
|
| |||||
PREFERRED STOCK — 3.6% |
|
| ||||
GERMANY— 3.6% |
|
| ||||
Consumer Discretionary — 3.6% |
|
| ||||
Volkswagen(B) | 5,189 |
| 882,842 |
| ||
TOTAL PREFERRED STOCK |
| 882,842 |
| |||
|
| |||||
SHORT-TERM INVESTMENT(C)(D) — 6.6% |
|
| ||||
Invesco Government & Agency Portfolio, Cl Institutional, 2.270% | 1,643,490 |
| 1,643,490 |
| ||
TOTAL SHORT-TERM INVESTMENT |
| 1,643,490 |
| |||
|
| |||||
TOTAL INVESTMENTS — 106.3% |
| 26,291,875 |
| |||
OTHER ASSETS LESS LIABILITIES — (6.3)% |
| (1,559,086 | ) | |||
NET ASSETS — 100% | $ | 24,732,789 |
| |||
The accompanying notes are an integral part of the financial statements.
46
Schedule of Investments(Unaudited)September 30, 2019
KraneShares Electric Vehicles and Future Mobility Index ETF(concluded)
‡ Industries are utilized for compliance purposes, whereas sectors are utilized for reporting.
* Non-income producing security.
(A) This security or a partial position of this security is on loan at September 30, 2019. The total market value of securities on loan at September 30, 2019 was $1,596,887.
(B) Currently, no stated interest rate.
(C) The rate shown is the 7-day effective yield as of September 30, 2019.
(D) This security was purchased with cash collateral held from securities on loan. The total value of such security as of September 30, 2019 was $1,643,490.
ADR — American Depositary Receipt
Cl — Class
As of September30, 2019, all of the Fund’s investments were considered Level 1 of the fair value hierarchy, in accordance with the authoritative guidance under U.S. GAAP.
For the period ended September30, 2019, there have been no transfers between Level1, Level 2 or Level 3 investments. Transfers between levels are recognized at period end.
The accompanying notes are an integral part of the financial statements.
47
Schedule of Investments(Unaudited)September 30, 2019
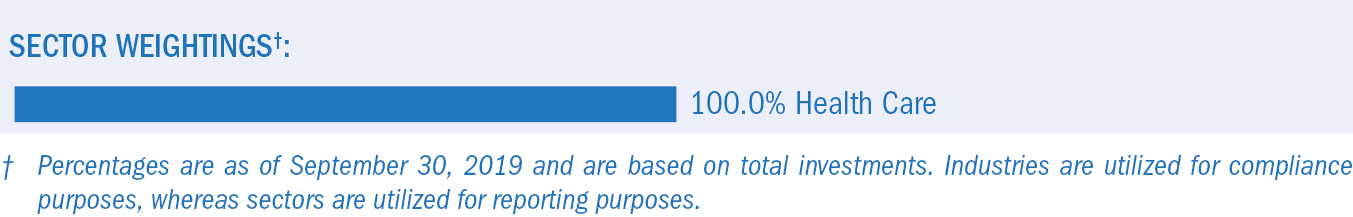
Shares | Value | ||||
COMMON STOCK — 99.9%‡ |
| ||||
CHINA — 99.9% |
| ||||
Health Care — 99.9% |
| ||||
3SBio* | 149,000 | $ | 247,085 | ||
Aier Eye Hospital Group, Cl A | 107,830 |
| 535,586 | ||
Alibaba Health Information Technology* | 392,000 |
| 342,526 | ||
Beijing SL Pharmaceutical, Cl A | 34,902 |
| 60,995 | ||
Beijing Tiantan Biological Products, Cl A | 36,758 |
| 146,132 | ||
Beijing Tongrentang, Cl A | 47,568 |
| 179,182 | ||
BGI Genomics, Cl A | 14,100 |
| 126,326 | ||
Changchun High & New Technology Industry Group, Cl A | 5,800 |
| 320,295 | ||
Chengdu Kanghong Pharmaceutical Group, Cl A | 19,210 |
| 89,605 | ||
China Medical System Holdings | 158,000 |
| 187,841 | ||
China National Accord Medicines, Cl A | 11,832 |
| 72,057 | ||
China National Medicines, Cl A | 26,055 |
| 99,423 | ||
China Reform Health Management and Services Group, Cl A* | 31,000 |
| 76,141 | ||
China Resources Double Crane Pharmaceutical, Cl A | 35,407 |
| 60,489 | ||
China Resources Pharmaceutical Group | 185,500 |
| 173,920 | ||
China Resources Sanjiu Medical & Pharmaceutical, Cl A | 32,709 |
| 133,425 | ||
China Traditional Chinese Medicine Holdings | 264,000 |
| 121,234 | ||
Chongqing Zhifei Biological Products, Cl A | 46,900 |
| 311,629 | ||
CSPC Pharmaceutical Group | 532,000 |
| 1,068,153 | ||
Dong-E-E-Jiao, Cl A | 3,600 |
| 15,365 | ||
Dong-E-E-Jiao, Cl E | 19,214 |
| 82,009 | ||
Genscript Biotech* | 110,000 |
| 210,756 | ||
Guangzhou Baiyunshan Pharmaceutical Holdings, Cl A | 49,246 |
| 239,293 | ||
Guizhou Bailing Group Pharmaceutical, Cl A | 48,600 |
| 70,574 | ||
Hangzhou Tigermed Consulting, Cl A | 25,550 |
| 222,004 | ||
Huadong Medicine, Cl A | 59,022 |
| 216,543 | ||
Hualan Biological Engineering, Cl A | 49,064 |
| 235,660 | ||
Hubei Jumpcan Pharmaceutical, Cl A | 26,275 |
| 104,199 | ||
Humanwell Healthcare Group, Cl A | 47,270 |
| 81,550 | ||
Hutchison China MediTech ADR* | 6,818 |
| 121,633 | ||
Jafron Biomedical, Cl A | 14,300 |
| 151,987 | ||
Jiangsu Hengrui Medicine, Cl A | 133,609 |
| 1,509,492 | ||
Jiangsu Yuyue Medical Equipment & Supply, Cl A | 34,210 |
| 103,475 | ||
Jilin Aodong Pharmaceutical Group, Cl A | 40,611 |
| 87,578 | ||
Jinyu Bio-Technology, Cl A | 41,168 |
| 108,783 | ||
Joincare Pharmaceutical Group Industry, Cl A | 66,048 |
| 90,731 | ||
Jointown Pharmaceutical Group, Cl A | 63,550 |
| 126,990 | ||
Lepu Medical Technology Beijing, Cl A | 59,500 |
| 208,798 | ||
Livzon Pharmaceutical Group, Cl A | 20,940 |
| 77,823 | ||
Luye Pharma Group | 133,000 |
| 94,838 | ||
Meinian Onehealth Healthcare Holdings, Cl A | 133,410 |
| 227,171 | ||
Shandong Buchang Pharmaceuticals, Cl A | 39,869 |
| 106,467 | ||
Shandong Weigao Group Medical Polymer, Cl H | 240,000 |
| 247,060 | ||
The accompanying notes are an integral part of the financial statements.
48
Schedule of Investments(Unaudited)September 30, 2019
KraneShares MSCI All China Health Care Index ETF(concluded)
Shares | Value | ||||
COMMON STOCK(continued) |
| ||||
Health Care(continued) |
| ||||
Shanghai Fosun Pharmaceutical Group, Cl A | 67,759 | $ | 239,773 | ||
Shanghai Fosun Pharmaceutical Group, Cl H | 58,500 |
| 157,082 | ||
Shanghai Henlius Biotech, Cl H* | 504 |
| — | ||
Shanghai Pharmaceuticals Holding, Cl A | 64,994 |
| 165,643 | ||
Shanghai Pharmaceuticals Holding, Cl H | 96,600 |
| 174,978 | ||
Shenzhen Hepalink Pharmaceutical Group, Cl A | 36,228 |
| 94,360 | ||
Shenzhen Kangtai Biological Products, Cl A | 23,000 |
| 239,108 | ||
Shenzhen Mindray Bio-Medical Electronics, Cl A | 14,100 |
| 364,209 | ||
Shenzhen Salubris Pharmaceuticals, Cl A | 29,643 |
| 77,623 | ||
Shijiazhuang Yiling Pharmaceutical, Cl A | 41,525 |
| 62,742 | ||
Sichuan Kelun Pharmaceutical, Cl A | 49,300 |
| 178,527 | ||
Sihuan Pharmaceutical Holdings Group | 446,000 |
| 67,702 | ||
Sino Biopharmaceutical | 790,500 |
| 1,004,335 | ||
Sinopharm Group, Cl H | 142,400 |
| 445,942 | ||
SSY Group | 178,000 |
| 140,776 | ||
Tasly Pharmaceutical Group, Cl A | 50,352 |
| 109,853 | ||
Tong Ren Tang Technologies, Cl H | 69,000 |
| 62,756 | ||
Tonghua Dongbao Pharmaceutical, Cl A | 70,691 |
| 173,233 | ||
Walvax Biotechnology, Cl A | 54,100 |
| 204,470 | ||
Winning Health Technology Group, Cl A | 57,100 |
| 126,974 | ||
WuXi AppTec, Cl A | 51,205 |
| 621,671 | ||
WuXi AppTec, Cl H | 18,200 |
| 198,962 | ||
Wuxi Biologics Cayman* | 66,500 |
| 678,623 | ||
Yifan Pharmaceutical, Cl A | 41,839 |
| 78,567 | ||
Yunnan Baiyao Group, Cl A | 35,465 |
| 377,683 | ||
Zhangzhou Pientzehuang Pharmaceutical, Cl A | 20,823 |
| 297,071 | ||
Zhejiang Conba Pharmaceutical, Cl A | 92,400 |
| 81,904 | ||
Zhejiang Huahai Pharmaceutical, Cl A | 44,116 |
| 91,306 | ||
Zhejiang NHU, Cl A | 72,933 |
| 218,456 | ||
TOTAL COMMON STOCK |
| ||||
(Cost $14,545,795) |
| 15,827,152 | |||
| |||||
TOTAL INVESTMENTS — 99.9% |
| ||||
(Cost $14,545,795) |
| 15,827,152 | |||
OTHER ASSETS LESS LIABILITIES — 0.1% |
| 19,798 | |||
NET ASSETS — 100% | $ | 15,846,950 | |||
‡ Industries are utilized for compliance purposes, whereas sectors are utilized for reporting.
* Non-income producing security.
ADR — American Depositary Receipt
Cl — Class
As of September30, 2019, all of the Fund’s investments were considered Level 1 of the fair value hierarchy, in accordance with the authoritative guidance under U.S. GAAP.
For the period ended September30, 2019, there have been no transfers between Level1, Level 2 or Level 3 investments. Transfers between levels are recognized at period end.
Amounts designated as “—” are $0 or have been rounded to $0.
The accompanying notes are an integral part of the financial statements.
49
Schedule of Investments(Unaudited)September 30, 2019
KraneShares CCBS China Corporate High Yield Bond USD Index ETF
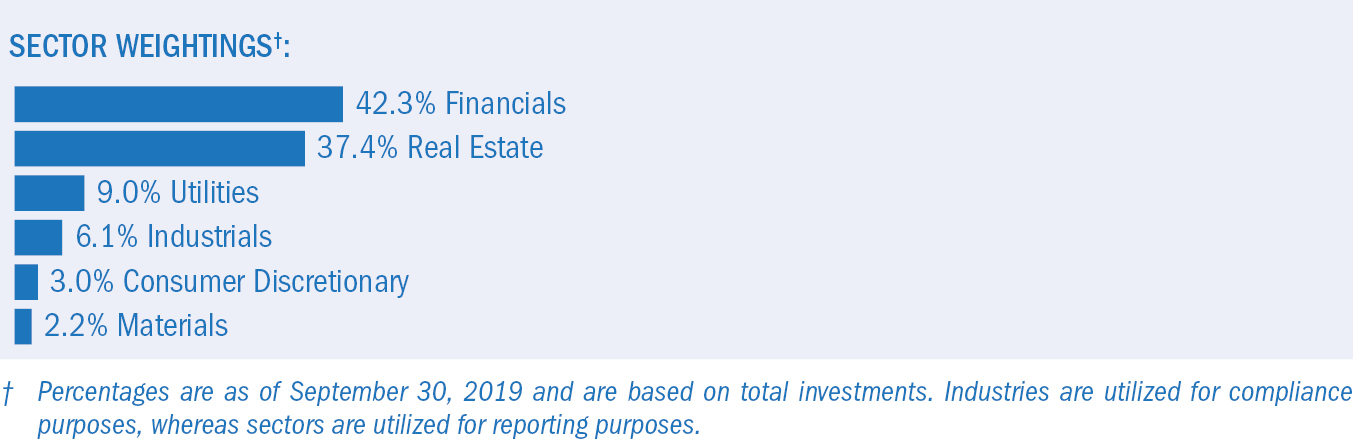
Face | Value | |||||
CORPORATE OBLIGATIONS — 95.8% |
|
| ||||
CHINA — 73.3% |
|
| ||||
Consumer Discretionary — 2.9% |
|
| ||||
Baoxin Auto Finance I |
|
| ||||
5.625%, VAR US Treas Yield Curve Rate T Note Const Mat3 Yr+8.909%, 10/30/2020‡ | $ | 200,000 | $ | 159,517 | ||
Golden Eagle Retail Group |
|
| ||||
4.625%, 05/21/2023 |
| 200,000 |
| 190,500 | ||
|
| 350,017 | ||||
Financials — 29.1% |
|
| ||||
Bank of Communications |
|
| ||||
5.000%, VAR US Treas Yield Curve Rate T Note Const Mat5 Yr+3.344%, 07/29/2020‡ |
| 300,000 |
| 303,510 | ||
CCB Life Insurance |
|
| ||||
4.500%, VAR US Treas Yield Curve Rate T Note Const Mat5 Yr+2.680%, 04/21/2022 |
| 300,000 |
| 295,647 | ||
CFLD Cayman Investment |
|
| ||||
8.600%, 04/08/2024 |
| 200,000 |
| 197,500 | ||
China Construction Bank |
|
| ||||
4.650%, VAR US Treas Yield Curve Rate T Note Const Mat5 Yr+2.974%, 12/16/2020‡ |
| 400,000 |
| 405,080 | ||
China Life Insurance |
|
| ||||
4.000%, VAR US Treas Yield Curve Rate T Note Const Mat5 Yr+2.294%, 07/03/2020 |
| 200,000 |
| 200,300 | ||
China Reinsurance Finance |
|
| ||||
3.375%, 03/09/2022 |
| 400,000 |
| 399,906 | ||
Fortune Star BVI |
|
| ||||
5.950%, 01/29/2021 |
| 200,000 |
| 198,961 | ||
GLP China Holdings |
|
| ||||
4.974%, 02/26/2024 |
| 200,000 |
| 210,221 | ||
Guotai Junan Holdings |
|
| ||||
3.875%, 03/11/2022 |
| 200,000 |
| 204,308 | ||
Industrial & Commercial Bank of China |
|
| ||||
6.000%, VAR US Treas Yield Curve Rate T Note Const Mat5 Yr+4.382%, 12/10/2019‡ |
| 300,000 |
| 301,526 | ||
Poly Real Estate Finance |
|
| ||||
4.750%, 09/17/2023 |
| 200,000 |
| 210,556 | ||
The accompanying notes are an integral part of the financial statements.
50
Schedule of Investments(Unaudited)September 30, 2019
KraneShares CCBS China Corporate High Yield Bond USD Index ETF(continued)
Face | Value | |||||
CORPORATE OBLIGATIONS(continued) |
|
| ||||
Financials (continued) |
|
| ||||
Ronshine China Holdings |
|
| ||||
8.750%, 04/25/2021 | $ | 200,000 | $ | 199,907 | ||
Sino-Ocean Land Treasure IV |
|
| ||||
5.250%, 03/30/2022 |
| 200,000 |
| 205,702 | ||
Westwood Group Holdings |
|
| ||||
5.375%, 10/19/2023 |
| 200,000 |
| 212,756 | ||
|
| 3,545,880 | ||||
Industrials — 4.2% |
|
| ||||
CNAC HK Synbridge |
|
| ||||
5.000%, 05/05/2020 |
| 300,000 |
| 303,232 | ||
Huzhou City Investment Development Group |
|
| ||||
4.875%, 12/20/2020 |
| 200,000 |
| 202,299 | ||
|
| 505,531 | ||||
Materials — 2.1% |
|
| ||||
Chinalco Capital Holdings |
|
| ||||
4.250%, 04/21/2022 |
| 250,000 |
| 252,411 | ||
|
| |||||
Real Estate — 30.6% |
|
| ||||
Central Plaza Development |
|
| ||||
7.125%, VAR US Treas Yield Curve Rate T Note Const Mat5 Yr+10.532%, 12/02/2019‡ |
| 200,000 |
| 200,000 | ||
Chengdu Economic & Technological Development Zone State-Owned Assets Investment |
|
| ||||
7.500%, 02/12/2022 |
| 200,000 |
| 200,998 | ||
China Aoyuan Group |
|
| ||||
7.950%, 09/07/2020 |
| 200,000 |
| 206,486 | ||
China Evergrande Group |
|
| ||||
7.500%, 06/28/2020 |
| 400,000 |
| 330,745 | ||
Country Garden Holdings |
|
| ||||
8.000%, 09/27/2021 |
| 400,000 |
| 434,239 | ||
Fantasia Holdings Group |
|
| ||||
15.000%, 12/18/2021 |
| 200,000 |
| 203,983 | ||
Franshion Brilliant |
|
| ||||
5.750%, VAR US Treas Yield Curve Rate T Note Const Mat5 Yr+3.859%, 01/17/2022‡ |
| 200,000 |
| 193,594 | ||
Kaisa Group Holdings |
|
| ||||
8.500%, 06/30/2020 |
| 200,000 |
| 181,224 | ||
Logan Property Holdings |
|
| ||||
5.250%, 05/23/2020 |
| 200,000 |
| 192,705 | ||
Shimao Property Holdings |
|
| ||||
6.125%, 02/21/2022 |
| 300,000 |
| 317,957 | ||
Shui On Development Holding |
|
| ||||
6.400%, VAR US Treas Yield Curve Rate T Note Const Mat5 Yr+7.627%, 06/20/2022‡ |
| 200,000 |
| 198,599 | ||
Sunac China Holdings |
|
| ||||
8.350%, 04/19/2021 |
| 200,000 |
| 197,711 | ||
Times China Holdings |
|
| ||||
6.600%, 11/30/2020 |
| 200,000 |
| 197,205 | ||
The accompanying notes are an integral part of the financial statements.
51
Schedule of Investments(Unaudited)September 30, 2019
KraneShares CCBS China Corporate High Yield Bond USD Index ETF(continued)
Face | Value | |||||
CORPORATE OBLIGATIONS(continued) |
|
| ||||
Real Estate (continued) |
|
| ||||
Well Hope Development |
|
| ||||
3.875%, VAR US Treas Yield Curve Rate T Note Const Mat5 Yr+6.927%, 10/19/2022‡ | $ | 200,000 | $ | 197,800 | ||
Wuhan Real Estate Development & Investment Group |
|
| ||||
5.700%, 08/09/2021 |
| 250,000 |
| 257,867 | ||
Yuzhou Properties |
|
| ||||
8.500%, 02/04/2022 |
| 200,000 |
| 202,526 | ||
|
| 3,713,639 | ||||
Utilities — 4.4% |
|
| ||||
Lenovo Group |
|
| ||||
4.750%, 03/29/2023 |
| 200,000 |
| 203,308 | ||
Nuoxi Capital |
|
| ||||
5.350%, 01/24/2023 |
| 200,000 |
| 149,404 | ||
Tsinghua Unic |
|
| ||||
5.375%, 01/31/2023 |
| 200,000 |
| 181,805 | ||
|
| 534,517 | ||||
TOTAL CHINA |
|
| 8,901,995 | |||
|
| |||||
HONG KONG — 22.5% |
|
| ||||
Financials — 11.4% |
|
| ||||
Bank of East Asia |
|
| ||||
5.500%, VAR US Treas Yield Curve Rate T Note Const Mat5 Yr+3.834%, 12/02/2020‡ |
| 250,000 |
| 250,704 | ||
China CITIC Bank International |
|
| ||||
7.100%, VAR US Treas Yield Curve Rate T Note Const Mat5 Yr+4.151%, 11/06/2023‡ |
| 200,000 |
| 215,365 | ||
CMB Wing Lung Bank |
|
| ||||
6.500%, VAR US Treas Yield Curve Rate T Note Const Mat5 Yr+3.948%, 01/24/2024‡ |
| 250,000 |
| 263,690 | ||
Industrial & Commercial Bank of China Asia |
|
| ||||
4.250%, VAR US Treas Yield Curve Rate T Note Const Mat5 Yr+3.135%, 07/21/2021‡ |
| 300,000 |
| 300,285 | ||
Nanyang Commercial Bank |
|
| ||||
5.000%, VAR US Treas Yield Curve Rate T Note Const Mat5 Yr+3.205%, 06/02/2022‡ |
| 350,000 |
| 343,825 | ||
|
| 1,373,869 | ||||
Industrials — 1.7% |
| |||||
Celestial Miles |
|
| ||||
5.750%, VAR US Treas Yield Curve Rate T Note Const Mat5 Yr+8.205%, 01/31/2024‡ |
| 200,000 |
| 209,018 | ||
|
| |||||
Real Estate — 5.2% |
|
| ||||
HLP Finance |
|
| ||||
4.750%, 06/25/2022 |
| 200,000 |
| 209,615 | ||
Metropolitan Light |
|
| ||||
5.500%, 11/21/2020 |
| 180,000 |
| 185,497 | ||
NWD Finance BVI |
|
| ||||
5.750%, 10/05/2021‡ |
| 250,000 |
| 247,607 | ||
|
| 642,719 | ||||
The accompanying notes are an integral part of the financial statements.
52
Schedule of Investments(Unaudited)September 30, 2019
KraneShares CCBS China Corporate High Yield Bond USD Index ETF(concluded)
Face | Value | |||||
CORPORATE OBLIGATIONS(continued) |
|
| ||||
Utilities — 4.2% |
|
| ||||
OVPH |
|
| ||||
5.875%, 03/01/2021‡ | $ | 500,000 | $ | 509,375 | ||
TOTAL HONG KONG |
|
| 2,734,981 | |||
TOTAL CORPORATE OBLIGATIONS |
|
| ||||
(Cost $11,543,767) |
|
| 11,636,976 | |||
|
| |||||
TOTAL INVESTMENTS — 95.8% |
|
| ||||
(Cost $11,543,767) |
|
| 11,636,976 | |||
OTHER ASSETS LESS LIABILITIES — 4.2% |
|
| 514,453 | |||
NET ASSETS — 100% |
| $ | 12,151,429 | |||
‡ Perpetual Bond — Maturity Date listed represents the next call date.
VAR — Variable Rate
As of September30, 2019, all of the Fund’s investments were considered Level 2 of the fair value hierarchy, in accordance with the authoritative guidance under U.S. GAAP.
For the period ended September30, 2019, there have been no transfers between Level1, Level 2 or Level 3 investments. Transfers between levels are recognized at period end.
The accompanying notes are an integral part of the financial statements.
53
Schedule of Investments (Unaudited)September 30, 2019
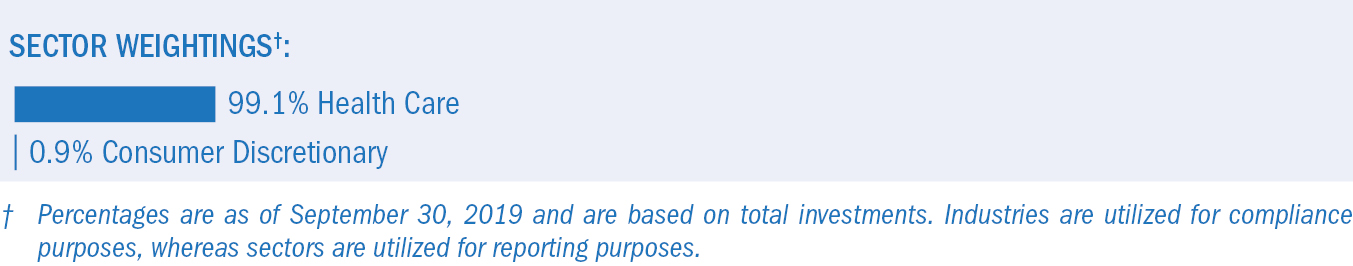
Shares | Value | ||||
COMMON STOCK — 99.0%‡ |
| ||||
BRAZIL — 8.7% |
| ||||
Health Care — 8.7% |
| ||||
Fleury | 1,300 | $ | 8,239 | ||
Hapvida Participacoes e Investimentos | 2,800 |
| 36,541 | ||
Notre Dame Intermedica Participacoes | 2,000 |
| 26,168 | ||
Odontoprev | 2,400 |
| 9,357 | ||
Qualicorp Consultoria e Corretora de Seguros | 1,100 |
| 8,189 | ||
TOTAL BRAZIL |
| 88,494 | |||
| |||||
CHINA — 39.9% |
| ||||
Health Care — 39.9% |
| ||||
3SBio* | 6,500 |
| 10,779 | ||
Aier Eye Hospital Group, Cl A | 7,416 |
| 36,835 | ||
Changchun High & New Technology Industry Group, Cl A | 400 |
| 22,089 | ||
China Biologic Products Holdings* | 94 |
| 10,760 | ||
China Medical System Holdings | 6,000 |
| 7,133 | ||
Chongqing Zhifei Biological Products, Cl A | 3,913 |
| 26,000 | ||
Genscript Biotech* | 4,000 |
| 7,664 | ||
Huadong Medicine, Cl A | 4,440 |
| 16,289 | ||
Hualan Biological Engineering, Cl A | 3,300 |
| 15,851 | ||
Jiangsu Hengrui Medicine, Cl A | 5,190 |
| 58,631 | ||
Lepu Medical Technology Beijing, Cl A | 4,222 |
| 14,816 | ||
Luye Pharma Group | 8,000 |
| 5,705 | ||
Shandong Weigao Group Medical Polymer, Cl H | 12,000 |
| 12,353 | ||
Shanghai Fosun Pharmaceutical Group, Cl H | 1,500 |
| 4,028 | ||
Shanghai Henlius Biotech, Cl H* | 11 |
| — | ||
Shanghai Pharmaceuticals Holding, Cl H | 2,200 |
| 3,985 | ||
Shenzhen Mindray Bio-Medical Electronics, Cl A | 2,300 |
| 59,410 | ||
Sichuan Kelun Pharmaceutical, Cl A | 3,393 |
| 12,287 | ||
Sihuan Pharmaceutical Holdings Group | 23,000 |
| 3,491 | ||
Walvax Biotechnology, Cl A | 3,700 |
| 13,984 | ||
WuXi AppTec, Cl H | 280 |
| 3,061 | ||
Wuxi Biologics Cayman* | 3,500 |
| 35,717 | ||
Zai Lab ADR* | 155 |
| 5,014 | ||
Zhangzhou Pientzehuang Pharmaceutical, Cl A | 1,400 |
| 19,973 | ||
TOTAL CHINA |
| 405,855 | |||
| |||||
HONG KONG — 3.0% |
| ||||
Health Care — 3.0% |
| ||||
Innovent Biologics* | 3,000 |
| 9,548 | ||
Microport Scientific | 4,000 |
| 3,623 | ||
Ping An Healthcare and Technology* | 2,700 |
| 15,791 | ||
YiChang HEC ChangJiang Pharmaceutical, Cl H | 400 |
| 1,952 | ||
TOTAL HONG KONG |
| 30,914 | |||
The accompanying notes are an integral part of the financial statements.
54
Schedule of Investments(Unaudited)September 30, 2019
KraneShares Emerging Markets Healthcare Index ETF(continued)
Shares | Value | ||||
COMMON STOCK (continued) |
| ||||
HUNGARY — 1.4% |
| ||||
Health Care — 1.4% |
| ||||
Richter Gedeon Nyrt | 867 | $ | 14,024 | ||
TOTAL HUNGARY |
| 14,024 | |||
| |||||
INDIA — 10.1% |
| ||||
Health Care — 10.1% |
| ||||
Aurobindo Pharma | 2,620 |
| 21,775 | ||
Lupin | 1,989 |
| 20,087 | ||
Piramal Enterprises | 791 |
| 18,221 | ||
Sun Pharmaceutical Industries | 7,829 |
| 43,023 | ||
TOTAL INDIA |
| 103,106 | |||
| |||||
INDONESIA — 2.5% |
| ||||
Health Care — 2.5% |
| ||||
Kalbe Farma | 211,600 |
| 24,969 | ||
TOTAL INDONESIA |
| 24,969 | |||
| |||||
MALAYSIA — 8.0% |
| ||||
Health Care — 8.0% |
| ||||
Hartalega Holdings | 13,700 |
| 17,178 | ||
IHH Healthcare | 35,700 |
| 48,430 | ||
KPJ Healthcare | 19,500 |
| 4,122 | ||
Top Glove | 10,600 |
| 11,266 | ||
TOTAL MALAYSIA |
| 80,996 | |||
| |||||
SOUTH AFRICA — 2.8% |
| ||||
Health Care — 2.8% |
| ||||
Aspen Pharmacare Holdings | 1,983 |
| 11,241 | ||
Life Healthcare Group Holdings | 6,284 |
| 9,399 | ||
Netcare | 6,586 |
| 7,623 | ||
TOTAL SOUTH AFRICA |
| 28,263 | |||
| |||||
SOUTH KOREA — 16.3% |
| ||||
Consumer Discretionary — 0.9% |
| ||||
HLB* | 180 |
| 9,089 | ||
| |||||
Health Care — 15.4% |
| ||||
ABLBio* | 194 |
| 2,741 | ||
Celltrion* | 297 |
| 40,720 | ||
Celltrion Healthcare* | 658 |
| 27,725 | ||
Daewoong | 274 |
| 3,379 | ||
Daewoong Pharmaceutical | 55 |
| 6,851 | ||
Genexine* | 91 |
| 3,865 | ||
Green Cross | 54 |
| 5,124 | ||
Hanall Biopharma* | 224 |
| 4,888 | ||
Hanmi Pharm | 53 |
| 12,229 | ||
Hanmi Science | 287 |
| 9,501 | ||
Helixmith* | 91 |
| 5,044 | ||
Hugel* | 20 |
| 6,446 | ||
Komipharm International* | 257 |
| 2,632 | ||
Medy-Tox | 25 |
| 7,526 | ||
SillaJen* | 329 |
| 2,239 | ||
The accompanying notes are an integral part of the financial statements.
55
Schedule of Investments(Unaudited)September 30, 2019
KraneShares Emerging Markets Healthcare Index ETF(concluded)
Shares | Value | ||||
COMMON STOCK (continued) |
| ||||
Health Care (continued) |
| ||||
Yuhan | 62 | $ | 11,844 | ||
Yungjin Pharmaceutical* | 908 |
| 3,553 | ||
| 156,307 | ||||
TOTAL SOUTH KOREA |
| 165,396 | |||
| |||||
THAILAND — 6.3% |
| ||||
Health Care — 6.3% |
| ||||
Bangkok Chain Hospital | 12,400 |
| 6,406 | ||
Bangkok Dusit Medical Services | 60,700 |
| 48,028 | ||
Bumrungrad Hospital | 2,400 |
| 10,044 | ||
TOTAL THAILAND |
| 64,478 | |||
TOTAL COMMON STOCK |
| 1,006,495 | |||
| |||||
TOTAL INVESTMENTS — 99.0% |
| 1,006,495 | |||
OTHER ASSETS LESS LIABILITIES — 1.0% |
| 10,235 | |||
NET ASSETS — 100% | $ | 1,016,730 | |||
‡ Industries are utilized for compliance purposes, whereas sectors are utilized for reporting.
* Non-income producing security.
ADR — American Depositary Receipt
Cl — Class
As of September30, 2019, all of the Fund’s investments were considered Level 1 of the fair value hierarchy, in accordance with the authoritative guidance under U.S. GAAP.
For the period ended September30, 2019, there have been no transfers between Level1, Level 2 or Level 3 investments. Transfers between levels are recognized at period end.
The accompanying notes are an integral part of the financial statements.
56
Schedule of Investments(Unaudited)September 30, 2019
Shares | Value | ||||
COMMON STOCK — 92.8%‡ |
| ||||
BRAZIL — 6.6% |
| ||||
Consumer Discretionary — 0.7% |
| ||||
Kroton Educacional | 1,000 | $ | 2,691 | ||
Lojas Renner | 550 |
| 6,651 | ||
Magazine Luiza | 800 |
| 7,095 | ||
| 16,437 | ||||
Consumer Staples — 1.2% |
| ||||
Ambev | 3,800 |
| 17,515 | ||
BRF* | 300 |
| 2,756 | ||
JBS | 600 |
| 4,713 | ||
Raia Drogasil | 200 |
| 4,603 | ||
| 29,587 | ||||
Energy — 0.8% |
| ||||
Petroleo Brasileiro | 2,200 |
| 15,966 | ||
Ultrapar Participacoes | 600 |
| 2,662 | ||
| 18,628 | ||||
Financials — 1.6% |
| ||||
B3 - Brasil Bolsa Balcao | 1,400 |
| 14,728 | ||
Banco Bradesco | 800 |
| 6,025 | ||
Banco do Brasil | 700 |
| 7,663 | ||
Banco Santander Brasil | 300 |
| 3,274 | ||
BB Seguridade Participacoes | 500 |
| 4,223 | ||
IRB Brasil Resseguros S | 300 |
| 2,700 | ||
| 38,613 | ||||
Industrials — 0.7% |
| ||||
CCR | 800 |
| 3,313 | ||
Embraer | 500 |
| 2,158 | ||
Localiza Rent a Car | 400 |
| 4,365 | ||
Rumo* | 800 |
| 4,717 | ||
WEG | 600 |
| 3,500 | ||
| 18,053 | ||||
The accompanying notes are an integral part of the financial statements.
57
Schedule of Investments(Unaudited)September 30, 2019
KraneShares MSCI Emerging Markets ex China Index ETF(continued)
Shares | Value | ||||
COMMON STOCK (continued) |
| ||||
Information Technology — 0.1% |
| ||||
Cielo | 800 | $ | 1,536 | ||
| |||||
Materials — 1.3% |
| ||||
Klabin | 500 |
| 1,840 | ||
Suzano | 400 |
| 3,241 | ||
Vale | 2,400 |
| 27,621 | ||
| 32,702 | ||||
Utilities — 0.2% |
| ||||
Cia de Saneamento Basico do Estado de Sao Paulo | 200 |
| 2,372 | ||
Equatorial Energia | 100 |
| 2,411 | ||
| 4,783 | ||||
TOTAL BRAZIL |
| 160,339 | |||
| |||||
CHILE — 0.9% |
| ||||
Consumer Discretionary — 0.1% |
| ||||
SACI Falabella | 514 |
| 2,876 | ||
| |||||
Energy — 0.1% |
| ||||
Empresas COPEC | 268 |
| 2,530 | ||
| |||||
Financials — 0.3% |
| ||||
Banco de Chile | 17,262 |
| 2,420 | ||
Banco de Credito e Inversiones | 33 |
| 2,081 | ||
Banco Santander Chile | 45,657 |
| 3,221 | ||
| 7,722 | ||||
Industrials — 0.1% |
| ||||
Latam Airlines Group | 207 |
| 2,291 | ||
| |||||
Materials — 0.1% |
| ||||
Empresas CMPC | 867 |
| 2,019 | ||
| |||||
Utilities — 0.2% |
| ||||
Enel Americas | 19,579 |
| 3,589 | ||
Enel Chile | 19,330 |
| 1,673 | ||
| 5,262 | ||||
TOTAL CHILE |
| 22,700 | |||
| |||||
COLOMBIA — 0.2% |
| ||||
Energy — 0.1% |
| ||||
Ecopetrol | 3,338 |
| 2,836 | ||
| |||||
Financials — 0.1% |
| ||||
Bancolombia | 154 |
| 1,736 | ||
TOTAL COLOMBIA |
| 4,572 | |||
| |||||
CZECH REPUBLIC — 0.2% |
| ||||
Financials — 0.1% |
| ||||
Komercni banka as | 51 |
| 1,723 | ||
| |||||
Utilities — 0.1% |
| ||||
CEZ | 109 |
| 2,405 | ||
TOTAL CZECH REPUBLIC |
| 4,128 | |||
The accompanying notes are an integral part of the financial statements.
58
Schedule of Investments(Unaudited)September 30, 2019
KraneShares MSCI Emerging Markets ex China Index ETF(continued)
Shares | Value | ||||
COMMON STOCK (continued) |
| ||||
EGYPT — 0.2% |
| ||||
Financials — 0.2% |
| ||||
Commercial International Bank Egypt SAE | 906 | $ | 4,320 | ||
TOTAL EGYPT |
| 4,320 | |||
| |||||
GREECE — 0.1% |
| ||||
Communication Services — 0.1% |
| ||||
Hellenic Telecommunications Organization | 166 |
| 2,288 | ||
TOTAL GREECE |
| 2,288 | |||
| |||||
HUNGARY — 0.4% |
| ||||
Energy — 0.1% |
| ||||
MOL Hungarian Oil & Gas | 248 |
| 2,333 | ||
| |||||
Financials — 0.3% |
| ||||
OTP Bank Nyrt | 152 |
| 6,327 | ||
TOTAL HUNGARY |
| 8,660 | |||
| |||||
INDIA — 13.5% |
| ||||
Communication Services — 0.3% |
| ||||
Bharti Airtel | 1,540 |
| 7,976 | ||
| |||||
Consumer Discretionary — 0.9% |
| ||||
Bajaj Auto | 56 |
| 2,325 | ||
Eicher Motors | 9 |
| 2,256 | ||
Mahindra & Mahindra | 503 |
| 3,883 | ||
Maruti Suzuki India | 85 |
| 8,055 | ||
Tata Motors | 1,250 |
| 2,072 | ||
Titan | 214 |
| 3,844 | ||
| 22,435 | ||||
Consumer Staples — 1.4% |
| ||||
Dabur India | 361 |
| 2,278 | ||
Godrej Consumer Products | 248 |
| 2,405 | ||
Hindustan Unilever | 525 |
| 14,682 | ||
ITC | 3,000 |
| 11,000 | ||
Nestle India | 16 |
| 3,136 | ||
| 33,501 | ||||
Energy — 2.3% |
| ||||
Bharat Petroleum | 522 |
| 3,463 | ||
Indian Oil | 1,500 |
| 3,120 | ||
Oil & Natural Gas | 961 |
| 1,787 | ||
Reliance Industries | 2,500 |
| 46,996 | ||
| 55,366 | ||||
Financials — 3.7% |
| ||||
Axis Bank | 1,600 |
| 15,465 | ||
Bajaj Finance | 160 |
| 9,135 | ||
Bajaj Finserv | 26 |
| 3,123 | ||
Housing Development Finance | 1,500 |
| 41,846 | ||
ICICI Bank | 2,000 |
| 12,240 | ||
Indiabulls Housing Finance | 208 |
| 751 | ||
State Bank of India | 1,500 |
| 5,732 | ||
Yes Bank | 1,500 |
| 876 | ||
| 89,168 | ||||
The accompanying notes are an integral part of the financial statements.
59
Schedule of Investments(Unaudited)September 30, 2019
KraneShares MSCI Emerging Markets ex China Index ETF(continued)
Shares | Value | ||||
COMMON STOCK (continued) |
| ||||
Health Care — 0.4% |
| ||||
Aurobindo Pharma | 180 | $ | 1,496 | ||
Dr Reddy’s Laboratories | 78 |
| 2,974 | ||
Piramal Enterprises | 55 |
| 1,267 | ||
Sun Pharmaceutical Industries | 750 |
| 4,122 | ||
| 9,859 | ||||
Industrials — 0.3% |
| ||||
Larsen & Toubro | 400 |
| 8,321 | ||
| |||||
Information Technology — 2.9% |
| ||||
HCL Technologies | 450 |
| 6,862 | ||
Infosys | 3,000 |
| 34,104 | ||
Tata Consultancy Services | 750 |
| 22,217 | ||
Tech Mahindra | 318 |
| 3,206 | ||
Wipro | 1,250 |
| 4,230 | ||
| 70,619 | ||||
Materials — 0.9% |
| ||||
Asian Paints | 212 |
| 5,271 | ||
Grasim Industries | 226 |
| 2,328 | ||
Hindalco Industries | 816 |
| 2,203 | ||
JSW Steel | 592 |
| 1,921 | ||
UltraTech Cement | 80 |
| 4,901 | ||
UPL | 373 |
| 3,179 | ||
Vedanta | 909 |
| 1,977 | ||
| 21,780 | ||||
Utilities — 0.4% |
| ||||
GAIL India | 1,400 |
| 2,657 | ||
NTPC | 1,800 |
| 2,984 | ||
Power Grid Corp of India | 1,600 |
| 4,494 | ||
| 10,135 | ||||
TOTAL INDIA |
| 329,160 | |||
| |||||
INDONESIA — 3.3% |
| ||||
Communication Services — 0.6% |
| ||||
Telekomunikasi Indonesia Persero | 46,000 |
| 13,967 | ||
| |||||
Consumer Discretionary — 0.4% |
| ||||
Astra International | 20,000 |
| 9,299 | ||
| |||||
Consumer Staples — 0.3% |
| ||||
Charoen Pokphand Indonesia | 6,300 |
| 2,374 | ||
Unilever Indonesia | 1,300 |
| 4,259 | ||
| 6,633 | ||||
Energy — 0.1% |
| ||||
United Tractors | 1,500 |
| 2,174 | ||
| |||||
Financials — 1.9% |
| ||||
Bank Central Asia | 8,700 |
| 18,601 | ||
Bank Mandiri Persero | 18,000 |
| 8,845 | ||
Bank Negara Indonesia Persero | 6,700 |
| 3,469 | ||
Bank Rakyat Indonesia Persero | 50,000 |
| 14,512 | ||
| 45,427 | ||||
TOTAL INDONESIA |
| 77,500 | |||
The accompanying notes are an integral part of the financial statements.
60
Schedule of Investments(Unaudited)September 30, 2019
KraneShares MSCI Emerging Markets ex China Index ETF(continued)
Shares | Value | ||||
COMMON STOCK (continued) |
| ||||
MALAYSIA — 3.0% |
| ||||
Communication Services — 0.3% |
| ||||
DiGi.Com | 3,000 | $ | 3,403 | ||
Maxis | 3,000 |
| 4,012 | ||
| 7,415 | ||||
Consumer Discretionary — 0.1% |
| ||||
Genting | 2,000 |
| 2,742 | ||
| |||||
Consumer Staples — 0.1% |
| ||||
Sime Darby Plantation | 2,300 |
| 2,598 | ||
| |||||
Financials — 1.5% |
| ||||
CIMB Group Holdings | 8,000 |
| 9,611 | ||
Hong Leong Bank | 500 |
| 1,954 | ||
Malayan Banking | 5,616 |
| 11,414 | ||
Public Bank | 2,600 |
| 12,469 | ||
| 35,448 | ||||
Health Care — 0.1% |
| ||||
IHH Healthcare | 2,000 |
| 2,713 | ||
| |||||
Materials — 0.2% |
| ||||
Petronas Chemicals Group | 3,000 |
| 5,402 | ||
| |||||
Utilities — 0.7% |
| ||||
Petronas Gas | 500 |
| 1,956 | ||
Tenaga Nasional | 4,500 |
| 14,660 | ||
| 16,616 | ||||
TOTAL MALAYSIA |
| 72,934 | |||
| |||||
MEXICO — 3.7% |
| ||||
Communication Services — 1.0% |
| ||||
America Movil | 28,000 |
| 20,791 | ||
Grupo Televisa | 2,000 |
| 3,917 | ||
| 24,708 | ||||
Consumer Staples — 1.2% |
| ||||
Fomento Economico Mexicano | 1,700 |
| 15,571 | ||
Grupo Bimbo, Ser A | 1,100 |
| 2,006 | ||
Wal-Mart de Mexico | 4,300 |
| 12,738 | ||
| 30,315 | ||||
Financials — 0.6% |
| ||||
Grupo Financiero Banorte, Cl O | 2,200 |
| 11,851 | ||
Grupo Financiero Inbursa, Cl O | 1,500 |
| 1,911 | ||
| 13,762 | ||||
Industrials — 0.2% |
| ||||
Alfa, Cl A | 2,200 |
| 1,939 | ||
Grupo Aeroportuario del Pacifico, Cl B | 200 |
| 1,929 | ||
Grupo Aeroportuario del Sureste, Cl B | 145 |
| 2,210 | ||
| 6,078 | ||||
Materials — 0.5% |
| ||||
Cemex | 12,500 |
| 4,862 | ||
Grupo Mexico | 2,900 |
| 6,796 | ||
| 11,658 | ||||
Real Estate — 0.2% |
| ||||
Fibra Uno Administracion† | 2,800 |
| 4,100 | ||
TOTAL MEXICO |
| 90,621 | |||
The accompanying notes are an integral part of the financial statements.
61
Schedule of Investments(Unaudited)September 30, 2019
KraneShares MSCI Emerging Markets ex China Index ETF(continued)
Shares | Value | ||||
COMMON STOCK (continued) |
| ||||
NETHERLANDS — 1.1% |
| ||||
Consumer Discretionary — 1.1% |
| ||||
Prosus* | 360 | $ | 26,433 | ||
TOTAL NETHERLANDS |
| 26,433 | |||
| |||||
PERU — 0.6% |
| ||||
Financials — 0.4% |
| ||||
Credicorp | 47 |
| 9,797 | ||
| |||||
Materials — 0.2% |
| ||||
Cia de Minas Buenaventura SAA ADR | 121 |
| 1,837 | ||
Southern Copper | 58 |
| 1,980 | ||
| 3,817 | ||||
TOTAL PERU |
| 13,614 | |||
| |||||
PHILIPPINES — 1.6% |
| ||||
Financials — 0.2% |
| ||||
BDO Unibank | 2,100 |
| 5,794 | ||
| |||||
Industrials — 0.6% |
| ||||
Ayala | 300 |
| 5,120 | ||
JG Summit Holdings | 3,500 |
| 4,896 | ||
SM Investments | 300 |
| 5,621 | ||
| 15,637 | ||||
Real Estate — 0.8% |
| ||||
Ayala Land | 10,500 |
| 10,018 | ||
SM Prime Holdings | 14,000 |
| 10,049 | ||
| 20,067 | ||||
TOTAL PHILIPPINES |
| 41,498 | |||
| |||||
POLAND — 1.4% |
| ||||
Communication Services — 0.1% |
| ||||
CD Projekt | 60 |
| 3,643 | ||
| |||||
Consumer Discretionary — 0.1% |
| ||||
LPP | 1 |
| 2,145 | ||
| |||||
Energy — 0.3% |
| ||||
Polski Koncern Naftowy ORLEN | 280 |
| 6,893 | ||
| |||||
Financials — 0.8% |
| ||||
Bank Polska Kasa Opieki | 165 |
| 4,214 | ||
Powszechna Kasa Oszczednosci Bank Polski | 825 |
| 8,091 | ||
Powszechny Zaklad Ubezpieczen | 600 |
| 5,594 | ||
Santander Bank Polska | 32 |
| 2,503 | ||
| 20,402 | ||||
Materials — 0.1% |
| ||||
KGHM Polska Miedz | 115 |
| 2,295 | ||
TOTAL POLAND |
| 35,378 | |||
| |||||
QATAR — 1.4% |
| ||||
Financials — 1.2% |
| ||||
Masraf Al Rayan QSC | 3,750 |
| 3,646 | ||
Qatar Islamic Bank SAQ | 1,100 |
| 4,713 | ||
Qatar National Bank QPSC | 3,900 |
| 20,662 | ||
| 29,021 | ||||
The accompanying notes are an integral part of the financial statements.
62
Schedule of Investments(Unaudited)September 30, 2019
KraneShares MSCI Emerging Markets ex China Index ETF(continued)
Shares | Value | ||||
COMMON STOCK (continued) |
| ||||
Industrials — 0.2% |
| ||||
Industries Qatar QSC | 1,750 | $ | 5,244 | ||
TOTAL QATAR |
| 34,265 | |||
| |||||
RUSSIA — 6.2% |
| ||||
Communication Services — 0.1% |
| ||||
Mobile TeleSystems PJSC ADR | 348 |
| 2,819 | ||
| |||||
Consumer Discretionary — 0.1% |
| ||||
X5 Retail Group GDR | 83 |
| 2,915 | ||
| |||||
Consumer Staples — 0.1% |
| ||||
Magnit PJSC GDR | 242 |
| 3,162 | ||
| |||||
Energy — 3.9% |
| ||||
Gazprom PJSC | 8,300 |
| 28,898 | ||
LUKOIL PJSC | 400 |
| 33,214 | ||
Novatek PJSC GDR | 70 |
| 14,280 | ||
Rosneft | 950 |
| 6,139 | ||
Tatneft PJSC | 1,150 |
| 12,184 | ||
| 94,715 | ||||
Financials — 1.2% |
| ||||
Sberbank of Russia PJSC | 8,250 |
| 28,955 | ||
| |||||
Materials — 0.8% |
| ||||
Alrosa PJSC | 1,750 |
| 2,009 | ||
MMC Norilsk Nickel PJSC | 50 |
| 12,859 | ||
Novolipetsk Steel PJSC | 820 |
| 1,797 | ||
Severstal PJSC | 140 |
| 2,014 | ||
| 18,679 | ||||
TOTAL RUSSIA |
| 151,245 | |||
| |||||
SOUTH AFRICA — 7.1% |
| ||||
Communication Services — 0.6% |
| ||||
Group | 1,400 |
| 8,892 | ||
MultiChoice Group* | 284 |
| 2,210 | ||
Vodacom Group | 425 |
| 3,353 | ||
| 14,455 | ||||
Consumer Discretionary — 2.7% |
| ||||
Absa Group | 600 |
| 6,049 | ||
Mr Price Group | 162 |
| 1,691 | ||
Naspers, Cl N | 360 |
| 54,491 | ||
Woolworths Holdings | 658 |
| 2,390 | ||
| 64,621 | ||||
Consumer Staples — 0.5% |
| ||||
Bid | 280 |
| 5,947 | ||
Clicks Group | 168 |
| 2,382 | ||
Oceana Group | 28 |
| 128 | ||
Shoprite Holdings | 281 |
| 2,273 | ||
Tiger Brands | 109 |
| 1,514 | ||
| 12,244 | ||||
Energy — 0.1% |
| ||||
Exxaro Resources | 174 |
| 1,499 | ||
The accompanying notes are an integral part of the financial statements.
63
Schedule of Investments(Unaudited)September 30, 2019
KraneShares MSCI Emerging Markets ex China Index ETF(continued)
Shares | Value | ||||
COMMON STOCK (continued) |
| ||||
Financials — 2.0% |
| ||||
Capitec Bank Holdings | 26 | $ | 2,208 | ||
Discovery | 244 |
| 1,835 | ||
FirstRand | 2,800 |
| 11,484 | ||
Nedbank Group | 335 |
| 5,011 | ||
Old Mutual | 3,300 |
| 4,207 | ||
Remgro | 355 |
| 3,821 | ||
RMB Holdings | 467 |
| 2,313 | ||
Sanlam | 1,216 |
| 5,981 | ||
Standard Bank Group | 1,100 |
| 12,673 | ||
| 49,533 | ||||
Industrials — 0.1% |
| ||||
Bidvest Group | 224 |
| 2,819 | ||
Information Technology — 0.3% |
| ||||
Sasol | 465 |
| 7,761 | ||
Materials — 0.5% |
| ||||
Anglo American Platinum | 35 |
| 2,108 | ||
AngloGold Ashanti | 330 |
| 6,183 | ||
Gold Fields | 541 |
| 2,716 | ||
| 11,007 | ||||
Real Estate — 0.3% |
| ||||
Growthpoint Properties† | 1,998 |
| 3,044 | ||
NEPI Rockcastle | 259 |
| 2,267 | ||
Redefine Properties† | 3,614 |
| 1,866 | ||
| 7,177 | ||||
TOTAL SOUTH AFRICA |
| 171,116 | |||
| |||||
SOUTH KOREA — 18.1% |
| ||||
Communication Services — 1.2% |
| ||||
Kakao | 34 |
| 3,852 | ||
NAVER | 125 |
| 16,406 | ||
NCSoft | 15 |
| 6,533 | ||
SK Telecom | 13 |
| 2,625 | ||
| 29,416 | ||||
Consumer Discretionary — 1.9% |
| ||||
Fila Korea | 32 |
| 1,549 | ||
Hyundai Mobis | 57 |
| 12,009 | ||
Hyundai Motor | 125 |
| 14,003 | ||
Kangwon Land | 81 |
| 2,001 | ||
Kia Motors | 250 |
| 9,531 | ||
LG Electronics | 95 |
| 5,353 | ||
Woongjin Coway | 36 |
| 2,546 | ||
| 46,992 | ||||
Consumer Staples — 0.9% |
| ||||
Amorepacific | 21 |
| 2,467 | ||
E-MART | 13 |
| 1,228 | ||
KT&G | 95 |
| 8,379 | ||
LG Household & Health Care | 8 |
| 8,741 | ||
| 20,815 | ||||
Energy — 0.4% |
| ||||
SK Innovation | 53 |
| 7,355 | ||
S-Oil | 31 |
| 2,576 | ||
| 9,931 | ||||
The accompanying notes are an integral part of the financial statements.
64
Schedule of Investments(Unaudited)September 30, 2019
KraneShares MSCI Emerging Markets ex China Index ETF(continued)
Shares | Value | ||||
COMMON STOCK (continued) |
| ||||
Financials — 2.0% |
| ||||
DB Insurance | 34 | $ | 1,467 | ||
Hana Financial Group | 300 |
| 8,841 | ||
Industrial Bank of Korea | 174 |
| 1,920 | ||
KB Financial Group | 358 |
| 12,780 | ||
Samsung Fire & Marine Insurance | 26 |
| 4,847 | ||
Samsung Life Insurance | 47 |
| 2,794 | ||
Shinhan Financial Group | 383 |
| 13,384 | ||
Woori Financial Group | 327 |
| 3,404 | ||
| 49,437 | ||||
Health Care — 0.6% |
| ||||
Celltrion* | 70 |
| 9,597 | ||
Celltrion Healthcare* | 33 |
| 1,390 | ||
Helixmith* | 10 |
| 554 | ||
Samsung Biologics* | 10 |
| 2,571 | ||
SillaJen* | 40 |
| 272 | ||
| 14,384 | ||||
Industrials — 1.0% |
| ||||
Hyundai Engineering & Construction | 54 |
| 2,090 | ||
Hyundai Heavy Industries Holdings | 6 |
| 1,753 | ||
Korea Shipbuilding & Offshore Engineering* | 26 |
| 2,695 | ||
LG | 85 |
| 4,974 | ||
Samsung C&T | 70 |
| 5,249 | ||
Samsung Heavy Industries* | 299 |
| 1,970 | ||
SK Holdings | 26 |
| 4,434 | ||
| 23,165 | ||||
Information Technology — 8.7% |
| ||||
LG Display | 148 |
| 1,751 | ||
Samsung Electro-Mechanics | 50 |
| 4,305 | ||
Samsung Electronics | 3,817 |
| 156,521 | ||
Samsung SDI | 45 |
| 8,389 | ||
Samsung SDS | 23 |
| 3,663 | ||
SK Hynix | 525 |
| 36,078 | ||
| 210,707 | ||||
Materials — 1.2% |
| ||||
Hyundai Steel | 54 |
| 1,756 | ||
Korea Zinc | 5 |
| 1,873 | ||
LG Chemical | 40 |
| 10,015 | ||
Lotte Chemical | 12 |
| 2,368 | ||
POSCO | 68 |
| 12,905 | ||
| 28,917 | ||||
Utilities — 0.2% |
| ||||
Korea Electric Power | 275 |
| 5,955 | ||
TOTAL SOUTH KOREA |
| 439,719 | |||
| |||||
TAIWAN — 18.0% |
| ||||
Communication Services — 0.8% |
| ||||
Chunghwa Telecom | 4,000 |
| 14,311 | ||
Far EasTone Telecommunications | 1,000 |
| 2,337 | ||
Taiwan Mobile | 1,000 |
| 3,610 | ||
| 20,258 | ||||
The accompanying notes are an integral part of the financial statements.
65
Schedule of Investments(Unaudited)September 30, 2019
KraneShares MSCI Emerging Markets ex China Index ETF(continued)
Shares | Value | ||||
COMMON STOCK (continued) |
| ||||
Consumer Discretionary — 0.6% |
| ||||
Hotai Motor | 1,000 | $ | 15,198 | ||
| |||||
Consumer Staples — 0.8% |
| ||||
President Chain Store | 1,000 |
| 9,347 | ||
Uni-President Enterprises | 4,000 |
| 9,644 | ||
| 18,991 | ||||
Energy — 0.1% |
| ||||
Formosa Petrochemical | 1,000 |
| 3,165 | ||
| |||||
Financials — 3.1% |
| ||||
Cathay Financial Holding | 6,000 |
| 7,910 | ||
Chailease Holding | 1,030 |
| 4,150 | ||
Chang Hwa Commercial Bank | 4,080 |
| 2,847 | ||
China Development Financial Holding | 9,000 |
| 2,680 | ||
CTBC Financial Holding | 12,000 |
| 7,968 | ||
E.Sun Financial Holding | 7,497 |
| 6,343 | ||
First Financial Holding | 7,070 |
| 4,968 | ||
Fubon Financial Holding | 6,000 |
| 8,616 | ||
Hua Nan Financial Holdings | 5,273 |
| 3,560 | ||
Mega Financial Holding | 8,000 |
| 7,414 | ||
Shanghai Commercial & Savings Bank* | 2,000 |
| 3,359 | ||
Shin Kong Financial Holding | 7,000 |
| 2,119 | ||
SinoPac Financial Holdings | 7,000 |
| 2,730 | ||
Taishin Financial Holding | 7,146 |
| 3,190 | ||
Taiwan Cooperative Financial Holding | 6,180 |
| 4,084 | ||
Yuanta Financial Holding | 7,000 |
| 4,174 | ||
| 76,112 | ||||
Industrials — 0.1% |
| ||||
Far Eastern New Century | 2,000 |
| 1,847 | ||
| |||||
Information Technology — 10.8% |
| ||||
ASE Technology Holding | 2,000 |
| 4,564 | ||
Asustek Computer | 1,000 |
| 6,656 | ||
AU Optronics | 6,000 |
| 1,520 | ||
Catcher Technology | 1,000 |
| 7,575 | ||
Delta Electronics | 2,000 |
| 8,542 | ||
Hon Hai Precision Industry | 12,000 |
| 28,314 | ||
Innolux | 6,000 |
| 1,276 | ||
Lite-On Technology | 1,000 |
| 1,589 | ||
MediaTek | 1,000 |
| 11,894 | ||
Novatek Microelectronics | 1,000 |
| 5,737 | ||
Pegatron | 1,000 |
| 1,741 | ||
Quanta Computer | 2,000 |
| 3,649 | ||
Taiwan Semiconductor Manufacturing | 20,000 |
| 175,346 | ||
United Microelectronics | 8,000 |
| 3,455 | ||
| 261,858 | ||||
Materials — 1.7% |
| ||||
Asia Cement | 2,000 |
| 2,791 | ||
China Steel | 9,000 |
| 6,672 | ||
Formosa Chemicals & Fibre | 2,000 |
| 5,589 | ||
Formosa Plastics | 4,000 |
| 12,185 | ||
The accompanying notes are an integral part of the financial statements.
66
Schedule of Investments(Unaudited)September 30, 2019
KraneShares MSCI Emerging Markets ex China Index ETF(continued)
Shares | Value | ||||
COMMON STOCK (continued) |
| ||||
Materials (continued) |
| ||||
Nan Ya Plastics | 5,000 | $ | 11,233 | ||
Taiwan Cement | 3,210 |
| 4,103 | ||
| 42,573 | ||||
TOTAL TAIWAN |
| 440,002 | |||
| |||||
THAILAND — 3.4% |
| ||||
Communication Services — 0.3% |
| ||||
Advanced Info Service | 1,000 |
| 7,193 | ||
| |||||
Consumer Staples — 0.5% |
| ||||
CP ALL | 5,000 |
| 13,284 | ||
| |||||
Energy — 0.9% |
| ||||
PTT | 10,500 |
| 15,878 | ||
PTT Exploration & Production | 1,400 |
| 5,539 | ||
| 21,417 | ||||
Financials — 0.7% |
| ||||
Kasikornbank | 1,800 |
| 9,210 | ||
Siam Commercial Bank | 1,800 |
| 6,945 | ||
| 16,155 | ||||
Health Care — 0.1% |
| ||||
Bangkok Dusit Medical Services | 3,500 |
| 2,770 | ||
| |||||
Industrials — 0.4% |
| ||||
Airports of Thailand | 4,300 |
| 10,510 | ||
| |||||
Materials — 0.4% |
| ||||
PTT Global Chemical | 2,300 |
| 4,042 | ||
Siam Cement | 400 |
| 5,336 | ||
| 9,378 | ||||
Real Estate — 0.1% |
| ||||
Central Pattana | 1,300 |
| 2,890 | ||
TOTAL THAILAND |
| 83,597 | |||
| |||||
TURKEY — 1.1% |
| ||||
Consumer Staples — 0.3% |
| ||||
BIM Birlesik Magazalar | 700 |
| 6,089 | ||
| |||||
Energy — 0.2% |
| ||||
Tupras Turkiye Petrol Rafinerileri | 200 |
| 5,083 | ||
| |||||
Financials — 0.6% |
| ||||
Akbank T.A.S. | 5,000 |
| 7,190 | ||
Turkiye Garanti Bankasi | 4,000 |
| 7,233 | ||
| 14,423 | ||||
TOTAL TURKEY |
| 25,595 | |||
| |||||
UNITED ARAB EMIRATES — 0.7% |
| ||||
Communication Services — 0.2% |
| ||||
Emirates Telecommunications Group PJSC | 1,165 |
| 5,233 | ||
Financials — 0.4% |
| ||||
Abu Dhabi Commercial Bank PJSC | 1,392 |
| 2,979 | ||
First Abu Dhabi Bank PJSC | 1,901 |
| 7,784 | ||
| 10,763 | ||||
The accompanying notes are an integral part of the financial statements.
67
Schedule of Investments(Unaudited)September 30, 2019
KraneShares MSCI Emerging Markets ex China Index ETF(continued)
Shares | Value | ||||
COMMON STOCK (continued) |
| ||||
Real Estate — 0.1% |
| ||||
Emaar Properties PJSC | 2,352 | $ | 2,952 | ||
TOTAL UNITED ARAB EMIRATES |
| 18,948 | |||
TOTAL COMMON STOCK |
| 2,258,632 | |||
| |||||
PREFERRED STOCK(A)— 5.8% |
| ||||
BRAZIL — 4.5% |
| ||||
Communication Services — 0.2% |
| ||||
Telefonica Brasil | 400 |
| 5,272 | ||
Consumer Discretionary — 0.1% |
| ||||
Lojas Americanas | 500 |
| 2,383 | ||
Consumer Staples — 0.1% |
| ||||
Cia Brasileira de Distribuicao | 100 |
| 1,921 | ||
Energy — 0.9% |
| ||||
Petroleo Brasileiro | 3,200 |
| 21,134 | ||
Financials — 3.0% |
| ||||
Banco Bradesco | 3,400 |
| 27,720 | ||
Itau Unibanco Holding | 4,000 |
| 33,676 | ||
Itausa — Investimentos Itau | 3,600 |
| 11,443 | ||
| 72,839 | ||||
Materials — 0.1% |
| ||||
Gerdau | 700 |
| 2,220 | ||
Utilities — 0.1% |
| ||||
Cia Energetica de Minas Gerais | 600 |
| 2,068 | ||
TOTAL BRAZIL |
| 107,837 | |||
| |||||
CHILE — 0.1% |
| ||||
Materials — 0.1% |
| ||||
Sociedad Quimica y Minera de Chile | 83 |
| 2,288 | ||
COLOMBIA — 0.2% |
| ||||
Financials — 0.2% |
| ||||
Bancolombia | 307 |
| 3,797 | ||
| |||||
RUSSIA — 0.1% |
| ||||
Energy — 0.1% |
| ||||
Surgutneftegas PJSC | 4,700 |
| 2,714 | ||
SOUTH KOREA — 0.9% |
| ||||
Information Technology — 0.9% |
| ||||
Samsung Electronics | 700 |
| 23,116 | ||
TOTAL PREFERRED STOCK |
| 139,752 | |||
RIGHTS — 0.0% |
| ||||
TAIWAN — 0.0% |
| ||||
Shin Kong Financial Holding, Expires 10/25/2019* | 32 |
| — | ||
The Shanghai Commercial, Expires 10/10/2019* | 162 |
| 84 | ||
TOTAL RIGHTS |
| 84 | |||
TOTAL INVESTMENTS — 98.6% |
| 2,398,468 | |||
OTHER ASSETS LESS LIABILITIES — 1.4% |
| 34,599 | |||
NET ASSETS — 100% | $ | 2,433,067 | |||
The accompanying notes are an integral part of the financial statements.
68
Schedule of Investments(Unaudited)September 30, 2019
KraneShares MSCI Emerging Markets ex China Index ETF(concluded)
‡ Industries are utilized for compliance purposes, whereas sectors are utilized for reporting.
* Non-income producing security.
(A) Currently, no stated interest rate.
† Real Estate Investment Trust
ADR — American Depositary Receipt
Cl — Class
GDR — Global Depositary Receipt
PJSC — Public Joint Stock Company
As of September30, 2019, all of the Fund’s investments were considered Level 1 of the fair value hierarchy, in accordance with the authoritative guidance under U.S. GAAP.
For the period ended September30, 2019, there have been no transfers between Level1, Level 2 or Level 3 investments. Transfers between levels are recognized at period end.
Amounts designated as “—” are $0 or have been rounded to $0.
The accompanying notes are an integral part of the financial statements.
69
KraneShares | KraneShares | KraneShares | ||||||||||
Assets: |
|
|
|
|
|
| ||||||
Investments at Value | $ | 3,893,211 |
| $ | 1,641,154,007 | * | $ | 550,195,591 |
| |||
Cash and Cash Equivalents |
| 27,150 |
|
| 1,863,518 |
|
| 233,023 |
| |||
Foreign Currency at Value |
| 5 |
|
| — |
|
| 591,329 |
| |||
Prepaid Expenses |
| 7 |
|
| 9,361 |
|
| 2,014 |
| |||
Receivable for Investment Securities Sold |
| — |
|
| 13,046,154 |
|
| — |
| |||
Dividend and Interest Receivable |
| — |
|
| 419,405 |
|
| — |
| |||
Total Assets |
| 3,920,373 |
|
| 1,656,492,445 |
|
| 551,021,957 |
| |||
Liabilities: |
|
|
|
|
|
| ||||||
Obligation to Return Securities Lending Collateral |
| — |
|
| 104,328,298 |
|
| — |
| |||
Payable for Capital Shares Redeemed |
| — |
|
| 49,706,761 |
|
| — |
| |||
Payable for Management Fees |
| 2,264 |
|
| 907,268 |
|
| 274,987 |
| |||
Payable for Trustees’ Fee |
| 19 |
|
| 8,738 |
|
| 840 |
| |||
Payable for Securities Lending Fees |
| — |
|
| 37,199 |
|
| — |
| |||
Unrealized Depreciation on Spot |
| — |
|
| 1,149 |
|
| — |
| |||
Total Liabilities |
| 2,283 |
|
| 154,989,413 |
|
| 275,827 |
| |||
Net Assets | $ | 3,918,090 |
| $ | 1,501,503,032 |
| $ | 550,746,130 |
| |||
Net Assets Consist of: |
|
|
|
|
|
| ||||||
Paid-in Capital | $ | 4,455,284 |
| $ | 1,982,935,561 |
| $ | 609,291,373 |
| |||
Total Distributable Loss |
| (537,194 | ) |
| (481,432,529 | ) |
| (58,545,243 | ) | |||
Net Assets | $ | 3,918,090 |
| $ | 1,501,503,032 |
| $ | 550,746,130 |
| |||
Outstanding Shares of Beneficial Interest (unlimited authorization — no par value) |
| 150,000 |
|
| 36,250,000 |
|
| 18,350,000 |
| |||
Net Asset Value, Offering and Redemption Price Per Share | $ | 26.12 |
| $ | 41.42 |
| $ | 30.01 |
| |||
Cost of Investments | $ | 3,804,492 |
| $ | 1,787,181,306 |
| $ | 575,987,704 |
| |||
Cost of Foreign Currency |
| 5 |
|
| — |
|
| 593,548 |
| |||
*Includes Market Value of Securities on Loan |
| — |
|
| 101,348,781 |
|
| — |
| |||
Amounts designated as “—” are $0 or have been rounded to $0.
The accompanying notes are an integral part of the financial statements.
70
Statements of Assets and Liabilities (Unaudited)(continued)
September 30, 2019
KraneShares | KraneShares | KraneShares | ||||||||||
Assets: |
|
|
|
|
|
| ||||||
Investments at Value | $ | 16,406,421 |
| $ | 7,009,686 |
| $ | 18,039,820 |
| |||
Affiliated Investments at Value |
| 14,866 |
|
| — |
|
| — |
| |||
Foreign Currency at Value |
| 863,656 |
|
| 1,338 |
|
| 7,373 |
| |||
Cash and Cash Equivalents |
| 50,844 |
|
| 12,650 |
|
| 83,862 |
| |||
Dividend and Interest Receivable |
| 264,578 |
|
| 8,320 |
|
| 32,936 |
| |||
Receivable from Adviser for Withholding/Value Added Tax |
| 37,239 |
|
| — |
|
| — |
| |||
Prepaid Expenses |
| 80 |
|
| — |
|
| 89 |
| |||
Reclaim Receivable |
| — |
|
| 428 |
|
| 2,373 |
| |||
Total Assets |
| 17,637,684 |
|
| 7,032,422 |
|
| 18,166,453 |
| |||
Liabilities: |
|
|
|
|
|
| ||||||
Payable for Management Fees |
| 8,162 |
|
| 2,847 |
|
| 11,770 |
| |||
Payable for Foreign Capital Gains Tax |
| 2,114 |
|
| — |
|
| — |
| |||
Payable for Trustees’ Fee |
| 43 |
|
| 101 |
|
| 47 |
| |||
Unrealized Depreciation on Spot Contracts |
| — |
|
| — |
|
| 2 |
| |||
Other Accrued Expenses |
| — |
|
| 317 |
|
| — |
| |||
Total Liabilities |
| 10,319 |
|
| 3,265 |
|
| 11,819 |
| |||
Net Assets | $ | 17,627,365 |
| $ | 7,029,157 |
| $ | 18,154,634 |
| |||
Net Assets Consist of: |
|
|
|
|
|
| ||||||
Paid-in Capital | $ | 19,125,365 |
| $ | 7,133,748 |
| $ | 22,871,716 |
| |||
Total Distributable Loss |
| (1,498,000 | ) |
| (104,591 | ) |
| (4,717,082 | ) | |||
Net Assets | $ | 17,627,365 |
| $ | 7,029,157 |
| $ | 18,154,634 |
| |||
Outstanding Shares of Beneficial Interest (unlimited authorization — no par value) |
| 550,000 |
|
| 300,000 |
|
| 800,002 |
| |||
Net Asset Value, Offering and Redemption Price Per Share | $ | 32.05 |
| $ | 23.43 |
| $ | 22.69 |
| |||
Cost of Investments | $ | 17,104,638 |
| $ | 7,067,403 |
| $ | 19,749,177 |
| |||
Cost of Affiliated Investments |
| 15,241 |
|
| — |
|
| — |
| |||
Cost of Foreign Currency |
| 868,183 |
|
| 1,335 |
|
| 7,366 |
| |||
Amounts designated as “—” are $0 or have been rounded to $0.
The accompanying notes are an integral part of the financial statements.
71
Statements of Assets and Liabilities (Unaudited)(continued)
September 30, 2019
KraneShares | KraneShares | KraneShares | ||||||||||
Assets: |
|
|
|
|
|
| ||||||
Investments at Value | $ | 22,783,054 | * | $ | 3,423,654 |
| $ | 26,291,875 | * | |||
Cash and Cash Equivalents |
| 6,205 |
|
| 36,184 |
|
| 11,374 |
| |||
Foreign Currency at Value |
| 3,964 |
|
| 4,867 |
|
| 924 |
| |||
Dividend and Interest Receivable |
| 13,436 |
|
| 17,008 |
|
| 47,774 |
| |||
Reclaim Receivable |
| 2,663 |
|
| — |
|
| 40,046 |
| |||
Prepaid Expenses |
| 120 |
|
| 17 |
|
| 131 |
| |||
Total Assets |
| 22,809,442 |
|
| 3,481,730 |
|
| 26,392,124 |
| |||
Liabilities: |
|
|
|
|
|
| ||||||
Payable for Investment Securities Purchased |
| 213,232 |
|
| — |
|
| — |
| |||
Obligation to Return Securities Lending Collateral |
| 851,781 |
|
| — |
|
| 1,643,490 |
| |||
Payable for Management Fees |
| 14,361 |
|
| 2,307 |
|
| 14,910 |
| |||
Payable for Securities Lending Fees |
| 151 |
|
| — |
|
| 822 |
| |||
Payable for Trustees’ Fee |
| 151 |
|
| 35 |
|
| 113 |
| |||
Unrealized Depreciation on Spot |
| — |
|
| 1 |
|
| — |
| |||
Total Liabilities |
| 1,079,676 |
|
| 2,343 |
|
| 1,659,335 |
| |||
Net Assets | $ | 21,729,766 |
| $ | 3,479,387 |
| $ | 24,732,789 |
| |||
Net Assets Consist of: |
|
|
|
|
|
| ||||||
Paid-in Capital | $ | 29,050,519 |
| $ | 5,571,254 |
| $ | 29,694,509 |
| |||
Total Distributable Loss |
| (7,320,753 | ) |
| (2,091,867 | ) |
| (4,961,720 | ) | |||
Net Assets | $ | 21,729,766 |
| $ | 3,479,387 |
| $ | 24,732,789 |
| |||
Outstanding Shares of Beneficial Interest (unlimited authorization — no par value) |
| 1,000,002 |
|
| 200,002 |
|
| 1,200,002 |
| |||
Net Asset Value, Offering and Redemption Price Per Share | $ | 21.73 |
| $ | 17.40 |
| $ | 20.61 |
| |||
Cost of Investments | $ | 25,528,250 |
| $ | 3,780,029 |
| $ | 28,702,149 |
| |||
Cost of Foreign Currency |
| 3,977 |
|
| 4,865 |
|
| 937 |
| |||
*Includes Market Value of Securities on Loan |
| 823,981 |
|
| — |
|
| 1,596,887 |
| |||
Amounts designated as “—” are $0 or have been rounded to $0.
The accompanying notes are an integral part of the financial statements.
72
Statements of Assets and Liabilities (Unaudited)(concluded)
September 30, 2019
KraneShares | KraneShares | KraneShares | KraneShares | ||||||||||||
Assets: |
|
|
|
|
|
|
| ||||||||
Investments at Value | $ | 15,827,152 |
| $ | 11,636,976 | $ | 1,006,495 |
| $ | 2,398,468 |
| ||||
Cash and Cash Equivalents |
| 704,247 |
|
| 327,981 |
| 10,500 |
|
| 30,359 |
| ||||
Foreign Currency at Value |
| 3,579 |
|
| — |
| 68 |
|
| 466 |
| ||||
Receivable for Investment Securities Sold |
| 381,937 |
|
| — |
| — |
|
| — |
| ||||
Dividend and Interest Receivable |
| 2,160 |
|
| 193,066 |
| 255 |
|
| 4,464 |
| ||||
Prepaid Expenses |
| 180 |
|
| 212 |
| 24 |
|
| — |
| ||||
Reclaim Receivable |
| — |
|
| — |
| 73 |
|
| 282 |
| ||||
Total Assets |
| 16,919,255 |
|
| 12,158,235 |
| 1,017,415 |
|
| 2,434,039 |
| ||||
Liabilities: |
|
|
|
|
|
|
| ||||||||
Payable for Capital Shares Redeemed |
| 1,062,267 |
|
| — |
| — |
|
| — |
| ||||
Payable for Management |
| 9,656 |
|
| 6,806 |
| 666 |
|
| 957 |
| ||||
Payable for Trustees’ Fee |
| 276 |
|
| — |
| 19 |
|
| 4 |
| ||||
Unrealized Depreciation on Spot Contracts |
| 106 |
|
| — |
| — |
|
| 1 |
| ||||
Other Accrued Expenses |
| — |
|
| — |
| — |
|
| 10 |
| ||||
Total Liabilities |
| 1,072,305 |
|
| 6,806 |
| 685 |
|
| 972 |
| ||||
Net Assets | $ | 15,846,950 |
| $ | 12,151,429 | $ | 1,016,730 |
| $ | 2,433,067 |
| ||||
Net Assets Consist of: |
|
|
|
|
|
|
| ||||||||
Paid-in Capital | $ | 24,788,138 |
| $ | 11,935,858 | $ | 1,614,891 |
| $ | 2,500,050 |
| ||||
Total Distributable Earnings/(Loss) |
| (8,941,188 | ) |
| 215,571 |
| (598,161 | ) |
| (66,983 | ) | ||||
Net Assets | $ | 15,846,950 |
| $ | 12,151,429 | $ | 1,016,730 |
| $ | 2,433,067 |
| ||||
Outstanding Shares of Beneficial Interest (unlimited authorization – no par value) |
| 750,002 |
|
| 300,001 |
| 50,002 |
|
| 100,002 |
| ||||
Net Asset Value, Offering and Redemption Price Per Share | $ | 21.13 |
| $ | 40.50 | $ | 20.33 |
| $ | 24.33 |
| ||||
Cost of Investments | $ | 14,545,795 |
| $ | 11,543,767 | $ | 1,034,446 |
| $ | 2,529,499 |
| ||||
Cost of Foreign Currency |
| 3,579 |
|
| — |
| 68 |
|
| 466 |
| ||||
Amounts designated as “—” are $0 or have been rounded to $0.
The accompanying notes are an integral part of the financial statements.
73
KraneShares | KraneShares | KraneShares | ||||||||||
Investment Income: |
|
|
|
|
|
| ||||||
Dividend Income | $ | 101,416 |
| $ | 4,420,024 |
| $ | 14,058,438 |
| |||
Interest Income |
| 545 |
|
| 39,034 |
|
| 82,722 |
| |||
Security Lending Income |
| — |
|
| 2,671,620 |
|
| — |
| |||
Less: Foreign Taxes Withheld |
| (10,162 | ) |
| — |
|
| (1,408,381 | ) | |||
Total Investment Income |
| 91,799 |
|
| 7,130,678 |
|
| 12,732,779 |
| |||
Expenses: |
|
|
|
|
|
| ||||||
Management Fees† |
| 12,958 |
|
| 5,708,068 |
|
| 2,520,944 |
| |||
Trustees’ Fees |
| 205 |
|
| 93,416 |
|
| 34,039 |
| |||
Security Lending Fees† |
| — |
|
| 267,630 |
|
| — |
| |||
Insurance Expense |
| 25 |
|
| 14,969 |
|
| 4,443 |
| |||
Total Expenses |
| 13,188 |
|
| 6,084,083 |
|
| 2,559,426 |
| |||
Management Fee Waiver† |
| — |
|
| — |
|
| (646,400 | ) | |||
Net Expenses |
| 13,188 |
|
| 6,084,083 |
|
| 1,913,026 |
| |||
Net Investment Income |
| 78,611 |
|
| 1,046,595 |
|
| 10,819,753 |
| |||
Net Realized Loss on: |
|
|
|
|
|
| ||||||
Investments |
| (77,808 | ) |
| (29,029,523 | ) |
| (7,274,668 | ) | |||
Foreign Currency Translations |
| (3 | ) |
| (9,886 | ) |
| (652,112 | ) | |||
Net RealizedLosson Investments and Foreign Currency Translations |
| (77,811 | ) |
| (29,039,409 | ) |
| (7,926,780 | ) | |||
Net Change in Unrealized Depreciation on: |
|
|
|
|
|
| ||||||
Investments |
| (396,761 | ) |
| (199,846,783 | ) |
| (40,786,042 | ) | |||
Foreign Currency Translations |
| — |
|
| (1,147 | ) |
| (2,219 | ) | |||
Net Change in Unrealized Depreciation on Investments and Foreign Currency Translations |
| (396,761 | ) |
| (199,847,930 | ) |
| (40,788,261 | ) | |||
Net Realized and Unrealized Loss on Investments and Foreign Currency Translations |
| (474,572 | ) |
| (228,887,339 | ) |
| (48,715,041 | ) | |||
Net Decrease in Net Assets Resulting from Operations | $ | (395,961 | ) | $ | (227,840,744 | ) | $ | (37,895,288 | ) | |||
† See Note 3 in Notes to Financial Statements.
Amounts designated as “—” are $0 or have been rounded to $0.
The accompanying notes are an integral part of the financial statements.
74
Statements of Operations (Unaudited)(continued)
For the Period Ended September 30, 2019
KraneShares | KraneShares | KraneShares | ||||||||||
Investment Income: |
|
|
|
|
|
| ||||||
Dividend Income | $ | 207 |
| $ | 149,782 |
| $ | 548,956 |
| |||
Dividend from Affiliated Investment |
| 3,318 |
|
| — |
|
| — |
| |||
Less: Foreign Taxes Withheld |
| (473 | ) |
| (11,976 | ) |
| (53,313 | ) | |||
Interest Income |
| 324,266 |
|
| 272 |
|
| 1,639 |
| |||
Less: Foreign Withholding/Value Added Tax |
| (37,239 | ) |
| — |
|
| — |
| |||
Reimbursement of Foreign Withholding/Value Added Tax |
| 37,239 |
|
| — |
|
| — |
| |||
Total Investment Income |
| 327,318 |
|
| 138,078 |
|
| 497,282 |
| |||
Expenses: |
|
|
|
|
|
| ||||||
Management Fees† |
| 63,934 |
|
| 24,569 |
|
| 78,646 |
| |||
Trustees’ Fees |
| 1,002 |
|
| 385 |
|
| 1,075 |
| |||
Insurance Expense |
| 137 |
|
| 390 |
|
| 157 |
| |||
Total Expenses |
| 65,073 |
|
| 25,344 |
|
| 79,878 |
| |||
Management Fee Waiver† |
| (11,283 | ) |
| (6,830 | ) |
| — |
| |||
Net Expenses |
| 53,790 |
|
| 18,514 |
|
| 79,878 |
| |||
Net Investment Income |
| 273,528 |
|
| 119,564 |
|
| 417,404 |
| |||
Net Realized Gain (Loss) on: |
|
|
|
|
|
| ||||||
Investments |
| 24,881 |
|
| (26,095 | ) |
| (596,809 | ) | |||
Affiliated Investments |
| (18,041 | ) |
| — |
|
| — |
| |||
Foreign Currency Translations |
| (300,152 | ) |
| (168 | ) |
| (1,980 | ) | |||
Net Realized Loss on Investments, Affiliated Investments and Foreign Currency Translations |
| (293,312 | ) |
| (26,263 | ) |
| (598,789 | ) | |||
Net Change in Unrealized Appreciation (Depreciation) on: |
|
|
|
|
|
| ||||||
Investments |
| (863,067 | ) |
| (750,639 | ) |
| (690,106 | ) | |||
Affiliated Investments |
| 6,618 |
|
| — |
|
| — |
| |||
Foreign Currency Translations |
| (30,751 | ) |
| 109 |
|
| 144 |
| |||
Net Change in Unrealized Depreciation on Investments, Affiliated Investments and Foreign Currency Translations |
| (887,200 | ) |
| (750,530 | ) |
| (689,962 | ) | |||
Net Realized and Unrealized Loss on Investments, Affiliated Investments and Foreign Currency Translations |
| (1,180,512 | ) |
| (776,793 | ) |
| (1,288,751 | ) | |||
Net Decrease in Net Assets Resulting from Operations | $ | (906,984 | ) | $ | (657,229 | ) | $ | (871,347 | ) | |||
† See Note 3 in Notes to Financial Statements.
Amounts designated as “—” are $0 or have been rounded to $0.
The accompanying notes are an integral part of the financial statements.
75
Statements of Operations (Unaudited)(continued)
For the Period Ended September 30, 2019
KraneShares | KraneShares | KraneShares | ||||||||||
Investment Income: |
|
|
|
|
|
| ||||||
Dividend Income | $ | 431,872 |
| $ | 101,255 |
| $ | 493,390 |
| |||
Interest Income |
| 232 |
|
| 116 |
|
| 714 |
| |||
Security Lending Income |
| 7,413 |
|
| — |
|
| 36,901 |
| |||
Less: Foreign Taxes Withheld |
| (16,460 | ) |
| (3,690 | ) |
| (42,342 | ) | |||
Total Investment Income |
| 423,057 |
|
| 97,681 |
|
| 488,663 |
| |||
Expenses: |
|
|
|
|
|
| ||||||
Management Fees† |
| 99,918 |
|
| 14,568 |
|
| 106,177 |
| |||
Trustees’ Fees |
| 1,279 |
|
| 182 |
|
| 1,533 |
| |||
Security Lending Fees† |
| 744 |
|
| — |
|
| 3,688 |
| |||
Insurance Expense |
| 210 |
|
| 30 |
|
| 249 |
| |||
Total Expenses |
| 102,151 |
|
| 14,780 |
|
| 111,647 |
| |||
Net Expenses |
| 102,151 |
|
| 14,780 |
|
| 111,647 |
| |||
Net Investment Income |
| 320,906 |
|
| 82,901 |
|
| 377,016 |
| |||
Net Realized Gain (Loss) on: |
|
|
|
|
|
| ||||||
Investments |
| (640,019 | ) |
| (21,184 | ) |
| 70,851 |
| |||
Foreign Currency Translations |
| (4,074 | ) |
| 369 |
|
| (423 | ) | |||
Net Realized Gain (Loss) on Investments and Foreign Currency Translations |
| (644,093 | ) |
| (20,815 | ) |
| 70,428 |
| |||
Net Change in Unrealized Appreciation (Depreciation) on: |
|
|
|
|
|
| ||||||
Investments |
| (1,032,773 | ) |
| (639,135 | ) |
| (197,984 | ) | |||
Foreign Currency Translations |
| (363 | ) |
| 1 |
|
| (978 | ) | |||
Net Change in Unrealized Depreciation on Investments and Foreign Currency Translations |
| (1,033,136 | ) |
| (639,134 | ) |
| (198,962 | ) | |||
Net Realized and Unrealized Loss on Investments and Foreign Currency Translations |
| (1,677,229 | ) |
| (659,949 | ) |
| (128,534 | ) | |||
Net Increase (Decrease) in Net Assets Resulting from Operations | $ | (1,356,323 | ) | $ | (577,048 | ) | $ | 248,482 |
| |||
† See Note 3 in Notes to Financial Statements.
Amounts designated as “—” are $0 or have been rounded to $0.
The accompanying notes are an integral part of the financial statements.
76
Statements of Operations (Unaudited)(concluded)
For the Period Ended September 30, 2019
KraneShares | KraneShares | KraneShares | KraneShares | |||||||||||||
Investment Income: |
|
|
|
|
|
|
|
| ||||||||
Dividend Income | $ | 250,614 |
| $ | — |
| $ | 8,988 |
| $ | 79,167 |
| ||||
Interest Income |
| 1,659 |
|
| 355,131 |
|
| 109 |
|
| 64 |
| ||||
Security Lending Income |
| 741 |
|
| — |
|
| 902 |
|
| — |
| ||||
Less: Foreign Taxes Withheld |
| (19,240 | ) |
| (4,670 | ) |
| (546 | ) |
| (7,252 | ) | ||||
Total Investment Income |
| 233,774 |
|
| 350,461 |
|
| 9,453 |
|
| 71,979 |
| ||||
Expenses: |
|
|
|
|
|
|
|
| ||||||||
Management Fees† |
| 97,356 |
|
| 41,648 |
|
| 8,140 |
|
| 6,606 |
| ||||
Trustees’ Fees |
| 1,329 |
|
| 679 |
|
| 130 |
|
| 123 |
| ||||
Security Lending Fees† |
| 74 |
|
| — |
|
| 90 |
|
| — |
| ||||
Insurance Expense |
| 269 |
|
| 91 |
|
| 29 |
|
| 10 |
| ||||
Total Expenses |
| 99,028 |
|
| 42,418 |
|
| 8,389 |
|
| 6,739 |
| ||||
Management Fee Waiver† |
| (9,553 | ) |
| — |
|
| — |
|
| (1,139 | ) | ||||
Net Expenses |
| 89,475 |
|
| 42,418 |
|
| 8,389 |
|
| 5,600 |
| ||||
Net Investment Income |
| 144,299 |
|
| 308,043 |
|
| 1,064 |
|
| 66,379 |
| ||||
Net Realized Gain (Loss) on: |
|
|
|
|
|
|
|
| ||||||||
Investments |
| (4,114,623 | ) |
| 62,716 |
|
| (235,685 | ) |
| (9 | ) | ||||
Foreign Currency Translations |
| (1,684 | ) |
| — |
|
| 486 |
|
| (2,293 | ) | ||||
Net Realized Gain (Loss) on Investments and Foreign Currency Translations |
| (4,116,307 | ) |
| 62,716 |
|
| (235,199 | ) |
| (2,302 | ) | ||||
Net Change in Unrealized Appreciation (Depreciation) on: |
|
|
|
|
|
|
|
| ||||||||
Investments |
| 1,360,503 |
|
| (145,408 | ) |
| (133,801 | ) |
| (131,031 | ) | ||||
Foreign Currency Translations |
| (108 | ) |
| — |
|
| (8 | ) |
| (29 | ) | ||||
Net Change in Unrealized Appreciation (Depreciation) on Investments and Foreign Currency Translations |
| 1,360,395 |
|
| (145,408 | ) |
| (133,809 | ) |
| (131,060 | ) | ||||
Net Realized and Unrealized Loss on Investments and Foreign Currency Translations |
| (2,755,912 | ) |
| (82,692 | ) |
| (369,008 | ) |
| (133,362 | ) | ||||
Net Increase (Decrease) in Net Assets Resulting from Operations | $ | (2,611,613 | ) | $ | 225,351 |
| $ | (367,944 | ) | $ | (66,983 | ) | ||||
† See Note 3 in Notes to Financial Statements.
(1) Commenced Operations on April 12, 2019.
Amounts designated as “—” are $0 or have been rounded to $0.
The accompanying notes are an integral part of the financial statements.
77
KraneShares CICC China Leaders 100 | ||||||||
Period Ended | Year Ended | |||||||
Operations: |
|
|
|
| ||||
Net Investment Income | $ | 78,611 |
| $ | 73,945 |
| ||
Net Realized Loss on Investments and Foreign Currency Translations |
| (77,811 | ) |
| (330,149 | ) | ||
Net Change in Unrealized Appreciation (Depreciation) on Investments and Foreign Currency Translations |
| (396,761 | ) |
| 172,753 |
| ||
Net Decrease in Net Assets Resulting from Operations |
| (395,961 | ) |
| (83,451 | ) | ||
Distributions: |
| — |
|
| (445,172 | ) | ||
Capital Share Transactions:(1) |
|
|
|
| ||||
Issued |
| 2,830,761 |
|
| — |
| ||
Redeemed |
| (1,316,762 | ) |
| (1,753,543 | ) | ||
Increase (Decrease) in Net Assets from Capital Share Transactions |
| 1,513,999 |
|
| (1,753,543 | ) | ||
Total Increase (Decrease) in Net Assets |
| 1,118,038 |
|
| (2,282,166 | ) | ||
Net Assets: |
|
|
|
| ||||
Beginning of Period |
| 2,800,052 |
|
| 5,082,218 |
| ||
End of Period | $ | 3,918,090 |
| $ | 2,800,052 |
| ||
Share Transactions: |
|
|
|
| ||||
Issued |
| 100,000 |
|
| — |
| ||
Redeemed |
| (50,000 | ) |
| (50,000 | ) | ||
Net Increase (Decrease) in Shares Outstanding from Share Transactions |
| 50,000 |
|
| (50,000 | ) | ||
(1) Includes transaction costs related to creations and redemptions.
Amounts designated as “—” are $0 or have been rounded to $0.
The accompanying notes are an integral part of the financial statements.
78
Statements of Changes in Net Assets(continued)
KraneShares CSI China Internet ETF | ||||||||
Period Ended | Year Ended | |||||||
Operations: |
|
|
|
| ||||
Net Investment Income | $ | 1,046,595 |
| $ | 3,207,090 |
| ||
Net Realized Loss on Investments and Foreign Currency Translations |
| (29,039,409 | ) |
| (192,395,663 | ) | ||
Net Change in Unrealized Appreciation (Depreciation) on Investments and Foreign Currency Translations |
| (199,847,930 | ) |
| (63,848,491 | ) | ||
Net Decrease in Net Assets Resulting from Operations |
| (227,840,744 | ) |
| (253,037,064 | ) | ||
Distributions: |
| — |
|
| (52,775,933 | ) | ||
Capital Share Transactions:(1) |
|
|
|
| ||||
Issued |
| 277,906,696 |
|
| 1,491,668,993 |
| ||
Redeemed |
| (623,067,504 | ) |
| (739,973,651 | ) | ||
Increase (Decrease) in Net Assets from Capital Share Transactions |
| (345,160,808 | ) |
| 751,695,342 |
| ||
Total Increase (Decrease) in Net Assets |
| (573,001,552 | ) |
| 445,882,345 |
| ||
Net Assets: |
|
|
|
| ||||
Beginning of Period |
| 2,074,504,584 |
|
| 1,628,622,239 |
| ||
End of Period | $ | 1,501,503,032 |
| $ | 2,074,504,584 |
| ||
Share Transactions: |
|
|
|
| ||||
Issued |
| 6,500,000 |
|
| 32,250,000 |
| ||
Redeemed |
| (14,350,000 | ) |
| (14,800,000 | ) | ||
Net Increase (Decrease) in Shares Outstanding from Share Transactions |
| (7,850,000 | ) |
| 17,450,000 |
| ||
(1) Includes transaction costs related to creations and redemptions.
Amounts designated as “—” are $0 or have been rounded to $0.
The accompanying notes are an integral part of the financial statements.
79
Statements of Changes in Net Assets(continued)
KraneShares Bosera MSCI China A | ||||||||
Period Ended | Year Ended | |||||||
Operations: |
|
|
|
| ||||
Net Investment Income | $ | 10,819,753 |
| $ | 7,821,817 |
| ||
Net Realized Loss on Investments and Foreign Currency Translations |
| (7,926,780 | ) |
| (36,526,206 | ) | ||
Net Change in Unrealized Appreciation (Depreciation) on Investments and Foreign Currency Translations |
| (40,788,261 | ) |
| (17,097,577 | ) | ||
Net Decrease in Net Assets Resulting from Operations |
| (37,895,288 | ) |
| (45,801,966 | ) | ||
Distributions: |
| — |
|
| (10,889,028 | ) | ||
Capital Share Transactions:(1) |
|
|
|
| ||||
Issued |
| 168,045,162 |
|
| 542,064,331 |
| ||
Redeemed |
| (183,438,977 | ) |
| (234,661,691 | ) | ||
Increase (Decrease) in Net Assets from Capital Share Transactions |
| (15,393,815 | ) |
| 307,402,640 |
| ||
Total Increase (Decrease) in Net Assets |
| (53,289,103 | ) |
| 250,711,646 |
| ||
Net Assets: |
|
|
|
| ||||
Beginning of Period |
| 604,035,233 |
|
| 353,323,587 |
| ||
End of Period | $ | 550,746,130 |
| $ | 604,035,233 |
| ||
Share Transactions: |
|
|
|
| ||||
Issued |
| 5,400,000 |
|
| 16,750,000 |
| ||
Redeemed |
| (6,000,000 | ) |
| (8,050,000 | ) | ||
Net Increase (Decrease) in Shares Outstanding from Share Transactions |
| (600,000 | ) |
| 8,700,000 |
| ||
(1) Includes transaction costs related to creations and redemptions.
Amounts designated as “—” are $0 or have been rounded to $0.
The accompanying notes are an integral part of the financial statements.
80
Statements of Changes in Net Assets(continued)
KraneShares E Fund China Commercial | ||||||||
Period Ended | Year Ended | |||||||
Operations: |
|
|
|
| ||||
Net Investment Income | $ | 273,528 |
| $ | 473,954 |
| ||
Net Realized Loss on Investments, Affiliated Investments and Foreign Currency Translations |
| (293,312 | ) |
| (488,707 | ) | ||
Net Change in Unrealized Appreciation (Depreciation) on Investments, Affiliated Investments and Foreign Currency Translations |
| (887,200 | ) |
| (332,349 | ) | ||
Net Decrease in Net Assets Resulting from Operations |
| (906,984 | ) |
| (347,102 | ) | ||
Distributions: |
| (329,050 | ) |
| (704,248 | ) | ||
Return of Capital: |
| — |
|
| (28,559 | ) | ||
Capital Share Transactions:(1) |
|
|
|
| ||||
Issued |
| 1,658,205 |
|
| 6,871,858 |
| ||
Redeemed |
| (1,617,038 | ) |
| — |
| ||
Increase in Net Assets from Capital Share Transactions |
| 41,167 |
|
| 6,871,858 |
| ||
Total Increase (Decrease) in Net Assets |
| (1,194,867 | ) |
| 5,791,949 |
| ||
Net Assets: |
|
|
|
| ||||
Beginning of Period |
| 18,822,232 |
|
| 13,030,283 |
| ||
End of Period | $ | 17,627,365 |
| $ | 18,822,232 |
| ||
Share Transactions: |
|
|
|
| ||||
Issued |
| 50,000 |
|
| 200,000 |
| ||
Redeemed |
| (50,000 | ) |
| — |
| ||
Net Increase in Shares Outstanding from Share Transactions |
| — |
|
| 200,000 |
| ||
(1) Includes transaction costs related to creations and redemptions.
Amounts designated as “—” are $0 or have been rounded to $0.
The accompanying notes are an integral part of the financial statements.
81
Statements of Changes in Net Assets(continued)
KraneShares MSCI All China Index ETF | ||||||||
Period Ended | Year Ended | |||||||
Operations: |
|
|
|
| ||||
Net Investment Income | $ | 119,564 |
| $ | 22,681 |
| ||
Net Realized Gain (Loss) on Investments and Foreign Currency Translations |
| (26,263 | ) |
| 59,468 |
| ||
Net Change in Unrealized Appreciation (Depreciation) on Investments and Foreign Currency Translations |
| (750,530 | ) |
| 300,685 |
| ||
Net Increase (Decrease) in Net Assets Resulting from Operations |
| (657,229 | ) |
| 382,834 |
| ||
Distributions: |
| — |
|
| (43,104 | ) | ||
Capital Share Transactions:(1) |
|
|
|
| ||||
Issued |
| 1,316,745 |
|
| 3,333,442 |
| ||
Increase in Net Assets from Capital Share Transactions |
| 1,316,745 |
|
| 3,333,442 |
| ||
Total Increase in Net Assets |
| 659,516 |
|
| 3,673,172 |
| ||
Net Assets: |
|
|
|
| ||||
Beginning of Period |
| 6,369,641 |
|
| 2,696,469 |
| ||
End of Period | $ | 7,029,157 |
| $ | 6,369,641 |
| ||
Share Transactions: |
|
|
|
| ||||
Issued |
| 50,000 |
|
| 150,000 |
| ||
Net Increase in Shares Outstanding from Share Transactions |
| 50,000 |
|
| 150,000 |
| ||
(1) Includes transaction costs related to creations and redemptions.
Amounts designated as “—” are $0 or have been rounded to $0.
The accompanying notes are an integral part of the financial statements.
82
Statements of Changes in Net Assets(continued)
KraneShares MSCI One Belt One Road | ||||||||
Period Ended | Year Ended | |||||||
Operations: |
|
|
|
| ||||
Net Investment Income | $ | 417,404 |
| $ | 558,784 |
| ||
Net Realized Loss on Investments and Foreign Currency Translations |
| (598,789 | ) |
| (3,080,305 | ) | ||
Net Change in Unrealized Appreciation (Depreciation) on Investments and Foreign Currency Translations |
| (689,962 | ) |
| 42,282 |
| ||
Net Decrease in Net Assets Resulting from Operations |
| (871,347 | ) |
| (2,479,239 | ) | ||
Distributions: |
| — |
|
| (553,422 | ) | ||
Capital Share Transactions:(1) |
|
|
|
| ||||
Issued |
| — |
|
| 2,531,004 |
| ||
Redeemed |
| (2,295,818 | ) |
| (10,224,309 | ) | ||
Decrease in Net Assets from Capital Share Transactions |
| (2,295,818 | ) |
| (7,693,305 | ) | ||
Total Decrease in Net Assets |
| (3,167,165 | ) |
| (10,725,966 | ) | ||
Net Assets: |
|
|
|
| ||||
Beginning of Period |
| 21,321,799 |
|
| 32,047,765 |
| ||
End of Period | $ | 18,154,634 |
| $ | 21,321,799 |
| ||
Share Transactions: |
|
|
|
| ||||
Issued |
| — |
|
| 100,000 |
| ||
Redeemed |
| (100,000 | ) |
| (450,000 | ) | ||
Net Decrease in Shares Outstanding from Share Transactions |
| (100,000 | ) |
| (350,000 | ) | ||
(1) Includes transaction costs related to creations and redemptions.
Amounts designated as “—” are $0 or have been rounded to $0.
The accompanying notes are an integral part of the financial statements.
83
Statements of Changes in Net Assets(continued)
KraneShares Emerging Markets | ||||||||
Period Ended | Year Ended | |||||||
Operations: |
|
|
|
| ||||
Net Investment Income (Loss) | $ | 320,906 |
| $ | (5,737 | ) | ||
Net Realized Loss on Investments and Foreign Currency Translations |
| (644,093 | ) |
| (4,658,595 | ) | ||
Net Change in Unrealized Appreciation (Depreciation) on Investments and Foreign Currency Translations |
| (1,033,136 | ) |
| (1,646,885 | ) | ||
Net Decrease in Net Assets Resulting from Operations |
| (1,356,323 | ) |
| (6,311,217 | ) | ||
Capital Share Transactions:(1) |
|
|
|
| ||||
Issued |
| — |
|
| 31,316,594 |
| ||
Redeemed |
| (5,594,142 | ) |
| (20,153,426 | ) | ||
Increase (Decrease) in Net Assets from Capital Share Transactions |
| (5,594,142 | ) |
| 11,163,168 |
| ||
Total Increase (Decrease) in Net Assets |
| (6,950,465 | ) |
| 4,851,951 |
| ||
Net Assets: |
|
|
|
| ||||
Beginning of Period |
| 28,680,231 |
|
| 23,828,280 |
| ||
End of Period | $ | 21,729,766 |
| $ | 28,680,231 |
| ||
Share Transactions: |
|
|
|
| ||||
Issued |
| — |
|
| 1,250,000 |
| ||
Redeemed |
| (250,000 | ) |
| (900,000 | ) | ||
Net Increase (Decrease) in Shares Outstanding from Share Transactions |
| (250,000 | ) |
| 350,000 |
| ||
(1) Includes transaction costs related to creations and redemptions.
Amounts designated as “—” are $0 or have been rounded to $0.
The accompanying notes are an integral part of the financial statements.
84
Statements of Changes in Net Assets(continued)
KraneShares MSCI China Environment | ||||||||
Period Ended | Year Ended | |||||||
Operations: |
|
|
|
| ||||
Net Investment Income | $ | 82,901 |
| $ | 116,395 |
| ||
Net Realized Loss on Investments and Foreign Currency Translations |
| (20,815 | ) |
| (1,570,720 | ) | ||
Net Change in Unrealized Appreciation (Depreciation) on Investments and Foreign Currency Translations |
| (639,134 | ) |
| 441,845 |
| ||
Net Decrease in Net Assets Resulting from Operations |
| (577,048 | ) |
| (1,012,480 | ) | ||
Distributions: |
| — |
|
| (107,314 | ) | ||
Capital Share Transactions:(1) |
|
|
|
| ||||
Issued |
| — |
|
| 2,265,922 |
| ||
Redeemed |
| — |
|
| (4,248,046 | ) | ||
Decrease in Net Assets from Capital Share |
| — |
|
| (1,982,124 | ) | ||
Total Decrease in Net Assets |
| (577,048 | ) |
| (3,101,918 | ) | ||
Net Assets: |
|
|
|
| ||||
Beginning of Period |
| 4,056,435 |
|
| 7,158,353 |
| ||
End of Period | $ | 3,479,387 |
| $ | 4,056,435 |
| ||
Share Transactions: |
|
|
|
| ||||
Issued |
| — |
|
| 100,000 |
| ||
Redeemed |
| — |
|
| (200,000 | ) | ||
Net Decrease in Shares Outstanding from Share Transactions |
| — |
|
| (100,000 | ) | ||
(1) Includes transaction costs related to creations and redemptions.
Amounts designated as “—” are $0 or have been rounded to $0.
The accompanying notes are an integral part of the financial statements.
85
Statements of Changes in Net Assets(continued)
KraneShares Electric Vehicles and | ||||||||
Period Ended | Year Ended | |||||||
Operations: |
|
|
|
| ||||
Net Investment Income | $ | 377,016 |
| $ | 305,894 |
| ||
Net Realized Gain (Loss) on Investments and Foreign Currency Translations |
| 70,428 |
|
| (2,855,760 | ) | ||
Net Change in Unrealized Appreciation (Depreciation) on Investments and Foreign Currency Translations |
| (198,962 | ) |
| (996,927 | ) | ||
Net Increase (Decrease) in Net Assets Resulting from Operations |
| 248,482 |
|
| (3,546,793 | ) | ||
Distributions: |
| — |
|
| (382,192 | ) | ||
Capital Share Transactions:(1) |
|
|
|
| ||||
Issued |
| 1,036,536 |
|
| 10,157,198 |
| ||
Redeemed |
| (9,578,071 | ) |
| — |
| ||
Increase (Decrease) in Net Assets from Capital Share Transactions |
| (8,541,535 | ) |
| 10,157,198 |
| ||
Total Increase (Decrease) in Net Assets |
| (8,293,053 | ) |
| 6,228,213 |
| ||
Net Assets: |
|
|
|
| ||||
Beginning of Period |
| 33,025,842 |
|
| 26,797,629 |
| ||
End of Period | $ | 24,732,789 |
| $ | 33,025,842 |
| ||
Share Transactions: |
|
|
|
| ||||
Issued |
| 50,000 |
|
| 450,000 |
| ||
Redeemed |
| (450,000 | ) |
| — |
| ||
Net Increase (Decrease) in Shares Outstanding from Share Transactions |
| (400,000 | ) |
| 450,000 |
| ||
(1) Includes transaction costs related to creations and redemptions.
Amounts designated as “—” are $0 or have been rounded to $0.
The accompanying notes are an integral part of the financial statements.
86
Statements of Changes in Net Assets(continued)
KraneShares MSCI All China Healthcare | ||||||||
Period Ended | Year Ended | |||||||
Operations: |
|
|
|
| ||||
Net Investment Income | $ | 144,299 |
| $ | 24,544 |
| ||
Net Realized Loss on Investments and Foreign Currency Translations |
| (4,116,307 | ) |
| (6,156,072 | ) | ||
Net Change in Unrealized Appreciation (Depreciation) on Investments and Foreign Currency Translations |
| 1,360,395 |
|
| (248,794 | ) | ||
Net Decrease in Net Assets Resulting from Operations |
| (2,611,613 | ) |
| (6,380,322 | ) | ||
Distributions: |
| — |
|
| (136,712 | ) | ||
Capital Share Transactions:(1) |
|
|
|
| ||||
Issued |
| — |
|
| 52,247,029 |
| ||
Redeemed |
| (20,545,304 | ) |
| (10,724,139 | ) | ||
Increase (Decrease) in Net Assets from Capital Share Transactions |
| (20,545,304 | ) |
| 41,522,890 |
| ||
Total Increase (Decrease) in Net Assets |
| (23,156,917 | ) |
| 35,005,856 |
| ||
Net Assets: |
|
|
|
| ||||
Beginning of Period |
| 39,003,867 |
|
| 3,998,011 |
| ||
End of Period | $ | 15,846,950 |
| $ | 39,003,867 |
| ||
Share Transactions: |
|
|
|
| ||||
Issued |
| — |
|
| 2,150,000 |
| ||
Redeemed |
| (1,000,000 | ) |
| (550,000 | ) | ||
Net Increase (Decrease) in Shares Outstanding from Share Transactions |
| (1,000,000 | ) |
| 1,600,000 |
| ||
(1) Includes transaction costs related to creations and redemptions.
Amounts designated as “—” are $0 or have been rounded to $0.
The accompanying notes are an integral part of the financial statements.
87
Statements of Changes in Net Assets(continued)
KraneShares CCBS China Corporate High | ||||||||
Period Ended | Period Ended | |||||||
Operations: |
|
|
|
| ||||
Net Investment Income | $ | 308,043 |
| $ | 431,819 |
| ||
Net Realized Gain (Loss) on Investments and Foreign Currency Translations |
| 62,716 |
|
| (12,382 | ) | ||
Net Change in Unrealized Appreciation (Depreciation) on Investments and Foreign Currency Translations |
| (145,408 | ) |
| 238,617 |
| ||
Net Increase in Net Assets Resulting from Operations |
| 225,351 |
|
| 658,054 |
| ||
Distributions: |
| (293,714 | ) |
| (374,120 | ) | ||
Return of Capital: |
| — |
|
| (49,368 | ) | ||
Capital Share Transactions:(2) |
|
|
|
| ||||
Issued |
| — |
|
| 11,985,226 |
| ||
Redeemed |
| — |
|
| — |
| ||
Increase in Net Assets from Capital Share Transactions |
| — |
|
| 11,985,226 |
| ||
Total Increase (Decrease) in Net Assets |
| (68,363 | ) |
| 12,219,792 |
| ||
Net Assets: |
|
|
|
| ||||
Beginning of Period |
| 12,219,792 |
|
| — |
| ||
End of Period | $ | 12,151,429 |
| $ | 12,219,792 |
| ||
Share Transactions: |
|
|
|
| ||||
Issued |
| — |
|
| 300,001 |
| ||
Redeemed |
| — |
|
| — |
| ||
Net Increase in Shares Outstanding from Share Transactions |
| — |
|
| 300,001 |
| ||
(1) Commenced operations on June 26, 2018.
(2) Includes transaction costs related to creations and redemptions.
Amounts designated as “—” are $0 or have been rounded to $0.
The accompanying notes are an integral part of the financial statements.
88
Statements of Changes in Net Assets(continued)
KraneShares Emerging Markets | ||||||||
Period Ended | Period Ended | |||||||
Operations: |
|
|
|
| ||||
Net Investment Income (Loss) | $ | 1,064 |
| $ | (7,486 | ) | ||
Net Realized Loss on Investments and Foreign Currency Translations |
| (235,199 | ) |
| (327,821 | ) | ||
Net Change in Unrealized Appreciation (Depreciation) on Investments and Foreign Currency Translations |
| (133,809 | ) |
| 105,842 |
| ||
Net Decrease in Net Assets Resulting from Operations |
| (367,944 | ) |
| (229,465 | ) | ||
Distributions: |
| — |
|
| (752 | ) | ||
Capital Share Transactions:(2) |
|
|
|
| ||||
Issued |
| — |
|
| 5,708,901 |
| ||
Redeemed |
| (3,091,737 | ) |
| (1,002,273 | ) | ||
Increase (Decrease) in Net Assets from Capital Share Transactions |
| (3,091,737 | ) |
| 4,706,628 |
| ||
Total Decrease in Net Assets |
| (3,459,681 | ) |
| 4,476,411 |
| ||
Net Assets: |
|
|
|
| ||||
Beginning of Period |
| 4,476,411 |
|
| — |
| ||
End of Period(2) | $ | 1,016,730 |
| $ | 4,476,411 |
| ||
Share Transactions: |
|
|
|
| ||||
Issued |
| (150,000 | ) |
| 250,002 |
| ||
Redeemed |
| — |
|
| (50,000 | ) | ||
Net Increase (Decrease) in Shares Outstanding from Share Transactions |
| (150,000 | ) |
| 200,002 |
| ||
(1) Commenced operations on August 29, 2018.
(2) Includes transaction costs related to creations and redemptions.
Amounts designated as “—” are $0 or have been rounded to $0.
The accompanying notes are an integral part of the financial statements.
89
Statements of Changes in Net Assets (concluded)
KraneShares MSCI | ||||
Period Ended | ||||
Operations: |
|
| ||
Net Investment Income | $ | 66,379 |
| |
Net Realized Loss on Investments and Foreign Currency Translations |
| (2,302 | ) | |
Net Change in Unrealized Appreciation (Depreciation) on Investments and Foreign Currency Translations |
| (131,060 | ) | |
Net Decrease in Net Assets Resulting from Operations |
| (66,983 | ) | |
Distributions: |
| — |
| |
Capital Share Transactions:(2) |
|
| ||
Issued |
| 2,500,050 |
| |
Increase in Net Assets from Capital Share Transactions |
| 2,500,050 |
| |
Total Increase in Net Assets |
| 2,433,067 |
| |
Net Assets: |
|
| ||
Beginning of Period |
| — |
| |
End of Period | $ | 2,433,067 |
| |
Share Transactions: |
|
| ||
Issued |
| 100,002 |
| |
Net Increase in Shares Outstanding from Share Transactions |
| 100,002 |
| |
(1) Commenced operations on April 12, 2019.
(2) Includes transaction costs related to creations and redemptions.
Amounts designated as “—” are $0 or have been rounded to $0.
The accompanying notes are an integral part of the financial statements.
90
(This page intentionally left blank.)
91
Selected Per Share Data & Ratios
For the Periods Ended September 30, 2019 (Unaudited)
For the Years/Periods Ended March 31 (unless otherwise indicated)
For a Share Outstanding Throughout Each Period
| Net Asset | Net | Net Realized | Total from |
| Distribution | Return of | |||||||
KraneShares CICC China Leaders 100 Index ETF(3)# | ||||||||||||||
2019*** | 28.00 | 0.57 | (2.45) | (1.88) | — | — | — | |||||||
2019 | 33.88 | 0.66 | (2.09) | (1.43) | (0.68) | (3.77) | — | |||||||
2018(1) | 34.06 | 0.24 | 7.22 | 7.46 | (0.30) | (7.34) | — | |||||||
2017 | 28.02 | 0.21 | 6.54 | 6.75 | (0.33) | — | (0.38) | |||||||
2016 | 34.20 | 0.18 | (3.21) | (3.03) | (0.25) | (2.89) | (0.01) | |||||||
2015 | 31.42 | 0.12 | 2.97 | 3.09 | (0.31) | — | — | |||||||
KraneShares CSI China Internet ETF | ||||||||||||||
2019*** | 47.04 | 0.03 | (5.65) | (5.62) | — | — | — | |||||||
2019 | 61.11 | 0.10 | (12.90) | (12.80) | (0.01) | (1.26) | — | |||||||
2018(1) | 42.21 | (0.19) | 19.43 | 19.24 | (0.34) | — | — | |||||||
2017 | 35.76 | (0.27) | 7.13 | 6.86 | (0.30) | — | (0.11) | |||||||
2016 | 34.18 | (0.20) | 1.84 | 1.64 | (0.06) | — | —(4) | |||||||
2015 | 35.93 | (0.14) | (1.32) | (1.46) | (0.29) | — | — | |||||||
KraneShares Bosera MSCI China A Share ETF | ||||||||||||||
2019*** | 31.88 | 0.51 | (2.38) | (1.87) | — | — | — | |||||||
2019 | 34.47 | 0.60 | (2.27) | (1.67) | (0.52) | (0.40) | — | |||||||
2018(1) | 28.38 | 0.21 | 6.22 | 6.43 | (0.18) | (0.16) | — | |||||||
2017 | 30.37 | (0.01) | (0.67) | (0.68) | — | (0.85) | (0.46) | |||||||
2016 | 53.55 | 0.62 | (13.67) | (13.05) | (0.41) | (9.72) | — | |||||||
2015 | 28.92 | (0.22) | 24.90 | 24.68 | (0.05) | — | — | |||||||
KraneShares E Fund China Commercial Paper ETF | ||||||||||||||
2019*** | 34.22 | 0.48 | (2.07) | (1.59) | (0.58) | — | — | |||||||
2019 | 37.23 | 1.31 | (2.29) | (0.98) | (1.95) | — | (0.08) | |||||||
2018(1) | 32.82 | 1.07 | 3.34 | 4.41 | — | — | — | |||||||
2017 | 34.18 | 0.61 | (1.96) | (1.35) | — | — | (0.01) | |||||||
2016 | 34.81 | 1.01 | (1.39) | (0.38) | (0.21) | (0.01) | (0.03) | |||||||
2015(2) | 35.00 | 0.39 | (0.35) | 0.04 | (0.23) | — | — | |||||||
(1) March 29, 2018 represents the last business day of the Fund’s reporting period in 2018.
(2) The Fund commenced operations on December 2, 2014.
(3) Effective August 1, 2014, the KraneShares CSI China Five Year Plan ETF changed its name to KraneShares CSI New China ETF. Effective June 1, 2016, the KraneShares CSI New China ETF changed its name to KraneShares Zacks New China ETF. Effective November 1, 2018, the KraneShares Zacks New China ETF was renamed the KraneShares CICC China Leaders 100 Index ETF.
(4) Amount was less than $0.01 per share.
(5) Pursuant to an Investment Advisory Agreement between the Trust and the Adviser, the Fund paid the Adviser a fee, calculated daily and paid monthly, at an annual rate of 0.78% of the average daily net assets of the Fund (prior to March 24, 2016, the Fund paid the Adviser at an annual rate of 1.10% of the average daily net assets of the Fund). Effective March 24, 2016, pursuant to the terms of an Expense Limitation Agreement, the Adviser had contractually agreed to reduce its management fee to 0.68% of the Fund’s average daily net assets until July 31, 2017.
(6) As of February 17, 2017, pursuant to the terms of an Expense Limitation Agreement, the Adviser had contractually agreed to waive its management fee by 0.20% of the Fund’s average daily net assets. The contractual fee waiver will remain in effect until October 4, 2019.
(7) As of July 28, 2017, pursuant to the terms of an Expense Limitation Agreement, the Adviser has contractually agreed to reduce its management fee and/or reimburse the Fund in an amount equal to the fees paid by the Fund to counsel to the Independent Trustees of the Trust until July 31, 2018.
(8) Fund received reimbursement from third-party for dilution to shareholders for an accounting error. Absent the reimbursement, total return would have been (4.44)%.
(9) The expenses during the year include a one-time, non-recurring expense. Had this expense not been included, the net and gross expense ratios for the period would have been 0.59% and 0.71%, respectively.
The accompanying notes are an integral part of the financial statements.
92
Total from | Net Asset | Total | Net Assets | Ratio of | Ratio of Expenses | Ratio of Net | Portfolio | |||||||
— | 26.12 | (6.71) | 3,918 | 0.69† | 0.69† | 4.14† | 72†† | |||||||
(4.45) | 28.00 | (0.62) | 2,800 | 0.70 | 0.70 | 2.21 | 181 | |||||||
(7.64) | 33.88 | 22.57 | 5,082 | 0.71(7) | 0.71(7) | 0.64 | 105 | |||||||
(0.71) | 34.06 | 24.54 | 3,406 | 0.84 | 0.84 | 0.55 | 86 | |||||||
(3.15) | 28.02 | (9.71) | 2,803 | 0.73 | 0.73 | 0.60 | 575 | |||||||
(0.31) | 34.20 | 9.92 | 3,421 | 0.71 | 0.71 | 0.37 | 36 | |||||||
— | 41.42 | (11.95) | 1,501,503 | 0.73† | 0.73† | 0.13† | 15†† | |||||||
(1.27) | 47.04 | (20.44) | 2,074,505 | 0.75(10) | 0.76(10) | 0.20 | 70 | |||||||
(0.34) | 61.11 | 45.62 | 1,628,622 | 0.70(7) | 0.70(7) | (0.33) | 29 | |||||||
(0.41) | 42.21 | 19.44 | 291,257 | 0.81 | 0.81 | (0.72) | 35 | |||||||
(0.06) | 35.76 | 4.77 | 194,869 | 0.72 | 0.72 | (0.56) | 27 | |||||||
(0.29) | 34.18 | (4.09) | 131,612 | 0.71 | 0.71 | (0.39) | 43 | |||||||
— | 30.01 | (5.87) | 550,746 | 0.60† | 0.80† | 3.36† | 71†† | |||||||
(0.92) | 31.88 | (4.01) | 604,035 | 0.60 | 0.80 | 2.05 | 106 | |||||||
(0.34) | 34.47 | 22.68 | 353,324 | 0.60 | 0.80 | 0.61 | 52 | |||||||
(1.31) | 28.38 | (2.04) | 52,494 | 0.72(6) | 0.84(6) | (0.04) | 95 | |||||||
(10.13) | 30.37 | (27.18) | 4,555 | 0.93(5) | 1.18(5) | 1.18 | 116 | |||||||
(0.05) | 53.55 | 85.37 | 26,774 | 1.31 | 1.51 | (0.55) | 110 | |||||||
(0.58) | 32.05 | (4.68) | 17,627 | 0.57†^ | 0.69†^ | 2.92†^ | —†† | |||||||
(2.03) | 34.22 | (2.52) | 18,822 | 0.58^ | 0.70^ | 3.76^ | — | |||||||
— | 37.23 | 13.44 | 13,030 | 0.77^(7)(9) | 0.89^(7)(9) | 3.10^ | — | |||||||
(0.01) | 32.82 | (3.95)(8) | 9,845 | 0.95^ | 1.07^ | 1.84^ | — | |||||||
(0.25) | 34.18 | (1.11) | 18,799 | 0.57^ | 0.69^ | 2.92^ | 717 | |||||||
(0.23) | 34.81 | 0.13 | 8,702 | 0.60†^ | 0.72†^ | 3.46†^ | —†† |
(10) During the year ended March 31, 2019, the Fund participated in securities lending, generating $9,746,130 in security lending income. The expense ratios include $968,632 in security lending fees paid to the Adviser. Had these fees been excluded, the expense ratios would have been 0.69% and 0.70%, respectively.
* Per share data calculated using average shares method
** Total return is based on the change in net asset value of a share during the year or period and assumes reinvestment of dividends and distributions at net asset value. Total return is for the period indicated and periods of less than one year have not been annualized. The return shown does not reflect the deduction of taxes that a shareholder would pay on Fund distributions or the redemption of Fund shares. Excludes effects of standard creation and redemption transaction fees associated with creation units.
*** For the six-month period ended September 30, 2019. All ratios for the period have been annualized, except for the Total Return.
† Annualized.
†† Portfolio turnover rate is for the period indicated and periods of less than one year have not been annualized. Excludes effect of in-kind transfers.
^ The ratios of expenses and net investment income/(loss) to Average Net Assets reflect the expenses and net investment income/(loss), respectively, for the year/period as reported in the Statements of Operations and do not reflect the Fund’s proportionate share of the income and expenses of the money market funds.
# After the close of the markets on September 13, 2016, the Fund effected a 2 for 1 share split. Per share data has been adjusted to reflect the share split.
Amounts designated as “—” are $0 or have been rounded to $0.
The accompanying notes are an integral part of the financial statements.
93
Financial Highlights (concluded)
Selected Per Share Data & Ratios
For the Periods Ended September 30, 2019 (Unaudited)
For the Years/Periods Ended March 31 (unless otherwise indicated)
For a Share Outstanding Throughout Each Period
| Net Asset | Net | Net Realized | Total from | Distribution | Distribution | Return of | |||||||
KraneShares MSCI All China Index ETF | ||||||||||||||
2019*** | 25.48 | 0.40 | (2.45) | (2.05) | — | — | — | |||||||
2019 | 26.96 | 0.18 | (1.23) | (1.05) | (0.43) | — | — | |||||||
2018(1) | 22.56 | 0.45 | 4.28 | 4.73 | (0.33) | — | — | |||||||
2017 | 21.66 | 0.37 | 1.88 | 2.25 | (0.70) | (0.47) | (0.18) | |||||||
2016 | 25.63 | 0.29 | (3.86) | (3.57) | (0.35) | (0.05) | — | |||||||
2015(2) | 25.00 | — | 0.63 | 0.63 | — | — | — | |||||||
KraneShares MSCI One Belt One Road Index ETF | ||||||||||||||
2019*** | 23.69 | 0.48 | (1.48) | (1.00) | — | — | — | |||||||
2019 | 25.64 | 0.48 | (1.82) | (1.34) | (0.61) | — | — | |||||||
2018(1)(3) | 25.00 | 0.08 | 0.59^ | 0.67 | (0.03) | — | — | |||||||
KraneShares Emerging Markets Consumer Technology Index ETF | ||||||||||||||
2019*** | 22.94 | 0.28 | (1.49) | (1.21) | — | — | — | |||||||
2019 | 26.48 | (0.00) | (3.54) | (3.54) | — | — | — | |||||||
2018(1)(4) | 25.00 | (0.03) | 1.51^ | 1.48 | — | — | — | |||||||
KraneShares MSCI China Environment Index ETF | ||||||||||||||
2019*** | 20.28 | 0.41 | (3.29) | (2.88) | — | — | — | |||||||
2019 | 23.86 | 0.39 | (3.61) | (3.22) | (0.36) | — | — | |||||||
2018(1)(5) | 25.00 | (0.09) | (1.05) | (1.14) | — | — | — | |||||||
KraneShares Electric Vehicles and Future Mobility Index ETF | ||||||||||||||
2019*** | 20.64 | 0.25 | (0.28) | (0.03) | — | — | — | |||||||
2019 | 23.30 | 0.21 | (2.62) | (2.41) | (0.25) | — | — | |||||||
2018(1)(6) | 25.00 | 0.02 | (1.72) | (1.70) | — | — | — | |||||||
KraneShares MSCI All China Health Care Index ETF | ||||||||||||||
2019*** | 22.29 | 0.12 | (1.28) | (1.16) | — | — | — | |||||||
2019 | 26.65 | 0.02 | (4.30) | (4.28) | (0.04) | (0.04) | — | |||||||
2018(1)(7) | 25.00 | (0.03) | 1.68 | 1.65 | — | — | — | |||||||
KraneShares CCBS China Corporate High Yield Bond USD Index ETF | ||||||||||||||
2019*** | 40.73 | 1.03 | (0.28) | 0.75 | (0.98) | — | — | |||||||
2019(8) | 40.00 | 1.55 | 0.67 | 2.22 | (1.31) | —# | (0.18) | |||||||
KraneShares Emerging Markets Healthcare Index ETF | ||||||||||||||
2019*** | 22.38 | 0.01 | (2.06) | (2.05) | — | — | — | |||||||
2019(9) | 25.00 | (0.04) | (2.58) | (2.62) | —# | — | — | |||||||
KraneShares MSCI Emerging Markets ex China Index ETF | ||||||||||||||
2019***(10) | 25.00 | 0.66 | (1.33) | (0.67) | — | — | — | |||||||
(1) March 29, 2018 represents the last business day of the Fund’s reporting period in 2018.
(2) The Fund commenced operations on February 12, 2015.
(3) The Fund commenced operations on September 7, 2017.
(4) The Fund commenced operations on October 11, 2017.
(5) The Fund commenced operations on October 12, 2017.
(6) The Fund commenced operations on January 18, 2018.
(7) The Fund commenced operations on January 31, 2018.
(8) The Fund commenced operations on June 26, 2018.
(9) The Fund commenced operations on August 29, 2018.
(10) The Fund commenced operations on April 12, 2019.
(11) As of July 28, 2017, pursuant to the terms of an Expense Limitation Agreement, the Adviser has contractually agreed to reduce its management fee and/or reimburse the Fund in an amount equal to the fees paid by the Fund to counsel to the Independent Trustees of the Trust until July 31, 2018.
(12) The expense ratio includes interest expense. Had this expense been excluded, the ratios would have been 0.78%, 0.79% and 0.53%, respectively.
(13) The expense ratio includes interest expense. Had this expense been excluded, the ratios would have been 0.78%, 0.78% and (0.22)%, respectively.
(14) The expense ratio includes interest expense. Had this expense been excluded, the ratios would have been 0.78%, 0.79% and (0.78)%, respectively.
(15) The expense ratio includes interest expense. Had this expense been excluded, the ratios would have been 0.69%, 0.69% and 0.44%, respectively.
(16) The expense ratio includes interest expense. Had this expense been excluded, the ratios would have been 0.79%, 0.79% and (0.79)%, respectively.
The accompanying notes are an integral part of the financial statements.
94
Total from | Net Asset | Total | Net Assets | Ratio of | Ratio of Expenses | Ratio of Net | Portfolio | |||||||
— | 23.43 | (8.05) | 7,029 | 0.51† | 0.51† | 0.70† | 2†† | |||||||
(0.43) | 25.48 | (3.52) | 6,370 | 0.67 | 0.69 | 0.74 | 62 | |||||||
(0.33) | 26.96 | 20.99 | 2,696 | 0.63‡‡(11) | 0.72‡‡(11) | 1.75‡‡ | 3 | |||||||
(1.35) | 22.56 | 11.24 | 2,256 | 0.37‡‡ | 0.73‡‡ | 1.70‡‡ | 25 | |||||||
(0.40) | 21.66 | (14.00) | 2,166 | 0.91‡ | 1.12‡ | 1.27‡ | 1 | |||||||
— | 25.63 | 2.52 | 2,563 | 0.88†‡ | 0.88†‡ | (0.07)†‡ | 8†† | |||||||
— | 22.69 | (4.22) | 18,155 | 0.79† | 0.79† | 4.15† | 15†† | |||||||
(0.61) | 23.69 | (4.94) | 21,322 | 0.79 | 0.79 | 2.05 | 72 | |||||||
(0.03) | 25.64 | 2.67 | 32,048 | 0.79†‡‡(11)(12) | 0.80†‡‡(11)(12) | 0.52†(12) | 1†† | |||||||
— | 21.73 | (5.27) | 21,730 | 0.80† | 0.80† | 2.51† | 24†† | |||||||
— | 22.94 | (13.37) | 28,680 | 0.80 | 0.80 | (0.02) | 119 | |||||||
— | 26.48 | 5.92 | 23,828 | 0.79†(11)(13) | 0.79†(11)(13) | (0.23)†(13) | —†† | |||||||
— | 17.40 | (14.20) | 3,479 | 0.79† | 0.79† | 4.45† | 19†† | |||||||
(0.36) | 20.28 | (13.28) | 4,056 | 0.79 | 0.80 | 1.92 | 147 | |||||||
— | 23.86 | (4.56) | 7,158 | 0.78†(11)(14) | 0.79†(11)(14) | (0.78)†(14) | 36†† | |||||||
— | 20.61 | (0.15) | 24,733 | 0.72† | 0.72† | 2.42† | 28†† | |||||||
(0.25) | 20.64 | (10.19) | 33,026 | 0.70 | 0.70 | 0.98 | 74 | |||||||
— | 23.30 | (6.80) | 26,798 | 0.70†(15) | 0.70†(15) | 0.43†(15) | 18†† | |||||||
— | 21.13 | (5.20) | 15,847 | 0.72† | 0.80† | 1.16† | 22†† | |||||||
(0.08) | 22.29 | (15.99) | 39,004 | 0.79 | 0.79 | 0.08 | 71 | |||||||
— | 26.65 | 6.60 | 3,998 | 0.82†(16) | 0.82†(16) | (0.82)†(16) | —†† | |||||||
(0.98) | 40.50 | 1.85 | 12,151 | 0.69† | 0.69† | 5.04† | 36†† | |||||||
(1.49) | 40.73 | 5.72 | 12,220 | 0.69† | 0.69† | 5.13† | 38†† | |||||||
— | 20.33 | (9.16) | 1,017 | 0.81† | 0.81† | 0.10† | 35†† | |||||||
— | 22.38 | (10.47) | 4,476 | 0.79† | 0.79† | (0.34)† | 57†† | |||||||
— | 24.33 | (2.68) | 2,433 | 0.49† | 0.59† | 5.84† | —†† |
* Per share data calculated using average shares method.
** Total return is based on the change in net asset value of a share during the year or period and assumes reinvestment of dividends and distributions at net asset value. Total return is for the period indicated and periods of less than one year have not been annualized. The return shown does not reflect the deduction of taxes that a shareholder would pay on Fund distributions or the redemption of Fund shares. Excludes effects of standard creation and redemption transaction fees associated with creation units.
*** For the six-month period ended September 30, 2019. All ratios for the period have been annualized, except for the Total Return.
# Amount was less than $0.01 per share.
^ Realized and unrealized gains and losses per share are balancing amounts necessary to reconcile the change in net asset value per share for the period, and may not reconcile with the aggregate gains and losses in the Statement of Operations due to share transactions for the period.
† Annualized.
†† Portfolio turnover rate is for the period indicated and periods of less than one year have not been annualized. Excludes effect of in-kind transfers.
‡ The ratios of expenses and net investment income/(loss) to Average Net Assets reflect the expenses and net investment income/(loss), respectively, for the year/period as reported in the Statements of Operations and do not reflect the Fund’s proportionate share of the income and expenses from investments in other investment companies, except for investments in the KraneShares Bosera MSCI China A Share ETF.
‡‡ The ratios of expenses and net investment income/(loss) to Average Net Assets reflect the expenses and net investment income/(loss), respectively, for the year/period as reported in the Statements of Operations and do not reflect the Fund’s proportionate share of the income and expenses from investments in other investment companies.
Amounts designated as “—” are $0 or have been rounded to $0.
The accompanying notes are an integral part of the financial statements.
95
1. ORGANIZATION
KraneShares Trust (the “Trust”) is a Delaware Statutory Trust formed on February3, 2012. The Trust is registered under the Investment Company Act of 1940, as amended, as an open-end management investment company. As of September30, 2019, the Trust had sixteen operational series. The financial statements herein and the related notes pertain to the KraneShares CICC China Leaders 100 Index ETF, KraneShares CSI China Internet ETF, KraneShares Bosera MSCI China A Share ETF, KraneShares E Fund China Commercial Paper ETF, KraneShares MSCI All China Index ETF, KraneShares MSCI One Belt One Road Index ETF, KraneShares Emerging Markets Consumer Technology Index ETF, KraneShares MSCI China Environment Index ETF, KraneShares Electric Vehicles and Future Mobility Index ETF, KraneShares MSCI All China Health Care Index ETF, KraneShares CCBS China Corporate High Yield Bond USD Index ETF, KraneShares Emerging Markets Healthcare Index ETF and KraneSharesMSCI EmergingMarkets ex China Index ETF (each, a “Fund” and collectively, the “Funds”). KraneShares Bosera MSCI China A Share ETF and KraneShares MSCI All China Index ETF and KraneShares MSCI Emerging Markets ex China Index ETF are diversified Funds, as defined under Section 5(b)(1) of the Investment Company Act of 1940; while the KraneShares CICC China Leaders 100 Index ETF, KraneShares CSI China Internet ETF, KraneShares E Fund China Commercial Paper ETF, KraneShares MSCI One Belt One Road Index ETF, KraneShares Emerging Markets Consumer Technology Index ETF, KraneShares MSCI China Environment Index ETF, KraneShares Electric Vehicles and Future Mobility Index ETF, KraneShares MSCI All China Health Care Index ETF, KraneShares CCBS China Corporate High Yield Bond USD Index ETF and KraneShares Emerging Markets Healthcare Index ETF are non-diversified Funds. Krane Funds Advisors, LLC (“Krane” or the ‘‘Adviser’’), a Delaware limited liability company, serves as the investment adviser for the Funds and is subject to the supervision of the Board of Trustees (the ‘‘Board’’). The Adviser is responsible for managing the investment activities of the Funds, the Funds’ business affairs and other administrative matters. The Adviser may use sub-advisers (each, a “Sub-Adviser” or collectively, the “Sub-Advisers”) to perform the day-to-day management of the Funds.
China International Capital Corporation (USA) Holdings Inc., a wholly-owned, indirect subsidiary of China International Capital Corporation Limited owns a majority stake in Krane. Central Huijin Investment Limited, a mainland Chinese-domiciled entity, currently holds approximately 46.2% of the shares of China International Capital Corporation Limited. Central Huijin Investment Limited is a wholly-owned subsidiary of China Investment Corporation, which is a mainland Chinese sovereign wealth fund. KFA One Holdings, LLC, located at 280 Park Avenue 32nd Floor, New York, New York, 10017, holds the remaining equity interests in Krane and Jonathan Krane, through his equity interests in KFA One Holdings, LLC, beneficially owns more than 10% of the equity interests in Krane.
Shares of the Funds are listed and traded on the NYSE Arca, Inc. (“NYSE Arca”), (the “Exchange”). Market prices for Fund shares (“Shares”) may be different from their net asset value (“NAV”). The Funds issue and redeem Shares on a continuous basis at NAV only in large blocks of Shares, typically 50,000 Shares or multiples thereof, called “Creation Units”. This does not mean, however, that individual investors will be able to redeem and purchase Shares directly with the series of the Trust. Only Authorized Participants can redeem and purchase Creation Units of Shares directly. Each Fund will issue and redeem Shares for a basket of securities and/or a balancing cash amount. Individual shares trade in the secondary market at market prices that change throughout the day.
96
Notes to Financial Statements (Unaudited)(continued)
The investment objective of each Fund is to seek investment results that generally correspond (before fees and expenses) to its respective index listed below (each, an “Underlying Index”):
KraneShares Funds | Index | |
KraneShares CICC China Leaders 100 Index ETF | CSI CICC Select 100 Index | |
KraneShares CSI China Internet ETF | CSI Overseas China Internet Index | |
KraneShares Bosera MSCI China A Share ETF | MSCI China A Inclusion Index | |
KraneShares E Fund China Commercial Paper ETF | CSI Diversified High Grade Commercial Paper Index | |
KraneShares MSCI All China Index ETF | MSCI China All Shares Index | |
KraneShares MSCI One Belt One Road Index ETF | MSCI Global China Infrastructure Exposure Index | |
KraneShares Emerging Markets Consumer Technology Index ETF | Solactive Emerging Market Consumer Technology Index | |
KraneShares MSCI China Environment Index ETF | MSCI China IMI Environment 10/40 Index | |
KraneShares Electric Vehicles and Future Mobility Index ETF | Solactive Electric Vehicles and Future Mobility Index | |
KraneShares MSCI All China Health Care Index ETF | MSCI China All Shares Health Care 10/40 Index | |
KraneShares CCBS China Corporate High Yield Bond USD Index ETF | Solactive USD China Corporate High Yield Bond Index | |
KraneShares Emerging Markets Healthcare Index ETF | Solactive Emerging Markets Healthcare Index | |
KraneShares MSCI Emerging Markets ex ChinaIndex ETF | MSCI Emerging Markets ex China Index |
2. SIGNIFICANT ACCOUNTING POLICIES
The following is a summary of the significant accounting policies followed by the Funds. The Funds are investment companies that apply the accounting and reporting guidance issued in Topic 946 by the U.S. Financial Accounting Standards Board (“FASB”).
USE OF ESTIMATES — The preparation of financial statements in conformity with U.S. generally accepted accounting principles (“U.S. GAAP”) requires management to make estimates and assumptions that affect the reported amounts of assets and liabilities and disclosure of contingent assets and liabilities at the date of the financial statements and the reported amounts of increases and decreases in net assets from operations during the reporting period. Actual results could differ from those estimates, and could have a material impact to the Funds.
SECURITY VALUATION — The NAV per share of each Fund is computed by dividing the value of the net assets of a Fund (i.e., the value of its total assets less total liabilities and withholdings) by the total number of shares of a Fund outstanding, rounded to the nearest cent. Expenses and fees, including without limitation, the management, administration and distribution fees, are accrued daily and taken into account for purposes of determining NAV. The NAV per share for each Fund normally is calculated by the Administrator and determined as of the regularly scheduled close of the regular trading session on the NYSE (ordinarily 4:00 p.m., Eastern Time) on each day that the Exchange is open.
In calculating the values of each Fund’s portfolio securities, securities listed on a securities exchange, market or automated quotation system for which quotations are readily available (except for securities traded on NASDAQ), including securities traded over the counter, are valued at the last reported sale price on the primary exchange or market (foreign or domestic) on which they are traded (or at the time as of which the Fund’s NAV is calculated if a security’s exchange is normally open at that time). If there is no such reported sale, such securities are valued at the most recently reported bid price. For securities traded on NASDAQ, the NASDAQ Official Closing Price will be used. If available, debt securities are priced based upon valuations provided by independent, third-party
97
Notes to Financial Statements (Unaudited)(continued)
pricing agents. Such values generally reflect the last reported sales price if the security is actively traded. The third-party pricing agents may also value debt securities at an evaluated bid price by employing methodologies that utilize actual market transactions, broker-supplied valuations, or other methodologies designed to identify the market value for such securities. Debt obligations with remaining maturities of sixty days or less may be valued at their amortized cost, which approximates market value. The prices for foreign securities are reported in local currency and converted to U.S. dollars using currency exchange rates. The value of a swap contract is equal to the obligation (or rights) under the swap contract, which will generally be equal to the net amounts to be paid or received under the contract based upon the relative values of the positions held by each party to the contract as determined by the applicable independent, third party pricing agent. Exchange-traded options are valued at the last reported sales price on the exchange on which they are listed. If there is no such reported sale on the valuation date, long positions are valued at the most recent bid price, and short positions are valued at the most recent ask price. Futures are valued at the settlement price established by the board of trade on which they are traded. Foreign currency forward contracts are valued at the current day’s interpolated foreign exchange rate, as calculated using the current day’s spot rate and the 30-, 60-, 90- and 180-day forward rates provided by an independent pricing agent. The exchange rates used for valuation are captured as of the close of the London Stock Exchange each day normally at 4:00 p.m. Greenwich Mean Time. Prices for most securities held by a Fund are provided daily by independent pricing agents. If a security price cannot be obtained from an independent, third-party pricing agent, the Fund seeks to obtain bid and ask prices from two broker-dealers who make a market in the portfolio instrument and determines the average of the two. As of and during the period ended September30, 2019, the Funds did not hold options, swaps and futures.
Investments in open-end investment companies that do not trade on an exchange are valued at the end of day NAV per share. Investments in open-end investment companies that trade on an exchange are valued at the last reported sale price or official closing price as of the close of the customary trading session on the exchange where the security is principally traded. If there is no such reported sale, such securities are valued at the most recently reported bid price.
Securities for which market prices are not ‘‘readily available,’’ or are not deemed to reflect current market values, or are debt securities where no evaluated price is available from the Trust’s third-party pricing agents pursuant to established methodologies, are fair valued in accordance with the Trust’s valuation policies and procedures approved by the Board of Trustees. Some of the more common reasons that may necessitate that a security be valued using ‘‘fair value’’ pricing may include, but are not limited to: the security’s trading has been halted or suspended; the security’s primary trading market is temporarily closed; or the security has not been traded for an extended period of time. A Fund may fair value certain of the foreign securities held by the Fund each day the Fund calculates its NAV.
In addition, a Fund may fair value its securities if an event that may materially affect the value of the Fund’s securities that trade outside of the United States (a ‘‘Significant Event’’) has occurred between the time of the security’s last close and the time that the Fund calculates its NAV. A Significant Event may relate to a single issuer or to an entire market sector, country or region. Events that may be Significant Events may include: government actions, natural disasters, armed conflict, acts of terrorism and significant market fluctuations. If Krane becomes aware of a Significant Event that has occurred with respect to a portfolio instrument or group of portfolio instruments after the closing of the exchange or market on which the portfolio instrument or portfolio instruments principally trade,
98
Notes to Financial Statements (Unaudited)(continued)
but before the time at which a Fund calculates its NAV, it will notify the Administrator and may request that an ad hoc meeting of the Fair Valuation Committee be called.
With respect to trade-halted securities, the Trust typically will fair value a trade-halted security by adjusting the security’s last market close price by the security’s sector performance, as measured by a predetermined index, unless Krane recommends and the Trust’s Fair Valuation Committee determines to make additional adjustments. Certain foreign securities exchanges have mechanisms in place that confine one day’s price movement in an individual security to a pre-determined price range based on that day’s opening price (‘‘Collared Securities’’). Fair value determinations for Collared Securities will generally be capped based on any applicable pre-determined ‘‘limit down’’ or ‘‘limit up’’ prices established by the relevant foreign securities exchange. As an example, China A-Shares can only be plus or minus ten percent in one day of trading in the relevant mainland China equity market. As a result, the fair value price determination on a given day will generally be capped plus or minus ten percent.
Fair value pricing involves subjective judgments and it is possible that a fair value determination for a security is materially different than the value that could actually be realized upon the sale of the security or that another fund that uses market quotations or its own fair value procedures to price the same securities. In addition, fair value pricing could result in a difference between the prices used to calculate a Fund’s NAV and the prices used by the Underlying Index. This may adversely affect a Fund’s ability to track the Underlying Index.
Trading in securities on many foreign exchanges is normally completed before the close of business on each Business Day. In addition, securities trading in a particular country or countries may not take place on each Business Day or may take place on days that are not Business Days. Changes in valuations on certain securities may occur at times or on days on which a Fund’s NAV is not calculated and on which Fund shares do not trade and sales and redemptions of shares do not occur. As a result, the value of a Fund’s portfolio securities and the net asset value of its shares may change on days when you will not be able to purchase or sell your shares. Fund shares are purchased or sold on a national securities exchange at market prices, which may be higher or lower than NAV. No secondary sales will be made to brokers or dealers at a concession by the Distributor or by a Fund. Purchases and sales of shares in the secondary market, which will not involve a Fund, will be subject to customary brokerage commissions and charges. Transactions in Fund shares will be priced at NAV only if you purchase or redeem shares directly from a Fund in Creation Units.
As of September30, 2019, the total market value of securities valued in accordance with Fair Value Procedures is as follows:
KraneShares Funds | Fair Valued | % of | |||
KraneShares CICC China Leaders 100 Index ETF | $ | — | 0.0% | ||
KraneShares MSCI All China Index ETF |
| — | 0.0% | ||
KraneShares MSCI One Belt One Road Index ETF |
| 363,605 | 2.0% | ||
KraneShares MSCI China Environment Index ETF |
| 224,474 | 6.5% | ||
In accordance with the authoritative guidance on fair value measurements and disclosure under U.S. GAAP, the Funds disclose the fair value of their investments in a hierarchy that prioritizes the inputs to valuation techniques used to measure the fair value. The objective of a fair value measurement is to determine the price that would be received to sell an asset or paid to transfer a liability in an orderly transaction between market participants at the measurement date (an exit price). Accordingly,
99
Notes to Financial Statements (Unaudited)(continued)
the fair value hierarchy gives the highest priority to quoted prices (unadjusted) in active markets for identical assets or liabilities (Level 1) and the lowest priority to unobservable inputs (Level 3). The three levels of the fair value hierarchy are described below:
Level 1 — Unadjusted quoted prices in active markets for identical, unrestricted assets or liabilities that the Funds have the ability to access at the measurement date.
Level 2 — Other significant observable inputs (including quoted prices in non-active markets, quoted prices for similar investments, fair value of investments for which the Funds have the ability to fully redeem tranches at net asset value as of the measurement date or within the near term, and short-term investments valued at amortized cost).
Level 3 — Significant unobservable inputs (including the Funds’ own assumptions in determining the fair value of investments, broker quotes, fair value of investments for which the Funds do not have the ability to fully redeem tranches at net asset value as of the measurement date or within the near term).
Investments are classified within the level of the lowest significant input considered in determining fair value. Investments classified within Level 3 whose fair value measurement considers several inputs may include Level 1 or Level 2 inputs as components of the overall fair value measurement. For details of the investment classification, refer to each Fund’s Schedule of Investments.
The valuation techniques and significant amounts of unobservable inputs used in the fair valuation measurement of the Fund’s Level 3 securities are outlined in the table below. A significant increase or decrease in any of those inputs in isolation would result in a significantly higher or lower fair value measurement.
KraneShares MSCI One Belt One Road Index ETF
Quantitative information about Level 3 fair value measurements | ||||||||
Assets | Fair Value at | Valuation | Unobservable Input | Discount | ||||
Common Stock | $363,605 | Discount from the Last Traded Price | Last Traded Price Comparability Adjustment % | 0.0% | ||||
KraneShares MSCI China Environment Index ETF
Quantitative information about Level 3 fair value measurements | ||||||||
Assets | Fair Value at | Valuation | Unobservable Input | Discount | ||||
Common Stock | $224,474 | Discount from the Last Traded Price | Last Traded Price Comparability Adjustment % | 0.0% | ||||
FEDERAL INCOME TAXES — It is each Fund’s intention to qualify or continue to qualify as a regulated investment company for federal income tax purposes by complying with the appropriate provisions of Subchapter M of the Internal Revenue Code of 1986, as amended, and to distribute annually all or substantially all of its taxable income and gains to shareholders. Accordingly, no provisions for federal income taxes have been made in the financial statements.
The Funds evaluate tax positions taken or expected to be taken in the course of preparing the Funds’ tax returns to determine whether it is “more-likely-than-not” (i.e., greater than 50 percent) that each tax position will be sustained upon examination by a taxing authority based on the technical merits
100
Notes to Financial Statements (Unaudited)(continued)
of the position. Tax positions not deemed to meet the more-likely-than-not threshold are recorded as a tax benefit or expense in the current year. The Funds did not record any tax provisions in the current period. However, management’s conclusions regarding tax positions may be subject to review and adjustment at a later date based on factors including, but not limited to, examination by tax authorities (i.e., the last three tax year ends, as applicable), on-going analysis of and changes to tax laws, regulations and interpretations thereof.
As of September30, 2019, management of the Funds has reviewed all open tax years since inception and concluded that there is no tax liability resulting from unrecognized tax benefits relating to uncertain income tax positions taken or expected to be taken in future tax returns. The Funds are also not aware of any tax positions for which it is reasonably possible that the total amounts of unrecognized tax benefits will significantly change in the next 12months.
SECURITY TRANSACTIONS AND INVESTMENT INCOME — Security transactions are accounted for on the trade date for financial reporting purposes. Costs used in determining realized gains and losses on the sale of investment securities are based on specific identification. Dividend income is recorded, net of any applicable withholding tax, on the ex-dividend date, or for certain foreign securities, when the information becomes available to the Funds. Interest income is recognized on the accrual basis from the settlement date.
Dividend income received from affiliated funds is recognized on the ex-dividend date and is recorded as income distributions in the Statement of Operations. Capital gain distributions received from affiliated funds are recognized on ex-dividend date and are recorded on the Statement of Operations as such. Costs used in determining realized gains and losses on the sales of affiliated funds are on the basis of specific identification. See details on the Statements of Operations.
FOREIGN CURRENCY — The books and records of the Funds are maintained in U.S. dollars. Investment securities and other assets and liabilities denominated in a foreign currency are translated into U.S. dollars on the date of valuation. Purchases and sales of investment securities, income and expenses are translated into U.S. dollars at the relevant rates of exchange prevailing on the respective dates of such transactions. The Funds do not isolate that portion of realized or unrealized gains and losses resulting from changes in the foreign exchange rate from fluctuations arising from changes in the market prices of the securities. These gains and losses are included in net realized and unrealized gains and losses on foreign currency translations on the Statements of Operations. Net realized and unrealized gains and losses on foreign currency transactions and translations represent net foreign exchange gains or losses from foreign currency exchange contracts, disposition of foreign currencies, currency gains or losses realized between trade and settlement dates on securities transactions and the difference between the amount of the investment income and foreign withholding taxes recorded on the Funds’ books and the U.S. dollar equivalent amounts actually received or paid.
DIVIDENDS AND DISTRIBUTIONS TO SHAREHOLDERS — The Funds distribute their net investment income at least annually. Any net realized capital gains are distributed annually. All distributions are recorded on the ex-dividend date.
CASH OVERDRAFT CHARGES — Per the terms of an agreement with Brown Brothers Harriman & Co. (“BBH”), the Funds’ Custodian, if a Fund has a cash overdraft on a given day, it will be assessed an overdraft charge of LIBOR plus 2.00%. Cash overdraft charges are included in “Interest Expense” on the Statements of Operations.
SECURITIES LENDING — The Funds may lend securities from their portfolios to brokers, dealers and other financial institutions. In connection with such loans, a Fund remains the beneficial owner of
101
Notes to Financial Statements (Unaudited)(continued)
the loaned securities and continues to receive payments in amounts approximately equal to the interest, dividends or other distributions payable on the loaned securities. A Fund also has the right to terminate a loan at any time. A Fund does not have the right to vote on securities while they are on loan. Loans of portfolio securities will not exceed 33 1/3% of the value of a Fund’s total assets (including the value of all assets received as collateral for the loan). A Fund will receive collateral consisting of cash in the form of U.S. dollars, foreign currency, or securities issued or fully guaranteed by the U.S. Government which will be maintained at all times in an amount equal to at least 102% on domestic securities and 105% on international securities of the current market value of the loaned securities. If the collateral consists of cash, a Fund will reinvest the cash and pay the borrower a pre-negotiated fee or “rebate” from any return earned on the investment. Should the borrower of the securities fail financially, a Fund may experience delays in recovering the loaned securities or exercising its rights in the collateral. In a loan transaction, a Fund will also bear the risk of any decline in value of securities acquired with cash collateral. Krane and a sub-adviser are subject to potential conflicts of interest because the compensation paid to them increases in connection with any net income received by a Fund from a securities lending program. Each Fund pays Krane 10% of any net monthly income received from the investment of cash collateral and loan fees received from borrowers in respect of each securities loan (net of any amounts paid to the custodian and/or securities lending agent or rebated to borrowers) (see Note 3).
The following table discloses the securities on loan as of September30, 2019:
KraneShares Funds | Market Value of | Cash Collateral for | ||||
KraneShares CSI China Internet ETF | $ | 101,348,781 | $ | 104,328,298 | ||
KraneShares Emerging Markets Consumer Technology Index ETF |
| 823,981 |
| 851,781 | ||
KraneShares Electric Vehicles and Future Mobility Index ETF |
| 1,596,887 |
| 1,643,490 | ||
CREATION UNITS — The Funds issue and redeem Shares at NAV and only in large blocks of Shares (each block of Shares for a Fund is a Creation Unit of 50,000 Shares, or multiples thereof).
Except when aggregated in Creation Units, Shares are not redeemable securities of a Fund. Shares of a Fund may only be purchased or redeemed by certain Authorized Participants. An Authorized Participant is either (i) a broker-dealer or other participant in the clearing process through the Continuous Net Settlement System of the National Securities Clearing Corporation or (ii) a Depository Trust Company (‘‘DTC’’) participant and, in each case, must have executed a Participant Agreement with the Distributor. Most retail investors will not qualify as Authorized Participants or have the resources to buy and sell whole Creation Units. Therefore, they will be unable to purchase or redeem the Shares directly from a Fund. Rather, most retail investors will purchase Shares in the secondary market with the assistance of a broker and will be subject to customary brokerage commissions or fees when buying or selling Shares. If a Creation Unit is purchased or redeemed for cash, a higher transaction fee will be charged.
102
Notes to Financial Statements (Unaudited)(continued)
The following table discloses Creation Unit breakdown for the period ended September30, 2019:
KraneShares Funds | Creation | Standard Transaction | Value at | Standard Transaction | Maximum | ||||||
KraneShares CICC China Leaders 100 Index ETF | 50,000 | $ 800 | $1,306,000 | $ 2,500 | 2.00% | ||||||
KraneShares CSI China Internet ETF | 50,000 |
| 500 | 2,071,000 | 500 | 2.00% | |||||
KraneShares Bosera MSCI China A Share ETF | 50,000 |
| 5,800 | 1,500,500 | 5,800 | 2.00% | |||||
KraneShares E Fund China Commercial Paper ETF | 50,000 |
| 1,000 | 1,602,500 | 1,000 | 2.00% | |||||
KraneShares MSCI All China Index ETF | 50,000 |
| 8,500 | 1,171,500 | 8,500 | 2.00% | |||||
KraneShares MSCI One Belt One Road Index ETF | 50,000 |
| 3,900 | 1,134,500 | 3,900 | 2.00% | |||||
KraneShares Emerging Markets Consumer Technology Index ETF | 50,000 |
| 1,500 | 1,086,500 | 1,500 | 2.00% | |||||
KraneShares MSCI China Environment Index ETF | 50,000 |
| 750 | 870,000 | 750 | 2.00% | |||||
KraneShares Electric Vehicles and Future Mobility Index ETF | 50,000 |
| 1,100 | 1,030,500 | 1,100 | 2.00% | |||||
KraneShares MSCI All China Health Care Index ETF | 50,000 |
| 1,320 | 1,056,500 | 1,320 | 2.00% | |||||
KraneShares CCBS China Corporate High Yield Bond USD Index Fund | 50,000 |
| 1,000 | 2,025,000 | 1,000 | 2.00% | |||||
KraneShares Emerging Markets Healthcare Index ETF | 50,000 |
| 2,800 | 1,016,500 | 2,800 | 2.00% | |||||
KraneShares MSCI Emerging Markets ex China Index ETF | 50,000 |
| 17,500 | 1,216,500 | 17,500 | 2.00% | |||||
* As a percentage of the Creation Unit(s) purchased.
CASH AND CASH EQUIVALENTS — Idle cash and currency balances may be swept into various overnight sweep accounts and are classified as cash equivalents on the Statement of Assets and Liabilities. These amounts, at times, may exceed United States federally insured limits. Amounts swept are available on the next business day.
103
Notes to Financial Statements (Unaudited)(continued)
3. RELATED PARTY TRANSACTIONS
INVESTMENT ADVISORY AGREEMENT — The Adviser serves as investment adviser to each Fund pursuant to an Investment Advisory Agreement between the Trust on behalf of each Fund and the Adviser (the “Agreement”). Under the Agreement, Krane is responsible for reviewing, supervising and administering each Fund’s investment program and the general management and administration of the Trust. In addition to these services, to the extent a Fund engages in securities lending, Krane will: (i) assist the securities lending agent of the Fund (the “Agent”) to determine which securities are available for loan, (ii) monitor the Agent’s activities to ensure that securities loans are effected in accordance with Krane’s instructions and in accordance with applicable procedures and guidelines adopted by the Board, (iii) make recommendations to the Board regarding the Fund’s participation in securities lending; (iv) prepare appropriate periodic reports for, and seek appropriate periodic approvals from, the Board with respect to securities lending activities, (v) respond to Agent inquiries concerning the Agent’s activities, and (vi) such other related duties as Krane deems necessary or appropriate (this provision became effective with respect to the Funds on the later of October5, 2017, or the date the Fund commenced operations). The Board of Trustees of the Trust supervises Krane and establishes policies that Krane must follow in its management activities.
The Agreement requires the Adviser to pay all operating expenses of the Funds, except: (a) interest and taxes (including, but not limited to, income, excise, transaction, transfer and withholding taxes); (b) expenses of the Funds incurred with respect to the acquisition and disposition of portfolio securities and the execution of portfolio transactions, including brokerage commissions and short sale dividend or interest expense; (c) expenses incurred in connection with any distribution plan adopted by the Trust in compliance with Rule 12b-1 under the Investment Company Act, including distribution fees; (d) “Acquired Fund Fees and Expenses” (as defined by Form N-1A under the 1940 Act); (e) litigation expenses; (f) the compensation payable to the Adviser under the Agreement; (g) compensation and expenses of the Independent Trustees (including any fees of independent legal counsel to the Independent Trustees); and (h) any expenses determined to be extraordinary expenses by the Board. In addition, effective on the later of October5, 2017, or the date the Fund commenced operations, under the Agreement, while the fees and expenses related to the Funds’ securities lending-related activities reduce the gross revenues and income of the Funds from such activities, they are not fees and expenses for which Krane is responsible.
Each Agreement provides that each Fund pays a unitary (or unified) fee to the Adviser for advisory and management services provided to the Fund, subject to the exceptions noted herein. In this context, there exists a risk that a Trust service provider will seek recourse against the Trust if is not timely paid by Krane for the fees and expenses for which it is responsible, which could materially adversely affect the Funds. Pursuant to the Agreement between the Trust and the Adviser, the Funds below pay the Adviser a fee, which is calculated daily and paid monthly, at the following annual rates, based on a percentage of the average daily net assets of each Fund. In addition, as compensation for the services provided by the Adviser in connection with any securities lending-related activities, each Fund pays the Adviser 10% of the monthly investment income received from the investment of cash collateral and loan fees received from borrowers in respect to securities loans (net of any amounts paid to the custodian and/or securities lending agent or rebated to borrowers), included on the Statements of Operations as “Security Lending Fees”.
104
Notes to Financial Statements (Unaudited)(continued)
KraneShares Funds | Management | |
KraneShares CICC China Leaders 100 Index ETF | 0.68% | |
KraneShares CSI China Internet ETF | 0.68% | |
KraneShares Bosera MSCI China A Share ETF | 0.78% | |
KraneShares E Fund China Commercial Paper ETF | 0.68% | |
KraneShares MSCI All China Index ETF | 0.68% | |
KraneShares MSCI One Belt One Road Index ETF | 0.78% | |
KraneShares Emerging Markets Consumer Technology Index ETF | 0.78% | |
KraneShares MSCI China Environment Index ETF | 0.78% | |
KraneShares Electric Vehicles and Future Mobility Index ETF | 0.68% | |
KraneShares MSCI All China Health Care Index ETF | 0.78% | |
Kraneshares CCBS China Corporate High Yield Bond USD Index Fund | 0.68% | |
Kraneshares Emerging Markets Healthcare Index ETF | 0.78% | |
KraneShares MSCI Emerging Markets ex China Index ETF | 0.58% |
Prior to July31, 2018, pursuant to the terms of an Expense Limitation Agreement, the Adviser had contractually agreed to reduce its management fee and/or reimburse the Funds, except for KraneShares Bosera MSCI China A Share ETF, KraneShares Electric Vehicles and Future Mobility Index ETF, KraneShares MSCI All China Health Care Index ETF, KraneShares CCBS China Corporate High Yield Bond USD Index ETF and KraneShares Emerging Markets Healthcare Index ETF, in an amount equal to the fees paid by the Funds to counsel to the independent Trustees of the Trust.
Pursuant to the terms of an Expense Limitation Agreement, the Adviser has contractually agreed to waive its management fee for the KraneShares Bosera MSCI China A Share ETF by 0.20% of the Fund’s average daily net assets. This contractual fee waiver will continue until August1, 2020, and may only be terminated prior thereto by the Board. In addition, the Fee Waiver Agreement will terminate if the Investment Advisory Agreement for the Fund is terminated.
Pursuant to the terms of an Expense Limitation Agreement, the Adviser has contractually agreed to reduce its management fee for the KraneShares E Fund China Commercial Paper ETF by 0.12% of the Fund’s average daily net assets until August1, 2020. The Expense Limitation Agreement may only be terminated prior thereto by the Board. In addition, the Fee Waiver Agreement will terminate if the Investment Advisory Agreement for the Fund is terminated.
Effective April12, 2019, pursuant to the terms of an Expense Limitation Agreement, Krane has contractually agreed to waive its advisory fee for the the KraneShares MSCI All China Index ETF by 0.20% of the Fund’s average daily net assets and reduce its management fee in an amount equal to any Acquired Fund Fees and Expenses incurred by the Fund from its investments in the KraneShares Bosera MSCI China A Share ETF. This Expense Limitation Agreement will continue until August20, 2020. The Expense Limitation Agreement may only be terminated prior thereto by the Board. In addition, the Fee Waiver Agreement will terminate if the Investment Advisory Agreement for the Fund is terminated.
The Adviser and each Sub-Adviser bear all of their own costs associated with providing these advisory services.
105
Notes to Financial Statements (Unaudited)(continued)
SUB-ADVISORY AGREEMENT — Bosera Asset Management (International) Co., Ltd. (“Bosera”), operating out of Hong Kong, serves as the Sub-Adviser to the KraneShares Bosera MSCI China A Share ETF and is responsible for the day-to-day management of the Fund, subject to the supervision by the Adviser and the Board. For the services Bosera provides to KraneShares Bosera MSCI China A Share ETF, the Adviser pays Bosera a fee equal to 50% of the net revenue the Adviser receives from the Fund.
CCB Securities Ltd. (“CCBS”), located at 18/F CCB Centre, 18 Wang Chiu Road, Kowloon Bay, Kowloon, Hong Kong, serves as the sub-adviser of KraneShares CCBS China Corporate High Yield Bond USD Index ETF. CCBS is responsible for the day-to-day investment management of the Fund, subject to the supervision of Krane and the Board. The Adviser has entered into a Sub-Advisory Agreement with CCBS pursuant to which the Adviser has agreed to pay CCBS a fee equal to 50% of net revenue earned by the Adviser from the Fund. For these purposes, net revenue is defined as gross revenue less gross fund-related expenses (including any waiver by the Adviser of its compensation under the investment advisory agreement and any payments or reimbursements by Krane of the Fund’s expenses).
E Fund Management (Hong Kong) Co., Limited (‘‘E Fund”), operating out of Hong Kong, serves as the Sub-Adviser to the KraneShares E Fund China Commercial Paper ETF and is responsible for the day-to-day management of the Fund, subject to the supervision by the Adviser and the Board. For the services E Fund provides to KraneShares E Fund China Commercial Paper ETF, the Adviser pays E Fund a fee equal to 50% of the net revenue the Adviser receives from the Fund.
DISTRIBUTION AGREEMENT — SEI Investments Distribution Co. (the “Distributor”), a wholly-owned subsidiary of SEI Investments Company, and an affiliate of the administrator, serves as the Funds’ distributor of Creation Units pursuant to a Distribution Agreement. The Distributor does not maintain any secondary market in Fund shares.
The Trust has adopted a Distribution and Service Plan (“Plan”) pursuant to Rule 12b-1 under the 1940 Act. In accordance with its Plan, each Fund is authorized to pay an amount up to 0.25% of its average daily net assets each year for certain distribution-related activities. For the period ended September30, 2019 no fees were charged under the Plan. Fees would only be charged under the Plan upon approval by the Board.
ADMINISTRATOR, CUSTODIAN AND TRANSFER AGENT — SEI Investments Global Funds Services (the “Administrator”) serves as the Funds’ Administrator pursuant to an Administration Agreement. BBH serves as the Funds’ Custodian and Transfer Agent pursuant to a Custodian and Transfer Agent Agreement.
106
Notes to Financial Statements (Unaudited)(continued)
4. INVESTMENT TRANSACTIONS
For the period ended September30, 2019, the purchases and sales of investments in securities excluding in-kind transactions, long-term U.S. Government and short-term securities were:
KraneShares Funds | Purchases | Sales and | ||||
KraneShares CICC China Leaders 100 Index ETF | $ | 4,246,983 | $ | 2,674,707 | ||
KraneShares CSI China Internet ETF |
| 256,526,825 |
| 305,539,683 | ||
KraneShares Bosera MSCI China A Share ETF |
| 444,867,107 |
| 447,746,514 | ||
KraneShares E Fund China Commercial Paper ETF |
| — |
| — | ||
KraneShares MSCI All China Index ETF |
| 1,377,665 |
| 151,014 | ||
KraneShares MSCI One Belt One Road Index ETF |
| 2,930,715 |
| 3,853,074 | ||
KraneShares Emerging Markets Consumer Technology Index ETF |
| 6,011,477 |
| 7,484,021 | ||
KraneShares MSCI China Environment Index ETF |
| 718,104 |
| 684,195 | ||
KraneShares Electric Vehicles and Future Mobility Index ETF |
| 8,389,831 |
| 9,711,010 | ||
KraneShares MSCI All China Health Care Index ETF |
| 5,481,884 |
| 25,831,538 | ||
KraneShares CCBS China Corporate High Yield Bond USD Index Fund |
| 4,673,866 |
| 4,124,195 | ||
KraneShares Emerging Markets Healthcare Index ETF |
| 812,279 |
| 3,450,000 | ||
KraneShares MSCI Emerging Markets ex China Index ETF |
| 2,529,528 |
| — | ||
During the period ended September30, 2019, there were no purchases or sales of long-term U.S. government securities for the Funds.
For the period ended September30, 2019, in-kind transactions associated with creations and redemptions were:
KraneShares Funds | Purchases | Sales and | Realized Gain | |||||||
KraneShares CSI China Internet ETF | $ | 206,457,618 | $ | 464,952,691 | $ | 44,484,274 |
| |||
KraneShares MSCI All China Index ETF |
| 228,015 |
| — |
| — |
| |||
KraneShares MSCI One Belt One Road Index ETF |
| — |
| 1,029,681 |
| 3,842 |
| |||
KraneShares Emerging Markets Consumer Technology Index ETF |
| — |
| 3,548,967 |
| 502,459 |
| |||
KraneShares Electric Vehicles and Future Mobility Index ETF |
| 779,547 |
| 7,300,477 |
| 879,881 |
| |||
KraneShares MSCI All China Health Care Index ETF |
| — |
| 57,500 |
| 3,830 |
| |||
KraneShares Emerging Markets Healthcare Index ETF |
| — |
| 450,453 |
| (2,295 | ) | |||
5. TAX INFORMATION
The amount and character of income and capital gain distributions to be paid, if any, are determined in accordance with Federal income tax regulations, which may differ from U.S. GAAP. As a result, net investment income (loss) and net realized gain (loss) on investment transactions for a reporting period may differ significantly from distributions during such period. These book/tax differences may be temporary or permanent. To the extent these differences are permanent in nature, they are charged or credited to undistributed net investment income (loss), accumulated net realized gain (loss) or paid-in capital, as appropriate, in the period that the differences arise.
107
Notes to Financial Statements (Unaudited)(continued)
The tax character of dividends and distributions paid during the years or periods ended March31, 2019 and March29, 2018 were as follows:
KraneShares Funds | Ordinary | Long-Term | Return of | Totals | ||||||||
KraneShares CICC China Leaders 100 Index ETF | ||||||||||||
2019 | $ | 244,415 | $ | 200,757 | $ | — | $ | 445,172 | ||||
2018 |
| 44,526 |
| 1,101,598 |
| — |
| 1,146,124 | ||||
KraneShares CSI China Internet ETF | ||||||||||||
2019 | $ | 620,213 | $ | 52,155,720 | $ | — | $ | 52,775,933 | ||||
2018 |
| 7,001,175 |
| — |
| — |
| 7,001,175 | ||||
KraneShares Bosera MSCI China A Share ETF | ||||||||||||
2019 | $ | 10,176,902 | $ | 712,126 | $ | — | $ | 10,889,028 | ||||
2018 |
| 2,946,446 |
| — |
| — |
| 2,946,446 | ||||
KraneShares E Fund China Commercial Paper ETF | ||||||||||||
2019 | $ | 704,248 | $ | — | $ | 28,559 | $ | 732,807 | ||||
2018 |
| — |
| — |
| — |
| — | ||||
KraneShares MSCI All China Index ETF | ||||||||||||
2019 | $ | 43,104 | $ | — | $ | — | $ | 43,104 | ||||
2018 |
| 32,628 |
| — |
| — |
| 32,628 | ||||
KraneShares MSCI One Belt One Road Index ETF | ||||||||||||
2019 | $ | 553,422 | $ | — | $ | — | $ | 553,422 | ||||
2018 |
| 6,687 |
| — |
| — |
| 6,687 | ||||
KraneShares Emerging Market Consumer Technology Index ETF | ||||||||||||
2019 | $ | — | $ | — | $ | — | $ | — | ||||
2018 |
| — |
| — |
| — |
| — | ||||
KraneShares MSCI China Environment Index ETF | ||||||||||||
2019 | $ | 107,314 | $ | — | $ | — | $ | 107,314 | ||||
2018 |
| — |
| — |
| — |
| — | ||||
KraneShares Electric Vehicles and Future Mobility Index ETF | ||||||||||||
2019 | $ | 382,192 | $ | — | $ | — | $ | 382,192 | ||||
2018 |
| — |
| — |
| — |
| — | ||||
KraneShares MSCI All China Health Care Index ETF | ||||||||||||
2019 | $ | 136,712 | $ | — | $ | — | $ | 136,712 | ||||
2018 |
| — |
| — |
| — |
| — | ||||
KraneShares CCBS China Corporate High Yield Bond USD Index Fund | ||||||||||||
2019 | $ | 374,120 | $ | — | $ | 49,368 | $ | 423,488 | ||||
KraneShares Emerging Markets Healthcare Index ETF | ||||||||||||
2019 | $ | 752 | $ | — | $ | — | $ | 752 | ||||
108
Notes to Financial Statements (Unaudited)(continued)
As of March31, 2019, the components of tax basis distributable earnings (accumulated losses) were as follows:
KraneShares | KraneShares | KraneShares | KraneShares | KraneShares | ||||||||||||||||
Undistributed Ordinary Income | $ | — |
| $ | — |
| $ | — |
| $ | — |
| $ | 2,941 |
| |||||
Capital Loss Carryforwards |
| — |
|
| — |
|
| (7,407,733 | ) |
| (28,632 | ) |
| (131,967 | ) | |||||
Post October Losses |
| (623,235 | ) |
| (93,150,121 | ) |
| (15,932,668 | ) |
| — |
|
| — |
| |||||
Qualified Late-Year Loss Deferrals |
| (3,477 | ) |
| — |
|
| (66,907 | ) |
| (391,750 | ) |
| — |
| |||||
Unrealized |
| 485,480 |
|
| (160,441,670 | ) |
| 2,757,359 |
|
| 158,417 |
|
| 681,664 |
| |||||
Other Temporary Differences |
| (1 | ) |
| 6 |
|
| (6 | ) |
| (11 | ) |
| — |
| |||||
Total Distributable Earnings (Accumulated Losses) | $ | (141,233 | ) | $ | (253,591,785 | ) | $ | (20,649,955 | ) | $ | (261,976 | ) | $ | 552,638 |
| |||||
KraneShares | KraneShares | KraneShares | KraneShares | KraneShares | ||||||||||||||||
Undistributed Ordinary Income | $ | 44,176 |
| $ | 64,368 |
| $ | — |
| $ | — |
| $ | — |
| |||||
Post October Losses |
| — |
|
| — |
|
| (767,588 | ) |
| — |
|
| (1,522,222 | ) | |||||
Capital Loss Carryforwards |
| (2,564,896 | ) |
| (2,287,120 | ) |
| (700,820 | ) |
| (2,300,182 | ) |
| — |
| |||||
Qualified Late-Year Loss Deferrals |
| — |
|
| — |
|
| (44 | ) |
| (1,965 | ) |
| (64,320 | ) | |||||
Unrealized |
| (1,325,015 | ) |
| (3,741,678 | ) |
| (46,367 | ) |
| (2,908,055 | ) |
| (4,743,033 | ) | |||||
Other Temporary Differences |
| — |
|
| — |
|
| — |
|
| — |
|
| — |
| |||||
Total Distributable Earnings (Accumulated Losses) | $ | (3,845,735 | ) | $ | (5,964,430 | ) | $ | (1,514,819 | ) | $ | (5,210,202 | ) | $ | (6,329,575 | ) | |||||
109
Notes to Financial Statements (Unaudited)(continued)
KraneSharesCCBS | KraneShares | |||||||
Undistributed Ordinary Income | $ | — |
| $ | 17,204 |
| ||
Capital Loss Carryforwards |
| — |
|
| (277,708 | ) | ||
Post October Losses |
| (12,897 | ) |
| — |
| ||
Unrealized Appreciation (Depreciation) on Investments and Foreign Currency |
| 238,733 |
|
| 30,287 |
| ||
Other Temporary Differences |
| 58,098 |
|
| — |
| ||
Total Distributable Earnings (Accumulated Losses) | $ | 283,934 |
| $ | (230,217 | ) | ||
The KraneShares MSCI Emerging Markets ex China Index ETF did not commence operations prior to March31, 2019.
Qualified late year ordinary and Post-October capital losses (including currency and specified gain/loss items) represent losses realized from January1, 2019 through March31, 2019 and November1, 2018 through March31, 2019, respectively, that in accordance with federal income tax regulations, the Funds have elected to defer and treat as having arisen in the following fiscal year.
Under the Regulated Investment Company Modernization Act of 2010, the Funds are permitted to carry forward capital losses incurred in taxable years beginning after December22, 2010 for an unlimited period. Post-enactment capital losses that are carried forward will retain their character as either short-term or long-term capital losses rather than being considered all short-term as under previous law. Losses carried forward under these provisions are as follows:
KraneShares Funds | Short-Term | Long-Term | Total | ||||||
KraneShares Bosera MSCI China A Share ETF | $ | 7,407,733 | $ | — | $ | 7,407,733 | |||
KraneShares E Fund China Commercial Paper ETF |
| 28,288 |
| 344 |
| 28,632 | |||
KraneShares MSCI All China Index ETF |
| 7,048 |
| 124,920 |
| 131,968 | |||
KraneShares MSCI One Belt One Road Index ETF |
| 2,511,485 |
| 53,411 |
| 2,564,896 | |||
KraneShares Emerging Markets Consumer Technology Index ETF |
| 1,922,675 |
| 364,445 |
| 2,287,120 | |||
KraneShares MSCI China Environment Index ETF |
| 700,820 |
| — |
| 700,820 | |||
KraneShares Electric Vehicles and Future Mobility Index ETF |
| 1,885,086 |
| 415,096 |
| 2,300,182 | |||
KraneShares Emerging Markets Healthcare Index ETF |
| 277,708 |
| — |
| 277,708 | |||
During the year ended March31, 2019, KraneShares E Fund China Commercial Paper ETF and KraneShares MSCI All China Index ETF utilized $13,029 and $67,006 of capital loss carryforwards, respectively, to offset capital gains.
110
Notes to Financial Statements (Unaudited)(continued)
The differences between book and tax-basis unrealized appreciation and depreciation are attributable primarily to the tax deferral of losses on wash sales and investments in passive foreign investment companies. The federal tax cost and aggregate gross unrealized appreciation and depreciation on investments held by the Funds at September30, 2019 were as follows:
KraneShares Funds | Federal Tax | Aggregated | Aggregated | Net Unrealized | ||||||||||
KraneShares CICC China Leaders 100 Index ETF | $ | 3,804,492 | $ | 307,309 | $ | (218,590 | ) | $ | 88,719 |
| ||||
KraneShares CSI China Internet ETF |
| 1,787,181,306 |
| 113,699,389 |
| (259,726,688 | ) |
| (146,027,299 | ) | ||||
KraneShares Bosera MSCI China A Share ETF |
| 575,987,704 |
| 25,732,682 |
| (51,524,795 | ) |
| (25,792,113 | ) | ||||
KraneShares E Fund China Commercial Paper ETF |
| 17,119,879 |
| 16,044 |
| (714,636 | ) |
| (698,592 | ) | ||||
KraneShares MSCI All China Index ETF |
| 7,067,403 |
| 492,157 |
| (549,874 | ) |
| (57,717 | ) | ||||
KraneShares MSCI One Belt One Road Index ETF |
| 19,749,177 |
| 1,475,583 |
| (3,184,940 | ) |
| (1,709,357 | ) | ||||
KraneShares Emerging Markets Consumer Technology Index ETF |
| 25,528,250 |
| 1,631,083 |
| (4,376,279 | ) |
| (2,745,196 | ) | ||||
KraneShares MSCI China Environment Index ETF |
| 3,780,029 |
| 271,514 |
| (627,889 | ) |
| (356,375 | ) | ||||
KraneShares Electric Vehicles and Future Mobility Index ETF |
| 28,702,149 |
| 1,810,773 |
| (4,221,047 | ) |
| (2,410,274 | ) | ||||
KraneShares MSCI All China Healthcare Index ETF |
| 14,545,795 |
| 2,201,345 |
| (919,988 | ) |
| 1,281,357 |
| ||||
KraneShares CCBS China Corporate High Yield Bond USD Index ETF |
| 11,543,767 |
| 254,310 |
| (161,101 | ) |
| 93,209 |
| ||||
KraneShares Emerging Markets Healthcare Index ETF |
| 1,034,446 |
| 126,100 |
| (154,051 | ) |
| (27,951 | ) | ||||
KraneShares MSCI Emerging Markets ex China Index ETF |
| 2,529,499 |
| 90,287 |
| (221,318 | ) |
| (131,031 | ) | ||||
Uncertainties in the Chinese tax rules governing the taxation of income distributions and capital gains from investments in A Shares could result in unexpected tax liabilities for the Funds. China generally imposes withholding tax at a rate of 10% on dividends and interest derived by non-Chinese resident investors (including, for example, Qualified Foreign Institutional Investors (“QFII”)) from Chinese companies and those companies which are not Chinese tax residents, but which are deemed to be Chinese tax residents (e.g., under Notice 7). China also imposes withholding tax at a rate of 10% on capital gains derived by non-residents from investment in actual and constructive Chinese resident companies. The Chinese withholding taxes applied to dividends, interest and capital gains may, in principle, be subject to a reduced rate under an applicable Chinese tax treaty, but the application of such treaties in the case of a non-resident (e.g., in the case of a QFII acting on behalf of non-resident investors, such as the Funds) is also uncertain. The imposition of such taxes could have a material adverse effect on the Funds’ returns. The People’s Republic of China (the “PRC”) rules regarding the taxation of non-resident investors are
111
Notes to Financial Statements (Unaudited)(continued)
quickly evolving and certain of the tax regulations to be issued by the PRC State Administration of Taxation and/or the PRC Ministry of Finance to clarify matters may apply retrospectively. Such retroactively applied rules may be adverse to the Funds and their shareholders. It is also unclear how China’s value added tax (“VAT”) may be affected by tax treaty provisions. If such a tax is collected, the expenses will be passed on and borne by the Funds. The imposition of such taxes, as well as future changes in applicable PRC tax law, may adversely affect the Funds. If the Funds expect VAT to be imposed, they reserve the right to establish a reserve for such tax. If the Funds establish such a reserve but are not ultimately subject to the tax, shareholders who redeemed or sold their shares while the reserve was in place will effectively bear the tax and may not benefit from the later release, if any, of the reserve. Conversely, if the Funds do not establish such a reserve but ultimately are subject to the tax, shareholders who redeemed or sold their shares prior to the tax being withheld, reserved or paid will have effectively avoided the tax, even if they benefited from investments in a Fund. Effective November17, 2014, QFIIs, RQFIIs (i.e., QFIIs investing in Yuan, rather than foreign currency) and non-Chinese resident investors investing through the Hong Kong-Shanghai Stock Connect are exempted temporarily from the 10% capital gains tax that normally applies to sales of A Shares on a public Chinese exchange (such as the Shanghai Stock Exchange). However, such investors are still required to pay capital gains tax for gains realized on trades executed before November17, 2014. The Funds have recorded capital gains tax for gains realized prior to November17, 2014, and have reflected such taxes in the Statement of Assets and Liabilities.
On November7, 2018, China’s Ministry of Finance and the State Administration of Taxation jointly issued Circular 108. This circular announced a three year exemption from corporate income tax withholding (“WHT”) and Value Added Tax (“VAT”) for China-sourced bond interest derived by overseas institutional investors. The WHT and VAT exemptions apply from November7, 2018 to November6, 2021.
6. CONCENTRATION OF RISKS
As with all ETFs, shareholders of the Funds are subject to the risk that their investment could lose money. Each Fund is subject to certain of the principal risks noted below, any of which may adversely affect a Fund’s NAV, trading price, yield, total return and ability to meet its investment objective. A more complete description of principal risks is included in each Fund’s prospectus under the heading “Principal Risks”. The following risks pertain to all Funds, unless otherwise noted.
Cash and Cash Equivalents Risk— The Fund may hold cash or cash equivalents. Generally, such positions offer less potential for gain than other investments. Holding cash or cash equivalents, even strategically, may lead to missed investment opportunities. This is particularly true when the market for other investments in which the Fund may invest is rapidly rising. If the Fund holds cash uninvested it will be subject to the credit risk of the depositing institution holding the cash.
CHINA RISK — The Chinese economy is generally considered an emerging market and can be significantly affected by economic and political conditions in China and surrounding Asian countries. In addition, the Chinese economy is export-driven and highly reliant on trade. A downturn in the economies of China’s primary trading partners could slow or eliminate the growth of the Chinese economy and adversely impact the Fund’s investments. The Chinese government strictly regulates the payment of foreign currency denominated obligations and sets monetary policy. The Chinese government may introduce new laws and regulations that could have an adverse effect on the Fund. Although China has begun the process of privatizing certain sectors of its economy, privatized entities may lose money and/or be re-nationalized.
112
Notes to Financial Statements (Unaudited)(continued)
In the Chinese securities markets, a small number of issuers may represent a large portion of the entire market. The Chinese securities markets are subject to more frequent trading halts, low trading volume and price volatility. Further, the Chinese economy is heavily dependent upon trading with key partners. Recent developments in relations between the United States and China have heightened concerns of increased tariffs and restrictions on trade between the two countries. An increase in tariffs or trade restrictions or even the threat of such developments, could lead to significant reduction in international trade, which could have a negative impact on China’s export industry and a commensurately negative impact on the Fund.
The RMB Bond market is volatile with a risk of trading suspensions in particular securities and government interventions. Trading in RMB Bonds may be suspended without warning and for lengthy periods. Information on such trading suspensions, including as to their expected length, may be unavailable. Securities affected by trading suspensions may be or become illiquid. In recent years, Chinese entities have incurred significant levels of debt and Chinese financial institutions currently hold relatively large amounts of non-performing debt. Thus, there exists a possibility that widespread defaults could occur, which could trigger a financial crisis, freeze Chinese debt and finance markets and make certain Chinese securities illiquid.
CHINESE CREDIT RATING RISKS (KraneShares E Fund China Commercial Paper ETF and KraneShares CCBS China Corporate High Yield Bond USD Index ETF) — The debt securities included in Underlying Index securities, and therefore the securities held by the KraneShares E Fund China Commercial Paper ETF Fund, will generally be rated by Chinese ratings agencies (and not by U.S. nationally recognized statistical ratings organizations (“NRSROs”)). The rating criteria and methodology used by Chinese rating agencies may be different from those adopted by NRSROs and international credit rating agencies. Therefore, such rating systems may not provide an equivalent standard for comparison with securities rated by NRSROs or other international credit rating agencies.
CONCENTRATION RISK — Because the Fund’s assets are expected to be concentrated in an industry or group of industries to the extent that the Underlying Index concentrates in a particular industry or group of industries, the Fund is subject to loss due to adverse occurrences that may affect that industry or group of industries or sector. Market conditions, interest rates, and economic, regulatory, or financial developments could significantly affect a single industry or a group of related industries, and the securities of companies in that industry or group of industries could react similarly to these or other developments. Depending on the composition of each Fund’s Underlying Index, the Fund may be subject to principal risks, as outlined in each Funds’ prospectus. Each Fund may have significant exposure to other industries or sectors over time.
CURRENCY RISK — The Fund’s NAV is determined on the basis of the U.S. dollar, therefore, the Fund may lose value if the local currency of a foreign market depreciates against the U.S. dollar, even if the local currency value of the Fund’s holdings goes up. Currency exchange rates can be very volatile and can change quickly and unpredictably, which may adversely affect the Fund. The Fund may also be subject to delays in converting or transferring U.S. dollars to foreign currencies for the purpose of purchasing portfolio investments. This may hinder the Fund’s performance, including because any delay could result in the Fund missing an investment opportunity and purchasing securities at a higher price than originally intended, or incurring cash drag.
DEPOSITARY RECEIPTS RISK (KraneShares CICC China Leaders 100 Index ETF, KraneShares CSI China Internet ETF, KraneShares Bosera MSCI China A Share ETF, KraneShares MSCI All China Index ETF, KraneShares MSCI One Belt One Road Index ETF, KraneShares Emerging Markets Consumer
113
Notes to Financial Statements (Unaudited)(continued)
Technology Index ETF, KraneShares MSCI China Environment Index ETF, KraneShares Electric Vehicles and Future Mobility Index ETF, KraneShares MSCI All China Health Care Index ETF, KraneShares Emerging Markets Healthcare Index ETF and KraneShares MSCI Emerging Markets ex China Index ETF) — The Fund may hold the securities of foreign companies in the form of depositary receipts, including American Depositary Receipts and Global Depositary Receipts. Investing in depositary receipts entails the risks associated with foreign investments. The underlying securities of the depositary receipts in the Fund’s portfolio are subject to fluctuations in foreign currency exchange rates that may affect the value of the Fund’s portfolio. In addition, the value of the securities underlying the depositary receipts may change materially when the U.S. markets are not open for trading, which will affect the value of the depositary receipts. Like direct investments in foreign securities, investments in depositary receipts involve political and economic risks distinct from those associated with investing in the securities of U.S. issuers.
Emerging Markets Risk — The Fund’s investments in emerging markets are subject to greater risk of loss than investments in developed markets. This is due to, among other things, greater market volatility, greater risk of asset seizures and capital controls, lower trading volume, political and economic instability, greater risk of market shutdown and more governmental limitations on foreign investments than typically found in developed markets. The economies of emerging markets, and China in particular, may be heavily reliant upon international trade and may suffer disproportionately if international trading declines or is disrupted.
ETF Risk. As an ETF, the Fund is subject to the following risks:
Authorized Participants Concentration Risk. The Fund has a limited number of financial institutions that may act as Authorized Participants. To the extent they cannot or are otherwise unwilling to engage in creation and redemption transactions with the Fund and no other Authorized Participant steps in, shares of the Fund may trade like closed-end fund shares at a significant discount to net asset value (“NAV”) and may face delisting from the Exchange.
Cash Transactions Risk. Like other ETFs, the Fund sells and redeems its shares only in large blocks called Creation Units and only to “Authorized Participants.” Unlike many other ETFs, however, the Fund expects to effect its creations and redemptions at least partially or fully for cash, rather than in-kind securities. Thus, an investment in the Fund may be less tax-efficient than an investment in other ETFs as the Fund may recognize a capital gain that it could have avoided by making redemptions in-kind. As a result, the Fund may pay out higher capital gains distributions than ETFs that redeem in-kind. Further, paying redemption proceeds in cash rather than through in-kind delivery of portfolio securities may require the Fund to dispose of or sell portfolio investments to obtain the cash needed to distribute redemption proceeds at an inopportune time.
International Closed Market Trading Risk. Because certain of the Fund’s investments trade in markets that are closed when the Fund and Exchange are open, there are likely to be deviations between current pricing of an underlying security and stale pricing, resulting in the Fund trading at a discount or premium to NAV greater than those incurred by other ETFs.
New Fund Risk. The Fund is new. If the Fund does not grow large in size once it commences trading, it will be at greater risk than larger funds of wider bid-ask spreads for its shares, trading at a greater premium or discount to NAV, liquidation and/or a stop to trading.
114
Notes to Financial Statements (Unaudited)(continued)
Premium/Discount Risk. There may be times when the market price of the Fund’s shares is more than the NAV intra-day (at a premium) or less than the NAV intra-day (at a discount). As a result, shareholders of the Fund may pay more than NAV when purchasing shares and receive less than NAV when selling Fund shares. This risk is heightened in times of market volatility or periods of steep market declines. In such market conditions, market or stop loss orders to sell Fund shares may be executed at prices well below NAV.
Secondary Market Trading Risk. Investors buying or selling shares in the secondary market will normally pay brokerage commissions, which are often a fixed amount and may be a significant proportional cost for investors buying or selling relatively small amounts of shares. Secondary market trading is subject to bid-ask spreads and trading in Fund shares may be halted by the Exchange because of market conditions or other reasons. If a trading halt occurs, a shareholder may temporarily be unable to purchase or sell shares of the Fund. In addition, although the Fund’s shares are listed on the Exchange, there can be no assurance that an active trading market for shares will develop or be maintained or that the Fund’s shares will continue to be listed.
EQUITY SECURITIES RISK —The values of equity securities are subject to factors such as market fluctuations, changes in interest rates and perceived trends in stock prices. Equity securities are subject to volatile changes in value and their values may be more volatile than other asset classes. In the event of liquidation, equity securities are generally subordinate in rank to debt and other securities of the same issuer.
FIXED INCOME SECURITIES RISK (KraneShares E Fund China Commercial Paper ETF and KraneShares CCBS China Corporate High Yield Bond USD Index ETF) —Fixed income securities are subject to credit risk and interest rate risk. Credit risk refers to the possibility that the issuer of a security will not make timely interest payments or repay the principal of the debt issued (i.e., it defaults on its obligations). Interest rate risk refers to fluctuations in the value of a debt resulting from changes in the level of interest rates. When interest rates go up, the prices of most debt instruments go down; and when interest rates go down, the prices of most debt instruments go up. Debt instruments with longer durations tend to be more sensitive to interest rate changes, typically making them more volatile. The current low-interest-rate environment heightens the risks associated with rising interest rates.
FOREIGN SECURITIES RISK — Investments in securities of non-U.S. issuers may be less liquid than investments in U.S. issuers as foreign trading markets are not typically as active as U.S. markets and may have less governmental regulation and oversight. For example, non-U.S. issuers may be subject to different accounting, auditing, financial reporting and investor protection standards than U.S. issuers. As a result, there may be less information publicly available about non-U.S. issuers. Investments in non-U.S. securities also involve risk of loss due to foreign currency fluctuations and political or economic instability. Foreign markets also may have clearance and settlement procedures that make it difficult for the Funds to buy and sell securities. These factors could result in a loss to the Funds by causing the Funds to be unable to dispose of an investment or to miss an attractive investment opportunity, or by causing the Funds’ assets to be uninvested for some period of time.
FRONTIER MARKETS RISK — Frontier market countries generally have smaller economies and less developed capital markets or legal, regulatory and political systems than traditional emerging market countries. As a result, the risks of investing in emerging market countries are magnified in frontier market countries.
115
Notes to Financial Statements (Unaudited)(continued)
GEOGRAPHIC FOCUS RISK — The Funds’ investments will be focused in a particular country, countries, or region and therefore a Fund may be susceptible to adverse market, political, regulatory, and geographic events affecting that country, countries or region. Such geographic focus also may subject the Fund to a higher degree of volatility than a more geographically diversified fund.
HIGH PORTFOLIO TURNOVER RISK (KraneShares CICC China Leaders 100 Index ETF, KraneShares Bosera MSCI China A Share ETF, KraneShares MSCI All China Index ETF, KraneShares MSCI One Belt One Road Index ETF, KraneShares Emerging Markets Consumer Technology Index ETF, KraneShares MSCI China Environment Index ETF, KraneShares Electric Vehicles and Future Mobility Index ETF and KraneShares MSCI All China Health Care Index ETF) — The Fund may incur high turnover rates, which may increase the Fund’s brokerage commission costs and negatively impact the Fund’s performance. Such portfolio turnover also may generate net short-term capital gains.
INDUSTRY CONCENTRATION RISK (KraneShares E Fund China Commercial Paper ETF) — In following its methodology, each Fund’s Underlying Index from time to time may be concentrated to a significant degree in securities of issuers located in a single industry or group of industries or sector of the economy. To the extent that an Underlying Index concentrates in the securities of issuers in a particular industry or group of industries, each Fund also is expected to concentrate its investments to approximately the same extent. If a Fund concentrates its investments in an industry, the Fund may face more risks than if it were diversified broadly over industries. In addition, at times, an industry or sector may be out of favor and underperforms other industries or the market as a whole. Any factors detrimental to the performance of such industry or sector may disproportionately impact a Fund’s NAV.
The Fund utilizes a cash sweep program (the “Cash Sweep Program”). In the Cash Sweep Program, at least a portion of the Fund’s uninvested cash balance is used to purchase shares of funds that are registered in China, but not in the U.S., and that provide daily liquidity, including the E Fund Money Market Fund. The Fund may also invest in other similar investment companies that are registered in China and provide daily liquidity (collectively, the “PRC Investment Companies”). The Fund’s investments in the PRC Investment Companies are, in conjunction with other investments in investment companies (other than U.S. money market funds), subject to the limitations imposed by Section 12(d)(1) and the rules thereunder. The PRC Investment Companies are intended to provide liquidity, increased diversity of holdings, and a return on investment that is similar to the return on investments in underlying index constituents. Investments in the PRC Investment Companies are subject to the risks faced by them, which include credit risk, interest rate risk, currency risk, foreign investment risk, and custody risk. The PRC Investment Companies are PRC-domiciled funds and the Fund, therefore, will not enjoy the protections of the United States securities laws, including the 1940 Act, with respect to its investments in the PRC Investment Companies. In addition, E Fund is subject to conflicts of interest in allocating Fund assets to PRC Investment Companies that are sponsored by E Fund or its affiliates.
Investment in Investment Companies Risk — The Fund may invest in other investment companies, including those advised, sponsored or otherwise serviced by the Adviser, the Sub-Adviser and/or their affiliates. The Fund will indirectly be exposed to the risks of investments by such funds. Moreover, the Fund will incur its pro rata share of the underlying fund’s expenses. the Adviser and the Sub-Adviser are subject to conflicts of interest in allocating Fund assets to investment companies that are advised, sponsored or otherwise serviced by the Adviser and the Sub-Adviser and/or their affiliates. To the extent that the Fund invests in investment companies or other pooled investment vehicles that are not registered pursuant to the 1940 Act, including foreign investment companies, it will not enjoy the protections of the 1940 Act.
116
Notes to Financial Statements (Unaudited)(continued)
Large Capitalization Company Risk (KraneShares CICC China Leaders 100 Index ETF, KraneShares CSI China Internet ETF, KraneShares Bosera MSCI China A Share ETF, KraneShares MSCI All China Index ETF, KraneShares MSCI One Belt One Road Index ETF, KraneShares Emerging Markets Consumer Technology Index ETF, KraneShares MSCI China Environment Index ETF, KraneShares Electric Vehicles and Future Mobility Index ETF, KraneShares MSCI All China Health Care Index ETF, KraneShares Emerging Markets Healthcare Index ETF and KraneShares MSCI Emerging Markets ex China Index ETF) — Investments in large capitalization companies may go in and out of favor based on market and economic conditions and may underperform other market segments. Some large capitalization companies may be unable to respond quickly to new competitive challenges and attain the high growth rate of successful smaller companies, especially during extended periods of economic expansion. As such, returns on investments in stocks of large capitalization companies could trail the returns on investments in stocks of small and mid-capitalization companies.
LIQUIDITY RISK — Certain of the Funds’ investments are subject to liquidity risk, which exists when an investment is or becomes difficult to purchase or sell at a reasonable time or price. If a transaction is particularly large or if the relevant market is or becomes illiquid, it may not be possible to initiate a transaction or liquidate, which may cause the Funds to suffer significant losses and difficulties in meeting redemptions. If a number of securities held by the Funds halt trading, it may have a cascading effect and cause the Funds to halt trading. Volatility in market prices will increase the risk of the Funds being subject to a trading halt.
Management Risk — Because the Fund may not fully replicate the Underlying Index and may hold less than the total number of securities in the Underlying Index, the Fund is subject to management risk. This is the risk that Krane or its subadviser’s E Fund’s security selection process, which is subject to a number of constraints, may not produce the intended results.
MARKET RISK — The values of the Funds’ holdings could decline generally or could underperform other investments. In addition, there is a risk that policy changes by the U.S. Government, Federal Reserve, and/or other government actors, such as continuing to raise interest rates, could cause increased volatility in global financial markets and higher levels of Fund redemptions, which could have a negative impact on the Funds. Further, the Funds are susceptible to the risk that certain investments may be difficult or impossible to sell at a favorable time or price. Market developments may cause the Funds’ investments to become less liquid and subject to erratic price movements. Such market developments may also cause the Funds to encounter difficulties in timely honoring redemptions, especially if market events cause an increased incidence of shareholder redemptions.
Non-Diversified Fund Risk (KraneShares CICC China Leaders 100 Index ETF, KraneShares CSI China Internet ETF, KraneShares E Fund China Commercial Paper ETF, KraneShares MSCI One Belt One Road Index ETF, KraneShares Emerging Markets Consumer Technology Index ETF, KraneShares MSCI China Environment Index ETF, KraneShares Electric Vehicles and Future Mobility Index ETF, KraneShares MSCI All China Health Care Index ETF, KraneShares CCBS China Corporate High Yield Bond USD Index ETF and KraneShares Emerging Markets Healthcare Index ETF) — Because the Fund is non-diversified and may invest a greater portion of its assets in fewer issuers than a diversified fund, changes in the market value of a single portfolio holding could cause greater fluctuations in the Fund’s share price than would occur in a diversified fund. This may increase the Fund’s volatility and cause the performance of a single portfolio holding or a relatively small number of portfolio holdings to have a greater impact on the Fund’s performance.
117
Notes to Financial Statements (Unaudited)(continued)
Passive Investment Risk — The Fund is not actively managed, does not seek to “beat” the Underlying Index and does not take temporary defensive positions when markets decline. Therefore, the Fund may not sell a security due to current or projected underperformance of a security, industry or sector. There is no guarantee that the Underlying Index will create the desired exposure. The Underlying Index may not contain an appropriate mix of securities, but the Fund’s investment objective and principal investment strategies impose limits on the Fund’s ability to invest in securities not included in the Underlying Index.
SECURITIES LENDING RISK — To the extent a Fund lends its securities, it may be subject to the following risks: (1) borrowers of the Funds’ securities typically provide collateral in the form of cash that is reinvested in securities; (2) the securities in which the collateral is invested may not perform sufficiently to cover the return collateral payments owed to borrowers; (3) delays may occur in the recovery of securities from borrowers, which could interfere with the Funds’ ability to vote proxies or to settle transactions; and (4) there is the risk of possible loss of rights in the collateral should the borrower fail financially.
Small and Mid-Capitalization Company Risk (KraneShares CICC China Leaders 100 Index ETF, KraneShares CSI China Internet ETF, KraneShares MSCI One Belt One Road Index ETF, KraneShares Emerging Markets Consumer Technology Index ETF, KraneShares MSCI China Environment Index ETF, KraneShares Electric Vehicles and Future Mobility Index ETF, KraneShares Emerging Markets Healthcare Index ETF and KraneShares MSCI Emerging Markets ex China Index ETF) — Investing in the securities of small and medium capitalization companies involves greater risk and the possibility of greater price volatility than investing in larger capitalization companies and more established companies. Since small and medium-sized companies may have limited operating histories, product lines and financial resources, the securities of these companies may lack sufficient market liquidity and can be sensitive to expected changes in interest rates, borrowing costs and earnings.
Tax Risk — In order to qualify for the favorable tax treatment generally available to regulated investment companies, the Fund must satisfy certain income, asset diversification and distribution requirements each year. If the Fund were to fail to qualify as a regulated investment company, it would be taxed in the same manner as an ordinary corporation, and distributions to its shareholders would not be deductible by the Fund in computing its taxable income, which would adversely affect the Fund’s performance.
Tracking Error Risk — The Fund’s return may not match or achieve a high degree of correlation with the return of the Underlying Index. This may be due to, among other factors, the Fund holding cash under certain circumstances in lieu of Underlying Index securities, such as when the Fund is subject to delays converting U.S. dollars into a foreign currency to purchase foreign securities. The Fund may not be able to invest in certain components of the Underlying Index due to legal restrictions imposed by foreign governments or other regulatory reasons. In addition, securities included in the Underlying Index may be suspended from trading. To the extent that the Fund employs a representative sampling strategy or calculates its NAV based on fair value prices and the value of the Underlying Index is based on securities’ closing prices on local foreign markets, the Fund’s ability to track the Underlying Index may be adversely affected. Changes in currency exchange rates or delays in converting currencies may also cause tracking error.
VALUATION RISK — Independent market quotations for the non-U.S. securities held by the Funds may not be readily available and such securities may be fair valued. Fair valuation is subjective and different market participants may assign different prices to the same security. As a result, there is a risk that the Funds may not be able to sell a security at the price assigned to the security by the
118
Notes to Financial Statements (Unaudited)(concluded)
Fund. In addition, the securities in which the Funds invest may trade on days that the Funds do not price their shares; as a result, the value of Fund shares may change on days when investors cannot purchase or sell their holdings.
7. OTHER
At September30, 2019, all shares issued by the Funds were in Creation Unit aggregations to Authorized Participants through primary market transactions (e.g., transactions directly with the Funds). However, the individual shares that make up those Creation Units are traded on the NYSE Arca Exchange (e.g., secondary market transactions). Some of those individual shares have been bought and sold by persons that are not Authorized Participants. Each Authorized Participant has entered into an agreement with the Funds’ Distributor.
8. INDEMNIFICATIONS
In the normal course of business, the Funds enter into contracts that provide general indemnifications. The Funds’ maximum exposure under these arrangements is dependent on future claims that may be made against the Funds and, therefore, cannot be established; however, based on experience, the risk of loss from such claims is considered remote.
9. REGULATORY MATTERS
On August17, 2018, the SEC adopted amendments to Regulation S-X. These changes are effective for periods after November5, 2018. The updates to Registered Investment Companies were mainly focused on simplifying the presentation of distributable earnings by eliminating the need to present the components of distributable earning on a book basis in the Statement of Assets and Liabilities. The update also impacted the presentation of undistributed net investment income and distribution to shareholders on the Statement of Changes in Net Assets. The amounts presented in the current Statement of Changes in Net Assets represent the aggregated total distributions of net investment income and realized capital gains, except for distributions classified as return of capital which are still presented separately.
10. NEW ACCOUNTING PRONOUNCEMENTS
In August 2018, the FASB issued Accounting Standards Update 2018-13, Fair Value Measurement (Topic 820). The new guidance includes additions and modifications to disclosures requirements for fair value measurements. For public entities, the amendments are effective for financial statements issued for fiscal years beginning after December15, 2019, and interim periods within those fiscal years. At this time, management is currently evaluating the impact of this new guidance on the financial statements and disclosures.
11. SUBSEQUENT EVENTS
On October20, 2019, the Adviser’s reimbursement of the withholding taxes settled in the Fund’s accounts.
The Funds have evaluated the need for additional disclosures and/or adjustments resulting from subsequent events. Based on this evaluation, other than the above, no additional disclosures or adjustments were required to the financial statements as of the date the financial statements were issued.
119
At an in-person meeting on May24, 2019, the Board of Trustees (“Board”) of the KraneShares Trust (“Trust”), including a majority of the Trustees who are not “interested persons” of the Trust (the “Independent Trustees”), voted to renew the existing advisory agreement between Krane Funds Advisors, LLC (“Krane”) and the Trust (the “Advisory Agreement”), on behalf of each of the following series of the Trust: KraneShares CSI China Internet ETF (“KWEB”), KraneShares Bosera MSCI China A Share ETF (“KBA”), KraneShares MSCI One Belt One Road Index ETF (“OBOR”), KraneShares MSCI China Environment Index ETF (“KGRN”), KraneShares Electric Vehicles and Future Mobility Index ETF (“KARS”), KraneShares MSCI All China Health Care Index ETF (“KURE”), KraneShares Emerging Markets Consumer Technology Index ETF (“KEMQ”), KraneShares E Fund China Commercial Paper ETF (“KCNY”), KraneShares MSCI All China Index ETF (“KALL”), KraneShares CICC China Leaders 100 Index ETF (“KFYP”), KraneShares CCBS China Corporate High Yield Bond USD Index ETF (“KCCB”) and, KraneShares Emerging Markets Healthcare Index ETF (“KMED”).
At the same meeting, the Board voted to renew the existing subadvisory agreement between Krane and Bosera Asset Management (International) Co., Ltd. (“Bosera”) with respect to KBA, the existing subadvisory agreement between Krane and CCB Securities Ltd. (“CCBS”) with respect to KCCB, and the existing subadvisory agreement between Krane and E Fund Management (Hong Kong) Co., Ltd (“E Fund”) with respect to KCNY (the “Subadvisory Agreements”). E Fund, Bosera and CCBS are collectively referred to herein as the “Subadvisers,” and the Subadvisory Agreements and the Advisory Agreement are collectively referred to herein as the “Agreements.”
The Board took note of relevant judicial precedent and regulations adopted by the SEC setting forth factors to be considered by a board when evaluating investment advisory agreements including, among other matters: (1) the nature, extent and quality of the services provided by Krane and each Subadviser; (2) the costs of the services provided and profitability to Krane with respect to its relationship with the Funds; (3) the advisory fees and total expense ratios of each Fund compared to a relevant peer group of funds; (4) the extent to which economies of scale would be realized as a Fund grows and whether the advisory fee for the Fund would enable investors to share in the benefits of economies of scale; and (5) other benefits received by Krane and the Subadvisers from their relationship with the Funds.
In advance of the meeting, the Board requested, and Krane provided, certain information relating to the proposed Advisory Agreements. The Board also requested, and Bosera, CCBS and E-Fund provided, certain information relating to the respective Subadvisory Agreement. In addition to such information, the Board noted that the evaluation process with respect to Krane and the Subadvisers is an ongoing one. For example, the Board recognized that, at its regulatory scheduled meetings, it receives and considers information regarding, among other matters, the investment performance of the Funds, the services provided by Krane and the Subadvisers, and the expenses incurred by the Funds. The Board also receives information informally outside of the Board meetings. The Board’s consideration of the Agreements included information previously received at such meetings and outside of the meetings.
Nature, Quality and Extent of Services. Based on written and oral reports received by the Board prior to and at the May24, 2019 meeting, and a presentation from senior representatives of Krane at the May24, 2019 meeting and in executive session with the Independent Trustees prior to the Board meeting, the Board considered the nature, quality and extent of the overall services provided by Krane under the Advisory Agreement and by each Subadviser under the Subadvisory Agreements. The Board considered the responsibilities of Krane and the Subadvisers and discussed resources committed by Krane to manage the Funds. The Board considered the significant time and effort invested by Krane in structuring the Trust and the Funds, obtaining necessary exemptive relief from the Securities and Exchange Commission (“SEC”), identifying and evaluating potential subadvisers,
120
Approval of New Fund Advisory Agreements & Board Considerations (Unaudited)(continued)
developing new products, assessing the market appeal of each Fund’s investment strategy and arranging and overseeing service providers. The Board considered that Krane is responsible for establishing and monitoring each Fund’s investment program and either directly managing the day-to-day investment activities of the Funds or selecting and overseeing the Subadvisers, as applicable. The Board took note of its experience with the services provided by Krane and the Subadvisers, and considered Krane’s analysis and recommendations regarding each Subadviser. The Board also considered that Krane has established a securities lending program that benefits certain Funds and noted that Krane employs an experienced portfolio management team. The Board noted that Krane continually evaluates its existing compliance and operational staff, and that it continues to seek and retain qualified staff in these areas as its business continues to grow.
Performance. The Board considers the performance of each operational Fund throughout the year. At each regular meeting of the Board, Krane reviews each operational Fund’s performance for various periods versus an identified peer group. The Board also regularly reviews the tracking error of each operational Fund that seeks to provide investment results correlated to the performance of an underlying index, and the Board noted that such information indicates that each Fund’s performance is reasonably correlated to that of the identified underlying index. The Board noted its discussions with Krane related to factors, such as the use of fair value pricing by the Funds and the Funds’ asset inflows and outflows, that affect the performance of the Funds but not their underlying indices. The Board also noted Krane’s view that each Fund offers investors unique investment exposure.
At the meeting, the Board was provided with and considered, among other things, information regarding each operational Fund’s returns against a group of comparable funds (“peer group”) and its respective Morningstar category. The Board also considered the Morningstar ratings received by KALL, KBA, KCNY, KFYP and KWEB based on their three-year performance records, acknowledging that those were the only Funds that had been operational for at least three years as of the date of the Board meeting. The Board noted that certain of the Funds had not yet commenced operations and thus such comparative data were not available. With respect to the operational Funds, the Board noted as follows:
With respect to KFYP, the Board noted that (1) the Fund’s tracking error was more than that of its peers; (2) the Fund’s performance was generally in line with its peer group for the one-year, three-year and since-inception periods ended March31, 2019; and (3) the Fund outperformed its Morningstar category for the one-year, three-year and five-year periods ended March31, 2019.
With respect to KWEB, the Board noted that: (1) the Fund’s tracking error was less than that of its peers; (2) the Fund underperformed its peer group for the three-year period, overperformed the since inception period, and was in line with the one-year period as compared to its peer group; and (3) the Fund underperformed its Morningstar category for the one-year, three-year and five-year periods ended March31, 2019.
With respect to KBA, the Board noted that: (1) the Fund’s tracking error was generally in line with its peers; (2) the Fund performance was generally in line with its peer group for the one-year and three-year periods ended March31, 2019, but underperformed its peer group for the since-inception period ended March31, 2019; and (3) the Fund outperformed its Morningstar category for the one-year and five-year periods ended March31, 2019, but underperformed its Morningstar category for the three-year period ended March31, 2019.
With respect to OBOR, the Board noted that: (1) the Fund’s tracking error was generally in line with its peers; (2) the Fund’s performance was generally in line with its peer group for the one-year and
121
Approval of New Fund Advisory Agreements & Board Considerations (Unaudited)(continued)
since-inception periods ended March31, 2019; and (3) the Fund outperformed its Morningstar category for the one-year period ended March31, 2019.
With respect to KGRN, the Board noted that: (1) the Fund’s tracking error was more than that of its peers; (2) the Fund underperformed its peer group for the one-year period ended March31, 2019; and (3) the Fund underperformed its Morningstar category for the one-year period ended March31, 2019.
With respect to KARS, the Board noted that: (1) the Fund’s tracking error was more than that of its peers; (2) the Fund’s performance was generally in line with its peer group for the since-inception period ended March31, 2019; and (3) the Fund underperformed its Morningstar category for the one-year period ended March31, 2019.
With respect to KURE, the Board noted that: (1) the Fund’s tracking error was generally in line with that of its peers: (2) the Fund’s performance was generally in line with its peer group for the since-inception period ended March31, 2019; and (3) the Fund underperformed its Morningstar category for the one-year period ended March31, 2019.
With respect to KEMQ, the Board noted that: (1) the Fund’s tracking error was more than that of its peers; (2) the Fund overperformed its peer group for the one-year and since-inception periods ended March31, 2019; and (3) the Fund underperformed its Morningstar category for the one-year period ended March31, 2019.
With respect to KCNY, the Board noted that: (1) the Fund’s tracking error was more than that of its peers; (2) the Fund underperformed its peer group for the one-year, three-year and since-inception periods ended March31, 2019; and (3) the Fund underperformed its Morningstar category for the one-year and three-year periods ended March31, 2019. In assessing the Fund’s relative performance, the Board considered the impact of the Fund’s average portfolio weighted duration as compared to that of its peer group and the Morningstar category.
With respect to KALL, the Board noted that: (1) the Fund’s tracking error was less than that of its peers; (2) the Fund outperformed its peer group for the one-year and three-year periods ended March31, 2019 and underperformed its peers for the since-inception period ended March31, 2019; and (3) the Fund outperformed its Morningstar category for the one-year and since-inception periods ended March31, 2019, and underperformed its Morningstar category for the three-year period ended March31, 2019.
With respect to KCCB, the Board noted that the Fund had less than one year of performance, but that, during that time: (1) the Fund’s tracking error was generally in line with that of its peers; and (2) the Fund overperformed it underlying index.
With respect to KMED, the Board noted that the Fund had less than one year of performance, but that, during that time, (1) the Fund’s tracking error was more than that of its peer group; (2) the Fund underperformed its Morningstar category for the since-inception period ended March31, 2019.
Comparative Fees and Expenses. The Board considered that Krane has entered into a unitary advisory fee arrangement with the Funds, under which Krane, and not the Funds, is responsible for paying many of the Funds’ expenses, including those of the Funds’ principal service providers and the Subadvisers. The Board considered the information provided by Krane regarding the amounts paid by it to the Funds’ service providers under the arrangement. The Board reviewed and considered the fees paid by the Funds in light of the nature, quality and extent of the services provided or obtained by Krane. The Board also considered the net expense ratios of the currently operational Funds compared to those of their peer groups. The
122
Approval of New Fund Advisory Agreements & Board Considerations (Unaudited)(continued)
Board noted that: (1) management fees paid by KBA, KFYP, KALL, KGRN, KURE, KMED, OBOR, KCCB and KCNY were higher than their peer groups; (2) the KFYP, KGRN, KURE, KMED, OBOR, KCCB, and KCNY total expense ratios were higher than their peer groups; and (3) the KWEB, KBA, KALL, KEMQ, and KARS total expense ratios were the same or lower than their peer groups. The Board noted Krane’s representation that each Fund offers unique investment exposure for shareholders and potential investors in registered funds and that Krane only offers certain of these investment strategies in accounts not generally available to US retail investors. The Board also considered the effect of each Fund’s assets under management on its net expense ratio.
Although the Board received information regarding the fees paid to the Subadvisers under the Subadvisory Agreements, the Board noted the arm’s-length nature of the relationship between Krane and the Subadvisers with respect to the negotiation of subadvisory fee rates. The Board also considered that Krane (and not the Funds) pays the Subadviser’s fees.
Costs and Profitability. The Board noted that Krane continued to waive certain fees and that, although Krane was now profitable, it was not making a profit from its relationship with certain of the Funds under the Advisory Agreement. The Board also considered Krane’s commitment to the success of the Funds and the use of a unitary fee structure under which Krane bears the risk if certain of the Funds’ expenses increase. The Board considered the effect of each Fund’s assets under management on the potential profitability of such Fund under the unitary fee structure in light of the costs associated with the personnel, systems and equipment necessary to manage the Funds and to meet the regulatory and compliance requirements of the SEC and other regulatory bodies as well as other expenses Krane pays in accordance with the Advisory Agreement.
The Board did not consider information regarding the costs of services provided or profits realized by each Subadviser from its relationship with the Funds, noting instead the arm’s-length nature of the relationship between Krane and the Subadvisers with respect to the negotiation of the subadvisory fee rate on behalf of each Fund and that Krane, and not the Fund, was responsible for paying the subadvisory fees under each subadvisory agreement.
Other Benefits. The Board then considered the extent to which Krane and the Subadvisers derive ancillary benefits from the Funds’ operations, including potential benefits to Krane and the Subadvisers as a result of their ability to use Fund assets to engage in soft dollar transactions.
Economies of Scale. The Board considered Krane’s representation that none of the Funds were currently in a position to realize economies of scale. The Board also noted that Krane continues to reinvest a portion of its profits in its business, including through the addition of compliance and operations personnel, and that any economies of scale are shared with the Funds in this manner. The Board thus determined to continue monitoring for potential economies of scale, but concluded that, at present, they were not a material factor for the Board to consider.
Conclusion. The Board did not identify any single factor as being of paramount importance, and different Trustees may have given different weight to different factors. The Board reviewed a memorandum from Independent Trustee counsel discussing the legal standards applicable to its consideration of the Agreements. The Board noted that, as in the past, it would continue to monitor the Funds at its regular meetings and outside of the Board meetings. Based on its review, including consideration of each of the factors referenced above, the Board determined, in the exercise of its reasonable business judgment, that the advisory and subadvisory arrangements, as outlined in the Agreements, were reasonable in light of the factors considered by the Board.
123
Approval of New Fund Advisory Agreements & Board Considerations (Unaudited)(continued)
At an in-person meeting on March22, 2019, the Board of Trustees (“Board”) of the KraneShares Trust (“Trust”), including a majority of the Trustees who are not “interested persons” of the Trust, as that term is defined in the Investment Company Act of 1940, as amended (the “1940 Act”), approved the investment advisory agreement (“Advisory Agreement”) between Krane Funds Advisors, LLC (“Krane”) and the Trust with respect to KraneShares MSCI Emerging Markets ex China Index ETF (“KEMX”) (the “Agreement”).
In advance of the meeting, the Board considered that the evaluation process with respect to Krane is an ongoing one and, in this regard, noted that it considers information at each regularly scheduled meeting related to, among other matters, the services provided by Krane to each operational series of the Trust. The Board also noted that it receives additional information from Krane outside of the regularly scheduled Board meetings and at executive sessions held by the Independent Trustees.
In evaluating the Agreement, the Board considered, among other matters: (1) the nature, extent, and quality of the services to be provided by Krane; (2) the proposed compensation to be paid under the Agreement; (3) the estimated costs of the services to be provided by Krane and Krane’s profitability expectations with respect to its services to KEMX; (4) the extent to which economies of scale could be realized by Krane as KEMX grows and whether the Agreement would enable investors to share in the benefits of economies of scale; and (5) other benefits Krane anticipated it may receive from its relationship with KEMX.
Nature, Extent, and Quality of Services
Based on the written and oral reports received by the Board prior to and at the March22, 2019 meeting, including in executive session, the Board considered the nature, quality, and extent of the overall services to be provided by Krane under the Agreement. Among other things, the Board considered the personnel, experience and resources of Krane, and the ability of each to provide or obtain such services as may be necessary to manage KEMX. The Board took note of the qualifications, background and responsibilities of the senior personnel that would provide services to KEMX, and recent senior compliance personnel hired by Krane. The Board recognized that Krane had invested significant time and effort in structuring the Trust and KEMX, obtaining the necessary exemptive relief from the U.S. Securities and Exchange Commission, assessing the market appeal of KEMX’s investment strategies, and arranging service providers. The Board also considered the financial condition of Krane, and its current ownership structure. The Board noted that Krane is part of a larger family of investment management firms with significant resources.
The Board considered that Krane would be responsible for establishing and monitoring KEMX’s investment programs and carrying out directives of the Board. The Board noted that Krane would be responsible for the day-to-day investment activities of KEMX. The Board also considered the securities lending services that Krane may provide to KEMX under the Advisory Agreement. The Board considered that the Krane portfolio managers currently successfully manage a number of other funds. The Board considered that Krane has undertaken to continue to evaluate their existing compliance and operational staff and to seek and retain qualified staff in these areas as their businesses continue to grow.
Investment Performance
The Board noted that, because KEMX had not yet commenced investment operations, they had no investment performance. The Board considered that, once KEMX commences operations, it would receive regular reports regarding the performance of KEMX relative to their peer funds, including
124
Approval of New Fund Advisory Agreements & Board Considerations (Unaudited)(continued)
tracking error of KEMX compared to its peer funds. The Board also considered its experience with Krane’s management of existing operational series of the Trust that pursue different investment strategies and Krane’s significant experience in managing portfolios with various investment objectives.
Compensation
The Board reviewed and considered the compensation proposed to be received by Krane under the Advisory Agreement in light of the nature, quality, and extent of the services to be provided by Krane. The Board received written presentations from Krane prior to and at the March22, 2019 meeting and had the opportunity to ask questions of senior representatives of Krane at the March22, 2019 meeting. The Board considered that Krane has entered into a unitary advisory fee arrangement with KEMX, under which Krane, and not KEMX, is responsible for paying many of KEMX’s expenses, including those of KEMX’s principal service providers, and considered the information provided by Krane regarding the amounts that would be paid by it to KEMX’s service providers under the arrangement.
The Board noted that the proposed advisory fee rate for KEMX under Schedule A of the Advisory Agreement (“advisory fee rate”) was in line with the peer group funds identified by Krane (“peer group funds”), and the proposed advisory fee rate for KSCD was below the peer group funds. The Board considered Krane’s representations regarding the competitive marketplace for KEMX, including Krane’s evaluation of its fees compared to other market participants.
The Board also considered the compensation paid to Krane by other advisory clients, including existing operational series of the Trust, as compared to KEMX. The Board recognized that Krane may receive additional compensation resulting from any securities lending-related services it provides to KEMX under Schedule B to the Advisory Agreement. The Board took note that it was not possible to estimate what such compensation might amount to and that such compensation would be monitored to ensure it is appropriate in light of the services to be provided by Krane.
Costs and Profitability
The Board considered the estimated cost of services and profitability of Krane with respect to KEMX. The Board noted that, because KEMX had not yet launched, it was difficult to estimate how profitable Krane’s services to KEMX under the Advisory Agreement would be to Krane. The Board received information from Krane regarding its financial stability and its profitability and had an opportunity to pose questions to Krane’s chief executive officer (“CEO”) and other senior members of management related to these matters, Krane’s broader business strategy and how launching KEMX could impact Krane’s profitability. The Board considered information from Krane regarding the range of assets KEMX was expected to gather and at what level of assets it expected its services to KEMX to become profitable. The Board also considered information previously provided by Krane regarding the cost of its services and profitability with respect to the existing operational series of the Trust and the similarities and differences between those series and KEMX. The Board noted Krane’s commitment to KEMX, including its proposal of a unitary fee structure under which Krane will bear many of KEMX’s expenses.
Other Benefits
The Board considered the extent to which Krane would derive ancillary benefits from KEMX’s operations, including potential benefits to Krane as a result of its ability to use the assets of KEMX to engage in soft-dollar transactions and that Krane could potentially benefit from any trades in KEMX
125
Approval of New Fund Advisory Agreements & Board Considerations (Unaudited)(concluded)
conducted through a broker-dealer affiliated with the majority owner of Krane. The Board did not observe any other potential benefits to be realized by Krane from its relationship with KEMX.
Economies of Scale
The Board considered whether Krane would realize economies of scale with respect to its services to KEMX as it grows larger, including the extent to which this would be reflected in the level of fees to be paid by KEMX to Krane. The Board noted that the proposed advisory fees for KEMX do not include breakpoints, and that it was difficult — before the commencement of investment operations — to accurately evaluate potential economies of scale. The Board took note, however, that Krane consistently reinvests a portion of its profits in its business, including through the addition of additional compliance and operations personnel, and that such reinvestment benefits the Trust. Based on these and other considerations, including that KEMX was newly organized, the Board considered economies of scale not to be a material factor in its consideration of the Advisory Agreement.
Conclusion
The Board did not identify any single factor as being of paramount importance, and different Trustees may have given different weight to different factors. The Board reviewed a memorandum from Independent Trustee counsel discussing the legal standards applicable to its consideration of the Agreement. The Independent Trustees met in executive session with Krane’s CEO and Independent Trustee counsel to address such standards and recent developments in this area of the law, and to consider Krane’s financial stability and strategic initiatives and to consider how KEMX and other strategic initiatives would impact Krane’s business and staffing. The Board noted that, once KEMX becomes operational, it will continue to monitor KEMX at its regular meetings, during executive sessions of the Independent Trustees, and outside of the Board meetings. Based on its review, including consideration of each of the factors referenced above, the Board determined, in the exercise of its reasonable business judgment, that the advisory arrangements as outlined in the Agreement, was reasonable.
126
As a shareholder of a Fund, you incur two types of costs: (1) transaction costs, including brokerage expenses; and (2) ongoing costs. All Exchange Traded Funds (“ETFs”) have operating expenses. As a shareholder of an ETF, your investment is affected by these ongoing costs, which include (among others) costs for ETF management, administrative services, commissions, and shareholder reports like this one. It is important for you to understand the impact of these costs on your investment returns. In addition, a shareholder is responsible for brokerage fees as a result of their investment in the Fund.
Operating expenses such as these are deducted from an ETF’s gross income and directly reduce its final investment return. These expenses are expressed as a percentage of the ETF’s average net assets; this percentage is known as the ETF’s expense ratio.
The following examples use the expense ratio and are intended to help you understand the ongoing costs (in dollars) of investing in your Fund and to compare these costs with those of other funds. The examples are based on an investment of $1,000 made at the beginning of the period shown and held for the entire period (April1, 2019 to September30, 2019).
The table on the next page illustrates your Fund’s costs in two ways:
Actual Fund Return. This section helps you to estimate the actual expenses that your Fund incurred over the period. The “Expenses Paid During Period” column shows the actual dollar expense cost incurred by a $1,000 investment in the Fund, and the “Ending Account Value” number is derived from deducting that expense cost from the Fund’s gross investment return.
You can use this information, together with the actual amount you invested in the Fund, to estimate the expenses you paid over that period. Simply divide your actual account value by $1,000 to arrive at a ratio (for example, an $8,600 account value divided by $1,000 = 8.6), then multiply that ratio by the number shown for your Fund under “Expenses Paid During Period.”
Hypothetical 5% Return. This section helps you compare your Fund’s costs with those of other funds. It assumes that the Fund had an annual 5% return before expenses during the year, but that the expense ratio (Column 3) for the period is unchanged. This example is useful in making comparisons because the Securities and Exchange Commission requires all funds to make this 5% calculation. You can assess your Fund’s comparative cost by comparing the hypothetical result for your Fund in the “Expenses Paid During Period” column with those that appear in the same charts in the shareholder reports for other funds.
NOTE: Because the return is set at 5% for comparison purposes — NOT your Fund’s actual return — the account values shown may not apply to your specific investment.
Please note that the expenses shown in the table are meant to highlight your ongoing costs only and do not reflect any transactional costs, including brokerage commissions on the purchases and sale of Fund shares. Therefore, the expense examples are useful in comparing ongoing costs only, and will not help you determine the relative total costs of owning different funds. If these transactional costs had been included, your costs would have been higher.
127
Disclosure of Fund Expenses (Unaudited)(concluded)
Beginning | Ending | Annualized | Expenses | ||||||||
KraneShares CICC China Leaders 100 Index ETF | |||||||||||
Actual Fund Return | $ | 1,000.00 | $ | 932.90 | 0.69% | $ | 3.33 | ||||
Hypothetical 5% Return |
| 1,000.00 |
| 1,021.55 | 0.69 |
| 3.49 | ||||
KraneShares CSI China Internet ETF | |||||||||||
Actual Fund Return | $ | 1,000.00 | $ | 880.50 | 0.73% | $ | 3.43 | ||||
Hypothetical 5% Return |
| 1,000.00 |
| 1,021.35 | 0.73 |
| 3.69 | ||||
KraneShares Bosera MSCI China A Share ETF | |||||||||||
Actual Fund Return | $ | 1,000.00 | $ | 941.30 | 0.60% | $ | 2.89 | ||||
Hypothetical 5% Return |
| 1,000.00 |
| 1,022.03 | 0.60 |
| 3.01 | ||||
KraneShares E Fund China Commercial Paper ETF | |||||||||||
Actual Fund Return | $ | 1,000.00 | $ | 953.20 | 0.57% | $ | 2.78 | ||||
Hypothetical 5% Return |
| 1,000.00 |
| 1,022.15 | 0.57 |
| 2.88 | ||||
KraneShares MSCI All China Index ETF |
|
|
| ||||||||
Actual Fund Return | $ | 1,000.00 | $ | 919.50 | 0.51% | $ | 2.45 | ||||
Hypothetical 5% Return |
| 1,000.00 |
| 1,022.45 | 0.51 |
| 2.58 | ||||
KraneShares MSCI One Belt One Road Index ETF | |||||||||||
Actual Fund Return | $ | 1,000.00 | $ | 957.80 | 0.79% | $ | 3.87 | ||||
Hypothetical 5% Return |
| 1,000.00 |
| 1,021.05 | 0.79 |
| 3.99 | ||||
KraneShares Emerging Markets Consumer Technology Index ETF | |||||||||||
Actual Fund Return | $ | 1,000.00 | $ | 947.30 | 0.80% | $ | 3.91 | ||||
Hypothetical 5% Return |
| 1,000.00 |
| 1,021.00 | 0.80 |
| 4.04 | ||||
KraneShares MSCI China Environment Index ETF | |||||||||||
Actual Fund Return | $ | 1,000.00 | $ | 858.00 | 0.79% | $ | 3.67 | ||||
Hypothetical 5% Return |
| 1,000.00 |
| 1,021.05 | 0.79 |
| 3.99 | ||||
KraneShares Electric Vehicles and Future Mobility Index ETF | |||||||||||
Actual Fund Return | $ | 1,000.00 | $ | 998.50 | 0.72% | $ | 3.60 | ||||
Hypothetical 5% Return |
| 1,000.00 |
| 1,021.40 | 0.72 |
| 3.64 | ||||
KraneShares MSCI All China Healthcare Index ETF | |||||||||||
Actual Fund Return | $ | 1,000.00 | $ | 948.00 | 0.72% | $ | 3.51 | ||||
Hypothetical 5% Return |
| 1,000.00 |
| 1,021.40 | 0.72 |
| 3.64 | ||||
KraneShares CCBS China Corporate High Yield Bond USD Index ETF | |||||||||||
Actual Fund Return | $ | 1,000.00 | $ | 1,018.50 | 0.69% | $ | 3.48 | ||||
Hypothetical 5% Return |
| 1,000.00 |
| 1,021.55 | 0.69 |
| 3.49 | ||||
KraneShares Emerging Markets Healthcare Index ETF | |||||||||||
Actual Fund Return | $ | 1,000.00 | $ | 908.40 | 0.81% | $ | 3.86 | ||||
Hypothetical 5% Return |
| 1,000.00 |
| 1,020.95 | 0.81 |
| 4.09 | ||||
KraneShares MSCI Emerging Markets ex China Index ETF | |||||||||||
Actual Fund Return(2) | $ | 1,000.00 | $ | 973.20 | 0.49% | $ | 2.26 | ||||
Hypothetical 5% Return |
| 1,000.00 |
| 1,022.55 | 0.49 |
| 2.48 | ||||
(1) Expenses are equal to the Fund’s annualized expense ratio multiplied by the average account value over the period, multiplied by 183/366 (to reflect the one-half year period from 04/01/19-09/30/19).
(2) Expenses are equal to the Fund’s annualized expense ratio multiplied by the average account value over the period, multiplied by 171/366 (to reflect the one-half year period from 04/12/19-09/30/19).
128
Net asset value, or “NAV”, is the price per Share at which the Funds issue and redeem Shares to Authorized Participants. It is calculated in accordance with the policies described in Note 2 in Notes to Financial Statements. The “Market Price” of the Funds generally is determined using the midpoint between the highest bid and the lowest offer on the stock exchange on which the Shares of the Funds are listed for trading, as of the time that the Funds’ NAV is calculated. The Funds’ Market Price may be at, above or below their NAV. The NAV of the Funds will fluctuate with changes in the market value of their holdings. The Market Price of the Funds will fluctuate in accordance with changes in their NAV, as well as market supply and demand of Fund Shares.
Premiums or discounts are the differences (expressed as a percentage) between the NAV and Market Price of the Funds on a given day, generally at the time NAV is calculated. A premium is the amount that the Funds are trading above the reported NAV, expressed as a percentage of the NAV. A discount is the amount that the Funds are trading below the reported NAV, expressed as a percentage of the NAV. Shareholders may pay more than NAV when they buy Fund Shares and receive less than NAV when they sell those Shares, because Shares are bought and sold at Market Price.
Further information regarding premiums and discounts is available on the Funds’ website athttp://kraneshares.com. The premium and discount information contained on the website represents past performance and cannot be used to predict future results.
129
(This page intentionally left blank.)
(This page intentionally left blank.)
(This page intentionally left blank.)
![]()
KraneShares Trust:
280 Park Avenue 32nd Floor
New York, New York 10017
1-855-857-2638
http://kraneshares.com/
Investment Adviser:
Krane Funds Advisors, LLC
280 Park Avenue 32nd Floor
New York, New York 10017
Distributor:
SEI Investments Distribution Co.
One Freedom Valley Drive
Oaks, PA 19456
Administrator:
SEI Investments Global Funds Services
One Freedom Valley Drive
Oaks, PA 19456
This information must be preceded or accompanied by a current prospectus for the Funds described.
![]()
KraneShares Trust:
280 Park Avenue, 32nd Floor
New York, New York 10017
KRS-SA-001-0700
Item 2. Code of Ethics.
Not applicable for semi-annual report.
Item 3. Audit Committee Financial Expert.
Not applicable for semi-annual report.
Item 4. Principal Accountant Fees and Services.
Not applicable for semi-annual report.
Item 5. Audit Committee of Listed Registrants.
Not applicable for semi-annual report.
Item 6. Schedule of Investments.
Schedule of Investments is included as part of the Report to Shareholders filed under Item 1 of this form.
Item 7. Disclosure of Proxy Voting Policies and Procedures for Closed-End Management Investment Companies.
Not applicable to open-end management investment companies.
Item 8. Portfolio Managers of Closed-End Management Investment Companies.
Not applicable to open-end management investment companies.
Item 9. Purchases of Equity Securities by Closed-End Management Company and Affiliated Purchasers.
Not applicable to open-end management investment companies.
Item 10. Submission of Matters to a Vote of Security Holders.
There have been no changes to the procedures by which shareholders may recommend nominees to the Registrant’s Board of Trustees during the period covered by this report.
Item 11. Controls and Procedures.
(a) The Registrant’s principal executive and principal financial officers, or persons performing similar functions, have concluded that the Registrant’s disclosure controls and procedures (as defined in Rule 30a-3(c) under the Investment Company Act (17 CFR § 270.30a-3(c)) as of a date within 90 days of the filing date of the report, are effective based on the evaluation of these controls and procedures required by Rule 30a-3(b) under the Investment Company Act (17 CFR § 270.30a-3(b)) and Rules 13a-15(b) or 15d-15(b) under the Securities Exchange Act of 1934 (17 CFR § 240.13a-15(b) or § 240.15d-15(b)).
(b) There has been no change in the Registrant’s internal control over financial reporting (as defined in Rule 30a-3(d) under the 1940 Act (17 CFR § 270.30a-3(d)) that occurred during the most recent half-year period covered by this report that has materially affected, or is reasonably likely to materially affect, the Registrant’s internal control over financial reporting.
Item 12. Disclosure of Securities Lending Activities for Closed-End Management Investment Companies.
Not applicable to open-end management investment companies.
Items 13. Exhibits.
(a)(1) Not applicable for semi-annual report.
(a)(2) A certification for the principal executive officer and the principal financial officer of the Registrant as required by Rule 30a-2(a) under the 1940 Act, as amended (17 CFR 270.30a-2(a)), is filed herewith.
(b) Officer certification as required by Rule 30a-2(b) under the 1940 Act, as amended (17 CFR 270.30a-2(b)) also accompany this filing as an exhibit.
SIGNATURES
Pursuant to the requirements of the Securities Exchange Act of 1934 and the Investment Company Act of 1940, the Registrant has duly caused this report to be signed on its behalf by the undersigned, thereunto duly authorized.
| (Registrant) | KraneShares Trust | |
| By (Signature and Title) | /s/ Jonathan Krane | |
| Jonathan Krane | ||
| Principal Executive Officer |
Date: December 9, 2019
Pursuant to the requirements of the Securities Exchange Act of 1934 and the Investment Company Act of 1940, this report has been signed below by the following persons on behalf of the Registrant and in the capacities and on the dates indicated.
| By (Signature and Title) | /s/ Jonathan Krane | |
| Jonathan Krane | ||
| Principal Executive Officer |
Date: December 9, 2019
| By (Signature and Title) | /s/ Jonathan Krane | |
| Jonathan Krane | ||
| Principal Financial Officer |
Date: December 9, 2019