UNITED STATES
SECURITIES AND EXCHANGE COMMISSION
Washington, D.C. 20549
FORM N-CSR
CERTIFIED SHAREHOLDER REPORT OF REGISTERED MANAGEMENT
INVESTMENT COMPANIES
Investment Company Act File Number 811-22698
KraneShares Trust
(Exact name of registrant as specified in charter)
280 Park Avenue, 32nd Floor
New York, New York 10017
(Address of principal executive offices) (Zip code)
Jonathan Krane
KraneShares Trust
280 Park Avenue, 32nd Floor
New York, New York 10017
(Name and address of agent for service)
Copy to:
Stacy L. Fuller
K&L Gates LLP
1601 K Street NW
Washington, DC 20006-1600
Registrant’s telephone number, including area code: (212) 933-0393
Date of fiscal year end: March 31, 2023
Date of reporting period: March 31, 2023
Form N-CSR is to be used by management investment companies to file reports with the Commission not later than 10 days after the transmission to stockholders of any report that is required to be transmitted to stockholders under Rule 30e-1 under the Investment Company Act of 1940 (17 CFR 270.30e-1). The Commission may use the information provided on Form N-CSR in its regulatory, disclosure review, inspection, and policymaking roles.
A registrant is required to disclose the information specified by Form N-CSR, and Commission will make this information public. A registrant is not required to respond to the collection of information contained in Form N-CSR unless the Form displays a currently valid Office of Management and Budget (“OMB”) control number. Please direct comments concerning the accuracy of the information collection burden estimate and any suggestions for reducing the burden to Secretary, Securities and Exchange Commission, 450 Fifth Street, NW, Washington, DC 20549-0609. The OMB has reviewed this collection of information under the clearance requirements of 44 U.S.C. § 3507.
Item 1. Reports to Stockholders.
| (a) | A copy of the report transmitted to stockholders pursuant to Rule 30e-1 under the Investment Company Act, as amended (the “Act”) [17 CFR § 270.30e-1], is attached hereto. |
| (b) | Not applicable to the Registrant. |
| |  |
| | Annual Report KraneShares CICC China Leaders 100 Index ETF KraneShares CSI China Internet ETF KraneShares Bosera MSCI China A 50 Connect Index ETF KraneShares Bloomberg China Bond Inclusion Index ETF KraneShares MSCI All China Index ETF KraneShares MSCI One Belt One Road Index ETF KraneShares Emerging Markets Consumer Technology Index ETF KraneShares MSCI China Clean Technology Index ETF KraneShares Electric Vehicles and Future Mobility Index ETF KraneShares MSCI All China Health Care Index ETF KraneShares Asia Pacific High Income Bond ETF KraneShares Emerging Markets Healthcare Index ETF KraneShares MSCI Emerging Markets ex China Index ETF KraneShares MSCI China ESG Leaders Index ETF KraneShares CICC China 5G & Semiconductor Index ETF KraneShares CICC China Consumer Leaders Index ETF KraneShares SSE STAR Market 50 Index ETF KraneShares Hang Seng TECH Index ETF KraneShares China Innovation ETF KraneShares S&P Pan Asia Dividend Aristocrats Index ETF KraneShares China Internet and Covered Call Strategy ETF March 31, 2023 | | |
Table of Contents
The Funds file their complete schedules of Fund holdings with the Securities and Exchange Commission (the “Commission”) for the first and third quarters of each fiscal year as an exhibit to their reports on Form N-PORT. The Funds’ Form N-PORT reports are available on the Commission’s website at http://www.sec.gov.
A description of the policies and procedures that KraneShares Trust uses to determine how to vote proxies relating to Fund securities, as well as information relating to how the Funds voted proxies relating to Fund securities during the most recent 12-month year ended June 30, are available (i) without charge, upon request, by calling 855-857-2638; and (ii) on the Commission’s website at http://www.sec.gov.
Fund shares may only be purchased or redeemed from a Fund in Creation Unit aggregations. Investors who cannot transact in Creation Units of a Fund’s shares must buy or sell Fund shares in the secondary market at their market price, which may be at a premium or discount to a Fund’s net asset value, with the assistance of a broker. In doing so, the investor may incur brokerage commissions and may pay more than net asset value when buying Fund shares and receive less than net asset value when selling Fund shares.
Shareholder Letter (Unaudited)
Dear Shareholders:
We are pleased to send you the Annual Report for the KraneShares Trust exchange-traded funds (ETFs) for the 12-month period ended March 31, 2023 (the Period). For the Period, the ETFs delivered the following returns:
| Fund | | Fund
Return* | | | Underlying
Index
Return** | | | Morningstar
Peer Group
Median
Return | |
| KraneShares CICC China Leaders 100 Index ETF (KFYP) | | | -13.15 | % | | | -12.51 | %(a) | | | -8.11 | %(1) |
| KraneShares CSI China Internet ETF (KWEB) | | | 5.86 | % | | | 6.36 | %(b) | | | -8.11 | %(1) |
| KraneShares Bosera MSCI China A 50 Connect ETF (KBA) | | | -12.63 | % | | | -11.57 | %(c) | | | -8.11 | %(1) |
| KraneShares Bloomberg China Bond Inclusion Index ETF (KBND) | | | -3.98 | % | | | -4.82 | %(d) | | | -1.42 | %(2) |
| KraneShares MSCI All China Index ETF (KALL) | | | -6.44 | % | | | -6.44 | %(e) | | | -8.11 | %(1) |
| KraneShares MSCI One Belt One Road Index ETF (OBOR) | | | -14.98 | % | | | -14.69 | %(f) | | | -6.71 | %(3) |
| KraneShares Emerging Markets Consumer Technology Index ETF (KEMQ) | | | -15.30 | % | | | -14.47 | %(g) | | | -9.39 | %(4) |
| KraneShares MSCI China Clean Technology Index ETF (KGRN) | | | -20.71 | % | | | -21.68 | %(h) | | | -8.11 | %(1) |
| KraneShares Electric Vehicles and Future Mobility Index ETF (KARS) | | | -21.78 | % | | | -21.56 | %(i) | | | -5.11 | %(5) |
| KraneShares MSCI All China Health Care Index ETF (KURE) | | | -12.65 | % | | | -12.43 | %(j) | | | -8.11 | %(1) |
| KraneShares Asia Pacific High Income Bond ETF (KHYB) | | | -0.44 | % | | | N/A | | | | -6.55 | %(6) |
| KraneShares Emerging Markets Healthcare Index ETF (KMED) | | | -14.97 | % | | | -14.90 | %(k) | | | -9.39 | %(4) |
| KraneShares MSCI Emerging Markets ex China Index ETF (KEMX) | | | -12.12 | % | | | -13.32 | %(l) | | | -9.39 | %(4) |
| KraneShares MSCI China ESG Leaders Index ETF (KESG) | | | -10.38 | % | | | -9.62 | %(m) | | | -8.11 | %(1) |
| KraneShares CICC China 5G & Semiconductor Index ETF (KFVG) | | | -9.62 | % | | | -9.32 | %(n) | | | -8.11 | %(1) |
| KraneShares CICC China Consumer Leaders Index ETF (KBUY) | | | 1.64 | % | | | 2.32 | %(o) | | | -8.11 | %(1) |
| KraneShares SSE STAR Market 50 Index ETF (KSTR) | | | -9.97 | % | | | -8.05 | %(p) | | | -8.11 | %(1) |
| KraneShares Hang Seng TECH Index ETF (KTEC) | | | -4.37 | % | | | -5.15 | %(q) | | | -8.11 | %(1) |
| KraneShares China Innovation ETF (KGRO) | | | -6.60 | % | | | N/A | | | | -8.11 | %(1) |
| KraneShares S&P Pan Asia Dividend Aristocrats Index ETF (KDIV) | | | 6.08 | %^ | | | 6.36 | %^(r) | | | -5.14 | %(7) |
| KraneShares China Internet and Covered Call Strategy ETF (KLIP) | | | -3.56 | %^ | | | N/A | | | | -8.11 | %(1) |
| * | Return based on net asset value as of March 31, 2023. |
| ** | Return as of March 31, 2023. |
| ^ | Return period since Fund inception (less than one-year period). |
Shareholder Letter (Unaudited) (continued)
| (a) | The CSI CICC Select 100 Index. |
| (b) | The CSI Overseas China Internet Index. |
| (c) | The MSCI China A 50 Connect Index. |
| (d) | The Bloomberg China Inclusion Focused Bond Index. |
| (e) | The MSCI China All Shares Index. |
| (f) | The MSCI Global China Infrastructure Exposure Index. |
| (g) | The Solactive Emerging Markets Consumer Technology Index. |
| (h) | The MSCI China IMI Environment 10/40 Index. |
| (i) | The Bloomberg Electric Vehicles Index. |
| (j) | The MSCI All Shares Health Care 10/40 Index. |
| (k) | The Solactive Emerging Markets Healthcare Index. |
| (l) | The MSCI Emerging Markets ex China Index. |
| (m) | The MSCI China ESG Leaders 10/40 Index. |
| (n) | The CICC China 5G and Semiconductor Leaders Index. |
| (o) | The CICC China Consumer Leaders Index. |
| (p) | The Shanghai Stock Exchange Science and Technology Innovation Board 50 Index. |
| (q) | The Hang Seng TECH Index. |
| (r) | The S&P Pan Asia Dividend Aristocrats Index. |
Morningstar Peer Group Information
| | Morningstar Peer Group Median | | Morningstar Peer Group Name | | Morningstar Peer Group Description |
| (1) | -8.11% | | U.S. ETF China Region | | The Morningstar Fund China Region Category portfolios invest almost exclusively in stocks from China, Taiwan, and Hong Kong. These portfolios invest at least 70% of total assets in equities and invest at least 75% of stock assets in one specific region or a combination of China and/or Taiwan. |
| | | | | | |
| (2) | -1.42% | | U.S. ETF Emerging Markets Local Currency Bond | | The Morningstar Fund Emerging Markets Local Currency Bond Category portfolios invest more than 65% of their assets in foreign bonds from developing countries in the local currency. Funds in this category have a mandate to maintain exposure to currencies of emerging markets. The largest portion of the emerging markets bond market comes from Latin America, followed by Eastern Europe, Africa, the Middle East, and Asia. |
| | | | | | |
| (3) | -6.71% | | U.S. ETF Infrastructure | | The Morningstar Fund Infrastructure Category portfolios invest more than 60% of their assets in stocks of companies engaged in infrastructure activities. Industries considered to be part of the infrastructure sector include oil & gas midstream; waste management; airports; integrated shipping; railroads; shipping & ports; trucking; engineering & construction; infrastructure operations; and the utilities sector. |
Shareholder Letter (Unaudited) (continued)
| | Morningstar Peer Group Median | | Morningstar Peer Group Name | | Morningstar Peer Group Description |
| (4) | -9.39% | | U.S. ETF Diversified Emerging Markets | | The Morningstar Fund Diversified Emerging Markets Category portfolios tend to divide their assets among 20 or more nations, although they tend to focus on the emerging markets of Asia and Latin America rather than those of the Middle East, Africa, or Europe. These portfolios invest predominantly in emerging market equities, but some funds also invest in both equities and fixed income instruments among emerging markets. |
| | | | | | |
| (5) | -5.11% | | U.S. ETF Industrials | | The Morningstar Fund Industrials Category portfolios seek capital appreciation by investing inequity securities of U.S. or non-U.S. companies that are engaged in services related to cyclical industries. This includes and is not limited to companies in aerospace and defense, automotive, chemicals, construction, environmental services, machinery, paper, and transportation. |
| | | | | | |
| (6) | -6.55% | | U.S. ETF Emerging Markets Bond | | The Morningstar Fund Emerging Markets Bond portfolios invest more than 65% of their assets in foreign bonds from developing countries. The largest portion of the emerging-markets bond market comes from Latin America, followed by Eastern Europe. Africa, the Middle East, and Asia make up the rest. |
| | | | | | |
| (7) | -5.14% | | U.S. ETF Diversified Pacific/Asia | | The Morningstar Fund Diversified Pacific/Asia Category portfolios have a wider investment range than other Asia-oriented portfolios. These portfolios can invest throughout the Pacific Rim, including Australia and New Zealand. As a results, country weightings for these portfolios vary tremendously, though most retain some exposure to Japan and Hong Kong. These portfolios invest at least 70% of their total assets in equities and invest at least 75% of assets in Pacific countries, including at least 10% in Japan. |
We are encouraged by recent developments in China’s capital markets. The challenging macroeconomic environment and resulting volatility in global equity markets that ensued over the past year led many U.S. and global investors to seek diversified sources of return, including China equities.
| ● | We believe that China’s capital markets will continue to grow and become an essential element of a well-designed investment portfolio. |
| ● | We believe that investors should have low-cost, transparent tools to obtain exposure to China’s equity and fixed income markets. |
| ● | China’s National Party Congress (NPC), held last year, resulted in positive policy changes including the removal of COVID restrictions and the provision of support for the real estate industry. |
| ● | We believe the further development of China’s capital markets offers a long-term value proposition. |
Shareholder Letter (Unaudited) (concluded)
| ● | We are dedicated to helping investors obtain more complete passive and active market exposures and more balanced investment portfolios that include exposure to China. |
Thank you for investing with us.
Jonathan Krane, CEO
March 31, 2023
Management Discussion of Fund Performance (Unaudited)
KraneShares CICC China Leaders 100 Index ETF
The KraneShares CICC China Leaders 100 Index ETF (the Fund) seeks to provide investment results that, before fees and expenses, correspond generally to the price and yield performance of the CSI CICC Select 100 Index (the Underlying Index).
The Underlying Index takes a smart-beta approach to systematically investing in companies listed in Mainland China. This quantitative approach reflects CICC’s top down and bottom-up research process, seeking to deliver the 100 leading companies in Mainland China.
China A Share Leaders Review
During the 12-month period ended March 31, 2023 (the Period), the Fund’s holdings were somewhat skewed towards growth and consumer industries. As a result, they were negatively impacted by China’s pandemic lockdowns at the beginning of the Period. Furthermore, declines in the prices of equities of real estate developers in connection with the government’s campaign to deleverage real estate developers also negatively impacted the Fund’s performance for the Period.
Still, during the Period the Fund outperformed the broader China equity market, as represented by the MSCI China Index. Further, we remain confident in the smart-beta approach to investing in China’s onshore (A Share/Mainland) equity market and CICC’s research process as represented in the Underlying Index, including because the Underlying Index generated a return profile that was significantly less volatile than the MSCI China Index during the Period.
The best performing sector within the Fund was Communication Services. Meanwhile, companies in the Real Estate sector detracted the most of any single sector from the Fund’s performance.
For the Period, the NAV of the Fund decreased by -13.15% while the Underlying Index decreased by -12.51%. The deviation between the Fund’s performance and that of the Underlying Index can be mainly attributed to management fees.
Management Discussion of Fund Performance (Unaudited) (continued)
KraneShares CICC China Leaders 100 Index ETF (continued)
Growth of a $10,000 Investment‡
(at Net Asset Value)‡

AVERAGE ANNUAL TOTAL RETURNS FOR THE PERIOD ENDED MARCH 31, 2023*
| | | One Year
Return | | | Three Year
Return | | | Five Year
Return | | | Annualized
Inception to Date | |
| | | Net
Asset
Value | | | Market
Price^ | | | Net
Asset
Value | | | Market
Price^ | | | Net
Asset
Value | | | Market
Price^ | | | Net
Asset
Value | | | Market
Price^ | |
| KraneShares CICC China Leaders 100 Index ETF | | | -13.15 | % | | | -12.86 | %‡ | | | 4.78 | %‡ | | | 5.20 | %‡ | | | 0.47 | %‡ | | | 0.67 | %‡ | | | 7.13 | %‡ | | | 7.08 | %‡ |
| Hybrid KFYP Index (Net)** | | | N/A | | | | -12.51 | %‡ | | | N/A | | | | 6.54 | %‡ | | | N/A | | | | 1.66 | %‡ | | | N/A | | | | 7.47 | %‡ |
| S&P 500 Index | | | N/A | | | | -7.73 | %‡ | | | N/A | | | | 18.60 | %‡ | | | N/A | | | | 11.19 | %‡ | | | N/A | | | | 11.68 | %‡ |
| * | The Fund commenced operations on July 22, 2013. |
| ** | The Hybrid KFYP Index (Net) consists of the CSI China Overseas Five Year Plan Index from the inception of the Fund through May 31, 2016, the Zacks New China Index from June 1, 2016 through November 1, 2018, and the CSI CICC Select 100 Index going forward. From June 1, 2016 to November 1, 2018, the Fund sought to provide investment results that, before fees and expenses, corresponded generally to the price and yield performance of the Zacks New China Index. Prior to June 1, 2016, the Fund was known as the KraneShares CSI New China ETF and sought to provide investment results that, before fees and expenses, corresponded generally to the price and yield performance of the CSI Overseas China Five Year Plan Index. Hybrid KFYP Index (Net) reflects reinvested dividends net of withholding taxes, but reflects no deduction for fees, expenses, or other taxes. |
| ‡ | Unaudited. |
| ^ | Beginning December 23, 2020, market price returns are based on the official closing price of an ETF share or, if it more accurately reflects the market value of an ETF share at the time as of which the ETF calculates current NAV per share, the midpoint between the national best bid and national best offer (“NBBO”) as of that time. Prior to that date, market price returns were based on the midpoint between the Bid and Ask price. NAVs are calculated using prices as of 4:00 PM Eastern Time. |
Management Discussion of Fund Performance (Unaudited) (continued)
KraneShares CICC China Leaders 100 Index ETF (concluded)
The performance data quoted herein represents past performance and the return and value of an investment in the Fund will fluctuate so that, when redeemed, shares may be worth less than their original cost. Current performance may be lower or higher than the performance data quoted. Past performance is no guarantee of future performance and should not be considered as a representation of the future results of the Fund. For performance data current to the most recent month end, please call 855-857-2638 or visit www.kraneshares.com. The Fund’s performance assumes the reinvestment of all dividends and all capital gains. Index returns assume reinvestment of dividends and, unlike a Fund’s returns, do not reflect any fees or expenses. If such fees and expenses were included in the index returns, the performance would have been lower. As stated in the Fund’s prospectus, the Fund’s operating expense ratio is 0.68%. Please note that one cannot invest directly in an unmanaged index. There are no assurances that the Fund will meet its stated objectives. The Fund’s holdings and allocations are subject to change and should not be considered recommendations to buy individual securities. For further information on the Fund’s objectives, risks, and strategies, see the Fund’s prospectus. Returns shown do not reflect the deduction of taxes that a shareholder would pay on Fund distributions or the redemption of Fund shares.
Management Discussion of Fund Performance (Unaudited) (continued)
KraneShares CSI China Internet ETF
The KraneShares CSI China Internet ETF (the Fund) seeks to provide investment results that, before fees and expenses, correspond generally to the price and yield performance of the CSI Overseas China Internet Index (the Underlying Index).
The Underlying Index is designed to measure the performance of the investable universe of publicly traded, China-based companies whose primary business or businesses are in the Internet and Internet-related sectors (China Internet Companies), as defined by the index sponsor, China Securities Index Co., Ltd. (CSI).
China Internet Review
Although global markets saw declines due to rising global interest rates, U.S. and Hong Kong-listed stocks of Chinese internet issuers saw positive catalysts during the 12-month period ended March 31, 2023 (the Period) as many of the geopolitical and policy-related issues that had been weighing on the sector in prior periods were resolved. We believe that the two most important developments for the sector during the Period were the China government’s removal of pandemic restrictions and the achievement of full access to the audit books of U.S.-listed, China-based firms by the U.S. Public Company Accounting Oversight Board (PCAOB).
Following the National Party Congress, held in October of 2022, China’s government removed all domestic, pandemic-related restrictions. This development improved the outlook for China’s consumer market and led to a rebound in the stock price of certain China Internet Companies.
On December 15th, 2022, the PCAOB announced that the agency had secured complete access to inspect and investigate China-based firms and their auditors for the first time in history. This announcement was significant for China Internet Companies, many of which are listed publicly in the U.S., because the U.S. Congress in 2022, required U.S.-listed foreign companies to allow the PCAOB to inspect their audit books to remain listed publicly on U.S. exchanges. This development significantly reduced the risk of the American depositary receipts (ADRs) of China Internet Companies being delisted from U.S. exchanges.
We see three potential positive catalysts for China Internet Companies in the year to come:
| ● | We believe that The People’s Bank of China (PBOC) is likely to maintain a dovish monetary policy stance, to the benefit of growth equities. |
| ● | China retail sales increased +10.6% year-over-year (YoY) in March, setting the stage for a potential rebound in consumer spending this year, which we would expect to benefit China Internet Companies. |
| ● | Alibaba’s recent restructuring into six separate business groups, each individually able to raise capital, indicates the company’s focus on generating shareholder value; and a resulting IPO would likely result in at least one new issuer, which would be included in the Fund in the future. |
China capital market overview (April 1, 2022 to March 31, 2023)
| ● | China’s equity market, as measured by the MSCI China All Shares Index, was down for the Period, returning -6.44%, while China’s currency, the Renminbi (RMB) depreciated -8.4% against the U.S. dollar. |
| ● | The best-performing sectors across China’s equity markets included Energy (+23.08%), Communication Services (+8.93%), and Utilities (+0.18%). |
Management Discussion of Fund Performance (Unaudited) (continued)
KraneShares CSI China Internet ETF (continued)
| ● | The worst-performing sectors across China’s equity markets included Real Estate (-29.55%), Materials (-18.28%), and Information Technology (-10.98%). |
For the Period, the NAV of the Fund increased by 5.86%, while the Underlying Index increased by 6.36%. The deviation between the Fund’s performance and that of the Underlying Index can be mainly attributed to management fees.
Management Discussion of Fund Performance (Unaudited) (continued)
KraneShares CSI China Internet ETF (continued)
Growth of a $10,000 Investment‡
(at Net Asset Value)‡

AVERAGE ANNUAL TOTAL RETURNS FOR THE PERIOD ENDED MARCH 31, 2023*
| | | One Year
Return | | | Three Year
Return | | | Five Year
Return | | | Annualized
Inception to Date | |
| | | Net
Asset
Value | | | Market
Price^ | | | Net
Asset
Value | | | Market
Price^ | | | Net
Asset
Value | | | Market
Price^ | | | Net
Asset
Value | | | Market
Price^ | |
| KraneShares CSI China Internet ETF | | | 5.86 | % | | | 9.40 | %‡ | | | -9.30 | %‡ | | | -9.38 | %‡ | | | -10.61 | %‡ | | | -10.67 | %‡ | | | 3.83 | %‡ | | | 3.81 | %‡ |
| CSI Overseas China Internet | | | N/A | | | | 6.36 | %‡ | | | N/A | | | | -8.78 | %‡ | | | N/A | | | | -10.18 | %‡ | | | N/A | | | | 4.04 | %‡ |
| S&P 500 Index | | | N/A | | | | -7.73 | %‡ | | | N/A | | | | 18.60 | %‡ | | | N/A | | | | 11.19 | %‡ | | | N/A | | | | 11.77 | %‡ |
| * | The Fund commenced operations on July 31, 2013. |
| ‡ | Unaudited. |
| ^ | Beginning December 23, 2020, market price returns are based on the official closing price of an ETF share or, if it more accurately reflects the market value of an ETF share at the time as of which the ETF calculates current NAV per share, the midpoint between the national best bid and national best offer (“NBBO”) as of that time. Prior to that date, market price returns were based on the midpoint between the Bid and Ask price. NAVs are calculated using prices as of 4:00 PM Eastern Time. |
The performance data quoted herein represents past performance and the return and value of an investment in the Fund will fluctuate so that, when redeemed, shares may be worth less than their original cost. Current performance may be lower or higher than the performance data quoted. Past performance is no guarantee of future performance and should not be considered as a representation of the future results of the Fund. For performance data current to the most recent month end, please call 855-857-2638 or visit www.kraneshares.com. The Fund’s performance assumes the reinvestment of all dividends and all capital gains. Index returns assume reinvestment of dividends and, unlike a Fund’s returns, do not reflect any fees or expenses. If such fees and expenses were included in the index returns, the performance would have been lower. As stated in the Fund’s prospectus, the Fund’s operating expense ratio is 0.69%. Please note that one cannot invest directly in an unmanaged index. There are no assurances that the Fund will meet its stated objectives. The Fund’s holdings and allocations are subject to change and should not be considered recommendations to buy individual securities. For further information on the
Management Discussion of Fund Performance (Unaudited) (continued)
KraneShares CSI China Internet ETF (concluded)
Fund’s objectives, risks, and strategies, see the Fund’s prospectus. Returns shown do not reflect the deduction of taxes that a shareholder would pay on Fund distributions or the redemption of Fund shares.
Management Discussion of Fund Performance (Unaudited) (continued)
KraneShares Bosera MSCI China A 50 Connect Index ETF
The KraneShares Bosera MSCI China A 50 Connect Index ETF (the Fund) seeks to provide investment results that, before fees and expenses, correspond generally to the price and yield performance of the MSCI China A 50 Connect Index (the Underlying Index).
The Underlying Index is constructed from the MSCI China A Index (the Parent Index), a broad-based benchmark index, which captures large and mid-cap China A shares listed on the Shanghai and Shenzhen exchanges and accessible through the Northbound Stock Connect channel. The Underlying Index aims to reflect the performance of the 50 largest securities representing each Global Industry Classification Standard (GICS®) sector and reflecting the sector weight allocation of the Parent Index.
China A Share Review
Several macroeconomic headwinds impacted the Fund’s performance during the 12-month period ended March 31, 2023 (the Period), including a slump in consumer demand stemming from pandemic restrictions in China and the strengthening of the U.S. dollar due to the most aggressive interest rate hiking cycle in history from the U.S. Federal Reserve, which weighed on the value of assets denominated in currencies other than the U.S. Dollar, including China’s Renminbi. Although pandemic restrictions were removed during the period, benefiting consumer-oriented holdings, the Fund’s holdings in other sectors, such as Information Technology and Financials, nonetheless detracted from its overall performance for the period.
We see three potential positive catalysts for China’s A share equity market in the year to come:
| ● | We believe that there will be continued government support for key industries that are captured by the Fund’s holdings. |
| ● | The potential relative attractiveness of China A shares due to the dovish monetary policy stance we expect from the People’s Bank of China (PBOC) as compared to other global central banks. |
| ● | China’s retail sales increased +10.6% year-over-year in March, setting the stage for a rebound in consumer spending during the coming year, which should, in turn, lead to increased revenue for some of the companies held by the Fund, which would contribute to Fund performance. |
China capital market overview (April 1, 2022 to March 31, 2023)
| ● | China’s equity market, as measured by the MSCI China All Shares Index, was down for the period returning -6.44%, while China’s currency, the renminbi (RMB) depreciated -8.4% against the U.S. dollar. |
| ● | The best-performing sectors across China’s equity markets included Energy (+23.08%), Communication Services (+8.93%), and Utilities (+0.18%). |
| ● | The worst-performing sectors across China’s equity markets included Real Estate (-29.55%), Materials (-18.28%), and Information Technology (-10.98%). |
The Fund had exposure to Communication Services and Consumer Discretionary, which contributed positively to its performance, and to Real Estate and Information Technology, which detracted from its performance. The Fund’s performance was also negatively impacted by the decline in the value of China’s currency, the Renminbi, compared to the U.S. dollar.
For the Period, the NAV of the Fund decreased by -12.63% while the Underlying Index decreased by -11.57%. The deviation between the Fund’s performance and that of the Underlying Index can be mainly attributed to management fees and currency translations.
Management Discussion of Fund Performance (Unaudited) (continued)
KraneShares Bosera MSCI China A 50 Connect Index ETF (continued)
Growth of a $10,000 Investment‡
(at Net Asset Value)‡

AVERAGE ANNUAL TOTAL RETURNS FOR THE PERIOD ENDED MARCH 31, 2023*
| | | One Year
Return | | | Three Year
Return | | | Five Year
Return | | | Annualized
Inception to Date | |
| | | Net
Asset
Value | | | Market
Price^ | | | Net
Asset
Value | | | Market
Price^ | | | Net
Asset
Value | | | Market
Price^ | | | Net
Asset
Value | | | Market
Price^ | |
| KraneShares Bosera MSCI China A 50 Connect Index ETF | | | -12.63 | % | | | -12.10 | %‡ | | | 6.45 | %‡ | | | 6.33 | %‡ | | | 1.71 | %‡ | | | 1.34 | %‡ | | | 6.03 | %‡ | | | 6.00 | %‡ |
| Hybrid KBA Index (Net)** | | | N/A | | | | -11.57 | %‡ | | | N/A | | | | 7.24 | %‡ | | | N/A | | | | 1.96 | %‡ | | | N/A | | | | 7.04 | %‡ |
| S&P 500 Index | | | N/A | | | | -7.73 | %‡ | | | N/A | | | | 18.60 | %‡ | | | N/A | | | | 11.19 | %‡ | | | N/A | | | | 11.13 | %‡ |
| * | The Fund commenced operations on March 4, 2014. |
| ** | The Hybrid KBA Index consists of the MSCI China A Index from the inception of the Fund through October 23, 2014, the MSCI China A International Index from October 23, 2014 through December 26, 2017, the MSCI China A Inclusion Index from December 27, 2017 to May 29, 2019, the MSCI China A Index from May 29, 2019 to January 5, 2022, and the MSCI China A 50 Connect Index going forward. From October 23, 2014 through December 26, 2017, the Fund sought investment results that, before fees and expenses, corresponded to the price and yield performance of the MSCI China A International Index. Prior to October 23, 2014, the Fund sought investment results that, before fees and expenses, corresponded to the price and yield performance of the MSCI China A Index. |
| ‡ | Unaudited. |
| ^ | Beginning December 23, 2020, market price returns are based on the official closing price of an ETF share or, if it more accurately reflects the market value of an ETF share at the time as of which the ETF calculates current NAV per share, the midpoint between the national best bid and national best offer (“NBBO”) as of that time. Prior to that date, market price returns were based on the midpoint between the Bid and Ask price. NAVs are calculated using prices as of 4:00 PM Eastern Time. |
The performance data quoted herein represents past performance and the return and value of an investment in the Fund will fluctuate so that, when redeemed, shares may be worth less than their original cost. Current performance may be lower or higher than the performance data quoted. Past performance is no guarantee of future performance and should not be considered as a
Management Discussion of Fund Performance (Unaudited) (continued)
KraneShares Bosera MSCI China A 50 Connect Index ETF (concluded)
representation of the future results of the Fund. For performance data current to the most recent month end, please call 855-857-2638 or visit www.kraneshares.com. The Fund’s performance assumes the reinvestment of all dividends and all capital gains. Index returns assume reinvestment of dividends and, unlike a Fund’s returns, do not reflect any fees or expenses. If such fees and expenses were included in the index returns, the performance would have been lower. As stated in the Fund’s prospectus, as supplemented, the Fund’s gross operating expense ratio is 0.79% and its net expense ratio is 0.56% due to a Fee Waiver whereby the Fund’s investment manager, Krane Funds Advisors, LLC, has contractually agreed to reduce its management fee by 0.23% of the Fund’s average daily net assets until August 1, 2023. Please note that one cannot invest directly in an unmanaged index. There are no assurances that the Fund will meet its stated objectives. The Fund’s holdings and allocations are subject to change and should not be considered recommendations to buy individual securities. For further information on the Fund’s objectives, risks, and strategies, see the Fund’s prospectus. Returns shown do not reflect the deduction of taxes that a shareholder would pay on Fund distributions or the redemption of Fund shares.
Management Discussion of Fund Performance (Unaudited) (continued)
KraneShares Bloomberg China Bond Inclusion Index ETF
The KraneShares Bloomberg China Bond Inclusion Index ETF (the Fund) seeks to provide investment results that, before expenses and fees, correspond generally to the price and yield performance of the Bloomberg China Inclusion Focused Bond Index (the Underlying Index).
The underlying index is designed to track the performance of China’s onshore, renminbi-denominated bond market.
China Investment Grade & Government Bond Market Review
China’s high-quality bonds moved lower during the 12-month period ended March 31, 2023 (the Period) primarily due to global central banks hiking interest rates while China kept rates steady, making China’s risk-free rate less attractive to investors. Nonetheless, as the People’s Bank of China’s target rates remain relatively unchanged since the end of 2021, high quality bonds were remarkably stable during the period, especially compared to high quality bonds in the U.S., realized losses on which resulted in the collapse or near-collapse of multiple banks.
We see three potential positive catalysts for China’s investment grade and government bond market going forward:
| ● | Increased demand for China’s currency, the Renminbi, stemming from the recent commitments from multiple countries, especially oil-exporters, to transact in the currency as opposed to the U.S. dollar. |
| ● | The Renminbi may also appreciate as the U.S. dollar comes down from its recent highs and as the U.S. Federal Reserve could pivot on rate hikes in the event of a recession or other market signals. |
| ● | China’s government is currently urging businesses to increase borrowing, which may lead to an increase in issuance in the high-quality corporate bond segment, which is the focus of the Fund. |
For the Period, the NAV of the Fund decreased by -3.98% while the Underlying Index decreased by -4.82%. The deviation between the Fund’s performance and that of the Underlying Index can be mainly attributed to management fees and the Fund sampling the Underlying Index rather than replicating it.
Management Discussion of Fund Performance (Unaudited) (continued)
KraneShares Bloomberg China Bond Inclusion Index ETF (continued)
Growth of a $10,000 Investment‡
(at Net Asset Value)‡

AVERAGE ANNUAL TOTAL RETURNS FOR THE PERIOD ENDED MARCH 31, 2023*
| | | One Year
Return | | | Three Year
Return | | | Five Year
Return | | | Annualized
Inception to Date | |
| | | Net
Asset
Value | | | Market
Price^ | | | Net
Asset
Value | | | Market
Price^ | | | Net
Asset
Value | | | Market
Price^ | | | Net
Asset
Value | | | Market
Price^ | |
| KraneShares Bloomberg China Bond Inclusion Index ETF | | | -3.98 | % | | | -4.04 | %‡ | | | 3.44 | %‡ | | | 3.44 | %‡ | | | 0.97 | %‡ | | | 0.90 | %‡ | | | 1.50 | %‡ | | | 1.42 | %‡ |
| Bloomberg China Inclusion Focused Bond Index | | | N/A | | | | -4.82 | %‡ | | | N/A | | | | 4.37 | %‡ | | | N/A | | | | 1.60 | %‡ | | | N/A | | | | 2.29 | %‡ |
| S&P U.S. Treasury Bill 3-6 Month Index** | | | N/A | | | | 2.57 | %‡ | | | N/A | | | | 0.90 | %‡ | | | N/A | | | | 1.49 | %‡ | | | N/A | | | | 1.12 | %‡ |
| S&P 500 Index | | | N/A | | | | -7.73 | %‡ | | | N/A | | | | 18.60 | %‡ | | | N/A | | | | 11.19 | %‡ | | | N/A | | | | 10.67 | %‡ |
| Bloomberg Global Aggregate Index | | | N/A | | | | -8.07 | %‡ | | | N/A | | | | -3.43 | %‡ | | | N/A | | | | -1.34 | %‡ | | | N/A | | | | 0.05 | %‡ |
| * | The Fund commenced operations on December 2, 2014. |
| ** | Index added to provide a fixed income benchmark for fixed income funds. |
| ‡ | Unaudited. |
| ^ | Beginning December 23, 2020, market price returns are based on the official closing price of an ETF share or, if it more accurately reflects the market value of an ETF share at the time as of which the ETF calculates current NAV per share, the midpoint between the national best bid and national best offer (“NBBO”) as of that time. Prior to that date, market price returns were based on the midpoint between the Bid and Ask price. NAVs are calculated using prices as of 4:00 PM Eastern Time. |
The performance data quoted herein represents past performance and the return and value of an investment in the Fund will fluctuate so that, when redeemed, shares may be worth less than their original cost. Current performance may be lower or higher than the performance data quoted. Past performance is no guarantee of future performance and should not be considered as a representation of the future results of the Fund. For performance data current to the most recent month end, please call 855-857-2638 or visit www.kraneshares.com. The Fund’s performance
Management Discussion of Fund Performance (Unaudited) (continued)
KraneShares Bloomberg China Bond Inclusion Index ETF (concluded)
assumes the reinvestment of all dividends and all capital gains. Index returns assume reinvestment of dividends and, unlike a Fund’s returns, do not reflect any fees or expenses. If such fees and expenses were included in the index returns, the performance would have been lower. As stated in the Fund’s prospectus, the Fund’s gross operating expense ratio is 0.68% and its net expense ratio is 0.48% due to a Fee Waiver Agreement whereby the Fund’s investment manager, Krane Funds Advisors, LLC, has contractually agreed to reduce its management fee by 0.20% of the Fund’s average daily net assets until August 1, 2023. Please note that one cannot invest directly in an unmanaged index. There are no assurances that the Fund will meet its stated objectives. The Fund’s holdings and allocations are subject to change and should not be considered recommendations to buy individual securities. For further information on the Fund’s objectives, risks, and strategies, see the Fund’s prospectus. Returns shown do not reflect the deduction of taxes that a shareholder would pay on Fund distributions or the redemption of Fund shares.
Management Discussion of Fund Performance (Unaudited) (continued)
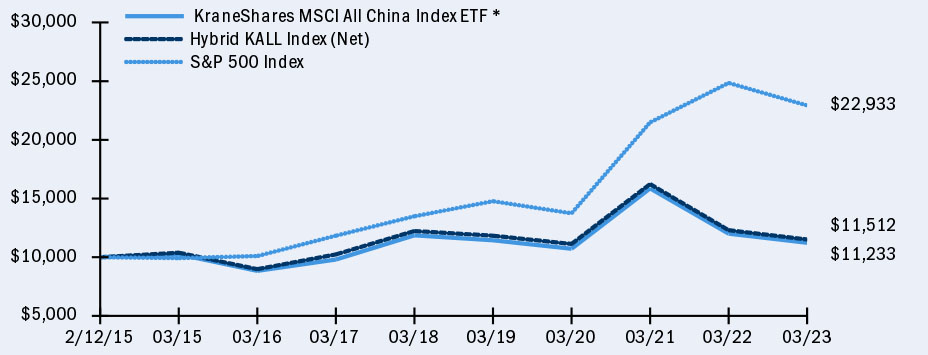
KraneShares MSCI All China Index ETF
The KraneShares MSCI All China Index ETF (the Fund) seeks to provide investment results that, before fees and expenses, correspond generally to the price and yield performance of the MSCI China All Shares Index (the Underlying Index).
The Underlying Index seeks to track the equity market performance of companies based in China and listed in Mainland China, Hong Kong, and the United States. Companies available for inclusion must be headquartered in China and meet the market capitalization minimums required by the MSCI Global Investable Market Indexes Methodology.
Broad China Equity Market Review
Offshore China equities outpaced onshore China (Mainland/A Shares) during the 12-month period ended March 31, 2023 (the Period) due to a strong rebound from 2022 lows. Meanwhile, onshore China (Mainland/A Shares) exhibited significantly less volatility, though underperformed. We believe the past 12 months’ performance disparity between onshore China (Mainland/A Shares) and offshore China demonstrates why a balanced allocation to both is important to achieve a well-rounded China allocation.
We see three potential positive catalysts for broad China equities in the year to come:
| ● | Ample liquidity in Mainland China, driven by what we expect to be dovish central bank policy in China, in contrast to the hawkish policy in the U.S. and Europe. |
| ● | The recent resolution of multiple macroeconomic headwinds that had weighed on China’s offshore equity markets in past periods. These headwinds included China’s restrictive COVID policy and the achievement of full access to the audit books of U.S.-listed China-based firms by the Public Company Accounting Oversight Board, significantly lowering the risk that certain ADRs in the Fund’s portfolio may be delisted from U.S. exchanges. |
| ● | China retail sales increased +10.6% year-over-year in March, setting the stage for a rebound in consumer spending this year, which may benefit both onshore China (Mainland/A Shares) and offshore China equities. |
China capital market overview (April 1, 2022 to March 31, 2023)
| ● | China’s equity market, as measured by the MSCI China All Shares Index, was down for the period returning -6.44%, while China’s currency, the renminbi (RMB) depreciated -8.4% against the U.S. dollar. |
| ● | The best performing sectors across China’s equity markets included Energy (+23.08%), Communication Services (+8.93%), and Utilities (+0.18%). |
| ● | The worst performing sectors across China’s equity markets included Real Estate (-29.55%), Materials (-18.28%), and Information Technology (-10.98%). |
Within the Fund, as a result, the best-performing sectors for the Period were Energy and Communication Services. Meanwhile, the worst-performing sectors were Real Estate and Materials.
For the Period, the NAV of the Fund decreased by -6.44% while the Underlying Index decreased by -6.44%.
Management Discussion of Fund Performance (Unaudited) (continued)
KraneShares MSCI All China Index ETF (continued)
Growth of a $10,000 Investment‡
(at Net Asset Value)‡
AVERAGE ANNUAL TOTAL RETURNS FOR THE PERIOD ENDED MARCH 31, 2023*
| | | One Year
Return | | | Three Year
Return | | | Five Year
Return | | | Annualized
Inception to Date | |
| | | Net
Asset
Value | | | Market
Price^ | | | Net
Asset
Value | | | Market
Price^ | | | Net
Asset
Value | | | Market
Price^ | | | Net
Asset
Value | | | Market
Price^ | |
| KraneShares MSCI All China Index ETF | | | -6.44 | % | | | -5.01 | %‡ | | | 1.55 | %‡ | | | 1.72 | %‡ | | | -1.09 | %‡ | | | -1.33 | %‡ | | | 1.44 | %‡ | | | 1.48 | %‡ |
| Hybrid KALL Index (Net)** | | | N/A | | | | -6.44 | %‡ | | | N/A | | | | 1.13 | %‡ | | | N/A | | | | -1.21 | %‡ | | | N/A | | | | 1.75 | %‡ |
| S&P 500 Index | | | N/A | | | | -7.73 | %‡ | | | N/A | | | | 18.60 | %‡ | | | N/A | | | | 11.19 | %‡ | | | N/A | | | | 10.74 | %‡ |
| * | The Fund commenced operations on February 12, 2015. |
| ** | The Hybrid KALL Index (Net) consists of the FTSE Emerging incl. China Overseas non-R/QFII GDP Weighted Index from the inception of the Fund through July 31, 2018, and the MSCI China All Shares Index going forward. Prior to July 31, 2018, the Fund was known as the KraneShares FTSE Emerging Markets Plus ETF and sought to provide investment results that, before fees and expenses, corresponded generally to the price and yield performance of the FTSE Emerging incl. China Overseas non-R/QFII GDP Weighted Index. |
| ‡ | Unaudited. |
| ^ | Beginning December 23, 2020, market price returns are based on the official closing price of an ETF share or, if it more accurately reflects the market value of an ETF share at the time as of which the ETF calculates current NAV per share, the midpoint between the national best bid and national best offer (“NBBO”) as of that time. Prior to that date, market price returns were based on the midpoint between the Bid and Ask price. NAVs are calculated using prices as of 4:00 PM Eastern Time. |
The performance data quoted herein represents past performance and the return and value of an investment in the Fund will fluctuate so that, when redeemed, shares may be worth less than their original cost. Current performance may be lower or higher than the performance data quoted. Past performance is no guarantee of future performance and should not be considered as a representation of the future results of the Fund. For performance data current to the most recent month end, please call 855-857-2638 or visit www.kraneshares.com. The Fund’s performance assumes the reinvestment of all dividends and all capital gains. Index returns assume reinvestment of dividends and, unlike a Fund’s returns, do not reflect any fees or expenses. If such fees and
Management Discussion of Fund Performance (Unaudited) (continued)
KraneShares MSCI All China Index ETF (concluded)
expenses were included in the index returns, the performance would have been lower. As stated in the Fund’s prospectus, the Fund’s gross operating expense ratio is 0.68% and its net expense ratio is 0.48% due to an a Fee Waiver whereby the Fund’s investment manager, Krane Funds Advisors, LLC, has contractually agreed to reduce its management fee by 0.20% of the Fund’s average daily net assets until August 1, 2023. Please note that one cannot invest directly in an unmanaged index. There are no assurances that the Fund will meet its stated objectives. The Fund’s holdings and allocations are subject to change and should not be considered recommendations to buy individual securities. For further information on the Fund’s objectives, risks, and strategies, see the Fund’s prospectus. Returns shown do not reflect the deduction of taxes that a shareholder would pay on Fund distributions or the redemption of Fund shares.
Management Discussion of Fund Performance (Unaudited) (continued)
KraneShares MSCI One Belt One Road Index ETF
The KraneShares MSCI One Belt One Road Index ETF (the Fund) seeks to provide investment results that, before fees and expenses, correspond generally to the price and yield performance of the MSCI Global China Infrastructure Exposure Index (the Underlying Index).
The Underlying Index aims to identify potential beneficiaries of the “Belt & Road” or “One Belt One Road” (OBOR) initiative based on how their geography, revenue, and sector attributes align with the broad theme. OBOR seeks to capture the economic growth and monetize the potential upside for the companies involved in China’s One Belt One Road initiative.
Emerging Markets/Belt & Road Review
China launched the “Belt & Road Initiative” or “One Belt One Road” (OBOR) in 2013. The Belt & Road Initiative is an infrastructure development strategy that was designed by the government to allow China to export any excess infrastructure construction capacity to other regions of the world.
The emerging markets (EM) economies included in China’s Belt & Road Initiative were adversely impacted by a steady increase in the value of the U.S. dollar during the 12-month period ended March 31, 2023 (the Period). In this regard, their U.S. dollar-denominated debts became more of a burden across the board, although certain commodity-exporting EM countries in the Belt & Road Initiative contemporaneously benefitted from rising oil prices.
The challenges faced by Belt & Road Initiative countries and issuers during the Period have included economic crises in Pakistan and Sri Lanka. These crises have threatened ongoing projects in both countries. In response, China’s Export-Import Bank has extended the deadline for repayment of principal and interest on loans to Sri Lanka by two years, and the China Development Bank has extended another $700 million in loans to Pakistan to help the country whether further challenges. Compounding the challenges for Belt & Road Initiative countries, however, has been the unclear status of Italy as a signatory within the Initiative.
Nonetheless, OBOR-related projects are likely to continue as various EM economies emerge from economic crises, and Italy’s new center-right ruling coalition may clarify the status of the partnership. Moreover, OBOR-funded energy projects in the Middle East may continue to benefit from China’s reopening and heightened prices for oil and gas.
We see three potential positive catalysts for OBOR-related equities in the year to come:
| ● | The International Monetary Fund has predicted that the growth gap between developed and emerging markets will reverse in favor of EM for the first time in nearly a decade, forecasting growth of 4% for EM in 2023 compared to 1.2% for developed markets. |
| ● | Recent events suggest to us that key state-backed lenders are ready and willing to extend additional credit and restructure debt agreements when necessary to ensure that projects are completed, which could benefit OBOR-related companies. |
| ● | The significant rise in the value of the U.S. dollar over the past year makes borrowing in Renminbi more attractive to developing countries, which may lead to continued demand for China-originated financing for infrastructure projects across the developing world, a key component of the OBOR initiative. |
Emerging Markets Overview (April 1, 2022 to March 31, 2023)
Emerging Market equities, as measured by the MSCI Emerging Markets Index, were down for the period, returning -10.39%.
Management Discussion of Fund Performance (Unaudited) (continued)
KraneShares MSCI One Belt One Road Index ETF (continued)
The best performing sectors across the Emerging Market equity market included Energy (+4.22%), Consumer Staples (-0.08%), and Consumer Discretionary (-3.86%).
The worst performing sectors across the Emerging Market equity market included Health Care (-15.02%), Materials (-15.21%), and Real Estate (-16.16%).
Within the Fund, the best-performing sectors for the period were Energy and Industrials. Meanwhile, the worst-performing sectors were Consumer Staples and Materials. At the end of the Period, the top country weights within the Fund were China, Singapore, and Kuwait.
For the Period, the NAV of the Fund decreased by -14.98% while the Underlying Index decreased by -14.69%. The deviation between the Fund’s performance and that of the Underlying Index can be mainly attributed to management fees.
Management Discussion of Fund Performance (Unaudited) (continued)
KraneShares MSCI One Belt One Road Index ETF (continued)
Growth of a $10,000 Investment‡
(at Net Asset Value)‡

AVERAGE ANNUAL TOTAL RETURNS FOR THE PERIOD ENDED MARCH 31, 2023*
| | | One Year
Return | | | Three Year
Return | | | Five Year
Return | | | Annualized
Inception to Date | |
| | | Net
Asset
Value | | | Market
Price^ | | | Net
Asset
Value | | | Market
Price^ | | | Net
Asset
Value | | | Market
Price^ | | | Net
Asset
Value | | | Market
Price^ | |
| KraneShares MSCI One Belt Road Index ETF | | | -14.98 | % | | | -15.53 | %‡ | | | 11.71 | %‡ | | | 12.05 | %‡ | | | 0.72 | %‡ | | | 0.32 | %‡ | | | 1.13 | %‡ | | | 1.05 | %‡ |
| MSCI Global China Infrastructure Exposure Index (Net) | | | N/A | | | | -14.69 | %‡ | | | N/A | | | | 12.25 | %‡ | | | N/A | | | | 1.81 | %‡ | | | N/A | | | | 2.18 | %‡ |
| S&P 500 Index | | | N/A | | | | -7.73 | %‡ | | | N/A | | | | 18.60 | %‡ | | | N/A | | | | 11.19 | %‡ | | | N/A | | | | 11.58 | %‡ |
| * | The Fund commenced operations on September 7, 2017. |
| ‡ | Unaudited. |
| ^ | Beginning December 23, 2020, market price returns are based on the official closing price of an ETF share or, if it more accurately reflects the market value of an ETF share at the time as of which the ETF calculates current NAV per share, the midpoint between the national best bid and national best offer (“NBBO”) as of that time. Prior to that date, market price returns were based on the midpoint between the Bid and Ask price. NAVs are calculated using prices as of 4:00 PM Eastern Time. |
The performance data quoted herein represents past performance and the return and value of an investment in the Fund will fluctuate so that, when redeemed, shares may be worth less than their original cost. Current performance may be lower or higher than the performance data quoted. Past performance is no guarantee of future performance and should not be considered as a representation of the future results of the Fund. For performance data current to the most recent month end, please call 855-857-2638 or visit www.kraneshares.com. The Fund’s performance assumes the reinvestment of all dividends and all capital gains. Index returns assume reinvestment of dividends and, unlike a Fund’s returns, do not reflect any fees or expenses. If such fees and expenses were included in the index returns, the performance would have been lower. As stated in the Fund’s prospectus, the Fund’s operating expense ratio is 0.78%. Please note that one cannot invest directly in an unmanaged index. There are no assurances that the Fund will meet its stated objectives. The Fund’s holdings and allocations are subject to change and should
Management Discussion of Fund Performance (Unaudited) (continued)
KraneShares MSCI One Belt One Road Index ETF (concluded)
not be considered recommendations to buy individual securities. For further information on the Fund’s objectives, risks, and strategies, see the Fund’s prospectus. Returns shown do not reflect the deduction of taxes that a shareholder would pay on Fund distributions or the redemption of Fund shares.
Management Discussion of Fund Performance (Unaudited) (continued)
KraneShares Emerging Markets Consumer Technology Index ETF
The KraneShares Emerging Markets Consumer Technology Index ETF (the Fund) seeks to provide investment results that, before fees and expenses, correspond generally to the price and yield performance of the Solactive Emerging Markets Consumer Technology Index (the Underlying Index).
The Underlying Index selects companies from 26 eligible countries within emerging markets whose primary business or businesses are internet retail, internet software/services, purchase, payment processing, or software for internet and E-Commerce transactions.
Emerging Markets Consumer Technology Review
Many emerging markets (EM) countries were adversely impacted by a steady increase in the value of the U.S. dollar during the 12-month period ended March 31, 2023 (the Period), which meant that their U.S. dollar-denominated debts became more of a burden. However, certain commodity-exporting EM countries benefitted from rising oil prices, and e-commerce companies held by the Fund, especially those which derive significant revenues from China, experienced a recovery during the Period when China removed pandemic restrictions.
The International Monetary Fund has predicted that the growth gap between developed and emerging markets will favor the latter for the first time in nearly a decade. Developed economies are anticipated to experience a slowdown in growth from 2.7% in 2022 to 1.2% and 1.4% in 2023 and 2024, respectively. On the other hand, EM economies are expected to experience growth, increasing from 3.9% in 2022 to 4.0% in 2023 and 4.3% in 2024.
We see three potential positive catalysts for EM consumer technology companies in the year to come:
| ● | The U.S. dollar may see declines in the year ahead given its current high level versus EM currencies, which may improve the economic outlook for many EM countries. |
| ● | China retail sales increased +10.6% year-over-year (YoY) in March, setting the stage for a rebound in consumer spending this year, which we expect to benefit consumer technology companies, among others. |
| ● | Alibaba’s recent restructuring into six separate business groups, each individually able to raise capital, indicates the company’s focus on generating shareholder value; and a resulting IPO would likely result in a new issuer, which would be included in the Underlying Index and Fund in the future. |
Emerging Markets Overview (April 1, 2022 to March 31, 2023)
| ● | Emerging Market equities, as measured by the MSCI Emerging Markets Index, were down for the period, returning -10.39%. |
| ● | The best performing sectors across EM equity markets included Energy (+4.22%), Consumer Staples (-0.08%), and Consumer Discretionary (-3.86%). |
| ● | The worst performing sectors across EM equity markets included Health Care (-15.02%), Materials (-15.21%), and Real Estate (-16.16%). |
Within the Fund, exposure to the Consumer Discretionary and Consumer Staples sectors contributed positively to performance, while its exposure to the Communication Services and Financials sectors detracted from performance.
Management Discussion of Fund Performance (Unaudited) (continued)
KraneShares Emerging Markets Consumer Technology Index ETF (continued)
For the Period, the NAV of the Fund decreased by -15.30% while the Underlying Index decreased by -14.47%. The deviation between the Fund’s performance and that of the Underlying Index can be mainly attributed to management fees and currency translations.
Management Discussion of Fund Performance (Unaudited) (continued)
KraneShares Emerging Markets Consumer Technology Index ETF (continued)
Growth of a $10,000 Investment‡
(at Net Asset Value)‡

AVERAGE ANNUAL TOTAL RETURNS FOR THE PERIOD ENDED MARCH 31, 2023*
| | | One Year
Return | | | Three Year
Return | | | Five Year
Return | | | Annualized
Inception to Date | |
| | | Net
Asset
Value | | | Market
Price^ | | | Net
Asset
Value | | | Market
Price^ | | | Net
Asset
Value | | | Market
Price^ | | | Net
Asset
Value | | | Market
Price^ | |
| KraneShares Emerging Markets Consumer Technology Index ETF | | | -15.30 | % | | | -14.60 | %‡ | | | -7.08 | %‡ | | | -7.32 | %‡ | | | -9.63 | %‡ | | | -9.89 | %‡ | | | -7.88 | %‡ | | | -7.96 | %‡ |
| Solactive Emerging Markets Consumer Technology Index | | | N/A | | | | -14.47 | %‡ | | | N/A | | | | -6.00 | %‡ | | | N/A | | | | -8.76 | %‡ | | | N/A | | | | -6.73 | %‡ |
| S&P 500 Index | | | N/A | | | | -7.73 | %‡ | | | N/A | | | | 18.60 | %‡ | | | N/A | | | | 11.19 | %‡ | | | N/A | | | | 11.02 | %‡ |
| * | The Fund commenced operations on October 11, 2017. |
| ‡ | Unaudited. |
| ^ | Beginning December 23, 2020, market price returns are based on the official closing price of an ETF share or, if it more accurately reflects the market value of an ETF share at the time as of which the ETF calculates current NAV per share, the midpoint between the national best bid and national best offer (“NBBO”) as of that time. Prior to that date, market price returns were based on the midpoint between the Bid and Ask price. NAVs are calculated using prices as of 4:00 PM Eastern Time. |
The performance data quoted herein represents past performance and the return and value of an investment in the Fund will fluctuate so that, when redeemed, shares may be worth less than their original cost. Current performance may be lower or higher than the performance data quoted. Past performance is no guarantee of future performance and should not be considered as a representation of the future results of the Fund. For performance data current to the most recent month end, please call 855-857-2638 or visit www.kraneshares.com. The Fund’s performance assumes the reinvestment of all dividends and all capital gains. Index returns assume reinvestment of dividends and, unlike a Fund’s returns, do not reflect any fees or expenses. If such fees and expenses were included in the index returns, the performance would have been lower. As stated in the Fund’s prospectus, the Fund’s gross operating expense ratio is 0.79% and its net expense ratio
Management Discussion of Fund Performance (Unaudited) (continued)
KraneShares Emerging Markets Consumer Technology Index ETF (concluded)
is 0.59% due to a Fee Waiver whereby the Fund’s investment manager, Krane Funds Advisors, LLC, has contractually agreed to reduce its management fee by 0.20% of the Fund’s average daily net assets until August 1, 2023.
Please note that one cannot invest directly in an unmanaged index. There are no assurances that the Fund will meet its stated objectives. The Fund’s holdings and allocations are subject to change and should not be considered recommendations to buy individual securities. For further information on the Fund’s objectives, risks, and strategies, see the Fund’s prospectus. Returns shown do not reflect the deduction of taxes that a shareholder would pay on Fund distributions or the redemption of Fund shares.
Management Discussion of Fund Performance (Unaudited) (continued)
KraneShares MSCI China Clean Technology Index ETF
The KraneShares MSCI China Clean Technology Index ETF (the Fund) seeks to provide investment results that, before fees and expenses, correspond generally to the price and yield performance of the MSCI China IMI Environment 10/40 Index (the Underlying Index).
The Underlying Index is comprised of securities that derive at least 50% of their revenues from environmentally beneficial products and services. The Underlying Index is based on five key Clean Technology environmental themes: Alternative Energy, Sustainable Water, Green Building, Pollution Prevention, and Energy Efficiency. The Underlying Index aims to serve as a benchmark for investors seeking exposure to Chinese companies that focus on contributing to a more environmentally sustainable economy by making efficient use of scarce natural resources or by mitigating the impact of environmental degradation. Constituent selection is based on data from MSCI Environment, Social, and Governance (ESG).
China Clean Technology Review:
Several macroeconomic headwinds impacted the Fund’s performance during the 12-month period ending March 31, 2023 (the Period), including the most aggressive interest rate hiking cycle in history from the U.S. Federal Reserve. On the other hand, the passage of the Inflation Reduction Act (IRA) in the U.S. favors U.S. suppliers of clean energy technologies, such as solar panels, and the clean technology companies generally held by the Fund.
The best-performing sector within the Fund was Information Technology, while the worst-performing sectors were Real Estate and Utilities. Information technology company Kingsoft Cloud was one of the best-performing companies in the Fund. Meanwhile, real estate developers YueXiu and Soho saw declines following a slump in China’s real estate sector.
We see three potential positive catalysts for China’s clean technology equities in the year to come:
| ● | Increasing domestic demand for solar panels as China ramps up its efforts to achieve peak carbon emissions by 2030 and net zero emissions by 2060. Solar currently makes up less than 5% of China’s total energy mix, but we believe that sales have the potential to increase. |
| ● | A rebound in China’s real estate development industry, which may uplift sustainable developers as well. |
| ● | China’s continued leadership in the transition to electric vehicles (EVs) as 6 million EVs were sold in the country in 2022 compared to only 2.6 million in Europe and 800,000 in the U.S. |
For the Period, the NAV of the Fund decreased by -20.71% while the Underlying Index decreased by -21.68%. The deviation between the Fund’s performance and that of the Underlying Index can be mainly attributed to management fees and currency translations.
Management Discussion of Fund Performance (Unaudited) (continued)
KraneShares MSCI China Clean Technology Index ETF (continued)
Growth of a $10,000 Investment‡
(at Net Asset Value)‡

AVERAGE ANNUAL TOTAL RETURNS FOR THE PERIOD ENDED MARCH 31, 2023*
| | | One Year
Return | | | Three Year
Return | | | Five Year
Return | | | Annualized
Inception to Date | |
| | | Net
Asset
Value | | | Market
Price^ | | | Net
Asset
Value | | | Market
Price^ | | | Net
Asset
Value | | | Market
Price^ | | | Net
Asset
Value | | | Market
Price^ | |
| KraneShares MSCI China Clean Technology Index ETF | | | -20.71 | % | | | -20.31 | %‡ | | | 20.76 | %‡ | | | 20.82 | %‡ | | | 5.81 | %‡ | | | 5.53 | %‡ | | | 4.40 | %‡ | | | 4.45 | %‡ |
| MSCI China IMI Environment 10/40 Index (Net) | | | N/A | | | | -21.68 | %‡ | | | N/A | | | | 17.38 | %‡ | | | N/A | | | | 4.21 | %‡ | | | N/A | | | | 3.01 | %‡ |
| S&P 500 Index | | | N/A | | | | -7.73 | %‡ | | | N/A | | | | 18.60 | %‡ | | | N/A | | | | 11.19 | %‡ | | | N/A | | | | 11.06 | %‡ |
| * | The Fund commenced operations on October 12, 2017. |
| ‡ | Unaudited. |
| ^ | Beginning December 23, 2020, market price returns are based on the official closing price of an ETF share or, if it more accurately reflects the market value of an ETF share at the time as of which the ETF calculates current NAV per share, the midpoint between the national best bid and national best offer (“NBBO”) as of that time. Prior to that date, market price returns were based on the midpoint between the Bid and Ask price. NAVs are calculated using prices as of 4:00 PM Eastern Time. |
The performance data quoted herein represents past performance and the return and value of an investment in the Fund will fluctuate so that, when redeemed, shares may be worth less than their original cost. Current performance may be lower or higher than the performance data quoted. Past performance is no guarantee of future performance and should not be considered as a representation of the future results of the Fund. For performance data current to the most recent month end, please call 855-857-2638 or visit www.kraneshares.com. The Fund’s performance assumes the reinvestment of all dividends and all capital gains. Index returns assume reinvestment of dividends and, unlike a Fund’s returns, do not reflect any fees or expenses. If such fees and expenses were included in the index returns, the performance would have been lower. As stated in the Fund’s prospectus, the Fund’s gross operating expense ratio is 0.78%. Please note that one cannot invest directly in an unmanaged index. There are no assurances that the Fund will meet its stated objectives. The Fund’s holdings and allocations are subject to change and should
Management Discussion of Fund Performance (Unaudited) (continued)
KraneShares MSCI China Clean Technology Index ETF (concluded)
not be considered recommendations to buy individual securities. For further information on the Fund’s objectives, risks, and strategies, see the Fund’s prospectus. Returns shown do not reflect the deduction of taxes that a shareholder would pay on Fund distributions or the redemption of Fund shares.
Management Discussion of Fund Performance (Unaudited) (continued)
KraneShares Electric Vehicles and Future Mobility Index ETF
The KraneShares Electric Vehicle and Future Mobility Index ETF (the Fund) seeks to provide investment results that, before fees and expenses, correspond generally to the price and yield performance of the Bloomberg Electric Vehicles Index (the Underlying Index).
The Underlying Index seeks to measure the performance of companies that are engaged in the production of electric vehicles, their components, or other initiatives that may change the future of mobility. This includes issuers engaged in electric vehicles, autonomous driving, lithium and/ or copper production, lithium-ion/lead acid battery production, hydrogen fuel cell manufacturing, and/or electric infrastructure businesses.
Global Electric Vehicle Market Review:
Global electric vehicles equities were mostly flat during the 12-month period ended March 31, 2023 (the Period) as higher U.S. interest rates made growth equities appear less attractive. Nonetheless, sales of electric vehicles (EVs) continued to rise. EV sales increased +60% to reach 10.3 million vehicles in 2022, up from 6.5 million vehicles in 2021. China continued to lead in sales as 6 million EVs were sold in China during 2022. Meanwhile, Europe and the U.S. tracked behind, logging sales of 2.6 million and 800,000 EVs, respectively.
We see three potential positive catalysts for EV equities in the year to come:
| ● | The passage of the Inflation Reduction Act (IRA) in the United States, which includes over $300 billion in investment in the transition from fossil fuels to renewable energy, including incentives for manufacturers and buyers of EVs. |
| ● | At least six provinces in China have launched their own EV subsidy programs following the expiration at the end of 2022 of national subsidies for purchases of new EVs. |
| ● | The potential for a pivot from the U.S. Federal Reserve on interest rate hikes and for new metals supply to come online, both of which would provide support to EV manufacturers on both a fundamental and sentimental level. |
For the Period, the NAV of the Fund decreased by -21.78% while the Underlying Index decreased by -21.56%. The deviation between the Fund’s performance and that of the Underlying Index can be mainly attributed to management fees.
Companies involved in battery production were among the best performing of the Fund’s holdings during the Period. Meanwhile, companies involved in hydrogen and fuel cell technologies, charging technologies, and vehicle production detracted the most from the Fund’s performance for the period.
Management Discussion of Fund Performance (Unaudited) (continued)
KraneShares Electric Vehicles and Future Mobility Index ETF (continued)
Growth of a $10,000 Investment‡
(at Net Asset Value)‡

AVERAGE ANNUAL TOTAL RETURNS FOR THE PERIOD ENDED MARCH 31, 2023*
| | | One Year
Return | | | Three Year
Return | | | Five Year
Return | | | Annualized
Inception to Date | |
| | | Net
Asset
Value | | | Market
Price^ | | | Net
Asset
Value | | | Market
Price^ | | | Net
Asset
Value | | | Market
Price^ | | | Net
Asset
Value | | | Market
Price^ | |
| KraneShares Electric Vehicles and Future Mobility Index ETF | | | -21.78 | % | | | -21.35 | %‡ | | | 20.30 | %‡ | | | 20.81 | %‡ | | | 7.97 | %‡ | | | 7.77 | %‡ | | | 6.20 | %‡ | | | 6.26 | %‡ |
| Hybrid KARS Index (Net)** | | | N/A | | | | -21.56 | %‡ | | | N/A | | | | 21.70 | %‡ | | | N/A | | | | 8.68 | %‡ | | | N/A | | | | 6.80 | %‡ |
| S&P 500 Index | | | N/A | | | | -7.73 | %‡ | | | N/A | | | | 18.60 | %‡ | | | N/A | | | | 11.19 | %‡ | | | N/A | | | | 9.59 | %‡ |
| * | The Fund commenced operations on January 18, 2018. |
| ** | The Hybrid KARS Index consists of the Solactive Electric Vehicles and Future Mobility Index from the inception of the Fund through June 15, 2021 and the Bloomberg Electric Vehicles Total Return Index going forward. |
| ‡ | Unaudited. |
| ^ | Beginning December 23, 2020, market price returns are based on the official closing price of an ETF share or, if it more accurately reflects the market value of an ETF share at the time as of which the ETF calculates current NAV per share, the midpoint between the national best bid and national best offer (“NBBO”) as of that time. Prior to that date, market price returns were based on the midpoint between the Bid and Ask price. NAVs are calculated using prices as of 4:00 PM Eastern Time. |
The performance data quoted herein represents past performance and the return and value of an investment in the Fund will fluctuate so that, when redeemed, shares may be worth less than their original cost. Current performance may be lower or higher than the performance data quoted. Past performance is no guarantee of future performance and should not be considered as a representation of the future results of the Fund. For performance data current to the most recent month end, please call 855-857-2638 or visit www.kraneshares.com. The Fund’s performance assumes the reinvestment of all dividends and all capital gains. Index returns assume reinvestment of dividends and, unlike a Fund’s returns, do not reflect any fees or expenses. If such fees and expenses were included in the index returns, the performance would have been lower. As stated in the Fund’s prospectus, the Fund’s operating expense ratio is 0.70%. Please note that
Management Discussion of Fund Performance (Unaudited) (continued)
KraneShares Electric Vehicles and Future Mobility Index ETF (concluded)
one cannot invest directly in an unmanaged index. There are no assurances that the Fund will meet its stated objectives. The Fund’s holdings and allocations are subject to change and should not be considered recommendations to buy individual securities. For further information on the Fund’s objectives, risks, and strategies, see the Fund’s prospectus. Returns shown do not reflect the deduction of taxes that a shareholder would pay on Fund distributions or the redemption of Fund shares.
Management Discussion of Fund Performance (Unaudited) (continued)
KraneShares MSCI All China Health Care Index ETF
The KraneShares MSCI All China Health Care Index ETF (the Fund) seeks to provide investment results that, before fees and expenses, track the price and yield performance of the MSCI China All Shares Health Care 10/40 Index (the Underlying Index).
The Underlying Index is a free float-adjusted market capitalization weighted index designed to track the equity market performance of Chinese companies engaged in the health care sector. The securities in the Index include all types of publicly issued shares of Chinese issuers, which are listed in Mainland China, Hong Kong, and the United States. Issuers eligible for inclusion must be classified under the Global Industry Classification Standard (GICS®) as engaged in the healthcare sector. The issuers included in the Underlying Index may include small-cap, mid-cap, and large-cap companies.
China Health Care Review:
Several macroeconomic headwinds impacted the Fund’s performance during the 12-month period ended March 31, 2023 (the Period), including an aggressive rate hiking cycle pursued by global central banks, which made growth equities appear less attractive due to the resulting increase in the risk-free rates in many countries, the placement of some China-based pharmaceutical companies on the U.S. “unverified list,” indicating that the end-use of imported materials could not be verified by U.S. inspectors due to COVID restrictions, and regulatory changes to China’s central procurement program, especially the inclusion of medical devices in the program.
We see three potential positive catalysts for China’s healthcare equities in the year to come:
| ● | Wuxi Biologics has been removed from the U.S. “unverified list,” which is a list of companies that import sensitive materials from the U.S. and are unable to submit to inspections. Wuxi Biologics was removed from the unverified list following the end of China’s pandemic restrictions, which enabled U.S. inspectors to gain access to Wuxi’s facilities. We believe that this means that being added to the unverified list is no longer a material risk to China’s pharmaceutical companies as COVID restrictions were the only reason for the companies’ inclusion on the list. |
| ● | On December 15th, 2022, the Public Company Accounting Oversight Board (PCAOB) announced that the agency had secured complete access to inspect and investigate China-based firms and their auditors for the first time in history. This announcement was significant for China healthcare companies, many of which are listed publicly in the U.S., because the U.S. Congress in 2022 required U.S.-listed foreign companies to allow the PCAOB to inspect their audit books to remain listed publicly on U.S. exchanges. Thus, the achievement of full access to the audit books of U.S.-listed China-based firms by the PCAOB significantly lowers the risk that certain ADRs in the Fund’s portfolio may be delisted from U.S. exchanges. |
| ● | According to a paper published by Lancet Public Health this year, life expectancy in China is likely to increase to over 80 by 2035 and to potentially as high as 90 for women in certain areas. This could create long-term, steadily growing demand for healthcare in China for the foreseeable future. |
The best-performing industries within the Fund were medical/nursing services and medical distributors. Meanwhile, pharmaceuticals and biotechnology were the worst-performing industries within the Fund.
Management Discussion of Fund Performance (Unaudited) (continued)
KraneShares MSCI All China Health Care Index ETF (continued)
For the Period, the NAV of the Fund decreased by -12.65% while the Underlying Index decreased by -12.43%. The deviation between the Fund’s performance and that of the Underlying Index can be mainly attributed to management fees.
Management Discussion of Fund Performance (Unaudited) (continued)
KraneShares MSCI All China Health Care Index ETF (continued)
Growth of a $10,000 Investment‡
(at Net Asset Value)‡

AVERAGE ANNUAL TOTAL RETURNS FOR THE PERIOD ENDED MARCH 31, 2023*
| | | One Year
Return | | | Three Year
Return | | | Five Year
Return | | | Annualized
Inception to Date | |
| | | Net
Asset
Value | | | Market
Price^ | | | Net
Asset
Value | | | Market
Price^ | | | Net
Asset
Value | | | Market
Price^ | | | Net
Asset
Value | | | Market
Price^ | |
| KraneShares MSCI All China Health Care Index ETF | | | -12.65 | % | | | -11.85 | %‡ | | | 0.02 | %‡ | | | -0.35 | %‡ | | | -2.11 | %‡ | | | -2.69 | %‡ | | | -0.82 | %‡ | | | -1.04 | %‡ |
| MSCI China All Shares Health Care 10/40 Index | | | N/A | | | | -12.43 | %‡ | | | N/A | | | | 1.00 | %‡ | | | N/A | | | | -1.54 | %‡ | | | N/A | | | | -0.11 | %‡ |
| S&P 500 Index | | | N/A | | | | -7.73 | %‡ | | | N/A | | | | 18.60 | %‡ | | | N/A | | | | 11.19 | %‡ | | | N/A | | | | 9.46 | %‡ |
| * | The Fund commenced operations on January 31, 2018. |
| ‡ | Unaudited. |
| ^ | Beginning December 23, 2020, market price returns are based on the official closing price of an ETF share or, if it more accurately reflects the market value of an ETF share at the time as of which the ETF calculates current NAV per share, the midpoint between the national best bid and national best offer (“NBBO”) as of that time. Prior to that date, market price returns were based on the midpoint between the Bid and Ask price. NAVs are calculated using prices as of 4:00 PM Eastern Time. |
The performance data quoted herein represents past performance and the return and value of an investment in the Fund will fluctuate so that, when redeemed, shares may be worth less than their original cost. Current performance may be lower or higher than the performance data quoted. Past performance is no guarantee of future performance and should not be considered as a representation of the future results of the Fund. For performance data current to the most recent month end, please call 855-857-2638 or visit www.kraneshares.com. The Fund’s performance assumes the reinvestment of all dividends and all capital gains. Index returns assume reinvestment of dividends and, unlike a Fund’s returns, do not reflect any fees or expenses. If such fees and expenses were included in the index returns, the performance would have been lower. As stated in the Fund’s prospectus, the Fund’s gross operating expense ratio is 0.79% and its net expense ratio is 0.65% due to a Fee Waiver whereby the Fund’s investment manager, Krane Funds Advisors, LLC, has contractually agreed to reduce its management fee by 0.14% of the Fund’s average daily
Management Discussion of Fund Performance (Unaudited) (continued)
KraneShares MSCI All China Health Care Index ETF (concluded)
net assets until August 1, 2023. Please note that one cannot invest directly in an unmanaged index. There are no assurances that the Fund will meet its stated objectives. The Fund’s holdings and allocations are subject to change and should not be considered recommendations to buy individual securities. For further information on the Fund’s objectives, risks, and strategies, see the Fund’s prospectus. Returns shown do not reflect the deduction of taxes that a shareholder would pay on Fund distributions or the redemption of Fund shares.
Management Discussion of Fund Performance (Unaudited) (continued)
KraneShares Asia Pacific High Income Bond ETF
The KraneShares Asia Pacific High Income Bond ETF (the Fund) seeks to provide a total return that, before fees and expenses, exceeds that of the JP Morgan Asia Credit Index (JACI) Non-Investment Grade Corporate Index (the Benchmark Index) over a complete market cycle.
The Benchmark Index is comprised of liquid U.S. dollar denominated debt instruments issued out of Asia ex-Japan. It is based on the composition and established methodology of the J.P. Morgan Asia Credit Index (JACI), which is market capitalization weighted. The Benchmark Index is limited to issuers classified as non-investment grade based on the middle rating among Moody’s, Fitch, and S&P.
Asia High Yield Bond Market Review:
Asia’s high yield bond market was relatively unchanged from the prior year during the 12-month period ended March 31, 2023 (the Period) as the slump in China’s real estate market, stemming from tightening government policies that were introduced in 2021 and included the “three red lines” policy limiting developer leverage, continued to weigh on the performance of Asia’s high yield bond market. However, positive signs of a recovery emerged in the first quarter of 2023, including the stabilization of home prices in January following 16 consecutive months of price declines.
Portfolio manager Wai Hoong Leong and his Singapore-based team reversed from their high cash position of 18% in the second quarter of 2022 to under 10% by the end of the Period due to improving credit conditions. The team also reversed its underweights versus the benchmark to the Real Estate and Consumer Discretionary sectors from the beginning of the Period, while keeping duration lower than the Benchmark Index.
We see three potential positive catalysts for the Asia high yield bond market going forward:
| ● | The potential for a recession in the U.S. or other market changes that cause the U.S. Federal Reserve to end its rate hike cycle, the most aggressive in history, making high yield securities more attractive. This may also cause emerging Asian economies to appear relatively more attractive sources of growth compared to the U.S. and developed economies. Both of these developments should benefit the Fund. |
| ● | The potential for a sustained recovery in China’s real estate sector as the government has become more supportive of the sector in recent months. |
| ● | Issuance may increase in Asia’s high yield bond market following a slump over the past 12 months as market participants gain confidence in the outlooks for their businesses, especially in the Consumer [Staples] [Discretionary] sector following China’s removal of pandemic restrictions, which dampened Chinese consumer activity. |
For the Period, the NAV of the Fund decreased by -0.44% while the Benchmark Index decreased by -0.62%.
Management Discussion of Fund Performance (Unaudited) (continued)
KraneShares Asia Pacific High Income Bond ETF (continued)
Growth of a $10,000 Investment‡
(at Net Asset Value)‡

AVERAGE ANNUAL TOTAL RETURNS FOR THE PERIOD ENDED MARCH 31, 2023*,†
| | | One Year
Return | | | Three Year
Return | | | Annualized
Inception to Date | |
| | | Net
Asset
Value | | | Market
Price^ | | | Net
Asset
Value | | | Market
Price^ | | | Net
Asset
Value | | | Market
Price^ | |
| KraneShares Asia Pacific High Income Bond ETF | | | -0.44 | % | | | -0.66 | %‡ | | | -3.54 | %‡ | | | -3.99 | %‡ | | | -1.88 | %‡ | | | -1.85 | %‡ |
| J.P. Morgan Asia Credit (JACI) Non-Investment Grade Corporates Index | | | N/A | | | | -0.62 | %‡ | | | N/A | | | | -4.26 | %‡ | | | N/A | | | | -1.65 | %‡ |
| Lipper China Region Funds Classification | | | N/A | | | | -8.18 | %‡ | | | N/A | | | | 3.39 | %‡ | | | N/A | | | | N/A | |
| Bloomberg Global Aggregate Index | | | N/A | | | | -8.06 | %‡ | | | N/A | | | | -3.43 | %‡ | | | N/A | | | | -0.79 | %‡ |
| * | The Fund commenced operations on June 26, 2018. |
| † | Prior to August 1, 2021, the Fund previously sought to track the performance of the Solactive USD China Corporate High Yield Bond Index, before fees and expenses. Its performance prior to that date would have been different if the current goal and principal investment strategies had been in effect. |
| ‡ | Unaudited. |
| ^ | Beginning December 23, 2020, market price returns are based on the official closing price of an ETF share or, if it more accurately reflects the market value of an ETF share at the time as of which the ETF calculates current NAV per share, the midpoint between the national best bid and national best offer (“NBBO”) as of that time. Prior to that date, market price returns were based on the midpoint between the Bid and Ask price. NAVs are calculated using prices as of 4:00 PM Eastern Time. |
The performance data quoted herein represents past performance and the return and value of an investment in the Fund will fluctuate so that, when redeemed, shares may be worth less than their original cost. Current performance may be lower or higher than the performance data quoted. Past performance is no guarantee of future performance and should not be considered as a representation of the future results of the Fund. For performance data current to the most recent month end, please call 855-857-2638 or visit www.kraneshares.com. The Fund’s performance assumes the reinvestment of all dividends and all capital gains. Index returns assume reinvestment of dividends and, unlike a Fund’s returns, do not reflect any fees or expenses. If such fees and expenses were included in the index returns, the performance would have been lower.
Management Discussion of Fund Performance (Unaudited) (continued)
KraneShares Asia Pacific High Income Bond ETF (concluded)
As stated in the Fund’s prospectus, the Fund’s operating expense ratio is 0.69%. Please note that one cannot invest directly in an unmanaged index. There are no assurances that the Fund will meet its stated objectives. The Fund’s holdings and allocations are subject to change and should not be considered recommendations to buy individual securities. For further information on the Fund’s objectives, risks, and strategies, see the Fund’s prospectus. Returns shown do not reflect the deduction of taxes that a shareholder would pay on Fund distributions or the redemption of Fund shares.
Management Discussion of Fund Performance (Unaudited) (continued)
KraneShares Emerging Markets Healthcare Index ETF
The KraneShares Emerging Markets Healthcare Index ETF (the Fund) seeks to provide investment results that, before fees and expenses, correspond generally to the price and yield performance of the Solactive Emerging Markets Healthcare Index (the Underlying Index).
The Underlying Index seeks to track the equity market performance of companies engaged in the health care sector in various emerging markets. The issuers include small-cap, mid-cap, and large-cap companies involved in hospital management, healthcare management, pharmaceutical manufacturing, and biotechnology, among other sub-industries.
Emerging Markets Healthcare Review:
During the 12-month period ended March 31, 2023 (the Period), emerging market (EM) healthcare companies continued to build on the progress made in response to the pandemic. They continued to rapidly expand their virtual health services for patients and establish partnerships with developed market companies to produce and/or acquire vaccines, treatments, and equipment. Within the Fund, the best-performing holdings were mainly involved in the healthcare technology and medical devices industries. Meanwhile, the worst-performing holdings were mainly those involved in healthcare facilities management and biotechnology industries.
The Fund was down for the Period as a strong U.S. dollar and rising U.S. interest rates continued to weigh on EM and growth equities. Meanwhile, waning demand for COVID vaccines and concerns over future funding both had a negative impact on the global biotechnology industry. Brazil’s private healthcare industry was particularly hard-hit as provider Hapvida has had to grapple with tightening credit conditions and newly elected President Lula da Silva’s plans to make public healthcare more competitive with private alternatives.
We see three potential positive catalysts for EM healthcare equities in the year to come:
| ● | The International Monetary Fund has predicted that the growth gap between developed and emerging markets will reverse in favor of EM for the first time in nearly a decade, forecasting growth of 4% for EM in 2023 compared to 1.2% for developed markets. |
| ● | Wuxi Biologics has been removed from the U.S. “unverified list,” which is a list of companies that import sensitive materials from the U.S. and are unable to submit to inspections. Wuxi Biologics was removed from the unverified list following the end of China’s pandemic restrictions, which enabled U.S. inspectors to gain access to Wuxi’s facilities. We believe that this means that being added to the unverified list is no longer a material risk to China’s pharmaceutical companies as COVID restrictions were the only reason for the companies’ inclusion on the list. |
| ● | The achievement of full access to the audit books of U.S.-listed China-based firms by the U.S. Public Company Accounting Oversight Board (PCAOB) significantly lowers the risk of the ADRs issued by companies in the Fund from being removed from U.S. exchanges. |
Emerging Markets Overview (March 31, 2022 to March 31, 2023)
| ● | Emerging Market equities, as measured by the MSCI Emerging Markets Index, were down for the period, returning -10.39%. |
| ● | The best performing sectors across the Emerging Market equity market included Consumer Staples (+0.08%), Consumer Discretionary (-3.86%), and Energy (+4.22%). |
Management Discussion of Fund Performance (Unaudited) (continued)
KraneShares Emerging Markets Healthcare Index ETF (continued)
| ● | The worst performing sectors across the Emerging Market equity market included Health Care (-15.02%), Materials (-15.21%), and Real Estate (-16.16%). |
For the Period, the NAV of the Fund decreased by -14.97% while the Underlying Index decreased by -14.90%. The deviation between the Fund’s performance and that of the Underlying Index can be mainly attributed to management fees.
Management Discussion of Fund Performance (Unaudited) (continued)
KraneShares Emerging Markets Healthcare Index ETF (continued)
Growth of a $10,000 Investment‡
(at Net Asset Value)‡
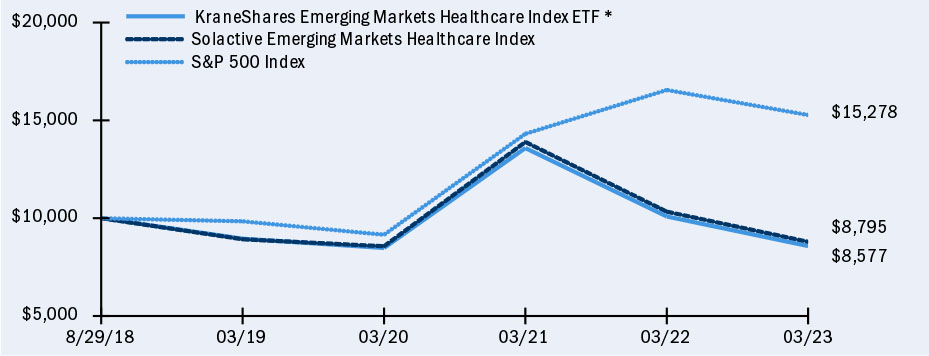
AVERAGE ANNUAL TOTAL RETURNS FOR THE PERIOD ENDED MARCH 31, 2023*
| | | One Year
Return | | | Three Year
Return | | | Annualized
Inception to Date | |
| | | Net
Asset
Value | | | Market
Price^ | | | Net
Asset
Value | | | Market
Price^ | | | Net
Asset
Value | | | Market
Price^ | |
| KraneShares Emerging Markets Healthcare Index ETF | | | -14.97 | % | | | -14.19 | %‡ | | | 0.37 | %‡ | | | 0.42 | %‡ | | | -3.29 | %‡ | | | -3.26 | %‡ |
| Solactive Emerging Markets Healthcare Index | | | N/A | | | | -14.90 | %‡ | | | N/A | | | | 0.88 | %‡ | | | N/A | | | | -2.76 | %‡ |
| S&P 500 Index | | | N/A | | | | -7.73 | %‡ | | | N/A | | | | 18.60 | %‡ | | | N/A | | | | 9.68 | %‡ |
| * | The Fund commenced operations on August 29, 2018. |
| ‡ | Unaudited. |
| ^ | Beginning December 23, 2020, market price returns are based on the official closing price of an ETF share or, if it more accurately reflects the market value of an ETF share at the time as of which the ETF calculates current NAV per share, the midpoint between the national best bid and national best offer (“NBBO”) as of that time. Prior to that date, market price returns were based on the midpoint between the Bid and Ask price. NAVs are calculated using prices as of 4:00 PM Eastern Time. |
The performance data quoted herein represents past performance and the return and value of an investment in the Fund will fluctuate so that, when redeemed, shares may be worth less than their original cost. Current performance may be lower or higher than the performance data quoted. Past performance is no guarantee of future performance and should not be considered as a representation of the future results of the Fund. For performance data current to the most recent month end, please call 855-857-2638 or visit www.kraneshares.com. The Fund’s performance assumes the reinvestment of all dividends and all capital gains. Index returns assume reinvestment of dividends and, unlike a Fund’s returns, do not reflect any fees or expenses. If such fees and expenses were included in the index returns, the performance would have been lower. As stated in the Fund’s prospectus, the Fund’s operating expense ratio is 0.79%. Please note that one cannot invest directly in an unmanaged index. There are no assurances that the Fund will meet its stated objectives. The Fund’s holdings and allocations are subject to change and should not be considered recommendations to buy individual securities. For further information on the
Management Discussion of Fund Performance (Unaudited) (continued)
KraneShares Emerging Markets Healthcare Index ETF (concluded)
Fund’s objectives, risks, and strategies, see the Fund’s prospectus. Returns shown do not reflect the deduction of taxes that a shareholder would pay on Fund distributions or the redemption of Fund shares.
Management Discussion of Fund Performance (Unaudited) (continued)
KraneShares MSCI Emerging Markets ex China Index ETF
The KraneShares MSCI Emerging Markets ex China Index ETF (the Fund) seeks to provide investment results that, before fees and expenses, correspond generally to the price and yield performance of the MSCI Emerging Markets ex China Index (the Underlying Index).
The Underlying Index is a free float-adjusted market capitalization weighted index designed to track the equity market performance of mid- and large-cap companies of emerging market countries, excluding China. The Underlying Index is based on the MSCI Emerging Markets Index (universe) but excludes the securities of Chinese issuers.
Emerging Markets ex China Review:
Emerging markets (EM) excluding China (EM ex China) were adversely impacted by a steady increase in the value of the U.S. Dollar during the 12-month period ended March 31, 2023 (the Period), which meant that their U.S. Dollar-denominated debts became more of a burden. However, many commodity-exporting EM countries benefitted from heightened oil prices; and consumer-oriented stocks recovered somewhat. Meanwhile, South Korea and Taiwan lagged due to slowing global demand for their semiconductor exports. Due to the latter’s higher weight in the Fund’s Underlying Index, these opposing forces negatively impacted the Fund’s performance.
We see three potential positive catalysts for EM ex China equities in the year to come:
| ● | The International Monetary Fund has predicted that the growth gap between developed and emerging markets will reverse to favor the latter for the first time in nearly a decade, forecasting growth of 4% for EM in 2023 compared to 1.2% for developed markets. |
| ● | Although China’s equity valuations saw a significant increase compared to other EM equity valuations in the fourth quarter of 2022, we believe the latter may close this gap over the next 12 months as EM ex China economies rebound and benefit from the Chinese population’s increased spending on energy, travel, and raw materials. |
| ● | The U.S. dollar may see declines in the year ahead given its current high level versus EM currencies, which may improve the economic outlook for many EM countries to the extent that it mitigates the drag of their U.S. dollar denominated debt burden. |
Emerging Markets Overview (April 1, 2022 to March 31, 2023)
| ● | Emerging Market equities, as measured by the MSCI Emerging Markets Index, were down for the period, returning -10.39%. |
| ● | The best performing sectors across the EM equity market included Energy (+4.22%), Consumer Staples (-0.08%), and Consumer Discretionary (-3.86%). |
| ● | The worst performing sectors across the EM equity market included Health Care (-15.02%), Materials (-15.21%), and Real Estate (-16.16%). |
Within the Fund, exposure for the Period to the Consumer Discretionary and Consumer Staples sectors benefitted the Fund, while exposure to the Communication Services and Financials sectors detracted from Fund performance. The best-performing country exposure for the Fund was Turkey, and the worst-performing country exposure was Colombia.
For the Period, the NAV of the Fund decreased by -12.12% while the Underlying Index decreased by -13.32%. The deviation between the Fund’s performance and that of the Underlying Index can be mainly attributed to management fees and the Fund’s usage of representative sampling to seek to track the Underlying Index’s performance.
Management Discussion of Fund Performance (Unaudited) (continued)
KraneShares MSCI Emerging Markets ex China Index ETF (continued)
Growth of a $10,000 Investment‡
(at Net Asset Value)‡

AVERAGE ANNUAL TOTAL RETURNS FOR THE PERIOD ENDED MARCH 31, 2023*
| | | One Year
Return | | | Three Year
Return | | | Annualized
Inception to Date | |
| | | Net
Asset
Value | | | Market
Price^ | | | Net
Asset
Value | | | Market
Price^ | | | Net
Asset
Value | | | Market
Price^ | |
| KraneShares MSCI Emerging Markets ex China Index ETF | | | -12.12 | % | | | -11.40 | %‡ | | | 14.80 | %‡ | | | 14.88 | %‡ | | | 3.47 | %‡ | | | 3.72 | %‡ |
| MSCI Emerging Markets Ex China Index | | | N/A | | | | -13.32 | %‡ | | | N/A | | | | 14.30 | %‡ | | | N/A | | | | 2.44 | %‡ |
| S&P 500 Index | | | N/A | | | | -7.73 | %‡ | | | N/A | | | | 18.60 | %‡ | | | N/A | | | | 11.15 | %‡ |
| * | The Fund commenced operations on April 12, 2019. |
| ‡ | Unaudited. |
| ^ | Beginning December 23, 2020, market price returns are based on the official closing price of an ETF share or, if it more accurately reflects the market value of an ETF share at the time as of which the ETF calculates current NAV per share, the midpoint between the national best bid and national best offer (“NBBO”) as of that time. Prior to that date, market price returns were based on the midpoint between the Bid and Ask price. NAVs are calculated using prices as of 4:00 PM Eastern Time. |
The performance data quoted herein represents past performance and the return and value of an investment in the Fund will fluctuate so that, when redeemed, shares may be worth less than their original cost. Current performance may be lower or higher than the performance data quoted. Past performance is no guarantee of future performance and should not be considered as a representation of the future results of the Fund. For performance data current to the most recent month end, please call 855-857-2638 or visit www.kraneshares.com. The Fund’s performance assumes the reinvestment of all dividends and all capital gains. Index returns assume reinvestment of dividends and, unlike a Fund’s returns, do not reflect any fees or expenses. If such fees and expenses were included in the index returns, the performance would have been lower. As stated in the Fund’s prospectus, as supplemented, the Fund’s gross operating expense ratio is 0.59% and its net expense ratio is 0.23% due to a Fee Waiver whereby the Fund’s investment manager, Krane Funds Advisors, LLC, has contractually agreed to reduce its management fee by 0.35% of the Fund’s average daily net assets until August 1, 2022. Please note that one cannot invest directly in an unmanaged index. There are no assurances that the Fund will meet its stated objectives.
Management Discussion of Fund Performance (Unaudited) (continued)
KraneShares MSCI Emerging Markets ex China Index ETF (concluded)
The Fund’s holdings and allocations are subject to change and should not be considered recommendations to buy individual securities. For further information on the Fund’s objectives, risks, and strategies, see the Fund’s prospectus. Returns shown do not reflect the deduction of taxes that a shareholder would pay on Fund distributions or the redemption of Fund shares.
Management Discussion of Fund Performance (Unaudited) (continued)
KraneShares MSCI China ESG Leaders Index ETF
The KraneShares MSCI China ESG Leaders Index ETF (the Fund) seeks to provide investment results that, before fees and expenses, correspond generally to the price and yield performance of the MSCI China ESG Leaders 10/40 Index (the Underlying Index).
The Underlying Index is designed to measure the performance of Chinese companies with high Environmental, Social and Governance (ESG) ratings relative to their sector peers. The Underlying Index consists of small-cap, mid-cap and large-cap companies in China. In order to ensure diversification, the Underlying Index limits individual constituent weights to 10% and the cumulative weight of all constituents with a weight of over 5% to 40% of its composition.
China ESG Review:
Chinese companies with the highest MSCI ESG rankings tend to be highly concentrated in growth sectors and, as such, were caught up in the global growth selloff during the 12-month period ended March 31, 2023 (the Period). Nonetheless, we continue to see strong client interest in strategies that consider ESG factors. Furthermore, we are encouraged by the Fund’s performance since inception, which has outpaced the broader China equity market, as represented by the MSCI China Index. These performance results reinforce our thesis that ESG considerations may lead to outperformance in China.
President Xi’s pledge last year to promote “common prosperity” in the government’s oversight of private businesses led to investor enthusiasm for Chinese companies with high ESG rankings. With Xi installed for a third term, we believe this emphasis may continue.
We see three potential positive catalysts for China ESG equities in the year to come:
| ● | We believe that The People’s Bank of China (PBOC) is likely to maintain a dovish monetary policy stance, to the benefit of growth equities. |
| ● | China retail sales increased +3.5% year-over-year in the first two months of 2023, setting the stage for a rebound in consumer spending this year, which could benefit consumer-oriented ESG equities. |
| ● | New regulations globally surrounding ESG disclosure and adherence to sustainability standards in investment processes may cause more investors to seek ESG characteristics in their China investments. Meanwhile, China’s government continues to support industries with a high concentration of companies with high ESG ratings, such as manufacturers of electric vehicles and solar panels. |
Communication Services was the best-performing sector within the Fund. Meanwhile, Real Estate was the worst-performing sector.
For the Period, the NAV of the Fund decreased by -10.38% while the Underlying Index decreased by -9.62%. The deviation between the Fund’s performance and that of the Underlying Index can be mainly attributed to management fees.
Management Discussion of Fund Performance (Unaudited) (continued)
KraneShares MSCI China ESG Leaders Index ETF (concluded)
Growth of a $10,000 Investment‡
(at Net Asset Value)‡

AVERAGE ANNUAL TOTAL RETURNS FOR THE PERIOD ENDED MARCH 31, 2023*
| | | One Year
Return | | | Annualized
Inception to Date | |
| | | Net
Asset
Value | | | Market
Price^ | | | Net
Asset
Value | | | Market
Price^ | |
| KraneShares MSCI China ESG Leaders Index ETF | | | -10.38 | % | | | -8.64 | %‡ | | | -6.44 | %‡ | | | -6.53 | %‡ |
| MSCI China ESG Leaders 10/40 Index | | | N/A | | | | -9.62 | %‡ | | | N/A | | | | -5.77 | %‡ |
| * | The Fund commenced operations on July 28, 2020. |
| ‡ | Unaudited. |
| ^ | Beginning December 23, 2020, market price returns are based on the official closing price of an ETF share or, if it more accurately reflects the market value of an ETF share at the time as of which the ETF calculates current NAV per share, the midpoint between the national best bid and national best offer (“NBBO”) as of that time. Prior to that date, market price returns were based on the midpoint between the Bid and Ask price. NAVs are calculated using prices as of 4:00 PM Eastern Time. |
The performance data quoted herein represents past performance and the return and value of an investment in the Fund will fluctuate so that, when redeemed, shares may be worth less than their original cost. Current performance may be lower or higher than the performance data quoted. Past performance is no guarantee of future performance and should not be considered as a representation of the future results of the Fund. For performance data current to the most recent month end, please call 855-857-2638 or visit www.kraneshares.com. The Fund’s performance assumes the reinvestment of all dividends and all capital gains. Index returns assume reinvestment of dividends and, unlike a Fund’s returns, do not reflect any fees or expenses. If such fees and expenses were included in the index returns, the performance would have been lower. As stated in the Fund’s prospectus, the Fund’s operating expense ratio is 0.59%. Please note that one cannot invest directly in an unmanaged index. There are no assurances that the Fund will meet its stated objectives. The Fund’s holdings and allocations are subject to change and should not be considered recommendations to buy individual securities. For further information on the Fund’s objectives, risks, and strategies, see the Fund’s prospectus. Returns shown do not reflect the deduction of taxes that a shareholder would pay on Fund distributions or the redemption of Fund shares.
Management Discussion of Fund Performance (Unaudited) (continued)
KraneShares CICC China 5G & Semiconductor Index ETF
The KraneShares CICC China 5G & Semiconductor Index ETF (the Fund) seeks to provide investment results that, before expenses and fees, correspond generally to the price and yield performance of the CICC China 5G and Semiconductor Leaders Index (the Underlying Index).
The Underlying Index is designed to track the performance of companies engaged in 5G and semiconductor related businesses, including 5G equipment, semiconductors, electronic components, and data centers.
China 5G & Semiconductor Market Review:
China’s 5G and semiconductor-related equities were down for the 12-month period ending March 31, 2023 (the Period) due to a global risk-off environment and geopolitical concerns that led to negative sentiment towards the semiconductor industry.
Regarding the semiconductor component of the strategy, in late 2022, the U.S. government implemented a series of restrictions on the export of certain varieties of high-end semiconductors to Mainland China. China’s share of U.S. semiconductor exports declined from $7 billion in 2021 to $5 billion in 2022. These restrictions were initially viewed as negative for China’s industry, but they have likely accelerated the timeline in which China could become self-sufficient in producing semiconductors. A self-sufficient China semiconductor industry would lead to a significant increase in the revenues of China’s leading semiconductor manufacturers and catalyze the Fund’s performance.
Regarding the 5G component of the strategy, the Fund’s performance benefited from holding stocks of companies mainly involved in the production of telecommunications equipment. We believe that the relative outperformance of these names was tied partially to the Chinese government’s reiteration of its goal to increase the nation’s 5G penetration rate as part of the 14th Five Year Plan.
We see three potential positive catalysts for China’s 5G & semiconductor companies in the year to come.
| ● | China’s imports of U.S.-made and/or designed semiconductors are likely to continue to fall given new export restrictions, representing a significant opportunity for local semiconductor manufacturers to grow their business. |
| ● | We expect ample liquidity in China’s equity markets driven by dovish central bank policy in China, in contrast to the hawkish policy in the U.S. and Europe. We believe that such dovish policies are likely to benefit growth-oriented technology stocks, such as those of 5G and semiconductor issuers, listed in Mainland China. |
| ● | According to a report from UBS, China is projected to have over 400 million 5G users by 2025, accounting for 40% of total global use and driving China’s 5G industry forward. |
For the Period, the NAV of the Fund decreased by -9.62% while the Underlying Index decreased by -9.32%. The deviation between the Fund’s performance and that of the Underlying Index can be mainly attributed to management fees.
Management Discussion of Fund Performance (Unaudited) (continued)
KraneShares CICC China 5G & Semiconductor Index ETF (continued)
Growth of a $10,000 Investment‡
(at Net Asset Value)‡
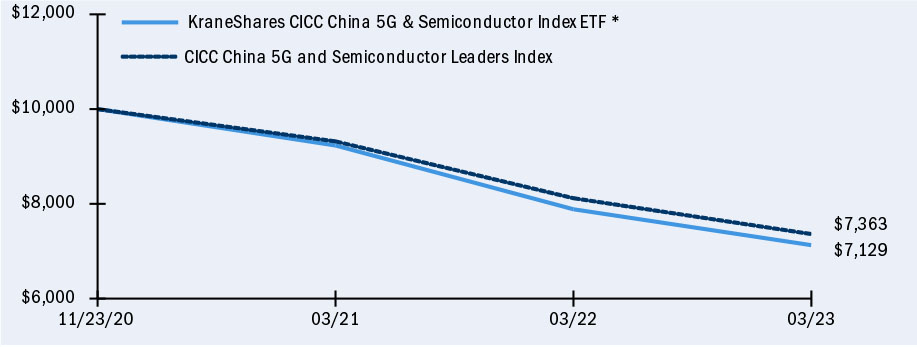
AVERAGE ANNUAL TOTAL RETURNS FOR THE PERIOD ENDED MARCH 31, 2023*
| | | One Year | | | Annualized | |
| | | Return | | | Inception to Date | |
| | | Net | | | | | | Net | | | | |
| | | Asset | | | Market | | | Asset | | | Market | |
| | | Value | | | Price^ | | | Value | | | Price^ | |
| KraneShares CICC China 5G & Semiconductor Index ETF | | | -9.62 | % | | | -8.72 | %‡ | | | -13.41 | %‡ | | | -13.51 | %‡ |
| CICC China 5G And Semiconductor Leaders Index | | | N/A | | | | -9.32 | %‡ | | | N/A | | | | -12.21 | %‡ |
| S&P 500 Index | | | N/A | | | | -7.73 | %‡ | | | N/A | | | | N/A | |
| * | The Fund commenced operations on November 23, 2020. |
| ‡ | Unaudited. |
| ^ | Beginning December 23, 2020, market price returns are based on the official closing price of an ETF share or, if it more accurately reflects the market value of an ETF share at the time as of which the ETF calculates current NAV per share, the midpoint between the national best bid and national best offer (“NBBO”) as of that time. Prior to that date, market price returns were based on the midpoint between the Bid and Ask price. NAVs are calculated using prices as of 4:00 PM Eastern Time. |
The performance data quoted herein represents past performance and the return and value of an investment in the Fund will fluctuate so that, when redeemed, shares may be worth less than their original cost. Current performance may be lower or higher than the performance data quoted. Past performance is no guarantee of future performance and should not be considered as a representation of the future results of the Fund. For performance data current to the most recent month end, please call 855-857-2638 or visit www.kraneshares.com. The Fund’s performance assumes the reinvestment of all dividends and all capital gains. Index returns assume reinvestment of dividends and, unlike a Fund’s returns, do not reflect any fees or expenses. If such fees and expenses were included in the index returns, the performance would have been lower. As stated in the Fund’s prospectus, the Fund’s gross operating expense ratio is 0.79% and its net expense ratio is 0.64% due to a Fee Waiver whereby the Fund’s investment manager, Krane Funds Advisors, LLC, has contractually agreed to reduce its management fee by 0.14% of the Fund’s average daily net assets until August 1, 2022. Please note that one cannot invest directly in an unmanaged index. There are no assurances that the Fund will meet its stated objectives. The Fund’s holdings and allocations are subject to change and should not be considered recommendations to buy
Management Discussion of Fund Performance (Unaudited) (continued)
KraneShares CICC China 5G & Semiconductor Index ETF (concluded)
individual securities. For further information on the Fund’s objectives, risks, and strategies, see the Fund’s prospectus. Returns shown do not reflect the deduction of taxes that a shareholder would pay on Fund distributions or the redemption of Fund shares.
Management Discussion of Fund Performance (Unaudited) (continued)
KraneShares CICC China Consumer Leaders Index ETF
The KraneShares CICC China Consumer Leaders Index ETF (the Fund) seeks to provide investment results that, before fees and expenses, correspond generally to the price and yield performance of the CICC China Consumer Leaders Index (the Underlying Index).
The Underlying Index consists of the investable universe of publicly traded China-based companies whose primary business or businesses are in the consumption-related industries such as home appliance, food & beverage, apparel & clothing, hotels, restaurants, and duty-free goods.
China Consumer Leaders Review:
The stocks of China’s local consumer brands moved higher during the 12-month period ended March 31, 2023 (the Period), mostly due to the lifting of pandemic restrictions following China’s National Party Congress in October 2022, which led to an increase in consumer spending compared to one year earlier. The first evidence of this increase in consumer spending was reported by China’s Tourism Ministry in data from the Chinese Lunar New Year holiday in late January 2023, which signaled a rebound in consumer activities following the lifting of the pandemic restrictions. The data indicated a +23% rise in domestic trips taken during the seven-day holiday in 2022 as compared to the same holiday in 2021.
We believe that with the lifting of pandemic restrictions, China can return to normal and that consumption-related companies will be direct beneficiaries of the country’s reopening. We also believe that a recovery in the service sector (e.g., travel as evidenced by the activity around the Chinese Lunar New Year) will likely lead to a resurgence of demand for consumer products. As China’s inflation remains low and its high target for GDP growth remains intact, there appears to be significant policy support for China’s consumer market. In time, we expect China to strive to rebalance its economy through consumption rather than investments and exports, which will create a long-term opportunity for the leading consumer brands in China.
We see three potential positive catalysts for China’s consumer brands in the year to come:
| ● | China retail sales increased +10.6% year-over-year in March, setting the stage for a rebound in consumer spending this year, which may benefit both onshore and offshore China equities. |
| ● | According to sources on the ground in China, consumers are beginning to perceive many local brands on equal footing with foreign brands, which, in the past, had been perceived as higher quality and more fashionable. |
| ● | Many global banks have upgraded their 2023 GDP growth estimates for China to above 6% year-over-year, mostly owing to the heightened level of consumption, which may benefit the leading local China brands. |
Within the Fund, the best-performing sectors during the Period were Consumer Discretionary and Consumer Staples. Meanwhile, the worst-performing sectors were Materials and Information Technology.
For the Period, the NAV of the Fund increased by 1.64% while the Underlying Index increased by 2.32%. The deviation between the Fund’s performance and that of the Underlying Index can be mainly attributed to management fees.
Management Discussion of Fund Performance (Unaudited) (continued)
KraneShares CICC China Consumer Leaders Index ETF (concluded)
Growth of a $10,000 Investment‡
(at Net Asset Value)‡

AVERAGE ANNUAL TOTAL RETURNS FOR THE PERIOD ENDED MARCH 31, 2023*
| | | One Year | | | Annualized | |
| | | Return | | | Inception to Date | |
| | | Net | | | | | | Net | | | | |
| | | Asset | | | Market | | | Asset | | | Market | |
| | | Value | | | Price^ | | | Value | | | Price^ | |
| KraneShares CICC China Consumer Leaders Index ETF | | | 1.64 | % | | | 2.85 | %‡ | | | -8.78 | %‡ | | | -8.82 | %‡ |
| CICC China Consumer Leaders Index | | | N/A | | | | 2.32 | %‡ | | | N/A | | | | -7.77 | %‡ |
| S&P 500 Index | | | N/A | | | | -7.73 | %‡ | | | N/A | | | | N/A | |
| * | The Fund commenced operations on December 8, 2020. |
| ‡ | Unaudited. |
| ^ | Beginning December 23, 2020, market price returns are based on the official closing price of an ETF share or, if it more accurately reflects the market value of an ETF share at the time as of which the ETF calculates current NAV per share, the midpoint between the national best bid and national best offer (“NBBO”) as of that time. Prior to that date, market price returns were based on the midpoint between the Bid and Ask price. NAVs are calculated using prices as of 4:00 PM Eastern Time. |
The performance data quoted herein represents past performance and the return and value of an investment in the Fund will fluctuate so that, when redeemed, shares may be worth less than their original cost. Current performance may be lower or higher than the performance data quoted. Past performance is no guarantee of future performance and should not be considered as a representation of the future results of the Fund. For performance data current to the most recent month end, please call 855-857-2638 or visit www.kraneshares.com. The Fund’s performance assumes the reinvestment of all dividends and all capital gains. Index returns assume reinvestment of dividends and, unlike a Fund’s returns, do not reflect any fees or expenses. If such fees and expenses were included in the index returns, the performance would have been lower. As stated in the Fund’s prospectus, the Fund’s operating expense ratio is 0.69%. Please note that one cannot invest directly in an unmanaged index. There are no assurances that the Fund will meet its stated objectives. The Fund’s holdings and allocations are subject to change and should not be considered recommendations to buy individual securities. For further information on the Fund’s objectives, risks, and strategies, see the Fund’s prospectus. Returns shown do not reflect the deduction of taxes that a shareholder would pay on Fund distributions or the redemption of Fund shares.
Management Discussion of Fund Performance (Unaudited) (continued)
KraneShares SSE STAR Market 50 Index ETF
The KraneShares SSE STAR Market 50 Index ETF (the Fund) seeks to provide investment results that, before fees and expenses, correspond generally to the price and yield performance of the Shanghai Stock Exchange (SSE) Science and Technology Innovation Board 50 Index (the Underlying Index).
The Underlying Index is comprised of the 50 largest companies listed on the SSE Science and Technology Innovation Board (STAR Market) as determined by market capitalization and liquidity.
STAR Market Review:
China’s STAR Market was not spared the global selloff in growth equities during the 12-month period ended March 31, 2023 (the Period). Nonetheless, the STAR market continues to attract new listings, accounting for 41% of the total capital raised through new listings in Mainland China in 2022. Since its launch in 2019, the STAR market has allowed 486 companies, mostly in the technology industry, to raise a total of 102 billion USD in capital.
We see three potential positive catalysts for the STAR Market in the years to come:
| ● | Ample liquidity driven by what we expect to be a dovish central bank policy in China, in contrast to the hawkish policy in the U.S. and Europe, which is likely to create the conditions for a vibrant IPO market in China over the next few years and lead to new listings on the STAR market. |
| ● | China’s increasing support for high technology companies, such as semiconductor manufacturing, which represent a majority of companies in the Underlying Index and Fund portfolio, after restrictions on the export of high-end chips to China implemented by the U.S. last year. |
| ● | The potential revival of financial technology company Ant Group’s IPO on the STAR Market. |
The best-performing holdings for the period were mainly in the software industry. Beijing Kingsoft Office Software was the top-performing holding in the Fund. Meanwhile, pharmaceuticals, including Shanghai Junshi Biosciences Co., were the primary detractors from the Fund’s performance.
For the Period, the NAV of the Fund decreased by -9.97% while the Underlying Index decreased by -8.05%. The deviation between the Fund’s performance and that of the Underlying Index can be mainly attributed to management fees and the Underlying Index’s inclusion of an issuer that cannot be held by the Fund due to restrictions imposed by the U.S. Department of Treasury.
Management Discussion of Fund Performance (Unaudited) (continued)
KraneShares SSE STAR Market 50 Index ETF (concluded)
Growth of a $10,000 Investment‡
(at Net Asset Value)‡

AVERAGE ANNUAL TOTAL RETURNS FOR THE PERIOD ENDED MARCH 31, 2023*
| | | One Year | | | Annualized | |
| | | Return | | | Inception to Date | |
| | | Net | | | | | | Net | | | | |
| | | Asset | | | Market | | | Asset | | | Market | |
| | | Value | | | Price^ | | | Value | | | Price^ | |
| KraneShares SSE Star Market 50 Index ETF | | | -9.97 | % | | | -8.81 | %‡ | | | -16.50 | %‡ | | | -16.29 | %‡ |
| SSE Science & Technology Innovation Board 50 Index | | | N/A | | | | -8.05 | %‡ | | | N/A | | | | -15.42 | %‡ |
| * | The Fund commenced operations on January 26, 2021. |
| ‡ | Unaudited. |
| ^ | Beginning December 23, 2020, market price returns are based on the official closing price of an ETF share or, if it more accurately reflects the market value of an ETF share at the time as of which the ETF calculates current NAV per share, the midpoint between the national best bid and national best offer (“NBBO”) as of that time. Prior to that date, market price returns were based on the midpoint between the Bid and Ask price. NAVs are calculated using prices as of 4:00 PM Eastern Time. |
The performance data quoted herein represents past performance and the return and value of an investment in the Fund will fluctuate so that, when redeemed, shares may be worth less than their original cost. Current performance may be lower or higher than the performance data quoted. Past performance is no guarantee of future performance and should not be considered as a representation of the future results of the Fund. For performance data current to the most recent month end, please call 855-857-2638 or visit www.kraneshares.com. The Fund’s performance assumes the reinvestment of all dividends and all capital gains. Index returns assume reinvestment of dividends and, unlike a Fund’s returns, do not reflect any fees or expenses. If such fees and expenses were included in the index returns, the performance would have been lower. As stated in the Fund’s prospectus, the Fund’s operating expense ratio is 0.88%. Please note that one cannot invest directly in an unmanaged index. There are no assurances that the Fund will meet its stated objectives. The Fund’s holdings and allocations are subject to change and should not be considered recommendations to buy individual securities. For further information on the Fund’s objectives, risks, and strategies, see the Fund’s prospectus. Returns shown do not reflect the deduction of taxes that a shareholder would pay on Fund distributions or the redemption of Fund shares.
Management Discussion of Fund Performance (Unaudited) (continued)
KraneShares Hang Seng TECH Index ETF
The KraneShares Hang Seng TECH Index ETF (the Fund) seeks to provide investment results that, before expenses and fees, correspond generally to the price and yield performance of the Hang Seng TECH Index (the Underlying Index).
The Underlying Index is designed to track the performance of the 30 largest technology companies listed in Hong Kong that have high business exposure to technology themes and pass the Underlying Index’s screening criteria.
Hong Kong-listed Technology Market Review:
During the 12-month period ended March 31, 2023 (Period), global markets saw declines due to rising global interest rates; and Hong Kong-listed technology stocks were not spared the downdraft in growth equities. Following China’s National Party Congress, held in October 2022, China’s government removed all domestic pandemic-related restrictions. This development improved the outlook for China’s consumer market and led to a rebound in many of China’s Hong Kong-listed, consumer and internet-related equities. As a result, stocks of internet and consumer companies were the best performing among the Fund’s holdings, while electric vehicle companies and data center operators detracted from the Fund’s performance.
We see three potential positive catalysts for Hong Kong-listed technology equities in the year to come:
| ● | We believe that The People’s Bank of China (PBOC) is likely to maintain a dovish monetary policy stance, to the benefit of growth equities. |
| ● | China retail sales increased +3.5% year-over-year in the first two months of 2023, setting the stage for a rebound in consumer spending this year. |
| ● | Alibaba’s recent restructuring into six separate business groups, each individually able to raise capital, indicates the company’s focus on generating shareholder value; and a resulting IPO would likely result in a new issuer, which would be included in the Underlying Index and Fund portfolio in the future. |
For the Period, the NAV of the Fund decreased by -4.37% while the Underlying Index decreased by -5.15%. The deviation between the Fund’s performance and that of the Underlying Index can be mainly attributed to management fees.
Management Discussion of Fund Performance (Unaudited) (continued)
KraneShares Hang Seng TECH Index ETF (concluded)
Growth of a $10,000 Investment‡
(at Net Asset Value)‡

AVERAGE ANNUAL TOTAL RETURNS FOR THE PERIOD ENDED MARCH 31, 2023*
| | | One Year | | | Annualized | |
| | | Return | | | Inception to Date | |
| | | Net | | | | | | Net | | | | |
| | | Asset | | | Market | | | Asset | | | Market | |
| | | Value | | | Price^ | | | Value | | | Price^ | |
| KraneShares Hang Seng TECH Index ETF | | | -4.37 | % | | | -1.85 | %‡ | | | -29.36 | %‡ | | | -29.74 | %‡ |
| Hang Seng TECH Index | | | N/A | | | | -5.15 | %‡ | | | N/A | | | | -28.98 | %‡ |
| * | The Fund commenced operations on June 8, 2021. |
| ‡ | Unaudited. |
| ^ | Beginning December 23, 2020, market price returns are based on the official closing price of an ETF share or, if it more accurately reflects the market value of an ETF share at the time as of which the ETF calculates current NAV per share, the midpoint between the national best bid and national best offer (“NBBO”) as of that time. Prior to that date, market price returns were based on the midpoint between the Bid and Ask price. NAVs are calculated using prices as of 4:00 PM Eastern Time. |
The performance data quoted herein represents past performance and the return and value of an investment in the Fund will fluctuate so that, when redeemed, shares may be worth less than their original cost. Current performance may be lower or higher than the performance data quoted. Past performance is no guarantee of future performance and should not be considered as a representation of the future results of the Fund. For performance data current to the most recent month end, please call 855-857-2638 or visit www.kraneshares.com. The Fund’s performance assumes the reinvestment of all dividends and all capital gains. Index returns assume reinvestment of dividends and, unlike a Fund’s returns, do not reflect any fees or expenses. If such fees and expenses were included in the index returns, the performance would have been lower. As stated in the Fund’s prospectus, the Fund’s operating expense ratio is 0.69%. Please note that one cannot invest directly in an unmanaged index. There are no assurances that the Fund will meet its stated objectives. The Fund’s holdings and allocations are subject to change and should not be considered recommendations to buy individual securities. For further information on the Fund’s objectives, risks, and strategies, see the Fund’s prospectus. Returns shown do not reflect the deduction of taxes that a shareholder would pay on Fund distributions or the redemption of Fund shares.
Management Discussion of Fund Performance (Unaudited) (continued)
KraneShares China Innovation ETF
The KraneShares China Innovation ETF (KGRO) is an active ETF which provides investors with core exposure to the brightest high-growth areas within China’s economy by combining “New China” growth sectors. KGRO primarily invests in the following ETFs:
| ● | KraneShares CSI China Internet ETF (KWEB) |
| ● | KraneShares MSCI All China Health Care Index ETF (KURE) |
| ● | KraneShares MSCI China Clean Technology Index ETF (KGRN) |
| ● | KraneShares CICC China 5G & Semiconductor Index ETF (KFVG) |
| ● | KraneShares SSE STAR Market 50 Index ETF (KSTR) |
In addition to investments in these ETFs, KGRO may invest up to 15% of its net assets in the securities of private companies that align with the themes represented by the ETFs or appear to be attractive opportunities, including those that may be preparing for an initial public offering.
China Innovation Review:
China’s growth equities were down for the 12-month period ended March 31, 2023 (Period) as global central banks engaged in the most aggressive interest rate hiking cycle in decades. This is reflected in the Fund’s performance for the Period. Nonetheless, internet and e-commerce outperformed during the Period as several of the macroeconomic and geopolitical headwinds that had weighed on such issuers in previous periods were resolved, including as a result of China removing pandemic restrictions following the National Party Congress. Technology companies also saw a significant rebound in the first quarter of 2023 on significant policy support for key industries, such as semiconductors, although the sector was still down for the overall Period.
The best performing ETF in the portfolio was the KraneShares CSI China Internet ETF, reflecting the rebound in internet and e-commerce stocks during the Period thanks to the removal of pandemic restrictions. Meanwhile, the worst-performing ETF was the KraneShares MSCI China Clean Technology Index ETF, reflecting the underperformance of the Information Technology sector for the Period.
We see three potential positive catalysts for China growth equities in the year to come:
| ● | We believe that The People’s Bank of China (PBOC) is likely to maintain a dovish monetary policy stance, to the benefit of growth equities. |
| ● | China retail sales increased +3.5% year-over-year in the first two months of 2023, setting the stage for a rebound in consumer spending this year. |
| ● | Alibaba’s recent restructuring into six separate business groups, each individually able to raise capital, indicates the company’s focus on generating shareholder value; and a resulting IPO would likely result in a new issuer, which would be included in the Underlying Index and Fund portfolio in the future. |
For the Period, the NAV of the Fund decreased by -6.60% while the Underlying Index decreased by -6.44%. The deviation between the Fund’s performance and that of the Underlying Index can be mainly attributed to management fees.
Management Discussion of Fund Performance (Unaudited) (continued)
KraneShares China Innovation ETF (concluded)
Growth of a $10,000 Investment‡
(at Net Asset Value)‡

AVERAGE ANNUAL TOTAL RETURNS FOR THE PERIOD ENDED MARCH 31, 2023*
| | | One Year | | | Annualized | |
| | | Return | | | Inception to Date | |
| | | Net | | | | | | Net | | | | |
| | | Asset | | | Market | | | Asset | | | Market | |
| | | Value | | | Price^ | | | Value | | | Price^ | |
| KraneShares China Innovation ETF | | | -6.60 | % | | | -6.91 | %‡ | | | -20.74 | %‡ | | | -20.70 | %‡ |
| China All Shares Index | | | N/A | | | | -6.44 | %‡ | | | N/A | | | | -14.49 | %‡ |
| * | The Fund commenced operations on October 5, 2021. |
| ‡ | Unaudited. |
| ^ | Beginning December 23, 2020, market price returns are based on the official closing price of an ETF share or, if it more accurately reflects the market value of an ETF share at the time as of which the ETF calculates current NAV per share, the midpoint between the national best bid and national best offer (“NBBO”) as of that time. Prior to that date, market price returns were based on the midpoint between the Bid and Ask price. NAVs are calculated using prices as of 4:00 PM Eastern Time. |
The performance data quoted herein represents past performance and the return and value of an investment in the Fund will fluctuate so that, when redeemed, shares may be worth less than their original cost. Current performance may be lower or higher than the performance data quoted. Past performance is no guarantee of future performance and should not be considered as a representation of the future results of the Fund. For performance data current to the most recent month end, please call 855-857-2638 or visit www.kraneshares.com. The Fund’s performance assumes the reinvestment of all dividends and all capital gains. Index returns assume reinvestment of dividends and, unlike a Fund’s returns, do not reflect any fees or expenses. If such fees and expenses were included in the index returns, the performance would have been lower. As stated in the Fund’s prospectus, the Fund’s operating expense ratio is 0.64%, which includes fees and expenses incurred indirectly as a result of investments in underlying Funds. Please note that one cannot invest directly in an unmanaged index. There are no assurances that the Fund will meet its stated objectives. The Fund’s holdings and allocations are subject to change and should not be considered recommendations to buy individual securities. For further information on the Fund’s objectives, risks, and strategies, see the Fund’s prospectus. Returns shown do not reflect the deduction of taxes that a shareholder would pay on Fund distributions or the redemption of Fund shares.
Management Discussion of Fund Performance (Unaudited) (continued)
KraneShares S&P Pan Asia Dividend Aristocrats Index ETF
The KraneShares S&P Pan Asia Dividend Aristocrats Index ETF seeks to provide investment results that, before fees and expenses, correspond generally to the price and yield performance of the S&P Pan Asia Dividend Aristocrats Index (the Underlying Index).
The Underlying Index is designed to measure the performance of constituents in the S&P Pan Asia BMI Index that have followed a policy of consistently increasing dividends every year for the last seven years (Asia dividend growers). The S&P Pan Asia BMI Index is a comprehensive benchmark index that includes securities of companies from the Asia-Pacific region, including developed and emerging market countries.
Asia Dividend Growers Review:
Asia dividend growers outpaced by a wide margin global equities, as measured by the MSCI All Country World Index (ACWI), from the Fund’s inception on September 15, 2022 to the Fund’s fiscal year end on March 31, 2023 (the Period). This significant outperformance was likely due to the relative attractiveness of the companies’ dividend payments amid rising U.S. interest rates and the global risk-off environment, which broadly favored value-oriented companies with strong cash flows and balance sheets.
We see three potential positive catalysts for Asia dividend growers in the year to come:
| ● | China’s reopening is likely to contribute to strong economic growth in the Asia Pacific region this year compared to other regions globally. |
| ● | Dividend yields in Japan, which made up approximately 31% of the portfolio as of the end of the period, are expected to remain elevated over the next year compared to other developed markets, with Nikko forecasting a 2.6% dividend yield for 2023 compared to 2.1% for the MSCI World Index. |
| ● | We believe that investors may continue to search for yield and diversification over the year to come, which may continue to benefit Asia dividend growers. |
For the Period, the NAV of the Fund increased by 6.08% while the Underlying Index increased by 6.36%. The deviation between the Fund’s performance and that of the Underlying Index can be mainly attributed to management fees.
Within the Fund, the best-performing sectors during the Period were Healthcare and Consumer Staples. Meanwhile, the worst-performing sectors were Financials and Utilities.
Management Discussion of Fund Performance (Unaudited) (continued)
KraneShares S&P Pan Asia Dividend Aristocrats Index ETF (concluded)
Growth of a $10,000 Investment‡
(at Net Asset Value)‡

AVERAGE ANNUAL TOTAL RETURNS FOR THE PERIOD ENDED MARCH 31, 2023*
| | | Cumulative | |
| | | Inception to Date | |
| | | Net
Asset | | | Market | |
| | | Value | | | Price^ | |
| KraneShares S&P Pan Asia Dividend Aristocrats Index ETF | | 6.08 | % | | | -6.33 | %‡ |
| S&P Pan Asia Dividend Aristocrats Index | | N/A | | | | 6.36 | %‡ |
| * | The Fund commenced operations on September 14, 2022. |
| ‡ | Unaudited. |
| ^ | Beginning December 23, 2020, market price returns are based on the official closing price of an ETF share or, if it more accurately reflects the market value of an ETF share at the time as of which the ETF calculates current NAV per share, the midpoint between the national best bid and national best offer (“NBBO”) as of that time. Prior to that date, market price returns were based on the midpoint between the Bid and Ask price. NAVs are calculated using prices as of 4:00 PM Eastern Time. |
The performance data quoted herein represents past performance and the return and value of an investment in the Fund will fluctuate so that, when redeemed, shares may be worth less than their original cost. Current performance may be lower or higher than the performance data quoted. Past performance is no guarantee of future performance and should not be considered as a representation of the future results of the Fund. For performance data current to the most recent month end, please call 855-857-2638 or visit www.kraneshares.com. The Fund’s performance assumes the reinvestment of all dividends and all capital gains. Index returns assume reinvestment of dividends and, unlike a Fund’s returns, do not reflect any fees or expenses. If such fees and expenses were included in the index returns, the performance would have been lower. As stated in the Fund’s prospectus, the Fund’s operating expense ratio is 0.68%, which includes fees and expenses incurred indirectly as a result of investments in underlying Funds. Please note that one cannot invest directly in an unmanaged index. There are no assurances that the Fund will meet its stated objectives. The Fund’s holdings and allocations are subject to change and should not be considered recommendations to buy individual securities. For further information on the Fund’s objectives, risks, and strategies, see the Fund’s prospectus. Returns shown do not reflect the deduction of taxes that a shareholder would pay on Fund distributions or the redemption of Fund shares.
Management Discussion of Fund Performance (Unaudited) (continued)
KraneShares China Internet and Covered Call Strategy ETF
The KraneShares China Internet and Covered Call Strategy ETF (the Fund) seeks to provide current income by following a “covered call” or “buy-write” strategy. The Fund buys shares of the KraneShares CSI China Internet ETF and “writes” or “sells” corresponding call options on the KraneShares CSI China Internet ETF, which seeks to provide investment results that, before expenses and fees, correspond generally to the price and yield performance of the CSI Overseas China Internet Index (the Underlying Index).
The Underlying Index is designed to measure the performance of the investable universe of publicly traded China-based companies whose primary business or businesses are in the Internet and Internet-related sectors (China Internet Companies), as defined by the index sponsor, China Securities Index Co., Ltd. (CSI).
China Internet Review
Although global markets saw declines due to rising global interest rates, U.S. and Hong Kong-listed stocks of Chinese internet issuers saw positive catalysts during the 12-month period ended March 31, 2023 (the Period) as many of the geopolitical and policy-related issues that had been weighing on the sector in prior periods were resolved. We believe that the two most important developments for the sector during the Period were the China government’s removal of pandemic restrictions and the achievement of full access to the audit books of U.S.-listed, China-based firms by the U.S. Public Company Accounting Oversight Board (PCAOB).
Following the National Party Congress, held in October of 2022, China’s government removed all domestic, pandemic-related restrictions. This development improved the outlook for China’s consumer market and led to a rebound in the stock price of certain China Internet Companies.
On December 15th, 2022, the PCAOB announced that the agency had secured complete access to inspect and investigate China-based firms and their auditors for the first time in history. This announcement was significant for China Internet Companies, many of which are listed publicly in the U.S., because the U.S. Congress in 2022, required U.S.-listed foreign companies to allow the PCAOB to inspect their audit books to remain listed publicly on U.S. exchanges. This development significantly reduced the risk of the American depositary receipts (ADRs) of China Internet Companies being delisted from U.S. exchanges.
Despite the rebound in the prices of China Internet Companies during the Period, U.S. and Hong Kong-listed shares of such companies continued to exhibit a high level of volatility. As a result, from the Fund’s inception on January 12, 2023, the Fund was able to generate a significant premium income, which tends to be directly correlated to the volatility of the reference asset, which in this case us the KraneShares CSI China Internet ETF (KWEB). In March, the Fund paid out a distribution of approximately $1.10 per share, reflecting the premium income received.
We see four potential positive catalysts for the Fund in the year to come:
| ● | We believe that The People’s Bank of China (PBOC) is likely to maintain a dovish monetary policy stance, to the benefit of growth equities. |
| ● | China retail sales increased +10.6% year-over-year (YoY) in March, setting the stage for a potential rebound in consumer spending this year, which we would expect to benefit China Internet Companies. |
| ● | Alibaba’s recent restructuring into six separate business groups, each individually able to raise capital, indicates the company’s focus on generating shareholder value; and a resulting IPO |
Management Discussion of Fund Performance (Unaudited) (continued)
KraneShares China Internet and Covered Call Strategy ETF (continued)
would likely result in a new issuers, which would be included in the Underlying Index and Fund portfolio in the future.
| ● | The potential for a continuation of the heightened level of volatility of KWEB seen during the Period due to continued U.S.-China tensions, which may allow the Fund to continue to earn significant option premiums. |
From the Fund’s inception on January 12, 2023 to the Fund’s fiscal year end on March 31, 2023, the NAV of the Fund decreased by 3.56%.
Growth of a $10,000 Investment‡
(at Net Asset Value)‡

AVERAGE ANNUAL TOTAL RETURNS FOR THE PERIOD ENDED MARCH 31, 2023*
| | | Cumulative | |
| | | Inception to Date | |
| | | Net
Asset | | | Market | |
| | | Value | | | Price^ | |
| KraneShares China Internet and Covered Call Strategy ETF | | -3.56 | % | | | -3.48 | %‡ |
| CSI Overseas China Internet Index | | N/A | | | | -9.48 | %‡ |
| * | The Fund commenced operations on January 12, 2023. |
| ‡ | Unaudited. |
| ^ | Beginning December 23, 2020, market price returns are based on the official closing price of an ETF share or, if it more accurately reflects the market value of an ETF share at the time as of which the ETF calculates current NAV per share, the midpoint between the national best bid and national best offer (“NBBO”) as of that time. Prior to that date, market price returns were based on the midpoint between the Bid and Ask price. NAVs are calculated using prices as of 4:00 PM Eastern Time. |
The performance data quoted herein represents past performance and the return and value of an investment in the Fund will fluctuate so that, when redeemed, shares may be worth less than their original cost. Current performance may be lower or higher than the performance data quoted. Past performance is no guarantee of future performance and should not be considered as a representation of the future results of the Fund. For performance data current to the most recent month end, please call 855-857-2638 or visit www.kraneshares.com. The Fund’s performance assumes the reinvestment of all dividends and all capital gains. Index returns assume reinvestment of dividends and, unlike a Fund’s returns, do not reflect any fees or expenses. If such fees and expenses were included in the index returns, the performance would have been lower. As stated
Management Discussion of Fund Performance (Unaudited) (continued)
KraneShares China Internet and Covered Call Strategy ETF (concluded)
in the Fund’s prospectus, the Fund’s operating expense ratio is 0.26%, which includes fees and expenses incurred indirectly as a result of investments in underlying Funds. Please note that one cannot invest directly in an unmanaged index. There are no assurances that the Fund will meet its stated objectives. The Fund’s holdings and allocations are subject to change and should not be considered recommendations to buy individual securities. For further information on the Fund’s objectives, risks, and strategies, see the Fund’s prospectus. Returns shown do not reflect the deduction of taxes that a shareholder would pay on Fund distributions or the redemption of Fund shares.
Schedule of Investments March 31, 2023
KraneShares CICC China Leaders 100 Index ETF

| | | Shares | | | Value | |
| COMMON STOCK — 100.0%‡ | | | | | | |
| CHINA — 100.0% | | | | | | | | |
| Communication Services — 0.8% | | | | | | | | |
| China South Publishing & Media Group, Cl A | | | 9,100 | | | $ | 15,425 | |
| G-bits Network Technology Xiamen, Cl A | | | 500 | | | | 34,712 | |
| | | | | | | | 50,137 | |
| Consumer Discretionary — 17.6% | | | | | | | | |
| Changchun Faway Automobile Components, Cl A | | | 7,500 | | | | 9,534 | |
| Chongqing Department Store, Cl A | | | 2,600 | | | | 10,268 | |
| Chongqing Zongshen Power Machinery, Cl A | | | 8,500 | | | | 9,122 | |
| FAWER Automotive Parts, Cl A | | | 9,000 | | | | 6,304 | |
| Fuyao Glass Industry Group, Cl A | | | 19,900 | | | | 100,727 | |
| Gree Electric Appliances of Zhuhai, Cl A | | | 55,800 | | | | 298,611 | |
| Guangdong Vanward New Electric, Cl A | | | 3,600 | | | | 4,707 | |
| Guangdong Xinbao Electrical Appliances Holdings, Cl A | | | 4,200 | | | | 10,421 | |
| Guangzhou Automobile Group, Cl A | | | 27,400 | | | | 44,448 | |
| Hisense Home Appliances Group, Cl A | | | 5,600 | | | | 17,084 | |
| HLA Group, Cl A | | | 21,600 | | | | 19,627 | |
| Huayu Automotive Systems, Cl A | | | 19,600 | | | | 47,778 | |
| IKD, Cl A | | | 4,500 | | | | 15,845 | |
| Jiangsu Changshu Automotive Trim Group, Cl A | | | 3,200 | | | | 9,063 | |
| KingClean Electric, Cl A | | | 1,500 | | | | 6,391 | |
| Loncin Motor, Cl A | | | 12,700 | | | | 9,543 | |
| Midea Group, Cl A | | | 43,000 | | | | 336,934 | |
| Ningbo Huaxiang Electronic, Cl A | | | 6,200 | | | | 13,371 | |
| Wuchan Zhongda Group, Cl A | | | 38,600 | | | | 27,261 | |
| Zhejiang Hangmin, Cl A | | | 7,800 | | | | 9,507 | |
| Zhejiang Supor, Cl A | | | 2,100 | | | | 16,559 | |
| Zhejiang Wanfeng Auto Wheel, Cl A* | | | 19,400 | | | | 17,571 | |
| Zhejiang Weixing Industrial Development, Cl A | | | 7,900 | | | | 10,791 | |
| | | | | | | | 1,051,467 | |
The accompanying notes are an integral part of the financial statements.
Schedule of Investments March 31, 2023
KraneShares CICC China Leaders 100 Index ETF (continued)
| | | Shares | | | Value | |
| COMMON STOCK (continued) | | | | | | |
| Consumer Staples — 4.9% | | | | | | | | |
| Heilongjiang Agriculture, Cl A | | | 9,100 | | | $ | 17,783 | |
| Henan Shuanghui Investment & Development, Cl A | | | 13,000 | | | | 49,105 | |
| Jiangsu Yanghe Brewery JSC, Cl A | | | 7,500 | | | | 180,704 | |
| Meihua Holdings Group, Cl A | | | 26,500 | | | | 37,740 | |
| Shanghai Flyco Electrical Appliance, Cl A | | | 600 | | | | 7,224 | |
| | | | | | | | 292,556 | |
| Energy — 4.6% | | | | | | | | |
| China Shenhua Energy, Cl A | | | 41,000 | | | | 168,184 | |
| Shanxi Lu’an Environmental Energy Development, Cl A | | | 14,800 | | | | 47,284 | |
| Yankuang Energy Group, Cl A | | | 11,400 | | | | 59,047 | |
| | | | | | | | 274,515 | |
| Financials — 33.6% | | | | | | | | |
| Agricultural Bank of China, Cl A | | | 396,600 | | | | 179,609 | |
| Bank of China, Cl A | | | 261,900 | | | | 128,904 | |
| Bank of Communications, Cl A | | | 340,400 | | | | 253,294 | |
| China Construction Bank, Cl A | | | 83,300 | | | | 72,052 | |
| China Merchants Bank, Cl A | | | 63,900 | | | | 318,881 | |
| Industrial & Commercial Bank of China, Cl A | | | 436,800 | | | | 283,682 | |
| Industrial Bank, Cl A | | | 119,100 | | | | 292,924 | |
| Jiangsu Financial Leasing, Cl A | | | 14,800 | | | | 12,694 | |
| Ping An Bank, Cl A | | | 119,500 | | | | 218,038 | |
| Postal Savings Bank of China, Cl A | | | 134,800 | | | | 91,276 | |
| Shanghai Pudong Development Bank, Cl A | | | 145,700 | | | | 152,546 | |
| | | | | | | | 2,003,900 | |
| Health Care — 4.0% | | | | | | | | |
| Anhui Anke Biotechnology Group, Cl A | | | 14,600 | | | | 23,492 | |
| China Animal Healthcare*(A) | | | 4,000 | | | | — | |
| Hubei Jumpcan Pharmaceutical, Cl A | | | 4,700 | | | | 19,492 | |
| Jointown Pharmaceutical Group, Cl A | | | 11,700 | | | | 25,454 | |
| Shandong Buchang Pharmaceuticals, Cl A | | | 7,000 | | | | 20,223 | |
| Sichuan Kelun Pharmaceutical, Cl A | | | 14,300 | | | | 59,180 | |
| Sunflower Pharmaceutical Group, Cl A | | | 3,700 | | | | 11,859 | |
| Wuhan Easydiagnosis Biomedicine, Cl A | | | 1,200 | | | | 9,675 | |
| Yunnan Baiyao Group, Cl A | | | 9,000 | | | | 71,688 | |
| | | | | | | | 241,063 | |
| Industrials — 18.4% | | | | | | | | |
| Anhui Construction Engineering Group, Cl A | | | 15,000 | | | | 13,193 | |
| Anhui Heli, Cl A | | | 6,300 | | | | 16,476 | |
| China Railway Group, Cl A | | | 129,100 | | | | 129,339 | |
| China State Construction Engineering, Cl A | | | 260,900 | | | | 220,352 | |
| CNPC Capital, Cl A | | | 31,900 | | | | 32,424 | |
| CRRC, Cl A | | | 150,600 | | | | 134,212 | |
| Daqin Railway, Cl A | | | 74,200 | | | | 77,687 | |
| Hangcha Group, Cl A | | | 4,400 | | | | 12,609 | |
The accompanying notes are an integral part of the financial statements.
Schedule of Investments March 31, 2023
KraneShares CICC China Leaders 100 Index ETF (continued)
| | | Shares | | | Value | |
| COMMON STOCK (continued) | | | | | | |
| Industrials (continued) | | | | | | | | |
| Hefei Meiya Optoelectronic Technology, Cl A | | | 4,400 | | | $ | 20,695 | |
| Jiangsu Guotai International Group, Cl A | | | 12,400 | | | | 14,824 | |
| Jingjin Equipment, Cl A | | | 3,600 | | | | 14,678 | |
| Long Yuan Construction Group, Cl A | | | 13,300 | | | | 9,567 | |
| Shanghai International Port Group, Cl A | | | 37,500 | | | | 30,252 | |
| Shanghai Mechanical and Electrical Industry, Cl A | | | 3,900 | | | | 7,377 | |
| Shanghai Pudong Construction, Cl A | | | 8,500 | | | | 8,677 | |
| Shanghai Tunnel Engineering, Cl A | | | 27,900 | | | | 23,158 | |
| Shenzhen Tagen Group, Cl A | | | 16,300 | | | | 12,722 | |
| Sichuan Road & Bridge, Cl A | | | 23,200 | | | | 46,621 | |
| Sinotrans, Cl A | | | 19,600 | | | | 11,873 | |
| Sumec, Cl A | | | 6,400 | | | | 6,011 | |
| Tian Di Science & Technology, Cl A | | | 21,000 | | | | 15,535 | |
| XCMG Construction Machinery, Cl A | | | 73,700 | | | | 74,373 | |
| Xiamen C & D, Cl A | | | 18,600 | | | | 32,691 | |
| Xiamen ITG Group, Cl A | | | 19,200 | | | | 24,100 | |
| Xiamen Xiangyu, Cl A | | | 14,300 | | | | 22,385 | |
| Zhejiang Chint Electrics, Cl A | | | 13,300 | | | | 54,170 | |
| Zhejiang Weixing New Building Materials, Cl A | | | 8,100 | | | | 28,674 | |
| | | | | | | | 1,094,675 | |
| Information Technology — 7.1% | | | | | | | | |
| Avary Holding Shenzhen, Cl A | | | 8,600 | | | | 38,847 | |
| China Railway Signal & Communication, Cl A | | | 32,114 | | | | 25,346 | |
| Foxconn Industrial Internet, Cl A | | | 46,900 | | | | 117,603 | |
| Hanergy Thin Film Power Group*(A) | | | 65,064 | | | | — | |
| Olympic Circuit Technology | | | 2,700 | | | | 7,222 | |
| Tongwei, Cl A | | | 33,400 | | | | 189,244 | |
| Universal Scientific Industrial Shanghai, Cl A | | | 8,400 | | | | 21,638 | |
| Yangling Metron New Material, Cl A | | | 2,400 | | | | 15,699 | |
| Zhejiang Jiecang Linear Motion Technology, Cl A | | | 2,500 | | | | 8,963 | |
| | | | | | | | 424,562 | |
| Materials — 1.5% | | | | | | | | |
| Anhui Jinhe Industrial, Cl A | | | 4,200 | | | | 18,397 | |
| China Lumena New Materials*(A) | | | 718 | | | | — | |
| Gansu Qilianshan Cement Group, Cl A* | | | 7,900 | | | | 12,183 | |
| Huaibei Mining Holdings, Cl A | | | 12,300 | | | | 24,287 | |
| Jiangsu Asia-Pacific Light Alloy Technology, Cl A | | | 7,700 | | | | 6,660 | |
| Nantong Jiangshan Agrochemical & Chemical, Cl A | | | 2,200 | | | | 12,773 | |
| Shanghai Zijiang Enterprise Group, Cl A | | | 15,100 | | | | 12,467 | |
| Tianhe Chemicals Group*(A) | | | 40,000 | | | | — | |
| | | | | | | | 86,767 | |
| Real Estate — 4.4% | | | | | | | | |
| China Vanke, Cl A | | | 84,300 | | | | 187,079 | |
| Gemdale, Cl A | | | 39,100 | | | | 47,827 | |
The accompanying notes are an integral part of the financial statements.
Schedule of Investments March 31, 2023
KraneShares CICC China Leaders 100 Index ETF (continued)
| | | Shares | | | Value | |
| COMMON STOCK (continued) | | | | | | |
| Real Estate (continued) | | | | | | | | |
| Hangzhou Binjiang Real Estate Group, Cl A | | | 15,800 | | | $ | 21,052 | |
| Rongan Property, Cl A | | | 11,800 | | | | 4,914 | |
| | | | | | | | 260,872 | |
| Utilities — 3.1% | | | | | | | | |
| China National Nuclear Power, Cl A | | | 117,000 | | | | 108,868 | |
| Fujian Funeng, Cl A | | | 9,500 | | | | 16,960 | |
| SDIC Power Holdings, Cl A | | | 37,200 | | | | 58,558 | |
| | | | | | | | 184,386 | |
| TOTAL CHINA | | | | | | | 5,964,900 | |
| | | | | | | | | |
TOTAL COMMON STOCK
(Cost $5,950,237) | | | | | | | 5,964,900 | |
| | | | | | | | | |
TOTAL INVESTMENTS — 100.0%
(Cost $5,950,237) | | | | | | | 5,964,900 | |
| OTHER ASSETS LESS LIABILITIES – 0.0% | | | | | | | (325 | ) |
| NET ASSETS - 100% | | | | | | $ | 5,964,575 | |
| ‡ | Industries are utilized for compliance purposes, whereas sectors are utilized for reporting. |
| * | Non-income producing security. |
| (A) | Level 3 security in accordance with fair value hierarchy. |
The accompanying notes are an integral part of the financial statements.
Schedule of Investments March 31, 2023
KraneShares CICC China Leaders 100 Index ETF (concluded)
The following summarizes the market value of the Fund’s investments used as of March 31, 2023, based on the inputs used to value them:
| Investments in Securities | | Level 1 | | | Level 2 | | | Level 3^ | | | Total | |
| Common Stock | | | | | | | | | | | | | | | | |
| China | | | | | | | | | | | | | | | | |
| Communication Services | | $ | 50,137 | | | $ | — | | | $ | — | | | $ | 50,137 | |
| Consumer Discretionary | | | 1,051,467 | | | | — | | | | — | | | | 1,051,467 | |
| Consumer Staples | | | 292,556 | | | | — | | | | — | | | | 292,556 | |
| Energy | | | 274,515 | | | | — | | | | — | | | | 274,515 | |
| Financials | | | 2,003,900 | | | | — | | | | — | | | | 2,003,900 | |
| Health Care | | | 241,063 | | | | — | | | | — | ‡‡ | | | 241,063 | |
| Industrials | | | 1,094,675 | | | | — | | | | — | | | | 1,094,675 | |
| Information Technology | | | 424,562 | | | | — | | | | — | ‡‡ | | | 424,562 | |
| Materials | | | 86,767 | | | | — | | | | — | ‡‡ | | | 86,767 | |
| Real Estate | | | 260,872 | | | | — | | | | — | | | | 260,872 | |
| Utilities | | | 184,386 | | | | — | | | | — | | | | 184,386 | |
| Total Common Stock | | | 5,964,900 | | | | — | | | | — | | | | 5,964,900 | |
| Total Investments in Securities | | $ | 5,964,900 | | | $ | — | | | $ | — | | | $ | 5,964,900 | |
| ^ | A reconciliation of Level 3 investments, including certain disclosures related to significant inputs used in valuing Level 3 investments is only presented when the Fund has over 1% of Level 3 investments at the end of the period in relation to net assets. |
| ‡‡ | Security or securities with a market value of $0. |
Amounts designated as “—” are $0 or have been rounded to $0.
See “Glossary” for abbreviations.
The accompanying notes are an integral part of the financial statements.
Schedule of Investments March 31, 2023
KraneShares CSI China Internet ETF

| | | Shares | | | Value | |
| COMMON STOCK — 100.0%‡ | | | | | | |
| CHINA — 100.0% | | | | | | | | |
| Communication Services — 45.0% | | | | | | | | |
| Autohome ADR | | | 2,352,891 | | | $ | 78,751,262 | |
| Baidu, Cl A* | | | 15,677,034 | | | | 296,966,854 | |
| Bilibili, Cl Z* | | | 8,943,144 | | | | 216,003,937 | |
| China Literature* | | | 15,298,000 | | | | 78,926,490 | |
| iQIYI ADR* | | | 12,407,979 | | | | 90,330,087 | |
| JOYY ADR | | | 1,541,752 | | | | 48,071,827 | |
| Kanzhun ADR* | | | 10,760,196 | | | | 204,766,530 | |
| Kingsoft | | | 32,814,200 | | | | 161,563,937 | |
| Kuaishou Technology, Cl B* | | | 29,490,300 | | | | 227,095,540 | |
| NetEase | | | 16,600,805 | | | | 291,837,667 | |
| Tencent Holdings | | | 14,748,675 | | | | 724,850,326 | |
| Tencent Music Entertainment Group ADR* | | | 32,313,996 | | | | 267,559,887 | |
| Weibo ADR* | | | 3,019,704 | | | | 60,575,262 | |
| | | | | | | | 2,747,299,606 | |
| Consumer Discretionary — 36.7% | | | | | | | | |
| Alibaba Group Holding* | | | 44,419,464 | | | | 568,120,075 | |
| JD.com, Cl A | | | 13,290,990 | | | | 291,218,456 | |
| Meituan, Cl B* | | | 23,025,848 | | | | 420,921,040 | |
| PDD Holdings ADR* | | | 4,068,795 | | | | 308,821,540 | |
| TAL Education Group ADR* | | | 15,923,703 | | | | 102,070,936 | |
| Tongcheng Travel Holdings* | | | 42,280,600 | | | | 91,994,554 | |
| Trip.com Group* | | | 6,913,400 | | | | 258,747,753 | |
| Vipshop Holdings ADR* | | | 13,215,343 | | | | 200,608,907 | |
| | | | | | | | 2,242,503,261 | |
| Consumer Staples — 6.0% | | | | | | | | |
| Alibaba Health Information Technology* | | | 173,194,000 | | | | 125,318,240 | |
| Dada Nexus ADR* | | | 3,153,018 | | | | 26,706,062 | |
| JD Health International* | | | 23,151,850 | | | | 172,239,064 | |
The accompanying notes are an integral part of the financial statements.
Schedule of Investments March 31, 2023
KraneShares CSI China Internet ETF (concluded)
| | | Shares | | | Value | |
| COMMON STOCK (continued) | | | | | | |
| Consumer Staples (continued) | | | | | | | | |
| Ping An Healthcare and Technology*(A) | | | 17,991,400 | | | $ | 45,517,386 | |
| | | | | | | | 369,780,752 | |
| Financials — 3.3% | | | | | | | | |
| 360 DigiTech ADR | | | 3,833,709 | | | | 74,373,955 | |
| Lufax Holding ADR | | | 28,333,266 | | | | 57,799,863 | |
| ZhongAn Online P&C Insurance, Cl H*(A) | | | 22,309,900 | | | | 70,340,578 | |
| | | | | | | | 202,514,396 | |
| Industrials — 3.5% | | | | | | | | |
| Full Truck Alliance ADR* | | | 28,012,923 | | | | 213,178,344 | |
| | | | | | | | | |
| Information Technology — 1.0% | | | | | | | | |
| Chindata Group Holdings ADR* | | | 5,666,237 | | | | 39,606,996 | |
| Ming Yuan Cloud Group Holdings(A) | | | 35,823,000 | | | | 22,954,247 | |
| | | | | | | | 62,561,243 | |
| Real Estate — 4.5% | | | | | | | | |
| KE Holdings ADR* | | | 14,472,227 | | | | 272,656,757 | |
| TOTAL CHINA | | | | | | | 6,110,494,359 | |
| | | | | | | | | |
TOTAL COMMON STOCK
(Cost $7,130,394,689) | | | | | | | 6,110,494,359 | |
| | | | | | | | | |
| SHORT-TERM INVESTMENT — 0.5% | | | | | | | | |
| Invesco Government & Agency Portfolio, Cl Institutional, 4.430%(B)(C) | | | 31,393,462 | | | | 31,393,462 | |
TOTAL SHORT-TERM INVESTMENT
(Cost $31,393,462) | | | | | | | 31,393,462 | |
| | | | | | | | | |
TOTAL INVESTMENTS — 100.5%
(Cost $7,161,788,151) | | | | | | | 6,141,887,821 | |
| OTHER ASSETS LESS LIABILITIES – (0.5)% | | | | | | | (30,218,433 | ) |
| NET ASSETS - 100% | | | | | | $ | 6,111,669,388 | |
| ‡ | Industries are utilized for compliance purposes, whereas sectors are utilized for reporting. |
| * | Non-income producing security. |
| (A) | This security or a partial position of this security is on loan at March 31, 2023. The total market value of securities on loan at March 31, 2023 was $29,815,441. |
| (B) | The rate shown is the 7-day effective yield as of March 31, 2023. |
| (C) | This security was purchased with cash collateral held from securities on loan. The total value of such security as of March 31, 2023 was $31,393,462. |
As of March 31, 2023, all of the Fund’s investments were considered Level 1 of the fair value hierarchy, in accordance with the authoritative guidance under U.S. GAAP.
See “Glossary” for abbreviations.
The accompanying notes are an integral part of the financial statements.
Schedule of Investments March 31, 2023
KraneShares Bosera MSCI China A 50 Connect Index ETF

| | | Shares | | | Value | |
| COMMON STOCK — 99.9%‡ | | | | | | |
| CHINA — 99.9% | | | | | | | | |
| Communication Services — 1.4% | | | | | | | | |
| China United Network Communications, Cl A | | | 5,352,800 | | | $ | 4,224,684 | |
| Focus Media Information Technology, Cl A | | | 2,430,602 | | | | 2,431,558 | |
| | | | | | | | 6,656,242 | |
| Consumer Discretionary — 6.1% | | | | | | | | |
| BYD, Cl A | | | 436,989 | | | | 16,291,399 | |
| China Tourism Group Duty Free, Cl A | | | 470,632 | | | | 12,557,862 | |
| | | | | | | | 28,849,261 | |
| Consumer Staples — 16.4% | | | | | | | | |
| Foshan Haitian Flavouring & Food, Cl A | | | 430,720 | | | | 4,800,619 | |
| Inner Mongolia Yili Industrial Group, Cl A | | | 713,612 | | | | 3,025,990 | |
| Jiangsu Yanghe Brewery JSC, Cl A | | | 168,122 | | | | 4,050,713 | |
| Kweichow Moutai, Cl A | | | 140,189 | | | | 37,153,464 | |
| Luzhou Laojiao, Cl A | | | 164,146 | | | | 6,090,132 | |
| Muyuan Foods, Cl A | | | 593,545 | | | | 4,235,100 | |
| Shanxi Xinghuacun Fen Wine Factory, Cl A | | | 136,016 | | | | 5,395,244 | |
| Wuliangye Yibin, Cl A | | | 432,879 | | | | 12,417,859 | |
| | | | | | | | 77,169,121 | |
| Energy — 3.2% | | | | | | | | |
| China Shenhua Energy, Cl A | | | 1,783,047 | | | | 7,314,146 | |
| Shaanxi Coal Industry, Cl A | | | 2,620,716 | | | | 7,762,201 | |
| | | | | | | | 15,076,347 | |
| Financials — 17.5% | | | | | | | | |
| Agricultural Bank of China, Cl A | | | 13,291,307 | | | | 6,019,246 | |
| Bank of Communications, Cl A | | | 6,127,999 | | | | 4,559,881 | |
| Bank of Ningbo, Cl A | | | 1,031,818 | | | | 4,103,352 | |
| China Merchants Bank, Cl A | | | 3,220,758 | | | | 16,072,602 | |
| China Pacific Insurance Group, Cl A | | | 1,068,714 | | | | 4,033,764 | |
| CITIC Securities, Cl A | | | 1,911,922 | | | | 5,701,828 | |
The accompanying notes are an integral part of the financial statements.
Schedule of Investments March 31, 2023
KraneShares Bosera MSCI China A 50 Connect Index ETF (continued)
| | | Shares | | | Value | |
| COMMON STOCK (continued) | | | | | | |
| Financials (continued) | | | | | | | | |
| East Money Information, Cl A | | | 2,062,994 | | | $ | 6,017,177 | |
| Industrial & Commercial Bank of China, Cl A | | | 9,821,826 | | | | 6,378,831 | |
| Industrial Bank, Cl A | | | 3,243,522 | | | | 7,977,383 | |
| Ping An Bank, Cl A | | | 3,029,771 | | | | 5,528,087 | |
| Ping An Insurance Group of China, Cl A | | | 1,691,298 | | | | 11,230,496 | |
| Shanghai Pudong Development Bank, Cl A | | | 4,582,646 | | | | 4,797,989 | |
| | | | | | | | 82,420,636 | |
| Health Care — 9.2% | | | | | | | | |
| Aier Eye Hospital Group, Cl A | | | 1,548,467 | | | | 7,005,789 | |
| Chongqing Zhifei Biological Products, Cl A | | | 345,270 | | | | 4,119,227 | |
| Jiangsu Hengrui Pharmaceuticals, Cl A | | | 1,376,239 | | | | 8,581,328 | |
| Shenzhen Mindray Bio-Medical Electronics, Cl A | | | 261,694 | | | | 11,878,415 | |
| WuXi AppTec, Cl A | | | 553,382 | | | | 6,406,284 | |
| Zhangzhou Pientzehuang Pharmaceutical, Cl A | | | 130,150 | | | | 5,389,609 | |
| | | | | | | | 43,380,652 | |
| Industrials — 15.6% | | | | | | | | |
| China State Construction Engineering, Cl A | | | 9,130,858 | | | | 7,711,761 | |
| Contemporary Amperex Technology, Cl A | | | 531,753 | | | | 31,441,513 | |
| COSCO SHIPPING Holdings, Cl A | | | 2,773,960 | | | | 4,455,431 | |
| Eve Energy, Cl A | | | 444,469 | | | | 4,511,160 | |
| NARI Technology, Cl A | | | 1,457,576 | | | | 5,754,064 | |
| SF Holding, Cl A | | | 1,065,959 | | | | 8,596,219 | |
| Shenzhen Inovance Technology, Cl A | | | 578,778 | | | | 5,924,904 | |
| Sungrow Power Supply, Cl A | | | 323,438 | | | | 4,938,725 | |
| | | | | | | | 73,333,777 | |
| Information Technology — 13.7% | | | | | | | | |
| BOE Technology Group, Cl A | | | 19,508,345 | | | | 12,612,971 | |
| LONGi Green Energy Technology, Cl A | | | 3,798,591 | | | | 22,352,465 | |
| Luxshare Precision Industry, Cl A | | | 3,692,550 | | | | 16,297,699 | |
| Tongwei, Cl A | | | 2,341,605 | | | | 13,267,492 | |
| | | | | | | | 64,530,627 | |
| Materials — 12.1% | | | | | | | | |
| Wanhua Chemical Group, Cl A | | | 2,398,899 | | | | 33,492,994 | |
| Zijin Mining Group, Cl A | | | 12,929,792 | | | | 23,327,963 | |
| | | | | | | | 56,820,957 | |
| Real Estate — 1.6% | | | | | | | | |
| China Vanke, Cl A | | | 1,567,600 | | | | 3,478,838 | |
| Poly Developments and Holdings Group, Cl A | | | 1,929,677 | | | | 3,970,459 | |
| | | | | | | | 7,449,297 | |
| Utilities — 3.1% | | | | | | | | |
| China Three Gorges Renewables Group, Cl A | | | 4,448,000 | | | | 3,549,436 | |
The accompanying notes are an integral part of the financial statements.
Schedule of Investments March 31, 2023
KraneShares Bosera MSCI China A 50 Connect Index ETF (concluded)
| | | Shares | | | Value | |
| COMMON STOCK (continued) | | | | | | |
| Utilities (continued) | | | | | | | | |
| China Yangtze Power, Cl A | | | 3,534,394 | | | $ | 10,936,739 | |
| | | | | | | | 14,486,175 | |
| TOTAL CHINA | | | | | | | 470,173,092 | |
| | | | | | | | | |
TOTAL COMMON STOCK
(Cost $530,344,133) | | | | | | | 470,173,092 | |
| | | | | | | | | |
| RIGHT — 0.0% | | | | | | | | |
| CHINA — 0.0% | | | | | | | | |
| Health Care — 0.0% | | | | | | | | |
| Kangmei Pharma‡‡*(A) | | | 66,139 | | | | — | |
| TOTAL CHINA | | | | | | | — | |
| | | | | | | | | |
TOTAL RIGHT
(Cost $–) | | | | | | | — | |
| | | | | | | | | |
TOTAL INVESTMENTS — 99.9%
(Cost $530,344,133) | | | | | | | 470,173,092 | |
| OTHER ASSETS LESS LIABILITIES – 0.1% | | | | | | | 699,975 | |
| NET ASSETS - 100% | | | | | | $ | 470,873,067 | |
| ‡ | Industries are utilized for compliance purposes, whereas sectors are utilized for reporting. |
| * | Non-income producing security. |
| (A) | Level 3 security in accordance with fair value hierarchy. |
| ‡‡ | Expiration date not available. |
The following summarizes the market value of the Fund’s investments used as of March 31, 2023, based on the inputs used to value them:
| Investments in Securities | | Level 1 | | | Level 2 | | | Level 3^ | | | Total | |
| Common Stock | | | | | | | | | | | | | | | | |
| China | | $ | 470,173,092 | | | $ | — | | | $ | — | | | $ | 470,173,092 | |
| Total Common Stock | | | 470,173,092 | | | | — | | | | — | | | | 470,173,092 | |
| Right | | | — | | | | — | | | | — | ‡‡ | | | — | |
| Total Investments in Securities | | $ | 470,173,092 | | | $ | — | | | $ | — | | | $ | 470,173,092 | |
| ^ | A reconciliation of Level 3 investments, including certain disclosures related to significant inputs used in valuing Level 3 investments is only presented when the Fund has over 1% of Level 3 investments at the end of the period in relation to net assets. |
| ‡‡ | Security or securities with a market value of $0. |
Amounts designated as “—” are $0 or have been rounded to $0.
See “Glossary” for abbreviations.
The accompanying notes are an integral part of the financial statements.
Schedule of Investments March 31, 2023
KraneShares Bloomberg China Bond Inclusion Index ETF
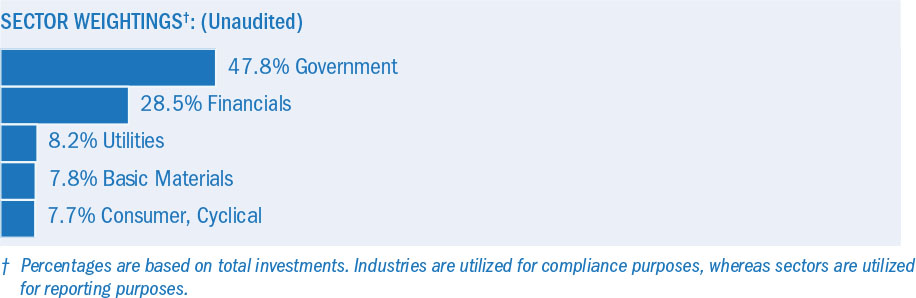
| | | Face Amount(A) | | | Value | |
| GLOBAL BONDS — 47.4% | | | | | | | | |
| CHINA — 47.4% | | | | | | | | |
| Agricultural Development Bank of China | | | | | | | | |
| 3.350%, 03/24/2026 | | | 930,000 | | | $ | 137,408 | |
| 3.060%, 08/05/2023 | | | 3,500,000 | | | | 510,822 | |
| China Development Bank | | | | | | | | |
| 4.040%, 04/10/2027 | | | 1,650,000 | | | | 249,976 | |
| 4.040%, 07/06/2028 | | | 1,650,000 | | | | 253,223 | |
| 3.430%, 01/14/2027 | | | 3,450,000 | | | | 512,981 | |
| 3.300%, 03/03/2026 | | | 2,360,000 | | | | 349,603 | |
| 3.090%, 06/18/2030 | | | 820,000 | | | | 119,908 | |
| China Government Bond | | | | | | | | |
| 4.080%, 10/22/2048 | | | 1,190,000 | | | | 197,796 | |
| 3.530%, 10/18/2051 | | | 2,700,000 | | | | 412,510 | |
| 3.290%, 05/23/2029 | | | 1,600,000 | | | | 241,137 | |
| 3.020%, 10/22/2025 | | | 2,500,000 | | | | 369,143 | |
| 2.690%, 08/15/2032 | | | 2,000,000 | | | | 286,517 | |
| 2.680%, 05/21/2030 | | | 1,800,000 | | | | 258,966 | |
| 2.260%, 02/24/2025 | | | 3,000,000 | | | | 435,412 | |
| 2.180%, 08/25/2025 | | | 2,000,000 | | | | 289,022 | |
| Export-Import Bank of China | | | | | | | | |
| 3.860%, 05/20/2029 | | | 1,030,000 | | | | 157,610 | |
| 3.230%, 03/23/2030 | | | 1,160,000 | | | | 171,183 | |
| 3.180%, 03/11/2032 | | | 1,000,000 | | | | 147,164 | |
| 2.930%, 03/02/2025 | | | 1,240,000 | | | | 181,616 | |
| | | | | | | | 5,281,997 | |
TOTAL GLOBAL BONDS
(Cost $5,544,072) | | | | | | | 5,281,997 | |
| | | | | | | | | |
| CORPORATE OBLIGATIONS — 19.8% | | | | | | | | |
| CHINA — 15.9% | | | | | | | | |
| Basic Materials — 5.2% | | | | | | | | |
| China Baowu Steel Group, MTN | | | | | | | | |
| 2.370%, 05/22/2023 | | | 4,000,000 | | | | 582,291 | |
The accompanying notes are an integral part of the financial statements.
Schedule of Investments March 31, 2023
KraneShares Bloomberg China Bond Inclusion Index ETF (concluded)
| | | Face Amount(A) | | | Value | |
| CORPORATE OBLIGATIONS (continued) | | | | | | | | |
| Consumer, Cyclical — 5.2% | | | | | | | | |
| Zhejiang Geely Holding Group, MTN | | | | | | | | |
| 3.300%, 03/28/2025 | | | 4,000,000 | | | $ | 574,259 | |
| | | | | | | | | |
| Utilities — 5.5% | | | | | | | | |
| State Grid Corp of China, MTN | | | | | | | | |
| 2.880%, 08/30/2027 | | | 4,300,000 | | | | 618,824 | |
| TOTAL CHINA | | | | | | | 1,775,374 | |
| | | | | | | | | |
| SUPRANATIONAL — 3.9% | | | | | | | | |
| Government — 3.9% | | | | | | | | |
| New Development Bank | | | | | | | | |
| 2.450%, 01/27/2025 | | | 3,000,000 | | | | 433,766 | |
| | | | | | | | | |
TOTAL CORPORATE OBLIGATIONS
(Cost $2,237,746) | | | | | | | 2,209,140 | |
| | | | | | | | | |
TOTAL INVESTMENTS — 67.2%
(Cost $7,781,818) | | | | | | | 7,491,137 | |
| OTHER ASSETS LESS LIABILITIES – 32.8% | | | | | | | 3,654,011 | |
| NET ASSETS - 100% | | | | | | $ | 11,145,148 | |
| (A) | In CNY unless otherwise indicated. |
As of March 31, 2023, all of the Fund’s investments were considered Level 2 of the fair value hierarchy, in accordance with the authoritative guidance under U.S. GAAP.
See “Glossary” for abbreviations.
The accompanying notes are an integral part of the financial statements.
Schedule of Investments March 31, 2023
KraneShares MSCI All China Index ETF

| | | Shares | | | Value | |
| COMMON STOCK — 99.8%‡ | | | | | | | | |
| CHINA — 99.6% | | | | | | | | |
| Communication Services — 13.5% | | | | | | | | |
| Autohome ADR | | | 520 | | | $ | 17,404 | |
| Baidu, Cl A* | | | 6,550 | | | | 124,075 | |
| Bilibili, Cl Z* | | | 1,260 | | | | 30,433 | |
| Focus Media Information Technology, Cl A | | | 28,500 | | | | 28,511 | |
| iQIYI ADR* | | | 2,698 | | | | 19,642 | |
| Kingsoft | | | 14,400 | | | | 70,900 | |
| Kuaishou Technology, Cl B* | | | 5,600 | | | | 43,124 | |
| NetEase | | | 3,900 | | | | 68,561 | |
| Tencent Holdings | | | 15,358 | | | | 754,797 | |
| Tencent Music Entertainment Group ADR* | | | 3,636 | | | | 30,106 | |
| | | | | | | | 1,187,553 | |
| Consumer Discretionary — 22.9% | | | | | | | | |
| Alibaba Group Holding* | | | 41,124 | | | | 525,971 | |
| ANTA Sports Products | | | 4,600 | | | | 66,803 | |
| BYD, Cl A | | | 2,300 | | | | 85,746 | |
| BYD, Cl H | | | 3,500 | | | | 102,459 | |
| China Tourism Group Duty Free, Cl A | | | 2,300 | | | | 61,371 | |
| Chongqing Changan Automobile, Cl A | | | 27,838 | | | | 48,320 | |
| Fuyao Glass Industry Group, Cl A | | | 8,100 | | | | 41,000 | |
| Geely Automobile Holdings | | | 23,000 | | | | 29,593 | |
| Great Wall Motor, Cl H | | | 16,500 | | | | 20,368 | |
| Guangzhou Automobile Group, Cl H | | | 18,000 | | | | 11,350 | |
| H World Group ADR* | | | 777 | | | | 38,057 | |
| Haier Smart Home, Cl A | | | 8,500 | | | | 28,072 | |
| Haier Smart Home, Cl H | | | 11,200 | | | | 35,241 | |
| Huayu Automotive Systems, Cl A | | | 4,600 | | | | 11,213 | |
| JD.com, Cl A | | | 5,522 | | | | 120,988 | |
| Li Auto, Cl A* | | | 3,500 | | | | 43,695 | |
The accompanying notes are an integral part of the financial statements.
Schedule of Investments March 31, 2023
KraneShares MSCI All China Index ETF (continued)
| | | Shares | | | Value | |
| COMMON STOCK (continued) | | | | | | | | |
| Consumer Discretionary (continued) | | | | | | | | |
| Li Ning | | | 7,500 | | | $ | 59,141 | |
| Meituan, Cl B* | | | 12,266 | | | | 224,223 | |
| New Oriental Education & Technology Group* | | | 5,700 | | | | 22,219 | |
| NIO ADR* | | | 4,568 | | | | 48,010 | |
| PDD Holdings ADR* | | | 1,368 | | | | 103,831 | |
| SAIC Motor, Cl A | | | 11,557 | | | | 24,167 | |
| Shenzhen Overseas Chinese Town, Cl A* | | | 27,400 | | | | 19,271 | |
| Shenzhou International Group Holdings | | | 3,800 | | | | 39,888 | |
| TAL Education Group ADR* | | | 2,876 | | | | 18,435 | |
| TravelSky Technology, Cl H | | | 7,000 | | | | 13,073 | |
| Trip.com Group ADR* | | | 1,915 | | | | 72,138 | |
| Vipshop Holdings ADR* | | | 1,837 | | | | 27,886 | |
| Yum China Holdings | | | 1,204 | | | | 76,322 | |
| | | | | | | | 2,018,851 | |
| Consumer Staples — 11.2% | | | | | | | | |
| Alibaba Health Information Technology* | | | 18,000 | | | | 13,024 | |
| Anhui Gujing Distillery, Cl A | | | 1,400 | | | | 60,344 | |
| China Mengniu Dairy | | | 14,000 | | | | 57,427 | |
| China Resources Beer Holdings | | | 4,000 | | | | 32,102 | |
| Foshan Haitian Flavouring & Food, Cl A | | | 4,779 | | | | 53,263 | |
| Guangdong Haid Group, Cl A | | | 4,900 | | | | 41,620 | |
| Henan Shuanghui Investment & Development, Cl A | | | 5,200 | | | | 19,642 | |
| Inner Mongolia Yili Industrial Group, Cl A | | | 7,700 | | | | 32,651 | |
| Jiangsu Yanghe Brewery JSC, Cl A | | | 1,600 | | | | 38,550 | |
| Kweichow Moutai, Cl A | | | 1,000 | | | | 265,024 | |
| Luzhou Laojiao, Cl A | | | 2,300 | | | | 85,334 | |
| Muyuan Foods, Cl A | | | 8,602 | | | | 61,378 | |
| New Hope Liuhe, Cl A* | | | 13,500 | | | | 26,008 | |
| Shanxi Xinghuacun Fen Wine Factory, Cl A | | | 1,660 | | | | 65,846 | |
| Tingyi Cayman Islands Holding | | | 14,000 | | | | 23,328 | |
| Want Want China Holdings | | | 23,000 | | | | 14,796 | |
| Wuliangye Yibin, Cl A | | | 3,200 | | | | 91,797 | |
| | | | | | | | 982,134 | |
| Energy — 3.7% | | | | | | | | |
| China Oilfield Services, Cl H | | | 16,000 | | | | 16,408 | |
| China Petroleum & Chemical, Cl A | | | 46,600 | | | | 38,136 | |
| China Petroleum & Chemical, Cl H | | | 96,500 | | | | 57,040 | |
| China Shenhua Energy, Cl H | | | 11,500 | | | | 36,185 | |
| PetroChina, Cl A | | | 22,400 | | | | 19,310 | |
| PetroChina, Cl H | | | 67,984 | | | | 40,271 | |
| Shaanxi Coal Industry, Cl A | | | 11,900 | | | | 35,246 | |
| Shanxi Lu’an Environmental Energy Development, Cl A | | | 7,600 | | | | 24,281 | |
The accompanying notes are an integral part of the financial statements.
Schedule of Investments March 31, 2023
KraneShares MSCI All China Index ETF (continued)
| | | Shares | | | Value | |
| COMMON STOCK (continued) | | | | | | | | |
| Energy (continued) | | | | | | | | |
| Yankuang Energy Group, Cl H | | | 16,000 | | | $ | 57,274 | |
| | | | | | | | 324,151 | |
| Financials — 20.1% | | | | | | | | |
| Agricultural Bank of China, Cl A | | | 87,500 | | | | 39,626 | |
| Agricultural Bank of China, Cl H | | | 104,397 | | | | 38,700 | |
| Bank of Beijing, Cl A | | | 28,100 | | | | 18,004 | |
| Bank of China, Cl A | | | 34,700 | | | | 17,079 | |
| Bank of China, Cl H | | | 240,396 | | | | 92,178 | |
| Bank of Communications, Cl A | | | 43,600 | | | | 32,443 | |
| Bank of Communications, Cl H | | | 32,000 | | | | 20,138 | |
| Bank of Hangzhou, Cl A | | | 14,200 | | | | 24,007 | |
| Bank of Jiangsu, Cl A | | | 22,200 | | | | 22,694 | |
| Bank of Nanjing, Cl A | | | 14,000 | | | | 18,266 | |
| Bank of Ningbo, Cl A | | | 7,200 | | | | 28,633 | |
| Bank of Shanghai, Cl A | | | 18,604 | | | | 16,227 | |
| China CITIC Bank, Cl H | | | 32,000 | | | | 16,102 | |
| China Construction Bank, Cl A | | | 12,000 | | | | 10,380 | |
| China Construction Bank, Cl H | | | 275,000 | | | | 178,313 | |
| China Everbright Bank, Cl A | | | 54,900 | | | | 24,063 | |
| China Galaxy Securities, Cl H | | | 38,000 | | | | 19,121 | |
| China Life Insurance, Cl H | | | 23,483 | | | | 38,590 | |
| China Merchants Bank, Cl A | | | 17,800 | | | | 88,828 | |
| China Merchants Bank, Cl H | | | 13,000 | | | | 66,408 | |
| China Merchants Securities, Cl A | | | 9,500 | | | | 19,077 | |
| China Minsheng Banking, Cl A | | | 50,900 | | | | 25,571 | |
| China Minsheng Banking, Cl H | | | 29,500 | | | | 10,109 | |
| China Pacific Insurance Group, Cl A | | | 7,200 | | | | 27,176 | |
| China Pacific Insurance Group, Cl H | | | 10,800 | | | | 28,686 | |
| CITIC Securities, Cl A | | | 15,845 | | | | 47,254 | |
| CITIC Securities, Cl H | | | 8,000 | | | | 17,080 | |
| East Money Information, Cl A | | | 13,000 | | | | 37,917 | |
| Everbright Securities, Cl A | | | 10,300 | | | | 22,858 | |
| GF Securities, Cl A | | | 10,000 | | | | 22,964 | |
| Guosen Securities, Cl A | | | 10,900 | | | | 14,872 | |
| Guotai Junan Securities, Cl A | | | 8,300 | | | | 17,356 | |
| Haitong Securities, Cl A | | | 12,600 | | | | 16,164 | |
| Huatai Securities, Cl A | | | 11,900 | | | | 22,128 | |
| Huatai Securities, Cl H | | | 9,200 | | | | 10,513 | |
| Huaxia Bank, Cl A | | | 18,500 | | | | 14,493 | |
| Industrial & Commercial Bank of China, Cl A | | | 66,900 | | | | 43,449 | |
| Industrial & Commercial Bank of China, Cl H | | | 211,441 | | | | 112,590 | |
| Industrial Bank, Cl A | | | 20,000 | | | | 49,190 | |
| Industrial Securities, Cl A | | | 27,569 | | | | 24,569 | |
| New China Life Insurance, Cl A | | | 4,000 | | | | 17,765 | |
The accompanying notes are an integral part of the financial statements.
Schedule of Investments March 31, 2023
KraneShares MSCI All China Index ETF (continued)
| | | Shares | | | Value | |
| COMMON STOCK (continued) | | | | | | | | |
| Financials (continued) | | | | | | | | |
| New China Life Insurance, Cl H | | | 3,700 | | | $ | 8,795 | |
| Orient Securities, Cl A | | | 14,100 | | | | 20,101 | |
| People’s Insurance Group of China, Cl H | | | 54,452 | | | | 18,174 | |
| PICC Property & Casualty, Cl H | | | 29,510 | | | | 30,112 | |
| Ping An Bank, Cl A | | | 19,891 | | | | 36,293 | |
| Ping An Insurance Group of China, Cl A | | | 10,200 | | | | 67,730 | |
| Ping An Insurance Group of China, Cl H | | | 19,000 | | | | 123,682 | |
| Shanghai Pudong Development Bank, Cl A | | | 28,600 | | | | 29,944 | |
| Shenwan Hongyuan Group, Cl A | | | 32,800 | | | | 19,917 | |
| | | | | | | | 1,766,329 | |
| Health Care — 5.3% | | | | | | | | |
| Beijing Tongrentang, Cl A | | | 2,144 | | | | 17,215 | |
| Changchun High & New Technology Industry Group, Cl A | | | 1,400 | | | | 33,291 | |
| China Medical System Holdings | | | 9,000 | | | | 14,217 | |
| CSPC Pharmaceutical Group | | | 45,520 | | | | 44,766 | |
| Genscript Biotech* | | | 14,000 | | | | 29,962 | |
| Guangzhou Baiyunshan Pharmaceutical Holdings, Cl A | | | 2,300 | | | | 11,079 | |
| Huadong Medicine, Cl A | | | 2,980 | | | | 20,109 | |
| Jiangsu Hengrui Pharmaceuticals, Cl A | | | 5,616 | | | | 35,018 | |
| Shanghai Fosun Pharmaceutical Group, Cl A | | | 3,900 | | | | 18,395 | |
| Shanghai Pharmaceuticals Holding, Cl A | | | 7,600 | | | | 22,543 | |
| Shenzhen Mindray Bio-Medical Electronics, Cl A | | | 1,100 | | | | 49,929 | |
| Sinopharm Group, Cl H | | | 6,400 | | | | 19,363 | |
| Wuxi Biologics Cayman* | | | 11,500 | | | | 71,198 | |
| Yunnan Baiyao Group, Cl A | | | 2,140 | | | | 17,046 | |
| Zai Lab ADR* | | | 374 | | | | 12,439 | |
| Zhangzhou Pientzehuang Pharmaceutical, Cl A | | | 700 | | | | 28,988 | |
| Zhejiang NHU, Cl A | | | 7,032 | | | | 18,380 | |
| | | | | | | | 463,938 | |
| Industrials — 6.9% | | | | | | | | |
| AECC Aviation Power, Cl A | | | 3,900 | | | | 24,505 | |
| China Conch Venture Holdings | | | 8,000 | | | | 13,962 | |
| China Eastern Airlines, Cl A* | | | 24,400 | | | | 18,298 | |
| China Energy Engineering, Cl A | | | 79,637 | | | | 27,948 | |
| China Merchants Port Holdings | | | 16,734 | | | | 25,666 | |
| China Railway Group, Cl H | | | 23,000 | | | | 14,035 | |
| China Southern Airlines, Cl A* | | | 23,000 | | | | 26,358 | |
| CITIC | | | 23,780 | | | | 27,809 | |
| Contemporary Amperex Technology, Cl A | | | 2,000 | | | | 118,256 | |
| COSCO SHIPPING Holdings, Cl A | | | 24,420 | | | | 39,223 | |
| Daqin Railway, Cl A | | | 15,500 | | | | 16,228 | |
| Fosun International | | | 11,500 | | | | 8,438 | |
| Metallurgical Corp of China, Cl A | | | 40,600 | | | | 23,057 | |
| Power Construction Corp of China, Cl A | | | 18,600 | | | | 19,312 | |
The accompanying notes are an integral part of the financial statements.
Schedule of Investments March 31, 2023
KraneShares MSCI All China Index ETF (continued)
| | | Shares | | | Value | |
| COMMON STOCK (continued) | | | | | | | | |
| Industrials (continued) | | | | | | | | |
| Sany Heavy Industry, Cl A | | | 13,500 | | | $ | 33,596 | |
| SF Holding, Cl A | | | 4,400 | | | | 35,483 | |
| Shanghai International Airport, Cl A* | | | 1,600 | | | | 12,985 | |
| Shanghai International Port Group, Cl A | | | 12,700 | | | | 10,245 | |
| Weichai Power, Cl A | | | 17,188 | | | | 31,561 | |
| Zhejiang Chint Electrics, Cl A | | | 3,800 | | | | 15,477 | |
| Zhuzhou CRRC Times Electric, Cl H | | | 3,100 | | | | 13,486 | |
| Zoomlion Heavy Industry Science and Technology, Cl A | | | 16,100 | | | | 14,559 | |
| ZTO Express Cayman ADR* | | | 1,406 | | | | 40,296 | |
| | | | | | | | 610,783 | |
| Information Technology — 5.1% | | | | | | | | |
| BOE Technology Group, Cl A | | | 47,800 | | | | 30,905 | |
| GDS Holdings, Cl A* | | | 9,500 | | | | 22,994 | |
| Hanergy Thin Film Power Group*(A) | | | 4,364 | | | | — | |
| Iflytek, Cl A | | | 3,200 | | | | 29,673 | |
| Kingboard Holdings | | | 4,500 | | | | 13,815 | |
| Kingdee International Software Group* | | | 16,000 | | | | 25,926 | |
| Lenovo Group | | | 32,000 | | | | 34,650 | |
| LONGi Green Energy Technology, Cl A | | | 9,629 | | | | 56,660 | |
| Luxshare Precision Industry, Cl A | | | 11,774 | | | | 51,966 | |
| Sunny Optical Technology Group | | | 3,000 | | | | 36,287 | |
| Unigroup Guoxin Microelectronics, Cl A* | | | 2,320 | | | | 37,543 | |
| Xiaomi, Cl B* | | | 42,600 | | | | 65,664 | |
| Yonyou Network Technology, Cl A | | | 5,325 | | | | 19,502 | |
| ZTE, Cl H | | | 7,600 | | | | 22,268 | |
| | | | | | | | 447,853 | |
| Materials — 4.1% | | | | | | | | |
| Anhui Conch Cement, Cl A | | | 3,800 | | | | 15,632 | |
| Anhui Conch Cement, Cl H | | | 7,000 | | | | 24,255 | |
| Baoshan Iron & Steel, Cl A | | | 28,400 | | | | 25,806 | |
| China National Building Material, Cl H | | | 18,000 | | | | 14,767 | |
| China Northern Rare Earth Group High-Tech, Cl A | | | 10,500 | | | | 39,891 | |
| CMOC Group, Cl H | | | 54,000 | | | | 32,675 | |
| Ganfeng Lithium Group, Cl A | | | 3,120 | | | | 30,199 | |
| Inner Mongolia BaoTou Steel Union, Cl A | | | 63,900 | | | | 17,586 | |
| Rongsheng Petrochemical, Cl A | | | 12,450 | | | | 27,430 | |
| Shandong Hualu Hengsheng Chemical, Cl A | | | 5,440 | | | | 27,924 | |
| Tianqi Lithium, Cl A | | | 1,540 | | | | 16,936 | |
| Wanhua Chemical Group, Cl A | | | 2,900 | | | | 40,489 | |
| Zhejiang Huayou Cobalt, Cl A | | | 1,704 | | | | 13,647 | |
| Zijin Mining Group, Cl A | | | 17,900 | | | | 32,295 | |
| | | | | | | | 359,532 | |
The accompanying notes are an integral part of the financial statements.
Schedule of Investments March 31, 2023
KraneShares MSCI All China Index ETF (continued)
| | | Shares | | | Value | |
| COMMON STOCK (continued) | | | | | | | | |
| Real Estate — 3.4% | | | | | | | | |
| China Evergrande Group*(A) | | | 13,000 | | | $ | 631 | |
| China Merchants Shekou Industrial Zone Holdings, Cl A | | | 9,100 | | | | 18,048 | |
| China Overseas Land & Investment | | | 16,839 | | | | 40,671 | |
| China Resources Land | | | 14,214 | | | | 64,824 | |
| China Vanke, Cl A | | | 10,443 | | | | 23,175 | |
| China Vanke, Cl H | | | 9,300 | | | | 14,667 | |
| Country Garden Holdings* | | | 53,612 | | | | 15,093 | |
| Gemdale, Cl A | | | 10,600 | | | | 12,966 | |
| KE Holdings ADR* | | | 2,141 | | | | 40,337 | |
| Longfor Group Holdings | | | 8,000 | | | | 22,573 | |
| Poly Developments and Holdings Group, Cl A | | | 12,700 | | | | 26,131 | |
| Seazen Holdings, Cl A* | | | 6,400 | | | | 15,228 | |
| Shimao Group Holdings*(A) | | | 17,500 | | | | 2,242 | |
| Sunac China Holdings*(A) | | | 13,000 | | | | 1,726 | |
| | | | | | | | 298,312 | |
| Utilities — 3.4% | | | | | | | | |
| China Gas Holdings | | | 11,000 | | | | 15,498 | |
| China Longyuan Power Group, Cl H | | | 16,000 | | | | 18,283 | |
| China Resources Gas Group | | | 7,600 | | | | 28,028 | |
| China Resources Power Holdings | | | 14,000 | | | | 29,819 | |
| China Yangtze Power, Cl A | | | 21,400 | | | | 66,220 | |
| ENN Energy Holdings | | | 2,382 | | | | 32,650 | |
| Guangdong Investment | | | 16,000 | | | | 16,367 | |
| Huadian Power International, Cl A | | | 50,700 | | | | 42,747 | |
| Huaneng Power International, Cl H* | | | 45,077 | | | | 23,659 | |
| Sichuan Chuantou Energy, Cl A | | | 13,500 | | | | 25,988 | |
| | | | | | | | 299,259 | |
| TOTAL CHINA | | | | | | | 8,758,695 | |
| | | | | | | | | |
| HONG KONG — 0.2% | | | | | | | | |
| Health Care — 0.2% | | | | | | | | |
| Sino Biopharmaceutical | | | 36,500 | | | | 20,459 | |
| TOTAL HONG KONG | | | | | | | 20,459 | |
| | | | | | | | | |
TOTAL COMMON STOCK
(Cost $10,372,666) | | | | | | | 8,779,154 | |
The accompanying notes are an integral part of the financial statements.
Schedule of Investments March 31, 2023
KraneShares MSCI All China Index ETF (concluded)
| | | Shares | | | Value | |
| RIGHT — 0.0% | | | | | | | | |
| CHINA — 0.0% | | | | | | | | |
| Health Care — 0.0% | | | | | | | | |
| Kangmei Pharma‡‡*(A) | | | 480 | | | $ | — | |
| TOTAL CHINA | | | | | | | — | |
| | | | | | | | | |
TOTAL RIGHT
(Cost $–) | | | | | | | — | |
| | | | | | | | | |
TOTAL INVESTMENTS — 99.8%
(Cost $10,372,666) | | | | | | | 8,779,154 | |
| OTHER ASSETS LESS LIABILITIES – 0.2% | | | | | | | 15,367 | |
| NET ASSETS - 100% | | | | | | $ | 8,794,521 | |
| ‡ | Industries are utilized for compliance purposes, whereas sectors are utilized for reporting. |
| * | Non-income producing security. |
| ‡‡ | Expiration date not available. |
| (A) | Level 3 security in accordance with fair value hierarchy. |
The following summarizes the market value of the Fund’s investments used as of March 31, 2023, based on the inputs used to value them:
| Investments in Securities | | Level 1 | | | Level 2 | | | Level 3^ | | | Total | |
| Common Stock | | | | | | | | | | | | | | | | |
| China | | | | | | | | | | | | | | | | |
| Communication Services | | $ | 1,187,553 | | | $ | — | | | $ | — | | | $ | 1,187,553 | |
| Consumer Discretionary | | | 2,018,851 | | | | — | | | | — | | | | 2,018,851 | |
| Consumer Staples | | | 982,134 | | | | — | | | | — | | | | 982,134 | |
| Energy | | | 324,151 | | | | — | | | | — | | | | 324,151 | |
| Financials | | | 1,766,329 | | | | — | | | | — | | | | 1,766,329 | |
| Health Care | | | 463,938 | | | | — | | | | — | | | | 463,938 | |
| Industrials | | | 610,783 | | | | — | | | | — | | | | 610,783 | |
| Information Technology | | | 447,853 | | | | — | | | | — | ‡‡ | | | 447,853 | |
| Materials | | | 359,532 | | | | — | | | | — | | | | 359,532 | |
| Real Estate | | | 293,713 | | | | — | | | | 4,599 | | | | 298,312 | |
| Utilities | | | 299,259 | | | | — | | | | — | | | | 299,259 | |
| Hong Kong | | | 20,459 | | | | — | | | | — | | | | 20,459 | |
| Total Common Stock | | | 8,774,555 | | | | — | | | | 4,599 | | | | 8,779,154 | |
| Right | | | — | | | | — | | | | — | ‡‡ | | | — | |
| Total Investments in Securities | | $ | 8,774,555 | | | $ | — | | | $ | 4,599 | | | $ | 8,779,154 | |
| ^ | A reconciliation of Level 3 investments, including certain disclosures related to significant inputs used in valuing Level 3 investments is only presented when the Fund has over 1% of Level 3 investments at the end of the period in relation to net assets. |
| ‡‡ | Security or securities with a market value of $0. |
Amounts designated as “—” are $0 or have been rounded to $0.
See “Glossary” for abbreviations.
The accompanying notes are an integral part of the financial statements.
Schedule of Investments March 31, 2023
KraneShares MSCI One Belt One Road Index ETF

| | | Shares | | | Value | |
| COMMON STOCK — 99.2%‡ | | | | | | | | |
| CHINA — 47.7% | | | | | | | | |
| Energy — 0.4% | | | | | | | | |
| Guanghui Energy, Cl A | | | 14,700 | | | $ | 19,800 | |
| | | | | | | | | |
| Financials — 4.5% | | | | | | | | |
| Bank of Changsha, Cl A | | | 9,200 | | | | 10,597 | |
| Bank of Chengdu, Cl A | | | 8,400 | | | | 16,586 | |
| Bank of Guiyang, Cl A | | | 8,427 | | | | 6,761 | |
| Bank of Hangzhou, Cl A | | | 13,500 | | | | 22,823 | |
| Bank of Jiangsu, Cl A | | | 33,655 | | | | 34,404 | |
| Bank of Nanjing, Cl A | | | 23,591 | | | | 30,780 | |
| Bank of Ningbo, Cl A | | | 14,846 | | | | 59,040 | |
| Bank of Suzhou, Cl A | | | 8,400 | | | | 8,513 | |
| Chongqing Rural Commercial Bank, Cl A | | | 20,500 | | | | 10,956 | |
| | | | | | | | 200,460 | |
| Industrials — 22.1% | | | | | | | | |
| Beijing New Building Materials, Cl A | | | 3,908 | | | | 15,274 | |
| Beijing-Shanghai High Speed Railway, Cl A | | | 92,100 | | | | 70,007 | |
| China Conch Venture Holdings | | | 12,500 | | | | 21,815 | |
| China Energy Engineering, Cl A | | | 72,900 | | | | 25,584 | |
| China First Heavy Industries, Cl A* | | | 15,500 | | | | 7,200 | |
| China Lesso Group Holdings | | | 9,000 | | | | 8,048 | |
| China Railway Group, Cl H | | | 31,500 | | | | 19,221 | |
| China State Construction Engineering, Cl A | | | 94,700 | | | | 79,982 | |
| CRRC, Cl H | | | 33,000 | | | | 17,992 | |
| Dajin Heavy Industry, Cl A | | | 1,300 | | | | 6,669 | |
| Daqin Railway, Cl A | | | 33,832 | | | | 35,422 | |
| Dongfang Electric, Cl A | | | 6,500 | | | | 17,946 | |
| Fangda Carbon New Material, Cl A* | | | 8,700 | | | | 8,159 | |
| Farasis Energy Gan Zhou, Cl A* | | | 2,747 | | | | 9,396 | |
| Gotion High-tech, Cl A | | | 3,900 | | | | 16,929 | |
The accompanying notes are an integral part of the financial statements.
Schedule of Investments March 31, 2023
KraneShares MSCI One Belt One Road Index ETF (continued)
| | | Shares | | | Value | |
| COMMON STOCK (continued) | | | | | | | | |
| Industrials (continued) | | | | | | | | |
| Guangdong Kinlong Hardware Products, Cl A | | | 800 | | | $ | 9,367 | |
| Guangzhou Great Power Energy & Technology, Cl A | | | 1,100 | | | | 9,129 | |
| Jiangsu Expressway, Cl H | | | 10,000 | | | | 9,325 | |
| Jiangsu Hengli Hydraulic, Cl A | | | 3,000 | | | | 28,928 | |
| Jiangxi Special Electric Motor, Cl A* | | | 4,000 | | | | 8,964 | |
| Liaoning Port, Cl A | | | 43,200 | | | | 10,065 | |
| Luoyang Xinqianglian Slewing Bearing, Cl A | | | 850 | | | | 5,632 | |
| Metallurgical Corp of China, Cl A | | | 39,700 | | | | 22,546 | |
| Ming Yang Smart Energy Group, Cl A | | | 5,000 | | | | 16,389 | |
| NARI Technology, Cl A | | | 14,960 | | | | 59,057 | |
| Ningbo Deye Technology, Cl A | | | 400 | | | | 15,025 | |
| Ningbo Orient Wires & Cables, Cl A | | | 1,600 | | | | 11,489 | |
| Ningbo Ronbay New Energy Technology, Cl A | | | 1,116 | | | | 11,116 | |
| North Industries Group Red Arrow, Cl A | | | 3,100 | | | | 10,310 | |
| Power Construction Corp of China, Cl A | | | 39,100 | | | | 40,596 | |
| Riyue Heavy Industry, Cl A | | | 2,200 | | | | 7,125 | |
| Shanghai Construction Group, Cl A | | | 20,000 | | | | 7,951 | |
| Shanghai Electric Group, Cl A* | | | 28,400 | | | | 18,279 | |
| Shanghai International Port Group, Cl A | | | 21,210 | | | | 17,111 | |
| Shenzhen Inovance Technology, Cl A | | | 6,150 | | | | 62,957 | |
| Shenzhen International Holdings | | | 10,993 | | | | 9,719 | |
| Shuangliang Eco-Energy Systems, Cl A* | | | 4,200 | | | | 9,596 | |
| Sichuan Road & Bridge, Cl A | | | 11,700 | | | | 23,511 | |
| Sieyuan Electric, Cl A | | | 1,800 | | | | 11,984 | |
| Suzhou Maxwell Technologies, Cl A | | | 440 | | | | 19,542 | |
| TBEA, Cl A | | | 8,675 | | | | 27,425 | |
| Titan Wind Energy Suzhou, Cl A | | | 4,100 | | | | 8,812 | |
| Wuxi Shangji Automation, Cl A | | | 900 | | | | 13,382 | |
| XCMG Construction Machinery, Cl A | | | 27,248 | | | | 27,497 | |
| Xiangtan Electric Manufacturing, Cl A* | | | 3,000 | | | | 8,995 | |
| Yangzijiang Shipbuilding Holdings | | | 22,900 | | | | 20,669 | |
| Zhefu Holding Group, Cl A | | | 12,200 | | | | 7,230 | |
| Zhejiang Expressway, Cl H | | | 12,000 | | | | 9,539 | |
| Zhejiang Weixing New Building Materials, Cl A | | | 3,700 | | | | 13,098 | |
| Zhuzhou CRRC Times Electric, Cl H | | | 4,100 | | | | 17,836 | |
| Zhuzhou Kibing Group, Cl A | | | 6,000 | | | | 9,113 | |
| Zoomlion Heavy Industry Science and Technology, Cl A | | | 16,000 | | | | 14,469 | |
| | | | | | | | 993,422 | |
| Materials — 4.9% | | | | | | | | |
| Anhui Conch Cement, Cl H | | | 9,500 | | | | 32,918 | |
| Chengtun Mining Group, Cl A | | | 7,200 | | | | 5,997 | |
| China National Building Material, Cl H | | | 29,000 | | | | 23,791 | |
| China Northern Rare Earth Group High-Tech, Cl A | | | 8,224 | | | | 31,244 | |
| China Rare Earth Resources And Technology, Cl A* | | | 2,300 | | | | 11,310 | |
| China Resources Cement Holdings | | | 20,000 | | | | 9,809 | |
The accompanying notes are an integral part of the financial statements.
Schedule of Investments March 31, 2023
KraneShares MSCI One Belt One Road Index ETF (continued)
| | | Shares | | | Value | |
| COMMON STOCK (continued) | | | | | | | | |
| Materials (continued) | | | | | | | | |
| Henan Shenhuo Coal & Power, Cl A | | | 5,100 | | | $ | 13,160 | |
| Huaxin Cement, Cl A | | | 3,100 | | | | 7,020 | |
| Jinduicheng Molybdenum, Cl A | | | 6,100 | | | | 10,357 | |
| Shenghe Resources Holding, Cl A | | | 4,000 | | | | 8,242 | |
| Tangshan Jidong Cement, Cl A | | | 6,100 | | | | 7,710 | |
| Western Mining, Cl A | | | 5,500 | | | | 10,147 | |
| Xiamen Tungsten, Cl A | | | 3,300 | | | | 9,793 | |
| Yintai Gold, Cl A | | | 6,600 | | | | 12,658 | |
| Youngy, Cl A | | | 600 | | | | 6,620 | |
| Yunnan Chihong Zinc & Germanium, Cl A | | | 11,600 | | | | 8,750 | |
| Yunnan Tin, Cl A | | | 3,800 | | | | 8,223 | |
| | | | | | | | 217,749 | |
| Utilities — 15.8% | | | | | | | | |
| Beijing Enterprises Holdings | | | 4,000 | | | | 14,395 | |
| CECEP Solar Energy, Cl A | | | 9,200 | | | | 9,177 | |
| CECEP Wind-Power, Cl A | | | 14,800 | | | | 8,340 | |
| CGN Power, Cl H | | | 81,000 | | | | 19,399 | |
| China Gas Holdings | | | 22,200 | | | | 31,278 | |
| China Longyuan Power Group, Cl H | | | 26,000 | | | | 29,710 | |
| China National Nuclear Power, Cl A | | | 42,300 | | | | 39,360 | |
| China Power International Development | | | 38,000 | | | | 15,103 | |
| China Resources Gas Group | | | 7,000 | | | | 25,816 | |
| China Resources Power Holdings | | | 14,635 | | | | 31,172 | |
| China Three Gorges Renewables Group, Cl A | | | 65,100 | | | | 51,949 | |
| China Yangtze Power, Cl A | | | 51,600 | | | | 159,670 | |
| ENN Energy Holdings | | | 6,000 | | | | 82,243 | |
| ENN Natural Gas, Cl A | | | 6,000 | | | | 18,217 | |
| GD Power Development, Cl A* | | | 40,500 | | | | 22,410 | |
| Huadian Power International, Cl A | | | 18,242 | | | | 15,380 | |
| Huaneng Power International, Cl H* | | | 31,000 | | | | 16,270 | |
| Kunlun Energy | | | 30,000 | | | | 23,465 | |
| SDIC Power Holdings, Cl A | | | 16,906 | | | | 26,612 | |
| Shanghai Electric Power, Cl A | | | 6,500 | | | | 9,399 | |
| Shenergy, Cl A | | | 11,419 | | | | 9,744 | |
| Shenzhen Energy Group, Cl A | | | 10,800 | | | | 9,609 | |
| Sichuan Chuantou Energy, Cl A | | | 8,384 | | | | 16,140 | |
| Wintime Energy, Cl A* | | | 50,800 | | | | 11,392 | |
| Zhejiang Zheneng Electric Power, Cl A* | | | 25,300 | | | | 13,189 | |
| | | | | | | | 709,439 | |
| TOTAL CHINA | | | | | | | 2,140,870 | |
The accompanying notes are an integral part of the financial statements.
Schedule of Investments March 31, 2023
KraneShares MSCI One Belt One Road Index ETF (continued)
| | | Shares | | | Value | |
| COMMON STOCK (continued) | | | | | | | | |
| HONG KONG — 0.2% | | | | | | | | |
| Industrials — 0.2% | | | | | | | | |
| Hutchison Port Holdings Trust, Cl U | | | 45,900 | | | $ | 8,583 | |
| TOTAL HONG KONG | | | | | | | 8,583 | |
| | | | | | | | | |
| INDIA — 2.5% | | | | | | | | |
| Energy — 0.3% | | | | | | | | |
| Great Eastern Shipping | | | 1,669 | | | | 13,090 | |
| | | | | | | | | |
| Industrials — 0.6% | | | | | | | | |
| AIA Engineering | | | 785 | | | | 27,730 | |
| | | | | | | | | |
| Materials — 1.6% | | | | | | | | |
| Fine Organic Industries | | | 143 | | | | 7,494 | |
| PI Industries | | | 1,397 | | | | 51,510 | |
| Vinati Organics | | | 464 | | | | 10,210 | |
| | | | | | | | 69,214 | |
| TOTAL INDIA | | | | | | | 110,034 | |
| | | | | | | | | |
| INDONESIA — 4.3% | | | | | | | | |
| Energy — 2.2% | | | | | | | | |
| Adaro Energy Indonesia | | | 256,400 | | | | 49,589 | |
| Bukit Asam | | | 71,400 | | | | 18,999 | |
| Indo Tambangraya Megah | | | 7,200 | | | | 18,919 | |
| Medco Energi Internasional | | | 134,800 | | | | 9,080 | |
| | | | | | | | 96,587 | |
| Materials — 2.1% | | | | | | | | |
| Indah Kiat Pulp & Paper | | | 48,600 | | | | 24,309 | |
| Merdeka Copper Gold* | | | 217,500 | | | | 60,777 | |
| Pabrik Kertas Tjiwi Kimia | | | 25,000 | | | | 11,213 | |
| | | | | | | | 96,299 | |
| TOTAL INDONESIA | | | | | | | 192,886 | |
| | | | | | | | | |
| ISRAEL — 5.1% | | | | | | | | |
| Industrials — 2.7% | | | | | | | | |
| Elbit Systems | | | 485 | | | | 82,031 | |
| ZIM Integrated Shipping Services | | | 1,629 | | | | 38,412 | |
| | | | | | | | 120,443 | |
| Materials — 2.4% | | | | | | | | |
| ICL Group | | | 12,809 | | | | 85,840 | |
| Israel | | | 73 | | | | 23,881 | |
| | | | | | | | 109,721 | |
| TOTAL ISRAEL | | | | | | | 230,164 | |
| | | | | | | | | |
| JORDAN — 0.3% | | | | | | | | |
| Financials — 0.3% | | | | | | | | |
| Arab Bank | | | 1,854 | | | | 12,382 | |
| TOTAL JORDAN | | | | | | | 12,382 | |
The accompanying notes are an integral part of the financial statements.
Schedule of Investments March 31, 2023
KraneShares MSCI One Belt One Road Index ETF (continued)
| | | Shares | | | Value | |
| COMMON STOCK (continued) | | | | | | | | |
| KAZAKHSTAN — 0.8% | | | | | | | | |
| Energy — 0.8% | | | | | | | | |
| NAC Kazatomprom JSC GDR | | | 1,195 | | | $ | 35,252 | |
| TOTAL KAZAKHSTAN | | | | | | | 35,252 | |
| | | | | | | | | |
| KUWAIT — 8.4% | | | | | | | | |
| Financials — 8.4% | | | | | | | | |
| Kuwait Finance House | | | 133,528 | | | | 359,439 | |
| Kuwait Projects Holding* | | | 37,515 | | | | 15,038 | |
| TOTAL KUWAIT | | | | | | | 374,477 | |
| | | | | | | | | |
| MALAYSIA — 2.7% | | | | | | | | |
| Industrials — 1.2% | | | | | | | | |
| Malaysia Airports Holdings | | | 12,200 | | | | 18,774 | |
| Pentamaster | | | 9,000 | | | | 9,994 | |
| Sime Darby | | | 48,500 | | | | 23,632 | |
| | | | | | | | 52,400 | |
| Materials — 1.5% | | | | | | | | |
| Petronas Chemicals Group | | | 43,300 | | | | 69,378 | |
| TOTAL MALAYSIA | | | | | | | 121,778 | |
| | | | | | | | | |
| PHILIPPINES — 3.2% | | | | | | | | |
| Industrials — 3.2% | | | | | | | | |
| Aboitiz Equity Ventures | | | 30,610 | | | | 27,251 | |
| International Container Terminal Services | | | 18,330 | | | | 71,951 | |
| JG Summit | | | 52,402 | | | | 46,171 | |
| TOTAL PHILIPPINES | | | | | | | 145,373 | |
| | | | | | | | | |
| POLAND — 1.6% | | | | | | | | |
| Materials — 1.6% | | | | | | | | |
| KGHM Polska Miedz | | | 2,527 | | | | 71,709 | |
| TOTAL POLAND | | | | | | | 71,709 | |
| | | | | | | | | |
| RUSSIA — 0.0% | | | | | | | | |
| Energy — 0.0% | | | | | | | | |
| Rosneft Oil PJSC(A) | | | 33,666 | | | | — | |
| Sovcomflot PJSC*(A) | | | 9,110 | | | | — | |
| Surgutneftegas PJSC(A) | | | 143,400 | | | | — | |
| | | | | | | | — | |
| Materials — 0.0% | | | | | | | | |
| MMC Norilsk Nickel PJSC(A) | | | 1,239 | | | | — | |
| Polymetal International*(A) | | | 7,154 | | | | — | |
| Segezha Group PJSC(A) | | | 78,500 | | | | — | |
| | | | | | | | — | |
| TOTAL RUSSIA | | | | | | | — | |
The accompanying notes are an integral part of the financial statements.
Schedule of Investments March 31, 2023
KraneShares MSCI One Belt One Road Index ETF (continued)
| | | Shares | | | Value | |
| COMMON STOCK (continued) | | | | | | | | |
| SINGAPORE — 9.8% | | | | | | | | |
| Financials — 6.1% | | | | | | | | |
| Oversea-Chinese Banking | | | 29,512 | | | $ | 274,577 | |
| | | | | | | | | |
| Industrials — 3.7% | | | | | | | | |
| Keppel | | | 12,800 | | | | 54,202 | |
| Sembcorp Marine* | | | 248,114 | | | | 22,207 | |
| Singapore Airlines | | | 11,700 | | | | 50,424 | |
| Singapore Technologies Engineering | | | 13,600 | | | | 37,438 | |
| | | | | | | | 164,271 | |
| TOTAL SINGAPORE | | | | | | | 438,848 | |
| | | | | | | | | |
| SOUTH AFRICA — 5.0% | | | | | | | | |
| Materials — 5.0% | | | | | | | | |
| Anglo American Platinum | | | 962 | | | | 51,726 | |
| Impala Platinum Holdings | | | 15,461 | | | | 142,763 | |
| Kumba Iron Ore | | | 1,203 | | | | 30,491 | |
| TOTAL SOUTH AFRICA | | | | | | | 224,980 | |
| | | | | | | | | |
| THAILAND — 4.5% | | | | | | | | |
| Energy — 3.8% | | | | | | | | |
| PTT | | | 184,100 | | | | 169,591 | |
| | | | | | | | | |
| Materials — 0.7% | | | | | | | | |
| Indorama Ventures* | | | 31,100 | | | | 31,377 | |
| TOTAL THAILAND | | | | | | | 200,968 | |
| | | | | | | | | |
| TURKEY — 2.5% | | | | | | | | |
| Industrials — 1.6% | | | | | | | | |
| Kontrolmatik Enerji Ve Muhendislik | | | 1,334 | | | | 9,868 | |
| Turk Hava Yollari AO* | | | 9,993 | | | | 61,692 | |
| | | | | | | | 71,560 | |
| Materials — 0.9% | | | | | | | | |
| Sasa Polyester Sanayi* | | | 8,029 | | | | 41,996 | |
| TOTAL TURKEY | | | | | | | 113,556 | |
| | | | | | | | | |
| UNITED ARAB EMIRATES — 0.6% | | | | | | | | |
| Industrials — 0.6% | | | | | | | | |
| Air Arabia PJSC | | | 48,174 | | | | 27,809 | |
| TOTAL UNITED ARAB EMIRATES | | | | | | | 27,809 | |
| | | | | | | | | |
TOTAL COMMON STOCK
(Cost $5,435,115) | | | | | | | 4,449,669 | |
The accompanying notes are an integral part of the financial statements.
Schedule of Investments March 31, 2023
KraneShares MSCI One Belt One Road Index ETF (continued)
| | | Shares | | | Value | |
| PREFERRED STOCK — 0.0% | | | | | | | | |
| RUSSIA— 0.0% | | | | | | | | |
| Energy — 0.0% | | | | | | | | |
| Surgutneftegas PJSC(A)(B) | | | 136,600 | | | $ | — | |
| | | | | | | | | |
TOTAL PREFERRED STOCK
(Cost $74,846) | | | | | | | — | |
| | | | | | | | | |
TOTAL INVESTMENTS — 99.2%
(Cost $5,509,961) | | | | | | | 4,449,669 | |
| OTHER ASSETS LESS LIABILITIES – 0.8% | | | | | | | 35,564 | |
| NET ASSETS - 100% | | | | | | $ | 4,485,233 | |
| ‡ | Industries are utilized for compliance purposes, whereas sectors are utilized for reporting. |
| * | Non-income producing security. |
| (A) | Level 3 security in accordance with fair value hierarchy. |
| (B) | Currently, no stated interest rate. |
The accompanying notes are an integral part of the financial statements.
Schedule of Investments March 31, 2023
KraneShares MSCI One Belt One Road Index ETF (concluded)
The following summarizes the market value of the Fund’s investments used as of March 31, 2023, based on the inputs used to value them:
| Investments in Securities | | Level 1 | | | Level 2 | | | Level 3^ | | | Total | |
| Common Stock | | | | | | | | | | | | | | | | |
| China | | $ | 2,140,870 | | | $ | — | | | $ | — | | | $ | 2,140,870 | |
| Hong Kong | | | 8,583 | | | | — | | | | — | | | | 8,583 | |
| India | | | 110,034 | | | | — | | | | — | | | | 110,034 | |
| Indonesia | | | 192,886 | | | | — | | | | — | | | | 192,886 | |
| Israel | | | 230,164 | | | | — | | | | — | | | | 230,164 | |
| Jordan | | | 12,382 | | | | — | | | | — | | | | 12,382 | |
| Kazakhstan | | | 35,252 | | | | — | | | | — | | | | 35,252 | |
| Kuwait | | | 374,477 | | | | — | | | | — | | | | 374,477 | |
| Malaysia | | | 121,778 | | | | — | | | | — | | | | 121,778 | |
| Philippines | | | 145,373 | | | | — | | | | — | | | | 145,373 | |
| Poland | | | 71,709 | | | | — | | | | — | | | | 71,709 | |
| Russia | | | | | | | | | | | | | | | | |
| Energy | | | — | | | | — | | | | — | ‡‡ | | | — | |
| Materials | | | — | | | | — | | | | — | ‡‡ | | | — | |
| Singapore | | | 438,848 | | | | — | | | | — | | | | 438,848 | |
| South Africa | | | 224,980 | | | | — | | | | — | | | | 224,980 | |
| Thailand | | | 200,968 | | | | — | | | | — | | | | 200,968 | |
| Turkey | | | 113,556 | | | | — | | | | — | | | | 113,556 | |
| United Arab Emirates | | | 27,809 | | | | — | | | | — | | | | 27,809 | |
| Total Common Stock | | | 4,449,669 | | | | — | | | | — | | | | 4,449,669 | |
| Preferred Stock | | | | | | | | | | | | | | | | |
| Russia | | | | | | �� | | | | | | | | | | |
| Energy | | | — | | | | — | | | | — | ‡‡ | | | — | |
| Total Preferred Stock | | | — | | | | — | | | | — | | | | — | |
| Total Investments in Securities | | $ | 4,449,669 | | | $ | — | | | $ | — | | | $ | 4,449,669 | |
| ^ | A reconciliation of Level 3 investments, including certain disclosures related to significant inputs used in valuing Level 3 investments is only presented when the Fund has over 1% of Level 3 investments at the end of the period in relation to net assets. |
| ‡‡ | Security or securities with a market value of $0. |
Amounts designated as “—” are $0 or have been rounded to $0.
See “Glossary” for abbreviations.
The accompanying notes are an integral part of the financial statements.
Schedule of Investments March 31, 2023
KraneShares Emerging Markets Consumer Technology Index ETF

| | | Shares | | | Value | |
| COMMON STOCK — 99.8%‡ | | | | | | | | |
| BRAZIL — 10.9% | | | | | | | | |
| Consumer Discretionary — 3.7% | | | | | | | | |
| MercadoLibre* | | | 850 | | | $ | 1,120,351 | |
| | | | | | | | | |
| Financials — 4.6% | | | | | | | | |
| Cielo | | | 239,100 | | | | 228,713 | |
| Pagseguro Digital, Cl A* | | | 26,049 | | | | 223,240 | |
| StoneCo, Cl A* | | | 25,304 | | | | 241,400 | |
| XP, Cl A* | | | 60,541 | | | | 718,622 | |
| | | | | | | | 1,411,975 | |
| Information Technology — 2.6% | | | | | | | | |
| TOTVS | | | 144,400 | | | | 801,993 | |
| TOTAL BRAZIL | | | | | | | 3,334,319 | |
| | | | | | | | | |
| CHINA — 40.8% | | | | | | | | |
| Communication Services — 14.5% | | | | | | | | |
| Baidu, Cl A* | | | 58,514 | | | | 1,108,419 | |
| JOYY ADR | | | 7,607 | | | | 237,186 | |
| Kuaishou Technology, Cl B* | | | 107,800 | | | | 830,134 | |
| NetEase | | | 62,400 | | | | 1,096,975 | |
| Tencent Holdings | | | 23,675 | | | | 1,163,551 | |
| | | | | | | | 4,436,265 | |
| Consumer Discretionary — 18.9% | | | | | | | | |
| Alibaba Group Holding* | | | 95,200 | | | | 1,217,598 | |
| JD.com, Cl A | | | 45,225 | | | | 990,924 | |
| Meituan, Cl B* | | | 63,798 | | | | 1,166,242 | |
| PDD Holdings ADR* | | | 11,472 | | | | 870,725 | |
| Trip.com Group* | | | 19,200 | | | | 718,598 | |
The accompanying notes are an integral part of the financial statements.
Schedule of Investments March 31, 2023
KraneShares Emerging Markets Consumer Technology Index ETF (continued)
| | | Shares | | | Value | |
| COMMON STOCK (continued) | | | | | | | | |
| Consumer Discretionary (continued) | | | | | | | | |
| Vipshop Holdings ADR* | | | 52,825 | | | $ | 801,883 | |
| | | | | | | | 5,765,970 | |
| Consumer Staples — 4.9% | | | | | | | | |
| Alibaba Health Information Technology* | | | 1,030,000 | | | | 745,278 | |
| JD Health International* | | | 102,350 | | | | 761,437 | |
| | | | | | | | 1,506,715 | |
| Real Estate — 2.5% | | | | | | | | |
| KE Holdings, Cl A* | | | 121,500 | | | | 748,352 | |
| TOTAL CHINA | | | | | | | 12,457,302 | |
| | | | | | | | | |
| EGYPT — 0.7% | | | | | | | | |
| Financials — 0.7% | | | | | | | | |
| E-Finance for Digital & Financial Investments | | | 404,595 | | | | 226,468 | |
| TOTAL EGYPT | | | | | | | 226,468 | |
| | | | | | | | | |
| INDIA — 8.5% | | | | | | | | |
| Consumer Discretionary — 5.2% | | | | | | | | |
| FSN E-Commerce Ventures* | | | 421,118 | | | | 636,680 | |
| MakeMyTrip* | | | 9,001 | | | | 220,254 | |
| Zomato* | | | 1,167,735 | | | | 724,661 | |
| | | | | | | | 1,581,595 | |
| Financials — 3.3% | | | | | | | | |
| One 97 Communications* | | | 100,695 | | | | 780,246 | |
| PB Fintech* | | | 31,754 | | | | 246,861 | |
| | | | | | | | 1,027,107 | |
| TOTAL INDIA | | | | | | | 2,608,702 | |
| | | | | | | | | |
| INDONESIA — 0.7% | | | | | | | | |
| Consumer Discretionary — 0.7% | | | | | | | | |
| Bukalapak.com* | | | 13,594,500 | | | | 224,845 | |
| TOTAL INDONESIA | | | | | | | 224,845 | |
| | | | | | | | | |
| JAPAN — 2.6% | | | | | | | | |
| Communication Services — 2.6% | | | | | | | | |
| Nexon | | | 33,900 | | | | 803,625 | |
| TOTAL JAPAN | | | | | | | 803,625 | |
| | | | | | | | | |
| MALAYSIA — 0.8% | | | | | | | | |
| Industrials — 0.8% | | | | | | | | |
| My EG Services | | | 1,364,000 | | | | 236,478 | |
| TOTAL MALAYSIA | | | | | | | 236,478 | |
The accompanying notes are an integral part of the financial statements.
Schedule of Investments March 31, 2023
KraneShares Emerging Markets Consumer Technology Index ETF (continued)
| | | Shares | | | Value | |
| COMMON STOCK (continued) | | | | | | | | |
| RUSSIA — 0.0% | | | | | | | | |
| Communication Services — 0.0% | | | | | | | | |
| VK GDR*(A) | | | 49,503 | | | $ | — | |
| Yandex, Cl A*(A) | | | 31,479 | | | | — | |
| | | | | | | | — | |
| Consumer Discretionary — 0.0% | | | | | | | | |
| Ozon Holdings PLC ADR*(A) | | | 58,005 | | | | — | |
| | | | | | | | | |
| Industrials — 0.0% | | | | | | | | |
| HeadHunter Group PLC ADR*(A) | | | 11,746 | | | | — | |
| TOTAL RUSSIA | | | | | | | — | |
| | | | | | | | | |
| SINGAPORE — 3.8% | | | | | | | | |
| Communication Services — 3.8% | | | | | | | | |
| Sea ADR* | | | 13,423 | | | | 1,161,761 | |
| TOTAL SINGAPORE | | | | | | | 1,161,761 | |
| | | | | | | | | |
| SOUTH AFRICA — 3.7% | | | | | | | | |
| Consumer Discretionary — 3.7% | | | | | | | | |
| Naspers, Cl N | | | 6,094 | | | | 1,131,030 | |
| TOTAL SOUTH AFRICA | | | | | | | 1,131,030 | |
| | | | | | | | | |
| SOUTH KOREA — 21.6% | | | | | | | | |
| Communication Services — 18.1% | | | | | | | | |
| Kakao | | | 16,454 | | | | 772,239 | |
| Kakao Games*(B) | | | 21,997 | | | | 704,593 | |
| Krafton* | | | 5,980 | | | | 842,901 | |
| NAVER | | | 4,796 | | | | 744,165 | |
| NCSoft | | | 2,409 | | | | 687,440 | |
| Neowiz* | | | 6,844 | | | | 210,285 | |
| Netmarble* | | | 16,866 | | | | 858,944 | |
| Pearl Abyss*(B) | | | 7,160 | | | | 254,369 | |
| Studio Dragon* | | | 3,862 | | | | 208,548 | |
| Wemade(B) | | | 6,090 | | | | 234,834 | |
| | | | | | | | 5,518,318 | |
| Consumer Discretionary — 2.9% | | | | | | | | |
| Coupang, Cl A* | | | 55,021 | | | | 880,336 | |
| | | | | | | | | |
| Information Technology — 0.6% | | | | | | | | |
| Douzone Bizon | | | 7,085 | | | | 190,751 | |
| TOTAL SOUTH KOREA | | | | | | | 6,589,405 | |
The accompanying notes are an integral part of the financial statements.
Schedule of Investments March 31, 2023
KraneShares Emerging Markets Consumer Technology Index ETF (continued)
| | | Shares | | | Value | |
| COMMON STOCK (continued) | | | | | | | | |
| SWEDEN — 0.7% | | | | | | | | |
| Information Technology — 0.7% | | | | | | | | |
| Truecaller, Cl B*(B) | | | 72,494 | | | $ | 213,017 | |
| TOTAL SWEDEN | | | | | | | 213,017 | |
| | | | | | | | | |
| TAIWAN — 2.8% | | | | | | | | |
| Consumer Discretionary — 2.8% | | | | | | | | |
| momo.com | | | 29,000 | | | | 860,071 | |
| TOTAL TAIWAN | | | | | | | 860,071 | |
| | | | | | | | | |
| THAILAND — 0.6% | | | | | | | | |
| Information Technology — 0.6% | | | | | | | | |
| Forth | | | 209,800 | | | | 196,333 | |
| TOTAL THAILAND | | | | | | | 196,333 | |
| | | | | | | | | |
| UNITED ARAB EMIRATES — 0.7% | | | | | | | | |
| Financials — 0.7% | | | | | | | | |
| Network International Holdings PLC* | | | 70,629 | | | | 213,781 | |
| TOTAL UNITED ARAB EMIRATES | | | | | | | 213,781 | |
| | | | | | | | | |
| URUGUAY — 0.9% | | | | | | | | |
| Financials — 0.9% | | | | | | | | |
| Dlocal, Cl A* | | | 15,936 | | | | 258,482 | |
| TOTAL URUGUAY | | | | | | | 258,482 | |
| | | | | | | | | |
TOTAL COMMON STOCK
(Cost $45,317,060) | | | | | | | 30,515,619 | |
| | | | | | | | | |
| SHORT-TERM INVESTMENT — 2.3% | | | | | | | | |
| Invesco Government & Agency Portfolio, Cl Institutional, 4.430%(C)(D) | | | 696,591 | | | | 696,591 | |
| | | | | | | | |
TOTAL SHORT-TERM INVESTMENT
(Cost $696,591) | | | | | | | 696,591 | |
| | | | | | | | | |
TOTAL INVESTMENTS — 102.1%
(Cost $46,013,651) | | | | | | | 31,212,210 | |
| OTHER ASSETS LESS LIABILITIES – (2.1)% | | | | | | | (650,637 | ) |
| NET ASSETS - 100% | | | | | | $ | 30,561,573 | |
| ‡ | Industries are utilized for compliance purposes, whereas sectors are utilized for reporting. |
| * | Non-income producing security. |
| (A) | Level 3 security in accordance with fair value hierarchy. |
| (B) | This security or a partial position of this security is on loan at March 31, 2023. The total market value of securities on loan at March 31, 2023 was $632,846. |
| (C) | The rate shown is the 7-day effective yield as of March 31, 2023. |
| (D) | This security was purchased with cash collateral held from securities on loan. The total value of such security as of March 31, 2023 was $696,591. |
The accompanying notes are an integral part of the financial statements.
Schedule of Investments March 31, 2023
KraneShares Emerging Markets Consumer Technology Index ETF (concluded)
The following summarizes the market value of the Fund’s investments used as of March 31, 2023, based on the inputs used to value them:
| Investments in Securities | | Level 1 | | | Level 2 | | | Level 3^ | | | Total | |
| Common Stock | | | | | | | | | | | | | | | | |
| Brazil | | $ | 3,334,319 | | | $ | — | | | $ | — | | | $ | 3,334,319 | |
| China | | | 12,457,302 | | | | — | | | | — | | | | 12,457,302 | |
| Egypt | | | 226,468 | | | | — | | | | — | | | | 226,468 | |
| India | | | 2,608,702 | | | | — | | | | — | | | | 2,608,702 | |
| Indonesia | | | 224,845 | | | | — | | | | — | | | | 224,845 | |
| Japan | | | 803,625 | | | | — | | | | — | | | | 803,625 | |
| Malaysia | | | 236,478 | | | | — | | | | — | | | | 236,478 | |
| Russia | | | | | | | | | | | | | | | | |
| Communication Services | | | — | | | | — | | | | — | ‡‡ | | | — | |
| Consumer Discretionary | | | — | | | | — | | | | — | ‡‡ | | | — | |
| Industrials | | | — | | | | — | | | | — | ‡‡ | | | — | |
| Singapore | | | 1,161,761 | | | | — | | | | — | | | | 1,161,761 | |
| South Africa | | | 1,131,030 | | | | — | | | | — | | | | 1,131,030 | |
| South Korea | | | 6,589,405 | | | | — | | | | — | | | | 6,589,405 | |
| Sweden | | | 213,017 | | | | — | | | | — | | | | 213,017 | |
| Taiwan | | | 860,071 | | | | — | | | | — | | | | 860,071 | |
| Thailand | | | 196,333 | | | | — | | | | — | | | | 196,333 | |
| United Arab Emirates | | | 213,781 | | | | — | | | | — | | | | 213,781 | |
| Uruguay | | | 258,482 | | | | — | | | | — | | | | 258,482 | |
| Total Common Stock | | | 30,515,619 | | | | — | | | | — | | | | 30,515,619 | |
| Short-Term Investment | | | 696,591 | | | | — | | | | — | | | | 696,591 | |
| Total Investments in Securities | | $ | 31,212,210 | | | $ | — | | | $ | — | | | $ | 31,212,210 | |
| ^ | A reconciliation of Level 3 investments, including certain disclosures related to significant inputs used in valuing Level 3 investments is only presented when the Fund has over 1% of Level 3 investments at the end of the period in relation to net assets. |
| ‡‡ | Security or securities with a market value of $0. |
Amounts designated as “—” are $0 or have been rounded to $0.
See “Glossary” for abbreviations.
The accompanying notes are an integral part of the financial statements.
Schedule of Investments March 31, 2023
KraneShares MSCI China Clean Technology Index ETF
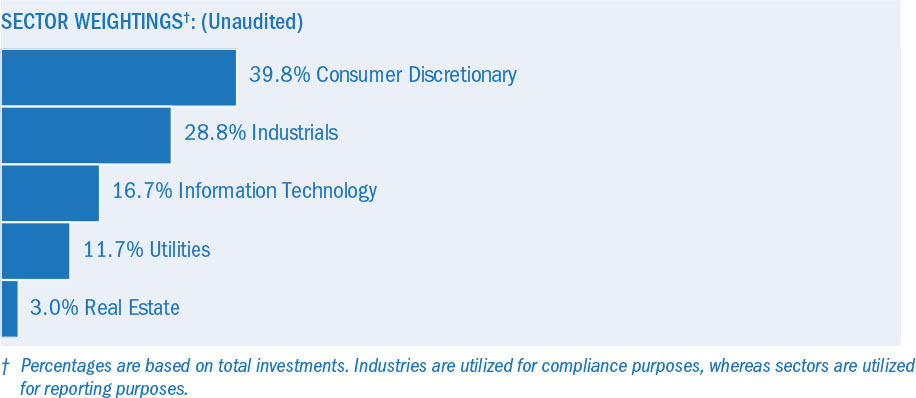
| | | Shares | | | Value | |
| COMMON STOCK — 100.0%‡ | | | | | | | | |
| CHINA — 97.3% | | | | | | | | |
| Consumer Discretionary — 39.8% | | | | | | | | |
| BYD, Cl A | | | 33,900 | | | $ | 1,263,827 | |
| BYD, Cl H | | | 259,000 | | | | 7,581,985 | |
| Li Auto, Cl A* | | | 685,900 | | | | 8,562,882 | |
| NIO ADR* | | | 863,565 | | | | 9,076,068 | |
| Tianneng Power International | | | 1,159,885 | | | | 1,372,663 | |
| XPeng, Cl A* | | | 927,000 | | | | 5,166,434 | |
| Yadea Group Holdings | | | 1,964,694 | | | | 5,068,192 | |
| | | | | | | | 38,092,051 | |
| Industrials — 28.5% | | | | | | | | |
| Beijing Easpring Material Technology, Cl A | | | 50,700 | | | | 424,660 | |
| China Conch Venture Holdings | | | 2,227,000 | | | | 3,886,636 | |
| China Everbright Environment Group | | | 6,324,216 | | | | 2,714,999 | |
| Contemporary Amperex Technology, Cl A | | | 137,750 | | | | 8,144,888 | |
| CT Environmental Group*(A) | | | 329,000 | | | | — | |
| Dajin Heavy Industry, Cl A | | | 66,600 | | | | 341,665 | |
| Dynagreen Environmental Protection Group, Cl H | | | 648,000 | | | | 219,579 | |
| Emeren Group ADR* | | | 53,968 | | | | 240,158 | |
| Ginlong Technologies, Cl A* | | | 39,150 | | | | 761,530 | |
| GoodWe Technologies, Cl A | | | 12,034 | | | | 507,221 | |
| Gotion High-tech, Cl A | | | 179,100 | | | | 777,448 | |
| Ming Yang Smart Energy Group, Cl A | | | 227,100 | | | | 744,400 | |
| Pylon Technologies, Cl A | | | 17,380 | | | | 621,320 | |
| Riyue Heavy Industry, Cl A | | | 104,000 | | | | 336,808 | |
| Sungrow Power Supply, Cl A | | | 148,800 | | | | 2,272,096 | |
| Titan Wind Energy Suzhou, Cl A | | | 179,109 | | | | 384,962 | |
| Xinjiang Goldwind Science & Technology, Cl A | | | 346,135 | | | | 556,453 | |
| Zhejiang Weiming Environment Protection, Cl A | | | 171,100 | | | | 454,452 | |
The accompanying notes are an integral part of the financial statements.
Schedule of Investments March 31, 2023
KraneShares MSCI China Clean Technology Index ETF (continued)
| | | Shares | | | Value | |
| COMMON STOCK (continued) | | | | | | | | |
| Industrials (continued) | | | | | | | | |
| Zhuzhou CRRC Times Electric, Cl H | | | 888,500 | | | $ | 3,865,283 | |
| | | | | | | | 27,254,558 | |
| Information Technology — 16.7% | | | | | | | | |
| China Railway Signal & Communication, Cl A | | | 717,532 | | | | 566,310 | |
| Chindata Group Holdings ADR* | | | 220,394 | | | | 1,540,554 | |
| Hengdian Group DMEGC Magnetics, Cl A | | | 157,500 | | | | 471,539 | |
| JA Solar Technology, Cl A | | | 225,620 | | | | 1,883,863 | |
| Kingsoft Cloud Holdings ADR* | | | 181,675 | | | | 1,615,091 | |
| LONGi Green Energy Technology, Cl A | | | 686,946 | | | | 4,042,272 | |
| Shanghai Aiko Solar Energy, Cl A* | | | 128,300 | | | | 618,586 | |
| Tuya ADR* | | | 344,452 | | | | 651,014 | |
| Xinyi Solar Holdings | | | 3,845,588 | | | | 4,609,836 | |
| | | | | | | | 15,999,065 | |
| Real Estate — 2.0% | | | | | | | | |
| China Evergrande Group*(A) | | | 7,881,000 | | | | 382,458 | |
| Guangzhou R&F Properties, Cl H* | | | 2,859,600 | | | | 615,637 | |
| Shimao Group Holdings*(A) | | | 2,540,500 | | | | 325,484 | |
| SOHO China* | | | 3,470,000 | | | | 579,074 | |
| | | | | | | | 1,902,653 | |
| Utilities — 10.3% | | | | | | | | |
| Beijing Enterprises Water Group | | | 6,642,500 | | | | 1,658,520 | |
| CECEP Solar Energy, Cl A | | | 390,700 | | | | 389,716 | |
| CECEP Wind-Power, Cl A | | | 652,800 | | | | 367,879 | |
| China Datang Renewable Power, Cl H | | | 3,769,000 | | | | 1,349,167 | |
| China Everbright Greentech | | | 982,000 | | | | 201,405 | |
| China Longyuan Power Group, Cl H | | | 3,133,800 | | | | 3,580,938 | |
| China Three Gorges Renewables Group, Cl A | | | 2,857,800 | | | | 2,280,480 | |
| | | | | | | | 9,828,105 | |
| TOTAL CHINA | | | | | | | 93,076,432 | |
| | | | | | | | | |
| HONG KONG — 2.7% | | | | | | | | |
| Industrials — 0.2% | | | | | | | | |
| China High Speed Transmission Equipment Group* | | | 640,000 | | | | 238,881 | |
| | | | | | | | | |
| Real Estate — 1.1% | | | | | | | | |
| Yuexiu Real Estate Investment Trust† | | | 3,961,000 | | | | 1,009,178 | |
| | | | | | | | | |
| Utilities — 1.4% | | | | | | | | |
| Canvest Environmental Protection Group | | | 837,000 | | | | 387,048 | |
| Concord New Energy Group | | | 10,460,000 | | | | 932,745 | |
| | | | | | | | 1,319,793 | |
| TOTAL HONG KONG | | | | | | | 2,567,852 | |
The accompanying notes are an integral part of the financial statements.
Schedule of Investments March 31, 2023
KraneShares MSCI China Clean Technology Index ETF (concluded)
| | | Shares | | | Value | |
| COMMON STOCK (continued) | | | | | | | | |
| Utilities (continued) | | | | | | | | |
TOTAL COMMON STOCK
(Cost $125,747,403) | | | | | | $ | 95,644,284 | |
| | | | | | | | |
TOTAL INVESTMENTS — 100.0%
(Cost $125,747,403) | | | | | | | 95,644,284 | |
| OTHER ASSETS LESS LIABILITIES – 0.0% | | | | | | | (33,743 | ) |
| NET ASSETS - 100% | | | | | | $ | 95,610,541 | |
| ‡ | Industries are utilized for compliance purposes, whereas sectors are utilized for reporting. |
| * | Non-income producing security. |
| † | Real Estate Investment Trust |
| (A) | Level 3 security in accordance with fair value hierarchy. |
The following summarizes the market value of the Fund’s investments used as of March 31, 2023, based on the inputs used to value them:
| Investments in Securities | | Level 1 | | | Level 2 | | | Level 3^ | | | Total | |
| Common Stock | | | | | | | | | | | | | | | | |
| China | | | | | | | | | | | | | | | | |
| Consumer Discretionary | | $ | 38,092,051 | | | $ | — | | | $ | — | | | $ | 38,092,051 | |
| Industrials | | | 27,254,558 | | | | — | | | | — | ‡‡ | | | 27,254,558 | |
| Information Technology | | | 15,999,065 | | | | — | | | | — | | | | 15,999,065 | |
| Real Estate | | | 1,194,711 | | | | — | | | | 707,942 | | | | 1,902,653 | |
| Utilities | | | 9,828,105 | | | | — | | | | — | | | | 9,828,105 | |
| Hong Kong | | | 2,567,852 | | | | — | | | | — | | | | 2,567,852 | |
| Total Common Stock | | | 94,936,342 | | | | — | | | | 707,942 | | | | 95,644,284 | |
| Total Investments in Securities | | $ | 94,936,342 | | | $ | — | | | $ | 707,942 | | | $ | 95,644,284 | |
| ^ | A reconciliation of Level 3 investments, including certain disclosures related to significant inputs used in valuing Level 3 investments is only presented when the Fund has over 1% of Level 3 investments at the end of the period in relation to net assets. |
| ‡‡ | Security or securities with a market value of $0. |
Amounts designated as “—” are $0 or have been rounded to $0.
See “Glossary” for abbreviations.
The accompanying notes are an integral part of the financial statements.
Schedule of Investments March 31, 2023
KraneShares Electric Vehicles and Future Mobility Index ETF

| | | Shares | | | Value | |
| COMMON STOCK — 94.4%‡ | | | | | | | | |
| AUSTRALIA — 8.3% | | | | | | | | |
| Materials — 8.3% | | | | | | | | |
| Allkem* | | | 380,537 | | | $ | 3,027,801 | |
| IGO | | | 473,429 | | | | 4,049,112 | |
| Lynas Rare Earths* | | | 580,137 | | | | 2,463,394 | |
| Mineral Resources | | | 33,203 | | | | 1,792,142 | |
| Pilbara Minerals | | | 1,495,031 | | | | 3,945,122 | |
| TOTAL AUSTRALIA | | | | | | | 15,277,571 | |
| | | | | | | | | |
| BELGIUM — 2.4% | | | | | | | | |
| Materials — 2.4% | | | | | | | | |
| Umicore | | | 130,650 | | | | 4,430,089 | |
| TOTAL BELGIUM | | | | | | | 4,430,089 | |
| | | | | | | | | |
| CANADA — 3.7% | | | | | | | | |
| Industrials — 2.9% | | | | | | | | |
| Ballard Power Systems*(A) | | | 150,931 | | | | 840,891 | |
| Magna International | | | 86,954 | | | | 4,651,125 | |
| | | | | | | | 5,492,016 | |
| Materials — 0.8% | | | | | | | | |
| Lithium Americas*(A) | | | 65,729 | | | | 1,427,888 | |
| TOTAL CANADA | | | | | | | 6,919,904 | |
| | | | | | | | | |
| CHINA — 32.5% | | | | | | | | |
| Consumer Discretionary — 15.7% | | | | | | | | |
| BYD, Cl A | | | 193,000 | | | | 7,195,238 | |
| Geely Automobile Holdings | | | 3,222,000 | | | | 4,145,530 | |
| Guangzhou Automobile Group, Cl H | | | 1,724,000 | | | | 1,087,115 | |
| Li Auto, Cl A* | | | 400,700 | | | | 5,002,401 | |
| NIO ADR* | | | 476,826 | | | | 5,011,441 | |
The accompanying notes are an integral part of the financial statements.
Schedule of Investments March 31, 2023
KraneShares Electric Vehicles and Future Mobility Index ETF (continued)
| | | Shares | | | Value | |
| COMMON STOCK (continued) | | | | | | | | |
| Consumer Discretionary (continued) | | | | | | | | |
| Shenzhen Kedali Industry, Cl A | | | 40,736 | | | $ | 766,933 | |
| XPeng, Cl A* | | | 712,700 | | | | 3,972,080 | |
| Yadea Group Holdings | | | 716,000 | | | | 1,847,018 | |
| | | | | | | | 29,027,756 | |
| Industrials — 8.0% | | | | | | | | |
| Beijing Easpring Material Technology, Cl A | | | 91,300 | | | | 764,722 | |
| China Baoan Group, Cl A | | | 459,107 | | | | 760,131 | |
| Contemporary Amperex Technology, Cl A | | | 120,289 | | | | 7,112,453 | |
| Eve Energy, Cl A | | | 365,360 | | | | 3,708,239 | |
| Gotion High-tech, Cl A | | | 319,189 | | | | 1,385,555 | |
| Guangzhou Great Power Energy & Technology, Cl A | | | 81,200 | | | | 673,859 | |
| Qingdao TGOOD Electric, Cl A | | | 187,600 | | | | 482,160 | |
| | | | | | | | 14,887,119 | |
| Materials — 8.8% | | | | | | | | |
| Chengxin Lithium Group, Cl A | | | 163,500 | | | | 822,107 | |
| CMOC Group, Cl A | | | 3,144,500 | | | | 2,742,789 | |
| Ganfeng Lithium Group, Cl A | | | 288,858 | | | | 2,795,914 | |
| GEM, Cl A | | | 917,540 | | | | 998,067 | |
| Guangzhou Tinci Materials Technology, Cl A | | | 344,294 | | | | 2,103,676 | |
| Ningbo Shanshan, Cl A | | | 407,100 | | | | 1,021,411 | |
| Shanghai Putailai New Energy Technology, Cl A | | | 247,862 | | | | 1,801,406 | |
| Tianqi Lithium, Cl H | | | 64,200 | | | | 432,228 | |
| Xiamen Tungsten, Cl A | | | 253,451 | | | | 752,163 | |
| Youngy, Cl A | | | 46,600 | | | | 514,159 | |
| Zhejiang Huayou Cobalt, Cl A | | | 287,263 | | | | 2,300,682 | |
| | | | | | | | 16,284,602 | |
| TOTAL CHINA | | | | | | | 60,199,477 | |
| | | | | | | | | |
| GERMANY — 3.2% | | | | | | | | |
| Consumer Discretionary — 2.1% | | | | | | | | |
| Mercedes-Benz Group | | | 25,419 | | | | 1,954,692 | |
| Volkswagen | | | 10,984 | | | | 1,885,501 | |
| | | | | | | | 3,840,193 | |
| Information Technology — 1.1% | | | | | | | | |
| Infineon Technologies | | | 51,306 | | | | 2,100,334 | |
| TOTAL GERMANY | | | | | | | 5,940,527 | |
| | | | | | | | | |
| INDONESIA — 0.7% | | | | | | | | |
| Materials — 0.7% | | | | | | | | |
| Aneka Tambang | | | 5,316,900 | | | | 741,093 | |
| Vale Indonesia* | | | 1,329,700 | | | | 589,717 | |
| TOTAL INDONESIA | | | | | | | 1,330,810 | |
The accompanying notes are an integral part of the financial statements.
Schedule of Investments March 31, 2023
KraneShares Electric Vehicles and Future Mobility Index ETF (continued)
| | | Shares | | | Value | |
| COMMON STOCK (continued) | | | | | | | | |
| JAPAN — 8.5% | | | | | | | | |
| Consumer Discretionary — 4.2% | | | | | | | | |
| Panasonic Holdings | | | 869,600 | | | $ | 7,723,099 | |
| | | | | | | | | |
| Industrials — 4.2% | | | | | | | | |
| Nidec | | | 150,200 | | | | 7,724,991 | |
| | | | | | | | | |
| Materials — 0.1% | | | | | | | | |
| W-Scope* | | | 31,100 | | | | 293,030 | |
| TOTAL JAPAN | | | | | | | 15,741,120 | |
| | | | | | | | | |
| NETHERLANDS — 0.6% | | | | | | | | |
| Industrials — 0.6% | | | | | | | | |
| Alfen Beheer BV* | | | 13,946 | | | | 1,107,886 | |
| TOTAL NETHERLANDS | | | | | | | 1,107,886 | |
| | | | | | | | | |
| SOUTH KOREA — 12.3% | | | | | | | | |
| Industrials — 5.7% | | | | | | | | |
| Ecopro | | | 31,596 | | | | 5,448,632 | |
| LG Energy Solution* | | | 11,520 | | | | 5,167,784 | |
| | | | | | | | 10,616,416 | |
| Information Technology — 6.2% | | | | | | | | |
| L&F | | | 15,411 | | | | 3,711,141 | |
| Samsung SDI | | | 13,631 | | | | 7,695,806 | |
| | | | | | | | 11,406,947 | |
| Materials — 0.4% | | | | | | | | |
| SK IE Technology*(A) | | | 11,552 | | | | 631,795 | |
| TOTAL SOUTH KOREA | | | | | | | 22,655,158 | |
| | | | | | | | | |
| SWEDEN — 0.7% | | | | | | | | |
| Consumer Discretionary — 0.7% | | | | | | | | |
| Volvo Car, Cl B* | | | 313,222 | | | | 1,365,157 | |
| TOTAL SWEDEN | | | | | | | 1,365,157 | |
| | | | | | | | | |
| UNITED STATES — 21.5% | | | | | | | | |
| Consumer Discretionary — 12.6% | | | | | | | | |
| Aptiv* | | | 63,684 | | | | 7,144,708 | |
| Ford Motor | | | 150,893 | | | | 1,901,252 | |
| Lucid Group*(A) | | | 351,119 | | | | 2,822,997 | |
| Rivian Automotive, Cl A* | | | 237,745 | | | | 3,680,293 | |
| Tesla* | | | 37,166 | | | | 7,710,458 | |
| | | | | | | | 23,259,708 | |
| Industrials — 3.2% | | | | | | | | |
| Blink Charging*(A) | | | 27,343 | | | | 236,517 | |
The accompanying notes are an integral part of the financial statements.
Schedule of Investments March 31, 2023
KraneShares Electric Vehicles and Future Mobility Index ETF (continued)
| | | Shares | | | Value | |
| COMMON STOCK (continued) | | | | | | | | |
| Industrials (continued) | | | | | | | | |
| ChargePoint Holdings*(A) | | | 180,966 | | | $ | 1,894,714 | |
| Nikola*(A) | | | 242,001 | | | | 292,821 | |
| Plug Power*(A) | | | 293,396 | | | | 3,438,601 | |
| | | | | | | | 5,862,653 | |
| Information Technology — 0.9% | | | | | | | | |
| SolarEdge Technologies* | | | 5,675 | | | | 1,724,916 | |
| | | | | | | | | |
| Materials — 4.8% | | | | | | | | |
| Albemarle | | | 29,199 | | | | 6,454,147 | |
| Livent* | | | 113,829 | | | | 2,472,366 | |
| | | | | | | | 8,926,513 | |
| TOTAL UNITED STATES | | | | | | | 39,773,790 | |
| | | | | | | | |
TOTAL COMMON STOCK
(Cost $216,111,084) | | | | | | | 174,741,489 | |
| | | | | | | | | |
| PREFERRED STOCK — 5.0% | | | | | | | | |
| CHILE— 2.3% | | | | | | | | |
| Materials — 2.3% | | | | | | | | |
| Sociedad Quimica y Minera de Chile(B) | | | 53,737 | | | | 4,336,425 | |
| | | | | | | | | |
| GERMANY— 2.7% | | | | | | | | |
| Consumer Discretionary — 2.7% | | | | | | | | |
| Dr Ing hc F Porsche*(B) | | | 39,415 | | | | 5,053,040 | |
| | | | | | | | |
TOTAL PREFERRED STOCK
(Cost $8,818,572) | | | | | | | 9,389,465 | |
| | | | | | | | | |
| SHORT-TERM INVESTMENT — 4.6% | | | | | | | | |
| Invesco Government & Agency Portfolio, Cl Institutional, 4.430%(C)(D) | | | 8,431,059 | | | | 8,431,059 | |
| | | | | | | | | |
TOTAL SHORT-TERM INVESTMENT
(Cost $8,431,059) | | | | | | | 8,431,059 | |
| | | | | | | | |
TOTAL INVESTMENTS — 104.0%
(Cost $233,360,715) | | | | | | | 192,562,013 | |
| OTHER ASSETS LESS LIABILITIES – (4.0)% | | | | | | | (7,456,273 | ) |
| NET ASSETS - 100% | | | | | | $ | 185,105,740 | |
| ‡ | Industries are utilized for compliance purposes, whereas sectors are utilized for reporting. |
| * | Non-income producing security. |
| (A) | This security or a partial position of this security is on loan at March 31, 2023. The total market value of securities on loan at March 31, 2023 was $8,113,787. |
| (B) | Currently, no stated interest rate. |
| (C) | The rate shown is the 7-day effective yield as of March 31, 2023. |
| (D) | This security was purchased with cash collateral held from securities on loan. The total value of such security as of March 31, 2023 was $8,431,059. |
The accompanying notes are an integral part of the financial statements.
Schedule of Investments March 31, 2023
KraneShares Electric Vehicles and Future Mobility Index ETF (concluded)
As of March 31, 2023, all of the Fund’s investments were considered Level 1 of the fair value hierarchy, in accordance with the authoritative guidance under U.S. GAAP.
See “Glossary” for abbreviations.
The accompanying notes are an integral part of the financial statements.
Schedule of Investments March 31, 2023
KraneShares MSCI All China Health Care Index ETF
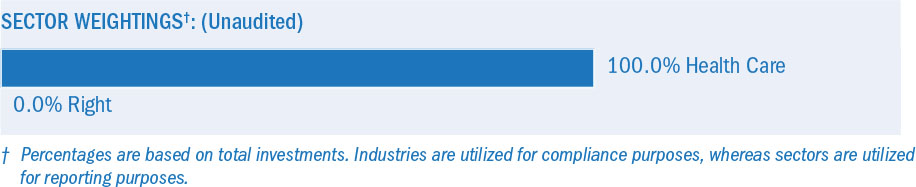
| | | Shares | | | Value | |
| COMMON STOCK — 100.0%‡ | | | | | | | | |
| CHINA — 96.6% | | | | | | | | |
| Health Care — 96.6% | | | | | | | | |
| 3SBio | | | 568,000 | | | $ | 565,833 | |
| Aier Eye Hospital Group, Cl A | | | 811,137 | | | | 3,669,860 | |
| Akeso* | | | 181,000 | | | | 931,522 | |
| Apeloa Pharmaceutical, Cl A | | | 136,892 | | | | 424,592 | |
| Asymchem Laboratories Tianjin, Cl A | | | 39,024 | | | | 757,663 | |
| Autobio Diagnostics, Cl A | | | 62,530 | | | | 554,887 | |
| BeiGene* | | | 237,018 | | | | 3,907,048 | |
| Beijing Tiantan Biological Products, Cl A | | | 186,942 | | | | 675,650 | |
| Beijing Tongrentang, Cl A | | | 153,890 | | | | 1,235,638 | |
| Beijing Wantai Biological Pharmacy Enterprise, Cl A | | | 68,530 | | | | 1,159,081 | |
| Betta Pharmaceuticals, Cl A | | | 47,063 | | | | 402,694 | |
| BGI Genomics, Cl A | | | 47,127 | | | | 473,514 | |
| Bloomage Biotechnology, Cl A | | | 55,945 | | | | 923,822 | |
| Changchun High & New Technology Industry Group, Cl A | | | 45,608 | | | | 1,084,529 | |
| China Medical System Holdings | | | 511,000 | | | | 807,190 | |
| China Meheco, Cl A | | | 168,000 | | | | 335,643 | |
| China National Medicines, Cl A | | | 84,455 | | | | 458,106 | |
| China Resources Pharmaceutical Group | | | 604,000 | | | | 478,586 | |
| China Resources Sanjiu Medical & Pharmaceutical, Cl A | | | 110,990 | | | | 928,513 | |
| China Traditional Chinese Medicine Holdings | | | 1,068,000 | | | | 559,173 | |
| Chongqing Zhifei Biological Products, Cl A | | | 181,749 | | | | 2,168,348 | |
| CSPC Pharmaceutical Group | | | 3,428,889 | | | | 3,372,126 | |
| Daan Gene, Cl A | | | 157,947 | | | | 370,528 | |
| Dong-E-E-Jiao, Cl A | | | 74,640 | | | | 575,943 | |
| Genscript Biotech* | | | 444,000 | | | | 950,223 | |
| Guangzhou Baiyunshan Pharmaceutical Holdings, Cl A | | | 157,740 | | | | 759,839 | |
| Guangzhou Kingmed Diagnostics Group, Cl A | | | 51,399 | | | | 659,393 | |
| Hangzhou Tigermed Consulting, Cl A | | | 42,350 | | | | 590,235 | |
| Hangzhou Tigermed Consulting, Cl H | | | 46,400 | | | | 435,631 | |
| Hansoh Pharmaceutical Group | | | 450,000 | | | | 781,916 | |
| Huadong Medicine, Cl A | | | 197,641 | | | | 1,333,666 | |
| Hualan Biological Engineering, Cl A | | | 208,047 | | | | 661,347 | |
| Hubei Jumpcan Pharmaceutical, Cl A | | | 106,300 | | | | 440,846 | |
| Humanwell Healthcare Group, Cl A | | | 184,300 | | | | 718,704 | |
| Hygeia Healthcare Holdings* | | | 127,600 | | | | 907,022 | |
| Imeik Technology Development, Cl A | | | 24,200 | | | | 1,969,005 | |
The accompanying notes are an integral part of the financial statements.
Schedule of Investments March 31, 2023
KraneShares MSCI All China Health Care Index ETF (continued)
| | | Shares | | | Value | |
| COMMON STOCK (continued) | | | | | | | | |
| Health Care (continued) | | | | | | | | |
| Innovent Biologics* | | | 409,500 | | | $ | 1,833,633 | |
| iRay Technology, Cl A | | | 8,164 | | | | 430,152 | |
| Jafron Biomedical, Cl A | | | 91,390 | | | | 403,898 | |
| Jiangsu Hengrui Pharmaceuticals, Cl A | | | 716,928 | | | | 4,470,295 | |
| Jiangsu Yuyue Medical Equipment & Supply, Cl A | | | 114,910 | | | | 532,776 | |
| Joincare Pharmaceutical Group Industry, Cl A | | | 210,545 | | | | 403,780 | |
| Joinn Laboratories China, Cl A | | | 51,324 | | | | 391,322 | |
| Jointown Pharmaceutical Group, Cl A | | | 210,606 | | | | 458,180 | |
| Lepu Medical Technology Beijing, Cl A | | | 202,800 | | | | 684,534 | |
| Livzon Pharmaceutical Group, Cl A | | | 70,059 | | | | 381,344 | |
| Meinian Onehealth Healthcare Holdings, Cl A* | | | 434,683 | | | | 475,998 | |
| Microport Scientific* | | | 242,300 | | | | 569,794 | |
| Nanjing King-Friend Biochemical Pharmaceutical, Cl A | | | 186,484 | | | | 442,631 | |
| Ovctek China, Cl A | | | 102,293 | | | | 493,344 | |
| Pharmaron Beijing, Cl A | | | 112,050 | | | | 799,017 | |
| Pharmaron Beijing, Cl H | | | 75,300 | | | | 316,070 | |
| Porton Pharma Solutions, Cl A | | | 62,100 | | | | 335,399 | |
| Shandong Buchang Pharmaceuticals, Cl A | | | 125,583 | | | | 362,816 | |
| Shandong Weigao Group Medical Polymer, Cl H | | | 983,200 | | | | 1,570,625 | |
| Shanghai Fosun Pharmaceutical Group, Cl A | | | 240,829 | | | | 1,135,883 | |
| Shanghai Fosun Pharmaceutical Group, Cl H | | | 189,500 | | | | 538,328 | |
| Shanghai Junshi Biosciences, Cl A* | | | 87,220 | | | | 610,145 | |
| Shanghai Medicilon, Cl A | | | 10,150 | | | | 230,626 | |
| Shanghai Pharmaceuticals Holding, Cl A | | | 311,794 | | | | 924,853 | |
| Shanghai Pharmaceuticals Holding, Cl H | | | 295,500 | | | | 551,102 | |
| Shanghai RAAS Blood Products, Cl A | | | 765,234 | | | | 716,505 | |
| Shenzhen Kangtai Biological Products, Cl A | | | 127,577 | | | | 587,790 | |
| Shenzhen Mindray Bio-Medical Electronics, Cl A | | | 137,255 | | | | 6,230,069 | |
| Shenzhen New Industries Biomedical Engineering, Cl A | | | 88,200 | | | | 785,635 | |
| Shenzhen Salubris Pharmaceuticals, Cl A | | | 125,365 | | | | 645,510 | |
| Shijiazhuang Yiling Pharmaceutical, Cl A | | | 191,450 | | | | 811,543 | |
| Sichuan Kelun Pharmaceutical, Cl A | | | 158,715 | | | | 656,835 | |
| Sinopharm Group, Cl H | | | 515,200 | | | | 1,558,736 | |
| Tonghua Dongbao Pharmaceutical, Cl A | | | 226,991 | | | | 391,358 | |
| Topchoice Medical, Cl A* | | | 38,441 | | | | 723,669 | |
| Walvax Biotechnology, Cl A | | | 183,000 | | | | 919,090 | |
| WuXi AppTec, Cl A | | | 290,620 | | | | 3,364,392 | |
| WuXi AppTec, Cl H | | | 134,784 | | | | 1,411,378 | |
| Wuxi Biologics Cayman* | | | 1,337,135 | | | | 8,278,366 | |
| Yunnan Baiyao Group, Cl A | | | 203,723 | | | | 1,622,712 | |
| Zai Lab ADR* | | | 32,708 | | | | 1,087,868 | |
| Zhangzhou Pientzehuang Pharmaceutical, Cl A | | | 67,934 | | | | 2,813,197 | |
| Zhejiang Huahai Pharmaceutical, Cl A | | | 167,872 | | | | 493,058 | |
| Zhejiang Jiuzhou Pharmaceutical, Cl A | | | 101,200 | | | | 490,431 | |
| Zhejiang NHU, Cl A | | | 353,730 | | | | 924,591 | |
The accompanying notes are an integral part of the financial statements.
Schedule of Investments March 31, 2023
KraneShares MSCI All China Health Care Index ETF (continued)
| | | Shares | | | Value | |
| COMMON STOCK (continued) | | | | | | | | |
| Health Care (continued) | | | | | | | | |
| Zhejiang Wolwo Bio-Pharmaceutical, Cl A | | | 59,136 | | | $ | 409,895 | |
| TOTAL CHINA | | | | | | | 91,297,489 | |
| | | | | | | | | |
| HONG KONG — 2.3% | | | | | | | | |
| Health Care — 2.3% | | | | | | | | |
| Sino Biopharmaceutical | | | 3,916,750 | | | | 2,195,390 | |
| TOTAL HONG KONG | | | | | | | 2,195,390 | |
| | | | | | | | | |
| UNITED STATES — 1.1% | | | | | | | | |
| Health Care — 1.1% | | | | | | | | |
| Legend Biotech ADR* | | | 21,431 | | | | 1,033,403 | |
| TOTAL UNITED STATES | | | | | | | 1,033,403 | |
| | | | | | | | |
TOTAL COMMON STOCK
(Cost $112,170,471) | | | | | | | 94,526,282 | |
| | | | | | | | | |
| RIGHT — 0.0% | | | | | | | | |
| CHINA — 0.0% | | | | | | | | |
| Health Care — 0.0% | | | | | | | | |
| Kangmei Pharma‡‡*(A) | | | 118,157 | | | | — | |
| TOTAL CHINA | | | | | | | — | |
| | | | | | | | |
TOTAL RIGHT
(Cost $–) | | | | | | | — | |
| | | | | | | | |
TOTAL INVESTMENTS — 100.0%
(Cost $112,170,471) | | | | | | | 94,526,282 | |
| OTHER ASSETS LESS LIABILITIES – 0.0% | | | | | | | (34,242 | ) |
| NET ASSETS - 100% | | | | | | $ | 94,492,040 | |
| ‡ | Industries are utilized for compliance purposes, whereas sectors are utilized for reporting. |
| * | Non-income producing security. |
| (A) | Level 3 security in accordance with fair value hierarchy. |
| ‡‡ | Expiration date not available. |
The accompanying notes are an integral part of the financial statements.
Schedule of Investments March 31, 2023
KraneShares MSCI All China Health Care Index ETF (concluded)
The following summarizes the market value of the Fund’s investments used as of March 31, 2023, based on the inputs used to value them:
| Investments in Securities | | Level 1 | | | Level 2 | | | Level 3^ | | | Total | |
| Common Stock | | | | | | | | | | | | | | | | �� |
| China | | $ | 91,297,489 | | | $ | — | | | $ | — | | | $ | 91,297,489 | |
| Hong Kong | | | 2,195,390 | | | | — | | | | — | | | | 2,195,390 | |
| United States | | | 1,033,403 | | | | — | | | | — | | | | 1,033,403 | |
| Total Common Stock | | | 94,526,282 | | | | — | | | | — | | | | 94,526,282 | |
| Right | | | — | | | | — | | | | — | ‡‡ | | | — | |
| Total Investments in Securities | | $ | 94,526,282 | | | $ | — | | | $ | — | | | $ | 94,526,282 | |
| ^ | A reconciliation of Level 3 investments, including certain disclosures related to significant inputs used in valuing Level 3 investments is only presented when the Fund has over 1% of Level 3 investments at the end of the period in relation to net assets. |
| ‡‡ | Security or securities with a market value of $0. |
Amounts designated as “—” are $0 or have been rounded to $0.
See “Glossary” for abbreviations.
The accompanying notes are an integral part of the financial statements.
Schedule of Investments March 31, 2023
KraneShares Asia Pacific High Income Bond ETF

| | | Face Amount | | | Value | |
| CORPORATE OBLIGATIONS — 94.1% | | | | | | | | |
| AUSTRALIA — 0.9% | | | | | | | | |
| Real Estate — 0.9% | | | | | | | | |
| Scentre Group Trust 2 | | | | | | | | |
| 4.750%, US Treas Yield Curve Rate T Note Const Mat 5 Yr + 4.379%, 09/24/2080(A) | | $ | 200,000 | | | $ | 180,055 | |
| | | | | | | | | |
| CHINA — 33.1% | | | | | | | | |
| Consumer Discretionary — 4.2% | | | | | | | | |
| Fortune Star BVI | | | | | | | | |
| 6.750%, 07/02/2023 | | | 300,000 | | | | 290,910 | |
| Golden Eagle Retail Group | | | | | | | | |
| 4.625%, 05/21/2023 | | | 200,000 | | | | 197,506 | |
| Health & Happiness H&H International Holdings | | | | | | | | |
| 5.625%, 10/24/2024 | | | 400,000 | | | | 351,700 | |
| | | | | | | | 840,116 | |
| Financials — 2.5% | | | | | | | | |
| Huarong Finance II, MTN | | | | | | | | |
| 5.000%, 11/19/2025 | | | 200,000 | | | | 172,775 | |
| ZhongAn Online P&C Insurance | | | | | | | | |
| 3.125%, 07/16/2025 | | | 400,000 | | | | 337,646 | |
| | | | | | | | 510,421 | |
| Materials — 3.2% | | | | | | | | |
| China Hongqiao Group | | | | | | | | |
| 7.375%, 05/02/2023 | | | 400,000 | | | | 399,440 | |
| 6.250%, 06/08/2024 | | | 250,000 | | | | 240,445 | |
| | | | | | | | 639,885 | |
The accompanying notes are an integral part of the financial statements.
Schedule of Investments March 31, 2023
KraneShares Asia Pacific High Income Bond ETF (continued)
| | | Face Amount | | | Value | |
| CORPORATE OBLIGATIONS (continued) | | | | | | | | |
| Real Estate — 23.2% | | | | | | | | |
| Country Garden Holdings | | | | | | | | |
| 8.000%, 01/27/2024 | | $ | 250,000 | | | $ | 216,425 | |
| 6.150%, 09/17/2025 | | | 250,000 | | | | 159,829 | |
| 5.625%, 12/15/2026 | | | 200,000 | | | | 113,853 | |
| 5.125%, 01/17/2025 | | | 270,000 | | | | 173,953 | |
| Gemdale Ever Prosperity Investment, MTN | | | | | | | | |
| 4.950%, 08/12/2024 | | | 200,000 | | | | 183,150 | |
| Greentown China Holdings | | | | | | | | |
| 5.650%, 07/13/2025 | | | 200,000 | | | | 184,100 | |
| 4.700%, 04/29/2025 | | | 200,000 | | | | 182,350 | |
| Hopson Development Holdings | | | | | | | | |
| 7.000%, 05/18/2024 | | | 300,000 | | | | 259,284 | |
| New Metro Global | | | | | | | | |
| 6.800%, 08/05/2023 | | | 200,000 | | | | 186,100 | |
| 4.800%, 12/15/2024 | | | 200,000 | | | | 143,800 | |
| 4.500%, 05/02/2026 | | | 200,000 | | | | 125,838 | |
| RKPF Overseas 2019 A | | | | | | | | |
| 6.700%, 09/30/2024 | | | 200,000 | | | | 183,966 | |
| 6.000%, 09/04/2025 | | | 250,000 | | | | 197,323 | |
| RKPF Overseas 2019 E | | | | | | | | |
| 7.750%, US Treas Yield Curve Rate T Note Const Mat 5 Yr+ 6.003%‡ (A) | | | 200,000 | | | | 122,187 | |
| RKPF Overseas 2020 A | | | | | | | | |
| 5.200%, 01/12/2026 | | | 200,000 | | | | 142,505 | |
| Seazen Group | | | | | | | | |
| 6.150%, 04/15/2023 | | | 200,000 | | | | 195,190 | |
| 6.000%, 08/12/2024 | | | 200,000 | | | | 150,200 | |
| 4.450%, 07/13/2025 | | | 200,000 | | | | 130,046 | |
| Shui On Development Holding | | | | | | | | |
| 6.150%, 08/24/2024 | | | 200,000 | | | | 179,900 | |
| 5.750%, 11/12/2023 | | | 500,000 | | | | 488,600 | |
| 5.500%, 06/29/2026 | | | 200,000 | | | | 152,090 | |
| Wanda Properties Overseas | | | | | | | | |
| 6.875%, 07/23/2023 | | | 200,000 | | | | 190,100 | |
| Yanlord Land HK | | | | | | | | |
| 6.800%, 02/27/2024 | | | 431,000 | | | | 417,398 | |
| 5.125%, 05/20/2026 | | | 200,000 | | | | 166,002 | |
| | | | | | | | 4,644,189 | |
| TOTAL CHINA | | | | | | | 6,634,611 | |
| | | | | | | | | |
| HONG KONG — 16.1% | | | | | | | | |
| Communication Services — 1.7% | | | | | | | | |
| HKT Capital No. 6 | | | | | | | | |
| 3.000%, 01/18/2032 | | | 400,000 | | | | 339,376 | |
The accompanying notes are an integral part of the financial statements.
Schedule of Investments March 31, 2023
KraneShares Asia Pacific High Income Bond ETF (continued)
| | | Face Amount | | | Value | |
| CORPORATE OBLIGATIONS (continued) | | | | | | | | |
| Consumer Discretionary — 6.8% | | | | | | | | |
| Li & Fung, MTN | | | | | | | | |
| 5.000%, 08/18/2025 | | $ | 250,000 | | | $ | 232,625 | |
| LS Finance 2025 | | | | | | | | |
| 4.500%, 06/26/2025 | | | 400,000 | | | | 343,120 | |
| Melco Resorts Finance | | | | | | | | |
| 5.625%, 07/17/2027 | | | 200,000 | | | | 176,000 | |
| 5.250%, 04/26/2026 | | | 200,000 | | | | 180,250 | |
| 4.875%, 06/06/2025 | | | 450,000 | | | | 423,225 | |
| | | | | | | | 1,355,220 | |
| Financials — 2.1% | | | | | | | | |
| Bank of East Asia, MTN | | | | | | | | |
| 6.750%, US Treas Yield Curve Rate T Note Const Mat 1 Yr+ 2.100%, 03/15/2027 | | | 250,000 | | | | 248,368 | |
| FWD Group | | | | | | | | |
| 6.375%, US Treas Yield Curve Rate T Note Const Mat 5 Yr+ 4.876%‡ (A) | | | 200,000 | | | | 183,600 | |
| | | | | | | | 431,968 | |
| Health Care — 0.9% | | | | | | | | |
| PCGI Intermediate, MTN | | | | | | | | |
| 4.750%, 10/28/2024 | | | 200,000 | | | | 189,600 | |
| | | | | | | | | |
| Industrials — 2.8% | | | | | | | | |
| Celestial Dynasty | | | | | | | | |
| 4.250%, 06/27/2029 | | | 200,000 | | | | 173,400 | |
| Celestial Miles | | | | | | | | |
| 5.750%, US Treas Yield Curve Rate T Note Const Mat 5 Yr+ 8.205%‡ (A) | | | 400,000 | | | | 391,480 | |
| | | | | | | | 564,880 | |
| Real Estate — 1.8% | | | | | | | | |
| NWD, MTN | | | | | | | | |
| 4.500%, 05/19/2030 | | | 200,000 | | | | 167,169 | |
| NWD Finance BVI | | | | | | | | |
| 6.150%, US Treas Yield Curve Rate T Note Const Mat 3 Yr+ 6.201%‡ | | | 200,000 | | | | 185,000 | |
| | | | | | | | 352,169 | |
| TOTAL HONG KONG | | | | | | | 3,233,213 | |
| | | | | | | | | |
| INDIA — 15.1% | | | | | | | | |
| Energy — 6.2% | | | | | | | | |
| Clean Renewable Power Mauritius Pte | | | | | | | | |
| 4.250%, 03/25/2027 | | | 186,000 | | | | 160,905 | |
| Continuum Energy Levanter Pte | | | | | | | | |
| 4.500%, 02/09/2027 | | | 186,000 | | | | 163,785 | |
| Greenko Solar Mauritius | | | | | | | | |
| 5.550%, 01/29/2025 | | | 400,000 | | | | 383,000 | |
The accompanying notes are an integral part of the financial statements.
Schedule of Investments March 31, 2023
KraneShares Asia Pacific High Income Bond ETF (continued)
| | | Face Amount | | | Value | |
| CORPORATE OBLIGATIONS (continued) | | | | | | | | |
| Energy (continued) | | | | | | | | |
| HPCL-Mittal Energy | | | | | | | | |
| 5.250%, 04/28/2027 | | $ | 400,000 | | | $ | 375,000 | |
| ReNew Wind Energy AP2 | | | | | | | | |
| 4.500%, 07/14/2028 | | | 200,000 | | | | 167,941 | |
| | | | | | | | 1,250,631 | |
| Financials — 1.4% | | | | | | | | |
| Shriram Finance, MTN | | | | | | | | |
| 4.150%, 07/18/2025 | | | 300,000 | | | | 276,750 | |
| | | | | | | | | |
| Industrials — 5.6% | | | | | | | | |
| India Airport Infrastructure | | | | | | | | |
| 6.250%, 10/25/2025 | | | 250,000 | | | | 236,109 | |
| JSW Steel | | | | | | | | |
| 5.050%, 04/05/2032 | | | 200,000 | | | | 163,682 | |
| Magnum Holdings | | | | | | | | |
| 5.375%, 10/31/2026 | | | 400,000 | | | | 350,282 | |
| Periama Holdings | | | | | | | | |
| 5.950%, 04/19/2026 | | | 400,000 | | | | 377,224 | |
| | | | | | | | 1,127,297 | |
| Materials — 1.9% | | | | | | | | |
| Vedanta Resources | | | | | | | | |
| 7.125%, 05/31/2023 | | | 200,000 | | | | 185,831 | |
| Vedanta Resources Finance II | | | | | | | | |
| 8.000%, 04/23/2023 | | | 200,000 | | | | 190,500 | |
| | | | | | | | 376,331 | |
| TOTAL INDIA | | | | | | | 3,031,009 | |
| | | | | | | | | |
| INDONESIA — 6.1% | | | | | | | | |
| Energy — 3.7% | | | | | | | | |
| Medco Bell Pte | | | | | | | | |
| 6.375%, 01/30/2027 | | | 600,000 | | | | 540,400 | |
| Saka Energi Indonesia | | | | | | | | |
| 4.450%, 05/05/2024 | | | 200,000 | | | | 190,624 | |
| | | | | | | | 731,024 | |
| Financials — 1.6% | | | | | | | | |
| Bank Negara Indonesia Persero | | | | | | | | |
| 4.300%, US Treas Yield Curve Rate T Note Const Mat 5 Yr+ 3.466%‡ (A) | | | 400,000 | | | | 324,200 | |
| | | | | | | | | |
| Industrials — 0.8% | | | | | | | | |
| Japfa Comfeed Indonesia | | | | | | | | |
| 5.375%, 03/23/2026 | | | 200,000 | | | | 167,760 | |
| TOTAL INDONESIA | | | | | | | 1,222,984 | |
The accompanying notes are an integral part of the financial statements.
Schedule of Investments March 31, 2023
KraneShares Asia Pacific High Income Bond ETF (continued)
| | | Face Amount | | | Value | |
| CORPORATE OBLIGATIONS (continued) | | | | | | | | |
| JAPAN — 1.0% | | | | | | | | |
| Communication Services — 1.0% | | | | | | | | |
| SoftBank Group | | | | | | | | |
| 5.500%, 04/20/2023 | | $ | 200,000 | | | $ | 199,020 | |
| | | | | | | | | |
| MACAU — 11.8% | | | | | | | | |
| Consumer Discretionary — 11.8% | | | | | | | | |
| Champion Path Holdings | | | | | | | | |
| 4.500%, 01/27/2026 | | | 200,000 | | | | 176,000 | |
| MGM China Holdings | | | | | | | | |
| 5.875%, 05/15/2026 | | | 200,000 | | | | 188,260 | |
| 5.375%, 05/15/2024 | | | 200,000 | | | | 195,307 | |
| 5.250%, 06/18/2025 | | | 200,000 | | | | 189,499 | |
| 4.750%, 02/01/2027 | | | 200,000 | | | | 179,142 | |
| Sands China | | | | | | | | |
| 5.625%, 08/08/2025 | | | 300,000 | | | | 292,007 | |
| 4.875%, 06/18/2030 | | | 200,000 | | | | 176,942 | |
| Studio City | | | | | | | | |
| 7.000%, 02/15/2027 | | | 200,000 | | | | 188,677 | |
| Studio City Finance | | | | | | | | |
| 6.500%, 01/15/2028 | | | 200,000 | | | | 168,302 | |
| 6.000%, 07/15/2025 | | | 250,000 | | | | 229,075 | |
| Wynn Macau | | | | | | | | |
| 5.500%, 10/01/2027 | | | 200,000 | | | | 174,512 | |
| 5.125%, 12/15/2029 | | | 250,000 | | | | 204,750 | |
| | | | | | | | 2,362,473 | |
| TOTAL MACAU | | | | | | | 2,362,473 | |
| | | | | | | | | |
| MALAYSIA — 0.8% | | | | | | | | |
| Energy — 0.8% | | | | | | | | |
| Petronas Capital, MTN | | | | | | | | |
| 2.480%, 01/28/2032 | | | 200,000 | | | | 170,007 | |
| | | | | | | | | |
| PHILIPPINES — 2.8% | | | | | | | | |
| Energy — 1.9% | | | | | | | | |
| Petron | | | | | | | | |
| 4.600%, US Treas Yield Curve Rate T Note Const Mat 5 Yr+ 4.769%‡ (A) | | | 400,000 | | | | 380,680 | |
| | | | | | | | | |
| Financials — 0.9% | | | | | | | | |
| Rizal Commercial Banking | | | | | | | | |
| 6.500%, US Treas Yield Curve Rate T Note Const Mat 5 Yr+ 6.236%‡ (A) | | | 200,000 | | | | 175,942 | |
| TOTAL PHILIPPINES | | | | | | | 556,622 | |
The accompanying notes are an integral part of the financial statements.
Schedule of Investments March 31, 2023
KraneShares Asia Pacific High Income Bond ETF (concluded)
| | | Face Amount | | | Value | |
| CORPORATE OBLIGATIONS (continued) | | | | | | | | |
| SOUTH KOREA — 0.9% | | | | | | | | |
| Financials — 0.9% | | | | | | | | |
| Kookmin Bank, MTN | | | | | | | | |
| 4.350%, US Treas Yield Curve Rate T Note Const Mat 5 Yr+ 2.639%‡ (A) | | $ | 200,000 | | | $ | 189,305 | |
| | | | | | | | | |
| THAILAND — 4.4% | | | | | | | | |
| Financials — 4.4% | | | | | | | | |
| Kasikornbank, MTN | | | | | | | | |
| 5.275%, US Treas Yield Curve Rate T Note Const Mat 5 Yr+ 4.940%‡ (A) | | | 200,000 | | | | 182,624 | |
| 4.000%, US Treas Yield Curve Rate T Note Const Mat 5 Yr+ 3.337%‡ (A) | | | 400,000 | | | | 331,200 | |
| Krung Thai Bank | | | | | | | | |
| 4.400%, US Treas Yield Curve Rate T Note Const Mat 5 Yr+ 3.530%‡ (A) | | | 200,000 | | | | 176,060 | |
| TMBThanachart Bank, MTN | | | | | | | | |
| 4.900%, US Treas Yield Curve Rate T Note Const Mat 5 Yr+ 3.256%‡ (A) | | | 200,000 | | | | 183,048 | |
| | | | | | | | 872,932 | |
| TOTAL THAILAND | | | | | | | 872,932 | |
| | | | | | | | | |
| VIETNAM — 1.1% | | | | | | | | |
| Energy — 1.1% | | | | | | | | |
| Mong Duong Finance Holdings BV | | | | | | | | |
| 5.125%, 05/07/2029 | | | 250,000 | | | | 211,184 | |
| | | | | | | | |
TOTAL CORPORATE OBLIGATIONS
(Cost $19,252,157) | | | | | | | 18,863,415 | |
| | | | | | | | |
TOTAL INVESTMENTS — 94.1%
(Cost $19,252,157) | | | | | | | 18,863,415 | |
| OTHER ASSETS LESS LIABILITIES – 5.9% | | | | | | | 1,181,858 | |
| NET ASSETS - 100% | | | | | | $ | 20,045,273 | |
| ‡ | Perpetual security with no stated maturity date. |
| (A) | Variable or floating rate security. The rate shown is the effective interest rate as of period end. The rates for certain securities are not based on published reference rates and spreads and are either determined by the issuer or agent based on current market conditions; by using a formula based on the rates of underlying loans; or by adjusting periodically based on prevailing interest rates. |
As of March 31, 2023, all of the Fund’s investments were considered Level 2 of the fair value hierarchy, in accordance with the authoritative guidance under U.S. GAAP.
See “Glossary” for abbreviations.
The accompanying notes are an integral part of the financial statements.
Schedule of Investments March 31, 2023
KraneShares Emerging Markets Healthcare Index ETF

| | | Shares | | | Value | |
| COMMON STOCK — 100.0%‡ | | | | | | | | |
| BRAZIL — 5.4% | | | | | | | | |
| Health Care — 5.4% | | | | | | | | |
| Blau Farmaceutica | | | 1,000 | | | $ | 4,753 | |
| Fleury | | | 2,200 | | | | 6,300 | |
| Hapvida Participacoes e Investimentos* | | | 49,404 | | | | 25,529 | |
| Hypera | | | 3,600 | | | | 26,768 | |
| Rede D’Or Sao Luiz | | | 11,800 | | | | 49,432 | |
| TOTAL BRAZIL | | | | | | | 112,782 | |
| | | | | | | | | |
| CHINA — 44.6% | | | | | | | | |
| Consumer Staples — 2.3% | | | | | | | | |
| JD Health International* | | | 6,400 | | | | 47,613 | |
| | | | | | | | | |
| Health Care — 42.3% | | | | | | | | |
| 3SBio | | | 5,500 | | | | 5,479 | |
| Aier Eye Hospital Group, Cl A | | | 17,096 | | | | 77,348 | |
| AK Medical Holdings | | | 2,000 | | | | 2,334 | |
| Akeso* | | | 2,000 | | | | 10,293 | |
| Angelalign Technology | | | 400 | | | | 5,946 | |
| Beijing Tongrentang, Cl A | | | 3,400 | | | | 27,300 | |
| CanSino Biologics, Cl H | | | 200 | | | | 1,070 | |
| Changchun High & New Technology Industry Group, Cl A | | | 1,000 | | | | 23,779 | |
| China Evergrande New Energy Vehicle Group*(A) | | | 16,000 | | | | 1,504 | |
| China Medical System Holdings | | | 6,000 | | | | 9,478 | |
| China Resources Sanjiu Medical & Pharmaceutical, Cl A | | | 2,300 | | | | 19,241 | |
| Chongqing Zhifei Biological Products, Cl A | | | 4,113 | | | | 49,070 | |
| CSPC Pharmaceutical Group | | | 28,000 | | | | 27,537 | |
| Genscript Biotech* | | | 4,000 | | | | 8,561 | |
| Hansoh Pharmaceutical Group | | | 14,000 | | | | 24,326 | |
| Huadong Medicine, Cl A | | | 4,340 | | | | 29,286 | |
| Hygeia Healthcare Holdings | | | 1,200 | | | | 8,530 | |
| InnoCare Pharma* | | | 4,000 | | | | 4,265 | |
| Innovent Biologics* | | | 3,500 | | | | 15,672 | |
| Jiangsu Hengrui Pharmaceuticals, Cl A | | | 16,259 | | | | 101,381 | |
| Jinxin Fertility Group | | | 5,000 | | | | 3,350 | |
The accompanying notes are an integral part of the financial statements.
Schedule of Investments March 31, 2023
KraneShares Emerging Markets Healthcare Index ETF (continued)
| | | Shares | | | Value | |
| COMMON STOCK (continued) | | | | | | | | |
| Health Care (continued) | | | | | | | | |
| Lepu Medical Technology Beijing, Cl A | | | 4,200 | | | $ | 14,177 | |
| Lifetech Scientific* | | | 10,000 | | | | 3,554 | |
| Luye Pharma Group* | | | 8,000 | | | | 3,710 | |
| Microport Scientific* | | | 4,000 | | | | 9,406 | |
| New Horizon Health* | | | 1,000 | | | | 3,465 | |
| Remegen, Cl H* | | | 500 | | | | 2,666 | |
| Shandong Weigao Group Medical Polymer, Cl H | | | 10,800 | | | | 17,253 | |
| Shanghai Fosun Pharmaceutical Group, Cl H | | | 1,500 | | | | 4,261 | |
| Shanghai Pharmaceuticals Holding, Cl H | | | 2,200 | | | | 4,103 | |
| Shenzhen Mindray Bio-Medical Electronics, Cl A | | | 2,200 | | | | 99,859 | |
| Shenzhen New Industries Biomedical Engineering, Cl A | | | 2,100 | | | | 18,706 | |
| Shenzhen Salubris Pharmaceuticals, Cl A | | | 2,700 | | | | 13,902 | |
| Shijiazhuang Yiling Pharmaceutical, Cl A | | | 4,000 | | | | 16,956 | |
| Simcere Pharmaceutical Group | | | 7,000 | | | | 7,357 | |
| Sinopharm Group, Cl H | | | 3,200 | | | | 9,682 | |
| Topchoice Medical, Cl A* | | | 700 | | | | 13,178 | |
| Walvax Biotechnology, Cl A | | | 3,800 | | | | 19,085 | |
| WuXi AppTec, Cl H | | | 858 | | | | 8,984 | |
| Wuxi Biologics Cayman* | | | 9,281 | | | | 57,460 | |
| Yunnan Baiyao Group, Cl A | | | 1,980 | | | | 15,771 | |
| Zai Lab* | | | 2,000 | | | | 6,637 | |
| Zhangzhou Pientzehuang Pharmaceutical, Cl A | | | 1,500 | | | | 62,116 | |
| Zhejiang NHU, Cl A | | | 7,524 | | | | 19,666 | |
| | | | | | | | 887,704 | |
| TOTAL CHINA | | | | | | | 935,317 | |
| | | | | | | | | |
| HUNGARY — 1.0% | | | | | | | | |
| Health Care — 1.0% | | | | | | | | |
| Richter Gedeon Nyrt | | | 1,042 | | | | 21,802 | |
| TOTAL HUNGARY | | | | | | | 21,802 | |
| | | | | | | | | |
| INDIA — 12.7% | | | | | | | | |
| Health Care — 12.7% | | | | | | | | |
| Apollo Hospitals Enterprise | | | 739 | | | | 38,764 | |
| Divi’s Laboratories | | | 1,431 | | | | 49,161 | |
| Dr Reddy’s Laboratories | | | 927 | | | | 52,144 | |
| Max Healthcare Institute* | | | 5,580 | | | | 29,950 | |
| Sun Pharmaceutical Industries | | | 8,025 | | | | 95,998 | |
| TOTAL INDIA | | | | | | | 266,017 | |
| | | | | | | | | |
| INDONESIA — 3.1% | | | | | | | | |
| Consumer Staples — 0.4% | | | | | | | | |
| Industri Jamu Dan Farmasi Sido Muncul | | | 154,300 | | | | 8,953 | |
The accompanying notes are an integral part of the financial statements.
Schedule of Investments March 31, 2023
KraneShares Emerging Markets Healthcare Index ETF (continued)
| | | Shares | | | Value | |
| COMMON STOCK (continued) | | | | | | | | |
| Health Care — 2.7% | | | | | | | | |
| Kalbe Farma | | | 245,600 | | | $ | 34,397 | |
| Metro Healthcare Indonesia TBK* | | | 186,700 | | | | 6,151 | |
| Mitra Keluarga Karyasehat | | | 80,400 | | | | 15,710 | |
| | | | | | | | 56,258 | |
| TOTAL INDONESIA | | | | | | | 65,211 | |
| | | | | | | | | |
| MALAYSIA — 3.3% | | | | | | | | |
| Health Care — 3.3% | | | | | | | | |
| IHH Healthcare | | | 47,500 | | | | 61,898 | |
| Top Glove* | | | 38,400 | | | | 8,180 | |
| TOTAL MALAYSIA | | | | | | | 70,078 | |
| | | | | | | | | |
| SOUTH AFRICA — 1.9% | | | | | | | | |
| Health Care — 1.9% | | | | | | | | |
| Aspen Pharmacare Holdings | | | 2,343 | | | | 24,190 | |
| Life Healthcare Group Holdings | | | 8,299 | | | | 9,023 | |
| Netcare | | | 8,325 | | | | 6,949 | |
| TOTAL SOUTH AFRICA | | | | | | | 40,162 | |
| | | | | | | | | |
| SOUTH KOREA — 16.0% | | | | | | | | |
| Health Care — 16.0% | | | | | | | | |
| Alteogen* | | | 245 | | | | 7,462 | |
| Celltrion | | | 734 | | | | 84,412 | |
| Celltrion Healthcare | | | 874 | | | | 40,393 | |
| Celltrion Pharm* | | | 197 | | | | 12,561 | |
| Daewoong Pharmaceutical | | | 59 | | | | 4,768 | |
| Green Cross | | | 54 | | | | 5,065 | |
| Hanmi Pharm | | | 64 | | | | 12,492 | |
| Hanmi Science | | | 367 | | | | 10,986 | |
| Hugel* | | | 66 | | | | 6,484 | |
| Samsung Biologics* | | | 147 | | | | 88,978 | |
| Seegene | | | 243 | | | | 4,629 | |
| SK Biopharmaceuticals* | | | 345 | | | | 16,775 | |
| SK Bioscience* | | | 348 | | | | 19,273 | |
| ST Pharm | | | 96 | | | | 5,457 | |
| Yuhan | | | 392 | | | | 15,227 | |
| TOTAL SOUTH KOREA | | | | | | | 334,962 | |
| | | | | | | | | |
| THAILAND — 6.2% | | | | | | | | |
| Health Care — 6.2% | | | | | | | | |
| Bangkok Chain Hospital | | | 12,100 | | | | 7,219 | |
| Bangkok Dusit Medical Services, Cl F | | | 80,600 | | | | 69,534 | |
| Bumrungrad Hospital | | | 4,000 | | | | 26,437 | |
| Chularat Hospital, Cl F | | | 54,100 | | | | 5,727 | |
| Mega Lifesciences | | | 3,700 | | | | 4,517 | |
The accompanying notes are an integral part of the financial statements.
Schedule of Investments March 31, 2023
KraneShares Emerging Markets Healthcare Index ETF (continued)
| | | Shares | | | Value | |
| COMMON STOCK (continued) | | | | | | | | |
| Health Care (continued) | | | | | | | | |
| Ramkhamhaeng Hospital | | | 5,400 | | | $ | 8,409 | |
| Thonburi Healthcare Group | | | 3,600 | | | | 7,159 | |
| TOTAL THAILAND | | | | | | | 129,002 | |
| | | | | | | | | |
| UNITED ARAB EMIRATES — 4.8% | | | | | | | | |
| Industrials — 4.8% | | | | | | | | |
| International Holding PJSC* | | | 922 | | | | 99,418 | |
| TOTAL UNITED ARAB EMIRATES | | | | | | | 99,418 | |
| | | | | | | | | |
| UNITED STATES — 1.0% | | | | | | | | |
| Health Care — 1.0% | | | | | | | | |
| Legend Biotech ADR* | | | 425 | | | | 20,493 | |
| TOTAL UNITED STATES | | | | | | | 20,493 | |
| | | | | | | | | |
TOTAL COMMON STOCK
(Cost $2,894,498) | | | | | | |
2,095,244 | |
| | | | | | | | | |
| RIGHT — 0.0% | | | | | | | | |
| CHINA — 0.0% | | | | | | | | |
| Health Care — 0.0% | | | | | | | | |
| Kangmei Pharma‡‡*(A) | | | 5,516 | | | | — | |
| TOTAL CHINA | | | | | | | — | |
| | | | | | | | | |
TOTAL RIGHT
(Cost $–) | | | | | | |
— | |
| | | | | | | | | |
TOTAL INVESTMENTS — 100.0%
(Cost $2,894,498) | | | | | | |
2,095,244 | |
| OTHER ASSETS LESS LIABILITIES – 0.0% | | | | | | | (174 | ) |
| NET ASSETS - 100% | | | | | | $ | 2,095,070 | |
| ‡ | Industries are utilized for compliance purposes, whereas sectors are utilized for reporting. |
| * | Non-income producing security. |
| (A) | Level 3 security in accordance with fair value hierarchy. |
| ‡‡ | Expiration date not available. |
The accompanying notes are an integral part of the financial statements.
Schedule of Investments March 31, 2023
KraneShares Emerging Markets Healthcare Index ETF (concluded)
The following summarizes the market value of the Fund’s investments used as of March 31, 2023, based on the inputs used to value them:
| Investments in Securities | | Level 1 | | | Level 2 | | | Level 3^ | | | Total | |
| Common Stock | | | | | | | | | | | | | | | | |
| Brazil | | $ | 112,782 | | | $ | — | | | $ | — | | | $ | 112,782 | |
| China | | | | | | | | | | | | | | | | |
| Consumer Staples | | | 47,613 | | | | — | | | | — | | | | 47,613 | |
| Health Care | | | 886,200 | | | | — | | | | 1,504 | | | | 887,704 | |
| Hungary | | | 21,802 | | | | — | | | | — | | | | 21,802 | |
| India | | | 266,017 | | | | — | | | | — | | | | 266,017 | |
| Indonesia | | | 65,211 | | | | — | | | | — | | | | 65,211 | |
| Malaysia | | | 70,078 | | | | — | | | | — | | | | 70,078 | |
| South Africa | | | 40,162 | | | | — | | | | — | | | | 40,162 | |
| South Korea | | | 334,962 | | | | — | | | | — | | | | 334,962 | |
| Thailand | | | 129,002 | | | | — | | | | — | | | | 129,002 | |
| United Arab Emirates | | | 99,418 | | | | — | | | | — | | | | 99,418 | |
| United States | | | 20,493 | | | | — | | | | — | | | | 20,493 | |
| Total Common Stock | | | 2,093,740 | | | | — | | | | 1,504 | | | | 2,095,244 | |
| Right | | | — | | | | — | | | | — | ‡‡ | | | — | |
| Total Investments in Securities | | $ | 2,093,740 | | | $ | — | | | $ | 1,504 | | | $ | 2,095,244 | |
| ^ | A reconciliation of Level 3 investments, including certain disclosures related to significant inputs used in valuing Level 3 investments is only presented when the Fund has over 1% of Level 3 investments at the end of the period in relation to net assets. |
| ‡‡ | Security or securities with a market value of $0. |
Amounts designated as “—” are $0 or have been rounded to $0.
See “Glossary” for abbreviations.
The accompanying notes are an integral part of the financial statements.
Schedule of Investments March 31, 2023
KraneShares MSCI Emerging Markets ex China Index ETF

| | | Shares | | | Value | |
| COMMON STOCK — 95.8%‡ | | | | | | | | |
| AUSTRALIA — 0.3% | | | | | | | | |
| Materials — 0.3% | | | | | | | | |
| AngloGold Ashanti | | | 3,843 | | | $ | 93,441 | |
| TOTAL AUSTRALIA | | | | | | | 93,441 | |
| | | | | | | | | |
| BRAZIL — 5.4% | | | | | | | | |
| Communication Services — 0.1% | | | | | | | | |
| Telefonica Brasil | | | 4,700 | | | | 35,837 | |
| | | | | | | | | |
| Consumer Discretionary — 0.2% | | | | | | | | |
| Lojas Renner | | | 8,225 | | | | 26,880 | |
| Magazine Luiza* | | | 37,000 | | | | 24,154 | |
| | | | | | | | 51,034 | |
| Consumer Staples — 0.6% | | | | | | | | |
| Ambev | | | 44,300 | | | | 125,205 | |
| Raia Drogasil | | | 11,700 | | | | 56,420 | |
| | | | | | | | 181,625 | |
| Energy — 0.7% | | | | | | | | |
| Petroleo Brasileiro | | | 36,600 | | | | 191,220 | |
| Ultrapar Participacoes | | | 10,700 | | | | 29,461 | |
| | | | | | | | 220,681 | |
| Financials — 0.8% | | | | | | | | |
| B3 - Brasil Bolsa Balcao | | | 49,000 | | | | 100,025 | |
| Banco Bradesco | | | 12,288 | | | | 28,718 | |
| Banco do Brasil | | | 8,200 | | | | 63,252 | |
| Banco Santander Brasil | | | 3,600 | | | | 19,029 | |
| BB Seguridade Participacoes | | | 5,900 | | | | 37,830 | |
| | | | | | | | 248,854 | |
The accompanying notes are an integral part of the financial statements.
Schedule of Investments March 31, 2023
KraneShares MSCI Emerging Markets ex China Index ETF (continued)
| | | Shares | | | Value | |
| COMMON STOCK (continued) | | | | | | | | |
| Industrials — 0.8% | | | | | | | | |
| CCR | | | 9,400 | | | $ | 23,731 | |
| Localiza Rent a Car | | | 6,920 | | | | 72,881 | |
| Rumo | | | 9,400 | | | | 34,947 | |
| WEG | | | 14,100 | | | | 112,767 | |
| | | | | | | | 244,326 | |
| Materials — 1.9% | | | | | | | | |
| Klabin | | | 5,900 | | | | 21,050 | |
| Suzano | | | 6,900 | | | | 56,613 | |
| Vale | | | 30,900 | | | | 489,317 | |
| | | | | | | | 566,980 | |
| Utilities — 0.3% | | | | | | | | |
| Cia de Saneamento Basico do Estado de Sao Paulo | | | 2,400 | | | | 23,956 | |
| Equatorial Energia | | | 10,500 | | | | 55,832 | |
| | | | | | | | 79,788 | |
| TOTAL BRAZIL | | | | | | | 1,629,125 | |
| | | | | | | | | |
| CHILE — 0.6% | | | | | | | | |
| Consumer Discretionary — 0.0% | | | | | | | | |
| Falabella | | | 6,017 | | | | 13,912 | |
| | | | | | | | | |
| Energy — 0.1% | | | | | | | | |
| Empresas Copec | | | 3,138 | | | | 22,267 | |
| | | | | | | | | |
| Financials — 0.3% | | | | | | | | |
| Banco de Chile | | | 532,555 | | | | 52,002 | |
| Banco de Credito e Inversiones | | | 461 | | | | 13,585 | |
| Banco Santander Chile | | | 531,412 | | | | 23,694 | |
| | | | | | | | 89,281 | |
| Materials — 0.1% | | | | | | | | |
| Empresas CMPC | | | 10,138 | | | | 17,034 | |
| | | | | | | | | |
| Utilities — 0.1% | | | | | | | | |
| Enel Americas | | | 227,921 | | | | 30,183 | |
| Enel Chile | | | 225,362 | | | | 12,360 | |
| | | | | | | | 42,543 | |
| TOTAL CHILE | | | | | | | 185,037 | |
| | | | | | | | | |
| COLOMBIA — 0.0% | | | | | | | | |
| Financials — 0.0% | | | | | | | | |
| Bancolombia | | | 1,787 | | | | 13,420 | |
| TOTAL COLOMBIA | | | | | | | 13,420 | |
The accompanying notes are an integral part of the financial statements.
Schedule of Investments March 31, 2023
KraneShares MSCI Emerging Markets ex China Index ETF (continued)
| | | Shares | | | Value | |
| COMMON STOCK (continued) | | | | | | | | |
| CZECH REPUBLIC — 0.3% | | | | | | | | |
| Financials — 0.1% | | | | | | | | |
| Komercni Banka | | | 581 | | | $ | 19,291 | |
| | | | | | | | | |
| Utilities — 0.2% | | | | | | | | |
| CEZ | | | 1,238 | | | | 60,213 | |
| TOTAL CZECH REPUBLIC | | | | | | | 79,504 | |
| | | | | | | | | |
| EGYPT — 0.1% | | | | | | | | |
| Financials — 0.1% | | | | | | | | |
| Commercial International Bank Egypt SAE | | | 21,159 | | | | 35,043 | |
| TOTAL EGYPT | | | | | | | 35,043 | |
| | | | | | | | | |
| GREECE — 0.1% | | | | | | | | |
| Communication Services — 0.1% | | | | | | | | |
| Hellenic Telecommunications Organization | | | 1,858 | | | | 27,231 | |
| TOTAL GREECE | | | | | | | 27,231 | |
| | | | | | | | | |
| HUNGARY — 0.3% | | | | | | | | |
| Energy — 0.1% | | | | | | | | |
| MOL Hungarian Oil & Gas | | | 2,888 | | | | 21,151 | |
| | | | | | | | | |
| Financials — 0.1% | | | | | | | | |
| OTP Bank Nyrt | | | 1,773 | | | | 50,554 | |
| | | | | | | | | |
| Health Care — 0.1% | | | | | | | | |
| Richter Gedeon Nyrt | | | 1,430 | | | | 29,921 | |
| TOTAL HUNGARY | | | | | | | 101,626 | |
| | | | | | | | | |
| INDIA — 18.1% | | | | | | | | |
| Communication Services — 0.6% | | | | | | | | |
| Bharti Airtel | | | 17,930 | | | | 163,412 | |
| | | | | | | | | |
| Consumer Discretionary — 1.4% | | | | | | | | |
| Bajaj Auto | | | 659 | | | | 31,151 | |
| Eicher Motors | | | 1,053 | | | | 37,783 | |
| Mahindra & Mahindra | | | 7,433 | | | | 104,799 | |
| Maruti Suzuki India | | | 995 | | | | 100,395 | |
| Tata Motors* | | | 14,563 | | | | 74,567 | |
| Titan | | | 2,492 | | | | 76,259 | |
| | | | | | | | 424,954 | |
| Consumer Staples — 1.8% | | | | | | | | |
| Dabur India | | | 4,204 | | | | 27,874 | |
| Godrej Consumer Products* | | | 2,889 | | | | 34,034 | |
| Hindustan Unilever | | | 7,270 | | | | 226,493 | |
| ITC | | | 34,945 | | | | 163,069 | |
The accompanying notes are an integral part of the financial statements.
Schedule of Investments March 31, 2023
KraneShares MSCI Emerging Markets ex China Index ETF (continued)
| | | Shares | | | Value | |
| COMMON STOCK (continued) | | | | | | | | |
| Consumer Staples (continued) | | | | | | | | |
| Nestle India | | | 327 | | | $ | 78,403 | |
| | | | | | | | 529,873 | |
| Energy — 2.4% | | | | | | | | |
| Bharat Petroleum | | | 6,073 | | | | 25,443 | |
| Indian Oil | | | 48,606 | | | | 46,073 | |
| Oil & Natural Gas | | | 20,662 | | | | 37,976 | |
| Reliance Industries | | | 22,023 | | | | 624,667 | |
| | | | | | | | 734,159 | |
| Financials — 4.6% | | | | | | | | |
| Axis Bank | | | 22,139 | | | | 231,270 | |
| Bajaj Finance | | | 2,026 | | | | 138,467 | |
| Bajaj Finserv | | | 3,101 | | | | 47,789 | |
| Housing Development Finance | | | 14,731 | | | | 470,614 | |
| ICICI Bank | | | 37,325 | | | | 398,422 | |
| State Bank of India | | | 17,464 | | | | 111,298 | |
| | | | | | | | 1,397,860 | |
| Health Care — 0.6% | | | | | | | | |
| Aurobindo Pharma | | | 2,098 | | | | 13,226 | |
| Dr Reddy’s Laboratories | | | 913 | | | | 51,356 | |
| Sun Pharmaceutical Industries | | | 8,726 | | | | 104,384 | |
| | | | | | | | 168,966 | |
| Industrials — 0.5% | | | | | | | | |
| Larsen & Toubro | | | 5,783 | | | | 152,290 | |
| | | | | | | | | |
| Information Technology — 4.2% | | | | | | | | |
| HCL Technologies | | | 10,489 | | | | 138,511 | |
| Infosys ADR | | | 36,755 | | | | 641,007 | |
| Tata Consultancy Services | | | 8,726 | | | | 340,397 | |
| Tech Mahindra | | | 6,022 | | | | 80,739 | |
| Wipro | | | 14,557 | | | | 64,697 | |
| | | | | | | | 1,265,351 | |
| Materials — 1.5% | | | | | | | | |
| Asian Paints | | | 3,279 | | | | 110,187 | |
| Grasim Industries | | | 2,635 | | | | 52,349 | |
| Hindalco Industries | | | 16,255 | | | | 80,175 | |
| JSW Steel | | | 6,893 | | | | 57,714 | |
| UltraTech Cement | | | 936 | | | | 86,811 | |
| UPL | | | 4,339 | | | | 37,890 | |
| Vedanta | | | 10,584 | | | | 35,345 | |
| | | | | | | | 460,471 | |
The accompanying notes are an integral part of the financial statements.
Schedule of Investments March 31, 2023
KraneShares MSCI Emerging Markets ex China Index ETF (continued)
| | | Shares | | | Value | |
| COMMON STOCK (continued) | | | | | | | | |
| Utilities — 0.5% | | | | | | | | |
| GAIL India | | | 24,471 | | | $ | 31,310 | |
| NTPC | | | 28,281 | | | | 60,256 | |
| Power Grid Corp of India | | | 24,855 | | | | 68,260 | |
| | | | | | | | 159,826 | |
| TOTAL INDIA | | | | | | | 5,457,162 | |
| | | | | | | | | |
| INDONESIA — 3.4% | | | | | | | | |
| Communication Services — 0.5% | | | | | | | | |
| Telkom Indonesia Persero | | | 535,300 | | | | 144,941 | |
| | | | | | | | | |
| Consumer Discretionary — 0.3% | | | | | | | | |
| Astra International | | | 232,400 | | | | 92,994 | |
| | | | | | | | | |
| Consumer Staples — 0.2% | | | | | | | | |
| Charoen Pokphand Indonesia | | | 73,100 | | | | 24,327 | |
| Unilever Indonesia | | | 75,500 | | | | 21,903 | |
| | | | | | | | 46,230 | |
| Energy — 0.2% | | | | | | | | |
| Adaro Energy Indonesia | | | 122,100 | | | | 23,615 | |
| United Tractors | | | 17,100 | | | | 33,186 | |
| | | | | | | | 56,801 | |
| Financials — 2.2% | | | | | | | | |
| Bank Central Asia | | | 506,000 | | | | 295,275 | |
| Bank Mandiri Persero | | | 209,300 | | | | 144,121 | |
| Bank Negara Indonesia Persero | | | 77,800 | | | | 48,513 | |
| Bank Rakyat Indonesia Persero | | | 581,400 | | | | 183,402 | |
| | | | | | | | 671,311 | |
| TOTAL INDONESIA | | | | | | | 1,012,277 | |
| | | | | | | | | |
| MALAYSIA — 2.4% | | | | | | | | |
| Communication Services — 0.2% | | | | | | | | |
| CelcomDigi Bhd | | | 34,900 | | | | 34,326 | |
| Maxis | | | 34,900 | | | | 32,666 | |
| | | | | | | | 66,992 | |
| Consumer Discretionary — 0.1% | | | | | | | | |
| Genting | | | 22,900 | | | | 24,184 | |
| | | | | | | | | |
| Consumer Staples — 0.1% | | | | | | | | |
| Sime Darby Plantation | | | 26,500 | | | | 25,644 | |
| | | | | | | | | |
| Financials — 1.3% | | | | | | | | |
| CIMB Group Holdings | | | 95,455 | | | | 114,871 | |
| Hong Leong Bank | | | 5,900 | | | | 27,037 | |
| Malayan Banking | | | 64,916 | | | | 126,080 | |
The accompanying notes are an integral part of the financial statements.
Schedule of Investments March 31, 2023
KraneShares MSCI Emerging Markets ex China Index ETF (continued)
| | | Shares | | | Value | |
| COMMON STOCK (continued) | | | | | | | | |
| Financials (continued) | | | | | | | | |
| Public Bank | | | 150,900 | | | $ | 136,793 | |
| | | | | | | | 404,781 | |
| Health Care — 0.1% | | | | | | | | |
| IHH Healthcare | | | 22,900 | | | | 29,841 | |
| | | | | | | | | |
| Materials — 0.2% | | | | | | | | |
| Petronas Chemicals Group | | | 34,900 | | | | 55,919 | |
| | | | | | | | | |
| Utilities — 0.4% | | | | | | | | |
| Petronas Gas | | | 5,900 | | | | 22,036 | |
| Tenaga Nasional | | | 43,200 | | | | 90,365 | |
| | | | | | | | 112,401 | |
| TOTAL MALAYSIA | | | | | | | 719,762 | |
| | | | | | | | | |
| MEXICO — 5.0% | | | | | | | | |
| Communication Services — 1.1% | | | | | | | | |
| America Movil | | | 289,000 | | | | 302,989 | |
| Grupo Televisa | | | 22,900 | | | | 24,186 | |
| | | | | | | | 327,175 | |
| Consumer Staples — 1.5% | | | | | | | | |
| Fomento Economico Mexicano | | | 19,400 | | | | 184,588 | |
| Grupo Bimbo, Ser A | | | 12,900 | | | | 64,786 | |
| Wal-Mart de Mexico | | | 50,000 | | | | 199,463 | |
| | | | | | | | 448,837 | |
| Financials — 0.9% | | | | | | | | |
| Grupo Financiero Banorte, Cl O | | | 26,500 | | | | 222,937 | |
| Grupo Financiero Inbursa, Cl O* | | | 17,600 | | | | 37,771 | |
| | | | | | | | 260,708 | |
| Industrials — 0.5% | | | | | | | | |
| Grupo Aeroportuario del Pacifico, Cl B | | | 4,800 | | | | 93,206 | |
| Grupo Aeroportuario del Sureste, Cl B | | | 1,675 | | | | 51,135 | |
| | | | | | | | 144,341 | |
| Materials — 0.9% | | | | | | | | |
| Cemex* | | | 145,500 | | | | 79,696 | |
| Grupo Mexico | | | 26,500 | | | | 125,235 | |
| Southern Copper | | | 829 | | | | 63,212 | |
| | | | | | | | 268,143 | |
| Real Estate — 0.1% | | | | | | | | |
| Fibra Uno Administracion† | | | 32,600 | | | | 45,444 | |
| TOTAL MEXICO | | | | | | | 1,494,648 | |
The accompanying notes are an integral part of the financial statements.
Schedule of Investments March 31, 2023
KraneShares MSCI Emerging Markets ex China Index ETF (continued)
| | | Shares | | | Value | |
| COMMON STOCK (continued) | | | | | | | | |
| PERU — 0.4% | | | | | | | | |
| Financials — 0.2% | | | | | | | | |
| Credicorp | | | 609 | | | $ | 80,625 | |
| | | | | | | | | |
| Materials — 0.2% | | | | | | | | |
| Cia de Minas Buenaventura SAA ADR | | | 6,611 | | | | 54,078 | |
| TOTAL PERU | | | | | | | 134,703 | |
| | | | | | | | | |
| PHILIPPINES — 1.2% | | | | | | | | |
| Financials — 0.2% | | | | | | | | |
| BDO Unibank | | | 29,304 | | | | 69,265 | |
| | | | | | | | | |
| Industrials — 0.5% | | | | | | | | |
| Ayala | | | 3,490 | | | | 41,727 | |
| JG Summit | | | 43,435 | | | | 38,270 | |
| SM Investments | | | 3,490 | | | | 57,070 | |
| | | | | | | | 137,067 | |
| Real Estate — 0.5% | | | | | | | | |
| Ayala Land | | | 119,400 | | | | 58,201 | |
| SM Prime | | | 162,900 | | | | 98,282 | |
| | | | | | | | 156,483 | |
| Utilities — 0.0% | | | | | | | | |
| ACEN | | | 9,960 | | | | 1,121 | |
| TOTAL PHILIPPINES | | | | | | | 363,936 | |
| | | | | | | | | |
| POLAND — 1.2% | | | | | | | | |
| Communication Services — 0.1% | | | | | | | | |
| CD Projekt | | | 706 | | | | 18,227 | |
| | | | | | | | | |
| Consumer Discretionary — 0.2% | | | | | | | | |
| LPP | | | 33 | | | | 73,384 | |
| | | | | | | | | |
| Energy — 0.2% | | | | | | | | |
| Polski Koncern Naftowy Orlen | | | 3,261 | | | | 44,085 | |
| | | | | | | | | |
| Financials — 0.6% | | | | | | | | |
| Bank Polska Kasa Opieki | | | 1,927 | | | | 38,226 | |
| Powszechna Kasa Oszczednosci Bank Polski | | | 9,612 | | | | 63,633 | |
| Powszechny Zaklad Ubezpieczen | | | 6,982 | | | | 56,854 | |
| Santander Bank Polska | | | 376 | | | | 25,468 | |
| | | | | | | | 184,181 | |
| Materials — 0.1% | | | | | | | | |
| KGHM Polska Miedz | | | 1,343 | | | | 38,110 | |
| TOTAL POLAND | | | | | | | 357,987 | |
The accompanying notes are an integral part of the financial statements.
Schedule of Investments March 31, 2023
KraneShares MSCI Emerging Markets ex China Index ETF (continued)
| | | Shares | | | Value | |
| COMMON STOCK (continued) | | | | | | | | |
| QATAR — 1.3% | | | | | | | | |
| Financials — 1.0% | | | | | | | | |
| Masraf Al Rayan | | | 45,520 | | | $ | 36,954 | |
| Qatar Islamic Bank | | | 13,350 | | | | 65,209 | |
| Qatar National Bank | | | 47,322 | | | | 208,919 | |
| | | | | | | | 311,082 | |
| Industrials — 0.3% | | | | | | | | |
| Industries Qatar | | | 21,227 | | | | 75,811 | |
| TOTAL QATAR | | | | | | | 386,893 | |
| | | | | | | | | |
| ROMANIA — 0.1% | | | | | | | | |
| Real Estate — 0.1% | | | | | | | | |
| NEPI Rockcastle | | | 5,510 | | | | 32,083 | |
| TOTAL ROMANIA | | | | | | | 32,083 | |
| | | | | | | | | |
| RUSSIA — 0.0% | | | | | | | | |
| Communication Services — 0.0% | | | | | | | | |
| Mobile TeleSystems PJSC ADR*(A),(B) | | | 3,839 | | | | — | |
| | | | | | | | | |
| Consumer Discretionary — 0.0% | | | | | | | | |
| X5 Retail Group GDR*(A),(B) | | | 915 | | | | — | |
| | | | | | | | | |
| Consumer Staples — 0.0% | | | | | | | | |
| Magnit PJSC GDR*(A),(B) | | | 2,616 | | | | — | |
| | | | | | | | | |
| Energy — 0.0% | | | | | | | | |
| Gazprom PJSC(A),(B) | | | 89,700 | | | | — | |
| LUKOIL PJSC(A),(B) | | | 3,729 | | | | — | |
| Novatek PJSC GDR*(A),(B) | | | 756 | | | | — | |
| Rosneft Oil PJSC(A),(B) | | | 10,270 | | | | — | |
| Tatneft PJSC(A),(B) | | | 16,537 | | | | — | |
| | | | | | | | — | |
| Financials — 0.0% | | | | | | | | |
| Sberbank of Russia PJSC(A),(B) | | | 99,330 | | | | — | |
| | | | | | | | | |
| Materials — 0.0% | | | | | | | | |
| Alrosa PJSC*(A),(B) | | | 18,910 | | | | — | |
| MMC Norilsk Nickel PJSC(A),(B) | | | 670 | | | | — | |
| Novolipetsk Steel PJSC*(A),(B) | | | 8,860 | | | | — | |
| Severstal PAO*(A),(B) | | | 1,512 | | | | — | |
| | | | | | | | — | |
| TOTAL RUSSIA | | | | | | | — | |
The accompanying notes are an integral part of the financial statements.
Schedule of Investments March 31, 2023
KraneShares MSCI Emerging Markets ex China Index ETF (continued)
| | | Shares | | | Value | |
| COMMON STOCK (continued) | | | | | | | | |
| SOUTH AFRICA — 5.9% | | | | | | | | |
| Communication Services — 0.6% | | | | | | | | |
| MTN Group | | | 16,311 | | | $ | 117,185 | |
| MultiChoice Group | | | 3,306 | | | | 22,986 | |
| Vodacom Group | | | 4,946 | | | | 34,021 | |
| | | | | | | | 174,192 | |
| Consumer Discretionary — 1.7% | | | | | | | | |
| Absa Group | | | 6,988 | | | | 71,596 | |
| Mr Price Group | | | 1,885 | | | | 15,320 | |
| Naspers, Cl N | | | 2,232 | | | | 414,253 | |
| Woolworths Holdings | | | 7,651 | | | | 27,568 | |
| | | | | | | | 528,737 | |
| Consumer Staples — 0.6% | | | | | | | | |
| Bid | | | 3,261 | | | | 73,243 | |
| Clicks Group | | | 1,957 | | | | 28,362 | |
| Shoprite Holdings | | | 6,225 | | | | 77,980 | |
| | | | | | | | 179,585 | |
| Energy — 0.1% | | | | | | | | |
| Exxaro Resources | | | 2,017 | | | | 21,207 | |
| | | | | | | | | |
| Financials — 1.9% | | | | | | | | |
| Capitec Bank | | | 1,012 | | | | 96,263 | |
| Discovery* | | | 6,946 | | | | 54,593 | |
| FirstRand | | | 43,525 | | | | 148,121 | |
| Nedbank Group | | | 4,404 | | | | 53,831 | |
| Old Mutual | | | 38,413 | | | | 25,547 | |
| Remgro | | | 4,123 | | | | 31,239 | |
| Sanlam | | | 14,156 | | | | 44,975 | |
| Standard Bank Group | | | 12,815 | | | | 124,817 | |
| | | | | | | | 579,386 | |
| Industrials — 0.4% | | | | | | | | |
| Bidvest Group | | | 2,612 | | | | 37,308 | |
| Sasol | | | 5,412 | | | | 73,207 | |
| | | | | | | | 110,515 | |
| Materials — 0.5% | | | | | | | | |
| Anglo American Platinum | | | 686 | | | | 36,886 | |
| Gold Fields | | | 7,791 | | | | 104,070 | |
| | | | | | | | 140,956 | |
| Real Estate — 0.1% | | | | | | | | |
| Growthpoint Properties† | | | 43,841 | | | | 32,271 | |
| TOTAL SOUTH AFRICA | | | | | | | 1,766,849 | |
The accompanying notes are an integral part of the financial statements.
Schedule of Investments March 31, 2023
KraneShares MSCI Emerging Markets ex China Index ETF (continued)
| | | Shares | | | Value | |
| COMMON STOCK (continued) | | | | | | | | |
| SOUTH KOREA — 18.4% | | | | | | | | |
| Communication Services — 1.2% | | | | | | | | |
| Kakao | | | 2,493 | | | $ | 117,004 | |
| NAVER* | | | 1,224 | | | | 189,921 | |
| NCSoft | | | 181 | | | | 51,651 | |
| | | | | | | | 358,576 | |
| Consumer Discretionary — 2.1% | | | | | | | | |
| Coway | | | 423 | | | | 17,058 | |
| Hyundai Mobis | | | 671 | | | | 111,331 | |
| Hyundai Motor | | | 1,461 | | | | 207,055 | |
| Kangwon Land | | | 947 | | | | 14,476 | |
| Kia | | | 2,911 | | | | 181,120 | |
| LG Electronics | | | 1,112 | | | | 98,486 | |
| | | | | | | | 629,526 | |
| Consumer Staples — 0.8% | | | | | | | | |
| Amorepacific | | | 412 | | | | 43,294 | |
| E-MART | | | 436 | | | | 35,366 | |
| KT&G | | | 1,639 | | | | 105,628 | |
| LG H&H | | | 99 | | | | 45,627 | |
| | | | | | | | 229,915 | |
| Energy — 0.4% | | | | | | | | |
| HD Hyundai | | | 352 | | | | 15,710 | |
| SK Innovation* | | | 622 | | | | 85,700 | |
| S-Oil | | | 364 | | | | 22,396 | |
| | | | | | | | 123,806 | |
| Financials — 1.9% | | | | | | | | |
| DB Insurance | | | 399 | | | | 22,956 | |
| Hana Financial Group | | | 3,494 | | | | 109,234 | |
| Industrial Bank of Korea | | | 2,033 | | | | 15,772 | |
| KB Financial Group | | | 4,172 | | | | 152,703 | |
| Samsung Fire & Marine Insurance | | | 532 | | | | 84,182 | |
| Samsung Life Insurance | | | 552 | | | | 26,628 | |
| Shinhan Financial Group | | | 4,460 | | | | 121,105 | |
| Woori Financial Group | | | 3,806 | | | | 33,357 | |
| | | | | | | | 565,937 | |
| Health Care — 0.9% | | | | | | | | |
| Celltrion | | | 923 | | | | 106,190 | |
| Celltrion Healthcare | | | 1,639 | | | | 75,802 | |
| Samsung Biologics* | | | 173 | | | | 104,716 | |
| | | | | | | | 286,708 | |
| Industrials — 1.0% | | | | | | | | |
| Hyundai Engineering & Construction | | | 634 | | | | 17,751 | |
The accompanying notes are an integral part of the financial statements.
Schedule of Investments March 31, 2023
KraneShares MSCI Emerging Markets ex China Index ETF (continued)
| | | Shares | | | Value | |
| COMMON STOCK (continued) | | | | | | | | |
| Industrials (continued) | | | | | | | | |
| Korea Shipbuilding & Offshore Engineering* | | | 305 | | | $ | 18,157 | |
| LG | | | 1,270 | | | | 80,774 | |
| Samsung C&T | | | 1,136 | | | | 94,416 | |
| Samsung Heavy Industries* | | | 10,958 | | | | 43,517 | |
| SK Holdings | | | 458 | | | | 60,687 | |
| | | | | | | | 315,302 | |
| Information Technology — 8.1% | | | | | | | | |
| LG Display | | | 1,725 | | | | 21,770 | |
| Samsung Electro-Mechanics | | | 781 | | | | 91,607 | |
| Samsung Electronics | | | 33,990 | | | | 1,670,976 | |
| Samsung SDI | | | 528 | | | | 298,099 | |
| Samsung SDS | | | 275 | | | | 24,504 | |
| SK Hynix | | | 4,304 | | | | 292,917 | |
| SK Square* | | | 841 | | | | 25,684 | |
| | | | | | | | 2,425,557 | |
| Materials — 1.8% | | | | | | | | |
| Hyundai Steel | | | 634 | | | | 16,899 | |
| Korea Zinc | | | 63 | | | | 26,761 | |
| LG Chemical | | | 470 | | | | 257,050 | |
| Lotte Chemical | | | 145 | | | | 21,251 | |
| POSCO Holdings | | | 795 | | | | 224,726 | |
| | | | | | | | 546,687 | |
| Utilities — 0.2% | | | | | | | | |
| Korea Electric Power* | | | 4,943 | | | | 68,382 | |
| TOTAL SOUTH KOREA | | | | | | | 5,550,396 | |
| | | | | | | | | |
| TAIWAN — 27.0% | | | | | | | | |
| Communication Services — 1.3% | | | | | | | | |
| Chunghwa Telecom | | | 47,000 | | | | 184,465 | |
| Far EasTone Telecommunications | | | 34,000 | | | | 83,974 | |
| Taiwan Mobile | | | 34,000 | | | | 112,785 | |
| | | | | | | | 381,224 | |
| Consumer Staples — 0.7% | | | | | | | | |
| President Chain Store | | | 12,000 | | | | 106,215 | |
| Uni-President Enterprises | | | 47,000 | | | | 110,988 | |
| | | | | | | | 217,203 | |
| Energy — 0.1% | | | | | | | | |
| Formosa Petrochemical | | | 12,000 | | | | 33,500 | |
| | | | | | | | | |
| Financials — 5.9% | | | | | | | | |
| Cathay Financial Holding | | | 70,000 | | | | 96,100 | |
| Chailease Holding | | | 23,152 | | | | 169,947 | |
The accompanying notes are an integral part of the financial statements.
Schedule of Investments March 31, 2023
KraneShares MSCI Emerging Markets ex China Index ETF (continued)
| | | Shares | | | Value | |
| COMMON STOCK (continued) | | | | | | | | |
| Financials (continued) | | | | | | | | |
| Chang Hwa Commercial Bank | | | 179,660 | | | $ | 102,376 | |
| China Development Financial Holding | | | 216,000 | | | | 89,032 | |
| CTBC Financial Holding | | | 141,000 | | | | 101,186 | |
| E.Sun Financial Holding | | | 144,910 | | | | 120,411 | |
| First Financial Holding | | | 146,220 | | | | 127,022 | |
| Fubon Financial Holding | | | 81,740 | | | | 151,681 | |
| Hua Nan Financial Holdings | | | 122,567 | | | | 89,970 | |
| Mega Financial Holding | | | 98,625 | | | | 106,893 | |
| Shanghai Commercial & Savings Bank | | | 75,000 | | | | 115,650 | |
| Shin Kong Financial Holding | | | 356,000 | | | | 98,449 | |
| SinoPac Financial Holdings | | | 82,560 | | | | 45,012 | |
| Taishin Financial Holding | | | 253,648 | | | | 138,289 | |
| Taiwan Cooperative Financial Holding | | | 129,634 | | | | 111,124 | |
| Yuanta Financial Holding | | | 143,138 | | | | 105,071 | |
| | | | | | | | 1,768,213 | |
| Industrials — 0.3% | | | | | | | | |
| Far Eastern New Century | | | 105,000 | | | | 107,940 | |
| | | | | | | | | |
| Information Technology — 16.4% | | | | | | | | |
| ASE Technology Holding | | | 38,000 | | | | 140,406 | |
| Asustek Computer | | | 12,000 | | | | 107,398 | |
| AUO | | | 95,600 | | | | 57,773 | |
| Catcher Technology | | | 12,000 | | | | 74,883 | |
| Delta Electronics | | | 24,000 | | | | 237,261 | |
| Hon Hai Precision Industry | | | 105,000 | | | | 358,650 | |
| Innolux | | | 60,580 | | | | 28,850 | |
| Lite-On Technology | | | 47,000 | | | | 113,149 | |
| MediaTek | | | 12,000 | | | | 310,173 | |
| Novatek Microelectronics | | | 12,000 | | | | 170,063 | |
| Pegatron | | | 37,000 | | | | 84,700 | |
| Quanta Computer | | | 36,000 | | | | 105,348 | |
| Taiwan Semiconductor Manufacturing | | | 171,000 | | | | 2,993,448 | |
| United Microelectronics | | | 94,000 | | | | 163,317 | |
| | | | | | | | 4,945,419 | |
| Materials — 2.3% | | | | | | | | |
| Asia Cement | | | 47,000 | | | | 66,840 | |
| China Steel | | | 157,000 | | | | 159,333 | |
| Formosa Chemicals & Fibre | | | 36,000 | | | | 81,701 | |
| Formosa Plastics | | | 47,000 | | | | 141,706 | |
| Nan Ya Plastics | | | 59,000 | | | | 150,177 | |
| Taiwan Cement | | | 69,404 | | | | 82,973 | |
| | | | | | | | 682,730 | |
| TOTAL TAIWAN | | | | | | | 8,136,229 | |
The accompanying notes are an integral part of the financial statements.
Schedule of Investments March 31, 2023
KraneShares MSCI Emerging Markets ex China Index ETF (continued)
| | | Shares | | | Value | |
| COMMON STOCK (continued) | | | | | | | | |
| THAILAND — 2.3% | | | | | | | | |
| Communication Services — 0.3% | | | | | | | | |
| Advanced Info Service | | | 11,800 | | | $ | 73,157 | |
| | | | | | | | 73,157 | |
| Consumer Staples — 0.3% | | | | | | | | |
| CP ALL | | | 55,900 | | | | 101,354 | |
| | | | | | | | 101,354 | |
| Energy — 0.6% | | | | | | | | |
| PTT | | | 121,200 | | | | 111,648 | |
| PTT Exploration & Production | | | 17,000 | | | | 74,821 | |
| | | | | | | | 186,469 | |
| Health Care — 0.2% | | | | | | | | |
| Bangkok Dusit Medical Services, Cl F | | | 65,600 | | | | 56,593 | |
| | | | | | | | 56,593 | |
| Industrials — 0.4% | | | | | | | | |
| Airports of Thailand* | | | 50,200 | | | | 104,231 | |
| | | | | | | | 104,231 | |
| Materials — 0.4% | | | | | | | | |
| Indorama Ventures | | | 36,300 | | | | 36,624 | |
| PTT Global Chemical | | | 26,600 | | | | 35,588 | |
| Siam Cement | | | 6,100 | | | | 56,193 | |
| | | | | | | | 128,405 | |
| Real Estate — 0.1% | | | | | | | | |
| Central Pattana | | | 16,300 | | | | 32,772 | |
| | | | | | | | 32,772 | |
| TOTAL THAILAND | | | | | | | 682,981 | |
| | | | | | | | | |
| TURKEY — 0.6% | | | | | | | | |
| Consumer Staples — 0.2% | | | | | | | | |
| BIM Birlesik Magazalar | | | 8,142 | | | | 63,075 | |
| | | | | | | | | |
| Energy — 0.2% | | | | | | | | |
| Turkiye Petrol Rafinerileri | | | 2,328 | | | | 64,291 | |
| | | | | | | | | |
| Financials — 0.2% | | | | | | | | |
| Akbank | | | 58,231 | | | | 51,390 | |
| TOTAL TURKEY | | | | | | | 178,756 | |
| | | | | | | | | |
| UNITED ARAB EMIRATES — 1.3% | | | | | | | | |
| Communication Services — 0.5% | | | | | | | | |
| Emirates Telecommunications Group PJSC | | | 25,472 | | | | 153,005 | |
The accompanying notes are an integral part of the financial statements.
Schedule of Investments March 31, 2023
KraneShares MSCI Emerging Markets ex China Index ETF (continued)
| | | Shares | | | Value | |
| COMMON STOCK (continued) | | | | | | | | |
| Financials — 0.6% | | | | | | | | |
| Abu Dhabi Commercial Bank PJSC | | | 25,850 | | | $ | 58,423 | |
| First Abu Dhabi Bank PJSC | | | 38,100 | | | | 133,621 | |
| | | | | | | | 192,044 | |
| Real Estate — 0.2% | | | | | | | | |
| Emaar Properties PJSC | | | 28,538 | | | | 43,516 | |
| TOTAL UNITED ARAB EMIRATES | | | | | | | 388,565 | |
| | | | | | | | | |
| UNITED STATES — 0.1% | | | | | | | | |
| Consumer Staples — 0.1% | | | | | | | | |
| JBS | | | 7,000 | | | | 24,644 | |
| TOTAL UNITED STATES | | | | | | | 24,644 | |
| | | | | | | | | |
TOTAL COMMON STOCK
(Cost $32,166,056) | | | | | | | 28,852,298 | |
| | | | | | | | | |
| PREFERRED STOCK — 3.5% | | | | | | | | |
| BRAZIL — 2.1% | | | | | | | | |
| Energy — 0.6% | | | | | | | | |
| Petroleo Brasileiro(C) | | | 39,600 | | | | 183,151 | |
| | | | | | | | | |
| Financials — 1.3% | | | | | | | | |
| Banco Bradesco(C) | | | 52,871 | | | | 137,333 | |
| Itau Unibanco Holding(C) | | | 38,000 | | | | 185,419 | |
| Itausa(C) | | | 47,882 | | | | 77,627 | |
| | | | | | | | 400,379 | |
| Materials — 0.1% | | | | | | | | |
| Gerdau(C) | | | 8,575 | | | | 42,771 | |
| | | | | | | | | |
| Utilities — 0.1% | | | | | | | | |
| Cia Energetica de Minas Gerais(C) | | | 9,923 | | | | 22,389 | |
| TOTAL BRAZIL | | | | | | | 648,690 | |
| | | | | | | | | |
| CHILE — 0.4% | | | | | | | | |
| Materials — 0.4% | | | | | | | | |
| Sociedad Quimica y Minera de Chile(C) | | | 1,475 | | | | 119,028 | |
| | | | | | | | | |
| COLOMBIA — 0.1% | | | | | | | | |
| Financials — 0.1% | | | | | | | | |
| Bancolombia(C) | | | 3,583 | | | | 22,440 | |
| | | | | | | | | |
| RUSSIA — 0.0% | | | | | | | | |
| Energy — –% | | | | | | | | |
| Surgutneftegas PJSC(A),(B)(C) | | | 50,900 | | | | — | |
| | | | | | | | | |
| SOUTH KOREA — 0.9% | | | | | | | | |
| Information Technology — 0.9% | | | | | | | | |
| Samsung Electronics(C) | | | 6,396 | | | | 264,811 | |
| | | | | | | | | |
TOTAL PREFERRED STOCK
(Cost $1,169,619) | | | | | | | 1,054,969 | |
| | | | | | | | | |
TOTAL INVESTMENTS — 99.3%
(Cost $33,335,675) | | | | | | | 29,907,267 | |
| OTHER ASSETS LESS LIABILITIES – 0.7% | | | | | | | 204,368 | |
| NET ASSETS - 100% | | | | | | $ | 30,111,635 | |
The accompanying notes are an integral part of the financial statements.
Schedule of Investments March 31, 2023
KraneShares MSCI Emerging Markets ex China Index ETF (continued)
| ‡ | Industries are utilized for compliance purposes, whereas sectors are utilized for reporting. |
| * | Non-income producing security. |
| † | Real Estate Investment Trust |
| (A) | Level 3 security in accordance with fair value hierarchy. |
| (B) | Due to the financial uncertainty surrounding Russia and its markets, and the inability to liquidate the positions due to market closures and restrictions, the Russian securities have been determined to be worthless. |
| (C) | Currently, no stated interest rate. |
The accompanying notes are an integral part of the financial statements.
Schedule of Investments March 31, 2023
KraneShares MSCI Emerging Markets ex China Index ETF (continued)
The following summarizes the market value of the Fund’s investments used as of March 31, 2023, based on the inputs used to value them:
| Investments in Securities | | Level 1 | | | Level 2 | | | Level 3^ | | | Total | |
| Common Stock | | | | | | | | | | | | | | | | |
| Australia | | $ | 93,441 | | | $ | — | | | $ | — | | | $ | 93,441 | |
| Brazil | | | 1,629,125 | | | | — | | | | — | | | | 1,629,125 | |
| Chile | | | 185,037 | | | | — | | | | — | | | | 185,037 | |
| Colombia | | | 13,420 | | | | — | | | | — | | | | 13,420 | |
| Czech Republic | | | 79,504 | | | | — | | | | — | | | | 79,504 | |
| Egypt | | | 35,043 | | | | — | | | | — | | | | 35,043 | |
| Greece | | | 27,231 | | | | — | | | | — | | | | 27,231 | |
| Hungary | | | 101,626 | | | | — | | | | — | | | | 101,626 | |
| India | | | 5,457,162 | | | | — | | | | — | | | | 5,457,162 | |
| Indonesia | | | 1,012,277 | | | | — | | | | — | | | | 1,012,277 | |
| Malaysia | | | 719,762 | | | | — | | | | — | | | | 719,762 | |
| Mexico | | | 1,494,648 | | | | — | | | | — | | | | 1,494,648 | |
| Peru | | | 134,703 | | | | — | | | | — | | | | 134,703 | |
| Philippines | | | 363,936 | | | | — | | | | — | | | | 363,936 | |
| Poland | | | 357,987 | | | | — | | | | — | | | | 357,987 | |
| Qatar | | | 386,893 | | | | — | | | | — | | | | 386,893 | |
| Romania | | | 32,083 | | | | — | | | | — | | | | 32,083 | |
| Russia | | | | | | | | | | | | | | | | |
| Communication Services | | | — | | | | — | | | | — | ‡‡ | | | — | |
| Consumer Discretionary | | | — | | | | — | | | | — | ‡‡ | | | — | |
| Consumer Staples | | | — | | | | — | | | | — | ‡‡ | | | — | |
| Energy | | | — | | | | — | | | | — | ‡‡ | | | — | |
| Financials | | | — | | | | — | | | | — | ‡‡ | | | — | |
| Materials | | | — | | | | — | | | | — | ‡‡ | | | — | |
| South Africa | | | 1,766,849 | | | | — | | | | — | | | | 1,766,849 | |
| South Korea | | | 5,550,396 | | | | — | | | | — | | | | 5,550,396 | |
| Taiwan | | | 8,136,229 | | | | — | | | | — | | | | 8,136,229 | |
| Thailand | | | 682,981 | | | | — | | | | — | | | | 682,981 | |
| Turkey | | | 178,756 | | | | — | | | | — | | | | 178,756 | |
| United Arab Emirates | | | 388,565 | | | | — | | | | — | | | | 388,565 | |
| United States | | | 24,644 | | | | — | | | | — | | | | 24,644 | |
| Total Common Stock | | | 28,852,298 | | | | — | | | | — | | | | 28,852,298 | |
| Preferred Stock | | | | | | | | | | | | | | | | |
| Brazil | | | 648,690 | | | | — | | | | — | | | | 648,690 | |
| Chile | | | 119,028 | | | | — | | | | — | | | | 119,028 | |
| Colombia | | | 22,440 | | | | — | | | | — | | | | 22,440 | |
| Russia | | | | | | | | | | | | | | | | |
| Energy | | | — | | | | — | | | | — | ‡‡ | | | — | |
| South Korea | | | 264,811 | | | | — | | | | — | | | | 264,811 | |
| Total Preferred Stock | | | 1,054,969 | | | | — | | | | — | | | | 1,054,969 | |
| Total Investments in Securities | | $ | 29,907,267 | | | $ | — | | | $ | — | | | $ | 29,907,267 | |
| ^ | A reconciliation of Level 3 investments, including certain disclosures related to significant inputs used in valuing Level 3 investments is only presented when the Fund has over 1% of Level 3 investments at the end of the period in relation to net assets. |
The accompanying notes are an integral part of the financial statements.
Schedule of Investments March 31, 2023
KraneShares MSCI Emerging Markets ex China Index ETF (concluded)
| ‡‡ | Security or securities with a market value of $0. |
Amounts designated as “—” are $0 or have been rounded to $0.
See “Glossary” for abbreviations.
The accompanying notes are an integral part of the financial statements.
Schedule of Investments March 31, 2023
KraneShares MSCI China ESG Leaders Index ETF

| | | Shares | | | Value | |
| COMMON STOCK — 99.9%‡ | | | | | | | | |
| CHINA — 99.0% | | | | | | | | |
| Communication Services — 18.4% | | | | | | | | |
| 37 Interactive Entertainment Network Technology Group, Cl A | | | 900 | | | $ | 3,728 | |
| Baidu, Cl A* | | | 12,000 | | | | 227,314 | |
| China Ruyi Holdings* | | | 40,000 | | | | 10,446 | |
| NetEase | | | 13,000 | | | | 228,536 | |
| Tencent Holdings | | | 9,100 | | | | 447,236 | |
| | | | | | | | 917,260 | |
| Consumer Discretionary — 30.5% | | | | | | | | |
| Alibaba Group Holding* | | | 34,936 | | | | 446,828 | |
| BYD, Cl A | | | 801 | | | | 29,862 | |
| BYD, Cl H | | | 6,000 | | | | 175,644 | |
| Li Auto, Cl A* | | | 7,600 | | | | 94,880 | |
| Meituan, Cl B* | | | 25,070 | | | | 458,289 | |
| Pop Mart International Group | | | 3,800 | | | | 10,359 | |
| Tongcheng Travel Holdings* | | | 8,400 | | | | 18,277 | |
| Vipshop Holdings ADR* | | | 2,734 | | | | 41,502 | |
| XPeng, Cl A* | | | 5,900 | | | | 32,882 | |
| Yadea Group Holdings | | | 10,000 | | | | 25,796 | |
| Yum China Holdings | | | 2,896 | | | | 183,578 | |
| | | | | | | | 1,517,897 | |
| Consumer Staples — 4.0% | | | | | | | | |
| Alibaba Health Information Technology* | | | 12,000 | | | | 8,683 | |
| Angel Yeast, Cl A | | | 300 | | | | 1,824 | |
| Anjoy Foods Group, Cl A | | | 200 | | | | 4,765 | |
| By-health, Cl A | | | 700 | | | | 2,176 | |
| China Feihe | | | 25,000 | | | | 18,758 | |
| China Mengniu Dairy | | | 22,000 | | | | 90,243 | |
| Dali Foods Group | | | 14,000 | | | | 5,850 | |
| Henan Shuanghui Investment & Development, Cl A | | | 1,400 | | | | 5,288 | |
The accompanying notes are an integral part of the financial statements.
Schedule of Investments March 31, 2023
KraneShares MSCI China ESG Leaders Index ETF (continued)
| | | Shares | | | Value | |
| COMMON STOCK (continued) | | | | | | | | |
| Consumer Staples (continued) | | | | | | | | |
| Inner Mongolia Yili Industrial Group, Cl A | | | 2,600 | | | $ | 11,025 | |
| Jonjee Hi-Tech Industrial And Commercial Holding, Cl A | | | 300 | | | | 1,621 | |
| Ping An Healthcare and Technology* | | | 3,500 | | | | 8,855 | |
| Uni-President China Holdings | | | 9,000 | | | | 9,080 | |
| Want Want China Holdings | | | 33,000 | | | | 21,229 | |
| Yihai International Holding | | | 3,000 | | | | 8,809 | |
| | | | | | | | 198,206 | |
| Financials — 14.0% | | | | | | | | |
| China Construction Bank, Cl H | | | 676,000 | | | | 438,326 | |
| China Merchants Bank, Cl A | | | 8,600 | | | | 42,917 | |
| China Merchants Bank, Cl H | | | 27,500 | | | | 140,479 | |
| Far East Horizon | | | 11,000 | | | | 9,893 | |
| Huatai Securities, Cl A | | | 3,000 | | | | 5,579 | |
| Huatai Securities, Cl H | | | 11,000 | | | | 12,569 | |
| Orient Securities, Cl A | | | 3,100 | | | | 4,419 | |
| Postal Savings Bank of China, Cl A | | | 11,100 | | | | 7,516 | |
| Postal Savings Bank of China, Cl H | | | 56,000 | | | | 33,244 | |
| | | | | | | | 694,942 | |
| Health Care — 9.4% | | | | | | | | |
| 3SBio | | | 10,500 | | | | 10,460 | |
| China Medical System Holdings | | | 9,000 | | | | 14,216 | |
| China Resources Sanjiu Medical & Pharmaceutical, Cl A | | | 400 | | | | 3,346 | |
| CSPC Pharmaceutical Group | | | 63,800 | | | | 62,744 | |
| Genscript Biotech* | | | 8,000 | | | | 17,121 | |
| Guangzhou Baiyunshan Pharmaceutical Holdings, Cl A | | | 600 | | | | 2,890 | |
| Guangzhou Kingmed Diagnostics Group, Cl A | | | 200 | | | | 2,566 | |
| Hansoh Pharmaceutical Group | | | 8,000 | | | | 13,901 | |
| Huadong Medicine, Cl A | | | 700 | | | | 4,724 | |
| Jafron Biomedical, Cl A | | | 300 | | | | 1,326 | |
| Joincare Pharmaceutical Group Industry, Cl A | | | 800 | | | | 1,534 | |
| Livzon Pharmaceutical Group, Cl A | | | 200 | | | | 1,089 | |
| Microport Scientific* | | | 4,500 | | | | 10,582 | |
| Ovctek China, Cl A | | | 380 | | | | 1,833 | |
| Pharmaron Beijing, Cl A | | | 350 | | | | 2,496 | |
| Pharmaron Beijing, Cl H | | | 1,350 | | | | 5,667 | |
| Shandong Weigao Group Medical Polymer, Cl H | | | 18,000 | | | | 28,754 | |
| Shanghai Fosun Pharmaceutical Group, Cl A | | | 900 | | | | 4,245 | |
| Shanghai Fosun Pharmaceutical Group, Cl H | | | 3,500 | | | | 9,943 | |
| Shanghai Pharmaceuticals Holding, Cl A | | | 1,200 | | | | 3,559 | |
| Shanghai Pharmaceuticals Holding, Cl H | | | 5,500 | | | | 10,257 | |
| Shenzhen Mindray Bio-Medical Electronics, Cl A | | | 500 | | | | 22,695 | |
| Sinopharm Group, Cl H | | | 9,600 | | | | 29,045 | |
| Topchoice Medical, Cl A* | | | 200 | | | | 3,765 | |
| WuXi AppTec, Cl A | | | 1,120 | | | | 12,966 | |
The accompanying notes are an integral part of the financial statements.
Schedule of Investments March 31, 2023
KraneShares MSCI China ESG Leaders Index ETF (continued)
| | | Shares | | | Value | |
| COMMON STOCK (continued) | | | | | | | | |
| Health Care (continued) | | | | | | | | |
| WuXi AppTec, Cl H | | | 2,500 | | | $ | 26,178 | |
| Wuxi Biologics Cayman* | | | 25,000 | | | | 154,778 | |
| Yunnan Baiyao Group, Cl A | | | 720 | | | | 5,735 | |
| Zhejiang Jiuzhou Pharmaceutical, Cl A | | | 300 | | | | 1,454 | |
| | | | | | | | 469,869 | |
| Industrials — 9.3% | | | | | | | | |
| Air China, Cl A* | | | 3,100 | | | | 4,830 | |
| Air China, Cl H* | | | 14,000 | | | | 12,520 | |
| Beijing Capital International Airport, Cl H* | | | 14,000 | | | | 10,308 | |
| Beijing Easpring Material Technology, Cl A | | | 300 | | | | 2,513 | |
| BOC Aviation | | | 1,500 | | | | 11,589 | |
| China Baoan Group, Cl A | | | 1,100 | | | | 1,821 | |
| China Communications Services, Cl H | | | 16,000 | | | | 7,868 | |
| China Conch Venture Holdings | | | 11,500 | | | | 20,070 | |
| China Eastern Airlines, Cl A* | | | 4,700 | | | | 3,525 | |
| China Everbright Environment Group | | | 26,000 | | | | 11,162 | |
| China Lesso Group Holdings | | | 8,000 | | | | 7,154 | |
| China Southern Airlines, Cl A* | | | 4,600 | | | | 5,272 | |
| China Southern Airlines, Cl H* | | | 14,000 | | | | 9,987 | |
| CITIC | | | 41,000 | | | | 47,947 | |
| Contemporary Amperex Technology, Cl A | | | 1,000 | | | | 59,128 | |
| COSCO SHIPPING Holdings, Cl A | | | 5,300 | | | | 8,513 | |
| COSCO SHIPPING Holdings, Cl H | | | 22,000 | | | | 24,747 | |
| Fosun International | | | 17,000 | | | | 12,474 | |
| Jiangsu Expressway, Cl H | | | 8,000 | | | | 7,460 | |
| Jiangsu Zhongtian Technology, Cl A | | | 1,400 | | | | 3,484 | |
| Keda Industrial Group, Cl A | | | 800 | | | | 1,681 | |
| Ming Yang Smart Energy Group, Cl A | | | 900 | | | | 2,950 | |
| SF Holding, Cl A | | | 2,000 | | | | 16,129 | |
| Shanghai Electric Group, Cl A* | | | 5,300 | | | | 3,411 | |
| Shanghai M&G Stationery, Cl A | | | 400 | | | | 2,860 | |
| Shenzhen Inovance Technology, Cl A | | | 1,150 | | | | 11,772 | |
| Shenzhen International Holdings | | | 9,913 | | | | 8,764 | |
| Sungrow Power Supply, Cl A | | | 600 | | | | 9,162 | |
| Titan Wind Energy Suzhou, Cl A | | | 800 | | | | 1,719 | |
| Weichai Power, Cl A | | | 2,800 | | | | 5,141 | |
| Weichai Power, Cl H | | | 14,000 | | | | 22,472 | |
| Xinjiang Goldwind Science & Technology, Cl A | | | 1,400 | | | | 2,251 | |
| Zhejiang Chint Electrics, Cl A | | | 900 | | | | 3,666 | |
| Zhejiang Expressway, Cl H | | | 10,000 | | | | 7,949 | |
| Zhejiang Weixing New Building Materials, Cl A | | | 700 | | | | 2,478 | |
| Zoomlion Heavy Industry Science and Technology, Cl A | | | 2,900 | | | | 2,622 | |
| ZTO Express Cayman ADR | | | 2,987 | | | | 85,607 | |
| | | | | | | | 463,006 | |
The accompanying notes are an integral part of the financial statements.
Schedule of Investments March 31, 2023
KraneShares MSCI China ESG Leaders Index ETF (continued)
| | | Shares | | | Value | |
| COMMON STOCK (continued) | | | | | | | | |
| Information Technology — 2.9% | | | | | | | | |
| AAC Technologies Holdings* | | | 5,000 | | | $ | 12,331 | |
| Kingdee International Software Group* | | | 19,000 | | | | 30,787 | |
| Lenovo Group | | | 50,000 | | | | 54,141 | |
| Unisplendour, Cl A | | | 1,151 | | | | 4,909 | |
| Xinyi Solar Holdings | | | 34,000 | | | | 40,757 | |
| | | | | | | | 142,925 | |
| Materials — 1.8% | | | | | | | | |
| BBMG, Cl A | | | 3,500 | | | | 1,249 | |
| Chengtun Mining Group, Cl A | | | 1,300 | | | | 1,083 | |
| Chengxin Lithium Group, Cl A | | | 300 | | | | 1,508 | |
| China Jushi, Cl A | | | 1,686 | | | | 3,587 | |
| China Resources Cement Holdings | | | 16,000 | | | | 7,847 | |
| CMOC Group, Cl A | | | 7,500 | | | | 6,542 | |
| CMOC Group, Cl H | | | 24,000 | | | | 14,522 | |
| Ganfeng Lithium Group, Cl A | | | 640 | | | | 6,195 | |
| Ganfeng Lithium Group, Cl H | | | 2,480 | | | | 15,417 | |
| GEM, Cl A | | | 2,100 | | | | 2,284 | |
| Huaxin Cement, Cl A | | | 600 | | | | 1,359 | |
| Jiangsu Eastern Shenghong, Cl A | | | 1,700 | | | | 3,372 | |
| Shandong Nanshan Aluminum, Cl A | | | 4,900 | | | | 2,419 | |
| Shanghai Putailai New Energy Technology, Cl A | | | 600 | | | | 4,361 | |
| Sichuan Yahua Industrial Group, Cl A | | | 400 | | | | 1,233 | |
| Sinopec Shanghai Petrochemical, Cl A | | | 3,000 | | | | 1,472 | |
| Skshu Paint, Cl A* | | | 240 | | | | 4,068 | |
| Yunnan Energy New Material, Cl A | | | 400 | | | | 6,630 | |
| Zhejiang Huayou Cobalt, Cl A | | | 680 | | | | 5,446 | |
| Zhejiang Yongtai Technology, Cl A | | | 300 | | | | 914 | |
| | | | | | | | 91,508 | |
| Real Estate — 5.8% | | | | | | | | |
| China Overseas Land & Investment | | | 26,500 | | | | 64,006 | |
| China Resources Land | | | 22,000 | | | | 100,332 | |
| China Resources Mixc Lifestyle Services | | | 4,600 | | | | 24,172 | |
| China Vanke, Cl A | | | 4,000 | | | | 8,877 | |
| China Vanke, Cl H | | | 11,900 | | | | 18,767 | |
| Country Garden Services Holdings | | | 15,000 | | | | 25,949 | |
| Greentown Service Group | | | 10,000 | | | | 6,319 | |
| Longfor Group Holdings | | | 13,000 | | | | 36,682 | |
| Shimao Group Holdings*(A) | | | 12,500 | | | | 1,601 | |
| | | | | | | | 286,705 | |
| Utilities — 2.9% | | | | | | | | |
| Beijing Enterprises Water Group | | | 28,000 | | | | 6,991 | |
| CECEP Solar Energy, Cl A | | | 1,600 | | | | 1,596 | |
| CECEP Wind-Power, Cl A | | | 2,700 | | | | 1,521 | |
The accompanying notes are an integral part of the financial statements.
Schedule of Investments March 31, 2023
KraneShares MSCI China ESG Leaders Index ETF (continued)
| | | Shares | | | Value | |
| COMMON STOCK (continued) | | | | | | | | |
| Utilities (continued) | | | | | | | | |
| China Resources Gas Group | | | 6,500 | | | $ | 23,972 | |
| China Three Gorges Renewables Group, Cl A | | | 11,900 | | | | 9,496 | |
| ENN Energy Holdings | | | 5,600 | | | | 76,760 | |
| ENN Natural Gas, Cl A | | | 1,100 | | | | 3,340 | |
| Kunlun Energy | | | 26,000 | | | | 20,336 | |
| | | | | | | | 144,012 | |
| TOTAL CHINA | | | | | | | 4,926,330 | |
| | | | | | | | | |
| HONG KONG — 0.9% | | | | | | | | |
| Consumer Staples — 0.1% | | | | | | | | |
| Vinda International Holdings | | | 3,000 | | | | 7,254 | |
| | | | | | | | | |
| Health Care — 0.8% | | | | | | | | |
| Sino Biopharmaceutical | | | 73,000 | | | | 40,917 | |
| TOTAL HONG KONG | | | | | | | 48,171 | |
| | | | | | | | | |
TOTAL COMMON STOCK
(Cost $5,874,589) | | | | | | | 4,974,501 | |
| | | | | | | | | |
TOTAL INVESTMENTS — 99.9%
(Cost $5,874,589) | | | | | | | 4,974,501 | |
| OTHER ASSETS LESS LIABILITIES – 0.1% | | | | | | | 2,970 | |
| NET ASSETS - 100% | | | | | | $ | 4,977,471 | |
| ‡ | Industries are utilized for compliance purposes, whereas sectors are utilized for reporting. |
| * | Non-income producing security. |
| (A) | Level 3 security in accordance with fair value hierarchy. |
The accompanying notes are an integral part of the financial statements.
Schedule of Investments March 31, 2023
KraneShares MSCI China ESG Leaders Index ETF (concluded)
The following summarizes the market value of the Fund’s investments used as of March 31, 2023, based on the inputs used to value them:
| Investments in Securities | | Level 1 | | | Level 2 | | | Level 3^ | | | Total | |
| Common Stock | | | | | | | | | | | | | | | | |
| China | | | | | | | | | | | | | | | | |
| Communication Services | | $ | 917,260 | | | $ | — | | | $ | — | | | $ | 917,260 | |
| Consumer Discretionary | | | 1,517,897 | | | | — | | | | — | | | | 1,517,897 | |
| Consumer Staples | | | 198,206 | | | | — | | | | — | | | | 198,206 | |
| Financials | | | 694,942 | | | | — | | | | — | | | | 694,942 | |
| Health Care | | | 469,869 | | | | — | | | | — | | | | 469,869 | |
| Industrials | | | 463,006 | | | | — | | | | — | | | | 463,006 | |
| Information Technology | | | 142,925 | | | | — | | | | — | | | | 142,925 | |
| Materials | | | 91,508 | | | | — | | | | — | | | | 91,508 | |
| Real Estate | | | 285,104 | | | | — | | | | 1,601 | | | | 286,705 | |
| Utilities | | | 144,012 | | | | — | | | | — | | | | 144,012 | |
| Hong Kong | | | 48,171 | | | | — | | | | — | | | | 48,171 | |
| Total Common Stock | | | 4,972,900 | | | | — | | | | 1,601 | | | | 4,974,501 | |
| Total Investments in Securities | | $ | 4,972,900 | | | $ | — | | | $ | 1,601 | | | $ | 4,974,501 | |
| ^ | A reconciliation of Level 3 investments, including certain disclosures related to significant inputs used in valuing Level 3 investments is only presented when the Fund has over 1% of Level 3 investments at the end of the period in relation to net assets. |
Amounts designated as “ —” are $0 or have been rounded to $0.
See “Glossary” for abbreviations.
The accompanying notes are an integral part of the financial statements.
Schedule of Investments March 31, 2023
KraneShares CICC China 5G & Semiconductor Index ETF

| | | Shares | | | Value | |
| COMMON STOCK — 100.0%‡ | | | | | | | | |
| CHINA — 100.0% | | | | | | | | |
| Industrials — 3.5% | | | | | | | | |
| Ginlong Technologies, Cl A* | | | 13,700 | | | $ | 266,487 | |
| Suzhou Maxwell Technologies, Cl A | | | 6,000 | | | | 266,480 | |
| | | | | | | | 532,967 | |
| Information Technology — 96.5% | | | | | | | | |
| Advanced Micro-Fabrication Equipment China, Cl A* | | | 19,332 | | | | 415,253 | |
| Avary Holding Shenzhen, Cl A | | | 84,585 | | | | 382,076 | |
| BOE Technology Group, Cl A | | | 1,299,230 | | | | 840,007 | |
| Chaozhou Three-Circle Group, Cl A | | | 64,664 | | | | 283,428 | |
| China Resources Microelectronics, Cl A | | | 45,269 | | | | 398,550 | |
| China Zhenhua Group Science & Technology, Cl A | | | 18,000 | | | | 236,058 | |
| Foxconn Industrial Internet, Cl A | | | 632,174 | | | | 1,585,199 | |
| GigaDevice Semiconductor, Cl A | | | 23,000 | | | | 408,603 | |
| GoerTek, Cl A | | | 121,722 | | | | 379,312 | |
| Hangzhou Silan Microelectronics, Cl A | | | 48,700 | | | | 262,459 | |
| Hua Hong Semiconductor* | | | 45,000 | | | | 199,205 | |
| Luxshare Precision Industry, Cl A | | | 250,005 | | | | 1,103,440 | |
| Maxscend Microelectronics, Cl A | | | 18,269 | | | | 330,936 | |
| Montage Technology, Cl A | | | 39,568 | | | | 400,560 | |
| NAURA Technology Group, Cl A | | | 17,118 | | | | 662,680 | |
| Sanan Optoelectronics, Cl A | | | 167,200 | | | | 514,214 | |
| SG Micro, Cl A | | | 12,400 | | | | 280,238 | |
| Shenzhen Transsion Holdings, Cl A | | | 29,332 | | | | 432,251 | |
| StarPower Semiconductor, Cl A | | | 5,929 | | | | 237,037 | |
| Sunny Optical Technology Group | | | 37,900 | | | | 458,424 | |
| TCL Zhonghuan Renewable Energy Technology, Cl A | | | 104,400 | | | | 736,712 | |
| Unigroup Guoxin Microelectronics, Cl A | | | 30,900 | | | | 500,038 | |
| Will Semiconductor Shanghai, Cl A | | | 41,906 | | | | 555,913 | |
| Wingtech Technology, Cl A | | | 43,055 | | | | 346,394 | |
| Xiaomi, Cl B* | | | 714,400 | | | | 1,101,184 | |
| Yealink Network Technology, Cl A | | | 32,380 | | | | 358,395 | |
| Zhejiang Jingsheng Mechanical & Electrical, Cl A | | | 43,220 | | | | 410,909 | |
| ZTE, Cl H | | | 254,200 | | | | 744,795 | |
| | | | | | | | 14,564,270 | |
| TOTAL CHINA | | | | | | | 15,097,237 | |
The accompanying notes are an integral part of the financial statements.
Schedule of Investments March 31, 2023
KraneShares CICC China 5G & Semiconductor Index ETF (concluded)
| | | Shares | | | Value | |
| COMMON STOCK (continued) | | | | | | | | |
| Information Technology (continued) | | | | | | | | |
| | | | | | | | | |
TOTAL COMMON STOCK
(Cost $17,470,076) | | | | | | $ | 15,097,237 | |
| | | | | | | | | |
TOTAL INVESTMENTS — 100.0%
(Cost $17,470,076) | | | | | | | 15,097,237 | |
| OTHER ASSETS LESS LIABILITIES – 0.0% | | | | | | | (825 | ) |
| NET ASSETS - 100% | | | | | | $ | 15,096,412 | |
| ‡ | Industries are utilized for compliance purposes, whereas sectors are utilized for reporting. |
| * | Non-income producing security. |
As of March 31, 2023, all of the Fund’s investments were considered Level 1 of the fair value hierarchy, in accordance with the authoritative guidance under U.S. GAAP.
See “Glossary” for abbreviations.
The accompanying notes are an integral part of the financial statements.
Schedule of Investments March 31, 2023
KraneShares CICC China Consumer Leaders Index ETF

| | | Shares | | | Value | |
| COMMON STOCK — 99.9%‡ | | | | | | | | |
| CHINA — 99.9% | | | | | | | | |
| Consumer Discretionary — 38.4% | | | | | | | | |
| ANTA Sports Products | | | 21,400 | | | $ | 310,779 | |
| Bosideng International Holdings | | | 84,000 | | | | 46,869 | |
| DR, Cl A | | | 9,300 | | | | 72,005 | |
| Ecovacs Robotics, Cl A | | | 4,000 | | | | 48,112 | |
| Gree Electric Appliances of Zhuhai, Cl A | | | 59,400 | | | | 317,876 | |
| Haidilao International Holding* | | | 37,000 | | | | 100,160 | |
| Haier Smart Home, Cl A | | | 91,300 | | | | 301,528 | |
| Li Ning | | | 40,000 | | | | 315,416 | |
| Midea Group, Cl A | | | 71,365 | | | | 559,194 | |
| Oppein Home Group, Cl A | | | 3,400 | | | | 59,798 | |
| Shenzhen Overseas Chinese Town, Cl A | | | 85,400 | | | | 60,065 | |
| Yum China Holdings | | | 7,750 | | | | 487,315 | |
| | | | | | | | 2,679,117 | |
| Consumer Staples — 60.7% | | | | | | | | |
| China Mengniu Dairy | | | 72,000 | | | | 295,339 | |
| China Resources Beer Holdings | | | 36,000 | | | | 288,919 | |
| Chongqing Brewery, Cl A | | | 4,136 | | | | 75,284 | |
| Eastroc Beverage Group, Cl A | | | 1,800 | | | | 50,433 | |
| Foshan Haitian Flavouring & Food, Cl A | | | 25,856 | | | | 288,180 | |
| Henan Shuanghui Investment & Development, Cl A | | | 22,935 | | | | 86,633 | |
| Hengan International Group | | | 14,500 | | | | 67,051 | |
| Inner Mongolia Yili Industrial Group, Cl A | | | 74,700 | | | | 316,757 | |
| Jiangsu Yanghe Brewery JSC, Cl A | | | 11,417 | | | | 275,080 | |
| Kweichow Moutai, Cl A | | | 2,700 | | | | 715,565 | |
| Luzhou Laojiao, Cl A | | | 11,300 | | | | 419,252 | |
| Proya Cosmetics, Cl A | | | 2,800 | | | | 74,145 | |
| Shanghai Flyco Electrical Appliance, Cl A | | | 9,717 | | | | 116,989 | |
| Shanxi Xinghuacun Fen Wine Factory, Cl A | | | 7,800 | | | | 309,397 | |
| Tsingtao Brewery, Cl H | | | 14,000 | | | | 152,842 | |
| Want Want China Holdings | | | 106,000 | | | | 68,192 | |
| Wuliangye Yibin, Cl A | | | 22,000 | | | | 631,107 | |
| | | | | | | | 4,231,165 | |
The accompanying notes are an integral part of the financial statements.
Schedule of Investments March 31, 2023
KraneShares CICC China Consumer Leaders Index ETF (concluded)
| | | Shares | | | Value | |
| COMMON STOCK (continued) | | | | | | | | |
| Real Estate — 0.8% | | | | | | | | |
| Youngor Group, Cl A | | | 57,600 | | | $ | 54,687 | |
| TOTAL CHINA | | | | | | | 6,964,969 | |
| | | | | | | | | |
TOTAL COMMON STOCK
(Cost $6,867,158) | | | | | | | 6,964,969 | |
| | | | | | | | | |
TOTAL INVESTMENTS — 99.9%
(Cost $6,867,158) | | | | | | | 6,964,969 | |
| OTHER ASSETS LESS LIABILITIES – 0.1% | | | | | | | 4,865 | |
| NET ASSETS - 100% | | | | | | $ | 6,969,834 | |
| ‡ | Industries are utilized for compliance purposes, whereas sectors are utilized for reporting. |
| * | Non-income producing security. |
As of March 31, 2023, all of the Fund’s investments were considered Level 1 of the fair value hierarchy, in accordance with the authoritative guidance under U.S. GAAP.
See “Glossary” for abbreviations.
The accompanying notes are an integral part of the financial statements.
Schedule of Investments March 31, 2023
KraneShares SSE STAR Market 50 Index ETF
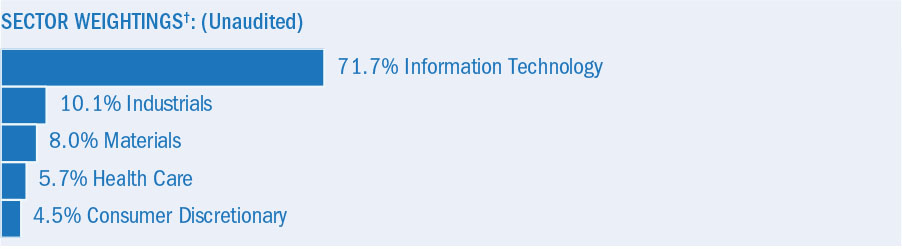
| | | Shares | | | Value | |
| COMMON STOCK — 99.7%‡ | | | | | | | | |
| CHINA — 99.7% | | | | | | | | |
| Consumer Discretionary — 4.5% | | | | | | | | |
| Beijing Roborock Technology, Cl A | | | 20,369 | | | $ | 1,082,610 | |
| Ninebot GDR* | | | 155,726 | | | | 853,542 | |
| Tianneng Battery Group, Cl A | | | 49,318 | | | | 247,477 | |
| | | | | | | | 2,183,629 | |
| Health Care — 5.7% | | | | | | | | |
| Bloomage Biotechnology, Cl A | | | 35,069 | | | | 579,096 | |
| iRay Technology, Cl A | | | 13,171 | | | | 693,964 | |
| Nanjing Vazyme Biotech, Cl A | | | 13,047 | | | | 77,135 | |
| Shanghai Junshi Biosciences, Cl A* | | | 138,980 | | | | 972,231 | |
| Shanghai United Imaging Healthcare, Cl A* | | | 17,919 | | | | 402,462 | |
| | | | | | | | 2,724,888 | |
| Industrials — 10.1% | | | | | | | | |
| GoodWe Technologies, Cl A | | | 26,988 | | | | 1,137,535 | |
| Hoymiles Power Electronics, Cl A | | | 6,168 | | | | 597,947 | |
| Ningbo Ronbay New Energy Technology, Cl A | | | 98,480 | | | | 980,885 | |
| Pylon Technologies, Cl A | | | 31,835 | | | | 1,138,073 | |
| Sany Heavy Energy, Cl A* | | | 51,960 | | | | 237,279 | |
| Zhuhai CosMX Battery, Cl A | | | 40,654 | | | | 111,532 | |
| Zhuzhou CRRC Times Electric, Cl A | | | 94,891 | | | | 659,662 | |
| | | | | | | | 4,862,913 | |
| Information Technology — 71.4% | | | | | | | | |
| 3peak, Cl A | | | 21,676 | | | | 768,559 | |
| ACM Research Shanghai, Cl A* | | | 14,124 | | | | 197,217 | |
| Advanced Micro-Fabrication Equipment China, Cl A* | | | 157,030 | | | | 3,373,014 | |
| Amlogic Shanghai, Cl A* | | | 105,367 | | | | 1,290,678 | |
| ASR Microelectronics, Cl A* | | | 13,642 | | | | 151,591 | |
| Beijing Kingsoft Office Software, Cl A | | | 67,158 | | | | 4,625,651 | |
| Cambricon Technologies, Cl A* | | | 72,953 | | | | 1,975,392 | |
| China Railway Signal & Communication, Cl A | | | 941,480 | | | | 743,061 | |
| China Resources Microelectronics, Cl A | | | 192,219 | | | | 1,692,304 | |
| Everdisplay Optronics Shanghai, Cl A* | | | 1,510,023 | | | | 565,107 | |
| GalaxyCore, Cl A* | | | 108,666 | | | | 278,022 | |
| Guobo Electronics, Cl A | | | 11,649 | | | | 148,596 | |
| Hygon Information Technology, Cl A* | | | 75,808 | | | | 851,878 | |
The accompanying notes are an integral part of the financial statements.
Schedule of Investments March 31, 2023
KraneShares SSE STAR Market 50 Index ETF (concluded)
| | | Shares | | | Value | |
| COMMON STOCK (continued) | | | | | | | | |
| Information Technology (continued) | | | | | | | | |
| Jinko Solar, Cl A | | | 546,038 | | | $ | 1,107,613 | |
| Loongson Technology, Cl A* | | | 11,678 | | | | 249,314 | |
| Montage Technology, Cl A | | | 288,876 | | | | 2,924,389 | |
| National Silicon Industry Group, Cl A* | | | 397,757 | | | | 1,354,759 | |
| Qi An Xin Technology Group, Cl A* | | | 99,319 | | | | 1,009,489 | |
| Shanghai Friendess Electronic Technology, Cl A | | | 15,864 | | | | 423,448 | |
| Shanghai Fudan Microelectronics Group, Cl A | | | 96,498 | | | | 919,832 | |
| Shenzhen Transsion Holdings, Cl A | | | 117,063 | | | | 1,725,099 | |
| SICC, Cl A* | | | 14,015 | | | | 149,246 | |
| Suzhou Novosense Microelectronics, Cl A | | | 11,009 | | | | 466,135 | |
| Trina Solar, Cl A | | | 394,844 | | | | 2,994,980 | |
| Verisilicon Microelectronics Shanghai, Cl A* | | | 90,597 | | | | 1,278,355 | |
| Xinjiang Daqo New Energy, Cl A | | | 108,929 | | | | 771,368 | |
| Yuneng Technology* | | | 8,737 | | | | 422,480 | |
| Zhejiang Supcon Technology, Cl A | | | 126,599 | | | | 1,914,480 | |
| | | | | | | | 34,372,057 | |
| Materials — 8.0% | | | | | | | | |
| Cathay Biotech, Cl A | | | 63,410 | | | | 569,803 | |
| Hunan Changyuan Lico, Cl A | | | 279,647 | | | | 611,637 | |
| Jiangsu Cnano Technology, Cl A | | | 67,630 | | | | 666,915 | |
| Suzhou Nanomicro Technology, Cl A | | | 58,441 | | | | 425,247 | |
| Western Superconducting Technologies, Cl A | | | 118,247 | | | | 1,403,853 | |
| Zhongfu Shenying Carbon Fiber, Cl A* | | | 26,093 | | | | 146,892 | |
| | | | | | | | 3,824,347 | |
| TOTAL CHINA | | | | | | | 47,967,834 | |
| | | | | | | | | |
TOTAL COMMON STOCK
(Cost $52,333,165) | | | | | | | 47,967,834 | |
| | | | | | | | | |
TOTAL INVESTMENTS — 99.7%
(Cost $52,333,165) | | | | | | | 47,967,834 | |
| OTHER ASSETS LESS LIABILITIES – 0.3% | | | | | | | 161,676 | |
| NET ASSETS - 100% | | | | | | $ | 48,129,510 | |
| ‡ | Industries are utilized for compliance purposes, whereas sectors are utilized for reporting. |
| * | Non-income producing security. |
As of March 31, 2023, all of the Fund’s investments were considered Level 1 of the fair value hierarchy, in accordance with the authoritative guidance under U.S. GAAP.
See “Glossary” for abbreviations.
The accompanying notes are an integral part of the financial statements.
Schedule of Investments March 31, 2023
KraneShares Hang Seng TECH Index ETF

| | | Shares | | | Value | |
| COMMON STOCK — 94.9%‡ | | | | | | | | |
| CHINA — 94.9% | | | | | | | | |
| Communication Services — 31.3% | | | | | | | | |
| Baidu, Cl A* | | | 17,150 | | | $ | 324,869 | |
| Bilibili, Cl Z* | | | 7,860 | | | | 189,843 | |
| China Literature* | | | 14,000 | | | | 72,230 | |
| Kingsoft | | | 29,000 | | | | 142,784 | |
| Kuaishou Technology, Cl B* | | | 78,100 | | | | 601,424 | |
| NetEase | | | 18,505 | | | | 325,313 | |
| Tencent Holdings | | | 12,900 | | | | 633,994 | |
| Weibo, Cl A* | | | 140 | | | | 3,085 | |
| | | | | | | | 2,293,542 | |
| Consumer Discretionary — 34.7% | | | | | | | | |
| Alibaba Group Holding* | | | 51,600 | | | | 659,958 | |
| Haier Smart Home, Cl H | | | 74,026 | | | | 232,924 | |
| JD.com, Cl A | | | 16,110 | | | | 352,975 | |
| Li Auto, Cl A* | | | 26,200 | | | | 327,085 | |
| Meituan, Cl B* | | | 34,580 | | | | 632,135 | |
| NIO, Cl A* | | | 1,530 | | | | 15,505 | |
| Trip.com Group* | | | 3,100 | | | | 116,024 | |
| XPeng, Cl A* | | | 36,500 | | | | 203,425 | |
| | | | | | | | 2,540,031 | |
| Consumer Staples — 5.6% | | | | | | | | |
| Alibaba Health Information Technology* | | | 164,000 | | | | 118,666 | |
| JD Health International* | | | 33,700 | | | | 250,712 | |
| Ping An Healthcare and Technology* | | | 15,300 | | | | 38,708 | |
| | | | | | | | 408,086 | |
| Financials — 1.1% | | | | | | | | |
| ZhongAn Online P&C Insurance, Cl H* | | | 25,800 | | | | 81,344 | |
| | | | | | | | | |
| Information Technology — 22.2% | | | | | | | | |
| AAC Technologies Holdings* | | | 22,000 | | | | 54,258 | |
| BYD Electronic International | | | 24,000 | | | | 74,599 | |
| GDS Holdings, Cl A* | | | 11,600 | | | | 28,077 | |
| Hua Hong Semiconductor* | | | 20,000 | | | | 88,535 | |
The accompanying notes are an integral part of the financial statements.
Schedule of Investments March 31, 2023
KraneShares Hang Seng TECH Index ETF (concluded)
| | | Shares | | | Value | |
| COMMON STOCK (continued) | | | | | | | | |
| Information Technology (continued) | | | | | | | | |
| Kingdee International Software Group* | | | 85,000 | | | $ | 137,733 | |
| Lenovo Group | | | 222,000 | | | | 240,384 | |
| SenseTime Group, Cl B* | | | 508,000 | | | | 172,139 | |
| Sunny Optical Technology Group | | | 21,640 | | | | 261,749 | |
| Xiaomi, Cl B* | | | 365,600 | | | | 563,540 | |
| | | | | | | | 1,621,014 | |
| TOTAL CHINA | | | | | | | 6,944,017 | |
| | | | | | | | | |
TOTAL COMMON STOCK
(Cost $6,130,779) | | | | | | | 6,944,017 | |
| | | | | | | | | |
TOTAL INVESTMENTS — 94.9%
(Cost $6,130,779) | | | | | | | 6,944,017 | |
| OTHER ASSETS LESS LIABILITIES – 5.1% | | | | | | | 370,788 | |
| NET ASSETS - 100% | | | | | | $ | 7,314,805 | |
| ‡ | Industries are utilized for compliance purposes, whereas sectors are utilized for reporting. |
| * | Non-income producing security. |
As of March 31, 2023, all of the Fund’s investments were considered Level 1 of the fair value hierarchy, in accordance with the authoritative guidance under U.S. GAAP.
See “Glossary” for abbreviations.
The accompanying notes are an integral part of the financial statements.
Schedule of Investments March 31, 2023
KraneShares China Innovation ETF

| | | Shares | | | Value | |
| EXCHANGE - TRADED FUNDS — 100.0% | | | | | | | | |
| KraneShares CICC China 5G and Semiconductor Index ETF‡ | | | 14,816 | | | $ | 262,320 | |
| KraneShares CSI China Internet ETF*‡ | | | 15,155 | | | | 472,684 | |
| KraneShares MSCI All China Health Care Index ETF‡ | | | 17,947 | | | | 368,272 | |
| KraneShares MSCI China Clean Technology Index ETF‡ | | | 11,210 | | | | 320,491 | |
| KraneShares SSE STAR Market 50 Index ETF*‡ | | | 10,161 | | | | 172,534 | |
TOTAL EXCHANGE - TRADED FUNDS
(Cost $2,325,788) | | | | | | | 1,596,301 | |
| | | | | | | | | |
TOTAL INVESTMENTS — 100.0%
(Cost $2,325,788) | | | | | | | 1,596,301 | |
| OTHER ASSETS LESS LIABILITIES – 0.0% | | | | | | | 758 | |
| NET ASSETS - 100% | | | | | | $ | 1,597,059 | |
| * | Non-income producing security. |
| ‡ | Affiliated Investment. |
As of March 31, 2023, all of the Fund’s investments were considered Level 1 of the fair value hierarchy, in accordance with the authoritative guidance under U.S. GAAP.
Transactions with affiliated companies during the period ended March 31, 2023 are as follows:
| Value as of 3/31/2022 | | | Purchases at
Cost | | | Proceeds
from Sale | | | Change in
Unrealized
Appreciation
(Depreciation) | | | Realized
Gain/(Loss) | | | Value as of
3/31/2023 | | | Dividend
Income | | | Capital
Gain
Distributions | |
| KraneShares CICC China 5G and Semiconductor Index ETF | | | | | | | | | | | | | | | | | | |
| $ | 433,558 | | | $ | 16,145 | | | $ | (155,765 | ) | | $ | (22,438 | ) | | $ | (9,180 | ) | | $ | 262,320 | | | $ | 816 | | | $ | — | |
| KraneShares CSI China Internet ETF | | | | | | | | | | | | | | | | | |
| | 759,535 | | | | 9,011 | | | | (383,427 | ) | | | 126,216 | | | | (38,651 | ) | | | 472,684 | | | | — | | | | — | |
| KraneShares MSCI All China Health Care Index ETF | | | | | | | | | | | | | | | | | |
| | 696,488 | | | | 9,033 | | | | (280,489 | ) | | | 3,581 | | | | (60,341 | ) | | | 368,272 | | | | 217 | | | | — | |
| KraneShares MSCI China Clean Technology Index ETF | | | | | | | | | | | | | | | | | |
| | 603,644 | | | | 40,705 | | | | (282,187 | ) | | | (70,724 | ) | | | 29,053 | | | | 320,491 | | | | 1,029 | | | | 4,378 | |
| KraneShares SSE STAR Market 50 Index ETF | | | | | | | | | | | | | | | | | |
| | 296,468 | | | | 9,020 | | | | (111,235 | ) | | | (13,550 | ) | | | (8,169 | ) | | | 172,534 | | | | — | | | | — | |
| $ | 2,789,693 | | | $ | 83,914 | | | $ | (1,213,103 | ) | | $ | 23,085 | | | $ | (87,288 | ) | | $ | 1,596,301 | | | $ | 2,062 | | | $ | 4,378 | |
See “Glossary” for abbreviations.
The accompanying notes are an integral part of the financial statements.
Schedule of Investments March 31, 2023
KraneShares S&P Pan Asia Dividend Aristocrats Index ETF

| | | Shares | | | Value | |
| COMMON STOCK — 99.2%‡ | | | | | | | | |
| AUSTRALIA — 15.4% | | | | | | | | |
| Communication Services — 1.1% | | | | | | | | |
| carsales.com | | | 1,983 | | | $ | 29,391 | |
| | | | | | | | | |
| Consumer Discretionary — 3.1% | | | | | | | | |
| JB Hi-Fi | | | 2,910 | | | | 82,773 | |
| | | | | | | | | |
| Financials — 1.2% | | | | | | | | |
| Steadfast Group | | | 8,108 | | | | 31,768 | |
| | | | | | | | | |
| Health Care — 2.9% | | | | | | | | |
| EBOS Group | | | 1,024 | | | | 29,791 | |
| Sonic Healthcare | | | 1,972 | | | | 46,015 | |
| | | | | | | | 75,806 | |
| Information Technology — 1.2% | | | | | | | | |
| Altium | | | 664 | | | | 16,935 | |
| Technology One | | | 1,480 | | | | 14,412 | |
| | | | | | | | 31,347 | |
| Materials — 2.2% | | | | | | | | |
| Brickworks | | | 2,187 | | | | 33,177 | |
| Northern Star Resources | | | 2,920 | | | | 24,074 | |
| | | | | | | | 57,251 | |
| Real Estate — 1.4% | | | | | | | | |
| Charter Hall Group† | | | 4,871 | | | | 35,886 | |
| | | | | | | | | |
| Utilities — 2.3% | | | | | | | | |
| APA Group | | | 8,861 | | | | 60,059 | |
| TOTAL AUSTRALIA | | | | | | | 404,281 | |
The accompanying notes are an integral part of the financial statements.
Schedule of Investments March 31, 2023
KraneShares S&P Pan Asia Dividend Aristocrats Index ETF (continued)
| | | Shares | | | Value | |
| COMMON STOCK (continued) | | | | | | | | |
| CHINA — 26.6% | | | | | | | | |
| Consumer Discretionary — 2.3% | | | | | | | | |
| Bosideng International Holdings | | | 110,000 | | | $ | 61,376 | |
| | | | | | | | | |
| Financials — 5.9% | | | | | | | | |
| New China Life Insurance, Cl H | | | 40,300 | | | | 95,797 | |
| Ping An Insurance Group of China, Cl H | | | 9,000 | | | | 58,586 | |
| | | | | | | | 154,383 | |
| Health Care — 5.9% | | | | | | | | |
| China Medical System Holdings | | | 37,000 | | | | 58,446 | |
| CSPC Pharmaceutical Group | | | 26,000 | | | | 25,570 | |
| Sinopharm Group, Cl H | | | 23,200 | | | | 70,191 | |
| | | | | | | | 154,207 | |
| Real Estate — 5.2% | | | | | | | | |
| China Resources Land | | | 12,000 | | | | 54,726 | |
| Longfor Group Holdings | | | 29,000 | | | | 81,829 | |
| | | | | | | | 136,555 | |
| Utilities — 7.3% | | | | | | | | |
| China Gas Holdings | | | 40,400 | | | | 56,921 | |
| China Resources Gas Group | | | 13,000 | | | | 47,943 | |
| Guangdong Investment | | | 86,000 | | | | 87,972 | |
| | | | | | | | 192,836 | |
| TOTAL CHINA | | | | | | | 699,357 | |
| | | | | | | | | |
| HONG KONG — 10.8% | | | | | | | | |
| Financials — 0.8% | | | | | | | | |
| AIA Group | | | 2,000 | | | | 21,058 | |
| | | | | | | | | |
| Industrials — 0.8% | | | | | | | | |
| Techtronic Industries | | | 2,000 | | | | 21,618 | |
| | | | | | | | | |
| Real Estate — 4.2% | | | | | | | | |
| Link REIT† | | | 8,300 | | | | 53,395 | |
| Swire Properties | | | 22,000 | | | | 56,612 | |
| | | | | | | | 110,007 | |
| Utilities — 5.0% | | | | | | | | |
| CK Infrastructure Holdings | | | 14,000 | | | | 76,153 | |
| Hong Kong & China Gas | | | 61,000 | | | | 53,696 | |
| | | | | | | | 129,849 | |
| TOTAL HONG KONG | | | | | | | 282,532 | |
The accompanying notes are an integral part of the financial statements.
Schedule of Investments March 31, 2023
KraneShares S&P Pan Asia Dividend Aristocrats Index ETF (continued)
| | | Shares | | | Value | |
| COMMON STOCK (continued) | | | | | | | | |
| INDIA — 1.0% | | | | | | | | |
| Information Technology — 1.0% | | | | | | | | |
| Infosys ADR | | | 1,454 | | | $ | 25,358 | |
| TOTAL INDIA | | | | | | | 25,358 | |
| | | | | | | | | |
| INDONESIA — 0.9% | | | | | | | | |
| Financials — 0.9% | | | | | | | | |
| Bank Central Asia | | | 42,600 | | | | 24,859 | |
| TOTAL INDONESIA | | | | | | | 24,859 | |
| | | | | | | | | |
| JAPAN — 31.0% | | | | | | | | |
| Communication Services — 1.9% | | | | | | | | |
| Hakuhodo DY Holdings | | | 1,100 | | | | 12,356 | |
| KDDI | | | 600 | | | | 18,452 | |
| Nippon Telegraph & Telephone | | | 600 | | | | 17,862 | |
| | | | | | | | 48,670 | |
| Consumer Discretionary — 4.2% | | | | | | | | |
| Fujitsu General | | | 100 | | | | 2,806 | |
| Hikari Tsushin | | | 100 | | | | 13,953 | |
| Open House Group | | | 400 | | | | 14,877 | |
| Rinnai | | | 300 | | | | 7,292 | |
| Sekisui Chemical | | | 1,100 | | | | 15,505 | |
| Sekisui House | | | 1,200 | | | | 24,327 | |
| Seria | | | 500 | | | | 9,851 | |
| TS Tech | | | 1,800 | | | | 22,708 | |
| | | | | | | | 111,319 | |
| Consumer Staples — 3.8% | | | | | | | | |
| Asahi Group Holdings | | | 400 | | | | 14,799 | |
| Kao | | | 300 | | | | 11,647 | |
| Lion | | | 700 | | | | 7,526 | |
| Morinaga | | | 400 | | | | 11,286 | |
| Seven & i Holdings | | | 300 | | | | 13,468 | |
| Sundrug | | | 500 | | | | 13,656 | |
| Takara Holdings | | | 2,000 | | | | 15,358 | |
| Welcia Holdings | | | 200 | | | | 4,259 | |
| Yakult Honsha | | | 100 | | | | 7,236 | |
| | | | | | | | 99,235 | |
| Financials — 3.2% | | | | | | | | |
| Chiba Bank | | | 1,900 | | | | 12,206 | |
| SBI Holdings | | | 1,400 | | | | 27,602 | |
| Tokio Marine Holdings | | | 900 | | | | 17,224 | |
| Tokyo Century | | | 400 | | | | 13,239 | |
The accompanying notes are an integral part of the financial statements.
Schedule of Investments March 31, 2023
KraneShares S&P Pan Asia Dividend Aristocrats Index ETF (continued)
| | | Shares | | | Value | |
| COMMON STOCK (continued) | | | | | | | | |
| Financials (continued) | | | | | | | | |
| Zenkoku Hosho | | | 400 | | | $ | 15,013 | |
| | | | | | | | 85,284 | |
| Health Care — 2.8% | | | | | | | | |
| Alfresa Holdings | | | 1,400 | | | | 17,841 | |
| Astellas Pharma | | | 1,100 | | | | 15,563 | |
| Mani | | | 600 | | | | 8,142 | |
| Medipal Holdings | | | 1,000 | | | | 13,555 | |
| Shionogi | | | 200 | | | | 8,982 | |
| Ship Healthcare Holdings | | | 400 | | | | 7,324 | |
| Terumo | | | 100 | | | | 2,685 | |
| | | | | | | | 74,092 | |
| Industrials — 3.7% | | | | | | | | |
| Benefit One | | | 600 | | | | 8,457 | |
| COMSYS Holdings | | | 1,200 | | | | 22,027 | |
| EXEO Group | | | 1,300 | | | | 23,413 | |
| Kurita Water Industries | | | 200 | | | | 9,077 | |
| Sanwa Holdings | | | 2,100 | | | | 22,343 | |
| SHO-BOND Holdings | | | 300 | | | | 12,353 | |
| | | | | | | | 97,670 | |
| Information Technology — 3.7% | | | | | | | | |
| Azbil | | | 300 | | | | 8,137 | |
| Itochu Techno-Solutions | | | 500 | | | | 12,228 | |
| Murata Manufacturing | | | 200 | | | | 12,082 | |
| NEC Networks & System Integration | | | 1,000 | | | | 12,135 | |
| Nomura Research Institute | | | 200 | | | | 4,606 | |
| NTT Data | | | 300 | | | | 3,904 | |
| Oracle Japan NIP | | | 200 | | | | 14,321 | |
| Otsuka | | | 400 | | | | 14,081 | |
| SCSK | | | 800 | | | | 11,631 | |
| TIS | | | 200 | | | | 5,245 | |
| | | | | | | | 98,370 | |
| Materials — 2.0% | | | | | | | | |
| Nippon Sanso Holdings | | | 600 | | | | 10,739 | |
| Nissan Chemical | | | 300 | | | | 13,502 | |
| Nitto Denko | | | 200 | | | | 12,848 | |
| Shin-Etsu Chemical | | | 500 | | | | 16,061 | |
| | | | | | | | 53,150 | |
| Real Estate — 5.1% | | | | | | | | |
| Aeon Mall | | | 1,000 | | | | 13,051 | |
| Hulic | | | 2,400 | | | | 19,602 | |
| Japan Metropolitan Fund Invest† | | | 29 | | | | 21,071 | |
| Japan Real Estate Investment† | | | 5 | | | | 19,836 | |
The accompanying notes are an integral part of the financial statements.
Schedule of Investments March 31, 2023
KraneShares S&P Pan Asia Dividend Aristocrats Index ETF (continued)
| | | Shares | | | Value | |
| COMMON STOCK (continued) | | | | | | | | |
| Real Estate (continued) | | | | | | | | |
| Mori Hills REIT Investment† | | | 18 | | | $ | 19,962 | |
| Nomura Real Estate Holdings | | | 900 | | | | 19,814 | |
| Tokyo Tatemono | | | 1,600 | | | | 19,415 | |
| | | | | | | | 132,751 | |
| Utilities — 0.6% | | | | | | | | |
| Nippon Gas | | | 1,000 | | | | 14,456 | |
| TOTAL JAPAN | | | | | | | 814,997 | |
| | | | | | | | | |
| NEW ZEALAND — 1.1% | | | | | | | | |
| Health Care — 1.1% | | | | | | | | |
| Fisher & Paykel Healthcare | | | 1,729 | | | | 28,829 | |
| TOTAL NEW ZEALAND | | | | | | | 28,829 | |
| | | | | | | | | |
| PHILIPPINES — 1.6% | | | | | | | | |
| Industrials — 1.6% | | | | | | | | |
| International Container Terminal Services | | | 10,690 | | | | 41,962 | |
| TOTAL PHILIPPINES | | | | | | | 41,962 | |
| | | | | | | | | |
| TAIWAN — 9.2% | | | | | | | | |
| Financials — 1.1% | | | | | | | | |
| Chailease Holding | | | 4,000 | | | | 29,362 | |
| | | | | | | | | |
| Information Technology — 8.1% | | | | | | | | |
| Advantech | | | 3,000 | | | | 36,555 | |
| Sinbon Electronics | | | 4,000 | | | | 44,930 | |
| Wistron | | | 96,000 | | | | 131,951 | |
| | | | | | | | 213,436 | |
| TOTAL TAIWAN | | | | | | | 242,798 | |
| | | | | | | | | |
| THAILAND — 0.7% | | | | | | | | |
| Financials — 0.7% | | | | | | | | |
| Krungthai Card | | | 12,300 | | | | 19,514 | |
| TOTAL THAILAND | | | | | | | 19,514 | |
| | | | | | | | | |
| UNITED STATES — 0.9% | | | | | | | | |
| Information Technology — 0.9% | | | | | | | | |
| Computershare | | | 1,602 | | | | 23,165 | |
| TOTAL UNITED STATES | | | | | | | 23,165 | |
| | | | | | | | | |
TOTAL COMMON STOCK
(Cost $2,497,865) | | | | | | | 2,607,652 | |
| | | | | | | | | |
TOTAL INVESTMENTS — 99.2%
(Cost $2,497,865) | | | | | | | 2,607,652 | |
| OTHER ASSETS LESS LIABILITIES – 0.8% | | | | | | | 21,278 | |
| NET ASSETS - 100% | | | | | | $ | 2,628,930 | |
The accompanying notes are an integral part of the financial statements.
Schedule of Investments March 31, 2023
KraneShares S&P Pan Asia Dividend Aristocrats Index ETF (concluded)
| ‡ | Industries are utilized for compliance purposes, whereas sectors are utilized for reporting. |
| † | Real Estate Investment Trust |
As of March 31, 2023, all of the Fund’s investments were considered Level 1 of the fair value hierarchy, in accordance with the authoritative guidance under U.S. GAAP.
See “Glossary” for abbreviations.
The accompanying notes are an integral part of the financial statements.
Schedule of Investments March 31, 2023
KraneShares China Internet and Covered Call Strategy ETF

| | | Shares | | | Value | |
| EXCHANGE - TRADED FUND — 106.2% | | | | | | | | |
| KraneShares CSI China Internet ETF*‡ | | | 180,912 | | | $ | 5,642,645 | |
TOTAL EXCHANGE - TRADED FUND
(Cost $5,970,676) | | | | | | | 5,642,645 | |
| | | | | | | | | |
TOTAL INVESTMENTS — 106.2%
(Cost $5,970,676) | | | | | | | 5,642,645 | |
| OTHER ASSETS LESS LIABILITIES – (6.2)% | | | | | | | (328,661 | ) |
| NET ASSETS - 100% | | | | | | $ | 5,313,984 | |
WRITTEN OPTIONS — (10.3)%
(Premiums Received $(347,588)) | | | | | | $ | (547,635 | ) |
| * | Non-income producing security. |
| ‡ | Affiliated Investment. |
| Description | | Number of
Contracts | | | Notional
Amount | | | Exercise
Price | | | Expiration Date | | Market Value | |
| WRITTEN OPTIONS — (10.3)% | | | | | | | | | | | | | | | | | | |
| Call Options | | | | | | | | | | | | | | | | | | |
| KWEB US | | | (1,452 | ) | | | (4,528,788 | ) | | $ | 28.50 | | | 04/22/23 | | $ | (454,955 | ) |
| KWEB US | | | (186 | ) | | | (580,134 | ) | | $ | 28.67 | | | 04/22/23 | | | (55,744 | ) |
| KWEB US | | | (171 | ) | | | (533,349 | ) | | $ | 31.19 | | | 05/20/23 | | | (36,936 | ) |
| Total Written Options (Premiums Received $347,588) | | | | | | (547,635 | ) |
As of March 31, 2023, all of the Fund’s investments were considered Level 1 of the fair value hierarchy, in accordance with the authoritative guidance under U.S. GAAP.
Transactions with affiliated companies during the period ended March 31, 2023 are as follows:
Value as of
1/12/2023 | | | Purchases at
Cost | | | Proceeds
from Sale | | | Change in
Unrealized
Appreciation/
(Depreciation) | | | Realized
Gain/(Loss) | | | Value as of
3/31/2023 | | | Dividend
Income | | | Capital
Gain
Distributions | |
| KraneShares CSI China Internet ETF | | | | | | | | | | | | | | | |
| $ | — | | | $ | 5,994,799 | | | $ | (24,299 | ) | | $ | (328,031 | ) | | $ | 176 | | | $ | 5,642,645 | | | $ | — | | | $ | — | |
See “Glossary” for abbreviations.
The accompanying notes are an integral part of the financial statements.
Schedule of Investments March 31, 2023
Glossary (abbreviations which may be used in preceding Schedule of Investments):
Fund Abbreviations
ADR — American Depositary Receipt
Cl — Class
ETF — Exchange-Traded Fund
GDR — Global Depositary Receipt
JSC — Joint-Stock Company
MTN — Medium Term Note
PJSC — Public Joint-Stock Company
Statements of Assets and Liabilities
March 31, 2023
| | | KraneShares CICC
China Leaders 100
Index ETF | | | KraneShares CSI
China Internet ETF | | | KraneShares
Bosera MSCI China
A 50 Connect Index
ETF | |
| Assets: | | | | | | | | | | | | |
| Investments at Value | | $ | 5,964,900 | | | $ | 6,141,887,821 | * | | $ | 470,173,092 | |
| Cash and Cash Equivalents | | | 3,143 | | | | 3,202,209 | | | | 231,436 | |
| Foreign Currency at Value | | | 5 | | | | — | | | | 7,199,092 | |
| Receivable for Capital Shares Sold | | | — | | | | — | | | | 11,178 | |
| Receivable for Investment Securities Sold | | | — | | | | — | | | | 4,989 | |
| Dividend and Interest Receivable | | | — | | | | 1,455,205 | | | | — | |
| Total Assets | | | 5,968,048 | | | | 6,146,545,235 | | | | 477,619,787 | |
| | | | | | | | | | | | | |
| Liabilities: | | | | | | | | | | | | |
| Payable for Management Fees | | | 3,430 | | | | 3,428,609 | | | | 220,664 | |
| Payable for Trustees’ Fee | | | 43 | | | | 45,427 | | | | 3,434 | |
| Payable for Investment Securities Purchased | | | — | | | | — | | | | 780 | |
| Obligation to Return Securities Lending Collateral | | | — | | | | 31,393,462 | | | | — | |
| Payable for Capital Shares Redeemed | | | — | | | | — | | | | 6,521,842 | |
| Payable for Securities Lending Fees | | | — | | | | 8,349 | | | | — | |
| Total Liabilities | | | 3,473 | | | | 34,875,847 | | | | 6,746,720 | |
| Net Assets | | $ | 5,964,575 | | | $ | 6,111,669,388 | | | $ | 470,873,067 | |
| | | | | | | | | | | | | |
| Net Assets Consist of: | | | | | | | | | | | | |
| Paid-in Capital | | $ | 7,229,529 | | | $ | 11,449,252,623 | | | $ | 638,410,630 | |
| Total Distributable Loss | | | (1,264,954 | ) | | | (5,337,583,235 | ) | | | (167,537,563 | ) |
| Net Assets | | $ | 5,964,575 | | | $ | 6,111,669,388 | | | $ | 470,873,067 | |
| Outstanding Shares of Beneficial Interest (unlimited authorization - no par value) | | | 250,000 | | | | 195,600,000 | | | | 18,050,000 | |
| Net Asset Value, Offering and Redemption Price Per Share | | $ | 23.86 | | | $ | 31.25 | | | $ | 26.09 | |
| Cost of Investments | | $ | 5,950,237 | | | $ | 7,161,788,151 | | | $ | 530,344,133 | |
| Cost of Foreign Currency | | | 5 | | | | — | | | | 7,186,781 | |
| | *Includes Market Value of Securities on Loan | | | — | | | | 29,815,441 | | | | — | |
| * | Includes Market Value of Securities on Loan. |
Amounts designated as “—” are $0 or have been rounded to $0.
The accompanying notes are an integral part of the financial statements.
Statements of Assets and Liabilities (continued)
March 31, 2023
| | | KraneShares
Bloomberg China
Bond Inclusion
Index ETF | | | KraneShares MSCI
All China Index ETF | | | KraneShares MSCI
One Belt One Road
Index ETF | |
| Assets: | | | | | | | | | | | | |
| Investments at Value | | $ | 7,491,137 | | | $ | 8,779,154 | | | $ | 4,449,669 | |
| Cash and Cash Equivalents | | | 630,583 | | | | 10,124 | | | | 32,647 | |
| Foreign Currency at Value | | | 12,110 | | | | 39 | | | | 1,337 | |
| Receivable for Investment Securities Sold | | | 2,913,221 | | | | — | | | | — | |
| Dividend and Interest Receivable | | | 109,431 | | | | 302 | | | | 6,834 | |
| Reclaim Receivable | | | — | | | | 79 | | | | 92 | |
| Receivable from Adviser | | | — | | | | 7,295 | | | | — | |
| Other Receivable | | | — | | | | 1,083 | | | | — | |
| Total Assets | | | 11,156,482 | | | | 8,798,076 | | | | 4,490,579 | |
| | | | | | | | | | | | | |
| Liabilities: | | | | | | | | | | | | |
| Unrealized Depreciation on Spot Contracts | | | 6,731 | | | | — | | | | 1 | |
| Payable for Management Fees | | | 4,524 | | | | 3,492 | | | | 2,989 | |
| Payable for Trustees’ Fee | | | 79 | | | | 63 | | | | 33 | |
| Payable for Foreign Capital Gains Tax | | | — | | | | — | | | | 2,323 | |
| Total Liabilities | | | 11,334 | | | | 3,555 | | | | 5,346 | |
| Net Assets | | $ | 11,145,148 | | | $ | 8,794,521 | | | $ | 4,485,233 | |
| | | | | | | | | | | | | |
| Net Assets Consist of: | | | | | | | | | | | | |
| Paid-in Capital | | $ | 11,465,755 | | | $ | 15,893,905 | | | $ | 8,878,840 | |
| Total Distributable Loss | | | (320,607 | ) | | | (7,099,384 | ) | | | (4,393,607 | ) |
| Net Assets | | $ | 11,145,148 | | | $ | 8,794,521 | | | $ | 4,485,233 | |
| Outstanding Shares of Beneficial Interest (unlimited authorization - no par value) | | | 350,000 | | | | 400,000 | | | | 200,002 | |
| Net Asset Value, Offering and Redemption Price Per Share | | $ | 31.84 | | | $ | 21.99 | | | $ | 22.43 | |
| Cost of Investments | | $ | 7,781,818 | | | $ | 10,372,666 | | | $ | 5,509,961 | |
| Cost of Foreign Currency | | | 12,091 | | | | 39 | | | | 1,332 | |
Amounts designated as “—” are $0 or have been rounded to $0.
The accompanying notes are an integral part of the financial statements.
Statements of Assets and Liabilities (continued)
March 31, 2023
| | | KraneShares
Emerging Markets
Consumer
Technology Index
ETF | | | KraneShares
MSCI China Clean
Technology Index
ETF | | | KraneShares
Electric Vehicles
and Future Mobility
Index ETF | |
| Assets: | | | | | | | | | | | | |
| Investments at Value | | $ | 31,212,210 | * | | $ | 95,644,284 | | | $ | 192,562,013 | * |
| Cash and Cash Equivalents | | | 33,114 | | | | 27,874 | | | | 498,971 | |
| Foreign Currency at Value | | | 56 | | | | 59 | | | | 73,766 | |
| Dividend and Interest Receivable | | | 20,780 | | | | — | | | | 189,351 | |
| Reclaim Receivable | | | 5,968 | | | | — | | | | 323,433 | |
| Unrealized Appreciation on Spot Contracts | | | — | | | | — | | | | 45 | |
| Total Assets | | | 31,272,128 | | | | 95,672,217 | | | | 193,647,579 | |
| | | | | | | | | | | | | |
| Liabilities: | | | | | | | | | | | | |
| Obligation to Return Securities Lending Collateral | | | 696,591 | | | | — | | | | 8,431,059 | |
| Payable for Management Fees | | | 13,436 | | | | 60,982 | | | | 105,027 | |
| Payable for Securities Lending Fees | | | 309 | | | | — | | | | 4,364 | |
| Payable for Trustees’ Fee | | | 219 | | | | 694 | | | | 1,389 | |
| Total Liabilities | | | 710,555 | | | | 61,676 | | | | 8,541,839 | |
| Net Assets | | $ | 30,561,573 | | | $ | 95,610,541 | | | $ | 185,105,740 | |
| | | | | | | | | | | | | |
| Net Assets Consist of: | | | | | | | | | | | | |
| Paid-in Capital | | $ | 85,729,026 | | | $ | 168,044,502 | | | $ | 282,812,711 | |
| Total Distributable Loss | | | (55,167,453 | ) | | | (72,433,961 | ) | | | (97,706,971 | ) |
| Net Assets | | $ | 30,561,573 | | | $ | 95,610,541 | | | $ | 185,105,740 | |
| Outstanding Shares of Beneficial Interest (unlimited authorization - no par value) | | | 2,000,002 | | | | 3,350,002 | | | | 6,050,002 | |
| Net Asset Value, Offering and Redemption Price Per Share | | $ | 15.28 | | | $ | 28.54 | | | $ | 30.60 | |
| Cost of Investments | | $ | 46,013,651 | | | $ | 125,747,403 | | | $ | 233,360,715 | |
| Cost of Foreign Currency | | | 55 | | | | 57 | | | | 60,217 | |
| | *Includes Market Value of Securities on Loan | | | 632,846 | | | | — | | | | 8,113,787 | |
| * | Includes Market Value of Securities on Loan. |
Amounts designated as “—” are $0 or have been rounded to $0.
The accompanying notes are an integral part of the financial statements.
Statements of Assets and Liabilities (continued)
March 31, 2023
| | | KraneShares MSCI
All China Health
Care Index ETF | | | KraneShares Asia
Pacific High Income
Bond ETF | | | KraneShares
Emerging Markets
Healthcare Index
ETF | |
| Assets: | | | | | | | | | | | | |
| Investments at Value | | $ | 94,526,282 | | | $ | 18,863,415 | | | $ | 2,095,244 | |
| Cash and Cash Equivalents | | | 17,842 | | | | 1,427,814 | | | | 4,417 | |
| Foreign Currency at Value | | | 73 | | | | 383 | | | | — | |
| Dividend and Interest Receivable | | | 348 | | | | 281,261 | | | | 2,582 | |
| Total Assets | | | 94,544,545 | | | | 20,572,873 | | | | 2,102,243 | |
| | | | | | | | | | | | | |
| Liabilities: | | | | | | | | | | | | |
| Payable for Management Fees | | | 51,760 | | | | 11,704 | | | | 1,380 | |
| Payable for Trustees’ Fee | | | 710 | | | | 146 | | | | 15 | |
| Payable for Securities Lending Fees | | | 35 | | | | — | | | | 1 | |
| Payable for Investment Securities Purchased | | | — | | | | 515,750 | | | | — | |
| Foreign Currency Payable at Value | | | — | | | | — | | | | 361 | |
| Payable for Foreign Capital Gains Tax | | | — | | | | — | | | | 5,416 | |
| Total Liabilities | | | 52,505 | | | | 527,600 | | | | 7,173 | |
| Net Assets | | $ | 94,492,040 | | | $ | 20,045,273 | | | $ | 2,095,070 | |
| | | | | | | | | | | | | |
| Net Assets Consist of: | | | | | | | | | | | | |
| Paid-in Capital | | $ | 171,477,863 | | | $ | 28,615,457 | | | $ | 3,759,926 | |
| Total Distributable Loss | | | (76,985,823 | ) | | | (8,570,184 | ) | | | (1,664,856 | ) |
| Net Assets | | $ | 94,492,040 | | | $ | 20,045,273 | | | $ | 2,095,070 | |
| Outstanding Shares of Beneficial Interest (unlimited authorization - no par value) | | | 4,550,002 | | | | 750,001 | | | | 100,002 | |
| Net Asset Value, Offering and Redemption Price Per Share | | $ | 20.77 | | | $ | 26.73 | | | $ | 20.95 | |
| Cost of Investments | | $ | 112,170,471 | | | $ | 19,252,157 | | | $ | 2,894,498 | |
| Cost of Foreign Currency | | | 73 | | | | 371 | | | | (362 | ) |
Amounts designated as “—” are $0 or have been rounded to $0.
The accompanying notes are an integral part of the financial statements.
Statements of Assets and Liabilities (continued)
March 31, 2023
| | | KraneShares MSCI
Emerging Markets
ex China Index ETF | | | KraneShares MSCI
China ESG Leaders
Index ETF | | | KraneShares
CICC China 5G &
Semiconductor
Index ETF | |
| Assets: | | | | | | | | | | | | |
| Investments at Value | | $ | 29,907,267 | | | $ | 4,974,501 | | | $ | 15,097,237 | |
| Cash and Cash Equivalents | | | 101,420 | | | | 5,376 | | | | — | |
| Foreign Currency at Value | | | 15,074 | | | | — | | | | — | |
| Dividend and Interest Receivable | | | 117,113 | | | | — | | | | — | |
| Reclaim Receivable | | | 462 | | | | — | | | | — | |
| Receivable for Investment Securities Sold | | | — | | | | — | | | | 230,395 | |
| Total Assets | | | 30,141,336 | | | | 4,979,877 | | | | 15,327,632 | |
| | | | | | | | | | | | | |
| Liabilities: | | | | | | | | | | | | |
| Payable for Foreign Capital Gains Tax | | | 24,440 | | | | — | | | | — | |
| Payable for Management Fees | | | 5,080 | | | | 2,370 | | | | 7,738 | |
| Payable for Trustees’ Fee | | | 179 | | | | 36 | | | | 101 | |
| Unrealized Depreciation on Spot Contracts | | | 2 | | | | — | | | | 16 | |
| Payable for Investment Securities Purchased | | | — | | | | — | | | | 140,703 | |
| Payable to Custodian | | | — | | | | — | | | | 82,662 | |
| Total Liabilities | | | 29,701 | | | | 2,406 | | | | 231,220 | |
| Net Assets | | $ | 30,111,635 | | | $ | 4,977,471 | | | $ | 15,096,412 | |
| | | | | | | | | | | | | |
| Net Assets Consist of: | | | | | | | | | | | | |
| Paid-in Capital | | $ | 35,254,875 | | | $ | 8,616,093 | | | $ | 29,808,217 | |
| Total Distributable Loss | | | (5,143,240 | ) | | | (3,638,622 | ) | | | (14,711,805 | ) |
| Net Assets | | $ | 30,111,635 | | | $ | 4,977,471 | | | $ | 15,096,412 | |
| Outstanding Shares of Beneficial Interest (unlimited authorization - no par value) | | | 1,200,002 | | | | 250,000 | | | | 850,002 | |
| Net Asset Value, Offering and Redemption Price Per Share | | $ | 25.09 | | | $ | 19.91 | | | $ | 17.76 | |
| Cost of Investments | | $ | 33,335,675 | | | $ | 5,874,589 | | | $ | 17,470,076 | |
| Cost of Foreign Currency | | | 14,734 | | | | — | | | | — | |
Amounts designated as “—” are $0 or have been rounded to $0.
The accompanying notes are an integral part of the financial statements.
Statements of Assets and Liabilities (continued)
March 31, 2023
| | | KraneShares CICC
China Consumer
Leaders Index ETF | | | KraneShares SSE
STAR Market 50
Index ETF | | | KraneShares Hang
Seng TECH Index
ETF | |
| Assets: | | | | | | | | | | | | |
| Investments at Value | | $ | 6,964,969 | | | $ | 47,967,834 | | | $ | 6,944,017 | |
| Cash and Cash Equivalents | | | 57,584 | | | | 37,623 | | | | 17,397 | |
| Foreign Currency at Value | | | 1 | | | | 158,131 | | | | — | |
| Receivable for Investment Securities Sold | | | 45,515 | | | | — | | | | 357,457 | |
| Unrealized Appreciation on Spot Contracts | | | 8 | | | | — | | | | — | |
| Receivable for Capital Shares Sold | | | — | | | | — | | | | 25 | |
| Total Assets | | | 7,068,077 | | | | 48,163,588 | | | | 7,318,896 | |
| | | | | | | | | | | | | |
| Liabilities: | | | | | | | | | | | | |
| Payable for Investment Securities Purchased | | | 94,210 | | | | — | | | | — | |
| Payable for Management Fees | | | 3,982 | | | | 33,746 | | | | 3,978 | |
| Payable for Trustees’ Fee | | | 51 | | | | 320 | | | | 51 | |
| Unrealized Depreciation on Spot Contracts | | | — | | | | 12 | | | | 62 | |
| Total Liabilities | | | 98,243 | | | | 34,078 | | | | 4,091 | |
| Net Assets | | $ | 6,969,834 | | | $ | 48,129,510 | | | $ | 7,314,805 | |
| | | | | | | | | | | | | |
| Net Assets Consist of: | | | | | | | | | | | | |
| Paid-in Capital | | $ | 27,891,815 | | | $ | 73,645,379 | | | $ | 11,206,977 | |
| Total Distributable Loss | | | (20,921,981 | ) | | | (25,515,869 | ) | | | (3,892,172 | ) |
| Net Assets | | $ | 6,969,834 | | | $ | 48,129,510 | | | $ | 7,314,805 | |
| Outstanding Shares of Beneficial Interest (unlimited authorization - no par value) | | | 350,002 | | | | 2,850,000 | | | | 550,002 | |
| Net Asset Value, Offering and Redemption Price Per Share | | $ | 19.91 | | | $ | 16.89 | | | $ | 13.30 | |
| Cost of Investments | | $ | 6,867,158 | | | $ | 52,333,165 | | | $ | 6,130,779 | |
| Cost of Foreign Currency | | | 1 | | | | 158,352 | | | | — | |
Amounts designated as “—” are $0 or have been rounded to $0.
The accompanying notes are an integral part of the financial statements.
Statements of Assets and Liabilities (concluded)
March 31, 2023
| | | KraneShares China
Innovation ETF | | | KraneShares S&P
Pan Asia Dividend
Aristocrats Index
ETF | | | KraneShares
China Internet
and Covered Call
Strategy ETF | |
| Assets: | | | | | | | | | | | | |
| Investments at Value | | $ | 1,596,301 | | | $ | 2,607,652 | | | $ | 5,642,645 | |
| Cash and Cash Equivalents | | | 926 | | | | 11,017 | | | | 185,004 | |
| Foreign Currency at Value | | | — | | | | 620 | | | | — | |
| Receivable for Capital Shares Sold | | | — | | | | — | | | | 531,924 | |
| Receivable for Investment Securities Sold | | | — | | | | — | | | | 36,418 | |
| Dividend and Interest Receivable | | | — | | | | 11,157 | | | | — | |
| Unrealized Appreciation on Spot Contracts | | | — | | | | 1 | | | | — | |
| Total Assets | | | 1,597,227 | | | | 2,630,447 | | | | 6,395,991 | |
| | | | | | | | | | | | | |
| Liabilities: | | | | | | | | | | | | |
| Written Options at Value | | | — | | | | — | | | | 547,635 | |
| Payable for Management Fees | | | 157 | | | | 1,498 | | | | 990 | |
| Payable for Trustees’ Fee | | | 11 | | | | 19 | | | | 33 | |
| Payable for Investment Securities Purchased | | | — | | | | — | | | | 533,349 | |
| Total Liabilities | | | 168 | | | | 1,517 | | | | 1,082,007 | |
| Net Assets | | $ | 1,597,059 | | | $ | 2,628,930 | | | $ | 5,313,984 | |
| | | | | | | | | | | | | |
| Net Assets Consist of: | | | | | | | | | | | | |
| Paid-in Capital | | $ | 2,448,505 | | | $ | 2,500,050 | | | $ | 5,842,063 | |
| Total Distributable Earnings/(Loss) | | | (851,446 | ) | | | 128,880 | | | | (528,079 | ) |
| Net Assets | | $ | 1,597,059 | | | $ | 2,628,930 | | | $ | 5,313,984 | |
| Outstanding Shares of Beneficial Interest (unlimited authorization - no par value) | | | 100,002 | | | | 100,002 | | | | 250,002 | |
| Net Asset Value, Offering and Redemption Price Per Share | | $ | 15.97 | | | $ | 26.29 | | | $ | 21.26 | |
| Cost of Investments | | $ | 2,325,788 | | | $ | 2,497,865 | | | $ | 5,970,676 | |
| Cost of Foreign Currency | | | — | | | | 616 | | | | — | |
| Written Options, Premiums Received | | | — | | | | — | | | | 347,588 | |
Amounts designated as “—” are $0 or have been rounded to $0.
The accompanying notes are an integral part of the financial statements.
Statements of Operations
For the Year Ended March 31, 2023
| | | KraneShares CICC
China Leaders 100
Index ETF | | | KraneShares CSI
China Internet ETF | | | KraneShares Bosera
MSCI China A 50
Connect Index ETF | |
| Investment Income: | | | | | | | | | | | | |
| Dividend Income | | $ | 305,975 | | | $ | 78,933,611 | | | $ | 14,609,313 | |
| Interest Income | | | 406 | | | | 270,697 | | | | 7,467 | |
| Security Lending Income | | | — | | | | 3,155,440 | | | | — | |
| Less: Foreign Taxes Withheld | | | (30,637 | ) | | | — | | | | (1,461,599 | ) |
| Total Investment Income | | | 275,744 | | | | 82,359,748 | | | | 13,155,181 | |
| | | | | | | | | | | | | |
| Expenses: | | | | | | | | | | | | |
| Management Fees† | | | 44,615 | | | | 43,182,019 | | | | 4,319,739 | |
| Trustees’ Fees | | | 294 | | | | 288,541 | | | | 25,424 | |
| Security Lending Fees† | | | — | | | | 301,354 | | | | — | |
| Insurance Expense | | | 117 | | | | 81,751 | | | | 7,584 | |
| Total Expenses | | | 45,026 | | | | 43,853,665 | | | | 4,352,747 | |
| Management Fee Waiver† | | | — | | | | — | | | | (1,320,906 | ) |
| Net Expenses | | | 45,026 | | | | 43,853,665 | | | | 3,031,841 | |
| Net Investment Income | | | 230,718 | | | | 38,506,083 | | | | 10,123,340 | |
| | | | | | | | | | | | | |
| Net Realized Gain (Loss) on: | | | | | | | | | | | | |
| Investments | | | (1,259,104 | ) | | | (2,232,239,153 | ) | | | (100,887,697 | ) |
| Foreign Currency Translations | | | 340 | | | | (142,082 | ) | | | (722,531 | ) |
| Net Realized Loss | | | (1,258,764 | ) | | | (2,232,381,235 | ) | | | (101,610,228 | ) |
| | | | | | | | | | | | | |
| Net Change in Unrealized Appreciation (Depreciation) on: | | | | | | | | | | | | |
| Investments | | | (273,162 | ) | | | 2,302,137,112 | | | | (2,753,333 | ) |
| Foreign Currency Translations | | | — | | | | 1,108 | | | | (36,079 | ) |
| Net Change in Unrealized Appreciation (Depreciation) | | | (273,162 | ) | | | 2,302,138,220 | | | | (2,789,412 | ) |
| Net Realized and Unrealized Gain (Loss) | | | (1,531,926 | ) | | | 69,756,985 | | | | (104,399,640 | ) |
| Net Increase (Decrease) in Net Assets Resulting from Operations | | $ | (1,301,208 | ) | | $ | 108,263,068 | | | $ | (94,276,300 | ) |
| † | See Note 3 in Notes to Financial Statements. |
Amounts designated as “—” are $0 or have been rounded to $0.
The accompanying notes are an integral part of the financial statements.
Statements of Operations (continued)
For the Year Ended March 31, 2023
| | | KraneShares
Bloomberg China
Bond Inclusion Index
ETF | | | KraneShares MSCI
All China Index ETF | | | KraneShares MSCI
One Belt One Road
Index ETF | |
| Investment Income: | | | | | | | | | | | | |
| Dividend Income | | $ | — | | | $ | 225,567 | | | $ | 239,797 | |
| Interest Income | | | 359,992 | | | | 682 | | | | 687 | |
| Less: Foreign Taxes Withheld | | | — | | | | (16,504 | ) | | | (26,875 | ) |
| Total Investment Income | | | 359,992 | | | | 209,745 | | | | 213,609 | |
| | | | | | | | | | | | | |
| Expenses: | | | | | | | | | | | | |
| Management Fees† | | | 92,989 | | | | 53,233 | | | | 44,408 | |
| Trustees’ Fees | | | 629 | | | | 329 | | | | 254 | |
| Insurance Expense | | | 153 | | | | 203 | | | | 103 | |
| Total Expenses | | | 93,771 | | | | 53,765 | | | | 44,765 | |
| Management Fee Waiver† | | | (27,350 | ) | | | (15,657 | ) | | | — | |
| Net Expenses | | | 66,421 | | | | 38,108 | | | | 44,765 | |
| Net Investment Income | | | 293,571 | | | | 171,637 | | | | 168,844 | |
| | | | | | | | | | | | | |
| Net Realized Gain (Loss) on: | | | | | | | | | | | | |
| Investments | | | (17,798 | ) | | | (6,453,755 | ) | | | 50,123 | |
| Foreign Currency Translations | | | (454,914 | ) | | | 2,550 | | | | (3,167 | ) |
| Net Realized Gain (Loss) | | | (472,712 | ) | | | (6,451,205 | ) | | | 46,956 | |
| | | | | | | | | | | | | |
| Net Change in Unrealized Appreciation (Depreciation) on: | | | | | | | | | | | | |
| Investments | | | (434,722 | ) | | | 4,729,576 | | | | (1,350,068 | ) |
| Accrued Foreign Capital Gains Tax on Appreciated Securities | | | — | | | | — | | | | 1,054 | |
| Foreign Currency Translations | | | (1,656 | ) | | | (28 | ) | | | 213 | |
| Net Change in Unrealized Appreciation (Depreciation) | | | (436,378 | ) | | | 4,729,548 | | | | (1,348,801 | ) |
| Net Realized and Unrealized Loss | | | (909,090 | ) | | | (1,721,657 | ) | | | (1,301,845 | ) |
| Net Decrease in Net Assets Resulting from Operations | | $ | (615,519 | ) | | $ | (1,550,020 | ) | | $ | (1,133,001 | ) |
| † | See Note 3 in Notes to Financial Statements. |
Amounts designated as “—” are $0 or have been rounded to $0.
The accompanying notes are an integral part of the financial statements.
Statements of Operations (continued)
For the Year Ended March 31, 2023
| | | KraneShares
Emerging Markets
Consumer
Technology Index ETF | | | KraneShares
MSCI China Clean
Technology Index ETF | | | KraneShares Electric
Vehicles and Future
Mobility Index ETF | |
| Investment Income: | | | | | | | | | | | | |
| Dividend Income | | $ | 415,141 | | | $ | 1,427,531 | | | $ | 3,672,913 | |
| Interest Income | | | 1,560 | | | | 7,420 | | | | 7,080 | |
| Security Lending Income | | | 61,311 | | | | — | | | | 676,692 | |
| Less: Foreign Taxes Withheld | | | — | | | | (37,819 | ) | | | (474,377 | ) |
| Total Investment Income | | | 478,012 | | | | 1,397,132 | | | | 3,882,308 | |
| | | | | | | | | | | | | |
| Expenses: | | | | | | | | | | | | |
| Management Fees† | | | 296,203 | | | | 931,302 | | | | 1,545,275 | |
| Trustees’ Fees | | | 1,649 | | | | 5,400 | | | | 10,180 | |
| Security Lending Fees† | | | 6,087 | | | | — | | | | 67,245 | |
| Insurance Expense | | | 805 | | | | 1,856 | | | | 3,530 | |
| Total Expenses | | | 304,744 | | | | 938,558 | | | | 1,626,230 | |
| Management Fee Waiver† | | | (75,950 | ) | | | — | | | | — | |
| Net Expenses | | | 228,794 | | | | 938,558 | | | | 1,626,230 | |
| Net Investment Income | | | 249,218 | | | | 458,574 | | | | 2,256,078 | |
| | | | | | | | | | | | | |
| Net Realized Gain (Loss) on: | | | | | | | | | | | | |
| Investments | | | (21,039,753 | ) | | | (32,326,631 | ) | | | (41,582,319 | ) |
| Foreign Currency Translations | | | (36,077 | ) | | | (738 | ) | | | (49,822 | ) |
| Net Realized Loss | | | (21,075,830 | ) | | | (32,327,369 | ) | | | (41,632,141 | ) |
| | | | | | | | | | | | | |
| Net Change in Unrealized Appreciation (Depreciation) on: | | | | | | | | | | | | |
| Investments | | | 12,502,057 | | | | 533,750 | | | | (23,328,171 | ) |
| Foreign Currency Translations | | | (240 | ) | | | 2 | | | | 4,849 | |
| Net Change in Unrealized Appreciation (Depreciation) | | | 12,501,817 | | | | 533,752 | | | | (23,323,322 | ) |
| Net Realized and Unrealized Loss | | | (8,574,013 | ) | | | (31,793,617 | ) | | | (64,955,463 | ) |
| Net Decrease in Net Assets Resulting from Operations | | $ | (8,324,795 | ) | | $ | (31,335,043 | ) | | $ | (62,699,385 | ) |
| † | See Note 3 in Notes to Financial Statements. |
Amounts designated as “—” are $0 or have been rounded to $0.
The accompanying notes are an integral part of the financial statements.
Statements of Operations (continued)
For the Year Ended March 31, 2023
| | | KraneShares MSCI
All China Health
Care Index ETF | | | KraneShares Asia
Pacific High Income
Bond ETF | | | KraneShares
Emerging Markets
Healthcare Index ETF | |
| Investment Income: | | | | | | | | | | | | |
| Dividend Income | | $ | 1,126,320 | | | $ | — | | | $ | 18,224 | |
| Interest Income | | | 9,540 | | | | 1,966,337 | | | | 37 | |
| Security Lending Income | | | 19,536 | | | | — | | | | 122 | |
| Less: Foreign Taxes Withheld | | | (88,165 | ) | | | (650 | ) | | | (2,869 | ) |
| Total Investment Income | | | 1,067,231 | | | | 1,965,687 | | | | 15,514 | |
| | | | | | | | | | | | | |
| Expenses: | | | | | | | | | | | | |
| Management Fees† | | | 831,225 | | | | 150,544 | | | | 16,978 | |
| Trustees’ Fees | | | 4,939 | | | | 985 | | | | 100 | |
| Security Lending Fees† | | | 1,908 | | | | — | | | | — | |
| Insurance Expense | | | 1,441 | | | | 386 | | | | 140 | |
| Total Expenses | | | 839,513 | | | | 151,915 | | | | 17,218 | |
| Management Fee Waiver† | | | (149,193 | ) | | | — | | | | — | |
| Net Expenses | | | 690,320 | | | | 151,915 | | | | 17,218 | |
| Net Investment Income (Loss) | | | 376,911 | | | | 1,813,772 | | | | (1,704 | ) |
| | | | | | | | | | | | | |
| Net Realized Gain (Loss) on: | | | | | | | | | | | | |
| Investments | | | (41,109,231 | ) | | | (3,640,259 | ) | | | (360,559 | ) |
| Foreign Currency Translations | | | (31,628 | ) | | | — | | | | (254 | ) |
| Net Realized Loss | | | (41,140,859 | ) | | | (3,640,259 | ) | | | (360,813 | ) |
| | | | | | | | | | | | | |
| Net Change in Unrealized Appreciation (Depreciation) on: | | | | | | | | | | | | |
| Investments | | | 23,296,248 | | | | 924,572 | | | | (12,631 | ) |
| Accrued Foreign Capital Gains Tax on Appreciated Securities | | | — | | | | — | | | | 6,195 | |
| Foreign Currency Translations | | | — | | | | 12 | | | | (252 | ) |
| Net Change in Unrealized Appreciation (Depreciation) | | | 23,296,248 | | | | 924,584 | | | | (6,688 | ) |
| Net Realized and Unrealized Loss | | | (17,844,611 | ) | | | (2,715,675 | ) | | | (367,501 | ) |
| Net Decrease in Net Assets Resulting from Operations | | $ | (17,467,700 | ) | | $ | (901,903 | ) | | $ | (369,205 | ) |
| † | See Note 3 in Notes to Financial Statements. |
Amounts designated as “—” are $0 or have been rounded to $0.
The accompanying notes are an integral part of the financial statements.
Statements of Operations (continued)
For the Year Ended March 31, 2023
| | | KraneShares MSCI
Emerging Markets ex
China Index ETF | | | KraneShares MSCI
China ESG Leaders
Index ETF | | | KraneShares
CICC China 5G &
Semiconductor Index
ETF | |
| Investment Income: | | | | | | | | | | | | |
| Dividend Income | | $ | 951,054 | | | $ | 147,892 | | | $ | 195,421 | |
| Interest Income | | | 2,191 | | | | 11 | | | | 909 | |
| Less: Foreign Taxes Withheld | | | (158,460 | ) | | | (7,336 | ) | | | (18,680 | ) |
| Total Investment Income | | | 794,785 | | | | 140,567 | | | | 177,650 | |
| | | | | | | | | | | | | |
| Expenses: | | | | | | | | | | | | |
| Management Fees† | | | 121,761 | | | | 31,861 | | | | 124,591 | |
| Trustees’ Fees | | | 933 | | | | 182 | | | | 704 | |
| Insurance Expense | | | 377 | | | | 101 | | | | 288 | |
| Total Expenses | | | 123,071 | | | | 32,144 | | | | 125,583 | |
| Management Fee Waiver† | | | (73,476 | ) | | | — | | | | (22,362 | ) |
| Net Expenses | | | 49,595 | | | | 32,144 | | | | 103,221 | |
| Net Investment Income | | | 745,190 | | | | 108,423 | | | | 74,429 | |
| | | | | | | | | | | | | |
| Net Realized Gain (Loss) on: | | | | | | | | | | | | |
| Investments | | | (1,515,588 | ) | | | (2,244,873 | ) | | | (2,834,021 | ) |
| Foreign Currency Translations | | | (63,432 | ) | | | (989 | ) | | | (8,140 | ) |
| Net Realized Loss | | | (1,579,020 | ) | | | (2,245,862 | ) | | | (2,842,161 | ) |
| | | | | | | | | | | | | |
| Net Change in Unrealized Appreciation (Depreciation) on: | | | | | | | | | | | | |
| Investments | | | (2,900,389 | ) | | | 1,510,945 | | | | 268,404 | |
| Accrued Foreign Capital Gains Tax on Appreciated Securities | | | 38,160 | | | | — | | | | — | |
| Foreign Currency Translations | | | 1,019 | | | | — | | | | (39 | ) |
| Net Change in Unrealized Appreciation (Depreciation) | | | (2,861,210 | ) | | | 1,510,945 | | | | 268,365 | |
| Net Realized and Unrealized Loss | | | (4,440,230 | ) | | | (734,917 | ) | | | (2,573,796 | ) |
| Net Decrease in Net Assets Resulting from Operations | | $ | (3,695,040 | ) | | $ | (626,494 | ) | | $ | (2,499,367 | ) |
| † | See Note 3 in Notes to Financial Statements. |
Amounts designated as “—” are $0 or have been rounded to $0.
The accompanying notes are an integral part of the financial statements.
Statements of Operations (continued)
For the Year or Period Ended March 31, 2023
| | | KraneShares CICC
China Consumer
Leaders Index ETF | | | KraneShares SSE
STAR Market 50
Index ETF | | | KraneShares Hang
Seng TECH Index ETF | |
| Investment Income: | | | | | | | | | | | | |
| Dividend Income | | $ | 224,091 | | | $ | 239,472 | | | $ | 84,189 | |
| Interest Income | | | 2,013 | | | | 5,175 | | | | (22 | ) |
| Less: Foreign Taxes Withheld | | | (20,827 | ) | | | (24,033 | ) | | | (546 | ) |
| Total Investment Income | | | 205,277 | | | | 220,614 | | | | 83,621 | |
| | | | | | | | | | | | | |
| Expenses: | | | | | | | | | | | | |
| Management Fees† | | | 69,342 | | | | 439,952 | | | | 51,290 | |
| Trustees’ Fees | | | 436 | | | | 2,242 | | | | 334 | |
| Insurance Expense | | | 604 | | | | 877 | | | | 65 | |
| Total Expenses | | | 70,382 | | | | 443,071 | | | | 51,689 | |
| Net Investment Income (Loss) | | | 134,895 | | | | (222,457 | ) | | | 31,932 | |
| | | | | | | | | | | | | |
| Net Realized Gain (Loss) on: | | | | | | | | | | | | |
| Investments | | | (11,379,761 | ) | | | (14,304,417 | ) | | | (4,107,247 | ) |
| Foreign Currency Translations | | | 16,309 | | | | (9,946 | ) | | | (981 | ) |
| Net Realized Loss | | | (11,363,452 | ) | | | (14,314,363 | ) | | | (4,108,228 | ) |
| | | | | | | | | | | | | |
| Net Change in Unrealized Appreciation (Depreciation) on: | | | | | | | | | | | | |
| Investments | | | 10,213,831 | | | | 7,893,383 | | | | 2,353,980 | |
| Foreign Currency Translations | | | 175 | | | | (7,863 | ) | | | (34 | ) |
| Net Change in Unrealized Appreciation (Depreciation) | | | 10,214,006 | | | | 7,885,520 | | | | 2,353,946 | |
| Net Realized and Unrealized Loss | | | (1,149,446 | ) | | | (6,428,843 | ) | | | (1,754,282 | ) |
| Net Decrease in Net Assets Resulting from Operations | | $ | (1,014,551 | ) | | $ | (6,651,300 | ) | | $ | (1,722,350 | ) |
| † | See Note 3 in Notes to Financial Statements. |
The accompanying notes are an integral part of the financial statements.
Statements of Operations (concluded)
For the Year or Period Ended March 31, 2023
| | | KraneShares China
Innovation ETF | | | KraneShares S&P
Pan Asia Dividend
Aristocrats Index
ETF(1) | | | KraneShares China
Internet and Covered
Call Strategy ETF(2) | |
| Investment Income: | | | | | | | | | | | | |
| Dividend Income | | $ | — | | | $ | 50,181 | | | $ | — | |
| Dividend from Affiliated Investment | | | 2,062 | | | | — | | | | — | |
| Interest Income | | | 4 | | | | 42 | | | | 920 | |
| Less: Foreign Taxes Withheld | | | — | | | | (4,620 | ) | | | — | |
| Total Investment Income | | | 2,066 | | | | 45,603 | | | | 920 | |
| | | | | | | | | | | | | |
| Expenses: | | | | | | | | | | | | |
| Management Fees† | | | 4,781 | | | | 9,216 | | | | 1,983 | |
| Trustees’ Fees | | | 88 | | | | 69 | | | | 50 | |
| Insurance Expense | | | 24 | | | | — | | | | — | |
| Total Expenses | | | 4,893 | | | | 9,285 | | | | 2,033 | |
| Management Fee Waiver† | | | (2,193 | ) | | | — | | | | — | |
| Net Expenses | | | 2,700 | | | | 9,285 | | | | 2,033 | |
| Net Investment Income (Loss) | | | (634 | ) | | | 36,318 | | | | (1,113 | ) |
| | | | | | | | | | | | | |
| Net Realized Gain (Loss) on: | | | | | | | | | | | | |
| Investments | | | — | | | | 1,826 | | | | — | |
| Affiliated Investments | | | (91,666 | ) | | | — | | | | 176 | |
| Capital Gain Distributions Received From Affiliated Fund | | | 4,378 | | | | — | | | | — | |
| Foreign Currency Translations | | | — | | | | 3,289 | | | | — | |
| Written Options | | | — | | | | — | | | | 395,776 | |
| Net Realized Gain (Loss) | | | (87,288 | ) | | | 5,115 | | | | 395,952 | |
| | | | | | | | | | | | | |
| Net Change in Unrealized Appreciation (Depreciation) on: | | | | | | | | | | | | |
| Investments | | | — | | | | 109,787 | | | | — | |
| Affiliated Investments | | | 23,085 | | | | — | | | | (328,031 | ) |
| Foreign Currency Translations | | | — | | | | (11 | ) | | | — | |
| Written Options | | | — | | | | — | | | | (200,047 | ) |
| Net Change in Unrealized Appreciation (Depreciation) | | | 23,085 | | | | 109,776 | | | | (528,078 | ) |
| Net Realized and Unrealized Gain (Loss) | | | (64,203 | ) | | | 114,891 | | | | (132,126 | ) |
| Net Increase (Decrease) in Net Assets Resulting from Operations | | $ | (64,837 | ) | | $ | 151,209 | | | $ | (133,239 | ) |
| † | See Note 3 in Notes to Financial Statements. |
| (1) | Commenced operations on September 15, 2022. |
| (2) | Commenced operations on January 12, 2023. |
Amounts designated as “—” are $0 or have been rounded to $0.
The accompanying notes are an integral part of the financial statements.
Statements of Changes in Net Assets
| | | KraneShares CICC
China Leaders 100
Index ETF | |
| | | Year Ended
March 31,
2023 | | | Year Ended
March 31,
2022 | |
| Operations: | | | | | | | | |
| Net Investment Income | | $ | 230,718 | | | $ | 250,564 | |
| Net Realized Gain (Loss) | | | (1,258,764 | ) | | | 548,689 | |
| Net Change in Unrealized Appreciation (Depreciation) | | | (273,162 | ) | | | (442,945 | ) |
| Net Increase (Decrease) in Net Assets Resulting from Operations | | | (1,301,208 | ) | | | 356,308 | |
| Distributions | | | (267,141 | ) | | | (1,242,906 | ) |
| | | | | | | | | |
| Capital Share Transactions:(1) | | | | | | | | |
| Issued | | | 29,678 | | | | 3,147,630 | |
| Redeemed | | | (2,571,456 | ) | | | (4,749,351 | ) |
| Decrease in Net Assets from Capital Share Transactions | | | (2,541,778 | ) | | | (1,601,721 | ) |
| Total Decrease in Net Assets | | | (4,110,127 | ) | | | (2,488,319 | ) |
| | | | | | | | | |
| Net Assets: | | | | | | | | |
| Beginning of Year | | | 10,074,702 | | | | 12,563,021 | |
| End of Year | | $ | 5,964,575 | | | $ | 10,074,702 | |
| | | | | | | | | |
| Share Transactions: | | | | | | | | |
| Issued | | | — | | | | 100,000 | |
| Redeemed | | | (100,000 | ) | | | (150,000 | ) |
| Net Decrease in Shares Outstanding from Share Transactions | | | (100,000 | ) | | | (50,000 | ) |
| (1) | Includes transaction costs related to creations and redemptions. |
Amounts designated as “—” are $0 or have been rounded to $0.
The accompanying notes are an integral part of the financial statements.
Statements of Changes in Net Assets (continued)
| | | KraneShares CSI
China Internet ETF | |
| | | Year Ended
March 31,
2023 | | | Year Ended
March 31,
2022 | |
| Operations: | | | | | | | | |
| Net Investment Income (Loss) | | $ | 38,506,083 | | | $ | (7,133,279 | ) |
| Net Realized Loss | | | (2,232,381,235 | ) | | | (1,972,722,327 | ) |
| Net Change in Unrealized Appreciation (Depreciation) | | | 2,302,138,220 | | | | (3,543,610,616 | ) |
| Net Increase (Decrease) in Net Assets Resulting from Operations | | | 108,263,068 | | | | (5,523,466,222 | ) |
| Distributions | | | — | | | | (455,309,639 | ) |
| | | | | | | | | |
| Capital Share Transactions:(1) | | | | | | | | |
| Issued | | | 3,037,376,264 | | | | 10,834,164,254 | |
| Redeemed | | | (3,273,504,223 | ) | | | (2,278,114,147 | ) |
| Increase (Decrease) in Net Assets from Capital Share Transactions | | | (236,127,959 | ) | | | 8,556,050,107 | |
| Total Increase (Decrease) in Net Assets | | | (127,864,891 | ) | | | 2,577,274,246 | |
| | | | | | | | | |
| Net Assets: | | | | | | | | |
| Beginning of Year | | | 6,239,534,279 | | | | 3,662,260,033 | |
| End of Year | | $ | 6,111,669,388 | | | $ | 6,239,534,279 | |
| | | | | | | | | |
| Share Transactions: | | | | | | | | |
| Issued | | | 100,950,000 | | | | 224,400,000 | |
| Redeemed | | | (116,750,000 | ) | | | (61,450,000 | ) |
| Net Increase (Decrease) in Shares Outstanding from Share Transactions | | | (15,800,000 | ) | | | 162,950,000 | |
| (1) | Includes transaction costs related to creations and redemptions. |
Amounts designated as “—” are $0 or have been rounded to $0.
The accompanying notes are an integral part of the financial statements.
Statements of Changes in Net Assets (continued)
| | | KraneShares Bosera
MSCI China A 50
Connect Index ETF | |
| | | Year Ended
March 31,
2023 | | | Year Ended
March 31,
2022 | |
| Operations: | | | | | | | | |
| Net Investment Income | | $ | 10,123,340 | | | $ | 7,399,447 | |
| Net Realized Gain (Loss) | | | (101,610,228 | ) | | | 178,885,405 | |
| Net Change in Unrealized Appreciation (Depreciation) | | | (2,789,412 | ) | | | (237,940,238 | ) |
| Net Decrease in Net Assets Resulting from Operations | | | (94,276,300 | ) | | | (51,655,386 | ) |
| Distributions | | | (111,275,241 | ) | | | (64,359,649 | ) |
| | | | | | | | | |
| Capital Share Transactions:(1) | | | | | | | | |
| Issued | | | 254,963,186 | | | | 91,859,183 | |
| Redeemed | | | (137,931,980 | ) | | | (218,814,477 | ) |
| Increase (Decrease) in Net Assets from Capital Share Transactions | | | 117,031,206 | | | | (126,955,294 | ) |
| Total Decrease in Net Assets | | | (88,520,335 | ) | | | (242,970,329 | ) |
| | | | | | | | | |
| Net Assets: | �� | | | | | | | |
| Beginning of Year | | | 559,393,402 | | | | 802,363,731 | |
| End of Year | | $ | 470,873,067 | | | $ | 559,393,402 | |
| | | | | | | | | |
| Share Transactions: | | | | | | | | |
| Issued | | | 7,300,000 | | | | 2,050,000 | |
| Redeemed | | | (4,350,000 | ) | | | (5,200,000 | ) |
| Net Increase (Decrease) in Shares Outstanding from Share Transactions | | | 2,950,000 | | | | (3,150,000 | ) |
| (1) | Includes transaction costs related to creations and redemptions. |
Amounts designated as “—” are $0 or have been rounded to $0.
The accompanying notes are an integral part of the financial statements.
Statements of Changes in Net Assets (continued)
| | | KraneShares Bloomberg
China Bond | |
| | | Inclusion Index ETF | |
| | | Year Ended
March 31,
2023 | | | Year Ended
March 31,
2022 | |
| Operations: | | | | | | | | |
| Net Investment Income | | $ | 293,571 | | | $ | 212,675 | |
| Net Realized Gain (Loss) | | | (472,712 | ) | | | 180,221 | |
| Net Change in Unrealized Appreciation (Depreciation) | | | (436,378 | ) | | | 242,411 | |
| Net Increase (Decrease) in Net Assets Resulting from Operations | | | (615,519 | ) | | | 635,307 | |
| Distributions | | | (93,427 | ) | | | (936,375 | ) |
| Return of Capital | | | (233,872 | ) | | | — | |
| | | | | | | | | |
| Capital Share Transactions:(1) | | | | | | | | |
| Issued | | | 1,710,911 | | | | 1,752,884 | |
| Redeemed | | | (3,208,976 | ) | | | — | |
| Increase (Decrease) in Net Assets from Capital Share Transactions | | | (1,498,065 | ) | | | 1,752,884 | |
| Total Increase (Decrease) in Net Assets | | | (2,440,883 | ) | | | 1,451,816 | |
| | | | | | | | | |
| Net Assets: | | | | | | | | |
| Beginning of Year | | | 13,586,031 | | | | 12,134,215 | |
| End of Year | | $ | 11,145,148 | | | $ | 13,586,031 | |
| | | | | | | | | |
| Share Transactions: | | | | | | | | |
| Issued | | | 50,000 | | | | 50,000 | |
| Redeemed | | | (100,000 | ) | | | — | |
| Net Increase (Decrease) in Shares Outstanding from Share Transactions | | | (50,000 | ) | | | 50,000 | |
| (1) | Includes transaction costs related to creations and redemptions. |
Amounts designated as “—” are $0 or have been rounded to $0.
The accompanying notes are an integral part of the financial statements.
Statements of Changes in Net Assets (continued)
| | | KraneShares MSCI All
China Index ETF | |
| | | Year Ended March 31,
2023 | | | Year Ended
March 31,
2022 | |
| Operations: | | | | | | | | |
| Net Investment Income | | $ | 171,637 | | | $ | 320,231 | |
| Net Realized Gain (Loss) | | | (6,451,205 | ) | | | 651,122 | |
| Net Change in Unrealized Appreciation (Depreciation) | | | 4,729,548 | | | | (6,493,293 | ) |
| Net Decrease in Net Assets Resulting from Operations | | | (1,550,020 | ) | | | (5,521,940 | ) |
| Distributions | | | (311,974 | ) | | | (928,865 | ) |
| | | | | | | | | |
| Capital Share Transactions:(1) | | | | | | | | |
| Issued | | | 3,417,132 | | | | 3,218,338 | |
| Redeemed | | | (8,941,286 | ) | | | (2,988,805 | ) |
| Increase (Decrease) in Net Assets from Capital Share Transactions | | | (5,524,154 | ) | | | 229,533 | |
| Total Decrease in Net Assets | | | (7,386,148 | ) | | | (6,221,272 | ) |
| | | | | | | | | |
| Net Assets: | | | | | | | | |
| Beginning of Year | | | 16,180,669 | | | | 22,401,941 | |
| End of Year | | $ | 8,794,521 | | | $ | 16,180,669 | |
| | | | | | | | | |
| Share Transactions: | | | | | | | | |
| Issued | | | 150,000 | | | | 100,000 | |
| Redeemed | | | (400,000 | ) | | | (100,000 | ) |
| Net Decrease in Shares Outstanding from Share Transactions | | | (250,000 | ) | | | — | |
| (1) | Includes transaction costs related to creations and redemptions. |
Amounts designated as “—” are $0 or have been rounded to $0.
The accompanying notes are an integral part of the financial statements.
Statements of Changes in Net Assets (continued)
| | | KraneShares MSCI One
Belt One Road | |
| | | Index ETF | |
| | | Year Ended
March 31,
2023 | | | Year Ended
March 31,
2022 | |
| Operations: | | | | | | | | |
| Net Investment Income | | $ | 168,844 | | | $ | 315,016 | |
| Net Realized Gain | | | 46,956 | | | | 1,131,670 | |
| Net Change in Unrealized Appreciation (Depreciation) | | | (1,348,801 | ) | | | (1,396,666 | ) |
| Net Increase (Decrease) in Net Assets Resulting from Operations | | | (1,133,001 | ) | | | 50,020 | |
| Distributions | | | (215,731 | ) | | | (297,852 | ) |
| | | | | | | | | |
| Capital Share Transactions:(1) | | | | | | | | |
| Issued | | | 12,878 | | | | 2,198 | |
| Redeemed | | | (2,468,601 | ) | | | (1,563,737 | ) |
| Decrease in Net Assets from Capital Share Transactions | | | (2,455,723 | ) | | | (1,561,539 | ) |
| Total Decrease in Net Assets | | | (3,804,455 | ) | | | (1,809,371 | ) |
| | | | | | | | | |
| Net Assets: | | | | | | | | |
| Beginning of Year | | | 8,289,688 | | | | 10,099,059 | |
| End of Year | | $ | 4,485,233 | | | $ | 8,289,688 | |
| | | | | | | | | |
| Share Transactions: | | | | | | | | |
| Redeemed | | | (100,000 | ) | | | (50,000 | ) |
| Net Decrease in Shares Outstanding from Share Transactions | | | (100,000 | ) | | | (50,000 | ) |
| (1) | Includes transaction costs related to creations and redemptions. |
The accompanying notes are an integral part of the financial statements.
Statements of Changes in Net Assets (continued)
|
| KraneShares Emerging
Markets Consumer
Technology Index ETF |
|
| | | Year Ended
March 31,
2023 | | | Year Ended
March 31,
2022 | |
| Operations: | | | | | | | | |
| Net Investment Income (Loss) | | $ | 249,218 | | | $ | (165,301 | ) |
| Net Realized Loss | | | (21,075,830 | ) | | | (19,277,596 | ) |
| Net Change in Unrealized Appreciation (Depreciation) | | | 12,501,817 | | | | (31,537,956 | ) |
| Net Decrease in Net Assets Resulting from Operations | | | (8,324,795 | ) | | | (50,980,853 | ) |
| Distributions | | | — | | | | (250,511 | ) |
| | | | | | | | | |
| Capital Share Transactions:(1) | | | | | | | | |
| Issued | | | 2,557,125 | | | | 37,293,138 | |
| Redeemed | | | (19,605,280 | ) | | | (40,731,527 | ) |
| Decrease in Net Assets from Capital Share Transactions | | | (17,048,155 | ) | | | (3,438,389 | ) |
| Total Decrease in Net Assets | | | (25,372,950 | ) | | | (54,669,753 | ) |
| | | | | | | | | |
| Net Assets: | | | | | | | | |
| Beginning of Year | | | 55,934,523 | | | | 110,604,276 | |
| End of Year | | $ | 30,561,573 | | | $ | 55,934,523 | |
| | | | | | | | | |
| Share Transactions: | | | | | | | | |
| Issued | | | 150,000 | | | | 1,350,000 | |
| Redeemed | | | (1,250,000 | ) | | | (1,700,000 | ) |
| Net Decrease in Shares Outstanding from Share Transactions | | | (1,100,000 | ) | | | (350,000 | ) |
| (1) | Includes transaction costs related to creations and redemptions. |
Amounts designated as “—” are $0 or have been rounded to $0.
The accompanying notes are an integral part of the financial statements.
Statements of Changes in Net Assets (continued)
| | | KraneShares MSCI
China Clean
Technology Index ETF | |
| | | Year Ended
March 31,
2023 | | | Year Ended
March 31,
2022 | |
| Operations: | | | | | | | | |
| Net Investment Income | | $ | 458,574 | | | $ | 831,350 | |
| Net Realized Gain (Loss) | | | (32,327,369 | ) | | | 4,228,847 | |
| Net Change in Unrealized Appreciation (Depreciation) | | | 533,752 | | | | (23,098,574 | ) |
| Net Decrease in Net Assets Resulting from Operations | | | (31,335,043 | ) | | | (18,038,377 | ) |
| Distributions | | | (1,776,032 | ) | | | (757,516 | ) |
| | | | | | | | | |
| Capital Share Transactions:(1) | | | | | | | | |
| Issued | | | 5,598,103 | | | | 56,347,141 | |
| Redeemed | | | (23,735,159 | ) | | | (31,865,907 | ) |
| Increase (Decrease) in Net Assets from Capital Share Transactions | | | (18,137,056 | ) | | | 24,481,234 | |
| Total Increase (Decrease) in Net Assets | | | (51,248,131 | ) | | | 5,685,341 | |
| | | | | | | | | |
| Net Assets: | | | | | | | | |
| Beginning of Year | | | 146,858,672 | | | | 141,173,331 | |
| End of Year | | $ | 95,610,541 | | | $ | 146,858,672 | |
| | | | | | | | | |
| Share Transactions: | | | | | | | | |
| Issued | | | 150,000 | | | | 1,250,000 | |
| Redeemed | | | (800,000 | ) | | | (750,000 | ) |
| Net Increase (Decrease) in Shares Outstanding from Share Transactions | | | (650,000 | ) | | | 500,000 | |
| (1) | Includes transaction costs related to creations and redemptions. |
The accompanying notes are an integral part of the financial statements.
Statements of Changes in Net Assets (continued)
| | KraneShares Electric
Vehicles and
Future Mobility Index ETF | |
| | | Year Ended
March 31,
2023 | | | Year Ended
March 31,
2022 | |
| Operations: | | | | | | | | |
| Net Investment Income | | $ | 2,256,078 | | | $ | 447,423 | |
| Net Realized Gain (Loss) | | | (41,632,141 | ) | | | 9,642,454 | |
| Net Change in Unrealized Appreciation (Depreciation) | | | (23,323,322 | ) | | | (30,971,355 | ) |
| Net Decrease in Net Assets Resulting from Operations | | | (62,699,385 | ) | | | (20,881,478 | ) |
| Distributions | | | (2,090,551 | ) | | | (21,884,257 | ) |
| | | | | | | | | |
| Capital Share Transactions:(1) | | | | | | | | |
| Issued | | | 5,211,336 | | | | 161,175,495 | |
| Redeemed | | | (52,076,878 | ) | | | (20,218,326 | ) |
| Increase (Decrease) in Net Assets from Capital Share Transactions | | | (46,865,542 | ) | | | 140,957,169 | |
| Total Increase (Decrease) in Net Assets | | | (111,655,478 | ) | | | 98,191,434 | |
| | | | | | | | | |
| Net Assets: | | | | | | | | |
| Beginning of Year | | | 296,761,218 | | | | 198,569,784 | |
| End of Year | | $ | 185,105,740 | | | $ | 296,761,218 | |
| | | | | | | | | |
| Share Transactions: | | | | | | | | |
| Issued | | | 150,000 | | | | 3,300,000 | |
| Redeemed | | | (1,600,000 | ) | | | (500,000 | ) |
| Net Increase (Decrease) in Shares Outstanding from Share Transactions | | | (1,450,000 | ) | | | 2,800,000 | |
| (1) | Includes transaction costs related to creations and redemptions. |
The accompanying notes are an integral part of the financial statements.
Statements of Changes in Net Assets (continued)
| | KraneShares MSCI All
China Health
Care Index ETF | |
| | | Year Ended
March 31,
2023 | | | Year Ended
March 31,
2022 | |
| Operations: | | | | | | | | |
| Net Investment Income (Loss) | | $ | 376,911 | | | $ | (85,433 | ) |
| Net Realized Loss | | | (41,140,859 | ) | | | (1,397,169 | ) |
| Net Change in Unrealized Appreciation (Depreciation) | | | 23,296,248 | | | | (57,562,032 | ) |
| Net Decrease in Net Assets Resulting from Operations | | | (17,467,700 | ) | | | (59,044,634 | ) |
| Distributions | | | (50,955 | ) | | | (21,078,396 | ) |
| | | | | | | | | |
| Capital Share Transactions:(1) | | | | | | | | |
| Issued | | | 11,751,147 | | | | 44,149,338 | |
| Redeemed | | | (36,551,437 | ) | | | (41,679,374 | ) |
| Increase (Decrease) in Net Assets from Capital Share Transactions | | | (24,800,290 | ) | | | 2,469,964 | |
| Total Decrease in Net Assets | | | (42,318,945 | ) | | | (77,653,066 | ) |
| | | | | | | | | |
| Net Assets: | | | | | | | | |
| Beginning of Year | | | 136,810,985 | | | | 214,464,051 | |
| End of Year | | $ | 94,492,040 | | | $ | 136,810,985 | |
| | | | | | | | | |
| Share Transactions: | | | | | | | | |
| Issued | | | 550,000 | | | | 1,300,000 | |
| Redeemed | | | (1,750,000 | ) | | | (1,150,000 | ) |
| Net Increase (Decrease) in Shares Outstanding from Share Transactions | | | (1,200,000 | ) | | | 150,000 | |
| (1) | Includes transaction costs related to creations and redemptions. |
The accompanying notes are an integral part of the financial statements.
Statements of Changes in Net Assets (continued)
| | | KraneShares Asia
Pacific High Income
Bond ETF | |
| | | Year Ended March 31,
2023 | | | Year Ended
March 31,
2022 | |
| Operations: | | | | | | | | |
| Net Investment Income | | $ | 1,813,772 | | | $ | 1,006,947 | |
| Net Realized Loss | | | (3,640,259 | ) | | | (3,985,978 | ) |
| Net Change in Unrealized Appreciation (Depreciation) | | | 924,584 | | | | (1,285,892 | ) |
| Net Decrease in Net Assets Resulting from Operations | | | (901,903 | ) | | | (4,264,923 | ) |
| Distributions | | | (2,002,618 | ) | | | (1,214,239 | ) |
| Return of Capital | | | — | | | | (192,065 | ) |
| | | | | | | | | |
| Capital Share Transactions:(1) | | | | | | | | |
| Issued | | | 4,213,744 | | | | 29,733,209 | |
| Redeemed | | | (7,799,091 | ) | | | (7,312,822 | ) |
| Increase (Decrease) in Net Assets from Capital Share Transactions | | | (3,585,347 | ) | | | 22,420,387 | |
| Total Increase (Decrease) in Net Assets | | | (6,489,868 | ) | | | 16,749,160 | |
| | | | | | | | | |
| Net Assets: | | | | | | | | |
| Beginning of Year | | | 26,535,141 | | | | 9,785,981 | |
| End of Year | | $ | 20,045,273 | | | $ | 26,535,141 | |
| | | | | | | | | |
| Share Transactions: | | | | | | | | |
| Issued | | | 150,000 | | | | 900,000 | |
| Redeemed | | | (300,000 | ) | | | (250,000 | ) |
| Net Increase (Decrease) in Shares Outstanding from Share Transactions | | | (150,000 | ) | | | 650,000 | |
| (1) | Includes transaction costs related to creations and redemptions. |
Amounts designated as “—” are $0 or have been rounded to $0.
The accompanying notes are an integral part of the financial statements.
Statements of Changes in Net Assets (continued)
| | | KraneShares Emerging
Markets Healthcare
Index ETF | |
| | | Year Ended March 31,
2023 | | | Year Ended
March 31,
2022 | |
| Operations: | | | | | | | | |
| Net Investment Income (Loss) | | $ | (1,704 | ) | | $ | 11,822 | |
| Net Realized Loss | | | (360,813 | ) | | | (171,867 | ) |
| Net Change in Unrealized Appreciation (Depreciation) | | | (6,688 | ) | | | (878,739 | ) |
| Net Decrease in Net Assets Resulting from Operations | | | (369,205 | ) | | | (1,038,784 | ) |
| Distributions | | | (4,560 | ) | | | (10,783 | ) |
| | | | | | | | | |
| Capital Share Transactions:(1) | | | | | | | | |
| Issued | | | — | | | | 2,217 | |
| Redeemed | | | — | | | | (1,492,577 | ) |
| Decrease in Net Assets from Capital Share Transactions | | | — | | | | (1,490,360 | ) |
| Total Decrease in Net Assets | | | (373,765 | ) | | | (2,539,927 | ) |
| | | | | | | | | |
| Net Assets: | | | | | | | | |
| Beginning of Year | | | 2,468,835 | | | | 5,008,762 | |
| End of Year | | $ | 2,095,070 | | | $ | 2,468,835 | |
| | | | | | | | | |
| Share Transactions: | | | | | | | | |
| Redeemed | | | — | | | | (50,000 | ) |
| Net Decrease in Shares Outstanding from Share Transactions | | | — | | | | (50,000 | ) |
| (1) | Includes transaction costs related to creations and redemptions. |
Amounts designated as “—” are $0 or have been rounded to $0.
The accompanying notes are an integral part of the financial statements.
Statements of Changes in Net Assets (continued)
| | KraneShares MSCI
Emerging Markets
ex China Index ETF | |
| | | Year Ended
March 31,
2023 | | | Year Ended
March 31,
2022 | |
| Operations: | | | | | | | | |
| Net Investment Income | | $ | 745,190 | | | $ | 720,486 | |
| Net Realized Gain (Loss) | | | (1,579,020 | ) | | | 335,656 | |
| Net Change in Unrealized Appreciation (Depreciation) | | | (2,861,210 | ) | | | (851,279 | ) |
| Net Increase (Decrease) in Net Assets Resulting from Operations | | | (3,695,040 | ) | | | 204,863 | |
| Distributions | | | (693,378 | ) | | | (1,341,512 | ) |
| | | | | | | | | |
| Capital Share Transactions:(1) | | | | | | | | |
| Issued | | | 14,955,300 | | | | 9,310,517 | |
| Redeemed | | | (13,153,943 | ) | | | (6,466,320 | ) |
| Increase in Net Assets from Capital Share Transactions | | | 1,801,357 | | | | 2,844,197 | |
| Total Increase (Decrease) in Net Assets | | | (2,587,061 | ) | | | 1,707,548 | |
| | | | | | | | | |
| Net Assets: | | | | | | | | |
| Beginning of Year | | | 32,698,696 | | | | 30,991,148 | |
| End of Year | | $ | 30,111,635 | | | $ | 32,698,696 | |
| | | | | | | | | |
| Share Transactions: | | | | | | | | |
| Issued | | | 600,000 | | | | 300,000 | |
| Redeemed | | | (500,000 | ) | | | (200,000 | ) |
| Net Increase in Shares Outstanding from Share Transactions | | | 100,000 | | | | 100,000 | |
| (1) | Includes transaction costs related to creations and redemptions. |
The accompanying notes are an integral part of the financial statements.
Statements of Changes in Net Assets (continued)
| | | 189 KraneShares MSCI
China ESG
Leaders Index ETF | |
| | | Year Ended
March 31,
2023 | | | Year Ended
March 31,
2022 | |
| Operations: | | | | | | | | |
| Net Investment Income | | $ | 108,423 | | | $ | 141,014 | |
| Net Realized Loss | | | (2,245,862 | ) | | | (413,967 | ) |
| Net Change in Unrealized Appreciation (Depreciation) | | | 1,510,945 | | | | (2,750,597 | ) |
| Net Decrease in Net Assets Resulting from Operations | | | (626,494 | ) | | | (3,023,550 | ) |
| Distributions | | | (100,843 | ) | | | (219,611 | ) |
| | | | | | | | | |
| Capital Share Transactions:(1) | | | | | | | | |
| Issued | | | 12,606 | | | | 2,806 | |
| Redeemed | | | (2,245,452 | ) | | | (1,660,518 | ) |
| Decrease in Net Assets from Capital Share Transactions | | | (2,232,846 | ) | | | (1,657,712 | ) |
| Total Decrease in Net Assets | | | (2,960,183 | ) | | | (4,900,873 | ) |
| | | | | | | | | |
| Net Assets: | | | | | | | | |
| Beginning of Year | | | 7,937,654 | | | | 12,838,527 | |
| End of Year | | $ | 4,977,471 | | | $ | 7,937,654 | |
| | | | | | | | | |
| Share Transactions: | | | | | | | | |
| Redeemed | | | (100,000 | ) | | | (50,000 | ) |
| Net Decrease in Shares Outstanding from Share Transactions | | | (100,000 | ) | | | (50,000 | ) |
| (1) | Includes transaction costs related to creations and redemptions. |
The accompanying notes are an integral part of the financial statements.
Statements of Changes in Net Assets (continued)
| | KraneShares CICC
China 5G & Semiconductor
Index ETF | |
| | | Year Ended
March 31,
2023 | | | Year Ended
March 31,
2022 | |
| Operations: | | | | | | | | |
| Net Investment Income | | $ | 74,429 | | | $ | 140,986 | |
| Net Realized Loss | | | (2,842,161 | ) | | | (1,232,367 | ) |
| Net Change in Unrealized Appreciation (Depreciation) | | | 268,365 | | | | 2,467,447 | |
| Net Increase (Decrease) in Net Assets Resulting from Operations | | | (2,499,367 | ) | | | 1,376,066 | |
| Distributions | | | (45,914 | ) | | | — | |
| | | | | | | | | |
| Capital Share Transactions:(1) | | | | | | | | |
| Issued | | | 3,203 | | | | 7,848,791 | |
| Redeemed | | | (4,057,370 | ) | | | (106,409,148 | ) |
| Decrease in Net Assets from Capital Share Transactions | | | (4,054,167 | ) | | | (98,560,357 | ) |
| Total Decrease in Net Assets | | | (6,599,448 | ) | | | (97,184,291 | ) |
| | | | | | | | | |
| Net Assets: | | | | | | | | |
| Beginning of Year | | | 21,695,860 | | | | 118,880,151 | |
| End of Year | | $ | 15,096,412 | | | $ | 21,695,860 | |
| | | | | | | | | |
| Share Transactions: | | | | | | | | |
| Issued | | | — | | | | 300,000 | |
| Redeemed | | | (250,000 | ) | | | (4,350,000 | ) |
| Net Decrease in Shares Outstanding from Share Transactions | | | (250,000 | ) | | | (4,050,000 | ) |
| (1) | Includes transaction costs related to creations and redemptions. |
Amounts designated as “—” are $0 or have been rounded to $0.
The accompanying notes are an integral part of the financial statements.
Statements of Changes in Net Assets (continued)
| | | KraneShares CICC
China Consumer
Leaders Index ETF | |
| | | Year Ended
March 31,
2023 | | | Year Ended
March 31,
2022 | |
| Operations: | | | | | | | | |
| Net Investment Income | | $ | 134,895 | | | $ | 330,472 | |
| Net Realized Loss | | | (11,363,452 | ) | | | (7,146,359 | ) |
| Net Change in Unrealized Appreciation (Depreciation) | | | 10,214,006 | | | | (6,860,658 | ) |
| Net Decrease in Net Assets Resulting from Operations | | | (1,014,551 | ) | | | (13,676,545 | ) |
| Distributions | | | (68,755 | ) | | | (267,348 | ) |
| | | | | | | | | |
| Capital Share Transactions:(1) | | | | | | | | |
| Issued | | | 293,649 | | | | 19,432,252 | |
| Redeemed | | | (36,769,983 | ) | | | (15,178,158 | ) |
| Increase (Decrease) in Net Assets from Capital Share Transactions | | | (36,476,334 | ) | | | 4,254,094 | |
| Total Decrease in Net Assets | | | (37,559,640 | ) | | | (9,689,799 | ) |
| | | | | | | | | |
| Net Assets: | | | | | | | | |
| Beginning of Year | | | 44,529,474 | | | | 54,219,273 | |
| End of Year | | $ | 6,969,834 | | | $ | 44,529,474 | |
| | | | | | | | | |
| Share Transactions: | | | | | | | | |
| Issued | | | — | | | | 800,000 | |
| Redeemed | | | (1,900,000 | ) | | | (650,000 | ) |
| Net Increase (Decrease) in Shares Outstanding from Share Transactions | | | (1,900,000 | ) | | | 150,000 | |
| (1) | Includes transaction costs related to creations and redemptions. |
Amounts designated as “—” are $0 or have been rounded to $0.
The accompanying notes are an integral part of the financial statements.
Statements of Changes in Net Assets (continued)
| | KraneShares SSE
STAR Market 50
Index ETF | |
| | | Year Ended March 31, 2023 | | | Year Ended
March 31,
2022 | |
| Operations: | | | | | | | | |
| Net Investment Loss | | $ | (222,457 | ) | | $ | (597,970 | ) |
| Net Realized Loss | | | (14,314,363 | ) | | | (5,609,501 | ) |
| Net Change in Unrealized Appreciation (Depreciation) | | | 7,885,520 | | | | (2,007,586 | ) |
| Net Decrease in Net Assets Resulting from Operations | | | (6,651,300 | ) | | | (8,215,057 | ) |
| | | | | | | | | |
| Capital Share Transactions:(1) | | | | | | | | |
| Issued | | | 2,467,586 | | | | 25,541,153 | |
| Redeemed | | | (13,360,925 | ) | | | (45,373,706 | ) |
| Decrease in Net Assets from Capital Share Transactions | | | (10,893,339 | ) | | | (19,832,553 | ) |
| Total Decrease in Net Assets | | | (17,544,639 | ) | | | (28,047,610 | ) |
| | | | | | | | | |
| Net Assets: | | | | | | | | |
| Beginning of Year | | | 65,674,149 | | | | 93,721,759 | |
| End of Year | | $ | 48,129,510 | | | $ | 65,674,149 | |
| | | | | | | | | |
| Share Transactions: | | | | | | | | |
| Issued | | | 150,000 | | | | 1,000,000 | |
| Redeemed | | | (800,000 | ) | | | (1,950,000 | ) |
| Net Decrease in Shares Outstanding from Share Transactions | | | (650,000 | ) | | | (950,000 | ) |
| (1) | Includes transaction costs related to creations and redemptions. |
The accompanying notes are an integral part of the financial statements.
Statements of Changes in Net Assets (continued)
| | | KraneShares Hang
Seng TECH Index ETF | |
| | | Year Ended
March 31,
2023 | | | Period Ended
March 31,
2022(1) | |
| Operations: | | | | | | | | |
| Net Investment Income | | $ | 31,932 | | | $ | 2,441 | |
| Net Realized Loss | | | (4,108,228 | ) | | | (620,063 | ) |
| Net Change in Unrealized Appreciation (Depreciation) | | | 2,353,946 | | | | (1,540,772 | ) |
| Net Decrease in Net Assets Resulting from Operations | | | (1,722,350 | ) | | | (2,158,394 | ) |
| Distributions | | | (11,428 | ) | | | — | |
| | | | | | | | | |
| Capital Share Transactions:(2) | | | | | | | | |
| Issued | | | 7,531,750 | | | | 7,728,841 | |
| Redeemed | | | (4,053,614 | ) | | | — | |
| Increase in Net Assets from Capital Share Transactions | | | 3,478,136 | | | | 7,728,841 | |
| Total Increase in Net Assets | | | 1,744,358 | | | | 5,570,447 | |
| | | | | | | | | |
| Net Assets: | | | | | | | | |
| Beginning of Year/Period | | | 5,570,447 | | | | — | |
| End of Year/Period | | $ | 7,314,805 | | | $ | 5,570,447 | |
| | | | | | | | | |
| Share Transactions: | | | | | | | | |
| Issued | | | 550,001 | | | | 400,001 | |
| Redeemed | | | (400,000 | ) | | | — | |
| Net Increase in Shares Outstanding from Share Transactions | | | 150,001 | | | | 400,001 | |
| (1) | Commenced operations on June 8, 2021. |
| (2) | Includes transaction costs related to creations and redemptions. |
Amounts designated as “—” are $0 or have been rounded to $0.
The accompanying notes are an integral part of the financial statements.
Statements of Changes in Net Assets (continued)
| | | KraneShares China
Innovation ETF | |
| | | Year Ended
March 31,
2023 | | | Period Ended
March 31,
2022(1) | |
| Operations: | | | | | | | | |
| Net Investment Loss | | $ | (634 | ) | | $ | (688 | ) |
| Net Realized Gain (Loss) | | | (87,288 | ) | | | 115,589 | |
| Net Change in Unrealized Appreciation (Depreciation) | | | 23,085 | | | | (752,572 | ) |
| Net Decrease in Net Assets Resulting from Operations | | | (64,837 | ) | | | (637,671 | ) |
| Distributions | | | (110,615 | ) | | | (4,286 | ) |
| Return of Capital | | | (53,934 | ) | | | — | |
| | | | | | | | | |
| Capital Share Transactions:(2) | | | | | | | | |
| Issued | | | — | | | | 3,479,534 | |
| Redeemed | | | (1,011,132 | ) | | | — | |
| Increase (Decrease) in Net Assets from Capital Share Transactions | | | (1,011,132 | ) | | | 3,479,534 | |
| Total Increase (Decrease) in Net Assets | | | (1,240,518 | ) | | | 2,837,577 | |
| | | | | | | | | |
| Net Assets: | | | | | | | | |
| Beginning of Year/Period | | | 2,837,577 | | | | — | |
| End of Year/Period | | $ | 1,597,059 | | | $ | 2,837,577 | |
| | | | | | | | | |
| Share Transactions: | | | | | | | | |
| Issued | | | — | | | | 150,002 | |
| Redeemed | | | (50,000 | ) | | | — | |
| Net Increase (Decrease) in Shares Outstanding from Share Transactions | | | (50,000 | ) | | | 150,002 | |
| (1) | Commenced operations on October 5, 2021. |
| (2) | Includes transaction costs related to creations and redemptions. |
Amounts designated as “—” are $0 or have been rounded to $0.
The accompanying notes are an integral part of the financial statements.
Statements of Changes in Net Assets (concluded)
| | | KraneShares S&P Pan Asia Dividend Aristocrats Index ETF | | | KraneShares China Internet and Covered Call Strategy ETF | |
| | | Period Ended
March 31,
2023(1) | | | Period Ended
March 31,
2023(2) | |
| Operations: | | | | | | | | |
| Net Investment Income (Loss) | | $ | 36,318 | | | $ | (1,113 | ) |
| Net Realized Gain | | | 5,115 | | | | 395,952 | |
| Net Change in Unrealized Appreciation (Depreciation) | | | 109,776 | | | | (528,078 | ) |
| Net Increase (Decrease) in Net Assets Resulting from Operations | | | 151,209 | | | | (133,239 | ) |
| Distributions | | | (22,329 | ) | | | (395,952 | ) |
| Return of Capital | | | — | | | | (139,051 | ) |
| | | | | | | | | |
| Capital Share Transactions:(3) | | | | | | | | |
| Issued | | | 2,500,050 | | | | 5,982,226 | |
| Increase in Net Assets from Capital Share Transactions | | | 2,500,050 | | | | 5,982,226 | |
| Total Increase in Net Assets | | | 2,628,930 | | | | 5,313,984 | |
| | | | | | | | | |
| Net Assets: | | | | | | | | |
| Beginning of Period | | | — | | | | — | |
| End of Period | | $ | 2,628,930 | | | $ | 5,313,984 | |
| | | | | | | | | |
| Share Transactions: | | | | | | | | |
| Issued | | | 100,002 | | | | 250,002 | |
| Net Increase in Shares Outstanding from Share Transactions | | | 100,002 | | | | 250,002 | |
| (1) | Commenced operations on September 15, 2022. |
| (2) | Commenced operations on January 12, 2023. |
| (3) | Includes transaction costs related to creations and redemptions. |
Amounts designated as “—” are $0 or have been rounded to $0.
The accompanying notes are an integral part of the financial statements.
Financial Highlights
Selected Per Share Data & Ratios
For the Years Ended March 31
For a Share Outstanding Throughout Each Period
| | | Net Asset
Value,
Beginning of
Period
($) | | Net Investment
Income (Loss)
($)* | | Net Realized and
Unrealized Gain
(Loss)
on Investments
($) | | Total
from
Operations
($) | | Distribution
from Net
Investment
Income
($) | | Distribution from
Capital Gains
($) | | Return of
Capital
($) |
| KraneShares CICC China Leaders 100 Index ETF |
| 2023 | | 28.78 | | 0.87 | | (4.72) | | (3.85) | | (0.84) | | (0.23) | | — |
| 2022 | | 31.41 | | 0.62 | | 0.30 | | 0.92 | | (0.63) | | (2.92) | | — |
| 2021 | | 25.03 | | 0.80 | | 6.41 | | 7.21 | | (0.83) | | — | | — |
| 2020 | | 28.00 | | 0.06 | | (2.98) | | (2.92) | | (0.05) | | — | | — |
| 2019 | | 33.88 | | 0.66 | | (2.09) | | (1.43) | | (0.68) | | (3.77) | | — |
| KraneShares CSI China Internet ETF |
| 2023 | | 29.52 | | 0.18 | | 1.55 | | 1.73 | | — | | — | | — |
| 2022 | | 75.59 | | (0.05) | | (43.44) | | (43.49) | | — | | (2.58) | | — |
| 2021 | | 45.19 | | (0.28) | | 30.90 | | 30.62 | | (0.22) | | — | | — |
| 2020 | | 47.04 | | (0.02) | | (1.79) | | (1.81) | | (0.04) | | — | | — |
| 2019 | | 61.11 | | 0.10 | | (12.90) | | (12.80) | | (0.01) | | (1.26) | | — |
| KraneShares Bosera MSCI China A 50 Connect Index ETF |
| 2023 | | 37.05 | | 0.57 | | (5.28) | | (4.71) | | (0.54) | | (5.71) | | — |
| 2022 | | 43.97 | | 0.43 | | (3.41) | | (2.98) | | (0.49) | | (3.45) | | — |
| 2021 | | 29.51 | | 0.30 | | 14.46 | | 14.76 | | (0.30) | | — | | — |
| 2020 | | 31.88 | | 0.47 | | (2.34) | | (1.87) | | (0.50) | | — | | — |
| 2019 | | 34.47 | | 0.60 | | (2.27) | | (1.67) | | (0.52) | | (0.40) | | — |
| KraneShares Bloomberg China Bond Inclusion Index ETF |
| 2023 | | 33.97 | | 0.68 | | (2.05) | | (1.37) | | (0.22) | | — | | (0.54) |
| 2022 | | 34.67 | | 0.55 | | 1.12 | | 1.67 | | (2.37) | | — | | — |
| 2021 | | 32.31 | | 0.60 | | 2.57 | | 3.17 | | (0.81) | | — | | — |
| 2020 | | 34.22 | | 0.81 | | (1.75) | | (0.94) | | — | | — | | (0.97) |
| 2019 | | 37.23 | | 1.31 | | (2.29) | | (0.98) | | (1.95) | | — | | (0.08) |
| * | Per share data calculated using average shares method. |
| ** | Total return is based on the change in net asset value of a share during the year or period and assumes reinvestment of dividends and distributions at net asset value. Total return is for the period indicated and periods of less than one year have not been annualized. The return shown does not reflect the deduction of taxes that a shareholder would pay on Fund distributions or the redemption of Fund shares. Excludes effects of standard creation and redemption transaction fees associated with creation units. |
| ^ | The ratios of expenses and net investment income/(loss) to Average Net Assets reflect the expenses and net investment income/(loss), respectively, for the year/period as reported in the Statements of Operations and do not reflect the Fund’s proportionate share of the income and expenses of the money market funds. |
| ~ | During the periods, certain fees were waived. (See Note 3 in the Notes to Financial Statements). |
| (1) | During the year ended March 31, 2023, 2022, 2021, 2020, and 2019 the Fund participated in securities lending, generating $3,155,440, $3,419,311, $3,716,046, $5,794,534, and $9,746,130, respectively, in security lending income. The expense ratios include $301,354, $337,352, $376,498, $579,613, and $968,632, respectively, in security lending fees paid to the Adviser. Had these fees been excluded, the expense ratios would have been 0.69%, 0.68%, 0.69%, 0,69%, and 0.69%, respectively. |
The accompanying notes are an integral part of the financial statements.
Total from
Distributions
($) | | Net Asset
Value, End
of Period
($) | | Total Return
(%)** | | Net Assets
End of Period
($)(000) | |
Ratio of
Expenses to
Average Net
Assets
(%)~ | | Ratio of Expenses
to Average Net
Assets (Excluding
Waivers, as
applicable)
(%)~ | | Ratio of Net
Investment
Income (Loss)
to Average Net
Assets
(%) | | Portfolio
Turnover
(%) |
| | | | | | | | | | | | | | | |
| (1.07) | | 23.86 | | (13.15) | | 5,965 | | 0.69 | | 0.69 | | 3.52 | | 90 |
| (3.55) | | 28.78 | | 2.77 | | 10,075 | | 0.68 | | 0.68 | | 2.00 | | 167 |
| (0.83) | | 31.41 | | 28.90 | | 12,563 | | 0.69 | | 0.69 | | 2.68 | | 143 |
| (0.05) | | 25.03 | | (10.45) | | 16,273 | | 0.69 | | 0.69 | | 0.23 | | 126 |
| (4.45) | | 28.00 | | (0.62) | | 2,800 | | 0.70 | | 0.70 | | 2.21 | | 181 |
| | | | | | | | | | | | | | | |
| — | | 31.25 | | 5.86 | | 6,111,669 | | 0.69(1) | | 0.69 | | 0.61 | | 60 |
| (2.58) | | 29.52 | | (57.99) | | 6,239,534 | | 0.69(1) | | 0.69 | | (0.12) | | 60 |
| (0.22) | | 75.59 | | 67.77 | | 3,662,260 | | 0.70(1) | | 0.70 | | (0.39) | | 89 |
| (0.04) | | 45.19 | | (3.85) | | 2,313,638 | | 0.73(1) | | 0.73 | | (0.05) | | 33 |
| (1.27) | | 47.04 | | (20.44) | | 2,074,505 | | 0.75(1) | | 0.76 | | 0.20 | | 70 |
| | | | | | | | | | | | | | | |
| (6.25) | | 26.09 | | (12.63) | | 470,873 | | 0.55 | | 0.78 | | 1.83 | | 68 |
| (3.94) | | 37.05 | | (7.96) | | 559,393 | | 0.59 | | 0.79 | | 0.97 | | 89 |
| (0.30) | | 43.97 | | 50.00 | | 802,364 | | 0.59 | | 0.79 | | 0.74 | | 35 |
| (0.50) | | 29.51 | | (5.98) | | 507,508 | | 0.59 | | 0.80 | | 1.52 | | 91 |
| (0.92) | | 31.88 | | (4.01) | | 604,035 | | 0.60 | | 0.80 | | 2.05 | | 106 |
| | | | | | | | | | | | | | | |
| (0.76) | | 31.84 | | (3.98) | | 11,145 | | 0.49 | | 0.69 | | 2.15 | | 151 |
| (2.37) | | 33.97 | | 4.89 | | 13,586 | | 0.42 | | 0.68 | | 1.59 | | 159 |
| (0.81) | | 34.67 | | 9.91 | | 12,134 | | 0.57^ | | 0.69^ | | 1.80^ | | — |
| (0.97) | | 32.31 | | (2.75) | | 12,924 | | 0.57^ | | 0.70^ | | 2.46^ | | — |
| (2.03) | | 34.22 | | (2.52) | | 18,822 | | 0.58^ | | 0.70^ | | 3.76^ | | — |
The accompanying notes are an integral part of the financial statements.
Financial Highlights (continued)
Selected Per Share Data & Ratios
For the Years Ended March 31
For a Share Outstanding Throughout Each Period
| | | Net Asset
Value,
Beginning of
Period
($) | | Net Investment
Income (Loss)
($)* | | Net Realized and
Unrealized Gain
(Loss)
on Investments
($) | | Total
from
Operations
($) | | Distribution
from Net
Investment
Income
($) | | Distribution from
Capital Gains
($) | | Return of
Capital
($) |
| KraneShares MSCI All China Index ETF |
| 2023 | | 24.89 | | 0.50 | | (2.15) | | (1.65) | | (0.77) | | (0.48) | | — |
| 2022 | | 34.46 | | 0.47 | | (8.71) | | (8.24) | | (0.40) | | (0.93) | | — |
| 2021 | | 23.53 | | 0.22 | | 11.06 | | 11.28 | | (0.35) | | — | | — |
| 2020 | | 25.48 | | 0.36 | | (1.93) | | (1.57) | | (0.38) | | — | | — |
| 2019 | | 26.96 | | 0.18 | | (1.23) | | (1.05) | | (0.43) | | — | | — |
| KraneShares MSCI One Belt One Road Index ETF |
| 2023 | | 27.63 | | 0.73 | | (4.85) | | (4.12) | | (1.08) | | — | | — |
| 2022 | | 28.85 | | 0.95 | | (1.18) | | (0.23) | | (0.99) | | — | | — |
| 2021 | | 17.76 | | 0.48 | | 11.16 | | 11.64 | | (0.55) | | — | | — |
| 2020 | | 23.69 | | 0.70 | | (5.58) | | (4.88) | | (1.05) | | — | | — |
| 2019 | | 25.64 | | 0.48 | | (1.82) | | (1.34) | | (0.61) | | — | | — |
| KraneShares Emerging Markets Consumer Technology Index ETF |
| 2023 | | 18.04 | | 0.10 | | (2.86) | | (2.76) | | — | | — | | — |
| 2022 | | 32.06 | | (0.05) | | (13.90) | | (13.95) | | (0.01) | | (0.06) | | — |
| 2021 | | 19.55 | | 0.11 | | 13.14 | | 13.25 | | (0.74) | | — | | — |
| 2020 | | 22.94 | | 0.10 | | (3.07) | | (2.97) | | (0.42) | | — | | — |
| 2019 | | 26.48 | | — | | (3.54) | | (3.54) | | — | | — | | — |
| KraneShares MSCI China Clean Technology Index ETF |
| 2023 | | 36.71 | | 0.12 | | (7.75) | | (7.63) | | (0.10) | | (0.44) | | — |
| 2022 | | 40.34 | | 0.21 | | (3.65) | | (3.44) | | (0.19) | | — | | — |
| 2021 | | 16.60 | | (0.28) | | 24.02 | | 23.74 | | —# | | — | | — |
| 2020 | | 20.28 | | 0.70 | | (3.29) | | (2.59) | | (1.09) | | — | | — |
| 2019 | | 23.86 | | 0.39 | | (3.61) | | (3.22) | | (0.36) | | — | | — |
| KraneShares Electric Vehicles and Future Mobility Index ETF |
| 2023 | | 39.57 | | 0.33 | | (8.98) | | (8.65) | | (0.32) | | — | | — |
| 2022 | | 42.25 | | 0.08 | | 0.39(3) | | 0.47 | | (0.52) | | (2.63) | | — |
| 2021 | | 19.02 | | 0.08 | | 23.21 | | 23.29 | | (0.06) | | — | | — |
| 2020 | | 20.64 | | 0.33 | | (1.51) | | (1.18) | | (0.44) | | — | | — |
| 2019 | | 23.30 | | 0.21 | | (2.62) | | (2.41) | | (0.25) | | — | | — |
| * | Per share data calculated using average shares method. |
| ** | Total return is based on the change in net asset value of a share during the year or period and assumes reinvestment of dividends and distributions at net asset value. Total return is for the period indicated and periods of less than one year have not been annualized. The return shown does not reflect the deduction of taxes that a shareholder would pay on Fund distributions or the redemption of Fund shares. Excludes effects of standard creation and redemption transaction fees associated with creation units. |
| # | Amount represents less than $0.005 per share. |
| ~ | During the periods, certain fees were waived. (See Note 3 in the Notes to Financial Statements). |
| (1) | The expense ratio includes $6,087 in security lending fees paid to the Adviser. Had these fees been excluded, the expense ratios would have been 0.58%. |
| (2) | The expense ratio includes $67,245 in security lending fees paid to the Adviser. Had these fees been excluded, the expense ratios would have been 0.69%. |
| (3) | Realized and unrealized gains and losses per share are balancing amounts necessary to reconcile the change in net asset value per share for the period, and may not reconcile with the aggregate gains and losses in the Statement of Operations due to share transactions for the period. |
The accompanying notes are an integral part of the financial statements.
Total from
Distributions
($) | | Net Asset
Value, End
of Period
($) | | Total Return
(%)** | | Net Assets
End of Period
($)(000) | |
Ratio of
Expenses to
Average Net
Assets
(%)~ | | Ratio of Expenses
to Average Net
Assets (Excluding
Waivers, as
applicable)
(%)~ | | Ratio of Net
Investment
Income (Loss)
to Average Net
Assets
(%) | | Portfolio
Turnover
(%) |
| | | | | | | | | | | | | | | |
| (1.25) | | 21.99 | | (6.44) | | 8,795 | | 0.49 | | 0.69 | | 2.19 | | 55 |
| (1.33) | | 24.89 | | (24.35) | | 16,181 | | 0.48 | | 0.68 | | 1.49 | | 18 |
| (0.35) | | 34.46 | | 47.97 | | 22,402 | | 0.49 | | 0.69 | | 0.67 | | 45 |
| (0.38) | | 23.53 | | (6.30) | | 7,059 | | 0.49 | | 0.69 | | 1.47 | | 7 |
| (0.43) | | 25.48 | | (3.52) | | 6,370 | | 0.67 | | 0.69 | | 0.74 | | 62 |
| | | | | | | | | | | | | | | |
| (1.08) | | 22.43 | | (14.98) | | 4,485 | | 0.79 | | 0.79 | | 2.96 | | 34 |
| (0.99) | | 27.63 | | (1.11) | | 8,290 | | 0.78 | | 0.78 | | 3.12 | | 36 |
| (0.55) | | 28.85 | | 65.82 | | 10,099 | | 0.79 | | 0.79 | | 2.07 | | 39 |
| (1.05) | | 17.76 | | (21.78) | | 7,105 | | 0.80 | | 0.80 | | 3.03 | | 30 |
| (0.61) | | 23.69 | | (4.94) | | 21,322 | | 0.79 | | 0.79 | | 2.05 | | 72 |
| | | | | | | | | | | | | | | |
| — | | 15.28 | | (15.30) | | 30,562 | | 0.60(1) | | 0.80 | | 0.66 | | 87 |
| (0.07) | | 18.04 | | (43.57) | | 55,935 | | 0.59 | | 0.79 | | (0.17) | | 97 |
| (0.74) | | 32.06 | | 67.85 | | 110,604 | | 0.59 | | 0.79 | | 0.36 | | 112 |
| (0.42) | | 19.55 | | (13.29) | | 22,485 | | 0.81 | | 0.81 | | 0.46 | | 56 |
| — | | 22.94 | | (13.37) | | 28,680 | | 0.80 | | 0.80 | | (0.02) | | 119 |
| | | | | | | | | | | | | | | |
| (0.54) | | 28.54 | | (20.71) | | 95,611 | | 0.79 | | 0.79 | | 0.38 | | 49 |
| (0.19) | | 36.71 | | (8.61) | | 146,859 | | 0.78 | | 0.78 | | 0.48 | | 62 |
| — | | 40.34 | | 143.03 | | 141,173 | | 0.78 | | 0.78 | | (0.65) | | 164 |
| (1.09) | | 16.60 | | (13.17) | | 1,661 | | 0.79 | | 0.79 | | 3.81 | | 53 |
| (0.36) | | 20.28 | | (13.28) | | 4,056 | | 0.79 | | 0.80 | | 1.92 | | 147 |
| | | | | | | | | | | | | | | |
| (0.32) | | 30.60 | | (21.78) | | 185,106 | | 0.72(2) | | 0.72 | | 0.99 | | 69 |
| (3.15) | | 39.57 | | 0.04 | | 296,761 | | 0.70 | | 0.70 | | 0.17 | | 114 |
| (0.06) | | 42.25 | | 122.46 | | 198,570 | | 0.70 | | 0.70 | | 0.21 | | 81 |
| (0.44) | | 19.02 | | (6.15) | | 17,116 | | 0.72 | | 0.72 | | 1.57 | | 53 |
| (0.25) | | 20.64 | | (10.19) | | 33,026 | | 0.70 | | 0.70 | | 0.98 | | 74 |
The accompanying notes are an integral part of the financial statements.
Financial Highlights (continued)
Selected Per Share Data & Ratios
For the Years/Periods Ended March 31
For a Share Outstanding Throughout Each Period
| | | Net Asset
Value,
Beginning of
Period
($) | | Net Investment
Income (Loss)
($)* | | Net Realized and
Unrealized Gain
(Loss)
on Investments
($) | | Total
from
Operations
($) | | Distribution
from Net
Investment
Income
($) | | Distribution from
Capital Gains
($) | | Return of
Capital
($) |
| KraneShares MSCI All China Health Care Index ETF |
| 2023 | | 23.79 | | 0.07 | | (3.08) | | (3.01) | | (0.01) | | — | | — |
| 2022 | | 38.30 | | (0.02) | | (10.44) | | (10.46) | | — | | (4.05) | | — |
| 2021 | | 23.78 | | (0.09) | | 14.61 | | 14.52 | | —# | | — | | — |
| 2020 | | 22.29 | | 0.07 | | 1.48 | | 1.55 | | (0.06) | | — | | — |
| 2019 | | 26.65 | | 0.02 | | (4.30) | | (4.28) | | (0.04) | | (0.04) | | — |
| KraneShares Asia Pacific High Income Bond ETF |
| 2023 | | 29.48 | | 2.23 | | (2.44) | | (0.21) | | (2.54) | | — | | — |
| 2022 | | 39.14 | | 1.78 | | (9.26) | | (7.48) | | (1.88) | | — | | (0.30) |
| 2021 | | 37.32 | | 2.10 | | 2.44 | | 4.54 | | (2.58) | | (0.14) | | — |
| 2020 | | 40.73 | | 2.08 | | (3.49) | | (1.41) | | (1.81) | | (0.19) | | — |
| 2019(1) | | 40.00 | | 1.55 | | 0.67 | | 2.22 | | (1.31) | | —# | | (0.18) |
| KraneShares Emerging Markets Healthcare Index ETF |
| 2023 | | 24.69 | | (0.02) | | (3.67) | | (3.69) | | (0.05) | | — | | — |
| 2022 | | 33.39 | | 0.09 | | (8.68) | | (8.59) | | (0.11) | | — | | — |
| 2021 | | 20.85 | | (0.02) | | 12.57 | | 12.55 | | (0.01) | | — | | — |
| 2020 | | 22.38 | | 0.01 | | (1.16) | | (1.15) | | (0.37) | | — | | (0.01) |
| 2019(2) | | 25.00 | | (0.04) | | (2.58) | | (2.62) | | —# | | — | | — |
| KraneShares MSCI Emerging Markets ex China Index ETF |
| 2023 | | 29.73 | | 0.91 | | (4.56) | | (3.65) | | (0.99) | | — | | — |
| 2022 | | 30.99 | | 0.79 | | (0.56) | | 0.23 | | (0.73) | | (0.76) | | — |
| 2021 | | 18.41 | | 0.55 | | 12.53 | | 13.08 | | (0.50) | | — | | — |
| 2020(3) | | 25.00 | | 0.60 | | (6.45) | | (5.85) | | (0.74) | | — | | — |
| KraneShares MSCI China ESG Leaders Index ETF |
| 2023 | | 22.68 | | 0.40 | | (2.77) | | (2.37) | | (0.40) | | — | | — |
| 2022 | | 32.10 | | 0.39 | | (9.18) | | (8.79) | | (0.33) | | (0.30) | | — |
| 2021(4) | | 25.00 | | (0.07) | | 7.32 | | 7.25 | | — | | (0.15) | | — |
| KraneShares CICC China 5G & Semiconductor Index ETF |
| 2023 | | 19.72 | | 0.08 | | (1.99) | | (1.91) | | (0.05) | | — | | — |
| 2022 | | 23.08 | | 0.04 | | (3.40) | | (3.36) | | — | | — | | — |
| 2021(5) | | 25.00 | | (0.06) | | (1.86) | | (1.92) | | — | | — | | — |
| KraneShares CICC China Consumer Leaders Index ETF |
| 2023 | | 19.79 | | 0.26 | | 0.06 | | 0.32 | | (0.20) | | — | | — |
| 2022 | | 25.82 | | 0.15 | | (6.06) | | (5.91) | | (0.12) | | — | | — |
| 2021(6) | | 25.00 | | (0.05) | | 0.87 | | 0.82 | | — | | — | | — |
| * | Per share data calculated using average shares method. |
| ** | Total return is based on the change in net asset value of a share during the year or period and assumes reinvestment of dividends and distributions at net asset value. Total return is for the period indicated and periods of less than one year have not been annualized. The return shown does not reflect the deduction of taxes that a shareholder would pay on Fund distributions or the redemption of Fund shares. Excludes effects of standard creation and redemption transaction fees associated with creation units. |
| † | Annualized. |
| †† | Portfolio turnover rate is for the period indicated and periods of less than one year have not been annualized. |
| # | Amount represents less than $0.005 per share. |
| ~ | During the periods, certain fees were waived. (See Note 3 in the Notes to Financial Statements). |
| (1) | The Fund commenced operations on June 26, 2018. |
| (2) | The Fund commenced operations on August 29, 2018. |
The accompanying notes are an integral part of the financial statements.
Total from
Distributions
($) | | Net Asset
Value, End
of Period
($) | | Total Return
(%)** | | Net Assets
End of Period
($)(000) | |
Ratio of
Expenses to
Average Net
Assets
(%)~ | | Ratio of Expenses
to Average Net
Assets (Excluding
Waivers, as
applicable)
(%)~ | | Ratio of Net
Investment
Income (Loss)
to Average Net
Assets
(%) | | Portfolio
Turnover
(%) |
| | | | | | | | | | | | | | | |
| (0.01) | | 20.77 | | (12.65) | | 94,492 | | 0.65(7) | | 0.79 | | 0.35 | | 32 |
| (4.05) | | 23.79 | | (28.88) | | 136,811 | | 0.65 | | 0.79 | | (0.04) | | 44 |
| — | | 38.30 | | 61.06 | | 214,464 | | 0.65 | | 0.79 | | (0.25) | | 45 |
| (0.06) | | 23.78 | | 6.95 | | 32,110 | | 0.69 | | 0.79 | | 0.32 | | 101 |
| (0.08) | | 22.29 | | (15.99) | | 39,004 | | 0.79 | | 0.79 | | 0.08 | | 71 |
| | | | | | | | | | | | | | | |
| (2.54) | | 26.73 | | (0.44) | | 20,045 | | 0.69 | | 0.69 | | 8.19 | | 119 |
| (2.18) | | 29.48 | | (19.73) | | 26,535 | | 0.68 | | 0.68 | | 5.33 | | 150 |
| (2.72) | | 39.14 | | 12.32 | | 9,786 | | 0.69 | | 0.69 | | 5.32 | | 53 |
| (2.00) | | 37.32 | | (3.72) | | 11,197 | | 0.70 | | 0.70 | | 5.12 | | 70 |
| (1.49) | | 40.73 | | 5.72 | | 12,220 | | 0.69† | | 0.69† | | 5.13† | | 38†† |
| | | | | | | | | | | | | | | |
| (0.05) | | 20.95 | | (14.97) | | 2,095 | | 0.79 | | 0.79 | | (0.08) | | 36 |
| (0.11) | | 24.69 | | (25.77) | | 2,469 | | 0.81 | | 0.81 | | 0.29 | | 28 |
| (0.01) | | 33.39 | | 60.18 | | 5,009 | | 0.80 | | 0.80 | | (0.05) | | 73 |
| (0.38) | | 20.85 | | (5.25) | | 1,043 | | 0.80 | | 0.80 | | 0.04 | | 61 |
| — | | 22.38 | | (10.47) | | 4,476 | | 0.79† | | 0.79† | | (0.34)† | | 57†† |
| | | | | | | | | | | | | | | |
| (0.99) | | 25.09 | | (12.12) | | 30,112 | | 0.24 | | 0.59 | | 3.55 | | 50 |
| (1.49) | | 29.73 | | 0.57 | | 32,699 | | 0.23 | | 0.58 | | 2.52 | | 23 |
| (0.50) | | 30.99 | | 71.19 | | 30,991 | | 0.30 | | 0.58 | | 1.90 | | 19 |
| (0.74) | | 18.41 | | (24.31) | | 1,841 | | 0.50† | | 0.60† | | 2.54† | | 5†† |
| | | | | | | | | | | | | | | |
| (0.40) | | 19.91 | | (10.38) | | 4,977 | | 0.59 | | 0.59 | | 1.97 | | 42 |
| (0.63) | | 22.68 | | (27.63) | | 7,938 | | 0.59 | | 0.59 | | 1.30 | | 57 |
| (0.15) | | 32.10 | | 29.05 | | 12,839 | | 0.58† | | 0.58† | | (0.35)† | | 30†† |
| | | | | | | | | | | | | | | |
| (0.05) | | 17.76 | | (9.62) | | 15,096 | | 0.65 | | 0.79 | | 0.47 | | 25 |
| — | | 19.72 | | (14.56) | | 21,696 | | 0.65 | | 0.79 | | 0.17 | | 58 |
| — | | 23.08 | | (7.68) | | 118,880 | | 0.64† | | 0.78† | | (0.64)† | | 59†† |
| | | | | | | | | | | | | | | |
| (0.20) | | 19.91 | | 1.64 | | 6,970 | | 0.69 | | 0.69 | | 1.32 | | 46 |
| (0.12) | | 19.79 | | (22.98) | | 44,529 | | 0.68 | | 0.68 | | 0.63 | | 62 |
| — | | 25.82 | | 3.28 | | 54,219 | | 0.68† | | 0.68† | | (0.63)† | | 50†† |
| (3) | The Fund commenced operations on April 12, 2019. |
| (4) | The Fund commenced operations on July 28, 2020. |
| (5) | The Fund commenced operations on November 23, 2020. |
| (6) | The Fund commenced operations on December 8, 2020. |
| (7) | The expense ratio includes $1,908 in security lending fees paid to the Adviser. Had these fees been excluded, the expense ratios would have been 0.64%. |
The accompanying notes are an integral part of the financial statements.
Financial Highlights (concluded)
Selected Per Share Data & Ratios
For the Years/Periods Ended March 31
For a Share Outstanding Throughout Each Period
| | | Net Asset
Value,
Beginning of
Period
($) | | Net Investment
Income (Loss)
($)* | | Net Realized and
Unrealized Gain
(Loss)
on Investments
($) | | Total
from
Operations
($) | | Distribution
from Net
Investment
Income
($) | | Distribution from
Capital Gains
($) | | Return of
Capital
($) |
| KraneShares SSE STAR Market 50 Index ETF |
| 2023 | | 18.76 | | (0.07) | | (1.80) | | (1.87) | | — | | — | | — |
| 2022 | | 21.06 | | (0.14) | | (2.16) | | (2.30) | | — | | — | | — |
| 2021(1) | | 25.00 | | (0.03) | | (3.91) | | (3.94) | | — | | — | | — |
| KraneShares Hang Seng TECH Index ETF |
| 2023 | | 13.93 | | 0.05 | | (0.66) | | (0.61) | | (0.02) | | — | | — |
| 2022(2) | | 25.00 | | 0.01 | | (11.08) | | (11.07) | | — | | — | | — |
| KraneShares China Innovation ETF |
| 2023 | | 18.92 | | (0.01) | | (1.29) | | (1.30) | | — | | (1.11) | | (0.54) |
| 2022(3) | | 25.00 | | (0.01) | | (6.03) | | (6.04) | | (0.04) | | — | | — |
| KraneShares S&P Pan Asia Dividend Aristocrats Index ETF |
| 2023(4) | | 25.00 | | 0.37 | | 1.14 | | 1.51 | | (0.22) | | — | | — |
| KraneShares China Internet and Covered Call Strategy ETF |
| 2023(5) | | 25.00 | | (0.01) | | (0.91) | | (0.92) | | (2.09) | | — | | (0.73) |
| * | Per share data calculated using average shares method. |
| ** | Total return is based on the change in net asset value of a share during the year or period and assumes reinvestment of dividends and distributions at net asset value. Total return is for the period indicated and periods of less than one year have not been annualized. The return shown does not reflect the deduction of taxes that a shareholder would pay on Fund distributions or the redemption of Fund shares. Excludes effects of standard creation and redemption transaction fees associated with creation units. |
| † | Annualized. |
| †† | Portfolio turnover rate is for the period indicated and periods of less than one year have not been annualized. |
| ~ | During the periods, certain fees were waived. (See Note 3 in the Notes to Financial Statements). |
| (1) | The Fund commenced operations on January 26, 2021. |
| (2) | The Fund commenced operations on June 8, 2021. |
| (3) | The Fund commenced operations on October 5, 2021. |
| (4) | The Fund commenced operations on September 15, 2022. |
| (5) | The Fund commenced operations on January 12, 2023. |
The accompanying notes are an integral part of the financial statements.
Total from
Distributions
($) | | Net Asset
Value, End
of Period
($) | | Total Return
(%)** | | Net Assets
End of Period
($)(000) | |
Ratio of
Expenses to
Average Net
Assets
(%)~ | | Ratio of Expenses
to Average Net
Assets (Excluding
Waivers, as
applicable)
(%)~ | | Ratio of Net
Investment
Income (Loss)
to Average Net
Assets
(%) | | Portfolio
Turnover
(%) |
| | | | | | | | | | | | | | | |
| — | | 16.89 | | (9.97) | | 48,130 | | 0.89 | | 0.89 | | (0.44) | | 43 |
| — | | 18.76 | | (10.92) | | 65,674 | | 0.88 | | 0.88 | | (0.57) | | 78 |
| — | | 21.06 | | (15.76) | | 93,722 | | 0.88† | | 0.88† | | (0.88)† | | 12†† |
| | | | | | | | | | | | | | | |
| (0.02) | | 13.30 | | (4.37) | | 7,315 | | 0.69 | | 0.69 | | 0.42 | | 126 |
| — | | 13.93 | | (44.28) | | 5,570 | | 0.68† | | 0.68† | | 0.09† | | 60†† |
| | | | | | | | | | | | | | | |
| (1.65) | | 15.97 | | (6.60) | | 1,597 | | 0.14 | | 0.26 | | (0.03) | | 4 |
| (0.04) | | 18.92 | | (24.19) | | 2,838 | | 0.25† | | 0.25† | | (0.06)† | | 4†† |
| | | | | | | | | | | | | | | |
| (0.22) | | 26.29 | | 6.08 | | 2,629 | | 0.68† | | 0.68† | | 2.68† | | 35†† |
| | | | | | | | | | | | | | | |
| (2.82) | | 21.26 | | (3.56) | | 5,314 | | 0.26† | | 0.26† | | (0.14)† | | —†† |
The accompanying notes are an integral part of the financial statements.
Notes to Financial Statements
1. ORGANIZATION
KraneShares Trust (the “Trust”) is a Delaware Statutory Trust formed on February 3, 2012. The Trust is registered under the Investment Company Act of 1940, as amended (the “Investment Company Act”), as an open-end management investment company. As of March 31, 2023, the Trust had thirty-one operational series. The financial statements herein and the related notes pertain to the following 21 series: KraneShares CICC China Leaders 100 Index ETF, KraneShares CSI China Internet ETF, KraneShares Bosera MSCI China A 50 Connect Index ETF, KraneShares Bloomberg China Bond Inclusion Index ETF, KraneShares MSCI All China Index ETF, KraneShares MSCI One Belt One Road Index ETF, KraneShares Emerging Markets Consumer Technology Index ETF, KraneShares MSCI China Clean Technology Index ETF, KraneShares Electric Vehicles and Future Mobility Index ETF, KraneShares MSCI All China Health Care Index ETF, KraneShares Asia Pacific High Income Bond ETF, KraneShares Emerging Markets Healthcare Index ETF, KraneShares MSCI Emerging Markets ex China Index ETF, KraneShares MSCI China ESG Leaders Index ETF, KraneShares CICC China 5G & Semiconductor Index ETF, KraneShares CICC China Consumer Leaders Index ETF, KraneShares SSE STAR Market 50 Index ETF, KraneShares Hang Seng TECH Index ETF, KraneShares China Innovation ETF, KraneShares S&P Pan Asia Dividend Aristocrats Index ETF and KraneShares China Internet and Covered Call Strategy ETF (each, a “Fund” and collectively, the “Funds”). KraneShares Bosera MSCI China A 50 Connect Index ETF, KraneShares MSCI All China Index ETF, KraneShares MSCI Emerging Markets ex China Index ETF, KraneShares Emerging Markets Consumer Technology Index ETF, KraneShares MSCI One Belt One Road Index ETF and KraneShares Electric Vehicles and Future Mobility Index ETF are diversified Funds. All other Funds are non-diversified Funds, as defined under Section 5(b)(1) of the Investment Company Act. Krane Funds Advisors, LLC (“Krane” or the “Adviser”), a Delaware limited liability company, serves as the investment adviser for the Funds and is subject to the supervision of the Board of Trustees (the “Board”). The Adviser is responsible for managing the investment activities of the Funds, the Funds’ business affairs and other administrative matters. The Adviser may use sub-advisers (each, a “Sub-Adviser” or collectively, the “Sub-Advisers”) to perform the day-to-day management of the Funds.
China International Capital Corporation (USA) Holdings Inc., a wholly-owned, indirect subsidiary of China International Capital Corporation Limited owns a majority stake in Krane. As of March 31, 2023, Central Huijin Investment Limited, a mainland Chinese-domiciled entity, and HKSCC Nominees Limited, held approximately 40.1% and 39.4%, respectively, of the shares of China International Capital Corporation Limited. Central Huijin Investment Limited is a wholly-owned subsidiary of China Investment Corporation, which is a mainland Chinese sovereign wealth fund. KFA One Holdings, LLC, located at 280 Park Avenue 32nd Floor, New York, New York, 10017, holds the remaining equity interests in Krane and Jonathan Krane, through his equity interests in KFA One Holdings, LLC, beneficially owns more than 10% of the equity interests in Krane.
Shares of the Funds are listed and traded on the NYSE Arca, Inc. (“NYSE Arca”) (the “Exchange”). Market prices for Fund shares (“Shares”) may be different from their net asset value (“NAV”). The Funds issue and redeem Shares on a continuous basis at NAV only in large blocks of Shares, typically 25,000, 50,000 or 100,000 Shares or multiples thereof, called “Creation Units”. This does not mean, however, that individual investors will be able to redeem and purchase Shares directly with the series of the Trust. Only Authorized Participants can redeem and purchase Creation Units of Shares directly. Each Fund will issue and redeem Shares for a basket of securities and/or a balancing cash amount. Individual shares trade in the secondary market at market prices that change throughout the day.
Notes to Financial Statements (continued)
The investment objective of each of the following Funds is to seek to provide a total return that (before fees and expenses) tracks the performance of its respective index listed below (each, an “Underlying Index”):
| KraneShares Funds | | Index |
| KraneShares CICC China Leaders 100 Index ETF | | CSI CICC Select 100 Index |
| KraneShares CSI China Internet ETF | | CSI Overseas China Internet Index |
| KraneShares Bosera MSCI China A 50 Connect Index ETF | | MSCI China A 50 Connect Index |
| KraneShares Bloomberg China Bond Inclusion Index ETF | | Bloomberg China Inclusion Focused Bond Index |
| KraneShares MSCI All China Index ETF | | MSCI China All Shares Index |
| KraneShares MSCI One Belt One Road Index ETF | | MSCI Global China Infrastructure Exposure Index |
| KraneShares Emerging Markets Consumer Technology Index ETF | | Solactive Emerging Markets Consumer Technology Index |
| KraneShares MSCI China Clean Technology Index ETF | | MSCI China IMI Environment 10/40 Index |
| KraneShares Electric Vehicles and Future Mobility Index ETF | | Bloomberg Electric Vehicles Index |
| KraneShares MSCI All China Health Care Index ETF | | MSCI China All Shares Health Care 10/40 Index |
| KraneShares Emerging Markets Healthcare Index ETF | | Solactive Emerging Markets Healthcare Index |
| KraneShares MSCI Emerging Markets ex China Index ETF | | MSCI Emerging Markets ex China Index |
| KraneShares MSCI China ESG Leaders Index ETF | | MSCI China ESG Leaders 10/40 Index |
| KraneShares CICC China 5G & Semiconductor Index ETF | | CICC China 5G and Semiconductor Leaders Index |
| KraneShares CICC China Consumer Leaders Index ETF | | CICC China Consumer Leaders Index |
| KraneShares SSE STAR Market 50 Index ETF | | SSE Science and Technology Innovation Board 50 Index |
| KraneShares Hang Seng TECH Index ETF | | Hang Seng TECH Index |
| KraneShares S&P Pan Asia Dividend Aristocrats Index ETF | | S&P Pan Asia Dividend Aristocrats® Index |
2. SIGNIFICANT ACCOUNTING POLICIES
The following is a summary of the significant accounting policies followed by the Funds. The Funds are investment companies that apply the accounting and reporting guidance issued in Topic 946 by the U.S. Financial Accounting Standards Board (“FASB”).
USE OF ESTIMATES — The preparation of financial statements in conformity with U.S. generally accepted accounting principles (“U.S. GAAP”) requires management to make estimates and assumptions that affect the reported amounts of assets and liabilities and disclosure of contingent assets and liabilities at the date of the financial statements and the reported amounts of increases and decreases in net assets from operations during the reporting period. Actual results could differ from those estimates, and could have a material impact to the Funds.
SECURITY VALUATION — The NAV per share of each Fund is computed by dividing the value of the net assets of a Fund (i.e., the value of its total assets less total liabilities and withholdings) by the total number of shares of a Fund outstanding, rounded to the nearest cent. Expenses and fees,
Notes to Financial Statements (continued)
including without limitation, the management, administration and distribution fees, are accrued daily and taken into account for purposes of determining NAV. The NAV per share for each Fund normally is calculated by the Administrator (as defined below) and determined as of the regularly scheduled close of normal trading on each day that the Exchange is scheduled to be open for business (normally 4:00 p.m., Eastern Time). Any assets or liabilities denominated in currencies other than the U.S. dollar are converted into U.S. dollars at the current market rates on the date of valuation as quoted by one or more sources.
Securities listed on a securities exchange (i.e., exchange-traded equity securities), market or automated quotation system for which quotations are readily available (except for securities traded on NASDAQ), including securities traded over the counter, are valued by independent pricing agents at the last reported sale price on the primary exchange or market (foreign or domestic) on which they are traded (or at the time as of which the Fund’s NAV is calculated if a security’s exchange is normally open at that time). If there is no such reported sale, such securities are valued at the most recently reported bid price. For securities traded on NASDAQ, the NASDAQ Official Closing Price will be used.
If a security price cannot be obtained from an independent, third-party pricing agent, the Fund seeks to obtain bid and ask prices from two broker-dealers who make a market in the portfolio instrument and determines the average of the two.
If available, debt securities are priced based upon valuations provided by independent, third-party pricing agents. Such values generally reflect the last reported sales price if the security is actively traded. The third-party pricing agents may also value debt securities at an evaluated bid price by employing methodologies that utilize actual market transactions, broker-supplied valuations, or other methodologies designed to identify the market value for such securities. Debt obligations with remaining maturities of sixty days or less may be valued at their amortized cost, which approximates market value.
The prices for foreign securities are reported in local currency and converted to U.S. dollars using currency exchange rates. The exchange rates used for valuation are captured as of the close of the London Stock Exchange each day normally at 4:00 p.m. Greenwich Mean Time. The value of a swap contract is equal to the obligation (or rights) under the swap contract, which will generally be equal to the net amounts to be paid or received under the contract based upon the relative values of the positions held by each party to the contract as determined by the applicable independent, third party pricing agent. Exchange-traded options, except as discussed below for FLEX options, are valued at the last reported sales price on the exchange on which they are listed. If there is no such reported sale on the valuation date, long positions are valued at the most recent bid price, and short positions are valued at the most recent ask price. Over-the-counter (“OTC”) options are valued based upon prices determined by the applicable independent, third party pricing agent. Futures are valued at the settlement price established by the board of trade on which they are traded. Foreign currency forward contracts are valued at the current day’s interpolated foreign exchange rate, as calculated using the current day’s spot rate and the 30-, 60-, 90- and 180-day forward rates provided by an independent pricing agent. As of and during the year ended March 31, 2023, the Funds did not hold swaps or foreign currency forward contracts.
Notes to Financial Statements (continued)
FLEX (short for flexible) options are normally valued using a model-based price provided by a third-party pricing vendor. On days when a trade in a FLEX options occurs, the trade price will be used to value such FLEX options in lieu of the model price.
On certain days, the settlement price for futures may not be available at the time the Fund calculates its NAV. On such days, the best available price (which is typically the last trade price) may be used to value futures.
Investments in open-end investment companies that do not trade on an exchange are valued at the end of day NAV per share. Investments in open-end investment companies that trade on an exchange are valued in the same manner as other exchange-traded equity securities (described above).
Securities issued by a wholly owned subsidiary of a Fund will be valued at the subsidiary’s net asset value, which will be determined using the same pricing policies and procedures applicable to the Fund.
Investments for which market prices are not “readily available,” or are not deemed to reflect current market values, or are debt securities where no evaluated price is available from third-party pricing agents pursuant to established methodologies, are fair valued in accordance with Krane’s valuation policies and procedures approved by the Board. Some of the more common reasons that may necessitate that a security be valued using “fair value” pricing may include, but are not limited to: the security’s trading has been halted or suspended; the security’s primary trading market is temporarily closed; or the security has not been traded for an extended period of time.
In addition, a Fund may fair value its securities if an event that may materially affect the value of a Fund’s securities that trade outside of the United States (a “Significant Event”) has occurred between the time of the security’s last close and the time that a Fund calculates its NAV. A Significant Event may relate to a single issuer or to an entire market sector, country or region. Events that may be Significant Events may include: government actions, natural disasters, armed conflict, acts of terrorism and significant market fluctuations. If Krane becomes aware of a Significant Event that has occurred with respect to a portfolio instrument or group of portfolio instruments after the closing of the exchange or market on which the portfolio instrument or portfolio instruments principally trade, but before the time at which a Fund calculates its NAV, it will notify the Administrator and may request that an ad hoc meeting of the Fair Valuation Committee be called.
With respect to trade-halted securities, the Adviser typically will fair value a trade-halted security by adjusting the security’s last market close price by the security’s sector performance, as measured by a predetermined index, unless Krane’s Fair Valuation Committee determines to make additional adjustments. Certain foreign securities exchanges have mechanisms in place that confine one day’s price movement in an individual security to a pre-determined price range based on that day’s opening price (“Collared Securities”). Fair value determinations for Collared Securities will generally be capped based on any applicable pre-determined “limit down” or “limit up” prices established by the relevant foreign securities exchange. As an example, China A-Shares can only be plus or minus ten percent in one day of trading in the relevant mainland China equity market. As a result, the fair value price determination on a given day will generally be capped plus or minus ten percent.
Notes to Financial Statements (continued)
Fair value pricing involves subjective judgments and it is possible that a fair value determination for a security is materially different than the value that could actually be realized upon the sale of the security or that another fund that uses market quotations or its own fair value procedures to price the same securities. In addition, fair value pricing could result in a difference between the prices used to calculate a Fund’s NAV and the prices used by the Underlying Index. This may adversely affect a Fund’s ability to track its Underlying Index.
Trading in securities on many foreign exchanges is normally completed before the close of business on each Business Day (a “Business Day”, as used herein, is any day on which the Exchange is open for business). In addition, securities trading in a particular country or countries may not take place on each Business Day or may take place on days that are not Business Days. Changes in valuations on certain securities may occur at times or on days on which a Fund’s NAV is not calculated and on which Fund shares do not trade and sales and redemptions of shares do not occur. As a result, the value of a Fund’s portfolio securities and the net asset value of its shares may change on days when share purchases or sales cannot occur.
Fund shares are purchased or sold on a national securities exchange at market prices, which may be higher or lower than NAV. Transactions in Fund shares will be priced at NAV only if shares are purchased or redeemed directly from a Fund in Creation Units. No secondary sales will be made to brokers or dealers at concession by the Distributor or by a Fund. Purchases and sales of shares in the secondary market, which will not involve a Fund, will be subject to customary brokerage commissions and charges.
In accordance with the authoritative guidance on fair value measurements and disclosure under U.S. GAAP, the Funds disclose the fair value of their investments in a hierarchy that prioritizes the inputs to valuation techniques used to measure the fair value. The objective of a fair value measurement is to determine the price that would be received to sell an asset or paid to transfer a liability in an orderly transaction between market participants at the measurement date (an exit price). Accordingly, the fair value hierarchy gives the highest priority to quoted prices (unadjusted) in active markets for identical assets or liabilities (Level 1) and the lowest priority to unobservable inputs (Level 3). The three levels of the fair value hierarchy are described below:
Level 1 — Unadjusted quoted prices in active markets for identical, unrestricted assets or liabilities that the Funds have the ability to access at the measurement date.
Level 2 — Other significant observable inputs (including quoted prices in non-active markets, quoted prices for similar investments, fair value of investments for which the Funds have the ability to fully redeem tranches at net asset value as of the measurement date or within the near term, and short-term investments valued at amortized cost).
Level 3 — Significant unobservable inputs (including the Funds’ own assumptions in determining the fair value of investments, broker quotes, fair value of investments for which the Funds do not have the ability to fully redeem tranches at net asset value as of the measurement date or within the near term).
Notes to Financial Statements (continued)
Investments are classified within the level of the lowest significant input considered in determining fair value. Investments classified within Level 3 whose fair value measurement considers several inputs may include Level 1 or Level 2 inputs as components of the overall fair value measurement. For details of the investment classification, refer to each Fund’s Schedule of Investments.
FEDERAL INCOME TAXES — It is each Fund’s intention to qualify or continue to qualify as a regulated investment company for federal income tax purposes by complying with the appropriate provisions of Subchapter M of the Internal Revenue Code of 1986, as amended (the “Code”), and to distribute annually all or substantially all of its taxable income and gains to shareholders. Accordingly, no provisions for federal income taxes have been made in the financial statements.
The Funds evaluate tax positions taken or expected to be taken in the course of preparing the Funds’ tax returns to determine whether it is “more-likely-than-not” (i.e., greater than 50 percent) that each tax position will be sustained upon examination by a taxing authority based on the technical merits of the position. Tax positions not deemed to meet the more-likely-than-not threshold are recorded as a tax benefit or expense in the current year. The Funds did not record any tax provisions in the current period. However, management’s conclusions regarding tax positions may be subject to review and adjustment at a later date based on factors including, but not limited to, examination by tax authorities (i.e., the last three tax year ends, as applicable), on-going analysis of and changes to tax laws, regulations and interpretations thereof.
As of March 31, 2023, management of the Funds has reviewed all open tax years since inception and concluded that there is no tax liability resulting from unrecognized tax benefits relating to uncertain income tax positions taken or expected to be taken in future tax returns. The Funds are also not aware of any tax positions for which it is reasonably possible that the total amounts of unrecognized tax benefits will significantly change in the next 12 months.
SECURITY TRANSACTIONS AND INVESTMENT INCOME — Security transactions are accounted for on the trade date for financial reporting purposes. Costs used in determining realized gains and losses on the sale of investment securities are based on specific identification. Dividend income is recorded, net of any applicable withholding tax, on the ex-dividend date, or for certain foreign securities, when the information becomes available to the Funds. Interest income is recognized on the accrual basis from the settlement date and includes the amortization of premiums and the accretion of discount calculated using the effective interest method.
Dividend income received from affiliated funds is recognized on the ex-dividend date and is recorded as income distributions in the Statement of Operations. Capital gain distributions received from affiliated funds are recognized on ex-dividend date and are recorded on the Statement of Operations as such. Costs used in determining realized gains and losses on the sales of affiliated funds are on the basis of specific identification. See details on the Statements of Operations.
OPTIONS — The KraneShares China Internet and Covered Call Strategy ETF writes (sells) at the money Flexible Exchange call options (“FLEX options”) on the KraneShares CSI China Internet ETF (“Underlying Fund”). The KraneShares China Internet and Covered Call Strategy ETF will cover such options by holding the Underlying Fund. FLEX options are exchange-traded options contracts with uniquely customizable terms like exercise price, style, and expiration date. Each FLEX option written will generally (i) have an expiration date greater than 30 days; (ii) have an exercise price generally at the prevailing market price of the Underlying Fund; and (iii) be traded on a national securities exchange. The KraneShares China Internet and Covered Call Strategy ETF will attempt to hold each FLEX option written until expiration. However, if there are redemptions in the
Notes to Financial Statements (continued)
KraneShares China Internet and Covered Call Strategy ETF, it may not be able to hold such options until expiration. In addition, each FLEX option written generally will only be subject to exercise on its expiration date.
As of March 31, 2023, the KraneShares China Internet and Covered Call Strategy ETF had open written option positions. Refer to the KraneShares China Internet and Covered Call Strategy ETF’s Schedule of Investments for details regarding open options as of March 31, 2023. All options held during the period were equity options.
For the period ended March 31, 2023, the average monthly cost for written options held during the period by the KraneShares China Internet and Covered Call Strategy ETF was $252,778.
FOREIGN CURRENCY — The books and records of the Funds are maintained in U.S. dollars. Investment securities and other assets and liabilities denominated in a foreign currency are translated into U.S. dollars on the date of valuation. Purchases and sales of investment securities, income and expenses are translated into U.S. dollars at the relevant rates of exchange prevailing on the respective dates of such transactions. The Funds do not isolate that portion of realized or unrealized gains and losses resulting from changes in the foreign exchange rate from fluctuations arising from changes in the market prices of the securities. The Funds report certain foreign-currency-related transactions as components of realized gains for financial reporting purposes, whereas such components are treated as ordinary income for Federal income tax purposes.
DIVIDENDS AND DISTRIBUTIONS TO SHAREHOLDERS — Each Fund, except for the KraneShares Asia Pacific High Income Bond ETF, the KraneShares Bloomberg China Bond Inclusion Index ETF and the KraneShares China Internet and Covered Call Strategy ETF intends to pay out dividends, if any, at least annually; each of the KraneShares Asia Pacific High Income Bond ETF, the KraneShares Bloomberg China Bond Inclusion Index ETF and the KraneShares China Internet and Covered Call Strategy ETF intend to pay out dividends, if any, at least monthly. The Funds distribute their net investment income at least annually. Any net realized capital gains are distributed annually. All distributions are recorded on the ex-dividend date.
CASH OVERDRAFT CHARGES — Per the terms of an agreement with Brown Brothers Harriman & Co. (“BBH”), the Funds’ Custodian, if a Fund has a cash overdraft on a given day, it will be assessed an overdraft charge of the BBH Base Rate plus 2.00%. Cash overdraft charges are included in “Interest Expense” on the Statements of Operations.
SECURITIES LENDING — The Funds may lend securities from their portfolios to brokers, dealers and other financial institutions. In connection with such loans, a Fund remains the beneficial owner of the loaned securities and continues to receive payments in amounts approximately equal to the interest, dividends or other distributions payable on the loaned securities. A Fund also has the right to terminate a loan at any time. A Fund does not have the right to vote on securities while they are on loan. Loans of portfolio securities will not exceed 33 1/3% of the value of a Fund’s total assets (including the value of all assets received as collateral for the loan). A Fund will receive collateral in an amount equal to at least 100% of the current market value of the loaned securities. If the collateral consists of cash, a Fund will reinvest the cash and pay the borrower a pre-negotiated fee or “rebate” from any return earned on the investment. Should the borrower of the securities fail financially, a Fund may experience delays in recovering the loaned securities or exercising its rights in the collateral. In a loan transaction, a Fund will also bear the risk of any decline in value of securities acquired with cash collateral. Krane and a sub-adviser are subject to potential conflicts of interest because the compensation paid to them increases in connection with any net
Notes to Financial Statements (continued)
income received by a Fund from a securities lending program. Each Fund pays Krane 10% of any net monthly income received from the investment of cash collateral and loan fees received from borrowers in respect of each securities loan (net of any amounts paid to the custodian and/or securities lending agent or rebated to borrowers) (see Note 3).
The following table discloses the securities on loan as of March 31, 2023:
| KraneShares Funds | | Market Value
Securities on Loan | | | Cash Collateral for
Securities on Loan | |
| KraneShares CSI China Internet ETF | | $ | 29,815,441 | | | $ | 31,393,462 | |
| KraneShares Emerging Markets Consumer Technology Index ETF | | | 632,846 | | | | 696,591 | |
| KraneShares Electric Vehicles and Future Mobility Index ETF | | | 8,113,787 | | | | 8,431,059 | |
CREATION UNITS — The Funds issue and redeem Shares at NAV and only in large blocks of Shares (each block of Shares for a Fund is a Creation Unit of 25,000 Shares, 50,000 Shares, 100,000 Shares, or multiples thereof). In its discretion, the Trust reserves the right to increase or decrease the number of each Fund’s shares that constitute a Creation Unit.
Except when aggregated in Creation Units, Shares are not redeemable securities of a Fund. Shares of a Fund may only be purchased or redeemed by certain Authorized Participants. An Authorized Participant is either (i) a broker-dealer or other participant in the clearing process through the Continuous Net Settlement System of the National Securities Clearing Corporation or (ii) a Depository Trust Company (“DTC”) participant and, in each case, must have executed a Participant Agreement with the Distributor. Most retail investors will not qualify as Authorized Participants or have the resources to buy and sell whole Creation Units. Therefore, they will be unable to purchase or redeem the Shares directly from a Fund. Rather, most retail investors will purchase Shares in the secondary market with the assistance of a broker and will be subject to customary brokerage commissions or fees when buying or selling Shares. If a Creation Unit is purchased or redeemed for cash, a higher transaction fee may be charged.
The following table discloses Creation Unit breakdown for the year ended March 31, 2023:
| KraneShares Funds | | Creation
Unit
Shares | | | Standard
Transaction Fee -
Subscriptions | | | Value at
March 31,
2023 | | | Standard
Transaction Fee -
Redemptions | | | Maximum
Variable
Transaction
Fee* | |
| KraneShares CICC China Leaders 100 Index ETF | | | 50,000 | | | $ | 1,700 | | | $ | 1,193,000 | | | $ | 1,700 | | | | 2.00 | % |
| KraneShares CSI China Internet ETF | | | 50,000 | | | | 500 | | | | 1,562,500 | | | | 500 | | | | 2.00 | % |
| KraneShares Bosera MSCI China A 50 Connect Index ETF | | | 50,000 | | | | 850 | | | | 1,304,500 | | | | 850 | | | | 2.00 | % |
| KraneShares Bloomberg China Bond Inclusion Index ETF | | | 50,000 | | | | 500 | | | | 1,592,000 | | | | 500 | | | | 2.00 | % |
| KraneShares MSCI All China Index ETF | | | 50,000 | | | | 4,250 | | | | 1,099,500 | | | | 4,250 | | | | 2.00 | % |
| KraneShares MSCI One Belt One Road Index ETF | | | 50,000 | | | | 3,600 | | | | 1,121,500 | | | | 3,600 | | | | 2.00 | % |
| KraneShares Emerging Markets Consumer Technology Index ETF | | | 50,000 | | | | 1,500 | | | | 764,000 | | | | 1,500 | | | | 2.00 | % |
| KraneShares MSCI China Clean Technology Index ETF | | | 50,000 | | | | 800 | | | | 1,427,000 | | | | 800 | | | | 2.00 | % |
| KraneShares Electric Vehicles and Future Mobility Index ETF | | | 50,000 | | | | 800 | | | | 1,530,000 | | | | 800 | | | | 2.00 | % |
Notes to Financial Statements (continued)
| KraneShares Funds | | Creation
Unit
Shares | | | Standard
Transaction Fee -
Subscriptions | | | Value at
March 31,
2023 | | | Standard
Transaction Fee -
Redemptions | | | Maximum
Variable
Transaction
Fee* | |
| KraneShares MSCI All China Health Care Index ETF | | | 50,000 | | | $ | 1,200 | | | $ | 1,038,500 | | | $ | 1,200 | | | | 2.00 | % |
| KraneShares Asia Pacific High Income Bond ETF | | | 50,000 | | | | 600 | | | | 1,336,500 | | | | 600 | | | | 2.00 | % |
| KraneShares Emerging Markets Healthcare Index ETF | | | 50,000 | | | | 2,100 | | | | 1,047,500 | | | | 2,100 | | | | 2.00 | % |
| KraneShares MSCI Emerging Markets ex China Index ETF | | | 100,000 | | | | 15,000 | | | | 2,509,000 | | | | 15,000 | | | | 2.00 | % |
| KraneShares MSCI China ESG Leaders Index ETF | | | 50,000 | | | | 2,100 | | | | 995,500 | | | | 2,100 | | | | 2.00 | % |
| KraneShares CICC China 5G & Semiconductor Index ETF | | | 50,000 | | | | 500 | | | | 888,000 | | | | 500 | | | | 2.00 | % |
| KraneShares CICC China Consumer Leaders Index ETF | | | 50,000 | | | | 500 | | | | 995,500 | | | | 500 | | | | 2.00 | % |
| KraneShares SSE STAR Market 50 Index ETF | | | 50,000 | | | | 2,250 | | | | 844,500 | | | | 2,250 | | | | 2.00 | % |
| KraneShares Hang Seng TECH Index ETF | | | 50,000 | | | | 550 | | | | 665,000 | | | | 550 | | | | 2.00 | % |
| KraneShares China Innovation ETF | | | 50,000 | | | | 50 | | | | 798,500 | | | | 50 | | | | 2.00 | % |
| KraneShares S&P Pan Asia Dividend Aristocrats Index ETF | | | 50,000 | | | | 1,800 | | | | 1,314,500 | | | | 1,800 | | | | 2.00 | % |
| KraneShares China Internet and Covered Call Strategy ETF | | | 25,000 | | | | 10 | | | | 531,500 | | | | 10 | | | | 2.00 | % |
| * | As a percentage of the Creation Unit(s) purchased/redeemed. |
The Adviser may adjust the transaction fees from time to time based on actual experience.
CASH AND CASH EQUIVALENTS — Idle cash and currency balances may be swept into various overnight sweep accounts and are classified as cash equivalents on the Statement of Assets and Liabilities. These amounts, at times, may exceed United States federally insured limits. Amounts swept are available on the next business day.
3. RELATED PARTY TRANSACTIONS
INVESTMENT ADVISORY AGREEMENT — The Adviser serves as investment adviser to each Fund pursuant to an Investment Advisory Agreement between the Trust on behalf of each Fund and the Adviser (the “Agreement”). Under the Agreement, Krane is responsible for reviewing, supervising and administering each Fund’s investment program and the general management and administration of the Trust. In addition to these services, to the extent a Fund engages in securities lending, Krane will: (i) determine which securities are available for loan and notify the securities lending agent for a Fund (the “Agent”), (ii) monitor the Agent’s activities to ensure that securities loans are effected in accordance with Krane’s instructions and in accordance with applicable procedures and guidelines adopted by the Board, (iii) make recommendations to the Board regarding the Fund’s participation in securities lending; (iv) prepare appropriate periodic reports for, and seek appropriate periodic approvals from, the Board with respect to securities lending activities, (v) respond to Agent inquiries concerning the Agent’s activities, and (vi) such other related duties as Krane deems necessary or appropriate. The Board of Trustees of the Trust supervises Krane and establishes policies that Krane must follow in its management activities.
Notes to Financial Statements (continued)
The Agreement requires the Adviser to pay all operating expenses of the Funds, except: (a) interest and taxes (including, but not limited to, income, excise, transaction, transfer and withholding taxes); (b) expenses of the Funds incurred with respect to the acquisition and disposition of portfolio securities and the execution of portfolio transactions, including brokerage commissions and short sale dividend or interest expense; (c) expenses incurred in connection with any distribution plan adopted by the Trust in compliance with Rule 12b-1 under the Investment Company Act, including distribution fees; (d) “Acquired Fund Fees and Expenses” (as defined by Form N-1A under the Investment Company Act); (e) litigation expenses; (f) the compensation payable to the Adviser under the Agreement; (g) compensation and expenses of the Independent Trustees (including any fees of independent legal counsel to the Independent Trustees); and (h) any expenses determined to be extraordinary expenses by the Board. In addition, under the Agreement, while the fees and expenses related to the Funds’ securities lending-related activities reduce the gross revenues and income of the Funds from such activities, they are not fees and expenses for which Krane is responsible.
Each Agreement provides that each Fund pays a unitary (or unified) fee to the Adviser for advisory and management services provided to the Fund, subject to the exceptions noted herein. In this context, there exists a risk that a Trust service provider will seek recourse against the Trust if it is not timely paid by Krane for the fees and expenses for which it is responsible, which could materially adversely affect the Funds. Pursuant to the Agreement between the Trust and the Adviser, the Funds below pay the Adviser a fee, which is calculated daily and paid monthly, at the following annual rates, based on a percentage of the average daily net assets of each Fund. In addition, as compensation for the services provided by the Adviser in connection with any securities lending-related activities, each Fund pays the Adviser 10% of the monthly investment income received from the investment of cash collateral and loan fees received from borrowers in respect to securities loans (net of any amounts paid to the custodian and/or securities lending agent or rebated to borrowers), included on the Statements of Operations as “Security Lending Fees”.
| KraneShares Funds | | Management
Fee |
| KraneShares CICC China Leaders 100 Index ETF | | 0.68% |
| KraneShares CSI China Internet ETF | | 0.68% |
| KraneShares Bosera MSCI China A 50 Connect Index ETF | | 0.78% |
| KraneShares Bloomberg China Bond Inclusion Index ETF | | 0.68% |
| KraneShares MSCI All China Index ETF | | 0.68% |
| KraneShares MSCI One Belt One Road Index ETF | | 0.78% |
| KraneShares Emerging Markets Consumer Technology Index ETF | | 0.78% |
| KraneShares MSCI China Clean Technology Index ETF | | 0.78% |
| KraneShares Electric Vehicles and Future Mobility Index ETF | | 0.68% |
| KraneShares MSCI All China Health Care Index ETF | | 0.78% |
| KraneShares Asia Pacific High Income Bond ETF | | 0.68% |
| KraneShares Emerging Markets Healthcare Index ETF | | 0.78% |
| KraneShares MSCI Emerging Markets ex China Index ETF | | 0.58% |
| KraneShares MSCI China ESG Leaders Index ETF | | 0.58% |
| KraneShares CICC China 5G & Semiconductor Index | | 0.78% |
| KraneShares CICC China Consumer Leaders Index ETF | | 0.68% |
| KraneShares SSE STAR Market 50 Index ETF | | 0.88% |
| KraneShares Hang Seng TECH Index ETF | | 0.68% |
Notes to Financial Statements (continued)
| KraneShares Funds | | Management
Fee |
| KraneShares China Innovation ETF | | 0.25% |
| KraneShares S&P Pan Asia Dividend Aristocrats Index ETF | | 0.68% |
| KraneShares China Internet and Covered Call Strategy ETF | | 0.94%* |
| * | The Fund’s management fee of 0.94% of the Fund’s average daily net assets is reduced by the amount of any acquired fund fees and expenses incurred by the Fund that are attributable to the Fund’s investment in affiliated acquired funds such as KraneShares CSI China Internet ETF. This fee reduction is currently expected to be 0.69% of the Fund’s average daily net assets reducing the Fund’s management fee to 0.25% of the Fund’s average daily net assets. |
The Adviser bears all of its own costs associated with providing these advisory services.
Pursuant to the terms of Fee Waiver Agreements, Krane has contractually agreed to waive its management fee for the below listed Funds by the following amounts of the Fund’s average daily net assets until August 1, 2023. The Fee Waiver Agreements may only be terminated prior thereto by the Board. In addition, the Fee Waiver Agreements will terminate if the Investment Advisory Agreement for a Fund is terminated.
| KraneShares Funds | | Fee Waiver
Fee |
| KraneShares Bosera MSCI China A 50 Connect Index ETF | | 0.23% |
| KraneShares Bloomberg China Bond Inclusion Index ETF | | 0.20% |
| KraneShares MSCI All China Index ETF | | 0.20% |
| KraneShares Emerging Markets Consumer Technology Index ETF | | 0.20% |
| KraneShares MSCI All China Health Care Index ETF | | 0.14% |
| KraneShares MSCI Emerging Markets ex China Index ETF | | 0.35% |
| KraneShares CICC China 5G & Semiconductor Index ETF | | 0.14% |
Effective June 1, 2022, Krane has contractually agreed to waive its management fee by 0.15% of the average daily net assets of KraneShares China Innovation ETF. This contractual fee waiver will continue until the date of the Fund’s first investment in an initial public offering (“IPO”) and or a pre-IPO, and may only be terminated prior thereto by the Board. In addition, the fee waiver will terminate if the Investment Advisory Agreement for the Fund is terminated.
SUB-ADVISORY AGREEMENT — Bosera Asset Management (International) Co., Ltd. (“Bosera”), operating out of Hong Kong, serves as the Sub-Adviser to the KraneShares Bosera MSCI China A 50 Connect Index ETF and KraneShares SSE STAR Market 50 Index ETF and is responsible for the day-to-day management of the Funds, subject to the supervision by the Adviser and the Board. For the services Bosera provides to KraneShares Bosera MSCI China A 50 Connect Index ETF, the Adviser pays Bosera a fee equal to 50% of the net revenue the Adviser receives from the Fund. For the services Bosera provides to KraneShares SSE STAR Market 50 Index ETF, the Adviser pays Bosera a twelve basis points (0.12%) sub-advisory fee based upon the monthly average assets under management of KraneShares SSE STAR Market 50 Index ETF.
Nikko Asset Management Americas Inc. (“Nikko”) serves as the investment sub-adviser to KraneShares Asia Pacific High Income Bond ETF. Nikko is responsible for the day-to-day investment management of the Fund, subject to the supervision of Krane and the Board. Nikko delegates to its affiliate Nikko Asset Management Asia, Ltd. (“Nikko Asia”), a registered investment adviser with the SEC, certain of its responsibilities for the management of the Fund. Krane has entered into a Sub-Advisory Agreement with Nikko pursuant to which Krane has agreed to pay Nikko 36.77% of
Notes to Financial Statements (continued)
the sum of: (i) the total gross advisory fee due to the Adviser from the Fund under the terms of the Advisory Agreement minus (ii) any applicable fee waivers from time to time entered into between the Fund and the Adviser.
DISTRIBUTION AGREEMENT — SEI Investments Distribution Co. (the “Distributor”), a wholly-owned subsidiary of SEI Investments Company, and an affiliate of the Administrator, serves as the Funds’ distributor of Creation Units pursuant to a Distribution Agreement. The Distributor does not maintain any secondary market in Fund shares.
The Trust has adopted a Distribution and Service Plan (“Plan”) pursuant to Rule 12b-1 under the Investment Company Act. In accordance with its Plan, each Fund is authorized to pay an amount up to 0.25% of its average daily net assets each year for certain distribution-related activities. For the year ended March 31, 2023, no fees were charged under the Plan. Fees would only be charged under the Plan upon approval by the Board.
ADMINISTRATOR, CUSTODIAN AND TRANSFER AGENT — SEI Investments Global Funds Services (the “Administrator”) serves as the Funds’ Administrator pursuant to an Administration Agreement. BBH serves as the Funds’ Custodian and Transfer Agent pursuant to a Custodian and Transfer Agent Agreement.
4. INVESTMENT TRANSACTIONS
For the year ended March 31, 2023, the purchases and sales of investments in securities excluding in-kind transactions, long-term U.S. Government and short-term securities were:
| KraneShares Funds | | Purchases | | | Sales and
Maturities | |
| KraneShares CICC China Leaders 100 Index ETF | | $ | 6,013,494 | | | $ | 8,589,803 | |
| KraneShares CSI China Internet ETF | | | 3,786,756,821 | | | | 3,924,487,694 | |
| KraneShares Bosera MSCI China A 50 Connect Index ETF | | | 384,329,147 | | | | 369,305,890 | |
| KraneShares Bloomberg China Bond Inclusion Index ETF | | | 16,585,250 | | | | 16,831,868 | |
| KraneShares MSCI All China Index ETF | | | 4,353,928 | | | | 9,495,910 | |
| KraneShares MSCI One Belt One Road Index ETF | | | 1,907,490 | | | | 3,390,062 | |
| KraneShares Emerging Markets Consumer Technology Index ETF | | | 33,466,396 | | | | 44,286,883 | |
| KraneShares MSCI China Clean Technology Index ETF | | | 57,966,830 | | | | 73,673,849 | |
| KraneShares Electric Vehicles and Future Mobility Index ETF | | | 156,090,055 | | | | 174,283,682 | |
| KraneShares MSCI All China Health Care Index ETF | | | 33,766,109 | | | | 56,881,499 | |
| KraneShares Asia Pacific High Income Bond ETF | | | 16,404,357 | | | | 19,455,516 | |
| KraneShares Emerging Markets Healthcare Index ETF | | | 790,813 | | | | 793,977 | |
| KraneShares MSCI Emerging Markets ex China Index ETF | | | 12,043,581 | | | | 10,928,438 | |
| KraneShares MSCI China ESG Leaders Index ETF | | | 2,376,286 | | | | 4,442,967 | |
| KraneShares CICC China 5G & Semiconductor Index ETF | | | 3,986,473 | | | | 8,038,183 | |
| KraneShares CICC China Consumer Leaders Index ETF | | | 4,629,652 | | | | 41,075,676 | |
| KraneShares SSE STAR Market 50 Index ETF | | | 21,859,409 | | | | 32,975,520 | |
| KraneShares Hang Seng TECH Index ETF | | | 12,673,076 | | | | 9,173,346 | |
| KraneShares China Innovation ETF | | | 83,913 | | | | 1,208,724 | |
| KraneShares S&P Pan Asia Dividend Aristocrats Index ETF | | | 2,080,210 | | | | 866,470 | |
| KraneShares China Internet and Covered Call Strategy ETF | | | — | | | | 24,299 | |
For the year ended March 31, 2023, there were no purchases or sales of long-term U.S. government securities for the Funds.
Notes to Financial Statements (continued)
For the year ended March 31, 2023, in-kind transactions associated with creations and redemptions were:
| KraneShares Funds | | Purchases | | | Sales | | | Realized Gain/
(Loss) | |
| KraneShares CSI China Internet ETF | | $ | 953,090,271 | | | $ | 1,032,175,755 | | | $ | 68,892,595 | |
| KraneShares MSCI All China Index ETF | | | 210,510 | | | | 726,625 | | | | (1,002,628 | ) |
| KraneShares MSCI One Belt One Road Index ETF | | | — | | | | 995,838 | | | | 145,257 | |
| KraneShares Emerging Markets Consumer Technology Index ETF | | | 969,753 | | | | 6,936,558 | | | | (1,180,826 | ) |
| KraneShares MSCI China Clean Technology Index ETF | | | 1,684,354 | | | | 5,549,896 | | | | (1,661,098 | ) |
| KraneShares Electric Vehicles and Future Mobility Index ETF | | | 2,903,991 | | | | 31,945,588 | | | | 1,038,046 | |
| KraneShares MSCI All China Health Care Index ETF | | | 257,293 | | | | 1,551,179 | | | | (266,110 | ) |
| KraneShares MSCI Emerging Markets ex China Index ETF | | | 3,388,632 | | | | 2,720,716 | | | | 148,083 | |
| KraneShares MSCI China ESG Leaders Index ETF | | | — | | | | 156,198 | | | | (10,126 | ) |
| KraneShares China Innovation ETF | | | — | | | | 961,844 | | | | 34,251 | |
| KraneShares S&P Pan Asia Dividend Aristocrats Index ETF | | | 1,282,299 | | | | — | | | | — | |
| KraneShares China Internet and Covered Call Strategy ETF | | | 5,994,799 | | | | — | | | | — | |
5. TAX INFORMATION
The amount and character of income and capital gain distributions to be paid, if any, are determined in accordance with Federal income tax regulations, which may differ from U.S. GAAP. As a result, net investment income (loss) and net realized gain (loss) on investment transactions for a reporting period may differ significantly from distributions during such period. These book/tax differences may be temporary or permanent. To the extent these differences are permanent in nature, they are charged or credited to distributable earnings (loss) or paid-in capital, as appropriate, in the period that the differences arise.
The permanent differences primarily consist of foreign currency translations, investments in passive foreign investment companies (“PFICs”), net operating loss, perpetual bond adjustments and distribution reclassification. The permanent differences that are credited or charged to Paid-in Capital and Distributable Earnings for the fiscal year ended March 31, 2023 are primarily related to redemptions in-kind, net operating loss, distributions in excess and utilization of earnings and profits on shareholder redemptions.
| KraneShares Funds | | Distributable
Earnings/(Loss) | | | Paid-in Capital | |
| KraneShares CSI China Internet ETF | | $ | 175,506,387 | | | $ | (175,506,387 | ) |
| KraneShares Bloomberg China Bond Inclusion Index ETF | | | 161,343 | | | | (161,343 | ) |
| KraneShares MSCI All China Index ETF | | | 1,002,628 | | | | (1,002,628 | ) |
| KraneShares MSCI One Belt One Road Index ETF | | | (119,057 | ) | | | 119,057 | |
| KraneShares Emerging Markets Consumer Technology Index ETF | | | 1,334,071 | | | | (1,334,071 | ) |
| KraneShares MSCI China Clean Technology Index ETF | | | 1,773,873 | | | | (1,773,873 | ) |
Notes to Financial Statements (continued)
| KraneShares Funds | | Distributable
Earnings/(Loss) | | | Paid-in Capital | |
| KraneShares Electric Vehicles and Future Mobility Index ETF | | $ | 32,276 | | | $ | (32,276 | ) |
| KraneShares MSCI All China Health Care Index ETF | | | 280,758 | | | | (280,758 | ) |
| KraneShares Emerging Markets Healthcare Index ETF | | | 1,219 | | | | (1,219 | ) |
| KraneShares MSCI Emerging Markets ex China Index ETF | | | (49,643 | ) | | | 49,643 | |
| KraneShares MSCI China ESG Leaders Index ETF | | | 22,493 | | | | (22,493 | ) |
| KraneShares SSE STAR Market 50 Index ETF | | | 138,931 | | | | (138,931 | ) |
| KraneShares China Innovation ETF | | | (34,037 | ) | | | 34,037 | |
| KraneShares China Internet and Covered Call Strategy ETF | | | 1,112 | | | | (1,112 | ) |
The tax character of dividends and distributions paid during the years or periods ended March 31, 2023 and March 31, 2022 were as follows:
| KraneShares Funds | | | Ordinary
Income | | | Long-Term
Capital Gain | | | Return of
Capital | | | Totals | |
| KraneShares CICC China Leaders 100 Index ETF | | | | | | | | | | | | | | | | | |
| 2023 | | | $ | 209,433 | | | $ | 57,708 | | | $ | — | | | $ | 267,141 | |
| 2022 | | | | 576,817 | | | | 666,089 | | | | — | | | | 1,242,906 | |
| KraneShares CSI China Internet ETF | | | | | | | | | | | | | | | | | |
| 2023 | | | $ | — | | | $ | — | | | $ | — | | | $ | — | |
| 2022 | | | | — | | | | 455,309,639 | | | | — | | | | 455,309,639 | |
| KraneShares Bosera MSCI China A 50 Connect Index ETF | | | | | | | | | | | | | | | | | |
| 2023 | | | $ | 9,640,424 | | | $ | 101,634,817 | | | $ | — | | | $ | 111,275,241 | |
| 2022 | | | | 8,007,641 | | | | 56,352,008 | | | | — | | | | 64,359,649 | |
| KraneShares Bloomberg China Bond Inclusion Index ETF | | | | | | | | | | | | | | | | | |
| 2023 | | | $ | 93,427 | | | $ | — | | | $ | 233,872 | | | $ | 327,299 | |
| 2022 | | | | 936,375 | | | | — | | | | — | | | | 936,375 | |
| KraneShares MSCI All China Index ETF | | | | | | | | | | | | | | | | | |
| 2023 | | | $ | 192,809 | | | $ | 119,165 | | | $ | — | | | $ | 311,974 | |
| 2022 | | | | 280,169 | | | | 648,696 | | | | — | | | | 928,865 | |
| KraneShares MSCI One Belt One Road Index ETF | | | | | | | | | | | | | | | | | |
| 2023 | | | $ | 215,731 | | | $ | — | | | $ | — | | | $ | 215,731 | |
| 2022 | | | | 297,852 | | | | — | | | | — | | | | 297,852 | |
| KraneShares Emerging Markets Consumer Technology Index ETF | | | | | | | | | | | | | | | | | |
| 2023 | | | $ | — | | | $ | — | | | $ | — | | | $ | — | |
| 2022 | | | | 250,511 | | | | — | | | | — | | | | 250,511 | |
| KraneShares MSCI China Clean Technology Index ETF | | | | | | | | | | | | | | | | | |
| 2023 | | | $ | 337,960 | | | $ | 1,438,072 | | | $ | — | | | $ | 1,776,032 | |
| 2022 | | | | 750,577 | | | | 6,939 | | | | — | | | | 757,516 | |
| KraneShares Electric Vehicles and Future Mobility Index ETF | | | | | | | | | | | | | | | | | |
| 2023 | | | $ | 2,090,551 | | | $ | — | | | $ | — | | | $ | 2,090,551 | |
| 2022 | | | | 16,115,832 | | | | 5,768,425 | | | | — | | | | 21,884,257 | |
Notes to Financial Statements (continued)
| KraneShares Funds | | | Ordinary
Income | | | Long-Term
Capital Gain | | | Return of
Capital | | | Totals | |
| KraneShares MSCI All China Health Care Index ETF | | | | | | | | | | | | | | | | | |
| 2023 | | | $ | 50,955 | | | $ | — | | | $ | — | | | $ | 50,955 | |
| 2022 | | | | — | | | | 21,078,396 | | | | — | | | | 21,078,396 | |
| KraneShares Asia Pacific High Income Bond ETF | | | | | | | | | | | | | | | | | |
| 2023 | | | $ | 2,002,618 | | | $ | — | | | $ | — | | | $ | 2,002,618 | |
| 2022 | | | | 1,214,239 | | | | — | | | | 192,065 | | | | 1,406,304 | |
| KraneShares Emerging Markets Healthcare Index ETF | | | | | | | | | | | | | | | | | |
| 2023 | | | $ | 4,560 | | | $ | — | | | $ | — | | | $ | 4,560 | |
| 2022 | | | | 10,783 | | | | — | | | | — | | | | 10,783 | |
| KraneShares MSCI Emerging Markets ex China Index ETF | | | | | | | | | | | | | | | | | |
| 2023 | | | $ | 693,378 | | | $ | — | | | $ | — | | | $ | 693,378 | |
| 2022 | | | | 681,402 | | | | 660,110 | | | | — | | | | 1,341,512 | |
| KraneShares MSCI China ESG Leaders Index ETF | | | | | | | | | | | | | | | | | |
| 2023 | | | $ | 100,843 | | | $ | — | | | $ | — | | | $ | 100,843 | |
| 2022 | | | | 219,611 | | | | — | | | | — | | | | 219,611 | |
| KraneShares CICC China 5G & Semiconductor Index ETF | | | | | | | | | | | | | | | | | |
| 2023 | | | $ | 45,914 | | | $ | — | | | $ | — | | | $ | 45,914 | |
| 2022 | | | | — | | | | — | | | | — | | | | — | |
| KraneShares CICC China Consumer Leaders Index ETF | | | | | | | | | | | | | | | | | |
| 2023 | | | $ | 68,755 | | | $ | — | | | $ | — | | | $ | 68,755 | |
| 2022 | | | | 267,348 | | | | — | | | | — | | | | 267,348 | |
| KraneShares SSE STAR Market 50 Index ETF | | | | | | | | | | | | | | | | | |
| 2023 | | | $ | — | | | $ | — | | | $ | — | | | $ | — | |
| 2022 | | | | — | | | | — | | | | — | | | | — | |
| KraneShares Hang Seng TECH Index ETF | | | | | | | | | | | | | | | | | |
| 2023 | | | $ | 11,428 | | | $ | — | | | $ | — | | | $ | 11,428 | |
| 2022 | | | | — | | | | — | | | | — | | | | — | |
| KraneShares China Innovation ETF | | | | | | | | | | | | | | | | | |
| 2023 | | | $ | — | | | $ | 110,615 | | | $ | 53,934 | | | $ | 164,549 | |
| 2022 | | | | 3,228 | | | | 1,058 | | | | — | | | | 4,286 | |
| KraneShares S&P Pan Asia Dividend Aristocrats Index ETF | | | | | | | | | | | | | | | | | |
| 2023 | | | $ | 22,329 | | | $ | — | | | $ | — | | | $ | 22,329 | |
| KraneShares China Internet and Covered Call Strategy ETF | | | | | | | | | | | | | | | | | |
| 2023 | | | $ | 395,952 | | | $ | — | | | $ | 139,051 | | | $ | 535,003 | |
Notes to Financial Statements (continued)
As of March 31, 2023, the components of tax basis distributable earnings (distributable losses) were as follows:
| | | KraneShares
CICC China
Leaders 100
Index ETF | | | KraneShares
CSI China
Internet ETF | | | KraneShares
Bosera MSCI
China A 50
Connect Index
ETF | | | KraneShares
Bloomberg
China Bond
Inclusion Index
ETF | |
| Undistributed Ordinary Income | | $ | 32,495 | | | $ | 42,166,340 | | | $ | — | | | $ | — | |
| Capital Loss Carryforwards | | | (1,226,300 | ) | | | (1,191,143,119 | ) | | | (71,581,132 | ) | | | (28,413 | ) |
| Post October Losses | | | — | | | | (887,681,082 | ) | | | — | | | | — | |
| Qualified Late-Year Loss Deferrals | | | — | | | | — | | | | (602,309 | ) | | | — | |
| Unrealized Depreciation on Investments and Foreign Currency | | | (71,149 | ) | | | (3,300,925,375 | ) | | | (95,050,139 | ) | | | (292,191 | ) |
| Other Temporary Differences | | | — | | | | 1 | | | | (303,983 | ) | | | (3 | ) |
| Total Distributable Losses | | $ | (1,264,954 | ) | | $ | (5,337,583,235 | ) | | $ | (167,537,563 | ) | | $ | (320,607 | ) |
| | | KraneShares
MSCI All China
Index ETF | | | KraneShares
MSCI One Belt
One Road Index
ETF | | | KraneShares
Emerging
Markets
Consumer
Technology
Index ETF | | | KraneShares
MSCI China
Clean
Technology
Index ETF | |
| Undistributed Ordinary Income | | $ | 23,929 | | | $ | 17,410 | | | $ | 27,451 | | | $ | — | |
| Capital Loss Carryforwards | | | (5,474,769 | ) | | | (3,191,194 | ) | | | (36,647,128 | ) | | | (30,716,725 | ) |
| Post October Losses | | | — | | | | — | | | | — | | | | (191,872 | ) |
| Unrealized Depreciation on Investments and Foreign Currency | | | (1,648,547 | ) | | | (1,219,823 | ) | | | (18,547,775 | ) | | | (41,525,364 | ) |
| Other Temporary Differences | | | 3 | | | | — | | | | (1 | ) | | | — | |
| Total Distributable Losses | | $ | (7,099,384 | ) | | $ | (4,393,607 | ) | | $ | (55,167,453 | ) | | $ | (72,433,961 | ) |
| | | KraneShares
Electric
Vehicles and
Future Mobility
Index ETF | | | KraneShares
MSCI All China
Health Care
Index ETF | | | KraneShares
Asia Pacific
High Income
Bond ETF | | | KraneShares
Emerging
Markets
Healthcare
Index ETF | |
| Undistributed Ordinary Income | | $ | 90,533 | | | $ | 87,921 | | | $ | 547,248 | | | $ | — | |
| Capital Loss Carryforwards | | | (47,045,059 | ) | | | (40,418,259 | ) | | | (8,222,667 | ) | | | (841,415 | ) |
| Post October Losses | | | — | | | | — | | | | — | | | | (1,992 | ) |
| Unrealized Depreciation on Investments and Foreign Currency | | | (50,752,445 | ) | | | (36,655,486 | ) | | | (926,347 | ) | | | (821,449 | ) |
| Other Temporary Differences | | | — | | | | 1 | | | | 31,582 | | | | — | |
| Total Distributable Losses | | $ | (97,706,971 | ) | | $ | (76,985,823 | ) | | $ | (8,570,184 | ) | | $ | (1,664,856 | ) |
Notes to Financial Statements (continued)
| | | KraneShares
MSCI Emerging
Markets ex
China Index ETF | | | KraneShares
MSCI China
ESG Leaders
Index ETF | | | KraneShares
CICC China
5G&
Semiconductor
Index ETF | | | KraneShares
CICC China
Consumer
Leaders Index
ETF | |
| Undistributed Ordinary Income | | $ | 153,114 | | | $ | 33,045 | | | $ | — | | | $ | — | |
| Capital Loss Carryforwards | | | (1,531,324 | ) | | | (2,261,521 | ) | | | (10,998,460 | ) | | | (19,363,165 | ) |
| Qualified Late-Year Loss Deferrals | | | — | | | | — | | | | (22,431 | ) | | | (1,098 | ) |
| Unrealized Depreciation on Investments and Foreign Currency | | | (3,765,032 | ) | | | (1,410,143 | ) | | | (3,690,912 | ) | | | (1,557,715 | ) |
| Other Temporary Differences | | | 2 | | | | (3 | ) | | | (2 | ) | | | (3 | ) |
| Total Distributable Losses | | $ | (5,143,240 | ) | | $ | (3,638,622 | ) | | $ | (14,711,805 | ) | | $ | (20,921,981 | ) |
| | | KraneShares
SSE STAR
Market 50
Index ETF | | | KraneShares
Hang Seng
TECH Index ETF | | | KraneShares
China
Innovation ETF | | | KraneShares
S&P Pan
Asia Dividend
Aristocrats
Index ETF | |
| Undistributed Ordinary Income | | $ | — | | | $ | 21,861 | | | $ | — | | | $ | 31,646 | |
| Capital Loss Carryforwards | | | (19,056,687 | ) | | | (2,908,579 | ) | | | (121,539 | ) | | | (1,654 | ) |
| Qualified Late-Year Loss Deferrals | | | (94,680 | ) | | | — | | | | (422 | ) | | | — | |
| Unrealized Appreciation (Depreciation) on Investments and Foreign Currency | | | (6,364,498 | ) | | | (1,005,455 | ) | | | (729,487 | ) | | | 98,888 | |
| Other Temporary Differences | | | (4 | ) | | | 1 | | | | 2 | | | | — | |
| Total Distributable Earnings/(Loss) | | $ | (25,515,869 | ) | | $ | (3,892,172 | ) | | $ | (851,446 | ) | | $ | 128,880 | |
| | | KraneShares
China Internet
and Covered
Call Strategy
ETF | |
| Unrealized Depreciation on Investments and Foreign Currency | | | (528,078 | ) |
| Other Temporary Differences | | | (1 | ) |
| Total Distributable Losses | | $ | (528,079 | ) |
Qualified late year ordinary and Post-October capital losses (including currency and specified gain/loss items) represent losses realized from January 1, 2023 through March 31, 2023 and November 1, 2022 through March 31, 2023, respectively, that in accordance with federal income tax regulations, the Funds have elected to defer and treat as having arisen in the following fiscal year.
Other temporary differences primarily consist of late year and specified loss deferrals, PFICs mark to market, perpetual bond adjustments, and book adjustments not recognized for tax.
Notes to Financial Statements (continued)
The Funds have capital loss carryforwards as follows:
| KraneShares Funds | | Short-Term Loss | | | Long-Term Loss | | | Total | |
| KraneShares CICC China Leaders 100 Index ETF | | $ | 1,221,254 | | | $ | 5,046 | | | $ | 1,226,300 | |
| KraneShares CSI China Internet ETF | | | 613,197,112 | | | | 577,946,007 | | | | 1,191,143,119 | |
| KraneShares Bosera MSCI China A 50 Connect Index ETF | | | 62,330,691 | | | | 9,250,441 | | | | 71,581,132 | |
| KraneShares Bloomberg China Bond Inclusion Index ETF | | | 22,024 | | | | 6,389 | | | | 28,413 | |
| KraneShares MSCI All China Index ETF | | | 196,232 | | | | 5,278,537 | | | | 5,474,769 | |
| KraneShares MSCI One Belt One Road Index ETF | | | 2,378,781 | | | | 812,413 | | | | 3,191,194 | |
| KraneShares Emerging Markets Consumer Technology Index ETF | | | 21,320,388 | | | | 15,326,740 | | | | 36,647,128 | |
| KraneShares MSCI China Clean Technology Index ETF | | | 5,134,830 | | | | 25,581,895 | | | | 30,716,725 | |
| KraneShares Electric Vehicles and Future Mobility Index ETF | | | 29,718,100 | | | | 17,326,959 | | | | 47,045,059 | |
| KraneShares MSCI All China Health Care Index ETF | | | 3,901,437 | | | | 36,516,822 | | | | 40,418,259 | |
| KraneShares Asia Pacific High Income Bond ETF | | | 6,743,141 | | | | 1,479,526 | | | | 8,222,667 | |
| KraneShares Emerging Markets Healthcare Index ETF | | | 533,970 | | | | 307,445 | | | | 841,415 | |
| KraneShares MSCI Emerging Markets ex China Index ETF | | | 10,980 | | | | 1,520,344 | | | | 1,531,324 | |
| KraneShares MSCI China ESG Leaders Index ETF | | | 307,053 | | | | 1,954,468 | | | | 2,261,521 | |
| KraneShares CICC China 5G & Semiconductor Index ETF | | | 8,222,486 | | | | 2,775,974 | | | | 10,998,460 | |
| KraneShares CICC China Consumer Leaders Index ETF | | | 6,819,078 | | | | 12,544,087 | | | | 19,363,165 | |
| KraneShares SSE STAR Market 50 Index ETF | | | 7,176,205 | | | | 11,880,482 | | | | 19,056,687 | |
| KraneShares Hang Seng TECH Index ETF | | | 2,115,907 | | | | 792,672 | | | | 2,908,579 | |
| KraneShares China Innovation ETF | | | 15,404 | | | | 106,135 | | | | 121,539 | |
| KraneShares S&P Pan Asia Dividend Aristocrats Index ETF | | | 1,654 | | | | — | | | | 1,654 | |
During the year ended March 31, 2023, the following Funds utilized capital loss carryforwards, to offset capital gains:
| KraneShares Funds | | Amount
Utilized | |
| KraneShares MSCI One Belt One Road Index ETF | | $ | 60,113 | |
The differences between book and tax-basis unrealized appreciation and depreciation are attributable primarily to the tax deferral of losses on wash sales and investments in PFICs. The federal tax cost and aggregate gross unrealized appreciation and depreciation on investments held by the Funds at March 31, 2023 were as follows:
| KraneShares Funds | |
Federal Tax
Cost | | | Aggregated
Gross
Unrealized
Appreciation | | | Aggregated
Gross
Unrealized
Depreciation | | |
Net Unrealized
Appreciation
(Depreciation) | |
| KraneShares CICC China Leaders 100 Index ETF | | $ | 6,036,049 | | | $ | 500,548 | | | $ | (571,697 | ) | | $ | (71,149 | ) |
| KraneShares CSI China Internet ETF | | | 9,442,813,196 | | | | 224,250,872 | | | | (3,525,176,247 | ) | | | (3,300,925,375 | ) |
| KraneShares Bosera MSCI China A 50 Connect Index ETF | | | 565,235,541 | | | | 8,213,209 | | | | (103,263,348 | ) | | | (95,050,139 | ) |
| KraneShares Bloomberg China Bond Inclusion Index ETF | | | 7,782,145 | | | | 64,818 | | | | (357,009 | ) | | | (292,191 | ) |
| KraneShares MSCI All China Index ETF | | | 10,427,690 | | | | 363,909 | | | | (2,012,456 | ) | | | (1,648,547 | ) |
Notes to Financial Statements (continued)
| KraneShares Funds | |
Federal Tax
Cost | | | Aggregated
Gross
Unrealized
Appreciation | | | Aggregated
Gross
Unrealized
Depreciation | | |
Net Unrealized
Appreciation
(Depreciation) | |
| KraneShares MSCI One Belt One Road Index ETF | | $ | 5,667,259 | | | $ | 399,653 | | | $ | (1,617,152 | ) | | $ | (1,217,499 | ) |
| KraneShares Emerging Markets Consumer Technology Index ETF | | | 49,758,857 | | | | 732,900 | | | | (19,280,675 | ) | | | (18,547,775 | ) |
| KraneShares MSCI China Clean Technology Index ETF | | | 137,169,650 | | | | 8,410,176 | | | | (49,935,542 | ) | | | (41,525,366 | ) |
| KraneShares Electric Vehicles and Future Mobility Index ETF | | | 243,311,872 | | | | 12,321,634 | | | | (63,074,079 | ) | | | (50,752,445 | ) |
| KraneShares MSCI All China Health Care Index ETF | | | 131,181,768 | | | | 3,727,729 | | | | (40,383,215 | ) | | | (36,655,486 | ) |
| KraneShares Asia Pacific High Income Bond ETF | | | 19,789,774 | | | | 320,337 | | | | (1,246,684 | ) | | | (926,347 | ) |
| KraneShares Emerging Markets Healthcare Index ETF | | | 2,911,288 | | | | 183,554 | | | | (999,587 | ) | | | (816,033 | ) |
| KraneShares MSCI Emerging Markets ex China Index ETF | | | 33,647,851 | | | | 730,264 | | | | (4,470,856 | ) | | | (3,740,592 | ) |
| KraneShares MSCI China ESG Leaders Index ETF | | | 6,384,644 | | | | 247,571 | | | | (1,657,714 | ) | | | (1,410,143 | ) |
| KraneShares CICC China 5G & Semiconductor Index ETF | | | 18,788,134 | | | | 851,493 | | | | (4,542,405 | ) | | | (3,690,912 | ) |
| KraneShares CICC China Consumer Leaders Index ETF | | | 8,522,693 | | | | 412,904 | | | | (1,970,619 | ) | | | (1,557,715 | ) |
| KraneShares SSE STAR Market 50 Index ETF | | | 54,327,040 | | | | 3,766,812 | | | | (10,131,312 | ) | | | (6,364,500 | ) |
| KraneShares Hang Seng TECH Index ETF | | | 7,949,408 | | | | 969,563 | | | | (1,975,018 | ) | | | (1,005,455 | ) |
| KraneShares China Innovation ETF | | | 2,325,788 | | | | — | | | | (729,487 | ) | | | (729,487 | ) |
| KraneShares S&P Pan Asia Dividend Aristocrats Index ETF | | | 2,508,753 | | | | 195,613 | | | | (96,725 | ) | | | 98,888 | |
| KraneShares China Internet and Covered Call Strategy ETF | | | 5,970,676 | | | | — | | | | (528,078 | ) | | | (528,078 | ) |
Uncertainties in the Chinese tax rules governing the taxation of income distributions and capital gains from investments in A Shares could result in unexpected tax liabilities for the Funds. China generally imposes withholding tax at a rate of 10% on dividends and interest derived by non-Chinese resident investors (including, for example, Qualified Foreign Institutional Investors (“QFII”)) from Chinese companies and those companies which are not Chinese tax residents, but which are deemed to be Chinese tax residents (e.g., under Notice 7). China also imposes withholding tax at a rate of 10% on capital gains derived by non-residents from investment in actual and constructive Chinese resident companies. The Chinese withholding taxes applied to dividends, interest and capital gains may, in principle, be subject to a reduced rate under an applicable Chinese tax treaty, but the application of such treaties in the case of a non-resident (e.g., in the case of a QFII acting on behalf of non-resident investors, such as the Funds) is also uncertain. The imposition of such taxes could have a material adverse effect on the Funds’ returns. The People’s Republic of China (the “PRC”) rules regarding the taxation of non-resident investors are quickly evolving and certain
Notes to Financial Statements (continued)
of the tax regulations to be issued by the PRC State Administration of Taxation and/or the PRC Ministry of Finance to clarify matters may apply retrospectively. Such retroactively applied rules may be adverse to the Funds and their shareholders. It is also unclear how China’s value added tax (“VAT”) may be affected by tax treaty provisions. If such a tax is collected, the expenses will be passed on and borne by the Funds. The imposition of such taxes, as well as future changes in applicable PRC tax law, may adversely affect the Funds. If the Funds expect VAT to be imposed, they reserve the right to establish a reserve for such tax. If the Funds establish such a reserve but are not ultimately subject to the tax, shareholders who redeemed or sold their shares while the reserve was in place will effectively bear the tax and may not benefit from the later release, if any, of the reserve. Conversely, if the Funds do not establish such a reserve but ultimately are subject to the tax, shareholders who redeemed or sold their shares prior to the tax being withheld, reserved or paid will have effectively avoided the tax, even if they benefited from investments in a Fund. Effective November 17, 2014, QFIIs, RQFIIs (i.e., QFIIs investing in Yuan, rather than foreign currency) and non-Chinese resident investors investing through the Hong Kong-Shanghai Stock Connect are exempted temporarily from the 10% capital gains tax that normally applies to sales of A Shares on a public Chinese exchange (such as the Shanghai Stock Exchange). However, such investors are still required to pay capital gains tax for gains realized on trades executed before November 17, 2014.
On November 7, 2018, China’s Ministry of Finance and the State Administration of Taxation jointly issued Circular 108. This circular announced a three year exemption from corporate income tax withholding (“WHT”) and Value Added Tax (“VAT”) for China-sourced bond interest derived by overseas institutional investors. The WHT and VAT exemptions were extended to December 31, 2025.
6. CONCENTRATION OF RISKS
As with all ETFs, shareholders of the Funds are subject to the risk that their investment could lose money. Each Fund is subject to certain of the principal risks noted below, any of which may adversely affect a Fund’s NAV, trading price, yield, total return and ability to meet its investment objective. A more complete description of principal risks is included in each Fund’s prospectus under the heading “Principal Risks”.
CHINA RISK — The Chinese economy is generally considered an emerging market and can be significantly affected by economic and political conditions in China and surrounding Asian countries. China may be subject to considerable degrees of economic, political and social instability. In addition, the Chinese economy is export-driven and highly reliant on trade with key partners. A downturn in the economies of China’s primary trading partners could slow or eliminate the growth of the Chinese economy and adversely impact the Fund’s investments. The Chinese government strictly regulates the payment of foreign currency denominated obligations and sets monetary policy. The Chinese government may introduce new laws and regulations that could have an adverse effect on the Fund. Although China has begun the process of privatizing certain sectors of its economy, privatized entities may lose money and/or be re-nationalized.
In the Chinese securities markets, a small number of issuers may represent a large portion of the entire market. The Chinese securities markets are subject to more frequent trading halts, low trading volume and price volatility. Recent developments in relations between the United States and China have heightened concerns of increased tariffs and restrictions on trade between the two
Notes to Financial Statements (continued)
countries. An increase in tariffs or trade restrictions or even the threat of such developments, could lead to significant reduction in international trade, which could have a negative impact on China’s export industry and a commensurately negative impact on the Fund.
The RMB Bond market is volatile with a risk of trading suspensions in particular securities and government interventions. Trading in RMB Bonds may be suspended without warning and for lengthy periods. Information on such trading suspensions, including as to their expected length, may be unavailable. Securities affected by trading suspensions may be or become illiquid. In recent years, Chinese entities have incurred significant levels of debt and Chinese financial institutions currently hold relatively large amounts of non-performing debt. Thus, there exists a possibility that widespread defaults could occur, which could trigger a financial crisis, freeze Chinese debt and finance markets and make certain Chinese securities illiquid.
In addition, trade relations between the U.S. and China have recently been strained. Worsening trade relations between the two countries could adversely impact the Fund, particularly to the extent that the Chinese government restricts foreign investments in on-shore Chinese companies or the U.S. government restricts investments by U.S. investors in China including by limiting the ability of Chinese issuers to list on the U.S. exchanges. Worsening trade relations may also result in market volatility and volatility in the price of Fund shares. In addition, the U.S government has imposed restrictions on the ability of U.S. investors to hold and/or acquire securities of certain Chinese companies, which may adversely impact the Fund, may mean that the Fund’s Underlying Index may need to adjust its methodology or could increase tracking error for the Fund.
CONCENTRATION RISK — Because the assets of certain Funds are expected to be concentrated in an industry or group of industries to the extent that the Underlying Index concentrates in a particular industry or group of industries, the Fund is subject to loss due to adverse occurrences that may affect that industry or group of industries or sector. Market conditions, interest rates, and economic, regulatory, or financial developments could significantly affect a single industry or a group of related industries, and the securities of companies in that industry or group of industries could react similarly to these or other developments. Depending on the composition of each Fund’s Underlying Index, the Fund may be subject to principal risks, as outlined in each Fund’s prospectus. Each Fund may have significant exposure to other industries or sectors over time.
CURRENCY RISK — The Funds’ assets will be invested in instruments denominated in foreign currencies and the income received by the Fund may be in foreign currencies. The Fund will compute and expects to distribute its income in U.S. dollars, and the computation of income will be made on the date that the income is earned by the Fund at the foreign exchange rate in effect on that date. The Fund will conduct its foreign currency exchange transactions either on a spot (i.e., cash) basis at the spot rate prevailing in the foreign currency exchange market at the time the Fund wishes to enter into the transaction, or through forward, futures or options contracts to purchase or sell foreign currencies.
The Fund’s NAV is determined on the basis of the U.S. dollar. The Fund may therefore lose value if the local currency of a foreign investment depreciates against the U.S. dollar, even if the local currency value of the Fund’s holdings goes up. Currency exchange rates can be very volatile and can change quickly and unpredictably, which may adversely affect the Fund. The Fund may also be subject to delays in converting or transferring U.S. dollars to foreign currencies and vice versa. This may adversely affect the Fund’s performance over time.
Notes to Financial Statements (continued)
DERIVATIVES RISK — The use of derivatives (including swaps, futures, forwards, structured notes and options) may involve leverage, which includes risks that are different from, and greater than, the risks associated with investing directly in a reference asset, because a small investment in a derivative can result in a large impact on the Fund and may cause the Fund to be more volatile. Derivatives may at times be highly illiquid, and the Fund may not be able to close out or sell a derivative at a particular time or at an anticipated price. Derivatives can be difficult to value and valuation may be more difficult in times of market turmoil. There may be imperfect correlation between the derivative and that of the reference asset, resulting in unexpected returns that could materially adversely affect the Fund. Certain derivatives (such as swaps and options) are bi-lateral agreements that expose the Fund to counterparty risk, which is the risk of loss in the event that the counterparty to an agreement fails to make required payments or otherwise comply with the terms of derivative. In that case, the Fund may suffer losses potentially equal to, or greater than, the full value of the derivative if the counterparty fails to perform its obligations. That risk is generally thought to be greater with over-the-counter (OTC) derivatives than with derivatives that are exchange traded or centrally cleared. Counterparty risks are compounded by the fact that there are only a limited number of ways available to invest in certain reference assets and, therefore, there may be few counterparties to swaps or options based on those reference assets. Many derivatives are subject to segregation requirements that require the Fund to segregate the market or notional value of the derivatives, which could impede the portfolio management of the Fund.
EMERGING MARKETS RISK — A Funds’ investments in emerging markets are subject to greater risk of loss than investments in developed markets. This is due to, among other things, greater market volatility, greater risk of asset seizures and capital controls, lower trading volume, political and economic instability, greater risk of market shutdown and more governmental limitations on foreign investments than typically found in developed markets. The economies of emerging markets, and China in particular, may be heavily reliant upon international trade and may suffer disproportionately if international trading declines or is disrupted.
LIQUIDITY RISK — Certain of the Funds’ investments are subject to liquidity risk, which exists when an investment is or becomes difficult to purchase or sell at a reasonable time and price. If a transaction is particularly large or if the relevant market is or becomes illiquid, it may not be possible to initiate a transaction or liquidate a position, which may cause the Funds to suffer significant losses and difficulties in meeting redemptions. Liquidity risk may be the result of, among other things, market turmoil, the reduced number and capacity of traditional market participants, or the lack of an active trading market. Markets for securities or financial instruments could be disrupted by a number of events, including, but not limited to, an economic crisis, natural disasters, new legislation or regulatory changes inside or outside the U.S. Liquid investments may become less liquid after being purchased by the Fund, particularly during periods of market stress. In addition, if a number of securities held by the Fund stop trading, it may have a cascading effect and cause the Fund to halt trading. Volatility in market prices will increase the risk of the Fund being subject to a trading halt. Certain countries in which the Fund may invest may be subject to extended settlement delays and/or foreign holidays, during which the Fund will unlikely be able to convert holdings to cash.
MARKET RISK — The values of the Fund’s holdings could decline generally or could underperform other investments. In addition, there is a risk that policy changes by the U.S. Government, Federal Reserve, and/or other government actors could cause volatility in global financial markets, negative sentiment and higher levels of Fund redemptions, which could have a negative impact on the Fund and could result in losses. Geopolitical and other risks, including environmental and public
Notes to Financial Statements (concluded)
health risks may add to instability in world economies and markets generally. Changes in value may be temporary or may last for extended periods. Further, the Fund is susceptible to the risk that certain investments may be difficult or impossible to sell at a favorable time or price. Market developments may also cause the Fund’s investments to become less liquid and subject to erratic price movements. Such market developments may also cause the Fund to encounter difficulties in timely honoring redemptions, especially if market events cause an increased incidence of shareholder redemptions.
NON-DIVERSIFIED FUND RISK — Because a Fund is non-diversified and may invest a greater portion of its assets in fewer issuers than a diversified fund, changes in the market value of a single portfolio holding could cause greater fluctuations in the Fund’s share price than would occur in a diversified fund. This may increase the Fund’s volatility and cause the performance of a single portfolio holding or a relatively small number of portfolio holdings to have a greater impact on the Fund’s performance.
VALUATION RISK — Independent market quotations for the non-U.S. securities held by the Funds may not be readily available and such securities may be fair valued by a pricing service at an evaluated price. These valuations involve subjectivity and different market participants may assign different prices to the same investment. As a result, there is a risk that a Fund may not be able to sell an investment at the price assigned to the investment by the Fund. In addition, the securities in which the Funds invest may trade on days that the Funds do not price their shares; as a result, the value of Fund shares may change on days when investors cannot purchase or sell their holdings.
7. OTHER
At March 31, 2023, all shares issued by the Funds were in Creation Unit aggregations to Authorized Participants through primary market transactions (e.g., transactions directly with the Funds). However, the individual shares that make up those Creation Units are traded on the Exchange (e.g., secondary market transactions). Some of those individual shares have been bought and sold by persons that are not Authorized Participants. Each Authorized Participant has entered into an agreement with the Funds’ Distributor.
8. INDEMNIFICATIONS
In the normal course of business, the Funds enter into contracts that provide general indemnifications. The Funds’ maximum exposure under these arrangements is dependent on future claims that may be made against the Funds and, therefore, cannot be established; however, based on experience, the risk of loss from such claims is considered remote.
9. SUBSEQUENT EVENTS
The Funds have evaluated the need for additional disclosures and/or adjustments resulting from subsequent events through the date the financial statements were issued.
Based on this evaluation, no additional disclosures or adjustments were required to the financial statements as of the date the financial statements were issued.
Report of Independent Registered Public Accounting Firm
To the Shareholders and Board of Trustees
KraneShares Trust:
Opinion on the Financial Statements
We have audited the accompanying statements of assets and liabilities of the funds listed in the Appendix, twenty-one of the funds comprising KraneShares Trust (collectively, the Funds), including the schedules of investments, as of March 31, 2023, the related statements of operations for the year or period listed in the Appendix, the statements of changes in net assets for each of the years or periods in the two-year period listed in the Appendix, and the related notes (collectively, the financial statements) and the financial highlights for each of the years or periods in the five-year period listed in the Appendix. In our opinion, the financial statements and financial highlights present fairly, in all material respects, the financial position of each of the Funds as of March 31, 2023, the results of its operations for the year or period listed in the Appendix, the changes in its net assets for each of the years or periods in the two-year period listed in the Appendix, and the financial highlights for each of the years or periods in the five-year period listed in the Appendix, in conformity with U.S. generally accepted accounting principles.
Basis for Opinion
These financial statements and financial highlights are the responsibility of the Funds’ management. Our responsibility is to express an opinion on these financial statements and financial highlights based on our audits. We are a public accounting firm registered with the Public Company Accounting Oversight Board (United States) (PCAOB) and are required to be independent with respect to the Funds in accordance with the U.S. federal securities laws and the applicable rules and regulations of the Securities and Exchange Commission and the PCAOB.
We conducted our audits in accordance with the standards of the PCAOB. Those standards require that we plan and perform the audit to obtain reasonable assurance about whether the financial statements and financial highlights are free of material misstatement, whether due to error or fraud. Our audits included performing procedures to assess the risks of material misstatement of the financial statements and financial highlights, whether due to error or fraud, and performing procedures that respond to those risks. Such procedures included examining, on a test basis, evidence regarding the amounts and disclosures in the financial statements and financial highlights. Such procedures included examining, on a test basis, evidence regarding the amounts and disclosures in the financial statements and financial highlights. Such procedures also included confirmation of securities owned as of March 31, 2023, by correspondence with the custodian, transfer agent, and brokers or by other appropriate auditing procedures when replies from brokers were not received. Our audits also included evaluating the accounting principles used and significant estimates made by management, as well as evaluating the overall presentation of the financial statements and financial highlights. We believe that our audits provide a reasonable basis for our opinion.

We have served as the auditor of one or more KraneShares investment companies since 2017.
Philadelphia, Pennsylvania
May 29, 2023
Report of Independent Registered Public Accounting Firm (continued)
Appendix
Funds with commencement of operations prior to March 31, 2019:
KraneShares CICC China Leaders 100 Index ETF
KraneShares CSI China Internet ETF
KraneShares Bosera MSCI China A 50 Connect Index ETF
KraneShares Bloomberg China Bond Inclusion Index ETF
KraneShares MSCI All China Index ETF
KraneShares MSCI One Belt One Road Index ETF
KraneShares Emerging Markets Consumer Technology Index ETF
KraneShares MSCI China Clean Technology Index ETF
KraneShares Electric Vehicles and Future Mobility Index ETF
KraneShares MSCI All China Health Care Index ETF
Statement of operations for the year ended March 31, 2023
Statements of changes in net assets for each of the years in the two-year period ended March 31, 2023
Financial highlights each of the years in the five-year period ended March 31, 2023
Funds with commencement of operations during the year ended March 31, 2019:
KraneShares Asia Pacific High Income Bond ETF
Statement of operations for the year ended March 31, 2023
Statements of changes in net assets for each of the years in the two-year period ended March 31, 2023
Financial highlights for each of the years in the four-year period ended March 31, 2023 and the period from June 26, 2018 (commencement of operations) through March 31, 2019
KraneShares Emerging Markets Healthcare Index ETF
Statement of operations for the year ended March 31, 2023
Statements of changes in net assets for each of the years in the two-year period ended March 31, 2023
Financial highlights for each of the years in the four-year period ended March 31, 2023 and the period from August 29, 2018 (commencement of operations) through March 31, 2019
Funds with commencement of operations during the year ended March 31, 2020:
KraneShares MSCI Emerging Markets ex China Index ETF
Statement of operations for the year ended March 31, 2023
Statements of changes in net assets for each of the years in the two-year period ended March 31, 2023
Financial highlights for each of the years in the three-year period ended March 31, 2023 and the period from April 12, 2019 (commencement of operations) through March 31, 2020
Funds with commencement of operations during the year ended March 31, 2021:
KraneShares MSCI China ESG Leaders Index ETF
Statement of operations for the year ended March 31, 2023
Statements of changes in net assets for each of the years in the two-year period ended March 31, 2023
Financial highlights for each of the years in the two-year period ended March 31, 2023 and the period from July 28, 2020 (commencement of operations) through March 31, 2021
KraneShares CICC China 5G & Semiconductor Index ETF
Report of Independent Registered Public Accounting Firm (concluded)
Statement of operations for the year ended March 31, 2023
Statements of changes in net assets for each of the years in the two-year period ended March 31, 2023
Financial highlights for each of the years in the two-year period ended March 31, 2023 and the period from November 23, 2020 (commencement of operations) through March 31, 2021
KraneShares CICC China Consumer Leaders Index ETF
Statement of operations for the year ended March 31, 2023
Statements of changes in net assets for each of the years in the two-year period ended March 31, 2023
Financial highlights for each of the years in the two-year period ended March 31, 2023 and the period from December 8, 2020 (commencement of operations) through March 31, 2021
KraneShares SSE STAR Market 50 Index ETF
Statement of operations for the year ended March 31, 2023
Statements of changes in net assets for each of the years in the two-year period ended March 31, 2023
Financial highlights for each of the years in the two-year period ended March 31, 2023 and the period from January 26, 2021 (commencement of operations) through March 31, 2021
Funds with commencement of operations during the year ended March 31, 2022:
KraneShares Heng Seng TECH Index ETF
Statement of operations for the year ended March 31, 2023
Statements of changes in net assets for the year ended March 31, 2023 and the period from June 8, 2021 (commencement of operations) through March 31, 2022
Financial highlights for the year ended March 31, 2023 and the period from June 8, 2021 (commencement of operations) through March 31, 2022
KraneShares China Innovation ETF
Statement of operations for the year ended March 31, 2023
Statements of changes in net assets for the year ended March 31, 2023 and the period from October 5, 2021 (commencement of operations) through March 31, 2022
Financial highlights for the year ended March 31, 2023 and the period from October 5, 2021 (commencement of operations) through March 31, 2022
Funds with commencement of operations during the year ended March 31, 2023:
KraneShares S&P Pan Asia Dividend Aristocrats Index ETF
Statements of operations and changes in net assets and financial highlights for the period from September 15, 2022 (commencement of operations) through March 31, 2023
KraneShares China Internet & Covered Call Strategy ETF
Statements of operations and changes in net assets and the financial highlights for the period from January 12, 2023 (commencement of operations) through March 31, 2023
Trustees and Officers of the Trust (Unaudited)
March 31, 2023
Set forth below are the names, addresses, years of birth, positions with the Trust, terms of office and lengths of time served; the principal occupations for the last five years; number of Funds in fund complex overseen; and other directorships outside the fund complex of each of the persons currently serving as Trustees and Officers of the Trust. The Trust’s Statement of Additional Information (“SAI”) includes additional information about the Trustees and Officers. The SAI may be obtained without charge, upon request, by calling 1-855-857-2638. The following chart lists Trustees and Officers as of March 31, 2023.
| | | | | | | Number of | | Other |
| | | Position(s) | | | | Funds in Trust | | Directorships |
| Name, Address | | Held | | Principal Occupation(s) | | Overseen by | | Held by |
| (Year of Birth) | | with Trust | | During the Past 5 Years | | Trustee | | Trustees |
| Interested Trustee1 | | | | | | | | |
| | | | | | | | | |
Jonathan Krane2 (1968) 280 Park Avenue 32nd Floor New York, New York, 10017 | | Trustee and Chairman of the Board, No set term; served since 2012 | | Chief Executive Officer of Krane Funds Advisors, LLC from 2011 to present. Chief Executive Officer of Krane Portfolio Advisors, LLC from 2018 to present. Principal of Krane Capital LLC from 2009 to 2011. | | 38 | | None |
| | | | | | | | | |
| Independent Trustees1 | | | | | | | | |
| | | | | | | | | |
Patrick P. Campo (1970) 280 Park Avenue 32nd Floor New York, New York, 10017 | | Trustee, No set term; served since 2017 | | From 2019 to present, Director of Research and from 2013 to 2019 Director of Long Short Equity, Titan Advisors. | | 38 | | None |
| | | | | | | | | |
John Ferguson (1966) 280 Park Avenue 32nd Floor New York, New York, 10017 | | Trustee, No set term; served since 2012 | | Chief Operating Officer of Shrewsbury River Capital from 2017 to 2020. Chief Operating Officer of Kang Global Investors LP (hedge fund adviser) from 2014 to 2016. President of Alden Global Capital, LLC (hedge fund adviser) from 2012 to 2014 (formerly, Chief Operating Officer from 2011 to 2012). Senior Managing Director and Chief Operating Officer of K2 Advisors, LLC from 2005 to 2011. | | 38 | | None |
Trustees and Officers of the Trust (Unaudited) (continued)
March 31, 2023
| | | | | | | Number of | | Other |
| | | Position(s) | | | | Funds in Trust | | Directorships |
| Name, Address | | Held | | Principal Occupation(s) | | Overseen by | | Held by |
| (Year of Birth) | | with Trust | | During the Past 5 Years | | Trustee | | Trustees |
| Independent Trustees1 | | | | | | | | |
| | | | | | | | | |
Matthew Stroyman (1968) 280 Park Avenue 32nd Floor New York, New York, 10017 | | Trustee, No set term; served since 2012 | | Founder and President of BlackRidge Ventures from 2018 to present (principal investment activities and strategic advisory services in a variety of industries to clients and partners that include institutional investment firms, family offices and high net-worth individuals). Co-Founder, President and Chief Operating Officer of Arcturus (real estate asset and investment management services firm) from 2007 to 2017. | | 38 | | None |
| | | | | | | Number of | | Other |
| | | Position(s) | | | | Funds in Trust | | Directorships |
| Name, Address | | Held | | Principal Occupation(s) | | Overseen by | | Held by |
| (Year of Birth) | | with Trust | | During the Past 5 Years | | Trustee | | Trustees |
| Officers1 | | | | | | | | |
| | | | | | | | | |
Jonathan Krane (1968) 280 Park Avenue 32nd Floor New York, New York, 10017 | | Principal Executive Officer and Principal Financial Officer, No set term; served since 2012 | | Chief Executive Officer of Krane Funds Advisors, LLC from 2011 to present. Chief Executive Officer of Krane Portfolio Advisors, LLC from 2018 to present. Principal of Krane Capital LLC from 2009 to 2011. | | 38 | | None |
| | | | | | | | | |
Jennifer Tarleton (formerly Krane) (1966) 280 Park Avenue 32nd Floor New York, New York, 10017 | | Vice President and Secretary, No set term; served since 2012 | | Vice President of Krane Funds Advisors, LLC from 2011 to present. | | 38 | | None |
Trustees and Officers of the Trust (Unaudited) (concluded)
March 31, 2023
| | | | | | | Number of | | Other |
| | | Position(s) | | | | Funds in Trust | | Directorships |
| Name, Address | | Held | | Principal Occupation(s) | | Overseen by | | Held by |
| (Year of Birth) | | with Trust | | During the Past 5 Years | | Trustee | | Trustees |
| Officers1 | | | | | | | | |
| | | | | | | | | |
Michael Quain (1957) 280 Park Avenue 32nd Floor New York, New York, 10017 | | Chief Compliance Officer and AntiMoney Laundering Officer, No Set Term; served since 2015 | | Principal/President of Quain Compliance Consulting, LLC from 2014 to present. First Vice President of Aberdeen Asset Management Inc. from May 2013 to September 2013. | | 38 | | None |
| | | | | | | | | |
Eric Olsen (1970) SEI Investments Company One Freedom Valley Drive Oaks, PA 19456 | | Assistant Treasurer, No set term; served since 2021 | | Director of Accounting, SEI Investments Global Fund Services (March 2021 to present); Deputy Head of Fund Operations, Traditional Assets, Aberdeen Standard Investments (August 2013 to February 2021). | | 38 | | None |
| | | | | | | | | |
David Adelman (1964) 280 Park Avenue 32nd Floor New York, New York, 10017 | | Assistant Secretary, No set term; served since 2021 | | Managing Director and the General Counsel, Krane Fund Advisors, LLC from 2021. Partner, Reed Smith LLP from 2015 to 2021. | | 38 | | None |
| | | | | | | | | |
Jonathan Shelon (1974) 280 Park Avenue 32nd Floor New York, New York, 10017 | | Assistant Secretary, No set term; served since 2019 | | Chief Operating Officer, Krane Funds Advisors, LLC from 2015 to present. Chief Operating Officer, CICC Wealth Management (USA) LLC from 2018 to present. Chief Investment Officer of Specialized Strategies, J.P. Morgan from 2011 to 2015. | | 38 | | None |
| 1 | Each Trustee serves until his or her successor is duly elected or appointed and qualified. |
| 2 | Mr. Krane is an “interested” person of the Trust, as that term is defined in the 1940 Act, by virtue of his ownership and controlling interest in the Adviser. |
Approval of Advisory Agreement (Unaudited)
Approval of Advisory Agreement for KraneShares China Internet and Covered Call Strategy ETF
At a meeting held on December 1-2, 2022, the Board of Trustees (the “Board”) of KraneShares Trust (the “Trust”), including a majority of the Trustees who are not “interested persons” of the Trust, as that term is defined in the Investment Company Act of 1940, as amended (the “Independent Trustees”), approved the existing investment advisory agreement (the “Advisory Agreement”) between Krane Funds Advisors, LLC (“Krane”) and the Trust, on behalf of a proposed new series of the Trust, KraneShares China Internet and Covered Call Strategy ETF (the “New Fund”).
In advance of the meeting, and at a separate meeting of the Independent Trustees in executive session held on December 1, 2022, the Board received and considered information provided by Krane in response to the Independent Trustees’ written request for information regarding the New Fund and the Advisory Agreement. The Board noted that it considers information at each of its regularly scheduled meetings related to, among other matters, the services provided by Krane to each series of the Trust, and that such information will include information related to the New Fund after it is operational. The Board considered that the Independent Trustees also receive additional information outside of regularly scheduled Board meetings and at executive sessions held by the Independent Trustees. As a result, the Board considered that its evaluation process with respect to Krane and each series of the Trust is an ongoing one.
In evaluating the Advisory Agreement with respect to the New Fund, the Board considered, among other matters: (1) the nature, extent, and quality of the services to be provided to the New Fund by Krane; (2) the proposed compensation to be paid by the New Fund under the Advisory Agreement and related fee waivers; (3) the estimated costs of the services to be provided by Krane and the profitability expectations of Krane with respect to its relationship with the New Fund; (4) the extent to which economies of scale could be realized as the New Fund grows and whether the unitary fee charged under the Advisory Agreement will enable investors in the New Fund to share in any such economies of scale; and (5) other benefits Krane anticipates it may receive from its relationship with the New Fund.
Nature, Extent and Quality of Services
Based on written and oral reports received by the Board prior to and at the December 1, 2022 executive session of the Independent Trustees and December 1-2, 2022 meeting of the Board, the Board considered the nature, quality, and extent of the overall services to be provided by Krane to the New Fund under the Advisory Agreement. The Board took note of the qualifications, background and responsibilities of Krane personnel who will provide services to the New Fund.
The Board considered Krane’s representation that the New Fund represented a unique investment opportunity for retail investors. They noted that the portfolio would consist of investments in component securities of the CSI Overseas China Internet Index (“Index”) and at the money covered call options written by Krane on the Index. The Board noted that the Index is also the underlying index for KraneShares CSI China Internet ETF (“KWEB”) and considered that Krane intends to manage the New Fund’s portfolio by purchasing KWEB and writing covered call options on KWEB. The Board considered the hypothetical results of the proposed portfolio construction and considered the relative volatility of the New Fund compared to historical volatility of KWEB. The Board noted the portfolio management expertise necessary to write covered call options on the New Fund’s portfolio and considered the expertise and experience of Krane’s portfolio staff in this regard.
Approval of Advisory Agreement (Unaudited) (continued)
The Board recognized that Krane invests significant time and effort in structuring new series of the Trust, including the New Fund. They considered Krane’s evaluation of the market appeal for the New Fund, and considered that Krane worked with the Trust’s service providers to manage the administrative and other requirements for the New Fund. The Board also noted that Krane continually evaluates its existing compliance and operational staff, as well as its investment professionals, and that Krane has consistently sought to retain qualified and experienced staff in these areas as its business has grown. The Board considered Krane’s current ownership structure, financial strength and long-term strategic plans, and noted that Krane is part of a family of investment management firms with significant resources, including administrative resources utilized by Krane.
Investment Performance
The Board noted that, because the New Fund has not yet commenced investment operations, it has no investment performance. The Board considered, however, Krane’s representations with respect to hypothetical results of a model proposed portfolio and considered the resulting relative volatility of the New Fund compared to historical volatility of KWEB. The Board noted that once the New Fund commences operations, the Board will receive regular reports regarding its performance relative its respective broad Morningstar peer group, as well as a select group of competitors identified by Krane. The Board also considered that at its regular meetings it will receive information regarding the New Fund against the performance of an identified index. The Board considered that there are limited peers available for the New Fund.
Compensation
The Board considered that, pursuant to the Advisory Agreement, Krane will enter into a unitary advisory fee arrangement for the New Funds. The Board considered the proposed fee for the New Fund compared to its Morningstar universe and against a custom peer group. The Board considered that Krane will waive any acquired fund fees and expenses due to the New Fund’s investment in KWEB and considered the results of such waiver on the New Fund’s advisory fee. The Board considered that the proposed fee rate for the New Fund is above the median of its peer group, and took note of the unique nature of the strategy followed by the New Fund. The Board also considered that under the unitary fee arrangement, Krane will be responsible for paying most of the expenses incurred by the New Fund, including those of its principal service providers. The Board noted that, under the unitary fee structure, Krane takes the risk that the New Fund may not be successful in raising sufficient assets to enable Krane to cover the cost of such expenses.
Costs and Profitability
The Board considered the estimated cost of Krane’s services with respect to the New Fund. The Board noted that, because the New Fund has not yet launched, it was difficult to estimate how profitable it will be to Krane, although the Board recognized that the New Fund will leverage procedures and systems put in place in connection with management of other series of the Trust. The Independent Trustees received information from Krane regarding its overall profitability, particularly in light of recent market performance, and discussed with Krane’s management how launching the New Fund could impact such profitability. The Board considered information previously provided by Krane regarding the cost of its services and its profitability with respect to the existing operational series of the Trust. The Board noted Krane’s continuing commitment to operating the Trust and its continued use of a unitary fee structure under which it will bear many of the expenses of the New Funds.
Approval of Advisory Agreement (Unaudited) (concluded)
Other Benefits
The Board considered the extent to which Krane could derive ancillary benefits from the operations of the New Fund including, in particular, the effect the New Fund could have on KWEB’s assets and the fees earned by Krane on KWEB. They noted that it was unlikely that the New Fund would participate in the Trust’s securities lending program, and considered whether Krane would benefit as a result of its ability to use the New Fund’s assets to engage in soft dollar transactions.
Economies of Scale
The Board considered whether Krane would realize economies of scale with respect to its services as the New Fund grows, including the extent to which this is reflected in the level of fees to be paid by the New Fund. The Board noted that the proposed advisory fee for the New Fund does not includes breakpoints, and considered that it is not possible—before the commencement of investment operations—to accurately evaluate potential economies of scale. The Board also noted that Krane continues to reinvest a portion of its profits in its business, including through the evolution of its compliance and investment infrastructure, and that any economies of scale could be shared with the New Fund in this manner. Based on these and other considerations, including that the New Fund is newly organized, the Board considered economies of scale not to be a material factor in its consideration of the Advisory Agreement.
Conclusion
The Board did not identify any single factor as being of paramount importance, and different Trustees may have given different weight to different factors in their review of the Advisory Agreement. The Board reviewed a memorandum from Independent Trustee counsel discussing the legal standards and judicial precedent applicable to its consideration of the Advisory Agreement. The Board noted that, consistent with its approach to other series of the Trust, it will continue to monitor the New Fund at its regular meetings, during executive sessions of the Independent Trustees and outside of the Board meetings. Based on its review, including consideration of each of the factors referenced above, the Board determined, in the exercise of its reasonable business judgment, that the advisory arrangements, as outlined in the Advisory Agreement, were reasonable in light of the factors considered by the Board.
Disclosure of Fund Expenses (Unaudited)
As a shareholder of a Fund, you incur two types of costs: (1) transaction costs, including brokerage expenses; and (2) ongoing costs. All Exchange Traded Funds (“ETFs”) have operating expenses. As a shareholder of an ETF, your investment is affected by these ongoing costs, which include (among others) costs for ETF management, administrative services, commissions, and shareholder reports like this one. It is important for you to understand the impact of these costs on your investment returns. In addition, a shareholder is responsible for brokerage fees as a result of their investment in the Fund. Operating expenses such as these are deducted from an ETF’s gross income and directly reduce its final investment return. These expenses are expressed as a percentage of the ETF’s average net assets; this percentage is known as the ETF’s expense ratio.
The following examples use the expense ratio and are intended to help you understand the ongoing costs (in dollars) of investing in your Fund and to compare these costs with those of other funds. The examples are based on an investment of $1,000 made at the beginning of the period shown and held for the entire period (October 1, 2022 to March 31, 2023).
The table on the next page illustrates your Fund’s costs in two ways:
Actual Fund Return. This section helps you to estimate the actual expenses that your Fund incurred over the period. The “Expenses Paid During Period” column shows the actual dollar expense cost incurred by a $1,000 investment in the Fund, and the “Ending Account Value” number is derived from deducting that expense cost from the Fund’s gross investment return.
You can use this information, together with the actual amount you invested in the Fund, to estimate the expenses you paid over that period. Simply divide your actual account value by $1,000 to arrive at a ratio (for example, an $8,600 account value divided by $1,000 = 8.6), then multiply that ratio by the number shown for your Fund under “Expenses Paid During Period.”
Hypothetical 5% Return. This section helps you compare your Fund’s costs with those of other funds. It assumes that the Fund had an annual 5% return before expenses during the year, but that the expense ratio (Column 3) for the period is unchanged. This example is useful in making comparisons because the Securities and Exchange Commission requires all funds to make this 5% calculation. You can assess your Fund’s comparative cost by comparing the hypothetical result for your Fund in the “Expenses Paid During Period” column with those that appear in the same charts in the shareholder reports for other funds.
NOTE: Because the return is set at 5% for comparison purposes — NOT your Fund’s actual return — the account values shown may not apply to your specific investment.
Please note that the expenses shown in the table are meant to highlight your ongoing costs only and do not reflect any transactional costs, including brokerage commissions on the purchases and sale of Fund shares. Therefore, the expense examples are useful in comparing ongoing costs only, and will not help you determine the relative total costs of owning different funds. If these transactional costs had been included, your costs would have been higher.
Disclosure of Fund Expenses (Unaudited) (continued)
| | |
Beginning
Account Value
10/1/2022 | | | Ending
Account
Value
3/31/2023 | | |
Annualized
Expense
Ratios | | |
Expenses
Paid During
Period(1) | |
| KraneShares CICC China Leaders 100 Index ETF | | | | | | | | | | | | | | | | |
| Actual Fund Return | | $ | 1,000.00 | | | $ | 1,085.80 | | | | 0.69 | % | | $ | 3.59 | |
| Hypothetical 5% Return | | | 1,000.00 | | | | 1,021.49 | | | | 0.69 | | | | 3.48 | |
| | | | | | | | | | | | | | | | | |
| KraneShares CSI China Internet ETF | | | | | | | | | | | | | | | | |
| Actual Fund Return | | $ | 1,000.00 | | | $ | 1,268.30 | | | | 0.69 | % | | $ | 3.90 | |
| Hypothetical 5% Return | | | 1,000.00 | | | | 1,021.49 | | | | 0.69 | | | | 3.48 | |
| | | | | | | | | | | | | | | | | |
| KraneShares Bosera MSCI China A 50 Connect Index ETF | | | | | | | | | | | | | | | | |
| Actual Fund Return | | $ | 1,000.00 | | | $ | 1,058.20 | | | | 0.56 | % | | $ | 2.87 | |
| Hypothetical 5% Return | | | 1,000.00 | | | | 1,022.14 | | | | 0.56 | | | | 2.82 | |
| | | | | | | | | | | | | | | | | |
| KraneShares Bloomberg China Bond Inclusion Index ETF | | | | | | | | | | | | | | | | |
| Actual Fund Return | | $ | 1,000.00 | | | $ | 1,047.00 | | | | 0.49 | % | | $ | 2.50 | |
| Hypothetical 5% Return | | | 1,000.00 | | | | 1,022.49 | | | | 0.49 | | | | 2.47 | |
| | | | | | | | | | | | | | | | | |
| KraneShares MSCI All China Index ETF | | | | | | | | | | | | | | | | |
| Actual Fund Return | | $ | 1,000.00 | | | $ | 1,147.20 | | | | 0.49 | % | | $ | 2.62 | |
| Hypothetical 5% Return | | | 1,000.00 | | | | 1,022.49 | | | | 0.49 | | | | 2.47 | |
| | | | | | | | | | | | | | | | | |
| KraneShares MSCI One Belt One Road Index ETF | | | | | | | | | | | | | | | | |
| Actual Fund Return | | $ | 1,000.00 | | | $ | 1,045.40 | | | | 0.79 | % | | $ | 4.03 | |
| Hypothetical 5% Return | | | 1,000.00 | | | | 1,020.99 | | | | 0.79 | | | | 3.98 | |
| | | | | | | | | | | | | | | | | |
| KraneShares Emerging Markets Consumer Technology Index ETF | | | | | | | | | | | | | | | | |
| Actual Fund Return | | $ | 1,000.00 | | | $ | 1,151.50 | | | | 0.60 | % | | $ | 3.22 | |
| Hypothetical 5% Return | | | 1,000.00 | | | | 1,021.94 | | | | 0.60 | | | | 3.02 | |
| | | | | | | | | | | | | | | | | |
| KraneShares MSCI China Clean Technology Index ETF | | | | | | | | | | | | | | | | |
| Actual Fund Return | | $ | 1,000.00 | | | $ | 1,027.80 | | | | 0.79 | % | | $ | 3.99 | |
| Hypothetical 5% Return | | | 1,000.00 | | | | 1,020.99 | | | | 0.79 | | | | 3.98 | |
| | | | | | | | | | | | | | | | | |
| KraneShares Electric Vehicles and Future Mobility Index ETF | | | | | | | | | | | | | | | | |
| Actual Fund Return | | $ | 1,000.00 | | | $ | 1,010.20 | | | | 0.72 | % | | $ | 3.61 | |
| Hypothetical 5% Return | | | 1,000.00 | | | | 1,021.34 | | | | 0.72 | | | | 3.63 | |
| | | | | | | | | | | | | | | | | |
| KraneShares MSCI All China Health Care Index ETF | | | | | | | | | | | | | | | | |
| Actual Fund Return | | $ | 1,000.00 | | | $ | 1,166.10 | | | | 0.65 | % | | $ | 3.51 | |
| Hypothetical 5% Return | | | 1,000.00 | | | | 1,021.69 | | | | 0.65 | | | | 3.28 | |
| | | | | | | | | | | | | | | | | |
| KraneShares Asia Pacific High Income Bond ETF | | | | | | | | | | | | | | | | |
| Actual Fund Return | | $ | 1,000.00 | | | $ | 1,101.90 | | | | 0.69 | % | | $ | 3.62 | |
| Hypothetical 5% Return | | | 1,000.00 | | | | 1,021.49 | | | | 0.69 | | | | 3.48 | |
| | | | | | | | | | | | | | | | | |
| KraneShares Emerging Markets Healthcare Index ETF | | | | | | | | | | | | | | | | |
| Actual Fund Return | | $ | 1,000.00 | | | $ | 1,068.40 | | | | 0.80 | % | | $ | 4.13 | |
| Hypothetical 5% Return | | | 1,000.00 | | | | 1,020.94 | | | | 0.80 | | | | 4.03 | |
| | | | | | | | | | | | | | | | | |
| KraneShares MSCI Emerging Markets ex China Index ETF | | | | | | | | | | | | | | | | |
| Actual Fund Return | | $ | 1,000.00 | | | $ | 1,148.40 | | | | 0.24 | % | | $ | 1.29 | |
| Hypothetical 5% Return | | | 1,000.00 | | | | 1,023.74 | | | | 0.24 | | | | 1.21 | |
Disclosure of Fund Expenses (Unaudited) (concluded)
| | |
Beginning
Account Value
10/1/2022 | | | Ending
Account
Value
3/31/2023 | | |
Annualized
Expense
Ratios | | |
Expenses
Paid During
Period(1) | |
| KraneShares MSCI China ESG Leaders Index ETF | | | | | | | | | | | | | | | | |
| Actual Fund Return | | $ | 1,000.00 | | | $ | 1,164.20 | | | | 0.59 | % | | $ | 3.18 | |
| Hypothetical 5% Return | | | 1,000.00 | | | | 1,021.99 | | | | 0.59 | | | | 2.97 | |
| | | | | | | | | | | | | | | | | |
| KraneShares CICC China 5G & Semiconductor Index ETF | | | | | | | | | | | | | | | | |
| Actual Fund Return | | $ | 1,000.00 | | | $ | 1,214.00 | | | | 0.65 | % | | $ | 3.59 | |
| Hypothetical 5% Return | | | 1,000.00 | | | | 1,021.69 | | | | 0.65 | | | | 3.28 | |
| | | | | | | | | | | | | | | | | |
| KraneShares CICC China Consumer Leaders Index ETF | | | | | | | | | | | | | | | | |
| Actual Fund Return | | $ | 1,000.00 | | | $ | 1,095.00 | | | | 0.68 | % | | $ | 3.55 | |
| Hypothetical 5% Return | | | 1,000.00 | | | | 1,021.54 | | | | 0.68 | | | | 3.43 | |
| | | | | | | | | | | | | | | | | |
| KraneShares SSE STAR Market 50 Index ETF | | | | | | | | | | | | | | | | |
| Actual Fund Return | | $ | 1,000.00 | | | $ | 1,168.90 | | | | 0.89 | % | | $ | 4.81 | |
| Hypothetical 5% Return | | | 1,000.00 | | | | 1,020.49 | | | | 0.89 | | | | 4.48 | |
| | | | | | | | | | | | | | | | | |
| KraneShares Hang Seng TECH Index ETF | | | | | | | | | | | | | | | | |
| Actual Fund Return | | $ | 1,000.00 | | | $ | 1,267.40 | | | | 0.69 | % | | $ | 3.90 | |
| Hypothetical 5% Return | | | 1,000.00 | | | | 1,021.49 | | | | 0.69 | | | | 3.48 | |
| | | | | | | | | | | | | | | | | |
| KraneShares China Innovation ETF | | | | | | | | | | | | | | | | |
| Actual Fund Return | �� | $ | 1,000.00 | | | $ | 1,179.60 | | | | 0.11 | % | | $ | 0.60 | |
| Hypothetical 5% Return | | | 1,000.00 | | | | 1,024.38 | | | | 0.11 | | | | 0.56 | |
| | | | | | | | | | | | | | | | | |
| KraneShares S&P Pan Asia Dividend Aristocrats Index ETF | | | | | | | | | | | | | | | | |
| Actual Fund Return | | $ | 1,000.00 | | | $ | 1,169.80 | | | | 0.68 | % | | $ | 3.68 | |
| Hypothetical 5% Return | | | 1,000.00 | | | | 1,021.54 | | | | 0.68 | | | | 3.43 | |
| | | | | | | | | | | | | | | | | |
| KraneShares China Internet and Covered Call Strategy ETF | | | | | | | | | | | | | | | | |
| Actual Fund Return(2) | | $ | 1,000.00 | | | $ | 964.40 | | | | 0.27 | % | | $ | 0.57 | |
| Hypothetical 5% Return | | | 1,000.00 | | | | 1,023.59 | | | | 0.27 | | | | 1.36 | |
| (1) | Expenses are equal to the Fund’s annualized expense ratio multiplied by the average account value over the period, multiplied by 182/365 (to reflect the one-half year period) unless otherwise indicated. |
| (2) | Expenses are equal to the Fund’s annualized expense ratio multiplied by the average account value over the period, multiplied by 79/365 (to reflect the period from 1/12/23- 3/31/23). |
Notice To Shareholders (Unaudited)
For shareholders that do not have a March 31, 2023 tax year end, this notice is for informational purposes only. For shareholders with a March 31, 2023 tax year end, please consult your tax advisor as to the pertinence of this notice. For the fiscal year ended March 31, 2023, the Funds are designating the following items with regard to distributions paid during the year.
Return of
Capital(1) | | | Long-Term
Capital
Gain
Distributions | | | Ordinary
Income
Distributions | | | Total
Distributions | | | Qualifying
for
Corporate
Dividends
Received
Deduction(2) | | | Qualifying
Dividend
Income(3) | | | U.S.
Government
Interest(4) | | | Interest
Related
Dividends(5) | | | Short Term
Capital
Gain
Dividends(6) | | | Foreign
Tax
Credit | |
| KraneShares CICC China Leaders 100 Index ETF(7) |
| | 0.00 | % | | | 19.41 | % | | | 80.59 | % | | | 100.00 | % | | | 0.00 | % | | | 100.00 | % | | | 0.00 | % | | | 0.13 | % | | | 0.00 | % | | | 10.16 | % |
| KraneShares CSI China Internet ETF |
| | 0.00 | % | | | 0.00 | % | | | 0.00 | % | | | 0.00 | % | | | 0.00 | % | | | 0.00 | % | | | 0.00 | % | | | 0.00 | % | | | 0.00 | % | | | 0.00 | % |
| KraneShares Bosera MSCI China A 50 Connect Index ETF(7) |
| | 0.00 | % | | | 90.15 | % | | | 9.85 | % | | | 100.00 | % | | | 0.00 | % | | | 100.00 | % | | | 0.00 | % | | | 0.05 | % | | | 0.00 | % | | | 1.30 | % |
| KraneShares Bloomberg China Bond Inclusion Index ETF |
| | 71.46 | % | | | 0.00 | % | | | 28.54 | % | | | 100.00 | % | | | 0.00 | % | | | 0.00 | % | | | 0.00 | % | | | 0.00 | % | | | 0.00 | % | | | 0.00 | % |
| KraneShares MSCI All China Index ETF (7) |
| | 0.00 | % | | | 36.28 | % | | | 63.72 | % | | | 100.00 | % | | | 0.25 | % | | | 81.86 | % | | | 0.00 | % | | | 0.24 | % | | | 0.00 | % | | | 5.02 | % |
| KraneShares MSCI One Belt One Road Index ETF(7) |
| | 0.00 | % | | | 0.00 | % | | | 100.00 | % | | | 100.00 | % | | | 0.00 | % | | | 81.15 | % | | | 0.00 | % | | | 0.21 | % | | | 0.00 | % | | | 11.07 | % |
| KraneShares Emerging Markets Consumer Technology Index ETF |
| | 0.00 | % | | | 0.00 | % | | | 0.00 | % | | | 0.00 | % | | | 0.00 | % | | | 0.00 | % | | | 0.00 | % | | | 0.00 | % | | | 0.00 | % | | | 0.00 | % |
| KraneShares MSCI China Clean Technology Index ETF(7) |
| | 0.00 | % | | | 80.97 | % | | | 19.03 | % | | | 100.00 | % | | | 0.00 | % | | | 100.00 | % | | | 0.00 | % | | | 0.57 | % | | | 0.00 | % | | | 0.00 | % |
| KraneShares Electric Vehicles and Future Mobility Index ETF(7) |
| | 0.00 | % | | | 0.00 | % | | | 100.00 | % | | | 100.00 | % | | | 14.10 | % | | | 100.00 | % | | | 0.00 | % | | | 0.16 | % | | | 0.00 | % | | | 18.47 | % |
| KraneShares MSCI All China Health Care Index ETF |
| | 0.00 | % | | | 0.00 | % | | | 100.00 | % | | | 100.00 | % | | | 0.00 | % | | | 100.00 | % | | | 0.00 | % | | | 1.04 | % | | | 0.00 | % | | | 63.26 | % |
| KraneShares Asia Pacific High Income Bond ETF |
| | 0.00 | % | | | 0.00 | % | | | 100.00 | % | | | 100.00 | % | | | 0.00 | % | | | 0.00 | % | | | 0.00 | % | | | 0.07 | % | | | 0.00 | % | | | 0.00 | % |
| KraneShares Emerging Markets Healthcare Index ETF |
| | 0.00 | % | | | 0.00 | % | | | 100.00 | % | | | 100.00 | % | | | 0.00 | % | | | 100.00 | % | | | 0.00 | % | | | 0.00 | % | | | 0.00 | % | | | 0.00 | % |
| KraneShares MSCI Emerging Markets ex China Index ETF(7) |
| | 0.00 | % | | | 0.00 | % | | | 100.00 | % | | | 100.00 | % | | | 0.34 | % | | | 39.67 | % | | | 0.00 | % | | | 0.19 | % | | | 0.00 | % | | | 18.60 | % |
| KraneShares MSCI China ESG Leaders Index ETF(7) |
| | 0.00 | % | | | 0.00 | % | | | 100.00 | % | | | 100.00 | % | | | 1.33 | % | | | 62.28 | % | | | 0.00 | % | | | 0.01 | % | | | 0.00 | % | | | 6.78 | % |
| KraneShares CICC China 5G & Semiconductor Index ETF |
| | 0.00 | % | | | 0.00 | % | | | 100.00 | % | | | 100.00 | % | | | 0.00 | % | | | 100.00 | % | | | 0.00 | % | | | 0.54 | % | | | 0.00 | % | | | 0.00 | % |
| KraneShares CICC China Consumer Leaders Index ETF(7) |
| | 0.00 | % | | | 0.00 | % | | | 100.00 | % | | | 100.00 | % | | | 2.01 | % | | | 100.00 | % | | | 0.00 | % | | | 1.26 | % | | | 0.00 | % | | | 23.25 | % |
| KraneShares SSE Star Market 50 Index ETF |
| | 0.00 | % | | | 0.00 | % | | | 0.00 | % | | | 0.00 | % | | | 0.00 | % | | | 0.00 | % | | | 0.00 | % | | | 0.00 | % | | | 0.00 | % | | | 0.00 | % |
| KraneShares Hang Seng TECH Index ETF |
| | 0.00 | % | | | 0.00 | % | | | 100.00 | % | | | 100.00 | % | | | 0.00 | % | | | 14.02 | % | | | 0.00 | % | | | 0.00 | % | | | 0.00 | % | | | 0.00 | % |
| KraneShares China Innovation ETF |
| | 32.78 | % | | | 67.22 | % | | | 0.00 | % | | | 100.00 | % | | | 0.00 | % | | | 0.00 | % | | | 0.00 | % | | | 0.00 | % | | | 0.00 | % | | | 0.00 | % |
| KraneShares S&P Pan Asia Dividend Aristocrats Index ETF |
| | 0.00 | % | | | 0.00 | % | | | 100.00 | % | | | 100.00 | % | | | 0.00 | % | | | 53.40 | % | | | 0.00 | % | | | 0.06 | % | | | 0.00 | % | | | 17.04 | % |
Notice To Shareholders (Unaudited) (concluded)
Return of
Capital(1) | | |
Long-Term
Capital
Gain
Distributions | | |
Ordinary
Income
Distributions | | |
Total
Distributions | | | Qualifying
for
Corporate
Dividends
Received
Deduction(2) | | |
Qualifying
Dividend
Income(3) | | |
U.S.
Government
Interest(4) | | |
Interest
Related
Dividends(5) | | |
Short Term
Capital
Gain
Dividends(6) | | |
Foreign
Tax
Credit | |
| KraneShares China Internet and Covered Call Strategy ETF |
| | 35.12 | % | | | 0.00 | % | | | 64.88 | % | | | 100.00 | % | | | 0.00 | % | | | 0.00 | % | | | 0.00 | % | | | 0.23 | % | | | 100.00 | % | | | 0.00 | % |
| (1) | Return of capital is a payment received from the fund that is not considered to be taxable income. The return of capital distribution is considered to be a return of the investor’s original investment and reduces the investor’s cost basis in the fund. |
| (2) | Qualifying dividends represent dividends which qualify for the corporate dividends received deduction and are reflected as a percentage of ordinary income distributions (the total of short term capital gain and net investment income distributions). |
| (3) | The percentage in this column represents the amount of “Qualifying Dividend Income” as created by the Jobs and Growth Relief Reconciliation Act of 2003 and is reflected as a percentage of ordinary income distributions (the total of short term capital gain and net investment income distributions). It is the intention of each of the aforementioned funds to designate the maximum amount permitted by law. |
| (4) | “U.S. Government Interest” represents the amount of interest that was derived from U.S. Government obligations and distributed during the fiscal year. Generally, interest from direct U.S. Government obligations is exempt from state income tax. However, for shareholders who are residents of California, Connecticut and New York, the statutory threshold requirements were not satisfied to permit exemption of these amounts from state income. |
| (5) | The percentage in this column represents the amount of “Interest Related Dividends” and is reflected as a percentage of ordinary income distributions that is exempt from U.S. withholding tax when paid for foreign investors. |
| (6) | The percentage in this column represents the amount of “Short Term Capital Gain Dividends” and is reflected as a percentage of short term capital gain distributions that is exempt from U.S. withholding tax when paid for foreign investors. |
| (7) | The following Funds intend to pass through a foreign tax credit to their shareholders. For the fiscal year ended March 31, 2023, the total amount of foreign source income and amount of foreign tax to be paid is as follows: |
KraneShares Funds | | Foreign
Source
Income | | | Foreign Tax
Credit Pass
Through | |
| KraneShares CICC China Leaders 100 Index ETF | | $ | 262,176 | | | $ | 30,201 | |
| KraneShares Bosera MSCI China A 50 Connect Index ETF | | | 11,475,483 | | | | 1,461,599 | |
| KraneShares MSCI All China Index ETF | | | 189,569 | | | | 16,504 | |
| KraneShares MSCI One Belt One Road Index ETF | | | 196,688 | | | | 26,857 | |
| KraneShares Electric Vehicles and Future Mobility Index ETF | | | 2,277,359 | | | | 473,744 | |
| KraneShares MSCI All China Health Care Index ETF | | | 278,213 | | | | 87,722 | |
| KraneShares MSCI Emerging Markets ex China Index ETF | | | 895,915 | | | | 158,460 | |
| KraneShares MSCI China ESG Leaders Index ETF | | | 115,785 | | | | 7,333 | |
| KraneShares CICC China Consumer Leaders Index ETF | | | 125,495 | | | | 20,827 | |
| KraneShares S&P Pan Asia Dividend Aristocrats Index ETF | | | 43,293 | | | | 4,587 | |
The allocable share of foreign tax credit will be reported on Form 1099-DIV.
Supplemental Information (Unaudited)
Net asset value, or “NAV”, is the price per Share at which the Funds issue and redeem Shares to Authorized Participants. It is calculated in accordance with the policies described in Note 2 in Notes to Financial Statements. The “Market Price” of the Funds generally is determined using the closing price on the stock exchange on which the Shares of the Funds are listed for trading. The Funds’ Market Price may be at, above or below their NAV. The NAV of the Funds will fluctuate with changes in the market value of their holdings. The Market Price of the Funds will fluctuate in accordance with changes in their NAV, as well as market supply and demand of Fund Shares.
Premiums or discounts are the differences (expressed as a percentage) between the NAV and Market Price of the Funds on a given day, generally at the time NAV is calculated. A premium is the amount that the Funds are trading above the reported NAV, expressed as a percentage of the NAV. A discount is the amount that the Funds are trading below the reported NAV, expressed as a percentage of the NAV. Shareholders may pay more than NAV when they buy Fund Shares and receive less than NAV when they sell those Shares, because Shares are bought and sold at Market Price.
Further information regarding premiums and discounts is available on the Funds’ website at http://kraneshares.com. The premium and discount information contained on the website represents past performance and cannot be used to predict future results.

KraneShares Trust: 280 Park Avenue 32nd Floor New York, NY 10017 1-855-857-2638 http://kraneshares.com/ | | Distributor: SEI Investments Distribution Co. One Freedom Valley Drive Oaks, PA 19456 |
| | | |
Investment Adviser: Krane Funds Advisors, LLC 280 Park Avenue 32nd Floor New York, NY 10017 | | Administrator: SEI Investments Global Funds Services One Freedom Valley Drive Oaks, PA 19456 |
| | | |
Sub-Adviser: Bosera Asset Management (International) Co., Ltd. Suite 4109 Jardine House One Connaught Place Central, Hong Kong | | Independent Registered Public Accounting Firm: KPMG LLP 1601 Market Street Philadelphia, PA 19103 |
| | | |
Sub-Adviser: Nikko Asset Management Americas, Inc. 605 Third Avenue 38th Floor New York, NY 10158 | | |
This information must be preceded or accompanied by a current prospectus for the Funds described.
KraneShares Trust:
280 Park Avenue, 32nd Floor
New York, NY 10017
KRS-AR-001-1000
Item 2. Code of Ethics.
The Registrant has adopted a code of ethics that applies to the Registrant’s principal executive officer, principal financial officer, and any person who performs a similar function. During the period covered by the report, there were no amendments to the code of ethics, and the Registrant did not grant any waivers from a provision of the code of ethics.
Item 3. Audit Committee Financial Expert.
(a)(1) The Registrant’s Board of Trustees has determined that the Registrant has an audit committee financial expert serving on the audit committee.
(a)(2) The audit committee financial expert, John Ferguson, is an independent trustee as defined in Form N-CSR Item 3 (a)(2).
Item 4. Principal Accountant Fees and Services.
Fees billed by KPMG LLP (“KPMG”) related to the Registrant.
KPMG billed the Registrant aggregate fees for services rendered to the Registrant for the last two fiscal years as follows:
| | 2023 | 2022 |
| | | All fees and services to the Registrant that were pre-approved | All fees and services to service affiliates that were pre-approved | All other fees and services to service affiliates that did not require pre-approval | All fees and services to the Registrant that were pre-approved | All fees and services to service affiliates that were pre-approved | All other fees and services to service affiliates that did not require pre-approval |
| (a) | Audit Fees | $751,300 | $0 | N/A | $623,800 | $0 | N/A |
| (b) | Audit-Related Fees | $0 | $0 | N/A | $0 | $0 | N/A |
| (c) | Tax Fees(1) | $130,900 | $0 | N/A | $112,157 | $0 | N/A |
| (d) | All Other Fees | $6,531 | $0 | N/A | $0 | $0 | N/A |
Notes:
(1) These services included tax return preparation and tax compliance for the Funds.
(e)(1) Pursuant to the requirements of the Sarbanes-Oxley Act of 2002, the SEC adopted Rule 2-01 under Regulation S-X, which, among other things, requires a fund’s audit committee to pre-approve certain audit and non-audit services that are provided by its independent auditors in order to ensure the auditors’ independence. The Registrant’s Board of Trustees has established an Audit Committee that has been charged with, among other things, assisting the Board of Trustees in its oversight of: the Registrant’s independent auditors; preapproving all audit and non-audit services provided by the Registrant’s independent auditors; the integrity of the Funds’ financial statements; the independent auditors’ qualifications and independence; and the use of appropriate accounting principles.
(e)(2) Percentage of fees billed applicable to non-audit services approved pursuant to the “de minimis” exception of Rule 2-01(c)(7)(i)(C) were as follows for KPMG:
| | 2023 | 2022 |
Audit-Related Fees | 0% | 0% |
| Tax Fees | 0% | 0% |
All Other Fees | 0% | 0% |
(f) Not applicable.
(g) The aggregate non-audit fees and services billed by KPMG for the last two fiscal years were $0 and $0, respectively.
(h) During the past fiscal year, all non-audit services provided by the Registrant’s principal accountant to either the Registrant’s investment adviser or to entities controlling, controlled by, or under common control with the Registrant’s investment adviser that provides ongoing services to the Registrant were pre-approved by the Audit Committee of the Registrant’s Board of Trustees. Included in the audit committee’s pre-approval was the review and consideration as to whether the provision of these non-audit services is compatible with maintaining the principal accountant’s independence.
(i) Not applicable. The Registrant has not retained, for the preparation of the audit report on the financial statements included in the Form N-CSR, a registered public accounting firm that has a branch or office that is located in a foreign jurisdiction and that the Public Company Accounting Oversight Board (the “PCAOB”) has determined that the PCAOB is unable to inspect or investigate completely because of a position taken by an authority in the foreign jurisdiction.
(j) Not applicable. The Registrant is not a “foreign issuer,” as defined in 17 CFR 240.3b-4.
Item 5. Audit Committee of Listed Registrants.
(a) The Registrant has a separately-designated standing Audit Committee, which is composed of the Registrant’s Independent Trustees, Messrs. Patrick Campo, John Ferguson and Matthew Stroyman.
(b) Not applicable.
Item 6. Investments.
(a) The Schedule of Investments is included as part of the Report to Shareholders filed under Item 1 of this form.
(b) Not applicable.
Item 7. Disclosure of Proxy Voting Policies and Procedures for Closed-End Management Investment Companies.
Not applicable.
Item 8. Portfolio Managers of Closed-End Management Investment Companies.
Not applicable.
Item 9. Purchases of Equity Securities by Closed-End Management Investment Company and Affiliated Purchasers.
Not applicable.
Item 10. Submission of Matters to a Vote of Security Holders.
There have been no changes to the procedures by which shareholders may recommend nominees to the Registrant’s Board of Trustees during the period covered by this report.
Item 11. Controls and Procedures.
(a) The Registrant’s principal executive and principal financial officers, or persons performing similar functions, have concluded that the Registrant’s disclosure controls and procedures (as defined in Rule 30a-3(c) under the Act (17 CFR § 270.30a-3(c)) as of a date within 90 days of the filing date of the report, are effective based on the evaluation of these controls and procedures required by Rule 30a-3(b) under the Act (17 CFR § 270.30a-3(b)) and Rules 13a-15(b) or 15d-15(b) under the Securities Exchange Act of 1934 (17 CFR § 240.13a-15(b) or § 240.15d-15(b)).
(b) There has been no change in the Registrant’s internal control over financial reporting (as defined in Rule 30a-3(d) under the Act (17 CFR § 270.30a-3(d)) that occurred during the period covered by this report that has materially affected, or is reasonably likely to materially affect, the Registrant’s internal control over financial reporting.
Item 12. Disclosure of Securities Lending Activities for Closed-End Management Investment Companies.
Not applicable.
Items 13. Exhibits.
(a)(1) Code of Ethics filed herewith.
(a)(2) A certification for the principal executive officer and the principal financial officer of the Registrant as required by Rule 30a-2(a) under the Act (17 CFR 270.30a-2(a)), is filed herewith.
(a)(3) Not applicable to the Registrant.
(a)(4) Not applicable to the Registrant.
(b) Officer certification filed herewith.
SIGNATURES
Pursuant to the requirements of the Securities Exchange Act of 1934 and the Investment Company Act of 1940, the Registrant has duly caused this report to be signed on its behalf by the undersigned, thereunto duly authorized.
| (Registrant) | KraneShares Trust |
| | |
| By (Signature and Title) | /s/ Jonathan Krane |
| | Jonathan Krane |
| | Principal Executive Officer |
Date: June 9, 2023
Pursuant to the requirements of the Securities Exchange Act of 1934 and the Investment Company Act of 1940, this report has been signed below by the following persons on behalf of the Registrant and in the capacities and on the dates indicated.
| By (Signature and Title) | /s/ Jonathan Krane |
| | Jonathan Krane |
| | Principal Executive Officer |
Date: June 9, 2023
| By (Signature and Title) | /s/ Jonathan Krane |
| | Jonathan Krane |
| | Principal Financial Officer |
Date: June 9, 2023