UNITED STATES
SECURITIES AND EXCHANGE COMMISSION
Washington, D.C. 20549
FORM N-CSR
CERTIFIED SHAREHOLDER REPORT OF REGISTERED MANAGEMENT
INVESTMENT COMPANIES
Investment Company Act File Number 811-22698
KraneShares Trust
(Exact name of registrant as specified in charter)
280 Park Avenue, 32nd Floor
New York, New York 10017
(Address of principal executive offices) (Zip code)
Jonathan Krane
KraneShares Trust
280 Park Avenue, 32nd Floor
New York, New York 10017
(Name and address of agent for service)
Copy to:
Stacy L. Fuller
K&L Gates LLP
1601 K Street NW
Washington, DC 20006-1600
Registrant’s telephone number, including area code: (212) 933-0393
Date of fiscal year end: March 31, 2023
Date of reporting period: March 31, 2023
Form N-CSR is to be used by management investment companies to file reports with the Commission not later than 10 days after the transmission to stockholders of any report that is required to be transmitted to stockholders under Rule 30e-1 under the Investment Company Act of 1940 (17 CFR 270.30e-1). The Commission may use the information provided on Form N-CSR in its regulatory, disclosure review, inspection, and policymaking roles.
A registrant is required to disclose the information specified by Form N-CSR, and Commission will make this information public. A registrant is not required to respond to the collection of information contained in Form N-CSR unless the Form displays a currently valid Office of Management and Budget (“OMB”) control number. Please direct comments concerning the accuracy of the information collection burden estimate and any suggestions for reducing the burden to Secretary, Securities and Exchange Commission, 450 Fifth Street, NW, Washington, DC 20549-0609. The OMB has reviewed this collection of information under the clearance requirements of 44 U.S.C. § 3507.
Item 1. Reports to Stockholders.
| (a) | A copy of the report transmitted to stockholders pursuant to Rule 30e-1 under the Investment Company Act, as amended (the “Act”) [17 CFR § 270.30e-1], is attached hereto. |
| (b) | Not applicable to the Registrant. |
| | Annual Report KraneShares Global Carbon Transformation ETF KraneShares Global Carbon Strategy ETF KraneShares European Carbon Allowance Strategy ETF KraneShares California Carbon Allowance Strategy ETF KraneShares Global Carbon Offset Strategy ETF KraneShares Electrification Metals Strategy ETF March 31, 2023 | | |
Table of Contents
The Funds file their complete schedules of Fund holdings with the Securities and Exchange Commission (the “Commission”) for the first and third quarters of each fiscal year as an exhibit to their reports on Form N-PORT. The Funds’ Form N-PORT reports are available on the Commission’s website at http://www.sec.gov.
A description of the policies and procedures that KraneShares Trust uses to determine how to vote proxies relating to Fund securities, as well as information relating to how the Funds voted proxies relating to Fund securities during the most recent 12-month year ended June 30, are available (i) without charge, upon request, by calling 855-857-2638; and (ii) on the Commission’s website at http://www.sec.gov.
Fund shares may only be purchased or redeemed from a Fund in Creation Unit aggregations. Investors who cannot transact in Creation Units of a Fund’s shares must buy or sell Fund shares in the secondary market at their market price, which may be at a premium or discount to a Fund’s net asset value, with the assistance of a broker. In doing so, the investor may incur brokerage commissions and may pay more than net asset value when buying Fund shares and receive less than net asset value when selling Fund shares.
Shareholder Letter (Unaudited)
Dear Shareholders:
We are pleased to send you the Annual Report for the climate-related series of the KraneShares Trust exchange-traded funds (ETFs), the KraneShares Global Carbon Strategy ETF (KRBN), KraneShares California Carbon Allowance Strategy ETF (KCCA), KraneShares European Carbon Allowance Strategy ETF (KEUA), KraneShares Electrification Metals Strategy ETF (KMET), KraneShares Global Carbon Transformation ETF (KGHG) and KraneShares Global Carbon Offset Strategy ETF (KSET), for the 12-month period ended March 31, 2023 (Period).
For the Period, the ETFs delivered the following returns:
Fund |
|
Fund
Return* |
|
|
Underlying
Index
Return** |
|
| Morningstar
Peer Group
Median
Return |
|
| KraneShares Global Carbon Transformation ETF (KGHG) | | | -7.14 | % | | | N/A | | | | N/A | |
| KraneShares Global Carbon Strategy ETF (KRBN) | | | 4.43 | % | | | 5.90 | %(a) | | | N/A | |
| KraneShares European Carbon Allowance Strategy ETF (KEUA) | | | 18.08 | % | | | 13.51 | %(b) | | | N/A | |
| KraneShares California Carbon Allowance Strategy ETF (KCCA) | | | -6.83 | % | | | -5.43 | %(c) | | | N/A | |
| KraneShares Global Carbon Offset Strategy ETF (KSET) | | | -76.74 | %^ | | | -68.00 | %(d) | | | N/A | |
| KraneShares Electrification Metals Strategy ETF (KMET) | | | 3.33 | %^ | | | 4.77 | %(e) | | | -4.96 | (1) |
| * | Return based on net asset value as of March 31, 2023. |
| ** | Return as of March 31, 2023. |
| ^ | Return period since Fund inception (less than one-year period). |
| (a) | IHS Markit Global Carbon Index. |
| (b) | IHS Markit Carbon EUA Index. |
| (c) | IHS Markit Carbon CCA Index. |
| (d) | S&P GSCI Global Voluntary Carbon Liquidity Weighted Index. |
| (e) | Bloomberg Electrification Metals Index. |
Morningstar Peer Group Information
| | Morningstar Peer Group Median | | Morningstar Peer Group Name | | Morningstar Peer Group Description |
| (1) | -4.96% | | U.S. ETF Commodities Focused | | The Morningstar Fund Commodities Focused Category portfolios invest in commodities or raw materials, mainly through futures contracts. |
Climate issues seem to be clearly on the minds of most investors. Going forward, we believe that the energy transition (from using fossil fuels to renewable energy sources) is not optional. Indeed, we believe the transition is already in progress, regardless of societies’ differing views on appropriate climate action. For these reasons, we see an opportunity in climate-related investment strategies.
Climate-related investments also have the potential to provide investors with exposure to an uncorrelated asset class. The challenging macroeconomic environment, including volatility in global equity markets that ensued over the past year, has led many investors to seek uncorrelated sources of return.
Shareholder Letter (Unaudited) (concluded)
We believe investors should consider adjusting their portfolios now to take advantage of what could be a significant global allocation of capital in favor of climate initiatives, and we offer the ETFs as a means for investors to express their interest in climate-related investments in their portfolio for several reasons:
| ● | We believe that climate will continue to grow and become an essential element of a well-designed investment portfolio. |
| ● | We believe that investors should have low-cost, transparent tools to invest in and/or hedge against climate-related risks, including climate change. |
| ● | The passing of the Inflation Reduction Act (IRA) in the U.S. and Europe’s response with the Green Deal Industrial Plan may have set the stage for significant public and private capital to be invested in global decarbonization efforts. |
| ● | Several market-specific reforms have been approved or are pending approval, which could further restrict the supply of carbon (pollution) credits within carbon markets and result in an increase in the value of existing credits in which certain of the ETFs invest. |
| ● | We are dedicated to helping investors obtain more complete passive and active market exposures and more balanced investment portfolios. |
Thank you for investing with us.
Jonathan Krane, CEO
March 31, 2023
Management Discussion of Fund Performance (Unaudited)
KraneShares Global Carbon Transformation ETF
The KraneShares Global Carbon Transformation ETF (the Fund) is an actively managed ETF that aims to capture the low-carbon leaders of the future. The Fund focuses on companies in traditionally high emissions industries that are on the cusp of the transition away from fossil fuels to renewable technology.
Global Carbon Transformation Review
Macroeconomic conditions and policy uncertainty caused ongoing volatility among the companies in the decarbonization space. Additionally, the U.S. dollar strength, which peaked in September 2022, implied some weakness in most other currencies. With a heavier allocation toward Euro-dominated equities, the Fund experienced some negative currency exchange impact on returns. However, by Period-end, the U.S. dollar sold off more than 9%, diminishing some of the distortion created by the foreign exchange effect. Also, towards the end of 2022 and into 2023, we received greater clarity on climate-related policy developments in both the United States and Europe, confirming substantial policy support for a range of activities related to the energy transition. Energy transition companies largely performed in line with global equities, as measured by the MSCI World Index, during the Period.
We continue to believe that companies in high-impact industries with a stated commitment and demonstrated action towards decarbonization may see superior growth compared to their peers and their own histories as well as be revalued as their businesses become “greener.”
Within the Fund, the best-performing sectors for the period were Utilities and Information Technology. Meanwhile, the worst-performing sectors were Materials and Industrials.
For the Period, the NAV of the Fund decreased by -7.14%.
Management Discussion of Fund Performance (Unaudited) (continued)
KraneShares Global Carbon Transformation ETF (concluded)
Growth of a $10,000 Investment‡
(at Net Asset Value)‡

AVERAGE ANNUAL TOTAL RETURNS FOR THE PERIOD ENDED MARCH 31, 2023*
|
| One Year
Return |
|
| Annualized
Inception to Date |
|
|
| Net
Asset
Value |
|
|
Market
Price^ |
|
| Net
Asset
Value |
|
|
Market
Price^ |
|
| KraneShares Global Carbon Transformation ETF | | | -7.14 | % | | | -6.99 | %‡ | | | 0.14 | %‡ | | | -0.17 | %‡ |
| MSCI World Index | | | N/A | | | | -6.54 | %‡ | | | N/A | | | | -0.26 | %‡ |
| * | The Fund commenced operations on March 15, 2022. |
| ‡ | Unaudited. |
| ^ | Beginning December 23, 2020, market price returns are based on the official closing price of an ETF share or, if it more accurately reflects the market value of an ETF share at the time as of which the ETF calculates current NAV per share, the midpoint between the national best bid and national best offer (“NBBO”) as of that time. Prior to that date, market price returns were based on the midpoint between the Bid and Ask price. NAVs are calculated using prices as of 4:00 PM Eastern Time. |
The performance data quoted herein represents past performance and the return and value of an investment in the Fund will fluctuate so that, when redeemed, shares may be worth less than their original cost. Current performance may be lower or higher than the performance data quoted. Past performance is no guarantee of future performance and should not be considered as a representation of the future results of the Fund. For performance data current to the most recent month end, please call 855-857-2638 or visit www.kraneshares.com. The Fund’s performance assumes the reinvestment of all dividends and all capital gains. Index returns assume reinvestment of dividends and, unlike a Fund’s returns, do not reflect any fees or expenses. If such fees and expenses were included in the index returns, the performance would have been lower. As stated in the Fund’s prospectus, the Fund’s operating expense ratio is 0.89%. Please note that one cannot invest directly in an unmanaged index. There are no assurances that the Fund will meet its stated objectives. The Fund’s holdings and allocations are subject to change and should not be considered recommendations to buy individual securities. For further information on the Fund’s objectives, risks, and strategies, see the Fund’s prospectus. Returns shown do not reflect the deduction of taxes that a shareholder would pay on Fund distributions or the redemption of Fund shares.
Management Discussion of Fund Performance (Unaudited) (continued)
KraneShares Global Carbon Strategy ETF
The KraneShares Global Carbon Strategy ETF (Fund) seeks to provide investment results that, before fees and expenses, correspond generally to the price and yield performance of the IHS Markit Global Carbon Index (Underlying Index).
The Underlying Index offers broad coverage of cap-and-trade carbon allowances by tracking the most traded carbon credit futures contracts. The Underlying Index introduces a new measure for investing in and/or hedging risk while supporting environmentally responsible investing.
Currently, the Underlying Index covers the major European and North American cap-and-trade programs (Programs): European Union Allowances (EUA), California Carbon Allowances (CCA), the Regional Greenhouse Gas Initiative (RGGI), and United Kingdom Allowances (UKA).
Global Carbon Market Review
During the 12-month period ended March 31, 2023 (Period), several macroeconomic headwinds impacted the Fund’s performance, including the energy crisis and invasion of Ukraine at the start of the Period to inflation and recessionary concerns later in 2022. At the same time, all four of the Programs are seeing major policy updates, which include several supply tightening measures – meaning, actions that are expected to reduce the supply of carbon credits. During the Period, increased energy costs and a lack of cost-effective abatement technologies supported demand for credits in the Programs, as several European economies accepted a heavier reliance on coal as a short-term solution to weaning themselves off of Russian gas, which became restricted or unavailable as a result of the war in Ukraine.
The EUA market, which is 60% of the Underlying Index and Fund, experienced some volatility during the Period amidst the ongoing energy crisis, the invasion of Ukraine and ongoing deliberations by EU member states related to Emissions Trading System (ETS) reforms, which have the potential to impact the value of EUAs. As a result, the Fund experienced some related price volatility early in the Period and rebounded, as discussed below. Fortunately, the start of 2023 welcomed the official approval of a wave of new policy updates to the EU ETS, including several measures that tighten the emissions cap, phase out the distribution by the ETS of free allowances to member states and companies, and impose a tariff on foreign companies that are energy-intensive producers. Such a tariff would compel these producers to pay the EUA price on goods imported into the region to establish a more level playing field across borders. EUA prices increased in the first quarter of 2023 on renewed economic sentiment, appreciating by 9.5%. In February 2023, the market was even testing levels above the key €100 ($110) threshold.
The best performing Program within the Fund was the EUA Program. The remaining markets were down or flat for the Period as CCA and RGGI markets absorbed the impact from the economic slowdown and various inflationary pressures. A more muted economic rebound than expected in the UK also weighed on UKAs. However, we expect policy changes to be approved this year for the UKA Program, which should tighten the supply of allowances and improve their price performance going forward.
We see three potential positive catalysts for carbon credits markets in the year to come:
| ● | The European Union’s “Fit for 55” package, which tightens and strengthens the EUA Program through new policy measures to reduce greenhouse gas (GHG) emissions, saw final approval and initial implementation during the Period. The tightening of the EUA supply should go some distance to detaching EUAs from the economic cycle as Europe grapples with energy security concerns stemming from the conflict in Ukraine. |
Management Discussion of Fund Performance (Unaudited) (continued)
KraneShares Global Carbon Strategy ETF (continued)
| ● | The California State Assembly effectively passed legislation that instructs the carbon market regulator to start its review of the CCA Program and implement changes by January 1, 2025. The review is expected to result in reforms comparable to the EU’s “Fit for 55” plan and, subsequently, upward price pressure similar to that which occurred after the EU’s “Fit-for-55” package. |
| ● | Both the RGGI and UKA Programs are undergoing market reviews, which are expected to be completed this year and include supply tightening measures to achieve more ambitious carbon emissions reduction targets within the respective regions. |
Global Carbon Market Overview (April 1, 2022 to March 31, 2023)
| ● | The Underlying Index returned -8.49% in 2022, with the internal price of carbon in the index falling from $51.45 to $47.89. |
| ● | EUAs ended 2022 at $90 while UKAs came in close at $89. California continued to hold the middle at $30 and RGGI ended just above $14. |
For the Period, the NAV of the Fund increased by 4.43% while the Underlying Index increased by 5.90%. The deviation between the Fund’s performance and that of the Underlying Index can be mainly attributed to management fees and tax diversification requirements.
Management Discussion of Fund Performance (Unaudited) (continued)
KraneShares Global Carbon Strategy ETF (concluded)
Growth of a $10,000 Investment‡
(at Net Asset Value)‡

AVERAGE ANNUAL TOTAL RETURNS FOR THE PERIOD ENDED MARCH 31, 2023*
|
| One Year
Return |
|
| Annualized
Inception to Date |
|
|
| Net
Asset
Value |
|
|
Market
Price^ |
|
| Net
Asset
Value |
|
|
Market
Price^ |
|
| KraneShares Global Carbon Strategy ETF | | | 4.43 | % | | | 3.90 | %‡ | | | 39.68 | %‡ | | | 39.56 | %‡ |
| IHS Markit Global Carbon Index | | | N/A | | | | 5.90 | %‡ | | | N/A | | | | 40.44 | %‡ |
| * | The Fund commenced operations on July 29, 2020. |
| ‡ | Unaudited. |
| ^ | Beginning December 23, 2020, market price returns are based on the official closing price of an ETF share or, if it more accurately reflects the market value of an ETF share at the time as of which the ETF calculates current NAV per share, the midpoint between the national best bid and national best offer (“NBBO”) as of that time. Prior to that date, market price returns were based on the midpoint between the Bid and Ask price. NAVs are calculated using prices as of 4:00 PM Eastern Time. |
The performance data quoted herein represents past performance and the return and value of an investment in the Fund will fluctuate so that, when redeemed, shares may be worth less than their original cost. Current performance may be lower or higher than the performance data quoted. Past performance is no guarantee of future performance and should not be considered as a representation of the future results of the Fund. For performance data current to the most recent month end, please call 855-857-2638 or visit www.kraneshares.com. The Fund’s performance assumes the reinvestment of all dividends and all capital gains. Index returns assume reinvestment of dividends and, unlike a Fund’s returns, do not reflect any fees or expenses. If such fees and expenses were included in the index returns, the performance would have been lower. As stated in the Fund’s prospectus, the Fund’s operating expense ratio is 0.78%. Please note that one cannot invest directly in an unmanaged index. There are no assurances that the Fund will meet its stated objectives. The Fund’s holdings and allocations are subject to change and should not be considered recommendations to buy individual securities. For further information on the Fund’s objectives, risks, and strategies, see the Fund’s prospectus. Returns shown do not reflect the deduction of taxes that a shareholder would pay on Fund distributions or the redemption of Fund shares.
Management Discussion of Fund Performance (Unaudited) (continued)
KraneShares European Carbon Allowance Strategy ETF
The KraneShares European Carbon Allowance Strategy ETF (the Fund) seeks to provide investment results that, before fees and expenses, correspond generally to the price and yield performance of the IHS Markit Carbon EUA Index (the Underlying Index).
The Underlying Index tracks the most traded European Union Allowances (EUA) futures contracts. The Fund provides a vehicle for investing in and/or hedging risk while supporting environmentally responsible investing.
EUA Market Review
During the 12-month period ended March 31, 2023 (Period), the EUA market experienced some volatility during the Period amidst the ongoing energy crisis, and the invasion of Ukraine and the ongoing deliberations by EU member states related to of the Emissions Trading System (ETS) reforms, which have the potential to impact the value of EUAs. As a result, the Fund experienced some related price volatility early in the Period and rebounded, as discussed below. Fortunately, the start of 2023 welcomed the official approval of a wave of new policy updates to the EU ETS, including the Fit for 55 package, which includes several measures that tighten the emissions cap, phase out the distribution by the ETS of free allowances to member states and companies. Another key policy provision is the Carbon Border Adjustment Mechanism (CBAM), which will and may result in act as a tariff on foreign companies by requiring that are energy-intensive producers. Such a tariff would cause these producers to pay the EUA price on goods imported into the region to establish a more level playing field across borders. CBAM also coincides with the phase-out of free allowances.
EUA prices were impacted by the energy crisis in 2022 and looming macroeconomic sentiment; however, expectations of a rebound in industrial output provided additional support for EUAs. EUA prices increased in the first quarter of 2023 on renewed economic sentiment, appreciating by 9.5%. In February 2023, the market was even testing levels above the key €100 ($110) threshold.
We see three key positive catalysts for EUA market in the year to come:
| ● | The progression of new market policy surrounding the ETS Program is expected to support EUA prices through both the introduction of several supply tightening measures and by reducing regulatory uncertainty that had been hovering over the market last year. |
| ● | The CBAM carbon levy will indirectly bring more foreign companies into the Program as they could potentially hedge the tariffs in the EUA market, creating greater price discovery dynamics. |
| ● | Expectations of a rebound in industrial output provide additional support for EUAs. |
EUA Market Overview (April 1, 2022 to March 31, 2023)
| ● | The Underlying Index returned -6.17% in 2022. Consistent with that, the EUA price declined from $92.88 to $89.94. |
For the Period, the NAV of the Fund increased by 18.08% while the Underlying Index increased by 13.51%. The deviation between the Fund’s performance and that of the Underlying Index can be mainly attributed to tax diversification requirements.
Management Discussion of Fund Performance (Unaudited) (continued)
KraneShares European Carbon Allowance Strategy ETF (continued)
Growth of a $10,000 Investment‡
(at Net Asset Value)‡

AVERAGE ANNUAL TOTAL RETURNS FOR THE PERIOD ENDED MARCH 31, 2023*
|
| One Year
Return |
|
| Annualized
Inception to Date |
|
|
| Net
Asset
Value |
|
|
Market
Price^ |
|
| Net
Asset
Value |
|
|
Market
Price^ |
|
| KraneShares European Carbon Allowance Strategy ETF | | | 18.08 | % | | | 17.94 | %‡ | | | 23.01 | %‡ | | | 23.11 | %‡ |
| IHS Markit Carbon EUA Index | | | N/A | | | | 13.51 | %‡ | | | N/A | | | | 19.33 | %‡ |
| * | The Fund commenced operations on October 4, 2021. |
| ‡ | Unaudited. |
| ^ | Beginning December 23, 2020, market price returns are based on the official closing price of an ETF share or, if it more accurately reflects the market value of an ETF share at the time as of which the ETF calculates current NAV per share, the midpoint between the national best bid and national best offer (“NBBO”) as of that time. Prior to that date, market price returns were based on the midpoint between the Bid and Ask price. NAVs are calculated using prices as of 4:00 PM Eastern Time. |
The performance data quoted herein represents past performance and the return and value of an investment in the Fund will fluctuate so that, when redeemed, shares may be worth less than their original cost. Current performance may be lower or higher than the performance data quoted. Past performance is no guarantee of future performance and should not be considered as a representation of the future results of the Fund. For performance data current to the most recent month end, please call 855-857-2638 or visit www.kraneshares.com. The Fund’s performance assumes the reinvestment of all dividends and all capital gains. Index returns assume reinvestment of dividends and, unlike a Fund’s returns, do not reflect any fees or expenses. If such fees and expenses were included in the index returns, the performance would have been lower. As stated in the Fund’s prospectus, the Fund’s operating expense ratio is 0.78%. Please note that one cannot invest directly in an unmanaged index. There are no assurances that the Fund will meet its stated objectives. The Fund’s holdings and allocations are subject to change and should not be considered recommendations to buy individual securities. For further information on the Fund’s objectives, risks, and strategies, see the Fund’s prospectus. Returns shown do not reflect the deduction of taxes that a shareholder would pay on Fund distributions or the redemption of Fund shares.
Management Discussion of Fund Performance (Unaudited) (continued)
KraneShares California Carbon Allowance Strategy ETF
The KraneShares California Carbon Allowance Strategy ETF (the Fund) seeks to provide investment results that, before fees and expenses, correspond generally to the price and yield performance of the IHS Markit Carbon CCA Index (the Underlying Index).
The Underlying Index tracks the most traded California Carbon Allowances (CCA) futures contracts. The Fund provides a vehicle for participating in the price of carbon and investing in and/or hedging risk while supporting environmentally responsible investing.
CCA Market Review
California is in the midst of reviewing and updating its Program regulations to ensure the Program is on track to meet the state’s goal of carbon neutrality by 2045 and 48% emission reductions by 2030 versus 1990 under the 2022 Scoping Plan. During the Period, an economic slowdown and inflationary pressures adversely impacted demand for allowances and, as a result, CCA performance.
We see two potential positive catalysts for the CCA market in the year to come:
| ● | The California Air Resources Board (CARB) approved its final 2022 Scoping Plan update on December 15, 2022, raising the emission reductions target to 48% of the 1990 level by 2030 and calls for carbon neutrality by 2045. This could result in further tightening of the annual emissions cap to help meet these goals, which would apply upward price pressure on CCAs, to the benefit of the Fund. |
| ● | Regulators have stressed that the Program will play a critical role in achieving the new target in the 2022 Scoping Plan, with the state Air and Resource Board (ARB) publishing its expectation for the Program to account for at least 40% of the planned carbon emissions reductions. |
CCA Market Overview (April 1, 2022 to March 31, 2023)
| ● | The Underlying Index returned -13.99% in 2022, driven by the decline in the price of CCAs from $27.93 to $23.20. |
| ● | The 2023 reserve price, which sets the price floor for CCAs, rose to $22.21, an increase of 12.74% from the last year, computed based on the 5% plus inflation observed in 2022. |
For the Period, the NAV of the Fund decreased by -6.83% while the Underlying Index decreased by -5.43%. The deviation between the Fund’s performance and that of the Underlying Index can be mainly attributed to management fees and the difference between the yield earned by the Fund on its cash collateral and the yield assumed by the index.
Management Discussion of Fund Performance (Unaudited) (continued)
KraneShares California Carbon Allowance Strategy ETF (continued)
Growth of a $10,000 Investment‡
(at Net Asset Value)‡

AVERAGE ANNUAL TOTAL RETURNS FOR THE PERIOD ENDED MARCH 31, 2023*
|
| One Year
Return |
|
| Annualized
Inception to Date |
|
|
| Net
Asset
Value |
|
|
Market
Price^ |
|
| Net
Asset
Value |
|
|
Market
Price^ |
|
| KraneShares California Carbon Allowance Strategy ETF | | | -6.83 | % | | | -6.83 | %‡ | | | -2.68 | %‡ | | | -2.98 | %‡ |
| IHS Markit Carbon CCA Index | | | N/A | | | | -5.43 | %‡ | | | N/A | | | | -2.19 | %‡ |
| * | The Fund commenced operations on October 4, 2021. |
| ‡ | Unaudited. |
| ^ | Beginning December 23, 2020, market price returns are based on the official closing price of an ETF share or, if it more accurately reflects the market value of an ETF share at the time as of which the ETF calculates current NAV per share, the midpoint between the national best bid and national best offer (“NBBO”) as of that time. Prior to that date, market price returns were based on the midpoint between the Bid and Ask price. NAVs are calculated using prices as of 4:00 PM Eastern Time. |
The performance data quoted herein represents past performance and the return and value of an investment in the Fund will fluctuate so that, when redeemed, shares may be worth less than their original cost. Current performance may be lower or higher than the performance data quoted. Past performance is no guarantee of future performance and should not be considered as a representation of the future results of the Fund. For performance data current to the most recent month end, please call 855-857-2638 or visit www.kraneshares.com. The Fund’s performance assumes the reinvestment of all dividends and all capital gains. Index returns assume reinvestment of dividends and, unlike a Fund’s returns, do not reflect any fees or expenses. If such fees and expenses were included in the index returns, the performance would have been lower. As stated in the Fund’s prospectus, the Fund’s operating expense ratio is 0.78%. Please note that one cannot invest directly in an unmanaged index. There are no assurances that the Fund will meet its stated objectives. The Fund’s holdings and allocations are subject to change and should not be considered recommendations to buy individual securities. For further information on the Fund’s objectives, risks, and strategies, see the Fund’s prospectus. Returns shown do not reflect the deduction of taxes that a shareholder would pay on Fund distributions or the redemption of Fund shares.
Management Discussion of Fund Performance (Unaudited) (continued)
KraneShares Global Carbon Offset Strategy ETF
The KraneShares Global Carbon Offset Strategy ETF (the Fund) seeks to provide investment results that, before fees and expenses, correspond generally to the price and yield performance of the S&P GSCI Global Voluntary Carbon Liquidity Weighted Index (the Underlying Index).
The Underlying Index provides broad coverage of the voluntary carbon market by tracking carbon offset futures contracts. These futures contracts include Nature-Based Global Emission Offsets (N-GEOs) and Global Emission Offsets (GEOs), which trade through the Chicago Mercantile Exchange (CME) Group, the world’s largest financial derivatives exchange. The Fund is designed to dynamically add additional offset markets as they reach scale.
Global Carbon Offset Market Review
Concerns over offset quality weighed on the offset market during the 12-month period ended March 31, 2023 (Period), with purchases by companies down 4% in 2022. At the same, there has been a widespread focus on companies improving their sustainability efforts to mitigate their carbon footprint. Currently, more than one-third of the world’s largest companies have declared net zero targets. However, adopting more sustainable operational practices is likely not going to be enough to reach their emissions targets, so buying offset credits has become a key means of filling the gap to stay on track to reach emissions reduction goals. As the market matures and greater regulatory standards are adopted, the offsets market is well positioned to play a central role in global decarbonization efforts.
We see three potential positive catalysts for the global carbon offset market in the year to come:
| ● | Increased interest in offsets by companies globally to reach their net zero and emissions reduction goals. |
| ● | The Integrity Council, an independent governance body for the voluntary carbon market, recently published the Core Carbon Principles and Assessment Framework, which establishes a rigorous standard on disclosure and sustainable development aspects for high-quality carbon credits, which should help address concerns surrounding some offset credits. |
| ● | The market may be shaping up for renewed optimism as some stipulate that last year’s criticism on offset quality has run its course. |
Global Carbon Offset Market Overview (April 1, 2022 to March 31, 2023)
| ● | The Underlying Index was down -68.00% for the Period. |
| ● | Nature-based global emissions offset (N-GEO) futures prices declined from $14.52 to $3.47 and global emission offset (GEO) futures prices declined from $7.06 to $2.45 for the reporting period. |
For the Period, the NAV of the Fund decreased by -76.74% while the Underlying Index decreased by -68.00%. The deviation between the Fund’s performance and that of the Underlying Index can be mainly attributed to management fees and tax diversification requirements.
Management Discussion of Fund Performance (Unaudited) (continued)
KraneShares Global Carbon Offset Strategy ETF (continued)
Growth of a $10,000 Investment‡
(at Net Asset Value)‡
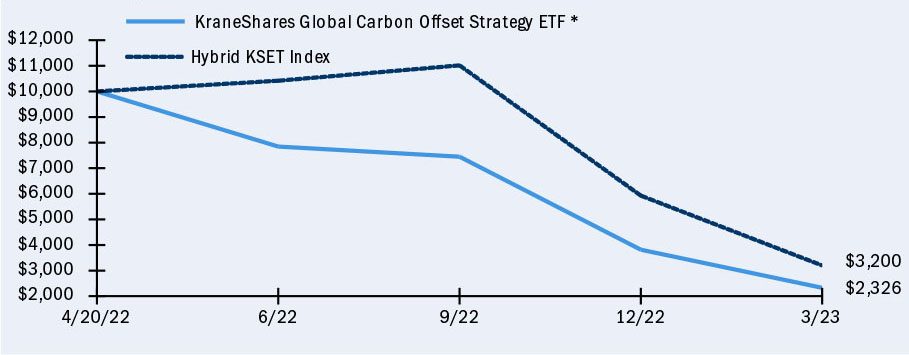
AVERAGE ANNUAL TOTAL RETURNS FOR THE PERIOD ENDED MARCH 31, 2023*
|
| Cumulative
Inception to Date |
|
|
| Net
Asset
Value |
|
|
Market
Price^ |
|
| KraneShares Global Carbon Offset Strategy | | | -76.74 | % | | | -76.90 | %‡ |
| Hybrid KSET Index** | | | N/A | | | | -68.00 | %‡ |
| * | The Fund commenced operations on April 20, 2022. |
| ** | The Hybrid KSET Index consists of the IHS Markit Global Carbon TR Index from the inception of the Fund through July 31, 2022 and the S&P GSCI Global Voluntary Carbon Liquidity Weighted Index going forward. |
| ‡ | Unaudited. |
| ^ | Beginning December 23, 2020, market price returns are based on the official closing price of an ETF share or, if it more accurately reflects the market value of an ETF share at the time as of which the ETF calculates current NAV per share, the midpoint between the national best bid and national best offer (“NBBO”) as of that time. Prior to that date, market price returns were based on the midpoint between the Bid and Ask price. NAVs are calculated using prices as of 4:00 PM Eastern Time. |
The performance data quoted herein represents past performance and the return and value of an investment in the Fund will fluctuate so that, when redeemed, shares may be worth less than their original cost. Current performance may be lower or higher than the performance data quoted. Past performance is no guarantee of future performance and should not be considered as a representation of the future results of the Fund. For performance data current to the most recent month end, please call 855-857-2638 or visit www.kraneshares.com. The Fund’s performance assumes the reinvestment of all dividends and all capital gains. Index returns assume reinvestment of dividends and, unlike a Fund’s returns, do not reflect any fees or expenses. If such fees and expenses were included in the index returns, the performance would have been lower. As stated in the Fund’s prospectus, the Fund’s operating expense ratio is 0.79%. Please note that one cannot invest directly in an unmanaged index. There are no assurances that the Fund will meet its stated objectives. The Fund’s holdings and allocations are subject to change and should not be considered recommendations to buy individual securities. For further information on the
Management Discussion of Fund Performance (Unaudited) (concluded)
KraneShares Global Carbon Offset Strategy ETF (concluded)
Fund’s objectives, risks, and strategies, see the Fund’s prospectus. Returns shown do not reflect the deduction of taxes that a shareholder would pay on Fund distributions or the redemption of Fund shares.
Management Discussion of Fund Performance (Unaudited) (continued)
KraneShares Electrification Metals Strategy ETF
The KraneShares Electrification Metals Strategy ETF (the Fund) seeks to provide investment results that, before fees and expenses, correspond generally to the price and yield performance of the Bloomberg Electrification Metals Index (the Underlying Index).
The Bloomberg Electrification Metals Index seeks to cover the key metals involved in a range of electrification uses. Currently, the Underlying Index is composed of futures contracts on aluminum, copper, nickel, zinc, cobalt, and lithium.
Electrification Metals Market Review
In the first half of the 12-month period ending March 31, 2023 (Period), metals prices rose sharply following the invasion of Ukraine and the lockdowns in China. Subsequently, most metal prices (including nickel and cobalt) underwent a decline. By contrast, lithium prices reached an all-time high at year-end as electric vehicle (EV) makers trended toward lithium-based chemical compounds over nickel-based battery chemistry.
Although some metals are seeing new supply become available through investments in new refineries, others are expected to continue to face supply and demand imbalances for the foreseeable future, which may support favorable prices for metals.
We see three potential positive catalysts for the electrification metals in the year to come:
| ● | Both the domestic Inflation Reduction Act (IRA) and Europe’s Green Deal Industrial Plan are likely to induce significant new investments in clean energy technology, which will require increased amounts of copper, aluminum, nickel, cobalt, and lithium; accordingly, the demand for metals may strengthen. |
| ● | EV battery makers continue to experiment with different battery chemistries, which may exacerbate supply and demand imbalances for the metals to which the Fund has exposure. |
| ● | China’s reopening may revive the country’s construction sector, which in turn could fuel demand for base metals. |
For the Period, the NAV of the Fund increased by 3.33% while the Underlying Index increased by 4.77%. The deviation between the Fund’s performance and that of the Underlying Index can be mainly attributed to management fees and the difference between the yield earned by the Fund on its cash collateral and the yield assumed by the index.
Management Discussion of Fund Performance (Unaudited) (continued)
KraneShares Electrification Metals Strategy ETF (concluded)
Growth of a $10,000 Investment‡
(at Net Asset Value)‡

AVERAGE ANNUAL TOTAL RETURNS FOR THE PERIOD ENDED MARCH 31, 2023*
| | | Cumulative
Inception to Date | |
| | | Net
Asset
Value | | | Market
Price^ | |
| KraneShares Electrification Metals Strategy ETF | | | 3.33 | % | | | 2.73 | %‡ |
| Bloomberg Electrification Metals Index | | | N/A | | | | 4.77 | %‡ |
| * | The Fund commenced operations on October 13, 2022. |
| ‡ | Unaudited. |
| ^ | Beginning December 23, 2020, market price returns are based on the official closing price of an ETF share or, if it more accurately reflects the market value of an ETF share at the time as of which the ETF calculates current NAV per share, the midpoint between the national best bid and national best offer (“NBBO”) as of that time. Prior to that date, market price returns were based on the midpoint between the Bid and Ask price. NAVs are calculated using prices as of 4:00 PM Eastern Time. |
The performance data quoted herein represents past performance and the return and value of an investment in the Fund will fluctuate so that, when redeemed, shares may be worth less than their original cost. Current performance may be lower or higher than the performance data quoted. Past performance is no guarantee of future performance and should not be considered as a representation of the future results of the Fund. For performance data current to the most recent month end, please call 855-857-2638 or visit www.kraneshares.com. The Fund’s performance assumes the reinvestment of all dividends and all capital gains. Index returns assume reinvestment of dividends and, unlike a Fund’s returns, do not reflect any fees or expenses. If such fees and expenses were included in the index returns, the performance would have been lower. As stated in the Fund’s prospectus, the Fund’s operating expense ratio is 0.79%, which includes fees and expenses incurred indirectly as a result of investments in underlying Funds. Please note that one cannot invest directly in an unmanaged index. There are no assurances that the Fund will meet its stated objectives. The Fund’s holdings and allocations are subject to change and should not be considered recommendations to buy individual securities. For further information on the Fund’s objectives, risks, and strategies, see the Fund’s prospectus. Returns shown do not reflect the deduction of taxes that a shareholder would pay on Fund distributions or the redemption of Fund shares.
Schedule of Investments March 31, 2023
KraneShares Global Carbon Transformation ETF

| | | Shares | | | Value | |
| COMMON STOCK — 97.2%‡ | | | | | | | | |
| AUSTRALIA — 2.9% | | | | | | | | |
| Materials — 2.9% | | | | | | | | |
| Fortescue Metals Group | | | 4,733 | | | $ | 71,292 | |
| TOTAL AUSTRALIA | | | | | | | 71,292 | |
| | | | | | | | | |
| BRAZIL — 0.9% | | | | | | | | |
| Materials — 0.9% | | | | | | | | |
| Vale ADR, Cl B | | | 1,495 | | | | 23,591 | |
| TOTAL BRAZIL | | | | | | | 23,591 | |
| | | | | | | | | |
| CANADA — 5.5% | | | | | | | | |
| Energy — 2.2% | | | | | | | | |
| Cameco* | | | 2,111 | | | | 55,245 | |
| | | | | | | | | |
| Industrials — 0.5% | | | | | | | | |
| Ballard Power Systems* | | | 2,046 | | | | 11,396 | |
| | | | | | | | | |
| Materials — 1.8% | | | | | | | | |
| Teck Resources, Cl B | | | 1,234 | | | | 45,041 | |
| | | | | | | | | |
| Utilities — 1.0% | | | | | | | | |
| Atco, Cl I | | �� | 761 | | | | 24,359 | |
| TOTAL CANADA | | | | | | | 136,041 | |
| | | | | | | | | |
| FRANCE — 15.4% | | | | | | | | |
| Energy — 3.8% | | | | | | | | |
| TotalEnergies | | | 1,586 | | | | 93,668 | |
| | | | | | | | | |
| Industrials — 7.0% | | | | | | | | |
| Legrand | | | 736 | | | | 67,233 | |
| Rexel | | | 4,500 | | | | 107,314 | |
| | | | | | | | 174,547 | |
| Materials — 1.1% | | | | | | | | |
| Air Liquide | | | 171 | | | | 28,614 | |
The accompanying notes are an integral part of the financial statements.
Schedule of Investments March 31, 2023
KraneShares Global Carbon Transformation ETF (continued)
| | | Shares | | | Value | |
| COMMON STOCK (continued) | | | | | | | | |
| Utilities — 3.5% | | | | | | | | |
| Engie | | | 5,446 | | | $ | 86,231 | |
| TOTAL FRANCE | | | | | | | 383,060 | |
| | | | | | | | | |
| GERMANY — 9.2% | | | | | | | | |
| Industrials — 3.7% | | | | | | | | |
| Siemens | | | 579 | | | | 93,892 | |
| | | | | | | | | |
| Materials — 1.7% | | | | | | | | |
| thyssenkrupp | | | 5,782 | | | | 41,561 | |
| | | | | | | | | |
| Utilities — 3.8% | | | | | | | | |
| RWE | | | 2,186 | | | | 94,144 | |
| TOTAL GERMANY | | | | | | | 229,597 | |
| | | | | | | | | |
| GREECE — 1.7% | | | | | | | | |
| Energy — 1.7% | | | | | | | | |
| Motor Oil Hellas Corinth Refineries | | | 1,680 | | | | 43,222 | |
| TOTAL GREECE | | | | | | | 43,222 | |
| | | | | | | | | |
| INDIA — 3.1% | | | | | | | | |
| Energy — 3.1% | | | | | | | | |
| Reliance Industries GDR | | | 1,377 | | | | 77,594 | |
| TOTAL INDIA | | | | | | | 77,594 | |
| | | | | | | | | |
| ITALY — 6.4% | | | | | | | | |
| Energy — 3.8% | | | | | | | | |
| Eni | | | 6,854 | | | | 96,105 | |
| | | | | | | | | |
| Industrials — 2.6% | | | | | | | | |
| Industrie De Nora* | | | 3,196 | | | | 64,168 | |
| TOTAL ITALY | | | | | | | 160,273 | |
| | | | | | | | | |
| LUXEMBOURG — 2.4% | | | | | | | | |
| Materials — 2.4% | | | | | | | | |
| ArcelorMittal | | | 2,011 | | | | 60,892 | |
| TOTAL LUXEMBOURG | | | | | | | 60,892 | |
| | | | | | | | | |
| NEW ZEALAND — 1.2% | | | | | | | | |
| Utilities — 1.2% | | | | | | | | |
| Contact Energy | | | 6,462 | | | | 31,292 | |
| TOTAL NEW ZEALAND | | | | | | | 31,292 | |
| | | | | | | | | |
| NORWAY — 6.6% | | | | | | | | |
| Industrials — 2.6% | | | | | | | | |
| Aker, Cl A | | | 499 | | | | 32,018 | |
The accompanying notes are an integral part of the financial statements.
Schedule of Investments March 31, 2023
KraneShares Global Carbon Transformation ETF (continued)
| | | Shares | | | Value | |
| COMMON STOCK (continued) | | | | | | |
| Industrials (continued) | | | | | | | | |
| NEL* | | | 24,018 | | | $ | 32,554 | |
| | | | | | | | 64,572 | |
| Materials — 4.0% | | | | | | | | |
| Norsk Hydro | | | 13,558 | | | | 100,716 | |
| TOTAL NORWAY | | | | | | | 165,288 | |
| | | | | | | | | |
| PORTUGAL — 2.5% | | | | | | | | |
| Utilities — 2.5% | | | | | | | | |
| EDP - Energias de Portugal | | | 11,296 | | | | 61,559 | |
| TOTAL PORTUGAL | | | | | | | 61,559 | |
| | | | | | | | | |
| SOUTH KOREA — 2.2% | | | | | | | | |
| Energy — 2.2% | | | | | | | | |
| SK Innovation* | | | 401 | | | | 55,229 | |
| TOTAL SOUTH KOREA | | | | | | | 55,229 | |
| | | | | | | | | |
| SPAIN — 2.2% | | | | | | | | |
| Utilities — 2.2% | | | | | | | | |
| Iberdrola | | | 4,337 | | | | 54,116 | |
| TOTAL SPAIN | | | | | | | 54,116 | |
| | | | | | | | | |
| UNITED KINGDOM — 6.3% | | | | | | | | |
| Energy — 4.3% | | | | | | | | |
| BP | | | 16,878 | | | | 106,597 | |
| | | | | | | | | |
| Utilities — 2.0% | | | | | | | | |
| SSE PLC | | | 2,233 | | | | 49,781 | |
| TOTAL UNITED KINGDOM | | | | | | | 156,378 | |
| | | | | | | | | |
| UNITED STATES — 28.7% | | | | | | | | |
| Energy — 9.9% | | | | | | | | |
| Baker Hughes, Cl A | | | 3,349 | | | | 96,652 | |
| Cheniere Energy | | | 248 | | | | 39,085 | |
| New Fortress Energy, Cl A | | | 746 | | | | 21,955 | |
| Schlumberger | | | 1,807 | | | | 88,723 | |
| | | | | | | | 246,415 | |
| Industrials — 11.4% | | | | | | | | |
| Bloom Energy, Cl A* | | | 1,505 | | | | 29,995 | |
| Chart Industries* | | | 56 | | | | 7,022 | |
| Fluence Energy, Cl A* | | | 2,942 | | | | 59,575 | |
| Quanta Services | | | 551 | | | | 91,819 | |
| Schneider Electric | | | 567 | | | | 94,670 | |
| | | | | | | | 283,081 | |
The accompanying notes are an integral part of the financial statements.
Schedule of Investments March 31, 2023
KraneShares Global Carbon Transformation ETF (concluded)
| | | Shares | | | Value | |
| COMMON STOCK (continued) | | | | | | |
| Information Technology — 1.0% | | | | | | | | |
| SolarEdge Technologies* | | | 80 | | | $ | 24,316 | |
| | | | | | | | | |
| Materials — 3.0% | | | | | | | | |
| Air Products and Chemicals | | | 161 | | | | 46,241 | |
| Linde | | | 84 | | | | 29,578 | |
| | | | | | | | 75,819 | |
| Utilities — 3.4% | | | | | | | | |
| AES | | | 3,524 | | | | 84,858 | |
| TOTAL UNITED STATES | | | | | | | 714,489 | |
| | | | | | | | |
TOTAL COMMON STOCK
(Cost $2,239,067) | | | | | | | 2,423,913 | |
| | | | | | | | |
TOTAL INVESTMENTS — 97.2%
(Cost $2,239,067) | | | | | | | 2,423,913 | |
| OTHER ASSETS LESS LIABILITIES – 2.8% | | | | | | | 68,805 | |
| NET ASSETS - 100% | | | | | | $ | 2,492,718 | |
| ‡ | Industries are utilized for compliance purposes, whereas sectors are utilized for reporting. |
| * | Non-income producing security. |
As of March 31, 2023, all of the Fund’s investments were considered Level 1 of the fair value hierarchy, in accordance with the authoritative guidance under U.S. GAAP.
See “Glossary for abbreviations”.
The accompanying notes are an integral part of the financial statements.
Consolidated Schedule of Investments March 31, 2023
KraneShares Global Carbon Strategy ETF

| | | Shares | | | Value | |
| SHORT-TERM INVESTMENT — 30.1% | | | | | | | | |
| State Street Institutional U.S. Government Money Market Fund, Cl Premier, 4.700%(A) | | | 191,074,584 | | | $ | 191,074,584 | |
TOTAL SHORT-TERM INVESTMENT
(Cost $191,074,584) | | | | | | | 191,074,584 | |
| | | | | | | | | |
TOTAL INVESTMENTS — 30.1%
(Cost $191,074,584) | | | | | | | 191,074,584 | |
| OTHER ASSETS LESS LIABILITIES – 69.9% | | | | | | | 444,203,333 | |
| NET ASSETS - 100% | | | | | | $ | 635,277,917 | |
A list of the open futures contracts held by the Fund at March 31, 2023, is as follows:
| Type of Contract | | Number of
Contracts | | | Expiration
Date | | Notional
Amount | | | Value | | | Unrealized
Appreciation/
(Depreciation) | |
| Long Contracts | | | | | | | | | | | | | | | | | | |
| CA Carbon Allowance 2024^ | | | 962 | | | Dec-2024 | | $ | 29,535,871 | | | $ | 31,851,820 | | | $ | 2,315,949 | |
| CA Carbon Allowance 2023^ | | | 5,125 | | | Dec-2023 | | | 145,621,122 | | | | 159,233,750 | | | | 13,612,628 | |
| Euro FX 2023^ | | | 10 | | | Jun-2023 | | | 1,327,376 | | | | 1,362,937 | | | | 35,561 | |
| ICE ECX Emission 2023^ | | | 3,544 | | | Dec-2023 | | | 320,025,655 | | | | 353,964,908 | | | | 17,481,373 | |
| ICE ECX Emission 2024^ | | | 307 | | | Dec-2024 | | | 29,134,640 | | | | 32,063,177 | | | | 1,402,513 | |
| RGGI Vintage 2023^ | | | 2,083 | | | Dec-2023 | | | 29,011,181 | | | | 27,974,690 | | | | (1,036,491 | ) |
| UK Emission Allowance 2023^ | | | 321 | | | Dec-2023 | | | 29,126,458 | | | | 29,342,743 | | | | (764,035 | ) |
| | | | | | | | | $ | 583,782,303 | | | $ | 635,794,025 | | | $ | 33,047,498 | |
| ^ | Security is held by the Fund’s Subsidiary, KFA Global Carbon Subsidiary, Ltd., as of March 31, 2023. |
| (A) | The rate shown is the 7-day effective yield as of March 31, 2023. |
As of March 31, 2023, all of the Fund’s investments and other financial instruments were considered Level 1 of the fair value hierarchy, in accordance with the authoritative guidance under U.S. GAAP.
See “Glossary” for abbreviations.
The accompanying notes are an integral part of the financial statements.
Consolidated Schedule of Investments March 31, 2023
KraneShares European Carbon Allowance Strategy ETF

| | | Shares | | | Value | |
| SHORT-TERM INVESTMENT — 6.4% | | | | | | | | |
| State Street Institutional U.S. Government Money Market Fund, Cl Premier, 4.700%(A) | | | 2,011,311 | | | $ | 2,011,311 | |
TOTAL SHORT-TERM INVESTMENT
(Cost $2,011,311) | | | | | | | 2,011,311 | |
| | | | | | | | | |
TOTAL INVESTMENTS — 6.4%
(Cost $2,011,311) | | | | | | | 2,011,311 | |
| OTHER ASSETS LESS LIABILITIES – 93.6% | | | | | | | 29,460,819 | |
| NET ASSETS - 100% | | | | | | $ | 31,472,130 | |
A list of the open futures contracts held by the Fund at March 31, 2023, is as follows:
| Type of Contract | | Number of
Contracts | | | Expiration
Date | | Notional
Amount | | | Value | | | Unrealized
Appreciation/
(Depreciation) | |
| Long Contracts | | | | | | | | | | | | | | | | | | |
| Euro^ | | | 5 | | | Jun-2023 | | $ | 663,701 | | | $ | 681,469 | | | $ | 17,768 | |
| ICE ECX Emission 2023^ | | | 314 | | | Dec-2023 | | | 29,449,326 | | | | 31,361,450 | | | | 831,255 | |
| | | | | | | | | $ | 30,113,027 | | | $ | 32,042,919 | | | $ | 849,023 | |
| ^ | Security is held by the KraneShares European Carbon Subsidiary, Ltd. as of March 31, 2023. |
| (A) | The rate shown is the 7-day effective yield as of March 31, 2023. |
As of March 31, 2023, all of the Fund’s investments and other financial instruments were considered Level 1 of the fair value hierarchy, in accordance with the authoritative guidance under U.S. GAAP.
See “Glossary” for abbreviations.
The accompanying notes are an integral part of the financial statements.
Consolidated Schedule of Investments March 31, 2023
KraneShares California Carbon Allowance Strategy ETF

| | | Shares | | | Value | |
| SHORT-TERM INVESTMENT — 71.3% | | | | | | | | |
| State Street Institutional U.S. Government Money Market Fund, Cl Premier, 4.700%(A) | | | 163,500,000 | | | $ | 163,500,000 | |
TOTAL SHORT-TERM INVESTMENT
(Cost $163,500,000) | | | | | | | 163,500,000 | |
| | | | | | | | | |
TOTAL INVESTMENTS — 71.3%
(Cost $163,500,000) | | | | | | | 163,500,000 | |
| OTHER ASSETS LESS LIABILITIES – 28.7% | | | | | | | 65,809,688 | |
| NET ASSETS - 100% | | | | | | $ | 229,309,688 | |
A list of the open futures contracts held by the Fund at March 31, 2023, is as follows:
| Type of Contract | | Number of
Contracts | | | Expiration
Date | | Notional
Amount | | | Value | | | Unrealized
Appreciation/
(Depreciation) | |
| Long Contracts | | | | | | | | | | | | | | | | | | |
| CA Carbon Allowance 2022^ | | | 7,366 | | | Dec-2023 | | $ | 209,222,993 | | | $ | 228,861,620 | | | $ | 19,638,627 | |
| ^ | Security is held by the KraneShares California Carbon Subsidiary, Ltd. as of March 31, 2023. |
| (A) | The rate shown is the 7-day effective yield as of March 31, 2023. |
As of March 31, 2023, all of the Fund’s investments and other financial instruments were considered Level 1 of the fair value hierarchy, in accordance with the authoritative guidance under U.S. GAAP.
See “Glossary” for abbreviations.
The accompanying notes are an integral part of the financial statements.
Consolidated Schedule of Investments March 31, 2023
KraneShares Global Carbon Offset Strategy ETF

| | | Shares | | | Value | |
| SHORT-TERM INVESTMENT — 0.1% | | | | | | | | |
| State Street Institutional U.S. Government Money Market Fund,Cl Premier, 4.700%(A) | | | 1,170 | | | $ | 1,170 | |
TOTAL SHORT-TERM INVESTMENT
(Cost $1,170) | | | | | | | 1,170 | |
| | | | | | | | | |
TOTAL INVESTMENTS — 0.1%
(Cost $1,170) | | | | | | | 1,170 | |
| OTHER ASSETS LESS LIABILITIES – 99.9% | | | | | | | 2,319,521 | |
| NET ASSETS - 100% | | | | | | $ | 2,320,691 | |
A list of the open futures contracts held by the Fund at March 31, 2023, is as follows:
| Type of Contract | | Number of
Contracts | | | Expiration
Date | | Notional
Amount | | | Value | | | Unrealized
Appreciation/
(Depreciation) | |
| Long Contracts | | | | | | | | | | | | | | | | | | |
| CBL Global Emission Offset 2023^ | | | 110 | | | Dec-2023 | | $ | 357,747 | | | $ | 269,500 | | | $ | (88,247 | ) |
| CBL Nature-Based Global Emission Offset 2023^ | | | 300 | | | Dec-2023 | | | 1,494,456 | | | | 1,041,000 | | | | (453,456 | ) |
| | | | | | | | | $ | 1,852,203 | | | $ | 1,310,500 | | | $ | (541,703 | ) |
| ^ | Security is held by the KraneShares Global Carbon Offset Strategy Subsidiary, Ltd. as of March 31, 2023. |
| (A) | The rate shown is the 7-day effective yield as of March 31, 2023. |
As of March 31, 2023, all of the Fund’s investments and other financial instruments were considered Level 1 of the fair value hierarchy, in accordance with the authoritative guidance under U.S. GAAP.
See “Glossary” for abbreviations.
The accompanying notes are an integral part of the financial statements.
Consolidated Schedule of Investments March 31, 2023
KraneShares Electrification Metals Strategy ETF
| | | Shares | | | Value | |
| SHORT-TERM INVESTMENT — 52.0% | | | | | | | | |
| State Street Institutional U.S. Government Money Market Fund, Cl Premier, 4.700%(A) | | | 12,067,868 | | | $ | 12,067,868 | |
TOTAL SHORT-TERM INVESTMENT
(Cost $12,067,868) | | | | | | | 12,067,868 | |
| | | | | | | | | |
TOTAL INVESTMENTS — 52.0%
(Cost $12,067,868) | | | | | | | 12,067,868 | |
| OTHER ASSETS LESS LIABILITIES – 48.0% | | | | | | | 11,150,823 | |
| NET ASSETS - 100% | | | | | | $ | 23,218,691 | |
A list of the open futures contracts held by the Fund at March 31, 2023, is as follows:
| Type of Contract | | Number of
Contracts | | | Expiration
Date | | Notional
Amount | | | Value | | | Unrealized
Appreciation/
(Depreciation) | |
| Long Contracts | | | | | | | | | | | | | | | | | | |
| Aluminum Futures 2023^ | | | 31 | | | May-2023 | | $ | 1,862,089 | | | $ | 1,855,156 | | | $ | (6,933 | ) |
| Cobalt Fast Market 2023^ | | | 60 | | | May-2023 | | | 2,387,234 | | | | 2,281,782 | | | | (105,452 | ) |
| Copper 2023^ | | | 62 | | | May-2023 | | | 6,327,688 | | | | 6,346,475 | | | | 18,787 | |
| Lithium LiOH COME 2023^ | | | 14 | | | May-2023 | | | 1,046,682 | | | | 805,000 | | | | (241,682 | ) |
| LME Nickel 2023^ | | | 36 | | | May-2023 | | | 5,681,398 | | | | 5,130,000 | | | | (551,398 | ) |
| LME Primary Aluminum 2023^ | | | 53 | | | May-2023 | | | 3,182,430 | | | | 3,171,719 | | | | (10,711 | ) |
| LME Zinc 2023^ | | | 48 | | | May-2023 | | | 3,688,316 | | | | 3,515,700 | | | | (172,616 | ) |
| | | | | | | | | $ | 24,175,837 | | | $ | 23,105,832 | | | $ | (1,070,005 | ) |
| ^ | Security is held by the KraneShares Technology Metals Strategy Subsidiary, Ltd. as of March 31, 2023. |
| (A) | The rate shown is the 7-day effective yield as of March 31, 2023. |
As of March 31, 2023, all of the Fund’s investments and other financial instruments were considered Level 1 of the fair value hierarchy, in accordance with the authoritative guidance under U.S. GAAP.
See “Glossary” for abbreviations.
The accompanying notes are an integral part of the financial statements.
Schedule of Investments/Consolidated Schedules of Investments March 31, 2023
Glossary (abbreviations used in preceding Schedule of Investments):
Fund Abbreviations
ADR — American Depositary Receipt
Cl — Class
GDR — Global Depositary Receipt
Statement of Assets and Liabilities/Consolidated Statements of Assets and Liabilities
March 31, 2023
| | | KraneShares Global Carbon Transformation ETF | | | KraneShares Global Carbon Strategy ETF(1) | | | KraneShares European Carbon Allowance Strategy ETF(2) | |
| Assets: | | | | | | | | | | | | |
| Investments at Value | | $ | 2,423,913 | | | $ | 191,074,584 | | | $ | 2,011,311 | |
| Cash and Cash Equivalents | | | 61,102 | | | | 200,051,485 | | | | 13,669,904 | |
| Foreign Currency at Value | | | 3,504 | | | | 110,045,545 | | | | 9,180,491 | |
| Cash Collateral on Futures Contracts | | | — | | | | 77,625,821 | | | | 14,575 | |
| Reclaim Receivable | | | 4,417 | | | | — | | | | — | |
| Dividend and Interest Receivable | | | 1,625 | | | | 731,258 | | | | 7,697 | |
| Foreign Currency Due from Broker | | | — | | | | 51,674,193 | | | | 6,526,280 | |
| Variation Margin Receivable on Future Contracts | | | — | | | | 4,175,194 | | | | 49,625 | |
| Unrealized Appreciation on Spot Contracts | | | — | | | | 343,474 | | | | 38,704 | |
| Total Assets | | | 2,494,561 | | | | 635,721,554 | | | | 31,498,587 | |
| | | | | | | | | | | | | |
| Liabilities: | | | | | | | | | | | | |
| Payable for Management Fees | | | 1,820 | | | | 430,183 | | | | 22,896 | |
| Payable for Trustees’ Fee | | | 19 | | | | 7,080 | | | | 373 | |
| Unrealized Depreciation on Spot Contracts | | | 4 | | | | — | | | | — | |
| Variation Margin Payable on Future Contracts | | | — | | | | 6,374 | | | | 3,188 | |
| Total Liabilities | | | 1,843 | | | | 443,637 | | | | 26,457 | |
| Net Assets | | $ | 2,492,718 | | | $ | 635,277,917 | | | $ | 31,472,130 | |
| | | | | | | | | | | | | |
| Net Assets Consist of: | | | | | | | | | | | | |
| Paid-in Capital | | $ | 2,500,050 | | | $ | 589,178,966 | | | $ | 31,332,169 | |
| Total Distributable Earnings/(Loss) | | | (7,332 | ) | | | 46,098,951 | | | | 139,961 | |
| Net Assets | | $ | 2,492,718 | | | $ | 635,277,917 | | | $ | 31,472,130 | |
| Outstanding Shares of Beneficial Interest (unlimited authorization - no par value) | | | 100,002 | | | | 16,000,000 | | | | 925,006 | |
| Net Asset Value, Offering and Redemption Price Per Share | | $ | 24.93 | | | $ | 39.70 | | | $ | 34.02 | |
| Cost of Investments | | $ | 2,239,067 | | | $ | 191,074,584 | | | $ | 2,011,311 | |
| Cost of Foreign Currency | | | 3,465 | | | | 105,434,455 | | | | 8,680,128 | |
| (1) | KraneShares Global Carbon Strategy ETF includes the account of the Fund’s Subsidiary, KFA Global Carbon Subsidiary, Ltd. |
| (2) | KraneShares European Carbon Allowance Strategy ETF includes the account of the Fund’s Subsidiary, KraneShares European Carbon Subsidiary, Ltd. |
Amounts designated as “—” are $0 or have been rounded to $0.
The accompanying notes are an integral part of the financial statements.
Consolidated Statements of Assets and Liabilities (concluded)
March 31, 2023
| | | KraneShares California Carbon Allowance Strategy ETF(1) | | | KraneShares Global Carbon Offset Strategy ETF(2) | | | KraneShares Electrification Metals Strategy ETF(3) | |
| Assets: | | | | | | | | | | | | |
| Investments at Value | | $ | 163,500,000 | | | $ | 1,170 | | | $ | 12,067,868 | |
| Cash Collateral on Futures Contracts | | | 47,318,852 | | | | 570,996 | | | | 4,663,439 | |
| Cash and Cash Equivalents | | | 18,015,935 | | | | 1,750,094 | | | | 6,456,772 | |
| Dividend and Interest Receivable | | | 627,819 | | | | 4 | | | | 46,201 | |
| Total Assets | | | 229,462,606 | | | | 2,322,264 | | | | 23,234,280 | |
| | | | | | | | | | | | | |
| Liabilities: | | | | | | | | | | | | |
| Payable for Management Fees | | | 150,827 | | | | 1,539 | | | | 15,354 | |
| Payable for Trustees’ Fee | | | 2,091 | | | | 34 | | | | 235 | |
| Total Liabilities | | | 152,918 | | | | 1,573 | | | | 15,589 | |
| Net Assets | | $ | 229,309,688 | | | $ | 2,320,691 | | | $ | 23,218,691 | |
| | | | | | | | | | | | | |
| Net Assets Consist of: | | | | | | | | | | | | |
| Paid-in Capital | | $ | 252,733,348 | | | $ | 10,000,050 | | | $ | 22,618,491 | |
| Total Distributable Earnings/(Loss) | | | (23,423,660 | ) | | | (7,679,359 | ) | | | 600,200 | |
| Net Assets | | $ | 229,309,688 | | | $ | 2,320,691 | | | $ | 23,218,691 | |
| Outstanding Shares of Beneficial Interest (unlimited authorization - no par value) | | | 9,575,002 | | | | 400,002 | | | | 900,002 | |
| Net Asset Value, Offering and Redemption Price Per Share | | $ | 23.95 | | | $ | 5.80 | | | $ | 25.80 | |
| Cost of Investments | | $ | 163,500,000 | | | $ | 1,170 | | | $ | 12,067,868 | |
| (1) | KraneShares California Carbon Allowance Strategy ETF includes the account of the Fund’s Subsidiary, KraneShares California Carbon Subsidiary, Ltd. |
| (2) | KraneShares Global Carbon Offset Strategy ETF includes the account of the Fund’s Subsidiary, KraneShares Global Carbon Offset Strategy Subsidiary, Ltd. |
| (3) | KraneShares Electrification Metals Strategy ETF includes the account of the Fund’s Subsidiary, KraneShares Technology Metals Strategy Subsidiary, Ltd. |
Amounts designated as “—” are $0 or have been rounded to $0.
The accompanying notes are an integral part of the financial statements.
Statements of Operations/Consolidated Statements of Operations
For the Year or Period Ended March 31, 2023
| | | KraneShares Global Carbon Transformation ETF | | | KraneShares Global Carbon Strategy ETF(1) | | | KraneShares European Carbon Allowance Strategy ETF(2) | |
| Investment Income: | | | | | | | | | | | | |
| Dividend Income | | $ | 66,820 | | | $ | 301,941 | | | $ | — | |
| Interest Income | | | 672 | | | | 5,673,308 | | | | 69,032 | |
| Less: Foreign Taxes Withheld | | | (5,076 | ) | | | — | | | | — | |
| Total Investment Income | | | 62,416 | | | | 5,975,249 | | | | 69,032 | |
| | | | | | | | | | | | | |
| Expenses: | | | | | | | | | | | | |
| Management Fees† | | | 21,218 | | | | 7,127,903 | | | | 184,462 | |
| Trustees’ Fees | | | 104 | | | | 41,790 | | | | 1,190 | |
| Insurance Expense | | | — | | | | 19,956 | | | | 400 | |
| Total Expenses | | | 21,322 | | | | 7,189,649 | | | | 186,052 | |
| Net Investment Income (Loss) | | | 41,094 | | | | (1,214,400 | ) | | | (117,020 | ) |
| | | | | | | | | | | | | |
| Net Realized Gain (Loss) on: | | | | | | | | | | | | |
| Investments | | | (207,214 | ) | | | (4,206,232 | ) | | | — | |
| Futures Contracts | | | — | | | | 57,313,559 | | | | (535,756 | ) |
| Foreign Currency Translations | | | (5,620 | ) | | | (29,252,866 | ) | | | (680,430 | ) |
| Net Realized Gain (Loss) | | | (212,834 | ) | | | 23,854,461 | | | | (1,216,186 | ) |
| | | | | | | | | | | | | |
| Net Change in Unrealized Appreciation (Depreciation) on: | | | | | | | | | | | | |
| Investments | | | (21,622 | ) | | | 1,741,343 | | | | — | |
| Futures Contracts | | | — | | | | (26,818,949 | ) | | | 4,060,337 | |
| Foreign Currency Translations | | | 144 | | | | 3,859,334 | | | | 488,883 | |
| Net Change in Unrealized Appreciation (Depreciation) | | | (21,478 | ) | | | (21,218,272 | ) | | | 4,549,220 | |
| Net Realized and Unrealized Gain (Loss) | | | (234,312 | ) | | | 2,636,189 | | | | 3,333,034 | |
| Net Increase (Decrease) in Net Assets Resulting from Operations | | $ | (193,218 | ) | | $ | 1,421,789 | | | $ | 3,216,014 | |
| † | See Note 4 in Notes to Financial Statements. |
| (1) | KraneShares Global Carbon Strategy ETF includes the account of the Fund’s Subsidiary, KFA Global Carbon Subsidiary, Ltd. |
| (2) | KraneShares European Carbon Allowance Strategy ETF includes the account of the Fund’s Subsidiary, KraneShares European Carbon Subsidiary, Ltd. |
Amounts designated as “—” are $0 or have been rounded to $0.
The accompanying notes are an integral part of the financial statements.
Consolidated Statements of Operations (concluded)
For the Year or Period Ended March 31, 2023
| | | KraneShares California Carbon Allowance Strategy ETF(1) | | | KraneShares Global Carbon Offset Strategy ETF(2)(3) | | | KraneShares Electrification Metals Strategy ETF(4)(5) | |
| Investment Income: | | | | | | | | | | | | |
| Interest Income | | $ | 4,189,626 | | | $ | 37,994 | | | $ | 226,100 | |
| Total Investment Income | | | 4,189,626 | | | | 37,994 | | | | 226,100 | |
| | | | | | | | | | | | | |
| Expenses: | | | | | | | | | | | | |
| Management Fees† | | | 1,723,443 | | | | 43,019 | | | | 79,324 | |
| Trustees’ Fees | | | 10,935 | | | | 323 | | | | 670 | |
| Insurance Expense | | | 1,338 | | | | — | | | | — | |
| Total Expenses | | | 1,735,716 | | | | 43,342 | | | | 79,994 | |
| Net Investment Income (Loss) | | | 2,453,910 | | | | (5,348 | ) | | | 146,106 | |
| | | | | | | | | | | | | |
| Net Realized Gain (Loss) on: | | | | | | | | | | | | |
| Futures Contracts | | | (42,498,467 | ) | | | (7,122,300 | ) | | | 1,551,770 | |
| Net Realized Gain (Loss) | | | (42,498,467 | ) | | | (7,122,300 | ) | | | 1,551,770 | |
| | | | | | | | | | | | | |
| Net Change in Unrealized Appreciation (Depreciation) on: | | | | | | | | | | | | |
| Futures Contracts | | | 22,137,284 | | | | (541,703 | ) | | | (1,070,005 | ) |
| Net Change in Unrealized Appreciation (Depreciation) | | | 22,137,284 | | | | (541,703 | ) | | | (1,070,005 | ) |
| Net Realized and Unrealized Gain (Loss) | | | (20,361,183 | ) | | | (7,664,003 | ) | | | 481,765 | |
| Net Increase (Decrease) in Net Assets Resulting from Operations | | $ | (17,907,273 | ) | | $ | (7,669,351 | ) | | $ | 627,871 | |
| † | See Note 4 in Notes to Financial Statements. |
| (1) | KraneShares California Carbon Allowance Strategy ETF includes the account of the Fund’s Subsidiary, KraneShares California Carbon Subsidiary, Ltd. |
| (2) | Commenced operations on April 20, 2022. |
| (3) | KraneShares Global Carbon Offset Strategy ETF includes the account of the Fund’s Subsidiary, KraneShares Global Carbon Offset Strategy Subsidiary, Ltd. |
| (4) | Commenced operations on October 13, 2022. |
| (5) | KraneShares Electrification Metals Strategy ETF includes the account of the Fund’s Subsidiary, KraneShares Technology Metals Strategy Subsidiary, Ltd. |
Amounts designated as “—” are $0 or have been rounded to $0.
The accompanying notes are an integral part of the financial statements.
Statements of Changes in Net Assets
| | | KraneShares Global Carbon Transformation ETF | |
| | | Year Ended
March 31,
2023 | | | Period Ended
March 31,
2022(1) | |
| Operations: | | | | | | | | |
| Net Investment Income | | $ | 41,094 | | | $ | 2,323 | |
| Net Realized Loss | | | (212,834 | ) | | | (12,921 | ) |
| Net Change in Unrealized Appreciation (Depreciation) | | | (21,478 | ) | | | 206,475 | |
| Net Increase (Decrease) in Net Assets Resulting from Operations | | | (193,218 | ) | | | 195,877 | |
| Distributions | | | (9,991 | ) | | | — | |
| | | | | | | | | |
| Capital Share Transactions:(2) | | | | | | | | |
| Issued | | | — | | | | 2,500,050 | |
| Increase in Net Assets from Capital Share Transactions | | | — | | | | 2,500,050 | |
| Total Increase (Decrease) in Net Assets | | | (203,209 | ) | | | 2,695,927 | |
| | | | | | | | | |
| Net Assets: | | | | | | | | |
| Beginning of Year/Period | | | 2,695,927 | | | | — | |
| End of Year/Period | | $ | 2,492,718 | | | $ | 2,695,927 | |
| | | | | | | | | |
| Share Transactions: | | | | | | | | |
| Issued | | | — | | | | 100,002 | |
| Net Increase in Shares Outstanding from Share Transactions | | | — | | | | 100,002 | |
| (1) | Commenced operations on March 15, 2022. |
| (2) | Includes transaction costs related to creations and redemptions. |
Amounts designated as “—” are $0 or have been rounded to $0.
The accompanying notes are an integral part of the financial statements.
Consolidated Statements of Changes in Net Assets (continued)
| | | KraneShares Global Carbon Strategy ETF(1) | |
| | | Year Ended
March 31,
2023 | | | Year Ended
March 31,
2022 | |
| Operations: | | | | | | | | |
| Net Investment Loss | | $ | (1,214,400 | ) | | $ | (8,080,173 | ) |
| Net Realized Gain | | | 23,854,461 | | | | 193,844,669 | |
| Net Change in Unrealized Appreciation (Depreciation) | | | (21,218,272 | ) | | | 52,338,033 | |
| Net Increase in Net Assets Resulting from Operations | | | 1,421,789 | | | | 238,102,529 | |
| Distributions | | | (132,430,808 | ) | | | (7,929,920 | ) |
| | | | | | | | | |
| Capital Share Transactions:(2) | | | | | | | | |
| Issued | | | 44,916,398 | | | | 1,640,898,191 | |
| Redeemed | | | (641,881,247 | ) | | | (601,519,925 | ) |
| Increase (Decrease) in Net Assets from Capital Share Transactions | | | (596,964,849 | ) | | | 1,039,378,266 | |
| Total Increase (Decrease) in Net Assets | | | (727,973,868 | ) | | | 1,269,550,875 | |
| | | | | | | | | |
| Net Assets: | | | | | | | | |
| Beginning of Year | | | 1,363,251,785 | | | | 93,700,910 | |
| End of Year | | $ | 635,277,917 | | | $ | 1,363,251,785 | |
| | | | | | | | | |
| Share Transactions: | | | | | | | | |
| Issued | | | 1,150,000 | | | | 40,500,000 | |
| Redeemed | | | (14,450,000 | ) | | | (14,500,000 | ) |
| Net Increase (Decrease) in Shares Outstanding from Share Transactions | | | (13,300,000 | ) | | | 26,000,000 | |
| (1) | KraneShares Global Carbon Strategy ETF includes the account of the Fund’s Subsidiary, KFA Global Carbon Subsidiary, Ltd. |
| (2) | Includes transaction costs related to creations and redemptions. |
The accompanying notes are an integral part of the financial statements.
Consolidated Statements of Changes in Net Assets (continued)
| | | KraneShares European Carbon Allowance Strategy ETF(1) | |
| | | Year Ended
March 31,
2023 | | | Period Ended
March 31,
2022(2) | |
| Operations: | | | | | | | | |
| Net Investment Loss | | $ | (117,020 | ) | | $ | (72,530 | ) |
| Net Realized Loss | | | (1,216,186 | ) | | | (1,046,086 | ) |
| Net Change in Unrealized Appreciation (Depreciation) | | | 4,549,220 | | | | (3,020,891 | ) |
| Net Increase (Decrease) in Net Assets Resulting from Operations | | | 3,216,014 | | | | (4,139,507 | ) |
| | | | | | | | | |
| Capital Share Transactions:(3) | | | | | | | | |
| Issued | | | 20,531,219 | | | | 37,462,344 | |
| Redeemed | | | (21,085,266 | ) | | | (4,512,674 | ) |
| Increase (Decrease) in Net Assets from Capital Share Transactions | | | (554,047 | ) | | | 32,949,670 | |
| Total Increase in Net Assets | | | 2,661,967 | | | | 28,810,163 | |
| | | | | | | | | |
| Net Assets: | | | | | | | | |
| Beginning of Year/Period | | | 28,810,163 | | | | — | |
| End of Year/Period | | $ | 31,472,130 | | | $ | 28,810,163 | |
| | | | | | | | | |
| Share Transactions: | | | | | | | | |
| Issued | | | 600,000 | | | | 1,150,006 | |
| Redeemed | | | (675,000 | ) | | | (150,000 | ) |
| Net Increase (Decrease) in Shares Outstanding from Share Transactions | | | (75,000 | ) | | | 1,000,006 | |
| (1) | KraneShares European Carbon Allowance Strategy ETF includes the account of the Fund’s Subsidiary, KraneShares European Carbon Subsidiary, Ltd. |
| (2) | Commenced operations on October 4, 2021. |
| (3) | Includes transaction costs related to creations and redemptions. |
Amounts designated as “—” are $0 or have been rounded to $0.
The accompanying notes are an integral part of the financial statements.
Consolidated Statements of Changes in Net Assets (continued)
| | | KraneShares California Carbon Allowance Strategy ETF(1) | |
| | | Year Ended March 31,
2023 | | | Period Ended
March 31,
2022(2) | |
| Operations: | | | | | | | | |
| Net Investment Income (Loss) | | $ | 2,453,910 | | | $ | (400,866 | ) |
| Net Realized Loss | | | (42,498,467 | ) | | | (1,831,314 | ) |
| Net Change in Unrealized Appreciation (Depreciation) | | | 22,137,284 | | | | (2,498,657 | ) |
| Net Decrease in Net Assets Resulting from Operations | | | (17,907,273 | ) | | | (4,730,837 | ) |
| Distributions | | | (589,669 | ) | | | — | |
| | | | | | | | | |
| Capital Share Transactions:(3) | | | | | | | | |
| Issued | | | 161,770,906 | | | | 143,880,285 | |
| Redeemed | | | (53,113,424 | ) | | | (300 | ) |
| Increase in Net Assets from Capital Share Transactions | | | 108,657,482 | | | | 143,879,985 | |
| Total Increase in Net Assets | | | 90,160,540 | | | | 139,149,148 | |
| | | | | | | | | |
| Net Assets: | | | | | | | | |
| Beginning of Year/Period | | | 139,149,148 | | | | — | |
| End of Year/Period | | $ | 229,309,688 | | | $ | 139,149,148 | |
| | | | | | | | | |
| Share Transactions: | | | | | | | | |
| Issued | | | 6,425,000 | | | | 5,400,002 | |
| Redeemed | | | (2,250,000 | ) | | | — | |
| Net Increase in Shares Outstanding from Share Transactions | | | 4,175,000 | | | | 5,400,002 | |
| (1) | KraneShares California Carbon Allowance Strategy ETF includes the account of the Fund’s Subsidiary, KraneShares California Carbon Subsidiary, Ltd. |
| (2) | Commenced operations on October 4, 2021. |
| (3) | Includes transaction costs related to creations and redemptions. |
Amounts designated as “—” are $0 or have been rounded to $0.
The accompanying notes are an integral part of the financial statements.
Consolidated Statements of Changes in Net Assets (continued)
| | | KraneShares Global Carbon Offset Strategy ETF(1) | |
| | | Period Ended
March 31,
2023(2) | |
| Operations: | | | | |
| Net Investment Loss | | $ | (5,348 | ) |
| Net Realized Loss | | | (7,122,300 | ) |
| Net Change in Unrealized Appreciation (Depreciation) | | | (541,703 | ) |
| Net Decrease in Net Assets Resulting from Operations | | | (7,669,351 | ) |
| Distributions | | | (10,008 | ) |
| | | | | |
| Capital Share Transactions:(3) | | | | |
| Issued | | | 10,000,050 | |
| Increase in Net Assets from Capital Share Transactions | | | 10,000,050 | |
| Total Increase in Net Assets | | | 2,320,691 | |
| | | | | |
| Net Assets: | | | | |
| Beginning of Period | | | — | |
| End of Period | | $ | 2,320,691 | |
| | | | | |
| Share Transactions: | | | | |
| Issued | | | 400,002 | |
| Net Increase in Shares Outstanding from Share Transactions | | | 400,002 | |
| (1) | KraneShares Global Carbon Offset Strategy ETF includes the account of the Fund’s Subsidiary, KraneShares Global Carbon Offset Strategy Subsidiary, Ltd. |
| (2) | Commenced operations on April 20, 2022. |
| (3) | Includes transaction costs related to creations and redemptions. |
Amounts designated as “—” are $0 or have been rounded to $0.
The accompanying notes are an integral part of the financial statements.
Consolidated Statements of Changes in Net Assets (concluded)
| | | KraneShares Electrification Metals Strategy ETF(1) | |
| | | Period Ended
March 31,
2023(2) | |
| Operations: | | | | |
| Net Investment Income | | $ | 146,106 | |
| Net Realized Gain | | | 1,551,770 | |
| Net Change in Unrealized Appreciation (Depreciation) | | | (1,070,005 | ) |
| Net Increase in Net Assets Resulting from Operations | | | 627,871 | |
| Distributions | | | (27,671 | ) |
| | | | | |
| Capital Share Transactions:(3) | | | | |
| Issued | | | 22,618,491 | |
| Increase in Net Assets from Capital Share Transactions | | | 22,618,491 | |
| Total Increase in Net Assets | | | 23,218,691 | |
| | | | | |
| Net Assets: | | | | |
| Beginning of Period | | | — | |
| End of Period | | $ | 23,218,691 | |
| | | | | |
| Share Transactions: | | | | |
| Issued | | | 900,002 | |
| Net Increase in Shares Outstanding from Share Transactions | | | 900,002 | |
| (1) | KraneShares Electrification Metals Strategy ETF includes the account of the Fund’s Subsidiary, KraneShares Technology Metals Strategy Subsidiary, Ltd. |
| (2) | Commenced operations on October 13, 2022. |
| (3) | Includes transaction costs related to creations and redemptions. |
Amounts designated as “—” are $0 or have been rounded to $0.
The accompanying notes are an integral part of the financial statements.
Financial Highlights/Consolidated Financial Highlights
Selected Per Share Data & Ratios
For the Years/Periods Ended March 31
For a Share Outstanding Throughout Each Period
| | Net Asset
Value,
Beginning of
Period
($) | |
Net Investment
Income (Loss)
($)* | | Net Realized and
Unrealized Gain
(Loss)
on Investments
($) | |
Total
from
Operations
($) | | Distribution
from Net
Investment
Income
($) | |
Return of
Capital
($) |
| KraneShares Global Carbon Transformation ETF | | | | | | | |
| 2023 | | 26.96 | | 0.41 | | (2.34) | | (1.93) | | (0.10) | | — |
| 2022(1) | | 25.00 | | 0.02 | | 1.94 | | 1.96 | | — | | — |
| KraneShares Global Carbon Strategy ETF | | | | | | | |
| 2023(2) | | 46.53 | | (0.06) | | 1.59 | | 1.53 | | (8.36) | | — |
| 2022(2) | | 28.39 | | (0.38) | | 18.77 | | 18.39 | | (0.25) | | — |
| 2021(2)(3) | | 20.00 | | (0.12) | | 8.51 | | 8.39 | | — | | — |
| KraneShares European Carbon Allowance Strategy ETF | | | | | | | |
| 2023(4) | | 28.81 | | (0.15) | | 5.36 | | 5.21 | | — | | — |
| 2022(4)(5)(6) | | 25.00 | | (0.13) | | 3.94 | | 3.81 | | — | | — |
| KraneShares California Carbon Allowance Strategy ETF | | | | | | | |
| 2023(7) | | 25.77 | | 0.26 | | (2.02) | | (1.76) | | (0.06) | | — |
| 2022(5)(7) | | 25.00 | | (0.11) | | 0.88 | | 0.77 | | — | | — |
| KraneShares Global Carbon Offset Strategy ETF | | | | | | | |
| 2023(8)(9) | | 25.00 | | (0.01) | | (19.16) | | (19.17) | | (0.03) | | — |
| KraneShares Electrification Metals Strategy ETF | | | | | | | |
| 2023(10)(11) | | 25.00 | | 0.18 | | 0.65 | | 0.83 | | (0.03) | | — |
| * | Per share data calculated using average shares method. |
| ** | Total return is based on the change in net asset value of a share during the year or period and assumes reinvestment of dividends and distributions at net asset value. Total return is for the period indicated and periods of less than one year have not been annualized. The return shown does not reflect the deduction of taxes that a shareholder would pay on Fund distributions or the redemption of Fund shares. Excludes effects of standard creation and redemption transaction fees associated with creation units. |
| † | Annualized. |
| †† | Portfolio turnover rate is for the period indicated and periods of less than one year have not been annualized. Excludes effect of in-kind transfers. |
| (1) | The Fund commenced operations on March 16, 2022. |
| (2) | KraneShares Global Carbon Strategy ETF includes the account of the Fund’s Subsidiary, KFA Global Carbon Subsidiary, Ltd. |
| (3) | The Fund commenced operations on July 29, 2020. |
| (4) | KraneShares European Carbon Allowance Strategy ETF includes the account of the Fund’s Subsidiary, KraneShares European Carbon Subsidiary, Ltd. |
| (5) | The Fund commenced operations on October 4, 2021. |
| (6) | All per share amounts and net asset values have been adjusted as a result of a 3 to 1 forward stock split on December 10, 2021. |
| (7) | KraneShares California Carbon Allowance Strategy ETF includes the account of the Fund’s Subsidiary, KraneShares California Carbon Subsidiary, Ltd. |
| (8) | The Fund commenced operations on April 20, 2022. |
| (9) | KraneShares Global Carbon Offset Strategy ETF includes the account of the Fund’s Subsidiary, KraneShares Global Carbon Offset Strategy Subsidiary, Ltd. |
| (10) | KraneShares Electrification Metals Strategy ETF includes the account of the Fund’s Subsidiary, KraneShares Technology Metals Strategy Subsidiary, Ltd. |
The accompanying notes are an integral part of the financial statements.
Total from
Distributions
($) | | Net Asset
Value, End
of Period
($) | |
Total Return
(%)** | |
Net Assets
End of Period
($)(000) | |
Ratio of
Expenses to
Average Net
Assets
(%) | | Ratio of Expenses
to Average Net
Assets (Excluding
Waivers, as
applicable)
(%) | | Ratio of Net
Investment
Income (Loss)
to Average Net
Assets
(%) | |
Portfolio
Turnover
(%) |
| | | | | | | | | | | | | | | | |
| (0.10) | | 24.93 | | (7.14) | | 2,493 | | 0.88 | | 0.88 | | 1.70 | | 89 | |
| — | | 26.96 | | 7.84 | | 2,696 | | 0.89† | | 0.89† | | 2.16† | | 1 | †† |
| | | | | | | | | | | | | | | | |
| (8.36) | | 39.70 | | 4.43 | | 635,278 | | 0.79 | | 0.79 | | (0.13) | | — | |
| (0.25) | | 46.53 | | 64.71 | | 1,363,252 | | 0.87 | | 0.87 | | (0.86) | | — | |
| — | | 28.39 | | 41.95 | | 93,701 | | 0.78† | | 0.78† | | (0.72)† | | — | †† |
| | | | | | | | | | | | | | | | |
| — | | 34.02 | | 18.08 | | 31,472 | | 0.79 | | 0.79 | | (0.49) | | — | |
| — | | 28.81 | | 15.24 | | 28,810 | | 0.87† | | 0.87† | | (0.87)† | | — | †† |
| | | | | | | | | | | | | | | | |
| (0.06) | | 23.95 | | (6.83) | | 229,310 | | 0.79 | | 0.79 | | 1.11 | | — | |
| — | | 25.77 | | 3.08 | | 139,149 | | 0.91† | | 0.91† | | (0.91)† | | — | †† |
| | | | | | | | | | | | | | | | |
| (0.03) | | 5.80 | | (76.74) | | 2,321 | | 0.79† | | 0.79† | | (0.10)† | | — | †† |
| | | | | | | | | | | | | | | | |
| (0.03) | | 25.80 | | 3.33 | | 23,219 | | 0.79† | | 0.79† | | 1.44† | | — | †† |
| (11) | The Fund commenced operations on October 13, 2022. |
The accompanying notes are an integral part of the financial statements.
Notes to Financial Statements/Notes to Consolidated Financial Statements
1. ORGANIZATION
KraneShares Trust (the “Trust”) is a Delaware Statutory Trust formed on February 3, 2012. The Trust is registered under the Investment Company Act of 1940, as amended (the “Investment Company Act”), as an open-end management investment company. As of March 31, 2023, the Trust had thirty-one operational series. The financial statements herein and the related notes pertain to the following 6 series: KraneShares Global Carbon Transformation ETF, KraneShares Global Carbon Strategy ETF, KraneShares European Carbon Allowance Strategy ETF, KraneShares California Carbon Allowance Strategy ETF, KraneShares Global Carbon Offset Strategy ETF and KraneShares Electrification Metals Strategy ETF (each, a “Fund” and collectively, the “Funds”). All Funds are non-diversified Funds, as defined under Section 5(b)(1) of the Investment Company Act. Krane Funds Advisors, LLC (“Krane” or the “Adviser”), a Delaware limited liability company, serves as the investment adviser for the Funds and is subject to the supervision of the Board of Trustees (the “Board”). The Adviser is responsible for managing the investment activities of the Funds, the Funds’ business affairs and other administrative matters. The Adviser may use sub-advisers (each, a “Sub-Adviser” or collectively, the “Sub-Advisers”) to perform the day-to-day management of the Funds.
China International Capital Corporation (USA) Holdings Inc., a wholly-owned, indirect subsidiary of China International Capital Corporation Limited owns a majority stake in Krane. As of March 31, 2023, Central Huijin Investment Limited, a mainland Chinese-domiciled entity, and HKSCC Nominees Limited, held approximately 40.1% and 39.4%, respectively, of the shares of China International Capital Corporation Limited. Central Huijin Investment Limited is a wholly-owned subsidiary of China Investment Corporation, which is a mainland Chinese sovereign wealth fund. KFA One Holdings, LLC, located at 280 Park Avenue 32nd Floor, New York, New York, 10017, holds the remaining equity interests in Krane and Jonathan Krane, through his equity interests in KFA One Holdings, LLC, beneficially owns more than 10% of the equity interests in Krane.
The KFA Global Carbon Subsidiary, Ltd. is a wholly-owned subsidiary of the KraneShares Global Carbon Strategy ETF (“Subsidiary”). The Subsidiary is organized under the laws of the Cayman Islands as an exempt limited company. Information regarding the KraneShares Global Carbon Strategy ETF and its subsidiary has been consolidated in the Consolidated Schedule of Investments, Consolidated Statements of Assets and Liabilities, Consolidated Statements of Operations, Consolidated Statements of Changes in Net Assets and Consolidated Financial Highlights.
The KraneShares European Carbon Subsidiary, Ltd. is a wholly-owned subsidiary of the KraneShares European Carbon Allowance Strategy ETF (“Subsidiary”). The Subsidiary is organized under the laws of the Cayman Islands as an exempt limited company. Information regarding the KraneShares European Carbon Allowance Strategy ETF and its subsidiary has been consolidated in the Consolidated Schedule of Investments, Consolidated Statements of Assets and Liabilities, Consolidated Statements of Operations, Consolidated Statements of Changes in Net Assets and Consolidated Financial Highlights.
The KraneShares California Carbon Subsidiary, Ltd. is a wholly-owned subsidiary of the KraneShares California Carbon Allowance Strategy ETF (“Subsidiary”). The Subsidiary is organized under the laws of the Cayman Islands as an exempt limited company. Information regarding the KraneShares California Carbon Allowance Strategy ETF and its subsidiary has been consolidated in the Consolidated Schedule of Investments, Consolidated Statements of Assets and Liabilities, Consolidated Statements of Operations, Consolidated Statements of Changes in Net Assets and Consolidated Financial Highlights.
Notes to Financial Statements/Notes to Consolidated Financial Statements (continued)
The KraneShares Global Carbon Offset Strategy Subsidiary, Ltd. is a wholly-owned subsidiary of the KraneShares Global Carbon Offset Strategy ETF (“Subsidiary”). The Subsidiary is organized under the laws of the Cayman Islands as an exempt limited company. Information regarding the KraneShares Global Carbon Offset Strategy ETF and its subsidiary has been consolidated in the Consolidated Schedule of Investments, Consolidated Statements of Assets and Liabilities, Consolidated Statements of Operations, Consolidated Statements of Changes in Net Assets and Consolidated Financial Highlights.
The KraneShares Technology Metals Strategy Subsidiary, Ltd. is a wholly-owned subsidiary of the KraneShares Electrification Metals Strategy ETF (“Subsidiary”). The Subsidiary is organized under the laws of the Cayman Islands as an exempt limited company. Information regarding the KraneShares Electrification Metals Strategy ETF and its subsidiary has been consolidated in the Consolidated Schedule of Investments, Consolidated Statements of Assets and Liabilities, Consolidated Statements of Operations, Consolidated Statements of Changes in Net Assets and Consolidated Financial Highlights.
Shares of the Funds are listed and traded on the NYSE Arca, Inc. (“NYSE Arca”) (the “Exchange”). Market prices for Fund shares (“Shares”) may be different from their net asset value (“NAV”). The Funds issue and redeem Shares on a continuous basis at NAV only in large blocks of Shares, typically 50,000 or 100,000 Shares or multiples thereof, called “Creation Units”. This does not mean, however, that individual investors will be able to redeem and purchase Shares directly with the series of the Trust. Only Authorized Participants (“Authorized Participants”) (refer to Note 2) can redeem and purchase Creation Units of Shares directly. Each Fund will issue and redeem Shares for a basket of securities and/or a balancing cash amount. Individual shares trade in the secondary market at market prices that change throughout the day.
The investment objective of each of the following Funds is to seek to provide a total return that (before fees and expenses) tracks the performance of its respective index listed below (each, an “Underlying Index”):
| KraneShares Funds | | Index |
| KraneShares Global Carbon Strategy ETF | | IHS Markit Global Carbon Index |
| KraneShares European Carbon Allowance Strategy ETF | | IHS Markit Carbon EUA Index |
| KraneShares California Carbon Allowance Strategy ETF | | IHS Markit Carbon CCA Index |
| KraneShares Global Carbon Offset Strategy ETF | | S&P GSCI Global Voluntary Carbon Liquidity Weighted Index |
| KraneShares Electrification Metals Strategy ETF | | Bloomberg Electrification Metals Index |
The investment objective of the KraneShares Global Carbon Transformation ETF is to seek long-term growth of capital. The KraneShares Global Carbon Transformation ETF is actively managed and does not track an index.
2. SIGNIFICANT ACCOUNTING POLICIES
The following is a summary of the significant accounting policies followed by the Funds. The Funds are investment companies that apply the accounting and reporting guidance issued in Topic 946 by the U.S. Financial Accounting Standards Board (“FASB”).
USE OF ESTIMATES — The preparation of financial statements in conformity with U.S. generally accepted accounting principles (“U.S. GAAP”) requires management to make estimates and assumptions that affect the reported amounts of assets and liabilities and disclosure of contingent
Notes to Financial Statements/Notes to Consolidated Financial Statements (continued)
assets and liabilities at the date of the financial statements and the reported amounts of increases and decreases in net assets from operations during the reporting period. Actual results could differ from those estimates, and could have a material impact to the Funds.
SECURITY VALUATION — The NAV per share of each Fund is computed by dividing the value of the net assets of a Fund (i.e., the value of its total assets less total liabilities and withholdings) by the total number of shares of a Fund outstanding, rounded to the nearest cent. Expenses and fees, including without limitation, the management, administration and distribution fees, are accrued daily and taken into account for purposes of determining NAV. The NAV per share for each Fund normally is calculated by the Administrator (as defined below) and determined as of the regularly scheduled close of normal trading on each day that the Exchange is scheduled to be open for business (normally 4:00 p.m., Eastern Time). Any assets or liabilities denominated in currencies other than the U.S. dollar are converted into U.S. dollars at the current market rates on the date of valuation as quoted by one or more sources.
Securities listed on a securities exchange (i.e., exchange-traded equity securities), market or automated quotation system for which quotations are readily available (except for securities traded on NASDAQ), including securities traded over the counter, are valued by independent pricing agents at the last reported sale price on the primary exchange or market (foreign or domestic) on which they are traded (or at the time as of which the Fund’s NAV is calculated if a security’s exchange is normally open at that time). If there is no such reported sale, such securities are valued at the most recently reported bid price. For securities traded on NASDAQ, the NASDAQ Official Closing Price will be used.
If a security price cannot be obtained from an independent, third-party pricing agent, the Fund seeks to obtain bid and ask prices from two broker-dealers who make a market in the portfolio instrument and determines the average of the two.
If available, debt securities are priced based upon valuations provided by independent, third-party pricing agents. Such values generally reflect the last reported sales price if the security is actively traded. The third-party pricing agents may also value debt securities at an evaluated bid price by employing methodologies that utilize actual market transactions, broker-supplied valuations, or other methodologies designed to identify the market value for such securities. Debt obligations with remaining maturities of sixty days or less may be valued at their amortized cost, which approximates market value.
The prices for foreign securities are reported in local currency and converted to U.S. dollars using currency exchange rates. The exchange rates used for valuation are captured as of the close of the London Stock Exchange each day normally at 4:00 p.m. Greenwich Mean Time. The value of a swap contract is equal to the obligation (or rights) under the swap contract, which will generally be equal to the net amounts to be paid or received under the contract based upon the relative values of the positions held by each party to the contract as determined by the applicable independent, third party pricing agent. Exchange-traded options are valued at the last reported sales price on the exchange on which they are listed. If there is no such reported sale on the valuation date, long positions are valued at the most recent bid price, and short positions are valued at the most recent ask price. Over-the-counter (“OTC”) options are valued based upon prices determined by the applicable independent, third party pricing agent. Futures are valued at the settlement price established by the board of trade on which they are traded. Foreign currency forward contracts are valued at the current day’s interpolated foreign exchange rate, as calculated using the current day’s
Notes to Financial Statements/Notes to Consolidated Financial Statements (continued)
spot rate and the 30-, 60-, 90- and 180-day forward rates provided by an independent pricing agent. As of and during the year ended March 31, 2023, the Funds did not hold options, swaps or foreign currency forward contracts.
Securities issued by a wholly-owned subsidiary of a Fund will be valued at the subsidiary’s net asset value, which will be determined using the same pricing policies and procedures applicable to the Fund.
Investments in open-end investment companies that do not trade on an exchange are valued at the end of day NAV per share. Investments in open-end investment companies that trade on an exchange are valued in the same manner as other exchange-traded equity securities (described above).
Investments for which market prices are not “readily available,” or are not deemed to reflect current market values, or are debt securities where no evaluated price is available from third-party pricing agents pursuant to established methodologies, are fair valued in accordance with the Adviser’s valuation policies and procedures approved by the Board. Some of the more common reasons that may necessitate that a security be valued using “fair value” pricing may include, but are not limited to: the security’s trading has been halted or suspended; the security’s primary trading market is temporarily closed; or the security has not been traded for an extended period of time.
In addition, a Fund may fair value its securities if an event that may materially affect the value of a Fund’s securities that trade outside of the United States (a “Significant Event”) has occurred between the time of the security’s last close and the time that a Fund calculates its NAV. A Significant Event may relate to a single issuer or to an entire market sector, country or region. Events that may be Significant Events may include: government actions, natural disasters, armed conflict, acts of terrorism and significant market fluctuations. If Krane becomes aware of a Significant Event that has occurred with respect to a portfolio instrument or group of portfolio instruments after the closing of the exchange or market on which the portfolio instrument or portfolio instruments principally trade, but before the time at which a Fund calculates its NAV, it will notify the Administrator and may request that an ad hoc meeting of the Fair Valuation Committee be called.
With respect to trade-halted securities, the Adviser typically will fair value a trade-halted security by adjusting the security’s last market close price by the security’s sector performance, as measured by a predetermined index, unless Krane’s Fair Valuation Committee determines to make additional adjustments. Certain foreign securities exchanges have mechanisms in place that confine one day’s price movement in an individual security to a pre-determined price range based on that day’s opening price (“Collared Securities”). Fair value determinations for Collared Securities will generally be capped based on any applicable pre-determined “limit down” or “limit up” prices established by the relevant foreign securities exchange. As an example, China A-Shares can only be plus or minus ten percent in one day of trading in the relevant mainland China equity market. As a result, the fair value price determination on a given day will generally be capped plus or minus ten percent.
Fair value pricing involves subjective judgments and it is possible that a fair value determination for a security is materially different than the value that could actually be realized upon the sale of the security or that another fund that uses market quotations or its own fair value procedures to price the same securities. In addition, fair value pricing could result in a difference between the prices used to calculate a Fund’s NAV and the prices used by the Underlying Index. This may adversely affect a Fund’s ability to track its Underlying Index.
Notes to Financial Statements/Notes to Consolidated Financial Statements (continued)
Trading in securities on many foreign exchanges is normally completed before the close of business on each Business Day (a “Business Day”, as used herein, is any day on which the Exchange is open for business). In addition, securities trading in a particular country or countries may not take place on each Business Day or may take place on days that are not Business Days. Changes in valuations on certain securities may occur at times or on days on which a Fund’s NAV is not calculated and on which Fund shares do not trade and sales and redemptions of shares do not occur. As a result, the value of a Fund’s portfolio securities and the net asset value of its shares may change on days when share purchases or sales cannot occur. Fund shares are purchased or sold on a national securities exchange at market prices, which may be higher or lower than NAV. Transactions in Fund shares will be priced at NAV only if shares are purchased or redeemed directly from a Fund in Creation Units. No secondary sales will be made to brokers or dealers at a concession by the Distributor or by a Fund. Purchases and sales of shares in the secondary market, which will not involve a Fund, will be subject to customary brokerage commissions and charges.
In accordance with the authoritative guidance on fair value measurements and disclosure under U.S. GAAP, the Funds disclose the fair value of their investments in a hierarchy that prioritizes the inputs to valuation techniques used to measure the fair value. The objective of a fair value measurement is to determine the price that would be received to sell an asset or paid to transfer a liability in an orderly transaction between market participants at the measurement date (an exit price). Accordingly, the fair value hierarchy gives the highest priority to quoted prices (unadjusted) in active markets for identical assets or liabilities (Level 1) and the lowest priority to unobservable inputs (Level 3). The three levels of the fair value hierarchy are described below:
Level 1 — Unadjusted quoted prices in active markets for identical, unrestricted assets or liabilities that the Funds have the ability to access at the measurement date.
Level 2 — Other significant observable inputs (including quoted prices in non-active markets, quoted prices for similar investments, fair value of investments for which the Funds have the ability to fully redeem tranches at net asset value as of the measurement date or within the near term, and short-term investments valued at amortized cost).
Level 3 — Significant unobservable inputs (including the Funds’ own assumptions in determining the fair value of investments, broker quotes, fair value of investments for which the Funds do not have the ability to fully redeem tranches at net asset value as of the measurement date or within the near term).
Investments are classified within the level of the lowest significant input considered in determining fair value. Investments classified within Level 3 whose fair value measurement considers several inputs may include Level 1 or Level 2 inputs as components of the overall fair value measurement. For details of the investment classification, refer to each Fund’s Schedule of Investments.
FEDERAL INCOME TAXES — It is each Fund’s intention to qualify or continue to qualify as a regulated investment company for federal income tax purposes by complying with the appropriate provisions of Subchapter M of the Internal Revenue Code of 1986, as amended (the “Code”), and to distribute annually all or substantially all of its taxable income and gains to shareholders. Accordingly, no provisions for federal income taxes have been made in the financial statements.
The Funds evaluate tax positions taken or expected to be taken in the course of preparing the Funds’ tax returns to determine whether it is “more-likely-than-not” (i.e., greater than 50 percent) that each tax position will be sustained upon examination by a taxing authority based on the technical merits of the position. Tax positions not deemed to meet the more-likely-than-not
Notes to Financial Statements/Notes to Consolidated Financial Statements (continued)
threshold are recorded as a tax benefit or expense in the current year. The Funds did not record any tax provisions in the current period. However, management’s conclusions regarding tax positions may be subject to review and adjustment at a later date based on factors including, but not limited to, examination by tax authorities (i.e., the last three tax year ends, as applicable), on-going analysis of and changes to tax laws, regulations and interpretations thereof.
As of March 31, 2023, management of the Funds has reviewed all open tax years since inception and concluded that there is no tax liability resulting from unrecognized tax benefits relating to uncertain income tax positions taken or expected to be taken in future tax returns. The Funds are also not aware of any tax positions for which it is reasonably possible that the total amounts of unrecognized tax benefits will significantly change in the next 12 months.
SECURITY TRANSACTIONS AND INVESTMENT INCOME — Security transactions are accounted for on the trade date for financial reporting purposes. Costs used in determining realized gains and losses on the sale of investment securities are based on specific identification. Dividend income is recorded, net of any applicable withholding tax, on the ex-dividend date, or for certain foreign securities, when the information becomes available to the Funds. Interest income is recognized on the accrual basis from the settlement date and includes the amortization of premiums and the accretion of discount calculated using the effective interest method.
FOREIGN CURRENCY — The books and records of the Funds are maintained in U.S. dollars. Investment securities and other assets and liabilities denominated in a foreign currency are translated into U.S. dollars on the date of valuation. Purchases and sales of investment securities, income and expenses are translated into U.S. dollars at the relevant rates of exchange prevailing on the respective dates of such transactions. The Funds do not isolate that portion of realized or unrealized gains and losses resulting from changes in the foreign exchange rate from fluctuations arising from changes in the market prices of the securities. The Funds report certain foreign-currency-related transactions as components of realized gains for financial reporting purposes, whereas such components are treated as ordinary income for Federal income tax purposes.
FUTURES — The KraneShares Global Carbon Strategy ETF, KraneShares European Carbon Allowance Strategy ETF, KraneShares California Carbon Allowance Strategy ETF, KraneShares Global Carbon Offset Strategy ETF and KraneShares Electrification Metals Strategy ETF will each utilize its respective Subsidiary for purposes of investing in commodity futures that are the same as or similar to those included in the Index. Initial margin deposits of cash or securities are made upon entering into futures contracts. The contracts are marked-to-market daily and the resulting changes in value are accounted for as unrealized gains and losses. Variation margin payments are paid or received, depending upon whether unrealized gains or losses are incurred. When contracts are closed, the Fund records a realized gain or loss equal to the difference between the proceeds from (or cost of) the closing transaction and the amount invested in the contract.
As of March 31, 2023, the KraneShares Global Carbon Strategy ETF, KraneShares European Carbon Allowance Strategy ETF, KraneShares California Carbon Allowance Strategy ETF, KraneShares Global Carbon Offset Strategy ETF and KraneShares Electrification Metals Strategy ETF had open futures contracts. Refer to the Fund’s Consolidated Schedule of Investments for details regarding open futures contracts as of March 31, 2023.
Notes to Financial Statements/Notes to Consolidated Financial Statements (continued)
For the year ended March 31, 2023, the average monthly notional amount of futures contracts were as follows:
| KraneShares Global Carbon Strategy ETF | | | | |
| Average Monthly Notional Value Long | | $ | 1,036,045,512 | |
| KraneShares European Carbon Allowance Strategy ETF | | | | |
| Average Monthly Notional Value Long | | $ | 31,062,609 | |
| KraneShares California Carbon Allowance Strategy ETF | | | | |
| Average Monthly Notional Value Long | | $ | 228,094,544 | |
| KraneShares Global Carbon Offset Strategy ETF | | | | |
| Average Monthly Notional Value Long | | $ | 5,884,433 | |
| KraneShares Electrification Metals Strategy ETF | | | | |
| Average Monthly Notional Value Long | | $ | 22,325,363 | |
DIVIDENDS AND DISTRIBUTIONS TO SHAREHOLDERS — KraneShares Global Carbon Transformation ETF pays out to its shareholders net investment income and net realized capital gains, if any, once a year (usually in December). KraneShares Global Carbon Strategy ETF, KraneShares European Carbon Allowance Strategy ETF, KraneShares California Carbon Allowance Strategy ETF, KraneShares Global Carbon Offset Strategy ETF and KraneShares Electrification Metals Strategy ETF may pay out net investment income, if any, at least semi-annually in June and December, but may pay such income as frequently as quarterly. KraneShares Global Carbon Strategy ETF, KraneShares European Carbon Allowance Strategy ETF, KraneShares California Carbon Allowance Strategy ETF, KraneShares Global Carbon Offset Strategy ETF and KraneShares Electrification Metals Strategy ETF pays out to its shareholders net realized capital gains, if any, once a year (usually in December). Each Fund may make distributions on a more frequent basis. Each Fund reserves the right to declare special distributions, including if, in its reasonable discretion, such action is necessary or advisable to preserve the status of the Fund as a regulated investment company under Subchapter M of the Code, or to avoid imposition of income or excise taxes on undistributed income.
CASH OVERDRAFT CHARGES — Per the terms of an agreement with Brown Brothers Harriman & Co. (“BBH”), the Funds’ Custodian, if a Fund has a cash overdraft on a given day, it will be assessed an overdraft charge of the BBH Base Rate plus 2.00%. Cash overdraft charges are included in “Interest Expense” on the Statements of Operations.
SECURITIES LENDING — The Funds may lend securities from their portfolios to brokers, dealers and other financial institutions. In connection with such loans, a Fund remains the beneficial owner of the loaned securities and continues to receive payments in amounts approximately equal to the interest, dividends or other distributions payable on the loaned securities. A Fund also has the right to terminate a loan at any time. A Fund does not have the right to vote on securities while they are on loan. Loans of portfolio securities will not exceed 33 1/3% of the value of a Fund’s total assets (including the value of all assets received as collateral for the loan). A Fund will receive collateral in an amount equal to at least 100% of the current market value of the loaned securities. If the collateral consists of cash, a Fund will reinvest the cash and pay the borrower a pre-negotiated fee or “rebate” from any return earned on the investment. Should the borrower of the securities fail financially, a Fund may experience delays in recovering the loaned securities or exercising its rights in the collateral. In a loan transaction, a Fund will also bear the risk of any decline in value of securities acquired with cash collateral. Krane and a sub-adviser are subject to potential
Notes to Financial Statements/Notes to Consolidated Financial Statements (continued)
conflicts of interest because the compensation paid to them increases in connection with any net income received by a Fund from a securities lending program. Each Fund pays Krane 10% of any net monthly income received from the investment of cash collateral and loan fees received from borrowers in respect of each securities loan (net of any amounts paid to the custodian and/or securities lending agent or rebated to borrowers) (see Note 4).
CREATION UNITS — The Funds issue and redeem Shares at NAV and only in large blocks of Shares (each block of Shares for a Fund is a Creation Unit of 25,000 Shares, 50,000 Shares, 100,000 Shares, or multiples thereof). In its discretion, the Trust reserves the right to increase or decrease the number of each Fund’s shares that constitute a Creation Unit.
Except when aggregated in Creation Units, Shares are not redeemable securities of a Fund. Shares of a Fund may only be purchased or redeemed by certain Authorized Participants. An Authorized Participant is either (i) a broker-dealer or other participant in the clearing process through the Continuous Net Settlement System of the National Securities Clearing Corporation or (ii) a Depository Trust Company (“DTC”) participant and, in each case, must have executed a Participant Agreement with the Distributor. Most retail investors will not qualify as Authorized Participants or have the resources to buy and sell whole Creation Units. Therefore, they will be unable to purchase or redeem the Shares directly from a Fund. Rather, most retail investors will purchase Shares in the secondary market with the assistance of a broker and will be subject to customary brokerage commissions or fees when buying or selling Shares. If a Creation Unit is purchased or redeemed for cash, a higher transaction fee may be charged.
The following table discloses Creation Unit breakdown for the year ended March 31, 2023:
| KraneShares Funds | | Creation
Unit
Shares | | | Standard
Transaction Fee -
Subscriptions | | | Value at
March 31,
2023 | | | Standard
Transaction Fee -
Redemptions | | | Maximum
Variable
Transaction
Fee* | |
| KraneShares Global Carbon Transformation ETF | | | 50,000 | | | $ | 1,050 | | | $ | 1,246,500 | | | $ | 1,050 | | | | 2.00 | % |
| KraneShares Global Carbon Strategy ETF | | | 50,000 | | | | 50 | | | | 1,985,000 | | | | 50 | | | | 2.00 | % |
| KraneShares European Carbon Allowance Strategy ETF | | | 25,000 | | | | 50 | | | | 850,500 | | | | 50 | | | | 2.00 | % |
| KraneShares California Carbon Allowance Strategy ETF | | | 25,000 | | | | 50 | | | | 598,750 | | | | 50 | | | | 2.00 | % |
| KraneShares Global Carbon Offset Strategy ETF | | | 50,000 | | | | 50 | | | | 290,000 | | | | 50 | | | | 2.00 | % |
| KraneShares Electrification Metals Strategy ETF | | | 50,000 | | | | 100 | | | | 1,290,000 | | | | 100 | | | | 2.00 | % |
| * | As a percentage of the Creation Unit(s) purchased/redeemed. |
The Adviser may adjust the transaction fees from time to time based on actual experience.
CASH AND CASH EQUIVALENTS — Idle cash and currency balances may be swept into various overnight sweep accounts and are classified as cash equivalents on the Statement of Assets and Liabilities. These amounts, at times, may exceed United States federally insured limits. Amounts swept are available on the next business day.
Notes to Financial Statements/Notes to Consolidated Financial Statements (continued)
3. DERIVATIVES TRANSACTIONS
The following tables are the exposure by type of risk on derivatives held throughout the year.
The fair value of derivative instruments as of March 31, 2023, was as follows:
KraneShares Global Carbon Strategy ETF
Consolidated Statement of Assets and Liabilities Location |
| Asset
Derivatives |
|
| Liability
Derivatives |
|
| Commodities Risk Futures contracts | | Unrealized appreciation/(depreciation) on futures contracts* | | $ | 34,812,463 | | | $ | (1,800,526 | ) |
| Foreign Exchange Risk Futures contracts | | Unrealized appreciation/(depreciation) on futures contracts* | | | 35,561 | | | | — | |
| | | | | $ | 34,848,024 | | | $ | (1,800,526 | ) |
KraneShares European Carbon Allowance Strategy ETF
Consolidated Statement of Assets and Liabilities Location | | Asset
Derivatives | | | Liability
Derivatives | |
| Commodities Risk Futures contracts | | Unrealized appreciation/(depreciation) on futures contracts* | | $ | 831,255 | | | $ | — | |
| Foreign Exchange Risk Futures contracts | | Unrealized appreciation/(depreciation) on futures contracts* | | | 17,768 | | | | — | |
| | | | | $ | 849,023 | | | $ | — | |
KraneShares California Carbon Allowance Strategy ETF
Consolidated Statement of Assets and Liabilities Location | | Asset
Derivatives | | | Liability
Derivatives | |
| Commodities Risk Futures contracts | | Unrealized appreciation/(depreciation) on futures contracts* | | $ | 19,638,627 | | | $ | — | |
| | | | | $ | 19,638,627 | | | $ | — | |
KraneShares Global Carbon Offset Strategy ETF
Consolidated Statement of Assets and Liabilities Location | | Asset
Derivatives | | | Liability
Derivatives | |
| Commodities Risk Futures contracts | | Unrealized appreciation/(depreciation) on futures contracts* | | $ | — | | | $ | (541,703 | ) |
| | | | | $ | — | | | $ | (541,703 | ) |
KraneShares Electrification Metals Strategy ETF
Consolidated Statement of Assets and Liabilities Location | | Asset
Derivatives | | | Liability
Derivatives | |
| Commodities Risk Futures contracts | | Unrealized appreciation/(depreciation) on futures contracts* | | $ | 18,787 | | | $ | (1,088,792 | ) |
| | | | | $ | 18,787 | | | $ | (1,088,792 | ) |
| * | Unrealized appreciation (depreciation) on Futures Contracts is included in distributable earnings (loss). |
Notes to Financial Statements/Notes to Consolidated Financial Statements (continued)
The effect of derivative instruments on the Consolidated Statements of Operations for the year ended March 31, 2023, was as follows:
The amount of realized gain (loss) on derivatives recognized in income:
KraneShares Global Carbon Strategy ETF
| | | Net Realized
Gain/(Loss)* | | | Change in
Unrealized
Appreciation/
(Depreciation)** | |
| Commodities Risk | | | | | | | | |
| Futures contracts | | $ | 59,520,756 | | | $ | (27,017,145 | ) |
| Foreign Exchange | | | | | | | | |
| Risk Futures contracts | | | (2,207,197 | ) | | | 198,196 | |
| | | $ | 57,313,559 | | | $ | (26,818,949 | ) |
KraneShares European Carbon Allowance Strategy ETF
| | | Net Realized
Gain/(Loss)* | | | Change in
Unrealized
Appreciation/
(Depreciation)** | |
| Commodities Risk | | | | | | | | |
| Futures contracts | | $ | (1,525,381 | ) | | $ | 4,036,861 | |
| Foreign Exchange | | | | | | | | |
| Risk Futures contracts | | | 989,625 | | | | 23,476 | |
| | | $ | (535,756 | ) | | $ | 4,060,337 | |
KraneShares California Carbon Allowance Strategy ETF
| | | Net Realized
Gain/(Loss)* | | | Change in
Unrealized
Appreciation/
(Depreciation)** | |
| Commodities Risk | | | | | | | | |
| Futures contracts | | $ | (42,498,467 | ) | | $ | 22,137,284 | |
| | | $ | (42,498,467 | ) | | $ | 22,137,284 | |
KraneShares Global Carbon Offset Strategy ETF
| | | Net Realized
Gain/(Loss)* | | | Change in
Unrealized
Appreciation/
(Depreciation)** | |
| Commodities Risk | | | | | | | | |
| Futures contracts | | $ | (7,122,300 | ) | | $ | (541,703 | ) |
| | | $ | (7,122,300 | ) | | $ | (541,703 | ) |
Notes to Financial Statements/Notes to Consolidated Financial Statements (continued)
KraneShares Electrification Metals Strategy ETF
| | | Net Realized
Gain/(Loss)* | | | Change in
Unrealized
Appreciation/
(Depreciation)** | |
| Commodities Risk | | | | | | | | |
| Futures contracts | | $ | 1,551,770 | | | $ | (1,070,005 | ) |
| | | $ | 1,551,770 | | | $ | (1,070,005 | ) |
| * | Futures contracts are included in net realized gain (loss) on Futures Contracts. |
| ** | Futures contracts are included in change in unrealized appreciation (depreciation) on Futures Contracts. |
4. RELATED PARTY TRANSACTIONS
INVESTMENT ADVISORY AGREEMENT — The Adviser serves as investment adviser to each Fund pursuant to an Investment Advisory Agreement between the Trust on behalf of each Fund and the Adviser (the “Agreement”). Under the Agreement, Krane is responsible for reviewing, supervising and administering each Fund’s investment program and the general management and administration of the Trust. In addition to these services, to the extent a Fund engages in securities lending, Krane will: (i) determine which securities are available for loan and notify the securities lending agent for a Fund (the “Agent”), (ii) monitor the Agent’s activities to ensure that securities loans are effected in accordance with Krane’s instructions and in accordance with applicable procedures and guidelines adopted by the Board, (iii) make recommendations to the Board regarding the Fund’s participation in securities lending; (iv) prepare appropriate periodic reports for, and seek appropriate periodic approvals from, the Board with respect to securities lending activities, (v) respond to Agent inquiries concerning the Agent’s activities, and (vi) such other related duties as Krane deems necessary or appropriate. The Board of Trustees of the Trust supervises Krane and establishes policies that Krane must follow in its management activities.
The Agreement requires the Adviser to pay all operating expenses of the Funds, except: (a) interest and taxes (including, but not limited to, income, excise, transaction, transfer and withholding taxes); (b) expenses of the Funds incurred with respect to the acquisition and disposition of portfolio securities and the execution of portfolio transactions, including brokerage commissions and short sale dividend or interest expense; (c) expenses incurred in connection with any distribution plan adopted by the Trust in compliance with Rule 12b-1 under the Investment Company Act, including distribution fees; (d) “Acquired Fund Fees and Expenses” (as defined by Form N-1A under the Investment Company Act); (e) litigation expenses; (f) the compensation payable to the Adviser under the Agreement; (g) compensation and expenses of the Independent Trustees (including any fees of independent legal counsel to the Independent Trustees); and (h) any expenses determined to be extraordinary expenses by the Board. In addition, under the Agreement, while the fees and expenses related to the Funds’ securities lending-related activities reduce the gross revenues and income of the Funds from such activities, they are not fees and expenses for which Krane is responsible.
Each Agreement provides that each Fund pays a unitary (or unified) fee to the Adviser for advisory and management services provided to the Fund, subject to the exceptions noted herein. In this context, there exists a risk that a Trust service provider will seek recourse against the Trust if it is not timely paid by Krane for the fees and expenses for which it is responsible, which could materially adversely affect the Funds. Pursuant to the Agreement between the Trust and the Adviser, the
Notes to Financial Statements/Notes to Consolidated Financial Statements (continued)
Funds below pay the Adviser a fee, which is calculated daily and paid monthly, at the following annual rates, based on a percentage of the average daily net assets of each Fund. In addition, as compensation for the services provided by the Adviser in connection with any securities lending-related activities, each Fund pays the Adviser 10% of the monthly investment income received from the investment of cash collateral and loan fees received from borrowers in respect to securities loans (net of any amounts paid to the custodian and/or securities lending agent or rebated to borrowers), included on the Statements of Operations as “Security Lending Fees”.
| KraneShares Funds | | Management
Fee |
| KraneShares Global Carbon Transformation ETF | | 0.88% |
| KraneShares Global Carbon Strategy ETF | | 0.78% |
| KraneShares European Carbon Allowance Strategy ETF | | 0.78% |
| KraneShares California Carbon Allowance Strategy ETF | | 0.78% |
| KraneShares Global Carbon Offset Strategy ETF | | 0.78% |
| KraneShares Electrification Metals Strategy ETF | | 0.78% |
The Adviser bears all of its own costs associated with providing these advisory services.
SUB-ADVISORY AGREEMENT — Climate Finance Partners (“CFP”) serves as the Sub-Adviser of the KraneShares Global Carbon Strategy ETF, KraneShares California Carbon Allowance Strategy ETF, KraneShares European Carbon Allowance Strategy ETF and KraneShares Global Carbon Offset Strategy ETF. CFP provides non-discretionary sub-advisory services to the Funds, which includes research and portfolio modeling services related to the Funds’ investments and the monitoring of such investments. For the services CFP provides to KraneShares Global Carbon Strategy ETF, KraneShares California Carbon Allowance Strategy ETF, KraneShares European Carbon Allowance Strategy ETF and KraneShares Global Carbon Offset Strategy ETF, the Adviser pays CFP a fee equal to 32% of the Net Revenue received by Krane from each Fund. Net Revenue is defined for these purposes as gross revenue under Schedule A of the Advisory Agreement minus gross fund-related expenses (including any waiver by Krane of its compensation under the Advisory Agreement and any reimbursements by Krane of the Fund’s expenses).
DISTRIBUTION AGREEMENT — SEI Investments Distribution Co. (the “Distributor”), a wholly-owned subsidiary of SEI Investments Company, and an affiliate of the Administrator, serves as the Funds’ distributor of Creation Units pursuant to a Distribution Agreement. The Distributor does not maintain any secondary market in Fund shares.
The Trust has adopted a Distribution and Service Plan (“Plan”) pursuant to Rule 12b-1 under the Investment Company Act. In accordance with its Plan, each Fund is authorized to pay an amount up to 0.25% of its average daily net assets each year for certain distribution-related activities. For the year ended March 31, 2023, no fees were charged under the Plan. Fees would only be charged under the Plan upon approval by the Board.
ADMINISTRATOR, CUSTODIAN AND TRANSFER AGENT — SEI Investments Global Funds Services (the “Administrator”) serves as the Funds’ Administrator pursuant to an Administration Agreement. BBH serves as the Funds’ Custodian and Transfer Agent pursuant to a Custodian and Transfer Agent Agreement.
Notes to Financial Statements/Notes to Consolidated Financial Statements (continued)
5. BASIS FOR CONSOLIDATION FOR THE KRANESHARES GLOBAL CARBON STRATEGY ETF, KRANESHARES CALIFORNIA CARBON ALLOWANCE STRATEGY ETF, KRANESHARES EUROPEAN CARBON ALLOWANCE STRATEGY ETF, KRANESHARES GLOBAL CARBON OFFSET STRATEGY ETF AND KRANESHARES ELECTRIFICATION METALS STRATEGY ETF
The Consolidated Schedule of Investments, Consolidated Statement of Assets and Liabilities, Consolidated Statements of Operations, Consolidated Statements of Changes in Net Assets and the Consolidated Financial Highlights of the KraneShares Global Carbon Strategy ETF, KraneShares California Carbon Allowance Strategy ETF, KraneShares European Carbon Allowance Strategy ETF, KraneShares Global Carbon Offset Strategy ETF and KraneShares Electrification Metals Strategy ETF include the accounts of each Fund’s Subsidiary. All intercompany accounts and transactions have been eliminated in consolidation for the Funds. The Subsidiaries have a fiscal year end of March 31 for financial statements consolidation purposes.
The Subsidiaries are classified as controlled foreign corporations under the Code. The Subsidiaries’ taxable income is included in the calculation of the Funds’ taxable income. Net losses of the Subsidiaries are not deductible by the Funds either in the current period or carried forward to future periods.
The KraneShares Global Carbon Strategy ETF, KraneShares California Carbon Allowance Strategy ETF, KraneShares European Carbon Allowance Strategy ETF, KraneShares Global Carbon Offset Strategy ETF and KraneShares Electrification Metals Strategy ETF investment in each of their respective Subsidiary may not exceed 25% of the value of its total assets (ignoring any subsequent market appreciation in the Subsidiary’s value), which limitation is imposed by the Code and is measured at the end of each quarter.
A summary of the investments in each Subsidiary is as follows:
| KraneShares Funds | | Inception
Date of
Subsidiary | | Subsidiary
Net Assets at
March 31,
2023 | | | % of Total
Net Assets at
March 31,
2023 | |
| KFA Global Carbon Subsidiary, Ltd. | | July 29, 2020 | | $ | 133,468,834 | | | | 21.01 | % |
| KraneShares European Carbon, Subsidiary Ltd. | | October 4, 2021 | | $ | 6,587,292 | | | | 20.93 | % |
| KraneShares California Carbon, Subsidiary Ltd. | | October 4, 2021 | | $ | 47,318,849 | | | | 20.64 | % |
| KraneShares Global Carbon Offset Strategy, Subsidiary Ltd. | | April 20, 2022 | | $ | 571,057 | | | | 24.61 | % |
| KraneShares Technology Metals Strategy Subsidiary, Ltd. | | October 12, 2022 | | $ | 4,663,454 | | | | 20.08 | % |
6. INVESTMENT TRANSACTIONS
For the year ended March 31, 2023, the purchases and sales of investments in securities excluding in-kind transactions, long-term U.S. Government and short-term securities were:
| KraneShares Funds | | Purchases | | | Sales and
Maturities | |
| KraneShares Global Carbon Transformation ETF | | $ | 2,113,596 | | | $ | 2,153,909 | |
| KraneShares Global Carbon Strategy ETF | | | — | | | | 73,187,579 | |
For the year ended March 31, 2023, there were no purchases or sales of long-term U.S. government securities for the Funds.
Notes to Financial Statements/Notes to Consolidated Financial Statements (continued)
For the year ended March 31, 2023, there were no in-kind transactions associated with creations and redemptions.
7. TAX INFORMATION
The amount and character of income and capital gain distributions to be paid, if any, are determined in accordance with Federal income tax regulations, which may differ from U.S. GAAP. As a result, net investment income (loss) and net realized gain (loss) on investment transactions for a reporting period may differ significantly from distributions during such period. These book/tax differences may be temporary or permanent. To the extent these differences are permanent in nature, they are charged or credited to distributable earnings (loss) or paid-in capital, as appropriate, in the period that the differences arise.
The permanent differences primarily consist of foreign currency translations, net operating loss, and utilization of earnings and profits on shareholder redemptions.
| KraneShares Funds | | Distributable
Earnings/(Loss) | | | Paid-in
Capital | |
| KraneShares Global Carbon Strategy ETF | | $ | (2,662,571 | ) | | $ | 2,662,571 | |
| KraneShares European Carbon Allowance Strategy ETF | | | 1,063,454 | | | | (1,063,454 | ) |
| KraneShares California Carbon Allowance Strategy ETF | | | (207,818 | ) | | | 207,818 | |
The tax character of dividends and distributions paid during the years or periods ended March 31, 2023 and March 31, 2022 were as follows:
| KraneShares Funds | | Ordinary
Income | | | Long-Term
Capital Gain | | | Totals | |
| KraneShares Global Carbon Transformation ETF | | | | | | | | | | | | |
| 2023 | | $ | 9,991 | | | $ | — | | | $ | 9,991 | |
| 2022 | | | — | | | | — | | | | — | |
| KraneShares Global Carbon Strategy ETF | | | | | | | | | | | | |
| 2023 | | $ | 132,430,808 | | | $ | — | | | $ | 132,430,808 | |
| 2022 | | | 7,929,920 | | | | — | | | | 7,929,920 | |
| KraneShares European Carbon Allowance Strategy ETF | | | | | | | | | | | | |
| 2023 | | $ | — | | | $ | — | | | $ | — | |
| 2022 | | | — | | | | — | | | | — | |
| KraneShares California Carbon Allowance Strategy ETF | | | | | | | | | | | | |
| 2023 | | $ | 589,669 | | | $ | — | | | $ | 589,669 | |
| 2022 | | | — | | | | — | | | | — | |
| KraneShares Global Carbon Offset Strategy ETF | | | | | | | | | | | | |
| 2023 | | $ | 10,008 | | | $ | — | | | $ | 10,008 | |
| KraneShares Electrification Metals Strategy ETF | | | | | | | | | | | | |
| 2023 | | $ | 27,671 | | | $ | — | | | $ | 27,671 | |
As of March 31, 2023, the components of tax basis distributable earnings (accumulated losses) were as follows:
Notes to Financial Statements/Notes to Consolidated Financial Statements (continued)
| | | KraneShares
Global Carbon
Transformation
ETF | | | KraneShares
Global Carbon
Strategy ETF | | | KraneShares
European
Carbon
Allowance
Strategy ETF | | | KraneShares
California
Carbon
Allowance
Strategy ETF | |
| Undistributed Ordinary Income | | $ | 14,888 | | | $ | 23,965,843 | | | $ | — | | | $ | 1,870,814 | |
| Capital Loss Carryforwards | | | (177,480 | ) | | | (2,573,805 | ) | | | — | | | | — | |
| Unrealized Appreciation (Depreciation) on Investments and Foreign Currency | | | 155,263 | | | | 24,706,912 | | | | 139,958 | | | | (25,294,474 | ) |
| Other Temporary Differences | | | (3 | ) | | | 1 | | | | 3 | | | | — | |
| Total Distributable Earnings/(Loss) | | $ | (7,332 | ) | | $ | 46,098,951 | | | $ | 139,961 | | | $ | (23,423,660 | ) |
| | | KraneShares
Global Carbon
Offset Strategy
ETF | | | KraneShares
Electrification
Metals Strategy
ETF | |
| Undistributed Ordinary Income | | $ | 7,791 | | | $ | 1,334,925 | |
| Unrealized Depreciation on Investments and Foreign Currency | | | (7,687,148 | ) | | | (734,725 | ) |
| Other Temporary Differences | | | (2 | ) | | | — | |
| Total Distributable Earnings/(Loss) | | $ | (7,679,359 | ) | | $ | 600,200 | |
Qualified late year ordinary and Post-October capital losses (including currency and specified gain/loss items) represent losses realized from January 1, 2023 through March 31, 2023 and November 1, 2022 through March 31, 2023, respectively, that in accordance with federal income tax regulations, the Funds have elected to defer and treat as having arisen in the following fiscal year.
Other temporary differences primarily consist of wash sales and book adjustments not recognized for tax.
The Funds have capital loss carryforwards as follows:
| KraneShares Funds | | Short-Term Loss | | | Long-Term Loss | | | Total | |
| KraneShares Global Carbon Transformation ETF | | $ | 165,357 | | | $ | 12,123 | | | $ | 177,480 | |
| KraneShares Global Carbon Strategy ETF | | | 993,016 | | | | 1,580,789 | | | | 2,573,805 | |
The differences between book and tax-basis unrealized appreciation and depreciation are attributable primarily to the tax deferral of losses on wash sales and investments in PFICs. The federal tax cost and aggregate gross unrealized appreciation and depreciation on investments held by the Funds at March 31, 2023, were as follows:
| KraneShares Funds | | Federal Tax
Cost | | | Aggregated
Gross
Unrealized
Appreciation | | | Aggregated
Gross
Unrealized
Depreciation | | | Net Unrealized
Appreciation
(Depreciation) | |
| KraneShares Global Carbon Transformation ETF | | $ | 2,268,800 | | | $ | 243,911 | | | $ | (88,648 | ) | | $ | 155,263 | |
| KraneShares Global Carbon Strategy ETF | | | 191,074,584 | | | | 24,706,912 | | | | — | | | | 24,706,912 | |
Notes to Financial Statements/Notes to Consolidated Financial Statements (continued)
| KraneShares Funds | | Federal Tax
Cost | | | Aggregated
Gross
Unrealized
Appreciation | | | Aggregated
Gross
Unrealized
Depreciation | | | Net Unrealized
Appreciation
(Depreciation) | |
| KraneShares European Carbon Allowance Strategy ETF | | $ | 3,399,681 | | | $ | — | | | $ | 139,958 | | | $ | 139,958 | |
| KraneShares California Carbon Allowance Strategy ETF | | | 208,433,101 | | | | — | | | | (25,294,474 | ) | | | (25,294,474 | ) |
| KraneShares Global Carbon Offset Strategy ETF | | | 7,146,615 | | | | — | | | | (7,687,148 | ) | | | (7,687,148 | ) |
| KraneShares Electrification Metals Strategy ETF | | | 12,067,868 | | | | — | | | | (734,725 | ) | | | (734,725 | ) |
8. CONCENTRATION OF RISKS
As with all ETFs, shareholders of the Funds are subject to the risk that their investment could lose money. Each Fund is subject to certain of the principal risks noted below, any of which may adversely affect a Fund’s NAV, trading price, yield, total return and ability to meet its investment objective. A more complete description of principal risks is included in each Fund’s prospectus under the heading “Principal Risks”.
CONCENTRATION RISK — Because the assets of certain Funds are expected to be concentrated in an industry or group of industries to the extent that the Underlying Index concentrates in a particular industry or group of industries, the Fund is subject to loss due to adverse occurrences that may affect that industry or group of industries or sector. Market conditions, interest rates, and economic, regulatory, or financial developments could significantly affect a single industry or a group of related industries, and the securities of companies in that industry or group of industries could react similarly to these or other developments. Depending on the composition of each Fund’s Underlying Index, the Fund may be subject to principal risks, as outlined in each Fund’s prospectus. Each Fund may have significant exposure to other industries or sectors over time.
CURRENCY RISK — The Funds’ assets will be invested in instruments denominated in foreign currencies and the income received by the Fund may be in foreign currencies. The Fund will compute and expects to distribute its income in U.S. dollars, and the computation of income will be made on the date that the income is earned by the Fund at the foreign exchange rate in effect on that date. The Fund will conduct its foreign currency exchange transactions either on a spot (i.e., cash) basis at the spot rate prevailing in the foreign currency exchange market at the time the Fund wishes to enter into the transaction, or through forward, futures or options contracts to purchase or sell foreign currencies.
The Fund’s NAV is determined on the basis of the U.S. dollar. The Fund may therefore lose value if the local currency of a foreign investment depreciates against the U.S. dollar, even if the local currency value of the Fund’s holdings goes up. Currency exchange rates can be very volatile and can change quickly and unpredictably, which may adversely affect the Fund. The Fund may also be subject to delays in converting or transferring U.S. dollars to foreign currencies and vice versa. This may adversely affect the Fund’s performance over time.
DERIVATIVES RISK — The use of derivatives (including swaps, futures, forwards, structured notes and options) may involve leverage, which includes risks that are different from, and greater than, the risks associated with investing directly in a reference asset, because a small investment in a derivative can result in a large impact on the Fund and may cause the Fund to be more volatile.
Notes to Financial Statements/Notes to Consolidated Financial Statements (continued)
Derivatives may at times be highly illiquid, and the Fund may not be able to close out or sell a derivative at a particular time or at an anticipated price. Derivatives can be difficult to value and valuation may be more difficult in times of market turmoil. There may be imperfect correlation between the derivative and that of the reference asset, resulting in unexpected returns that could materially adversely affect the Fund. Certain derivatives (such as swaps and options) are bi-lateral agreements that expose the Fund to counterparty risk, which is the risk of loss in the event that the counterparty to an agreement fails to make required payments or otherwise comply with the terms of derivative. In that case, the Fund may suffer losses potentially equal to, or greater than, the full value of the derivative if the counterparty fails to perform its obligations. That risk is generally thought to be greater with over-the-counter (OTC) derivatives than with derivatives that are exchange traded or centrally cleared. Counterparty risks are compounded by the fact that there are only a limited number of ways available to invest in certain reference assets and, therefore, there may be few counterparties to swaps or options based on those reference assets. Many derivatives are subject to segregation requirements that require the Fund to segregate the market or notional value of the derivatives, which could impede the portfolio management of the Fund.
EMERGING MARKETS RISK — A Fund’s investments in emerging markets are subject to greater risk of loss than investments in developed markets. This is due to, among other things, greater market volatility, greater risk of asset seizures and capital controls, lower trading volume, political and economic instability, greater risk of market shutdown and more governmental limitations on foreign investments than typically found in developed markets. The economies of emerging markets, and China in particular, may be heavily reliant upon international trade and may suffer disproportionately if international trading declines or is disrupted.
LIQUIDITY RISK — Certain of the Funds’ investments are subject to liquidity risk, which exists when an investment is or becomes difficult to purchase or sell at a reasonable time and price. If a transaction is particularly large or if the relevant market is or becomes illiquid, it may not be possible to initiate a transaction or liquidate a position, which may cause the Funds to suffer significant losses and difficulties in meeting redemptions. Liquidity risk may be the result of, among other things, market turmoil, the reduced number and capacity of traditional market participants, or the lack of an active trading market. Markets for securities or financial instruments could be disrupted by a number of events, including, but not limited to, an economic crisis, natural disasters, new legislation or regulatory changes inside or outside the U.S. Liquid investments may become less liquid after being purchased by the Fund, particularly during periods of market stress. In addition, if a number of securities held by the Fund stop trading, it may have a cascading effect and cause the Fund to halt trading. Volatility in market prices will increase the risk of the Fund being subject to a trading halt. Certain countries in which the Fund may invest may be subject to extended settlement delays and/or foreign holidays, during which the Fund will unlikely be able to convert holdings to cash.
MARKET RISK — The values of the Fund’s holdings could decline generally or could underperform other investments. In addition, there is a risk that policy changes by the U.S. Government, Federal Reserve, and/or other government actors could cause volatility in global financial markets, negative sentiment and higher levels of Fund redemptions, which could have a negative impact on the Fund and could result in losses. Geopolitical and other risks, including environmental and public health risks may add to instability in world economies and markets generally. Changes in value may be temporary or may last for extended periods. Further, the Fund is susceptible to the risk that certain investments may be difficult or impossible to sell at a favorable time or price. Market developments may also cause the Fund’s investments to become less liquid and subject to erratic
Notes to Financial Statements/Notes to Consolidated Financial Statements (concluded)
price movements. Such market developments may also cause the Fund to encounter difficulties in timely honoring redemptions, especially if market events cause an increased incidence of shareholder redemptions.
NON-DIVERSIFIED FUND RISK — Because a Fund is non-diversified and may invest a greater portion of its assets in fewer issuers than a diversified fund, changes in the market value of a single portfolio holding could cause greater fluctuations in the Fund’s share price than would occur in a diversified fund. This may increase the Fund’s volatility and cause the performance of a single portfolio holding or a relatively small number of portfolio holdings to have a greater impact on the Fund’s performance.
VALUATION RISK — Independent market quotations for the non-U.S. securities held by the Funds may not be readily available and such securities may be fair valued by a pricing service at an evaluated price. These valuations involve subjectivity and different market participants may assign different prices to the same investment. As a result, there is a risk that a Fund may not be able to sell an investment at the price assigned to the investment by the Fund. In addition, the securities in which the Funds invest may trade on days that the Funds do not price their shares; as a result, the value of Fund shares may change on days when investors cannot purchase or sell their holdings.
9. OTHER
At March 31, 2023, all shares issued by the Funds were in Creation Unit aggregations to Authorized Participants through primary market transactions (e.g., transactions directly with the Funds). However, the individual shares that make up those Creation Units are traded on the Exchange (e.g., secondary market transactions). Some of those individual shares have been bought and sold by persons that are not Authorized Participants. Each Authorized Participant has entered into an agreement with the Funds’ Distributor.
10. INDEMNIFICATIONS
In the normal course of business, the Funds enter into contracts that provide general indemnifications. The Funds’ maximum exposure under these arrangements is dependent on future claims that may be made against the Funds and, therefore, cannot be established; however, based on experience, the risk of loss from such claims is considered remote.
11. SUBSEQUENT EVENTS
The Funds have evaluated the need for additional disclosures and/or adjustments resulting from subsequent events through the date the financial statements were issued.
In preparing these financial statements, management has evaluated the need for additional disclosures and/or adjustments resulting from subsequent events through the date the financial statements were issued. On May 2, 2023, the Board approved the liquidation of the KraneShares Global Carbon Transformation ETF. The Fund was liquidated on May 26, 2023.
No additional disclosures or adjustments were required to the financial statements as of the date the financial statements were issued other than the liquidation described above.
Report of Independent Registered Public Accounting Firm
To the Shareholders and Board of Trustees
KraneShares Trust:
Opinion on the Financial Statements
We have audited the accompanying statement of assets and liabilities and the consolidated statements of assets and liabilities of the funds listed in the Appendix, six of the funds comprising KraneShares Trust (collectively, the Funds), including the schedule of investments and the consolidated schedules of investments, as of March 31, 2023, the related statement of operations and consolidated statements of operations for the year or period listed in the Appendix, the statements of changes in net assets and consolidated statements of changes in net assets for each of the years or periods in the two-year period listed in the Appendix, and the related notes (collectively, the financial statements) and the financial highlights and consolidated financial highlights for each of the years or periods in the three year period listed in the Appendix. In our opinion, the financial statements and financial highlights present fairly, in all material respects, the financial position of each of the Funds as of March 31, 2023, the results of its operations for the year or period listed in the Appendix, the changes in its net assets for each of the years or periods in the two-year period listed in the Appendix, and the financial highlights for each of the years or periods in the three-year period listed in the Appendix, in conformity with U.S. generally accepted accounting principles.
Basis for Opinion
These financial statements and financial highlights are the responsibility of the Funds’ management. Our responsibility is to express an opinion on these financial statements and financial highlights based on our audits. We are a public accounting firm registered with the Public Company Accounting Oversight Board (United States) (PCAOB) and are required to be independent with respect to the Funds in accordance with the U.S. federal securities laws and the applicable rules and regulations of the Securities and Exchange Commission and the PCAOB.
We conducted our audits in accordance with the standards of the PCAOB. Those standards require that we plan and perform the audit to obtain reasonable assurance about whether the financial statements and financial highlights are free of material misstatement, whether due to error or fraud. Our audits included performing procedures to assess the risks of material misstatement of the financial statements and financial highlights, whether due to error or fraud, and performing procedures that respond to those risks. Such procedures included examining, on a test basis, evidence regarding the amounts and disclosures in the financial statements and financial highlights. Such procedures included examining, on a test basis, evidence regarding the amounts and disclosures in the financial statements and financial highlights. Such procedures also included confirmation of securities owned as of March 31, 2023, by correspondence with the custodian, transfer agent, and brokers or by other appropriate auditing procedures when replies from brokers were not received. Our audits also included evaluating the accounting principles used and significant estimates made by management, as well as evaluating the overall presentation of the financial statement and financial highlights. We believe that our audits provide a reasonable basis for our opinion.

We have served as the auditor of one or more KraneShares investment companies since 2017.
Philadelphia, Pennsylvania
May 29, 2023
Report of Independent Registered Public Accounting Firm (concluded)
Appendix
Funds with commencement of operations during the year ended March 31, 2021:
KraneShares Global Carbon Strategy ETF
Consolidated schedule of investments as of March 31, 2023
Consolidated statement of assets and liabilities as of March 31, 2023
Consolidated statement of operations for the year ended March 31, 2023
Consolidated statements of changes in net assets for each of the years in the two-year period ended March 31, 2023
Consolidated financial highlights for each of the years in the two-year period ended March 31, 2023 and the period from July 29, 2020 (commencement of operations) through March 31, 2021
Funds with commencement of operations during the year ended March 31, 2022:
KraneShares Global Carbon Transformation ETF
Schedule of investments as of March 31, 2023
Statement of assets and liabilities as of March 31, 2023
Statement of operations for the year ended March 31, 2023
Statements of changes in net assets and financial highlights for the year ended March 31, 2023 and the period from March 16, 2022 (commencement of operations) through March 31, 2022
KraneShares European Carbon Allowance Strategy ETF
KraneShares California Carbon Allowance Strategy ETF
Consolidated schedule of investments as of March 31, 2023
Consolidated statement of assets and liabilities as of March 31, 2023
Consolidated statement of operations for the year ended March 31, 2023
Consolidated statements of changes in net assets and consolidated financial highlights for the year ended March 31, 2023 and the period from October 4, 2021 (commencement of operations) through March 31, 2022
Funds with commencement of operations during the year ended March 31, 2023:
KraneShares Global Carbon Offset Strategy ETF
Consolidated schedule of investments as of March 31, 2023
Consolidated statement of assets and liabilities as of March 31, 2023
Consolidated statements of operations and changes in net assets and consolidated financial highlights for the period from April 20, 2022 (commencement of operations) through March 31, 2023
KraneShares Electrification Metals Strategy ETF
Consolidated schedule of investments as of March 31, 2023
Consolidated statement of assets and liabilities as of March 31, 2023
Consolidated statements of operations and changes in net assets and consolidated financial highlights for the period from October 13, 2022 (commencement of operations) through March 31, 2023
Trustees and Officers of the Trust (Unaudited)
March 31, 2023
Set forth below are the names, addresses, years of birth, positions with the Trust, terms of office and lengths of time served; the principal occupations for the last five years; number of Funds in fund complex overseen; and other directorships outside the fund complex of each of the persons currently serving as Trustees and Officers of the Trust. The Trust’s Statement of Additional Information (“SAI”) includes additional information about the Trustees and Officers. The SAI may be obtained without charge, upon request, by calling 1-855-857-2638. The following chart lists Trustees and Officers as of March 31, 2023.
Name, Address
(Year of Birth) |
|
Position(s)
Held
with Trust |
|
Principal Occupation(s)
During the Past 5 Years |
| Number of
Funds in Trust
Overseen by
Trustee |
| Other
Directorships
Held by
Trustees |
| Interested Trustee1 | | | | | | | | |
| | | | | | | | | |
Jonathan Krane2 (1968) 280 Park Avenue 32nd Floor New York, New York, 10017 | | Trustee and Chairman of the Board, No set term; served since 2012 | | Chief Executive Officer of Krane Funds Advisors, LLC from 2011 to present. Chief Executive Officer of Krane Portfolio Advisors, LLC from 2018 to present. Principal of Krane Capital LLC from 2009 to 2011. | | 38 | | None |
| | | | | | | | | |
| Independent Trustees1 | | | | | | | | |
| | | | | | | | | |
Patrick P. Campo (1970) 280 Park Avenue 32nd Floor New York, New York, 10017 | | Trustee, No set term; served since 2017 | | From 2019 to present, Director of Research and from 2013 to 2019 Director of Long Short Equity, Titan Advisors. | | 38 | | None |
| | | | | | | | | |
John Ferguson (1966) 280 Park Avenue 32nd Floor New York, New York, 10017 | | Trustee, No set term; served since 2012 | | Chief Operating Officer of Shrewsbury River Capital from 2017 to 2020. Chief Operating Officer of Kang Global Investors LP (hedge fund adviser) from 2014 to 2016. President of Alden Global Capital, LLC (hedge fund adviser) from 2012 to 2014 (formerly, Chief Operating Officer from 2011 to 2012). Senior Managing Director and Chief Operating Officer of K2 Advisors, LLC from 2005 to 2011. | | 38 | | None |
Trustees and Officers of the Trust (Unaudited) (continued)
March 31, 2023
Name, Address
(Year of Birth) |
|
Position(s)
Held
with Trust |
|
Principal Occupation(s)
During the Past 5 Years |
| Number of
Funds in Trust
Overseen by
Trustee |
| Other
Directorships
Held by
Trustees |
| Independent Trustees1 | | | | | | | | |
| | | | | | | | | |
Matthew Stroyman (1968) 280 Park Avenue 32nd Floor New York, New York, 10017 | | Trustee, No set term; served since 2012 | | Founder and President of BlackRidge Ventures from 2018 to present (principal investment activities and strategic advisory services in a variety of industries to clients and partners that include institutional investment firms, family offices and high net-worth individuals). Co-Founder, President and Chief Operating Officer of Arcturus (real estate asset and investment management services firm) from 2007 to 2017. | | 38 | | None |
Name, Address
(Year of Birth) |
|
Position(s)
Held
with Trust |
|
Principal Occupation(s)
During the Past 5 Years |
| Number of
Funds in Trust
Overseen by
Trustee |
| Other
Directorships
Held by
Trustees |
| Officers1 | | | | | | | | |
| | | | | | | | | |
Jonathan Krane (1968) 280 Park Avenue 32nd Floor New York, New York, 10017 | | Principal Executive Officer and Principal Financial Officer, No set term; served since 2012 | | Chief Executive Officer of Krane Funds Advisors, LLC from 2011 to present. Chief Executive Officer of Krane Portfolio Advisors, LLC from 2018 to present. Principal of Krane Capital LLC from 2009 to 2011. | | 38 | | None |
| | | | | | | | | |
Jennifer Tarleton (formerly Krane) (1966) 280 Park Avenue 32nd Floor New York, New York, 10017 | | Vice President and Secretary, No set term; served since 2012 | | Vice President of Krane Funds Advisors, LLC from 2011 to present. | | 38 | | None |
Trustees and Officers of the Trust (Unaudited) (concluded)
March 31, 2023
| | | | | | | Number of | | Other |
| | | Position(s) | | | | Funds in Trust | | Directorships |
| Name, Address | | Held | | Principal Occupation(s) | | Overseen by | | Held by |
| (Year of Birth) | | with Trust | | During the Past 5 Years | | Trustee | | Trustees |
| Officers1 | | | | | | | | |
| | | | | | | | | |
Michael Quain (1957) 280 Park Avenue 32nd Floor New York, New York, 10017 | | Chief Compliance Officer and AntiMoney Laundering Officer, No Set Term; served since 2015 | | Principal/President of Quain Compliance Consulting, LLC from 2014 to present. First Vice President of Aberdeen Asset Management Inc. from May 2013 to September 2013. | | 38 | | None |
| | | | | | | | | |
Eric Olsen (1970) SEI Investments Company One Freedom Valley Drive Oaks, PA 19456 | | Assistant Treasurer, No set term; served since 2021 | | Director of Accounting, SEI Investments Global Fund Services (March 2021 to present); Deputy Head of Fund Operations, Traditional Assets, Aberdeen Standard Investments (August 2013 to February 2021). | | 38 | | None |
| | | | | | | | | |
David Adelman (1964) 280 Park Avenue 32nd Floor New York, New York, 10017 | | Assistant Secretary, No set term; served since 2021 | | Managing Director and the General Counsel, Krane Fund Advisors, LLC from 2021. Partner, Reed Smith LLP from 2015 to 2021. | | 38 | | None |
| | | | | | | | | |
Jonathan Shelon (1974) 280 Park Avenue 32nd Floor New York, New York, 10017 | | Assistant Secretary, No set term; served since 2019 | | Chief Operating Officer, Krane Funds Advisors, LLC from 2015 to present. Chief Operating Officer, CICC Wealth Management (USA) LLC from 2018 to present. Chief Investment Officer of Specialized Strategies, J.P. Morgan from 2011 to 2015. | | 38 | | None |
| 1 | Each Trustee serves until his or her successor is duly elected or appointed and qualified. |
| 2 | Mr. Krane is an “interested” person of the Trust, as that term is defined in the 1940 Act, by virtue of his ownership and controlling interest in the Adviser. |
Approval of Advisory Agreement (Unaudited)
Approval of Advisory Agreement of KraneShares Electrification Metals Strategy ETF
At a meeting held on May 25-26, 2022, the Board of Trustees (the “Board”) of KraneShares Trust (the “Trust”), including a majority of the Trustees who are not “interested persons” of the Trust, as that term is defined in the Investment Company Act of 1940, as amended (the “Independent Trustees”), approved the existing investment advisory agreement (the “Advisory Agreement”) between Krane Funds Advisors, LLC (“Krane”) and the Trust, on behalf of KraneShares Electrification Metals Strategy ETF (“KMET”).
In advance of the meeting, and at a separate meeting of the Independent Trustees in executive session held on May 25, 2022, the Board received and considered information provided by Krane in response to the Independent Trustees’ written request related to the Board’s consideration of the Advisory Agreement. The Board also noted that it also considers information at each of its regularly scheduled meetings related to, among other matters, the services provided by Krane, which will include KMET. The Board considered that the Independent Trustees also receive additional information outside of regularly scheduled Board meetings and at executive sessions held by the Independent Trustees. As a result, the Board considered that its evaluation process with respect to Krane is an ongoing one.
In evaluating the Advisory Agreement, the Board considered, among other matters: (1) the nature, extent, and quality of the services to be provided to KMET by Krane; (2) the proposed compensation to be paid by KMET under the Advisory Agreement; (3) the estimated costs of the services to be provided by Krane and the profitability expectations of Krane with respect to its relationship with KMET; (4) the extent to which economies of scale could be realized as KMET s and whether the unitary fee charged under the Advisory Agreement will enable investors in KMET to share in any such economies of scale; and (5) other benefits Krane anticipates it may receive from its relationship with KMET.
Nature, Extent and Quality of Services
Based on written and oral reports received by the Board prior to and at the May 25, 2022 executive session of the Independent Trustees and May 25-26, 2022 meeting of the Board, the Board considered the nature, quality, and extent of the overall services to be provided by Krane to KMET under the Advisory Agreement. The Board took note of the qualifications, background and responsibilities of Krane personnel who will provide services to the KMET.
The Board recognized that Krane invests significant time and effort in structuring new series of the Trust. They considered the time expended by Krane to structure KMET, including assessing its market appeal and investment strategy, and arranging service providers for the Trust. The Board noted that Krane continually evaluates its existing compliance and operational staff, as well as its investment professionals, and that Krane has consistently sought to retain qualified and experienced staff in these areas as its business has grown. The Board also considered Krane’s current ownership structure, financial strength and long-term strategic plans. The Board noted that Krane is part of a family of investment management firms with significant resources, including administrative resources utilized by Krane.
Investment Performance
The Board noted that, because KMET has not yet commenced investment operations, it has no investment performance. The Board noted that once KMET commences operations the Board will receive regular reports regarding its performance relative to its broad Morningstar peer group, as
Approval of Advisory Agreement (Unaudited) (continued)
well as a select group of competitors identified by Krane. The Board also considered that at its regular meetings it will receive information regarding each Fund against the performance of an identified index.
Compensation
The Board considered that, pursuant to the Advisory Agreement, Krane will enter into a unitary advisory fee arrangement for KMET. Under the unitary fee arrangement, Krane will be responsible for paying most of the expenses incurred by KMET, including those of its principal service providers. The Board noted that, under the unitary fee structure, Krane takes the risk that KMET may not be successful in raising assets.
Costs and Profitability
The Board considered the estimated cost of Krane’s services with respect to KMET. The Board noted that, because KMET has not yet launched, it was difficult to estimate how profitable it would be to Krane, although the Board recognized that KMET will leverage procedures and systems put in place in connection with management of other series of the Trust. The Independent Trustees received information from Krane regarding its overall profitability and discussed with Krane’s management how launching KMET could impact such profitability. The Board considered information previously provided by Krane regarding the cost of its services and its profitability with respect to the existing operational series of the Trust. The Board noted Krane’s continuing commitment to operating the Trust, and considered its proposal to implement a unitary fee structure under which it will bear many of KMET’s expenses.
Other Benefits
The Board considered the extent to which Krane could derive ancillary benefits from KMET’s operations. They noted that it was unlikely that KMET would participate in the Trust’s securities lending program, and considered whether Krane would benefit as a result of its ability to use KMET’s assets to engage in soft dollar transactions.
Economies of Scale
The Board considered whether Krane would realize economies of scale with respect to its services as KMET grows, including the extent to which this is reflected in the level of fees to be paid by KMET. The Board noted that KMET’s proposed advisory fees do not includes breakpoints, and considered that it is not possible—before the commencement of investment operations—to accurately evaluate potential economies of scale. The Board also noted that Krane continues to reinvest a portion of its profits in its business, including through the evolution of its compliance and investment infrastructure, and that any economies of scale could be shared with KMET in this manner. Based on these and other considerations, including that KMET is newly organized, the Board considered economies of scale not to be a material factor in its consideration of the Advisory Agreement.
Conclusion
The Board did not identify any single factor as being of paramount importance, and different Trustees may have given different weight to different factors in their review of the Advisory Agreement. The Board reviewed a memorandum from Independent Trustee counsel discussing the legal standards and judicial precedent applicable to its consideration of the Advisory Agreement. The Board noted that, consistent with its approach to other series of the Trust, it will continue to monitor KMET at its regular meetings, during executive sessions of the Independent Trustees and
Approval of Advisory Agreement (Unaudited) (concluded)
outside of the Board meetings. Based on its review, including consideration of each of the factors referenced above, the Board determined, in the exercise of its reasonable business judgment, that the advisory arrangements, as outlined in the Advisory Agreement, were reasonable in light of the factors considered by the Board.
Disclosure of Fund Expenses (Unaudited)
As a shareholder of a Fund, you incur two types of costs: (1) transaction costs, including brokerage expenses; and (2) ongoing costs. All Exchange Traded Funds (“ETFs”) have operating expenses. As a shareholder of an ETF, your investment is affected by these ongoing costs, which include (among others) costs for ETF management, administrative services, commissions, and shareholder reports like this one. It is important for you to understand the impact of these costs on your investment returns. In addition, a shareholder is responsible for brokerage fees as a result of their investment in the Fund.
Operating expenses such as these are deducted from an ETF’s gross income and directly reduce its final investment return. These expenses are expressed as a percentage of the ETF’s average net assets; this percentage is known as the ETF’s expense ratio.
The following examples use the expense ratio and are intended to help you understand the ongoing costs (in dollars) of investing in your Fund and to compare these costs with those of other funds. The examples are based on an investment of $1,000 made at the beginning of the period shown and held for the entire period (October 1, 2022 to March 31, 2023).
The table on the next page illustrates your Fund’s costs in two ways:
Actual Fund Return. This section helps you to estimate the actual expenses that your Fund incurred over the period. The “Expenses Paid During Period” column shows the actual dollar expense cost incurred by a $1,000 investment in the Fund, and the “Ending Account Value” number is derived from deducting that expense cost from the Fund’s gross investment return.
You can use this information, together with the actual amount you invested in the Fund, to estimate the expenses you paid over that period. Simply divide your actual account value by $1,000 to arrive at a ratio (for example, an $8,600 account value divided by $1,000 = 8.6), then multiply that ratio by the number shown for your Fund under “Expenses Paid During Period.”
Hypothetical 5% Return. This section helps you compare your Fund’s costs with those of other funds. It assumes that the Fund had an annual 5% return before expenses during the year, but that the expense ratio (Column 3) for the period is unchanged. This example is useful in making comparisons because the Securities and Exchange Commission requires all funds to make this 5% calculation. You can assess your Fund’s comparative cost by comparing the hypothetical result for your Fund in the “Expenses Paid During Period” column with those that appear in the same charts in the shareholder reports for other funds.
NOTE: Because the return is set at 5% for comparison purposes — NOT your Fund’s actual return — the account values shown may not apply to your specific investment.
Please note that the expenses shown in the table are meant to highlight your ongoing costs only and do not reflect any transactional costs, including brokerage commissions on the purchases and sale of Fund shares. Therefore, the expense examples are useful in comparing ongoing costs only, and will not help you determine the relative total costs of owning different funds. If these transactional costs had been included, your costs would have been higher.
Disclosure of Fund Expenses (Unaudited) (concluded)
| | | | | | Ending | | | | | | | |
| | | Beginning | | | Account | | | Annualized | | | Expenses | |
| | | Account Value | | | Value | | | Expense | | | Paid During | |
| | | 10/1/2022 | | | 3/31/2023 | | | Ratios | | | Period(1) | |
| KraneShares Global Carbon Transformation ETF | | | | | | | | | | | | | | | | |
| Actual Fund Return | | $ | 1,000.00 | | | $ | 1,189.90 | | | | 0.88 | % | | $ | 4.80 | |
| Hypothetical 5% Return | | | 1,000.00 | | | | 1,020.54 | | | | 0.88 | | | | 4.43 | |
| | | | | | | | | | | | | | | | | |
| KraneShares Global Carbon Strategy ETF | | | | | | | | | | | | | | | | |
| Actual Fund Return | | $ | 1,000.00 | | | $ | 1,296.10 | | | | 0.79 | % | | $ | 4.52 | |
| Hypothetical 5% Return | | | 1,000.00 | | | | 1,020.99 | | | | 0.79 | | | | 3.98 | |
| | | | | | | | | | | | | | | | | |
| KraneShares European Carbon Allowance Strategy ETF | | | | | | | | | | | | | | | | |
| Actual Fund Return | | $ | 1,000.00 | | | $ | 1,472.70 | | | | 0.79 | % | | $ | 4.87 | |
| Hypothetical 5% Return | | | 1,000.00 | | | | 1,020.99 | | | | 0.79 | | | | 3.98 | |
| | | | | | | | | | | | | | | | | |
| KraneShares California Carbon Allowance Strategy ETF | | | | | | | | | | | | | | | | |
| Actual Fund Return | | $ | 1,000.00 | | | $ | 1,085.40 | | | | 0.79 | % | | $ | 4.11 | |
| Hypothetical 5% Return | | | 1,000.00 | | | | 1,020.99 | | | | 0.79 | | | | 3.98 | |
| | | | | | | | | | | | | | | | | |
| KraneShares Global Carbon Offset Strategy ETF | | | | | | | | | | | | | | | | |
| Actual Fund Return | | $ | 1,000.00 | | | $ | 312.20 | | | | 0.79 | % | | $ | 2.58 | |
| Hypothetical 5% Return | | | 1,000.00 | | | | 1,020.99 | | | | 0.79 | | | | 3.98 | |
| | | | | | | | | | | | | | | | | |
| KraneShares Electrification Metals Strategy ETF | | | | | | | | | | | | | | | | |
| Actual Fund Return(2) | | $ | 1,000.00 | | | $ | 1,033.30 | | | | 0.79 | % | | $ | 3.72 | |
| Hypothetical 5% Return | | | 1,000.00 | | | | 1,020.99 | | | | 0.79 | | | | 3.98 | |
| (1) | Expenses are equal to the Fund’s annualized expense ratio multiplied by the average account value over the period, multiplied by 182/365 (to reflect the one-half year period) unless otherwise indicated. |
| (2) | Expenses are equal to Fund’s annualized expense ratio multiplied by the average account value over the period, multiplied by 169/365 (to reflect the period from 10/13/22- 3/31/23). |
Notice To Shareholders (Unaudited)
For shareholders that do not have a March 31, 2023 tax year end, this notice is for informational purposes only. For shareholders with a March 31, 2023 tax year end, please consult your tax advisor as to the pertinence of this notice. For the fiscal year ended March 31, 2023, the Funds are designating the following items with regard to distributions paid during the year.
Return of
Capital(1) | | | Long-Term
Capital
Gain
Distributions | | | Ordinary
Income
Distributions | | | Total
Distributions | | | Qualifying
for
Corporate
Dividends
Received
Deduction(2) | | | Qualifying
Dividend
Income(3) | | | U.S.
Government
Interest(4) | | | Interest
Related
Dividends(5) | | | Short Term
Capital
Gain
Dividends(6) | | | Foreign
Tax
Credit | |
| KraneShares Global Carbon Transformation ETF | | | | | | | | |
| | 0.00 | % | | | 0.00 | % | | | 100.00 | % | | | 100.00 | % | | | 28.74 | % | | | 100.00 | % | | | 0.00 | % | | | 1.31 | % | | | 0.00 | % | | | 29.57 | % |
| KraneShares Global Carbon Strategy ETF | | | | | | | | |
| | 0.00 | % | | | 0.00 | % | | | 100.00 | % | | | 100.00 | % | | | 0.00 | % | | | 0.00 | % | | | 0.00 | % | | | 0.25 | % | | | 0.00 | % | | | 0.00 | % |
| KraneShares European Carbon Allowance Strategy ETF | | | | | | | | |
| | 0.00 | % | | | 0.00 | % | | | 0.00 | % | | | 0.00 | % | | | 0.00 | % | | | 0.00 | % | | | 0.00 | % | | | 0.00 | % | | | 0.00 | % | | | 0.00 | % |
| KraneShares California Carbon Allowance Strategy ETF | | | | | | | | |
| | 0.00 | % | | | 0.00 | % | | | 100.00 | % | | | 100.00 | % | | | 0.00 | % | | | 0.00 | % | | | 0.00 | % | | | 65.59 | % | | | 0.00 | % | | | 0.00 | % |
| KraneShares Global Carbon Offset Strategy ETF | | | | | | | | |
| | 0.00 | % | | | 0.00 | % | | | 100.00 | % | | | 100.00 | % | | | 0.00 | % | | | 0.00 | % | | | 0.00 | % | | | 100.00 | % | | | 0.00 | % | | | 0.00 | % |
| KraneShares Electrification Metals Strategy ETF | | | | | | | | |
| | 0.00 | % | | | 0.00 | % | | | 100.00 | % | | | 100.00 | % | | | 0.00 | % | | | 0.00 | % | | | 54.66 | % | | | 15.63 | % | | | 0.00 | % | | | 0.00 | % |
| (1) | Return of capital is a payment received from the fund that is not considered to be taxable income. The return of capital distribution is considered to be a return of the investor’s original investment and reduces the investor’s cost basis in the fund. |
| (2) | Qualifying dividends represent dividends which qualify for the corporate dividends received deduction and are reflected as a percentage of ordinary income distributions (the total of short term capital gain and net investment income distributions). |
| (3) | The percentage in this column represents the amount of “Qualifying Dividend Income” as created by the Jobs and Growth Relief Reconciliation Act of 2003 and is reflected as a percentage of ordinary income distributions (the total of short term capital gain and net investment income distributions). It is the intention of each of the aforementioned funds to designate the maximum amount permitted by law. |
| (4) | “U.S. Government Interest” represents the amount of interest that was derived from U.S. Government obligations and distributed during the fiscal year. Generally, interest from direct U.S. Government obligations is exempt from state income tax. However, for shareholders who are residents of California, Connecticut and New York, the statutory threshold requirements were not satisfied to permit exemption of these amounts from state income. |
| (5) | The percentage in this column represents the amount of “Interest Related Dividends” and is reflected as a percentage of ordinary income distributions that is exempt from U.S. withholding tax when paid for foreign investors. |
| (6) | The percentage in this column represents the amount of “Short Term Capital Gain Dividends” and is reflected as a percentage of short term capital gain distributions that is exempt from U.S. withholding tax when paid for foreign investors. |
| (7) | The following Funds intend to pass through a foreign tax credit to their shareholders. For the fiscal year ended March 31, 2023, the total amount of foreign source income and amount of foreign tax to be paid is as follows: |
Notice To Shareholders (Unaudited) (concluded)
| KraneShares Funds | | Foreign
Source
Income | | | Foreign Tax
Credit Pass
Through | |
| KraneShares Global Carbon Transformation ETF | | $ | 32,133 | | | $ | 4,194 | |
The allocable share of foreign tax credit will be reported on Form 1099-DIV.
Supplemental Information (Unaudited)
Net asset value, or “NAV”, is the price per Share at which the Funds issue and redeem Shares to Authorized Participants. It is calculated in accordance with the policies described in Note 2 in Notes to Financial Statements. The “Market Price” of the Funds generally is determined using the closing price on the stock exchange on which the Shares of the Funds are listed for trading. The Funds’ Market Price may be at, above or below their NAV. The NAV of the Funds will fluctuate with changes in the market value of their holdings. The Market Price of the Funds will fluctuate in accordance with changes in their NAV, as well as market supply and demand of Fund Shares.
Premiums or discounts are the differences (expressed as a percentage) between the NAV and Market Price of the Funds on a given day, generally at the time NAV is calculated. A premium is the amount that the Funds are trading above the reported NAV, expressed as a percentage of the NAV. A discount is the amount that the Funds are trading below the reported NAV, expressed as a percentage of the NAV. Shareholders may pay more than NAV when they buy Fund Shares and receive less than NAV when they sell those Shares, because Shares are bought and sold at Market Price.
Further information regarding premiums and discounts is available on the Funds’ website at http://kraneshares.com. The premium and discount information contained on the website represents past performance and cannot be used to predict future results.

KraneShares Trust:
280 Park Avenue 32nd Floor
New York, NY 10017
1-855-857-2638
http://kraneshares.com/
Investment Adviser:
Krane Funds Advisors, LLC
280 Park Avenue 32nd Floor
New York, NY 10017
Sub-Adviser:
Climate Finance Partners LLC
251 Little Falls Drive
Wilmington, DE 19808
Distributor:
SEI Investments Distribution Co.
One Freedom Valley Drive
Oaks, PA 19456
Administrator:
SEI Investments Global Funds Services
One Freedom Valley Drive
Oaks, PA 19456
Independent Registered Public
Accounting Firm:
KPMG LLP
1601 Market Street
Philadelphia, PA 19103
This information must be preceded or accompanied by a current prospectus for the Funds described.
KraneShares Trust:
280 Park Avenue, 32nd Floor
New York, NY 10017
KRS-AR-004-0100
Item 2. Code of Ethics.
The Registrant has adopted a code of ethics that applies to the Registrant’s principal executive officer, principal financial officer, and any person who performs a similar function. During the period covered by the report, there were no amendments to the code of ethics, and the Registrant did not grant any waivers from a provision of the code of ethics.
Item 3. Audit Committee Financial Expert.
(a)(1) The Registrant’s Board of Trustees has determined that the Registrant has an audit committee financial expert serving on the audit committee.
(a)(2) The audit committee financial expert, John Ferguson, is an independent trustee as defined in Form N-CSR Item 3 (a)(2).
Item 4. Principal Accountant Fees and Services.
Fees billed by KPMG LLP (“KPMG”) related to the Registrant.
KPMG billed the Registrant aggregate fees for services rendered to the Registrant for the last two fiscal years as follows:
| | 2023 | 2022 |
| | | All fees and services to the Registrant that were pre-approved | All fees and services to service affiliates that were pre-approved | All other fees and services to service affiliates that did not require pre-approval | All fees and services to the Registrant that were pre-approved | All fees and services to service affiliates that were pre-approved | All other fees and services to service affiliates that did not require pre-approval |
| (a) | Audit Fees | $751,300 | $0 | N/A | $623,800 | $0 | N/A |
| (b) | Audit-Related Fees | $0 | $0 | N/A | $0 | $0 | N/A |
| (c) | Tax Fees(1) | $130,900 | $0 | N/A | $112,157 | $0 | N/A |
| (d) | All Other Fees | $6,531 | $0 | N/A | $0 | $0 | N/A |
Notes:
(1) These services included tax return preparation and tax compliance for the Funds.
(e)(1) Pursuant to the requirements of the Sarbanes-Oxley Act of 2002, the SEC adopted Rule 2-01 under Regulation S-X, which, among other things, requires a fund’s audit committee to pre-approve certain audit and non-audit services that are provided by its independent auditors in order to ensure the auditors’ independence. The Registrant’s Board of Trustees has established an Audit Committee that has been charged with, among other things, assisting the Board of Trustees in its oversight of: the Registrant’s independent auditors; preapproving all audit and non-audit services provided by the Registrant’s independent auditors; the integrity of the Funds’ financial statements; the independent auditors’ qualifications and independence; and the use of appropriate accounting principles.
(e)(2) Percentage of fees billed applicable to non-audit services approved pursuant to the “de minimis” exception of Rule 2-01(c)(7)(i)(C) were as follows for KPMG:
| | 2023 | 2022 |
Audit-Related Fees | 0% | 0% |
| Tax Fees | 0% | 0% |
All Other Fees | 0% | 0% |
(f) Not applicable.
(g) The aggregate non-audit fees and services billed by KPMG for the last two fiscal years were $0 and $0, respectively.
(h) During the past fiscal year, all non-audit services provided by the Registrant’s principal accountant to either the Registrant’s investment adviser or to entities controlling, controlled by, or under common control with the Registrant’s investment adviser that provides ongoing services to the Registrant were pre-approved by the Audit Committee of the Registrant’s Board of Trustees. Included in the audit committee’s pre-approval was the review and consideration as to whether the provision of these non-audit services is compatible with maintaining the principal accountant’s independence.
(i) Not applicable. The Registrant has not retained, for the preparation of the audit report on the financial statements included in the Form N-CSR, a registered public accounting firm that has a branch or office that is located in a foreign jurisdiction and that the Public Company Accounting Oversight Board (the “PCAOB”) has determined that the PCAOB is unable to inspect or investigate completely because of a position taken by an authority in the foreign jurisdiction.
(j) Not applicable. The Registrant is not a “foreign issuer,” as defined in 17 CFR 240.3b-4.
Item 5. Audit Committee of Listed Registrants.
(a) The Registrant has a separately-designated standing Audit Committee, which is composed of the Registrant’s Independent Trustees, Messrs. Patrick Campo, John Ferguson and Matthew Stroyman.
(b) Not applicable.
Item 6. Investments.
(a) The Schedule of Investments is included as part of the Report to Shareholders filed under Item 1 of this form.
(b) Not applicable.
Item 7. Disclosure of Proxy Voting Policies and Procedures for Closed-End Management Investment Companies.
Not applicable.
Item 8. Portfolio Managers of Closed-End Management Investment Companies.
Not applicable.
Item 9. Purchases of Equity Securities by Closed-End Management Investment Company and Affiliated Purchasers.
Not applicable.
Item 10. Submission of Matters to a Vote of Security Holders.
There have been no changes to the procedures by which shareholders may recommend nominees to the Registrant’s Board of Trustees during the period covered by this report.
Item 11. Controls and Procedures.
(a) The Registrant’s principal executive and principal financial officers, or persons performing similar functions, have concluded that the Registrant’s disclosure controls and procedures (as defined in Rule 30a-3(c) under the Act (17 CFR § 270.30a-3(c)) as of a date within 90 days of the filing date of the report, are effective based on the evaluation of these controls and procedures required by Rule 30a-3(b) under the Act (17 CFR § 270.30a-3(b)) and Rules 13a-15(b) or 15d-15(b) under the Securities Exchange Act of 1934 (17 CFR § 240.13a-15(b) or § 240.15d-15(b)).
(b) There has been no change in the Registrant’s internal control over financial reporting (as defined in Rule 30a-3(d) under the Act (17 CFR § 270.30a-3(d)) that occurred during the period covered by this report that has materially affected, or is reasonably likely to materially affect, the Registrant’s internal control over financial reporting.
Item 12. Disclosure of Securities Lending Activities for Closed-End Management Investment Companies.
Not applicable.
Items 13. Exhibits.
(a)(1) Code of Ethics filed herewith.
(a)(2) A certification for the principal executive officer and the principal financial officer of the Registrant as required by Rule 30a-2(a) under the Act (17 CFR 270.30a-2(a)), is filed herewith.
(a)(3) Not applicable to the Registrant.
(a)(4) Not applicable to the Registrant.
(b) Officer certification filed herewith.
SIGNATURES
Pursuant to the requirements of the Securities Exchange Act of 1934 and the Investment Company Act of 1940, the Registrant has duly caused this report to be signed on its behalf by the undersigned, thereunto duly authorized.
| (Registrant) | KraneShares Trust |
| | |
| By (Signature and Title) | /s/ Jonathan Krane |
| | Jonathan Krane |
| | Principal Executive Officer |
Date: June 9, 2023
Pursuant to the requirements of the Securities Exchange Act of 1934 and the Investment Company Act of 1940, this report has been signed below by the following persons on behalf of the Registrant and in the capacities and on the dates indicated.
| By (Signature and Title) | /s/ Jonathan Krane |
| | Jonathan Krane |
| | Principal Executive Officer |
Date: June 9, 2023
| By (Signature and Title) | /s/ Jonathan Krane |
| | Jonathan Krane |
| | Principal Financial Officer |
Date: June 9, 2023