UNITED STATES
SECURITIES AND EXCHANGE COMMISSION
Washington, D.C. 20549
FORM N-CSR
CERTIFIED SHAREHOLDER REPORT OF REGISTERED MANAGEMENT
INVESTMENT COMPANIES
Investment Company Act File Number 811-22698
KraneShares Trust
(Exact name of registrant as specified in charter)
280 Park Avenue, 32nd Floor
New York, New York 10017
(Address of principal executive offices) (Zip code)
Jonathan Krane
KraneShares Trust
280 Park Avenue, 32nd Floor
New York, New York 10017
(Name and address of agent for service)
Copy to:
Stacy L. Fuller
K&L Gates LLP
1601 K Street NW
Washington, DC 20006-1600
Registrant’s telephone number, including area code: (212) 933-0393
Date of fiscal year end: March 31, 2024
Date of reporting period: March 31, 2024
Form N-CSR is to be used by management investment companies to file reports with the Commission not later than 10 days after the transmission to stockholders of any report that is required to be transmitted to stockholders under Rule 30e-1 under the Investment Company Act of 1940 (17 CFR 270.30e-1). The Commission may use the information provided on Form N-CSR in its regulatory, disclosure review, inspection, and policymaking roles.
A registrant is required to disclose the information specified by Form N-CSR, and Commission will make this information public. A registrant is not required to respond to the collection of information contained in Form N-CSR unless the Form displays a currently valid Office of Management and Budget (“OMB”) control number. Please direct comments concerning the accuracy of the information collection burden estimate and any suggestions for reducing the burden to Secretary, Securities and Exchange Commission, 450 Fifth Street, NW, Washington, DC 20549-0609. The OMB has reviewed this collection of information under the clearance requirements of 44 U.S.C. § 3507.
Item 1. Reports to Stockholders.
| (a) | A copy of the report transmitted to stockholders pursuant to Rule 30e-1 under the Investment Company Act, as amended (the “Act”) [17 CFR § 270.30e-1], is attached hereto. |
| | Annual Report Quadratic Interest Rate Volatility and Inflation Hedge ETF Quadratic Deflation ETF March 31, 2024 | | |
Table of Contents
The Funds file their complete schedules of Fund holdings with the Securities and Exchange Commission (the “Commission”) for the first and third quarters of each fiscal year as an exhibit to their reports on Form N-PORT. The Funds’ Form N-PORT reports are available on the Commission’s website at https://www.sec.gov.
A description of the policies and procedures that KraneShares Trust uses to determine how to vote proxies relating to Fund securities, as well as information relating to how the Funds voted proxies relating to Fund securities during the most recent 12-month year ended June 30, are available (i) without charge, upon request, by calling 855-857-2638; and (ii) on the Commission’s website at https://www.sec.gov.
Fund shares may only be purchased or redeemed from a Fund in Creation Unit aggregations. Investors who cannot transact in Creation Units of a Fund’s shares must buy or sell Fund shares in the secondary market at their market price, which may be at a premium or discount to a Fund’s net asset value, with the assistance of a broker. In doing so, the investor may incur brokerage commissions and may pay more than net asset value when buying Fund shares and receive less than net asset value when selling Fund shares.
Management Discussion of Fund Performance (Unaudited)
Quadratic Interest Rate Volatility and Inflation Hedge ETF and Quadratic Deflation ETF
Dear Shareholder:
We are pleased to present the Annual Report for the Quadratic Interest Rate Volatility and Inflation Hedge ETF (IVOL) and the Quadratic Deflation ETF (BNDD, and together with IVOL, the “Funds”) for the fiscal period ending March 31, 2024.
IVOL is a fixed income ETF that seeks to hedge relative interest rate movements, whether these movements arise from falling short-term interest rates or rising long-term interest rates, and to benefit from market stress when fixed income volatility increases, while providing the potential for enhanced inflation-protected income.
BNDD is a fixed income ETF that seeks to benefit from lower growth, deflation, lower or negative long-term interest rates, and/or a reduction in the spread between shorter and longer term interest rates by investing in U.S. Treasuries and options.
The Funds are actively managed and designed to help investors diversify their portfolios.
During the Funds’ fiscal year ended March 31, 2024 (“Period”), the macro environment remained challenging as global central banks sought to set monetary policy such that inflation would be brought under control without pushing economies into recession. Investors remained concerned about inflation, recession, and geopolitical events, and there was also growing alarm about the high U.S. Federal deficit and its impact on the government’s overall debt servicing costs. We do not believe that these concerns were reflected in asset prices as of the end of the Period.
The persistence of elevated inflation and the difficulty central banks have historically encountered trying to lower it remain a concern in many economies around the world, including the United States (“U.S.”). For this reason, governments and central banks, including the Federal Reserve (“the Fed”) hiked interest rates aggressively during the Period. As a result, inflation slowly trended toward the Fed’s inflation target, and markets began to try to identify when the Fed might begin cutting rates. While some investors remained concerned about the persistence of inflation, others became more concerned about long-term growth and the potential for deflation.
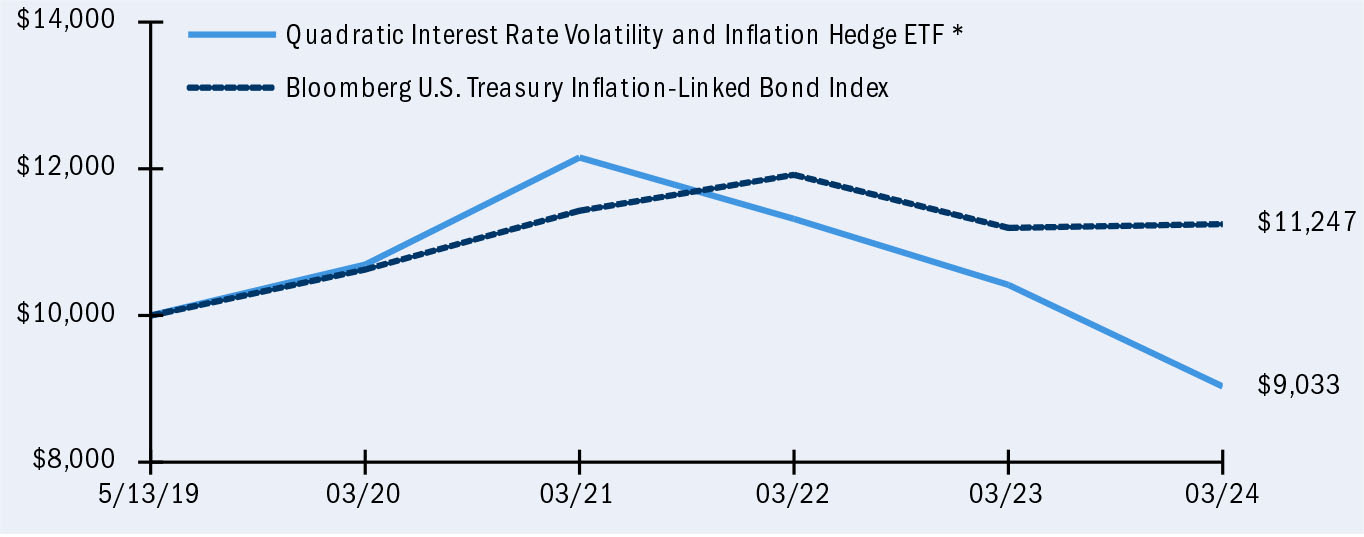
During the Period, IVOL underperformed a portfolio of TIPS, represented by the Bloomberg US Treasury Inflation-Linked Bond Index*. This was a result of IVOL’s options positions losing value due to the deep and prolonged inversion of the yield curve. As the yield curve remained inverted for the longest period in U.S. history, IVOL’s performance was negatively impacted. Historically, the yield curve has been mean-reverting. If and when the forward curve resumes its upward slope, which we believe it will, the options in IVOL should gain in value.
BNDD significantly outperformed a portfolio composed entirely of long dated Treasury bonds during the Period, represented by the Bloomberg Long U.S. Treasury Index*. This was largely due to BNDD’s options exposure, which benefited from the market’s expectations that disinflationary trends will continue and inflation will be low in the coming years. BNDD owns options related to the spread between shorter and longer term interest rates. Its options are designed to increase in value in times of lower growth, deflation, and lower or negative long-term interest rates. During the Period, the long-lasting inversion of the yield curve caused the options owned by BNDD to increase in value, allowing it to outperform a portfolio of only long dated Treasuries. The absolute return of the Fund was nevertheless negative for the Period due to the negative performance of the long-dated Treasury bonds held by the Fund.
Management Discussion of Fund Performance (Unaudited) (concluded)
Quadratic Interest Rate Volatility and Inflation Hedge ETF and Quadratic Deflation ETF (concluded)
We are grateful for your trust and proud of our efforts to help diversify investor portfolios by providing exposure to these innovative fixed income strategies. Thank you for investing with us.
| * | The fund strategy is benchmark agnostic, and this index is provided for comparative purposes. |
Management Discussion of Fund Performance (Unaudited)
Quadratic Interest Rate Volatility and Inflation Hedge ETF
Growth of a $10,000 Investment‡
(at Net Asset Value)‡
AVERAGE ANNUAL TOTAL RETURNS FOR THE PERIOD ENDED MARCH 31, 2024*
| | | One Year
Return | | | Three Year
Return | | | Annualized
Inception to Date | |
| | | Net
Asset
Value | | | Market
Price^ | | | Net
Asset
Value | | | Market
Price^ | | | Net
Asset
Value | | | Market
Price^ | |
| Quadratic Interest Rate Volatility and Inflation Hedge ETF | | | -13.30 | % | | | -13.63 | %‡ | | | -9.42 | %‡ | | | -9.58 | %‡ | | | -2.06 | %‡ | | | -2.09 | %‡ |
| Bloomberg U.S. Treasury Inflation-Linked Bond Index** | | | N/A | | | | 0.45 | %‡ | | | N/A | | | | -0.53 | %‡ | | | N/A | | | | 2.43 | %‡ |
| * | The Fund’s inception date was on May 13, 2019. Since shares of the Fund did not trade in the secondary market until after the Fund’s inception date, for the period from inception date to the first day of secondary market trading in shares of the Fund, the net asset value of the Fund is used as a proxy for the secondary market trading price to calculate market price returns. |
| ** | The Bloomberg US Treasury Inflation-Linked Bond Index measures the performance of the US Treasury Inflation Protected Securities (TIPS) market. Federal Reserve holdings of US TIPS are not index eligible and are excluded from the face amount outstanding of each bond in the index. The US TIPS Index is a subset and the largest component of the Global Inflation-Linked Bond Index. US TIPS are not eligible for other Bloomberg nominal Treasury or broad-based aggregate bond indices. The US TIPS Index was launched in March 1997. |
| ‡ | Unaudited. |
| ^ | Beginning December 23, 2020, market price returns are based on the official closing price of an ETF share or, if it more accurately reflects the market value of an ETF share at the time as of which the ETF calculates current NAV per share, the midpoint between the national best bid and national best offer (“NBBO”) as of that time. Prior to that date, market price returns were based on the midpoint between the Bid and Ask price. NAVs are calculated using prices as of 4:00 PM Eastern Time. |
The performance data quoted herein represents past performance and the return and value of an investment in the Fund will fluctuate so that, when redeemed, may be worth less than its original cost. Current performance may be lower or higher than the performance data quoted. Past performance is no guarantee of future performance and should not be considered as a representation of the future results of the Fund. For performance data current to the most recent month end, please call (855-857-2638) or visit www.kraneshares.com. The Fund’s performance assumes the reinvestment of all dividends and all capital gains. Index returns assume reinvestment
Management Discussion of Fund Performance (Unaudited) (continued)
Quadratic Interest Rate Volatility and Inflation Hedge ETF (concluded)
of dividends and, unlike a Fund’s returns, do not reflect any fees or expenses. If such fees and expenses were included in the index returns, the performance would have been lower. As stated in the Fund’s prospectus as supplemented, the Fund’s operating expense ratio is 1.03%. Please note that one cannot invest directly in an unmanaged index. There are no assurances that the Fund will meet its stated objectives. The Fund’s holdings and allocations are subject to change and should not be considered recommendations to buy individual securities. For further information on the Fund’s objectives, risks, and strategies, see the Fund’s prospectus. Returns shown do not reflect the deduction of taxes that a shareholder would pay on Fund distributions or the redemption of Fund shares.
Management Discussion of Fund Performance (Unaudited) (continued)
Quadratic Deflation ETF
Growth of a $10,000 Investment‡
(at Net Asset Value)‡

AVERAGE ANNUAL TOTAL RETURNS FOR THE PERIOD ENDED MARCH 31, 2024*
| | | One Year
Return | | | Annualized
Inception to Date | |
| | | Net
Asset
Value | | | Market
Price^ | | | Net
Asset
Value | | | Market
Price^ | |
| Quadratic Deflation ETF | | | -1.08 | % | | | -1.27 | %‡ | | | -3.54 | %‡ | | | -3.60 | %‡ |
| Bloomberg Long U.S. Treasury Index** | | | N/A | | | | -6.08 | %‡ | | | N/A | | | | -13.32 | %‡ |
| * | The Fund’s inception date was on September 20, 2021. Since shares of the Fund did not trade in the secondary market until after the Fund’s inception date, for the period from inception date to the first day of secondary market trading in shares of the Fund, the net asset value of the Fund is used as a proxy for the secondary market trading price to calculate market price returns. |
| ** | The Bloomberg Long U.S. Treasury Index measures US dollar-denominated, fixed rate, nominal debt issued by the US Treasury with 10 years or more to maturity. |
| ‡ | Unaudited. |
| ^ | Beginning December 23, 2020, market price returns are based on the official closing price of an ETF share or, if it more accurately reflects the market value of an ETF share at the time as of which the ETF calculates current NAV per share, the midpoint between the national best bid and national best offer (“NBBO”) as of that time. Prior to that date, market price returns were based on the midpoint between the Bid and Ask price. NAVs are calculated using prices as of 4:00 PM Eastern Time |
The performance data quoted herein represents past performance and the return and value of an investment in the Fund will fluctuate so that, when redeemed, may be worth less than its original cost. Current performance may be lower or higher than the performance data quoted. Past performance is no guarantee of future performance and should not be considered as a representation of the future results of the Fund. For performance data current to the most recent month end, please call (855-857-2638) or visit www.kraneshares.com. The Fund’s performance assumes the reinvestment of all dividends and all capital gains. Index returns assume reinvestment of dividends and, unlike a Fund’s returns, do not reflect any fees or expenses. If such fees and expenses were included in the index returns, the performance would have been lower. As stated in the Fund’s prospectus as supplemented, the Fund’s operating expense ratio is 1.04%. Please note that one cannot invest directly in an unmanaged index. There are no assurances that the Fund will meet its stated objectives. The Fund’s holdings and allocations are subject to change and should not be considered recommendations to buy individual securities. For further information on the
Management Discussion of Fund Performance (Unaudited) (concluded)
Quadratic Deflation ETF (concluded)
Fund’s objectives, risks, and strategies, see the Fund’s prospectus. Returns shown do not reflect the deduction of taxes that a shareholder would pay on Fund distributions or the redemption of Fund shares.
Schedule of Investments March 31, 2024
Quadratic Interest Rate Volatility and Inflation Hedge ETF

| | | Shares | | | Value | |
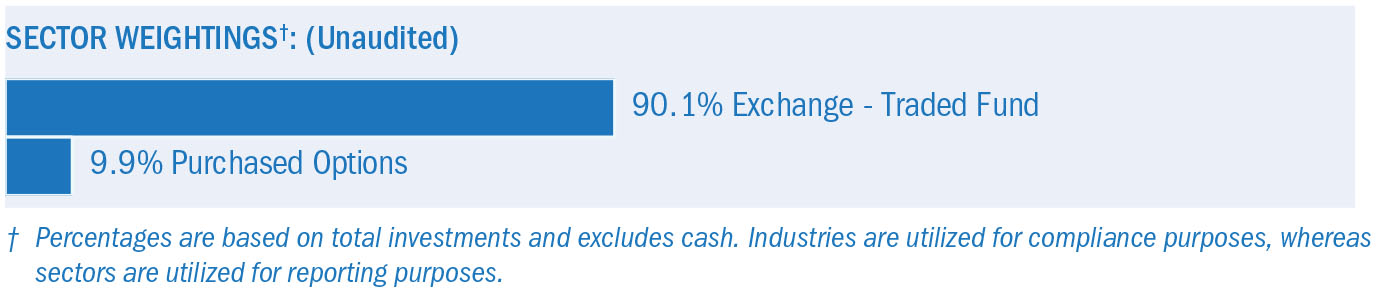
| EXCHANGE - TRADED FUND — 81.0% | | | | | | | | |
| Schwab US TIPS ETF ‡ | | | 12,277,579 | | | $ | 640,398,521 | |
TOTAL EXCHANGE - TRADED FUND
(Cost $743,715,908) | | | | | | | 640,398,521 | |
| | | | | | | | | |
| PURCHASED OPTIONS(A) — 11.4% | | | | | | | | |
TOTAL PURCHASED OPTIONS
(Cost $195,387,500) | | | | | | | 90,125,718 | |
| | | | | | | | | |
TOTAL INVESTMENTS — 92.4%
(Cost $939,103,408) | | | | | | | 730,524,239 | |
| OTHER ASSETS LESS LIABILITIES – 7.6% | | | | | | | 59,974,402 | |
| NET ASSETS - 100% | | | | | | $ | 790,498,641 | |
| ‡ | For financial information on the Schwab US TIPS ETF, please go to the Commission’s website at https:// www.sec.gov. |
| (A) | Refer to option table below. |
A list of open option contracts held by the Fund as of March 31, 2024 was as follows:
| | | | | Number of | | | Notional | | | Exercise | | | Expiration | | Market | |
| Description | | Counterparty | | Contracts^ | | | Amount† | | | Price | | | Date | | Value | |
| PURCHASED OPTIONS — 11.4% | | | | | | | | | | | | | | | | | | |
| Call Options | | | | | | | | | | | | | | | | | | | | |
| CMS 10Y - 2Y | | Goldman Sachs | | | 300,000 | | | $ | 14,250,000 | | | | 0.20 | % | | 04/14/27 | | $ | 12,074,469 | |
| CMS 10Y - 2Y | | Morgan Stanley | | | 300,000 | | | | 13,837,500 | | | | 0.10 | | | 07/15/26 | | | 12,254,474 | |
| CMS 10Y - 2Y | | Nomura | | | 500,000 | | | | 23,750,000 | | | | 0.05 | | | 04/08/26 | | | 20,426,938 | |
| CMS 10Y - 2Y | | Morgan Stanley | | | 1,075,000 | | | | 36,850,000 | | | | 0.30 | | | 11/13/24 | | | 6,569,173 | |
| CMS 10Y - 2Y | | Morgan Stanley | | | 200,000 | | | | 9,500,000 | | | | 0.28 | | | 12/09/26 | | | 7,048,059 | |
| CMS 10Y - 2Y | | Goldman Sachs | | | 350,000 | | | | 18,637,500 | | | | 0.08 | | | 09/17/25 | | | 10,940,822 | |
| CMS 10Y - 2Y | | Morgan Stanley | | | 250,000 | | | | 10,937,500 | | | | 0.03 | | | 01/28/26 | | | 9,921,669 | |
| CMS 10Y - 2Y | | Goldman Sachs | | | 400,000 | | | | 18,200,000 | | | | 0.27 | | | 03/13/25 | | | 5,697,600 | |
| CMS 10Y - 2Y | | Nomura | | | 200,000 | | | | 7,600,000 | | | | 0.13 | | | 06/25/25 | | | 5,040,924 | |
| CMS 10Y - 2Y | | Goldman Sachs | | | 1,550,000 | | | | 41,825,000 | | | | 0.48 | | | 06/19/24 | | | 151,590 | |
| Total Purchased Options | | | | | | | | $ | 195,387,500 | | | | | | | | | $ | 90,125,718 | |
| † | Represents cost. |
| ^ | Value equals 10,000 x Number of Contracts x Market Price |
The accompanying notes are an integral part of the financial statements.
Schedule of Investments March 31, 2024
Quadratic Interest Rate Volatility and Inflation Hedge ETF (concluded)
The following summarizes the market value of the Fund’s investments and other financial instruments used as of March 31, 2024, based on the inputs used to value them:
| Investments in Securities | | Level 1 | | | Level 2 | | | Level 3 | | | Total | |
| Exchange - Traded Fund | | $ | 640,398,521 | | | $ | — | | | $ | — | | | $ | 640,398,521 | |
| Purchased Options | | | — | | | | 90,125,718 | | | | — | | | | 90,125,718 | |
| Total Investments in Securities | | $ | 640,398,521 | | | $ | 90,125,718 | | | $ | — | | | $ | 730,524,239 | |
Amounts designated as “—” are $0.
See “Glossary” for abbreviations.
The accompanying notes are an integral part of the financial statements.
Schedule of Investments March 31, 2024
Quadratic Deflation ETF
| | | Shares | | | Value | |
| EXCHANGE - TRADED FUND — 76.1% | | | | | | | | |
| Vanguard Long-Term Treasury ETF ‡ | | | 385,694 | | | $ | 22,848,513 | |
TOTAL EXCHANGE - TRADED FUND
(Cost $34,687,900) | | | | | | | 22,848,513 | |
| | | | | | | | | |
| PURCHASED OPTIONS(A) — 8.4% | | | | | | | | |
TOTAL PURCHASED OPTIONS
(Cost $2,600,500) | | | | | | | 2,501,720 | |
| | | | | | | | | |
TOTAL INVESTMENTS — 84.5%
(Cost $37,288,400) | | | | | | | 25,350,233 | |
| OTHER ASSETS LESS LIABILITIES – 15.5% | | | | | | | 4,665,810 | |
| NET ASSETS - 100% | | | | | | $ | 30,016,043 | |
| ‡ | For financial information on the Vanguard Long-Term Treasury ETF, please go to the Commission’s website at https://www.sec.gov. |
| (A) | Refer to option table below. |
A list of open option contracts held by the Fund as of March 31, 2024 was as follows:
| | | | | Number of | | | Notional | | | Exercise | | | Expiration | | Market | |
| Description | | Counterparty | | Contracts^ | | | Amount† | | | Price | | | Date | | Value | |
| PURCHASED OPTIONS — 8.4% | | | | | | | | | | | | | | | | | | |
| Put Options | | | | | | | | | | | | | | | | | | | | |
| CMS 30Y – 2Y | | Goldman Sachs | | | 30,000 | | | $ | 1,080,000 | | | | (0.07 | )% | | 12/18/24 | | $ | 1,512,823 | |
| CMS 30Y – 2Y | | Goldman Sachs | | | 15,000 | | | | 843,000 | | | | (0.30 | ) | | 03/12/25 | | | 528,990 | |
| CMS 30Y – 2Y | | Nomura | | | 20,000 | | | | 677,500 | | | | (0.65 | ) | | 05/07/24 | | | 459,907 | |
| Total Purchased Options | | | | | | | | $ | 2,600,500 | | | | | | | | | $ | 2,501,720 | |
| † | Represents cost. |
| ^ | Value equals 10,000 x Number of Contracts x Market Price |
The accompanying notes are an integral part of the financial statements.
Schedule of Investments March 31, 2024
Quadratic Deflation ETF (concluded)
The following summarizes the market value of the Fund’s investments used as of March 31, 2024, based on the inputs used to value them:
| Investments in Securities | | Level 1 | | | Level 2 | | | Level 3 | | | Total | |
| Exchange - Traded Fund | | $ | 22,848,513 | | | $ | — | | | $ | — | | | $ | 22,848,513 | |
| Purchased Options | | | — | | | | 2,501,720 | | | | — | | | | 2,501,720 | |
| Total Investments in Securities | | $ | 22,848,513 | | | $ | 2,501,720 | | | $ | — | | | $ | 25,350,233 | |
Amounts designated as “—” are $0.
See “Glossary” for abbreviations.
The accompanying notes are an integral part of the financial statements.
Schedule of Investments March 31, 2024
Glossary (abbreviations which may be used in preceding Schedule of Investments):
Fund Abbreviations
CMS — Constant Maturity Swap
ETF — Exchange-Traded Fund
Statements of Assets and Liabilities
March 31, 2024
| | | Quadratic Interest
Rate Volatility and
Inflation Hedge ETF | | | Quadratic
Deflation ETF | |
| Assets: | | | | | | | | |
| Investments at Value | | $ | 730,524,239 | | | $ | 25,350,233 | |
| Cash and Cash Equivalents | | | 60,538,268 | | | | 4,675,944 | |
| Dividend and Interest Receivable | | | 127,020 | | | | 18,975 | |
| Total Assets | | | 791,189,527 | | | | 30,045,152 | |
| | | | | | | | | |
| Liabilities: | | | | | | | | |
| Payable for Management Fees | | | 682,812 | | | | 28,724 | |
| Payable for Trustees’ Fees | | | 8,074 | | | | 385 | |
| Total Liabilities | | | 690,886 | | | | 29,109 | |
| Net Assets | | $ | 790,498,641 | | | $ | 30,016,043 | |
| | | | | | | | | |
| Net Assets Consist of: | | | | | | | | |
| Paid-in Capital | | $ | 1,032,355,184 | | | $ | 45,618,179 | |
| Total Distributable Loss | | | (241,856,543 | ) | | | (15,602,136 | ) |
| Net Assets | | $ | 790,498,641 | | | $ | 30,016,043 | |
| Outstanding Shares of Beneficial Interest (unlimited authorization - no par value) | | | 41,700,002 | | | | 2,000,002 | |
| Net Asset Value, Offering and Redemption Price Per Share | | $ | 18.96 | | | $ | 15.01 | |
| Cost of Investments | | $ | 939,103,408 | | | $ | 37,288,400 | |
Amounts designated as “—” are $0.
The accompanying notes are an integral part of the financial statements.
Statements of Operations
For the year ended March 31, 2024
| | | Quadratic Interest
Rate Volatility and
Inflation Hedge ETF | | | Quadratic
Deflation ETF | |
| Investment Income: | | | | | | | | |
| Dividend Income | | $ | 21,553,293 | | | $ | 1,621,256 | |
| Interest Income | | | 2,182,098 | | | | 406,381 | |
| Total Investment Income | | | 23,735,391 | | | | 2,027,637 | |
| | | | | | | | | |
| Expenses: | | | | | | | | |
| Management Fees† | | | 8,673,582 | | | | 582,067 | |
| Trustees’ Fees | | | 87,138 | | | | 5,355 | |
| Insurance Expense | | | 12,194 | | | | 468 | |
| Total Expenses | | | 8,772,914 | | | | 587,890 | |
| Management Fee Waiver† | | | — | | | | (12,880 | ) |
| Net Expenses | | | 8,772,914 | | | | 575,010 | |
| Net Investment Income | | | 14,962,477 | | | | 1,452,627 | |
| | | | | | | | | |
| Net Realized Gain (Loss) on: | | | | | | | | |
| Investments | | | (22,171,319 | ) | | | (3,258,707 | ) |
| Purchased Options | | | (97,841,250 | ) | | | 185,750 | |
| Net Realized Loss | | | (120,012,569 | ) | | | (3,072,957 | ) |
| | | | | | | | | |
| Net Change in Unrealized Appreciation (Depreciation) on: | | | | | | | | |
| Investments | | | 2,382,124 | | | | (2,688,277 | ) |
| Purchased Options | | | (11,033,441 | ) | | | 1,048,817 | |
| Net Change in Unrealized Appreciation (Depreciation) | | | (8,651,317 | ) | | | (1,639,460 | ) |
| Net Realized and Unrealized Loss | | | (128,663,886 | ) | | | (4,712,417 | ) |
| Net Decrease in Net Assets Resulting from Operations | | $ | (113,701,409 | ) | | $ | (3,259,790 | ) |
| † | See Note 3 in Notes to Financial Statements. |
Amounts designated as “—” are $0.
The accompanying notes are an integral part of the financial statements.
Statements of Changes in Net Assets
| | | Quadratic Interest Rate Volatility
and Inflation Hedge ETF | |
| | | Year Ended
March 31,
2024 | | | Year Ended
March 31,
2023 | |
| Operations: | | | | | | | | |
| Net Investment Income | | $ | 14,962,477 | | | $ | 62,269,660 | |
| Net Realized Loss | | | (120,012,569 | ) | | | (262,020,148 | ) |
| Net Change in Unrealized Appreciation (Depreciation) | | | (8,651,317 | ) | | | 60,840,248 | |
| Net Decrease in Net Assets Resulting from Operations | | | (113,701,409 | ) | | | (138,910,240 | ) |
| Return of Capital: | | | (31,848,020 | ) | | | (45,477,586 | ) |
| | | | | | | | | |
| Capital Share Transactions:(1) | | | | | | | | |
| Issued | | | 449,171,784 | | | | 237,513,555 | |
| Redeemed | | | (299,178,909 | ) | | | (1,004,612,436 | ) |
| Increase (Decrease) in Net Assets from Capital Share Transactions | | | 149,992,875 | | | | (767,098,881 | ) |
| Total Increase (Decrease) in Net Assets | | | 4,443,446 | | | | (951,486,707 | ) |
| | | | | | | | | |
| Net Assets: | | | | | | | | |
| Beginning of Year | | | 786,055,195 | | | | 1,737,541,902 | |
| End of Year | | $ | 790,498,641 | | | $ | 786,055,195 | |
| | | | | | | | | |
| Share Transactions: | | | | | | | | |
| Issued | | | 21,650,000 | | | | 9,800,000 | |
| Redeemed | | | (14,625,000 | ) | | | (43,175,000 | ) |
| Net Increase (Decrease) in Shares Outstanding from Share Transactions | | | 7,025,000 | | | | (33,375,000 | ) |
| (1) | Includes transaction costs related to creations and redemptions. |
Amounts designated as “—” are $0.
The accompanying notes are an integral part of the financial statements.
Statements of Changes in Net Assets (concluded)
| | | Quadratic Deflation ETF | |
| | | Year Ended
March 31,
2024 | | | Year Ended
March 31,
2023 | |
| Operations: | | | | | | | | |
| Net Investment Income | | $ | 1,452,627 | | | $ | 903,425 | |
| Net Realized Loss | | | (3,072,957 | ) | | | (13,286,332 | ) |
| Net Change in Unrealized Appreciation (Depreciation) | | | (1,639,460 | ) | | | (5,119,712 | ) |
| Net Decrease in Net Assets Resulting from Operations | | | (3,259,790 | ) | | | (17,502,619 | ) |
| Distributions: | | | (2,094,154 | ) | | | (13,991,230 | ) |
| Return of Capital: | | | (271,781 | ) | | | — | |
| | | | | | | | | |
| Capital Share Transactions:(1) | | | | | | | | |
| Issued | | | 109,412,230 | | | | 95,591,053 | |
| Redeemed | | | (162,408,103 | ) | | | (114,453,674 | ) |
| Decrease in Net Assets from Capital Share Transactions | | | (52,995,873 | ) | | | (18,862,621 | ) |
| Total Decrease in Net Assets | | | (58,621,598 | ) | | | (50,356,470 | ) |
| | | | | | | | | |
| Net Assets: | | | | | | | | |
| Beginning of Year | | | 88,637,641 | | | | 138,994,111 | |
| End of Year | | $ | 30,016,043 | | | $ | 88,637,641 | |
| | | | | | | | | |
| Share Transactions: | | | | | | | | |
| Issued | | | 7,125,000 | | | | 5,350,000 | |
| Redeemed | | | (10,725,000 | ) | | | (5,150,000 | ) |
| Net Increase (Decrease) in Shares Outstanding from Share Transactions | | | (3,600,000 | ) | | | 200,000 | |
| (1) | Includes transaction costs related to creations and redemptions. |
Amounts designated as “—” are $0.
The accompanying notes are an integral part of the financial statements.
Financial Highlights
Selected Per Share Data & Ratios
For the Years/Periods Ended March 31
For a Share Outstanding Throughout Each Period
| | | Net Asset
Value,
Beginning of
Period
($) | | Net Investment
Income (Loss)
($)* | | Net Realized and
Unrealized Gain (Loss)
on Investments
($) | | Total
from
Operations
($) | | Distribution
from Net
Investment
Income
($) | | Return of
Capital
($) |
| Quadratic Interest Rate Volatility and Inflation Hedge ETF |
| 2024 | | 22.67 | | 0.36 | | (3.32) | | (2.96) | | — | | (0.75) |
| 2023 | | 25.53 | | 1.15 | | (3.16) | | (2.01) | | — | | (0.85) |
| 2022 | | 28.47 | | 0.93 | | (2.84) | | (1.91) | | (0.82) | | (0.21) |
| 2021 | | 25.97 | | (0.02) | | 3.51 | | 3.49 | | (0.90) | | (0.09) |
| 2020(1) | | 25.00 | | 0.17 | | 1.54 | | 1.71 | | (0.51) | | (0.23) |
| Quadratic Deflation ETF |
| 2024 | | 15.83 | | 0.37 | | (0.55) | | (0.18) | | (0.57) | | (0.07) |
| 2023 | | 25.74 | | 0.29 | | (3.79) | | (3.50) | | (6.41) | | — |
| 2022(2) | | 25.00 | | 0.03 | | 1.21(3) | | 1.24 | | (0.50) | | — |
| * | Per share data calculated using average shares method. |
| ** | Total return is based on the change in net asset value of a share during the year or period and assumes reinvestment of dividends and distributions at net asset value. Total return is for the period indicated and periods of less than one year have not been annualized. The return shown does not reflect the deduction of taxes that a shareholder would pay on Fund distributions or the redemption of Fund shares. Excludes effects of standard creation and redemption transaction fees associated with creation units. |
| ~ | During the periods, certain fees were waived. (See Note 3 in the Notes to Financial Statements). |
| † | Annualized. |
| †† | Portfolio turnover rate is for the period indicated and periods of less than one year have not been annualized. Excludes effect of in-kind transfers. |
| ‡ | The ratios of expenses and net investment income/(loss) to Average Net Assets reflect the expenses and net investment income/(loss), respectively, for the year/period as reported in the Statements of Operations and do not reflect the Fund’s proportionate share of the income and expenses from investments in other investment companies. |
| (1) | The Fund’s inception date was on May 13, 2019. |
| (2) | The Fund’s inception date was on September 20, 2021. |
| (3) | Realized and unrealized gains and losses per share are balancing amounts necessary to reconcile the change in net asset value per share for the period, and may not reconcile with the aggregate gains and losses in the Statement of Operations due to share transactions for the period. |
Amounts designated as “—” are $0 or have been rounded to $0.
The accompanying notes are an integral part of the financial statements.
Total from
Distributions
($) | | Net Asset
Value, End
of Period
($) | | Total Return
(%)** | | Net Assets,
End of Period
($)(000) | |
Ratio of
Expenses to
Average Net
Assets
(%)~ | | Ratio of Expenses
to Average Net
Assets (Excluding
Waivers, as
applicable)
(%)~ | | Ratio of Net
Investment
Income (Loss)
to Average Net
Assets
(%) | | Portfolio
Turnover
(%) |
| | | | | | | | | | | | | | | |
| (0.75) | | 18.96 | | (13.30) | | 790,499 | | 1.00‡ | | 1.00‡ | | 1.71‡ | | — | |
| (0.85) | | 22.67 | | (7.95) | | 786,055 | | 1.00‡ | | 1.00‡ | | 4.82‡ | | — | |
| (1.03) | | 25.53 | | (6.88) | | 1,737,542 | | 0.98‡ | | 0.99‡ | | 3.38‡ | | — | |
| (0.99) | | 28.47 | | 13.65 | | 2,629,858 | | 0.94‡ | | 0.99‡ | | (0.06)‡ | | — | |
| (0.74) | | 25.97 | | 6.95 | | 100,647 | | 0.97†‡ | | 1.02†‡ | | 0.78†‡ | | — | †† |
| | | | | | | | | | | | | | | | |
| (0.64) | | 15.01 | | (1.08) | | 30,016 | | 0.98‡ | | 1.00‡ | | 2.48‡ | | — | |
| (6.41) | | 15.83 | | (12.08) | | 88,638 | | 0.95‡ | | 1.00‡ | | 1.37‡ | | — | |
| (0.50) | | 25.74 | | 4.97 | | 138,994 | | 0.94†‡ | | 0.99†‡ | | 0.24†‡ | | — | †† |
The accompanying notes are an integral part of the financial statements.
Notes to Financial Statements
1. ORGANIZATION
KraneShares Trust (the “Trust”) is a Delaware Statutory Trust formed on February 3, 2012. The Trust is registered under the Investment Company Act of 1940, as amended (the “Investment Company Act”), as an open-end management investment company. As of March 31, 2024, the Trust had twenty-eight operational series. The financial statements herein and the related notes pertain to the Quadratic Interest Rate Volatility and Inflation Hedge ETF and the Quadratic Deflation ETF, (each, a “Fund” and collectively, the “Funds”). The Funds are non-diversified Funds, as defined under Section 5(b)(1) of the Investment Company Act. Krane Funds Advisors, LLC (“Krane” or the “Adviser”), a Delaware limited liability company, serves as the investment adviser for the Funds and is subject to the supervision of the Board of Trustees (the “Board”). Quadratic Capital Management LLC (“Quadratic” or “Sub-Adviser”) serves as the sub-adviser to the Funds and is responsible for the day-to-day management of the Funds.
China International Capital Corporation (USA) Holdings Inc., a wholly-owned, indirect subsidiary of China International Capital Corporation Limited owns a majority stake in Krane. As of March 31, 2024, Central Huijin Investment Limited, a mainland Chinese-domiciled entity, and HKSCC Nominees Limited, held approximately 40.1% and 39.4%, respectively, of the shares of China International Capital Corporation Limited. Central Huijin Investment Limited is a wholly-owned subsidiary of China Investment Corporation, which is a mainland Chinese sovereign wealth fund. KFA One Holdings, LLC, located at 280 Park Avenue 32nd Floor, New York, New York, 10017, holds the remaining equity interests in Krane and Jonathan Krane, through his equity interests in KFA One Holdings, LLC, beneficially owns more than 10% of the equity interests in Krane.
Shares of the Funds are listed and traded on the NYSE Arca, Inc. (the “Exchange”). Market prices for Fund shares (“Shares”) may be different from their net asset value (“NAV”). The Funds issue and redeem Shares on a continuous basis at NAV only in large blocks of Shares, typically 25,000 Shares or multiples thereof, called “Creation Units”. This does not mean, however, that individual investors will be able to redeem and purchase Shares directly with the series of the Trust. Only Authorized Participants can redeem and purchase Creation Units of Shares directly. Each Fund will issue and redeem Shares for a basket of securities and/or a balancing cash amount. Individual shares trade in the secondary market at market prices that change throughout the day.
As of March 31, 2024, all shares issued by the Funds were in Creation Units to Authorized Participants through primary market transactions (e.g., transactions directly with the Funds). However, the individual shares that make up those Creation Units are traded on the Exchange (i.e., secondary market transactions). Some of those individual shares have been bought and sold by persons that are not Authorized Participants. Each Authorized Participant has entered into an agreement with the Funds’ Distributor.
The Quadratic Interest Rate Volatility and Inflation Hedge ETF is a fixed income ETF that seeks to hedge relative interest rate movements, whether these movements arise from falling short-term interest rates or rising long-term interest rates, and to benefit from market stress when fixed income volatility increases, while providing the potential for enhanced inflation-protected income. The Fund is actively managed and does not track an index. The Fund’s investment in the Schwab US TIPS ETF represents greater than 75% of the Fund’s total investments. For further financial information, available upon request, on the Schwab US TIPS ETF, please go to the Commission’s website at https://www.sec.gov.
Notes to Financial Statements (continued)
The Quadratic Deflation ETF is a fixed income ETF that seeks to benefit from lower growth, deflation, lower or negative long-term interest rates, and/or a reduction in the spread between shorter and longer term interest rates by investing in US Treasuries and options. The Fund is actively managed and does not track an index. The Fund’s investment in the Vanguard Long-Term Treasury ETF represents greater than 75% of the Fund’s total investments. For further financial information, available upon request, on the Vanguard Long-Term Treasury ETF, please go to the Commission’s website at https://www.sec.gov.
2. SIGNIFICANT ACCOUNTING POLICIES
The following is a summary of the significant accounting policies followed by the Funds. The Funds are investment companies that apply the accounting and reporting guidance issued in Topic 946 by the U.S. Financial Accounting Standards Board (“FASB”).
USE OF ESTIMATES — The preparation of financial statements in conformity with U.S. generally accepted accounting principles (“U.S. GAAP”) requires management to make estimates and assumptions that affect the reported amounts of assets and liabilities and disclosure of contingent assets and liabilities at the date of the financial statements and the reported amounts of increases and decreases in net assets from operations during the reporting period. Actual results could differ from those estimates, and could have a material impact to the Funds.
SECURITY VALUATION — The NAV per share of each Fund is computed by dividing the value of the net assets of a Fund (i.e., the value of its total assets less total liabilities and withholdings) by the total number of shares of a Fund outstanding, rounded to the nearest cent. Expenses and fees, including without limitation, the management, administration and distribution fees, are accrued daily and taken into account for purposes of determining NAV. The NAV per share for each Fund normally is calculated by the Administrator (as defined below) and determined as of the regularly scheduled close of the normal trading on each day that the NYSE is scheduled to be open for business (normally 4:00 p.m., Eastern Time). Any assets or liabilities denominated in currencies other than the U.S. dollar are converted into U.S. dollars at the current market rates on the date of valuation as quoted by one or more sources.
Securities listed on a securities exchange (i.e. exchange-traded equity securities), market or automated quotation system for which quotations are readily available (except for securities traded on NASDAQ), including securities traded over the counter, are valued by independent pricing agents at the last reported sale price on the primary exchange or market (foreign or domestic) on which they are traded (or at the time as of which the Fund’s NAV is calculated if a security’s exchange is normally open at that time). If there is no such reported sale, such securities are valued at the most recently reported bid price. For securities traded on NASDAQ, the NASDAQ Official Closing Price will be used. If a security price cannot be obtained from an independent, third-party pricing agent, the Fund seeks to obtain bid and ask prices from two broker-dealers who make a market in the portfolio instrument and determines the average of the two.
If available, debt securities are priced based upon valuations provided by independent third-party pricing agents. Such values generally reflect the last reported sales price if the security is actively traded. The third-party pricing agents may also value debt securities at an evaluated bid price by employing methodologies that utilize actual market transactions, broker-supplied valuations, or other methodologies designed to identify the market value for such securities. Debt obligations with remaining maturities of sixty days or less may be valued at their amortized cost, which approximates market value.
Notes to Financial Statements (continued)
The prices for foreign securities are reported in local currency and converted to U.S. dollars using currency exchange rates. The exchange rates used for valuation are captured as of the close of the London Stock Exchange each day normally at 4:00 p.m. Greenwich Mean Time.
The value of a swap contract is equal to the obligation (or rights) under the swap contract, which will generally be equal to the net amounts to be paid or received under the contract based upon the relative values of the positions held by each party to the contract as determined by the applicable independent, third party pricing agent.
Exchange-traded options are valued at the closing price in the market in which they are principally traded. If no closing price is available, exchange-traded options are valued at the mean of their most recent bid and asked price, if available, and otherwise at their closing bid price. Over-the-counter (“OTC”) options are valued based upon prices determined by the applicable independent, third party pricing agent.
Futures are valued at the settlement price established by the board of trade on which they are traded. Foreign currency forward contracts are valued at the current day’s interpolated foreign exchange rate, as calculated using the current day’s spot rate and the 30-, 60-, 90- and 180-day forward rates provided by an independent pricing agent. As of and during the year ended March 31, 2024, the Funds did not hold swaps, futures or foreign currency forward contracts.
Investments in open-end investment companies that do not trade on an exchange are valued at the end of day NAV per share. Investments in open-end investment companies that trade on an exchange are valued in the same manner as other exchange-traded equity securities (described above).
Investments for which market prices are not “readily available,” or are not deemed to reflect current market values, or are debt securities where no evaluated price is available from third-party pricing agents pursuant to established methodologies, are fair valued in accordance with the Adviser’s valuation policies and procedures approved by the Board. Some of the more common reasons that may necessitate that a security be valued using “fair value” pricing may include, but are not limited to: the security’s trading has been halted or suspended; the security’s primary trading market is temporarily closed; or the security has not been traded for an extended period of time.
In addition, a Fund may fair value its securities if an event that may materially affect the value of a Fund’s securities that trade outside of the United States (a “Significant Event”) has occurred between the time of the security’s last close and the time that a Fund calculates its NAV. A Significant Event may relate to a single issuer or to an entire market sector, country or region. Events that may be Significant Events may include: government actions, natural disasters, armed conflict, acts of terrorism and significant market fluctuations. If Krane becomes aware of a Significant Event that has occurred with respect to a portfolio instrument or group of portfolio instruments after the closing of the exchange or market on which the portfolio instrument or portfolio instruments principally trade, but before the time at which a Fund calculates its NAV, it will notify the Administrator and may request that an ad hoc meeting of the Fair Value Pricing Committee be called.
With respect to trade-halted securities, the Adviser typically will fair value a trade-halted security by adjusting the security’s last market close price by the security’s sector performance, as measured by a predetermined index, unless Krane’s Fair Value Pricing Committee determines to make additional adjustments.
Notes to Financial Statements (continued)
Fair value pricing involves subjective judgments and it is possible that a fair value determination for a security is materially different than the value that could actually be realized upon the sale of the security or that another fund that uses market quotations or its own fair value procedures to price the same securities.
Trading in securities on many foreign exchanges is normally completed before the close of business on each Business Day (a “Business Day”, as used herein, is any day on which the Exchange is open for business). In addition, securities trading in a particular country or countries may not take place on each Business Day or may take place on days that are not Business Days. Changes in valuations on certain securities may occur at times or on days on which a Fund’s NAV is not calculated and on which Fund shares do not trade and sales and redemptions of shares do not occur. As a result, the value of a Fund’s portfolio securities and the net asset value of its shares may change on days when share purchases or sales cannot occur. Fund shares are purchased or sold on a national securities exchange at market prices, which may be higher or lower than NAV. Transactions in Fund shares will be priced at NAV only if shares are purchased or redeemed directly from a Fund in Creation Units. No secondary sales will be made to brokers or dealers at a concession by the Distributor or by a Fund. Purchases and sales of shares in the secondary market, which will not involve a Fund, will be subject to customary brokerage commissions and charges.
In accordance with the authoritative guidance on fair value measurements and disclosure under U.S. GAAP, the Funds disclose the fair value of their investments in a hierarchy that prioritizes the inputs to valuation techniques used to measure the fair value. The objective of a fair value measurement is to determine the price that would be received to sell an asset or paid to transfer a liability in an orderly transaction between market participants at the measurement date (an exit price). Accordingly, the fair value hierarchy gives the highest priority to quoted prices (unadjusted) in active markets for identical assets or liabilities (Level 1) and the lowest priority to unobservable inputs (Level 3). The three levels of the fair value hierarchy are described below:
Level 1 – Unadjusted quoted prices in active markets for identical, unrestricted assets or liabilities that the Funds have the ability to access at the measurement date.
Level 2 – Other significant observable inputs (including quoted prices in non-active markets, quoted prices for similar investments, fair value of investments for which the Funds have the ability to fully redeem tranches at net asset value as of the measurement date or within the near term, and short-term investments valued at amortized cost).
Level 3 – Significant unobservable inputs (including the Fund’s own assumptions in determining the fair value of investments, broker quotes, fair value of investments for which the Fund does not have the ability to fully redeem tranches at net asset value as of the measurement date or within the near term).
Investments are classified within the level of the lowest significant input considered in determining fair value. Investments classified within Level 3 whose fair value measurement considers several inputs may include Level 1 or Level 2 inputs as components of the overall fair value measurement. For details of the investment classification, refer to each Fund’s Schedule of Investments.
FEDERAL INCOME TAXES — It is each Fund’s intention to qualify or continue to qualify as a regulated investment company for federal income tax purposes by complying with the appropriate provisions of Subchapter M of the Internal Revenue Code of 1986, as amended, and to distribute annually all or substantially all of its taxable income and gains to shareholders. Accordingly, no provisions for federal income taxes have been made in the financial statements.
Notes to Financial Statements (continued)
The Funds evaluate tax positions taken or expected to be taken in the course of preparing the Funds’ tax returns to determine whether it is “more-likely-than-not” (i.e., greater than 50 percent) that each tax position will be sustained upon examination by a taxing authority based on the technical merits of the position. Tax positions not deemed to meet the more-likely-than-not threshold are recorded as a tax benefit or expense in the current year. The Funds did not record any tax provisions in the current period. However, management’s conclusions regarding tax positions may be subject to review and adjustment at a later date based on factors including, but not limited to, examination by tax authorities (i.e., the last three tax year ends, as applicable), on-going analysis of and changes to tax laws, regulations and interpretations thereof.
As of March 31, 2024, management of the Funds has reviewed all open tax years since inception and concluded that there is no tax liability resulting from unrecognized tax benefits relating to uncertain income tax positions taken or expected to be taken in future tax returns. The Funds are also not aware of any tax positions for which it is reasonably possible that the total amounts of unrecognized tax benefits will significantly change in the next twelve months.
SECURITY TRANSACTIONS AND INVESTMENT INCOME — Security transactions are accounted for on the trade date for financial reporting purposes. Costs used in determining realized gains and losses on the sale of investment securities are based on specific identification. Dividend income is recorded, net of any applicable withholding tax, on the ex-dividend date, or for certain foreign securities, when the information becomes available to the Funds. Interest income is recognized on the accrual basis from the settlement date and includes the amortization of premiums and the accretion of discount calculated using the effective interest method.
OPTIONS — The Quadratic Interest Rate Volatility and Inflation Hedge ETF purchases options seeking to benefit from relative interest rate movements, whether these movements arise from falling short-term interest rates or rising long-term interest rates (i.e., the spread between interest rates on U.S. interest rates and shorter-term interest widens), and to benefit from market stress when fixed income volatility increases. The Quadratic Deflation ETF purchases options seeking to benefit from relative interest rate movements, whether these movements arise from rising short-term interest rates or falling long-term interest rates (i.e., the spread between interest rates on U.S. interest rates and shorter-term interest narrows). When each Fund purchases an option, the Fund pays a cost (premium) to purchase the option. The Funds’ investments in options will be traded in the OTC market. OTC derivative instruments generally have more flexible terms negotiated between the buyer and the seller. These instruments would generally be subject to greater counterparty risk. Many of the protections afforded to exchange participants will not be available for OTC options and there is no daily price fluctuation limits. OTC instruments also may be subject to greater liquidity risk. Under the Funds’ option contracts, the Funds pay upfront for the option contracts (i.e., the premium), and counterparties are not required to post variation margin. There is no potential additional cash outflow or future liability for the Funds under the options; the Funds’ only potential loss on such options is the premium paid in advance. However, the Funds’ options contracts are subject to counterparty risk, which is the risk of non-performance by an options counterparty. Such non-performance could result in a material loss to the Funds.
As of March 31, 2024, the Funds have open purchased option positions. Refer to each Fund’s Schedule of Investments for details regarding open options as of March 31, 2024.
For the year ended March 31, 2024, the average monthly cost for purchased options in the Quadratic Interest Rate Volatility and Inflation Hedge ETF and Quadratic Deflation ETF was $121,436,181 and $4,827,298, respectively.
Notes to Financial Statements (continued)
The following is a summary by counterparty of the market value of OTC financial derivative instruments and collateral (received)/pledged for each Fund as of March 31, 2024:
Quadratic Interest Rate Volatility and Inflation Hedge ETF
| Quadratic Interest Rate Volatility and Inflation Hedge ETF |
| | | Financial Derivative | | | Financial Derivative | | | | | | | | | | |
| | | Assets | | | Liabilities | | | Net Market | | | Collateral | | | | |
| | | | | | Total Over | | | | | | Total Over | | | Value of OTC | | | (Received)/ | | | Net | |
| Counterparty | | Option | | | the Counter | | | Option | | | the Counter | | | Derivatives | | | Pledged | | | Exposure† | |
| Goldman Sachs | | $ | 28,864,481 | | | $ | 28,864,481 | | | $ | — | | | $ | — | | | $ | 28,864,481 | | | $ | — | | | $ | 28,864,481 | |
| Morgan Stanley | | | 35,793,375 | | | | 35,793,375 | | | | — | | | | — | | | | 35,793,375 | | | | — | | | | 35,793,375 | |
| Nomura | | | 25,467,862 | | | | 25,467,862 | | | | — | | | | — | | | | 25,467,862 | | | | — | | | | 25,467,862 | |
| Total over the counter | | $ | 90,125,718 | | | $ | 90,125,718 | | | $ | — | | | $ | — | | | | | | | | | | | | | |
| Quadratic Deflation ETF |
| | | Financial Derivative | | | Financial Derivative | | | | | | | | | | |
| | | Assets | | | Liabilities | | | Net Market | | | Collateral | | | | |
| | | | | | Total Over | | | | | | Total Over | | | Value of OTC | | | (Received)/ | | | Net | |
| Counterparty | | Option | | | the Counter | | | Option | | | the Counter | | | Derivatives | | | Pledged | | | Exposure† | |
| Goldman Sachs | | $ | 2,041,813 | | | $ | 2,041,813 | | | $ | — | | | $ | — | | | $ | 2,041,813 | | | $ | — | | | $ | 2,041,813 | |
| Nomura | | | 459,907 | | | | 459,907 | | | | — | | | | — | | | | 459,907 | | | | — | | | | 459,907 | |
| Total over the counter | | $ | 2,501,720 | | | $ | 2,501,720 | | | $ | — | | | $ | — | | | | | | | | | | | | | |
| † | Net Exposure represents the net receivable/(payable) that would be due from/to the counterparty in the event of default. Exposure from OTC financial derivative instruments can be netted only across transactions governed under the same master agreement with the same legal entity. |
DIVIDENDS AND DISTRIBUTIONS TO SHAREHOLDERS — Each Fund has a practice of seeking to pay monthly distributions at a level rate. To help maintain more stable monthly distributions, the distribution paid by a Fund for any particular monthly period may be more or less than the amount of net income actually earned by the Fund during such period. The practice of seeking to pay distributions at a level rate may result in a return of capital to shareholders, which is not taxable but reduces a shareholder’s basis in his or her shares, if the Fund’s income and gains are not sufficient to support the level rate distribution.
Ordinarily, each Fund typically distributes any net investment income monthly and makes any capital gain distributions once a year (usually in December). Each Fund may make distributions on a more frequent basis. All distributions are recorded on the ex-dividend date.
CASH OVERDRAFT CHARGES — Per the terms of an agreement with Brown Brothers Harriman & Co. (“BBH”), the Funds’ Custodian, if a Fund has a cash overdraft on a given day, it will be assessed an overdraft charge of BBH Overdraft Base Rate plus 2.00%. Cash overdraft charges are included in “Interest Expense” on the Statements of Operations.
Notes to Financial Statements (continued)
CREATION UNITS — The Funds issue and redeem Shares at NAV and only in large blocks of Shares (each block of Shares is a Creation Unit of 25,000 Shares, or multiples thereof). In its discretion, the Trust reserves the right to increase or decrease the number of each Fund’s shares that constitute a Creation Unit.
Except when aggregated in Creation Units, Shares are not redeemable securities of a Fund. Shares of a Fund may only be purchased or redeemed by certain Authorized Participants. An Authorized Participant is either (i) a broker-dealer or other participant in the clearing process through the Continuous Net Settlement System of the National Securities Clearing Corporation or (ii) a Depository Trust Company participant and, in each case, must have executed a Participant Agreement with the Distributor. Most retail investors will not qualify as Authorized Participants or have the resources to buy and sell whole Creation Units. Therefore, they will be unable to purchase or redeem the Shares directly from a Fund. Rather, most retail investors will purchase Shares in the secondary market with the assistance of a broker and will be subject to customary brokerage commissions or fees when buying or selling Shares. If a Creation Unit is purchased or redeemed for cash, a higher transaction fee may be charged.
The Adviser may adjust the transaction fees from time to time based on actual experience.
CASH AND CASH EQUIVALENTS — Idle cash balances may be swept into various overnight sweep accounts and are classified as cash equivalents on the Statement of Assets and Liabilities. These amounts, at times, may exceed United States federally insured limits. Amounts swept are usually available on the next business day. For that reason, each Fund is subject to custodial risk as a result of (1) holding cash at the Fund’s custodian because such cash deposits are unsecured liabilities of the custodian and (2) the custodian, at times, sweeping excess cash to other banks, which would be unsecured liabilities of those other banks.
3. RELATED PARTY TRANSACTIONS
INVESTMENT ADVISORY AGREEMENT — The Adviser serves as investment adviser to each Fund pursuant to an Investment Advisory Agreement between the Trust on behalf of each Fund and the Adviser (the “Agreement”). Under the Agreement, Krane is responsible for reviewing, supervising and administering each Fund’s investment program and the general management and administration of the Trust. The Board supervises Krane and establishes policies that Krane must follow in its management activities.
The Agreement requires the Adviser to pay all operating expenses of the Funds, except: (a) interest and taxes (including, but not limited to, income, excise, transaction, transfer and withholding taxes); (b) expenses of the Funds incurred with respect to the acquisition and disposition of portfolio securities and the execution of portfolio transactions, including brokerage commissions and short sale dividend or interest expense; (c) expenses incurred in connection with any distribution plan adopted by the Trust in compliance with Rule 12b-1 under the Investment Company Act, including distribution fees; (d) “Acquired Fund Fees and Expenses” (as defined by Form N-1A under the Investment Company Act); (e) litigation expenses; (f) the compensation payable to the Adviser under the Agreement; (g) compensation and expenses of the Independent Trustees (including any fees of independent legal counsel to the Independent Trustees); and (h) any expenses determined to be extraordinary expenses by the Board. Under the Agreement, a portion of the premium for the insurance policy, which covers the Trust and Independent Trustees, is treated as an expense of the Independent Trustees.
Notes to Financial Statements (continued)
The Agreement provides that each Fund pays a unitary (or unified) fee to the Adviser for advisory and management services provided to the Funds, subject to the exceptions noted herein. In this context, there exists a risk that a Trust service provider will seek recourse against the Trust if it is not timely paid by Krane for the fees and expenses for which it is responsible, which could materially adversely affect the Funds. Pursuant to the Agreement between the Trust and the Adviser, the Funds pay the Adviser a fee, which is calculated daily and paid monthly, at the following annual rates, based on a percentage of the average daily net assets of each Fund.
| | | Management
Fee |
| Quadratic Interest Rate Volatility and Inflation Hedge ETF | | 0.99% |
| Quadratic Deflation ETF | | 0.99% |
Pursuant to the terms of a Fee Waiver Agreement, Krane has contractually agreed to waive its management fee for the Quadratic Deflation ETF by 0.05% of the Fund’s average daily net assets. This Fee Waiver agreement will continue until August 1, 2023. The Fee Waiver Agreement may only be terminated prior thereto by the Board.
The Adviser bears all of its own costs associated with providing these advisory services.
SUB-ADVISORY AGREEMENT — Quadratic serves as the Sub-Adviser to the Funds and is responsible for the day-to-day management of the Funds, subject to the supervision by the Adviser and the Board. For the services Quadratic provides to the Funds, the Adviser pays Quadratic a fee equal to 76% of the sum of: (i) the total gross management fee due to the Adviser from the Fund under the terms of the Advisory Agreement minus (ii) any applicable fee waivers from time to time entered into between the Fund and the Adviser. Under the Sub-Advisory Agreement, the fee will be calculated daily and paid monthly.
DISTRIBUTION AGREEMENT — SEI Investments Distribution Co. (the “Distributor”), a wholly-owned subsidiary of SEI Investments Company, and an affiliate of the Administrator, serves as the Funds’ distributor of Creation Units pursuant to a Distribution Agreement. The Distributor does not maintain any secondary market in Fund shares.
The Trust has adopted a Distribution and Service Plan (“Plan”) pursuant to Rule 12b-1 under the Investment Company Act. In accordance with the Plan, each Fund is authorized to pay an amount up to 0.25% of its average daily net assets each year for certain distribution-related activities. For the year ended March 31, 2024, no fees were charged under the Plan, since no such fees are currently paid by the Funds and the Board has not currently approved the commencement of any payments under the Plan. Fees would only be charged under the Plan upon approval by the Board.
ADMINISTRATOR, CUSTODIAN AND TRANSFER AGENT — SEI Investments Global Funds Services (the “Administrator”) serves as the Funds’ Administrator pursuant to an Administration Agreement. BBH serves as the Funds’ Custodian and Transfer Agent pursuant to a Custodian and Transfer Agent Agreement.
4. INVESTMENT TRANSACTIONS
For the year ended March 31, 2024, the purchases and sales of investments in securities excluding in-kind transactions, options, long-term U.S. Government and short-term securities in the Funds were:
Notes to Financial Statements (continued)
| | | Purchases | | | Sales and
Maturities | |
| Quadratic Interest Rate Volatility and Inflation Hedge ETF | | $ | — | | | $ | 95,707,770 | |
For the year ended March 31, 2024, in-kind transactions associated with creations and redemptions were:
| | | Purchases | | | Sales | | | Realized
Gain/(Loss) | |
| Quadratic Interest Rate Volatility and Inflation Hedge ETF | | $ | 383,136,134 | | | $ | 256,229,782 | | | $ | (1,044,263 | ) |
| Quadratic Deflation ETF | | | 84,606,188 | | | | 126,556,119 | | | | (3,258,707 | ) |
5. TAX INFORMATION
The amount and character of income and capital gain distributions to be paid, if any, are determined in accordance with Federal income tax regulations, which may differ from U.S. GAAP. For example, the income or loss resulting from the Funds’ investments in derivatives tied to interest rates is characterized as ordinary income or loss, even though such derivatives may be characterized as capital assets and realized gain (loss) for purposes of U.S. GAAP. As a result, net investment income (loss) and net realized gain (loss) on investment transactions for a reporting period may differ significantly from distributions during such period. These book/tax differences may be temporary or permanent. The permanent difference is income or loss resulting from the Funds’ investments in derivatives tied to interest rates that is characterized as ordinary income or loss, even though such derivatives may be characterized as capital assets for purposes of U.S. GAAP. The permanent difference that is credited or charged to Paid-in-Capital and Distributable Earnings is redemption-in-kind transactions. To the extent these differences are permanent in nature, such as redemption in kind transactions and net operating loss, they are charged or credited to distributable earnings (loss) or paid-in capital, as appropriate, in the period that the differences arise.
| | | Distributable
Earnings/(Loss) | | |
Paid-in
Capital | |
| Quadratic Interest Rate Volatility and Inflation Hedge ETF | | $ | 104,333,164 | | | $ | (104,333,164 | ) |
| Quadratic Deflation ETF | | | 3,651,663 | | | | (3,651,663 | ) |
The tax character of dividends and distributions paid during the years or periods ended March 31, 2024 and March 31, 2023 were as follows:
| | | Ordinary
Income | | | Long-Term
Capital Gain | | | Return of
Capital | | |
Totals | |
| Quadratic Interest Rate Volatility and Inflation Hedge ETF | | | | | | | | | | | | | | | | |
| 2024 | | $ | — | | | $ | — | | | $ | 31,848,020 | | | $ | 31,848,020 | |
| 2023 | | | — | | | | — | | | | 45,477,586 | | | | 45,477,586 | |
| | | | | | | | | | | | | | | | | |
| Quadratic Deflation ETF | | | | | | | | | | | | | | | | |
| 2024 | | $ | 2,094,154 | | | $ | — | | | $ | 271,781 | | | $ | 2,365,935 | |
| 2023 | | | 13,991,230 | | | | — | | | | — | | | | 13,991,230 | |
Notes to Financial Statements (continued)
As of March 31, 2024, the components of tax basis distributable losses were as follows:
| | | Quadratic
Interest Rate
Volatility and
Inflation Hedge
ETF | | | Quadratic
Deflation ETF | |
| Capital Loss Carryforwards | | | (22,620,861 | ) | | | (3,535,219 | ) |
| Qualified Late-Year Loss Deferrals | | | (1,773,513 | ) | | | (128,750 | ) |
| Unrealized Depreciation on Investments and Foreign Currency | | | (217,462,169 | ) | | | (11,938,167 | ) |
| Total Distributable Loss | | $ | (241,856,543 | ) | | $ | (15,602,136 | ) |
Qualified late year ordinary and Post-October capital losses represent losses realized from January 1, 2024 through March 31, 2024 and November 1, 2023 through March 31, 2024, respectively, that, in accordance with Federal income tax regulations, the Funds have elected to defer and treat as having arisen in the following fiscal year.
The Funds have capital loss carryforwards as follows:
| | | Long-Term
Loss | | | Total | |
| Quadratic Interest Rate Volatility and Inflation Hedge ETF | | $ | 22,620,861 | | | $ | 22,620,861 | |
| Quadratic Deflation ETF | | | 3,535,219 | | | | 3,535,219 | |
The federal tax cost and aggregate gross unrealized appreciation and depreciation on investments held by the Fund at March 31, 2024, were as follows:
| | | Federal Tax
Cost | | | Aggregated
Gross
Unrealized
Appreciation | | | Aggregated
Gross
Unrealized
Depreciation | | | Net Unrealized
Depreciation | |
| Quadratic Interest Rate Volatility and Inflation Hedge ETF | | $ | 947,986,408 | | | $ | — | | | $ | (217,462,169 | ) | | $ | (217,462,169 | ) |
| Quadratic Deflation ETF | | | 37,288,400 | | | | 432,823 | | | | (12,370,990 | ) | | | (11,938,167 | ) |
6. CONCENTRATION OF RISKS
As with all exchange-traded funds (“ETFs”), shareholders of the Funds are subject to the risk that their investment could lose money. Each Fund is subject to certain of the principal risks noted below, any of which may adversely affect a Fund’s NAV, trading price, yield, total return and ability to meet its investment objective. A more complete description of principal risks is included in each Fund’s prospectus under the heading “Principal Risks”.
CASH AND CASH EQUIVALENTS RISK — The Funds may hold cash or cash equivalents. Generally, such positions offer less potential for gain than other investments. Holding cash or cash equivalents, even strategically, may lead to missed investment opportunities. This is particularly true when the market for other investments in which the Funds may invest is rapidly rising. If a Fund holds cash uninvested it will be subject to the credit risk of the depositing institution holding the cash.
Notes to Financial Statements (continued)
DERIVATIVES RISK — The use of derivatives (including swaps, futures, forwards, structured notes and options) may involve leverage, which includes risks that are different from, and greater than, the risks associated with investing directly in a reference asset, because a small investment in a derivative can result in a large impact on a Fund and may cause a Fund to be more volatile. Derivatives may at times be highly illiquid, and a Fund may not be able to close out or sell a derivative at a particular time or at an anticipated price. Derivatives can be difficult to value and valuation may be more difficult in times of market turmoil. There may be imperfect correlation between the derivative and that of the reference asset, resulting in unexpected returns that could materially adversely affect a Fund. Certain derivatives (such as swaps and options) are bi-lateral agreements that expose the Funds to counterparty risk, which is the risk of loss in the event that the counterparty to an agreement fails to make required payments or otherwise comply with the terms of derivative. In that case, the Funds may suffer losses potentially equal to, or greater than, the full value of the derivative if the counterparty fails to perform its obligations. That risk is generally thought to be greater with over-the-counter (OTC) derivatives than with derivatives that are exchange traded or centrally cleared. Counterparty risks are compounded by the fact that there are only a limited number of ways available to invest in certain reference assets and, therefore, there may be few counterparties to swaps or options based on those reference assets. Many derivatives are subject to segregation requirements that require the Funds to segregate the market or notional value of the derivatives, which could impede the portfolio management of the Funds.
The derivative instruments and techniques that the Funds may principally use include:
Options Risk. If a Fund buys an option, it buys a legal contract giving it the right to buy or sell a specific amount of the underlying instrument or swap on the underlying instrument at an agreed-upon price typically in exchange for a premium paid by the Funds. In general, most options on interest rate swaps are “European-style” options, which means that they can only be exercised at the end of the option term. A decision as to whether, when and how to use options involves the exercise of skill and judgment and even a well-conceived option transaction may be unsuccessful because of market behavior or unexpected events. The prices of options can be highly volatile and the use of options can lower total returns.
The options strategies used by Quadratic Deflation ETF may involve writing covered options and are structured as long call spreads, long put spreads or long butterflies. If there is a broad market move, the strategies may not have the same return as a strategy composed of only long options. The Funds will pay a premium for their options strategies and they are structured to limit the potential loss to the Funds to the market value of the options strategy; however, there is no guarantee that this will occur. If an option that a Fund has purchased is never exercised or closed out, the Fund will lose the amount of the premium it paid and the use of those funds.
OTC options generally have more flexible terms negotiated between the buyer and the seller, but the counterparties may be required to post “variation margin” as frequently as daily to reflect any gains or losses in such options contracts. Where, as here, such variation margin is not required to be posted, such instruments are generally subject to greater credit risk and counterparty risk, which is the risk that the other party to the derivative will fail to make required payments or otherwise comply with the terms of the option. Counterparty risk may arise because of market activities and developments, the counterparty’s financial condition (including financial difficulties, bankruptcy, or insolvency), or other reasons. OTC instruments also may be subject to greater liquidity risk.
Notes to Financial Statements (continued)
ETF RISK. As ETFs, the Funds are subject to the following risks:
Authorized Participants Concentration Risk. The Funds have a limited number of financial institutions that may act as Authorized Participants. To the extent that Authorized Participants exit the business or are otherwise unable to proceed in creation and redemption transactions with the Fund and no other Authorized Participant is able to step forward to create or redeem, shares of that Fund may be more likely to trade at a premium or discount to NAV and possible face trading halts or delisting. Authorized Participant concentration risk may be heightened for ETFs, such as the Funds, that invest in securities issued by non-U.S. issuers or other securities or instruments that have lower trading volumes.
Premium/Discount Risk. There may be times when the market price of a Fund’s shares is more than the NAV intra-day (at a premium) or less than the NAV intra-day (at a discount). As a result, shareholders of that Fund may pay more than NAV when purchasing shares and receive less than NAV when selling Fund shares. This risk is heightened in times of market volatility or periods of steep market declines. In such market conditions, market or stop loss orders to sell Fund shares may be executed at prices well below NAV.
Secondary Market Trading Risk. Investors buying or selling shares in the secondary market will normally pay brokerage commissions, which are often a fixed amount and may be a significant proportional cost for investors buying or selling relatively small amounts of shares. Secondary market trading is subject to bid-ask spreads and trading in a Fund’s shares may be halted by the Exchange because of market conditions or other reasons. If a trading halt occurs, a shareholder may temporarily be unable to purchase or sell shares of a Fund. In addition, although the Funds’ shares are listed on the Exchange, there can be no assurance that an active trading market for shares will develop or be maintained or that a Fund’s shares will continue to be listed.
FIXED INCOME SECURITIES RISK — Investing in fixed income securities subjects the Funds to the following risks:
Credit Risk. Credit risk refers to the possibility that the issuer of a security will not be able to make payments of interest and principal when due. Changes in an issuer’s credit rating or the market’s perception of an issuer’s creditworthiness may also affect the value of an investment in that issuer.
Event Risk. Event risk is the risk that an unexpected event could interfere with an issuer’s ability to make timely interest or principal payments or that causes market speculation about the issuer’s ability to make such payments, which could cause the credit quality and market value of an issuer’s bonds and/or other debt securities to decline significantly.
Interest Rate Risk. Generally, the value of fixed income securities will change inversely with changes in interest rates. As interest rates rise, the market value of fixed income securities tends to decrease. Conversely, as interest rates fall, the market value of fixed income securities tends to increase. This risk will be greater for long-term securities than for short-term securities. The current low interest rate environment increases the risks associated with rising interest rates.
Maturity Risk. The value of the Funds’ fixed income investments is also dependent on their maturity. Generally, the longer the maturity of a fixed income security, the greater its sensitivity to changes in interest rates.
Notes to Financial Statements (continued)
HEDGING RISK — The Quadratic Interest Rate Volatility and Inflation Hedge ETF seeks to mitigate (or hedge) the risk associated with the potential impact of a steepening U.S. interest rate curve (“curve risk”), an increase in inflation and inflation expectations, and an increase in interest rate volatility on the performance of U.S. government bonds. The Quadratic Deflation ETF seeks to mitigate (or hedge) the risk associated with the potential impact of a flattening or inverting U.S. interest rate curve (“curve risk”), deflation and deflationary expectations on the performance of U.S. government bonds.
Neither of the Funds seek to mitigate credit risk, non-curve interest rate risk, or other factors influencing the price of U.S. government bonds, which factors may have a greater impact on the bonds’ returns than the U.S. interest rate curve or inflation. Further, there is no guarantee that the Funds’ investments will eliminate or mitigate curve risk, inflation (deflation) risk or the potential impact of interest rate volatility on long positions in U.S. government bonds. If interest rates rise or fall in parallel within the U.S. interest rate curve, the Funds will not be hedged.
In addition, for the Quadratic Interest Rate Volatility and Inflation Hedge ETF, when the U.S. interest rate curve flattens or inverts, the Fund’s investments in options may lose value or end up worthless. Under such circumstances, the Fund will generally underperform a portfolio comprised solely of U.S. government bonds (without the options owned by the Fund). In a flattening or inverted curve environment, the Fund’s hedging strategy could result in disproportionately larger losses in the Fund’s options as compared to gains or losses in its U.S. government bond positions attributable to interest rate changes. There is no guarantee that the Fund will have positive returns, even in environments of sharply rising inflation rates in which the Fund’s options might be expected to mitigate the effects of such rises. The Fund will incur expenses when entering into positions in rate-linked options. Moreover, to the extent that curve risk has been priced into the U.S. government bonds owned by the Fund, the Fund will underperform other investments even during periods of curve steepening.
In addition, for the Quadratic Deflation ETF when the U.S. interest rate curve steepens, the Fund’s investments in options may lose value or end up worthless. Under such circumstances, the Fund will generally underperform a portfolio comprised solely of U.S. government bonds (without the options owned by the Fund). In a steepening curve environment, the Fund’s hedging strategy could result in disproportionately larger losses in the Fund’s options as compared to gains or losses in its U.S. government bond positions attributable to interest rate changes. There is no guarantee that the Fund will have positive returns, even in environments of sharply declining inflation rates. The Fund will incur expenses when entering into positions in rate-linked options. Moreover, to the extent that curve risk has been priced into the U.S. government bonds owned by the Fund, the Fund will underperform other investments even during periods of curve flattening.
HIGH PORTFOLIO TURNOVER RISK — The Funds may incur high portfolio turnover rates, which may increase the Funds’ brokerage commission costs and negatively impact the Funds’ performance. Such portfolio turnover also may generate net short-term capital gains.
INVESTMENT IN INVESTMENT COMPANIES RISK — When a Fund invests in other investment companies (or funds), it will indirectly be exposed to the risks of such funds’ investments. Moreover, a Fund will incur its pro rata share of such funds’ expenses. Additionally, investments in ETFs are subject to ETF Risk.
Notes to Financial Statements (continued)
LARGE SHAREHOLDER RISK — To the extent a large number of shares of a Fund is held by a single shareholder or a small group of shareholders, the Fund is subject to the risk that redemption by those shareholders of all or a large portion of their shares will adversely affect the Fund’s performance by forcing the Fund to sell securities, potentially at disadvantageous prices, to raise the cash needed to satisfy such redemption requests. This risk may be heightened during periods of declining or illiquid markets, or to the extent that such large shareholders have short investment horizons or unpredictable cash flow needs. Such redemptions may also increase transaction costs and/or have adverse tax consequences for remaining shareholders.
LIQUIDITY RISK — The Funds’ investments are subject to liquidity risk, which exists when an investment is or becomes difficult or impossible to purchase or sell at an advantageous time and price. Liquidity risk may be the result of, among other things, market turmoil, the reduced number and capacity of traditional market participants, or the lack of an active trading market. Markets for securities or financial instruments could be disrupted by a number of events, including, but not limited to, an economic crisis, natural disasters, new legislation or regulatory changes inside or outside the U.S. Liquid investments may become less liquid after being purchased by a Fund, particularly during periods of market stress. In addition, if a transaction is particularly large or if the relevant market is or becomes illiquid, it may not be possible to initiate a transaction or liquidate a position, which may cause a Fund to suffer significant losses and difficulties in meeting redemptions. If a number of securities held by a Fund stop trading, it may have a cascading effect and cause a Fund to halt trading. Volatility in market prices will increase the risk of a Fund being subject to a trading halt.
MANAGEMENT RISK — The Funds are actively-managed and may not meet their investment objectives based on the Sub-Adviser’s success or failure to implement investment strategies for the Funds. The Sub-Adviser’s evaluations and assumptions regarding investments, interest rates, inflation, and other factors may not successfully achieve the Funds’ investment objective given actual market conditions.
MARKET RISK — The values of the Funds’ holdings could decline generally or could underperform other investments. In addition, there is a risk that policy changes by the U.S. Government, Federal Reserve, and/or other government actors could cause volatility in global financial markets and negative sentiment, which could have a negative impact on a Fund and could result in losses. Geopolitical and other risks, including environmental and public health risks may add to instability in world economies and markets generally. Changes in value may be temporary or may last for extended periods. Further, the Funds are susceptible to the risk that certain investments may be difficult or impossible to sell at a favorable time or price. Market developments may also cause a Funds’ investment to become less liquid and subject to erratic price movements.
NON-DIVERSIFIED FUND RISK — Because the Funds are non-diversified and may invest a greater portion of their assets in fewer issuers than a diversified fund, changes in the market value of a single portfolio holding could cause greater fluctuations in a Fund’s share price than would occur in a diversified fund. This may increase a Fund’s volatility and cause the performance of a single portfolio holding or a relatively small number of portfolio holdings to have a greater impact on the Fund’s performance.
RATE-LINKED DERIVATIVES INVESTMENT RISK — The Funds exposure to derivatives tied to interest rates subjects the Funds to greater volatility than investments in traditional securities, such as stocks and bonds. Investing in derivatives tied to interest rates, including through options tied to the shape of the U.S. interest rate curve, can be extremely volatile. The value of such investments
Notes to Financial Statements (continued)
may fluctuate rapidly based on a variety of factors, including overall market movements; economic events and policies; changes in interest rates or inflation rates; changes in monetary and exchange control programs; war; acts of terrorism; natural disasters; and technological developments.
The Quadratic Interest Rate Volatility and Inflation Hedge ETF is expected to benefit from the options it holds if the U.S. interest rate curve steepens during the time period in which the Fund holds the options. However, if the U.S. interest rate curve flattens or inverts, the Fund will lose money on the options, up to the amount invested in option premiums, and underperform an otherwise identical bond fund that had not used such options. Rate-linked derivatives may lose money if interest rates change in a manner not anticipated by the Sub-Adviser. An increase in interest rates may cause the value of securities held directly or indirectly by the Fund to decline to the extent that the increase is not linked to a steepening of the U.S. interest rate curve or the Fund’s hedging strategy is not effectively implemented. Even if the Fund is hedged against losses due to interest rate increases linked to U.S. interest rate curve steepening, outright interest rate increases may lead to heightened volatility in the fixed-income markets and may positively affect the value of the Fund’s options while negatively impacting the Fund’s investments in TIPS. There can be no assurance that the Fund’s interest-rate linked options will accurately deliver positive returns if inflation experienced in the United States or the rate of expected future inflation reflected in the prices and yields of bonds held by the Fund rises. The Fund could lose money on the options held by the Fund, and the present value of the Fund’s portfolio investments could decrease if inflation increases. These interest rate-linked options may also cause the Fund’s net asset value and returns to be more volatile and expose the Fund to increased counterparty risk. Fluctuations in the steepness of the U.S. interest rate curve or the price of the options owned by the Fund could materially adversely affect an investment in the Fund. The Fund’s investments in options are not intended to mitigate duration and credit risk or other factors influencing the price of U.S. government bonds, which may have a greater impact on the bonds’ returns than curve risk. Moreover, to the extent that curve risk has been priced into the government bonds owned directly or indirectly by the Fund, the Fund could underperform other investments even during inflationary periods. There is no guarantee that the Fund will have positive performance even in environments of sharply rising inflation. There is no guarantee that the Fund will be able to successfully mitigate inflation risk or that bond values and interest rates will match changes in inflation rates.
The Quadratic Deflation ETF is expected to benefit from the options it holds if the U.S. interest rate curve flattens or inverts during the time period in which the Fund holds the options. However, if the U.S. interest rate curve steepens, the Fund will lose money on the options, up to the amount invested in option premiums, and underperform an otherwise identical bond fund that had not used such options. Rate-linked derivatives may lose money if interest rates change in a manner not anticipated by the Sub-Adviser. An increase in interest rates may cause the value of securities held directly or indirectly by the Fund to decline to the extent that the increase is not linked to a flattening or inverting of the U.S. interest rate curve or the Fund’s hedging strategy is not effectively implemented. Even if the Fund is hedged against losses due to interest rate increases linked to U.S. interest rate curve flattening or inverting, outright interest rate increases may lead to heightened volatility in the fixed-income markets and may positively affect the value of the Fund’s options while negatively impacting the Fund’s investments in Treasuries. There can be no assurance that the Fund’s interest-rate linked options will accurately deliver positive returns if deflation experienced in the United States or the rate of expected future inflation reflected in the prices and yields of bonds held by the Fund declines. The Fund could lose money on the options held by the Fund, and the present value of the Fund’s portfolio investments could decrease if deflation occurs. These interest
Notes to Financial Statements (continued)
rate-linked options may also cause the Fund’s net asset value and returns to be more volatile and expose the Fund to increased counterparty risk. Fluctuations in the steepness of the U.S. interest rate curve or the price of the options owned by the Fund could materially adversely affect an investment in the Fund. The Fund’s investments in options are not intended to mitigate duration and credit risk or other factors influencing the price of U.S. government bonds, which may have a greater impact on the bonds’ returns than curve risk. Moreover, to the extent that curve risk has been priced into the government bonds owned directly or indirectly by the Fund, the Fund could underperform other investments even during deflationary periods. There is no guarantee that the Fund will have positive performance even in environments of sharply declining inflation. There is no guarantee that the Fund will be able to successfully mitigate deflation risk or that bond values and interest rates will match changes in inflation rates.
RETURN OF CAPITAL DISTRIBUTIONS FROM THE FUND REDUCE THE TAX BASIS OF FUND SHARES — Historically, a portion of the Funds’ distributions have been treated as a return of capital for tax purposes. Return of capital distributions are not taxable income to you but reduce your tax basis in your shares of a Fund. Such a reduction in tax basis will result in larger taxable gains and/or lower tax losses on a subsequent sale of shares of a Fund. There is no guarantee that the character of the Funds’ distributions will be similar in the future.
TAX RISK — To qualify for the favorable U.S. federal income tax treatment accorded to a regulated investment company (“RIC”) under the Internal Revenue Code of 1986, as amended (the “Code”), each Fund must satisfy certain income, asset diversification and distribution requirements each year. Among other requirements, each Fund must derive at least 90% of its gross income each taxable year from certain qualifying sources of income and the Fund’s assets must be diversified so that at least 50% of the value of the Fund’s total assets is represented by cash and cash items, U.S. government securities, securities of other RICs, and other securities, subject to certain other limitations (see the “Taxes” section in the SAI for additional information). The Funds’ investments in certain rate-linked derivative instruments (such as rate-linked options) may generate income that is not qualifying income and such investments may not be treated as investments in “securities” for purposes of the asset diversification requirement. The Funds will also need to manage their exposure to derivatives counterparties for purposes of satisfying the diversification test. If a Fund were to fail to meet the qualifying income test or asset diversification test and fail to qualify as a RIC, it would be taxed in the same manner as an ordinary corporation, and distributions to its shareholders would not be deductible by the Fund in computing its taxable income, which would adversely affect the Fund’s performance. The failure by the Fund to qualify as a RIC would have significant negative tax consequences to Fund shareholders and would significantly and adversely affect a shareholder’s return on its investment in the Fund. Under certain circumstances, the Fund may be able to cure a failure to meet the qualifying income test or asset diversification test if such failure was due to reasonable cause and not willful neglect, but to do so the Fund may incur significant fund-level taxes, which would effectively reduce (and could eliminate) the Fund’s returns.
TIPS RISK — U.S. Treasury Inflation-Protected Securities (“TIPS”) are debt instruments issued by the by the United States Department of the Treasury. The principal of TIPS increases with inflation and decreases with deflation, as measured by the Consumer Price Index (“CPI”). When TIPS mature, investors are paid the adjusted principal or original principal, whichever is greater. Interest payments on TIPS are unpredictable and will fluctuate as the principal and corresponding interest payments are adjusted for inflation. Inflation-indexed bonds generally pay a lower nominal interest rate than a comparable non-inflation-indexed bond. There can be no assurance that the CPI will
Notes to Financial Statements (concluded)
accurately measure the real rate of inflation in the prices of goods and services. Any increases in the principal amount of TIPS will be considered taxable ordinary income, even though the Fund or applicable underlying ETF will not receive the principal until maturity. As a result, the Fund may make income distributions to shareholders that exceed the cash it receives. In addition, TIPS are subject to credit risk, interest rate risk, and maturity risk.
U.S. GOVERNMENT OBLIGATIONS RISK — Obligations of U.S. Government agencies and authorities receive varying levels of support and may not be backed by the full faith and credit of the U.S. Government, which could affect a Fund’s ability to recover should they default. No assurance can be given that the U.S. Government will provide financial support to its agencies and authorities if it is not obligated by law to do so. Additionally, market prices and yields of securities supported by the full faith and credit of the U.S. government or other countries may decline or be negative for short or long periods of time.
VALUATION RISK — Independent market quotations for certain investments held by the Funds may not be readily available, and such investments may be fair valued or valued by a pricing service at an evaluated price. These valuations involve subjectivity and different market participants may assign different prices to the same investment. As a result, there is a risk that a Fund may not be able to sell an investment at the price assigned to the investment by the Fund.
7. INDEMNIFICATIONS
In the normal course of business, the Funds enter into contracts that provide general indemnifications. The Funds’ maximum exposure under these arrangements is dependent on future claims that may be made against the Funds and, therefore, cannot be established; however, based on experience, the risk of loss from such claims is considered remote.
8. SUBSEQUENT EVENTS
The Funds have evaluated the need for additional disclosures and/or adjustments resulting from subsequent events. Based on this evaluation, no additional disclosures and/or adjustments were required to the financial statements as of the date the financial statements were issued.
Report of Independent Registered Public Accounting Firm
To the Shareholders and Board of Trustees
KraneShares Trust:
Opinion on the Financial Statements
We have audited the accompanying statements of assets and liabilities of the funds listed in the Appendix, two of the funds comprising KraneShares Trust (the Funds), including the schedules of investments, as of March 31, 2024, the related statements of operations for the year then ended, the statements of changes in net assets for each of the years in the two-year period then ended, and the related notes (collectively, the financial statements) and the financial highlights for each of the years or periods listed in the Appendix. In our opinion, the financial statements and financial highlights present fairly, in all material respects, the financial position of each of the Funds as of March 31, 2024, the results of its operations for the year then ended, the changes in its net assets for each of the years in the two-year period then ended, and the financial highlights for each of the years or periods listed in the Appendix, in conformity with U.S. generally accepted accounting principles.
Basis for Opinion
These financial statements and financial highlights are the responsibility of the Funds’ management. Our responsibility is to express an opinion on these financial statements and financial highlights based on our audits. We are a public accounting firm registered with the Public Company Accounting Oversight Board (United States) (PCAOB) and are required to be independent with respect to the Funds in accordance with the U.S. federal securities laws and the applicable rules and regulations of the Securities and Exchange Commission and the PCAOB.
We conducted our audits in accordance with the standards of the PCAOB. Those standards require that we plan and perform the audit to obtain reasonable assurance about whether the financial statements and financial highlights are free of material misstatement, whether due to error or fraud. Our audits included performing procedures to assess the risks of material misstatement of the financial statements and financial highlights, whether due to error or fraud, and performing procedures that respond to those risks. Such procedures included examining, on a test basis, evidence regarding the amounts and disclosures in the financial statements and financial highlights. Such procedures also included confirmation of securities owned as of March 31, 2024, by correspondence with custodian, transfer agent, and brokers or by other appropriate auditing procedures when replies from brokers were not received. Our audits also included evaluating the accounting principles used and significant estimates made by management, as well as evaluating the overall presentation of the financial statements and financial highlights. We believe that our audits provide a reasonable basis for our opinion.

We have served as the auditor of one or more KraneShares investment companies since 2017.
Philadelphia, Pennsylvania
May 29, 2024
Report of Independent Registered Public Accounting Firm (concluded)
Appendix
Funds with inception during the year ended March 31, 2020:
Quadratic Interest Rate Volatility and Inflation Hedge ETF
Statement of operations for the year ended March 31, 2024
Statements of changes in net assets for each of the years in the two-year period ended March 31, 2024
Financial highlights for each of the years in the four-year period ended March 31, 2024 and the period from May 13, 2019 (inception) through March 31, 2020
Funds with inception during the year ended March 31, 2022:
Quadratic Deflation ETF
Statement of operations for the year ended March 31, 2024
Statements of changes in net assets for each of the years in the two-year period ended March 31, 2024
Financial highlights for each of the years in the two-year period ended March 31, 2024 and the period from September 20, 2021 (inception) through March 31, 2022
Trustees and Officers of the Trust (Unaudited)
March 31, 2024
Set forth below are the names, addresses, years of birth, positions with the Trust, terms of office and lengths of time served; the principal occupations for the last five years; number of Funds in fund complex overseen; and other directorships outside the fund complex of each of the persons currently serving as Trustees and Officers of the Trust. The Trust’s Statement of Additional Information (“SAI”) includes additional information about the Trustees and Officers. The SAI may be obtained without charge, upon request, by calling 1-855-857-2638. The following chart lists Trustees and Officers as of March 31, 2024.
Name, Address
(Year of Birth) | | Position(s)
Held
with Trust | | Principal Occupation(s)
During the Past 5 Years | | Number of
Funds in Trust
Overseen by
Trustee | | Other
Directorships Held by
Trustees |
| Interested Trustee1 | | | | | | | | |
| | | | | | | | | |
Jonathan Krane2 (1968) 280 Park Avenue 32nd Floor New York, New York, 10017 | | Trustee and Chairman of the Board, No set term; served since 2012 | | Chief Executive Officer of Krane Funds Advisors, LLC from 2011 to present. | | 28 | | None |
| | | | | | | | | |
| Independent Trustees1 | | | | | | | | |
| | | | | | | | | |
Patrick P. Campo
(1970)
280 Park Avenue
32nd Floor
New York,
New York, 10017 | | Trustee, No set term; served since 2017 | | Managing Director of Ibis Global AM LLC from 2023 to present. From 2019 to 2023, Director of Research and from 2013 to 2019 Director of Long Short Equity, Titan Advisors. | | 28 | | None |
| | | | | | | | | |
John Ferguson
(1966)
280 Park Avenue
32nd Floor
New York,
New York, 10017 | | Trustee, No set term; served since 2012 | | Independent Director of K2 Advisors Offshore Fund Complex from 2022 to present. Chief Compliance Officer of Covey Advisors LLC 2023 to present. Chief Operating Officer of Shrewsbury River Capital from 2017 to 2020. Chief Operating Officer of Kang Global Investors LP (hedge fund adviser) from 2014 to 2016. President of Alden Global Capital, LLC (hedge fund adviser) from 2012 to 2014 (formerly, Chief Operating Officer from 2011 to 2012). Senior Managing Director and Chief Operating Officer of K2 Advisors, LLC from 2005 to 2011. | | 28 | | None |
Trustees and Officers of the Trust (Unaudited) (continued)
March 31, 2024
Name, Address
(Year of Birth) | | Position(s)
Held
with Trust | | Principal Occupation(s)
During the Past 5 Years | | Number of
Funds in Trust
Overseen by
Trustee | | Other
Directorships
Held by
Trustees |
| Independent Trustees1 | | | | | | | | |
| | | | | | | | | |
Matthew Stroyman
(1968)
280 Park Avenue
32nd Floor
New York,
New York, 10017 | | Trustee, No set term; served since 2012 | | Founder and President of BlackRidge Ventures from 2018 to present (principal investment activities and strategic advisory services in a variety of industries to clients and partners that include institutional investment firms, family offices and high net-worth individuals). Co-Founder, President and Chief Operating Officer of Arcturus (real estate asset and investment management services firm) from 2007 to 2017. | | 28 | | None |
Name, Address
(Year of Birth) | | Position(s)
Held
with Trust | | Principal Occupation(s)
During the Past 5 Years | | Number of
Funds in Trust
Overseen by
Trustee | | Other
Directorships
Held by
Trustees |
| Officers1 | | | | | | | | |
| | | | | | | | | |
Jonathan Krane
(1968)
280 Park Avenue
32nd Floor
New York,
New York, 10017 | | Principal Executive Officer and Principal Financial Officer, No set term; served since 2012 | | Chief Executive Officer of Krane Funds Advisors, LLC from 2011 to present. | | 28 | | None |
| | | | | | | | | |
Jennifer Tarleton
(formerly Krane)
(1966)
280 Park Avenue
32nd Floor
New York,
New York, 10017 | | Vice President and Secretary, No set term; served since 2012 | | Vice President of Krane Funds Advisors, LLC from 2011 to present. | | 28 | | None |
Trustees and Officers of the Trust (Unaudited) (concluded)
March 31, 2024
Name, Address
(Year of Birth) | | Position(s)
Held
with Trust | | Principal Occupation(s)
During the Past 5 Years | | Number of
Funds in Trust
Overseen by
Trustee | | Other
Directorships
Held by
Trustees |
| Officers1 | | | | | | | | |
| | | | | | | | | |
Michael Quain (1957) 280 Park Avenue 32nd Floor New York, New York, 10017 | | Chief Compliance Officer and Anti-Money Laundering Officer, No Set Term; served since 2015 | | Principal/President of Quain Compliance Consulting, LLC from 2014 to present. | | 28 | | None |
| | | | | | | | | |
Eric Olsen (1970) SEI Investments Company One Freedom Valley Drive Oaks, PA 19456 | | Assistant Treasurer, No set term; served since 2021 | | Director of Accounting, SEI Investments Global Fund Services (March 2021 to present); Deputy Head of Fund Operations, Traditional Assets, Aberdeen Standard Investments (August 2013 to February 2021). | | 28 | | None |
| | | | | | | | | |
David Adelman (1964) 280 Park Avenue 32nd Floor New York, New York, 10017 | | Assistant Secretary, No set term; served since 2021 | | Managing Director and the General Counsel, Krane Fund Advisors, LLC from 2021. Partner, Reed Smith LLP from 2015 to 2021 | | 28 | | None |
| | | | | | | | | |
Jonathan Shelon (1974) 280 Park Avenue 32nd Floor New York, New York, 10017 | | Assistant Secretary, No set term; served since 2019 | | Chief Operating Officer, Krane Funds Advisors, LLC from 2015 to present. Chief Investment Officer of Specialized Strategies, J.P. Morgan from 2011 to 2015. | | 28 | | None |
| 1 | Each Trustee serves until his or her successor is duly elected or appointed and qualified. |
| 2 | Mr. Krane is an “interested” person of the Trust, as that term is defined in the 1940 Act, by virtue of his ownership and controlling interest in the Adviser. |
Disclosure of Fund Expenses (Unaudited)
As a shareholder of a Fund, you incur two types of costs: (1) transaction costs, including brokerage expenses; and (2) ongoing costs. All ETFs have operating expenses. As a shareholder of an ETF, your investment is affected by these ongoing costs, which include (among others) costs for ETF management, administrative services, commissions, and shareholder reports like this one. It is important for you to understand the impact of these costs on your investment returns. In addition, a shareholder is responsible for brokerage fees as a result of their investment in the Fund.
Operating expenses such as these are deducted from an ETF’s gross income and directly reduce its final investment return. These expenses are expressed as a percentage of the ETF’s average net assets; this percentage is known as the ETF’s expense ratio.
The following examples use the expense ratio and are intended to help you understand the ongoing costs (in dollars) of investing in your Fund and to compare these costs with those of other funds. The examples are based on an investment of $1,000 made at the beginning of the period shown and held for the entire period (October 1, 2023 to March 31, 2024).
The table on the next page illustrates your Fund’s costs in two ways:
Actual Fund Return. This section helps you to estimate the actual expenses that your Fund incurred over the period. The “Expenses Paid During Period” column shows the actual dollar expense cost incurred by a $1,000 investment in the Fund, and the “Ending Account Value” number is derived from deducting that expense cost from the Fund’s gross investment return.
You can use this information, together with the actual amount you invested in the Fund, to estimate the expenses you paid over that period. Simply divide your actual account value by $1,000 to arrive at a ratio (for example, an $8,600 account value divided by $1,000 = 8.6), then multiply that ratio by the number shown for your Fund under “Expenses Paid During Period.”
Hypothetical 5% Return. This section helps you compare your Fund’s costs with those of other funds. It assumes that the Fund had an annual 5% return before expenses during the year, but that the expense ratio (Column 3) for the period is unchanged. This example is useful in making comparisons because the Securities and Exchange Commission requires all funds to make this 5% calculation. You can assess your Fund’s comparative cost by comparing the hypothetical result for your Fund in the “Expenses Paid During Period” column with those that appear in the same charts in the shareholder reports for other funds.
NOTE: Because the return is set at 5% for comparison purposes — NOT your Fund’s actual return — the account values shown may not apply to your specific investment.
Please note that the expenses shown in the table are meant to highlight your ongoing costs only and do not reflect any transactional costs, including brokerage commissions on the purchases and sale of Fund shares. Therefore, the expense examples are useful in comparing ongoing costs only, and will not help you determine the relative total costs of owning different funds. If these transactional costs had been included, your costs would have been higher.
Disclosure of Fund Expenses (Unaudited) (concluded)
| | | Beginning
Account Value
10/1/2023 | | | Ending
Account Value
3/31/2024 | | | Annualized
Expense
Ratios | | | Expenses
Paid During
Period(1) | |
| Quadratic Interest Rate Volatility and Inflation Hedge ETF | | | | | | | | | | | | | | | | |
| Actual Fund Return | | $ | 1,000.00 | | | $ | 937.10 | | | | 1.01 | % | | $ | 4.89 | |
| Hypothetical 5% Return | | | 1,000.00 | | | | 1,019.95 | | | | 1.01 | | | | 5.10 | |
| | | | | | | | | | | | | | | | | |
| Quadratic Deflation ETF | | | | | | | | | | | | | | | | |
| Actual Fund Return | | $ | 1,000.00 | | | $ | 1,077.80 | | | | 1.01 | % | | $ | 5.25 | |
| Hypothetical 5% Return | | | 1,000.00 | | | | 1,019.95 | | | | 1.01 | | | | 5.10 | |
| (1) | Expenses are equal to the Fund’s annualized expense ratio multiplied by the average account value over the period, multiplied by 183/366 (to reflect the one-half year period) unless otherwise indicated. |
Notice To Shareholders (Unaudited)
For shareholders that do not have a March 31, 2024 tax year end, this notice is for informational purposes only. For shareholders with a March 31, 2024 tax year end, please consult your tax advisor as to the pertinence of this notice. For the fiscal year ended March 31, 2024, the Funds are designating the following items with regard to distributions paid during the year.
Return of
Capital(1) | | | Long-Term
Capital Gain
Distributions | | | Ordinary
Income
Distributions | | | Total
Distributions | | | Qualifying for
Corporate
Dividends
Received
Deduction(2) | | | Qualifying
Dividend
Income(3) | | | U.S.
Government
Interest(4) | | | Interest
Related
Dividends(5) | | | Short Term
Capital Gain
Dividends(6) | | | Foreign Tax
Credit(7) | |
| Quadratic Interest Rate Volatility and Inflation Hedge ETF | | | | | | | |
| | 100.00 | % | | | 0.00 | % | | | 0.00 | % | | | 100.00 | % | | | 0.00 | % | | | 0.00 | % | | | 0.00 | % | | | 0.00 | % | | | 0.00 | % | | | 0.00 | % |
| Quadratic Deflation ETF | | | | | | | |
| | 12.92 | % | | | 0.00 | % | | | 87.08 | % | | | 100.00 | % | | | 0.00 | % | | | 0.00 | % | | | 51.50 | % | | | 75.30 | % | | | 0.00 | % | | | 0.00 | % |
| (1) | Return of capital is a payment received from the fund that is not considered to be taxable income. The return of capital distribution is considered to be a return of the investor’s original investment and reduces the investor’s cost basis in the fund. |
| (2) | Qualifying dividends represent dividends which qualify for the corporate dividends received deduction and are reflected as a percentage of ordinary income distributions (the total of short term capital gain and net investment income distributions). |
| (3) | The percentage in this column represents the amount of “Qualifying Dividend Income” as created by the Jobs and Growth Relief Reconciliation Act of 2003 and is reflected as a percentage of ordinary income distributions (the total of short term capital gain and net investment income distributions). It is the intention of each of the aforementioned funds to designate the maximum amount permitted by law. |
| (4) | “U.S. Government Interest” represents the amount of interest that was derived from U.S. Government obligations and distributed during the fiscal year. Generally, interest from direct U.S. Government obligations is exempt from state income tax. However, for shareholders who are residents of California, Connecticut and New York, the statutory threshold requirements were not satisfied to permit exemption of these amounts from state income. |
| (5) | The percentage in this column represents the amount of “Interest Related Dividends” and is reflected as a percentage of ordinary income distributions that is exempt from U.S. withholding tax when paid for foreign investors. |
| (6) | The percentage in this column represents the amount of “Short Term Capital Gain Dividends” and is reflected as a percentage of short term capital gain distributions that is exempt from U.S. withholding tax when paid for foreign investors. |
| (7) | The allocable share of foreign tax credit will be reported on Form 1099-DIV. |
Supplemental Information (Unaudited)
Net asset value, or “NAV”, is the price per Share at which the Funds issue and redeem Shares to Authorized Participants. It is calculated in accordance with the policies described in Note 2 in Notes to Financial Statements. The “Market Price” of the Funds generally is determined using the closing price on the stock exchange on which the Shares of the Funds are listed for trading. The Funds’ Market Price may be at, above or below their NAV. The NAV of the Funds will fluctuate with changes in the market value of their holdings. The Market Price of the Funds will fluctuate in accordance with changes in their NAV, as well as market supply and demand of Fund Shares.
Premiums or discounts are the differences (expressed as a percentage) between the NAV and Market Price of the Funds on a given day, generally at the time NAV is calculated. A premium is the amount that the Funds are trading above the reported NAV, expressed as a percentage of the NAV. A discount is the amount that the Funds are trading below the reported NAV, expressed as a percentage of the NAV. Shareholders may pay more than NAV when they buy Fund Shares and receive less than NAV when they sell those Shares, because Shares are bought and sold at Market Price.
Further information regarding premiums and discounts is available on the Funds’ website at https://kfafunds.com/ivol/, https://kfafunds.com/bndd/, https://www.ivoletf.com/ivol-specifications/, and https://www.bnddetf.com/bndd-specifications/. The premium and discount information contained on the website represents past performance and cannot be used to predict future results.
This page intentionally left blank.

| KraneShares Trust: | | Investment Sub-Adviser: |
| 280 Park Avenue 32nd Floor | | Quadratic Capital Management LLC |
| New York, NY 10017 | | 39 Lewis Street, 4th Floor |
| 1-855-857-2638 | | Greenwich, CT 06830 |
| http://kfafunds.com | | |
| | | |
| For inquires specific to The Quadratic Interest | | Distributor: |
| Rate Volatility and Inflation Hedge ETF and | | SEI Investments Distribution Co. |
| Quadratic Deflation ETF | | One Freedom Valley Drive |
| +1-833-IVOL-ETF | | Oaks, PA 19456 |
| (+1-833-486-5383) | | |
| https://www.ivoletf.com | | |
| | | |
| 1-888-BNDD-007 | | Administrator: |
| (1-888-263-3007) | | SEI Investments Global Funds Services |
| https://www.bnddetf.com | | One Freedom Valley Drive |
| | | Oaks, PA 19456 |
| | |
| Investment Adviser: | | Independent Registered Public Accounting Firm: |
| Krane Funds Advisors, LLC | | KPMG LLP |
| 280 Park Avenue 32nd Floor | | 1601 Market Street |
| New York, NY 10017 | | Philadelphia, PA 19103 |
This information must be preceded or accompanied by a current prospectus for the Funds described.

KraneShares Trust:
280 Park Avenue, 32nd Floor
New York, NY 10017
KRS-AR-003-0400
| (b) | Not applicable to the Registrant. |
Item 2. Code of Ethics.
The Registrant has adopted a code of ethics that applies to the Registrant’s principal executive officer, principal financial officer, and any person who performs a similar function. During the period covered by the report, there were no amendments to the code of ethics, and the Registrant did not grant any waivers from a provision of the code of ethics.
Item 3. Audit Committee Financial Expert.
(a)(1) The Registrant’s Board of Trustees has determined that the Registrant has an audit committee financial expert serving on the audit committee.
(a)(2) The audit committee financial expert, John Ferguson, is an independent trustee as defined in Form N-CSR Item 3 (a)(2).
Item 4. Principal Accountant Fees and Services.
Fees billed by KPMG LLP (“KPMG”) related to the Registrant.
KPMG billed the Registrant aggregate fees for services rendered to the Registrant for the last two fiscal years as follows:
| | 2024 | 2023 |
| | | All fees and services to the Registrant that were pre-approved | All fees and services to service affiliates that were pre-approved | All other fees and services to service affiliates that did not require pre-approval | All fees and services to the Registrant that were pre-approved | All fees and services to service affiliates that were pre-approved | All other fees and services to service affiliates that did not require pre-approval |
| (a) | Audit Fees | $587,250 | $0 | N/A | $751,300 | $0 | N/A |
| (b) | Audit-Related Fees | $0 | $0 | N/A | $0 | $0 | N/A |
| (c) | Tax Fees(1) | $178,000 | $0 | N/A | $130,900 | $0 | N/A |
| (d) | All Other Fees | $9,000 | $0 | N/A | $6,531 | $0 | N/A |
Notes:
(1) These services included tax return preparation and tax compliance for the Funds.
(e)(1) Pursuant to the requirements of the Sarbanes-Oxley Act of 2002, the SEC adopted Rule 2-01 under Regulation S-X, which, among other things, requires a fund’s audit committee to pre-approve certain audit and non-audit services that are provided by its independent auditors in order to ensure the auditors’ independence. The Registrant’s Board of Trustees has established an Audit Committee that has been charged with, among other things, assisting the Board of Trustees in its oversight of: the Registrant’s independent auditors; preapproving all audit and non-audit services provided by the Registrant’s independent auditors; the integrity of the Funds’ financial statements; the independent auditors’ qualifications and independence; and the use of appropriate accounting principles.
(e)(2) Percentage of fees billed applicable to non-audit services approved pursuant to the “de minimis” exception of Rule 2-01(c)(7)(i)(C) were as follows for KPMG:
| | 2024 | 2023 |
Audit-Related Fees | 0% | 0% |
| Tax Fees | 0% | 0% |
All Other Fees | 0% | 0% |
(f) Not applicable.
(g) The aggregate non-audit fees and services billed by KPMG for the last two fiscal years were $0 and $0, respectively.
(h) During the past fiscal year, all non-audit services provided by the Registrant’s principal accountant to either the Registrant’s investment adviser or to entities controlling, controlled by, or under common control with the Registrant’s investment adviser that provides ongoing services to the Registrant were pre-approved by the Audit Committee of the Registrant’s Board of Trustees. Included in the audit committee’s pre-approval was the review and consideration as to whether the provision of these non-audit services is compatible with maintaining the principal accountant’s independence.
(i) Not applicable. The Registrant has not retained, for the preparation of the audit report on the financial statements included in the Form N-CSR, a registered public accounting firm that has a branch or office that is located in a foreign jurisdiction and that the Public Company Accounting Oversight Board (the “PCAOB”) has determined that the PCAOB is unable to inspect or investigate completely because of a position taken by an authority in the foreign jurisdiction.
(j) Not applicable. The Registrant is not a “foreign issuer,” as defined in 17 CFR 240.3b-4.
Item 5. Audit Committee of Listed Registrants.
(a) The Registrant has a separately-designated standing Audit Committee, which is composed of the Registrant’s Independent Trustees, Messrs. Patrick Campo, John Ferguson and Matthew Stroyman.
(b) Not applicable to the Registrant.
Item 6. Investments.
(a) The Schedule of Investments is included as part of the Report to Shareholders filed under Item 1 of this form.
(b) Not applicable.
Item 7. Reserved.
Item 8. Reserved.
Item 9. Reserved.
Item 10. Reserved.
Item 11. Reserved.
Item 12. Disclosure of Proxy Voting Policies and Procedures for Closed-End Management Investment Companies.
Not applicable to the Registrant.
Item 13. Portfolio Managers of Closed-End Management Investment Companies.
Not applicable to the Registrant.
Item 14. Purchases of Equity Securities by Closed-End Management Investment Company and Affiliated Purchasers.
Not applicable to the Registrant.
Item 15. Submission of Matters to a Vote of Security Holders.
There have been no changes to the procedures by which shareholders may recommend nominees to the Registrant’s Board of Trustees during the period covered by this report.
Item 16. Controls and Procedures.
(a) The Registrant’s principal executive and principal financial officers, or persons performing similar functions, have concluded that the Registrant’s disclosure controls and procedures (as defined in Rule 30a-3(c) under the Act (17 CFR § 270.30a-3(c))) as of a date within 90 days of the filing date of the report, are effective based on the evaluation of these controls and procedures required by Rule 30a-3(b) under the Act (17 CFR § 270.30a-3(b)) and Rules 13a-15(b) or 15d-15(b) under the Securities Exchange Act of 1934 (17 CFR § 240.13a-15(b) or § 240.15d-15(b)).
(b) There has been no change in the Registrant’s internal control over financial reporting (as defined in Rule 30a-3(d) under the Act (17 CFR § 270.30a-3(d))) that occurred during the period covered by this report that has materially affected, or is reasonably likely to materially affect, the Registrant’s internal control over financial reporting.
Item 17. Disclosure of Securities Lending Activities for Closed-End Management Investment Companies.
Not applicable to the Registrant.
Item 18. Recovery of Erroneously Awarded Compensation.
(a) Not applicable.
(b) Not applicable.
Item 19. Exhibits.
(a)(1) Code of Ethics filed herewith.
(a)(2) Not applicable.
(a)(3) A separate certification for the principal executive officer and the principal financial officer of the Registrant as required by Rule 30a-2(a) under the Act (17 CFR § 270.30a-2(a)), is filed herewith.
(a)(4) Not applicable.
(a)(5) Not applicable.
(b) Officer certifications as required by Rule 30a-2(b) under the Act (17 CFR § 270.30a-2(b)) also accompany this filing as exhibits.
SIGNATURES
Pursuant to the requirements of the Securities Exchange Act of 1934 and the Investment Company Act of 1940, the Registrant has duly caused this report to be signed on its behalf by the undersigned, thereunto duly authorized.
| (Registrant) | KraneShares Trust |
| | |
| By (Signature and Title) | /s/ Jonathan Krane |
| | Jonathan Krane |
| | Principal Executive Officer |
Date: June 6, 2024
Pursuant to the requirements of the Securities Exchange Act of 1934 and the Investment Company Act of 1940, this report has been signed below by the following persons on behalf of the Registrant and in the capacities and on the dates indicated.
| By (Signature and Title) | /s/ Jonathan Krane |
| | Jonathan Krane |
| | Principal Executive Officer |
Date: June 6, 2024
| By (Signature and Title) | /s/ Jonathan Krane |
| | Jonathan Krane |
| | Principal Financial Officer |
Date: June 6, 2024