ANNUAL REPORT
June 30, 2023
Brown Advisory Growth Equity Fund
Brown Advisory Flexible Equity Fund
Brown Advisory Equity Income Fund
Brown Advisory Sustainable Growth Fund
Brown Advisory Mid-Cap Growth Fund
Brown Advisory Small-Cap Growth Fund
Brown Advisory Small-Cap Fundamental Value Fund
Brown Advisory Sustainable Small-Cap Core Fund
Brown Advisory Sustainable Value Fund
Brown Advisory Global Leaders Fund
Brown Advisory Sustainable International Leaders Fund
Brown Advisory Intermediate Income Fund
Brown Advisory Sustainable Bond Fund
Brown Advisory Maryland Bond Fund
Brown Advisory Tax-Exempt Bond Fund
Brown Advisory Tax-Exempt Sustainable Bond Fund
Brown Advisory Mortgage Securities Fund
Brown Advisory – WMC Strategic European Equity Fund
Brown Advisory Emerging Markets Select Fund
Brown Advisory – Beutel Goodman Large-Cap Value Fund
TABLE OF CONTENTS
Brown Advisory Growth Equity Fund | 1 |
Brown Advisory Flexible Equity Fund | 5 |
Brown Advisory Equity Income Fund | 9 |
Brown Advisory Sustainable Growth Fund | 13 |
Brown Advisory Mid-Cap Growth Fund | 17 |
Brown Advisory Small-Cap Growth Fund | 21 |
Brown Advisory Small-Cap Fundamental Value Fund | 26 |
Brown Advisory Sustainable Small-Cap Core Fund | 29 |
Brown Advisory Sustainable Value Fund | 33 |
Brown Advisory Global Leaders Fund | 37 |
Brown Advisory Sustainable International Leaders Fund | 41 |
Brown Advisory Intermediate Income Fund | 45 |
Brown Advisory Sustainable Bond Fund | 50 |
Brown Advisory Maryland Bond Fund | 57 |
Brown Advisory Tax-Exempt Bond Fund | 62 |
Brown Advisory Tax-Exempt Sustainable Bond Fund | 68 |
Brown Advisory Mortgage Securities Fund | 73 |
Brown Advisory – WMC Strategic European Equity Fund | 83 |
Brown Advisory Emerging Markets Select Fund | 87 |
Brown Advisory – Beutel Goodman Large-Cap Value Fund | 91 |
Statements of Assets and Liabilities | 95 |
Statements of Operations | 100 |
Statements of Changes in Net Assets | 105 |
Financial Highlights | 115 |
Notes to Financial Statements | 123 |
Report of Independent Registered Public Accounting Firm | 139 |
Additional Information | 141 |
The views in the report contained herein were those of the Funds’ investment adviser, Brown Advisory LLC, or, for the sub-advised funds, of the respective sub-adviser, as of June 30, 2023 and may not reflect their views on the date this report is first published or anytime thereafter. This report may contain discussions about certain investments both held and not held in the portfolio as of June 30, 2023. All current and future holdings are subject to risk and are subject to change. While these views are intended to assist shareholders in understanding their investment in each Fund, they do not constitute investment advice, are not a guarantee of future performance and are not intended as an offer or solicitation with respect to the purchase or sale of any security. Performance figures include the reinvestment of dividend and capital gain distributions.
The Global Industry Classification Standard (GICS®) was developed by and is the exclusive property of MSCI, Inc. and Standard & Poor’s Financial Services LLC (“S&P”). GICS® is a service mark of MSCI, Inc. and S&P and has been licensed for use by the Administrator, U.S. Bancorp Fund Services, LLC.
GLOSSARY OF TERMS
Absolute basis is to express as a fixed amount rather than referring to variable factors.
Absolute performance refers to the percentage rise or fall in the share price of a security over a stated period.
Absolute return refers to the percent amount that an asset rises or declines in value in a given period.
Alpha refers to the abnormal rate of return on a security or portfolio in excess of what would be predicted by an equilibrium model like the capital asset pricing model (CAPM).
American Rescue Plan (ARP) is a $1.9 trillion economic stimulus bill passed by the 117th United States Congress and signed into law by President Joe Biden on March 11, 2021, to speed up the United States’ recovery from the economic and health effects of the COVID-19 pandemic and the ongoing recession.
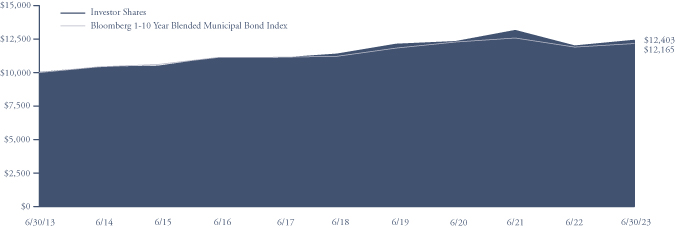
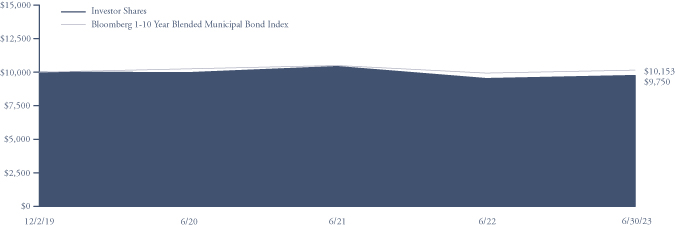
Bloomberg 1-10 Year Blended Municipal Bond Index is a market index of high quality, domestic fixed income securities with maturities of less than 10 years.
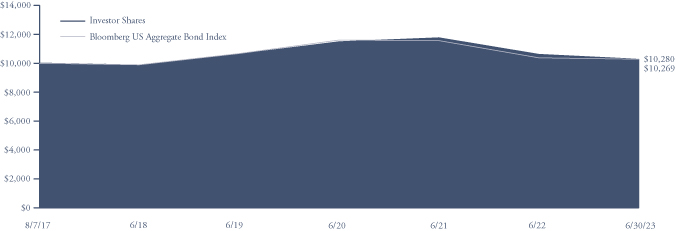
Bloomberg Intermediate US Aggregate Bond Index represents domestic taxable investment-grade bonds with index components for government and corporate securities, mortgage pass-through securities and asset-backed securities with average maturities and durations in the intermediate range. This index represents a sector of the Bloomberg US Aggregate Bond Index.
Bloomberg Mortgage Backed Securities Index is a market value-weighted index which covers the mortgage-backed securities component of the Bloomberg US Aggregate Bond Index. The index is composed of agency mortgage-backed passthrough securities of the Government National Mortgage Association (Ginnie Mae), the Federal National Mortgage Association (Fannie Mae), and the Federal Home Loan Mortgage Corporation (Freddie Mac) with a minimum $150 million par amount outstanding and a weighted-average maturity of at least 1 year. The index includes reinvestment of income.
Bloomberg US Aggregate Bond Index is a broad-based benchmark that measures the investment grade, US dollar-denominated, fixed-rate taxable bond market. The index includes Treasuries, government-related and corporate securities, MBS, ABS and CMBS.
Bloomberg US Corporate High Yield Index measures the US Dollar denominated, high-yield, fixed-rate corporate bond market.
Basis point(s) (bps) is a unit that is equal to 1/100th of 1%, and is used to denote the change in a financial instrument. The basis point is commonly used for calculating changes in interest rates, equity indexes and the yield of a fixed-income security. 1% is equal to 100 basis points.
Beta is a measure of the volatility, or systematic risk, of a security or a portfolio in comparison to the market as a whole.
Book value is the net asset value of a company, calculated by total assets minus intangible assets (patents, goodwill) and liabilities.
CAPEX, or capital expenditures, are funds used by a company to acquire or upgrade physical assets such as property, industrial buildings or equipment. It is often used to undertake new projects or investments by the firm. This type of outlay is also made by companies to maintain or increase the scope of their operations.
Cash flow measures the cash generating capability of a company by adding non-cash charges (e.g. depreciation) and interest expense to pretax income.
Consumer Price Index (CPI) is a measure that examines the weighted average of prices of a basket of consumer goods and services, such as transportation, food, and medical care. It is calculated by taking price changes for each item in the predetermined basket of goods and averaging them.
Coronavirus Aid, Relief, and Economic Security Act (CARES Act), also known as the CARES Act, is a $2.2 trillion economic stimulus bill passed by the 116th U.S. Congress and signed into law by President Donald Trump on March 27, 2020, in response to the economic fallout of the COVID-19 pandemic in the United States.
Correlation is a statistical measurement of how two securities move in relation to each other.
Credit spread is the difference in yield between a U.S. Treasury bond and another debt security of the same maturity but different credit quality. Credit spreads between U.S. Treasuries and other bond issuances are measured in basis points, with a 1% difference in yield equal to a spread of 100 basis points.
Dividend Yield is a financial ratio that shows how much a company pays out in dividends each year relative to its share price. In the absence of any capital gains, the dividend yield is the return on investment for a stock.
Downside Capture is a statistical measure of a fund’s performance in down markets. For example, a fund with downside capture of 90% would only have declined 90% as much as the related index during the same down market period.
Duration is a measure of the sensitivity of the price of a fixed-income investment to a change in interest rates. Duration is expressed as a number of years.
GLOSSARY OF TERMS
Duration contribution equals the spread duration, or the measure of the sensitivity of the price of a bond or other debt instrument to a change in interest rates, of a security or market segment multiplied by the size of the allocation to it.
Earnings growth is a measure of growth in a company’s net income over a specific period, often one year. The term can apply to actual data from previous periods or estimated data for future periods.
Earnings per share (EPS) is calculated by taking the total earnings divided by the number of shares outstanding.
Earnings Yield is the earnings per share for the most recent 12-month period divided by the current market price per share. The earnings yield shows the percentage of each dollar invested in the stock that was earned by the company.
EBITDA is the Earnings Before Interest, Taxes, Depreciation and Amortization. An approximate measure of a company’s operating cash flow based on data from the company’s income statement.
Enterprise Value (EV) is a measure of a company’s value, often used as an alternative to straightforward market capitalization. Enterprise Value is calculated as market capitalization plus debt, minority interest and preferred shares, minus total cash and cash equivalents.
Environmental, Social and Governance (ESG) is an evaluation of a firm’s collective conscientiousness for social and environmental factors. The criteria are a set of standards for a company’s operations that socially conscious investors use to screen potential investments. Environmental criteria consider how a company performs as a steward of nature. Social criteria examine how it manages relationships with employees, suppliers, customers, and the communities where it operates. Governance deals with a company’s leadership, executive pay, audits, internal controls, and shareholder rights.
FTSE All-World Index is a market capitalization weighted index representing the performance of large and mid-capitalization stocks from the FTSE Global Equity Index Series.
FTSE Emerging Index is a market capitalization weighted index representing the performance of over 790 large and mid-capitalization companies in 22 emerging markets.
Forward price to earnings ratio uses forecasted earnings, rather than current earnings, to calculate the price to earnings ratio.
Free Cash Flow is the operating cash flows (net income plus amortization and depreciation) minus capital expenditures and dividends. Free cash flow is the amount of cash that a company has left over after it has paid all of its expenses, including investments.
Free Cash Flow (FCF) Conversion represents the cash a company generates after accounting for cash outflows to support operations and maintain its capital assets. Unlike earnings or net income, free cash flow is a measure of profitability that excludes the non-cash expenses of the income statement and includes spending on equipment and assets as well as changes in working capital from the balance sheet.
Free Cash Flow (FCF) Yield is a financial ratio that compares the free cash flow per share a company is expected to earn against its market value per share. The ratio is calculated by taking the free cash flow per share divided by the current share price.
Global Financial Crisis refers to the financial crisis of 2007-2008, which was a severe worldwide economic crisis. Prior to the COVID-19 recession in 2020, it was considered by many economists to have been the most serious financial crisis since the Great Depression.
Government agency residential mortgage-backed security is an instrument whose principal and interest payments are guaranteed by a government agency such as the Federal National Mortgage Association (Fannie Mae) and the Federal Home Loan Mortgage Corporation (Freddie Mac).
Gross Domestic Product (GDP) is the monetary value of all the goods and services produced by an economy over a specified period. It includes consumption, government purchases, investments, and exports minus imports.
ICE BofAML 0-3 Month US Treasury Bill Index is a subset of the ICE BofAML US Treasury Bill Index and includes all securities with a remaining term to final maturity less than 3 months.
Inflation rate refers to the rate of increase in prices over a given period of time. Inflation is typically a broad measure, such as the overall increase in prices or the increase in the cost of living in a country.
Internal rate of return (IRR) is a metric used in financial analysis to estimate the profitability of potential investments. IRR is a discount rate that makes the net present value (NPV) of all cash flows equal to zero in a discounted cash flow analysis.
Mandatory convertible is a bond issued by a company which must be converted into shares to common stock on or before a specific date.
Meme stocks are stocks that see dramatic price increases, mostly fueled by people on social media (primarily Reddit, Twitter and Tik Tok). These stocks rarely have company fundamentals that back the rise in price and are often highly volatile.
Mortgage-backed security (MBS) is an investment similar to a bond that is made up of a bundle of home loans bought from the banks that issued them. Investors in MBS receive periodic payments similar to bond coupon payments.
GLOSSARY OF TERMS
MSCI ACWI ex USA Index is an index that captures large and mid cap representation across Developed Markets countries (excluding the US) and Emerging Markets countries. The index covers the majority of the global equity opportunity set outside the US.
MSCI All Country World Index (ACWI) is a free float-adjusted market capitalization index that is designed to measure equity market performance in the large- and mid-cap segments of certain developed markets and global emerging markets countries.
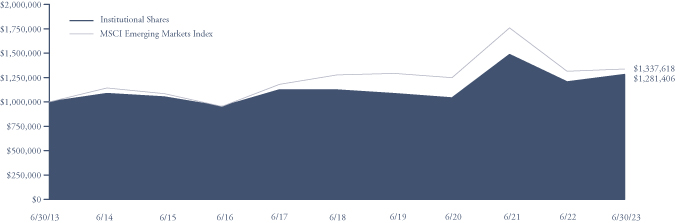
MSCI Emerging Markets Index is a free float-adjusted market capitalization index that is designed to measure equity market performance in the global emerging markets.
MSCI Emerging Markets Small Cap Index is a free float-adjusted market capitalization index that is designed to measure small cap equity market performance in the global emerging markets.
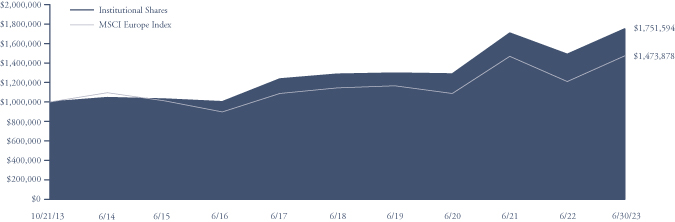
MSCI Europe Index is an index that captures large and mid cap representation across 15 developed market countries in Europe.
Net present value (NPV) is the difference between the present value of cash inflows and the present value of cash outflows over a period of time. NPV is used in capital budgeting and investment planning to analyze the profitability of a projected investment or project.
90% active share is an active share that was developed to quantify the degree of active management and measures the fraction of portfolio (based on position weights) that differs from the benchmark index. A portfolio with an active share of more than 60% is considered actively managed. Therefore, a 90% active share portfolio significantly differs from its index.
Positive Convexity is a measure describing the sensitivity of a bond’s duration to changes in yield where a fall in yields leads to a greater increase in price than price declines due to an increase in yields providing downside protection for investors.
Price to Book Value Ratio (P/B) is ratio used to compare a stock’s market value to its book value. It is calculated by dividing the current closing price of the stock by the latest quarter’s book value per share.
Price to earnings ratio (P/E) is a common tool for comparing the prices of different common stocks and is calculated by dividing the current market price of a stock by the earnings per share.
Quantitative Easing is an expansionary monetary policy implemented by a central bank aiming to increase the money supply and decrease interest rates by buying bonds in order to inject liquidity into the economy.
Relative performance measures how a stock is performing relative to a specific market or index.
Return of Capital (ROC) is a return from an investment that is not considered income. The return of capital is when some or all of the money an investor has in an investment is paid back to him or her, thus decreasing the value of the investment.
Return on Capital Employed (ROCE) is a financial ratio that measures a company’s profitability and the efficiency with which its capital is employed. Return on Capital Employed (ROCE) is calculated as: ROCE = Earnings Before Interest and Tax (EBIT) / Capital Employed.
Return on Equity (ROE) is the amount of net income returned as a percentage of shareholders equity. Return on equity measures a corporation’s profitability by revealing how much profit a company generates with the money shareholders have invested.
Return on Invested Capital (ROIC) is a calculation used to assess a company’s efficiency at allocating the capital under its control to profitable investments. ROIC is typically calculated by taking a company’s net income, subtracting dividends the company paid out and dividing that amount by the company’s total capital.
Risk-adjusted return refers to a calculation of the profit or potential profit from an investment that takes into account the degree of risk that must be accepted in order to achieve it. The risk is usually measured in comparison to U.S. Treasuries.
Russell Midcap Growth Index measures the performance of the mid-capitalization growth sector of the U.S. equity market.
Russell 1000® Growth Index measures the performance of the large-cap growth segment of the of the U.S. equity universe. It includes those Russell 1000® companies with higher price to book value ratios and higher forecasted growth values.
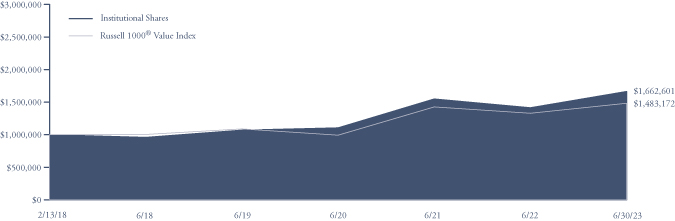
Russell 1000® Value Index measures the performance of the large-cap value segment of the U.S. equity universe. It includes those Russell 1000® companies with lower price to book value ratios and lower expected growth values.
Russell 2000® Growth Index measures the performance of the small-cap growth segment of the U.S. equity universe. It includes those Russell 2000® companies with higher price to book value ratios and higher forecasted growth values.
Russell 2000® Index measures the performance of the 2,000 smallest companies in the Russell 3000® Index.
Russell 2000® Value Index measures the performance of the small-cap value segment of the U.S. equity universe. It includes those Russell 2000® companies with lower price to book value ratios and lower forecasted growth values.
Russell 3000® Index measures the performance of the 3,000 largest U.S. companies representing approximately 98% of the investable U.S. equity market.
GLOSSARY OF TERMS
S&P 500 Index (“S&P 500”) is a market-value weighted index representing the performance of 500 widely held, publicly traded large capitalization stocks.
Securitized credit refers to the transformation of illiquid, nonmarketed assets into liquid, marketable assets, or in other words, securities.
Sell-side research is investment research issued by an investment bank or brokerage firm that is circulated to the firm’s clients. The ultimate outcome of the research is to provide a report including a set of financial estimates, a price target, and a recommendation of a stock’s expected performance.
Standard deviation is a statistical measure of the extent to which returns of an asset vary from its average.
Sustainable Business Advantage Drivers (SBA Drivers) refers to characteristic determined to help drive material value for customers and meaningful differentiation versus peers, as well as strong ESG risk management.
Tangible Book Value (“TBV”) is a valuation ratio expressing the price of a security compared to its hard, or tangible, book value as reported in the company’s balance sheet. The tangible book value number is equal to the company’s total book value less the value of any intangible assets.
Tier 1 Capital Ratio is a comparison between a banking firm’s core equity capital and total risk-weighted assets. A firm’s core equity capital is known as its Tier 1 capital and is the measure of a bank’s financial strength based on the sum of its equity capital and disclosed reserves, and sometimes non-redeemable, non-cumulative preferred stock. A firm’s risk-weighted assets include all assets that the firm holds that are systematically weighted for credit risk. Central banks typically develop the weighting scale for different asset classes, such as cash and coins, which have zero risk, versus a letter or credit, which carries more risk.
Turnover refers to a fund buying or selling securities. (The fund “turns over” its portfolio.) A fund pays transaction costs, such as commissions, when it buys and sells securities. Additionally, a higher turnover rate may result in higher taxes when the fund shares are held in a taxable account.
Yield concessions is when an investor gives up some yield by buying a lower yielding bond that if one were to invest in a higher yielding bond.
Yield Curve is a line that plots the yields of securities having equal credit quality but different maturity dates.
Yield Spread is the difference between yields on differing securities, calculated by deducting the yield of one security from another.
The broad based market indexes referenced in the following management commentaries are considered representative of their indicated market, the indexes are unmanaged and do not reflect the deduction of fees, such as, investment management and fund accounting fees, or taxes associated with a mutual fund. Investors cannot invest directly in an index.
Brown Advisory Growth Equity FundA Message to Our Shareholders
June 30, 2023
Dear Shareholder:
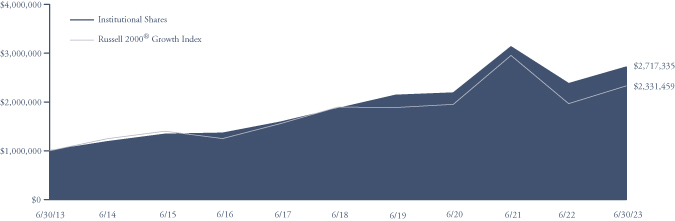
During the 12-month period ended June 30, 2023, the Brown Advisory Growth Equity Fund Institutional Shares (the “Fund”) increased 20.22% in value. During the same period, the Russell 1000® Growth Index (the “Index”), the Fund’s benchmark, increased 27.11%.
The market has thus far shrugged off several ongoing macroeconomic challenges, from banking turmoil in the U.S., a debt ceiling crisis, and the Fed’s continued effort to tamp down inflation. Despite these economic headwinds, U.S. growth stocks posted strong absolute returns, mostly driven by a subset of mega-cap companies (a consistent trend in recent quarters; year-to-date more than 70% of the Index’s return came from the 10 largest constituents by market capitalization).
This narrow market leadership has pushed the Index into historic territory. As of the end of the period, the top 10 companies represented 53% of our benchmark, the highest percentage in its history. The information technology sector, according to GICS, is now 43% of the benchmark, just shy of the peak of the technology bubble in the late 1990s. While these dynamics have created a challenging environment from a relative performance perspective, our Fund’s companies have executed well, fundamentally.
From a sector perspective, information technology and communication services were the largest detractors to relative performance during the period. While the portfolio’s information technology stocks, on average, returned more than 40% during the period, our underweight to the sector was the primary driver of relative underperformance. Match Group, the online dating provider, has underperformed during the period due to macroeconomic uncertainties, foreign exchange headwinds and management team changes. The new management team is relentlessly focused on Tinder, the company’s largest and most profitable brand, and ensuring that profitability is optimized across its user base, something we expect to benefit the company in the back half of this year.
Health care and consumer discretionary were the largest positive contributing sectors to relative performance during the period. Intuitive Surgical, the provider of advanced robotic-surgical solutions and longest held name in the Fund, was a top contributor to absolute performance during the period. The company recently reported impressive results across geographies and raised guidance for the remainder of the fiscal year. The company’s procedure growth of 26% significantly exceeded Wall Street consensus estimates of 14%.
While the concentration in the benchmark (and in U.S. equities generally) has made it challenging to outperform, we are generally pleased with our companies’ fundamental execution. We hope that the month of June, where fundamentals mattered more than market cap, compared to recent months, is indicative of what to expect over the coming quarters.
Sincerely,
Kenneth M. Stuzin, CFA
Portfolio Manager
Brown Advisory Growth Equity FundA Message to Our Shareholders
June 30, 2023
Past performance is not a guarantee of future results.
Mutual fund investing involves risk. Principal loss is possible.
Investments in smaller and medium capitalization companies generally carry greater risk than is customarily associated with larger companies for various reasons such as narrower markets, limited financial resources and less liquid stock.
The value of the Fund’s investments in REITs may change in response to changes in the real estate market such as declines in the value of real estate, lack of available capital or financing opportunities, and increases in property taxes or operating costs.
Investments in foreign securities entail certain risks not associated with investments in domestic securities, such as volatility of currency exchange rates, and in some cases, political and economic instability and relatively illiquid markets. These risks are greater for investments in emerging markets.
The Fund may invest in ETFs, which may trade at a discount to the aggregate value of the underlying securities and although expense ratios for ETFs are generally low, frequent trading of ETFs by the Fund can generate brokerage expenses.
Fund holdings and sector allocations are subject to change and should not be considered a recommendation to buy or sell any security. For a complete list of fund holdings, please refer to the Schedule of Investments provided in this report.
Definitions for terms and indices are provided in the Glossary of Terms.
Brown Advisory Growth Equity FundPerformance Information & Portfolio Holdings Summary
June 30, 2023
GROWTH OF A $1,000,000 INVESTMENT
The following chart reflects the change in value of a hypothetical $1,000,000 investment, including reinvested dividends and distributions, in the Fund as measured against broad-based securities market indices. The Russell 1000® Growth Index measures the performance of the large-cap growth segment of the U.S. equity universe. It includes those Russell 1000® companies with higher price to book ratios and higher forecasted growth values. The S&P 500 Index is a market-value weighted index representing the performance of 500 widely held, publicly traded large capitalization stocks. The indexes are unmanaged and do not reflect the deduction of fees, such as investment management fees. Investors cannot invest directly in an index.

| PORTFOLIO HOLDINGS | % of Net Assets |
| | | |
Information Technology | | 30.5% |
Health Care | | 21.2% |
Financials | | 9.8% |
Consumer Discretionary | | 8.7% |
Industrials | | 8.2% |
Consumer Staples | | 6.8% |
Communication Services | | 5.6% |
Real Estate Investment Trusts | | 3.1% |
Real Estate | | 2.9% |
Money Market Funds | | 2.1% |
Other Assets and Liabilities | | 1.1% |
| | | 100.0% |
Average Annual Total Return | One Year | Five Year | Ten Year |
| Institutional Shares | 20.22% | 10.93% | 12.41% |
| Investor Shares | 20.03% | 10.76% | 12.25% |
| Advisor Shares | 19.76% | 10.49% | 11.97% |
Russell 1000® Growth Index | 27.11% | 15.14% | 15.74% |
| S&P 500 Index | 19.59% | 12.31% | 12.86% |
| | Institutional Shares | Investor Shares | Advisor Shares |
Gross Expense Ratio1 | 0.66% | 0.81% | 1.06% |
Net Expense Ratio1 | 0.66% | 0.81% | 1.06% |
Past performance does not guarantee future results. The performance data quoted represents past performance and current returns may be lower or higher. The investment return and net asset value will fluctuate so that an investor’s shares, when redeemed, may be worth more or less than the original cost. To obtain performance information current to the most recent month end, please visit our website at brownadvisory.com/mf/growth-equity-fund. The performance table and graph above do not reflect the deduction of taxes that a shareholder would pay on Fund distributions or the redemption of Fund shares. Performance data does not reflect the imposition of the redemption fee of 1.00% on shares redeemed within 14 days, and if it did, performance would have been lower. Short-term performance, in particular, is not a good indication of the Fund’s future performance, and an investment should not be made based solely on returns. Returns shown are calculated using the net asset values (“NAV”) that were used for shareholder transactions as of the respective period ends. These NAV, and the returns calculated from them, may differ from the NAV and returns shown elsewhere in this report.
1 | Per the Fund’s prospectus dated October 31, 2022. Refer to the financial highlights for the gross and net expense ratios for the year ended as of the date of this report. Please note that the expense ratios per the prospectus include acquired fund fees and expenses (as applicable) and the expense ratios in the financial highlights do not. |
Brown Advisory Growth Equity FundSchedule of Investments
June 30, 2023
| Shares | | Security Description | | Value $ | |
| Common Stocks — 93.7% | | | |
| | | | |
| Communication Services — 5.6% | | | |
| | 775,983 | | Alphabet, Inc. — Class C* | | | 93,870,664 | |
| | 1,164,379 | | Match Group, Inc.* | | | 48,729,261 | |
| | | | | | | 142,599,925 | |
| Consumer Discretionary — 8.7% | | | | |
| | 758,537 | | Amazon.com, Inc.* | | | 98,882,883 | |
| | 1,352,463 | | Chewy, Inc.* | | | 53,381,715 | |
| | 183,523 | | Lululemon Athletica, Inc.* | | | 69,463,455 | |
| | | | | | | 221,728,053 | |
| Consumer Staples — 6.8% | | | | |
| | 169,406 | | Costco Wholesale Corp. | | | 91,204,802 | |
| | 410,842 | | Estee Lauder Companies, Inc. | | | 80,681,152 | |
| | | | | | | 171,885,954 | |
| Financials — 9.8% | | | | |
| | 243,875 | | MasterCard, Inc. | | | 95,916,038 | |
| | 519,633 | | Progressive Corp. | | | 68,783,820 | |
| | 206,688 | | S&P Global, Inc. | | | 82,859,152 | |
| | | | | | | 247,559,010 | |
| Health Care — 21.2% | | | | |
| | 174,666 | | Align Technology, Inc.* | | | 61,768,884 | |
| | 427,080 | | DexCom, Inc.* | | | 54,884,051 | |
| | 861,137 | | Edwards Lifesciences Corp.* | | | 81,231,053 | |
| | 337,006 | | Intuitive Surgical, Inc.* | | | 115,235,832 | |
| | 166,916 | | Thermo Fisher Scientific, Inc. | | | 87,088,423 | |
| | 343,242 | | Veeva Systems, Inc.* | | | 67,869,241 | |
| | 407,274 | | Zoetis, Inc. | | | 70,136,655 | |
| | | | | | | 538,214,139 | |
| Industrials — 8.2% | | | | |
| | 144,694 | | Cintas Corp. | | | 71,924,493 | |
| | 452,644 | | Generac Holdings, Inc.* | | | 67,502,800 | |
| | 319,437 | | IDEX Corp. | | | 68,762,009 | |
| | | | | | | 208,189,302 | |
| Information Technology — 30.5% | | | | |
| | 173,558 | | Adobe, Inc.* | | | 84,868,126 | |
| | 376,288 | | Atlassian Corp.* | | | 63,144,889 | |
| | 344,401 | | Autodesk, Inc.* | | | 70,467,889 | |
| | 213,697 | | Intuit, Inc. | | | 97,913,829 | |
| | 347,332 | | Microsoft Corp. | | | 118,280,439 | |
| | 284,475 | | NVIDIA Corp. | | | 120,338,615 | |
| | 330,127 | | NXP Semiconductors NV | | | 67,570,394 | |
| | 210,858 | | ServiceNow, Inc.* | | | 118,495,870 | |
| | 530,027 | | Shopify, Inc.* | | | 34,239,744 | |
| | | | | | | 775,319,795 | |
| Real Estate — 2.9% | | | | |
| | 829,901 | | CoStar Group, Inc.* | | | 73,861,189 | |
Total Common Stocks (Cost $1,412,241,143) | | | 2,379,357,367 | |
| | | | | |
| Real Estate Investment Trusts — 3.1% | | | | |
| | 337,947 | | SBA Communications Corp. | | | 78,322,597 | |
Total Real Estate Investment Trusts (Cost $48,355,046) | | | 78,322,597 | |
| | | | | |
| Short-Term Investments — 2.1% | | | | |
| | | | | |
| Money Market Funds — 2.1% | | | | |
| | 51,949,309 | | First American Government | | | | |
| | | | Obligations Fund — Class Z, 4.97%# | | | 51,949,309 | |
Total Short-Term Investments (Cost $51,949,309) | | | 51,949,309 | |
Total Investments — 98.9% (Cost $1,512,545,498) | | | 2,509,629,273 | |
Other Assets in Excess of Liabilities — 1.1% | | | 29,102,233 | |
| NET ASSETS — 100.0% | | $ | 2,538,731,506 | |
* | Non-income producing |
# | Annualized seven-day yield as of the date of this report. |
The accompanying notes are an integral part of these financial statements.
Brown Advisory Flexible Equity FundA Message to Our Shareholders
June 30, 2023
Dear Shareholder:
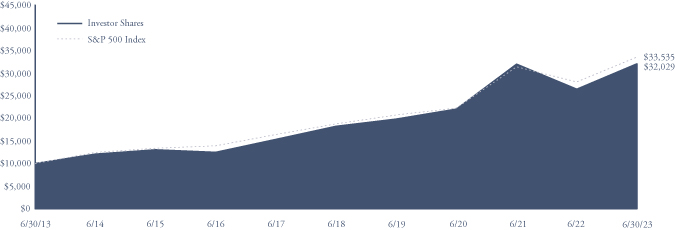
During the twelve-month period ended June 30, 2023 the Brown Advisory Flexible Equity Fund Investor Shares (the “Fund”) returned 21.24%. During the same period, the S&P 500 Index (the “Index”), the Fund’s benchmark, returned 19.59%.
While outperformance over the course of a year is always welcome, we remind shareholders that our focus remains on longer-term investment horizons. It is interesting to note that more recently, the market’s strong performance has been primarily driven by some of the largest companies within the S&P 500 Index. These companies now have more sway on the returns as the Index has become top heavy with the ten largest companies accounting for nearly 30% of the market value.
The U.S. equity markets have demonstrated remarkable resilience in the face of various concerns looming over the economy. Investors thus far have successfully overcome worries regarding a slowing economy, prominent bank failures, a weaker than expected China recovery, the possibility of a policy error by the Fed, and the risk of a U.S. default due to a political stalemate earlier in the year. As we stand today, the outlook remains uncertain, as is often the case. On one hand, a pessimistic view perceives the glass as half-empty as the money supply dwindles, consumers exhaust their excess savings, and potential commercial real estate losses pose a contagion risk. On the other hand, an optimistic investor recognizes the glass as half-full, with full employment, healthy consumer balance sheets and companies reporting robust quarterly results. Furthermore, the Fed’s hiking cycle may be nearing its end, and there is a possibility of rate cuts in the near future.
In the twelve-month period, communications services and financials sectors contributed the most to the portfolio’s return relative to the Index. Both had a larger weighting and a higher return than the Index. Information technology detracted the most from the results. While the return was strongly positive, both the return and the weighting were lower than the Index.
The largest contributors to returns in the twelve-month period were Microsoft, Meta, First Citizens BancShares, Apple and Booking Holdings. Meta (formerly known as Facebook) is particularly interesting as it illustrates stock prices getting disconnected from the underlying business value. Meta’s stock is the best performing stock in the portfolio as it has more than doubled this year, which is in stark contrast from the previous year when it was one of the biggest detractors to return in the portfolio. We had strong conviction that Meta’s business would recover from some of the challenges that had led to a situation of a ‘perfect storm’ for it in 2022. In fact, we had added to our position when the stock was lower and when Mark Zuckerberg proclaimed this year as the ‘year of efficiency’ and brought in more expense discipline to the company.
The biggest detractors were Avantor, SBA Communications, CarMax, Nomad Foods and Suncor Energy. Generally speaking, investors have shied away from businesses that are economically sensitive (e.g., Suncor) as well as from businesses that are more levered (e.g., SBA Communications) due to higher interest rate costs. We see nothing wrong with most of these businesses and plan to continue to hold them, especially at these prices, viewing them as attractive outside of the short-term cyclical concerns.
Since our semi-annual report at the end of 2022, no holdings were eliminated and we added one new investment, Uber Technologies. Uber is a strong global consumer brand that has transformed rideshare. It has built a two-sided network of consumers and drivers at scale that is difficult to disrupt. In the past, our biggest reservation of investing in Uber was its mentality of growth regardless of cost. We believe Uber’s management is now focused on profitable growth for the long-term to drive value creation. We see tremendous potential for its free cash flow to grow from here if it can execute on its existing strategy and achieve its margin targets.
We look for investment bargains among long-term attractive businesses with shareholder-oriented managers – those with productive assets and productive managers. These businesses should have or develop competitive advantages that result in good business economics, managers who allocate capital well, capacity to adjust to changes in the world and the ability to grow business value over time. Bargains in these types of stocks can arise for various reasons, but are often due to short-term investor perceptions, temporary business challenges that should improve, company or industry changes for the better or as-yet-unrecognized potential for long-term growth and development. Despite the occasional investment that will go awry, and stretches when the general stock market, or our investment selection, is unrewarding, we are optimistic about the long-term outlook for equities of good businesses purchased at reasonable prices and our ability to find them.
Sincerely,
Maneesh Bajaj
Portfolio Manager
Brown Advisory Flexible Equity FundA Message to Our Shareholders
June 30, 2023
Past performance is not a guarantee of future results.
Mutual fund investing involves risk. Principal loss is possible.
Investments in smaller and medium-sized capitalization companies generally carry greater risk than is customarily associated with larger companies for various reasons such as narrower markets, limited financial resources and less liquid stock.
Investments in foreign securities entail certain risks not associated with investments in domestic securities, such as volatility of currency exchange rates, and in some cases, political and economic instability and relatively illiquid markets. These risks are greater for investments in emerging markets.
The value of the Fund’s investments in REITS may change in response to changes in the real estate market such as declines in the value of real estate, lack of available capital or financing opportunities, and increases in property taxes or operating costs.
Fund holdings and sector allocations are subject to change and should not be considered a recommendation to buy or sell any security. For a complete list of fund holdings, please refer to the Schedule of Investments provided in this report.
Definitions for terms and indices are provided in the Glossary of Terms.
Brown Advisory Flexible Equity FundPerformance Information & Portfolio Holdings Summary
June 30, 2023
GROWTH OF A $10,000 INVESTMENT
The following chart reflects the change in value of a hypothetical $10,000 investment, including reinvested dividends and distributions, in the Fund as measured against the broad-based securities market index. The S&P 500 Index (“Index”) is a market-value weighted index representing the performance of 500 widely held, publicly traded large capitalization stocks. The Index is unmanaged and does not reflect the deduction of fees, such as investment management fees. Investors cannot invest directly in an index.
| PORTFOLIO HOLDINGS | % of Net Assets |
| | | |
Financials | | 25.7% |
Information Technology | | 21.0% |
Health Care | | 13.3% |
Communication Services | | 12.5% |
Consumer Discretionary | | 11.7% |
Industrials | | 7.3% |
Energy | | 3.2% |
Money Market Funds | | 2.6% |
Consumer Staples | | 1.4% |
Real Estate Investment Trusts | | 1.2% |
Other Assets and Liabilities | | 0.1% |
| | | 100.0% |
Average Annual Total Return | One Year | Five Year | Ten Year |
| Institutional Shares | 21.44% | 12.11% | 12.53% |
| Investor Shares | 21.24% | 11.94% | 12.35% |
| Advisor Shares | 20.93% | 11.66% | 12.07% |
| S&P 500 Index | 19.59% | 12.31% | 12.86% |
| | Institutional Shares | Investor Shares | Advisor Shares |
Gross Expense Ratio1 | 0.53% | 0.68% | 0.93% |
Net Expense Ratio1 | 0.53% | 0.68% | 0.93% |
Past performance does not guarantee future results. The performance data quoted represents past performance and current returns may be lower or higher. The investment return and net asset value will fluctuate so that an investor’s shares, when redeemed, may be worth more or less than the original cost. To obtain performance information current to the most recent month end, please visit our website at brownadvisory.com/mf/flexible-equity-fund. The performance table and graph above do not reflect the deduction of taxes that a shareholder would pay on Fund distributions or the redemption of Fund shares. Performance data does not reflect the imposition of the redemption fee of 1.00% on shares redeemed within 14 days, and if it did, performance would have been lower. Short-term performance, in particular, is not a good indication of the Fund’s future performance, and an investment should not be made based solely on returns. Returns shown are calculated using the net asset values (“NAV”) that were used for shareholder transactions as of the respective period ends. These NAV, and the returns calculated from them, may differ from the NAV and returns shown elsewhere in this report.
1 | Per the Fund’s prospectus dated October 31, 2022. Refer to the financial highlights for the gross and net expense ratios for the year ended as of the date of this report. Please note that the expense ratios per the prospectus include acquired fund fees and expenses (as applicable) and the expense ratios in the financial highlights do not. |
Brown Advisory Flexible Equity FundSchedule of Investments
June 30, 2023
| Shares | | Security Description | | Value $ | |
| Common Stocks — 96.1% | | | |
| | | | |
| Communication Services — 12.5% | | | |
| | 128,683 | | Alphabet, Inc. — Class A* | | | 15,403,355 | |
| | 213,558 | | Alphabet, Inc. — Class C* | | | 25,834,111 | |
| | 87,739 | | Meta Platforms, Inc.* | | | 25,179,338 | |
| | 16,947 | | Netflix, Inc.* | | | 7,464,984 | |
| | 191,307 | | Pinterest, Inc.* | | | 5,230,334 | |
| | 67,270 | | T-Mobile US, Inc.* | | | 9,343,803 | |
| | | | | | | 88,455,925 | |
| Consumer Discretionary — 11.7% | | | | |
| | 179,168 | | Amazon.com, Inc.* | | | 23,356,341 | |
| | 7,231 | | Booking Holdings, Inc.* | | | 19,526,086 | |
| | 75,601 | | Bright Horizons Family Solutions, Inc.* | | | 6,989,312 | |
| | 148,080 | | CarMax, Inc.* | | | 12,394,296 | |
| | 41,724 | | Lowe’s Companies, Inc. | | | 9,417,107 | |
| | 128,178 | | TJX Companies, Inc. | | | 10,868,213 | |
| | | | | | | 82,551,355 | |
| Consumer Staples — 1.4% | | | | |
| | 558,760 | | Nomad Foods, Ltd.* | | | 9,789,475 | |
| | | | | |
| Energy — 3.2% | | | | |
| | 314,876 | | Baker Hughes Co. | | | 9,953,230 | |
| | 439,531 | | Suncor Energy, Inc. | | | 12,887,049 | |
| | | | | | | 22,840,279 | |
| Financials — 25.7% | | | | |
| | 36,675 | | Ameriprise Financial, Inc. | | | 12,181,968 | |
| | 473,107 | | Bank of America Corp. | | | 13,573,440 | |
| | 86,537 | | Berkshire Hathaway, Inc.* | | | 29,509,117 | |
| | 63,313 | | Blackstone, Inc. | | | 5,886,209 | |
| | 130,966 | | Charles Schwab Corp. | | | 7,423,153 | |
| | 10,671 | | First Citizens BancShares, Inc. | | | 13,695,695 | |
| | 90,354 | | Fiserv, Inc.* | | | 11,398,157 | |
| | 331,539 | | KKR & Co., Inc. | | | 18,566,184 | |
| | 87,556 | | MasterCard, Inc. | | | 34,435,775 | |
| | 147,829 | | Visa, Inc. | | | 35,106,431 | |
| | | | | | | 181,776,129 | |
| Health Care — 13.3% | | | | |
| | 58,270 | | Agilent Technologies, Inc. | | | 7,006,968 | |
| | 26,197 | | Align Technology, Inc.* | | | 9,264,307 | |
| | 481,489 | | Avantor, Inc.* | | | 9,889,784 | |
| | 201,057 | | Edwards Lifesciences Corp.* | | | 18,965,707 | |
| | 33,760 | | Elevance Health, Inc. | | | 14,999,230 | |
| | 78,890 | | Merck & Co., Inc. | | | 9,103,117 | |
| | 51,141 | | UnitedHealth Group, Inc. | | | 24,580,410 | |
| | | | | | | 93,809,523 | |
| Industrials — 7.3% | | | | |
| | 73,404 | | Canadian National Railway Co. | | | 8,887,022 | |
| | 257,424 | | Carrier Global Corp. | | | 12,796,547 | |
| | 92,297 | | Otis Worldwide Corp. | | | 8,215,356 | |
| | 144,340 | | Uber Technologies, Inc.* | | | 6,231,158 | |
| | 34,778 | | United Rentals, Inc. | | | 15,489,078 | |
| | | | | | | 51,619,161 | |
| Information Technology — 21.0% | | | | |
| | 32,057 | | Accenture PLC | | | 9,892,149 | |
| | 24,510 | | Adobe, Inc.* | | | 11,985,145 | |
| | 60,541 | | Analog Devices, Inc. | | | 11,793,992 | |
| | 159,734 | | Apple, Inc. | | | 30,983,604 | |
| | 31,297 | | Intuit, Inc. | | | 14,339,973 | |
| | 153,623 | | Microsoft Corp. | | | 52,314,776 | |
| | 171,889 | | Taiwan Semiconductor | | | | |
| | | | Manufacturing Co., Ltd. ADR | | | 17,347,038 | |
| | | | | | | 148,656,677 | |
Total Common Stocks (Cost $302,226,838) | | | 679,498,524 | |
| | | | | |
| Real Estate Investment Trusts — 1.2% | | | | |
| | 37,241 | | SBA Communications Corp. | | | 8,630,974 | |
Total Real Estate Investment Trusts (Cost $6,641,597) | | | 8,630,974 | |
| | | | | |
| Short-Term Investments — 2.6% | | | | |
| | | | | |
| Money Market Funds — 2.6% | | | | |
| | 18,388,478 | | First American Government | | | | |
| | | | Obligations Fund — Class Z, 4.97%# | | | 18,388,478 | |
Total Short-Term Investments (Cost $18,388,478) | | | 18,388,478 | |
Total Investments — 99.9% (Cost $327,256,913) | | | 706,517,976 | |
Other Assets in Excess of Liabilities — 0.1% | | | 673,698 | |
| NET ASSETS — 100.0% | | $ | 707,191,674 | |
ADR — American Depositary Receipt
* | Non-income producing |
# | Annualized seven-day yield as of the date of this report. |
The accompanying notes are an integral part of these financial statements.
Brown Advisory Equity Income FundA Message to Our Shareholders
June 30, 2023
Dear Shareholder:
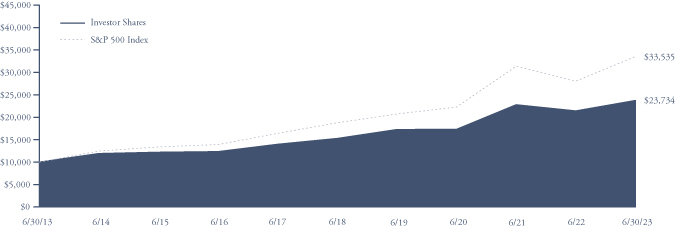
During the 12-month period ended June 30, 2023, the Brown Advisory Equity Income Fund Investor Shares (the “Fund”) increased 10.87% in value. During the same period, the S&P 500 Index (the “Index”), the Fund’s benchmark, increased 19.59%.
In recent months, the attention of investors seemed to shift rapidly and dramatically away from shorter-term economic concerns and toward the long-term growth potential of the emerging technology of Generative AI. This sudden shift and narrowing of investor enthusiasm seemed to crest during the spring, when a small cohort of very large, tech-related companies accounted for virtually all of the Index’s positive performance. During the springtime run-up, the vast majority of the Fund’s holdings meaningfully trailed the strong performance of the Index’s tech-related leaders.
The current narrow and bifurcated nature of the U.S. stock market is unusual, but it is certainly not unprecedented. Most recently in 2020, the Fund similarly trailed the Index during the market’s sharp recovery from its Covid-related lows. Some investors might also recall the market environment of the late 1990’s, when technology- and internet-related companies dominated all other possible investment options. Then as now, the type of defensive and income-oriented businesses favored by the Fund were largely overshadowed by the general fervor for other segments of the stock market.
Given the enthusiasm for AI, the information technology sector was by far the best performing sector for the Index over the past year. Unfortunately, the sector detracted from relative performance as the Fund’s holdings did not keep pace with the Index’s surging advance, despite strong performance from large holdings such as Microsoft and Apple. In particular, Microsoft has clearly benefited from the early excitement amongst investors. Through its partnership with OpenAI, Microsoft is already integrating AI technology into many of its well-known software products.
In March, several of the Fund’s financial stocks were hit hard by the turbulence created by the failures of Silicon Valley Bank and Signature Bank. Worries about deposit flight, uninsured deposits, accounting losses for owned securities, and the prospect of increased regulation battered the stock prices of many financial services companies, especially small- and mid-sized banks. The Fund added regional bank Truist Financial amidst the turmoil. Formed by the combination of Suntrust and BB&T a few years ago, Truist has a large presence in key Southeastern US markets and appears well-positioned to accelerate its business growth rate over the coming years.
The Fund also added Internet access and data transport services provider Cogent Communications during the same period. Cogent is a stable, well-managed business that caters primarily to corporate customers and has steadily grown its dividend over time. The company also has a history of executing savvy acquisitions, and its recent deal to acquire Sprint’s wireline assets from T-Mobile seems to fit that mold.
To make room for Truist and Cogent, the Fund exited investment manager T. Rowe Price Group and defense technologies provider L3Harris Technologies. T. Rowe Price’s near-term earnings growth has been hampered by persistent outflows from some of its largest funds, primarily several that are focused on large U.S. stocks. As for L3Harris, the company’s dividend growth rate has slowed recently as its strategic priorities have shifted toward acquisitions and higher research and development program investments.
While the large majority of the Fund’s holdings continued to increase their dividends over the past year, the rate of absolute dividend growth has noticeably slowed in recent months. This change may reflect the uncertain macroeconomic environment as management teams continue to adjust to operating in a world of higher inflation and interest rates.
While we anticipate a challenging investment backdrop for the remainder of 2023, we are nonetheless optimistic about finding opportunities in fundamentally strong businesses that are run by management teams who are committed to paying consistent dividends to shareholders. In the end, the Fund’s long-term goal is to build the best possible portfolio of investments offering above-average yields with strong potential for future growth at reasonable valuations.
Sincerely,
Brian Graney, CFA
Portfolio Manager
Brown Advisory Equity Income FundA Message to Our Shareholders
June 30, 2023
Past performance is not a guarantee of future results.
Mutual fund investing involves risk. Principal loss is possible. Investments in foreign securities and ADRs entail certain risks not associated with investments in domestic securities, such as volatility of currency exchange rates, and in some cases, political and economic instability and relatively illiquid markets.
Diversification does not assure a profit nor protect against loss in a declining market.
Fund holdings and sector allocations are subject to change and should not be considered a recommendation to buy or sell any security. For a complete list of fund holdings, please refer to the Schedule of Investments provided in this report.
Dividends are not guaranteed and a company’s future abilities to pay dividends may be limited. A company currently paying dividends may cease paying dividends at any time.
Definitions for terms and indices are provided in the Glossary of Terms.
Brown Advisory Equity Income FundPerformance Information & Portfolio Holdings Summary
June 30, 2023
GROWTH OF A $10,000 INVESTMENT
The following chart reflects the change in value of a hypothetical $10,000 investment, including reinvested dividends and distributions, in the Fund as measured against a broad-based securities market index. The S&P 500 Index (“Index”) is a market-value weighted index representing the performance of 500 widely held, publicly traded large capitalization stocks. The Index is unmanaged and does not reflect the deduction of fees, such as investment management fees. Investors cannot invest directly in an index.
| PORTFOLIO HOLDINGS | % of Net Assets |
| | | |
Information Technology | | 20.7% |
Health Care | | 19.2% |
Financials | | 15.0% |
Consumer Discretionary | | 9.0% |
Industrials | | 8.8% |
Consumer Staples | | 7.2% |
Materials | | 4.5% |
Real Estate Investment Trusts | | 3.9% |
Communication Services | | 3.5% |
Energy | | 3.5% |
Money Market Funds | | 3.1% |
Utilities | | 1.9% |
Other Assets and Liabilities | | (0.3)% |
| | | 100.0% |
Average Annual Total Return | One Year | Five Year | Ten Year |
| Institutional Shares | 10.95% | 9.37% | 9.19% |
| Investor Shares | 10.87% | 9.22% | 9.03% |
| Advisor Shares | 10.51% | 8.92% | 8.75% |
| S&P 500 Index | 19.59% | 12.31% | 12.86% |
| | Institutional Shares | Investor Shares | Advisor Shares |
Gross Expense Ratio1 | 0.79% | 0.94% | 1.19% |
Net Expense Ratio1 | 0.76% | 0.91% | 1.16% |
Past performance does not guarantee future results. The performance data quoted represents past performance and current returns may be lower or higher. The investment return and net asset value will fluctuate so that an investor’s shares, when redeemed, may be worth more or less than the original cost. To obtain performance information current to the most recent month end, please visit our website at brownadvisory.com/mf/equity-income-fund. The performance table and graph above do not reflect the deduction of taxes that a shareholder would pay on Fund distributions or the redemption of Fund shares. Investment performance reflects periods during which fee waivers were in effect. In the absence of such waivers, total return would have been reduced. Performance data does not reflect the imposition of the redemption fee of 1.00% on shares redeemed within 14 days, and if it did, performance would have been lower. Short-term performance, in particular, is not a good indication of the Fund’s future performance, and an investment should not be made based solely on returns. Returns shown are calculated using the net asset values (“NAV”) that were used for shareholder transactions as of the respective period ends. These NAV, and the returns calculated from them, may differ from the NAV and returns shown elsewhere in this report.
1 | Per the Fund’s prospectus dated October 31, 2022. Refer to the financial highlights for the gross and net expense ratios for the year ended as of the date of this report. Please note that the expense ratios per the prospectus include acquired fund fees and expenses (as applicable) and the expense ratios in the financial highlights do not. |
Brown Advisory Equity Income FundSchedule of Investments
June 30, 2023
| Shares | | Security Description | | Value $ | |
| Common Stocks — 92.7% | | | |
| | | | |
| Communication Services — 3.5% | | | |
| | 11,317 | | Cogent Communications Holdings, Inc. | | | 761,521 | |
| | 42,915 | | Comcast Corp. | | | 1,783,118 | |
| | | | | | | 2,544,639 | |
| Consumer Discretionary — 9.0% | | | | |
| | 12,619 | | Best Buy Co., Inc. | | | 1,034,127 | |
| | 5,739 | | Home Depot, Inc. | | | 1,782,763 | |
| | 6,327 | | Lowe’s Companies, Inc. | | | 1,428,004 | |
| | 7,698 | | McDonald’s Corp. | | | 2,297,160 | |
| | | | | | | 6,542,054 | |
| Consumer Staples — 7.2% | | | | |
| | 13,783 | | Procter & Gamble Co. | | | 2,091,432 | |
| | 10,406 | | Target Corp. | | | 1,372,551 | |
| | 32,912 | | Unilever PLC ADR | | | 1,715,703 | |
| | | | | | | 5,179,686 | |
| Energy — 3.5% | | | | |
| | 37,222 | | Baker Hughes Co. | | | 1,176,587 | |
| | 79,285 | | Kinder Morgan, Inc. | | | 1,365,288 | |
| | | | | | | 2,541,875 | |
| Financials — 14.4% | | | | |
| | 8,447 | | Ameriprise Financial, Inc. | | | 2,805,756 | |
| | 50,878 | | Bank of America Corp. | | | 1,459,690 | |
| | 16,295 | | Blackstone, Inc. | | | 1,514,946 | |
| | 8,977 | | Chubb Ltd. | | | 1,728,611 | |
| | 12,676 | | JPMorgan Chase & Co. | | | 1,843,597 | |
| | 36,070 | | Truist Financial Corp. | | | 1,094,724 | |
| | | | | | | 10,447,324 | |
| Health Care — 19.2% | | | | |
| | 14,912 | | AbbVie, Inc. | | | 2,009,094 | |
| | 2,159 | | Becton, Dickinson & Co. | | | 569,998 | |
| | 21,216 | | CVS Health Corp. | | | 1,466,662 | |
| | 15,603 | | Gilead Sciences, Inc. | | | 1,202,523 | |
| | 4,033 | | Johnson & Johnson | | | 667,542 | |
| | 17,136 | | Medtronic PLC | | | 1,509,682 | |
| | 26,736 | | Merck & Co., Inc. | | | 3,085,067 | |
| | 17,182 | | Novartis AG ADR | | | 1,733,836 | |
| | 3,446 | | UnitedHealth Group, Inc. | | | 1,656,285 | |
| | | | | | | 13,900,689 | |
| Industrials — 8.8% | | | | |
| | 10,395 | | Automatic Data Processing, Inc. | | | 2,284,717 | |
| | 5,773 | | Cummins, Inc. | | | 1,415,309 | |
| | 10,475 | | Otis Worldwide Corp. | | | 932,380 | |
| | 9,749 | | United Parcel Service, Inc. | | | 1,747,508 | |
| | | | | | | 6,379,914 | |
| Information Technology — 20.7% | | | | |
| | 4,702 | | Accenture PLC | | | 1,450,943 | |
| | 9,346 | | Analog Devices, Inc. | | | 1,820,694 | |
| | 25,745 | | Apple, Inc. | | | 4,993,758 | |
| | 31,264 | | Cisco Systems, Inc. | | | 1,617,599 | |
| | 15,073 | | Microsoft Corp. | | | 5,132,960 | |
| | | | | | | 15,015,954 | |
| Materials — 4.5% | | | | |
| | 15,822 | | Dow, Inc. | | | 842,680 | |
| | 6,315 | | Linde PLC | | | 2,406,520 | |
| | | | | | | 3,249,200 | |
| Utilities — 1.9% | | | | | | |
| | 27,116 | | Dominion Energy, Inc. | | | 1,404,338 | |
Total Common Stocks (Cost $35,300,075) | | | 67,205,673 | |
| | | | | |
| Preferred Stocks — 0.6% | | | | |
| | | | | | | |
| Financials — 0.6% | | | | |
| | 6,373 | | KKR & Co., Inc. — Series C, 6.00% | | | 421,255 | |
Total Preferred Stocks (Cost $331,644) | | | 421,255 | |
| | | | | |
| Real Estate Investment Trusts — 3.9% | | | | |
| | 6,350 | | American Tower Corp. | | | 1,231,519 | |
| | 23,774 | | Hannon Armstrong Sustainable | | | | |
| | | | Infrastructure Capital, Inc. | | | 594,350 | |
| | 15,546 | | W.P. Carey, Inc. | | | 1,050,288 | |
Total Real Estate Investment Trusts (Cost $2,310,384) | | | 2,876,157 | |
| | | | | |
| Short-Term Investments — 3.1% | | | | |
| | | | | |
| Money Market Funds — 3.1% | | | | |
| | 2,237,337 | | First American Government | | | | |
| | | | Obligations Fund — Class Z, 4.97%# | | | 2,237,337 | |
Total Short-Term Investments (Cost $2,237,337) | | | 2,237,337 | |
Total Investments — 100.3% (Cost $40,179,440) | | | 72,740,422 | |
Liabilities in Excess of Other Assets — (0.3)% | | | (209,520 | ) |
| NET ASSETS — 100.0% | | $ | 72,530,902 | |
ADR — American Depositary Receipt
| # | Annualized seven-day yield as of the date of this report. |
The accompanying notes are an integral part of these financial statements.
Brown Advisory Sustainable Growth FundA Message to Our Shareholders
June 30, 2023
Dear Shareholder:
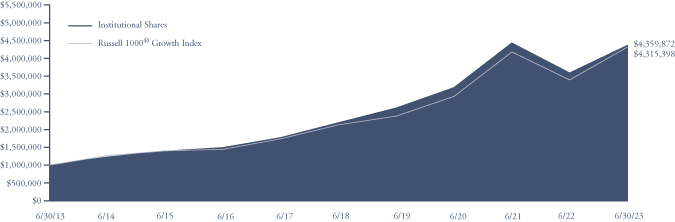
During the 12-month period ended June 30, 2023, the Brown Advisory Sustainable Growth Fund Institutional Shares (the “Fund”) increased in value by 21.63%. During the same period, the Russell 1000® Growth Index, the Fund’s benchmark, increased 27.11%.
The past year has been volatile, with the market fluctuating between upswings and downswings on a nearly monthly cadence. While each quarter experienced a similar degree of volatility, the direction of the market shifted dramatically between the back half of 2022 and the first two quarters of 2023, with investor concerns about geopolitical and macroeconomic uncertainty giving way to optimism about gradually improving economic indicators, stronger-than-expected resilience in corporate earnings, and the potential of a paradigm shift in technology driven by artificial intelligence. Against the backdrop of an uncertain macro environment and a sharp market rotation, the strategy underperformed the benchmark due to unfavorable sector allocation and stock selection. From a sector allocation perspective, our underweight to communication services and lack of exposure to energy and consumer staples had positive contributions to relative returns but were not enough to offset the negative impact of our overweight to health care and underweight to information technology. Inclusive of stock selection and interaction, strong performance from our industrials and consumer discretionary names was outweighed by weakness in our health care and financial services names. The strategy’s large active weight in semiconductors was a key contributor to absolute returns during the period, as companies like Nvidia, Marvell, Monolithic Power and Cadence Design Systems benefited from investor enthusiasm about artificial intelligence.
Consistent with our historical approach during periods of market turbulence, we sought to take advantage of short-term dislocations to upgrade the portfolio via strategic trades that we believe will better position the portfolio for long-term success. Our valuation discipline is a key aspect of our fundamentally-driven approach that helps us identify companies that may be trading at a short-term discount relative to our view of their business model strengths and long-term upside/downside potential. This approach defined our trading activity over the past year, including the one new name that we initiated, the one stock we fully exited, and the 133 adjustments to position sizes that we made to existing holdings during the period. True to our “one in, one out” philosophy, we eliminated Enphase from the portfolio in the first quarter of 2023 in order to make room for Gartner, a company that we believe possesses a superior business model, stronger pricing power, and less downside risk. We also took advantage of strong share price appreciation by trimming a number of our top-performing names like Nvidia and Cadence, in order to fund incremental additions to other high-conviction portfolio holdings that we believed were trading down on short-term weakness.
We remain fully invested and disciplined in our process of finding investment opportunities at the intersection of strong fundamentals, sustainable business advantages and attractive valuations. This philosophy has served us well over the last thirteen and a half years, and we believe it will continue to do so in the years ahead.
Sincerely,
David Powell, Karina Funk
Portfolio Managers
Brown Advisory Sustainable Growth FundA Message to Our Shareholders
June 30, 2023
Past performance is not a guarantee of future results.
Mutual fund investing involves risk. Principal loss is possible.
The Adviser assesses a company’s Environmental, Social and Governance (“ESG”) profile through conducting ESG research and leveraging engagement when appropriate through dialogue with company management teams as part of its fundamental due diligence process. The Adviser views ESG characteristics as material to fundamentals and seeks to understand their impact on companies in which the Fund may invest. The Fund’s consideration of ESG characteristics as part of the investment process could cause it to make or avoid investments that could result in the Fund underperforming similar funds that do not take ESG characteristics into consideration.
Investments in smaller and medium-sized capitalization companies generally carry greater risk than is customarily associated with larger companies for various reasons such as narrower markets, limited financial resources and less liquid stock.
The value of the Fund’s investments in REITS may change in response to changes in the real estate market such as declines in the value of real estate, lack of available capital or financing opportunities, and increases in property taxes or operating costs.
Fund holdings and sector allocations are subject to change and should not be considered a recommendation to buy or sell any security. For a complete list of fund holdings, please refer to the Schedule of Investments provided in this report.
Because the Fund’s ESG criteria exclude securities of certain issuers for nonfinancial reasons, the Fund may forgo some market opportunities available to the funds that do not use these criteria.
Definitions for terms and indices are provided in the Glossary of Terms.
Brown Advisory Sustainable Growth FundPerformance Information & Portfolio Holdings Summary
June 30, 2023
GROWTH OF A $1,000,000 INVESTMENT
The following chart reflects the change in value of a hypothetical $1,000,000 investment, including reinvested dividends and distributions, in the Fund as measured against a broad-based securities market index. The Russell 1000® Growth Index (“Index”) measures the performance of the large-cap growth segment of the U.S. equity universe. It includes those Russell 1000® companies with higher price to book ratios and higher forecasted growth values. The Index is unmanaged and does not reflect the deduction of fees, such as investment management fees. Investors cannot invest directly in an index.
| PORTFOLIO HOLDINGS | % of Net Assets |
| | |
Information Technology | | 39.2% |
Health Care | | 21.2% |
Consumer Discretionary | | 11.2% |
Financials | | 10.8% |
Industrials | | 6.3% |
Communication Services | | 3.8% |
Real Estate Investment Trusts | | 3.6% |
Materials | | 2.0% |
Money Market Funds | | 1.7% |
Other Assets and Liabilities | | 0.2% |
| | | 100.0% |
Average Annual Total Return | One Year | Five Year | Ten Year |
| Institutional Shares | 21.63% | 14.78% | 15.86% |
| Investor Shares | 21.42% | 14.60% | 15.69% |
| Advisor Shares | 21.14% | 14.32% | 15.39% |
Russell 1000® Growth Index | 27.11% | 15.14% | 15.74% |
| | Institutional Shares | Investor Shares | Advisor Shares |
Gross Expense Ratio1 | 0.63% | 0.78% | 1.03% |
Net Expense Ratio1 | 0.63% | 0.78% | 1.03% |
Past performance does not guarantee future results. The performance data quoted represents past performance and current returns may be lower or higher. The investment return and net asset value will fluctuate so that an investor’s shares, when redeemed, may be worth more or less than the original cost. To obtain performance information current to the most recent month end, please visit our website at brownadvisory.com/mf/sustainable-growth-fund. The performance table and graph above do not reflect the deduction of taxes that a shareholder would pay on Fund distributions or the redemption of Fund shares. Performance data does not reflect the imposition of the redemption fee of 1.00% on shares redeemed within 14 days, and if it did, performance would have been lower. Short-term performance, in particular, is not a good indication of the Fund’s future performance, and an investment should not be made based solely on returns. Returns shown are calculated using the net asset values (“NAV”) that were used for shareholder transactions as of the respective period ends. These NAV, and the returns calculated from them, may differ from the NAV and returns shown elsewhere in this report.
1 | Per the Fund’s prospectus dated October 31, 2022. Refer to the financial highlights for the gross and net expense ratios for the year ended as of the date of this report. Please note that the expense ratios per the prospectus include acquired fund fees and expenses (as applicable) and the expense ratios in the financial highlights do not. |
Brown Advisory Sustainable Growth FundSchedule of Investments
June 30, 2023
| Shares | | Security Description | | Value $ | |
| Common Stocks — 94.5% | | | |
| | | | |
| Communication Services — 3.8% | | | |
| | 2,399,135 | | Alphabet, Inc. — Class A* | | | 287,176,460 | |
| | | | | |
| Consumer Discretionary — 11.2% | | | | |
| | 2,766,839 | | Amazon.com, Inc.* | | | 360,685,132 | |
| | 88,224 | | Chipotle Mexican Grill, Inc.* | | | 188,711,136 | |
| | 422,009 | | Home Depot, Inc. | | | 131,092,876 | |
| | 1,625,931 | | NIKE, Inc. | | | 179,454,004 | |
| | | | | | | 859,943,148 | |
| Financials — 10.8% | | | | |
| | 1,692,454 | | Blackstone, Inc. | | | 157,347,448 | |
| | 1,789,867 | | Block, Inc.* | | | 119,151,446 | |
| | 428,719 | | MSCI, Inc. | | | 201,193,540 | |
| | 1,466,094 | | Visa, Inc. | | | 348,168,003 | |
| | | | | | | 825,860,437 | |
| Health Care — 21.2% | | | | |
| | 385,732 | | Bio-Rad Laboratories, Inc.* | | | 146,238,716 | |
| | 1,201,197 | | Danaher Corp. | | | 288,287,280 | |
| | 2,114,104 | | Edwards Lifesciences Corp.* | | | 199,423,430 | |
| | 422,903 | | IDEXX Laboratories, Inc.* | | | 212,394,574 | |
| | 476,362 | | Thermo Fisher Scientific, Inc. | | | 248,541,874 | |
| | 675,510 | | UnitedHealth Group, Inc. | | | 324,677,126 | |
| | 525,639 | | West Pharmaceutical Services, Inc. | | | 201,041,148 | |
| | | | | | | 1,620,604,148 | |
| Industrials — 6.3% | | | | |
| | 2,625,499 | | Fortive Corp. | | | 196,308,560 | |
| | 1,253,424 | | Verisk Analytics, Inc. | | | 283,311,427 | |
| | | | | | | 479,619,987 | |
| Information Technology — 39.2% | | | | |
| | 353,211 | | Adobe, Inc.* | | | 172,716,647 | |
| | 837,768 | | Analog Devices, Inc. | | | 163,205,584 | |
| | 763,465 | | Atlassian Corp.* | | | 128,117,062 | |
| | 752,731 | | Autodesk, Inc.* | | | 154,016,290 | |
| | 954,731 | | Cadence Design Systems, Inc.* | | | 223,903,514 | |
| | 3,480,202 | | Dynatrace, Inc.* | | | 179,125,997 | |
| | 413,323 | | Gartner, Inc.* | | | 144,791,180 | |
| | 674,401 | | Intuit, Inc. | | | 309,003,794 | |
| | 3,145,946 | | Marvell Technology, Inc. | | | 188,064,652 | |
| | 1,174,603 | | Microsoft Corp. | | | 399,999,306 | |
| | 419,910 | | Monolithic Power Systems, Inc. | | | 226,847,979 | |
| | 1,040,159 | | NVIDIA Corp. | | | 440,008,060 | |
| | 486,788 | | ServiceNow, Inc.* | | | 273,560,252 | |
| | | | | | | 3,003,360,317 | |
| Materials — 2.0% | | | | |
| | 835,355 | | Ecolab, Inc. | | | 155,952,425 | |
Total Common Stocks (Cost $5,087,430,142) | | | 7,232,516,922 | |
| | | | | |
| Real Estate Investment Trusts — 3.6% | | | | |
| | 1,413,509 | | American Tower Corp. | | | 274,135,935 | |
Total Real Estate Investment Trusts (Cost $300,537,606) | | | 274,135,935 | |
| | | | | |
| Short-Term Investments — 1.7% | | | | |
| | | | | |
| Money Market Funds — 1.7% | | | | |
| | 134,012,462 | | First American Government | | | | |
| | | | Obligations Fund — Class Z, 4.97%# | | | 134,012,462 | |
Total Short-Term Investments (Cost $134,012,462) | | | 134,012,462 | |
Total Investments — 99.8% (Cost $5,521,980,210) | | | 7,640,665,319 | |
Other Assets in Excess of Liabilities — 0.2% | | | 12,297,570 | |
| NET ASSETS — 100.0% | | $ | 7,652,962,889 | |
* | Non-income producing |
# | Annualized seven-day yield as of the date of this report. |
The accompanying notes are an integral part of these financial statements.
Brown Advisory Mid-Cap Growth FundA Message to Our Shareholders
June 30, 2023
Dear Shareholder:
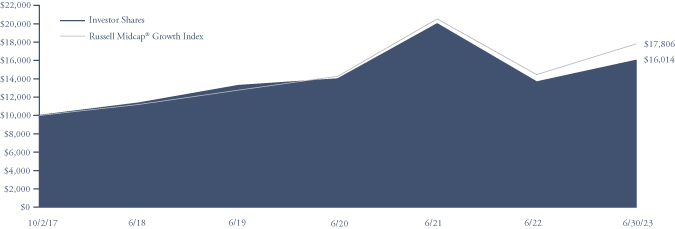
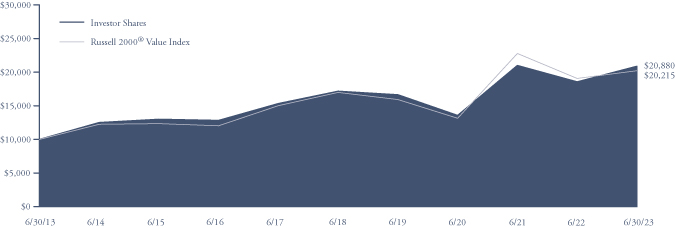
During the twelve-month period ended June 2023, the Brown Advisory Mid-Cap Growth Fund Investor Shares (the “Fund”) increased 17.26% in value. During the same period, the Russell Midcap® Growth Index, the Fund’s benchmark, increased 23.13%.
We seek to produce attractive, risk-adjusted returns over a full market cycle by owning companies that we believe are well-positioned to grow their enterprise value meaningfully (or compound) over time. We define a firm’s potential to compound with a set of traits we call the three Gs—durable growth, sound governance and scalable go-to-market strategies. This philosophy typically leads us to own higher-quality, less-cyclical businesses. Finally, we strive to mitigate risk through deep due diligence, a valuation sensitivity, and by employing a structured sell discipline.
During the last twelve months, signs of economic growth slowing emerged, the pace of inflation eased but remained elevated, the U.S. 10-year Treasury yield popped 84 basis points to end the period at 3.81%, and, most recently, the AI theme emerged, sending numerous tech stocks soaring. With that backdrop, large caps, tech, and growth-oriented investments (sometimes regardless of quality or valuation, in our view) led returns in the U.S markets while small-caps and value benchmarks generally lagged. The Russell Midcap Growth Index nearly kept pace with the NASDAQ thanks to (approximately) 30% gains in the tech, consumer discretionary, and industrial sectors. In our view, the Fund underperformed during this period due to a lack of exposure to momentum-oriented investments in the aforementioned sectors as well as selection effects in the health care sector.
The Fund’s two largest contributors during the last twelve months were Dexcom and CoStar Group. Continuous glucose monitor (CGM) maker Dexcom’s stock price benefited from the company’s solid results and the approval of its next-generation sensor during the period. CoStar Group’s growth accelerated in the segments that should drive profit growth over the coming years (CoStar suite and multifamily). Solid results helped lift its share price out of a brief drawdown following the company’s announcement of a major investment in a new residential real estate information business, which we think could be quite additive to shareholder value in five-to-ten years.
The Fund’s two largest detractors were Match Group and SBA Communications. Match Group’s revenue growth slowed as execution issues emerged at Tinder, by far the largest top-line contributor of the firm’s 45+ online dating brands. The company’s new CEO has taken several steps to improve execution and we continue to hold the position. Results at SBA Communications have generally been in line with our expectations. Nonetheless, the cell-tower REIT’s share price underperformed during the last twelve months due to rising rates (which hurts its valuation multiples) and fears of slightly lower growth in the future. Like with Match Group’s shares, we continue to hold this stock due to its solid long-term prospects and reasonable valuation.
The Fund added 27 new investments during the period, including eleven in technology, five in health care, five in industrials, three in consumer discretionary, one in materials, one in consumer staples, and one in the financials vertical. The Fund exited 21 investments during the period to fund those opportunities.
As always, we remain committed to seeking attractive, risk-adjusted returns over a full market cycle by owning a diversified portfolio of companies, each of which we believe could one day grow much larger. We thank you for your support and interest and look forward to updating you in our next letter.
Sincerely,
George Sakellaris, CFA
Portfolio Manager
Brown Advisory Mid-Cap Growth FundA Message to Our Shareholders
June 30, 2023
Past performance is not a guarantee of future results.
Mutual fund investing involves risk. Principal loss is possible.
Investments in smaller and medium-sized capitalization companies generally carry greater risk than is customarily associated with larger companies for various reasons such as narrower markets, limited financial resources and less liquid stock.
The value of the Fund’s investments in REITS may change in response to changes in the real estate market such as declines in the value of real estate, lack of available capital or financing opportunities, and increases in property taxes or operating costs
Investments in foreign securities entail certain risks not associated with investments in domestic securities, such as volatility of currency exchange rates, and in some cases, political and economic instability and relatively illiquid markets.
Fund holdings and sector allocations are subject to change and should not be considered a recommendation to buy or sell any security. For a complete list of fund holdings, please refer to the Schedule of Investments provided in this report.
Definitions for terms and indices are provided in the Glossary of Terms.
Brown Advisory Mid-Cap Growth FundPerformance Information & Portfolio Holdings Summary
June 30, 2023
GROWTH OF A $10,000 INVESTMENT
The following chart reflects the change in value of a hypothetical $10,000 investment, including reinvested dividends and distributions, in the Fund compared with the broad-based securities market index. The Russell Midcap® Growth Index (“Index”) measures the performance of the mid-capitalization growth sector of the U.S. equity market. The Index is unmanaged and does not reflect the deduction of fees, such as investment management fees. Investors cannot invest directly in an index.
| PORTFOLIO HOLDINGS | % of Net Assets |
| | |
Industrials | | 25.2% |
Health Care | | 19.7% |
Information Technology | | 17.7% |
Consumer Discretionary | | 9.4% |
Money Market Funds | | 5.9% |
Financials | | 5.3% |
Consumer Staples | | 4.6% |
Communication Services | | 4.2% |
Real Estate | | 3.5% |
Materials | | 2.0% |
Real Estate Investment Trusts | | 1.9% |
Other Assets and Liabilities | | 0.6% |
| | | 100.0% |
| | | | Since Inception |
Average Annual Total Return | One Year | Five Year | (10/2/17) |
Institutional Shares1 | 17.38% | 7.28% | 8.72% |
| Investor Shares | 17.26% | 7.11% | 8.55% |
Russell Midcap® Growth Index | 23.13% | 9.71% | 10.57% |
| | Institutional Shares | Investor Shares |
Gross Expense Ratio2 | 0.79% | 0.94% |
Net Expense Ratio2 | 0.79% | 0.94% |
Past performance does not guarantee future results. The performance data quoted represents past performance and current returns may be lower or higher. The investment return and net asset value will fluctuate so that an investor’s shares, when redeemed, may be worth more or less than the original cost. To obtain performance information current to the most recent month end, please visit our website at brownadvisory.com/mf/mid-cap-growth-fund. The performance table and graph above do not reflect the deduction of taxes that a shareholder would pay on Fund distributions or the redemption of Fund shares. Investment performance reflects periods during which fee waivers were in effect. In the absence of such waivers, total return would have been reduced. Performance data does not reflect the imposition of the redemption fee of 1.00% on shares redeemed within 14 days, and if it did, performance would have been lower. Short-term performance, in particular, is not a good indication of the Fund’s future performance, and an investment should not be made based solely on returns. Returns shown are calculated using the net asset values (“NAV”) that were used for shareholder transactions as of the respective period ends. These NAV, and the returns calculated from them, may differ from the NAV and returns shown elsewhere in this report.
1 | Performance information for the Institutional Shares, prior to its inception date of July 2, 2018, is based on the performance of Investor Shares, and adjusted for the lower expenses applicable to Institutional Shares. |
2 | Per the Fund’s prospectus dated October 31, 2022. Refer to the financial highlights for the gross and net expense ratios for the year ended as of the date of this report. Please note that the expense ratios per the prospectus include acquired fund fees and expenses (as applicable) and the expense ratios in the financial highlights do not. |
Brown Advisory Mid-Cap Growth FundSchedule of Investments
June 30, 2023
| Shares | | Security Description | | Value $ | |
| Common Stocks — 91.6% | | | |
| | | | |
| Communication Services — 4.2% | | | |
| | 39,063 | | Match Group, Inc.* | | | 1,634,786 | |
| | 43,193 | | Pinterest, Inc.* | | | 1,180,897 | |
| | 15,344 | | Trade Desk, Inc.* | | | 1,184,864 | |
| | | | | | | 4,000,547 | |
| Consumer Discretionary — 9.4% | | | | |
| | 15,621 | | Bright Horizons Family Solutions, Inc.* | | | 1,444,161 | |
| | 665 | | Chipotle Mexican Grill, Inc.* | | | 1,422,435 | |
| | 6,346 | | Five Below, Inc.* | | | 1,247,243 | |
| | 2,857 | | Lululemon Athletica, Inc.* | | | 1,081,375 | |
| | 4,104 | | Pool Corp. | | | 1,537,523 | |
| | 21,079 | | Ross Stores, Inc. | | | 2,363,588 | |
| | | | | | | 9,096,325 | |
| Consumer Staples — 4.6% | | | | |
| | 7,155 | | Casey’s General Stores, Inc. | | | 1,744,961 | |
| | 17,612 | | Church & Dwight Co., Inc. | | | 1,765,251 | |
| | 5,585 | | Dollar General Corp. | | | 948,221 | |
| | | | | | | 4,458,433 | |
| Financials — 5.3% | | | | |
| | 5,000 | | Jack Henry & Associates, Inc. | | | 836,650 | |
| | 22,289 | | KKR & Co., Inc. | | | 1,248,184 | |
| | 19,645 | | Tradeweb Markets, Inc. | | | 1,345,290 | |
| | 9,467 | | WEX, Inc.* | | | 1,723,656 | |
| | | | | | | 5,153,780 | |
| Health Care — 19.7% | | | | |
| | 21,788 | | agilon health, Inc.* | | | 377,804 | |
| | 5,354 | | Align Technology, Inc.* | | | 1,893,389 | |
| | 6,628 | | Alnylam Pharmaceuticals, Inc.* | | | 1,258,922 | |
| | 2,393 | | argenx SE ADR* | | | 932,624 | |
| | 4,839 | | Ascendis Pharma A/S ADR* | | | 431,881 | |
| | 4,478 | | Bio-Rad Laboratories, Inc.* | | | 1,697,699 | |
| | 8,219 | | Bio-Techne Corp. | | | 670,917 | |
| | 18,943 | | DexCom, Inc.* | | | 2,434,365 | |
| | 25,407 | | Edwards Lifesciences Corp.* | | | 2,396,642 | |
| | 19,351 | | HealthEquity, Inc.* | | | 1,221,822 | |
| | 3,145 | | IDEXX Laboratories, Inc.* | | | 1,579,513 | |
| | 19,497 | | Inari Medical, Inc.* | | | 1,133,556 | |
| | 8,601 | | Veeva Systems, Inc.* | | | 1,700,676 | |
| | 3,227 | | West Pharmaceutical Services, Inc. | | | 1,234,231 | |
| | | | | | | 18,964,041 | |
| Industrials — 25.2% | | | | |
| | 17,959 | | Booz Allen Hamilton Holding Corp. | | | 2,004,225 | |
| | 5,607 | | Carlisle Cos, Inc. | | | 1,438,364 | |
| | 5,319 | | Cintas Corp. | | | 2,643,968 | |
| | 27,352 | | Copart, Inc.* | | | 2,494,776 | |
| | 6,455 | | Equifax, Inc. | | | 1,518,862 | |
| | 3,651 | | Generac Holdings, Inc.* | | | 544,474 | |
| | 48,225 | | Genpact, Ltd. | | | 1,811,813 | |
| | 5,242 | | IDEX Corp. | | | 1,128,393 | |
| | 5,899 | | Paycom Software, Inc. | | | 1,894,995 | |
| | 34,224 | | Rentokil Initial PLC ADR | | | 1,335,078 | |
| | 6,277 | | SiteOne Landscape Supply, Inc.* | | | 1,050,519 | |
| | 7,866 | | Trex Co, Inc.* | | | 515,695 | |
| | 9,443 | | Verisk Analytics, Inc. | | | 2,134,401 | |
| | 26,434 | | Waste Connections, Inc. | | | 3,778,211 | |
| | | | | | | 24,293,774 | |
| Information Technology — 17.7% | | | | |
| | 2,630 | | Atlassian Corp.* | | | 441,340 | |
| | 6,515 | | Autodesk, Inc.* | | | 1,333,034 | |
| | 4,916 | | Cadence Design Systems, Inc.* | | | 1,152,900 | |
| | 12,328 | | Crowdstrike Holdings, Inc.* | | | 1,810,613 | |
| | 37,929 | | Dynatrace, Inc.* | | | 1,952,206 | |
| | 6,520 | | Elastic NV* | | | 418,062 | |
| | 2,213 | | Fair Isaac Corp.* | | | 1,790,782 | |
| | 5,377 | | Gartner, Inc.* | | | 1,883,617 | |
| | 984 | | HubSpot, Inc.* | | | 523,577 | |
| | 2,193 | | KLA Corp. | | | 1,063,649 | |
| | 25,820 | | Marvell Technology, Inc. | | | 1,543,519 | |
| | 1,829 | | Monolithic Power Systems, Inc. | | | 988,081 | |
| | 3,564 | | NXP Semiconductors NV | | | 729,480 | |
| | 6,390 | | Workday, Inc.* | | | 1,443,437 | |
| | | | | | | 17,074,297 | |
| Materials — 2.0% | | | | |
| | 8,566 | | Vulcan Materials Co. | | | 1,931,119 | |
| | | | | |
| Real Estate — 3.5% | | | | |
| | 37,373 | | CoStar Group, Inc.* | | | 3,326,197 | |
Total Common Stocks (Cost $68,580,438) | | | 88,298,513 | |
| | | | | |
| Real Estate Investment Trusts — 1.9% | | | | |
| | 7,712 | | SBA Communications Corp. | | | 1,787,333 | |
Total Real Estate Investment Trusts (Cost $1,541,572) | | | 1,787,333 | |
| | | | | |
| Short-Term Investments — 5.9% | | | | |
| | | | | |
| Money Market Funds — 5.9% | | | | |
| | 5,686,143 | | First American Government | | | | |
| | | | Obligations Fund — Class Z, 4.97%# | | | 5,686,143 | |
Total Short-Term Investments (Cost $5,686,143) | | | 5,686,143 | |
Total Investments — 99.4% (Cost $75,808,153) | | | 95,771,989 | |
Other Assets in Excess of Liabilities — 0.6% | | | 607,125 | |
| NET ASSETS — 100.0% | | $ | 96,379,114 | |
ADR — American Depositary Receipt
# | Annualized seven-day yield as of the date of this report. |
The accompanying notes are an integral part of these financial statements.
Brown Advisory Small-Cap Growth FundA Message to Our Shareholders
June 30, 2023
Dear Shareholder:
During the twelve-month period ended June 30, 2023, the Brown Advisory Small-Cap Growth Fund Institutional Shares (the “Fund”) returned 14.33%. During the same period, the Russell 2000® Growth Index (the “Index”), the Fund’s benchmark, returned 18.53%.
For the twelve-month period, the largest contributors to the Fund’s overall performance were the information technology, materials, real estate, utilities and energy sectors in approximately equal proportion. Consumer discretionary and industrials were laggards due to a relative lack of cyclicality.
At the individual stock level, EVO Payments, ChampionX Corporation and Workiva were the strongest contributors. EVO Payments, a global merchant acquirer and payment processor servicing company, agreed to be acquired by Global Payments for $34 in cash per share. Detractors included Clarus Corporation, Azenta and Blackline. Clarus, a manufacturer of outdoor sporting equipment, was the victim of inventory rationalization at several national account customers, which prompted it to lower guidance.
There were roughly an equal number of additions to and deletions from the portfolio over the twelve-month period. A substantial amount of the portfolio turnover was due to M&A activity and our desire to eliminate positions where our investment thesis appeared violated or we believed a poor risk/reward dynamic necessitated a redeployment of capital. For example, Biohaven Pharmaceutical Holdings, CMC Materials, EVO Payments, IAA, ManTech International Corporation and Terminix were all acquired during the period. Catalent, Nevro Corp, and Progyny are situations that fell into the latter bucket. We were pleased that the team was able to redeploy the vast majority of the proceeds into a diverse collection of businesses that we hope to own for the next several years.
Overall, we were pleased with the strategy’s absolute return, representing a solid rebound from the challenging market conditions experienced toward the end of 2021 and most of 2022. The portfolio did not keep pace with the benchmark primarily due to a lack of cyclicality (or perhaps beta) in the consumer discretionary and industrials sectors. Given the portfolio held up quite well compared with the Index during the downdraft, we remain pleased with the longer run performance and will strive to continue to drive solid risk-adjusted returns going forward.
Sincerely,
Christopher Berrier
Portfolio Manager
Brown Advisory Small-Cap Growth FundA Message to Our Shareholders
June 30, 2023
Past performance is not a guarantee of future results.
Mutual fund investing involves risk. Principal loss is possible.
Investments in smaller companies generally carry greater risk than is customarily associated with larger companies for various reasons such as narrower markets, limited financial resources and less liquid stock.
The value of the Fund’s investments in REITs may change in response to changes in the real estate market such as declines in the value of real estate, lack of available capital or financing opportunities, and increases in property taxes or operating costs.
The Fund may invest in ETFs, which may trade at a discount to the aggregate value of the underlying securities and although expense ratios for ETFs are generally low, frequent trading of ETFs by the Fund can generate brokerage expenses.
Earnings growth is not representative of the fund’s future performance. Diversification does not assure a profit, nor does it protect against a loss in a declining market.
Privately Placement issued securities are restricted securities that are not publicly traded. Delay or difficulty in selling such securities may result in a loss to the Fund.
Fund holdings and sector allocations are subject to change and should not be considered a recommendation to buy or sell any security. For a complete list of fund holdings, please refer to the Schedule of Investments provided in this report.
Definitions for terms and indices are provided in the Glossary of Terms.
Brown Advisory Small-Cap Growth FundPerformance Information & Portfolio Holdings Summary
June 30, 2023
GROWTH OF A $1,000,000 INVESTMENT
The following chart reflects the change in value of a hypothetical $1,000,000 investment, including reinvested dividends and distributions, in the Fund compared with the broad-based securities market index. The Russell 2000® Growth Index (“Index”) measures the performance of the small-cap growth segment of the U.S. equity universe. It includes those Russell 2000® companies with higher price to book ratios and higher forecasted growth values. The Index is unmanaged and does not reflect the deduction of fees, such as investment management fees. Investors cannot invest directly in an index.
| PORTFOLIO HOLDINGS | % of Net Assets |
| | |
Health Care | | 22.6% |
Industrials | | 18.8% |
Information Technology | | 15.5% |
Consumer Discretionary | | 11.0% |
Money Market Funds | | 8.2% |
Energy | | 4.8% |
Communication Services | | 4.2% |
Financials | | 4.0% |
Materials | | 3.4% |
Consumer Staples | | 3.3% |
Exchange Traded Funds | | 2.3% |
Real Estate Investment Trusts | | 1.6% |
Real Estate | | 0.5% |
Private Placements | | 0.1% |
Other Assets and Liabilities | | (0.3)% |
| | | 100.0% |
Average Annual Total Return | One Year | Five Year | Ten Year |
| Institutional Shares | 14.33% | 7.80% | 10.51% |
| Investor Shares | 14.17% | 7.64% | 10.35% |
| Advisor Shares | 13.91% | 7.36% | 10.07% |
Russell 2000® Growth Index | 18.53% | 4.22% | 8.83% |
| | Institutional Shares | Investor Shares | Advisor Shares |
Gross Expense Ratio1 | 0.96% | 1.11% | 1.36% |
Net Expense Ratio1 | 0.96% | 1.11% | 1.36% |
Past performance does not guarantee future results. The performance data quoted represents past performance and current returns may be lower or higher. The investment return and net asset value will fluctuate so that an investor’s shares, when redeemed, may be worth more or less than the original cost. To obtain performance information current to the most recent month end, please visit our website at brownadvisory.com/mf/small-cap-growth-fund. The performance table and graph above do not reflect the deduction of taxes that a shareholder would pay on Fund distributions or the redemption of Fund shares. Performance data does not reflect the imposition of the redemption fee of 1.00% on shares redeemed within 14 days, and if it did, performance would have been lower. Short-term performance, in particular, is not a good indication of the Fund’s future performance, and an investment should not be made based solely on returns. Returns shown are calculated using the net asset values (“NAV”) that were used for shareholder transactions as of the respective period ends. These NAV, and the returns calculated from them, may differ from the NAV and returns shown elsewhere in this report.
1 | Per the Fund’s prospectus dated October 31, 2022. Refer to the financial highlights for the gross and net expense ratios for the year ended as of the date of this report. Please note that the expense ratios per the prospectus include acquired fund fees and expenses (as applicable) and the expense ratios in the financial highlights do not. |
Brown Advisory Small-Cap Growth FundSchedule of Investments
June 30, 2023
| Shares | | Security Description | | Value $ | |
| Common Stocks — 88.1% | | | |
| | | | |
| Communication Services — 4.2% | | | |
| | 2,568,082 | | Angi, Inc.* | | | 8,474,670 | |
| | 395,982 | | Cogent Communications Holdings, Inc. | | | 26,645,629 | |
| | 1,376,974 | | Pinterest, Inc.* | | | 37,646,469 | |
| | 150,473 | | Take-Two Interactive Software, Inc.* | | | 22,143,607 | |
| | | | | | | 94,910,375 | |
| Consumer Discretionary — 11.0% | | | | |
| | 702,677 | | Bright Horizons Family Solutions, Inc.* | | | 64,962,489 | |
| | 168,523 | | Choice Hotels International, Inc. | | | 19,804,823 | |
| | 247,096 | | Churchill Downs, Inc. | | | 34,388,350 | |
| | 1,529,261 | | Clarus Corp. | | | 13,977,445 | |
| | 521,079 | | First Watch Restaurant Group, Inc.* | | | 8,806,235 | |
| | 1,424,015 | | Leslie’s, Inc.* | | | 13,371,501 | |
| | 397,098 | | MakeMyTrip, Ltd.* | | | 10,713,704 | |
| | 3,928,152 | | Mister Car Wash, Inc.* | | | 37,906,667 | |
| | 73,651 | | TopBuild Corp.* | | | 19,592,639 | |
| | 1,231,517 | | Vizio Holding Corp.* | | | 8,312,740 | |
| | 176,536 | | XPEL, Inc.* | | | 14,867,862 | |
| | | | | | | 246,704,455 | |
| Consumer Staples — 3.3% | | | | |
| | 212,623 | | Casey’s General Stores, Inc. | | | 51,854,497 | |
| | 602,153 | | Simply Good Foods Co.* | | | 22,032,779 | |
| | | | | | | 73,887,276 | |
| Energy — 4.8% | | | | |
| | 560,307 | | Cactus, Inc. | | | 23,712,192 | |
| | 1,583,020 | | ChampionX Corp. | | | 49,136,941 | |
| | 397,893 | | Denbury, Inc.* | | | 34,322,250 | |
| | | | | | | 107,171,383 | |
| Financials — 4.0% | | | | |
| | 127,688 | | Houlihan Lokey, Inc. | | | 12,553,007 | |
| | 790,909 | | Prosperity Bancshares, Inc. | | | 44,670,540 | |
| | 174,324 | | WEX, Inc.* | | | 31,739,171 | |
| | | | | | | 88,962,718 | |
| Health Care — 22.6% | | | | |
| | 2,094,879 | | Abcam PLC ADR* | | | 51,261,689 | |
| | 1,988,733 | | Accolade, Inc.* | | | 26,788,234 | |
| | 1,205,866 | | agilon health, Inc.* | | | 20,909,717 | |
| | 1,171,633 | | Alignment Healthcare, Inc.* | | | 6,736,890 | |
| | 142,794 | | Arvinas, Inc.* | | | 3,544,147 | |
| | 154,661 | | Ascendis Pharma A/S ADR* | | | 13,803,494 | |
| | 250,020 | | Azenta, Inc.* | | | 11,670,934 | |
| | 185,084 | | Blueprint Medicines Corp.* | | | 11,697,309 | |
| | 530,596 | | Bruker Corp. | | | 39,221,656 | |
| | 1,357,913 | | Definitive Healthcare Corp.* | | | 14,937,043 | |
| | 560,051 | | Encompass Health Corp. | | | 37,921,053 | |
| | 472,481 | | Establishment Labs Holdings, Inc.* | | | 32,416,921 | |
| | 620,990 | | HealthEquity, Inc.* | | | 39,209,309 | |
| | 441,451 | | Inari Medical, Inc.* | | | 25,665,961 | |
| | 103,084 | | Karuna Therapeutics, Inc.* | | | 22,353,765 | |
| | 2,037,760 | | NeoGenomics, Inc.* | | | 32,746,803 | |
| | 348,141 | | Neurocrine Biosciences, Inc.* | | | 32,829,696 | |
| | 469,334 | | OrthoPediatrics Corp.* | | | 20,580,296 | |
| | 1,011,050 | | Phreesia, Inc.* | | | 31,352,661 | |
| | 1,179,350 | | SI-BONE, Inc.* | | | 31,818,863 | |
| | | | | | | 507,466,441 | |
| Industrials — 18.8% | | | | |
| | 511,630 | | AZEK Co., Inc.* | | | 15,497,273 | |
| | 178,390 | | Casella Waste Systems, Inc.* | | | 16,135,375 | |
| | 111,155 | | Curtiss-Wright Corp. | | | 20,414,727 | |
| | 144,929 | | FTI Consulting, Inc.* | | | 27,565,496 | |
| | 1,327,036 | | Genpact, Ltd. | | | 49,856,743 | |
| | 49,471 | | IDEX Corp. | | | 10,649,127 | |
| | 210,105 | | John Bean Technologies Corp. | | | 25,485,736 | |
| | 296,523 | | Knight-Swift Transportation Holdings, Inc. | | | 16,474,818 | |
| | 234,721 | | MSA Safety, Inc. | | | 40,832,065 | |
| | 1,130,090 | | Mueller Water Products, Inc. | | | 18,341,361 | |
| | 1,066,795 | | Rentokil Initial PLC ADR | | | 41,615,673 | |
| | 62,394 | | SiteOne Landscape Supply, Inc.* | | | 10,442,260 | |
| | 111,673 | | Valmont Industries, Inc. | | | 32,502,427 | |
| | 271,932 | | Waste Connections, Inc. | | | 38,867,241 | |
| | 292,351 | | Woodward, Inc. | | | 34,763,457 | |
| | 834,453 | | Zurn Elkay Water Solutions Corp. | | | 22,438,441 | |
| | | | | | | 421,882,220 | |
| Information Technology — 15.5% | | | | |
| | 493,910 | | Bentley Systems, Inc. | | | 26,784,739 | |
| | 605,356 | | BlackLine, Inc.* | | | 32,580,260 | |
| | 441,502 | | CCC Intelligent Solutions Holdings, Inc.* | | | 4,949,237 | |
| | 929,217 | | Clear Secure, Inc. | | | 21,529,958 | |
| | 816,037 | | Dynatrace, Inc.* | | | 42,001,424 | |
| | 326,749 | | Entegris, Inc. | | | 36,210,324 | |
| | 387,374 | | Envestnet, Inc.* | | | 22,990,647 | |
| | 4,818,071 | | Infinera Corp.* | | | 23,271,283 | |
| | 129,638 | | Lattice Semiconductor Corp.* | | | 12,454,323 | |
| | 91,879 | | Littelfuse, Inc. | | | 26,765,272 | |
| | 353,140 | | Power Integrations, Inc. | | | 33,431,764 | |
| | 740,953 | | PROS Holdings, Inc.* | | | 22,821,352 | |
| | 21,049 | | SiTime Corp.* | | | 2,483,151 | |
| | 377,571 | | Workiva, Inc.* | | | 38,383,868 | |
| | | | | | | 346,657,602 | |
| Materials — 3.4% | | | | |
| | 523,375 | | HB Fuller Co. | | | 37,426,546 | |
| | 192,008 | | Quaker Houghton | | | 37,422,359 | |
| | | | | | | 74,848,905 | |
| Real Estate — 0.5% | | | | |
| | 764,721 | | DigitalBridge Group, Inc. | | | 11,249,046 | |
Total Common Stocks (Cost $1,642,144,383) | | | 1,973,740,421 | |
| | | | | |
| Private Placements — 0.1% | | | | |
| | 19,200 | | StepStone VC Global Partners IV-B, L.P.*^† | | | 1,160,365 | |
| | 91,769 | | StepStone VC Global Partners V-B, L.P.*~† | | | 108,565 | |
Total Private Placements (Cost $–) | | | 1,268,930 | |
| | | | | |
| Real Estate Investment Trusts — 1.6% | | | | |
| | 211,345 | | EastGroup Properties, Inc. | | | 36,689,492 | |
Total Real Estate Investment Trusts (Cost $23,195,542) | | | 36,689,492 | |
| | | | | |
| Exchange Traded Funds — 2.3% | | | | |
| | 627,322 | | SPDR S&P Biotech Exchange Traded Fund | | | 52,193,190 | |
Total Exchange Traded Funds (Cost $50,624,409) | | | 52,193,190 | |
The accompanying notes are an integral part of these financial statements.
Brown Advisory Small-Cap Growth FundSchedule of Investments
June 30, 2023
| Shares | | Security Description | | Value $ | |
| Short-Term Investments — 8.2% | | | |
| | | | |
| Money Market Funds — 8.2% | | | |
| | 184,800,488 | | First American Government | | | |
| | | | Obligations Fund — Class Z, 4.97%# | | | 184,800,488 | |
Total Short-Term Investments (Cost $184,800,488) | | | 184,800,488 | |
Total Investments — 100.3% (Cost $1,900,764,822) | | | 2,248,692,521 | |
Liabilities in Excess of Other Assets — (0.3)% | | | (6,752,157 | ) |
| NET ASSETS — 100.0% | | $ | 2,241,940,364 | |
ADR — American Depositary Receipt
| ^ | Security is exempt from registration under Regulation D of the Securities Act of 1933. Security was acquired from February 2008 to April 2018 as part of a $2,000,000 capital commitment. As of the date of this report, $1,920,000 of the capital commitment has been fulfilled by the Fund. |
| ~ | Security is exempt from registration under Regulation D of the Securities Act of 1933. Security was acquired from October 2012 to August 2018 as part of a $100,000 capital commitment. As of the date of this report, $91,000 of the capital commitment has been fulfilled by the Fund. |
| † | These securities are being fair valued, using significant unobservable inputs (Level 3), under the supervision of the Board of Trustees. Further, they may not be sold by the Fund. Total unfunded capital commitments related to these holdings are immaterial and total $89,000, or 0.0% of the Fund’s net assets as of the date of this report. |
| # | Annualized seven-day yield as of the date of this report. |
The accompanying notes are an integral part of these financial statements.
Brown Advisory Small-Cap Fundamental Value FundA Message to Our Shareholders
June 30, 2023
Dear Shareholder:
During the 12-month period ended June 30, 2023, the Brown Advisory Small-Cap Fundamental Value Fund Investor Shares (the “Fund”) increased 12.49% in value. During the same period, the Russell 2000® Value Index (the “Index”), the Fund’s benchmark, increased 6.01%.
The Fund’s largest overweight positions during the period were in industrials and communication services. The largest underweight positions were in health care and real estate.
From an individual stock perspective, the top contributor for the period was Eagle Materials. Eagle announced a strong quarter reflecting high demand for cement and reflecting recent price increases. The company expects the environment to remain strong and further expects that government infrastructure projects are only starting to be awarded. The bottom contributor was Owens & Minor, which we sold during the period. We believe Owens & Minor experienced deeper-than-expected challenges in its product manufacturing business which resulted in reduced cash flow generation and increased leverage, causing us to move on from the stock.
The Fund made 16 new investments over the 12-month period—six additions in financials, three in industrials, three in consumer discretionary, one in communication services, one in real estate, one in information technology and one in materials. Notable additions include two previously owned companies, Enpro Industrials and Assured Guaranty. In both cases, we are particularly excited about corporate actions that they have taken to simplify and improve their business positioning.
EnPro is a high-quality small-cap multi-industrial with a heavy aftermarket focus. It has two businesses, both with leading market positions. Sealing Technologies produces mission critical seals and critical process technology components that create impenetrable barriers through which air and gas cannot move. Advanced Surface Technologies provides cleaning, coating, and refurbishment services to advanced node semiconductor equipment manufacturers and fabs. At the time of purchase, we think the market is missing the value of the relatively new AST business segment, as well as the upgraded quality of the management team.
Assured Guaranty is the leading municipal bond insurance company in the world. The firm maintains a greater than 50% market share in the company’s niche industry and shares a duopoly with one other firm. Later this summer, it expects to receive approval from regulators to begin to release a substantial amount of excess capital from its subsidiaries; if, as expected, much of this capital goes towards share buybacks, we believe it could create a substantial amount of shareholder value.
During the period, the Fund sold 11 of its investments. The exits were diversified, with four in industrials, three in consumer discretionary, and one in the information technology, one in energy, one in health care and one in financials.
During the period, small-cap value stocks generally trailed growth peers, especially larger growth stocks. We will closely monitor this and the broader equity markets. We will also keenly watch how AI influences investors and how the impact of falling bank liquidity, and general economic conditions will impact the market. As we head into the next several months, we will continue to put new ideas to work and discover new opportunities.
Sincerely,
J. David Schuster
Portfolio Manager
Past performance is not a guarantee of future results.
Mutual fund investing involves risk. Principal loss is possible. Investments in smaller companies generally carry greater risk than is customarily associated with larger companies for various reasons such as narrower markets, limited financial resources and less liquid stock.
The value of the Fund’s investments in REITs may change in response to changes in the real estate market such as declines in the value of real estate, lack of available capital or financing opportunities, and increases in property taxes or operating costs.
The Fund may invest in ETFs, which may trade at a discount to the aggregate value of the underlying securities and although expense ratios for ETFs are generally low, frequent trading of ETFs by the Fund can generate brokerage expenses.
Diversification does not assure a profit, nor does it protect against a loss in a declining market.
Fund holdings and sector allocations are subject to change and should not be considered a recommendation to buy or sell any security. For a complete list of fund holdings, please refer to the Schedule of Investments provided in this report.
Definitions for terms and indices are provided in the Glossary of Terms.
Brown Advisory Small-Cap Fundamental Value FundPerformance Information & Portfolio Holdings Summary
June 30, 2023
GROWTH OF A $10,000 INVESTMENT
The following chart reflects the change in value of a hypothetical $10,000 investment, including reinvested dividends and distributions, in the Fund as measured against a broad-based securities market index. The Russell 2000® Value Index (“Index”) measures the performance of small-cap value segment of the U.S. equity universe. It includes those Russell 2000® companies with lower price to book ratios and lower forecasted growth values. The Index is unmanaged and does not reflect the deduction of fees, such as investment management fees. Investors cannot invest directly in an index.
| PORTFOLIO HOLDINGS | % of Net Assets |
| | |
Financials | | 20.9% |
Industrials | | 18.0% |
Consumer Discretionary | | 11.3% |
Real Estate Investment Trusts | | 9.4% |
Energy | | 7.4% |
Materials | | 7.3% |
Information Technology | | 7.1% |
Communication Services | | 6.2% |
Money Market Funds | | 4.6% |
Consumer Staples | | 2.7% |
Health Care | | 2.4% |
Utilities | | 2.2% |
Other Assets and Liabilities | | 0.5% |
| | | 100.0% |
Average Annual Total Return | One Year | Five Year | Ten Year |
| Institutional Shares | 12.67% | 4.15% | 7.81% |
| Investor Shares | 12.49% | 3.99% | 7.64% |
| Advisor Shares | 12.25% | 3.74% | 7.37% |
Russell 2000® Value Index | 6.01% | 3.54% | 7.29% |
| | Institutional Shares | Investor Shares | Advisor Shares |
Gross Expense Ratio1 | 0.95% | 1.10% | 1.35% |
Net Expense Ratio1 | 0.95% | 1.10% | 1.35% |
Past performance does not guarantee future results. The performance data quoted represents past performance and current returns may be lower or higher. The investment return and net asset value will fluctuate so that an investor’s shares, when redeemed, may be worth more or less than the original cost. To obtain performance information current to the most recent month end, please visit our website at brownadvisory.com/mf/small-cap-fundamental-value-fund. The performance table and graph above do not reflect the deduction of taxes that a shareholder would pay on Fund distributions or the redemption of Fund shares. Performance data does not reflect the imposition of the redemption fee of 1.00% on shares redeemed within 14 days, and if it did, performance would have been lower. Short-term performance, in particular, is not a good indication of the Fund’s future performance, and an investment should not be made based solely on returns. Returns shown are calculated using the net asset values (“NAV”) that were used for shareholder transactions as of the respective period ends. These NAV, and the returns calculated from them, may differ from the NAV and returns shown elsewhere in this report.
1 | Per the Fund’s prospectus dated October 31, 2022. Refer to the financial highlights for the gross and net expense ratios for the year ended as of the date of this report. Please note that the expense ratios per the prospectus include acquired fund fees and expenses (as applicable) and the expense ratios in the financial highlights do not. |
Brown Advisory Small-Cap Fundamental Value FundSchedule of Investments
June 30, 2023
| Shares | | Security Description | | Value $ | |
| Common Stocks — 85.5% | | | |
| | | | |
| Communication Services — 6.2% | | | |
| | 45,696 | | Cable One, Inc. | | | 30,025,928 | |
| | 185,829 | | Nexstar Media Group, Inc. | | | 30,949,820 | |
| | 1,414,876 | | WideOpenWest, Inc.* | | | 11,941,553 | |
| | | | | | | 72,917,301 | |
| Consumer Discretionary — 11.3% | | | | |
| | 603,663 | | La-Z-Boy, Inc. | | | 17,288,908 | |
| | 834,709 | | Modine Manufacturing Co.* | | | 27,562,091 | |
| | 236,941 | | Monarch Casino & Resort, Inc. | | | 16,692,493 | |
| | 74,806 | | Murphy USA, Inc. | | | 23,272,895 | |
| | 59,235 | | Oxford Industries, Inc. | | | 5,829,909 | |
| | 353,027 | | Signet Jewelers Ltd. | | | 23,038,542 | |
| | 711,838 | | Vista Outdoor, Inc.* | | | 19,696,558 | |
| | | | | | | 133,381,396 | |
| Consumer Staples — 2.7% | | | | |
| | 298,546 | | Sprouts Farmers Market, Inc.* | | | 10,965,594 | |
| | 420,063 | | TreeHouse Foods, Inc.* | | | 21,162,774 | |
| | | | | | | 32,128,368 | |
| Energy — 7.4% | | | | |
| | 1,212,122 | | ChampionX Corp. | | | 37,624,267 | |
| | 1,944,609 | | Oceaneering International, Inc.* | | | 36,364,188 | |
| | 409,569 | | REX American Resources Corp.* | | | 14,257,097 | |
| | | | | | | 88,245,552 | |
| Financials — 20.9% | | | | |
| | 161,797 | | Alerus Financial Corp. | | | 2,909,110 | |
| | 516,193 | | Amalgamated Financial Corp. | | | 8,305,545 | |
| | 167,551 | | Assurant, Inc. | | | 21,064,512 | |
| | 63,719 | | Assured Guaranty, Ltd. | | | 3,555,520 | |
| | 755,842 | | Bancorp, Inc.* | | | 24,678,241 | |
| | 429,879 | | Dime Community Bancshares, Inc. | | | 7,578,767 | |
| | 2,022,799 | | Eastern Bankshares, Inc. | | | 24,819,744 | |
| | 275,529 | | First Bancorp | | | 8,196,988 | |
| | 152,658 | | Hanover Insurance Group, Inc. | | | 17,254,934 | |
| | 842,833 | | International Money Express, Inc.* | | | 20,674,694 | |
| | 1,136,057 | | MGIC Investment Corp. | | | 17,938,340 | |
| | 928,470 | | Pacific Premier Bancorp, Inc. | | | 19,200,760 | |
| | 314,116 | | Peapack Gladstone Financial Corp. | | | 8,506,261 | |
| | 451,542 | | Premier Financial Corp. | | | 7,233,703 | |
| | 29,798 | | Primerica, Inc. | | | 5,892,853 | |
| | 219,340 | | Seacoast Banking Corp. of Florida | | | 4,847,414 | |
| | 237,956 | | UMB Financial Corp. | | | 14,491,520 | |
| | 52,466 | | Virtus Investment Partners, Inc. | | | 10,360,461 | |
| | 4,062 | | White Mountains Insurance Group Ltd. | | | 5,641,752 | |
| | 377,752 | | WSFS Financial Corp. | | | 14,248,805 | |
| | | | | | | 247,399,924 | |
| Health Care — 2.4% | | | | |
| | 842,494 | | Patterson Cos, Inc. | | | 28,021,350 | |
| | | | | |
| Industrials — 18.0% | | | | |
| | 225,432 | | Albany International Corp. | | | 21,028,297 | |
| | 161,458 | | Civeo Corp.* | | | 3,145,202 | |
| | 99,515 | | CRA International, Inc. | | | 10,150,530 | |
| | 282,637 | | Crane NXT Co. | | | 15,952,032 | |
| | 141,826 | | Curtiss-Wright Corp. | | | 26,047,763 | |
| | 175,279 | | EnPro Industries, Inc. | | | 23,405,005 | |
| | 536,502 | | Federal Signal Corp. | | | 34,352,223 | |
| | 81,237 | | Kadant, Inc. | | | 18,042,738 | |
| | 928,470 | | Leonardo DRS, Inc.* | | | 16,099,670 | |
| | 1,783,827 | | Mueller Water Products, Inc. | | | 28,951,512 | |
| | 589,645 | | Thermon Group Holdings, Inc.* | | | 15,684,557 | |
| | | | | | | 212,859,529 | |
| Information Technology — 7.1% | | | | |
| | 687,082 | | CTS Corp. | | | 29,290,306 | |
| | 857,388 | | NCR Corp.* | | | 21,606,177 | |
| | 196,258 | | Onto Innovation, Inc.* | | | 22,858,169 | |
| | 217,647 | | PC Connection, Inc. | | | 9,815,880 | |
| | | | | | | 83,570,532 | |
| Materials — 7.3% | | | | |
| | 78,191 | | Chase Corp. | | | 9,478,313 | |
| | 205,462 | | Eagle Materials, Inc. | | | 38,302,226 | |
| | 399,415 | | Ingevity Corp.* | | | 23,229,977 | |
| | 715,592 | | Orion S.A. | | | 15,184,862 | |
| | | | | | | 86,195,378 | |
| Utilities — 2.2% | | | | |
| | 413,631 | | Portland General Electric Co. | | | 19,370,340 | |
| | 502,653 | | Star Group L.P. | | | 6,866,240 | |
| | | | | | | 26,236,580 | |
Total Common Stocks (Cost $781,089,846) | | | 1,010,955,910 | |
| | | | | |
| Real Estate Investment Trusts — 9.4% | | | | |
| | 203,092 | | CTO Realty Growth, Inc. | | | 3,480,997 | |
| | 120,163 | | EastGroup Properties, Inc. | | | 20,860,297 | |
| | 809,058 | | Equity Commonwealth | | | 16,391,515 | |
| | 875,666 | | Essential Properties Realty Trust, Inc. | | | 20,613,178 | |
| | 496,222 | | Getty Realty Corp. | | | 16,782,228 | |
| | 673,928 | | Global Medical REIT, Inc. | | | 6,152,963 | |
| | 2,482,803 | | Ladder Capital Corp. | | | 26,938,412 | |
Total Real Estate Investment Trusts (Cost $90,177,604) | | | 111,219,590 | |
| | | | | |
| Short-Term Investments — 4.6% | | | | |
| | | | | |
| Money Market Funds — 4.6% | | | | |
| | 54,928,108 | | First American Government | | | | |
| | | | Obligations Fund — Class Z, 4.97%# | | | 54,928,108 | |
Total Short-Term Investments (Cost $54,928,108) | | | 54,928,108 | |
Total Investments — 99.5% (Cost $926,195,558) | | | 1,177,103,608 | |
Other Assets in Excess of Liabilities — 0.5% | | | 5,662,485 | |
| NET ASSETS — 100.0% | | $ | 1,182,766,093 | |
| * | Non-income producing |
| # | Annualized seven-day yield as of the date of this report. |
The accompanying notes are an integral part of these financial statements.
Brown Advisory Sustainable Small-Cap Core FundA Message to Our Shareholders
June 30, 2023
Dear Shareholder:
During the 12-month period ended June 30, 2023, the Brown Advisory Sustainable Small-Cap Core Fund Institutional Shares (the “Fund”) increased 13.68% in value. During the same period, the Russell 2000® Index, the Fund’s benchmark, increased 12.31%.
We began the period with increasingly cautious forward-looking commentary and guidance from many of our portfolio companies’ management teams, and with investors fearful of an impending recession as the Fed continued hiking interest rates to curb high inflation, coupled with geopolitical instability. Market volatility was further compounded by the banking crisis in early March; regional banks represent a meaningful portion of our benchmark index, and this situation put pressure on the broader asset class. Small caps began to rally towards the end of the period as investors weighed the likelihood of the Fed approaching the end of its hiking cycle, along with both slowing inflation and resilient economic data. Despite this strength, large caps outpaced small caps due to both the euphoria surrounding artificial intelligence, and the fear of a U.S. government debt default that was eventually avoided in the eleventh hour. We remain excited about the small-cap asset class, with valuations trading at historical lows. Activity in the Fund during the period should reflect this sentiment.
Strong stock selection within the Fund’s industrials and financials sectors offset weakness in the consumer discretionary and health care sectors. The largest contributors to returns included Comfort Systems, Federal Signal, Onto Innovation, SPX Technologies, and Bancorp Inc. The Fund’s single largest contributor, Comfort Systems, benefited from a strong demand backdrop, which led to better-than-expected revenue and bookings growth. The company has been gaining market share, both organically and through tuck-in acquisitions, and its value proposition around supporting the efficiency and sustainability of customers’ buildings, combined with the company’s track record of execution, has led to strong free cash flow generation.
The Fund’s largest detractors included Owens & Minor, Eastern Bankshares, United Natural Foods, UMB Financial, and Infinera. Owens & Minor, the Fund’s largest detractor, was operating in a challenged industry environment characterized by lower hospital procedure volumes, industry destocking, and foreign exchange headwinds. This was coupled with company-specific execution issues which drove a cut to Owens & Minor’s full year guidance.
We took advantage of the volatile markets to initiate fifteen new positions in the Fund, including Arvinas, Assurant, Assured Guaranty, Azenta, Cable One, Encompass Health, EnPro Industries, Entegris, First Watch Restaurant Group, Infinera, Karuna Therapeutics, United Natural Foods, Valmont Industries, WSFS Financial, and Wyndham Hotels & Resorts.
Many of these additions to the portfolio replaced fourteen positions that were eliminated during the period, including Biohaven (acquired), CMC Materials (acquired), Denny’s, EVO Payments (acquired), Fate Therapeutics, IAA (acquired), McGrath RentCorp, National Vision, Nevro, Owens & Minor, Simpson Manufacturing, United Natural Foods, Veritex, and Warby Parker.
Broadly speaking, the market’s strong returns at the tail end of this 12-month period has taken many equity market participants by surprise, especially considering the many issues that have vexed investors such as the regional bank crisis, the debt ceiling drama, pesky inflation and geopolitical uncertainty. Despite a lack of directional clarity in the market, we remain steadfast in our long-term investment approach which seeks investment opportunities that reflect strong business fundamentals, attractive valuations and Sustainable Drivers.
Sincerely,
Timothy Hathaway, CFA
Emily Dwyer
Brown Advisory Sustainable Small-Cap Core FundA Message to Our Shareholders
June 30, 2023
Past performance is not a guarantee of future results.
Mutual fund investing involves risk. Principal loss is possible.
Investments in smaller companies generally carry greater risk than is customarily associated with larger companies for various reasons such as narrower markets, limited financial resources and less liquid stock. The value of the Fund’s investments in REITS may change in response to changes in the real estate market such as declines in the value of real estate, lack of available capital or financing opportunities, and increases in property taxes or operating costs.
The Fund may invest in ETFs, which may trade at a discount to the aggregate value of the underlying securities and although expense ratios for ETFs are generally low, frequent trading of ETFs by the Fund can generate brokerage expenses.
Earnings growth is not representative of the fund’s future performance. Diversification does not assure a profit, nor does it protect against a loss in a declining market.
The Fund’s consideration of ESG characteristics as part of the investment process could cause it to make or avoid investments that could result in the Fund underperforming similar funds that do not take ESG characteristics into consideration. Because the Fund’s ESG criteria exclude securities of certain issuers for nonfinancial reasons, the Fund may forgo some market opportunities available to the funds that do not use these criteria.
Fund holdings and sector allocations are subject to change and should not be considered a recommendation to buy or sell any security. For a complete list of fund holdings, please refer to the Schedule of Investments provided in this report.
Definitions for terms and indices are provided in the Glossary of Terms.
Brown Advisory Sustainable Small-Cap Core FundPerformance Information & Portfolio Holdings Summary
June 30, 2023
GROWTH OF A $1,000,000 INVESTMENT
The following chart reflects the change in value of a hypothetical $1,000,000 investment, including reinvested dividends and distributions, in the Fund as measured against a broad-based securities market index. The Russell 2000® Index (“Index”) measures the performance of a small-cap segment of the U.S. equity universe. The Index includes the 2,000 stocks with the lowest market capitalization in the Russell 3000® Index. The Index is unmanaged and does not reflect the deduction of fees, such as investment management fees. Investors cannot invest directly in an index.
| PORTFOLIO HOLDINGS | % of Net Assets |
| | |
Industrials | | 19.0% |
Health Care | | 17.1% |
Financials | | 15.0% |
Information Technology | | 13.5% |
Money Market Funds | | 6.6% |
Consumer Discretionary | | 6.5% |
Communication Services | | 5.0% |
Materials | | 3.8% |
Real Estate Investment Trusts | | 3.8% |
Consumer Staples | | 2.9% |
Real Estate | | 1.2% |
Other Assets and Liabilities | | 5.6% |
| | | 100.0% |
| | | Since Inception |
Average Annual Total Return | One Year | (9/30/21) |
| Institutional Shares | 13.68% | -6.99% |
| Investor Shares | 13.57% | -7.11% |
Russell 2000® Index | 12.31% | -7.15% |
| | Institutional Shares | Investor Shares |
Gross Expense Ratio1 | 1.36% | 1.51% |
Net Expense Ratio1 | 0.93% | 1.08% |
Past performance does not guarantee future results. The performance data quoted represents past performance and current returns may be lower or higher. The investment return and net asset value will fluctuate so that an investor’s shares, when redeemed, may be worth more or less than the original cost. To obtain performance information current to the most recent month end, please visit our website at brownadvisory.com/mf/funds/sustainable-small-cap-core-fund. The performance table and graph above do not reflect the deduction of taxes that a shareholder would pay on Fund distributions or the redemption of Fund shares. Investment performance reflects periods during which fee waivers were in effect. In the absence of such waivers, total return would have been reduced. Performance data does not reflect the imposition of the redemption fee of 1.00% on shares redeemed within 14 days, and if it did, performance would have been lower. Short-term performance, in particular, is not a good indication of the Fund’s future performance, and an investment should not be made based solely on returns. Returns shown are calculated using the net asset values (“NAV”) that were used for shareholder transactions as of the respective period ends. These NAV, and the returns calculated from them, may differ from the NAV and returns shown elsewhere in this report.
1 | Per the Fund’s prospectus dated October 31, 2022. Refer to the financial highlights for the gross and net expense ratios for the period ended as of the date of this report. Please note that the expense ratios per the prospectus include acquired fund fees and expenses (as applicable) and the expense ratios in the financial highlights do not. |
Brown Advisory Sustainable Small-Cap Core FundSchedule of Investments
June 30, 2023
| Shares | | Security Description | | Value $ | |
| Common Stocks — 84.0% | | | |
| | | | |
| Communication Services — 5.0% | | | |
| | 80,177 | | Angi, Inc.* | | | 264,584 | |
| | 1,727 | | Cable One, Inc. | | | 1,134,777 | |
| | 16,228 | | EchoStar Corp.* | | | 281,394 | |
| | 5,937 | | Nexstar Media Group, Inc. | | | 988,807 | |
| | | | | | | 2,669,562 | |
| Consumer Discretionary — 6.5% | | | | |
| | 14,182 | | Bright Horizons Family Solutions, Inc.* | | | 1,311,126 | |
| | 3,647 | | Choice Hotels International, Inc. | | | 428,595 | |
| | 21,405 | | First Watch Restaurant Group, Inc.* | | | 361,745 | |
| | 3,242 | | TopBuild Corp.* | | | 862,437 | |
| | 7,576 | | Wyndham Hotels & Resorts, Inc. | | | 519,486 | |
| | | | | | | 3,483,389 | |
| Consumer Staples — 2.9% | | | | |
| | 18,322 | | Sprouts Farmers Market, Inc.* | | | 672,967 | |
| | 17,758 | | TreeHouse Foods, Inc.* | | | 894,648 | |
| | | | | | | 1,567,615 | |
| Financials — 15.0% | | | | |
| | 4,351 | | Assurant, Inc. | | | 547,008 | |
| | 1,827 | | Assured Guaranty, Ltd. | | | 101,947 | |
| | 66,682 | | AvidXchange Holdings, Inc.* | | | 692,159 | |
| | 36,134 | | Bancorp, Inc.* | | | 1,179,776 | |
| | 85,692 | | Eastern Bankshares, Inc. | | | 1,051,441 | |
| | 66,283 | | MGIC Investment Corp. | | | 1,046,608 | |
| | 24,167 | | Pacific Premier Bancorp, Inc. | | | 499,774 | |
| | 3,540 | | Primerica, Inc. | | | 700,070 | |
| | 7,609 | | Prosperity Bancshares, Inc. | | | 429,756 | |
| | 5,196 | | UMB Financial Corp. | | | 316,436 | |
| | 5,074 | | WEX, Inc.* | | | 923,823 | |
| | 14,429 | | WSFS Financial Corp. | | | 544,262 | |
| | | | | | | 8,033,060 | |
| Health Care — 17.1% | | | | |
| | 20,454 | | Abcam PLC ADR* | | | 500,510 | |
| | 39,305 | | Accolade, Inc.* | | | 529,438 | |
| | 40,890 | | Alignment Healthcare, Inc.* | | | 235,118 | |
| | 3,541 | | Arvinas, Inc.* | | | 87,888 | |
| | 5,373 | | Ascendis Pharma A/S ADR* | | | 479,540 | |
| | 11,205 | | Azenta, Inc.* | | | 523,049 | |
| | 6,607 | | Blueprint Medicines Corp.* | | | 417,562 | |
| | 1,968 | | Charles River Laboratories International, Inc.* | | | 413,772 | |
| | 12,456 | | Encompass Health Corp. | | | 843,396 | |
| | 14,570 | | HealthEquity, Inc.* | | | 919,949 | |
| | 10,800 | | Inari Medical, Inc.* | | | 627,912 | |
| | 2,149 | | Karuna Therapeutics, Inc.* | | | 466,011 | |
| | 49,840 | | NeoGenomics, Inc.* | | | 800,929 | |
| | 4,598 | | Neurocrine Biosciences, Inc.* | | | 433,591 | |
| | 13,636 | | OrthoPediatrics Corp.* | | | 597,939 | |
| | 22,938 | | Phreesia, Inc.* | | | 711,307 | |
| | 21,546 | | SI-BONE, Inc.* | | | 581,311 | |
| | | | | | | 9,169,222 | |
| Industrials — 19.0% | | | | |
| | 29,016 | | AZEK Co., Inc.* | | | 878,894 | |
| | 5,972 | | Comfort Systems USA, Inc. | | | 980,603 | |
| | 3,999 | | EnPro Industries, Inc. | | | 533,986 | |
| | 28,787 | | Federal Signal Corp. | | | 1,843,233 | |
| | 12,949 | | Genpact, Ltd. | | | 486,494 | |
| | 2,403 | | John Bean Technologies Corp. | | | 291,484 | |
| | 84,494 | | Mueller Water Products, Inc. | | | 1,371,338 | |
| | 2,449 | | SiteOne Landscape Supply, Inc.* | | | 409,865 | |
| | 16,560 | | SPX Technologies, Inc.* | | | 1,407,103 | |
| | 2,484 | | Valmont Industries, Inc. | | | 722,968 | |
| | 4,862 | | Woodward, Inc. | | | 578,140 | |
| | 23,766 | | Zurn Elkay Water Solutions Corp. | | | 639,068 | |
| | | | | | | 10,143,176 | |
| Information Technology — 13.5% | | | | |
| | 1,550 | | Aspen Technology, Inc.* | | | 259,796 | |
| | 9,619 | | BlackLine, Inc.* | | | 517,695 | |
| | 21,489 | | CTS Corp. | | | 916,076 | |
| | 10,940 | | Dynatrace, Inc.* | | | 563,081 | |
| | 2,819 | | Entegris, Inc. | | | 312,402 | |
| | 6,060 | | Envestnet, Inc.* | | | 359,661 | |
| | 87,964 | | Infinera Corp.* | | | 424,866 | |
| | 2,378 | | Littelfuse, Inc. | | | 692,735 | |
| | 13,812 | | Onto Innovation, Inc.* | | | 1,608,683 | |
| | 6,483 | | Power Integrations, Inc. | | | 613,746 | |
| | 9,424 | | Workiva, Inc.* | | | 958,044 | |
| | | | | | | 7,226,785 | |
| Materials — 3.8% | | | | |
| | 14,587 | | HB Fuller Co. | | | 1,043,116 | |
| | 17,336 | | Ingevity Corp.* | | | 1,008,262 | |
| | | | | | | 2,051,378 | |
| Real Estate — 1.2% | | | | |
| | 43,092 | | DigitalBridge Group, Inc. | | | 633,883 | |
Total Common Stocks (Cost $41,007,170) | | | 44,978,070 | |
| | | | | |
| Real Estate Investment Trusts — 3.8% | | | | |
| | 4,563 | | EastGroup Properties, Inc. | | | 792,136 | |
| | 22,868 | | Essential Properties Realty Trust, Inc. | | | 538,313 | |
| | 17,054 | | Hannon Armstrong Sustainable | | | | |
| | | | Infrastructure Capital, Inc. | | | 426,350 | |
| | 3,717 | | W.P. Carey, Inc. | | | 251,121 | |
Total Real Estate Investment Trusts (Cost $2,072,210) | | | 2,007,920 | |
| | | | | |
| Short-Term Investments — 6.6% | | | | |
| | | | | |
| Money Market Funds — 6.6% | | | | |
| | 3,519,714 | | First American Government | | | | |
| | | | Obligations Fund — Class Z, 4.97%# | | | 3,519,714 | |
Total Short-Term Investments (Cost $3,519,714) | | | 3,519,714 | |
Total Investments — 94.4% (Cost $46,599,094) | | | 50,505,704 | |
Other Assets in Excess of Liabilities — 5.6% | | | 2,969,666 | |
| NET ASSETS — 100.0% | | $ | 53,475,370 | |
ADR — American Depositary Receipt
# | Annualized seven-day yield as of the date of this report. |
The accompanying notes are an integral part of these financial statements.
Brown Advisory Sustainable Value FundA Message to Our Shareholders
June 30, 2023
Dear Shareholder:
During the four-month period ended June 30, 2023 the Brown Advisory Sustainable Value Fund Institutional Shares (the “Fund”) increased 0.30% in value. During the same period, the Russell 1000® Value Index (the “Index”), the Fund’s benchmark, increased 3.60%. Period gains came primarily in June, and we were pleased that our value-oriented strategy kept pace during that rapid market rise.
The Fund’s largest overweight positions during the period were in communication services and information technology, while the largest underweight positions were in consumer staples and financials.
Utilities were a positive contributor for the strategy as Constellation Energy put some of its excess balance sheet capacity to work and acquired a stake in a Texas nuclear facility at an attractive multiple. We continue to think that Constellation has one of the more differentiated capital allocation frameworks among utilities on a go forward basis. Our biggest detractors in the quarter were financials, health care, and consumer discretionary.
From an individual stock perspective, Alphabet Inc. (GOOG) was the top contributor for the period. GOOG has now recovered most of the losses the stock saw following the launch of ChatGPT, which sparked fears that Google was behind on AI. Since then the market has become more comfortable with search market share stability given GOOG’s wide moat around browser usage. While Google may have fumbled some initial marketing attempts, they are arguably further along on AI than any other company in the world. The company took advantage of the recent share price weakness and accelerated its capital returns to shareholders through its buyback program. The bottom contributor was Truist Financial Corporation (TFC) as broader banking system concerns pulled down the super-regional and regional banks. Concerns mostly center around heightened regulatory uncertainty in the future, capital levels given losses in securities portfolios, and continued negative sentiment around the commercial real estate sector.
The Fund made two new investments in the period since its inception on February 28, 2023. One addition in the materials sector and one in information technology. These additions include CRH public limited company Sponsored ADR and TD SYNNEX Corporation. CRH is a leading building materials company in North America with attractive assets across cement, aggregates, concrete, asphalt and outdoor living products. CRH is listed in the UK despite earning the bulk of its business in North America, so it is not on the radar of many U.S. investors; that is set to change on September 25th when the company moves its primary listing to the U.S. The heavy materials sector is well-positioned going forward, in our view, thanks to accelerating federal infrastructure spending, healthy state and local budgets and limited new supply growth. CRH presents us an opportunity the buy a market leader at a significant discount to its peers (as of June 30, the stock traded at just 7.4x EBITDA and was earning a FCF yield of 8%). The company is sitting on its best balance sheet in its 50-year history, setting up the potential for accelerating capital returns to shareholders going forward. Our Sustainable Cash Flow Advantage thesis centers around CRH’s leading positions among its peers in terms of circularity, emissions, and innovation. CRH is one of the largest recyclers in North America in terms of weight (42.4m tons last year) with 1 in every 4 miles of roads built with recycled materials. CRH is a leader within the industry in terms of sustainability with a target of a 30% reduction in absolute emissions by 2030 and a goal to be net zero by 2050. From an innovation standpoint in 2022, $12.6bn of CRH’s revenues (~40%) came from products with enhanced sustainable attributes, according to their 2022 Annual Report. TD Synnex (the result of a 2021 merger of Synnex and Tech Data) is a leading global IT distributor with ~20% market share and $60B+ in revenue. It has a durable FCF profile and a well-defined capital allocation plan with a goal of returning at least 50% of FCF to shareholders on an annual basis. Concerns over the PC cycle brought valuation down to a very attractive level of just 7x EV/EBITDA or ~11% FCF yield. TD Synnex’s size and scale is unmatched within the industry; according to company reports, it partners with over 1,500 original equipment manufacturers (OEM), carries 200,000 SKUs and serves more than 150,000 customers. As the IT ecosystem becomes increasingly complex and hardware and software solutions become more combined over time, we believe its Sustainable Cash Flow Advantage is derived from its position as partner of choice for both the OEM as well as their fragmented customer bases. The company’s unique ability to become a solutions aggregator for their resellers should, in our assessment, reduce overall costs, reduce time to market, and extend customer relationships further into the future.
We continue to believe that a portfolio of companies that generate consistently high levels of free cash flow, possess a Sustainable Cash Flow Advantage (SCFA), exhibit capital discipline, and trade at attractive valuations will lead to compelling risk-adjusted returns over the long term while providing a margin of safety for our investors.
Sincerely,
Michael Poggi
Portfolio Manager
Brown Advisory Sustainable Value FundA Message to Our Shareholders
June 30, 2023
Past performance is not a guarantee of future results.
Mutual fund investing involves risk. Principal loss is possible.
The Adviser assesses a company’s Environmental, Social and Governance (“ESG”) profile through conducting ESG research and leveraging engagement when appropriate through dialogue with company management teams as part of its fundamental due diligence process. The Adviser views ESG characteristics as material to fundamentals and seeks to understand their impact on companies in which the Fund may invest. The Fund’s consideration of ESG characteristics as part of the investment process could cause it to make or avoid investments that could result in the Fund underperforming similar funds that do not take ESG characteristics into consideration.
Large Capitalization Company Risk. Large capitalization companies may be unable to respond quickly to new competitive challenges like changes in consumer tastes or innovative smaller competitors. In addition, large capitalization companies are sometimes unable to attain the high growth rates of successful, smaller companies, especially during extended periods of economic expansion.
Fund holdings and sector allocations are subject to change and should not be considered a recommendation to buy or sell any security. For a complete list of fund holdings, please refer to the Schedule of Investments provided in this report.
Because the Fund’s ESG criteria exclude securities of certain issuers for nonfinancial reasons, the Fund may forgo some market opportunities available to the funds that do not use these criteria.
Definitions for terms and indices are provided in the Glossary of Terms.
Brown Advisory Sustainable Value FundPerformance Information & Portfolio Holdings Summary
June 30, 2023
GROWTH OF A $1,000,000 INVESTMENT
The following chart reflects the change in value of a hypothetical $1,000,000 investment, including reinvested dividends and distributions, in the Fund as measured against a broad-based securities market index. The Russell 1000® Value Index (“Index”) measures the performance of the large-cap value segment of the U.S. equity universe. It includes those Russell 1000® companies with lower price to book ratios and lower expected growth values. The Index is unmanaged and does not reflect the deduction of fees, such as investment management fees. Investors cannot invest directly in an index.
| PORTFOLIO HOLDINGS | % of Net Assets |
| | |
Financials | | 15.9% |
Health Care | | 14.5% |
Industrials | | 12.9% |
Information Technology | | 11.1% |
Communication Services | | 10.9% |
Energy | | 6.2% |
Consumer Discretionary | | 6.1% |
Money Market Funds | | 5.6% |
Consumer Staples | | 4.6% |
Utilities | | 3.5% |
Materials | | 2.4% |
Real Estate | | 1.8% |
Other Assets and Liabilities | | 4.5% |
| | | 100.0% |
| | Since Inception |
Total Return | (2/28/23) |
| Institutional Shares | 0.30% |
| Investor Shares | 0.20% |
Russell 1000® Value Index | 3.60% |
| | Institutional Shares | Investor Shares |
Gross Expense Ratio1 | 1.16% | 1.31% |
Net Expense Ratio1 | 0.71% | 0.86% |
Past performance does not guarantee future results. The performance data quoted represents past performance and current returns may be lower or higher. The investment return and net asset value will fluctuate so that an investor’s shares, when redeemed, may be worth more or less than the original cost. To obtain performance information current to the most recent month end, please visit our website at brownadvisory.com/mf/funds/sustainable-value-fund. The performance table and graph above do not reflect the deduction of taxes that a shareholder would pay on Fund distributions or the redemption of Fund shares. Investment performance reflects periods during which fee waivers were in effect. In the absence of such waivers, total return would have been reduced. Performance data does not reflect the imposition of the redemption fee of 1.00% on shares redeemed within 14 days, and if it did, performance would have been lower. Short-term performance, in particular, is not a good indication of the Fund’s future performance, and an investment should not be made based solely on returns. Returns shown are calculated using the net asset values (“NAV”) that were used for shareholder transactions as of the respective period ends. These NAV, and the returns calculated from them, may differ from the NAV and returns shown elsewhere in this report.
1 | Per the Fund’s prospectus dated February 28, 2023. Refer to the financial highlights for the gross and net expense ratios for the period ended as of the date of this report. Please note that the expense ratios per the prospectus include acquired fund fees and expenses (as applicable) and the expense ratios in the financial highlights do not. |
Brown Advisory Sustainable Value FundSchedule of Investments
June 30, 2023
| Shares | | Security Description | | Value $ | |
| Common Stocks — 89.9% | | | |
| | | | |
| Communication Services — 10.9% | | | |
| | 8,983 | | Alphabet, Inc. — Class C* | | | 1,086,674 | |
| | 46,594 | | Comcast Corp. | | | 1,935,981 | |
| | 4,379 | | Nexstar Media Group, Inc. | | | 729,322 | |
| | 12,648 | | T-Mobile US, Inc.* | | | 1,756,807 | |
| | | | | | | 5,508,784 | |
| Consumer Discretionary — 6.1% | | | | |
| | 9,612 | | Best Buy Co., Inc. | | | 787,703 | |
| | 7,819 | | Expedia Group, Inc.* | | | 855,320 | |
| | 21,101 | | Wyndham Hotels & Resorts, Inc. | | | 1,446,896 | |
| | | | | | | 3,089,919 | |
| Consumer Staples — 4.6% | | | | |
| | 44,108 | | Unilever PLC ADR | | | 2,299,350 | |
| | | | | |
| Energy — 6.2% | | | | |
| | 46,673 | | ChampionX Corp. | | | 1,448,730 | |
| | 34,191 | | Schlumberger NV | | | 1,679,462 | |
| | | | | | | 3,128,192 | |
| Financials — 15.9% | | | | |
| | 2,465 | | Ameriprise Financial, Inc. | | | 818,775 | |
| | 8,011 | | Assurant, Inc. | | | 1,007,143 | |
| | 58,295 | | Bank of America Corp. | | | 1,672,483 | |
| | 9,733 | | Charles Schwab Corp. | | | 551,666 | |
| | 30,613 | | Fidelity National Information Services, Inc. | | | 1,674,531 | |
| | 16,656 | | KKR & Co., Inc. | | | 932,736 | |
| | 9,137 | | Morgan Stanley | | | 780,300 | |
| | 18,970 | | Truist Financial Corp. | | | 575,739 | |
| | | | | | | 8,013,373 | |
| Health Care — 14.5% | | | | |
| | 6,593 | | AbbVie, Inc. | | | 888,275 | |
| | 2,410 | | Bio-Rad Laboratories, Inc.* | | | 913,679 | |
| | 12,198 | | Centene Corp.* | | | 822,755 | |
| | 1,597 | | Elevance Health, Inc. | | | 709,531 | |
| | 9,917 | | Gilead Sciences, Inc. | | | 764,303 | |
| | 17,386 | | Medtronic PLC | | | 1,531,707 | |
| | 14,617 | | Merck & Co., Inc. | | | 1,686,656 | |
| | | | | | | 7,316,906 | |
| Industrials — 12.9% | | | | |
| | 13,074 | | Ferguson PLC | | | 2,056,671 | |
| | 5,671 | | Lincoln Electric Holdings, Inc. | | | 1,126,431 | |
| | 16,902 | | Masco Corp. | | | 969,837 | |
| | 7,119 | | Trane Technologies PLC | | | 1,361,579 | |
| | 7,085 | | Waste Connections, Inc. | | | 1,012,659 | |
| | | | | | | 6,527,177 | |
| Information Technology — 11.1% | | | | |
| | 4,229 | | Applied Materials, Inc. | | | 611,260 | |
| | 30,839 | | Cisco Systems, Inc. | | | 1,595,610 | |
| | 10,254 | | Cognizant Technology Solutions Corp. | | | 669,381 | |
| | 12,506 | | Micron Technology, Inc. | | | 789,254 | |
| | 4,833 | | NXP Semiconductors NV | | | 989,218 | |
| | 10,113 | | TD SYNNEX Corp. | | | 950,622 | |
| | | | | | | 5,605,345 | |
| Materials — 2.4% | | | | | | |
| | 21,927 | | CRH PLC ADR | | | 1,221,992 | |
| | | | | |
| Real Estate — 1.8% | | | | |
| | 11,426 | | CBRE Group, Inc.* | | | 922,192 | |
| | | | | |
| Utilities — 3.5% | | | | |
| | 19,116 | | Constellation Energy Corp. | | | 1,750,070 | |
Total Common Stocks (Cost $43,918,037) | | | 45,383,300 | |
| | | | | |
| Short-Term Investments — 5.6% | | | | |
| | | | | | | |
| Money Market Funds — 5.6% | | | | |
| | 2,820,271 | | First American Government | | | | |
| | | | Obligations Fund — Class Z, 4.97%# | | | 2,820,271 | |
Total Short-Term Investments (Cost $2,820,271) | | | 2,820,271 | |
Total Investments — 95.5% (Cost $46,738,308) | | | 48,203,571 | |
Other Assets in Excess of Liabilities — 4.5% | | | 2,267,058 | |
| NET ASSETS — 100.0% | | $ | 50,470,629 | |
ADR — American Depositary Receipt
# | Annualized seven-day yield as of the date of this report. |
The accompanying notes are an integral part of these financial statements.
Brown Advisory Global Leaders FundA Message to Our Shareholders
June 30, 2023
Dear Shareholder:
During the twelve-month period ended June 30, 2023, the Brown Advisory Global Leaders Fund Investor Shares (the “Fund”) increased 21.63% in value. During the same period, the MSCI All Country World Index (ACWI), the Fund’s benchmark, increased 16.53%.
For the 12 months ended June 30, 2023, the market environment was driven by recession fears, geopolitical risks both in Europe and Asia and a banking crisis in the U.S. Our bottom-up, quality approach to investment selection, combined with our focus on active capital allocation, performed well in this environment. Over the reporting period, the main drivers for outperformance were industrials and financials. The differentiated nature of our financials investments became clear. Amid global concerns about a potential banking and credit crisis, our investments in securities exchanges benefited from volatility while the emerging market banks’ largely uncorrelated nature translated into outperformance within the financial sector. Artificial intelligence (AI) (especially excitement around generative AI) was also a driver that impacted individual companies’ share performance during the reporting period. So far, we have benefited from our AI-related investments, particularly in technical infrastructure, cloud datacenter and leading application software companies; however, we remain attentive to developments in this dynamic landscape.
During the past year, we invested in four new companies while exiting one. We invested in Coloplast, London Stock Exchange Group, Ferguson and General Electric while exiting Tencent Holdings. Coloplast, a leading global medical device manufacturer, was our first health care investment since 2019. Our valuation discipline, which includes a 10% weighted-average-cost-of capital (WACC) threshold, meant that many attractive health care companies did not pass the Fund’s valuation test over the previous years. London Stock Exchange Group (LSEG), Ferguson and General Electric are all new investments with multiple economic moats, strong fundamental and sustainable competitive advantages. We believe we have initiated positions at opportune moments of time, be it due to the execution on the turnaround at Refinitiv at LSEG or General Electric’s business model simplification linking up with a cash-harvesting period following the GE9X engine approval and a period of heightened shop visits for its CFM56 engines.
The Global Leaders strategy is focused on delivering attractive long-term performance by investing in a concentrated portfolio of companies that can uniquely solve problems for their customers and generate attractive economics for shareholders. Given its concentrated nature, the Global Leaders strategy’s performance is primarily an output of our investment selection. The Global Leaders team remains dedicated to executing on our investment process that we believe will deliver value for our investors over the long run.
Sincerely,
Mick Dillon, Bertie Thomson
Portfolio Managers
Brown Advisory Global Leaders FundA Message to Our Shareholders
June 30, 2023
Past performance is not a guarantee of future results.
Mutual fund investing involves risk. Principal loss is possible.
The Fund invests in small and medium capitalization companies which carry greater risk than is associated with larger companies for various reasons, such as narrower markets, limited financial resources and less liquid stock.
The Fund may invest in ETFs, which may trade at a discount to the aggregate value of the underlying securities and although expense ratios for ETFs are generally low, frequent trading of ETFs by the Fund can generate brokerage expenses.
Investments in foreign securities entail certain risks not associated with investments in domestic securities, such as volatility of currency exchange rates, and in some cases, political and economic instability and relatively illiquid markets. These risks are greater for investments in emerging markets.
The Adviser assesses a company’s Environmental, Social and Governance (“ESG”) profile through conducting ESG research and leveraging engagement when appropriate through dialogue with company management teams as part of its fundamental due diligence process. The Adviser views ESG characteristics as material to fundamentals and seeks to understand their impact on companies in which the Fund may invest. The Fund’s consideration of ESG characteristics as part of the investment process could cause it to make or avoid investments that could result in the Fund underperforming similar funds that do not take ESG characteristics into consideration.
Fund holdings and sector allocations are subject to change and should not be considered a recommendation to buy or sell any security. For a complete list of fund holdings, please refer to the Schedule of Investments provided in this report.
The Fund’s ESG criteria may exclude securities of certain issuers for nonfinancial reasons, therefore the Fund may forgo some market opportunities available to funds that do not use these criteria.
Definitions for terms and indices are provided in the Glossary of Terms.
Brown Advisory Global Leaders FundPerformance Information & Portfolio Holdings Summary
June 30, 2023
GROWTH OF A $10,000 INVESTMENT
The following chart reflects the change in value of a hypothetical $10,000 investment, including reinvested dividends and distributions, in the Fund as measured against a broad-based securities market index. The MSCI All Country World Index (ACWI) is a free float-adjusted market capitalization index that is designed to measure equity market performance in the large- and mid-cap segments of certain developed markets and global emerging markets countries. The Index is unmanaged and does not reflect the deduction of fees, such as investment management fees. Investors cannot invest directly in an index.
| PORTFOLIO HOLDINGS | % of Net Assets |
| | |
Financials | | 31.7% |
Information Technology | | 24.9% |
Industrials | | 15.0% |
Communication Services | | 7.2% |
Health Care | | 6.8% |
Consumer Staples | | 6.6% |
Consumer Discretionary | | 4.1% |
Materials | | 2.3% |
Money Market Funds | | 1.0% |
Other Assets and Liabilities | | 0.4% |
| | | 100.0% |
| | | | Since Inception |
Average Annual Total Return | One Year | Five Year | (7/1/15) |
Institutional Shares1 | 21.83% | 10.40% | 10.87% |
| Investor Shares | 21.63% | 10.23% | 10.70% |
| MSCI All Country World Index (ACWI) | 16.53% | 8.10% | 8.05% |
| | Institutional Shares | Investor Shares |
Gross Expense Ratio2 | 0.75% | 0.90% |
Net Expense Ratio2 | 0.75% | 0.90% |
Past performance does not guarantee future results. The performance data quoted represents past performance and current returns may be lower or higher. The investment return and net asset value will fluctuate so that an investor’s shares, when redeemed, may be worth more or less than the original cost. To obtain performance information current to the most recent month end, please visit our website at brownadvisory.com/mf/global-leaders-fund. The performance table and graph above do not reflect the deduction of taxes that a shareholder would pay on Fund distributions or the redemption of Fund shares. Investment performance reflects periods during which fee waivers were in effect. In the absence of such waivers, total return would have been reduced. Performance data does not reflect the imposition of the redemption fee of 1.00% on shares redeemed within 14 days, and if it did, performance would have been lower. Short-term performance, in particular, is not a good indication of the Fund’s future performance, and an investment should not be made based solely on returns. Returns shown are calculated using the net asset values (“NAV”) that were used for shareholder transactions as of the respective period ends. These NAV, and the returns calculated from them, may differ from the NAV and returns shown elsewhere in this report.
1 | Performance information for the Institutional Shares, prior to its inception date of October 31, 2018, is based on the performance of Investor Shares, and adjusted for the lower expenses applicable to Institutional Shares. |
2 | Per the Fund’s prospectus dated October 31, 2022. Refer to the financial highlights for the gross and net expense ratios for the year ended as of the date of this report. Please note that the expense ratios per the prospectus include acquired fund fees and expenses (as applicable) and the expense ratios in the financial highlights do not. |
Brown Advisory Global Leaders FundSchedule of Investments
June 30, 2023
| Shares | | Security Description | | Value $ | |
| Common Stocks — 98.6% | | | |
| | | | |
| Brazil — 2.7% | | | |
| | 12,868,627 | | B3 S.A. — Brasil Bolsa Balcao | | | 39,265,411 | |
| | | | | |
| China — 3.1% | | | | |
| | 4,464,444 | | AIA Group, Ltd. | | | 45,343,124 | |
| | | | | |
| Denmark — 1.9% | | | | |
| | 228,212 | | Coloplast A/S | | | 28,557,585 | |
| | | | | |
| France — 4.3% | | | | |
| | 407,897 | | Safran S.A. | | | 63,921,586 | |
| | | | | |
| Germany — 6.4% | | | | |
| | 542,850 | | CTS Eventim AG & Co. KGaA | | | 34,333,244 | |
| | 322,835 | | Deutsche Boerse AG | | | 59,600,180 | |
| | | | | | | 93,933,424 | |
| India — 3.4% | | | | |
| | 2,449,332 | | HDFC Bank, Ltd. | | | 50,830,539 | |
| | | | | |
| Indonesia — 2.4% | | | | |
| | 97,072,664 | | Bank Rakyat Indonesia Persero | | | 35,440,420 | |
| | | | | |
| Netherlands — 5.0% | | | | |
| | 52,955 | | ASML Holding NV ADR | | | 38,379,136 | |
| | 285,331 | | Wolters Kluwer NV | | | 36,229,560 | |
| | | | | | | 74,608,696 | |
| Sweden — 1.8% | | | | |
| | 2,087,138 | | Atlas Copco AB | | | 26,023,444 | |
| | | | | |
| Switzerland — 2.6% | | | | |
| | 128,445 | | Roche Holding AG | | | 39,236,102 | |
| | | | | |
| Taiwan — 3.3% | | | | |
| | 482,208 | | Taiwan Semiconductor | | | | |
| | | | Manufacturing Co., Ltd. ADR | | | 48,664,432 | |
| | | | | |
| United Kingdom — 7.3% | | | | |
| | 409,857 | | London Stock Exchange Group PLC | | | 43,622,562 | |
| | 1,239,998 | | Unilever PLC | | | 64,572,081 | |
| | | | | | | 108,194,643 | |
| United States — 54.4% | | | | |
| | | | | |
| Communication Services — 4.9% | | | | |
| | 602,325 | | Alphabet, Inc. — Class C* | | | 72,863,256 | |
| | | | | |
| Consumer Discretionary — 4.1% | | | | |
| | 9,991 | | Booking Holdings, Inc.* | | | 26,978,997 | |
| | 391,906 | | TJX Companies, Inc. | | | 33,229,710 | |
| | | | | | | 60,208,707 | |
| Consumer Staples — 2.2% | | | | |
| | 168,294 | | Estee Lauder Companies, Inc. | | | 33,049,576 | |
| | | | | |
| Financials — 13.2% | | | | |
| | 587,283 | | Charles Schwab Corp. | | | 33,287,200 | |
| | 144,579 | | MasterCard, Inc. | | | 56,862,921 | |
| | 120,628 | | Moody’s Corp. | | | 41,944,768 | |
| | 265,857 | | Visa, Inc. | | | 63,135,720 | |
| | | | | | | 195,230,609 | |
| Health Care — 2.2% | | | | |
| | 341,279 | | Edwards Lifesciences Corp.* | | | 32,192,848 | |
| | | | | |
| Industrials — 6.5% | | | | |
| | 280,769 | | Allegion PLC | | | 33,697,895 | |
| | 144,967 | | Ferguson PLC | | | 22,804,759 | |
| | 135,412 | | General Electric Co. | | | 14,875,008 | |
| | 278,573 | | Otis Worldwide Corp. | | | 24,795,783 | |
| | | | | | | 96,173,445 | |
| Information Technology — 19.0% | | | | |
| | 75,580 | | Adobe, Inc.* | | | 36,957,864 | |
| | 140,903 | | Autodesk, Inc.* | | | 28,830,163 | |
| | 87,851 | | Intuit, Inc. | | | 40,252,450 | |
| | 677,121 | | Marvell Technology, Inc. | | | 40,478,293 | |
| | 395,110 | | Microsoft Corp. | | | 134,550,759 | |
| | | | | | | 281,069,529 | |
| Materials — 2.3% | | | | | | |
| | 126,692 | | Sherwin-Williams Co. | | | 33,639,260 | |
Total United States | | | 804,427,230 | |
Total Common Stocks (Cost $1,053,869,750) | | | 1,458,446,636 | |
| | | | | |
| Short-Term Investments — 1.0% | | | | |
| | | | | |
| Money Market Funds — 1.0% | | | | |
| | 15,191,809 | | First American Government | | | | |
| | | | Obligations Fund — Class Z, 4.97%# | | | 15,191,809 | |
Total Short-Term Investments (Cost $15,191,809) | | | 15,191,809 | |
Total Investments — 99.6% (Cost $1,069,061,559) | | | 1,473,638,445 | |
Other Assets in Excess of Liabilities — 0.4% | | | 5,509,129 | |
| NET ASSETS — 100.0% | | $ | 1,479,147,574 | |
ADR — American Depositary Receipt
# | Annualized seven-day yield as of the date of this report. |
The accompanying notes are an integral part of these financial statements.
Brown Advisory Sustainable International Leaders FundA Message to Our Shareholders
June 30, 2023
Dear Shareholder:
During the twelve-month period ended June 30, 2023, the Brown Advisory Sustainable International Leaders Fund Institutional Shares (the “Fund”) increased 25.24% in value. During the same period, the MSCI ACWI ex USA Index (the “Index”), the Fund’s benchmark, increased 12.72%.
The main drivers for outperformance were industrials and consumer discretionary. Our industrial exposure is mainly in quality cyclical companies that typically benefit from subscription-like revenues from maintenance, business or service contracts, like the Swedish compressor business Atlas, or the French aerospace engine manufacturer Safran. These two businesses performed strongly as they benefited from a recovery in their end markets. Within consumer discretionary, investments in LVMH and Compass Group, both companies with a history of strong execution across multiple economic cycles, outperformed the Index.
During the past year we invested in three new companies: Grupo Aeroportuario del Pacifico (GAP), Tata Consultancy Services (TCS), and Howdens Joinery. GAP is an attractive infrastructure asset with a dominant market position and high returns on invested capital. It is set to benefit from a number of secular growth trends in the Mexican market such as air travel penetration and industrial near shoring. TCS is a leading Indian IT service company that we believe is well positioned to benefit from a multi-year technology upgrade cycle. We expect its superior execution capability to allow TCS to capture a greater share of its customers’ IT budgets at the expense of smaller players. We also initiated a position in Howdens Joinery, UK’s market leader in the production and supply of kitchen products. The company’s unique trade-only business model, its guaranteed availability of stock and a large network of depots in close proximity to its clients offer meaningful competitive advantages vs. peers. We exited our holdings in Taiwan Semiconductor Manufacturing Company (TSMC) and Chinese technology company Tencent as well as e-commerce platform Shopify and beauty company Shiseido during this period. The exit of TSMC was primarily a reflection of rising geopolitical risks and their impact on the semiconductor industry, while the sale of Tencent reflects our growing concern around the changed regulatory environment in China. Shopify has a leading position in e-commerce platform solutions but its decision to invest in the fulfillment business made it more difficult to predict free cash flows for the business. We therefore sold out of our position. Finally, we exited our investment in Shiseido as we became increasingly concerned about the company’s competitive position in its key markets, Japan and China.
We view the Fund as a collection of strong business models that may be positioned to increase their intrinsic value over a long period of time in a wide range of macroeconomic scenarios. The attractive portfolio characteristics highlighted here are reflected in the strategy’s 20.1% ROIC (ex. financials), 7.7% three-year sales growth and a 4.0% free cash flow “FCF” yield (ex. financials) as of June 30, 2023.
Sincerely,
Priyanka Agnihotri
Portfolio Manager
Brown Advisory Sustainable International Leaders FundA Message to Our Shareholders
June 30, 2023
Past performance is not a guarantee of future results.
Mutual fund investing involves risk. Principal loss is possible. The Fund invests in small and medium capitalization companies which carry greater risk than is associated with larger companies for various reasons, such as narrower markets, limited financial resources and less liquid stock.
The Fund may invest in ETFs, which may trade at a discount to the aggregate value of the underlying securities and although expense ratios for ETFs are generally low, frequent trading of ETFs by the Fund can generate brokerage expenses.
Investments in foreign securities entail certain risks not associated with investments in domestic securities, such as volatility of currency exchange rates, and in some cases, political and economic instability and relatively illiquid markets. These risks are greater for investments in emerging markets.
The Adviser assesses a company’s Environmental, Social and Governance (“ESG”) profile through conducting ESG research and leveraging engagement when appropriate through dialogue with company management teams as part of its fundamental due diligence process. The Adviser views ESG characteristics as material to fundamentals and seeks to understand their impact on companies in which the Fund may invest. The Fund’s consideration of ESG characteristics as part of the investment process could cause it to make or avoid investments that could result in the Fund underperforming similar funds that do not take ESG characteristics into consideration.
Fund holdings and sector allocations are subject to change and should not be considered a recommendation to buy or sell any security. For a complete list of fund holdings, please refer to the Schedule of Investments provided in this report.
Because the Fund’s ESG criteria exclude securities of certain issuers for nonfinancial reasons, the Fund may forgo some market opportunities available to funds that do not use these criteria.
In addition, the Sub-Adviser utilizes the services of third-party data providers for purposes of conducting its ESG due diligence process and such data is inherently subject to interpretation, restatement, delay and omission outside the Sub-Adviser’s control.
The Fund is new with no operating history and there can be no assurance that the Fund will grow to or maintain an economically viable size.
Definitions for terms and indices are provided in the Glossary of Terms.
Brown Advisory Sustainable International Leaders FundPerformance Information & Portfolio Holdings Summary
June 30, 2023
GROWTH OF A $1,000,000 INVESTMENT
The following chart reflects the change in value of a hypothetical $1,000,000 investment, including reinvested dividends and distributions, in the Fund as measured against a broad-based securities market index. The MSCI ACWI ex USA Index is an index that captures large and mid cap representation across Developed Markets countries (excluding the US) and Emerging Markets countries. The index covers the majority of the global equity opportunity set outside the US. The Index is unmanaged and does not reflect the deduction of fees, such as investment management fees. Investors cannot invest directly in an index.
| PORTFOLIO HOLDINGS | % of Net Assets |
| | |
United Kingdom | | 22.6% |
Netherlands | | 10.3% |
France | | 8.2% |
Germany | | 7.5% |
Switzerland | | 7.0% |
India | | 5.9% |
United States | | 5.4% |
Denmark | | 4.0% |
Brazil | | 3.9% |
Canada | | 3.8% |
Sweden | | 3.6% |
China | | 3.5% |
Indonesia | | 3.2% |
Japan | | 3.1% |
Finland | | 2.9% |
Mexico | | 2.2% |
Money Market Funds | | 1.5% |
Other Assets and Liabilities | | 1.4% |
| | | 100.0% |
| | | Since Inception |
Average Annual Total Return | One Year | (2/28/22) |
| Institutional Shares | 25.24% | 4.06% |
| Investor Shares | 25.03% | 3.84% |
| MSCI ACWI ex USA Index | 12.72% | -1.96%
|
| | Institutional Shares | Investor Shares |
Gross Expense Ratio1 | 4.26% | 4.41% |
Net Expense Ratio1 | 0.85% | 1.00% |
Past performance does not guarantee future results. The performance data quoted represents past performance and current returns may be lower or higher. The investment return and net asset value will fluctuate so that an investor’s shares, when redeemed, may be worth more or less than the original cost. To obtain performance information current to the most recent month end, please visit our website at brownadvisory.com/mf/funds/sustainable-international-leaders-fund. The performance table and graph above do not reflect the deduction of taxes that a shareholder would pay on Fund distributions or the redemption of Fund shares. Investment performance reflects periods during which fee waivers were in effect. In the absence of such waivers, total return would have been reduced. Performance data does not reflect the imposition of the redemption fee of 1.00% on shares redeemed within 14 days, and if it did, performance would have been lower. Short-term performance, in particular, is not a good indication of the Fund’s future performance, and an investment should not be made based solely on returns. Returns shown are calculated using the net asset values (“NAV”) that were used for shareholder transactions as of the respective period ends. These NAV, and the returns calculated from them, may differ from the NAV and returns shown elsewhere in this report.
1 | Per the Fund’s prospectus dated October 31, 2022. Refer to the financial highlights for the gross and net expense ratios for the period ended as of the date of this report. Please note that the expense ratios per the prospectus include acquired fund fees and expenses (as applicable) and the expense ratios in the financial highlights do not. |
Brown Advisory Sustainable International Leaders FundSchedule of Investments
June 30, 2023
| Shares | | Security Description | | Value $ | |
| Common Stocks — 97.1% | | | |
| | | | |
| Brazil — 3.9% | | | |
| | 307,896 | | B3 S.A. — Brasil Bolsa Balcao | | | 939,468 | |
| | | | | |
| Canada — 3.8% | | | | |
| | 6,463 | | Waste Connections, Inc. | | | 923,676 | |
| | | | | |
| China — 3.5% | | | | |
| | 84,300 | | AIA Group, Ltd. | | | 856,193 | |
| | | | | |
| Denmark — 4.0% | | | | |
| | 7,811 | | Coloplast A/S | | | 977,439 | |
| | | | | |
| Finland — 2.9% | | | | |
| | 13,723 | | Kone OYJ | | | 716,954 | |
| | | | | |
| France — 8.2% | | | | |
| | 995 | | LVMH Moet Hennessy Louis Vuitton SE | | | 938,199 | |
| | 6,766 | | Safran S.A. | | | 1,060,301 | |
| | | | | | | 1,998,500 | |
| Germany — 7.5% | | | | |
| | 12,744 | | CTS Eventim AG & Co. KGaA | | | 806,011 | |
| | 5,469 | | Deutsche Boerse AG | | | 1,009,659 | |
| | | | | | | 1,815,670 | |
| India — 5.9% | | | | |
| | 13,680 | | HDFC Bank Ltd. ADR | | | 953,496 | |
| | 11,874 | | Tata Consultancy Services Ltd. | | | 479,797 | |
| | | | | | | 1,433,293 | |
| Indonesia — 3.2% | | | | |
| | 2,107,883 | | Bank Rakyat Indonesia Persero Tbk PT | | | 769,571 | |
| | | | | |
| Japan — 3.1% | | | | |
| | 1,588 | | Keyence Corp. | | | 754,549 | |
| | | | | |
| Mexico — 2.2% | | | | |
| | 29,993 | | Grupo Aeroportuario del Pacifico SAB de CV | | | 539,776 | |
| | | | | | | |
| Netherlands — 10.3% | | | | |
| | 520 | | Adyen NV* | | | 900,469 | |
| | 910 | | ASML Holding NV | | | 660,050 | |
| | 7,435 | | Wolters Kluwer NV | | | 944,050 | |
| | | | | | | 2,504,569 | |
| Sweden — 3.6% | | | | |
| | 70,931 | | Atlas Copco AB | | | 884,402 | |
| | | | | |
| Switzerland — 7.0% | | | | |
| | 2,659 | | Roche Holding AG | | | 812,245 | |
| | 3,091 | | Sika AG | | | 885,264 | |
| | | | | | | 1,697,509 | |
| United Kingdom — 22.6% | | | | |
| | 31,051 | | Compass Group PLC | | | 869,528 | |
| | 23,533 | | Experian PLC | | | 903,222 | |
| | 72,492 | | Howden Joinery Group PLC | | | 592,288 | �� |
| | 9,250 | | London Stock Exchange Group PLC | | | 984,511 | |
| | 161,464 | | Rentokil Initial PLC | | | 1,262,443 | |
| | 17,115 | | Unilever PLC | | | 891,252 | |
| | | | | | | 5,503,244 | |
| United States — 5.4% | | | | |
| | 260 | | Booking Holdings, Inc.* | | | 702,086 | |
| | 3,007 | | NXP Semiconductors NV | | | 615,473 | |
| | | | | | | 1,317,559 | |
Total Common Stocks (Cost $20,264,035) | | | 23,632,372 | |
| | | | | |
| Short-Term Investments — 1.5% | | | | |
| | | | | |
Money Market Funds — 1.5% | | | | |
| | 371,672 | | First American Government | | | | |
| | | | Obligations Fund — Class Z, 4.97%# | | | 371,672 | |
Total Short-Term Investments (Cost $371,672) | | | 371,672 | |
Total Investments — 98.6% (Cost $20,635,707) | | | 24,004,044 | |
Other Assets in Excess of Liabilities — 1.4% | | | 342,683 | |
| NET ASSETS — 100.0% | | $ | 24,346,727 | |
ADR — American Depositary Receipt
# | Annualized seven-day yield as of the date of this report. |
The accompanying notes are an integral part of these financial statements.
Brown Advisory Intermediate Income FundA Message to Our Shareholders
June 30, 2023
Dear Shareholder:
During the 12-month period ended June 30, 2023, the Brown Advisory Intermediate Income Fund Investor Shares (the “Fund”) returned -1.44% behind the -0.60% return for the Bloomberg Intermediate US Aggregate Bond Index, the Fund’s benchmark.
The Fund aims to generate performance primarily through individual security analysis, supported by a detailed and disciplined research process focused on downside protection. Duration and sector weightings are determined mainly by an analysis of the intermediate-term risk/reward as opposed to any particular macro forecast.
During the period, the Federal Reserve aggressively raised the Federal Funds Rate in 75 basis point increments in an attempt to close the gap between monetary policy and the prevailing inflationary environment. The move higher in interest rates was not parallel with shorter Treasury yields moving aggressively higher, thus, inverting the yield curve as investors priced in the growing risk of recession. As to be expected, highly interest rate sensitive portions of the economy such as housing and autos suffered early, however the broader economy proved very resilient directly challenging the Federal Reserve’s effort to slow economic activity which put the real economy at odds with the market’s consensus of an imminent recession.
During the summer of 2022, we were positioned defensively against rising interest rates but began to extend duration as the Federal Reserve altered its commentary around the expected terminal policy rate and expressed a desire to move away from outsized policy adjustments. Intermediate and longer-term interest rates then moved lower in anticipation of a future recessionary period. We completely closed our duration underweight in the first quarter of 2023 and have maintained this stance.
Given the continued resilience of corporate balance sheets, we also lessened our underweight to corporate credit. We invested in companies that we believed would exhibit less cyclicality if a recession did occur, such as industrial technology, consumer non-cyclical, and utilities. Ultimately, our underweight was a headwind to overall performance as corporate bonds closed the period in a robust manner. We continued to refine our securitized bond exposure, almost completely eliminating our commercial mortgage-backed and collateralized mortgage bond exposure in favor of government-backed mortgage bonds. On a relative value basis, mortgage bonds were attractive given their elevated yield, high quality, and limited extension risk going forward. Broadly, securitized bonds were a detractor to performance, though, as they were greatly impacted by the Federal Reserve’s interest rate policy. Lastly, although we primarily utilize Treasuries for liquidity and duration management of the Fund, we continued to hold an elevated amount in Treasuries as we look to navigate the last leg of the monetary cycle.
Looking forward, we believe income will return to being the primary driver of return, rather than capital appreciation resulting from a secular period of ever lower interest rates. We expect our research focused investment process will continue to identify attractive individual security opportunities, enhancing the yield and income profile of the Fund. Finally, we also believe duration will be a valuable tool when the Federal Reserve succeeds in cooling the economy and shifts to a dovish stance.
Sincerely,
Jason T. Vlosich
Portfolio Manager
Past performance is not a guarantee of future results.
Mutual fund investing involves risk. Principal loss is possible. The Fund is subject to interest rate risk which is the risk that debt securities in the Fund’s portfolio will decline in value because of increases in market interest rates. Investments in Asset Backed and Mortgage Backed Securities include additional risks that investors should be aware of such as credit risk, prepayment risk, possible illiquidity and default, as well as increased susceptibility to adverse economic developments. Investments in debt securities typically decrease in value when interest rates rise.
The risk is usually greater for longer-term debt securities. Inflation-indexed bonds see the principal value of the security increased as the Consumer Price Index increases. Should the Consumer Price Index decline, those securities should be adversely impacted. Diversification does not assure a profit, nor does it protect against a loss in a declining market.
Fund holdings and sector allocations are subject to change and should not be considered a recommendation to buy or sell any security. For a complete list of fund holdings, please refer to the Schedule of Investments provided in this report.
Definitions for terms and indices are provided in the Glossary of Terms.
Brown Advisory Intermediate Income FundPerformance Information & Portfolio Holdings Summary
June 30, 2023
GROWTH OF A $10,000 INVESTMENT
The following chart reflects the change in value of a hypothetical $10,000 investment, including reinvested dividends and distributions, in the Fund as measured against a broad-based bond index. The Bloomberg Intermediate US Aggregate Bond Index (“Index”) represents domestic taxable investment grade bonds, with index components for government and corporate securities, mortgage pass-through securities, and asset-backed securities with average maturities and durations in the intermediate range. The Index is unmanaged and does not reflect the deduction of fees, such as investment management fees. Investors cannot invest directly in an index.
| PORTFOLIO HOLDINGS | % of Net Assets |
| | |
U.S. Treasury Notes | | 39.4% |
Mortgage Backed Securities | | 21.1% |
Corporate Bonds & Notes | | 18.2% |
Affiliated Mutual Funds | | 12.0% |
Asset Backed Securities | | 4.8% |
Money Market Funds | | 4.2% |
Other Assets and Liabilities* | | 0.3% |
| | | 100.0% |
* Includes unrealized appreciation (depreciation) on futures contracts.
Average Annual Total Return | One Year | Five Year | Ten Year |
| Investor Shares | -1.44% | 0.64% | 1.11% |
| Advisor Shares | -1.62% | 0.41% | 0.86% |
| Bloomberg Intermediate US Aggregate Bond Index | -0.60% | 0.83% | 1.33% |
| | Investor Shares | Advisor Shares |
Gross Expense Ratio1 | 0.56% | 0.81% |
Net Expense Ratio1 | 0.52% | 0.77% |
Past performance does not guarantee future results. The performance data quoted represents past performance and current returns may be lower or higher. The investment return and net asset value will fluctuate so that an investor’s shares, when redeemed, may be worth more or less than the original cost. To obtain performance information current to the most recent month end, please visit our website at brownadvisory.com/mf/intermediate-income-fund. The performance table and graph above do not reflect the deduction of taxes that a shareholder would pay on Fund distributions or the redemption of Fund shares. Investment performance reflects periods during which fee waivers were in effect. In the absence of such waivers, total return would have been reduced. Performance data does not reflect the imposition of the redemption fee of 1.00% on shares redeemed within 14 days, and if it did, performance would have been lower. Short-term performance, in particular, is not a good indication of the Fund’s future performance, and an investment should not be made based solely on returns. Returns shown are calculated using the net asset values (“NAV”) that were used for shareholder transactions as of the respective period ends. These NAV, and the returns calculated from them, may differ from the NAV and returns shown elsewhere in this report.
1 | Per the Fund’s prospectus dated October 31, 2022. Refer to the financial highlights for the gross and net expense ratios for the year ended as of the date of this report. Please note that the expense ratios per the prospectus include acquired fund fees and expenses (as applicable) and the expense ratios in the financial highlights do not. |
Brown Advisory Intermediate Income FundSchedule of Investments
June 30, 2023
| Par Value | | Security Description | | Rate | | Maturity | | Value $ | |
| Mortgage Backed Securities — 21.1% | | | | | | | | |
| | 1,629,682 | | Bayview MSR Opportunity Master Fund Trust, Series 2021-INV5 A-5#^ | | 2.50 | % | | 11/25/2051 | | | 1,398,595 | |
| | 1,737,466 | | Bayview Opportunity Master Fund VI Trust, Series 2021-INV6 A-5#^ | | 2.50 | % | | 10/25/2051 | | | 1,483,972 | |
| | 1,661,879 | | FHLMC PC, Pool# WA-3311 | | 2.21 | % | | 04/01/2038 | | | 1,220,557 | |
| | 1,520,336 | | FHLMC PC, Pool# SD-0913 | | 2.50 | % | | 02/01/2052 | | | 1,299,003 | |
| | 814,398 | | FHLMC PC, Pool# QE-0622 | | 2.00 | % | | 04/01/2052 | | | 670,975 | |
| | 1,342,387 | | FHLMC PC, Pool# RA-7927 | | 4.50 | % | | 09/01/2052 | | | 1,292,416 | |
| | 957,019 | | FHLMC PC, Pool# QF-0492 | | 5.50 | % | | 09/01/2052 | | | 962,263 | |
| | 453,067 | | FHLMC REMIC, Series 5145 AB | | 1.50 | % | | 09/25/2049 | | | 345,696 | |
| | 852,581 | | FHLMC REMIC, Series 4634 MA | | 4.50 | % | | 11/15/2054 | | | 830,852 | |
| | 117,277 | | FHMS, Series Q-006 APT2# | | 2.76 | % | | 10/25/2028 | | | 110,770 | |
| | 65,601 | | FHMS, Series Q-010 APT1# | | 4.90 | % | | 04/25/2046 | | | 65,192 | |
| | 80,442 | | FHMS, Series Q-007 APT1# | | 5.02 | % | | 10/25/2047 | | | 80,075 | |
| | 750,000 | | FNMA, Pool# BL1160 | | 3.64 | % | | 01/01/2026 | | | 715,609 | |
| | 8,269 | | FNMA, Pool# 628837 | | 6.50 | % | | 03/01/2032 | | | 8,450 | |
| | 343,964 | | FNMA, Pool# MA2998 | | 3.50 | % | | 04/01/2032 | | | 329,958 | |
| | 11,997 | | FNMA, Pool# 663238 | | 5.50 | % | | 09/01/2032 | | | 11,949 | |
| | 17,339 | | FNMA, Pool# 744805 (6 Month LIBOR USD + 1.52%) | | 4.27 | % | | 11/01/2033 | | | 16,926 | |
| | 9,037 | | FNMA, Pool# 741373 (1 Year CMT Rate + 2.28%) | | 4.41 | % | | 12/01/2033 | | | 8,871 | |
| | 20,383 | | FNMA, Pool# 764342 (6 Month LIBOR USD + 1.52%) | | 3.90 | % | | 02/01/2034 | | | 19,992 | |
| | 1,511,528 | | FNMA, Pool# BQ3248 | | 2.00 | % | | 11/01/2050 | | | 1,243,449 | |
| | 1,389,046 | | FNMA, Pool# BQ6307 | | 2.00 | % | | 11/01/2050 | | | 1,143,259 | |
| | 765,943 | | FNMA, Pool# MA4208 | | 2.00 | % | | 12/01/2050 | | | 630,588 | |
| | 830,135 | | FNMA, Pool# BR5634 | | 2.00 | % | | 03/01/2051 | | | 683,220 | |
| | 1,075,337 | | FNMA, Pool# FM6555 | | 2.00 | % | | 04/01/2051 | | | 884,411 | |
| | 1,387,635 | | FNMA, Pool# FS0031 | | 2.50 | % | | 10/01/2051 | | | 1,178,365 | |
| | 1,174,089 | | FNMA, Pool# MA4492 | | 2.00 | % | | 12/01/2051 | | | 959,311 | |
| | 1,536,605 | | FNMA, Pool# FS0348 | | 2.00 | % | | 01/01/2052 | | | 1,263,641 | |
| | 1,364,789 | | FNMA, Pool# CB2548 | | 2.50 | % | | 01/01/2052 | | | 1,164,567 | |
| | 683,495 | | FNMA, Pool# BW0025 | | 4.00 | % | | 07/01/2052 | | | 643,202 | |
| | 298,993 | | FNMA REMIC Trust, Series 2016-M10 | | 2.35 | % | | 11/25/2045 | | | 285,321 | |
| | 189,787 | | FREMF Mortgage Trust, Series 2020-KF74 B (1 Month LIBOR USD + 2.15%)^ | | 7.34 | % | | 01/25/2027 | | | 180,333 | |
| | 8,923 | | GNMA Pool, Pool# 781186X | | 9.00 | % | | 06/15/2030 | | | 8,914 | |
| | 2,463,443 | | GNMA REMIC Trust, Series 2021-084 ED | | 1.00 | % | | 07/16/2060 | | | 1,836,909 | |
| | 924,391 | | JP Morgan Mortgage Trust, Series 2020-LTV2 A15#^ | | 3.00 | % | | 11/25/2050 | | | 831,828 | |
| | 1,378,657 | | JP Morgan Mortgage Trust, Series 2022-LTV2 A4#^ | | 3.50 | % | | 09/25/2052 | | | 1,237,463 | |
| | 1,756,986 | | RCKT Mortgage Trust, Series 2022-2 A6#^ | | 2.50 | % | | 02/25/2052 | | | 1,506,168 | |
Total Mortgage Backed Securities (Cost $29,113,702) | | | | | | | | 26,553,070 | |
| | | | | | | | | | |
| Corporate Bonds & Notes — 18.2% | | | | | | | | | |
| | 686,000 | | American Tower Corp. | | 3.60 | % | | 01/15/2028 | | | 632,366 | |
| | 1,485,000 | | Analog Devices, Inc. | | 1.70 | % | | 10/01/2028 | | | 1,276,720 | |
| | 754,000 | | Aptiv PLC | | 3.25 | % | | 03/01/2032 | | | 645,827 | |
| | 1,349,000 | | Citigroup, Inc. | | 3.20 | % | | 10/21/2026 | | | 1,263,646 | |
| | 1,311,000 | | Clorox Co. | | 4.40 | % | | 05/01/2029 | | | 1,275,311 | |
| | 694,000 | | Comcast Corp. | | 3.40 | % | | 04/01/2030 | | | 638,090 | |
| | 1,211,000 | | Consolidated Edison Co. of New York, Inc. | | 3.35 | % | | 04/01/2030 | | | 1,101,586 | |
| | 719,000 | | Crown Castle, Inc. | | 3.30 | % | | 07/01/2030 | | | 636,013 | |
| | 1,450,000 | | DH Europe Finance II Sarl | | 2.60 | % | | 11/15/2029 | | | 1,277,037 | |
| | 1,315,000 | | Dollar General Corp. | | 3.88 | % | | 04/15/2027 | | | 1,255,497 | |
| | 1,296,000 | | Dollar Tree, Inc. | | 4.20 | % | | 05/15/2028 | | | 1,228,607 | |
| | 680,000 | | Fortis, Inc. | | 3.06 | % | | 10/04/2026 | | | 626,877 | |
| | 1,325,000 | | Hasbro, Inc. | | 3.55 | % | | 11/19/2026 | | | 1,231,555 | |
| | 644,000 | | JB Hunt Transport Services, Inc. | | 3.88 | % | | 03/01/2026 | | | 621,516 | |
| | 1,291,000 | | Keysight Technologies, Inc. | | 4.60 | % | | 04/06/2027 | | | 1,270,976 | |
| | 1,345,000 | | Morgan Stanley | | 3.13 | % | | 07/27/2026 | | | 1,260,206 | |
| | 895,000 | | Oracle Corp. | | 6.15 | % | | 11/09/2029 | | | 932,795 | |
| | 764,000 | | Revvity, Inc. | | 1.90 | % | | 09/15/2028 | | | 647,655 | |
The accompanying notes are an integral part of these financial statements.
Brown Advisory Intermediate Income FundSchedule of Investments
June 30, 2023
| Par Value | | Security Description | | Rate | | Maturity | | Value $ | |
| Corporate Bonds & Notes — 18.2% (Continued) | | | | | | | | |
| | 604,000 | | SYSCO Corp. | | 5.95 | % | | 04/01/2030 | | | 632,685 | |
| | 1,275,000 | | Trimble, Inc. | | 6.10 | % | | 03/15/2033 | | | 1,292,329 | |
| | 1,451,000 | | Verizon Communications, Inc. | | 2.10 | % | | 03/22/2028 | | | 1,275,394 | |
| | 1,354,000 | | Wells Fargo & Co. | | 3.00 | % | | 10/23/2026 | | | 1,257,792 | |
| | 730,000 | | Xylem, Inc. | | 1.95 | % | | 01/30/2028 | | | 640,885 | |
Total Corporate Bonds & Notes (Cost $25,030,866) | | | | |
| | | 22,921,365 | |
| | | | | | | | | | |
| Asset Backed Securities — 4.8% | | | | | | | | | |
| | 510,000 | | American Homes 4 Rent Trust, Series 2015-SFR2 C^ | | 4.69 | % | | 10/18/2052 | | | 494,159 | |
| | 900,000 | | CarMax Auto Owner Trust, Series 2021-2 C | | 1.34 | % | | 02/16/2027 | | | 823,382 | |
| | 296,586 | | Dext ABS LLC, Series 2021-1 A^ | | 1.12 | % | | 02/15/2028 | | | 284,837 | |
| | 322,503 | | FHF Trust, Series 2021-2A A^ | | 0.83 | % | | 12/15/2026 | | | 307,273 | |
| | 73,849 | | FHF Trust, Series 2021-1A A^ | | 1.27 | % | | 03/15/2027 | | | 70,962 | |
| | 786,882 | | FREED ABS Trust, Series 2022-1FP B^ | | 1.91 | % | | 03/19/2029 | | | 778,561 | |
| | 590,000 | | GTP Acquisition Partners I LLC, Series 2015-1-2^ | | 3.48 | % | | 06/15/2050 | | | 563,616 | |
| | 1,575,000 | | HPEFS Equipment Trust, Series 2021-2A B^ | | 0.61 | % | | 09/20/2028 | | | 1,548,641 | |
| | 419,643 | | JPMorgan Chase Bank NA — CACLN, Series 2021-3 B^ | | 0.76 | % | | 02/26/2029 | | | 399,704 | |
| | 260,808 | | MVW Owner Trust, Series 2017-1A A^ | | 2.42 | % | | 12/20/2034 | | | 259,224 | |
| | 47,127 | | Santander Drive Auto Receivables Trust, Series 2019-3 D | | 2.68 | % | | 10/15/2025 | | | 47,044 | |
| | 445,000 | | Tesla Auto Lease Trust, Series 2021-A C^ | | 1.18 | % | | 03/20/2025 | | | 433,178 | |
Total Asset Backed Securities (Cost $6,293,187) | | | | |
| | | 6,010,581 | |
| | | | | | | | | | |
| U.S. Treasury Notes — 39.4% | | | | | | | | | |
| | 10,000,000 | | United States Treasury Note | | 2.63 | % | | 12/31/2023 | | | 9,870,549 | |
| | 3,320,000 | | United States Treasury Note | | 2.75 | % | | 05/15/2025 | | | 3,189,534 | |
| | 6,775,000 | | United States Treasury Note | | 2.25 | % | | 03/31/2026 | | | 6,376,440 | |
| | 6,395,000 | | United States Treasury Note | | 2.88 | % | �� | 05/15/2028 | | | 6,035,531 | |
| | 6,200,000 | | United States Treasury Note | | 3.25 | % | | 06/30/2029 | | | 5,933,109 | |
| | 2,735,000 | | United States Treasury Note | | 0.88 | % | | 11/15/2030 | | | 2,213,961 | |
| | 18,635,000 | | United States Treasury Note | | 1.88 | % | | 02/15/2032 | | | 15,966,046 | |
Total U.S. Treasury Notes (Cost $52,797,630) | | | | |
| | | 49,585,170 | |
The accompanying notes are an integral part of these financial statements.
Brown Advisory Intermediate Income FundSchedule of Investments
June 30, 2023
| Shares | | Security Description | | Value $ | |
| Affiliated Mutual Funds (Note 3) — 12.0% | | | |
| | 1,654,617 | | Brown Advisory Mortgage Securities Fund — Institutional Shares | | | 15,057,017 | |
Total Affiliated Mutual Funds (Cost $16,952,513) | | | 15,057,017 | |
| | | | | |
| Short-Term Investments — 4.2% | | | | |
| | | | | |
| Money Market Funds — 4.2% | | | | |
| | 5,252,688 | | First American Government Obligations Fund — Class Z, 4.97%* | | | 5,252,688 | |
Total Short-Term Investments (Cost $5,252,688) | | | 5,252,688 | |
Total Investments — 99.7% (Cost $135,440,586) | | | 125,379,891 | |
Other Assets in Excess of Liabilities — 0.3% | | | 400,353 | |
| NET ASSETS — 100.0% | | $ | 125,780,244 | |
| ^ | Security exempt from registration under Rule 144A of the Securities Act of 1933. These securities may be resold in transactions exempt from registration, normally to qualified institutional buyers. |
| # | Variable rate security. Rate disclosed is as of the date of this report. |
| * | Annualized seven-day yield as of the date of this report. |
| Futures Contracts — Long (Note 6) | | | | | | | | | | | | | |
| | | | | | | Notional | | | Notional | | | Unrealized Appreciation | |
| Issue | | Contracts | | Expiration Date | | Amount | | | Value | | | (Depreciation) | |
U.S. Treasury 5-Year Note Futures | | 59 | | 09/29/2023 | | $ | 6,439,321 | | | $ | 6,318,532 | | | $ | (120,789 | ) |
U.S. Treasury 2-Year Note Futures | | 78 | | 09/29/2023 | | | 16,070,074 | | | | 15,860,812 | | | | (209,262 | ) |
U.S. Treasury Long Bond Futures | | 7 | | 09/20/2023 | | | 889,544 | | | | 888,344 | | | | (1,200 | ) |
| | | | | | | $ | 23,398,939 | | | $ | 23,067,688 | | | $ | (331,251 | ) |
| | | | | | | | | | | | | | | | | |
| Futures Contracts — Short (Note 6) | | | | | | | | | | | | | | | | |
| | | | | | | Notional | | | Notional | | | Unrealized Appreciation | |
| Issue | | Contracts | | Expiration Date | | Amount | | | Value | | | (Depreciation) | |
U.S. Treasury 10-Year Note Futures | | (26) |
| 09/20/2023 | | $ | (2,970,244 | ) | | $ | (2,918,906 | ) | | $ | 51,338 | |
U.S. Treasury 10-Year Ultra Futures | | (53) |
| 09/20/2023 | | | (6,332,903 | ) | | | (6,277,187 | ) | | | 55,716 | |
U.S. Treasury Ultra Bond Futures | | (1) |
| 09/20/2023 | | | (134,592 | ) | | | (136,219 | ) | | | (1,627 | ) |
| | | | | | | $ | (9,437,739 | ) | | $ | (9,332,312 | ) | | $ | 105,427 | |
There is no variation margin due to or from the Fund as of the date of this report.
The accompanying notes are an integral part of these financial statements.
Brown Advisory Sustainable Bond FundA Message to Our Shareholders
June 30, 2023
Dear Shareholder:
During the 12-month period ended June 30, 2023, the Brown Advisory Sustainable Bond Fund Investor Shares (the “Fund”) returned -3.16%, trailing its benchmark, the Bloomberg US Aggregate Bond Index, which returned -0.94%.
The negative total return was driven by an increase in Treasury yields, as expectations for an end to the Fed tightening cycle diminished. Relative underperformance for the period was primarily driven by positioning for a steeper yield curve, positioning within the mortgage sector, and a defensive underweight position in corporate credit.
The Fund seeks to take a sustainable and dynamic approach to fixed income. We believe that dynamic asset allocation informed by comprehensive top-down macro analysis, combined with rigorous, bottom-up security selection and a differentiated sustainable investment approach, can deliver an attractive stream of income and risk-adjusted returns through the economic cycle while producing positive environmental and social impact.
We maintain our conviction that economic weakness is ahead, not behind, for the U.S. economy. We expect that to change as the full effect of tighter monetary policy has yet to be felt. Evidence of this impact within interest-rate-sensitive sectors and signs of inflection points within macroeconomic indicators and labor markets give us more confidence in our view.
Additionally, we expect inflation to moderate in the months ahead. Shelter represents the largest weight in price indices and the moderation in rental rates and home prices will soon be reflected. Recent data on other core measures of inflation and wage growth are also encouraging.
In our view, a weak growth outlook coupled with declining inflation will result in the end of the monetary policy tightening cycle. This should result in a meaningful steepening of yield curves, returning to more conventional upward sloping yield curves. The Fund is currently long duration yet positioned for a steeper yield curve.
The Fund remains defensively positioned within credit, liquidity, and structure risk as we expect better fundamental-valuation alignment in the coming months and quarters.
Lastly, we believe over the cycle our research focused investment process may continue to generate attractive income as individual security selection returns to the forefront of relative performance.
Sincerely,
Chris Diaz, CFA
Portfolio Manager
Amy Hauter, CFA
Portfolio Manager
Colby Stilson
Portfolio Manager
Brown Advisory Sustainable Bond FundA Message to Our Shareholders
June 30, 2023
Past performance is not a guarantee of future results.
Mutual fund investing involves risk. Principal loss is possible. The Fund is non-diversified which means it may invest a large percentage of its assets in the securities of fewer issuers. Concentration in a limited number of issuers exposes the Fund to greater market risk than if its assets were diversified among a greater number of issuers. The Fund is also subject to interest rate risk which is the risk that debt securities in the Fund’s portfolio will decline in value because of an increase in market interest rates. This risk is usually greater for longer- term debt securities. Income from tax-exempt funds may be subject to state and local taxes and a portion of income may be subject to the Federal Alternative minimum tax for certain investors. The Adviser utilizes ESG analysis in connection with the Fund’s investments in fixed-income securities. ESG factors are considered systematically and comprehensively through leveraging a repeatable process that strives to minimize risk and capture opportunity.
Diversification does not assure a profit nor protect against loss in a declining market.
Fund holdings and sector allocations are subject to change and should not be considered a recommendation to buy or sell any security. For a complete list of fund holdings, please refer to the Schedule of Investments provided in this report.
Because the Fund’s ESG criteria exclude securities of certain issuers for nonfinancial reasons, the Fund may forgo some market opportunities available to the funds that do not use these criteria.
Credit Quality weights by rating are derived from the highest bond rating as determined by Standard & Poor’s (“S&P”), Moody’s or Fitch. Bond ratings are grades given to bonds that indicate their credit quality as determined by private independent rating services such as S&P, Moody’s and Fitch. These firms evaluate a bond issuer’s financial strength, or its ability to pay a bond’s principal and interest in a timely fashion. Ratings are expressed as letters ranging from ‘AAA’, which is the highest grade, to ‘D’, which is the lowest grade. In limited situations when none of the three rating agencies have issued a formal rating, the Advisor will classify the security as nonrated.
Definitions for terms and indices are provided in the Glossary of Terms.
Brown Advisory Sustainable Bond FundPerformance Information & Portfolio Holdings Summary
June 30, 2023
GROWTH OF A $10,000 INVESTMENT
The following chart reflects the change in value of a hypothetical $10,000 investment, including reinvested dividends and distributions, in the Fund as measured against a broad-based securities market index. The Bloomberg US Aggregate Bond Index (“Index”) is a broad-based benchmark that measures the investment grade US dollar-denominated, fixed rate taxable bond market. The Index includes Treasuries, government-related and corporate securities, MBS, ABS and CMBS. The Index is unmanaged and does not reflect the deduction of fees, such as investment management fees. Investors cannot invest directly in an index.
| PORTFOLIO HOLDINGS | % of Net Assets |
| | |
Money Market Funds | | 38.2% |
Mortgage Backed Securities | | 28.8% |
Corporate Bonds & Notes | | 22.6% |
Foreign Government Bonds | | 22.6% |
U.S. Treasury Securities | | 14.1% |
Asset Backed Securities | | 3.7% |
Municipal Bonds | | 1.3% |
U.S. Treasury Bills | | 0.3% |
Other Assets and Liabilities* | | (31.6)% |
| | | 100.0% |
* Includes unrealized appreciation (depreciation) on futures contracts.
| | | | Since Inception |
Average Annual Total Return | One Year | Five Year | (8/7/17) |
Institutional Shares1 | -3.22% | 0.82% | 0.48% |
| Investor Shares | -3.16% | 0.79% | 0.45% |
| Bloomberg US Aggregate Bond Index | -0.94% | 0.77% | 0.47% |
| | Institutional Shares | Investor Shares |
Gross Expense Ratio2 | 0.44% | 0.49% |
Net Expense Ratio2 | 0.44% | 0.49% |
Past performance does not guarantee future results. The performance data quoted represents past performance and current returns may be lower or higher. The investment return and net asset value will fluctuate so that an investor’s shares, when redeemed, may be worth more or less than the original cost. To obtain performance information current to the most recent month end, please visit our website at brownadvisory.com/mf/sustainable-bond-fund. The performance table and graph above do not reflect the deduction of taxes that a shareholder would pay on Fund distributions or the redemption of Fund shares. Investment performance reflects periods during which fee waivers were in effect. In the absence of such waivers, total return would have been reduced. Performance data does not reflect the imposition of the redemption fee of 1.00% on shares redeemed within 14 days, and if it did, performance would have been lower. Short-term performance, in particular, is not a good indication of the Fund’s future performance, and an investment should not be made based solely on returns. Returns shown are calculated using the net asset values (“NAV”) that were used for shareholder transactions as of the respective period ends. These NAV, and the returns calculated from them, may differ from the NAV and returns shown elsewhere in this report.
1 | Performance information for the Institutional Shares, prior to its inception date of July 2, 2018, is based on the performance of Investor Shares, and adjusted for the lower expenses applicable to Institutional Shares. |
2 | Per the Fund’s prospectus dated October 31, 2022. Refer to the financial highlights for the gross and net expense ratios for the year ended as of the date of this report. Please note that the expense ratios per the prospectus include acquired fund fees and expenses (as applicable) and the expense ratios in the financial highlights do not. |
Brown Advisory Sustainable Bond FundSchedule of Investments
June 30, 2023
| Par Value | | Security Description | | Rate | | Maturity | | Value $ | |
| Mortgage Backed Securities — 28.8% | | | | | | |
| | 620,328 | | FHLMC PC, Pool# G3-1063 | | 3.50 | % | | 11/01/2037 | | | 588,041 | |
| | 1,094,192 | | FHLMC PC, Pool# QC-5510 | | 3.50 | % | | 07/01/2051 | | | 999,510 | |
| | 5,103,350 | | FHLMC PC, Pool# RA-6064 | | 2.50 | % | | 09/01/2051 | | | 4,417,457 | |
| | 1,797,183 | | FHLMC PC, Pool# QD-7054 | | 3.00 | % | | 02/01/2052 | | | 1,585,227 | |
| | 1,849,515 | | FHLMC PC, Pool# QD-5888 | | 3.50 | % | | 02/01/2052 | | | 1,688,343 | |
| | 1,884,437 | | FHLMC PC, Pool# RA-6699 | | 3.50 | % | | 02/01/2052 | | | 1,720,205 | |
| | 1,795,394 | | FHLMC PC, Pool# QD-7450 | | 3.00 | % | | 03/01/2052 | | | 1,585,816 | |
| | 166,921 | | FHLMC PC, Pool# QE-0380 | | 2.50 | % | | 04/01/2052 | | | 142,632 | |
| | 251,513 | | FHLMC REMIC, Series 4094 NI~ | | 2.50 | % | | 03/15/2027 | | | 3,578 | |
| | 1,608,247 | | FHLMC REMIC, Series 4107 LI~ | | 3.00 | % | | 08/15/2027 | | | 111,121 | |
| | 1,164,626 | | FHLMC REMIC, Series 4143 IA~ | | 3.50 | % | | 09/15/2042 | | | 97,269 | |
| | 84,872 | | FHLMC SCRTT, Series 2017-1 M1#^ | | 4.00 | % | | 01/25/2056 | | | 83,823 | |
| | 73,940 | | FHLMC STACR, Series 2015-HQ2 M3 (1 Month LIBOR USD + 3.25%) | | 8.40 | % | | 05/27/2025 | | | 74,790 | |
| | 6,322,999 | | FHMS, Series Q-013 XPT1#~ | | 1.66 | % | | 05/25/2025 | | | 129,025 | |
| | 5,506,786 | | FHMS, Series Q-013 XPT2#~ | | 1.81 | % | | 05/25/2027 | | | 145,650 | |
| | 300,000 | | FHMS, Series K-W03 A2 | | 3.02 | % | | 06/25/2027 | | | 279,392 | |
| | 131,203 | | FHMS, Series Q-010 APT1# | | 4.90 | % | | 04/25/2046 | | | 130,384 | |
| | 148,508 | | FHMS, Series Q-007 APT1# | | 5.02 | % | | 10/25/2047 | | | 147,830 | |
| | 1,620,000 | | FNMA, Pool# BS4700 | | 2.43 | % | | 02/01/2032 | | | 1,331,097 | |
| | 439,197 | | FNMA, Pool# MA2897 | | 3.00 | % | | 02/01/2037 | | | 405,978 | |
| | 246,709 | | FNMA, Pool# 467095 | | 5.90 | % | | 01/01/2041 | | | 257,998 | |
| | 162,459 | | FNMA, Pool# 469130 | | 4.87 | % | | 10/01/2041 | | | 161,765 | |
| | 97,658 | | FNMA, Pool# BH7686 | | 4.50 | % | | 12/01/2047 | | | 95,344 | |
| | 142,843 | | FNMA, Pool# BK5105 | | 5.50 | % | | 05/01/2048 | | | 143,449 | |
| | 213,316 | | FNMA, Pool# BK8032 | | 5.50 | % | | 06/01/2048 | | | 214,853 | |
| | 145,916 | | FNMA, Pool# BN4936 | | 5.50 | % | | 12/01/2048 | | | 145,717 | |
| | 146,124 | | FNMA, Pool# BN4921 | | 5.50 | % | | 01/01/2049 | | | 145,856 | |
| | 5,571,796 | | FNMA, Pool# FM8754 | | 3.00 | % | | 09/01/2051 | | | 4,949,620 | |
| | 2,027,723 | | FNMA, Pool# BT7699 | | 4.00 | % | | 09/01/2051 | | | 1,962,806 | |
| | 1,208,586 | | FNMA, Pool# FS0031 | | 2.50 | % | | 10/01/2051 | | | 1,026,318 | |
| | 627,372 | | FNMA, Pool# FS1480 | | 2.50 | % | | 11/01/2051 | | | 536,434 | |
| | 2,760,046 | | FNMA, Pool# FS0491 | | 3.50 | % | | 01/01/2052 | | | 2,521,289 | |
| | 1,086,918 | | FNMA, Pool# FS0731 | | 2.00 | % | | 02/01/2052 | | | 894,296 | |
| | 1,806,183 | | FNMA, Pool# CB2909 | | 3.50 | % | | 02/01/2052 | | | 1,648,355 | |
| | 1,835,532 | | FNMA, Pool# BV4532 | | 3.50 | % | | 03/01/2052 | | | 1,674,999 | |
| | 2,512,767 | | FNMA, Pool# MA4565 | | 3.50 | % | | 03/01/2052 | | | 2,294,105 | |
| | 5,032,734 | | FNMA REMIC Trust, Series 2021-95 WI#~ | | 0.00 | % | | 05/25/2035 | | | 138,190 | |
| | 197,830 | | FNMA REMIC Trust, Series 2012-65 HJ | | 5.00 | % | | 07/25/2040 | | | 196,756 | |
| | 25,660,000 | | FNMA, 2.00%, Due TBA July | | 2.00 | % | | 07/15/2053 | | | 20,931,945 | |
| | 13,945,000 | | FNMA, 2.50%, Due TBA July | | 2.50 | % | | 07/15/2053 | | | 11,827,103 | |
| | 9,100,000 | | FNMA, 3.00%, Due TBA July | | 3.00 | % | | 07/15/2053 | | | 8,010,488 | |
| | 6,350,000 | | FNMA, 3.50%, Due TBA July | | 3.50 | % | | 07/15/2053 | | | 5,787,182 | |
| | 24,700,000 | | FNMA, 4.00%, Due TBA July | | 4.00 | % | | 07/15/2053 | | | 23,182,301 | |
| | 7,200,000 | | FNMA, 4.50%, Due TBA July | | 4.50 | % | | 07/15/2053 | | | 6,922,688 | |
| | 9,400,000 | | FNMA, 5.00%, Due TBA July | | 5.00 | % | | 07/15/2053 | | | 9,215,675 | |
| | 544,670 | | GNMA, Pool# 781950X | | 4.50 | % | | 07/15/2035 | | | 534,486 | |
| | 661,299 | | GNMA, Pool# MA7106M | | 2.00 | % | | 01/20/2036 | | | 587,455 | |
| | 644,238 | | GNMA, Pool# MA7164M | | 2.00 | % | | 02/20/2036 | | | 572,349 | |
| | 241,195 | | GNMA, Pool# 723334X | | 5.00 | % | | 09/15/2039 | | | 242,421 | |
| | 2,773,950 | | GNMA, Pool# 783467X | | 4.00 | % | | 10/15/2041 | | | 2,701,663 | |
| | 1,070,664 | | GNMA, Pool# MA2754M | | 3.50 | % | | 04/20/2045 | | | 1,005,519 | |
| | 3,232,617 | | GNMA, Pool# 784507C | | 4.00 | % | | 12/20/2047 | | | 3,095,719 | |
| | 294,915 | | GNMA, Pool# MA7774M | | 6.00 | % | | 11/20/2051 | | | 308,709 | |
| | 26,785,000 | | GNMA, 2.00%, Due TBA July | | 2.00 | % | | 07/15/2053 | | | 22,519,281 | |
| | 16,800,000 | | GNMA, 2.50%, Due TBA July | | 2.50 | % | | 07/15/2053 | | | 14,550,375 | |
| | 8,800,000 | | GNMA, 3.00%, Due TBA July | | 3.00 | % | | 07/15/2053 | | | 7,864,656 | |
The accompanying notes are an integral part of these financial statements.
Brown Advisory Sustainable Bond FundSchedule of Investments
June 30, 2023
| Par Value | | Security Description | | Rate | | | Maturity | | Value $ | |
| Mortgage Backed Securities — 28.8% (Continued) | | | | | | | | |
| | 5,350,000 | | GNMA, 3.50%, Due TBA July | | 3.50 | % | | 07/15/2053 | | | 4,938,510 | |
| | 14,434,000 | | GNMA, 4.00%, Due TBA July | | 4.00 | % | | 07/15/2053 | | | 13,659,864 | |
| | 4,915,000 | | GNMA, 4.50%, Due TBA July | | 4.50 | % | | 07/15/2053 | | | 4,744,127 | |
| | 1,250,000 | | GNMA, 5.00%, Due TBA July | | 5.00 | % | | 07/15/2053 | | | 1,228,418 | |
| | 1,945,537 | | GNMA REMIC Trust, Series 2017-167 SE (1 Month LIBOR USD + 6.20%)~ | | 1.04 | % | | 11/20/2047 | | | 207,518 | |
| | 920,150 | | GNMA REMIC Trust, Series 2021-125 UL | | 1.50 | % | | 07/20/2051 | | | 694,658 | |
| | 1,343,418 | | GNMA REMIC Trust, Series 2021-158 JD | | 1.50 | % | | 09/20/2051 | | | 996,959 | |
| | 2,104,659 | | GNMA REMIC Trust, Series 2021-160 DK | | 2.00 | % | | 09/20/2051 | | | 1,462,765 | |
| | 1,383,690 | | GNMA REMIC Trust, Series 2021-177 KD | | 2.00 | % | | 10/20/2051 | | | 1,091,749 | |
| | 2,605,978 | | GNMA REMIC Trust, Series 2022-009 CD | | 2.00 | % | | 01/20/2052 | | | 2,098,828 | |
| | 371,888 | | GNMA REMIC Trust, Series 2014-45 B1#~ | | 0.55 | % | | 07/16/2054 | | | 3,926 | |
| | 231,427 | | GNMA REMIC Trust, Series 2014-135 I0#~ | | 0.43 | % | | 01/16/2056 | | | 4,321 | |
| | 234,507 | | GNMA REMIC Trust, Series 2015-172 I0#~ | | 0.61 | % | | 03/16/2057 | | | 5,045 | |
| | 442,218 | | GNMA REMIC Trust, Series 2016-40 I0#~ | | 0.61 | % | | 07/16/2057 | | | 9,798 | |
| | 297,382 | | GNMA REMIC Trust, Series 2016-56 I0#~ | | 1.00 | % | | 11/16/2057 | | | 12,822 | |
| | 450,759 | | GNMA REMIC Trust, Series 2016-98 I0#~ | | 0.86 | % | | 05/16/2058 | | | 17,627 | |
| | 8,461,789 | | GNMA REMIC Trust, Series 2021-084 ED | | 1.00 | % | | 07/16/2060 | | | 6,309,680 | |
Total Mortgage Backed Securities (Cost $221,095,968) | | | | | | | | 212,021,948 | |
| | | | | | | | | | |
| Corporate Bonds & Notes — 22.6% | | | | | | | | | |
| | 8,155,000 | | AerCap Ireland Capital DAC / AerCap Global Aviation Trust | | 3.00 | % | | 10/29/2028 | | | 7,057,630 | |
| | 3,450,000 | | AIB Group PLC (Fixed until 10/14/2025, then SOFR + 3.46%)^ | | 7.58 | % | | 10/14/2026 | | | 3,506,174 | |
| | 4,320,000 | | Amphenol Corp. | | 2.80 | % | | 02/15/2030 | | | 3,785,807 | |
| | 8,295,000 | | Aptiv PLC | | 3.25 | % | | 03/01/2032 | | | 7,104,951 | |
| | 7,330,000 | | AT&T, Inc. | | 4.35 | % | | 03/01/2029 | | | 7,044,128 | |
| | 7,095,000 | | CaixaBank S.A. (Fixed until 01/18/2028, then SOFR + 2.70%)^ | | 6.21 | % | | 01/18/2029 | | | 7,084,463 | |
| | 5,960,000 | | Consolidated Edison Co. of New York, Inc. | | 3.35 | % | | 04/01/2030 | | | 5,421,515 | |
| | 7,980,000 | | Crown Castle, Inc. | | 3.30 | % | | 07/01/2030 | | | 7,058,946 | |
| | 7,960,000 | | DH Europe Finance II Sarl | | 2.60 | % | | 11/15/2029 | | | 7,010,494 | |
| | 8,050,000 | | Equinix, Inc. | | 3.20 | % | | 11/18/2029 | | | 7,077,647 | |
| | 7,600,000 | | Fortis, Inc. | | 3.06 | % | | 10/04/2026 | | | 7,006,269 | |
| | 39,250,000 | | Kreditanstalt fuer Wiederaufbau | | 0.63 | % | | 01/22/2026 | | | 35,468,890 | |
| | 7,249,000 | | Marvell Technology, Inc. | | 4.88 | % | | 06/22/2028 | | | 7,038,930 | |
| | 3,380,000 | | Micron Technology, Inc. | | 6.75 | % | | 11/01/2029 | | | 3,515,639 | |
| | 3,795,000 | | Nationwide Building Society (Fixed until 03/08/2028, then 3 Month LIBOR USD + 1.45%)^ | | 4.30 | % | | 03/08/2029 | | | 3,519,572 | |
| | 3,660,000 | | NatWest Group PLC (Fixed until 01/27/2029, then 3 Month LIBOR USD + 1.91%) | | 5.08 | % | | 01/27/2030 | | | 3,494,719 | |
| | 3,765,000 | | NatWest Group PLC (Fixed until 08/10/2025, then 5 Year Swap Rate USD + 5.72%) | | 8.00 | % | | 12/29/2049 | | | 3,668,352 | |
| | 2,260,000 | | Oracle Corp. | | 6.15 | % | | 11/09/2029 | | | 2,355,437 | |
| | 4,883,000 | | Oracle Corp. | | 4.65 | % | | 05/06/2030 | | | 4,720,967 | |
| | 8,850,000 | | Revvity, Inc. | | 2.25 | % | | 09/15/2031 | | | 7,106,846 | |
| | 6,120,000 | | Roper Technologies, Inc. | | 1.75 | % | | 02/15/2031 | | | 4,857,692 | |
| | 7,955,000 | | Societe Generale S.A. (Fixed until 01/19/2027, then 1 Year CMT Rate + 1.30%)^ | | 2.80 | % | | 01/19/2028 | | | 7,053,348 | |
| | 6,890,000 | | Sprint LLC | | 7.63 | % | | 02/15/2025 | | | 7,044,102 | |
| | 615,000 | | T-Mobile USA, Inc. | | 5.05 | % | | 07/15/2033 | | | 604,126 | |
| | 7,005,000 | | Trimble, Inc. | | 6.10 | % | | 03/15/2033 | | | 7,100,206 | |
Total Corporate Bonds & Notes (Cost $173,325,439) | | | | | | | | 166,706,850 | |
| | | | | | | | | | |
| Foreign Government Bonds — 22.6% | | | | | | | | | |
| | 37,500,000 | | Asian Development Bank | | 2.88 | % | | 05/06/2025 | | | 36,084,552 | |
| | 10,200,000 | | Asian Development Bank | | 1.88 | % | | 03/15/2029 | | | 8,986,240 | |
| | 14,100,000 | | Council Of Europe Development Bank | | 3.00 | % | | 06/16/2025 | | | 13,569,853 | |
| | 3,150,000 | | European Investment Bank | | 2.88 | % | | 08/15/2023 | | | 3,141,655 | |
| | 24,655,000 | | European Investment Bank | | 1.38 | % | | 03/15/2027 | | | 22,088,159 | |
| | 39,880,000 | | Inter-American Development Bank | | 0.88 | % | | 04/20/2026 | | | 35,990,782 | |
| | 10,625,000 | | Inter-American Development Bank (SOFR + 0.28%) | | 4.82 | % | | 04/12/2027 | | | 10,628,551 | |
| | 38,700,000 | | International Bank for Reconstruction & Development | | 0.63 | % | | 04/22/2025 | | | 35,780,664 | |
Total Foreign Government Bonds (Cost $169,185,768) | | | | | | | | 166,270,456 | |
The accompanying notes are an integral part of these financial statements.
Brown Advisory Sustainable Bond FundSchedule of Investments
June 30, 2023
| Par Value | | Security Description | | Rate | | Maturity | | Value $ | |
| U.S. Treasury Securities — 14.1% | | | | | | | | |
| | 2,650,000 | | United States Treasury Bond | | 3.88 | % | | 02/15/2043 | | | 2,584,578 | |
| | 2,445,000 | | United States Treasury Note | | 3.88 | % | | 12/31/2027 | | | 2,411,142 | |
| | 2,980,000 | | United States Treasury Note | | 3.50 | % | | 04/30/2028 | | | 2,896,071 | |
| | 3,486,000 | | United States Treasury Note | | 3.50 | % | | 04/30/2030 | | | 3,385,233 | |
| | 4,805,000 | | United States Treasury Note | | 3.50 | % | | 02/15/2033 | | | 4,681,121 | |
| | 16,000,000 | | United States Treasury Note | | 1.25 | % | | 07/31/2023 | | | 15,950,989 | |
| | 6,270,000 | | United States Treasury Note | | 3.25 | % | | 06/30/2027 | | | 6,031,201 | |
| | 12,560,000 | | United States Treasury Note | | 2.88 | % | | 05/15/2028 | | | 11,853,991 | |
| | 3,800,000 | | United States Treasury Note | | 2.88 | % | | 04/30/2029 | | | 3,564,281 | |
| | 11,765,000 | | United States Treasury Note | | 0.88 | % | | 11/15/2030 | | | 9,523,676 | |
| | 20,490,000 | | United States Treasury Note | | 1.88 | % | | 02/15/2032 | | | 17,555,367 | |
| | 53,020,000 | | United States Treasury STRIP+ | | 4.25 | % | | 05/15/2043 | | | 23,163,464 | |
Total U.S. Treasury Securities (Cost $106,067,359) | | | | | | | | 103,601,114 | |
| | | | | | | | | | |
| Asset Backed Securities — 3.7% | | | | | | | | | |
| | 540,000 | | American Homes 4 Rent, Series 2014-SFR2 D^ | | 5.15 | % | | 10/17/2036 | | | 529,541 | |
| | 520,000 | | American Homes 4 Rent, Series 2015-SFR1 D^ | | 4.41 | % | | 04/18/2052 | | | 501,389 | |
| | 1,000,000 | | AmeriCredit Automobile Receivables Trust, Series 2020-2 C | | 1.48 | % | | 02/18/2026 | | | 964,236 | |
| | 2,255,000 | | CarMax Auto Owner Trust, Series 2021-2 C | | 1.34 | % | | 02/16/2027 | | | 2,063,030 | |
| | 1,000,000 | | CNH Equipment Trust, Series 2020-A A4 | | 1.51 | % | | 04/15/2027 | | | 972,261 | |
| | 2,650,000 | | CNH Equipment Trust, Series 2021-C B | | 1.41 | % | | 04/16/2029 | | | 2,376,052 | |
| | 34,370 | | Dext ABS LLC, Series 2020-1 A^ | | 1.46 | % | | 02/16/2027 | | | 34,299 | |
| | 1,306,908 | | Dext ABS LLC, Series 2021-1 A^ | | 1.12 | % | | 02/15/2028 | | | 1,255,136 | |
| | 870,000 | | Dext ABS LLC, Series 2021-1 B^ | | 1.76 | % | | 02/15/2028 | | | 794,297 | |
| | 585,980 | | Drive Auto Receivables Trust, Series 2019-3 D | | 3.18 | % | | 10/15/2026 | | | 582,065 | |
| | 1,008,731 | | Drive Auto Receivables Trust, Series 2020-1 D | | 2.70 | % | | 05/17/2027 | | | 992,292 | |
| | 467,339 | | FHF Trust, Series 2021-2A A^ | | 0.83 | % | | 12/15/2026 | | | 445,269 | |
| | 698,084 | | FHF Trust, Series 2021-1A A^ | | 1.27 | % | | 03/15/2027 | | | 670,792 | |
| | 1,000,000 | | GM Financial Automobile Leasing Trust, Series 2021-2 C | | 1.01 | % | | 05/20/2025 | | | 979,553 | |
| | 1,975,000 | | HPEFS Equipment Trust, Series 2021-2 B^ | | 0.61 | % | | 09/20/2028 | | | 1,941,947 | |
| | 2,000,000 | | HPEFS Equipment Trust, Series 2021-1 TR^ | | 1.03 | % | | 03/20/2031 | | | 1,930,493 | |
| | 3,775,000 | | John Deere Owner Trust, Series 2023-B A2 | | 5.59 | % | | 06/15/2026 | | | 3,774,522 | |
| | 1,149,930 | | JPMorgan Chase Bank NA — CACLN, Series 2021-3 B^ | | 0.76 | % | | 02/26/2029 | | | 1,095,295 | |
| | 730,263 | | MVW Owner Trust, Series 2017-1A A^ | | 2.42 | % | | 12/20/2034 | | | 725,827 | |
| | 591,741 | | Newtek Small Business Loan Trust, Series 2018-1 A (1 Month LIBOR USD + -0.55%)^ | | 7.70 | % | | 02/25/2044 | | | 584,487 | |
| | 136,117 | | Oportun Funding XIII LLC, Series 2019-A A^ | | 3.08 | % | | 08/08/2025 | | | 133,712 | |
| | 1,075,000 | | PFS Financing Corp., Series 2021-A A^ | | 0.71 | % | | 04/15/2026 | | | 1,030,056 | |
| | 62,051 | | Santander Drive Auto Receivables Trust, Series 2019-3 D | | 2.68 | % | | 10/15/2025 | | | 61,941 | |
| | 138,980 | | SoFi Consumer Loan Program Trust, Series 2021-1 A^ | | 0.49 | % | | 09/25/2030 | | | 136,950 | |
| | 2,705,000 | | Tesla Auto Lease Trust, Series 2021-A C^ | | 1.18 | % | | 03/20/2025 | | | 2,633,141 | |
Total Asset Backed Securities (Cost $28,327,325) | | | | | | | | 27,208,583 | |
| | | | | | | | | | |
| Municipal Bonds — 1.3% | | | | | | | | | |
| | 230,000 | | American Municipal Power, Inc. | | 6.05 | % | | 02/15/2043 | | | 248,360 | |
| | 2,650,000 | | California Health Facilities Financing Authority | | 3.03 | % | | 06/01/2034 | | | 2,220,869 | |
| | 1,325,000 | | Colorado Health Facilities Authority | | 3.36 | % | | 12/01/2030 | | | 1,162,740 | |
| | 1,200,000 | | Health Care Authority for Baptist Health | | 5.50 | % | | 11/15/2043 | | | 1,118,939 | |
| | 100,000 | | Honolulu, City & County Hawaii | | 3.00 | % | | 09/01/2027 | | | 93,656 | |
| | 30,000 | | Los Angeles California Community College District | | 6.60 | % | | 08/01/2042 | | | 36,395 | |
| | 430,000 | | Los Angeles California Wastewater System Revenue | | 3.49 | % | | 06/01/2029 | | | 401,020 | |
| | 15,000 | | Maryland Community Development Administration | | 3.24 | % | | 09/01/2048 | | | 14,469 | |
| | 3,300,000 | | Metropolitan Pier & Exposition Authority | | 3.96 | % | | 12/15/2026 | | | 3,126,938 | |
| | 1,000,000 | | New York City Housing Development Corp. | | 2.71 | % | | 08/01/2031 | | | 822,615 | |
| | 355,000 | | University of California | | 2.99 | % | | 05/15/2026 | | | 335,249 | |
| | 25,000 | | University of North Texas System | | 3.69 | % | | 04/15/2030 | | | 23,313 | |
Total Municipal Bonds (Cost $10,779,708) | | | | | | | | 9,604,563 | |
The accompanying notes are an integral part of these financial statements.
Brown Advisory Sustainable Bond FundSchedule of Investments
June 30, 2023
| Shares/ | | | | | |
| Par Value | | Security Description | | Value $ | |
| Short-Term Investments — 38.5% | | | |
| | | | |
| Money Market Funds — 38.2% | | | |
| | 281,273,994 | | First American Government Obligations Fund — Class Z, 4.97%* | | | 281,273,994 | |
| | | | | |
| U.S. Treasury Bills — 0.3% | | | | |
| | 2,050,000 | | United States Treasury Bill, 04/13/2023, 4.87%† | | | 2,047,152 | |
Total Short-Term Investments (Cost $283,320,680) | | | 283,321,146 | |
Total Investments — 131.6% (Cost $992,102,247) | | | 968,734,660 | |
Liabilities in Excess of Other Assets — (31.6)% | | | (232,513,549 | ) |
| NET ASSETS — 100.0% | | $ | 736,221,111 | |
| # | Variable rate security. Rate disclosed is as of the date of this report. |
| ^ | Security exempt from registration under Rule 144A of the Securities Act of 1933. These securities may be resold in transactions exempt from registration, normally to qualified institutional buyers. |
| ~ | Interest only security |
| * | Annualized seven-day yield as of the date of this report. |
| + | Zero coupon bond. Rate disclosed is calculated yield to maturity as of the date of this report. |
| † | This security is pledged as collateral in connection with open futures contracts. Rate disclosed is yield to maturity as of the date of this report. |
| Futures Contracts — Long (Note 6) | | | | | | | | | | | | | |
| | | | | | | Notional | | | Notional | | | Unrealized Appreciation | |
| Issue | | Contracts | | Expiration Date | | Amount | | | Value | | | (Depreciation) | |
Canadian 10-Year Bond Futures* | | 96 | | 09/20/2023 | | $ | 9,026,615 | | | $ | 8,879,321 | | | $ | (147,294 | ) |
U.S. Treasury 5-Year Note Futures | | 798 | | 09/29/2023 | | | 87,073,973 | | | | 85,460,813 | | | | (1,613,160 | ) |
U.S. Treasury 2-Year Note Futures | | 309 | | 09/29/2023 | | | 63,497,368 | | | | 62,833,219 | | | | (664,149 | ) |
U.S. Treasury 10-Year Note Futures | | 100 | | 09/20/2023 | | | 11,333,015 | | | | 11,226,563 | | | | (106,452 | ) |
U.S. Treasury Long Bond Futures | | 8 | | 09/20/2023 | | | 1,016,621 | | | | 1,015,250 | | | | (1,371 | ) |
U.S. Treasury Ultra Bond Futures | | 310 | | 09/20/2023 | | | 41,711,415 | | | | 42,227,813 | | | | 516,398 | |
Australian 10-Year Bond Futures^ | | 97 | | 09/15/2023 | | | 7,632,418 | | | | 7,506,671 | | | | (125,747 | ) |
| | | | | | | $ | 221,291,425 | | | $ | 219,149,650 | | | $ | (2,141,775 | ) |
| | | | | | | | | | | | | | | | | |
| Futures Contracts — Short (Note 6) | | | | | | | | | | | | | | | | |
| | | | | | | Notional | | | Notional | | | Unrealized Appreciation | |
| Issue | | Contracts | | Expiration Date | | Amount | | | Value | | | (Depreciation) | |
U.S. Treasury 10-Year Ultra Note Futures | | (66) |
| 09/20/2023 | | $ | (7,886,101 | ) | | $ | (7,816,875 | ) | | $ | 69,226 | |
| | | | | | | $ | (7,886,101 | ) | | $ | (7,816,875 | ) | | $ | 69,226 | |
There is no variation margin due to or from the Fund as of the date of this report.
| * | These futures contracts are denominated in Canadian Dollars. Notional Amount, Notional Value, and Unrealized Appreciation (Depreciation) have been translated into U.S. Dollars as of the date of this report. |
| ^ | These futures contracts are denominated in Australian Dollars. Notional Amount, Notional Value, and Unrealized Appreciation (Depreciation) have been translated into U.S. Dollars as of the date of this report. |
The accompanying notes are an integral part of these financial statements.
Brown Advisory Maryland Bond FundA Message to Our Shareholders
June 30, 2023
Dear Shareholder:
During the 12-month period ended June 30, 2023, the Brown Advisory Maryland Bond Fund Investor Shares (the “Fund”) increased 2.73% in value. During the same period, the Bloomberg 1-10 Year Blended Municipal Bond Index, the Fund’s benchmark, increased 2.22%.
After a tumultuous start in 2022, the municipal bond market began to find its footing in the autumn of last year. Broad interest rates showed early signs of stabilization after reaching 2022 peak levels in October, helped by modest improvements in inflation data, and a downshift in the size of Fed rate hikes. Market volatility persisted into the first half of 2023, but as inflation continued to moderate, broad interest rates began to settle into a trading range. The tone of the municipal bond market improved dramatically and contributed to municipals outperforming most other U.S. investment-grade fixed income sectors over the 12-month period. We believe the performance has been driven by increased investor demand, the majority of which has been focused down the curve, as investors have been reluctant to take on duration risk given the continued monetary policy and macroeconomic uncertainty.
This segmentation in maturity demand for municipals has impacted the shape of the muni yield curve, with short and intermediate high-grade yields remaining low, and ultra-short and longer-maturity yields holding at more elevated levels. We believe retail investors remain somewhat gun-shy after last year’s very tough market environment for bonds, particularly when short-term T-Bills are yielding 5.25% or more. Looking at the aggregate level of household balance sheets as reported in the Fed Flow of Funds report, we can see that households have built up very large cash balances and U.S. Treasury positions, while also reducing their aggregate ownership of municipal bonds. At the same time, many state and local government maximum income tax rates have moved higher, with some states opting to add new “millionaire’s brackets”, making tax-exempt municipal income very compelling for these high taxpayers. We believe these shifts could indicate a large amount of dry powder that could return to municipal bonds once macroeconomic factors become less pronounced and interest rate volatility declines. These conditions could also provide a meaningful tailwind for municipal bonds as capital begins to flow back into the asset class.
Within the Fund, yield curve positioning and individual security selection drove much of the relative outperformance during the period. We have kept overall portfolio duration slightly elevated relative to our benchmark while maintaining a barbell, with overweight positions in both floating-rate and 10-year and slightly longer duration bonds, which have recently been higher yielding. We added to our ultra-short duration position overweight during the period as the Fed continued to hike rates and yield curves continued to invert. We believe this ultra-short duration overweight will help provide capital preservation during periods of interest rate volatility, while also currently providing higher yields compared to the tight valuations in some intermediate maturity bonds.
Within credit we have been very focused on late-cycle dynamics, by being opportunistic regarding relatively tight credit spreads and reducing credit risk in spread sectors that could underperform if economic growth deteriorates. The typical forms of revenue (sales, income, and property taxes) for government issuers have been robust, including providing some cushion for inflation concerns, and there has been an incredible amount of federal fiscal stimulus to municipal borrowers. However, we are cognizant of the fact that further credit improvement will be difficult in any potential slowdown given a backdrop of lower economic activity, abating wage pressures, and stressed property valuations. Therefore, we are being more selective at this point in the cycle, preferring issuers that have a more robust financial footing.
Given the speed and magnitude of the tightening of monetary policy since the Fed most recently started raising rates, we are watchful for unforeseen risks that may yet surprise the market this year. As we progress deeper into this economic cycle, macroeconomic uncertainty will likely continue to remain at the front of investors’ minds, which may keep market volatility at elevated levels broadly across assets. Yet, we believe the worst of the persistent negative sentiment within municipals is behind us, and that the asset class now appears poised to serve more of its traditional roles such as providing diversification, capital preservation, and tax-efficient income.
Sincerely,
Stephen M. Shutz, CFA
Portfolio Manager
Joshua R. Perry, CFA, CAIA, FRM
Portfolio Manager
Brown Advisory Maryland Bond FundA Message to Our Shareholders
June 30, 2023
Past performance is not a guarantee of future results.
Mutual fund investing involves risk. Principal loss is possible. The Fund is non-diversified which means it may invest a large percentage of its assets in the securities of fewer issuers. Investment in a limited number of issuers exposes the Fund to greater market risk than if its assets were diversified among a greater number of issuers. The Fund is also subject to interest rate risk which is the risk that debt securities in the Fund’s portfolio will decline in value because of an increase in market interest rates. Municipal securities are subject to adverse political or economic factors, including changes in the tax law. Income from tax-exempt funds may be subject to state and local taxes and a portion of income may be subject to the federal alternative minimum tax for certain investors.
Fund holdings and sector allocations are subject to change and should not be considered a recommendation to buy or sell any security. For a complete list of fund holdings, please refer to the Schedule of Investments provided in this report. Credit Quality weights by rating are derived from the highest bond rating as determined by Standard & Poor’s (“S&P”), Moody’s or Fitch. Bond ratings are grades given to bonds that indicate their credit quality as determined by private independent rating services such as S&P, Moody’s and Fitch. These firms evaluate a bond issuer’s financial strength, or its ability to pay a bond’s principal and interest in a timely fashion. Ratings are expressed as letters ranging from ‘AAA’, which is the highest grade, to ‘D’, which is the lowest grade. In limited situations when none of the three rating agencies have issued a formal rating, the Advisor will classify the security as nonrated.
Definitions for terms and indices are provided in the Glossary of Terms.
Brown Advisory Maryland Bond FundPerformance Information & Portfolio Holdings Summary
June 30, 2023
GROWTH OF A $10,000 INVESTMENT
The following chart reflects the change in value of a hypothetical $10,000 investment, including reinvested dividends and distributions, in the Fund as measured against the broad-based municipal bond index. The Bloomberg 1-10 Year Blended Municipal Bond Index (“Index”) is a market index of high quality, domestic fixed income securities with maturities of less than 10 years. The Index is unmanaged and does not reflect the deduction of fees, such as investment management fees. Investors cannot invest directly in an index.
| PORTFOLIO HOLDINGS | % of Net Assets |
| | |
Revenue Bonds | | 81.4% |
General Obligation Bonds | | 16.1% |
Money Market Funds | | 2.2% |
Other Assets and Liabilities | | 0.3% |
| | | 100.0% |
Average Annual Total Return | One Year | Five Year | Ten Year |
| Investor Shares | 2.73% | 1.15% | 1.54% |
| Bloomberg 1-10 Year Blended Municipal Bond Index | 2.22% | 1.65% | 1.98% |
| | Investor Shares |
Gross Expense Ratio1 | 0.47% |
Net Expense Ratio1 | 0.47% |
Past performance does not guarantee future results. The performance data quoted represents past performance and current returns may be lower or higher. The investment return and net asset value will fluctuate so that an investor’s shares, when redeemed, may be worth more or less than the original cost. To obtain performance information current to the most recent month end, please visit our website at brownadvisory.com/mf/maryland-bond-fund. The performance table and graph above do not reflect the deduction of taxes that a shareholder would pay on Fund distributions or the redemption of Fund shares. Performance data does not reflect the imposition of the redemption fee of 1.00% on shares redeemed within 14 days, and if it did, performance would have been lower. Short-term performance, in particular, is not a good indication of the Fund’s future performance, and an investment should not be made based solely on returns. Returns shown are calculated using the net asset values (“NAV”) that were used for shareholder transactions as of the respective period ends. These NAV, and the returns calculated from them, may differ from the NAV and returns shown elsewhere in this report.
1 | Per the Fund’s prospectus dated October 31, 2022. Refer to the financial highlights for the gross and net expense ratios for the year ended as of the date of this report. Please note that the expense ratios per the prospectus include acquired fund fees and expenses (as applicable) and the expense ratios in the financial highlights do not. |
Brown Advisory Maryland Bond FundSchedule of Investments
June 30, 2023
| Par Value | | Security Description | | Rate | | Maturity | | Value $ | |
| Municipal Bonds — 97.5% | | | | | | | | |
| | | | | | | | | |
| General Obligation Bonds — 16.1% | | | | | | | | |
| | 1,650,000 | | Baltimore County Maryland | | 5.00 | % | | 08/01/2028 | | | 1,683,546 | |
| | 1,520,000 | | Baltimore County Maryland | | 4.00 | % | | 02/01/2033 | | | 1,525,018 | |
| | 7,875,000 | | Howard County Maryland | | 1.75 | % | | 08/15/2036 | | | 5,868,024 | |
| | 7,000,000 | | Maryland State | | 5.00 | % | | 08/01/2023 | | | 7,008,883 | |
| | 1,000,000 | | Maryland State | | 5.00 | % | | 08/01/2025 | | | 1,040,909 | |
| | 3,370,000 | | Montgomery County Maryland | | 3.00 | % | | 10/01/2034 | | | 3,280,273 | |
| | 1,350,000 | | Prince George’s County Maryland | | 5.00 | % | | 10/01/2024 | | | 1,380,733 | |
| | 1,500,000 | | Prince George’s County Maryland | | 5.00 | % | | 10/01/2025 | | | 1,561,581 | |
| | 1,550,000 | | Prince George’s County Maryland | | 5.00 | % | | 10/01/2026 | | | 1,646,476 | |
| | 1,290,000 | | St Mary’s County Maryland | | 5.00 | % | | 05/01/2028 | | | 1,418,706 | |
| | | | | | | | | | | | 26,414,149 | |
| Revenue Bonds — 81.4% | | | | | | | | | |
| | 975,000 | | Austin, Texas | | 7.88 | % | | 09/01/2026 | | | 978,063 | |
| | 520,000 | | Baltimore, Maryland | | 5.00 | % | | 06/15/2030 | | | 527,915 | |
| | 225,000 | | Baltimore, Maryland^ | | 3.25 | % | | 06/01/2031 | | | 202,175 | |
| | 1,550,000 | | Baltimore, Maryland | | 4.50 | % | | 06/01/2033 | | | 1,522,020 | |
| | 670,000 | | Baltimore, Maryland | | 5.00 | % | | 06/15/2033 | | | 680,024 | |
| | 1,260,000 | | Baltimore, Maryland^ | | 3.50 | % | | 06/01/2039 | | | 1,051,637 | |
| | 1,750,000 | | California Municipal Finance Authority^ | | 5.00 | % | | 11/01/2039 | | | 1,742,876 | |
| | 1,000,000 | | Cedar Rapids, Iowa# | | 7.49 | % | | 08/15/2029 | | | 998,750 | |
| | 1,860,000 | | Dallas Fort Worth Texas International Airport | | 5.25 | % | | 11/01/2027 | | | 1,866,486 | |
| | 1,550,000 | | Franklin County Ohio | | 5.00 | % | | 11/15/2034 | | | 1,556,175 | |
| | 1,995,000 | | Frederick County Maryland | | 5.00 | % | | 07/01/2029 | | | 2,177,716 | |
| | 1,390,000 | | Frederick County Maryland | | 5.00 | % | | 07/01/2030 | | | 1,533,080 | |
| | 1,410,000 | | Frederick County Maryland | | 3.75 | % | | 07/01/2039 | | | 1,242,448 | |
| | 1,000,000 | | Gaithersburg, City of Maryland | | 5.00 | % | | 01/01/2028 | | | 1,005,233 | |
| | 2,000,000 | | Gaithersburg, City of Maryland | | 5.00 | % | | 01/01/2033 | | | 1,991,032 | |
| | 2,000,000 | | Lancaster County Pennsylvania Hospital Authority | | 5.00 | % | | 07/01/2035 | | | 1,924,925 | |
| | 2,650,000 | | Lehigh County Pennsylvania (SIFMA Municipal Swap Index + 1.10%) | | 5.07 | % | | 08/15/2038 | | | 2,618,461 | |
| | 1,245,000 | | Maryland Community Development Administration | | 5.00 | % | | 09/01/2030 | | | 1,354,284 | |
| | 1,030,000 | | Maryland Community Development Administration | | 5.00 | % | | 09/01/2031 | | | 1,117,693 | |
| | 3,930,000 | | Maryland Community Development Administration | | 4.60 | % | | 03/01/2042 | | | 3,950,603 | |
| | 2,660,000 | | Maryland Community Development Administration | | 2.41 | % | | 07/01/2043 | | | 1,986,503 | |
| | 1,140,000 | | Maryland Community Development Administration Local Government Infrastructure | | 4.00 | % | | 06/01/2035 | | | 1,199,766 | |
| | 1,000,000 | | Maryland Economic Development Corp. | | 5.00 | % | | 07/01/2028 | | | 1,068,588 | |
| | 750,000 | | Maryland Economic Development Corp. | | 5.00 | % | | 07/01/2029 | | | 811,569 | |
| | 2,600,000 | | Maryland Economic Development Corp.# | | 4.10 | % | | 10/01/2036 | | | 2,651,564 | |
| | 1,500,000 | | Maryland Economic Development Corp. | | 4.00 | % | | 07/01/2040 | | | 1,439,143 | |
| | 4,500,000 | | Maryland Economic Development Corp. | | 4.50 | % | | 07/01/2044 | | | 4,204,030 | |
| | 1,100,000 | | Maryland Stadium Authority | | 1.42 | % | | 05/01/2025 | | | 1,020,580 | |
| | 3,000,000 | | Maryland Stadium Authority | | 5.00 | % | | 05/01/2030 | | | 3,166,159 | |
| | 1,000,000 | | Maryland Stadium Authority | | 4.00 | % | | 06/01/2037 | | | 1,045,444 | |
| | 1,000,000 | | Maryland Stadium Authority | | 5.00 | % | | 09/01/2037 | | | 1,132,764 | |
| | 5,000,000 | | Maryland Stadium Authority | | 5.00 | % | | 05/01/2038 | | | 5,317,069 | |
| | 1,340,000 | | Maryland Stadium Authority Built to Learn Revenue | | 4.00 | % | | 06/01/2035 | | | 1,390,959 | |
| | 1,500,000 | | Maryland State Department of Transportation | | 0.91 | % | | 08/01/2026 | | | 1,315,993 | |
| | 1,715,000 | | Maryland State Department of Transportation | | 5.00 | % | | 10/01/2027 | | | 1,832,524 | |
| | 1,260,000 | | Maryland State Department of Transportation | | 4.00 | % | | 12/01/2029 | | | 1,298,599 | |
| | 1,000,000 | | Maryland State Department of Transportation | | 5.00 | % | | 08/01/2033 | | | 1,103,959 | |
| | 1,150,000 | | Maryland State Department of Transportation | | 4.00 | % | | 08/01/2038 | | | 1,128,735 | |
| | 500,000 | | Maryland State Health & Higher Educational Facilities | | 5.00 | % | | 08/15/2023 | | | 500,717 | |
| | 420,000 | | Maryland State Health & Higher Educational Facilities | | 5.00 | % | | 07/01/2026 | | | 434,529 | |
| | 4,000,000 | | Maryland State Health & Higher Educational Facilities | | 5.00 | % | | 08/15/2027 | | | 4,098,604 | |
| | 2,000,000 | | Maryland State Health & Higher Educational Facilities | | 5.00 | % | | 07/01/2029 | | | 2,126,718 | |
The accompanying notes are an integral part of these financial statements.
Brown Advisory Maryland Bond FundSchedule of Investments
June 30, 2023
| Shares/ | | | | | | | | | | |
| Par Value | | Security Description | | Rate | | Maturity | | Value $ | |
| Municipal Bonds — 97.5% (Continued) | | | | | | | | |
| | | | | | | | | |
| Revenue Bonds — 81.4% (Continued) | | | | | | | | |
| | 100,000 | | Maryland State Health & Higher Educational Facilities | | 4.00 | % | | 10/01/2030 | | | 100,917 | |
| | 300,000 | | Maryland State Health & Higher Educational Facilities | | 4.00 | % | | 10/01/2031 | | | 302,603 | |
| | 1,250,000 | | Maryland State Health & Higher Educational Facilities | | 5.00 | % | | 08/15/2033 | | | 1,280,827 | |
| | 1,955,000 | | Maryland State Health & Higher Educational Facilities | | 5.00 | % | | 07/01/2034 | | | 2,020,241 | |
| | 5,000,000 | | Maryland State Health & Higher Educational Facilities# | | 3.72 | % | | 04/01/2035 | | | 5,000,000 | |
| | 2,000,000 | | Maryland State Health & Higher Educational Facilities# | | 3.68 | % | | 07/01/2036 | | | 2,000,000 | |
| | 5,000,000 | | Maryland State Health & Higher Educational Facilities | | 5.00 | % | | 05/15/2037 | | | 5,123,036 | |
| | 1,200,000 | | Maryland State Health & Higher Educational Facilities | | 5.00 | % | | 07/01/2037 | | | 1,240,959 | |
| | 1,500,000 | | Maryland State Health & Higher Educational Facilities | | 5.00 | % | | 07/01/2038 | | | 1,525,799 | |
| | 4,335,000 | | Maryland State Health & Higher Educational Facilities | | 5.00 | % | | 05/15/2042 | | | 4,473,211 | |
| | 2,650,000 | | Maryland State Health & Higher Educational Facilities (SIFMA Municipal Swap Index + 0.28%) | | 4.29 | % | | 07/01/2042 | | | 2,641,623 | |
| | 1,310,000 | | Maryland State Health & Higher Educational Facilities | | 5.00 | % | | 07/01/2043 | | | 1,318,030 | |
| | 4,000,000 | | Maryland State Health & Higher Educational Facilities# | | 5.00 | % | | 07/01/2045 | | | 4,197,248 | |
| | 2,500,000 | | Maryland State Transportation Authority | | 5.00 | % | | 07/01/2023 | | | 2,500,000 | |
| | 1,510,000 | | Maryland State Transportation Authority | | 5.00 | % | | 07/01/2025 | | | 1,568,446 | |
| | 3,000,000 | | Maryland State Transportation Authority | | 5.00 | % | | 07/01/2025 | | | 3,116,119 | |
| | 4,420,000 | | Maryland State Transportation Authority | | 5.00 | % | | 07/01/2028 | | | 4,791,388 | |
| | 4,330,000 | | Maryland State Transportation Authority | | 4.00 | % | | 06/01/2035 | | | 4,318,105 | |
| | 1,500,000 | | Metropolitan Washington DC Airports Authority | | 5.00 | % | | 10/01/2040 | | | 1,571,266 | |
| | 5,000,000 | | Miami-Dade County Florida Expressway Authority (1 Month LIBOR USD + 1.05%) | | 6.22 | % | | 07/01/2032 | | | 5,015,805 | |
| | 365,000 | | New Hope Texas Cultural Education Facilities Finance Corp.(d) | | 5.50 | % | | 07/01/2046 | | | 164,250 | |
| | 820,000 | | New Hope Texas Cultural Education Facilities Finance Corp.(d) | | 5.75 | % | | 07/01/2051 | | | 369,000 | |
| | 6,760,000 | | New Jersey Transportation Trust Fund Authority+ | | 4.56 | % | | 12/15/2038 | | | 3,479,762 | |
| | 2,000,000 | | Newport News Virginia Economic Development Authority | | 5.00 | % | | 12/01/2031 | | | 2,021,112 | |
| | 2,000,000 | | North Carolina Medical Care Commission | | 5.00 | % | | 10/01/2031 | | | 1,962,814 | |
| | 1,000,000 | | St Mary’s College of Maryland | | 4.00 | % | | 09/01/2024 | | | 1,005,985 | |
| | | | | | | | | | | | 133,424,658 | |
Total Municipal Bonds (Cost $165,816,982) | | | | | | | | 159,838,807 | |
| | | | | | | | | | |
| Short-Term Investments — 2.2% | | | | | | | | | |
| | | | | | | | | | |
| Money Market Funds — 2.2% | | | | | | | | | |
| | 3,582,287 | | First American Government Obligations Fund — Class Z, 4.97%* | | | | | | | | 3,582,287 | |
Total Short-Term Investments (Cost $3,582,287) | | | | | | | | 3,582,287 | |
Total Investments — 99.7% (Cost $169,399,269) | | | | | | | | 163,421,094 | |
Other Assets in Excess of Liabilities — 0.3% | | | | | | | | 540,224 | |
| NET ASSETS — 100.0% | | | | | | | $ | 163,961,318 | |
| # | Variable rate security. Rate disclosed is as of the date of this report. |
| ^ | Security exempt from registration under Rule 144A of the Securities Act of 1933. These securities may be resold in transactions exempt from registration, normally to qualified institutional buyers. |
| + | Zero coupon bond. Rate disclosed is calculated yield to maturity as of the date of this report. |
| (d) | Security is in default and missed all or a portion of its last payment of interest as of the date of this report. |
| * | Annualized seven-day yield as of the date of this report. |
The accompanying notes are an integral part of these financial statements.
Brown Advisory Tax-Exempt Bond FundA Message to Our Shareholders
June 30, 2023
Dear Shareholder:
During the 12-month period ended June 30, 2023, the Brown Advisory Tax-Exempt Bond Fund Investor Shares (the “Fund”) increased 3.54% in value. During the same period, the Bloomberg 1-10 Year Blended Municipal Bond Index, the Fund’s benchmark, increased 2.22%.
After a tumultuous start in 2022, the municipal bond market began to find its footing in the autumn of last year. Broad interest rates showed early signs of stabilization after reaching 2022 peak levels in October, helped by modest improvements in inflation data, and a downshift in the size of Fed rate hikes. Market volatility persisted into the first half of 2023, but as inflation continued to moderate, broad interest rates began to settle into a trading range. The tone of the municipal bond market improved dramatically and contributed to municipals outperforming most other U.S. investment-grade fixed income sectors over the 12-month period. We believe the performance has been driven by increased investor demand, the majority of which has been focused down the curve, as investors have been reluctant to take on duration risk given the continued monetary policy and macroeconomic uncertainty.
This segmentation in maturity demand for municipals has impacted the shape of the muni yield curve, with short and intermediate high-grade yields remaining low, and ultra-short and longer-maturity yields holding at more elevated levels. We believe retail investors remain somewhat gun-shy after last year’s very tough market environment for bonds, particularly when short-term T-Bills are yielding 5.25% or more. Looking at the aggregate level of household balance sheets as reported in the Fed Flow of Funds report, we can see that households have built up very large cash balances and U.S. Treasury positions, while also reducing their aggregate ownership of municipal bonds. At the same time, many state and local government maximum income tax rates have moved higher, with some states opting to add new “millionaire’s brackets”, making tax-exempt municipal income very compelling for these high taxpayers. We believe these shifts could indicate a large amount of dry powder that could return to municipal bonds once macroeconomic factors become less pronounced and interest rate volatility declines. These conditions could also provide a meaningful tailwind for municipal bonds as capital begins to flow back into the asset class.
Within the Fund, yield curve positioning and individual security selection drove much of the relative outperformance during the period. We have kept overall portfolio duration slightly elevated relative to our benchmark while maintaining a barbell, with overweight positions in both floating-rate and 10-year and slightly longer duration bonds, which have recently been higher yielding. We added to our ultra-short duration position overweight during the period as the Fed continued to hike rates and yield curves continued to invert. We believe this ultra-short duration overweight will help provide capital preservation during periods of interest rate volatility, while also currently providing higher yields compared to the tight valuations in some intermediate maturity bonds.
Within credit we have been very focused on late-cycle dynamics, by being opportunistic regarding relatively tight credit spreads and reducing credit risk in spread sectors that could underperform if economic growth deteriorates. The typical forms of revenue (sales, income, and property taxes) for government issuers have been robust, including providing some cushion for inflation concerns, and there has been an incredible amount of federal fiscal stimulus to municipal borrowers. However, we are cognizant of the fact that further credit improvement will likely be difficult in any potential slowdown given a backdrop of lower economic activity, abating wage pressures, and stressed property valuations. Therefore, we are being more selective at this point in the cycle, preferring issuers that have a more robust financial footing.
Given the speed and magnitude of the tightening of monetary policy since the Fed most recently started raising rates, we are watchful for unforeseen risks that may yet surprise the market this year. As we progress deeper into this economic cycle, macroeconomic uncertainty will likely continue to remain at the front of investors’ minds, which may keep market volatility at elevated levels broadly across assets. Yet, we believe the worst of the persistent negative sentiment within municipals is behind us, and that the asset class now appears poised to serve more of its traditional roles such as providing diversification, capital preservation, and tax-efficient income.
Sincerely,
Stephen M. Shutz, CFA
Portfolio Manager
Joshua R. Perry, CFA, CAIA, FRM
Portfolio Manager
Brown Advisory Tax-Exempt Bond FundA Message to Our Shareholders
June 30, 2023
Past performance is not a guarantee of future results.
Mutual fund investing involves risk. Principal loss is possible. The Fund is non-diversified which means it may invest a large percentage of its assets in the securities of fewer issuers. Concentration in a limited number of issuers exposes the Fund to greater market risk than if its assets were diversified among a greater number of issuers. The Fund is also subject to interest rate risk which is the risk that debt securities in the Fund’s portfolio will decline in value because of an increase in market interest rates. This risk is usually greater for longer- term debt securities. Income from tax-exempt funds may be subject to state and local taxes and a portion of income may be subject to the Federal Alternative minimum tax for certain investors.
Diversification does not assure a profit nor protect against loss in a declining market.
Fund holdings and sector allocations are subject to change and should not be considered a recommendation to buy or sell any security. For a complete list of fund holdings, please refer to the Schedule of Investments provided in this report.
Credit Quality weights by rating are derived from the highest bond rating as determined by Standard & Poor’s (“S&P”), Moody’s or Fitch. Bond ratings are grades given to bonds that indicate their credit quality as determined by private independent rating services such as S&P, Moody’s and Fitch. These firms evaluate a bond issuer’s financial strength, or its ability to pay a bond’s principal and interest in a timely fashion. Ratings are expressed as letters ranging from ‘AAA’, which is the highest grade, to ‘D’, which is the lowest grade. In limited situations when none of the three rating agencies have issued a formal rating, the Advisor will classify the security as nonrated.
Definitions for terms and indices are provided in the Glossary of Terms.
Brown Advisory Tax-Exempt Bond FundPerformance Information & Portfolio Holdings Summary
June 30, 2023
GROWTH OF A $10,000 INVESTMENT
The following chart reflects the change in value of a hypothetical $10,000 investment, including reinvested dividends and distributions, in the Fund as measured against the broad-based municipal bond index. The Bloomberg 1-10 Year Blended Municipal Bond Index (“Index”) is a market index of high quality, domestic fixed income securities with maturities of less than 10 years. The Index is unmanaged and does not reflect the deduction of fees, such as investment management fees. Investors cannot invest directly in an index.
| PORTFOLIO HOLDINGS | % of Net Assets |
| | |
Revenue Bonds | | 84.8% |
General Obligation Bonds | | 13.3% |
Money Market Funds | | 1.2% |
Other Assets and Liabilities | | 0.7% |
| | | 100.0% |
Average Annual Total Return | One Year | Five Year | Ten Year |
Institutional Shares1 | 3.59% | 1.80% | 2.23% |
| Investor Shares | 3.54% | 1.75% | 2.18% |
| Bloomberg 1-10 Year Blended Municipal Bond Index | 2.22% | 1.65% | 1.98% |
| | Institutional Shares | Investor Shares |
Gross Expense Ratio2 | 0.42% | 0.47% |
Net Expense Ratio2 | 0.42% | 0.47% |
Past performance does not guarantee future results. The performance data quoted represents past performance and current returns may be lower or higher. The investment return and net asset value will fluctuate so that an investor’s shares, when redeemed, may be worth more or less than the original cost. To obtain performance information current to the most recent month end, please visit our website at brownadvisory.com/mf/tax-exempt-bond-fund. The performance table and graph above do not reflect the deduction of taxes that a shareholder would pay on Fund distributions or the redemption of Fund shares. Performance data does not reflect the imposition of the redemption fee of 1.00% on shares redeemed within 14 days, and if it did, performance would have been lower. Short-term performance, in particular, is not a good indication of the Fund’s future performance, and an investment should not be made based solely on returns. Returns shown are calculated using the net asset values (“NAV”) that were used for shareholder transactions as of the respective period ends. These NAV, and the returns calculated from them, may differ from the NAV and returns shown elsewhere in this report.
1 | Performance information for the Institutional Shares, prior to its inception date of July 2, 2018, is based on the performance of Investor Shares, and adjusted for the lower expenses applicable to Institutional Shares. |
2 | Per the Fund’s prospectus dated October 31, 2022. Refer to the financial highlights for the gross and net expense ratios for the year ended as of the date of this report. Please note that the expense ratios per the prospectus include acquired fund fees and expenses (as applicable) and the expense ratios in the financial highlights do not. |
Brown Advisory Tax-Exempt Bond FundSchedule of Investments
June 30, 2023
| Par Value | | Security Description | | Rate | | Maturity | | Value $ | |
| Municipal Bonds — 98.1% | | | | | | | | |
| | | | | | | | | |
| General Obligation Bonds — 13.3% | | | | | | | | |
| | 9,000,000 | | Chicago Illinois Park District | | 5.00 | % | | 01/01/2044 | | | 9,458,987 | |
| | 5,000,000 | | Comal Texas Independent School District | | 2.50 | % | | 02/01/2038 | | | 4,078,924 | |
| | 3,365,000 | | Des Moines, City of Iowa | | 1.75 | % | | 06/01/2038 | | | 2,399,599 | |
| | 4,545,000 | | Des Moines, City of Iowa | | 2.00 | % | | 06/01/2038 | | | 3,365,883 | |
| | 7,875,000 | | Douglas County Omaha Nebraska School District | | 1.88 | % | | 12/15/2038 | | | 5,650,755 | |
| | 6,475,000 | | Fort Worth, City of Texas | | 2.00 | % | | 03/01/2038 | | | 4,812,228 | |
| | 4,740,000 | | Frisco, City of Texas | | 2.00 | % | | 02/15/2038 | | | 3,514,415 | |
| | 1,675,000 | | Frisco, City of Texas | | 2.00 | % | | 02/15/2038 | | | 1,241,908 | |
| | 6,580,000 | | Hempstead, Town of New York | | 2.13 | % | | 06/15/2037 | | | 5,228,206 | |
| | 6,720,000 | | Hempstead, Town of New York | | 2.13 | % | | 06/15/2038 | | | 5,212,594 | |
| | 2,830,000 | | Henderson, City of Nevada | | 2.00 | % | | 06/01/2038 | | | 2,073,527 | |
| | 1,585,000 | | Henderson, City of Nevada | | 2.00 | % | | 06/01/2039 | | | 1,136,459 | |
| | 3,470,000 | | Illinois, State of | | 5.00 | % | | 11/01/2024 | | | 3,531,692 | |
| | 4,050,000 | | Illinois, State of | | 5.00 | % | | 12/01/2025 | | | 4,187,812 | |
| | 1,700,000 | | Illinois, State of | | 4.00 | % | | 10/01/2033 | | | 1,736,920 | |
| | 8,980,000 | | Illinois, State of | | 5.00 | % | | 05/01/2039 | | | 9,019,731 | |
| | 1,270,000 | | Lewiston, City of Maine | | 1.75 | % | | 02/15/2038 | | | 885,650 | |
| | 1,270,000 | | Lewiston, City of Maine | | 1.75 | % | | 02/15/2039 | | | 861,290 | |
| | 5,810,000 | | Madison Wisconsin Metropolitan School District | | 1.88 | % | | 03/01/2038 | | | 4,219,802 | |
| | 830,000 | | Massachusetts, Commonwealth of (3 Month LIBOR USD + 0.57%) | | 4.12 | % | | 05/01/2037 | | | 829,800 | |
| | 5,005,000 | | New York, City of New York | | 4.00 | % | | 08/01/2038 | | | 5,065,829 | |
| | 2,000,000 | | New York, City of New York | | 4.00 | % | | 08/01/2038 | | | 2,031,192 | |
| | 10,000,000 | | New York, City of New York# | | 4.21 | % | | 04/01/2042 | | | 10,000,000 | |
| | 3,543,800 | | Puerto Rico, Commonwealth of | | 5.25 | % | | 07/01/2023 | | | 3,543,800 | |
| | 5,870,000 | | Rutherford, County of Tennessee | | 1.88 | % | | 04/01/2039 | | | 4,166,525 | |
| | 4,455,000 | | Somerville, City of Massachusetts | | 2.00 | % | | 10/15/2038 | | | 3,308,757 | |
| | 1,645,000 | | Suffolk, City of Virginia | | 1.88 | % | | 02/01/2038 | | | 1,207,067 | |
| | 1,385,000 | | Suffolk, City of Virginia | | 1.88 | % | | 02/01/2040 | | | 972,029 | |
| | 1,525,000 | | Willis Texas Independent School District | | 2.00 | % | | 02/15/2038 | | | 1,123,385 | |
| | 1,500,000 | | Willis Texas Independent School District | | 2.00 | % | | 02/15/2039 | | | 1,077,353 | |
| | | | | | | | | | | | 105,942,119 | |
| Revenue Bonds — 84.8% | | | | | | | | | |
| | 5,310,000 | | American Municipal Power, Inc. | | 4.00 | % | | 02/15/2037 | | | 5,294,343 | |
| | 5,940,000 | | American Municipal Power, Inc. | | 4.00 | % | | 02/15/2038 | | | 5,856,890 | |
| | 4,200,000 | | Austin, Texas | | 7.88 | % | | 09/01/2026 | | | 4,213,195 | |
| | 6,295,000 | | Bartow County Georgia Development Authority# | | 3.95 | % | | 12/01/2032 | | | 6,287,759 | |
| | 17,000,000 | | Black Belt Energy Gas District# | | 4.00 | % | | 12/01/2048 | | | 16,995,084 | |
| | 11,685,000 | | Black Belt Energy Gas District (SIFMA Municipal Swap Index + 0.62%) | | 4.63 | % | | 12/01/2048 | | | 11,670,030 | |
| | 24,000,000 | | Black Belt Energy Gas District (SIFMA Municipal Swap Index + 0.35%) | | 4.36 | % | | 10/01/2052 | | | 23,343,017 | |
| | 7,670,000 | | Black Belt Energy Gas District# | | 5.25 | % | | 01/01/2054 | | | 8,099,115 | |
| | 10,325,000 | | Buckeye Ohio Tobacco Settlement Financing Authority | | 4.00 | % | | 06/01/2037 | | | 10,326,886 | |
| | 5,000,000 | | California Community Choice Financing Authority (SIFMA Municipal Swap Index + 0.45%) | | 4.46 | % | | 02/01/2052 | | | 4,718,139 | |
| | 10,000,000 | | California Earthquake Authority | | 5.60 | % | | 07/01/2027 | | | 10,003,681 | |
| | 1,050,000 | | California Infrastructure & Economic Development Bank (SIFMA Municipal Swap Index + 0.35%) | | 4.36 | % | | 08/01/2047 | | | 1,038,142 | |
| | 12,000,000 | | California Infrastructure & Economic Development Bank#^ | | 3.65 | % | | 01/01/2050 | | | 11,949,904 | |
| | 7,150,000 | | Central Plains Energy Project# | | 5.00 | % | | 03/01/2050 | | | 7,179,936 | |
| | 3,200,000 | | Chicago Illinois Board of Education Dedicated Capital Improvement Tax | | 5.25 | % | | 04/01/2036 | | | 3,515,970 | |
| | 3,700,000 | | Chicago Illinois Board of Education Dedicated Capital Improvement Tax | | 5.25 | % | | 04/01/2037 | | | 4,025,767 | |
| | 3,250,000 | | Chicago Illinois Board of Education Dedicated Capital Improvement Tax | | 5.25 | % | | 04/01/2040 | | | 3,473,748 | |
| | 3,000,000 | | Chicago Illinois Midway International Airport | | 5.00 | % | | 01/01/2035 | | | 3,002,359 | |
| | 4,095,000 | | Chicago Illinois Waterworks Revenue | | 5.00 | % | | 11/01/2044 | | | 4,128,755 | |
| | 7,715,000 | | Colorado Health Facilities Authority | | 5.00 | % | | 12/01/2035 | | | 7,771,380 | |
| | 3,000,000 | | Delaware Valley Pennsylvania Regional Finance Authority (SIFMA Municipal Swap Index + 0.40%) | | 4.41 | % | | 03/01/2057 | | | 2,961,744 | |
| | 7,680,000 | | Du Page, County of Illinois | | 3.00 | % | | 05/15/2047 | | | 5,579,359 | |
| | 20,000,000 | | Farmington, City of New Mexico | | 1.80 | % | | 04/01/2029 | | | 17,215,264 | |
| | 11,875,000 | | Gainesville Florida Utilities System Revenue# | | 3.65 | % | | 10/01/2042 | | | 11,875,000 | |
| | 5,000,000 | | Grand Forks, County of North Dakota^(d)~ | | 6.63 | % | | 12/15/2031 | | | 2,500,000 | |
The accompanying notes are an integral part of these financial statements.
Brown Advisory Tax-Exempt Bond FundSchedule of Investments
June 30, 2023
| Par Value | | Security Description | | Rate | | Maturity | | Value $ | |
| Municipal Bonds — 98.1% (Continued) | | | | | | | | |
| | | | | | | | | |
| Revenue Bonds — 84.8% (Continued) | | | | | | | | |
| | 2,500,000 | | Grand Forks, County of North Dakota^(d)~ | | 9.00 | % | | 06/15/2044 | | | 1,250,000 | |
| | 4,050,000 | | Harris County Texas Sports Authority+ | | 4.50 | % | | 11/15/2034 | | | 2,359,648 | |
| | 1,000,000 | | Henrico County Virginia Economic Development Authority# | | 9.10 | % | | 08/23/2027 | | | 1,000,000 | |
| | 10,335,000 | | Illinois Sales Tax Revenue | | 3.00 | % | | 06/15/2031 | | | 9,784,215 | |
| | 3,000,000 | | Illinois State Toll Highway Authority | | 5.00 | % | | 01/01/2031 | | | 3,003,756 | |
| | 4,150,000 | | Illinois State Toll Highway Authority | | 5.00 | % | | 01/01/2038 | | | 4,169,531 | |
| | 4,891,008 | | Industrial Development Authority of the City of St. Louis Missouri | | 2.22 | % | | 12/01/2038 | | | 3,742,388 | |
| | 1,585,000 | | Kentucky Public Energy Authority# | | 4.00 | % | | 12/01/2049 | | | 1,577,582 | |
| | 4,100,000 | | Kentucky Public Energy Authority (1 Month LIBOR USD + 1.30%) | | 4.76 | % | | 12/01/2049 | | | 4,091,953 | |
| | 3,000,000 | | Lancaster County Pennsylvania Hospital Authority | | 5.00 | % | | 07/01/2035 | | | 2,887,388 | |
| | 2,280,000 | | Las Vegas Nevada Redevelopment Agency | | 5.00 | % | | 06/15/2028 | | | 2,359,719 | |
| | 9,800,000 | | Lehigh County Pennsylvania (SIFMA Municipal Swap Index + 1.10%) | | 4.40 | % | | 08/15/2038 | | | 9,683,365 | |
| | 7,950,000 | | Los Angeles California Department of Airports | | 4.00 | % | | 05/15/2042 | | | 7,838,377 | |
| | 5,000,000 | | Louisville/Jefferson County Kentucky Metropolitan Government | | 5.75 | % | | 10/01/2042 | | | 5,013,428 | |
| | 17,720,000 | | Love Field Texas Airport Modernization Corp. | | 4.00 | % | | 11/01/2036 | | | 17,611,313 | |
| | 17,000,000 | | Main Street Natural Gas, Inc. (1 Month LIBOR USD + 0.83%) | | 4.29 | % | | 08/01/2048 | | | 16,989,820 | |
| | 5,000,000 | | Main Street Natural Gas, Inc. (SIFMA Municipal Swap Index + 0.57%) | | 4.58 | % | | 08/01/2048 | | | 4,994,556 | |
| | 5,290,000 | | Maricopa County Arizona Industrial Development Authority (SIFMA Municipal Swap Index + 0.57%) | | 4.58 | % | | 01/01/2035 | | | 5,274,812 | |
| | 5,000,000 | | Maryland Community Development Administration | | 2.41 | % | | 07/01/2043 | | | 3,734,028 | |
| | 3,000,000 | | Maryland Economic Development Corp. | | 4.38 | % | | 07/01/2036 | | | 2,871,567 | |
| | 3,055,000 | | Massachusetts Housing Finance Agency | | 4.00 | % | | 12/01/2033 | | | 3,045,790 | |
| | 1,495,000 | | Metropolitan Pier & Exposition Authority+ | | 2.42 | % | | 12/15/2033 | | | 990,836 | |
| | 5,000,000 | | Metropolitan Pier & Exposition Authority+ | | 5.66 | % | | 06/15/2036 | | | 2,900,332 | |
| | 10,165,000 | | Metropolitan Pier & Exposition Authority+ | | 4.26 | % | | 06/15/2037 | | | 5,556,139 | |
| | 20,365,000 | | Metropolitan Pier & Exposition Authority+ | | 5.07 | % | | 12/15/2037 | | | 10,834,276 | |
| | 1,705,000 | | Metropolitan Transportation Authority+ | | 3.19 | % | | 11/15/2029 | | | 1,346,454 | |
| | 5,050,000 | | Metropolitan Transportation Authority | | 5.00 | % | | 11/15/2032 | | | 5,106,977 | |
| | 6,000,000 | | Metropolitan Transportation Authority+ | | 3.59 | % | | 11/15/2033 | | | 3,950,919 | |
| | 17,590,000 | | Metropolitan Transportation Authority | | 5.00 | % | | 11/15/2038 | | | 17,591,333 | |
| | 15,000,000 | | Metropolitan Transportation Authority | | 5.00 | % | | 11/15/2038 | | | 15,005,657 | |
| | 5,000,000 | | Metropolitan Transportation Authority | | 5.00 | % | | 11/15/2038 | | | 5,001,886 | |
| | 5,835,000 | | Metropolitan Transportation Authority | | 5.00 | % | | 11/15/2038 | | | 5,835,442 | |
| | 5,000,000 | | Metropolitan Transportation Authority | | 5.25 | % | | 11/15/2044 | | | 5,022,640 | |
| | 10,000,000 | | Miami-Dade County Florida Aviation Revenue | | 5.00 | % | | 10/01/2024 | | | 10,013,224 | |
| | 3,595,000 | | Miami-Dade County Florida Aviation Revenue | | 5.00 | % | | 10/01/2036 | | | 3,610,194 | |
| | 6,055,000 | | Miami-Dade County Florida Expressway Authority (1 Month LIBOR USD + 1.05%) | | 6.22 | % | | 07/01/2026 | | | 6,060,344 | |
| | 5,260,000 | | Miami-Dade County Florida Expressway Authority (1 Month LIBOR USD + 1.05%) | | 6.22 | % | | 07/01/2029 | | | 5,272,168 | |
| | 8,260,000 | | Miami-Dade County Florida Expressway Authority (1 Month LIBOR USD + 1.05%) | | 6.22 | % | | 07/01/2032 | | | 8,286,111 | |
| | 2,500,000 | | Mobile Alabama Industrial Development Board# | | 3.78 | % | | 06/01/2034 | | | 2,500,000 | |
| | 1,080,000 | | New Hope Texas Cultural Education Facilities Finance Corp.(d) | | 5.00 | % | | 07/01/2031 | | | 486,000 | |
| | 1,750,000 | | New Hope Texas Cultural Education Facilities Finance Corp.(d) | | 5.25 | % | | 07/01/2036 | | | 787,500 | |
| | 4,000,000 | | New Hope Texas Cultural Education Facilities Finance Corp. | | 5.00 | % | | 07/01/2046 | | | 2,000,000 | |
| | 250,000 | | New Hope Texas Cultural Education Facilities Finance Corp.(d) | | 5.50 | % | | 07/01/2046 | | | 112,500 | |
| | 2,000,000 | | New Hope Texas Cultural Education Facilities Finance Corp.(d) | | 5.75 | % | | 07/01/2051 | | | 900,000 | |
| | 12,745,000 | | New Jersey Economic Development Authority | | 7.43 | % | | 02/15/2029 | | | 13,702,917 | |
| | 11,000,000 | | New Jersey Transportation Trust Fund Authority | | 5.75 | % | | 12/15/2028 | | | 11,112,221 | |
| | 1,000,000 | | New Jersey Transportation Trust Fund Authority+ | | 2.21 | % | | 12/15/2035 | | | 613,276 | |
| | 10,050,000 | | New Jersey Transportation Trust Fund Authority+ | | 4.23 | % | | 12/15/2037 | | | 5,515,584 | |
| | 5,000,000 | | New Jersey Transportation Trust Fund Authority+ | | 5.15 | % | | 12/15/2038 | | | 2,616,954 | |
| | 21,355,000 | | New Jersey Transportation Trust Fund Authority+ | | 4.62 | % | | 12/15/2039 | | | 10,615,077 | |
| | 13,565,000 | | New Mexico Municipal Energy Acquisition Authority# | | 5.00 | % | | 11/01/2039 | | | 13,856,365 | |
| | 2,000,000 | | New York Convention Center Development Corp.+ | | 3.94 | % | | 11/15/2032 | | | 1,407,908 | |
| | 8,730,000 | | New York Convention Center Development Corp.+ | | 4.30 | % | | 11/15/2035 | | | 5,319,936 | |
| | 5,750,000 | | New York Convention Center Development Corp.+ | | 3.84 | % | | 11/15/2037 | | | 3,107,479 | |
| | 6,700,000 | | New York Liberty Development Corp. | | 3.00 | % | | 09/15/2043 | | | 5,418,382 | |
| | 8,970,000 | | New York State Dormitory Authority | | 4.00 | % | | 03/15/2039 | | | 9,030,958 | |
| | 1,745,000 | | New York State Mortgage Agency | | 4.70 | % | | 04/01/2036 | | | 1,739,044 | |
The accompanying notes are an integral part of these financial statements.
Brown Advisory Tax-Exempt Bond FundSchedule of Investments
June 30, 2023
| Shares/ | | | | | | | | | | |
| Par Value | | Security Description | | Rate | | Maturity | | Value $ | |
| Municipal Bonds — 98.1% (Continued) | | | | | | | | |
| | | | | | | | | |
| Revenue Bonds — 84.8% (Continued) | | | | | | | | |
| | 5,500,000 | | New York Transportation Development Corp. | | 5.00 | % | | 07/01/2041 | | | 5,500,270 | |
| | 3,375,000 | | Newport News Virginia Economic Development Authority | | 5.00 | % | | 12/01/2031 | | | 3,410,626 | |
| | 1,760,000 | | Niagara County New York Tobacco Asset Securitization Corp. | | 5.00 | % | | 05/15/2024 | | | 1,771,250 | |
| | 2,000,000 | | North Carolina Medical Care Commission | | 5.00 | % | | 10/01/2031 | | | 1,962,814 | |
| | 1,000,000 | | Park Creek Colorado Metropolitan District | | 5.00 | % | | 12/01/2034 | | | 1,022,852 | |
| | 10,000,000 | | Patriots Energy Group Financing Agency (1 Month LIBOR USD + 0.86%) | | 4.32 | % | | 10/01/2048 | | | 9,993,935 | |
| | 16,249,000 | | Puerto Rico Sales Tax Financing Corp Sales Tax Revenue+ | | 5.82 | % | | 07/01/2031 | | | 11,612,252 | |
| | 6,234,000 | | Puerto Rico Sales Tax Financing Corp Sales Tax Revenue+ | | 4.50 | % | | 07/01/2033 | | | 4,059,814 | |
| | 3,675,000 | | San Diego California Tobacco Settlement Revenue Funding Corp. | | 4.00 | % | | 06/01/2032 | | | 3,628,805 | |
| | 1,100,000 | | Tampa, City of Florida+ | | 4.66 | % | | 09/01/2039 | | | 518,819 | |
| | 1,280,000 | | Tampa, City of Florida+ | | 4.75 | % | | 09/01/2041 | | | 539,657 | |
| | 1,850,000 | | Tampa, City of Florida+ | | 3.75 | % | | 09/01/2045 | | | 624,566 | |
| | 3,045,000 | | Terrebonne Parish Louisiana+ | | 3.16 | % | | 04/01/2036 | | | 1,869,754 | |
| | 15,115,000 | | Texas Municipal Gas Acquisition & Supply Corp II (3 Month LIBOR USD + 0.87%) | | 4.59 | % | | 09/15/2027 | | | 15,122,450 | |
| | 7,870,000 | | Texas Municipal Gas Acquisition & Supply Corp II (SIFMA Municipal Swap Index + 0.55%) | | 3.85 | % | | 09/15/2027 | | | 7,775,349 | |
| | 15,345,000 | | Texas Municipal Gas Acquisition & Supply Corp II (3 Month LIBOR USD + 0.69%) | | 4.35 | % | | 09/15/2027 | | | 15,269,128 | |
| | 1,630,000 | | Texas Municipal Power Agency | | 3.00 | % | | 09/01/2035 | | | 1,488,453 | |
| | 460,000 | | Tobacco Settlement Authority | | 5.25 | % | | 06/01/2032 | | | 457,715 | |
| | 4,505,000 | | Tobacco Settlement Finance Authority | | 2.55 | % | | 06/01/2029 | | | 3,848,725 | |
| | 23,310,000 | | Tobacco Settlement Financing Corp. | | 5.00 | % | | 06/01/2035 | | | 23,664,256 | |
| | 5,000,000 | | Tobacco Settlement Financing Corp. | | 5.25 | % | | 06/01/2046 | | | 5,192,183 | |
| | 7,960,000 | | TSASC, Inc. | | 5.00 | % | | 06/01/2030 | | | 8,327,699 | |
| | 1,070,000 | | TSASC, Inc. | | 5.00 | % | | 06/01/2031 | | | 1,117,697 | |
| | 5,661,923 | | Utah Housing Corp. | | 3.00 | % | | 01/21/2052 | | | 4,902,042 | |
| | 9,518,413 | | Utah Housing Corp. | | 4.50 | % | | 06/21/2052 | | | 9,328,780 | |
| | 4,955,642 | | Utah Housing Corp. | | 5.00 | % | | 10/21/2052 | | | 4,942,484 | |
| | 11,840,226 | | Vermont Student Assistance Corp. (1 Month LIBOR USD + 1.00%) | | 5.85 | % | | 06/02/2042 | | | 11,865,032 | |
| | 1,230,000 | | Virginia Small Business Financing Authority | | 4.00 | % | | 12/01/2036 | | | 1,130,064 | |
| | 2,540,000 | | Washington Health Care Facilities Authority | | 5.00 | % | | 10/01/2033 | | | 2,540,630 | |
| | 1,610,000 | | Wisconsin Health & Educational Facilities Authority | | 5.00 | % | | 05/01/2027 | | | 1,625,232 | |
| | | | | | | | | | | | 674,649,069 | |
Total Municipal Bonds (Cost $789,132,197) | | | | | | | | 780,591,188 | |
| | | | | | | | | | |
| Short-Term Investments — 1.2% | | | | | | | | | |
| | | | | | | | | | |
| Money Market Funds — 1.2% | | | | | | | | | |
| | 9,788,932 | | First American Government Obligations Fund — Class Z, 4.97%* | | | | | | | | 9,788,932 | |
Total Short-Term Investments (Cost $9,788,932) | | | | | | | | 9,788,932 | |
Total Investments — 99.3% (Cost $798,921,129) | | | | | | | | 790,380,120 | |
Other Assets in Excess of Liabilities — 0.7% | | | | | | | | 5,660,921 | |
| NET ASSETS — 100.0% | | | | | | | $ | 796,041,041 | |
| + | Zero coupon bond. Rate disclosed is calculated yield to maturity as of the date of this report. |
| # | Variable rate security. Rate disclosed is as of the date of this report. |
| ^ | Security exempt from registration under Rule 144A of the Securities Act of 1933. These securities may be resold in transactions exempt from registration, normally to qualified institutional buyers. |
| (d) | Security is in default and missed all or a portion of its last payment of interest as of the date of this report. |
| ~ | Non-income producing |
| * | Annualized seven-day yield as of the date of this report. |
The accompanying notes are an integral part of these financial statements.
Brown Advisory Tax-Exempt Sustainable Bond FundA Message to Our Shareholders
June 30, 2023
Dear Shareholder:
During the 12-month period ended June 30, 2023, the Brown Advisory Tax-Exempt Sustainable Bond Fund Investor Shares (the “Fund”) increased 2.39% in value. During the same period, the Bloomberg 1-10 year Blended Municipal Bond Index, the Fund’s benchmark, increased 2.22%.
After a tumultuous start in 2022, the municipal bond market began to find its footing in the autumn of last year. Broad interest rates showed early signs of stabilization after reaching 2022 peak levels in October, helped by modest improvements in inflation data, and a downshift in the size of Fed rate hikes. Market volatility persisted into the first half of 2023, but as inflation continued to moderate, broad interest rates began to settle into a trading range. The tone of the municipal bond market improved dramatically and contributed to municipals outperforming most other U.S. investment-grade fixed income sectors over the 12-month period. We believe the performance has been driven by increased investor demand, the majority of which has been focused down the curve, as investors have been reluctant to take on duration risk given the continued monetary policy and macroeconomic uncertainty.
This segmentation in maturity demand for municipals has impacted the shape of the muni yield curve, with short and intermediate high-grade yields remaining low, and ultra-short and longer-maturity yields holding at more elevated levels. We believe retail investors remain somewhat gun-shy after last year’s very tough market environment for bonds, particularly when short-term T-Bills are yielding 5.25% or more. Looking at the aggregate level of household balance sheets as reported in the Fed Flow of Funds report, we can see that households have built up very large cash balances and U.S. Treasury positions, while also reducing their aggregate ownership of municipal bonds. At the same time, many state and local government maximum income tax rates have moved higher, with some states opting to add new “millionaire’s brackets”, making tax-exempt municipal income very compelling for these high taxpayers. We believe these shifts could indicate a large amount of dry powder that could return to municipal bonds once macroeconomic factors become less pronounced and interest rate volatility declines. These conditions could also provide a meaningful tailwind for municipal bonds as capital begins to flow back into the asset class.
Within the Fund, yield curve positioning and individual security selection drove much of the relative outperformance during the period. We have kept overall portfolio duration slightly elevated relative to our benchmark while maintaining a barbell, with overweight positions in both floating-rate and 10-year and slightly longer duration bonds, which have recently been higher yielding. We added to our ultra-short duration position overweight during the period as the Fed continued to hike rates and yield curves continued to invert. We believe this ultra-short duration overweight will help provide capital preservation during periods of interest rate volatility, while also currently providing higher yields compared to the tight valuations in some intermediate maturity bonds.
Within credit we have been very focused on late-cycle dynamics, by being opportunistic regarding relatively tight credit spreads and reducing credit risk in spread sectors that could underperform if economic growth deteriorates. The typical forms of revenue (sales, income, and property taxes) for government issuers have been robust, including providing some cushion for inflation concerns, and there has been an incredible amount of federal fiscal stimulus to municipal borrowers. However, we are cognizant of the fact that further credit improvement will be difficult in any potential slowdown given a backdrop of lower economic activity, abating wage pressures, and stressed property valuations. Therefore, we are being more selective at this point in the cycle, preferring issuers that have a more robust financial footing.
Given the speed and magnitude of the tightening of monetary policy since the Fed most recently started raising rates, we are watchful for unforeseen risks that may yet surprise the market this year. As we progress deeper into this economic cycle, macroeconomic uncertainty will likely continue to remain at the front of investors’ minds, which may keep market volatility at elevated levels broadly across assets. Yet, we believe the worst of the persistent negative sentiment within municipals is behind us, and that the asset class now appears poised to serve more of its traditional roles such as providing diversification, capital preservation, and tax-efficient income.
From a sustainability perspective, high interest rates and inflation did not temper demand in the sustainable debt markets during the first half of this year, when green bonds set a new half-year issuance record ($382bn), with an increase in municipal issuance year over year. Social and sustainability bond issuance also grew from the prior year, while the market saw a continued decline in sustainability-linked bonds and loans, following a similar trend in recent quarters as investor confidence in those structures continues to decline.
Brown Advisory Tax-Exempt Sustainable Bond FundA Message to Our Shareholders
June 30, 2023
While we do not invest solely in labeled bonds, they often give us the ability to target specific impact opportunities and timely sustainability issues. With evolving regulatory landscapes and rapidly increasing sustainability challenges, we expect issuance to continue on this growth trajectory.
Sincerely,
Stephen M. Shutz, CFA
Portfolio Manager
Amy N. Hauter, CFA
Portfolio Manager
Past performance is not a guarantee of future results.
Mutual fund investing involves risk. Principal loss is possible. The Fund is non-diversified which means it may invest a large percentage of its assets in the securities of fewer issuers. Concentration in a limited number of issuers exposes the Fund to greater market risk than if its assets were diversified among a greater number of issuers. The Fund is also subject to interest rate risk which is the risk that debt securities in the Fund’s portfolio will decline in value because of an increase in market interest rates. This risk is usually greater for longer- term debt securities. Income from tax-exempt funds may be subject to state and local taxes and a portion of income may be subject to the Federal Alternative minimum tax for certain investors. The Adviser utilizes ESG analysis in connection with the Fund’s investments in fixed-income securities. ESG factors are considered systematically and comprehensively through leveraging a repeatable process that strives to minimize risk and capture opportunity.
Diversification does not assure a profit nor protect against loss in a declining market.
Fund holdings and sector allocations are subject to change and should not be considered a recommendation to buy or sell any security. For a complete list of fund holdings, please refer to the Schedule of Investments provided in this report.
Because the Fund’s ESG criteria exclude securities of certain issuers for nonfinancial reasons, the Fund may forgo some market opportunities available to the funds that do not use these criteria.
Credit Quality weights by rating are derived from the highest bond rating as determined by Standard & Poor’s (“S&P”), Moody’s or Fitch. Bond ratings are grades given to bonds that indicate their credit quality as determined by private independent rating services such as S&P, Moody’s and Fitch. These firms evaluate a bond issuer’s financial strength, or its ability to pay a bond’s principal and interest in a timely fashion. Ratings are expressed as letters ranging from ‘AAA’, which is the highest grade, to ‘D’, which is the lowest grade. In limited situations when none of the three rating agencies have issued a formal rating, the Advisor will classify the security as nonrated.
Definitions for terms and indices are provided in the Glossary of Terms.
Brown Advisory Tax-Exempt Sustainable Bond FundPerformance Information & Portfolio Holdings Summary
June 30, 2023
GROWTH OF A $10,000 INVESTMENT
The following chart reflects the change in value of a hypothetical $10,000 investment, including reinvested dividends and distributions, in the Fund as measured against the broad-based municipal bond index. The Bloomberg 1-10 Year Blended Municipal Bond Index (“Index”) is a market index of high quality, domestic fixed income securities with maturities of less than 10 years. The Index is unmanaged and does not reflect the deduction of fees, such as investment management fees. Investors cannot invest directly in an index.
| PORTFOLIO HOLDINGS | % of Net Assets |
| | |
Revenue Bonds | | 84.7% |
General Obligation Bonds | | 13.8% |
Money Market Funds | | 0.7% |
Other Assets and Liabilities | | 0.8% |
| | | 100.0% |
| | | Since Inception |
Average Annual Total Return | One Year | (12/2/19) |
| Investor Shares | 2.39% | -0.71% |
| Bloomberg 1-10 Year Blended Municipal Bond Index | 2.22% | 0.43% |
| | Investor Shares |
Gross Expense Ratio1 | 0.49% |
Net Expense Ratio1 | 0.49% |
Past performance does not guarantee future results. The performance data quoted represents past performance and current returns may be lower or higher. The investment return and net asset value will fluctuate so that an investor’s shares, when redeemed, may be worth more or less than the original cost. To obtain performance information current to the most recent month end, please visit our website at brownadvisory.com/mf/tax-exempt-sustainable-bond-fund. The performance table and graph above do not reflect the deduction of taxes that a shareholder would pay on Fund distributions or the redemption of Fund shares. Performance data does not reflect the imposition of the redemption fee of 1.00% on shares redeemed within 14 days, and if it did, performance would have been lower. Short-term performance, in particular, is not a good indication of the Fund’s future performance, and an investment should not be made based solely on returns. Returns shown are calculated using the net asset values (“NAV”) that were used for shareholder transactions as of the respective period ends. These NAV, and the returns calculated from them, may differ from the NAV and returns shown elsewhere in this report.
1 | Per the Fund’s prospectus dated October 31, 2022. Refer to the financial highlights for the gross and net expense ratios for the year ended as of the date of this report. Please note that the expense ratios per the prospectus include acquired fund fees and expenses (as applicable) and the expense ratios in the financial highlights do not. |
Brown Advisory Tax-Exempt Sustainable Bond FundSchedule of Investments
June 30, 2023
| Par Value | | Security Description | | Rate | | Maturity | | Value $ | |
| Municipal Bonds — 98.5% | | | | | | | | |
| | | | | | | | | |
| General Obligation Bonds — 13.8% | | | | | | | | |
| | 1,805,000 | | Bondurant-Farrar Iowa Community School District | | 2.00 | % | | 06/01/2038 | | | 1,308,514 | |
| | 2,555,000 | | Bondurant-Farrar Iowa Community School District | | 2.00 | % | | 06/01/2039 | | | 1,816,749 | |
| | 1,035,000 | | Calumet, County of Wisconsin | | 1.75 | % | | 12/01/2037 | | | 732,621 | |
| | 1,320,000 | | Calumet, County of Wisconsin | | 1.88 | % | | 12/01/2038 | | | 932,535 | |
| | 2,650,000 | | Calumet, County of Wisconsin | | 1.88 | % | | 12/01/2039 | | | 1,814,704 | |
| | 3,195,000 | | Cartersville, City of Georgia | | 2.00 | % | | 10/01/2039 | | | 2,323,047 | |
| | 2,425,000 | | Chicago Illinois Park District | | 4.00 | % | | 01/01/2034 | | | 2,445,788 | |
| | 2,930,000 | | Chicago Illinois Park District | | 4.00 | % | | 01/01/2036 | | | 2,942,747 | |
| | 3,845,000 | | Fairfield, City of California+ | | 4.32 | % | | 04/01/2038 | | | 2,083,162 | |
| | 4,950,000 | | Illinois, State of | | 5.00 | % | | 02/01/2039 | | | 4,965,614 | |
| | 1,000,000 | | Westosha Wisconsin Central High School District | | 2.00 | % | | 03/01/2038 | | | 738,721 | |
| | 1,500,000 | | Westosha Wisconsin Central High School District | | 2.00 | % | | 03/01/2039 | | | 1,085,521 | |
| | 10,000,000 | | Wisconsin, State of (SIFMA Municipal Swap Index + 0.42%) | | 4.43 | % | | 05/01/2025 | | | 9,976,648 | |
| | 4,585,000 | | York County South Carolina Fort Mill School District No. 4 | | 1.88 | % | | 03/01/2037 | | | 3,437,771 | |
| | 4,675,000 | | York County South Carolina Fort Mill School District No. 4 | | 1.88 | % | | 03/01/2038 | | | 3,395,532 | |
| | | | | | | | | | | | 39,999,674 | |
| Revenue Bonds — 84.7% | | | | | | | | | |
| | 5,410,000 | | Alabama Housing Finance Authority# | | 5.00 | % | | 09/01/2024 | | | 5,441,559 | |
| | 890,000 | | Alaska Housing Finance Corp. | | 4.60 | % | | 12/01/2042 | | | 892,716 | |
| | 1,750,000 | | Allegheny County Pennsylvania Hospital Development Authority | | | | | | | | | |
| | | | (SIFMA Municipal Swap Index + 0.58%) | | 4.59 | % | | 11/15/2026 | | | 1,711,379 | |
| | 1,000,000 | | American Municipal Power, Inc. | | 5.00 | % | | 02/15/2036 | | | 1,077,393 | |
| | 1,200,000 | | Arizona Industrial Development Authority | | 4.00 | % | | 07/01/2041 | | | 1,071,300 | |
| | 2,250,000 | | Austin, Texas | | 7.88 | % | | 09/01/2026 | | | 2,257,069 | |
| | 1,000,000 | | Baltimore County Maryland | | 4.00 | % | | 01/01/2039 | | | 929,192 | |
| | 1,525,000 | | Baltimore County Maryland | | 4.00 | % | | 01/01/2040 | | | 1,402,250 | |
| | 750,000 | | Buffalo New York Sewer Authority | | 4.00 | % | | 06/15/2051 | | | 705,367 | |
| | 5,000,000 | | California Community Choice Financing Authority (SIFMA Municipal Swap Index + 0.45%) | | 4.46 | % | | 02/01/2052 | | | 4,718,140 | |
| | 5,000,000 | | California Community Choice Financing Authority# | | 5.50 | % | | 05/01/2054 | | | 5,278,004 | |
| | 4,210,000 | | California Earthquake Authority | | 5.39 | % | | 07/01/2023 | | | 4,210,000 | |
| | 8,095,000 | | California Earthquake Authority | | 5.60 | % | | 07/01/2027 | | | 8,097,979 | |
| | 2,000,000 | | California Infrastructure & Economic Development Bank | | 4.00 | % | | 05/01/2046 | | | 1,918,153 | |
| | 4,360,000 | | California Infrastructure & Economic Development Bank (SIFMA Municipal Swap Index + 0.35%) | | 4.36 | % | | 08/01/2047 | | | 4,310,763 | |
| | 8,000,000 | | California Infrastructure & Economic Development Bank#^ | | 3.65 | % | | 01/01/2050 | | | 7,966,602 | |
| | 1,170,000 | | California Municipal Finance Authority^ | | 5.00 | % | | 11/01/2029 | | | 1,203,157 | |
| | 1,575,000 | | California Municipal Finance Authority^ | | 5.00 | % | | 11/01/2049 | | | 1,481,327 | |
| | 1,180,000 | | California School Finance Authority^ | | 5.00 | % | | 07/01/2037 | | | 1,211,965 | |
| | 1,500,000 | | Colorado Health Facilities Authority | | 4.00 | % | | 12/01/2040 | | | 1,291,215 | |
| | 3,000,000 | | Dallas Fort Worth Texas International Airport | | 5.00 | % | | 11/01/2034 | | | 3,496,490 | |
| | 2,500,000 | | District of Columbia Housing Finance Agency# | | 5.00 | % | | 12/01/2026 | | | 2,562,324 | |
| | 7,935,000 | | Douglas, County of Nebraska (SIFMA Municipal Swap Index + 0.53%) | | 4.54 | % | | 07/01/2035 | | | 7,813,211 | |
| | 7,495,000 | | Du Page, County of Illinois | | 3.00 | % | | 05/15/2047 | | | 5,444,961 | |
| | 2,722,000 | | Fairfax County Virginia Redevelopment & Housing Authority# | | 5.00 | % | | 01/01/2025 | | | 2,725,652 | |
| | 2,000,000 | | Florida Development Finance Corp. | | 4.00 | % | | 11/15/2035 | | | 2,005,942 | |
| | 2,500,000 | | Grand Forks, County of North Dakota^(d)~ | | 7.00 | % | | 12/15/2043 | | | 1,250,000 | |
| | 2,500,000 | | Grand Forks, County of North Dakota^(d)~ | | 9.00 | % | | 06/15/2044 | | | 1,250,000 | |
| | 2,700,000 | | Illinois Housing Development Authority | | 4.85 | % | | 10/01/2042 | | | 2,766,032 | |
| | 4,452,000 | | Indiana Housing & Community Development Authority# | | 5.00 | % | | 10/01/2026 | | | 4,530,313 | |
| | 2,445,504 | | Industrial Development Authority of the City of St. Louis Missouri | | 2.22 | % | | 12/01/2038 | | | 1,871,194 | |
| | 9,000,000 | | Lakeland Florida Hospital System | | 5.00 | % | | 11/15/2045 | | | 9,033,295 | |
| | 2,380,000 | | Lancaster County Pennsylvania Hospital Authority | | 5.00 | % | | 08/15/2042 | | | 2,446,253 | |
| | 2,000,000 | | Los Angeles California Department of Airports | | 5.00 | % | | 05/15/2038 | | | 2,175,808 | |
| | 7,020,000 | | Louisville/Jefferson County Kentucky Metropolitan Government | | 5.75 | % | | 10/01/2042 | | | 7,038,853 | |
| | 2,500,000 | | Maryland Community Development Administration | | 2.41 | % | | 07/01/2043 | | | 1,867,014 | |
| | 1,275,000 | | Maryland Economic Development Corp. | | 4.00 | % | | 07/01/2040 | | | 1,223,272 | |
| | 10,000,000 | | Maryland State Health & Higher Educational Facilities | | 5.00 | % | | 08/15/2038 | | | 10,008,689 | |
The accompanying notes are an integral part of these financial statements.
Brown Advisory Tax-Exempt Sustainable Bond FundSchedule of Investments
June 30, 2023
| Par Value | | Security Description | | Rate | | Maturity | | Value $ | |
| Municipal Bonds — 98.5% (Continued) | | | | | | | | |
| | | | | | | | | |
| Revenue Bonds — 84.7% (Continued) | | | | | | | | |
| | 6,000,000 | | Memphis Tennessee Health Educational and Housing Facility Board# | | 5.00 | % | | 07/01/2027 | | | 6,168,976 | |
| | 135,000 | | Metropolitan Pier & Exposition Authority+ | | 2.31 | % | | 12/15/2031 | | | 97,187 | |
| | 270,000 | | Metropolitan Pier & Exposition Authority+ | | 2.87 | % | | 06/15/2034 | | | 175,007 | |
| | 175,000 | | Metropolitan Pier & Exposition Authority+ | | 2.96 | % | | 06/15/2037 | | | 95,654 | |
| | 1,175,000 | | Metropolitan Pier & Exposition Authority+ | | 3.58 | % | | 12/15/2038 | | | 594,869 | |
| | 3,300,000 | | Metropolitan Pier & Exposition Authority+ | | 5.09 | % | | 06/15/2046 | | | 1,109,128 | |
| | 375,000 | | Metropolitan Pier & Exposition Authority+ | | 3.44 | % | | 12/15/2051 | | | 94,336 | |
| | 590,000 | | Metropolitan Pier & Exposition Authority+ | | 3.60 | % | | 12/15/2052 | | | 140,781 | |
| | 12,500,000 | | Metropolitan Transportation Authority (SIFMA Municipal Swap Index + 0.43%) | | 4.44 | % | | 11/01/2031 | | | 12,290,949 | |
| | 5,000,000 | | Metropolitan Transportation Authority | | 5.00 | % | | 11/15/2033 | | | 5,001,613 | |
| | 5,000,000 | | Metropolitan Transportation Authority | | 5.00 | % | | 11/15/2038 | | | 5,001,886 | |
| | 1,250,000 | | Metropolitan Transportation Authority | | 5.00 | % | | 11/15/2038 | | | 1,334,351 | |
| | 1,870,000 | | Metropolitan Transportation Authority | | 5.00 | % | | 11/15/2042 | | | 1,869,931 | |
| | 4,455,000 | | Miami Beach Florida Health Facilities | | 5.00 | % | | 11/15/2039 | | | 4,481,726 | |
| | 1,000,000 | | Montana Board of Housing | | 4.90 | % | | 12/01/2042 | | | 1,022,603 | |
| | 2,500,000 | | Nebraska Investment Finance Authority | | 4.35 | % | | 09/01/2043 | | | 2,463,472 | |
| | 2,775,000 | | Nevada Housing Division# | | 5.00 | % | | 12/01/2025 | | | 2,812,154 | |
| | 1,800,000 | | New Hampshire Housing Finance Authority | | 4.65 | % | | 07/01/2047 | | | 1,812,656 | |
| | 2,075,000 | | New Hope Texas Cultural Education Facilities Finance Corp.(d) | | 5.50 | % | | 07/01/2046 | | | 933,750 | |
| | 6,910,000 | | New Jersey Economic Development Authority (SIFMA Municipal Swap Index + 1.25%) | | 5.26 | % | | 09/01/2025 | | | 6,918,346 | |
| | 1,000,000 | | New Jersey Economic Development Authority | | 3.47 | % | | 06/15/2027 | | | 940,802 | |
| | 2,665,000 | | New Jersey Economic Development Authority | | 4.00 | % | | 06/15/2036 | | | 2,698,907 | |
| | 1,765,000 | | New Jersey Housing & Mortgage Finance Agency | | 1.60 | % | | 10/01/2026 | | | 1,640,592 | |
| | 1,985,000 | | New York City Housing Development Corp. | | 2.60 | % | | 11/01/2034 | | | 1,732,987 | |
| | 4,500,000 | | New York City Housing Development Corp.# | | 4.00 | % | | 05/01/2062 | | | 4,500,000 | |
| | 6,340,000 | | New York Liberty Development Corp. | | 3.00 | % | | 09/15/2043 | | | 5,127,245 | |
| | 4,660,000 | | New York Liberty Development Corp. | | 3.13 | % | | 09/15/2050 | | | 3,628,009 | |
| | 1,950,000 | | New York State Housing Finance Agency | | 1.60 | % | | 11/01/2024 | | | 1,891,409 | |
| | 1,321,608 | | New York State Housing Finance Agency | | 1.65 | % | | 05/15/2039 | | | 934,292 | |
| | 2,285,000 | | North Dakota Housing Finance Agency | | 4.60 | % | | 07/01/2043 | | | 2,305,050 | |
| | 1,500,000 | | Portland Maine General Airport Revenue | | 4.00 | % | | 01/01/2038 | | | 1,474,680 | |
| | 6,220,000 | | San Francisco California Airport Commission-San Francisco International Airport | | 5.00 | % | | 05/01/2038 | | | 6,749,094 | |
| | 7,000,000 | | Seattle Washington Municipal Light & Power (SIFMA Municipal Swap Index + 0.49%) | | 4.50 | % | | 11/01/2046 | | | 7,000,999 | |
| | 10,000,000 | | Tampa Bay Florida Water | | 5.00 | % | | 10/01/2038 | | | 10,029,510 | |
| | 1,957,000 | | Utah Housing Corp.# | | 5.00 | % | | 08/01/2025 | | | 1,979,969 | |
| | 1,887,308 | | Utah Housing Corp. | | 3.00 | % | | 01/21/2052 | | | 1,634,014 | |
| | 4,759,481 | | Utah Housing Corp. | | 4.50 | % | | 06/21/2052 | | | 4,664,659 | |
| | 2,477,821 | | Utah Housing Corp. | | 5.00 | % | | 10/21/2052 | | | 2,471,242 | |
| | 2,250,000 | | Virginia Small Business Financing Authority | | 4.00 | % | | 01/01/2036 | | | 2,186,701 | |
| | | | | | | | | | | | 244,694,369 | |
Total Municipal Bonds (Cost $295,696,492) | | | | | | | | 284,694,043 | |
| | | | | | | | | | |
| Short-Term Investments — 0.7% | | | | | | | | | |
| | | | | | | | | | |
| Money Market Funds — 0.7% | | | | | | | | | |
| | 1,959,564 | | First American Government Obligations Fund — Class Z, 4.97%* | | | | | | | | 1,959,564 | |
Total Short-Term Investments (Cost $1,959,564) | | | | | | | | 1,959,564 | |
Total Investments — 99.2% (Cost $297,656,056) | | | | | | | | 286,653,607 | |
Other Assets in Excess of Liabilities — 0.8% | | | | | | | | 2,339,062 | |
| NET ASSETS — 100.0% | | | | | | | $ | 288,992,669 | |
| + | Zero coupon bond. Rate disclosed is calculated yield to maturity as of the date of this report. |
| # | Variable rate security. Rate disclosed is as of the date of this report. |
| ^ | Security exempt from registration under Rule 144A of the Securities Act of 1933. These securities may be resold in transactions exempt from registration, normally to qualified institutional buyers. |
| (d) | Security is in default and missed all or a portion of its last payment of interest as of the date of this report. |
| ~ | Non-income producing |
| * | Annualized seven-day yield as of the date of this report. |
The accompanying notes are an integral part of these financial statements.
Brown Advisory Mortgage Securities FundA Message to Our Shareholders
June 30, 2023
Dear Shareholder:
During the 12-month period ended June 30, 2023, the Brown Advisory Mortgage Securities Fund Investor Shares (the “Fund”) decreased 2.11% in value. During the same period, the Bloomberg Mortgage Backed Securities Index, the Fund’s benchmark, decreased 1.52%.
The Fund aims to generate performance primarily through strong current income generation from high quality mortgage-related securities selected to have favorable relative valuations and principal repayment characteristics. This is supplemented by select securitized credit positions in mortgage and asset backed securities. We believe this combination can deliver attractive income generation with relatively low correlation to equity and corporate credit.
With the Fed more than a year into an aggressive interest rate hiking cycle, inflation has moderated in recent quarters, with U.S. CPI dropping to 3.0% recently, down from more than 6% at the start of the year and 9% a year ago. However, mixed economic data, including more stubborn inflation from core CPI measures, strength in the employment and labor markets, and stronger than expected consumer spending has encouraged the Fed to continue raising rates, albeit with a softening tone. Furthermore, expensive housing continues to pressure consumers, particularly new homebuyers and those who were unable to benefit from the abnormally low mortgage rates of 2020 and 2021.
While interest rates entered the year with declining volatility and signs of stabilization, this changed by February as short-term rates rose to new interim heights, resulting in the most inverted yield curve in more than 40 years. Interest rate volatility, as measured by the Ice BofA MOVE Index, also peaked early in the year and reached its highest point since 2008 before easing in the second quarter. As a result, mortgage rates were also volatile over the period, and positive momentum from the end of 2022 dissipated by February with the average 30-year fixed mortgage rate closing the first half of the year just shy of its recent peak of 7.42% at 7.04%.
Under this volatile rate environment, mortgage sector performance was mixed. Security selection within MBS was a negative contributor over the first half of the year, primarily in January when strong investor demand and declining interest rate volatility leading into the year led to strong sector performance. Our conservative allocation to MBS and our exposure to less interest rate sensitive mortgage assets caused us to lag during this period. This was offset by positive performance for our positions in asset backed securities and commercial mortgage backed securities, which contributed positively despite volatility during the early spring. Finally, the severe flattening of the yield curve in the second quarter negatively impacted performance, while the resulting curve inversion additionally weakened the carry position of the Fund.
Despite an uncertain environment, we believe that mortgage investors will start to transition from macroeconomic to security-specific thinking, as policymakers reach an inflection point in the tightening cycle. Consumers continue to feel the pressure of inflation and a tightening borrowing environment, and regardless of whether inflation continues its normalizing trend, the impact of the past inflationary years will likely weigh on consumers for years to come. Costs are likely to remain high within the housing market, where tight supply shows no signs of easing as low locked-in mortgage rates discourage mobility. Offsetting these negative headwinds is a resilient labor market, potentially allowing consumers to weather this challenging environment, but also challenging progress in disinflation. We continue to believe the risk-reward favors conservative positioning, and we will continue to focus on short duration and high credit quality sectors. We have been adding recently to short securitized credit positions, which we believe provide attractive yield along with high credit quality, and we will continue to look for these opportunities.
Sincerely,
Garritt Conover, CFA, CAIA
Portfolio Manager
Chris Roof
Associate Portfolio Manager
Brown Advisory Mortgage Securities FundA Message to Our Shareholders
June 30, 2023
Past performance is not a guarantee of future results.
Mutual fund investing involves risk. Principal loss is possible. The Fund is subject to interest rate risk which is the risk that debt securities in the Fund’s portfolio will decline in value because of increases in market interest rates. Investments in Asset Backed and Mortgage Backed Securities include additional risks that investors should be aware of such as credit risk, prepayment risk, possible illiquidity and default, as well as increased susceptibility to adverse economic developments. Investments in debt securities typically decrease in value when interest rates rise. The risk is usually greater for longer-term debt securities. Inflation-indexed bonds see the principal value of the security increased as the Consumer Price Index increases. Should the Consumer Price Index decline, those securities should be adversely impacted. Diversification does not assure a profit, nor does it protect against a loss in a declining market.
Fund holdings and sector allocations are subject to change and should not be considered a recommendation to buy or sell any security. For a complete list of fund holdings, please refer to the Schedule of Investments provided in this report.
Definitions for terms and indices are provided in the Glossary of Terms.
Brown Advisory Mortgage Securities FundPerformance Information & Portfolio Holdings Summary
June 30, 2023
GROWTH OF A $10,000 INVESTMENT
The following chart reflects the change in value of a hypothetical $10,000 investment, including reinvested dividends and distributions, in the Fund as measured against a broad-based bond index. The Bloomberg Mortgage Backed Securities Index (“Index”) is a market value-weighted index which covers the mortgage-backed securities component of the Bloomberg US Aggregate Bond Index. The Index is composed of agency mortgage-backed passthrough securities of the Government National Mortgage Association (Ginnie Mae), the Federal National Mortgage Association (Fannie Mae), and the Federal Home Loan Mortgage Corporation (Freddie Mac) with a minimum $150 million par amount outstanding and a weighted-average maturity of at least 1 year. The Index includes reinvestment of income. The Index is unmanaged and does not reflect the deduction of fees, such as investment management fees. Investors cannot invest directly in an index.
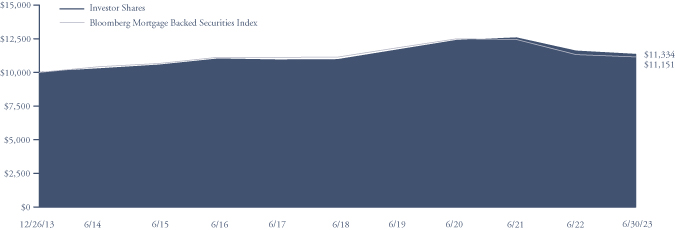
| PORTFOLIO HOLDINGS | % of Net Assets |
| | |
Mortgage Backed Securities | | 87.4% |
Money Market Funds | | 28.5% |
Asset Backed Securities | | 7.5% |
U.S. Treasury Notes | | 1.4% |
Municipal Bonds | | 0.2% |
Liabilities in Excess of Other Assets* | | (25.0)% |
| | | 100.0% |
* Includes unrealized appreciation (depreciation) on futures contracts.
| | | | Since Inception |
Average Annual Total Return | One Year | Five Year | (12/26/13) |
Institutional Shares1 | -2.06% | 0.74% | 1.36% |
| Investor Shares | -2.11% | 0.71% | 1.33% |
| Bloomberg Mortgage Backed Securities Index | -1.52% | 0.03% | 1.15% |
| | Institutional Shares | Investor Shares |
Gross Expense Ratio2 | 0.44% | 0.49% |
Net Expense Ratio2 | 0.44% | 0.49% |
Past performance does not guarantee future results. The performance data quoted represents past performance and current returns may be lower or higher. The investment return and net asset value will fluctuate so that an investor’s shares, when redeemed, may be worth more or less than the original cost. To obtain performance information current to the most recent month end, please visit our website at brownadvisory.com/mf/mortgage-securities-fund. The performance table and graph above do not reflect the deduction of taxes that a shareholder would pay on Fund distributions or the redemption of Fund shares. Performance data does not reflect the imposition of the redemption fee of 1.00% on shares redeemed within 14 days, and if it did, performance would have been lower. Short-term performance, in particular, is not a good indication of the Fund’s future performance, and an investment should not be made based solely on returns. Returns shown are calculated using the net asset values (“NAV”) that were used for shareholder transactions as of the respective period ends. These NAV, and the returns calculated from them, may differ from the NAV and returns shown elsewhere in this report.
1 | Performance information for the Institutional Shares, prior to its inception date of May 13, 2014, is based on the performance of the Investor Shares, and adjusted for the lower expenses applicable to the Institutional Shares. |
2 | Per the Fund’s prospectus dated October 31, 2022. Refer to the financial highlights for the gross and net expense ratios for the year ended as of the date of this report. Please note that the expense ratios per the prospectus include acquired fund fees and expenses (as applicable) and the expense ratios in the financial highlights do not. |
Brown Advisory Mortgage Securities FundSchedule of Investments
June 30, 2023
| Par Value | | Security Description | | Rate | | Maturity | | Value $ | |
| Mortgage Backed Securities — 87.4% | | | | | | | | |
| | 2,316,530 | | Angel Oak Mortgage Trust, Series 2022-1 A1^+ | | 2.88 | % | | 12/25/2066 | | | 2,019,332 | |
| | 3,000,951 | | Bayview MSR Opportunity Master Fund Trust INV2, Series 2022-2 A1#^ | | 3.00 | % | | 12/25/2051 | | | 2,533,785 | |
| | 34,830 | | FHLMC PC, Pool# N3-0530 | | 5.50 | % | | 01/01/2029 | | | 34,772 | |
| | 47,014 | | FHLMC PC, Pool# C5-3878 | | 5.50 | % | | 12/01/2030 | | | 47,267 | |
| | 104,410 | | FHLMC PC, Pool# C9-1366 | | 4.50 | % | | 04/01/2031 | | | 102,654 | |
| | 49,055 | | FHLMC PC, Pool# C6-6421 | | 6.50 | % | | 02/01/2032 | | | 50,518 | |
| | 157,126 | | FHLMC PC, Pool# N7-0078 | | 5.50 | % | | 01/01/2033 | | | 154,327 | |
| | 39,618 | | FHLMC PC, Pool# A1-4256 | | 5.50 | % | | 10/01/2033 | | | 39,790 | |
| | 119,014 | | FHLMC PC, Pool# G3-0932 | | 4.50 | % | | 03/01/2034 | | | 117,015 | |
| | 378,296 | | FHLMC PC, Pool# C9-1826 | | 3.00 | % | | 05/01/2035 | | | 353,486 | |
| | 18,928 | | FHLMC PC, Pool# 1J-0204 (12 Month LIBOR USD + 1.75%) | | 5.12 | % | | 05/01/2035 | | | 18,427 | |
| | 106,489 | | FHLMC PC, Pool# N7-0071 | | 6.00 | % | | 06/01/2035 | | | 105,484 | |
| | 35,862 | | FHLMC PC, Pool# A4-6629 | | 5.00 | % | | 08/01/2035 | | | 36,085 | |
| | 232,582 | | FHLMC PC, Pool# K9-3365 | | 3.50 | % | | 11/01/2035 | | | 220,484 | |
| | 228,191 | | FHLMC PC, Pool# K9-3349 | | 4.00 | % | | 11/01/2035 | | | 220,232 | |
| | 16,652 | | FHLMC PC, Pool# 1L-1263 (1 Year CMT Rate + 2.25%) | | 4.61 | % | | 03/01/2036 | | | 16,799 | |
| | 15,350 | | FHLMC PC, Pool# 1H-1348 (1 Year CMT Rate + 2.14%) | | 4.17 | % | | 10/01/2036 | | | 15,625 | |
| | 109,820 | | FHLMC PC, Pool# G2-0028 | | 7.50 | % | | 12/01/2036 | | | 111,917 | |
| | 65,772 | | FHLMC PC, Pool# B3-1891 | | 5.38 | % | | 01/01/2037 | | | 66,018 | |
| | 83,222 | | FHLMC PC, Pool# B3-1900 | | 5.38 | % | | 02/01/2037 | | | 83,597 | |
| | 4,292 | | FHLMC PC, Pool# 84-7727 (12 Month LIBOR USD + 1.74%) | | 5.49 | % | | 02/01/2037 | | | 4,204 | |
| | 41,228 | | FHLMC PC, Pool# B3-1934 | | 5.38 | % | | 04/01/2037 | | | 41,411 | |
| | 83,665 | | FHLMC PC, Pool# B3-1976 | | 5.10 | % | | 05/01/2037 | | | 83,187 | |
| | 21,704 | | FHLMC PC, Pool# 1J-1681 (12 Month LIBOR USD + 1.98%) | | 5.73 | % | | 06/01/2037 | | | 21,565 | |
| | 48,508 | | FHLMC PC, Pool# U3-0653 | | 5.13 | % | | 07/01/2037 | | | 48,630 | |
| | 61,024 | | FHLMC PC, Pool# U3-0606 | | 5.10 | % | | 09/01/2037 | | | 60,681 | |
| | 199,325 | | FHLMC PC, Pool# U3-0681 | | 5.10 | % | | 09/01/2037 | | | 198,793 | |
| | 43,655 | | FHLMC PC, Pool# 1G-2249 (12 Month LIBOR USD + 1.78%) | | 4.03 | % | | 10/01/2037 | | | 42,747 | |
| | 123,377 | | FHLMC PC, Pool# T3-0346 | | 5.38 | % | | 10/01/2037 | | | 124,187 | |
| | 620,328 | | FHLMC PC, Pool# G3-1063 | | 3.50 | % | | 11/01/2037 | | | 588,041 | |
| | 73,977 | | FHLMC PC, Pool# U3-0800 | | 5.10 | % | | 11/01/2037 | | | 73,552 | |
| | 3,188,172 | | FHLMC PC, Pool# WA-3311 | | 2.21 | % | | 04/01/2038 | | | 2,341,534 | |
| | 129,826 | | FHLMC PC, Pool# U3-1874 | | 5.38 | % | | 04/01/2038 | | | 130,497 | |
| | 286,757 | | FHLMC PC, Pool# N7-0082 | | 6.00 | % | | 07/01/2038 | | | 285,209 | |
| | 108,391 | | FHLMC PC, Pool# G0-4655 | | 6.00 | % | | 08/01/2038 | | | 113,088 | |
| | 122,490 | | FHLMC PC, Pool# G0-4540 | | 6.00 | % | | 08/01/2038 | | | 127,763 | |
| | 88,897 | | FHLMC PC, Pool# U3-2470 | | 5.10 | % | | 11/01/2038 | | | 88,402 | |
| | 61,353 | | FHLMC PC, Pool# G0-8348 | | 5.00 | % | | 06/01/2039 | | | 61,903 | |
| | 271,843 | | FHLMC PC, Pool# C0-3427 | | 5.50 | % | | 10/01/2039 | | | 278,666 | |
| | 74,822 | | FHLMC PC, Pool# G0-8828 | | 5.50 | % | | 04/01/2048 | | | 74,674 | |
| | 1,394,811 | | FHLMC PC, Pool# QC-5310 | | 3.00 | % | | 08/01/2051 | | | 1,233,271 | |
| | 3,778,527 | | FHLMC PC, Pool# QD-5779 | | 3.00 | % | | 01/01/2052 | | | 3,329,273 | |
| | 3,190,503 | | FHLMC PC, Pool# SD-0846 | | 2.50 | % | | 02/01/2052 | | | 2,725,253 | |
| | 5,187,561 | | FHLMC PC, Pool# SD-8196 | | 3.50 | % | | 02/01/2052 | | | 4,734,688 | |
| | 3,906,261 | | FHLMC PC, Pool# RA-6966 | | 2.00 | % | | 03/01/2052 | | | 3,204,684 | |
| | 1,795,394 | | FHLMC PC, Pool# QD-7450 | | 3.00 | % | | 03/01/2052 | | | 1,585,816 | |
| | 4,185,949 | | FHLMC PC, Pool# QD-7999 | | 4.00 | % | | 03/01/2052 | | | 3,933,172 | |
| | 551,981 | | FHLMC PC, Pool# QE-0622 | | 2.00 | % | | 04/01/2052 | | | 454,772 | |
| | 977,681 | | FHLMC PC, Pool# QE-0380 | | 2.50 | % | | 04/01/2052 | | | 835,419 | |
| | 3,102,115 | | FHLMC PC, Pool# QD-9382 | | 4.00 | % | | 04/01/2052 | | | 2,916,770 | |
| | 2,591,306 | | FHLMC PC, Pool# QD-9775 | | 4.00 | % | | 04/01/2052 | | | 2,434,549 | |
| | 2,850,316 | | FHLMC PC, Pool# QE-0898 | | 4.50 | % | | 04/01/2052 | | | 2,742,457 | |
| | 3,750,634 | | FHLMC PC, Pool# RA-7374 | | 3.00 | % | | 05/01/2052 | | | 3,306,925 | |
| | 3,138,911 | | FHLMC PC, Pool# QE-2358 | | 3.50 | % | | 05/01/2052 | | | 2,868,763 | |
| | 3,209,001 | | FHLMC PC, Pool# QE-3174 | | 3.50 | % | | 06/01/2052 | | | 2,932,794 | |
| | 2,826,771 | | FHLMC PC, Pool# QF-0493 | | 5.50 | % | | 09/01/2052 | | | 2,838,249 | |
| | 3,257,043 | | FHLMC PC, Pool# QF-0773 | | 5.50 | % | | 09/01/2052 | | | 3,251,481 | |
The accompanying notes are an integral part of these financial statements.
Brown Advisory Mortgage Securities FundSchedule of Investments
June 30, 2023
| Par Value | | Security Description | | Rate | | Maturity | | Value $ | |
| Mortgage Backed Securities — 87.4% (Continued) | | | | | | | | |
| | 3,501,052 | | FHLMC PC, Pool# SD-1846 | | 4.50 | % | | 10/01/2052 | | | 3,374,014 | |
| | 1,890 | | FHLMC REMIC, Series 1843 Z | | 7.00 | % | | 04/15/2026 | | | 1,888 | |
| | 42,695 | | FHLMC REMIC, Series 2517 Z | | 5.50 | % | | 10/15/2032 | | | 40,996 | |
| | 568,321 | | FHLMC REMIC, Series 2907 VZ | | 4.50 | % | | 05/15/2034 | | | 544,925 | |
| | 167,354 | | FHLMC REMIC, Series 2890 ZA | | 5.00 | % | | 11/15/2034 | | | 166,039 | |
| | 306,254 | | FHLMC REMIC, Series 3150 DZ | | 5.50 | % | | 05/15/2036 | | | 307,524 | |
| | 166,828 | | FHLMC REMIC, Series 3294 CB | | 5.50 | % | | 03/15/2037 | | | 169,588 | |
| | 138,291 | | FHLMC REMIC, Series 3830 NB | | 4.50 | % | | 02/15/2039 | | | 137,642 | |
| | 762,204 | | FHLMC REMIC, Series 4121 DH | | 2.00 | % | | 10/15/2042 | | | 557,500 | |
| | 418,568 | | FHLMC REMIC, Series 4872 AB | | 4.00 | % | | 08/15/2047 | | | 403,799 | |
| | 127,323 | | FHLMC REMIC, Series 4891 PA | | 3.50 | % | | 07/15/2048 | | | 121,058 | |
| | 687,817 | | FHLMC REMIC, Series 4888 AC | | 3.50 | % | | 01/15/2049 | | | 638,517 | |
| | 2,072,784 | | FHLMC REMIC, Series 5080 PB | | 1.25 | % | | 03/25/2050 | | | 1,549,136 | |
| | 2,690,149 | | FHLMC REMIC, Series 5083 UB | | 1.25 | % | | 03/25/2051 | | | 2,034,635 | |
| | 282,908 | | FHLMC SCRTT, Series 2017-1 M1#^ | | 4.00 | % | | 01/25/2056 | | | 279,411 | |
| | 6,046,532 | | FHMS, Series K-035 X1#~ | | 0.57 | % | | 08/25/2023 | | | 1,143 | |
| | 5,846,067 | | FHMS, Series K-040 X1#~ | | 0.81 | % | | 09/25/2024 | | | 37,310 | |
| | 6,692,031 | | FHMS, Series Q-013 XPT1#~ | | 1.66 | % | | 05/25/2025 | | | 136,556 | |
| | 5,567,171 | | FHMS, Series Q-013 XPT2#~ | | 1.81 | % | | 05/25/2027 | | | 147,247 | |
| | 547,295 | | FHMS, Series Q-006 APT2# | | 2.76 | % | | 10/25/2028 | | | 516,927 | |
| | 361,347 | | FHMS, Series Q-004 A2H# | | 4.17 | % | | 01/25/2046 | | | 359,066 | |
| | 109,336 | | FHMS, Series Q-010 APT1# | | 4.90 | % | | 04/25/2046 | | | 108,654 | |
| | 787,014 | | FHMS, Series Q-004 A4H# | | 4.50 | % | | 08/25/2046 | | | 782,481 | |
| | 705,430 | | FHMS, Series Q-007 APT1# | | 5.02 | % | | 10/25/2047 | | | 702,213 | |
| | 777,938 | | FHS, Series 366 IO~ | | 4.00 | % | | 08/01/2049 | | | 134,415 | |
| | 1,000,000 | | FNMA, Pool# AN9202 | | 3.32 | % | | 05/01/2025 | | | 954,522 | |
| | 9,105 | | FNMA, Pool# 336422 (3 Year CMT Rate + 2.30%) | | 3.43 | % | | 10/01/2025 | | | 8,981 | |
| | 10,405 | | FNMA, Pool# 344903 | | 5.50 | % | | 10/01/2025 | | | 10,364 | |
| | 33,275 | | FNMA, Pool# 356232 | | 6.50 | % | | 01/01/2026 | | | 34,004 | |
| | 14,858 | | FNMA, Pool# 406521 (1 Year CMT Rate + 2.52%) | | 3.90 | % | | 05/01/2026 | | | 14,444 | |
| | 30,365 | | FNMA, Pool# 356329 (1 Year CMT Rate + 2.65%) | | 4.78 | % | | 01/01/2027 | | | 29,645 | |
| | 11,252 | | FNMA, Pool# 363850 (1 Year CMT Rate + 2.13%) | | 4.90 | % | | 04/01/2027 | | | 11,044 | |
| | 19,252 | | FNMA, Pool# 406380 (1 Year CMT Rate + 2.17%) | | 4.34 | % | | 11/01/2027 | | | 18,918 | |
| | 150,000 | | FNMA, Pool# AN8842 | | 3.32 | % | | 04/01/2028 | | | 141,174 | |
| | 2,698,256 | | FNMA, Pool# BL0387 | | 4.28 | % | | 05/01/2028 | | | 2,638,441 | |
| | 346,492 | | FNMA, Pool# 257203 | | 5.00 | % | | 05/01/2028 | | | 344,074 | |
| | 767,318 | | FNMA, Pool# 958720 | | 5.65 | % | | 10/01/2028 | | | 799,632 | |
| | 310,969 | | FNMA, Pool# 957502 | | 3.98 | % | | 07/01/2029 | | | 309,803 | |
| | 27,056 | | FNMA, Pool# 520478 (1 Year CMT Rate + 2.10%) | | 4.23 | % | | 11/01/2029 | | | 26,495 | |
| | 59,745 | | FNMA, Pool# AL0898 | | 5.00 | % | | 02/01/2031 | | | 59,766 | |
| | 1,127,094 | | FNMA, Pool# AI4717 | | 4.50 | % | | 07/01/2031 | | | 1,113,905 | |
| | 27,735 | | FNMA, Pool# 656181 (1 Year CMT Rate + 2.16%) | | 4.35 | % | | 08/01/2031 | | | 26,962 | |
| | 2,150,000 | | FNMA, Pool# BL4313 | | 2.31 | % | | 09/01/2031 | | | 1,822,816 | |
| | 29,102 | | FNMA, Pool# 723313 (1 Year CMT Rate + 2.54%) | | 4.54 | % | | 09/01/2031 | | | 28,736 | |
| | 788,025 | | FNMA, Pool# 470828 | | 3.53 | % | | 03/01/2032 | | | 729,755 | |
| | 8,076 | | FNMA, Pool# 642122 (1 Year CMT Rate + 2.27%) | | 4.40 | % | | 03/01/2032 | | | 7,664 | |
| | 7,752 | | FNMA, Pool# 628837 | | 6.50 | % | | 03/01/2032 | | | 7,922 | |
| | 12,657 | | FNMA, Pool# 640225 (1 Year CMT Rate + 2.27%) | | 4.40 | % | | 04/01/2032 | | | 12,080 | |
| | 31,907 | | FNMA, Pool# 662138 (1 Year CMT Rate + 2.30%) | | 4.30 | % | | 09/01/2032 | | | 31,505 | |
| | 24,731 | | FNMA, Pool# 668309 (1 Year CMT Rate + 2.02%) | | 4.02 | % | | 11/01/2032 | | | 24,340 | |
| | 24,377 | | FNMA, Pool# 696546 (6 Month LIBOR USD + 2.26%) | | 4.63 | % | | 03/01/2033 | | | 23,708 | |
| | 5,334 | | FNMA, Pool# 555819 (6 Month LIBOR USD + 1.03%) | | 4.28 | % | | 07/01/2033 | | | 5,225 | |
| | 25,829 | | FNMA, Pool# 744805 (6 Month LIBOR USD + 1.52%) | | 4.27 | % | | 11/01/2033 | | | 25,214 | |
| | 11,017 | | FNMA, Pool# 751498 (1 Year CMT Rate + 2.22%) | | 4.34 | % | | 11/01/2033 | | | 10,760 | |
| | 23,006 | | FNMA, Pool# 741373 (1 Year CMT Rate + 2.28%) | | 4.41 | % | | 12/01/2033 | | | 22,582 | |
| | 24,385 | | FNMA, Pool# 764342 (6 Month LIBOR USD + 1.52%) | | 3.90 | % | | 02/01/2034 | | | 23,917 | |
| | 24,998 | | FNMA, Pool# 774969 (1 Year CMT Rate + 2.28%) | | 5.28 | % | | 04/01/2034 | | | 24,624 | |
The accompanying notes are an integral part of these financial statements.
Brown Advisory Mortgage Securities FundSchedule of Investments
June 30, 2023
| Par Value | | Security Description | | Rate | | Maturity | | Value $ | |
| Mortgage Backed Securities — 87.4% (Continued) | | | | | | | | |
| | 100,197 | | FNMA, Pool# 783554 (1 Year CMT Rate + 2.21%) | | 4.21 | % | | 07/01/2034 | | | 99,113 | |
| | 2,814 | | FNMA, Pool# 819649 (12 Month LIBOR USD + 1.52%) | | 4.12 | % | | 03/01/2035 | | | 2,743 | |
| | 34,991 | | FNMA, Pool# 889829 | | 5.00 | % | | 07/01/2035 | | | 35,262 | |
| | 29,412 | | FNMA, Pool# 830970 (12 Month LIBOR USD + 1.83%) | | 4.08 | % | | 08/01/2035 | | | 28,857 | |
| | 421,930 | | FNMA, Pool# AL7654 | | 3.00 | % | | 09/01/2035 | | | 393,729 | |
| | 20,199 | | FNMA, Pool# 837329 (1 Year CMT Rate + 2.04%) | | 4.04 | % | | 09/01/2035 | | | 19,945 | |
| | 46,974 | | FNMA, Pool# 836715 (12 Month LIBOR USD + 1.77%) | | 4.02 | % | | 10/01/2035 | | | 46,165 | |
| | 108,124 | | FNMA, Pool# 842006 | | 4.25 | % | | 10/01/2035 | | | 105,685 | |
| | 18,352 | | FNMA, Pool# 922680 (12 Month LIBOR USD + 1.91%) | | 4.88 | % | | 11/01/2035 | | | 18,622 | |
| | 228,910 | | FNMA, Pool# 850232 | | 4.25 | % | | 12/01/2035 | | | 223,987 | |
| | 11,138 | | FNMA, Pool# 865849 (12 Month LIBOR USD + 1.54%) | | 3.94 | % | | 03/01/2036 | | | 10,872 | |
| | 202,875 | | FNMA, Pool# AB0577 | | 4.00 | % | | 03/01/2036 | | | 190,642 | |
| | 9,289 | | FNMA, Pool# 877009 (12 Month LIBOR USD + 2.38%) | | 6.15 | % | | 03/01/2036 | | | 9,298 | |
| | 16,774 | | FNMA, Pool# 868568 (12 Month LIBOR USD + 1.74%) | | 4.61 | % | | 04/01/2036 | | | 16,473 | |
| | 33,960 | | FNMA, Pool# 882017 (6 Month LIBOR USD + 1.56%) | | 4.31 | % | | 05/01/2036 | | | 33,132 | |
| | 17,045 | | FNMA, Pool# 745626 (1 Year CMT Rate + 2.14%) | | 4.99 | % | | 05/01/2036 | | | 16,767 | |
| | 4,154 | | FNMA, Pool# 872895 (12 Month LIBOR USD + 1.88%) | | 6.13 | % | | 06/01/2036 | | | 4,091 | |
| | 15,447 | | FNMA, Pool# 886163 (12 Month LIBOR USD + 1.83%) | | 4.08 | % | | 07/01/2036 | | | 15,184 | |
| | 214,787 | | FNMA, Pool# 896838 | | 5.45 | % | | 07/01/2036 | | | 211,620 | |
| | 69,036 | | FNMA, Pool# 745818 | | 6.50 | % | | 09/01/2036 | | | 71,177 | |
| | 26,706 | | FNMA, Pool# 995521 (12 Month LIBOR USD + 1.82%) | | 5.32 | % | | 05/01/2037 | | | 26,003 | |
| | 26,003 | | FNMA, Pool# 941050 (12 Month LIBOR USD + 1.70%) | | 3.95 | % | | 08/01/2037 | | | 25,469 | |
| | 35,634 | | FNMA, Pool# 950382 (6 Month LIBOR USD + 1.11%) | | 5.54 | % | | 08/01/2037 | | | 35,941 | |
| | 30,334 | | FNMA, Pool# 952835 (1 Year CMT Rate + 2.32%) | | 4.75 | % | | 09/01/2037 | | | 30,606 | |
| | 1,427,758 | | FNMA, Pool# MA3208 | | 4.50 | % | | 10/01/2037 | | | 1,394,098 | |
| | 67,667 | | FNMA, Pool# 955233 | | 6.50 | % | | 12/01/2037 | | | 69,866 | |
| | 206,912 | | FNMA, Pool# AD0100 | | 7.00 | % | | 12/01/2038 | | | 220,297 | |
| | 83,580 | | FNMA, Pool# 930507 | | 6.50 | % | | 02/01/2039 | | | 85,395 | |
| | 1,346,429 | | FNMA, Pool# AS2249 | | 4.00 | % | | 04/01/2039 | | | 1,295,444 | |
| | 199,120 | | FNMA, Pool# AL0407 | | 6.50 | % | | 04/01/2039 | | | 202,838 | |
| | 155,946 | | FNMA, Pool# AD0427 | | 5.50 | % | | 10/01/2039 | | | 159,756 | |
| | 220,610 | | FNMA, Pool# AD0941 | | 5.50 | % | | 04/01/2040 | | | 226,499 | |
| | 575,653 | | FNMA, Pool# 467095 | | 5.90 | % | | 01/01/2041 | | | 601,995 | |
| | 275,474 | | FNMA, Pool# AH8447 | | 5.50 | % | | 04/01/2041 | | | 275,632 | |
| | 893,522 | | FNMA, Pool# 469130 | | 4.87 | % | | 10/01/2041 | | | 889,708 | |
| | 226,507 | | FNMA, Pool# BC1738 | | 4.50 | % | | 09/01/2043 | | | 222,355 | |
| | 206,118 | | FNMA, Pool# AS1429 | | 4.00 | % | | 12/01/2043 | | | 199,022 | |
| | 234,999 | | FNMA, Pool# AV7739 | | 4.00 | % | | 01/01/2044 | | | 226,394 | |
| | 136,132 | | FNMA, Pool# AW6485 | | 4.00 | % | | 06/01/2044 | | | 131,441 | |
| | 188,641 | | FNMA, Pool# AY0382 | | 4.00 | % | | 11/01/2044 | | | 180,579 | |
| | 337,806 | | FNMA, Pool# AW9534 | | 4.00 | % | | 03/01/2045 | | | 323,817 | |
| | 117,670 | | FNMA, Pool# AZ4154 | | 4.00 | % | | 06/01/2045 | | | 113,951 | |
| | 940,713 | | FNMA, Pool# AZ7828 | | 4.00 | % | | 08/01/2045 | | | 899,507 | |
| | 509,623 | | FNMA, Pool# BA3674 | | 4.50 | % | | 10/01/2045 | | | 500,667 | |
| | 316,880 | | FNMA, Pool# BC6366 | | 4.50 | % | | 02/01/2046 | | | 309,737 | |
| | 192,045 | | FNMA, Pool# BD1241 | | 4.50 | % | | 05/01/2046 | | | 187,630 | |
| | 693,607 | | FNMA, Pool# BD5189 | | 4.50 | % | | 07/01/2046 | | | 681,094 | |
| | 167,820 | | FNMA, Pool# BD8599 | | 4.50 | % | | 11/01/2046 | | | 164,550 | |
| | 291,723 | | FNMA, Pool# BH7686 | | 4.50 | % | | 12/01/2047 | | | 284,812 | |
| | 329,649 | | FNMA, Pool# BJ8287 | | 4.50 | % | | 01/01/2048 | | | 320,511 | |
| | 350,249 | | FNMA, Pool# BK5105 | | 5.50 | % | | 05/01/2048 | | | 351,735 | |
| | 377,751 | | FNMA, Pool# BK8032 | | 5.50 | % | | 06/01/2048 | | | 380,472 | |
| | 1,000,000 | | FNMA, Pool# AN9931 | | 4.24 | % | | 08/01/2048 | | | 885,971 | |
| | 182,348 | | FNMA, Pool# BN4936 | | 5.50 | % | | 12/01/2048 | | | 182,099 | |
| | 105,170 | | FNMA, Pool# BN4921 | | 5.50 | % | | 01/01/2049 | | | 104,977 | |
| | 2,653,389 | | FNMA, Pool# BP5419 | | 3.00 | % | | 05/01/2050 | | | 2,373,106 | |
| | 1,389,046 | | FNMA, Pool# BQ6307 | | 2.00 | % | | 11/01/2050 | | | 1,143,259 | |
The accompanying notes are an integral part of these financial statements.
Brown Advisory Mortgage Securities FundSchedule of Investments
June 30, 2023
| Par Value | | Security Description | | Rate | | Maturity | | Value $ | |
| Mortgage Backed Securities — 87.4% (Continued) | | | | | | | | |
| | 2,885,516 | | FNMA, Pool# BQ3248 | | 2.00 | % | | 11/01/2050 | | | 2,373,751 | |
| | 995,726 | | FNMA, Pool# MA4208 | | 2.00 | % | | 12/01/2050 | | | 819,765 | |
| | 830,135 | | FNMA, Pool# BR5634 | | 2.00 | % | | 03/01/2051 | | | 683,220 | |
| | 3,714,531 | | FNMA, Pool# FM8754 | | 3.00 | % | | 09/01/2051 | | | 3,299,747 | |
| | 3,286,462 | | FNMA, Pool# FS0031 | | 2.50 | % | | 10/01/2051 | | | 2,790,828 | |
| | 460,292 | | FNMA, Pool# FS1480 | | 2.50 | % | | 11/01/2051 | | | 393,572 | |
| | 4,994,980 | | FNMA, Pool# FM9760 | | 3.50 | % | | 11/01/2051 | | | 4,563,800 | |
| | 1,173,114 | | FNMA, Pool# MA4492 | | 2.00 | % | | 12/01/2051 | | | 958,514 | |
| | 3,348,896 | | FNMA, Pool# FS0348 | | 2.00 | % | | 01/01/2052 | | | 2,753,995 | |
| | 3,087,152 | | FNMA, Pool# CB2548 | | 2.50 | % | | 01/01/2052 | | | 2,634,251 | |
| | 3,118,174 | | FNMA, Pool# CB2539 | | 2.50 | % | | 01/01/2052 | | | 2,667,398 | |
| | 1,086,918 | | FNMA, Pool# FS0731 | | 2.00 | % | | 02/01/2052 | | | 894,296 | |
| | 2,709,274 | | FNMA, Pool# CB2909 | | 3.50 | % | | 02/01/2052 | | | 2,472,533 | |
| | 4,023,213 | | FNMA, Pool# CB3103 | | 2.50 | % | | 03/01/2052 | | | 3,456,117 | |
| | 2,872,012 | | FNMA, Pool# FS0832 | | 3.50 | % | | 03/01/2052 | | | 2,621,719 | |
| | 1,974,317 | | FNMA, Pool# MA4565 | | 3.50 | % | | 03/01/2052 | | | 1,802,511 | |
| | 1,454,544 | | FNMA, Pool# FS0922 | | 3.50 | % | | 03/01/2052 | | | 1,328,007 | |
| | 2,686,607 | | FNMA, Pool# BV4532 | | 3.50 | % | | 03/01/2052 | | | 2,451,640 | |
| | 4,236,939 | | FNMA, Pool# FS0945 | | 4.00 | % | | 03/01/2052 | | | 3,982,381 | |
| | 3,745,955 | | FNMA, Pool# FS1521 | | 3.00 | % | | 04/01/2052 | | | 3,329,260 | |
| | 740,453 | | FNMA, Pool# BW0025 | | 4.00 | % | | 07/01/2052 | | | 696,802 | |
| | 9,915 | | FNMA REMIC Trust, Series 1996-23 G | | 6.50 | % | | 07/25/2026 | | | 9,890 | |
| | 1,992,944 | | FNMA REMIC Trust, Series 2017-T1 A | | 2.90 | % | | 06/25/2027 | | | 1,845,443 | |
| | 586,929 | | FNMA REMIC Trust, Series 2012-139 HI~ | | 2.50 | % | | 12/25/2027 | | | 21,056 | |
| | 44,191 | | FNMA REMIC Trust, Series 2013-15 QI~ | | 3.00 | % | | 03/25/2028 | | | 1,973 | |
| | 96,020 | | FNMA REMIC Trust, Series 2001-80 Z | | 6.00 | % | | 01/25/2032 | | | 95,063 | |
| | 142,894 | | FNMA REMIC Trust, Series 2006-M2 A2A# | | 5.27 | % | | 10/25/2032 | | | 141,152 | |
| | 264,179 | | FNMA REMIC Trust, Series 2003-71 MB | | 5.50 | % | | 08/25/2033 | | | 265,363 | |
| | 1,175,745 | | FNMA REMIC Trust, Series 2014-8 IQ~ | | 4.00 | % | | 03/25/2034 | | | 136,843 | |
| | 6,470,657 | | FNMA REMIC Trust, Series 2021-95 WI#~ | | 0.00 | % | | 05/25/2035 | | | 177,673 | |
| | 1,660,087 | | FNMA REMIC Trust, Series 2005-73 EZ | | 5.50 | % | | 08/25/2035 | | | 1,650,590 | |
| | 588,232 | | FNMA REMIC Trust, Series 2005-110 GL | | 5.50 | % | | 12/25/2035 | | | 594,160 | |
| | 267,673 | | FNMA REMIC Trust, Series 2006-21 Z | | 5.50 | % | | 04/25/2036 | | | 267,982 | |
| | 829,308 | | FNMA REMIC Trust, Series 2006-112 QC | | 5.50 | % | | 11/25/2036 | | | 835,862 | |
| | 379,959 | | FNMA REMIC Trust, Series 2007-22 A | | 5.50 | % | | 03/25/2037 | | | 386,210 | |
| | 418,000 | | FNMA REMIC Trust, Series 2008-2 PH | | 5.50 | % | | 02/25/2038 | | | 423,698 | |
| | 579,411 | | FNMA REMIC Trust, Series 2009-20 DA (1 Month LIBOR USD + 7.40%)~ | | 2.25 | % | | 04/25/2039 | | | 68,749 | |
| | 989,148 | | FNMA REMIC Trust, Series 2012-65 HJ | | 5.00 | % | | 07/25/2040 | | | 983,778 | |
| | 729,840 | | FNMA REMIC Trust, Series 2012-27 PI~ | | 4.50 | % | | 02/25/2042 | | | 63,324 | |
| | 47,342 | | FNMA REMIC Trust, Series 2012-10 UF (1 Month LIBOR USD + 0.55%) | | 5.70 | % | | 02/25/2042 | | | 46,763 | |
| | 290,514 | | FNMA REMIC Trust, Series 2013-34 IG~ | | 3.00 | % | | 05/25/2042 | | | 32,557 | |
| | 6,283 | | FNMA REMIC Trust, Series 2003-W10 3A5 | | 4.30 | % | | 06/25/2043 | | | 5,903 | |
| | 1,741 | | FNMA REMIC Trust, Series 2003-W12 1A9 | | 4.48 | % | | 06/25/2043 | | | 1,674 | |
| | 10,445 | | FNMA REMIC Trust, Series 2003-W12 1A8 | | 4.55 | % | | 06/25/2043 | | | 10,007 | |
| | 5,967 | | FNMA REMIC Trust, Series 2003-W12 2A7 | | 4.68 | % | | 06/25/2043 | | | 5,700 | |
| | 6,961 | | FNMA REMIC Trust, Series 2003-W12 2A6 | | 5.00 | % | | 06/25/2043 | | | 6,750 | |
| | 335,742 | | FNMA REMIC Trust, Series 2015-40 LI~ | | 4.50 | % | | 03/25/2045 | | | 62,202 | |
| | 188,024 | | FNMA REMIC Trust, Series 2018-86 JA | | 4.00 | % | | 05/25/2047 | | | 179,732 | |
| | 873,033 | | FNMA REMIC Trust, Series 2019-37 IM~ | | 5.00 | % | | 07/25/2049 | | | 121,084 | |
| | 24,700,000 | | FNMA, 2.00%, Due TBA July | | 2.00 | % | | 07/15/2053 | | | 20,148,832 | |
| | 9,000,000 | | FNMA, 2.50%, Due TBA July | | 2.50 | % | | 07/15/2053 | | | 7,633,125 | |
| | 3,500,000 | | FNMA, 3.00%, Due TBA July | | 3.00 | % | | 07/15/2053 | | | 3,080,957 | |
| | 13,650,000 | | FNMA, 3.50%, Due TBA July | | 3.50 | % | | 07/15/2053 | | | 12,440,162 | |
| | 19,450,000 | | FNMA, 4.00%, Due TBA July | | 4.00 | % | | 07/15/2053 | | | 18,254,889 | |
| | 3,200,000 | | FNMA, 5.00%, Due TBA July | | 5.00 | % | | 07/15/2053 | | | 3,137,251 | |
| | 627,436 | | FREMF Mortgage Trust, Series 2020-KF74 B (1 Month LIBOR USD + 2.15%)^ | | 7.34 | % | | 01/25/2027 | | | 596,181 | |
| | 842,540 | | FREMF Mortgage Trust, Series 2019-KF73 B (1 Month LIBOR USD + 2.45%)^ | | 7.64 | % | | 11/25/2029 | | | 780,652 | |
The accompanying notes are an integral part of these financial statements.
Brown Advisory Mortgage Securities FundSchedule of Investments
June 30, 2023
| Par Value | | Security Description | | Rate | | Maturity | | Value $ | |
| Mortgage Backed Securities — 87.4% (Continued) | | | | | | | | |
| | 3,567 | | GNMA, Pool# 783374X | | 5.50 | % | | 04/15/2024 | | | 3,560 | |
| | 22,402 | | GNMA, Pool# 728160X | | 5.25 | % | | 11/15/2024 | | | 22,101 | |
| | 149,738 | | GNMA, Pool# 623145X | | 5.50 | % | | 10/15/2028 | | | 150,552 | |
| | 726,486 | | GNMA, Pool# 589694X | | 4.50 | % | | 08/15/2029 | | | 704,871 | |
| | 24,970 | | GNMA, Pool# 728157X | | 3.75 | % | | 11/15/2029 | | | 24,087 | |
| | 219,672 | | GNMA, Pool# 770225C | | 4.25 | % | | 08/20/2031 | | | 218,241 | |
| | 248,097 | | GNMA, Pool# 003160M | | 6.00 | % | | 11/20/2031 | | | 257,464 | |
| | 344,425 | | GNMA, Pool# 003489M | | 6.00 | % | | 12/20/2033 | | | 360,581 | |
| | 182,939 | | GNMA, Pool# 782173M | | 5.50 | % | | 05/20/2035 | | | 188,528 | |
| | 661,299 | | GNMA, Pool# MA7106M | | 2.00 | % | | 01/20/2036 | | | 587,455 | |
| | 644,238 | | GNMA, Pool# MA7164M | | 2.00 | % | | 02/20/2036 | | | 572,349 | |
| | 39,490 | | GNMA, Pool# 784315X | | 6.00 | % | | 06/15/2036 | | | 40,603 | |
| | 190,434 | | GNMA, Pool# 770226C | | 4.75 | % | | 09/20/2036 | | | 188,469 | |
| | 112,604 | | GNMA, Pool# 004194M | | 5.50 | % | | 07/20/2038 | | | 116,404 | |
| | 608,119 | | GNMA, Pool# AC0521C | | 5.50 | % | | 05/20/2042 | | | 625,014 | |
| | 872,191 | | GNMA, Pool# BM9287C | | 4.00 | % | | 08/20/2049 | | | 830,097 | |
| | 373,760 | | GNMA, Pool# MA7834M | | 6.00 | % | | 01/20/2052 | | | 389,426 | |
| | 1,878,117 | | GNMA, Pool# CJ2171C | | 4.00 | % | | 05/20/2052 | | | 1,766,085 | |
| | 224,318 | | GNMA REMIC Trust, Series 2013-168 IA~ | | 2.50 | % | | 11/16/2028 | | | 7,920 | |
| | 352,321 | | GNMA REMIC Trust, Series 2004-93 PD | | 5.00 | % | | 11/16/2034 | | | 345,633 | |
| | 62,165 | | GNMA REMIC Trust, Series 2006-40 B | | 6.00 | % | | 08/20/2036 | | | 62,238 | |
| | 371,580 | | GNMA REMIC Trust, Series 2012-52 WA# | | 6.19 | % | | 04/20/2038 | | | 379,508 | |
| | 656,035 | | GNMA REMIC Trust, Series 2016-012 KI~ | | 5.00 | % | | 09/20/2038 | | | 89,605 | |
| | 382,499 | | GNMA REMIC Trust, Series 2017-083 ID~ | | 7.00 | % | | 01/20/2039 | | | 48,328 | |
| | 456,021 | | GNMA REMIC Trust, Series 2011-2 DP# | | 5.46 | % | | 03/20/2039 | | | 454,163 | |
| | 626,007 | | GNMA REMIC Trust, Series 2010-105 IB~ | | 4.50 | % | | 01/16/2040 | | | 59,061 | |
| | 463,425 | | GNMA REMIC Trust, Series 2016-68 IC#~ | | 6.00 | % | | 01/20/2040 | | | 64,618 | |
| | 682,000 | | GNMA REMIC Trust, Series 2011-156 PM | | 2.00 | % | | 04/20/2040 | | | 544,724 | |
| | 779,446 | | GNMA REMIC Trust, Series 2017-083 IK~ | | 6.00 | % | | 05/20/2040 | | | 144,383 | |
| | 222,099 | | GNMA REMIC Trust, Series 2016-112 AW# | | 7.00 | % | | 12/20/2040 | | | 231,529 | |
| | 1,031,828 | | GNMA REMIC Trust, Series 2012-143 IC~ | | 5.00 | % | | 10/16/2041 | | | 162,689 | |
| | 831,612 | | GNMA REMIC Trust, Series 2012-97 GB | | 2.00 | % | | 08/16/2042 | | | 677,294 | |
| | 551,473 | | GNMA REMIC Trust, Series 2013-86 IA~ | | 5.00 | % | | 06/20/2043 | | | 63,113 | |
| | 785,642 | | GNMA REMIC Trust, Series 2017-103 IM~ | | 5.00 | % | | 06/20/2043 | | | 104,244 | |
| | 349,926 | | GNMA REMIC Trust, Series 2014-06 IG~ | | 4.50 | % | | 01/16/2044 | | | 42,039 | |
| | 158,686 | | GNMA REMIC Trust, Series 2011-127 C# | | 3.50 | % | | 03/16/2047 | | | 155,549 | |
| | 296,695 | | GNMA REMIC Trust, Series 2018-127 PB | | 3.00 | % | | 09/20/2047 | | | 273,809 | |
| | 2,775 | | GNMA REMIC Trust, Series 2018-166 AB | | 4.00 | % | | 10/20/2047 | | | 2,756 | |
| | 1,945,537 | | GNMA REMIC Trust, Series 2017-167 SE (1 Month LIBOR USD + 6.20%)~ | | 1.04 | % | | 11/20/2047 | | | 207,518 | |
| | 37,134 | | GNMA REMIC Trust, Series 2018-166 BA | | 3.50 | % | | 11/20/2047 | | | 36,746 | |
| | 1,989,803 | | GNMA REMIC Trust, Series 2018-036 LI~ | | 5.00 | % | | 03/20/2048 | | | 275,827 | |
| | 497,311 | | GNMA REMIC Trust, Series 2018-153 QA | | 3.50 | % | | 11/20/2048 | | | 468,597 | |
| | 579,422 | | GNMA REMIC Trust, Series 2019-162 KB | | 2.00 | % | | 12/20/2049 | | | 385,047 | |
| | 552,000 | | GNMA REMIC Trust, Series 2021-050 PL | | 1.25 | % | | 03/20/2051 | | | 257,320 | |
| | 1,840,300 | | GNMA REMIC Trust, Series 2021-125 UL | | 1.50 | % | | 07/20/2051 | | | 1,389,316 | |
| | 1,049,804 | | GNMA REMIC Trust, Series 2021-160 DK | | 2.00 | % | | 09/20/2051 | | | 729,627 | |
| | 1,791,418 | | GNMA REMIC Trust, Series 2021-177 KD | | 2.00 | % | | 10/20/2051 | | | 1,413,451 | |
| | 2,655,492 | | GNMA REMIC Trust, Series 2022-009 CD | | 2.00 | % | | 01/20/2052 | | | 2,138,705 | |
| | 1,099,277 | | GNMA REMIC Trust, Series 2014-135 I0#~ | | 0.43 | % | | 01/16/2056 | | | 20,523 | |
| | 1,113,910 | | GNMA REMIC Trust, Series 2015-172 I0#~ | | 0.61 | % | | 03/16/2057 | | | 23,963 | |
| | 2,153,348 | | GNMA REMIC Trust, Series 2016-40 I0#~ | | 0.61 | % | | 07/16/2057 | | | 47,710 | |
| | 1,450,182 | | GNMA REMIC Trust, Series 2016-56 I0#~ | | 1.00 | % | | 11/16/2057 | | | 62,528 | |
| | 2,141,107 | | GNMA REMIC Trust, Series 2016-98 I0#~ | | 0.86 | % | | 05/16/2058 | | | 83,730 | |
| | 5,500,000 | | GNMA, 2.00%, Due TBA July | | 2.00 | % | | 07/15/2053 | | | 4,624,082 | |
| | 8,600,000 | | GNMA, 3.00%, Due TBA July | | 3.00 | % | | 07/15/2053 | | | 7,685,914 | |
| | 4,242,316 | | JP Morgan Mortgage Trust, Series 2021-INV4 A2#^ | | 3.00 | % | | 01/25/2052 | | | 3,581,903 | |
| | 5,937,425 | | Mello Mortgage Capital Acceptance, Series 2021-INV4 A3#^ | | 2.50 | % | | 12/26/2051 | | | 4,794,577 | |
The accompanying notes are an integral part of these financial statements.
Brown Advisory Mortgage Securities FundSchedule of Investments
June 30, 2023
| Shares/ | | | | | | | | | | |
| Par Value | | Security Description | | Rate | | Maturity | | Value $ | |
| Mortgage Backed Securities — 87.4% (Continued) | | | | | | | | |
| | 3,342,860 | | Mello Mortgage Capital Acceptance, Series 2022-INV2 A2#^ | | 3.50 | % | | 04/25/2052 | | | 2,905,714 | |
| | 3,130,788 | | RCKT Mortgage Trust, Series 2021-6 A1#^ | | 2.50 | % | | 12/25/2051 | | | 2,528,167 | |
| | 3,083,252 | | RCKT Mortgage Trust, Series 2022-4 A1#^ | | 4.00 | % | | 06/25/2052 | | | 2,774,565 | |
| | 244,283 | | SBA, Pool# 522053 (PRIME + 0.62%) | | 8.62 | % | | 05/25/2026 | | | 244,385 | |
Total Mortgage Backed Securities (Cost $284,053,054) | | | | | | | | 265,447,329 | |
| | | | | | | | | | | | | |
| Asset Backed Securities — 7.5% | | | | | | | | | |
| | 3,500,000 | | American Express Credit Account Master Trust, Series 2022-2 A | | 3.39 | % | | 05/15/2027 | | | 3,379,773 | |
| | 1,862,746 | | American Homes 4 Rent Trust, Series 2014-SFR2 A^ | | 3.79 | % | | 10/17/2036 | | | 1,807,497 | |
| | 2,130,000 | | American Homes 4 Rent Trust, Series 2014-SFR2 B^ | | 4.29 | % | | 10/17/2036 | | | 2,074,698 | |
| | 2,290,098 | | American Homes 4 Rent Trust, Series 2014-SFR3 A^ | | 3.68 | % | | 12/18/2036 | | | 2,210,533 | |
| | 308,517 | | American Homes 4 Rent Trust, Series 2015-SFR1 A^ | | 3.47 | % | | 04/18/2052 | | | 295,237 | |
| | 212,512 | | American Homes 4 Rent Trust, Series 2015-SFR2 A^ | | 3.73 | % | | 10/18/2052 | | | 203,652 | |
| | 250,000 | | American Homes 4 Rent Trust, Series 2015-SFR2 C^ | | 4.69 | % | | 10/18/2052 | | | 242,235 | |
| | 1,404,000 | | AmeriCredit Automobile Receivables Trust, Series 2021-1 D | | 1.21 | % | | 12/18/2026 | | | 1,281,590 | |
| | 1,505,000 | | CarMax Auto Owner Trust, Series 2021-2 C | | 1.34 | % | | 02/16/2027 | | | 1,376,878 | |
| | 566,648 | | Dext ABS LLC, Series 2021-1 A^ | | 1.12 | % | | 02/15/2028 | | | 544,201 | |
| | 380,000 | | Dext ABS LLC, Series 2021-1 B^ | | 1.76 | % | | 02/15/2028 | | | 346,934 | |
| | 561,966 | | FHF Trust, Series 2021-2A A^ | | 0.83 | % | | 12/15/2026 | | | 535,427 | |
| | 314,904 | | FHF Trust, Series 2021-1A A^ | | 1.27 | % | | 03/15/2027 | | | 302,593 | |
| | 2,985,000 | | John Deere Owner Trust, Series 2023-B A2 | | 5.59 | % | | 06/15/2026 | | | 2,984,623 | |
| | 792,053 | | JPMorgan Chase Bank NA — CACLN, Series 2021-3 B^ | | 0.76 | % | | 02/26/2029 | | | 754,421 | |
| | 1,505,000 | | PFS Financing Corp., Series 2021-A A^ | | 0.71 | % | | 04/15/2026 | | | 1,442,079 | |
| | 1,500,000 | | Toyota Auto Receivables Owner Trust, Series 2023-B A2A | | 5.28 | % | | 05/15/2026 | | | 1,494,102 | |
| | 1,500,000 | | Verizon Master Trust, Series 2022-4 A | | 3.40 | % | | 11/20/2028 | | | 1,446,782 | |
Total Asset Backed Securities (Cost $23,594,915) | | | | | | | | 22,723,255 | |
| | | | | | | | | | | | | |
| U.S. Treasury Notes — 1.4% | | | | | | | | | |
| | 1,040,000 | | United States Treasury Note | | 3.88 | % | | 12/31/2027 | | | 1,025,599 | |
| | 2,600,000 | | United States Treasury Note | | 2.88 | % | | 05/15/2028 | | | 2,453,852 | |
| | 1,000,000 | | United States Treasury Note | | 2.88 | % | | 05/15/2032 | | | 927,363 | |
Total U.S. Treasury Notes (Cost $4,553,270) | | | | | | | | 4,406,814 | |
| | | | | | | | | | | | | |
| Municipal Bonds — 0.2% | | | | | | | | | |
| | 505,000 | | Colorado Health Facilities Authority | | 2.80 | % | | 12/01/2026 | | | 472,584 | |
Total Municipal Bonds (Cost $505,000) | | | | | | | | 472,584 | |
| | | | | | | | | | |
| Short-Term Investments — 28.5% | | | | | | | | | |
| | | | | | | | | | |
| Money Market Funds — 28.5% | | | | | | | | | |
| | 86,667,019 | | First American Government Obligations Fund — Class Z, 4.97%* | | | | | | | | 86,667,019 | |
Total Short-Term Investments (Cost $86,667,019) | | | | | | | | 86,667,019 | |
Total Investments — 125.0% (Cost $399,373,258) | | | | | | | | 379,717,001 | |
Liabilities in Excess of Other Assets — (25.0)% | | | | | | | | (76,034,237 | ) |
| NET ASSETS — 100.0% | | | | | | | $ | 303,682,764 | |
| # | Variable rate security. Rate disclosed is as of the date of this report. |
| ^ | Security exempt from registration under Rule 144A of the Securities Act of 1933. These securities may be resold in transactions exempt from registration, normally to qualified institutional buyers. |
| ~ | Interest only security |
| * | Annualized seven-day yield as of the date of this report. |
| + | Step bond. Coupon rate will either increase (step-up bond) or decrease (step-down bond) at regular intervals until maturity. Interest rate shown is the rate in effect as of the date of this report. |
The accompanying notes are an integral part of these financial statements.
Brown Advisory Mortgage Securities FundSchedule of Investments
June 30, 2023
| Futures Contracts — Long (Note 6) | | | | | | | | | | | | | |
| | | | | | | Notional | | | Notional | | | Unrealized Appreciation | |
| Issue | | Contracts | | Expiration Date | | Amount | | | Value | | | (Depreciation) | |
U.S. Treasury 10-Year Note Futures | | 65 | | 09/20/2023 | | $ | 7,424,478 | | | $ | 7,297,266 | | | $ | (127,212 | ) |
U.S. Treasury 10-Year Ultra Futures | | 109 | | 09/20/2023 | | | 13,017,104 | | | | 12,909,687 | | | | (107,417 | ) |
U.S. Treasury 5-Year Note Futures | | 110 | | 09/29/2023 | | | 12,005,513 | | | | 11,780,312 | | | | (225,201 | ) |
| | | | | | | $ | 32,447,095 | | | $ | 31,987,265 | | | $ | (459,830 | ) |
| | | | | | | | | | | | | | | | | |
| Futures Contracts — Short (Note 6) | | | | | | | | | | | | | | | | |
| | | | | | | Notional | | | Notional | | | Unrealized Appreciation | |
| Issue | | Contracts | | Expiration Date | | Amount | | | Value | | | (Depreciation) | |
U.S. Treasury 2-Year Note Futures | | (5) |
| 09/29/2023 | | $ | (1,016,827 | ) | | $ | (1,016,719 | ) | | $ | 108 | |
U.S. Treasury Long Bond Futures | | (14) |
| 09/20/2023 | | | (1,774,471 | ) | | | (1,776,688 | ) | | | (2,217 | ) |
U.S. Treasury Ultra Bond Futures | | (17) |
| 09/20/2023 | | | (2,303,182 | ) | | | (2,315,718 | ) | | | (12,536 | ) |
| | | | | | | $ | (5,094,480 | ) | | $ | (5,109,125 | ) | | $ | (14,645 | ) |
There is no variation margin due to or from the Fund as of the date of this report.
Brown Advisory – WMC Strategic European Equity FundA Message to Our Shareholders
June 30, 2023
Dear Shareholder:
During the 12-month period ended June 30, 2023, the Brown Advisory – WMC Strategic European Equity Fund Institutional Shares (the “Fund”) increased 17.50% in value. During the same period, the MSCI Europe Index, the Fund’s benchmark, increased 21.81%.
For the 12 months ended June 30, 2023, the portfolio underperformed the benchmark. Security selection drove underperformance. Selection in health care, industrials, and consumer discretionary detracted the most from relative performance. This was partially offset by selection within materials, energy, and financials. Sector allocation, a result of our bottom-up stock selection process, also detracted to relative performance, driven by the Fund’s underweights to consumer discretionary and information technology which was partially offset by our overweight to industrials and underweight to materials.
From an individual stock perspective, our top relative contributors were Publicis Groupe (communication services), Rheinmetall (industrials), and Technip Energies (energy). Our top relative detractors were United Internet (communication services), British-American Tobacco (consumer staples), and Grifols (health care). During the period, we purchased new positions in Haleon, Bayer, KBC, and AIB. We sold our positions in Safran and Swedish Match.
Haleon is a British consumer healthcare company. It is the consumer spin off from GlaxoSmithKline (July 2022), and key brands include Sensodyne, Advil, Centrum, Voltarol, Panadol, and Tums. We expect that Haleon will be resilient in a weaker economic environment due to its exposure to attractive consumer categories creating lower cyclicality. We like that the stock is trading at a discount and believe it can continue to deliver moderate growth over the long term.
Safran is a multinational aircraft engine and aerospace components company based in France. We added to our position as the stock has been weak in recent times and we continue to be attracted to the company long term. We believe that Safran is well positioned to take advantage of the post Covid-19 air travel recovery. Safran is a high-quality company with competitive advantages in an attractive industry. The company has a dominant position in the narrow body engine market and a very long product cycle industry with extremely high barriers to entry. The share price of the stock rose recently due to positive Q1 2023 results with increased revenues. We decided to use the share price strength to eliminate our position.
Sincerely,
Carl Dirk Enderlein, CFA, Senior Managing Director and Equity Portfolio Manager
Past performance is not a guarantee of future results.
Mutual fund investing involves risk. Principal loss is possible. Investments focused in a single geographic region may be exposed to greater risk than investments diversified among various geographies. Investments in foreign securities entail certain risks not associated with investments in domestic securities, such as volatility of currency exchange rates, and in some cases, political and economic instability and relatively illiquid markets. These risks are greater in emerging markets. Investments in smaller and medium capitalization companies generally carry greater risk than is customarily associated with larger companies for various reasons such as narrower markets, limited financial resources and less liquid stock. The Fund may invest in ETFs, which may trade at a discount to the aggregate value of the underlying securities and although expense ratios for ETFs are generally low, frequent trading of ETFs by the Fund can generate brokerage expenses. The value of investments in REITs may change in response to changes in the real estate market such as declines in the value of real estate, lack of available capital or financing opportunities, and increases in property taxes or operating costs. Derivatives involve risks different from, and in certain cases, greater than the risks presented by more traditional investments. Investors will indirectly bear the principal risks and its share of the fees and expenses of the Fund’s investment in other Investment Companies.
Fund holdings and sector allocations are subject to change and should not be considered a recommendation to buy or sell any security. For a complete list of fund holdings, please refer to the Schedule of Investments provided in this report.
Definitions for terms and indices are provided in the Glossary of Terms.
Brown Advisory – WMC Strategic European Equity FundPerformance Information & Portfolio Holdings Summary
June 30, 2023
GROWTH OF A $1,000,000 INVESTMENT
The following chart reflects the change in value of a hypothetical $1,000,000 investment, including reinvested dividends and distributions, in the Fund as measured against a broad-based securities market index. The MSCI Europe Index (“Index”) is an index that captures large and mid cap representation across 15 developed market countries in Europe. The Index is unmanaged and does not reflect the deduction of fees, such as investment management fees. Investors cannot invest directly in an index.
| PORTFOLIO HOLDINGS | % of Net Assets |
| | |
United Kingdom | | 34.2% |
Germany | | 15.6% |
France | | 12.6% |
Switzerland | | 6.3% |
Belgium | | 5.4% |
Sweden | | 4.7% |
Austria | | 4.2% |
Spain | | 4.1% |
Netherlands | | 3.6% |
Money Market Funds | | 2.7% |
Ireland | | 2.2% |
Portugal | | 1.9% |
Czech Republic | | 0.9% |
Denmark | | 0.5% |
Italy | | 0.0% |
Other Assets and Liabilities | | 1.1% |
| | | 100.0% |
| | | | Since Inception |
Average Annual Total Return | One Year | Five Year | (10/21/13) |
| Institutional Shares | 17.50% | 6.36% | 5.95% |
| Investor Shares | 17.30% | 6.18% | 5.79% |
| Advisor Shares | 17.05% | 5.94% | 5.54% |
| MSCI Europe Index | 21.81% | 5.19% | 4.08% |
| | Institutional Shares | Investor Shares | Advisor Shares |
Gross Expense Ratio1 | 1.04% | 1.19% | 1.44% |
Net Expense Ratio1 | 1.04% | 1.19% | 1.44% |
Past performance does not guarantee future results. The performance data quoted represents past performance and current returns may be lower or higher. The investment return and net asset value will fluctuate so that an investor’s shares, when redeemed, may be worth more or less than the original cost. To obtain performance information current to the most recent month end, please visit our website at brownadvisory.com/mf/wmc-strategic-european-equity-fund. The performance table and graph above do not reflect the deduction of taxes that a shareholder would pay on Fund distributions or the redemption of Fund shares. Performance data does not reflect the imposition of the redemption fee of 1.00% on shares redeemed within 14 days, and if it did, performance would have been lower. Short-term performance, in particular, is not a good indication of the Fund’s future performance, and an investment should not be made based solely on returns. Returns shown are calculated using the net asset values (“NAV”) that were used for shareholder transactions as of the respective period ends. These NAV, and the returns calculated from them, may differ from the NAV and returns shown elsewhere in this report.
1 | Per the Fund’s prospectus dated October 31, 2022. Refer to the financial highlights for the gross and net expense ratios for the year ended as of the date of this report. Please note that the expense ratios per the prospectus include acquired fund fees and expenses (as applicable) and the expense ratios in the financial highlights do not. |
Brown Advisory – WMC Strategic European Equity FundSchedule of Investments
June 30, 2023
| Shares | | Security Description | | Value $ | |
| Common Stocks — 95.1% | | | |
| | | | |
| Austria — 4.2% | | | |
| | 237,616 | | Erste Group Bank AG | | | 8,335,085 | |
| | 73,239 | | Vienna Insurance Group AG Wiener | | | | |
| | | | Versicherung Gruppe | | | 1,914,872 | |
| | | | | | | 10,249,957 | |
| Belgium — 5.4% | | | | |
| | 2,510 | | Azelis Group NV | | | 57,189 | |
| | 75,097 | | KBC Group NV | | | 5,241,845 | |
| | 88,766 | | UCB S.A. | | | 7,869,878 | |
| | | | | | | 13,168,912 | |
| Czech Republic — 0.9% | | | | |
| | 71,605 | | Komercni banka, a.s. | | | 2,183,205 | |
| | | | | |
| Denmark — 0.5% | | | | |
| | 13,942 | | Royal Unibrew A/S | | | 1,247,995 | |
| | | | | |
| France — 12.6% | | | | |
| | 159,500 | | Bureau Veritas S.A. | | | 4,375,900 | |
| | 9,034 | | Dassault Aviation S.A. | | | 1,809,976 | |
| | 347,127 | | Elis S.A. | | | 6,752,751 | |
| | 11,877 | | Legrand S.A. | | | 1,178,247 | |
| | 73,228 | | Publicis Groupe S.A. | | | 5,877,020 | |
| | 56,264 | | SPIE S.A. | | | 1,819,531 | |
| | 237,148 | | Technip Energies NV | | | 5,462,973 | |
| | 23,857 | | Thales S.A. | | | 3,574,477 | |
| | | | | | | 30,850,875 | |
| Germany — 14.5% | | | | |
| | 95,857 | | Bayer AG | | | 5,306,184 | |
| | 16,631 | | Beiersdorf AG | | | 2,202,342 | |
| | 82,932 | | Brenntag SE | | | 6,470,213 | |
| | 8,621 | | Hannover Rueck SE | | | 1,830,230 | |
| | 115,530 | | Hensoldt AG | | | 3,794,570 | |
| | 45,316 | | Jenoptik AG | | | 1,556,853 | |
| | 33,061 | | Rheinmetall AG | | | 9,057,156 | |
| | 26,180 | | Siemens Healthineers AG | | | 1,483,764 | |
| | 229,513 | | United Internet AG | | | 3,231,659 | |
| | 14,642 | | Washtec AG | | | 572,245 | |
| | | | | | | 35,505,216 | |
| Ireland — 2.2% | | | | |
| | 1,254,220 | | AIB Group PLC | | | 5,278,525 | |
| | | | | |
| Italy — 0.0% | | | | |
| | 2,933 | | MARR SpA | | | 45,027 | |
| | | | | |
| Netherlands — 3.6% | | | | |
| | 41,233 | | Heineken NV | | | 4,240,273 | |
| | 67,898 | | QIAGEN NV* | | | 3,052,021 | |
| | 12,004 | | Wolters Kluwer NV | | | 1,524,193 | |
| | | | | | | 8,816,487 | |
| Portugal — 1.9% | | | | |
| | 168,391 | | Jeronimo Martins SGPS S.A. | | | 4,638,945 | |
| | | | | |
| Spain — 4.1% | | | | |
| | 122,400 | | Almirall S.A. | | | 1,011,962 | |
| | 785,877 | | Bankinter S.A. | | | 4,836,904 | |
| | 132,969 | | Fluidra S.A. | | | 2,592,718 | |
| | 35,789 | | Laboratorios Farmaceuticos Rovi S.A. | | | 1,657,434 | |
| | | | | | | 10,099,018 | |
| Sweden — 4.7% | | | | |
| | 67,925 | | Alfa Laval AB | | | 2,477,744 | |
| | 85,705 | | Assa Abloy AB | | | 2,060,088 | |
| | 120,427 | | Hexpol AB | | | 1,278,689 | |
| | 73,762 | | Sandvik AB | | | 1,440,144 | |
| | 179,077 | | Trelleborg AB | | | 4,346,072 | |
| | | | | | | 11,602,737 | |
| Switzerland — 6.3% | | | | |
| | 106,838 | | ABB Ltd. | | | 4,203,098 | |
| | 25,330 | | Julius Baer Group, Ltd. | | | 1,598,514 | |
| | 53,479 | | Novartis AG | | | 5,391,722 | |
| | 210,763 | | UBS Group AG | | | 4,271,886 | |
| | | | | | | 15,465,220 | |
| United Kingdom — 34.2% | | | | |
| | 728,407 | | BAE Systems PLC | | | 8,588,844 | |
| | 538,603 | | Beazley PLC | | | 4,038,022 | |
| | 297,113 | | British American Tobacco PLC | | | 9,871,732 | |
| | 140,442 | | Bunzl PLC | | | 5,351,985 | |
| | 66,624 | | Compass Group PLC | | | 1,865,686 | |
| | 1,073,689 | | ConvaTec Group PLC | | | 2,800,262 | |
| | 52,889 | | CRH PLC | | | 2,917,752 | |
| | 2,054,926 | | Haleon PLC | | | 8,434,399 | |
| | 129,665 | | Hikma Pharmaceuticals PLC | | | 3,120,364 | |
| | 179,022 | | IMI PLC | | | 3,734,430 | |
| | 35,351 | | Next PLC | | | 3,099,800 | |
| | 443,837 | | Prudential PLC | | | 6,268,498 | |
| | 628,662 | | Rotork PLC | | | 2,435,849 | |
| | 673,828 | | RS Group PLC | | | 6,519,909 | |
| | 157,891 | | Savills PLC | | | 1,706,590 | |
| | 1,106,031 | | Serco Group PLC | | | 2,187,059 | |
| | 214,569 | | Smith & Nephew PLC | | | 3,461,720 | |
| | 190,199 | | Smiths Group PLC | | | 3,979,304 | |
| | 13,944 | | Softcat PLC | | | 251,228 | |
| | 71,676 | | Spectris PLC | | | 3,274,930 | |
| | | | | | | 83,908,363 | |
Total Common Stocks (Cost $191,342,254) | | | 233,060,482 | |
| | | | | |
| Preferred Stocks — 1.1% | | | | |
| | | | | |
| Germany — 1.1% | | | | |
| | 65,995 | | Fuchs Petrolub SE | | | 2,611,081 | |
Total Preferred Stocks (Cost $2,280,062) | | | 2,611,081 | |
The accompanying notes are an integral part of these financial statements.
Brown Advisory – WMC Strategic European Equity FundSchedule of Investments
June 30, 2023
| Shares | | Security Description | | Value $ | |
| Short-Term Investments — 2.7% | | | |
| | | | |
| Money Market Funds — 2.7% | | | |
| | 6,732,961 | | First American Government | | | |
| | | | Obligations Fund — Class Z, 4.97%# | | | 6,732,961 | |
Total Short-Term Investments (Cost $6,732,961) | | | 6,732,961 | |
Total Investments — 98.9% (Cost $200,355,277) | | | 242,404,524 | |
Other Assets in Excess of Liabilities — 1.1% | | | 2,613,295 | |
| NET ASSETS — 100.0% | | $ | 245,017,819 | |
* | Non-income producing |
# | Annualized seven-day yield as of the date of this report. |
The accompanying notes are an integral part of these financial statements.
Brown Advisory Emerging Markets Select FundA Message to Our Shareholders
June 30, 2023
Dear Shareholder:
During the year ended June 30, 2023 the Brown Advisory Emerging Markets Select Fund Institutional Shares (the “Fund”) increased 6.27% in value. During the same period, the MSCI Emerging Markets Index, the Fund’s benchmark, increased 1.75%.
The strategy’s philosophy of buying stocks at a discount to estimated value led to positive stock selection during the period across most market sectors but especially within information technology, financials, and consumer discretionary. From a regional perspective, broadly positive stock selection across Asia drove the majority of the Fund’s outperformance. Currency exposure was also a positive contributor to relative performance driven almost entirely by a lack of exposure to the Russian Ruble, which depreciated 39.1% during the period relative to the U.S. dollar.
An area of strength within the portfolio included technology companies which had resilient demand for their products and services like Flex Ltd. and Lite-On Technology Corp. Emerging market banks also helped performance. Hungarian Bank, OTP Bank, reported a string of earnings reports with revenue ahead of expectations and credit costs lower than anticipated. Finally, the Fund’s holdings exposed to China’s post-COVID economic reopening were a positive contributor. These included consumer companies such as online travel advisor Trip.com, hotel operator H World Group, and restaurant owner Yum China Holdings.
The area of weakest relative performance was within consumer staples companies. Chinese dairy companies China Mengniu Dairy and Inner Mongolia Yili Industrial Group were key detractors. South African energy and chemical company Sasol, was a top individual detractor due to moderating oil prices and coal quality issues in its mining operations. China Tourism Group Duty Free was another top relative detractor as the recovery of its duty-free services business remained tepid due to depressed international Chinese travel.
Over the period, the Fund found new investments in Brazilian financials and energy companies, Chinese technology and insurance companies, as well as industrial companies in South Korea. The Fund trimmed exposure to some Chinese consumer companies as well as automotive manufacturers in China and Turkey.
The Fund remains overweight Asia and the Greater China regional specifically due to a positive long-term view of Asia’s growth potential combined with the strategy’s search for mispriced value. Despite geopolitical tensions and the stalled reopening in China, valuations appear attractive and the government is taking encouraging steps to support the economy.
We continue to believe that owning high quality businesses trading at reasonable valuations provides good potential to outperform the broader market over time.
Sincerely,
Jordan Wruble
Portfolio Manager
Past performance is not a guarantee of future results.
Mutual fund investing involves risk. Principal loss is possible. The Fund may invest in ETFs, which may trade at a discount to the aggregate value of the underlying securities and although expense ratios for ETFs are generally low, frequent trading of ETFs by the Fund can generate brokerage expenses. The Fund may invest in foreign securities which involve greater volatility and political, economic and currency risks and differences in accounting methods. These risks are greater in emerging markets. Derivatives may involve certain costs and risks such as liquidity, interest rate, market, credit, management, and the risk that a position could not be closed when most advantageous. Investing in derivatives could lose more than the amount invested. The Fund invests in smaller and medium-sized companies which carry greater risk than is associated with larger companies for various reasons, such as narrower markets, limited financial resources and less liquid stock.
Fund holdings and sector allocations are subject to change and should not be considered a recommendation to buy or sell any security. For a complete list of fund holdings, please refer to the Schedule of Investments provided in this report.
Definitions for terms and indices are provided in the Glossary of Terms.
Brown Advisory Emerging Markets Select FundPerformance Information & Portfolio Holdings Summary
June 30, 2023
GROWTH OF A $1,000,000 INVESTMENT
The following chart reflects the change in value of a hypothetical $1,000,000 investment, including reinvested dividends and distributions, in the Fund as measured against a broad-based securities market index. The MSCI Emerging Markets Index is a free float-adjusted market capitalization index that is designed to measure equity market performance in the global emerging markets. The Index is unmanaged and does not reflect the deduction of fees, such as investment management fees. Investors cannot invest directly in an index.
| PORTFOLIO HOLDINGS | % of Net Assets |
| | |
China | | 33.0% |
India | | 15.5% |
Taiwan | | 13.8% |
South Korea | | 13.1% |
Brazil | | 5.8% |
Indonesia | | 3.5% |
Singapore | | 3.3% |
United States | | 3.2% |
Money Market Funds | | 3.2% |
Thailand | | 1.7% |
Hungary | | 1.1% |
United Kingdom | | 0.9% |
United Arab Emirates | | 0.7% |
South Africa | | 0.7% |
Turkey | | 0.3% |
Russia | | 0.0% |
Other Assets and Liabilities | | 0.2% |
| | | 100.0% |
Average Annual Total Return | One Year | Five Year | Ten Year |
| Institutional Shares | 6.27% | 2.68% | 2.51% |
| Investor Shares | 6.01% | 2.52% | 2.35% |
| Advisor Shares | 5.76% | 2.25% | 2.09% |
| MSCI Emerging Markets Index | 1.75% | 0.93% | 2.95% |
| | Institutional Shares | Investor Shares | Advisor Shares |
Gross Expense Ratio1 | 1.11% | 1.26% | 1.51% |
Net Expense Ratio1 | 1.11% | 1.26% | 1.51% |
Past performance does not guarantee future results. The performance data quoted represents past performance and current returns may be lower or higher. The investment return and net asset value will fluctuate so that an investor’s shares, when redeemed, may be worth more or less than the original cost. To obtain performance information current to the most recent month end, please visit our website at brownadvisory.com/mf/emerging-markets-select-fund. The performance table and graph above do not reflect the deduction of taxes that a shareholder would pay on Fund distributions or the redemption of Fund shares. Performance data does not reflect the imposition of the redemption fee of 1.00% on shares redeemed within 14 days, and if it did, performance would have been lower. Short-term performance, in particular, is not a good indication of the Fund’s future performance, and an investment should not be made based solely on returns. Returns shown are calculated using the net asset values (“NAV”) that were used for shareholder transactions as of the respective period ends. These NAV, and the returns calculated from them, may differ from the NAV and returns shown elsewhere in this report.
1 | Per the Fund’s prospectus dated October 31, 2022. Refer to the financial highlights for the gross and net expense ratios for the year ended as of the date of this report. Please note that the expense ratios per the prospectus include acquired fund fees and expenses (as applicable) and the expense ratios in the financial highlights do not. |
Brown Advisory Emerging Markets Select FundSchedule of Investments
June 30, 2023
| Shares | | Security Description | | Value $ | |
| Common Stocks — 94.1% | | | |
| | | | |
| Brazil — 3.7% | | | |
| | 3,302,800 | | Ambev S.A. | | | 10,636,393 | |
| | 291,500 | | Banco do Brasil S.A. | | | 3,013,502 | |
| | 714,100 | | Natura & Co. Holding S.A.* | | | 2,501,035 | |
| | 865,900 | | Neoenergia S.A. | | | 3,842,858 | |
| | | | | | | 19,993,788 | |
| China — 33.0% | | | | |
| | 1,029,128 | | AIA Group, Ltd. | | | 10,452,338 | |
| | 1,628,927 | | Alibaba Group Holding, Ltd.* | | | 16,956,854 | |
| | 315,357 | | ANTA Sports Products, Ltd. | | | 3,240,585 | |
| | 449,114 | | Baidu, Inc.* | | | 7,659,990 | |
| | 14,929 | | Baidu, Inc. ADR* | | | 2,043,929 | |
| | 2,678,000 | | Brilliance China Automotive Holdings, Ltd. | | | 1,093,999 | |
| | 4,513,000 | | China Construction Bank Corp. | | | 2,921,823 | |
| | 1,027,827 | | China Mengniu Dairy Co., Ltd. | | | 3,884,456 | |
| | 2,643,746 | | China Overseas Land & Investment, Ltd. | | | 5,783,579 | |
| | 1,258,435 | | China Pacific Insurance Group Co., Ltd. | | | 3,267,102 | |
| | 145,581 | | China Tourism Group Duty Free Corp., Ltd. | | | 2,222,004 | |
| | 94,120 | | Contemporary Amperex Technology Co., Ltd. | | | 2,973,838 | |
| | 1,067,000 | | Galaxy Entertainment Group, Ltd.* | | | 6,797,556 | |
| | 2,862,600 | | GF Securities Co., Ltd. | | | 3,957,580 | |
| | 749,600 | | Haier Smart Home Co., Ltd. | | | 2,363,906 | |
| | 309,300 | | Hangzhou Tigermed Consulting Co., Ltd. | | | 2,752,745 | |
| | 132,201 | | Hong Kong Exchanges & Clearing Ltd. | | | 5,008,965 | |
| | 616,395 | | Inner Mongolia Yili Industrial Group Co., Ltd. | | | 2,405,209 | |
| | 624,105 | | KE Holdings, Inc.* | | | 3,082,760 | |
| | 125,125 | | KE Holdings, Inc. ADR* | | | 1,858,106 | |
| | 14,683 | | Kweichow Moutai Co., Ltd. | | | 3,422,669 | |
| | 4,718,000 | | Lenovo Group, Ltd. | | | 4,943,882 | |
| | 624,832 | | Li Ning Co., Ltd. | | | 3,374,207 | |
| | 435,343 | | Meituan* | | | 6,826,578 | |
| | 267,200 | | Midea Group Co., Ltd. | | | 2,171,990 | |
| | 9,877,324 | | Pacific Basin Shipping Ltd. | | | 3,013,762 | |
| | 433,000 | | Ping An Insurance Group Co. of China, Ltd. | | | 2,766,469 | |
| | 1,255,800 | | Sany Heavy Industry Co., Ltd. | | | 2,879,071 | |
| | 82,000 | | Shenzhen Mindray Bio-Medical | | | | |
| | | | Electronics Co., Ltd. | | | 3,393,316 | |
| | 394,514 | | Shenzhou International Group Holdings Ltd. | | | 3,789,100 | |
| | 457,941 | | Tencent Holdings, Ltd. | | | 19,417,238 | |
| | 189,420 | | Trip.com Group, Ltd.* | | | 6,612,541 | |
| | 140,928 | | Trip.com Group, Ltd. ADR* | | | 4,932,480 | |
| | 360,987 | | Tsingtao Brewery Co., Ltd. | | | 3,295,801 | |
| | 2,491,000 | | Weichai Power Co., Ltd. | | | 3,664,941 | |
| | 526,812 | | Yifeng Pharmacy Chain Co., Ltd. | | | 2,688,402 | |
| | 2,099,500 | | Yue Yuen Industrial Holdings, Ltd. | | | 2,748,542 | |
| | 2,834,500 | | Zhejiang Longsheng Group Co., Ltd. | | | 3,653,381 | |
| | 101,374 | | ZTO Express Cayman, Inc. | | | 2,544,289 | |
| | 54,997 | | ZTO Express Cayman, Inc. ADR | | | 1,379,325 | |
| | | | | | | 178,245,308 | |
| Hungary — 1.1% | | | | |
| | 163,961 | | OTP Bank PLC | | | 5,828,887 | |
| | | | | |
| India — 15.5% | | | | |
| | 305,205 | | AU Small Finance Bank, Ltd. | | | 2,812,163 | |
| | 604,226 | | Aurobindo Pharma, Ltd. | | | 5,366,125 | |
| | 567,120 | | Axis Bank, Ltd. | | | 6,843,071 | |
| | 360,331 | | Container Corp. of India, Ltd. | | | 2,912,596 | |
| | 655,666 | | DLF Ltd.* | | | 3,930,588 | |
| | 285,442 | | Godrej Consumer Products, Ltd.* | | | 3,766,281 | |
| | 164,956 | | Godrej Properties, Ltd.* | | | 3,161,895 | |
| | 219,808 | | HDFC Bank, Ltd. | | | 4,561,635 | |
| | 747,883 | | ICICI Bank, Ltd. | | | 8,562,503 | |
| | 138,915 | | Kotak Mahindra Bank, Ltd. | | | 3,133,016 | |
| | 204,800 | | Larsen & Toubro, Ltd. | | | 6,192,639 | |
| | 553,143 | | Macrotech Developers, Ltd.* | | | 4,594,696 | |
| | 297,834 | | Mahindra & Mahindra, Ltd. | | | 5,291,730 | |
| | 264,386 | | Reliance Industries, Ltd. | | | 8,241,199 | |
| | 160,809 | | SBI Life Insurance Co., Ltd. | | | 2,565,538 | |
| | 298,111 | | Shriram Finance Ltd. | | | 6,319,339 | |
| | 68,922 | | Siemens, Ltd. | | | 3,169,857 | |
| | 321,664 | | State Bank of India | | | 2,252,907 | |
| | | | | | | 83,677,778 | |
| Indonesia — 3.5% | | | | |
| | 9,955,301 | | Bank Central Asia Tbk PT | | | 6,105,571 | |
| | 10,973,600 | | Bank Mandiri Persero Tbk PT | | | 3,818,894 | |
| | 7,897,234 | | Bank Negara Indonesia Persero Tbk | | | 4,845,355 | |
| | 11,278,213 | | Bank Rakyat Indonesia Persero Tbk | | | 4,117,581 | |
| | | | | | | 18,887,401 | |
| Russia — 0.0% | | | | |
| | 184,769 | | Sberbank of Russia PJSC ADR†+* | | | 1,848 | |
| | | | | |
| Singapore — 3.3% | | | | |
| | 241,467 | | DBS Group Holdings, Ltd. | | | 5,638,926 | |
| | 1,798,948 | | Singapore Telecommunications, Ltd. | | | 3,331,958 | |
| | 218,200 | | United Overseas Bank, Ltd. | | | 4,527,925 | |
| | 1,588,508 | | Wilmar International, Ltd. | | | 4,475,167 | |
| | | | | | | 17,973,976 | |
| South Africa — 0.7% | | | | |
| | 324,642 | | Sasol, Ltd. | | | 4,022,067 | |
| | | | | |
| South Korea — 13.1% | | | | |
| | 118,173 | | DB Insurance Co., Ltd. | | | 6,711,930 | |
| | 249,461 | | Hankook Tire & Technology Co., Ltd. | | | 6,544,812 | |
| | 43,547 | | HD Hyundai Heavy Industries Co., Ltd.* | | | 4,376,456 | |
| | 62,687 | | Hyundai Mipo Dockyard Co., Ltd.* | | | 4,015,148 | |
| | 48,620 | | KB Financial Group, Inc. | | | 1,764,648 | |
| | 13,996 | | POSCO Holdings, Inc. | | | 4,142,144 | |
| | 634,661 | | Samsung Electronics Co., Ltd. | | | 34,946,518 | |
| | 241,203 | | Samsung Engineering Co., Ltd.* | | | 5,201,609 | |
| | 118,140 | | Shinhan Financial Group Co., Ltd. | | | 3,054,182 | |
| | | | | | | 70,757,447 | |
| Taiwan — 13.8% | | | | |
| | 189,756 | | Advantech Co., Ltd. | | | 2,498,272 | |
| | 7,400,000 | | Compal Electronics, Inc. | | | 6,959,971 | |
| | 4,410,741 | | CTBC Financial Holding Co., Ltd. | | | 3,527,133 | |
| | 467,000 | | Elite Material Co., Ltd. | | | 3,667,929 | |
| | 3,567,000 | | Hon Hai Precision Industry Co., Ltd. | | | 12,968,685 | |
| | 1,097,000 | | Lite-On Technology Corp. | | | 3,652,945 | |
| | 236,078 | | Realtek Semiconductor Corp.* | | | 2,943,567 | |
| | 2,084,030 | | Taiwan Semiconductor | | | | |
| | | | Manufacturing Co., Ltd. | | | 38,498,981 | |
| | | | | | | 74,717,483 | |
The accompanying notes are an integral part of these financial statements.
Brown Advisory Emerging Markets Select FundSchedule of Investments
June 30, 2023
| Shares | | Security Description | | Value $ | |
| Common Stocks — 94.1% (Continued) | | | |
| | | | |
| Thailand — 1.7% | | | |
| | 436,800 | | Bangkok Bank PCL | | | 2,138,909 | |
| | 217,700 | | Bangkok Bank PCL NVDR | | | 980,787 | |
| | 2,303,300 | | Indorama Ventures PCL NVDR | | | 2,229,756 | |
| | 1,223,500 | | SCB X PCL | | | 3,611,536 | |
| | | | | | | 8,960,988 | |
| Turkey — 0.3% | | | | |
| | 1,756,743 | | Akbank T.A.S. | | | 1,365,253 | |
| | | | | |
| United Arab Emirates — 0.7% | | | | |
| | 1,830,865 | | Abu Dhabi Commercial Bank PJSC | | | 4,042,559 | |
| | | | | |
| United Kingdom — 0.9% | | | | |
| | 534,436 | | Standard Chartered PLC | | | 4,649,652 | |
| | | | | |
| United States — 2.8% | | | | |
| | 117,377 | | Cognizant Technology Solutions Corp. | | | 7,662,371 | |
| | 33,196 | | Credicorp Ltd. | | | 4,901,057 | |
| | 88,605 | | Flex, Ltd.* | | | 2,449,042 | |
| | | | | | | 15,012,470 | |
Total Common Stocks (Cost $459,253,789) | | | 508,136,905 | |
| | | | | |
| Preferred Stocks — 2.1% | | | | |
| | | | | |
| Brazil — 2.1% | | | | |
| | 2,244,595 | | Cia Energetica de Minas Gerais | | | 6,019,088 | |
| | 431,800 | | Itau Unibanco Holding S.A. | | | 2,561,113 | |
| | 442,800 | | Petroleo Brasileiro S.A. | | | 2,731,781 | |
Total Preferred Stocks (Cost $7,895,061) | | | 11,311,982 | |
| | | | | |
| Exchange Traded Funds — 0.4% | | | | |
| | | | | | | |
United States — 0.4% | | | | |
| | 31,780 | | iShares MSCI All Country Asia ex | | | | |
| | | | Japan Exchange Traded Fund | | | 2,111,464 | |
Total Exchange Traded Funds (Cost $2,115,501) | | | 2,111,464 | |
| | | | | |
| Short-Term Investments — 3.2% | | | | |
| | | | | |
| Money Market Funds — 3.2% | | | | |
| | 17,117,549 | | First American Government | | | | |
| | | | Obligations Fund — Class Z, 4.97%# | | | 17,117,549 | |
Total Short-Term Investments (Cost $17,117,549) | | | 17,117,549 | |
Total Investments — 99.8% (Cost $486,381,900) | | | 538,677,900 | |
Other Assets in Excess of Liabilities — 0.2% | | | 1,032,936 | |
| NET ASSETS — 100.0% | | $ | 539,710,836 | |
ADR — American Depositary Receipt
| † | This security is being fair valued, using significant unobservable inputs (Level 3), under the supervision of the Board of Trustees. |
| + | Restricted security as to resale. As of the date of this report, the Fund held restricted securities with a fair value of $1,848 or 0.0% of net assets. Security was acquired from December 2021 to February 2022 at an acquisition cost of $2,890,347. |
NVDR — Non-Voting Depositary Receipt
| # | Annualized seven-day yield as of the date of this report. |
The accompanying notes are an integral part of these financial statements.
Brown Advisory – Beutel Goodman Large-Cap Value FundA Message to Our Shareholders
June 30, 2023
Dear Shareholder:
During the 12-month period ended June 30, 2023, the Brown Advisory – Beutel Goodman Large-Cap Value Fund Institutional Shares (the “Fund”) increased by 17.67%. During the same period, the Russell 1000® Value Index, the Fund’s benchmark, increased by 11.54%.
The period saw diverging performance for U.S. equities. In 2023, central banks worldwide began to temper the hiking cycle that caused so much volatility with stocks in 2022. Inflation remains a key concern for central banks, but price rises have reduced from the historically high peaks reached in the summer of 2022. In March and April of 2023, the stability of the global banking system was called into question after the collapse of Silicon Valley Bank, Signature Bank and First Republic in the U.S, as well as Swiss banking giant Credit Suisse, which was acquired by UBS in a fire-sale deal. Amid this upheaval, regulators in the U.S. and Europe were quick to respond with measures designed to protect the banking system in their respective jurisdictions.
Relative outperformance was driven primarily by stock selection in the health care, financials and communication services sectors, as well as having no exposure to the underperforming utilities and real estate sectors. The main detractors from relative performance were a combination of stock selection and an overweight in consumer staples, stock selection in information technology, as well as having no exposure to the outperforming energy sector. While we comment on sector allocation effects on performance, we caution that sector weights are solely a product of our bottom-up stock selection process.
During the period we initiated positions in Carlyle Group and Qualcomm and exited from positions in MillerKnoll, AutoZone and Verizon Communications.
From an individual stock perspective, Omnicom Group, Biogen and Ameriprise Financial were the top contributors to performance over the period. In its most recent earnings results, Omnicom delivered organic growth of 5.2% and a forecast for 3-5% growth for the year. With a healthy balance sheet, we believe the stock remains highly attractive and has strong fundamentals. Biogen reported better-than-expected FY 2022 results in April with revenue of $2.46 billion (-3% year over year). Despite the decline, results were better than consensus, and by a large margin. Key for the business will likely be the development of its new Leqembi and Zuranolone drugs, while the company has also been actively reshaping its leadership team with the appointment of a new CEO and a new head of R&D. For Ameriprise, operating earnings in Q1 2023 increased by 25% from the prior year as business momentum and interest earnings more than offset equity market pressures.
The largest detractors from performance over the period were MillerKnoll, Gen Digital and Verizon Communications. Towards the end of the period, MillerKnoll breached our downside threshold and we decided to sell our position. We believe our original investment thesis is generally intact. That is, as the clear market leader, with strong brand value and scale in operations, significant room for international expansion and retail opportunity (centered on the home office), we believe the business is positioned to generate higher profitability, strong free cash flows and good returns. However, the balance sheet is the key factor that increased the company’s risk profile to levels that no longer fit with our investment process and philosophy. Specifically, the balance sheet has not improved as had been expected following the Knoll acquisition. Gen Digital is the name for the combined Norton internet security and privacy protection, LifeLock identity protection, and Avast! internet security and privacy platforms. Gen Digital posted generally good results during the period, but this was not reflected in its market performance. We also note that while cash flows are strong, the net debt at Gen Digital is related to the Avast acquisition, leading to higher near-term interest costs. We will be closely monitoring the balance sheet over the next few quarters. Verizon’s most recent earnings results were met with a negative market reaction, amid falling subscriber numbers and an update from management that higher interest costs and inflation meant their guidance would fall towards the low end of their full-year targets. We note that late last year, based on an investment thesis review, we exited our position in Verizon.
Once again, the U.S. equity market is being propelled higher by the strength of its mega caps. This appears to us as more of a flight to safety, however questionable that “safety” may be. In our view, the strength of the mega caps, in many cases, seems to have been driven by momentum, good stories (“AI wave on the way!”), and supposedly “fortress balance sheets” that do not always seem to account for low recurring revenues, heavy capital investment, unproven revenue opportunities and net debt. In our experience, purchasing expensive stocks of companies that have already factored in great news and upside potential does not typically protect capital in the long term. Instead, capital preservation typically comes from purchasing the shares of strong businesses at low valuation multiples that are discounting bad news.
Brown Advisory – Beutel Goodman Large-Cap Value FundA Message to Our Shareholders
June 30, 2023
We are surprised to see in the current market an almost exact replica of conditions at the end of 2021, when a small number of expensive mega caps drove almost all of the market’s return. Meanwhile, many of the holdings in our portfolio, spanning the health care, consumer staples, consumer discretionary and even information technology sectors, are currently trading near all-time low multiples. Like at the end of 2021, we do not view this dichotomy as sustainable. The value wave we saw in 2022 was more like a ripple in comparison, but this does not mean there are no further waves to come.
Everyone is worried about missing out, but no one seems worried about “missing in” (i.e., being part of the large group of investors that seems to have forgotten that valuations matter). Looking at a potential “climb down” to averages, we think the Fund is well-positioned. For example, should the Russell 1000® Growth Index correct to average long-term trading multiples, there is an approximate 30% downside. Should the Russell 1000® Value Index correct the same way, there is an approximate 5% downside.
Thus, while the valuation gap between our portfolio and the market is currently wide, we believe the portfolio, which in our assessment is full of market leaders with high ROEs, strong balance sheets and improving fundamentals, provides significant opportunity for us to protect capital and deliver capital appreciation over the long term.
We thank you for your continued investment in the Fund.
Sincerely,
Rui Cardoso, CFA
Portfolio Manager
Glenn Fortin, CFA
Portfolio Manager
Past performance is not a guarantee of future results.
Mutual fund investing involves risk. Principal loss is possible. The Fund is non-diversified, which means that it may invest a significant portion of its assets in the securities of a single issuer or small number of issuers. Investment by the Fund in securities of a limited number of issuers exposes it to greater risk and potential monetary losses than if its assets were diversified among the securities of a greater number of issuers. The Fund may invest in ETFs, which may trade at a discount to the aggregate value of the underlying securities and although expense ratios for ETFs are generally low, frequent trading of ETFs by the Fund can generate brokerage expenses. In addition, the Fund is susceptible to risks from investments in derivatives, private placements, REITs, and its investments in other investment companies.
Fund holdings and sector allocations are subject to change and should not be considered a recommendation to buy or sell any security. For a complete list of fund holdings, please refer to the Schedule of Investments provided in this report.
Definitions for terms and indices are provided in the Glossary of Terms.
Brown Advisory – Beutel Goodman Large-Cap Value FundPerformance Information & Portfolio Holdings Summary
June 30, 2023
GROWTH OF A $1,000,000 INVESTMENT
The following chart reflects the change in value of a hypothetical $1,000,000 investment, including reinvested dividends and distributions, in the Fund as measured against a broad-based securities market index. The Russell 1000® Value Index (“Index”) measures the performance of the large-cap value segment of the U.S. equity universe. It includes those Russell 1000® companies with lower price to book ratios and lower expected growth values. The Index is unmanaged and does not reflect the deduction of fees, such as investment management fees. Investors cannot invest directly in an index.
| PORTFOLIO HOLDINGS | % of Net Assets |
| | |
Information Technology | | 16.9% |
Financials | | 15.3% |
Consumer Discretionary | | 14.6% |
Industrials | | 13.4% |
Health Care | | 13.1% |
Communication Services | | 12.3% |
Consumer Staples | | 10.8% |
Money Market Funds | | 2.2% |
Materials | | 0.8% |
Other Assets and Liabilities | | 0.6% |
| | | 100.0% |
| | | | Since Inception |
Average Annual Total Return | One Year | Five Year | (2/13/18) |
| Institutional Shares | 17.67% | 11.66% | 9.92% |
Investor Shares1 | 17.46% | 11.47% | 9.74% |
Russell 1000® Value Index | 11.54% | 8.11% | 7.61% |
| | Institutional Shares | Investor Shares |
Gross Expense Ratio2 | 0.55% | 0.70% |
Net Expense Ratio2 | 0.55% | 0.70% |
Past performance does not guarantee future results. The performance data quoted represents past performance and current returns may be lower or higher. The investment return and net asset value will fluctuate so that an investor’s shares, when redeemed, may be worth more or less than the original cost. To obtain performance information current to the most recent month end, please visit our website at brownadvisory.com/mf/beutel-goodman-large-cap-value-fund. The performance table and graph above do not reflect the deduction of taxes that a shareholder would pay on Fund distributions or the redemption of Fund shares. Performance data does not reflect the imposition of the redemption fee of 1.00% on shares redeemed within 14 days, and if it did, performance would have been lower. Short-term performance, in particular, is not a good indication of the Fund’s future performance, and an investment should not be made based solely on returns. Returns shown are calculated using the net asset values (“NAV”) that were used for shareholder transactions as of the respective period ends. These NAV, and the returns calculated from them, may differ from the NAV and returns shown elsewhere in this report.
1 | Performance information for the Investor Shares, prior to its inception date of June 30, 2021, is based on the performance of Institutional Shares, and adjusted for the higher expenses applicable to Investor Shares. |
2 | Per the Fund’s prospectus dated October 31, 2022. Refer to the financial highlights for the gross and net expense ratios for the year ended as of the date of this report. Please note that the expense ratios per the prospectus include acquired fund fees and expenses (as applicable) and the expense ratios in the financial highlights do not. |
Brown Advisory – Beutel Goodman Large-Cap Value FundSchedule of Investments
June 30, 2023
| Shares | | Security Description | | Value $ | |
| Common Stocks — 97.2% | | | |
| | | | |
| Communication Services — 12.3% | | | |
| | 1,186,395 | | Comcast Corp. | | | 49,294,712 | |
| | 1,598,685 | | Interpublic Group of Companies, Inc. | | | 61,677,267 | |
| | 982,702 | | Omnicom Group, Inc. | | | 93,504,096 | |
| | | | | | | 204,476,075 | |
| Consumer Discretionary — 14.6% | | | | |
| | 1,023,555 | | eBay, Inc. | | | 45,742,673 | |
| | 1,339,550 | | Gentex Corp. | | | 39,195,233 | |
| | 1,672,674 | | Harley-Davidson, Inc. | | | 58,894,851 | |
| | 481,220 | | Polaris, Inc. | | | 58,193,935 | |
| | 1,029,590 | | Tempur Sealy International, Inc. | | | 41,255,671 | |
| | | | | | | 243,282,363 | |
| Consumer Staples — 10.8% | | | | |
| | 1,150,950 | | Campbell Soup Co. | | | 52,609,925 | |
| | 882,101 | | Kellogg Co. | | | 59,453,607 | |
| | 494,845 | | Kimberly-Clark Corp. | | | 68,318,301 | |
| | | | | | | 180,381,833 | |
| Financials — 15.3% | | | | |
| | 383,250 | | American Express Co. | | | 66,762,150 | |
| | 159,780 | | Ameriprise Financial, Inc. | | | 53,072,525 | |
| | 74,105 | | BlackRock, Inc. | | | 51,216,930 | |
| | 938,910 | | Carlyle Group Inc. | | | 29,998,175 | |
| | 895,460 | | SEI Investments Co. | | | 53,387,324 | |
| | | | | | | 254,437,104 | |
| Health Care — 13.1% | | | | |
| | 142,291 | | AmerisourceBergen Corp. | | | 27,381,057 | |
| | 324,805 | | Amgen, Inc. | | | 72,113,206 | |
| | 216,890 | | Biogen, Inc.* | | | 61,781,117 | |
| | 490,095 | | Merck & Co., Inc. | | | 56,552,062 | |
| | | | | | | 217,827,442 | |
| Industrials — 13.4% | | | | |
| | 202,635 | | Cummins, Inc. | | | 49,677,997 | |
| | 1,487,419 | | Flowserve Corp. | | | 55,257,615 | |
| | 981,000 | | Masco Corp. | | | 56,289,780 | |
| | 56,100 | | Parker-Hannifin Corp. | | | 21,881,244 | |
| | 363,850 | | Westinghouse Air Brake | | | | |
| | | | Technologies Corp. | | | 39,903,430 | |
| | | | | | | 223,010,066 | |
| Information Technology — 16.9% | | | | |
| | 845,167 | | Amdocs, Ltd. | | | 83,544,758 | |
| | 2,871,035 | | Gen Digital, Inc. | | | 53,257,699 | |
| | 970,005 | | NetApp, Inc. | | | 74,108,382 | |
| | 602,440 | | QUALCOMM, Inc. | | | 71,714,458 | |
| | | | | | | 282,625,297 | |
| Materials — 0.8% | | | | |
| | 89,700 | | PPG Industries, Inc. | | | 13,302,510 | |
Total Common Stocks (Cost $1,409,533,119) | | | 1,619,342,690 | |
| | | | | |
| Short-Term Investments — 2.2% | | | | |
| | | | | |
| Money Market Funds — 2.2% | | | | |
| | 37,081,327 | | First American Government | | | | |
| | | | Obligations Fund — Class Z, 4.97%# | | | 37,081,327 | |
Total Short-Term Investments (Cost $37,081,327) | | | 37,081,327 | |
Total Investments — 99.4% (Cost $1,446,614,446) | | | 1,656,424,017 | |
Other Assets in Excess of Liabilities — 0.6% | | | 10,173,888 | |
| NET ASSETS — 100.0% | | $ | 1,666,597,905 | |
| * | Non-income producing |
| # | Annualized seven-day yield as of the date of this report. |
The accompanying notes are an integral part of these financial statements.
Statements of Assets and Liabilities
June 30, 2023
| | | BROWN | | | BROWN | | | BROWN | | | BROWN | |
| | | ADVISORY | | | ADVISORY | | | ADVISORY | | | ADVISORY | |
| | | GROWTH | | | FLEXIBLE | | | EQUITY | | | SUSTAINABLE | |
| | | EQUITY | | | EQUITY | | | INCOME | | | GROWTH | |
| | | FUND | | | FUND | | | FUND | | | FUND | |
| ASSETS | | | | | | | | | | | | |
| Investments: | | | | | | | | | | | | |
| Total investments, at cost | | $ | 1,512,545,498 | | | $ | 327,256,913 | | | $ | 40,179,440 | | | $ | 5,521,980,210 | |
| Net unrealized appreciation (depreciation) | | | 997,083,775 | | | | 379,261,063 | | | | 32,560,982 | | | | 2,118,685,109 | |
| Total investments, at value | | | 2,509,629,273 | | | | 706,517,976 | | | | 72,740,422 | | | | 7,640,665,319 | |
| Cash | | | — | | | | 37,210 | | | | | | | | — | |
| Receivables: | | | | | | | | | | | | | | | | |
| Investments sold | | | 30,903,447 | | | | — | | | | — | | | | — | |
| Fund shares sold | | | 1,333,370 | | | | 844,102 | | | | 212 | | | | 16,960,189 | |
| Interest and dividends | | | 541,305 | | | | 258,784 | | | | 97,944 | | | | 4,714,973 | |
| Foreign tax reclaims | | | — | | | | — | | | | 30,026 | | | | — | |
| Prepaid expenses and other assets | | | 116,936 | | | | 50,328 | | | | 39,371 | | | | 297,999 | |
| Total Assets | | | 2,542,524,331 | | | | 707,708,400 | | | | 72,907,975 | | | | 7,662,638,480 | |
| LIABILITIES | | | | | | | | | | | | | | | | |
| Payables: | | | | | | | | | | | | | | | | |
| Fund shares redeemed | | | 2,227,169 | | | | 118,443 | | | | 57,958 | | | | 5,132,730 | |
| Distribution to shareholders | | | — | | | | — | | | | 246,307 | | | | — | |
| Accrued Liabilities: | | | | | | | | | | | | | | | | |
Investment advisory fees, net
| | | 1,180,128 | | | | 242,438 | | | | 31,240 | | | | 3,195,580 | |
| Service fees | | | 84,066 | | | | 54,421 | | | | 6,628 | | | | 300,407 | |
| Administration, accounting and transfer agent fees | | | 101,764 | | | | 29,049 | | | | 3,622 | | | | 294,627 | |
| Business management fees | | | 101,680 | | | | 28,250 | | | | 2,942 | | | | 307,119 | |
| Trustee fees | | | 18,144 | | | | 5,083 | | | | 545 | | | | 55,606 | |
| Distribution fees | | | 2,798 | | | | 1,043 | | | | 215 | | | | 71,351 | |
| Professional fees | | | 43,540 | | | | 27,763 | | | | 22,463 | | | | 87,141 | |
| Custodian fees | | | 13,779 | | | | 3,812 | | | | 999 | | | | 35,930 | |
| Other liabilities | | | 19,757 | | | | 6,424 | | | | 4,154 | | | | 195,100 | |
| Total Liabilities | | | 3,792,825 | | | | 516,726 | | | | 377,073 | | | | 9,675,591 | |
| NET ASSETS | | $ | 2,538,731,506 | | | $ | 707,191,674 | | | $ | 72,530,902 | | | $ | 7,652,962,889 | |
| | | | | | | | | | | | | | | | | |
| COMPONENTS OF NET ASSETS | | | | | | | | | | | | | | | | |
| Paid-in capital | | $ | 1,477,437,302 | | | $ | 315,173,021 | | | $ | 36,033,213 | | | $ | 5,604,321,779 | |
| Total distributable earnings (loss) | | | 1,061,294,204 | | | | 392,018,653 | | | | 36,497,689 | | | | 2,048,641,110 | |
| NET ASSETS | | $ | 2,538,731,506 | | | $ | 707,191,674 | | | $ | 72,530,902 | | | $ | 7,652,962,889 | |
| COMPUTATION OF NET ASSET VALUE | | | | | | | | | | | | | | | | |
| Institutional Shares: | | | | | | | | | | | | | | | | |
| Net assets | | $ | 1,837,800,778 | | | $ | 259,933,060 | | | $ | 18,093,933 | | | $ | 5,145,710,684 | |
| Shares outstanding (unlimited shares authorized) | | | 68,732,378 | | | | 8,139,209 | | | | 1,321,822 | | | | 119,451,730 | |
| Net asset value per share | | $ | 26.74 | | | $ | 31.94 | | | $ | 13.69 | | | $ | 43.08 | |
| Investor Shares: | | | | | | | | | | | | | | | | |
| Net assets | | $ | 687,057,830 | | | $ | 442,013,276 | | | $ | 53,364,149 | | | $ | 2,150,631,909 | |
| Shares outstanding (unlimited shares authorized) | | | 26,299,680 | | | | 13,882,608 | | | | 3,899,296 | | | | 50,850,497 | |
| Net asset value per share | | $ | 26.12 | | | $ | 31.84 | | | $ | 13.69 | | | $ | 42.29 | |
| Advisor Shares: | | | | | | | | | | | | | | | | |
| Net assets | | $ | 13,872,898 | | | $ | 5,245,338 | | | $ | 1,072,820 | | | $ | 356,620,296 | |
| Shares outstanding (unlimited shares authorized) | | | 582,379 | | | | 165,385 | | | | 78,467 | | | | 8,681,978 | |
| Net asset value per share | | $ | 23.82 | | | $ | 31.72 | | | $ | 13.67 | | | $ | 41.08 | |
The accompanying notes are an integral part of these financial statements.
Statements of Assets and Liabilities
June 30, 2023
| | | BROWN | | | BROWN | | | BROWN | | | BROWN | |
| | | ADVISORY | | | ADVISORY | | | ADVISORY | | | ADVISORY | |
| | | MID-CAP | | | SMALL-CAP | | | SMALL-CAP | | | SUSTAINABLE | |
| | | GROWTH | | | GROWTH | | | FUNDAMENTAL | | | SMALL-CAP | |
| | | FUND | | | FUND | | | VALUE FUND | | | CORE FUND | |
| ASSETS | | | | | | | | | | | | |
| Investments: | | | | | | | | | | | | |
| Total investments, at cost | | $ | 75,808,153 | | | $ | 1,900,764,822 | | | $ | 926,195,558 | | | $ | 46,599,094 | |
| Net unrealized appreciation (depreciation) | | | 19,963,836 | | | | 347,927,699 | | | | 250,908,050 | | | | 3,906,610 | |
| Total investments, at value | | | 95,771,989 | | | | 2,248,692,521 | | | | 1,177,103,608 | | | | 50,505,704 | |
| Receivables: | | | | | | | | | | | | | | | | |
| Investments sold | | | 193,488 | | | | — | | | | 3,698,523 | | | | 852,471 | |
| Fund shares sold | | | 1,618,514 | | | | 6,448,852 | | | | 2,862,316 | | | | 2,552,730 | |
| Interest and dividends | | | 26,755 | | | | 1,647,383 | | | | 2,082,960 | | | | 45,850 | |
| Foreign tax reclaims | | | 1,540 | | | | — | | | | — | | | | — | |
| Prepaid expenses and other assets | | | 33,628 | | | | 112,910 | | | | 63,459 | | | | 29,121 | |
| Total Assets | | | 97,645,914 | | | | 2,256,901,666 | | | | 1,185,810,866 | | | | 53,985,876 | |
| LIABILITIES | | | | | | | | | | | | | | | | |
| Payables: | | | | | | | | | | | | | | | | |
| Investments purchased | | | 714,061 | | | | 12,234,109 | | | | 1,938,715 | | | | 453,466 | |
| Fund shares redeemed | | | 462,955 | | | | 747,491 | | | | 70,686 | | | | — | |
| Accrued Liabilities: | | | | | | | | | | | | | | | | |
| Investment advisory fees, net | | | 49,269 | | | | 1,519,619 | | | | 804,774 | | | | 28,383 | |
| Service fees | | | 2,910 | | | | 106,437 | | | | 71,476 | | | | 155 | |
| Administration, accounting and transfer agent fees | | | 4,503 | | | | 90,857 | | | | 52,986 | | | | 2,622 | |
| Business management fees | | | 3,785 | | | | 89,389 | | | | 47,340 | | | | 2,022 | |
| Trustee fees | | | 675 | | | | 16,010 | | | | 8,133 | | | | 372 | |
| Distribution fees | | | — | | | | 1,944 | | | | 545 | | | | — | |
| Professional fees | | | 21,131 | | | | 40,830 | | | | 31,781 | | | | 15,924 | |
| Custodian fees | | | 2,324 | | | | 12,077 | | | | 7,166 | | | | 2,618 | |
| Other liabilities | | | 5,187 | | | | 102,539 | | | | 11,171 | | | | 4,944 | |
| Total Liabilities | | | 1,266,800 | | | | 14,961,302 | | | | 3,044,773 | | | | 510,506 | |
| NET ASSETS | | $ | 96,379,114 | | | $ | 2,241,940,364 | | | $ | 1,182,766,093 | | | $ | 53,475,370 | |
| | | | | | | | | | | | | | | | | |
| COMPONENTS OF NET ASSETS | | | | | | | | | | | | | | | | |
| Paid-in capital | | $ | 93,409,605 | | | $ | 1,912,002,915 | | | $ | 898,334,288 | | | $ | 56,895,572 | |
| Total distributable earnings (loss) | | | 2,969,509 | | | | 329,937,449 | | | | 284,431,805 | | | | (3,420,202 | ) |
| NET ASSETS | | $ | 96,379,114 | | | $ | 2,241,940,364 | | | $ | 1,182,766,093 | | | $ | 53,475,370 | |
| COMPUTATION OF NET ASSET VALUE | | | | | | | | | | | | | | | | |
| Institutional Shares: | | | | | | | | | | | | | | | | |
| Net assets | | $ | 71,960,220 | | | $ | 1,349,939,833 | | | $ | 588,593,728 | | | $ | 51,934,956 | |
| Shares outstanding (unlimited shares authorized) | | | 5,312,656 | | | | 30,347,219 | | | | 21,266,262 | | | | 5,893,287 | |
| Net asset value per share | | $ | 13.55 | | | $ | 44.48 | | | $ | 27.68 | | | $ | 8.81 | |
| Investor Shares: | | | | | | | | | | | | | | | | |
| Net assets | | $ | 24,418,894 | | | $ | 882,356,206 | | | $ | 591,487,010 | | | $ | 1,540,414 | |
| Shares outstanding (unlimited shares authorized) | | | 1,818,925 | | | | 39,890,701 | | | | 21,412,384 | | | | 175,272 | |
| Net asset value per share | | $ | 13.42 | | | $ | 22.12 | | | $ | 27.62 | | | $ | 8.79 | |
| Advisor Shares: | | | | | | | | | | | | | | | | |
| Net assets | | $ | — | | | $ | 9,644,325 | | | $ | 2,685,355 | | | $ | — | |
| Shares outstanding (unlimited shares authorized) | | | — | | | | 460,809 | | | | 97,941 | | | | — | |
| Net asset value per share | | $ | — | | | $ | 20.93 | | | $ | 27.42 | | | $ | — | |
The accompanying notes are an integral part of these financial statements.
Statements of Assets and Liabilities
June 30, 2023
| | | BROWN | | | BROWN | | | BROWN | | | BROWN | |
| | | ADVISORY | | | ADVISORY | | | ADVISORY | | | ADVISORY | |
| | | SUSTAINABLE | | | GLOBAL | | | SUSTAINABLE | | | INTERMEDIATE | |
| | | VALUE | | | LEADERS | | | INTERNATIONAL | | | INCOME | |
| | | FUND | | | FUND | | | LEADERS FUND | | | FUND | |
| ASSETS | | | | | | | | | | | | |
| Investments: | |
| | | | | | | | | | |
| Investments – unaffiliated, at cost | | $ | 46,738,308 | | | $ | 1,069,061,559 | | | $ | 20,635,707 | | | $ | 118,488,073 | |
| Investments – affiliated, at cost (Note 3) | | | — | | | | — | | | | — | | | | 16,952,513 | |
| Total investments, at cost | | | 46,738,308 | | | | 1,069,061,559 | | | | 20,635,707 | | | | 135,440,586 | |
| Net unrealized appreciation (depreciation) – unaffiliated | | | 1,465,263 | | | | 404,576,886 | | | | 3,368,337 | | | | (8,165,199 | ) |
| Net unrealized appreciation (depreciation) – affiliated (Note 3) | | | — | | | | — | | | | — | | | | (1,895,496 | ) |
| Total net unrealized appreciation (depreciation) | | | 1,465,263 | | | | 404,576,886 | | | | 3,368,337 | | | | (10,060,695 | ) |
| Investments – unaffiliated, at value | | | 48,203,571 | | | | 1,473,638,445 | | | | 24,004,044 | | | | 110,322,874 | |
| Investments – affiliated, at value (Note 3) | | | — | | | | — | | | | — | | | | 15,057,017 | |
| Total investments, at value | | | 48,203,571 | | | | 1,473,638,445 | | | | 24,004,044 | | | | 125,379,891 | |
| Cash deposit at broker – futures contracts (Note 6) | | | — | | | | — | | | | — | | | | 409,706 | |
| Gross unrealized appreciation – futures contracts (Note 6) | | | — | | | | — | | | | — | | | | 107,054 | |
| Receivables: | | | | | | | | | | | | | | | | |
| Investments sold | | | — | | | | 13,601,059 | | | | — | | | | — | |
| Fund shares sold | | | 2,818,000 | | | | 5,928,648 | | | | 303,500 | | | | 219,138 | |
| Interest and dividends | | | 64,405 | | | | 1,031,586 | | | | 25,393 | | | | 555,826 | |
| Foreign tax reclaims | | | 3,119 | | | | 1,666,725 | | | | 21,233 | | | | — | |
| Prepaid expenses and other assets | | | 39,244 | | | | 66,537 | | | | 39,046 | | | | 38,764 | |
| Total Assets | | | 51,128,339 | | | | 1,495,933,000 | | | | 24,393,216 | | | | 126,710,379 | |
| LIABILITIES | | | | | | | | | | | | | | | | |
| Gross unrealized depreciation – futures contracts (Note 6) | | | — | | | | — | | | | — | | | | 332,878 | |
| Payables: | | | | | | | | | | | | | | | | |
| Investments purchased | | | 609,174 | | | | 14,835,509 | | | | 14,198 | | | | — | |
| Fund shares redeemed | | | 20,000 | | | | 957,984 | | | | — | | | | 325,575 | |
| Distribution to shareholders | | | — | | | | — | | | | — | | | | 194,565 | |
| Accrued Liabilities: | | | | | | | | | | | | | | | | |
| Investment advisory fees, net | | | 1,486 | | | | 770,868 | | | | 2,876 | | | | 27,275 | |
| Service fees | | | 20 | | | | 9,510 | | | | 179 | | | | 5,168 | |
| Administration, accounting and transfer agent fees | | | 1,909 | | | | 63,956 | | | | 1,637 | | | | 7,759 | |
| Business management fees | | | 1,854 | | | | 59,298 | | | | 942 | | | | 5,168 | |
| Trustee fees | | | 289 | | | | 10,591 | | | | 170 | | | | 1,003 | |
| Distribution fees | | | — | | | | — | | | | — | | | | 651 | |
| Professional fees | | | 14,415 | | | | 34,891 | | | | 15,666 | | | | 23,554 | |
| Custodian fees | | | 2,824 | | | | 25,829 | | | | 3,480 | | | | 1,121 | |
| Other liabilities | | | 5,739 | | | | 16,990 | | | | 7,341 | | | | 5,418 | |
| Total Liabilities | | | 657,710 | | | | 16,785,426 | | | | 46,489 | | | | 930,135 | |
| NET ASSETS | | $ | 50,470,629 | | | $ | 1,479,147,574 | | | $ | 24,346,727 | | | $ | 125,780,244 | |
| COMPONENTS OF NET ASSETS | | | | | | | | | | | | | | | | |
| Paid-in capital | | $ | 48,896,961 | | | $ | 1,130,475,859 | | | $ | 21,055,034 | | | $ | 142,794,932 | |
| Total distributable earnings (loss) | | | 1,573,668 | | | | 348,671,715 | | | | 3,291,693 | | | | (17,014,688 | ) |
| NET ASSETS | | $ | 50,470,629 | | | $ | 1,479,147,574 | | | $ | 24,346,727 | | | $ | 125,780,244 | |
| COMPUTATION OF NET ASSET VALUE | | | | | | | | | | | | | | | | |
| Institutional Shares: | | | | | | | | | | | | | | | | |
| Net assets | | $ | 50,307,224 | | | $ | 1,401,528,099 | | | $ | 22,884,026 | | | $ | — | |
| Shares outstanding (unlimited shares authorized) | | | 5,013,635 | | | | 63,468,329 | | | | 2,175,502 | | | | — | |
| Net asset value per share | | $ | 10.03 | | | $ | 22.08 | | | $ | 10.52 | | | $ | — | |
| Investor Shares: | | | | | | | | | | | | | | | | |
| Net assets | | $ | 163,405 | | | $ | 77,619,475 | | | $ | 1,462,701 | | | $ | 122,640,903 | |
| Shares outstanding (unlimited shares authorized) | | | 16,302 | | | | 3,528,012 | | | | 139,432 | | | | 12,774,168 | |
| Net asset value per share | | $ | 10.02 | | | $ | 22.00 | | | $ | 10.49 | | | $ | 9.60 | |
| Advisor Shares: | | | | | | | | | | | | | | | | |
| Net assets | | $ | — | | | $ | — | | | $ | — | | | $ | 3,139,341 | |
| Shares outstanding (unlimited shares authorized) | | | — | | | | — | | | | — | | | | 334,845 | |
| Net asset value per share | | $ | — | | | $ | — | | | $ | — | | | $ | 9.38 | |
The accompanying notes are an integral part of these financial statements.
Statements of Assets and Liabilities
June 30, 2023
| | | | | | | | | | | | BROWN | |
| | | BROWN | | | BROWN | | | BROWN | | | ADVISORY | |
| | | ADVISORY | | | ADVISORY | | | ADVISORY | | | TAX-EXEMPT | |
| | | SUSTAINABLE | | | MARYLAND | | | TAX-EXEMPT | | | SUSTAINABLE | |
| | | BOND FUND | | | BOND FUND | | | BOND FUND | | | BOND FUND | |
| ASSETS | | | | | | | | | | | | |
| Investments: | |
| | | | | | | | | | |
| Total investments, at cost | | $ | 992,102,247 | | | $ | 169,399,269 | | | $ | 798,921,129 | | | $ | 297,656,056 | |
| Net unrealized appreciation (depreciation) | | | (23,367,587 | ) | | | (5,978,175 | ) | | | (8,541,009 | ) | | | (11,002,449 | ) |
| Total investments, at value | | | 968,734,660 | | | | 163,421,094 | | | | 790,380,120 | | | | 286,653,607 | |
| Cash – segregated for open TBA transactions | | | 722,000 | | | | — | | | | — | | | | — | |
| Cash deposit at broker – futures contracts (Note 6) | | | 5,120,460 | | | | — | | | | — | | | | — | |
| Gross unrealized appreciation – futures contracts (Note 6) | | | 585,624 | | | | — | | | | — | | | | — | |
| Receivables: | | | | | | | | | | | | | | | | |
| Fund shares sold | | | 5,544,986 | | | | 77 | | | | 2,726,792 | | | | 105,600 | |
| Interest and dividends | | | 4,074,445 | | | | 2,088,639 | | | | 5,671,997 | | | | 2,953,311 | |
| Prepaid expenses and other assets | | | 52,082 | | | | 16,990 | | | | 77,759 | | | | 53,007 | |
| Total Assets | | | 984,834,257 | | | | 165,526,800 | | | | 798,856,668 | | | | 289,765,525 | |
| LIABILITIES | | | | | | | | | | | | | | | | |
| Gross unrealized depreciation – futures contracts (Note 6) | | | 2,658,173 | | | | — | | | | — | | | | — | |
| Payables: | | | | | | | | | | | | | | | | |
| Investments purchased | | | 245,489,596 | | | | 1,125,410 | | | | — | | | | — | |
| Fund shares redeemed | | | 160,480 | | | | 18,948 | | | | 466,731 | | | | 43,457 | |
| Distribution to shareholders | | | — | | | | 327,469 | | | | 2,042,139 | | | | 589,805 | |
| Accrued Liabilities: | | | | | | | | | | | | | | | | |
| Investment advisory fees | | | 180,786 | | | | 40,222 | | | | 194,271 | | | | 71,413 | |
| Service fees | | | 517 | | | | 6,704 | | | | 320 | | | | 11,902 | |
| Administration, accounting and transfer agent fees | | | 39,319 | | | | 9,743 | | | | 35,389 | | | | 14,137 | |
| Business management fees | | | 30,131 | | | | 6,704 | | | | 32,379 | | | | 11,902 | |
| Trustee fees | | | 5,032 | | | | 1,259 | | | | 5,754 | | | | 2,309 | |
| Professional fees | | | 27,923 | | | | 23,147 | | | | 28,560 | | | | 21,011 | |
| Custodian fees | | | 6,052 | | | | 1,002 | | | | 4,099 | | | | 1,729 | |
| Other liabilities | | | 15,137 | | | | 4,874 | | | | 5,985 | | | | 5,191 | |
| Total Liabilities | | | 248,613,146 | | | | 1,565,482 | | | | 2,815,627 | | | | 772,856 | |
| NET ASSETS | | $ | 736,221,111 | | | $ | 163,961,318 | | | $ | 796,041,041 | | | $ | 288,992,669 | |
| | | | | | | | | | | | | | | | | |
| COMPONENTS OF NET ASSETS | | | | | | | | | | | | | | | | |
| Paid-in capital | | $ | 855,708,198 | | | $ | 178,470,225 | | | $ | 889,132,340 | | | $ | 314,586,571 | |
| Total distributable earnings (loss) | | | (119,487,087 | ) | | | (14,508,907 | ) | | | (93,091,299 | ) | | | (25,593,902 | ) |
| NET ASSETS | | $ | 736,221,111 | | | $ | 163,961,318 | | | $ | 796,041,041 | | | $ | 288,992,669 | |
| COMPUTATION OF NET ASSET VALUE | | | | | | | | | | | | | | | | |
| Institutional Shares: | | | | | | | | | | | | | | | | |
| Net assets | | $ | 723,392,575 | | | $ | — | | | $ | 787,874,099 | | | $ | — | |
| Shares outstanding (unlimited shares authorized) | | | 84,075,873 | | | | — | | | | 84,833,406 | | | | — | |
| Net asset value per share | | $ | 8.60 | | | $ | — | | | $ | 9.29 | | | $ | — | |
| Investor Shares: | | | | | | | | | | | | | | | | |
| Net assets | | $ | 12,828,536 | | | $ | 163,961,318 | | | $ | 8,166,942 | | | $ | 288,992,669 | |
| Shares outstanding (unlimited shares authorized) | | | 1,490,333 | | | | 16,743,768 | | | | 878,892 | | | | 31,885,980 | |
| Net asset value per share | | $ | 8.61 | | | $ | 9.79 | | | $ | 9.29 | | | $ | 9.06 | |
| Advisor Shares: | | | | | | | | | | | | | | | | |
| Net assets | | $ | — | | | $ | — | | | $ | — | | | $ | — | |
| Shares outstanding (unlimited shares authorized) | | | — | | | | — | | | | — | | | | — | |
| Net asset value per share | | $ | — | | | $ | — | | | $ | — | | | $ | — | |
The accompanying notes are an integral part of these financial statements.
Statements of Assets and Liabilities
June 30, 2023
| | | | | | BROWN | | | | | | | |
| | | | | | ADVISORY – | | | | | | BROWN | |
| | | BROWN | | | WMC | | | BROWN | | | ADVISORY – | |
| | | ADVISORY | | | STRATEGIC | | | ADVISORY | | | BEUTEL | |
| | | MORTGAGE | | | EUROPEAN | | | EMERGING | | | GOODMAN | |
| | | SECURITIES | | | EQUITY | | | MARKETS | | | LARGE-CAP | |
| | | FUND | | | FUND | | | SELECT FUND | | | VALUE FUND | |
| ASSETS | | | | | | | | | | | | |
| Investments: | | | | | | | | | | | | |
| Total investments, at cost | | $ | 399,373,258 | | | $ | 200,355,277 | | | $ | 486,381,900 | | | $ | 1,446,614,446 | |
| Net unrealized appreciation (depreciation) | | | (19,656,257 | ) | | | 42,049,247 | | | | 52,296,000 | | | | 209,809,571 | |
| Total investments, at value | | | 379,717,001 | | | | 242,404,524 | | | | 538,677,900 | | | | 1,656,424,017 | |
| Cash – segregated for open TBA transactions | | | 709,000 | | | | — | | | | — | | | | — | |
| Foreign currency (Cost of $—, $11, $723,044, and $—, respectively.) | | | — | | | | 11 | | | | 723,073 | | | | — | |
| Cash deposit at broker – futures contracts (Note 6) | | | 1,505,081 | | | | — | | | | — | | | | — | |
| Gross unrealized appreciation – futures contracts (Note 6) | | | 108 | | | | — | | | | — | | | | — | |
| Receivables: | | | | | | | | | | | | | | | | |
| Investments sold | | | 6,909 | | | | 955,875 | | | | — | | | | 14,135,065 | |
| Fund shares sold | | | 114,585 | | | | 271,226 | | | | 1,922,755 | | | | 4,929,220 | |
| Interest and dividends | | | 1,101,737 | | | | 230,057 | | | | 1,862,498 | | | | 2,546,795 | |
| Foreign tax reclaims | | | — | | | | 1,828,113 | | | | 24,873 | | | | — | |
| Prepaid expenses and other assets | | | 43,124 | | | | 40,079 | | | | 54,829 | | | | 77,080 | |
| Total Assets | | | 383,197,545 | | | | 245,729,885 | | | | 543,265,928 | | | | 1,678,112,177 | |
| LIABILITIES | | | | | | | | | | | | | | | | |
| Gross unrealized depreciation – futures contracts (Note 6) | | | 474,583 | | | | — | | | | — | | | | — | |
| Payables: | | | | | | | | | | | | | | | | |
| Due to custodian | | | 863,559 | | | | — | | | | — | | | | — | |
| Investments purchased | | | 77,172,820 | | | | 319,396 | | | | 2,706,284 | | | | 10,239,981 | |
| Fund shares redeemed | | | 169,513 | | | | 144,441 | | | | 295,846 | | | | 450,301 | |
| Distribution to shareholders | | | 682,266 | | | | — | | | | — | | | | — | |
| Accrued Liabilities: | | | | | | | | | | | | | | | | |
| Investment advisory fees | | | 75,770 | | | | 179,065 | | | | 394,612 | | | | 598,426 | |
| Service fees | | | 59 | | | | 2,133 | | | | 274 | | | | 304 | |
| Administration, accounting and transfer agent fees | | | 25,346 | | | | 11,083 | | | | 26,815 | | | | 68,275 | |
| Business management fees | | | 12,628 | | | | 9,948 | | | | 21,923 | | | | 66,492 | |
| Trustee fees | | | 2,416 | | | | 1,898 | | | | 4,111 | | | | 12,399 | |
| Distribution fees | | | — | | | | 541 | | | | 46 | | | | — | |
| Professional fees | | | 25,536 | | | | 24,992 | | | | 27,558 | | | | 35,343 | |
| Custodian fees | | | 3,601 | | | | 13,229 | | | | 69,316 | | | | 9,109 | |
| Other liabilities | | | 6,684 | | | | 5,340 | | | | 8,307 | | | | 33,642 | |
| Total Liabilities | | | 79,514,781 | | | | 712,066 | | | | 3,555,092 | | | | 11,514,272 | |
| NET ASSETS | | $ | 303,682,764 | | | $ | 245,017,819 | | | $ | 539,710,836 | | | $ | 1,666,597,905 | |
| | | | | | | | | | | | | | | | | |
| COMPONENTS OF NET ASSETS | | | | | | | | | | | | | | | | |
| Paid-in capital | | $ | 344,864,682 | | | $ | 223,567,524 | | | $ | 568,868,970 | | | $ | 1,472,417,124 | |
| Total distributable earnings (loss) | | | (41,181,918 | ) | | | 21,450,295 | | | | (29,158,134 | ) | | | 194,180,781 | |
| NET ASSETS | | $ | 303,682,764 | | | $ | 245,017,819 | | | $ | 539,710,836 | | | $ | 1,666,597,905 | |
| COMPUTATION OF NET ASSET VALUE | | | | | | | | | | | | | | | | |
| Institutional Shares: | | | | | | | | | | | | | | | | |
| Net assets | | $ | 302,292,881 | | | $ | 227,406,932 | | | $ | 537,465,846 | | | $ | 1,664,063,062 | |
| Shares outstanding (unlimited shares authorized) | | | 33,210,550 | | | | 19,244,550 | | | | 50,576,551 | | | | 121,681,915 | |
| Net asset value per share | | $ | 9.10 | | | $ | 11.82 | | | $ | 10.63 | | | $ | 13.68 | |
| Investor Shares: | | | | | | | | | | | | | | | | |
| Net assets | | $ | 1,389,883 | | | $ | 14,921,698 | | | $ | 2,025,417 | | | $ | 2,534,843 | |
| Shares outstanding (unlimited shares authorized) | | | 152,414 | | | | 1,267,550 | | | | 190,764 | | | | 185,777 | |
| Net asset value per share | | $ | 9.12 | | | $ | 11.77 | | | $ | 10.62 | | | $ | 13.64 | |
| Advisor Shares: | | | | | | | | | | | | | | | | |
| Net assets | | $ | — | | | $ | 2,689,189 | | | $ | 219,573 | | | $ | — | |
| Shares outstanding (unlimited shares authorized) | | | — | | | | 231,895 | | | | 20,618 | | | | — | |
| Net asset value per share | | $ | — | | | $ | 11.60 | | | $ | 10.65 | | | $ | — | |
The accompanying notes are an integral part of these financial statements.
Statements of Operations
For the Year Ended June 30, 2023
| | | BROWN | | | BROWN | | | BROWN | | | BROWN | |
| | | ADVISORY | | | ADVISORY | | | ADVISORY | | | ADVISORY | |
| | | GROWTH | | | FLEXIBLE | | | EQUITY | | | SUSTAINABLE | |
| | | EQUITY | | | EQUITY | | | INCOME | | | GROWTH | |
| | | FUND | | | FUND | | | FUND | | | FUND | |
| INVESTMENT INCOME | | | | | | | | | | | | |
| Dividend income | | $ | 10,768,271 | | | $ | 5,739,076 | | | $ | 1,797,181 | | | $ | 40,190,052 | |
| Less: foreign taxes withheld | | | (244,362 | ) | | | (188,506 | ) | | | (11,034 | ) | | | — | |
| Interest Income | | | 2,057,119 | | | | 693,068 | | | | 88,924 | | | | 4,587,113 | |
| Total investment income | | | 12,581,028 | | | | 6,243,638 | | | | 1,875,071 | | | | 44,777,165 | |
| EXPENSES | | | | | | | | | | | | | | | | |
| Investment advisory fees | | | 13,506,956 | | | | 2,735,029 | | | | 448,827 | | | | 33,265,353 | |
| Business management fees | | | 1,159,723 | | | | 316,879 | | | | 37,402 | | | | 3,120,210 | |
| Service fees -- Investor Shares (Note 3) | | | 994,831 | | | | 615,710 | | | | 82,267 | | | | 2,809,530 | |
| Administration, accounting and transfer agent fees | | | 593,273 | | | | 163,019 | | | | 21,455 | | | | 1,575,003 | |
| Trustee fees | | | 128,253 | | | | 34,687 | | | | 4,194 | | | | 331,823 | |
| Professional fees | | | 119,083 | | | | 47,936 | | | | 24,924 | | | | 277,817 | |
| Miscellaneous expenses | | | 104,066 | | | | 37,828 | | | | 24,756 | | | | 380,538 | |
| Registration fees | | | 91,831 | | | | 45,737 | | | | 42,079 | | | | 331,453 | |
| Custodian fees | | | 77,698 | | | | 20,484 | | | | 4,017 | | | | 188,238 | |
| Insurance fees | | | 35,141 | | | | 9,046 | | | | 1,147 | | | | 80,839 | |
| Distribution fees – Advisor Shares (Note 3) | | | 31,287 | | | | 11,509 | | | | 2,691 | | | | 793,436 | |
| Service fees – Advisor Shares (Note 3) | | | 18,772 | | | | 6,906 | | | | 1,615 | | | | 476,061 | |
| Total Expenses | | | 16,860,914 | | | | 4,044,770 | | | | 695,374 | | | | 43,630,301 | |
| Expenses waived by adviser – expense cap (Note 3) | | | — | | | | — | | | | (40,287 | ) | | | — | |
| Net Expenses | | | 16,860,914 | | | | 4,044,770 | | | | 655,087 | | | | 43,630,301 | |
| NET INVESTMENT INCOME (LOSS) | | | (4,279,886 | ) | | | 2,198,868 | | | | 1,219,984 | | | | 1,146,864 | |
| NET REALIZED AND UNREALIZED GAIN (LOSS) | | | | | | | | | | | | | | | | |
| Net realized gain (loss) on investments | | | 94,224,857 | | | | 17,278,494 | | | | 5,843,278 | | | | 5,075,647 | |
| Net change in unrealized appreciation (depreciation) on investments | | | 345,339,165 | | | | 105,107,069 | | | | 693,112 | | | | 1,273,242,361 | |
| NET REALIZED AND UNREALIZED GAIN (LOSS) | | | 439,564,022 | | | | 122,385,563 | | | | 6,536,390 | | | | 1,278,318,008 | |
| INCREASE (DECREASE) IN NET ASSETS FROM OPERATIONS | | $ | 435,284,136 | | | $ | 124,584,431 | | | $ | 7,756,374 | | | $ | 1,279,464,872 | |
The accompanying notes are an integral part of these financial statements.
Statements of Operations
For the Year Ended June 30, 2023
| | | BROWN | | | BROWN | | | BROWN | | | BROWN | |
| | | ADVISORY | | | ADVISORY | | | ADVISORY | | | ADVISORY | |
| | | MID-CAP | | | SMALL-CAP | | | SMALL-CAP | | | SUSTAINABLE | |
| | | GROWTH | | | GROWTH | | | FUNDAMENTAL | | | SMALL-CAP | |
| | | FUND | | | FUND | | | VALUE FUND | | | CORE FUND | |
| INVESTMENT INCOME | | | | | | | | | | | | |
| Dividend income | | $ | 374,062 | | | $ | 10,265,308 | | | $ | 17,860,780 | | | $ | 346,243 | |
| Less: foreign taxes withheld | | | (10,003 | ) | | | (102,946 | ) | | | (1,494 | ) | | | (372 | ) |
| Interest Income | | | 186,730 | | | | 6,788,703 | | | | 1,690,174 | | | | 117,695 | |
| Total investment income | | | 550,789 | | | | 16,951,065 | | | | 19,549,460 | | | | 463,566 | |
| EXPENSES | | | | | | | | | | | | | | | | |
| Investment advisory fees | | | 666,233 | | | | 17,438,315 | | | | 9,970,471 | | | | 356,117 | |
| Business management fees | | | 51,249 | | | | 1,025,783 | | | | 586,498 | | | | 20,948 | |
| Service fees – Investor Shares (Note 3) | | | 34,706 | | | | 1,192,498 | | | | 882,102 | | | | 2,074 | |
| Registration fees | | | 32,493 | | | | 115,618 | | | | 51,255 | | | | 36,948 | |
| Administration, accounting and transfer agent fees | | | 29,388 | | | | 523,561 | | | | 306,177 | | | | 14,239 | |
| Miscellaneous expenses | | | 25,355 | | | | 287,360 | | | | 58,846 | | | | 21,455 | |
| Professional fees | | | 24,798 | | | | 105,010 | | | | 70,606 | | | | 17,199 | |
| Custodian fees | | | 13,967 | | | | 66,697 | | | | 44,885 | | | | 17,012 | |
| Trustee fees | | | 5,958 | | | | 109,830 | | | | 64,192 | | | | 2,115 | |
| Insurance fees | | | 1,769 | | | | 28,386 | | | | 17,009 | | | | 519 | |
| Interest expense on line of credit | | | 557 | | | | — | | | | — | | | | — | |
| Distribution fees – Advisor Shares (Note 3) | | | — | | | | 23,865 | | | | 7,381 | | | | — | |
| Service fees – Advisor Shares (Note 3) | | | — | | | | 14,319 | | | | 4,429 | | | | — | |
| Total Expenses | | | 886,473 | | | | 20,931,242 | | | | 12,063,851 | | | | 488,626 | |
| Expenses waived by adviser – expense cap (Note 3) | | | (11,288 | ) | | | — | | | | — | | | | (96,918 | ) |
| Net Expenses | | | 875,185 | | | | 20,931,242 | | | | 12,063,851 | | | | 391,708 | |
| NET INVESTMENT INCOME (LOSS) | | | (324,396 | ) | | | (3,980,177 | ) | | | 7,485,609 | | | | 71,858 | |
| NET REALIZED AND UNREALIZED GAIN (LOSS) | | | | | | | | | | | | | | | | |
| Net realized gain (loss) on investments | | | (5,529,060 | ) | | | (8,554,578 | ) | | | 96,965,631 | | | | (6,281,256 | ) |
| Net change in unrealized appreciation (depreciation) on investments | | | 21,470,002 | | | | 286,188,644 | | | | 35,523,126 | | | | 11,304,700 | |
| NET REALIZED AND UNREALIZED GAIN (LOSS) | | | 15,940,942 | | �� | | 277,634,066 | | | | 132,488,757 | | | | 5,023,444 | |
| INCREASE (DECREASE) IN NET ASSETS FROM OPERATIONS | | $ | 15,616,546 | | | $ | 273,653,889 | | | $ | 139,974,366 | | | $ | 5,095,302 | |
The accompanying notes are an integral part of these financial statements.
Statements of Operations
For the Year Ended June 30, 2023
| | | BROWN | | | BROWN | | | BROWN | | | BROWN | |
| | | ADVISORY | | | ADVISORY | | | ADVISORY | | | ADVISORY | |
| | | SUSTAINABLE | | | GLOBAL | | | SUSTAINABLE | | | INTERMEDIATE | |
| | | VALUE | | | LEADERS | | | INTERNATIONAL | | | INCOME | |
| | | FUND* | | | FUND | | | LEADERS FUND | | | FUND | |
| INVESTMENT INCOME | | | | | | | | | | | | |
| Dividend income – unaffiliated | | $ | 247,122 | | | $ | 18,417,876 | | | $ | 306,201 | | | $ | — | |
| Dividend income – affiliated (Note 3) | | | — | | | | — | | | | — | | | | 489,493 | |
| Less: foreign taxes withheld | | | (1,423 | ) | | | (1,678,322 | ) | | | (33,911 | ) | | | — | |
| Interest Income | | | 45,586 | | | | 900,350 | | | | 13,636 | | | | 3,396,450 | |
| Total investment income | | | 291,285 | | | | 17,639,904 | | | | 285,926 | | | | 3,885,943 | |
| EXPENSES | | | | | | | | | | | | | | | | |
| Investment advisory fees | | | 72,075 | | | | 8,068,001 | | | | 113,574 | | | | 394,077 | |
| Miscellaneous expenses | | | 22,016 | | | | 59,228 | | | | 31,583 | | | | 29,240 | |
| Registration fees | | | 16,268 | | | | 51,958 | | | | 37,890 | | | | 32,952 | |
| Professional fees | | | 14,415 | | | | 73,990 | | | | 16,041 | | | | 27,779 | |
| Business management fees | | | 6,006 | | | | 620,616 | | | | 7,572 | | | | 65,680 | |
| Custodian fees | | | 5,900 | | | | 163,258 | | | | 25,012 | | | | 8,086 | |
| Administration, accounting and transfer agent fees | | | 3,388 | | | | 332,139 | | | | 6,698 | | | | 51,601 | |
| Trustee fees | | | 361 | | | | 66,943 | | | | 660 | | | | 7,324 | |
| Service fees – Investor Shares (Note 3) | | | 111 | | | | 112,746 | | | | 1,625 | | | | 64,059 | |
| Insurance fees | | | 26 | | | | 16,923 | | | | 73 | | | | 2,107 | |
| Distribution fees – Advisor Shares (Note 3) | | | — | | | | — | | | | — | | | | 8,106 | |
| Service fees – Advisor Shares (Note 3) | | | — | | | | — | | | | — | | | | 1,621 | |
| Total Expenses | | | 140,566 | | | | 9,565,802 | | | | 240,728 | | | | 692,632 | |
| Expenses waived by adviser – expense cap (Note 3) | | | (56,368 | ) | | | — | | | | (110,385 | ) | | | — | |
| Expenses waived by adviser – investments in affiliates (Note 3) | | | — | | | | — | | | | — | | | | (47,084 | ) |
| Net Expenses | | | 84,198 | | | | 9,565,802 | | | | 130,343 | | | | 645,548 | |
| NET INVESTMENT INCOME (LOSS) | | | 207,087 | | | | 8,074,102 | | | | 155,583 | | | | 3,240,395 | |
| NET REALIZED AND UNREALIZED GAIN (LOSS) | | | | | | | | | | | | | | | | |
| Net realized gain (loss) on: | | | | | | | | | | | | | | | | |
| Investments and foreign currency transactions – unaffiliated | | | (98,682 | ) | | | (27,957,625 | ) | | | (165,459 | ) | | | (4,019,911 | ) |
| Investments – affiliated (Note 3) | | | — | | | | — | | | | — | | | | (178,456 | ) |
| Less: foreign capital gains taxes paid | | | — | | | | (55,597 | ) | | | — | | | | — | |
| Futures contracts (Note 6) | | | — | | | | — | | | | — | | | | (60,328 | ) |
| Net realized gain (loss) | | | (98,682 | ) | | | (28,013,222 | ) | | | (165,459 | ) | | | (4,258,695 | ) |
| Net change in unrealized appreciation (depreciation) on: | | | | | | | | | | | | | | | | |
| Investments and foreign currency transactions – unaffiliated | | | 1,465,263 | | | | 274,035,271 | | | | 4,216,118 | | | | (268,249 | ) |
| Investments – affiliated (Note 3) | | | — | | | | — | | | | — | | | | (683,679 | ) |
| Futures contracts (Note 6) | | | — | | | | — | | | | — | | | | (225,824 | ) |
| Net change in unrealized appreciation (depreciation) | | | 1,465,263 | | | | 274,035,271 | | | | 4,216,118 | | | | (1,177,752 | ) |
| NET REALIZED AND UNREALIZED GAIN (LOSS) | | | 1,366,581 | | | | 246,022,049 | | | | 4,050,659 | | | | (5,436,447 | ) |
| INCREASE (DECREASE) IN NET ASSETS FROM OPERATIONS | | $ | 1,573,668 | | | $ | 254,096,151 | | | $ | 4,206,242 | | | $ | (2,196,052 | ) |
* Inception date of Fund was February 28, 2023. Results of operations are for the period from March 1, 2023 to June 30, 2023.
The accompanying notes are an integral part of these financial statements.
Statements of Operations
For the Year Ended June 30, 2023
| | | | | | | | | | | | BROWN | |
| | | BROWN | | | BROWN | | | BROWN | | | ADVISORY | |
| | | ADVISORY | | | ADVISORY | | | ADVISORY | | | TAX-EXEMPT | |
| | | SUSTAINABLE | | | MARYLAND | | | TAX-EXEMPT | | | SUSTAINABLE | |
| | | BOND FUND | | | BOND FUND | | | BOND FUND | | | BOND FUND | |
| INVESTMENT INCOME | | | | | | | | | | | | |
| Interest Income | | $ | 10,913,859 | | | $ | 4,796,630 | | | $ | 26,869,387 | | | $ | 9,460,133 | |
| Total investment income | | | 10,913,859 | | | | 4,796,630 | | | | 26,869,387 | | | | 9,460,133 | |
| EXPENSES | | | | | | | | | | | | | | | | |
| Investment advisory fees | | | 1,009,823 | | | | 497,156 | | | | 2,255,552 | | | | 907,428 | |
| Business management fees | | | 168,304 | | | | 82,859 | | | | 375,925 | | | | 151,238 | |
| Administration, accounting and transfer agent fees | | | 107,162 | | | | 60,130 | | | | 219,499 | | | | 97,718 | |
| Registration fees | | | 52,918 | | | | 14,296 | | | | 58,793 | | | | 55,213 | |
| Professional fees | | | 32,672 | | | | 28,643 | | | | 54,124 | | | | 29,999 | |
| Miscellaneous expenses | | | 29,759 | | | | 26,255 | | | | 40,814 | | | | 29,536 | |
| Custodian fees | | | 17,043 | | | | 5,616 | | | | 22,287 | | | | 10,674 | |
| Trustee fees | | | 16,847 | | | | 9,235 | | | | 42,331 | | | | 16,566 | |
| Service fees – Investor Shares (Note 3) | | | 5,387 | | | | 82,859 | | | | 4,190 | | | | 151,238 | |
| Insurance fees | | | 4,579 | | | | 2,428 | | | | 12,260 | | | | 4,805 | |
| Interest expense and fees on floating rate note obligations | | | — | | | | — | | | | 202,936 | | | | 46,270 | |
| Total expenses | | | 1,444,494 | | | | 809,477 | | | | 3,288,711 | | | | 1,500,685 | |
| NET INVESTMENT INCOME (LOSS) | | | 9,469,365 | | | | 3,987,153 | | | | 23,580,676 | | | | 7,959,448 | |
| NET REALIZED AND UNREALIZED GAIN (LOSS) | | | | | | | | | | | | | | | | |
| Net realized gain (loss) on: | | | | | | | | | | | | | | | | |
| Investments | | | (16,191,539 | ) | | | (3,837,761 | ) | | | (47,633,476 | ) | | | (13,460,318 | ) |
| Futures contracts (Note 6) | | | (8,967,945 | ) | | | — | | | | — | | | | — | |
| Net realized gain (loss) | | | (25,159,484 | ) | | | (3,837,761 | ) | | | (47,633,476 | ) | | | (13,460,318 | ) |
| Net change in unrealized appreciation (depreciation) on: | | | | | | | | | | | | | | | | |
| Investments | | | 5,364,657 | | | | 3,652,185 | | | | 48,140,333 | | | | 8,854,591 | |
| Futures contracts (Note 6) | | | (1,623,915 | ) | | | — | | | | — | | | | — | |
| Net change in unrealized appreciation (depreciation) | | | 3,740,742 | | | | 3,652,185 | | | | 48,140,333 | | | | 8,854,591 | |
| NET REALIZED AND UNREALIZED GAIN (LOSS) | | | (21,418,742 | ) | | | (185,576 | ) | | | 506,857 | | | | (4,605,727 | ) |
| INCREASE (DECREASE) IN NET ASSETS FROM OPERATIONS | | $ | (11,949,377 | ) | | $ | 3,801,577 | | | $ | 24,087,533 | | | $ | 3,353,721 | |
The accompanying notes are an integral part of these financial statements.
Statements of Operations
For the Year Ended June 30, 2023
| | | | | | BROWN | | | | | | | |
| | | | | | ADVISORY – | | | | | | BROWN | |
| | | BROWN | | | WMC | | | BROWN | | | ADVISORY – | |
| | | ADVISORY | | | STRATEGIC | | | ADVISORY | | | BEUTEL | |
| | | MORTGAGE | | | EUROPEAN | | | EMERGING | | | GOODMAN | |
| | | SECURITIES | | | EQUITY | | | MARKETS | | | LARGE-CAP | |
| | | FUND | | | FUND | | | SELECT FUND | | | VALUE FUND | |
| INVESTMENT INCOME | | | | | | | | | | | | |
| Dividend income | | $ | — | | | $ | 6,355,237 | | | $ | 14,187,923 | | | $ | 34,509,448 | |
| Less: foreign taxes withheld | | | — | | | | (491,091 | ) | | | (1,544,988 | ) | | | — | |
| Interest Income | | | 10,585,784 | | | | 224,635 | | | | 585,988 | | | | 1,449,341 | |
| Total investment income | | | 10,585,784 | | | | 6,088,781 | | | | 13,228,923 | | | | 35,958,789 | |
| EXPENSES | | | | | | | | | | | | | | | | |
| Investment advisory fees | | | 925,904 | | | | 1,944,111 | | | | 4,475,037 | | | | 6,619,867 | |
| Administration, accounting and transfer agent fees | | | 158,095 | | | | 64,663 | | | | 149,624 | | | | 373,851 | |
| Business management fees | | | 154,317 | | | | 108,006 | | | | 248,613 | | | | 735,541 | |
| Registration fees | | | 38,667 | | | | 43,642 | | | | 52,574 | | | | 80,313 | |
| Professional fees | | | 35,466 | | | | 32,844 | | | | 43,847 | | | | 79,639 | |
| Miscellaneous expenses | | | 33,830 | | | | 34,933 | | | | 92,900 | | | | 58,272 | |
| Custodian fees | | | 23,424 | | | | 78,560 | | | | 425,611 | | | | 50,377 | |
| Trustee fees | | | 17,107 | | | | 12,684 | | | | 27,572 | | | | 77,288 | |
| Insurance fees | | | 4,582 | | | | 3,907 | | | | 7,669 | | | | 18,608 | |
| Service fees – Investor Shares (Note 3) | | | 888 | | | | 20,823 | | | | 4,664 | | | | 1,533 | |
| Distribution fees – Advisor Shares (Note 3) | | | — | | | | 6,335 | | | | 208 | | | | — | |
| Interest expense on line of credit | | | — | | | | 5,246 | | | | 26 | | | | — | |
| Service fees – Advisor Shares (Note 3) | | | — | | | | 3,801 | | | | 124 | | | | — | |
| Total Expenses | | | 1,392,280 | | | | 2,359,555 | | | | 5,528,469 | | | | 8,095,289 | |
| NET INVESTMENT INCOME (LOSS) | | | 9,193,504 | | | | 3,729,226 | | | | 7,700,454 | | | | 27,863,500 | |
| NET REALIZED AND UNREALIZED GAIN (LOSS) | | | | | | | | | | | | | | | | |
| Net realized gain (loss) on: | | | | | | | | | | | | | | | | |
| Investments and foreign currency transactions | | | (2,062,808 | ) | | | (4,071,080 | ) | | | (38,389,741 | ) | | | (1,597,544 | ) |
| Less: foreign capital gains taxes paid | | | — | | | | — | | | | (643,461 | ) | | | — | |
| Futures contracts (Note 6) | | | (1,857,534 | ) | | | — | | | | — | | | | — | |
| Net realized gain (loss) | | | (3,920,342 | ) | | | (4,071,080 | ) | | | (39,033,202 | ) | | | (1,597,544 | ) |
| Net change in unrealized appreciation (depreciation) on: | | | | | | | | | | | | | | | | |
| Investments and foreign currency transactions | | | (11,336,246 | ) | | | 24,114,599 | | | | 50,890,808 | | | | 204,984,398 | |
| Futures contracts (Note 6) | | | (684,785 | ) | | | — | | | | — | | | | — | |
| Net change in unrealized appreciation (depreciation) | | | (12,021,031 | ) | | | 24,114,599 | | | | 50,890,808 | | | | 204,984,398 | |
| NET REALIZED AND UNREALIZED GAIN (LOSS) | | | (15,941,373 | ) | | | 20,043,519 | | | | 11,857,606 | | | | 203,386,854 | |
| INCREASE (DECREASE) IN NET ASSETS FROM OPERATIONS | | $ | (6,747,869 | ) | | $ | 23,772,745 | | | $ | 19,558,060 | | | $ | 231,250,354 | |
The accompanying notes are an integral part of these financial statements.
Statements of Changes in Net Assets
| | | BROWN ADVISORY | | | BROWN ADVISORY | |
| | | GROWTH EQUITY FUND | | | FLEXIBLE EQUITY FUND | |
| | | Fiscal | | | Fiscal | | | Fiscal | | | Fiscal | |
| | | Year Ended | | | Year Ended | | | Year Ended | | | Year Ended | |
| | | June 30, | | | June 30, | | | June 30, | | | June 30, | |
| | | 2023 | | | 2022 | | | 2023 | | | 2022 | |
| OPERATIONS | | | | | | | | | | | | |
| Net investment income (loss) | | $ | (4,279,886 | ) | | $ | (10,136,680 | ) | | $ | 2,198,868 | | | $ | 1,272,601 | |
| Net realized gain (loss) | | | 94,224,857 | | | | 320,512,928 | | | | 17,278,494 | | | | 25,839,531 | |
| Net change in unrealized appreciation (depreciation) | | | 345,339,165 | | | | (1,249,655,850 | ) | | | 105,107,069 | | | | (153,627,836 | ) |
| Increase (Decrease) in Net Assets from Operations | | | 435,284,136 | | | | (939,279,602 | ) | | | 124,584,431 | | | | (126,515,704 | ) |
| DISTRIBUTIONS FROM EARNINGS | | | | | | | | | | | | | | | | |
| Institutional Shares | | | (107,639,242 | ) | | | (275,948,219 | ) | | | (7,731,108 | ) | | | (8,262,600 | ) |
| Investor Shares | | | (45,764,956 | ) | | | (138,356,314 | ) | | | (14,223,370 | ) | | | (18,655,194 | ) |
| Advisor Shares | | | (871,243 | ) | | | (5,590,446 | ) | | | (147,568 | ) | | | (219,055 | ) |
Total Distributions from earnings | | | (154,275,441 | ) | | | (419,894,979 | ) | | | (22,102,046 | ) | | | (27,136,849 | ) |
| CAPITAL SHARE TRANSACTIONS | | | | | | | | | | | | | | | | |
| Sale of shares: | | | | | | | | | | | | | | | | |
| Institutional Shares | | | 352,800,458 | | | | 381,560,551 | | | | 64,414,428 | | | | 70,583,169 | |
| Investor Shares | | | 36,590,247 | | | | 80,619,358 | | | | 30,651,069 | | | | 40,988,352 | |
| Advisor Shares | | | 10,151,247 | | | | 26,896,936 | | | | 309,244 | | | | 620,867 | |
| Reinvestment of distributions: | | | | | | | | | | | | | | | | |
| Institutional Shares | | | 100,551,486 | | | | 253,768,575 | | | | 4,788,472 | | | | 5,836,134 | |
| Investor Shares | | | 40,450,324 | | | | 118,404,207 | | | | 9,054,154 | | | | 12,052,985 | |
| Advisor Shares | | | 620,663 | | | | 4,917,946 | | | | 123,434 | | | | 183,082 | |
| Redemption of shares: | | | | | | | | | | | | | | | | |
| Institutional Shares | | | (434,576,260 | ) | | | (435,493,543 | ) | | | (41,913,971 | ) | | | (31,443,322 | ) |
| Investor Shares | | | (167,203,846 | ) | | | (236,840,067 | ) | | | (63,537,532 | ) | | | (50,904,012 | ) |
| Advisor Shares | | | (11,934,066 | ) | | | (34,397,837 | ) | | | (418,189 | ) | | | (1,078,121 | ) |
| Redemption fees: | | | | | | | | | | | | | | | | |
| Institutional Shares | | | 6,352 | | | | 11,465 | | | | 777 | | | | 444 | |
| Investor Shares | | | 2,703 | | | | 5,389 | | | | 1,465 | | | | 972 | |
| Advisor Shares | | | 47 | | | | 189 | | | | 16 | | | | 12 | |
Increase (Decrease) from Capital Share Transactions | | | (72,540,645 | ) | | | 159,453,169 | | | | 3,473,367 | | | | 46,840,562 | |
Increase (Decrease) in Net Assets | | | 208,468,050 | | | | (1,199,721,412 | ) | | | 105,955,752 | | | | (106,811,991 | ) |
| NET ASSETS | | | | | | | | | | | | | | | | |
| Beginning of period | | | 2,330,263,456 | | | | 3,529,984,868 | | | | 601,235,922 | | | | 708,047,913 | |
| End of period | | $ | 2,538,731,506 | | | $ | 2,330,263,456 | | | $ | 707,191,674 | | | $ | 601,235,922 | |
| SHARE TRANSACTIONS | | | | | | | | | | | | | | | | |
| Sale of shares: | | | | | | | | | | | | | | | | |
| Institutional Shares | | | 14,949,462 | | | | 12,166,771 | | | | 2,252,589 | | | | 2,178,083 | |
| Investor Shares | | | 1,590,304 | | | | 2,669,038 | | | | 1,088,185 | | | | 1,250,402 | |
| Advisor Shares | | | 457,461 | | | | 879,009 | | | | 10,885 | | | | 18,139 | |
| Reinvestment of distributions: | | | | | | | | | | | | | | | | |
| Institutional Shares | | | 4,371,804 | | | | 7,470,373 | | | | 173,202 | | | | 170,965 | |
| Investor Shares | | | 1,798,592 | | | | 3,553,548 | | | | 327,852 | | | | 354,732 | |
| Advisor Shares | | | 30,232 | | | | 160,194 | | | | 4,487 | | | | 5,407 | |
| Redemption of shares: | | | | | | | | | | | | | | | | |
| Institutional Shares | | | (18,251,670 | ) | | | (14,049,474 | ) | | | (1,487,103 | ) | | | (1,040,187 | ) |
| Investor Shares | | | (7,257,688 | ) | | | (7,987,226 | ) | | | (2,239,954 | ) | | | (1,543,659 | ) |
| Advisor Shares | | | (554,229 | ) | | | (1,383,504 | ) | | | (14,896 | ) | | | (33,585 | ) |
Increase (Decrease) in shares outstanding | | | (2,865,732 | ) | | | 3,478,729 | | | | 115,247 | | | | 1,360,297 | |
The accompanying notes are an integral part of these financial statements.
Statements of Changes in Net Assets
| | | BROWN ADVISORY | | | BROWN ADVISORY | |
| | | EQUITY INCOME FUND | | | SUSTAINABLE GROWTH FUND | |
| | | Fiscal | | | Fiscal | | | Fiscal | | | Fiscal | |
| | | Year Ended | | | Year Ended | | | Year Ended | | | Year Ended | |
| | | June 30, | | | June 30, | | | June 30, | | | June 30, | |
| | | 2023 | | | 2022 | | | 2023 | | | 2022 | |
| OPERATIONS | | | | | | | | | | | | |
| Net investment income (loss) | | $ | 1,219,984 | | | $ | 1,207,032 | | | $ | 1,146,864 | | | $ | (11,031,544 | ) |
| Net realized gain (loss) | | | 5,843,278 | | | | 5,457,390 | | | | 5,075,647 | | | | (16,664,224 | ) |
| Net change in unrealized appreciation (depreciation) | | | 693,112 | | | | (11,189,300 | ) | | | 1,273,242,361 | | | | (1,339,789,979 | ) |
| Increase (Decrease) in Net Assets from Operations | | | 7,756,374 | | | | (4,524,878 | ) | | | 1,279,464,872 | | | | (1,367,485,747 | ) |
| DISTRIBUTIONS FROM EARNINGS | | | | | | | | | | | | | | | | |
| Institutional Shares | | | (1,775,016 | ) | | | (2,468,228 | ) | | | (10,470 | ) | | | (78,187,846 | ) |
| Investor Shares | | | (5,219,631 | ) | | | (6,587,623 | ) | | | — | | | | (43,902,480 | ) |
| Advisor Shares | | | (96,254 | ) | | | (115,648 | ) | | | — | | | | (9,653,371 | ) |
Total Distributions from earnings | | | (7,090,901 | ) | | | (9,171,499 | ) | | | (10,470 | ) | | | (131,743,697 | ) |
| CAPITAL SHARE TRANSACTIONS | | | | | | | | | | | | | | | | |
| Sale of shares: | | | | | | | | | | | | | | | | |
| Institutional Shares | | | 1,100,358 | | | | 478,781 | | | | 2,078,959,516 | | | | 2,005,175,548 | |
| Investor Shares | | | 1,529,072 | | | | 2,046,470 | | | | 625,782,512 | | | | 1,030,622,970 | |
| Advisor Shares | | | 15,154 | | | | 321,496 | | | | 66,763,534 | | | | 123,776,024 | |
| Reinvestment of distributions: | | | | | | | | | | | | | | | | |
| Institutional Shares | | | 1,359,198 | | | | 2,152,132 | | | | 6,609 | | | | 56,556,940 | |
| Investor Shares | | | 2,987,657 | | | | 3,880,879 | | | | — | | | | 41,803,230 | |
| Advisor Shares | | | 88,881 | | | | 106,378 | | | | — | | | | 8,653,932 | |
| Redemption of shares: | | | | | | | | | | | | | | | | |
| Institutional Shares | | | (4,518,036 | ) | | | (3,116,960 | ) | | | (1,155,544,299 | ) | | | (1,135,113,014 | ) |
| Investor Shares | | | (6,888,886 | ) | | | (4,323,081 | ) | | | (563,765,771 | ) | | | (718,411,760 | ) |
| Advisor Shares | | | (307,507 | ) | | | (177,341 | ) | | | (70,829,290 | ) | | | (180,098,827 | ) |
| Redemption fees: | | | | | | | | | | | | | | | | |
| Institutional Shares | | | 110 | | | | 3 | | | | 39,252 | | | | 71,351 | |
| Investor Shares | | | 254 | | | | 9 | | | | 18,500 | | | | 38,236 | |
| Advisor Shares | | | 5 | | | | — | | | | 3,129 | | | | 8,071 | |
Increase (Decrease) from Capital Share Transactions | | | (4,633,740 | ) | | | 1,368,766 | | | | 981,433,692 | | | | 1,233,082,701 | |
Increase (Decrease) in Net Assets | | | (3,968,267 | ) | | | (12,327,611 | ) | | | 2,260,888,094 | | | | (266,146,743 | ) |
| NET ASSETS | | | | | | | | | | | | | | | | |
| Beginning of period | | | 76,499,169 | | | | 88,826,780 | | | | 5,392,074,795 | | | | 5,658,221,538 | |
| End of period | | $ | 72,530,902 | | | $ | 76,499,169 | | | $ | 7,652,962,889 | | | $ | 5,392,074,795 | |
| SHARE TRANSACTIONS | | | | | | | | | | | | | | | | |
| Sale of shares: | | | | | | | | | | | | | | | | |
| Institutional Shares | | | 82,290 | | | | 31,118 | | | | 55,092,165 | | | | 44,847,524 | |
| Investor Shares | | | 114,756 | | | | 130,733 | | | | 17,015,921 | | | | 23,190,272 | |
| Advisor Shares | | | 1,115 | | | | 22,390 | | | | 1,818,879 | | | | 2,850,773 | |
| Reinvestment of distributions: | | | | | | | | | | | | | | | | |
| Institutional Shares | | | 100,311 | | | | 136,846 | | | | 192 | | | | 1,164,442 | |
| Investor Shares | | | 219,723 | | | | 245,871 | | | | — | | | | 874,545 | |
| Advisor Shares | | | 6,567 | | | | 6,775 | | | | — | | | | 185,707 | |
| Redemption of shares: | | | | | | | | | | | | | | | | |
| Institutional Shares | | | (332,348 | ) | | | (201,386 | ) | | | (31,017,390 | ) | | | (26,141,586 | ) |
| Investor Shares | | | (511,748 | ) | | | (281,899 | ) | | | (15,389,715 | ) | | | (16,972,925 | ) |
| Advisor Shares | | | (21,222 | ) | | | (11,181 | ) | | | (1,952,691 | ) | | | (4,579,686 | ) |
Increase (Decrease) in shares outstanding | | | (340,556 | ) | | | 79,267 | | | | 25,567,361 | | | | 25,419,066 | |
The accompanying notes are an integral part of these financial statements.
Statements of Changes in Net Assets
| | | BROWN ADVISORY | | | BROWN ADVISORY | |
| | | MID-CAP GROWTH FUND | | | SMALL-CAP GROWTH FUND | |
| | | Fiscal | | | Fiscal | | | Fiscal | | | Fiscal | |
| | | Year Ended | | | Year Ended | | | Year Ended | | | Year Ended | |
| | | June 30, | | | June 30, | | | June 30, | | | June 30, | |
| | | 2023 | | | 2022 | | | 2023 | | | 2022 | |
| OPERATIONS | | | | | | | | | | | | |
| Net investment income (loss) | | $ | (324,396 | ) | | $ | (936,942 | ) | | $ | (3,980,177 | ) | | $ | (14,384,338 | ) |
| Net realized gain (loss) | | | (5,529,060 | ) | | | 2,710,782 | | | | (8,554,578 | ) | | | 286,916,765 | |
| Net change in unrealized appreciation (depreciation) | | | 21,470,002 | | | | (60,667,176 | ) | | | 286,188,644 | | | | (850,780,591 | ) |
| Increase (Decrease) in Net Assets from Operations | | | 15,616,546 | | | | (58,893,336 | ) | | | 273,653,889 | | | | (578,248,164 | ) |
| DISTRIBUTIONS FROM EARNINGS | | | | | | | | | | | | | | | | |
| Institutional Shares | | | (4,694,458 | ) | | | (13,572,347 | ) | | | (90,997,761 | ) | | | (172,748,427 | ) |
| Investor Shares | | | (1,478,899 | ) | | | (2,932,131 | ) | | | (59,674,115 | ) | | | (97,870,446 | ) |
| Advisor Shares | | | — | | | | — | | | | (715,728 | ) | | | (1,547,788 | ) |
Total Distributions from earnings | | | (6,173,357 | ) | | | (16,504,478 | ) | | | (151,387,604 | ) | | | (272,166,661 | ) |
| CAPITAL SHARE TRANSACTIONS | | | | | | | | | | | | | | | | |
| Sale of shares: | | | | | | | | | | | | | | | | |
| Institutional Shares | | | 22,890,113 | | | | 43,107,130 | | | | 313,252,992 | | | | 372,938,090 | |
| Investor Shares | | | 1,781,026 | | | | 3,875,663 | | | | 212,108,666 | | | | 252,904,768 | |
| Advisor Shares | | | — | | | | — | | | | 991,855 | | | | 1,726,282 | |
| Reinvestment of distributions: | | | | | | | | | | | | | | | | |
| Institutional Shares | | | 3,302,277 | | | | 9,182,645 | | | | 81,812,339 | | | | 154,065,376 | |
| Investor Shares | | | 1,478,899 | | | | 2,932,130 | | | | 48,936,409 | | | | 76,826,888 | |
| Advisor Shares | | | — | | | | — | | | | 562,578 | | | | 1,239,714 | |
| Redemption of shares: | | | | | | | | | | | | | | | | |
| Institutional Shares | | | (56,129,763 | ) | | | (54,921,938 | ) | | | (286,513,304 | ) | | | (585,487,048 | ) |
| Investor Shares | | | (4,037,738 | ) | | | (3,688,971 | ) | | | (131,723,686 | ) | | | (133,061,987 | ) |
| Advisor Shares | | | — | | | | — | | | | (1,734,771 | ) | | | (3,897,674 | ) |
| Redemption fees: | | | | | | | | | | | | | | | | |
| Institutional Shares | | | — | | | | 304 | | | | 996 | | | | 2,524 | |
| Investor Shares | | | — | | | | 73 | | | | 626 | | | | 1,510 | |
| Advisor Shares | | | — | | | | — | | | | 8 | | | | 20 | |
Increase (Decrease) from Capital Share Transactions | | | (30,715,186 | ) | | | 487,036 | | | | 237,694,708 | | | | 137,258,463 | |
Increase (Decrease) in Net Assets | | | (21,271,997 | ) | | | (74,910,778 | ) | | | 359,960,993 | | | | (713,156,362 | ) |
| NET ASSETS | | | | | | | | | | | | | | | | |
| Beginning of period | | | 117,651,111 | | | | 192,561,889 | | | | 1,881,979,371 | | | | 2,595,135,733 | |
| End of period | | $ | 96,379,114 | | | $ | 117,651,111 | | | $ | 2,241,940,364 | | | $ | 1,881,979,371 | |
| SHARE TRANSACTIONS | | | | | | | | | | | | | | | | |
| Sale of shares: | | | | | | | | | | | | | | | | |
| Institutional Shares | | | 1,799,089 | | | | 2,774,064 | | | | 7,324,161 | | | | 7,339,569 | |
| Investor Shares | | | 141,511 | | | | 239,082 | | | | 9,912,100 | | | | 9,959,575 | |
| Advisor Shares | | | — | | | | — | | | | 48,938 | | | | 67,703 | |
| Reinvestment of distributions: | | | | | | | | | | | | | | | | |
| Institutional Shares | | | 265,456 | | | | 543,030 | | | | 1,951,630 | | | | 2,953,141 | |
| Investor Shares | | | 119,846 | | | | 174,428 | | | | 2,345,945 | | | | 2,954,880 | |
| Advisor Shares | | | — | | | | — | | | | 28,456 | | | | 50,191 | |
| Redemption of shares: | | | | | | | | | | | | | | | | |
| Institutional Shares | | | (4,464,660 | ) | | | (3,620,568 | ) | | | (6,684,586 | ) | | | (10,441,879 | ) |
| Investor Shares | | | (319,291 | ) | | | (225,993 | ) | | | (6,200,437 | ) | | | (5,242,403 | ) |
| Advisor Shares | | | — | | | | — | | | | (85,972 | ) | | | (148,477 | ) |
Increase (Decrease) in shares outstanding | | | (2,458,049 | ) | | | (115,957 | ) | | | 8,640,235 | | | | 7,492,300 | |
The accompanying notes are an integral part of these financial statements.
Statements of Changes in Net Assets
| | | BROWN ADVISORY SMALL-CAP | | | BROWN ADVISORY SUSTAINABLE | |
| | | FUNDAMENTAL VALUE FUND | | | SMALL-CAP CORE FUND | |
| | | Fiscal | | | Fiscal | | | Fiscal | | | Period | |
| | | Year Ended | | | Year Ended | | | Year Ended | | | Ended | |
| | | June 30, | | | June 30, | | | June 30, | | | June 30, | |
| | | 2023 | | | 2022 | | | 2023 | | | | 2022 | * |
| OPERATIONS | | | | | | | | | | | | | |
| Net investment income (loss) | | $ | 7,485,609 | | | $ | 2,737,257 | | | $ | 71,858 | | | $ | (45,905 | ) |
| Net realized gain (loss) | | | 96,965,631 | | | | 63,768,049 | | | | (6,281,256 | ) | | | (1,070,893 | ) |
| Net change in unrealized appreciation (depreciation) | | | 35,523,126 | | | | (217,250,624 | ) | | | 11,304,700 | | | | (7,398,090 | ) |
| Increase (Decrease) in Net Assets from Operations | | | 139,974,366 | | | | (150,745,318 | ) | | | 5,095,302 | | | | (8,514,888 | ) |
| DISTRIBUTIONS FROM EARNINGS | | | | | | | | | | | | | | | | |
| Institutional Shares | | | (33,185,482 | ) | | | (4,049,873 | ) | | | (588 | ) | | | — | |
| Investor Shares | | | (34,842,760 | ) | | | (3,302,606 | ) | | | (28 | ) | | | — | |
| Advisor Shares | | | (166,836 | ) | | | (25,337 | ) | | | — | | | | — | |
Total Distributions from earnings | | | (68,195,078 | ) | | | (7,377,816 | ) | | | (616 | ) | | | — | |
| CAPITAL SHARE TRANSACTIONS | | | | | | | | | | | | | | | | |
| Sale of shares: | | | | | | | | | | | | | | | | |
| Institutional Shares | | | 123,319,902 | | | | 140,051,213 | | | | 33,653,477 | | | | 46,059,576 | |
| Investor Shares | | | 53,655,900 | | | | 66,382,144 | | | | 1,807,860 | | | | 1,451,889 | |
| Advisor Shares | | | 40,206 | | | | 979,581 | | | | — | | | | — | |
| Reinvestment of distributions: | | | | | | | | | | | | | | | | |
| Institutional Shares | | | 20,951,164 | | | | 2,331,041 | | | | 389 | | | | — | |
| Investor Shares | | | 24,128,958 | | | | 1,810,880 | | | | 28 | | | | — | |
| Advisor Shares | | | 138,370 | | | | 23,318 | | | | — | | | | — | |
| Redemption of shares: | | | | | | | | | | | | | | | | |
| Institutional Shares | | | (154,796,904 | ) | | | (92,456,588 | ) | | | (19,543,834 | ) | | | (4,797,874 | ) |
| Investor Shares | | | (85,835,294 | ) | | | (73,150,092 | ) | | | (1,264,572 | ) | | | (471,459 | ) |
| Advisor Shares | | | (839,784 | ) | | | (5,249,287 | ) | | | — | | | | — | |
| Redemption fees: | | | | | | | | | | | | | | | | |
| Institutional Shares | | | 96 | | | | 745 | | | | 58 | | | | 32 | |
| Investor Shares | | | 99 | | | | 783 | | | | 2 | | | | — | |
| Advisor Shares | | | — | | | | 9 | | | | — | | | | — | |
Increase (Decrease) from Capital Share Transactions | | | (19,237,287 | ) | | | 40,723,747 | | | | 14,653,408 | | | | 42,242,164 | |
Increase (Decrease) in Net Assets | | | 52,542,001 | | | | (117,399,387 | ) | | | 19,748,094 | | | | 33,727,276 | |
| NET ASSETS | | | | | | | | | | | | | | | | |
| Beginning of period | | | 1,130,224,092 | | | | 1,247,623,479 | | | | 33,727,276 | | | | — | |
| End of period | | $ | 1,182,766,093 | | | $ | 1,130,224,092 | | | $ | 53,475,370 | | | $ | 33,727,276 | |
| SHARE TRANSACTIONS | | | | | | | | | | | | | | | | |
| Sale of shares: | | | | | | | | | | | | | | | | |
| Institutional Shares | | | 4,488,167 | | | | 4,772,862 | | | | 4,020,237 | | | | 4,822,727 | |
| Investor Shares | | | 1,971,442 | | | | 2,260,434 | | | | 216,947 | | | | 154,549 | |
| Advisor Shares | | | 1,455 | | | | 33,132 | | | | — | | | | — | |
| Reinvestment of distributions: | | | | | | | | | | | | | | | | |
| Institutional Shares | | | 761,092 | | | | 76,504 | | | | 46 | | | | — | |
| Investor Shares | | | 878,374 | | | | 60,122 | | | | 3 | | | | — | |
| Advisor Shares | | | 5,080 | | | | 781 | | | | — | | | | — | |
| Redemption of shares: | | | | | | | | | | | | | | | | |
| Institutional Shares | | | (5,538,829 | ) | | | (3,228,452 | ) | | | (2,377,529 | ) | | | (572,194 | ) |
| Investor Shares | | | (3,122,087 | ) | | | (2,541,718 | ) | | | (146,693 | ) | | | (49,534 | ) |
| Advisor Shares | | | (30,535 | ) | | | (188,010 | ) | | | — | | | | — | |
Increase (Decrease) in shares outstanding | | | (585,841 | ) | | | 1,245,655 | | | | 1,713,011 | | | | 4,355,548 | |
* | Inception date of Fund was September 30, 2021. Results of operations are for the period from October 1, 2021 to June 30, 2022. |
The accompanying notes are an integral part of these financial statements.
Statements of Changes in Net Assets
| | BROWN ADVISORY | | BROWN ADVISORY | |
| | SUSTAINABLE VALUE FUND | | GLOBAL LEADERS FUND | |
| | | Period | | | Fiscal | | | Fiscal | |
| | | Ended | | | Year Ended | | | Year Ended | |
| | | June 30, | | | June 30, | | | June 30, | |
| | | 2023* |
| | 2023 | | | 2022 | |
| OPERATIONS | | | | | | | | | | | | |
| Net investment income (loss) | | $ | 207,087 | | | $ | 8,074,102 | | | $ | 5,863,125 | |
| Net realized gain (loss) | | | (98,682 | ) | | | (28,013,222 | ) | | | (16,477,413 | ) |
| Net change in unrealized appreciation (depreciation) | | | 1,465,263 | | | | 274,035,271 | | | | (254,311,964 | ) |
| Increase (Decrease) in Net Assets from Operations | | | 1,573,668 | | | | 254,096,151 | | | | (264,926,252 | ) |
| DISTRIBUTIONS FROM EARNINGS | | | | | | | | | | | | |
| Institutional Shares | | | — | | | | (6,991,035 | ) | | | (14,988,324 | ) |
| Investor Shares | | | — | | | | (395,703 | ) | | | (1,060,271 | ) |
Total Distributions from earnings | | | — | | | | (7,386,738 | ) | | | (16,048,595 | ) |
| CAPITAL SHARE TRANSACTIONS | | | | | | | | | | | | |
| Sale of shares: | | | | | | | | | | | | |
| Institutional Shares | | | 49,585,364 | | | | 325,301,984 | | | | 339,081,573 | |
| Investor Shares | | | 1,664,985 | | | | 3,611,292 | | | | 4,247,887 | |
| Reinvestment of distributions: | | | | | | | | | | | | |
| Institutional Shares | | | — | | | | 1,666,735 | | | | 9,094,459 | |
| Investor Shares | | | — | | | | 326,640 | | | | 914,903 | |
| Redemption of shares: | | | | | | | | | | | | |
| Institutional Shares | | | (889,573 | ) | | | (206,154,158 | ) | | | (186,765,509 | ) |
| Investor Shares | | | (1,463,815 | ) | | | (17,052,237 | ) | | | (6,590,291 | ) |
| Redemption fees: | | | | | | | | | | | | |
| Institutional Shares | | | — | | | | 14 | | | | 234 | |
| Investor Shares | | | — | | | | 1 | | | | 18 | |
Increase (Decrease) from Capital Share Transactions | | | 48,896,961 | | | | 107,700,271 | | | | 159,983,274 | |
Increase (Decrease) in Net Assets | | | 50,470,629 | | | | 354,409,684 | | | | (120,991,573 | ) |
| NET ASSETS | | | | | | | | | | | | |
| Beginning of period | | | — | | | | 1,124,737,890 | | | | 1,245,729,463 | |
| End of period | | $ | 50,470,629 | | | $ | 1,479,147,574 | | | $ | 1,124,737,890 | |
| SHARE TRANSACTIONS | | | | | | | | | | | | |
| Sale of shares: | | | | | | | | | | | | |
| Institutional Shares | | | 5,106,507 | | | | 16,769,670 | | | | 15,443,430 | |
| Investor Shares | | | 167,746 | | | | 187,404 | | | | 191,281 | |
| Reinvestment of distributions: | | | | | | | | | | | | |
| Institutional Shares | | | — | | | | 88,798 | | | | 397,518 | |
| Investor Shares | | | — | | | | 17,449 | | | | 40,127 | |
| Redemption of shares: | | | | | | | | | | | | |
| Institutional Shares | | | (92,872 | ) | | | (10,875,202 | ) | | | (9,234,359 | ) |
| Investor Shares | | | (151,444 | ) | | | (865,869 | ) | | | (298,602 | ) |
Increase (Decrease) in shares outstanding | | | 5,029,937 | | | | 5,322,250 | | | | 6,539,395 | |
* | Inception date of Fund was February 28, 2023. Results of operations are for the period from March 1, 2023 to June 30, 2023. |
The accompanying notes are an integral part of these financial statements.
Statements of Changes in Net Assets
| | | BROWN ADVISORY SUSTAINABLE | | | BROWN ADVISORY | |
| | | INTERNATIONAL LEADERS FUND | | | INTERMEDIATE INCOME FUND | |
| | | Fiscal | | | Period | | | Fiscal | | | Fiscal | |
| | | Year Ended | | | Ended | | | Year Ended | | | Year Ended | |
| | | June 30, | | | June 30, | | | June 30, | | | June 30, | |
| | | 2023 | | | 2022* |
| | 2023 | | | 2022 | |
| OPERATIONS | | | | | | | | | | | | | | | |
| Net investment income (loss) | | $ | 155,583 | | | $ | 34,438 | | | $ | 3,240,395 | | | $ | 1,860,766 | |
| Net realized gain (loss) | | | (165,459 | ) | | | (62,944 | ) | | | (4,258,695 | ) | | | (2,248,374 | ) |
| Net change in unrealized appreciation (depreciation) | | | 4,216,118 | | | | (847,139 | ) | | | (1,177,752 | ) | | | (11,863,071 | ) |
| Increase (Decrease) in Net Assets from Operations | | | 4,206,242 | | | | (875,645 | ) | | | (2,196,052 | ) | | | (12,250,679 | ) |
| DISTRIBUTIONS FROM EARNINGS | | | | | | | | | | | | | | | | |
| Institutional Shares | | | (35,516 | ) | | | — | | | | — | | | | — | |
| Investor Shares | | | (3,388 | ) | | | — | | | | (3,207,474 | ) | | | (3,417,677 | ) |
| Advisor Shares | | | — | | | | — | | | | (75,420 | ) | | | (70,097 | ) |
Total Distributions from earnings | | | (38,904 | ) | | | — | | | | (3,282,894 | ) | | | (3,487,774 | ) |
| CAPITAL SHARE TRANSACTIONS | | | | | | | | | | | | | | | | |
| Sale of shares: | | | | | | | | | | | | | | | | |
| Institutional Shares | | | 13,043,816 | | | | 7,086,900 | | | | — | | | | — | |
| Investor Shares | | | 1,375,819 | | | | 167,720 | | | | 16,553,797 | | | | 23,387,636 | |
| Advisor Shares | | | — | | | | — | | | | 159,427 | | | | 6,265 | |
| Reinvestment of distributions: | | | | | | | | | | | | | | | | |
| Institutional Shares | | | 6,722 | | | | — | | | | — | | | | — | |
| Investor Shares | | | 2,778 | | | | — | | | | 925,384 | | | | 1,761,869 | |
| Advisor Shares | | | — | | | | — | | | | 70,124 | | | | 64,688 | |
| Redemption of shares: | | | | | | | | | | | | | | | | |
| Institutional Shares | | | (215,587 | ) | | | — | | | | — | | | | — | |
| Investor Shares | | | (329,690 | ) | | | (83,444 | ) | | | (29,348,887 | ) | | | (37,678,396 | ) |
| Advisor Shares | | | — | | | | — | | | | (229,653 | ) | | | (110,539 | ) |
| Redemption fees: | | | | | | | | | | | | | | | | |
| Institutional Shares | | | — | | | | — | | | | — | | | | — | |
| Investor Shares | | | — | | | | — | | | | 241 | | | | — | |
| Advisor Shares | | | — | | | | — | | | | 6 | | | | — | |
Increase (Decrease) from Capital Share Transactions | | | 13,883,858 | | | | 7,171,176 | | | | (11,869,561 | ) | | | (12,568,477 | ) |
Increase (Decrease) in Net Assets | | | 18,051,196 | | | | 6,295,531 | | | | (17,348,507 | ) | | | (28,306,930 | ) |
| NET ASSETS | | | | | | | | | | | | | | | | |
| Beginning of period | | | 6,295,531 | | | | — | | | | 143,128,751 | | | | 171,435,681 | |
| End of period | | $ | 24,346,727 | | | $ | 6,295,531 | | | $ | 125,780,244 | | | $ | 143,128,751 | |
| SHARE TRANSACTIONS | | | | | | | | | | | | | | | | |
| Sale of shares: | | | | | | | | | | | | | | | | |
| Institutional Shares | | | 1,462,731 | | | | 738,279 | | | | — | | | | — | |
| Investor Shares | | | 164,665 | | | | 18,580 | | | | 1,695,318 | | | | 2,183,133 | |
| Advisor Shares | | | — | | | | — | | | | 16,547 | | | | 599 | |
| Reinvestment of distributions: | | | | | | | | | | | | | | | | |
| Institutional Shares | | | 740 | | | | — | | | | — | | | | — | |
| Investor Shares | | | 306 | | | | — | | | | 95,347 | | | | 164,134 | |
| Advisor Shares | | | — | | | | — | | | | 7,400 | | | | 6,202 | |
| Redemption of shares: | | | | | | | | | | | | | | | | |
| Institutional Shares | | | (26,248 | ) | | | — | | | | — | | | | — | |
| Investor Shares | | | (34,394 | ) | | | (9,725 | ) | | | (3,014,392 | ) | | | (3,539,398 | ) |
| Advisor Shares | | | — | | | | — | | | | (24,348 | ) | | | (10,639 | ) |
Increase (Decrease) in shares outstanding | | | 1,567,800 | | | | 747,134 | | | | (1,224,128 | ) | | | (1,195,969 | ) |
* | Inception date of Fund was February 28, 2022. Results of operations are for the period from March 1, 2022 to June 30, 2022. |
The accompanying notes are an integral part of these financial statements.
Statements of Changes in Net Assets
| | | BROWN ADVISORY | | | BROWN ADVISORY | |
| | | SUSTAINABLE BOND FUND | | | MARYLAND BOND FUND | |
| | | Fiscal | | | Fiscal | | | Fiscal | | | Fiscal | |
| | | Year Ended | | | Year Ended | | | Year Ended | | | Year Ended | |
| | | June 30, | | | June 30, | | | June 30, | | | June 30, | |
| | | 2023 | | | 2022 | | | 2023 | | | 2022 | |
| OPERATIONS | | | | | | | | | | | | |
| Net investment income (loss) | | $ | 9,469,365 | | | $ | 3,953,652 | | | $ | 3,987,153 | | | $ | 3,250,505 | |
| Net realized gain (loss) | | | (25,159,484 | ) | | | (9,154,540 | ) | | | (3,837,761 | ) | | | 210,870 | |
| Net change in unrealized appreciation (depreciation) | | | 3,740,742 | | | | (25,164,517 | ) | | | 3,652,185 | | | | (18,477,603 | ) |
| Increase (Decrease) in Net Assets from Operations | | | (11,949,377 | ) | | | (30,365,405 | ) | | | 3,801,577 | | | | (15,016,228 | ) |
| DISTRIBUTIONS FROM EARNINGS | | | | | | | | | | | | | | | | |
| Institutional Shares | | | (9,183,982 | ) | | | (8,001,304 | ) | | | — | | | | — | |
| Investor Shares | | | (287,987 | ) | | | (194,495 | ) | | | (4,607,468 | ) | | | (4,014,863 | ) |
Total Distributions from earnings | | | (9,471,969 | ) | | | (8,195,799 | ) | | | (4,607,468 | ) | | | (4,014,863 | ) |
| CAPITAL SHARE TRANSACTIONS | | | | | | | | | | | | | | | | |
| Sale of shares: | | | | | | | | | | | | | | | | |
| Institutional Shares | | | 180,573,932 | | | | 159,424,414 | | | | — | | | | — | |
| Investor Shares | | | 9,585,925 | | | | 11,554,019 | | | | 174,773,197 | | | | 56,966,673 | |
| Reinvestment of distributions: | | | | | | | | | | | | | | | | |
| Institutional Shares | | | 2,286,754 | | | | 3,802,817 | | | | — | | | | — | |
| Investor Shares | | | 266,441 | | | | 162,462 | | | | 929,140 | | | | 952,297 | |
| Redemption of shares: | | | | | | | | | | | | | | | | |
| Institutional Shares | | | (71,731,117 | ) | | | (42,360,363 | ) | | | — | | | | — | |
| Investor Shares | | | (9,806,662 | ) | | | (2,924,624 | ) | | | (180,499,653 | ) | | | (55,806,102 | ) |
| Redemption fees: | | | | | | | | | | | | | | | | |
| Institutional Shares | | | 1,010 | | | | 1,302 | | | | — | | | | — | |
| Investor Shares | | | 36 | | | | 25 | | | | — | | | | 110 | |
| Proceeds from shares issued in fund reorganization (Note 9) | | | | | | | | | | | | | | | | |
| Institutional Shares | | | 331,003,377 | | | | — | | | | — | | | | — | |
| Investor Shares | | | 878,796 | | | | — | | | | — | | | | — | |
Increase (Decrease) from Capital Share Transactions | | | 443,058,492 | | | | 129,660,052 | | | | (4,797,316 | ) | | | 2,112,978 | |
Increase (Decrease) in Net Assets | | | 421,637,146 | | | | 91,098,848 | | | | (5,603,207 | ) | | | (16,918,113 | ) |
| NET ASSETS | | | | | | | | | | | | | | | | |
| Beginning of period | | | 314,583,965 | | | | 223,485,117 | | | | 169,564,525 | | | | 186,482,638 | |
| End of period | | $ | 736,221,111 | | | $ | 314,583,965 | | | $ | 163,961,318 | | | $ | 169,564,525 | |
| SHARE TRANSACTIONS | | | | | | | | | | | | | | | | |
| Sale of shares: | | | | | | | | | | | | | | | | |
| Institutional Shares | | | 20,636,386 | | | | 15,961,037 | | | | — | | | | — | |
| Investor Shares | | | 1,081,597 | | | | 1,186,336 | | | | 18,023,157 | | | | 5,651,669 | |
| Reinvestment of distributions: | | | | | | | | | | | | | | | | |
| Institutional Shares | | | 260,828 | | | | 375,350 | | | | — | | | | — | |
| Investor Shares | | | 30,316 | | | | 16,498 | | | | 95,116 | | | | 90,983 | |
| Redemption of shares: | | | | | | | | | | | | | | | | |
| Institutional Shares | | | (8,155,671 | ) | | | (4,269,472 | ) | | | — | | | | — | |
| Investor Shares | | | (1,108,532 | ) | | | (298,090 | ) | | | (18,676,506 | ) | | | (5,577,877 | ) |
| Shares issued in fund reorganization (Note 9) | | | | | | | | | | | | | | | | |
| Institutional Shares | | | 38,304,761 | | | | — | | | | — | | | | — | |
| Investor Shares | | | 101,652 | | | | — | | | | — | | | | — | |
Increase (Decrease) in shares outstanding | | | 51,151,337 | | | | 12,971,659 | | | | (558,233 | ) | | | 164,775 | |
The accompanying notes are an integral part of these financial statements.
Statements of Changes in Net Assets
| | | | | | | | | BROWN ADVISORY | |
| | | BROWN ADVISORY | | | TAX-EXEMPT SUSTAINABLE | |
| | | TAX-EXEMPT BOND FUND | | | BOND FUND | |
| | | Fiscal | | | Fiscal | | | Fiscal | | | Fiscal | |
| | | Year Ended | | | Year Ended | | | Year Ended | | | Year Ended | |
| | | June 30, | | | June 30, | | | June 30, | | | June 30, | |
| | | 2023 | | | 2022 | | | 2023 | | | 2022 | |
| OPERATIONS | | | | | | | | | | | | |
| Net investment income (loss) | | $ | 23,580,676 | | | $ | 19,682,290 | | | $ | 7,959,448 | | | $ | 3,423,105 | |
| Net realized gain (loss) | | | (47,633,476 | ) | | | (9,540,526 | ) | | | (13,460,318 | ) | | | (865,645 | ) |
| Net change in unrealized appreciation (depreciation) | | | 48,140,333 | | | | (112,871,511 | ) | | | 8,854,591 | | | | (23,410,467 | ) |
| Increase (Decrease) in Net Assets from Operations | | | 24,087,533 | | | | (102,729,747 | ) | | | 3,353,721 | | | | (20,853,007 | ) |
| DISTRIBUTIONS FROM EARNINGS | | | | | | | | | | | | | | | | |
| Institutional Shares | | | (26,053,611 | ) | | | (34,628,408 | ) | | | — | | | | — | |
| Investor Shares | | | (287,501 | ) | | | (374,891 | ) | | | (7,959,450 | ) | | | (5,478,484 | ) |
Total Distributions from earnings | | | (26,341,112 | ) | | | (35,003,299 | ) | | | (7,959,450 | ) | | | (5,478,484 | ) |
| CAPITAL SHARE TRANSACTIONS | | | | | | | | | | | | | | | | |
| Sale of shares: | | | | | | | | | | | | | | | | |
| Institutional Shares | | | 663,635,553 | | | | 637,663,948 | | | | — | | | | — | |
| Investor Shares | | | 1,633,814 | | | | 4,335,508 | | | | 277,423,997 | | | | 396,995,743 | |
| Reinvestment of distributions: | | | | | | | | | | | | | | | | |
| Institutional Shares | | | 5,222,194 | | | | 9,825,503 | | | | — | | | | — | |
| Investor Shares | | | 198,959 | | | | 294,490 | | | | 1,966,078 | | | | 1,763,101 | |
| Redemption of shares: | | | | | | | | | | | | | | | | |
| Institutional Shares | | | (684,366,338 | ) | | | (896,185,976 | ) | | | — | | | | — | |
| Investor Shares | | | (4,123,128 | ) | | | (4,099,830 | ) | | | (311,401,610 | ) | | | (225,943,989 | ) |
| Redemption fees: | | | | | | | | | | | | | | | | |
| Institutional Shares | | | 2,116 | | | | 17,483 | | | | — | | | | — | |
| Investor Shares | | | 27 | | | | 228 | | | | 3,970 | | | | — | |
Increase (Decrease) from Capital Share Transactions | | | (17,796,803 | ) | | | (248,148,646 | ) | | | (32,007,565 | ) | | | 172,814,855 | |
Increase (Decrease) in Net Assets | | | (20,050,382 | ) | | | (385,881,692 | ) | | | (36,613,294 | ) | | | 146,483,364 | |
| NET ASSETS | | | | | | | | | | | | | | | | |
| Beginning of period | | | 816,091,423 | | | | 1,201,973,115 | | | | 325,605,963 | | | | 179,122,599 | |
| End of period | | $ | 796,041,041 | | | $ | 816,091,423 | | | $ | 288,992,669 | | | $ | 325,605,963 | |
| SHARE TRANSACTIONS | | | | | | | | | | | | | | | | |
| Sale of shares: | | | | | | | | | | | | | | | | |
| Institutional Shares | | | 72,302,156 | | | | 65,221,608 | | | | — | | | | — | |
| Investor Shares | | | 176,346 | | | | 426,907 | | | | 30,707,463 | | | | 42,084,402 | |
| Reinvestment of distributions: | | | | | | | | | | | | | | | | |
| Institutional Shares | | | 565,465 | | | | 965,050 | | | | — | | | | — | |
| Investor Shares | | | 21,550 | | | | 29,233 | | | | 217,344 | | | | 178,766 | |
| Redemption of shares: | | | | | | | | | | | | | | | | |
| Institutional Shares | | | (74,745,047 | ) | | | (92,881,842 | ) | | | — | | | | — | |
| Investor Shares | | | (447,059 | ) | | | (426,915 | ) | | | (34,843,481 | ) | | | (24,043,028 | ) |
Increase (Decrease) in shares outstanding | | | (2,126,589 | ) | | | (26,665,959 | ) | | | (3,918,674 | ) | | | 18,220,140 | |
The accompanying notes are an integral part of these financial statements.
Statements of Changes in Net Assets
| | | | | | | | | BROWN ADVISORY – | |
| | | BROWN ADVISORY | | | WMC STRATEGIC | |
| | | MORTGAGE SECURITIES FUND | | | EUROPEAN EQUITY FUND | |
| | | Fiscal | | | Fiscal | | | Fiscal | | | Fiscal | |
| | | Year Ended | | | Year Ended | | | Year Ended | | | Year Ended | |
| | | June 30, | | | June 30, | | | June 30, | | | June 30, | |
| | | 2023 | | | 2022 | | | 2023 | | | 2022 | |
| OPERATIONS | | | | | | | | | | | | |
| Net investment income (loss) | | $ | 9,193,504 | | | $ | 3,074,230 | | | $ | 3,729,226 | | | $ | 5,111,540 | |
| Net realized gain (loss) | | | (3,920,342 | ) | | | (12,028,236 | ) | | | (4,071,080 | ) | | | 19,984,117 | |
| Net change in unrealized appreciation (depreciation) | | | (12,021,031 | ) | | | (19,041,561 | ) | | | 24,114,599 | | | | (73,227,666 | ) |
| Increase (Decrease) in Net Assets from Operations | | | (6,747,869 | ) | | | (27,995,567 | ) | | | 23,772,745 | | | | (48,132,009 | ) |
| DISTRIBUTIONS FROM EARNINGS | | | | | | | | | | | | | | | | |
| Institutional Shares | | | (9,638,698 | ) | | | (4,677,567 | ) | | | (4,638,118 | ) | | | (39,782,444 | ) |
| Investor Shares | | | (52,840 | ) | | | (74,133 | ) | | | (312,015 | ) | | | (2,675,078 | ) |
| Advisor Shares | | | — | | | | — | | | | (66,310 | ) | | | (291,103 | ) |
Total Distributions from earnings | | | (9,691,538 | ) | | | (4,751,700 | ) | | | (5,016,443 | ) | | | (42,748,625 | ) |
| CAPITAL SHARE TRANSACTIONS | | | | | | | | | | | | | | | | |
| Sale of shares: | | | | | | | | | | | | | | | | |
| Institutional Shares | | | 61,373,989 | | | | 118,379,326 | | | | 74,999,578 | | | | 73,379,075 | |
| Investor Shares | | | 175,883 | | | | 3,065,938 | | | | 5,643,182 | | | | 3,769,255 | |
| Advisor Shares | | | — | | | | — | | | | 642,046 | | | | 85,946 | |
| Reinvestment of distributions: | | | | | | | | | | | | | | | | |
| Institutional Shares | | | 2,100,585 | | | | 1,066,255 | | | | 1,932,897 | | | | 25,171,967 | |
| Investor Shares | | | 46,398 | | | | 69,579 | | | | 209,903 | | | | 2,448,466 | |
| Advisor Shares | | | — | | | | — | | | | 61,604 | | | | 261,014 | |
| Redemption of shares: | | | | | | | | | | | | | | | | |
| Institutional Shares | | | (55,235,735 | ) | | | (65,225,740 | ) | | | (99,210,794 | ) | | | (198,998,347 | ) |
| Investor Shares | | | (937,681 | ) | | | (32,413,085 | ) | | | (10,980,068 | ) | | | (21,380,373 | ) |
| Advisor Shares | | | — | | | | — | | | | (770,892 | ) | | | (1,020,116 | ) |
| Redemption fees: | | | | | | | | | | | | | | | | |
| Institutional Shares | | | — | | | | 1,196 | | | | 93 | | | | 155 | |
| Investor Shares | | | — | | | | 53 | | | | 6 | | | | 11 | |
| Advisor Shares | | | — | | | | — | | | | 1 | | | | 1 | |
Increase (Decrease) from Capital Share Transactions | | | 7,523,439 | | | | 24,943,522 | | | | (27,472,444 | ) | | | (116,282,946 | ) |
Increase (Decrease) in Net Assets | | | (8,915,968 | ) | | | (7,803,745 | ) | | | (8,716,142 | ) | | | (207,163,580 | ) |
| NET ASSETS | | | | | | | | | | | | | | | | |
| Beginning of period | | | 312,598,732 | | | | 320,402,477 | | | | 253,733,961 | | | | 460,897,541 | |
| End of period | | $ | 303,682,764 | | | $ | 312,598,732 | | | $ | 245,017,819 | | | $ | 253,733,961 | |
| SHARE TRANSACTIONS | | | | | | | | | | | | | | | | |
| Sale of shares: | | | | | | | | | | | | | | | | |
| Institutional Shares | | | 6,588,484 | | | | 11,590,189 | | | | 6,596,970 | | | | 5,914,962 | |
| Investor Shares | | | 18,626 | | | | 290,909 | | | | 483,769 | | | | 314,904 | |
| Advisor Shares | | | — | | | | — | | | | 61,589 | | | | 7,401 | |
| Reinvestment of distributions: | | | | | | | | | | | | | | | | |
| Institutional Shares | | | 228,007 | | | | 105,899 | | | | 180,946 | | | | 2,137,667 | |
| Investor Shares | | | 5,022 | | | | 6,750 | | | | 19,782 | | | | 208,879 | |
| Advisor Shares | | | — | | | | — | | | | 5,902 | | | | 22,571 | |
| Redemption of shares: | | | | | | | | | | | | | | | | |
| Institutional Shares | | | (5,961,698 | ) | | | (6,667,160 | ) | | | (10,012,965 | ) | | | (17,491,598 | ) |
| Investor Shares | | | (101,285 | ) | | | (3,082,802 | ) | | | (1,081,748 | ) | | | (1,728,896 | ) |
| Advisor Shares | | | — | | | | — | | | | (70,370 | ) | | | (84,585 | ) |
Increase (Decrease) in shares outstanding | | | 777,156 | | | | 2,243,785 | | | | (3,816,125 | ) | | | (10,698,695 | ) |
The accompanying notes are an integral part of these financial statements.
Statements of Changes in Net Assets
| | | BROWN ADVISORY | | | BROWN ADVISORY – | |
| | | EMERGING MARKETS | | | BEUTEL GOODMAN | |
| | | SELECT FUND | | | LARGE-CAP VALUE FUND | |
| | | Fiscal | | | Fiscal | | | Fiscal | | | Fiscal | |
| | | Year Ended | | | Year Ended | | | Year Ended | | | Year Ended | |
| | | June 30, | | | June 30, | | | June 30, | | | June 30, | |
| | | 2023 | | | 2022 | | | 2023 | | | 2022 | |
| OPERATIONS | | | | | | | | | | | | |
| Net investment income (loss) | | $ | 7,700,454 | | | $ | 7,078,760 | | | $ | 27,863,500 | | | $ | 20,726,650 | |
| Net realized gain (loss) | | | (39,033,202 | ) | | | (25,774,876 | ) | | | (1,597,544 | ) | | | 53,479,529 | |
| Net change in unrealized appreciation (depreciation) | | | 50,890,808 | | | | (103,939,313 | ) | | | 204,984,398 | | | | (188,731,926 | ) |
| Increase (Decrease) in Net Assets from Operations | | | 19,558,060 | | | | (122,635,429 | ) | | | 231,250,354 | | | | (114,525,747 | ) |
| DISTRIBUTIONS FROM EARNINGS | | | | | | | | | | | | | | | | |
| Institutional Shares | | | (6,069,695 | ) | | | (3,771,869 | ) | | | (52,068,822 | ) | | | (100,197,515 | ) |
| Investor Shares | | | (47,726 | ) | | | (28,421 | ) | | | (26,989 | ) | | | (11,377 | ) |
| Advisor Shares | | | (270 | ) | | | (102 | ) | | | — | | | | — | |
Total Distributions from earnings | | | (6,117,691 | ) | | | (3,800,392 | ) | | | (52,095,811 | ) | | | (100,208,892 | ) |
| CAPITAL SHARE TRANSACTIONS | | | | | | | | | | | | | | | | |
| Sale of shares: | | | | | | | | | | | | | | | | |
| Institutional Shares | | | 215,596,170 | | | | 266,062,494 | | | | 435,357,095 | | | | 449,186,248 | |
| Investor Shares | | | 611,646 | | | | 720,579 | | | | 2,340,189 | | | | 233,378 | |
| Advisor Shares | | | 192,224 | | | | 19,089 | | | | — | | | | — | |
| Reinvestment of distributions: | | | | | | | | | | | | | | | | |
| Institutional Shares | | | 1,405,878 | | | | 838,107 | | | | 27,731,260 | | | | 68,672,974 | |
| Investor Shares | | | 47,075 | | | | 26,928 | | | | 26,670 | | | | 11,084 | |
| Advisor Shares | | | 271 | | | | 101 | | | | — | | | | — | |
| Redemption of shares: | | | | | | | | | | | | | | | | |
| Institutional Shares | | | (196,962,728 | ) | | | (167,258,402 | ) | | | (215,339,444 | ) | | | (215,216,159 | ) |
| Investor Shares | | | (3,226,011 | ) | | | (1,192,540 | ) | | | (163,756 | ) | | | (33,532 | ) |
| Advisor Shares | | | (7,708 | ) | | | (10,393 | ) | | | — | | | | — | |
| Redemption fees: | | | | | | | | | | | | | | | | |
| Institutional Shares | | | 2,375 | | | | 270 | | | | 557 | | | | 750 | |
| Investor Shares | | | 20 | | | | 2 | | | | — | | | | — | |
| Advisor Shares | | | — | | | | — | | | | — | | | | — | |
Increase (Decrease) from Capital Share Transactions | | | 17,659,212 | | | | 99,206,235 | | | | 249,952,571 | | | | 302,854,743 | |
Increase (Decrease) in Net Assets | | | 31,099,581 | | | | (27,229,586 | ) | | | 429,107,114 | | | | 88,120,104 | |
| NET ASSETS | | | | | | | | | | | | | | | | |
| Beginning of period | | | 508,611,255 | | | | 535,840,841 | | | | 1,237,490,791 | | | | 1,149,370,687 | |
| End of period | | $ | 539,710,836 | | | $ | 508,611,255 | | | $ | 1,666,597,905 | | | $ | 1,237,490,791 | |
| SHARE TRANSACTIONS | | | | | | | | | | | | | | | | |
| Sale of shares: | | | | | | | | | | | | | | | | |
| Institutional Shares | | | 21,527,213 | | | | 23,021,825 | | | | 33,565,417 | | | | 34,023,120 | |
| Investor Shares | | | 61,146 | | | | 62,170 | | | | 179,132 | | | | 17,585 | |
| Advisor Shares | | | 18,626 | | | | 1,630 | | | | — | | | | — | |
| Reinvestment of distributions: | | | | | | | | | | | | | | | | |
| Institutional Shares | | | 140,167 | | | | 70,846 | | | | 2,078,008 | | | | 5,328,934 | |
| Investor Shares | | | 4,693 | | | | 2,276 | | | | 2,023 | | | | 860 | |
| Advisor Shares | | | 27 | | | | 9 | | | | — | | | | — | |
| Redemption of shares: | | | | | | | | | | | | | | | | |
| Institutional Shares | | | (20,841,533 | ) | | | (15,503,874 | ) | | | (16,734,091 | ) | | | (16,332,410 | ) |
| Investor Shares | | | (306,384 | ) | | | (103,606 | ) | | | (12,640 | ) | | | (2,571 | ) |
| Advisor Shares | | | (724 | ) | | | (876 | ) | | | — | | | | — | |
Increase (Decrease) in shares outstanding | | | 603,231 | | | | 7,550,400 | | | | 19,077,849 | | | | 23,035,518 | |
The accompanying notes are an integral part of these financial statements.
Financial Highlights
| | | | | | | From Investment | | | Distributions to | | | | | | | | | | | | Ratios to Average | | | | |
| | | | | | | Operations(a) | | | Shareholders From | | | | | | | | | | | | Net Assets(b) | | | | |
| | | | | | | | | | Net | | | | | | | | | | | | | | | | | | | | | | | | | | | | | | | | | | |
| For a Share | | | | | | | | Realized | | | | | | | | | | | | | | | Net | | | | | | Net | | | | | | | | | | | | | |
| Outstanding | | Net Asset | | | Net | | | & | | | | | | | | | | | | | | | Asset | | | | | Assets at | | | Net | | | | | | | | | | |
| Throughout | | Value, | | | Investment | | | Unrealized | | | | | | Net | | | Net | | | | | | Value, | | | | | | End of | | | Investment | | | | | | Gross | | | Portfolio | |
| Each Fiscal Period: | | Beginning | | | Income | | | Gains | | | | | | Investment | | | Realized | | | | | | End of | | | Total | | | Period | | | Income | | | Net | | | Expenses | | | Turnover | |
| Beginning | Ending | | of Period | | | (Loss) | | | (Losses) | | | Total | | | Income | | | Gains | | | Total | | | Period | | Return(c) | | | | (000’s | ) | | (Loss) | | | Expenses | | | (d) | | | Rate(c) | |
| | | | | | | | | | | | | | | | | | | | | | | | | | | | | | | | | | | | | | | | | | | | | |
| BROWN ADVISORY GROWTH EQUITY FUND: | | | | | | | |
| | | | | | | | | | | | | | | | | | | | | | | | | | | | | | | | | | | | | | | | | | | | | |
| Institutional Shares* | | | | | | | |
| 07/01/22 | 06/30/23 | | $ | 23.82 | | | (0.03 | ) | | 4.59 | | | 4.56 | | | — | | | (1.64 | ) | | (1.64 | ) | | $ | 26.74 | | | 20.22 | % | | $ | 1,837,801 | | | (0.14 | )% | | 0.68 | % | | 0.68 | % | | 21 | % |
| 07/01/21 | 06/30/22 | | | 37.39 | | | (0.09 | ) | | (9.01 | ) | | (9.10 | ) | | — | | | (4.47 | ) | | (4.47 | ) | | | 23.82 | | | (27.88 | ) | | | 1,611,983 | | | (0.26 | ) | | 0.66 | | | 0.66 | | | 21 | |
| 07/01/20 | 06/30/21 | | | 29.05 | | | (0.06 | ) | | 10.02 | | | 9.96 | | | — | | | (1.62 | ) | | (1.62 | ) | | | 37.39 | | | 35.14 | | | | 2,321,278 | | | (0.19 | ) | | 0.67 | | | 0.67 | | | 25 | |
| 07/01/19 | 06/30/20 | | | 24.80 | | | (0.04 | ) | | 5.56 | | | 5.52 | | | — | | | (1.27 | ) | | (1.27 | ) | | | 29.05 | | | 22.88 | | | | 1,849,565 | | | (0.16 | ) | | 0.69 | | | 0.69 | | | 22 | |
| 07/01/18 | 06/30/19 | | | 23.91 | | | (0.04 | ) | | 3.38 | | | 3.34 | | | — | | | (2.45 | ) | | (2.45 | ) | | | 24.80 | | | 16.69 | | | | 1,523,633 | | | (0.19 | ) | | 0.70 | | | 0.70 | | | 22 | |
| | | | | | | | |
| Investor Shares* | | | | | | | |
| 07/01/22 | 06/30/23 | | | 23.35 | | | (0.07 | ) | | 4.48 | | | 4.41 | | | — | | | (1.64 | ) | | (1.64 | ) | | | 26.12 | | | 20.03 | | | | 687,058 | | | (0.29 | ) | | 0.83 | | | 0.83 | | | 21 | |
| 07/01/21 | 06/30/22 | | | 36.79 | | | (0.13 | ) | | (8.84 | ) | | (8.97 | ) | | — | | | (4.47 | ) | | (4.47 | ) | | | 23.35 | | | (28.02 | ) | | | 704,341 | | | (0.41 | ) | | 0.81 | | | 0.81 | | | 21 | |
| 07/01/20 | 06/30/21 | | | 28.64 | | | (0.11 | ) | | 9.88 | | | 9.77 | | | — | | | (1.62 | ) | | (1.62 | ) | | | 36.79 | | | 34.98 | | | | 1,174,666 | | | (0.34 | ) | | 0.82 | | | 0.82 | | | 25 | |
| 07/01/19 | 06/30/20 | | | 24.50 | | | (0.08 | ) | | 5.49 | | | 5.41 | | | — | | | (1.27 | ) | | (1.27 | ) | | | 28.64 | | | 22.70 | | | | 983,640 | | | (0.31 | ) | | 0.84 | | | 0.84 | | | 22 | |
| 07/01/18 | 06/30/19 | | | 23.69 | | | (0.08 | ) | | 3.34 | | | 3.26 | | | — | | | (2.45 | ) | | (2.45 | ) | | | 24.50 | | | 16.50 | | | | 828,388 | | | (0.34 | ) | | 0.85 | | | 0.85 | | | 22 | |
| | | | | | | | |
| Advisor Shares* | | | | | | | |
| 07/01/22 | 06/30/23 | | | 21.48 | | | (0.12 | ) | | 4.10 | | | 3.98 | | | — | | | (1.64 | ) | | (1.64 | ) | | | 23.82 | | | 19.76 | | | | 13,873 | | | (0.54 | ) | | 1.08 | | | 1.08 | | | 21 | |
| 07/01/21 | 06/30/22 | | | 34.27 | | | (0.20 | ) | | (8.12 | ) | | (8.32 | ) | | — | | | (4.47 | ) | | (4.47 | ) | | | 21.48 | | | (28.20 | ) | | | 13,940 | | | (0.66 | ) | | 1.06 | | | 1.06 | | | 21 | |
| 07/01/20 | 06/30/21 | | | 26.84 | | | (0.18 | ) | | 9.23 | | | 9.05 | | | — | | | (1.62 | ) | | (1.62 | ) | | | 34.27 | | | 34.63 | | | | 34,042 | | | (0.59 | ) | | 1.07 | | | 1.07 | | | 25 | |
| 07/01/19 | 06/30/20 | | | 23.09 | | | (0.14 | ) | | 5.16 | | | 5.02 | | | — | | | (1.27 | ) | | (1.27 | ) | | | 26.84 | | | 22.39 | | | | 13,692 | | | (0.56 | ) | | 1.09 | | | 1.09 | | | 22 | |
| 07/01/18 | 06/30/19 | | | 22.53 | | | (0.13 | ) | | 3.14 | | | 3.01 | | | — | | | (2.45 | ) | | (2.45 | ) | | | 23.09 | | | 16.22 | | | | 6,683 | | | (0.59 | ) | | 1.10 | | | 1.10 | | | 22 | |
| | | | | | | | | | | | | | | | | | | | | | | | | | | | | | | | | | | | | | | | | | | | | | | |
| BROWN ADVISORY FLEXIBLE EQUITY FUND: | | | | | | | |
| | | | | | | | | | | | | | | | | | | | | | | | | | | | | | | | | | | | | | | | | | | | | | | |
| Institutional Shares* | | | | | | | |
| 07/01/22 | 06/30/23 | | | 27.31 | | | 0.13 | | | 5.55 | | | 5.68 | | | (0.13 | ) | | (0.92 | ) | | (1.05 | ) | | | 31.94 | | | 21.44 | | | | 259,933 | | | 0.45 | | | 0.54 | | | 0.54 | | | 12 | |
| 07/01/21 | 06/30/22 | | | 34.26 | | | 0.09 | | | (5.71 | ) | | (5.62 | ) | | (0.06 | ) | | (1.27 | ) | | (1.33 | ) | | | 27.31 | | | (17.18 | ) | | | 196,675 | | | 0.29 | | | 0.53 | | | 0.53 | | | 10 | |
| 07/01/20 | 06/30/21 | | | 24.36 | | | 0.07 | | | 10.76 | | | 10.83 | | | (0.09 | ) | | (0.84 | ) | | (0.93 | ) | | | 34.26 | | | 45.26 | | | | 201,849 | | | 0.25 | | | 0.54 | | | 0.54 | | | 13 | |
| 07/01/19 | 06/30/20 | | | 22.92 | | | 0.11 | | | 2.50 | | | 2.61 | | | (0.15 | ) | | (1.02 | ) | | (1.17 | ) | | | 24.36 | | | 11.29 | | | | 134,574 | | | 0.47 | | | 0.56 | | | 0.56 | | | 12 | |
| 07/01/18 | 06/30/19 | | | 21.94 | | | 0.17 | | | 1.63 | | | 1.80 | | | (0.08 | ) | | (0.74 | ) | | (0.82 | ) | | | 22.92 | | | 8.94 | | | | 135,190 | | | 0.78 | | | 0.57 | | | 0.57 | | | 14 | |
| | | | | | | | |
| Investor Shares* | | | | | | | |
| 07/01/22 | 06/30/23 | | | 27.20 | | | 0.08 | | | 5.54 | | | 5.62 | | | (0.06 | ) | | (0.92 | ) | | (0.98 | ) | | | 31.84 | | | 21.24 | | | | 442,013 | | | 0.30 | | | 0.69 | | | 0.69 | | | 12 | |
| 07/01/21 | 06/30/22 | | | 34.16 | | | 0.04 | | | (5.70 | ) | | (5.66 | ) | | (0.03 | ) | | (1.27 | ) | | (1.30 | ) | | | 27.20 | | | (17.32 | ) | | | 400,090 | | | 0.14 | | | 0.68 | | | 0.68 | | | 10 | |
| 07/01/20 | 06/30/21 | | | 24.31 | | | 0.03 | | | 10.73 | | | 10.76 | | | (0.07 | ) | | (0.84 | ) | | (0.91 | ) | | | 34.16 | | | 45.05 | | | | 500,233 | | | 0.10 | | | 0.69 | | | 0.69 | | | 13 | |
| 07/01/19 | 06/30/20 | | | 22.88 | | | 0.07 | | | 2.49 | | | 2.56 | | | (0.11 | ) | | (1.02 | ) | | (1.13 | ) | | | 24.31 | | | 11.12 | | | | 362,695 | | | 0.32 | | | 0.71 | | | 0.71 | | | 12 | |
| 07/01/18 | 06/30/19 | | | 21.90 | | | 0.14 | | | 1.63 | | | 1.77 | | | (0.05 | ) | | (0.74 | ) | | (0.79 | ) | | | 22.88 | | | 8.77 | | | | 343,917 | | | 0.63 | | | 0.72 | | | 0.72 | | | 14 | |
| | | | | | | | |
| Advisor Shares* | | | | | | | |
| 07/01/22 | 06/30/23 | | | 27.11 | | | 0.01 | | | 5.52 | | | 5.53 | | | — | | | (0.92 | ) | | (0.92 | ) | | | 31.72 | | | 20.93 | | | | 5,245 | | | 0.05 | | | 0.94 | | | 0.94 | | | 12 | |
| 07/01/21 | 06/30/22 | | | 34.10 | | | (0.04 | ) | | (5.68 | ) | | (5.72 | ) | | — | | | (1.27 | ) | | (1.27 | ) | | | 27.11 | | | (17.51 | ) | | | 4,471 | | | (0.11 | ) | | 0.93 | | | 0.93 | | | 10 | |
| 07/01/20 | 06/30/21 | | | 24.30 | | | (0.04 | ) | | 10.72 | | | 10.68 | | | (0.04 | ) | | (0.84 | ) | | (0.88 | ) | | | 34.10 | | | 44.69 | | | | 5,965 | | | (0.15 | ) | | 0.94 | | | 0.94 | | | 13 | |
| 07/01/19 | 06/30/20 | | | 22.90 | | | 0.02 | | | 2.48 | | | 2.50 | | | (0.08 | ) | | (1.02 | ) | | (1.10 | ) | | | 24.30 | | | 10.84 | | | | 4,403 | | | 0.07 | | | 0.96 | | | 0.96 | | | 12 | |
| 07/01/18 | 06/30/19 | | | 21.91 | | | 0.08 | | | 1.65 | | | 1.73 | | | — | | | (0.74 | ) | | (0.74 | ) | | | 22.90 | | | 8.52 | | | | 4,652 | | | 0.38 | | | 0.97 | | | 0.97 | | | 14 | |
The accompanying notes are an integral part of these financial statements.
Financial Highlights
| | | | | | | From Investment | | | Distributions to | | | | | | | | | | | | Ratios to Average | | | | |
| | | | | | | Operations(a) | | | Shareholders From | | | | | | | | | | | | Net Assets(b) | | | | |
| | | | | | | | | | Net | | | | | | | | | | | | | | | | | | | | | | | | | | | | | | | | | | |
| For a Share | | | | | | | | Realized | | | | | | | | | | | | | | | Net | | | | | | Net | | | | | | | | | | | | | |
| Outstanding | | Net Asset | | | Net | | | & | | | | | | | | | | | | | | | Asset | | | | | Assets at | | | Net | | | | | | | | | | |
| Throughout | | Value, | | | Investment | | | Unrealized | | | | | | Net | | | Net | | | | | | Value, | | | | | | End of | | | Investment | | | | | | Gross | | | Portfolio | |
| Each Fiscal Period: | | Beginning | | | Income | | | Gains | | | | | | Investment | | | Realized | | | | | | End of | | | Total | | | Period | | | Income | | | Net | | | Expenses | | | Turnover | |
| Beginning | Ending | | of Period | | | (Loss) | | | (Losses) | | | Total | | | Income | | | Gains | | | Total | | | Period | | Return(c) | | | | (000’s | ) | | (Loss) | | | Expenses | | | (d) | | | Rate(c) | |
| | | | | | | | | | | | | | | | | | | | | | | | | | | | | | | | | | | | | | | | | | | | | |
| BROWN ADVISORY EQUITY INCOME FUND: | | | | | | | |
| | | | | | | | | | | | | | | | | | | | | | | | | | | | | | | | | | | | | | | | | | | | | |
| Institutional Shares* | |
| 07/01/22 | 06/30/23 | | $ | 13.57 | | | 0.24 | | | 1.21 | | | 1.45 | | | (0.24 | ) | | (1.09 | ) | | | (1.33 | ) | | $ | 13.69 | | | 10.95 | % | | $ | 18,094 | | | 1.75 | % | | 0.76 | % | | 0.81 | % | | 6 | % |
| 07/01/21 | 06/30/22 | | | 15.98 | | | 0.23 | | | (0.96 | ) | | (0.73 | ) | | (0.23 | ) | | (1.45 | ) | | | (1.68 | ) | | | 13.57 | | | (5.87 | ) | | | 19,964 | | | 1.46 | | | 0.76 | | | 0.79 | | | 11 | |
| 07/01/20 | 06/30/21 | | | 12.97 | | | 0.23 | | | 3.75 | | | 3.98 | | | (0.23 | ) | | (0.74 | ) | | | (0.97 | ) | | | 15.98 | | | 31.84 | | | | 24,045 | | | 1.59 | | | 0.77 | | | 0.80 | | | 20 | |
| 07/01/19 | 06/30/20 | | | 14.15 | | | 0.23 | | | (0.10 | ) | | 0.13 | | | (0.23 | ) | | (1.08 | ) | | | (1.31 | ) | | | 12.97 | | | 0.46 | | | | 22,026 | | | 1.66 | | | 0.80 | | | 0.80 | | | 16 | |
| 07/01/18 | 06/30/19 | | | 14.41 | | | 0.26 | | | 1.33 | | | 1.59 | | | (0.27 | ) | | (1.58 | ) | | | (1.85 | ) | | | 14.15 | | | 13.12 | | | | 26,449 | | | 1.87 | | | 0.80 | | | 0.80 | | | 11 | |
| | | | | | | | |
| Investor Shares* | | | | | | | |
| 07/01/22 | 06/30/23 | | | 13.56 | | | 0.22 | | | 1.22 | | | 1.44 | | | (0.22 | ) | | (1.09 | ) | | | (1.31 | ) | | | 13.69 | | | 10.87 | | | | 53,364 | | | 1.60 | | | 0.91 | | | 0.96 | | | 6 | |
| 07/01/21 | 06/30/22 | | | 15.97 | | | 0.21 | | | (0.96 | ) | | (0.75 | ) | | (0.21 | ) | | (1.45 | ) | | | (1.66 | ) | | | 13.56 | | | (6.02 | ) | | | 55,288 | | | 1.31 | | | 0.91 | | | 0.94 | | | 11 | |
| 07/01/20 | 06/30/21 | | | 12.96 | | | 0.21 | | | 3.75 | | | 3.96 | | | (0.21 | ) | | (0.74 | ) | | | (0.95 | ) | | | 15.97 | | | 31.67 | | | | 63,600 | | | 1.44 | | | 0.92 | | | 0.95 | | | 20 | |
| 07/01/19 | 06/30/20 | | | 14.15 | | | 0.21 | | | (0.11 | ) | | 0.10 | | | (0.21 | ) | | (1.08 | ) | | | (1.29 | ) | | | 12.96 | | | 0.24 | | | | 55,228 | | | 1.51 | | | 0.95 | | | 0.95 | | | 16 | |
| 07/01/18 | 06/30/19 | | | 14.40 | | | 0.24 | | | 1.34 | | | 1.58 | | | (0.25 | ) | | (1.58 | ) | | | (1.83 | ) | | | 14.15 | | | 13.03 | | | | 62,309 | | | 1.72 | | | 0.95 | | | 0.95 | | | 11 | |
| | | | | | | | |
| Advisor Shares* | | | | | | | |
| 07/01/22 | 06/30/23 | | | 13.55 | | | 0.18 | | | 1.21 | | | 1.39 | | | (0.18 | ) | | (1.09 | ) | | | (1.27 | ) | | | 13.67 | | | 10.51 | | | | 1,073 | | | 1.35 | | | 1.16 | | | 1.21 | | | 6 | |
| 07/01/21 | 06/30/22 | | | 15.96 | | | 0.17 | | | (0.96 | ) | | (0.79 | ) | | (0.17 | ) | | (1.45 | ) | | | (1.62 | ) | | | 13.55 | | | (6.24 | ) | | | 1,247 | | | 1.06 | | | 1.16 | | | 1.19 | | | 11 | |
| 07/01/20 | 06/30/21 | | | 12.96 | | | 0.17 | | | 3.74 | | | 3.91 | | | (0.17 | ) | | (0.74 | ) | | | (0.91 | ) | | | 15.96 | | | 31.27 | | | | 1,182 | | | 1.19 | | | 1.17 | | | 1.20 | | | 20 | |
| 07/01/19 | 06/30/20 | | | 14.14 | | | 0.17 | | | (0.10 | ) | | 0.07 | | | (0.17 | ) | | (1.08 | ) | | | (1.25 | ) | | | 12.96 | | | 0.05 | | | | 886 | | | 1.26 | | | 1.20 | | | 1.20 | | | 16 | |
| 07/01/18 | 06/30/19 | | | 14.40 | | | 0.21 | | | 1.33 | | | 1.54 | | | (0.22 | ) | | (1.58 | ) | | | (1.80 | ) | | | 14.14 | | | 12.67 | | | | 1,017 | | | 1.47 | | | 1.20 | | | 1.20 | | | 11 | |
| | | | | | | | | | | | | | | | | | | | | | | | | | | | | | | | | | | | | | | | | | | | | | | | |
| BROWN ADVISORY SUSTAINABLE GROWTH FUND: | | | | | | | |
| | | | | | | | | | | | | | | | | | | | | | | | | | | | | | | | | | | | | | | | | | | | | | | | |
| Institutional Shares* | | | | | | | |
| 07/01/22 | 06/30/23 | | | 35.42 | | | 0.03 | | | 7.63 | | | 7.66 | | | — | + | | — | | | | — | | | | 43.08 | | | 21.63 | | | | 5,145,711 | | | 0.08 | | | 0.63 | | | 0.63 | | | 13 | |
| 07/01/21 | 06/30/22 | | | 44.56 | | | (0.04 | ) | | (8.19 | ) | | (8.23 | ) | | — | | | (0.91 | ) | | | (0.91 | ) | | | 35.42 | | | (19.02 | ) | | | 3,378,590 | | | (0.10 | ) | | 0.63 | | | 0.63 | | | 19 | |
| 07/01/20 | 06/30/21 | | | 31.96 | | | (0.03 | ) | | 12.63 | | | 12.60 | | | — | | | — | | | | — | | | | 44.56 | | | 39.42 | | | | 3,364,728 | | | (0.08 | ) | | 0.65 | | | 0.65 | | | 23 | |
| 07/01/19 | 06/30/20 | | | 26.39 | | | 0.01 | | | 5.77 | | | 5.78 | | | — | | | (0.21 | ) | | | (0.21 | ) | | | 31.96 | | | 22.01 | | | | 1,601,989 | | | 0.05 | | | 0.70 | | | 0.70 | | | 20 | |
| 07/01/18 | 06/30/19 | | | 23.02 | | | 0.03 | | | 4.12 | | | 4.15 | | | — | | | (0.78 | ) | | | (0.78 | ) | | | 26.39 | | | 18.89 | | | | 749,949 | | | 0.10 | | | 0.73 | | | 0.73 | | | 21 | |
| | | | | | | | |
| Investor Shares* | | | | | | | |
| 07/01/22 | 06/30/23 | | | 34.83 | | | (0.02 | ) | | 7.48 | | | 7.46 | | | — | | | — | | | | — | | | | 42.29 | | | 21.42 | | | | 2,150,632 | | | (0.07 | ) | | 0.78 | | | 0.78 | | | 13 | |
| 07/01/21 | 06/30/22 | | | 43.90 | | | (0.11 | ) | | (8.05 | ) | | (8.16 | ) | | — | | | (0.91 | ) | | | (0.91 | ) | | | 34.83 | | | (19.15 | ) | | | 1,714,513 | | | (0.25 | ) | | 0.78 | | | 0.78 | | | 19 | |
| 07/01/20 | 06/30/21 | | | 31.52 | | | (0.09 | ) | | 12.47 | | | 12.38 | | | — | | | — | | | | — | | | | 43.90 | | | 39.28 | | | | 1,849,429 | | | (0.23 | ) | | 0.80 | | | 0.80 | | | 23 | |
| 07/01/19 | 06/30/20 | | | 26.07 | | | (0.03 | ) | | 5.69 | | | 5.66 | | | — | | | (0.21 | ) | | | (0.21 | ) | | | 31.52 | | | 21.82 | | | | 1,108,023 | | | (0.10 | ) | | 0.85 | | | 0.85 | | | 20 | |
| 07/01/18 | 06/30/19 | | | 22.79 | | | (0.01 | ) | | 4.07 | | | 4.06 | | | — | | | (0.78 | ) | | | (0.78 | ) | | | 26.07 | | | 18.68 | | | | 374,769 | | | (0.05 | ) | | 0.88 | | | 0.88 | | | 21 | |
| | | | | | | | |
| Advisor Shares* | | | | | | | |
| 07/01/22 | 06/30/23 | | | 33.91 | | | (0.11 | ) | | 7.28 | | | 7.17 | | | — | | | — | | | | — | | | | 41.08 | | | 21.14 | | | | 356,620 | | | (0.32 | ) | | 1.03 | | | 1.03 | | | 13 | |
| 07/01/21 | 06/30/22 | | | 42.87 | | | (0.21 | ) | | (7.84 | ) | | (8.05 | ) | | — | | | (0.91 | ) | | | (0.91 | ) | | | 33.91 | | | (19.35 | ) | | | 298,972 | | | (0.50 | ) | | 1.03 | | | 1.03 | | | 19 | |
| 07/01/20 | 06/30/21 | | | 30.86 | | | (0.18 | ) | | 12.19 | | | 12.01 | | | — | | | — | | | | — | | | | 42.87 | | | 38.92 | | | | 444,064 | | | (0.48 | ) | | 1.05 | | | 1.05 | | | 23 | |
| 07/01/19 | 06/30/20 | | | 25.59 | | | (0.09 | ) | | 5.57 | | | 5.48 | | | — | | | (0.21 | ) | | | (0.21 | ) | | | 30.86 | | | 21.53 | | | | 285,542 | | | (0.35 | ) | | 1.10 | | | 1.10 | | | 20 | |
| 07/01/18 | 06/30/19 | | | 22.44 | | | (0.07 | ) | | 4.00 | | | 3.93 | | | — | | | (0.78 | ) | | | (0.78 | ) | | | 25.59 | | | 18.39 | | | | 250,871 | | | (0.30 | ) | | 1.13 | | | 1.13 | | | 21 | |
The accompanying notes are an integral part of these financial statements.
Financial Highlights
| | | | | | | From Investment | | | Distributions to | | | | | | | | | | | | Ratios to Average | | | | |
| | | | | | | Operations(a) | | | Shareholders From | | | | | | | | | | | | Net Assets(b) | | | | |
| | | | | | | | | | Net | | | | | | | | | | | | | | | | | | | | | | | | | | | | | | | | | | |
| For a Share | | | | | | | | Realized | | | | | | | | | | | | | | | Net | | | | | | Net | | | | | | | | | | | | | |
| Outstanding | | Net Asset | | | Net | | | & | | | | | | | | | | | | | | | Asset | | | | | | Assets at | | | Net | | | | | | | | | | |
| Throughout | | Value, | | | Investment | | | Unrealized | | | | | | Net | | | Net | | | | | | Value, | | | | | | End of | | | Investment | | | | | | Gross | | | Portfolio | |
| Each Fiscal Period: | | Beginning | | | Income | | | Gains | | | | | | Investment | | | Realized | | | | | | End of | | | Total | | | Period | | | Income | | | Net | | | Expenses | | | Turnover | |
| Beginning | Ending | | of Period | | | (Loss) | | | (Losses) | | | Total | | | Income | | | Gains | | | Total | | | Period | | | Return(c) | | | | (000’s | ) | | (Loss) | | | Expenses | | | (d) | | | Rate(c) | |
| | | | | | | | | | | | | | | | | | | | | | | | | | | | | | | | | | | | | | | | | | | | | |
| BROWN ADVISORY MID-CAP GROWTH FUND: | | | | | | | |
| | | | | | | | | | | | | | | | | | | | | | | | | | | | | | | | | | | | | | | | | | | | | |
| Institutional Shares* | | | | | | | |
| 07/01/22 | 06/30/23 | | $ | 12.29 | | | (0.04 | ) | | 2.11 | | | | 2.07 | | | — | | | (0.81 | ) | | | (0.81 | ) | | $ | 13.55 | | | 17.38 | % | | $ | 71,960 | | | (0.28 | )% | | 0.82 | % | | 0.83 | % | | 55 | % |
| 07/01/21 | 06/30/22 | | | 19.86 | | | (0.09 | ) | | (5.73 | ) | | | (5.82 | ) | | — | | | (1.75 | ) | | | (1.75 | ) | | | 12.29 | | | (31.54 | ) | | | 94,754 | | | (0.52 | ) | | 0.79 | | | 0.79 | | | 48 | |
| 07/01/20 | 06/30/21 | | | 13.86 | | | (0.08 | ) | | 6.08 | | | | 6.00 | | | — | | | — | | | | — | | | | 19.86 | | | 43.03 | | | | 159,180 | | | (0.44 | ) | | 0.76 | | | 0.79 | | | 48 | |
| 07/01/19 | 06/30/20 | | | 13.14 | | | (0.01 | ) | | 0.77 | | | | 0.76 | | | — | | | (0.04 | ) | | | (0.04 | ) | | | 13.86 | | | 5.68 | | | | 100,367 | | | (0.11 | ) | | 0.70 | | | 0.88 | | | 35 | |
| 07/02/18^ | 06/30/19 | | | 11.42 | | | (0.00 | ) | | 1.83 | | | | 1.83 | | | — | | | (0.11 | ) | | | (0.11 | ) | | | 13.14 | | | 16.36 | | | | 42,404 | | | (0.00 | ) | | 0.70 | | | 1.04 | | | 46 | |
| | | | | | | | |
| Investor Shares* | | | | | | | |
| 07/01/22 | 06/30/23 | | | 12.20 | | | (0.05 | ) | | 2.08 | | | | 2.03 | | | — | | | (0.81 | ) | | | (0.81 | ) | | | 13.42 | | | 17.26 | | | | 24,419 | | | (0.43 | ) | | 0.97 | | | 0.98 | | | 55 | |
| 07/01/21 | 06/30/22 | | | 19.76 | | | (0.11 | ) | | (5.70 | ) | | | (5.81 | ) | | — | | | (1.75 | ) | | | (1.75 | ) | | | 12.20 | | | (31.70 | ) | | | 22,897 | | | (0.67 | ) | | 0.94 | | | 0.94 | | | 48 | |
| 07/01/20 | 06/30/21 | | | 13.81 | | | (0.10 | ) | | 6.05 | | | | 5.95 | | | — | | | — | | | | — | | | | 19.76 | | | 42.90 | | | | 33,381 | | | (0.59 | ) | | 0.91 | | | 0.94 | | | 48 | |
| 07/01/19 | 06/30/20 | | | 13.12 | | | (0.03 | ) | | 0.76 | | | | 0.73 | | | — | | | (0.04 | ) | | | (0.04 | ) | | | 13.81 | | | 5.46 | | | | 28,477 | | | (0.26 | ) | | 0.85 | | | 1.03 | | | 35 | |
| 07/01/18 | 06/30/19 | | | 11.36 | | | (0.02 | ) | | 1.89 | | | | 1.87 | | | — | | | (0.11 | ) | | | (0.11 | ) | | | 13.12 | | | 16.80 | | | | 2,933 | | | (0.15 | ) | | 0.85 | | | 1.19 | | | 46 | |
| | | | | | | | | | | | | | | | | | | | | | | | | | | | | | | | | | | | | | | | | | | | | | | | | |
| BROWN ADVISORY SMALL-CAP GROWTH FUND: | | | | |
| | | | | | | | | | | | | | | | | | | | | | | | | | | | | | | | | | | | | | | | | | | | | | | | | |
| Institutional Shares* | | | | | | | |
| 07/01/22 | 06/30/23 | | | 41.98 | | | (0.06 | ) | | 5.88 | | | | 5.82 | | | — | | | (3.32 | ) | | | (3.32 | ) | | | 44.48 | | | 14.33 | | | | 1,349,940 | | | (0.13 | ) | | 0.96 | | | 0.96 | | | 29 | |
| 07/01/21 | 06/30/22 | | | 63.00 | | | (0.32 | ) | | (13.47 | ) | | | (13.79 | ) | | — | | | (7.23 | ) | | | (7.23 | ) | | | 41.98 | | | (24.11 | ) | | | 1,165,292 | | | (0.59 | ) | | 0.95 | | | 0.95 | | | 27 | |
| 07/01/20 | 06/30/21 | | | 44.31 | | | (0.34 | ) | | 19.48 | | | | 19.14 | | | — | | | (0.45 | ) | | | (0.45 | ) | | | 63.00 | | | 43.31 | | | | 1,758,121 | | | (0.61 | ) | | 0.95 | | | 0.95 | | | 32 | |
| 07/01/19 | 06/30/20 | | | 44.24 | | | (0.20 | ) | | 1.15 | | | | 0.95 | | | — | | | (0.88 | ) | | | (0.88 | ) | | | 44.31 | | | 2.18 | | | | 1,039,126 | | | (0.48 | ) | | 0.97 | | | 0.97 | | | 29 | |
| 07/01/18 | 06/30/19 | | | 40.64 | | | (0.15 | ) | | 5.52 | | | | 5.37 | | | (0.18 | ) | | (1.59 | ) | | | (1.77 | ) | | | 44.24 | | | 14.56 | | | | 838,698 | | | (0.36 | ) | | 0.98 | | | 0.98 | | | 44 | |
| | | | | | | | |
| Investor Shares* | | | | | | | |
| 07/01/22 | 06/30/23 | | | 20.91 | | | (0.06 | ) | | 2.92 | | | | 2.86 | | | — | | | (1.65 | ) | | | (1.65 | ) | | | 22.12 | | | 14.17 | | | | 882,356 | | | (0.28 | ) | | 1.11 | | | 1.11 | | | 29 | |
| 07/01/21 | 06/30/22 | | | 31.42 | | | (0.20 | ) | | (6.71 | ) | | | (6.91 | ) | | — | | | (3.60 | ) | | | (3.60 | ) | | | 20.91 | | | (24.23 | ) | | | 707,378 | | | (0.74 | ) | | 1.10 | | | 1.10 | | | 27 | |
| 07/01/20 | 06/30/21 | | | 22.13 | | | (0.21 | ) | | 9.72 | | | | 9.51 | | | — | | | (0.22 | ) | | | (0.22 | ) | | | 31.42 | | | 43.11 | | | | 822,075 | | | (0.76 | ) | | 1.10 | | | 1.10 | | | 32 | |
| 07/01/19 | 06/30/20 | | | 22.13 | | | (0.13 | ) | | 0.57 | | | | 0.44 | | | — | | | (0.44 | ) | | | (0.44 | ) | | | 22.13 | | | 2.02 | | | | 511,028 | | | (0.63 | ) | | 1.12 | | | 1.12 | | | 29 | |
| 07/01/18 | 06/30/19 | | | 20.34 | | | (0.10 | ) | | 2.77 | | | | 2.67 | | | (0.08 | ) | | (0.80 | ) | | | (0.88 | ) | | | 22.13 | | | 14.40 | | | | 493,421 | | | (0.51 | ) | | 1.13 | | | 1.13 | | | 44 | |
| | | | | | | | |
| Advisor Shares* | | | | | | | |
| 07/01/22 | 06/30/23 | | | 19.83 | | | (0.11 | ) | | 2.78 | | | | 2.67 | | | — | | | (1.57 | ) | | | (1.57 | ) | | | 20.93 | | | 13.91 | | | | 9,644 | | | (0.53 | ) | | 1.36 | | | 1.36 | | | 29 | |
| 07/01/21 | 06/30/22 | | | 29.88 | | | (0.26 | ) | | (6.37 | ) | | | (6.63 | ) | | — | | | (3.42 | ) | | | (3.42 | ) | | | 19.83 | | | (24.44 | ) | | | 9,309 | | | (0.99 | ) | | 1.35 | | | 1.35 | | | 27 | |
| 07/01/20 | 06/30/21 | | | 21.10 | | | (0.26 | ) | | 9.25 | | | | 8.99 | | | — | | | (0.21 | ) | | | (0.21 | ) | | | 29.88 | | | 42.74 | | | | 14,939 | | | (1.01 | ) | | 1.35 | | | 1.35 | | | 32 | |
| 07/01/19 | 06/30/20 | | | 21.15 | | | (0.18 | ) | | 0.55 | | | | 0.37 | | | — | | | (0.42 | ) | | | (0.42 | ) | | | 21.10 | | | 1.78 | | | | 12,159 | | | (0.88 | ) | | 1.37 | | | 1.37 | | | 29 | |
| 07/01/18 | 06/30/19 | | | 19.46 | | | (0.15 | ) | | 2.64 | | | | 2.49 | | | (0.04 | ) | | (0.76 | ) | | | (0.80 | ) | | | 21.15 | | | 14.08 | | | | 14,489 | | | (0.76 | ) | | 1.38 | | | 1.38 | | | 44 | |
The accompanying notes are an integral part of these financial statements.
| | | | | | | From Investment | | | Distributions to | | | | | | | | | | | | Ratios to Average | | | | |
| | | | | | | Operations(a) | | | Shareholders From | | | | | | | | | | | | Net Assets(b) | | | | |
| | | | | | | | | Net | | | | | | | | | | | | | | | | | | | | | | | | | | | | | | | | | | |
| For a Share | | | | | | | Realized | | | | | | | | | | | | | | | Net | | | | | | Net | | | | | | | | | | | | | |
| Outstanding | | Net Asset | | | Net | | & | | | | | | | | | | | | | | | Asset | | | | | Assets at | | | Net | | | | | | | | | | |
| Throughout | | Value, | | | Investment | | Unrealized | | | | | | Net | | | Net | | | | | | Value, | | | | | | End of | | | Investment | | | | | | Gross | | | Portfolio | |
| Each Fiscal Period: | | Beginning | | | Income | | Gains | | | | | | Investment | | Realized | | | | | | End of | | | Total | | | Period | | | Income | | | Net | | | Expenses | | | Turnover | |
| Beginning | Ending | | of Period | | | (Loss) | | (Losses) | | | Total | | | Income | | | Gains | | | Total | | | Period | | Return(c) | | | | (000’s | ) | | (Loss) | | | Expenses | | | (d) | | | Rate(c) | |
| | | | | | | | | | | | | | | | | | | | | | | | | | | | | | | | | | | | | | | | | | |
| BROWN ADVISORY SMALL-CAP FUNDAMENTAL VALUE FUND: | | | | |
| | | | | | | | | | | | | | | | | | | | | | | | | | | | | | | | | | | | | | | | | | |
| Institutional Shares* | | | | |
| 07/01/22 | 06/30/23 | | $ | 26.09 | | | 0.20 | | 3.09 | | | | 3.29 | | | (0.13 | ) | | (1.57 | ) | | | (1.70 | ) | | $ | 27.68 | | | 12.67 | % | | $ | 588,594 | | | 0.71 | % | | 0.95 | % | | 0.95 | % | | 35 | % |
| 07/01/21 | 06/30/22 | | | 29.65 | | | 0.09 | | (3.45 | ) | | | (3.36 | ) | | (0.10 | ) | | (0.10 | ) | | | (0.20 | ) | | | 26.09 | | | (11.45 | ) | | | 562,382 | | | 0.29 | | | 0.95 | | | 0.95 | | | 27 | |
| 07/01/20 | 06/30/21 | | | 19.25 | | | 0.11 | | 10.44 | | | | 10.55 | | | (0.15 | ) | | — | | | | (0.15 | ) | | | 29.65 | | | 54.97 | | | | 591,096 | | | 0.43 | | | 0.95 | | | 0.95 | | | 42 | |
| 07/01/19 | 06/30/20 | | | 24.77 | | | 0.21 | | (4.46 | ) | | | (4.25 | ) | | (0.13 | ) | | (1.14 | ) | | | (1.27 | ) | | | 19.25 | | | (18.38 | ) | | | 336,819 | | | 0.94 | | | 0.97 | | | 0.97 | | | 56 | |
| 07/01/18 | 06/30/19 | | | 29.16 | | | 0.29 | | (1.54 | ) | | | (1.25 | ) | | (0.21 | ) | | (2.93 | ) | | | (3.14 | ) | | | 24.77 | | | (2.91 | ) | | | 447,846 | | | 1.10 | | | 0.97 | | | 0.97 | | | 36 | |
| | | | | |
| Investor Shares* | | | | |
| 07/01/22 | 06/30/23 | | | 26.04 | | | 0.16 | | 3.08 | | | | 3.24 | | | (0.09 | ) | | (1.57 | ) | | | (1.66 | ) | | | 27.62 | | | 12.49 | | | | 591,487 | | | 0.56 | | | 1.10 | | | 1.10 | | | 35 | |
| 07/01/21 | 06/30/22 | | | 29.60 | | | 0.04 | | (3.45 | ) | | | (3.41 | ) | | (0.05 | ) | | (0.10 | ) | | | (0.15 | ) | | | 26.04 | | | (11.59 | ) | | | 564,689 | | | 0.14 | | | 1.10 | | | 1.10 | | | 27 | |
| 07/01/20 | 06/30/21 | | | 19.22 | | | 0.07 | | 10.42 | | | | 10.49 | | | (0.11 | ) | | — | | | | (0.11 | ) | | | 29.60 | | | 54.74 | | | | 648,403 | | | 0.28 | | | 1.10 | | | 1.10 | | | 42 | |
| 07/01/19 | 06/30/20 | | | 24.75 | | | 0.18 | | (4.46 | ) | | | (4.28 | ) | | (0.11 | ) | | (1.14 | ) | | | (1.25 | ) | | | 19.22 | | | (18.49 | ) | | | 432,498 | | | 0.79 | | | 1.12 | | | 1.12 | | | 56 | |
| 07/01/18 | 06/30/19 | | | 29.12 | | | 0.25 | | (1.53 | ) | | | (1.28 | ) | | (0.16 | ) | | (2.93 | ) | | | (3.09 | ) | | | 24.75 | | | (3.05 | ) | | | 577,212 | | | 0.95 | | | 1.12 | | | 1.12 | | | 36 | |
| | | | | | | | | | | | | | | | | | | | | | | | | | | | | | | | | | | | | | | | | | | | | | | | |
| Advisor Shares* | | | | | | | | | | | | | | | | | | | | | | | | | | | | | | | | | | | | | | | | | | | | | | |
| 07/01/22 | 06/30/23 | | | 25.86 | | | 0.09 | | 3.07 | | | | 3.16 | | | (0.03 | ) | | (1.57 | ) | | | (1.60 | ) | | | 27.42 | | | 12.25 | | | | 2,685 | | | 0.31 | | | 1.35 | | | 1.35 | | | 35 | |
| 07/01/21 | 06/30/22 | | | 29.43 | | | (0.03 | ) | (3.43 | ) | | | (3.46 | ) | | (0.01 | ) | | (0.10 | ) | | | (0.11 | ) | | | 25.86 | | | (11.82 | ) | | | 3,154 | | | (0.11 | ) | | 1.35 | | | 1.35 | | | 27 | |
| 07/01/20 | 06/30/21 | | | 19.10 | | | 0.01 | | 10.36 | | | | 10.37 | | | (0.04 | ) | | — | | | | (0.04 | ) | | | 29.43 | | | 54.37 | | | | 8,125 | | | 0.03 | | | 1.35 | | | 1.35 | | | 42 | |
| 07/01/19 | 06/30/20 | | | 24.64 | | | 0.12 | | (4.44 | ) | | | (4.32 | ) | | (0.08 | ) | | (1.14 | ) | | | (1.22 | ) | | | 19.10 | | | (18.71 | ) | | | 4,480 | | | 0.54 | | | 1.37 | | | 1.37 | | | 56 | |
| 07/01/18 | 06/30/19 | | | 28.98 | | | 0.19 | | (1.51 | ) | | | (1.32 | ) | | (0.09 | ) | | (2.93 | ) | | | (3.02 | ) | | | 24.64 | | | (3.27 | ) | | | 8,393 | | | 0.70 | | | 1.37 | | | 1.37 | | | 36 | |
| | | | | | | | | | | | | | | | | | | | | | | | | | | | | | | | | | | | | | | | | | | | | | | | |
| BROWN ADVISORY SUSTAINABLE SMALL-CAP CORE FUND: | | | | |
| | | | | | | | | | | | | | | | | | | | | | | | | | | | | | | | | | | | | | | | | | | | | | | | |
| Institutional Shares* | | | | |
| 07/01/22 | 06/30/23 | | | 7.74 | | | 0.01 | | 1.06 | | | | 1.07 | | | — | | | — | + | | | — | | | | 8.81 | | | 13.83 | | | | 51,935 | | | 0.18 | | | 0.93 | | | 1.16 | | | 66 | |
| 09/30/21^ | 06/30/22 | | | 10.00 | | | (0.02 | ) | (2.24 | ) | | | (2.26 | ) | | — | | | — | | | | — | | | | 7.74 | | | (22.60 | ) | | | 32,915 | | | (0.22 | ) | | 0.93 | | | 1.36 | | | 19 | |
| | | | | |
| Investor Shares* | | | | |
| 07/01/22 | 06/30/23 | | | 7.73 | | | 0.00 | | 1.06 | | | | 1.06 | | | — | | | — | + | | | — | | | | 8.79 | | | 13.71 | | | | 1,540 | | | 0.03 | | | 1.08 | | | 1.31 | | | 66 | |
| 09/30/21^ | 06/30/22 | | | 10.00 | | | (0.02 | ) | (2.25 | ) | | | (2.27 | ) | | — | | | — | | | | — | | | | 7.73 | | | (22.70 | ) | | | 812 | | | (0.37 | ) | | 1.08 | | | 1.51 | | | 19 | |
| | | | | | | | | | | | | | | | | | | | | | | | | | | | | | | | | | | | | | | | | | | | | | | | |
| BROWN ADVISORY SUSTAINABLE VALUE FUND: | | | | |
| | | | | | | | | | | | | | | | | | | | | | | | | | | | | | | | | | | | | | | | | | | | | | | | |
| Institutional Shares* | | | | |
| 02/28/23^ | 06/30/23 | | | 10.00 | | | 0.06 | | (0.03 | ) | | | 0.03 | | | — | | | — | | | | — | | | | 10.03 | | | 0.30 | | | | 50,307 | | | 1.72 | | | 0.70 | | | 1.17 | | | 7 | |
| | | | | |
| Investor Shares* | | | | |
| 02/28/23^ | 06/30/23 | | | 10.00 | | | 0.05 | | (0.03 | ) | | | 0.02 | | | — | | | — | | | | — | | | | 10.02 | | | 0.20 | | | | 163 | | | 1.57 | | | 0.85 | | | 1.32 | | | 7 | |
The accompanying notes are an integral part of these financial statements.
Financial Highlights
| | | | | | | From Investment | | | Distributions to | | | | | | | | | | | | Ratios to Average | | | | |
| | | | | | | Operations(a) | | | Shareholders From | | | | | | | | | | | | Net Assets(b) | | | | |
| | | | | | | | | | Net | | | | | | | | | | | | | | | | | | | | | | | | | | | | | | | | | | |
| For a Share | | | | | | | | Realized | | | | | | | | | | | | | | | Net | | | | | | Net | | | | | | | | | | | | | |
| Outstanding | | Net Asset | | | Net | | | & | | | | | | | | | | | | | | | Asset | | | | | Assets at | | | Net | | | | | | | | | | |
| Throughout | | Value, | | | Investment | | | Unrealized | | | | | | Net | | | Net | | | | | | Value, | | | | | | End of | | Investment | | | | | | Gross | | | Portfolio | |
| Each Fiscal Period: | | Beginning | | | Income | | | Gains | | | | | | Investment | | | Realized | | | | | | End of | | | Total | | | Period | | | Income | | | Net | | | Expenses | | | Turnover | |
| Beginning | Ending | | of Period | | | (Loss) | | | (Losses) | | | Total | | | Income | | | Gains | | | Total | | | Period | | Return(c) | | | | (000’s | ) | | (Loss) | | | Expenses | | | (d) | | | Rate(c) | |
| | | | | | | | | | | | | | | | | | | | | | | | | | | | | | | | | | | | | | | | | | | | | |
| BROWN ADVISORY GLOBAL LEADERS FUND: | | | | | | | |
| | | | | | | | | | | | | | | | | | | | | | | | | | | | | | | | | | | | | | | | | | | | | |
| Institutional Shares* | | | | | | | |
| 07/01/22 | 06/30/23 | | $ | 18.24 | | | 0.13 | | | 3.83 | | | | 3.96 | | | (0.12 | ) | | — | | | | (0.12 | ) | | $ | 22.08 | | | 21.83 | % | | $ | 1,401,528 | | | 0.66 | % | | 0.76 | % | | 0.76 | % | | 19 | % |
| 07/01/21 | 06/30/22 | | | 22.60 | | | 0.10 | | | (4.19 | ) | | | (4.09 | ) | | (0.02 | ) | | (0.25 | ) | | | (0.27 | ) | | | 18.24 | | | (18.34 | ) | | | 1,048,587 | | | 0.45 | | | 0.75 | | | 0.75 | | | 25 | |
| 07/01/20 | 06/30/21 | | | 16.38 | | | 0.03 | | | 6.22 | | | | 6.25 | | | (0.03 | ) | | — | | | | (0.03 | ) | | | 22.60 | | | 38.17 | | | | 1,149,790 | | | 0.16 | | | 0.76 | | | 0.76 | | | 14 | |
| 07/01/19 | 06/30/20 | | | 15.24 | | | 0.07 | | | 1.13 | | | | 1.20 | | | (0.06 | ) | | — | | | | (0.06 | ) | | | 16.38 | | | 7.85 | | | | 605,983 | | | 0.45 | | | 0.75 | | | 0.82 | | | 27 | |
| 10/31/18^ | 06/30/19 | | | 13.13 | | | 0.07 | | | 2.07 | | | | 2.14 | | | (0.03 | ) | | — | | | | (0.03 | ) | | | 15.24 | | | 16.38 | | | | 214,263 | | | 0.71 | | | 0.75 | | | 0.88 | | | 23 | |
| | | | | | | | |
| Investor Shares* | | | | | | | |
| 07/01/22 | 06/30/23 | | | 18.18 | | | 0.10 | | | 3.82 | | | | 3.92 | | | (0.10 | ) | | — | | | | (0.10 | ) | | | 22.00 | | | 21.63 | | | | 77,619 | | | 0.51 | | | 0.91 | | | 0.91 | | | 19 | |
| 07/01/21 | 06/30/22 | | | 22.54 | | | 0.07 | | | (4.17 | ) | | | (4.10 | ) | | (0.01 | ) | | (0.25 | ) | | | (0.26 | ) | | | 18.18 | | | (18.45 | ) | | | 76,150 | | | 0.30 | | | 0.90 | | | 0.90 | | | 25 | |
| 07/01/20 | 06/30/21 | | | 16.36 | | | — | | | 6.20 | | | | 6.20 | | | (0.02 | ) | | — | | | | (0.02 | ) | | | 22.54 | | | 37.91 | | | | 95,940 | | | 0.01 | | | 0.91 | | | 0.91 | | | 14 | |
| 07/01/19 | 06/30/20 | | | 15.23 | | | 0.05 | | | 1.12 | | | | 1.17 | | | (0.04 | ) | | — | | | | (0.04 | ) | | | 16.36 | | | 7.68 | | | | 66,813 | | | 0.30 | | | 0.90 | | | 0.97 | | | 27 | |
| 07/01/18 | 06/30/19 | | | 13.82 | | | 0.08 | | | 1.36 | | | | 1.44 | | | (0.03 | ) | | — | | | | (0.03 | ) | | | 15.23 | | | 10.49 | | | | 18,943 | | | 0.60 | | | 0.86 | | | 1.07 | | | 23 | |
| | | | | | | | | | | | | | | | | | | | | | | | | | | | | | | | | | | | | | | | | | | | | | | | | |
| BROWN ADVISORY SUSTAINABLE INTERNATIONAL LEADERS FUND: | | | | |
| | | | | | | | | | | | | | | | | | | | | | | | | | | | | | | | | | | | | | | | | | | | | | | | | |
| Institutional Shares* | | | | |
| 07/01/22 | 06/30/23 | | | 8.43 | | | 0.10 | | | 2.01 | | | | 2.11 | | | (0.02 | ) | | — | | | | (0.02 | ) | | | 10.52 | | | 25.09 | | | | 22,884 | | | 1.04 | | | 0.85 | | | 1.58 | | | 21 | |
| 02/28/22^ | 06/30/22 | | | 10.00 | | | 0.06 | | | (1.63 | ) | | | (1.57 | ) | | — | | | — | | | | — | | | | 8.43 | | | (15.70 | ) | | | 6,221 | | | 1.96 | | | 0.85 | | | 4.26 | | | 12 | |
| | | | | | | | |
| Investor Shares* | | | | | | | |
| 07/01/22 | 06/30/23 | | | 8.42 | | | 0.08 | | | 2.01 | | | | 2.09 | | | (0.02 | ) | | — | | | | (0.02 | ) | | | 10.49 | | | 24.88 | | | | 1,463 | | | 0.89 | | | 1.00 | | | 1.73 | | | 21 | |
| 02/28/22^ | 06/30/22 | | | 10.00 | | | 0.05 | | | (1.63 | ) | | | (1.58 | ) | | — | | | — | | | | — | | | | 8.42 | | | (15.80 | ) | | | 75 | | | 1.81 | | | 1.00 | | | 4.41 | | | 12 | |
| | | | | | | | | | | | | | | | | | | | | | | | | | | | | | | | | | | | | | | | | | | | | | | | | |
| BROWN ADVISORY INTERMEDIATE INCOME FUND: | | | | | | | |
| | | | | | | | | | | | | | | | | | | | | | | | | | | | | | | | | | | | | | | | | | | | | | | | | |
| Investor Shares* | | | | | | | |
| 07/01/22 | 06/30/23 | | | 9.99 | | | 0.24 | | | (0.38 | ) | | | (0.14 | ) | | (0.25 | ) | | — | | | | (0.25 | ) | | | 9.60 | | | (1.44 | ) | | | 122,641 | | | 2.47 | | | 0.49 | | | 0.52 | | | 32 | |
| 07/01/21 | 06/30/22 | | | 11.05 | | | 0.12 | | | (0.94 | ) | | | (0.82 | ) | | (0.14 | ) | | (0.10 | ) | | | (0.24 | ) | | | 9.99 | | | (7.60 | ) | | | 139,856 | | | 1.17 | | | 0.46 | | | 0.50 | | | 58 | |
| 07/01/20 | 06/30/21 | | | 11.06 | | | 0.11 | | | 0.02 | | | | 0.13 | | | (0.13 | ) | | (0.01 | ) | | | (0.14 | ) | | | 11.05 | | | 1.11 | | | | 167,774 | | | 1.02 | | | 0.47 | | | 0.50 | | | 50 | |
| 07/01/19 | 06/30/20 | | | 10.72 | | | 0.24 | | | 0.35 | | | | 0.59 | | | (0.25 | ) | | — | | | | (0.25 | ) | | | 11.06 | | | 5.55 | | | | 148,300 | | | 2.24 | | | 0.49 | | | 0.53 | | | 105 | |
| 07/01/18 | 06/30/19 | | | 10.35 | | | 0.27 | | | 0.36 | | | | 0.63 | | | (0.26 | ) | | — | | | | (0.26 | ) | | | 10.72 | | | 6.24 | | | | 135,175 | | | 2.63 | | | 0.47 | | | 0.53 | | | 82 | |
| | | | | | | | |
| Advisor Shares* | | | | | | | |
| 07/01/22 | 06/30/23 | | | 9.76 | | | 0.21 | | | (0.37 | ) | | | (0.16 | ) | | (0.22 | ) | | — | | | | (0.22 | ) | | | 9.38 | | | (1.62 | ) | | | 3,139 | | | 2.22 | | | 0.74 | | | 0.77 | | | 32 | |
| 07/01/21 | 06/30/22 | | | 10.80 | | | 0.10 | | | (0.93 | ) | | | (0.83 | ) | | (0.11 | ) | | (0.10 | ) | | | (0.21 | ) | | | 9.76 | | | (7.82 | ) | | | 3,273 | | | 0.92 | | | 0.71 | | | 0.75 | | | 58 | |
| 07/01/20 | 06/30/21 | | | 10.82 | | | 0.08 | | | 0.01 | | | | 0.09 | | | (0.10 | ) | | (0.01 | ) | | | (0.11 | ) | | | 10.80 | | | 0.79 | | | | 3,661 | | | 0.77 | | | 0.72 | | | 0.75 | | | 50 | |
| 07/01/19 | 06/30/20 | | | 10.49 | | | 0.21 | | | 0.34 | | | | 0.55 | | | (0.22 | ) | | — | | | | (0.22 | ) | | | 10.82 | | | 5.32 | | | | 3,624 | | | 1.99 | | | 0.74 | | | 0.78 | | | 105 | |
| 07/01/18 | 06/30/19 | | | 10.13 | | | 0.24 | | | 0.36 | | | | 0.60 | | | (0.24 | ) | | — | | | | (0.24 | ) | | | 10.49 | | | 6.01 | | | | 3,615 | | | 2.38 | | | 0.72 | | | 0.78 | | | 82 | |
The accompanying notes are an integral part of these financial statements.
Financial Highlights
| | | | | | | From Investment | | | Distributions to | | | | | | | | | | | | Ratios to Average | | | | |
| | | | | | | Operations(a) | | | Shareholders From | | | | | | | | | | | | Net Assets(b) | | | | |
| | | | | | | | | | Net | | | | | | | | | | | | | | | | | | | | | | | | | | | | | | | | | | |
| For a Share | | | | | | | | Realized | | | | | | | | | | | | | | | Net | | | | | | Net | | | | | | | | | | | | | |
| Outstanding | | Net Asset | | | Net | | | & | | | | | | | | | | | | | | | Asset | | | | | | Assets at | | | Net | | | | | | | | | | |
| Throughout | | Value, | | | Investment | | | Unrealized | | | | | | Net | | | Net | | | | | | Value, | | | | | | End of | | Investment | | | | | | Gross | | | Portfolio | |
| Each Fiscal Period: | | Beginning | | | Income | | | Gains | | | | | | Investment | | | Realized | | | | | | End of | | | Total | | | Period | | | Income | | | Net | | | Expenses | | | Turnover | |
| Beginning | Ending | | of Period | | | (Loss) | | | (Losses) | | | Total | | | Income | | | Gains | | | Total | | | Period | | Return(c) | | | | (000’s | ) | | (Loss) | | | Expenses | | | (d) | | | Rate(c) | |
| | | | | | | | | | | | | | | | | | | | | | | | | | | | | | | | | | | | | | | | | | | | | |
| BROWN ADVISORY SUSTAINABLE BOND FUND: | | | | |
| | | | | | | | | | | | | | | | | | | | | | | | | | | | | | | | | | | | | | | | | | | | | |
| Institutional Shares* | |
| 07/01/22 | 06/30/23 | | $ | 9.14 | | | 0.25 | | | (0.54 | ) | | | (0.29 | ) | | (0.25 | ) | | — | | | | (0.25 | ) | | $ | 8.60 | | | (3.22 | )% | | $ | 723,393 | | | 2.81 | % | | 0.43 | % | | 0.43 | % | | 277 | % |
| 07/01/21 | 06/30/22 | | | 10.42 | | | 0.14 | | | (1.13 | ) | | | (0.99 | ) | | (0.15 | ) | | (0.14 | ) | | | (0.29 | ) | | | 9.14 | | | (9.71 | ) | | | 301,917 | | | 1.43 | | | 0.44 | | | 0.44 | | | 113 | |
| 07/01/20 | 06/30/21 | | | 10.54 | | | 0.16 | | | 0.10 | | | | 0.26 | | | (0.17 | ) | | (0.21 | ) | | | (0.38 | ) | | | 10.42 | | | 2.44 | | | | 218,476 | | | 1.56 | | | 0.45 | | | 0.45 | | | 89 | |
| 07/01/19 | 06/30/20 | | | 10.13 | | | 0.27 | | | 0.54 | | | | 0.81 | | | (0.28 | ) | | (0.12 | ) | | | (0.40 | ) | | | 10.54 | | | 8.14 | | | | 153,472 | | | 2.63 | | | 0.48 | | | 0.48 | | | 97 | |
| 07/02/18^ | 06/30/19 | | | 9.70 | | | 0.30 | | | 0.42 | | | | 0.72 | | | (0.29 | ) | | — | | | | (0.29 | ) | | | 10.13 | | | 7.60 | | | | 126,466 | | | 3.08 | | | 0.55 | | | 0.52 | | | 66 | |
| | |
| Investor Shares* | |
| 07/01/22 | 06/30/23 | | | 9.14 | | | 0.24 | | | (0.53 | ) | | | (0.29 | ) | | (0.24 | ) | | — | | | | (0.24 | ) | | | 8.61 | | | (3.16 | ) | | | 12,829 | | | 2.76 | | | 0.48 | | | 0.48 | | | 277 | |
| 07/01/21 | 06/30/22 | | | 10.42 | | | 0.13 | | | (1.13 | ) | | | (1.00 | ) | | (0.14 | ) | | (0.14 | ) | | | (0.28 | ) | | | 9.14 | | | (9.76 | ) | | | 12,667 | | | 1.38 | | | 0.49 | | | 0.49 | | | 113 | |
| 07/01/20 | 06/30/21 | | | 10.54 | | | 0.16 | | | 0.10 | | | | 0.26 | | | (0.17 | ) | | (0.21 | ) | | | (0.38 | ) | | | 10.42 | | | 2.39 | | | | 5,009 | | | 1.51 | | | 0.50 | | | 0.50 | | | 89 | |
| 07/01/19 | 06/30/20 | | | 10.13 | | | 0.26 | | | 0.54 | | | | 0.80 | | | (0.27 | ) | | (0.12 | ) | | | (0.39 | ) | | | 10.54 | | | 8.09 | | | | 2,125 | | | 2.58 | | | 0.53 | | | 0.53 | | | 97 | |
| 07/01/18 | 06/30/19 | | | 9.70 | | | 0.29 | | | 0.43 | | | | 0.72 | | | (0.29 | ) | | — | | | | (0.29 | ) | | | 10.13 | | | 7.54 | | | | 884 | | | 3.03 | | | 0.60 | | | 0.57 | | | 66 | |
| | | | | | | | | | | | | | | | | | | | | | | | | | | | | | | | | | | | | | | | | | | | | | | | | |
| BROWN ADVISORY MARYLAND BOND FUND: | | | | |
| | | | | | | | | | | | | | | | | | | | | | | | | | | | | | | | | | | | | | | | | | | | | | | | | |
| Investor Shares* | | | | | | | |
| 07/01/22 | 06/30/23 | | | 9.80 | | | 0.24 | | | 0.02 | | | | 0.26 | | | (0.27 | ) | | — | | | | (0.27 | ) | | | 9.79 | | | 2.73 | | | | 163,961 | | | 2.41 | | | 0.49 | | | 0.49 | | | 51 | |
| 07/01/21 | 06/30/22 | | | 10.88 | | | 0.19 | | | (1.04 | ) | | | (0.85 | ) | | (0.23 | ) | | — | | | | (0.23 | ) | | | 9.80 | | | (7.90 | ) | | | 169,565 | | | 1.79 | | | 0.47 | | | 0.47 | | | 22 | |
| 07/01/20 | 06/30/21 | | | 10.67 | | | 0.21 | | | 0.26 | | | | 0.47 | | | (0.26 | ) | | — | | | | (0.26 | ) | | | 10.88 | | | 4.41 | | | | 186,483 | | | 1.94 | | | 0.48 | | | 0.48 | | | 17 | |
| 07/01/19 | 06/30/20 | | | 10.80 | | | 0.25 | | | (0.09 | ) | | | 0.16 | | | (0.29 | ) | | — | | | | (0.29 | ) | | | 10.67 | | | 1.44 | | | | 176,198 | | | 2.31 | | | 0.49 | | | 0.49 | | | 37 | |
| 07/01/18 | 06/30/19 | | | 10.50 | | | 0.28 | | | 0.30 | | | | 0.58 | | | (0.28 | ) | | — | | | | (0.28 | ) | | | 10.80 | | | 5.65 | | | | 182,072 | | | 2.69 | | | 0.49 | | | 0.49 | | | 33 | |
| | | | | | | | | | | | | | | | | | | | | | | | | | | | | | | | | | | | | | | | | | | | | | | | | |
| BROWN ADVISORY TAX-EXEMPT BOND FUND: | | | | |
| | | | | | | | | | | | | | | | | | | | | | | | | | | | | | | | | | | | | | | | | | | | | | | | | |
| Institutional Shares* | | | | | | | |
| 07/01/22 | 06/30/23 | | | 9.29 | | | 0.29 | | | 0.04 | | | | 0.33 | | | (0.33 | ) | | — | | | | (0.33 | ) | | | 9.29 | | | 3.59 | | | | 787,874 | | | 3.14 | | | 0.44 | | | 0.44 | | | 79 | |
| 07/01/21 | 06/30/22 | | | 10.50 | | | 0.18 | | | (1.08 | ) | | | (0.90 | ) | | (0.26 | ) | | (0.05 | ) | | | (0.31 | ) | | | 9.29 | | | (8.75 | ) | | | 805,608 | | | 1.73 | | | 0.41 | | | 0.41 | | | 50 | |
| 07/01/20 | 06/30/21 | | | 10.08 | | | 0.20 | | | 0.49 | | | | 0.69 | | | (0.27 | ) | | — | | | | (0.27 | ) | | | 10.50 | | | 6.87 | | | | 1,190,436 | | | 1.92 | | | 0.40 | | | 0.40 | | | 47 | |
| 07/01/19 | 06/30/20 | | | 10.20 | | | 0.24 | | | (0.08 | ) | | | 0.16 | | | (0.28 | ) | | — | | | | (0.28 | ) | | | 10.08 | | | 1.59 | | | | 1,072,444 | | | 2.38 | | | 0.42 | | | 0.42 | | | 80 | |
| 07/02/18^ | 06/30/19 | | | 9.90 | | | 0.33 | | | 0.30 | | | | 0.63 | | | (0.33 | ) | | — | | | | (0.33 | ) | | | 10.20 | | | 6.51 | | | | 950,832 | | | 3.36 | | | 0.43 | | | 0.43 | | | 53 | |
| | | | | | | | |
| Investor Shares* | | | | | | | |
| 07/01/22 | 06/30/23 | | | 9.29 | | | 0.29 | | | 0.03 | | | | 0.32 | | | (0.32 | ) | | — | | | | (0.32 | ) | | | 9.29 | | | 3.54 | | | | 8,167 | | | 3.09 | | | 0.49 | | | 0.49 | | | 79 | |
| 07/01/21 | 06/30/22 | | | 10.50 | | | 0.17 | | | (1.07 | ) | | | (0.90 | ) | | (0.26 | ) | | (0.05 | ) | | | (0.31 | ) | | | 9.29 | | | (8.80 | ) | | | 10,484 | | | 1.68 | | | 0.46 | | | 0.46 | | | 50 | |
| 07/01/20 | 06/30/21 | | | 10.09 | | | 0.19 | | | 0.48 | | | | 0.67 | | | (0.26 | ) | | — | | | | (0.26 | ) | | | 10.50 | | | 6.72 | | | | 11,537 | | | 1.87 | | | 0.45 | | | 0.45 | | | 47 | |
| 07/01/19 | 06/30/20 | | | 10.20 | | | 0.24 | | | (0.07 | ) | | | 0.17 | | | (0.28 | ) | | — | | | | (0.28 | ) | | | 10.09 | | | 1.64 | | | | 9,982 | | | 2.33 | | | 0.47 | | | 0.47 | | | 80 | |
| 07/01/18 | 06/30/19 | | | 9.90 | | | 0.33 | | | 0.30 | | | | 0.63 | | | (0.33 | ) | | — | | | | (0.33 | ) | | | 10.20 | | | 6.49 | | | | 19,395 | | | 3.31 | | | 0.48 | | | 0.48 | | | 53 | |
| | | | | | | | | | | | | | | | | | | | | | | | | | | | | | | | | | | | | | | | | | | | | | | | | |
| BROWN ADVISORY TAX-EXEMPT SUSTAINABLE BOND FUND: | | | | | | | |
| | | | | | | | | | | | | | | | | | | | | | | | | | | | | | | | | | | | | | | | | | | | | | | | | |
| Investor Shares* | | | | | | | |
| 07/01/22 | 06/30/23 | | | 9.09 | | | 0.24 | | | (0.03 | ) | | | 0.21 | | | (0.24 | ) | | — | | | | (0.24 | ) | | | 9.06 | | | 2.39 | | | | 288,993 | | | 2.63 | | | 0.50 | | | 0.50 | | | 111 | |
| 07/01/21 | 06/30/22 | | | 10.19 | | | 0.15 | | | (1.01 | ) | | | (0.86 | ) | | (0.14 | ) | | (0.10 | ) | | | (0.24 | ) | | | 9.09 | | | (8.60 | ) | | | 325,606 | | | 1.49 | | | 0.49 | | | 0.49 | | | 61 | |
| 07/01/20 | 06/30/21 | | | 9.88 | | | 0.13 | | | 0.32 | | | | 0.45 | | | (0.13 | ) | | (0.01 | ) | | | (0.14 | ) | | | 10.19 | | | 4.57 | | | | 179,123 | | | 1.32 | | | 0.49 | | | 0.49 | | | 66 | |
| 12/02/19^ | 06/30/20 | | | 10.00 | | | 0.08 | | | (0.12 | ) | | | (0.04 | ) | | (0.08 | ) | | — | | | | (0.08 | ) | | | 9.88 | | | (0.37 | ) | | | 157,032 | | | 1.45 | | | 0.55 | | | 0.55 | | | 39 | |
The accompanying notes are an integral part of these financial statements.
Financial Highlights
| | | | | | | From Investment | | | Distributions to | | | | | | | | | | | | Ratios to Average | | | | |
| | | | | | | Operations(a) | | | Shareholders From | | | | | | | | | | | | Net Assets(b) | | | | |
| | | | | | | | | | Net | | | | | | | | | | | | | | | | | | | | | | | | | | | | | | | | | | |
| For a Share | | | | | | | | Realized | | | | | | | | | | | | | | | Net | | | | | | Net | | | | | | | | | | | | | |
| Outstanding | | Net Asset | | | Net | | | & | | | | | | | | | | | | | | | Asset | | | | | | Assets at | | | Net | | | | | | | | | | |
| Throughout | | Value, | | | Investment | | | Unrealized | | | | | | Net | | | Net | | | | | | Value, | | | | | | End of | | Investment | | | | | | Gross | | | Portfolio | |
| Each Fiscal Period: | | Beginning | | | Income | | | Gains | | | | | | Investment | | | Realized | | | | | | End of | | | Total | | | Period | | | Income | | | Net | | | Expenses | | | Turnover | |
| Beginning | Ending | | of Period | | | (Loss) | | | (Losses) | | | Total | | | Income | | | Gains | | | Total | | | Period | | Return(c) | | | | (000’s | ) | | (Loss) | | | Expenses | | | (d) | | | Rate(c) | |
| | | | | | | | | | | | | | | | | | | | | | | | | | | | | | | | | | | | | | | | | | | | | |
| BROWN ADVISORY MORTGAGE SECURITIES FUND: | | | | | | | |
| | | | | | | | | | | | | | | | | | | | | | | | | | | | | | | | | | | | | | | | | | | | | |
| Institutional Shares* | | | | | | | |
| 07/01/22 | 06/30/23 | | $ | 9.59 | | | 0.28 | | | (0.48 | ) | | | (0.20 | ) | | (0.29 | ) | | — | | | | (0.29 | ) | | $ | 9.10 | | | (2.06 | )% | | $ | 302,293 | | | 2.98 | % | | 0.45 | % | | 0.45 | % | | 229 | % |
| 07/01/21 | 06/30/22 | | | 10.56 | | | 0.10 | | | (0.92 | ) | | | (0.82 | ) | | (0.15 | ) | | — | | | | (0.15 | ) | | | 9.59 | | | (7.86 | ) | | | 310,388 | | | 0.94 | | | 0.44 | | | 0.44 | | | 204 | |
| 07/01/20 | 06/30/21 | | | 10.46 | | | (0.03 | ) | | 0.19 | | | | 0.16 | | | (0.06 | ) | | — | | | | (0.06 | ) | | | 10.56 | | | 1.53 | | | | 288,526 | | | (0.27 | ) | | 0.45 | | | 0.45 | | | 148 | |
| 07/01/19 | 06/30/20 | | | 10.02 | | | 0.11 | | | 0.50 | | | | 0.61 | | | (0.17 | ) | | — | | | | (0.17 | ) | | | 10.46 | | | 6.09 | | | | 238,202 | | | 1.07 | | | 0.47 | | | 0.47 | | | 139 | |
| 07/01/18 | 06/30/19 | | | 9.65 | | | 0.22 | | | 0.42 | | | | 0.64 | | | (0.27 | ) | | — | | | | (0.27 | ) | | | 10.02 | | | 6.72 | | | | 281,728 | | | 2.29 | | | 0.47 | | | 0.47 | | | 200 | |
| | | | | | | | |
| Investor Shares* | | | | | | | |
| 07/01/22 | 06/30/23 | | | 9.61 | | | 0.27 | | | (0.47 | ) | | | (0.20 | ) | | (0.29 | ) | | — | | | | (0.29 | ) | | | 9.12 | | | (2.11 | ) | | | 1,390 | | | 2.93 | | | 0.50 | | | 0.50 | | | 229 | |
| 07/01/21 | 06/30/22 | | | 10.57 | | | 0.09 | | | (0.91 | ) | | | (0.82 | ) | | (0.14 | ) | | — | | | | (0.14 | ) | | | 9.61 | | | (7.81 | ) | | | 2,211 | | | 0.89 | | | 0.49 | | | 0.49 | | | 204 | |
| 07/01/20 | 06/30/21 | | | 10.47 | | | (0.03 | ) | | 0.19 | | | | 0.16 | | | (0.06 | ) | | — | | | | (0.06 | ) | | | 10.57 | | | 1.48 | | | | 31,876 | | | (0.32 | ) | | 0.50 | | | 0.50 | | | 148 | |
| 07/01/19 | 06/30/20 | | | 10.02 | | | 0.11 | | | 0.50 | | | | 0.61 | | | (0.16 | ) | | — | | | | (0.16 | ) | | | 10.47 | | | 6.15 | | | | 9,755 | | | 1.02 | | | 0.52 | | | 0.52 | | | 139 | |
| 07/01/18 | 06/30/19 | | | 9.66 | | | 0.22 | | | 0.40 | | | | 0.62 | | | (0.26 | ) | | — | | | | (0.26 | ) | | | 10.02 | | | 6.55 | | | | 266 | | | 2.24 | | | 0.52 | | | 0.52 | | | 200 | |
| | | | | | | | | | | | | | | | | | | | | | | | | | | | | | | | | | | | | | | | | | | | | | | | | |
| BROWN ADVISORY — WMC STRATEGIC EUROPEAN EQUITY FUND: | | | | | | | |
| | | | | | | | | | | | | | | | | | | | | | | | | | | | | | | | | | | | | | | | | | | | | | | | | |
| Institutional Shares* | | | | |
| 07/01/22 | 06/30/23 | | | 10.34 | | | 0.19 | | | 1.58 | | | | 1.77 | | | (0.21 | ) | | (0.08 | ) | | | (0.29 | ) | | | 11.82 | | | 17.50 | | | | 227,407 | | | 1.74 | | | 1.08 | | | 1.08 | | | 73 | |
| 07/01/21 | 06/30/22 | | | 13.08 | | | 0.15 | | | (1.68 | ) | | | (1.53 | ) | | (0.11 | ) | | (1.10 | ) | | | (1.21 | ) | | | 10.34 | | | (12.75 | ) | | | 232,340 | | | 1.22 | | | 1.04 | | | 1.04 | | | 43 | |
| 07/01/20 | 06/30/21 | | | 10.51 | | | 0.13 | | | 3.20 | | | | 3.33 | | | (0.03 | ) | | (0.73 | ) | | | (0.76 | ) | | | 13.08 | | | 32.55 | | | | 417,419 | | | 1.12 | | | 1.05 | | | 1.05 | | | 51 | |
| 07/01/19 | 06/30/20 | | | 11.15 | | | 0.03 | | | (0.07 | ) | | | (0.04 | ) | | (0.10 | ) | | (0.50 | ) | | | (0.60 | ) | | | 10.51 | | | (0.66 | ) | | | 287,081 | | | 0.29 | | | 1.09 | | | 1.09 | | | 53 | |
| 07/01/18 | 06/30/19 | | | 12.42 | | | 0.07 | | | (0.16 | ) | | | (0.09 | ) | | (0.20 | ) | | (0.98 | ) | | | (1.18 | ) | | | 11.15 | | | 0.84 | | | | 470,903 | | | 0.62 | | | 1.07 | | | 1.07 | | | 34 | |
| | | | | |
| Investor Shares* | | | | |
| 07/01/22 | 06/30/23 | | | 10.30 | | | 0.17 | | | 1.58 | | | | 1.75 | | | (0.20 | ) | | (0.08 | ) | | | (0.28 | ) | | | 11.77 | | | 17.30 | | | | 14,922 | | | 1.59 | | | 1.23 | | | 1.23 | | | 73 | |
| 07/01/21 | 06/30/22 | | | 13.03 | | | 0.13 | | | (1.67 | ) | | | (1.54 | ) | | (0.09 | ) | | (1.10 | ) | | | (1.19 | ) | | | 10.30 | | | (12.89 | ) | | | 19,007 | | | 1.07 | | | 1.19 | | | 1.19 | | | 43 | |
| 07/01/20 | 06/30/21 | | | 10.48 | | | 0.12 | | | 3.18 | | | | 3.30 | | | (0.02 | ) | | (0.73 | ) | | | (0.75 | ) | | | 13.03 | | | 32.36 | | | | 39,751 | | | 0.97 | | | 1.20 | | | 1.20 | | | 51 | |
| 07/01/19 | 06/30/20 | | | 11.12 | | | 0.01 | | | (0.06 | ) | | | (0.05 | ) | | (0.09 | ) | | (0.50 | ) | | | (0.59 | ) | | | 10.48 | | | (0.77 | ) | | | 22,224 | | | 0.14 | | | 1.24 | | | 1.24 | | | 53 | |
| 07/01/18 | 06/30/19 | | | 12.41 | | | 0.05 | | | (0.17 | ) | | | (0.12 | ) | | (0.19 | ) | | (0.98 | ) | | | (1.17 | ) | | | 11.12 | | | 0.58 | | | | 18,100 | | | 0.47 | | | 1.22 | | | 1.22 | | | 34 | |
| | |
| Advisor Shares* | |
| 07/01/22 | 06/30/23 | | | 10.17 | | | 0.14 | | | 1.56 | | | | 1.70 | | | (0.19 | ) | | (0.08 | ) | | | (0.27 | ) | | | 11.60 | | | 17.05 | | | | 2,689 | | | 1.34 | | | 1.48 | | | 1.48 | | | 73 | |
| 07/01/21 | 06/30/22 | | | 12.88 | | | 0.10 | | | (1.65 | ) | | | (1.55 | ) | | (0.06 | ) | | (1.10 | ) | | | (1.16 | ) | | | 10.17 | | | (13.09 | ) | | | 2,387 | | | 0.82 | | | 1.44 | | | 1.44 | | | 43 | |
| 07/01/20 | 06/30/21 | | | 10.38 | | | 0.08 | | | 3.16 | | | | 3.24 | | | (0.01 | ) | | (0.73 | ) | | | (0.74 | ) | | | 12.88 | | | 32.01 | | | | 3,728 | | | 0.72 | | | 1.45 | | | 1.45 | | | 51 | |
| 07/01/19 | 06/30/20 | | | 11.03 | | | (0.01 | ) | | (0.07 | ) | | | (0.08 | ) | | (0.07 | ) | | (0.50 | ) | | | (0.57 | ) | | | 10.38 | | | (1.04 | ) | | | 3,816 | | | (0.11 | ) | | 1.49 | | | 1.49 | | | 53 | |
| 07/01/18 | 06/30/19 | | | 12.30 | | | 0.02 | | | (0.16 | ) | | | (0.14 | ) | | (0.15 | ) | | (0.98 | ) | | | (1.13 | ) | | | 11.03 | | | 0.42 | | | | 7,563 | | | 0.22 | | | 1.47 | | | 1.47 | | | 34 | |
The accompanying notes are an integral part of these financial statements.
Financial Highlights
| | �� | | | | | From Investment | | | Distributions to | | | | | | | | | | | | Ratios to Average | | | | |
| | | | | | | Operations(a) | | | Shareholders From | | | | | | | | | | | | Net Assets(b) | | | | |
| | | | | | | | | | Net | | | | | | | | | | | | | | | | | | | | | | | | | | | | | | | | | | |
| For a Share | | | | | | | | Realized | | | | | | | | | | | | | | | Net | | | | | | Net | | | | | | | | | | | | | |
| Outstanding | | Net Asset | | | Net | | | & | | | | | | | | | | | | | | | Asset | | | | | | Assets at | | | Net | | | | | | | | | | |
| Throughout | | Value, | | | Investment | | | Unrealized | | | | | | Net | | | Net | | | | | | Value, | | | | | | End of | | | Investment | | | | | | Gross | | | Portfolio | |
| Each Fiscal Period: | | Beginning | | | Income | | | Gains | | | | | | Investment | | | Realized | | | | | | End of | | | Total | | | Period | | | Income | | | Net | | | Expenses | | | Turnover | |
| Beginning | Ending | | of Period | | | (Loss) | | | (Losses) | | | Total | | | Income | | | Gains | | | Total | | | Period | | | Return(c) | | | | (000’s | ) | | (Loss) | | | Expenses | | | (d) | | | Rate(c) | |
| | | | | | | | | | | | | | | | | | | | | | | | | | | | | | | | | | | | | | | | | | | | | |
| BROWN ADVISORY EMERGING MARKETS SELECT FUND: | | | | | | | |
| | | | | | | | | | | | | | | | | | | | | | | | | | | | | | | | | | | | | | | | | | | | | |
| Institutional Shares* | | | | | | | |
| 07/01/22 | 06/30/23 | | $ | 10.13 | | | 0.16 | | | 0.47 | | | | 0.63 | | | (0.13 | ) | | — | | | | (0.13 | ) | | $ | 10.63 | | | 6.27 | % | | $ | 537,466 | | | 1.55 | % | | 1.11 | % | | 1.11 | % | | 69 | % |
| 07/01/21 | 06/30/22 | | | 12.57 | | | 0.14 | | | (2.50 | ) | | | (2.36 | ) | | (0.08 | ) | | — | | | | (0.08 | ) | | | 10.13 | | | (18.87 | ) | | | 504,216 | | | 1.25 | | | 1.10 | | | 1.10 | | | 70 | |
| 07/01/20 | 06/30/21 | | | 8.86 | | | 0.09 | | | 3.69 | | | | 3.78 | | | (0.07 | ) | | — | | | | (0.07 | ) | | | 12.57 | | | 42.71 | | | | 529,908 | | | 0.78 | | | 1.12 | | | 1.12 | | | 61 | |
| 07/01/19 | 06/30/20 | | | 9.34 | | | 0.11 | | | (0.48 | ) | | | (0.37 | ) | | (0.11 | ) | | — | | | | (0.11 | ) | | | 8.86 | | | (4.04 | ) | | | 267,282 | | | 1.27 | | | 1.16 | | | 1.16 | | | 62 | |
| 07/01/18 | 06/30/19 | | | 10.06 | | | 0.11 | | | (0.48 | ) | | | (0.37 | ) | | (0.35 | ) | | — | | | | (0.35 | ) | | | 9.34 | | | (3.35 | ) | | | 326,693 | | | 1.20 | | | 1.26 | | | 1.26 | | | 131 | |
| | | | | | | | |
| Investor Shares* | | | | | | | |
| 07/01/22 | 06/30/23 | | | 10.13 | | | 0.14 | | | 0.46 | | | | 0.60 | | | (0.11 | ) | | — | | | | (0.11 | ) | | | 10.62 | | | 6.01 | | | | 2,025 | | | 1.40 | | | 1.26 | | | 1.26 | | | 69 | |
| 07/01/21 | 06/30/22 | | | 12.56 | | | 0.13 | | | (2.50 | ) | | | (2.37 | ) | | (0.06 | ) | | — | | | | (0.06 | ) | | | 10.13 | | | (18.93 | ) | | | 4,368 | | | 1.10 | | | 1.25 | | | 1.25 | | | 70 | |
| 07/01/20 | 06/30/21 | | | 8.85 | | | 0.07 | | | 3.69 | | | | 3.76 | | | (0.05 | ) | | — | | | | (0.05 | ) | | | 12.56 | | | 42.56 | | | | 5,908 | | | 0.63 | | | 1.27 | | | 1.27 | | | 61 | |
| 07/01/19 | 06/30/20 | | | 9.33 | | | 0.10 | | | (0.49 | ) | | | (0.39 | ) | | (0.09 | ) | | — | | | | (0.09 | ) | | | 8.85 | | | (4.29 | ) | | | 4,202 | | | 1.12 | | | 1.31 | | | 1.31 | | | 62 | |
| 07/01/18 | 06/30/19 | | | 10.03 | | | 0.10 | | | (0.48 | ) | | | (0.38 | ) | | (0.32 | ) | | — | | | | (0.32 | ) | | | 9.33 | | | (3.42 | ) | | | 5,063 | | | 1.05 | | | 1.41 | | | 1.41 | | | 131 | |
| | | | | |
| Advisor Shares* | | | | |
| 07/01/22 | 06/30/23 | | | 10.16 | | | 0.12 | | | 0.46 | | | | 0.58 | | | (0.09 | ) | | — | | | | (0.09 | ) | | | 10.65 | | | 5.76 | | | | 220 | | | 1.15 | | | 1.51 | | | 1.51 | | | 69 | |
| 07/01/21 | 06/30/22 | | | 12.60 | | | 0.10 | | | (2.50 | ) | | | (2.40 | ) | | (0.04 | ) | | — | | | | (0.04 | ) | | | 10.16 | | | (19.11 | ) | | | 27 | | | 0.85 | | | 1.50 | | | 1.50 | | | 70 | |
| 07/01/20 | 06/30/21 | | | 8.87 | | | 0.04 | | | 3.70 | | | | 3.74 | | | (0.01 | ) | | — | | | | (0.01 | ) | | | 12.60 | | | 42.17 | | | | 24 | | | 0.38 | | | 1.52 | | | 1.52 | | | 61 | |
| 07/01/19 | 06/30/20 | | | 9.37 | | | 0.08 | | | (0.50 | ) | | | (0.42 | ) | | (0.08 | ) | | — | | | | (0.08 | ) | | | 8.87 | | | (4.61 | ) | | | 52 | | | 0.87 | | | 1.56 | | | 1.56 | | | 62 | |
| 07/01/18 | 06/30/19 | | | 10.07 | | | 0.07 | | | (0.47 | ) | | | (0.40 | ) | | (0.30 | ) | | — | | | | (0.30 | ) | | | 9.37 | | | (3.66 | ) | | | 167 | | | 0.80 | | | 1.66 | | | 1.66 | | | 131 | |
| | | | | | | | | | | | | | | | | | | | | | | | | | | | | | | | | | | | | | | | | | | | | | | | | |
| BROWN ADVISORY – BEUTEL GOODMAN LARGE-CAP VALUE FUND: | | | | | | | |
| | | | | | | | | | | | | | | | | | | | | | | | | | | | | | | | | | | | | | | | | | | | | | | | | |
| Institutional Shares* | | | | | | | |
| 07/01/22 | 06/30/23 | | | 12.04 | | | 0.25 | | | 1.86 | | | | 2.11 | | | (0.22 | ) | | (0.25 | ) | | | (0.47 | ) | | | 13.68 | | | 17.67 | | | | 1,664,063 | | | 1.89 | | | 0.55 | | | 0.55 | | | 17 | |
| 07/01/21 | 06/30/22 | | | 14.41 | | | 0.23 | | | (1.42 | ) | | | (1.19 | ) | | (0.20 | ) | | (0.98 | ) | | | (1.18 | ) | | | 12.04 | | | (8.68 | ) | | | 1,237,283 | | | 1.71 | | | 0.55 | | | 0.55 | | | 33 | |
| 07/01/20 | 06/30/21 | | | 10.61 | | | 0.20 | | | 3.99 | | | | 4.19 | | | (0.39 | ) | | — | | | | (0.39 | ) | | | 14.41 | | | 40.12 | | | | 1,149,351 | | | 1.52 | | | 0.55 | | | 0.55 | | | 42 | |
| 07/01/19 | 06/30/20 | | | 10.47 | | | 0.56 | | | (0.20 | ) | | | 0.36 | | | (0.10 | ) | | (0.12 | ) | | | (0.22 | ) | | | 10.61 | | | 3.27 | | | | 452,012 | | | 5.26 | | | 0.57 | | | 0.57 | | | 32 | |
| 07/01/18 | 06/30/19 | | | 9.58 | | | 0.20 | | | 0.89 | | | | 1.09 | | | (0.11 | ) | | (0.09 | ) | | | (0.20 | ) | | | 10.47 | | | 11.62 | | | | 296,963 | | | 1.97 | | | 0.60 | | | 0.60 | | | 45 | |
| | | | | | | | |
| Investor Shares* | | | | | | | |
| 07/01/22 | 06/30/23 | | | 12.02 | | | 0.23 | | | 1.85 | | | | 2.08 | | | (0.21 | ) | | (0.25 | ) | | | (0.46 | ) | | | 13.64 | | | 17.46 | | | | 2,535 | | | 1.74 | | | 0.70 | | | 0.70 | | | 17 | |
| 07/01/21^ | 06/30/22 | | | 14.41 | | | 0.21 | | | (1.42 | ) | | | (1.21 | ) | | (0.20 | ) | | (0.98 | ) | | | (1.18 | ) | | | 12.02 | | | (8.87 | ) | | | 208 | | | 1.56 | | | 0.70 | | | 0.70 | | | 33 | |
| * | Redemption fees of less than $0.005/share are not presented and are included in net realized & unrealized gains (losses) from investment operations. The increase in the portfolio turnover rate for Brown Advisory Emerging Markets Select Fund for the year ended June 30, 2019 was primarily the result of a change in sub-advisers during the year. |
| ^ | Information presented is for the entire history of the share class. |
+ | Distribution made was less than $0.005/share. |
| (a) | Calculated based on average shares outstanding during the fiscal period. |
| (b) | Annualized for periods less than one year. Ratios include only income and expenses of the funds themselves, as presented in the Statements of Operations, and do not include any additional or pro rata amounts of income or expenses from the ownership of any other investment companies (as applicable). |
| (c) | Not annualized for periods less than one year. Portfolio turnover rates are calculated at the fund level (not by individual share class). |
| (d) | Reflects the expense ratio excluding any expense waivers or expense recoupments. |
The accompanying notes are an integral part of these financial statements.
Notes to Financial Statements
June 30, 2023
Note 1. Organization
Brown Advisory Funds (the “Trust”) is registered under the Investment Company Act of 1940 as an open-ended management investment company. The Trust offers the following series of shares (each a “Fund,” and collectively, the “Funds”):
| • | Brown Advisory Growth Equity Fund (“Growth Equity Fund”) seeks to achieve capital appreciation by primarily investing in equity securities, |
| | |
| • | Brown Advisory Flexible Equity Fund (“Flexible Equity Fund”) seeks to achieve long-term growth of capital, |
| | |
| • | Brown Advisory Equity Income Fund (“Equity Income Fund”) seeks to provide current dividend yield and dividend growth, |
| | |
| • | Brown Advisory Sustainable Growth Fund (“Sustainable Growth Fund”) seeks to achieve capital appreciation, |
| | |
| • | Brown Advisory Mid-Cap Growth Fund (“Mid-Cap Growth Fund”) seeks to achieve long-term capital appreciation, |
| | |
| • | Brown Advisory Small-Cap Growth Fund (“Small-Cap Growth Fund”) seeks to achieve long-term capital appreciation by primarily investing in equity securities, |
| | |
| • | Brown Advisory Small-Cap Fundamental Value Fund (“Small-Cap Fundamental Value Fund”) seeks to achieve long-term capital appreciation, |
| | |
| • | Brown Advisory Sustainable Small-Cap Core Fund (“Sustainable Small-Cap Core Fund”) seeks to achieve long-term capital appreciation by investing primarily in equity securities of small-cap companies, |
| | |
| • | Brown Advisory Sustainable Value Fund (“Sustainable Value Fund”) seeks to achieve long-term capital appreciation, |
| | |
| • | Brown Advisory Global Leaders Fund (“Global Leaders Fund”) seeks to achieve long-term capital appreciation by investing primarily in global equities, |
| | |
| • | Brown Advisory Sustainable International Leaders Fund (“Sustainable International Leaders Fund”) seeks to achieve long- term capital appreciation by investing primarily in international equities, |
| | |
| • | Brown Advisory Intermediate Income Fund (“Intermediate Income Fund”) seeks to provide a high level of current income consistent with the preservation of principal within an intermediate-term maturity structure, |
| | |
| • | Brown Advisory Sustainable Bond Fund (“Sustainable Bond Fund”) seeks to provide a competitive total return consistent with the preservation of principal while giving special consideration to certain environmental, social and governance criteria, |
| | |
| • | Brown Advisory Maryland Bond Fund (“Maryland Bond Fund”) seeks to provide a high level of current income exempt from both Federal and Maryland State income taxes without undue risk, |
| | |
| • | Brown Advisory Tax-Exempt Bond Fund (“Tax-Exempt Bond Fund”) seeks to provide a high level of current income exempt from Federal income tax by investing primarily in intermediate-term investment grade municipal bonds, |
| | |
| • | Brown Advisory Tax-Exempt Sustainable Bond Fund (“Tax-Exempt Sustainable Bond Fund”) seeks to provide a high level of current income exempt from Federal income tax by investing primarily in intermediate-term investment grade municipal bonds while giving special consideration to certain environmental, social, and governance criteria, |
| | |
| • | Brown Advisory Mortgage Securities Fund (“Mortgage Securities Fund”) seeks to maximize total return consistent with preservation of capital, |
| | |
| • | Brown Advisory – WMC Strategic European Equity Fund (“WMC Strategic European Equity Fund”) seeks to achieve total return by investing principally in equity securities issued by companies established or operating in Europe, |
| | |
| • | Brown Advisory Emerging Markets Select Fund (“Emerging Markets Select Fund”) seeks to achieve total return by investing principally in equity securities issued by companies established or operating in emerging markets, and |
| | |
| • | Brown Advisory – Beutel Goodman Large-Cap Value Fund (“Beutel Goodman Large-Cap Value Fund”) seeks to achieve capital appreciation. |
Notes to Financial Statements
June 30, 2023
The Funds inception dates are as follows. Operations commenced the first business day after the inception date.
| | Institutional | Investor | Advisor | | | Institutional | Investor | Advisor |
Fund | Shares | Shares | Shares | | Fund | Shares | Shares | Shares |
Growth Equity | 10/19/2012 | 6/28/1999 | 5/18/2006 | | Intermediate Income | — | 11/2/1995 | 5/13/1991 |
Flexible Equity | 10/19/2012 | 11/30/2006 | 1/24/2007 | | Sustainable Bond | 7/2/2018 | 8/7/2017 | — |
Equity Income | 10/19/2012 | 12/29/2011 | 12/29/2011 | | Maryland Bond | — | 12/21/2000 | — |
Sustainable Growth | 6/29/2012 | 6/29/2012 | 6/29/2012 | | Tax-Exempt Bond | 7/2/2018 | 6/29/2012 | — |
Mid-Cap Growth | 7/2/2018 | 10/2/2017 | — | | Tax-Exempt | | | |
Small-Cap Growth | 9/20/2002 | 6/28/1999 | 4/25/2006 | | Sustainable Bond | — | 12/2/2019 | — |
Small-Cap | | | | | Mortgage Securities | 5/13/2014 | 12/26/2013 | — |
Fundamental Value | 10/19/2012 | 12/31/2008 | 7/28/2011 | | WMC Strategic | | | |
Sustainable | | | | | European Equity | 10/21/2013 | 10/21/2013 | 10/21/2013 |
Small-Cap Core | 9/30/2021 | 9/30/2021 | — | | Emerging | | | |
Sustainable Value | 2/28/2023 | 2/28/2023 | — | | Markets Select | 12/12/2012 | 12/12/2012 | 12/12/2012 |
Global Leaders | 10/31/2018 | 7/1/2015 | — | | Beutel Goodman | | | |
Sustainable | | | | | Large-Cap Value | 2/13/2018 | 6/30/2021 | — |
International Leaders | 2/28/2022 | 2/28/2022 | — | | | | | |
Note 2. Significant Accounting Policies
The following is a summary of significant accounting policies consistently followed by the Funds. These policies are in conformity with accounting principles generally accepted in the United States of America (“U.S. GAAP”). The Funds are investment companies and follow the investment company accounting and reporting guidance of the Financial Accounting Standards Board Accounting Standards Codification Topic 946 Financial Services – Investment Companies, which is part of U.S. GAAP.
A. Security Valuation – The Funds have adopted pricing and valuation procedures pursuant to Rule 2a-5 under the 1940 Act. Under these procedures, the Adviser serves as the Funds Valuation Designee. The Valuation Designee performs all fair value determinations along with all other responsibilities in accordance with Rule 2a-5. As Valuation Designee, the Adviser is authorized to make all necessary determinations of fair values of portfolio securities and other assets for which market quotations are not readily available or if it is deemed that the prices obtained from independent pricing services are inaccurate or unreliable.
The Funds have adopted US GAAP fair value accounting standards which establish an authoritative definition of fair value and set out a hierarchy for measuring fair value. These standards require additional disclosures about the various inputs and valuation techniques used to develop the measurements of fair value and a discussion of changes in valuation techniques and related inputs, if any, during the period. These inputs are summarized in the three broad levels listed below:
| Level 1 – | Quoted prices in active markets for identical securities. |
| | |
| Level 2 – | Evaluated price based on other significant observable inputs (including quoted prices for similar securities, interest rates, prepayment spreads, credit risk, etc). |
| | |
| Level 3 – | Significant unobservable inputs (including the Fund’s own assumptions in determining the fair value of investments). |
The inputs or methodology used for valuing securities are not necessarily an indication of the risk associated with investing in those securities.
Domestic Equity Securities – Domestic equity securities that are traded on a national securities exchange, except those listed on the NASDAQ Global Market® (“NASDAQ”), are valued at the last reported sale price on the exchange on which the security is principally traded. Securities traded on NASDAQ will be valued at the NASDAQ Official Closing Price (“NOCP”). If, on a particular day, an exchange-traded or NASDAQ security does not trade, then the mean between the most recent quoted bid and asked prices will be used. All equity securities that are not traded on a listed exchange are valued at the last sale price in the over- the counter market. If a non-exchange traded security does not trade on a particular day, then the mean between the last quoted closing bid and asked price will be used. Such domestic equity securities are typically categorized as Level 1 securities. Investments in other domestic open-ended mutual funds are valued at their reported Net Asset Value (“NAV”) and are typically categorized as Level 1 securities. Investments in Exchange Traded Funds (“ETFs”) and Closed-End Funds are valued at their last reported sale price and are typically categorized as Level 1 securities.
Notes to Financial Statements
June 30, 2023
Foreign Equity Securities – For foreign equity securities that are traded on foreign exchanges, the Funds have selected ICE Data Services (“ICE”) to provide pricing data. The use of ICE’s pricing services with respect to these foreign exchange traded securities is designed to capture events occurring after a foreign exchange closes that may affect the value of certain holdings of the Funds that are traded on those foreign exchanges. The Funds utilize a confidence interval when determining whether or not to utilize these prices provided by ICE. The confidence interval is a measure of the relationship that each foreign exchange traded security has to movements in various indices and the price of the foreign exchange traded security’s corresponding American Depositary Receipt, if one exists. ICE provides a confidence interval for each foreign exchange traded security for which it provides a price. If the confidence interval provided by ICE is equal to or greater than a predefined level utilized by the Funds, the Funds will value that foreign exchange traded security at that price. If the confidence interval provided by ICE is less than the predefined level utilized by the Funds, the Funds will value that foreign exchange traded security at the preceding closing price on its respective foreign exchange, or, if there were no transactions on the preceding day, at the mean between the bid and the asked prices. Such foreign securities are typically categorized as Level 2 securities. Foreign securities for which the local market closing prices are utilized are typically categorized as Level 1 securities.
Debt Securities – Debt securities are valued by using the mean between the closing bid and asked prices provided by an independent pricing service. If the closing bid and asked prices are not readily available, the independent pricing service may provide a price determined by a matrix pricing method. These techniques generally consider such factors as yields or prices of bonds of comparable quality, type of issue, coupon, maturity, ratings and general market conditions. Fixed income debt instruments, such as commercial paper, banker’s acceptances and U.S. Treasury Bills, having a maturity of less than 60 days are valued at amortized cost when the amortized cost value is determined to approximate fair value established using market-based and issuer-specific factors. Such debt securities are typically categorized as Level 2.
Exchange Traded Options – Exchange traded options are valued at the composite price, using the National Best Bid and Offer quotes (NBBO). NBBO consists of the highest bid price and lowest ask price across any of the exchanges on which an option is quoted, thus providing a view across the entire U.S. options marketplace. Specifically, composite pricing calculates the mean of the highest bid price and lowest ask price across the exchanges where the option is traded. Such options are typically categorized as Level 2.
Futures Contracts – Futures contracts are generally valued at the settlement prices established each day on the exchange on which they are traded and are categorized as Level 1 securities.
Forward Foreign Currency Contracts – Forward foreign currency contracts are valued at the prevailing forward exchange rates of the underlying currencies and are categorized as Level 2 securities.
Securities for which quotations are not readily available, or for which quotations are deemed to be inaccurate or unreliable, are valued at their respective fair values as determined in good faith under guidelines and procedures adopted by the Board of Trustees. These are generally considered Level 3 securities when significant unobservable inputs are utilized in the determination of the fair value. When a security is “fair valued,” consideration is given to the facts and circumstances relevant to the particular situation, including a review of various factors set forth in the guidelines and procedures adopted by the Board of Trustees. Fair value pricing is an inherently subjective process, and no single standard exists for determining fair value. Different funds could reasonably arrive at different values for the same security. The use of fair value pricing by a fund may cause the net asset value of its shares to differ significantly from the net asset value that would be calculated without regard to such considerations. As of the date of this report, the Small-Cap Growth Fund and Emerging Markets Select Fund held Level 3 securities for which significant and unobservable inputs or assumptions were used in the determination of fair value. The total value of such securities held as of the date of this report was $1,268,930 or 0.1% of Small-Cap Growth Fund’s net assets and $1,848 or 0.0% of Emerging Market Select Fund’s net assets. The following is a summary of inputs used to value the Funds’ investments as of June 30, 2023:
Notes to Financial Statements
June 30, 2023
| | | Level 1 | | | Level 2 | | | Level 3 | |
| Growth Equity Fund | | | | | | | | | |
Common Stocks | | $ | 2,379,357,367 | | | $ | — | | | $ | — | |
REIT^ | | | 78,322,597 | | | | — | | | | — | |
Short-Term Investments | | | 51,949,309 | | | | — | | | | — | |
Total Investments | | $ | 2,509,629,273 | | | $ | — | | | $ | — | |
| | | | | | | | | | | | | |
| Flexible Equity Fund | | | | | | | | | | | | |
Common Stocks | | $ | 679,498,524 | | | $ | — | | | $ | — | |
REIT^ | | | 8,630,974 | | | | — | | | | — | |
Short-Term Investments | | | 18,388,478 | | | | — | | | | — | |
Total Investments | | $ | 706,517,976 | | | $ | — | | | $ | — | |
| | | | | | | | | | | | | |
| Equity Income Fund | | | | | | | | | | | | |
Common Stocks | | $ | 67,205,673 | | | $ | — | | | $ | — | |
Preferred Stocks | | | 421,255 | | | | — | | | | — | |
REIT^ | | | 2,876,157 | | | | — | | | | — | |
Short-Term Investments | | | 2,237,337 | | | | — | | | | — | |
Total Investments | | $ | 72,740,422 | | | $ | — | | | $ | — | |
| | | | | | | | | | | | | |
| Sustainable Growth Fund | | | | | | | | | | | | |
Common Stocks | | $ | 7,232,516,922 | | | $ | — | | | $ | — | |
REIT^ | | | 274,135,935 | | | | — | | | | — | |
Short-Term Investments | | | 134,012,462 | | | | — | | | | — | |
Total Investments | | $ | 7,640,665,319 | | | $ | — | | | $ | — | |
| | | | | | | | | | | | | |
| Mid-Cap Growth Fund | | | | | | | | | | | | |
Common Stocks | | $ | 88,298,513 | | | $ | — | | | $ | — | |
REIT^ | | | 1,787,333 | | | | — | | | | — | |
Short-Term Investments | | | 5,686,143 | | | | — | | | | — | |
Total Investments | | $ | 95,771,989 | | | $ | — | | | $ | — | |
| | | | | | | | | | | | | |
| Small-Cap Growth Fund† | | | | | | | | | | | | |
Common Stocks | | $ | 1,973,740,421 | | | $ | — | | | $ | — | |
Private Placements | | | — | | | | — | | | | 1,268,930 | |
REIT^ | | | 36,689,492 | | | | — | | | | — | |
Exchange Traded Funds | | | 52,193,190 | | | | — | | | | — | |
Short-Term Investments | | | 184,800,488 | | | | — | | | | — | |
Total Investments | | $ | 2,247,423,591 | | | $ | — | | | $ | 1,268,930 | |
| | | | | | | | | | | | | |
| Small-Cap Fundamental Value Fund | | | | | | | | | | | | |
Common Stocks | | $ | 1,010,955,910 | | | $ | — | | | $ | — | |
REIT^ | | | 111,219,590 | | | | — | | | | — | |
Short-Term Investments | | | 54,928,108 | | | | — | | | | — | |
Total Investments | | $ | 1,177,103,608 | | | $ | — | | | $ | — | |
| | | | | | | | | | | | | |
| Sustainable Small-Cap Core Fund | | | | | | | | | | | | |
Common Stocks | | $ | 44,978,070 | | | $ | — | | | $ | — | |
REIT^ | | | 2,007,920 | | | | — | | | | — | |
Short-Term Investments | | | 3,519,714 | | | | — | | | | — | |
Total Investments | | $ | 50,505,704 | | | $ | — | | | $ | — | |
| | | | | | | | | | | | | |
| Sustainable Value Fund | | | | | | | | | | | | |
Common Stocks | | $ | 45,383,300 | | | $ | — | | | $ | — | |
Short-Term Investments | | | 2,820,271 | | | | — | | | | — | |
Total Investments | | $ | 48,203,571 | | | $ | — | | | $ | — | |
| | | | | | | | | | | | | |
| Global Leaders Fund | | | | | | | | | | | | |
Common Stocks: | | | | | | | | | | | | |
Brazil | | $ | 39,265,411 | | | $ | — | | | $ | — | |
China | | | — | | | | 45,343,124 | | | | — | |
Denmark | | | — | | | | 28,557,585 | | | | — | |
France | | | — | | | | 63,921,586 | | | | — | |
Germany | | | — | | | | 93,933,424 | | | | — | |
India | | | — | | | | 50,830,539 | | | | — | |
Indonesia | | | — | | | | 35,440,420 | | | | — | |
Netherlands | | | 38,379,136 | | | | 36,229,560 | | | | — | |
Sweden | | | — | | | | 26,023,444 | | | | — | |
Switzerland | | | — | | | | 39,236,102 | | | | — | |
Taiwan | | | 48,664,432 | | | | — | | | | — | |
United Kingdom | | | — | | | | 108,194,643 | | | | — | |
United States | | | 804,427,230 | | | | — | | | | — | |
Short-Term Investments | | | 15,191,809 | | | | — | | | | — | |
Total Investments | | $ | 945,928,018 | | | $ | 527,710,427 | | | $ | — | |
| | | | | | | | | | | | | |
| Sustainable International Leaders Fund | | | | | | | | | | | | |
Common Stocks: | | | | | | | | | | | | |
Brazil | | $ | 939,468 | | | $ | — | | | $ | — | |
Canada | | | 923,676 | | | | — | | | | — | |
China | | | — | | | | 856,193 | | | | — | |
Denmark | | | — | | | | 977,439 | | | | — | |
Finland | | | — | | | | 716,954 | | | | — | |
France | | | — | | | | 1,998,500 | | | | — | |
Germany | | | — | | | | 1,815,670 | | | | — | |
India | | | 953,496 | | | | 479,797 | | | | — | |
Indonesia | | | — | | | | 769,571 | | | | — | |
Japan | | | — | | | | 754,549 | | | | — | |
Mexico | | | 539,776 | | | | — | | | | — | |
Netherlands | | | — | | | | 2,504,569 | | | | — | |
Sweden | | | — | | | | 884,402 | | | | — | |
Switzerland | | | — | | | | 1,697,509 | | | | — | |
United Kingdom | | | — | | | | 5,503,244 | | | | — | |
United States | | | 1,317,559 | | | | — | | | | — | |
Short-Term Investments | | | 371,672 | | | | — | | | | — | |
Total Investments | | $ | 5,045,647 | | | $ | 18,958,397 | | | $ | — | |
| | | | | | | | | | | | | |
| Intermediate Income Fund | | | | | | | | | | | | |
Mortgage Backed Securities | | $ | — | | | $ | 26,553,070 | | | $ | — | |
Corporate Bonds & Notes | | | — | | | | 22,921,365 | | | | — | |
Asset Backed Securities | | | — | | | | 6,010,581 | | | | — | |
U.S. Treasury Notes | | | — | | | | 49,585,170 | | | | — | |
Affiliated Mutual Funds | | | 15,057,017 | | | | — | | | | — | |
Short-Term Investments | | | 5,252,688 | | | | — | | | | — | |
Total Investments | | $ | 20,309,705 | | | $ | 105,070,186 | | | $ | — | |
Futures Contracts – Long* | | $ | (331,251 | ) | | $ | — | | | $ | — | |
Futures Contracts – Short* | | $ | 105,427 | | | $ | — | | | $ | — | |
Notes to Financial Statements
June 30, 2023
| | | Level 1 | | | Level 2 | | | Level 3 | |
| Sustainable Bond Fund | | | | | | | | | |
Mortgage Backed Securities | | $ | — | | | $ | 212,021,948 | | | $ | — | |
Corporate Bonds & Notes | | | — | | | | 166,706,850 | | | | — | |
Foreign Government Bonds | | | — | | | | 166,270,456 | | | | — | |
U.S. Treasury Securities | | | — | | | | 103,601,114 | | | | — | |
Asset Backed Securities | | | — | | | | 27,208,583 | | | | — | |
Municipal Bonds | | | — | | | | 9,604,563 | | | | — | |
Short-Term Investments | | | 281,273,994 | | | | 2,047,152 | | | | — | |
Total Investments | | $ | 281,273,994 | | | $ | 687,460,666 | | | $ | — | |
Futures Contracts – Long* | | $ | (2,141,775 | ) | | $ | — | | | $ | — | |
Futures Contracts – Short* | | $ | 69,226 | | | $ | — | | | $ | — | |
| | | | | | | | | | | | | |
| Maryland Bond Fund | | | | | | | | | | | | |
Municipal Bonds | | $ | — | | | $ | 159,838,807 | | | $ | — | |
Short-Term Investments | | | 3,582,287 | | | | — | | | | — | |
Total Investments | | $ | 3,582,287 | | | $ | 159,838,807 | | | $ | — | |
| | | | | | | | | | | | | |
| Tax-Exempt Bond Fund | | | | | | | | | | | | |
Municipal Bonds | | $ | — | | | $ | 780,591,188 | | | $ | — | |
Short-Term Investments | | | 9,788,932 | | | | — | | | | — | |
Total Investments | | $ | 9,788,932 | | | $ | 780,591,188 | | | $ | — | |
| | | | | | | | | | | | | |
| Tax-Exempt Sustainable Bond Fund | | | | | | | | | | | | |
Municipal Bonds | | $ | — | | | $ | 284,694,043 | | | $ | — | |
Short-Term Investments | | | 1,959,564 | | | | — | | | | — | |
Total Investments | | $ | 1,959,564 | | | $ | 284,694,043 | | | $ | — | |
| | | | | | | | | | | | | |
| Mortgage Securities Fund | | | | | | | | | | | | |
Mortgage Backed Securities | | $ | — | | | $ | 265,447,329 | | | $ | — | |
Asset Backed Securities | | | — | | | | 22,723,255 | | | | — | |
U.S. Treasury Notes | | | — | | | | 4,406,814 | | | | — | |
Municipal Bonds | | | — | | | | 472,584 | | | | — | |
Short-Term Investments | | | 86,667,019 | | | | — | | | | — | |
Total Investments | | $ | 86,667,019 | | | $ | 293,049,982 | | | $ | — | |
Futures Contracts – Long* | | $ | (459,830 | ) | | $ | — | | | $ | — | |
Futures Contracts – Short* | | $ | (14,645 | ) | | $ | — | | | $ | — | |
| | | | | | | | | | | | | |
| WMC Strategic European Equity Fund | | | | | | | | | | | | |
Common Stocks: | | | | | | | | | | | | |
Austria | | $ | — | | | $ | 10,249,957 | | | $ | — | |
Belgium | | | 57,189 | | | | 13,111,723 | | | | — | |
Czech Republic | | | — | | | | 2,183,205 | | | | — | |
Denmark | | | — | | | | 1,247,995 | | | | — | |
France | | | — | | | | 30,850,875 | | | | — | |
Germany | | | — | | | | 35,505,216 | | | | — | |
Ireland | | | — | | | | 5,278,525 | | | | — | |
Italy | | | — | | | | 45,027 | | | | — | |
Netherlands | | | — | | | | 8,816,487 | | | | — | |
Portugal | | | — | | | | 4,638,945 | | | | — | |
Spain | | | — | | | | 10,099,018 | | | | — | |
Sweden | | | — | | | | 11,602,737 | | | | — | |
Switzerland | | | — | | | | 15,465,220 | | | | — | |
United Kingdom | | | 2,187,059 | | | | 81,721,304 | | | | — | |
Preferred Stocks | | | — | | | | 2,611,081 | | | | — | |
Short-Term Investments | | | 6,732,961 | | | | — | | | | — | |
Total Investments | | $ | 8,977,209 | | | $ | 233,427,315 | | | $ | — | |
| | | | | | | | | | | | | |
| Emerging Markets Select Fund† | | | | | | | | | | | | |
Common Stocks: | | | | | | | | | | | | |
Brazil | | $ | 19,993,788 | | | $ | — | | | $ | — | |
China | | | 10,213,840 | | | | 168,031,468 | | | | — | |
Hungary | | | — | | | | 5,828,887 | | | | — | |
India | | | — | | | | 83,677,778 | | | | — | |
Indonesia | | | — | | | | 18,887,401 | | | | — | |
Russia | | | — | | | | — | | | | 1,848 | |
Singapore | | | — | | | | 17,973,976 | | | | — | |
South Africa | | | — | | | | 4,022,067 | | | | — | |
South Korea | | | — | | | | 70,757,447 | | | | — | |
Taiwan | | | — | | | | 74,717,483 | | | | — | |
Thailand | | | — | | | | 8,960,988 | | | | — | |
Turkey | | | — | | | | 1,365,253 | | | | — | |
United Arab Emirates | | | 4,042,559 | | | | — | | | | — | |
United Kingdom | | | — | | | | 4,649,652 | | | | — | |
United States | | | 15,012,470 | | | | — | | | | — | |
Preferred Stocks | | | 11,311,982 | | | | — | | | | — | |
Exchange Traded Funds | | | 2,111,464 | | | | — | | | | — | |
Short-Term Investments | | | 17,117,549 | | | | — | | | | — | |
Total Investments | | $ | 79,803,652 | | | $ | 458,872,400 | | | $ | 1,848 | |
| | | | | | | | | | | | | |
| Beutel Goodman Large-Cap Value Fund | | | | | | | | | | | | |
Common Stocks | | $ | 1,619,342,690 | | | $ | — | | | $ | — | |
Short-Term Investments | | | 37,081,327 | | | | — | | | | — | |
Total Investments | | $ | 1,656,424,017 | | | $ | — | | | $ | — | |
| ^ | Real Estate Investment Trusts |
| * | Amounts presented for Futures Contracts represent total unrealized appreciation (depreciation) as of the date of this report. |
| † | A reconciliation of Level 3 investments is presented when the Fund has a significant amount of Level 3 investments at the beginning and/or end of the period in relation to net assets. |
B. Securities Transactions and Investment Income – Investment securities transactions are accounted for on trade date. Discounts/premiums on debt securities purchased are accreted/amortized to contractual maturity, estimated maturity, or next call date, as applicable. Dividend income is recorded on the ex-dividend date. Interest income is recorded on an accrual basis. Income and capital gains on some foreign securities may be subject to foreign withholding or capital gains taxes. Identified cost of investments sold is used to determine the gain and loss for both financial statement and Federal income tax purposes. Distributions deemed to be a return of capital are recorded as a reduction of the cost of the related investments or as realized capital gains when there is no remaining cost basis on the investments.
Notes to Financial Statements
June 30, 2023
C. Expenses and Share Class Allocations – Expenses directly attributable to a Fund are charged to that Fund. Expenses attributable to more than one Fund are allocated to the respective Funds on the basis of relative net assets or other appropriate methods. In Funds with multiple share classes, each share class has equal rights to earnings and assets except that each share class bears different shareholder servicing and/or Rule 12b-1 distribution expenses. Each share class has exclusive voting rights with respect to matters that affect just that share class. Income, expenses (other than expenses attributable to a specific share class), and realized and unrealized capital gains or losses on investments are allocated to each share class on the basis of relative net assets.
D. Foreign Currency – Investment securities and other assets and liabilities denominated in foreign currencies are translated into U.S. Dollar amounts at the date of valuation. Purchases and sales of investment securities and income and expense items denominated in foreign currencies are translated into U.S. Dollar amounts on the respective dates of such transactions.
The Funds do not isolate the portion of the results of operations resulting from changes in foreign exchange rates on investments from the fluctuations arising from changes in market prices of securities held. Such fluctuations are included with the net realized and unrealized gain or loss from investments. Some of the Funds may invest in forward foreign currency contracts. These amounts are presented separately from realized and unrealized gains and losses from investments in the financial statements.
E. Options – The Funds may invest in options. When a Fund writes an option, an amount equal to the premium received by a Fund is recorded as a liability and is subsequently adjusted to the current value of the option written. Premiums received from writing options that expire unexercised are treated by a Fund on the expiration date as realized gain from investments. The difference between the premium and the amount paid on effecting a closing purchase transaction, including brokerage commissions, is also treated as a realized gain, or if the premium is less than the amount paid for closing purchase transaction, as a realized loss. If a call option is exercised, the premium is added to the proceeds from the sale of the underlying security or currency determining whether a Fund has a realized gain or loss. If a put option is exercised, the premium reduces the cost basis of the securities purchase by a Fund. A Fund, as a writer of an option, bears the market risk of an unfavorable change in the price of the security underlying the written option.
When a Fund purchases an option, an amount equal to the premium paid by a Fund is recorded as an investment and is subsequently adjusted to the current value of the option purchased. If an option expires on the stipulated expiration date or if a Fund enters into a closing sale transaction, a gain or loss is realized. If a call option is exercised, the cost of the security acquired is increased by the premium paid for the call. If a put option is exercised, a gain or loss is realized from the sale of the underlying security, and the proceeds from such sale are decreased by the premium originally paid. Written and purchased options are non-income producing securities. None of the Funds purchased, sold or wrote any options during the year ended June 30, 2023.
F. To-Be-Announced Securities – Some of the Funds may invest in to-be-announced securities (“TBAs”). TBAs is a term that is generally used to describe forward-settling mortgage-backed securities. These TBAs are generally issued by U.S. Government Agencies or U.S. Government Sponsored Entities such as Freddie Mac, Fannie Mae and Ginnie Mae. The actual mortgage-backed security that will be delivered to the buyer at the time TBAs trades are entered into is not known, however, the terms of the acceptable pools of loans that will comprise the mortgage-backed security are determined at the time the trade is entered into (coupon rate, maturity, credit quality, etc.). Investment in TBAs will generally increase a Fund’s exposure to interest rate risk and could also expose a Fund to counterparty default risk. In order to mitigate counterparty default risk, the Funds only enter into TBAs with counterparties for which the risk of default is determined to be remote. As a purchaser or seller of TBAs, the Funds segregate cash or cash equivalents as collateral as required in accordance with applicable industry regulations.
G. Tender Option Bonds – Maryland Bond Fund, Tax-Exempt Bond Fund and Tax-Exempt Sustainable Bond Fund may engage in tender option bond (“TOB”) transactions up to 5% of its net assets which are accounted for by the funds as a secured borrowing. In a typical TOB transaction, a Fund or another party deposits fixed-rate municipal bonds or other securities into a special purposes entity, referred to as a tender option bond trust (a “TOB Trust”). The TOB Trust generally issues short-term floating rate interests (“Floaters”), which are generally sold to third party investors (often money market funds) and residual interests (“Residual Interests”), which are generally held by the Fund or party that contributed the securities to the TOB Trust. The interest rates payable on the Residual Interests bear an inverse relationship to the interest rate on the Floaters. The interest rate on the Floaters is reset by a remarketing process typically every 7 to 35 days. After income is paid on the Floaters at current, short- term rates, the residual income from the underlying bond held by the TOB Trust goes to the Residual Interests. If a Fund is the depositor of the municipal bonds or other securities to the TOB Trust, the Fund will receive the proceeds from the TOB Trust’s sale of the Floaters, less certain transaction costs. These proceeds may be used by the Fund to invest in other securities, which would have a leveraging effect on the Fund.
Notes to Financial Statements
June 30, 2023
Residual Interests may be more volatile and less liquid than other municipal bonds of comparable maturity. In most circumstances, the holder of the Residual Interests bears substantially all of the underlying bond’s downside investment risk and also benefits from any appreciation in the value of the underlying bond. Investments in Residual Interests typically will involve greater risk than investments in the underlying municipal bond, including the risk of loss of principal. Because changes in the interest rate on the Floaters inversely affect the residual interest paid on the Residual Interests, the value of the Residual Interests is generally more volatile than that of a fixed-rate municipal bond. Floaters and Residual Interests are subject to interest rate adjustment formulas which generally reduce or, in the extreme, eliminate the interest received by the Residual Interests when short-term interest rates rise, and increase the interest received when short-term interest rates fall.
The Residual Interests held by a Fund provide the Fund with the right to: (1) cause the holders of the Floaters to tender their notes at par, and (2) cause the sale of the underlying bond held by the TOB Trust, thereby collapsing the TOB Trust. A Fund may invest in a TOB Trust on either a non-recourse and recourse basis. Each Fund does not currently intend to invest in a TOB Trust on a recourse basis, although each Fund reserves the right to do so in the future. TOB Trusts are typically supported by a liquidity facility provided by a third-party bank or other financial institution (the “Liquidity Provider”) that allows the holders of the Floaters to tender their Floaters in exchange for payment of par plus accrued interest on any business day (subject to the non- occurrence of a TOTE, as such term is defined below). Depending on the structure of the TOB Trust, the Liquidity Provider may purchase the tendered Floaters, or the TOB Trust may draw upon a loan from the Liquidity Provider to purchase the tendered Floaters.
The TOB Trust may also be collapsed without the consent of a Fund, as the holder of the Residual Interest, upon the occurrence of certain “tender option termination events” (or “TOTEs”) as defined in the TOB Trust agreements. Such termination events typically include the bankruptcy or default of the municipal bond, a substantial downgrade in credit quality of the municipal bond, or a judgment or ruling that interest on the underlying municipal bond is subject to federal income taxation. Upon the occurrence of a TOTE, the TOB Trust would generally be liquidated in full with the proceeds typically applied first to any accrued fees owed to the trustee, remarketing agent and liquidity provider, and then to the holders of the Floaters up to par plus accrued interest owed on the Floaters and a portion of gain share, if any, with the balance paid out to the holder of the Residual Interests. In the case of a mandatory termination event, as defined in the TOB Trust agreements, after the payment of fees, the holders of the Floaters would be paid before the holders of the Residual Interests (i.e., the Fund). In contrast, in the case of a TOTE, after payment of fees, the holders of the Floaters and the holders of the Residual Interests would be paid pro rata in proportion to the respective face values of their certificates.
Under GAAP, securities of a Fund that are deposited into a TOB Trust continue to be treated as investments of the Fund and are presented on the Fund’s Schedule of Investments and outstanding Floaters issued by a TOB Trust are presented as “Floating rate note obligations, interest and fees” in the liabilities section of the Fund’s Statement of Assets and Liabilities and also includes interest and fees associated with the floating rate obligations. Interest income from the underlying security is recorded by the Fund on an accrual basis and included as part of “Interest Income” on the Statements of Operations. Interest expense and other fees incurred on the Floaters is included on the Statement of Operations as “Interest expense and fees on floating rate note obligations”. During the year ended as of the date of this report, the Tax-Exempt Bond Fund and Tax-Exempt Sustainable Bond Fund engaged in TOB transactions and $202,936 and $46,270 of such expenses were incurred, respectively. As of the date of this report, none of the Funds had outstanding floating rate obligations related to its tender option bond transactions. The average amount of outstanding floating rate note obligations for the Tax-Exempt Bond Fund and Tax-Exempt Sustainable Bond Fund during the period of this report was $8,845,518 and $1,864,542, respectively.
H. Distributions to Shareholders – For Maryland Bond Fund, Tax-Exempt Bond Fund and Tax-Exempt Sustainable Bond Fund, distributions of net investment income, if any, are declared daily and paid monthly. Distributions to shareholders of net investment income, if any, are declared and paid monthly for the Intermediate Income Fund, Sustainable Bond Fund and Mortgage Securities Fund and quarterly for the Equity Income Fund. The remaining Funds declare and pay net investment income, if any, at least annually. Distributions to shareholders of net capital gains, if any, are declared and paid at least annually. Distributions are recorded on the ex-dividend date. If a Fund is involved in a reorganization in which it acquires, or is being acquired by another fund, an additional distribution of net investment income and/or capital gains may be made prior to such reorganization.
I. Use of Estimates – The preparation of financial statements in conformity with accounting principles generally accepted in the United States of America requires management to make estimates and assumptions that affect the reported amounts of assets and liabilities at the date of the financial statements and the reported amount of revenue and expenses during the reporting period. Actual results could differ from those estimates.
Notes to Financial Statements
June 30, 2023
J. Federal Taxes – Each Fund has elected to be taxed as a “regulated investment company” and intends to distribute substantially all taxable income to its shareholders and otherwise comply with the provisions of the Internal Revenue Code applicable to regulated investment companies. Therefore, no provision for federal income taxes or excise taxes has been made.
The Funds recognize tax benefits of uncertain tax positions only where the position is “more likely than not” to be sustained assuming examination by tax authorities.
The Funds have analyzed their tax positions and have concluded that no liability for unrecognized tax benefits should be recorded related to uncertain income tax positions taken on returns filed for open tax years (2020-2022) as of June 30, 2023 or are expected to be taken in the Funds’ 2023 tax returns. The Funds identify their major tax jurisdictions as U.S. Federal and Delaware State; however, the Funds are not aware of any tax position for which it is reasonably possible that the total amounts of unrecognized tax benefits will change materially in the next year.
K. Redemption Fees – A shareholder who redeems or exchanges shares of the Funds within fourteen days of purchase will incur a redemption fee of 1.00% of the current net asset value of shares redeemed or exchanged, subject to certain exceptions. The fee is charged for the benefit of the remaining shareholders and will be paid to the Fund to help offset transaction costs. The fee is accounted for as an addition to paid-in capital. Each Fund reserves the right to modify the terms of or terminate the fee at any time.
L. Guarantees and Indemnifications – In the normal course of business, the Funds enter into contracts with service providers that contain general indemnification clauses. The Funds’ maximum exposure under these arrangements is unknown as this would involve future claims that may be made against the Funds that have not yet occurred. However, based on experience, the Funds expect the risk of loss to be remote.
M. New Accounting Pronouncements and SEC Regulations –In June 2022, the FASB issued Accounting Standards Update No. 2022-03 (“ASU 2022-03”), Fair Value Measurement (Topic 820)—Fair Value Measurement of Equity Securities Subject to Contractual Sales Restrictions. The amendments in ASU 2022-03 clarify that a contractual restriction on a sale of an equity security is not considered a part of the unit of account of the equity security and, therefore, is not considered in measuring fair value. The amendments also clarify that an entity cannot, as a separate unit of account, recognize and measure a contractual sale restriction. The amendments in ASU 2022-03 also require the following disclosures for equity securities subject to contractual sale restrictions: (i) the fair value of equity securities subject to contractual sale restrictions reflected in the balance sheet, (ii) the nature and remaining duration of the restriction(s), and (iii) the circumstances that could cause a lapse in the restriction(s). The amendments in ASU 2022-03 are effective for fiscal years beginning after December 15, 2023, and interim periods within those fiscal years for public business entities (early adoption is also permitted). Management is currently evaluating the potential effect that this ASU amendment will have on the Funds’ financial statements.
Notes to Financial Statements
June 30, 2023
Note 3. Commitments and Other Affiliated Party Transactions
Investment Adviser – Brown Advisory LLC serves as Investment Adviser (“the Adviser”) to the Funds. Pursuant to investment advisory agreements, the Adviser receives a management fee, accrued daily and payable monthly, from each Fund at an annual rate of the Fund’s average daily net assets as follows:
Fund | Breakpoint | Annual Fee | Fund | Breakpoint | Annual Fee |
Growth Equity and | First $1.5 billion | 0.60% | Flexible Equity | First $150 million | 0.50% |
Sustainable Growth | $1.5 billion to $3 billion | 0.55% | | $150 million to $250 million | 0.45% |
| | $3 billion to $6 billion | 0.50% | | $250 million to $1 billion | 0.40% |
| | Over $6 billion | 0.45% | | Over $1 billion | 0.38% |
Fund | Annual Fee | | Fund | Annual Fee |
Equity Income | 0.60% | | Sustainable Bond | 0.30% |
Mid-Cap Growth | 0.65% | | Maryland Bond | 0.30% |
Small-Cap Growth | 0.85% | | Tax-Exempt Bond | 0.30% |
Small-Cap Fundamental Value | 0.85% | | Tax-Exempt Sustainable Bond | 0.30% |
Sustainable Small-Cap Core | 0.85% | | Mortgage Securities Fund | 0.30% |
Sustainable Value | 0.60% | | WMC Strategic European Equity2 | 0.90% |
Global Leaders1 | 0.65% | | Emerging Markets Select2,3 | 0.90% |
Sustainable International Leaders1 | 0.75% | | Beutel Goodman Large-Cap Value4 | 0.45% |
Intermediate Income | 0.30% | | | |
1 | Brown Advisory Limited (“BAL”) serves as sub-adviser to the Global Leaders Fund and the Sustainable International Leaders Fund and makes investment decisions on their behalf. BAL is compensated for its services by the Adviser. |
2 | Wellington Management Company LLP (“Wellington”) serves as sub-adviser to the WMC Strategic European Equity Fund and the Emerging Markets Select Fund and makes investment decisions on their behalf. Wellington is compensated for its services by the Adviser. |
3 | Pzena Investment Management, LLC (“Pzena”) serves as sub-adviser to the Emerging Markets Select Fund and makes investment decisions on its behalf. Pzena is compensated for its services by the Adviser. |
4 | Beutel, Goodman & Company Ltd. (“Beutel Goodman”) serves as sub-adviser to the Beutel Goodman Large-Cap Value Fund and makes investment decisions on its behalf. Beutel Goodman is compensated for its services by the Adviser. |
These fees are reported on the Funds’ Statements of Operations as “Investment advisory fees”.
Business Management Fees – The Adviser is also entitled to receive an annual business management fee of 0.05%, accrued daily and payable monthly, of the Funds’ average daily net assets in exchange for its management and oversight of the non-investment advisory services provided to the Funds and the Trust. These fees are reported on the Funds’ Statements of Operations as “Business management fees”.
Fee Waivers and Expense Reimbursements (Operating Expense Caps) – The Adviser has contractually agreed to waive a portion of its fees and reimburse certain expenses to limit total annual operating expenses as follows:
Fund(s): | Institutional Shares | Investor Shares | Advisor Shares |
Growth Equity, Flexible Equity, Sustainable Growth and Mid-Cap Growth | 0.82% | 0.97% | 1.22% |
Equity Income | 0.76% | 0.91% | 1.16% |
Small-Cap Growth | 1.04% | 1.19% | 1.44% |
Small-Cap Fundamental Value | 1.03% | 1.18% | 1.43% |
Sustainable Small-Cap Core | 0.93% | 1.08% | 1.33% |
Global Leaders | 0.87% | 1.02% | 1.27% |
Sustainable International Leaders | 0.85% | 1.00% | 1.25% |
Intermediate Income | 0.48% | 0.53% | 0.78% |
Sustainable Bond | 0.53% | 0.58% | 0.83% |
Maryland Bond and Mortgage Securities | 0.55% | 0.60% | 0.85% |
Tax-Exempt Bond and Tax-Exempt Sustainable Bond | 0.62% | 0.67% | 0.92% |
WMC Strategic European Equity | 1.11% | 1.26% | 1.51% |
Emerging Markets Select | 1.17% | 1.32% | 1.57% |
Sustainable Value and Beutel Goodman Large-Cap Value | 0.70% | 0.85% | 1.10% |
Notes to Financial Statements
June 30, 2023
During the year ended June 30, 2023, the Adviser waived $40,287 in expenses for Equity Income Fund, $11,288 in expenses for Mid-Cap Growth Fund, $96,918 in expenses for Sustainable Small-Cap Core Fund, $56,368 in expenses for Sustainable Value Fund and $110,385 in expenses for Sustainable International Leaders Fund. The Adviser may recoup any waived amounts from the Funds if such reimbursement does not cause the Funds to exceed its existing expense limitations or the limitation in place at the time the reduction was originally made and the amount recouped is made within three years after the date on which the Adviser waived the expense. The Funds must pay their current ordinary operating expenses before the Adviser is entitled to any recoupment of previously waived fees and/or expenses. The cumulative amounts of previously waived fees that the Adviser may recoup from the Funds are shown below:
| | | June 30, | |
| | | 2024 | | | 2025 | | | 2026 | | | Total | |
Equity Income Fund | | $ | 20,506 | | | $ | 22,413 | | | $ | 40,287 | | | $ | 83,206 | |
Mid-Cap Growth Fund | | | 53,751 | | | | — | | | | 11,288 | | | | 65,039 | |
Sustainable Small-Cap Core Fund | | | N/A | | | | 89,225 | | | | 96,918 | | | | 186,143 | |
Sustainable Value Fund | | | N/A | | | | N/A | | | | 56,368 | | | | 56,368 | |
Global Leaders Fund | | | 84,839 | | | | — | | | | — | | | | 84,839 | |
Sustainable International Leaders Fund | | | N/A | | | | 59,952 | | | | 110,385 | | | | 170,337 | |
Distribution – ALPS Distributors, Inc. (the “Distributor”) serves as principal underwriter for shares of the Funds and acts as each Fund’s Distributor in a continuous public offering of each Fund’s shares.
Rule 12b-1 Distribution Fees – Under a Distribution Plan adopted pursuant to Rule 12b-1 under the Act (“Distribution Plan”), each Fund pays ALPS Distributors, Inc. (the “Distributor”), or any other entity as authorized by the Board, as compensation for the distribution-related and/or shareholder services provided by such entities an aggregate fee equal to 0.25% of the average daily net assets of Advisor Shares for each Fund. The Distributor may pay any or all amounts received under the Rule 12b-1 Plan to financial intermediaries or other persons, including the Adviser, for any distribution or service activity. These fees are reported in the Funds’ Statements of Operations as “Distribution fees – Advisor Shares”.
Shareholder Servicing Fees – The Trust has also adopted a Shareholder Service Plan under which each Fund may pay a fee of up to 0.15% of the average daily net assets of each Fund’s Investor and Advisor Shares (except for the Intermediate Income Fund, Sustainable Bond Fund, Maryland Bond Fund, Tax-Exempt Bond Fund, Tax-Exempt Sustainable Bond Fund and Mortgage Securities Fund, which may pay a fee of up to 0.05%) for shareholder services provided to the Funds by financial institutions, including the Adviser. The Adviser serves as the shareholder servicing agent of the Funds. These fees are reported in the Funds’ Statements of Operations as “Service fees – Investor Shares” and “Service fees – Advisor Shares”.
Investments in Affiliates – Intermediate Income Fund – The Intermediate Income Fund and Mortgage Securities Fund are considered affiliates since Brown Advisory LLC is the Adviser to both of the Funds. In seeking to achieve its investment objective, the Intermediate Income Fund invests a portion of its assets into the Mortgage Securities Fund. As of June 30, 2023, the Intermediate Income Fund owned shares of the Mortgage Securities Fund with a total value of $15,057,017, or 12.0% of the Intermediate Income Fund’s net assets.
The Intermediate Income Fund has entered into a Fee Waiver Agreement (the “Agreement”) with the Adviser. Per the Agreement, the Intermediate Income Fund will waive Advisory Fees in an amount equal to the Advisory Fees earned by the Mortgage Securities Fund on the assets invested into it by the Intermediate Income Fund. For example, if the Intermediate Income Fund owned $10,000,000 worth of the Mortgage Securities Fund for an entire year, it would waive, on an annual basis, $30,000 in Advisory Fees ($10,000,000 multiplied by 0.30%, the annual Advisory Fee ratio for the Mortgage Securities Fund). For the year ended June 30, 2023 the Intermediate Income Fund waived $47,084 in Advisory Fees per the terms of the Agreement. This is a permanent waiver of fees and these waived fees may not be recouped by the Adviser at any time in the future.
Notes to Financial Statements
June 30, 2023
See the table below for details of the Intermediate Income Fund’s investment in the Mortgage Securities Fund Institutional Shares for the year ended June 30, 2023:
| | | | Net | Change In | | | | |
| Beginning | | | Realized | Unrealized | Ending | | | Shares |
| Market Value | | | Gains | Appreciation | Market Value | Dividend | Capital Gain | Owned at |
06/30/2022 | Purchases | Sales | (Losses) | (Depreciation) | 06/30/2023 | Income | Distributions | 06/30/2023 |
| $17,238,512 | $— | $(1,319,360) | $(178,456) | $(683,679) | $15,057,017 | $489,493 | $— | 1,654,617 |
Other Service Providers – U.S. Bancorp Fund Services, LLC (“Fund Services”), doing business as U.S. Bank Global Fund Services, an indirect wholly-owned subsidiary of U.S. Bancorp, serves as the Funds’ Administrator (“Administrator”), and in that capacity, performs various administrative services for the Funds. Fund Services also serves as the Funds’ fund accountant and transfer agent. Certain officers of the Trust are employees of Fund Services and the Funds’ custodian, U.S. Bank, N.A., is an affiliate of the Administrator. Fees paid to Fund Services and U.S. Bank, N.A. for its service can be found in the Statements of Operations as “Administration, accounting and transfer agent fees” and “Custodian fees”, respectively. Additional amounts for miscellaneous expenses may be paid by the Funds to Fund Services and included in “Miscellaneous expenses” in the Statements of Operations.
Rule 17a-7 Transactions – Each Fund is permitted to purchase and sell securities to certain affiliated parties under specified conditions outlined in procedures adopted by the Board of Trustees pursuant to Rule 17a-7 under the 1940 Act. Pursuant to these procedures, during the year ended June 30, 2023, the WMC Strategic European Equity Fund engaged in securities purchases of $432,422. The WMC Strategic European Equity Fund engaged in such securities sales of $207,382, resulting in realized loss of $184,798. These transactions are included in the purchases and sales table in Note 4.
Note 4. Purchases and Sales of Securities
The cost of purchases and the proceeds from sales of investments (including maturities), other than short-term investments, for the year ended June 30, 2023 were as follows:
| Fund | | Purchases | | | Sales | | Fund | | Purchases | | | Sales | |
Growth Equity | | $ | 484,597,005 | | | $ | 726,608,764 | | Sustainable International Leaders | | $ | 16,689,023 | | | $ | 3,083,369 | |
Flexible Equity | | | 75,113,433 | | | | 87,461,894 | | Intermediate Income | | | 39,120,124 | | | | 59,396,317 | |
Equity Income | | | 4,513,880 | | | | 15,528,701 | | Sustainable Bond | | | 1,011,950,954 | | | | 844,029,804 | |
Sustainable Growth | | | 1,732,316,520 | | | | 796,556,476 | | Maryland Bond | | | 81,144,415 | | | | 86,928,901 | |
Mid-Cap Growth | | | 52,977,649 | | | | 91,600,444 | | Tax-Exempt Bond | | | 587,527,765 | | | | 623,320,891 | |
Small-Cap Growth | | | 606,783,706 | | | | 535,756,938 | | Tax-Exempt Sustainable Bond | | | 325,592,913 | | | | 355,139,192 | |
Small-Cap Fundamental Value | | | 393,793,244 | | | | 493,602,986 | | Mortgage Securities | | | 718,966,057 | | | | 743,580,882 | |
Sustainable Small-Cap Core | | | 34,897,812 | | | | 25,786,686 | | WMC Strategic European Equity | | | 151,484,171 | | | | 183,472,059 | |
Sustainable Value | | | 46,241,303 | | | | 2,224,583 | | Emerging Markets Select | | | 339,369,781 | | | | 327,408,101 | |
Global Leaders | | | 323,087,217 | | | | 226,338,430 | | Beutel Goodman Large-Cap Value | | | 454,731,465 | | | | 240,715,765 | |
Purchases and sales of U.S. Government securities are included in the totals above and include U.S. Treasury Bonds and Notes. The Funds listed below purchased and sold U.S. Government securities for the year ended June 30, 2023 as follows:
| Fund | | Purchases | | | Sales | | Fund | | Purchases | | | Sales | |
Intermediate Income | | $ | 18,018,560 | | | $ | 16,925,392 | | Mortgage Securities | | $ | 16,679,209 | | | $ | 12,125,155 | |
Sustainable Bond | | | 39,315,673 | | | | 107,420,317 | | | | | | | | | | |
Notes to Financial Statements
June 30, 2023
Note 5. Federal Income Tax and Distribution Information
At June 30, 2023, the components of distributable earnings (accumulated losses) on a tax basis were as follows:
| | | Growth | | | Flexible | | | Equity | | | Sustainable | | | Mid-Cap | | | Small-Cap | |
| | | Equity | | | Equity | | | Income | | | Growth | | | Growth | | | Growth | |
| | | Fund | | | Fund | | | Fund | | | Fund | | | Fund | | | Fund | |
Cost of investments | | $ | 1,535,723,919 | | | $ | 328,324,983 | | | $ | 40,268,342 | | | $ | 5,582,240,678 | | | $ | 78,039,082 | | | $ | 1,905,904,882 | |
Unrealized appreciation | | | 1,140,360,699 | | | | 396,823,553 | | | | 34,119,508 | | | | 2,467,452,019 | | | | 22,276,670 | | | | 497,691,030 | |
Unrealized depreciation | | | (166,455,345 | ) | | | (18,630,560 | ) | | | (1,647,428 | ) | | | (409,027,378 | ) | | | (4,543,763 | ) | | | (154,903,391 | ) |
Net unrealized app (dep) | | | 973,905,354 | | | | 378,192,993 | | | | 32,472,080 | | | | 2,058,424,641 | | | | 17,732,907 | | | | 342,787,639 | |
Undistributed income | | | — | | | | 1,552,294 | | | | 9,272 | | | | 633,371 | | | | — | | | | — | |
Undistributed capital gains | | | 89,595,945 | | | | 12,273,366 | | | | 4,016,337 | | | | — | | | | — | | | | — | |
Total undistributed earnings | | | 89,595,945 | | | | 13,825,660 | | | | 4,025,609 | | | | 633,371 | | | | — | | | | — | |
Other accumulated gains (losses) | | | (2,207,095 | ) | | | — | | | | — | | | | (10,416,902 | ) | | | (14,763,398 | ) | | | (12,850,190 | ) |
Total distributable earnings (losses) | | $ | 1,061,294,204 | | | $ | 392,018,653 | | | $ | 36,497,689 | | | $ | 2,048,641,110 | | | $ | 2,969,509 | | | $ | 329,937,449 | |
| | | | | | | | | | | | | | | | | | | | | | | | | |
| | | Small-Cap | | | Sustainable | | | Sustainable | | | Global | | | Sustainable | | | Intermediate | |
| | | Fundamental | | | Small-Cap | | | Value | | | Leaders | | | International | | | Income | |
| | | Value Fund | | | Core Fund | | | Fund | | | Fund | | | Leaders Fund | | | Fund | |
Cost of investments | | $ | 942,751,710 | | | $ | 51,311,851 | | | $ | 46,760,185 | | | $ | 1,079,850,957 | | | $ | 20,710,081 | | | $ | 135,650,291 | |
Unrealized appreciation | | | 328,662,910 | | | | 7,152,961 | | | | 2,664,240 | | | | 417,862,519 | | | | 3,611,319 | | | | 62,650 | |
Unrealized depreciation | | | (94,311,012 | ) | | | (7,959,108 | ) | | | (1,220,854 | ) | | | (24,075,031 | ) | | | (317,356 | ) | | | (10,333,050 | ) |
Net unrealized app (dep) | | | 234,351,898 | | | | (806,147 | ) | | | 1,443,386 | | | | 393,787,488 | | | | 3,293,963 | | | | (10,270,400 | ) |
Undistributed income | | | 4,395,256 | | | | 60,483 | | | | 207,087 | | | | 7,529,353 | | | | 145,740 | | | | 203,200 | |
Undistributed capital gains | | | 45,684,651 | | | | — | | | | — | | | | — | | | | — | | | | — | |
Total undistributed earnings | | | 50,079,907 | | | | 60,483 | | | | 207,087 | | | | 7,529,353 | | | | 145,740 | | | | 203,200 | |
Other accumulated gains (losses) | | | — | | | | (2,674,538 | ) | | | (76,805 | ) | | | (52,645,126 | ) | | | (148,010 | ) | | | (6,947,488 | ) |
Total distributable earnings (losses) | | $ | 284,431,805 | | | $ | (3,420,202 | ) | | $ | 1,573,668 | | | $ | 348,671,715 | | | $ | 3,291,693 | | | $ | (17,014,688 | ) |
| | | | | | | | | | | | | | | | | | | | | | | | | |
| | | Sustainable | | | Maryland | | | Tax-Exempt | | | Tax-Exempt | | | Mortgage | | | WMC Strategic | |
| | | Bond | | | Bond | | | Bond | | | Sustainable | | | Securities | | | European | |
| | | Fund | | | Fund | | | Fund | | | Bond Fund | | | Fund | | | Equity Fund | |
Cost of investments | | $ | 992,202,229 | | | $ | 171,275,315 | | | $ | 803,858,955 | | | $ | 297,656,057 | | | $ | 399,373,258 | | | $ | 217,772,421 | |
Unrealized appreciation | | | 952,692 | | | | 416,711 | | | | 11,074,889 | | | | 954,522 | | | | 526,789 | | | | 48,963,948 | |
Unrealized depreciation | | | (24,420,261 | ) | | | (8,270,932 | ) | | | (24,553,724 | ) | | | (11,956,972 | ) | | | (20,183,046 | ) | | | (24,331,845 | ) |
Net unrealized app (dep) | | | (23,467,569 | ) | | | (7,854,221 | ) | | | (13,478,835 | ) | | | (11,002,450 | ) | | | (19,656,257 | ) | | | 24,632,103 | |
Undistributed income | | | 236,768 | | | 325,158^ | | | 2,037,489^ | | | 589,676^ | | | | 726,635 | | | | 3,666,609 | |
Undistributed capital gains | | | — | | | | — | | | | — | | | | — | | | | — | | | | — | |
Total undistributed earnings | | | 236,768 | | | | 325,158 | | | | 2,037,489 | | | | 589,676 | | | | 726,635 | | | | 3,666,609 | |
Other accumulated gains (losses) | | | (96,256,286 | ) | | | (6,979,844 | ) | | | (81,649,953 | ) | | | (15,181,128 | ) | | | (22,252,296 | ) | | | (6,848,417 | ) |
Total distributable earnings (losses) | | $ | (119,487,087 | ) | | $ | (14,508,907 | ) | | $ | (93,091,299 | ) | | $ | (25,593,902 | ) | | $ | (41,181,918 | ) | | $ | 21,450,295 | |
Notes to Financial Statements
June 30, 2023
| | | Emerging | | | Beutel Goodman | |
| | | Markets | | | Large-Cap | |
| | | Select Fund | | | Value Fund | |
Cost of investments | | $ | 503,380,053 | | | $ | 1,471,401,478 | |
Unrealized appreciation | | | 88,415,689 | | | | 250,521,408 | |
Unrealized depreciation | | | (53,117,842 | ) | | | (65,498,869 | ) |
Net unrealized app (dep) | | | 35,297,847 | | | | 185,022,539 | |
Undistributed income | | | 5,806,405 | | | | 9,158,242 | |
Undistributed capital gains | | | — | | | | — | |
Total undistributed earnings | | | 5,806,405 | | | | 9,158,242 | |
Other accumulated gains (losses) | | | (70,262,386 | ) | | | — | |
Total distributable earnings (losses) | | $ | (29,158,134 | ) | | $ | 194,180,781 | |
^ Represents income that is exempt from federal income taxes.
At June 30, 2023 the differences between tax basis and book basis amounts were primarily due to wash sales, post-October losses, post-December ordinary losses, timing differences related to the amortization of premium on certain fixed income securities, and distributions payable.
At June 30, 2023, the following capital loss carryforwards and tax deferrals were available and outstanding, respectively:
| | | Capital Loss Carryforwards (Non-Expiring) | | | Tax Deferrals | |
| | | | | | | | | | | | Post-October | | | Post-December | |
| Fund | | Short-Term | | | Long-Term | | | Total | | | Capital Losses | | | Ordinary Losses | |
Growth Equity | | $ | — | | | $ | — | | | $ | — | | | $ | — | | | $ | (2,207,095 | ) |
Flexible Equity | | | — | | | | — | | | | — | | | | — | | | | — | |
Equity Income | | | — | | | | — | | | | — | | | | — | | | | — | |
Sustainable Growth | | | (10,416,902 | ) | | | — | | | | (10,416,902 | ) | | | — | | | | — | |
Mid-Cap Growth | | | (14,047,357 | ) | | | — | | | | (14,047,357 | ) | | | — | | | | (716,041 | ) |
Small-Cap Growth | | | (10,979,509 | ) | | | — | | | | (10,979,509 | ) | | | — | | | | (1,870,681 | ) |
Small-Cap Fundamental Value | | | — | | | | — | | | | — | | | | — | | | | — | |
Sustainable Small-Cap Core | | | (790,691 | ) | | | (1,883,847 | ) | | | (2,674,538 | ) | | | — | | | | — | |
Sustainable Value | | | (76,805 | ) | | | — | | | | (76,805 | ) | | | — | | | | — | |
Global Leaders | | | (25,649,815 | ) | | | (27,041,597 | ) | | | (52,691,412 | ) | | | — | | | | — | |
Sustainable International Leaders | | | (118,493 | ) | | | (30,158 | ) | | | (148,651 | ) | | | — | | | | — | |
Intermediate Income | | | (3,359,226 | ) | | | (3,393,698 | ) | | | (6,752,924 | ) | | | — | | | | — | |
Sustainable Bond | | | (49,177,149 | ) | | | (46,793,685 | ) | | | (95,970,834 | ) | | | — | | | | — | |
Maryland Bond | | | (423,859 | ) | | | (6,228,516 | ) | | | (6,652,375 | ) | | | — | | | | — | |
Tax-Exempt Bond | | | (23,621,614 | ) | | | (55,986,200 | ) | | | (79,607,814 | ) | | | — | | | | — | |
Tax-Exempt Sustainable Bond | | | (4,994,894 | ) | | | (9,596,429 | ) | | | (14,591,323 | ) | | | — | | | | — | |
Mortgage Securities | | | (21,570,030 | ) | | | — | | | | (21,570,030 | ) | | | — | | | | — | |
WMC Strategic European Equity | | | (3,938,055 | ) | | | (2,880,706 | ) | | | (6,818,761 | ) | | | — | | | | — | |
Emerging Markets Select | | | (39,691,845 | ) | | | (30,600,013 | ) | | | (70,291,858 | ) | | | — | | | | — | |
Beutel Goodman Large-Cap Value | | | — | | | | — | | | | — | | | | — | | | | — | |
Notes to Financial Statements
June 30, 2023
Distributions during the fiscal periods ended as noted were characterized for tax purposes as follows:
| | | Tax-Exempt Income | | | Ordinary Income | | | Long-Term Capital Gain^ | |
| Fund | | June 30, 2023 | | | June 30, 2022 | | | June 30, 2023 | | | June 30, 2022 | | | June 30, 2023 | | | June 30, 2022 | |
Growth Equity | | $ | — | | | $ | — | | | $ | — | | | $ | 1,757,252 | | | $ | 154,275,441 | | | $ | 418,137,727 | |
Flexible Equity | | | — | | | | — | | | | 1,834,982 | | | | 4,916,461 | | | | 20,267,064 | | | | 22,220,388 | |
Equity Income | | | — | | | | — | | | | 1,210,713 | | | | 1,607,286 | | | | 5,880,188 | | | | 7,564,213 | |
Sustainable Growth | | | — | | | | — | | | | 10,470 | | | | 21,264,932 | | | | — | | | | 110,478,765 | |
Mid-Cap Growth | | | — | | | | — | | | | — | | | | 7,954,927 | | | | 6,173,357 | | | | 8,549,551 | |
Small-Cap Growth | | | — | | | | — | | | | — | | | | 12,395,676 | | | | 151,387,604 | | | | 259,770,985 | |
Small-Cap Fundamental Value | | | — | | | | — | | | | 4,527,234 | | | | 3,250,435 | | | | 63,667,844 | | | | 4,127,381 | |
Sustainable Small-Cap Core | | | — | | | | — | | | | 440 | | | | — | | | | 176 | | | | — | |
Sustainable Value | | | — | | | | N/A | | | | — | | | | N/A | | | | — | | | | N/A | |
Global Leaders | | | — | | | | — | | | | 7,386,738 | | | | 12,129,396 | | | | — | | | | 3,919,199 | |
Sustainable International Leaders | | | — | | | | — | | | | 38,904 | | | | — | | | | — | | | | — | |
Intermediate Income | | | — | | | | — | | | | 3,282,894 | | | | 2,233,923 | | | | — | | | | 1,253,851 | |
Sustainable Bond | | | — | | | | — | | | | 9,471,969 | | | | 5,056,872 | | | | — | | | | 3,138,927 | |
Maryland Bond | | | 4,470,119 | | | | 4,002,989 | | | | 137,349 | | | | 11,874 | | | | — | | | | — | |
Tax-Exempt Bond | | | 24,497,918 | | | | 28,844,025 | | | | 1,843,194 | | | | 786,796 | | | | — | | | | 5,372,478 | |
Tax-Exempt Sustainable Bond | | | 7,295,855 | | | | 3,218,015 | | | | 663,595 | | | | 1,351,822 | | | | — | | | | 908,647 | |
Mortgage Securities | | | — | | | | — | | | | 9,691,538 | | | | 4,751,700 | | | | — | | | | — | |
WMC Strategic European Equity | | | — | | | | — | | | | 3,633,267 | | | | 13,640,249 | | | | 1,383,176 | | | | 29,108,376 | |
Emerging Markets Select | | | — | | | | — | | | | 6,117,691 | | | | 3,800,392 | | | | — | | | | — | |
Beutel Goodman Large-Cap Value | | | — | | | | — | | | | 36,650,998 | | | | 58,920,702 | | | | 15,444,813 | | | | 41,288,190 | |
| ^ | Designated as a long-term capital gain dividend, pursuant to Internal Revenue Code Section 852(b)(3). The Funds, as applicable, have also designated earnings and profits distributed to shareholders on the redemption of shares as capital gains in order to reduce earnings and profits of the Fund related to net capital gains to zero as of the date of this report. |
U.S GAAP requires that certain components of net assets (presented on the Statements of Assets and Liabilities) be reclassified for permanent differences between financial reporting and tax reporting. These reclassifications are primarily the result of net operating losses, investments in real estate investment trusts, foreign currency transactions, distribution reclassifications, equalization, capital loss carryforwards from the merger of Brown Advisory Total Return Fund into Sustainable Bond Fund, and income adjustments to asset-backed security transactions. These reclassifications have no impact on the net assets of the Funds or the Funds’ NAV’s. For the year ended June 30, 2023, the following reclassifications were made:
| | | Paid-in | | | Distributable | | | | | Paid-in | | | Distributable | |
| Fund | | Capital | | | Earnings (Loss) | | | Fund | | Capital | | | Earnings (Loss) | |
Growth Equity | | $ | 15,361,902 | | | $ | (15,361,902 | ) | | Sustainable International Leaders | | $ | — | | | $ | — | |
Flexible Equity | | | 1,967,565 | | | | (1,967,565 | ) | | Intermediate Income | | | — | | | | — | |
Equity Income | | | 547,673 | | | | (547,673 | ) | | Sustainable Bond | | | 55,954,413 | | | | (55,954,413 | ) |
Sustainable Growth | | | — | | | | — | | | Maryland Bond | | | — | | | | — | |
Mid-Cap Growth | | | (24 | ) | | | 24 | | | Tax-Exempt Bond | | | — | | | | — | |
Small-Cap Growth | | | (14,196,908 | ) | | | 14,196,908 | | | Tax-Exempt Sustainable Bond | | | — | | | | — | |
Small-Cap Fundamental Value | | | 9,479,578 | | | | (9,479,578 | ) | | Mortgage Securities | | | — | | | | — | |
Sustainable Small-Cap Core | | | — | | | | — | | | WMC Strategic European Equity | | | — | | | | — | |
Sustainable Value | | | — | | | | — | | | Emerging Markets Select | | | — | | | | — | |
Global Leaders | | | — | | | | — | | | Beutel Goodman Large-Cap Value | | | — | | | | — | |
Note 6. Futures Contracts
The Intermediate Income Fund, Sustainable Bond Fund, and Mortgage Securities Fund invested in futures contracts during the year ended June 30, 2023. At the time a Fund purchases or enters into a futures contract, the Fund deposits and maintains as collateral an initial margin with the broker, as required by the terms of the contract. This collateral may consist of cash and/or securities (generally U.S. Treasury Bills). Thereafter, in connection with changes in the value of the futures contracts, the Funds may send or receive collateral to or from the broker. Such amounts are included on the Statements of Assets and Liabilities as “Cash deposit at broker – futures contracts” or “Cash collateral from broker – futures contracts”. Securities pledged as collateral, if there are any, are included on the Statements of Assets and Liabilities as part of “Total investments, at value”. These securities are also tickmarked on the Schedules of Investments as being pledged in connection with open futures contracts.
Notes to Financial Statements
June 30, 2023
Pursuant to the contract, the Fund agrees to receive from or pay to the broker an amount of cash equal to the fluctuation in the value of the contract. These daily fluctuations are known as variation margin and are recorded by the Fund as unrealized gains or losses on futures contracts. When these futures contracts are closed, realized gains or losses on futures contracts are recorded by the Fund. The realized gains or losses are reported in the Statement of Operations as net realized gains or losses from futures contracts. Depending upon the agreement with the broker, the Funds may or may not settle variation margin daily. The Funds attempt to mitigate counterparty credit risk by only entering into futures contracts with brokers that the Funds believe have the financial resources to honor their obligations and by monitoring the financial stability of these brokers. The “Notional Amount” of futures contracts shown on the Schedule of Investments represents the notional value of the futures contracts on the day they were opened. The “Notional Value” of futures contracts shown on the Schedule of Investments represents the notional value of the futures contracts as of the date of this report. For long futures contracts, an excess of Notional Value over Notional Amount results in unrealized appreciation on the futures contract (and an excess of Notional Amount over Notional Value results in unrealized depreciation on the futures contract). The opposite is true for short futures contracts. For futures contracts denominated in foreign currencies, both the Notional Amount and Notional Value have been translated into U.S. Dollars as of the date of this report. These unrealized appreciation (depreciation) amounts represent the net impact on a Fund’s net assets as a result of open futures contracts as of the date of this report. The use of long futures contracts by the Funds subjects them to a risk of loss in excess of the gross unrealized appreciation and/or gross unrealized depreciation amounts shown on the Statements of Assets and Liabilities and up to the total Notional Amount of the futures contract as shown on the Schedule of Investments. The use of short futures contracts by the Funds subjects them to a risk of loss in excess of the gross unrealized appreciation and/or gross unrealized depreciation amounts shown on the Statements of Assets and Liabilities and, hypothetically, up to an unlimited amount of loss that could exceed the Notional Amount of the futures contracts as shown on the Schedules of Investments.
During the year ended June 30, 2023, investments in futures contracts were as follows:
| | | | | Average Notional Value Outstanding | |
Fund | | Risk Type | | Long Futures Contracts | | | Short Futures Contracts | |
Intermediate Income | | Interest Rate | | $ | 19,518,680 | | | $ | (11,696,546 | ) |
Sustainable Bond | | Interest Rate & Currency | | | 84,039,924 | | | | (27,491,520 | ) |
Mortgage Securities | | Interest Rate | | | 22,084,989 | | | | (19,388,362 | ) |
Investment in long futures contracts increases a Fund’s exposure to interest rate risk, while investment in short futures contracts serves to reduce a Fund’s exposure to interest rate risk. Assets and/or liabilities related to futures contracts were not subject to an arrangement wherein those assets and/or liabilities were, or could have been, settled on a net basis with any other derivative related obligations.
Note 7. Line of Credit
As of June 30, 2023, Brown Advisory Funds has a secured line of credit of up to $100,000,000 with U.S. Bank, N.A. The interest rate on the line of credit as of the date of this report was 8.25% (prime rate). The following table shows the details of the Funds’ borrowing activity during the year ended June 20, 2023. Funds that are not listed did not utilize the line of credit during the period.
| | | Maximum | | | | | | | | | | |
| | | Outstanding | | | Average | | | Total Interest | | | Average Annual | |
Fund | | Balance | | | Daily Balance | | | Expense Incurred | | | Interest Rate | |
Mid-Cap Growth | | $ | 3,210,000 | | | $ | 8,795 | | | $ | 557 | | | | 6.25 | % |
WMC Strategic European Equity | | | 9,673,000 | | | | 82,792 | | | | 5,246 | | | | 6.25 | % |
Emerging Markets Select | | | 150,000 | | | | 411 | | | | 26 | | | | 6.25 | % |
Note 8. Market Disruptions
On February 24, 2022, Russia commenced a military attack on Ukraine. The outbreak of hostilities between the two countries could result in more widespread conflict and could have a severe adverse effect on the region and the markets. In addition, sanctions imposed on Russia by the United States and other countries, and any sanctions imposed in the future could have a significant adverse impact on the Russian economy and related markets. The price and liquidity of investments may fluctuate widely as a result of the conflict and related events. How long such conflict and related events will last and whether it will escalate further cannot be predicted, nor its effect on the Funds.
Notes to Financial Statements
June 30, 2023
Note 9. Merger of Funds
As of the close of business on June 23, 2023, pursuant to an Agreement and Plan of Reorganization approved by the Funds’ Board of Trustees, all of the assets, subject to the liabilities, of the Brown Advisory Total Return Fund (“Total Return Fund”) were transferred to the Sustainable Bond Fund in exchange for shares of the Sustainable Bond Fund of equal value. The purpose of the transaction was to combine two funds with similar investment strategies and investments into a single fund having a larger asset base that has the potential to produce economies of scale. The exchange ratio was 1.00361 for Institutional Shares and 1.00281 for Investor Shares. The net asset values of the Sustainable Bond Fund Institutional and Investor Shares on the close of business June 23, 2023, both before and after the reorganization, were $8.64 and $8.65, respectively. A total of 38,304,761 Institutional Shares and 101,652 Investor Shares were issued to shareholders of the Total Return Fund in the exchange. The Total Return Fund’s net assets at the reorganization date of $331,882,173, including $10,046,076 of unrealized depreciation, were combined with those of the Sustainable Bond Fund. Assuming the acquisition had been completed on July 1, 2022, the beginning of the annual reporting period of the Sustainable Bond Fund, proforma results of operations for the year ended June 30, 2023 would include net investment income of $20,007,896 and net realized and change in unrealized gain (loss) of $(42,438,611), resulting in a decrease in net assets of $22,430,715. Prior to the reorganization, the Sustainable Bond Fund net assets totaled $392,221,571. Immediately after the reorganization, the net assets of the Sustainable Bond Fund totaled $724,103,744. The exchange was a tax-free event to the Total Return Fund shareholders. For financial reporting purposes, assets received and shares issued by the Sustainable Bond Fund were recorded at fair value; however, the cost basis of investments received from the Total Return Fund was carried forward to align ongoing reporting of the Sustainable Bond Fund’s realized and unrealized gains and losses with amounts distributable to shareholders for tax purposes.
Note 10. Subsequent Events
In preparing these financial statements, the Funds have evaluated events and transactions for potential recognition through the date the financial statements were issued. No material events or transactions occurred subsequent to June 30, 2023 that would require recognition or disclosure in these financial statements.
Report of Independent Registered Public Accounting Firm
To the Shareholders and Board of Trustees
Brown Advisory Funds
Baltimore, MD
Opinion on the Financial Statements
We have audited the accompanying statements of assets and liabilities of Brown Advisory Growth Equity Fund, Brown Advisory Flexible Equity Fund, Brown Advisory Equity Income Fund, Brown Advisory Sustainable Growth Fund, Brown Advisory Mid-Cap Growth Fund, Brown Advisory Small-Cap Growth Fund, Brown Advisory Small-Cap Fundamental Value Fund, Brown Advisory Sustainable Small-Cap Core Fund, Brown Advisory Sustainable Value Fund, Brown Advisory Global Leaders Fund, Brown Advisory Sustainable International Leaders Fund, Brown Advisory Intermediate Income Fund, Brown Advisory Sustainable Bond Fund, Brown Advisory Maryland Bond Fund, Brown Advisory Tax-Exempt Fund, Brown Advisory Tax-Exempt Sustainable Bond Fund, Brown Advisory Mortgage Securities Fund, Brown Advisory – WMC Strategic European Equity Fund, Brown Advisory Emerging Markets Select Fund and Brown Advisory – Beutel Goodman Large-Cap Value Fund (the “Funds”), each a series of Brown Advisory Funds (the “Trust”), including the schedules of investments, as of June 30, 2023, the related statements of operations, the statement of changes in net assets and the financial highlights for each of the periods indicated in the table below, and the related notes (collectively referred to as the “financial statements”). In our opinion, the financial statements present fairly, in all material respects, the financial position of the Funds as of June 30, 2023, the results of their operations, the changes in their net assets and their financial highlights for each of the periods indicated in the table below, in conformity with accounting principles generally accepted in the United States of America.
| Individual Funds | | | |
| constituting | | | |
| Brown Advisory | Statement of | Statements of | |
Funds | Operations | Changes in Net Assets | Financial Highlights |
Brown Advisory Growth | For the year ended | For each of the two years | For each of the five years in the period |
Equity Fund, Brown Advisory | June 30, 2023 | in the period ended | ended June 30, 2023 |
Flexible Equity Fund, Brown | | June 30, 2023 | |
Advisory Equity Income Fund, | | | |
Brown Advisory Sustainable | | | |
Growth Fund, Brown Advisory | | | |
Mid-Cap Growth Fund, Brown | | | |
Advisory Small-Cap Growth | | | |
Fund, Brown Advisory | | | |
Small-Cap Fundamental Value | | | |
Fund, Brown Advisory Global | | | |
Leaders Fund, Brown Advisory | | | |
Intermediate Income Fund, | | | |
Brown Advisory Sustainable | | | |
Bond Fund, Brown Advisory | | | |
Maryland Bond Fund, Brown | | | |
Advisory Tax-Exempt Bond | | | |
Fund, Brown Advisory Mortgage | | | |
Securities Fund, Brown Advisory – | | | |
WMC Strategic European Equity | | | |
Fund, Brown Advisory Emerging | | | |
Markets Select Fund, Brown | | | |
Advisory – Beutel Goodman | | | |
Large-Cap Value Fund | | | |
| | | | |
Brown Advisory Tax-Exempt | For the year ended | For each of the two years | For each of the three years in the period |
Sustainable Bond Fund | June 30, 2023 | in the period ended | ended June 30, 2023 and the period from |
| | | June 30, 2023 | December 2, 2019 (commencement of |
| | | | operations) through June 30, 2020 |
Report of Independent Registered Public Accounting Firm
| Individual Funds | | | |
| constituting | | | |
| Brown Advisory | Statement of | Statements of | |
Funds | Operations | Changes in Net Assets | Financial Highlights |
Brown Advisory Sustainable | For the year ended | For the year ended | For the year ended June 30, 2023 and |
Small-Cap Core Fund | June 30, 2023 | June 30, 2023 and for | for the period from September 30, 2021 |
| | | the period from | (commencement of operations) through |
| | | September 30, 2021 | June 30, 2022 |
| | | (commencement of | |
| | | operations) through | |
| | | June 30, 2022 | |
| | | | |
Brown Advisory Sustainable | For the year ended | For the year ended | For the year ended June 30, 2023 and |
International Leaders Fund | June 30, 2023 | June 30, 2023 and for | for the period from March 1, 2022 |
| | | the period from | (commencement of operations) through |
| | | March 1, 2022 | June 30, 2022 |
| | | (commencement of | |
| | | operations) through | |
| | | June 30, 2022 | |
| | | | |
Brown Advisory | For the period from | For the period from | For the period from February 28, 2023 |
Sustainable Value Fund | February 28, 2023 | February 28, 2023 | (commencement of operations) through |
| | (commencement of | (commencement of | June 30, 2023 |
| | operations) through | operations) through | |
| | June 30, 2023 | June 30, 2023 | |
Basis for Opinion
These financial statements are the responsibility of the Funds’ management. Our responsibility is to express an opinion on the Funds’ financial statements based on our audits. We are a public accounting firm registered with the Public Company Accounting Oversight Board (United States) (“PCAOB”) and are required to be independent with respect to the Funds in accordance with the U.S. federal securities laws and the applicable rules and regulations of the Securities and Exchange Commission and the PCAOB. We have served as the auditor of one or more of the funds in the Trust since 2008.
We conducted our audits in accordance with the standards of the PCAOB. Those standards require that we plan and perform the audits to obtain reasonable assurance about whether the financial statements are free of material misstatement, whether due to error or fraud. The Funds are not required to have, nor were we engaged to perform, an audit of the Funds’ internal control over financial reporting. As part of our audits we are required to obtain an understanding of internal control over financial reporting, but not for the purpose of expressing an opinion on the effectiveness of the Funds’ internal control over financial reporting. Accordingly, we express no such opinion.
Our audits included performing procedures to assess the risks of material misstatement of the financial statements, whether due to error or fraud, and performing procedures that respond to those risks. Such procedures included examining, on a test basis, evidence regarding the amounts and disclosures in the financial statements. Our audits also included evaluating the accounting principles used and significant estimates made by management, as well as evaluating the overall presentation of the financial statements. Our procedures included confirmation of securities owned as of June 30, 2023 by correspondence with the custodian and brokers; when replies were not received from brokers, we performed other auditing procedures. We believe that our audits provide a reasonable basis for our opinion.
|  |
| TAIT, WELLER & BAKER LLP |
Philadelphia, Pennsylvania
August 25, 2023
Expense Example For the Six Months Ended June 30, 2023 (Unaudited)
As a shareholder of a Fund you incur two types of costs: (1) transaction costs, including redemption fees and exchange fees; and (2) ongoing costs, including investment advisory fees; distribution and/or service fees; and other Fund expenses. This example is intended to help you understand your ongoing costs (in dollars) of investing in a Fund and to compare these costs with the ongoing costs of investing in other mutual funds. The example is based on an investment of $1,000 invested at the beginning of the six month period and held for the entire period (January 1, 2023 – June 30, 2023).
Actual Expenses
The Actual Expenses columns in the following table provides information about actual account values based on actual returns and actual expenses. As a shareholder you will be assessed fees for outgoing wire transfers, returned checks and stop payment orders at prevailing rates charged by U.S. Bancorp Fund Services, LLC, the Funds’ transfer agent. If you request that a redemption be made by wire transfer, currently, the Funds’ transfer agent charges a $15.00 fee. You will be charged a redemption fee equal to 1.00% of the net amount of the redemption if you redeem your shares less than 14 days after you purchase, with certain limited exceptions. Individual Retirement Accounts (“IRA”) that are held directly at the Funds will be charged a $15.00 annual maintenance fee. IRAs held by broker-dealers or through other means, may or may not incur an annual maintenance fee. Yet, if IRAs maintenance fees are charged to accounts held elsewhere, the fees charged may be more or may be less than $15.00. To the extent the Funds invest in shares of other investment companies as part of their investment strategy, you will indirectly bear your proportionate share of any fees and expenses charged by the underlying funds in which the Funds invest in addition to the expenses of the Funds. Actual expenses of the underlying funds may vary. These expenses are not included in the example below. The example below includes, but is not limited to, investment advisory, shareholder servicing, fund accounting, custody and transfer agent fees. However, the example below does not include portfolio trading commissions and related expenses. You may use the information in this line, together with the amount you invested, to estimate the expenses that you paid over the period. Simply divide your account value by $1,000 (for example, an $8,600 account value divided by $1,000 = 8.6). Then, multiply the result by the number in the first line under the heading entitled “Expenses Paid During the Period” to estimate the expenses you paid on your account during this period.
Hypothetical Example for Comparison Purposes
The Hypothetical Expenses columns in the following table provides information about hypothetical account values based on a hypothetical return and hypothetical expenses based on the Funds’ actual expense ratio and an assumed rate of return of 5% per year before expenses, which is not the Funds’ actual return. The hypothetical account values and expenses may not be used to estimate the actual ending account balance or expenses you paid for the period. You may use this information to compare the ongoing costs of investing in the Funds and other funds. To do so, compare this 5% hypothetical example with the 5% hypothetical examples that appear in the shareholder reports of the other funds. Please note that the expenses shown in the table are meant to highlight your ongoing costs only and do not reflect any transactional costs, such as sales charges (loads), redemption fees or exchange fees. Therefore, the hypothetical information in the table is useful in comparing ongoing costs only and will not help you determine the relative total costs of owning different funds. In addition, if these transactional costs were included, your costs would have been higher.
| | | Actual Expenses | Hypothetical Expenses | |
| | Beginning | Ending | Expenses | Ending | Expenses | Annualized |
| | Account Value | Account Value | Paid During | Account Value | Paid During | Net Expense |
| | January 1, 2023 | June 30, 2023 | the Period* | June 30, 2023 | the Period* | Ratio* |
| Growth Equity Fund | | | | | | |
Institutional Shares | $1,000.00 | $1,234.50 | $3.77 | $1,021.42 | $3.41 | 0.68% |
Investor Shares | $1,000.00 | $1,233.20 | $4.60 | $1,020.68 | $4.16 | 0.83% |
Advisor Shares | $1,000.00 | $1,231.60 | $5.98 | $1,019.44 | $5.41 | 1.08% |
| | | | | | | |
| Flexible Equity Fund | | | | | | |
Institutional Shares | $1,000.00 | $1,201.70 | $2.95 | $1,022.12 | $2.71 | 0.54% |
Investor Shares | $1,000.00 | $1,200.60 | $3.76 | $1,021.37 | $3.46 | 0.69% |
Advisor Shares | $1,000.00 | $1,199.20 | $5.13 | $1,020.13 | $4.71 | 0.94% |
| | | | | | | |
| Equity Income Fund | | | | | | |
Institutional Shares | $1,000.00 | $1,059.40 | $3.88 | $1,021.03 | $3.81 | 0.76% |
Investor Shares | $1,000.00 | $1,058.60 | $4.64 | $1,020.28 | $4.56 | 0.91% |
Advisor Shares | $1,000.00 | $1,056.60 | $5.92 | $1,019.04 | $5.81 | 1.16% |
Expense Example For the Six Months Ended June 30, 2023 (Unaudited)
| | | Actual Expenses | Hypothetical Expenses | |
| | Beginning | Ending | Expenses | Ending | Expenses | Annualized |
| | Account Value | Account Value | Paid During | Account Value | Paid During | Net Expense |
| | January 1, 2023 | June 30, 2023 | the Period* | June 30, 2023 | the Period* | Ratio* |
| Sustainable Growth Fund | | | | | | |
Institutional Shares | $1,000.00 | $1,245.40 | $3.51 | $1,021.67 | $3.16 | 0.63% |
Investor Shares | $1,000.00 | $1,244.60 | $4.34 | $1,020.93 | $3.91 | 0.78% |
Advisor Shares | $1,000.00 | $1,243.00 | $5.73 | $1,019.69 | $5.16 | 1.03% |
| | | | | | | |
| Mid-Cap Growth Fund | | | | | | |
Institutional Shares | $1,000.00 | $1,138.80 | $4.35 | $1,020.73 | $4.11 | 0.82% |
Investor Shares | $1,000.00 | $1,137.30 | $5.14 | $1,019.98 | $4.86 | 0.97% |
| | | | | | | |
| Small-Cap Growth Fund | | | | | | |
Institutional Shares | $1,000.00 | $1,099.90 | $5.00 | $1,020.03 | $4.81 | 0.96% |
Investor Shares | $1,000.00 | $1,099.40 | $5.78 | $1,019.29 | $5.56 | 1.11% |
Advisor Shares | $1,000.00 | $1,097.50 | $7.07 | $1,018.05 | $6.80 | 1.36% |
| | | | | | | |
| Small-Cap Fundamental Value Fund | | | | | | |
Institutional Shares | $1,000.00 | $1,027.80 | $4.78 | $1,020.08 | $4.76 | 0.95% |
Investor Shares | $1,000.00 | $1,026.80 | $5.53 | $1,019.34 | $5.51 | 1.10% |
Advisor Shares | $1,000.00 | $1,025.80 | $6.78 | $1,018.10 | $6.76 | 1.35% |
| | | | | | | |
| Sustainable Small-Cap Core Fund | | | | | | |
Institutional Shares | $1,000.00 | $1,075.70 | $4.79 | $1,020.18 | $4.66 | 0.93% |
Investor Shares | $1,000.00 | $1,075.90 | $5.56 | $1,019.44 | $5.41 | 1.08% |
| | | | | | | |
| Sustainable Value Fund | | | | | | |
Institutional Shares | $1,000.00 | $1,003.00 | $2.34 | $1,021.32 | $3.51 | 0.70% |
Investor Shares | $1,000.00 | $1,002.00 | $2.84 | $1,020.58 | $4.26 | 0.85% |
| | | | | | | |
| Global Leaders Fund | | | | | | |
Institutional Shares | $1,000.00 | $1,173.20 | $4.10 | $1,021.03 | $3.81 | 0.76% |
Investor Shares | $1,000.00 | $1,172.70 | $4.90 | $1,020.28 | $4.56 | 0.91% |
| | | | | | | |
| Sustainable International Leaders Fund | | | | | | |
Institutional Shares | $1,000.00 | $1,158.60 | $4.55 | $1,020.58 | $4.26 | 0.85% |
Investor Shares | $1,000.00 | $1,157.80 | $5.35 | $1,019.84 | $5.01 | 1.00% |
| | | | | | | |
| Intermediate Income Fund | | | | | | |
Investor Shares | $1,000.00 | $1,011.80 | $2.44 | $1,022.36 | $2.46 | 0.49% |
Advisor Shares | $1,000.00 | $1,011.90 | $3.69 | $1,021.12 | $3.71 | 0.74% |
| | | | | | | |
| Sustainable Bond Fund | | | | | | |
Institutional Shares | $1,000.00 | $1,007.10 | $2.09 | $1,022.71 | $2.11 | 0.42% |
Investor Shares | $1,000.00 | $1,008.00 | $2.34 | $1,022.46 | $2.36 | 0.47% |
| | | | | | | |
| Maryland Bond Fund | | | | | | |
Investor Shares | $1,000.00 | $1,020.90 | $2.46 | $1,022.36 | $2.46 | 0.49% |
| | | | | | | |
| Tax-Exempt Bond Fund | | | | | | |
Institutional Shares | $1,000.00 | $1,032.60 | $2.07 | $1,022.76 | $2.06 | 0.41% |
Investor Shares | $1,000.00 | $1,032.40 | $2.32 | $1,022.51 | $2.31 | 0.46% |
| | | | | | | |
| Tax-Exempt Sustainable Bond Fund | | | | | | |
Investor Shares | $1,000.00 | $1,019.50 | $2.40 | $1,022.41 | $2.41 | 0.48% |
| | | | | | | |
| Mortgage Securities Fund | | | | | | |
Institutional Shares | $1,000.00 | $1,014.80 | $2.25 | $1,022.56 | $2.26 | 0.45% |
Investor Shares | $1,000.00 | $1,015.60 | $2.50 | $1,022.32 | $2.51 | 0.50% |
Expense Example For the Six Months Ended June 30, 2023 (Unaudited)
| | | Actual Expenses | Hypothetical Expenses | |
| | Beginning | Ending | Expenses | Ending | Expenses | Annualized |
| | Account Value | Account Value | Paid During | Account Value | Paid During | Net Expense |
| | January 1, 2023 | June 30, 2023 | the Period* | June 30, 2023 | the Period* | Ratio* |
| WMC Strategic European Equity Fund | | | | | | |
Institutional Shares | $1,000.00 | $1,123.60 | $5.58 | $1,019.54 | $5.31 | 1.06% |
Investor Shares | $1,000.00 | $1,122.00 | $6.37 | $1,018.79 | $6.06 | 1.21% |
Advisor Shares | $1,000.00 | $1,121.90 | $7.68 | $1,017.55 | $7.30 | 1.46% |
| | | | | | | |
| Emerging Markets Select Fund | | | | | | |
Institutional Shares | $1,000.00 | $1,071.60 | $5.65 | $1,019.34 | $5.51 | 1.10% |
Investor Shares | $1,000.00 | $1,070.60 | $6.42 | $1,018.60 | $6.26 | 1.25% |
Advisor Shares | $1,000.00 | $1,069.30 | $7.70 | $1,017.36 | $7.50 | 1.50% |
| | | | | | | |
| Beutel Goodman Large-Cap Value Fund | | | | | | |
Institutional Shares | $1,000.00 | $1,062.90 | $2.81 | $1,022.07 | $2.76 | 0.55% |
Investor Shares | $1,000.00 | $1,061.50 | $3.58 | $1,021.32 | $3.51 | 0.70% |
| * | The calculations are based on expenses incurred during the most recent six-month period ended as of the date of this report. The dollar amounts shown as expenses paid during the period are equal to the annualized six-month net expense ratio multiplied by the average account value during the period, multiplied by the number of days (181) in the most recent six-month period divided by the number of days in the Funds’ fiscal year (365). For Sustainable Value Fund, actual expenses paid during the period are based on the period from the Fund’s commencement of operations to the date of this report (122 days). |
Liquidity Risk Management Program (Unaudited)
In accordance with Rule 22e-4 of the Investment Company Act of 1940 (the “Liquidity Rule”), the Brown Advisory Funds (the “Trust”) adopted and implemented a liquidity risk management program (the “Program”) for each investment series of the Trust (each a “Fund” and collectively, the “Funds”) which seeks to assess, manage and review each Fund’s Liquidity Risk. “Liquidity Risk” is defined in Rule 22e-4 as the risk that a fund could not meet requests to redeem shares issued by the fund without significant dilution of remaining investors’ interest in the fund. The Program includes policies and procedures reasonably designed to comply with the requirements of the Liquidity Rule, including: (i) assess and manage each Fund’s Liquidity Risk; (ii) classification of portfolio holdings; (iii) establishment of a highly liquid investment minimum (“HLIM”), as applicable and (iv) compliance with the Liquidity Rule’s 15% limit on holdings of illiquid investments.
The Board of Trustees (the “Board”) of the Funds has designated Brown Advisory LLC (the “Adviser”), investment adviser to the Trust, to administer the Program. The Adviser has delegated the day-to-day management of the Program to its Investment Risk Management Committee (the “Committee”) which consists of representatives from various departments at the Adviser, including portfolio management, due diligence, trading, legal and compliance. Certain aspects of the Program rely on third parties to perform certain functions, including the provision of market data.
At the meeting of the Board on May 16, 2023, the Adviser provided a written report to the Board addressing the operations and effectiveness of the Program for the period from April 1, 2022 through March 31, 2023 (the “Reporting Period”) and specific liquidity events arising during the Reporting Period, including the impact on Fund liquidity caused by certain extended non-U.S. market closures. During the Reporting Period, each of the Funds qualified as a fund that primarily holds assets that are highly liquid investments and, therefore, no Fund was required to establish an HLIM. The report concluded that the Program is operating effectively to assess and manage each Fund’s Liquidity Risk and it was further reported that the Program continues to be reasonably designed to monitor and respond to the Funds’ liquidity developments, as applicable.
Please refer to your Fund’s prospectus for more information regarding the Fund’s exposure to Liquidity Risk and other risks to which it may be subject.
Board of Trustees Approval of the Adoption of the Investment Advisory Agreement for
the Brown Advisory Sustainable Value Fund (Unaudited)
The adoption of the Investment Advisory Agreement between the Trust, on behalf of the Brown Advisory Sustainable Value Fund (the “Fund”), and Brown Advisory LLC (“Brown Advisory” or the “Adviser”), was approved by the Board of Trustees during an in-person meeting of the Board held on November 2, 2022. In accordance with the Investment Company Act of 1940, the Board of Trustees was required to consider the approval of the initial adoption of the Investment Advisory Agreement at an in-person meeting. The relevant provisions of the Investment Company Act of 1940 specifically provide that it is the duty of the Board to request and evaluate such information as the Board determines is necessary to allow them to properly consider the approval of the adoption of the Investment Advisory Agreement, and it is the duty of the Adviser to furnish the Trustees with such information that is responsive to their request.
Accordingly, in determining whether to approve the adoption of the Investment Advisory Agreement between Brown Advisory and the Trust with respect to the Fund, the Board of Trustees requested, and the Adviser provided, information and data relevant to the Board’s consideration. This included materials prepared by the Adviser and by the Trust’s administrator that provided the Board with information regarding the investment performance of the Adviser with respect to the other Funds in the Trust, the investment performance of the Adviser with respect to its performance in the investment strategy to be used for the Fund, and the investment experience and background of the proposed portfolio manager for the Fund, as well as information regarding the estimated fees and expenses of the Fund, as compared to other similar mutual funds.
The Board initially considered matters with respect to the proposed establishment and organization of the Fund at a meeting of the Board held on September 13, 2022, in order to consider various matters with respect to the proposed approval of the Agreement. At this meeting, the Board reviewed with representatives of the Adviser various matters with respect to the proposed management and operation of the Fund, including the nature and extent of the duties and responsibilities of the Adviser with respect to the Fund, the compliance oversight process involving the Fund and its operations, and the proposed fees and expenses of the Fund. During this initial meeting, representatives of the Adviser made presentations to the Board regarding their proposal to provide investment advisory services to the Fund.
The Board then met again at a meeting of the Board of Trustees held on November 2, 2022 in order to consider matters with respect to the Fund and the members of the Board reviewed and considered the proposed approval of the adoption of the Investment Advisory Agreement. In addition, the Board also considered the adoption of an Expense Limitation Agreement with respect to the Fund which would limit the total operating expenses of the Fund through October 31, 2024, as well as a Business Management Agreement with Brown Advisory pursuant to which Brown Advisory would provide certain business management services to the Fund. At this meeting, representatives of the Adviser reviewed for the members of the Board their experience and background in managing the other Funds in the Trust, and they also reviewed information regarding the investment advisory process proposed to be followed with respect to the Fund. During this meeting, the Board engaged in a thorough review process in connection with determining whether to approve the adoption of the proposed Investment Advisory Agreement.
Following their consideration and review of these matters, the Trustees determined that the adoption of the Investment Advisory Agreement with the Adviser with respect to the Fund would enable shareholders of the Fund to obtain high quality services at a cost that is appropriate, reasonable, and in the best interests of the Fund and its shareholders. Accordingly, the Board, including a majority of the Independent Trustees, unanimously approved the Investment Advisory Agreement for the Fund. In reaching their decision, the Trustees requested and obtained from the Adviser such information as they deemed reasonably necessary to evaluate the Investment Advisory Agreement. The Trustees also carefully considered the projected profitability data and comparative fee, expense and performance information prepared by Trust management. In considering the adoption of the Investment Advisory Agreement with respect to the Fund, the Trustees evaluated a number of factors that they believed, in light of their reasonable business judgment, to be relevant. They based their decision on the following considerations, among others, although they did not identify any one specific consideration or any particular information that was controlling of their decision:
The nature, extent and quality of the advisory services to be provided. The Trustees concluded that Brown Advisory is capable of providing high quality services to the Fund, as indicated by the nature and quality of services provided in the past to the other Funds in the Trust, Brown Advisory’s management capabilities demonstrated with respect to the other Funds in the Trust, Brown Advisory’s investment and compliance oversight processes, and the competitive investment performance of the other Funds in the Trust. The Trustees also determined that Brown Advisory proposed to provide investment advisory services that were of the same quality as services provided to the other Funds in the Trust, and that these services are appropriate in scope and extent in light of the Fund’s proposed operations, the competitive landscape of the investment company business and investor needs. On the basis
Board of Trustees Approval of the Adoption of the Investment Advisory Agreement for
the Brown Advisory Sustainable Value Fund (Unaudited)
of the Trustees’ assessment of the nature, extent and quality of the advisory services to be provided by Brown Advisory, the Trustees concluded that Brown Advisory is capable of generating a level of long-term investment performance that is appropriate in light of the Fund’s investment objectives, policies and strategies and competitive with many other comparable investment companies.
The cost of advisory services to be provided and the expected level of profitability. On the basis of comparative information derived from the data that was included with the Board materials provided to the Board at their meeting, the Trustees determined that the overall projected expense ratios for each respective class of shares of the Fund are competitive with industry averages. The Trustees also noted that Brown Advisory had proposed a contractual commitment for the benefit of shareholders of the Fund to limit the Fund’s operating expenses through October 31, 2024. The Board also focused on Brown Advisory’s projected level of profitability with respect to the Fund, and noted that Brown Advisory’s expected level of profitability was acceptable and not unreasonable. Accordingly, on the basis of the Board’s review of the fees to be charged by Brown Advisory for investment advisory services, the investment advisory oversight services to be provided to the Fund by Brown Advisory, and the estimated level of profitability from Brown Advisory’s relationship with the Fund, the Board concluded that the level of investment advisory fees and Brown Advisory’s projected profitability are appropriate in light of the management fees, overall expense ratios and investment performance of comparable investment companies.
The extent to which economies of scale may be realized as the Fund grows and whether the advisory fees reflect possible economies of scale. While it was noted that the Fund’s investment advisory fees will not decrease as the Fund’s assets grow because they will not be subject to investment advisory fee breakpoints, the Trustees concluded that the Fund’s investment advisory fees are appropriate in light of the projected size of the Fund, and appropriately reflect the current economic environment for Brown Advisory and the competitive nature of the mutual fund market. The Trustees took into consideration that Brown Advisory has previously informed the Board that the Adviser has consistently attempted to set the investment advisory fees at a level that provides for economies of scale by being set at a starting point that is at a reasonable rate without necessarily requiring the imposition of breakpoints, which approach has been favorably recognized by relevant court decisions as one of the acceptable means of achieving economies of scale. The Trustees then noted that they will have the opportunity to periodically re-examine whether the Fund has achieved economies of scale, and the appropriateness of the investment advisory fees payable to Brown Advisory with respect to the Fund, in the future at which time the implementation of fee breakpoints on the Fund could be considered.
Benefits to Brown Advisory from its relationship with the Fund (and any corresponding benefits to the Fund). The Trustees concluded that other benefits that may be derived by Brown Advisory from its relationship with the Fund, including any potential “soft dollar” benefits in connection with the Fund’s brokerage transactions and use of the Fund’s performance track record in advertising materials, are reasonable and fair, and consistent with industry practice and the best interests of the Fund and its shareholders. In addition, the Trustees determined that the Fund will benefit from its relationship with Brown Advisory by virtue of Brown Advisory’s provision of business management and shareholder services, in addition to investment advisory services, at a cost to the Fund that is generally comparable to the costs of an outside service provider, which the Trustees determined to be reasonable, fair and in the best interests of the shareholders of the Fund in light of the nature and quality of the services to be provided and the necessity of the services for the Fund’s operations.
Other Considerations. In approving the Investment Advisory Agreement, the Trustees determined that Brown Advisory has made a substantial commitment to the recruitment and retention of high quality personnel, and maintains the financial, compliance and operational resources reasonably necessary to manage the Fund in a professional manner that is consistent with the best interests of the Fund and its shareholders. The Board also considered the nature of the oversight duties to be performed by Brown Advisory which include extensive investment management services, and the Board determined that the advisory fee fairly compensates Brown Advisory for the services that it is to perform pursuant to the Investment Advisory Agreement. The Trustees also concluded that Brown Advisory has made a significant entrepreneurial commitment to the management and success of the Fund, which entails a substantial financial and professional commitment, including the Expense Limitation Agreement under which Brown Advisory has undertaken to waive a portion of its fees to the benefit of the Fund’s shareholders to the extent necessary in accordance with the terms of the Expense Limitation Agreement. The Board also considered matters with respect to the brokerage practices of Brown Advisory, including its soft dollar arrangements and its best-execution procedures, and noted that these were reasonable and consistent with standard industry practice.
Board of Trustees Approval of the Adoption of the Investment Advisory Agreement for
the Brown Advisory Sustainable Value Fund (Unaudited)
The Board also considered various matters with respect to the proposed distribution and shareholder servicing arrangements applicable to the Fund and they considered the distribution fees and the non-distribution shareholder servicing fees payable with respect to certain of the share classes of the Fund, including certain of such fees which may be payable to the Adviser for the shareholder administrative services that it proposed to provide to shareholders of the Fund. The Board took note of the fact that the non-distribution related shareholder administrative fees payable to the Adviser are intended to compensate the Adviser for providing certain administrative services to those shareholders of the Fund covered by the applicable servicing arrangements in the relevant share classes.
The Board also took into consideration the nature and extent of the business management fees payable to Brown Advisory by the Fund pursuant to which Brown Advisory will provide certain business management services to the Fund, which the Board approved based upon a finding that the business management fees to be charged are fair and reasonable in light of the usual and customary charges made by others for services of the same nature and quality and based upon the level and quality of business management services provided by Brown Advisory to the other Funds in the Trust.
In connection with the Fund’s sustainable-related investment strategy, the Trustees reviewed with the Adviser the efforts that the Adviser has taken in response to various regulatory developments relating to the Securities and Exchange Commission’s ongoing monitoring and oversight of various types of investment strategies and practices relating to ESG-related and sustainable-related investment practices, including with respect to marketing and disclosure in connection with such investment strategies and practices, and the Trustees considered the extensive resources that the Adviser has devoted to its sustainable investing business and to its compliance oversight operations that are related to its sustainable investing business.
It was noted that in making their determination, the Trustees had considered and relied upon the materials provided to them at the Board meeting with respect to the proposed contract and the presentations of the representatives of Brown Advisory. In reaching their conclusion with respect to the approval of the adoption of the Investment Advisory Agreement and the level of fees to be paid under the Agreement, the Trustees did not identify any one single factor as being controlling, rather, the Trustees took note of a combination of factors that had influenced their decision making process. They noted the level and quality of investment advisory services provided by Brown Advisory to each of the other Funds in the Trust, and they found that these services will benefit the Fund and its shareholders and also reflected management’s overall commitment to the growth and development of the Fund.
Trustees and Executive Officers
The Board is responsible for the overall management of the Trust, including general supervision and review of the investment activities of the Funds. The Board, in turn, elects the Officers of the Trust, who are responsible for administering the day-to-day operations of the Trust and each of the Funds. The current Trustees and Officers of the Trust, their ages and positions with the Trust, term of office with the Trust and length of time served, their principal occupations for the past five years and other directorships held during the past five years are set forth in the table below.
Additional information about the Trustees of the Trust can be found in the Statement of Additional Information, which is available, without charge, upon request, by calling Brown Advisory Funds toll free at 1-800-540-6807 or by accessing our website at www.brownadvisory.com/mf/how-to-invest.
| | | | | Number of | Other |
| | | Term of | | Portfolios in | Directorships |
| | | Office and | | Fund Complex | Held During |
| Name, Age | Position with | Length of | Principal Occupation(s) | Overseen by | the Past |
| and Address | the Trust | Time Served | During Past 5 Years | Trustees | 5 Years(2) |
Independent Trustees of the Trust(1) | | | | |
Georgette D. Kiser | Trustee | Indefinite Term; | Operating Executive, The Carlyle Group | 20 | Aflac, Inc. (insurance |
Age: 55 | | Since November | (investment management firm) (since 2018); | | firm); Jacobs Engineering |
c/o Brown Advisory LLC | | 2021 | Chief Information Officer, The Carlyle Group | | Group Inc. (technical |
901 South Bond Street | | | (2015 to 2018); formerly, Vice President and | | professional and |
Suite 400 | | | Head of Enterprise Solutions and Capabilities, | | consulting services |
Baltimore, MD 21231 | | | T. Rowe Price Associates, Inc. (investment | | firm); NCR Corp. |
| | | | management firm) (2012 to 2015) and executive | | (enterprise technology |
| | | | officer, various positions, T. Rowe Price | | firm); Adtalem Global |
| | | | Associates, Inc. (1996 to 2012). | | Education Inc. |
| | | | | | (workforce solutions |
| | | | | | firm). |
Henry H. Hopkins | Trustee | Indefinite Term; | Retired; Formerly, Vice President and Chief | 20 | None. |
Age: 80 | | Since 2012 | Legal Counsel, T. Rowe Price Associates, Inc. | | |
c/o Brown Advisory LLC | | Indefinite Term; | (investment management firm) (1998 to 2008). | | |
901 South Bond Street | | Since 2015 | | | |
Suite 400 | | | | | |
Baltimore, MD 21231 | | | | | |
Kyle Prechtl Legg | Trustee | Indefinite Term; | Retired; Formerly President and Chief Executive | 20 | Director, SunTrust |
Age: 71 | | Since 2012 | Officer, Legg Mason Capital Management, LLC | | Banks, Inc. (bank |
c/o Brown Advisory LLC | | | (investment management firm) (2006 to 2009). | | holding company) |
901 South Bond Street | | | | | (2011 to 2018); |
Suite 400 | | | | | Director, BrightSphere |
Baltimore, MD 21231 | | | | | Investment Group |
| | | | | | plc (asset management |
| | | | | | holding company) |
| | | | | | (2014 to 2018). |
Thomas F. O’Neil III | Chairman | Indefinite Term; | Managing Director, Berkeley Research Group
| 20 | None. |
Age: 66 | and | Since 2012 | (global management counsulting firm) (since 2021). | | |
c/o Brown Advisory LLC | Trustee | | Governance and Compliance Adviser | | |
901 South Bond Street | | | (healthcare, financial services and retail | | |
Suite 400 | | | businesses). Formerly, Global Chief Compliance | | |
Baltimore, MD 21231 | | | Officer, Cigna Corporation (health services | | |
| | | | company) (2016 to 2020). Formerly, President, | | |
| | | | The Saranac Group LLC (strategic consulting | | |
| | | | firm) (2010 to 2016). | | |
Neal F. Triplett, CFA | Trustee | Indefinite Term; | President, DUMAC, Inc. (university endowment | 20 | None. |
Age: 52 | | Since 2012 | investment organization) (since 1999). | | |
c/o Brown Advisory LLC | | | | | |
901 South Bond Street | | | | | |
Suite 400 | | | | | |
Baltimore, MD 21231 | | | | | |
Trustees and Executive Officers
| | | | | Number of | Other |
| | | Term of | | Portfolios in | Directorships |
| | | Office and | | Fund Complex | Held During |
| Name, Age | Position with | Length of | Principal Occupation(s) | Overseen by | the Past |
| and Address | the Trust | Time Served | During Past 5 Years | Trustees | 5 Years(2) |
| Interested Trustees and Officers of the Trust |
Michael D. Hankin(3) | Trustee | Indefinite Term | President and Chief Executive Officer, Brown | 20 | Stanley Black & |
Age: 65 | | Since 2012 | Advisory Incorporated and affiliates (investment | | Decker, Inc. (industrial |
c/o Brown Advisory | | | management firm) (since 1993). | | tools and hardware) |
Incorporated | | | | | (since 2016). |
901 South Bond Street | | | | | |
Suite 400 | | | | | |
Baltimore, MD 21231 | | | | | |
Margaret W. | Trustee | Indefinite Term; | Managing Director, Membership Engagement, | 20 | None |
Adams, CAIA(4) | | Since March | FCLTGlobal (non-profit organization focused | | |
Age: 61 | | 2023 | on innovative global investment-related | | |
c/o Brown Advisory LLC | | | initiatives) (since 2018); formerly, Partner | | |
901 South Bond Street | | | and Senior Managing Director, Wellington | | |
Suite 400 | | | Management Company LLP (institutional | | |
Baltimore, MD 21231 | | | investment management firm) (2006-2017) | | |
Paul J. Chew | President/ | Indefinite Term; | Chief Investment Officer, Brown Advisory | Not | Not |
Age: 57 | Principal | Since October 2018 | Incorporated and affiliates (investment | Applicable. | Applicable. |
c/o Brown Advisory | Executive | | management firm) (since 1995). | | |
Incorporated | Officer | | | | |
901 South Bond Street | | | | | |
Suite 400 | Senior Vice | 2016 to | | | |
Baltimore, MD 21231 | President | October 2018 | | | |
Carey E. Buxton | Vice | Indefinite Term; | Head of Sustainable Investing Business | Not | Not |
Age: 35 | President | Since 2015 | (since 2020); Chief Operating Officer, | Applicable. | Applicable. |
c/o Brown Advisory | | | Institutional Investing (since 2018); | | |
Incorporated | | | Product Manager, Brown Advisory | | |
901 South Bond Street | | | Incorporated and affiliates (investment | | |
Suite 400 | | | management firm) (2013 to 2018). | | |
Baltimore, MD 21231 | | | | | |
Nicole Nesbitt | Vice | Indefinite Term; | Head of U.S. Institutional Sales and Client | Not | Not |
Age: 52 | President | Since November | Service (since 2018); Head of Institutional | Applicable. | Applicable. |
c/o Brown Advisory | | 2022 | Relationship Management, Brown Advisory | | |
Incorporated | | | Incorporated and affiliates (investment | | |
901 South Bond Street | | | management firm) (2008 to 2018) | | |
Suite 400 | | | | | |
Baltimore, MD 21231 | | | | | |
Jason T. Meix | Treasurer/ | Indefinite Term; | Vice President, U.S. Bancorp Fund | Not | Not |
Age: 44 | Principal | Since 2012 | Services, LLC (fund administrative services firm) | Applicable. | Applicable. |
c/o Brown Advisory LLC | Financial | | (since 2008). | | |
901 South Bond Street | Officer | | | | |
Suite 400 | | | | | |
Baltimore, MD 21231 | | | | | |
Edward L. Paz | Secretary | Indefinite Term; | Vice President and Counsel, U.S. Bancorp Fund | Not | Not |
Age: 52 | | Since 2012 | Services, LLC (fund administrative services firm) | Applicable. | Applicable. |
c/o Brown Advisory LLC | | | (since 2007). | | |
901 South Bond Street | | | | | |
Suite 400 | | | | | |
Baltimore, MD 21231 | | | | | |
Trustees and Executive Officers
| | | | | Number of | Other |
| | | Term of | | Portfolios in | Directorships |
| | | Office and | | Fund Complex | Held During |
| Name, Age | Position with | Length of | Principal Occupation(s) | Overseen by | the Past |
| and Address | the Trust | Time Served | During Past 5 Years | Trustees | 5 Years(2) |
Brett D. Rogers | Chief | Indefinite Term; | General Counsel and Chief Compliance | Not | Not |
Age: 47 | Compliance | Since 2012 | Officer, Brown Advisory Incorporated and | Applicable. | Applicable. |
c/o Brown Advisory | Officer | | affiliates (investment management firm) | | |
Incorporated | | | (since 2009). | | |
901 South Bond Street | Anti-Money | Indefinite Term: | | | |
Suite 400 | Laundering | Since 2012 | | | |
Baltimore, MD 21231 | Officer | | | | |
(1) | The Trustees of the Trust who are not “interested persons” of the Trust as defined in the 1940 Act (“Independent Trustees”). |
(2) | The directorships disclosed in this column include only the directorships of those companies that a Trustee serves on that are required to report to the SEC under applicable Federal securities laws including publicly traded corporations that are registered with the SEC under the 1934 Act and investment companies that are registered with the SEC under the 1940 Act, and it therefore excludes various other types of directorships that the Trustees of the Trust may currently hold in other types of organizations, including private companies and not-for-profit organizations, which are expressly excluded from the disclosure requirements for mutual fund board members. |
(3) | Mr. Hankin is considered an “interested person” of the Trust, as defined in the 1940 Act, because of his current position with Brown Advisory Incorporated, the parent company of the Adviser, and Mr. Hardiman is considered an “interested person” of the Trust, as defined in the 1940 Act, because of his previous position with Brown Advisory Incorporated. |
(4) | Ms. Adams is considered an “interested person” of the Trust, as defined in the Investment Company Act of 1940, as amended (the “1940 Act”) because of the financial interest that she currently has in Wellington Management Company LLP (“Wellington”), a Sub-Adviser to two of the series in the Trust, as the result of certain payments that she is entitled to receive from Wellington as the result of her previous employment with the firm. Ms. Adams has not been employed by Wellington during the past five years. |
Information About Proxy Voting (Unaudited)
A description of the policies and procedures that the Funds use to determine how to vote proxies relating to portfolio securities is available without charge upon request by calling toll-free at (800) 540-6807 and by accessing the Funds’ website at www.brownadvisory.com/mf/how-to-invest (refer to Appendix B in the Statement of Additional Information). Furthermore, you can obtain the description on the SEC’s website at www.sec.gov.
Information regarding how the Funds voted proxies relating to portfolio securities during the year ended June 30 is available without charge, by calling toll-free at (800) 540-6807. In addition, you can obtain the Funds’ proxy voting records on the SEC’s website at www.sec.gov.
Information About the Portfolio Holdings (Unaudited)
The Funds file their complete schedule of portfolio holdings for their first and third fiscal quarters with the SEC on Form N-PORT. The Funds’ Form N-PORT is available without charge, upon request, by calling toll-free at (800) 540-6807. Furthermore, you can obtain the Form N-PORT on the SEC’s website at www.sec.gov. The Funds’ schedules of portfolio holdings are posted on their website at www.brownadvisory.com/mf/how-to-invest within ten business days after calendar quarter end.
Householding (Unaudited)
In an effort to decrease costs, the Funds will reduce the number of duplicate Prospectuses and annual and semi-annual reports that you receive by sending only one copy of each to those addresses shown by two or more accounts. Please call the Transfer Agent toll free at (800) 540-6807 to request individual copies of these documents. The Funds will begin sending individual copies 30 days after receiving your request. This policy does not apply to account statements.
Federal Tax Status of Dividends Declared during the Tax Year (Unaudited)
For Federal Income Tax purposes, distributions from short-term capital gains are classified as ordinary income. The percentage of ordinary income distributions designated as qualifying for the corporate dividend received deduction (“DRD”), the individual qualified dividend rate (“QDI”), the qualifying interest income exempt from U.S. tax for foreign shareholders (“QII”) and the qualifying short-term capital gain distributions exempt from U.S. tax for foreign shareholders (“QSTCG”) is presented below:
| | Income Distributions | | | | | | | | | | | | | | | | |
Fund | Exempt from Federal Tax | | | QDI | | | DRD | | | QII | | | QSTCG |
Growth Equity | | 0.00 | % | | | 0.00 | % | | | 0.00 | % | | | 0.00 | % | | | 0.00 | % |
Flexible Equity | | 0.00 | % | | | 100.00 | % | | | 0.00 | % | | | 0.00 | % | | | 0.00 | % |
Equity Income | | 0.00 | % | | | 100.00 | % | | | 0.00 | % | | | 0.00 | % | | | 0.00 | % |
Sustainable Growth | | 0.00 | % | | | 100.00 | % | | | 0.00 | % | | | 0.00 | % | | | 0.00 | % |
Mid-Cap Growth | | 0.00 | % | | | 0.00 | % | | | 10.00 | % | | | 0.00 | % | | | 0.00 | % |
Small-Cap Growth | | 0.00 | % | | | 0.00 | % | | | 0.00 | % | | | 0.00 | % | | | 0.00 | % |
Small-Cap Fundamental Value | | 0.00 | % | | | 100.00 | % | | | 0.00 | % | | | 0.00 | % | | | 0.00 | % |
Sustainable Small-Cap Core | | 0.00 | % | | | 100.00 | % | | | 0.00 | % | | | 0.00 | % | | | 0.00 | % |
Sustainable Value | | 0.00 | % | | | 0.00 | % | | | 0.00 | % | | | 0.00 | % | | | 0.00 | % |
Global Leaders | | 0.00 | % | | | 32.19 | % | | | 0.00 | % | | | 19.97 | % | | | 0.00 | % |
Sustainable International Leaders | | 0.00 | % | | | 0.00 | % | | | 0.00 | % | | | 0.00 | % | | | 0.00 | % |
Intermediate Income | | 0.00 | % | | | 0.00 | % | | | 100.00 | % | | | 0.00 | % | | | 0.00 | % |
Sustainable Bond | | 0.00 | % | | | 0.00 | % | | | 100.00 | % | | | 0.00 | % | | | 0.00 | % |
Maryland Bond | | 97.02 | % | | | 0.00 | % | | | 100.00 | % | | | 0.00 | % | | | 97.02 | % |
Tax-Exempt Bond | | 92.06 | % | | | 0.00 | % | | | 100.00 | % | | | 0.00 | % | | | 92.06 | % |
Tax-Exempt Sustainable Bond | | 94.19 | % | | | 0.00 | % | | | 100.00 | % | | | 0.00 | % | | | 94.19 | % |
Mortgage Securities | | 0.00 | % | | | 0.00 | % | | | 100.00 | % | | | 0.00 | % | | | 0.00 | % |
WMC Strategic European Equity | | 0.00 | % | | | 0.00 | % | | | 0.00 | % | | | 0.00 | % | | | 0.00 | % |
Emerging Markets Select | | 0.00 | % | | | 1.64 | % | | | 0.00 | % | | | 0.00 | % | | | 0.00 | % |
Beutel Goodman Large-Cap Value | | 0.00 | % | | | 76.70 | % | | | 0.00 | % | | | 17.68 | % | | | 0.00 | % |
The Funds, as applicable, intend to elect to pass through to shareholders the credit for taxes paid to foreign countries. Such credits for taxes paid to foreign countries will be included in shareholders’ Form 1099-DIV.
BROWN ADVISORY FUNDS
At Brown Advisory, we believe that you deserve frank and open communication on all aspects of our relationship. In this spirit, we provide this annual summary of our policies relating to confidentiality and privacy of client information, mutual funds, conflicts of interest, trading commissions, proxy voting and Form ADV annual notice.
CONFIDENTIALITY AND PRIVACY POLICY
Brown Advisory takes the confidentiality of your personal information and the privacy of your account very seriously. Our commitment to safeguard your personal information goes beyond our legal obligation to process your transactions accurately and securely. Whether we serve you online, in person, on the telephone or by mail, the principles that guide the way in which we conduct business are built upon the core values of trust and integrity.
We limit access to your personal information to only those employees with a business reason to know such information. We train and consistently remind all employees to respect client privacy and to recognize the importance of the confidentiality of such information. Those who violate our privacy policy are subject to disciplinary action. This commitment also applies to the sharing of information among Brown Advisory and its affiliates.
We maintain physical, electronic and procedural safeguards that comply with applicable laws and regulations to protect your personal information, including various measures to protect your personal information while it is stored electronically.
Federal law requires us to inform you that we have on record personal information about you and that we obtain such information from you directly (e.g., information you provide to us on account applications and other forms, such as your name, address, social security number, occupation, assets and income) and indirectly (e.g., information on our computer systems about your transactions with us, such as your account balance and account holdings). Any personal information you choose to provide is kept confidential and allows us to: (i) provide better and more complete investment and strategic advice; (ii) develop new services that meet additional needs you may have; and, (iii) comply with legal and regulatory requirements.
In addition, in the normal conduct of our business, it may become necessary for us to share information relating to our clients that we have on record, as described above, with companies not affiliated with us who are under contract to perform services on our behalf. For example, we have contracted with companies to assist us in complying with anti-terrorist and anti-money laundering statutory requirements (including the identification and reporting of activities that may involve terrorist acts or money laundering activities), companies that provide clearing services, and other vendors that provide services directly related to your account relationship with us. Our agreements with these companies require that they keep your information confidential and not use such information for any unrelated purpose.
We do not sell information about you to third parties, and we do not otherwise disclose information to third parties without your permission or unless required by law.
(This Page Intentionally Left Blank.)
INVESTMENT ADVISER
Brown Advisory LLC
901 South Bond Street, Suite 400
Baltimore, MD 21231
www.brownadvisory.com
DISTRIBUTOR
ALPS Distributors, Inc.
1290 Broadway, Suite 1000
Denver, CO 80203
CUSTODIAN
U.S. Bank, N.A.
Custody Operations
1555 North Rivercenter Drive, Suite 302
Milwaukee, WI 53212
TRANSFER AGENT
U.S. Bank Global Fund Services
P.O. Box 701
Milwaukee, WI 53201-0701
(800) 540-6807
INDEPENDENT REGISTERED PUBLIC
ACCOUNTING FIRM
Tait, Weller & Baker LLP
Two Liberty Place
50 South 16th Street, Suite 2900
Philadelphia, PA 19102
LEGAL COUNSEL
Dechert LLP
1900 K Street, NW
Washington, DC 20006
| | Institutional Shares
| Investor Shares
| Advisor Shares
|
| | Symbol | CUSIP | Symbol | CUSIP | Symbol | CUSIP |
Growth Equity Fund | BAFGX | 115233702 | BIAGX | 115233504 | BAGAX | 115233603 |
Flexible Equity Fund | BAFFX | 115233843 | BIAFX | 115233868 | BAFAX | 115233850 |
Equity Income Fund | BAFDX | 115233660 | BIADX | 115233686 | BADAX | 115233678 |
Sustainable Growth Fund | BAFWX | 115233207 | BIAWX | 115233306 | BAWAX | 115233405 |
Mid-Cap Growth Fund | BAFMX | 115233413 | BMIDX | 115233439 | — | — |
Small-Cap Growth Fund | BAFSX | 115233819 | BIASX | 115233835 | BASAX | 115233827 |
Small-Cap Fundamental Value Fund | BAUUX | 115233777 | BIAUX | 115233793 | BAUAX | 115233785 |
Sustainable Small-Cap Core Fund | BAFYX | 115233298 | BIAYX | 115233280 | — | —- |
Sustainable Value Fund | BASVX | 115233256 | BISVX | 115233249 | — | —- |
Global Leaders Fund | BAFLX | 115233355 | BIALX | 115233462 | — | — |
Sustainable International Leaders Fund | BAILX | 115233272 | BISLX | 115233264 | — | — |
Intermediate Income Fund | — | — | BIAIX | 115233744 | BAIAX | 115233736 |
Sustainable Bond Fund | BAISX | 115233389 | BASBX | 115233447 | — | — |
Maryland Bond Fund | — | — | BIAMX | 115233751 | — | — |
Tax-Exempt Bond Fund | BTEIX | 115233371 | BIAEX | 115233108 | — | — |
Tax-Exempt Sustainable Bond Fund | — | — | BITEX | 115233348 | — | — |
Mortgage Securities Fund | BAFZX | 115233546 | BIAZX | 115233587 | — | — |
WMC Strategic European Equity Fund | BAFHX | 115233629 | BIAHX | 115233611 | BAHAX | 115233595 |
Emerging Markets Select Fund | BAFQX | 115233652 | BIAQX | 115233645 | BAQAX | 115233637 |
Beutel Goodman Large-Cap Value Fund | BVALX | 115233421 | BIAVX | 115233314 | — | — |
This report is submitted for the general information of the shareholders of each Fund. It is not authorized for distribution to prospective investors unless preceded or accompanied by an effective prospectus, which includes information regarding the Funds’ risks, objectives, fees and expenses, experience of their management, and other information.
BX-ANNUAL