Filed by LinnCo, LLC and Linn Energy, LLC
Commission File Nos. 001-35695 and 000-51719
Pursuant to Rule 425 Under the Securities Act of 1933
And Deemed Filed Pursuant to Rule 14a-12
Under the Securities Exchange Act of 1934
Subject Company: Berry Petroleum Company
Commission File No. 001-09735
 RBC Capital Markets MLP Conference Dallas, Texas November 21, 2013 |
 Forward-Looking Statements and Risk Factors Statements made in these presentation slides and by representatives of LINN Energy, LLC and LinnCo, LLC (collectively the “Company”) during the course of this presentation that are not historical facts are forward-looking statements. These statements are based on certain assumptions and expectations made by the Company which reflect management’s experience, estimates and perception of historical trends, current conditions, anticipated future developments, potential for reserves and drilling, completion of current and future acquisitions, future distributions, future growth, benefits of acquisitions, future competitive position and other factors believed to be appropriate. Such statements are subject to a number of assumptions, risks and uncertainties, many of which are beyond the control of the Company, which may cause actual results to differ materially from those implied or anticipated in the forward- looking statements. These include risks relating to financial performance and results, indebtedness under LINN Energy’s credit facility and Senior Notes, access to capital markets, availability of sufficient cash flow to pay distributions and execute our business plan, prices and demand for natural gas, oil and natural gas liquids, LINN Energy’s ability to replace reserves and efficiently develop LINN Energy’s current reserves, LINN Energy’s ability to make acquisitions on economically acceptable terms, regulation, availability of connections and equipment and other important factors that could cause actual results to differ materially from those anticipated or implied in the forward-looking statements. See “Risk Factors” in LINN Energy’s 2012 Annual Report on Form 10-K, Forms 10-Q, Registration Statement on Form S-4, each as amended, and any other public filings. We undertake no obligation to publicly update any forward-looking statements, whether as a result of new information or future events. The market data in this presentation has been prepared as of November 4, 2013, except as otherwise noted. |
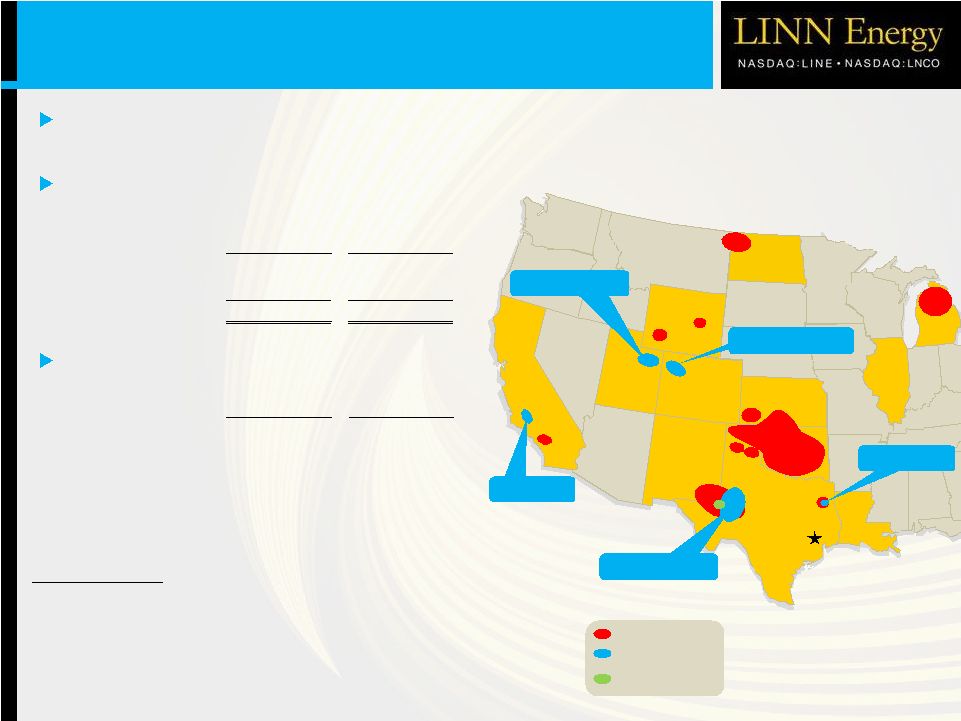 3 LINN Operations Berry Operations LINN Overview Corporate Headquarters (Houston) NM TX KS IL LA MI ND OK CA East Texas WY UT CO California Uinta Basin Piceance Basin Permian Basin East Goldsmith Field Acquisition LINN Energy IPO in 2006 with initial enterprise value of ~$713 million Completed or announced 60 transactions for ~$15 billion (1) Large, long-life diversified reserve base ($ in billions) Current (2) PF Berry (2)(3) Equity market cap $7.5 $10.7 Total net debt 7.0 8.8 Enterprise value $14.5 $19.5 Note: Market data as of November 4, 2013 (LINE and LNCO closing prices of $31.80 and $33.36 respectively). Unless noted otherwise, all operational and reserve data as of December 31, 2012. Estimates of proved reserves for the East Goldsmith Field acquisition were calculated as of the effective date of the acquisition using forward strip oil and natural gas prices, which differ from estimates calculated in accordance with SEC rules and regulations. Estimates of proved reserves for the East Goldsmith Field acquisition based solely on data provided by seller. (1) Includes pending Berry transaction and 15 acquisitions comprising the Appalachian Basin properties sold in July 2008. (2) Pro forma for the East Goldsmith Field acquisition and $500 million term loan facility. (3) Pro forma for pending merger with Berry Petroleum (“Berry”), which remains subject to closing conditions, including shareholder and unitholder approval. (4) Pro forma for the East Goldsmith Field acquisition and Panther divestiture. (5) Well count does not include ~2,500 royalty interest wells. ($ in billions) Current (4) PF Berry (3)(4) Total proved reserves ~5.0 Tcfe ~6.6 Tcfe % proved developed 64% 62% % liquids 47% 54% Reserve life-index ~17 years ~17 years Gross productive wells (5) ~16,000 ~19,000 |
 MLP and Independent E&P Rankings Note: Market data as of November 4, 2013 (LINE closing price of $31.80). Source: Bloomberg. (1) Pro forma for pending Berry transaction, which remains subject to closing conditions, including shareholder and unitholder approvals. LINN is one of the largest MLP and independent E&P companies 7 th largest public MLP / LLC (1) 12 th largest domestic independent oil & natural gas company (1) 4 Rank Master Limited Partnership Enterprise Value ($MM) Rank Independent E&P Enterprise Value ($MM) 1. Enterprise Products Partners $76,272 1. ConocoPhillips $107,892 2. Kinder Morgan Energy Partners $56,267 2. Occidental Petroleum Corp. $82,744 3. Energy Transfer Equity $56,048 3. Anadarko Petroleum Corp. $59,803 4. Energy Transfer Partners $46,065 4. EOG Resources Inc. $54,972 5. Williams Partners $31,313 5. Apache Corp. $44,858 6. Plains All American Pipeline $25,659 6. Chesapeake Energy Corp. $36,157 7. Linn Energy LLC (PF Berry) (1) $19,460 7. Devon Energy Corporation $31,919 8. ONEOK Partners $17,932 8. Pioneer Natural Resources Co. $31,856 9. Enbridge Energy Partners $16,713 9. Marathon Oil Corporation $31,540 10. Magellan Midstream Partners $15,060 10. Noble Energy Inc. $30,817 11. Markwest Energy Partners $14,843 11. Continental Resources Inc. $26,421 12. Cheniere Energy Partners $14,712 12. Linn Energy LLC (PF Berry) (1) $19,460 13. LINN Energy LLC $14,534 13. Cabot Oil & Gas Corp. $15,949 14. Access Midstream Partners $13,964 14. EQT Corp. $15,879 15. El Paso Pipeline Partners $13,012 15. Range Resources Corp. $15,583 16. Boardwalk Pipeline Partners $11,299 16. Concho Resources Inc. $15,434 17. Western Gas Equity Partners $10,894 17. Southwestern Energy Co. $15,207 18. Sunoco Logistics Partners $9,645 18. LINN Energy LLC $14,534 19. Buckeye Partners $9,601 19. Murphy Oil Corp. $12,749 20. Regency Energy Partners $9,289 20. Denbury Resources Inc. $10,486 21. Spectra Energy Partners $9,080 21. Cimarex Energy Co. $10,065 22. Targa Resources Partners $8,542 22. Whiting Petroleum Corp. $9,949 23. Western Gas Partners $8,260 23. QEP Resources Inc. $9,255 24. Atlas Energy LP $7,657 24. Cobalt International Energy $9,216 25. Amerigas Partners $6,585 25. MDU Resources Group Inc. $7,793 |
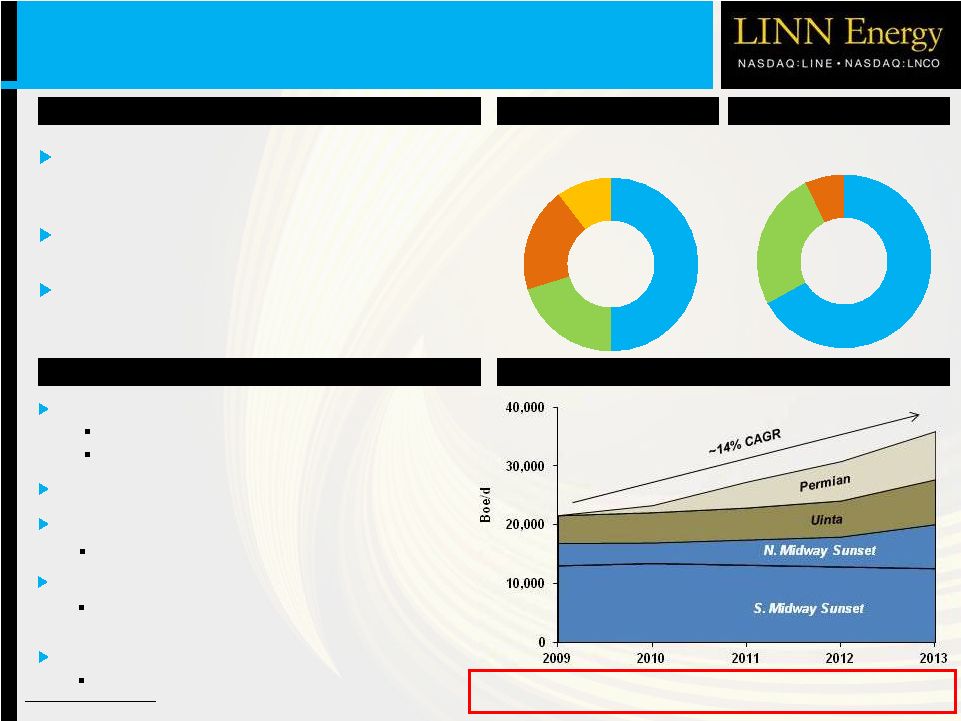 Pending Berry Transaction Overview (1) Reserve estimates for pending Berry transaction based solely on data provided by seller. Proved Reserves Q3'13 Production ~41 MBoe/d ~1.65 Tcfe Berry’s Margin and Oil Production Growth Transaction Update The final Registration Statement on Form S-4 was declared effective by the SEC on November 14, 2013 Unitholder / shareholder meetings scheduled for December 16, 2013 Valued at ~$4.9 billion, including debt Transaction Highlights Oil 67% Natural Gas 26% NGLs 7% California 50% Permian 20% Uinta 20% East TX and Piceance 10% $30 $36 $45 $49 $49 Margin $ / BOE Long-life, low-decline, mature assets Increases LINN’s production by ~30% Increases LINN’s liquids exposure Dominant California position Significant additional resources ~15% decline rate Reserve life of >18 years Berry’s reserves are ~75% liquids Upon closing, LINN will be the 5th largest producer in California Probable and possible reserves total ~3.8 Tcfe |
 6 First ever acquisition of a public C-Corp. by an upstream LLC or MLP Structure allows for: Tax free transaction to Berry shareholders LINN to acquire Berry (C-Corp.) and convert it into an LLC with no immediate payment of tax Provides LINN with the financial flexibility to consider merging with both private and public C-Corps. Financial Highlights Expected to be accretive to cash available for distribution Potential for additional operational synergies All stock consideration and greatly increased size result in significantly improved debt metrics Pending Berry Transaction Highlights o Accretion expected to increase in subsequent years |
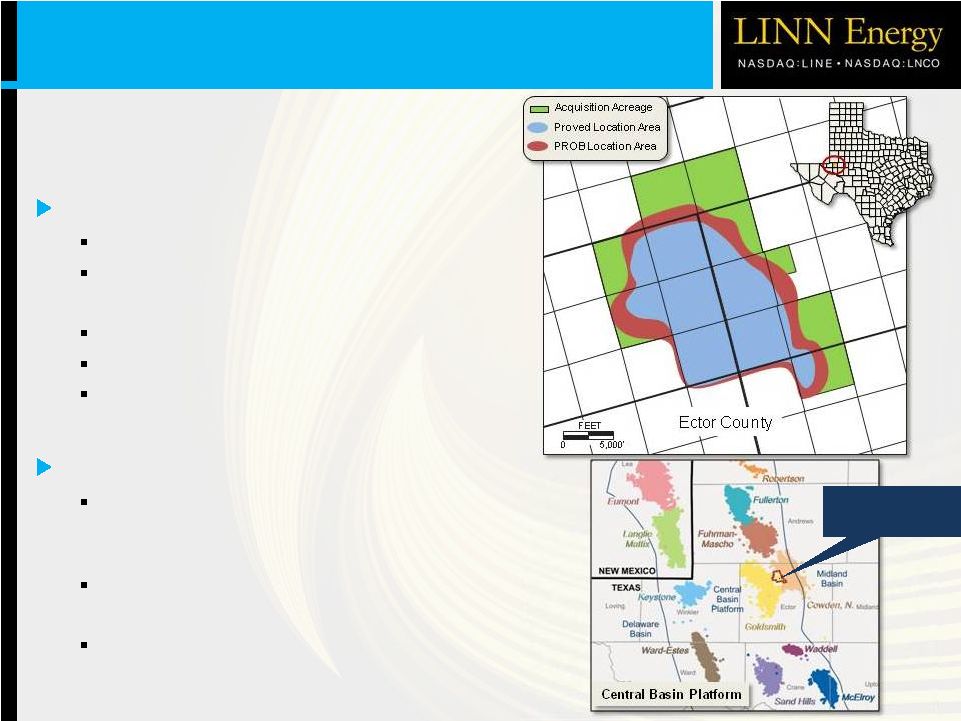 Asset Overview Net production ~4,800 Boe/d Proved reserves of ~30 MMBoe (~70% oil) o Large infill drilling inventory Reserves-to-production ratio of ~17 years ~98% operated working interest 124 producing wells on 6,250 net acres o Majority held by production Platform for Growth Expect to drill ~300 wells over the next 4-5 years o Proven downspacing from 40 acres to 10 acres Future Clearfork waterflood o Additional reserve potential of ~24 MMBoe CO 2 flood potential in Glorieta, San Andres and Holt intervals 7 East Goldsmith Field – $525 million acquisition of properties located in the Central Basin Platform of the Permian Basin closed on October 31. East Goldsmith Field Acquisition East Goldsmith Area |
 LINN Operational Update 8 Granite Wash 8 rigs drilling in the region o 2 rigs targeting the Hogshooter interval in the Mayfield area of western Oklahoma o 6 rigs focused on developing high-return, liquids-rich opportunities in the Texas Panhandle 12 Hogshooter wells producing in the Mayfield area with gross average IP rates of ~3,800 Boe/d (~74% liquids) Permian Basin 4 rigs drilling vertical Wolfberry wells Drilled 68 wells YTD 2013 and have reduced costs by ~15% Potential for horizontal Wolfcamp and Spraberry o Expect to participate in 4 non-operated horizontal Wolfcamp wells beginning in Q4 o Expect to spud 1 operated horizontal Wolfcamp well in late 2013 or early 2014 Jonah Field 2 rigs drilling in the region Expect to participate in 19 operated and non-operated wells, with an additional 24 wells expected to be drilling or awaiting completion by year-end Hugoton Field Commenced 1-rig drilling program in Q2’13 ~400 potential drilling locations and plan to drill ~80 wells next year Identified a significant number of locations to sustain program for the next ~5 years |
 LinnCo Structure – Advantages 9 Shareholders receive Form 1099 rather than a Schedule K-1 No state income tax filing requirements No UBTI (1) implications Reduces Tax Reporting Burdens Estimated tax at LinnCo (2) o $0.00 per share for 2013 o $0.01 per share for 2014 o $0.07 per share for 2015 Efficient Tax Structure (1) Unrelated business taxable income. (2) Includes pending Berry merger and assumes current strip prices and estimated capital spending. Simple & Fair Structure 1 LinnCo share = 1 vote of LINN unit Similar economic interest |
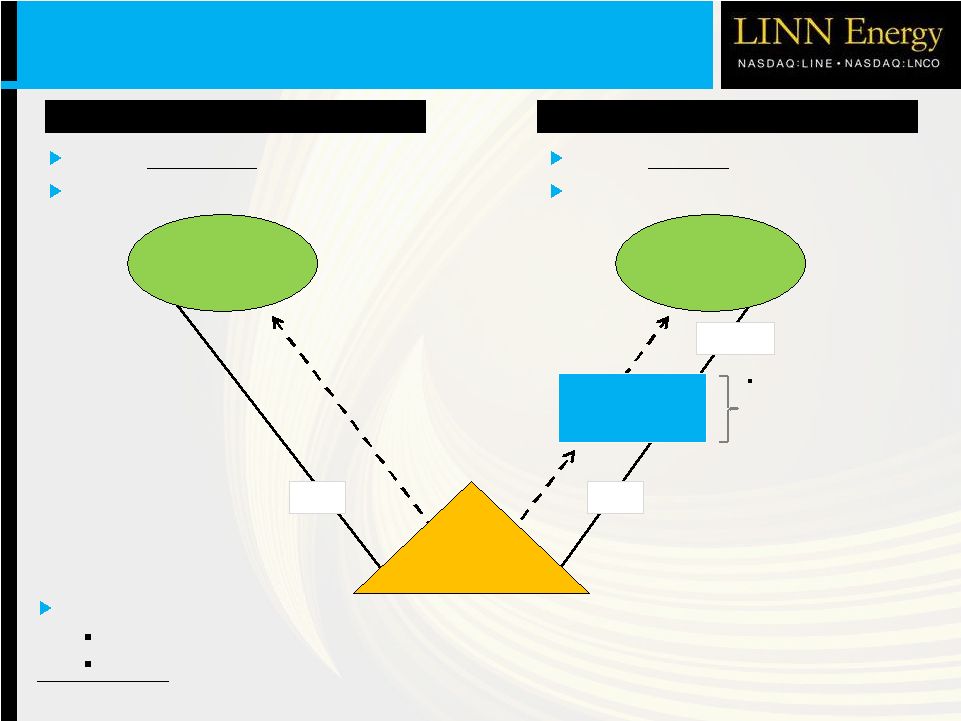 LinnCo Structure 10 LINE Unitholders LLC Units LNCO Shareholders LinnCo Common Shares Current distribution of $2.90 / unit (1) Schedule K-1 (partnership) LINE LNCO Current dividend of $2.90 / share (2) Form 1099 (C-Corp.) LLC Units Investors now have the ability to own LINN Energy two ways: LINE (Partnership for tax purposes / K-1) LNCO (C-Corp. for tax purposes / 1099) Tax liability to LinnCo on LINN Energy’s distribution estimated to be $0.00, $0.01 and $0.07 per share for 2013, 2014 and 2015, respectively (3) $2.90 Distribution $2.90 Distribution $2.90 Dividend (1) Represents the current annualized cash distribution of $2.90 per unit. (2) Represents the current annualized cash dividend of $2.90 per share. (3) Includes pending Berry merger and assumes current strip prices and estimated capital spending. LINN Energy, LLC |
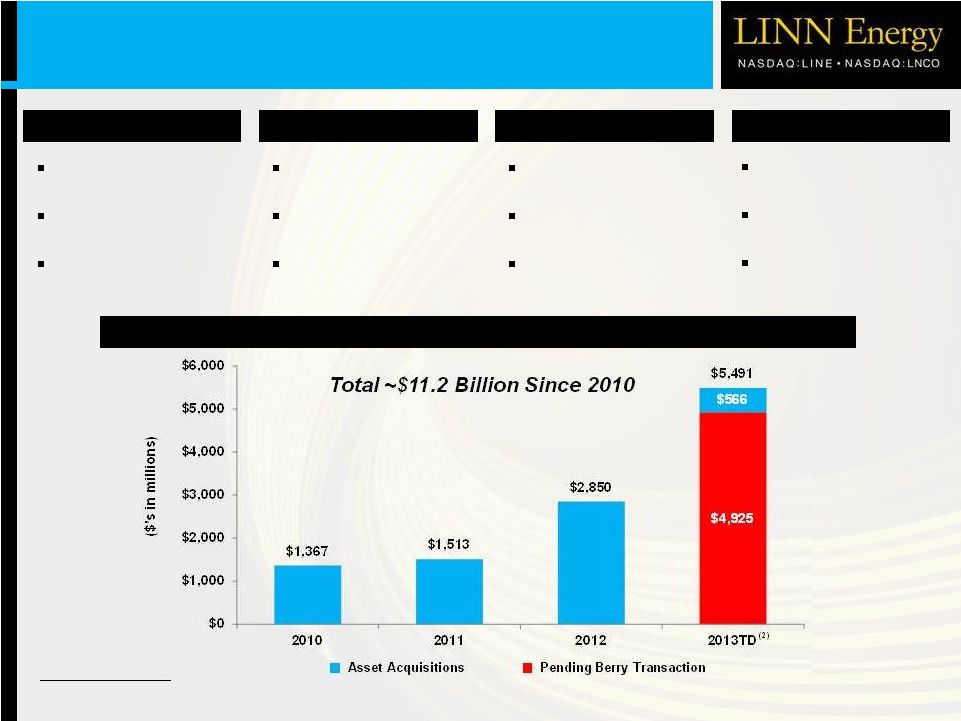 LINN Has Created an Acquisition Machine Screened 189 opportunities Bid 41 for ~$10.1 billion Closed 13 for ~$1.4 billion Screened 122 opportunities Bid 31 for ~$7.5 billion Closed 12 for ~$1.5 billion (1) Business Development data as of November 1, 2013. (2) Includes pending Berry transaction, with an implied value of ~$4.9 billion as of November 4, 2013. Historical Acquisitions and Joint Venture 11 Screened 246 opportunities Bid 20 for ~$9.2 billion Closed 7 for ~$2.9 billion 2010 2011 2012 YTD 2013 (1) (2) Screened 223 opportunities Bid 10 for ~$7.9 billion Closed or announced 3 for ~$5.5 billion Note: “Asset Acquisitions” based on total consideration. |
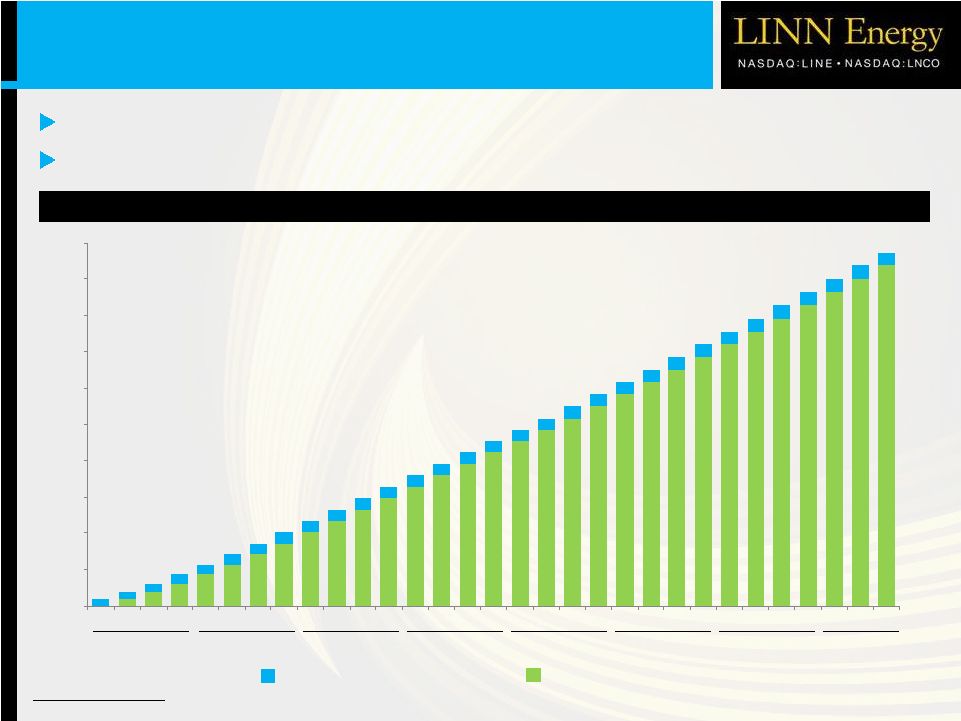
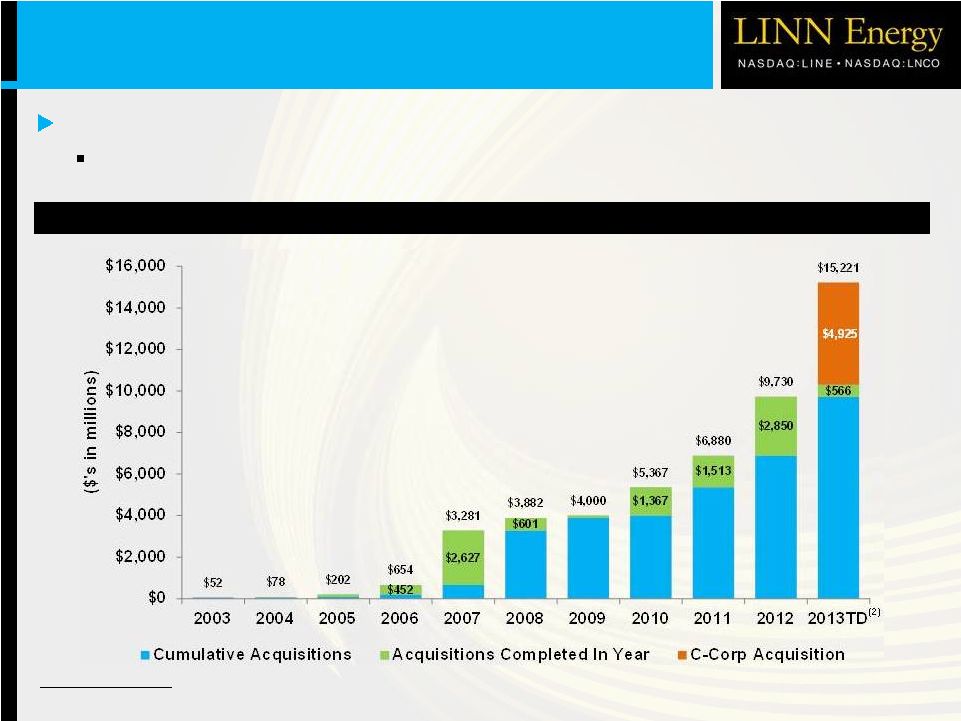 Growth Through Accretive Acquisitions Value of Acquisitions Per Year (1) 12 ~$15 billion of acquisitions in the Company’s history Includes 60 separate transactions (1) (1) Includes pending Berry transaction and 15 acquisitions comprising the Appalachian Basin properties sold in July 2008. (2) Includes pending Berry transaction, with an implied value of ~$4.9 billion as of November 4, 2013. |
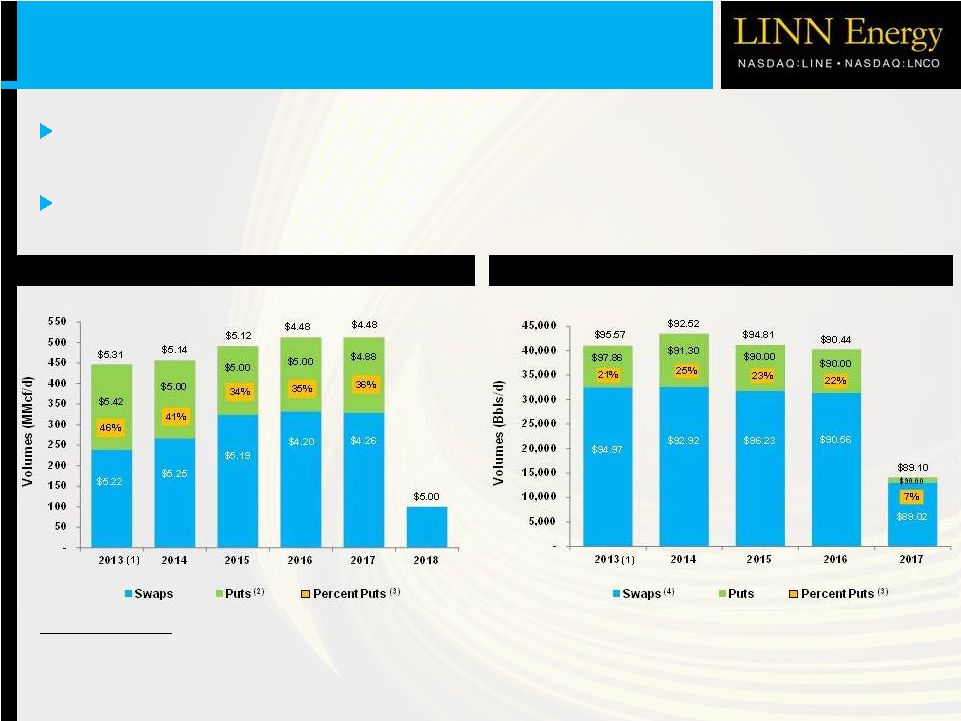 Natural Gas Positions 13 LINN is hedged ~100% on expected natural gas production through 2017; and ~100% on expected oil production through 2016 Puts provide price upside opportunity Oil Positions Significant Hedge Position (Does Not Include Pending Berry Transaction) Note: Except as otherwise indicated, illustrations represent full-year hedge positions as of September 30, 2013. (1) Represents the period October-December 2013. (2) Excludes natural gas puts used to indirectly hedge NGL revenues. (3) Calculated as percentage of hedged volume in the form of puts. (4) Includes certain outstanding fixed price oil swaps of approximately 5,384 MBbls which may be extended annually at prices of $100.00 per Bbl for each of the years ending December 31, 2017, and December 31, 2018, and $90.00 per Bbl for the year ending December 31, 2019, if the counterparties determine that the strike prices are in-the-money on a designated date in each respective preceding year. The extension for each year is exercisable without respect to the other years. |
 C-Corp. Peers % Hedged (1) Note: LINN’s hedge percentages based on internal estimates. Excludes NGL production and natural gas puts used to hedge NGL revenues associated with BP Hugoton acquisition. Source: Production estimates based on Bloomberg consensus, and hedge information based on publicly available sources. (1) Represents simple average and peer group includes: CLR, FST, XEC, KWK, NFX, PXD, PXP, RRC, SWN and WLL. (2) Represents simple average and peer group includes: BBEP, EVEP, LGCY, LRE, MEMP, MCEP, PSE, QRE and VNR. LINN’s cash flow is notably more protected from oil and natural gas price uncertainty than its C-Corp. and Upstream MLP / LLC peers Significant Hedge Position (Equivalent Basis) (Does Not Include Pending Berry Transaction) % Swaps % Puts 14 Upstream MLP / LLC Peers % Hedged (2) |
 0.40 0.43 0.52 0.52 0.57 0.57 0.63 0.63 0.63 0.63 0.63 0.63 0.63 0.63 0.63 0.63 0.63 0.66 0.66 0.66 0.69 0.69 0.69 0.73 0.73 0.73 0.73 0.73 0.73 0.73 $0.40 $0.80 $1.23 $1.75 $2.27 $2.84 $3.41 $4.04 $4.67 $5.30 $5.93 $6.56 $7.19 $7.82 $8.45 $9.08 $9.71 $10.34 $11.00 $11.66 $12.32 $13.01 $13.70 $14.39 $15.12 $15.84 $16.57 $17.29 $18.02 $18.74 $19.47 $- $2.00 $4.00 $6.00 $8.00 $10.00 $12.00 $14.00 $16.00 $18.00 $20.00 Q1 Q2 Q3 Q4 Q1 Q2 Q3 Q4 Q1 Q2 Q3 Q4 Q1 Q2 Q3 Q4 Q1 Q2 Q3 Q4 Q1 Q2 Q3 Q4 Q1 Q2 Q3 Q4 Q1 Q2 Q3 Distribution History Distribution History 15 Quarterly Distribution Cumulative Distribution Consistently paid distribution for 31 quarters 81% increase in quarterly distribution since January 2006 IPO (1) (1) The Q1 2006 distribution, adjusted for the partial period from the Company's closing of the IPO on January 19, 2006 through March 31, 2006, equates to $0.32 per unit. 2006 2007 2008 2009 2010 2011 (1) 2012 2013 |
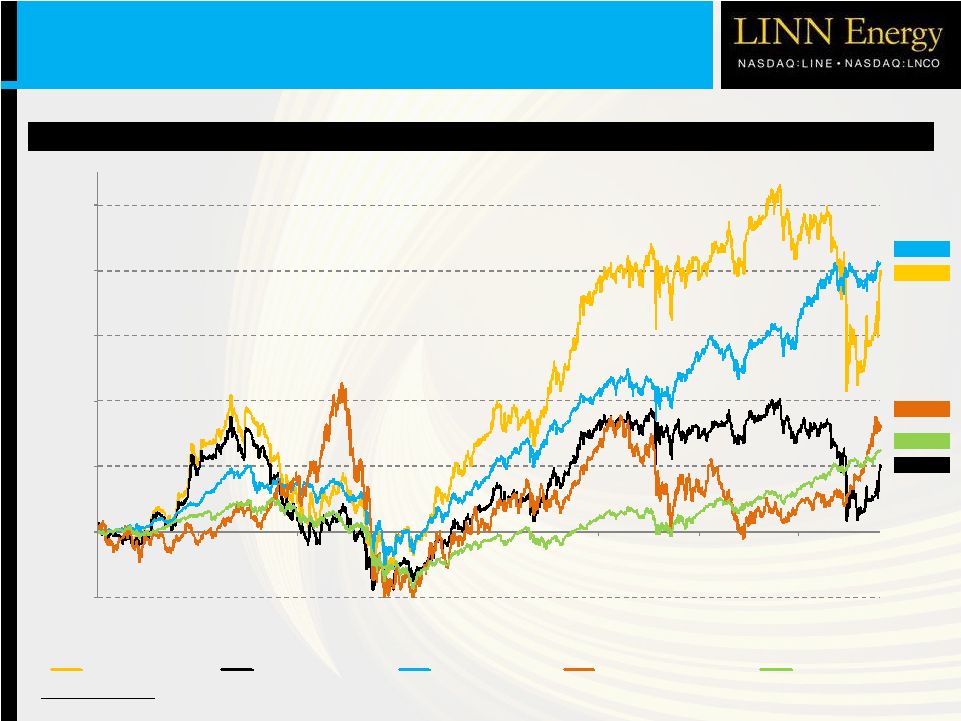 Note: Market data as of November 4, 2013 (LINE closing price of $31.80). Source: Bloomberg. LINN Total Return and Unit Price Appreciation (LINE IPO – Present of ~201%) LINN Historical Return 16 ~62% ~82% ~51% ~206% ~201% (50%) 0% 50% 100% 150% 200% 250% 2006 2007 2008 2009 2010 2011 2012 2013 LINE Total Return (TR) LINE Price Appreciation Alerian MLP TR Index S&P Mid-Cap E&P TR Index S&P 500 TR Index |
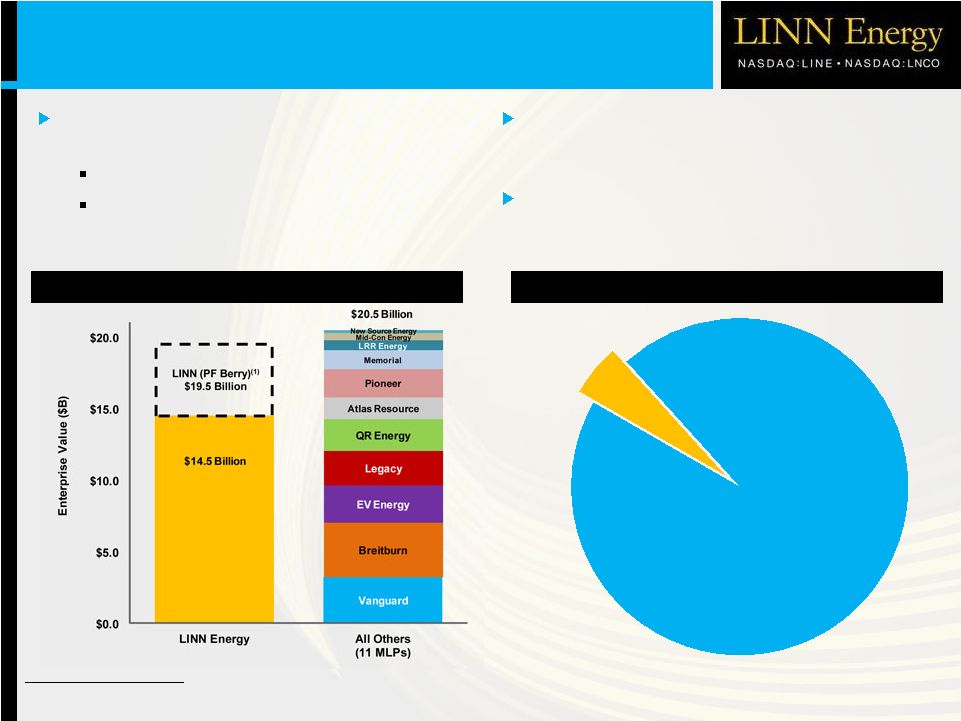 E&P MLP / LLC 5% All Others 95% 17 Size Advantage in E&P MLP/LLC Market LINN has a significant size advantage in the E&P MLP / LLC market E&P market presents significantly more acquisition opportunities than rest of MLP market E&P sector has room to grow; $40 billion versus $766 billion for all other sectors LINE vs. Other Upstream MLPs MLP / LLC Total EV: $806 Billion $40 Billion $766 Billion Note: Market data as of November 4, 2013 (LINE closing price of $31.80). Source: Bloomberg and FactSet. (1) Pro forma for pending Berry transaction, which remains subject to closing conditions, including shareholder and unitholder approvals. Greater access to capital markets Ability to complete larger transactions |
 LINN Energy’s mission is to acquire, develop and maximize cash flow from a growing portfolio of long-life oil and natural gas assets. |
 19 Capital Structure (9/30/13) ($ in millions) (1) Pro forma for the East Goldsmith Field acquisition, which closed on October 31. LINN Berry Credit facility (1) $1,733 Credit facility $636 Term loan due 2018 (1) 500 Senior notes: Senior notes: 6.50% Senior notes due 2019 750 10.25% Senior notes due 2014 205 6.25% Senior notes due 2019 1,800 6.75% Senior notes due 2020 300 8.625% Senior notes due 2020 1,300 6.375% Senior notes due 2022 600 7.75% Senior notes due 2021 1,000 1,105 4,850 Total debt $7,083 Total debt $1,741 Credit facility note amount $4,000 Credit facility note amount $1,200 Less: outstanding borrowings + LCs (1,738) Less: outstanding borrowings + LCs (663) Undrawn capacity $2,262 Undrawn capacity $537 Debt Summary Debt Summary Liquidity Liquidity |
 20 Proved Reserves The following table sets forth certain information with respect to LINN’s proved reserves for the year ended December 31, 2012, calculated on the basis required by SEC rules: Region Proved Reserves (Bcfe) % Natural Gas % Proved Developed Mid-Continent 1,648 51% 59% Hugoton Basin 1,010 56% 85% Green River Basin 1,017 72% 43% Permian Basin 403 19% 56% Michigan/Illinois 266 97% 94% California 181 8% 96% Williston/Powder River Basin 189 8% 66% East Texas 82 82% 100% Total 4,796 54% 65% |
 The U.S. Securities and Exchange Commission (“SEC”) permits oil and gas companies, in their filings with the SEC, to disclose only resources that qualify as "reserves" as defined by SEC rules. We use terms describing hydrocarbon quantities in this presentation including “inventory” and “resource potential” that the SEC’s guidelines prohibit us from including in filings with the SEC. These estimates are by their nature more speculative than estimates of reserves prepared in accordance with SEC definitions and guidelines and accordingly are substantially less certain. Investors are urged to consider closely the reserves disclosures in LINN Energy’s Annual Report on Form 10-K for the year ended December 31, 2012, available from LINN Energy at 600 Travis, Suite 5100, Houston, Texas 77002 (Attn: Investor Relations). You can also obtain this report from the SEC by calling 1-800-SEC-0330 or from the SEC’s website at www.sec.gov. In this communication, the terms other than “proved reserves” refer to the Company's internal estimates of hydrocarbon volumes that may be potentially discovered through exploratory drilling or recovered with additional drilling or recovery techniques. Those estimates may be based on economic assumptions with regard to commodity prices that may differ from the prices required by the SEC to be used in calculating proved reserves. In addition, these hydrocarbon volumes may not constitute reserves within the meaning of the Society of Petroleum Engineer's Petroleum Resource Management System or the SEC’s oil and gas disclosure rules. Unless otherwise stated, hydrocarbon volume estimates have not been risked by Company management. Factors affecting ultimate recovery include the scope of our ongoing drilling program, which will be directly affected by the availability of capital, drilling and production costs, commodity prices, availability of drilling services and equipment, drilling results, lease expirations, transportation constraints, regulatory approvals and other factors, and actual drilling results, including geological and mechanical factors affecting recovery rates. Accordingly, actual quantities that may be ultimately recovered from the Company's interests may differ substantially from the Company’s estimates of potential resources. In addition, our estimates of reserves may change significantly as development of the Company's resource plays and prospects provide additional data. 21 |
Additional Information about the Proposed Transactions and Where to Find It
In connection with the proposed transactions, LINN and LinnCo have filed with the SEC a registration statement on Form S-4 (Registration No. 333-187484) that includes a joint proxy statement of LinnCo, LINN and Berry that also constitutes a prospectus of LINN and LinnCo. Each of Berry, LINN and LinnCo also plan to file other relevant documents with the SEC regarding the proposed transactions. INVESTORS ARE URGED TO READ THE JOINT PROXY STATEMENT/PROSPECTUS AND OTHER RELEVANT DOCUMENTS FILED WITH THE SEC IF AND WHEN THEY BECOME AVAILABLE BECAUSE THEY WILL CONTAIN IMPORTANT INFORMATION. You may obtain a free copy of the joint proxy statement/prospectus and other relevant documents filed by Berry, LINN and LinnCo with the SEC at the SEC’s website at www.sec.gov. You may also obtain these documents by contacting LINN’s and LinnCo’s Investor Relations department at (281) 840-4193 or via e-mail at ir@linnenergy.com.
Participants in the Solicitation
LinnCo, LINN and Berry and their respective directors and executive officers and other members of management and employees may be deemed to be participants in the solicitation of proxies in respect of the proposed transactions. Information about LinnCo and LINN’s directors and executive officers is available in the Registration Statement on Form S-4 relating to the merger. Information about Berry’s directors and executive officers is available in Berry’s Form 10-K/A for the year ended December 31, 2012, dated April 30, 2013. Other information regarding the participants in the proxy solicitations and a description of their direct and indirect interests, by security holdings or otherwise, will be contained in the joint proxy statement/prospectus and other relevant materials to be filed with the SEC regarding the proposed transactions when they become available. Investors should read the joint proxy statement/prospectus carefully when it becomes available before making any voting or investment decisions. You may obtain free copies of these documents from Berry, LINN or LinnCo using the sources indicated above.
This document shall not constitute an offer to sell or the solicitation of an offer to buy any securities, nor shall there be any sale of securities in any jurisdiction in which such offer, solicitation or sale would be unlawful prior to registration or qualification under the securities laws of any such jurisdiction. No offering of securities shall be made except by means of a prospectus meeting the requirements of Section 10 of the U.S. Securities Act of 1933, as amended.
Cautionary Note Regarding Forward-Looking Statements
This document contains forward-looking statements, which are all statements other than statements of historical facts. These forward-looking statements involve significant risks and uncertainties that could cause actual results to differ materially from those anticipated. Important economic, political, regulatory, legal, technological, competitive and other uncertainties are identified in the documents filed with the SEC by LINN and LinnCo from time to time, including their respective Annual Reports on Form 10-K, Quarterly Reports on Form 10-Q, and Current Reports on Form 8-K. The forward-looking statements including in this press release are made only as of the date hereof. None of LINN nor LinnCo undertakes any obligation to update the forward-looking statements included in this press release to reflect subsequent events or circumstances.