Filed by LinnCo, LLC and Linn Energy, LLC
Commission File Nos. 001-35695 and 000-51719
Pursuant to Rule 425 Under the Securities Act of 1933
And Deemed Filed Pursuant to Rule 14a-12
Under the Securities Exchange Act of 1934
Subject Company: Berry Petroleum Company
Commission File No. 001-09735
 Merger Overview December 2013 |
 Forward-Looking Statements and Risk Factors Statements made in these presentation slides and by representatives of LINN Energy, LLC, LinnCo, LLC and Berry Petroleum Company (collectively, the “Companies”) during the course of this presentation that are not historical facts are forward-looking statements. These statements are based on certain assumptions and expectations made by the Companies which reflect management’s experience, estimates and perception of historical trends, current conditions, anticipated future developments, potential for reserves and drilling, completion of current and future acquisitions, future distributions, future growth, benefits of acquisitions, future competitive position and other factors believed to be appropriate. Such statements are subject to a number of assumptions, risks and uncertainties, many of which are beyond the control of the Companies, which may cause actual results to differ materially from those implied or anticipated in the forward-looking statements. These include risks relating to financial performance and results, the integration of Berry’s business and operations with those of LINN Energy, indebtedness under the companies’ credit facilities and Senior Notes, access to capital markets, availability of sufficient cash flow to pay distributions and execute our business plan, prices and demand for natural gas, oil and natural gas liquids, the Companies’ ability to replace reserves and efficiently develop current reserves, LINN Energy’s ability to make acquisitions on economically acceptable terms, the regulatory environment, availability of connections and equipment and other important factors that could cause actual results to differ materially from those anticipated or implied in the forward-looking statements. See “Risk Factors” in LINN Energy, LinnCo and Berry’s 2012 Annual Report on Form 10-K, Forms 10-Q, Registration Statement on Form S-4, each as amended, and any other public filings. We undertake no obligation to publicly update any forward-looking statements, whether as a result of new information or future events. The market data in this presentation has been prepared as of November 29, 2013, except as otherwise noted. |
 Transaction Overview Mark E. Ellis LINN Energy Chairman, President and CEO |
 Transaction Overview Consideration LinnCo to acquire Berry for 1.68 common shares of LinnCo Transaction Value ~$4.9 billion (includes assumed debt) Premium ~14% to Berry’s closing price on November 1, 2013 ~24% to Berry’s 30-day average on November 1, 2013 ~45% to Berry’s closing price on February 20, 2013 (day prior to announcement) Key Conditions Subject to shareholder / unitholder approval of Berry, LINN Energy, and LinnCo Timing Shareholder / unitholder meetings December 16, 2013 Expected closing to be immediately after 4 ISS (1) Recommendation ISS recommends a vote FOR all LINN Energy and LinnCo’s proposals Believe “support for this merger is warranted” (1) Institutional Shareholder Services Inc.. |
 Expected Benefits to LINN 5 Expected to be accretive to cash available for distribution Improves diversification, scale and growth potential Increases LINN’s production by ~30% Increases LINN’s liquids exposure o Berry’s reserves are ~75% liquids Significant California position o Upon closing, LINN will be the 5th largest producer in California Significant operational and field synergies in the Permian Basin Berry’s long-life, low-decline, mature assets fit well ~15% decline rate Reserve life of >18 years Significant additional resources Estimate Berry’s probable and possible reserves total ~630 MMBoe All stock consideration and greatly increased size result in significantly improved debt metrics |
 ($ in billions) Current (2) PF Berry (2)(3) Equity market cap $7.1 $10.3 Total net debt 7.1 8.8 Enterprise value $14.2 $19.1 6 LINN Operations Berry Operations Corporate Headquarters (Houston) NM TX KS IL LA MI ND OK CA East Texas WY UT CO California Uinta Basin Piceance Basin Permian Basin East Goldsmith Field Acquisition LINN Energy IPO in 2006 with initial enterprise value of ~$713 million Completed or announced 60 transactions for ~$15 billion (1) Large, long-life diversified reserve base Note: Market data as of November 29, 2013 (LINE and LNCO closing prices of $30.42 and $31.18, respectively). Unless noted otherwise, all operational and reserve data as of December 31, 2012. Estimates of proved reserves for the East Goldsmith Field acquisition were calculated as of the effective date of the acquisition using forward strip oil and natural gas prices, which differ from estimates calculated in accordance with SEC rules and regulations. Estimates of proved reserves for the East Goldsmith Field acquisition based solely on data provided by seller. (1) Includes pending Berry Petroleum (“Berry”) transaction and 15 acquisitions comprising the Appalachian Basin properties sold in July 2008. (2) Pro forma for the East Goldsmith Field acquisition and $500 million term loan facility. (3) Pro forma for pending merger with Berry, with an implied value of ~$4.9 billion as of the day prior to the updated exchange ratio, or November 1, 2013, which remains subject to closing conditions, including shareholder and unitholder approval. (4) Pro forma for the East Goldsmith Field acquisition and Panther divestiture. (5) Well count does not include ~2,500 royalty interest wells. LINN Energy And Berry Petroleum ($ in billions) Current (4) PF Berry (3)(4) Total proved reserves ~832 MMBoe ~1,107 MMBoe % proved developed 64% 62% % liquids 47% 54% Reserve life-index ~17 years ~17 years Gross productive wells (5) ~16,000 ~19,000 |
 MLP and Independent E&P Size Rankings LINN is one of the largest MLP and independent E&P companies 8 largest public MLP / LLC (1) 12 largest domestic independent oil & natural gas company (1) 7 Note: Market data as of November 29, 2013 (LINE closing price of $30.42). Source: Bloomberg. (1) Pro forma for pending Berry transaction, which remains subject to closing conditions, including shareholder and unitholder approvals. Rank Master Limited Partnership Enterprise Value ($MM) Rank Independent E&P Enterprise Value ($MM) 1. Enterprise Products Partners $76,565 1. ConocoPhillips $107,396 2. Energy Transfer Equity $57,957 2. Occidental Petroleum Corp. $80,511 3. Kinder Morgan Energy Partners $56,697 3. Anadarko Petroleum Corp. $56,278 4. Energy Transfer Partners $43,583 4. EOG Resources Inc. $50,035 5. Williams Partners $30,856 5. Apache Corp. $46,200 6. Plains All American Pipeline $25,850 6. Chesapeake Energy Corp. $34,834 7. Plains GP Holdings LP $23,185 7. Marathon Oil Corporation $31,454 8. LINN Energy LLC $19,121 8. Devon Energy Corporation $30,360 9. ONEOK Partners $17,788 9. Noble Energy Inc. $28,701 10. Enbridge Energy Partners $17,151 10. Pioneer Natural Resources Co. $26,937 11. Magellan Midstream Partners $16,558 11. Continental Resources Inc. $24,321 12. Markwest Energy Partners $15,138 12. Linn Energy LLC (PF Berry) (1) $19,121 13. Access Midstream Partners $14,210 13. Range Resources Corp. $15,757 14. Cheniere Energy Partners $14,445 14. EQT Corp. $15,730 15. El Paso Pipeline Partners $13,345 15. Cabot Oil & Gas Corp. $15,671 16. Western Gas Equity Partners $12,379 16. Southwestern Energy Co. $15,492 17. Buckeye Partners $11,267 17. Concho Resources Inc. $14,577 18. Boardwalk Pipeline Partners $10,359 18. Murphy Oil Corp. $14,210 19. Sunoco Logistics Partners $9,779 19. Denbury Resources Inc. $9,364 20. Spectra Energy Partners $9,451 20. Cimarex Energy Co. $9,109 21. Western Gas Partners $8,854 21. Whiting Petroleum Corp. $9,053 22. Targa Resources Partners $8,472 22. QEP Resources Inc. $8,999 23. Regency Energy Partners $8,382 23. Cobalt International Energy $8,899 24. Atlas Energy LP $7,657 24. MDU Resources Group Inc. $7,589 25. Nustar Energy LP $6,644 25. SM Energy Co. $7,532 th th |
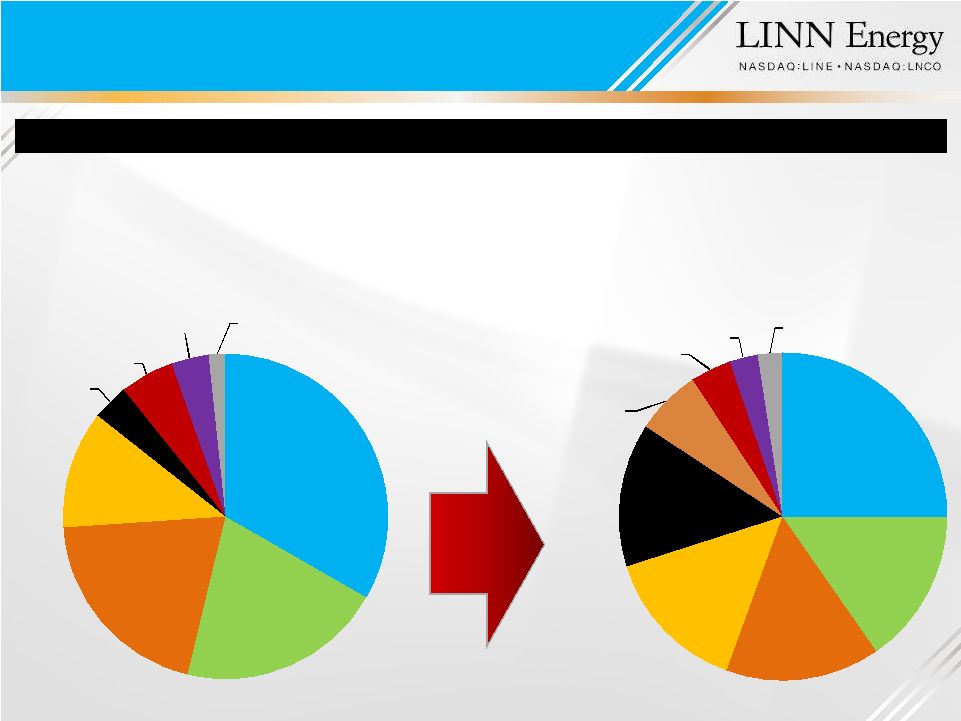 Strong, Diversified Reserve Base Oil Proved Reserves Increase ~185 MMBbls LINN Energy ~832 MMBoe (~47% Liquids) LINN Energy + Berry PF ~1,107 MMBoe (~54% Liquids) 8 Mid-Con 33% Green River 20% Hugoton 20% Permian 12% California 4% Michigan 5% Williston/ Powder River 4% E. Texas 2% Mid-Con 25% Green River 15% Hugoton 15% Permian 15% California 14% Rocky Mountains 7% Michigan 4% Williston/ Powder River 3% E. Texas 2% |
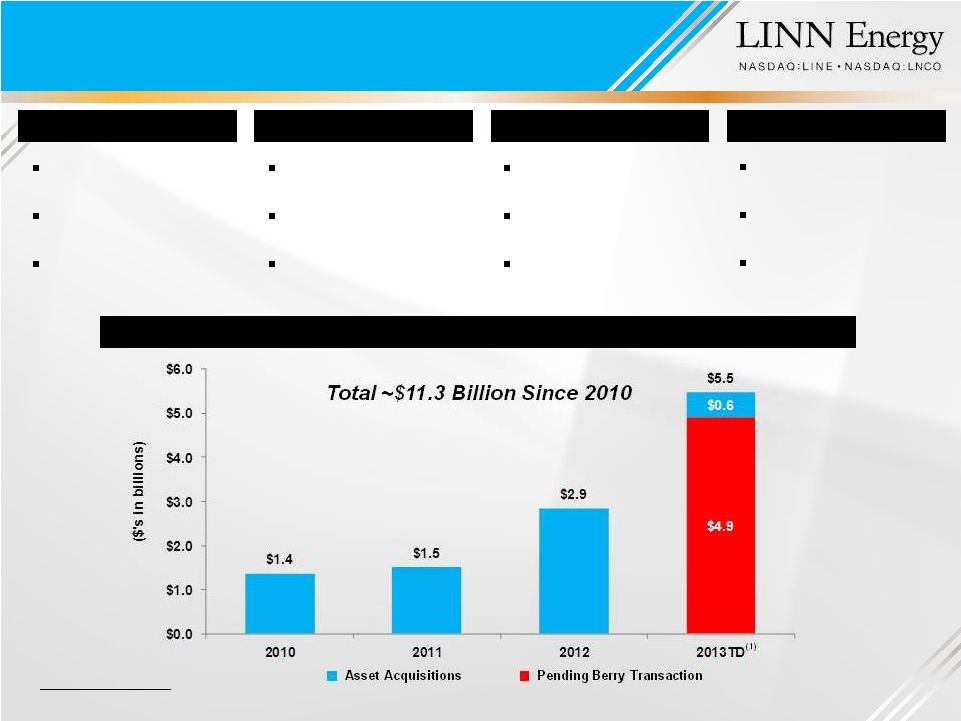 Screened 189 opportunities Bid 41 for ~$10.1 billion Closed 13 for ~$1.4 billion Screened 122 opportunities Bid 31 for ~$7.5 billion Closed 12 for ~$1.5 billion Note: “Asset Acquisitions” based on total consideration. (1)Includes pending Berry transaction, which remains subject to closing conditions, including shareholder and unitholder approval. Historical Acquisitions and Joint Venture 9 Screened 246 opportunities Bid 20 for ~$9.2 billion Closed 7 for ~$2.9 billion 2010 2011 2012 YTD 2013 (1) Screened 223 opportunities Bid 10 for ~$7.9 billion Closed or announced 3 for ~$5.5 billion LINN Has Created an Acquisition Machine |
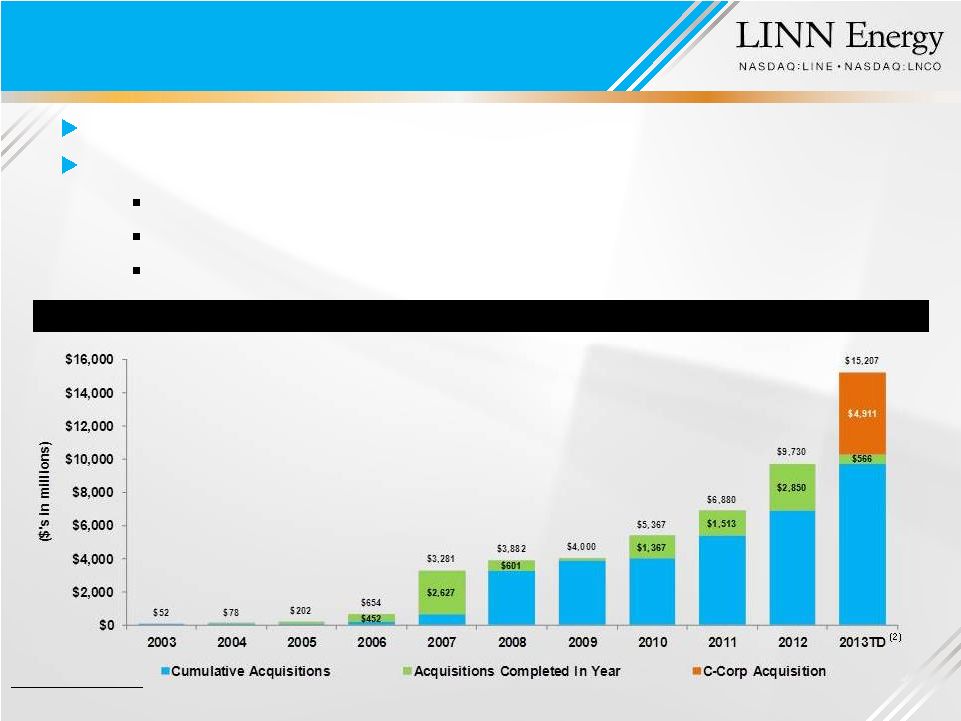 10 ~$15 billion in acquisitions across 60 separate transactions (1) Strong record of: (1) Includes pending Berry transaction and 15 acquisitions comprising the Appalachian Basin properties sold in July 2008. Berry transaction subject to closing conditions, including shareholder and unitholder approval. (2) Includes pending Berry transaction, which remains subject to closing conditions, including shareholder and unitholder approval. Growth Through Accretive Acquisitions Value of Acquisitions Per Year (1) Evaluating acquisitions Integrating assets Pursuing multiple acquisitions simultaneously |
 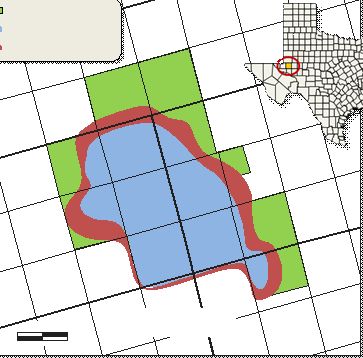     Ector County 0 5,000’ FEET Acquisition Acreage Proved Location Area PROB Location Area Asset Overview Net production ~4,800 Boe/d Proved reserves of ~30 MMBoe (~70% oil) o Large infill drilling inventory Reserves-to-production ratio of ~17 years ~98% operated working interest 124 producing wells on 6,250 net acres o Majority held by production Asset provides both short and long-term upside potential Expect to drill ~300 wells over the next 4-5 years o Proven downspacing from 40 acres to 10 acres Future horizontal Clearfork potential Future Clearfork waterflood o Additional reserve potential of ~24 MMBoe CO 2 flood potential in Glorieta, San Andres and Holt intervals East Goldsmith Field – $525 million acquisition of properties located in the Central Basin Platform of the Permian Basin closed on October 31. Recent Permian Acquisition (Q3’13) East Goldsmith Field |
 12 Efficiently integrated 60 separate transactions across multiple basins Currently operate: ~70% of wells 15 total operated rigs running o 8 rigs focusing on horizontal drilling 7 primary operated regions Strong track record of operational performance Operate ~210 horizontal wells in the Granite Wash o Reduced drilling costs by ~14% year-to-date o Reduced cycle times in the Granite Wash from ~54 days in 2011 to ~35 days currently Operate ~370 wells in the Permian Basin o Reduced drilling costs by ~15% year-to-date o Reduced cycle times in the Wolfberry play from ~89 days in 2011 to ~54 days currently Implemented >320 maintenance and optimization projects since assuming operations in the Hugoton Basin during July 2012 Efficiency through economies of scale Ability to manage large, technically complex capital programs Pad drilling techniques Simultaneous-operations processes (SIM Ops) Efficient Integration and Operations Significant, strategic gas gathering systems Jayhawk Gas Plant Water handling infrastructure |
 13 Granite Wash 8 rigs drilling in the region o 2 rigs targeting the Hogshooter interval in the Mayfield area of western Oklahoma o 6 rigs focused on developing high-return, liquids-rich opportunities in the Texas Panhandle 12 Hogshooter wells producing in the Mayfield area with gross average IP rates of ~3,800 Boe/d (~74% liquids) (1) Permian Basin 4 rigs drilling vertical Wolfberry wells Drilled 68 wells YTD 2013 and have reduced costs by ~15% (1) Potential for horizontal Wolfcamp and Spraberry o Spud 1 non-operated horizontal Wolfcamp well and expect to participate in another 3 during late 2013 or early 2014 o Expect to spud 1 operated horizontal Wolfcamp well in 2014 Jonah Field 2 rigs drilling in the region; participated in 27 operated and non-operated wells in 2013 (1) Expect to participate in an additional 19 operated and non-operated wells by year-end 2013, with an additional 24 wells expected to be drilling or awaiting completion at that time (1) Hugoton Field Commenced 1-rig drilling program in Q2’13 ~400 potential drilling locations and plan to drill ~80 wells next year Identified a significant number of locations to sustain program for the next ~5 years LINN Operational Update (1) Operational data as of LINN Energy’s Third Quarter 2013 Earnings Press Release, filed on October 28, 2013. |
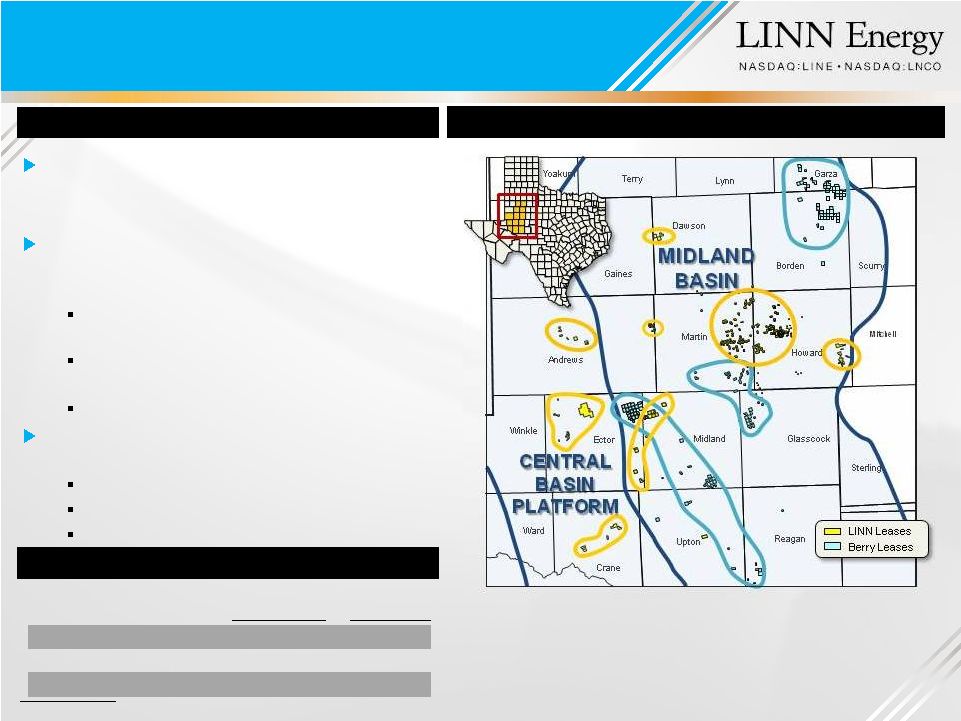
 LINN Berry Pro Forma Energy (3) + Petroleum = LINN Q3'13 PF Production (Boe/d) ~17,800 ~8,355 ~26,155 Proved Reserves (MMBoe) 97 63 160 Net Acreage ~104,000 ~60,000 ~164,000 Well Count (Gross) ~1,800 ~325 ~2,125 Significant operational and field synergies in the Permian Basin 80% liquids ~160 MMBoe proved reserves Production of >26,000 Boe/d in Q3’13 Currently running 7 combined rigs Combined position of >160,000 net acres adds size and operational scale (1) Operational and reserve data as of December 31, 2012, pro forma for the East Goldsmith Field acquisition and pending Berry Merger. (2) Includes LINN’s New Mexico operations. (3) Pro forma for the East Goldsmith Field acquisition. Permian Basin Significant Improvement in Size and Scale Overview (1)(2) 14 Operations Map Permian Basin Operational Overview |
 LINN Berry Energy Petroleum Net Acreage ~27,600 ~32,000 Avg. Working Interest 94% - % Held by Production (HBP) ~100% - 15 Permian Basin Horizontal Wolfcamp Potential Currently active in non-operated horizontal Wolfcamp (Diamondback operated) and expect to begin operated activity in 2014 LINN’s operational capabilities provide the greatest opportunity to develop the combined horizontal Wolfcamp acreage Larger size and scope enhances combined value Experienced technical team o Operate ~210 horizontal Granite Wash Better access to capital Currently evaluating multiple strategies to maximize value for its Permian position Drilling the acreage ourselves Joint-ventures Asset-trades for producing assets (1) Includes only current Wolfcamp operations. Wolfcamp Operations Map Overview Wolfcamp Operational Overview (1) |
 Strategic Highlights Robert F. Heinemann Berry Petroleum President and CEO |
 Expected Benefits to Berry 17 Berry believes that LINN is offering a compelling value to Berry shareholders Berry shareholders to receive 1.68 common shares of LinnCo o ~14% premium to Berry’s closing price on November 1, 2013 o ~24% premium to Berry’s 30-day average on November 1, 2013 o ~45% premium to Berry’s closing price on February 20, 2013 (day prior to announcement) LINN’s tax attributes and unique structure benefit Berry shareholders Significant dividend increase (1) Represents an increase of ~9x Berry’s assets fit well in an MLP / yield structure Meaningful increases to a more diverse set of reserves and production Significantly increases size and scale with lower cost and greater access to capital Berry believes that LINN is the most logical buyer; Berry did not receive a topping bid after the initial announcement Berry’s Board and management believe negotiated terms are in the best interest of shareholders. (1) Subject to the declaration by the Boards of Directors of LINN Energy and LinnCo. |
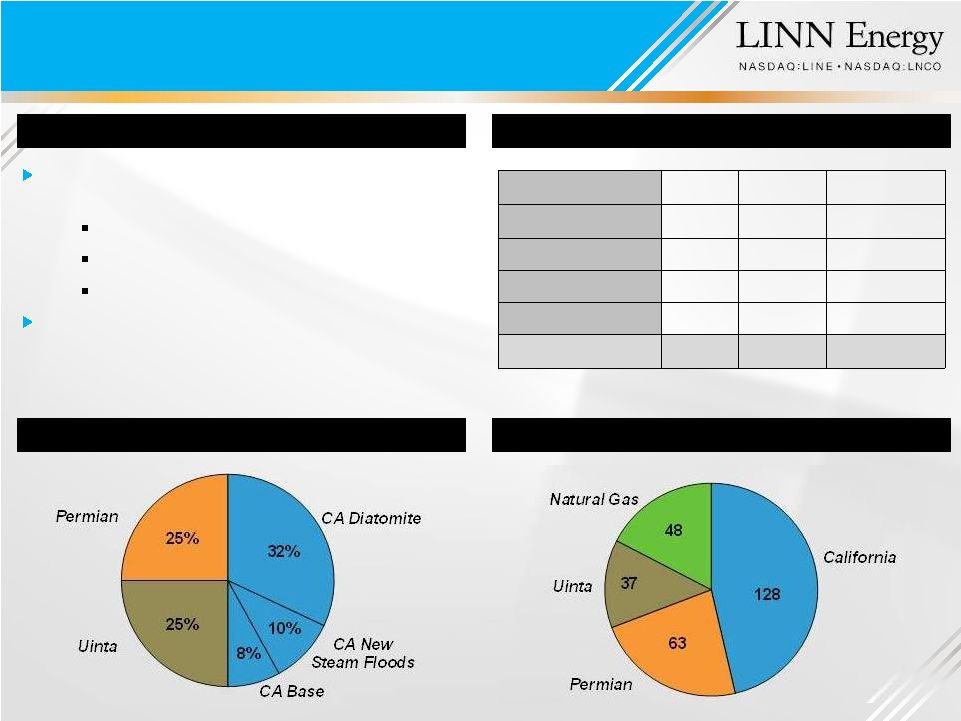 Key Statistics 2011 2012 2013E Production (Boe/d) 35,687 36,402 40,500 – 40,800 • Oil 24,771 27,393 32,400 – 32,600 • Oil Percentage 70% 75% ~80% • Nat Gas 10,916 ~9,000 -5 to 10% Total Capital ($MM) $527 $675 ~$600 276 MMBoe Proved Reserves Year End 2012 2013 Capital Distribution Overview Berry Petroleum is a Denver-based independent E&P company focused on developing its oil assets in the: San Joaquin Basin in California Uinta Basin in Utah Permian Basin in Texas Berry’s strategy is to grow oil production 10% - 15% per year while generating top quartile operating margins to increase its Cash Flow per Share at a double-digit pace Berry Petroleum Overview 18 |
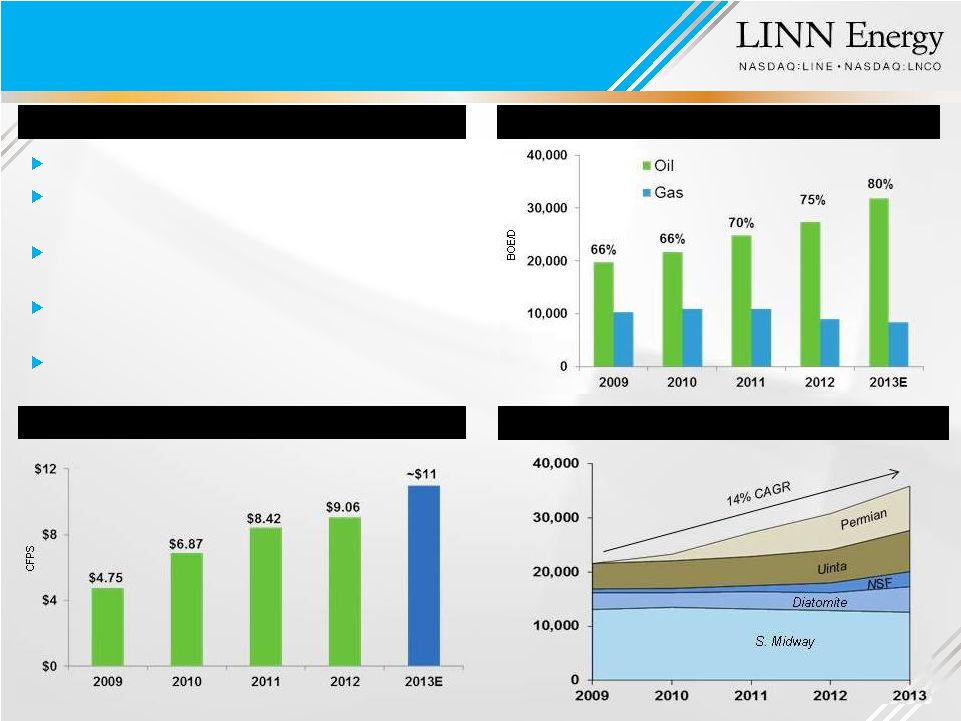 Invest only in the development of crude oil Increase oil production from five assets in three basins Improve margin from oil growth and improved marketing realizations Balance cash flow and capital investment to minimize issuing equity Combine the four parts of the plan to drive cash flow per share growth Growth from Assets in Three Oil Basins Cash Flow Per Share Invest in Consistent Oil Growth Commentary 19 Berry’s Business Plan |
 Highlights from Last 12 Months Production Growth of 5 Oily Assets (Q3‘12 – Q3’13) Oil production has grown 20% since Q3’12 with total production growing ~14% Production mix increased to ~80% oil Diatomite production increased from 3,500 Boe/d to 5,260 Boe/d and New Steam Floods grew 71% to 3,300 Boe/d Berry’s 2013 total margin is ~$49 / Boe Berry’s 2013 Performance Top-Tier Operating Margins Q3 2013 Margin Per BOE, BRY vs. Peers (1) |
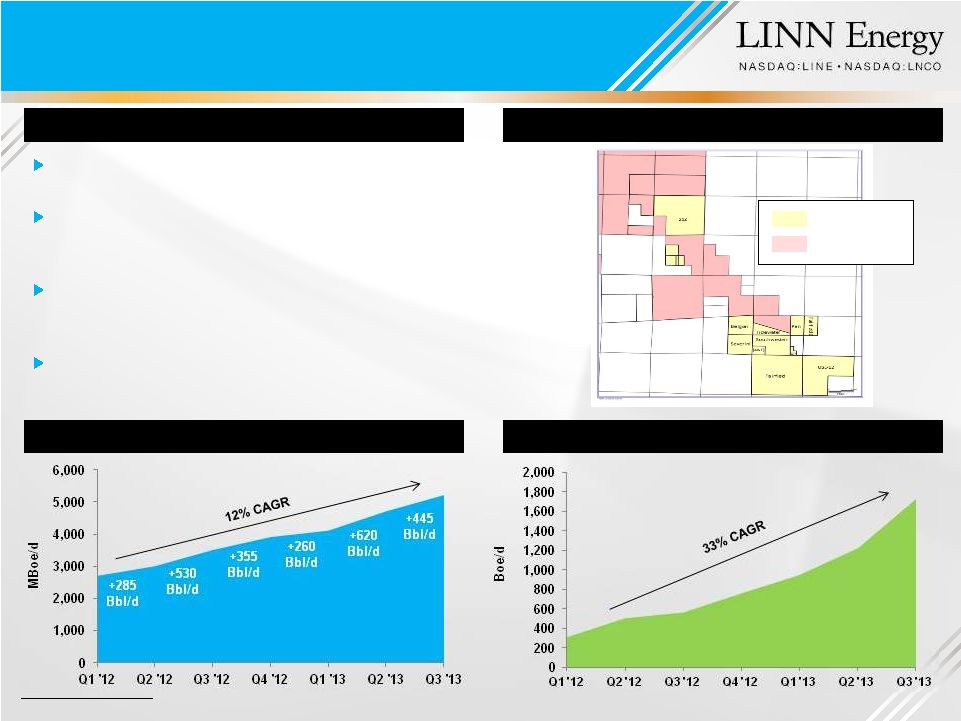
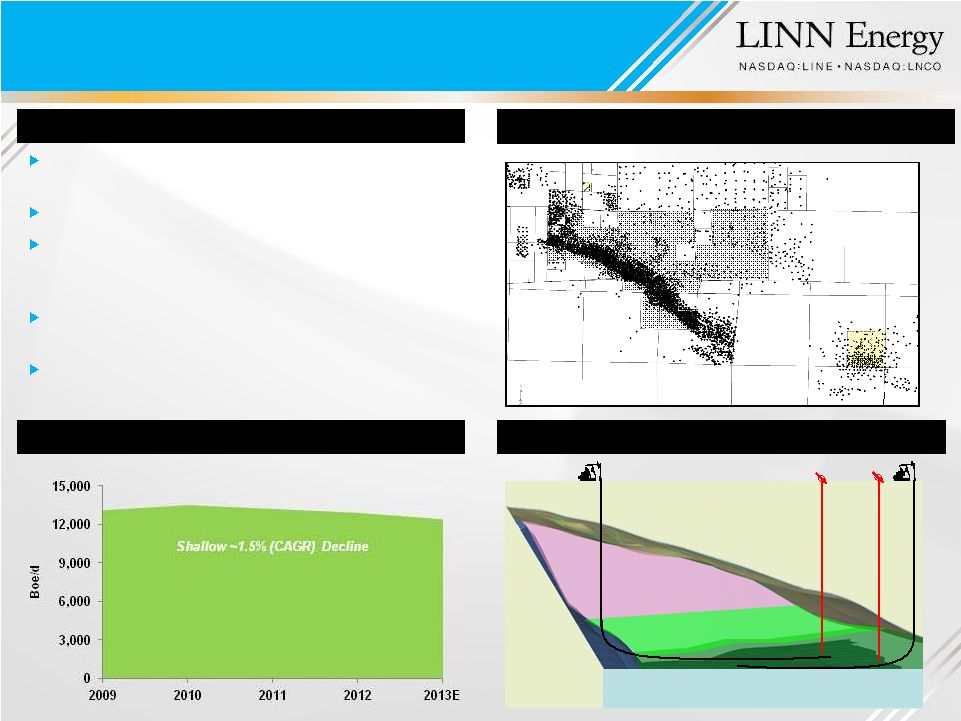     35 36 31 32 33 28 29 30 26 29 28 27 26 32 33 34 35 36 25 2 3 4 5 34 27 1 0 35 36 31 32 33 28 29 30 26 29 28 27 26 32 33 34 35 36 25 2 3 4 5 34 27 1 0 Ethel D S. Midway Stable production from legacy assets in the 9 largest U.S. field Produced 12,275 Bo/d in Q3, 92% NRI Produce heavy crude (13° API) using steam injection with development focused on deeper pay zones and continuous injection in flanks South Midway expected to deliver ~$250 MM of free cash flow in 2013 Successfully maximizing cash flow and achieving more shallow decline than 5% - 8% forecast South Midway Production History Asset Highlights South Midway-Sunset Field Map Continuous Steam Injection at South Midway Continuous Vertical Steam Injectors Wet Zone Depletion 21 South Midway-Sunset th |
 22 Diatomite has 360 million barrels of oil in place on 540 acres, targeting ~1,000 wells on 5/8 acre spacing Focusing on consistently growing the completion count, integrating technology and operations to deliver production growth Accelerating conversion to steam flooding from cyclic steaming at McKittrick 21Z should enhance performance, drive production growth and value Strategy is to pursue other smaller developments and bolt-on opportunities to leverage expertise Asset Highlights North Midway Assets Diatomite Quarterly Production Note: Data provided by seller. Source: Berry Petroleum. Chevron acreage Berry acreage McKittrick 21Z Quarterly Production McKittrick 21Z Diatomite North Midway-Sunset |
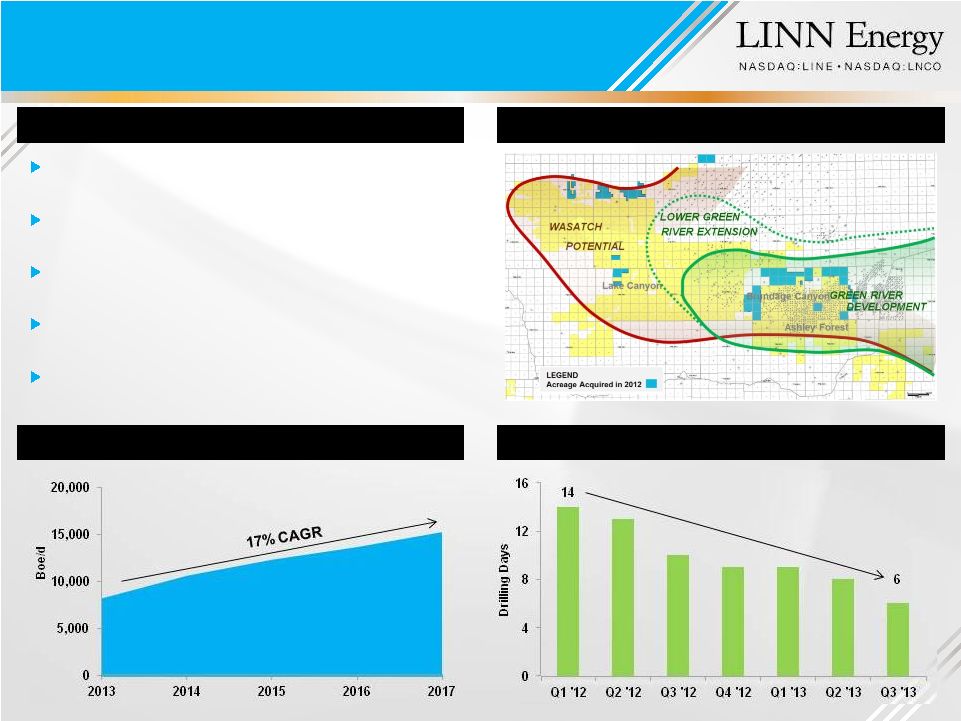 Compiled ~122,000 net acres with ~75 MMBoe of risked resource since entering basin in 2003 Current production on 40-acre spacing; historically 60% crude oil and 40% gas Significant drilling inventory targeting the Green River and Wasatch reservoirs Improving margins through railing crude oil to markets outside of Salt Lake City Reduced average drilling days from 12 days in 2012 to fewer than 8 days in 2013 Asset Highlights Uinta Resource Development Drilling Days by Quarter Risked Production Profile 23 Uinta Assets |
 Receiving Value for Heavy Oil Assets Berry Heavy Oil Assets Fit MLP Profile Observations Merger Benefits for Berry 24 Combined size and scale can fully maximize the value of Berry’s assets Berry’s long-lived reserves with shallow decline are an ideal fit for the Upstream MLP model Merger is a tax-free event for Berry shareholders with an approximate 9x increase in the dividend (1) The pro forma company has greater asset and geographic diversification LINN’s conservative hedging strategy protects cash flow for 4-6 years Potential for further upside as LINN provides: (1) Subject to the declaration by the Boards of Directors of LINN Energy and LinnCo. Established acquisition and growth track record Proven technical teams which are complimentary to Berry’s |
 Financial Highlights Kolja Rockov LINN Energy Executive Vice President and CFO |
 26 First ever acquisition of a public C-Corp. by an upstream LLC or MLP Expected to be accretive to cash available for distribution All stock consideration and greatly increased size result in significantly improved debt metrics Greater access to capital markets Increases access to institutional market Financial Highlights Transaction value of $4.9 billion, including assumed debt of ~$1.7 billion Accretion expected to increase in subsequent years Transaction provides additional liquidity and financial flexibility Liquidity / float of LNCO increases ~3x |
 27 Reduces Tax Reporting Burdens Shareholders receive Form 1099 rather than a Schedule K-1 No state income tax filing requirements No UBTI (1) implications Efficient Tax Structure Estimated tax at LinnCo (2) estimated to be $0.00, $0.01 and $0.07 per share for 2013, 2014 and 2015, respectively Simple & Fair Structure 1 LinnCo share = 1 vote of LINN unit Similar economic interest Expands Investor Base and Access to Capital Institutions Tax-exempt organizations Incremental retail investors (including IRA accounts) Tax-Efficient Way to Acquire E&P C-Corps. Both private and public (1) Unrelated business taxable income. (2) Includes pending Berry merger and assumes current strip prices and estimated capital spending. LinnCo Structure Advantages |
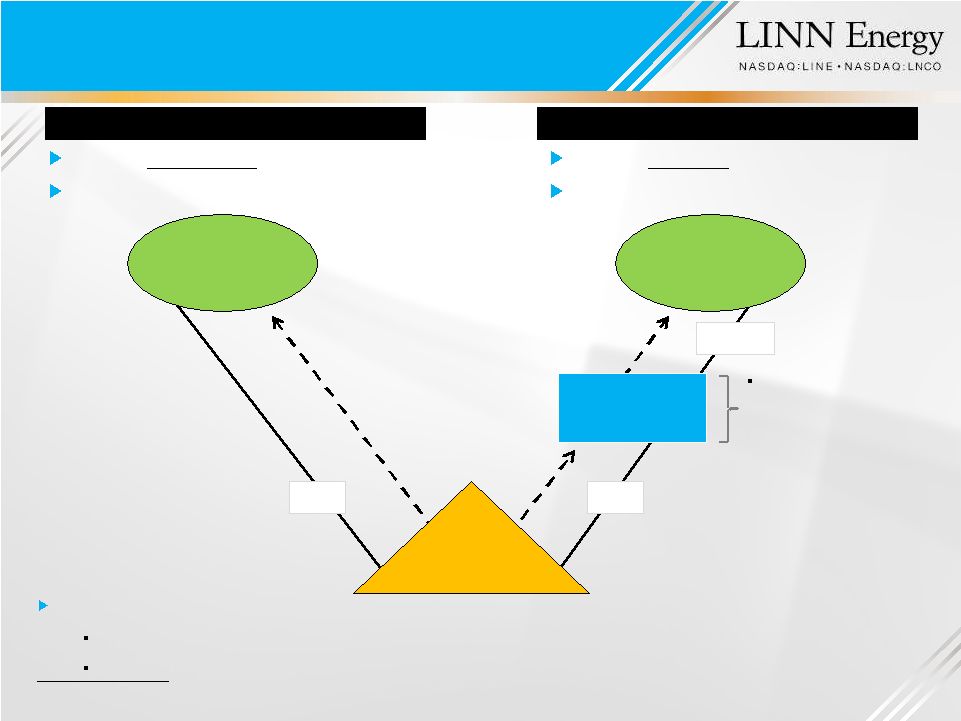 28 LINE Unitholders LLC Units LNCO Shareholders LinnCo Common Shares Current distribution of $2.90 / unit (1) Schedule K-1 (partnership) LINE LNCO Current dividend of $2.90 / share (2) Form 1099 (C-Corp.) LLC Units Investors now have the ability to own LINN Energy two ways: LINE (Partnership for tax purposes / K-1) LNCO (C-Corp. for tax purposes / 1099) Tax liability to LinnCo on LINN Energy’s distribution estimated to be $0.00, $0.01 and $0.07 per share for 2013, 2014 and 2015, respectively (3) $2.90 Distribution $2.90 Distribution $2.90 Dividend (1) Represents the current annualized cash distribution of $2.90 per unit. (2) Represents the current annualized cash dividend of $2.90 per share. (3) Includes pending Berry merger and assumes current strip prices and estimated capital spending. LinnCo Structure Overview LINN Energy, LLC |
 Natural Gas Positions 29 Oil Positions (1) Represents the period October-December 2013. (2) Excludes natural gas puts used to indirectly hedge NGL revenues. (3) Calculated as percentage of hedged volume in the form of puts. (4) Includes certain outstanding fixed price oil swaps of approximately 5,384 MBbls which may be extended annually at prices of $100.00 per Bbl for each of the years ending December 31, 2017, and December 31, 2018, and $90.00 per Bbl for the year ending December 31, 2019, if the counterparties determine that the strike prices are in-the-money on a designated date in each respective preceding year. The extension for each year is exercisable without respect to the other years. Significant Hedge Position (Graphs Do Not Include Pending Berry Transaction) LINN is hedged ~100% on expected natural gas production through 2017; ~100% on expected oil production through 2016 LINN partnered with Berry to hedge a portion of the production from the transaction before closing As a result, Berry is significantly hedged for 2014 (~90% hedged) on expected oil production Note: Except as otherwise indicated, illustrations represent full-year hedge positions as of September 30, 2013. |
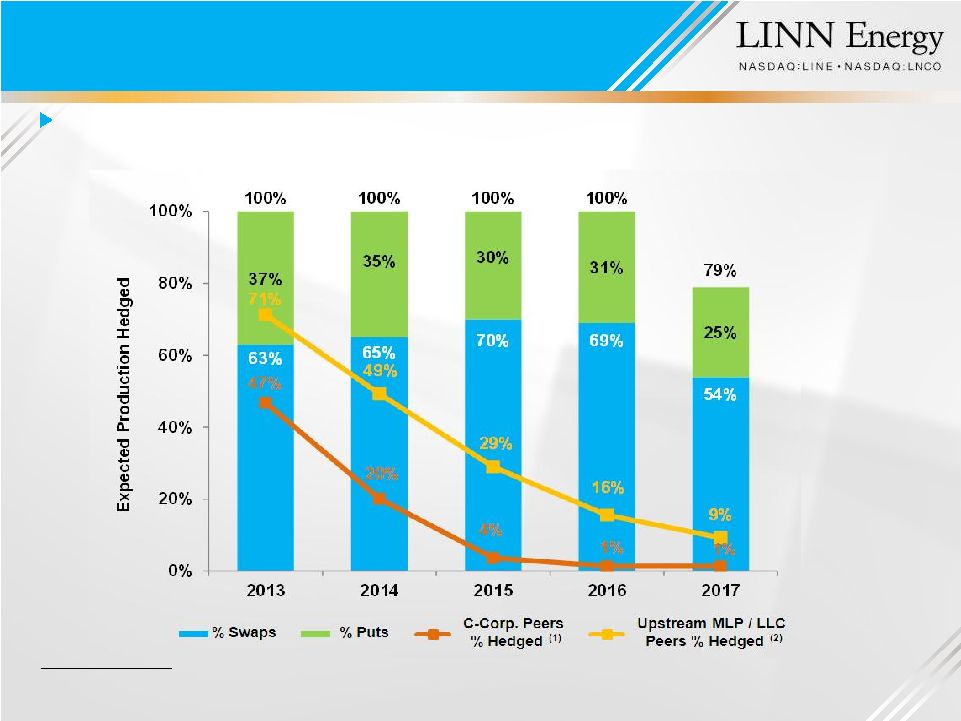 Note: LINN’s hedge percentages based on internal estimates. Excludes NGL production and natural gas puts used to hedge NGL revenues associated with BP Hugoton acquisition. Source: Production estimates based on Bloomberg consensus, and hedge information based on publicly available sources. (1) Represents simple average and peer group includes: CLR, FST, XEC, KWK, NFX, PXD, PXP, RRC, SWN and WLL. (2) Represents simple average and peer group includes: BBEP, EVEP, LGCY, LRE, MEMP, MCEP, PSE, QRE and VNR. LINN’s cash flow is notably more protected from oil and natural gas price uncertainty than its C-Corp. and Upstream MLP / LLC peers Significant Hedge Position (Equivalent Basis) (Does Not Include Pending Berry Transaction) 30 |
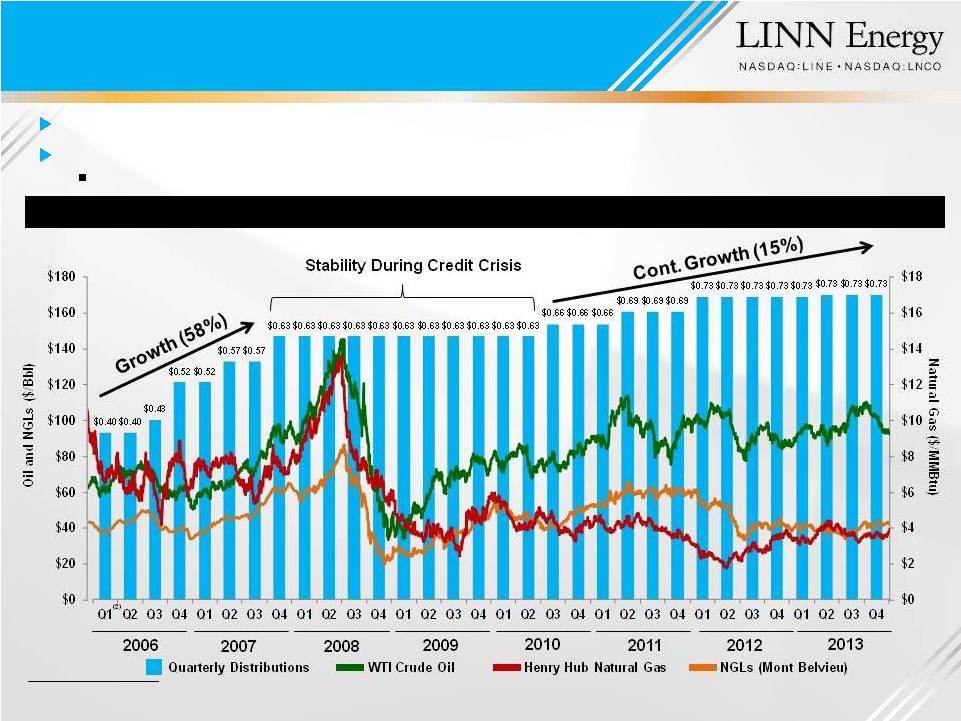 LINN’s Distribution Stability and Growth 31 Distribution History LINN has performed well through all kinds of commodity price cycles Distribution stability maintained throughout the Credit Crisis (i.e. 2008 – 2009) 16 out of 74 MLPs (23%) were forced to reduce or suspend distributions (1) Source for commodity prices: Bloomberg. (1) Source: Wells Fargo Securities, LLC research note entitled “MLP Primer - - Fourth Edition” published on November 19, 2010. (2) The Q1 2006 distribution, adjusted for the partial period from the Company's closing of the IPO on January 19, 2006 through March 31, 2006, equates to $0.32 per unit. |
 $20.20 0.40 0.43 0.52 0.52 0.57 0.57 0.63 0.63 0.63 0.63 0.63 0.63 0.63 0.63 0.63 0.63 0.63 0.66 0.66 0.66 0.69 0.69 0.69 0.73 0.73 0.73 0.73 0.73 0.73 0.73 0.73 $0.40 $0.80 $1.23 $1.75 $2.27 $2.84 $3.41 $4.04 $4.67 $5.30 $5.93 $6.56 $7.19 $7.82 $8.45 $9.08 $9.71 $10.34 $11.00 $11.66 $12.32 $13.01 $13.70 $14.39 $15.12 $15.84 $16.57 $17.29 $18.02 $18.74 $19.47 $- $2.00 $4.00 $6.00 $8.00 $10.00 $12.00 $14.00 $16.00 $18.00 $20.00 Q1 Q2 Q3 Q4 Q1 Q2 Q3 Q4 Q1 Q2 Q3 Q4 Q1 Q2 Q3 Q4 Q1 Q2 Q3 Q4 Q1 Q2 Q3 Q4 Q1 Q2 Q3 Q4 Q1 Q2 Q3 Q4 Distribution History Distribution History 32 Quarterly Distribution Cumulative Distribution Consistently paid distribution for 32 quarters 81% increase in quarterly distribution since January 2006 IPO (1) (1) The Q1 2006 distribution, adjusted for the partial period from the Company's closing of the IPO on January 19, 2006 through March 31, 2006, equates to $0.32 per unit. (2) Includes December’s distribution / dividend to be paid December 17, 2013 (LINE) and December 18, 2013 (LNCO), respectively. 2006 2007 2008 2009 2010 2011 (1) 2012 2013 (2) |
 (125%) (75%) (25%) 25% 75% 125% 175% 225% 275% 2006 2007 2008 2009 2010 2011 2012 2013 LINE Total Return (TR) BRY Total Return (TR) Alerian MLP TR Index S&P Mid-Cap E&P TR Index S&P 500 TR Index Note: Market data as of November 29, 2013 (LINE and BRY closing price of $30.42 and $50.32, respectively). Source: Bloomberg. LINN Total Return and Unit Price Appreciation (LINE IPO – Present of ~190%) LINN Historical Return 33 ~66% ~67% ~64% ~207% ~190% |
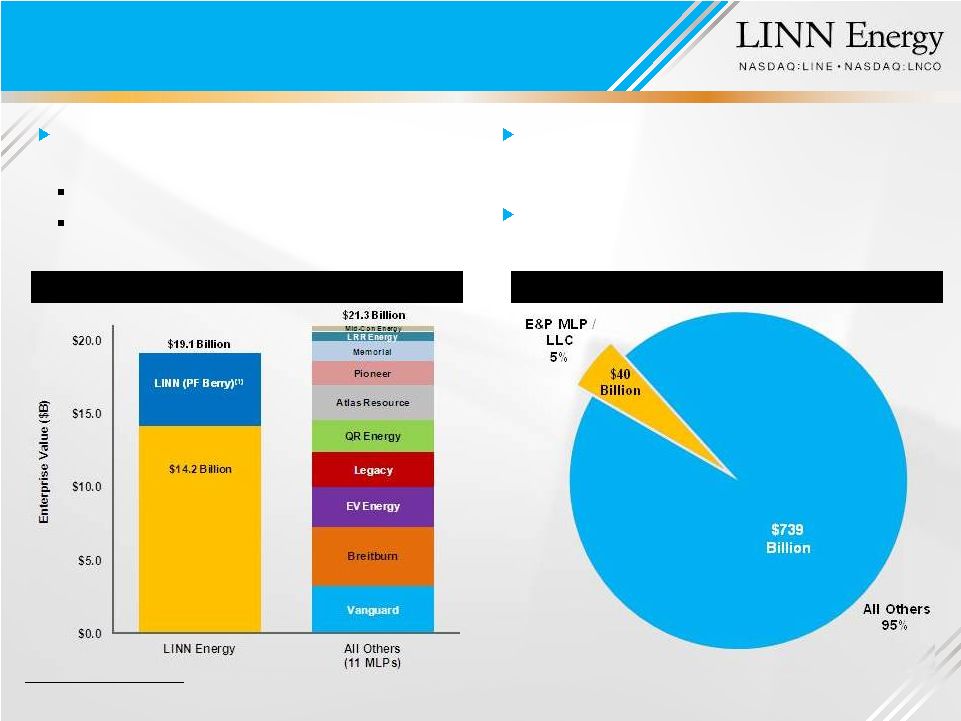 34 Current Landscape for E&P MLPs LINN has a significant size advantage in the E&P MLP / LLC market E&P market presents significantly more acquisition opportunities than rest of MLP market E&P sector has room to grow; $40 billion versus $739 billion for all other sectors LINE vs. Other Upstream MLPs MLP / LLC Total EV: $779 Billion Note: Market data as of November 29, 2013 (LINE and LNCO closing price of $30.42 and $31.18, respectively). Source: Bloomberg and FactSet. (1) Pro forma for pending Berry transaction, which remains subject to closing conditions, including shareholder and unitholder approvals. Greater access to capital markets Ability to complete larger transactions |
 35 LINN reiterates Q4 estimated production guidance of ~840 – 860 MMcfe/d 2013E organic production growth of 8 – 10% remains on-track (in spite of severe winter weather in the Permian and Mid-Continent regions) (2) LINN’s updated Q4 “excess of net cash (3) ” is expected to be ~5 – 10% above the Company’s current distribution amount compared to previous guidance of 0% (1) Production on-track NGL prices continue to increase Continuing to realize lower operating expenses Berry’s 2013 estimated production is expected to be ~40,800 Boe/d, representin g the high end of its previously updated guidance Q4 production expected to be ~44,000 Boe/d Improving LINN’s distribution stability Generated excess of net cash (3) in Q3 (~1% above the distribution amount) Expect to generate excess of net cash (3) in Q4 (~5 – 10% above the Company’s distribution amount) (1) Pending Berry merger expected to be accretive to cash available for distribution (1) Does not include pending Berry transaction due to the fractional impact to the Company's quarterly guidance as a result of the potential December 16, 2013 closing. (2) Percentage growth estimate calculated by removing production volumes associated with the Panther assets. (3) Excess (shortfall) of net cash provided by (used in) operating activities after distributions to unitholders and discretionary adjustments considered by the Board of Directors. Updated Q4 2013 Guidance (1) |
 Combined company will be one of the largest independent oil and natural gas companies in North America Combined company has a geographically diverse, long lived asset base with strong and stable cash flow Potential for production optimization and cost savings Substantial size can be a benefit in the MLP market Accretive to LINN’s cash available for distribution Berry shareholders have the opportunity to participate in future upside LINN and LinnCo are currently trading at historically high yields (~10% & ~9% for LINN & LinnCo, respectively) Summary 36 Pro forma production of ~180,000 Boe/d Proved reserves of approximately >1.1 billion Boe (54 percent liquids) LINN targets hedging ~100% of expected production for 4 – 6 years Identified ~$20 million of synergies in G&A Greater access to capital markets Ability to complete larger transactions Accretion expected to increase in subsequent years Proven acquisition track record Potential to revert to historically lower yields |
 LINN Energy’s mission is to acquire, develop and maximize cash flow from a growing portfolio of long-life oil and natural gas assets. |
 38 Berry Bonds Transaction triggers Change of Control and investor option to put bonds at 101% of par; LINN plans to make a Change of Control offer pursuant to the indenture If bonds are put, LINN has sufficient liquidity to redeem any tendered Berry bonds ~$2.7 billion of pro forma capacity ~$1.1 billion of Berry bonds outstanding Berry will be an unrestricted LINN subsidiary with ~$435 million of initial restricted payments capacity Berry bond coupons and maturities fit well within existing LINN bond complex Berry Revolver LINN has received lender commitments for the following: Maintain Berry’s existing $1.2 billion revolver post-closing ($1.4 billion borrowing base) Conform material terms and covenants of the Berry revolver to match LINN revolver At closing, Berry revolver will be fully drawn with proceeds available to LINN LINN intends to use any cash distributed from Berry, up to the initial restricted payments capacity of ~$435 million, to reduce borrowings under its own revolver Excess cash of ~$100 million would remain on Berry’s balance sheet to fund capex or to be distributed to LINN in the future if Berry generates additional restricted payments capacity Significantly enhances LINN’s liquidity and positions balance sheet for future growth Berry Bonds and Revolver Post-Closing |
 39 Capital Structure (9/30/13) (1) Pro forma for the financing of LINN’s $525 million East Goldsmith Field acquisition, which closed on October 31. (2) Berry’s initial restricted payments capacity allows up to ~$435 million to be distributed to LINN. At closing, Berry’s revolver will be fully drawn. LINN intends to use any cash distributed from Berry, up to the initial restricted payments capacity of ~$435 million, to reduce borrowings under its own revolver. Excess cash would remain on Berry’s balance sheet to fund capex or to be distributed to LINN in the future if Berry generates additional restricted payments capacity. (3) LINN and Berry had outstanding letters of credit of ~$5 million and ~$27 million, respectively, at September 30, 2013, which reduce availability under the separate credit facilities. ($ in millions) LINN Pro Forma Capital Structure at 9/30/13 Summary Balance Sheet Before Merger (1) Adjustments (2) After Merger Cash and cash equivalents $27 $ --- $27 Credit facility (1) $1,730 $(435) $1,295 Term loan due 2018 (1) 500 --- 500 Senior notes: 6.50% Senior notes due 2019 750 --- 750 6.25% Senior notes due 2019 1,800 --- 1,800 8.625% Senior notes due 2020 1,300 --- 1,300 7.75% Senior notes due 2021 1,000 --- 1,000 4,850 --- 4,850 Total debt $7,080 $(435) $6,645 Availability Credit facility note amount $4,000 $ --- $4,000 Less: outstanding borrowings + LCs (3) (1,735) 435 (1,300) Undrawn capacity $2,265 $435 $2,700 Berry Pro Forma Capital Structure at 9/30/13 Summary Balance Sheet Before Merger Adjustments (2) After Merger Cash and cash equivalents $24 $102 $126 Credit facility $636 $537 $1,173 Senior notes: 10.25% Senior notes due 2014 205 --- 205 6.75% Senior notes due 2020 300 --- 300 6.375% Senior notes due 2022 600 --- 600 1,105 --- 1,105 Total debt $1,741 $537 $2,278 Availability Credit facility note amount $1,200 $ --- $1,200 Less: outstanding borrowings + LCs (3) (663) (537) (1,200) Undrawn capacity $537 $(537) $ --- |
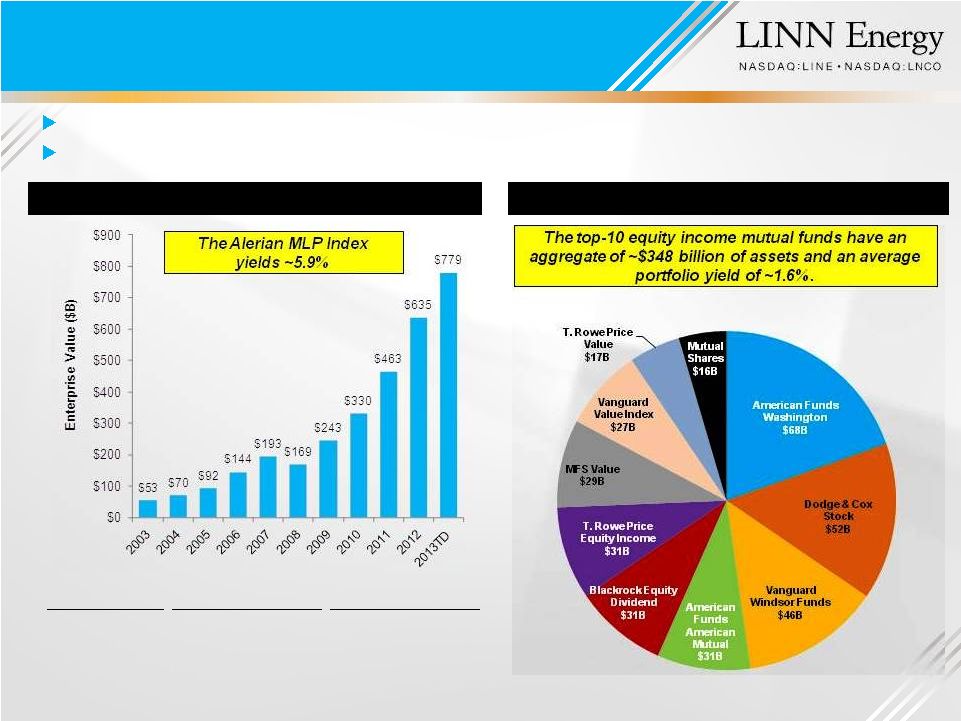 Appendix Substantial Institutional Yield Market 40 LinnCo structure allows LINN to access the much larger institutional market MLP sector has grown tremendously but still remains primarily retail Note: Market data as of November 29, 2013. Source for MLP Enterprise Value chart: R.W. Baird Equity Research and FactSet. Source for Income Mutual Funds chart: Morningstar. Source for table: Wells Fargo Securities, LLC. MLP Sector’s Enterprise Value Growth Top-10 Equity Income Mutual Funds Average MLP Average MLP Time Period Follow-Ons ($MM) Issuances / Year 2003 - 2009 $150.9 42 2010 - 2013TD $251.8 60 % Increase 67% 43% |
Additional Information about the Proposed Transactions and Where to Find It
In connection with the proposed transactions, LINN and LinnCo have filed with the SEC a registration statement on Form S-4 (Registration No. 333-187484) that includes a joint proxy statement of LinnCo, LINN and Berry that also constitutes a prospectus of LINN and LinnCo. Each of Berry, LINN and LinnCo also plan to file other relevant documents with the SEC regarding the proposed transactions. INVESTORS ARE URGED TO READ THE JOINT PROXY STATEMENT/PROSPECTUS AND OTHER RELEVANT DOCUMENTS FILED WITH THE SEC IF AND WHEN THEY BECOME AVAILABLE BECAUSE THEY WILL CONTAIN IMPORTANT INFORMATION. You may obtain a free copy of the joint proxy statement/prospectus and other relevant documents filed by Berry, LINN and LinnCo with the SEC at the SEC’s website at www.sec.gov. You may also obtain these documents by contacting LINN’s and LinnCo’s Investor Relations department at (281) 840-4193 or via e-mail at ir@linnenergy.com.
Participants in the Solicitation
LinnCo, LINN and Berry and their respective directors and executive officers and other members of management and employees may be deemed to be participants in the solicitation of proxies in respect of the proposed transactions. Information about LinnCo and LINN’s directors and executive officers is available in the Registration Statement on Form S-4 relating to the merger. Information about Berry’s directors and executive officers is available in Berry’s Form 10-K/A for the year ended December 31, 2012, dated April 30, 2013. Other information regarding the participants in the proxy solicitations and a description of their direct and indirect interests, by security holdings or otherwise, will be contained in the joint proxy statement/prospectus and other relevant materials to be filed with the SEC regarding the proposed transactions when they become available. Investors should read the joint proxy statement/prospectus carefully when it becomes available before making any voting or investment decisions. You may obtain free copies of these documents from Berry, LINN or LinnCo using the sources indicated above.
This document shall not constitute an offer to sell or the solicitation of an offer to buy any securities, nor shall there be any sale of securities in any jurisdiction in which such offer, solicitation or sale would be unlawful prior to registration or qualification under the securities laws of any such jurisdiction. No offering of securities shall be made except by means of a prospectus meeting the requirements of Section 10 of the U.S. Securities Act of 1933, as amended.
Cautionary Note Regarding Forward-Looking Statements
This document contains forward-looking statements, which are all statements other than statements of historical facts. These forward-looking statements involve significant risks and uncertainties that could cause actual results to differ materially from those anticipated. Important economic, political, regulatory, legal, technological, competitive and other uncertainties are identified in the documents filed with the SEC by LINN and LinnCo from time to time, including their respective Annual Reports on Form 10-K, Quarterly Reports on Form 10-Q, and Current Reports on Form 8-K. The forward-looking statements including in this press release are made only as of the date hereof. None of LINN nor LinnCo undertakes any obligation to update the forward-looking statements included in this press release to reflect subsequent events or circumstances.