Filed Pursuant to Rule 424(b)(3)
Registration No. 333-185676
TRILINC GLOBAL IMPACT FUND, LLC
SUPPLEMENT NO. 1 DATED MAY 12, 2015
TO THE PROSPECTUS DATED APRIL 27, 2015
This prospectus supplement (“Supplement”) is part of and should be read in conjunction with the prospectus of TriLinc Global Impact Fund, LLC (the “Company”), dated April 27, 2015 (the “Prospectus”). Unless otherwise defined herein, capitalized terms used in this Supplement shall have the same meanings as in the Prospectus.
The purposes of this Supplement are as follows:
A.To provide information regarding our public offering;
B. To provide information regarding distributions declared; and
C. To update the section of the Prospectus titled “Business.”
A. Status of Our Public Offering
As of May 11, 2015, we had raised gross proceeds of approximately $85.5 million from the sale of approximately 9.0 million units of our limited liability company interest, including units issued pursuant to our distribution reinvestment plan.
B. Declaration of Distributions
On April 21, 2015, with the authorization of our board of managers, the Company declared distributions for all classes of units for the period from April 1 through April 30, 2015. These distributions were calculated based on unitholders of record for each day in an amount equal to $0.00197808 per unit per day (less the distribution fee with respect to Class C units). On May 1, 2015, $339,463 of these distributions were paid in cash and on April 30, 2015, $169,836 were reinvested in the Company’s units for those investors participating in the Company’s unit Distribution Reinvestment Plan. Some or all of the Company’s distributions have been and may continue to be paid from sources other than cash flow from operations, such as capital contributions from the Sponsor, cash resulting from a waiver or deferral of fees, and/or proceeds from this offering.
C. Update to the Section Titled “Business”
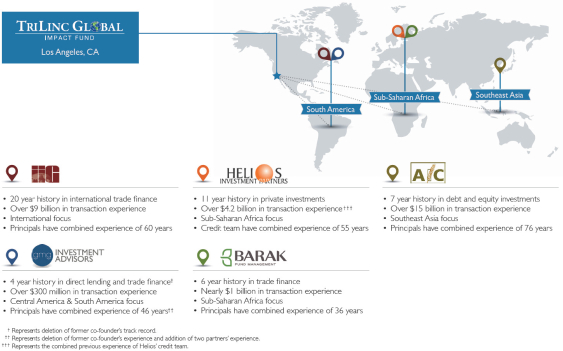
On May 4, 2015, the Company, through our Advisor, entered into a sub-advisory agreement with Helios Investment Partners LLP to become a sub-advisor for the Company’s investments in Sub-Saharan Africa.
| 1. | a. The fifth paragraph in the “Business—Investment Strategy—Expertise—Investing with Sub-advisors” section of the Prospectus on page 63 of the Prospectus is deleted in its entirety and replaced with the following: |
As of May 12, 2015, our Advisor has selected five institutional-class sub-advisors with access to a robust pipeline of highly selective investment opportunities. Collectively, the sub-advisors have deployed more than $29.5 billion in developing economy debt transactions. The management teams have an average of approximately 23 years of local market experience. The following are the selected managers to act as sub-advisors:
b. The following is inserted as the last bullet point in the “Business—Investment Strategy—Expertise—Investing with Sub-advisors” section of the Prospectus on page 64 of the Prospectus:
| • | Helios Investment Partners, LLP (Helios): is an Africa-focused private investment firm managing funds totaling over $3 billion. Established in 2004, led and managed by a predominantly African team and based in London, Nigeria, and Kenya, Helios has completed investments in countries across the African continent. Helios’ portfolio companies operate in more than 35 countries in all regions of the continent, and the firm’s diverse investor base comprises a broad range of the world’s leading investors, including sovereign wealth funds, corporate and public pension funds, endowments and foundations, funds of funds, family offices and development finance institutions across the US, Europe, Asia and Africa. |
Recipient of the Overseas Private Investment Corporation’s 2014 Impact Award in Private Equity, Helios is a solutions provider that bridges international capital and know-how to African talent and enterprise. Differentiated by a combination of world-class investment skills, deep local and international networks, and a thorough understanding of the African environment, the firm is well-positioned to generate strong risk-adjusted returns from investments in the African market.
The Helios credit team’s senior members collectively have more than 55 years of investment experience in institutional lending, debt structuring, trading and risk management with previous tenures at leading financial institutions including Standard Chartered PLC, Bank of America N.A., Citibank N.A. and Renaissance Financial Holdings Limited and have completed over $4.2 billion in debt transactions across Africa. These investment professionals lead the Helios credit team’s disciplined loan structuring and diligent risk management processes and procedures to create attractive investment and impact opportunities for the Company’s term loan strategy throughout Sub-Saharan Africa. As one of the leading investment firms in the region, Helios’ regional networks will support the credit team’s mandate to provide financing to companies not well-served by banks or equity investors. Helios serves as a secondary sub-advisor.
c. The map in the “Business—Investment Strategy—Expertise—Investing with Sub-advisors” section of the Prospectus on page 64 of the Prospectus is deleted in its entirety and replaced with the following:
| 2. | The following information updates and supplements the “Business—Investments—Overview” section of the Prospectus to provide certain information regarding the Company’s investment portfolio as of April 30, 2015: |
Investments
Since the Company commenced operations and through April 30, 2015, the Company has funded in excess of $131.5 million in in aggregate investments, including $24.7 million in short-term investments. As of April 30, 2015, the Company’s portfolio consisted of $76.3 million in total loan commitments, with $56.8 million in current loan outstandings across 18 separate investments. Given the Company’s weighted average portfolio duration of less than a year, a significant portion of the secured borrower debt has paid off and been reinvested in new transactions.
As of April 30, 2015, the Company had the following investments:
| Investment Portfolio | ||||||||||||||||||||||
| Description | Sector | Country | Investment Type | Maturity1 | Interest Rate2 | Total Loan Commitment3 | Total Amount Outstanding4 | Primary Impact Objective | ||||||||||||||
Agricultural Supplies Producer | Agricultural Chemicals | South Africa | Trade Finance | 3/12/2015 | 13.00 | % | $ | 10,000,000 | $ | 1,495,758 | Job Creation | |||||||||||
Agriculture Distributor | Farm-Product Raw Materials | Argentina | Trade Finance | 12/11/2015 | 9.00 | % | $ | 7,000,000 | $ | 7,000,000 | Job Creation | |||||||||||
Beef Exporter | Meat Products | Argentina | Trade Finance | 6/4/2015 | 11.98 | % | $ | 7,000,000 | $ | 6,000,000 | Job Creation | |||||||||||
Candle Distributor | Miscellaneous Manufacturing Industries | South Africa | Trade Finance | 6/1/2015 | 12.91 | % | $ | 1,400,000 | $ | 1,375,422 | Job Creation | |||||||||||
Cement Distributor | Cement, Hydraulic | Kenya | Trade Finance | 9/30/2015 | 14.25 | % | $ | 7,000,000 | $ | 7,000,000 | Job Creation | |||||||||||
Construction Materials Distributor | Hardware, Plumbing, and Heating Equipment | South Africa | Trade Finance | 7/1/2015 | 12.75 | % | $ | 750,000 | $ | 412,100 | Job Creation | |||||||||||
Consumer Goods Distributor | Groceries and Related Products | Namibia | Trade Finance | 5/14/2015 | 12.00 | % | $ | 2,000,000 | $ | 2,000,000 | Job Creation | |||||||||||
Dairy Co-Operative | Dairy Products | Argentina | Trade Finance | 2/25/2016 | 10.85 | % | $ | 6,000,000 | $ | 6,000,000 | Job Creation | |||||||||||
Diaper Manufacturer5 | Converted Paper and Paperboard Products | Peru | Term Loan | 6/15/2017 | 15.57 | % | $ | 2,750,000 | $ | 2,750,000 | Job Creation | |||||||||||
Farm Supplies Distributor | Miscellaneous Non-Durable Goods | Zambia | Trade Finance | 10/25/2015 | 12.15 | % | $ | 15,000,000 | $ | 8,715,349 | Job Creation | |||||||||||
Fruit & Nut Distributor | Groceries and Related Products | South Africa | Trade Finance | 5/22/2015 | 17.50 | % | $ | 1,250,000 | $ | 1,038,939 | Job Creation | |||||||||||
Meat Processor6 | Meat Products | South Africa | Trade Finance | 1/28/2016 | 14.50 | % | $ | 2,800,000 | $ | 1,911,910 | Job Creation | |||||||||||
Mine Remediation Company | Metal Mining Services | South Africa | Trade Finance | 2/2/2016 | 17.50 | % | $ | 3,250,000 | $ | 2,547,135 | Job Creation | |||||||||||
Rice & Bean Importer | Groceries and Related Products | South Africa | Trade Finance | 4/28/2015 | 12.50 | % | $ | 1,000,000 | $ | 1,000,000 | Job Creation | |||||||||||
Soybean Distributor7 | Fats and Oils | Argentina | Trade Finance | 2/3/2016 | 8.89 | % | $ | 3,100,000 | $ | 3,100,000 | Job Creation | |||||||||||
Sugar Producer | Field Crops, Except Cash Grains | Brazil | Term Loan | 5/15/2017 | 12.43 | % | $ | 3,000,000 | $ | 3,000,000 | Capacity- Building | |||||||||||
Textile Distributor8 | Apparel, Piece Goods, and Notions | South Africa | Trade Finance | 7/9/2015 | 15.00 | % | $ | 2,500,000 | $ | 1,371,445 | Job Creation | |||||||||||
Waste Management Equipment Distributor9 | Machinery, Equipment, and Supplies | South Africa | Trade Finance | 5/14/2015 | 19.50 | % | $ | 500,000 | $ | 100,000 | Equality & Empowerment | |||||||||||
Investment Portfolio Total | $ | 76,300,000 | $ | 56,818,058 | ||||||||||||||||||
Short-Term Investments10 | ||||||||||||||||||||||
Rice Producer | Cash Grains | Tanzania | Short-Term | 5/5/2015 | 11.50 | % | $ | 3,900,000 | $ | 3,900,000 | N/A | |||||||||||
Farm Supplies Importer | Miscellaneous Non-Durable Goods | South Africa | Short-Term | 5/25/2015 | 13.00 | % | $ | 2,000,000 | $ | 750,000 | N/A | |||||||||||
Agricultural Products Exporter11 | Farm-Product Raw Materials | Singapore | Short-Term | 7/22/2015 | 9.00 | % | $ | 10,000,000 | $ | 10,000,000 | N/A | |||||||||||
Short-Term Investment Total | $ | 15,900,000 | $ | 14,650,000 | ||||||||||||||||||
Investment Portfolio and Short-Term Investment Totals | $ | 92,200,000 | $ | 71,468,058 | ||||||||||||||||||
| 1 | Given the nature of trade finance contracts, trade finance borrowers typically have a 30 day grace period relative to the maturity date. |
| 2 | Interest rates are as of April 30, 2015. Interest rates include contractual rates and accrued fees where applicable. |
| 3 | The total loan commitment represents the maximum amount that can be borrowed under the agreement. The actual amount drawn on the loan by the borrower may change over time. Loan commitments are subject to availability of funds and do not represent a contractual obligation to provide funds to a borrower. |
| 4 | The total amount outstanding represents the actual amount borrowed under the loan as of April 30, 2015. In some instances where there is a $0 balance, the borrower may have paid back the original amount borrowed under a trade finance facility and under an agreement, may borrow again. |
| 5 | The interest rate includes 2.50% of deferred interest. |
| 6 | On April 6, 2015, the Company funded $600,000 as part of an existing $2,800,000 revolving trade finance facility at a fixed interest rate of 14.50% to the vertically-integrated Meat Processor operating in the country’s rural provinces. The transaction, set to mature on December 15, 2015, is supported by inventory. TriLinc financing is expected to support the borrower’s continued growth through the expansion of its distribution network and the addition of more retail outlets in the country’s underserved low- to middle-income consumer market. As a part of this growth, the borrower anticipates that it will expand its employee base. |
| 7 | On April 10, 2015, the Company funded $3,100,000 as part of an existing $3,100,000 revolving trade finance facility at a fixed interest rate of 8.89% to the Soybean Distributor. The transaction, set to mature on February 3, 2016, is supported by a specific purchase order contract with a buyer based in the Netherlands. The borrower anticipates that the financing will support economic growth through job creation, increased exports and increased agricultural productivity. |
| 8 | On April 17, 2015, the Company funded $177,237 as part of an existing $2,500,000 revolving trade finance facility at a fixed interest rate of 15.00% to the Textile Distributor. The transaction, set to mature on July 2, 2015, is secured by specific inventory being imported into South Africa from Asia. The borrower anticipates that TriLinc financing will support employment generation. |
| 9 | On April 16, 2015, TriLinc funded $100,000 as part of an existing $500,000 purchase and repurchase trade finance facility at a fixed interest rate of 19.50% to the Waste Management Equipment Distributor. The transaction, set to mature on May 14, 2015, is supported by specific equipment. The borrower anticipates that TriLinc financing will support its objective of providing environmental management solutions while also promoting the participation of women and minorities in the workplace. |
| 10 | Short-term Investments are defined as investments that generally meet the standard underwriting guidelines for trade finance and term loan transactions and that also have the following characteristics: (1) maturity of less than one year, (2) loans to borrowers to whom, at the time of funding, the Company does not expect to re-lend. Impact data is not tracked for Short-term Investments. |
| 11 | The transaction is secured by specific collateral held by the borrower’s subsidiaries in Kenya, Tanzania, and Zambia. |
As of April 30, 2015 the Company had exited the following investments:
| Description | Sector | Country | Investment Type | Transaction Date | Transaction Amount | Payoff Date | Internal Rate of Return (“IRR”)1 | Primary Impact Objective | ||||||||||||||||
Electronics Retailer | Radio, Television, Consumer Electronics, and Music Stores | Indonesia | Term Loan | 7/26/2013 | $ | 5,000,000 | 6/17/2014 | 19.59 | % | Access to Finance | ||||||||||||||
Fertilizer Distributor | Agricultural Chemicals | Zambia | Trade Finance | 7/17/2014 | $ | 3,000,000 | 11/4/2014 | 12.65 | % | Job Creation | ||||||||||||||
Food Processor | Groceries and Related Products | Peru | Term Loan | 3/25/2014 | $ | 576,000 | 11/28/2014 | 14.01 | % | Job Creation | ||||||||||||||
Frozen Seafood Exporter | Groceries and Related Products | Ecuador | Trade Finance | 6/17/2013 | $ | 240,484 | 5/14/2014 | 13.49 | % | Job Creation | ||||||||||||||
Insulated Wire Manufacturer | Rolling, Drawing, and Extruding of Nonferrous Metals | Peru | Trade Finance | 5/2/2014 | $ | 1,991,000 | 12/2/2014 | 8.43 | % | Job Creation | ||||||||||||||
International Tuna Exporter | Groceries and Related Products | Ecuador | Trade Finance | 7/17/2013 | $ | 1,000,000 | 10/9/2013 | 13.58 | % | Job Creation | ||||||||||||||
Seafood Processing Company | Miscellaneous Food Preparations and Kindred Products | Ecuador | Trade Finance | 6/19/2013 | $ | 496,841 | 7/1/2013 | 13.44 | % | Job Creation | ||||||||||||||
Timber Exporter | Sawmills and Planing Mills | Chile | Trade Finance | 7/3/2013 | $ | 915,000 | 6/12/2014 | 10.25 | % | Job Creation | ||||||||||||||
Portfolio Totals | $ | 13,219,325 | ||||||||||||||||||||||
| 1 | Given that the loan has been paid off, this investment is no longer part of the Company’s portfolio. The internal rate of return is defined as the gross average annual return earned through the life of an investment. The internal rate of return was calculated by our Advisor (unaudited) as the investment (loan advance) was made and cash was received (principal, interest and fees). |
Certain Portfolio Characteristics1
Total Assets (est.) | $ | 76,447,020 | ||
Current Loan Commitments | $ | 76,300,000 | ||
Leverage | 0 | % | ||
Weighted Average Portfolio Loan Size | $ | 3,736,952 | ||
Weighted Average Portfolio Duration | 0.49 years | |||
Weighted Average Position Yield | 12.4 | % | ||
USD Denominated | 100 | % | ||
Countries | 7 |
Top Five Investments by Percentage
| Company Description | Country | % of Total Assets | ||||
Farm Supplies Distributor | Zambia | 11.4% | ||||
Agriculture Distributor | Argentina | 9.2% | ||||
Cement Distributor | Kenya | 9.2% | ||||
Beef Exporter | Argentina | 7.8% | ||||
Dairy Co-Operative | Argentina | 7.8% | ||||
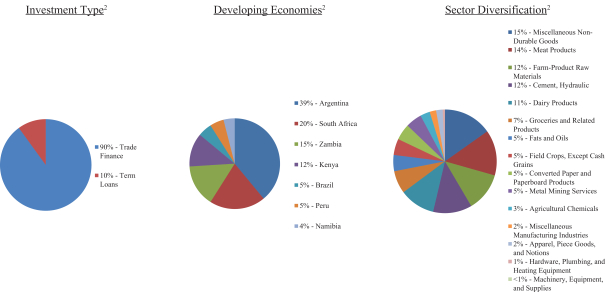
| 1 | All information provided in this section, with the exception of the Total Asset (est.) figure, pertains exclusively to the Company’s Investment Portfolio and therefore does not include the Company’s Short-Term Investments. |
| 2 | The above charts represent investment type, developing economy, and sector diversification as a percentage of the total amount outstanding of the Company’s Investment Portfolio. |