Filed Pursuant to Rule 424(b)(3)
Registration No. 333-185676
TRILINC GLOBAL IMPACT FUND, LLC
SUPPLEMENT NO. 3 DATED JUNE 5, 2015
TO THE PROSPECTUS DATED APRIL 27, 2015
This prospectus supplement (“Supplement”) is part of and should be read in conjunction with the prospectus of TriLinc Global Impact Fund, LLC (the “Company”), dated April 27, 2015, as supplemented by Prospectus Supplement No.1, dated May 12, 2015, and Prospectus Supplement No. 2, dated May 15, 2015 (the “Prospectus”). Unless otherwise defined herein, capitalized terms used in this Supplement shall have the same meanings as in the Prospectus.
The purposes of this Supplement are as follows:
| A. | To provide information regarding our public offering; |
| B. | To provide information regarding distributions declared; and |
| C. | To update the section of the Prospectus titled “Business.” |
| A. | Status of Our Public Offering |
As of June 3, 2015, we had raised gross proceeds of approximately $88.6 million from the sale of approximately 9.3 million units of our limited liability company interest, including units issued pursuant to our distribution reinvestment plan.
| B. | Declaration of Distributions |
On May 11, 2015, with the authorization of our board of managers, the Company declared distributions for all classes of units for the period from May 1 through May 31, 2015. These distributions were calculated based on unitholders of record for each day in an amount equal to $0.00197808 per unit per day (less the distribution fee with respect to Class C units). On June 1, 2015, $363,691 of these distributions were paid in cash and on May 31, 2015, $189,037 were reinvested in the Company’s units for those investors participating in the Company’s unit Distribution Reinvestment Plan. Some or all of the Company’s distributions have been and may continue to be paid from sources other than cash flow from operations, such as capital contributions from the Sponsor, cash resulting from a waiver or deferral of fees, and/or proceeds from this offering.
| C. | Update to the Section Titled “Business” |
| 1. | The following information updates and supplements the “Business—Investments—Overview” section of the Prospectus to provide certain information regarding the Company’s investment portfolio as of May 31, 2015: |
| Investments |
Since the Company commenced operations and through May 31, 2015, the Company has funded in excess of $138.5 million in in aggregate investments, including $25.7 million in short-term investments. As of May 31, 2015, the Company’s portfolio consisted of $76.3 million in total loan commitments, with $57.3 million in current loan outstandings across 18 separate investments. Given the Company’s weighted average portfolio duration of less than a year, a significant portion of the secured borrower debt has paid off and been reinvested in new transactions.
As of May 31, 2015, the Company had the following investments:
Investment Portfolio
Description | Sector | Country | Investment Type | Maturity1 | Interest Rate2 | Total Loan Commitment3 | Total Amount Outstanding4 | Primary Impact Objective | ||||||||||||||
Agricultural5 Supplies Producer | Agricultural Chemicals | South Africa | Trade Finance | 3/12/2015 | 13.00% | $ | 10,000,000 | $ | 1,440,676 | Job Creation | ||||||||||||
Agriculture Distributor6 | Farm-Product Raw Materials | Argentina | Trade Finance | 12/15/2015 | 9.00% | $ | 7,000,000 | $ | 7,000,000 | Job Creation | ||||||||||||
Beef Exporter | Meat Products | Argentina | Trade Finance | 6/4/2015 | 11.98% | $ | 7,000,000 | $ | 6,000,000 | Job Creation | ||||||||||||
Candle Distributor | Miscellaneous Manufacturing Industries | South Africa | Trade Finance | 6/1/2015 | 12.91% | $ | 1,400,000 | $ | 1,375,422 | Job Creation | ||||||||||||
Cement Distributor | Cement, Hydraulic | Kenya | Trade Finance | 9/30/2015 | 14.25% | $ | 7,000,000 | $ | 7,000,000 | Job Creation | ||||||||||||
Construction Materials Distributor | Hardware, Plumbing, and Heating Equipment | South Africa | Trade Finance | 7/1/2015 | 12.75% | $ | 750,000 | $ | 400,652 | Job Creation | ||||||||||||
Consumer Goods Distributor | Groceries and Related Products | Namibia | Trade Finance | 5/14/2015 | 12.00% | $ | 2,000,000 | $ | 2,000,000 | Job Creation | ||||||||||||
Dairy Co-Operative | Dairy Products | Argentina | Trade Finance | 2/25/2016 | 10.85% | $ | 6,000,000 | $ | 6,000,000 | Job Creation | ||||||||||||
Diaper Manufacturer7 | Converted Paper and Paperboard Products | Peru | Term Loan | 6/15/2017 | 15.57% | $ | 2,750,000 | $ | 2,750,000 | Job Creation | ||||||||||||
Farm Supplies Distributor8 | Miscellaneous Non-Durable Goods | Zambia | Trade Finance | 10/25/2015 | 12.18% | $ | 15,000,000 | $ | 9,435,349 | Job Creation | ||||||||||||
Fruit & Nut Distributor | Groceries and Related Products | South Africa | Trade Finance | 5/22/2015 | 17.50% | $ | 1,250,000 | $ | 932,029 | Job Creation | ||||||||||||
Meat Processor | Meat Products | South Africa | Trade Finance | 1/28/2016 | 14.50% | $ | 2,800,000 | $ | 1,911,910 | Job Creation | ||||||||||||
Mine Remediation Company | Metal Mining Services | South Africa | Trade Finance | 2/2/2016 | 17.50% | $ | 3,250,000 | $ | 2,503,860 | Job Creation | ||||||||||||
Rice & Bean Importer | Groceries and Related Products | South Africa | Trade Finance | 6/27/2015 | 12.50% | $ | 1,000,000 | $ | 1,000,000 | Job Creation | ||||||||||||
Soybean Distributor | Fats and Oils | Argentina | Trade Finance | 2/3/2016 | 8.89% | $ | 3,100,000 | $ | 3,100,000 | Job Creation | ||||||||||||
Sugar Producer | Field Crops, Except Cash Grains | Brazil | Term Loan | 5/15/2017 | 12.43% | $ | 3,000,000 | $ | 3,000,000 | Capacity- Building | ||||||||||||
Textile Distributor9 | Apparel, Piece Goods, and Notions | South Africa | Trade Finance | 8/13/2015 | 15.00% | $ | 2,500,000 | $ | 1,483,269 | Job Creation | ||||||||||||
Waste Management Equipment Distributor | Machinery, Equipment, and Supplies | South Africa | Trade Finance | 5/14/2015 | 19.50% | $ | 500,000 | $ | 0 | Equality & Empowerment | ||||||||||||
|
|
|
| |||||||||||||||||||
Investment Portfolio Total |
| $ | 76,300,000 | $ | 57,333,167 | |||||||||||||||||
|
|
|
| |||||||||||||||||||
Short-Term Investments10 | ||||||||||||||||||||||
Rice Producer | Cash Grains | Tanzania | Short-Term | 5/5/2015 | 11.50% | $ | 3,900,000 | $ | 3,900,000 | N/A | ||||||||||||
Farm Supplies Importer | Miscellaneous Non-Durable Goods | South Africa | Short-Term | 5/25/2015 | 13.00% | $ | 2,000,000 | $ | 750,000 | N/A | ||||||||||||
Agricultural Products Exporter11 | Farm-Product Raw Materials | Singapore | Short-Term | 7/22/2015 | 12.00% | $ | 10,000,000 | $ | 10,000,000 | N/A | ||||||||||||
Farm Supplies Wholesaler | Miscellaneous Non-Durable Goods | South Africa | Short-Term | 7/19/2015 | 12.50% | $ | 1,000,000 | $ | 1,000,000 | N/A | ||||||||||||
|
|
|
| |||||||||||||||||||
Short-Term Investment Total |
| $ | 16,900,000 | $ | 15,650,000 | |||||||||||||||||
|
|
|
| |||||||||||||||||||
Investment Portfolio and Short-Term Investment Totals |
| $ | 93,200,000 | $ | 72,983,167 | |||||||||||||||||
|
|
|
| |||||||||||||||||||
| 1 | Given the nature of trade finance contracts, trade finance borrowers typically have a 30 day grace period relative to the maturity date. |
| 2 | Interest rates are as of May 31, 2015. Interest rates include contractual rates and accrued fees where applicable. |
| 3 | The total loan commitment represents the maximum amount that can be borrowed under the agreement. The actual amount drawn on the loan by the borrower may change over time. Loan commitments are subject to availability of funds and do not represent a contractual obligation to provide funds to a borrower. |
| 4 | The total amount outstanding represents the actual amount borrowed under the loan as of May 31, 2015. In some instances where there is a $0 balance, the borrower may have paid back the original amount borrowed under a trade finance facility and under an agreement, may borrow again. |
| 5 | The Company and the borrower have mutually agreed to extend the maturity date through June 30, 2015. |
| 6 | On May 15 and May 19, 2015, the Company funded two separate transactions totaling $5,000,000 to the Agriculture Distributor as part of an existing $7,000,000 revolving trade finance facility at a fixed interest rate of 9.00%. Both transactions are set to mature on December 15, 2015 and are secured by the assignment of purchase contracts and receivables. The borrower anticipates that the Company’s financing will support economic growth through job creation, increased exports and increased agricultural productivity. |
| 7 | The interest rate includes 2.50% of deferred interest. |
| 8 | On May 21, 2015, TriLinc funded $720,000 as part of an existing $15,000,000 trade finance facility at an interest rate of 12.50% to the Farm Supplies Distributor engaged in the warehousing and trading of key agricultural commodities including fertilizer, maize, soya beans, ground nuts and seed. The transaction, set to mature on June 5, 2015, is secured by specific inventory. The borrower anticipates that the Company’s financing will support job creation and indirectly help local farmers improve agricultural productivity and food security. |
| 9 | On May 11 and May 14, 2015, the Company funded two separate transactions totaling $278,015 as part of an existing $2,500,000 revolving trade finance facility at a fixed interest rate of 15.00% to a South African textile distributor. Set to mature on July 30, 2015 and August 13, 2015, respectively, each transaction is secured by specific inventory being imported into South Africa from Asia. The borrower anticipates that the Company financing will support employment generation. |
| 10 | Short-Term Investments are defined as investments that generally meet the standard underwriting guidelines for trade finance and term loan transactions and that also have the following characteristics: (1) maturity of less than one year, (2) loans to borrowers to whom, at the time of funding, the Company does not expect to re-lend. Impact data is not tracked for Short-term Investments. |
| 11 | The transaction is secured by specific collateral held by the borrower’s subsidiaries in Kenya, Tanzania, and Zambia. |
As of May 31, 2015 the Company had exited the following investments:
Description | Sector | Country | Investment Type | Transaction Date | Transaction Amount | Payoff Date | Internal Rate of Return (“IRR”)1 | Primary Impact Objective | ||||||||||||||||
Electronics Retailer | Radio, Television, Consumer Electronics, and Music Stores | Indonesia | Term Loan | 7/26/2013 | $ | 5,000,000 | 6/17/2014 | 19.59 | % | | Access to Finance | | ||||||||||||
Fertilizer Distributor | Agricultural Chemicals | Zambia | Trade Finance | 7/17/2014 | $ | 3,000,000 | 11/4/2014 | 12.65 | % | | Job Creation | | ||||||||||||
Food Processor | Groceries and Related Products | Peru | Term Loan | 3/25/2014 | $ | 576,000 | 11/28/2014 | 14.01 | % | | Job Creation | | ||||||||||||
Frozen Seafood Exporter | Groceries and Related Products | Ecuador | Trade Finance | 6/17/2013 | $ | 240,484 | 5/14/2014 | 13.49 | % | | Job Creation | | ||||||||||||
Insulated Wire Manufacturer | Rolling, Drawing, and Extruding of Nonferrous Metals | Peru | Trade Finance | 5/2/2014 | $ | 1,991,000 | 12/2/2014 | 8.43 | % | | Job Creation | | ||||||||||||
International Tuna Exporter | Groceries and Related Products | Ecuador | Trade Finance | 7/17/2013 | $ | 1,000,000 | 10/9/2013 | 13.58 | % | | Job Creation | | ||||||||||||
Seafood Processing Company | Miscellaneous Food Preparations and Kindred Products | Ecuador | Trade Finance | 6/19/2013 | $ | 496,841 | 7/1/2013 | 13.44 | % | | Job Creation | | ||||||||||||
Timber Exporter | Sawmills and Planing Mills | Chile | Trade Finance | 7/3/2013 | $ | 915,000 | 6/12/2014 | 10.25 | % | | Job Creation | | ||||||||||||
|
| |||||||||||||||||||||||
Portfolio Totals | $ | 13,219,325 | ||||||||||||||||||||||
|
| |||||||||||||||||||||||
| 1 | Given that the loan has been paid off, this investment is no longer part of the Company’s portfolio. The internal rate of return is defined as the gross average annual return earned through the life of an investment. The internal rate of return was calculated by our Advisor (unaudited) as the investment (loan advance) was made and cash was received (principal, interest and fees). |
Certain Portfolio Characteristics1
Total Assets (est.) | $ | 79,547,272 | ||
Current Loan Commitments | $ | 76,300,000 | ||
Leverage | 0% | |||
Weighted Average Portfolio Loan Size | $ | 3,655,233 | ||
Weighted Average Portfolio Duration | 0.45 years | |||
Weighted Average Position Yield | 12.4% | |||
USD Denominated | 100% | |||
Countries2 | 7 | |||
Sectors2 | 15 |
Top Five Investments by Percentage
Company Description | Country | % of Total Assets | ||||
Farm Supplies Distributor | Zambia | 11.9% | ||||
Agriculture Distributor | Argentina | 8.8% | ||||
Cement Distributor | Kenya | 8.8% | ||||
Beef Exporter | Argentina | 7.5% | ||||
Dairy Co-Operative | Argentina | 7.5% | ||||
| 1 | All information provided in this section, with the exception of the Total Asset (est.) figure, pertains exclusively to the Company’s Investment Portfolio and therefore does not include the Company’s Short-Term Investments. |
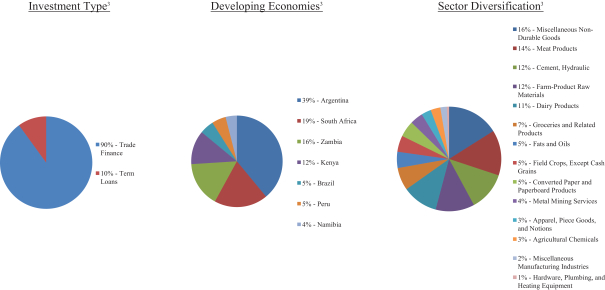
| 2 | This represents all countries/sectors where the Company currently has a loan commitment. Due to the revolving debt nature of trade finance facilities and the timing of funding, it is possible that certain commitments currently have a zero outstanding balance and would therefore not be represented in the country/sector allocation charts, which represents invested capital. |
| 3 | The above charts represent investment type, developing economy, and sector diversification as a percentage of the total amount outstanding of the Company’s Investment Portfolio. |