Filed Pursuant to Rule 424(b)(3)
Registration No. 333-185676
TRILINC GLOBAL IMPACT FUND, LLC
SUPPLEMENT NO. 7 DATED OCTOBER 13, 2016
TO THE PROSPECTUS DATED APRIL 28, 2016
This prospectus supplement (“Supplement”) is part of and should be read in conjunction with the prospectus of TriLinc Global Impact Fund, LLC (the “Company”), dated April 28, 2016, as supplemented by Prospectus Supplement No. 1, dated May 11, 2016, Prospectus Supplement No. 2, dated June 9, 2016, Prospectus Supplement No. 3, dated July 7, 2016, Prospectus Supplement No. 4, dated August 17, 2016, Prospectus Supplement No. 5, dated September 14, 2016, and Prospectus Supplement No. 6, dated September 22, 2016 (the “Prospectus”). Unless otherwise defined herein, capitalized terms used in this Supplement shall have the same meanings as in the Prospectus.
The purposes of this Supplement are as follows:
| A. | To provide information regarding our public offering; |
| B. | To provide information regarding distributions declared; |
| C. | To update information regarding dealer management and platform placement fees; |
| D. | To update the section of the Prospectus titled “Business;” |
| A. | Status of Our Public Offering |
As of October 7, 2016 we had raised gross proceeds of approximately $264.3 million from the sale of approximately 27.4 million units of our limited liability company interest, including units issued pursuant to our distribution reinvestment plan.
| B. | Declaration of Distributions |
On September 20, 2016, with the authorization of our board of managers, the Company declared distributions for all classes of units for the period from September 1 through September 30, 2016. These distributions were calculated based on unitholders of record for each day in an amount equal to $0.00197268 per unit per day (less the distribution fee with respect to Class C units). On October 3, 2016, $833,721 of these distributions were paid in cash and on September 30, 2016, $679,108 were reinvested in the Company’s units for those investors participating in the Company’s unit Distribution Reinvestment Plan. Some or all of the Company’s distributions have been and may continue to be paid from sources other than cash flow from operations, such as capital contributions from the Sponsor, cash resulting from a waiver or deferral of fees, and/or proceeds from this offering.
| C. | Removal of Dealer Manager Fee, and Addition of Platform Placement Fee, with Respect to Class I Units |
All references to the price of Class I units throughout the Prospectus shall be changed from $9.186 to $9.025.
The following supersedes and replaces the second paragraph contained on the cover page of our prospectus.
We are offering on a continuous basis up to $1,500,000,000 in units of our limited liability company interest, consisting of up to $1,250,000,000 of units in our primary offering and up to $250,000,000 of units pursuant to our distribution reinvestment plan. We are publicly offering three classes of units: Class A units, Class C units and Class I units. The unit classes have different sales commissions, dealer manager fees and there is an ongoing distribution fee with respect to Class C units. In addition, there is a platform placement fee with respect to Class I units, which is paid by our Advisor. We are offering to sell any combination of Class A, Class C and Class I units with a dollar value up to the maximum offering amount. The current offering price for the units in the primary offering is $10.000 per Class A unit, $9.576 per Class C unit and $9.025 per Class I unit. We reserve the right to reallocate the units we are offering between this offering and our distribution reinvestment plan. This is a best efforts offering, which means that SC Distributors, LLC, the dealer manager for this offering, will use its best efforts, but is not required, to sell any specific amount of units. The minimum permitted purchase is $2,000 in any class of our units.
The following supersedes and replaces the table and footnote (2) contained on the cover page of our prospectus.
| Aggregate Price to Public (1) | Selling Commissions (2) | Dealer Manager Fee (2) | Proceeds Before Expenses to Us (2)(3) | |||||||||||||
Primary Offering | ||||||||||||||||
Per Class A Unit | $ | 10.000 | $ | 0.700 | $ | 0.275 | $ | 9.025 | ||||||||
Per Class C Unit | $ | 9.576 | $ | 0.287 | $ | 0.263 | $ | 9.025 | ||||||||
Per Class I Unit | $ | 9.025 | — | $ | — | $ | 9.025 | |||||||||
Minimum Offering | $ | 2,000,000.00 | $ | 66,666.67 | $ | 48,333.33 | $ | 1,885,000 | ||||||||
Maximum Offering | $ | 1,250,000,000.00 | $ | 41,666,667.67 | $ | 22,355,333.33 | $ | 1,185,977,999 | ||||||||
Distribution Reinvestment Plan | ||||||||||||||||
Per Class A Unit | $ | 9.025 | — | — | $ | 9.025 | ||||||||||
Per Class C Unit | $ | 9.025 | — | — | $ | 9.025 | ||||||||||
Per Class I Unit | $ | 9.025 | — | — | $ | 9.025 | ||||||||||
Maximum Offering | $ | 250,000,000.00 | — | — | $ | 250,000,000.00 | ||||||||||
Total Maximum Offering | $ | 1,500,000,000.00 | $ | 45,930,667.67 | $ | 22,355,333.33 | $ | 1,431,714,000.00 | ||||||||
(Primary and Distribution Reinvestment Plan) | ||||||||||||||||
(2) The table assumes that 1/3 of primary offering gross proceeds come from sales of Class A units, 1/3 of primary offering gross proceeds come from sales of Class C units and 1/3 of primary offering gross proceeds come from sales of Class I units. For the 1/3 of primary offering proceeds allocated to Class I units, the dealer manager fee assumes that approximately $82,912,000 Class I units or 15.9% of the Class I units available for distribution have already been sold as of the date hereof with the applicable dealer manager fee of 1.75% per unit. No dealer manager fees will be paid on the remaining $331,442,000 Class I units or 84.1% of Class I units. We reserve the right to reallocate units being offered between Class A, Class C and Class I units. The table excludes the distribution fees for Class C units, which will be paid over time and will not be paid from offering proceeds, as well as the platform placement fee for Class I units, which is paid by our Advisor. With respect to Class C units, we have paid and will continue to pay our dealer manager a distribution fee that accrues daily equal to 1/365th of 0.80% of the amount of the net asset value for the Class C units for such day on a continuous basis from year to year. We will continue paying distribution fees with respect to all Class C units sold in this offering until the earlier to occur of the following: (i) a listing of the Class C units on a national securities exchange, (ii) following the completion of this offering, total underwriting compensation in this offering equaling 10% of the gross proceeds from our primary offering, or (iii) there are no longer any Class C units outstanding. The figures in the table are calculated based on rounding to three decimal points.
The following supersedes and replaces the “Questions and Answers – Q: What is the difference between the Class A, Class C and Class I units being offered?” section of our prospectus beginning on page 4.
Q: What is the difference between the Class A, Class C and Class I units being offered?
A: We are offering three classes of units, Class A units, Class C units and Class I units at a current offering price of $10.00 per Class A unit, $9.576 per Class C unit and $9.025 per Class I unit. The unit classes have different sales commissions and dealer manager fees, and there is an ongoing distribution fee with respect to Class C units. Specifically, we pay to our dealer manager a sales commission of up to 7.00% of gross proceeds from the sale of Class A units sold in the primary offering. For Class C units sold in the primary offering, we pay a sales commission of up to 3.00% of gross proceeds. In addition, for Class C units, we pay the dealer manager a distribution fee that accrues daily equal to 1/365th of 0.80% of the amount of the net asset value for the Class C units for such day on a continuous basis from year to year. We will continue paying the distribution fees with respect to Class C units sold in this offering until the earlier to occur of the following: (i) a listing of the Class C units on a national securities exchange, (ii) upon the completion of this offering, total underwriting compensation in this offering equaling 10% of the gross proceeds from the primary offering, or (iii) such Class C units no longer being outstanding. We do not pay any selling
commission or dealer manager fee with respect to Class I units. Our Advisor pays our dealer manager a platform placement fee in an amount equal to 0.40% of the gross proceeds from the primary offering of Class I units. We pay our dealer manager a dealer manager fee of up to 2.75% of gross proceeds from the primary offering of Class A and Class C units. See “Description of Units and Our Operating Agreement” and “Plan of Distribution” for a discussion of the differences between our classes of units.
Our Class A units, Class C units and Class I units are available for different categories of investors and/or different distribution channels. Class I units are available for purchase to institutional clients. Class A and C units each are available for purchase by the general public through different distribution channels (See “Plan of Distribution”). Only Class A units are available for purchase in this offering by our executive officers and board of managers and their immediate family members, as well as officers and employees of our Advisor and other affiliates of our Advisor and their immediate family members and, if approved by our management, joint venture partners, consultants and other service providers. When deciding which class of units to buy, you should consider, among other things, whether you are eligible to purchase one or more classes of units, the amount of your investment, the length of time you intend to hold the units (assuming you are able to dispose of them), the selling commission and fees attributable to each class of units and whether you qualify for any selling commission discounts described below. Before making your investment decision, please consult with your financial advisor regarding your account type and the classes of units you may be eligible to purchase.
The following supersedes and replaces the first paragraph of the “Prospectus Summary – Classes of Units – Class I Units” section of our prospectus on page 17 and the “Description of Units and our Operating Agreement – Classes of Units – Class I Units” section of our prospectus on page 169.
Class I Unit
No selling commission or dealer manager fee is paid for sales of any Class I units, and we do not pay our dealer manager a distribution fee with respect to the Class I units. Our Advisor pays our dealer manager a platform placement fee in an amount equal to 0.40% of the gross proceeds from the primary offering of Class I units. Class I units are available for purchase to certain institutional clients.
The following supersedes and replaces the “Prospectus Summary – Estimated Use of Proceeds” section of our prospectus beginning on page 18.
Assuming that 1/3 of the primary offering gross proceeds come from sales of Class A units, 1/3 of primary offering gross proceeds come from sales of Class C units and 1/3 of primary offering gross proceeds come from sales of Class I units and all of the units available for the distribution reinvestment plan are sold if we sell the maximum offering, our management team expects to invest approximately 89.25%, if only the minimum offering is sold, to 94.20%, if the maximum offering is sold, of the gross offering proceeds to make investments in accordance with our investment objectives and by following the strategies described in this prospectus. If all of our gross offering proceeds come from sales of Class A units, we expect to invest approximately 85.25%, if only the minimum offering is sold, to 90.63%, if the maximum offering is sold, of the gross offering proceeds. If gross proceeds are split evenly among the three classes of units (Classes A, C and I) and we only raise $750 million in this offering, we expect to invest approximately 92.67% and if we only raise $200 million in this offering, we expect to invest approximately 89.25%. If all of our gross offering proceeds come from sales of Class A units and we only raise $750 million in the offering, we expect to invest approximately 88.58%, and if we only raise $200 million in this offering, we expect to invest approximately 85.25%. The actual percentage of offering proceeds used to make investments will depend on the number of primary units sold and the number of units sold pursuant to our distribution reinvestment plan as well as whether we sell more or less than we have assumed of Class A units, Class C units or Class I units and actual organization and offering expenses incurred. See “Estimated Use of Proceeds.”
The following supersedes and replaces the table in the “Prospectus Summary – Our Expense Summary” section of our prospectus on page 24.
Unitholder Transaction Expenses (1) | ||||
Selling Commissions for Class A units, as % of Class A gross offering proceeds | 7.00 | % | ||
Selling Commissions for Class C units, as % of Class C gross offering proceeds | 3.00 | % | ||
Dealer Manager Fee for Class A and C units, as % of Class A and Class C gross offering proceeds | 2.75 | % | ||
Selling Commissions and Dealer Manager Fee for Class I units | — | |||
Maximum Aggregate Sale Charge (Load), as % of gross offering proceeds | 10.00 | % | ||
Maximum Reimbursement of Organization Expenses | 5.00 | % | ||
Ongoing Annual Company Expenses | ||||
Annual Management Fee, as % of Gross Assets (2) | 2.00 | % | ||
Incentive Fees, as % of investment income and capital gains (5) | (5 | ) | ||
Other Operating Expenses (3) | 0.75 | % | ||
Distribution Fee for Class C units (4) | 0.80 | % | ||
The following row supersedes and replaces the corresponding row in the table contained in the “Prospectus Summary – Compensation of the Dealer Manager and our Advisor” section of our prospectus beginning on page 25 and the table contained in the “Compensation of the Dealer Manager and our Advisor” section of our prospectus beginning on page 155.
| Dealer Manager Fee (1)(2)(3)(4)(5)(6) | We pay the dealer manager a dealer manager fee of up to 2.75% of gross offering proceeds from the sale of Class A and Class C units. We do not pay any dealer manager fees with respect to Class I units.
A portion of the dealer manager fee may be re-allowed to participating broker-dealers. | Actual amounts depend upon the number of Class I units purchased and, therefore, cannot be determined at this time. The aggregate dealer manager fee will equal $34,375,000.00 if we sell the maximum offering, assuming that all units sold are Class A units and/or Class C units, the maximum dealer manager fee is paid for each primary offering unit, and no reallocation of units between our primary offering and our distribution reinvestment plan. |
The following row is added to the table contained in the “Prospectus Summary – Compensation of the Dealer Manager and our Advisor” section of our prospectus beginning on page 25 and the table contained in the “Compensation of the Dealer Manager and our Advisor” section of our prospectus beginning on page 155.
| Platform Placement Fee (2)(4)(6) | With respect to our Class I units only, our Advisor pays the dealer manager a platform placement fee in an amount equal to 0.40% of the gross proceeds from the primary offering of Class I units.
A portion of the platform placement fee may be re-allowed to participating broker-dealers.
Our Advisor does not pay a platform placement fee with respect to Class A and Class C units. | Actual amounts depend upon the number of Class I units purchased and, therefore, cannot be determined at this time. The aggregate platform placement fee will equal $3,977,301 if we sell the maximum offering, assuming all remaining units sold are Class I units, that the net asset value per Class I units remains the same and no reallocation of units between our primary offering and our distribution reinvestment plan. |
The following supersedes and replaces the table and associated footnote (1) in the “Estimated Use of Proceeds”section of our prospectus on page 118.
| Minimum Primary Offering | Maximum Primary Offering | Maximum Primary Offering and Distribution Reinvestment Plan | ||||||||||||||||||||||
| Amount | % of Proceeds | Amount | % of Proceeds | Amount | % of Proceeds | |||||||||||||||||||
Gross Offering Proceeds | $ | 2,000,000 | 100.00 | % | $ | 1,250,000,000 | 100.00 | % | $ | 1,500,000,000 | 100.00 | % | ||||||||||||
Less Offering Expenses: | ||||||||||||||||||||||||
Selling Commissions (1)(2) | $ | 66,600 | 3.33 | % | $ | 41,666,667 | 3.33 | % | $ | 41,666,667 | 2.78 | % | ||||||||||||
Dealer Manager Fee (1)(2) | $ | 48,400 | 2.42 | % | $ | 22,355,333 | 1.79 | % | $ | 22,355,333 | 1.49 | % | ||||||||||||
Organization and Offering Expense Reimbursement (3) | $ | 100,000 | 5.00 | % | $ | 15,625,000 | 1.25 | % | $ | 18,750,000 | 1.25 | % | ||||||||||||
|
|
|
|
|
|
|
|
|
|
|
| |||||||||||||
Net Proceeds Available for Investment (4)(5) | $ | 1,785,000 | 89.25 | % | $ | 1,166,089,000 | 93.29 | % | $ | 1,412,964,000 | 94.20 | % | ||||||||||||
|
|
|
|
|
|
|
|
|
|
|
| |||||||||||||
(1) The figures in the table are calculated based on rounding to three decimal points. The table assumes that 1/3 of primary offering gross proceeds come from sales of Class A units, 1/3 of primary offering gross proceeds come from sales of Class C units and 1/3 of primary offering gross proceeds come from sales of Class I units. For the 1/3 of primary offering proceeds allocated to Class I units, the dealer manager fee assumes that approximately $82,912,000 Class I units or 15.9% of the Class I units available for distribution have already been sold as of the date hereof with the applicable dealer manager fee of 1.75% per unit. No dealer manager fees will be paid on the remaining $331,442,000 Class I units or 84.1% of Class I units. We reserve the right to reallocate units being offered among Class A, Class C and Class I units. If all of our gross offering proceeds come from sales of Class A units, we expect to invest approximately 85.25%, if only the minimum offering is sold, to 90.63%, if the maximum offering is sold, of the gross offering proceeds. If gross proceeds are split evenly among the three classes of units (Classes A, C and I) and we only raise $750 million in this offering, we expect to invest approximately 92.67% and if we only raise $200 million in this offering, we expect to invest approximately 89.25%. If all of our gross offering proceeds come from the sales of Class A units and we only raise $750 million in this offering, we expect to invest approximately 88.58% and if we only raise $200 million in this offering, we expect to invest approximately 85.25%. Because no sales commissions or dealer manager fees are paid on units sold pursuant to the DRIP offering, it is not necessary to make any assumptions regarding the number of Class A, Class C and Class I units sold in the distribution reinvestment plan. This table excludes the distribution fees for Class C units,
which are paid over time and cannot be paid from offering proceeds, as well as the platform placement fee in an amount equal 0.40% of the gross proceeds from the primary offering of Class I units, which is paid by our Advisor. With respect to Class C units, we pay our dealer manager a distribution fee that accrues daily equal to 1/365th of 0.80% of the amount of the net asset value for the Class C units for such day on a continuous basis from year to year. We will continue paying distribution fees with respect to all Class C units sold in this offering until the earlier to occur of the following: (i) a listing of the Class C units on a national securities exchange, (ii) following the completion of this offering, total underwriting compensation in this offering equaling 10% of the gross proceeds from the primary offering, or (iii) there are no longer any Class C units outstanding.
The following supersedes and replaces the third paragraph in the “Management’s Discussion and Analysis of Financial Condition and Results of Operations – The Offering” section of our prospectus on page 122.
We are publicly offering three classes of units: Class A units, Class C units and Class I units. The unit classes have different selling commissions and dealer manager fees and there is an ongoing distribution fee with respect to Class C units. In addition, there is a platform placement fee with respect to Class I units, which is paid by our Advisor. We are offering to sell any combination of Class A, Class C and Class I units with a dollar value up to the maximum offering amount. We reserve the right to reallocate the units between Class A, Class C and Class I and between the primary offering and our distribution reinvestment plan.
The following supersedes and replaces the table in the “Our Expenses– Unitholder Transaction Expenses”section of our prospectus on page 153.
Selling Commissions for Class A units, as % of Class A gross offering proceeds | 7.00 | % | ||
Selling Commissions for Class C units, as % of Class C gross offering proceeds | 3.00 | % | ||
Dealer Manager Fee for Class A and C units, as % of Class A and Class C gross offering proceeds | 2.75 | % | ||
Selling Commissions and Dealer Manager Fee for Class I units | — | |||
Maximum Aggregate Sale Charge (Load), as % of gross offering proceeds | 10.00 | % | ||
Maximum Reimbursement of Organization & Offering Expenses | 5.00 | % |
The following supersedes and replaces the second paragraph in the “Our Expenses– Ongoing Annual Company Expenses”section of our prospectus on page 153.
Dealer Manager Fee:In compensation for its services, our dealer manager is entitled to a fee of up to 2.75% for Class A and Class C units. There are no dealer manager fees on Class I units.
The following supersedes and replaces the second paragraph and corresponding table in the “Plan of Distribution– Underwriting Compensation– Summary”section of our prospectus on page 175.
The following table shows the fees we, or our Advisor, as applicable, will pay the dealer manager with respect to each class of units. The dealer manager fee is payable at the time you subscribe for units in the primary offering, the distribution fee for Class C units is payable on an ongoing basis and the platform placement fee is payable by the Advisor quarterly in arrears after you subscribe for Class I units in the primary offering:
| Class A | Class C | Class I | ||||||||||
Dealer Manager Fee (1) | 2.75 | % | 2.75 | % | None | |||||||
Distribution Fee (2) | None | 0.80 | % | None | ||||||||
Platform Placement Fee (3) | None | None | 0.40 | % | ||||||||
The following footnote is added to the “Plan of Distribution – Underwriting Compensation – Summary” section of our prospectus on page 175.
(3) Our Advisor pays the dealer manager a platform placement fee with respect to our Class I units sold in the primary offering in an amount equal 0.40% of the gross proceeds from the primary offering of Class I units.
The following supersedes and replaces the “Plan of Distribution– Underwriting Compensation– Dealer Manager Fee – Class I Units”section of our prospectus on page 176.
Dealer Manager Fee – Class I Units
We do not pay dealer manager fees on any Class I units.
The following is added to the “Plan of Distribution– Underwriting Compensation”section of our prospectus beginning on page 175
Platform Placement Fee – Class I Units Only
Our Advisor pays the dealer manager a platform placement fee with respect to our Class I units sold in the primary offering in an amount equal 0.40% of the gross proceeds from the primary offering of Class I units. The dealer manager may re-allow a portion of the platform placement fee to participating broker-dealers. Our Advisor pays such platform placement fee in exchange for providing platform placement services, such as introducing registered investment advisers with clients suitable for an investment in Class I units, communicating investment benefits with registered investment advisers, facilitating meetings between the Advisor and registered investment advisers and assisting with the subscription process.
Our Advisor does not pay a platform placement fee with respect to Class A units and Class C units.
The “Plan of Distribution– Special Discounts�� Class I Units”section of our prospectus on page 179 is deleted in its entirety.
The following supersedes and replaces the table in the “Plan of Distribution – Volume Discounts” section of our prospectus on page 180.
| Dollar Amount of Units Purchased | Class A | Class C | Class I | |||||||||||||||||||||||||||||||||
| Selling Commission Percentage | Dealer Manager Fee | Purchase Price per Unit to Investor (1) | Selling Commission Percentage | Dealer Manager Fee | Purchase Price per Unit to Investor (2) | Selling Commission Percentage | Dealer Manager Fee | Purchase Price per Unit to Investor (3) | ||||||||||||||||||||||||||||
$500,000 or less | 7.00 | % | 2.75 | % | $ | 10.00 | 3.00 | % | 2.75 | % | $ | 9.576 | — | — | $ | 9.025 | ||||||||||||||||||||
$500,001-$1,000,000 | 6.00 | % | 2.75 | % | $ | 9.890 | 2.50 | % | 2.75 | % | $ | 9.525 | — | — | $ | 9.025 | ||||||||||||||||||||
$1,000,001-$2,000,000 | 5.00 | % | 2.75 | % | $ | 9.783 | 2.00 | % | 2.75 | % | $ | 9.475 | — | — | $ | 9.025 | ||||||||||||||||||||
2,000,001-$3,000,000 | 4.00 | % | 2.75 | % | $ | 9.678 | 1.50 | % | 2.75 | % | $ | 9.426 | — | — | $ | 9.025 | ||||||||||||||||||||
$3,000,001-$5,000,000 | 3.00 | % | 2.35 | % | $ | 9.535 | 1.00 | % | 2.35 | % | $ | 9.338 | — | — | $ | 9.025 | ||||||||||||||||||||
$5,000,001-$10,000,000 | 2.00 | % | 2.35 | % | $ | 9.435 | 0.50 | % | 2.35 | % | $ | 9.290 | — | — | $ | 9.025 | ||||||||||||||||||||
$10,000,001 and above | 1.00 | % | 2.15 | % | $ | 9.319 | 0.00 | % | 2.15 | % | $ | 9.223 | — | — | $ | 9.025 | ||||||||||||||||||||
| D. | Update to the Section Titled “Business” |
| 1. | The following information updates and supplements the “Business – Investments – Overview” section of the Prospectus to provide certain information regarding the Company’s investment portfolio as of September 30, 2016: |
Investments
Since the Company commenced operations and through September 30, 2016, the Company has funded $409.7 million in aggregate investments, including $28 million in temporary investments. Of the aggregate investment amount, the Company has received $223.9 million in full aggregate transaction repayments from existing and exited trade finance, term loan, and temporary investment facilities. Of the aggregate transaction repayment amount, approximately $107.6 million represents transactions of trade finance, term loan, and temporary investment facilities that are closed and no longer part of the Company’s portfolio.
As of September 30, 2016 the Company had the following investments:
| Description | Sector | Country | Investment Type | Maturity1 | Interest Rate2 | Total Loan Commitment3 | Total Amount Outstanding4 | |||||||||||||
Agriculture Distributor | Farm-Product Raw Materials | Argentina | Trade Finance | 9/3/2016 | 9.00 | % | $ | 15,000,000 | $ | 5,000,000 | ||||||||||
Agricultural Products Exporter II5 | Farm-Product Raw Materials | Singapore | Trade Finance | 1/6/2017 | 11.50 | % | $ | 10,000,000 | $ | 10,000,000 | ||||||||||
Beef Exporter | Meat Products | Argentina | Trade Finance | 12/31/2016 | 11.50 | % | $ | 9,000,000 | $ | 9,000,000 | ||||||||||
Chia Seed Exporter6 | Field Crops, Except Cash Grains | Chile | Trade Finance | 12/11/2016 | 10.90 | % | $ | 2,500,000 | $ | 2,307,323 | ||||||||||
Clean Diesel Distributor | Bulk Fuel Stations and Terminals | Peru | Term Loan | 8/1/2019 | 11.50 | % | $ | 15,000,000 | $ | 15,000,000 | ||||||||||
Consumer Goods Distributor | Groceries and Related Products | Namibia | Trade Finance | 10/21/2016 | 12.00 | % | $ | 2,000,000 | $ | 750,000 | ||||||||||
Dairy Co-Operative | Dairy Products | Argentina | Trade Finance | 7/29/2016 | 10.67 | % | $ | 6,000,000 | $ | 6,000,000 | ||||||||||
Diaper Manufacturer | Converted Paper and Paperboard Products | Peru | Term Loan | 7/5/2017 | 14.04 | %7 | $ | 4,500,000 | $ | 3,700,000 | ||||||||||
Electronics Assembler8 | Communications Equipment | South Africa | Trade Finance | 1/26/2017 | 12.81 | % | $ | 11,000,000 | $ | 5,024,882 | ||||||||||
Farm Supplies Distributor9 | Miscellaneous Non-Durable Goods | Zambia | Trade Finance | 5/3/2016 | 12.43 | % | $ | 10,000,000 | $ | 5,078,526 | ||||||||||
Fish Processor & Exporter10 | Commercial Fishing | Ecuador | Trade Finance | N/A | N/A | $ | 0 | $ | 0 | |||||||||||
Fruit & Nut Distributor | Groceries and Related Products | South Africa | Trade Finance | 5/22/201511 | 12.00 | % | $ | 1,250,000 | $ | 652,420 | ||||||||||
Hospitality Service Provider | Hotels and Motels | Cabo Verde | Term Loan | 8/21/2021 | 13.50 | % | $ | 17,000,000 | $ | 17,000,000 | ||||||||||
Integrated Steel Producer12 | Steel Works, Blast Furnaces, and Rolling and Finishing Mills | Zambia | Trade Finance | 8/7/2017 | 13.00 | % | $ | 6,000,000 | $ | 6,000,000 | ||||||||||
International Development Logistics Provider | Lumber and Other Construction Materials | Italy | Trade Finance | 10/12/2016 | 8.50 | %13 | $ | 5,000,000 | $ | 221,392 | ||||||||||
IT Service Provider14 | Computer Programming and Data Processing | Brazil | Term Loan | 10/31/2019 | 13.50 | % | $ | 14,000,000 | $ | 10,961,417 | ||||||||||
Machinery and Equipment Provider15 | Machinery, Equipment, and Supplies | United Kingdom | Trade Finance | 12/5/2016 | 12.00 | % | $ | 1,500,000 | $ | 1,206,346 | ||||||||||
Marine Logistics Provider | Services Incidental to Water Transportation | Nigeria | Term Loan | 9/16/2020 | 15.11 | %16 | $ | 16,050,000 | $ | 13,505,067 | ||||||||||
Meat Processor II | Meat Products | South Africa | Trade Finance | 3/17/2017 | 14.50 | % | $ | 2,800,000 | $ | 851,100 | ||||||||||
Metals Trader17 | Metals and Minerals, Except Petroleum | United Kingdom | Trade Finance | 2/25/2017 | 9.24 | % | $ | 4,000,000 | $ | 3,582,028 | ||||||||||
Mine Remediation Company | Metal Mining Services | South Africa | Trade Finance | 8/15/2016 | 17.50 | % | $ | 2,500,000 | $ | 2,234,145 | ||||||||||
Oilseed Distributor | Fats and Oils | Argentina | Trade Finance | 12/15/2016 | 8.75 | % | $ | 6,000,000 | $ | 6,000,000 | ||||||||||
Power Producer | Electric Services | Ghana | Trade Finance | 3/10/2017 | 11.50 | % | $ | 11,500,000 | $ | 11,500,000 | ||||||||||
Railway Equipment Provider | Rental of Railroad Cars | South Africa | Term Loan | 1/31/2020 | 12.00 | % | $ | 5,000,000 | $ | 4,570,619 | ||||||||||
| Description | Sector | Country | Investment Type | Maturity1 | Interest Rate2 | Total Loan Commitment3 | Total Amount Outstanding4 | |||||||||||||||
Scrap Metal Recycler | Secondary Nonferrous Metals | Morocco | Trade Finance | 7/17/2017 | 11.00 | %18 | $ | 8,500,000 | $ | 3,800,000 | ||||||||||||
Sesame Seed Exporter19 | Farm-Product Raw Materials | Guatemala | Trade Finance | 3/31/2016 | 12.00 | % | $ | 2,000,000 | $ | 1,000,000 | ||||||||||||
Shrimp Exporter20 | Fresh or Frozen Packaged Fish | Ecuador | Trade Finance | 6/6/2017 | 9.25 | % | $ | 3,000,000 | $ | 2,209,452 | ||||||||||||
Sugar Producer21 | Field Crops, Except Cash Grains | Brazil | Term Loan | 5/15/2017 | 17.43 | % | $ | 3,000,000 | $ | 3,000,000 | ||||||||||||
Tin Producer | Primary Nonferrous Metals | Indonesia | Term Loan | 6/30/2020 | 12.00 | % | $ | 3,000,000 | $ | 3,000,000 | ||||||||||||
Vanilla Exporter22 | Groceries and Related Products | Mauritius | Trade Finance | 7/25/2017 | 11.00 | % | $ | 12,000,000 | $ | 10,464,146 | ||||||||||||
Investment Portfolio Total | $ | 209,100,000 | $ | 163,618,863 | ||||||||||||||||||
Temporary Investments23 | ||||||||||||||||||||||
| Description | Sector | Country | Investment Type | Maturity | Interest Rate | Total Loan Commitment | Total Amount Outstanding | |||||||||||||||
Financial Services Provider III24 | Miscellaneous Business Credit Institutions | Mauritius | Promissory Note | 10/16/2016 | 10.00 | % | $ | 5,000,000 | $ | 5,000,000 | ||||||||||||
Temporary Investments Total | $ | 5,000,000 | $ | 5,000,000 | ||||||||||||||||||
Investment Portfolio and Temporary Investments Totals | $ | 214,100,000 | $ | 168,618,863 | ||||||||||||||||||
| 1 | The Company’s trade finance borrowers may be granted flexibility with respect to repayment relative to the stated maturity date to accommodate specific contracts and/or business cycle characteristics. This flexibility in each case is agreed upon between the Company and the sub-advisor and between the sub-advisor and the borrower. |
| 2 | Interest rates are as of September 30, 2016 and, where applicable, are weighted averages amongst multiple transactions. Interest rates include contractual rates and accrued fees where applicable. |
| 3 | The total loan commitment represents the maximum amount that can be borrowed under the agreement. The actual amount drawn on the loan by the borrower may change over time. Loan commitments are subject to availability of funds and do not represent a contractual obligation to provide funds to a borrower. |
| 4 | The total amount outstanding represents the actual amount borrowed under the loan as of September 30, 2016. In some instances where there is a $0 balance, the borrower may have paid back the original amount borrowed under a trade finance facility and under an agreement, may borrow again. |
| 5 | The impact objective for the Agriculture Products Exporter is Access to New Products. |
| 6 | On September 12, 2016, the Company funded $500,000 as part of an existing $2,500,000 revolving trade finance facility with the Chia Seed Exporter. With a fixed interest rate of 10.90%, the transaction is set to mature on December 11, 2016 and is secured by inventory. The borrower anticipates that the Company’s financing will support the growth of its export business, improve agricultural productivity, and contribute to healthy customer lifestyles. |
| 7 | The interest rate includes 2.50% of deferred interest. |
| 8 | Between September 27 and September 28, 2016, the Company funded five transactions totaling $1,910,082 as part of an existing $11,000,000 senior secured trade finance facility with the Electronics Assembler that assembles affordable cellular phones and digital television converter sets. With fixed interest rates ranging between 12.00% and 13.00%, all five transactions are set to mature between January 5 and January 26, 2017 and are secured by the stock that is delivered to the borrower’s warehouse. The borrower anticipates that the Company’s financing will support its continued growth efforts and create more jobs, particularly among the country’s female population, while increasing the supply of affordable and accessible technology in the region. |
| 9 | The Company’s trade finance facility with the Farm Supplies Distributor serves to finance the shipment of farm supplies to a parastatal organization of the Government of Zambia and is secured by receivables. The delay in repayment is due to slow payment of the receivables by the Government of Zambia. The Company has determined that there is sufficient collateral, including an insurance policy should the Farm Supplies Distributor not pay, to cover the entire balance due from borrower. Payment is projected within the coming weeks. |
| 10 | As of September 30, 2016, the Company, together with its sub-advisor, was negotiating terms to extend the trade finance facility with the Fish Processor & Exporter for disbursement in October 2016. |
| 11 | As of March 31, 2016, the Company, together with its sub-advisor, had agreed to further extend the principal maturity date to facilitate the strategic sale of the Fruit & Nut Distributor, which closed in June 2016. On June 30, 2016, the Company placed the Fruit & Nut Distributor on non-accrual status effective February 1, 2016 and a restructure of the loan is being documented. Small payments are scheduled to be made on a quarterly basis. |
| 12 | On September 6, 2016, the Company funded $4,000,000 to the Integrated Steel Producer as part of an existing senior secured $6,000,000 trade finance facility. With an interest rate of 13.00% and maturity date of August 7, 2017, the transaction is secured by specific |
| inventory, receivables, and property. The borrower anticipates that the Company’s financing will continue to support its growth objectives, which include an expanding labor force and ongoing programs that contribute to greater equality and empowerment in the Zambian labor force. |
| 13 | The interest rate is a variable rate of 8.50% plus six month Euribor (if positive). |
| 14 | The cash flow coverage ratio for the IT Service Provider as of September 30, 2016 is >1.64x. |
| 15 | On September 21, 2016, the Company funded $372,800 as part of an existing $1,500,000 senior secured trade finance facility with the Machinery and Equipment Provider operating in Africa. With an interest rate of 12.00%, the transaction is secured by receivables and will mature on December 5, 2016. The Company’s financing will enable the trade of equipment and machinery products as well as maintenance services to an industrial client operating in Ghana. It is anticipated that the borrower’s activities in Ghana will improve productivity and competitiveness, through an innovative process that increases ease of access to machinery and equipment in a timely and cost effective manner. |
| 16 | The interest rate is a weighted average interest rate between three separate transactions which have a variable interest rate of one month Libor +10.5%. Two of the three transactions, totaling $12.1 million, include an additional 4.68% rate in deferred fixed interest. |
| 17 | On September 29, 2016, the Company funded $1,071,811 as part of an existing $4,000,000 senior secured revolving receivables trade finance facility to the Metals Trader. With an interest rate of six month Libor + 8.0%, the transaction is set to mature on February 25, 2017 and is secured by a bill of exchange and sales contracts. The Company’s financing will facilitate the trade of nickel cathodes into South Africa, a critical input to iron and steel production, for further value added processing. |
| 18 | The interest rate is a variable rate of one month Libor +10.50%. |
| 19 | During 2016, the Sesame Seed Exporter lost a major customer, which resulted in a slowdown in business, affecting its ability to repay the amount due under the participation. However, the Sesame Seed Exporter has been able to secure new customers to replace the lost order(s), which will enable the Sesame Seed Exporter to start making payments to the Company. The Company has determined that there is sufficient collateral to support the repayment of this facility. Repayments from these new contracts entered into is scheduled to be received in October. |
| 20 | On September 9, 2016, the Company funded $500,000 as part of an existing senior secured $3,000,000 revolving trade finance facility with the Ecuadorian Shrimp Exporter. With a fixed interest rate of 9.25%, the transaction is set to mature on June 6, 2017 and is secured by inventory, accounts receivable, and purchase contracts. The borrower anticipates that the Company’s timely financing will enable the borrower improve its competitiveness in the global marketplace while growing its employee base. |
| 21 | On August 27, 2015, the Company was informed that the Sugar Producer had filed for judicial recuperation with the local court in Brazil. On March 31, 2016, the Company placed the Sugar Producer on non-accrual status effective August 27, 2015. On June 14, 2016, the Company reached an agreement with the Sugar Producer on a repayment plan. The details of this plan has been ratified by the court and includes the full repayment of all principal and interest that is due. The first payment under this plan is expected in December 2016. |
| 22 | On September 26, 2016, the Company funded $3,262,347 to a Mauritian vanilla exporter as part of an existing $12,000,000 senior secured trade finance facility. With an interest rate of one month Libor +10.50%, the transaction is set to mature on June 25, 2017 and is secured by inventory and receivables. It is anticipated that the Company’s financing will continue to provide the borrower’s smallholder farmer suppliers with access to new international markets and off-takers, including large U.S.-based conglomerates. |
| 23 | Temporary investments are defined as short-term investments that are not trade finance or term loan transactions that generally expire within one year, are intended to generate a higher yield than would be realized on cash and may be unsecured positions. The temporary investments that are unsecured positions may present a higher level of risk. |
| 24 | The promissory note from the Mauritian Financial Services Provider is an unsecured position and therefore may present a higher risk profile. |
As of September 30, 2016 the Company had exited the following investments:
| Description | Sector | Country | Investment Type | Transaction Date | Transaction Amount | Payoff Date | Internal Rate of Return (“IRR”)1 | |||||||||||||
Agricultural Products Exporter I2 | Farm-Product Raw Materials | Singapore | Trade Finance | 4/23/2015 | $ | 10,000,000 | 2/29/2016 | 11.85 | % | |||||||||||
Agricultural Supplies Distributor I | Miscellaneous Non-Durable Goods | South Africa | Trade Finance | 10/15/2014 | $ | 15,202,091 | 8/14/2015 | 13.11 | % | |||||||||||
Agricultural Supplies Distributor II | Miscellaneous Non-Durable Goods | South Africa | Trade Finance | 10/06/2015 | $ | 8,563,423 | 6/1/2016 | 10.76 | % | |||||||||||
Candle Distributor | Miscellaneous Manufacturing Industries | South Africa | Trade Finance | 9/2/2014 | $ | 1,400,000 | 9/16/2015 | 14.27 | % | |||||||||||
Cement Distributor | Cement, Hydraulic | Kenya | Trade Finance | 9/23/2014 | $ | 12,000,000 | 10/15/2015 | 15.29 | % | |||||||||||
Construction Materials Distributor | Hardware, Plumbing, and Heating Equipment | South Africa | Trade Finance | 10/9/2014 | $ | 838,118 | 4/1/2016 | 13.00 | % | |||||||||||
Electronics Retailer | Radio, Television, Consumer Electronics, and Music Stores | Indonesia | Term Loan | 7/26/2013 | $ | 5,000,000 | 6/17/2014 | 19.59 | % | |||||||||||
Farm Supplies Wholesaler | Miscellaneous Non-Durable Goods | South Africa | Trade Finance | 5/28/2015 | $ | 2,250,000 | 1/19/2016 | 13.14 | % | |||||||||||
Fertilizer Distributor | Agricultural Chemicals | Zambia | Trade Finance | 7/17/2014 | $ | 3,000,000 | 11/4/2014 | 12.65 | % | |||||||||||
Food Processor | Groceries and Related Products | Peru | Term Loan | 3/25/2014 | $ | 576,000 | 11/28/2014 | 14.01 | % | |||||||||||
Frozen Seafood Exporter | Groceries and Related Products | Ecuador | Trade Finance | 6/17/2013 | $ | 240,484 | 5/14/2014 | 13.49 | % | |||||||||||
Industrial Materials Distributor | Mineral and Ores | South Africa | Trade Finance | 11/20/2014 | $ | 4,030,000 | 12/15/2015 | 13.64 | % | |||||||||||
Insulated Wire Manufacturer | Rolling, Drawing, and Extruding of Nonferrous Metals | Peru | Trade Finance | 5/2/2014 | $ | 1,991,000 | 12/2/2014 | 8.43 | % | |||||||||||
International Tuna Exporter | Groceries and Related Products | Ecuador | Trade Finance | 7/17/2013 | $ | 1,000,000 | 10/9/2013 | 13.58 | % | |||||||||||
Meat Processor I | Meat Products | South Africa | Trade Finance | 7/7/2014 | $ | 2,950,000 | 4/1/2016 | 14.08 | % | |||||||||||
Meat Producer2 | Meat Products | South Africa | Trade Finance | 11/27/2015 | $ | 1,500,000 | 2/3/2016 | 14.83 | % | |||||||||||
Rice & Bean Importer | Groceries and Related Products | South Africa | Trade Finance | 7/7/2014 | $ | 1,000,000 | 8/5/2015 | 12.97 | % | |||||||||||
Rice Importer | Farm-Product Raw Materials | Kenya | Trade Finance | 11/6/2015 | $ | 399,653 | 5/19/2016 | 11.50 | % | |||||||||||
Rice Producer | Cash Grains | Tanzania | Trade Finance | 1/22/2015 | $ | 3,900,000 | 4/1/2016 | 12.04 | % | |||||||||||
| Description | Sector | Country | Investment Type | Transaction Date | Transaction Amount | Payoff Date | Internal Rate of Return (“IRR”)1 | |||||||||||||||
Seafood Processing Company | Miscellaneous Food Preparations and Kindred Products | Ecuador | Trade Finance | 6/19/2013 | $ | 496,841 | 7/1/2013 | 13.44 | % | |||||||||||||
Textile Distributor | Apparel, Piece Goods, and Notions | South Africa | Trade Finance | 7/25/2014 | $ | 7,026,515 | 5/30/2016 | 15.81 | % | |||||||||||||
Timber Exporter | Sawmills and Planing Mills | Chile | Trade Finance | 7/3/2013 | $ | 915,000 | 6/12/2014 | 10.25 | % | |||||||||||||
Waste Management Equipment Distributor | Machinery, Equipment, and Supplies | South Africa | Trade Finance | 2/13/2015 | $ | 310,752 | 5/15/2015 | 20.19 | % | |||||||||||||
Investment Portfolio Total |
| $ | 84,589,877 | |||||||||||||||||||
Temporary Investments3 |
| |||||||||||||||||||||
| Description | Sector | Country | Investment Type | Transaction Date | Transaction Amount | Payoff Date | Internal Rate of Return (“IRR”) | |||||||||||||||
Agricultural Products Exporter II | Farm-Product Raw Materials | Singapore | Bridge Loan | 3/21/2016 | $ | 5,000,000 | 9/14/2016 | 29.84 | % | |||||||||||||
Financial Services Provider I | Miscellaneous Business Credit Institutions | Mauritius | Promissory Note | 9/23/2014 | $ | 3,000,000 | 11/17/2014 | 15.94 | % | |||||||||||||
Financial Services Provider II | Miscellaneous Business Credit Institutions | Mauritius | Promissory Note | 3/22/2016 | $ | 15,000,000 | 9/14/2016 | 32.04 | % | |||||||||||||
Temporary Investments Total | $ | 23,000,000 | ||||||||||||||||||||
Investment Portfolio and Temporary Investments Total | $ | 107,589,877 | ||||||||||||||||||||
| 1 | Given that the loan has been paid off, this investment is no longer part of the Company’s portfolio. The internal rate of return is defined as the gross average annual return earned through the life of an investment. The internal rate of return was calculated by our Advisor (unaudited) as the investment (loan advance) was made and cash was received (principal, interest and fees). |
| 2 | Impact data was not tracked for this investment. The Company does not track impact data for trade finance transactions that meet standard underwriting guidelines, but generally have the maturity of less than one year and involve borrowers with whom, at the time of funding, the Company does not expect to maintain an ongoing lending relationship or otherwise provide an open loan facility. |
| 3 | Temporary investments are defined as short-term investments that are not trade finance or term loan transactions that generally expire within one year, are intended to generate a higher yield than would be realized on cash and may be unsecured positions. The temporary investments that are unsecured positions may present a higher level of risk. |
Certain Portfolio Characteristics1
Total Assets (est.) | $ | 231,996,000 | ||
Current Loan Commitments | $ | 209,100,000 | ||
Leverage | 0% | |||
Weighted Average Portfolio Loan Size | $ | 6,757,917 | ||
Weighted Average Portfolio Duration2 | 1.43 years | |||
Average Collateral Coverage Ratio | 1.61x | |||
USD Denominated | 100% | |||
Senior Secured First-Lien | 100% | |||
Countries | 18 | |||
Sectors | 24 |
Top Five Investments by Percentage3
| Company Description | Country | % of Total Assets | ||||
Hospitality Service Provider | Cabo Verde | 7.3 | % | |||
Clean Diesel Distributor | Peru | 6.5 | % | |||
Marine Logistics Provider | Nigeria | 5.8 | % | |||
Power Producer | Ghana | 5.0 | % | |||
IT Service Provider | Brazil | 4.7 | % | |||
| Investment Type4 | Developing Economies4 | Sector Diversification4 | ||
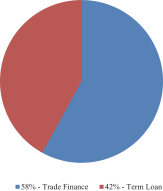 | 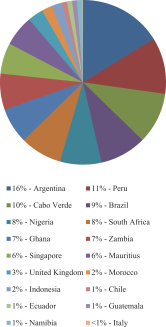 | 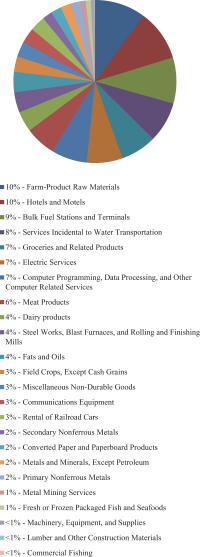 | ||
| 1 | All information provided in this section, with the exception of the Total Asset (est.) figure, does not include the Company’s temporary investment commitments such as the promissory note from the Mauritian Financial Services Provider comprising 3.0% of all the investments currently held by the Company. The promissory note from the Mauritian Financial Services Provider is an unsecured position. |
| 2 | Weighted average duration is the average period of time before the loans in the portfolio mature or come due weighted to properly account for the difference of investment sizes within the portfolio. Duration is calculated through the average turn of trade finance transactions and the contracted amortization of term loans. |
| 3 | This represents all countries/sectors where the Company currently has a loan commitment other than through a temporary investment. Due to the revolving debt nature of trade finance facilities and the timing of funding, it is possible that certain commitments currently have a zero outstanding balance and would therefore not be represented in the country/sector allocation charts, which represents invested capital. |
| 4 | The above charts represent investment type, developing economy, and sector diversification as a percentage of the total amount outstanding of the Company’s investments other than the Company’s temporary investments. The Company’s temporary investments include the promissory note from the Mauritian Financial Services Provider, which represents 3.0% of all the investments currently held by the Company. |
| 2. | The following disclosure supplements the “Business – Investments – Overview – Impact Overview” section of the Prospectus to provide an overview of the investment portfolio impact data collected by Company as of September 30, 2016: |
The Company’s borrower companies currently employ a total of 14,861 employees1
Percentage of the Borrowers that: | ||||
Comply with local environmental, labor, health, safety and business laws, standards and regulations | 100 | % | ||
Demonstrate their positive impact on the community through community service and/or community donations | 83 | % | ||
Commit to working towards implementing international environmental and health and safety best practices | 100 | % | ||
Implement environmentally sustainable practices including energy savings, waste reduction and/or water conservation | 93 | % | ||
Top 5 Borrower Impact Objectives | ||||
1. Job Creation | 79 | % | ||
2. Wage Increase | 24 | % | ||
3. Agricultural Productivity | 21 | % | ||
4. Capacity-Building | 17 | % | ||
5. Access to New Markets | 14 | % | ||
Top 5 Borrower Environmental and Social Practices | ||||
1. Maternity/Paternity Leave 2. Fair Hiring and Recruiting | ||||
3. Charitable Donation | ||||
4. Energy Savings | ||||
5. Fair Career Advancement |
| 1 | All information provided in this section pertains exclusively to the Company’s Investment Portfolio and therefore does not include the Company’s Temporary Investments. |
| 3. | The following disclosures are inserted in the section titled “Business – Investments – Investment Spotlights” on page 79 of the Prospectus: |
Power Producer
Investment Overview1 | ||
Investment Type | Senior Secured Trade Finance | |
Structure | Equipment Purchase Facility | |
Facility Amount2 | $11,500,000 | |
Approximate Repayment Period3 | <1 year | |
Interest Rate | 11.50% | |
Sector | Electric Services | |
Collateral Coverage Ratio4 | ³1.05x | |
Environmental, Social, and Governance Screens | Compliant | |
Primary Impact Objective | Access to Energy | |
| 1 | The Investment Overview section reflects the terms of the facility as of September 30, 2016. |
| 2 | The facility amount represents the current amount that is available to the borrower under the agreement. This amount may change over time. |
| 3 | Represents approximate repayment period of transactions drawn under the facility. Due to the revolving nature of trade finance facilities and the timing of their underlying transactions, the length of each transaction repayment period may vary, but generally will not exceed one year. |
| 4 | The collateral coverage ratio is the amount of collateral the borrower must maintain in relation to the total amount outstanding on the facility. |
Borrower Background
The Company has provided financing to an independent power producer that is engaged in the engineering, procurement, construction, operation, and maintenance of power generation facilities throughout Ghana. Founded in 2010, the borrower’s turn-key energy generation solutions enable companies operating in Ghana to realize efficiency and productivity gains by providing access to stable sources of electricity in a country characterized by rising energy demands and limited supply. The Company’s financing will support the import of three state-of-art aero-derivative gas turbines from the United States for the development and construction of two new power plants in Ghana. Once operational, the Company-financed equipment and associated power plants will help reduce the demand pressures and blackout frequency that currently burden the country’s electrical grid and hinder efficient delivery of power to residential and commercial end-users.
| • | Imported equipment financed by the Company is built to standards modeled after ISO 9001 quality management system criteria and will generate up to 547 GWh of power for the borrower’s commercial clients, helping decrease industrial dependence on the national electricity grid and enabling greater access for public consumption. |
| • | Committed to improving employee welfare, the borrower has implemented human resource policies that include maternity leave, fair hiring/recruiting and compensation practices (including a basic salary and allowances for health insurance, housing, transportation, and cell phone use), anti-sexual harassment, fair career advancement, and retirement savings. |
| • | As a responsible corporate citizen, the borrower administers a student scholarship initiative that finances student tuition, including textbooks and notebooks, at local secondary schools and tertiary education programs at the Kwame Nkrumah University of Science and Technology. |
Scrap Metal Recycler
Investment Overview
Investment Type: | Senior Secured Trade Finance | |
Structure: | Revolving Facility | |
Loan Commitment Amount: | $8,500,000 | |
Interest Rate: | One-Month Libor +10.50% | |
Sector: | Secondary Nonferrous Metals | |
Collateral Coverage Ratio: | ³1.25x | |
Primary Impact Objective: | Access to New Markets; Productivity & Competitiveness; Access to New Products; Job Creation |
Borrower Background
With a 2015 GDP of $100.4 billion and population of 34.4 million, Morocco is the sixth largest economy in Africa and also ranks sixth out of 53 African countries in the World Bank’s Ease of Doing Business 2016 index. Industrial output gains and rapid urbanization are key drivers of the country’s economic performance, encouraging the Government of Morocco to promote major investments in infrastructure development, according to the 2016 Morocco African Economic Outlook. The resulting demand for finished metal products and scrap metal inputs across the country has supported the growth of a relatively young but globally competitive metallurgical industry.
Recognizing these growth dynamics, the Company has extended up to an $8,500,000 senior secured trade finance facility in July 2016 to one of the country’s largest integrated metal scrap recycling and processing companies. Founded in 1988, the company is strategically located between Morocco’s capital city, Rabat, to its northeast and Casablanca to its southwest. The company currently sources metal scrap from 30 local micro, small, and medium size scrap collectors for processing into semi-finished and finished products, including billets, anodes, tubes, and wires. The company’s scrap metal sorting process allows scrap metal inputs to be fully “cleaned” before melting, therefore making the refining process more energy efficient and mitigating the release of pollutants. The Company’s financing will be used by the company to purchase raw material, primarily copper scrap, from its suppliers for manufacturing semi-finished and finished products for sale to clients operating in Morocco as well as throughout the region and Europe.
The Company’s borrower is the largest employer in the town, and the company considers its 420 employees a core component of its value proposition. Its employee-centric policies include capacity-building programs offering technical and management skills development, which combined with competitive wages and benefits contribute to its nation-wide reputation for low employee turnover. In addition, the company provides an on-site school for children from the local community. The school currently enrolls approximately 70 students and provides them with the opportunity to attain a basic education, learn metallurgical technical skills, and become a permanent company employee upon graduation. Today, an estimated 15% of the company’s workforce has come through its on-site school program.
Shrimp Exporter
Investment Overview
Investment Type:Senior Secured Trade Finance
Structure: Revolving Facility
Loan Commitment Amount:$3,000,000
Interest Rate:9.25%
Sector:Fresh or Frozen Packaged Fish and Seafood
Collateral Coverage Ratio:³5.88x
Borrower Background
Established in 2009, the company is an Ecuadorian shrimp processor engaged in the purchasing, processing, freezing, and packaging of shrimp sourced from licensed local suppliers. The company is the seventh largest shrimp exporter in the country with customers in Europe, China, and the United States. The company has promoted many energy saving initiatives throughout its production facilities, including upgrading the cooling and freezing equipment with more modern and energy-efficient units. The company anticipates that the Company’s financing will improve its competitiveness in the global marketplace while growing its employee base in a city plagued by one of largest unemployment rates in the country.
The Company’s trade finance facility is secured by inventory, accounts receivable, and purchase contracts.
Tin Producer
Investment Overview
Investment Type:Senior Secured Term Loan
Structure: Term Loan due 6/30/2020
Loan Commitment Amount:$3,000,000
Interest Rate:12.00%
Sector:Primary Nonferrous Metals
Cash Flow Coverage Ratio:³2.79x
Borrower Background
Founded in 2011, the company is an Indonesian tin producer that produces high quality tin ingots for export to blue chip customers operating in the global electronics and automotive industries. The Company’s financing assists the company in financing an eco-friendly electric furnace plant, which is projected to enhance the company’s production capacity by creating efficiencies in converting raw material to finished tin products, reducing emissions, and increasing the number of employment and training opportunities.
The facility is secured by plant property, machinery, and equipment.
Vanilla Exporter
Investment Overview
Investment Type:Senior Secured Trade Finance
Structure: Revolving Facility
Loan Commitment Amount:$12,000,000
Interest Rate:One Month Libor +10.50%
Sector:Groceries and Related Products
Collateral Coverage Ratio:³1.43x
Borrower Background
Founded in 2013, the company is a Mauritius-based vanilla exporter that sources processed, cured, and packaged vanilla beans for export from smallholder farmers in Madagascar, the world’s largest vanilla producer. It is anticipated that the Company’s financing will provide the company’s smallholder farmer suppliers with access to new international markets and customers, including large U.S.-based conglomerates such as McCormick & Company.
The Company’s trade finance facility is secured by accounts receivables and inventory.