UNITED STATES
SECURITIES AND EXCHANGE COMMISSION
WASHINGTON, D.C. 20549
FORM N-CSR
CERTIFIED SHAREHOLDER REPORT OF REGISTERED MANAGEMENT
INVESTMENT COMPANIES
Investment Company Act file number
811-22572
Total Income+ Real Estate Fund
(Exact name of registrant as specified in charter)
The Corporation Trust Company
1209 Orange Street, Wilmington, DE 19801
(Name and address of agent for service)
Registrant's telephone number, including area code:
1- 888-459-1059
Date of fiscal year end:
9/30
Date of reporting period: 9/30/14
Item 1. Reports to Stockholders.
| | | | | |
| | | | | |
| | | | | |
| | | | | |
| | |  | | |
| | | | | |
| | | | | |
| | | | | |
| | | | | |
| | | | | |
| | | | | |
| | | | | |
| | | | | |
| | | | | |
| | | | | |
| | | Annual Report | | |
| | | September 30, 2014 | | |
| | | | | |
| | | | | |
| | | | | |
| | | | | |
| | | | | |
| | | | | |
| | | | | |
| | | | | |
| | | | | |
| | | | | |
| | | Investor Information: 1-888-459-1059 | | |
| | | | | |
| | | | | |
| | | | | |
| | | | | |
| | | | | |
| | | | | |
| | | | | |
| | | | | |
| | | | | |
| | | | | |
| | This report and the financial statements contained herein are submitted for the general information of shareholders and are not authorized for distribution to prospective investors unless preceded or accompanied by an effective prospectus. Nothing herein contained is to be considered an offer of sale or solicitation of an offer to buy shares of the Total Income+ Real Estate Fund. Such offering is made only by prospectus, which includes details as to offering price and other material information. | |
| | | | | |
| | Distributed by Northern Lights Distributors, LLC
Member FINRA | |
| | | |
 | |  |
| | | |
| | | 2014 ANNUAL REPORT: (4Q 2013-3Q 2014) |
| | | Letter from the TI+ Portfolio Managers |
To Our Valued Shareholders:
We are pleased to report that the TI+ Fund continues to grow in its second year. We have added four new private equity real estate holdings and two new public real estate investments for a total of 17 TI+ Fund investments. These holdings attempt to fulfill our objective to offer a multi-sector, multi-strategy, multi-manager real estate portfolio. In October, the Fund reached $100 million in assets helped by the introduction of C and I share classes in April of this year.
We believe we have delivered on all of the Fund’s objectives including current income, capital appreciation, low volatility, and low correlation to the broader markets. We are proud to share these current highlights with you:
| + | NEW INVESTMENTS: Added four new private investments including Morgan Stanley Prime Property Fund, J.P. Morgan U.S. Real Estate Income and Growth Fund, Bentall Kennedy MEPT Edgemoor, and Prologis Targeted U.S. Logistics Fund. Added two new public real estate investments including J.P. Morgan Security Capital Real Estate Securities Fund and TCW Total Return Fund. |
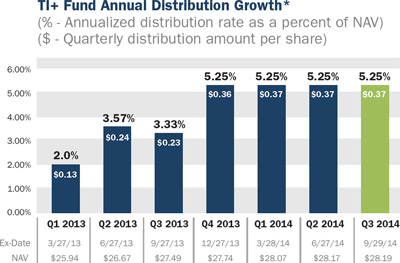
| + | DISTRIBUTIONS1: TI+ has paid seven consecutive quarterly distributions beginning in the first full quarter of Fund operations. The latest distribution of $0.37 per share is equivalent to a 5.25% annualized distribution yield on the 9/29/2014 ex-dividend date NAV of $28.19 per share. This distribution also represents a 5.92% distribution yield on the original $25.00 NAV per share. |
| + | ASSETS UNDER MANAGEMENT: As of October 7th, TI+ assets under management exceeded $100 million. Ramin Kamfar, Bluerock’s Chief Executive Officer, noted “Exceeding $100 million in AUM is a great milestone. It’s a continued investor validation that the TI+ Fund is meeting its mandate to deliver current income and total return with low volatility and correlation. With TI+ individual investors are now able to invest in institutional private equity real estate (iPERE), an asset class recognized for its ability to provide investors equity-like returns but with the lower volatility of fixed income. iPERE has, historically, been shown to improve the risk/return profile of diversified portfolios.” |
footnotes:
| 1 | The Fund’s distribution policy is to make quarterly distributions to shareholders. The level of quarterly distributions (including any return of capital) is not fixed. However, this distribution policy is subject to change. Shareholders should not assume that the source of a distribution from the Fund is net profit. A portion of the distributions consist of a return of capital based on the character of the distributions received from the underlying holdings, primarily Real Estate Investment Trusts. The final determination of the source and tax characteristics of all distributions in 2014 will be made after the end of the year. The fund’s distribution amounts were calculated based on income received from underlying investments including capital gains and return of capital realized from the disposition of such investments. |
This is an actively managed dynamic portfolio. There is no guarantee that any investment (or this investment) will achieve its objectives or goals, pay dividends and/or capital gains, generate positive returns, or avoid losses. Prior performance is not a guarantee of future results.
CORPORATE HEADQUARTERS | 712 FIFTH AVENUE | 9TH FLOOR | NEW YORK, NY 10019 | 877.826.BLUE (2583) | WWW.BLUEROCKRE.COM

| 2014 ANNUAL REPORT (4Q 2013 - 3Q 2014) | TOTAL INCOME+ REAL ESTATE FUND |  |
PERFORMANCE
Since inception (10/22/2012) through 9/30/2014, TI+ has experienced a total return of 20.05%, 9.88% annualized. The Fund was able to accomplish this primarily through investments in unique, institutional private equity real estate (iPERE) vehicles. These investments with best in class real estate, supplemented by select public real estate funds, have generated attractive returns through income and capital appreciation.
| | Performance as of 9.30.2014 |
| | Three Months2 | Six Months2 | Year-to-Date2 | One Year
as of 9.30.2014 | Since Inception
as of 9.30.20143 |
| TI+ Fund- Class A | 1.40% | 3.05% | 5.67% | 7.38% | 9.88% |
| TI+ Fund- Class A1 | | | | | |
| with Max Sales Charge | - 4.44% | - 2.87% | - 0.40% | 1.19% | 6.56% |
| 1 | The maximum sales charge for the Fund is 5.75%. Investors may be eligible for a reduction in sales charges. |
| 2 | Performance for periods less than one year is not annualized. |
| 3 | Inception date of the Fund is October 22, 2012. |
INCOME
TI+ Fund offers attractive cash distribution potential.
| * | The Fund’s distribution policy is to make quarterly distributions to shareholders. The Fund’s inception date is 10/22/12; however, its first distribution was made 3/27/13. The level of quarterly distributions (including any return of capital) is not fixed. However, this distribution policy is subject to change. The Fund’s distribution amounts were calculated based on the ordinary income received from the underlying investments, including short-term capital gains realized from the disposition of such investments. Shareholders should not assume that the source of a distribution from the Fund is net profit. |
A portion of the distributions consist of a return of capital based on the character of the distributions received from the underlying holdings, primarily Real Estate Investment Trusts. The final determination of the source and tax characteristics of all distributions in 2014 will be made after the end of the year. Shareholders should note that return of capital will reduce the tax basis of their shares and potentially increase the taxable gain, if any, upon disposition of their shares. There is no assurance that the Company will continue to declare distributions or that they will continue at these rates.
| |
| |
| Inception date of the Fund is October 22, 2012. The total annual fund operating expense ratio, gross of any fee waivers or expense reimbursements, is 5.07% (per most recent prospectus). |
The performance data quoted herein represents past performance. Current performance may be lower or higher than the performance data quoted above. Investment return and principal value will fluctuate, so that shares, when redeemed, may be worth more or less than their original cost. The Fund’s investment adviser has contractually agreed to reduce its fees and/or absorb expenses of the fund, at least until January 30, 2015, to ensure that the net annual fund Class A operating expenses will not exceed 1.84% for TIPRX, subject to possible recoupment from the Fund in future years.
Please review the Fund’s Prospectus for more detail on the expense waiver. Results shown reflect the full fee waiver, without which the results could have been lower. A fund’s performance, especially for very short periods of time, should not be the sole factor in making your investment decisions. Total returns are calculated using SEC form N-12a and reflect all fees and charges.
Past performance is no guarantee of future results
| 2014 ANNUAL REPORT (4Q 2013 - 3Q 2014) | TOTAL INCOME+ REAL ESTATE FUND | |
HIGHER RISK-ADJUSTED RETURNS
TI+ Fund has delivered higher risk-adjusted returns than stocks, bonds, or REITs since its inception, evidenced by its Sharpe Ratio (a risk adjusted performance measure that determines unit of return per unit of risk) of more than double the nearest competitive asset class.
TI+ Fund Performance vs. Other Asset Classes (Since inception thru 9.30.2014)
| | Annualized | Annualized | Up | Netural | | Percentage | vs. Annualized Alpha | vs. Annualized Alpha | | A higher Sharpe Ratio indicates that the investment has a higher return per unit of risk. |
| | Total Return | Sharpe Ratio | Days* | Down Days* | Down Days | 10.1.13 - 9.30.14 | 10.22.12 - 9.30.14 | |
| TI+ (A Shares no Load) | 9.88% | 2.87 | 420 | 67 | 14% | | | |
| Stocks | 20.42% | 1.33 | 287 | 200 | 41% | 6.74% | 8.92% | |
| Public REITs | 9.55% | 0.51 | 265 | 222 | 46% | 6.71% | 9.13% | |
| Bonds | 1.21% | 0.27 | 273 | 214 | 44% | 6.85% | 9.30% | |
| | | | | | | | | | | | |
LOWER VOLATILITY
TI+ Fund has experienced lower daily volatility (as measured by standard deviation) than competing asset classes since its inception, with nearly 75% less volatility than stocks and 80% less volatility than public REITs.
Since inception thru 9.30.2014
| | Annualized | | | A lower standard deviation means less volatile price changes. |
| Investment Type | Standard Deviation | Beta | |
| TI+ (A Shares no Load) | 3.84% | | |
| Bonds | 4.31% | 0.076 | |
| Stocks | 15.30% | 0.025 | |
| Public REITs | 18.75% | 0.028 | |
| | | | | | | |
LOWER CORRELATION
TI+ Fund has exhibited lower correlation compared to other asset classes since its inception.
TI+ Fund Correlation vs. Other Asset Classes (Since inception thru 9.30.2014)
| | | | Public | | | A low correlation indicates that the investments do not perform together in the same way, at the same time. |
| | TI+ Fund | Stocks | REITs | Bonds | |
| TI+ (A Shares no Load) | 1.00 | 0.10 | 0.14 | 0.09 | |
| Stocks | 0.10 | 1.00 | 0.63 | - 0.09 | |
| Public REITs | 0.14 | 0.63 | 1.00 | 0.30 | |
| Bonds | 0.09 | - 0.09 | 0.30 | 1.00 | |
| | | | | | | | | |
0 = No Correlation | 1 = Perfectly Positively Correlated | -1 = Perfectly Negatively Correlated
Page Sources:
| TI+ Fund: A-Shares, no load | Stocks: S&P 500 Total Return Ycharts Daily historical prices |
| REITs: MSCI U.S. REIT Index MSCI.com | Bonds: AGG Yahoo Finance daily historical prices |
Please see page 8 for a description of the risks and comparisons of the investment indexes selected.
| * | Number of days in period in which the index/investment has increased or decreased from the prior days’ closing price. |
Past performance is no guarantee of future results
| 2014 ANNUAL REPORT (4Q 2013 - 3Q 2014) | TOTAL INCOME+ REAL ESTATE FUND | |
| | » The Fund Sub-Advisor |
| | |
| |  |
| | |
| | The Fund’s Sub-Advisor, Mercer Investment Management, Inc., has a 40+ year track record as a leading advisor to the world’s most sophisticated institutional investors, including endowments, pension funds, sovereign wealth funds and family offices. Mercer has more than 3,300 clients worldwide and over $7.0 trillion in assets under advisement. |
| | |
| | Mercer’s analysis incorporates a comprehensive, disciplined process beginning with the evaluation of over 5,400 investment managers and 26,200 individual investments across all sectors from which it selects a strategic combination of ‘best in class’ institutional real estate managers and investments for TI+. |
| | |
LOOKING AHEAD
Prospects for the commercial real estate sector remain bright. A prolonged low interest rate environment continues to drive capital into real estate while construction of new product remains well below average as a percentage of inventory, for all major property types. Investments are attractive as institutional real estate maintains a cap rate spread over 10 year Treasuries above the historical average creating a cushion for cap rates to absorb interest rate increases. Property fundamentals are also strong with increasing demand and limited new supply putting downward pressure on vacancy rates and upward pressure on rental rates. We are optimistic these trends will allow the Fund to continue prospering in the coming year.
We thank you for the trust and confidence represented by your investment in the Total Income+ Real Estate Fund.
Sincerely,

Jordan Ruddy | Adam Lotterman
Portfolio Co-Managers, Total Income+ Real Estate Fund
| 2014 ANNUAL REPORT (4Q 2013 - 3Q 2014) | TOTAL INCOME+ REAL ESTATE FUND | |
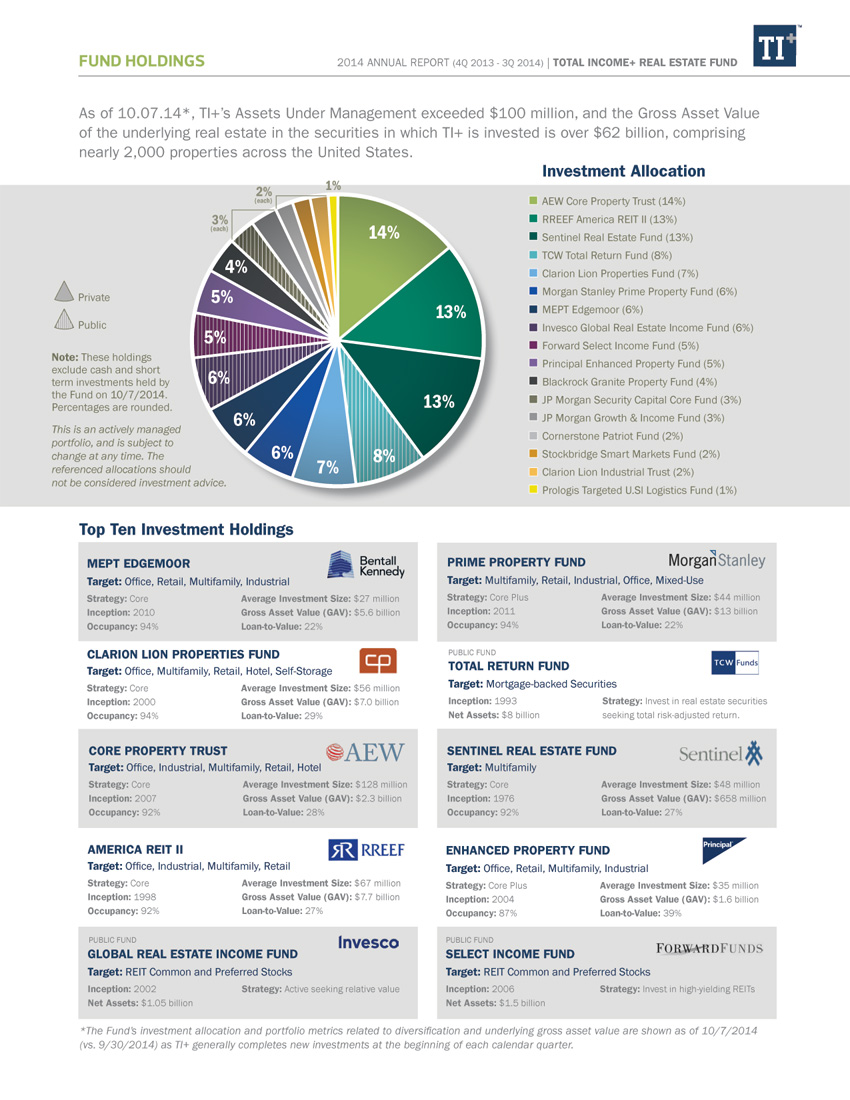
FUND DIVERSITY
Diversified by Sector
Property sectors each have different demand drivers and cycles. Historically, diversification has helped limit the downside of any one sector while making it possible to capture the benefits of growth cycles in other sectors.

The sector diversification presented above represents examples of how the TI+’s institutional fund investments are allocated as of the date herein, but is subject to change at any time.
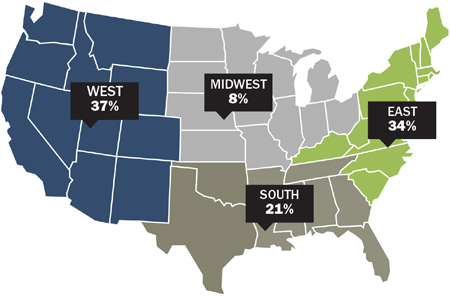
Diversified by Geography
Investments in top tier markets across the nation reduce reliance on any one city or state and provide the ability to benefit from well-performing submarkets in multiple regions.
The regions and allocations presented at left represent the TI+’s institutional fund investments as of Q1, but is subject to change at any time.
| 2014 ANNUAL REPORT (4Q 2013 - 3Q 2014) | TOTAL INCOME+ REAL ESTATE FUND | |
HIGHLIGHTED ASSETS
The properties pictured below are currently owned by the underlying third-party private equity real estate securities (iPERE) described herein. Each of these securities has been selected as an investment for TI+ Fund’s portfolio.

Active Portfolio; subject to change.
| 2014 ANNUAL REPORT (4Q 2013 - 3Q 2014) | TOTAL INCOME+ REAL ESTATE FUND | |
DEFINITIONS
AGG: The iShares Core Total U.S. Bond Market Exchange Traded Fund (ETF), previously the iShares Barclays Aggregate Bond Fund. The fund seeks investment results that correspond generally to the price and yield performance, before fees and expenses, of the Barclays U.S. Aggregate Bond Index. AGG is used as a proxy for the total U.S. investment grade bond market (iShares by Blackrock, Yahoo Finance).
Alpha: A measure of performance on a risk-adjusted basis. Alpha takes the volatility (price risk) of a mutual fund and compares its risk-adjusted performance to a benchmark index. The excess return of the fund relative to the return of the benchmark index is a fund’s alpha.
Annualized Standard Deviation: The standard deviation of the daily percentage change in an investment multiplied by the square root of the number of trading days in the period. Standard deviation shows how much variation from the average exists with a larger number indicating the data points are more spread out over a larger range of values.
Beta: A measure of the volatility, or systematic risk, of a security or a portfolio in comparison to the market as a whole. Beta is used in the capital asset pricing model (CAPM), a model that calculates the expected return of an asset based on its beta and expected market returns.
MSCI U.S. REIT Index: A free float-adjusted market capitalization weighted index that is comprised of equity REITs that are included in the MSCI US Investable Market 2500 Index, with the exception of specialty equity REITs that do not generate a majority of their revenue and income from real estate rental and leasing operations. The index represents approximately 85% of the US REIT universe. (www.msci.com). You cannot invest directly in an index. Benchmark performance should not be considered reflective of Fund performance.
NCREIF NPI Index: The National Council of Real Estate Fiduciaries Property Index (NPI) data is based on institutional investments and presented exclusive of leverage and fees. The NPI is based on the unleveraged returns from a large pool of individual, investment grade commercial real estate properties across retail, office, industrial, and apartment sectors. The market values of the properties in the NPI are determined by appraisals and not by market-based prices of the programs. You cannot invest directly in an index. Benchmark performance should not be considered reflective of Fund performance.
Sharpe Ratio: Measurement of the risk-adjusted performance. The annualized Sharpe ratio is calculated by subtracting the annualized risk-free rate - (3-month Treasury Bill) - from the annualized rate of return for a portfolio and dividing the result by the annualized standard deviation of the portfolio returns. You cannot invest directly in an index. Benchmark performance should not be considered reflective of Fund performance.
S&P 500: An index of 500 stocks chosen for market size, liquidity and industry grouping, among other factors. The S&P 500 is designed to be a leading indicator of U.S. equities and is meant to reflect the risk/return characteristics of the large cap universe. (Investopedia). You cannot invest directly in an index. Benchmark performance should not be considered reflective of Fund performance.


| Total Income+ Real Estate Fund |
| Portfolio Review (Unaudited) |
| Since Inception through September 30, 2014* |
Comparison of the change in value of a $10,000 investment
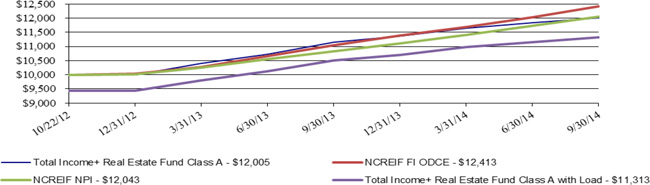
The Fund’s performance figures for the year ended September 30, 2014, compared to its benchmarks:
| | | Since Inception | Since Inception Class |
| | One Year | Class A * | C and Class I ** |
| Total Income+ Real Estate Fund: | | | |
| Class A | | | |
| Without Load | 7.38% | 9.88% | — |
| With Load + | 1.19% | 6.56% | — |
| Class C | N/A | — | 3.20% |
| Class I | N/A | — | 3.71% |
| NCREIF FI-ODCE | 12.40% | 13.16% | 3.25% |
| NCREIF NPI | 11.26% | 11.22% | 2.63% |
| * | Class A commenced operations October 22, 2012. |
| ** | Class C and Class I commenced operations April 1, 2014. |
| + | Adjusted for initial maximum sales charge of 5.75%. |
The NCREIF Fund Index -Open End Diversified Core Equity (“NCREIF FI-ODCE”) is an index of investment returns reporting on both a historical and current basis the results of 30 open-end commingled funds pursuing a core investment strategy. The NCREIF FI-ODCE Index is capitalization-weighted and is reported gross of fees. Measurement is time-weighted. The NCREIF FI-ODCE Index is calculated on a calendar quarter basis. Investors cannot invest directly in an index or benchmark. Performance above is since January 1, 2013.
The NCREIF Property Index (“NCREIF-NPI”) is a quarterly time series composite total rate of return measure of investment performance of a very large pool of individual commercial real estate properties acquired in the private market for investment purposes only. All properties in the NPI have been acquired, at least in part, on behalf of tax-exempt institutional investors - the great majority being pension funds. As such, all properties are held in a fiduciary environment. Investors cannot invest directly in an index or benchmark. Performance above is since January 1, 2013.
Past performance is not predictive of future results. The investment return and principal value of an investment will fluctuate. An investor’s shares, when redeemed, may be worth more or less than the original cost. Total return is calculated assuming reinvestment of all dividends and distributions. The Fund’s total gross annual operating expenses, including underlying funds and before any fee waiver, are 5.07%, 5.82%, and 4.82% for Class A, Class C and Class I, respectively, per the March 25, 2014 prospectus. The graph does not reflect the deduction of taxes that a shareholder would have to pay on Fund distributions or the redemption of Fund shares.
| Portfolio Composition as of September 30, 2014 |
| |
| | | Percent of Net Assets | |
| Real Estate Investment Trusts | | | 61.23 | % |
| Mutual Funds | | | 24.00 | % |
| Short-Term Investments | | | 15.73 | % |
| Total Investments | | | 100.96 | % |
| Other Assets Less Liabilities | | | (0.96 | )% |
| Total Net Assets | | | 100.00 | % |
| Total Income+ Real Estate Fund |
PORTFOLIO OF INVESTMENTS
September 30, 2014 |
| Shares | | | Security | | Value | |
| | | | | | | | | |
| | | | | REAL ESTATE INVESTMENT TRUSTS - 61.23 % | | | | |
| | | | | PRIVATE REAL ESTATE INVESTMENT TRUSTS - 58.83 % | | | | |
| | 13,191 | | | AEW Core Property Trust | | | 11,371,221 | |
| | 41 | | | Blackrock Granite Property | | | 3,215,387 | |
| | 5,055 | | | Clarion Lion Properties Fund | | | 5,702,414 | |
| | 1,320 | | | Clarion Lion Industrial Trust | | | 1,591,568 | |
| | 18,623 | | | Cornerstone Patriot Fund LP | | | 1,984,436 | |
| | 1,665,539 | | | J.P. Morgan US Real Estate Growth & Income LP | | | 2,048,612 | |
| | 359 | | | Morgan Stanley Prime Property Fund LLC | | | 5,207,944 | |
| | 404,183 | | | Principal Enhanced Property Fund LP | | | 4,138,837 | |
| | 108,407 | | | RREEF America REIT II, Inc. | | | 10,555,543 | |
| | 146 | | | Sentinel Real Estate Fund | | | 10,843,248 | |
| | 1,400 | | | Stockbridge Smart Markets Fund | | | 1,765,564 | |
| | | | | TOTAL PRIVATE REAL ESTATE INVESTMENT TRUSTS | | | 58,424,774 | |
| | | | | | | | | |
| | | | | PUBLIC NON-TRADED REAL ESTATE INVESTMENT TRUSTS - 2.34 % | | | | |
| | 13,206 | | | BehringerHarvard Multifamily REIT I, Inc. # | | | 129,552 | |
| | 68,376 | | | CNL Lifestyle Properties # | | | 467,009 | |
| | 61,761 | | | Dividend Capital Diversified Property Fund Class E | | | 437,888 | |
| | 27,152 | | | Hines Real Estate Investment Trust # | | | 163,728 | |
| | 139,980 | | | Inland American Real Estate Trust # | | | 964,461 | |
| | 13,546 | | | Landmark Apartment Trust of America # | | | 105,790 | |
| | 551 | | | Resource Real Estate Opportunity REIT # | | | 5,193 | |
| | 15,000 | | | TIER REIT, Inc. * # | | | 47,400 | |
| | | | | TOTAL PUBLIC NON-TRADED REAL ESTATE INVESTMENT TRUSTS | | | 2,321,021 | |
| | | | | | | | | |
| | | | | PUBLICLY TRADED REAL ESTATE INVESTMENT TRUSTS - 0.06% | | | | |
| | 2,650 | | | Columbia Property Trust | | | 63,255 | |
| | | | | TOTAL PUBLICLY TRADED REAL ESTATE INVESTMENT TRUSTS | | | | |
| | | | | | | | | |
| | | | | TOTAL REAL ESTATE INVESTMENT TRUSTS | | | 60,809,050 | |
| | | | | (Cost - $55,467,997) | | | | |
| | | | | | | | | |
| | | | | MUTUAL FUNDS - 24.00 % | | | | |
| | | | | CASH MANAGEMENT FUNDS - 5.75 % | | | | |
| | 70,310 | | | PIMCO Low Duration Fund | | | 724,193 | |
| | 503,099 | | | PIMCO Short-Term Fund | | | 4,985,712 | |
| | | | | | | | 5,709,905 | |
| | | | | EQUITY FUNDS - 11.50 % | | | | |
| | 156,167 | | | Forward Select Income Fund ^ | | | 3,941,662 | |
| | 574,200 | | | Invesco Global Real Estate Income Fund ^ | | | 5,116,124 | |
| | 136,431 | | | Security Capital US Core Real Estate Securities Fund ^ | | | 2,367,078 | |
| | | | | | | | 11,424,864 | |
| | | | | MORTGAGE BACKED SECURITIES FUND - 6.75 % | | | | |
| | 652,730 | | | TCW Total Return Bond Fund ^ | | | 6,697,014 | |
| | | | | | | | | |
| | | | | TOTAL MUTUAL FUNDS | | | 23,831,783 | |
| | | | | (Cost - $23,797,078) | | | | |
The accompanying notes are an integral part of these financial statements.
| Total Income+ Real Estate Fund |
PORTFOLIO OF INVESTMENTS (Continued)
September 30, 2014 |
| Shares | | | Security | | Value | |
| | | | | | | | | |
| | | | | SHORT-TERM INVESTMENTS - 15.73 % | | | | |
| | 15,623,374 | | | Dreyfus Cash Management - Institutional Class, 0.03% + ^ | | $ | 15,623,374 | |
| | | | | TOTAL SHORT-TERM INVESTMENTS | | | | |
| | | | | (Cost - $15,623,374) | | | | |
| | | | | | | | | |
| | | | | TOTAL INVESTMENTS - 100.96 % | | | | |
| | | | | (Cost - $94,888,449) (a) | | $ | 100,264,207 | |
| | | | | LIABILITIES IN EXCESS OF OTHER ASSETS - (0.96) % | | | (945,242 | ) |
| | | | | NET ASSETS - 100.00 % | | $ | 99,318,965 | |
| * | Non-income producing security. |
| # | Value estimated using Fair Valuation Procedures adopted by the Board of Trustees. Total value of such securities is $1,883,133 or 1.90% of net assets. |
| + | Money market fund; interest rate reflects the seven-day effective yield on September 30, 2014. |
| ^ | All or a portion of this security is held as collateral as of September 30, 2014. |
| (a) | Represents cost for financial reporting purposes. Aggregate cost for federal tax purposes is $94,055,722 and differs from the value by net unrealized appreciation (depreciation) of securities as follows: |
| Unrealized appreciation: | | $ | 6,304,483 | |
| Unrealized depreciation: | | | (95,998 | ) |
| Net unrealized appreciation: | | $ | 6,208,485 | |
Additional Information on Investments in Private Real Estate Investment Trusts (1)
The Fund has unfunded commitments of approximately $26,150,000 to four of the Private Investment Funds. The commitments will be funded when called through current assets at that time.
| (1) | This class includes investments in Private Real Estate Investment Trusts. The fair values of the investments in this class have been estimated using the net asset value per share of the investments. |
The accompanying notes are an integral part of these financial statements.
Total Income+ Real Estate Fund
STATEMENT OF ASSETS AND LIABILITIES
September 30, 2014
| Assets: | | | | |
| Investments in Securities at Value (identified cost $94,888,449) | | $ | 100,264,207 | |
| Dividends and Interest Receivable | | | 513,656 | |
| Receivable for Fund Shares Sold | | | 218,646 | |
| Prepaid Expenses and Other Assets | | | 45,292 | |
| Total Assets | | | 101,041,801 | |
| | | | | |
| Liabilities: | | | | |
| Loan Payable | | | 1,509,111 | |
| Distribution Fees | | | 6,955 | |
| Shareholder Servicing Fees Payable | | | 43,233 | |
| Payable to Other Affiliates | | | 16,579 | |
| Payable to Investment Advisor | | | 94,250 | |
| Other Accrued Expenses | | | 52,708 | |
| Total Liabilities | | | 1,722,836 | |
| | | | | |
| Net Assets | | $ | 99,318,965 | |
| | | | | |
| Class A: | | | | |
| Net Assets (no par value; unlimited number of shares authorized; 3,192,255 shares of beneficial interest outstanding) | | $ | 89,318,821 | |
| Net Asset Value and Redemption Price Per Share ($89,318,821/3,192,255 shares of beneficial interest outstanding) | | $ | 27.98 | |
| Maximum Offering Price Per Share ($27.98/0.9425) | | $ | 29.69 | |
| | | | | |
| Class C: | | | | |
| Net Assets (no par value; unlimited number of shares authorized; 233,211 shares of beneficial interest outstanding) | | $ | 6,504,911 | |
| Net Asset Value and Redemption Price Per Share * ($6,504,911/233,211 shares of beneficial interest outstanding) | | $ | 27.89 | |
| | | | | |
| Class I: | | | | |
| Net Assets (no par value; unlimited number of shares authorized; 124,679 shares of beneficial interest outstanding) | | $ | 3,495,233 | |
| Net Asset Value and Redemption Price Per Share ($3,495,233/124,679 shares of beneficial interest outstanding) | | $ | 28.03 | |
| | | | | |
| Composition of Net Assets: | | | | |
| At September 30, 2014, Net Assets Consisted of: | | | | |
| Paid-in-Interest | | $ | 93,203,248 | |
| Undistributed Net Investment Income | | | 745,265 | |
| Accumulated Net Realized Loss on Investments | | | (5,306 | ) |
| Net Unrealized Appreciation on Investments | | | 5,375,758 | |
| Net Assets | | $ | 99,318,965 | |
| * | Class C charges a 1.00% fee on shares redeemed less than 365 days after the purchase. |
The accompanying notes are an integral part of these financial statements.
Total Income+ Real Estate Fund
STATEMENT OF OPERATIONS
For the Year Ended September 30, 2014
| Investment Income: | | | | |
| Dividend Income | | $ | 1,726,043 | |
| Interest Income | | | 2,403 | |
| Total Investment Income | | | 1,728,446 | |
| Expenses: | | | | |
| Investment Advisory Fees | | | 982,850 | |
| Shareholder Servicing Fees | | | | |
| Class A | | | 158,386 | |
| Class C | | | 3,846 | |
| Distribution Fees | | | | |
| Class C | | | 11,540 | |
| Legal Fees | | | 110,308 | |
| Transfer Agent Fees | | | 83,522 | |
| Administration Fees | | | 56,204 | |
| Printing Expense | | | 51,301 | |
| Registration & Filing Fees | | | 43,166 | |
| Fund Accounting Fees | | | 37,555 | |
| Trustees’ Fees | | | 30,388 | |
| Professional Fees | | | 30,000 | |
| Audit Fees | | | 23,000 | |
| Insurance Expense | | | 14,411 | |
| Non 12b-1 Shareholder Servicing Fees | | | 13,937 | |
| Interest Expense | | | 12,693 | |
| Custody Fees | | | 12,313 | |
| Miscellaneous Expenses | | | 2,645 | |
| Total Expenses | | | 1,678,065 | |
| Less: Fees Waived/Reimbursed by Advisor | | | (509,750 | ) |
| Net Expenses | | | 1,168,315 | |
| | | | | |
| Net Investment Income | | | 560,131 | |
| | | | | |
| Net Realized and Unrealized Gain on Investments: | | | | |
| Net Realized Gain on: | | | | |
| Investments | | | 161,453 | |
| Distributions of Capital Gains From Underlying Investment Companies | | | 108,525 | |
| Total Net Realized Gain | | | 269,978 | |
| Net Change in Unrealized Appreciation on Investments | | | 3,785,677 | |
| Net Realized and Unrealized Gain on Investments | | | 4,055,655 | |
| | | | | |
| Net Increase in Net Assets Resulting From Operations | | $ | 4,615,786 | |
The accompanying notes are an integral part of these financial statements.
Total Income+ Real Estate Fund
STATEMENT OF CHANGES IN NET ASSETS
| | | For the Year | | | For the Period | |
| | | Ended | | | Ended | |
| | | September 30, 2014 | | | September 30, 2013* | |
| Operations: | | | | | | | | |
| Net Investment Income | | $ | 560,131 | | | $ | 351,215 | |
| Net Realized Gain on Investments | | | 161,453 | | | | 62,739 | |
| Distributions of Capital Gains From Underlying Investment Companies | | | 108,525 | | | | — | |
| Net Change in Unrealized Appreciation on Investments | | | 3,785,677 | | | | 1,590,081 | |
| Net Increase in Net Assets Resulting From Operations | | | 4,615,786 | | | | 2,004,035 | |
| | | | | | | | | |
| Distributions to Shareholders From: | | | | | | | | |
| Net Investment Income | | | | | | | | |
| Class A | | | (22,525 | ) | | | (271,191 | ) |
| Net Realized Capital Gain | | | | | | | | |
| Class A | | | (210,388 | ) | | | — | |
| Return of Capital | | | (3,615,085 | ) | | | (271,190 | ) |
| Total Distributions to Shareholders | | | (3,847,998 | ) | | | (542,381 | ) |
| | | | | | | | | |
| From Shares of Beneficial Interest: | | | | | | | | |
| Class A Shares: | | | | | | | | |
| Proceeds from Shares Issued (2,093,839 and 1,370,764 shares, respectively) | | | 58,438,507 | | | | 36,206,787 | |
| Distributions Reinvested (87,946 and 14,748 shares, respectively) | | | 2,436,617 | | | | 395,458 | |
| Cost of Shares Redeemed (377,444 and 1,598 shares, respectively) | | | (10,527,339 | ) | | | (43,230 | ) |
| Redemption Fees | | | 53,562 | | | | 863 | |
| Total From Beneficial Interest Transactions: Class A | | | 50,401,347 | | | | 36,559,878 | |
| | | | | | | | | |
| Class C Shares: | | | | | | | | |
| Proceeds from Shares Issued (230,363 and 0 shares, respectively) | | | 6,445,246 | | | | — | |
| Distributions Reinvested (3,211 and 0 shares, respectively) | | | 89,105 | | | | — | |
| Cost of Shares Redeemed (363 and 0 shares, respectively) | | | (10,166 | ) | | | — | |
| Total From Beneficial Interest Transactions: Class C | | | 6,524,185 | | | | — | |
| | | | | | | | | |
| Class I Shares: | | | | | | | | |
| Proceeds from Shares Issued (123,039 and 0 shares, respectively) | | | 3,458,409 | | | | — | |
| Distributions Reinvested (1,640 and 0 shares, respectively) | | | 45,704 | | | | — | |
| Total From Beneficial Interest Transactions: Class I | | | 3,504,113 | | | | — | |
| | | | | | | | | |
| Net Increase in Net Assets From Shares of Beneficial Interest | | | 60,429,645 | | | | 36,559,878 | |
| | | | | | | | | |
| Total Increase in Net Assets | | | 61,197,433 | | | | 38,021,532 | |
| | | | | | | | | |
| Net Assets: | | | | | | | | |
| Beginning of Period | | | 38,121,532 | | | | 100,000 | |
| End of Period | | $ | 99,318,965 | | | $ | 38,121,532 | |
| | | | | | | | | |
| Undistributed Net Investment Income | | $ | 745,265 | | | $ | 160,419 | |
| * | The Fund commenced operations October 22, 2012. |
The accompanying notes are an integral part of these financial statements.
Total Income+ Real Estate Fund
FINANCIAL HIGHLIGHTS
Class A
The table below sets forth financial data for one share of beneficial interest outstanding throughout each period presented.
| | | For the Year | | | For the Period* | |
| | | Ended | | | Ended | |
| | | September 30, 2014 | | | September 30, 2013 | |
| | | | | | | |
| Net Asset Value, Beginning of Period | | $ | 27.47 | | | $ | 25.00 | |
| Increase From Operations: | | | | | | | | |
| Net investment income (a) | | | 0.26 | | | | 0.67 | |
| Net gain from investments (both realized and unrealized) | | | 1.70 | | | | 2.40 | |
| Total from operations | | | 1.96 | | | | 3.07 | |
| | | | | | | | | |
| Less Distributions: | | | | | | | | |
| From net investment income | | | (0.01 | ) | | | (0.40 | ) |
| From net realized gain on investments | | | (0.11 | ) | | | — | |
| From paid in interest | | | (1.35 | ) | | | (0.20 | ) |
| Total Distributions | | | (1.47 | ) | | | (0.60 | ) |
| | | | | | | | | |
| Paid in interest from redemption fees (a) | | | 0.02 | | | | 0.00 | (i) |
| | | | | | | | | |
| Net Asset Value, End of Period | | $ | 27.98 | | | $ | 27.47 | |
| | | | | | | | | |
| Total Return (b)(h) | | | 7.38 | % | | | 12.36 | % (e) |
| | | | | | | | | |
| Ratios/Supplemental Data | | | | | | | | |
| Net assets, end of period (in 000’s) | | $ | 89,319 | | | $ | 38,122 | |
| Ratio to average net assets: | | | | | | | | |
| Expenses, Gross (c)(f) | | | 2.54 | % | | | 4.96 | % (d) |
| Expenses, Net of Reimbursement (f) | | | 1.76 | % | | | 0.01 | % (d) |
| Ratio to average net assets (excluding interest expense): | | | | | | | | |
| Expenses, Gross (c)(f) | | | 2.52 | % | | | 4.96 | % (d) |
| Expenses, Net of Reimbursement (f) | | | 1.74 | % | | | 0.01 | % (d) |
| Net investment income, Net of Reimbursement (f)(g) | | | 0.94 | % | | | 2.66 | % (d) |
| Portfolio turnover rate | | | 12 | % | | | 35 | % (e) |
| * | Class A commenced operations October 22, 2012. |
| (a) | Per share amounts are calculated using the average shares method, which more appropriately presents the per share data for the period. |
| (b) | Total returns are historical in nature and assume changes in share price, reinvestment of dividends and capital gains distributions, if any, and does not reflect the impact of sales charges. Had the Advisor not absorbed a portion of Fund expenses, total returns would have been lower. |
| (c) | Represents the ratio of expenses to average net asset absent fee waivers and/or expense reimbursements by the Advisor. |
| (f) | The ratios of expenses to average net assets and net investment income to average net assets do not reflect the expenses of the underlying investment companies in which the Fund invests. |
| (g) | Recognition of net investment income is affected by the timing and declaration of dividends by the underlying investment companies in which the Fund invests. |
| (h) | Includes adjustments in accordance with accounting principles generally accepted in the United States and, consequently, the net asset value for financial reporting purposes and the returns based upon those net asset values may differ from the net asset values and returns for shareholder transactions. |
| (i) | Less then $0.01 per share. |
The accompanying notes are an integral part of these financial statements.
Total Income+ Real Estate Fund
FINANCIAL HIGHLIGHTS
Class C
The table below sets forth financial data for one share of beneficial interest outstanding throughout the period presented.
| | | For the Period | |
| | | Ended | |
| | | September 30, 2014* | |
| | | | |
| Net Asset Value, Beginning of Period | | $ | 27.75 | |
| Increase From Operations: | | | | |
| Net investment loss (a) | | | (0.19 | ) |
| Net gain from investments (both realized and unrealized) | | | 1.07 | |
| Total from operations | | | 0.88 | |
| | | | | |
| Less Distributions: | | | | |
| From paid in interest | | | (0.74 | ) |
| Total Distributions | | | (0.74 | ) |
| | | | | |
| Net Asset Value, End of Period | | $ | 27.89 | |
| | | | | |
| Total Return (b)(e)(h) | | | 3.20 | % |
| | | | | |
| Ratios/Supplemental Data | | | | |
| Net assets, end of period (in 000’s) | | $ | 6,505 | |
| Ratio to average net assets: | | | | |
| Expenses, Gross (c)(d)(f) | | | 3.36 | % |
| Expenses, Net of Reimbursement (d)(f) | | | 2.61 | % |
| Ratio to average net assets (excluding interest expense): | | | | |
| Expenses, Gross (c)(d)(f) | | | 3.34 | % |
| Expenses, Net of Reimbursement (d)(f) | | | 2.59 | % |
| Net investment loss, Net of Reimbursement (d)(f)(g) | | | (1.36 | )% |
| Portfolio turnover rate (e) | | | 12 | % |
| * | Class C commenced operations April 1, 2014. |
| (a) | Per share amounts are calculated using the average shares method, which more appropriately presents the per share data for the period. |
| (b) | Total returns are historical in nature and assume changes in share price, reinvestment of dividends and capital gains distributions, if any. Had the Advisor not absorbed a portion of Fund expenses, total returns would have been lower. |
| (c) | Represents the ratio of expenses to average net asset absent fee waivers and/or expense reimbursements by the Advisor. |
| (f) | The ratios of expenses to average net assets and net investment income to average net assets do not reflect the expenses of the underlying investment companies in which the Fund invests. |
| (g) | Recognition of net investment income is affected by the timing and declaration of dividends by the underlying investment companies in which the Fund invests. |
| (h) | Includes adjustments in accordance with accounting principles generally accepted in the United States and, consequently, the net asset value for financial reporting purposes and the returns based upon those net asset values may differ from the net asset values and returns for shareholder transactions. |
The accompanying notes are an integral part of these financial statements.
Total Income+ Real Estate Fund
FINANCIAL HIGHLIGHTS
Class I
The table below sets forth financial data for one share of beneficial interest outstanding throughout the period presented.
| | | For the Period | |
| | | Ended | |
| | | September 30, 2014* | |
| | | | |
| Net Asset Value, Beginning of Period | | $ | 27.75 | |
| Increase From Operations: | | | | |
| Net investment loss (a) | | | (0.04 | ) |
| Net gain from investments (both realized and unrealized) | | | 1.06 | |
| Total from operations | | | 1.02 | |
| | | | | |
| Less Distributions: | | | | |
| From paid in interest | | | (0.74 | ) |
| Total Distributions | | | (0.74 | ) |
| | | | | |
| Net Asset Value, End of Period | | $ | 28.03 | |
| | | | | |
| Total Return (b)(e)(h) | | | 3.71 | % |
| | | | | |
| Ratios/Supplemental Data | | | | |
| Net assets, end of period (in 000’s) | | $ | 3,495 | |
| Ratio to average net assets: | | | | |
| Expenses, Gross (c)(d)(f) | | | 2.40 | % |
| Expenses, Net of Reimbursement (d)(f) | | | 1.61 | % |
| Ratio to average net assets (excluding interest expense): | | | | |
| Expenses, Gross (c)(d)(f) | | | 2.38 | % |
| Expenses, Net of Reimbursement (d)(f) | | | 1.59 | % |
| Net investment loss, Net of Reimbursement (d)(f)(g) | | | (0.24 | )% |
| Portfolio turnover rate (e) | | | 12 | % |
| * | Class I commenced operations April 1, 2014. |
| (a) | Per share amounts are calculated using the average shares method, which more appropriately presents the per share data for the period. |
| (b) | Total returns are historical in nature and assume changes in share price, reinvestment of dividends and capital gains distributions, if any. Had the Advisor not absorbed a portion of Fund expenses, total returns would have been lower. |
| (c) | Represents the ratio of expenses to average net asset absent fee waivers and/or expense reimbursements by the Advisor. |
| (f) | The ratios of expenses to average net assets and net investment income to average net assets do not reflect the expenses of the underlying investment companies in which the Fund invests. |
| (g) | Recognition of net investment income is affected by the timing and declaration of dividends by the underlying investment companies in which the Fund invests. |
| (h) | Includes adjustments in accordance with accounting principles generally accepted in the United States and, consequently, the net asset value for financial reporting purposes and the returns based upon those net asset values may differ from the net asset values and returns for shareholder transactions. |
The accompanying notes are an integral part of these financial statements.
Total Income+ Real Estate Fund
NOTES TO FINANCIAL STATEMENTS
September 30, 2014
Total Income+ Real Estate Fund (the “Fund”) was organized as a Delaware statutory trust on May 25, 2012 and is registered under the Investment Company Act of 1940, as amended, (the “1940 Act”), as a non-diversified, closed-end management investment company that operates as an interval fund with a continuous offering of Fund shares. The Fund’s primary investment objective is to generate current income while secondarily seeking long-term capital appreciation, with low to moderate volatility and low correlation to the broader markets. The Fund pursues its investment objectives by investing, under normal circumstances, at least 80% of assets in “real estate industry securities,” primarily in income producing equity and debt securities.
The Fund currently offers Class A, Class C, and Class I shares. The Advisor purchased the initial 4,000 shares of Class A for cash at $25.00 per share for a total cost of $100,000 on August 16, 2012. Class A shares commenced operations on October 22, 2012 and are offered at net asset value plus a maximum sales charge of 5.75%. Class C and Class I shares commenced operations on April 1, 2014 and are offered at net asset value. Each class represents an interest in the same assets of the Fund and classes are identical except for differences in their sales charge structures and ongoing service and distribution charges. All classes of shares have equal voting privileges except that each class has exclusive voting rights with respect to its service and/or distribution plans. The Fund’s income, expenses (other than class specific distribution fees) and realized and unrealized gains and losses are allocated proportionately each day based upon the relative net assets of each class.
| 2. | SUMMARY OF SIGNIFICANT ACCOUNTING POLICIES |
The following is a summary of significant accounting policies followed by the Fund in preparation of its financial statements. These policies are in conformity with accounting principles generally accepted in the United States of America (“GAAP”). The preparation of financial statements requires management to make estimates and assumptions that affect the reported amounts of assets and liabilities and disclosure of contingent assets and liabilities at the date of the financial statements and the reported amounts of income and expenses for the period. Actual results could differ from those estimates.
Security Valuation – Securities listed on an exchange are valued at the last reported sale price at the close of the regular trading session of the exchange on the business day the value is being determined, or in the case of securities listed on NASDAQ at the NASDAQ Official Closing Price (“NOCP”). In the absence of a sale such securities shall be valued at the last bid price. Short-term investments that mature in 60 days or less may be valued at amortized cost, provided such valuations represent fair value.
Valuation of Fund of Funds – The Fund may invest in portfolios of open-end investment companies and exchange traded funds (the “Underlying Funds”). The Underlying Funds value securities in their portfolios for which market quotations are readily available at their market values (generally the last reported sale price) and all other securities and assets at their fair value to the methods established by the board of directors of the Underlying Funds.
Open-ended investment companies are valued at their respective net asset values as reported by such investment companies. The shares of many closed-end investment companies, after their initial public offering, frequently trade at a price per share, which is different than the net asset value per share. The difference represents a market premium or market discount of such shares. There can be no assurances that the market discount or market premium on shares of any closed-end investment company purchased by the Fund will not change.
When price quotations for certain securities are not readily available, or if the available quotations are not believed to be reflective of market value by the Advisor, those securities will be valued at “fair value” as determined in good faith by the Valuation Committee using procedures adopted by and under the supervision of the Fund’s Board of
Total Income+ Real Estate Fund
NOTES TO FINANCIAL STATEMENTS (Continued)
September 30, 2014
Trustees (the “Board”). There can be no assurance that a Fund could purchase or sell a portfolio security at the price used to calculate a Fund’s Net Asset Value (“NAV”).
Fair valuation procedures may be used to value a substantial portion of the assets of the Fund. The Fund may use the fair value of a security to calculate its NAV when, for example, (1) a portfolio security is not traded in a public market or the principal market in which the security trades is closed, (2) trading in a portfolio security is suspended and not resumed prior to the normal market close, (3) a portfolio security is not traded in significant volume for a substantial period, or (4) the Advisor determines that the quotation or price for a portfolio security provided by a broker-dealer or independent pricing service is inaccurate.
Valuation of Private REITS – The Fund invests a significant portion of its assets in Private Real Estate Investment Trusts (“Private REITs”). The Private REITs measure their investment assets at fair value, and report a NAV per share on a calendar quarter basis. In accordance with Accounting Standards Codification (‘ASC”) 820, the Fund has elected to apply the practical expedient and to value its investments in Private REITs at their respective NAVs at each quarter. For non-calendar quarter days, the Valuation Committee estimates the fair value of each Private REIT by adjusting the most recent NAV for each REIT by the change in a proprietary benchmark that the Valuation Committee has deemed to be representative of the entire Private REIT market. As of September 30, 2014, all of the Fund’s investments in Private REITs were valued at the respective NAVs of the Private REITs.
Valuation of Public Non-Traded REITs – The Fund may invest a portion of its assets in Public Non-Traded Real Estate Investment Trusts (“Public Non-Traded REITs”). The Public Non-Traded REITs do not report periodic NAVs and therefore cannot be valued using the practical expedient. The Valuation Committee determines the fair value of Public Non-Traded REITs on a daily basis by considering various factors such as the most recent published NAV, the transaction price, secondary market trades, shareholder redemption and dividend reinvestment programs, and potential illiquidity discounts.
The “fair value” of securities may be difficult to determine and thus judgment plays a greater role in the valuation process. The fair valuation methodology may include or consider the following guidelines, as appropriate: (1) evaluation of all relevant factors, including but not limited to, pricing history, current market level, supply and demand of the respective security; (2) comparison to the values and current pricing of securities that have comparable characteristics; (3) knowledge of historical market information with respect to the security; (4) other factors relevant to the security which would include, but not be limited to, duration, yield, fundamental analytical data, the Treasury yield curve, and credit quality.
The values assigned to fair valued investments are based on available information and do not necessarily represent amounts that might ultimately be realized, since such amounts depend on future developments inherent in long-term investments. Changes in the fair valuation of portfolio securities may be less frequent and of greater magnitude than changes in the price of portfolio securities valued at their last sale price, by an independent pricing service, or based on market quotations. Imprecision in estimating fair value can also impact the amount of unrealized appreciation or depreciation recorded for a particular portfolio security and differences in the assumptions used could result in a different determination of fair value, and those differences could be material.
The Fund utilizes various methods to measure the fair value of its investments on a recurring basis. GAAP establishes a hierarchy that prioritizes inputs to valuation methods. The three levels of input are:
Level 1 – Unadjusted quoted prices in active markets for identical assets and liabilities that the Fund has the ability to access.
Level 2 – Observable inputs other than quoted prices included in Level 1 that are observable for the asset or liability, either directly or indirectly. These inputs may include quoted prices for the identical instrument on an inactive market, prices for similar instruments, interest rates, prepayment speeds, credit risk, yield curves, default rates and similar data.
Total Income+ Real Estate Fund
NOTES TO FINANCIAL STATEMENTS (Continued)
September 30, 2014
Level 3 – Unobservable inputs for the asset or liability, to the extent relevant observable inputs are not available, representing the Fund’s own assumptions about the assumptions a market participant would use in valuing the asset or liability, and would be based on the best information available.
The availability of observable inputs can vary from security to security and is affected by a wide variety of factors, including, for example, the type of security, whether the security is new and not yet established in the marketplace, the liquidity of markets, and other characteristics particular to the security. To the extent that valuation is based on models or inputs that are less observable or unobservable in the market, the determination of fair value requires more judgment. Accordingly, the degree of judgment exercised in determining fair value is greatest for instruments categorized in Level 3.
The inputs used to measure fair value may fall into different levels of the fair value hierarchy. In such cases, for disclosure purposes, the level in the fair value hierarchy within which the fair value measurement falls in its entirety, is determined based on the lowest level input that is significant to the fair value measurement in its entirety.
The inputs or methodology used for valuing securities are not necessarily an indication of the risk associated with investing in those securities. The following tables summarize the inputs used as of September 30, 2014 for the Fund’s assets and liabilities measured at fair value:
| Assets* | | Level 1 | | | Level 2 | | | Level 3 | | | Total | |
| Mutual Funds | | $ | 23,831,783 | | | | — | | | $ | — | | | $ | 23,831,783 | |
| Private Real Estate Investment Trusts | | | — | | | | 58,424,774 | | | | — | | | | 58,424,774 | |
| Public Non-Traded Real Estate Investment Trusts | | | — | | | | 437,888 | | | | 1,883,133 | | | | 2,321,021 | |
| Publicly Traded Real Estate Investment Trusts | | | 63,255 | | | | — | | | | — | | | | 63,255 | |
| Short-Term Investments | | | 15,623,374 | | | | — | | | | — | | | | 15,623,374 | |
| Total | | $ | 39,518,412 | | | $ | 58,862,662 | | | $ | 1,883,133 | | | $ | 100,264,207 | |
| * | Refer to the Portfolio of Investments for industry classifications. |
Transfers reflected in the tables below represent transfers to/ from Level 1, Level 2, and Level 3.
It is the Fund’s policy to record transfers into or out of any Level at the end of the reporting period.
The following amounts were transfers in/out of Level 2 Assets:
| | | Publicly Traded Real Estate | | | | |
| | | Investment Trust | | | Total | |
| Transfers from Level 2 into Level 1 | | $ | (63,255 | ) | | $ | (63,255 | ) |
| Transfers from Level 3 into Level 2 | | | 10,843,248 | | | | 10,843,248 | |
| Net Transfer In/(Out) of Level 2 | | $ | 10,779,993 | | | $ | 10,779,993 | |
The following is a reconciliation of assets in which Level 3 inputs were used in determining value:
| | | Real Estate | |
| | | Investment Trusts | |
| Beginning Balance | | $ | 9,201,673 | |
| Total realized gain (loss) | | | — | |
| Appreciation (Depreciation) | | | 638,266 | |
| Cost of Purchases | | | 3,000,000 | |
| Proceeds from Sales | | | (67,791 | ) |
| Return of Capital | | | (45,767 | ) |
| Net transfers in/out of level 3 | | | (10,843,248 | ) |
| Ending Balance | | $ | 1,883,133 | |
Total Income+ Real Estate Fund
NOTES TO FINANCIAL STATEMENTS (Continued)
September 30, 2014
Significant unobservable valuation inputs for material Level 3 investments as of September 30, 2014, are as follows:
| | | Fair Value at | | | Valuation | | | | |
| | | 9/30/2014 | | | Technique | | Unobservable Input | | Range (Weighted Average) |
| | | | | | | | | | |
| Public Non-Traded Real | | | | | | | | | | |
| Estate Investment Trusts | | $ | 1,883,133 | | | Transaction Data | | Dividend Reinvestment Plan Prices | | $6.94 - $8.15 |
| | | | | | | | | Redemption Prices | | $5.45 - $6.85 |
| | | | | | | | | Secondary Market Prices | | $4.01 - $10.03 |
| | | | | | | | | Weighting of Transaction Prices by Volume (b) | | 1x - 9x |
| | | | | | | | | Discount for Lack of Liquidity (a) | | 0%-30% (30%) |
| (a) | Represents amounts used when the reporting entity has determined that market participants would take into account these discounts when pricing the investments. |
| (b) | Represents amounts used when the reporting entity has determined that market participant would use such multiples when pricing the investments. |
Exchange Traded Funds – The Fund may invest in exchange traded funds (“ETFs”). ETFs are a type of fund bought and sold on a securities exchange. An ETF trades like common stock and typically represents a fixed portfolio of securities designed to track the performance and dividend yield of a particular domestic or foreign market index. The Fund may purchase an ETF to temporarily gain exposure to a portion of the U.S. or a foreign market while awaiting purchase of underlying securities. The risks of owning an ETF generally reflect the risks of owning the underlying securities they are designed to track, although the lack of liquidity on an ETF could result in it being more volatile. Additionally, ETFs have fees and expenses that reduce their value.
Security Transactions and Investment Income – Investment security transactions are accounted for on a trade date basis. Cost is determined and gains and losses are based upon the specific identification method for both financial statement and federal income tax purposes. Dividend income is recorded on the ex-dividend date and interest income is recorded on the accrual basis. Purchase discounts and premiums on securities are accreted and amortized over the life of the respective securities.
Federal Income Taxes – The Fund intends to comply with the requirements of Subchapter M of the Internal Revenue Code applicable to regulated investment companies and will distribute all of its taxable income, if any to shareholders. Accordingly, no provision for Federal income taxes is required in the financial statements.
The Fund recognizes the tax benefits of uncertain tax positions only when the position is “more likely than not” to be sustained assuming examination by tax authorities. Management has reviewed the tax positions and has concluded that no liability for unrecognized tax benefits should be recorded related to uncertain tax positions related to the open tax years (2013) or expected to be taken in the Fund’s 2014 tax returns. The Fund identifies its major tax jurisdiction as U.S. Federal. The Fund recognizes interest and penalties, if any, related to unrecognized tax benefits as income tax expense in the Statement of Operations. During the year ended September 30, 2014, the Fund did not incur any interest or penalties. Generally tax authorities can examine tax returns filed for the last three years.
Distributions to Shareholders – Distributions from investment income are declared and paid quarterly. Distributions from net realized capital gains, if any, are declared and paid annually and are recorded on the ex-dividend date. The character of income and gains to be distributed is determined in accordance with income tax regulations, which may differ from GAAP.
Indemnification – The Trust indemnifies its officers and Trustees for certain liabilities that may arise from the performance of their duties to the Trust. Additionally, in the normal course of business, the Fund enters into contracts that contain a variety of representations and warranties and which provide general indemnities. The Fund’s maximum exposure under these arrangements is unknown, as this would involve future claims that may be
Total Income+ Real Estate Fund
NOTES TO FINANCIAL STATEMENTS (Continued)
September 30, 2014
made against the Fund that have not yet occurred. However, based on experience, the Trust expects the risk of loss due to these warranties and indemnities to be remote.
| 3. | ADVISORY FEE AND OTHER RELATED PARTY TRANSACTIONS |
Advisory Fees – Pursuant to an investment advisory agreement with the Trust, with respect to the Fund, (the “Advisory Agreement”), investment advisory services are provided to the Fund by Bluerock Fund Advisor, LLC (the “Advisor”). Under the terms of the Advisory Agreement, the Advisor receives monthly fees calculated at an annual rate of 1.50% of the average daily net assets of the Fund. For the year ended September 30, 2014, the Advisor earned advisory fees of $982,850.
The Advisor has contractually agreed to waive all or part of its management fees and/or make payments to limit Fund expenses, (exclusive of any taxes, interest, broker commissions, acquired fund fees and expenses, and extraordinary expenses, such as litigation or reorganization costs, but inclusive of organizational costs and offering costs) at least until March 31, 2015, so that the total annual operating expenses of the Fund do not exceed 1.84%, 2.59% and 1.59% of the Fund’s average daily net assets for Class A, Class C and Class I shares, respectively. The Advisor had voluntarily agreed to further limit the annual operating expenses to 0.00% of the Fund’s average daily net assets for Class A from the Fund’s inception until October 31, 2013. Fee waivers and expense payments may be recouped by the Advisor from the Fund, to the extent that overall expenses fall below the expense limitation, within three fiscal years of when the amounts were waived or reimbursed. During the year ended September 30, 2014, the Advisor waived and reimbursed fees of $509,750. As of September 30, 2014, cumulative expenses subject to recapture pursuant to the aforementioned conditions amounted to $1,204,296 and will expire on September 30 of the years indicated below:
| 2016 | | | 2017 | |
| $ | 694,546 | | | $ | 509,750 | |
Sub-advisory services were provided to the Fund pursuant to agreements between the Advisor and Mercer Investment Management, Inc. (the “Sub-Adviser”). Under the terms of the sub-advisory agreements, the Advisor compensates the Sub-Advisor based on a portion of the Fund’s average daily net assets which it had been allocated to manage.
Pursuant to separate servicing agreements with Gemini Fund Services, (“GFS”), the Fund pays GFS customary fees for providing administration, fund accounting and transfer agency services to the Fund.
In addition, certain affiliates of GFS provide ancillary services to the Fund as follows:
Northern Lights Compliance Services, LLC (“NLCS”) - NLCS, an affiliate of GFS, provides a Chief Compliance Officer to the Trust, as well as related compliance services, pursuant to a consulting agreement between NLCS and the Trust. Under the terms of such agreement, NLCS receives customary fees from the Fund.
Gemcom, LLC (“Gemcom”) - Gemcom, an affiliate of GFS, provides EDGAR conversion and filing services as well as print management services for the Fund on an ad-hoc basis. For the provision of these services, Gemcom receives customary fees from the Fund.
Distributor – The distributor of the Fund is Northern Lights Distributors, LLC (the “Distributor”). The Board of Trustees has adopted, on behalf of the Fund, a Shareholder Services Plan and a Distribution Plan under which the Fund may compensate financial industry professionals for providing ongoing services in respect of clients with whom they have distributed shares of the Fund. Under the Shareholder Services Plan, the Fund pays up to 0.25% per year of the average daily net assets of each of Class A and Class C shares for such services. For the year ended September 30, 2014, the Fund incurred shareholder servicing fees of $158,386 and $3,846 for Class A and Class C
Total Income+ Real Estate Fund
NOTES TO FINANCIAL STATEMENTS (Continued)
September 30, 2014
shares, respectively. Under the Distribution Plans, the Fund pays 0.75% per year of its average daily net assets for such services for Class C shares. For the year ended September 30, 2014, the Fund incurred distributions fees of $11,540 for Class C shares.
The Distributor acts as the Fund’s principal underwriter in a continuous public offering of the Fund’s shares. The Distributor is an affiliate of GFS. For the year ended September 30, 2014, the Distributor received $1,779,743 in underwriting commissions for sales of the Fund’s shares, of which $248,189 was retained by the principal underwriter or other affiliated broker-dealers.
Trustees – The Fund pays each Trustee who is not affiliated with the Trust or Advisor a quarterly fee of $2,500, as well as reimbursement for any reasonable expenses incurred attending meetings. The “interested persons” who serve as Trustees of the Trust receive no compensation for their services as Trustees. None of the executive officers receive compensation from the Trust.
| 4. | INVESTMENT TRANSACTIONS |
The cost of purchases and proceeds from the sale of securities, other than short-term securities, for the year ended September 30, 2014 amounted to $56,979,900 and $7,211,491, respectively.
| 5. | REPURCHASE OFFERS / SHARES OF BENEFICIAL INTEREST |
Pursuant to Rule 23c-3 under the Investment Company Act of 1940, as amended, the Fund offers shareholders on a quarterly basis the option of redeeming shares, at net asset value, of no less than 5% and no more than 25% of the shares outstanding on the Repurchase Request Deadline. The Board shall determine the quarterly repurchase offer amount. There is no guarantee that shareholders will be able to sell all of the shares they desire in a quarterly repurchase offer, although each shareholder will have the right to require the Fund to purchase up to and including 5% of such shareholder’s shares in each quarterly repurchase. Limited liquidity will be provided to shareholders only through the Fund’s quarterly repurchases.
During the year ended September 30, 2014, the Fund completed four quarterly repurchase offers. The Fund offered to repurchase up to 5% of the number of its outstanding shares as of the Repurchase Pricing Dates. The results of the repurchase offers were as follows:
| | | Repurchase Offer | | | Repurchase Offer | | | Repurchase Offer | | | Repurchase Offer | |
| Commencement Date | | September 20, 2013 | | | December 20, 2013 | | | March 31, 2014 | | | June 30, 2014 | |
| Repurchase Request Deadline | | October 15, 2013 | | | January 21, 2014 | | | May 9, 2014 | | | August 8, 2014 | |
| Repurchase Pricing Date | | October 15, 2013 | | | January 21, 2014 | | | May 9, 2014 | | | August 8, 2014 | |
| | | | | | | | | | | | | |
| Net Asset Value as of Repurchase Offer Date: | | | | | | | | | |
| Class A | | $ | 27.63 | | | $ | 27.55 | | | $ | 27.99 | | | $ | 28.03 | |
| Class C | | | N/A | | | | N/A | | | | — | | | $ | 27.97 | |
| Class I | | | N/A | | | | N/A | | | | — | | | | — | |
| Amount Repurchased | | | | | | | | | | | | | | | | |
| Class A | | $ | 313,226 | | | $ | 2,499,561 | | | $ | 3,048,960 | | | $ | 4,665,592 | |
| Class C | | | N/A | | | | N/A | | | | — | | | $ | 10,166 | |
| Class I | | | N/A | | | | N/A | | | | — | | | | — | |
| | | | | | | | | | | | | | | | | |
| Percentage of Outstanding Shares Repurchased | | | | | | |
| Class A | | | 0.79 | % | | | 4.66 | % | | | 4.28 | % | | | 5.00 | % |
| Class C | | | N/A | | | | N/A | | | | — | | | | 0.21 | % |
| Class I | | | N/A | | | | N/A | | | | — | | | | — | |
Total Income+ Real Estate Fund
NOTES TO FINANCIAL STATEMENTS (Continued)
September 30, 2014
| 6. | DISTRIBUTIONS TO SHAREHOLDERS AND TAX COMPONENTS OF CAPITAL |
The tax character of fund distributions for the following periods was as follows:
| | | Fiscal Year Ended | | | Fiscal Period Ended | |
| | | September 30, 2014 | | | September 30, 2013 | |
| Ordinary Income | | $ | 22,525 | | | $ | 249,285 | |
| Long-Term Capital Gain | | | 210,388 | | | | 21,906 | |
| Return of Capital | | | 3,615,085 | | | | 271,190 | |
| | | $ | 3,847,998 | | | $ | 542,381 | |
As of September 30, 2014, the components of accumulated earnings/(deficit) on a tax basis were as follows:
| Late Year and | | | Unrealized | | | Total | |
| Post October | | | Appreciation/ | | | Accumulated | |
| Losses | | | (Depreciation) | | | Earnings/(Deficits) | |
| $ | (92,768 | ) | | $ | 6,208,485 | | | $ | 6,115,717 | |
The difference between book basis and tax basis distributable earnings and unrealized appreciation/(depreciation) is primarily attributable to the tax deferral of losses on wash sales and adjustments for partnerships.
Late year losses incurred after December 31 within the fiscal year are deemed to arise on the first business day of the following fiscal year for tax purposes. The Fund incurred and elected to defer such late year losses of $82,593.
Capital losses incurred after October 31 within the fiscal year are deemed to arise on the first business day of the following fiscal year for tax purposes. The Fund incurred and elected to defer such capital losses of $10,175.
Permanent book and tax differences, primarily attributable to tax adjustments for partnerships, resulted in reclassification for the fiscal year ended September 30, 2014 as follows:
| Undistributed | | | Accumulated | |
| Net Investment | | | Net Realized | |
| Income (Loss) | | | Gain (Loss) | |
| $ | 47,240 | | | $ | (47,240 | ) |
The Fund has a line of credit with a variable limit based on how many securities are pledged as collateral. This line of credit is intended to provide financing, if necessary, subject to certain restrictions, in connection with shareholder redemptions. Borrowings are secured by the Fund’s investments. Interest will be accrued at the 3 Month LIBOR rate plus 94.5 bps to be paid monthly. The credit facility is with BNP Paribas. During the year ended September 30, 2014, the Fund paid $12,693 in interest on the line of credit. Average borrowings and the average interest rate during the year ended September 30, 2014 were $1,982,303 and 1.24%, respectively. The largest outstanding amount borrowed during the year was $3,750,066.
Until April 1, 2014, Class A shares assessed a short-term redemption fee of 2.00% of the total redemption amount if shareholders sell their shares after holding them for less than 365 days. Class C may assess a short-term redemption fee of 1.00% of the total redemption amount if shareholders sell their shares after holding them for less than 365 days. The redemption fee does not apply to shares that were acquired through reinvestment of
Total Income+ Real Estate Fund
NOTES TO FINANCIAL STATEMENTS (Continued)
September 30, 2014
distributions. The redemption fee is paid directly to the Fund. For the year ended September 30, 2014, Class A assessed $53,562 in redemption fees and Class C did not assess any fees.
Subsequent events after the date of the Statement of Assets and Liabilities have been evaluated through the date the financial statements were issued. Management has concluded that there is no impact requiring adjustment or disclosure in the financial statements.

REPORT OF INDEPENDENT REGISTERED PUBLIC ACCOUNTING FIRM
To the Shareholders and Board of Trustees of
Total Income + Real Estate Fund
We have audited the accompanying statement of assets and liabilities of Total Income + Real Estate Fund, including the portfolio of investments, as of September 30, 2014, and the related statement of operations for the year then ended, and the statements of changes in net assets and the financial highlights for the year then ended and for the period October 22, 2012 (commencement of operations) through September 30, 2013. These financial statements and financial highlights are the responsibility of the Fund’s management. Our responsibility is to express an opinion on these financial statements and financial highlights based on our audits.
We conducted our audits in accordance with the standards of the Public Company Accounting Oversight Board (United States). Those standards require that we plan and perform the audits to obtain reasonable assurance about whether the financial statements and financial highlights are free of material misstatement. An audit includes examining, on a test basis, evidence supporting the amounts and disclosures in the financial statements. Our procedures included confirmation of securities owned as of September 30, 2014 by correspondence with the custodian and other appropriate parties. An audit also includes assessing the accounting principles used and significant estimates made by management, as well as evaluating the overall financial statement presentation. We believe that our audits provide a reasonable basis for our opinion.
As explained in the notes, the financial statements include securities valued at $1,883,133 (1.90% of net assets), whose fair values have been estimated by the Board of Trustees in the absence of readily ascertainable fair values. These estimated values may differ significantly from the values that would have been used had a ready market for the securities existed, and the differences could be material.
In our opinion, the financial statements and financial highlights referred to above present fairly, in all material respects, the financial position of Total Income + Real Estate Fund as of September 30, 2014, and the results of its operations for the year then ended, and the changes in its net assets and its financial highlights for the year then ended and for the period October 22, 2012 through September 30, 2013, in conformity with accounting principles generally accepted in the United States of America.

BBD, LLP
Philadelphia, Pennsylvania
December 1, 2014
Total Income+ Real Estate Fund
SUPPLEMENTAL INFORMATION (Unaudited)
September 30, 2014
The following is a list of the Trustees and executive officers of the Trust and each person’s principal occupation over the last five years.
Independent Trustees
Name, Address and
Age | | Position/Term
of Office* | | Principal Occupation During the
Past Five Years | | Number of
Portfolios in Fund
Complex**Overseen
by Trustee | | Other
Directorships
held by Trustee
During Last Five
Years |
| Bobby Majumder, 46 | | Trustee Since 2012 | | Partner, Perkins Coie LLP (2013 - Present); Partner, K&L Gates LLP (2005 – 2013) | | 1 | | Bluerock Enhanced Multifamily Trust, Inc. (2009 – Present) |
| Clayton Hosterman, 48 | | Trustee Since 2014 | | Principal, Treasurer’s Choice Processing (2013- Present); Senior Vice President, Merchant E- Solutions, Inc. (2012- 2013); Group Manager, Chase Paymentech (2006-2012) | | 1 | | None |
| Romano Tio, 54 | | Trustee Since 2012 | | Co-Founder and Managing Director, RM Capital Management LLC (2009 – Present); Managing Director, HCP Real Estate Investors LLC (2008 – 2009) | | 1 | | None |
Interested Trustees and Officers
Name, Address and
Age | | Position/Term
of Office* | | Principal Occupation During the
Past Five Years | | Number of
Portfolios in Fund
Complex**
Overseen by
Trustee | | Other
Directorships
held by Trustee
During Last 5
Years |
| Ramin Kamfar; 50 | | Trustee | | Chairman, Bluerock Real Estate, LLC (2002 – Present) | | 1 | | Bluerock Enhanced Multifamily Trust (2008 – Present) |
| James Babb; 49 | | Trustee | | Senior Managing Director, Bluerock Real Estate, LLC (2007 – Present) | | 1 | | Bluerock Enhanced Multifamily Trust, Inc. (2009 – Present) |
| Jordan Ruddy; 51 | | President | | President / COO, Bluerock Real Estate, LLC (2002 - Present) | | n/a | | n/a |
| Jerry Novack, 57 | | Treasurer | | Chief Financial Officer, Bluerock Real Estate, LLC (2002 – Present) | | n/a | | n/a |
| Michael Konig, 54 | | Secretary | | Attorney / General Counsel, Bluerock Real Estate, LLC ((2005 – Present) | | n/a | | n/a |
| Mark Marrone, 46 | | Chief Compliance Officer Since 2012 | | Senior Compliance Officer, Northern Lights Compliance Services, LLC (2009 – Present); Chief Financial Officer / Treasurer (2003–2009) and Chief Compliance Officer (2004–2009) Saratoga Capital Management, LLC | | n/a | | n/a |
| * | The term of office for each Trustee and officer listed above will continue indefinitely. |
| ** | The term “Fund Complex” refers to the Total Income+ Real Estate Fund. |
The Fund’s Statement of Additional Information includes additional information about the Trustees and is available free of charge, upon request, by calling toll-free at 1-888-459-1059.
Total Income+ Real Estate Fund
DISCLOSURE OF FUND EXPENSES (Unaudited)
September 30, 2014
As a shareholder of the Fund you incur (1) transactional costs, such as sales charges; and (2) ongoing costs, including management fees, distribution and shareholder service fees and other Fund operating expenses. This example is intended to help you understand your ongoing costs (in dollars) of investing in the Fund and to compare these costs with the ongoing costs of investing in other mutual funds. Please note, the expenses shown in the tables are meant to highlight ongoing costs only and do not reflect any transactional costs.
This example is based on an investment of $1,000 invested for the entire period beginning April 1, 2014 through September 30, 2014.
Actual Expenses: The first line of the table provides information about actual account values and actual expenses. You may use the information in this line, together with the amount you invested, to estimate the expenses that you paid over the period. Simply divide your account value by $1,000 (for example, an $8,600 account value divided by $1,000 = 8.6), then multiply the result by the number in the first line under the heading entitled “Expenses Paid During the Period” to estimate the expenses you paid on your account during the period.
Hypothetical Examples for Comparison Purposes: The second line of the table below provides information about hypothetical account values and hypothetical expenses based on the Fund’s actual expense ratio and an assumed rate of return of 5% per year before expenses, which is not the Fund’s actual return. The hypothetical account values and expenses may not be used to estimate the actual ending account balance or expenses you paid for the period. You may use this information to compare the ongoing costs of investing in the Fund and other funds. To do so, compare this 5% hypothetical example with the 5% hypothetical examples that appear in the shareholder reports of the other funds.
Please note that the expenses shown in the table are meant to highlight your ongoing costs only and do not reflect any transactional costs which may be applicable to your account. Therefore, the second line of the table is useful in comparing ongoing costs only, and will not help you determine the relative total costs of owning different funds. In addition, if these transactional costs were included, your costs would have been higher.
| | | Beginning | | Ending Account | | | | Expenses Paid |
| | | Account Value | | Value | | Expense | | During the Period |
| | | (4/1/14) | | (9/30/14) | | Ratios | | (4/1/14 to 9/30/14) |
| Actual | | | | | | | | |
| Class A | | $1,000.00 | | $1,032.30 | | 1.84% | | $9.37 |
| Class C | | $1,000.00 | | $1,032.00 | | 2.59% | | $13.19 |
| Class I | | $1,000.00 | | $1,037.10 | | 1.59% | | $8.12 |
| Hypothetical | | | | | | | | |
| (5% return before expenses) | | | | | | | | |
| Class A | | $1,000.00 | | $1,015.84 | | 1.84% | | $9.30 |
| Class C | | $1,000.00 | | $1,012.08 | | 2.59% | | $13.06 |
| Class I | | $1,000.00 | | $1,017.10 | | 1.59% | | $8.04 |
Expenses Paid During the Period are equal to Fund’s annualized expense ratio, multiplied by the number of days in the six month period from April 1, 2014 through September 30, 2014 (183) divided by the number of days in the fiscal year (365).
Total Income+ Real Estate Fund
SUPPLEMENTAL INFORMATION (Unaudited)
September 30, 2014
Approval of Investment Advisory Agreement
At a meeting held on July 30, 2014, the Board of Trustees (the “Board or the Trustees”) of the Total Income+ Real Estate Fund (the “Trust” or the “Fund”), including a majority of the Trustees who are not “interested persons” (the “Independent Trustees”), as such term is defined by the Investment Company Act of 1940, as amended, approved the renewal of the investment management agreement (the “Advisory Agreement”) between Bluerock Fund Advisor, LLC (the “Adviser”) and the Trust. In connection with the Board’s consideration of the Advisory Agreement, the Adviser provided the Board with written materials. In considering the Advisory Agreement, the Trustees did not identify any one factor as all important, but rather considered these factors collectively in light of surrounding circumstances. Further, each Trustee may have afforded a different weight to different factors. Matters considered by the Trustees in connection with the Board’s renewal of the Advisory Agreement included the following.
Nature, Extent and Quality of Services. The Trustees considered the depth and experience of the Adviser’s personnel with responsibilities to the Fund, noting that the Adviser had replaced and added additional staff dedicated to the Fund’s portfolio management. The Trustees considered that the Adviser maintains a continuous investment program for the Fund and also exercises oversight of the performance and compliance programs of the various service providers to the Fund and the Fund’s Sub-Adviser. The Trustees then reviewed the description provided by the Adviser of its practices for monitoring compliance with the Fund’s investment limitations and considered that the Adviser has not experienced any material compliance issues during the prior term of the Advisory Agreement, and concluded that such practices were adequate. The Board, including the Independent Trustees, then concluded that the Adviser had sufficient quality and depth of personnel, resources, investment methods and compliance policies and procedures essential to performing its duties under the Advisory Agreement and that the nature, overall quality and extent of the management services provided by the Adviser to the Fund were satisfactory and reliable.
Performance. The Trustees considered the performance of the Fund as compared to the performance of each of the NCREIF Property Index (“NPI”) and the NCREIF Fund Index - Open End Diversified Core Equity Index (“NFIODCE”), noting that each of the NPI and NFIODCE are unmanaged indices measuring the investment returns of pools of real estate and open-end funds that invest in real estate. The Trustees considered that the Fund (Class A Shares) had gross returns of 12.02% for the one-year period ended March 31, 2014, as compared to index returns of 11.17% and 13.71% for the NPI and NFIODCE, respectively. The Trustees noted that the Fund’s returns are inclusive of the Fund’s operating expenses, as compared to the NPI and NFIODCE, which are index returns that do not reflect operational expense. The Trustees concluded that the Adviser had made sound investment decisions for the Fund and that the overall performance of the Fund was satisfactory.
Fees and Expenses. As to the costs of the services provided and profits realized by the Adviser, the Trustees considered comparisons of the Fund’s advisory fee and overall expenses (Class A shares) to certain funds with similar investment objectives and strategies and those that also utilize a closed-end interval fund structure (each a “Peer Group”). With respect to the Peer Group comprised of exchange-traded closed-end funds that also invest in real-estate related securities, the Trustees considered that the Fund’s advisory fee of 1.50% was above the mean, but not the highest of the Peer Group, and the Fund’s overall expense ratio was higher than, but generally comparable to, the mean of the Peer Group. The Trustees also considered the fees of a Peer Group comprised of closed-end interval funds. The Trustees also considered that the Fund’s expense ratio includes the indirect costs of investing in other investment companies (acquired fund fees and expenses) in addition to the operating costs of the Fund. The Trustees considered that the Adviser has agreed to reimburse expenses to limit net annual operating expenses until at least March 31, 2015. The Trustees concluded that the advisory fee paid to the Adviser was fair and reasonable and that the expense ratio was acceptable in light of the size of the Fund, the breadth and knowledge of the Adviser’s personnel, and the Fund’s management fees being within an acceptable range of the Peer Groups.
Profitability. The Trustees considered the Adviser’s representation that, during the initial two-year term of the Advisory Agreement, the Fund had not yet reached operating scale in terms of assets, the Adviser was not yet profiting from the Fund, and the Adviser had subsidized Fund operating expenses in connection with servicing the Fund. The Board considered that the Adviser may be able to recoup previously waived advisory fees on a rolling three-year basis. The Trustees concluded that based on the services provided, the fees were reasonable and that profits from the Adviser’s relationship with the Fund were not excessive.
Economies of Scale. The Trustees reviewed and considered a profitability analysis and selected financial information of the Adviser, as well as the Sub-Adviser fee break points. They concluded that while the expenses of managing the Fund, as a percentage of the fees earned, are expected to decrease as the Fund’s assets grow, at the current and projected asset levels, economies of scale was not a relevant consideration at this time. The Trustees noted that they would revisit whether economies of scale exist in the future once the Fund has achieved sufficient scale.
Total Income+ Real Estate Fund
SUPPLEMENTAL INFORMATION (Unaudited) (Continued)
September 30, 2014
Conclusion. The Trustees, having requested and received such information from the Adviser as they believed reasonably necessary to evaluate the terms of the Advisory Agreement, and assisted by the advice of counsel, determined that continuation of the Advisory Agreement for an additional one-year term is in the best interests of the Fund and its shareholders.
Total Income+ Real Estate Fund
SUPPLEMENTAL INFORMATION (Unaudited)
September 30, 2014
Approval of Sub-advisory Agreement
At a meeting (the “Meeting”} held on July 30, 2014, the Board of Trustees (the “Board or the Trustees”) of The Total Income+ Real Estate Fund (the “Trust” or the “Fund”) including a majority of the Trustees who are not interested persons (the “Independent Trustees”), as such term is defined by the Investment Company Act of 1940, as amended, approved the renewal of the sub-advisory agreement (the “Sub-advisory Agreement”) between Mercer Investment Management, Inc. (the “Sub-Adviser”) and Bluerock Fund Advisor, LLC, with respect to the Fund. In connection with the Board’s consideration of the Sub-advisory Agreement, the Sub-Adviser provided the Board with written materials. In considering the Sub-advisory Agreement, the Trustees did not identify any one factor as all important, but rather considered these factors collectively in light of surrounding circumstances. Further, each Trustee may have afforded a different weight to different factors. Matters considered by the Trustees in connection with the Board’s renewal of the Sub-advisory Agreement included the following.
Nature, Extent and Quality of Services. The Trustees considered that the Sub-Adviser’s principal responsibilities are to assist the Adviser in recommending and establishing the Fund’s portfolio, including providing assistance in determining the Fund’s target investment allocations and selecting appropriate investments for the Fund. The Trustees further noted that the Sub-Adviser conducts research on various real estate investment managers and investment options and reviews potential investment opportunities available in the market, including detailed analysis and due diligence of such investment options. The Trustees considered that the Sub-Adviser has been successful in recommending suitable investments for the Fund, and concluded that Sub- Adviser had sufficient quality and depth of personnel, resources, investment methods and compliance policies and procedures essential to performing its duties under the Sub-advisory Agreement and that the nature, overall quality and extent of the services provided by Sub-Adviser to the Fund were satisfactory and reliable.
Performance. The Board considered that while the Sub-Adviser does not approve or make investment decisions for the Fund, it does provide investment recommendations based on its research to the Adviser. The Board considered that the Fund’s investment performance is indicative of the success of the Sub-Adviser’s research and recommendations to the Adviser. The Board recalled its discussions earlier in the Meeting of the Fund’s performance. The Trustees concluded that the overall performance of the Fund was satisfactory and that the Adviser’s continued relationship with the Sub-Adviser could be expected to continue to benefit shareholders.
Fees and Expenses. The Trustees then discussed the fees paid to the Sub-Adviser. The Board reviewed the Sub-Adviser’s fee schedule, noting that the sub-advisory fee at current asset levels is 0.20% of the Fund’s average daily net assets. The Trustees considered the asset-based sub-advisory fee as compared to the quantity of research and reporting generated by the Sub-Adviser and the Sub-Adviser’s general rates for such services, and concluded that, at present asset levels, the Sub-Advisory fees were acceptable in light of the quality of the services the Adviser and, indirectly, the Fund receive from the Sub-Adviser.
Economies of Scale. The Trustees considered whether economies of scale have been achieved with respect to the management of the Fund under the Sub-advisory Agreement and whether there is potential for realization of any further economies of scale. The Trustees considered that the Sub-Adviser has agreed to breakpoints in its fee above certain asset levels beginning with $250 million in assets under management and concluded that this remained a reasonable breakpoint.
Conclusion. Having requested and received such information from the Sub-Adviser as the Trustees believed to be reasonably necessary to evaluate the terms of the Sub-advisory Agreement, and as assisted by the advice of counsel, the Trustees determined that continuation of the Sub-advisory Agreement for an additional one-year term is in the best interests of the Fund and its shareholders.
NOTICE OF PRIVACY POLICY & PRACTICES
PRIVACY notice
Rev. Aug. 2012
| FACTS | WHAT DOES THE TOTAL INCOME+ REAL ESTATE FUND DO WITH YOUR PERSONAL INFORMATION? |
| | |
| Why? | Financial companies choose how they share your personal information. Federal law gives consumers the right to limit some but not all sharing. Federal law also requires us to tell you how we collect, share, and protect your personal information. Please read this notice carefully to understand what we do. |
| | |
| What? | The types of personal information we collect and share depend on the product or service you have with us. This information can include: |
| | |
| | ■ | Social Security number | ■ | Purchase History |
| | | | | |
| | ■ | Assets | ■ | Account Balances |
| | | | | |
| | ■ | Retirement Assets | ■ | Account Transactions |
| | | | | |
| | ■ | Transaction History | ■ | Wire Transfer Instructions |
| | | | | |
| | ■ | Checking Account Information | | |
| | |
| | When you are no longer our customer, we continue to share your information as described in this notice. |
| | |
| How? | All financial companies need to share customers’ personal information to run their everyday business. In the section below, we list the reasons financial companies can share their customers’ personal information; the reasons the Total Income+ Real Estate Fund chooses to share; and whether you can limit this sharing. |
| Reasons we can share your personal information | Does Total
Income+ Real
Estate Fund share? | Can you limit this sharing? |
For our everyday business purposes – such as to process your transactions, maintain your account(s), respond to court orders and legal investigations, or report to credit bureaus | Yes | No |
For our marketing purposes – to offer our products and services to you | No | We don’t share |
| For joint marketing with other financial companies | No | We don’t share |
For our affiliates’ everyday business purposes – information about your transactions and experiences | No | We don’t share |
For our affiliates’ everyday business purposes – information about your creditworthiness | No | We don’t share |
| For nonaffiliates to market to you | No | We don’t share |
| Questions? | Call 1-855-754-7930 |
| Who we are |
Who is providing this notice? | Total Income+ Real Estate Fund |
| What we do |
| How does Total Income+ Real Estate Fund protect my personal information? | To protect your personal information from unauthorized access and use, we use security measures that comply with federal law. These measures include computer safeguards and secured files and buildings. Our service providers are held accountable for adhering to strict policies and procedures to prevent any misuse of your nonpublic personal information. |
| How does Total Income+ Real Estate Fund collect my personal information? | We collect your personal information, for example, when you ■ Open an account ■ Provide account information ■ Give us your contact information ■ Make deposits or withdrawals from your account ■ Make a wire transfer ■ Tell us where to send the money ■ Tells us who receives the money ■ Show your government-issued ID ■ Show your driver’s license We also collect your personal information from other companies. |
| Why can’t I limit all sharing? | Federal law gives you the right to limit only ■ Sharing for affiliates’ everyday business purposes – information about your creditworthiness ■ Affiliates from using your information to market to you ■ Sharing for nonaffiliates to market to you State laws and individual companies may give you additional rights to limit sharing. |
| Definitions |
| Affiliates | Companies related by common ownership or control. They can be financial and nonfinancial companies. ■ Total Income+ Real Estate Fund does not share with our affiliates. |
| Nonaffiliates | Companies not related by common ownership or control. They can be financial and nonfinancial companies ■ Total Income+ Real Estate Fund does not share with nonaffiliates so they can market to you. |
| Joint marketing | A formal agreement between nonaffiliated financial companies that together market financial products or services to you. ■ Total Income+ Real Estate Fund does not jointly market. |
| | | | | | |
| Investment Adviser |
| Bluerock Fund Advisor, LLC |
| 70 East 55th Street |
| New York, NY 10022 |
| |
| Distributor |
| Northern Lights Distributors, LLC |
| 17605 Wright Street |
| Omaha, NE 68130 |
| |
| Legal Counsel |
| Thompson Hine LLP |
| 41 South High Street, Suite 1700 |
| Columbus, OH 43215 |
| |
| Independent Registered Public Accounting Firm |
| BBD, LLP |
| 1835 Market Street, 26th Floor |
| Philadelphia, PA 19103 |
| |
How to Obtain Proxy Voting Information
Information regarding how the Fund votes proxies relating to portfolio securities for the 12 month period ended June 30th as well as a description of the policies and procedures that the Fund used to determine how to vote proxies is available without charge, upon request, by calling 1-888-459-1059 or by referring to the Securities and Exchange Commission’s (“SEC”) website at http://www.sec.gov.
How to Obtain 1st and 3rd Fiscal Quarter Portfolio Holdings
The Fund files its complete schedule of portfolio holdings with the SEC for the first and third quarters of each fiscal year on Form N-Q. Form N-Q is available on the SEC’s website at http://www.sec.gov and may be reviewed and copied at the SEC’s Public Reference Room in Washington, DC (1-800-SEC-0330). The information on Form N-Q is available without charge, upon request, by calling 1-888-459-1059.
Item 2. Code of Ethics.
(a)
As of the end of the period covered by this report, the registrant has adopted a code of ethics that applies to the registrant's principal executive officer, principal financial officer, principal accounting officer or controller, or persons performing similar functions, regardless of whether these individuals are employed by the registrant or a third party.
(b)
For purposes of this item, “code of ethics” means written standards that are reasonably designed to deter wrongdoing and to promote:
(1)
Honest and ethical conduct, including the ethical handling of actual or apparent conflicts of interest between personal and professional relationships;
(2)
Full, fair, accurate, timely, and understandable disclosure in reports and documents that a registrant files with, or submits to, the Commission and in other public communications made by the registrant;
(3)
Compliance with applicable governmental laws, rules, and regulations;
(4)
The prompt internal reporting of violations of the code to an appropriate person or persons identified in the code; and
(5)
Accountability for adherence to the code.
(c)
Amendments: During the period covered by the report, there have not been any amendments to the provisions of the code of ethics.
(d)
Waivers: During the period covered by the report, the registrant has not granted any express or implicit waivers from the provisions of the code of ethics.
(e) The Code of Ethics is not posted on Registrant’ website.
(f) A copy of the Code of Ethics is attached as an exhibit.
Item 3. Audit Committee Financial Expert.
(a) The Registrant’s board of trustees has determined that Romano Tio is an audit committee financial expert, as defined in Item 3 of Form N-CSR. Mr. Tio is independent for purposes of this Item.
Item 4. Principal Accountant Fees and Services.
(a)
Audit Fees
2014 - $20,000
2013 - $17,000
(b)
Audit-Related Fees
2014 - $0
2013 - $0
(c)
Tax Fees
2014 - $3,000
2013 - $3,000
Preparation of Federal & State income tax returns, assistance with calculation of required income, capital gain and excise distributions and preparation of Federal excise tax returns.
(d)
All Other Fees
2014 - $0
2013 - $0
(e)
(1)
Audit Committee’s Pre-Approval Policies
The registrant’s Audit Committee is required to pre-approve all audit services and, when appropriate, any non-audit services (including audit-related, tax and all other services) to the registrant. The registrant’s Audit Committee also is required to pre-approve, when appropriate, any non-audit services (including audit-related, tax and all other services) to its adviser, or any entity controlling, controlled by or under common control with the adviser that provides ongoing services to the registrant, to the extent that the services may be determined to have an impact on the operations or financial reporting of the registrant. Services are reviewed on an engagement by engagement basis by the Audit Committee.
(2)
Percentages of Services Approved by the Audit Committee
2013
2014
Audit-Related Fees:
100.00% 100.00%
Tax Fees:
0.00%
0.00%
All Other Fees:
0.00%
0.00%
(f)
During the audit of registrant's financial statements for the most recent fiscal year, less than 50 percent of the hours expended on the principal accountant's engagement were attributed to work performed by persons other than the principal accountant's full-time, permanent employees.
(g)
The aggregate non-audit fees billed by the registrant's accountant for services rendered to the registrant, and rendered to the registrant's investment adviser (not including any sub-adviser whose role is primarily portfolio management and is subcontracted with or overseen by another investment adviser), and any entity controlling, controlled by, or under common control with the adviser that provides ongoing services to the registrant:
2014 - $0
2013 - $0
(h)
The registrant's audit committee has considered whether the provision of non-audit services to the registrant's investment adviser (not including any sub-adviser whose role is primarily portfolio management and is subcontracted with or overseen by another investment adviser), and any entity controlling, controlled by, or under common control with the investment adviser that provides ongoing services to the registrant, that were not pre-approved pursuant to paragraph (c)(7)(ii) of Rule 2-01 of Regulation S-X, is compatible with maintaining the principal accountant's independence.
Item 5. Audit Committee of Listed Companies. Not applicable
Item 6. Schedule of Investments. Schedule of investments in securities of unaffiliated issuers is included under Item 1.
Item 7. Disclosure of Proxy Voting Policies and Procedures for Closed-End Funds.
See attached Exhibit A for the Adviser’s proxy voting policies and procedures.
Item 8. Portfolio Managers of Closed-End Management Investment Companies.
Effective as of October 31, 2013, the Fund’s Co-Portfolio Managers oversee the day to day investment operations of the Fund.
Jordan B. Ruddy -- Mr. Ruddy has served as a member of the Investment Committee and as Chief Operating Officer of the Advisor since the inception of the Advisor in 2012. Mr. Ruddy brings over 25 years of institutional real estate investment experience working with some of leading public and private firms in the industry. Mr. Ruddy also serves as the Chief Operating Officer of the Advisor’s affiliate, Bluerock Real Estate, L.L.C., which he joined in 2002. Previously, Mr. Ruddy served as a real estate investment banker at Banc of America Securities LLC, and at Smith Barney Inc. and at JP Morgan Chase (previously the Chase Manhattan Bank), and as Vice President of Amerimar Enterprises, a real estate company specializing in value-added investments nationwide. Mr. Ruddy received an M.B.A. degree in Finance and Real Estate in 1995 from The Wharton School of the University of Pennsylvania, and a B.S. degree with high honors in Economics in 1986 from the London School of Economics.
Adam Lotterman -- Mr. Lotterman is a co-founder of the Advisor, and has served as Associate Portfolio Manager for the Fund, and as Associate Economist of the Advisor and a key member of its investment decision making team since inception in 2012. From 2010 to 2012, Mr. Lotterman was an Adjunct Professor at Nova Southeastern University, where he taught Real Estate Market Analysis in the Masters of Real Estate Development program. From 2011 to 2012, Mr. Lotterman was Vice President, New Business Development for Forman Capital LLC, a private commercial real estate firm. From 2010 to 2011, Mr. Lotterman worked with Bayview Asset Management where he led a team responsible for the valuation and acquisition of loan portfolios ranging in size from $100 million to $40 billion, as well as analysis and formulation of workout strategies on complex non-performing loans. Previously, Mr. Lotterman served as the Senior Analyst for Goodkin Consulting, where he developed extensive experience in real estate consulting, research and analysis on a national level, and with MMC Research, where he produced quarterly economic briefs, leading indicator analyses, demand analyses for acquisitions, market and sub-market analyses. Mr. Lotterman received an M.S. in International Real Estate in 2006 from Florida International University, where he graduated first in class, and a B.S. Degree in microbiology with a minor in chemistry in 1997 from the University of Florida.
Effective as of December 4, 2013, the Fund’s Co-Portfolio Managers are supported by an Assistant Portfolio Manager, Steven P. Siptrott.
Steven P. Siptrott - Mr. Siptrott has served as a Vice President of the Advisor’s affiliate, Bluerock Real Estate, L.L.C. since 2012. Previously, Mr. Siptrott was an Associate for Arsenal Real Estate Partners, a real estate investment management firm serving a variety of institutional clients that include pension plans, foundations, endowments from August 2011 to October 2012, and an Associate with The Townsend Group, one of the world’s largest institutional investment consultants dedicated to the real estate sector, providing investment services to many of the world’s largest and most sophisticated pension funds, endowments and Taft-Hartley plans from May 2010 to August 2011. Mr. Siptrott began his career as an Analyst with LaSalle Investment Management, the private equity investment arm of Jones Lang LaSalle, in 2007, where he was responsible for the asset management and portfolio management of a $5+ billion separate account. Mr. Siptrott received a B.A. in Economics in 2007 from the University of Chicago.
As of November 30, 2014, the Co-Portfolio Managers were responsible for the management of the following types of accounts in addition to the Fund:
Jordan Ruddy
| | | | |
Other Accounts By Type | Total Number of Accounts by Account Type | Total Assets By Account Type | Number of Accounts by Type Subject to a Performance Fee | Total Assets By Account Type Subject to a Performance Fee |
Registered Investment Companies | 0 | $0 | 0 | $0 |
Other Pooled Investment Vehicles | 0 | $0 | 0 | $0 |
Other Accounts | 0 | $0 | 0 | $0 |
Adam Lotterman
| | | | |
Other Accounts By Type | Total Number of Accounts by Account Type | Total Assets By Account Type | Number of Accounts by Type Subject to a Performance Fee | Total Assets By Account Type Subject to a Performance Fee |
Registered Investment Companies | 0 | $0 | 0 | $0 |
Other Pooled Investment Vehicles | 0 | $0 | 0 | $0 |
Other Accounts | 0 | $0 | 0 | $0 |
Because the Co-Portfolio Managers may manage assets for other pooled investment vehicles and/or other accounts (including institutional clients, pension plans and certain high net worth individuals) (collectively "Client Accounts"), or may be affiliated with such Client Accounts, there may be an incentive to favor one Client Account over another, resulting in conflicts of interest. For example, the Advisor may, directly or indirectly, receive fees from Client Accounts that are higher than the fee it receives from the Fund, or it may, directly or indirectly, receive a performance-based fee on a Client Account. In those instances, a portfolio manager may have an incentive to not favor the Fund over the Client Accounts. The Advisor has adopted trade allocation and other policies and procedures that it believes are reasonably designed to address these and other conflicts of interest. As of November 30, 2013 the Co-Portfolio Managers owned no Fund shares.
Mr. Ruddy does not receive compensation from the Advisor, but is compensated for his duties with an affiliate of the Advisor. Mr. Lotterman receives from the Advisor a salary and discretionary bonus and a share of the profits, if any, through his ownership share in the Advisor.
Item 9. Purchases of Equity Securities by Closed-End Funds. Not applicable
Item 10. Submission of Matters to a Vote of Security Holders. None
Item 11. Controls and Procedures.
(a)
Based on an evaluation of the Registrant’s disclosure controls and procedures as of a date within 90 days of filing date of this Form N-CSR, the principal executive officer and principal financial officer of the Registrant have concluded that the disclosure controls and procedures of the Registrant are reasonably designed to ensure that the information required in filings on Form N-CSR is recorded, processed, summarized, and reported by the filing date, including that information required to be disclosed is accumulated and communicated to the Registrant’s management, including the Registrant’s principal executive officer and principal financial officer, as appropriate to allow timely decisions regarding required disclosure.
(b)
There were no significant changes in the Registrant’s internal control over financial reporting that occurred during the Registrant’s last fiscal half-year that have materially affected, or are reasonably likely to materially affect, the Registrant’s internal control over financial reporting.
Item 12. Exhibits.
(a)(1)
Code of Ethics filed herewith.
(a)(2)
Certifications required by Section 302 of the Sarbanes-Oxley Act of 2002 (and Item 11(a)(2) of Form N-CSR) are filed herewith.
(a)(3)
Not applicable.
(b)
Certifications required by Section 906 of the Sarbanes-Oxley Act of 2002 (and Item 11(b) of Form N-CSR) are filed herewith.
SIGNATURES
Pursuant to the requirements of the Securities Exchange Act of 1934 and the Investment Company Act of 1940, the registrant has duly caused this report to be signed on its behalf by the undersigned, thereunto duly authorized.
(Registrant) Total Income+ Real Estate Fund
By (Signature and Title)
/s/ Jordan Ruddy
Jordan B. Ruddy, President
Date
12/9/14
Pursuant to the requirements of the Securities Exchange Act of 1934 and the Investment Company Act of 1940, this report has been signed below by the following persons on behalf of the registrant and in the capacities and on the dates indicated.
By (Signature and Title)
/s/ Jordan Ruddy
Jordan B. Ruddy, President
Date
12/9/14
By (Signature and Title)
/s/ Jerry Novack
Jerry Novack, Treasurer
Date
12/10/14
APPENDIX A
BLUEROCK FUND ADVISOR, LLC
PROXY VOTING POLICIES AND PROCEDURES
PROXY VOTING POLICY
Background: Pursuant to Rule 206(4)-6 and Rule 204-2 under the Advisers Act, it is a fraudulent, deceptive, or manipulative act, practice or course of business, within the meaning of Section 206(4) of the Advisers Act, for an investment advisor to exercise voting authority with respect to client securities, unless (i) the advisor has adopted and implemented written policies and procedures that are reasonably designed to ensure that the advisor votes proxies in the best interests of its clients, (ii) the advisor describes its proxy voting procedures to its clients and provides copies on request, and (iii) the advisor discloses to clients how they may obtain information on how the advisor voted their proxies.
Policy: The Advisor will vote proxies vote proxies on behalf of its individual clients. The Advisor, when acting on behalf of the Fund, must comply with the following voting restrictions unless it is determined that the Fund is not relying on Section 12(d)(1)(F) and or Rule 12d1-3:
·
WHEN THE FUND EXERCISES VOTING RIGHTS, BY PROXY OR OTHERWISE, WITH RESPECT TO ANY INVESTMENT COMPANY OWNED BY THE FUND, THE FUND WILL EITHER:
O
SEEK INSTRUCTION FROM THE FUND’S SHAREHOLDERS WITH REGARD TO THE VOTING OF ALL PROXIES AND VOTE IN ACCORDANCE WITH SUCH INSTRUCTIONS, OR
O
VOTE THE SHARES HELD BY THE FUND IN THE SAME PROPORTION AS THE VOTE OF ALL OTHER HOLDERS OF SUCH SECURITY.
In order to fulfill its responsibilities under the Advisers Act, the Advisor has adopted the following policies and procedures for proxy voting with regard to companies in the investment portfolio of the Fund(s).
Voting Proxies
1.
All proxies sent to clients that are actually received by the Advisor (to vote on behalf of the client) will be provided to the Operations Unit.
2.
The Operations Unit will generally adhere to the following procedures (subject to limited exception):
(a)
A written record of each proxy received by the Advisor (on behalf of its clients) will be kept in the Advisor’s files;
(b)
The Operations Unit will determine which of the Advisor holds the security to which the proxy relates;
(c)
Prior to voting any proxies, the Operations Unit will determine if there are any conflicts of interest related to the proxy in question in accordance with the general guidelines set forth below. If a conflict is identified, the Operations Unit will then make a determination (which may be in consultation with outside legal counsel) as to whether the conflict is material.
(e)
If no material conflict is identified pursuant to these procedures, the Operations Unit will vote the proxy in accordance with the guidelines set forth below. The Operations Unit will deliver the proxy in accordance with instructions related to such proxy in a timely and appropriate manner.
Conflicts of Interest
1.
As stated above, in evaluating how to vote a proxy, the Operations Unit will first determine whether there is a conflict of interest related to the proxy in question between Advisor and its Advisory Clients. This examination will include (but will not be limited to) an evaluation of whether the Advisor (or any affiliate of the Advisor) has any relationship with the company (or an affiliate of the company) to which the proxy relates outside of an investment in such company by a client of the Advisor.
2
If a conflict is identified and deemed “material” by the Operations Unit, the Advisor will determine whether voting in accordance with the proxy voting guidelines outlined below is in the best interests of the client (which may include utilizing an independent third party to vote such proxies).
3
With respect to material conflicts, the Advisor will determine whether it is appropriate to disclose the conflict to affected clients give such clients the opportunity to vote the proxies in question themselves. However, with respect to ERISA clients whose advisory contract reserves the right to vote proxies when the Advisor has determined that a material conflict exists that affects its best judgment as a fiduciary to the ERISA client, the Advisor will:
(a)
Give the ERISA client the opportunity to vote the proxies in question themselves; or
(b)
Follow designated special proxy voting procedures related to voting proxies pursuant to the terms of the investment management agreement with such ERISA clients (if any).
Proxy Voting Guidelines
See Attached
Disclosure of Procedures
A summary of above these proxy voting procedures will be included in Part II of the Advisor’s Form ADV and will be updated whenever these policies and procedures are updated. Clients will be provided with contact information as to how they can obtain information about: (a) the Advisor’s proxy voting procedures (i.e., a copy of these procedures); and (b) how the Advisor voted proxies that are relevant to the affected client.
Record-keeping Requirements
The Operations Unit will be responsible for maintaining files relating to the Advisor’s proxy voting procedures. Records will be maintained and preserved for five years from the end of the fiscal year during which the last entry was made on a record, with records for the first two years kept in the offices of the Advisor. Records of the following will be included in the files:
1.
Copies of these proxy voting policies and procedures, and any amendments thereto;
2.
A copy of each proxy statement that the Advisor actually received; provided, however, that the Advisor may rely on obtaining a copy of proxy statements from the SEC’s EDGAR system for those proxy statements that are so available;
3.
A record of each vote that the Advisor casts;
4.
A copy of any document that the Advisor created that was material to making a decision how to vote the proxies, or memorializes that decision (if any); and
5.
A copy of each written request for information on how the Advisor voted such client’s proxies and a copy of any written response to any request for information on how the Advisor voted proxies on behalf of clients.