united states
securities and exchange commission
washington, d.c. 20549
form n-csr
certified shareholder report of registered management
investment companies
Investment Company Act file number 811-22710
Total Income+ Real Estate Fund
(Exact name of registrant as specified in charter)
712 Fifth Avenue, 9th floor, New York NY 10019
(Name and address of agent for service)
Registrant's telephone number, including area code: 1- 888-459-1059
Date of fiscal year end: 9/30
Date of reporting period: 9/30/16
Item 1. Reports to Stockholders.
| | | |
| | | |
| | | |
| | | |
| | | |
| |  | |
| | | |
| | | |
| | | |
| | | |
| | | |
| | | |
| | | |
| | | |
| | | |
| | Annual Report | |
| | September 30, 2016 | |
| | | |
| | | |
| | | |
| | | |
| | | |
| | | |
| | | |
| | | |
| | | |
| | | |
| | | |
| | | |
| | | |
| | Investor Information: 1-888-459-1059 | |
| | | |
| | | |
| | | |
| | | |
| | | |
| | | |
| | | |
| | | |
| | | |
| | | |
| | | |
| | | |
| | | |
| | | |
| | This report and the financial statements contained herein are submitted for the general information of shareholders and are not authorized for distribution to prospective investors unless preceded or accompanied by an effective prospectus. Nothing herein contained is to be considered an offer of sale or solicitation of an offer to buy shares of the Total Income+ Real Estate Fund. Such offering is made only by prospectus, which includes details as to offering price and other material information. | |
| | | |
| | Distributed by Northern Lights Distributors, LLC | |
| | Member FINRA | |
| | | |
| | | |
| | | |
 | |  |
| | | |
| | | 2016 ANNUAL REPORT: (4Q 2015-3Q 2016) |
| | | Letter from the TI+ Portfolio Managers |
To Our Valued Shareholders:
We are pleased to report that TI+ has surpassed $500 million in assets under management in October 2016. We believe this validates our 4+ year track record of income, low volatility, capital appreciation, and low correlation to the broader markets.
Specifically, TI+ has paid 15 consecutive distributions, has experienced 85% less volatility than leading stock and REIT indexes since inception, and has performed similar to the public REIT market since inception, with a minimal 1.29% maximum drawdown and with approximately ½ the correlation to the S&P 500 relative to the public REIT market.
The low volatility combined with the Fund’s performance allows TI+ to have a risk-adjusted return 4 and 5 times higher than the S&P 500 and the MSCI US REIT Index, respectively. This indicates that for each unit of volatility, a TI+ investor has generated four to five times the return produced by the index.
By investing in low leverage, lower volatility, institutional real estate investments, in keeping with our investment thesis, TI+ has been able to produce stable cash flows that are not highly correlated to daily stock market fiuctuations.
| + | DISTRIBUTIONS1: TI+ has paid fifteen consecutive quarterly distributions beginning in the first full quarter of Fund operations (first quarter 2013). The latest distribution of $0.3834 per share is equivalent to a 5.25% annualized distribution rate on the 9/29/2016 ex-dividend date NAV of $29.21 per share. This distribution also represents a 6.13% distribution rate on the inception NAV of $25.00 per share. |
| + | ASSETS UNDER MANAGEMENT: As of October 18, 2016, TI+ assets exceeded $500 million. |
footnotes:
| 1 | The Fund’s distribution policy is to make quarterly distributions to shareholders. The level of quarterly distributions (including any return of capital) is not fixed. However, this distribution policy is subject to change. Shareholders should not assume that the source of a distribution from the Fund is net profit. A portion of the distributions consist of a return of capital based on the character of the distributions received from the underlying holdings, primarily Real Estate Investment Trusts. The final determination of the source and tax characteristics of all distributions will be made after the end of the year. The Fund’s distribution amounts were calculated based on income received from underlying investments including capital gains and return of capital realized from the disposition of such investments. |
This is an actively managed dynamic portfolio. There is no guarantee that any investment (or this investment) will achieve its objectives or goals, pay dividends and/or capital gains, generate positive returns, or avoid losses. Prior performance is not a guarantee of future results.
CORPORATE HEADQUARTERS | 712 FIFTH AVENUE | 9TH FLOOR | NEW YORK, NY 10019 | 877.826.BLUE (2583) | WWW.BLUEROCKRE.COM

| 2016 ANNUAL REPORT (10/1/2015 - 9/30/2016) | TOTAL INCOME+ REAL ESTATE FUND |  |
PERFORMANCE
From inception (10/22/2012) through 9/30/2016, TI+ experienced a total return of 38.27%, or 8.57% annualized. The Fund was able to accomplish this primarily through investments in unique, institutional private equity real estate (iPERE) vehicles. These investments with best-in-class real estate, supplemented by select public real estate securities, have generated attractive returns through income and capital appreciation.
| | Performance as of 9.30.2016 |
| | Year-to-Date2 | One Year | Two Years | Three Years | Since Inception3 |
| TI+ Fund- Class A | 4.00% | 7.51% | 7.32% | 7.44% | 8.57% |
TI+ Fund- Class A1
with Max Sales Charge | - 1.97% | 1.31% | 4.19% | 5.34% | 6.95% |
| 1 The maximum sales charge for the Fund is 5.75%. Investors may be eligible for a reduction in sales charges. | 2 | Performance for periods less than one year is not annualized. |
| | 3 | Inception date of the Fund is October 22, 2012. |
| | | |
INCOME
TI+ Fund offers attractive cash distribution potential.
TI+ Fund Historical Annualized Distribution Rate*
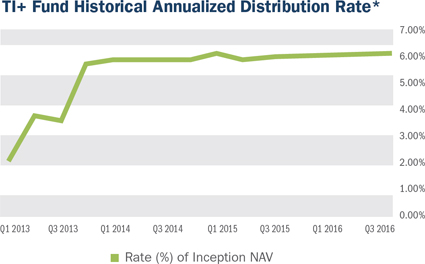
| * | The Fund’s distribution policy is to make quarterly distributions to shareholders. The Fund’s inception date is 10/22/12; however, its first distribution was made 3/27/13. The level of quarterly distributions (including any return of capital) is not fixed. However, this distribution policy is subject to change. The Fund’s distribution amounts were calculated based on the ordinary income received from the underlying investments, including short-term capital gains realized from the disposition of such investments. Shareholders should not assume that the source of a distribution from the Fund is net profit. |
A portion of the distributions consist of a return of capital based on the character of the distributions received from the underlying holdings, primarily Real Estate Investment Trusts. The final determination of the source and tax characteristics of all distributions will be made after the end of the year. Shareholders should note that return of capital will reduce the tax basis of their shares and potentially increase the taxable gain, if any, upon disposition of their shares. There is no assurance that the Company will continue to declare distributions or that they will continue at these rates.
Inception date of the Fund is October 22, 2012. The total annual fund operating expense ratio, gross of any fee waivers or expense reimbursements, is 2.46% for Class A shares (per the May 16, 2016 prospectus).
The performance data quoted herein represents past performance. Current performance may be lower or higher than the performance data quoted above. Investment return and principal value will fluctuate, so that shares, when redeemed, may be worth more or less than their original cost. The Fund’s investment advisor has contractually agreed to reduce its fees and/or absorb expenses of the fund, at least until February 1, 2017, to ensure that the net annual fund Class A operating expenses will not exceed 1.91% for TIPRX, subject to possible recoupment from the Fund.
Please review the Fund’s Prospectus for more detail on the expense waiver. Results shown reflect the full fee waiver, without which the results could have been lower. A fund’s performance, especially for very short periods of time, should not be the sole factor in making your investment decisions. Total returns are calculated using SEC form N-1A instructions and reflect all fees and charges.
Past performance is no guarantee of future results
| 2016 ANNUAL REPORT (10/1/2015 - 9/30/2016) | TOTAL INCOME+ REAL ESTATE FUND | |
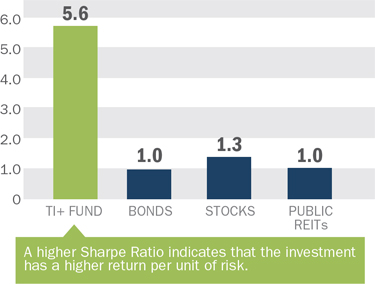
HIGHER RISK-ADJUSTED RETURNS
TI+ Fund has delivered higher risk-adjusted returns than stocks, bonds, or public REITs since its inception, evidenced by its Sharpe Ratio (a risk adjusted performance measure that determines unit of return per unit of risk) of more than four times the nearest competitive asset class.
Higher Risk-Adjusted Return Measured by Sharpe Ratio
(Since inception through 9/30/2016)
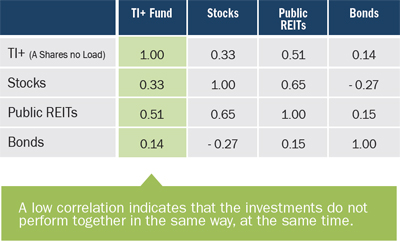
LOWER CORRELATION
TI+ Fund has exhibited lower correlation compared to other asset classes since its inception.
TI+ Fund Correlation vs. Other Asset Classes
(Since inception through 9/30/2016)
| LOWER VOLATILITY |
| |
| TI+ Fund has experienced lower daily volatility (as measured by standard deviation) than competing asset classes since its inception, with over 85% less volatility than stocks and public REITs. |
| |
| Lower Volatility Measured by Standard Deviation |
| (Since inception through 9/30/2016) |
| |
 |
| |
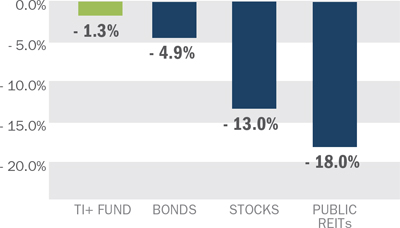
| LOW MAXIMUM DRAWDOWN |
| |
| Maximum drawdown is the maximum decline a security experiences prior to reaching its previous peak. |
| |
| Maximum Drawdown vs. Other Asset Classes |
| (Since inception through 9/30/2016) |
| |
 |
| |
Page Sources: Morningstar Direct
TI+ Fund: A-Shares, no load | Stocks: S&P 500 Total Return | REITs: MSCI U.S. REIT Index | Bonds: Barclays U.S. Aggregate Bond Index
Please see page 8 for a description of the risks and comparisons of the investment indexes selected.
| * | Percentage of days in period in which the index/investment has increased or stayed the same as the prior days’ closing price. |
Past performance is no guarantee of future results
| 2016 ANNUAL REPORT (10/1/2015 - 9/30/2016) | TOTAL INCOME+ REAL ESTATE FUND | |
| | » Fund Sub-Advisor |
| | |
| |  |
| | |
| | Mercer Investment Management, Inc., a sub-advisor to the Fund, has a 40+ year track record as a leading advisor to the world’s most sophisticated institutional investors, including endowments, pension funds, sovereign wealth funds and family offices. Mercer has more than 3,300 clients worldwide and over $9.0 trillion in assets under advisement. |
| | |
| | Mercer’s analysis incorporates a comprehensive, disciplined process beginning with the evaluation of over 5,400 investment managers and 26,200 individual investments across all sectors from which it selects a strategic combination of ‘best in class’ institutional real estate managers and investments for TI+. |
| | |
LOOKING AHEAD
The U.S. economy has been characterized by moderate growth, low inflation, and low interest rates for the last several years, a mix of conditions that have proven favorable to commercial real estate pricing and fundamentals. The upcoming Presidential inauguration introduces uncertainty for the financial markets as participants weigh the macro effects of potential new policies. A sharp rise in interest rates since the election, especially the 10-year U.S. Treasury rate, has not gone unnoticed; although this needs to be placed in context, as the 10-year Treasury was still trading below levels where it was last December. These, among other market factors, have impacted the public REIT market, increasing volatility, while private market, institutional property pricing remains mostly unchanged.
A review of the determinants and fundamentals of commercial real estate values remains favorable. Institutional real estate has experienced above-trend returns during this latest expansion cycle. As this phase matures, the appreciation component gives way to primarily income returns, historically the source of about 70% of the total return. As illustrated in the charts to the right, income drivers are strong with 5%+ annual net operating income (NOI) growth throughout all sectors and vacancy rates near the bottom of their 25-year averages. Favorable demographic trends combined with limited new supply are driving this NOI growth. With new supply forecast to remain low compared to historical trends and strong demand from tenants, we expect to see favorable NOI growth continue. In constructing the portfolio, we have been focused on investing where NOI growth is robust and insulated from downside risk.

Source: J.P. Morgan Guide to the Markets, Q2 2016
The Millennial cohort is forming households at a rapid rate and is largely choosing to rent, creating unprecedented demand for apartments, particularly highly amenitized, urban in-fill communities. E-commerce sales have been accelerating, creating a need for timely deliveries and is driving industrial demand, especially for those properties that give retailers access to the last mile of distribution. CBD office properties have been experiencing strong demand and we are encouraged to see the retail sector continue to recover.
| 2016 ANNUAL REPORT (10/1/2015 - 9/30/2016) | TOTAL INCOME+ REAL ESTATE FUND | |
Property market fundamentals are solid and capital markets have been quite restrained, helping to inhibit possible unhealthy and unsustainable price appreciation. Cap rate spread, the spread between the average cap rate and the 10-year U.S. Treasury yield, remains comfortably above its long term average, a historical indicator of above-trend returns in coming years. Loan markets also remain disciplined with tighter lending standards and higher debt service coverage requirements, a marked change from the pre-Recession years.
We are cognizant of the potential effects that changing governmental policies may have on commercial
real estate values. Additionally, we understand long term value and returns are driven by property sector fundamentals, including job growth, demographic demand drivers, high occupancy rates, and rising rents. To this end, we are focused on constructing an underlying portfolio of high-quality, diversified institutional real estate that continues to benefit from the aforementioned fundamentals. Thus, we remain optimistic that TI+ will continue to perform well on a risk-adjusted basis in the next fiscal year. We thank you for the trust and confidence represented by your investment in the Total Income+ Real Estate Fund.
Sincerely,

| Jordan Ruddy | Adam Lotterman |
| Portfolio Co-Managers |
| Total Income+ Real Estate Fund |
| FUND HOLDINGS | 2016 ANNUAL REPORT (10/1/2015 - 9/30/2016) | TOTAL INCOME+ REAL ESTATE FUND | |
As of 10/06/16, the Gross Asset Value of the underlying real estate in the securities in which TI+ is invested is over $134 billion, comprising nearly 2,300 properties across the United States.*
| | | | Portfolio | | Gross Asset | | Number of | | Typical Minimum | | Average Investment | | Inception |
| | | | | | Value ($MM) | | Investments | | Investment Required | | Size ($MM) | | Year |
| | PRIVATE EQUITY REAL ESTATE (Target of 15-20 Select Managers) |
| ■ | 14.1% | | Clarion Lion Properties Fund | | $ | 9,251 | | | 124 | | | $ | 5,000,000 | | | $75 | | 2000 |
| ■ | 11.6% | | Morgan Stanley Prime Property Fund | | $ | 20,181 | | | 341 | | | $ | 5,000,000 | | | $59 | | 1973 |
| ■ | 8.1% | | Blackstone Property Partners | | $ | 7,000 | | | 56 | | | $ | 10,000,000 | | | $125 | | 2014 |
| ■ | 7.0% | | Stockbridge Smart Markets Fund | | $ | 1,857 | | | 50 | | | $ | 5,000,000 | | | $37 | | 2011 |
| ■ | 5.5% | | Prudential PRISA I | | $ | 22,900 | | | 273 | | | $ | 5,000,000 | | | $84 | | 1970 |
| ■ | 5.4% | | Bentall Kennedy MEPT Edgemoor | | $ | 8,144 | | | 87 | | | $ | 5,000,000 | | | $94 | | 2010 |
| ■ | 4.4% | | AEW Core Property Trust | | $ | 7,869 | | | 145 | | | $ | 5,000,000 | | | $31 | | 2007 |
| ■ | 4.4% | | Prologis Targeted U.S. Logistics Fund | | $ | 5,312 | | | 172 | | | $ | 5,000,000 | | | $54 | | 2004 |
| ■ | 4.3% | | Invesco Core Real Estate | | $ | 11,100 | | | 93 | | | $ | 5,000,000 | | | $119 | | 2004 |
| ■ | 4.2% | | JP Morgan US Real Estate Growth & Income Fund | | $ | 4,124 | | | 86 | | | $ | 10,000,000 | | | $48 | | 2002 |
| ■ | 4.2% | | RREEF America REIT II | | $ | 12,243 | | | 109 | | | $ | 5,000,000 | | | $112 | | 1998 |
| ■ | 3.6% | | Blackrock Granite Property Fund | | $ | 2,600 | | | 41 | | | $ | 1,000,000 | | | $63 | | 1981 |
| ■ | 3.6% | | Sentinel Real Estate Fund | | $ | 1,420 | | | 25 | | | $ | 250,000 | | | $57 | | 1976 |
| ■ | 3.5% | | Principal Enhanced Property Fund | | $ | 2,215 | | | 39 | | | $ | 5,000,000 | | | $57 | | 2004 |
| ■ | 3.3% | | UBS Trumbull Property Growth & Income | | $ | 816 | | | 22 | | | $ | 5,000,000 | | | $37 | | 2006 |
| ■ | 2.8% | | Heitman America REIT LP | | $ | 8,720 | | | 81 | | | $ | 5,000,000 | | | $108 | | 2007 |
| ■ | 2.7% | | Clarion Lion Industrial Trust | | $ | 7,961 | | | 562 | | | $ | 2,500,000 | | | $14 | | 2002 |
| ■ | 1.4% | | Stockbridge Value Fund II | | $ | 529 | | | 19 | | | $ | 5,000,000 | | | $28 | | 2014 |
| | Totals / Averages | | $ | 134,000 | | | 2,325 | | | $ | 88,750,000 | | | $58 | | 1999 |
| | PUBLIC REAL ESTATE SECURITIES (Target of 50-100 Real Estate Securities) |
| ■ | 2.5% | | REIT Common & Preferred Stock | | | | | | | | | | | | | | | |
| GEOGRAPHIC DIVERSIFICATION | | | SECTOR DIVERSIFICATION |
| | | | |
| The regions and allocations presented represent the Funds’ institutional fund investments as of the date herein, but is subject to change at any time. | | | The sector diversification presented above represents examples of how the Funds’ institutional fund investments are allocated as of the date herein, but is subject to change at any time. |
| | | | |
 | | |  |
| | | | |
| 2,300+ Properties | | | |
Portfolio holdings are subject to change at any time and should not be considered investment advice. Data as of Q2 2016 based on allocations by the Fund on 10/4/2016. Diversification does not ensure profit. The organizations referenced above are not invested in Bluerock or the Total Income+ Real Estate Fund, and they may not be invested in the funds in which the Total Income+ Real Estate Fund invests.
| 2016 ANNUAL REPORT (10/1/2015 - 9/30/2016) | TOTAL INCOME+ REAL ESTATE FUND | |
HIGHLIGHTED ASSETS
The properties pictured below are currently owned by the underlying third-party private equity real estate securities described herein. Each of these securities has been selected as an investment for TI+ Fund’s portfolio.

Active Portfolio; subject to change.
| 2016 ANNUAL REPORT (10/1/2015 - 9/30/2016) | TOTAL INCOME+ REAL ESTATE FUND | |
DEFINITIONS
Barclays U.S. Aggregate Bond Index: The Barclays U.S. Aggregate Bond Index measures the performance of the U.S. investment grade bond market. The index invests in a wide spectrum of public, investment-grade, taxable, fixed income securities in the United States - including government, corporate, and international dollar-denominated bonds, as well as mortgage-backed and asset-backed securities, all with maturities of more than 1 year. Risks include rising interest rates, credit quality of the issuers and general economic conditions.
Standard Deviation: The standard deviation of the daily percentage change in an investment. Standard deviation shows how much variation from the average exists with a larger number indicating the data points are more spread out over a larger range of values.
MSCI U.S. REIT Index: A free float-adjusted market capitalization weighted index that is comprised of equity REITs that are included in the MSCI US Investable Market 2500 Index, with the exception of specialty equity REITs that do not generate a majority of their revenue and income from real estate rental and leasing operations. The index represents approximately 85% of the US REIT universe. (www.msci.com).
Sharpe Ratio: Measurement of the risk-adjusted performance. The annualized Sharpe ratio is calculated by subtracting the annualized risk-free rate - (3-month Treasury Bill) - from the annualized rate of return for a portfolio and dividing the result by the standard deviation of the portfolio returns.
S&P 500: An index of 500 stocks chosen for market size, liquidity and industry grouping, among other factors. The S&P 500 is designed to be a leading indicator of U.S. equities and is meant to reflect the risk/ return characteristics of the large cap universe. (Investopedia).
You cannot invest directly in an index. Benchmark performance should not be considered reflective of Fund performance.

| Total Income+ Real Estate Fund |
| Portfolio Review (Unaudited) |
| Since Inception through September 30, 2016* |
| |
| Comparison of the Change in Value of a $10,000 Investment |
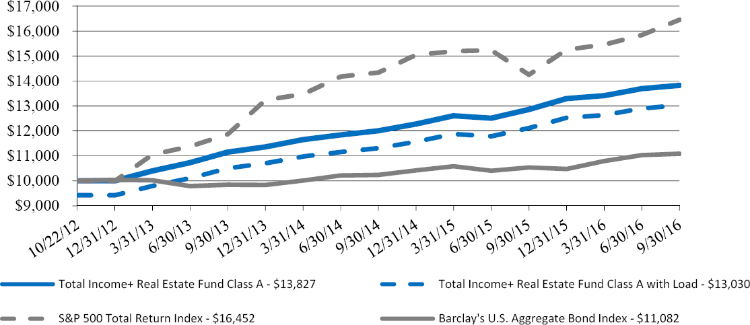
The Fund’s performance figures for the year ended September 30, 2016, compared to its benchmarks:
| | | | | Since Inception | Since Inception Class C |
| | One Year | Two Years | Three Years | Class A * | and Class I ** |
| Total Income+ Real Estate | | | | | |
| Fund: | | | | | |
| Class A | | | | | |
| Without Load | 7.51% | 7.32% | 7.44% | 8.57% | — |
| With Load + | 1.31% | 4.19% | 5.34% | 6.95% | — |
| Class C | 6.71% | 6.52% | N/A | — | 6.31% |
| Class I | 7.79% | 7.69% | N/A | — | 7.45% |
| S&P 500 Total Return Index | 15.43% | 7.11% | 11.16% | 13.47% | 8.01% |
| Barclays U.S. Aggregate Bond Index | 5.19% | 4.06% | 4.03% | 2.64% | 4.19% |
| * | Class A commenced operations October 22, 2012. |
| ** | Class C and Class I commenced operations April 1, 2014. |
| + | Adjusted for initial maximum sales charge of 5.75%. |
The S&P 500 Total Return Index is an unmanaged market capitalization-weighted index which is comprised of 500 of the largest U.S. domiciled companies and includes the reinvestment of all dividends. Investors cannot invest directly in an index or benchmark.
The Barclays U.S. Aggregate Bond Index is an unmanaged index which represents the U.S. investment-grade fixed-rate bond market (including government and corporate securities, mortgage pass-through securities and asset-backed securities). Investors cannot invest directly in an index or benchmark.
The performance data quoted is historical. Past performance is no guarantee of future results. The investment return and principal value of an investment will fluctuate. An investor’s shares, when redeemed, may be worth more or less than the original cost. Total return is calculated assuming reinvestment of all dividends and distributions. Total returns would have been lower had the Advisor not waived its fees and reimbursed a portion of the Fund’s expenses. Returns greater than one year are annualized. The Fund’s investment adviser has contractually agreed to reduce its fees and/or absorb expenses of the Fund, at least until February 1, 2017, to ensure that the net annual fund operating expenses and acquired fund fees and expenses (excluding taxes, interest, brokerage and extraordinary expenses) will not exceed 1.91%, 2.66% and 1.66%, respectively for Class A, Class C and Class I shares. The Fund has agreed to repay the Advisor in the amount of any fees the Advisor previously waived and or Fund expenses reimbursed, subject to the limitations that: (1) the reimbursement will be made only for fees and expenses incurred not more than three years from the end of the fiscal year in which they were incurred; (2) the reimbursement may not be made if it would cause the Expense Limitation then in effect or in effect at time of waiver to be exceeded; and (3) the reimbursement is approved by the Fund’s Board of Trustees.
| Total Income+ Real Estate Fund |
| Portfolio Review (Unaudited) (Continued) |
| Since Inception through September 30, 2016* |
The Fund’s total gross annual operating expenses, including the expenses of underlying funds and before any fee waiver, are 2.46%, 3.25%, and 2.24% for Class A, Class C and Class I, respectively, per the May 16, 2016 Class A and Class C share prospectus and the February 1, 2016 prospectus with respect to Class I shares. Class A shares are subject to a maximum sales charge imposed on purchases of 5.75% and Class C shares are subject to an early withdrawal charge of 1.00% if redeemed less than 365 days after the purchase. The above performance figures do not reflect the deduction of taxes that a shareholder would have to pay on Fund distributions or the redemption of the Fund shares. For performance information current to the most recent month-end, please call 1-888-459-1059.
| Portfolio Composition as of September 30, 2016 (Unaudited) |
| | | | |
| | | Percent of Net | |
| | | Assets | |
| Private Equity Real Estate Securities | | | 83.14 | % |
| Short-Term Investments | | | 13.41 | % |
| Public Equity Real Estate Securities | | | 2.07 | % |
| Preferred Stock | | | 0.78 | % |
| Total Investments | | | 99.40 | % |
| Other Assets Less Liabilities | | | 0.60 | % |
| Total Net Assets | | | 100.00 | % |
See the Portfolio of Investments in this annual report for a more detailed account of the Fund’s holdings.
| Total Income+ Real Estate Fund |
| PORTFOLIO OF INVESTMENTS |
| September 30, 2016 |
| Shares | | | Security | | Value | |
| | | | | PRIVATE EQUITY REAL ESTATE SECURITIES - 83.14% | | | | |
| | | | | APARTMENTS - 3.58% | | | | |
| | 212 | | | Sentinel Real Estate Fund | | $ | 17,580,176 | |
| | | | | | | | | |
| | | | | DIVERSIFIED - 75.61% | | | | |
| | 21,994 | | | AEW Core Property Trust | | | 21,334,253 | |
| | 194 | | | Blackrock Granite Property | | | 17,853,037 | |
| | 34,479 | | | Blackstone Property Partners ** | | | 40,669,880 | |
| | 61,148 | | | Clarion Lion Properties Fund | | | 82,744,041 | |
| | 11,968 | | | Heitman American Real Estate Fund | | | 13,756,985 | |
| | 127 | | | Invesco Real Estate Fund | | | 21,158,491 | |
| | 7,357,217 | | | J.P. Morgan US Real Estate Growth & Income LP | | | 10,520,821 | |
| | 12,139 | | | MEPT Edgemoor LP * | | | 22,501,755 | |
| | 1,997 | | | Morgan Stanley Prime Property Fund LLC | | | 34,169,992 | |
| | 719,857 | | | Principal Enhanced Property Fund LP | | | 8,386,330 | |
| | 15,737 | | | Prudential PRISA 1 | | | 21,987,436 | |
| | 162,069 | | | RREEF America REIT II, Inc. | | | 18,417,504 | |
| | 24,112 | | | Stockbridge Smart Markets Fund | | | 34,455,131 | |
| | — | | | Stockbridge Value Fund II | | | 7,064,344 | |
| | 765 | | | UBS Trumbull Property G&I Fund | | | 16,525,525 | |
| | | | | | | | 371,545,525 | |
| | | | | INDUSTRIAL - 3.95% | | | | |
| | 9,032 | | | Clarion Lion Industrial Trust | | | 13,399,475 | |
| | 5,209 | | | Prologis Targeted US Logistics | | | 6,001,647 | |
| | | | | | | | 19,401,122 | |
| | | | | | | | | |
| | | | | TOTAL PRIVATE EQUITY REAL ESTATE SECURITIES (Cost - $374,036,028) | | | 408,526,823 | |
| | | | | | | | | |
| | | | | PUBLIC EQUITY REAL ESTATE SECURITIES - 2.07% | | | | |
| | | | | PUBLIC NON-TRADED REAL ESTATE INVESTMENT TRUSTS - 0.27% | | | | |
| | | | | DIVERSIFIED - 0.23% | | | | |
| | 68,376 | | | CNL Lifestyle Properties # | | | 195,556 | |
| | 61,761 | | | Dividend Capital Diversified Property Fund | | | 461,975 | |
| | 140,161 | | | Highlands REIT # | | | 49,056 | |
| | 140,161 | | | InvenTrust Properties Trust # | | | 423,285 | |
| | | | | | | | 1,129,872 | |
| | | | | OFFICE - 0.04% | | | | |
| | 27,152 | | | Hines Real Estate Investment Trust # | | | 176,489 | |
| | | | | | | | | |
| | | | | TOTAL PUBLIC NON -TRADED REAL ESTATE INVESTMENT TRUSTS (Cost - $1,189,072) | | | 1,306,361 | |
| | | | | | | | | |
| | | | | PUBLICLY TRADED REAL ESTATE INVESTMENT TRUSTS - 1.80% | | | | |
| | | | | APARTMENTS - 0.16% | | | | |
| | 2,645 | | | American Campus Communities, Inc. | | | 134,551 | |
| | 2,455 | | | Apartment Investment & Management Co | | | 112,709 | |
| | 4,913 | | | Education Realty Trust, Inc. | | | 211,947 | |
| | 2,020 | | | Mid-America Apartment Communities, Inc. | | | 189,860 | |
| | 13,206 | | | Monogram Residential Trust, Inc. | | | 140,512 | |
| | | | | | | | 789,579 | |
The accompanying notes are an integral part of these financial statements.
| Total Income+ Real Estate Fund |
| PORTFOLIO OF INVESTMENTS (Continued) |
| September 30, 2016 |
| Shares | | | Security | | Value | |
| | | | | DATA CENTERS - 0.22% | | | | |
| | 4,418 | | | CoreSite Realty Corp | | $ | 327,109 | |
| | 7,040 | | | CyrusOne, Inc. | | | 334,893 | |
| | 2,474 | | | Digital Realty Trust, Inc. | | | 240,275 | |
| | 4,272 | | | DuPont Fabros Technology, Inc. | | | 176,220 | |
| | | | | | | | 1,078,497 | |
| | | | | DIVERSIFIED - 0.05% | | | | |
| | 2,083 | | | PS Business Parks, Inc. | | | 236,566 | |
| | | | | | | | | |
| | | | | HEALTHCARE - 0.13% | | | | |
| | 7,862 | | | Healthcare Realty Trust, Inc. | | | 267,780 | |
| | 6,808 | | | Healthcare Trust of America, Inc. | | | 222,077 | |
| | 2,960 | | | LTC Properties, Inc. | | | 153,890 | |
| | | | | | | | 643,747 | |
| | | | | HOTELS - 0.05% | | | | |
| | 17,520 | | | Xenia Hotels & Resorts, Inc. | | | 265,954 | |
| | | | | | | | | |
| | | | | INDUSTRIAL - 0.15% | | | | |
| | 4,598 | | | DCT Industrial Trust, Inc. | | | 223,233 | |
| | 7,749 | | | Duke Realty Corp. | | | 211,780 | |
| | 7,453 | | | First Industrial Realty Trust, Inc. | | | 210,324 | |
| | 2,034 | | | Prologis, Inc. | | | 108,900 | |
| | | | | | | | 754,237 | |
| | | | | MANUFACTURED HOMES - 0.09% | | | | |
| | 4,008 | | | Equity LifeStyle Properties, Inc. | | | 309,338 | |
| | 1,841 | | | Sun Communities, Inc. | | | 144,482 | |
| | | | | | | | 453,820 | |
| | | | | OFFICE - 0.13% | | | | |
| | 1,087 | | | Alexandria Real Estate Equities, Inc. | | | 118,233 | |
| | 2,650 | | | Columbia Property Trust, Inc. | | | 59,333 | |
| | 3,439 | | | Douglas Emmett, Inc. | | | 125,970 | |
| | 3,163 | | | Highwoods Properties, Inc. | | | 164,855 | |
| | 4,839 | | | Piedmont Office Realty Trust, Inc. | | | 105,345 | |
| | 1,968 | | | Tier REIT, Inc. | | | 30,386 | |
| | | | | | | | 604,122 | |
| | | | | REGIONAL MALLS - 0.05% | | | | |
| | 1,615 | | | Macerich Co. | | | 130,605 | |
| | 650 | | | Simon Property Group, Inc. | | | 134,557 | |
| | | | | | | | 265,162 | |
| | | | | SELF STORAGE - 0.16% | | | | |
| | 6,019 | | | CubeSmart | | | 164,078 | |
| | 2,667 | | | Extra Space Storage, Inc. | | | 211,786 | |
| | 3,403 | | | Iron Mountain, Inc. | | | 127,715 | |
| | 1,103 | | | Life Storage, Inc. | | | 98,101 | |
| | 798 | | | Public Storage | | | 178,066 | |
| | | | | | | | 779,746 | |
The accompanying notes are an integral part of these financial statements.
| Total Income+ Real Estate Fund |
| PORTFOLIO OF INVESTMENTS (Continued) |
| September 30, 2016 |
| Shares | | | Security | | Value | |
| | | | | SHOPPING CENTERS - 0.28% | | | | |
| | 5,415 | | | Equity One, Inc. | | $ | 165,753 | |
| | 1,339 | | | Federal Realty Investment Trust | | | 206,112 | |
| | 5,083 | | | Kimco Realty Corp. | | | 147,153 | |
| | 5,569 | | | Ramco-Gershenson Properties Trust | | | 104,363 | |
| | 2,742 | | | Regency Centers Corp. | | | 212,476 | |
| | 9,553 | | | Retail Opportunity Investments Corp. | | | 209,784 | |
| | 1,776 | | | Saul Centers, Inc. | | | 118,282 | |
| | 4,695 | | | Urstadt Biddle Properties, Inc. | | | 104,323 | |
| | 2,663 | | | Weingarten Realty Investors | | | 103,804 | |
| | | | | | | | 1,372,050 | |
| | | | | SINGLE TENANT - 0.18% | | | | |
| | 6,047 | | | Agree Realty Corp. | | | 298,964 | |
| | 3,993 | | | National Retail Properties, Inc. | | | 203,044 | |
| | 3,300 | | | Realty Income Corp. | | | 220,869 | |
| | 13,245 | | | Spirit Realty Capital, Inc. | | | 176,556 | |
| | | | | | | | 899,433 | |
| | | | | SPECIALITY- 0.15% | | | | |
| | 1,766 | | | Crown Castle International Corp. | | | 166,375 | |
| | 3,000 | | | EPR Properties | | | 236,220 | |
| | 923 | | | Equinix, Inc. | | | 332,511 | |
| | | | | | | | 735,106 | |
| | | | | | | | | |
| | | | | TOTAL PUBLICLY TRADED REAL ESTATE INVESTMENT TRUSTS (Cost - $8,657,269) | | | 8,878,019 | |
| | | | | | | | | |
| | | | | TOTAL PUBLIC EQUITY REAL ESTATE SECURITIES (Cost - $9,846,341) | | | 10,184,380 | |
| | | | | | | | | |
| | | | | PREFERRED STOCK - 0.78% | | | | |
| | | | | DATA CENTERS - 0.16% | | | | |
| | 14,812 | | | Digital Realty Trust, Inc. | | | 379,483 | |
| | | | | | | | | |
| | | | | INDUSTRIAL - 0.07% | | | | |
| | 14,580 | | | STAG Industrial, Inc. | | | 392,494 | |
| | 14,550 | | | Terreno Realty Corp. | | | 375,390 | |
| | | | | | | | 767,884 | |
| | | | | OFFICE PROPERTY - 0.16% | | | | |
| | 14,748 | | | Corporate Office Properties Trust | | | 381,972 | |
| | 14,766 | | | VEREIT, Inc. | | | 393,366 | |
| | | | | | | | 775,338 | |
| | | | | REGIONAL MALLS - 0.23% | | | | |
| | 15,350 | | | CBL & Associates Properties, Inc. | | | 383,904 | |
| | 14,725 | | | Taubman Centers, Inc. | | | 384,617 | |
| | 14,881 | | | Washington Prime Group, Inc. | | | 388,097 | |
| | | | | | | | 1,156,618 | |
| | | | | SHOPPING CENTERS - 0.16% | | | | |
| | 14,789 | | | Kimco Realty Corp. | | | 383,035 | |
| | 14,591 | | | Retail Properties of America, Inc. | | | 377,177 | |
| | | | | | | | 760,212 | |
| | | | | | | | | |
| | | | | TOTAL PREFERRED STOCK (Cost - $3,863,192) | | | 3,839,535 | |
The accompanying notes are an integral part of these financial statements.
| Total Income+ Real Estate Fund |
| PORTFOLIO OF INVESTMENTS (Continued) |
| September 30, 2016 |
| Shares | | | Security | | Value | |
| | | | | SHORT-TERM INVESTMENTS - 13.41% | | | | |
| | 65,944,645 | | | Dreyfus Cash Management - Institutional Class, 0.20% + | | $ | 65,944,645 | |
| | | | | TOTAL SHORT-TERM INVESTMENTS (Cost - $65,944,645) | | | | |
| | | | | | | | | |
| | | | | TOTAL INVESTMENTS - 99.40% (Cost - $453,690,206) (a) | | | 488,495,383 | |
| | | | | OTHER ASSETS LESS LIABILITIES - 0.60% | | | 2,921,267 | |
| | | | | NET ASSETS - 100.00% | | $ | 491,416,650 | |
| * | Non-income producing security. |
| ** | Holding is comprised of two entities with the same issuer. |
| # | Value estimated using Fair Valuation Procedures adopted by the Board of Trustees. Total value of such securities is $844,386 or 0.17% of net assets. |
| + | Money market fund; interest rate reflects the seven-day effective yield on September 30, 2016. |
| (a) | Represents cost for financial reporting purposes. Aggregate cost for federal tax purposes is $446,496,661 and differs from the value by net unrealized appreciation (depreciation) of securities as follows: |
| Unrealized appreciation: | | $ | 42,568,710 | |
| Unrealized depreciation: | | | (569,988 | ) |
| Net unrealized appreciation: | | $ | 41,998,722 | |
The accompanying notes are an integral part of these financial statements.
| Total Income+ Real Estate Fund |
| STATEMENT OF ASSETS AND LIABILITIES |
| September 30, 2016 |
| Assets: | | | |
| Investments in Securities at Value (identified cost $453,690,206) | | $ | 488,495,383 | |
| Dividends and Interest Receivable | | | 2,303,698 | |
| Receivable for Fund Shares Sold | | | 1,272,356 | |
| Prepaid Expenses and Other Assets | | | 110,651 | |
| Total Assets | | | 492,182,088 | |
| | | | | |
| Liabilities: | | | | |
| Loan Payable | | | 1,326 | |
| Redemptions Payable | | | 4,937 | |
| Payable to Investment Advisor | | | 437,278 | |
| Distribution Fees Payable | | | 99,490 | |
| Shareholder Servicing Fees Payable | | | 77,247 | |
| Payable to Related Parties | | | 45,572 | |
| Other Accrued Expenses | | | 99,588 | |
| Total Liabilities | | | 765,438 | |
| | | | | |
| Net Assets | | $ | 491,416,650 | |
| | | | | |
| Class A: | | | | |
| Net Assets (no par value; unlimited number of shares authorized; 7,783,628 shares of beneficial interest outstanding) | | $ | 226,712,012 | |
| Net Asset Value and Redemption Price Per Share ($226,712,012/7,783,628 shares of beneficial interest outstanding) | | $ | 29.13 | |
Maximum Offering Price Per Share
($29.13/0.9425) | | $ | 30.91 | |
| | | | | |
| Class C: | | | | |
| Net Assets (no par value; unlimited number of shares authorized; 5,378,227 shares of beneficial interest outstanding) | | $ | 153,859,317 | |
| Net Asset Value, Offering and Redemption Price Per Share * ($153,859,317/5,378,227 shares of beneficial interest outstanding) | | $ | 28.61 | |
| | | | | |
| Class I: | | | | |
| Net Assets (no par value; unlimited number of shares authorized; 3,773,245 shares of beneficial interest outstanding) | | $ | 110,845,321 | |
| Net Asset Value, Offering and Redemption Price Per Share ($110,845,321/3,773,245 shares of beneficial interest outstanding) | | $ | 29.38 | |
| | | | | |
| Composition of Net Assets: | | | | |
| At September 30, 2016, Net Assets Consisted of: | | | | |
| Paid-in-Capital | | $ | 453,475,134 | |
| Undistributed Net Investment Income | | | 3,161,971 | |
| Accumulated Net Realized Loss on Investments | | | (25,632 | ) |
| Net Unrealized Appreciation on Investments | | | 34,805,177 | |
| Net Assets | | $ | 491,416,650 | |
| | | | | |
Commitments and Contingencies (See Note 8)
| * | Class C charges a 1.00% fee on shares redeemed less than 365 days after the purchase. |
The accompanying notes are an integral part of these financial statements.
| Total Income+ Real Estate Fund |
| STATEMENT OF OPERATIONS |
| For the Year Ended September 30, 2016 |
| Investment Income: | | | | |
| Dividend Income | | $ | 8,183,112 | |
| Interest Income | | | 77,399 | |
| Total Investment Income | | | 8,260,511 | |
| | | | | |
| Expenses: | | | | |
| Investment Advisory Fees | | | 4,808,355 | |
| Shareholder Servicing Fees | | | | |
| Class A | | | 421,956 | |
| Class C | | | 224,256 | |
| Distribution Fees | | | | |
| Class C | | | 672,767 | |
| Transfer Agent Fees | | | 265,120 | |
| Administration Fees | | | 216,337 | |
| Printing Expense | | | 211,057 | |
| Custody Fees | | | 145,663 | |
| Legal Fees | | | 92,801 | |
| Registration & Filing Fees | | | 82,863 | |
| Non 12b-1 Shareholder Servicing Fees | | | 73,328 | |
| Fund Accounting Fees | | | 33,000 | |
| Professional Fees | | | 30,000 | |
| Trustees’ Fees | | | 30,000 | |
| Insurance Expense | | | 26,070 | |
| Audit Fees | | | 22,999 | |
| Miscellaneous Expenses | | | 2,006 | |
| Total Expenses | | | 7,358,578 | |
| Less: Fees Waived by Advisor | | | (997,305 | ) |
| | | | | |
| Net Expenses | | | 6,361,273 | |
| | | | | |
| Net Investment Income | | | 1,899,238 | |
| | | | | |
| Net Realized and Unrealized Gain on Investments: | | | | |
| Net Realized Loss on Investments | | | (688,489 | ) |
| Distributions of Capital Gains From Underlying Investment Companies | | | 1,353,129 | |
| Net Change in Unrealized Appreciation on Investments | | | 20,431,438 | |
| Net Realized and Unrealized Gain on Investments | | | 21,096,078 | |
| | | | | |
| Net Increase in Net Assets Resulting From Operations | | $ | 22,995,316 | |
| | | | | |
The accompanying notes are an integral part of these financial statements.
| Total Income+ Real Estate Fund |
| STATEMENTS OF CHANGES IN NET ASSETS |
| | | For the Year | | | For the Year | |
| | | Ended | | | Ended | |
| | | September 30, 2016 | | | September 30, 2015 | |
| Operations: | | | | | | | | |
| Net Investment Income | | $ | 1,899,238 | | | $ | 1,778,951 | |
| Net Realized Gain (Loss) on Investments | | | (688,489 | ) | | | (28,019 | ) |
| Distributions of Capital Gains From Underlying Investment Companies | | | 1,353,129 | | | | 488,862 | |
| Net Change in Unrealized Appreciation on Investments | | | 20,431,438 | | | | 8,997,981 | |
| Net Increase in Net Assets Resulting From Operations | | | 22,995,316 | | | | 11,237,775 | |
| | | | | | | | | |
| Distributions to Shareholders From: | | | | | | | | |
| Net Investment Income | | | | | | | | |
| Class A | | | — | | | | (314,591 | ) |
| Class C | | | — | | | | (41,887 | ) |
| Class I | | | — | | | | (30,565 | ) |
| Net Realized Capital Gain | | | | | | | | |
| Class A | | | (822,963 | ) | | | (943,414 | ) |
| Class C | | | (330,241 | ) | | | (126,183 | ) |
| Class I | | | (219,114 | ) | | | (91,452 | ) |
| Return of Capital | | | | | | | — | |
| Class A | | | (8,770,796 | ) | | | (4,600,938 | ) |
| Class C | | | (5,168,710 | ) | | | (1,069,132 | ) |
| Class I | | | (3,596,707 | ) | | | (761,717 | ) |
| Total Distributions to Shareholders | | | (18,908,531 | ) | | | (7,979,879 | ) |
| | | | | | | | | |
| From Shares of Beneficial Interest: | | | | | | | | |
| Class A Shares: | | | | | | | | |
| Proceeds from Shares Issued (3,421,945 and 1,992,920 shares, respectively) | | | 112,139,126 | | | | 56,646,923 | |
| Distributions Reinvested (205,646 and 124,251 shares, respectively) | | | 5,933,035 | | | | 3,501,243 | |
| Cost of Shares Redeemed (351,623 and 801,766 shares, respectively) | | | (23,123,152 | ) | | | (22,822,086 | ) |
| Total From Beneficial Interest Transactions: Class A | | | 94,949,009 | | | | 37,326,080 | |
| | | | | | | | | |
| Class C Shares: | | | | | | | | |
| Proceeds from Shares Issued (4,070,055 and 1,110,617 shares, respectively) | | | 117,608,881 | | | | 31,331,468 | |
| Distributions Reinvested (115,459 and 26,091) shares, respectively) | | | 3,279,175 | | | | 728,782 | |
| Cost of Shares Redeemed (143,656 and 33,550 shares, respectively) | | | (5,526,767 | ) | | | (949,669 | ) |
| Total From Beneficial Interest Transactions: Class C | | | 115,361,289 | | | | 31,110,581 | |
| | | | | | | | | |
| Class I Shares: | | | | | | | | |
| Proceeds from Shares Issued (2,923,747 and 755,244 shares, respectively) | | | 85,314,866 | | | | 21,587,153 | |
| Distributions Reinvested (85,361 and 23,387 shares, respectively) | | | 2,482,023 | | | | 662,010 | |
| Cost of Shares Redeemed (111,906 and 27,267 shares, respectively) | | | (3,259,036 | ) | | | (780,971 | ) |
| Total From Beneficial Interest Transactions: Class I | | | 84,537,853 | | | | 21,468,192 | |
| | | | | | | | | |
| Net Increase in Net Assets From Shares of Beneficial Interest | | | 294,848,151 | | | | 89,904,853 | |
| | | | | | | | | |
| Total Increase in Net Assets | | | 298,934,936 | | | | 93,162,749 | |
| | | | | | | | | |
| Net Assets: | | | | | | | | |
| Beginning of Year | | | 192,481,714 | | | | 99,318,965 | |
| End of Year | | $ | 491,416,650 | | | $ | 192,481,714 | |
| | | | | | | | | |
| Undistributed Net Investment Income | | $ | 3,161,971 | | | $ | 2,125,585 | |
| | | | | | | | | |
The accompanying notes are an integral part of these financial statements.
| Total Income+ Real Estate Fund |
| FINANCIAL HIGHLIGHTS |
| Class A |
| |
| The table below sets forth financial data for one share of beneficial interest outstanding throughout each period presented. |
| | | For the Year | | | For the Year | | | For the Year | | | For the Period* | |
| | | Ended | | | Ended | | | Ended | | | Ended | |
| | | September 30, 2016 | | | September 30, 2015 | | | September 30, 2014 | | | September 30, 2013 | |
| | | | | | | | | | | | | |
| Net Asset Value, Beginning of Period | | $ | 28.68 | | | $ | 27.98 | | | $ | 27.47 | | | $ | 25.00 | |
| Increase From Operations: | | | | | | | | | | | | | | | | |
| Net investment income (a) | | | 0.23 | | | | 0.39 | | | | 0.26 | | | | 0.67 | |
| Net gain from investments (both realized and unrealized) | | | 1.75 | | | | 1.81 | | | | 1.70 | | | | 2.40 | |
| Total from operations | | | 1.98 | | | | 2.20 | | | | 1.96 | | | | 3.07 | |
| | | | | | | | | | | | | | | | | |
| Less Distributions: | | | | | | | | | | | | | | | | |
| From net investment income | | | — | | | | (0.09 | ) | | | (0.01 | ) | | | (0.40 | ) |
| From net realized gain on investments | | | (0.16 | ) | | | (0.29 | ) | | | (0.11 | ) | | | — | |
| From return of capital | | | (1.37 | ) | | | (1.12 | ) | | | (1.35 | ) | | | (0.20 | ) |
| Total Distributions | | | (1.53 | ) | | | (1.50 | ) | | | (1.47 | ) | | | (0.60 | ) |
| | | | | | | | | | | | | | | | | |
| Paid in interest from redemption fees (a) | | | — | | | | — | | | | 0.02 | | | | 0.00 | (i) |
| | | | | | | | | | | | | | | | | |
| Net Asset Value, End of Period | | $ | 29.13 | | | $ | 28.68 | | | $ | 27.98 | | | $ | 27.47 | |
| | | | | | | | | | | | | | | | | |
| Total Return (b)(h) | | | 7.08 | % | | | 8.06 | % | | | 7.38 | % | | | 12.36 | % (e) |
| | | | | | | | | | | | | | | | | |
| Ratios/Supplemental Data | | | | | | | | | | | | | | | | |
| Net assets, end of period (in 000’s) | | $ | 226,712 | | | $ | 129,287 | | | $ | 89,319 | | | $ | 38,122 | |
| Ratio to average net assets(f): | | | | | | | | | | | | | | | | |
| Expenses, Gross (c) | | | 2.19 | % | | | 2.25 | % | | | 2.54 | % | | | 4.96 | % (d) |
| Expenses, Net of Reimbursement | | | 1.82 | % | | | 1.79 | % | | | 1.76 | % | | | 0.01 | % (d) |
| Ratio to average net assets (excluding interest expense)(f): | | | | | | | | | | | | | | | | |
| Expenses, Gross (c) | | | 2.19 | % | | | 2.24 | % | | | 2.52 | % | | | 4.96 | % (d) |
| Expenses, Net of Reimbursement | | | 1.82 | % | | | 1.78 | % | | | 1.74 | % | | | 0.01 | % (d) |
| Net investment income, Net of Reimbursement (f)(g) | | | 0.79 | % | | | 1.36 | % | | | 0.94 | % | | | 2.66 | % (d) |
| Portfolio turnover rate | | | 18 | % | | | 35 | % | | | 12 | % | | | 35 | % (e) |
| | | | | | | | | | | | | | | | | |
| * | Class A commenced operations October 22, 2012. |
| (a) | Per share amounts are calculated using the average shares method, which more appropriately presents the per share data for the period. |
| (b) | Total returns are historical in nature and assume changes in share price, reinvestment of dividends and capital gains distributions, if any, and does not reflect the impact of sales charges. Had the Advisor not absorbed a portion of Fund expenses, total returns would have been lower. |
| (c) | Represents the ratio of expenses to average net asset absent fee waivers and/or expense reimbursements by the Advisor. |
| (f) | The ratios of expenses to average net assets and net investment income to average net assets do not reflect the expenses of the underlying investment companies in which the Fund invests. |
| (g) | Recognition of net investment income is affected by the timing and declaration of dividends by the underlying investment companies in which the Fund invests. |
| (h) | Includes adjustments in accordance with accounting principles generally accepted in the United States and, consequently, the net asset value for financial reporting purposes and the returns based upon those net asset values may differ from the net asset values and returns for shareholder transactions. |
| (i) | Less then $0.01 per share. |
The accompanying notes are an integral part of these financial statements.
| Total Income+ Real Estate Fund |
| FINANCIAL HIGHLIGHTS |
| Class C |
| |
| The table below sets forth financial data for one share of beneficial interest outstanding throughout each period presented. |
| | | For the Year | | | For the Year | | | For the Period | |
| | | Ended | | | Ended | | | Ended | |
| | | September 30, 2016 | | | September 30, 2015 | | | September 30, 2014* | |
| | | | | | | | | | |
| Net Asset Value, Beginning of Period | | $ | 28.38 | | | $ | 27.89 | | | $ | 27.75 | |
| Increase From Operations: | | | | | | | | | | | | |
| Net investment income (loss) (a) | | | (0.01 | ) | | | 0.16 | | | | (0.19 | ) |
| Net gain from investments (both realized and unrealized) | | | 1.75 | | | | 1.82 | | | | 1.07 | |
| Total from operations | | | 1.74 | | | | 1.98 | | | | 0.88 | |
| | | | | | | | | | | | | |
| Less Distributions: | | | | | | | | | | | | |
| From net investment income | | | — | | | | (0.09 | ) | | | — | |
| From net realized gains on investments | | | (0.16 | ) | | | (0.29 | ) | | | — | |
| From return of capital | | | (1.35 | ) | | | (1.11 | ) | | | (0.74 | ) |
| Total Distributions | | | (1.51 | ) | | | (1.49 | ) | | | (0.74 | ) |
| | | | | | | | | | | | | |
| Net Asset Value, End of Period | | $ | 28.61 | | | $ | 28.38 | | | $ | 27.89 | |
| | | | | | | | | | | | | |
| Total Return (b)(h) | | | 6.28 | % | | | 7.28 | % | | | 3.20 | % (e) |
| | | | | | | | | | | | | |
| Ratios/Supplemental Data | | | | | | | | | | | | |
| Net assets, end of period (in 000’s) | | $ | 153,859 | | | $ | 37,920 | | | $ | 6,505 | |
| Ratio to average net assets (f): | | | | | | | | | | | | |
| Expenses, Gross (c) | | | 2.95 | % | | | 3.04 | % | | | 3.36 | % (d) |
| Expenses, Net of Reimbursement | | | 2.56 | % | | | 2.55 | % | | | 2.61 | % (d) |
| Ratio to average net assets (excluding interest expense)(f): | | | | | | | | | | | | |
| Expenses, Gross (c) | | | 2.95 | % | | | 3.02 | % | | | 3.34 | % (d) |
| Expenses, Net of Reimbursement | | | 2.56 | % | | | 2.54 | % | | | 2.59 | % (d) |
| Net investment Income (loss), Net of Reimbursement (f)(g) | | | (0.04 | )% | | | 0.55 | % | | | (1.36 | )% (d) |
| Portfolio turnover rate | | | 18 | % | | | 35 | % | | | 12 | % (e) |
| | | | | | | | | | | | | |
| * | Class C commenced operations April 1, 2014. |
| (a) | Per share amounts are calculated using the average shares method, which more appropriately presents the per share data for the period. |
| (b) | Total returns are historical in nature and assume changes in share price, reinvestment of dividends and capital gains distributions, if any. Had the Advisor not absorbed a portion of Fund expenses, total returns would have been lower. |
| (c) | Represents the ratio of expenses to average net asset absent fee waivers and/or expense reimbursements by the Advisor. |
| (f) | The ratios of expenses to average net assets and net investment income (loss) to average net assets do not reflect the expenses of the underlying investment companies in which the Fund invests. |
| (g) | Recognition of net investment income (loss) is affected by the timing and declaration of dividends by the underlying investment companies in which the Fund invests. |
| (h) | Includes adjustments in accordance with accounting principles generally accepted in the United States and, consequently, the net asset value for financial reporting purposes and the returns based upon those net asset values may differ from the net asset values and returns for shareholder transactions. |
The accompanying notes are an integral part of these financial statements.
| Total Income+ Real Estate Fund |
| FINANCIAL HIGHLIGHTS |
| Class I |
| |
| The table below sets forth financial data for one share of beneficial interest outstanding throughout each period presented. |
| | | For the Year | | | For the Year | | | For the Period | |
| | | Ended | | | Ended | | | Ended | |
| | | September 30, 2016 | | | September 30, 2015 | | | September 30, 2014* | |
| | | | | | | | | | |
| Net Asset Value, Beginning of Period | | $ | 28.85 | | | $ | 28.03 | | | $ | 27.75 | |
| Increase From Operations: | | | | | | | | | | | | |
| Net investment income (loss) (a) | | | 0.28 | | | | 0.45 | | | | (0.04 | ) |
| Net gain from investments (both realized and unrealized) | | | 1.79 | | | | 1.88 | | | | 1.06 | |
| Total from operations | | | 2.07 | | | | 2.33 | | | | 1.02 | |
| | | | | | | | | | | | | |
| Less Distributions: | | | | | | | | | | | | |
| From net investment income | | | — | | | | (0.10 | ) | | | — | |
| From net realized gains on investments | | | (0.16 | ) | | | (0.29 | ) | | | — | |
| From return of capital | | | (1.38 | ) | | | (1.12 | ) | | | (0.74 | ) |
| Total Distributions | | | (1.54 | ) | | | (1.51 | ) | | | (0.74 | ) |
| | | | | | | | | | | | | |
| Net Asset Value, End of Period | | $ | 29.38 | | | $ | 28.85 | | | $ | 28.03 | |
| | | | | | | | | | | | | |
| Total Return (b)(h) | | | 7.36 | % | | | 8.51 | % | | | 3.71 | % (e) |
| | | | | | | | | | | | | |
| Ratios/Supplemental Data | | | | | | | | | | | | |
| Net assets, end of period (in 000’s) | | $ | 110,845 | | | $ | 25,274 | | | $ | 3,495 | |
| Ratio to average net assets (f): | | | | | | | | | | | | |
| Expenses, Gross (c) | | | 1.96 | % | | | 2.03 | % | | | 2.40 | % (d) |
| Expenses, Net of Reimbursement | | | 1.56 | % | | | 1.54 | % | | | 1.61 | % (d) |
| Ratio to average net assets (excluding interest expense)(f): | | | | | | | | | | | | |
| Expenses, Gross (c) | | | 1.96 | % | | | 2.02 | % | | | 2.38 | % (d) |
| Expenses, Net of Reimbursement | | | 1.56 | % | | | 1.53 | % | | | 1.59 | % (d) |
| Net investment income (loss) , Net of Reimbursement (f)(g) | | | 0.96 | % | | | 1.59 | % | | | (0.24 | )% (d) |
| Portfolio turnover rate | | | 18 | % | | | 35 | % | | | 12 | % (e) |
| | | | | | | | | | | | | |
| * | Class I commenced operations April 1, 2014. |
| (a) | Per share amounts are calculated using the average shares method, which more appropriately presents the per share data for the period. |
| (b) | Total returns are historical in nature and assume changes in share price, reinvestment of dividends and capital gains distributions, if any. Had the Advisor not absorbed a portion of Fund expenses, total returns would have been lower. |
| (c) | Represents the ratio of expenses to average net asset absent fee waivers and/or expense reimbursements by the Advisor. |
| (f) | The ratios of expenses to average net assets and net investment income (loss) to average net assets do not reflect the expenses of the underlying investment companies in which the Fund invests. |
| (g) | Recognition of net investment income (loss) is affected by the timing and declaration of dividends by the underlying investment companies in which the Fund invests. |
| (h) | Includes adjustments in accordance with accounting principles generally accepted in the United States and, consequently, the net asset value for financial reporting purposes and the returns based upon those net asset values may differ from the net asset values and returns for shareholder transactions. |
The accompanying notes are an integral part of these financial statements.
| Total Income+ Real Estate Fund |
| NOTES TO FINANCIAL STATEMENTS |
| September 30, 2016 |
Total Income+ Real Estate Fund (the “Fund” or the “Trust”) was organized as a Delaware statutory trust on May 25, 2012 and is registered under the Investment Company Act of 1940, as amended, (the “1940 Act”), as a non- diversified, closed-end management investment company that operates as an interval fund with a continuous offering of Fund shares. The Fund’s primary investment objective is to generate current income while secondarily seeking long-term capital appreciation, with low to moderate volatility and low correlation to the broader markets. The Fund pursues its investment objectives by investing, under normal circumstances, at least 80% of assets in “real estate industry securities,” primarily in income producing equity and debt securities.
The Fund currently offers Class A, Class C, and Class I shares. Class A shares commenced operations on October 22, 2012 and are offered at net asset value plus a maximum sales charge of 5.75%. Class C and Class I shares commenced operations on April 1, 2014 and are offered at net asset value. Class C shares are subject to an early withdrawal charge of 1.00% if redeemed less than 365 days after purchase. Each class represents an interest in the same assets of the Fund and classes are identical except for differences in their sales charge structures and ongoing service and distribution charges. All classes of shares have equal voting privileges except that each class has exclusive voting rights with respect to its service and/or distribution plans. The Fund’s income, expenses (other than class specific distribution fees) and realized and unrealized gains and losses are allocated proportionately each day based upon the relative net assets of each class.
| 2. | SUMMARY OF SIGNIFICANT ACCOUNTING POLICIES |
The following is a summary of significant accounting policies followed by the Fund in preparation of its financial statements. These policies are in conformity with accounting principles generally accepted in the United States of America (“GAAP”). The preparation of financial statements requires management to make estimates and assumptions that affect the reported amounts of assets and liabilities and disclosure of contingent assets and liabilities at the date of the financial statements and the reported amounts of income and expenses for the period. Actual results could differ from those estimates.
Security Valuation – Securities listed on an exchange are valued at the last reported sale price at the close of the regular trading session of the exchange on the business day the value is being determined, or in the case of securities listed on NASDAQ at the NASDAQ Official Closing Price (“NOCP”). In the absence of a sale such securities shall be valued at the last bid price. Short-term investments that mature in 60 days or less may be valued at amortized cost, provided such valuations represent fair value.
Valuation of Fund of Funds – The Fund may invest in portfolios of open-end investment companies and exchange traded funds (the “Underlying Funds”). The Underlying Funds value securities in their portfolios for which market quotations are readily available at their market values (generally the last reported sale price) and all other securities and assets at their fair value to the methods established by the board of directors of the Underlying Funds.
Open-end investment companies are valued at their respective net asset values as reported by such investment companies. The shares of many closed-end investment companies, after their initial public offering, frequently trade at a price per share, which is different than the net asset value per share. The difference represents a market premium or market discount of such shares. There can be no assurances that the market discount or market premium on shares of any closed-end investment company purchased by the Fund will not change.
When price quotations for certain securities are not readily available, or if the available quotations are not believed to be reflective of market value by the Advisor (defined below), those securities will be valued at “fair value” as determined in good faith by the Valuation Committee using procedures adopted by and under the supervision of the Fund’s Board of Trustees (the “Board”). There can be no assurance that the Fund could purchase or sell a portfolio security at the price used to calculate a Fund’s net asset value (“NAV”).
| Total Income+ Real Estate Fund |
| NOTES TO FINANCIAL STATEMENTS (Continued) |
| September 30, 2016 |
Fair valuation procedures may be used to value a substantial portion of the assets of the Fund. The Fund may use the fair value of a security to calculate its NAV when, for example, (1) a portfolio security is not traded in a public market or the principal market in which the security trades is closed, (2) trading in a portfolio security is suspended and not resumed prior to the normal market close, (3) a portfolio security is not traded in significant volume for a substantial period, or (4) the Advisor determines that the quotation or price for a portfolio security provided by a broker-dealer or independent pricing service is inaccurate.
Valuation of Private Equity Real Estate Securities – The Fund invests a significant portion of its assets in Private Equity Real Estate Securities (“Private ERES”). The Private ERES measure their investment assets at fair value, and report a NAV per share on a calendar quarter basis. In accordance with Accounting Standards Codification (‘ASC”) 820, the Fund has elected to apply the practical expedient and to value its investments in Private ERES at their respective NAVs at each quarter. For non-calendar quarter-end days, the Valuation Committee estimates the fair value of each Private ERES by adjusting the most recent NAV for each REIT by the change in a proprietary benchmark that the Valuation Committee has deemed to be representative of the entire Private ERES market. As of September 30, 2016, all of the Fund’s investments in Private ERES were valued at the respective NAVs of the Private ERES.
Valuation of Public Non-Traded Equity Real Estate Securities – The Fund may invest a portion of its assets in Public Non-Traded Equity Real Estate Securities (“Public Non-Traded ERES”). The Public Non-Traded ERES do not report periodic NAVs with enough frequency to be valued using the practical expedient. The Valuation Committee determines the fair value of Public Non-Traded ERES on a daily basis by considering various factors such as the most recent published NAV, the transaction price, secondary market trades, shareholder redemption and dividend reinvestment programs, and potential illiquidity discounts.
The “fair value” of securities may be difficult to determine and thus judgment plays a greater role in the valuation process. The fair valuation methodology may include or consider the following guidelines, as appropriate: (1) evaluation of all relevant factors, including but not limited to, pricing history, current market level, supply and demand of the respective security; (2) comparison to the values and current pricing of securities that have comparable characteristics; (3) knowledge of historical market information with respect to the security; (4) other factors relevant to the security which would include, but not be limited to, duration, yield, fundamental analytical data, the Treasury yield curve, and credit quality.
The values assigned to fair valued investments are based on available information and do not necessarily represent amounts that might ultimately be realized, since such amounts depend on future developments inherent in long- term investments. Changes in the fair valuation of portfolio securities may be less frequent and of greater magnitude than changes in the price of portfolio securities valued at their last sale price, by an independent pricing service, or based on market quotations. Imprecision in estimating fair value can also impact the amount of unrealized appreciation or depreciation recorded for a particular portfolio security and differences in the assumptions used could result in a different determination of fair value, and those differences could be material.
The Fund utilizes various methods to measure the fair value of its investments on a recurring basis. GAAP establishes a hierarchy that prioritizes inputs to valuation methods. The three levels of input are:
Level 1 – Unadjusted quoted prices in active markets for identical assets and liabilities that the Fund has the ability to access.
Level 2 – Observable inputs other than quoted prices included in Level 1 that are observable for the asset or liability, either directly or indirectly. These inputs may include quoted prices for the identical instrument on an inactive market, prices for similar instruments, interest rates, prepayment speeds, credit risk, yield curves, default rates and similar data.
Level 3 – Unobservable inputs for the asset or liability, to the extent relevant observable inputs are not available, representing the Fund’s own assumptions about the assumptions a market participant would use in valuing the asset or liability, and would be based on the best information available.
| Total Income+ Real Estate Fund |
| NOTES TO FINANCIAL STATEMENTS (Continued) |
| September 30, 2016 |
The availability of observable inputs can vary from security to security and is affected by a wide variety of factors, including, for example, the type of security, whether the security is new and not yet established in the marketplace, the liquidity of markets, and other characteristics particular to the security. To the extent that valuation is based on models or inputs that are less observable or unobservable in the market, the determination of fair value requires more judgment. Accordingly,the degree of judgment exercised in determining fair value is greatest for instruments categorized in Level 3.
The inputs used to measure fair value may fall into different levels of the fair value hierarchy. such In cases, for disclosure purposes, the level in the fair value hierarchy within which the fair value measurement falls in its entirety, is determined based on the lowest level input that is significant to the fair value measurement in its entirety.
The inputs or methodology used for valuing securities are not necessarily an indication of the risk associated with investing in those securities. The following tables summarize the inputs used as of September 30, 2016 for the Fund’s assets and liabilities measured at fair value:
| Assets* | | Total Value | | | Level 1 | | | Level 2 | | | Level 3 | |
| Public Equity Real Estate Securities | | $ | 1,306,361 | | | $ | 461,974 | | | $ | — | | | $ | 844,387 | |
| Public Real Estate Investment Trusts | | | 8,878,019 | | | | 8,878,019 | | | | — | | | | — | |
| Short-Term Investments | | | 65,944,645 | | | | 65,944,645 | | | | — | | | | — | |
| Preferred Stock | | | 3,839,535 | | | | 3,839,535 | | | | | | | | | |
| Sub-Total | | $ | 79,968,560 | | | $ | 79,124,173 | | | $ | — | | | $ | 844,387 | |
| Private Equity Real Estate Securities (1) | | | 408,526,823 | | | | | | | | | | | | | |
| Total | | $ | 488,495,383 | | | | | | | | | | | | | |
| * | Refer to the Portfolio of Investments for industry classifications. |
There were no transfers into or out of Level 1, Level 2, and Level 3 during the period.
It is the Fund’s policy to record transfers into or out of any Level at the end of the reporting period.
| (1) | Management has elected to adopt ASU 2015-07, Disclosures for Investments in Certain Entities That Calculate Net Asset Value per Share (or Its Equivalent) — a consensus of the Emerging Issues Task Force issued, on May 1, 2015. The guidance in this standard is effective for interim and annual periods beginning after December 15, 2015, however early adoption is permitted. In accordance with Subtopic 820-10, certain investments that are measured at fair value using the net asset value per share (or its equivalent) have not been classified in the fair value hierarchy. The fair value amount presented in this table is intended to permit reconciliation of the fair value hierarchy to the amounts presented in the statement of assets and liabilities. |
The following is a reconciliation of assets in which Level 3 inputs were used in determining value:
| | | Public Equity Real | |
| | | Estate Securities | |
| Beginning Balance | | $ | 1,163,934 | |
| Total realized gain (loss) | | | 31,390 | |
| Appreciation (Depreciation) (a) | | | (240,270 | ) |
| Cost of Purchases | | | — | |
| Proceeds from Sales | | | (110,667 | ) |
| Return of Capital | | | — | |
| Net transfers in/out of level 3 | | | — | |
| Ending Balance | | $ | 844,387 | |
| (a) | Refer to the Statement of Operations under Net Realized Gain (Loss) on Investments section. |
| Total Income+ Real Estate Fund |
| NOTES TO FINANCIAL STATEMENTS (Continued) |
| September 30, 2016 |
Significant unobservable valuation inputs for material Level 3 investments as of September 30, 2016, are as follows:
| | | Fair Value at | | | Valuation | | | | | | | | |
| | | 9/30/2016 | | | Technique | | Unobservable Input | | Range | | | Weighted Average | |
| | | | | | | | | | | | | | |
| Public Non-Traded Real | | | | | | | | | | | | | | | | |
| Estate Investment Trusts | | $ | 844,387 | | | Transaction Data | | Discount for Lack of Liquidity (a) | | | 5.00% | | | | 5.00 | % |
| | | | | | | | | Mid-point of Liquidation Value | | | $6.35-$6.65 | | | | $6.50 | |
| (a) | Represents amounts used when the reporting entity has determined that market participants would take into account these discounts when pricing the investments. |
Other Investment Vehicles – The Fund may invest in other investment vehicles such as exchange traded funds (“ETFs”), index funds, closed-end funds and mutual funds. Such funds are bought and sold on a securities exchange. An ETF trades like common stock and typically represents a fixed portfolio of securities designed to track the performance and dividend yield of a particular domestic or foreign market index. The Fund may purchase an investment vehicle to temporarily gain exposure to a portion of the U.S. or a foreign market. The risks of owning such investment vehicles generally reflect the risks of owning the underlying securities they are designed to track, although any lack of liquidity could result in it being more volatile. Additionally, such investment vehicles have fees and expenses that reduce their value relative to their underlying holdings.
Security Transactions and Investment Income – Investment security transactions are accounted for on a trade date de basis. Cost is determined and gains and losses are based upon the specific identification method for both financial statement and federal income tax purposes. Dividend income is recorded on the ex-dividend date and interest income is recorded on the accrual basis. Purchase discounts and premiums on securities are accreted and amortized over the life of the respective securities.
Federal Income Taxes – The Fund intends to comply with the requirements of Subchapter M of the Internal Revenue Code applicable to regulated investment companies and will distribute all of its taxable income, if any to shareholders. Accordingly, no provision for Federal income taxes is required in the financial statements.
The Fund recognizes the tax benefits of uncertain tax positions only when the position is “more likely than not” to be sustained assuming examination by tax authorities. Management has reviewed the tax positions and has concluded that no liability for unrecognized tax benefits should be recorded related to uncertain tax positions related to the open tax years (2013-2015) or expected to be taken in the Fund’s 2016 tax returns. The Fund identifies its major tax jurisdictions as U.S. Federal. The Fund recognizes interest and penalties, if any, related to unrecognized tax benefits as income tax expense in the Statement of Operations. During the year ended September 30, 2016, the Fund did not incur any interest or penalties. Generally tax authorities can examine tax returns filed for the last three years.
Distributions to Shareholders – Distributions from investment income are declared and paid quarterly. Distributions from net realized capital gains, if any, are declared and paid annually and are recorded on the ex-dividend date. The character of income and gains to be distributed is determined in accordance with income tax regulations, which may differ from GAAP.
Indemnification – The Trust indemnifies its officers and Trustees for certain liabilities that may arise from the performance of their duties to the Trust. Additionally, in the normal course of business, the Fund enters into contracts that contain a variety of representations and warranties and which provide general indemnities. The Fund’s maximum exposure under these arrangements is unknown, as this would involve future claims that may be made against the Fund that have not yet occurred. However, based on experience, the Trust expects the risk of loss due to these warranties and indemnities to be remote.
| Total Income+ Real Estate Fund |
| NOTES TO FINANCIAL STATEMENTS (Continued) |
| September 30, 2016 |
| 3. | ADVISORY FEE AND OTHER RELATED PARTY TRANSACTIONS |
Advisory Fees – Pursuant to an investment advisory agreement with the Fund, (the “Advisory Agreement”), investment advisory services are provided to the Fund by Bluerock Fund Advisor, LLC (the “Advisor”). Under the terms of the Advisory Agreement, the Advisor receives monthly fees calculated at an annual rate of 1.50% of the average daily net assets of the Fund. For the year ended September 30, 2016, the Advisor earned advisory fees of $4,808,355.
The Advisor has contractually agreed to waive all or part of its management fees and/or make payments to limit Fund operating expenses and acquired fund fees and expenses (exclusive of any taxes, interest, brokerage and extraordinary expenses, but inclusive of organizational costs and offering costs) at least until February 1, 2017, so that the total annual operating expenses of the Fund do not exceed 1.91%, 2.66% and 1.66%, of the Fund’s average daily net assets for Class A, Class C and Class I shares, respectively.
The Fund had the following expense limitations in place pursuant to Board approval since inception:
| Class A | |
| Effective Date | | Expense Limitation | |
| 10/22/2012 | | | |
| (Commencement of operations) | | | |
| until 1/31/2015 | | | 1.84 | % |
| 2/1/2015 | | | 1.75 | % |
| 2/1/2016 | | | 1.91 | %* |
*Expense limitations includes acquired fund fees and expenses |
| |
| Class C | |
| Effective Date | | | Expense Limitation | |
| 4/1/2014 | | | | |
| (Commencement of operations) | | | | |
| until 1/31/2015 | | | 2.59 | % |
| 2/1/2015 | | | 2.50 | % |
| 2/1/2016 | | | 2.66 | %* |
*Expense limitations includes acquired fund fees and expenses |
| |
| Class I | |
| Effective Date | | | Expense Limitation | |
| 4/1/2014 | | | | |
| (Commencement of operations) | | | | |
| until 1/31/2015 | | | 1.59 | % |
| 2/1/2015 | | | 1.50 | % |
| 2/1/2016 | | | 1.66 | %* |
*Expense limitations includes acquired fund fees and expenses |
Fee waivers and expense payments may be recouped by the Advisor from the Fund, upon approval by the Fund’s Board, to the extent that overall expenses fall below the lesser of the expense limitation then in place or in place at the time of the waiver, within three fiscal years of when the amounts were waived or reimbursed. During the year ended September 30, 2016, the Advisor waived and reimbursed fees of $997,305. Including amounts waived during the year ended September 30, 2016, cumulative expenses subject to recapture pursuant to the aforementioned conditions amounted to $2,168,114 and will expire on September 30 of the years indicated below:
| 2017 | | | 2018 | | | 2019 | |
| $ | 509,750 | | | $ | 661,059 | | | $ | 997,305 | |
| Total Income+ Real Estate Fund |
| NOTES TO FINANCIAL STATEMENTS (Continued) |
| September 30, 2016 |
Sub-advisory services were provided to the Fund pursuant to agreements between the Advisor and each of Mercer Investment Management, Inc. and RREEF America, LLC (the “Sub-Advisors”). Under the terms of the sub-advisory agreements, the Advisor compensates the Sub-Advisors based on the Fund’s assets allocated to the respective Sub-Advisor. Under the terms of the Sub-Advisory Agreement with Mercer, the Sub-Advisor receives fees from the Advisor (not the Fund) as follows: 0.20% for up to $250 million in assets under advisement, 0.17% for $250 million to $500 million in assets under advisement, 0.12% for $500 million to $1 billion in assets under advisement, and 0.07% for $1 billion or more in assets under advisement. Under the terms of the Sub-Advisory Agreement with RREEF, the Sub-Advisor receives fees from the Advisor (not the Fund) as follows: 0.60% for up to $50 million in assets allocated to RR 0.55% EEF, for $50 million to $100 million in assets allocated to RREEF, 0.50% for greater than $100 million in assets allocated to RREEF.
Distributor – The distributor of the Fund is Northern Lights Distributors, LLC (the “Distributor”). The Board of Trustees has adopted, on behalf of the Fund, a Shareholder Services Plan and a Distribution Plan under which the Fund may compensate financial industry professionals for providing ongoing services in respect to clients with whom they have distributed shares of the Fund. Under the Shareholder Services Plan, the Fund pays up to 0.25% per year of the average daily net assets of each of Class A and Class C shares for such services. For the year ended September 30, 2016, the Fund incurred shareholder servicing fees of $421,956 and $224,256 for Class A and Class C shares, respectively. Under the Distribution Plan, the Fund pays 0.75% per year of its average daily net assets for such services for Class C shares. For the year ended September 30, 2016, the Fund incurred distribution fees of $672,767 for Class C shares.
The Distributor acts as the Fund’s principal underwriter in a continuous public offering of the Fund’s shares. For the year ended September 30, 2016, the Distributor received $4,251,462 in underwriting commissions for sales of Class A shares, of which $503,779 was retained by the principal underwriter or other affiliated broker-dealers.
In addition, certain affiliates of the Distributor provide services to the Fund as follows:
Gemini Fund Services, LLC (“GFS”) – GFS, an affiliate of the Distributor, provides administration, fund accounting, and transfer agent services to the Trust. Pursuant to separate servicing agreements with GFS, the Fund pays GFS customary fees for providing administration, fund accounting and transfer agency services to the Fund.
Northern Lights Compliance Services, LLC (“NLCS”) - NLCS, an affiliate of GFS and the Distributor, provides a Chief Compliance Officer to the Trust, as well as related compliance services, pursuant to a consulting agreement between NLCS and the Trust. Under the terms of such agreement, NLCS receives customary fees from the Fund.
Blu Giant, LLC (“Blu Giant”) – Blu Giant, an affiliate of GFS and the Distributor, provides EDGAR conversion and filing services as well as print management services for the Fund on an ad-hoc basis. For the provision of these services, Blu Giant receives customary fees from the Fund.
Trustees – The Fund pays each Trustee who is not affiliated with the Trust or Advisor a quarterly fee of $2,500, as well as reimbursement for any reasonable expenses incurred attending meetings. The “interested persons” who serve as Trustees of the Trust receive no compensation for their services as Trustees. None of the executive officers receive compensation from the Trust.
| 4. | INVESTMENT TRANSACTIONS |
The cost of purchases and proceeds from the sale of securities, other than short-term securities, for the year ended September 30, 2016 amounted to $281,289,238 and $52,342,907 respectively.
| 5. | REPURCHASE OFFERS / SHARES OF BENEFICIAL INTEREST |
Pursuant to Rule 23c-3 under the 1940 Act, the Fund offers shareholders on a quarterly basis the option of redeeming shares, at NAV, of no less than 5% and no more than 25% of the shares outstanding on the Repurchase
| Total Income+ Real Estate Fund |
| NOTES TO FINANCIAL STATEMENTS (Continued) |
| September 30, 2016 |
Request Deadline. The Board shall determine the quarterly repurchase offer amount. There is no guarantee that shareholders will be able to sell all of the shares they desire in a quarterly repurchase offer, although each shareholder will have the right to require the Fund to purchase up to and including 5% of such shareholder’s shares in each quarterly repurchase. Limited liquidity will be provided to shareholders only through the Fund’s quarterly repurchases.
During the fiscal year ended September 30, 2016, the Fund completed four quarterly repurchase offers. The Fund offered to repurchase up to 5% of the number of its outstanding shares as of the Repurchase Pricing Dates. The results of the repurchase offers were as follows:
| | | Repurchase Offer | | Repurchase Offer | | Repurchase Offer | | Repurchase Offer |
| Commencement Date | | September 30, 2015 | | December 31, 2015 | | March 29, 2016 | | June 28, 2016 |
| Repurchase Request Deadline | | November 9, 2015 | | February 9, 2016 | | May 6, 2016 | | August 5, 2016 |
| Repurchase Pricing Date | | November 9, 2015 | | February 9, 2016 | | May 6, 2016 | | August 5, 2016 |
| Net Asset Value as of Repurchase Offer Date: | | | | | | | | |
| Class A | | $28.70 | | $28.72 | | $29.00 | | $29.08 |
| Class C | | $28.38 | | $28.34 | | $28.57 | | $28.60 |
| Class I | | $28.88 | | $28.92 | | $29.22 | | $29.32 |
| Amount Repurchased | | | | | | | | |
| Class A | | $2,158,717 | | $3,771,134 | | $3,501,436 | | $3,696,851 |
| Class C | | $339,995 | | $808,049 | | $869,587 | | $2,600,046 |
| Class I | | $235,352 | | $1,269,731 | | $1,004,702 | | $749,251 |
The amounts listed above do not match the amounts listed in the Statement of Changes in Nets Assets due to transfer redemptions between Fund’s share classes.
| 6. | DISTRIBUTIONS TO SHAREHOLDERS AND TAX COMPONENTS OF CAPITAL |
The tax character of fund distributions for the following years was as follows:
| | | Fiscal Year Ended | | | Fiscal Year Ended | |
| | | September 30, 2016 | | | September 30, 2015 | |
| Ordinary Income | | $ | — | | | $ | 387,043 | |
| Long-Term Capital Gain | | | 1,372,318 | | | | 1,161,049 | |
| Return of Capital | | | 17,536,213 | | | | 6,431,787 | |
| | | $ | 18,908,531 | | | $ | 7,979,879 | |
As of September 30, 2016, the components of accumulated earnings/(deficit) on a tax basis were as follows:
| Undistributed | | | Undistributed | | | Post October Loss | | | Capital Loss | | | Other | | | Unrealized | | | Total | |
| Ordinary | | | Long-Term | | | and | | | Carry | | | Book/Tax | | | Appreciation/ | | | Accumulated | |
| Income | | | Gains | | | Late Year Loss | | | Forwards | | | Differences | | | (Depreciation) | | | Earnings/(Deficits) | |
| $ | — | | | $ | — | | | $ | (4,057,206 | ) | | $ | — | | | $ | — | | | $ | 41,998,722 | | | $ | 37,941,516 | |
The difference between book basis and tax basis distributable earnings and unrealized appreciation/(depreciation) is primarily attributable to adjustments for partnerships.
Late year losses incurred after December 31 within the fiscal year are deemed to arise on the first business day of the following fiscal year for tax purposes. The Fund incurred and elected to defer such late year losses of $4,057,206.
| Total Income+ Real Estate Fund |
| NOTES TO FINANCIAL STATEMENTS (Continued) |
| September 30, 2016 |
Permanent book and tax differences, primarily attributable to tax adjustments for partnerships, resulted in reclassification for the fiscal year ended September 30, 2016 as follows:
| Paid | | | Undistributed | | | Accumulated | |
| In | | | Net Investment | | | Net Realized | |
| Capital | | | Income (Loss) | | | Gains (Loss) | |
| $ | (513,118 | ) | | $ | (862,852 | ) | | $ | 1,375,970 | |
Class C shares may assess a short-term redemption fee of 1.00% of the total redemption amount if shareholders sell their shares after holding them for less than 365 days. The redemption fee does not apply to shares that were acquired through reinvestment of distributions. The redemption fee is paid directly to the Fund. For the fiscal year ended September 30, 2016, Class C did not assess any fees.
| 8. | COMMITMENTS AND CONTINGENCIES |
As of September 30, 2016, the Fund had unfunded capital call commitments for the below listed Private Equity Real Estate Securities:
| AEW Core Property Trust | | $ | 4,000,000 | |
| Clarion Lion Industrial Trust | | | 13,000,000 | |
| Heitman America Real Estate Trust | | | 16,800,000 | |
| J.P. Morgan Growth & Income | | | 18,000,000 | |
| Morgan Stanley Prime Property Fund | | | 65,000,000 | |
| Principal Enhanced Property Fund | | | 26,800,000 | |
| Prologis Targeted US Logistics | | | 20,600,000 | |
| RREEF America REIT II | | | 15,000,000 | |
| UBS Trumbull Property Growth | | | 19,000,000 | |
| Blackstone Property Partners | | | 57,448,174 | |
| Prudential PRISA I | | | 8,656,384 | |
| MEPT Edgemoor | | | 3,800,000 | |
| Stockbridge Value Fund II | | | 3,440,515 | |
| Invesco Core | | | 5,000,000 | |
| Invesco Income | | | 40,000,000 | |
| Total | | $ | 316,545,073 | |
Subsequent events after the date of the Statement of Assets and Liabilities have been evaluated through the date the financial statements were issued. Management has concluded that there is no impact requiring adjustment or disclosure in the financial statements.
The Fund completed a quarterly repurchase offer on November 7, 2016 which resulted in 2.86% of the Fund’s shares being repurchased for $14,987,772.

REPORT OF INDEPENDENT REGISTERED PUBLIC ACCOUNTING FIRM
To the Board of Trustees and the Shareholders of
Total Income + Real Estate Fund
We have audited the accompanying statement of assets and liabilities of Total Income + Real Estate Fund (the “Fund”) including the portfolio of investments, as of September 30, 2016, and the related statement of operations for the year then ended, the statements of changes in net assets for each of the years in the two-year period then ended and the financial highlights for each of the years in the three-year period then ended and for the period October 22, 2012 (commencement of operations) through September 30, 2013. These financial statements and financial highlights are the responsibility of the Fund’s management. Our responsibility is to express an opinion on these financial statements and financial highlights based on our audits.
We conducted our audits in accordance with the standards of the Public Company Accounting Oversight Board (United States). Those standards require that we plan and perform the audits to obtain reasonable assurance about whether the financial statements and financial highlights are free of material misstatement. An audit includes examining, on a test basis, evidence supporting the amounts and disclosures in the financial statements. Our procedures included confirmation of securities owned as of September 30, 2016 by correspondence with the custodian and other appropriate parties. An audit also includes assessing the accounting principles used and significant estimates made by management, as well as evaluating the overall financial statement presentation. We believe that our audits provide a reasonable basis for our opinion.
In our opinion, the financial statements and financial highlights referred to above present fairly, in all material respects, the financial position of Total Income + Real Estate Fund as of September 30, 2016, and the results of its operations for the year then ended, and the changes in its net assets for each of the years in the two-year period then ended and its financial highlights for each of the years in the three-year period then ended and for the period October 22, 2012 through September 30, 2013, in conformity with accounting principles generally accepted in the United States of America.

BBD, LLP
Philadelphia, Pennsylvania
November 29, 2016
| Total Income+ Real Estate Fund |
| SUPPLEMENTAL INFORMATION (Unaudited) |
| September 30, 2016 |
| |
The following is a list of the Trustees and executive officers of the Trust and each person’s principal occupation over the last five years.
Independent Trustees
| Name, Age | Position/Term of
Office* | Principal Occupation During
the Past Five Years | Number of
Portfolios in
Fund
Complex**
Overseen by
Trustee | Other Directorships
held by Trustee
During Last Five
Years |
| Bobby Majumder, 1968 | Trustee Since 2012 | Partner, Perkins Coie LLP (2013 -Present); Partner, K&L Gates LLP (2005– 2013) | 1 | Bluerock Residential Growth REIT, Inc. (2009– Present) |
| Clayton Hosterman, 1966 | Trustee Since 2014 | Director of Business Development for Sage Software, Inc. (2015-present); Principal and Director of Business Development for Banking, Accounting and Reseller Partners, Treasurer’s Choice Processing (2013-2015); Senior Vice President, Merchant E-Solutions, Inc. | 1 | None |
| | | (2012-2013); Group Manager, JPMorgan Chase-Paymentech (2006-2012). | | |
| Romano Tio, 1960 | Trustee Since 2012 | Co-Founder and Managing Director, RM Capital Management LLC(2009–Present) | 1 | Bluerock Residential Growth REIT, Inc. (2009 – Present) |
| Total Income+ Real Estate Fund |
| SUPPLEMENTAL INFORMATION (Unaudited) |
| September 30, 2016 |
| |
Interested Trustees and Officers
| Name, Age | Position/Term of
Office* | Principal Occupation During
the Past Five Years | Number of
Portfolios in
Fund
Complex**
Overseen by
Trustee | Other
Directorships held
by Trustee During
Last 5 Years |
| Ramin Kamfar, 1963 | Trustee Since 2012 | Chairman, Bluerock Real Estate, LLC (2002 – Present) | 1 | Bluerock Residential Growth REIT (2008 – Present). |
| James Babb, 1964 | Trustee Since 2012 | Senior Managing Director, Bluerock Real Estate, LLC (2007 – Present) | 1 | Bluerock Residential Growth REIT (2009 – 2014). |
| Jordan Ruddy, 1963 | Chief Operating Officer | President, Bluerock Real Estate, LLC (2002 – Present); Chief Executive Officer, CDI Group, Inc. (tradeshow exhibit manufacturer) 2003 – Present) | n/a | n/a |
| Jerry Novack, 1955 | Treasurer | Chief Financial Officer, Bluerock Real Estate, LLC (2002 – Present) | n/a | n/a |
| Michael Konig, 1960 | Secretary | Attorney / General Counsel, Bluerock Real Estate, LLC (2005 – Present) | n/a | n/a |
| William B. Kimme, 1962 | Chief Compliance Officer Since 2016 | Senior Compliance Officer, Northern Lights Compliance Services, LLC (2011 – Present); | n/a | n/a |
| * | The term of office for each Trustee and officer listed above will continue indefinitely. |
| ** | The term “Fund Complex” refers to the Total Income+ Real Estate Fund and Total Income+ Mortgage Fund |
The Fund’s Statement of Additional Information includes additional information about the Trustees and is available free of charge, upon request, by calling toll-free at 1-888-459-1059.
NOTICE OF PRIVACY POLICY & PRACTICES
PRIVACY notice
Rev. Aug. 2012
| FACTS | WHAT DOES THE TOTAL INCOME+ REAL ESTATE FUND DO WITH YOUR PERSONAL INFORMATION? |
| | |
| Why? | Financial companies choose how they share your personal information. Federal law gives consumers the right to limit some but not all sharing. Federal law also requires us to tell you how we collect, share, and protect your personal information. Please read this notice carefully to understand what we do. |
| | |
| What? | The types of personal information we collect and share depend on the product or service you have with us. This information can include: |
| | |
| | ■ | Social Security number | ■ | Purchase History |
| | | | | |
| | ■ | Assets | ■ | Account Balances |
| | | | | |
| | ■ | Retirement Assets | ■ | Account Transactions |
| | | | | |
| | ■ | Transaction History | ■ | Wire Transfer Instructions |
| | | | | |
| | ■ | Checking Account Information | | |
| | |
| | When you are no longer our customer, we continue to share your information as described in this notice. |
| | |
| How? | All financial companies need to share customers’ personal information to run their everyday business. In the section below, we list the reasons financial companies can share their customers’ personal information; the reasons the Total Income+ Real Estate Fund chooses to share; and whether you can limit this sharing. |
| Reasons we can share your personal information | Does Total
Income+ Real
Estate Fund share? | Can you limit this
sharing? |
For our everyday business purposes – such as to process your transactions, maintain your account(s), respond to court orders and legal investigations, or report to credit bureaus | Yes | No |
For our marketing purposes – to offer our products and services to you | No | We don’t share |
| For joint marketing with other financial companies | No | We don’t share |
For our affiliates’ everyday business purposes – information about your transactions and experiences | No | We don’t share |
For our affiliates’ everyday business purposes – information about your creditworthiness | No | We don’t share |
| For nonaffiliates to market to you | No | We don’t share |
| Questions? | Call 1-855-754-7930 |
| Who we are |
Who is providing this notice? | Total Income+ Real Estate Fund |
| What we do |
| How does Total Income+ Real Estate Fund protect my personal information? | To protect your personal information from unauthorized access and use, we use security measures that comply with federal law. These measures include computer safeguards and secured files and buildings. Our service providers are held accountable for adhering to strict policies and procedures to prevent any misuse of your nonpublic personal information. |
| How does Total Income+ Real Estate Fund collect my personal information? | We collect your personal information, for example, when you ■ Open an account ■ Provide account information ■ Give us your contact information ■ Make deposits or withdrawals from your account ■ Make a wire transfer ■ Tell us where to send the money ■ Tells us who receives the money ■ Show your government-issued ID ■ Show your driver’s license We also collect your personal information from other companies. |
| Why can’t I limit all sharing? | Federal law gives you the right to limit only ■ Sharing for affiliates’ everyday business purposes – information about your creditworthiness ■ Affiliates from using your information to market to you ■ Sharing for nonaffiliates to market to you State laws and individual companies may give you additional rights to limit sharing. |
| Definitions |
| Affiliates | Companies related by common ownership or control. They can be financial and nonfinancial companies. ■ Total Income+ Real Estate Fund does not share with our affiliates. |
| Nonaffiliates | Companies not related by common ownership or control. They can be financial and nonfinancial companies ■ Total Income+ Real Estate Fund does not share with nonaffiliates so they can market to you. |
| Joint marketing | A formal agreement between nonaffiliated financial companies that together market financial products or services to you. ■ Total Income+ Real Estate Fund doesn’t jointly market. |
| | | | | | |
| Investment Adviser |
| Bluerock Fund Advisor, LLC |
| 712 Fifth Avenue, 9th Floor |
| New York, NY 10019 |
| |
| Distributor |
| Northern Lights Distributors, LLC |
| 17605 Wright Street |
| Omaha, NE 68130 |
| |
| Legal Counsel |
| Thompson Hine LLP |
| 41 South High Street, Suite 1700 |
| Columbus, OH 43215 |
| |
| Independent Registered Public Accounting Firm |
| BBD, LLP |
| 1835 Market Street, 26th Floor |
| Philadelphia, PA 19103 |
| |
How to Obtain Proxy Voting Information
Information regarding how the Fund votes proxies relating to portfolio securities for the 12 month period ended June 30th as well as a description of the policies and procedures that the Fund used to determine how to vote proxies is available without charge, upon request, by calling 1-888-459-1059 or by referring to the Securities and Exchange Commission’s (“SEC”) website at http://www.sec.gov.
How to Obtain 1st and 3rd Fiscal Quarter Portfolio Holdings
The Fund files its complete schedule of portfolio holdings with the SEC for the first and third quarters of each fiscal year on Form N-Q. Form N-Q is available on the SEC’s website at http://www.sec.gov and may be reviewed and copied at the SEC’s Public Reference Room in Washington, DC (1-800-SEC-0330). The information on Form N-Q is available without charge, upon request, by calling 1-888-459-1059.
Item 2. Code of Ethics.
(a) As of the end of the period covered by this report, the registrant has adopted a code of ethics that applies to the registrant's principal executive officer, principal financial officer, principal accounting officer or controller, or persons performing similar functions, regardless of whether these individuals are employed by the registrant or a third party.
(b) For purposes of this item, “code of ethics” means written standards that are reasonably designed to deter wrongdoing and to promote:
| (1) | Honest and ethical conduct, including the ethical handling of actual or apparent conflicts of interest between personal and professional relationships; |
| (2) | Full, fair, accurate, timely, and understandable disclosure in reports and documents that a registrant files with, or submits to, the Commission and in other public communications made by the registrant; |
(3) Compliance with applicable governmental laws, rules, and regulations;
| (4) | The prompt internal reporting of violations of the code to an appropriate person or persons identified in the code; and |
(5) Accountability for adherence to the code.
(c) Amendments: During the period covered by the report, there have not been any amendments to the provisions of the code of ethics.
(d) Waivers: During the period covered by the report, the registrant has not granted any express or implicit waivers from the provisions of the code of ethics.
(e) The Code of Ethics is not posted on Registrant’ website.
(f) A copy of the Code of Ethics is attached as an exhibit.
Item 3. Audit Committee Financial Expert.
(a) The Registrant’s board of trustees has determined that Romano Tio is an audit committee financial expert, as defined in Item 3 of Form N-CSR. Mr. Tio is independent for purposes of this Item.
Item 4. Principal Accountant Fees and Services.
2016 - $20,500
2015 - $20,000
2016 - $0
2015 - $0
2016 - $3,000
2015 - $3,000
Preparation of Federal & State income tax returns, assistance with calculation of required income, capital gain and excise distributions and preparation of Federal excise tax returns.
2016 - $0
2015 - $0
| (e) | (1) Audit Committee’s Pre-Approval Policies |
The registrant’s Audit Committee is required to pre-approve all audit services and, when appropriate, any non-audit services (including audit-related, tax and all other services) to the registrant. The registrant’s Audit Committee also is required to pre-approve, when appropriate, any non-audit services (including audit-related, tax and all other services) to its adviser, or any entity controlling, controlled by or under common control with the adviser that provides ongoing services to the registrant, to the extent that the services may be determined to have an impact on the operations or financial reporting of the registrant. Services are reviewed on an engagement by engagement basis by the Audit Committee.
| (2) | Percentages of Services Approved by the Audit Committee |
| | | 2016 | | 2015 |
| Audit-Related Fees: | | | 100.00 | % | | | 100.00 | % |
| Tax Fees: | | | 100.00 | % | | | 100.00 | % |
| All Other Fees: | | | N/A | | | | N/A | |
| (f) | During the audit of registrant's financial statements for the most recent fiscal year, less than 50 percent of the hours expended on the principal accountant's engagement were attributed to work performed by persons other than the principal accountant's full-time, permanent employees. |
| (g) | The aggregate non-audit fees billed by the registrant's accountant for services rendered to the registrant, and rendered to the registrant's investment adviser (not including any sub-adviser whose role is primarily portfolio management and is subcontracted with or overseen by another investment adviser), and any entity controlling, controlled by, or under common control with the adviser that provides ongoing services to the registrant: |
2016 - $0
2015 - $0
(h) The registrant's audit committee has considered whether the provision of non-audit services to the registrant's investment adviser (not including any sub-adviser whose role is primarily portfolio management and is subcontracted with or overseen by another investment adviser), and any entity controlling, controlled by, or under common control with the investment adviser that provides ongoing services to the registrant, that were not pre-approved pursuant to paragraph (c)(7)(ii) of Rule 2-01 of Regulation S-X, is compatible with maintaining the principal accountant's independence.
Item 5. Audit Committee of Listed Companies. Not applicable
Item 6. Schedule of Investments. Schedule of investments in securities of unaffiliated issuers is included under Item 1.
Item 7. Disclosure of Proxy Voting Policies and Procedures for Closed-End Funds.
See attached Exhibit A for the Adviser’s proxy voting policies and procedures.
Item 8. Portfolio Managers of Closed-End Management Investment Companies.
Jordan B. Ruddy -- Mr. Ruddy has served as a member of the Investment Committee and as President of the Advisor since the inception of the Advisor in 2012. Mr. Ruddy brings over 25 years of institutional real estate investment experience working with some of leading public and private firms in the industry. Mr. Ruddy also serves as Chief Operating Officer of the Advisor’s affiliate, Bluerock, which he joined in 2002 and served as its President until January 2013. Previously, Mr. Ruddy served as a real estate investment banker at Banc of America Securities LLC, and at Smith Barney Inc. and at JP Morgan Chase (previously the Chase Manhattan Bank), and as Vice President of Amerimar Enterprises, a real estate company specializing in value-added investments nationwide. Mr. Ruddy received an M.B.A. degree in Finance and Real Estate in 1995 from The Wharton School of the University of Pennsylvania, and a B.S. degree with high honors in Economics in 1986 from the London School of Economics.
Adam Lotterman -- Mr. Lotterman is a co-founder of the Advisor and served as Associate Portfolio Manager to the Fund from its inception in 2012 until 2013, when he became the Fund’s Portfolio Manager. He has also served as Lead Economist of the Advisor since 2013, having previously served as Associate Economist, and has been a key member of its investment decision making team since its inception in 2012. From 2010 to 2012, Mr. Lotterman was an Adjunct Professor at Nova Southeastern University, where he taught Real Estate Market Analysis in the Masters of Real Estate Development program. From 2011 to 2012, Mr. Lotterman was Vice President, New Business Development for Forman Capital LLC, a private commercial real estate firm. From 2010 to 2011, Mr. Lotterman worked with Bayview Asset Management where he led a team responsible for the valuation and acquisition of loan portfolios ranging in size from $100 million to $40 billion, as well as analysis and formulation of workout strategies on complex non-performing loans. Previously, Mr. Lotterman served as the Senior Analyst for Goodkin Consulting, where he developed extensive experience in real estate consulting, research and analysis on a national level, and with Marcus & Millichap Company, where he produced quarterly economic briefs, leading indicator analyses, demand analyses for acquisitions, market and sub-market analyses. Mr. Lotterman received an M.S. in International Real Estate in 2006 from Florida International University, where he graduated first in class, and a B.S. Degree in microbiology with a minor in chemistry in 1997 from the University of Florida.
As of September 30, 2016, the Co-Portfolio Managers were responsible for the management of the following types of accounts in addition to the Fund:
Jordan Ruddy
| Other Accounts By Type | Total Number of Accounts by Account Type | Total Assets By Account Type | Number of Accounts by Type Subject to a Performance Fee | Total Assets By Account Type Subject to a Performance Fee |
| Registered Investment Companies | 0 | $0 | 0 | $0 |
| Other Pooled Investment Vehicles | 0 | $0 | 0 | $0 |
| Other Accounts | 0 | $0 | 0 | $0 |
Adam Lotterman
| Other Accounts By Type | Total Number of Accounts by Account Type | Total Assets By Account Type | Number of Accounts by Type Subject to a Performance Fee | Total Assets By Account Type Subject to a Performance Fee |
| Registered Investment Companies | 0 | $0 | 0 | $0 |
| Other Pooled Investment Vehicles | 0 | $0 | 0 | $0 |
| Other Accounts | 0 | $0 | 0 | $0 |
Because the Co-Portfolio Managers may manage assets for other pooled investment vehicles and/or other accounts (including institutional clients, pension plans and certain high net worth individuals) (collectively "Client Accounts"), or may be affiliated with such Client Accounts, there may be an incentive to favor one Client Account over another, resulting in conflicts of interest. For example, the Advisor may, directly or indirectly, receive fees from Client Accounts that are higher than the fee it receives from the Fund, or it may, directly or indirectly, receive a performance-based fee on a Client Account. In those instances, a portfolio manager may have an incentive to not favor the Fund over the Client Accounts. The Advisor has adopted trade allocation and other policies and procedures that it believes are reasonably designed to address these and other conflicts of interest.
As of September 30, 2016, the Portfolio Managers’ ownership of the Fund was as follows:
| Portfolio Managers | Dollar Range of Shares Owned |
| Jordan Ruddy | $50,000 to $100,000 |
| Adam Lotterman | $0 |
Mr. Ruddy does not receive compensation from the Advisor, but is compensated for his duties with an affiliate of the Advisor. Mr. Lotterman receives from the Advisor a salary and discretionary bonus and a share of the profits, if any, through his ownership share in the Advisor.
Item 9. Purchases of Equity Securities by Closed-End Funds. Not applicable
Item 10. Submission of Matters to a Vote of Security Holders. None
Item 11. Controls and Procedures.
(a) Based on an evaluation of the Registrant’s disclosure controls and procedures as of a date within 90 days of filing date of this Form N-CSR, the principal executive officer and principal financial officer of the Registrant have concluded that the disclosure controls and procedures of the Registrant are reasonably designed to ensure that the information required in filings on Form N-CSR is recorded, processed, summarized, and reported by the filing date, including that information required to be disclosed is accumulated and communicated to the Registrant’s management, including the Registrant’s principal executive officer and principal financial officer, as appropriate to allow timely decisions regarding required disclosure.
(b) There were no significant changes in the Registrant’s internal control over financial reporting that occurred during the Registrant’s last fiscal half-year that have materially affected, or are reasonably likely to materially affect, the Registrant’s internal control over financial reporting.
Item 12. Exhibits.
(a)(1) Code of Ethics filed herewith.
(a)(2) Certifications required by Section 302 of the Sarbanes-Oxley Act of 2002 (and Item 11(a)(2) of Form N-CSR) are filed herewith.
(a)(3) Not applicable.
(b) Certifications required by Section 906 of the Sarbanes-Oxley Act of 2002 (and Item 11(b) of Form N-CSR) are filed herewith.
SIGNATURES
Pursuant to the requirements of the Securities Exchange Act of 1934 and the Investment Company Act of 1940, the registrant has duly caused this report to be signed on its behalf by the undersigned, thereunto duly authorized.
(Registrant) Total Income+ Real Estate Fund
By (Signature and Title)
s/ Jordan Ruddy
Jordan B. Ruddy, President
Date: 12/9/16
Pursuant to the requirements of the Securities Exchange Act of 1934 and the Investment Company Act of 1940, this report has been signed below by the following persons on behalf of the registrant and in the capacities and on the dates indicated.
By (Signature and Title)
s/ Jordan Ruddy
Jordan B. Ruddy, President
Date 12/9/16
By (Signature and Title)
/s/ Jerry Novack
Jerry Novack, Treasurer
Date 12/9/16
APPENDIX A
BLUEROCK FUND ADVISOR, LLC
PROXY VOTING POLICIES AND PROCEDURES
Proxy Voting Policy
Background: Pursuant to Rule 206(4)-6 and Rule 204-2 under the Advisers Act, it is a fraudulent, deceptive, or manipulative act, practice or course of business, within the meaning of Section 206(4) of the Advisers Act, for an investment advisor to exercise voting authority with respect to client securities, unless (i) the advisor has adopted and implemented written policies and procedures that are reasonably designed to ensure that the advisor votes proxies in the best interests of its clients, (ii) the advisor describes its proxy voting procedures to its clients and provides copies on request, and (iii) the advisor discloses to clients how they may obtain information on how the advisor voted their proxies.
Policy: The Advisor will vote proxies vote proxies on behalf of its individual clients. The Advisor, when acting on behalf of the Fund, must comply with the following voting restrictions unless it is determined that the Fund is not relying on Section 12(d)(1)(F) and or Rule 12d1-3:
| · | when the Fund exercises voting rights, by proxy or otherwise, with respect to any investment company owned by the Fund, the Fund will either: |
| o | seek instruction from the Fund’s shareholders with regard to the voting of all proxies and vote in accordance with such instructions, or |
| o | vote the shares held by the Fund in the same proportion as the vote of all other holders of such security. |
In order to fulfill its responsibilities under the Advisers Act, the Advisor has adopted the following policies and procedures for proxy voting with regard to companies in the investment portfolio of the Fund(s).
Voting Proxies
| 1. | All proxies sent to clients that are actually received by the Advisor (to vote on behalf of the client) will be provided to the Operations Unit. |
| 2. | The Operations Unit will generally adhere to the following procedures (subject to limited exception): |
| (a) | A written record of each proxy received by the Advisor (on behalf of its clients) will be kept in the Advisor’s files; |
| (b) | The Operations Unit will determine which of the Advisor holds the security to which the proxy relates; |
| (c) | Prior to voting any proxies, the Operations Unit will determine if there are any conflicts of interest related to the proxy in question in accordance with the general guidelines set forth below. If a conflict is identified, the Operations Unit will then make a determination (which may be in consultation with outside legal counsel) as to whether the conflict is material. |
| (e) | If no material conflict is identified pursuant to these procedures, the Operations Unit will vote the proxy in accordance with the guidelines set forth below. The Operations Unit will deliver the proxy in accordance with instructions related to such proxy in a timely and appropriate manner. |
Conflicts of Interest
| 1. | As stated above, in evaluating how to vote a proxy, the Operations Unit will first determine whether there is a conflict of interest related to the proxy in question between Advisor and its Advisory Clients. This examination will include (but will not be limited to) an evaluation of whether the Advisor (or any affiliate of the Advisor) has any relationship with the company (or an affiliate of the company) to which the proxy relates outside of an investment in such company by a client of the Advisor. |
| 2 | If a conflict is identified and deemed “material” by the Operations Unit, the Advisor will determine whether voting in accordance with the proxy voting guidelines outlined below is in the best interests of the client (which may include utilizing an independent third party to vote such proxies). |
| 3 | With respect to material conflicts, the Advisor will determine whether it is appropriate to disclose the conflict to affected clients give such clients the opportunity to vote the proxies in question themselves. However, with respect to ERISA clients whose advisory contract reserves the right to vote proxies when the Advisor has determined that a material conflict exists that affects its best judgment as a fiduciary to the ERISA client, the Advisor will: |
| (a) | Give the ERISA client the opportunity to vote the proxies in question themselves; or |
| (b) | Follow designated special proxy voting procedures related to voting proxies pursuant to the terms of the investment management agreement with such ERISA clients (if any). |
Proxy Voting Guidelines
See Attached
Disclosure of Procedures
A summary of above these proxy voting procedures will be included in Part II of the Advisor’s Form ADV and will be updated whenever these policies and procedures are updated. Clients will be provided with contact information as to how they can obtain information about: (a) the Advisor’s proxy voting procedures (i.e., a copy of these procedures); and (b) how the Advisor voted proxies that are relevant to the affected client.
Record-keeping Requirements
The Operations Unit will be responsible for maintaining files relating to the Advisor’s proxy voting procedures. Records will be maintained and preserved for five years from the end of the fiscal year during which the last entry was made on a record, with records for the first two years kept in the offices of the Advisor. Records of the following will be included in the files:
1. Copies of these proxy voting policies and procedures, and any amendments thereto;
2. A copy of each proxy statement that the Advisor actually received; provided, however, that the Advisor may rely on obtaining a copy of proxy statements from the SEC’s EDGAR system for those proxy statements that are so available;
3. A record of each vote that the Advisor casts;
| 4. | A copy of any document that the Advisor created that was material to making a decision how to vote the proxies, or memorializes that decision (if any); and |
| 5. | A copy of each written request for information on how the Advisor voted such client’s proxies and a copy of any written response to any request for information on how the Advisor voted proxies on behalf of clients. |