UNITED STATES
SECURITIES AND EXCHANGE COMMISSION
Washington, D.C. 20549
FORM N-CSR
CERTIFIED SHAREHOLDER REPORT OF REGISTERED
MANAGEMENT INVESTMENT COMPANIES
Investment Company Act file number: 811-22710
BLUEROCK TOTAL INCOME+ REAL ESTATE FUND
(Exact name of registrant as specified in charter)
1345 Avenue of the Americas, 32nd Floor, New York, NY 10105
(Address of principal executive offices) (Zip code)
Bluerock Fund Advisor, LLC
1345 Avenue of the Americas, 32nd Floor,
New York, NY 10105
(Name and address of agent for service)
1-844-819-8287
(Registrant’s telephone number, including area code)
Date of fiscal year end: September 30
Date of reporting period: September 30, 2021
Item 1. Reports to Stockholders.

Annual Report
September 30, 2021
Investor Information: 1-844-819-8287
This report and the financial statements contained herein are submitted for the general information of shareholders and are not authorized for distribution to prospective investors unless preceded or accompanied by an effective prospectus. Nothing herein contained is to be considered an offer of sale or solicitation of an offer to buy shares of the Bluerock Total Income+ Real Estate Fund. Such offering is made only by prospectus, which includes details as to offering price and other material information.
Distributed by ALPS Distributors, Inc.
Member FINRA
TABLE OF CONTENTS
| Shareholder Letter | 1 |
| Portfolio Review | 9 |
| Portfolio of Investments | 11 |
| Statement of Assets and Liabilities | 15 |
| Statement of Operations | 16 |
| Statements of Changes in Net Assets | 17 |
| Statement of Cash Flows | 19 |
| Financial Highlights | 20 |
| Notes to Financial Statements | 25 |
| Report of Independent Registered Public Accounting Firm | 33 |
| Additional Information | 34 |
| Supplemental Information | 35 |
| Privacy Policy | 37 |

ANNUAL REPORT: (4Q 2020-3Q 2021) (unaudited)
Letter from the TI+ Portfolio Managers
To Our Valued Shareholders:
We thank you for your continued support of the Bluerock Total Income+ Real Estate Fund (“TI+” or the “Fund”). While globally we are still dealing with the pandemic and its impact on a return to “normalcy,” the U.S. economy has rebounded sharply from the 2020 low of the COVID-led recession with equity markets reaching new highs in September. Institutional private real estate has also performed well, led by high demand for industrial, apartments, life science and other specialty sectors coupled with constrained supply, which is characteristic of prior post-recession years. As of the end of Q3 2021, institutional private real estate generated higher yields than leading stock, investment grade bond, and even the highest rated junk bond indexes.^This yield premium combined with rental growth opportunities, particularly in the high demand sectors listed above, have attracted more capital to the asset class, which is continuing to drive performance. We believe institutional private real estate may continue to offer attractive investment opportunities relative to traditional debt and equity investments due to higher yields supported by longterm demographic and technological demand drivers.
Looking back on the Fund’s year ended September 30, 2021, we note the following highlights:
 | FUND HIGHLIGHTS |
| | |
 | STRONG PERFORMANCE POST RECESSION:
The Fund posted a 15%+ total net return in the trailing 12 months through September 30, 2021 after weathering the recession as the highest returning institutional real estate interval fund in 2020 (01.01.2020 - 12.31.2020)1.The Fund also celebrated its nine-year anniversary on 10.22.2021 and surpassed $3 billion in net assets under management. |
| | |
| BLUEROCK’S ACTIVE MANAGEMENT:
The Fund maintained a strategic overweight to sectors we believe have strong secular tailwinds driven by evolving consumer preferences, demographic changes, and technological advancement, including industrial, apartments, life science and other specialty sectors. We also maintained a significant underweight to sectors with challenging fundamentals, such as commodity office and retail. |
| | |
| | A FOCUS ON INSTITUTIONAL PRIVATE REAL ESTATE:
Approximately 95% of the total portfolio remains in institutional private real estate. TI+ has consistently focused on providing investors a diversified portfolio of institutional private real estate as opposed to public real estate securities. Historical evidence indicates that the two asset classes tend to perform similarly over long periods of time, but institutional private real estate has done so with 80% less volatility over the past 20 years.2 We believe access to a fund more heavily weighted to institutional private real estate is a valuable tool for investors in constructing their portfolios. |
| | |
| 1) | Source: Morningstar Direct; Institutional real estate interval funds are those identified as real estate by interval fund tracker and those that invest in institutional real estate. |
| 2) | Source: Morningstar Direct. Institutional real estate as measured by the NCREIF Property Index (NPI) and public real estate securities as measured by the MSCI U.S. Real Estate Investment Trust Index. For the 20 years ended 9.30.2021, the NPI generated an 8.40% return and a 4.67% standard deviation and the MSCI U.S. REIT Index generated a 10.17% return and 22.01% standard deviation. |
TI+ A-shares as of 9.30.2021: 1 year no load: 15.53%, with load: 8.90%, 3 year no load: 7.46%, with load: 5.36%, 5 year no load: 7.41%, with load: 6.15%, since inception (10.22.2012) no load: 7.92%, with load: 7.21%. Past Performance is not a guarantee of future results.
CORPORATE HEADQUARTERS | 1345 AVENUE OF THE AMERICAS | 32ND FLOOR | NEW YORK, NY 10105 | 877.826.BLUE (2583) | BLUEROCK.COM
1
 | ANNUAL REPORT (4Q 2020 - 3Q 2021) | BLUEROCK TOTAL INCOME+ REAL ESTATE FUND | (UNAUDITED) |
TI+ Active Overweights vs. the Index in Targeted Sectors Have Contributed to the Fund’s Performance

| 3) | National Council of Real Estate Investment Fiduciaries Property Index, Q3 2021 sector total returns. |
| 4) | Average quarterly return for specialty sector is the arithmetic average of all alternative property sectors including self storage, health care, and other categories. |
Market Overview
Given the economic rebound, market focus has shifted to inflation, rising interest rates, supply chain obstacles, and an accommodative Federal Reserve. Our view is that inflation may end up being stickier than the Fed had initially hoped, in part driven by supply chain bottlenecks and labor shortages. The Fed recently stated it will reduce its bond purchases (begin tapering) by $15 billion per month with a target of ending bond purchases by the middle of next year. Additionally, the Fed voted not to raise the Fed Funds rate in the fourth quarter, due in large part to a still recovering labor market and a desire to conclude bond purchases before raising rates.
Accommodative fiscal and monetary policies have turned a low interest environment into a negative real yield environment that is likely to have broad effects on all asset classes. Negative real yields for Treasuries and investment grade credit are unappealing for many bond market investors. Given the recent run up in equity prices and historically high stock valuations, institutional real estate looks particularly attractive.
While the Fed may see inflation as transitory, we recognize investors are concerned about inflation and how it might impact their investment portfolios. We believe our shareholders should feel confident in this environment due to institutional real estate’s historical performance in inflationary environments and the inherent benefits of inflation on real estate.
Historically, real estate has performed above its long terms averages in inflationary and rising rate periods, while investment grade bonds have performed below their long term average.
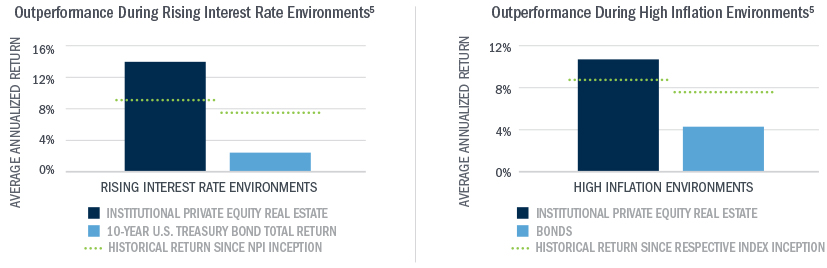
| 5) | Source: NCREIF, US Federal Reserve. A rising interest rate environment is defined as quarters when the Effective Federal Funds Rate (FFR) increased 25 basis points or more; NCREIF Property Index (NPI) and 10-year US Treasury Bond Total Return (ICE BofA US Treasury 7-10 yr.) tallied, averaged and annualized for those quarters. Analysis since NPI inception (Jan 1978) through Dec 2020. A high inflation environment is defined as quarters when the Consumer Price Index (CPI) increased 100 basis points or more; NCREIF Property Index (NPI) and Bloomberg Aggregate Bond Index tallied, averaged and annualized for those quarters. Analysis since Bloomberg Aggregate Bond Index inception (Jan 1980) through Dec 2020. |
2
| | ANNUAL REPORT (4Q 2020 - 3Q 2021) | BLUEROCK TOTAL INCOME+ REAL ESTATE FUND | (UNAUDITED) |
Outlook
We believe the current outlook presents tremendous opportunities for both institutional private real estate and TI+. While bond markets grapple with negative real yields and stock markets battle high valuations, institutional private real estate appears to be a beneficiary of the broader economic landscape where economic growth and inflation have pushed rental rates and values higher.
Institutional real estate as an asset class, like stocks, has typically exhibited differentiation across sectors and today’s environment is no different. The Fund’s investment strategy is thematic-based, attempting to capitalize on long-term structural trends, not just economic cycles. Accordingly, the Fund plans to maintain its focus on the industrial, apartment, life science and other specialty sectors. The growth of E-commerce is an undeniable long-term catalyst for industrial demand. Demographics and overall housing shortages continue to push apartment and single family rental housing demand higher, while specialty property sectors such as life sciences stand to benefit from increased pharmaceutical research and development.
The Fund offers access to a diversified, actively managed, institutional private real estate portfolio, supported by a 9-year track record of positive returns, low volatility and 35 consecutive quarterly distributions,* all of which we believe are essential components of a balanced investment portfolio. We believe these accomplishments and thematic approach may offer continued benefit to our shareholders and distinguish us from our peers.
Sincerely,
| | | | |
 |  |  |  |
| Adam Lotterman | Jordan Ruddy |
| Co-Chief Investment Officer and Senior Portfolio Manager | Co-Chief Investment Officer and Senior Portfolio Manager |
| Bluerock Total Income+ Real Estate Fund | Bluerock Total Income+ Real Estate Fund |
| | FUND SUB-ADVISORS |
| | | |
| |  | About Mercer Investment Management | |
| | Mercer Investment Management, Inc. (“Mercer”), acts as sub-advisor to the Fund’s private real estate investments. For more than 75 years, Mercer has been one of the world’s leading advisors to endowments, pension funds, sovereign wealth funds and family offices globally, with over 10,600 clients worldwide, and over $15.5 trillion in assets under advisement (as of 12.31.2020). Mercer works to evaluate over 6,700 investment managers and over 35,600 individual investments/strategies (as of 6.30.2021) and works with Bluerock to select a strategic combination of ‘best-in-class’ institutional real estate managers and investments for the Fund. | |
| | | |
| |  | About DWS | |
| | DWS Group GmbH and Co. KGaA (“DWS”) formerly Deutsche Asset Management), through its indirect subsidiary RREEF Investment, LLC, acts as sub-advisor to the Fund’s public real estate securities investments and is a registered investment adviser under the Investment Advisers Act of 1940. DWS’ real estate business in the U.S. dates back to 1975. Today, DWS has $1.0 trillion in assets under management and works with 675+ institutional clients. Of that total, approximately $81.8 billion of AUM is invested in public and private real estate globally, making DWS one of the largest real estate managers in the world (as of 6.30.2021). | |
| | | | | |
3
| | ANNUAL REPORT (4Q 2020 - 3Q 2021) | BLUEROCK TOTAL INCOME+ REAL ESTATE FUND | (UNAUDITED) |
Performance
From inception (10.22.2012) through 9.30.2021, TI+ (A Shares) generated a cumulative total return of 97.68%, or 7.92% annualized (load waived). The Fund was able to accomplish this primarily through private real estate investments, generating both income and capital appreciation. Private investments are supplemented with select public real estate securities. The Fund currently offers four share classes outstanding: A, C, I and L Shares.** A summary of the performance of each share class is presented below.
Fund Performance thru 9.30.2021†
| | One Year | Three Year | Five Year | Since Inception6 |
| TI+ Class A | 15.53% | 7.46% | 7.41% | 7.92% |
| TI+ Class A with Max Sales Charge7 | 8.90% | 5.36% | 6.15% | 7.21% |
| TI+ Class C | 14.65% | 6.66% | 6.61% | 7.13% |
| TI+ Class C with Load8 | 13.65% | 6.66% | 6.61% | 7.13% |
| TI+ Class I | 15.81% | 7.73% | 7.68% | 8.17% |
| TI+ Fund - Class L | 15.21% | 7.19% | 7.14% | 7.65% |
| TI+ Class L with Max Sales Charge8 | 10.32% | 5.65% | 6.22% | 7.13% |
| 6 | Since Inception returns as of October 22, 2012. Actual Inception date of the A Shares is October 22, 2012. Actual Inception date of the Fund’s C and I Shares is April 1, 2014. Actual Inception date for the L Shares is June 1, 2017 |
| 7 | The maximum sales charge for the A Shares is 5.75% and for L Shares is 4.25%. Investors may be eligible for a reduction in sales charges. |
| 8 | Adjusted for early withdrawal charge of 1.00%. |
| † | Returns for Class C, Class I and Class L Shares prior to their inception dates are based on the performance of Class A Shares. For Class C and Class L Shares, prior performance has been adjusted to reflect differences in expenses between the respective classes and Class A. The actual returns of Class I would have been different than those shown because Class I has lower expenses than Class A. |
The total annual fund operating expense ratio, gross of any fee waivers or expense reimbursements, is 2.18% for Class A, 2.93% for Class C, 1.92% for Class I and 2.42% for Class L per the February 1, 2021 prospectuses.
The performance data quoted here represents past performance. Current performance may be lower or higher than the performance data quoted above. Investment return and principal value will fluctuate, so that shares, when redeemed, may be worth more or less than their original cost. Past performance is not a guarantee of future results. The Fund’s investment advisor has contractually agreed to reduce its fees and/or absorb expenses of the Fund, at least until January 31, 2022, for Class A, C, I and L shares to ensure that the net annual fund operating expenses will not exceed 1.95% for Class A, 2.70% for Class C and 1.70% for Class I, and 2.20% for Class L, subject to possible recoupment from the Fund in future years. Please review the Fund’s Prospectuses for more detail on the expense waiver. Results shown reflect the full fee waiver, without which the results could have been lower. A Fund’s performance, especially for very short periods of time, should not be the sole factor in making your investment decisions. For performance information current to the most recent month end, please call toll-free 1-844-819-8287.
Total returns are calculated using SEC Form N-2 instructions and reflect all fees and charges.
** The Fund registered the offering of its Class M shares on February 1, 2020, however as of September 30, 2021 no such shares have been issued and therefore are not included in the Fund’s performance information.
4
| | ANNUAL REPORT (4Q 2020 - 3Q 2021) | BLUEROCK TOTAL INCOME+ REAL ESTATE FUND | (UNAUDITED) |
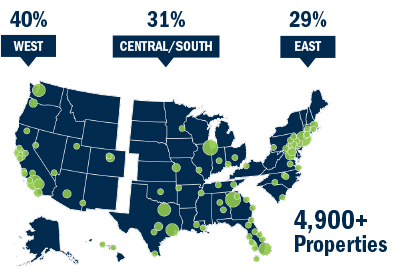
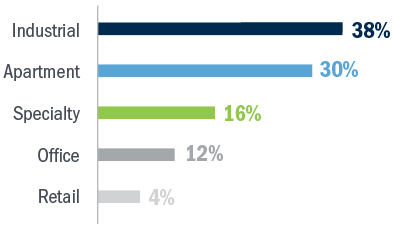
| Geographic Diversification | | Sector Diversification |
| | |
| The regions and allocations presented represent the Fund’s institutional fund investments as of 9.30.2021, but is subject to change at any time. | | The sector diversification presented represents examples of how the Fund’s institutional fund investments are allocated as of 9.30.2021, but is subject to change at any time. |
 | |  |
Highlighted Assets

As of 9.30.2021. The properties shown here are currently owned by the underlying third party institutional private equity real estate funds described herein. Diversification does not ensure profit and Holdings are subject to change.
5
| | ANNUAL REPORT (4Q 2020 - 3Q 2021) | BLUEROCK TOTAL INCOME+ REAL ESTATE FUND | (UNAUDITED) |
Fund Holdings
As of 9.30.2021, the Gross Asset Value of the underlying real estate in the institutional private real estate funds in which TI+ is invested is over $252 billion, comprising approximately 4,900 properties across the United States.
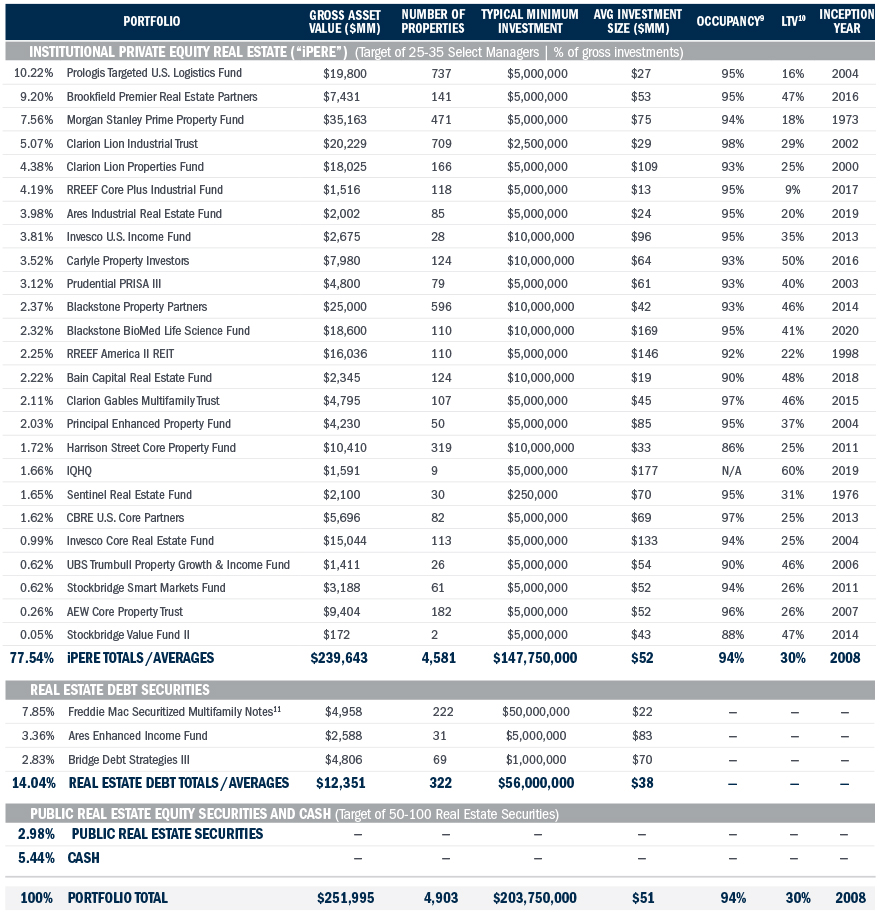
| 9 | Occupancy rates reported from underlying managers, average is the simple average of all private funds. Generally excludes properties under construction, but generally includes properties in lease-up. |
| 10 | Weighted average loan to value: outstanding loan balance divided by the total value of the underlying real estate. For IQHQ, estimated based on expected leverage target. |
| 11 | The Fund expects to invest in the privately offered subordinate classes of K-Notes. Because more-senior classes have payment priority over subordinate classes of K-Notes, the value of subordinate K-Notes is highly sensitive to the default rate and foreclosure recovery rate on the underlying apartment loans. Subordinate K-Notes are also subject to liquidity risk because they are not available to the investing public and have a limited secondary market composed of institutional investors. |
6
| | ANNUAL REPORT (4Q 2020 - 3Q 2021) | BLUEROCK TOTAL INCOME+ REAL ESTATE FUND | (UNAUDITED) |
Definitions
NFI-ODCE: a capitalization-weighted, gross of fee, time-weighted return index with an inception date of December 31, 1977. Supplemental data is also provided, such as equalweight and net of fee returns, for informational purposes and additional analysis.
Annualized Standard Deviation: The standard deviation of the daily percentage change in an investment multiplied by the square root of the number of trading days in the period. Standard deviation shows how much variation from the average exists with a larger number indicating the data points are more spread out over a larger range of values.
iPERE/NCREIF Property Index (NPI): Institutional private equity real estate (iPERE) can be described as high-quality commercial properties that are usually congregated in large investment portfolios managed professionally on behalf of third-party owners or beneficiaries. The leading benchmark index for iPERE is the National Council of Real Estate Investment Fiduciaries Price Index (NPI) which represents a collection of 7,000+ institutional properties representing all major commercial property types within the U.S. The NPI is a quarterly time series composite total rate of return measure of investment performance of a very large pool of individual commercial real estate properties acquired in the private market for investment purposes only. All properties in the NPI have been acquired, at least in part, on behalf of tax-exempt institutional investors - the great majority being pension funds. As such, all properties are held in a fiduciary environment.
^ Sources: Morningstar Direct, Standard & Poors, Yahoo Finance, Federal Reserve Economic Data. Institutional Real Estate: Yield is from the NCREIF Property Index (NPI) as of 9.30.2021, The NPI is a leading benchmark index for Institutional Real Estate which represents a collection of 9,700+ institutional properties representing all major commercial property types within the U.S. The NPI is a quarterly time series composite total rate of return measure of investment performance of a very large pool of individual commercial real estate properties acquired in the private market for investment purposes only. All properties in the NPI have been acquired, at least in part, on behalf of tax-exempt institutional investors - the great majority being pension funds. As such, all properties are held in a fiduciary environment. High Yield Bonds: Yield is from the ICE BofA U.S. High Yield BB Index Effective Yield, maximum drawdown is from the ICE BofA US High Yield. The ICE BofA US High Yield is an index that measures the performance of short-term US dollar denominated below investment grade corporate debt publicly issued in the US domestic market. Qualifying securities must have at least 18 months to final maturity at the time of issuance, at least one-year remaining term to final maturity as of the rebalancing date, a fixed coupon schedule and a minimum amount outstanding of $100 million. It is capitalization-weighted. Investment Grade Bonds: Yield is from the ICE BofA AAA US Corporate Index Effective Yield, maximum drawdown is from the ICE BofA AAA US Corporate. ICE BofA AAA US Corporate: A subset of the ICE BofA US Corporate Master Index tracks the performance of US dollar denominated investment grade rated corporate debt publicly issued in the US domestic market. This subset includes all securities with a given investment grade rating AAA. Public REITs: Yield is from the FTSE Nareit All Equity REITs, maximum drawdown is from the FTSE Nareit All Equity REITs. The FTSE Nareit All Equity REITs Index is a free-float adjusted, market capitalization-weighted index of U.S. equity REITs. Constituents of the index include all tax-qualified REITs with more than 50 percent of total assets in qualifying real estate assets other than mortgages secured by real property. T-Bonds: Yield is the 10-Year U.S Treasury Bond, maximum drawdown is from the BBgBarc US Treasury 10+ Year. The BBgBarc US Treasury 10+ Year is an index that measures U.S. Dollar denominated, fixed rate, nominal debt issued by the U.S. Treasury with 10 or more years to maturity. T-Bills: Yield is from the 3-Month Treasury Bill Yield, maximum drawdown is from the BBgBarc US Treasury Bill 1-3 Month The BBgBarc US Treasury Bill 1-3 Month is an index that measures the performance of public obligations of the U.S. Treasury with maturities of 1-3 month, including securities roll up to the U.S. Aggregate, U.S. Universal, and Global Aggregate Indices. You cannot invest directly in an index and unmanaged indices do not reflect fees, expenses or sales charges. Additionally, a rise in interest rates could cause a decline in the value of fixed income securities. The referenced yields are shown for general market comparisons. Past performance is not a guarantee of future results.
* The Fund’s distribution policy is to make quarterly distributions to shareholders. The level of quarterly distributions (including any return of capital) is not fixed. However, this distribution policy is subject to change. The Fund’s distribution amounts were calculated based on the ordinary income received from the underlying investments, including shortterm capital gains realized from the disposition of such investments. Shareholders should not assume that the source of a distribution from the Fund is net profit. All or a portion of the distributions consist of a return of capital based on the character of the distributions received from the underlying holdings, primarily Real Estate Investment Trusts. The final determination of the source and tax characteristics of all distributions will be made after the end of the year. Shareholders should note that return of capital will reduce the tax basis of their shares and potentially increase the taxable gain, if any, upon disposition of their shares. There is no assurance that the Company will continue to declare distributions or that they will continue at these rates.
You cannot invest directly in an index. Benchmark performance should not be considered reflective of Fund performance.
Risk Disclosures
Not FDIC Insured | No Bank Guarantee | May Lose Value
Investing in the Fund involves risks, including the risk that you may receive little or no return on your investment or that you may lose part or all of your investment.
The ability of the Fund to achieve its investment objective depends, in part, on the ability of the Advisor to allocate effectively the Fund’s assets across the various asset classes in which it invests and to select investments in each such asset class. There can be no assurance that the actual allocations will be effective in achieving the Fund’s investment objective or delivering positive returns.
Limited liquidity is provided to shareholders only through the Fund’s quarterly repurchase offers for no less than 5% of the Fund’s shares outstanding at net asset value. There is no guarantee that shareholders will be able to sell all of the shares they desire in a quarterly repurchase offer. Since inception, the Fund has made 35 repurchase offers, of which 31 have resulted in the repurchase of all shares tendered and four have resulted in the repurchase of less than all shares tendered. In connection with the August 2021 repurchase offer, the Fund repurchased 100% of the shares tendered. Quarterly repurchases by the Fund of its shares typically will be funded from available cash or sales of portfolio securities. The sale of securities to fund repurchases could reduce the market price of those securities, which in turn would reduce the Fund’s net asset value.
An investment in shares represents an indirect investment in the securities owned by the Fund. The value of these securities, like other market investments, may move up or down, sometimes rapidly and unpredictably. The Fund is “non-diversified” under the Investment Company Act of 1940 and therefore may invest more than 5% of its total assets in the securities of one or more issuers. As such, changes in the financial condition or market value of a single issuer may cause a greater fluctuation in the Fund’s net asset value than in a “diversified” fund. The Fund is not intended to be a complete investment program.
The Fund is subject to the risk that geopolitical and other similar events will disrupt the economy on a national or global level. For instance, war, terrorism, market manipulation, government defaults, government shutdowns, political changes or diplomatic developments, public health emergencies (such as the spread of infectious diseases, pandemics and epidemics) and natural/environmental disasters can all negatively impact the securities markets.

7
| | ANNUAL REPORT (4Q 2020 - 3Q 2021) | BLUEROCK TOTAL INCOME+ REAL ESTATE FUND | (UNAUDITED) |
The current novel coronavirus (COVID-19) global pandemic and the aggressive responses taken by many governments, including closing borders, restricting international and domestic travel, and the imposition of prolonged quarantines or similar restrictions, as well as the forced or voluntary closure of, or operational changes to, many retail and other businesses, have had negative impacts, and in many cases severe negative impacts, on markets worldwide. Potential impacts on the real estate market may include lower occupancy rates, decreased lease payments, defaults and foreclosures, among other consequences. It is not known how long such impacts, or any future impacts of other significant events described above, will or would last, but there could be a prolonged period of global economic slowdown.
The Fund will concentrate its investments in real estate industry securities. The value of the Fund’s shares will be affected by factors affecting the value of real estate and the earnings of companies engaged in the real estate industry. These factors include, among others: (i) changes in general economic and market conditions; (ii) changes in the value of real estate properties; (iii) risks related to local economic conditions, overbuilding and increased competition; (iv) increases in property taxes and operating expenses; (v) changes in zoning laws; (vi) casualty and condemnation losses; (vii) variations in rental income, neighborhood values or the appeal of property to tenants; (viii) the availability of financing and (ix) changes in interest rates. Many real estate companies utilize leverage, which increases investment risk and could adversely affect a company’s operations and market value in periods of rising interest rates. The value of securities of companies in the real estate industry may go through cycles of relative under-performance and over-performance in comparison to equity securities markets in general.
A significant portion of the Fund’s underlying investments are in private real estate investment funds managed by institutional investment managers (“Institutional Investment Funds”). Investments in Institutional Investment Funds pose specific risks, including: such investments require the Fund to bear a pro rata share of the vehicles’ expenses, including management and performance fees; the Advisor and Sub-Advisor will have no control over investment decisions may by such vehicle; such vehicle may utilize financial leverage; such investments have limited liquidity; the valuation of such investment as of a specific date may vary from the actual sale price that may be obtained if such investment were sold to a third party.
Additional risks related to an investment in the Fund are set forth in the “Risk Factors” section of the prospectus, which include, but are not limited to the following: convertible securities risk; correlation risk; credit risk; fixed income risk; leverage risk; risk of competition between underlying funds; and preferred securities risk.
Investors should carefully consider the investment objectives, risks, charges and expenses of the Fund. This and other important information about the Fund is contained in the prospectus, which can be obtained by calling toll free 844-819-8287, or online at bluerockfunds.com. The prospectus should be read carefully before investing.
The Fund is distributed by ALPS Distributors, Inc (“ALPS”). Bluerock Fund Advisor, LLC is not affiliated with ALPS, Mercer Investment Management, or DWS.
Additional Fund performance details available at bluerockfunds.com/performance. Investors may be eligible for a reduction in sales charges. Please see the Fund prospectus for details. Please note that the indices are for informational purposes only and are not reflective of any investment. As it is not possible to invest in the indices, the data shown does not reflect or compare features of an actual investment, such as its objectives, costs and expenses, liquidity, safety, guarantees or insurance, fluctuation of principal or return, or tax features.
There are limitations when comparing the Fund to stock, bond, and public real estate indices. Many open-end funds which track these indices offer daily liquidity, while closed-end interval funds offer liquidity only on a periodic basis. Deteriorating general market conditions will reduce the value of stock securities. When interest rates rise, the value of bond securities tends to fall. Real estate securities may decline because of adverse developments affecting the real estate industry and real property values. You cannot invest directly in an index and unmanaged indices do not reflect fees, expenses or sales charges. Please see definitions for a description of the risks and comparisons of the investment indexes selected.
8
| Bluerock Total Income+ Real Estate Fund | Portfolio Review |
| September 30, 2021 (Unaudited) |

The Fund’s performance figures for certain periods ended September 30, 2021, compared to its benchmarks:
| Bluerock Total Income+ Real Estate Fund: | | One Year | | Three Year | | Five Year | | Since Inception Class A* | | Since Inception Class C and Class I* | | Since Inception Class L* |
| Class A | | | | | | | | | | | | |
| Without Load | | | 15.53 | % | | | 7.46 | % | | | 7.41 | % | | | 7.92 | % | | | – | | | | – | |
| With Load(a) | | | 8.90 | % | | | 5.36 | % | | | 6.15 | % | | | 7.21 | % | | | – | | | | – | |
| Class C | | | | | | | | | | | | | | | | | | | | | | | | |
| Without Load | | | 14.65 | % | | | 6.66 | % | | | 6.61 | % | | | – | | | | 6.51 | % | | | – | |
| With Load(b) | | | 13.65 | % | | | 6.66 | % | | | 6.61 | % | | | – | | | | 6.51 | % | | | – | |
| Class I | | | 15.81 | % | | | 7.73 | % | | | 7.68 | % | | | – | | | | 7.60 | % | | | – | |
| Class L | | | | | | | | | | | | | | | | | | | | | | | | |
| Without Load | | | 15.21 | % | | | 7.19 | % | | | – | | | | – | | | | – | | | | 7.19 | % |
| With Load(c) | | | 10.32 | % | | | 5.65 | % | | | – | | | | – | | | | – | | | | 6.12 | % |
| S&P 500 Total Return Index | | | 30.00 | % | | | 15.99 | % | | | 16.90 | % | | | 15.37 | % | | | 13.86 | % | | | 16.25 | % |
| Bloomberg Barclays U.S. Aggregate Bond Index | | | -0.90 | % | | | 5.36 | % | | | 2.94 | % | | | 2.81 | % | | | 3.36 | % | | | 3.59 | % |
| * | Class A commenced operations October 22, 2012, Class C and Class I commenced operations April 1, 2014, and Class L commenced operations June 1, 2017. |
| (a) | Adjusted for initial maximum sales charge of 5.75%. |
| (b) | Adjusted for early withdrawal charge of 1.00%. |
| (c) | Adjusted for initial maximum sales charge of 4.25%. |
The S&P 500 Total Return Index is an unmanaged market capitalization-weighted index which is comprised of 500 of the largest U.S. domiciled companies and includes the reinvestment of all dividends. Investors cannot invest directly in an index or benchmark.
The Bloomberg Barclays U.S. Aggregate Bond Index is an unmanaged index which represents the U.S. investment-grade fixed-rate bond market (including government and corporate securities, mortgage pass-through securities and asset-backed securities). Investors cannot invest directly in an index or benchmark.
Total returns are calculated using closing Net Asset Value as of September 30, 2021, and may not match returns presented in the Financial Highlights due to adjustments under accounting principles generally accepted in the United States of America.
| Annual Report | September 30, 2021 | 9 |
| Bluerock Total Income+ Real Estate Fund | Portfolio Review |
September 30, 2021 (Unaudited)
The performance data quoted is historical. Past performance is no guarantee of future results. The investment return and principal value of an investment will fluctuate. An investor’s shares, when redeemed, may be worth more or less than the original cost. Total returns are calculated using closing Net Asset Value as of September 30, 2021. Total returns are calculated assuming reinvestment of all dividends and distributions. Total returns would have been lower had the Advisor not waived a portion of its fees. Returns greater than one year are annualized. The Advisor and the Fund have entered into an expense limitation agreement under which the Advisor has contractually agreed to reduce its fees and/or absorb expenses for Class A, Class C, Class I and Class L at least until January 31, 2022 to ensure that the net annual fund operating expenses (exclusive of any taxes, interest, brokerage commissions, acquired fund fees and expenses, and extraordinary expenses, such as litigation or reorganization costs, but inclusive of organizational costs and offering costs) will not exceed 1.95%, 2.70%, 1.70%, and 2.20% of the Fund’s average daily net assets attributable to the Class A, Class C, Class I and Class L shares, respectively. The Fund has agreed to repay the Advisor in the amount of any fees the Advisor previously waived and or Fund expenses reimbursed, pursuant to the expense limitation agreement, subject to the limitations therein that: (1) the reimbursement will be made if payable not more than three years from the date incurred; (2) the reimbursement may not be made if it would cause the Expense Limitation then in effect or in effect at time of waiver to be exceeded; and (3) the reimbursement is approved by the Fund’s Board of Trustees.
The Fund’s total gross annual operating expenses, including the expenses of underlying funds and before any fee waiver, are 2.18%, 2.93%, 1.92% and 2.42% for Class A, Class C, Class I and Class L, respectively, per the February 1, 2021 prospectus. Class A shares are subject to a maximum sales charge imposed on purchases of 5.75%. Class A shareholders who tender for repurchase Class A shares that were purchased in amounts of $1,000,000 or more that have been held less than one year (365 days) from the purchase date will be subject to an early withdrawal charge of 1.00% of the original purchase price. Class C shares are subject to an early withdrawal charge of 1.00% if redeemed less than 365 days after the purchase. Class L shares are subject to a maximum sales charge imposed on purchases of 4.25%. The Fund registered the offering of its Class M shares on February 1, 2020, however as of September 30, 2021 no such shares have been issued and therefore are not included in the Fund’s performance information. The above performance figures do not reflect the deduction of taxes that a shareholder would have to pay on Fund distributions or the redemption of the Fund shares. For performance information current to the most recent month-end, please call 1-844-819-8287.
Portfolio Composition as of September 30, 2021
| | | Percent of Net Assets |
| Private Real Estate Securities | | | 83.54 | % |
| Real Estate Debt Securities | | | 8.34 | % |
| Short-Term Investments | | | 5.33 | % |
| Public Equity Real Estate Securities | | | 2.06 | % |
| Total Investments | | | 99.27 | % |
| Other Assets in Excess of Liabilities | | | 0.73 | % |
| Total Net Assets | | | 100.00 | % |
See the Portfolio of Investments in this annual report for a more detailed account of the Fund’s holdings.
10
| Bluerock Total Income+ Real Estate Fund | Portfolio of Investments |
September 30, 2021
| Security | | Shares | | Value |
| PRIVATE REAL ESTATE SECURITIES (83.54%)(a) | | | | |
| Apartments (3.79%) | | | | |
| Clarion Gables Multifamily Trust | | | 47,284 | | | $ | 67,953,335 | |
| Sentinel Real Estate Fund | | | 490 | | | | 51,863,427 | |
| | | | | | | | 119,816,762 | |
| Diversified (51.61%) | | | | | | | | |
| AEW Core Property Trust | | | 7,239 | | | | 7,943,729 | |
| Ares Real Estate Enhanced Income Fund | | | N/A | | | | 102,128,567 | |
| Bain Capital Real Estate Fund I | | | N/A | | | | 74,398,548 | |
| Blackstone Property Partners | | | 47,161 | | | | 73,691,434 | |
| Bridge Debt Strategies Fund III, LP | | | N/A | | | | 88,309,864 | |
| Brookfield Premier Real Estate Partners | | | 191,278 | | | | 281,580,220 | |
| Carlyle Property Investors | | | 68,358 | | | | 110,516,665 | |
| CBRE U.S. Core Partners, LP | | | 31,687,739 | | | | 53,080,245 | |
| Clarion Lion Properties Fund | | | 79,857 | | | | 135,822,552 | |
| Harrison Street Core Property Fund | | | 35,400 | | | | 52,461,071 | |
| Invesco Core Real Estate Fund | | | 153 | | | | 31,202,233 | |
| Invesco U.S. Income Fund LP | | | 73,542 | | | | 116,565,114 | |
| Morgan Stanley Prime Property Fund LLC | | | 11,556 | | | | 233,186,294 | |
| PGIM PRISA III | | | 37,761 | | | | 97,576,374 | |
| Principal Enhanced Property Fund LP | | | 4,517,118 | | | | 62,008,518 | |
| RREEF America REIT II, Inc. | | | 512,415 | | | | 69,970,068 | |
| Stockbridge Smart Markets Fund | | | 10,937 | | | | 19,616,802 | |
| Stockbridge Value Fund II | | | N/A | | | | 1,315,816 | |
| UBS Trumbull Property Growth & Income Fund | | | 675 | | | | 19,453,238 | |
| | | | | | | | 1,630,827,352 | |
| Industrial (24.04%) | | | | | | | | |
| Ares Industrial Real Estate Fund | | | 56,533 | | | | 126,292,632 | |
| Clarion Lion Industrial Trust | | | 57,344 | | | | 165,184,034 | |
| Prologis Targeted U.S. Logistics | | | 131,934 | | | | 331,041,064 | |
| RREEF Core Plus Industrial Fund LP | | | 768,217 | | | | 137,231,904 | |
| | | | | | | | 759,749,634 | |
| Life Science (4.08%) | | | | | | | | |
| Blackstone BioMed Life Science Real Estate LP | | | N/A | | | | 74,914,192 | |
| IQHQ, Inc.(b)(c) | | | 2,961,021 | | | | 54,068,243 | |
| | | | | | | | 128,982,435 | |
| TOTAL PRIVATE REAL ESTATE SECURITIES (Cost $2,149,448,092) | | | | | | | 2,639,376,183 | |
| Security | | Principal | | Value |
| REAL ESTATE DEBT SECURITIES (8.34%) | | | | |
| American Campus Communities Operating Partnership LP, 3.625%, 11/15/2027 | | $ | 1,974,000 | | | | 2,155,122 | |
| Boston Properties LP, 2.900%, 3/15/2030 | | | 1,026,000 | | | | 1,063,920 | |
| Care Capital Properties, 5.125%, 8/15/2026 | | | 1,889,000 | | | | 2,114,562 | |
| EPR Properties, 4.500%, 6/01/2027 | | | 959,000 | | | | 1,041,135 | |
| Essex Portfolio LP, 3.875%, 5/01/2024 | | | 1,660,000 | | | | 1,775,498 | |
| FREMF 2018-K82 Mortgage Trust, Class X2A, IO, 0.100%, 9/25/2028(a)(c) | | | 1,072,640,380 | | | | 6,105,163 | |
| FREMF 2018-K82 Mortgage Trust, Class D, 0.000%, 10/25/2028(a)(c) | | | 100,392,906 | | | | 55,436,119 | |
| FREMF 2018-K82 Mortgage Trust, Class X2B, IO, 0.100%, 10/25/2028(a)(c) | | | 262,694,906 | | | | 1,560,362 | |
| FREMF 2019-K101 Mortgage Trust, Class X2A, IO, 0.100%, 10/25/2029(a)(c) | | | 1,185,651,224 | | | | 7,629,739 | |
| FREMF 2019-K101 Mortgage Trust, Class D, 0.000%, 1/25/2030(a)(c) | | | 109,477,635 | | | | 54,799,581 | |
| FREMF 2019-K101 Mortgage Trust, Class X2B, IO, 0.100%, 1/25/2030(a)(c) | | | 270,043,635 | | | | 1,825,493 | |
| FREMF 2019-K91 Mortgage Trust, Class X2A, IO, 0.100%, 3/25/2029(a)(c) | | | 1,131,930,876 | | | | 6,844,724 | |
| FREMF 2019-K91 Mortgage Trust, Class D, 0.000%, 10/25/2029(a)(c) | | | 103,857,565 | | | | 53,144,865 | |
| FREMF 2019-K91 Mortgage Trust, Class X2B, IO, 0.100%, 10/25/2029(a)(c) | | | 247,526,565 | | | | 1,595,243 | |
| FREMF 2019-KC03 Mortgage Trust, Class C, 4.365%, 1/25/2026(a)(c) | | | 58,088,000 | | | | 49,721,961 | |
The accompanying notes are an integral part of these financial statements.
| Annual Report | September 30, 2021 | 11 |
| Bluerock Total Income+ Real Estate Fund | Portfolio of Investments (Continued) |
September 30, 2021
| Security | | Principal | | Value |
| MPT Operating Partnership LP / MPT Finance Corp., 5.250%, 8/01/2026 | | $ | 1,957,000 | | | $ | 2,013,264 | |
| MPT Operating Partnership LP / MPT Finance Corp., 4.625%, 8/01/2029 | | | 1,810,000 | | | | 1,942,130 | |
| Public Storage, 2.370%, 9/15/2022 | | | 968,000 | | | | 986,060 | |
| Realty Income Corp., 4.650%, 8/01/2023 | | | 911,000 | | | | 971,467 | |
| Service Properties Trust, 4.350%, 10/01/2024 | | | 978,000 | | | | 990,939 | |
| Simon Property Group LP, 3.375%, 10/01/2024 | | | 911,000 | | | | 975,000 | |
| Simon Property Group LP, 3.300%, 1/15/2026 | | | 738,000 | | | | 798,878 | |
| Simon Property Group LP, 2.650%, 7/15/2030 | | | 998,000 | | | | 1,028,717 | |
| Spirit Realty LP, 2.100%, 3/15/2028 | | | 819,000 | | | | 814,743 | |
| Spirit Realty LP, 3.200%, 2/15/2031 | | | 1,026,000 | | | | 1,065,381 | |
| Ventas Realty LP, 2.650%, 1/15/2025 | | | 1,697,000 | | | | 1,773,587 | |
| Ventas Realty LP, 3.250%, 10/15/2026 | | | 731,000 | | | | 781,655 | |
| VEREIT Operating Partnership LP, 3.400%, 1/15/2028 | | | 863,000 | | | | 933,031 | |
| Welltower, Inc., 3.625%, 3/15/2024 | | | 923,000 | | | | 984,122 | |
| Welltower, Inc., 4.250%, 4/15/2028 | | | 704,000 | | | | 799,136 | |
| TOTAL REAL ESTATE DEBT SECURITIES (Cost $259,437,134) | | | | | | | 263,671,597 | |
| Security | | Shares | | Value |
| PUBLIC EQUITY REAL ESTATE SECURITIES (2.06%) | | | | |
| Public Non-Traded Real Estate Investment Trusts (0.01%) | | | | |
| Diversified (0.01%) | | | | |
| Highlands REIT, Inc.(b)(d) | | | 140,161 | | | | 39,245 | |
| Inventrust Properties Corp.(d) | | | 14,017 | | | | 397,100 | |
| Total Public Non-Traded Real Estate Investment Trusts (Cost $429,544) | | | | | | | 436,345 | |
| Publicly Traded Real Estate Investment Trusts (1.65%) | | | | | | | | |
| Apartments (0.08%) | | | | | | | | |
| Apartment Income REIT Corp. | | | 19,210 | | | | 937,640 | |
| AvalonBay Communities, Inc. | | | 4,397 | | | | 974,551 | |
| Mid-America Apartment Communities, Inc. | | | 2,714 | | | | 506,840 | |
| | | | | | | | 2,419,031 | |
| Communications (0.14%) | | | | | | | | |
| American Tower Corp. | | | 4,962 | | | | 1,316,964 | |
| Crown Castle International Corp. | | | 17,554 | | | | 3,042,460 | |
| | | | | | | | 4,359,424 | |
| Data Centers (0.26%) | | | | | | | | |
| CoreSite Realty Corp. | | | 7,336 | | | | 1,016,329 | |
| CyrusOne, Inc. | | | 16,947 | | | | 1,311,867 | |
| Equinix, Inc. | | | 7,627 | | | | 6,026,322 | |
| | | | | | | | 8,354,518 | |
| Diversified (0.03%) | | | | | | | | |
| Safehold, Inc. | | | 14,873 | | | | 1,069,220 | |
| | | | | | | | 1,069,220 | |
| Gaming (0.06%) | | | | | | | | |
| VICI Properties, Inc. | | | 63,567 | | | | 1,805,938 | |
| | | | | | | | 1,805,938 | |
| Healthcare (0.14%) | | | | | | | | |
| Medical Properties Trust, Inc. | | | 85,944 | | | | 1,724,896 | |
| Omega Healthcare Investors, Inc. | | | 27,189 | | | | 814,582 | |
| Welltower, Inc. | | | 22,838 | | | | 1,881,851 | |
| | | | | | | | 4,421,329 | |
| Hotels (0.15%) | | | | | | | | |
| Apple Hospitality REIT, Inc. | | | 119,014 | | | | 1,872,090 | |
| MGM Growth Properties LLC, Class A | | | 23,616 | | | | 904,493 | |
The accompanying notes are an integral part of these financial statements.
12
| Bluerock Total Income+ Real Estate Fund | Portfolio of Investments (Continued) |
September 30, 2021
| Security | | Shares | | Value |
| Hotels (continued) | | | | |
| Ryman Hospitality Properties, Inc. | | | 24,754 | | | $ | 2,071,910 | |
| | | | | | | | 4,848,493 | |
| Industrial (0.16%) | | | | | | | | |
| EastGroup Properties, Inc. | | | 9,757 | | | | 1,625,809 | |
| Prologis, Inc. | | | 18,450 | | | | 2,314,184 | |
| Rexford Industrial Realty, Inc. | | | 15,875 | | | | 900,906 | |
| | | | 4,840,899 | | | | | |
| Manufactured Homes (0.07%) | | | | | | | | |
| Sun Communities, Inc. | | | 12,576 | | | | 2,327,818 | |
| | | | | | | | 2,327,818 | |
| Regional Malls (0.07%) | | | | | | | | |
| Simon Property Group, Inc. | | | 18,626 | | | | 2,420,822 | |
| | | | | | | | 2,420,822 | |
| Self-Storage (0.24%) | | | | | | | | |
| Extra Space Storage, Inc. | | | 24,428 | | | | 4,103,659 | |
| Life Storage, Inc. | | | 29,005 | | | | 3,328,034 | |
| | | | | | | | 7,431,693 | |
| Shopping Center (0.04%) | | | | | | | | |
| NETSTREIT Corp. | | | 51,696 | | | | 1,222,610 | |
| | | | | | | | 1,222,610 | |
| Single Tenant (0.16%) | | | | | | | | |
| Agree Realty Corp. | | | 27,350 | | | | 1,811,391 | |
| Essential Properties Realty Trust, Inc. | | | 90,297 | | | | 2,521,093 | |
| Spirit Realty Capital, Inc. | | | 20,781 | | | | 956,757 | |
| | | | | | | | 5,289,241 | |
| Single-Family Rental (0.05%) | | | | | | | | |
| American Homes 4 Rent, Class A | | | 40,350 | | | | 1,538,142 | |
| | | | | | | | 1,538,142 | |
| Total Publicly Traded Real Estate Investment Trusts (Cost $43,925,399) | | | | | | | 52,349,178 | |
| Preferred Real Estate Securities (0.40%) | | | | | | | | |
| Data Center (0.08%) | | | | | | | | |
| Digital Realty Trust, Inc., Series L, 5.200% | | | 40,712 | | | | 1,107,366 | |
| Digital Realty Trust, Inc., Series J, 5.250% | | | 45,347 | | | | 1,173,580 | |
| | | | | | | | 2,280,946 | |
| Diversified (0.08%) | | | | | | | | |
| DigitalBridge Group, Inc., 7.125% | | | 66,991 | | | | 1,752,485 | |
| EPR Properties, Series G, 5.750% | | | 51,384 | | | | 1,331,873 | |
| | | | | | | | 3,084,358 | |
| Industrial (0.08%) | | | | | | | | |
| PS Business Parks, Inc., Series Z, 4.875% | | | 34,220 | | | | 944,472 | |
| PS Business Parks, Inc., Series X, 5.250% | | | 30,625 | | | | 810,338 | |
| Rexford Industrial Realty, Inc., Series B, 5.875% | | | 27,409 | | | | 717,842 | |
| | | | | | | | 2,472,652 | |
| Self-Storage (0.04%) | | | | | | | | |
| National Storage Affiliates Trust, Series A, 6.000% | | | 45,125 | | | | 1,182,726 | |
| | | | | | | | 1,182,726 | |
| Shopping Center (0.04%) | | | | | | | | |
| Kimco Realty Corp., Series L, 5.125% | | | 45,275 | | | | 1,180,319 | |
| | | | | | | | 1,180,319 | |
| Single Tenant (0.04%) | | | | | | | | |
| Spirit Realty Capital, Inc., Series A, 6.000% | | | 47,001 | | | | 1,223,436 | |
| | | | | | | | 1,223,436 | |
The accompanying notes are an integral part of these financial statements.
| Annual Report | September 30, 2021 | 13 |
| Bluerock Total Income+ Real Estate Fund | Portfolio of Investments (Continued) |
September 30, 2021
| Security | | Shares | | Value |
| Single-Family Rental (0.04%) | | | | |
| American Homes 4 Rent, Series G, 5.875% | | | 47,650 | | | $ | 1,235,565 | |
| | | | | | | | 1,235,565 | |
| Total Preferred Real Estate Securities (Cost $11,743,838) | | | | | | | 12,660,002 | |
| TOTAL PUBLIC EQUITY REAL ESTATE SECURITIES (Cost $56,098,781) | | | | | | | 65,445,525 | |
| SHORT TERM INVESTMENT (5.33%) | | | | | | | | |
| Fidelity Investments Money Market Fund - Government Portfolio - Class I, 0.010%(e) (Cost $168,557,789) | | | 168,557,789 | | | | 168,557,789 | |
| TOTAL INVESTMENTS (99.27%) (Cost $2,633,541,796) | | | | | | $ | 3,137,051,094 | |
| Other Assets In Excess Of Liabilities (0.73%) | | | | | | | 22,997,221 | |
| NET ASSETS (100.00%) | | | | | | $ | 3,160,048,315 | |
Common Abbreviations
IO - Interest Only Security
PO - Principal Only Security
| (a) | All or a portion of these securities are segregated as collateral for the Line of Credit as of September 30, 2021. |
| (b) | Non-income producing security. |
| (c) | Securities exempt from registration under Rule 144A of the Securities Act of 1933. These securities may be sold in the ordinary course of business in transactions exempt from registration, normally to qualified institutional buyers. As of September 30, 2021, the aggregate market value of those securities was $292,731,493, representing 9.26% of net assets. |
| (d) | Fair value estimated using fair valuation procedures adopted by the Board of Trustees. Total value of such securities is $436,345, representing 0.01% of net assets. |
| (e) | The rate shown is the 7-day effective yield as of September 30, 2021. |
The accompanying notes are an integral part of these financial statements.
14
| Bluerock Total Income+ Real Estate Fund | Statement of Assets and Liabilities |
September 30, 2021
| ASSETS | | |
| Investments, at value (Cost $2,633,541,796) | | $ | 3,137,051,094 | |
| Cash | | | 1,131,946 | |
| Receivable for shares sold | | | 10,601,222 | |
| Dividends and interest receivable | | | 16,760,730 | |
| Prepaid expenses and other assets | | | 85,399 | |
| Total Assets | | | 3,165,630,391 | |
| LIABILITIES | | | | |
| Line of credit interest payable | | | 94,933 | |
| Investment advisory fees payable | | | 3,695,197 | |
| Shareholder servicing fees payable | | | 225,906 | |
| Administration fees payable | | | 167,362 | |
| Transfer agency fees payable | | | 577,331 | |
| Distribution fees payable | | | 304,014 | |
| Trustees’ fees payable | | | 12,500 | |
| Accrued expenses and other liabilities | | | 504,833 | |
| Total Liabilities(a) | | | 5,582,076 | |
| NET ASSETS | | $ | 3,160,048,315 | |
| NET ASSETS CONSIST OF | | | | |
| Paid-in capital | | $ | 2,585,745,846 | |
| Total distributable earnings | | | 574,302,469 | |
| NET ASSETS | | $ | 3,160,048,315 | |
| PRICING OF SHARES | | | | |
| Class A: | | | | |
| Net asset value and redemption price | | $ | 32.66 | |
| Net assets | | $ | 573,539,730 | |
| Shares of beneficial interest outstanding (unlimited number of shares, no par value common stock authorized) | | | 17,561,636 | |
| Maximum offering price per share ((NAV/0.9425), based on maximum sales charge of 5.75% of the offering price) | | $ | 34.65 | |
| Class C: | | | | |
| Net asset value, offering and redemption price | | $ | 30.90 | |
| Net assets | | $ | 486,734,118 | |
| Shares of beneficial interest outstanding (unlimited number of shares, no par value common stock authorized) | | | 15,754,446 | |
| Class I: | | | | |
| Net asset value, offering and redemption price | | $ | 33.35 | |
| Net assets | | $ | 2,012,129,304 | |
| Shares of beneficial interest outstanding (unlimited number of shares, no par value common stock authorized) | | | 60,339,974 | |
| Class L: | | | | |
| Net asset value and redemption price | | $ | 32.31 | |
| Net assets | | $ | 87,645,163 | |
| Shares of beneficial interest outstanding (unlimited number of shares, no par value common stock authorized) | | | 2,712,664 | |
| Maximum offering price per share ((NAV/0.9575), based on maximum sales charge of 4.25% of the offering price) | | $ | 33.74 | |
| (a) | Separately, see Note 8 Commitment and Contingencies for detail on unfunded commitments. |
The accompanying notes are an integral part of these financial statements.
| Annual Report | September 30, 2021 | 15 |
| Bluerock Total Income+ Real Estate Fund | Statement of Operations |
For the Year Ended September 30, 2021
| INVESTMENT INCOME | | |
| Dividend Income | | $ | 75,967,486 | |
| Interest Income | | | 18,200,260 | |
| Total Investment Income | | | 94,167,746 | |
| | | | | |
| EXPENSES | | | | |
| Investment Advisory fees | | | 38,094,692 | |
| Administrative fees | | | 965,426 | |
| Transfer Agency fees | | | 3,068,003 | |
| Shareholder servicing fees: | | | | |
| Class A | | | 1,317,244 | |
| Class C | | | 1,095,774 | |
| Class L | | | 193,372 | |
| Distribution fees: | | | | |
| Class C | | | 3,287,323 | |
| Class L | | | 193,372 | |
| Legal fees | | | 112,705 | |
| Audit and tax fees | | | 26,000 | |
| Reports to shareholders and printing fees | | | 813,205 | |
| Custody fees | | | 123,091 | |
| Chief compliance officer fees | | | 59,659 | |
| Interest expense | | | 2,878,064 | |
| Trustees’ fees | | | 131,250 | |
| Other expenses | | | 330,399 | |
| Total Expenses | | | 52,689,579 | |
| Less: Fees waived/expenses reimbursed by Advisor (See Note 3) | | | (549,344 | ) |
| Recoupment of previously waived fees (See Note 3) | | | 32,630 | |
| Net Expenses | | | 52,172,865 | |
| Net Investment Income | | | 41,994,881 | |
| Net realized gain/(loss) on investments | | | 26,780,286 | |
| Net change in unrealized appreciation/(depreciation) on investments | | | 371,899,418 | |
| NET REALIZED AND UNREALIZED GAIN ON INVESTMENTS | | | 398,679,704 | |
| NET INCREASE IN NET ASSETS RESULTING FROM OPERATIONS | | $ | 440,674,585 | |
The accompanying notes are an integral part of these financial statements.
16
| Bluerock Total Income+ Real Estate Fund | Statements of Changes in Net Assets |
| | | For the Year Ended September 30, 2021 | | For the Year Ended September 30, 2020 |
| OPERATIONS: | | | | | | | | |
| Net investment income | | $ | 41,994,881 | | | $ | 35,789,012 | |
| Net realized gain on investments | | | 26,780,286 | | | | 69,143,294 | |
| Net change in unrealized appreciation/(depreciation) on investments | | | 371,899,418 | | | | (76,946,133 | ) |
| Net Increase in Net Assets Resulting from Operations | | | 440,674,585 | | | | 27,986,173 | |
| DISTRIBUTIONS TO SHAREHOLDERS: | | | | | | | | |
| Class A | | | | | | | | |
| From distributable earnings | | | (11,117,116 | ) | | | (19,550,413 | ) |
| From return of capital | | | (16,790,002 | ) | | | (9,366,652 | ) |
| Class C | | | | | | | | |
| From distributable earnings | | | (9,669,663 | ) | | | (15,572,816 | ) |
| From return of capital | | | (13,554,500 | ) | | | (7,494,043 | ) |
| Class I | | | | | | | | |
| From distributable earnings | | | (28,322,736 | ) | | | (45,573,427 | ) |
| From return of capital | | | (53,334,407 | ) | | | (22,312,717 | ) |
| Class L | | | | | | | | |
| From distributable earnings | | | (1,622,830 | ) | | | (2,519,359 | ) |
| From return of capital | | | (2,506,782 | ) | | | (1,237,752 | ) |
| Total Distributions to Shareholders | | | (136,918,036 | ) | | | (123,627,179 | ) |
| BENEFICIAL INTEREST TRANSACTIONS: | | | | | | | | |
| Class A | | | | | | | | |
| Shares sold | | | 99,334,955 | | | | 141,636,113 | |
| Distributions reinvested | | | 13,307,570 | | | | 14,577,926 | |
| Shares redeemed | | | (97,571,135 | ) | | | (80,005,865 | ) |
| Shares transferred out | | | (26,740,491 | ) | | | (64,998,822 | ) |
| Class C | | | | | | | | |
| Shares sold | | | 58,875,954 | | | | 92,956,793 | |
| Distributions reinvested | | | 14,215,722 | | | | 14,727,304 | |
| Shares redeemed | | | (63,536,358 | ) | | | (43,450,601 | ) |
| Shares transferred out | | | (6,518,764 | ) | | | (7,664,050 | ) |
| Class I | | | | | | | | |
| Shares sold | | | 732,585,726 | | | | 461,737,118 | |
| Distributions reinvested | | | 36,284,955 | | | | 33,154,791 | |
| Shares redeemed | | | (321,594,589 | ) | | | (249,555,303 | ) |
| Shares transferred in | | | 33,728,094 | | | | 106,259,987 | |
| Class L | | | | | | | | |
| Shares sold | | | 10,344,422 | | | | 21,060,878 | |
| Distributions reinvested | | | 2,733,534 | | | | 2,687,164 | |
| Shares redeemed | | | (6,683,966 | ) | | | (2,933,253 | ) |
| Shares transferred out | | | (468,839 | ) | | | (33,597,115 | ) |
| Net Increase in Net Assets Derived from Beneficial Interest Transactions | | | 478,296,790 | | | | 406,593,065 | |
| Net increase in net assets | | | 782,053,339 | | | | 310,952,059 | |
| NET ASSETS: | | | | | | | | |
| Beginning of year | | | 2,377,994,976 | | | | 2,067,042,917 | |
| End of year | | $ | 3,160,048,315 | | | $ | 2,377,994,976 | |
The accompanying notes are an integral part of these financial statements.
| Annual Report | September 30, 2021 | 17 |
| Bluerock Total Income+ Real Estate Fund | Statements of Changes in Net Assets |
| | | For the Year Ended September 30, 2021 | | For the Year Ended September 30, 2020 |
| Other Information | | | | | | | | |
| Share Transactions: | | | | | | | | |
| Class A | | | | | | | | |
| Beginning shares | | | 17,973,066 | | | | 17,641,782 | |
| Shares sold | | | 3,286,699 | | | | 4,676,755 | |
| Distributions reinvested | | | 441,606 | | | | 489,722 | |
| Shares redeemed | | | (3,252,326 | ) | | | (2,653,560 | ) |
| Shares transferred out | | | (887,409 | ) | | | (2,181,633 | ) |
| Net increase/(decrease) in shares outstanding | | | (411,430 | ) | | | 331,284 | |
| Ending shares | | | 17,561,636 | | | | 17,973,066 | |
| Class C | | | | | | | | |
| Beginning shares | | | 15,677,939 | | | | 13,738,958 | |
| Shares sold | | | 2,036,019 | | | | 3,200,967 | |
| Distributions reinvested | | | 496,961 | | | | 517,575 | |
| Shares redeemed | | | (2,228,298 | ) | | | (1,511,429 | ) |
| Shares transferred out | | | (228,175 | ) | | | (268,132 | ) |
| Net increase in shares outstanding | | | 76,507 | | | | 1,938,981 | |
| Ending shares | | | 15,754,446 | | | | 15,677,939 | |
| Class I | | | | | | | | |
| Beginning shares | | | 45,032,151 | | | | 33,636,423 | |
| Shares sold | | | 23,556,038 | | | | 15,005,892 | |
| Distributions reinvested | | | 1,175,998 | | | | 1,094,180 | |
| Shares redeemed | | | (10,521,668 | ) | | | (8,177,537 | ) |
| Shares transferred in | | | 1,097,455 | | | | 3,473,193 | |
| Net increase in shares outstanding | | | 15,307,823 | | | | 11,395,728 | |
| Ending shares | | | 60,339,974 | | | | 45,032,151 | |
| Class L | | | | | | | | |
| Beginning shares | | | 2,516,381 | | | | 2,928,639 | |
| Shares sold | | | 344,076 | | | | 696,858 | |
| Distributions reinvested | | | 91,549 | | | | 91,010 | |
| Shares redeemed | | | (223,825 | ) | | | (98,561 | ) |
| Shares transferred out | | | (15,517 | ) | | | (1,101,565 | ) |
| Net increase/(decrease) in shares outstanding | | | 196,283 | | | | (412,258 | ) |
| Ending shares | | | 2,712,664 | | | | 2,516,381 | |
The accompanying notes are an integral part of these financial statements.
18
| Bluerock Total Income+ Real Estate Fund | Statement of Cash Flows |
| | | For the Year Ended September 30, 2021 |
| Cash Flows from Operating Activities: | | |
| Net increase in net assets resulting from operations | | $ | 440,674,585 | |
| Adjustments to reconcile net increase in net assets resulting from operations to net cash used in operating activities: | | | | |
| Purchase of investment securities | | | (777,151,225 | ) |
| Proceeds from disposition of investment securities | | | 621,334,595 | |
| Net proceeds from short-term investment securities | | | 64,172,748 | |
| Net realized gain on investments | | | (26,780,286 | ) |
| Net change in unrealized appreciation/(depreciation) on investments | | | (371,899,418 | ) |
| Discount and premiums amortized | | | (11,024,637 | ) |
| (Increase)/Decrease in Assets: | | | | |
| Dividends and interest receivable | | | (1,720,194 | ) |
| Prepaid expenses and other assets | | | (30,811 | ) |
| Increase/(Decrease) in Liabilities: | | | | |
| Shareholder servicing fees payable | | | 11,832 | |
| Investment advisory fees payable | | | 820,993 | |
| Administrative fees payable | | | (1,976 | ) |
| Transfer agency fees payable | | | 321,404 | |
| Distribution fees payable | | | 23,453 | |
| Trustees’ fees payable | | | 12,500 | |
| Interest due on line of credit payable | | | (191,327 | ) |
| Accrued expenses and other liabilities | | | 241,293 | |
| Net Cash Used in Operating Activities | | | (61,186,471 | ) |
| Cash Flows from Financing Activities: | | | | |
| Change in Line of Credit Borrowing | | | (274,000,000 | ) |
| Proceeds from shares sold | | | 893,409,360 | |
| Payment on shares redeemed | | | (489,386,048 | ) |
| Cash distributions paid | | | (70,376,255 | ) |
| Net Cash Provided by Financing Activities | | | 59,647,057 | |
| Net Change in Cash | | | (1,539,414 | ) |
| Cash Beginning of Year | | $ | 2,671,360 | |
| Cash End of Year | | $ | 1,131,946 | |
| Non-cash financing Activities not included herein consist of reinvestment of distributions of: | | $ | 66,541,781 | |
| Cash paid for interest on lines of credit during the year was: | | | 3,069,391 | |
| The accompanying notes are an integral part of these financial statements. | |
| Annual Report | September 30, 2021 | 19 |
| Bluerock Total Income+ Real Estate Fund - Class A | Financial Highlights |
| The table below sets forth financial data for one share of beneficial interest outstanding throughout each year presented. |
| | | For the Year Ended September 30, 2021 | | For the Year Ended September 30, 2020 | | For the Year Ended September 30, 2019 | | For the Year Ended September 30, 2018 | | For the Year Ended September 30, 2017 |
| Net asset value, beginning of year | | $ | 29.26 | | | $ | 30.43 | | | $ | 30.00 | | | $ | 29.37 | | | $ | 29.13 | |
| INCOME FROM INVESTMENT OPERATIONS: | | | | | | | | | | | | | | | | | | | | |
| Net investment income(a) | | | 0.50 | | | | 0.46 | | | | 0.33 | | | | 0.21 | | | | 0.23 | |
| Net realized and unrealized gain/(loss) | | | 4.50 | | | | (0.05 | ) | | | 1.69 | | | | 2.00 | | | | 1.56 | |
| Total from investment operations | | | 5.00 | | | | 0.41 | | | | 2.02 | | | | 2.21 | | | | 1.79 | |
| DISTRIBUTIONS: | | | | | | | | | | | | | | | | | | | | |
| From net investment income | | | – | | | | (0.06 | ) | | | – | | | | – | | | | – | |
| From net realized gain on investments | | | (0.63 | ) | | | (1.02 | ) | | | (0.32 | ) | | | (0.54 | ) | | | (0.37 | ) |
| Return of capital | | | (0.97 | ) | | | (0.50 | ) | | | (1.27 | ) | | | (1.04 | ) | | | (1.18 | ) |
| Total distributions | | | (1.60 | ) | | | (1.58 | ) | | | (1.59 | ) | | | (1.58 | ) | | | (1.55 | ) |
| Net asset value, end of year | | $ | 32.66 | | | $ | 29.26 | | | $ | 30.43 | | | $ | 30.00 | | | $ | 29.37 | |
| TOTAL RETURN(b)(c) | | | 17.68 | % | | | 1.38 | % | | | 6.94 | % | | | 7.69 | % | | | 6.29 | % |
| RATIOS/SUPPLEMENTAL DATA: | | | | | | | | | | | | | | | | | | | | |
| Net assets, end of year (000s) | | $ | 573,540 | | | $ | 525,950 | | | $ | 536,913 | | | $ | 373,488 | | | $ | 291,772 | |
| Ratios to Average Net Assets (including interest expense) | | | | | | | | | | | | | | | | | | | | |
| Ratio of expenses to average net assets excluding fee waivers and reimbursements(d)(e) | | | 2.09 | % | | | 2.15 | % | | | 2.20 | % | | | 2.43 | % | | | 2.37 | % |
| Ratio of expenses to average net assets including fee waivers and reimbursements(e) | | | 2.06 | % | | | 2.17 | % | | | 2.21 | % | | | 2.37 | % | | | 2.21 | % |
| Ratio of net investment income to average net assets(e) | | | 1.65 | % | | | 1.53 | % | | | 1.10 | % | | | 0.71 | % | | | 0.80 | % |
| Ratios to Average Net Assets (excluding interest expense) | | | | | | | | | | | | | | | | | | | | |
| Ratio of expenses to average net assets excluding fee waivers and reimbursements(d)(e) | | | 1.98 | % | | | 1.91 | % | | | 1.94 | % | | | 1.99 | % | | | 2.04 | % |
| Ratio of expenses to average net assets including fee waivers and reimbursements(e) | | | 1.95 | % | | | 1.93 | % | | | 1.95 | % | | | 1.93 | % | | | 1.89 | % |
| Portfolio turnover rate | | | 26 | % | | | 27 | % | | | 8 | % | | | 13 | % | | | 16 | % |
| (a) | Per share amounts are calculated using the average shares method. |
| (b) | Includes adjustments in accordance with accounting principles generally accepted in the United States and, consequently, the net asset value for financial reporting purposes and the returns based upon those net asset values may differ from the net asset values and returns for shareholder transactions. |
| (c) | Total returns are historical in nature and assume changes in share price, reinvestment of dividends and capital gains distributions, if any, and does not reflect the impact of sales charges. Had the Advisor not absorbed a portion of the Fund expenses, total returns would have been lower. |
| (d) | Represents the ratio of expenses to average net assets absent fee waivers expense reimbursement and/or recoupment by the Advisor. |
| (e) | The ratios of expenses to average net assets and net investment income to average net assets do not directly reflect the expenses of the underlying institutional private real estate investments in which the Fund invests. The Fund invests in each underlying institutional private real estate investment based upon its net asset value, inclusive of management fees, which typically range from 0.50% to 1.30% on an annualized basis. The Fund’s Total Return is reported net of all fees and expenses. |
| The accompanying notes are an integral part of these financial statements. |
| 20 |
| Bluerock Total Income+ Real Estate Fund - Class C | Financial Highlights |
| The table below sets forth financial data for one share of beneficial interest outstanding throughout each year presented. |
| | | For the Year Ended September
30, 2021 | | For the Year Ended September
30, 2020 | | For the Year Ended September
30, 2019 | | For the Year Ended September
30, 2018 | | For the Year Ended September
30, 2017 |
| Net asset value, beginning of year | | $ | 27.89 | | | $ | 29.22 | | | $ | 29.02 | | | $ | 28.63 | | | $ | 28.61 | |
| INCOME FROM INVESTMENT OPERATIONS: | | | | | | | | | | | | | | | | | | | | |
| Net investment income/(loss)(a) | | | 0.26 | | | | 0.23 | | | | 0.10 | | | | (0.01 | ) | | | 0.01 | |
| Net realized and unrealized gain/(loss) | | | 4.27 | | | | (0.04 | ) | | | 1.63 | | | | 1.93 | | | | 1.52 | |
| Total from investment operations | | | 4.53 | | | | 0.19 | | | | 1.73 | | | | 1.92 | | | �� | 1.53 | |
| DISTRIBUTIONS: | | | | | | | | | | | | | | | | | | | | |
| From net investment income | | | – | | | | (0.06 | ) | | | – | | | | – | | | | – | |
| From net realized gain on investments | | | (0.63 | ) | | | (0.98 | ) | | | (0.32 | ) | | | (0.52 | ) | | | (0.37 | ) |
| Return of capital | | | (0.89 | ) | | | (0.48 | ) | | | (1.21 | ) | | | (1.01 | ) | | | (1.14 | ) |
| Total distributions | | | (1.52 | ) | | | (1.52 | ) | | | (1.53 | ) | | | (1.53 | ) | | | (1.51 | ) |
| Net asset value, end of year | | $ | 30.90 | | | $ | 27.89 | | | $ | 29.22 | | | $ | 29.02 | | | $ | 28.63 | |
| TOTAL RETURN(b)(c) | | | 16.81 | % | | | 0.63 | % | | | 6.15 | % | | | 6.86 | % | | | 5.50 | % |
| RATIOS/SUPPLEMENTAL DATA: | | | | | | | | | | | | | | | | | | | | |
| Net assets, end of year (000s) | | $ | 486,734 | | | $ | 437,183 | | | $ | 401,507 | | | $ | 290,549 | | | $ | 232,200 | |
| Ratios to Average Net Assets (including interest expense) | | | | | | | | | | | | | | | | | | | | |
| Ratio of expenses to average net assets excluding fee waivers and reimbursements(d)(e) | | | 2.81 | % | | | 2.90 | % | | | 2.95 | % | | | 3.18 | % | | | 3.13 | % |
| Ratio of expenses to average net assets including fee waivers and reimbursements(e) | | | 2.81 | % | | | 2.92 | % | | | 2.96 | % | | | 3.12 | % | | | 2.97 | % |
| Ratio of net investment income/(loss) to average net assets(e) | | | 0.91 | % | | | 0.79 | % | | | 0.35 | % | | | (0.04 | )% | | | 0.05 | % |
| Ratios to Average Net Assets (excluding interest expense) | | | | | | | | | | | | | | | | | | | | |
| Ratio of expenses to average net assets excluding fee waivers and reimbursements(d)(e) | | | 2.70 | % | | | 2.66 | % | | | 2.69 | % | | | 2.74 | % | | | 2.79 | % |
| Ratio of expenses to average net assets including fee waivers and reimbursements(e) | | | 2.70 | % | | | 2.68 | % | | | 2.70 | % | | | 2.68 | % | | | 2.63 | % |
| Portfolio turnover rate | | | 26 | % | | | 27 | % | | | 8 | % | | | 13 | % | | | 16 | % |
| (a) | Per share amounts are calculated using the average shares method. |
| (b) | Includes adjustments in accordance with accounting principles generally accepted in the United States and, consequently, the net asset value for financial reporting purposes and the returns based upon those net asset values may differ from the net asset values and returns for shareholder transactions. |
| (c) | Total returns are historical in nature and assume changes in share price, reinvestment of dividends and capital gains distributions, if any. Had the Advisor not absorbed a portion of the Fund expenses, total returns would have been lower. |
| (d) | Represents the ratio of expenses to average net assets absent fee waivers expense reimbursement and/or recoupment by the Advisor. |
| (e) | The ratios of expenses to average net assets and net investment income (loss) to average net assets do not directly reflect the expenses of the underlying institutional private real estate investments in which the Fund invests. The Fund invests in each underlying institutional private real estate investment based upon its net asset value, inclusive of management fees, which typically range from 0.50% to 1.30% on an annualized basis. The Fund’s Total Return is reported net of all fees and expenses. |
| The accompanying notes are an integral part of these financial statements. | |
| Annual Report | September 30, 2021 | 21 |
| Bluerock Total Income+ Real Estate Fund - Class I | Financial Highlights |
| The table below sets forth financial data for one share of beneficial interest outstanding throughout each year presented. |
| | | For the Year Ended September
30, 2021 | | For the Year Ended September
30, 2020 | | For the Year Ended September
30, 2019 | | For the Year Ended September
30, 2018 | | For the Year Ended September
30, 2017 |
| Net asset value, beginning of year | | $ | 29.80 | | | $ | 30.92 | | | $ | 30.40 | | | $ | 29.70 | | | $ | 29.38 | |
| INCOME FROM INVESTMENT OPERATIONS: | | | | | | | | | | | | | | | | | | | | |
| Net investment income(a) | | | 0.58 | | | | 0.56 | | | | 0.42 | | | | 0.29 | | | | 0.31 | |
| Net realized and unrealized gain/(loss) | | | 4.61 | | | | (0.07 | ) | | | 1.72 | | | | 2.01 | | | | 1.57 | |
| Total from investment operations | | | 5.19 | | | | 0.49 | | | | 2.14 | | | | 2.30 | | | | 1.88 | |
| DISTRIBUTIONS: | | | | | | | | | | | | | | | | | | | | |
| From net investment income | | | – | | | | (0.06 | ) | | | – | | | | – | | | | – | |
| From net realized gain on investments | | | (0.63 | ) | | | (1.04 | ) | | | (0.32 | ) | | | (0.54 | ) | | | (0.37 | ) |
| Return of capital | | | (1.01 | ) | | | (0.51 | ) | | | (1.30 | ) | | | (1.06 | ) | | | (1.19 | ) |
| Total distributions | | | (1.64 | ) | | | (1.61 | ) | | | (1.62 | ) | | | (1.60 | ) | | | (1.56 | ) |
| Net asset value, end of year | | $ | 33.35 | | | $ | 29.80 | | | $ | 30.92 | | | $ | 30.40 | | | $ | 29.70 | |
| TOTAL RETURN(b)(c) | | | 17.99 | % | | | 1.61 | % | | | 7.23 | % | | | 7.91 | % | | | 6.58 | % |
| RATIOS/SUPPLEMENTAL DATA: | | | | | | | | | | | | | | | | | | | | |
| Net assets, end of year (000s) | | $ | 2,012,129 | | | $ | 1,341,848 | | | $ | 1,040,017 | | | $ | 471,116 | | | $ | 257,366 | |
| Ratios to Average Net Assets (including interest expense) | | | | | | | | | | | | | | | | | | | | |
| Ratio of expenses to average net assets excluding fee waivers and reimbursements(d)(e) | | | 1.83 | % | | | 1.91 | % | | | 1.94 | % | | | 2.22 | % | | | 2.15 | % |
| Ratio of expenses to average net assets including fee waivers and reimbursements(e) | | | 1.81 | % | | | 1.91 | % | | | 1.95 | % | | | 2.15 | % | | | 1.99 | % |
| Ratio of net investment income to average net assets(e) | | | 1.89 | % | | | 1.82 | % | | | 1.38 | % | | | 0.95 | % | | | 1.06 | % |
| Ratios to Average Net Assets (excluding interest expense) | | | | | | | | | | | | | | | | | | | | |
| Ratio of expenses to average net assets excluding fee waivers and reimbursements(d)(e) | | | 1.72 | % | | | 1.67 | % | | | 1.69 | % | | | 1.75 | % | | | 1.80 | % |
| Ratio of expenses to average net assets including fee waivers and reimbursements(e) | | | 1.70 | % | | | 1.67 | % | | | 1.70 | % | | | 1.68 | % | | | 1.64 | % |
| Portfolio turnover rate | | | 26 | % | | | 27 | % | | | 8 | % | | | 13 | % | | | 16 | % |
| (a) | Per share amounts are calculated using the average shares method. |
| (b) | Includes adjustments in accordance with accounting principles generally accepted in the United States and, consequently, the net asset value for financial reporting purposes and the returns based upon those net asset values may differ from the net asset values and returns for shareholder transactions. |
| (c) | Total returns are historical in nature and assume changes in share price, reinvestment of dividends and capital gains distributions, if any. Had the Advisor not absorbed a portion of the Fund expenses, total returns would have been lower. |
| (d) | Represents the ratio of expenses to average net assets absent fee waivers expense reimbursement and/or recoupment by the Advisor. |
| (e) | The ratios of expenses to average net assets and net investment income to average net assets do not directly reflect the expenses of the underlying institutional private real estate investments in which the Fund invests. The Fund invests in each underlying institutional private real estate investment based upon its net asset value, inclusive of management fees, which typically range from 0.50% to 1.30% on an annualized basis. The Fund’s Total Return is reported net of all fees and expenses. |
| The accompanying notes are an integral part of these financial statements. |
| 22 |
| Bluerock Total Income+ Real Estate Fund - Class L | Financial Highlights |
| The table below sets forth financial data for one share of beneficial interest outstanding throughout each period presented. |
| | | For the Year Ended September
30, 2021 | | For the Year Ended September
30, 2020 | | For the Year Ended September
30, 2019 | | For the Year Ended September
30, 2018 | | For the Period Ended September
30, 2017(a) |
| Net asset value, beginning of period/year | | $ | 29.02 | | | $ | 30.25 | | | $ | 29.89 | | | $ | 29.34 | | | $ | 29.42 | |
| INCOME FROM INVESTMENT OPERATIONS: | | | | | | | | | | | | | | | | | | | | |
| Net investment income/(loss)(b) | | | 0.42 | | | | 0.37 | | | | 0.26 | | | | 0.13 | | | | (0.06 | ) |
| Net realized and unrealized gain/(loss) | | | 4.46 | | | | (0.03 | ) | | | 1.68 | | | | 1.99 | | | | 0.76 | |
| Total from investment operations | | | 4.88 | | | | 0.34 | | | | 1.94 | | | | 2.12 | | | | 0.70 | |
| DISTRIBUTIONS: | | | | | | | | | | | | | | | | | | | | |
| From net investment income | | | – | | | | (0.06 | ) | | | – | | | | – | | | | – | |
| From net realized gain on investments | | | (0.63 | ) | | | (1.01 | ) | | | (0.32 | ) | | | (0.53 | ) | | | – | |
| Return of capital | | | (0.96 | ) | | | (0.50 | ) | | | (1.26 | ) | | | (1.04 | ) | | | (0.78 | ) |
| Total distributions | | | (1.59 | ) | | | (1.57 | ) | | | (1.58 | ) | | | (1.57 | ) | | | (0.78 | ) |
| Net asset value, end of period/year | | $ | 32.31 | | | $ | 29.02 | | | $ | 30.25 | | | $ | 29.89 | | | $ | 29.34 | |
| TOTAL RETURN(c)(d) | | | 17.38 | % | | | 1.14 | % | | | 6.70 | % | | | 7.40 | % | | | 2.40%(e) | |
| RATIOS/SUPPLEMENTAL DATA: | | | | | | | | | | | | | | | | | | | | |
| Net assets, end of period/year (000s) | | $ | 87,645 | | | $ | 73,014 | | | $ | 88,605 | | | $ | 42,975 | | | $ | 5,059 | |
| Ratios to Average Net Assets (including interest expense) | | | | | | | | | | | | | | | | | | | | |
| Ratio of expenses to average net assets excluding fee waivers and reimbursements(f)(g) | | | 2.35 | % | | | 2.40 | % | | | 2.44 | % | | | 2.84 | % | | | 2.83 | %(h) |
| Ratio of expenses to average net assets including fee waivers and reimbursements(f) | | | 2.31 | % | | | 2.41 | % | | | 2.46 | % | | | 2.74 | % | | | 2.63 | %(h) |
| Ratio of net investment income/(loss) to average net assets(f) | | | 1.40 | % | | | 1.25 | % | | | 0.87 | % | | | 0.44 | % | | | (0.64 | )%(h) |
| Ratios to Average Net Assets (excluding interest expense) | | | | | | | | | | | | | | | | | | | | |
| Ratio of expenses to average net assets excluding fee waivers and reimbursements(f)(g) | | | 2.24 | % | | | 2.17 | % | | | 2.18 | % | | | 2.27 | % | | | 2.35 | %(h) |
| Ratio of expenses to average net assets including fee waivers and reimbursements(f) | | | 2.20 | % | | | 2.18 | % | | | 2.20 | % | | | 2.17 | % | | | 2.14 | %(h) |
| Portfolio turnover rate | | | 26 | % | | | 27 | % | | | 8 | % | | | 13 | % | | | 16 | %(e) |
| The accompanying notes are an integral part of these financial statements. | |
| Annual Report | September 30, 2021 | 23 |
| Bluerock Total Income+ Real Estate Fund - Class L | Financial Highlights |
| (a) | Class L commenced operations June 1, 2017. |
| (b) | Per share amounts are calculated using the average shares method. |
| (c) | Total returns are historical in nature and assume changes in share price, reinvestment of dividends and capital gains distributions, if any. Had the Advisor not absorbed a portion of the Fund expenses, total returns would have been lower. |
| (d) | Includes adjustments in accordance with accounting principles generally accepted in the United States and, consequently, the net asset value for financial reporting purposes and the returns based upon those net asset values may differ from the net asset values and returns for shareholder transactions. |
| (f) | The ratios of expenses to average net assets and net investment income (loss) to average net assets do not directly reflect the expenses of the underlying institutional private real estate investments in which the Fund invests. The Fund invests in each underlying institutional private real estate investment based upon its net asset value, inclusive of management fees, which typically range from 0.50% to 1.30% on an annualized basis. The Fund’s Total Return is reported net of all fees and expenses. |
| (g) | Represents the ratio of expenses to average net assets absent fee waivers expense reimbursement and/or recoupment by the Advisor. |
| The accompanying notes are an integral part of these financial statements. |
| 24 |
| Bluerock Total Income+ Real Estate Fund | Notes to Financial Statements |
| | September 30, 2021 |
1. ORGANIZATION
Bluerock Total Income+ Real Estate Fund (the “Fund” or the “Trust”) was organized as a Delaware statutory trust on May 25, 2012 and is registered under the Investment Company Act of 1940, as amended (the “1940 Act”), as a closed-end management investment company that operates as an interval fund with a continuous offering of Fund shares. The Fund is non-diversified. The Fund’s investment advisor is Bluerock Fund Advisor, LLC (the “Advisor”). The Fund’s primary investment objective is to generate current income while secondarily seeking long-term capital appreciation with low to moderate volatility and low correlation to the broader markets. The Fund pursues its investment objective by investing, under normal circumstances, at least 80% of its net assets plus the amount of any borrowings for investment purposes, in real estate industry securities, primarily in income producing equity and debt securities.
The Fund currently offers Class A, Class C, Class I, Class L and Class M shares. Class A shares commenced operations on October 22, 2012 and are offered at net asset value plus a maximum sales charge of 5.75%. Class A shareholders who tender for repurchase Class A shares that were purchased in amounts of $1,000,000 or more that have been held less than one year (365 days) from the purchase date will be subject to an early withdrawal charge of 1.00% of the original purchase price. Class C and Class I shares commenced operations on April 1, 2014 and are offered at net asset value. Class C shares are subject to an early withdrawal charge of 1.00% if redeemed less than 365 days after purchase. Class L shares commenced operations on June 1, 2017 and are offered at net asset value plus a maximum sales charge of 4.25%. The Fund registered the offering of its Class M shares on February 1, 2020, however as of September 30, 2021 no such shares have been issued. Each class represents an interest in the same assets of the Fund and classes are identical except for differences in their sales charge structures and ongoing shareholder service and distribution charges. All classes of shares have equal voting privileges except that each class has exclusive voting rights with respect to its shareholder service and/or distribution plans. The Fund’s income, expenses (other than class specific shareholder service and distribution fees) and realized and unrealized gains and losses are allocated proportionately each day based upon the relative net assets of each class.
2. SUMMARY OF SIGNIFICANT ACCOUNTING POLICIES
The following is a summary of significant accounting policies followed by the Fund in preparation of its financial statements. These policies are in conformity with accounting principles generally accepted in the United States of America (“GAAP”). The preparation of financial statements requires management to make estimates and assumptions that affect the reported amounts of assets and liabilities and disclosure of contingent assets and liabilities at the date of the financial statements and the reported amounts of income and expenses for the period. Actual results could differ from those estimates. The Fund is an investment company and accordingly follows the investment company accounting and reporting guidance of the Financial Accounting Standards Board (“FASB”) Accounting Standard Codification (“ASC”) Topic 946 “Financial Services – Investment Companies.”
A. Security Valuation – Securities listed on an exchange are valued at the last reported sale price at the close of the regular trading session of the exchange on the business day the value is being determined, or in the case of securities listed on NASDAQ, at the NASDAQ Official Closing Price. In the absence of a sale such securities shall be valued at the last bid price. Debt securities, including restricted securities, are valued based on evaluated prices received from a third party pricing vendor or from brokers who make markets in such securities. Debt securities are valued by pricing vendors who utilize matrix pricing which considers yield or price of bonds of comparable quality, coupon, maturity and type or by broker-supplied prices. When independent prices are unavailable or unreliable, debt securities may be valued utilizing pricing methodologies which consider similar factors that would be used by third party pricing vendors. Debt securities are generally categorized as Level 2 in the hierarchy but may be Level 3 depending on the circumstances. The Fund may invest a portion of its assets in below investment grade securities. The value of these securities can be more volatile due to changes in the credit quality of the issuer and is sensitive to changes in economic, market and regulatory conditions. Short-term investments that mature in 60 days or less may be valued at amortized cost, provided such valuations represent fair value.
Valuation of Underlying Funds – The Fund invests in portfolios of open-end investment companies and exchange traded funds (the “Underlying Funds”). The Underlying Funds value securities in their portfolios for which market quotations are readily available at their market values (generally the last reported sale price) and all other securities and assets/liabilities at their fair value to the methods established by the board of directors of the Underlying Funds.
Open-end investment companies are valued at their respective net asset values (“NAV”) as reported by such investment companies. The shares of many closed-end investment companies, after their initial public offering, frequently trade at a price per share, which is different than the NAV per share. The difference represents a market premium or market discount of such shares. There can be no assurances that the market discount or market premium on shares of any closed-end investment company purchased by the Fund will not change.
When price quotations for certain securities are not readily available, or if the available quotations are not believed to be reflective of market value by the Advisor, those securities will be valued at “fair value” as determined in good faith by the Valuation Committee using procedures adopted by and under the supervision of the Fund’s Board of Trustees (the “Board”). There can be no assurance that the Fund could purchase or sell a portfolio security at the price used to calculate the Fund’s NAV.
| Annual Report | September 30, 2021 | 25 |
| Bluerock Total Income+ Real Estate Fund | Notes to Financial Statements |
| | September 30, 2021 |
Fair valuation procedures may be used to value a substantial portion of the assets of the Fund. The Fund may use the fair value of a security to calculate its NAV when, for example, (1) a portfolio security is not traded in a public market or the principal market in which the security trades is closed, (2) trading in a portfolio security is suspended and not resumed prior to the normal market close, (3) a portfolio security is not traded in significant volume for a substantial period, or (4) the Advisor determines that the quotation or price for a portfolio security provided by a brokerdealer or independent pricing service is inaccurate.
Valuation of Private Real Estate Securities – The Fund invests a significant portion of its assets in Private Real Estate Securities (“Private Funds”), which includes securities that invest in real estate assets (“Private REITs”) and securities that invest in debt instruments secured or otherwise supported by real estate assets (“Private Debt”). The Private Funds measure their investment assets at fair value, and report a NAV per share on a calendar quarter basis. In accordance with ASC 820-10, the Fund has elected to apply the practical expedient or its equivalent, and to value its investments in Private Funds at their respective NAVs at each quarter. For non-calendar quarter-end days, the Valuation Committee estimates the fair value of each Private REIT by adjusting the most recent NAV for each Private REIT by the change in a proprietary benchmark that the Valuation Committee has deemed to be representative of the entire Private REIT market. For Private Debt, the Fund accrues income on a daily basis for each Private Debt investment. As of September 30, 2021, all of the Fund’s investments in Private Funds were valued at their respective NAVs.
Valuation of Public Non-Traded Equity Real Estate Securities – The Fund may invest a portion of its assets in Public Non-Traded Equity Real Estate Securities (“Public Non-Traded ERES”). The Public Non-Traded ERES do not report periodic NAVs with enough frequency to be valued using the practical expedient. The Valuation Committee determines the fair value of Public Non-Traded ERES on a daily basis by considering various factors such as the most recent published NAV, the transaction price, secondary market trades, shareholder redemption and dividend reinvestment programs, and potential illiquidity discounts.
The “fair value” of securities may be difficult to determine and thus judgment plays a greater role in the valuation process. The fair valuation methodology may include or consider the following guidelines, as appropriate: (1) evaluation of all relevant factors, including but not limited to, pricing history, current market level, supply and demand of the respective security; (2) comparison to the values and current pricing of securities that have comparable characteristics; (3) knowledge of historical market information with respect to the security; (4) other factors relevant to the security which would include, but not be limited to, duration, yield, fundamental analytical data, the Treasury yield curve, and credit quality.
The values assigned to fair valued investments are based on available information and do not necessarily represent amounts that might ultimately be realized, since such amounts depend on future developments inherent in long-term investments. Changes in the fair valuation of portfolio securities may be less frequent and of greater magnitude than changes in the price of portfolio securities valued at their last sale price, by an independent pricing service, or based on market quotations. Imprecision in estimating fair value can also impact the amount of unrealized appreciation or depreciation recorded for a particular portfolio security and differences in the assumptions used could result in a different determination of fair value, and those differences could be material.
The Fund utilizes various methods to measure the fair value of its investments on a recurring basis. GAAP establishes a hierarchy that prioritizes inputs to valuation methods. The three levels of input are:
| Level 1 – | Unadjusted quoted prices in active markets for identical assets and liabilities that the Fund has the ability to access. |
| Level 2 – | Observable inputs other than quoted prices included in Level 1 that are observable for the asset or liability, either directly or indirectly. These inputs may include quoted prices for the identical instrument on an inactive market, prices for similar instruments, interest rates, prepayment speeds, credit risk, yield curves, default rates and similar data. |
| Level 3 – | Unobservable inputs for the asset or liability, to the extent relevant observable inputs are not available, representing the Fund’s own assumptions about the assumptions a market participant would use in valuing the asset or liability, and would be based on the best information available. |
The availability of observable inputs can vary from security to security and is affected by a wide variety of factors, including, for example, the type of security, whether the security is new and not yet established in the marketplace, the liquidity of markets, and other characteristics particular to the security. To the extent that valuation is based on models or inputs that are less observable or unobservable in the market, the determination of fair value requires more judgment. Accordingly, the degree of judgment exercised in determining fair value is greatest for instruments categorized in Level 3.
The inputs used to measure fair value may fall into different levels of the fair value hierarchy. In such cases, for disclosure purposes, the level in the fair value hierarchy within which the fair value measurement falls in its entirety, is determined based on the lowest level input that is significant to the fair value measurement in its entirety. The valuation techniques used by the Fund to measure fair value during the year ended September 30, 2021, maximized the use of observable inputs and minimized the use of unobservable inputs.
| Bluerock Total Income+ Real Estate Fund | Notes to Financial Statements |
| | September 30, 2021 |
The inputs or methodology used for valuing securities are not necessarily an indication of the risk associated with investing in those securities. The following tables summarize the inputs used as of September 30, 2021 for the Fund’s assets measured at fair value:
| Investments in Securities at Value | | Level 1 | | Level 2 | | Level 3 | | Total |
| Private Real Estate Securities(a) | | $ | – | | | $ | – | | | $ | – | | | $ | 2,639,376,183 | |
| Real Estate Debt Securities | | | – | | | | 263,671,597 | | | | – | | | | 263,671,597 | |
| Public Non-Traded Real Estate Investment Trusts | | | – | | | | – | | | | 436,345 | | | | 436,345 | |
| Publicly Traded Real Estate Investment Trusts | | | 52,349,178 | | | | – | | | | – | | | | 52,349,178 | |
| Preferred Real Estate Securities | | | 12,660,002 | | | | – | | | | – | | | | 12,660,002 | |
| Short Term Investment | | | 168,557,789 | | | | – | | | | – | | | | 168,557,789 | |
| TOTAL | | $ | 233,566,969 | | | $ | 263,671,597 | | | $ | 436,345 | | | $ | 3,137,051,094 | |
| (a) | In accordance with ASC 820-10, investments that are measured at fair value using the NAV per share (or its equivalent) practical expedient have not been classified in the fair value hierarchy. The fair value amounts presented in this table are intended to permit reconciliation of the fair value hierarchy to the amounts presented in the Portfolio of Investments and Statement of Assets and Liabilities. |
B. Other Investment Vehicles – The Fund may invest in other investment vehicles such as exchange traded funds (“ETFs”), index funds, closed-end funds and mutual funds. Such funds are bought and sold on a securities exchange. An ETF trades like common stock and typically represents a fixed portfolio of securities designed to track the performance and dividend yield of a particular domestic or foreign market index. The Fund may purchase an investment vehicle to temporarily gain exposure to a portion of the U.S. or a foreign market. The risks of owning such investment vehicles generally reflect the risks of owning the underlying securities they are designed to track, although any lack of liquidity could result in it being more volatile. Additionally, such investment vehicles have fees and expenses that reduce their value relative to their underlying holdings.
C. Security Transactions and Investment Income – Investment security transactions are accounted for on a trade date basis. Cost is determined and gains and losses are based upon the specific identification method for both financial statement and federal income tax purposes. Dividend income is recorded on the ex-dividend date and interest income is recorded on the accrual basis. Non-cash dividends included in dividend income, if any, are recorded at the fair market value of the security received. Purchase discounts and premiums on securities are accreted and amortized to the earliest call date of the respective securities.
D. Federal Income Taxes – The Fund intends to comply with the requirements of Subchapter M of the Internal Revenue Code applicable to regulated investment companies and will distribute all of its taxable income, if any to shareholders. Accordingly, no provision for Federal income taxes is required in the financial statements.
The Fund recognizes the tax benefits of uncertain tax positions only when the position is “more likely than not” to be sustained assuming examination by tax authorities. Management has reviewed the tax positions and has concluded that no liability for unrecognized tax benefits should be recorded related to uncertain tax positions related to the open tax years (2018-2020) or expected to be taken in the Fund’s 2021 tax returns. The Fund identifies its major tax jurisdiction as U.S. Federal. The Fund recognizes interest and penalties, if any, related to unrecognized tax benefits as income tax expense in the Statement of Operations. During the year ended September 30, 2021, the Fund did not incur any interest or penalties. Generally tax authorities can examine tax returns filed for the last three years.
E. Distributions to Shareholders – Distributions from investment income are declared and paid quarterly. Distributions from net realized capital gains, if any, are declared and paid annually and are recorded on the ex-dividend date. The character of income and gains to be distributed is determined in accordance with income tax regulations, which may differ from GAAP.
For the year ended September 30, 2021, the Fund declared distributions to shareholders in the amount of $136,918,036, which resulted in $70,376,255 elected to be paid in cash and $66,541,781 that was reinvested through the Fund’s dividend reinvestment policy. During this same period, the Fund had total investment income of $94,167,746, net realized gains/(loss) on investments totaling $26,780,286, net change in unrealized appreciation on investments of $371,899,418 and net expenses of $52,172,865.
The Fund’s primary investment objective is to generate current income while secondarily seeking long-term capital appreciation with low to moderate volatility and low correlation to the broader markets. The Fund’s total return is expected to be comprised of income plus realized gains and unrealized gains, less Fund-level expenses. Therefore, a portion of the Fund’s total return has been comprised of unrealized gains.
| Annual Report | September 30, 2021 | 27 |
| Bluerock Total Income+ Real Estate Fund | Notes to Financial Statements |
| | September 30, 2021 |
The Fund’s distributions for any period may be higher or lower than the Fund’s net return and therefore should not be used as a measure of performance or confused with yield or income generated by the Fund’s underlying investments. Further, the actual distribution amounts and sources of those amounts for tax reporting purposes will depend upon the Fund’s investment experience during its fiscal year and may be subject to changes based on tax regulations. Distributions in excess of the Fund’s total return will cause the Fund’s NAV to decline. During the year ended September 30, 2021, the Fund’s Class A Shares had a starting NAV of $29.26, paid distributions of $1.60 and had an ending NAV of $32.66. The Fund’s Class C Shares had a starting NAV of $27.89, paid distributions of $1.52 and had an ending NAV of $30.90. The Fund’s Class I Shares had a starting NAV of $29.80, paid distributions of $1.64 and had an ending NAV of $33.35. The Fund’s Class L Shares had a starting NAV of $29.02, paid distributions of $1.59 and had an ending NAV of $32.31.
The Fund’s distribution policy is expected to result in distributions that equal a fixed percentage of the Fund’s current net asset value per share. All or a portion of a distribution may consist of a return of capital (i.e. from your original investment). Shareholders should not assume that the source of a distribution from the Fund is net profit. Shareholders should note that return of capital will reduce the tax basis of their shares and potentially increase the taxable gain, if any, upon disposition of their shares. Investors should not draw any conclusions about the Fund’s investment performance from the amount of its distribution.
The Fund’s historical NAV details are available on the Fund’s website at www.bluerockfunds.com/performance.
F. Cash and Cash Equivalents – Cash and cash equivalents are held with a financial institution. The asset of the Funds may be placed in deposit accounts at U.S. banks and such deposits generally exceed Federal Deposit Insurance Corporation ( “FDIC”) insurance limits. The FDIC insures deposit accounts up to $250,000 for each accountholder.
G. Indemnification – The Trust indemnifies its officers, trustees and distributor for certain liabilities that may arise from the performance of their duties to the Trust. Additionally, in the normal course of business, the Fund enters into contracts that contain a variety of representations and warranties and which provide general indemnities. The Fund’s maximum exposure under these arrangements is unknown, as this would involve future claims that may be made against the Fund that have not yet occurred. However, based on experience, the Trust expects the risk of loss due to these warranties and indemnities to be remote.
3. ADVISORY FEE AND OTHER RELATED PARTY TRANSACTIONS
A. Advisory Fees – Pursuant to an investment management agreement between the Trust and the Advisor, (the “Advisory Agreement”), investment advisory services are provided to the Fund by the Advisor. Under the terms of the Advisory Agreement, the Advisor receives monthly fees calculated at an annual rate of 1.50% of the average daily net assets of the Fund. For the year ended September 30, 2021, the Advisor earned advisory fees of $38,094,692.
Pursuant to an expense limitation agreement, the Advisor has contractually agreed to waive all or part of its management fees and/or make payments to limit Fund operating expenses (exclusive of any taxes, interest, acquired fund fees and expenses, brokerage and extraordinary expenses, but inclusive of organizational costs and offering costs) at least until January 31, 2022 so that the total annual operating expenses of the Fund do not exceed 1.95%, 2.70%, 1.70%, and 2.20%, of the Fund’s average daily net assets for Class A, Class C, Class I, and Class L shares, respectively.
Fee waivers and expense payments may be recouped by the Advisor from the Fund, upon approval by the Board, to the extent that the reimbursement occurs no more than three fiscal years from the fiscal year in which they were incurred and such reimbursement will not cause the expense limitation then in effect or in effect at the time of the waiver to be exceeded. During the year ended September 30, 2021, the Advisor waived fees and/or reimbursed expenses of $549,344 and recouped previously waived fees of $32,630. Cumulative fees and/or expenses subject to recapture pursuant to the aforementioned conditions amounted to $516,714 and will expire during the 2024 fiscal year.
Sub-advisory services were provided to the Fund pursuant to agreements between the Advisor and each of Mercer Investment Management, Inc. (“Mercer”) and RREEF America, LLC (“RREEF” and together with Mercer, the “Sub-Advisors”). Under each of the terms of the sub-advisory agreements, the Advisor compensates the Sub-Advisors based on the Fund’s assets allocated to the respective Sub-Advisor. Under the terms of the Sub-Advisory Agreement with Mercer, the Sub-Advisor receives fees from the Advisor (not the Fund) as follows: 0.025% of the Fund’s assets invested in publicly traded real estate securities, and 0.15% for up to $250 million in total Fund assets, 0.13% for $250 million to $500 million in total Fund assets, 0.12% for $500 million to $750 million in total Fund assets, 0.10% for $750 million to $1 billion in total Fund assets, 0.08% for $1 billion to $1.3 billion in total Fund assets, 0.07% for $1.3 billion to $1.5 billion in total Fund assets, 0.06% for $1.5 billion to $2 billion in total Fund assets, and 0.05% for $2 billion or more in total Fund assets invested in private real estate assets.
| Bluerock Total Income+ Real Estate Fund | Notes to Financial Statements |
| | September 30, 2021 |
Under the terms of a sub-advisory agreement between the Advisor and RREEF, RREEF receives fees from the Advisor (not the Fund) as follows: For the portion of the Fund invested in liquid real assets, sub-advisory fees are calculated at an annual rate of 0.60% for up to $50 million in assets allocated to RREEF, 0.55% for $50 million to $100 million in assets allocated to RREEF, and 0.50% for greater than $100 million in assets allocated to RREEF. For the portion of the Fund which is invested in non-publicly traded real estate related debt securities, sub-advisory fees are calculated at an annual rate of 0.75% for up to $350 million in assets allocated to RREEF, 0.60% in excess of $350 million through $700 million in assets allocated to RREEF, and 0.55% for assets in excess of $700 million allocated to RREEF.
B. Distributor – The distributor of the Fund is ALPS Distributors, Inc. (the “Distributor”). The Board has adopted, on behalf of the Fund, a Shareholder Services Plan and a Distribution Plan under which the Fund may compensate financial industry professionals for providing ongoing services in respect to clients with whom they have distributed shares of the Fund. Under the Shareholder Services Plan, the Fund pays up to 0.25% per year of the average daily net assets of each of Class A, Class C and Class L shares for such services. For the year ended September 30, 2021, the Fund incurred shareholder servicing fees of $1,317,244, $1,095,774 and $193,372 for Class A, Class C and Class L shares, respectively. Under the Distribution Plan, the Fund pays 0.75% and 0.25% per year of its average daily net assets for such services for Class C shares and Class L shares, respectively. For the year ended September 30, 2021, the Fund incurred distribution fees of $3,287,323 and $193,372 for Class C shares and Class L, respectively.
The Distributor acts as the Fund’s principal underwriter in a continuous public offering of the Fund’s shares. For the year ended September 30, 2021, the Distributor received $1,727,680 in underwriting commissions for sales of Class A shares, of which $290,471 was retained by the principal underwriter or other affiliated broker-dealers. For the year ended September 30, 2021, the Distributor received $275,352 in underwriting commissions for sales of Class L shares, of which $65,115 was retained by the principal underwriter or other affiliated broker-dealers. For the year ended September 30, 2021, the Distributor received $596,635 in underwriting commissions for sales of Class C.
C. ALPS Fund Services, Inc. (“ALPS”) – ALPS provides administration and fund accounting services to the Trust. Pursuant to separate servicing agreements with ALPS, the Fund pays ALPS customary fees for providing administration and fund accounting services to the Fund.
D. Transfer Agent – DST Systems, Inc., an affiliate of ALPS, serves as transfer, dividend paying and shareholder servicing agent for the Fund (“Transfer Agent”).
E. Trustees – Each Trustee who is not affiliated with the Trust or the Advisor receives an annual fee of $37,500, paid quarterly, of which $25,000 is paid in cash and the remaining $12,500 is paid in the equivalent amount of the Fund shares, as well as reimbursement for any reasonable expenses incurred attending the meetings.
4. INVESTMENT TRANSACTIONS
The cost of purchases and proceeds from the sale of securities, other than short-term securities, for the year ended September 30, 2021, amounted to $777,151,225 and $641,270,174 respectively.
5. REPURCHASE OFFERS / SHARES OF BENEFICIAL INTEREST
Pursuant to Rule 23c-3 under the 1940 Act, the Fund offers shareholders on a quarterly basis the option of redeeming shares, at NAV, of no less than 5% and no more than 25% of the shares outstanding on the Repurchase Request Deadline (as defined in the Fund’s prospectus). The Board shall determine the quarterly repurchase offer amount. There is no guarantee that shareholders will be able to sell all of the shares they desire in a quarterly repurchase offer, although each shareholder will have the right to require the Fund to purchase up to and including 5% of such shareholder’s shares in each quarterly repurchase. Limited liquidity will be provided to shareholders only through the Fund’s quarterly repurchases.
| Annual Report | September 30, 2021 | 29 |
| Bluerock Total Income+ Real Estate Fund | Notes to Financial Statements |
| | September 30, 2021 |
During the year ended September 30, 2021, the Fund completed four quarterly repurchase offers. The Fund offered to repurchase up to 5% of the number of its outstanding shares as of the Repurchase Pricing Dates. The results of the repurchase offers were as follows:
| | | Repurchase Offer | | | Repurchase Offer | | | Repurchase Offer | | | Repurchase Offer | |
| Commencement Date | | | September 29, 2020 | | | | December 29, 2020 | | | | March 25, 2021 | | | | June 24, 2021 | |
| Repurchase Request Deadline | | | November 10, 2020 | | | | February 9, 2021 | | | | May 6, 2021 | | | | August 5, 2021 | |
| Repurchase Pricing Date | | | November 10, 2020 | | | | February 9, 2021 | | | | May 6, 2021 | | | | August 5, 2021 | |
| Net Asset Value as of Repurchase Offer Date: | | | | | | | | | | | | | | | | |
| Class A | | $ | 29.27 | | | $ | 29.75 | | | $ | 30.13 | | | $ | 31.38 | |
| Class C | | $ | 27.87 | | | $ | 28.28 | | | $ | 28.59 | | | $ | 29.71 | |
| Class I | | $ | 29.82 | | | $ | 30.33 | | | $ | 30.74 | | | $ | 32.02 | |
| Class L | | $ | 29.02 | | | $ | 29.48 | | | $ | 29.84 | | | $ | 31.05 | |
| Amount Repurchased: | | | | | | | | | | | | | | | | |
| Class A | | $ | 23,758,902 | | | $ | 25,498,877 | | | $ | 33,190,429 | | | $ | 15,122,926 | |
| Class C | | $ | 13,848,158 | | | $ | 14,913,198 | | | $ | 25,178,047 | | | $ | 9,596,955 | |
| Class I | | $ | 82,975,370 | | | $ | 82,805,401 | | | $ | 109,839,583 | | | $ | 45,974,236 | |
| Class L | | $ | 1,415,840 | | | $ | 1,478,859 | | | $ | 2,170,206 | | | $ | 1,619,061 | |
| Total Number of Shares Tendered: | | | 4,140,061 | | | | 4,164,854 | | | | 5,628,311 | | | | 2,292,891 | |
| Percentage of Shares Tendered that were Repurchased: | | | 45.42 | % | | | 51.67 | % | | | 100.00 | % | | | 100.00 | % |
6. DISTRIBUTIONS TO SHAREHOLDERS AND TAX COMPONENTS OF CAPITAL
The tax character of Fund distributions for the following years was as follows:
| Year | | Ordinary Income | | | Long-Term Capital Gain | | | Return of Capital | |
| 2021 | | $ | – | | | $ | 50,732,345 | | | $ | 86,185,691 | |
| 2020 | | | 6,428,107 | | | | 76,787,908 | | | | 40,411,164 | |
As of September 30, 2021, the aggregate costs of investments, gross unrealized appreciation/(depreciation) and net unrealized appreciation for Federal tax purposes were as follows:
| | | Gross Appreciation (excess of value over tax cost) | | | Gross Depreciation (excess of tax cost over value) | | | Net Unrealized Appreciation | | | Cost of Investments for Income Tax Purposes | |
| | $ | 610,451,706 | | | $ | (22,366,673 | ) | | $ | 588,085,033 | | | $ | 2,548,966,061 | |
The difference between book basis and tax basis distributable earnings and unrealized appreciation/(depreciation) is primarily attributable to the tax deferral of losses on wash sales and tax adjustments for partnerships.
As of September 30, 2021, the components of accumulated earnings/(deficit) on a tax basis were as follows:
| | | Other cumulative effect of timing differences | | | Net unrealized appreciation on investments | | | Total | |
| | $ | (13,782,564 | ) | | $ | 588,085,033 | | | $ | 574,302,469 | |
The Fund elects to defer the year ended September 30, 2021, late year ordinary losses in the amount of $13,782,564.
Permanent book and tax differences, primarily attributable to net operating losses and tax adjustments for partnerships, resulted in reclassification for the fiscal year ended September 30, 2021 as follows:
| | | Paid-in Capital | | | Total Distributable Earnings | |
| | $ | (1,221,548 | ) | | $ | 1,221,548 | |
Included in the amounts reclassified was a net operating loss offset to Paid-in Capital in the amount of 1,358,774
| Bluerock Total Income+ Real Estate Fund | Notes to Financial Statements |
| | September 30, 2021 |
7. EARLY WITHDRAWAL CHANGE
Class C shareholders and certain Class A shareholders who tender for repurchase shares that have been held less than one year (365 days) from the purchase date will be subject to an early withdrawal charge of 1.00% of the original purchase price with respect to such shares. The early withdrawal change does not apply to shares that were acquired through reinvestment of distributions or in connection with the death or disability of the shareholder. The early withdrawal change is paid directly to the Fund. For the year ended September 30, 2021, the Fund did not receive any such fees.
8. COMMITMENTS AND CONTINGENCIES
Commitments – As of September 30, 2021, the Fund had unfunded commitments and/or contingencies for the below listed Private Real Estate Securities:
| Security | | Value | | | Unfunded Commitments | | | Redemption Frequency | | Redemption Notice (Days) |
| AEW Core Property Trust | | $ | 7,943,729 | | | $ | – | | | Quarterly | | 45 |
| Ares Industrial Real Estate Fund | | | 126,292,632 | | | | 30,000,000 | | | Quarterly | | 90 |
| Ares Real Estate Enhanced Income Fund | | | 102,128,567 | | | | 18,286,871 | | | Quarterly | | 90 |
| Bain Capital Real Estate Fund I | | | 74,398,548 | | | | 31,746,163 | | | None | | None |
| Blackstone Property Partners | | | 73,691,434 | | | | – | | | Quarterly | | 90 |
| Blackstone BioMed Life Science Real Estate LP | | | 74,914,192 | | | | 21,955,331 | | | Annual | | 180 |
| Bridge Debt Strategies Fund III, LP | | | 88,309,864 | | | | 5,574,061 | | | None | | None |
| Brookfield Premier Real Estate Partners | | | 281,580,220 | | | | – | | | Quarterly | | 90 |
| Carlyle Property Investors | | | 110,516,665 | | | | 140,000,000 | | | Quarterly | | 90 |
| CBRE U.S. Core Partners | | | 53,080,245 | | | | – | | | Quarterly | | 60 |
| Cortland Growth & Income Fund | | | – | | | | 100,000,000 | | | Quarterly | | 90 |
| Clarion Gables Multifamily Trust | | | 67,953,335 | | | | 30,000,000 | | | Quarterly | | 90 |
| Clarion Lion Industrial Trust | | | 165,184,034 | | | | 20,000,000 | | | Quarterly | | 90 |
| Clarion Lion Properties Fund | | | 135,822,552 | | | | – | | | Quarterly | | 90 |
| Harrison Street Core Property Fund | | | 52,461,071 | | | | – | | | Quarterly | | 45 |
| Invesco Core Real Estate Fund | | | 31,202,233 | | | | – | | | Quarterly | | 45 |
| Invesco U.S. Income Fund LP | | | 116,565,114 | | | | 30,000,000 | | | Quarterly | | 45 |
| IQHQ, Inc. | | | 54,068,243 | | | | 50,817,448 | | | None | | None |
| Morgan Stanley Prime Property Fund LLC | | | 233,186,294 | | | | 50,000,000 | | | Quarterly | | 90 |
| PGIM PRISA II | | | – | | | | 80,000,000 | | | Quarterly | | 90 |
| PGIM PRISA III | | | 97,576,374 | | | | 76,211,383 | | | Quarterly | | 90 |
| Principal Enhanced Property Fund LP | | | 62,008,518 | | | | 25,000,000 | | | Quarterly | | 90 |
| Prologis Targeted US Logistics | | | 331,041,064 | | | | 50,000,000 | | | Quarterly | | 90 |
| Realterm Logistics Income Fund LP | | | – | | | | 130,000,000 | | | Quarterly | | 90 |
| RREEF America REIT II, Inc. | | | 69,970,068 | | | | – | | | Quarterly | | 45 |
| RREEF Core Plus Industrial Fund LP | | | 137,231,904 | | | | 30,000,000 | | | Quarterly | | 60 |
| Sentinel Real Estate Fund | | | 51,863,427 | | | | 60,000,000 | | | Daily | | * |
| Stockbridge Smart Markets Fund | | | 19,616,802 | | | | – | | | Quarterly | | 45 |
| Stockbridge Value Fund II | | | 1,315,816 | | | | 511,701 | | | None | | None |
| TA Realty Core Property Fund | | | – | | | | 60,000,000 | | | Quarterly | | 45 |
| UBS Trumbull Property G&I Fund | | | 19,453,238 | | | | – | | | Quarterly | | 60 |
| Total | | $ | 2,639,376,183 | | | $ | 1,040,102,958 | | | | | |
| * | Written notice required for redemption, no minimum timeline required. |
Typically, when the Fund invests in a Private Fund, it makes a binding commitment to invest a specified amount of capital in the applicable Private Fund. The capital commitment may be drawn by the general partner of the Private Fund either all at once, or over time through a series of capital calls at the discretion of the general partner. As such, the Unfunded Commitments column above reflects the remaining amount of the Fund’s commitments to be called by the general partner of the Private Fund. Further, the organizational documents of the Private Funds in which the Fund invests typically have set redemption schedules and notification requirements. As such, the Redemption Frequency column above reflects the frequency in which the Private Fund accepts redemption requests and the Redemption Notice column reflects the number of days of advanced notice required. While redemptions can be requested at the frequency listed above, there is no guarantee the Fund will be paid all or any of the redemption amount at the time requested.
| Annual Report | September 30, 2021 | 31 |
| Bluerock Total Income+ Real Estate Fund | Notes to Financial Statements |
| | September 30, 2021 |
9. LINE OF CREDIT
Credit Facility – On November 23, 2016, the Fund entered into a secured, revolving line of credit agreement (“Credit Agreement”) with Credit Suisse for investment purposes, subject to annual renewal and other limitations of the 1940 Act for borrowings. Borrowings under the Credit Agreement bear interest up to the rate of 3 month LIBOR plus 205 basis points at the time of borrowing. During the year ended September 30, 2021, the average amount of borrowing outstanding, approximate weighted average interest rate on borrowings and total interest expense for the year ended September 30, 2021 were $98,112,994, 2.26% and $2,878,064 respectively. Note, of the total interest expense incurred, $1,780,483 was related to fees on unused borrowings. As of September 30, 2021, the Fund did not have outstanding borrowings under the Credit Agreement.
10. SUBSEQUENT EVENTS
The Fund completed a quarterly repurchase offer on November 4, 2021 which resulted in 1.65% of the Fund’s shares being repurchased for $55,261,278.
Subsequent events after the date of the Statement of Assets and Liabilities have been evaluated through the date the financial statements were issued. Except as stated above, management has concluded that there is no impact requiring adjustment or disclosure in the financial statements.
| Bluerock Total Income+ | Report of Independent Registered |
| Real Estate Fund | Public Accounting Firm |

To the Board of Trustees and the Shareholders of
Bluerock Total Income+ Real Estate Fund
Opinion on the Financial Statements
We have audited the accompanying statement of assets and liabilities of Bluerock Total Income+ Real Estate Fund (the “Fund”), including the portfolio of investments, as of September 30, 2021, and the related statements of operations and cash flows for the year then ended, the statements of changes in net assets for each of the years in the two-year period then ended, the financial highlights as noted in the table below, and the related notes (collectively referred to as the “financial statements”). In our opinion, the financial statements present fairly, in all material respects, the financial position of the Fund as of September 30, 2021, and the results of its operations and cash flows for the year then ended, the changes in its net assets for each of the years in the two-year period then ended and its financial highlights as noted in the table below, in conformity with accounting principles generally accepted in the United States of America.
| Share Class | Financial Highlights Presented |
| Class A | For each of the years in the five-year period ended September 30, 2021 |
| Class C | For each of the years in the five-year period ended September 30, 2021 |
| Class I | For each of the years in the five-year period ended September 30, 2021 |
| Class L | For each of the years in the four-year period ended September 30, 2021 and for the period from June 1, 2017 (commencement of operations) through September 30, 2017 |
Basis for Opinion
These financial statements are the responsibility of the Fund’s management. Our responsibility is to express an opinion on the Fund’s financial statements based on our audits. We are a public accounting firm registered with the Public Company Accounting Oversight Board (United States) (“PCAOB”) and are required to be independent with respect to the Fund in accordance with the U.S. federal securities law and the applicable rules and regulations of the Securities and Exchange Commission and the PCAOB.
We conducted our audits in accordance with the standards of the PCAOB. Those standards require that we plan and perform the audits to obtain reasonable assurance about whether the financial statements are free of material misstatement, whether due to error or fraud. The Fund is not required to have, nor were we engaged to perform, an audit of its internal control over financial reporting. As part of our audits we are required to obtain an understanding of internal control over financial reporting but not for the purpose of expressing an opinion on the effectiveness of the Fund’s internal control over financial reporting. Accordingly, we express no such opinion.
Our audits included performing procedures to assess the risk of material misstatement of the financial statements, whether due to error or fraud, and performing procedures that respond to those risks. Such procedures included examining, on a test basis, evidence regarding the amounts and disclosures in the financial statements. Our procedures included confirmation of securities owned as of September 30, 2021 by correspondence with the custodian, brokers, and other appropriate parties. Our audits also included evaluating the accounting principles used and significant estimates made by management, as well as evaluating the overall presentation of the financial statements. We believe that our audits provide a reasonable basis for our opinion.

BBD, LLP
We have served as the auditor of Bluerock Total Income+ Real Estate Fund since 2012.
Philadelphia, Pennsylvania
November 26, 2021
| Annual Report | September 30, 2021 | 33 |
| Bluerock Total Income+ Real Estate Fund | Additional Information |
| | September 30, 2021 (Unaudited) |
1. PROXY VOTING POLICIES AND VOTING RECORD
A description of the policies and procedures that the Fund uses to vote proxies relating to its portfolio securities is available without charge upon request by calling toll-free 844-819-8287 or on the Securities and Exchange Commission’s (“SEC”) website at http://www.sec.gov. Information regarding how the Fund voted proxies relating to underlying portfolio securities during the most recent 12-month period ended June 30th is available without charge upon request by calling toll-free 844-819-8287, or on the SEC’s website at http://www.sec.gov.
2. QUARTERLY PORTFOLIO HOLDINGS
The Fund files a monthly portfolio investments report with the SEC on Form N-PORT within 60 days after the end of the first and third quarters of each fiscal year. The filings are available upon request by calling 844-819-8287. Furthermore, you may obtain a copy of the filings on the SEC’s website at http://www.sec.gov.
3. TAX INFORMATION (UNAUDITED)
Pursuant to Section 852(b)(3) of the Internal Revenue Code, the Fund designated $50,732,345 as long-term capital gain distribution for the year ended September 30, 2021.
| Bluerock Total Income+ Real Estate Fund | Supplemental Information |
| | September 30, 2021 (Unaudited) |
The following is a list of the Trustees and executive officers of the Trust and each person’s principal occupation over the last five years.
INDEPENDENT TRUSTEES
| Name, Year of Birth | Position/ Term of Office* | Principal Occupation During the Past Five Years | Number of Portfolios in Fund Complex** Overseen by Trustee | Other Directorships Held By Trustee During Last Five Years |
Bobby Majumder,
1968 | Trustee Since 2012 | Partner, Frost Brown Todd, LLC (September 2021 – Present); Partner, Reed Smith (May 2019 – August 2021); Partner, Perkins Coie LLP (2013 – May 2019). | 1 | Bluerock Residential Growth REIT, Inc. (2009 – Present). |
Clayton Hosterman,
1966 | Trustee Since 2014 | Director of Business Development for Sage Software, Inc. (2015 – present); Principal and Director of Business Development for Banking, Accounting and Reseller Partners, Treasurer’s Choice Processing (2013 – 2015); Senior Vice President, Merchant E-Solutions, Inc. (2012 – 2013); Group Manager, JPMorgan Chase – Paymentech (2006 – 2012). | 1 | n/a |
Romano Tio,
1960 | Trustee Since 2012 | Senior Managing Director, Greystone (real estate lending, investment and advisory company) (2021 – present); Senior Managing Director, Ackman-Ziff Real Estate Capital Advisors (2017 – 2021); Co-Founder and Managing Director, RM Capital Management LLC (2009 – 2017). | 1 | Bluerock Residential Growth REIT, Inc. (2009 – Present). |
Kamal Jafarnia,
1966 | Trustee Since 2021 | General Counsel for Lonsdale Digital Management, Inc. (fintech and investment management firm) (2021 – present); General Counsel and CCO for Artivest Holdings and Altegris Investment Management (fintech enablement platform) (2018 – 2021); Attorney at Law at Kamal Jafarnia (2018); Managing Director for Legal and Business Development for Provasi Capital Partners, LP (investment management firm) (2017 – 2018); General Counsel and CCO for WP Carey, Inc. (investment management firm) (2014 – 2017). | 1 | Ashford Hospitality Trust, Inc. (2013 – Present); Bluerock Residential Growth REIT, Inc. (2019 – Present). |
INTERESTED TRUSTEES AND OFFICERS
| Name, Year of Birth | Position/ Term of Office* | Principal Occupation During the Past Five Years | Number of Portfolios in Fund Complex** Overseen by Trustee | Other Directorships Held By Trustee During Last 5 Years |
Ramin Kamfar,
1963 | Trustee Since 2012 | Chairman, Bluerock Real Estate, LLC (2002 – Present); Chairman, Bluerock Fund Advisor, LLC (2012 – Present) and Bluerock Asset Management, LLC (2018 – present). | 1 | Bluerock Residential Growth REIT (2008 – Present). |
Simon Adamiyatt,
1962 | Trustee Since 2019, Treasurer/ Chief Financial Officer Since 2018 | Executive Director, Bluerock Real Estate, LLC (2018 – Present); Executive Director and Chief Financial Officer of Earthport, Plc (financial technology company) (May 2015 – January 2018). | 1 | n/a |
| Annual Report | September 30, 2021 | 35 |
| Bluerock Total Income+ Real Estate Fund | Supplemental Information |
| | September 30, 2021 (Unaudited) |
INTERESTED TRUSTEES AND OFFICERS (CONTINUED)
| Name, Year of Birth | Position/ Term of Office* | Principal Occupation During the Past Five Years | Number of Portfolios in Fund Complex Overseen by Trustee | Other Directorships held by Trustee During Last 5 Years |
Jordan Ruddy,
1963 | President Since 2013 | Chief Operating Officer, Bluerock Real Estate, LLC (2002 – Present); President, Bluerock Fund Advisor, LLC (2013 – Present); President, Bluerock Asset Management, LLC (2020 – Present); Director, Bluerock Asset Management, LLC (2018 – 2020). | n/a | n/a |
Jason Emala,
1978 | Secretary Since 2018 | General Counsel/Chief Legal Officer/Chief Compliance Officer of the Advisor and various Bluerock entities (2018 – Present); VP and Asst. General Counsel, Cantor Fitzgerald (2016 – 2018). | n/a | n/a |
Patrick Chism,
1966 | Chief Compliance Officer Since 2017 | Managing Director, Vigilant Compliance, LLC (2020 – Present), Director, Vigilant Compliance, LLC (2016 – 2020). | n/a | n/a |
| * | The term of office for each Trustee and officer listed above will continue indefinitely. The Fund’s Statement of Additional Information includes additional information about the Trustees and is available upon request, free of charge, by calling toll-free 1-844-819-8287. |
| ** | The Fund Complex currently includes the Trust. |
| Bluerock Total Income+ Real Estate Fund | Privacy Policy |
| | September 30, 2021 (Unaudited) |
| FACTS | WHAT DOES THE BLUEROCK TOTAL INCOME+ REAL ESTATE FUND DO WITH YOUR PERSONAL INFORMATION? |
| Why? | Financial companies choose how they share your personal information. Federal law gives consumers the right to limit some but not all sharing. Federal law also requires us to tell you how we collect, share, and protect your personal information. Please read this notice carefully to understand what we do. |
| What? | The types of personal information we collect and share depend on the product or service you have with us. This information can include: |
| | • Social Security number • Assets • Retirement Assets • Transaction History • Checking Account Information | • Purchase History • Account Balances • Account Transactions • Wire Transfer Instructions |
| | When you are no longer our customer, we may continue to share your personal information as described in this notice. |
| How? | All financial companies need to share customers’ personal information to run their everyday business. In the section below, we list the reasons financial companies can share their customers’ personal information; the reasons the Fund chooses to share; and whether you can limit this sharing. |
| Reasons we can share your personal information | Does Bluerock Total Income+ Real Estate Fund share? | Can you limit this sharing? |
| For our everyday business purposes – such as to process your transactions, maintain your account(s), respond to court orders and legal investigations, or report to credit bureaus | Yes | No |
| For our marketing purposes – to offer our products and services to you | No | We don’t share |
| For joint marketing with other financial companies | No | We don’t share |
| For our affiliates’ everyday business purposes – information about your transactions and experiences | No | We don’t share |
| For our affiliates’ everyday business purposes – information about your creditworthiness | No | We don’t share |
| For nonaffiliates to market to you | No | We don’t share |
| Questions? | Call 1-844-819-8287 | | |
| Annual Report | September 30, 2021 | 37 |
| Bluerock Total Income+ Real Estate Fund | Privacy Policy |
| | September 30, 2021 (Unaudited) |
| Who We Are | |
| Who is providing this notice? | Bluerock Total Income+ Real Estate Fund |
| What We Do | |
How does Bluerock Total Income+ Real Estate Fund protect my personal information? | To protect your personal information from unauthorized access and use, we use security measures that comply with federal law. These measures include computer safeguards and secured files and buildings. Our service providers are held accountable for adhering to strict policies and procedures to prevent any misuse of your nonpublic personal information. |
How does Bluerock Total Income+ Real Estate Fund collect my personal information? | We collect your personal information, for example, when you · Open an account · Provide account information · Give us your contact information · Make deposits or withdrawals from your account · Make a wire transfer · Tell us where to send the money · Tells us who receives the money · Show your government-issued ID · Show your driver’s license We also collect your personal information from other companies. |
| Why can’t I limit all sharing? | Federal law gives you the right to limit only · Sharing for affiliates’ everyday business purposes – information about your creditworthiness · Affiliates from using your information to market to you · Sharing for nonaffiliates to market to you State laws and individual companies may give you additional rights to limit sharing. |
| Definitions | |
| Affiliates | Companies related by common ownership or control. They can be financial and nonfinancial companies. · Bluerock Total Income+ Real Estate Fund does not share with our affiliates. |
| Nonaffiliates | Companies not related by common ownership or control. They can be financial and nonfinancial companies · Bluerock Total Income+ Real Estate Fund does not share with nonaffiliates so they can market to you. |
| Joint marketing | A formal agreement between nonaffiliated financial companies that together market financial products or services to you. · Bluerock Total Income+ Real Estate Fund doesn’t jointly market. |
Page Intentionally Left Blank
Investment Adviser
Bluerock Fund Advisor, LLC
1345 Avenue of the Americas, 32nd Floor
New York, NY 10105
Distributor
ALPS Distributors, Inc.
1290 Broadway, Suite 1000
Denver, CO 80203
Legal Counsel
Thompson Hine LLP
41 South High Street, Suite 1700
Columbus, OH 43215
Independent Registered Public Accounting Firm
BBD, LLP
1835 Market Street, 3rd Floor
Philadelphia, PA 19103
How to Obtain Proxy Voting Information
Information regarding how the Fund votes proxies relating to portfolio securities for the 12 month period ended June 30th as well as a description of the policies and procedures that the Fund used to determine how to vote proxies is available without charge, upon request, by calling 1-844-819-8287 or by referring to the Securities and Exchange Commission’s (“SEC”) website at http://www.sec.gov.
How to Obtain 1st and 3rd Fiscal Quarter Portfolio Holdings
The Fund files a monthly portfolio investments report with the SEC on Form N-PORT within 60 days after the end of the first and third quarters of each fiscal year. The filings are available upon request by calling 844-819-8287. Furthermore, you may obtain a copy of the filings on the SEC’s website at http://www.sec.gov.
Item 2. Code of Ethics.
| (a) | As of the end of the period covered by this report, the registrant has adopted a code of ethics that applies to the registrant’s principal executive officer, principal financial officer, principal accounting officer or controller, or persons performing similar functions, regardless of whether these individuals are employed by the registrant or a third party. |
| (b) | For purposes of this item, “code of ethics” means written standards that are reasonably designed to deter wrongdoing and to promote: |
| (1) | Honest and ethical conduct, including the ethical handling of actual or apparent conflicts of interest between personal and professional relationships; |
| (2) | Full, fair, accurate, timely, and understandable disclosure in reports and documents that a registrant files with, or submits to, the Commission and in other public communications made by the registrant; |
| (3) | Compliance with applicable governmental laws, rules, and regulations; |
| (4) | The prompt internal reporting of violations of the code to an appropriate person or persons identified in the code; and |
| (5) | Accountability for adherence to the code. |
| (c) | During the period covered by this report, there were no amendments to the Fund’s Code of Ethics. |
| (d) | Waivers: During the period covered by the report, the registrant has not granted any express or implicit waivers from the provisions of the code of ethics. |
| (f) | The Registrant’s code of ethics referred to in Item 2(a) above is attached as an Exhibit 13(a)(1), hereto. |
Item 3. Audit Committee Financial Expert.
| (a) | The registrant’s board of directors has determined that the registrant has at least one audit committee financial expert serving on its audit committee. The registrant’s board of directors has determined that Romano Tio is an audit committee financial expert. Mr. Tio is “independent” as defined in paragraph (a)(2) of Item 3 to Form N-CSR. |
Item 4. Principal Accountant Fees and Services.
September 30, 2021 – $23,000
September 30, 2020 – $20,500
Audit fees represent the aggregate fees billed for the fiscal years ended September 30, 2021 and September 30, 2020 for professional services rendered by the principal accountant for the audit of the Registrant’s annual financial statements or services that are normally provided by the accountant in connection with statutory and regulatory filings or engagements.
September 30, 2021- $0
September 30, 2020 - $0
The registrant was not billed for any fees for the fiscal years ended September 30, 2021 and September 30, 2020 for assurance and related services that were reasonably related to the performance of the audit of the registrant’s financial statement and not otherwise included under “Audit Fees” above.
September 30, 2021 - $3,000
September 30, 2020 - $3,000
Tax fees” shown above were for the preparation of Federal & State income tax returns, assistance with calculation of required income, capital gain and excise distributions and preparation of Federal excise tax returns.
September 30, 2021 - $0
September 30, 2020 - $0
The registrant was not billed any fees for products and services not otherwise included in items (a) - (c) shown above for the fiscal years ended September 30, 2021 and September 30, 2020.
| (e) | (1) Audit Committee’s Pre-Approval Policies and Procedures |
The registrant’s Audit Committee is required to pre-approve all audit services and, when appropriate, any non-audit services (including audit-related, tax and all other services) to the registrant. The registrant’s Audit Committee also is required to pre-approve, when appropriate, any non-audit services (including audit-related, tax and all other services) to its adviser, or any entity controlling, controlled by or under common control with the adviser that provides ongoing services to the registrant, to the extent that the services may be determined to have an impact on the operations or financial reporting of the registrant. Services are reviewed on an engagement by engagement basis by the Audit Committee.
| | (2) | Percentages of Services Approved by the Audit Committee pursuant to paragraph (c)(7)(i)(C) of Rule 2-01 of Regulation S-X. |
| | 2021 | 2020 |
| Audit Related | 0% | 0% |
| Tax Fees | 0% | 0% |
| Other Fees | N/A | N/A |
| (f) | During the audit of registrant’s financial statements for the most recent fiscal year, less than 50 percent of the hours expended on the principal accountant’s engagement were attributed to work performed by persons other than the principal accountant’s full-time, permanent employees. |
| (g) | The aggregate non-audit fees billed by the registrant’s accountant for services rendered to the registrant, and rendered to the registrant’s investment adviser (not including any sub-adviser whose role is primarily portfolio management and is subcontracted with or overseen by another investment adviser), and any entity controlling, controlled by, or under common control with the adviser that provides ongoing services to the registrant: |
September 30, 2021 - $0
September 30, 2020 - $0
| (h) | The registrant’s audit committee has considered whether the provision of non-audit services to the registrant’s investment adviser (not including any sub-adviser whose role is primarily portfolio management and is subcontracted with or overseen by another investment adviser), and any entity controlling, controlled by, or under common control with the investment adviser that provides ongoing services to the registrant, that were not pre-approved pursuant to paragraph (c)(7)(ii) of Rule 2-01 of Regulation S-X, is compatible with maintaining the principal accountant’s independence. |
Item 5. Audit Committee of Listed Companies.
Not applicable.
Item 6. Schedule of Investments.
Schedule of investments in securities of unaffiliated issuers is included under Item 1.
Item 7. Disclosure of Proxy Voting Policies and Procedures for Closed-End Funds.
See attached Appendix A for the Adviser’s proxy voting policies and Appendix B Sub-Adviser’s proxy voting policies and procedures.
Item 8. Portfolio Managers of Closed-End Management Investment Companies.
(a)(1) Portfolio Managers
Advisor Portfolio Managers
The following are the Advisor’s portfolio managers as of the date of the filing of this report
Jordan B. Ruddy -- Mr. Ruddy currently serves as Co-CIO of the Advisor and Portfolio Manager of the Fund. Mr. Ruddy has served as a member of the Investment Committee and as President of the Advisor since the inception of the Advisor in 2012. Mr. Ruddy has also served in several senior officer capacities with Bluerock Asset Management, LLC since its inception in 2018 and is currently its President. Mr. Ruddy has served in several senior officer capacities with Bluerock Residential Growth REIT, a NYSE American publicly traded REIT since its founding in 2009 and is currently its President. Mr. Ruddy brings approximately 30 years of institutional real estate investment experience working with some of leading public and private firms in the industry. Prior to Bluerock, Mr. Ruddy served as a real estate investment banker at Banc of America Securities LLC, and at Smith Barney Inc. and at JP Morgan Chase (previously the Chase Manhattan Bank), and as Vice President of Amerimar Enterprises, a real estate company specializing in value-added investments nationwide. Mr. Ruddy received an M.B.A. degree in Finance and Real Estate in 1995 from The Wharton School of the University of Pennsylvania, and a B.S. degree with high honors in Economics in 1986 from the London School of Economics.
Adam Lotterman — Mr. Lotterman is co-founder of the Advisor and has been a key member of the Fund’s investment team since its inception in 2012. Mr. Lotterman currently serves as the Fund’s Senior Portfolio Manager, as well as the Advisor’s Co-Chief Investment Officer and Lead Economist. Prior to joining Bluerock, Mr. Lotterman was Vice President of Forman Capital, a private commercial real estate lender from 2011 to 2012. Mr. Lotterman was also an Adjunct Professor at Nova Southeastern University from 2010 to 2012, where he taught a master’s level course in Real Estate Market Analysis. Prior to that, Mr. Lotterman worked as a Senior Valuation Analyst at Bayview Asset Management (former hedge fund affiliate of The Blackstone Group) from 2010 to 2011, and from 2005 to 2010 Mr. Lotterman was the Senior Analyst for Goodkin Consulting, the former real estate consulting arm of PricewaterhouseCoopers. Mr. Lotterman received an M.S. in International Real Estate in 2006 from Florida International University, where he graduated first in class, and a B.S. Degree in microbiology with a minor in chemistry in 1997 from the University of Florida.
(a)(2)
Advisor Portfolio Managers
As of September 30, 2021, the Portfolio Managers listed above are also responsible for the day-to-day management of the following types of accounts in addition to the Fund:
Jordan Ruddy
| Other Accounts By Type | Total Number of Accounts by Account Type | Total Assets By Account Type | Number of Accounts by Type Subject to a Performance Fee | Total Assets By Account Type Subject to a Performance Fee |
| Registered Investment Companies | 0 | $0 | 0 | $0 |
| Other Pooled Investment Vehicles | 0 | $0 | 0 | $0 |
| Other Accounts | 0 | $0 | 0 | $0 |
Adam Lotterman
| Other Accounts By Type | Total Number of Accounts by Account Type | Total Assets By Account Type | Number of Accounts by Type Subject to a Performance Fee | Total Assets By Account Type Subject to a Performance Fee |
| Registered Investment Companies | 0 | $0 | 0 | $0 |
| Other Pooled Investment Vehicles | 0 | $0 | 0 | $0 |
| Other Accounts | 0 | $0 | 0 | $0 |
Because the Portfolio Managers may manage assets for other pooled investment vehicles and/or other accounts (including institutional clients, pension plans and certain high net worth individuals) (collectively “Client Accounts”), or may be affiliated with such Client Accounts, there may be an incentive to favor one Client Account over another, resulting in conflicts of interest. For example, the Advisor may, directly or indirectly, receive fees from Client Accounts that are higher than the fee it receives from the Fund, or it may, directly or indirectly, receive a performance-based fee on a Client Account. In those instances, a portfolio manager may have an incentive to not favor the Fund over the Client Accounts. The Advisor has adopted trade allocation and other policies and procedures that it believes are reasonably designed to address these and other conflicts of interest.
As of September 30, 2021, the Portfolio Managers’ ownership of the Fund was as follows:
| Portfolio Managers | Dollar Range of Shares Owned |
| Jordan Ruddy | $100,001-$500,000 |
| Adam Lotterman | $100,001-$500,000 |
Mr. Ruddy does not receive compensation from the Advisor, but is compensated for his duties by an affiliate of the Advisor. Mr. Lotterman receives a salary and discretionary bonus from an affiliate of the Advisor and a share of the profits, if any, through his ownership share in the Advisor.
Item 9. Purchases of Equity Securities by Closed-End Funds.
None.
Item 10. Submission of Matters to a Vote of Security Holders.
None.
Item 11. Controls and Procedures.
| (a) | Based on an evaluation of the Registrant’s disclosure controls and procedures as of a date within 90 days of filing date of this Form N-CSR, the principal executive officer and principal financial officer of the Registrant have concluded that the disclosure controls and procedures of the Registrant are reasonably designed to ensure that the information required in filings on Form N-CSR is recorded, processed, summarized, and reported by the filing date, including that information required to be disclosed is accumulated and communicated to the Registrant’s management, including the Registrant’s principal executive officer and principal financial officer, as appropriate to allow timely decisions regarding required disclosure. |
| (b) | There were no significant changes in the registrant’s internal control over financial reporting that occurred during the period covered by this report that has materially affected, or are reasonably likely to materially affect, the registrant’s internal control over financial reporting. |
Item 12. Disclosure of Securities Lending Activities for Closed-End Management Investment Companies.
None.
Item 13. Exhibits.
SIGNATURES
Pursuant to the requirements of the Securities Exchange Act of 1934 and the Investment Company Act of 1940, the registrant has duly caused this report to be signed on its behalf by the undersigned, thereunto duly authorized.
Bluerock Total Income+ Real Estate Fund
| By: | /s/ Jordan B. Ruddy | |
| | Jordan B. Ruddy | |
| | President | |
Date: December 8, 2021
Pursuant to the requirements of the Securities Exchange Act of 1934 and the Investment Company Act of 1940, this report has been signed below by the following persons on behalf of the registrant and in the capacities and on the dates indicated.
| By: | /s/ Jordan B. Ruddy | |
| | Jordan B. Ruddy | |
| | President | |
Date: December 8, 2021
| By: | /s/ Simon Adamiyatt | |
| | Simon Adamiyatt | |
| | Treasurer | |
Date: December 8, 2021
APPENDIX A
BLUEROCK FUND ADVISOR, LLC
PROXY VOTING POLICIES AND PROCEDURES
Proxy Voting Policy
Background: Pursuant to Rule 206(4)-6 and Rule 204-2 under the Advisers Act, it is a fraudulent, deceptive, or manipulative act, practice or course of business, within the meaning of Section 206(4) of the Advisers Act, for an investment adviser to exercise voting authority with respect to client securities, unless (i) the adviser has adopted and implemented written policies and procedures that are reasonably designed to ensure that the adviser votes proxies in the best interests of its clients, (ii) the adviser describes its proxy voting procedures to its clients and provides copies on request, and (iii) the adviser discloses to clients how they may obtain information on how the adviser voted their proxies.
Policy: The Advisor will vote proxies on behalf of its individual clients. In order to fulfill its responsibilities under the Advisors Act, the Advisor has adopted the following policies and procedures for proxy voting with regard to companies in the investment portfolio of the Fund(s).
Voting Proxies
| 1. | All proxies sent to clients that are actually received by the Advisor (to vote on behalf of the client) will be provided to the Operations Unit. |
| 2. | The Operations Unit will generally adhere to the following procedures (subject to limited exception): |
| (a) | A written record of each proxy received by the Advisor (on behalf of its clients) will be kept in the Advisor’s files; |
| (b) | The Operations Unit will determine which of the Advisor holds the security to which the proxy relates; |
| (c) | Prior to voting any proxies, the Operations Unit will determine if there are any conflicts of interest related to the proxy in question in accordance with the general guidelines set forth below. If a conflict is identified, the Operations Unit will then make a determination (which may be in consultation with outside legal counsel) as to whether the conflict is material. |
| (d) | If no material conflict is identified pursuant to these procedures, the Operations Unit will vote the proxy in accordance with the guidelines set forth below. The Operations Unit will deliver the proxy in accordance with instructions related to such proxy in a timely and appropriate manner |
Conflicts of Interest
| 1. | As stated above, in evaluating how to vote a proxy, the Operations Unit will first determine whether there is a conflict of interest related to the proxy in question between Advisor and its Advisory Clients. This examination will include (but will not be limited to) an evaluation of whether the Advisor (or any affiliate of the Advisor) has any relationship with the company (or an affiliate of the company) to which the proxy relates outside of an investment in such company by a client of the Advisor. |
| 2 | If a conflict is identified and deemed “material” by the Operations Unit, the Advisor will determine whether voting in accordance with the proxy voting guidelines outlined below is in the best interests of the client (which may include utilizing an independent third party to vote such proxies). |
| 3 | With respect to material conflicts, the Advisor will determine whether it is appropriate to disclose the conflict to affected clients give such clients the opportunity to vote the proxies in question themselves. However, with respect to ERISA clients whose advisory contract reserves the right to vote proxies when the Advisor has determined that a material conflict exists that affects its best judgment as a fiduciary to the ERISA client, the Advisor will: |
| (a) | Give the ERISA client the opportunity to vote the proxies in question themselves; or |
| (b) | Follow designated special proxy voting procedures related to voting proxies pursuant to the terms of the investment management agreement with such ERISA clients (if any). |
Proxy Voting Guidelines
| 1. | The Advisor, when acting on behalf of the Fund, must comply with the following voting restrictions unless it is determined that the Fund is not relying on Section 12(d)(1)(F) and or Rule 12d1-3: |
| a. | when the Fund exercises voting rights, by proxy or otherwise, with respect to any investment company owned by the Fund, the Fund will either |
| i. | seek instruction from the Fund’s shareholders with regard to the voting of all proxies and vote in accordance with such instructions, or |
| ii. | vote the shares held by the Fund in the same proportion as the vote of all other holders of such security. |
Disclosure of Procedures
A summary of above these proxy voting procedures will be included in Part 2 of the Advisor’s Form ADV (if applicable) and a Fund client’s statement of additional information, as applicable, and will be updated whenever these policies and procedures are updated. Clients will be provided with contact information as to how they can obtain information about:
(a) the Advisor’s proxy voting procedures (i.e., a copy of these procedures); and (b) how the Advisor voted proxies that are relevant to the affected client. Form N-PX will be filed with the SEC annually for each Fund client.
Record-keeping Requirements
The Operations Unit will be responsible for maintaining files relating to the Advisor’s proxy voting procedures. Records will be maintained and preserved for five years from the end of the fiscal year during which the last entry was made on a record, with records for the first two years kept in the offices of the Advisor. Records of the following will be included in the files:
| 1. | Copies of these proxy voting policies and procedures, and any amendments thereto; |
| 2. | A copy of each proxy statement that the Advisor actually received; provided, however, that the Advisor may rely on obtaining a copy of proxy statements from the SEC’s EDGAR system for those proxy statements that are so available; |
| 3. | A record of each vote that the Advisor casts; |
| 4. | A copy of any document that the Advisor created that was material to making a decision how to vote the proxies, or memorializes that decision (if any); and |
| 5. | A copy of each written request for information on how the Advisor voted such client’s proxies and a copy of any written response to any request for information on how the Advisor voted proxies on behalf of clients. |
APPENDIX B
RREEF
PROXY VOTING POLICIES AND PROCEDURES
DWS has adopted and implemented the following Policies and Guidelines, which it believes are reasonably designed to ensure that proxies are voted in the best economic interest of clients and in accordance with its fiduciary duties and local regulation. This Proxy Voting Policy and Guidelines – DWS (“Policy and Guidelines”) shall apply to all accounts managed by US domiciled advisers and to all US client accounts managed by non- US regional offices. Non-US regional offices are required to maintain procedures and to vote proxies as may be required by law on behalf of their non-US clients. In addition, DWS’s proxy policies reflect the fiduciary standards and responsibilities for ERISA accounts.
The attached guidelines represent a set of global recommendations that were determined by the Global Proxy Voting Sub-Committee (“the GPVSC”). These guidelines were developed to provide DWS with a comprehensive list of recommendations that represent how DWS will generally vote proxies for its clients. The recommendations derived from the application of these guidelines are not intended to influence the various DWS legal entities either directly or indirectly by parent or affiliated companies. In addition, the organizational structures and documents of the various DWS legal entities allows, where necessary or appropriate, the execution by individual DWS subsidiaries of the proxy voting rights independently of any parent or affiliated company. This applies in particular to non US fund management companies. The individuals that make proxy voting decisions are also free to act independently, subject to the normal and customary supervision by the Management/Boards of these DWS legal entities.
Capitalised terms have the meaning ascribed to them in the Glossary.
| 2. | DWS’S PROXY VOTING RESPONSIBILITIES |
Proxy votes are the property of DWS’s advisory clients.1 As such, DWS’s authority and responsibility to vote such proxies depend upon its contractual relationships with its clients or other delegated authority. DWS has delegated responsibility for effecting its advisory clients’ proxy votes to Institutional Shareholder Services (“ISS”), an independent third-party proxy voting specialist. ISS votes DWS’s advisory clients’ proxies in accordance with DWS’s proxy guidelines or DWS’s specific instructions. Where a client has given specific instructions as to how a proxy should be voted, DWS will notify ISS to carry out those instructions. Where no specific instruction exists, DWS will follow the procedures in voting the proxies set forth in this document. Certain Taft-Hartley clients may direct DWS to have ISS vote their proxies in accordance with Taft-Hartley Voting Guidelines.
Clients may in certain instances contract with their custodial agent and notify DWS that they wish to engage in securities lending transactions. In such cases, it is the responsibility of the custodian to deduct the number of shares that are on loan so that they do not get voted twice. To the extent a security is out on loan and DWS determines that a proxy vote (or other shareholder action) is materially important to the client’s account, DWS may request, on a best efforts basis, that the agent recall the security prior to the record date to allow DWS to vote the securities.
| 3.1 | Proxy Voting Activities are Conducted in the Best Economic Interest of Clients |
DWS has adopted the following Policies and Guidelines to ensure that proxies are voted in accordance with the best economic interest of its clients, as determined by DWS in good faith after appropriate review. DWS believes that responsibility including environmental, social and governance factors, and profitability, complement each other in many respects and has adopted Policies and Guidelines consistent with this belief.
| 1 | For purposes of this document, “clients” refers to persons or entities: (i) for which DWS serves as investment adviser or sub- adviser; (ii) for which DWS votes proxies; and (iii) that have an economic or beneficial ownership interest in the portfolio securities of issuers soliciting such proxies. |
| 3.2 | The Global Proxy Voting Sub-Committee |
The Global Proxy Voting Sub-Committee is an internal working group established by the applicable DWS’s Investment Risk Oversight Committee pursuant to a written charter. The GPVSC is responsible for overseeing DWS’s proxy voting activities, including:
| · | Adopting, monitoring and updating guidelines, attached as Attachment A (the “Guidelines”), that provide how DWS will generally vote proxies pertaining to a comprehensive list of common proxy voting matters; |
| · | Voting proxies where: (i) the issues are not covered by specific client instruction or the Guidelines; or (ii) where an exception to the Guidelines may be in the best economic interest of DWS’s clients; |
| · | Review recommendations for proxies where the Guidelines specify that the issues are to be determined on a case-by-case basis and ensure such proxies are voted in accordance with these Policies and Guidelines; and |
| · | Monitoring Proxy Vendor Oversight’s proxy voting activities (see below). |
DWS’s Proxy Vendor Oversight, a function of DWS’s Operations Group, is responsible for coordinating with ISS to administer DWS’s proxy voting process and for voting proxies in accordance with any specific client instructions or, if there are none, the Guidelines, and overseeing ISS’ proxy responsibilities in this regard.
| 3.3 | Availability of Proxy Voting Policies and Proxy Voting Record |
Copies of this Policy, as it may be updated from time to time, is made available to clients as required by law and otherwise at DWS’s discretion. Clients may also obtain information on how their proxies were voted by DWS as required by law and otherwise at DWS’s discretion. Note, however, that DWS must not selectively disclose its investment company clients’ proxy voting records. Proxy Vendor Oversight will make proxy voting reports available to advisory clients upon request. The investment companies’ proxy voting records will be disclosed to shareholders by means of publicly-available annual filings of each company’s proxy voting record for the 12-month periods ending June 30, if so required by relevant law.
The key aspects of DWS’s proxy voting process are delineated below.
| 4.1 | The GPVSC’s Proxy Voting Guidelines |
The Guidelines set forth the GPVSC’s standard voting positions on a comprehensive list of common proxy voting matters. The GPVSC has developed and continues to update the Guidelines based on consideration of current corporate governance principles, industry standards, client feedback, and the impact of the matter on issuers and the value of the investments.
The GPVSC will review the Guidelines as necessary to support the best economic interests of DWS’s clients and, in any event, at least annually. The GPVSC will make changes to the Guidelines, whether as a result of the annual review or otherwise, taking solely into account the best economic interests of clients. Before changing the Guidelines, the GPVSC will thoroughly review and evaluate the proposed change and the reasons therefore, and the GPVSC Chair will ask GPVSC members whether anyone outside of the DWS organization (but within Deutsche Bank and its affiliates) or any entity that identifies itself as an DWS advisory client has requested or attempted to influence the proposed change and whether any member has a conflict of interest with respect to the proposed change. If any such matter is reported to the GPVSC Chair, the Chair will promptly notify the Conflicts of Interest Management Sub-Committee and will defer the approval, if possible. Lastly, the GPVSC will fully document its rationale for approving any change to the Guidelines.
The Guidelines may reflect a voting position that differs from the actual practices of the public company(ies) within the Deutsche Bank organization or of the investment companies for which DWS or an affiliate serves as investment adviser or sponsor. Investment companies, particularly closed-end investment companies, are different from traditional operating companies. These differences may call for differences in the actual practices of the investment company and the voting positions of the investment company on the same or similar matters. Further, the manner in which DWS votes proxies on behalf investment company proxies may differ from the voting recommendations made by a DWS-advised or sponsored investment company soliciting proxies from its shareholders. Proxies solicited by closed-end (and open-end) investment companies are voted in accordance with the Guidelines.
| 4.2 | Specific Proxy Voting Decisions Made by the GPVSC |
Proxy Vendor Oversight will refer to the GPVSC all proxy proposals: (i) that are not covered by specific client instructions or the Guidelines; or (ii) that, in accordance with the Guidelines, should be evaluated and voted on a case-by-case basis.
Additionally, if Proxy Vendor Oversight,2 the GPVSC Chair or any member of the GPVSC, a Portfolio Manager, a Research Analyst or a sub-adviser believes that voting a particular proxy in accordance with the Guidelines may not be in the best economic interests of clients, that individual may bring the matter to the attention of the GPVSC Chair and/or Proxy Vendor Oversight.
If Proxy Vendor Oversight refers a proxy proposal to the GPVSC or the GPVSC determines that voting a particular proxy in accordance with the Guidelines is not in the best economic interests of clients, the GPVSC will evaluate and vote the proxy, subject to the procedures below regarding conflicts.
The GPVSC endeavours to hold meetings to decide how to vote particular proxies sufficiently before the voting deadline so that the procedures below regarding conflicts can be completed before the GPVSC’s voting determination.
| 4.3 | Proxies that Cannot Be Voted or Instances When DWS Abstains from Voting |
In some cases, the GPVSC may determine that it is in the best economic interests of its clients not to vote certain proxies, or that it may not be feasible to vote certain proxies. If the conditions below are met with regard to a proxy proposal, DWS will abstain from voting:
| Ø | Neither the Guidelines nor specific client instructions cover an issue; |
| Ø | ISS does not make a recommendation on the issue; and |
| Ø | The GPVSC cannot convene on the proxy proposal at issue to make a determination as to what would be in the client’s best interest. (This could happen, for example, if the Conflicts of Interest Management Sub-Committee found that there was a material conflict or if despite all best efforts being made, the GPVSC quorum requirement could not be met). |
In addition, it is DWS’s policy not to vote proxies of issuers subject to laws of those jurisdictions that impose restrictions upon selling shares after proxies are voted, in order to preserve liquidity. In other cases, it may not be possible to vote certain proxies, despite good faith efforts to do so. For example, some jurisdictions do not provide adequate notice to shareholders so that proxies may be voted on a timely basis. Voting rights on securities that have been loaned to third-parties transfer to those third-parties, with loan termination often being the only way to attempt to vote proxies on the loaned securities. Lastly, the GPVSC may determine that the costs to the client(s) associated with voting a particular proxy or group of proxies outweighs the economic benefits expected from voting the proxy or group of proxies.
| 2 | Proxy Vendor Oversight generally monitors upcoming proxy solicitations for heightened attention from the press or the industry and for novel or unusual proposals or circumstances, which may prompt Proxy Vendor Oversight to bring the solicitation to the attention of the GPVSC Chair. DWS Portfolio Managers, DWS Research Analysts and sub-advisers also may bring a particular proxy vote to the attention of the GPVSC Chair, as a result of their ongoing monitoring of portfolio securities held by advisory clients and/or their review of the periodic proxy voting record reports that the GPVSC Chair distributes to DWS portfolio managers and DWS research analysts. |
Proxy Vendor Oversight will coordinate with the GPVSC Chair regarding any specific proxies and any categories of proxies that will not or cannot be voted. The reasons for not voting any proxy shall be documented.
| 4.4 | Conflict of Interest Procedures |
4.4.1 Procedures to Address Conflicts of Interest and Improper Influence
Overriding Principle. In the limited circumstances where the GPVSC votes proxies,3 the GPVSC will vote those proxies in accordance with what it, in good faith, determines to be the best economic interests of DWS’s clients.4
Independence of the GPVSC. As a matter of Compliance policy, the GPVSC and Proxy Vendor Oversight are structured to be independent from other parts of Deutsche Bank. Members of the GPVSC and the employee responsible for Proxy Vendor Oversight are employees of DWS. As such, they may not be subject to the supervision or control of any employees of Deutsche Bank Corporate and Investment Banking division (“CIB”). Their compensation cannot be based upon their contribution to any business activity outside of DWS without prior approval of Legal and Compliance. They can have no contact with employees of Deutsche Bank outside of DWS regarding specific clients, business matters, or initiatives without the prior approval of Legal and Compliance. They furthermore may not discuss proxy votes with any person outside of DWS (and within DWS only on a need to know basis).
Conflict Review Procedures. The “Conflicts of Interest Management Sub-Committee” within DWS monitors for potential material conflicts of interest in connection with proxy proposals that are to be evaluated by the GPVSC. The Conflicts of Interest Management Sub-Committee members include DWS Compliance, the chief compliance officers of the advisors and the DWS Funds. Promptly upon a determination that a proxy vote shall be presented to the GPVSC, the GPVSC Chair shall notify the Conflicts of Interest Management Sub- Committee. The Conflicts of Interest Management Sub-Committee shall promptly collect and review any information deemed reasonably appropriate to evaluate, in its reasonable judgment, if DWS or any person participating in the proxy voting process has, or has the appearance of, a material conflict of interest. For the purposes of this policy, a conflict of interest shall be considered “material” to the extent that a reasonable person could expect the conflict to influence, or appear to influence, the GPVSC’s decision on the particular vote at issue. GPVSC should provide the Conflicts of Interest Management Sub-Committee a reasonable amount of time (no less than 24 hours) to perform all necessary and appropriate reviews. To the extent that a conflicts review cannot be sufficiently completed by the Conflicts of Interest Management Sub-Committee the proxies will be voted in accordance with the standard Guidelines.
The information considered by the Conflicts of Interest Management Sub-Committee may include without limitation information regarding: (i) DWS client relationships; (ii) any relevant personal conflict known by the Conflicts of Interest Management Sub-Committee or brought to the attention of that sub-committee; and (iii) any communications with members of the GPVSC (or anyone participating or providing information to the GPVSC) and any person outside of the DWS organization (but within Deutsche Bank and its affiliates) or any entity that identifies itself as an DWS advisory client regarding the vote at issue. In the context of any determination, the Conflicts of Interest Management Sub-Committee may consult with and shall be entitled to rely upon all applicable outside experts, including legal counsel.
| 3 | As mentioned above, the GPVSC votes proxies where: (i) neither a specific client instruction nor a Guideline directs how the proxy should be voted; or (ii) where voting in accordance with the Guidelines may not be in the best economic interests of clients. Further, the GPVSC will review recommendations for proxies where the Guidelines specify that the issues are to be determined on a case-by-case basis and ensure such proxies are voted in accordance with these Policies and Guidelines. |
| 4 | Proxy Vendor Oversight, who serves as the non-voting secretary of the GPVSC, may receive routine calls from proxy solicitors and other parties interested in a particular proxy vote. Any contact that attempts to exert improper pressure or influence shall be reported to the Conflicts of Interest Management Sub-Committee. |
Upon completion of the investigation, the Conflicts of Interest Management Sub-Committee will document its findings and conclusions. If the Conflicts of Interest Management Sub-Committee determines that: (i) DWS has a material conflict of interest that would prevent it from deciding how to vote the proxies concerned without further client consent; or (ii) certain individuals should be recused from participating in the proxy vote at issue, the Conflicts of Interest Management Sub-Committee will so inform the GPVSC Chair.
If notified that DWS has a material conflict of interest as described above, the GPVSC chair will obtain instructions as to how the proxies should be voted either from: (i) if time permits, the affected clients; or (ii) in accordance with the standard Guidelines. If notified that certain individuals should be recused from the proxy vote at issue, the GPVSC Chair shall do so in accordance with the procedures set forth below.
Note: Any DWS employee who becomes aware of a potential, material conflict of interest in respect of any proxy vote to be made on behalf of clients shall notify Compliance or the Conflicts of Interest Management Sub-Committee. Compliance shall call a meeting of the Conflict of Interest Management Sub- Committee to evaluate such conflict and determine a recommended course of action.
Procedures to be followed by the GPVSC. At the beginning of any discussion regarding how to vote any proxy, the GPVSC Chair (or his or her delegate) will inquire as to whether any GPVSC member (whether voting or ex officio) or any person participating in the proxy voting process has a personal conflict of interest or has actual knowledge of an actual or apparent conflict that has not been reported to the Conflicts of Interest Management Sub-Committee.
The GPVSC Chair also will inquire of these same parties whether they have actual knowledge regarding whether any Director, officer, or employee outside of the DWS organization (but within Deutsche Bank and its affiliates) or any entity that identifies itself as an DWS advisory client, has: (i) requested that DWS, Proxy Vendor Oversight (or any member thereof), or a GPVSC member vote a particular proxy in a certain manner;
(ii) attempted to influence DWS, Proxy Vendor Oversight (or any member thereof), a GPVSC member or any other person in connection with proxy voting activities; or (iii) otherwise communicated with a GPVSC member, or any other person participating or providing information to the GPVSC regarding the particular proxy vote at issue and which incident has not yet been reported to the Conflicts of Interest Management Sub-Committee.
If any such incidents are reported to the GPVSC Chair, the Chair will promptly notify the Conflicts of Interest Management Sub-Committee and, if possible, will delay the vote until the Conflicts of Interest Management Sub-Committee can complete the conflicts report. If a delay is not possible, the Conflicts of Interest Management Sub-Committee will instruct the GPVSC” (i) whether anyone should be recused from the proxy voting process or (ii) whether DWS should vote the proxy in accordance with the standard guidelines, seek instructions as to how to vote the proxy at issue from ISS or, if time permits, the affected clients. These inquiries and discussions will be properly reflected in the GPVSC’s minutes.
Duty to Report. Any DWS employee, including any GPVSC member (whether voting or ex officio), that is aware of any actual or apparent conflict of interest relevant to, or any attempt by any person outside of the DWS organization (but within Deutsche Bank and its affiliates) or any entity that identifies itself as an DWS advisory client to influence how DWS votes its proxies has a duty to disclose the existence of the situation to the GPVSC Chair (or his or her designee) and the details of the matter to the Conflicts of Interest Management Sub-Committee. In the case of any person participating in the deliberations on a specific vote, such disclosure should be made before engaging in any activities or participating in any discussion pertaining to that vote.
Recusal of Members. The GPVSC will recuse from participating in a specific proxy vote any GPVSC members (whether voting or ex officio) and/or any other person who: (i) are personally involved in a material conflict of interest; or (ii) who, as determined by the Conflicts of Interest Management Sub-Committee, have actual knowledge of a circumstance or fact that could affect their independent judgment, in respect of such vote. The GPVSC will also exclude from consideration the views of any person (whether requested or volunteered) if the GPVSC or any member thereof knows, or if the Conflicts of Interest Management Sub-Committee has determined, that such other person has a material conflict of interest with respect to the particular proxy or has attempted to influence the vote in any manner prohibited by these policies.
If, after excluding all relevant GPVSC voting members pursuant to the paragraph above, there are three or more GPVSC voting members remaining, those remaining GPVSC members will determine how to vote the proxy in accordance with these Policies and Guidelines. If there are fewer than three GPVSC voting members remaining, the GPVSC Chair will vote the proxy in accordance with the standard Guidelines or will obtain instructions as to how to have the proxy voted from, if time permits, the affected clients and otherwise from ISS.
4.4.2 Investment Companies and Affiliated Public Companies
Investment Companies. As reflected in the Guidelines, all proxies solicited by open-end and closed-end investment companies are voted in accordance with the Guidelines, unless the client directs DWS to vote differently on a specific proxy or specific categories of proxies. However, regarding investment companies for which DWS or an affiliate serves as investment adviser or principal underwriter, such proxies are voted in the same proportion as the vote of all other shareholders (i.e., “mirror” or “echo” voting). Master Fund proxies solicited from feeder Funds are voted in accordance with applicable provisions of Section 12 of the Investment Company Act of 1940 (“Investment Company Act”).
Subject to participation agreements with certain Exchange Traded Funds (“ETF”) issuers that have received exemptive orders from the US Securities and Exchange Commission (“SEC”) allowing investing DWS Funds to exceed the limits set forth in Section 12(d)(1)(A) and (B) of the Investment Company Act, DWS will echo vote proxies for ETFs in which Deutsche Bank holds more than 25% of outstanding voting shares globally when required to do so by participation agreements and SEC orders.
Affiliated Public Companies. For proxies solicited by non-investment company issuers of or within the DWS or Deutsche Bank organization (e.g., shares of DWS or Deutsche Bank), these proxies will be voted in the same proportion as the vote of other shareholders (i.e., “mirror” or “echo” voting). In markets where mirror voting is not permitted, DWS will “Abstain” from voting such shares.
Note: With respect to the DWS Central Cash Management Government Fund (registered under the Investment Company Act), the Fund is not required to engage in echo voting and the investment adviser will use these Guidelines and may determine, with respect to the DWS Central Cash Management Government Fund, to vote contrary to the positions in the Guidelines, consistent with the Fund’s best interest.
4.4.3 Other Procedures that Limit Conflicts of Interest
DWS and other entities in the Deutsche Bank organization have adopted a number of policies, procedures, and internal controls that are designed to avoid various conflicts of interest, including those that may arise in connection with proxy voting, including but not limited to:
| Ø | Code of Conduct– DB Group; |
| Ø | Conflicts of Interest Policy – DWS Group; |
| Ø | Code of Ethics – DWS US; |
| Ø | Code of Ethics – DWS ex US |
| Ø | Code of Professional Conduct – US. |
The GPVSC expects that these policies, procedures, and internal controls will greatly reduce the chance that the GPVSC (or its members) would be involved in, aware of, or influenced by an actual or apparent conflict of interest.
All impacted business units are required to adopt, implement, and maintain procedures to ensure compliance with this Section. At a minimum, such procedures must: (i) assign roles and responsibilities for carrying out the procedures, including responsibility for periodically updating the procedures; (ii) identify clear escalation paths for identified breaches of the procedures; and (iii) contain a legend or table mapping the procedures to this Section (e.g., cross-referencing Section or page numbers).
At a minimum, the following records must be properly maintained and readily accessible in order to evidence compliance with this Policy.
| Ø | DWS will maintain a record of each proxy vote cast by DWS that includes among other things, company name, meeting date, proposals presented, vote cast, and shares voted. |
| Ø | Proxy Vendor Oversight maintains records for each of the proxy ballots it votes. Specifically, the records include, but are not limited to: |
| · | The proxy statement (and any additional solicitation materials) and relevant portions of annual statements; |
| · | Any additional information considered in the voting process that may be obtained from an issuing company, its agents, or proxy research firms; |
| · | Analyst worksheets created for stock option plan and share increase analyses; and |
| · | Proxy Edge print-screen of actual vote election. |
| Ø | DWS will: (i) retain this Policy and the Guidelines; (ii) will maintain records of client requests for proxy voting information; and (iii) will retain any documents Proxy Vendor Oversight or the GPVSC prepared that were material to making a voting decision or that memorialized the basis for a proxy voting decision. |
| Ø | The GPVSC also will create and maintain appropriate records documenting its compliance with this Policy, including records of its deliberations and decisions regarding conflicts of interest and their resolution. |
| Ø | With respect to DWS’s investment company clients, ISS will create and maintain records of each company’s proxy voting record for the 12-month periods ending June 30. DWS will compile the following information for each matter relating to a portfolio security considered at any shareholder meeting held during the period covered by the report (and with respect to which the company was entitled to vote): |
| · | The name of the issuer of the portfolio security; |
| · | The exchange ticker symbol of the portfolio security (if symbol is available through reasonably practicable means); |
| · | The Council on Uniform Securities Identification Procedures (“CUSIP”) number for the portfolio security (if the number is available through reasonably practicable means); |
| · | The shareholder meeting date; |
| · | A brief identification of the matter voted on; |
| · | Whether the matter was proposed by the issuer or by a security holder; |
| · | Whether the company cast its vote on the matter; |
| · | How the company cast its vote (e.g., for or against proposal, or abstain; for or withhold regarding election of Directors); and |
| · | Whether the company cast its vote for or against Management. |
Note: This list is intended to provide guidance only in terms of the records that must be maintained in accordance with this policy. In addition, please note that records must be maintained in accordance with the Records Management Policy - Deutsche Bank Group and applicable policies and procedures thereunder.
With respect to electronically stored records, “properly maintained” is defined as complete, authentic (unalterable), usable and backed-up. At a minimum, records should be retained for a period of not less than six years (or longer, if necessary to comply with applicable regulatory requirements), the first three years in an appropriate DWS office.
| 6. | OVERSIGHT RESPONSIBILITES |
Proxy Vendor Oversight will review a reasonable sampling of votes on a regular basis to ensure that ISS has cast the votes in a manner consistent with the Guidelines. Proxy Vendor Oversight will provide the GPVSC with a quarterly report of its review and identify any issues encountered during the period. Proxy Vendor Oversight will also perform a post season review once a year on certain proposals to assess whether ISS voted consistent with the Guidelines.
In addition, the GPVSC will, in cooperation with Proxy Vendor Oversight and DWS Compliance, consider, on at least an annual basis, whether ISS has the capacity and competence to adequately analyze the matters for which it is responsible. This includes whether ISS has effective polices, and methodologies and a review of ISS’s policies and procedures with respect to conflicts.
The GPVSC also monitors the proxy voting process by reviewing summary proxy information presented by ISS to determine, among other things, whether any changes should be made to the Guidelines. This review will take place at least quarterly and is documented in the GPVSC’s minutes.
The GPVSC, in cooperation with Proxy Vendor Oversight, will review and document, no less frequently than annually, the adequacy of the Guidelines, including whether the Guidelines continue to be reasonably designed to ensure that DWS votes in the best interest of its clients.