UNITED STATES
SECURITIES AND EXCHANGE COMMISSION
Washington, D.C. 20549
FORM N-CSR
CERTIFIED SHAREHOLDER REPORT OF REGISTERED
MANAGEMENT INVESTMENT COMPANIES
Investment Company Act file number: 811-22710
BLUEROCK TOTAL INCOME+ REAL ESTATE FUND
(Exact name of registrant as specified in charter)
1345 Avenue of the Americas, 32nd Floor, New York, NY 10105
(Address of principal executive offices) (Zip code)
Bluerock Fund Advisor, LLC
1345 Avenue of the Americas, 32nd Floor,
New York, NY 10105
(Name and address of agent for service)
1-844-819-8287
(Registrant’s telephone number, including area code)
Date of fiscal year end: September 30
Date of reporting period: March 31, 2023
| Item | 1. Reports to Stockholders. |
(a)

TABLE OF CONTENTS
| Shareholder Letter | 1 |
| Portfolio Review | 10 |
| Portfolio of Investments | 12 |
| Statement of Assets and Liabilities | 15 |
| Statement of Operations | 16 |
| Statements of Changes in Net Assets | 17 |
| Statement of Cash Flows | 19 |
| Financial Highlights | 20 |
| Notes to Financial Statements | 26 |
| Renewal of Investment Advisory Agreement and Sub-Advisory Agreements | 38 |
| Additional Information | 41 |
| Change in Independent Registered Public Accounting Firm | 42 |
| Privacy Policy | 43 |

SEMI-ANNUAL REPORT: (4Q 2022-1Q 2023) (UNAUDITED)
Letter from the TI+ Portfolio Managers
To Our Valued Shareholders: We are pleased to provide you with an update on the Bluerock Total Income+ Real Estate Fund (“TI+” or the “Fund”) for the six-months ended March 31, 2023. Consistent with other asset classes, the private real estate market has been adjusting to the broader, higher-interest rate economic environment, and did so more significantly in Q4 2022 and Q1 2023. While transactions have slowed considerably, recent data indicate that the private real estate market has largely incorporated the effect of higher interest rates, and the market appears to have acknowledged a sustained, higher rate period with widening transaction cap rates. Accordingly, real estate valuations have followed suit, with cap rates increasing to create a return premium above the riskless rate (the 10-year U.S. Treasury yield). Importantly, real estate fundamentals in the Fund’s high conviction sectors remain positive, with strong rent growth providing support for valuations. We believe the Fund’s strategic overweight to the industrial sector, in particular, has the opportunity for outsized income growth going forward as favorable supply-demand factors persist. The Fund is conservatively positioned with low underlying leverage of 30%. Throughout the 10+ years of the Fund’s history, we have navigated a variety of economic and political environments, and we believe the Fund is well positioned for the next market expansion. | 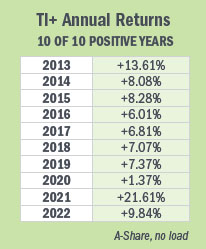 |
Looking back on the Fund’s prior six months ending March 31, 2023, we note the following highlights:
 | FUND HIGHLIGHTS |
| | |
 | ASSET MANAGER OF THE YEAR FINALIST: Bluerock Fund Advisor, the Fund’s manager, is proud to report that it was selected as one of three finalists for 2022 Asset Manager of the Year from the Money Management Institute and Barron’s (AUM <$25 billion category). The award recognizes innovation and leadership in the investment advisory solutions industry and honors the asset manager that best exemplifies innovation in delivering better outcomes for investors and financial advisors. |
| | |
| ACTIVELY MANAGED THE PORTFOLIO IN HIGH CONVICTION SECTORS: 92% of the Fund’s underlying portfolio is in industrial, residential, life sciences, and specialty sectors.
|
| | |
| INDEX OUTPERFORMANCE: The Fund (TIPWX) has outperformed the NCREIF ODCE Index by at least 120 basis points over each of the trailing 1, 2, 3, 4, 5 and 7-year time periods, demonstrating the consistent success of the Fund’s strategy over both short- and longer-term periods. |
| | |
| | PAID 41 CONSECUTIVE DISTRIBUTIONS AT A 5.25% ANNUAL RATE* |
| | |
| * | see full distribution disclosure on page 4. |
Past Performance is not a guarantee of future results.
CORPORATE HEADQUARTERS | 1345 AVENUE OF THE AMERICAS | 32ND FLOOR | NEW YORK, NY 10105 | 877.826.BLUE (2583) | BLUEROCK.COM
 | SEMI-ANNUAL REPORT (4Q 2022 - 1Q 2023) | BLUEROCK TOTAL INCOME+ REAL ESTATE FUND | (UNAUDITED) |
Market Overview:
The Financial Stability Report by the Board of Governors of the Federal Reserve from May 2023 notes that losses on CRE loans will depend on their leverage because owners of buildings with substantial equity cushions are less likely to default. The Report additionally states, LTVs were low for many mortgages because for most property types—office & retail being notable exceptions—values rose materially in the years leading up to the pandemic.
The chart below reflects the lower overall LTV ratios on commercial real estate over the last several years, a reflection of the conservative underwriting standards upheld by various lenders (right hand side), in stark contrast to the years preceding the Great Financial Crisis (left hand side).
Significantly Lower Loan-to-Value (LTV) Ratios in Recent Years vs. Pre-GFC Years

Source: American Council of Life Insurers, Moody’s Analytics
| KEY DRIVERS OF REAL ESTATE PERFORMANCE |
| | |
| LIMITED NEW SUPPLY New real estate supply as a percentage of total inventory is the lowest it has been in the trailing 10-year period compared to previous periods and is forecasted to remain at lower levels.1 |
| | |
| LOW LEVERAGE The use of leverage in the post Great Financial Crisis recovery from 2010-2019 has been the lowest of any real estate/economic recovery in the last 40+ years.2
|
| | |
| |
| HIGH EMPLOYMENT The U.S. unemployment rate was a low 3.5% as of March 2023, near the lowest level since 1969.3 |
| | |
Portfolio Construction
For the past several years, we have positioned the underlying portfolio to minimize expose to the office and retail sectors in favor of industrial, residential, life science, and specialty sectors. Compared to the institutional real estate benchmark (NCREIF ODCE), the portfolio is heavily overweight our high conviction sectors, which we believe positions the Fund well for any challenges, as well as the next market expansion.
Long Term Active Management into High Conviction Sectors and Away from Structurally Challenged Sectors

| 1 | Source: Clarion Partners |
| 2 | Source: Carlyle, Federal Reserve Flow of Funds |
| 3 | Source: Bureau of Labor Statistics, April 2023 |
| 4 | Specialty includes self storage, student housing, senior housing, medical office, land, data center, and life-sciences properties. |
| SEMI-ANNUAL REPORT (4Q 2022 - 1Q 2023) | BLUEROCK TOTAL INCOME+ REAL ESTATE FUND | (UNAUDITED) |
Outlook
While inflation remains above long-term rates, its downward trend suggests the Federal Reserve may soon pause its policy tightening. The bond market is already signaling a lower level of expected long-term inflation as evidenced by recent declines in the 10-year U.S. Treasury yield. Periods of high and falling inflation have historically resulted in above average returns for institutional private real estate.
Institutional Private Real Estate Returns During Various Inflationary Environments
NPI ANNUALIZED RETURN

Source: JP Morgan Guide to Alternatives, Q1 2023
However, we are confident that market returns will not be even across sectors. The Fund’s high conviction sectors (highlighted in green) are supported by favorable long-term supply and demand trends and are positioned to deliver outsized Net operating income (NOI) growth, a key driver of valuations.
5-YEAR ANNUALIZED NOI GROWTH RATE PROJECTION BY SECTOR

Source: Green Street, A Great Year Ahead for Commercial Real Estate? March 2023
| SEMI-ANNUAL REPORT (4Q 2022 - 1Q 2023) | BLUEROCK TOTAL INCOME+ REAL ESTATE FUND | (UNAUDITED) |
We are excited about these sectors, which reflect our thematic investing approach of capitalizing on long-term, structural demand drivers that transcend economic cycles. Just as we have demonstrated over the Fund’s history, we believe an actively managed portfolio that capitalizes on macro-economic and demographic trends can outperform the institutional real estate index.
We believe the Fund’s rare combination of total return, low volatility, and high risk-adjusted returns (as measured by the Sharpe and Sortino Ratios), combined with 41 consecutive quarterly distributions*, make it a valuable allocation for investment portfolios. We thank you for your continued support of Bluerock Total Income+ Real Estate Fund and look forward to the years ahead.
Sincerely,
 |  | | |  |  |
| Adam Lotterman | | | Jordan Ruddy |
| Co-Chief Investment Officer and | | | Co-Chief Investment Officer |
| Senior Portfolio Manager | | | and Portfolio Manager |
| Bluerock Total Income+ Real Estate Fund | | | Bluerock Total Income+ Real Estate Fund |
| | | FUND SUB-ADVISORS |
| | | |
| |  | About Mercer Investment Management | |
| | Mercer Investment Management, Inc. (“Mercer”), acts as sub-advisor to the Fund’s private real estate investments. For more than 75 years, Mercer has been one of the world’s leading advisors to endowments, pension funds, sovereign wealth funds and family offices globally, with over 16,000 clients worldwide, and over $16.2 trillion in assets under advisement (as of 6.30.2022). Mercer works to evaluate over 7,800 investment managers and over 36,000 individual investments/strategies (as of 12.31.2022). | |
| | | |
| | | |
| |  | About DWS | |
| | | | |
| | DWS Group GmbH and Co. KGaA (“DWS”), through its indirect subsidiary RREEF Investment, LLC, acts as sub-advisor to the Fund’s public real estate securities investments and is a registered investment adviser under the Investment Advisers Act of 1940. DWS’ real estate business in the U.S. dates back to 1975. Today, DWS has $877 billion in assets under management and works with 1,757 institutional clients. Of that total, approximately $83.7 billion of AUM is invested in public and private real estate globally, making DWS one of the largest real estate managers in the world (as of 12.31.2022). | |
| | | | | |
| * | The Fund’s distribution policy is to make quarterly distributions to shareholders. The level of quarterly distributions (including any return of capital) is not fixed. However, this distribution policy is subject to change. The Fund’s distribution amounts were calculated based on the ordinary income received from the underlying investments, including short-term capital gains realized from the disposition of such investments. Shareholders should not assume that the source of a distribution from the Fund is net profit. All or a portion of the distributions consist of a return of capital based on the character of the distributions received from the underlying holdings, primarily Real Estate Investment Trusts. The final determination of the source and tax characteristics of all distributions will be made after the end of the year. Shareholders should note that return of capital will reduce the tax basis of their shares and potentially increase the taxable gain, if any, upon disposition of their shares. There is no assurance that the Company will continue to declare distributions or that they will continue at these rates. |
| SEMI-ANNUAL REPORT (4Q 2022 - 1Q 2023) | BLUEROCK TOTAL INCOME+ REAL ESTATE FUND | (UNAUDITED) |
Performance
From inception (10.22.2012) through 3.31.2023, TI+ (A Shares) generated a cumulative total return of 124.47%, or 8.05% annualized (load waived). The Fund was able to accomplish this primarily through private real estate investments, generating both income and capital appreciation. Private investments are supplemented with select public real estate securities. The Fund currently offers five share classes outstanding: A, C, I, L and M Shares. A summary of the performance of each share class is presented below.
Fund Performance thru 3.31.2023†
| | One Year | Three Year | Five Year | Since Inception5 |
| TI+ Class A (TIPRX) | -2.33% | 8.64% | 7.95% | 8.05% |
| TI+ Class A with Max Sales Charge6 | -7.95% | 6.52% | 6.68% | 7.44% |
| TI+ Class C (TIPPX) | -3.02% | 7.85% | 7.16% | 7.26% |
| TI+ Class C with Load7 | -3.94% | 7.85% | 7.16% | 7.26% |
| TI+ Class I (TIPWX) | -2.07% | 8.92% | 8.23% | 8.31% |
| TI+ Fund - Class L (TIPLX) | -2.57% | 8.36% | 7.68% | 7.79% |
| TI+ Class L with Max Sales Charge6 | -6.71% | 6.80% | 6.75% | 7.34% |
| TI+ Fund - Class M (TIPMX) | -2.73% | 8.14% | 7.44% | 7.53% |
| 5) | Since Inception returns as of October 22, 2012. Actual Inception date of the A Shares is October 22, 2012. Actual Inception date of the Fund’s C and I Shares is April 1, 2014. Actual Inception date for the L Shares is June 1, 2017. Actual inception date for the M shares is December 27, 2021. |
| 6) | The maximum sales charge for the A Shares is 5.75% and for L Shares is 4.25%. Investors may be eligible for a reduction in sales charges. |
| 7) | Adjusted for early withdrawal charge of 1.00%. |
| † | Returns for Class C, Class I, Class L and Class M Shares prior to their inception dates are based on the performance of Class A Shares. For Class C, Class L , and Class M Shares, prior performance has been adjusted to reflect differences in expenses between the respective classes and Class A. The actual returns of Class I would have been different than those shown because Class I has lower expenses than Class A. |
The total annual fund operating expense ratio, gross of any fee waivers or expense reimbursements, is 2.04% for Class A, 2.74% for Class C, 1.78% for Class I, 2.29% for Class L and 2.58% for Class M per the February 1, 2023 prospectuses.
The performance data quoted here represents past performance. Current performance may be lower or higher than the performance data quoted above. Investment return and principal value will fluctuate, so that shares, when redeemed, may be worth more or less than their original cost. Past performance is not a guarantee of future results. The Fund’s investment advisor has contractually agreed to reduce its fees and/or absorb expenses of the Fund, at least until January 31, 2024, for Class A, C, I and L shares to ensure that the net annual fund operating expenses will not exceed 1.95% for Class A, 2.70% for Class C, 1.70% for Class I, 2.20% for Class L, and 2.45% for Class M, subject to possible recoupment from the Fund in future years. Please review the Fund’s Prospectuses for more detail on the expense waiver. Results shown reflect the full fee waiver, without which the results could have been lower. A Fund’s performance, especially for very short periods of time, should not be the sole factor in making your investment decisions. For performance information current to the most recent month end, please call toll-free 1-844-819-8287.
Total returns are calculated using SEC Form N-2 instructions and reflect all fees and charges.
| SEMI-ANNUAL REPORT (4Q 2022 - 1Q 2023) | BLUEROCK TOTAL INCOME+ REAL ESTATE FUND | (UNAUDITED) |
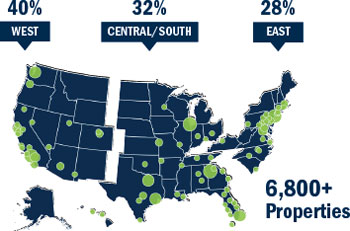
| Geographic Diversification | | Sector Diversification |
| The regions and allocations presented represent the Fund’s institutional fund investments as of 3.31.2023, but is subject to change at any time. | | The sector diversification presented represents examples of how the Fund’s institutional fund investments are allocated as of 3.31.2023 but is subject to change at any time. |
| | | |
 | |  |
Highlighted Assets

As of 3.31.2023. The properties shown here are currently owned by the underlying third party institutional private equity real estate funds described herein. Diversification does not ensure profit and Holdings are subject to change.
| SEMI-ANNUAL REPORT (4Q 2022 - 1Q 2023) | BLUEROCK TOTAL INCOME+ REAL ESTATE FUND | (UNAUDITED) |
Fund Holdings
As of 3.31.2023, the Gross Asset Value of the underlying real estate in the institutional private real estate funds in which TI+ is invested is over $389 billion, comprising over 6,800 properties across the United States.
| | | PORTFOLIO | GROSS ASSET
VALUE ($MM) | NUMBER OF
PROPERTIES | TYPICAL MINIMUM
INVESTMENT | AVG INVESTMENT
SIZE ($MM) | OCCUPANCY8 | LTV9 | INCEPTION
YEAR |
| | | | | | | | | | |
| | PRIVATE EQUITY REAL ESTATE (Target of 35-45 Select Managers | % of gross investments) |
| 9.80% | IQHQ | $ | 3,806 | 36 | $ | 5,000,000 | $106 | N/A | 60% | 2019 | |
| | 8.21% | Prologis Targeted US Logistics Fund | $ | 26,900 | 742 | $ | 5,000,000 | $36 | 98% | 13% | 2004 | |
| | 5.07% | Cortland Growth & Income Fund | $ | 8,280 | 79 | $ | 5,000,000 | $105 | 91% | 48% | 2018 | |
| | 4.83% | Morgan Stanley Prime Property Fund | $ | 44,065 | 543 | $ | 5,000,000 | $81 | 94% | 20% | 1973 | |
| | 4.77% | Brookfield Premier Real Estate Partners | $ | 10,667 | 178 | $ | 5,000,000 | $60 | 93% | 43% | 2016 | |
| | 4.15% | Realterm Logistics Income Fund | $ | 4,300 | 156 | $ | 5,000,000 | $28 | 98% | 35% | 2017 | |
| | 4.14% | Clarion Lion Industrial Trust | $ | 34,145 | 778 | $ | 2,500,000 | $44 | 98% | 26% | 2002 | |
| | 3.66% | CBRE U.S. Logisitics Partners | $ | 3,133 | 36 | $ | 10,000,000 | $87 | 99% | 29% | 2021 | |
| | 3.42% | CBRE U.S. Core Partners | $ | 11,713 | 213 | $ | 5,000,000 | $55 | 95% | 30% | 2013 | |
| | 3.19% | Invesco U.S. Income Fund | $ | 5,041 | 48 | $ | 10,000,000 | $105 | 92% | 32% | 2013 | |
| | 3.18% | Prudential PRISA II | $ | 17,500 | 160 | $ | 5,000,000 | $109 | 90% | 34% | 1980 | |
| | 3.06% | Clarion Lion Properties Fund | $ | 23,278 | 188 | $ | 5,000,000 | $124 | 93% | 21% | 2000 | |
| | 2.96% | RREEF Core Plus Industrial Fund | $ | 3,317 | 91 | $ | 5,000,000 | $36 | 98% | 8% | 2017 | |
| | 2.84% | Ares Industrial Real Estate Fund | $ | 5,477 | 202 | $ | 5,000,000 | $27 | 97% | 31% | 2019 | |
| | 2.83% | Carlyle Property Investors | $ | 13,630 | 200 | $ | 10,000,000 | $68 | 92% | 49% | 2016 | |
| | 2.55% | Prudential PRISA III | $ | 5,700 | 87 | $ | 5,000,000 | $66 | 85% | 32% | 2003 | |
| | 2.30% | Sentinel Real Estate Fund | $ | 3,200 | 36 | $ | 250,000 | $89 | 94% | 24% | 1976 | |
| | 2.03% | Invesco Core Real Estate Fund | $ | 17,860 | 131 | $ | 5,000,000 | $136 | 95% | 26% | 2004 | |
| | 1.92% | Blackstone Property Partners U.S. | $ | 32,200 | 1,303 | $ | 10,000,000 | $25 | 92% | 47% | 2014 | |
| | 1.85% | Clarion Gables Multifamily Trust | $ | 5,978 | 102 | $ | 5,000,000 | $59 | 95% | 40% | 2015 | |
| | 1.80% | TA Realty Core Property Fund | $ | 8,167 | 89 | $ | 5,000,000 | $92 | 96% | 22% | 2018 | |
| | 1.29% | TA Realty Logistics Fund | $ | 958 | 17 | $ | 5,000,000 | $56 | 87% | 17% | 2021 | |
| | 1.28% | BPP Life Science Fund | $ | 23,600 | 123 | $ | 10,000,000 | $192 | 93% | 43% | 2020 | |
| | 1.25% | Bridge Workforce Housing Fund I | $ | 1,188 | 28 | $ | 1,000,000 | $42 | 93% | 49% | 2017 | |
| | 1.21% | Principal Enhanced Property Fund | $ | 5,308 | 64 | $ | 5,000,000 | $83 | 97% | 35% | 2004 | |
| | 1.16% | Harrison Street Core Property Fund | $ | 14,042 | 397 | $ | 10,000,000 | $35 | 90% | 23% | 2011 | |
| | 1.04% | Stockbridge Smart Markets Fund | $ | 4,937 | 143 | $ | 5,000,000 | $35 | 96% | 22% | 2011 | |
| | 1.03% | RREEF America REIT II | $ | 19,773 | 128 | $ | 5,000,000 | $154 | 92% | 20% | 1998 | |
| | 1.01% | Bain Capital Real Estate Fund I | $ | 3,249 | 83 | $ | 10,000,000 | $39 | 91% | 51% | 2018 | |
| | 0.37% | AEW Core Property Trust | $ | 10,752 | 79 | $ | 5,000,000 | $136 | 97% | 25% | 2007 | |
| | 0.28% | Harrison Street Data Center | $ | 512 | 6 | $ | 5,000,000 | $85 | 96% | 45% | 2021 | |
| | 0.14% | Harrison Street Life Science | $ | 596 | 5 | $ | 5,000,000 | $119 | 81% | 53% | 2021 | |
| | 0.06% | Bain Capital Life Science Fund | $ | 3 | 2 | $ | 5,000,000 | $2 | N/A | 52% | 2020 | |
| | 0.01% | Stockbridge Value Fund II | $ | 122 | 2 | $ | 5,000,000 | $61 | 81% | 33% | 2014 | |
| | 88.70% | iPERE TOTALS / AVERAGES | $373,398 | 6,475 | $193,750,000 | $58 | 93% | 30% | 2011 | |
| | REAL ESTATE DEBT SECURITIES |
| | 4.06% | Freddie Mac Securitized Multifamily Notes10 | $4,958 | 222 | $ | 50,000,000 | $22 | — | — | — | |
| | 1.64% | Ares Real Estate Enhanced Income Fund | $4,800 | 46 | $ | 5,000,000 | $104 | — | — | — | |
| | 1.33% | Bridge Debt Strategies Fund IV | $3,850 | 79 | $ | 1,000,000 | $49 | — | — | — | |
| | 0.90% | H/2 Special Opportunities Fund V | | $539 | 9 | | N/A | $60 | — | — | — | |
| | 0.76% | Bridge Debt Strategies Fund III | $1,860 | 46 | $ | 1,000,000 | $40 | | | | |
| | 8.69% | REAL ESTATE DEBT TOTALS / AVERAGES | $16,007 | 402 | $57,000,000 | $40 | — | — | — | |
| | PUBLIC REAL ESTATE EQUITY SECURITIES AND CASH (Target of 25-50 Real Estate Securities) |
| | 2.36% PUBLIC REAL ESTATE SECURITIES | — | — | — | — | — | — | — | |
| | 0.25% | CASH | — | — | — | — | — | — | — | |
| | | | | | | | | | | |
| | 100% | PORTFOLIO TOTAL | $389,404 | 6,877 | $250,750,000 | $57 | 93% | 30% | 2011 | |
| | | | | | | | | | | | | |
| 8) | Occupancy rates reported from underlying managers, average is the simple average of all private funds. Generally excludes properties under construction, but generally includes properties in lease-up. |
| 9) | Weighted average loan to value: outstanding loan balance divided by the total value of the underlying real estate. For IQHQ, estimated based on expected leverage target. |
| 10) | The Fund expects to invest in the privately offered subordinate classes of K-Notes. Because more-senior classes have payment priority over subordinate classes of K-Notes, the value of subordinate K-Notes is highly sensitive to the default rate and foreclosure recovery rate on the underlying apartment loans. Subordinate K-Notes are also subject to liquidity risk because they are not available to the investing public and have a limited secondary market composed of institutional investors. |
| SEMI-ANNUAL REPORT (4Q 2022 - 1Q 2023) | BLUEROCK TOTAL INCOME+ REAL ESTATE FUND | (UNAUDITED) |
Definitions
NFI-ODCE: a capitalization-weighted, gross of fee, time-weighted return index with an inception date of December 31, 1977. Supplemental data is also provided, such as equal-weight and net of fee returns, for informational purposes and additional analysis.
iPERE/NCREIF Property Index (NPI): Institutional private equity real estate (iPERE) can be described as high-quality commercial properties that are usually congregated in large investment portfolios managed professionally on behalf of third-party owners or beneficiaries. The leading benchmark index for iPERE is the National Council of Real Estate Investment Fiduciaries Price Index (NPI) which represents a collection of 10,000+ institutional properties representing all major commercial property types within the U.S. The NPI is a quarterly time series composite total rate of return measure of investment performance of a very large pool of individual commercial real estate properties acquired in the private market for investment purposes only. All properties in the NPI have been acquired, at least in part, on behalf of tax-exempt institutional investors - the great majority being pension funds. As such, all properties are held in a fiduciary environment.
Sharpe Ratio: a measure of the return of an investment based on the level of risk (volatility). A higher number indicating a higher return per unit of risk.
Standard Deviation: measures volatility by calculating the daily dispersion of returns from the mean.
Sortino Ratio: a measure of the return of an investment based on the level of downside volatility. A higher number indicates a higher return per unit of downside.
Sources: Morningstar Direct, Standard & Poors, Yahoo Finance, Federal Reserve Economic Data. Institutional Real Estate: Yield is from the NCREIF Property Index (NPI) as of 9.30.2022, The NPI is a leading benchmark index for Institutional Real Estate which represents a collection of 10,000+ institutional properties representing all major commercial property types within the U.S. The NPI is a quarterly time series composite total rate of return measure of investment performance of a very large pool of individual commercial real estate properties acquired in the private market for investment purposes only. All properties in the NPI have been acquired, at least in part, on behalf of tax-exempt institutional investors - the great majority being pension funds. As such, all properties are held in a fiduciary environment. Bloomberg Barclays U.S. Aggregate Bond Index: A broad-based flagship benchmark that measures the investment grade, US dollar-denominated, fixed-rate taxable bond market. The index includes Treasuries, government-related and corporate securities, MBS (agency fixed-rate and hybrid ARM pass-throughs), ABS and CMBS (agency and non-agency). Provided the necessary inclusion rules are met, US Aggregate eligible securities also contribute to the multi-currency Global Aggregate Index and the US Universal Index, which includes high yield and emerging markets debt. Risks include rising interest rates or other economic factors that may negatively affect the value of the underlying bonds.
You cannot invest directly in an index and unmanaged indices do not reflect fees, expenses or sales charges. Additionally, a rise in interest rates could cause a decline in the value of fixed income securities. The referenced yields are shown for general market comparisons. Past performance is not a guarantee of future results.
You cannot invest directly in an index. Benchmark performance should not be considered reflective of Fund performance.
Risk Disclosures
Not FDIC Insured | No Bank Guarantee | May Lose Value
Investing in the Fund involves risks, including the risk that you may receive little or no return on your investment or that you may lose part or all of your investment.
The ability of the Fund to achieve its investment objective depends, in part, on the ability of the Advisor to allocate effectively the Fund’s assets across the various asset classes in which it invests and to select investments in each such asset class. There can be no assurance that the actual allocations will be effective in achieving the Fund’s investment objective or delivering positive returns.
Limited liquidity is provided to shareholders only through the Fund’s quarterly repurchase offers for no less than 5% of the Fund’s shares outstanding at net asset value. There is no guarantee that shareholders will be able to sell all of the shares they desire in a quarterly repurchase offer. Since inception, the Fund has made 41 repurchase offers, of which 36 have resulted in the repurchase of all shares tendered, five have resulted in the repurchase of less than all shares tendered. In connection with the February 2023 repurchase offer, the Fund repurchased 55.4% of all shares tendered for repurchase. Quarterly repurchases by the Fund of its shares typically will be funded from available cash or sales of portfolio securities. The sale of securities to fund repurchases could reduce the market price of those securities, which in turn would reduce the Fund’s net asset value.
An investment in shares represents an indirect investment in the securities owned by the Fund. The value of these securities, like other market investments, may move up or down, sometimes rapidly and unpredictably. The Fund is “non-diversified” under the Investment Company Act of 1940 and therefore may invest more than 5% of its total assets in the securities of one or more issuers. As such, changes in the financial condition or market value of a single issuer may cause a greater fluctuation in the Fund’s net asset value than in a “diversified” fund. The Fund is not intended to be a complete investment program.
The Fund is subject to the risk that geopolitical and other similar events will disrupt the economy on a national or global level. For instance, war, terrorism, market manipulation, government defaults, government shutdowns, political changes or diplomatic developments, public health emergencies (such as the spread of infectious diseases, pandemics and epidemics) and natural/environmental disasters can all negatively impact the securities markets.
The current novel coronavirus (COVID-19) global pandemic and the aggressive responses taken by many governments, including closing borders, restricting international and domestic travel, and the imposition of prolonged quarantines or similar restrictions, as well as the forced or voluntary closure of, or operational changes to, many retail and other businesses, have had negative impacts, and in many cases severe negative impacts, on markets worldwide. Potential impacts on the real estate market may include lower occupancy rates, decreased lease payments, defaults and foreclosures, among other consequences. It is not known how long such impacts, or any future impacts of other significant events described above, will or would last, but there could be a prolonged period of global economic slowdown.
The Fund will concentrate its investments in real estate industry securities. The value of the Fund’s shares will be affected by factors affecting the value of real estate and the earnings of companies engaged in the real estate industry. These factors include, among others: (i) changes in general economic and market conditions; (ii)changes in the value of real estate properties; (iii) risks related to local economic conditions, overbuilding and increased competition; (iv) increases in property taxes and operating expenses; (v) changes in zoning laws; (vi)casualty and condemnation losses; (vii) variations in rental income, neighborhood values or the appeal of property to tenants; (viii) the availability of financing; (ix) climate change; and (x) changes in interest rates. Many real estate companies utilize leverage, which increases investment risk and could adversely affect a company’s operations and market value in periods of rising interest rates. The value of securities of companies in the real estate industry may go through cycles of relative under-performance and over-performance in comparison to equity securities markets in general.

| SEMI-ANNUAL REPORT (4Q 2022 - 1Q 2023) | BLUEROCK TOTAL INCOME+ REAL ESTATE FUND | (UNAUDITED) |
A significant portion of the Fund’s underlying investments are in private real estate investment funds managed by institutional investment managers (“Institutional Investment Funds”). Investments in Institutional Investment Funds pose specific risks, including: such investments require the Fund to bear a pro rata share of the vehicles’ expenses, including management and performance fees; the Advisor and Sub-Advisor will have no control over investment decisions may by such vehicle; such vehicle may utilize financial leverage; such investments have limited liquidity; the valuation of such investment as of a specific date may vary from the actual sale price that may be obtained if such investment were sold to a third party.
Additional risks related to an investment in the Fund are set forth in the “Risk Factors” section of the prospectus, which include, but are not limited to the following: convertible securities risk; correlation risk; credit risk; fixed income risk; leverage risk; risk of competition between underlying funds; and preferred securities risk.
Investors should carefully consider the investment objectives, risks, charges and expenses of the Bluerock Total Income+ Real Estate Fund. This and other important information about the Fund is contained in the prospectus, which can be obtained by calling toll free 844-819-8287, or online at bluerock.com/ti-fund/documents. The prospectus should be read carefully before investing.
The Bluerock Total Income+ Real Estate Fund is distributed by ALPS Distributors, Inc (ALPS). Bluerock Fund Advisor, LLC is not affiliated with ALPS, Mercer Investment Management, or DWS.
Additional fund performance details available at bluerock.com/ti-fund/performance. Investors may be eligible for a reduction in sales charges. Please see the Fund Prospectus for details. Please note that the indices are for informational purposes only and are not reflective of any investment. As it is not possible to invest in the indices, the data shown does not reflect or compare features of an actual investment, such as its objectives, costs and expenses, liquidity, safety, guarantees or insurance, fluctuation of principal or return, or tax features.
There are limitations when comparing the Bluerock Total Income+ Real Estate Fund to Stock, Bond, and Public Real Estate indices. Many open-end funds which track these indices offer daily liquidity, while closed-end interval funds offer liquidity only on a periodic basis. Deteriorating general market conditions will reduce the value of stock securities. When interest rates rise, the value of bond securities tends to fall. Real estate securities may decline because of adverse developments affecting the real estate industry and real property values. You cannot invest directly in an index and unmanaged indices do not reflect fees, expenses or sales charges. Please see definitions for a description of the risks and comparisons of the investment indexes selected.
This semi-annual report may contain certain forward-looking statements. Such forward-looking statements can generally be identified by our use of forward-looking terminology such as “may,” “will,” “expect,” “intend,” “anticipate,” “estimate,” “believe,” “continue,” or other similar words. Because such statements include risks, uncertainties and contingencies, actual results may differ materially from the expectations, intentions, beliefs, plans or predictions of the future expressed or implied by such forward-looking statements. These risks, uncertainties and contingencies include, but are not limited to: uncertainties relating to changes in general economic and real estate conditions; uncertainties relating to the implementation of our investment strategy; uncertainties relating to capital proceeds; and other risk factors as outlined in the Fund’s prospectuses, statement of additional information, annual report and semi-annual report filed with the Securities and Exchange Commission.
| | BLU001080 |
| Bluerock Total Income+ Real Estate Fund | Portfolio Review |
March 31, 2023 (Unaudited)
Comparison of the Change in Value of a $10,000 Investment

The Fund’s performance figures for certain periods ended March 31, 2023, compared to select indexes:
| Bluerock Total Income+ Real Estate Fund: | 6 Month | 1 Year | 3 Year | 5 Year | 10 Year | Since Inception Class A* | Since Inception Class C and Class I* | Since Inception Class L* | Since Inception Class M* |
| Class A | | | | | | | | | |
| Without Load | -8.92% | -2.33% | 8.64% | 7.95% | 8.00% | 8.05% | – | – | – |
| With Load(a) | -14.14% | -7.95% | 6.52% | 6.68% | 7.36% | 7.44% | – | – | – |
| Class C | | | | | | | | | |
| Without Load | -9.23% | -3.02% | 7.85% | 7.16% | – | – | 6.77% | – | – |
| With Load(b) | -10.11% | -3.94% | 7.85% | 7.16% | – | – | 6.77% | – | – |
| Class I | -8.78% | -2.07% | 8.92% | 8.23% | – | – | 7.86% | – | – |
| Class L | | | | | | | | | |
| Without Load | -9.02% | -2.57% | 8.36% | 7.68% | – | – | – | 7.54% | – |
| With Load(c) | -12.88% | -6.71% | 6.80% | 6.75% | – | – | – | 6.74% | – |
| Class M | -9.09% | -2.73% | – | – | – | – | – | – | 3.89% |
| S&P 500 Total Return Index | 15.63% | -7.73% | 18.60% | 11.19% | 12.24% | 12.78% | 11.14% | 11.40% | -10.01% |
| Bloomberg U.S. Aggregate Bond Index | 4.89% | -4.78% | -2.77% | 0.91% | 1.36% | 1.33% | 1.54% | 0.73% | -8.35% |
| * | Class A commenced operations October 22, 2012, Class C and Class I commenced operations April 1, 2014, Class L commenced operations June 1, 2017, and Class M commenced operations December 27, 2021. |
| (a) | Adjusted for initial maximum sales charge of 5.75%. |
| (b) | Adjusted for early withdrawal charge of 1.00%. |
| (c) | Adjusted for initial maximum sales charge of 4.25%. |
The S&P 500 Total Return Index is an unmanaged market capitalization-weighted index which is comprised of 500 of the largest U.S. domiciled companies and includes the reinvestment of all dividends. Investors cannot invest directly in an index or benchmark.
The Bloomberg U.S. Aggregate Bond Index is an unmanaged index which represents the U.S. investment-grade fixed-rate bond market (including government and corporate securities, mortgage pass-through securities and asset-backed securities). Investors cannot invest directly in an index or benchmark.
Total returns are calculated using closing Net Asset Value as of March 31, 2023, and may not match returns presented in the Financial Highlights due to adjustments under accounting principles generally accepted in the United States of America.
10
| Bluerock Total Income+ Real Estate Fund | Portfolio Review |
March 31, 2023 (Unaudited)
The performance data quoted is historical. Past performance is no guarantee of future results. The investment return and principal value of an investment will fluctuate. An investor’s shares, when redeemed, may be worth more or less than the original cost. Total returns are calculated using closing Net Asset Value as of March 31, 2023. Total returns are calculated assuming reinvestment of all dividends and distributions. Total returns would have been lower had the Advisor not waived a portion of its fees. Returns greater than one year are annualized. The Advisor and the Fund have entered into an expense limitation and reimbursement agreement under which the Advisor has contractually agreed to waive its fees and to pay or absorb the ordinary operating expenses of the Fund (excluding any taxes, interest, brokerage commissions, acquired fund fees and expenses, and extraordinary expenses, such as litigation or reorganization costs, but including organizational costs and offering costs), to the extent that such expenses exceed 1.95%, 2.70%, 1.70%, 2.20% and 2.45% of the Fund's average daily net assets attributable to the Class A, Class C, Class I, Class L and Class M shares, respectively. In consideration of the Advisor's agreement to limit the Fund's expenses, the Fund has agreed to repay the Advisor in the amount of any fees the Advisor previously waived or Fund expenses reimbursed, subject to the limitations that: (1) the reimbursement will be made if payable not more than three years from the date incurred; (2) the reimbursement may not be made if it would cause the expense limitation then in effect or in effect at the time of the waiver to be exceeded; and (3) the reimbursement is approved by the Fund's Board of Trustees. The Expense Limitation Agreement will remain in effect at least until January 31, 2024 unless and until the Board approves its modification or termination. After January 31, 2024, the Expense Limitation Agreement may be renewed at the Advisor's and Board's discretion.
The Fund’s total gross annual operating expenses, including the expenses of underlying funds and before any fee waiver, are 2.04%, 2.74%, 1.78%, 2.29% and 2.56% for Class A, Class C, Class I, Class L and Class M, respectively, per the February 1, 2023 prospectus. Class A shares are subject to a maximum sales charge imposed on purchases of 5.75%. Class A shareholders who tender for repurchase Class A shares that were purchased in amounts of $1,000,000 or more that have been held less than one year (365 days) from the purchase date will be subject to an early withdrawal charge of 1.00% of the original purchase price. Class C shares are subject to an early withdrawal charge of 1.00% if redeemed less than 365 days after the purchase. Class L shares are subject to a maximum sales charge imposed on purchases of 4.25%. The above performance figures do not reflect the deduction of taxes that a shareholder would have to pay on Fund distributions or the redemption of the Fund shares. For performance information current to the most recent month-end, please call 1-844-819-8287.
Portfolio Composition as of March 31, 2023
| | Percent of
Net Assets |
| Private Real Estate Securities | 102.15% |
| Real Estate Debt Securities | 4.40% |
| Public Non-Traded Real Estate Investment Trusts | 0.00% |
| Publicly Traded Real Estate Investment Trusts | 2.36% |
| Open-Ended Mutual Fund | 0.20% |
| Short-Term Investment | 0.97% |
| Total Investments | 110.08% |
| Liabilities in Excess of Other Assets | (10.08)% |
| Total Net Assets | 100.00% |
See the Portfolio of Investments in this report for a more detailed account of the Fund’s holdings.
| Semi-Annual Report | March 31, 2023 | 11 |
| Bluerock Total Income+ Real Estate Fund | Portfolio of Investments |
March 31, 2023 (Unaudited)
| Security | | Shares | | | Value | |
| PRIVATE REAL ESTATE SECURITIES (102.15%)(a) | | | | | | | | |
| Apartments (11.02%) | | | | | | | | |
| Bridge Workforce Housing Fund I, LP | | | N/A | | | $ | 88,954,941 | |
| Clarion Gables Multifamily Trust | | | 78,285 | | | | 136,849,053 | |
| Cortland Growth & Income Fund | | | 233,432 | | | | 337,825,348 | |
| Sentinel Real Estate Fund | | | 1,335 | | | | 166,796,624 | |
| | | | | | | | 730,425,966 | |
| Data Centers (0.31%) | | | | | | | | |
| Harrison Street Data Center Fund(b) | | | N/A | | | | 20,376,200 | |
| | | | | | | | | |
| Diversified (48.07%) | | | | | | | | |
| AEW Core Property Trust | | | 21,925 | | | | 25,968,116 | |
| Ares Real Estate Enhanced Income Fund | | | N/A | | | | 117,549,621 | |
| Bain Capital Real Estate Fund I | | | N/A | | | | 71,552,020 | |
| Blackstone Property Partners U.S. | | | 83,352 | | | | 131,839,653 | |
| Bridge Debt Strategies Fund III, LP | | | N/A | | | | 54,563,257 | |
| Bridge Debt Strategies Fund IV, LP | | | N/A | | | | 95,465,380 | |
| Brookfield Premier Real Estate Partners | | | 203,822 | | | | 339,053,361 | |
| Carlyle Property Investors | | | 108,661 | | | | 209,742,143 | |
| CBRE U.S. Core Partners, LP | | | 133,957,632 | | | | 246,242,741 | |
| Clarion Lion Properties Fund | | | 120,367 | | | | 218,541,683 | |
| H/2 Special Opportunities Fund(b)(c) | | | N/A | | | | 65,318,020 | |
| Harrison Street Core Property Fund | | | 52,441 | | | | 84,054,997 | |
| Invesco Core Real Estate Fund | | | 681 | | | | 145,550,570 | |
| Invesco U.S. Income Fund LP | | | 132,226 | | | | 228,061,859 | |
| Morgan Stanley Prime Property Fund LLC | | | 16,398 | | | | 358,645,982 | |
| PGIM PRISA II | | | 148,856 | | | | 228,082,077 | |
| PGIM PRISA III | | | 61,977 | | | | 188,489,737 | |
| Principal Enhanced Property Fund LP | | | 6,175,011 | | | | 91,091,171 | |
| RREEF America REIT II, Inc. | | | 497,740 | | | | 73,390,099 | |
| Stockbridge Smart Markets Fund | | | 39,329 | | | | 76,633,125 | |
| Stockbridge Value Fund II | | | N/A | | | | 117,478 | |
| TA Realty Core Property Fund, LP | | | 91,130 | | | | 135,213,495 | |
| | | | | | | | 3,185,166,585 | |
| Industrial (30.54%) | | | | | | | | |
| Ares Industrial Real Estate Fund | | | 74,933 | | | | 202,839,470 | |
| CBRE U.S. Logistics Partners LP | | | 215,533,862 | | | | 273,015,332 | |
| Clarion Lion Industrial Trust | | | 80,015 | | | | 316,518,867 | |
| Prologis Targeted U.S. Logistics Fund(c) | | | 198,346 | | | | 612,990,967 | |
| Realterm Logistics Income Fund LP | | | 187,289 | | | | 311,116,918 | |
| RREEF Core Plus Industrial Fund LP | | | 935,544 | | | | 210,318,954 | |
| TA Realty Logistics Fund, LP | | | 85,054 | | | | 97,402,113 | |
| | | | | | | | 2,024,202,621 | |
| Life Science (12.21%) | | | | | | | | |
| Bain Capital Real Estate Life Science Fund(b) | | | N/A | | | | 3,716,683 | |
| Blackstone Property Partners Life Science | | | N/A | | | | 90,304,208 | |
| Harrison Street Life Science | | | N/A | | | | 10,344,484 | |
| IQHQ, Inc.(b)(c) | | | 25,663,327 | | | | 704,552,957 | |
| | | | | | | | 808,918,332 | |
| TOTAL PRIVATE REAL ESTATE SECURITIES (Cost $6,008,311,766) | | | | | | | 6,769,089,704 | |
| Security | | Principal | | | Value | |
| REAL ESTATE DEBT SECURITIES (4.40%)(d) | | | | | | | | |
| FREMF 2018-K82 Mortgage Trust, Class X2A, IO, 0.100%, 9/25/2028 | | $ | 1,065,680,614 | | | $ | 4,749,755 | |
| FREMF 2018-K82 Mortgage Trust, Class D, 0.000%, 10/25/2028 | | | 100,392,906 | | | | 63,242,062 | |
The accompanying notes are an integral part of these financial statements.
12
| Bluerock Total Income+ Real Estate Fund | Portfolio of Investments (Continued) |
March 31, 2023 (Unaudited)
| Security | | Principal | | | Value | |
| FREMF 2018-K82 Mortgage Trust, Class X2B, IO, 0.100%, 10/25/2028 | | $ | 262,694,906 | | | $ | 1,213,147 | |
| FREMF 2019-K101 Mortgage Trust, Class X2A, IO, 0.100%, 10/25/2029 | | | 1,179,983,393 | | | | 6,139,402 | |
| FREMF 2019-K101 Mortgage Trust, Class D, 0.000%, 1/25/2030 | | | 109,477,635 | | | | 61,525,079 | |
| FREMF 2019-K101 Mortgage Trust, Class X2B, IO, 0.100%, 1/25/2030 | | | 270,043,635 | | | | 1,463,632 | |
| FREMF 2019-K91 Mortgage Trust, Class X2A, IO, 0.100%, 3/25/2029 | | | 1,115,688,385 | | | | 5,364,621 | |
| FREMF 2019-K91 Mortgage Trust, Class D, 0.000%, 10/25/2029 | | | 103,857,565 | | | | 60,700,098 | |
| FREMF 2019-K91 Mortgage Trust, Class X2B, IO, 0.100%, 10/25/2029 | | | 247,526,565 | | | | 1,265,649 | |
| FREMF 2019-KC03 Mortgage Trust, Class C, 4.365%, 1/25/2026 | | | 58,088,000 | | | | 52,383,694 | |
| FREMF 2021-K132 Mortgage Trust, Class X2A, IO, 0.100%, 8/25/2031 | | | 978,791,587 | | | | 6,395,805 | |
| FREMF 2021-K132 Mortgage Trust, Class X2B, IO, 0.100%, 8/25/2031 | | | 230,992,666 | | | | 1,523,229 | |
| FREMF 2021-K132 Mortgage Trust, Class D, 0.000%, 12/25/2031 | | | 60,501,666 | | | | 25,621,021 | |
| TOTAL REAL ESTATE DEBT SECURITIES (Cost $285,946,357) | | | | | | | 291,587,194 | |
| Security | | Shares | | | Value | |
| PUBLIC EQUITY REAL ESTATE SECURITIES (2.36%) | | | | | | | | |
| Public Non-Traded Real Estate Investment Trusts (0.00%) | | | | | | | | |
| Diversified (0.00%) | | | | | | | | |
| Highlands REIT, Inc.(b)(e) | | | 140,161 | | | | 33,639 | |
| Total Public Non-Traded Real Estate Investment Trusts (Cost $51,627) | | | | | | | 33,639 | |
| | | | | | | | | |
| Publicly Traded Real Estate Investment Trusts (2.36%) | | | | | | | | |
| Apartments (0.26%) | | | | | | | | |
| AvalonBay Communities, Inc. | | | 57,416 | | | | 9,649,333 | |
| Mid-America Apartment Communities, Inc. | | | 49,688 | | | | 7,504,875 | |
| | | | | | | | 17,154,208 | |
| Data Centers (0.24%) | | | | | | | | |
| Equinix, Inc. | | | 22,330 | | | | 16,100,823 | |
| | | | | | | | 16,100,823 | |
| Diversified (0.08%) | | | | | | | | |
| WP Carey, Inc. | | | 71,060 | | | | 5,503,597 | |
| | | | | | | | 5,503,597 | |
| Gaming (0.13%) | | | | | | | | |
| VICI Properties, Inc. | | | 271,516 | | | | 8,856,852 | |
| | | | | | | | 8,856,852 | |
| Healthcare (0.19%) | | | | | | | | |
| Sabra Health Care REIT, Inc. | | | 227,405 | | | | 2,615,158 | |
| Ventas, Inc. | | | 17,892 | | | | 775,618 | |
| Welltower, Inc. | | | 131,744 | | | | 9,444,727 | |
| | | | | | | | 12,835,503 | |
| Hotels (0.07%) | | | | | | | | |
| Ryman Hospitality Properties, Inc.(b) | | | 48,454 | | | | 4,347,777 | |
| | | | | | | | 4,347,777 | |
| Industrial (0.45%) | | | | | | | | |
| EastGroup Properties, Inc. | | | 25,819 | | | | 4,268,397 | |
| Prologis, Inc. | | | 168,968 | | | | 21,082,137 | |
| Rexford Industrial Realty, Inc. | | | 72,013 | | | | 4,295,576 | |
| | | | | | | | 29,646,110 | |
| Manufactured Homes (0.08%) | | | | | | | | |
| Equity LifeStyle Properties, Inc. | | | 81,545 | | | | 5,474,116 | |
| | | | | | | | 5,474,116 | |
| Office (0.06%) | | | | | | | | |
| Alexandria Real Estate Equities, Inc. | | | 30,476 | | | | 3,827,481 | |
| | | | | | | | 3,827,481 | |
The accompanying notes are an integral part of these financial statements.
| Semi-Annual Report | March 31, 2023 | 13 |
| Bluerock Total Income+ Real Estate Fund | Portfolio of Investments (Continued) |
March 31, 2023 (Unaudited)
| Security | | Shares | | | Value | |
| Regional Malls (0.12%) | | | | | | | | |
| Simon Property Group, Inc. | | | 73,411 | | | $ | 8,219,830 | |
| | | | | | | | 8,219,830 | |
| Self-Storage (0.35%) | | | | | | | | |
| Extra Space Storage, Inc. | | | 21,957 | | | | 3,577,454 | |
| Iron Mountain, Inc. | | | 109,346 | | | | 5,785,497 | |
| Life Storage, Inc. | | | 27,959 | | | | 3,665,145 | |
| Public Storage | | | 32,546 | | | | 9,833,449 | |
| | | | | | | | 22,861,545 | |
| Shopping Center (0.11%) | | | | | | | | |
| Kimco Realty Corp. | | | 171,150 | | | | 3,342,559 | |
| Kite Realty Group Trust | | | 181,927 | | | | 3,805,913 | |
| | | | | | | | 7,148,472 | |
| Single Tenant (0.17%) | | | | | | | | |
| Agree Realty Corp. | | | 83,931 | | | | 5,758,506 | |
| Essential Properties Realty Trust, Inc. | | | 140,895 | | | | 3,501,241 | |
| Spirit Realty Capital, Inc. | | | 53,507 | | | | 2,131,719 | |
| | | | | | | | 11,391,466 | |
| Single-Family Rental (0.05%) | | | | | | | | |
| American Homes 4 Rent, Class A | | | 100,503 | | | | 3,160,819 | |
| | | | | | | | 3,160,819 | |
| Total Publicly Traded Real Estate Investment Trusts (Cost $156,858,222) | | | | | | | 156,528,599 | |
| | | | | | | | | |
| TOTAL PUBLIC EQUITY REAL ESTATE SECURITIES (Cost $156,909,849) | | | | | | | 156,562,238 | |
| | | | | | | | | |
| OPEN-ENDED MUTUAL FUND (0.20%) | | | | | | | | |
| Diversified (0.20%) | | | | | | | | |
| Cohen & Steers Institutional Realty Shares, Inc. | | | 298,719 | | | | 12,925,559 | |
| | | | | | | | | |
| TOTAL OPEN-ENDED MUTUAL FUND (Cost $15,000,000) | | | | | | | 12,925,559 | |
| SHORT TERM INVESTMENT (0.97%) | | | | | | | | |
| Fidelity Investments Money Market Fund - Government Portfolio - Class I, 4.700%(f) (Cost $64,441,939) | | | 64,441,939 | | | | 64,441,939 | |
| | | | | | | | | |
| TOTAL INVESTMENTS (110.08%) (Cost $6,530,609,911) | | | | | | $ | 7,294,606,634 | |
| LIABILITIES IN EXCESS OF OTHER ASSETS (-10.08%) | | | | | | | (667,812,483 | ) |
| NET ASSETS (100.00%) | | | | | | $ | 6,626,794,151 | |
Common Abbreviations
IO - Interest Only Security
| (a) | All or a portion of these securities are segregated as collateral for the Lines of Credit as of March 31, 2023. |
| (b) | Non-income producing security. |
| (c) | Holding is comprised of two share classes of the same underlying investment. |
| (d) | Securities exempt from registration under Rule 144A of the Securities Act of 1933. These securities may be sold in the ordinary course of business in transactions exempt from registration, normally to qualified institutional buyers. As of March 31, 2023, the aggregate market value of those securities was $291,587,194, representing 4.40% of net assets. |
| (e) | Fair value estimated using fair valuation procedures adopted by the Board of Trustees. Total value of such securities is $33,639, representing 0.00% of net assets. |
| (f) | The rate shown is the 7-day effective yield as of March 31, 2023. |
The accompanying notes are an integral part of these financial statements.
14
| Bluerock Total Income+ Real Estate Fund | Statement of Assets and Liabilities |
March 31, 2023 (Unaudited)
| ASSETS | | | |
| Investments, at value (Cost $6,530,609,911) | | $ | 7,294,606,634 | |
| Receivable for investments sold | | | 14,579 | |
| Receivable for shares sold | | | 6,158,225 | |
| Dividends and Interest receivable | | | 42,391,983 | |
| Deferred borrowing costs (See Note 9) | | | 14,547,900 | |
| Prepaid expenses and other assets | | | 1,619,675 | |
| Total Assets | | | 7,359,338,996 | |
| LIABILITIES | | | | |
| Payable for investments purchased | | | 46,627,143 | |
| Line of credit payable (See Note 9) | | | 675,000,000 | |
| Line of credit interest payable (See Note 9) | | | 785,071 | |
| Investment advisory fees payable | | | 8,326,339 | |
| Shareholder servicing fees payable | | | 342,842 | |
| Administration fees payable | | | 135,072 | |
| Transfer agency fees payable | | | 668,785 | |
| Distribution fees payable | | | 518,137 | |
| Trustees' fees payable | | | 3,932 | |
| Accrued expenses and other liabilities | | | 137,524 | |
| Total Liabilities(a) | | | 732,544,845 | |
| NET ASSETS | | $ | 6,626,794,151 | |
| NET ASSETS CONSIST OF | | | | |
| Paid-in capital | | $ | 5,752,583,835 | |
| Total distributable earnings | | | 874,210,316 | |
| NET ASSETS | | $ | 6,626,794,151 | |
| PRICING OF SHARES | | | | |
| Class A: | | | | |
| Net asset value, per share | | $ | 33.59 | |
| Net assets | | $ | 880,465,272 | |
| Shares of beneficial interest outstanding (unlimited number of shares, no par value common stock authorized) | | | 26,212,275 | |
| Maximum offering price per share ((NAV/0.9425), based on maximum sales charge of 5.75% of the offering price) | | $ | 35.64 | |
| Class C: | | | | |
| Net asset value, per share | | $ | 31.44 | |
| Net assets | | $ | 640,518,274 | |
| Shares of beneficial interest outstanding (unlimited number of shares, no par value common stock authorized) | | | 20,373,760 | |
| Class I: | | | | |
| Net asset value, per share | | $ | 34.43 | |
| Net assets | | $ | 4,850,428,949 | |
| Shares of beneficial interest outstanding (unlimited number of shares, no par value common stock authorized) | | | 140,872,438 | |
| Class L: | | | | |
| Net asset value, per share | | $ | 33.10 | |
| Net assets | | $ | 111,908,776 | |
| Shares of beneficial interest outstanding (unlimited number of shares, no par value common stock authorized) | | | 3,381,190 | |
| Maximum offering price per share ((NAV/0.9575), based on maximum sales charge of 4.25% of the offering price) | | $ | 34.57 | |
| Class M: | | | | |
| Net asset value, per share | | $ | 31.56 | |
| Net assets | | $ | 143,472,880 | |
| Shares of beneficial interest outstanding (unlimited number of shares, no par value common stock authorized) | | | 4,546,705 | |
| (a) | Separately, see Note 8. Commitments and Contingencies for detail of unfunded commitments |
The accompanying notes are an integral part of these financial statements.
| Semi-Annual Report | March 31, 2023 | 15 |
| Bluerock Total Income+ Real Estate Fund | Statement of Operations |
For the Six Months Ended March 31, 2023 (Unaudited)
| INVESTMENT INCOME | | | |
| Dividend Income | | $ | 92,893,846 | |
| Interest Income | | | 13,316,198 | |
| Total Investment Income | | | 106,210,044 | |
| | | | | |
| EXPENSES | | | | |
| Investment Advisory fees | | | 51,932,255 | |
| Administrative fees | | | 812,657 | |
| Transfer Agency fees | | | 3,282,169 | |
| Shareholder servicing fees: | | | | |
| Class A | | | 1,133,102 | |
| Class C | | | 843,549 | |
| Class L | | | 144,728 | |
| Distribution fees: | | | | |
| Class C | | | 2,530,647 | |
| Class L | | | 144,728 | |
| Class M | | | 525,712 | |
| Legal fees | | | 206,534 | |
| Audit and tax fees | | | 15,457 | |
| Reports to shareholders and printing fees | | | 507,078 | |
| Custody fees | | | 101,790 | |
| Chief compliance officer fees | | | 25,457 | |
| Offering cost (See Note 2) | | | 10,474 | |
| Interest expense (See Note 9) | | | 28,092,542 | |
| Trustees' fees | | | 88,931 | |
| Other expenses | | | 286,892 | |
| Total Expenses | | | 90,684,702 | |
| Recoupment of previously waived fees (See Note 3) | | | 12,248 | |
| Net Expenses | | | 90,696,950 | |
| Net Investment Income | | | 15,513,094 | |
| NET REALIZED AND UNREALIZED GAIN/(LOSS) ON INVESTMENTS | | | | |
| Net realized gain/(loss) on investments | | | (11,638,027 | ) |
| Net change in unrealized appreciation/(depreciation) on investments | | | (513,717,056 | ) |
| NET REALIZED AND UNREALIZED GAIN/(LOSS) ON INVESTMENTS | | | (525,355,083 | ) |
| NET DECREASE IN NET ASSETS RESULTING FROM OPERATIONS | | $ | (509,841,989 | ) |
The accompanying notes are an integral part of these financial statements.
16
| Bluerock Total Income+ Real Estate Fund | Statements of Changes in Net Assets |
| | | For the Six Months Ended March 31, 2023 (Unaudited) | | | For the Year Ended September 30, 2022 | |
| OPERATIONS: | | | | | | |
| Net investment income | | $ | 15,513,094 | | | $ | 58,536,284 | |
| Net realized gain on investments | | | (11,638,027 | ) | | | 4,453,394 | |
| Net change in unrealized appreciation/(depreciation) on investments | | | (513,717,056 | ) | | | 774,204,482 | |
| Net Increase/(Decrease) in Net Assets Resulting from Operations | | | (509,841,989 | ) | | | 837,194,160 | |
| DISTRIBUTIONS TO SHAREHOLDERS: | | | | | | | | |
| Class A | | | | | | | | |
| From distributable earnings | | | – | | | | (7,675,897 | ) |
| From return of capital | | | (23,634,565 | ) | | | (32,759,054 | ) |
| Class C | | | | | | | | |
| From distributable earnings | | | – | | | | (6,868,487 | ) |
| From return of capital | | | (17,386,910 | ) | | | (25,870,814 | ) |
| Class I | | | | | | | | |
| From distributable earnings | | | – | | | | (30,652,553 | ) |
| From return of capital | | | (131,468,681 | ) | | | (176,945,671 | ) |
| Class L | | | | | | | | |
| From distributable earnings | | | – | | | | (1,179,735 | ) |
| From return of capital | | | (3,008,890 | ) | | | (4,655,135 | ) |
| Class M | | | | | | | | |
| From distributable earnings | | | – | | | | – | |
| From return of capital | | | (3,732,233 | ) | | | (3,334,287 | ) |
| Total Distributions to Shareholders | | | (179,231,279 | ) | | | (289,941,633 | ) |
| BENEFICIAL INTEREST TRANSACTIONS: | | | | | | | | |
| Class A | | | | | | | | |
| Shares sold | | | 99,101,440 | | | | 326,482,026 | |
| Distributions reinvested | | | 10,703,660 | | | | 18,457,287 | |
| Shares redeemed | | | (61,654,614 | ) | | | (67,452,549 | ) |
| Shares transferred in/out(a)(b) | | | 2,066,804 | | | | (13,511,953 | ) |
| Class C | | | | | | | | |
| Shares sold | | | 42,631,661 | | | | 189,474,973 | |
| Distributions reinvested | | | 9,729,626 | | | | 19,316,744 | |
| Shares redeemed | | | (25,752,409 | ) | | | (40,073,381 | ) |
| Shares transferred out(a) | | | (22,505,712 | ) | | | (16,110,786 | ) |
| Class I | | | | | | | | |
| Shares sold | | | 607,539,458 | | | | 3,097,711,474 | |
| Distributions reinvested | | | 50,950,551 | | | | 85,274,417 | |
| Shares redeemed | | | (622,588,819 | ) | | | (320,068,884 | ) |
| Shares transferred in(b) | | | 28,406,785 | | | | 30,616,066 | |
| Class L | | | | | | | | |
| Shares sold | | | 10,559,388 | | | | 27,564,881 | |
| Distributions reinvested | | | 1,922,958 | | | | 3,695,999 | |
| Shares redeemed | | | (5,615,130 | ) | | | (5,652,265 | ) |
| Shares transferred out(a) | | | (7,967,877 | ) | | | (995,827 | ) |
| Class M | | | | | | | | |
| Shares sold | | | 21,801,932 | | | | 131,148,089 | |
| Distributions reinvested | | | 2,902,554 | | | | 2,650,602 | |
| Shares redeemed | | | (2,192,861 | ) | | | (2,231 | ) |
| Shares transferred in(b) | | | – | | | | 2,500 | |
| Net Increase in Net Assets Derived from Beneficial Interest Transactions | | | 140,039,395 | | | | 3,468,527,182 | |
| Net increase/(decrease) in net assets | | | (549,033,873 | ) | | | 4,015,779,709 | |
The accompanying notes are an integral part of these financial statements.
| Semi-Annual Report | March 31, 2023 | 17 |
| Bluerock Total Income+ Real Estate Fund | Statements of Changes in Net Assets (Continued) |
| | | For the Six Months Ended March 31, 2023 (Unaudited) | | | For the Year Ended September 30, 2022 | |
| NET ASSETS: | | | | | | | | |
| Beginning of year/period | | | 7,175,828,024 | | | | 3,160,048,315 | |
| End of year/period | | $ | 6,626,794,151 | | | $ | 7,175,828,024 | |
| | | | | | | | | |
| Other Information | | | | | | | | |
| Share Transactions: | | | | | | | | |
| Class A | | | | | | | | |
| Beginning shares | | | 24,823,702 | | | | 17,561,636 | |
| Shares sold | | | 2,755,934 | | | | 9,020,062 | |
| Distributions reinvested | | | 311,027 | | | | 510,773 | |
| Shares redeemed | | | (1,736,464 | ) | | | (1,889,318 | ) |
| Shares transferred in/out(a)(b) | | | 58,076 | | | | (379,451 | ) |
| Net increase in shares outstanding | | | 1,388,573 | | | | 7,262,066 | |
| Ending shares | | | 26,212,275 | | | | 24,823,702 | |
| Class C | | | | | | | | |
| Beginning shares | | | 20,257,084 | | | | 15,754,446 | |
| Shares sold | | | 1,262,517 | | | | 5,588,625 | |
| Distributions reinvested | | | 301,580 | | | | 568,822 | |
| Shares redeemed | | | (773,936 | ) | | | (1,177,505 | ) |
| Shares transferred out(a)(b) | | | (673,485 | ) | | | (477,304 | ) |
| Net increase in shares outstanding | | | 116,676 | | | | 4,502,638 | |
| Ending shares | | | 20,373,760 | | | | 20,257,084 | |
| Class I | | | | | | | | |
| Beginning shares | | | 139,230,213 | | | | 60,339,974 | |
| Shares sold | | | 16,549,336 | | | | 84,290,043 | |
| Distributions reinvested | | | 1,444,481 | | | | 2,297,038 | |
| Shares redeemed | | | (17,126,419 | ) | | | (8,540,362 | ) |
| Shares transferred in(b) | | | 774,827 | | | | 843,520 | |
| Net increase in shares outstanding | | | 1,642,225 | | | | 78,890,239 | |
| Ending shares | | | 140,872,438 | | | | 139,230,213 | |
| Class L | | | | | | | | |
| Beginning shares | | | 3,405,356 | | | | 2,712,664 | |
| Shares sold | | | 299,625 | | | | 776,936 | |
| Distributions reinvested | | | 56,634 | | | | 103,726 | |
| Shares redeemed | | | (162,206 | ) | | | (160,187 | ) |
| Shares transferred out(a) | | | (218,219 | ) | | | (27,783 | ) |
| Net increase/(decrease) in shares outstanding | | | (24,166 | ) | | | 692,692 | |
| Ending shares | | | 3,381,190 | | | | 3,405,356 | |
| Class M | | | | | | | | |
| Beginning shares | | | 3,875,173 | | | | – | |
| Shares sold | | | 648,129 | | | | 3,799,588 | |
| Distributions reinvested | | | 89,772 | | | | 75,570 | |
| Shares redeemed | | | (66,369 | ) | | | (64 | ) |
| Shares transferred in(b) | | | – | | | | 79 | |
| Net increase in shares outstanding | | | 671,532 | | | | 3,875,173 | |
| Ending shares | | | 4,546,705 | | | | 3,875,173 | |
| (a) | Shares transferred out - net reduction in shares of a particular class resulting from transfers to other share classes. |
| (b) | Shares transferred in - net increase in shares of a particular class resulting from transfers from other share classes. |
The accompanying notes are an integral part of these financial statements.
18
| Bluerock Total Income+ Real Estate Fund | Statement of Cash Flows |
| | | For the Six Months Ended March 31, 2023 (Unaudited) | |
| Cash Flows from Operating Activities: | | | | |
| Net decrease in net assets resulting from operations | | $ | (509,841,989 | ) |
| Adjustments to reconcile net increase in net assets resulting from operations to net cash used in operating activities: | | | | |
| Purchase of investment securities | | | (789,590,792 | ) |
| Proceeds from disposition of investment securities | | | 209,183,816 | |
| Net proceeds from short-term investment securities | | | 289,063,816 | |
| Net realized gain on investments | | | 11,638,027 | |
| Net change in unrealized appreciation/(depreciation) on investments | | | 513,717,056 | |
| Discount and premiums amortized | | | (5,912,552 | ) |
| (Increase)/Decrease in Assets: | | | | |
| Dividends and interest receivable | | | (10,787,902 | ) |
| Deferred borrowing costs | | | (14,547,900 | ) |
| Prepaid offering costs | | | 10,475 | |
| Prepaid expenses and other assets | | | (1,469,301 | ) |
| Increase/(Decrease) in Liabilities: | | | | |
| Shareholder servicing fees payable | | | (17,880 | ) |
| Investment advisory fees payable | | | (446,271 | ) |
| Administrative fees payable | | | (155,742 | ) |
| Transfer agency fees payable | | | (1,004,617 | ) |
| Distribution fees payable | | | (27,077 | ) |
| Trustees' fees payable | | | 3,932 | |
| Interest due on line of credit payable | | | 447,361 | |
| Accrued expenses and other liabilities | | | (702,258 | ) |
| Net Cash Used in Operating Activities | | | (310,439,798 | ) |
| | | | | |
| Cash Flows from Financing Activities: | | | | |
| Change in Line of Credit Borrowing | | | 325,000,000 | |
| Proceeds from shares sold | | | 799,582,083 | |
| Payment on shares redeemed | | | (717,803,833 | ) |
| Cash distributions paid | | | (103,021,930 | ) |
| Net Cash Provided by Financing Activities | | | 303,756,320 | |
| | | | | |
| Net Change in Cash | | | (6,683,478 | ) |
| | | | | |
| Cash Beginning of Year | | $ | 6,683,478 | |
| Cash End of Year | | $ | – | |
| | | | | |
| Non-cash financing activities not included herein consist of reinvestment of distributions of: | | $ | 76,209,349 | |
| Cash paid for interest on lines of credit during the Period was: | | | 25,718,081 | |
The accompanying notes are an integral part of these financial statements.
| Semi-Annual Report | March 31, 2023 | 19 |
| Bluerock Total Income+ Real Estate Fund - Class A | Financial Highlights |
The table below sets forth financial data for one share of beneficial interest outstanding throughout each year/period presented.
| | | For the Six Months Ended March 31, 2023 (Unaudited) | | | For the Year Ended September 30, 2022 | | | For the Year Ended September 30, 2021 | | | For the Year Ended September 30, 2020 | | | For the Year Ended September 30, 2019 | | | For the Year Ended September 30, 2018 | |
| Net asset value, beginning of period/year | | $ | 37.10 | | | $ | 32.66 | | | $ | 29.26 | | | $ | 30.43 | | | $ | 30.00 | | | $ | 29.37 | |
| INCOME FROM INVESTMENT OPERATIONS: | | | | | | | | | | | | | | | | | | | | | | | | |
| Net investment income(a) | | | 0.06 | | | | 0.38 | | | | 0.50 | | | | 0.46 | | | | 0.33 | | | | 0.21 | |
| Net realized and unrealized gain/(loss) | | | (2.65 | ) | | | 5.97 | | | | 4.50 | | | | (0.05 | ) | | | 1.69 | | | | 2.00 | |
| Total from investment operations | | | (2.59 | ) | | | 6.35 | | | | 5.00 | | | | 0.41 | | | | 2.02 | | | | 2.21 | |
| DISTRIBUTIONS: | | | | | | | | | | | | | | | | | | | | | | | | |
| From net investment income | | | – | | | | – | | | | – | | | | (0.06 | ) | | | – | | | | – | |
| From net realized gain on investments | | | – | | | | (0.42 | ) | | | (0.63 | ) | | | (1.02 | ) | | | (0.32 | ) | | | (0.54 | ) |
| Return of capital | | | (0.92 | ) | | | (1.49 | ) | | | (0.97 | ) | | | (0.50 | ) | | | (1.27 | ) | | | (1.04 | ) |
| Total distributions | | | (0.92 | ) | | | (1.91 | ) | | | (1.60 | ) | | | (1.58 | ) | | | (1.59 | ) | | | (1.58 | ) |
| Net asset value, end of period/year | | $ | 33.59 | | | $ | 37.10 | | | $ | 32.66 | | | $ | 29.26 | | | $ | 30.43 | | | $ | 30.00 | |
| TOTAL RETURN(b)(c) | | | (8.06 | )%(d) | | | 19.76 | % | | | 17.68 | % | | | 1.38 | % | | | 6.94 | % | | | 7.69 | % |
| RATIOS/SUPPLEMENTAL DATA: | | | | | | | | | | | | | | | | | | | | | | | | |
| Net assets, end of period/year (000s) | | $ | 880,465 | | | $ | 921,035 | | | $ | 573,540 | | | $ | 525,950 | | | $ | 536,913 | | | $ | 373,488 | |
| Ratios to Average Net Assets (including interest expense) | | | | | | | | | | | | | | | | | | | | | | | | |
| Ratio of expenses to average net assets excluding fee waivers and reimbursements(e)(f) | | | 2.73 | %(g) | | | 2.01 | % | | | 2.09 | % | | | 2.15 | % | | | 2.20 | % | | | 2.43 | % |
| Ratio of expenses to average net assets including fee waivers and reimbursements(f) | | | 2.73 | %(g) | | | 2.04 | % | | | 2.06 | % | | | 2.17 | % | | | 2.21 | % | | | 2.37 | % |
| Ratio of net investment income to average net assets(f) | | | 0.35 | %(g) | | | 1.06 | % | | | 1.65 | % | | | 1.53 | % | | | 1.10 | % | | | 0.71 | % |
| Ratios to Average Net Assets (excluding interest expense) | | | | | | | | | | | | | | | | | | | | | | | | |
| Ratio of expenses to average net assets excluding fee waivers and reimbursements(e)(f) | | | 1.91 | %(g) | | | 1.92 | % | | | 1.98 | % | | | 1.91 | % | | | 1.94 | % | | | 1.99 | % |
| Ratio of expenses to average net assets including fee waivers and reimbursements(f) | | | 1.91 | %(g) | | | 1.95 | % | | | 1.95 | % | | | 1.93 | % | | | 1.95 | % | | | 1.93 | % |
| Portfolio turnover rate | | | 3 | %(d) | | | 4 | % | | | 26 | % | | | 27 | % | | | 8 | % | | | 13 | % |
| (a) | Per share amounts are calculated using the average shares method. |
| (b) | Includes adjustments in accordance with accounting principles generally accepted in the United States and, consequently, the net asset value for financial reporting purposes and the returns based upon those net asset values may differ from the net asset values and returns for shareholder transactions. |
| (c) | Total returns are historical in nature and assumes changes in net asset value per share, reinvestment of dividends and capital gains distributions, if any, and do not reflect the impact of sales charges. Had the Advisor not absorbed a portion of the Fund expenses, total returns would have been lower. |
| (e) | Represents the ratio of expenses to average net assets absent fee waivers expense reimbursement and/or recoupment by the Advisor. |
| (f) | The ratios of expenses to average net assets and net investment income to average net assets do not directly reflect the expenses of the underlying institutional private real estate investments in which the Fund invests. The Fund invests in each underlying institutional private real estate investment based upon its net asset value, inclusive of management fees, which typically range from 0.50% to 1.30% on an annualized basis. The Fund’s Total Return is reported net of all fees and expenses. |
The accompanying notes are an integral part of these financial statements.
20
| Bluerock Total Income+ Real Estate Fund - Class C | Financial Highlights |
The table below sets forth financial data for one share of beneficial interest outstanding throughout each year/period presented.
| | | For the Six Months
Ended March 31, 2023 (Unaudited) | | | For the Year Ended September 30, 2022 | | | For the Year Ended September 30, 2021 | | | For the Year Ended September 30, 2020 | | | For the Year Ended September 30, 2019 | | | For the Year Ended September 30, 2018 | |
| Net asset value, beginning of period/year | | $ | 34.85 | | | $ | 30.90 | | | $ | 27.89 | | | $ | 29.22 | | | $ | 29.02 | | | $ | 28.63 | |
| INCOME FROM INVESTMENT OPERATIONS: | | | | | | | | | | | | | | | | | | | | | | | | |
| Net investment income/(loss)(a) | | | (0.06 | ) | | | 0.12 | | | | 0.26 | | | | 0.23 | | | | 0.10 | | | | (0.01 | ) |
| Net realized and unrealized gain/(loss) | | | (2.49 | ) | | | 5.63 | | | | 4.27 | | | | (0.04 | ) | | | 1.63 | | | | 1.93 | |
| Total from investment operations | | | (2.55 | ) | | | 5.75 | | | | 4.53 | | | | 0.19 | | | | 1.73 | | | | 1.92 | |
| DISTRIBUTIONS: | | | | | | | | | | | | | | | | | | | | | | | | |
| From net investment income | | | – | | | | – | | | | – | | | | (0.06 | ) | | | – | | | | – | |
| From net realized gain on investments | | | – | | | | (0.42 | ) | | | (0.63 | ) | | | (0.98 | ) | | | (0.32 | ) | | | (0.52 | ) |
| Return of capital | | | (0.86 | ) | | | (1.38 | ) | | | (0.89 | ) | | | (0.48 | ) | | | (1.21 | ) | | | (1.01 | ) |
| Total distributions | | | (0.86 | ) | | | (1.80 | ) | | | (1.52 | ) | | | (1.52 | ) | | | (1.53 | ) | | | (1.53 | ) |
| Net asset value, end of period/year | | $ | 31.44 | | | $ | 34.85 | | | $ | 30.90 | | | $ | 27.89 | | | $ | 29.22 | | | $ | 29.02 | |
| TOTAL RETURN(b)(c) | | | (8.37 | )%(d) | | | 18.90 | % | | | 16.81 | % | | | 0.63 | % | | | 6.15 | % | | | 6.86 | % |
| RATIOS/SUPPLEMENTAL DATA: | | | | | | | | | | | | | | | | | | | | | | | | |
| Net assets, end of period/year (000s) | | $ | 640,518 | | | $ | 706,009 | | | $ | 486,734 | | | $ | 437,183 | | | $ | 401,507 | | | $ | 290,549 | |
| Ratios to Average Net Assets (including interest expense) | | | | | | | | | | | | | | | | | | | | | | | | |
| Ratio of expenses to average net assets excluding fee waivers and reimbursements(e)(f) | | | 3.45 | %(g) | | | 2.74 | % | | | 2.81 | % | | | 2.90 | % | | | 2.95 | % | | | 3.18 | % |
| Ratio of expenses to average net assets including fee waivers and reimbursements(f) | | | 3.45 | %(g) | | | 2.74 | % | | | 2.81 | % | | | 2.92 | % | | | 2.96 | % | | | 3.12 | % |
| Ratio of net investment income/(loss) to average net assets(f) | | | (0.38 | )%(g) | | | 0.36 | % | | | 0.91 | % | | | 0.79 | % | | | 0.35 | % | | | (0.04 | )% |
| Ratios to Average Net Assets (excluding interest expense) | | | | | | | | | | | | | | | | | | | | | | | | |
| Ratio of expenses to average net assets excluding fee waivers and reimbursements(e)(f) | | | 2.64 | %(g) | | | 2.65 | % | | | 2.70 | % | | | 2.66 | % | | | 2.69 | % | | | 2.74 | % |
| Ratio of expenses to average net assets including fee waivers and reimbursements(f) | | | 2.64 | %(g) | | | 2.65 | % | | | 2.70 | % | | | 2.68 | % | | | 2.70 | % | | | 2.68 | % |
| Portfolio turnover rate | | | 3 | %(d) | | | 4 | % | | | 26 | % | | | 27 | % | | | 8 | % | | | 13 | % |
| (a) | Per share amounts are calculated using the average shares method. |
| (b) | Includes adjustments in accordance with accounting principles generally accepted in the United States and, consequently, the net asset value for financial reporting purposes and the returns based upon those net asset values may differ from the net asset values and returns for shareholder transactions. |
| (c) | Total returns are historical in nature and assumes changes in net asset value per share, and reinvestment of dividends and capital gains distributions, if any. Had the Advisor not absorbed a portion of the Fund expenses, total returns would have been lower. |
| (e) | Represents the ratio of expenses to average net assets absent fee waivers expense reimbursement and/or recoupment by the Advisor. |
| (f) | The ratios of expenses to average net assets and net investment income (loss) to average net assets do not directly reflect the expenses of the underlying institutional private real estate investments in which the Fund invests. The Fund invests in each underlying institutional private real estate investment based upon its net asset value, inclusive of management fees, which typically range from 0.50% to 1.30% on an annualized basis. The Fund’s Total Return is reported net of all fees and expenses. |
The accompanying notes are an integral part of these financial statements.
| Semi-Annual Report | March 31, 2023 | 21 |
| Bluerock Total Income+ Real Estate Fund - Class I | Financial Highlights |
The table below sets forth financial data for one share of beneficial interest outstanding throughout each year/period presented.
| | | For the Six Months Ended March 31, 2023 (Unaudited) | | | For the Year Ended September 30, 2022 | | | For the Year Ended September 30, 2021 | | | For the Year Ended September 30, 2020 | | | For the Year Ended September 30, 2019 | | | For the Year Ended September 30, 2018 | |
| Net asset value, beginning of period/year | | $ | 37.99 | | | $ | 33.35 | | | $ | 29.80 | | | $ | 30.92 | | | $ | 30.40 | | | $ | 29.70 | |
| INCOME FROM INVESTMENT OPERATIONS: | | | | | | | | | | | | | | | | | | | | | | | | |
| Net investment income(a) | | | 0.11 | | | | 0.48 | | | | 0.58 | | | | 0.56 | | | | 0.42 | | | | 0.29 | |
| Net realized and unrealized gain/(loss) | | | (2.73 | ) | | | 6.12 | | | | 4.61 | | | | (0.07 | ) | | | 1.72 | | | | 2.01 | |
| Total from investment operations | | | (2.62 | ) | | | 6.60 | | | | 5.19 | | | | 0.49 | | | | 2.14 | | | | 2.30 | |
| DISTRIBUTIONS: | | | | | | | | | | | | | | | | | | | | | | | | |
| From net investment income | | | – | | | | – | | | | – | | | | (0.06 | ) | | | – | | | | – | |
| From net realized gain on investments | | | – | | | | (0.42 | ) | | | (0.63 | ) | | | (1.04 | ) | | | (0.32 | ) | | | (0.54 | ) |
| Return of capital | | | (0.94 | ) | | | (1.54 | ) | | | (1.01 | ) | | | (0.51 | ) | | | (1.30 | ) | | | (1.06 | ) |
| Total distributions | | | (0.94 | ) | | | (1.96 | ) | | | (1.64 | ) | | | (1.61 | ) | | | (1.62 | ) | | | (1.60 | ) |
| Net asset value, end of period/year | | $ | 34.43 | | | $ | 37.99 | | | $ | 33.35 | | | $ | 29.80 | | | $ | 30.92 | | | $ | 30.40 | |
| TOTAL RETURN(b)(c) | | | (7.94 | )%(d) | | | 20.09 | % | | | 17.99 | % | | | 1.61 | % | | | 7.23 | % | | | 7.91 | % |
| RATIOS/SUPPLEMENTAL DATA: | | | | | | | | | | | | | | | | | | | | | | | | |
| Net assets, end of period/year (000s) | | $ | 4,850,429 | | | $ | 5,288,747 | | | $ | 2,012,129 | | | $ | 1,341,848 | | | $ | 1,040,017 | | | $ | 471,116 | |
| Ratios to Average Net Assets (including interest expense) | | | | | | | | | | | | | | | | | | | | | | | | |
| Ratio of expenses to average net assets excluding fee waivers and reimbursements(e)(f) | | | 2.47 | %(g) | | | 1.77 | % | | | 1.83 | % | | | 1.91 | % | | | 1.94 | % | | | 2.22 | % |
| Ratio of expenses to average net assets including fee waivers and reimbursements(f) | | | 2.47 | %(g) | | | 1.78 | % | | | 1.81 | % | | | 1.91 | % | | | 1.95 | % | | | 2.15 | % |
| Ratio of net investment income to average net assets(f) | | | 0.60 | %(g) | | | 1.30 | % | | | 1.89 | % | | | 1.82 | % | | | 1.38 | % | | | 0.95 | % |
| Ratios to Average Net Assets (excluding interest expense) | | | | | | | | | | | | | | | | | | | | | | | | |
| Ratio of expenses to average net assets excluding fee waivers and reimbursements(e)(f) | | | 1.66 | %(g) | | | 1.68 | % | | | 1.72 | % | | | 1.67 | % | | | 1.69 | % | | | 1.75 | % |
| Ratio of expenses to average net assets including fee waivers and reimbursements(f) | | | 1.66 | %(g) | | | 1.69 | % | | | 1.70 | % | | | 1.67 | % | | | 1.70 | % | | | 1.68 | % |
| Portfolio turnover rate | | | 3 | %(d) | | | 4 | % | | | 26 | % | | | 27 | % | | | 8 | % | | | 13 | % |
| (a) | Per share amounts are calculated using the average shares method. |
| (b) | Includes adjustments in accordance with accounting principles generally accepted in the United States and, consequently, the net asset value for financial reporting purposes and the returns based upon those net asset values may differ from the net asset values and returns for shareholder transactions. |
| (c) | Total returns are historical in nature and assumes changes in net asset value per share, and reinvestment of dividends and capital gains distributions, if any. Had the Advisor not absorbed a portion of the Fund expenses, total returns would have been lower. |
| (e) | Represents the ratio of expenses to average net assets absent fee waivers expense reimbursement and/or recoupment by the Advisor. |
| (f) | The ratios of expenses to average net assets and net investment income to average net assets do not directly reflect the expenses of the underlying institutional private real estate investments in which the Fund invests. The Fund invests in each underlying institutional private real estate investment based upon its net asset value, inclusive of management fees, which typically range from 0.50% to 1.30% on an annualized basis. The Fund’s Total Return is reported net of all fees and expenses. |
The accompanying notes are an integral part of these financial statements.
22
| Bluerock Total Income+ Real Estate Fund - Class L | Financial Highlights |
The table below sets forth financial data for one share of beneficial interest outstanding throughout each year/period presented.
| | | For the Six Months Ended March 31, 2023 (Unaudited) | | | For the Year Ended September 30, 2022 | | | For the Year Ended September 30, 2021 | | | For the Year Ended September 30, 2020 | | | For the Year Ended September 30, 2019 | | | For the Year Ended September 30, 2018 | |
| Net asset value, beginning of period/year | | $ | 36.61 | | | $ | 32.31 | | | $ | 29.02 | | | $ | 30.25 | | | $ | 29.89 | | | $ | 29.34 | |
| INCOME FROM INVESTMENT OPERATIONS: | | | | | | | | | | | | | | | | | | | | | | | | |
| Net investment income(a) | | | 0.01 | | | | 0.29 | | | | 0.42 | | | | 0.37 | | | | 0.26 | | | | 0.13 | |
| Net realized and unrealized gain/(loss) | | | (2.62 | ) | | | 5.90 | | | | 4.46 | | | | (0.03 | ) | | | 1.68 | | | | 1.99 | |
| Total from investment operations | | | (2.61 | ) | | | 6.19 | | | | 4.88 | | | | 0.34 | | | | 1.94 | | | | 2.12 | |
| DISTRIBUTIONS: | | | | | | | | | | | | | | | | | | | | | | | | |
| From net investment income | | | – | | | | – | | | | – | | | | (0.06 | ) | | | – | | | | – | |
| From net realized gain on investments | | | – | | | | (0.42 | ) | | | (0.63 | ) | | | (1.01 | ) | | | (0.32 | ) | | | (0.53 | ) |
| Return of capital | | | (0.90 | ) | | | (1.47 | ) | | | (0.96 | ) | | | (0.50 | ) | | | (1.26 | ) | | | (1.04 | ) |
| Total distributions | | | (0.90 | ) | | | (1.89 | ) | | | (1.59 | ) | | | (1.57 | ) | | | (1.58 | ) | | | (1.57 | ) |
| | | | | | | | | | | | | | | | | | | | | | | | | |
| Net asset value, end of period/year | | $ | 33.10 | | | $ | 36.61 | | | $ | 32.31 | | | $ | 29.02 | | | $ | 30.25 | | | $ | 29.89 | |
| TOTAL RETURN(b)(c) | | | (8.17 | )%(d) | | | 19.46 | % | | | 17.38 | % | | | 1.14 | % | | | 6.70 | % | | | 7.40 | % |
| | | | | | | | | | | | | | | | | | | | | | | | | |
| RATIOS/SUPPLEMENTAL DATA: | | | | | | | | | | | | | | | | | | | | | | | | |
| Net assets, end of period/year (000s) | | $ | 111,909 | | | $ | 124,675 | | | $ | 87,645 | | | $ | 73,014 | | | $ | 88,605 | | | $ | 42,975 | |
| Ratios to Average Net Assets (including interest expense) | | | | | | | | | | | | | | | | | | | | | | | | |
| Ratio of expenses to average net assets excluding fee waivers and reimbursements(e)(f) | | | 2.99 | %(g) | | | 2.28 | % | | | 2.35 | % | | | 2.40 | % | | | 2.44 | % | | | 2.84 | % |
| Ratio of expenses to average net assets including fee waivers and reimbursements(f) | | | 3.01 | %(g) | | | 2.29 | % | | | 2.31 | % | | | 2.41 | % | | | 2.46 | % | | | 2.74 | % |
| Ratio of net investment income to average net assets(f) | | | 0.06 | (g) | | | 0.81 | % | | | 1.40 | % | | | 1.25 | % | | | 0.87 | % | | | 0.44 | % |
| | | | | | | | | | | | | | | | | | | | | | | | | |
| Ratios to Average Net Assets (excluding interest expense) | | | | | | | | | | | | | | | | | | | | | | | | |
| Ratio of expenses to average net assets excluding fee waivers and reimbursements(e)(f) | | | 2.18 | %(g) | | | 2.20 | % | | | 2.24 | % | | | 2.17 | % | | | 2.18 | % | | | 2.27 | % |
| Ratio of expenses to average net assets including fee waivers and reimbursements(f) | | | 2.20 | %(g) | | | 2.21 | % | | | 2.20 | % | | | 2.18 | % | | | 2.20 | % | | | 2.17 | % |
| Portfolio turnover rate | | | 3 | %(d) | | | 4 | % | | | 26 | % | | | 27 | % | | | 8 | % | | | 13 | % |
| (a) | Per share amounts are calculated using the average shares method. |
| (b) | Total returns are historical in nature and assumes changes in net asset value per share, reinvestment of dividends and capital gains distributions, if any, and do not reflect the impact of sales charges. Had the Advisor not absorbed a portion of the Fund expenses, total returns would have been lower. |
| (c) | Includes adjustments in accordance with accounting principles generally accepted in the United States and, consequently, the net asset value for financial reporting purposes and the returns based upon those net asset values may differ from the net asset values and returns for shareholder transactions. |
| (e) | Represents the ratio of expenses to average net assets absent fee waivers expense reimbursement and/or recoupment by the Advisor. |
| (f) | The ratios of expenses to average net assets and net investment income (loss) to average net assets do not directly reflect the expenses of the underlying institutional private real estate investments in which the Fund invests. The Fund invests in each underlying institutional private real estate investment based upon its net asset value, inclusive of management fees, which typically range from 0.50% to 1.30% on an annualized basis. The Fund’s Total Return is reported net of all fees and expenses. |
The accompanying notes are an integral part of these financial statements.
| Semi-Annual Report | March 31, 2023 | 23 |
| Bluerock Total Income+ Real Estate Fund - Class M | Financial Highlights |
The table below sets forth financial data for one share of beneficial interest outstanding throughout the period presented.
| | | For the Six Months Ended March 31, 2023 (Unaudited) | | �� | For the Period Ended September 30, 2022 (a) | |
| Net asset value, beginning of period/year | | $ | 34.93 | | | $ | 31.78 | |
| INCOME FROM INVESTMENT OPERATIONS: | | | | | | | | |
| Net investment income/(loss)(b) | | | (0.02 | ) | | | 0.14 | |
| Net realized and unrealized gain/(loss) | | | (2.49 | ) | | | 4.39 | |
| Total from investment operations | | | (2.51 | ) | | | 4.53 | |
| DISTRIBUTIONS: | | | | | | | | |
| From net investment income | | | – | | | | – | |
| Return of capital | | | (0.86 | ) | | | (1.38 | ) |
| Total distributions | | | (0.86 | ) | | | (1.38 | ) |
| | | | | | | | | |
| Net asset value, end of period/year | | $ | 31.56 | | | $ | 34.93 | |
| TOTAL RETURN(c)(d) | | | (8.25 | )%(h) | | | 14.35 | %(h) |
| | | | | | | | | |
| RATIOS/SUPPLEMENTAL DATA: | | | | | | | | |
| Net assets, end of period/year (000s) | | $ | 143,473 | | | $ | 135,362 | |
| Ratios to Average Net Assets (including interest expense) | | | | | | | | |
| Ratio of expenses to average net assets excluding fee waivers and reimbursements(e)(f) | | | 3.17 | %(g) | | | 2.46 | %(g) |
| Ratio of expenses to average net assets including fee waivers and reimbursements(e) | | | 3.17 | %(g) | | | 2.46 | %(g) |
| Ratio of net investment income/(loss) to average net assets(e) | | | (0.09 | )%(g) | | | 0.54 | %(g) |
| | | | | | | | | |
| Ratios to Average Net Assets (excluding interest expense) | | | | | | | | |
| Ratio of expenses to average net assets excluding fee waivers and reimbursements(e)(f) | | | 2.34 | %(g) | | | 2.35 | %(g) |
| Ratio of expenses to average net assets including fee waivers and reimbursements(e) | | | 2.34 | %(g) | | | 2.35 | %(g) |
| Portfolio turnover rate | | | 3 | %(h) | | | 4 | %(h) |
| (a) | Class M commenced operations on December 27, 2021. |
| (b) | Per share amounts are calculated using the average shares method. |
| (c) | Total returns are historical in nature and assumes changes in net asset value per share, and reinvestment of dividends and capital gains distributions, if any. Had the Advisor not absorbed a portion of the Fund expenses, total returns would have been lower. |
| (d) | Includes adjustments in accordance with accounting principles generally accepted in the United States and, consequently, the net asset value for financial reporting purposes and the returns based upon those net asset values may differ from the net asset values and returns for shareholder transactions. |
| (e) | The ratios of expenses to average net assets and net investment income (loss) to average net assets do not directly reflect the expenses of the underlying institutional private real estate investments in which the Fund invests. The Fund invests in each underlying institutional private real estate investment based upon its net asset value, inclusive of management fees, which typically range from 0.50% to 1.30% on an annualized basis. The Fund’s Total Return is reported net of all fees and expenses. |
| (f) | Represents the ratio of expenses to average net assets absent fee waivers expense reimbursement and/or recoupment by the Advisor. |
The accompanying notes are an integral part of these financial statements.
24
| Bluerock Total Income+ Real Estate Fund | Financial Highlights |
The table below sets forth financial data for one share of beneficial interest outstanding throughout each period presented.
Information about the Fund's senior securities as of each period is shown in the following table:
| | | March 31, 2023 | | | September 30, 2022 | | | September 30, 2021 | | | September 30, 2020 | | | September 30, 2019 | | | September 30, 2018 | |
| Total Amount Outstanding under Line of Credit (000's) | | $ | 675,000 | | | $ | 350,000 | | | $ | – | | | $ | 274,000 | | | $ | 148,100 | | | $ | 103,200 | |
| Asset Coverage Per $1,000 of Line of Credit(a) | | | 10,817 | | | | 21,502 | | | | N/A | | | | 9,679 | | | | 14,957 | | | | 12,416 | |
| (a) | Calculated as the difference between the Fund's total assets and total liabilities (excluding the indebtedness represented by the Line of Credit) and dividing by the total amount outstanding on the Line of Credit. The Asset Coverage Ratio is then multiplied by $1,000 to determine the "Asset Coverage Per $1,000 of Line of Credit Outstanding). |
The accompanying notes are an integral part of these financial statements.
| Semi-Annual Report | March 31, 2023 | 25 |
| Bluerock Total Income+ Real Estate Fund | Notes to Financial Statements |
March 31, 2023 (Unaudited)
1. ORGANIZATION
Bluerock Total Income+ Real Estate Fund (the “Fund” or the “Trust”) was organized as a Delaware statutory trust on May 25, 2012 and is registered under the Investment Company Act of 1940, as amended (the “1940 Act”), as a closed-end management investment company that operates as an interval fund with a continuous offering of Fund shares. The Fund is non-diversified. The Fund’s investment advisor is Bluerock Fund Advisor, LLC (the “Advisor”). The Fund’s primary investment objective is to generate current income while secondarily seeking long-term capital appreciation with low to moderate volatility and low correlation to the broader markets. The Fund pursues its investment objective by investing, under normal circumstances, at least 80% of its net assets plus the amount of any borrowings for investment purposes, in real estate industry securities, primarily in income producing equity and debt securities.
The Fund currently offers Class A, Class C, Class I, Class L and Class M shares. Class A shares commenced operations on October 22, 2012 and are offered at net asset value plus a maximum sales charge of 5.75%. Class A shareholders who tender for repurchase Class A shares that were purchased in amounts of $1,000,000 or more that have been held less than one year (365 days) from the purchase date will be subject to an early withdrawal charge of 1.00% of the original purchase price. Class C and Class I shares commenced operations on April 1, 2014 and are offered at net asset value. Class C shares are subject to an early withdrawal charge of 1.00% if redeemed less than 365 days after purchase. Class L shares commenced operations on June 1, 2017 and are offered at net asset value plus a maximum sales charge of 4.25%. Class M shares commenced operations on December 27, 2021 and are offered at net asset value. Each class represents an interest in the same assets of the Fund and classes are identical except for differences in their sales charge structures and ongoing shareholder service and distribution charges. All classes of shares have equal voting privileges except that each class has exclusive voting rights with respect to its shareholder service and/or distribution plans. The Fund’s income, expenses (other than class specific shareholder service and distribution fees) and realized and unrealized gains and losses are allocated proportionately each day based upon the relative net assets of each class.
2. SUMMARY OF SIGNIFICANT ACCOUNTING POLICIES
The following is a summary of significant accounting policies followed by the Fund in preparation of its financial statements. These policies are in conformity with accounting principles generally accepted in the United States of America (“GAAP”). The preparation of financial statements requires management to make estimates and assumptions that affect the reported amounts of assets and liabilities and disclosure of contingent assets and liabilities at the date of the financial statements and the reported amounts of income and expenses for the period. Actual results could differ from those estimates. The Fund is an investment company and accordingly follows the investment company accounting and reporting guidance of the Financial Accounting Standards Board (“FASB”) Accounting Standard Codification (“ASC”) Topic 946 "Financial Services – Investment Companies."
A. Security Valuation – Securities listed on an exchange are valued at the last reported sale price at the close of the regular trading session of the exchange on the business day the value is being determined, or in the case of securities listed on NASDAQ, at the NASDAQ Official Closing Price. In the absence of a sale such securities shall be valued at the last bid price. Debt securities, including restricted securities, are valued based on evaluated prices received from a third party pricing vendor or from brokers who make markets in such securities. Debt securities are valued by pricing vendors who utilize matrix pricing which considers yield or price of bonds of comparable quality, coupon, maturity and type or by broker-supplied prices. When independent prices are unavailable or unreliable, debt securities may be valued utilizing pricing methodologies which consider similar factors that would be used by third party pricing vendors. Debt securities are generally categorized as Level 2 in the hierarchy but may be Level 3 depending on the circumstances. The Fund may invest a portion of its assets in below investment grade securities. The value of these securities can be more volatile due to changes in the credit quality of the issuer and are sensitive to changes in economic, market and regulatory conditions. Short-term investments that mature in 60 days or less may be valued at amortized cost, provided such valuations represent fair value.
Valuation of Underlying Funds – The Fund may invest in portfolios of open-end and closed-end investment companies and exchange-traded funds (“ETFs” and collectively the “Underlying Funds”). The Underlying Funds value securities in their portfolios for which market quotations are readily available at their market values (generally the last reported sale price) and all other securities and assets/liabilities at their fair value to the methods established by the board of directors of the Underlying Funds.
Open-end investment companies are valued at their respective net asset values (“NAV”) as reported by such investment companies. The shares of many closed-end investment companies, after their initial public offering, frequently trade at a price per share, which is different than the NAV per share. The difference represents a market premium or market discount of such shares. There can be no assurances that the market discount or market premium on shares of any closed-end investment company purchased by the Fund will not change. An ETF trades like common stock and typically represents a fixed portfolio of securities designed to track the performance and dividend yield of a particular domestic or foreign market index. The Fund may purchase an investment vehicle to temporarily gain exposure to a portion of the U.S. or a foreign market. The risks of owning such investment vehicles generally reflect the risks of owning the underlying securities they are designed to track, although any lack of liquidity could result in it being more volatile. Additionally, such investment vehicles have fees and expenses that reduce their value relative to their underlying holdings.
26
| Bluerock Total Income+ Real Estate Fund | Notes to Financial Statements |
March 31, 2023 (Unaudited)
When price quotations for certain securities are not readily available, or if the available quotations are not believed to be reflective of market value by the Advisor, those securities will be valued at “fair value” as determined in good faith by the Advisor, who has been named as the valuation designee by the Fund’s Board of Trustees (the “Board”). There can be no assurance that the Fund could purchase or sell a portfolio security at the price used to calculate the Fund’s NAV.
Fair valuation procedures may be used to value a substantial portion of the assets of the Fund. The Fund may use the fair value of a security to calculate its NAV when, for example, (1) a portfolio security is not traded in a public market or the principal market in which the security trades is closed, (2) trading in a portfolio security is suspended and not resumed prior to the normal market close, (3) a portfolio security is not traded in significant volume for a substantial period, or (4) the Advisor determines that the quotation or price for a portfolio security provided by a broker- dealer or independent pricing service is inaccurate.
Valuation of Private Real Estate Securities – The Fund invests a significant portion of its assets in Private Real Estate Securities (“Private Funds”), which includes securities that invest in real estate assets (“Private REITs”) and securities that invest in debt instruments secured or otherwise supported by real estate assets (“Private Debt”). The Private Funds measure their investment assets at fair value, and report a NAV per share on a calendar quarter basis. In accordance with ASC 820-10, the Fund has elected to apply the practical expedient, and to value its investments in Private Funds at their respective NAVs or NAV equivalents at each quarter. For non-calendar quarter-end days, the Advisor estimates the fair value of each Private REIT by adjusting the most recent NAV for each Private Fund by the change in a proprietary benchmark that the Advisor has deemed to be representative of the entire Private Fund market. For Private Debt, the Fund accrues income on a daily basis for each Private Debt investment. As of March 31, 2023, all of the Fund’s investments in Private Funds were valued at their respective NAVs.
Valuation of Public Non-Traded Equity Real Estate Securities – The Fund may invest a portion of its assets in Public Non-Traded Equity Real Estate Securities (“Public Non-Traded ERES”). The Public Non-Traded ERES do not report periodic NAVs with enough frequency to be valued using the practical expedient. The Advisor determines the fair value of Public Non-Traded ERES on a daily basis by considering various factors such as the most recent published NAV, the transaction price, secondary market trades, shareholder redemption and dividend reinvestment programs, and potential illiquidity discounts.
The “fair value” of securities may be difficult to determine and thus judgment plays a greater role in the valuation process. The fair valuation methodology may include or consider the following guidelines, as appropriate: (1) evaluation of all relevant factors, including but not limited to, pricing history, current market level, supply and demand of the respective security; (2) comparison to the values and current pricing of securities that have comparable characteristics; (3) knowledge of historical market information with respect to the security; (4) other factors relevant to the security which would include, but not be limited to, duration, yield, fundamental analytical data, the Treasury yield curve, and credit quality.
The values assigned to fair valued investments are based on available information and do not necessarily represent amounts that might ultimately be realized, since such amounts depend on future developments inherent in long-term investments. Changes in the fair valuation of portfolio securities may be less frequent and of greater magnitude than changes in the price of portfolio securities valued at their last sale price, by an independent pricing service, or based on market quotations. Imprecision in estimating fair value can also impact the amount of unrealized appreciation or depreciation recorded for a particular portfolio security and differences in the assumptions used could result in a different determination of fair value, and those differences could be material.
The Fund utilizes various methods to measure the fair value of its investments on a recurring basis. GAAP establishes a hierarchy that prioritizes inputs to valuation methods. The three levels of input are:
| Level 1 – | Unadjusted quoted prices in active markets for identical assets and liabilities that the Fund has the ability to access. |
| Level 2 – | Observable inputs other than quoted prices included in Level 1 that are observable for the asset or liability, either directly or indirectly. These inputs may include quoted prices for the identical instrument on an inactive market, prices for similar instruments, interest rates, prepayment speeds, credit risk, yield curves, default rates and similar data. |
| Level 3 – | Unobservable inputs for the asset or liability, to the extent relevant observable inputs are not available, representing the Fund’s own assumptions about the assumptions a market participant would use in valuing the asset or liability, and would be based on the best information available. |
The availability of observable inputs can vary from security to security and is affected by a wide variety of factors, including, for example, the type of security, whether the security is new and not yet established in the marketplace, the liquidity of markets, and other characteristics particular to the security. To the extent that valuation is based on models or inputs that are less observable or unobservable in the market, the determination of fair value requires more judgment. Accordingly, the degree of judgment exercised in determining fair value is greatest for instruments categorized in Level 3.
| Semi-Annual Report | March 31, 2023 | 27 |
| Bluerock Total Income+ Real Estate Fund | Notes to Financial Statements |
March 31, 2023 (Unaudited)
The inputs used to measure fair value may fall into different levels of the fair value hierarchy. In such cases, for disclosure purposes, the level in the fair value hierarchy within which the fair value measurement falls in its entirety, is determined based on the lowest level input that is significant to the fair value measurement in its entirety. The valuation techniques used by the Fund to measure fair value during the six months ended March 31, 2023, maximized the use of observable inputs and minimized the use of unobservable inputs.
The inputs or methodology used for valuing securities are not necessarily an indication of the risk associated with investing in those securities. The following tables summarize the inputs used as of March 31, 2023 for the Fund’s assets measured at fair value:
| Investments in Securities at Value | | Level 1 | | | Level 2 | | | Level 3 | | | Total | |
| Private Real Estate Securities(a) | | $ | – | | | $ | – | | | $ | – | | | $ | 6,769,089,704 | |
| Real Estate Debt Securities | | | – | | | | 291,587,194 | | | | – | | | | 291,587,194 | |
| Public Non-Traded Real Estate Investment Trusts | | | – | | | | – | | | | 33,639 | | | | 33,639 | |
| Publicly Traded Real Estate Investment Trusts | | | 156,528,599 | | | | – | | | | – | | | | 156,528,599 | |
| Open-Ended Mutual Fund | | | 12,925,559 | | | | – | | | | – | | | | 12,925,559 | |
| Short Term Investments | | | 64,441,939 | | | | – | | | | – | | | | 64,441,939 | |
| TOTAL | | $ | 233,896,097 | | | $ | 291,587,194 | | | $ | 33,639 | | | $ | 7,294,606,634 | |
| (a) | In accordance with ASC 820-10, investments that are measured at fair value using the NAV per share (or its equivalent) practical expedient have not been classified in the fair value hierarchy. The fair value amounts presented in this table are intended to permit reconciliation of the fair value hierarchy to the amounts presented in the Portfolio of Investments and Statement of Assets and Liabilities. |
B. Security Transactions and Investment Income – Investment security transactions are accounted for on a trade date basis. Cost is determined and gains and losses are based upon the specific identification method for both financial statement and federal income tax purposes. Dividend income is recorded on the ex-dividend date and interest income is recorded on the accrual basis. Non-cash dividends included in dividend income, if any, are recorded at the fair market value of the security received. Purchase discounts and premiums on securities are accreted and amortized to the earliest call date of the respective securities.
C. Federal Income Taxes – The Fund intends to comply with the requirements of Subchapter M of the Internal Revenue Code applicable to regulated investment companies and will distribute all of its taxable income, if any to shareholders. Accordingly, no provision for Federal income taxes is required in the financial statements.
The Fund recognizes the tax benefits of uncertain tax positions only when the position is “more likely than not” to be sustained assuming examination by tax authorities. Management has reviewed the tax positions and has concluded that no liability for unrecognized tax benefits should be recorded related to uncertain tax positions related to the open tax years or expected to be taken in the Fund’s 2023 tax returns. The Fund identifies its major tax jurisdiction as U.S. Federal. The Fund recognizes interest and penalties, if any, related to unrecognized tax benefits as income tax expense in the Statement of Operations. During the six months ended March 31, 2023, the Fund did not incur any interest or penalties. Generally tax authorities can examine tax returns filed for the last three years.
D. Distributions to Shareholders – Distributions from investment income are declared and paid quarterly. Distributions from net realized capital gains, if any, are declared and paid annually and are recorded on the ex-dividend date. The character of income and gains to be distributed is determined in accordance with income tax regulations, which may differ from GAAP.
For the six months ended March 31, 2023, the Fund declared distributions to shareholders in the amount of $179,231,279, which resulted in $103,021,930 elected to be paid in cash and $76,209,349 that was reinvested through the Fund’s dividend reinvestment policy. During this same period, the Fund had total investment income of $106,210,044, net realized gains/(loss) on investments totaling ($11,638,027), net change in unrealized depreciation on investments of ($513,717,056) and net expenses of $90,696,950.
The Fund’s primary investment objective is to generate current income while secondarily seeking long-term capital appreciation with low to moderate volatility and low correlation to the broader markets. The Fund’s total return is expected to be comprised of income plus realized gains and unrealized gains, less Fund-level expenses. Therefore, a portion of the Fund’s total return has been comprised of unrealized gains.
The Fund’s distributions for any period may be higher or lower than the Fund’s net return and therefore should not be used as a measure of performance or confused with yield or income generated by the Fund’s underlying investments. Further, the actual distribution amounts and sources of those amounts for tax reporting purposes will depend upon the Fund’s investment experience during its fiscal period and may be subject to changes based on tax regulations. Distributions in excess of the Fund’s total return will cause the Fund’s NAV to decline. During the six months ended March 31, 2023, the Fund’s Class A Shares had a starting NAV of $37.10, paid distributions of $0.92 and had an ending NAV of $33.59. The Fund’s Class C Shares had a starting NAV of $34.85, paid distributions of $0.86 and had an ending NAV of $31.44. The Fund’s Class I Shares had a starting NAV of $37.99, paid distributions of $0.94 and had an ending NAV of $34.43. The Fund’s Class L Shares had a starting NAV of $36.61, paid distributions of $0.90 and had an ending NAV of $33.10. The Fund’s Class M Shares had a starting NAV of $34.93, paid distributions of $0.86 and had an ending NAV of $31.56.
28
| Bluerock Total Income+ Real Estate Fund | Notes to Financial Statements |
March 31, 2023 (Unaudited)
The Fund’s distribution policy is expected to result in distributions that equal a fixed percentage of the Fund’s current net asset value per share. All or a portion of a distribution may consist of a return of capital (i.e. from your original investment). Shareholders should not assume that the source of a distribution from the Fund is net profit. Shareholders should note that return of capital will reduce the tax basis of their shares and potentially increase the taxable gain, if any, upon disposition of their shares. Investors should not draw any conclusions about the Fund’s investment performance from the amount of its distribution.
The Fund’s historical NAV details are available on the Fund’s website at https://bluerock.com/ti-fund/performance.
E. Cash and Cash Equivalents – Cash and cash equivalents are held with a financial institution. The asset of the Funds may be placed in deposit accounts at U.S. banks and such deposits generally exceed Federal Deposit Insurance Corporation (“FDIC”) insurance limits. The FDIC insures deposit accounts up to $250,000 for each account holder. At March 31, 2023, the Fund held $64,441,939 with the custodian. The Fund currently invests excess cash in a short term money market fund, which is valued at NAV on a daily basis and categorized as Level 1 in the hierarchy.
F. Indemnification – The Trust indemnifies its officers, trustees and distributor for certain liabilities that may arise from the performance of their duties to the Trust. Additionally, in the normal course of business, the Fund enters into contracts that contain a variety of representations and warranties and which provide general indemnities. The Fund’s maximum exposure under these arrangements is unknown, as this would involve future claims that may be made against the Fund that have not yet occurred. However, based on experience, the Trust expects the risk of loss due to these warranties and indemnities to be remote.
3. RELATED-PARTY TRANSACTIONS, SERVICE PROVIDERS AND TRUSTEE COMPENSATION
A. Advisory Agreement and Expense Limitation Agreement – Pursuant to an investment management agreement between the Trust and the Advisor, (the “Advisory Agreement”), investment advisory services are provided to the Fund by the Advisor. Under the terms of the Advisory Agreement, the Advisor receives monthly fees calculated at an annual rate of 1.50% of the average daily net assets of the Fund. For the six months ended March 31, 2023, the Advisor earned advisory fees of $51,932,255.
The Advisor and the Fund have entered into an expense limitation agreement (the “Expense Limitation Agreement”) under which the Advisor has contractually agreed to waive its fees and to pay or absorb the ordinary operating expenses of the Fund (excluding any taxes, interest, brokerage commissions, acquired fund fees and expenses, and extraordinary expenses, such as litigation or reorganization costs, but including organizational costs and offering costs), to the extent that such expenses exceed 1.95%, 2.70%, 1.70%, 2.20% and 2.45% of the Fund's average daily net assets attributable to the Class A, Class C, Class I, Class L and Class M shares, respectively. In consideration of the Advisor's agreement to limit the Fund's expenses, the Fund has agreed to repay the Advisor in the amount of any fees the Advisor previously waived or Fund expenses reimbursed, subject to the limitations that: (1) the reimbursement will be made if payable not more than three years from the date incurred; (2) the reimbursement may not be made if it would cause the expense limitation then in effect or in effect at the time of the waiver to be exceeded; and (3) the reimbursement is approved by the Fund's Board of Trustees. The Expense Limitation Agreement will remain in effect at least until January 31, 2024 unless and until the Board approves its modification or termination. After January 31, 2024, the Expense Limitation Agreement may be renewed at the Advisor's and Board's discretion. During the six months ended March 31, 2023, the Advisor recouped previously waived fees of $12,248. Cumulative fees and/or expenses subject to recapture pursuant to the aforementioned conditions amounted to $2,982 and will expire during the 2024 fiscal year.
Sub-advisory services were provided to the Fund pursuant to agreements between the Advisor and each of Mercer Investment Management, Inc. (“Mercer”) and RREEF America, LLC (“RREEF” and together with Mercer, the “Sub-Advisors”). Under each of the terms of the sub-advisory agreements, the Advisor compensates the Sub-Advisors based on the Fund’s assets allocated to the respective Sub-Advisor. Under the terms of the Sub-Advisory Agreement with Mercer, the Sub-Advisor receives fees from the Advisor (not the Fund) as follows: 0.025% of the Fund’s assets invested in publicly traded real estate securities, and 0.15% for up to $250 million in total Fund assets, 0.13% for $250 million to $500 million in total Fund assets, 0.12% for $500 million to $750 million in total Fund assets, 0.10% for $750 million to $1 billion in total Fund assets, 0.08% for $1 billion to $1.3 billion in total Fund assets, 0.07% for $1.3 billion to $1.5 billion in total Fund assets, 0.06% for $1.5 billion to $2 billion in total Fund assets, 0.05% for $2 billion to $2.5 billion in total Fund assets, 0.045% for $2.5 billion to $3 billion in total Fund assets, 0.04% for $3 billion to $3.5 billion in total Fund assets, 0.035% for $3.5 billion to $4 billion in total Fund assets, 0.03% for $4 billion to $4.5 billion in total Fund assets, 0.025% for $4.5 billion to $5 billion in total Fund assets, 0.02% for $5 billion to $5.5 billion in total Fund assets, 0.015% for $5.5 billion to $6 billion in total Fund assets, 0.010% for $6 billion or more in total Fund assets invested in private real estate assets.
| Semi-Annual Report | March 31, 2023 | 29 |
| Bluerock Total Income+ Real Estate Fund | Notes to Financial Statements |
March 31, 2023 (Unaudited)
Under the terms of a sub-advisory agreement between the Advisor and RREEF, RREEF receives fees from the Advisor (not the Fund) as follows: For the portion of the Fund invested in liquid real assets, sub-advisory fees are calculated at an annual rate of 0.60% for up to $50 million in assets allocated to RREEF, 0.55% for $50 million to $100 million in assets allocated to RREEF, and 0.50% for greater than $100 million in assets allocated to RREEF. For the portion of the Fund which is invested in non-publicly traded real estate related debt securities, sub-advisory fees are calculated at an annual rate of 0.75% for up to $350 million in assets allocated to RREEF, 0.60% in excess of $350 million through $700 million in assets allocated to RREEF, and 0.55% for assets in excess of $700 million allocated to RREEF.
B. Distributor – The distributor of the Fund is ALPS Distributors, Inc. (the “Distributor”). The Board has adopted, on behalf of the Fund, a Shareholder Services Plan and a Distribution Plan under which the Fund may compensate financial industry professionals for providing ongoing services in respect to clients with whom they have distributed shares of the Fund. Under the Shareholder Services Plan, the Fund pays up to 0.25% per year of the average daily net assets of each of Class A, Class C and Class L shares for such services. For the six months ended March 31, 2023, the Fund incurred shareholder servicing fees of $1,133,102, $843,549 and $144,728 for Class A, Class C and Class L shares, respectively. Under the Distribution Plan, the Fund pays 0.75% per year of its average daily net assets for such services for Class C shares and Class M shares, respectively and 0.25% per year of its average daily net assets for such services for Class L shares. For the six months ended March 31, 2023, the Fund incurred distribution fees of $2,530,647, $144,728 and $525,712 for Class C, Class L and Class M Shares, respectively.
The Distributor acts as the Fund’s principal underwriter in a continuous public offering of the Fund’s shares. For the six months ended March 31, 2023, the Distributor received $3,227,808 in underwriting commissions for sales of Class A shares, of which $559,564 was retained by the principal underwriter or other affiliated broker-dealers. For the six months ended March 31, 2023, the Distributor received $339,415 in underwriting commissions for sales of Class L shares, of which $75,997 was retained by the principal underwriter or other affiliated broker-dealers. For the six months ended March 31, 2023, the Distributor received $416,977 in underwriting commissions for sales of Class C.
| C. | ALPS Fund Services, Inc. (“ALPS”) – ALPS provides administration, compliance, and fund accounting services to the Trust. Pursuant to separate servicing agreements with ALPS, the Fund pays ALPS customary fees for providing administration, compliance, and fund accounting services to the Fund. |
| D. | Transfer Agent – DST Systems, Inc., an affiliate of ALPS, serves as transfer, dividend paying and shareholder servicing agent for the Fund (“Transfer Agent”) and receives customary fees from the Fund for providing such services. |
E. Trustee Compensation – Effective April 1, 2022, each Trustee who is not affiliated with the Trust or the Advisor receives an annual fee of $60,000, paid quarterly, of which $40,000 is paid in cash and the remaining $20,000 is paid in the equivalent amount of the Fund shares, as well as reimbursement for any reasonable expenses incurred attending the meetings.
4. INVESTMENT TRANSACTIONS
The cost of purchases and proceeds from the sale of securities, other than short-term securities, for the six months ended March 31, 2023, amounted to $834,340,218 and $209,050,339, respectively.
5. REPURCHASE OFFERS / SHARES OF BENEFICIAL INTEREST
Pursuant to Rule 23c-3 under the 1940 Act, the Fund offers shareholders on a quarterly basis the option of redeeming shares, at NAV, of no less than 5% and no more than 25% of the shares outstanding on the Repurchase Request Deadline (as defined in the Fund’s prospectus). The Board shall determine the quarterly repurchase offer amount. There is no guarantee that shareholders will be able to sell all of the shares they desire in a quarterly repurchase offer, although each shareholder will have the right to require the Fund to purchase up to and including 5% of such shareholder's shares in each quarterly repurchase. Limited liquidity will be provided to shareholders only through the Fund's quarterly repurchases.
30
| Bluerock Total Income+ Real Estate Fund | Notes to Financial Statements |
March 31, 2023 (Unaudited)
During the six months ended March 31, 2023, the Fund completed two quarterly repurchase offers. The Fund offered to repurchase up to 5% of the number of its outstanding shares as of the Repurchase Pricing Dates. The results of the repurchase offers were as follows:
| | | Repurchase Offer | | | Repurchase Offer | |
| Commencement Date | | | September 26, 2022 | | | | December 29, 2022 | |
| Repurchase Request Deadline | | | November 7, 2022 | | | | February 9, 2023 | |
| Repurchase Pricing Date | | | November 7, 2022 | | | | February 9, 2023 | |
| | | | | | | | | |
| Net Asset Value as of Repurchase Offer Date: | | | | | | | | |
| Class A | | $ | 37.17 | | | $ | 33.83 | |
| Class C | | $ | 34.89 | | | $ | 31.69 | |
| Class I | | $ | 38.07 | | | $ | 34.66 | |
| Class L | | $ | 36.67 | | | $ | 33.34 | |
| Class M | | $ | 34.98 | | | $ | 31.80 | |
| Amount Repurchased: | | | | | | | | |
| Class A | | $ | 32,385,057 | | | $ | 29,269,557 | |
| Class C | | $ | 13,368,569 | | | $ | 12,383,840 | |
| Class I | | $ | 323,623,501 | | | $ | 298,965,318 | |
| Class L | | $ | 2,281,398 | | | $ | 3,333,732 | |
| Class M | | $ | 905,632 | | | $ | 1,287,229 | |
| | | | | | | | | |
| Total Number of Shares Tendered: | | | 9,843,291 | | | | 10,022,104 | |
| Percentage of Shares Tendered that were Repurchased: | | | 100.00 | % | | | 55.38 | % |
6. DISTRIBUTIONS TO SHAREHOLDERS AND TAX COMPONENTS OF CAPITAL
The tax character of Fund distributions for the following years was as follows:
| Year | | | Ordinary Income | | | Long-Term Capital Gain | | | Return of Capital | |
| 2022 | | | $ | – | | | $ | 46,376,673 | | | $ | 243,564,960 | |
| 2021 | | | | – | | | | 50,732,345 | | | | 86,185,691 | |
As of March 31, 2023, the aggregate costs of investments, gross unrealized appreciation/(depreciation) and net unrealized appreciation for Federal tax purposes were as follows:
| | Gross Appreciation | | Gross Depreciation | | | | | Cost of Investments | |
| | (excess of value | | (excess of tax cost | | | Net Unrealized | | for Income Tax | |
| | over tax cost) | | over value) | | | Appreciation | | Purposes | |
| | $ | 1,070,024,581 | | $ | (164,701,160) | | | $ | 905,323,421 | | $ | 6,389,283,213 | |
The difference between book basis and tax basis distributable earnings and unrealized appreciation/(depreciation) is primarily attributable to the tax deferral of losses on wash sales and tax adjustments for partnerships.
As of September 30, 2022, the components of distributable earnings on a tax basis were as follows:
| | Accumulated net | | Other cumulative | | | Net unrealized | | | |
| | realized loss on | | effect of timing | | | appreciation on | | | |
| | investments | | differences | | | investments | | Total | |
| | $ | (3,300,895) | | $ | (31,253,169 | ) | | $ | 1,388,877,040 | | $ | 1,354,322,976 | |
The Fund elected to defer late year ordinary losses in the amount of $31,252,371.
The Fund elects to defer to the period ending September 30, 2023, capital losses recognized during the period 11/1 - 09/30/2022 in the amount of $3,300,895.
| Semi-Annual Report | March 31, 2023 | 31 |
| Bluerock Total Income+ Real Estate Fund | Notes to Financial Statements |
March 31, 2023 (Unaudited)
Permanent book and tax differences, primarily attributable to net operating losses and tax adjustments for partnerships, resulted in reclassification for the fiscal year ended September 30, 2022 as follows:
| | Paid-in Capital | | | Total Distributable Earnings | |
| | $ | 10,796,980 | | | $ | (10,796,980 | ) |
Included in the amounts reclassified was a net operating loss offset to Paid-in Capital in the amount of $4,323,774.
The amounts and characteristics of tax basis distributions and composition of distributable earnings/(accumulated losses) are finalized at fiscal year-end. Accordingly, tax basis balances have not been determined as of March 31, 2023.
7. EARLY WITHDRAWAL CHANGE
Class C shareholders and certain Class A shareholders who tender for repurchase shares that have been held less than one year (365 days) from the purchase date will be subject to an early withdrawal charge of 1.00% of the original purchase price with respect to such shares. The early withdrawal change does not apply to shares that were acquired through reinvestment of distributions or in connection with the death or disability of the shareholder. The early withdrawal change is paid directly to the Fund. For the six months ended March 31, 2023, the Fund did not receive any such fees.
32
| Bluerock Total Income+ Real Estate Fund | Notes to Financial Statements |
March 31, 2023 (Unaudited)
8. COMMITMENTS AND CONTINGENCIES
Commitments – As of March 31, 2023, the Fund had unfunded commitments and/or contingencies for the below listed Private Real Estate Securities:
| Security | | Value | | | Unfunded Commitments | | | Redemption Frequency | | Redemption Notice (Days) | |
| AEW Core Property Trust | | $ | 25,968,116 | | | $ | – | | | Quarterly | | | 45 | |
| Ares Industrial Real Estate Fund | | | 202,839,470 | | | | 157,250,000 | | | Quarterly | | | 90 | |
| Ares Real Estate Enhanced Income Fund | | | 117,549,621 | | | | – | | | Quarterly | | | 90 | |
| Bain Capital Real Estate Fund I | | | 71,552,020 | | | | 30,724,437 | | | None | | | None | |
| Bain Capital Real Estate Life Science | | | 3,716,683 | | | | 69,146,469 | | | None | | | None | |
| Blackstone Property Partners U.S. | | | 131,839,653 | | | | – | | | Quarterly | | | 90 | |
| Blackstone Property Partners Life Science | | | 90,304,208 | | | | 15,570,489 | | | Annual | | | 180 | |
| Bridge Debt Strategies Fund III, LP | | | 54,563,257 | | | | 5,574,061 | | | None | | | None | |
| Bridge Debt Strategies Fund IV, LP | | | 95,465,380 | | | | 3,409,145 | | | None | | | None | |
| Bridge Workforce Housing Fund I, LP | | | 88,954,941 | | | | 1,834,254 | | | None | | | None | |
| Brookfield Premier Real Estate Partners | | | 339,053,361 | | | | – | | | Quarterly | | | 90 | |
| Carlyle Property Investors | | | 209,742,143 | | | | 131,228,636 | | | Quarterly | | | 90 | |
| CBRE U.S. Core Partners, LP | | | 246,242,741 | | | | – | | | Quarterly | | | 60 | |
| CBRE U.S. Logistics Partners, LP | | | 273,015,332 | | | | – | | | Quarterly | | | 90 | |
| Clarion Gables Multifamily Trust | | | 136,849,053 | | | | – | | | Quarterly | | | 90 | |
| Clarion Lion Industrial Trust | | | 316,518,867 | | | | – | | | Quarterly | | | 90 | |
| Clarion Lion Properties Fund | | | 218,541,683 | | | | – | | | Quarterly | | | 90 | |
| Cortland Growth & Income Fund | | | 337,825,348 | | | | – | | | Quarterly | | | 90 | |
| Harrison Street Core Property Fund | | | 84,054,997 | | | | – | | | Quarterly | | | 45 | |
| Harrison Street Data Center Fund | | | 20,376,200 | | | | 6,371,359 | | | None | | | None | |
| Harrison Street Life Science Fund | | | 10,344,484 | | | | 8,323,500 | | | None | | | None | |
| H/2 Special Opportunities LP V | | | 65,318,020 | | | | 28,980,005 | | | None | | | None | |
| Invesco Core Real Estate Fund | | | 145,550,570 | | | | – | | | Quarterly | | | 45 | |
| Invesco U.S. Income Fund LP | | | 228,061,859 | | | | 40,000,000 | | | Quarterly | | | 45 | |
| IQHQ, Inc. | | | 704,552,957 | | | | – | | | Annual | | | * | |
| Morgan Stanley Prime Property Fund LLC | | | 358,645,982 | | | | – | | | Quarterly | | | 90 | |
| PGIM PRISA II | | | 228,082,077 | | | | – | | | Quarterly | | | 90 | |
| PGIM PRISA III | | | 188,489,737 | | | | – | | | Quarterly | | | 90 | |
| Principal Enhanced Property Fund LP | | | 91,091,171 | | | | – | | | Quarterly | | | 90 | |
| Prologis Targeted U.S. Logistics | | | 612,990,967 | | | | 350,000,000 | | | Quarterly | | | 90 | |
| Realterm Logistics Income Fund LP | | | 311,116,918 | | | | – | | | Quarterly | | | 90 | |
| RREEF America REIT II, Inc. | | | 73,390,099 | | | | – | | | Quarterly | | | 45 | |
| RREEF Core Plus Industrial Fund LP | | | 210,318,954 | | | | 22,500,000 | | | Quarterly | | | 60 | |
| Sentinel Real Estate Fund | | | 166,796,624 | | | | 3,049,689 | | | Daily | | | * | |
| Stockbridge Smart Markets Fund | | | 76,633,125 | | | | – | | | Quarterly | | | 45 | |
| Stockbridge Value Fund II | | | 117,478 | | | | 511,701 | | | None | | | None | |
| TA Realty Core Property Fund | | | 135,213,495 | | | | – | | | Quarterly | | | 45 | |
| TA Realty Logistics Fund | | | 97,402,113 | | | | – | | | Quarterly | | | 45 | |
| Total | | $ | 6,769,089,704 | | | $ | 874,473,745 | | | | | | | |
| * | Written notice required for redemption, no minimum timeline required. |
Typically, when the Fund invests in a Private Fund, it makes a binding commitment to invest a specified amount of capital in the applicable Private Fund. The capital commitment may be drawn by the general partner of the Private Fund either all at once, or over time through a series of capital calls at the discretion of the general partner. As such, the Unfunded Commitments column above reflects the remaining amount of the Fund’s commitments to be called by the general partner of the Private Fund. Further, the organizational documents of the Private Funds in which the Fund invests typically have set redemption schedules and notification requirements. As such, the Redemption Frequency column above reflects the frequency in which the Private Fund accepts redemption requests and the Redemption Notice column reflects the number of days of advanced notice required. While redemptions can be requested at the frequency listed above, there is no guarantee the Fund will be paid all or any of the redemption amount at the time requested.
| Semi-Annual Report | March 31, 2023 | 33 |
| Bluerock Total Income+ Real Estate Fund | Notes to Financial Statements |
March 31, 2023 (Unaudited)
9. LINE OF CREDIT
As of March 31, 2023, the Fund had two secured lines of credit with an aggregate maximum borrowing amount of $1,125,000,000.
On December 30, 2022, the Fund entered into a three-year secured, $125,000,000 revolving line of credit (the “Bank Credit Facility”) with Raymond James Bank. Borrowings under the Bank Credit Facility bear interest at a rate of one-month SOFR plus 3.61%. During the period from December 30, 2022 through March 31, 2023, the average amount of borrowing outstanding, approximate weighted average interest rate on borrowings and total interest expense with respect to the Bank Credit Facility were $125,000,000, 8.04% and $2,534,434 respectively. The Bank Credit Facility includes an unused commitment fee of 0.25% per annum and certain origination and structuring fees (the “Other LOC fees”). The Fund incurred Other LOC fees equal to approximately $51,894 during the period ended March 31, 2023. As of March 31, 2023, the Fund had outstanding borrowings of $125,000,000 under the Bank Credit Facility. As collateral for the Bank Credit Facility, the Fund grants Raymond James Bank a first position security interest in and lien on a select security held by the Fund in a designated collateral account.
On February 3, 2023, the Fund entered into an eighteen-month secured, $1,000,000,000 revolving line of credit (the “Non-Bank Credit Facility”) with D VI BL TIREF L.P., a real estate debt fund, American National Insurance Company and certain other lenders, all associated with a leading global alternative asset manager (the “Non-Bank Lenders”). Borrowings under the Non-Bank Credit Facility bear interest at a rate of one-month SOFR (subject to a floor of 3%) plus 8.25%. During the period from February 3, 2023 through March 31, 2023, the average amount of borrowing outstanding, approximate weighted average interest rate on borrowings and total interest expense with respect to the Non-Bank Credit Facility were $560,964,912, 12.99% and $11,383,856 respectively. The Non-Bank Credit Facility includes an unused commitment fee ranging from 0.0% and 0.50% per annum based on the undrawn portion and certain origination and structuring fees (the “Other LOC fees”). The Fund incurred Other LOC fees equal to approximately $1,968,935 during the period ended March 31, 2023. As of March 31, 2023, the Fund had outstanding borrowings of $550,000,000 under the Non-Bank Credit Facility. As collateral for the Non-Bank Credit Facility, the Fund grants the Non-Bank Lenders a first position security interest in and lien on select securities held by the Fund in a designated collateral account.
The Fund’s ability to borrow under the Bank Credit Facility and the Non-Bank Credit Facility are subject to the limitations of the 1940 Act.
On February 3, 2023, the Fund's credit facility with Credit Suisse was terminated. The Fund paid off all fees and no longer has any outstanding obligations under the Credit Suisse arrangement as of the termination date. From October 1, 2022 through February 3, 2023, borrowings under the Credit Suisse agreement were subject to a maximum borrowing amount of $600,000,000 and bore interest up to the rate of 3 month SOFR plus 205 basis points at the time of borrowing. During October 1, 2022 through February 3, 2023, the average amount of borrowing outstanding, approximate weighted average interest rate on borrowings and total interest expense for the period were $523,088,889, 6.70% and $12,100,854 respectively. Note, of the total interest expense incurred, $36,653 was related to fees on unused borrowings.
10. RISKS AND UNCERTAINTIES
In the normal course of business, the Fund faces certain risks and uncertainties. Set forth below is a summary of certain principal risks associated with the Fund. The following is not intended to be a complete list of all the potential risks associated with the Fund. For a more comprehensive list of potential risks the Fund may be subject to, please refer to the Fund’s Prospectus and Statement of Additional Information.
Market Risk. An investment in shares is subject to investment risk, including the possible loss of the entire principal amount invested. An investment in shares represents an indirect investment in the securities owned by the Fund. The value of these securities, like other market investments, may move up or down, sometimes rapidly and unpredictably. In addition, the Fund is subject to the risk that geopolitical and other similar events will disrupt the economy on a national or global level. For instance, war, terrorism, market manipulation, government defaults, government shutdowns, political changes or diplomatic developments, public health emergencies (such as the spread of infectious diseases, pandemics and epidemics) and natural/environmental disasters can all negatively impact the securities markets.
The current novel coronavirus (COVID-19) global pandemic and the aggressive responses taken by many governments, including closing borders, restricting international and domestic travel, and the imposition of prolonged quarantines or similar restrictions, as well as the forced or voluntary closure of, or operational changes to, many retail and other businesses, have had negative impacts, and in many cases severe negative impacts, on markets worldwide. Potential impacts on the real estate market may include lower occupancy rates, decreased lease payments, defaults and foreclosures, among other consequences. It is not known how long such impacts, or any future impacts of other significant events described above, will or would last, but there could be a prolonged period of global economic slowdown.
Therefore, the Fund could lose money over short periods due to short-term market movements and over longer periods during more prolonged market downturns. The foregoing could impair the Fund’s ability to maintain operational standards, disrupt the operations of the Fund and its service providers, adversely affect the performance, value and liquidity of the Fund’s investments, and negatively impact the Fund’s performance and your investment in the Fund. The value of your shares at any point in time may be worth less than the value of your original investment, even after taking into account any reinvestment of dividends and distributions.
34
| Bluerock Total Income+ Real Estate Fund | Notes to Financial Statements |
March 31, 2023 (Unaudited)
Real Estate Industry Concentration Risk. The Fund will concentrate its investments in securities of real estate industry issuers, and it may invest in real estate directly. As such, its portfolio will be significantly impacted by the performance of the real estate market and may experience more volatility and be exposed to greater risk than a more diversified portfolio. The value of companies of engaged in the real estate industry is affected by: (i) changes in general economic and market conditions; (ii) changes in the value of real estate properties; (iii) risks related to local economic conditions, overbuilding and increased competition; (iv) increases in property taxes and operating expenses; (v) changes in zoning laws; (vi) casualty and condemnation losses; (vii) variations in rental income, neighborhood values or the appeal of property to tenants; (viii) the availability of financing; (ix) climate change and (x) changes in interest rates and leverage. There are also special risks associated with particular sectors, or real estate operations, including, but not limited to, those risks described below:
Retail Properties. Retail properties are affected by shifts in consumer demand due to demographic changes, changes in spending patterns and lease terminations.
Office Properties. Office properties are affected by a downturn in the businesses operated by their tenants.
Hospitality Properties. Hotel properties and other properties in the hospitality real estate sector, such as motels and extended-stay properties, are affected by declines in business and leisure travel.
Healthcare Properties. Healthcare properties are affected by potential federal, state and local laws governing licenses, certification, adequacy of care, pharmaceutical distribution, rates, equipment, personnel and other factors regarding operations, and the continued availability of revenue from government reimbursement programs.
Industrial Properties. Industrial properties are affected by downturns in the manufacturing, processing and shipping of goods.
Multifamily Properties. Multifamily properties are affected by adverse economic conditions in the locale, oversupply and rent control laws.
Residential Properties. Residential properties can be significantly affected by the national, regional and local real estate markets. This segment of the real estate industry also is sensitive to interest rate fluctuations which can cause changes in the availability of mortgage capital and directly affect the purchasing power of potential homebuyers. Thus, residential properties can be significantly affected by changes in government spending, consumer confidence, demographic patterns and the level of new and existing home sales.
Shopping Centers. Shopping center properties are affected by changes in the local markets where their properties are located and dependent upon the successful operations and financial condition of their major tenants.
Self-Storage Properties. Self-storage properties are affected by changes to competing local properties, consumer and small business demand for storage space, and the ability of the management team.
Other factors may contribute to the risk of real estate investments:
Development Issues. Real estate development companies in which the Underlying Funds or the Fund may invest are affected by construction delays and insufficient tenant demand to occupy newly developed properties.
Lack of Insurance. Certain of the companies in the Fund’s portfolio may fail to carry comprehensive liability, fire, flood, wind or earthquake extended coverage and rental loss insurance, or insurance and may be subject to various policy specifications, limits and deductibles.
Dependence on Tenants. The ability of companies in the real estate industry in which the Fund may invest to make distributions to shareholders depends upon the ability of the tenants at their properties to generate enough income in excess of tenant operating expenses to make their lease payments.
Financial Leverage. Companies in the real estate industry in which the Fund may invest may be highly leveraged and financial covenants may affect their ability to operate effectively.
Financing Issues. Financial institutions in which the Fund may invest are subject to extensive government regulation. This regulation may limit both the amount and types of loans and other financial commitments a financial institution can make, and the interest rates and fees it can charge.
Environmental Issues. Owners of properties that may contain hazardous or toxic substances may be responsible for removal or remediation costs. Credit Market Conditions. Instability in credit markets can potentially make it more difficult for borrowers to obtain financing or refinancing on attractive terms or at all. Conditions in the credit markets may expose borrowers to increased interest expenses for borrowed money and tightening underwriting standards. There is also a risk that a general lack of liquidity or other events in the credit markets may adversely affect the ability of issuers in whose securities the Fund invests to finance real estate developments and projects or refinance completed projects.
| Semi-Annual Report | March 31, 2023 | 35 |
| Bluerock Total Income+ Real Estate Fund | Notes to Financial Statements |
March 31, 2023 (Unaudited)
Credit Risk. It is possible that issuers of debt securities may not make scheduled interest and principal payments, resulting in losses to the Fund. In addition, the credit quality of securities held may be lowered if an issuer’s financial condition changes and this also may negatively impact the Fund’s returns on investment in such securities.
Fixed Income Risk. Typically, a rise in interest rates causes a decline in the value of fixed income securities. Current conditions may result in a rise in interest rates, which in turn may result in a decline in the value of the fixed income investments held by the Fund. As a result, for the present, interest rate risk may be heightened. Fixed income securities are also subject to default risk.
Institutional Investment Fund Risk. The Fund’s investment in Institutional Investment Funds will require it to bear a pro rata share of the vehicles’ expenses, including management and performance fees. The fees the Fund pays to invest in an Institutional Investment Fund may be higher than if the manager of the Institutional Investment Fund managed the Fund’s assets directly. The performance fees charged by certain Institutional Investment Funds may create an incentive for its manager to make investments that are riskier and/or more speculative than those it might have made in the absence of a performance fee. Furthermore, Institutional Investment Funds, like the other “Underlying Funds” in which the Fund may invest, are subject to specific risks, depending on the nature of the vehicle, and also may employ leverage such that their returns are more than one times that of their benchmark which could amplify losses suffered by the Fund when compared to unleveraged investments. Shareholders of the Institutional Investment Funds are not entitled to the protections of the 1940 Act. For example, these funds need not have independent boards, shareholder approval of advisory contracts may not be required, may leverage to an unlimited extent, and may engage in joint transactions with affiliates. These characteristics present additional risks for shareholders.
Lack of Control Over Institutional Investment Funds and Other Portfolio Investments. Once the Advisor or RREEF has selected an Institutional Investment Fund, Private REIT, Public REIT, or Other Public Investment Vehicle (each, an “Underlying Fund” and together, the “Underlying Funds”) for investment by the Fund, the Advisor and RREEF will have no control over the investment decisions made by any such Underlying Fund. Although the Fund and the Advisor or RREEF will evaluate regularly each Underlying Fund and its manager to determine whether their respective investment programs are consistent with the Fund’s investment objective, the Advisor and RREEF will not have any control over the investments made by any Underlying Fund. Even though the Underlying Funds are subject to certain constraints, the managers may change aspects of their investment strategies. The managers may do so at any time (for example, such change may occur immediately after providing the Advisor with the quarterly unaudited financial information for an Institutional Investment Fund). The Advisor or RREEF may reallocate the Fund’s investments among the Underlying Funds, but the Advisor’s ability to do so may be constrained by the withdrawal limitations imposed by certain of the Underlying Funds, which may prevent the Fund from reacting rapidly to market changes should an Underlying Fund fail to effect portfolio changes consistent with such market changes and the demands of the Advisor. Such withdrawal limitations may also restrict the Advisor’s ability to terminate investments in Underlying Funds that are poorly performing or have otherwise had adverse changes. The Advisor and RREEF will be dependent on information provided by the Underlying Fund, including quarterly unaudited financial statements, which if inaccurate could adversely affect the Advisor’s or RREEF’s ability to manage the Fund’s investment portfolio in accordance with its investment objectives.
Leveraging Risk. The use of leverage, such as borrowing money to purchase securities or otherwise invest the Fund’s assets, will cause the Fund to incur additional expenses and may significantly magnify the Fund’s losses in the event of adverse performance of the Fund’s underlying investments. In addition to any borrowing utilized by the Fund, the Underlying Funds in which the Fund invests may utilize leverage, subject to the limitations of their charters and operative documents. Leverage by Underlying Funds and/or the Fund has the effect of potentially increasing losses.
REIT Risk. The value of investments in REIT shares may decline because of adverse developments affecting the real estate industry and real property values. In general, real estate values can be affected by a variety of factors, including supply and demand for properties, the economic health of the country or of different regions, and the strength of specific industries that rent properties. Also, qualification as a REIT under the Internal Revenue Code of 1986, as amended (the “Code”) in any particular year is a complex analysis that depends on a number of factors. There can be no assurance that an entity in which the Fund invests with the expectation that it will be taxed as a REIT will, in fact, qualify as a REIT. An entity that fails to qualify as a REIT would be subject to a corporate level tax, would not be entitled to a deduction for dividends paid to its shareholders and would not pass through to its shareholders the character of income earned by the entity.
Valuation of Institutional Investment Funds. Institutional Investment Funds are not publicly traded and the Fund may consider information provided by the institutional asset manager to determine the value of the Fund’s investment therein. The valuation provided by an institutional asset manager as of a specific date may vary from the actual sale price that may be obtained if such investment were sold to a third party. To determine the value of the Fund’s investment in Institutional Investment Funds, the Advisor considers, among other things, information provided by the Institutional Investment Funds, including quarterly unaudited financial statements, which if inaccurate could adversely affect the Advisor’s ability to value accurately the Fund’s shares. Institutional Investment Funds that invest primarily in publicly traded securities are more easily valued.
36
| Bluerock Total Income+ Real Estate Fund | Notes to Financial Statements |
March 31, 2023 (Unaudited)
11. SUBSEQUENT EVENTS
As outlined in the Fund's Quarterly Repurchase Offer Notice dated March 30, 2023, the Fund offered to repurchase up to 5% of its outstanding shares (the “Repurchase Offer”) at the net asset value of such shares on May 9, 2023 (the “Repurchase Date”). The repurchase requests received by the Fund by the Repurchase Date exceeded the number of shares of the Fund subject to the Repurchase Offer and as such, the Fund determined to repurchase shares on a pro rata basis. Accordingly, the Fund repurchased approximately 46.16% of the total number of shares tendered for repurchase which resulted in 9,877,368 repurchased shares for $334,658,646.
Subsequent events after the date of the Statement of Assets and Liabilities have been evaluated through the date the financial statements were issued. Except as stated above, management has concluded that there is no impact requiring adjustment or disclosure in the financial statements.
| Semi-Annual Report | March 31, 2023 | 37 |
| Bluerock Total Income+ | Renewal of Investment Advisory Agreement |
| Real Estate Fund | and Sub-Advisory Agreements |
| | March 31, 2023 (Unaudited) |
At a meeting held on November 9, 2022 (the “Meeting”), the Board of Trustees (the “Board”) of the Bluerock Total Income+ Real Estate Fund (the “Fund”), including a majority of the Trustees who are not “interested persons” (the “Independent Trustees”), as such term is defined by the 1940 Act, approved the renewal of the Investment Advisory Agreement (the “Bluerock Agreement”) with Bluerock Fund Advisor, LLC (“Bluerock”) as well as the renewal of the Sub-Advisory Agreement (the “Mercer Agreement”) between Bluerock and Mercer Investment Management, Inc. (“Mercer”) and the Sub-Advisory Agreement (the “RREEF Agreement”) between Bluerock and RREEF America, LLC (“RREEF” and together with Mercer, the “Sub-Advisers”).
In evaluating Bluerock and the Sub-Advisers and the fees charged under the Bluerock Agreement, Mercer Agreement, and RREEF Agreement, the Trustees concluded that no single factor reviewed by the Trustees was identified by the Trustees to be determinative as the principal factor in whether to renew each Agreement. Further, the Independent Trustees were advised by independent legal counsel throughout the process. The following summary does not identify all the matters considered by the Board but provides a summary of the principal matters the Board considered.
Bluerock Agreement
Nature, Extent and Quality of Services. The Board reviewed materials provided by Bluerock related to the Bluerock Agreement. With respect to the nature, extent and quality of services provided, the Trustees reviewed a description of the manner in which investment decisions were made for the Fund, the services provided by Bluerock, as well as each Sub-Adviser, the experience of the professional personnel performing services for the Fund, and Bluerock’s approach to risk mitigation.
The Board recognized the depth and experience of Bluerock personnel responsible for providing services to the Fund and noted such personnel included analysts and the most senior members of the management team who brought judgement, experience, and industry knowledge to the benefit of the Fund in the selection of investments and in the operations of the Fund. The Board acknowledged Bluerock’s attention to the potential impact of global economic factors on the Fund, which informed Bluerock’s investment allocations. The Board considered that Bluerock provided investment-related services including developing, reviewing, and adjusting the investment plan to execute the Fund strategy, it conducted extensive due diligence on prospective investments for the portion of the portfolio that it directly managed, and the scope of its sourcing of investments had increased over the last few years. In addition, the Board noted Bluerock provided ongoing review, management, and oversight of the portfolio including review of performance and relative value. The Board considered the depth and scope of the investment services provided to the Fund by Bluerock, including the monitoring and oversight of multiple sub-advisers and general oversight of the Fund’s other service providers. The Board also noted the important services provided by Bluerock beyond investment selection, including valuation of the portfolio, financial and reporting obligations, liquidity management, accounting support, and compliance support. The Board recognized that Bluerock actively managed the portfolio. The Board, including the Independent Trustees, concluded it was very pleased with the nature, extent, and quality of the management services provided by Bluerock to support the renewal of the Bluerock Agreement.
Performance. The Board considered the performance of the Fund (Class A shares, load waived) as compared to the performance of a group of three similarly structured closed-end interval funds selected by Bluerock with comparable investment objectives to that of the Fund (the “Peer Group”), and benchmark indices across bonds, equity and Public REITs, represented by the Bloomberg Aggregate Bond Index (“Bond Index”), S&P 500 Total Return Index (“S&P 500”), and the MSCI U.S. REIT Index (“REIT Index”), respectively. The Board also considered the performance of the Fund compared to the ODCE Index and a blended index reflecting the returns of a mix of Private REIT and Public REIT investments comprised of the ODCE Index and REIT Index weighted at 80% and 20%, respectively (the “Blended Index”).
The Board considered that as of September 30, 2022, the YTD, 1-year, 2-year, 3-year, 4-year, 5-year periods, the Fund’s Class A performance significantly exceeded its Peer Group, and with substantially less volatility, thereby delivering superior absolute and risk-adjusted returns. They noted that the Fund outperformed the ODCE Index and Blended Index for all time periods on a net basis with the exception of marginal underperformance on the since inception period. The Board observed that Class A shares outperformed the broader indices for all time periods on a net basis except for underperformance against the S&P 500 in the since inception period and provided outsized risk adjusted returns relative to the REIT Index, Bond Index, and S&P 500 Index for all time periods. With respect to the Fund’s risk-adjusted returns, the Trustees also noted that the Fund was ranked the top performing fund on a risk-adjusted basis across the entire Morningstar universe of real estate funds for the last five years. The Board considered the Fund’s low correlation to the Public REIT market and recognized Bluerock’s expertise in employing the Fund’s strategy. Based on the information provided, the Board agreed that Bluerock had provided a disciplined thematic approach to investing to drive performance and concluded that Bluerock had met the Fund’s investment objectives.
Fees and Expenses. As to the costs of the services provided by Bluerock, the Board considered a comparison of the Fund’s advisory fee and overall expenses to the Peer Group. The Board considered that the Fund’s advisory fee of 1.50% was above the average, but equal to one of the peers. The Board considered Bluerock’s robust investment management process in comparison to what appeared to be a more passive approach to portfolio management among the Peer Group, and noted that Bluerock has increased its sourcing of investments, it has a higher percentage of private securities in the Fund’s portfolio versus the Peer Group, and has more actively managed the portfolio in an effort to optimize risk-adjusted performance. The Board also considered the net expense ratio of the Fund, noting it was approximately in line with the Peer Group average. The Trustees noted that Bluerock had agreed to reimburse expenses to limit net annual operating expenses. The Board noted ancillary benefits derived by Bluerock. The Board noted that BCM, Bluerock’s affiliate, receives revenue from ALPS Distributors, Inc. (“ADI”) to support its marketing efforts. The Board considered the fees charged by the Sub-Advisers, including the breakpoints in sub-advisory fees, and the allocation of duties among Bluerock and each Sub-Adviser. The Board concluded that the advisory fee was not unreasonable relative to the value provided by Bluerock.
38
| Bluerock Total Income+ | Renewal of Investment Advisory Agreement |
| Real Estate Fund | and Sub-Advisory Agreements |
| | March 31, 2023 (Unaudited) |
Profitability. The Board considered the profitability of Bluerock and whether such profits were reasonable in light of the services provided to the Fund. The Board reviewed a profitability analysis for the one-year period ended September 30, 2022, prepared by Bluerock. The Board considered that the Fund was a specialized product and successful execution of the strategy required ongoing investment in quality personnel, research, and other resources. They acknowledged Bluerock had assumed significant business risks in managing the Fund and those risks were a relevant factor when assessing profits. The Trustees concluded that Bluerock’s profits were not unreasonable.
Economies of Scale. The Board considered whether economies of scale had been or would likely be realized by the shareholders and Bluerock. The Board noted the Fund had grown substantially in the last year, which reduces the impact of fixed costs on Fund performance, benefiting shareholders with enhanced returns. The Board recognized that to achieve economies of scale, Bluerock must continue to invest in marketing and distribution of the Fund. The Board noted that successful execution of the investment strategy had required additional Adviser resources as the Fund had grown. The Board concluded that breakpoints were not necessary at that time, that shareholders were benefitting from economies of scale, and agreed to revisit breakpoints in the future if Bluerock realized additional, material economies of scale in the future.
Conclusion. In considering the Bluerock Agreement, the Trustees did not identify any one factor as all important, but rather considered many factors collectively in light of surrounding circumstances. Further, each Trustee may have afforded a different weight to different factors. The Trustees, having requested and received such information from Bluerock as they believed reasonably necessary to evaluate the terms of the Bluerock Agreement, and assisted by the advice of independent counsel, determined that continuation of the Bluerock Agreement for an additional one year term was in the best interests of the Fund and its shareholders.
Mercer Agreement
Nature, Extent and Quality of Services. The Board considered the role of Mercer with respect to the Fund, noting that Mercer’s principal responsibility was to provide research on various real estate investment managers and investment opportunities to Bluerock. The Board noted that Mercer had significant experience in real estate investment and the team that provided services to Bluerock had strong credentials. The Board considered the ongoing monitoring by Mercer of certain investments in the Fund’s portfolio, which assisted Bluerock in various aspects of managing the portfolio, including determining the Fund’s target allocations, rebalancing the portfolio, and managing cash flows. The Board considered the depth and quality of the research performed by Mercer. Fund management noted it was satisfied with the service provided by Mercer and recommended renewal of the Mercer Agreement. The Board concluded that the nature, overall quality and extent of services provided by Mercer to Bluerock and the Fund were satisfactory.
Performance. The Board considered that Mercer’s function was to provide consultative services to Bluerock and that Mercer did not approve or make investment decisions for the Fund. The Board considered the Fund’s overall performance and that Bluerock continued to be satisfied with the services provided by Mercer and believed the services positively impacted performance, and recommended continuation of the agreement with Mercer. Based on the information provided, the Board concluded that Mercer’s performance supported renewal of the Mercer Agreement.
Fees and Expenses. The Board considered Mercer’s fees for its services and noted that Bluerock and Mercer had agreed to a tiered fee schedule providing for breakpoints at various levels. The Board considered the unique nature of the services provided by Mercer, and that Bluerock paid Mercer’s fees directly and was satisfied with Mercer’s services. They discussed Mercer’s typical fee arrangements as disclosed to the Board. The Board concluded that Mercer’s fees were not unreasonable.
Economies of Scale. The Board discussed whether economies of scale had been achieved with respect to the management of the Fund under the Mercer Agreement and whether there was potential for realization of any further economies of scale. They considered that Mercer likely benefited from some economies of scale because its research could be utilized with multiple clients. The Board considered that the Mercer Agreement included breakpoints in its fee above certain asset levels and concluded that while such breakpoints appeared reasonable, economies of scale would be best evaluated at Bluerock, rather than sub-advisory level.
Profitability. The Board noted that Mercer did not calculate profitability on a per client basis or provide similar sub-advisory services for any other account. The Board noted that Mercer was usually compensated on a per-investment basis with respect to the guidance and oversight it performed for other clients. The Board considered the fees paid to Mercer during the period and representations of Mercer of what Mercer estimated it would have received on its standard fee schedule, but also noted that such estimates did not include all services provided by Mercer to the Fund. With this context, and in light of the fact that Bluerock negotiated the Mercer fee at arm’s length, the Board concluded that Mercer’s profitability was not an impediment to renewal of the agreement.
| Semi-Annual Report | March 31, 2023 | 39 |
| Bluerock Total Income+ | Renewal of Investment Advisory Agreement |
| Real Estate Fund | and Sub-Advisory Agreements |
| | March 31, 2023 (Unaudited) |
Conclusion. The Board noted that in considering the Mercer Agreement, it did not identify any one factor as all important, but rather considered various factors collectively in light of surrounding circumstances. Further, it noted that each Trustee may have afforded a different weight to different factors. The Board, having requested and received such information from Mercer as the Board believed to be reasonably necessary to evaluate the terms of the Mercer Agreement, and as assisted by the advice of counsel, concluded that continuation of the Mercer Agreement for an additional one year term was in the best interests of the Fund and its shareholders.
RREEF Agreement
Nature, Extent and Quality of Services. The Board considered the role of RREEF with respect to the Fund and noted that RREEF managed the public sleeve of the portfolio and acted as sub-adviser to the direct real estate portion of the portfolio. The Board reviewed the experience of professional personnel performing services for the Fund, noting the personnel had impressive credentials and the team supporting the Fund was relatively stable except for one departure and one retirement. The Board considered RREEF’s risk management approach to constructing liquid real asset portfolios including RREEF’s underwriting process, its deep knowledge of the real estate markets and constituents in the benchmark, and that its portfolio construction process was supported by an independent risk management framework consistent with the Fund’s attention to risk-adjusted returns. The Board also considered RREEF’s debt risk management focused on due diligence and ongoing portfolio management that attempted to identify prospective risks early and actively adjust the portfolio to maximize returns and mitigate risks. Fund management reported that it was satisfied with the services provided by RREEF to the Fund and it recommended renewal of the RREEF Agreement. The Board concluded that RREEF had sufficient quality and depth of personnel, resources, investment methods and compliance policies and procedures essential to perform its duties to the Fund.
Performance. The Board considered that RREEF provided investment advice for the limited portion of the Fund’s portfolio allocated by Bluerock to publicly-traded real estate securities and debt securities. The Board reviewed the performance of the liquid real asset portfolio and took into account that RREEF had actively rotated its liquid real asset portfolio strategy with the expectation that it may generate increased performance. The Board noted that Bluerock monitors the liquid real asset portfolio performance on an ongoing basis. The Board also noted RREEF’s public debt securities had performed as expected. The Board concluded that RREEF’s overall performance was satisfactory and that Bluerock’s continued relationship with RREEF would benefit shareholders.
Fees and Expenses. The Board considered that RREEF’s sub-advisory fees for the liquid real assets portion of the account started at 0.60% of the average daily value of the assets allocated to RREEF and scaled downward depending on the applicable breakpoint. The Board noted that with respect to the Fund’s non-publicly traded real estate debt investments sub-advised by RREEF, fees started at 0.75% of the average daily value of the Fund’s direct debt investments and scaled downward depending on the applicable breakpoint. The Board noted that RREEF provided the range of fees it charged on other accounts managed by the firm, the fees charged the Fund were in the range of fees RREEF charged other accounts, and the Fund was not responsible for these fees because RREEF’s fees were paid directly by Bluerock. The Board concluded that based on RREEF’s experience, expertise, and services provided to the Fund, that the fees paid to RREEF were not unreasonable.
Profitability. The Board also considered the profitability of the two divisions of RREEF providing services. The Board reviewed RREEF’s reported expenses of delivering the services to the Fund across each investment strategy and fees earned during the period. The Board noted the profits realized by RREEF with respect to work completed on the liquid real asset portfolio was modest and the profits realized by RREEF on the debt securities portfolio was more robust, but that the reported costs of providing the services, particularly with respect to the debt securities, did not necessarily capture all business costs incurred across the organization and that RREEF’s overall profits were not unreasonable.
Economies of Scale. The Board considered whether economies of scale were likely achieved by RREEF. The Board considered that RREEF had agreed to breakpoints in its fees above certain asset levels and concluded that while such breakpoints appeared reasonable, economies of scale were considered at Bluerock renewal.
Conclusion. The Board noted that in considering the RREEF Agreement, it did not identify any one factor as all important, but rather considered various factors collectively in light of surrounding circumstances, and that each Trustee may have afforded a different weight to different factors. The Board, having requested and received such information from RREEF as the Board believed to be reasonably necessary to evaluate the terms of the RREEF Agreement, and as assisted by the advice of counsel, found that approval of the RREEF Agreement was in the best interests of the Fund and its shareholders.
40
| Bluerock Total Income+ Real Estate Fund | Additional Information |
March 31, 2023 (Unaudited)
1. PROXY VOTING POLICIES AND VOTING RECORD
A description of the policies and procedures that the Fund uses to vote proxies relating to its portfolio securities is available without charge upon request by calling toll-free 844-819-8287 or on the Securities and Exchange Commission’s (“SEC”) website at http://www.sec.gov. Information regarding how the Fund voted proxies relating to underlying portfolio securities during the most recent 12-month period ended June 30th is available without charge upon request by calling toll-free 844-819-8287, or on the SEC’s website at http://www.sec.gov.
2. QUARTERLY PORTFOLIO HOLDINGS
The Fund files a monthly portfolio investments report with the SEC on Form N-PORT within 60 days after the end of the first and third quarters of each fiscal year. The filings are available upon request by calling 844-819-8287. Furthermore, you may obtain a copy of the filings on the SEC’s website at https://www.sec.gov.
3. TAX INFORMATION (UNAUDITED)
Pursuant to Section 852(b)(3) of the Internal Revenue Code, the Fund designated $46,376,673 as long-term capital gain distribution for the year ended September 30, 2022.
| Semi-Annual Report | March 31, 2023 | 41 |
| | Change in Independent Registered |
| Bluerock Total Income+ Real Estate Fund | Public Accounting Firm |
March 31, 2023 (Unaudited)
On March 6, 2023, BBD LLP (BBD”) ceased to serve as the independent registered public accounting firm of the Fund. The Audit Committee of the Board of Trustees approved the replacement of BBD with Cohen & Company, Ltd. (“Cohen”) as a result of Cohen’s acquisition of BBD’s investment management audit practice.
The report of BBD on the financial statements of the Fund as of and for the fiscal year ended September 30, 2022, did not contain an adverse opinion or a disclaimer of opinion, and was not qualified or modified as to uncertainties, audit scope or accounting principles. During the fiscal year ended September 30, 2022, and during the subsequent interim period through March 6, 2023: (i) there were no disagreements between the registrant and BBD on any matter of accounting principles or practices, financial statement disclosure, or auditing scope or procedure, which disagreements, if not resolved to the satisfaction of BBD, would have caused it to make reference to the subject matter of the disagreements in its report on the financial statements of the Fund for such year or interim period; and (ii) there were no “reportable events,” as defined in Item 304(a)(1)(v) of Regulation S-K under the Securities Exchange Act of 1934, as amended.
The Fund requested that BBD furnish it with a letter addressed to the U.S. Securities and Exchange Commission stating that it agrees with the above statements. A copy of such letter is filed as an exhibit hereto.
On May 3, 2023, the Audit Committee of the Board of Trustees also recommended and approved the appointment of Cohen as the Fund’s independent registered public accounting firm for the fiscal year ending September 30, 2023.
During the fiscal year ended September 30, 2022, and during the interim period ended March 6, 2023, neither the Fund, nor anyone acting on its behalf, consulted with Cohen on behalf of the Fund regarding the application of accounting principles to a specified transaction (either completed or proposed), the type of audit opinion that might be rendered on the Fund’s financial statements, or any matter that was either: (i) the subject of a “disagreement,” as defined in Item 304(a)(1)(iv) of Regulation S-K and the instructions thereto; or (ii) “reportable events,” as defined in Item 304(a)(1)(v) of Regulation S-K.
42
| Bluerock Total Income+ Real Estate Fund | Privacy Policy |
March 31, 2023 (Unaudited)
| FACTS | WHAT DOES THE BLUEROCK TOTAL INCOME+ REAL ESTATE FUND DO WITH YOUR PERSONAL INFORMATION? |
| Why? | Financial companies choose how they share your personal information. Federal law gives consumers the right to limit some but not all sharing. Federal law also requires us to tell you how we collect, share, and protect your personal information. Please read this notice carefully to understand what we do. |
| What? | The types of personal information we collect and share depend on the product or service you have with us. This information can include: |
| ● Social Security number ● Assets ● Retirement Assets ● Transaction History ● Checking Account Information | ● Purchase History ● Account Balances ● Account Transactions ● Wire Transfer Instructions |
| When you are no longer our customer, we may continue to share your personal information as described in this notice. |
| How? | All financial companies need to share customers’ personal information to run their everyday business. In the section below, we list the reasons financial companies can share their customers’ personal information; the reasons the Fund chooses to share; and whether you can limit this sharing. |
| Reasons we can share your personal information | Does Bluerock Total Income+ Real Estate Fund share? | Can you limit this sharing? |
| For our everyday business purposes – such as to process your transactions, maintain your account(s), respond to court orders and legal investigations, or report to credit bureaus | Yes | No |
| For our marketing purposes – to offer our products and services to you | No | We don’t share |
| For joint marketing with other financial companies | No | We don’t share |
| For our affiliates’ everyday business purposes – information about your transactions and experiences | No | We don’t share |
| For our affiliates’ everyday business purposes – information about your creditworthiness | No | We don’t share |
| For nonaffiliates to market to you | No | We don’t share |
| Questions? | Call 1-844-819-8287 | | |
| Semi-Annual Report | March 31, 2023 | 43 |
| Bluerock Total Income+ Real Estate Fund | Privacy Policy |
March 31, 2023 (Unaudited)
| Who We Are | |
| Who is providing this notice? | Bluerock Total Income+ Real Estate Fund |
| What We Do | |
How does Bluerock Total Income+ Real Estate Fund protect my personal information? | To protect your personal information from unauthorized access and use, we use security measures that comply with federal law. These measures include computer safeguards and secured files and buildings. Our service providers are held accountable for adhering to strict policies and procedures to prevent any misuse of your nonpublic personal information. |
How does Bluerock Total Income+ Real Estate Fund collect my personal information? | We collect your personal information, for example, when you ● Open an account ● Provide account information ● Give us your contact information ● Make deposits or withdrawals from your account ● Make a wire transfer ● Tell us where to send the money ● Tells us who receives the money ● Show your government-issued ID ● Show your driver’s license We also collect your personal information from other companies. |
| Why can’t I limit all sharing? | Federal law gives you the right to limit only ● Sharing for affiliates’ everyday business purposes – information about your creditworthiness ● Affiliates from using your information to market to you ● Sharing for nonaffiliates to market to you State laws and individual companies may give you additional rights to limit sharing. |
| Definitions | |
| Affiliates | Companies related by common ownership or control. They can be financial and nonfinancial companies. ● Bluerock Total Income+ Real Estate Fund does not share with our affiliates. |
| Nonaffiliates | Companies not related by common ownership or control. They can be financial and nonfinancial companies ● Bluerock Total Income+ Real Estate Fund does not share with nonaffiliates so they can market to you. |
| Joint marketing | A formal agreement between nonaffiliated financial companies that together market financial products or services to you. ● Bluerock Total Income+ Real Estate Fund doesn’t jointly market. |
44
Page Intentionally Left Blank
Investment Adviser
Bluerock Fund Advisor, LLC
1345 Avenue of the Americas, 32nd Floor
New York, NY 10105
Distributor
ALPS Distributors, Inc.
1290 Broadway, Suite 1000
Denver, CO 80203
Legal Counsel
Thompson Hine LLP
41 South High Street, Suite 1700
Columbus, OH 43215
Independent Registered Public Accounting Firm
Cohen & Company
1835 Market Street, Suite 310
Philadelphia, PA 19103
How to Obtain Proxy Voting Information
Information regarding how the Fund votes proxies relating to portfolio securities for the 12 month period ended June 30th as well as a description of the policies and procedures that the Fund used to determine how to vote proxies is available without charge, upon request, by calling 1-844-819-8287 or by referring to the Securities and Exchange Commission’s (“SEC”) website at http://www.sec.gov.
How to Obtain 1st and 3rd Fiscal Quarter Portfolio Holdings
The Fund files a monthly portfolio investments report with the SEC on Form N-PORT within 60 days after the end of the first and third quarters of each fiscal year. The filings are available upon request by calling 844-819-8287. Furthermore, you may obtain a copy of the filings on the SEC’s website at http://www.sec.gov.
(b) Not applicable.
Item 2. Code of Ethics.
Not applicable to this report.
Item 3. Audit Committee Financial Expert.
Not applicable to this report.
Item 4. Principal Accountant Fees and Services.
Not applicable to this report.
Item 5. Audit Committee of Listed Registrants.
Not applicable to the Registrant.
Item 6. Investments.
| (a) | The schedule of investments is included as part of the Reports to Shareholders filed under Item 1(a) of this report. |
| (b) | Not applicable to the Registrant. |
Item 7. Disclosure of Proxy Voting Policies and Procedures for Closed-End Management Investment Companies.
| | Not applicable to this report. |
Item 8. Portfolio Managers of Closed-End Management Investment Companies.
Item 9. Purchases of Equity Securities by Closed-End Management Investment Company and Affiliates Purchasers.
None.
Item 10. Submission of Matters to a Vote of Security Holders.
None.
Item 11. Controls and Procedures.
| (a) | Based on an evaluation of the Registrant’s disclosure controls and procedures as of a date within 90 days of filing date of this Form N-CSR, the principal executive officer and principal financial officer of the Registrant have concluded that the disclosure controls and procedures of the Registrant are reasonably designed to ensure that the information required in filings on Form N-CSR is recorded, processed, summarized, and reported within 90 days of the filing date, including that information required to be disclosed is accumulated and communicated to the Registrant’s management, including the Registrant’s principal executive officer and principal financial officer, as appropriate to allow timely decisions regarding required disclosure. |
| (b) | There were no significant changes in the registrant’s internal control over financial reporting that occurred during the period covered by this report that has materially affected, or are reasonably likely to materially affect, the registrant’s internal control over financial reporting. |
Item 12. Disclosure of Securities Lending Activities for Closed-End Management Investment Companies.
Item 13. Exhibits.
| (a)(1) | Not applicable to this report. |
SIGNATURES
Pursuant to the requirements of the Securities Exchange Act of 1934 and the Investment Company Act of 1940, the registrant has duly caused this report to be signed on its behalf by the undersigned, thereunto duly authorized.
Bluerock Total Income+ Real Estate Fund
| By: | /s/ Jordan B. Ruddy | |
| | Jordan B. Ruddy | |
| | President | |
| | | |
| Date: | June 7, 2023 | |
Pursuant to the requirements of the Securities Exchange Act of 1934 and the Investment Company Act of 1940, this report has been signed below by the following persons on behalf of the registrant and in the capacities and on the dates indicated.
| By: | /s/ Jordan B. Ruddy | |
| | Jordan B. Ruddy | |
| | President | |
| | | |
| Date: | June 7, 2023 | |
| By: | /s/ Simon Adamiyatt | |
| | Simon Adamiyatt | |
| | Treasurer | |
| | | |
| Date: | June 7, 2023 | |