UNITED STATES
SECURITIES AND EXCHANGE COMMISSION
Washington, D.C. 20549
FORM N-CSR
CERTIFIED SHAREHOLDER REPORT OF REGISTERED
MANAGEMENT INVESTMENT COMPANIES
Investment Company Act file number: 811-22710
BLUEROCK TOTAL INCOME+ REAL ESTATE FUND
(Exact name of registrant as specified in charter)
1345 Avenue of the Americas, 32nd Floor, New York, NY 10105
(Address of principal executive offices) (Zip code)
Bluerock Fund Advisor, LLC
1345 Avenue of the Americas, 32nd Floor,
New York, NY 10105
(Name and address of agent for service)
1-844-819-8287
(Registrant’s telephone number, including area code)
Date of fiscal year end: September 30
Date of reporting period: March 31, 2020
Item 1. Reports to Stockholders.
(a)

Semi-Annual Report
March 31, 2020
Investor Information: 1-844-819-8287
This report and the financial statements contained herein are submitted for the general information of shareholders and are not authorized for distribution to prospective investors unless preceded or accompanied by an effective prospectus. Nothing herein contained is to be considered an offer of sale or solicitation of an offer to buy shares of the Bluerock Total Income+ Real Estate Fund. Such offering is made only by prospectus, which includes details as to offering price and other material information.
Distributed by ALPS Distributors, Inc.
Member FINRA
Shareholder Letter | 1 |
Portfolio Review | 9 |
Portfolio of Investments | 11 |
Statement of Assets and Liabilities | 14 |
Statement of Operations | 15 |
Statements of Changes in Net Assets | 16 |
Statement of Cash Flows | 18 |
Financial Highlights | 19 |
Notes to Financial Statements | 23 |
Renewal of Investment Advisory Agreement and Sub-Advisory Agreements | 31 |
Additional Information | 34 |
Privacy Policy | 35 |
Electronic Report Disclosure Beginning on January 1, 2021, as permitted by regulations adopted by the U.S. Securities and Exchange Commission, paper copies of the Fund’s annual and semi-annual shareholder reports will no longer be sent by mail, unless you specifically request paper copies of the reports from the Fund or from your financial intermediary, such as a broker-dealer or bank. Instead, the reports will be made available on the Fund’s website www.bluerockfunds.com, and you will be notified by mail each time a report is posted and provided with a website link to access the report.
If you already elected to receive shareholder reports electronically, you will not be affected by this change and you need not take any action. You may elect to receive shareholder reports and other communications from the Fund electronically by calling the Fund at (844) 819-8287, or submit a signed letter of instruction requesting paperless reports to PO Box 219445, Kansas City, MO 64121. If you own these shares through a financial intermediary, you may contact your financial intermediary to request your shareholder reports electronically.
You may elect to receive all future reports in paper free of charge. You can inform the Fund that you wish to continue receiving paper copies of your shareholder reports by calling the Fund at (844) 819-8287, or by submitting a signed letter of instruction requesting paper reports to PO Box 219445, Kansas City, MO 64121. If you own these shares through a financial intermediary, contact the financial intermediary to request paper copies. Your election to receive reports in paper will apply to all funds held with the fund complex or your financial intermediary.

| SEMI-ANNUAL REPORT: (4Q 2019-1Q 2020) (UNAUDITED) |
| Letter from the TI+ Portfolio Managers |
To Our Valued Shareholders:
The first half of 2020 has been defined by the COVID-19 pandemic and its far-reaching health, social, and economic impacts. Financial markets, reacting to tremendous near-term uncertainty, have faced significant volatility and drawdowns. Swift and unprecedented fiscal, monetary, and regulatory policy actions have tempered negative sentiment. However, uncertainty clouds the near-term outlook.
Despite these unforeseen challenges leading to the abrupt end of the historic 11-year economic expansion in March of 2020, the Bluerock Total Income+ Real Estate Fund (TI+ or the Fund) has outperformed major equity market indices over the past year and in Q1 of 2020. We believe this outperformance was a result of strategic efforts over the last two years to mitigate portfolio risk and to defensively position the Fund against late-cycle market conditions.
Risk Mitigation Measures
■ | We reduced and repositioned the Fund’s public security portfolio defensively as public REITs reached all-time valuation highs in 2019, limiting the significant downside risk from public securities. This action brought the Fund’s public REIT allocation to less than 3%, reducing its exposure to the MSCI U.S. REIT Index’s -44.03% decline since its peak on February 19, 2020. |
■ | We thoughtfully reduced the Fund’s exposure to traditionally cyclical sectors. As of 3/31/2020, the Fund’s hotel sector exposure was less than 0.1%, while retail and office sector exposures at 8% and 17% were each 56%* lower than the benchmark NCREIF ODCE Index. |
| ■ | We actively increased our exposure to traditionally defensive, cycle-agnostic sectors. The Fund’s multifamily and industrial sector exposures at 29% and 36%, were approximately 39% and 68%* higher, respectively, than the benchmark NCREIF ODCE Index. |
| ■ | We increased our senior real estate debt allocation to approximately 13% in an effort to benefit from structural protections and generate relatively attractive yields. |
*Fund exposures relative to the NCREIF ODCE include sector allocations in the Fund’s debt and private equity securities.
 | FUND STRUCTURAL BENEFITS |
| | |

| DIVERSIFICATION. The Fund’s investments hold approximately 3,800 underlying properties diversified across real estate sectors, geographies, strategies and managers, minimizing the potential impact from any one property, market, sector or manager. |
| | |
| CORE INSTITUTIONAL REAL ESTATE. Comprising 91% of the underlying portfolio with a 93% occupancy rate, such real estate has historically generated stable income returns across economic cycles, potentially minimizing the impact of a downturn. |
| | |
| LOW LEVERAGE. The Fund’s underlying investments have a low 27% weighted average loan-to-value ratio, which contributes to the stability of the portfolio. |
| | |
CORPORATE HEADQUARTERS | 1345 AVENUE OF THE AMERICAS | 32ND FLOOR | NEW YORK, NY 10105 | 877.826.BLUE (2583) | BLUEROCKRE.COM
 | SEMI-ANNUAL REPORT (4Q 2019- 1Q 2020) |BLUEROCK TOTAL INCOME+ REAL ESTATE FUND | (UNAUDITED) |
Outlook
Government imposed suppression efforts in response to COVID-19 have left some industries less affected, while thrusting others into crisis. As market conditions continues to unfold, we are keeping a close eye on transaction markets, income generation, market liquidity, and other fundamental indicators of long-term value. A wide variation of outcomes has been observed in the public real estate markets and we are already seeing disparate outcomes across private real estate sectors as the evolving situation accelerates some pre-existing trends.
The growth of e-commerce and its impact on in-store sales has been apparent for years, which COVID-19 related restrictions have greatly accelerated. While in-store sales are expected to recover from current conditions to some degree, e-commerce sales and their contribution to the performance of the industrial sector will likely persist. We believe the growth of e-commerce will likely come at the expense of non-grocery anchored retail centers, which may experience additional challenges.
We expect the apartment sector to weather short-term rent collection issues, aided by the CARES Act benefits and mortgage forbearance programs. Long term, we believe the apartment sector remains attractive as Millennials are likely to delay or avoid homeownership even longer in response to the recession’s potential impact on the for-sale housing market.
According to the National Council of Real Estate Investment Fiduciaries (NCREIF) special bulletin, the sector values most affected have been hotels, non-grocery anchored retail, co-working office, and senior housing while the sectors least affected include industrial and apartments.
Based on these trends and industry outlook, we believe the Fund currently has an attractive portfolio mix to help combat near-to-medium term economic turmoil. Further, we plan to strengthen our positions in the industrial and apartment sectors in hopes of positioning our portfolio to continue meeting the Fund’s objectives.
Institutional private real estate, as measured by the NCREIF Property Index, has an extensive track record of generating stable income with minimal drawdowns. Although there can be no guarantees of future performance, institutional real estate has historically generated higher risk-adjusted returns compared to the equity markets and has weathered multiple recessions including the S&L crisis, the “tech/dot.com” bust, the events of 9/11, and the Great Financial Crisis. Given institutional private real estate’s historical performance, we believe an allocation should remain a key component of individual investors’ portfolios.
We thank you for your trust and confidence in the Bluerock Total Income+ Real Estate Fund.
Sincerely,
| |  | |  |
| |  | |  |
| | | | |
| Jordan Ruddy | | Adam Lotterman |
| Co-Chief Investment Officer | | Co-Chief Investment Officer |
| Bluerock Total Income+ Real Estate Fund | | Bluerock Total Income+ Real Estate Fund |
| FUND SUB-ADVISORS |
| |  | About Mercer Investment Management | About Mercer Investment Management
| |
| | Mercer Investment Management, Inc., acts as sub-advisor to the TI+ Fund’s private real estate equity investments. For more than 75 years, Mercer has been one of the world’s leading advisors to endowments, pension funds, sovereign wealth funds and family offices globally, with over 3,700 clients worldwide, and $15.0 trillion in assets under advisement. Mercer works to evaluate over 7,100 investment managers and 35,000 individual investments/strategies and works with Bluerock to select a strategic combination of ‘best-in-class’ institutional real estate managers and investments for the Fund. | |
| | | |
| | 
| | About DWS | |
| | DWS (formerly Deutsche Asset Management), through its indirect subsidiary RREEF America, LLC, acts as sub-advisor to the TI+ Fund’s public real estate securities investments and is a registered investment adviser under the Advisers Act. DWS’ real estate business in the U.S. dates back to 1975. Today, DWS has $800+ billion in assets under management and works with 550+ institutional clients. Of that total, approximately $68 billion of AUM is invested in public and private real estate globally, making DWS one of the largest real estate managers in the world. | |
| | | |
| | SEMI-ANNUAL REPORT (4Q 2019- 1Q 2020) |BLUEROCK TOTAL INCOME+ REAL ESTATE FUND | (UNAUDITED) |
PERFORMANCE
From inception (10.22.2012) through 3.31.2020, TI+ (A Shares) generated a cumulative total return of 75.07%, or 7.82% annualized. The Fund was able to accomplish this primarily through investments in private real estate investments, which own best-in-class real estate, generating both income and capital appreciation. Private investments are supplemented with select public real estate securities. The Fund currently has four share classes outstanding: A, C, I and L Shares. A summary of the performance of each share class is presented below.
Fund Performance thru 3.31.2020†
| One Year | Three Year | Five Year | Since Inception2 |
TI+ Fund - Class A | 6.55% | 7.20% | 6.79% | 7.82% |
TI+ Fund - Class A
with Max Sales Charge1 | 0.43% | 5.10% | 5.53% | 6.96% |
TI+ Fund - Class C | 5.79% | 6.40% | 6.00% | 7.03% |
TI+ Fund - Class C
with Load 3 | 4.79% | 6.40% | 6.00% | 7.03% |
TI+ Fund - Class I | 6.85% | 7.47% | 7.06% | 8.07% |
TI+ Fund - Class L | 6.31% | 6.94% | 6.53% | 7.55% |
TI+ Fund - Class L
with Max Sales Charge1 | 1.78% | 5.40% | 5.61% | 6.93% |
1 | The maximum sales charge for the A Shares is 5.75% and for L Shares is 4.25%. Investors may be eligible for a reduction in sales charges. |
2 | Since Inception returns as of October 22, 2012. Actual Inception date of the A Shares is October 22, 2012. Actual Inception date of the Fund’s C and I Shares is April 1, 2014. Actual Inception date for the L Shares is June 1, 2017 |
3 | Adjusted for early withdrawal charge of 1.00%. |
† Returns for Class C, Class I and Class L Shares prior to their inception dates are based on the performance of Class A Shares. For Class C and Class L Shares, prior performance has been adjusted to reflect differences in expenses between the respective classes and Class A. The actual returns of Class I would have been different than those shown because Class I has lower expenses than Class A.
The total annual fund operating expense ratio, gross of any fee waivers or expense reimbursements, is 2.21% for Class A, 2.96% for Class C, 1.95% for Class I and 2.46% for Class L per the February 1, 2020 prospectuses.
The performance data quoted here represents past performance. Current performance may be lower or higher than the performance data quoted above. Investment return and principal value will fluctuate, so that shares, when redeemed, may be worth more or less than their original cost. Past performance is not a guarantee of future results. The Fund’s investment advisor has contractually agreed to reduce its fees and/or absorb expenses of the Fund, at least until January 31, 2021, for Class A, C, I and L shares to ensure that the net annual fund operating expenses will not exceed 1.95% for Class A, 2.70% for Class C and 1.70% for Class I, and 2.20% for Class L, subject to possible recoupment from the Fund in future years. Please review the Fund’s Prospectuses for more detail on the expense waiver. Results shown reflect the full fee waiver, without which the results could have been lower. A Fund’s performance, especially for very short periods of time, should not be the sole factor in making your investment decisions. For performance information current to the most recent month end, please call toll-free 1-844-819-8287.
Total returns are calculated using SEC Form N-2 instructions and reflect all fees and charges.
The Fund’s Class M Shares commenced operations on February 1, 2020, however as of March 31, 2020 no such shares have been issued and therefore are not included in the Fund’s performance information.
| | SEMI-ANNUAL REPORT (4Q 2019- 1Q 2020) |BLUEROCK TOTAL INCOME+ REAL ESTATE FUND | (UNAUDITED) |
LONG-TERM CAPITAL APPRECIATION
The Fund’s A Shares 7.82% annualized total net return has provided capital appreciation in addition to current income. TI+ generated this appreciation with a positive or neutral return 89% of all days from inception through 3.31.2020.

Past performance is not a guarantee of future results.
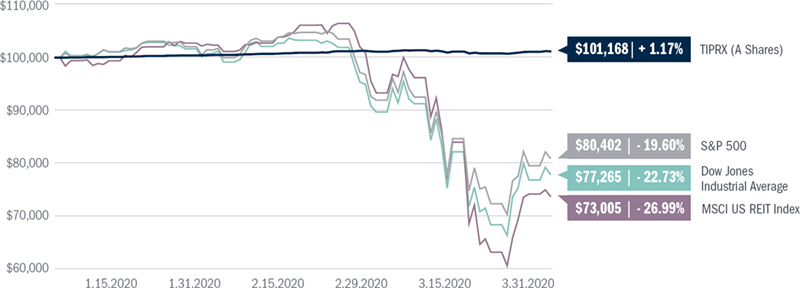
TI+: OUTPERFORMANCE OF EQUITY INDEXES IN A VOLATILE Q1 2020
TIPRX generated a positive return in Q1 while major equity indexes dropped 20%+ due to the COVID-19 bear market.
Hypothetical Growth of $100,000
1.1.2020 - 3.31.2020
Page Sources: Morningstar Direct
TI+ Fund: A-Shares, no load | Stocks: S&P 500 Total Return, Dow Jones Industrial Average | REITs: MSCI U.S. REIT Index
| ** | Please refer to the full descriptions and risks of select asset classes on pages 7-8. |
Past performance is not a guarantee of future results. Risk and liquidity factors vary significantly between asset classes.
| | SEMI-ANNUAL REPORT (4Q 2019- 1Q 2020) |BLUEROCK TOTAL INCOME+ REAL ESTATE FUND | (UNAUDITED) |
FUND HOLDINGS
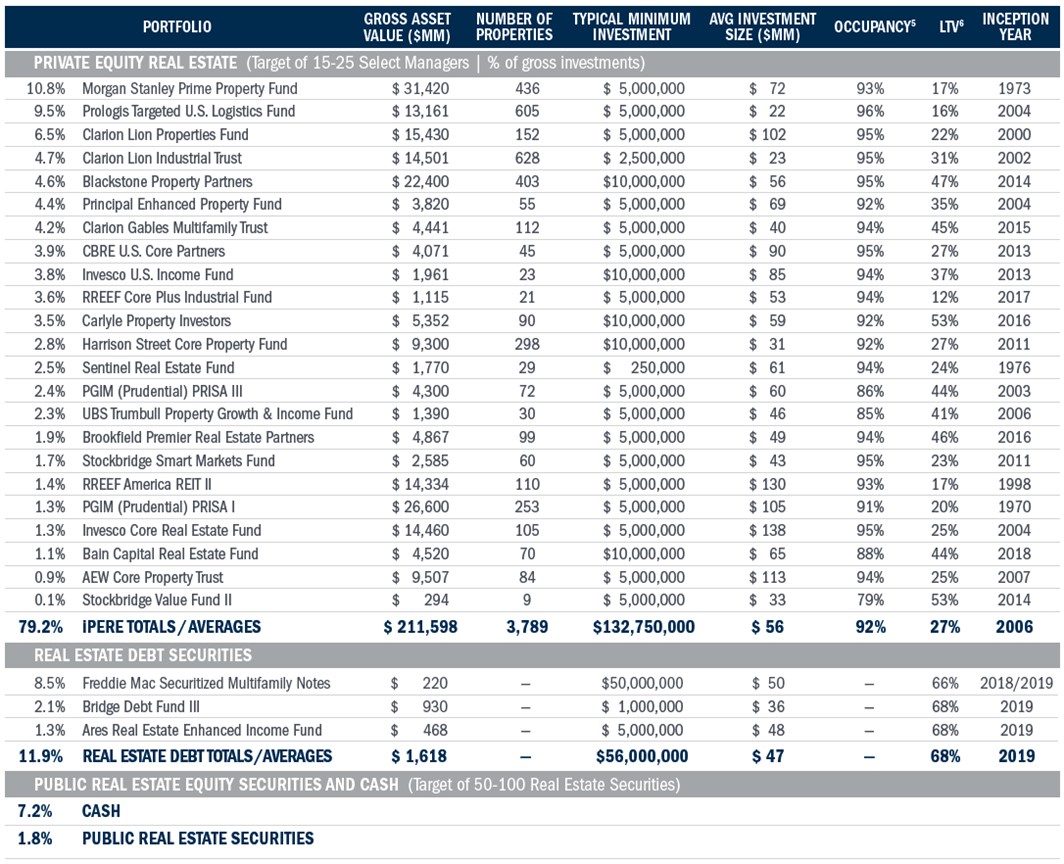
As of 3.31.2020, the Gross Asset Value of the underlying real estate in the institutional private equity real estate funds in which TI+ is invested is approximately $212 billion, comprising nearly 3,800 properties across the United States.4
GEOGRAPHIC DIVERSIFICATION The regions and allocations presented represent the Funds’ institutional fund investments as of the date herein, but is subject to change at any time. 
| | | SECTOR DIVERSIFICATION The sector diversification presented represents examples of how the Fund’s institutional fund investments are allocated as of the date herein, but is subject to change at any time. 
|
4 | Portfolio holdings are subject to change at any time and should not be considered investment advice. Underlying iPERE data as of 3.31.2020. Diversification does not ensure profit. The organizations referenced above are not invested in Bluerock or the Total Income+ Real Estate Fund, and they may not be invested in the funds in which the Bluerock Total Income+ Real Estate Fund invests. |
| | SEMI-ANNUAL REPORT (4Q 2019- 1Q 2020) |BLUEROCK TOTAL INCOME+ REAL ESTATE FUND | (UNAUDITED) |
HIGHLIGHTED ASSETS
The properties pictured below are currently owned by the underlying third-party institutional private equity real estate funds described herein.

Active Portfolio; subject to change.
| | SEMI-ANNUAL REPORT (4Q 2019- 1Q 2020) |BLUEROCK TOTAL INCOME+ REAL ESTATE FUND | (UNAUDITED) |
DEFINITIONS
Bloomberg Barclays U.S. Aggregate Bond Index: The BloombergBarclaysU.S. Aggregate Bond Index measures the performance of the U.S. investment grade bond market. The index invests in a wide spectrum of public, investment-grade, taxable, fixed income securities in the United States - including government, corporate, and international dollar-denominated bonds, as well as mortgage-backed and asset-backed securities, all with maturities of more than 1 year. Risks include rising interest rates, credit quality of the issuers and general economic conditions.
Correlation:The degree to which two securities move in relation to each other. Correlation is measured as a correlation coefficient, with a value falling between -1 and 1.0 = No Correlation | 1 = Perfectly Positively Correlated | -1 = Perfectly Negatively Correlated
MSCI U.S. REIT Index:A free float-adjusted market capitalization weighted index that is comprised of equity REITs that are included in the MSCI US Investable Market 2500 Index, with the exception of specialty equity REITs that do not generate a majority of their revenue and income from real estate rental and leasing operations. The index represents approximately 85% of the US REIT universe. (www.msci.com).
NCREIF ODCE Index: a capitalization-weighted, gross of fees, time-weighted return index with an inception date of January 1, 1978. Published reports may also contain equal-weighted and net of fees information. Open-end Funds are generally defined as infinite-life vehicles consisting of multiple investors who have the ability to enter or exit the fund on a periodic basis, subject to contribution and/or redemption requests, thereby providing a degree of potential investment liquidity. The term Diversified Core Equity style typically reflects lower risk investment strategies utilizing low leverage and generally represented by equity own-ership positions in stable US operating properties.
Sharpe Ratio: Measurement of the risk-adjusted performance. The annualized Sharpe Ratio is calculated by subtracting the annualized risk-free rate - (3-month Treasury Bill) - from the annualized rate of return for a portfolio and dividing the result by the standard deviation of the portfolio returns.
Standard Deviation: The measure of the daily percentage change in an investment. Standard deviation shows how much variation from the average exists with a larger number indicating the data points are more spread out over a larger range of values.
S&P 500: An index of 500 stocks chosen for market size, liquidity and industry grouping, among other factors. The S&P 500 is designed to be a leading indi-cator of U.S. equities and is meant to reflect the risk/return characteristics of the large cap universe. (Investopedia).
You cannot invest directly in an index. Benchmark performance should not be considered reflective of Fund performance.
| ** | Please note that the indices are for informational purposes only and are not reflective of any investment. As it is not possible to invest in the indices, the data shown does not reflect or compare features of an actual investment, such as its objectives, costs and expenses, liquidity, safety, guarantees or insurance, fluctuation of principal or return, or tax features. There are limitations when comparing the Bluerock Total Income Fund to Stock, Bond, and Public Real Estate indices. Many open-end funds which track these indices offer daily liquidity, while closed-end interval funds offer liquidity only on a periodic basis. Deteriorating general market conditions will reduce the value of stock securities. When interest rates rise, the value of bond securities tends to fall. Real estate securities may decline because of adverse developments affecting the real estate industry and real property values. |
RISK DISCLOSURES
Not FDIC Insured | No Bank Guarantee | May Lose Value
This material has been distributed for informational purposes only. The views and information discussed in this commentary are as of the date of publication, are subject to change without notification of any kind, and may not reflect the writer's current views. The views expressed represent an assessment of market conditions at a specific point in time, are opinions only and should not be relied upon as investment advice regarding a particular investment or markets in general. Such information does not constitute a recommendation to buy or sell specific securities or investment vehicles. It should not be assumed that any investment will be profitable or will equal the performance of the fund(s) or any securities or any sectors mentioned herein. The subject matter contained herein has been derived from several sources believed to be reliable and accurate, but not guaranteed, at the time of compilation.
This shareholder letter may contain certain forward-looking statements. Such forward-looking statements can generally be identified by our use of forward-looking terminology such as “may,” “will,” “expect,” “intend,” “anticipate,” “estimate,” “believe,” “continue,” or other similar words. Because such statements include risks, uncertainties and contingencies, actual results may differ materially from the expectations, intentions, beliefs, plans or predictions of the future expressed or implied by such forward-looking statements. These risks, uncertainties and contingencies include, but are not limited to: uncertainties relating to changes in general economic and real estate conditions; uncertainties relating to the implementation of our investment strategy; and other risk factors as outlined in the Fund's prospectuses and statement of additional information filed with the U.S. Securities and Exchange Commission.
Investing in the Fund's shares involves substantial risks, including the risk that you may receive little or no return on your investment or that you may lose part or all of your investment.
| | SEMI-ANNUAL REPORT (4Q 2019- 1Q 2020) |BLUEROCK TOTAL INCOME+ REAL ESTATE FUND | (UNAUDITED) |
RISK DISCLOSURES CONT.
The ability of the Fund to achieve its investment objective depends, in part, on the ability of the Advisor to allocate effectively the Fund's assets across the various asset classes in which it invests and to select investments in each such asset class. There can be no assurance that the actual allocations will be effective in achieving the Fund's investment objective or delivering positive returns.
Limited liquidity is provided to shareholders only through the Fund's quarterly repurchase offers for no less than 5% of the Fund's shares outstanding at net asset value. There is no guarantee that shareholders will be able to sell all of the shares they desire in a quarterly repurchase offer. Quarterly repurchases by the Fund of its shares typically will be funded from available cash or sales of portfolio securities. The sale of securities to fund repurchases could reduce the market price of those securities, which in turn would reduce the Fund's net asset value.
An investment in shares represents an indirect investment in the securities owned by the Fund. The value of these securities, like other market investments, may move up or down, sometimes rapidly and unpredictably. The Fund is "non-diversified" under the Investment Company Act of 1940 and therefore may invest more than 5% of its total assets in the securities of one or more issuers. As such, changes in the financial condition or market value of a single issuer may cause a greater fluctuation in the Fund's net asset value than in a "diversified" fund. The Fund is not intended to be a complete investment program.
The Fund is subject to the risk that geopolitical and other similar events will disrupt the economy on a national or global level. For instance, war, terrorism, market manipulation, government defaults, government shutdowns, political changes or diplomatic developments, public health emergencies (such as the spread of infectious diseases, pandemics and epidemics) and natural/environmental disasters can all negatively impact the securities markets.
The current novel coronavirus (COVID-19) global pandemic and the aggressive responses taken by many governments, including closing borders, restricting international and domestic travel, and the imposition of prolonged quarantines or similar restrictions, as well as the forced or voluntary closure of, or operational changes to, many retail and other businesses, have had negative impacts, and in many cases severe negative impacts, on markets worldwide. Potential impacts on the real estate market may include lower occupancy rates, decreased lease payments, defaults and foreclosures, among other consequences. It is not known how long such impacts, or any future impacts of other significant events described above, will or would last, but there could be a prolonged period of global economic slowdown.
The Fund will concentrate its investments in real estate industry securities. The value of the Fund's shares will be affected by factors affecting the value of real estate and the earnings of companies engaged in the real estate industry. These factors include, among others: (i) changes in general economic and market conditions; (ii) changes in the value of real estate properties; (iii) risks related to local economic conditions, overbuilding and increased competition; (iv) increases in property taxes and operating expenses; (v) changes in zoning laws; (vi) casualty and condemnation losses; (vii) variations in rental income, neighborhood values or the appeal of property to tenants; (viii) the availability of financing and (ix) changes in interest rates. Many real estate companies utilize leverage, which increases investment risk and could adversely affect a company's operations and market value in periods of rising interest rates. The value of securities of companies in the real estate industry may go through cycles of relative under-performance and over-performance in comparison to equity securities markets in general.
A significant portion of the Fund's underlying investments are in private real estate investment funds managed by institutional investment managers ("Institutional Investment Funds"). Investments in Institutional Investment Funds pose specific risks, including: such investments require the Fund to bear a pro rata share of the vehicles' expenses, including management and performance fees; the Advisor and Sub-Advisor will have no control over investment decisions may by such vehicle; such vehicle may utilize financial leverage; such investments have limited liquidity; the valuation of such investment as of a specific date may vary from the actual sale price that may be obtained if such investment were sold to a third party.
Additional risks related to an investment in the Fund are set forth in the "Risk Factors" section of the prospectus, which include, but are not limited to the following: convertible securities risk; correlation risk; credit risk; fixed income risk; leverage risk; risk of competition between underlying funds; and preferred securities risk.
Investors should carefully consider the investment objectives, risks, charges and expenses of the Bluerock Total Income+ Real Estate Fund. This and other important information about the Fund is contained in the prospectus, which can be obtained by calling toll free 844-819-8287, or online at bluerockfunds.com. The prospectus should be read carefully before investing. The Bluerock Total Income+ Real Estate Fund is distributed by ALPS Distributors, Inc (ALPS). Bluerock Fund Advisor, LLC is not affiliated with ALPS, Mercer Investment Management, or DWS. Neither Mercer Investment Management nor DWS are affiliated with ALPS.
 | BLU000581 |
| Bluerock Total Income+ Real Estate Fund | Portfolio Review |
March 31, 2020 (Unaudited)
Comparison of the Change in Value of a $10,000 Investment
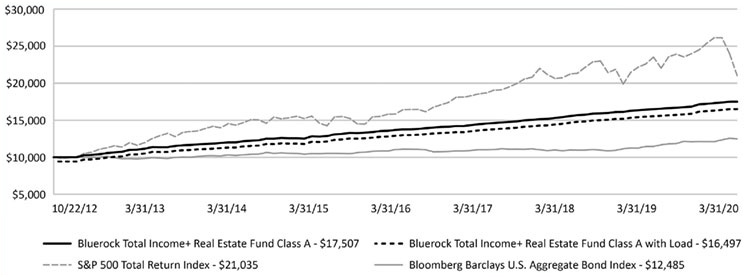
The Fund’s performance figures for certain periods ended March 31, 2020, compared to its benchmarks:
| Bluerock Total Income+ Real Estate Fund: | | Six Month | | One Year | | Three Year | | Five Year | | Since Inception Class A* | | Since Inception Class C and Class I* | | Since Inception Class L* | |
| Class A | | | | | | | | | | | | | | | |
| Without Load | | 3.95 | % | 6.55 | % | 7.20 | % | 6.79 | % | 7.82 | % | – | | – | |
| With Load(a) | | -2.03 | % | 0.43 | % | 5.10 | % | 5.53 | % | 6.96 | % | – | | – | |
| Class C | | | | | | | | | | | | | | | |
| Without Load | | 3.57 | % | 5.79 | % | 6.40 | % | 6.00 | % | – | | 6.24 | % | – | |
| With Load(b) | | 2.57 | % | 4.79 | % | 6.40 | % | 6.00 | % | – | | 6.24 | % | – | |
| Class I | | 4.10 | % | 6.85 | % | 7.47 | % | 7.06 | % | – | | 7.33 | % | – | |
| Class L | | | | | | | | | | | | | | | |
| Without Load | | 3.85 | % | 6.31 | % | – | | – | | – | | – | | 6.68 | % |
| With Load(c) | | -0.55 | % | 1.78 | % | – | | – | | – | | – | | 5.05 | % |
| S&P 500 Total Return Index | | -12.31 | % | -6.98 | % | 5.10 | % | 6.73 | % | 10.51 | % | 7.58 | % | 4.24 | % |
| Bloomberg Barclays U.S. Aggregate Bond Index | | 3.33 | % | 8.93 | % | 4.82 | % | 3.36 | % | 3.03 | % | 3.77 | % | 4.59 | % |
| * | Class A commenced operations October 22, 2012, Class C and Class I commenced operations April 1, 2014, and Class L commenced operations June 1, 2017. |
| (a) | Adjusted for initial maximum sales charge of 5.75%. |
| (b) | Adjusted for early withdrawal charge of 1.00%. |
| (c) | Adjusted for initial maximum sales charge of 4.25%. |
The S&P 500 Total Return Index is an unmanaged market capitalization-weighted index which is comprised of 500 of the largest U.S. domiciled companies and includes the reinvestment of all dividends. Investors cannot invest directly in an index or benchmark.
The Bloomberg Barclays U.S. Aggregate Bond Index is an unmanaged index which represents the U.S. investment-grade fixed-rate bond market (including government and corporate securities, mortgage pass-through securities and asset-backed securities). Investors cannot invest directly in an index or benchmark.
The performance data quoted is historical. Past performance is no guarantee of future results. The investment return and principal value of an investment will fluctuate. An investor’s shares, when redeemed, may be worth more or less than the original cost. Total returns are calculated using closing Net Asset Value as of March 31, 2020. Total returns are calculated assuming reinvestment of all dividends and distributions. Total returns
| Semi-Annual Report | March 31, 2020 | 9 |
| Bluerock Total Income+ Real Estate Fund | Portfolio Review |
March 31, 2020 (Unaudited)
would have been lower had the Advisor not waived a portion of its fees. Returns greater than one year are annualized. The Advisor and the Fund have entered into an expense limitation agreement under which the Advisor has contractually agreed to reduce its fees and/or absorb expenses for Class A, Class C, Class I and Class L at least until January 31, 2021 to ensure that the net annual fund operating expenses (exclusive of any taxes, interest, brokerage commissions, acquired fund fees and expenses, and extraordinary expenses, such as litigation or reorganization costs, but inclusive of organizational costs and offering costs) will not exceed 1.95%, 2.70%, 1.70%, and 2.20% of the Fund’s average daily net assets attributable to the Class A, Class C, Class I and Class L shares, respectively. The Fund has agreed to repay the Advisor in the amount of any fees the Advisor previously waived and or Fund expenses reimbursed, pursuant to the expense limitation agreement, subject to the limitations therein that: (1) the reimbursement will be made if payable not more than three fiscal years from the fiscal year in which they were incurred; (2) the reimbursement may not be made if it would cause the Expense Limitation then in effect or in effect at time of waiver to be exceeded; and (3) the reimbursement is approved by the Fund’s Board of Trustees.
The Fund’s total gross annual operating expenses, including the expenses of underlying funds and before any fee waiver, are 2.43%, 3.18%, 2.22% and 2.74% for Class A, Class C, Class I and Class L, respectively, per the February 1, 2020 prospectus. Class A shares are subject to a maximum sales charge imposed on purchases of 5.75%. Class A shareholders who tender for repurchase Class A shares that were purchased in amounts of $1,000,000 or more that have been held less than one year (365 days) from the purchase date will be subject to an early withdrawal charge of 1.00% of the original purchase price. Class C shares are subject to an early withdrawal charge of 1.00% if redeemed less than 365 days after the purchase. Class L shares are subject to a maximum sales charge imposed on purchases of 4.25%. The Fund's Class M shares commenced operations on February 1, 2020, however as of March 31, 2020 no such shares have been issued and therefore are not included in the Fund's performance information. The above performance figures do not reflect the deduction of taxes that a shareholder would have to pay on Fund distributions or the redemption of the Fund shares. For performance information current to the most recent month-end, please call 1-844-819-8287.
Portfolio Composition as of March 31, 2020 (Unaudited)
| | | Percent of Net Assets | |
| Private Real Estate Securities | | | 86.33 | % |
| Real Estate Debt Securities | | | 8.94 | % |
| Short-Term Investments | | | 7.72 | % |
| Public Equity Real Estate Securities | | | 1.39 | % |
| Preferred Stocks | | | 0.49 | % |
| Total Investments | | | 104.87 | % |
| Liabilities in Excess of Other Assets | | | -4.87 | % |
| Total Net Assets | | | 100.00 | % |
See the Portfolio of Investments in this annual report for a more detailed account of the Fund’s holdings.
| Bluerock Total Income+ Real Estate Fund | Portfolio of Investments |
March 31, 2020 (Unaudited)
| Security | | Principal | | | Value | |
| REAL ESTATE DEBT SECURITIES (8.94%)(a) | | | | | | | | |
| FREMF 2018-K82 Mortgage Trust, Class X2A, IO, 0.100%, 9/25/2028 | | $ | 1,073,973,435 | | | $ | 7,258,986 | |
| FREMF 2018-K82 Mortgage Trust, Class X2B, IO, 0.100%, 10/25/2028 | | | 262,694,906 | | | | 1,838,339 | |
| FREMF 2018-K82 Mortgage Trust, Class D, PO, 0.000%, 10/25/2028 | | | 100,392,906 | | | | 48,769,067 | |
| FREMF 2019-K101 Mortgage Trust, Class X2A, IO, 0.100%, 10/25/2052 | | | 1,189,011,379 | | | | 8,849,812 | |
| FREMF 2019-K101 Mortgage Trust, Class X2B, IO, 0.100%, 10/25/2052 | | | 270,043,635 | | | | 2,097,159 | |
| FREMF 2019-K101 Mortgage Trust, Class D, PO, 0.000%, 1/25/2030 | | | 109,477,635 | | | | 48,239,349 | |
| FREMF 2019-K91 Mortgage Trust, Class X2A, IO, 0.100%, 3/25/2029 | | | 1,136,167,864 | | | | 8,047,477 | |
| FREMF 2019-K91 Mortgage Trust, Class X2B, IO, 0.100%, 10/25/2029 | | | 247,526,565 | | | | 1,849,271 | |
| FREMF 2019-K91 Mortgage Trust, Class D, PO, 0.000%, 10/25/2029 | | | 103,857,565 | | | | 45,685,489 | |
| FREMF 2019-KC03 Mortgage Trust, Class C, 4.365%, 1/25/2026 | | | 58,088,000 | | | | 46,880,211 | |
| TOTAL REAL ESTATE DEBT SECURITIES (Cost $217,761,544) | | | | | | | 219,515,160 | |
| Security | | Shares | | | Value | |
| PRIVATE REAL ESTATE SECURITIES (86.33%)(b) | | | | | | | | |
| Apartments (7.07%) | | | | | | | | |
| Clarion Gables Multifamily Trust | | | 82,268 | | | | 108,547,756 | |
| Sentinel Real Estate Fund | | | 718 | | | | 65,088,663 | |
| | | | | | | | 173,636,419 | |
| Diversified (60.43%) | | | | | | | | |
| AEW Core Property Trust | | | 22,139 | | | | 22,543,294 | |
| Ares Real Estate Enhanced Income Fund | | | 34,365 | | | | 34,250,682 | |
| Bain Capital Real Estate Fund I | | | N/A | | | | 27,552,091 | |
| Blackstone Property Partners | | | 82,577 | | | | 114,583,089 | |
| Bridge Debt Strategies Fund III, LP | | | N/A | | | | 43,370,086 | |
| Brookfield Premier Real Estate Partners | | | 36,085 | | | | 50,122,087 | |
| Carlyle Property Investors | | | 67,957 | | | | 89,358,247 | |
| CBRE U.S. Core Partners, LP | | | 69,799,656 | | | | 102,227,218 | |
| Clarion Lion Properties Fund | | | 108,240 | | | | 168,528,537 | |
| Harrison Street Core Property Fund | | | 50,957 | | | | 72,067,909 | |
| Invesco Core Real Estate Fund | | | 174 | | | | 33,720,974 | |
| Invesco U.S. Income Fund LP | | | 69,420 | | | | 98,064,146 | |
| Morgan Stanley Prime Property Fund LLC | | | 14,470 | | | | 277,458,579 | |
| PGIM PRISA I | | | 19,009 | | | | 33,676,729 | |
| PGIM PRISA III | | | 30,536 | | | | 61,943,206 | |
| Principal Enhanced Property Fund LP | | | 8,735,240 | | | | 113,639,953 | |
| RREEF America REIT II, Inc. | | | 281,886 | | | | 35,950,488 | |
| Stockbridge Smart Markets Fund | | | 26,836 | | | | 42,608,296 | |
| Stockbridge Value Fund II | | | N/A | | | | 2,611,120 | |
| UBS Trumbull Property G&I Fund | | | 2,259 | | | | 58,816,499 | |
| | | | | | | | 1,483,093,230 | |
| Industrial (18.83%) |
| Clarion Lion Industrial Trust | | | 56,887 | | | | 122,605,825 | |
| Prologis Targeted U.S. Logistics(c) | | | 130,640 | | | | 244,927,623 | |
| RREEF Core Plus Industrial Fund LP | | | 703,549 | | | | 94,670,137 | |
| | | | | | | | 462,203,585 | |
| TOTAL PRIVATE REAL ESTATE SECURITIES (Cost $1,940,338,326) | | | | | | | 2,118,933,234 | |
| | | | | | | | | |
PUBLIC EQUITY REAL ESTATE SECURITIES (1.39%) | | | | | | | | |
| Public Non-Traded Real Estate Investment Trusts (0.02%) | | | | | | | | |
| Diversified (0.02%) | | | | | | | | |
| Highlands REIT, Inc.(d)(e) | | | 140,161 | | | | 47,655 | |
| Inventrust Properties Corp.(e) | | | 140,161 | | | | 420,229 | |
| Total Public Non-Traded Real Estate Investment Trusts (Cost $445,781) | | | | | | | 467,884 | |
The accompanying notes are an integral part of these financial statements.
| Semi-Annual Report | March 31, 2020 | 11 |
| Bluerock Total Income+ Real Estate Fund | Portfolio of Investments (Continued) |
March 31, 2020 (Unaudited)
| Security | | Shares | | | Value | |
| Publicly Traded Real Estate Investment Trusts (1.37%) | | | | | | | | |
| Apartments (0.18%) | | | | | | | | |
| AvalonBay Communities, Inc. | | | 2,865 | | | $ | 421,642 | |
| Equity Residential | | | 8,563 | | | | 528,423 | |
| Essex Property Trust, Inc. | | | 2,140 | | | | 471,314 | |
| Independence Realty Trust, Inc. | | | 85,254 | | | | 762,170 | |
| Mid-America Apartment Communities, Inc. | | | 9,194 | | | | 947,257 | |
| NexPoint Residential Trust, Inc. | | | 27,332 | | | | 689,040 | |
| UDR, Inc. | | | 16,331 | | | | 596,735 | |
| | | | | | | | 4,416,581 | |
| Communications (0.18%) | | | | | | | | |
| American Tower Corp. | | | 6,534 | | | | 1,422,779 | |
| Crown Castle International Corp. | | | 8,505 | | | | 1,228,122 | |
| SBA Communications Corp. | | | 6,337 | | | | 1,710,799 | |
| | | | | | | | 4,361,700 | |
| Data Centers (0.22%) | | | | | | | | |
| Digital Realty Trust, Inc. | | | 18,423 | | | | 2,559,140 | |
| Equinix, Inc. | | | 2,291 | | | | 1,430,890 | |
| QTS Realty Trust, Inc. | | | 24,962 | | | | 1,448,046 | |
| | | | | | | | 5,438,076 | |
| Diversified (0.08%) | | | | | | | | |
| Safehold, Inc. | | | 30,526 | | | | 1,930,159 | |
| | | | | | | | 1,930,159 | |
| Healthcare (0.06%) | | | | | | | | |
| Healthcare Realty Trust, Inc. | | | 20,118 | | | | 561,896 | |
| Healthcare Trust of America, Inc. | | | 22,386 | | | | 543,532 | |
| Physicians Realty Trust | | | 28,248 | | | | 393,777 | |
| | | | | | | | 1,499,205 | |
| Industrial (0.23%) | | | | | | | | |
| EastGroup Properties, Inc. | | | 7,930 | | | | 828,526 | |
| First Industrial Realty Trust, Inc. | | | 19,176 | | | | 637,218 | |
| Hannon Armstrong Sustainable Infrastructure Capital, Inc. | | | 41,550 | | | | 848,036 | |
| Prologis, Inc. | | | 11,787 | | | | 947,321 | |
| Rexford Industrial Realty, Inc. | | | 28,974 | | | | 1,188,224 | |
| Terreno Realty Corp. | | | 24,211 | | | | 1,252,920 | |
| | | | | | | | 5,702,245 | |
| Manufactured Homes (0.09%) | | | | | | | | |
| Equity LifeStyle Properties, Inc. | | | 19,710 | | | | 1,132,931 | |
| Sun Communities, Inc. | | | 8,313 | | | | 1,037,878 | |
| | | | | | | | 2,170,809 | |
| Office (0.11%) | | | | | | | | |
| Alexandria Real Estate Equities, Inc. | | | 7,069 | | | | 968,877 | |
| Easterly Government Properties, Inc. | | | 73,016 | | | | 1,799,114 | |
| | | | | | | | 2,767,991 | |
| Self-Storage (0.14%) | | | | | | | | |
| CubeSmart | | | 17,049 | | | | 456,743 | |
| Extra Space Storage, Inc. | | | 7,687 | | | | 736,107 | |
| Life Storage, Inc. | | | 10,266 | | | | 970,650 | |
| National Storage Affiliates Trust | | | 40,332 | | | | 1,193,827 | |
| | | | | | | | 3,357,327 | |
| Single Tenant (0.03%) | | | | | | | | |
| Agree Realty Corp. | | | 12,009 | | | | 743,357 | |
| | | | | | | | 743,357 | |
The accompanying notes are an integral part of these financial statements.
12
| Bluerock Total Income+ Real Estate Fund | Portfolio of Investments (Continued) |
March 31, 2020 (Unaudited)
| Security | | Shares | | | Value | |
| Single-Family Rental (0.05%) | | | | | | | | |
| American Homes 4 Rent | | | 33,906 | | | $ | 786,619 | |
| Invitation Homes, Inc. | | | 25,073 | | | | 535,810 | |
| | | | | | | | 1,322,429 | |
| Total Publicly Traded Real Estate Investment Trusts (Cost $32,007,424) | | | | | | | 33,709,879 | |
| | | | | | | | | |
| TOTAL PUBLIC EQUITY REAL ESTATE SECURITIES (Cost $32,453,205) | | | | | | | 34,177,763 | |
| | | | | | | | | |
| PREFERRED STOCKS (0.49%) | | | | | | | | |
| American Homes 4 Rent, 6.350%, Series E | | | 39,579 | | | | 949,896 | |
| American Homes 4 Rent, 5.875%, Series G | | | 39,750 | | | | 916,238 | |
| Digital Realty Trust, Inc., 5.250%, Series J | | | 40,477 | | | | 962,542 | |
| EPR Properties, 5.750%, Series G | | | 45,052 | | | | 700,559 | |
| Kimco Realty Corp., 5.125%, Series L | | | 40,450 | | | | 877,765 | |
| National Storage Affiliates Trust, 6.000%, Series A | | | 38,812 | | | | 891,512 | |
| PS Business Parks, Inc., 5.250%, Series X | | | 40,125 | | | | 922,474 | |
| PS Business Parks, Inc., 5.200%, Series W | | | 40,150 | | | | 921,844 | |
| Public Storage, 5.050%, Series G | | | 39,248 | | | | 952,156 | |
| Public Storage, 5.375%, Series V | | | 40,547 | | | | 977,993 | |
| Rexford Industrial Realty, Inc., 5.875%, Series A | | | 20,708 | | | | 480,426 | |
| Rexford Industrial Realty, Inc., 5.875%, Series B | | | 20,376 | | | | 445,623 | |
| Spirit Realty Capital, Inc., 6.000%, Series A | | | 40,631 | | | | 864,221 | |
| VEREIT, Inc., 6.700%, Series F | | | 40,607 | | | | 897,415 | |
| Vornado Realty Trust, 5.250%, Series M | | | 13,026 | | | | 254,789 | |
| TOTAL PREFERRED STOCKS (Cost $12,859,151) | | | | | | | 12,015,453 | |
| | | | | | | | | |
| SHORT TERM INVESTMENTS (7.72%) | | | | | | | | |
| Fidelity Investments Money Market Funds - Government Portfolio - Class I, 0.30%(Cost $189,489,388) | | | 189,489,388 | | | | 189,489,388 | |
| | | | | | | | | |
| TOTAL INVESTMENTS (104.87%) (Cost $2,392,901,614) | | | | | | $ | 2,574,130,998 | |
| LIABILITIES IN EXCESS OF OTHER ASSETS (-4.87%) | | | | | | | (119,493,709 | ) |
| NET ASSETS (100.00%) | | | | | | $ | 2,454,637,289 | |
Common Abbreviations
IO - Interest Only Security
PO - Principal Only Security
| (a) | Securities exempt from registration under Rule 144A of the Securities Act of 1933. These securities may be sold in the ordinary course of business in transactions exempt from registration, normally to qualified institutional buyers. As of March 31, 2020, the aggregate market value of those securities was $219,515,160, representing 8.94% of net assets. |
| (b) | All or a portion of these securities are segregated as collateral for the Line of Credit as of March 31, 2020. |
| (c) | Holding is comprised of two share classes of the same underlying investment. |
| (d) | Non-income producing security. |
| (e) | Fair value estimated using fair valuation procedures adopted by the Board of Trustees. Total value of such securities is $467,884, representing 0.02% of net assets. |
The accompanying notes are an integral part of these financial statements.
| Semi-Annual Report | March 31, 2020 | 13 |
Bluerock Total Income+ Real Estate Fund | Statement of Assets and Liabilities |
March 31, 2020 (Unaudited)
ASSETS | | | | |
Investments, at value (Cost $2,392,901,614) | | $ | 2,574,130,998 | |
Cash | | | 12,571,197 | |
Receivable for shares sold | | | 7,468,566 | |
Dividends and interest receivable | | | 18,423,898 | |
Prepaid expenses and other assets | | | 122,261 | |
Total Assets | | | 2,612,716,920 | |
LIABILITIES | | | | |
Line of credit payable | | | 154,000,000 | |
Line of credit interest payable | | | 228,333 | |
Investment advisory fees payable | | | 3,091,661 | |
Shareholder servicing fees payable | | | 230,334 | |
Administration fees payable | | | 94,732 | |
Transfer agency fees payable | | | 58,975 | |
Distribution fees payable | | | 302,823 | |
Due to custodian | | | 7,044 | |
Accrued expenses and other liabilities | | | 65,729 | |
Total Liabilities(a) | | | 158,079,631 | |
NET ASSETS | | $ | 2,454,637,289 | |
NET ASSETS CONSIST OF | | | | |
Paid-in capital | | $ | 2,227,137,179 | |
Total distributable earnings | | | 227,500,110 | |
NET ASSETS | | $ | 2,454,637,289 | |
PRICING OF SHARES | | | | |
Class A: | | | | |
Net asset value and redemption price | | $ | 30.11 | |
Net assets | | $ | 565,325,193 | |
Shares of beneficial interest outstanding (unlimited number of shares, no par value common stock authorized) | | | 18,778,352 | |
Maximum offering price per share ((NAV/0.9425), based on maximum sales charge of 5.75% of the offering price) | | $ | 31.95 | |
Class C: | | | | |
Net asset value, offering and redemption price | | $ | 28.80 | |
Net assets | | $ | 453,428,170 | |
Shares of beneficial interest outstanding (unlimited number of shares, no par value common stock authorized) | | | 15,744,202 | |
Class I: | | | | |
Net asset value, offering and redemption price | | $ | 30.62 | |
Net assets | | $ | 1,362,059,585 | |
Shares of beneficial interest outstanding (unlimited number of shares, no par value common stock authorized) | | | 44,476,781 | |
Class L: | | | | |
Net asset value and redemption price | | $ | 29.89 | |
Net assets | | $ | 73,824,341 | |
Shares of beneficial interest outstanding (unlimited number of shares, no par value common stock authorized) | | | 2,469,693 | |
Maximum offering price per share ((NAV/0.9575), based on maximum sales charge of 4.25% of the offering price) | | $ | 31.22 | |
(a) | Separately, see Note 8 Commitment and Contingencies for detail on unfunded commitments. |
The accompanying notes are an integral part of these financial statements.
14
Bluerock Total Income+ Real Estate Fund | Statement of Operations |
For the Six Months Ended March 31, 2020 (Unaudited)
INVESTMENT INCOME | | | | |
Dividend income | | $ | 30,491,465 | |
Interest | | | 7,730,851 | |
Total Investment Income | | | 38,222,316 | |
| | | | | |
EXPENSES | | | | |
Investment advisory fees | | | 16,912,616 | |
Administrative fees | | | 460,482 | |
Transfer Agency fees | | | 562,170 | |
Shareholder servicing fees: | | | | |
Class A | | | 681,636 | |
Class C | | | 534,487 | |
Class L | | | 100,367 | |
Distribution fees: | | | | |
Class C | | | 1,603,462 | |
Class L | | | 100,367 | |
Legal fees | | | 44,620 | |
Audit and tax fees | | | 11,750 | |
Reports to shareholders and printing fees | | | 328,590 | |
Custody fees | | | 54,571 | |
Chief compliance officer fees | | | 30,129 | |
Interest expense | | | 2,007,409 | |
Trustees' fees | | | 47,917 | �� |
Other expenses | | | 214,291 | |
Total Expenses | | | 23,694,864 | |
Recoupment of previously waived fees (See Note 3) | | | 219,042 | |
Net Expenses | | | 23,913,906 | |
Net Investment Income | | | 14,308,410 | |
Net realized gain/(loss) on investments | | | 46,529,246 | |
Net change in unrealized appreciation/(depreciation) on investments | | | (27,326,629 | ) |
NET REALIZED AND UNREALIZED GAIN ON INVESTMENTS | | | 19,202,617 | |
NET INCREASE IN NET ASSETS RESULTING FROM OPERATIONS | | $ | 33,511,027 | |
The accompanying notes are an integral part of these financial statements.
Semi-Annual Report | March 31, 2020 | 15 |
Bluerock Total Income+ Real Estate Fund | Statements of Changes in Net Assets |
| | For the Six Months Ended March 31, 2020 (Unaudited) | | For the Year Ended September 30, 2019 | |
OPERATIONS: | | | | | | | |
Net investment income | | $ | 14,308,410 | | $ | 16,746,223 | |
Net realized gain on investments | | | 46,529,246 | | | 6,996,972 | |
Net change in unrealized appreciation/(depreciation) on investments | | | (27,326,629 | ) | | 88,969,563 | |
Net Increase in Net Assets Resulting from Operations | | | 33,511,027 | | | 112,712,758 | |
DISTRIBUTIONS TO SHAREHOLDERS: | | | | | | | |
Class A | | | | | | | |
From distributable earnings | | | (10,703,459 | ) | | (4,322,594 | ) |
From return of capital | | | (3,751,639 | ) | | (20,268,110 | ) |
Class C | | | | | | | |
From distributable earnings | | | (8,530,851 | ) | | (3,365,580 | ) |
From return of capital | | | (2,990,125 | ) | | (14,930,780 | ) |
Class I | | | | | | | |
From distributable earnings | | | (24,853,275 | ) | | (5,759,735 | ) |
From return of capital | | | (8,711,251 | ) | | (35,088,851 | ) |
Class L | | | | | | | |
From distributable earnings | | | (1,357,585 | ) | | (534,202 | ) |
From return of capital | | | (475,843 | ) | | (3,034,353 | ) |
Total Distributions to Shareholders | | | (61,374,028 | ) | | (87,304,205 | ) |
BENEFICIAL INTEREST TRANSACTIONS: | | | | | | | |
Class A | | | | | | | |
Shares sold | | | 102,603,154 | | | 229,930,652 | |
Distributions reinvested | | | 7,440,989 | | | 13,638,889 | |
Shares redeemed | | | (40,729,516 | ) | | (45,478,111 | ) |
Shares transferred out | | | (34,693,645 | ) | | (41,853,107 | ) |
Class C | | | | | | | |
Shares sold | | | 71,494,532 | | | 129,145,908 | |
Distributions reinvested | | | 7,458,424 | | | 11,933,103 | |
Shares redeemed | | | (16,825,908 | ) | | (31,505,469 | ) |
Shares transferred out | | | (3,554,964 | ) | | (1,425,778 | ) |
Class I | | | | | | | |
Shares sold | | | 316,949,070 | | | 555,137,710 | |
Distributions reinvested | | | 17,233,970 | | | 22,702,402 | |
Shares redeemed | | | (69,435,555 | ) | | (67,085,843 | ) |
Shares transferred in | | | 71,676,748 | | | 43,654,088 | |
Class L | | | | | | | |
Shares sold | | | 18,993,276 | | | 45,320,799 | |
Distributions reinvested | | | 1,308,784 | | | 2,371,314 | |
Shares redeemed | | | (1,033,847 | ) | | (2,605,496 | ) |
Shares transferred out | | | (33,428,139 | ) | | (375,203 | ) |
Net Increase in Net Assets Derived from Beneficial Interest Transactions | | | 415,457,373 | | | 863,505,858 | |
Net increase in net assets | | | 387,594,372 | | | 888,914,411 | |
NET ASSETS: | | | | | | | |
Beginning of year | | | 2,067,042,917 | | | 1,178,128,506 | |
End of year | | $ | 2,454,637,289 | | $ | 2,067,042,917 | |
The accompanying notes are an integral part of these financial statements.
16
Bluerock Total Income+ Real Estate Fund | Statements of Changes in Net Assets |
| | For the Six
Months Ended
March 31, 2020
(Unaudited) | | For the
Year Ended
September 30, 2019 | |
Other Information | | | | | | | |
Share Transactions: | | | | | | | |
Class A | | | | | | | |
Beginning shares | | | 17,641,782 | | | 12,451,402 | |
Shares sold | | | 3,359,306 | | | 7,633,796 | |
Distributions reinvested | | | 245,679 | | | 455,793 | |
Shares redeemed | | | (1,332,088 | ) | | (1,509,363 | ) |
Shares transferred out | | | (1,136,327 | ) | | (1,389,846 | ) |
Net increase in shares outstanding | | | 1,136,570 | | | 5,190,380 | |
Ending shares | | | 18,778,352 | | | 17,641,782 | |
Class C | | | | | | | |
Beginning shares | | | 13,738,958 | | | 10,012,148 | |
Shares sold | | | 2,443,871 | | | 4,446,961 | |
Distributions reinvested | | | 257,107 | | | 414,114 | |
Shares redeemed | | | (574,159 | ) | | (1,085,210 | ) |
Shares transferred out | | | (121,575 | ) | | (49,055 | ) |
Net increase in shares outstanding | | | 2,005,244 | | | 3,726,810 | |
Ending shares | | | 15,744,202 | | | 13,738,958 | |
Class I | | | | | | | |
Beginning shares | | | 33,636,423 | | | 15,498,144 | |
Shares sold | | | 10,210,698 | | | 18,156,358 | |
Distributions reinvested | | | 559,569 | | | 747,430 | |
Shares redeemed | | | (2,233,645 | ) | | (2,194,162 | ) |
Shares transferred in | | | 2,303,736 | | | 1,428,653 | |
Net increase in shares outstanding | | | 10,840,358 | | | 18,138,279 | |
Ending shares | | | 44,476,781 | | | 33,636,423 | |
Class L | | | | | | | |
Beginning shares | | | 2,928,639 | | | 1,437,606 | |
Shares sold | | | 627,371 | | | 1,510,841 | |
Distributions reinvested | | | 43,506 | | | 79,640 | |
Shares redeemed | | | (34,039 | ) | | (86,907 | ) |
Shares transferred out | | | (1,095,784 | ) | | (12,541 | ) |
Net increase/(decrease) in shares outstanding | | | (458,946 | ) | | 1,491,033 | |
Ending shares | | | 2,469,693 | | | 2,928,639 | |
The accompanying notes are an integral part of these financial statements.
Semi-Annual Report | March 31, 2020 | 17 |
Bluerock Total Income+ Real Estate Fund | Statement of Cash Flows |
| | For the Six Months Ended
March 31, 2020
(Unaudited) | |
Cash Flows from Operating Activities: | | | | |
Net increase in net assets resulting from operations | | $ | 33,511,027 | |
Adjustments to reconcile net increase in net assets from operations to net cash used in operating activities: | | | | |
Purchase of investments securities | | | (644,816,618 | ) |
Proceeds from disposition of investment securities | | | 355,366,347 | |
Net purchases of short-term investment securities | | | (60,094,289 | ) |
Net realized gain on investments | | | (46,529,246 | ) |
Net change in unrealized depreciation on investments | | | 27,326,629 | |
Discount and premiums amortized | | | (4,588,834 | ) |
(Increase)/Decrease in Assets: | | | | |
Dividends and interest receivable | | | (6,896,987 | ) |
Prepaid expenses and other assets | | | (53,970 | ) |
Increase/(Decrease) in Liabilities: | | | | |
Shareholder servicing fees payable | | | 25,896 | |
Investment advisory fees payable | | | 642,439 | |
Administrative fees payable | | | 27,527 | |
Transfer agency fees payable | | | (18,811 | ) |
Distribution fees payable | | | 45,861 | |
Interest due on loan payable | | | 83,184 | |
Accrued expenses and other liabilities | | | (84,278 | ) |
Net Cash Used in Operating Activities | | | (346,054,123 | ) |
| | | | | |
Cash Flows from Financing Activities: | | | | |
Increase in Line of Credit Borrowing | | | 5,900,000 | |
Proceeds from shares sold | | | 508,674,963 | |
Payment on shares redeemed | | | (128,024,826 | ) |
Cash distributions paid | | | (27,931,861 | ) |
Due to custodian | | | 7,044 | |
Net Cash Provided by Financing Activities | | | 358,625,320 | |
| | | | | |
Net Change in Cash | | | 12,571,197 | |
| | | | | |
Cash Beginning of Period | | $ | – | |
| | | | | |
Cash End of Period | | $ | 12,571,197 | |
| | | | | |
Non-cash financing Activities not included herein consist of reinvestment of distributions of: | | $ | 33,442,167 | |
Cash paid for interest on lines of credit during the year was: | | | 1,924,225 | |
The accompanying notes are an integral part of these financial statements.
18
Bluerock Total Income+ Real Estate Fund - Class A | Financial Highlights |
The table below sets forth financial data for one share of beneficial interest outstanding throughout each period presented.
| | For the Six Months Ended March 31, 2020 (Unaudited) | | For the Year Ended September 30, 2019 | | For the Year Ended September 30, 2018 | | For the Year Ended September 30, 2017 | | For the Year Ended September 30, 2016 | | For the Year Ended September 30, 2015 | |
Net asset value, beginning of year | | $ | 30.43 | | $ | 30.00 | | $ | 29.37 | | $ | 29.13 | | $ | 28.68 | | $ | 27.98 | |
INCOME FROM INVESTMENT OPERATIONS: | | | | | | | | | | | | | | | | | | | |
Net investment income(a) | | | 0.19 | | | 0.33 | | | 0.21 | | | 0.23 | | | 0.23 | | | 0.39 | |
Net realized and unrealized gain | | | 0.30 | | | 1.69 | | | 2.00 | | | 1.56 | | | 1.75 | | | 1.81 | |
Total from investment operations | | | 0.49 | | | 2.02 | | | 2.21 | | | 1.79 | | | 1.98 | | | 2.20 | |
DISTRIBUTIONS: | | | | | | | | | | | | | | | | | | | |
From net investment income | | | – | | | – | | | – | | | – | | | – | | | (0.09 | ) |
From net realized gain on investments | | | (0.60 | ) | | (0.32 | ) | | (0.54 | ) | | (0.37 | ) | | (0.16 | ) | | (0.29 | ) |
Return of capital | | | (0.21 | ) | | (1.27 | ) | | (1.04 | ) | | (1.18 | ) | | (1.37 | ) | | (1.12 | ) |
Total distributions | | | (0.81 | ) | | (1.59 | ) | | (1.58 | ) | | (1.55 | ) | | (1.53 | ) | | (1.50 | ) |
Net asset value, end of period | | $ | 30.11 | | $ | 30.43 | | $ | 30.00 | | $ | 29.37 | | $ | 29.13 | | $ | 28.68 | |
TOTAL RETURN(b)(c) | | | 1.60 | % | | 6.94 | % | | 7.69 | % | | 6.29 | % | | 7.08 | % | | 8.06 | % |
RATIOS/SUPPLEMENTAL DATA: | | | | | | | | | | | | | | | | | | | |
Net assets, end of period (000s) | | $ | 565,325 | | $ | 536,913 | | $ | 373,488 | | $ | 291,772 | | $ | 226,712 | | $ | 129,287 | |
Ratios to Average Net Assets (including interest expense) | | | | | | | | | | | | | | | | | | | |
Ratio of expenses to average net assets excluding fee waivers and reimbursements(d)(e) | | | 2.08 | %(f) | | 2.20 | % | | 2.43 | % | | 2.37 | % | | 2.19 | % | | 2.25 | % |
Ratio of expenses to average net assets including fee waivers and reimbursements(e) | | | 2.11 | %(f) | | 2.21 | % | | 2.37 | % | | 2.21 | % | | 1.82 | % | | 1.79 | % |
Ratio of net investment income to average net assets(e) | | | 1.26 | %(f) | | 1.10 | % | | 0.71 | % | | 0.80 | % | | 0.79 | % | | 1.36 | % |
Ratios to Average Net Assets (excluding interest expense) | | | | | | �� | | | | | | | | | | | | | |
Ratio of expenses to average net assets excluding fee waivers and reimbursements(d)(e) | | | 1.90 | %(f) | | 1.94 | % | | 1.99 | % | | 2.04 | % | | 2.19 | % | | 2.24 | % |
Ratio of expenses to average net assets including fee waivers and reimbursements(e) | | | 1.93 | %(f) | | 1.95 | % | | 1.93 | % | | 1.89 | % | | 1.82 | % | | 1.78 | % |
Portfolio turnover rate | | | 14 | %(g) | | 8 | % | | 13 | % | | 16 | % | | 18 | % | | 35 | % |
(a) | Per share amounts are calculated using the average shares method. |
(b) | Total returns are historical in nature and assume changes in share price, reinvestment of dividends and capital gains distributions, if any, and does not reflect the impact of sales charges. Had the Advisor not absorbed a portion of the Fund expenses, total returns would have been lower. |
(c) | Includes adjustments in accordance with accounting principles generally accepted in the United States and, consequently, the net asset value for financial reporting purposes and the returns based upon those net asset values may differ from the net asset values and returns for shareholder transactions. |
(d) | Represents the ratio of expenses to average net assets absent fee waivers and/or expense reimbursement by the Advisor. |
(e) | The ratios of expenses to average net assets and net investment income to average net assets do not directly reflect the expenses of the underlying institutional private real estate investments in which the Fund invests. The Fund invests in each underlying institutional private real estate investment based upon its net asset value, inclusive of management fees, which typically range from 0.50% to 1.30% on an annualized basis. The Fund’s Total Return is reported net of all fees and expenses. |
(f) | Annualized. |
(g) | Not annualized. |
The accompanying notes are an integral part of these financial statements.
Semi-Annual Report | March 31, 2020 | 19 |
Bluerock Total Income+ Real Estate Fund - Class C | Financial Highlights |
The table below sets forth financial data for one share of beneficial interest outstanding throughout each period presented.
| | For the Six Months Ended March 31, 2020 (Unaudited) | | For the Year Ended September 30, 2019 | | For the Year Ended September 30, 2018 | | For the Year Ended September 30, 2017 | | For the Year Ended September 30, 2016 | | For the Year Ended September 30, 2015 | |
Net asset value, beginning of year | | $ | 29.22 | | $ | 29.02 | | $ | 28.63 | | $ | 28.61 | | $ | 28.38 | | $ | 27.89 | |
INCOME FROM INVESTMENT OPERATIONS: | | | | | | | | | | | | | | | | | | | |
Net investment income/(loss)(a) | | | 0.08 | | | 0.10 | | | (0.01 | ) | | 0.01 | | | (0.01 | ) | | 0.16 | |
Net realized and unrealized gain | | | 0.27 | | | 1.63 | | | 1.93 | | | 1.52 | | | 1.75 | | | 1.82 | |
Total from investment operations | | | 0.35 | | | 1.73 | | | 1.92 | | | 1.53 | | | 1.74 | | | 1.98 | |
DISTRIBUTIONS: | | | | | | | | | | | | | | | | | | | |
From net investment income | | | – | | | – | | | – | | | – | | | – | | | (0.09 | ) |
From net realized gain on investments | | | (0.57 | ) | | (0.32 | ) | | (0.52 | ) | | (0.37 | ) | | (0.16 | ) | | (0.29 | ) |
Return of capital | | | (0.20 | ) | | (1.21 | ) | | (1.01 | ) | | (1.14 | ) | | (1.35 | ) | | (1.11 | ) |
Total distributions | | | (0.77 | ) | | (1.53 | ) | | (1.53 | ) | | (1.51 | ) | | (1.51 | ) | | (1.49 | ) |
Net asset value, end of period | | $ | 28.80 | | $ | 29.22 | | $ | 29.02 | | $ | 28.63 | | $ | 28.61 | | $ | 28.38 | |
TOTAL RETURN(b)(c) | | | 1.21 | % | | 6.15 | % | | 6.86 | % | | 5.50 | % | | 6.28 | % | | 7.28 | % |
RATIOS/SUPPLEMENTAL DATA: | | | | | | | | | | | | | | | | | | | |
Net assets, end of period (000s) | | $ | 453,428 | | $ | 401,507 | | $ | 290,549 | | $ | 232,200 | | $ | 153,859 | | $ | 37,920 | |
Ratios to Average Net Assets (including interest expense) | | | | | | | | | | | | | | | | | | | |
Ratio of expenses to average net assets excluding fee waivers and reimbursements(d)(e) | | | 2.83 | %(f) | | 2.95 | % | | 3.18 | % | | 3.13 | % | | 2.95 | % | | 3.04 | % |
Ratio of expenses to average net assets including fee waivers and reimbursements(e) | | | 2.86 | %(f) | | 2.96 | % | | 3.12 | % | | 2.97 | % | | 2.56 | % | | 2.55 | % |
Ratio of net investment income/(loss) to average net assets(e) | | | 0.52 | %(f) | | 0.35 | % | | (0.04 | )% | | 0.05 | % | | (0.04 | )% | | 0.55 | % |
Ratios to Average Net Assets (excluding interest expense) | | | | | | | | | | | | | | | | | | | |
Ratio of expenses to average net assets excluding fee waivers and reimbursements(d)(e) | | | 2.65 | %(f) | | 2.69 | % | | 2.74 | % | | 2.79 | % | | 2.95 | % | | 3.02 | % |
Ratio of expenses to average net assets including fee waivers and reimbursements(e) | | | 2.68 | %(f) | | 2.70 | % | | 2.68 | % | | 2.63 | % | | 2.56 | % | | 2.54 | % |
Portfolio turnover rate | | | 14 | %(g) | | 8 | % | | 13 | % | | 16 | % | | 18 | % | | 35 | % |
(a) | Per share amounts are calculated using the average shares method. |
(b) | Total returns are historical in nature and assume changes in share price, reinvestment of dividends and capital gains distributions, if any. Had the Advisor not absorbed a portion of the Fund expenses, total returns would have been lower. |
(c) | Includes adjustments in accordance with accounting principles generally accepted in the United States and, consequently, the net asset value for financial reporting purposes and the returns based upon those net asset values may differ from the net asset values and returns for shareholder transactions. |
(d) | Represents the ratio of expenses to average net assets absent fee waivers and/or expense reimbursement by the Advisor. |
(e) | The ratios of expenses to average net assets and net investment income (loss) to average net assets do not directly reflect the expenses of the underlying institutional private real estate investments in which the Fund invests. The Fund invests in each underlying institutional private real estate investment based upon its net asset value, inclusive of management fees, which typically range from 0.50% to 1.30% on an annualized basis. The Fund’s Total Return is reported net of all fees and expenses. |
(f) | Annualized. |
(g) | Not annualized. |
The accompanying notes are an integral part of these financial statements.
20
Bluerock Total Income+ Real Estate Fund - Class I | Financial Highlights |
The table below sets forth financial data for one share of beneficial interest outstanding throughout each period presented.
| | For the Six Months Ended March 31, 2020 (Unaudited) | | For the Year Ended September 30, 2019 | | For the Year Ended September 30, 2018 | | For the Year Ended September 30, 2017 | | For the Year Ended September 30, 2016 | | For the Year Ended September 30, 2015 | |
Net asset value, beginning of year | | $ | 30.92 | | $ | 30.40 | | $ | 29.70 | | $ | 29.38 | | $ | 28.85 | | $ | 28.03 | |
INCOME FROM INVESTMENT OPERATIONS: | | | | | | | | | | | | | | | | | | | |
Net investment income(a) | | | 0.24 | | | 0.42 | | | 0.29 | | | 0.31 | | | 0.28 | | | 0.45 | |
Net realized and unrealized gain | | | 0.28 | | | 1.72 | | | 2.01 | | | 1.57 | | | 1.79 | | | 1.88 | |
Total from investment operations | | | 0.52 | | | 2.14 | | | 2.30 | | | 1.88 | | | 2.07 | | | 2.33 | |
DISTRIBUTIONS: | | | | | | | | | | | | | | | | | | | |
From net investment income | | | – | | | – | | | – | | | – | | | – | | | (0.10 | ) |
From net realized gain on investments | | | (0.61 | ) | | (0.32 | ) | | (0.54 | ) | | (0.37 | ) | | (0.16 | ) | | (0.29 | ) |
Return of capital | | | (0.21 | ) | | (1.30 | ) | | (1.06 | ) | | (1.19 | ) | | (1.38 | ) | | (1.12 | ) |
Total distributions | | | (0.82 | ) | | (1.62 | ) | | (1.60 | ) | | (1.56 | ) | | (1.54 | ) | | (1.51 | ) |
Net asset value, end of period | | $ | 30.62 | | $ | 30.92 | | $ | 30.40 | | $ | 29.70 | | $ | 29.38 | | $ | 28.85 | |
TOTAL RETURN(b)(c) | | | 1.69 | % | | 7.23 | % | | 7.91 | % | | 6.58 | % | | 7.36 | % | | 8.51 | % |
RATIOS/SUPPLEMENTAL DATA: | | | | | | | | | | | | | | | | | | | |
Net assets, end of period (000s) | | $ | 1,362,060 | | $ | 1,040,017 | | $ | 471,116 | | $ | 257,366 | | $ | 110,845 | | $ | 25,274 | |
Ratios to Average Net Assets (including interest expense) | | | | | | | | | | | | | | | | | | | |
Ratio of expenses to average net assets excluding fee waivers and reimbursements(d)(e) | | | 1.83 | %(f) | | 1.94 | % | | 2.22 | % | | 2.15 | % | | 1.96 | % | | 2.03 | % |
Ratio of expenses to average net assets including fee waivers and reimbursements(e) | | | 1.85 | %(f) | | 1.95 | % | | 2.15 | % | | 1.99 | % | | 1.56 | % | | 1.54 | % |
Ratio of net investment income to average net assets(e) | | | 1.56 | %(f) | | 1.38 | % | | 0.95 | % | | 1.06 | % | | 0.96 | % | | 1.59 | % |
Ratios to Average Net Assets (excluding interest expense) | | | | | | | | | | | | | | | | | | | |
Ratio of expenses to average net assets excluding fee waivers and reimbursements(d)(e) | | | 1.65 | %(f) | | 1.69 | % | | 1.75 | % | | 1.80 | % | | 1.96 | % | | 2.02 | % |
Ratio of expenses to average net assets including fee waivers and reimbursements(e) | | | 1.67 | %(f) | | 1.70 | % | | 1.68 | % | | 1.64 | % | | 1.56 | % | | 1.53 | % |
Portfolio turnover rate | | | 14 | %(g) | | 8 | % | | 13 | % | | 16 | % | | 18 | % | | 35 | % |
(a) | Per share amounts are calculated using the average shares method. |
(b) | Total returns are historical in nature and assume changes in share price, reinvestment of dividends and capital gains distributions, if any. Had the Advisor not absorbed a portion of the Fund expenses, total returns would have been lower. |
(c) | Includes adjustments in accordance with accounting principles generally accepted in the United States and, consequently, the net asset value for financial reporting purposes and the returns based upon those net asset values may differ from the net asset values and returns for shareholder transactions. |
(d) | Represents the ratio of expenses to average net assets absent fee waivers and/or expense reimbursement by the Advisor. |
(e) | The ratios of expenses to average net assets and net investment income (loss) to average net assets do not directly reflect the expenses of the underlying institutional private real estate investments in which the Fund invests. The Fund invests in each underlying institutional private real estate investment based upon its net asset value, inclusive of management fees, which typically range from 0.50% to 1.30% on an annualized basis. The Fund’s Total Return is reported net of all fees and expenses. |
(f) | Annualized. |
(g) | Not annualized. |
The accompanying notes are an integral part of these financial statements.
Semi-Annual Report | March 31, 2020 | 21 |
Bluerock Total Income+ Real Estate Fund - Class L | Financial Highlights |
The table below sets forth financial data for one share of beneficial interest outstanding throughout each period presented.
| | For the Six Months Ended March 31, 2020 (Unaudited) | | For the Year Ended September 30, 2019 | | For the Year Ended September 30, 2018 | | For the Period Ended September 30, 2017(a) | |
Net asset value, beginning of period | | $ | 30.25 | | $ | 29.89 | | $ | 29.34 | | $ | 29.42 | |
INCOME FROM INVESTMENT OPERATIONS: | | | | | | | | | | | | | |
Net investment income/(loss)(b) | | | 0.15 | | | 0.26 | | | 0.13 | | | (0.06 | ) |
Net realized and unrealized gain | | | 0.29 | | | 1.68 | | | 1.99 | | | 0.76 | |
Total from investment operations | | | 0.44 | | | 1.94 | | | 2.12 | | | 0.70 | |
| | | | | | | | | | | | | | |
DISTRIBUTIONS: | | | | | | | | | | | | | |
From net realized gain on investments | | | (0.59 | ) | | (0.32 | ) | | (0.53 | ) | | – | |
Return of capital | | | (0.21 | ) | | (1.26 | ) | | (1.04 | ) | | (0.78 | ) |
Total distributions | | | (0.80 | ) | | (1.58 | ) | | (1.57 | ) | | (0.78 | ) |
| | | | | | | | | | | | | | |
Net asset value, end of period | | $ | 29.89 | | $ | 30.25 | | $ | 29.89 | | $ | 29.34 | |
TOTAL RETURN(c)(d) | | | 1.46 | % | | 6.70 | % | | 7.40 | % | | 2.40 | %(e) |
| | | | | | | | | | | | | | |
RATIOS/SUPPLEMENTAL DATA: | | | | | | | | | | | | | |
Net assets, end of period (000s) | | $ | 73,824 | | $ | 88,605 | | $ | 42,975 | | $ | 5,059 | |
Ratios to Average Net Assets (including interest expense) | | | | | | | | | | | | | |
Ratio of expenses to average net assets excluding fee waivers and reimbursements(f)(g) | | | 2.32 | %(h) | | 2.44 | % | | 2.84 | % | | 2.83 | %(h) |
Ratio of expenses to average net assets including fee waivers and reimbursements(f) | | | 2.35 | %(h) | | 2.46 | % | | 2.74 | % | | 2.63 | %(h) |
| | | | | | | | | | | | | | |
Ratio of net investment income/(loss) to average net assets(f) | | | 0.96 | %(h) | | 0.87 | % | | 0.44 | % | | (0.64 | )%(h) |
Ratios to Average Net Assets (excluding interest expense) | | | | | | | | | | | | | |
Ratio of expenses to average net assets excluding fee waivers and reimbursements(f)(g) | | | 2.15 | %(h) | | 2.18 | % | | 2.27 | % | | 2.35 | %(h) |
Ratio of expenses to average net assets including fee waivers and reimbursements(f) | | | 2.18 | %(h) | | 2.20 | % | | 2.17 | % | | 2.14 | %(h) |
Portfolio turnover rate | | | 14 | %(i) | | 8 | % | | 13 | % | | 16 | %(i) |
(a) | Class L commenced operations June 1, 2017. |
(b) | Per share amounts are calculated using the average shares method. |
(c) | Total returns are historical in nature and assume changes in share price, reinvestment of dividends and capital gains distributions, if any. Had the Advisor not absorbed a portion of the Fund expenses, total returns would have been lower. |
(d) | Includes adjustments in accordance with accounting principles generally accepted in the United States and, consequently, the net asset value for financial reporting purposes and the returns based upon those net asset values may differ from the net asset values and returns for shareholder transactions. |
(e) | Not Annualized. |
(f) | The ratios of expenses to average net assets and net investment income (loss) to average net assets do not directly reflect the expenses of the underlying institutional private real estate investments in which the Fund invests. The Fund invests in each underlying institutional private real estate investment based upon its net asset value, inclusive of management fees, which typically range from 0.50% to 1.30% on an annualized basis. The Fund’s Total Return is reported net of all fees and expenses. |
(g) | Represents the ratio of expenses to average net assets absent fee waivers and/or expense reimbursement by the Advisor. |
(h) | Annualized. |
(i) | Not annualized. |
The accompanying notes are an integral part of these financial statements.
22
Bluerock Total Income+ Real Estate Fund | Notes to Financial Statements |
March 31, 2020 (Unaudited)
1. ORGANIZATION
Bluerock Total Income+ Real Estate Fund, formerly known as Total Income+ Real Estate Fund, (the “Fund” or the “Trust”) was organized as a Delaware statutory trust on May 25, 2012 and is registered under the Investment Company Act of 1940, as amended, (the “1940 Act”), as a non-diversified, closed-end management investment company that operates as an interval fund with a continuous offering of Fund shares. The Fund’s investment advisor is Bluerock Fund Advisor, LLC (the “Advisor”). The Fund’s primary investment objective is to generate current income while secondarily seeking long-term capital appreciation, with low to moderate volatility and low correlation to the broader markets. The Fund pursues its investment objectives by investing, under normal circumstances, at least 80% of assets plus the amount of any borrowings for investment purposes, in real estate industry securities, primarily in income producing equity and debt securities.
The Fund currently offers Class A, Class C, Class I, Class L and Class M shares. Class A shares commenced operations on October 22, 2012 and are offered at net asset value plus a maximum sales charge of 5.75%. Class A shareholders who tender for repurchase Class A shares that were purchased in amounts of $1,000,000 or more that have been held less than one year (365 days) from the purchase date will be subject to an early withdrawal charge of 1.00% of the original purchase price. Class C and Class I shares commenced operations on April 1, 2014 and are offered at net asset value. Class C shares are subject to an early withdrawal charge of 1.00% if redeemed less than 365 days after purchase. Class L shares commenced operations on June 1, 2017 and are offered at net asset value plus a maximum sales charge of 4.25%. Class M shares commenced operations on February 1, 2020 and are offered at net asset value, however as of March 31, 2020 no such shares have been issued. Each class represents an interest in the same assets of the Fund and classes are identical except for differences in their sales charge structures and ongoing service and distribution charges. All classes of shares have equal voting privileges except that each class has exclusive voting rights with respect to its service and/or distribution plans. The Fund’s income, expenses (other than class specific distribution fees) and realized and unrealized gains and losses are allocated proportionately each day based upon the relative net assets of each class.
2. SUMMARY OF SIGNIFICANT ACCOUNTING POLICIES
The following is a summary of significant accounting policies followed by the Fund in preparation of its financial statements. These policies are in conformity with accounting principles generally accepted in the United States of America (“GAAP”). The preparation of financial statements requires management to make estimates and assumptions that affect the reported amounts of assets and liabilities and disclosure of contingent assets and liabilities at the date of the financial statements and the reported amounts of income and expenses for the period. Actual results could differ from those estimates. The Fund is an investment company and accordingly follows the investment company accounting and reporting guidance of the Financial Accounting Standards Board (“FASB”) Accounting Standard Codification (“ASC”) Topic 946 “Financial Services – Investment Companies.”
A. Security Valuation –Securities listed on an exchange are valued at the last reported sale price at the close of the regular trading session of the exchange on the business day the value is being determined, or in the case of securities listed on NASDAQ, at the NASDAQ Official Closing Price (“NOCP”). In the absence of a sale such securities shall be valued at the last bid price. Debt securities, including restricted securities, are valued based on evaluated prices received from a third party pricing vendor or from brokers who make markets in such securities. Debt securities are valued by pricing vendors who utilize matrix pricing which considers yield or price of bonds of comparable quality, coupon, maturity and type or by broker-supplied prices. When independent prices are unavailable or unreliable, debt securities may be valued utilizing pricing methodologies which consider similar factors that would be used by third party pricing vendors. Debt securities are generally categorized as Level 2 in the hierarchy but may be Level 3 depending on the circumstances. The Fund may invest a portion of its assets in below investment grade securities. The value of these securities can be more volatile due to changes in the credit quality of the issuer and is sensitive to changes in economic, market and regulatory conditions. Short-term investments that mature in 60 days or less may be valued at amortized cost, provided such valuations represent fair value.
Valuation of Underlying Funds – The Fund invests in portfolios of open-end investment companies and exchange traded funds (the “Underlying Funds”). The Underlying Funds value securities in their portfolios for which market quotations are readily available at their market values (generally the last reported sale price) and all other securities and assets/liabilities at their fair value to the methods established by the board of directors of the Underlying Funds.
Open-end investment companies are valued at their respective net asset values (“NAV”) as reported by such investment companies. The shares of many closed-end investment companies, after their initial public offering, frequently trade at a price per share, which is different than the NAV per share. The difference represents a market premium or market discount of such shares. There can be no assurances that the market discount or market premium on shares of any closed-end investment company purchased by the Fund will not change.
When price quotations for certain securities are not readily available, or if the available quotations are not believed to be reflective of market value by the Advisor, those securities will be valued at “fair value” as determined in good faith by the Valuation Committee using procedures adopted by and under the supervision of the Fund’s Board of Trustees (the “Board”). There can be no assurance that the Fund could purchase or sell a portfolio security at the price used to calculate the Fund’s NAV.
Semi-Annual Report | March 31, 2020 | 23 |
Bluerock Total Income+ Real Estate Fund | Notes to Financial Statements |
March 31, 2020 (Unaudited)
Fair valuation procedures may be used to value a substantial portion of the assets of the Fund. The Fund may use the fair value of a security to calculate its NAV when, for example, (1) a portfolio security is not traded in a public market or the principal market in which the security trades is closed, (2) trading in a portfolio security is suspended and not resumed prior to the normal market close, (3) a portfolio security is not traded in significant volume for a substantial period, or (4) the Advisor determines that the quotation or price for a portfolio security provided by a broker-dealer or independent pricing service is inaccurate.
Valuation of Private Real Estate Securities – The Fund invests a significant portion of its assets in Private Real Estate Securities (“Private Funds”), which includes securities that invest in real estate assets (“Private REITs”) and securities that invest in debt instruments secured or otherwise supported by real estate assets (“Private Debt”). The Private Funds measure their investment assets at fair value, and report a NAV per share on a calendar quarter basis. In accordance with ASC 820-10, the Fund has elected to apply the practical expedient or its equivalent, and to value its investments in Private Funds at their respective NAVs at each quarter. For non-calendar quarter-end days, the Valuation Committee estimates the fair value of each Private REIT by adjusting the most recent NAV for each Private REIT by the change in a proprietary benchmark that the Valuation Committee has deemed to be representative of the entire Private REIT market. For Private Debt, the Fund accrues income on a daily basis for each Private Debt investment. As of March 31, 2020, all of the Fund’s investments in Private Funds were valued at their respective NAVs.
Valuation of Public Non-Traded Equity Real Estate Securities – The Fund may invest a portion of its assets in Public Non-Traded Equity Real Estate Securities (“Public Non-Traded ERES”). The Public Non-Traded ERES do not report periodic NAVs with enough frequency to be valued using the practical expedient. The Valuation Committee determines the fair value of Public Non-Traded ERES on a daily basis by considering various factors such as the most recent published NAV, the transaction price, secondary market trades, shareholder redemption and dividend reinvestment programs, and potential illiquidity discounts.
The “fair value” of securities may be difficult to determine and thus judgment plays a greater role in the valuation process. The fair valuation methodology may include or consider the following guidelines, as appropriate: (1) evaluation of all relevant factors, including but not limited to, pricing history, current market level, supply and demand of the respective security; (2) comparison to the values and current pricing of securities that have comparable characteristics; (3) knowledge of historical market information with respect to the security; (4) other factors relevant to the security which would include, but not be limited to, duration, yield, fundamental analytical data, the Treasury yield curve, and credit quality.
The values assigned to fair valued investments are based on available information and do not necessarily represent amounts that might ultimately be realized, since such amounts depend on future developments inherent in long-term investments. Changes in the fair valuation of portfolio securities may be less frequent and of greater magnitude than changes in the price of portfolio securities valued at their last sale price, by an independent pricing service, or based on market quotations. Imprecision in estimating fair value can also impact the amount of unrealized appreciation or depreciation recorded for a particular portfolio security and differences in the assumptions used could result in a different determination of fair value, and those differences could be material.
The Fund utilizes various methods to measure the fair value of its investments on a recurring basis. GAAP establishes a hierarchy that prioritizes inputs to valuation methods. The three levels of input are:
Level 1 – | Unadjusted quoted prices in active markets for identical assets and liabilities that the Fund has the ability to access. |
| |
Level 2 – | Observable inputs other than quoted prices included in Level 1 that are observable for the asset or liability, either directly or indirectly. These inputs may include quoted prices for the identical instrument on an inactive market, prices for similar instruments, interest rates, prepayment speeds, credit risk, yield curves, default rates and similar data. |
| |
Level 3 – | Unobservable inputs for the asset or liability, to the extent relevant observable inputs are not available, representing the Fund’s own assumptions about the assumptions a market participant would use in valuing the asset or liability, and would be based on the best information available. |
The availability of observable inputs can vary from security to security and is affected by a wide variety of factors, including, for example, the type of security, whether the security is new and not yet established in the marketplace, the liquidity of markets, and other characteristics particular to the security. To the extent that valuation is based on models or inputs that are less observable or unobservable in the market, the determination of fair value requires more judgment. Accordingly, the degree of judgment exercised in determining fair value is greatest for instruments categorized in Level 3.
24
Bluerock Total Income+ Real Estate Fund | Notes to Financial Statements |
March 31, 2020 (Unaudited)
The inputs used to measure fair value may fall into different levels of the fair value hierarchy. In such cases, for disclosure purposes, the level in the fair value hierarchy within which the fair value measurement falls in its entirety, is determined based on the lowest level input that is significant to the fair value measurement in its entirety. The valuation techniques used by the Fund to measure fair value during the six months ended March 31, 2020, maximized the use of observable inputs and minimized the use of unobservable inputs.
The inputs or methodology used for valuing securities are not necessarily an indication of the risk associated with investing in those securities. The following tables summarize the inputs used as of March 31, 2020 for the Fund’s assets measured at fair value:
Investments in Securities at Value | | Level 1 | | Level 2 | | Level 3 | | Total | |
Private Real Estate Securities (Measured at new asset value)(a) | | $ | – | | $ | – | | $ | – | | $ | 2,118,933,234 | |
Public Non-Traded Real Estate Investment Trusts | | | – | | | – | | | 467,884 | | | 467,884 | |
Publicly Traded Real Estate Investment Trusts | | | 33,709,879 | | | – | | | – | | | 33,709,879 | |
Real Estate Debt Securities | | | – | | | 219,515,160 | | | – | | | 219,515,160 | |
Preferred Stocks | | | 12,015,453 | | | – | | | – | | | 12,015,453 | |
Short Term Investments | | | 189,489,388 | | | – | | | – | | | 189,489,388 | |
TOTAL | | $ | 235,214,720 | | $ | 219,515,160 | | $ | 467,884 | | $ | 2,574,130,998 | |
(a) | In accordance with ASC 820-10, investments that are measured at fair value using the NAV per share (or its equivalent) practical expedient have not been classified in the fair value hierarchy. The fair value amounts presented in this table are intended to permit reconciliation of the fair value hierarchy to the amounts presented in the Portfolio of Investments and Statement of Assets and Liabilities. |
B. Other Investment Vehicles – The Fund may invest in other investment vehicles such as exchange traded funds (“ETFs”), index funds, closed-end funds and mutual funds. Such funds are bought and sold on a securities exchange. An ETF trades like common stock and typically represents a fixed portfolio of securities designed to track the performance and dividend yield of a particular domestic or foreign market index. The Fund may purchase an investment vehicle to temporarily gain exposure to a portion of the U.S. or a foreign market. The risks of owning such investment vehicles generally reflect the risks of owning the underlying securities they are designed to track, although any lack of liquidity could result in it being more volatile. Additionally, such investment vehicles have fees and expenses that reduce their value relative to their underlying holdings.
C. Security Transactions and Investment Income – Investment security transactions are accounted for on a trade date basis. Cost is determined and gains and losses are based upon the specific identification method for both financial statement and federal income tax purposes. Dividend income is recorded on the ex-dividend date and interest income is recorded on the accrual basis. Purchase discounts and premiums on securities are accreted and amortized over the life of the respective securities.
D. Federal Income Taxes – The Fund intends to comply with the requirements of Subchapter M of the Internal Revenue Code applicable to regulated investment companies and will distribute all of its taxable income, if any to shareholders. Accordingly, no provision for Federal income taxes is required in the financial statements.
The Fund recognizes the tax benefits of uncertain tax positions only when the position is “more likely than not” to be sustained assuming examination by tax authorities. Management has reviewed the tax positions and has concluded that no liability for unrecognized tax benefits should be recorded related to uncertain tax positions related to the open tax years (2017-2019) or expected to be taken in the Fund’s 2019 tax returns. The Fund identifies its major tax jurisdictions as U.S. Federal. The Fund recognizes interest and penalties, if any, related to unrecognized tax benefits as income tax expense in the Statement of Operations. During the six months ended March 31, 2020, the Fund did not incur any interest or penalties. Generally tax authorities can examine tax returns filed for the last three years.
E. Distributions to Shareholders – Distributions from investment income are declared and paid quarterly. Distributions from net realized capital gains, if any, are declared and paid annually and are recorded on the ex-dividend date. The character of income and gains to be distributed is determined in accordance with income tax regulations, which may differ from GAAP.
For the six months ended March 31, 2020, the Fund declared distributions to shareholders in the amount of $61,374,028, which resulted in $27,931,862 elected to be paid in cash and $33,442,167 that was reinvested through the Fund’s dividend reinvestment policy. During this same period, the Fund had total investment income of $38,222,316, net realized gains/(loss) on investments totaling $46,529,246, net change in unrealized appreciation on investments of $(27,326,629) and net expenses of $23,913,906.
Semi-Annual Report | March 31, 2020 | 25 |
Bluerock Total Income+ Real Estate Fund | Notes to Financial Statements |
March 31, 2020 (Unaudited)
The Fund’s primary investment objective is to generate current income while secondarily seeking long-term capital appreciation with low to moderate volatility and low correlation to the broader markets. The Fund’s total return is expected to be comprised of income plus realized gains and unrealized gains, less Fund-level expenses. Therefore, a portion of the Fund’s total return has been comprised of unrealized gains.
The Fund’s distributions for any period may be higher or lower than the Fund’s net return and therefore should not be used as a measure of performance or confused with yield or income generated by the Fund’s underlying investments. Further, the actual distribution amounts and sources of those amounts for tax reporting purposes will depend upon the Fund’s investment experience during its fiscal year and may be subject to changes based on tax regulations. Distributions in excess of the Fund’s total return will cause the Fund’s NAV to decline. During the six months ended March 31, 2020, the Fund’s Class A Shares had a starting NAV of $30.43, paid distributions of $0.81 and had an ending NAV of $30.11. The Fund’s Class C Shares had a starting NAV of $29.22, paid distributions of $0.77 and had an ending NAV of $28.80. The Fund’s Class I Shares had a starting NAV of $30.92, paid distributions of $0.82 and had an ending NAV of $30.62. The Fund’s Class L Shares had a starting NAV of $30.25, paid distributions of $0.80 and had an ending NAV of $29.89.
The Fund’s distribution policy is expected to result in distributions that equal a fixed percentage of the Fund’s current net asset value per share. All or a portion of a distribution may consist of a return of capital (i.e. from your original investment). Shareholders should not assume that the source of a distribution from the Fund is net profit. Shareholders should note that return of capital will reduce the tax basis of their shares and potentially increase the taxable gain, if any, upon disposition of their shares. Investors should not draw any conclusions about the Fund’s investment performance from the amount of its distribution.
The Fund’s historical NAV details are available on the Fund’s website at www.bluerockfunds.com/performance.
F. Indemnification – The Trust indemnifies its officers and the Board for certain liabilities that may arise from the performance of their duties to the Trust. Additionally, in the normal course of business, the Fund enters into contracts that contain a variety of representations and warranties and which provide general indemnities. The Fund’s maximum exposure under these arrangements is unknown, as this would involve future claims that may be made against the Fund that have not yet occurred. However, based on experience, the Trust expects the risk of loss due to these warranties and indemnities to be remote.
3. ADVISORY FEE AND OTHER RELATED PARTY TRANSACTIONS
A. Advisory Fees – Pursuant to an investment advisory agreement with the Fund, (the “Advisory Agreement”), investment advisory services are provided to the Fund by the Advisor. Under the terms of the Advisory Agreement, the Advisor receives monthly fees calculated at an annual rate of 1.50% of the average daily net assets of the Fund. For the six months ended March 31, 2020, the Advisor earned advisory fees of $16,912,616.
Pursuant to an expense limitation agreement, the Advisor has contractually agreed to waive all or part of its management fees and/or make payments to limit Fund operating expenses (exclusive of any taxes, interest, acquired fund fees and expenses, brokerage and extraordinary expenses, but inclusive of organizational costs and offering costs) at least until January 31, 2021 so that the total annual operating expenses of the Fund do not exceed 1.95%, 2.70%, 1.70%, 2.20% and 2.45%, of the Fund’s average daily net assets for Class A, Class C, Class I, Class L and Class M shares, respectively.
Fee waivers and expense payments may be recouped by the Advisor from the Fund, upon approval by the Board, to the extent that the reimbursement occurs no more than three fiscal years from the fiscal year in which they were incurred and such reimbursement will not cause the expense limitation then in effect or in effect at the time of the waiver to be exceeded. During the six months ended March 31, 2020, the Advisor did not waive any fees and/or reimburse expenses and recouped previously waived fees of $219,042. Including amounts waived during the six months ended March 31, 2020, cumulative fees and/or expenses subject to recapture pursuant to the aforementioned conditions amounted to $1,157,234 and will expire during the fiscal years indicated below:
| 2020 | | 2021 | | 2022 | | 2023 | |
| $ | 1,001,876 | | $ | 155,358 | | $ | 0 | | $ | 0 | |
Sub-advisory services were provided to the Fund pursuant to agreements between the Advisor and each of Mercer Investment Management, Inc. (“Mercer”) and RREEF America, LLC (“RREEF” and together with Mercer, the “Sub-Advisors”). Under each of the terms of the sub-advisory agreements, the Advisor compensates the Sub-Advisors based on the Fund’s assets allocated to the respective Sub-Advisor. Under the terms of the Sub-Advisory Agreement with Mercer, the Sub-Advisor receives fees from the Advisor (not the Fund) as follows: 0.0250% of the Fund’s assets invested in publicly traded real estate securities, and 0.15% for up to $250 million in total Fund assets, 0.13% for $250 million to $500 million in total Fund assets, 0.12% for $500 million to $750 million in total Fund assets, 0.10% for $750 million to $1 billion in total Fund assets, 0.08% for $1 billion to $1.3 billion in total Fund assets, 0.07% for $1.3 billion to $1.5 billion in total Fund assets, 0.06% for $1.5 billion to $2 billion in total Fund assets, and 0.05% for $2 billion or more in total Fund assets invested in private real estate assets.
26
Bluerock Total Income+ Real Estate Fund | Notes to Financial Statements |
March 31, 2020 (Unaudited)
Under the terms of the Sub-Advisory Agreement with RREEF, RREEF receives fees from the Advisor (not the Fund) as follows: For the portion of the Fund invested in liquid real assets, sub-advisory fees are calculated at an annual rate of 0.60% for up to $50 million in assets allocated to RREEF, 0.55% for $50 million to $100 million in assets allocated to RREEF, and 0.50% for greater than $100 million in assets allocated to RREEF. For the portion of the Fund which is invested in non-publicly traded real estate related debt securities, sub-advisory fees are calculated at an annual rate of 0.75% for up to $350 million in assets allocated to RREEF, 0.60% in excess of $350 million through $700 million in assets allocated to RREEF, and 0.55% for assets in excess of $700 million allocated to RREEF.
B. Distributor – The distributor of the Fund is ALPS Distributors, Inc., (the “Distributor”). The Board has adopted, on behalf of the Fund, a Shareholder Services Plan and a Distribution Plan under which the Fund may compensate financial industry professionals for providing ongoing services in respect to clients with whom they have distributed shares of the Fund. Under the Shareholder Services Plan, the Fund pays up to 0.25% per year of the average daily net assets of each of Class A, Class C and Class L shares for such services. For the six months ended March 31, 2020, the Fund incurred shareholder servicing fees of $681,636, $534,487 and $100,367 for Class A, Class C and Class L shares, respectively. Under the Distribution Plan, the Fund pays 0.75% and 0.25% per year of its average daily net assets for such services for Class C shares and Class L shares, respectively. For the six months ended March 31, 2020, the Fund incurred distribution fees of $1,603,462 and $100,367 for Class C shares and Class L, respectively.
The Distributor acts as the Fund’s principal underwriter in a continuous public offering of the Fund’s shares. For the six months ended March 31, 2020, the Distributor received $2,444,259 in underwriting commissions for sales of Class A shares, of which $407,577 was retained by the principal underwriter or other affiliated broker-dealers. For the six months ended March 31, 2020, the Distributor received $576,623 in underwriting commissions for sales of Class L shares, of which $131,855 was retained by the principal underwriter or other affiliated broker-dealers.
C. ALPS Fund Services, Inc. (“ALPS”) – ALPS provides administration and fund accounting services to the Trust. Pursuant to separate servicing agreements with ALPS, the Fund pays ALPS customary fees for providing administration and fund accounting services to the Fund.
D. Transfer Agent – DST Systems, Inc., an affiliate of ALPS, serves as transfer, dividend paying and shareholder servicing agent for the Fund (“Transfer Agent”).
E. Trustees – Effective January 1, 2020, each Trustee who is not affiliated with the Trust or Advisor receives an annual fee of $37,500, paid quarterly, of which $25,000 is paid in cash and the remaining $12,500 is paid in the equivalent amount of the Fund shares, as well as reimbursement for any reasonable expenses incurred attending the meetings. Prior to January 1, 2020, each Trustee who is not affiliated with the Trust or Advisor received an annual fee of $25,000, paid quarterly, as well as reimbursement for any reasonable expenses incurred attending the meetings. None of the executive officers receive compensation from the Trust.
4. INVESTMENT TRANSACTIONS
The cost of purchases and proceeds from the sale of securities, other than short-term securities, for the six months ended March 31, 2020, amounted to $644,816,618 and $313,929,422 respectively.
5. REPURCHASE OFFERS / SHARES OF BENEFICIAL INTEREST
Pursuant to Rule 23c-3 under the 1940 Act, the Fund offers shareholders on a quarterly basis the option of redeeming shares, at NAV, of no less than 5% and no more than 25% of the shares outstanding on the Repurchase Request Deadline (as defined in the Fund’s prospectus). The Board shall determine the quarterly repurchase offer amount. There is no guarantee that shareholders will be able to sell all of the shares they desire in a quarterly repurchase offer, although each shareholder will have the right to require the Fund to purchase up to and including 5% of such shareholder’s shares in each quarterly repurchase. Limited liquidity will be provided to shareholders only through the Fund’s quarterly repurchases.
Semi-Annual Report | March 31, 2020 | 27 |
Bluerock Total Income+ Real Estate Fund | Notes to Financial Statements |
March 31, 2020 (Unaudited)
During the six months ended March 31, 2020, the Fund completed two quarterly repurchase offers. The Fund offered to repurchase up to 5% of the number of its outstanding shares as of the Repurchase Pricing Dates. The results of the repurchase offers were as follows:
| | Repurchase Offer | | Repurchase Offer | |
Commencement Date | | | September 24, 2019 | | | December 27, 2019 | |
Repurchase Request Deadline | | | November 5, 2019 | | | February 4, 2020 | |
Repurchase Pricing Date | | | November 5, 2019 | | | February 4, 2020 | |
| | | | | | | |
Net Asset Value as of Repurchase Offer Date: | | | | | | | |
Class A | | $ | 30.54 | | $ | 30.60 | |
Class C | | $ | 29.31 | | $ | 29.30 | |
Class I | | $ | 31.04 | | $ | 31.11 | |
Class L | | $ | 30.36 | | $ | 30.39 | |
Amount Repurchased: | | | | | | | |
Class A | | $ | 16,480,456 | | $ | 24,249,060 | |
Class C | | $ | 8,963,853 | | $ | 7,862,055 | |
Class I | | $ | 23,565,149 | | $ | 45,870,406 | |
Class L | | $ | 580,460 | | $ | 453,387 | |
6. DISTRIBUTIONS TO SHAREHOLDERS AND TAX COMPONENTS OF CAPITAL
The tax character of Fund distributions for the following years was as follows:
Year | | Ordinary Income | | Long-Term Capital Gain | | Return of Capital | |
2019 | | $ | – | | $ | 13,982,111 | | $ | 73,322,094 | |
2018 | | | – | | | 16,930,680 | | | 35,764,078 | |
As of March 31, 2020, the aggregate costs of investments, gross unrealized appreciation/(depreciation) and net unrealized appreciation for Federal tax purposes were as follows:
| | Gross Appreciation (excess of value over tax cost) | | Gross Depreciation (excess of tax cost over value) | | Net Unrealized Appreciation | | Cost of Investments for Income Tax Purposes | |
| | $ | 270,333,569 | | $ | (41,910,311 | ) | $ | 228,423,258 | | $ | 2,345,707,740 | |
The difference between book basis and tax basis distributable earnings and unrealized appreciation/(depreciation) is primarily attributable to the tax deferral of losses on wash sales and tax adjustments for partnerships.
As of September 30, 2019, the components of accumulated earnings/(deficit) on a tax basis were as follows:
| | Other cumulative effect of timing differences | | Net unrealized appreciation on investments | | Total | |
| | $ | (15,419,679 | ) | $ | 254,853,932 | | $ | 239,434,253 | |
The Fund elects to defer the year ending September 30, 2019, late year ordinary losses in the amount of $15,419,679.
Permanent book and tax differences, primarily attributable to net operating losses and tax adjustments for partnerships, resulted in reclassification for the fiscal year ended September 30, 2019 as follows:
| | Paid-in Capital | | Total Distributable Earnings | |
| | $ | (12,478,848 | ) | $ | 12,478,848 | |
Included in the amounts offset to paid in capital were net operating losses of $10,827,714.
28
Bluerock Total Income+ Real Estate Fund | Notes to Financial Statements |
March 31, 2020 (Unaudited)
7. REDEMPTION FEES
Class C shareholders and certain Class A shareholders who tender for repurchase shares that have been held less than one year (365 days) from the purchase date will be subject to an early withdrawal charge of 1.00% of the original purchase price with respect to such shares. The redemption fee does not apply to shares that were acquired through reinvestment of distributions or in connection with the death or disability of the shareholder. The redemption fee is paid directly to the Fund. For the six months ended March 31, 2020, the Fund did not receive any such fees.
8. COMMITMENTS AND CONTINGENCIES
Commitments – As of March 31, 2020, the Fund had unfunded commitments and/or contingencies for the below listed Private Real Estate Securities:
Security | | Value | | Unfunded Commitments | | Redemption Frequency | | Redemption Notice (Days) | |
AEW Core Property Trust | | $ | 22,543,294 | | $ | – | | | Quarterly | | | 45 | |
Ares Enhanced Income Fund | | | 34,250,682 | | | 85,676,253 | | | Quarterly | | | 90 | |
Bain Capital Real Estate Fund I | �� | | 27,552,091 | | | 64,959,611 | | | None | | | None | |
Black Creek Industrial | | | – | | | 100,000,000 | | | Quarterly | | | 90 | |
Blackstone Property Partners | | | 114,583,089 | | | – | | | Quarterly | | | 90 | |
Bridge Debt Strategies Fund III, LP | | | 43,370,086 | | | 36,818,159 | | | None | | | None | |
Brookfield Premier Real Estate Partners | | | 50,122,087 | | | 230,325,931 | | | Quarterly | | | 90 | |
Carlyle Property Investors | | | 89,358,247 | | | 37,288,109 | | | Quarterly | | | 90 | |
CBRE U.S. Core Partners | | | 102,227,218 | | | 25,000,000 | | | Quarterly | | | 60 | |
Clarion Gables Multifamily Trust | | | 108,547,756 | | | – | | | Quarterly | | | 90 | |
Clarion Lion Industrial Trust | | | 122,605,825 | | | 18,000,000 | | | Quarterly | | | 90 | |
Clarion Lion Properties Fund | | | 168,528,537 | | | – | | | Quarterly | | | 90 | |
Harrison Street Core Property Fund | | | 72,067,909 | | | – | | | Quarterly | | | 45 | |
Invesco Core Real Estate Fund | | | 33,720,974 | | | – | | | Quarterly | | | 45 | |
Invesco U.S. Income Fund LP | | | 98,064,146 | | | 18,000,000 | | | Quarterly | | | 45 | |
Morgan Stanley Prime Property Fund LLC | | | 277,458,578 | | | – | | | Quarterly | | | 90 | |
PGIM PRISA I | | | 33,676,729 | | | – | | | Quarterly | | | 90 | |
PGIM PRISA III | | | 61,943,206 | | | 94,027,016 | | | Quarterly | | | 90 | |
Principal Enhanced Property Fund LP | | | 113,639,953 | | | – | | | Quarterly | | | 90 | |
Prologis Targeted US Logistics | | | 244,927,623 | | | 61,200,000 | | | Quarterly | | | 90 | |
RREEF America REIT II, Inc. | | | 35,950,488 | | | – | | | Quarterly | | | 45 | |
RREEF Core Plus Industrial Fund LP | | | 94,670,137 | | | 11,700,000 | | | Quarterly | | | 90 | |
Sentinel Real Estate Fund | | | 65,088,663 | | | 18,000,000 | | | Daily | | | * | |
Stockbridge Smart Markets Fund | | | 42,608,296 | | | – | | | Quarterly | | | 45 | |
Stockbridge Value Fund II | | | 2,611,120 | | | 823,713 | | | None | | | None | |
UBS Trumbull Property G&I Fund | | | 58,816,499 | | | 7,500,000 | | | Quarterly | | | 60 | |
* | Written notice required for redemption, no minimum timeline required. |
Typically, when the Fund invests in a Private Fund, it makes a binding commitment to invest a specified amount of capital in the applicable Private Fund. The capital commitment may be drawn by the general partner of the Private Fund either all at once, or over time through a series of capital calls at the discretion of the general partner. As such, the Unfunded Commitments column above reflects the remaining amount of the Fund’s commitments to be called by the general partner of the Private Fund. Further, the organizational documents of the Private Funds in which the Fund invests typically have set redemption schedules and notification requirements. As such, the Redemption Frequency column above reflects the frequency in which the Private Fund accepts redemption requests and the Redemption Notice column reflects the number of days of advanced notice required. While redemptions can be requested at the frequency listed above, there is no guarantee the Fund will be paid all or any of the redemption amount at the time requested.
Semi-Annual Report | March 31, 2020 | 29 |
Bluerock Total Income+ Real Estate Fund | Notes to Financial Statements |
March 31, 2020 (Unaudited)
9. LINE OF CREDIT
Credit Facility – On November 23, 2016, the Fund entered into a secured, revolving line of credit agreement (“Credit Agreement”) with Credit Suisse for investment purposes, subject to annual renewal and other limitations of the 1940 Act for borrowings. Borrowings under the Credit Agreement bear interest up to the rate of 3 month LIBOR plus 235 basis points at the time of borrowing. During the six months ended March 31, 2020, the average amount of borrowing outstanding, approximate weighted average interest rate on borrowings and total interest expense for the six months ended March 31, 2020 were $90,178,182, 3.60% and $2,007,409 respectively. Note, of the total interest expense incurred, $546,423 was related to fees on unused borrowings. As of March 31, 2020, the Fund had $154,000,000 of outstanding borrowings under the Credit Agreement.
10. SUBSEQUENT EVENTS
The Fund completed a quarterly repurchase offer on May 5, 2020 which resulted in 5% of the Fund’s shares being repurchased for $125,649,754.
Subsequent events after the date of the Statement of Assets and Liabilities have been evaluated through the date the financial statements were issued. Except as stated above, management has concluded that there is no impact requiring adjustment or disclosure in the financial statements.
30
Bluerock Total Income+ | Renewal of Investment Advisory Agreement |
Real Estate Fund | and Sub-Advisory Agreements |
March 31, 2020 (Unaudited)
At a meeting held on November 15, 2019 (the “Meeting”), the Board of Trustees (the “Board”) of the Fund, including a majority of the Trustees who are not “interested persons” (the “Independent Trustees”), as such term is defined by the 1940 Act, approved the renewal of the Advisory Agreement with Bluerock Fund Advisor, LLC (the “Adviser” or “BFA”), as well as the renewal of the Sub-Advisory Agreement (the “Mercer Agreement”) between BFA and Mercer Investment Management, Inc. (“Mercer”) and the Sub-Advisory Agreement (the “RREEF Agreement”) between BFA and RREEF America, LLC (“RREEF” and together with Mercer, the “Sub-Advisors”).
Matters considered by the Trustees in connection with the Board’s renewal of the Advisory Agreement and Sub-Advisory Agreements included the following:
Advisory Agreement with BFA
Nature, Extent and Quality of Services. The Board reviewed materials provided by the Adviser relating to the Advisory Agreement. With respect to the nature, extent and quality of services provided, the Trustees reviewed a description of the manner in which investment decisions were made for the Fund, a description of the services provided by the Adviser, including an overview of the experience of the professional personnel performing services for the Fund, key risks associated with the Adviser’s management of the Fund, and steps to mitigate those risks.
The Board recognized that the Adviser continued to expand the depth and experience of its personnel, noting the continued strong team employed with regard to the Fund. The Trustees agreed that the Adviser continued to have open lines of communication with the Board, and were accessible, forthcoming and transparent with their plans. The Board also considered the depth and scope of the investment services provided to the Fund by the Adviser, including with respect to the monitoring and oversight of multiple sub-advisers, the research and review associated with making investment decisions for the Fund, and general oversight of the Fund’s other service providers. The Trustees recognized the significant investments made by the Adviser to obtain each sub-adviser’s expertise across investment classes continued to provide positive benefits for the Fund. In addition, the Board took note of the efforts of the Adviser to actively manage the Fund’s portfolio and complete complex investments that require significant time and work, including its “hands on” approach with its investments, completing significant diligence and being willing to serve on committees of its underlying investments in order to drive returns and achieve gains for shareholders. With respect to compliance, the Board considered that BFA had developed its compliance policies and procedures with Vigilant to ensure such policies and procedures were consistent with industry best practice, noting no recent issues with regard to regulatory, litigation or similar matters. The Board, including the Independent Trustees, concluded that the Adviser’s quality and depth of personnel, resources, investment methods and compliance policies and procedures had shown itself as very strong in performing its duties under the Advisory Agreement. The Trustees acknowledged the dedication of the Adviser’s investment team and the efforts taken by the team to execute complex investments for the Fund. The Trustees accordingly agreed that they were very satisfied with the nature, overall quality and extent of the management services provided by the Adviser.
Performance. The Board considered the performance of the Fund (Class A shares, load waived) as compared to the performance of the Fund’s peer group, a selection of select, similarly structured closed-end interval funds with comparable investment objectives to that of the Fund (the “Peer Group”), and benchmark indices across bonds, equity and Public REITs, represented by the Barclays U.S. Aggregate Bond Index (“Bond Index”), S&P 500 Total Return Index (“S&P 500”), and the MSCI U.S. REIT Index (“REIT Index”), respectively. The Board also considered the performance of the Fund compared to the NCREIF Fund Index-Open End Diversified Core Equity Index (“NFIODCE”) and a blended index reflecting the returns of a mix of Private REIT and Public REIT investments comprised of the NFIODCE and MSCI U.S. REIT Index weighted at 80% and 20%, respectively (the “Blended Index”).
The Board considered that for the one year period, the Fund’s Class A shares’ performance outperformed the S&P 500 return and NFIODCE, but underperformed each of the other indices and Peer Group. The Board considered that for the period since the Fund’s inception (October 22, 2012) to September 30, 2019, the Fund outperformed the Bond Index but underperformed the other comparison indices. The Board noted that the Adviser primarily targeted delivering superior risk-adjusted returns in managing the strategy. With respect to the Fund’s risk-adjusted returns, the Trustees acknowledged that the Fund had outperformed each of the comparison indices and Peer Group funds across all time periods and was ranked the top performing fund on a risk adjusted basis across the entire Morningstar universe of real estate funds. The Board considered the Fund’s low correlation to the Public REIT market and recognized the Adviser’s expertise in employing the Fund’s strategy. Based on the information provided, the Board concluded that the Adviser had met the Fund’s investment objectives and that it was very satisfied with the Fund’s performance.
Fees and Expenses. As to the costs of the services provided by the Adviser, the Trustees considered a comparison of the Fund’s advisory fee and overall expenses to the Peer Group. The Board considered that the Fund’s advisory fee of 1.50% was equal to the highest of the Peer Group funds. The Board also considered the net expense ratio of the Fund, noting it was higher than the mean of the Peer Group, but within the range. The Trustees noted that the Adviser had agreed to reimburse expenses to limit net annual operating expenses and considered the significant skill and expertise provided by the Adviser, as well as the investments made towards the success of the Fund’s strategy. The Trustees considered the sub-advisory fee breakpoints. It was noted that the Adviser’s strategy appeared to require additional resources to execute compared to some of the Peer Group funds given the Adviser’s active management of the Fund’s portfolio, particularly in comparison to the Peer Group. In light of these factors, the Board concluded that the advisory fee was not unreasonable relative to the value provided by the Adviser.
Semi-Annual Report | March 31, 2020 | 31 |
Bluerock Total Income+ | Renewal of Investment Advisory Agreement |
Real Estate Fund | and Sub-Advisory Agreements |
March 31, 2020 (Unaudited)
Profitability. The Board considered the profitability of the Adviser and whether such profits were reasonable in light of the services provided to the Fund. The Board reviewed a profitability analysis prepared by the Adviser. The Board considered that, as the Fund was a specialized product, its complex strategy required appropriate expertise to successfully execute, and, accordingly, the Adviser had in nested in quality personal and other resources. They acknowledged the Adviser had assumed significant business risks in managing the Fund. The Trustees noted that the Adviser realized a reasonable, but not excessive profit in connection with its relationship with the Fund that warranted the compensation and agreed, given the specialized nature of the Fund’s strategy and other considerations noted, the advisory fee was appropriate.
Economies of Scale. The Board considered whether economies of scale had been or would likely be realized by the Adviser. The Trustees noted that successful execution of the strategy would likely require additional work as the Fund grows, they also noted the Adviser had been waiving fees as result of the expense cap until recently. Accordingly, the Board agreed that breakpoints were not necessary at this time, agreeing to revisit whether economies of scale had been realized in the future.
Conclusion. In considering the Advisory Agreement, the Trustees did not identify any one factor as all important, but rather considered many factors collectively in light of surrounding circumstances. Further, each Trustee may have afforded a different weight to different factors. The Trustees, having requested and received such information from the Adviser as they believed reasonably necessary to evaluate the terms of the Advisory Agreement, and assisted by the advice of independent counsel, determined that continuation of the Advisory Agreement for an additional one-year term was in the best interests of the Fund and its shareholders.
Sub-Advisory Agreement with Mercer
Nature, Extent and Quality of Services. The Board reviewed materials provided by Mercer related to the Mercer Agreement with the Adviser. The Board considered the role of Mercer with respect to the Fund, noting that Mercer’s principal responsibilities were to assist the Adviser by providing research and diligence services for the Fund’s portfolio of Private REITs and other non-traded securities, providing recommendations on investments and portfolio construction, and determining target allocations. The Board considered that Mercer’s services continued to be primarily consultative in nature and that the firm did not maintain responsibility with respect to the Fund’s adherence to its investment objective or limitations. The Board considered the depth of research performed by Mercer, noting that Mercer represented that its research process included visits to underlying investment managers and statistical analysis. The Board also considered the quality of communication between the Adviser and Mercer, noting that the Adviser reported it frequently met with Mercer, including in-person quarterly meetings, periodic calls and nearly daily communication. The Fund’s CCO noted Mercer did not experience any material compliance issues or major changes in personnel since the Board’s last approval. The Board also took into consideration that the Adviser had reported that its relationship with Mercer was positive and operating effectively. The Board concluded that the nature, overall quality and extent of services provided by Mercer to the Adviser and the Fund were satisfactory.
Performance. The Board considered that Mercer’s function was to provide consultative services to the Adviser and that Mercer did not approve or make investment decisions for the Fund. The Board considered the Fund’s overall performance, noting the Board’s conclusion that the Fund’s performance was satisfactory, and in line with the expectations of the Board. The Board considered that the Adviser continued to be satisfied with the performance of Mercer believed the service positively impacted performance, and recommended continuation of the agreement with Mercer. Based on the information provided, the Board concluded that Mercer’s performance supported the renewal.
Fees and Expenses. The Board considered Mercer’s fees for its services, noting that the Adviser and Mercer had agreed to a tiered fee schedule providing for breakpoints at various levels. The Board considered the quantity and quality of the research and reporting generated by Mercer and Mercer’s rates for the provision of such services, noting that Mercer did not provide similar sub-advisory services for any other account. In consideration of this and the fact that the Adviser was satisfied with Mercer’s service and the Adviser paid such fees, the Board concluded that Mercer’s fees were not unreasonable.
Economies of Scale. The Board discussed whether economies of scale had been achieved with respect to the management of the Fund under the Mercer Agreement and whether there was potential for realization of any further economies of scale. The Board considered that the Mercer Agreement included breakpoints in its fee above certain asset levels and concluded that while such breakpoints appeared reasonable, economies of scale would be best evaluated at the Adviser, rather than sub-advisory level.
Profitability. The Board noted that Mercer did not calculate profitability on a per client basis or provide similar sub-advisory services for any other account. The Board also noted that Mercer was usually compensated on a per-investment basis with respect to the monitoring and reporting that it performed for other clients. The Board considered the fees paid to Mercer during the period and representations of Mercer of what Mercer estimated it would have received on its standard pay schedule, but also noted that such estimates did not include all services provided by Mercer to the Fund. With this context, the Board concluded that Mercer’s profitability was not unreasonable.
32
Bluerock Total Income+ | Renewal of Investment Advisory Agreement |
Real Estate Fund | and Sub-Advisory Agreements |
March 31, 2020 (Unaudited)
Conclusion. The Board noted that in considering the Mercer Agreement, it did not identify any one factor as all important, but rather considered various factors collectively in light of surrounding circumstances. Further, it noted that each Trustee may have afforded a different weight to different factors. The Board, having requested and received such information from Mercer as the Board believed to be reasonably necessary to evaluate the terms of the Mercer Agreement, and as assisted by the advice of counsel, concluded that continuation of the Mercer Agreement for an additional one-year term was in the best interests of the Fund and its shareholders.
Sub-Advisory Agreement with RREEF
Nature, Extent and Quality of Services. The Board reviewed the materials provided by RREEF related to the RREEF Agreement. The Board reviewed the experience of professional personnel performing services for the Fund, a description of the manner in which investment decisions were made for the Fund by RREEF and a description of the investment advisory services provided by RREEF. The Board reviewed the extensive track record of RREEF and its affiliates. The Board considered the relative sophistication of techniques employed by RREEF in designing and executing investment strategies. The Board also considered the fact that the Adviser also utilized RREEF for debt investments. The Board recognized RREEF’s expertise in this area and long track record making these investments but also that the Adviser held final determination for these direct debt investments. The Board noted the results of a recent SEC exam of RREEF and were satisfied with the firm’s response. The Board concluded that RREEF had sufficient quality and depth of personnel, resources, investment methods and compliance policies and procedures essential to perform its duties under the RREEF Agreement.
Performance. The Board considered that RREEF provided investment advice for the limited portion of the Fund’s portfolio allocated by the Adviser to publicly-traded real estate securities and debt securities. The Board continued to acknowledge that the Fund received bespoke investment advice from RREEF that may not correlate to investment advice rendered for any other account or portfolio managed by RREEF. The Board considered that the publicly-traded real estate securities portion of the Fund managed by RREEF outperformed each of the one, three and since inception periods compared to its benchmark index, the MSCI U.S. REIT Index. The Board noted that RREEF’s initial work with respect to the Fund’s direct debt investments reflected the firm’s expertise in assisting the Adviser in selecting investments. The Board concluded that RREEF’s overall performance was satisfactory and that the Fund’s continued relationship with RREEF would benefit of shareholders.
Fees and Expenses. The Board then discussed the fees paid to RREEF. The Board considered that RREEF’s sub-advisory fees ranged from 0.60% of the average daily value of the assets allocated to RREEF and scaled downward depending on the applicable breakpoint. The Board noted that with respect to the Fund’s direct debt investments, which ranged from 0.75% of the average daily value of the Fund’s direct debt investments and scaled downward depending on the applicable breakpoint. The Board also commented that the Fund was not responsible for these fees, rather, these fees were paid by the Adviser. The Board considered the quality of services provided by RREEF and the level of fees charged by RREEF to other accounts, taking into account the nature and size of those accounts as compared to the portion of the Fund allocated to RREEF and the level of active management and personalized service the Fund received from RREEF. With respect to the direct debt investments, the Board noted RREEF’s representation that it did not provide similar direct services to other clients. The Board concluded that based on RREEF’s experience, expertise, and services provided to the Fund, that the fees to be paid to RREEF were not unreasonable.
Profitability. The Board also considered the profitability of RREEF. The Board considered RREEF’s expenses with respect to the Fund across each investment type and RREEFs fees earned during the period. The Board noted that RREEF estimated a not unreasonable profit earned in connection with its relationship with the Fund. The Board concluded that excessive profitability was not an issue with respect to RREEF.
Economies of Scale. The Board considered whether economies of scale were likely achieved by. RREEF. The Board considered that RREEF had agreed to breakpoints in its fee above certain asset levels and concluded that while such breakpoints appeared reasonable, economies of scale would be best evaluated at the Adviser, rather than sub-advisory level.
Conclusion. The Board noted that in considering the RREEF Agreement, it did not identify any one factor as all important, but rather considered various factors collectively in light of surrounding circumstances, and that each Trustee may have afforded a different weight to different factors. The Board, having requested and received such information from RREEF as the Board believed to be reasonably necessary to evaluate the terms of the RREEF Agreement, and as assisted by the advice of counsel, found that approval of the RREEF Agreement was in the best interests of the Fund and its shareholders.
Semi-Annual Report | March 31, 2020 | 33 |
Bluerock Total Income+ Real Estate Fund | Additional Information |
March 31, 2020 (Unaudited)
1. PROXY VOTING POLICIES AND VOTING RECORD
A description of the policies and procedures that the Fund uses to vote proxies relating to its portfolio securities is available without charge upon request by calling toll-free 844-819-8287 or on the Securities and Exchange Commission’s (“SEC”) website at http://www.sec.gov. Information regarding how the Fund voted proxies relating to underlying portfolio securities during the most recent 12-month period ended June 30th is available without charge upon request by calling toll-free 844-819-8287, or on the SEC’s website at http://www.sec.gov.
2. QUARTERLY PORTFOLIO HOLDINGS
The Fund files a complete listing of portfolio holdings for the Fund with the SEC as of the first and third quarters of each fiscal year on Form N-PORT. The filings are available upon request by calling 844-819-8287. Furthermore, you may obtain a copy of the filing on the SEC’s website at http://www.sec.gov. The Fund’s Form N-PORT may also be reviewed and copied at the SEC’s Public Reference Room in Washington, D.C., and information on the operation of the Public Reference Room may be obtained by calling 1-800-SEC-0330.
34
Bluerock Total Income+ Real Estate Fund | Privacy Policy |
March 31, 2020 (Unaudited)
FACTS | WHAT DOES THE BLUEROCK TOTAL INCOME+ REAL ESTATE FUND DO WITH YOUR PERSONAL INFORMATION? |
Why? | Financial companies choose how they share your personal information. Federal law gives consumers the right to limit some but not all sharing. Federal law also requires us to tell you how we collect, share, and protect your personal information. Please read this notice carefully to understand what we do. |
What? | The types of personal information we collect and share depend on the product or service you have with us. This information can include: |
| ● Social Security number | ● Purchase History |
| ● Assets | ● Account Balances |
| ● Retirement Assets | ● Account Transactions |
| ● Transaction History | ● Wire Transfer Instructions |
| ● Checking Account Information | |
| When you are no longer our customer, we may continue to share your personal information as described in this notice. |
How? | All financial companies need to share customers’ personal information to run their everyday business. In the section below, we list the reasons financial companies can share their customers’ personal information; the reasons the Fund chooses to share; and whether you can limit this sharing. |
Reasons we can share your personal information | Does Bluerock Total Income+
Real Estate Fund share? | Can you limit this sharing? |
For our everyday business purposes – such as to process your transactions, maintain your account(s), respond to court orders and legal investigations, or report to credit bureaus | Yes | No |
For our marketing purposes – to offer our products and services to you | No | We don’t share |
For joint marketing with other financial companies | No | We don’t share |
For our affiliates’ everyday business purposes – information about your transactions and experiences | No | We don’t share |
For our affiliates’ everyday business purposes – information about your creditworthiness | No | We don’t share |
For nonaffiliates to market to you | No | We don’t share |
Questions? | Call 1-844-819-8287 |
Semi-Annual Report | March 31, 2020 | 35 |
Bluerock Total Income+ Real Estate Fund | Privacy Policy |
March 31, 2020 (Unaudited)
Who We Are | |
Who is providing this notice? | Bluerock Total Income+ Real Estate Fund |
What We Do | |
How does Bluerock Total Income+ Real Estate Fund protect my personal information? | To protect your personal information from unauthorized access and use, we use security measures that comply with federal law. These measures include computer safeguards and secured files and buildings. |
| Our service providers are held accountable for adhering to strict policies and procedures to prevent any misuse of your nonpublic personal information. |
How does Bluerock Total Income+ Real Estate Fund collect my personal information? | We collect your personal information, for example, when you |
| ● Open an account |
| ● Provide account information |
| ● Give us your contact information |
| ● Make deposits or withdrawals from your account |
| ● Make a wire transfer |
| ● Tell us where to send the money |
| ● Tells us who receives the money |
| ● Show your government-issued ID |
| ● Show your driver’s license |
| We also collect your personal information from other companies. |
Why can’t I limit all sharing? | Federal law gives you the right to limit only |
| ● Sharing for affiliates’ everyday business purposes – information about your creditworthiness |
| ● Affiliates from using your information to market to you |
| ● Sharing for nonaffiliates to market to you |
| State laws and individual companies may give you additional rights to limit sharing. |
Definitions | |
Affiliates | Companies related by common ownership or control. They can be financial and nonfinancial companies. |
| ● Bluerock Total Income+ Real Estate Fund does not share with our affiliates. |
Nonaffiliates | Companies not related by common ownership or control. They can be financial and nonfinancial companies |
| ● Bluerock Total Income+ Real Estate Fund does not share with nonaffiliates so they can market to you. |
Joint marketing | A formal agreement between nonaffiliated financial companies that together market financial products or services to you. |
| ● Bluerock Total Income+ Real Estate Fund doesn’t jointly market. |
36
Investment Adviser
Bluerock Fund Advisor, LLC
1345 Avenue of the Americas, 32nd Floor
New York, NY 10105
Distributor
ALPS Distributors, Inc.
1290 Broadway, Suite 1000
Denver, CO 80203
Legal Counsel
Thompson Hine LLP
41 South High Street, Suite 1700
Columbus, OH 43215
Independent Registered Public Accounting Firm
BBD, LLP
1835 Market Street, 3rd Floor
Philadelphia, PA 19103
How to Obtain Proxy Voting Information
Information regarding how the Fund votes proxies relating to portfolio securities for the 12 month period ended June 30th as well as a description of the policies and procedures that the Fund used to determine how to vote proxies is available without charge, upon request, by calling 1-844-819-8287 or by referring to the Securities and Exchange Commission’s (“SEC”) website at http://www.sec.gov.
How to Obtain 1st and 3rd Fiscal Quarter Portfolio Holdings
The Fund files its complete schedule of portfolio holdings with the SEC for the first and third quarters of each fiscal year on Form N-PORT. Form N-PORT is available on the SEC’s website at http://www.sec.gov and may be reviewed and copied at the SEC’s Public Reference Room in Washington, DC (1-800-SEC-0330). The information on Form N-PORT is available without charge, upon request, by calling 1-844-819-8287.
(b) Not applicable.
Item 2. Code of Ethics.
Not applicable to this report.
Item 3. Audit Committee Financial Expert.
Not applicable to this report.
Item 4. Principal Accountant Fees and Services.
Not applicable to this report.
Item 5. Audit Committee of Listed Registrants.
Not applicable to the Registrant.
Item 6. Investments.
(a) | The schedule of investments is included as part of the Reports to Shareholders filed under Item 1 of this report. |
(b) Not applicable to the Registrant.
Item 7. Disclosure of Proxy Voting Policies and Procedures for Closed-End Management Investment Companies.
Not applicable to this report.
Item 8. Portfolio Managers of Closed-End Management Investment Companies.
Item 9. Purchases of Equity Securities by Closed-End Management Investment Company and Affiliates Purchasers.
None.
Item 10. Submission of Matters to a Vote of Security Holders.
None.
Item 11. Controls and Procedures.
(a) | Based on an evaluation of the Registrant’s disclosure controls and procedures as of a date within 90 days of filing date of this Form N-CSR, the principal executive officer and principal financial officer of the Registrant have concluded that the disclosure controls and procedures of the Registrant are reasonably designed to ensure that the information required in filings on Form N-CSR is recorded, processed, summarized, and reported within 90 days of the filing date, including that information required to be disclosed is accumulated and communicated to the Registrant’s management, including the Registrant’s principal executive officer and principal financial officer, as appropriate to allow timely decisions regarding required disclosure. |
(b) | There were no significant changes in the registrant’s internal control over financial reporting that occurred during the period covered by this report that has materially affected, or are reasonably likely to materially affect, the registrant’s internal control over financial reporting. |
Item 12. Disclosure of Securities Lending Activities for Closed-End Management Investment Companies.
None.
Item 13. Exhibits.
(a)(1) | Not applicable to this report. |
SIGNATURES
Pursuant to the requirements of the Securities Exchange Act of 1934 and the Investment Company Act of 1940, the registrant has duly caused this report to be signed on its behalf by the undersigned, thereunto duly authorized.
Bluerock Total Income+ Real Estate Fund
By: | /s/Jordan B. Ruddy | |
| Jordan B. Ruddy | |
| President | |
| | |
Date: | June 5, 2020 | |
Pursuant to the requirements of the Securities Exchange Act of 1934 and the Investment Company Act of 1940, this report has been signed below by the following persons on behalf of the registrant and in the capacities and on the dates indicated.
By: | /s/Jordan B. Ruddy | |
| Jordan B. Ruddy | |
| President | |
| | |
Date: | June 5, 2020 | |
By: | /s/Simon Adamiyatt | |
| Simon Adamiyatt | |
| Treasurer | |
| | |
Date: | June 5, 2020 | |