united states
securities and exchange commission
washington, d.c. 20549
form n-csr
certified shareholder report of registered management
investment companies
Investment Company Act file number 811-22710
Total Income+ Real Estate Fund
(Exact name of registrant as specified in charter)
712 Fifth Avenue, 9th floor, New York NY 10019
(Name and address of agent for service)
Registrant's telephone number, including area code: 1- 844-819-8287
Date of fiscal year end: 9/30
Date of reporting period: 3/31/18
Item 1. Reports to Stockholders.
| | | |
| | | |
| | | |
| | | |
| |  | |
| | | |
| | | |
| | | |
| | | |
| | | |
| | | |
| | | |
| | | |
| | | |
| | | |
| | Semi-Annual Report | |
| | March 31, 2018 | |
| | | |
| | | |
| | | |
| | | |
| | | |
| | | |
| | | |
| | | |
| | | |
| | | |
| | | |
| | Investor Information: 1-888-459-1059 | |
| | | |
| | | |
| | | |
| | | |
| | | |
| | | |
| | | |
| | | |
| | | |
| | | |
| | | |
| | This report and the financial statements contained herein are submitted for the general information of shareholders and are not authorized for distribution to prospective investors unless preceded or accompanied by an effective prospectus. Nothing herein contained is to be considered an offer of sale or solicitation of an offer to buy shares of the Total Income+ Real Estate Fund. Such offering is made only by prospectus, which includes details as to offering price and other material information. | |
| | | |
| | Distributed by ALPS Distributors, Inc. | |
| | Member FINRA | |
| | | |
 | |  |
| | | |
| | | SEMI ANNUAL REPORT: (4Q 2017-1Q 2018) |
| | | Letter from the TI+ Portfolio Managers |
To Our Valued Shareholders:
Now in our sixth year, Bluerock’s Total Income+ Real Estate Fund (TI+ or “the Fund”) has continued to meet its objective of generating current income while secondarily seeking long-term capital appreciation with low-to-moderate volatility and low correlation to the broader markets.
Despite first quarter stock market volatility, the Fund’s volatility remained low, driven by its investments in high quality, low leverage, private institutional real estate investments (iPERE), which produced stable cash flows that were not highly correlated to daily stock market fluctuations. In fact, from inception through the first quarter of this year, TI+ has achieved approximately 85% less volatility than the leading stock and public REIT indexes, and 45% less volatility than the Bloomberg Barclays U.S. Aggregate Bond Index.
Our portfolio has expanded to 21 private institutional funds encompassing more than 2,900 properties, with an aggregate underlying Gross Asset Value of approximately $165 billion in real estate holdings (as of March 31, 2018).
We are pleased to report that the Fund’s risk-adjusted performance (as measured by the Sharpe Ratio) compared favorably to leading stock, bond, and REIT indexes in 2017. For the second consecutive calendar year, TI+ generated the highest Sharpe Ratio among the Morningstar universe of global open-end, closed-end, and exchange-traded real estate funds (comprising over 1,200 funds). Since inception, the TI+ Sharpe Ratio was more than four times that of the S&P 500 and more than ten times that of the MSCI US REIT Index as reported by Morningstar, indicating that for each unit of volatility, a TI+ investor received four to ten times the return.1
TI+ continues to focus on providing individual investors with unique access to private institutional real estate funds typically only available to the largest pension funds and institutional investors. We look forward to continued expansion of our investor base this year, as our growing pool of investors discover the Fund’s capacity to generate income while limiting exposure to broader market volatility.
We are pleased to share these highlights with you:
| + | NEW INVESTMENTS: New iPERE investments include the RREEF Core Plus Industrial Fund, as well as recent additional investments in 10 existing private equity holdings. These include Morgan Stanley Prime Property Fund, Blackstone Property Partners, and Clarion Lion Industrial Trust, which are some of the oldest and most respected institutional real estate managers. |
| + | DISTRIBUTIONS2: TI+ has paid 21 consecutive quarterly distributions. The latest distribution of $0.3923 per share (Class A) is equivalent to a 5.25% annualized distribution rate on the 3/28/18 record dividend date NAV of $29.89 per share. This distribution also represents an effective 6.28% distribution rate on the inception $25.00 NAV per share (A share). |
| + | ASSETS UNDER MANAGEMENT: As of 5/7/18, the Fund had approximately $1 billion in assets under management (AUM). We believe this to be a continued validation by investors that TI+ is meeting its mandate to deliver current income and total return with lower volatility and lower correlation to the broader markets. |
Page Source: Morningstar Direct.
| 1 | The Sharpe ratio is an indicator of return earned per unit of volatility and is expressed as the average return earned in excess of the risk-free rate per unit of volatility or total risk. The annualized Sharpe Ratio is based on daily data from 01/01/2017-12/31/2017. Using Morningstar data compiled by Bluerock Fund Advisor, LLC, TIPRX received the highest Sharpe Ratio among 1,257 open, closed end, and exchange traded funds in the global real estate sector equity category for the one year period ending 12/31/2017. TIPRX A Shares; no load. Sharpe Ratio and standard deviation are only two forms of performance measure. The Sharpe Ratio would have been lower if the calculation reflected the load. |
| 2 | The Fund’s distribution policy is to make quarterly distributions to shareholders. The level of quarterly distributions (including any return of capital) is not fixed. The distribution policy is thus subject to change. Shareholders should not assume that the source of a distribution from the Fund is net profit. A portion of the distributions consists of return of capital based on the character of the distributions received from the underlying holdings, primarily Real Estate Investment Trusts. The final determination of the source and tax characteristics of all distributions will be made after the end of the year. The Fund’s distribution amounts were calculated based on income received from underlying investments including capital gains and return of capital realized from the disposition of such investments. |
This is an actively managed, dynamic portfolio. There is no guarantee that any investment (or this investment) will achieve its objectives or goals, pay dividends and/or capital gains, generate positive returns, or avoid losses. Prior performance is not a guarantee of future results.
| CORPORATE HEADQUARTERS | 712 FIFTH AVENUE | 9TH FLOOR | NEW YORK, NY 10019 | 877.826.BLUE (2583) | WWW.BLUEROCKRE.COM |
| SEMI ANNUAL REPORT (4Q 2017 - 1Q 2018) | TOTAL INCOME+ REAL ESTATE FUND |  |
PERFORMANCE
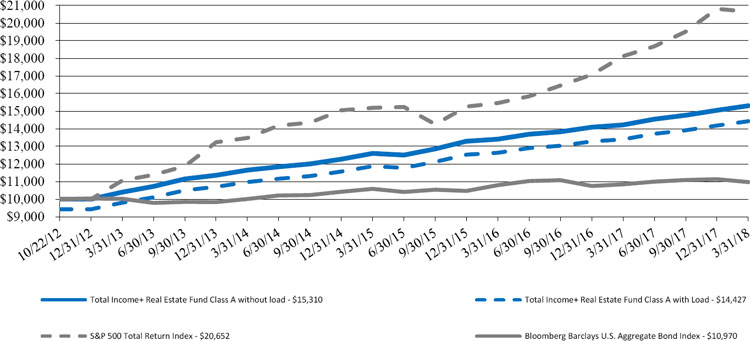
From inception (10/22/12) through 3/31/18, TI+ (A Shares) generated a cumulative total return of 53.1%, or 8.15% annualized. The Fund was able to accomplish this primarily through investments in iPERE funds, which own best-in-class real estate, generating both income and capital appreciation. Private investments are supplemented with select public real estate securities. The Fund offers four share classes: A, C, I and L Shares. A summary of the performance of all share classes is presented below.
Fund Performance thru 3/31/18*
| | One Year | Three Year | Five Year | Since Inception2 |
| TI+ Fund- Class A | 7.72% | 6.69% | 8.04% | 8.15% |
TI+ Fund- Class A
with Max Sales Charge1 | 1.54% | 4.60% | 6.77% | 6.97% |
| TI+ Fund- Class C | 6.92% | 5.91% | 7.24% | 7.35% |
TI+ Fund- Class C
with Load † | 5.92% | 5.91% | 7.24% | 7.35% |
| TI+ Fund- Class I | 7.99% | 6.96% | 8.29% | 8.38% |
| TI+ Fund- Class L | 7.39% | 6.41% | 7.76% | 7.86% |
TI+ Fund- Class L
with Max Sales Charge1 | 2.82% | 4.88% | 6.83% | 7.01% |
| Stocks | 13.99% | 10.78% | 13.31% | 14.27% |
| Public REITs | -4.38% | 0.87% | 5.86% | 7.30% |
| Bonds | 1.20% | 1.20% | 1.82% | 1.72% |
| 1 | The maximum sales charge is 5.75% for A Shares and 4.25% for L Shares. Investors may be eligible for a reduction in sales charges. |
| 2 | Inception date of the A Shares is October 22, 2012. Inception date of the C and I Shares is April 1, 2014. Inception date of the L Shares is June 1, 2017. |
| † | Adjusted for early withdrawal charge of 1.00%. |
| * | Returns for Class C, Class I and Class L Shares prior to their inception dates are based on the performance of Class A Shares. For Class C and Class L Shares, prior performance has been adjusted to reflect differences in expenses between the respective classes and Class A. The actual returns of Class I would have been different from those shown because Class I has lower expenses than Class A. |
The performance data quoted here represents past performance. Current performance may be lower or higher than the performance data quoted above. Investment return and principal value will fluctuate, so that shares, when redeemed, may be worth more or less than their original cost. Past performance is no guarantee of future results. A fund’s performance, especially for very short periods of time, should not be the sole factor in making your investment decisions. For performance information current to the most recent month end, please go online to www.bluerockfunds.com.
The total annual fund operating expense ratio, gross of any fee waivers or expense reimbursements, is 2.38% for Class A, 3.12% for Class C, 2.15% for Class I, and 2.69% for Class L. The Fund’s investment adviser has contractually agreed to reduce its fees and/or absorb expenses of the Fund, at least until January 31, 2019 for Class A, C, I, L shares, to ensure that the net annual fund operating expenses will not exceed 1.95% for Class A, 2.70% for Class C and 1.70% for Class I, and 2.20% for Class L, subject to possible recoupment from the Fund in future years. Please review the Fund’s Prospectus for more detail on the expense waiver. Results shown reflect the full fee waiver, without which the results could have been lower.
It is not possible to invest in an index. You cannot invest directly in an index and unmanaged indices do not reflect fees, expenses or sale charges.
Please see back page for a description of the risks and comparisons of the investment indexes selected.
| Page Sources: Morningstar Direct |
| Stocks: S&P 500 Total Return | REITs: MSCI U.S. REIT Index | Bonds: Bloomberg Barclays U.S. Aggregate Bond Index |
Past performance is no guarantee of future results
| SEMI ANNUAL REPORT (4Q 2017 - 1Q 2018) | TOTAL INCOME+ REAL ESTATE FUND | |
LONG-TERM CAPITAL APPRECIATION
The Fund’s 8.15% annualized return has provided capital appreciation in addition to current income. TI+ generated this appreciation with a positive or neutral return 92% of all days from inception through 3/31/18.
TI+ A Shares, no load
Hypothetical Growth of $10,000 | Inception through 3/31/18

RETURNS AND VOLATILITY
Investment returns should be analyzed with regard to volatility (risk). Risk and return tend to move in lockstep in the investment universe, as depicted in the quadrant chart below. The stock market (represented by the S&P 500), for example, has generated relatively high historical returns, but with high volatility and thus appears in the higher return/higher volatility quadrant. Bonds (represented by the Bloomberg Barclays U. S. Aggregate Bond Index) have generated relatively low returns, but with low volatility, placing them in the low return/low volatility quadrant. TI+, however, has generated a return/risk profile in the desirable upper left (higher return/lower volatility) quadrant.
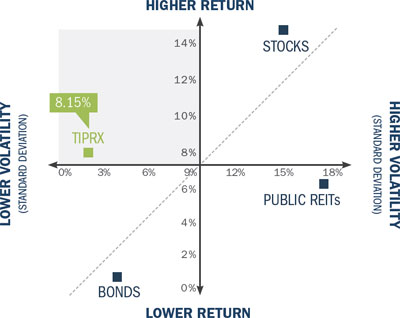
Quadrant chart illustrates total annualized returns and volatility from TI+ inception (10/22/12) through 3/31/18.
| Page Sources: Morningstar Direct |
| TI+ Fund: A-Shares, no load | Stocks: S&P 500 Total Return | REITs: MSCI U.S. REIT Index | Bonds: Bloomberg Barclays U.S. Aggregate Bond Index |
Past performance is no guarantee of future results
| SEMI ANNUAL REPORT (4Q 2017 - 1Q 2018) | TOTAL INCOME+ REAL ESTATE FUND | |
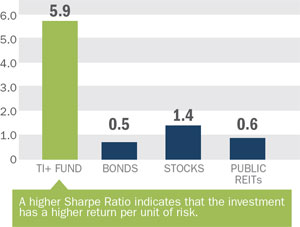
HIGHER RISK-ADJUSTED RETURNS
TI+ has delivered higher risk-adjusted returns than stocks, bonds, or public REITs since its inception, evidenced by its Sharpe Ratio (a risk adjusted performance measure that determines unit of return per unit of risk) of four times the nearest competitive asset class.
TI+ Risk-Adjusted Return Measured by Sharpe Ratio
(From inception through 3/31/2018)
LOWER CORRELATION
TI+ has exhibited lower correlation compared to other asset classes since its inception.
TI+ Fund Correlation vs. Other Asset Classes
(From inception through 3/31/2018)
| | TI+ Fund | Stocks | Public
REITs | Bonds |
| TI+ (A Shares no Load) | 1.00 | 0.33 | 0.48 | 0.13 |
| Stocks | 0.33 | 1.00 | 0.61 | - 0.25 |
| Public REITs | 0.48 | 0.61 | 1.00 | 0.18 |
| Bonds | 0.13 | - 0.25 | 0.18 | 1.00 |

0 = No Correlation | 1 = Perfectly Positively Correlated | -1 = Perfectly Negatively Correlated
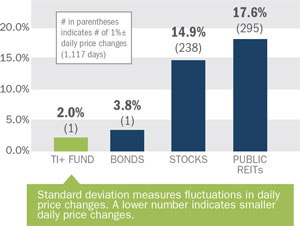
LOWER VOLATILITY
TI+ has experienced lower daily volatility (as measured by standard deviation) than competing asset classes since its inception, with over 85% less volatility than stocks and public REITs.
Lower Volatility Measured by Standard Deviation
(From inception through 3/31/2018)
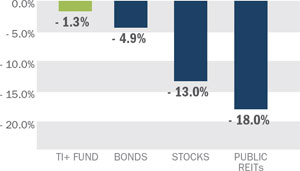
LOW MAXIMUM DRAWDOWN
Maximum drawdown is the maximum decline a security experiences prior to reaching its previous peak.
Maximum Drawdown vs. Other Asset Classes
(From inception through 3/31/2018)
Sharpe Ratio and standard deviation are only two forms of performance measure. The TI+ Sharpe Ratio would have been lower if the calculation reflected the load. Additional fund performance details available at bluerockfunds.com/performance. Investors may be eligible to purchase Class A share without load.
Please see page 8 for a description of the risks and comparisons of the investment indexes selected.
| Page Sources: Morningstar Direct |
| TI+ Fund: A-Shares, no load | Stocks: S&P 500 Total Return | REITs: MSCI U.S. REIT Index | Bonds: Bloomberg Barclays U.S. Aggregate Bond Index |
Past performance is no guarantee of future results
| SEMI ANNUAL REPORT (4Q 2017 - 1Q 2018) | TOTAL INCOME+ REAL ESTATE FUND | |
| | » Fund Sub-Advisors |
| | |
| |  |
| | |
| | Mercer Investment Management, Inc. acts as sub-advisor to the TI+ Fund’s private real estate equity investments. For more than 70 years, Mercer has been one of the world’s leading advisors to endowments, pension funds, sovereign wealth funds and family offices globally, with over 26,000 clients worldwide, and $11.0 trillion in assets under advisement. Mercer works to evaluate over 5,800 investment managers and 29,000 individual investments/strategies and works with Bluerock to select a strategic combination of ‘best-in-class’ institutional real estate managers and investments for the Fund. |
| | |
| |  |
| | |
| | DWS Group GmbH & Co. KGaA (DWS) is one of the world’s leading asset managers with more than $800 billion of assets under management as of March 31, 2018 in Active, Passive and Alternative strategies around the globe. DWS’s real estate investment business has been investing in real estate assets for more than 45 years. As part of the Alternatives platform, the real estate business has more than 450 employees around the world and $59 billion in assets under management, and offers a diverse range of strategies and solutions across the risk/return and geographic spectrums, including core and value-added real estate, real estate securities and real estate debt. RREEF America L.L.C., a subsidiary of DWS, acts as sub-advisor to the TI+ Fund’s public real estate securities investments and is a registered investment adviser under the Advisers Act. |
| | |
LOOKING AHEAD
The U.S. Economy showed continued improvement in 2017 and this momentum is expected to carry through 2018, spurred by a 17-year low unemployment rate,3 Federal Income Tax cuts, higher government spending and favorable financial conditions both in the U.S. and abroad. These positive factors have provided a strong fundamental backdrop for the U.S. real estate market, including Federal Income Tax reform, which specifically should have a net positive impact on commercial real estate in the year ahead.
This accelerating economic growth has prompted the Fed to forecast three rate increases for 2018. We believe commercial real estate markets will perform well in a rising rate environment with income growth driven by upward pressure on rents from increased demand in a strengthening economy. Despite these positive conditions, the specter of rising rates triggered a decline in the public REIT market, causing some significant drawdowns as a result of multiple sell-offs.
While the public REIT market battled with these sell-offs, the private institutional real estate market continued to perform well.4 Returns for institutional real estate, as measured by the NCREIF Property Index, remained close to long term averages, with income being the primary driver as the market cycle matures. As we progress into 2018, real estate fundamentals have remained solid in most markets with few signs of aggressive leverage, overbuilding, or demand-side weakness. Of course, each property sector is unique and has its own demand drivers and specific market conditions, which we monitor closely when managing the Fund’s allocations.
TI+ continues to overweight investments in the industrial and apartment sectors and underweight investments in the retail and office sectors compared to property sector allocations of the broader, NCREIF Property Index. Capitalizing on the growth in e-commerce, industrial sector performance continues to lead all sectors, a trend we expect to continue in the near term. We also remain mindful of opportunities in the public REIT market as select public market valuations become discounted to intrinsic asset value. While the Fund’s emphasis on private institutional real estate has benefitted its performance on both an absolute and risk-adjusted basis, increased public REIT allocations will be evaluated as market dislocations may make the sector attractive on a relative basis.
Our outlook for private institutional real estate remains positive. With rising interest rates suppressing stock and bond market returns, we see institutional real estate as a healthy, income driven, low volatility alternative. We thank you for the trust and confidence represented by your investment in the Total Income+ Real Estate Fund.
| Sincerely, | |
| | |
 | Jordan Ruddy | Adam Lotterman
Portfolio Co-Managers
Total Income+ Real Estate Fund |
3 The Bureau of Labor Statistics, 4 NCREIF Property Index
| FUND HOLDINGS | SEMI ANNUAL REPORT (4Q 2017 - 1Q 2018) | TOTAL INCOME+ REAL ESTATE FUND | |
As of 3.31.2018, the Gross Asset Value of the underlying real estate in the institutional private equity real estate funds in which TI+ is invested is approximately $165 billion, comprising over 2,900 properties across the United States.*
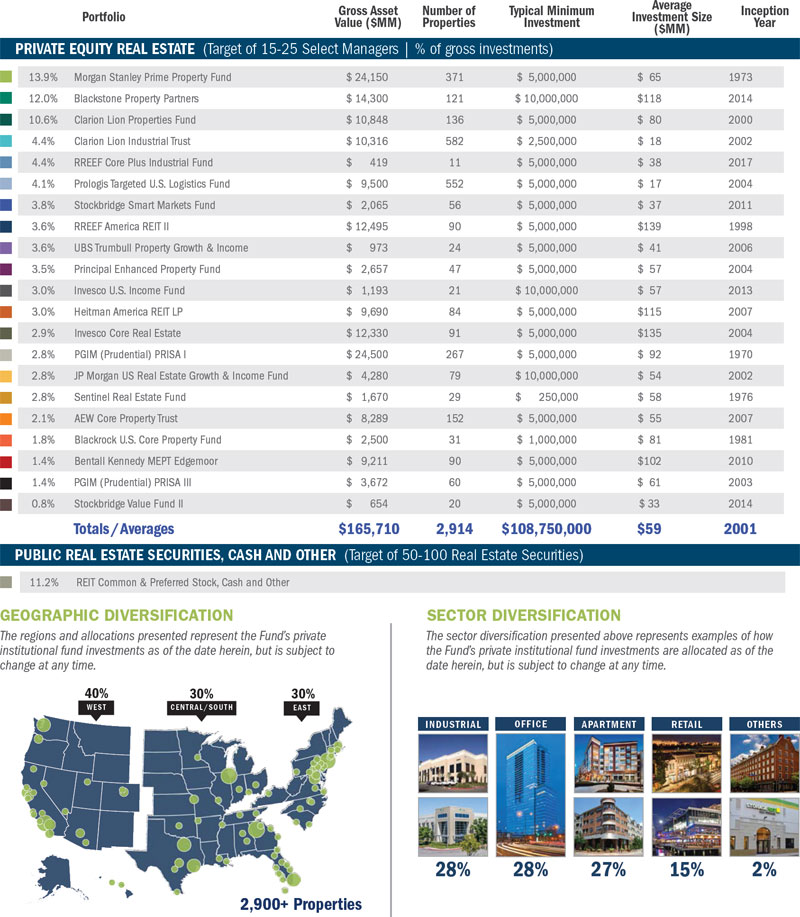
| * | Portfolio holdings are subject to change at any time and should not be considered investment advice. Underlying iPERE data as of Q4 2017 based on allocations by the Fund on 3.31.2018. Diversification does not ensure profit. The organizations referenced above are not invested in Bluerock or the Total Income+ Real Estate Fund, and they may not be invested in the funds in which the Total Income+ Real Estate Fund invests. |
| SEMI ANNUAL REPORT (4Q 2017 - 1Q 2018) | TOTAL INCOME+ REAL ESTATE FUND | |
HIGHLIGHTED ASSETS
The properties pictured below are currently owned by the underlying third-party institutional private equity real estate funds described herein.

Active Portfolio; subject to change.
| SEMI ANNUAL REPORT (4Q 2017 - 1Q 2018) | TOTAL INCOME+ REAL ESTATE FUND | |
DEFINITIONS
Bloomberg Barclays U.S. Aggregate Bond Index: The Barclays U.S. Aggregate Bond Index measures the performance of the U.S. investment grade bond market. The index invests in a wide spectrum of public, investment-grade, taxable, fixed income securities in the United States, including government, corporate, and international dollar-denominated bonds, as well as mortgage-backed and asset-backed securities, all with maturities of more than 1 year. Risks include rising interest rates, credit quality of the issuers and general economic conditions.
Standard Deviation: The measure of the daily percentage change in an investment. Standard deviation shows how much variation from the average exists with a larger number indicating the data points are more spread out over a larger range of values.
Correlation: The degree to which two securitiesv move in relation to each other. Correlation is measured as a correlation coefficient. A value falling between -1 and 1.0 = No Correlation. A value of 1 = Perfectly Positively Correlated. A value -1 = Perfectly Negatively Correlated.
MSCI U.S. REIT Index: A free float-adjusted market capitalization weighted index that is comprised of equity REITs that are included in the MSCI US Investable Market 2500 Index (with the exception of specialty equity REITs that do not generate a majority of their revenue and income from real estate rental and leasing operations). The index represents approximately 85% of the US REIT universe (www.msci.com).
NCREIF Property Index (NPI): The leading benchmark index for Institutional private equity real estate (iPERE) is the National Council of Real Estate Investment Fiduciaries Price Index (NPI) which represents a collection of 7,000+ institutional properties representing all major commercial property types within the U.S. The NPI is a quarterly time series composite total rate of return measure of investment performance of a very large pool of individual commercial real estate properties acquired in the private market for investment purposes only. All properties in the NPI have been acquired, at least in part, on behalf of tax-exempt institutional investors - the great majority being pension funds. As such, all properties are held in a fiduciary environment.
Sharpe Ratio: Measurement of the risk-adjusted performance. The annualized Sharpe Ratio is calculated by subtracting the annualized risk-free rate (3-month Treasury Bill) from the annualized rate of return for a portfolio and dividing the result by the standard deviation of the portfolio returns.
S&P 500: An index of 500 stocks chosen for market size, liquidity and industry grouping, among other factors. The S&P 500 is designed to be a leading indicator of U.S. equities and is meant to reflect the risk/return characteristics of the large cap universe (Investopedia).
You cannot invest directly in an index. Benchmark performance should not be considered to be reflective of Fund performance.
| SEMI ANNUAL REPORT (4Q 2017 - 1Q 2018) | TOTAL INCOME+ REAL ESTATE FUND | |
RISK DISCLOSURES
Not FDIC Insured | No Bank Guarantee | May Lose Value
Investing in the Fund involves risks, including the risk that you may receive little or no return on your investment or that you may lose part or all of your investment. The ability of the Fund to achieve its investment objective depends, in part, on the ability of the Advisor to allocate effectively the Fund’s assets in which it invests. There can be no assurance that the actual allocations will be effective in achieving the Fund’s investment objective or delivering positive returns.
The Fund’s investments may be negatively affected by the broad investment environment in the real estate market, the debt market and/or the equity securities market. The value of the Fund’s investments will increase or decrease based on changes in the prices of the investments it holds. This will cause the value of the Fund’s shares to increase or decrease. The Fund is “non-diversified” under the Investment Company Act of 1940 since changes in the financial condition or market value of a single issuer may cause a greater fluctuation in the Fund’s net asset value than in a “diversified” fund. The Fund is not intended to be a complete investment program.
Limited liquidity is provided to shareholders only through the Fund’s quarterly repurchase offers for no less than 5% of the Fund’s shares outstanding at net asset value. There is no guarantee that shareholders will be able to sell all of the shares they desire in a quarterly repurchase offer. Quarterly repurchases by the Fund of its shares typically will be funded from available cash or sales of portfolio securities. The sale of securities to fund repurchases could reduce the market price of those securities, which in turn would reduce the Fund’s net asset value.
Investing in the Fund’s shares involves substantial risks, including the risks set forth in the “Risk Factors” section of the prospectus, which include, but are not limited to the following:
The Fund may invest in convertible securities which are subject to risks associated with both debt securities and equity securities; correlation risk such as in down markets when the prices of securities and asset classes can also fall in tandem; credit risk related to the securities held by the Fund which may be lowered if an issuer’s financial condition changes which could negatively impact the Fund’s returns on investment in such securities; interest rate risk including a rise in interest rates which could negatively impact the value of fixed income securities.
The Fund’s investment in Institutional Investment Funds will require it to bear a pro rata share of the vehicles’ expenses, including management and performance fees; Issuer and non-diversification risk including the value of an issuer’s securities that are held in the Fund’s portfolio may decline for a number of reasons which directly relate to the issue and as a non-diversified fund.
The Fund may invest more than 5% of its total assets in the securities of one or more issuers; lack of control over institutional private investment funds and other portfolio investments; leverage risk which could cause the Fund to incur additional expenses and may significantly magnify the Fund’s losses in the event of adverse performance of the Fund’s underlying investments; management risk including the judgments of the Advisor or Sub-Advisor about the attractiveness, value and potential appreciation of particular real estate segment and securities in which the Fund invests may prove to be incorrect and may not produce the desired results; market risk; a risk that the amount of capital actually raised by the Fund through the offering of its shares may be insufficient to achieve profitability or allow the Fund to realize its investment objectives; option writing risk; possible competition between underlying funds and between the fund and the underlying funds; preferred securities risk which are subject to credit risk and interest rate risk.
The Fund will concentrate its investments in real estate and, as such, its portfolio will be significantly impacted by the performance of the real estate market; real estate development issues; insurance risk including certain of the companies in the Fund’s portfolio may fail to carry adequate insurance; dependence on tenants to pay rent; companies in the real estate industry in which the Fund may invest may be highly leveraged and financial covenants may affect their ability to operate effectively; environmental issues; current conditions including recent instability in the United States, European and other credit markets; REIT risk including the value of investments in REIT shares may decline because of adverse developments affecting the real estate industry and real property values; underlying funds risk, use of leverage by underlying funds; and valuation of Institutional Investment Funds as of a specific date may vary from the actual sale price that may be obtained if such Investments were sold to a third party.
Investors should carefully consider the investment objectives, risks, charges and expenses of the Total Income+ Real Estate Fund. This and other important information about the Fund is contained in the prospectus, which can be obtained online at www. bluerockfunds.com. The prospectus should be read carefully before investing. The Total Income+ Real Estate Fund is distributed by ALPS Distributors, Inc (ALPS). Bluerock Fund Advisor, LLC is not affiliated with ALPS, Mercer Investment Management, or DWS.

Total Income+ Real Estate Fund
Portfolio Review (Unaudited)
Since Inception through March 31, 2018
Comparison of the Change in Value of a $10,000 Investment
The Fund’s performance figures for the certain periods ended March 31, 2018, compared to its benchmarks:
| | | | | | | | | | | | | | | | | | | | |
| | | | | | | | | | | | | | | | Since | | | Inception | |
| | | | Six Months | | | One Year | | | Three Years | | | Five Years | | | Inception | | | Dates | |
| Total Income+ Real Estate Fund: | | | | | | | | | | | | | | | | | | | |
| Class A | | | | | | | | | | | | | | | | | | | |
| Without Load | | | 3.66% | | | 7.72% | | | 6.69% | | | 8.04% | | | 8.15% | | | 10/22/2012 | |
| With Load ^ | | | -2.29% | | | 1.54% | | | 4.60% | | | 6.77% | | | 6.97% | | | 10/22/2012 | |
| Class C | | | | | | | | | | | | | | | | | | | |
| Without Load | | | 3.29% | | | 6.92% | | | 5.91% | | | — | | | 6.29% | | | 4/1/2014 | |
| With Load ^^ | | | 2.29% | | | 5.92% | | | 5.91% | | | — | | | 6.29% | | | 4/1/2014 | |
| Class I | | | 3.79% | | | 7.99% | | | 6.96% | | | — | | | 7.39% | | | 4/1/2014 | |
| Class L | | | | | | | | | | | | | | | | | | | |
| Without Load | | | 3.55% | | | — | | | — | | | — | | | 5.53% | | | 6/1/2017 | |
| With Load ^^^ | | | -0.86% | | | — | | | — | | | — | | | 1.03% | | | 6/1/2017 | |
| S&P 500 Total Return Index | | | 5.84% | | | 13.99% | | | 10.78% | | | 13.31% | | | 14.27% | | | 10/22/2012 | |
| | | | | | | | | | | | | | | | 11.08% | | | 4/1/2014 | |
| | | | | | | | | | | | | | | | 10.42% | | | 6/1/2017 | |
| Bloomberg Barclays U.S. Aggregate Bond Index | | | -1.08% | | | 1.20% | | | 1.20% | | | 1.82% | | | 1.72% | | | 10/22/2012 | |
| | | | | | | | | | | | | | | | 2.34% | | | 4/1/2014 | |
| | | | | | | | | | | | | | | | -0.25% | | | 6/1/2017 | |
| ^ | Adjusted for initial maximum sales charge of 5.75%. |
| ^^ | Adjusted for contingent deferred sales charge of 1.00%. |
| ^^^ | Adjusted for initial maximum sales charge of 4.25%. |
The S&P 500 Total Return Index is an unmanaged market capitalization-weighted index which is comprised of 500 of the largest U.S. domiciled companies and includes the reinvestment of all dividends. Investors cannot invest directly in an index or benchmark.
The Bloomberg Barclays U.S. Aggregate Bond Index is an unmanaged index which represents the U.S. investment-grade fixed-rate bond market (including government and corporate securities, mortgage pass-through securities and asset-backed securities). Investors cannot invest directly in an index or benchmark.
The performance data quoted is historical. Past performance is no guarantee of future results. The investment return and principal value of an investment will fluctuate. An investor’s shares, when redeemed, may be worth more or less than the original cost. Total returns are
Total Income+ Real Estate Fund
Portfolio Review (Unaudited) (Continued)
Since Inception through March 31, 2018
calculated using the traded NAV on March 31, 2018. Total returns are calculated assuming reinvestment of all dividends and distributions. Total returns would have been lower had the Advisor not waived a portion of its fees. Returns greater than one year are annualized. The Advisor and the Fund have entered into an expense limitation agreement under which the Advisor has contractually agreed to reduce its fees and/or absorb expenses for Class A, Class C, Class I and Class L at least until January 31, 2019 to ensure that the net annual fund operating expenses (excluding of any taxes, interest, brokerage commissions, acquired fund fees and expenses, and extraordinary expenses, such as litigation or reorganization costs, but inclusive of organizational costs and offering costs) will not exceed 1.95%, 2.70%, 1.70%, and 2.20% of the Fund’s average daily net assets attributable to the Class A, Class C, Class I and Class L shares, respectively. However, for the period from February 1, 2018 through May 31, 2018, the Advisor will limit Fund expenses to 2.14% for Class L shares, consistent with the expense limitation in effect until May 31, 2018. The Fund has agreed to repay the Advisor in the amount of any fees the Advisor previously waived and or Fund expenses reimbursed, pursuant to the expense limitation agreement, subject to the limitations therein that: (1) the reimbursement will be made if payable not more than three fiscal years from the fiscal year in which they were incurred; (2) the reimbursement may not be made if it would cause the Expense Limitation then in effect or in effect at time of waiver to be exceeded; and (3) the reimbursement is approved by the Fund’s Board of Trustees.
The Fund’s total gross annual operating expenses, including the expenses of underlying funds and before any fee waiver, are 2.38%, 3.12%, 2.15% and 2.69% for Class A, Class C, Class I and Class L, respectively, per the January 31, 2018 prospectus. Class A shares are subject to a maximum sales charge imposed on purchases of 5.75%, Class C shares are subject to an early withdrawal charge of 1.00% if redeemed less than 365 days after the purchase and Class L shares are subject to a maximum sales charge imposed on purchases of 4.25%. The above performance figures do not reflect the deduction of taxes that a shareholder would have to pay on Fund distributions or the redemption of the Fund shares. For performance information current to the most recent month-end, please call 1-888-459-1059.
| Portfolio Composition as of March 31, 2018 (Unaudited) |
| |
| | | Percent of Net | |
| | | Assets | |
| Private Equity Real Estate Securities | | | 102.37 | % |
| Public Equity Real Estate Securities | | | 4.62 | % |
| Short-Term Investment | | | 7.89 | % |
| Common Stock | | | 0.39 | % |
| Total Investments | | | 115.27 | % |
| Liabilities Less Other Assets | | | -15.27 | % |
| Total Net Assets | | | 100.00 | % |
See the Portfolio of Investments in this semi-annual report for a more detailed account of the Fund’s holdings.
Total Income+ Real Estate Fund
PORTFOLIO OF INVESTMENTS (Unaudited)
March 31, 2018
| Shares | | | Security | | Value | |
| | | | | PRIVATE EQUITY REAL ESTATE SECURITIES ^ - 102.37% | | | | |
| | | | | APARTMENTS - 3.16% | | | | |
| | 342 | | | Sentinel Real Estate Fund | | $ | 29,447,011 | |
| | | | | | | | | |
| | | | | DIVERSIFIED - 84.06% | | | | |
| | 22,139 | | | AEW Core Property Trust | | | 22,080,905 | |
| | 194 | | | Blackrock US Core Property | | | 18,967,130 | |
| | 101,657 | | | Blackstone Property Partners * | | | 129,417,581 | |
| | 78,735 | | | Clarion Lion Properties Fund | | | 113,915,834 | |
| | 26,324 | | | Heitman American Real Estate Fund | | | 31,929,429 | |
| | 174 | | | Invesco Core Real Estate Fund | | | 31,257,934 | |
| | 25,090 | | | Invesco U.S. Income Fund LP | | | 32,119,676 | |
| | 19,862,877 | | | J.P. Morgan U.S. Real Estate Income and Growth Fund | | | 29,877,164 | |
| | 7,593 | | | MEPT Edgemoor LP ** | | | 15,395,616 | |
| | 8,116 | | | Morgan Stanley Prime Property Fund LLC | | | 148,822,025 | |
| | 3,000,170 | | | Principal Enhanced Property Fund LP | | | 36,802,689 | |
| | 19,193 | | | PGIM PRISA I | | | 30,031,473 | |
| | 9,075 | | | PGIM PRISA III | | | 15,027,725 | |
| | 323,369 | | | RREEF America REIT II, Inc. | | | 38,975,781 | |
| | 26,836 | | | Stockbridge Smart Markets Fund | | | 40,643,540 | |
| | 1 | | | Stockbridge Value Fund II | | | 8,823,371 | |
| | 1,632 | | | UBS Trumbull Property G&I Fund | | | 38,498,547 | |
| | | | | | | | 782,586,420 | |
| | | | | INDUSTRIAL - 15.15% | | | | |
| | 28,055 | | | Clarion Lion Industrial Trust | | | 47,960,811 | |
| | 31,201 | | | Prologis Targeted US Logistics * | | | 44,931,598 | |
| | 429,723 | | | RREEF Core Plus Industrial Fund LP | | | 48,156,051 | |
| | | | | | | | 141,048,460 | |
| | | | | | | | | |
| | | | | TOTAL PRIVATE EQUITY REAL ESTATE SECURITIES (Cost - $863,808,476) | | | 953,081,891 | |
| | | | | | | | | |
| | | | | PUBLIC EQUITY REAL ESTATE SECURITIES - 4.62% | | | | |
| | | | | PUBLIC NON-TRADED REAL ESTATE INVESTMENT TRUSTS - 0.05% | | | | |
| | | | | DIVERSIFIED - 0.05% | | | | |
| | 140,161 | | | Highlands REIT # ** | | | 43,450 | |
| | 140,161 | | | InvenTrust Properties Trust # | | | 458,325 | |
| | | | | TOTAL PUBLIC NON-TRADED REAL ESTATE INVESTMENT TRUSTS (Cost - $501,926) | | | 501,775 | |
| | | | | | | | | |
| | | | | PUBLICLY TRADED REAL ESTATE INVESTMENT TRUSTS - 4.57% | | | | |
| | | | | APARTMENTS - 0.34% | | | | |
| | 9,145 | | | Camden Property Trust | | | 769,826 | |
| | 101,012 | | | Independence Realty Trust, Inc. | | | 927,290 | |
| | 4,773 | | | Mid-America Apartment Communities, Inc. | | | 435,488 | |
| | 19,602 | | | NexPoint Residential Trust, Inc. | | | 486,914 | |
| | 15,098 | | | UDR, Inc. | | | 537,791 | |
| | | | | | | | 3,157,309 | |
| | | | | CASINO - 0.12% | | | | |
| | 31,975 | | | Gaming and Leisure Properties, Inc. | | | 1,070,203 | |
| | | | | | | | | |
| | | | | COMMUNICATIONS - 0.32% | | | | |
| | 6,480 | | | American Tower Corp | | | 941,803 | |
| | 9,301 | | | Crown Castle International Corp. | | | 1,019,483 | |
| | 5,842 | | | SBA Communications Corp. | | | 998,515 | |
| | | | | | | | 2,959,801 | |
| | | | | DATA CENTERS - 0.61% | | | | |
| | 16,101 | | | CoreSite Realty Corp. | | | 1,614,286 | |
| | 26,373 | | | CyrusOne, Inc. | | | 1,350,561 | |
| | 8,843 | | | Digital Realty Trust, Inc. | | | 931,875 | |
See accompanying notes to financial statements.
Total Income+ Real Estate Fund
PORTFOLIO OF INVESTMENTS (Unaudited)(Continued)
March 31, 2018
| Shares | | | Security | | Value | |
| | | | | DATA CENTERS (continued) - 0.61% | | | | |
| | 3,240 | | | Equinix, Inc. | | $ | 1,354,774 | |
| | 11,716 | | | QTS Realty Trust, Inc. | | | 424,353 | |
| | | | | | | | 5,675,849 | |
| | | | | DIVERSIFIED - 0.21% | | | | |
| | 58,563 | | | Armada Hoffler Properties, Inc. | | | 801,727 | |
| | 24,921 | | | Gladstone Commercial Corp. | | | 432,130 | |
| | 6,664 | | | PS Business Parks, Inc. | | | 753,299 | |
| | | | | | | | 1,987,156 | |
| | | | | HEALTHCARE - 0.26% | | | | |
| | 33,964 | | | CareTrust REIT, Inc. | | | 455,118 | |
| | 16,032 | | | Healthcare Realty Trust, Inc. | | | 444,247 | |
| | 66,464 | | | Medical Properties Trust, Inc. | | | 864,032 | |
| | 10,495 | | | Universal Health Realty Income Trust | | | 630,749 | |
| | | | | | | | 2,394,146 | |
| | | | | HOTELS - 0.25% | | | | |
| | 31,703 | | | Chatham Lodging Trust | | | 607,112 | |
| | 23,426 | | | MGM Growth Properties LLC | | | 621,726 | |
| | 13,494 | | | Pebblebrook Hotel Trust | | | 463,519 | |
| | 8,455 | | | Ryman Hospitality Properties, Inc. | | | 654,840 | |
| | | | | | | | 2,347,197 | |
| | | | | INDUSTRIAL - 0.84% | | | | |
| | 19,465 | | | DCT Industrial Trust, Inc. | | | 1,096,658 | |
| | 10,507 | | | EastGroup Properties, Inc. | | | 868,509 | |
| | 23,209 | | | First Industrial Realty Trust, Inc. | | | 678,399 | |
| | 12,279 | | | Liberty Property Trust | | | 487,845 | |
| | 69,189 | | | Monmouth Real Estate Investment Corp. | | | 1,040,602 | |
| | 15,718 | | | Prologis, Inc. | | | 990,077 | |
| | 39,515 | | | Rexford Industrial Realty, Inc. | | | 1,137,637 | |
| | 18,518 | | | STAG Industrial Inc | | | 442,951 | |
| | 31,269 | | | Terreno Realty Corp. | | | 1,079,093 | |
| | | | | | | | 7,821,771 | |
| | | | | MANUFACTURED HOMES - 0.36% | | | | |
| | 15,406 | | | Equity LifeStyle Properties, Inc. | | | 1,352,185 | |
| | 13,830 | | | Sun Communities, Inc. | | | 1,263,647 | |
| | 51,010 | | | UMH Properties Inc | | | 684,044 | |
| | | | | | | | 3,299,876 | |
| | | | | MEDIA & ENTERTAINMENT - 0.06% | | | | |
| | 8,890 | | | Lamar Advertising Co | | | 565,937 | |
| | | | | | | | | |
| | | | | OFFICE - 0.28% | | | | |
| | 6,872 | | | Alexandria Real Estate Equities, Inc. | | | 858,244 | |
| | 29,861 | | | Brandywine Realty Trust | | | 474,193 | |
| | 56,918 | | | Cousins Properties Inc | | | 494,048 | |
| | 22,076 | | | Douglas Emmett, Inc. | | | 811,514 | |
| | | | | | | | 2,637,999 | |
| | | | | SINGLE FAMILY - 0.12% | | | | |
| | 50,167 | | | Invitation Homes, Inc. | | | 1,145,313 | |
| | | | | | | | | |
| | | | | SINGLE TENANT - 0.40% | | | | |
| | 18,217 | | | Agree Realty Corp. | | | 875,145 | |
| | 42,107 | | | Four Corners Property Trust, Inc. | | | 972,251 | |
| | 39,264 | | | Getty Realty Corp. | | | 990,238 | |
| | 14,380 | | | WP Carey, Inc. | | | 891,416 | |
| | | | | | | | 3,729,050 | |
| | | | | STORAGE - 0.14% | | | | |
| | 7,779 | | | Extra Space Storage, Inc. | | | 679,573 | |
| | 24,665 | | | National Storage Affiliates Trust | | | 618,598 | |
| | | | | | | | 1,298,171 | |
See accompanying notes to financial statements.
Total Income+ Real Estate Fund
PORTFOLIO OF INVESTMENTS (Unaudited)(Continued)
March 31, 2018
| Shares | | | Security | | Value | |
| | | | | TIMBER - 0.26% | | | | |
| | 13,876 | | | Potlatch Corp | | $ | 722,246 | |
| | 34,526 | | | Rayonier Inc | | | 1,214,625 | |
| | 13,909 | | | Weyerhaeuser Co. | | | 486,815 | |
| | | | | | | | 2,423,686 | |
| | | | | | | | | |
| | | | | TOTAL PUBLICLY TRADED REAL ESTATE INVESTMENT TRUSTS (Cost - $43,426,297) | | | 42,513,464 | |
| | | | | | | | | |
| | | | | TOTAL PUBLIC EQUITY REAL ESTATE SECURITIES (Cost - $43,928,223) | | | 43,015,239 | |
| | | | | | | | | |
| | | | | COMMON STOCK - 0.39% | | | | |
| | 30,057 | | | InterXion Holding NV ** | | | 1,866,840 | |
| | 7,704 | | | Vail Resorts, Inc. | | | 1,707,977 | |
| | | | | TOTAL COMMON STOCK (Cost $3,107,635) | | | 3,574,817 | |
| | | | | | | | | |
| | | | | SHORT-TERM INVESTMENT - 7.89% | | | | |
| | 73,443,209 | | | Fidelity Investments Money Market Funds - Government Portfolio, 1.53% + (Cost - $73,443,209) | | | 73,443,209 | |
| | | | | | | | | |
| | | | | TOTAL INVESTMENTS - 115.27% (Cost - $984,287,543) | | $ | 1,073,115,156 | |
| | | | | LIABILITIES IN EXCESS OF OTHER ASSETS - (15.27)% | | | (142,154,489 | ) |
| | | | | NET ASSETS - 100.00% | | $ | 930,960,667 | |
| # | Valuation was based on the Fair Valuation Procedures adopted by the Board of Trustees. Total value of such securities is $501,775 or 0.05% of net assets. |
| + | Money market fund; interest rate reflects the seven-day effective yield on March 31, 2018. |
| ^ | All or a portion of these securities are segregated as collateral for the Line of Credit as of March 31, 2018. |
| * | Holding is comprised of two entities with the same issuer. |
| ** | Non-income producing security. |
See accompanying notes to financial statements.
Total Income+ Real Estate Fund
STATEMENT OF ASSETS AND LIABILITIES (Unaudited)
March 31, 2018
| Assets: | | | |
| Investments in Securities at Value (identified cost $984,287,543) | | $ | 1,073,115,156 | |
| Cash | | | 28,250 | |
| Dividends and Interest Receivable | | | 8,267,081 | |
| Receivable for Fund Shares Sold | | | 7,900,081 | |
| Prepaid Expenses and Other Assets | | | 78,884 | |
| Total Assets | | | 1,089,389,452 | |
| | | | | |
| Liabilities: | | | | |
| Line of Credit Payable | | | 144,600,000 | |
| Distributions Payable | | | 12,216,951 | |
| Payable to Investment Advisor | | | 1,112,487 | |
| Distribution Fees Payable | | | 169,364 | |
| Shareholder Servicing Fees Payable | | | 124,866 | |
| Interest Payable - Line of Credit | | | 128,419 | |
| Payable to Related Parties | | | 66,261 | |
| Other Accrued Expenses | | | 10,437 | |
| Total Liabilities | | | 158,428,785 | |
| | | | | |
| Net Assets | | $ | 930,960,667 | |
| | | | | |
| Class A: | | | | |
| Net Assets (no par value; unlimited number of shares | | | | |
| authorized; 10,690,946 shares of beneficial interest outstanding) | | $ | 316,946,563 | |
| Net Asset Value and Redemption Price Per Share | | | | |
| ($316,946,563/10,690,946 shares of beneficial interest outstanding) | | $ | 29.65 | |
| Maximum Offering Price Per Share | | | | |
| ($29.65/0.9425) | | $ | 31.45 | |
| | | | | |
| Class C: | | | | |
| Net Assets (no par value; unlimited number of shares | | | | |
| authorized; 8,674,514 shares of beneficial interest outstanding) | | $ | 249,718,613 | |
| Net Asset Value, Offering and Redemption Price Per Share * | | | | |
| ($249,718,613/8,674,514 shares of beneficial interest outstanding) | | $ | 28.79 | |
| | | | | |
| Class I: | | | | |
| Net Assets (no par value; unlimited number of shares | | | | |
| authorized; 11,434,803 shares of beneficial interest outstanding) | | $ | 342,980,599 | |
| Net Asset Value, Offering and Redemption Price Per Share | | | | |
| ($342,980,599/11,434,803 shares of beneficial interest outstanding) | | $ | 29.99 | |
| | | | | |
| Class L: | | | | |
| Net Assets (no par value; unlimited number of shares | | | | |
| authorized; 721,763 shares of beneficial interest outstanding) | | $ | 21,314,892 | |
| Net Asset Value and Redemption Price Per Share | | | | |
| ($21,314,892/721,763 shares of beneficial interest outstanding) | | $ | 29.53 | |
| Maximum Offering Price Per Share | | | | |
| ($29.53/0.9575) | | $ | 30.84 | |
| | | | | |
| Composition of Net Assets: | | | | |
| At March 31, 2018, Net Assets Consisted of: | | | | |
| Paid-in-Capital | | $ | 850,438,968 | |
| Undistributed Net Investment Loss | | | (7,974,379 | ) |
| Accumulated Net Realized Loss on Investments | | | (331,535 | ) |
| Net Unrealized Appreciation on Investments | | | 88,827,613 | |
| Net Assets | | $ | 930,960,667 | |
Commitments and Contingencies (See Note 8)
| * | Class C charges a 1.00% fee on shares redeemed less than 365 days after the purchase. |
See accompanying notes to financial statements.
Total Income+ Real Estate Fund
STATEMENT OF OPERATIONS (Unaudited)
For the Six Months Ended March 31, 2018
| Investment Income: | | | |
| Dividend Income | | $ | 16,709,964 | |
| Interest Income | | | 75,593 | |
| Total Investment Income | | | 16,785,557 | |
| | | | | |
| Expenses: | | | | |
| Investment Advisory Fees | | | 6,421,823 | |
| Shareholder Servicing Fees | | | | |
| Class A | | | 384,437 | |
| Class C | | | 298,585 | |
| Class L | | | 16,678 | |
| Distribution Fees | | | | |
| Class C | | | 895,753 | |
| Class L | | | 16,678 | |
| Interest Expense | | | 2,126,600 | |
| Administration Fees | | | 195,079 | |
| Transfer Agent Fees | | | 193,807 | |
| Printing Expense | | | 157,624 | |
| Networking Fees | | | 69,056 | |
| Legal Fees | | | 63,350 | |
| Registration & Filing Fees | | | 50,027 | |
| Custody Fees | | | 23,935 | |
| Professional Fees | | | 22,855 | |
| Fund Accounting Fees | | | 16,447 | |
| Trustees’ Fees | | | 14,946 | |
| Audit Fees | | | 11,752 | |
| Miscellaneous Expenses | | | 21,706 | |
| Total Expenses | | | 11,001,138 | |
| Less: Fees Waived by Advisor | | | (155,895 | ) |
| Net Expenses | | | 10,845,243 | |
| | | | | |
| Net Investment Income | | | 5,940,314 | |
| | | | | |
| Net Realized and Unrealized Gain (Loss) on Investments: | | | | |
| Net Realized Gain (Loss) on Investments | | | (295,646 | ) |
| Net Change in Unrealized Appreciation on Investments | | | 24,839,596 | |
| Net Realized and Unrealized Gain on Investments | | | 24,543,950 | |
| | | | | |
| Net Increase in Net Assets Resulting From Operations | | $ | 30,484,264 | |
| | | | | |
See accompanying notes to financial statements.
Total Income+ Real Estate Fund
STATEMENTS OF CHANGES IN NET ASSETS
| | | For the Six Months | | | For the Year | |
| | | Ended | | | Ended | |
| | | March 31, 2018 | | | September 30, 2017 | |
| Operations: | | (Unaudited) | | | | |
| Net Investment Income | | $ | 5,940,314 | | | $ | 4,043,982 | |
| Net Realized Gain (Loss) on Investments | | | (295,646 | ) | | | 6,468,556 | |
| Net Change in Unrealized Appreciation on Investments | | | 24,839,596 | | | | 29,182,840 | |
| Net Increase in Net Assets Resulting From Operations | | | 30,484,264 | | | | 39,695,378 | |
| | | | | | | | | |
| Distributions to Shareholders From: | | | | | | | | |
| Net Realized Capital Gain | | | | | | | | |
| Class A | | | — | | | | (2,914,853 | ) |
| Class C | | | — | | | | (2,207,688 | ) |
| Class I | | | — | | | | (1,957,569 | ) |
| Return of Capital | | | | | | | | |
| Class A | | | (8,264,812 | ) | | | (10,720,235 | ) |
| Class C | | | (6,438,713 | ) | | | (8,564,248 | ) |
| Class I | | | (8,436,035 | ) | | | (8,688,781 | ) |
| Class L * | | | (458,930 | ) | | | (72,992 | ) |
| Total Distributions to Shareholders | | | (23,598,490 | ) | | | (35,126,366 | ) |
| | | | | | | | | |
| From Shares of Beneficial Interest: | | | | | | | | |
| Class A Shares: | | | | | | | | |
| Proceeds from Shares Issued (1,853,786 and 3,457,837 shares, respectively) | | | 54,770,936 | | | | 101,111,759 | |
| Distributions Reinvested (169,757 and 294,975 shares, respectively) | | | 5,003,467 | | | | 8,574,035 | |
| Cost of Shares Redeemed (1,265,821 and 1,603,216 shares, respectively) | | | (37,395,332 | ) | | | (46,704,527 | ) |
| Total From Beneficial Interest Transactions: Class A | | | 22,379,071 | | | | 62,981,267 | |
| | | | | | | | | |
| Class C Shares: | | | | | | | | |
| Proceeds from Shares Issued (1,266,457 and 3,284,437 shares, respectively) | | | 36,428,730 | | | | 93,871,775 | |
| Distributions Reinvested (138,882 and 224,917 shares, respectively) | | | 3,976,252 | | | | 6,390,271 | |
| Cost of Shares Redeemed (840,583 and 777,823 shares, respectively) | | | (24,136,103 | ) | | | (22,224,764 | ) |
| Total From Beneficial Interest Transactions: Class C | | | 16,268,879 | | | | 78,037,282 | |
| | | | | | | | | |
| Class I Shares: | | | | | | | | |
| Proceeds from Shares Issued (3,410,981 and 5,280,801 shares, respectively) | | | 102,018,171 | | | | 155,794,816 | |
| Distributions Reinvested (145,114 and 185,479 shares, respectively) | | | 4,325,673 | | | | 5,448,470 | |
| Cost of Shares Redeemed (787,701 and 573,116 shares, respectively) | | | (23,517,991 | ) | | | (16,916,150 | ) |
| Total From Beneficial Interest Transactions: Class I | | | 82,825,853 | | | | 144,327,136 | |
| | | | | | | | | |
| Class L Shares: * | | | | | | | | |
| Proceeds from Shares Issued (538,208 and 171,870 shares, respectively) | | | 15,878,651 | | | | 5,047,918 | |
| Distributions Reinvested (11,121 and 1,930 shares, respectively) | | | 327,046 | | | | 56,304 | |
| Cost of Shares Redeemed (5 and 1,361 shares, respectively) | | | (135 | ) | | | (40,041 | ) |
| Total From Beneficial Interest Transactions: Class L | | | 16,205,562 | | | | 5,064,181 | |
| | | | | | | | | |
| Net Increase in Net Assets From Shares of Beneficial Interest | | | 137,679,365 | | | | 290,409,866 | |
| | | | | | | | | |
| Total Increase in Net Assets | | | 144,565,139 | | | | 294,978,878 | |
| | | | | | | | | |
| Net Assets: | | | | | | | | |
| Beginning of Period | | | 786,395,528 | | | | 491,416,650 | |
| End of Period | | $ | 930,960,667 | | | $ | 786,395,528 | |
| | | | | | | | | |
| Undistributed Net Investment Income (loss) | | $ | (7,974,379 | ) | | $ | 9,683,797 | |
| * | Class L shares commenced operations June 1, 2017. |
See accompanying notes to financial statements.
Total Income+ Real Estate Fund
STATEMENT OF CASH FLOWS (Unaudited)
For the Six Months Ended March 31, 2018
| Cash Flows From Operating Activities: | | | |
| Net Increase in Net Assets Resulting from Operations | | $ | 30,484,264 | |
| Adjustments to Reconcile Net Increase in Net Assets Resulting From Operations to Net Cash Used for Operating Activities: | | | | |
| Purchases of Long-Term Portfolio Investments | | | (188,511,205 | ) |
| Proceeds from Sale of Long-Term Portfolio Investments | | | 33,402,366 | |
| Net Short Term Investment Proceeds | | | (57,956,351 | ) |
| | | | | |
| Net Realized Loss on Investments | | | 295,646 | |
| Change in Unrealized Appreciation on Investments | | | (24,839,596 | ) |
| | | | | |
| Changes in Assets and Liabilities: | | | | |
| (Increase)/Decrease in Assets: | | | | |
| Cash | | | 167,744 | |
| Receivable for Securities Sold | | | 18,000,000 | |
| Dividends and Interest Receivable | | | (3,337,566 | ) |
| Prepaid Expenses and Other Assets | | | (40,299 | ) |
| Increase/(Decrease) in Liabilities: | | | | |
| Accrued Advisory Fees | | | 336,879 | |
| Distributions Payable | | | 12,216,951 | |
| Payable to Related Parties | | | (6,945 | ) |
| Interest Payable - Line of Credit | | | (29,889 | ) |
| Networking Fees Payable | | | 18,609 | |
| Accrued Shareholder Servicing Fee | | | 16,016 | |
| Other Accrued Expenses | | | (148,787 | ) |
| Net Cash Used for Operating Activities | | | (179,932,163 | ) |
| | | | | |
| Cash Flows From Financing Activities: | | | | |
| Increase in Line of Credit | | | 71,600,000 | |
| Proceeds from Shares Issued | | | 203,180,032 | |
| Payment on Shares Redeemed | | | (85,049,561 | ) |
| Cash Distributions Paid to Shareholders, Net of Reinvestments | | | (9,966,052 | ) |
| Net Cash Provided by Financing Activities | | | 179,764,419 | |
| | | | | |
| Net Increase (Decrease) in Cash | | | (167,744 | ) |
| Cash at Beginning of Period | | | 195,994 | |
| Cash at End of Period | | $ | 28,250 | |
| | | | | |
| Supplemental Disclosure of Non-Cash Activity: | | | | |
| Noncash Financing Activities not Included Above Consists of | | | | |
| Reinvestment of Distributions | | $ | 13,632,438 | |
| | | | | |
See accompanying notes to financial statements.
| Total Income+ Real Estate Fund |
| FINANCIAL HIGHLIGHTS |
| Class A |
| |
| The table below sets forth financial data for one share of beneficial interest outstanding throughout each period presented. |
| | | For the Six Months | | | For the Year | | | For the Year | | | For the Year | | | For the Year | | | For the Period* | |
| | | Ended | | | Ended | | | Ended | | | Ended | | | Ended | | | Ended | |
| | | March 31, 2018 | | | September 30, 2017 | | | September 30, 2016 | | | September 30, 2015 | | | September 30, 2014 | | | September 30, 2013 | |
| | | (Unaudited) | | | | | | | | | | | | | | | | |
| | | | | | | | | | | | | | | | | | | | | | | | | |
| Net Asset Value, Beginning of Period | | $ | 29.37 | | | $ | 29.13 | | | $ | 28.68 | | | $ | 27.98 | | | $ | 27.47 | | | $ | 25.00 | |
| Increase From Operations: | | | | | | | | | | | | | | | | | | | | | | | | |
| Net investment income (a) | | | 0.22 | | | | 0.23 | | | | 0.23 | | | | 0.39 | | | | 0.26 | | | | 0.67 | |
| Net gain from investments (both realized and unrealized) | | | 0.84 | | | | 1.56 | | | | 1.75 | | | | 1.81 | | | | 1.70 | | | | 2.40 | |
| Total from operations | | | 1.06 | | | | 1.79 | | | | 1.98 | | | | 2.20 | | | | 1.96 | | | | 3.07 | |
| | | | | | | | | | | | | | | | | | | | | | | | | |
| Less Distributions: | | | | | | | | | | | | | | | | | | | | | | | | |
| From net investment income | | | — | | | | — | | | | — | | | | (0.09 | ) | | | (0.01 | ) | | | (0.40 | ) |
| From net realized gain on investments | | | — | | | | (0.37 | ) | | | (0.16 | ) | | | (0.29 | ) | | | (0.11 | ) | | | — | |
| From return of capital | | | (0.78 | ) | | | (1.18 | ) | | | (1.37 | ) | | | (1.12 | ) | | | (1.35 | ) | | | (0.20 | ) |
| Total Distributions | | | (0.78 | ) | | | (1.55 | ) | | | (1.53 | ) | | | (1.50 | ) | | | (1.47 | ) | | | (0.60 | ) |
| | | | | | | | | | | | | | | | | | | | | | | | | |
| Paid in interest from redemption fees (a) | | | — | | | | — | | | | — | | | | — | | | | 0.02 | | | | 0.00 | (i) |
| | | | | | | | | | | | | | | | | | | | | | | | | |
| Net Asset Value, End of Period | | $ | 29.65 | | | $ | 29.37 | | | $ | 29.13 | | | $ | 28.68 | | | $ | 27.98 | | | $ | 27.47 | |
| | | | | | | | | | | | | | | | | | | | | | | | | |
| Total Return (b)(h) | | | 4.14 | % (e) | | | 6.29 | % | | | 7.08 | % | | | 8.06 | % | | | 7.38 | % | | | 12.36 | % (e) |
| | | | | | | | | | | | | | | | | | | | | | | | | |
| Ratios/Supplemental Data | | | | | | | | | | | | | | | | | | | | | | | | |
| Net assets, end of period (in 000’s) | | $ | 316,947 | | | $ | 291,772 | | | $ | 226,712 | | | $ | 129,287 | | | $ | 89,319 | | | $ | 38,122 | |
| Ratio to average net assets(f): | | | | | | | | | | | | | | | | | | | | | | | | |
| Expenses, Gross (c) | | | 2.44 | % (d) | | | 2.37 | % | | | 2.19 | % | | | 2.25 | % | | | 2.54 | % | | | 4.96 | % (d) |
| Expenses, Net of Reimbursement | | | 2.40 | % (d) | | | 2.21 | % | | | 1.82 | % | | | 1.79 | % | | | 1.76 | % | | | 0.01 | % (d) |
| Ratio to average net assets (excluding interest expense)(f): | | | | | | | | | | | | | | | | | | | | | | | | |
| Expenses, Gross (c) | | | 1.94 | % (d) | | | 2.04 | % | | | 2.19 | % | | | 2.24 | % | | | 2.52 | % | | | 4.96 | % (d) |
| Expenses, Net of Reimbursement | | | 1.91 | % (d) | | | 1.89 | % | | | 1.82 | % | | | 1.78 | % | | | 1.74 | % | | | 0.01 | % (d) |
| Net investment income, Net of Reimbursement (f)(g) | | | 1.51 | % (d) | | | 0.80 | % | | | 0.79 | % | | | 1.36 | % | | | 0.94 | % | | | 2.66 | % (d) |
| Portfolio turnover rate | | | 4 | % (e) | | | 16 | % | | | 18 | % | | | 35 | % | | | 12 | % | | | 35 | % (e) |
| | | | | | | | | | | | | | | | | | | | | | | | | |
| * | Class A commenced operations October 22, 2012. |
| (a) | Per share amounts are calculated using the average shares method, which more appropriately presents the per share data for the period. |
| (b) | Total returns are historical in nature and assume changes in share price, reinvestment of dividends and capital gains distributions, if any, and does not reflect the impact of sales charges. Had the Advisor not absorbed a portion of Fund expenses, total returns would have been lower. |
| (c) | Represents the ratio of expenses to average net assets absent fee waivers and/or expense reimbursements by the Advisor. |
| (f) | The ratios of expenses to average net assets and net investment income to average net assets do not reflect the expenses of the underlying investment companies in which the Fund invests. |
| (g) | Recognition of net investment income is affected by the timing and declaration of dividends by the underlying investment companies in which the Fund invests. |
| (h) | Includes adjustments in accordance with accounting principles generally accepted in the United States and, consequently, the net asset value for financial reporting purposes and the returns based upon those net asset values may differ from the net asset values and returns for shareholder transactions. |
| (i) | Less then $0.01 per share. |
See accompanying notes to financial statements.
| Total Income+ Real Estate Fund |
| FINANCIAL HIGHLIGHTS |
| Class C |
| |
| The table below sets forth financial data for one share of beneficial interest outstanding throughout each period presented. |
| | | For the Six Months | | | For the Year | | | For the Year | | | For the Year | | | For the Period | |
| | | Ended | | | Ended | | | Ended | | | Ended | | | Ended | |
| | | March 31, 2018 | | | September 30, 2017 | | | September 30, 2016 | | | September 30, 2015 | | | September 30, 2014* | |
| | | (Unaudited) | | | | | | | | | | | | | |
| | | | | | | | | | | | | | | | |
| Net Asset Value, Beginning of Period | | $ | 28.63 | | | $ | 28.61 | | | $ | 28.38 | | | $ | 27.89 | | | $ | 27.75 | |
| Increase From Operations: | | | | | | | | | | | | | | | | | | | | |
| Net investment income (loss) (a) | | | 0.11 | | | | 0.01 | | | | (0.01 | ) | | | 0.16 | | | | (0.19 | ) |
| Net gain from investments (both realized and unrealized) | | | 0.81 | | | | 1.52 | | | | 1.75 | | | | 1.82 | | | | 1.07 | |
| Total from operations | | | 0.92 | | | | 1.53 | | | | 1.74 | | | | 1.98 | | | | 0.88 | |
| | | | | | | | | | | | | | | | | | | | | |
| Less Distributions: | | | | | | | | | | | | | | | | | | | | |
| From net investment income | | | — | | | | — | | | | — | | | | (0.09 | ) | | | — | |
| From net realized gains on investments | | | — | | | | (0.37 | ) | | | (0.16 | ) | | | (0.29 | ) | | | — | |
| From return of capital | | | (0.76 | ) | | | (1.14 | ) | | | (1.35 | ) | | | (1.11 | ) | | | (0.74 | ) |
| Total Distributions | | | (0.76 | ) | | | (1.51 | ) | | | (1.51 | ) | | | (1.49 | ) | | | (0.74 | ) |
| | | | | | | | | | | | | | | | | | | | | |
| Net Asset Value, End of Period | | $ | 28.79 | | | $ | 28.63 | | | $ | 28.61 | | | $ | 28.38 | | | $ | 27.89 | |
| | | | | | | | | | | | | | | | | | | | | |
| Total Return (b)(h) | | | 3.75 | % (e) | | | 5.50 | % | | | 6.28 | % | | | 7.28 | % | | | 3.20 | % (e) |
| | | | | | | | | | | | | | | | | | | | | |
| Ratios/Supplemental Data | | | | | | | | | | | | | | | | | | | | |
| Net assets, end of period (in 000’s) | | $ | 249,719 | | | $ | 232,200 | | | $ | 153,859 | | | $ | 37,920 | | | $ | 6,505 | |
| Ratio to average net assets (f): | | | | | | | | | | | | | | | | | | | | |
| Expenses, Gross (c) | | | 3.19 | % (d) | | | 3.13 | % | | | 2.95 | % | | | 3.04 | % | | | 3.36 | % (d) |
| Expenses, Net of Reimbursement | | | 3.15 | % (d) | | | 2.97 | % | | | 2.56 | % | | | 2.55 | % | | | 2.61 | % (d) |
| Ratio to average net assets (excluding interest expense)(f): | | | | | | | | | | | | | | | | | | | | |
| Expenses, Gross (c) | | | 2.69 | % (d) | | | 2.79 | % | | | 2.95 | % | | | 3.02 | % | | | 3.34 | % (d) |
| Expenses, Net of Reimbursement | | | 2.65 | % (d) | | | 2.63 | % | | | 2.56 | % | | | 2.54 | % | | | 2.59 | % (d) |
| Net investment income (loss), Net of Reimbursement (f)(g) | | | 0.76 | % (d) | | | 0.05 | % | | | (0.04 | )% | | | 0.55 | % | | | (1.36 | )% (d) |
| Portfolio turnover rate | | | 4 | % (e) | | | 16 | % | | | 18 | % | | | 35 | % | | | 12 | % (e) |
| | | | | | | | | | | | | | | | | | | | | |
| * | Class C commenced operations April 1, 2014. |
| (a) | Per share amounts are calculated using the average shares method, which more appropriately presents the per share data for the period. |
| (b) | Total returns are historical in nature and assume changes in share price, reinvestment of dividends and capital gains distributions, if any. Had the Advisor not absorbed a portion of Fund expenses, total returns would have been lower. |
| (c) | Represents the ratio of expenses to average net assets absent fee waivers and/or expense reimbursements by the Advisor. |
| (f) | The ratios of expenses to average net assets and net investment income (loss) to average net assets do not reflect the expenses of the underlying investment companies in which the Fund invests. |
| (g) | Recognition of net investment income (loss) is affected by the timing and declaration of dividends by the underlying investment companies in which the Fund invests. |
| (h) | Includes adjustments in accordance with accounting principles generally accepted in the United States and, consequently, the net asset value for financial reporting purposes and the returns based upon those net asset values may differ from the net asset values and returns for shareholder transactions. |
See accompanying notes to financial statements.
| Total Income+ Real Estate Fund |
| FINANCIAL HIGHLIGHTS |
| Class I |
| |
| The table below sets forth financial data for one share of beneficial interest outstanding throughout each period presented. |
| | | For the Six Months | | | For the Year | | | For the Year | | | For the Year | | | For the Period | |
| | | Ended | | | Ended | | | Ended | | | Ended | | | Ended | |
| | | March 31, 2018 | | | September 30, 2017 | | | September 30, 2016 | | | September 30, 2015 | | | September 30, 2014* | |
| | | (Unaudited) | | | | | | | | | | | | | |
| | | | | | | | | | | | | | | | |
| Net Asset Value, Beginning of Period | | $ | 29.70 | | | $ | 29.38 | | | $ | 28.85 | | | $ | 28.03 | | | $ | 27.75 | |
| Increase From Operations: | | | | | | | | | | | | | | | | | | | | |
| Net investment income (loss) (a) | | | 0.26 | | | | 0.31 | | | | 0.28 | | | | 0.45 | | | | (0.04 | ) |
| Net gain from investments (both realized and unrealized) | | | 0.82 | | | | 1.57 | | | | 1.79 | | | | 1.88 | | | | 1.06 | |
| Total from operations | | | 1.08 | | | | 1.88 | | | | 2.07 | | | | 2.33 | | | | 1.02 | |
| | | | | | | | | | | | | | | | | | | | | |
| Less Distributions: | | | | | | | | | | | | | | | | | | | | |
| From net investment income | | | — | | | | — | | | | — | | | | (0.10 | ) | | | — | |
| From net realized gains on investments | | | — | | | | (0.37 | ) | | | (0.16 | ) | | | (0.29 | ) | | | — | |
| From return of capital | | | (0.79 | ) | | | (1.19 | ) | | | (1.38 | ) | | | (1.12 | ) | | | (0.74 | ) |
| Total Distributions | | | (0.79 | ) | | | (1.56 | ) | | | (1.54 | ) | | | (1.51 | ) | | | (0.74 | ) |
| | | | | | | | | | | | | | | | | | | | | |
| Net Asset Value, End of Period | | $ | 29.99 | | | $ | 29.70 | | | $ | 29.38 | | | $ | 28.85 | | | $ | 28.03 | |
| | | | | | | | | | | | | | | | | | | | | |
| Total Return (b)(h) | | | 4.20 | % (e) | | | 6.58 | % | | | 7.36 | % | | | 8.51 | % | | | 3.71 | % (e) |
| | | | | | | | | | | | | | | | | | | | | |
| Ratios/Supplemental Data | | | | | | | | | | | | | | | | | | | | |
| Net assets, end of period (in 000’s) | | $ | 342,981 | | | $ | 257,366 | | | $ | 110,845 | | | $ | 25,274 | | | $ | 3,495 | |
| Ratio to average net assets (f): | | | | | | | | | | | | | | | | | | | | |
| Expenses, Gross (c) | | | 2.19 | % (d) | | | 2.15 | % | | | 1.96 | % | | | 2.03 | % | | | 2.40 | % (d) |
| Expenses, Net of Reimbursement | | | 2.16 | % (d) | | | 1.99 | % | | | 1.56 | % | | | 1.54 | % | | | 1.61 | % (d) |
| Ratio to average net assets (excluding interest expense)(f): | | | | | | | | | | | | | | | | | | | | |
| Expenses, Gross (c) | | | 1.69 | % (d) | | | 1.80 | % | | | 1.96 | % | | | 2.02 | % | | | 2.38 | % (d) |
| Expenses, Net of Reimbursement | | | 1.66 | % (d) | | | 1.64 | % | | | 1.56 | % | | | 1.53 | % | | | 1.59 | % (d) |
| Net investment income (loss) , Net of Reimbursement (f)(g) | | | 1.76 | % (d) | | | 1.06 | % | | | 0.96 | % | | | 1.59 | % | | | (0.24 | )% (d) |
| Portfolio turnover rate | | | 4 | % (e) | | | 16 | % | | | 18 | % | | | 35 | % | | | 12 | % (e) |
| | | | | | | | | | | | | | | | | | | | | |
| * | Class I commenced operations April 1, 2014. |
| (a) | Per share amounts are calculated using the average shares method, which more appropriately presents the per share data for the period. |
| (b) | Total returns are historical in nature and assume changes in share price, reinvestment of dividends and capital gains distributions, if any. Had the Advisor not absorbed a portion of Fund expenses, total returns would have been lower. |
| (c) | Represents the ratio of expenses to average net assets absent fee waivers and/or expense reimbursements by the Advisor. |
| (f) | The ratios of expenses to average net assets and net investment income (loss) to average net assets do not reflect the expenses of the underlying investment companies in which the Fund invests. |
| (g) | Recognition of net investment income (loss) is affected by the timing and declaration of dividends by the underlying investment companies in which the Fund invests. |
| (h) | Includes adjustments in accordance with accounting principles generally accepted in the United States and, consequently, the net asset value for financial reporting purposes and the returns based upon those net asset values may differ from the net asset values and returns for shareholder transactions. |
See accompanying notes to financial statements.
| Total Income+ Real Estate Fund |
| FINANCIAL HIGHLIGHTS |
| Class L |
| |
| The table below sets forth financial data for one share of beneficial interest outstanding throughout the period presented. |
| | | For the Six Months | | | For the Period | |
| | | Ended | | | Ended | |
| | | March 31, 2018 | | | September 30, 2017* | |
| | | (Unaudited) | | | | |
| | | | | | | |
| Net Asset Value, Beginning of Period | | $ | 29.34 | | | $ | 29.42 | |
| Increase From Operations: | | | | | | | | |
| Net investment income (loss) (a) | | | 0.19 | | | | (0.06 | ) |
| Net gain from investments (both realized and unrealized) | | | 0.78 | | | | 0.76 | |
| Total from operations | | | 0.97 | | | | 0.70 | |
| | | | | | | | | |
| Less Distributions: | | | | | | | | |
| From net investment income | | | — | | | | — | |
| From return of capital | | | (0.78 | ) | | | (0.78 | ) |
| Total Distributions | | | (0.78 | ) | | | (0.78 | ) |
| | | | | | | | | |
| Net Asset Value, End of Period | | $ | 29.53 | | | $ | 29.34 | |
| | | | | | | | | |
| Total Return (b)(e)(h) | | | 3.83 | % | | | 2.40 | % |
| | | | | | | | | |
| Ratios/Supplemental Data | | | | | | | | |
| Net assets, end of period (in 000’s) | | $ | 21,315 | | | $ | 5,059 | |
| Ratio to average net assets (f): | | | | | | | | |
| Expenses, Gross (c)(d) | | | 2.69 | % | | | 2.83 | % |
| Expenses, Net of Reimbursement (d) | | | 2.64 | % | | | 2.63 | % |
| Ratio to average net assets (excluding interest expense)(f): | | | | | | | | |
| Expenses, Gross (c)(d) | | | 2.19 | % | | | 2.35 | % |
| Expenses, Net of Reimbursement (d) | | | 2.14 | % | | | 2.14 | % |
| Net investment income (loss), Net of Reimbursement (d)(f)(g) | | | 1.30 | % | | | (0.64 | )% |
| Portfolio turnover rate (e) | | | 4 | % | | | 16 | % |
| | | | | | | | | |
| * | Class L commenced operations June 1, 2017. |
| (a) | Per share amounts are calculated using the average shares method, which more appropriately presents the per share data for the period. |
| (b) | Total returns are historical in nature and assume changes in share price, reinvestment of dividends and capital gains distributions, if any. Had the Advisor not absorbed a portion of Fund expenses, total returns would have been lower. |
| (c) | Represents the ratio of expenses to average net assets absent fee waivers and/or expense reimbursements by the Advisor. |
| (f) | The ratios of expenses to average net assets and net investment loss to average net assets do not reflect the expenses of the underlying investment companies in which the Fund invests. |
| (g) | Recognition of net investment loss is affected by the timing and declaration of dividends by the underlying investment companies in which the Fund invests. |
| (h) | Includes adjustments in accordance with accounting principles generally accepted in the United States and, consequently, the net asset value for financial reporting purposes and the returns based upon those net asset values may differ from the net asset values and returns for shareholder transactions. |
See accompanying notes to financial statements.
| Total Income+ Real Estate Fund |
| NOTES TO FINANCIAL STATEMENTS (Unaudited) |
| March 31, 2018 |
Total Income+ Real Estate Fund (the “Fund” or the “Trust”) was organized as a Delaware statutory trust on May 25, 2012 and is registered under the Investment Company Act of 1940, as amended, (the “1940 Act”), as a non-diversified, closed-end management investment company that operates as an interval fund with a continuous offering of Fund shares. The Fund’s investment advisor is Bluerock Fund Advisor, LLC (the “Advisor”). The Fund’s primary investment objective is to generate current income while secondarily seeking long-term capital appreciation, with low to moderate volatility and low correlation to the broader markets. The Fund pursues its investment objectives by investing, under normal circumstances, at least 80% of assets plus the amount of any borrowings for investment purposes, in “real estate industry securities,” primarily in income producing equity and debt securities.
The Fund currently offers Class A, Class C, Class I and Class L shares. Class A shares commenced operations on October 22, 2012 and are offered at net asset value plus a maximum sales charge of 5.75%. Class C and Class I shares commenced operations on April 1, 2014 and are offered at net asset value. Class C shares are subject to an early withdrawal charge of 1.00% if redeemed less than 365 days after purchase. Class L shares commenced operations on June 1, 2017 and are offered at net asset value plus a maximum sales charge of 4.25%. Each class represents an interest in the same assets of the Fund and classes are identical except for differences in their sales charge structures and ongoing service and distribution charges. All classes of shares have equal voting privileges except that each class has exclusive voting rights with respect to its service and/or distribution plans. The Fund’s income, expenses (other than class specific distribution fees) and realized and unrealized gains and losses are allocated proportionately each day based upon the relative net assets of each class.
| 2. | SUMMARY OF SIGNIFICANT ACCOUNTING POLICIES |
The following is a summary of significant accounting policies followed by the Fund in preparation of its financial statements. These policies are in conformity with accounting principles generally accepted in the United States of America (“GAAP”). The preparation of financial statements requires management to make estimates and assumptions that affect the reported amounts of assets and liabilities and disclosure of contingent assets and liabilities at the date of the financial statements and the reported amounts of income and expenses for the period. Actual results could differ from those estimates. The Fund is an investment company and accordingly follows the investment company accounting and reporting guidance of the Financial Accounting Standards Board (“FASB”) Accounting Standard Codification Topic 946 “Financial Services – Investment Companies” including FASB Accounting Standard Update “ASU” 2013-08.
Security Valuation – Securities listed on an exchange are valued at the last reported sale price at the close of the regular trading session of the exchange on the business day the value is being determined, or in the case of securities listed on NASDAQ, at the NASDAQ Official Closing Price (“NOCP”). In the absence of a sale such securities shall be valued at the last bid price. Short-term investments that mature in 60 days or less may be valued at amortized cost, provided such valuations represent fair value.
Valuation of Fund of Funds – The Fund may invest in portfolios of open-end investment companies and exchange traded funds (the “Underlying Funds”). The Underlying Funds value securities in their portfolios for which market quotations are readily available at their market values (generally the last reported sale price) and all other securities and assets at their fair value to the methods established by the board of directors of the Underlying Funds.
Open-end investment companies are valued at their respective net asset values as reported by such investment companies. The shares of many closed-end investment companies, after their initial public offering, frequently trade at a price per share, which is different than the net asset value per share. The difference represents a market premium or market discount of such shares. There can be no assurances that the market discount or market premium on shares of any closed-end investment company purchased by the Fund will not change.
| Total Income+ Real Estate Fund |
| NOTES TO FINANCIAL STATEMENTS (Unaudited)(Continued) |
| March 31, 2018 |
| |
When price quotations for certain securities are not readily available, or if the available quotations are not believed to be reflective of market value by the Advisor (defined below), those securities will be valued at “fair value” as determined in good faith by the Valuation Committee using procedures adopted by and under the supervision of the Fund’s Board of Trustees (the “Board”). There can be no assurance that the Fund could purchase or sell a portfolio security at the price used to calculate a Fund’s net asset value (“NAV”).
Fair valuation procedures may be used to value a substantial portion of the assets of the Fund. The Fund may use the fair value of a security to calculate its NAV when, for example, (1) a portfolio security is not traded in a public market or the principal market in which the security trades is closed, (2) trading in a portfolio security is suspended and not resumed prior to the normal market close, (3) a portfolio security is not traded in significant volume for a substantial period, or (4) the Advisor determines that the quotation or price for a portfolio security provided by a broker-dealer or independent pricing service is inaccurate.
Valuation of Private Equity Real Estate Securities – The Fund invests a significant portion of its assets in Private Equity Real Estate Securities (“Private ERES”). The Private ERES measure their investment assets at fair value, and report a NAV per share on a calendar quarter basis. In accordance with Accounting Standards Codification (“ASC”) 820, the Fund has elected to apply the practical expedient and to value its investments in Private ERES at their respective NAVs at each quarter. For non-calendar quarter-end days, the Valuation Committee estimates the fair value of each Private ERES by adjusting the most recent NAV for each REIT by the change in a proprietary benchmark that the Valuation Committee has deemed to be representative of the entire Private ERES market. As of March 31, 2018, all of the Fund’s investments in Private ERES were valued at the respective NAVs of the Private ERES.
Valuation of Public Non-Traded Equity Real Estate Securities – The Fund may invest a portion of its assets in Public Non-Traded Equity Real Estate Securities (“Public Non-Traded ERES”). The Public Non-Traded ERES do not report periodic NAVs with enough frequency to be valued using the practical expedient. The Valuation Committee determines the fair value of Public Non-Traded ERES on a daily basis by considering various factors such as the most recent published NAV, the transaction price, secondary market trades, shareholder redemption and dividend reinvestment programs, and potential illiquidity discounts.
The “fair value” of securities may be difficult to determine and thus judgment plays a greater role in the valuation process. The fair valuation methodology may include or consider the following guidelines, as appropriate: (1) evaluation of all relevant factors, including but not limited to, pricing history, current market level, supply and demand of the respective security; (2) comparison to the values and current pricing of securities that have comparable characteristics; (3) knowledge of historical market information with respect to the security; (4) other factors relevant to the security which would include, but not be limited to, duration, yield, fundamental analytical data, the Treasury yield curve, and credit quality.
The values assigned to fair valued investments are based on available information and do not necessarily represent amounts that might ultimately be realized, since such amounts depend on future developments inherent in long-term investments. Changes in the fair valuation of portfolio securities may be less frequent and of greater magnitude than changes in the price of portfolio securities valued at their last sale price, by an independent pricing service, or based on market quotations. Imprecision in estimating fair value can also impact the amount of unrealized appreciation or depreciation recorded for a particular portfolio security and differences in the assumptions used could result in a different determination of fair value, and those differences could be material.
The Fund utilizes various methods to measure the fair value of its investments on a recurring basis. GAAP establishes a hierarchy that prioritizes inputs to valuation methods. The three levels of input are:
| Total Income+ Real Estate Fund |
| NOTES TO FINANCIAL STATEMENTS (Unaudited)(Continued) |
| March 31, 2018 |
Level 1 – Unadjusted quoted prices in active markets for identical assets and liabilities that the Fund has the ability to access.
Level 2 – Observable inputs other than quoted prices included in Level 1 that are observable for the asset or liability, either directly or indirectly. These inputs may include quoted prices for the identical instrument on an inactive market, prices for similar instruments, interest rates, prepayment speeds, credit risk, yield curves, default rates and similar data.
Level 3 – Unobservable inputs for the asset or liability, to the extent relevant observable inputs are not available, representing the Fund’s own assumptions about the assumptions a market participant would use in valuing the asset or liability, and would be based on the best information available.
The availability of observable inputs can vary from security to security and is affected by a wide variety of factors, including, for example, the type of security, whether the security is new and not yet established in the marketplace, the liquidity of markets, and other characteristics particular to the security. To the extent that valuation is based on models or inputs that are less observable or unobservable in the market, the determination of fair value requires more judgment. Accordingly, the degree of judgment exercised in determining fair value is greatest for instruments categorized in Level 3.
The inputs used to measure fair value may fall into different levels of the fair value hierarchy. In such cases, for disclosure purposes, the level in the fair value hierarchy within which the fair value measurement falls in its entirety, is determined based on the lowest level input that is significant to the fair value measurement in its entirety. The valuation techniques used by the Fund to measure fair value during the six months ended March 31, 2018, maximized the use of observable inputs and minimized the use of unobservable inputs.
The inputs or methodology used for valuing securities are not necessarily an indication of the risk associated with investing in those securities. The following tables summarize the inputs used as of March 31, 2018 for the Fund’s assets and liabilities measured at fair value:
| | | | | | | | | | | | | |
| Assets* | | Total Value | | | Level 1 | | | Level 2 | | | Level 3 | |
| Public Non-Traded Real Estate Investment Trusts | | $ | 501,775 | | | $ | — | | | $ | — | | | $ | 501,775 | |
| Publicly Traded Real Estate Investment Trusts | | | 42,513,464 | | | | 42,513,464 | | | | — | | | | — | |
| Common Stock | | | 3,574,817 | | | | 3,574,817 | | | | | | | | | |
| Short-Term Investment | | | 73,443,209 | | | | 73,443,209 | | | | — | | | | — | |
| Sub-Total | | $ | 120,033,265 | | | $ | 119,531,490 | | | $ | — | | | $ | 501,775 | |
| Private Equity Real Estate Securities (1) | | | 953,081,891 | | | | | | | | | | | | | |
| Total | | $ | 1,073,115,156 | | | | | | | | | | | | | |
| * | Refer to the Portfolio of Investments for industry classifications. |
There were no transfers into or out of Level 1, Level 2, or Level 3 during the period.
It is the Fund’s policy to record transfers into or out of any Level at the end of the reporting period.
(1) Management has elected to adopt ASU 2015-07, Disclosures for Investments in Certain Entities That Calculate Net Asset Value per Share (or Its Equivalent) — a consensus of the Emerging Issues Task Force issued, on May 1, 2015. The guidance in this standard is effective for interim and annual periods beginning after December 15, 2015. In accordance with Subtopic 820-10, certain investments that are measured at fair value using the net asset value per share (or its equivalent) have not been classified in the fair value hierarchy. The fair value amount presented in this table is intended to permit reconciliation of the fair value hierarchy to the amounts presented in the statement of assets and liabilities.
| Total Income+ Real Estate Fund |
| NOTES TO FINANCIAL STATEMENTS (Unaudited)(Continued) |
| March 31, 2018 |
The following is a reconciliation of assets in which Level 3 inputs were used in determining value:
| | | Public Non-Traded | |
| | | Real Estate | |
| | | Investment Trusts | |
| Beginning Balance | | $ | 498,972 | |
| Total realized gain (loss) | | | — | |
| Appreciation (Depreciation) | | | 2,803 | |
| Cost of Purchases | | | — | |
| Proceeds from Sales/Liquidating Distribution | | | — | |
| Return of Capital | | | — | |
| Accrued Interest | | | — | |
| Net transfers in/out of level 3 | | | — | |
| Ending Balance | | $ | 501,775 | |
Significant unobservable valuation inputs for material Level 3 investments as of March 31, 2018, are as follows:
| | | Fair Value at | | | Valuation | | | | | | | |
| | | 3/31/2018 | | | Technique | | Unobservable Input | | Range | | (Weighted Average) | |
| | | | | | | | | | | | | | | |
| Public Non-Traded Real Estate Investment Trusts | | $ | 501,775 | | | Transaction Data | | Discount for Lack of Liquidity (a) | | 5.00% - 8.00% | | | 5.26 | % |
| (a) | Represents amounts used when the reporting entity has determined that market participants would take into account these premiums and discounts when pricing the investments. |
Other Investment Vehicles – The Fund may invest in other investment vehicles such as exchange traded funds (“ETFs”), index funds, closed-end funds and mutual funds. Such funds are bought and sold on a securities exchange. An ETF trades like common stock and typically represents a fixed portfolio of securities designed to track the performance and dividend yield of a particular domestic or foreign market index. The Fund may purchase an investment vehicle to temporarily gain exposure to a portion of the U.S. or a foreign market. The risks of owning such investment vehicles generally reflect the risks of owning the underlying securities they are designed to track, although any lack of liquidity could result in it being more volatile. Additionally, such investment vehicles have fees and expenses that reduce their value relative to their underlying holdings.
Security Transactions and Investment Income – Investment security transactions are accounted for on a trade date basis. Cost is determined and gains and losses are based upon the specific identification method for both financial statement and federal income tax purposes. Dividend income is recorded on the ex-dividend date and interest income is recorded on the accrual basis. Purchase discounts and premiums on securities are accreted and amortized over the life of the respective securities.
Federal Income Taxes – The Fund intends to comply with the requirements of Subchapter M of the Internal Revenue Code applicable to regulated investment companies and will distribute all of its taxable income, if any to shareholders. Accordingly, no provision for Federal income taxes is required in the financial statements.
The Fund recognizes the tax benefits of uncertain tax positions only when the position is “more likely than not” to be sustained assuming examination by tax authorities. Management has reviewed the tax positions and has concluded that no liability for unrecognized tax benefits should be recorded related to uncertain tax positions related to the open tax years (2014-2017) or expected to be taken in the Fund’s 2018 tax returns. The Fund identifies its major tax jurisdictions as U.S. Federal. The Fund recognizes interest and penalties, if any, related to unrecognized tax benefits as income tax expense in the Statement of Operations. During the six months ended
| Total Income+ Real Estate Fund |
| NOTES TO FINANCIAL STATEMENTS (Unaudited)(Continued) |
| March 31, 2018 |
March 31, 2018, the Fund did not incur any interest or penalties. Generally tax authorities can examine tax returns filed for the last three years.
Distributions to Shareholders – Distributions from investment income are declared and paid quarterly. Distributions from net realized capital gains, if any, are declared and paid annually and are recorded on the ex-dividend date. The character of income and gains to be distributed is determined in accordance with income tax regulations, which may differ from GAAP.
For the six months ended March 31, 2018, the Fund declared distributions to shareholders in the amount of $23,598,490, which resulted in $9,966,042 elected to be paid in cash and $13,632,448 that was reinvested through the Fund’s dividend reinvestment policy. During this same period, the Fund had total investment income of $16,785,557, net realized loss on investments totaling $295,646, net change in unrealized appreciation on investments of $20,759,514 and paid net expenses of $10,845,243.
The Fund’s primary investment objective is to generate current income while secondarily seeking long-term capital appreciation with low to moderate volatility and low correlation to the broader markets. The Fund’s total return is expected to be comprised of income plus realized gains and unrealized gains, less Fund-level expenses. Therefore, a portion of the Fund’s total return has been comprised of unrealized gains.
The Fund’s distributions for any period may be higher or lower than the Fund’s net return and therefore should not be used as a measure of performance or confused with yield or income generated by the Fund’s underlying investments. Further, the actual distribution amounts and sources of those amounts for tax reporting purposes will depend upon the Fund’s investment experience during its fiscal year and may be subject to changes based on tax regulations. Distributions in excess of the Fund’s total return will cause the Fund’s NAV to decline. During the six months ended March 31, 2018, the Fund’s Class A Shares had a starting NAV of $29.37, paid a distribution of $0.78 and had an ending NAV of $29.65. During the six months ended March 31, 2018, the Fund’s Class C Shares had a starting NAV of $28.63, paid a distribution of $0.76 and had an ending NAV of $28.79 During the six months ended March 31, 2018, the Fund’s Class I Shares had a starting NAV of $29.70, paid a distribution of $0.79 and had an ending NAV of $29.99. During the six months ended March 31, 2018, the Fund’s Class L Shares had a starting NAV of $29.34, paid a distribution of $0.78 and had an ending NAV of $29.53.
The Fund’s distribution policy is expected to result in distributions that equal a fixed percentage of the Fund’s current net asset value per share. All or a portion of a distribution may consist of a return of capital (i.e. from your original investment). Shareholders should not assume that the source of a distribution from the Fund is net profit. Shareholders should note that return of capital will reduce the tax basis of their shares and potentially increase the taxable gain, if any, upon disposition of their shares. Investors should not draw any conclusions about the Fund’s investment performance from the amount of its distribution.
The Fund’s historical NAV is available on the Fund’s website at www.bluerockfunds.com/performance.
Indemnification – The Trust indemnifies its officers and Trustees for certain liabilities that may arise from the performance of their duties to the Trust. Additionally, in the normal course of business, the Fund enters into contracts that contain a variety of representations and warranties and which provide general indemnities. The Fund’s maximum exposure under these arrangements is unknown, as this would involve future claims that may be made against the Fund that have not yet occurred. However, based on experience, the Trust expects the risk of loss due to these warranties and indemnities to be remote.
| 3. | ADVISORY FEE AND OTHER RELATED PARTY TRANSACTIONS |
Advisory Fees – Pursuant to an investment advisory agreement with the Fund, (the “Advisory Agreement”), investment advisory services are provided to the Fund by the Advisor. Under the terms of the Advisory Agreement, the Advisor receives monthly fees calculated at an annual rate of 1.50% of the average daily net assets of the Fund. For six months ended March 31, 2018, the Advisor earned advisory fees of $6,421,823.
| Total Income+ Real Estate Fund |
| NOTES TO FINANCIAL STATEMENTS (Unaudited)(Continued) |
| March 31, 2018 |
| |
Pursuant to an expense limitation agreement and a side letter agreement the Advisor has contractually agreed to waive all or part of its management fees and/or make payments to limit Fund operating expenses (exclusive of any taxes, interest, brokerage commissions, acquired fund fees and expenses and extraordinary expenses, but inclusive of organizational costs and offering costs) at least until January 31, 2019 for Class A, Class C and Class I and at least until May 31, 2018 for Class L so that the total annual operating expenses of the Fund do not exceed 1.95%, 2.70%, 1.70% and 2.14%, of the Fund’s average daily net assets for Class A, Class C, Class I and Class L shares, respectively. Commencing on June 1, 2018 the expense limitation for Class L shares will be 2.20% at least until January 31, 2019.
The Fund had the following expense limitations in place pursuant to Board approval during the six months ended March 31, 2018:
| Class A | |
| Effective Date | | Expense Limitation | |
| 2/1/2017 | | | 1.89 | % |
| 2/1/2018 | | | 1.95 | % |
| Class C | |
| Effective Date | | Expense Limitation | |
| 2/1/2017 | | | 2.64 | % |
| 2/1/2018 | | | 2.70 | % |
| Class I | |
| Effective Date | | Expense Limitation | |
| 2/1/2017 | | | 1.64 | % |
| 2/1/2018 | | | 1.70 | % |
| Class L | |
| Effective Date | | Expense Limitation | |
| 2/1/2017 | | | 2.14 | % |
Fee waivers and expense payments may be recouped by the Advisor from the Fund, upon approval by the Fund’s Board, to the extent that overall expenses fall below the lesser of the expense limitation then in place or in place at the time of the waiver, within three fiscal years of when the amounts were waived or reimbursed. During the six months ended March 31, 2018, the Advisor waived fees and/or reimbursed expenses of $155,895. Including amounts waived during the six months ended March 31, 2018, cumulative fees and/or expenses subject to recapture pursuant to the aforementioned conditions amounted to $2,661,593 and will expire during the fiscal years indicated below:
| 2018 | | 2019 | | 2020 |
| $661,059 | | $997,305 | | $1,003,229 |
Sub-advisory services were provided to the Fund pursuant to agreements between the Advisor and each of Mercer Investment Management, Inc. (“Mercer”) and RREEF America, LLC (“RREEF” and together with Mercer, the “Sub-Advisors”). Under the terms of the sub-advisory agreements, the Advisor compensates the Sub-Advisors based on the Fund’s assets allocated to the respective Sub-Advisor. Under the terms of the Sub-Advisory Agreement with Mercer, the Sub-Advisor receives fees from the Advisor (not the Fund) as follows: 0.0250% of the Fund’s assets invested in publicly traded real estate securities, and 0.15% for up to $250 million in total Fund assets, 0.13% for $250 million to $500 million in total Fund assets, 0.12% for $500 million to $750 million in total Fund assets, 0.10% for $750 million to $1 billion in total Fund assets, 0.08% for $1 billion to $1.3 billion in total Fund assets, 0.07% for $1.3 billion to $1.5 billion in total Fund assets, 0.06% for $1.5 billion to $2 billion in total Fund assets, and 0.05% for $2 billion or more in total Fund assets invested in private real estate assets.
Under the terms of the Sub-Advisory Agreement with RREEF, the Sub-Advisor receives fees from the Advisor (not the Fund) as follows: 0.60% for up to $50 million in assets allocated to RREEF, 0.55% for $50 million to $100 million in assets allocated to RREEF, 0.50% for greater than $100 million in assets allocated to RREEF.
| Total Income+ Real Estate Fund |
| NOTES TO FINANCIAL STATEMENTS (Unaudited)(Continued) |
| March 31, 2018 |
Distributor – The distributor of the Fund is ALPS Distributors, Inc., (the “Distributor”). The Board of Trustees has adopted, on behalf of the Fund, a Shareholder Services Plan and a Distribution Plan under which the Fund may compensate financial industry professionals for providing ongoing services in respect to clients with whom they have distributed shares of the Fund. Under the Shareholder Services Plan, the Fund pays up to 0.25% per year of the average daily net assets of each of Class A, Class C and Class L shares for such services. For the six months ended March 31, 2018, the Fund incurred shareholder servicing fees of $384,437, $298,585 and $16,678 for Class A, Class C and Class L shares, respectively. Under the Distribution Plan, the Fund pays 0.75% and 0.25% per year of its average daily net assets for such services for Class C shares and Class L shares, respectively. For the six months ended March 31, 2018, the Fund incurred distribution fees of $895,753 and $16,678 for Class C shares and Class L, respectively. Effective January 1, 2018, ALPS Distributors, Inc., became the Funds’ Distributor. For the period October 1, 2017 to December 31, 2017, Northern Lights Distributors, LLC, an affiliate of Gemini Fund Services, LLC, (“GFS”) served as the Fund’s Distributor (“Prior Distributor”).
The Distributor acts as the Fund’s principal underwriter in a continuous public offering of the Fund’s shares. For the six months ended March 31, 2018, the Distributor received $1,479,840 in underwriting commissions for sales of Class A shares, of which $199,908 was retained by the principal underwriter or other affiliated broker-dealers. For the six months ended March 31, 2018, the Distributor received $671,626 in underwriting commissions for sales of Class L shares, of which $121,968 was retained by the principal underwriter or other affiliated broker-dealers.
In addition, certain affiliates of the Prior Distributor provide services to the Fund as follows:
Gemini Fund Services, LLC (“GFS”) – GFS, an affiliate of the Prior Distributor, provides administration, fund accounting, and transfer agent services to the Trust. Pursuant to separate servicing agreements with GFS, the Fund pays GFS customary fees for providing administration, fund accounting and transfer agency services to the Fund.
Blu Giant, LLC (“Blu Giant”) – Blu Giant, an affiliate of GFS and the Prior Distributor, provides EDGAR conversion and filing services as well as print management services for the Fund on an ad-hoc basis. For the provision of these services, Blu Giant receives customary fees from the Fund.
Trustees – Effective January 1, 2018 the Fund pays each Trustee who is not affiliated with the Trust or Advisor an annual fee of $25,000, as well as reimbursement for any reasonable expenses incurred attending meetings. Prior to January 1, 2018, each Trustee who is not affiliated with the Trust or Advisor received an annual fee of $10,000, as well as reimbursement for any reasonable expense incurred attending the meetings. The “interested persons” who serve as Trustees of the Trust receive no compensation for their services as Trustees. None of the executive officers receive compensation from the Trust.
| 4. | INVESTMENT TRANSACTIONS |
The cost of purchases and proceeds from the sale of securities, other than short-term securities, for the six months ended March 31, 2018, amounted to $188,507,428 and $33,402,366 respectively.
| 5. | REPURCHASE OFFERS / SHARES OF BENEFICIAL INTEREST |
Pursuant to Rule 23c-3 under the 1940 Act, the Fund offers shareholders on a quarterly basis the option of redeeming shares, at NAV, of no less than 5% and no more than 25% of the shares outstanding on the Repurchase Request Deadline. The Board shall determine the quarterly repurchase offer amount. There is no guarantee that shareholders will be able to sell all of the shares they desire in a quarterly repurchase offer, although each shareholder will have the right to require the Fund to purchase up to and including 5% of such shareholder’s shares in each quarterly repurchase. Limited liquidity will be provided to shareholders only through the Fund’s quarterly repurchases.
| Total Income+ Real Estate Fund |
| NOTES TO FINANCIAL STATEMENTS (Unaudited)(Continued) |
| March 31, 2018 |
During the six months ended March 31, 2018, the Fund completed two quarterly repurchase offers. The Fund offered to repurchase up to 5% of the number of its outstanding shares as of the Repurchase Pricing Dates. The results of the repurchase offers were as follows:
| | | Repurchase Offer | | Repurchase Offer |
| Commencement Date | | September 28, 2017 | | December 29, 2017 |
| Repurchase Request Deadline | | November 9, 2017 | | February 9, 2018 |
| Repurchase Pricing Date | | November 9, 2017 | | February 9, 2018 |
| | | | | |
| Net Asset Value as of Repurchase Offer Date: | | | | |
| Class A | | $29.48 | | $29.53 |
| Class C | | $28.72 | | $28.71 |
| Class I | | $29.82 | | $29.89 |
| Class L | | $29.44 | | $29.48 |
| | | | | |
| Amount Repurchased | | | | |
| Class A | | $9,329,379 | | $13,270,444 |
| Class C | | $10,241,071 | | $13,665,569 |
| Class I | | $11,238,514 | | $12,281,272 |
| Class L | | N/A | | N/A |
The amounts listed above do not match the amounts listed in the Statement of Changes in Nets Assets due to transfer redemptions between Fund’s share classes. In each period shown, the Fund met all repurchase requests made.
| 6. | DISTRIBUTIONS TO SHAREHOLDERS AND TAX COMPONENTS OF CAPITAL |
The tax character of Fund distributions for the following years was as follows:
| | | Fiscal Year Ended | | | Fiscal Year Ended | |
| | | September 30, 2017 | | | September 30, 2016 | |
| Ordinary Income | | $ | — | | | $ | — | |
| Long-Term Capital Gain | | | 7,080,110 | | | | 1,372,318 | |
| Return of Capital | | | 28,046,256 | | | | 17,536,213 | |
| | | $ | 35,126,366 | | | $ | 18,908,531 | |
As of September 30, 2017, the components of accumulated earnings/(deficit) on a tax basis were as follows:
| Undistributed | | | Undistributed | | | Post October Loss | | | Capital Loss | | | Other | | | Unrealized | | | Total | |
| Ordinary | | | Long-Term | | | and | | | Carry | | | Book/Tax | | | Appreciation/ | | | Accumulated | |
| Income | | | Gains | | | Late Year Loss | | | Forwards | | | Differences | | | (Depreciation) | | | Earnings/(Deficits) | |
| $ | — | | | $ | — | | | $ | (9,758,507 | ) | | $ | — | | | $ | — | | | $ | 83,394,432 | | | $ | 73,635,925 | |
The difference between book basis and tax basis distributable earnings and unrealized appreciation/(depreciation) is primarily attributable to the tax deferral of losses on wash sales and tax adjustments for partnerships.
Late year losses incurred after December 31 within the fiscal year are deemed to arise on the first business day of the following fiscal year for tax purposes. The Fund incurred and elected to defer such late year losses of $9,758,507.
| Total Income+ Real Estate Fund |
| NOTES TO FINANCIAL STATEMENTS (Unaudited)(Continued) |
| March 31, 2018 |
Permanent book and tax differences, primarily attributable to net operating losses and tax adjustments for partnerships, resulted in reclassification for the fiscal year ended September 30, 2017 as follows:
| Paid | | | Undistributed | | | Accumulated | |
| In | | | Net Investment | | | Net Realized | |
| Capital | | | Income (Loss) | | | Gains (Loss) | |
| $ | (3,079,141 | ) | | $ | 2,477,844 | | | $ | 601,297 | |
| 7. | AGGREGATE UNREALIZED APPRECIATION AND DEPRECIATION – TAX BASIS |
| | | | Gross | | | Gross | | | Net Unrealized | |
| | | | Unrealized | | | Unrealized | | | Appreciation/ | |
| Tax Cost | | | Appreciation | | | Depreciation | | | (Depreciation) | |
| $ | 964,881,128 | | | $ | 110,126,157 | | | $ | (1,892,129 | ) | | $ | 108,234,028 | |
Class C shareholders and certain Class A shareholders who tender for repurchase shares that have been held less than one year (365 days) from the purchase date will be subject to an early withdrawal charge of 1.00% of the original purchase price with respect to such shares. The redemption fee does not apply to shares that were acquired through reinvestment of distributions or in connection with the death or disability of the shareholder. The redemption fee is paid directly to the Fund. For the six months ended March 31, 2018, the Fund did not receive any such fees.
| 9. | COMMITMENTS AND CONTINGENCIES |
As of March 31, 2018, the Fund had unfunded capital commitments for the Private Equity Real Estate Securities listed below:
| | | | | | Unfunded | | | Redemption | | Redemption |
| Security Description | | Value | | | Commitments | | | Frequency | | Notice Days |
| AEW Core Property Trust | | $ | 22,080,905 | | | $ | — | | | Quarterly | | 45 |
| Blackrock US Core Property | | | 18,967,130 | | | | — | | | Quarterly | | 60 |
| Blackstone Property Partners | | | 129,417,581 | | | | — | | | Quarterly | | 90 |
| Carlyle Property Investors LP | | | — | | | | 50,000,000 | | | Quarterly | | 90 |
| Clarion Lion Industrial Trust | | | 47,960,811 | | | | 5,625,000 | | | Quarterly | | 90 |
| Clarion Lion Properties Fund | | | 113,915,834 | | | | — | | | Quarterly | | 90 |
| Heitman American Real Estate Fund | | | 31,929,429 | | | | — | | | Quarterly | | 90 |
| Invesco Core Real Estate Fund | | | 31,257,934 | | | | — | | | Quarterly | | 45 |
| Invesco U.S. Income Fund LP | | | 32,119,676 | | | | 25,000,000 | | | Quarterly | | 45 |
| Harrison Street Core Property Fund | | | — | | | | 38,000,000 | | | Quarterly | | 45 |
| J.P. Morgan U.S. Real Estate Income and Growth Fund | | | 29,877,164 | | | | — | | | Quarterly | | 90 |
| MEPT Edgemoor LP | | | 15,395,616 | | | | — | | | Quarterly | | * |
| Morgan Stanley Prime Property Fund LLC | | | 148,822,025 | | | | 40,000,000 | | | Quarterly | | 90 |
| PGIM PRISA I | | | 30,031,473 | | | | — | | | Quarterly | | 90 |
| PGIM PRISA III | | | 15,027,725 | | | | 53,774,059 | | | Quarterly | | 90 |
| Principal Enhanced Property Fund LP | | | 36,802,689 | | | | 8,000,000 | | | Quarterly | | 90 |
| Prologis Targeted US Logistics | | | 44,931,598 | | | | — | | | Quarterly | | 90 |
| RREEF America REIT II, Inc. | | | 38,975,781 | | | | 6,250,000 | | | Quarterly | | 45 |
| RREEF Core Plus Industrial Fund LP | | | 48,156,051 | | | | — | | | Quarterly | | 90 |
| Sentinel Real Estate Fund | | | 29,447,011 | | | | — | | | Daily | | * |
| Stockbridge Smart Markets Fund | | | 40,643,540 | | | | — | | | Quarterly | | 45 |
| Stockbridge Value Fund II | | | 8,823,371 | | | | 2,348,471 | | | None | | None |
| UBS Trumbull Property G&I Fund | | | 38,498,547 | | | | 12,000,000 | | | Quarterly | | 60 |
| * | Written notice required for redemption, no minimum timeline required. |
| Total Income+ Real Estate Fund |
| NOTES TO FINANCIAL STATEMENTS (Unaudited)(Continued) |
| March 31, 2018 |
Credit Facility – On November 23, 2016, the Fund entered into a secured, revolving line of credit agreement (“Credit Agreement”) with Credit Suisse for investment purposes, subject to the limitations of the 1940 Act for borrowings. Borrowings under the Credit Agreement bear interest at the rate of 3 month LIBOR plus 236 basis points at the time of borrowing. During the six months ended March 31, 2018, the average amount of borrowing outstanding was $107,105,027 and the total interest expense was $2,126,600. As of March 31, 2018, the Fund had $144,600,000 of outstanding borrowings under the Credit Agreement.
The Fund completed a quarterly repurchase offer on May 11, 2018 which resulted in 2.91% of the Fund’s shares being repurchased for $28,980,007.
Subsequent events after the date of the Statement of Assets and Liabilities have been evaluated through the date the financial statements were issued. Except as stated above, management has concluded that there is no impact requiring adjustment or disclosure in the financial statements.
Renewal of Investment Advisory Agreement and Sub-Advisory Agreements
Advisory Agreement
At a meeting held on November 17, 2017 (the “November Meeting”), the Board of Trustees (the “Board”) of the Fund, including a majority of the Trustees who are not “interested persons” (the “Independent Trustees”), as such term is defined by the 1940 Act, approved the renewal of the Advisory Agreement. Matters considered by the Trustees in connection with the Board’s renewal of the Advisory Agreement included the following:
Nature, Extent and Quality of Services. The Board reviewed materials provided by the Advisor relating to the Advisory Agreement. With respect to the nature, extent and quality of services provided, the Trustees reviewed a description of the manner in which investment decisions are made for the Fund, a description of the services provided by the Advisor, including an overview of the experience of professional personnel performing services for the Fund, key risks associated with the Advisor’s management of the Fund and factors to mitigate those risks, and the Advisor’s Form ADV.
The Board considered the depth and experience of the Advisor’s personnel with responsibilities to the Fund, noting the addition of certain key personnel, and noted that there had not been any significant turnover in the Advisor’s staff. The Board noted that the Fund continues to benefit from the careful attention of senior personnel of the Advisor, further noting that senior management is accessible, forthcoming and transparent with their plans. The Board also considered the depth and scope of the investment services provided by the Advisor to the Fund, including with respect to the monitoring and oversight of multiple sub-advisers, the research and review associated with making investment decisions for the Fund, and general oversight of the Fund’s other service providers. With respect to compliance, the Board considered that the Fund had retained an independent compliance consultant to ensure that the Advisor’s compliance policies and procedures were consistent with industry best practice and that the Advisor was adhering to such compliance policies and procedures.
The Board, including the Independent Trustees, concluded that the Advisor had sufficient quality and depth of personnel, resources, investment methods and compliance policies and procedures essential for performing its duties under the Advisory Agreement and that the nature, overall quality and extent of the management services provided by the Advisor to the Fund were executed with a high degree of professionalism and were satisfactory and reliable.
Performance. The Board considered the performance of the Fund (Class A shares, load waived) as compared to the performance of the Fund’s indices representing other asset classes, including bonds, equity and Public REITs, represented by the Barclays U.S. Aggregate Bond Index, S&P 500 Total Return Index, and the MSCI U.S. REIT Index, respectively. The Board also considered the performance of the Fund compared to the NCREIF Fund Index-Open End Diversified Core Equity Index (“NFIODCE”) and a blended index reflecting the returns of a mix of Private REIT and Public REIT investments comprised of the NCREIF Property Index (“NPI”) and MSCI U.S. REIT Index weighted at 80% and 20%, respectively (the “Blended Index”). The Board noted noting that each of the NPI and NFIODCE are unmanaged indices measuring the investment returns of pools of real estate and open-end funds that invest in real estate and considered the returns of the NFIODCE and Blended Index on both a gross return basis and also net of expenses.
The Board considered that for the one year period ended September 30, 2017, the Fund outperformed the Barclays U.S. Aggregate Bond Index, the NFIODCE (net of fees), the MSCI U.S. REIT Index and the Blended Index (net of fees), but underperformed the S&P 500 Total Return Index and marginally underperformed the NPI for the same period. The Board considered that for the period since the Fund’s
inception (October 22, 2012) to September 30, 2017, the Fund similarly outperformed the Barclays U.S. Aggregate Bond Index but underperformed the Blended Index (net of fees), the S&P 500 Total Return Index, the MSCI U.S. REIT Index the NFIODCE (net of fees) and the NPI.
The Board also considered that the Advisor factors risk management into its management of the Fund’s portfolio and considered additional portfolio statistics for the Fund as a measure of the Advisor’s performance. The Board considered the Fund’s volatility by reviewing the Fund’s standard deviation and Sharpe Ratio. The Board considered a selection of similarly structured closed-end interval funds with comparable investment objectives to that of the Fund (the “Peer Group”), and found that for the year to date and one year period ended September 30, 2017, the Fund’s Sharpe Ratio was higher than the Peer Group, reflecting that the Fund is delivering returns at considerably lower risk levels than its competitors. They also noted that the Fund’s performance for the year to date and one year period ended September 30, 2017 was also greater than the performance of the Peer Group. The Board considered the Fund’s low correlation to the Public REIT market and recognized the Advisor’s expertise in employing the Fund’s strategy. Based on the information provided, the Board concluded that the Advisor was meeting the Fund’s investment objectives and had delivered an acceptable level of investment returns to shareholders.
Fees and Expenses. As to the costs of the services provided by the Advisor, the Trustees considered a comparison of the Fund’s advisory fee and overall expenses to the Peer Group. The Board considered that the Fund’s advisory fee of 1.50% was above the mean and equal to the highest in the Peer Group.
The Board also considered the net expense ratio of the Fund, noting that the Advisor had agreed to reimburse expenses to limit net annual operating expenses. The Board considered that the Fund’s expense limit and net expense ratio (Class I shares) was lower than the mean of the Peer Group. The Board considered the significant skill and expertise provided by the adviser & sub-advisers, and in light of these factors, the Board concluded that the advisory fee and net expense ratios were not unreasonable.
Profitability. The Board also considered the profitability of the Advisor and whether such profits were reasonable in light of the services provided to the Fund. The Board reviewed a profitability analysis prepared by the Advisor for the year ended September 30, 2017. The Board considered that the Fund was a specialized product that required appropriate expertise, and found that the Advisor realized a reasonable profit in connection with its relationship with the Fund. The Trustees agreed that given the labor intensive nature of the Fund’s strategy, that the Advisor’s net profits both in terms of dollar amount and as a percentage of the advisory fee was reasonable and not excessive.
Economies of Scale. The Board considered the current and projected asset levels, and economies realized in the Fund’s total expenses and agreed that the lack of management fee breakpoints was appropriate at this time. The Board considered the breakpoints in the sub-advisory agreements. The Board considered the Advisor’s projections for reaching economies of scale at higher asset levels, and agreed to revisit whether economies of scale had been realized in the future once sufficient Fund size was achieved.
Conclusion. The Trustees, having requested and received such information from the Advisor as they believed reasonably necessary to evaluate the terms of the Advisory Agreement, and assisted by the advice of independent counsel, determined that continuation of the Advisory Agreement for an additional one-year term is in the best interests of the Fund and its shareholders. In considering the Advisory Agreement, the Trustees did not identify any one factor as all important, but rather considered these factors collectively in light of surrounding circumstances. Further, each Trustee may have afforded a different weight to different factors.
Sub-Advisory Agreement with Mercer
At the November Meeting, the Board, including a majority of the Independent Trustees, approved the renewal of the sub-advisory agreement (the “Mercer Agreement”) between Mercer and the Advisor, with respect to the Fund. In connection with the Board’s consideration of the Mercer Agreement, the Sub-Advisor provided the Board with written materials. Matters considered by the Board in connection with its renewal of the Sub-Advisory Agreement included the following:
Nature, Extent and Quality of Services. The Board reviewed materials provided by Mercer related to the Mercer Agreement with the Advisor. The Board considered the role of Mercer with respect to the Fund, noting that Mercer’s principal responsibilities were to assist the Advisor by providing research and diligence services for the Fund’s portfolio of Private REITs and other non-traded securities, providing recommendations to select such investments and establish the Fund’s portfolio construction, and determining target allocations.
The Board considered that Mercer’s services were primarily consultative in nature and Mercer did not maintain responsibility with respect to the Fund’s adherence to its investment objective or operations. The Board considered the depth of research performed by Mercer, noting that Mercer represents that its research process includes visits to underlying investment managers and degrees of statistical analysis. The Board also considered the quality of communication between the Advisor and Mercer, noting that the Advisor frequently meets with Mercer, including in-person quarterly meetings, periodic calls and daily communication. The Fund’s CCO noted Mercer did not experience any material compliance issues or major changes in personnel since the Board’s last approval. The Board also took into consideration that the Fund’s management team has reported that its relationship with Mercer was positive and operating effectively.
The Board concluded Mercer maintained sufficient quality and depth of personnel, resources, investment methods and compliance policies and procedures essential to continue performing its duties under the Mercer Agreement and that the nature, overall quality and extent of the management services provided by Mercer to the Advisor and the Fund were satisfactory and reliable.
Performance. The Board considered that Mercer’s function is to provide consultative services to the Advisor, and Mercer does not approve or make investment decisions for the Fund. The Board considered that the Fund’s overall performance is one indicator of Mercer’s performance. The Board considered its prior deliberations relating to the Fund’s performance in its review of the Advisor, noting that the Fund had outperformed certain of its benchmark indices and competitors on an absolute and risk-adjusted basis and the Board’s conclusion that the Advisor’s performance was satisfactory, and in line with the expectations of the Board and Advisor. The Board considered that the Advisor was satisfied with the performance of Mercer and recommended continuation of the agreement with Mercer. Based on the information provided, the Board concluded that Mercer’s performance was satisfactory.
Fees and Expenses. The Board considered Mercer’s fees for its services, noting that the Advisor and Mercer had agreed to a tiered fee schedule providing for breakpoints at various levels. The Board reviewed Mercer’s fee schedule, noting that Mercer and the Advisor have agreed to a reduction in the sub-advisory fee schedule. The Board considered that Mercer would be providing the same services as they were under the prior fee schedule, and the Board relied on a representation from the Advisor that there would be no change or diminution in the level of quality of services from Mercer. The Board reviewed the sub-advisory fee schedule and noted the fees and breakpoints. The Board considered the quantity and quality of the research and reporting generated by Mercer and Mercer’s rates for the
provision of such services (noting that Mercer did not provide similar sub-advisory services for any other account) and concluded that Mercer’s fees were acceptable.
Economies of Scale. The Board discussed whether economies of scale had been achieved with respect to the management of the Fund under the Mercer Agreement and whether there is potential for realization of any further economies of scale. The Board considered that the Mercer Agreement included breakpoints in its fee above certain asset levels and concluded that while such breakpoints appeared reasonable, economies of scale would be best evaluated at the Fund, rather than sub-advisory level.
Profitability. The Board also considered the profitability of Mercer. The Board noted that Mercer did not provide similar sub-advisory services for any other account and was generally compensated on a per-investment basis with respect to the monitoring and reporting that it performs. The Board considered the expenses of Mercer with respect to the Fund and compared them to the fees paid to Mercer during the period. The Board concluded that Mercer’s profitability appeared reasonable.
Conclusion. The Board, having requested and received such information from Mercer as the Board believed to be reasonably necessary to evaluate the terms of the Mercer Agreement, and as assisted by the advice of counsel, concluded that continuation of the Mercer Agreement for an additional one-year term was in the best interests of the Fund and its shareholders. The Board noted that in considering the Mercer Agreement, it did not identify any one factor as all important, but rather considered these factors collectively in light of surrounding circumstances. Further, it noted that each Trustee may have afforded a different weight to different factors.
Sub-Advisory Agreement with RREEF
At the November Meeting, the Board, including a majority of the Independent Trustees, approved the renewal of the sub-advisory agreement (the “RREEF Agreement”) between RREEF and the Advisor, with respect to the Fund. In connection with the Board’s consideration of the Sub-Advisory Agreement, the Sub-Advisor provided the Board with written materials. Matters considered by the Board in connection with its renewal of the RREEF Agreement included the following:
Nature, Extent and Quality of Services. The Board reviewed the materials provided by RREEF related to the RREEF Agreement. The Board reviewed the experience of professional personnel performing services for the Fund, a description of the manner in which investment decisions were made for the Fund by RREEF and a description of the investment advisory services provided by RREEF. The Board reviewed the extensive track record of RREEF and its affiliates.
The Board considered the relative sophistication and techniques employed by RREEF in designing and executing investment strategies for the Fund and RREEF’s other clients. The Board then concluded that RREEF maintains sufficient quality and depth of personnel, resources, investment methods and compliance policies and procedures essential to continue performing its duties under the RREEF Agreement.
Performance. The Board considered that RREEF provides investment advice to a limited portion of the Fund’s portfolio allocated to publicly-traded real estate securities. The Board noted that the Fund receives bespoke investment advice from RREEF that may not correlate to investment advice rendered for any other account or portfolio managed by RREEF. The Board considered that the portion of the Fund managed by RREEF outperformed its benchmark index, the MSCI U.S. REIT Index, for the one year period and since RREEF began managing a portion of the Fund. The Board noted that the Advisor was satisfied with RREEF’s performance, referencing the relative performance to RREEF’s benchmark, the MSCI U.S.
REIT Index. The Board concluded that RREEF’s overall performance was satisfactory and that the Fund’s continued relationship with RREEF would benefit of shareholders.
Fees and Expenses. The Board then discussed the fees paid to RREEF. The Board considered that RREEF’s sub-advisory fee ranged from 0.60% of the average daily value of the assets allocated to RREEF and scaled downward depending on the applicable breakpoint. The Board noted that the average fee for the fiscal year ended September 30, 2017 was 0.60%. The Board considered the quality of services provided by RREEF and the level of fees charged by RREEF to other accounts, taking into account the nature and size of those accounts as compared to the portion of the Fund allocated to RREEF and the level of active management and personalized service the Fund receives from RREEF. The Board concluded that based on RREEF’s experience, expertise, and services provided to the Fund, that the fees to be charged by the Advisor and paid to RREEF were reasonable.
Profitability. The Board also considered the profitability of RREEF. The Board considered RREEF’s expenses with respect to the Fund and RREEF’s fees earned during the period. The Board noted that RREEF estimated that it did not earn a profit in connection with its relationship with the Fund. The Board concluded that excessive profitability was not an issue with RREEF at current asset and allocation levels and the Board would further evaluate RREEF’s profitability in the future.
Economies of Scale. The Board considered whether economies of scale are present in the RREEF Agreement and whether such arrangement permits for potential realization of any further economies of scale. The Board considered that RREEF has agreed to breakpoints in its fee above certain asset levels and concluded that while such breakpoints appeared reasonable, economies of scale would be best evaluated at the Fund, rather than sub-advisory level.
Conclusion. The Board, having requested and received such information from RREEF as the Board believed to be reasonably necessary to evaluate the terms of the RREEF Agreement, and as assisted by the advice of counsel, found that approval of the RREEF Agreement for an additional year was in the best interests of the Fund and its shareholders. The Board noted that in considering the RREEF Agreement, it did not identify any one factor as all important, but rather considered these factors collectively in light of surrounding circumstances, and that each Trustee may have afforded a different weight to different factors.
NOTICE OF PRIVACY POLICY & PRACTICES
PRIVACY notice
Rev. Aug. 2012
| FACTS | WHAT DOES THE TOTAL INCOME+ REAL ESTATE FUND DO WITH YOUR PERSONAL INFORMATION? |
| | |
| Why? | Financial companies choose how they share your personal information. Federal law gives consumers the right to limit some but not all sharing. Federal law also requires us to tell you how we collect, share, and protect your personal information. Please read this notice carefully to understand what we do. |
| | |
| What? | The types of personal information we collect and share depend on the product or service you have with us. This information can include: |
| | |
| | ■ | Social Security number | ■ | Purchase History |
| | | | | |
| | ■ | Assets | ■ | Account Balances |
| | | | | |
| | ■ | Retirement Assets | ■ | Account Transactions |
| | | | | |
| | ■ | Transaction History | ■ | Wire Transfer Instructions |
| | | | | |
| | ■ | Checking Account Information | | |
| | |
| | When you are no longer our customer, we continue to share your information as described in this notice. |
| | |
| How? | All financial companies need to share customers’ personal information to run their everyday business. In the section below, we list the reasons financial companies can share their customers’ personal information; the reasons the Total Income+ Real Estate Fund chooses to share; and whether you can limit this sharing. |
| Reasons we can share your personal information | Does Total
Income+ Real
Estate Fund share? | Can you limit this sharing? |
For our everyday business purposes – such as to process your transactions, maintain your account(s), respond to court orders and legal investigations, or report to credit bureaus | Yes | No |
For our marketing purposes – to offer our products and services to you | No | We don’t share |
| For joint marketing with other financial companies | No | We don’t share |
For our affiliates’ everyday business purposes – information about your transactions and experiences | No | We don’t share |
For our affiliates’ everyday business purposes – information about your creditworthiness | No | We don’t share |
| For nonaffiliates to market to you | No | We don’t share |
| Questions? | Call 1-888-459-1059 |
| Who we are |
Who is providing this notice? | Total Income+ Real Estate Fund |
| What we do |
| How does Total Income+ Real Estate Fund protect my personal information? | To protect your personal information from unauthorized access and use, we use security measures that comply with federal law. These measures include computer safeguards and secured files and buildings. Our service providers are held accountable for adhering to strict policies and procedures to prevent any misuse of your nonpublic personal information. |
| How does Total Income+ Real Estate Fund collect my personal information? | We collect your personal information, for example, when you ■ Open an account ■ Provide account information ■ Give us your contact information ■ Make deposits or withdrawals from your account ■ Make a wire transfer ■ Tell us where to send the money ■ Tells us who receives the money ■ Show your government-issued ID ■ Show your driver’s license We also collect your personal information from other companies. |
| Why can’t I limit all sharing? | Federal law gives you the right to limit only ■ Sharing for affiliates’ everyday business purposes – information about your creditworthiness ■ Affiliates from using your information to market to you ■ Sharing for nonaffiliates to market to you State laws and individual companies may give you additional rights to limit sharing. |
| Definitions |
| Affiliates | Companies related by common ownership or control. They can be financial and nonfinancial companies. ■ Total Income+ Real Estate Fund does not share with our affiliates. |
| Nonaffiliates | Companies not related by common ownership or control. They can be financial and nonfinancial companies ■ Total Income+ Real Estate Fund does not share with nonaffiliates so they can market to you. |
| Joint marketing | A formal agreement between nonaffiliated financial companies that together market financial products or services to you. ■ Total Income+ Real Estate Fund doesn’t jointly market. |
| | | | | | |
| Investment Adviser |
| Bluerock Fund Advisor, LLC |
| 712 Fifth Avenue, 9th Floor |
| New York, NY 10019 |
| |
| Distributor |
| ALPS Distributors, Inc. |
| 1290 Broadway, Suite 1100 |
| Denver, Colorado 80203 |
| |
| Legal Counsel |
| Thompson Hine LLP |
| 41 South High Street, Suite 1700 |
| Columbus, OH 43215 |
| |
| Independent Registered Public Accounting Firm |
| BBD, LLP |
| 1835 Market Street, 26th Floor |
| Philadelphia, PA 19103 |
How to Obtain Proxy Voting Information
Information regarding how the Fund votes proxies relating to portfolio securities for the 12 month period ended June 30th as well as a description of the policies and procedures that the Fund used to determine how to vote proxies is available without charge, upon request, by calling 1-888-459-1059 or by referring to the Securities and Exchange Commission’s (“SEC”) website at http://www.sec.gov.
How to Obtain 1st and 3rd Fiscal Quarter Portfolio Holdings
The Fund files its complete schedule of portfolio holdings with the SEC for the first and third quarters of each fiscal year on Form N-Q. Form N-Q is available on the SEC’s website at http://www.sec.gov and may be reviewed and copied at the SEC’s Public Reference Room in Washington, DC (1-800-SEC-0330). The information on Form N-Q is available without charge, upon request, by calling 1-888-459-1059.
Item 2. Code of Ethics. Not applicable.
Item 3. Audit Committee Financial Expert. Not applicable.
Item 4. Principal Accountant Fees and Services. Not applicable.
Item 5. Audit Committee of Listed Companies. Not applicable
Item 6. Schedule of Investments. Schedule of investments in securities of unaffiliated issuers is included under Item 1.
Item 7. Disclosure of Proxy Voting Policies and Procedures for Closed-End Funds. Not applicable.
Item 8. Portfolio Managers of Closed-End Management Investment Companies. Not applicable.
Item 9. Purchases of Equity Securities by Closed-End Funds. Not applicable
Item 10. Submission of Matters to a Vote of Security Holders. None
Item 11. Controls and Procedures.
(a) Based on an evaluation of the Registrant’s disclosure controls and procedures as of a date within 90 days of filing date of this Form N-CSR, the principal executive officer and principal financial officer of the Registrant have concluded that the disclosure controls and procedures of the Registrant are reasonably designed to ensure that the information required in filings on Form N-CSR is recorded, processed, summarized, and reported by the filing date, including that information required to be disclosed is accumulated and communicated to the Registrant’s management, including the Registrant’s principal executive officer and principal financial officer, as appropriate to allow timely decisions regarding required disclosure.
(b) There were no significant changes in the Registrant’s internal control over financial reporting that occurred during the Registrant’s last fiscal half-year that have materially affected, or are reasonably likely to materially affect, the Registrant’s internal control over financial reporting.
Item 12. Exhibits.
(a)(1) Code of Ethics filed herewith.
(a)(2) Certifications required by Section 302 of the Sarbanes-Oxley Act of 2002 (and Item 11(a)(2) of Form N-CSR) are filed herewith.
(a)(3) Not applicable.
(b) Certifications required by Section 906 of the Sarbanes-Oxley Act of 2002 (and Item 11(b) of Form N-CSR) are filed herewith.
SIGNATURES
Pursuant to the requirements of the Securities Exchange Act of 1934 and the Investment Company Act of 1940, the registrant has duly caused this report to be signed on its behalf by the undersigned, thereunto duly authorized.
(Registrant) Total Income+ Real Estate Fund
By (Signature and Title)
s/ Jordan Ruddy
Jordan B. Ruddy, President
Date: May 30, 2018
Pursuant to the requirements of the Securities Exchange Act of 1934 and the Investment Company Act of 1940, this report has been signed below by the following persons on behalf of the registrant and in the capacities and on the dates indicated.
By (Signature and Title)
s/ Jordan Ruddy
Jordan B. Ruddy, President
Date May 30, 2018
By (Signature and Title)
/s/ Simon Adamiyatt
Simon Adamiyatt, Treasurer
Date May 30, 2018