united states
securities and exchange commission
washington, d.c. 20549
form n-csr
certified shareholder report of registered management
investment companies
Investment Company Act file number 811-22710
Total Income+ Real Estate Fund
(Exact name of registrant as specified in charter)
712 Fifth Avenue, 9th floor, New York NY 10019
(Name and address of agent for service)
Registrant's telephone number, including area code: 1- 888-459-1059
Date of fiscal year end: 9/30
Date of reporting period: 3/31/16
Item 1. Reports to Stockholders.
| | | |
| | | |
| | | |
| | | |
| |  | |
| | | |
| | | |
| | | |
| | | |
| | | |
| | | |
| | | |
| | | |
| | | |
| | | |
| | Semi-Annual Report | |
| | March 31, 2016 | |
| | | |
| | | |
| | | |
| | | |
| | | |
| | | |
| | | |
| | | |
| | | |
| | | |
| | | |
| | Investor Information: 1-888-459-1059 | |
| | | |
| | | |
| | | |
| | | |
| | | |
| | | |
| | | |
| | | |
| | | |
| | | |
| | | |
| | This report and the financial statements contained herein are submitted for the general information of shareholders and are not authorized for distribution to prospective investors unless preceded or accompanied by an effective prospectus. Nothing herein contained is to be considered an offer of sale or solicitation of an offer to buy shares of the Total Income+ Real Estate Fund. Such offering is made only by prospectus, which includes details as to offering price and other material information. | |
| | | |
| | Distributed by Northern Lights Distributors, LLC | |
| | Member FINRA | |
| | | |
 | |  |
| | | |
| | | SEMI ANNUAL REPORT: (4Q 2015-1Q 2016) |
| | | Letter from the TI+ Portfolio Managers |
To Our Valued Shareholders:
We are pleased to report that the Total Income+ Real Estate Fund (“TI+ or the “Fund”) continues to grow, with net assets of approximately $358 million as of May 24, 2016. The Fund is now invested in 18 private investments, up from 17 in our last semi-annual report, (as of 9/30/15) while the Gross Asset Value of the underlying real estate in the securities in which TI+ is invested is now over $124 billion, up from approximately $100 billion as of 9/30/15.
We continue to be pleased with the Fund’s risk-adjusted performance. Since inception through 3.31.2016, TI+ has experienced approximately 85% lower volatility than leading stock and public REIT indices and approximately 38% lower volatility than the leading bond index (Barclays U.S. Aggregate Bond Index). This allows TI+ to have a higher risk-adjusted return (as measured by the Sharpe Ratio). In fact, since inception, the TI+ Sharpe Ratio was more than four times that of the S&P 500 and more than five times that of the MSCI US REIT Index as reported by Morningstar. This indicates that for each unit of volatility, a TI+ investor received four to five times the return.
By investing in low leverage, lower volatility, institutional real estate investments, in keeping with our investment thesis, TI+ has been able to produce stable cash flows that are not highly correlated to daily stock market fluctuations.
We are pleased to share these highlights with you:
| + | NEW INVESTMENTS: New private investments include Invesco Core Real Estate Fund, as well as recent additional invesments in nine existing private equity holdings including AEW Core Property Trust, Prudential PRISA I, and Clarion Lion Properties Fund; some of the oldest and most respected institutional real estate sponsors. |
| + | DISTRIBUTIONS1: TI+ has paid quarterly distributions consistently since the beginning of its first full quarter. The latest distribution (for A shares) of $0.3819 per share is equivalent to a 5.25% annualized distribution rate on the 3/30/2016 ex-dividend date NAV of $29.10 per share. This distribution also represents a 6.1% distribution rate on the (A share) inception $25.00 NAV per share. |
| + | ASSETS UNDER MANAGEMENT: As of May 24, 2016, TI+ AUM was approximately $358 million. We believe this to be a continued validation by investors that TI+ is meeting its mandate to deliver current income and total return with low volatility and correlation. |
| 1 | The Fund’s distribution policy is to make quarterly distributions to shareholders. The level of quarterly distributions (including any return of capital) is not fixed. The distribution policy is thus subject to change. Shareholders should not assume that the source of a distribution from the Fund is net profit. A portion of the distributions consist of a return of capital based on the character of the distributions received from the underlying holdings, primarily Real Estate Investment Trusts. The final determination of the source and tax characteristics of all distributions will be made after the end of the year. The Fund’s distribution amounts were calculated based on income received from underlying investments including capital gains and return of capital realized from the disposition of such investments. |
This is an actively managed, dynamic portfolio. There is no guarantee that any investment (or this investment) will achieve its objectives or goals, pay dividends and/or capital gains, generate positive returns, or avoid losses. Prior performance is not a guarantee of future results.
CORPORATE HEADQUARTERS | 712 FIFTH AVENUE | 9TH FLOOR | NEW YORK, NY 10019 | 877.826.BLUE (2583) | WWW.BLUEROCKRE.COM

| SEMI ANNUAL REPORT (4Q 2015 - 1Q 2016) | TOTAL INCOME+ REAL ESTATE FUND |  |
PERFORMANCE
From inception (10/22/2012) through 3/31/2016, TI+ has generated a total return of 34.11%, or 8.91% annualized. TI+ was able to accomplish this primarily through investments in best-in-class, institutional private equity real estate (iPERE) vehicles as well as select public real estate funds.
| | Year-to-Date2 | One Year | Two Years | Three Years | Since Inception3 |
| TI+ Fund- Class A | 0.87% | 6.39% | 7.29% | 8.84% | 8.91% |
TI+ Fund- Class A1
with Max Sales Charge | - 4.93 | - 0.40% | 4.16% | 6.71% | 7.04% |
| 1 The maximum sales charge for the Fund is 5.75%. Investors may be eligible for a reduction in sales charges. | 2 | Performance for periods less than one year is not annualized. |
| | 3 | Inception date of the Fund is October 22, 2012. |
INCOME
TI+ Fund offers attractive cash distribution potential.
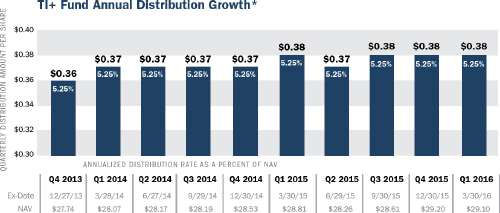
| * | The Fund’s distribution policy is to make quarterly distributions to shareholders. The level of quarterly distributions (including any return of capital) is not fixed, and is subject to change. The Fund’s distribution amounts were calculated based on the ordinary income received from the underlying investments, including short-term capital gains realized from the disposition of such investments. Shareholders should not assume that the source of a distribution from the Fund is net profit. |
A portion of the distributions consist of a return of capital based on the character of the distributions received from the underlying holdings, primarily Real Estate Investment Trusts. The final determination of the source and tax characteristics of all distributions will be made after the end of the year. Shareholders should note that return of capital will reduce the tax basis of their shares and potentially increase the taxable gain, if any, upon disposition of their shares. There is no assurance that the Company will continue to declare distributions or that they will continue at these rates.
Inception date of the Fund is October 22, 2012. The total annual fund operating expense ratio, gross of any fee waivers or expense reimbursements, is 2.46% (per most recent prospectus).
The performance data quoted herein represents past performance. Current performance may be lower or higher than the performance data quoted above. Investment return and principal value will fluctuate, so that shares, when redeemed, may be worth more or less than their original cost. The Fund’s investment adviser has contractually agreed to reduce its fees and/or absorb expenses of the fund, at least until February 1, 2017, to ensure that the net annual fund Class A operating expenses will not exceed 1.91%, subject to possible recoupment from the Fund in future years.
Please review the Fund’s Prospectus for more detail on the expense waiver. Results shown reflect the full fee waiver, without which the results could have been lower. A fund’s performance, especially for very short periods of time, should not be the sole factor in making your investment decisions. Total returns are calculated using SEC form N-12a and reflect all fees and charges.
For performance information current to the most recent month end, please call 888-459-1059.
Past performance is no guarantee of future results
| SEMI ANNUAL REPORT (4Q 2015 - 1Q 2016) | TOTAL INCOME+ REAL ESTATE FUND | |
HIGHER RISK-ADJUSTED RETURNS
TI+ has delivered higher risk-adjusted returns than stocks, bonds, or REITs since its inception, as evidenced by its Sharpe Ratio, which is more than double that of the nearest competitive asset class. The Sharpe Ratio is a performance measure that determines unit of return per unit of risk.
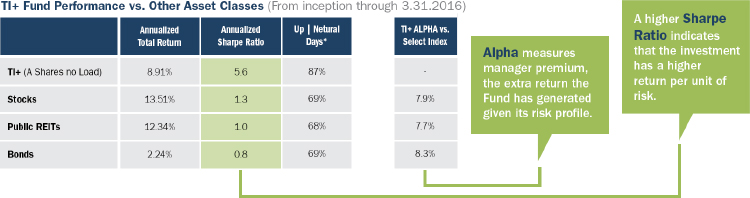
| * | Number of days in period in which the index/investment has increased or decreased from the prior days’ closing price. |
LOWER VOLATILITY
TI+ exhibits lower daily volatility as measured by standard deviation than competing asset classes, with approximately 85% less volatility than stocks and public REITs.
LOWER CORRELATION
TI+ has exhibited significantly lower correlation relative to other asset classes since its inception.
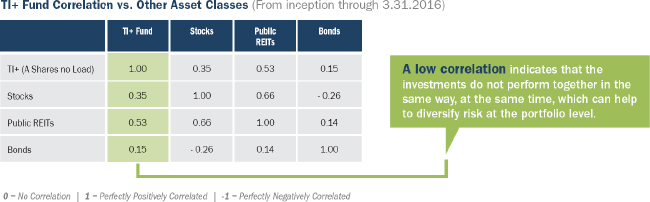
Source: Morningstar Direct
| TI+ Fund: A-Shares, no load | Stocks: S&P 500 Total Return |
| REITs: MSCI U.S. REIT Index | Bonds: Barclays U.S. Aggregate Bond Index |
Please see page 8 for a description of the risks and comparisons of the investment indexes selected.
Past performance is no guarantee of future results
| SEMI ANNUAL REPORT (4Q 2015 - 1Q 2016) | TOTAL INCOME+ REAL ESTATE FUND | |
| | » The Fund Sub-Advisor |
| | |
| |  |
| | |
| | The Fund’s Sub-Advisor, Mercer Investment Management (“Mercer”), has a 40+ year track record as a leading advisor to the world’s most sophisticated institutional investors, including endowments, pension funds, sovereign wealth funds and family offices. Mercer has more than 3,300 clients worldwide and over $9.0 trillion in assets under advisement. |
| | |
| | Mercer’s analysis incorporates a comprehensive, disciplined process beginning with the evaluation of over 5,400 investment managers and 26,200 individual investments across all sectors from which it selects a strategic combination of ‘best in class’ institutional real estate managers for potential investment in TI+ Fund. |
| | |
LOOKING AHEAD
The commercial real estate market has been on a strong run characterized by above trend returns in recent years. Improving property fundamentals, increasing capital flows, and declining cap rates have driven these outsized returns. While the market is exhibiting signs of maturing, commercial real estate fundamentals remain strong. As cap rates stabilize, property returns going forward will primarily be generated through income gains and likely revert to more historical norms. We are optimistic about advancing income levels due to strong property market fundamentals, low and declining unemployment, and favorable U.S. economic and demographic trends including household formation, particularly among the Millennial cohort. While we anticipate mild interest rate increases, we expect them to be slow, tempering any significant shifts in cap rates.
New construction across most of the major asset classes remains below the historical average of 2% of existing inventory. This has helped to keep vacancy levels moderate, converting increased user demand into increased rental rates. Investors and capital markets appear more disciplined in this cycle as leverage levels and transaction volumes remain below earlier, pre-recession periods.
The U.S. continues to be an economic safe haven in the world, and this has, in part, fueled demand for U.S. institutional real estate from non-U.S. investors. The attractiveness of U.S. property yields relative to other global asset classes has also been a major contributing factor to this trend. Additionally, cap rate spreads remain somewhat high relative to historical levels, with 10-year Treasury yields hovering near 2% and average cap rates for institutional real estate at roughly 4.5%-5.5%. Spreads at this level continue to imply there is cushion for cap rates to absorb a rise in interest rates.
Ultimately, the outlook for commercial real estate is driven by property level fundamentals and our view is that the combination of healthy market fundamentals, a gradual rise in interest rates, and disciplined capital markets signal an institutional real estate market that should achieve returns consistent with long term averages. For these reasons we are optimistic that TI+ will continue to perform well in the second half of this fiscal year.
We thank you for the trust and confidence represented by your investment in the Total Income+ Real Estate Fund.
Sincerely,
| |  |
| | Jordan Ruddy | Adam Lotterman |
| | Portfolio Co-Managers, Total Income+ Real Estate Fund |
| FUND HOLDINGS | SEMI ANNUAL REPORT (4Q 2015 - 1Q 2016) | TOTAL INCOME+ REAL ESTATE FUND | |
Investment Allocation
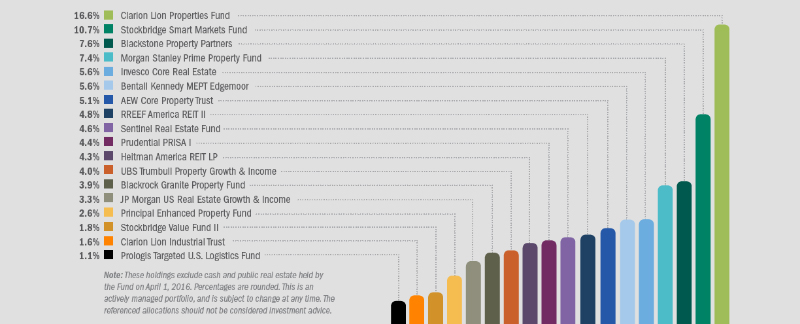
The Gross Asset Value of the underlying real estate in the securities in which TI+ is invested is over $124 billion, comprising nearly 2,400 properties across the United States with a combined occupancy of 93%*. The portfolio spans all major property sectors with approximately 25% weighted loan-to-value.
Top Ten Investment Holdings

| * | The Fund’s investment allocation and portfolio metrics related to diversification and underlying gross asset value are shown as of 4/1/2016(vs. 3/31/2016) as TI+ generally completes new investments at the beginning of each calendar quarter. |
| SEMI ANNUAL REPORT (4Q 2015 - 1Q 2016) | TOTAL INCOME+ REAL ESTATE FUND | |
FUND DIVERSITY
Diversified by Sector
Property sectors each have different demand drivers and cycles. Historically, diversification has helped limit the downside of any one sector while making it possible to capture the benefits of growth cycles in other sectors.
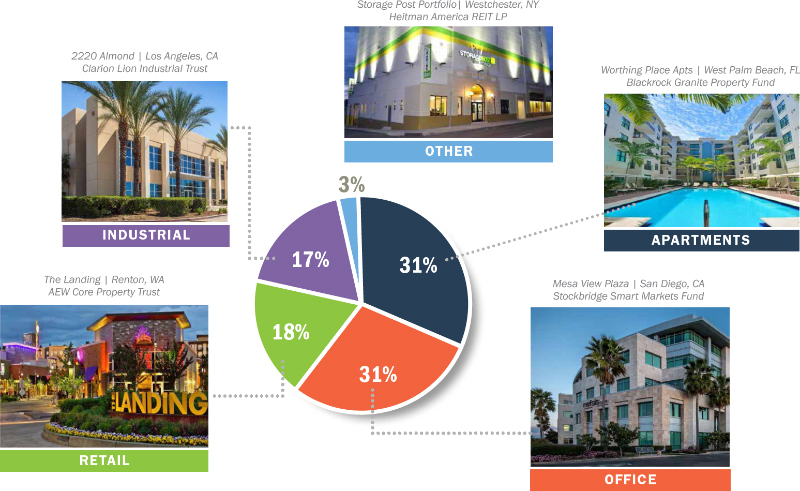
The sector diversification presented above represents examples of how the TI+’s institutional fund investments are allocated as of the date herein, but is subject to change at any time.
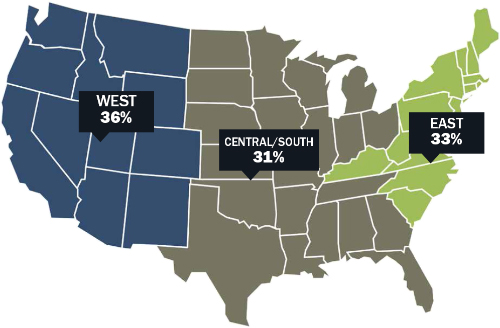
Diversified by Geography
Investments in top tier markets across the nation reduce reliance on any one city or state and provide the ability to benefit from well-performing submarkets in multiple regions.
The regions and allocations presented at left represent the TI+’s institutional fund investments as of Q1, but are subject to change at any time.
| SEMI ANNUAL REPORT (4Q 2015 - 1Q 2016) | TOTAL INCOME+ REAL ESTATE FUND | |
HIGHLIGHTED ASSETS
The properties pictured below are currently owned by the underlying third-party private equity real estate securities (iPERE) described herein. Each of these securities has been selected as an investment for TI+ Fund’s portfolio.

This is an actively managed dynamic portfolio. There is no guarantee that any investment (or this investment) will achieve its objectives or goals, pay dividends and/or capital gains, generate positive returns, or avoid losses. Prior performance is not a guarantee of future results.
| SEMI ANNUAL REPORT (4Q 2015 - 1Q 2016) | TOTAL INCOME+ REAL ESTATE FUND | |
DEFINITIONS
Barclays U.S. Aggregate Bond Index: A broad-based flagship benchmark that measures the investment grade, US dollar-denominated, fixed-rate taxable bond market. The index includes Treasuries, government-related and corporate securities, MBS (agency fixed-rate and hybrid ARM pass-throughs), ABS and CMBS (agency and non-agency). Provided the necessary inclusion rules are met, US Aggregate eligible securities also contribute to the multi-currency Global Aggregate Index and the US Universal Index, which includes high yield and emerging markets debt. Risks include rising interest rates or other economic factors that may negatively affect the value of the underlying bonds.
Alpha: A measure of performance on a risk-adjusted basis. Alpha takes the volatility (price risk) of a mutual fund and compares its risk-adjusted performance to a benchmark index. The excess return of the fund relative to the return of the benchmark index is a fund’s alpha.
Standard Deviation: The standard deviation of the daily percentage change in an investment multiplied by the square root of the number of trading days in the period. Standard deviation shows how much variation from the average exists with a larger number indicating the data points are more spread out over a larger range of values.
Beta: A measure of the volatility, or systematic risk, of a security or a portfolio in comparison to the market as a whole. Beta is used in the capital asset pricing model (CAPM), a model that calculates the expected return of an asset based on its beta and expected market returns.
MSCI U.S. REIT Index: A free float-adjusted market capitalization weighted index that is comprised of equity REITs that are included in the MSCI US Investable Market 2500 Index, with the exception of specialty equity REITs that do not generate a majority of their revenue and income from real estate rental and leasing operations. The index represents approximately 85% of the US REIT universe. (www.msci.com). You cannot invest directly in an index. Benchmark performance should not be considered reflective of Fund performance.
NCREIF NPI Index: The National Council of Real Estate Fiduciaries Property Index (NPI) data is based on institutional investments and presented exclusive of leverage and fees. The NPI is based on the unleveraged returns from a large pool of individual, investment grade commercial real estate properties across retail, office, industrial, and apartment sectors. The market values of the properties in the NPI are determined by appraisals and not by market-based prices of the programs. You cannot invest directly in an index. Benchmark performance should not be considered reflective of Fund performance.
Sharpe Ratio: Measurement of risk-adjusted performance. The annualized Sharpe ratio is calculated by subtracting the annualized risk-free rate (3-month Treasury Bill) from the annualized rate of return for a portfolio and dividing the result by the annualized standard deviation of the portfolio returns. You cannot invest directly in an index. Benchmark performance should not be considered reflective of Fund performance.
S&P 500: An index of 500 stocks chosen for market size, liquidity and industry grouping, among other factors. The S&P 500 is designed to be a leading indicator of U.S. equities and is meant to reflect the risk/ return characteristics of the large cap universe (source: Investopedia). You cannot invest directly in an index. Benchmark performance should not be considered reflective of Fund performance.
The indices shown are for informational purposes only and are not reflective of any investment. As it is not possible to invest in the indices, the data shown does not reflect or compare features of an actual investment, such as its objectives, costs and expenses, liquidity, safety, guarantees or insurance, fluctuation of principal or return, or tax features. Past performance is no guarantee of future results.
3463-NLD-5/27/2016

| Total Income+ Real Estate Fund |
| Portfolio Review (Unaudited) |
| Since Inception through March 31, 2016* |
The Fund’s performance figures for the period ended March 31, 2016, compared to its benchmarks:
| | Six | | | Since Inception | Since Inception Class C |
| | Months | One Year | Two Years | Class A * | and Class I ** |
| Total Income+ Real Estate | | | | | |
| Fund: | | | | | |
| Class A | | | | | |
| Without Load | 4.27% | 6.39% | 7.29% | 8.91% | — |
| With Load + | (1.74)% | (0.40)% | 4.16% | 7.04% | — |
| Class C | 3.89% | 5.61% | N/A | — | 6.51% |
| Class I | 4.41% | 6.68% | N/A | — | 7.67% |
| S&P 500 Total Return Index | 8.49% | 1.78% | 7.12% | 13.51% | 6.75% |
| Barclays Aggregate Bond Index | 2.44% | 1.96% | 3.82% | 2.24% | 3.88% |
| | | | | | |
| * | Class A commenced operations October 22, 2012. |
| ** | Class C and Class I commenced operations April 1, 2014. |
| + | Adjusted for initial maximum sales charge of 5.75%. |
The S&P 500 Total Return Index is an unmanaged market capitalization-weighted index which is comprised of 500 of the largest U.S. domiciled companies and includes the reinvestment of all dividends. Investors cannot invest directly in an index or benchmark.
The Barclays Aggregate Bond Index is an unmanaged index which represents the U.S. investment-grade fixed-rate bond market (including government and corporate securities, mortgage pass-through securities and asset-backed securities). Investors cannot invest directly in an index or benchmark.
The performance data quoted is historical. Past performance is no guarantee of future results. The investment return and principal value of an investment will fluctuate. An investor’s shares, when redeemed, may be worth more or less than the original cost. Total return is calculated assuming reinvestment of all dividends and distributions. Total returns would have been lower had the adviser not waived its fees and reimbursed a portion of the Fund’s expenses. Returns greater than one year are annualized. The Fund’s investment adviser has contractually agreed to reduce its fees and/or absorb expenses of the Fund, at least until February 1, 2017, to ensure that the net annual fund operating expenses and acquired fund fees and expenses (excluding certain expenses) will not exceed 1.91%, 2.66% and 1.66%, respectively for Class A, Class C and Class I, subject to possible recoupment from the Fund in future years. The Fund’s total gross annual operating expenses, including the expenses of underlying funds and before any fee waiver, are 2.46%, 3.25%, and 2.24% for Class A, Class C and Class I, respectively, per the February 1, 2016 prospectus. Class A shares are subject to a maximum sales charge imposed on purchases of 5.75% and Class C shares are subject to an early withdrawal charge of 1.00% if redeemed less than 365 days after the purchase. The above performance figures do not reflect the deduction of taxes that a shareholder would have to pay on fund distributions or the redemption of the fund shares. For performance information current to the most recent month-end, please call 1-888-459-1059.
Portfolio Composition as of March 31, 2016 (Unaudited)
| | | Percent of Net | |
| | | Assets | |
| Private Equity Real Estate Securities | | | 79.84 | % |
| Short-Term Investments | | | 15.43 | % |
| Public Equity Real Estate Funds | | | 3.32 | % |
| Public Equity Real Estate Securities | | | 0.59 | % |
| Total Investments | | | 99.18 | % |
| Other Assets Less Liabilities | | | 0.82 | % |
| Total Net Assets | | | 100.00 | % |
See the Portfolio of Investments in this semi-annual report for a more detailed account of the Fund’s holdings.
| Total Income+ Real Estate Fund |
| PORTFOLIO OF INVESTMENTS (Unaudited) |
| March 31, 2016 |
| Shares | | | Security | | Value | |
| | | | | PRIVATE EQUITY REAL ESTATE SECURITIES - 79.84% | | | | |
| | | | | APARTMENTS - 4.49% | | | | |
| | 175 | | | Sentinel Real Estate Fund | | $ | 14,251,437 | |
| | | | | | | | | |
| | | | | DIVERSIFIED - 72.74% | | | | |
| | 12,615 | | | AEW Core Property Trust | | | 12,024,480 | |
| | 138 | | | Blackrock Granite Property | | | 12,315,780 | |
| | 21,364 | | | Blackstone Property Partners ** | | | 24,523,513 | |
| | 39,713 | | | Clarion Lion Properties Fund | | | 52,651,183 | |
| | 11,968 | | | Heitman American Real Estate Fund | | | 13,435,158 | |
| | 7,403,417 | | | J.P. Morgan US Real Estate Growth & Income LP | | | 10,438,818 | |
| | 6,913 | | | MEPT Edgemoor LP* | | | 12,339,047 | |
| | 1,405 | | | Morgan Stanley Prime Property Fund LLC | | | 23,413,837 | |
| | 563,343 | | | Principal Enhanced Property Fund LP | | | 6,484,081 | |
| | 5,416 | | | Prudential PRISA 1 | | | 7,358,342 | |
| | 99,350 | | | RREEF America REIT II, Inc. | | | 11,067,612 | |
| | 24,112 | | | Stockbridge Smart Markets Fund | | | 33,665,939 | |
| | 1 | | | Stockbridge Value Fund II | | | 5,680,000 | |
| | 276 | | | UBS Trumbull Property G&I Fund | | | 5,511,270 | |
| | | | | | | | 230,909,060 | |
| | | | | INDUSTRIAL - 2.61% | | | | |
| | 3,506 | | | Clarion Lion Industrial Trust | | | 4,930,038 | |
| | 3,039 | | | Prologis Targeted US Logistics | | | 3,364,016 | |
| | | | | | | | 8,294,054 | |
| | | | | TOTAL PRIVATE EQUITY REAL ESTATE SECURITIES | | | 253,454,551 | |
| | | | | (Cost - $231,077,938) | | | | |
| | | | | | | | | |
| | | | | PUBLIC EQUITY REAL ESTATE SECURITIES - 0.59% | | | | |
| | | | | PUBLIC NON-TRADED REAL ESTATE INVESTMENT TRUSTS - 0.43% | | | | |
| | | | | DIVERSIFIED - 0.38% | | | | |
| | 68,376 | | | CNL Lifestyle Properties # | | | 196,923 | |
| | 61,761 | | | Dividend Capital Diversified Property Fund Class E | | | 458,269 | |
| | 140,161 | | | InvenTrust Properties Trust, Inc. # | | | 555,036 | |
| | | | | | | | 1,210,228 | |
| | | | | OFFICE - 0.05% | | | | |
| | 27,152 | | | Hines Real Estate Investment Trust # | | | 165,085 | |
| | | | | | | | | |
| | | | | PUBLICLY TRADED REAL ESTATE INVESTMENT TRUSTS - 0.16% | | | | |
| | | | | APARTMENTS - 0.04% | | | | |
| | 13,206 | | | Monogram Residential Trust, Inc. | | | 130,211 | |
| | | | | | | | | |
| | | | | OFFICE - 0.03% | | | | |
| | 2,650 | | | Columbia Property Trust | | | 58,274 | |
| | 1,968 | | | TIER REIT, INC. | | | 26,450 | |
| | | | | | | | 84,724 | |
The accompanying notes are an integral part of these financial statements.
| Total Income+ Real Estate Fund |
| PORTFOLIO OF INVESTMENTS (Unaudited) (Continued) |
| March 31, 2016 |
| Shares | | | Security | | Value | |
| | | | | HOTELS - 0.09% | | | | |
| | 17,520 | | | Xenia Hotels & Resorts,Inc. | | $ | 273,662 | |
| | | | | | | | | |
| | | | | TOTAL PUBLIC EQUITY REAL ESTATE SECURITIES | | | 1,863,910 | |
| | | | | (Cost - $1,917,068) | | | | |
| | | | | | | | | |
| | | | | PUBLIC REAL ESTATE FUNDS - 3.32% | | | | |
| | | | | EQUITY FUND - 1.33% | | | | |
| | 189,217 | | | Deutsche Real Estate Securities Fund | | | 4,232,789 | |
| | | | | | | | | |
| | | | | DEBT FUND - 1.34% | | | | |
| | 188,078 | | | Forward Select Income Fund | | | 4,252,443 | |
| | | | | | | | | |
| | | | | ASSET ALLOCATION FUND - 0.65% | | | | |
| | 110,011 | | | Security Capital US Core Real Estate Securities Fund | | | 2,058,306 | |
| | | | | | | | | |
| | | | | TOTAL PUBLIC REAL ESTATE FUNDS | | | 10,543,538 | |
| | | | | (Cost - $10,200,000) | | | | |
| | | | | | | | | |
| | | | | SHORT-TERM INVESTMENTS - 15.43% | | | | |
| | 48,943,356 | | | Dreyfus Cash Management - Institutional Class, 0.30% + ^ | | | 48,943,356 | |
| | | | | TOTAL SHORT-TERM INVESTMENTS | | | | |
| | | | | (Cost - $48,943,356) | | | | |
| | | | | | | | | |
| | | | | TOTAL INVESTMENTS - 99.18% | | | | |
| | | | | (Cost - $292,138,362)(a) | | $ | 314,805,355 | |
| | | | | OTHER ASSETS LESS LIABILITIES - 0.82% | | | 2,608,742 | |
| | | | | NET ASSETS - 100.00% | | $ | 317,414,097 | |
| * | Non-income producing security. |
| # | Value estimated using Fair Valuation Procedures adopted by the Board of Trustees. Total value of such securities is $917,044 or 0.29% of net assets. |
| + | Money market fund; interest rate reflects the seven-day effective yield on March 31, 2016. |
| ^ | All or a portion of this security is held as collateral as of March 31, 2016. |
| ** | Holding is comprised of two entities with the same issuer. |
| (a) | Represents cost for financial reporting purposes. Aggregate cost for federal tax purposes is $292,366,608 and differs from the value by net unrealized appreciation (depreciation) of securities as follows: |
| Unrealized appreciation: | | $ | 22,715,325 | |
| Unrealized depreciation: | | | (276,578 | ) |
| Net unrealized appreciation: | | $ | 22,438,747 | |
Additional Information on Investments in Private Real Estate Investment Trusts (1)
The Fund has unfunded commitments of approximately $230,873,120 to thirteen of the Private Investment Funds. The commitments will be funded when called through current assets at that time.
| (1) | This class includes investments in Private Real Estate Investment Trusts. The fair values of the investments in this class have been measured using the net asset value per share of the investments |
The accompanying notes are an integral part of these financial statements.
| Total Income+ Real Estate Fund |
| STATEMENT OF ASSETS AND LIABILITIES (Unaudited) |
| March 31, 2016 |
| Assets: | | | | |
| Investments in Securities at Value (identified cost $292,138,362) | | $ | 314,805,355 | |
| Dividends and Interest Receivable | | | 1,988,189 | |
| Receivable for Securities Sold | | | 1,000,000 | |
| Receivable for Fund Shares Sold | | | 1,973,006 | |
| Prepaid Expenses and Other Assets | | | 185,951 | |
| Total Assets | | | 319,952,501 | |
| | | | | |
| Liabilities: | | | | |
| Due to Custodian | | | 2,032,440 | |
| Payable to Investment Advisor | | | 395,418 | |
| Distribution Fees | | | 57,971 | |
| Shareholder Servicing Fees Payable | | | 50,791 | |
| Payable to Related Parties | | | 1,784 | |
| Total Liabilities | | | 2,538,404 | |
| | | | | |
| Net Assets | | $ | 317,414,097 | |
| | | | | |
| Class A: | | | | |
| Net Assets (no par value; unlimited number of shares authorized; 5,768,574 shares of beneficial interest outstanding) | | $ | 167,733,787 | |
Net Asset Value and Redemption Price Per Share
($167,733,787/5,768,574 shares of beneficial interest outstanding) | | $ | 29.08 | |
Maximum Offering Price Per Share
($29.08/0.9425) | | $ | 30.85 | |
| | | | | |
| Class C: | | | | |
| Net Assets (no par value; unlimited number of shares authorized; 3,105,629 shares of beneficial interest outstanding) | | $ | 88,988,138 | |
Net Asset Value, Offering and Redemption Price Per Share *
($88,988,138/3,105,629 shares of beneficial interest outstanding) | | $ | 28.65 | |
| | | | | |
| Class I: | | | | |
| Net Assets (no par value; unlimited number of shares authorized; 2,071,603 shares of beneficial interest outstanding) | | $ | 60,692,172 | |
Net Asset Value, Offering and Redemption Price Per Share *
($60,692,172/2,071,603 shares of beneficial interest outstanding) | | $ | 29.30 | |
| | | | | |
| Composition of Net Assets: | | | | |
| At March 31, 2016, Net Assets Consisted of: | | | | |
| Paid-in-Interest | | $ | 299,062,836 | |
| Undistributed Net Investment Loss | | | (2,448,561 | ) |
| Accumulated Net Realized Loss on Investments | | | (1,867,171 | ) |
| Net Unrealized Appreciation on Investments | | | 22,666,993 | |
| Net Assets | | $ | 317,414,097 | |
Commitments and Contingences (See Note 9)
| * | Class C charges a 1.00% fee on shares redeemed less than 365 days after the purchase. |
The accompanying notes are an integral part of these financial statements.
| Total Income+ Real Estate Fund |
| STATEMENT OF OPERATIONS (Unaudited) |
| For the Six Months Ended March 31, 2016 |
| Investment Income: | | | | |
| Dividend Income | | $ | 5,013,331 | |
| Interest Income | | | 26,119 | |
| Total Investment Income | | | 5,039,450 | |
| | | | | |
| Expenses: | | | | |
| Investment Advisory Fees | | | 1,821,892 | |
| Shareholder Servicing Fees | | | | |
| Class A | | | 178,524 | |
| Class C | | | 74,441 | |
| Distribution Fees | | | | |
| Class C | | | 223,324 | |
| Transfer Agent Fees | | | 82,944 | |
| Administration Fees | | | 82,546 | |
| Printing Expense | | | 55,069 | |
| Legal Fees | | | 32,589 | |
| Registration & Filing Fees | | | 25,069 | |
| Custody Fees | | | 20,766 | |
| Fund Accounting Fees | | | 16,774 | |
| Professional Fees | | | 15,292 | |
| Trustees’ Fees | | | 13,694 | |
| Insurance Expense | | | 13,035 | |
| Audit Fees | | | 12,973 | |
| Non 12b-1 Shareholder Servicing Fees | | | 12,623 | |
| Interest Expense | | | 1,302 | |
| Miscellaneous Expenses | | | 1,003 | |
| Total Expenses | | | 2,683,860 | |
| Less: Fees Waived/Reimbursed by Advisor | | | (306,372 | ) |
| Net Expenses | | | 2,377,488 | |
| | | | | |
| Net Investment Income | | | 2,661,962 | |
| | | | | |
| Net Realized and Unrealized Gain (Loss) on Investments: | | | | |
| Net Realized Loss on Investments | | | (1,173,247 | ) |
| Net Change in Unrealized Appreciation on Investments | | | 8,293,254 | |
| Net Realized and Unrealized Gain (Loss) on Investments | | | 7,120,007 | |
| | | | | |
| Net Increase in Net Assets Resulting From Operations | | $ | 9,781,969 | |
The accompanying notes are an integral part of these financial statements.
| Total Income+ Real Estate Fund |
| STATEMENTS OF CHANGES IN NET ASSETS |
| | | For the Six Months | | | For the Year | |
| | | Ended | | | Ended | |
| | | March 31, 2016 | | | September 30, 2015 | |
| | | (Unaudited) | | | | |
| Operations: | | | | | | | | |
| Net Investment Income | | $ | 2,661,962 | | | $ | 1,778,951 | |
| Net Realized Gain (Loss) on Investments | | | (1,173,247 | ) | | | (28,019 | ) |
| Distributions of Capital Gains From Underlying Investment Companies | | | — | | | | 488,862 | |
| Net Change in Unrealized Appreciation on Investments | | | 8,293,254 | | | | 8,997,981 | |
| Net Increase in Net Assets Resulting From Operations | | | 9,781,969 | | | | 11,237,775 | |
| | | | | | | | | |
| Distributions to Shareholders From: | | | | | | | | |
| Net Investment Income | | | | | | | | |
| Class A | | | — | | | | (314,591 | ) |
| Class C | | | — | | | | (41,887 | ) |
| Class I | | | — | | | | (30,565 | ) |
| Net Realized Capital Gain | | | | | | | | |
| Class A | | | — | | | | (943,414 | ) |
| Class C | | | — | | | | (126,183 | ) |
| Class I | | | — | | | | (91,452 | ) |
| Return of Capital | | | | | | | — | |
| Class A | | | (4,056,152 | ) | | | (4,600,938 | ) |
| Class C | | | (1,896,889 | ) | | | (1,069,132 | ) |
| Class I | | | (1,285,671 | ) | | | (761,717 | ) |
| Total Distributions to Shareholders | | | (7,238,712 | ) | | | (7,979,879 | ) |
| | | | | | | | | |
| From Shares of Beneficial Interest: | | | | | | | | |
| Class A Shares: | | | | | | | | |
| Proceeds from Shares Issued (1,657,106 and 1,992,920 shares, respectively) | | | 47,690,839 | | | | 56,646,923 | |
| Distributions Reinvested (86,833 and 124,251 shares, respectively) | | | 2,499,083 | | | | 3,501,243 | |
| Cost of Shares Redeemed (483,025 and 801,766 shares, respectively) | | | (13,902,655 | ) | | | (22,822,086 | ) |
| Total From Beneficial Interest Transactions: Class A | | | 36,287,267 | | | | 37,326,080 | |
| | | | | | | | | |
| Class C Shares: | | | | | | | | |
| Proceeds from Shares Issued (1,796,236 and 1,110,617 shares, respectively) | | | 51,158,991 | | | | 31,331,468 | |
| Distributions Reinvested (40,361 and 26,091) shares, respectively) | | | 1,145,779 | | | | 728,782 | |
| Cost of Shares Redeemed (43,189 and 33,550 shares, respectively) | | | (1,225,122 | ) | | | (949,669 | ) |
| Total From Beneficial Interest Transactions: Class C | | | 51,079,648 | | | | 31,110,581 | |
| | | | | | | | | |
| Class I Shares: | | | | | | | | |
| Proceeds from Shares Issued (1,227,246 and 755,244 shares, respectively) | | | 35,624,242 | | | | 21,587,153 | |
| Distributions Reinvested (31,141 and 23,387 shares, respectively) | | | 902,233 | | | | 662,010 | |
| Cost of Shares Redeemed (52,026 and 27,267 shares, respectively) | | | (1,504,264 | ) | | | (780,971 | ) |
| Total From Beneficial Interest Transactions: Class I | | | 35,022,211 | | | | 21,468,192 | |
| | | | | | | | | |
| Net Increase in Net Assets From Shares of Beneficial Interest | | | 122,389,126 | | | | 89,904,853 | |
| | | | | | | | | |
| Total Increase in Net Assets | | | 124,932,383 | | | | 93,162,749 | |
| | | | | | | | | |
| Net Assets: | | | | | | | | |
| Beginning of Year | | | 192,481,714 | | | | 99,318,965 | |
| End of Year | | $ | 317,414,097 | | | $ | 192,481,714 | |
| | | | | | | | | |
| Undistributed Net Investment Income (Loss) | | $ | (2,448,561 | ) | | $ | 2,125,585 | |
The accompanying notes are an integral part of these financial statements.
| Total Income+ Real Estate Fund |
| FINANCIAL HIGHLIGHTS |
| Class A |
The table below sets forth financial data for one share of beneficial interest outstanding throughout each period presented.
| | | For the Six Months | | | For the Year | | | For the Year | | | For the Period* | |
| | | Ended | | | Ended | | | Ended | | | Ended | |
| | | March 31, 2016 | | | September 30, 2015 | | | September 30, 2014 | | | September 30, 2013 | |
| | | (Unaudited) | | | | | | | | | | |
| | | | | | | | | | | | | |
| Net Asset Value, Beginning of Period | | $ | 28.68 | | | $ | 27.98 | | | $ | 27.47 | | | $ | 25.00 | |
| Increase From Operations: | | | | | | | | | | | | | | | | |
| Net investment income (a) | | | 0.34 | | | | 0.39 | | | | 0.26 | | | | 0.67 | |
| Net gain from investments (both realized and unrealized) | | | 0.81 | | | | 1.81 | | | | 1.70 | | | | 2.40 | |
| Total from operations | | | 1.15 | | | | 2.20 | | | | 1.96 | | | | 3.07 | |
| | | | | | | | | | | | | | | | | |
| Less Distributions: | | | | | | | | | | | | | | | | |
| From net investment income | | | — | | | | (0.09 | ) | | | (0.01 | ) | | | (0.40 | ) |
| From net realized gain on investments | | | — | | | | (0.29 | ) | | | (0.11 | ) | | | — | |
| From return of capital | | | (0.76 | ) | | | (1.12 | ) | | | (1.35 | ) | | | (0.20 | ) |
| Total Distributions | | | (0.76 | ) | | | (1.50 | ) | | | (1.47 | ) | | | (0.60 | ) |
| | | | | | | | | | | | | | | | | |
| Paid in interest from redemption fees (a) | | | 0.01 | | | | — | | | | 0.02 | | | | 0.00 | (i) |
| Net Asset Value, End of Period | | $ | 29.08 | | | $ | 28.68 | | | $ | 27.98 | | | $ | 27.47 | |
| | | | | | | | | | | | | | | | | |
| Total Return (b)(h) | | | 5.54 | % (e) | | | 8.06 | % | | | 7.38 | % | | | 12.36 | % (e) |
| | | | | | | | | | | | | | | | | |
| Ratios/Supplemental Data | | | | | | | | | | | | | | | | |
| Net assets, end of period (in 000’s) | | $ | 167,734 | | | $ | 129,287 | | | $ | 89,319 | | | $ | 38,122 | |
| Ratio to average net assets: | | | | | | | | | | | | | | | | |
| Expenses, Gross (c)(f) | | | 2.08 | % (d) | | | 2.25 | % | | | 2.54 | % | | | 4.96 | % (d) |
| Expenses, Net of Reimbursement (f) | | | 1.82 | % (d) | | | 1.79 | % | | | 1.76 | % | | | 0.01 | % (d) |
| Ratio to average net assets (excluding interest expense): | | | | | | | | | | | | | | | | |
| Expenses, Gross (c)(f) | | | 2.08 | % (d) | | | 2.24 | % | | | 2.52 | % | | | 4.96 | % (d) |
| Expenses, Net of Reimbursement (f) | | | 1.82 | % (d) | | | 1.78 | % | | | 1.74 | % | | | 0.01 | % (d) |
| Net investment income, Net of Reimbursement (f)(g) | | | 2.35 | % (d) | | | 1.36 | % | | | 0.94 | % | | | 2.66 | % (d) |
| Portfolio turnover rate | | | 16 | % (e) | | | 35 | % | | | 12 | % | | | 35 | % (e) |
| * | Class A commenced operations October 22, 2012. |
| (a) | Per share amounts are calculated using the average shares method, which more appropriately presents the per share data for the period. |
| (b) | Total returns are historical in nature and assume changes in share price, reinvestment of dividends and capital gains distributions, if any, and does not reflect the impact of sales charges. Had the Advisor not absorbed a portion of Fund expenses, total returns would have been lower. |
| (c) | Represents the ratio of expenses to average net assets absent fee waivers and/or expense reimbursements by the Advisor. |
| (f) | The ratios of expenses to average net assets and net investment income to average net assets do not reflect the expenses of the underlying investment companies in which the Fund invests. |
| (g) | Recognition of net investment income is affected by the timing and declaration of dividends by the underlying investment companies in which the Fund invests. |
| (h) | Includes adjustments in accordance with accounting principles generally accepted in the United States and, consequently, the net asset value for financial reporting purposes and the returns based upon those net asset values may differ from the net asset values and returns for shareholder transactions. |
| (i) | Less then $0.01 per share. |
The accompanying notes are an integral part of these financial statements.
| Total Income+ Real Estate Fund |
| FINANCIAL HIGHLIGHTS |
| Class C |
The table below sets forth financial data for one share of beneficial interest outstanding throughout each period presented.
| | | For the Six Months | | | For the Year | | | For the Period | |
| | | Ended | | | Ended | | | Ended | |
| | | March 31, 2016 | | | September 30, 2015 | | | September 30, 2014* | |
| | | (Unaudited) | | | | | | | |
| | | | | | | | | | |
| Net Asset Value, Beginning of Period | | $ | 28.38 | | | $ | 27.89 | | | $ | 27.75 | |
| Increase From Operations: | | | | | | | | | | | | |
| Net investment income (loss) (a) | | | 0.23 | | | | 0.16 | | | | (0.19 | ) |
| Net gain from investments (both realized and unrealized) | | | 0.80 | | | | 1.82 | | | | 1.07 | |
| Total from operations | | | 1.03 | | | | 1.98 | | | | 0.88 | |
| | | | | | | | | | | | | |
| Less Distributions: | | | | | | | | | | | | |
| From net investment income | | | — | | | | (0.09 | ) | | | — | |
| From net realized gains on investments | | | — | | | | (0.29 | ) | | | — | |
| From return of capital | | | (0.76 | ) | | | (1.11 | ) | | | (0.74 | ) |
| Total Distributions | | | (0.76 | ) | | | (1.49 | ) | | | (0.74 | ) |
| | | | | | | | | | | | | |
| Net Asset Value, End of Period | | $ | 28.65 | | | $ | 28.38 | | | $ | 27.89 | |
| | | | | | | | | | | | | |
| Total Return (b)(h) | | | 5.10 | % (e) | | | 7.28 | % | | | 3.20 | % (e) |
| | | | | | | | | | | | | |
| Ratios/Supplemental Data | | | | | | | | | | | | |
| Net assets, end of period (in 000’s) | | $ | 88,988 | | | $ | 37,920 | | | $ | 6,505 | |
| Ratio to average net assets: | | | | | | | | | | | | |
| Expenses, Gross (c)(f) | | | 2.82 | % (d) | | | 3.04 | % | | | 3.36 | % (d) |
| Expenses, Net of Reimbursement (f) | | | 2.59 | % (d) | | | 2.55 | % | | | 2.61 | % (d) |
| Ratio to average net assets (excluding interest expense): | | | | | | | | | | | | |
| Expenses, Gross (c)(f) | | | 2.82 | % (d) | | | 3.02 | % | | | 3.34 | % (d) |
| Expenses, Net of Reimbursement (f) | | | 2.59 | % (d) | | | 2.54 | % | | | 2.59 | % (d) |
| Net investment Income (loss), Net of Reimbursement (f) | | | 1.59 | % (d) | | | 0.55 | % | | | (1.36 | )% (d) |
| Portfolio turnover rate | | | 16 | % (e) | | | 35 | % | | | 12 | % (e) |
| * | Class C commenced operations April 1, 2014. |
| (a) | Per share amounts are calculated using the average shares method, which more appropriately presents the per share data for the period. |
| (b) | Total returns are historical in nature and assume changes in share price, reinvestment of dividends and capital gains distributions, if any. Had the Advisor not absorbed a portion of Fund expenses, total returns would have been lower. |
| (c) | Represents the ratio of expenses to average net assest absent fee waivers and/or expense reimbursements by the Advisor. |
| (f) | The ratios of expenses to average net assets and net investment income (loss) to average net assets do not reflect the expenses of the underlying investment companies in which the Fund invests. |
| (g) | Recognition of net investment income (loss) is affected by the timing and declaration of dividends by the underlying investment companies in which the Fund invests. |
| (h) | Includes adjustments in accordance with accounting principles generally accepted in the United States and, consequently, the net asset value for financial reporting purposes and the returns based upon those net asset values may differ from the net asset values and returns for shareholder transactions. |
The accompanying notes are an integral part of these financial statements.
| Total Income+ Real Estate Fund |
| FINANCIAL HIGHLIGHTS |
| Class I |
The table below sets forth financial data for one share of beneficial interest outstanding throughout each period presented.
| | | For the Six Months | | | For the Year | | | For the Period | |
| | | Ended | | | Ended | | | Ended | |
| | | March 31, 2016 | | | September 30, 2015 | | | September 30, 2014* | |
| | | (Unaudited) | | | | | | | |
| | | | | | | | | | |
| Net Asset Value, Beginning of Period | | $ | 28.85 | | | $ | 28.03 | | | $ | 27.75 | |
| Increase From Operations: | | | | | | | | | | | | |
| Net investment income (loss) (a) | | | 0.38 | | | | 0.45 | | | | (0.04 | ) |
| Net gain from investments (both realized and unrealized) | | | 0.84 | | | | 1.88 | | | | 1.06 | |
| Total from operations | | | 1.22 | | | | 2.33 | | | | 1.02 | |
| | | | | | | | | | | | | |
| Less Distributions: | | | | | | | | | | | | |
| From net investment income | | | — | | | | (0.10 | ) | | | — | |
| From net realized gains on investments | | | — | | | | (0.29 | ) | | | — | |
| From return of capital | | | (0.77 | ) | | | (1.12 | ) | | | (0.74 | ) |
| Total Distributions | | | (0.77 | ) | | | (1.51 | ) | | | (0.74 | ) |
| | | | | | | | | | | | | |
| Net Asset Value, End of Period | | $ | 29.30 | | | $ | 28.85 | | | $ | 28.03 | |
| | | | | | | | | | | | | |
| Total Return (b)(h) | | | 5.71 | % (e) | | | 8.51 | % | | | 3.71 | % (e) |
| | | | | | | | | | | | | |
| Ratios/Supplemental Data | | | | | | | | | | | | |
| Net assets, end of period (in 000’s) | | $ | 60,692 | | | $ | 25,274 | | | $ | 3,495 | |
| Ratio to average net assets: | | | | | | | | | | | | |
| Expenses, Gross (c)(f) | | | 1.84 | % (d) | | | 2.03 | % | | | 2.40 | % (d) |
| Expenses, Net of Reimbursement (f) | | | 1.57 | % (d) | | | 1.54 | % | | | 1.61 | % (d) |
| Ratio to average net assets (excluding interest expense): | | | | | | | | | | | | |
| Expenses, Gross (c)(f) | | | 1.84 | % (d) | | | 2.02 | % | | | 2.38 | % (d) |
| Expenses, Net of Reimbursement (f) | | | 1.57 | % (d) | | | 1.53 | % | | | 1.59 | % (d) |
| Net investment income (loss), Net of Reimbursement (f) | | | 2.60 | % (d) | | | 1.59 | % | | | (0.24 | )% (d) |
| Portfolio turnover rate | | | 16 | % (e) | | | 35 | % | | | 12 | % (e) |
| * | Class I commenced operations April 1, 2014. |
| (a) | Per share amounts are calculated using the average shares method, which more appropriately presents the per share data for the period. |
| (b) | Total returns are historical in nature and assume changes in share price, reinvestment of dividends and capital gains distributions, if any. Had the Advisor not absorbed a portion of Fund expenses, total returns would have been lower. |
| (c) | Represents the ratio of expenses to average net assest absent fee waivers and/or expense reimbursements by the Advisor. |
| (f) | The ratios of expenses to average net assets and net investment income (loss) to average net assets do not reflect the expenses of the underlying investment companies in which the Fund invests. |
| (g) | Recognition of net investment income (loss) is affected by the timing and declaration of dividends by the underlying investment companies in which the Fund invests. |
| (h) | Includes adjustments in accordance with accounting principles generally accepted in the United States and, consequently, the net asset value for financial reporting purposes and the returns based upon those net asset values may differ from the net asset values and returns for shareholder transactions. |
The accompanying notes are an integral part of these financial statements.
| Total Income+ Real Estate Fund |
| NOTES TO FINANCIAL STATEMENTS (Unaudited) |
| March 31, 2016 |
| |
Total Income+ Real Estate Fund (the “Fund” or the “Trust”) was organized as a Delaware statutory trust on May 25, 2012 and is registered under the Investment Company Act of 1940, as amended, (the “1940 Act”), as a non-diversified, closed-end management investment company that operates as an interval fund with a continuous offering of Fund shares. The Fund’s primary investment objective is to generate current income while secondarily seeking long-term capital appreciation, with low to moderate volatility and low correlation to the broader markets. The Fund pursues its investment objectives by investing, under normal circumstances, at least 80% of assets in “real estate industry securities,” primarily in income producing equity and debt securities.
The Fund currently offers Class A, Class C, and Class I shares. Class A shares commenced operations on October 22, 2012 and are offered at net asset value plus a maximum sales charge of 5.75%. Class C and Class I shares commenced operations on April 1, 2014 and are offered at net asset value. Class C shares are subject to an early withdrawal charge of 1.00% if redeemed less than 365 days after purchase. Each class represents an interest in the same assets of the Fund and classes are identical except for differences in their sales charge structures and ongoing service and distribution charges. All classes of shares have equal voting privileges except that each class has exclusive voting rights with respect to its service and/or distribution plans. The Fund’s income, expenses (other than class specific distribution fees) and realized and unrealized gains and losses are allocated proportionately each day based upon the relative net assets of each class.
| 2. | SUMMARY OF SIGNIFICANT ACCOUNTING POLICIES |
The following is a summary of significant accounting policies followed by the Fund in preparation of its financial statements. These policies are in conformity with accounting principles generally accepted in the United States of America (“GAAP”). The preparation of financial statements requires management to make estimates and assumptions that affect the reported amounts of assets and liabilities and disclosure of contingent assets and liabilities at the date of the financial statements and the reported amounts of income and expenses for the period. Actual results could differ from those estimates.
Security Valuation – Securities listed on an exchange are valued at the last reported sale price at the close of the regular trading session of the exchange on the business day the value is being determined, or in the case of securities listed on NASDAQ at the NASDAQ Official Closing Price (“NOCP”). In the absence of a sale such securities shall be valued at the last bid price. Short-term investments that mature in 60 days or less may be valued at amortized cost, provided such valuations represent fair value.
Valuation of Fund of Funds – The Fund may invest in portfolios of open-end investment companies and exchange traded funds (the “Underlying Funds”). The Underlying Funds value securities in their portfolios for which market quotations are readily available at their market values (generally the last reported sale price) and all other securities and assets at their fair value to the methods established by the board of directors of the Underlying Funds.
Open-end investment companies are valued at their respective net asset values as reported by such investment companies. The shares of many closed-end investment companies, after their initial public offering, frequently trade at a price per share, which is different than the net asset value per share. The difference represents a market premium or market discount of such shares. There can be no assurances that the market discount or market premium on shares of any closed-end investment company purchased by the Fund will not change.
When price quotations for certain securities are not readily available, or if the available quotations are not believed to be reflective of market value by the Advisor (defined below), those securities will be valued at “fair value” as determined in good faith by the Valuation Committee using procedures adopted by and under the supervision of
| Total Income+ Real Estate Fund |
| NOTES TO FINANCIAL STATEMENTS (Unaudited) (Continued) |
| March 31, 2016 |
| |
the Fund’s Board of Trustees (the “Board”). There can be no assurance that the Fund could purchase or sell a portfolio security at the price used to calculate a Fund’s net asset value (“NAV”).
Fair valuation procedures may be used to value a substantial portion of the assets of the Fund. The Fund may use the fair value of a security to calculate its NAV when, for example, (1) a portfolio security is not traded in a public market or the principal market in which the security trades is closed, (2) trading in a portfolio security is suspended and not resumed prior to the normal market close, (3 ) a portfolio security is not traded in significant volume for a substantial period, or (4) the Advisor determines that the quotation or price for a portfolio security provided by a broker-dealer or independent pricing service is inaccurate.
Valuation of Private Equity Real Estate Securities – The Fund invests a significant portion of its assets in Private Equity Real Estate Securities (“Private ERES”). The Private ERES measure their investment assets at fair value, and report a NAV per share on a calendar quarter basis. In accordance with Accounting Standards Codification (‘ASC”) 820, the Fund has elected to apply the practical expedient and to value its investments in Private ERES at their respective NAVs at each quarter. For non-calendar quarter-end days, the Valuation Committee estimates the fair value of each Private ERES by adjusting the most recent NAV for each REIT by the change in a proprietary benchmark that the Valuation Committee has deemed to be representative of the entire Private ERES market. As of March 31, 2016, all of the Fund’s investments in Private ERES were valued at the respective NAVs of the Private ERES.
Valuation of Public Non-Traded Equity Real Estate Securities – The Fund may invest a portion of its assets in Public Non-Traded Equity Real Estate Securities (“Public Non-Traded ERES”). The Public Non-Traded ERES do not report periodic NAVs and therefore cannot be valued using the practical expedient. The Valuation Committee determines the fair value of Public Non-Traded ERES on a daily basis by considering various factors such as the most recent published NAV, the transaction price, secondary market trades, shareholder redemption and dividend reinvestment programs, and potential illiquidity discounts.
The “fair value” of securities may be difficult to determine and thus judgment plays a greater role in the valuation process. The fair valuation methodology may include or consider the following guidelines, as appropriate: (1) evaluation of all relevant factors, including but not limited to, pricing history, current market level, supply and demand of the respective security; (2) comparison to the values and current pricing of securities that have comparable characteristics; (3) knowledge of historical market information with respect to the security; (4) other factors relevant to the security which would include, but not be limited to, duration, yield, fundamental analytical data, the Treasury yield curve, and credit quality.
The values assigned to fair valued investments are based on available information and do not necessarily represent amounts that might ultimately be realized, since such amounts depend on future developments inherent in long-term investments. Changes in the fair valuation of portfolio securities may be less frequent and of greater magnitude than changes in the price of portfolio securities valued at their last sale price, by an independent pricing service, or based on market quotations. Imprecision in estimating fair value can also impact the amount of unrealized appreciation or depreciation recorded for a particular portfolio security and differences in the assumptions used could result in a different determination of fair value, and those differences could be material.
The Fund utilizes various methods to measure the fair value of its investments on a recurring basis. GAAP establishes a hierarchy that prioritizes inputs to valuation methods. The three levels of input are:
Level 1 – Unadjusted quoted prices in active markets for identical assets and liabilities that the Fund has the ability to access.
Level 2 – Observable inputs other than quoted prices included in Level 1 that are observable for the asset or liability, either directly or indirectly. These inputs may include quoted prices for the identical instrument on an
| Total Income+ Real Estate Fund |
| NOTES TO FINANCIAL STATEMENTS (Unaudited) (Continued) |
| March 31, 2016 |
| |
inactive market, prices for similar instruments, interest rates, prepayment speeds, credit risk, yield curves, default rates and similar data.
Level 3 – Unobservable inputs for the asset or liability, to the extent relevant observable inputs are not available, representing the Fund’s own assumptions about the assumptions a market participant would use in valuing the asset or liability, and would be based on the best information available.
The availability of observable inputs can vary from security to security and is affected by a wide variety of factors, including, for example, the type of security, whether the security is new and not yet established in the marketplace, the liquidity of markets, and other characteristics particular to the security. To the extent that valuation is based on models or inputs that are less observable or unobservable in the market, the determination of fair value requires more judgment. Accordingly, the degree of judgment exercised in determining fair value is greatest for instruments categorized in Level 3.
The inputs used to measure fair value may fall into different levels of the fair value hierarchy. In such cases, for disclosure purposes, the level in the fair value hierarchy within which the fair value measurement falls in its entirety, is determined based on the lowest level input that is significant to the fair value measurement in its entirety.
The inputs or methodology used for valuing securities are not necessarily an indication of the risk associated with investing in those securities. The following tables summarize the inputs used as of March 31, 2016 for the Fund’s assets and liabilities measured at fair value:
| Assets* | | Total Value | | | Level 1 | | | Level 2 | | | Level 3 | |
| Public Equity Real Estate Securities | | $ | 1,863,910 | | | $ | 946,866 | | | $ | — | | | $ | 917,044 | |
| Public Real Estate Funds | | | 10,543,538 | | | | 10,543,538 | | | | — | | | | — | |
| Short-Term Investments | | | 48,943,356 | | | | 48,943,356 | | | | — | | | | — | |
| Sub-Total | | $ | 61,350,804 | | | $ | 60,433,760 | | | $ | — | | | $ | 917,044 | |
| Private Equity Real Estate Securities (1) | | | 253,454,551 | | | | | | | | | | | | | |
| Total | | $ | 314,805,355 | | | | | | | | | | | | | |
| * | Refer to the Portfolio of Investments for industry classifications. |
There were no transfers into or out of Level 1, Level 2, and Level 3 during the period.
It is the Fund’s policy to record transfers into or out of any Level at the end of the reporting period.
| (1) | Management has elected to adopt ASU 2015-07, Disclosures for Investments in Certain Entities That Calculate Net Asset Value per Share (or Its Equivalent) — a consensus of the Emerging Issues Task Force issued, on May 1, 2015. The guidance in this standard is effective for interim and annual periods beginning after December 15, 2015, however early adoption is permitted. In accordance with Subtopic 820-10, certain investments that are measured at fair value using the net asset value per share (or its equivalent) have not been classified in the fair value hierarchy. The fair value amount presented in this table is intended to permit reconciliation of the fair value hierarchy to the amounts presented in the statement of assets and liabilities. |
The following is a reconciliation of assets in which Level 3 inputs were used in determining value:
| | | Public Equity Real | |
| | | Estate Securities | |
| Beginning Balance | | $ | 1,163,934 | |
| Total realized gain (loss) | | | 31,390 | |
| Appreciation (Depreciation) (a) | | | (167,613 | ) |
| Cost of Purchases | | | — | |
| Proceeds from Sales | | | (110,667 | ) |
| Return of Capital | | | — | |
| Net transfers in/out of level 3 | | | — | |
| Ending Balance | | $ | 917,044 | |
| (a) | Refer to the Statement of Operations under Net Realized Gain (Loss) on Investments section. |
| Total Income+ Real Estate Fund |
| NOTES TO FINANCIAL STATEMENTS (Unaudited) (Continued) |
| March 31, 2016 |
| |
Significant unobservable valuation inputs for material Level 3 investments as of March 31, 2016, are as follows:
| | | Fair Value at | | | Valuation | | | | | | |
| | | 12/31/2015 | | | Technique | | Unobservable Input | | Range | | Weighted Average |
Public Non-Traded Real
Estate Investment Trusts | | $ | 917,044 | | | Transaction Data | | Dividend Reinvestment Plan Prices | | $0.00 - $6.65 | | $1.20 |
| | | | | | | | | Redemption Prices | | $0.00 - $5.45 | | $0.98 |
| | | | | | | | | Weighting of Transaction Prices by Volume (b) | | 1x - 9x | | 4.50x |
| | | | | | | | | Discount for Lack of Liquidity (a) | | 0%-5% | | 4.10% |
| (a) | Represents amounts used when the reporting entity has determined that market participants would take into account these discounts when pricing the investments. |
| (b) | Represents amounts used when the reporting entity has determined that market participant would use such multiples when pricing the investments. |
Exchange Traded Funds – The Fund may invest in exchange traded funds (“ETFs”). ETFs are a type of fund bought and sold on a securities exchange. An ETF trades like common stock and typically represents a fixed portfolio of securities designed to track the performance and dividend yield of a particular domestic or foreign market index. The Fund may purchase an ETF to temporarily gain exposure to a portion of the U.S. or a foreign market while awaiting purchase of underlying securities. The risks of owning an ETF generally reflect the risks of owning the underlying securities they are designed to track, although the lack of liquidity on an ETF could result in it being more volatile. Additionally, ETFs have fees and expenses that reduce their value.
Security Transactions and Investment Income – Investment security transactions are accounted for on a trade date basis. Cost is determined and gains and losses are based upon the specific identification method for both financial statement and federal income tax purposes. Dividend income is recorded on the ex-dividend date and interest income is recorded on the accrual basis. Purchase discounts and premiums on securities are accreted and amortized over the life of the respective securities.
Federal Income Taxes – The Fund intends to comply with the requirements of Subchapter M of the Internal Revenue Code applicable to regulated investment companies and will distribute all of its taxable income, if any to shareholders. Accordingly, no provision for Federal income taxes is required in the financial statements.
The Fund recognizes the tax benefits of uncertain tax positions only when the position is “more likely than not” to be sustained assuming examination by tax authorities. Management has reviewed the tax positions and has concluded that no liability for unrecognized tax benefits should be recorded related to uncertain tax positions related to the open tax years (2013-2015) or expected to be taken in the Fund’s 2016 tax returns. The Fund identifies its major tax jurisdiction as U.S. Federal. The Fund recognizes interest and penalties, if any, related to unrecognized tax benefits as income tax expense in the Statement of Operations. During the six months ended March 31, 2016, the Fund did not incur any interest or penalties. Generally tax authorities can examine tax returns filed for the last three years.
Distributions to Shareholders – Distributions from investment income are declared and paid quarterly. Distributions from net realized capital gains, if any, are declared and paid annually and are recorded on the ex-dividend date. The character of income and gains to be distributed is determined in accordance with income tax regulations, which may differ from GAAP.
Indemnification – The Trust indemnifies its officers and Trustees for certain liabilities that may arise from the performance of their duties to the Trust. Additionally, in the normal course of business, the Fund enters into contracts that contain a variety of representations and warranties and which provide general indemnities. The Fund’s maximum exposure under these arrangements is unknown, as this would involve future claims that may be made against the Fund that have not yet occurred. However, based on experience, the Trust expects the risk of loss due to these warranties and indemnities to be remote.
| Total Income+ Real Estate Fund |
| NOTES TO FINANCIAL STATEMENTS (Unaudited) (Continued) |
| March 31, 2016 |
| |
| 3. | ADVISORY FEE AND OTHER RELATED PARTY TRANSACTIONS |
Advisory Fees – Pursuant to an investment advisory agreement with the Trust, with respect to the Fund, (the “Advisory Agreement”), investment advisory services are provided to the Fund by Bluerock Fund Advisor, LLC (the “Advisor”). Under the terms of the Advisory Agreement, the Advisor receives monthly fees calculated at an annual rate of 1.50% of the average daily net assets of the Fund. For the six months ended March 31, 2016, the Advisor earned advisory fees of $1,821,892.
The Advisor has contractually agreed to waive all or part of its management fees and/or make payments to limit Fund operating expenses and acquired fund fees and expenses (exclusive of any taxes, interest, broker commissions and extraordinary expenses, such as litigation or reorganization costs, but inclusive of organizational costs and offering costs) at least until February 1, 2017, so that the total annual operating expenses of the Fund do not exceed 1.91%, 2.66% and 1.66%, of the Fund’s average daily net assets for Class A, Class C and Class I shares, respectively.
The Fund had the following expense limitations in place pursuant to Board approval since inception:
| Class A |
| Effective Date | Expense Limitation |
| 10/22/2012 | | |
| (Commencement of operations) | | |
| until 1/31/2015 | | 1.84% |
| 2/1/2015 | | 1.75% |
| 2/1/2016 | | 1.91%* |
| | | |
| * Expense limitations includes fund fees and expenses |
| | | |
| Class C |
| Effective Date | Expense Limitation |
| 4/1/2014 | | |
| (Commencement of operations) | | |
| until 1/31/2015 | | 2.59% |
| 2/1/2015 | | 2.50% |
| 2/1/2016 | | 2.66%* |
| | | |
| * Expense limitations includes fund fees and expenses |
| |
| Class I |
| Effective Date | Expense Limitation |
| 4/1/2014 | | |
| (Commencement of operations) | | |
| until 1/31/2015 | | 1.59% |
| 2/1/2015 | | 1.50% |
| 2/1/2016 | | 1.66%* |
| | | |
| * Expense limitations includes fund fees and expenses |
Fee waivers and expense payments may be recouped by the Advisor from the Fund, to the extent that overall expenses fall below the lesser of the expense limitation then in place or in place at the time of the waiver, within three fiscal years of when the amounts were waived or reimbursed. During the six months ended March 31, 2016, the Advisor waived and reimbursed fees of $306,372. Excluding amounts waived during the six months ended March 31, 2016, cumulative expenses subject to recapture pursuant to the aforementioned conditions amounted to $1,865,355 and will expire on September 30 of the years indicated below:
| Total Income+ Real Estate Fund |
| NOTES TO FINANCIAL STATEMENTS (Unaudited) (Continued) |
| March 31, 2016 |
| 2016 | | | 2017 | | | 2018 | |
| $ | 694,546 | | | $ | 509,750 | | | $ | 661,059 | |
| | | | | | | | | | | |
Sub-advisory services were provided to the Fund pursuant to an agreement between the Advisor and Mercer Investment Management, Inc. (the “Sub-Advisor”). Under the terms of the sub-advisory agreement, the Advisor compensates the Sub-Advisor based on the Fund’s average daily net assets. The Advisor pays the Sub-Advisor, not the Fund.
Distributor – The distributor of the Fund is Northern Lights Distributors, LLC (the “Distributor”). The Board of Trustees has adopted, on behalf of the Fund, a Shareholder Services Plan and a Distribution Plan under which the Fund may compensate financial industry professionals for providing ongoing services in respect of clients with whom they have distributed shares of the Fund. Under the Shareholder Services Plan, the Fund pays up to 0.25% per year of the average daily net assets of each of Class A and Class C shares for such services. For the six months ended March 31, 2016, the Fund incurred shareholder servicing fees of $178,524 and $74,441 for Class A and Class C shares, respectively. Under the Distribution Plan, the Fund pays 0.75% per year of its average daily net assets for such services for Class C shares. For the six months ended March 31, 2016, the Fund incurred distribution fees of $223,324 for Class C shares.
The Distributor acts as the Fund’s principal underwriter in a continuous public offering of the Fund’s shares. For the six months ended March 31, 2016, the Distributor received $1,556,069 in underwriting commissions for sales of Class A shares, of which $211,603 was retained by the principal underwriter or other affiliated broker-dealers.
In addition, certain affiliates of the Distributor provide services to the Fund as follows:
Gemini Fund Services, LLC (“GFS”) – GFS, an affiliate of the Distributor, provides administration, fund accounting, and transfer agent services to the Trust. Pursuant to separate servicing agreements with GFS, the Fund pays GFS customary fees for providing administration, fund accounting and transfer agency services to the Fund.
Northern Lights Compliance Services, LLC (“NLCS”) – NLCS, an affiliate of GFS and the Distributor, provides a Chief Compliance Officer to the Trust, as well as related compliance services, pursuant to a consulting agreement between NLCS and the Trust. Under the terms of such agreement, NLCS receives customary fees from the Fund.
Blu Giant, LLC (“Blu Giant”) – Blu Giant, an affiliate of GFS and the Distributor, provides EDGAR conversion and filing services as well as print management services for the Fund on an ad-hoc basis. For the provision of these services, Blu Giant receives customary fees from the Fund.
Trustees – The Fund pays each Trustee who is not affiliated with the Trust or Advisor a quarterly fee of $2,500, as well as reimbursement for any reasonable expenses incurred attending meetings. The “interested persons” who serve as Trustees of the Trust receive no compensation for their services as Trustees. None of the executive officers receive compensation from the Trust.
| 4. | INVESTMENT TRANSACTIONS |
The cost of purchases and proceeds from the sale of securities, other than short-term securities, for the six months ended March 31, 2016 amounted to $116,547,270 and $33,951,872 respectively.
| 5. | REPURCHASE OFFERS / SHARES OF BENEFICIAL INTEREST |
Pursuant to Rule 23c-3 under the 1940 Act, the Fund offers shareholders on a quarterly basis the option of redeeming shares, at NAV, of no less than 5% and no more than 25% of the shares outstanding on the Repurchase
| Total Income+ Real Estate Fund |
| NOTES TO FINANCIAL STATEMENTS (Unaudited) (Continued) |
| March 31, 2016 |
| |
Request Deadline. The Board shall determine the quarterly repurchase offer amount. There is no guarantee that shareholders will be able to sell all of the shares they desire in a quarterly repurchase offer, although each shareholder will have the right to require the Fund to purchase up to and including 5% of such shareholder’s shares in each quarterly repurchase. Limited liquidity will be provided to shareholders only through the Fund’s quarterly repurchases.
During the six months ended March 31, 2016, the Fund completed two quarterly repurchase offers. The Fund offered to repurchase up to 5% of the number of its outstanding shares as of the Repurchase Pricing Dates. The results of the repurchase offers were as follows:
| | | Repurchase Offer | | Repurchase Offer |
| Commencement Date | | September 30, 2015 | | December 31, 2015 |
| Repurchase Request Deadline | | November 9, 2015 | | February 9, 2016 |
| Repurchase Pricing Date | | November 9, 2015 | | February 9, 2016 |
| Net Asset Value as of Repurchase Offer Date: | | | | |
| Class A | | $28.70 | | $28.72 |
| Class C | | $28.38 | | $28.34 |
| Class I | | $28.88 | | $28.92 |
| Amount Repurchased | | | | |
| Class A | | $2,158,717 | | $3,771,134 |
| Class C | | $339,995 | | $808,049 |
| Class I | | $235,352 | | $1,269,731 |
| 6. | DISTRIBUTIONS TO SHAREHOLDERS AND TAX COMPONENTS OF CAPITAL |
The tax character of fund distributions for the following years was as follows:
| | | Fiscal Year Ended | | | Fiscal Year Ended | |
| | | September 30, 2015 | | | September 30, 2014 | |
| Ordinary Income | | $ | 387,043 | | | $ | 22,525 | |
| Long-Term Capital Gain | | | 1,161,049 | | | | 210,388 | |
| Return of Capital | | | 6,431,787 | | | | 3,615,085 | |
| | | $ | 7,979,879 | | | $ | 3,847,998 | |
As of September 30, 2015, the components of accumulated earnings/(deficit) on a tax basis were as follows:
| Undistributed | | | Undistributed | | | Post October Loss | | | Capital Loss | | | Other | | | Unrealized | | | Total | |
| Ordinary | | | Long-Term | | | and | | | Carry | | | Book/Tax | | | Appreciation/ | | | Accumulated | |
| Income | | | Gains | | | Late Year Loss | | | Forwards | | | Differences | | | (Depreciation) | | | Earnings/(Deficits) | |
| $ | — | | | $ | — | | | $ | (1,740,525 | ) | | $ | — | | | $ | — | | | $ | 17,545,925 | | | $ | 15,805,400 | |
| | | | | | | | | | | | | | | | | | | | | | | | | | | |
The difference between book basis and tax basis distributable earnings and unrealized appreciation/(depreciation) is primarily attributable to the tax deferral of losses on wash sales and adjustments for partnerships.
Late year losses incurred after December 31 within the fiscal year are deemed to arise on the first business day of the following fiscal year for tax purposes. The Fund incurred and elected to defer such late year losses of $1,065,338.
Capital losses incurred after October 31 within the fiscal year are deemed to arise on the first business day of the following fiscal year for tax purposes. The Fund incurred and elected to defer such capital losses of $675,187.
| Total Income+ Real Estate Fund |
| NOTES TO FINANCIAL STATEMENTS (Unaudited) (Continued) |
| March 31, 2016 |
| |
Permanent book and tax differences, primarily attributable to tax adjustments for partnerships, resulted in reclassification for the fiscal year ended September 30, 2015 as follows:
| Undistributed | | | Accumulated | |
| Net Investment | | | Net Realized | |
| Income (Loss) | | | Gain (Loss) | |
| $ | (34,113 | ) | | $ | 34,113 | |
Class C shares may assess a short-term redemption fee of 1.00% of the total redemption amount if shareholders sell their shares after holding them for less than 365 days. The redemption fee does not apply to shares that were acquired through reinvestment of distributions. The redemption fee is paid directly to the Fund. For the six months ended March 31, 2016, Class C did not assess any fees.
| 8. | COMMITMENTS AND CONTIGENCIES |
As of March 31, 2016, the Fund had unfunded capital call commitments for the below listed Private Equity Real Estate Securities:
| AEW Core Property Trust | | $ | 4,000,000 | |
| Clarion Lion Industrial Trust | | | 8,000,000 | |
| J.P. Morgan Growth & Income | | | 10,000,000 | |
| Morgan Stanley Prime Property Fund | | | 45,000,000 | |
| Principal Enhanced Property Fund | | | 10,600,000 | |
| Prologis Targeted US Logistics | | | 10,000,000 | |
| RREEF America REIT II | | | 8,000,000 | |
| UBS Trumbull Property Growth | | | 10,000,000 | |
| Blackstone Property Partners | | | 72,500,000 | |
| Prudential PRISA I | | | 25,500,000 | |
| MEPT Edgemoor | | | 5,200,000 | |
| Stockbridge Value Fund II | | | 4,573,120 | |
| Invesco Core | | | 17,500,000 | |
| Total | | $ | 230,873,120 | |
| 9. | NEW ACCOUNTING PRONOUNCEMENT |
In May 2015, the Financial Accounting Standards Board (“FASB”) issued Accounting Standards Update (“ASU”) 2015-07, “Disclosures for Investments in Certain Entities That Calculate Net Asset Value per Share (or Its Equivalent)”, modifying ASC 946 “Financial Services – Investment Companies”. Under the modifications, investments in affiliated and private investment funds valued at Net Asset Value are no longer included in the fair value hierarchy disclosed in Footnote 2. ASU 2015-07 is effective for fiscal years beginning on or after December 15, 2015, and interim periods within those annual periods. Early application is permitted. Management is currently evaluating the implications of ASU 2015-07 and its impact on financial statement disclosures.
| Total Income+ Real Estate Fund |
| NOTES TO FINANCIAL STATEMENTS (Unaudited) (Continued) |
| March 31, 2016 |
| |
Subsequent events after the date of the Statement of Assets and Liabilities have been evaluated through the date the financial statements were issued. Management has concluded that there is no impact requiring adjustment or disclosure in the financial statements.
The Fund completed a quarterly repurchase offer on May 8, 2016 which resulted in 1.54% of the Fund’s shares being repurchased for $5,375,725.
RREEF America, LLC commenced operations as the Fund’s sub-advisor on May 17, 2016
| Total Income+ Real Estate Fund |
| PROXY VOTE INFORMATION (Unaudited) |
| March 31, 2016 |
| |
At a Special Meeting of Shareholders of the Fund, held at the offices of Gemini Fund Services, LLC, 80 Arkay Drive, Suite 110, Hauppauge, NY 11788, on Thursday, February 18, 2016, shareholders of record at the close of business on December 23, 2015 voted to approve the following proposals:
Proposal 1: To elect Clayton Hosterman to the Board of the Trust.
| Shares Voted In Favor | | Shares Withheld |
| 7,289,290 | | 96,295 |
| | | |
Proposal 2: To approve an investment sub-advisory agreement between Bluerock Fund Advisor, LLC and RREEF America L.L.C.
| Shares Voted In Favor | | Shares Voted Against | | Abstentions |
| 4,083,394 | | 33,584 | | 80,939 |
| Total Income+ Real Estate Fund |
| SUPPLEMENTAL INFORMATION (Unaudited) |
| March 31, 2016 |
| |
Approval of Investment Advisory and Sub-Advisory Agreement
At a meeting held on November 18, 2015 (the “November Meeting”), the Board of Trustees (the “Board”) of the Total Income+ Real Estate Fund (the “Trust” or the “Fund”), including a majority of the Trustees who are not “interested persons” (the “Independent Trustees”), as such term is defined by the Investment Company Act of 1940, as amended (the “1940 Act”), approved the renewal of the investment management agreement (the “Advisory Agreement”) between Bluerock Fund Advisor, LLC (the “Advisor”) and the Trust. Matters considered by the Trustees in connection with the Board’s renewal of Advisory Agreement included the following:
Nature, Extent and Quality of Services. The Board reviewed materials provided by the Advisor relating to the Advisory Agreement between the Trust and the Advisor. With respect to the nature, extent and quality of services provided, the Independent Trustees reviewed the Advisor’s Form ADV, a description of the manner in which investment decisions are made for the Fund, a description of the services provided by the Advisor and those services provided by the Sub-Advisors and executed by the Advisor, a review of the experience of professional personnel performing services for the Fund, including the team of individuals that primarily monitor and execute the investment and administration process, and a certification from the Advisor certifying that it has adopted a Code of Ethics containing provisions reasonably necessary to prevent Access Persons, as that term is defined in Rule 17j-1 under the 1940 Act, from violating such Codes of Ethics.
The Board considered the depth and experience of the Advisor’s personnel with responsibilities to the Fund, and noted that the Board is familiar and comfortable with the wide range of services provided to the Fund by the Advisor. The Board considered that the Advisor maintains a continuous investment program for the Fund and also exercises oversight of the performance and compliance programs of the various service providers to the Fund and the Fund’s Sub-Advisor(s). The Board also considered that the Advisor has not experienced any material compliance issues during the prior term of the Advisory Agreement, and concluded that the Advisor’s compliance practices were adequate. The Board, including the Independent Trustees, then concluded that the Advisor had sufficient quality and depth of personnel, resources, investment methods and compliance policies and procedures essential to performing its duties under the Advisory Agreement and that the nature, overall quality and extent of the management services provided by the Advisor to the Fund were satisfactory and reliable.
Performance. The Board considered the performance of the Fund (Class A shares) as compared to the performance of indices representing other asset classes, including bonds, equity and Public REITs, represented by the Barclays U.S. Aggregate Bond Index, S&P 500 Total Return Index, and the MSCI U.S. REIT Index, respectively. The Board also considered the performance of the Fund compared to the NCREIF Property Index (“NPI”) and the NCREIF Fund Index-Open End Diversified Core Equity Index (“NFIODCE”), noting that each of the NPI and NFIODCE are unmanaged indices measuring the investment returns of pools of real estate and open-end funds that invest in real estate. The Board considered that for the one year period ended September 30, 2015 and year to date period ended October 31, 2015, the Fund outperformed each of the Barclays U.S. Aggregate Bond Index, S&P 500 Total Return Index, and the MSCI U.S. REIT Index. The Board also considered that for the one year period ended September 30, 2015, the Fund underperformed the NPI and NFIODCE, but took into account that the performance of the NPI and NFIODCE is depicted gross of fees and the fact that the Fund held cash related to fund inflows which caused some the underperformance compared to the NPI and NFIODCE.
The Board also considered additional portfolio statistics for the Fund, noting that the Advisor consistently views as among the Fund’s primary objectives to ability to generate a high risk-adjusted return. The Board reviewed statistics comparing the Fund’s Sharpe Ratio, Alpha and Standard Deviation as compared to bonds, equity and Public REITs, and determined that the information reflects that the Fund is delivering a stable, low volatility return with lower risk as compared to the other asset classes. Based on the information provided, the Board concluded that the performance was satisfactory and that the Advisor was meeting its investment objectives and could be expected to obtain an acceptable level of investment returns to shareholders.
| Total Income+ Real Estate Fund |
| SUPPLEMENTAL INFORMATION (Unaudited) (Continued) |
| March 31, 2015 |
| |
Fees and Expenses. As to the costs of the services provided by the Advisor, the Trustees considered a comparison of the Fund’s advisory fee and overall expenses (Class A shares) to certain funds with similar investment objectives and strategies or those that also utilize a closed-end interval fund structure (the “Peer Group”). The Board considered that the Fund’s advisory fee of 1.50% was above the mean and comparable to the highest in the Peer Group. The Board considered separately only those funds in the Peer Group that primarily are focused on real estate and REIT investing similar to the Fund’s strategy, and found that while the Fund’s advisory fee was also in line with the highest of the group, it was generally within the range of the comparable funds. The Board also took into consideration the Fund’s overall expense ratio as compared to its Peer Group and found that the Fund’s overall expense ratio was less than the mean of its Peer Group. The Board observed that the Advisor had set its expense cap at a rate equal to its advisory fee plus any 12b-1 fees applicable to each share class. The Board noted that this cap would cause the Advisor to always pay the other expenses of the Fund, effectively causing its advisory fee to be reduced by such amount. In light of each of these considerations, the Board concluded that the advisory fee was reasonable and that the expense ratio was acceptable in light of the factors considered.
Profitability. The Board also considered the profitability of the Advisor and whether such profits are reasonable in light of the services provided to the Fund. The Board reviewed a profitability analysis prepared by the Advisor the year ended June 30, 2015 and considered that based on current assets levels, the Advisor’s net profits both in terms of dollar amount and as a percentage of the advisory fee was not excessive, and factored in with ancillary costs borne by affiliates of the Advisor for marketing the Fund, the Fund was not currently generating a profit for the Advisor.
Economies of Scale. The Board considered the Advisor’s profitability analysis and took into account certain costs of the Advisor, including compensating the Fund’s Sub-Advisor, and concluded that at the current and projected asset levels, economies of scale was not a relevant consideration at this time. The Board agreed to revisit whether economies of scale exist in the future once the Fund has achieved sufficient scale.
Conclusion. The Trustees, having requested and received such information from the Advisor as they believed reasonably necessary to evaluate the terms of the Advisory Agreement, and assisted by the advice of independent counsel, determined that continuation of the Advisory Agreement for an additional one-year term is in the best interests of the Fund and its future shareholders. In considering the Advisory Agreement, the Trustees did not identify any one factor as all important, but rather considered these factors collectively in light of surrounding circumstances. Further, each Trustee may have afforded a different weight to different factors.
Approval of Sub-Advisory Agreement with Mercer Investment Management, Inc.
At the November Meeting, the Board, including a majority of the Independent Trustees, approved the renewal of the sub-advisory agreement (for this section only, the “Sub-Advisory Agreement”) between Mercer Investment Management, Inc. (for this section only, the “Sub-Advisor”) and the Advisor, with respect to the Fund. In connection with the Board’s consideration of the Sub-Advisory Agreement, the Sub-Advisor provided the Board with written materials. Matters considered by the Trustees in connection with the Board’s renewal of the Sub-Advisory Agreement included the following.
Nature, Extent and Quality of Services. The Board reviewed materials provided by the Sub-Advisor related to the Sub-Advisory Agreement with the Advisor. The Board considered that the Sub-Advisor’s principal responsibilities are to assist the Advisor in recommending and establishing the Fund’s portfolio, including providing assistance in determining the Fund’s target investment allocations and selecting appropriate investments for the Fund. The Trustees further noted that the Sub-Advisor conducts research on various real estate investment managers and investment options and reviews potential investment opportunities available in the market, including detailed analysis and due diligence of such investment options. The Sub-Advisor also provides the Fund with an ongoing program of monitoring the Fund’s investment options in conjunction with the Fund’s overall portfolio management, taking into account
| Total Income+ Real Estate Fund |
| SUPPLEMENTAL INFORMATION (Unaudited) (Continued) |
| March 31, 2015 |
| |
changing portfolio allocations, rebalancing and growth. The Trustees considered that the Advisor meets with the Sub-Advisor on a frequent basis, including in-person quarterly meetings, periodic calls and daily communication.
The Board considered the Advisor’s report that the Sub-Advisor had provided a strong overall level of service to the Fund and that the Advisor was satisfied with the communication between it and the Sub-Advisor. The Board further considered that the Sub-Advisor has not experienced any material compliance issues, and concluded that the Sub-Advisor had sufficient quality and depth of personnel, resources, investment methods and compliance policies and procedures essential to performing its duties under the Sub-advisory Agreement and that the nature, overall quality and extent of the management services provided by the Sub-Advisor to the Advisor and the Fund was satisfactory and reliable.
Performance. The Board considered that while the Sub-Advisor does not approve or make investment decisions for the Fund, it does provide investment recommendations based on its research to the Advisor. The Board considered that the Fund’s investment performance is indicative of the success of the Sub-Advisor’s research and recommendations to the Advisor. The Board recalled its prior deliberations relating to the Fund’s performance in its review of the Advisor, noting that the Fund has performed well against its benchmark indices and as compared to other asset classes, and that as compared to those asset classes, has been successful in achieving its investment objective of delivering strong risk-adjusted returns. The Board concluded that the overall performance of the Fund was satisfactory and that the Advisor’s continued relationship with the Sub-Advisor could be expected to benefit shareholders.
Fees and Expenses. The Board then discussed the fees paid to the Sub-Advisor. The Board reviewed the Sub-Advisor’s fee schedule, noting that the sub-advisory fee at current asset levels is 0.20% of the Fund’s average daily net assets. The Board considered the asset-based subadvisory fee as compared to the quantity of research and reporting generated by the Sub-Advisor and the Sub-Advisor’s general rates for such services, and concluded that, at present asset levels, the Sub-Advisory fees were acceptable in light of the quality of the services the Advisor and, indirectly, the Fund, receive from the Sub-Advisor.
Economies of Scale. The Board discussed whether economies of scale have been achieved with respect to the management of the Fund under the Sub-Advisory Agreement and whether there is potential for realization of any further economies of scale. The Board considered that the Sub-Advisor has agreed to breakpoints in its fee above certain asset levels beginning with $250 million in assets under management and concluded that this remained appropriate at this time.
Profitability. The Board also considered the profitability of the Sub-Advisor and noted that the Sub-Advisor had provided a profitability analysis comparing the primary work performed as Sub-Advisor to the Fund to fees charged to its other clients for similar services. The Board observed the fact that the Sub-Advisor would have generally earned fees in excess of the amount it earned as Sub-Advisor to the Fund for similar services. In consideration of this fact, along with the fact that the Sub-Advisor also provided additional services regarding the Fund’s portfolio construction and that its profitability would be limited by breakpoints in its sub-advisory fee, the Board concluded that its profitability was not unreasonable.
Conclusion. The Board, having requested and received such information from the Sub-Advisor as the Independent Trustees believed to be reasonably necessary to evaluate the terms of the Sub-Advisory Agreement, and as assisted by the advice of counsel, that continuation of the Sub-Advisory Agreement between the Advisor and Sub-Advisor for an additional one-year term is in the best interests of the Fund and its shareholders. The Board noted that in considering the Sub-Advisory Agreement, it did not identify any one factor as all important, but rather considered these factors collectively in light of surrounding circumstances. Further, it noted that each Trustee may have afforded a different weight to different factors.
| Total Income+ Real Estate Fund |
| SUPPLEMENTAL INFORMATION (Unaudited) (Continued) |
| March 31, 2015 |
Approval of Sub-Advisory Agreement with RREEF America L.L.C.
At a meeting of the Board held on October 19, 2015, the Board, including the Independent Trustees, deliberated whether to approve a Sub-Advisory Agreement (for this section only, the “Sub-Advisory Agreement”) between the Advisor and RREEF America L.L.C. (” RREEF”). In determining to approve the Sub-Advisory Agreement, the Trustees considered written materials provided by RREEF and the Advisor (the “Report”) that had been provided to the Board prior to the meeting. The following summarizes the Trustees’ review process and the information on which their conclusions were based:
Nature, Extent and Quality of Services. The Board reviewed the materials provided by the RREEF related to the proposed Sub-Advisory Agreement between the Advisor and RREEF. With respect to the nature, extent and quality of services provided, the Board reviewed RREEF’s Form ADV, a review of the experience of professional personnel performing services for the Fund, a description of the manner in which investment decisions are made for the Fund by RREEF, a description of the investment advisory services to be provided by RREEF, and a certification from RREEF certifying that it has adopted a Code of Ethics containing provisions reasonably necessary to prevent Access Persons, as that term is defined in Rule 17j-1 under the 1940 Act, from engaging in conduct prohibited by Rule 17j-1(b) and that RREEF has adopted procedures reasonably necessary to prevent Access Persons from violating such Codes of Ethics.
The Board considered that RREEF is being recommended by the Advisor specifically to assist the Advisor in selecting investments for the portion of the Fund’s portfolio dedicated to publicly-traded securities. The Board took into account that RREEF is not managing real estate directly, but rather is selecting securities that are managed by other investment managers that directly manage real estate. The Board considered that RREEF has an extensive track record providing real estate investment and advisory services to various pooled investment vehicles, including private funds, registered investment companies and other collective investment funds, and direct advisory services to a variety of clients, with over $8.7 billion in assets under management as of June 30, 2015. The Board considered the relative sophistication and techniques employed by RREEF in designing and executing investment strategies for its other clients and the degree of strategy customization available to the Fund. The Board also considered that RREEF has not experienced any recent material compliance issues. The Board then concluded that RREEF had sufficient quality and depth of personnel, resources, investment methods and compliance policies and procedures essential to performing its duties under the Sub-Advisory Agreement.
Performance. The Board considered that RREEF will provide investment advice to a limited portion of the Fund’s portfolio allocated to publicly-traded real estate securities. The Board noted that the Fund may receive bespoke investment advice from RREEF that may not correlate to investment advice rendered for any other account or portfolio managed by RREEF. The Board considered that RREEF had submitted a track record of investment returns for another U.S. real-estate based investment fund advised by RREEF, as compared to a benchmark index (MSCI U.S. REIT Index) for various periods dating to December 31, 1999, and found the returns to be comparable to the benchmark. The Board also considered the performance returns of composite domestic and global real-estate accounts as compared to their benchmark indices and found those returns to be in the range of the index returns. The Board concluded that the overall performance of RREEF was satisfactory and that the Fund’s relationship with RREEF could be expected to benefit shareholders.
Fees and Expenses. The Board then discussed the fees paid to RREEF. The Board considered that RREEF’s fee ranged from 0.60% of the average daily value of the assets under management and scaled downward depending on the applicable breakpoint and level of assets. The Board considered the quality of services to be provided by RREEF and the level of fees charged by RREEF to other accounts, taking into account the nature and size of those accounts as compared to the portion of the Fund allocated to RREEF and the level of active management and personalized service the Fund could expect to receive from RREEF. The Board noted that the Advisor would pay RREEF from its advisory fee and that RREEF would not be paid by the Fund directly. The Board
| Total Income+ Real Estate Fund |
| SUPPLEMENTAL INFORMATION (Unaudited) (Continued) |
| March 31, 2015 |
| |
concluded that based on RREEF’s experience, expertise, and services to be provided to the Fund, that the fees to be charged by RREEF were reasonable and in the best interests of the Fund and its shareholders.
Economies of Scale. The Board considered whether economies of scale would be present in the Sub-Advisory Agreement and whether such arrangement permits for the potential realization of any further economies of scale. The Board noted that RREEF has agreed to breakpoints in its fee above certain asset levels and concluded that while such breakpoints appeared reasonable, economies of scale would be best evaluated at the Fund, rather than sub-advisory level.
Conclusion. The Board, having requested and received such information from RREEF as the Board believed to be reasonably necessary to evaluate the terms of the Sub-Advisory Agreement, and as assisted by the advice of counsel, found that approval of the Sub-Advisory Agreement between the Advisor and RREEF for an initial two-year term is in the best interests of the Fund and its shareholders. The Board noted that in considering the Sub-Advisory Agreement, it did not identify any one factor as all important, but rather considered these factors collectively in light of surrounding circumstances, and that each Trustee may have afforded a different weight to different factors.
| * | Due to timing of renewal schedule, these deliberations may not relate to current fund performance. |
NOTICE OF PRIVACY POLICY & PRACTICES
PRIVACY notice
Rev. Aug. 2012
| FACTS | WHAT DOES THE TOTAL INCOME+ REAL ESTATE FUND DO WITH YOUR PERSONAL INFORMATION? |
| | |
| Why? | Financial companies choose how they share your personal information. Federal law gives consumers the right to limit some but not all sharing. Federal law also requires us to tell you how we collect, share, and protect your personal information. Please read this notice carefully to understand what we do. |
| | |
| What? | The types of personal information we collect and share depend on the product or service you have with us. This information can include: |
| | |
| | ■ | Social Security number | ■ | Purchase History |
| | | | | |
| | ■ | Assets | ■ | Account Balances |
| | | | | |
| | ■ | Retirement Assets | ■ | Account Transactions |
| | | | | |
| | ■ | Transaction History | ■ | Wire Transfer Instructions |
| | | | | |
| | ■ | Checking Account Information | | |
| | |
| | When you are no longer our customer, we continue to share your information as described in this notice. |
| | |
| How? | All financial companies need to share customers’ personal information to run their everyday business. In the section below, we list the reasons financial companies can share their customers’ personal information; the reasons the Total Income+ Real Estate Fund chooses to share; and whether you can limit this sharing. |
| Reasons we can share your personal information | Does Total
Income+ Real
Estate Fund share? | Can you limit this sharing? |
For our everyday business purposes – such as to process your transactions, maintain your account(s), respond to court orders and legal investigations, or report to credit bureaus | Yes | No |
For our marketing purposes – to offer our products and services to you | No | We don’t share |
| For joint marketing with other financial companies | No | We don’t share |
For our affiliates’ everyday business purposes – information about your transactions and experiences | No | We don’t share |
For our affiliates’ everyday business purposes – information about your creditworthiness | No | We don’t share |
| For nonaffiliates to market to you | No | We don’t share |
| Questions? | Call 1-855-754-7930 |
| Who we are |
Who is providing this notice? | Total Income+ Real Estate Fund |
| What we do |
| How does Total Income+ Real Estate Fund protect my personal information? | To protect your personal information from unauthorized access and use, we use security measures that comply with federal law. These measures include computer safeguards and secured files and buildings. Our service providers are held accountable for adhering to strict policies and procedures to prevent any misuse of your nonpublic personal information. |
| How does Total Income+ Real Estate Fund collect my personal information? | We collect your personal information, for example, when you ■ Open an account ■ Provide account information ■ Give us your contact information ■ Make deposits or withdrawals from your account ■ Make a wire transfer ■ Tell us where to send the money ■ Tells us who receives the money ■ Show your government-issued ID ■ Show your driver’s license We also collect your personal information from other companies. |
| Why can’t I limit all sharing? | Federal law gives you the right to limit only ■ Sharing for affiliates’ everyday business purposes – information about your creditworthiness ■ Affiliates from using your information to market to you ■ Sharing for nonaffiliates to market to you State laws and individual companies may give you additional rights to limit sharing. |
| Definitions |
| Affiliates | Companies related by common ownership or control. They can be financial and nonfinancial companies. ■ Total Income+ Real Estate Fund does not share with our affiliates. |
| Nonaffiliates | Companies not related by common ownership or control. They can be financial and nonfinancial companies ■ Total Income+ Real Estate Fund does not share with nonaffiliates so they can market to you. |
| Joint marketing | A formal agreement between nonaffiliated financial companies that together market financial products or services to you. ■ Total Income+ Real Estate Fund doesn’t jointly market. |
| | | | | | |
| Investment Adviser |
| Bluerock Fund Advisor, LLC |
| 712 Fifth Avenue, 9th Floor |
| New York, NY 10019 |
| |
| Distributor |
| Northern Lights Distributors, LLC |
| 17605 Wright Street |
| Omaha, NE 68130 |
| |
| Legal Counsel |
| Thompson Hine LLP |
| 41 South High Street, Suite 1700 |
| Columbus, OH 43215 |
| |
| Independent Registered Public Accounting Firm |
| BBD, LLP |
| 1835 Market Street, 26th Floor |
| Philadelphia, PA 19103 |
How to Obtain Proxy Voting Information
Information regarding how the Fund votes proxies relating to portfolio securities for the 12 month period ended June 30th as well as a description of the policies and procedures that the Fund used to determine how to vote proxies is available without charge, upon request, by calling 1-888-459-1059 or by referring to the Securities and Exchange Commission’s (“SEC”) website at http://www.sec.gov.
How to Obtain 1st and 3rd Fiscal Quarter Portfolio Holdings
The Fund files its complete schedule of portfolio holdings with the SEC for the first and third quarters of each fiscal year on Form N-Q. Form N-Q is available on the SEC’s website at http://www.sec.gov and may be reviewed and copied at the SEC’s Public Reference Room in Washington, DC (1-800-SEC-0330). The information on Form N-Q is available without charge, upon request, by calling 1-888-459-1059.
Item 2. Code of Ethics. Not applicable.
Item 3. Audit Committee Financial Expert. Not applicable.
Item 4. Principal Accountant Fees and Services. Not applicable.
Item 5. Audit Committee of Listed Companies. Not applicable
Item 6. Schedule of Investments. Schedule of investments in securities of unaffiliated issuers is included under Item 1.
Item 7. Disclosure of Proxy Voting Policies and Procedures for Closed-End Funds. Not applicable.
Item 8. Portfolio Managers of Closed-End Management Investment Companies. Not applicable.
Item 9. Purchases of Equity Securities by Closed-End Funds. Not applicable
Item 10. Submission of Matters to a Vote of Security Holders. None
Item 11. Controls and Procedures.
(a) Based on an evaluation of the Registrant’s disclosure controls and procedures as of a date within 90 days of filing date of this Form N-CSR, the principal executive officer and principal financial officer of the Registrant have concluded that the disclosure controls and procedures of the Registrant are reasonably designed to ensure that the information required in filings on Form N-CSR is recorded, processed, summarized, and reported by the filing date, including that information required to be disclosed is accumulated and communicated to the Registrant’s management, including the Registrant’s principal executive officer and principal financial officer, as appropriate to allow timely decisions regarding required disclosure.
(b) There were no significant changes in the Registrant’s internal control over financial reporting that occurred during the Registrant’s last fiscal half-year that have materially affected, or are reasonably likely to materially affect, the Registrant’s internal control over financial reporting.
Item 12. Exhibits.
(a)(1) Code of Ethics filed herewith.
(a)(2) Certifications required by Section 302 of the Sarbanes-Oxley Act of 2002 (and Item 11(a)(2) of Form N-CSR) are filed herewith.
(a)(3) Not applicable.
(b) Certifications required by Section 906 of the Sarbanes-Oxley Act of 2002 (and Item 11(b) of Form N-CSR) are filed herewith.
SIGNATURES
Pursuant to the requirements of the Securities Exchange Act of 1934 and the Investment Company Act of 1940, the registrant has duly caused this report to be signed on its behalf by the undersigned, thereunto duly authorized.
(Registrant) Total Income+ Real Estate Fund
By (Signature and Title)
s/ Jordan Ruddy
Jordan B. Ruddy, President
Date: May 31, 2016
Pursuant to the requirements of the Securities Exchange Act of 1934 and the Investment Company Act of 1940, this report has been signed below by the following persons on behalf of the registrant and in the capacities and on the dates indicated.
By (Signature and Title)
s/ Jordan Ruddy
Jordan B. Ruddy, President
Date May 31, 2016
By (Signature and Title)
/s/ Jerry Novack
Jerry Novack, Treasurer
Date May 31, 2016