UNITED STATES
SECURITIES AND EXCHANGE COMMISSION
Washington, D.C. 20549
FORM N-CSR
CERTIFIED SHAREHOLDER REPORT OF REGISTERED MANAGEMENT
INVESTMENT COMPANIES
Investment Company Act file number 811-22715
Guggenheim Credit Allocation Fund
(Exact name of registrant as specified in charter)
2455 Corporate West Drive, Lisle, IL 60532
(Address of principal executive offices) (Zip code)
Amy J. Lee
2455 Corporate West Drive, Lisle, IL 60532
(Name and address of agent for service)
Registrant's telephone number, including area code: (630) 505-3700
Date of fiscal year end: May 31
Date of reporting period: June 26, 2013 - November 30, 2013
Item 1. Reports to Stockholders.
The registrant's semi-annual report transmitted to shareholders pursuant to Rule 30e-1 under the Investment Company Act of 1940, as amended (the “Investment Company Act”), is as follows:
GUGGENHEIMINVESTMENTS.COM/GGM
... YOUR LINK TO THE LATEST, MOST UP-TO-DATE INFORMATION ABOUT
GUGGENHEIM CREDIT ALLOCATION FUND
The shareholder report you are reading right now is just the beginning of the story. Online at guggenheiminvestments.com/ggm, you will find:
| · | Daily, weekly and monthly data on share prices, distributions and more |
| · | Portfolio overviews and performance analyses |
| · | Announcements, press releases and special notices |
| · | Fund and adviser contact information |
Guggenheim Partners Investment Management, LLC and Guggenheim Funds Investment Advisors, LLC are constantly updating and expanding shareholder information services on the Fund’s website in an ongoing effort to provide you with the most current information about how your Fund’s assets are managed and the results of our efforts. It is just one more small way we are working to keep you better informed about your investment in the Fund.
November 30, 2013 |
DEAR SHAREHOLDER
We thank you for your investment in the Guggenheim Credit Allocation Fund (the “Fund”). This report covers the Fund’s performance for the initial fiscal period from the Fund’s inception on June 26, 2013, through November 30, 2013.
The Fund’s investment objective is to seek total return through a combination of current income and capital appreciation.
Under normal market conditions, the Fund invests at least 80% of its net assets, plus the amount of any borrowings for investment purposes, in fixed-income securities, debt securities, loans and investments with economic characteristics similar to fixed-income securities, debt securities and loans (collectively, “credit securities”). The Fund seeks to achieve its investment objective by investing in a portfolio of credit securities selected from a variety of sectors and credit qualities. The Fund may invest in credit securities of any duration or maturity. Credit securities in which the Fund may invest may pay fixed or variable rates of interest. The Fund may invest without limitation in securities of non-U.S. issuers, including issuers in emerging markets.
All Fund returns cited—whether based on net asset value (“NAV”) or market price—assume the reinvestment of all distributions. For the initial fiscal period ended November 30, 2013, the Fund provided a total return based on market price of -8.70% and a total return based on NAV of 4.03%. The NAV performance of the Fund reflects fees and expenses of the Fund.
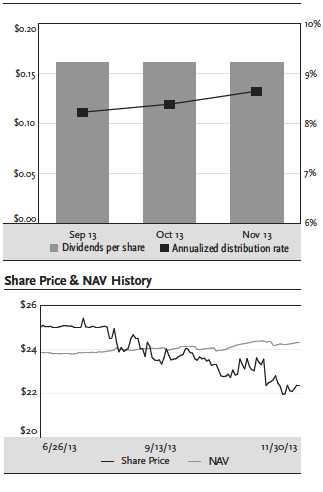
As of November 30, 2013, the Fund’s market price of $22.35 per share represented a discount of 7.99% to its NAV of $24.29 per share. As of the commencement of the Fund’s operations on June 26, 2013, the Fund’s market price was $25.00 per share and its NAV was $23.82 per share. The market value of the Fund’s shares fluctuates from time to time and it may be higher or lower than the Fund’s NAV.
The Fund paid monthly distributions beginning in September 2013. The distribution each month was $0.16146. The distribution as of November 30, 2013, represents an annualized distribution rate of 8.67% based on the Fund’s closing market price of $22.35 on November 30, 2013. The Fund’s distribution rate is not constant and is subject to change based on the performance of the Fund.
Guggenheim Funds Investment Advisors, LLC (the “Adviser”) serves as the investment adviser to the Fund. Guggenheim Partners Investment Management, LLC (“GPIM” or the “Sub-Adviser”) serves as the Fund’s investment sub-adviser and is responsible for the management of the Fund’s portfolio of investments. Each of the Adviser and the Sub-Adviser is an affiliate of Guggenheim Partners, LLC (“Guggenheim”), a global diversified financial services firm.
We encourage shareholders to consider the opportunity to reinvest their distributions from the Fund through the Dividend Reinvestment Plan (“DRIP”), which is described in detail on page 26 of this report. When shares trade at a discount to NAV, the DRIP takes advantage of the discount by reinvesting the monthly dividend distribution in common shares of the Fund purchased in the market at a price less than NAV. Conversely, when the market price of the Fund’s common shares is at a premium above NAV, the DRIP reinvests participants’ dividends in newly-issued common shares at the greater of NAV per share or 95% of the market price per share. The DRIP provides a cost-effective means to accumulate additional shares and enjoy the benefits of compounding returns over time. Since the Fund endeavors to maintain a stable monthly distribution, the DRIP effectively provides an income averaging technique, which causes shareholders to accumulate a larger number of Fund shares when the market price is depressed than when the price is higher.
To learn more about the Fund’s performance and investment strategy, we encourage you to read the Questions & Answers section of this report, which begins on page 5. You’ll find information on GPIM’s investment philosophy, views on the economy and market environment, and detailed information about the factors that impacted the Fund’s performance.
DEAR SHAREHOLDER continued | November 30, 2013 |
We appreciate your investment and look forward to serving your investment needs in the future. For the most up-to-date information on your investment, please visit the Fund’s website at guggenheiminvestments.com/ggm.
Sincerely,

Donald C. Cacciapaglia
Chief Executive Officer
Guggenheim Credit Allocation Fund
December 31, 2013
QUESTIONS & ANSWERS | November 30, 2013 |
Guggenheim Credit Allocation Fund (the “Fund”) is managed by a team of seasoned professionals at Guggenheim Partners Investment Management, LLC (“GPIM”). This team includes B. Scott Minerd, Global Chief Investment Officer; Anne B. Walsh, CFA, JD, Senior Managing Director; Jeffrey B. Abrams, Senior Managing Director and Portfolio Manager; Kevin H. Gundersen, Senior Managing Director and Portfolio Manager; and James W. Michal, Managing Director and Portfolio Manager. In the following interview, the investment team discusses the market environment and the Fund’s performance for the initial fiscal period ended November 30, 2013.
What is the Fund’s investment objective and how is it pursued?
The Guggenheim Credit Allocation Fund’s investment objective is to seek total return through a combination of current income and capital appreciation.
Under normal market conditions, the Fund invests at least 80% of its net assets, plus the amount of any borrowings for investment purposes, in fixed-income securities, debt securities, loans and investments with economic characteristics similar to fixed-income securities, debt securities and loans (collectively, “credit securities”). Credit securities in which the Fund may invest consist of corporate bonds, loans and loan participations, asset-backed securities (all or a portion of which may consist of collateralized loan obligations), mortgage-backed securities (both residential mortgage-backed securities and commercial mortgage-backed securities), U.S. Government and agency securities, mezzanine and preferred securities, convertible securities, commercial paper, municipal securities and sovereign government and supranational debt securities. The Fund will seek to achieve its investment objective by investing in a portfolio of credit securities selected from a variety of sectors and credit qualities. The Fund may invest in credit securities that are rated below investment grade, or, if unrated, determined to be of comparable quality (also known as “high yield securities” or “junk bonds”). The Fund may invest in credit securities of any duration or maturity. Credit securities in which the Fund may invest may pay fixed or variable rates of interest. The Fund may invest without limitation in securities of non-U.S. issuers, including issuers in emerging markets.
The Fund may, but is not required to, use various derivatives transactions for hedging and risk management purposes, to facilitate portfolio management and to earn income or enhance total return. The Fund may use such transactions as a means to synthetically implement the Fund’s investment strategies. In addition, as an alternative to holding investments directly, the Fund may also obtain investment exposure by investing in other investment companies. To the extent that the Fund invests in synthetic investments with economic characteristics similar to credit securities, the value of such investments will be counted as credit securities for purposes of the Fund’s policy of investing at least 80% of its net assets, plus the amount of any borrowings for investment purposes, in credit securities (the “80% Policy”).
The Fund may invest in open-end funds, closed-end funds and exchange-traded funds. For purposes of the Fund’s 80% Policy, the Fund will include its investments in other investment companies that have a policy of investing at least 80% of their net assets, plus the amount of any borrowings for investment purposes, in one or more types of credit securities.
The Fund uses financial leverage (borrowing) to finance the purchase of additional securities. Although financial leverage may create an opportunity for increased return for shareholders, it also results in additional risks and can magnify the effect of any losses. There is no assurance that the strategy will be successful. If income and gains earned on securities purchased with the financial leverage proceeds are greater than the cost of the financial leverage, common shareholders’ return will be greater than if financial leverage had not been used. Conversely, if the income or gains from the securities purchased with the proceeds of financial leverage are less than the cost of the financial leverage, common shareholders’ return will be less than if financial leverage had not been used.
What were the significant events affecting the economy and market environment over the past six months?
Speculation on the future of quantitative easing dominated financial headlines for much of the period, causing increased interest rate volatility and driving investor demand for shorter duration assets. The yield on the 10-year Treasury note hit a two-year high of 3.0% in early September, about 140 basis points above the lows seen in May.
The Federal Reserve (the “Fed”) surprised most market participants on September 18, 2013 with its inaction on what was expected to be the beginning of tapering its $85 billion per month asset purchase program. Given sluggish job growth and malaise in the housing data in recent months, the Fed announced that it would continue to maintain the pace of purchases until there was significant improvement in the aforementioned areas. Investors that were positioned in longer-duration fixed income assets benefitted as benchmark 10-year U.S. Treasury bond yields declined in the wake of the Fed announcement, closing the third quarter at 2.6%. The soft patch in economic growth added downward pressure to interest rates in the short term, but reacceleration is expected to ultimately push interest rates higher over the long term.
The fundamental outlook for the global economy continues to improve. We are seeing a synchronous global economic expansion for the first time since 2007. In Europe, the periphery has struggled through several years of contraction, but lower prices and unit labor costs have led to the start of a recovery. Germany’s economy has been weighed down by the peripheral nations, but overall, Europe has shown signs of expansion from recent manufacturing data. Asian economies, notably China and Japan, have seen substantial monetary accommodation from their respective regimes and look to return to higher levels of growth in the coming years.
Here in the United States, we continue to see strong evidence of seasonal strength in the stock market. The data-distorting effects of the October U.S. government shutdown are being flushed from the system, providing a truer reading of what is occurring domestically. Despite a shutdown that lasted far longer than originally anticipated, the U.S. economy held up fairly well, indicating a high degree of underlying strength.
QUESTIONS & ANSWERS continued | November 30, 2013 |
At period end, the likelihood of the Fed tapering quantitative easing in December appeared to be remote. However, given strong employment data released in early December, many market participants placed a higher probability of the Fed reducing purchases in the next few meetings. (After the period end, on December 18, 2013, the Fed announced that it would begin to taper in January 2014, reducing monthly asset purchases from $85 billion to $75 billion). Our expectation is interest rates are likely to remain range bound into 2014 before continuing an ascent higher.
How did the Fund perform for the initial fiscal period?
All Fund returns cited—whether based on net asset value (“NAV”) or market price—assume the reinvestment of all distributions. For the initial fiscal period ended November 30, 2013, the Fund provided a total return based on market price of -8.70% and a total return based on NAV of 4.03%. The NAV performance of the Fund reflects fees and expenses of the Fund.
As of November 30, 2013, the Fund’s market price of $22.35 per share represented a discount of 7.99% to its NAV of $24.29 per share. As of the Fund’s commencement of operations on June 26, 2013, the Fund’s market price was $25.00 per share and its NAV was $23.82 per share. The market value of the Fund’s shares fluctuates from time to time and it may be higher or lower than the Fund’s NAV.
The Fund paid monthly distributions beginning in September 2013. The distribution each month was $0.16146. The distribution as of November 30, 2013, represents an annualized distribution rate of 8.67% based on the Fund’s closing market price of $22.35 on November 30, 2013. The Fund’s distribution rate is not constant and is subject to change based on the performance of the Fund.
Discuss how proceeds were invested and how the Fund is now allocated.
For much of the period, the Fund focused on investing proceeds from the initial public offering. Assets now are mostly in senior loans and high yield bonds. The largest sector concentration is in consumer names. The Fund regularly rebalances and cycles securities in and out of the portfolio on a relative value basis. During the ramp-up period, the Fund also insured that cash proceeds of the initial public offering were fully invested. Toward the end of the period the Fund began employing financing through borrowing to seek to enhance return.
Senior loans are currently a preferred investment for the Fund, as their floating-rate coupons help mitigate interest-rate risk, while their seniority in capital structure, maintenance covenants and secured status enhance credit quality. We continue to view single B bank loans as having risk comparable to BB corporate bonds.
The Fund purchased many senior loans in the primary market, realizing an immediate improvement in value due to original issue discounts, and loans benefited from strong demand from collateralized loan obligations (“CLOs”) and loan funds.
As the Fed continues to engineer an environment of ample liquidity, resulting in low defaults, we see this as an optimal time to take prudent credit risk. Reflecting this sentiment, investors have begun transitioning into assets with enhanced structural protections through increased allocations to bank loans. Lower rated, upper middle-market bank loans offer comparable yields to BB bonds but provide a much greater degree of comfort, in the event of rising rates and deteriorating credit quality. For investors seeking to participate in the credit rally while remaining protected on the downside, we believe bank loans are the investment vehicles best positioned to provide this flexibility. As of November 30, 2013, floating rate securities were 53.6% of long-term investments.
Volatility during the period put pressure on high yield bonds, but also presented purchase opportunities, many featuring attractive yield and credit metrics at points of temporary price weakness. When interest rates decline, the search for yield can outweigh the need to protect from rising interest rates, spurring demand for high yield bonds over senior loans.
The Fund also had a small allocation to asset-backed securities (“ABS”). This was predicated on the decline in interest rates after the Fed declined to taper, and ABS spreads were tightening. The sector also benefitted from positive trends in the broader market as uncertainty around a government shutdown and debt ceiling hike abated. In addition, overall ABS supply is down, creating favorable tightening conditions.
The Fund kept interest-rate duration short over the summer amid increased rate volatility and the potential for rising rates but later selectively added duration, especially as interest rates fell after the September 18, 2013 Fed announcement. We expect interest rates to head lower through the remainder of the year with room for further credit spread compression in the near-term.
Credit quality was also closely monitored in the wake of softening in underwriting standards, which may be a result of increased demand for new issuance.
What have market conditions been like over the past six months for the main asset classes the Fund invests in?
Issuance across corporate sectors has remained robust throughout 2013 as investors have maintained intense demand, creating a positive technical bid. As of period end, $881 billion of investment grade corporate bonds have been issued, approaching the 2012 total of $928 billion. In high yield, corporate bond issuance is $296 billion for the year compared to $347 billion for the 2012 total while leveraged loan issuance has reached $513 billion for the year compared to $274 billion in the prior year.
Much of the new issuance across the corporate credit sector has been repricings and refinancing as issuers look to lock in historically low rates. As demand for bank loans has grown in 2013, the CLO market has thrived. Over $75 billion has been issued in the U.S. CLO market year-to-date through November, which exceeds full year 2012 issuance and is the third highest year of issuance on record. Issuance slowed during the middle of the year as new regulations widened CLO liabilities making CLO economics more difficult. A robust CLO market is important for loans, as CLOs have historically represented a more sustainable, long-term source of demand.
QUESTIONS & ANSWERS continued | November 30, 2013 |
While positive fundamentals should help sustain the credit cycle in the near term, there are several notable trends that investors should continue monitoring. Particularly, the growing prominence of retail investors in the bank loan market can contribute to volatility, as we have witnessed in the high yield sector.
Fundamental factors and monetary policy are underpinning our constructive stance on leveraged credit, including attractive coverage ratios, a more distant maturity wall and low default rates. The decline in the 10-year yield since the Fed refrained from tapering has helped ease short-term interest rate concerns and may reignite the search for yield in high yield bonds. Since January 2009, high yield bonds as represented by the Credit Suisse High Yield Index have recorded 18.3% annualized total return as the result of investor search for yield. The index is designed to mirror the investable universe of the $US-denominated high yield debt market.
The ABS market showed modestly positive performance over the period as interest rate volatility led to increased demand for floating rate securities. Despite the negative effects of increased interest rate volatility and the subsequent impact on housing data, the non-Agency RMBS market also maintained positive performance for the period.
How did other markets perform in this environment?
For the initial fiscal period ended November 30, 2013, the Standard & Poor’s 500 Index (the “S&P 500”) rose 13.66% (this and all other returns cited in this section are total return). The Morgan Stanley Capital International (“MSCI”) Europe-Australasia-Far East (“EAFE”) Index rose 17.37% and the MSCI Emerging Market Index rose 13.98%.
In the bond market, the Barclays U.S. Aggregate Bond Index returned 1.50% for the period, while the Barclays U.S. Corporate High Yield Index returned 6.16%. The return of the Barclays 1-3 Month U.S. Treasury Bill Index was 0.01%.
The Bank of America Merrill Lynch ABS AA-BBB Securities Master Index gained 1.98% for the period, while the Credit Suisse Leveraged Loan Index returned 2.70%.
What is the Fund’s leverage strategy?
Since leverage adds to performance when the cost of leverage is less than the total return generated by investments, the use of leverage contributed to the Fund’s total return during this period. The purpose of leverage (borrowing) is to fund the purchase of additional securities that provide increased income and potentially greater appreciation to common shareholders than could be achieved from an unlevered portfolio. Leverage results in greater NAV volatility and entails more downside risk than an unleveraged portfolio.
As of November 30, 2013, the amount of leverage was approximately 21% of total managed assets. The Fund employs leverage through reverse repurchase agreements, under which the Fund temporarily transfers possession of portfolio securities and receives cash which can be used for additional investments. There is no guarantee that the Fund’s leverage strategy will be successful. The Fund’s use of leverage may cause the Fund’s NAV and market price of common shares to be more volatile and can magnify the effect of any losses.
Index Definitions
Indices are unmanaged and reflect no expenses. It is not possible to invest directly in an index.
The Standard & Poor’s 500 Index is a capitalization-weighted index of 500 stocks. The index is designed to measure performance of the broad domestic economy through changes in the aggregate market value of 500 stocks representing all major industries.
BofA/ML ABS Master AA-BBB Index is a subset of The BofA Merrill Lynch U.S. Fixed Rate Asset Backed Securities Index including all securities rated AA1 through BBB3, inclusive.
The Barclays U.S. Aggregate Bond Index represents securities that are U.S. domestic, taxable, and dollar denominated. The index covers the U.S. investment grade fixed rate bond market, with index components for government and corporate securities, mortgage pass-through securities, and asset-backed securities.
The Barclays U.S. Corporate High Yield Index is an unmanaged index of below investment grade bonds issued by U.S. corporations.
The Barclays 1-3 Month U.S. Treasury Bill Index tracks the performance of U.S. Treasury bills with a remaining maturity of one to three months. U.S. Treasury bills, which are short-term loans to the U.S. government, are full faith-and-credit obligations of the U.S. Treasury and are generally regarded as being free of any risk of default.
The Credit Suisse Leveraged Loan Index is an index designed to mirror the investable universe of the $US-denominated leveraged loan market.
The MSCI EAFE Index is a capitalization weighted measure of stock markets in Europe, Australasia and the Far East.
The MSCI Emerging Markets Index is a free float-adjusted market capitalization weighted index that is designed to measure equity market performance in the global emerging markets.
Risks and Other Considerations
The views expressed in this report reflect those of the portfolio managers only through the report period as stated on the cover. These views are subject to change at any time, based on market and other conditions and should not be construed as a recommendation of any kind. The material may also include forward looking statements that involve risk and uncertainty, and there is no guarantee that any predictions will come to pass. There can be no assurance that the Trust will achieve its investment objectives. The value of the Trust will fluctuate with the value of the underlying securities. Historically, closed-end funds often trade at a discount to their net asset value. There can be no assurance that the Trust will achieve its investment objectives.
Please see guggenheiminvestments.com/ggm for a detailed discussion of the Trust’s risks and considerations.
FUND SUMMARY (Unaudited) | November 30, 2013 |
Fund Statistics | ||
Share Price | $22.35 | |
Common Share Net Asset Value | $24.29 | |
Premium/(Discount) to NAV | -7.99% | |
Net Assets Applicable to Common Shares ($000) | $160,992 | |
Total Returns | ||
(Inception 6/26/2013) | Market | NAV |
Since Inception | -8.70% | 4.03% |
Performance data quoted represents past performance, which is no guarantee of future results and current performance may be lower or higher than the figures shown. NAV performance data reflects fees and expenses of the Fund. For more current information, please visit guggenheiminvestments.com/ggm. The investment return and principal value of an investment will fluctuate with changes in the market conditions and other factors so that an investor’s shares, when sold, may be worth more or less than their original cost.
% of Net | |
Fund Breakdown | Assets |
Corporate Bonds | 54.4% |
Asset Backed Securities | 4.8% |
Term Loans | 59.9% |
Total Investments | 119.1% |
Other Assets in excess of other Liabilities | 7.8% |
Reverse Repurchase Agreements | -26.9% |
Total Net Assets | 100.0% |
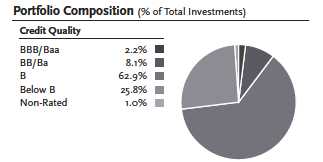
Ratings shown are assigned by one or more Nationally Recognized Statistical Credit Rating Organizations (“NRSCRO”), such as Standard & Poor’s, Moody’s and Fitch. The ratings are an indication of an issuer’s cred-itworthiness and typically range from AAA or Aaa (highest) to D (lowest). When two or more ratings are available, the lower rating is used; when only one is available, that rating is used. The Non-Rated category consists of securities that have not been rated by an NRSCRO. U.S. Treasury securities and U.S. Government Agency securities are not rated but deemed to be equivalent to securities rated AA+/Aaa.
Portfolio composition and holdings are subject to change daily. For more information, please visit guggenheiminvestments.com/ggm. The above summaries are provided for informational purposes only and should not be viewed as recommendations. Past performance does not guarantee future results.
Distributions to Shareholders & Annualized Distribution Rate
PORTFOLIO OF INVESTMENTS (Unaudited) | November 30, 2013 |
Principal Amount | Description | Rating* | Coupon | Maturity | Optional Call Provisions** | Value | |
Long-Term Investments – 119.1% | |||||||
Corporate Bonds – 54.4% | |||||||
Advertising – 2.0% | |||||||
$ 3,000,000 | Sitel, LLC / Sitel Finance Corp.(a) (b) | B | 11.000% | 08/01/2017 | 08/01/14 @ 106 | $ 3,232,500 | |
Agriculture – 1.2% | |||||||
1,881,000 | Vector Group Ltd. | B+ | 7.750% | 02/15/2021 | 02/15/16 @ 106 | 1,979,753 | |
Chemicals – 2.0% | |||||||
3,000,000 | TPC Group, Inc.(a) | B | 8.750% | 12/15/2020 | 12/15/16 @ 104 | 3,168,750 | |
Commercial Services – 0.7% | |||||||
19,000 | RR Donnelley & Sons Co. | BB– | 6.500% | 11/15/2023 | N/A | 18,952 | |
1,135,000 | ServiceMaster Co. | CCC+ | 7.000% | 08/15/2020 | 08/15/15 @ 105 | 1,085,344 | |
1,104,296 | |||||||
Consumer Services – 1.3% | |||||||
1,500,000 | Travelport, LLC | CCC– | 11.875% | 09/01/2016 | 09/01/14 @ 100 | 1,518,750 | |
500,000 | Travelport, LLC / Travelport Holdings, Inc.(a) (c) | CCC– | 6.364% | 03/01/2016 | 08/23/14 @ 100 | 498,750 | |
2,017,500 | |||||||
Diversified Financial Services – 5.5% | |||||||
3,000,000 | Harbinger Group, Inc.(a) | B | 7.875% | 07/15/2019 | 01/15/16 @ 106 | 3,217,500 | |
1,000,000 | Jefferies Finance, LLC / JFIN Co-Issuer Corp.(a) (b) | B+ | 7.375% | 04/01/2020 | 04/01/16 @ 106 | 1,036,250 | |
500,000 | Nationstar Mortgage, LLC / Nationstar Capital Corp. | B+ | 6.500% | 08/01/2018 | 08/01/15 @ 103 | 508,750 | |
2,000,000 | Nationstar Mortgage, LLC / Nationstar Capital Corp.(b) | B+ | 6.500% | 07/01/2021 | 01/01/17 @ 103 | 1,900,000 | |
2,000,000 | Oxford Finance, LLC / Oxford Finance Co-Issuer, Inc.(a) | B | 7.250% | 01/15/2018 | 01/15/15 @ 104 | 2,122,500 | |
8,785,000 | |||||||
Entertainment – 0.6% | |||||||
1,000,000 | Gibson Brands, Inc.(a) (b) | B | 8.875% | 08/01/2018 | 02/01/16 @ 107 | 1,022,500 | |
Food – 2.0% | |||||||
1,100,000 | JBS USA, LLC / JBS USA Finance, Inc.(a) | BB | 7.250% | 06/01/2021 | 06/01/15 @ 105 | 1,141,250 | |
2,000,000 | KeHE Distributors, LLC / KeHE Finance Corp.(a) | B | 7.625% | 08/15/2021 | 08/15/17 @ 104 | 2,090,000 | |
3,231,250 | |||||||
Forest Products & Paper – 0.9% | |||||||
1,401,000 | Unifrax I, LLC / Unifrax Holding Co.(a) (b) | B– | 7.500% | 02/15/2019 | 02/15/15 @ 104 | 1,439,528 | |
Gas – 0.6% | |||||||
1,000,000 | NGL Energy Partners, LP / NGL Energy Finance Corp.(a) | BB– | 6.875% | 10/15/2021 | 10/15/16 @ 105 | 1,017,500 | |
Household Products & Housewares – 1.9% | |||||||
3,000,000 | Central Garden and Pet Co.(b) | CCC+ | 8.250% | 03/01/2018 | 03/01/14 @ 104 | 3,030,000 | |
Leisure Time – 1.1% | |||||||
1,550,000 | Sabre, Inc.(a) (b) | B | 8.500% | 05/15/2019 | 05/15/15 @ 106 | 1,714,688 | |
Media – 1.4% | |||||||
2,300,000 | Expo Event Transco, Inc.(a) (b) | B– | 9.000% | 06/15/2021 | 06/15/16 @ 105 | 2,328,750 | |
Mining – 0.6% | |||||||
500,000 | KGHM International Ltd. (Canada)(a) (b) | BB– | 7.750% | 06/15/2019 | 06/15/15 @ 104 | 523,750 | |
2,000,000 | Mirabela Nickel Ltd. (Australia)(a) (b) (d) | D | 8.750% | 04/15/2018 | 04/15/15 @ 104 | 480,000 | |
1,003,750 | |||||||
Oil & Gas – 13.5% | |||||||
1,026,000 | Atlas Energy Holdings Operating Co., LLC / Atlas Resource | ||||||
Finance Corp.(a) (b) | B– | 7.750% | 01/15/2021 | 01/15/17 @ 104 | 969,570 | ||
2,000,000 | Atlas Energy Holdings Operating Co., LLC / Atlas Resource | ||||||
Finance Corp.(a) | B– | 9.250% | 08/15/2021 | 08/15/17 @ 105 | 2,035,000 |
See notes to financial statements.
GGM l GUGGENHEIM CREDIT ALLOCATION FUND SEMIANNUAL REPORT l 9
PORTFOLIO OF INVESTMENTS (Unaudited) | November 30, 2013 |
Principal Amount | Description | Rating* | Coupon | Maturity | Optional Call Provisions** | Value | |
Oil & Gas continued | |||||||
$ 3,000,000 | BreitBurn Energy Partners, LP / BreitBurn Finance Corp. | B– | 7.875% | 04/15/2022 | 01/15/17 @ 104 | $ 3,067,500 | |
3,000,000 | Endeavor Energy Resources, LP / EER Finance, Inc.(a) | B+ | 7.000% | 08/15/2021 | 08/15/16 @ 105 | 3,000,000 | |
3,000,000 | Legacy Reserves LP / Legacy Reserves Finance Corp.(a) | B– | 8.000% | 12/01/2020 | 12/01/16 @ 104 | 3,097,500 | |
3,000,000 | Memorial Production Partners, LP / Memorial Production Finance Corp.(a) | B– | 7.625% | 05/01/2021 | 05/01/17 @ 104 | 3,082,500 | |
1,000,000 | Midstates Petroleum Co., Inc. / Midstates Petroleum Co., LLC(b) | B– | 10.750% | 10/01/2020 | 10/01/16 @ 105 | 1,090,000 | |
2,000,000 | Midstates Petroleum Co., Inc. / Midstates Petroleum Co., LLC | B– | 9.250% | 06/01/2021 | 06/01/16 @ 107 | 2,087,500 | |
3,000,000 | SandRidge Energy, Inc. | B– | 8.750% | 01/15/2020 | 01/15/15 @ 104 | 3,240,000 | |
21,669,570 | |||||||
Oil & Gas Services – 0.1% | |||||||
200,000 | IronGate Energy Services, LLC(a) (b) | NR | 11.000% | 07/01/2018 | 07/01/16 @ 105 | 196,000 | |
Other Industrials – 1.1% | |||||||
EUR 1,300,000 | Deutsche Raststatten (Denmark) | B | 6.750% | 12/30/2020 | N/A | 1,766,184 | |
Packaging & Containers – 1.3% | |||||||
$ 2,020,000 | Pretium Packaging, LLC / Pretium Finance, Inc.(b) | B– | 11.500% | 04/01/2016 | 04/01/14 @ 106 | 2,156,350 | |
Pipelines – 4.4% | |||||||
2,000,000 | Atlas Pipeline Partners, LP / Atlas Pipeline Finance Corp.(a) | B+ | 5.875% | 08/01/2023 | 02/01/18 @ 103 | 1,940,000 | |
2,000,000 | Crestwood Midstream Partners, LP(a) | BB | 6.000% | 12/15/2020 | 12/15/16 @ 103 | 2,047,500 | |
3,000,000 | Eagle Rock Energy Partners, LP/Eagle Rock Energy Finance Corp. | B | 8.375% | 06/01/2019 | 06/01/15 @ 104 | 3,090,000 | |
7,077,500 | |||||||
Property & Casualty – 0.4% | |||||||
650,000 | Prosight Global, Inc.(d) | NR | 7.500% | 11/20/2020 | N/A | 649,315 | |
Retail – 3.7% | |||||||
500,000 | Checkers & Rally’s Restaurants, Inc.(a)(d) | NR | 11.625% | 11/01/2016 | 05/01/15 @ 103 | 513,750 | |
2,000,000 | Checkers Drive-In Restaurants, Inc.(a) | B– | 11.000% | 12/01/2017 | 06/01/15 @ 108 | 2,225,000 | |
3,000,000 | GRD Holdings III Corp.(a) (b) | B | 10.750% | 06/01/2019 | 06/01/15 @ 108 | 3,270,000 | |
6,008,750 | |||||||
Software – 5.8% | |||||||
3,000,000 | Aspect Software, Inc.(b) | CCC+ | 10.625% | 05/15/2017 | 05/15/14 @ 105 | 3,067,500 | |
3,000,000 | Eagle Midco, Inc.(a) | CCC+ | 9.000% | 06/15/2018 | 12/15/14 @ 102 | 3,075,000 | |
3,000,000 | First Data Corp.(a) (e) | B– | 8.750% | 01/15/2022 | 01/15/16 @ 104 | 3,217,500 | |
9,360,000 | |||||||
Telecommunications – 2.3% | |||||||
3,000,000 | Alcatel-Lucent USA, Inc.(a) | CCC+ | 8.875% | 01/01/2020 | 07/01/16 @ 104 | 3,281,250 | |
350,000 | Level 3 Financing, Inc.(a) | CCC+ | 6.125% | 01/15/2021 | 11/15/16 @ 103 | 355,250 | |
3,636,500 | |||||||
Total Corporate Bonds – 54.4% | |||||||
(Cost $86,825,637) | 87,595,934 | ||||||
Asset Backed Securities – 4.8% | |||||||
Collateralized Debt Obligations – 1.9% | |||||||
1,191,143 | RAIT CRE CDO Ltd. (Cayman Islands) (c) | BB– | 0.498% | 11/20/2046 | N/A | 987,165 | |
2,339,407 | SRERS Funding Ltd., Series 2011-RS, Class A1B1 (Cayman Islands)(a) (b) (c) | Baa3 | 0.419% | 05/09/2046 | N/A | 2,104,843 | |
3,092,008 | |||||||
Collateralized Loan Obligations – 2.0% | |||||||
750,000 | KKR Financial CLO Ltd., Series 2007-1X, Class A(b) (c) | BBB+ | 5.241% | 05/15/2021 | N/A | 744,236 | |
1,500,000 | Newstar Trust, Series 2013-1A, Class E(a) (b) (c) | BBB– | 5.701% | 09/20/2023 | N/A | 1,500,118 |
See notes to financial statements.
10 l GGM l GUGGENHEIM CREDIT ALLOCATION FUND SEMIANNUAL REPORT
PORTFOLIO OF INVESTMENTS (Unaudited) | November 30, 2013 |
Principal Amount | Description | Rating* | Coupon | Maturity | Optional Call Provisions** | Value | |
Collateralized Loan Obligations continued | |||||||
$ 500,000 | Salus CLO Ltd. (Cayman Islands)(a) (b) (c) | NR | 7.002% | 03/05/2021 | N/A | $ 499,980 | |
400,000 | Turbn, Series 2013-1A, Class B | BBB | 6.375% | 12/15/2048 | N/A | 392,580 | |
3,136,914 | |||||||
Other ABS – 0.9% | |||||||
1,492,187 | Emerald Aviation Finance Ltd. (Cayman Islands)(a) | BBB | 6.350% | 10/15/2038 | 10/15/18 @ 100 | 1,503,611 | |
Total Asset Backed Securities – 4.8% | |||||||
(Cost $7,660,145) | 7,732,533 | ||||||
Term Loans – 59.9%(f) | |||||||
Aerospace & Defense – 5.9% | |||||||
900,000 | Camp Systems International, 2nd Lien(b) | CCC | 10.000% | 11/30/2019 | N/A | 919,971 | |
4,000,000 | Doncasters Group Limited, 2nd Lien(b) | CCC+ | 9.500% | 10/09/2020 | N/A | 4,020,000 | |
1,500,000 | Nana Development, 1st Lien(b) | B+ | 8.000% | 03/15/2018 | N/A | 1,522,500 | |
3,000,000 | Total Safety U.S., Inc., 2nd Lien(b) | CCC | 9.250% | 09/13/2020 | N/A | 3,060,000 | |
9,522,471 | |||||||
Automotive – 1.0% | |||||||
1,540,000 | Keystone Automotive, 1st Lien(b) | B | 7.000% | 08/15/2019 | N/A | 1,564,063 | |
Banking – 1.9% | |||||||
3,000,000 | Ranpak, 2nd Lien(b) | B– | 8.500% | 04/23/2020 | N/A | 3,090,000 | |
Building Materials – 2.2% | |||||||
EUR 1,320,423 | Ursa Insulation B.V.(b) (d) | B | 5.233% | 04/26/2021 | N/A | 1,793,931 | |
1,250,000 | Ursa Insulation B.V., Lien 1(b) (d) | B | 7.750% | 04/26/2020 | N/A | 1,698,254 | |
3,492,185 | |||||||
Chemicals – 1.6% | |||||||
$ 2,600,000 | Royal Adhesives and Sealants(b) | B | 5.500% | 07/31/2018 | N/A | 2,624,908 | |
Consumer Products – 0.8% | |||||||
592,477 | Targus Group International, Inc.(b) | B | 12.000% | 05/24/2016 | N/A | 512,492 | |
714,665 | Totes Isotoner Corp.(b) | B | 7.252% | 07/07/2017 | N/A | 719,132 | |
1,231,624 | |||||||
Diversified Manufacturing – 1.6% | |||||||
2,600,000 | Minimax Viking, Lien 1(b) | B | 4.500% | 08/07/2020 | N/A | 2,621,658 | |
Electric – 1.9% | |||||||
2,962,500 | Astoria Generating Co. Acquisitions(b) | B | 8.500% | 10/26/2017 | N/A | 3,051,390 | |
Energy-Alternate Sources – 1.9% | |||||||
3,000,000 | Panda Temple II Power, 1st Lien(b) | B | 7.250% | 04/03/2019 | N/A | 3,093,750 | |
Entertainment – 1.9% | |||||||
3,000,000 | Steinway Musical Instruments, 2nd Lien(b) | B– | 9.250% | 09/18/2020 | N/A | 3,082,500 | |
Environmental Control – 0.3% | |||||||
500,000 | Paradigm, Ltd., 2nd Lien(b) (d) | CCC+ | 10.500% | 07/30/2020 | N/A | 505,937 | |
Food & Beverage – 8.6% | |||||||
2,910,000 | Advance Pierre Foods, Inc., Lien 2(b) | CCC+ | 9.500% | 10/10/2017 | N/A | 2,890,590 | |
1,795,500 | Arctic Glacier Holdings, 1st Lien(b) | B– | 6.000% | 05/10/2019 | N/A | 1,797,744 | |
4,000,000 | CTI Foods Holding Co. LLC, 2nd Lien(b) | CCC+ | 8.250% | 06/28/2021 | N/A | 4,040,000 | |
100,000 | Del Monte Foods Co., Lien 1 | B+ | 4.250% | 01/26/2021 | N/A | 100,688 | |
1,100,000 | DS Waters of America, 1st Lien(b) | BB– | 5.250% | 08/30/2020 | N/A | 1,108,938 | |
4,000,000 | Reddy ICE Holdings, Inc., 2nd Lien(b) | CCC+ | 10.750% | 10/01/2019 | N/A | 3,960,000 | |
13,897,960 |
See notes to financial statements.
PORTFOLIO OF INVESTMENTS (Unaudited) | November 30, 2013 |
Principal Amount | Description | Rating* | Coupon | Maturity | Optional Call Provisions** | Value | |
Health Care – 1.3% | |||||||
$ 1,995,000 | Apria Healthcare, 1st Lien(b) | BB– | 6.750% | 04/06/2020 | N/A | $ 2,006,631 | |
Insurance – 0.7% | |||||||
1,100,000 | Cetera Financial Group, 1st Lien(b) | B+ | 6.500% | 08/07/2019 | N/A | 1,111,000 | |
Iron & Steel – 2.5% | |||||||
4,000,000 | Oxbow Carbon, 2nd Lien(b) | BB– | 8.000% | 01/18/2020 | N/A | 4,075,000 | |
Machinery-Construction & Mining – 1.6% | |||||||
2,500,000 | Mei Conlux Holdings, 1st Lien(b) | B | 5.000% | 08/21/2020 | N/A | 2,515,625 | |
Media – 1.5% | |||||||
1,682,761 | Endurance International Group, Lien 1(b) | B | 6.250% | 11/09/2019 | N/A | 1,694,330 | |
399,000 | Hemisphere Media Group Inc., 1st Lien(b) | B | 6.250% | 07/30/2020 | N/A | 401,745 | |
39,158 | Max Broadcast Group(b) (d) | B– | 6.250% | 02/28/2014 | N/A | 34,459 | |
398,307 | Max Broadcast Group LLC(b) (d) | B– | 6.250% | 02/28/2014 | N/A | 350,511 | |
2,481,045 | |||||||
Oil Field Services – 2.0% | |||||||
2,985,000 | Rice Energy, 2nd Lien(b) | CCC+ | 8.500% | 10/25/2018 | N/A | 3,052,162 | |
200,000 | Varel International Energy(b) | B | 9.250% | 07/17/2017 | N/A | 205,000 | |
3,257,162 | |||||||
Other Finance – 2.9% | |||||||
4,000,000 | Digital Insight, 2nd Lien(b) | CCC+ | 8.750% | 08/01/2020 | N/A | 4,033,320 | |
350,000 | Grosvenor Capital Management | BB– | 3.750% | 11/25/2020 | N/A | 350,000 | |
250,000 | Santander Asset Management, 1st Lien | BB | 4.250% | 11/26/2020 | N/A | 250,625 | |
4,633,945 | |||||||
Other Industrials – 1.3% | |||||||
2,000,000 | Mitchell International, Inc., 2nd Lien(b) | CCC | 8.500% | 10/11/2021 | N/A | 2,033,130 | |
Retail – 2.1% | |||||||
2,943,750 | Eddie Bauer Licensing Senior Secured Notes(b) (d) | B– | 9.500% | 06/28/2018 | N/A | 2,870,156 | |
500,000 | Hudson Bay Co., 2nd Lien(b) | B– | 8.250% | 11/04/2021 | N/A | 515,418 | |
3,385,574 | |||||||
Technology – 7.5% | |||||||
1,975,000 | Aspect Software, Inc.(b) | B | 7.000% | 05/07/2016 | N/A | 1,983,384 | |
2,000,000 | Greenway Medical Technology, 1st Lien(b) | B+ | 6.000% | 11/04/2020 | N/A | 2,000,000 | |
2,200,000 | Greenway Medical Technology, 2nd Lien(b) | CCC+ | 9.250% | 11/04/2021 | N/A | 2,211,000 | |
3,990,000 | Landesk Group, Inc., 1st Lien(b) | B+ | 5.250% | 08/07/2020 | N/A | 4,019,925 | |
1,900,000 | P2 Energy Solutions, 1st Lien(b) | B+ | 5.000% | 10/30/2020 | N/A | 1,913,062 | |
12,127,371 | |||||||
Transportation – 4.0% | |||||||
2,224,686 | Travelport Holdings, 2nd Lien, Tranche 1(b) | CCC+ | 9.500% | 01/31/2016 | N/A | 2,308,111 | |
3,990,000 | US Shipping Corp., Lien 1(b) | B | 9.000% | 04/30/2018 | N/A | 4,109,700 | |
6,417,811 |
See notes to financial statements.
PORTFOLIO OF INVESTMENTS (Unaudited) | November 30, 2013 |
Principal Amount | Description | Rating* | Coupon | Maturity | Optional Call Provisions** | Value | |
Wireless – 2.9% | |||||||
$ 1,595,980 | Alcatel Lucent, Lien 1(b) | B+ | 5.750% | 01/30/2019 | N/A | $ 1,612,873 | |
2,980,566 | Expert Global Solutions, Lien 1(b) | B– | 8.500% | 04/03/2018 | N/A | 3,036,452 | |
4,649,325 | |||||||
Total Term Loans – 59.9% | |||||||
(Cost $95,340,293) | 96,472,065 | ||||||
Total Long-Term Investments – 119.1% | |||||||
(Cost $189,826,075) | 191,800,532 | ||||||
Total Investments – 119.1% | |||||||
(Cost $189,826,075) | 191,800,532 | ||||||
Other Assets in excess of Liabilities – 7.8% | 12,600,851 | ||||||
Reverse Repurchase Agreements – (26.9%) | (43,409,480) | ||||||
Net Assets – 100.0% | $ 160,991,903 |
CDO – Collateralized Debt Obligation
CLO – Collateralized Loan Obligation
EUR – Euro
LLC – Limited Liability Company
LP – Limited Partnership
N/A – Not Applicable
| • | Ratings shown are per Standard & Poor’s Rating Group, Moody’s Investor Services, Inc. or Fitch Ratings. Securities classified as NR are not rated. (For securities not rated by Standard & Poor’s Rating Group, the rating by Moody’s Investor Services, Inc. is provided. Likewise, for securities not rated by Standard & Poor’s Rating Group and Moody’s Investor Services, Inc., the rating by Fitch Ratings is provided.) All ratings are unaudited. The ratings apply to the credit worthiness of the issuers of the underlying securities and not to the Fund or its shares. |
| ** | Date and price of the earliest optional call or put provision. There may be other call provisions at varying prices at later dates. All optional call provisions are unaudited. |
| (a) | Securities are exempt from registration under Rule 144A of the Securities Act of 1933. These securities may be resold in transactions exempt from registration, normally to qualified institutional buyers. At November 30, 2013, these securities amounted to $62,948,588, which represents 39.1% of net assets applicable. |
| (b) | All or a portion of these securities have been physically segregated in connection with reverse repurchase agreements and unfunded loan commitments. As of November 30, 2013, the total amount segregated was $123,751,416. |
| (c) | Floating or variable rate coupon. The rate shown is as of November 30, 2013. |
| (d) | Illiquid security. |
| (e) | Paid-in-kind toggle note. The issuer in each interest period has the option to pay interest in cash or to issue payment-in-kind shares of the note. |
| (f) | Term loans held by the Fund have a variable interest rate feature which is periodically adjusted based on an underlying interest rate benchmark. In addition, term loans may include mandatory and/or optional prepayment terms. As a result, the actual maturity dates of the loan may be different than the amounts disclosed in the portfolios of investments. Term loans may be considered restricted in that the Fund may be contractually obligated to secure approval from the Agent Bank and/or Borrower prior to the sale or disposition of loan. |
See notes to financial statements.
STATEMENT OF ASSETS AND LIABILITIES (Unaudited) | November 30, 2013 | |
Assets | |
Investments in securities, at value (cost $189,826,075) | $ 191,800,532 |
Foreign currency, at value (cost $82,910) | 82,901 |
Cash | 7,440,573 |
Receivable for securities sold | 7,136,903 |
Interest receivable | 3,348,948 |
Unrealized appreciation on unfunded commitments | 5,833 |
Other assets | 4,905 |
Total assets | 209,820,595 |
Liabilities | |
Reverse repurchase agreements | 43,409,480 |
Payable for securities purchased | 5,079,742 |
Advisory fee payable | 165,287 |
Interest due on borrowings | 18,570 |
Administrative fee payable | 4,541 |
Unrealized depreciation on forward foreign currency contracts | 169 |
Accrued expenses and other liabilities | 150,903 |
Total liabilities | 48,828,692 |
Net Assets | $ 160,991,903 |
Composition of Net Assets | |
Common stock, $.01 par value per share; unlimited number of shares authorized, | |
6,629,189 shares issued and outstanding | $ 662,919 |
Additional paid-in capital | 157,277,718 |
Accumulated undistributed net investment income | 948,719 |
Accumulated net realized loss on investments and foreign currency transactions | 124,366 |
Accumulated net unrealized appreciation on investments, foreign currency translations | |
and unfunded commitments | 1,978,181 |
Net Assets | $ 160,991,903 |
Net Asset Value (based on 6,629,189 shares outstanding) | $ 24.29 |
See notes to financial statements.
14 l GGM l GUGGENHEIM CREDIT ALLOCATION FUND SEMIANNUAL REPORT
STATEMENT OF OPERATIONS For the period June 26, 2013* through November 30, 2013 (Unaudited) | November 30, 2013 |
Investment Income | ||
Interest | $ 5,202,016 | |
Total income | $ 5,202,016 | |
Expenses | ||
Advisory fee | 753,920 | |
Interest expense | 69,996 | |
Fund accounting | 41,552 | |
Professional fees | 36,628 | |
Trustees’ fees and expenses | 28,655 | |
Administrative fee | 20,727 | |
Printing expenses | 20,170 | |
Custodian fee | 12,151 | |
NYSE listing fee | 9,664 | |
Transfer agent fee | 7,984 | |
Miscellaneous | 40,803 | |
Total expenses | 1,042,250 | |
Net investment income | 4,159,766 | |
Realized and Unrealized Gain (Loss) on Investments and Unfunded Commitments | ||
Net realized gain (loss) on: | ||
Investments | 278,065 | |
Foreign currency transactions | (153,699) | |
Net change in unrealized appreciation (depreciation) on: | ||
Investments | 1,974,457 | |
Foreign currency translations | (2,109) | |
Unfunded commitments | 5,833 | |
Net realized and unrealized gain (loss) on investments, foreign currency transactions | ||
and unfunded commitments | 2,102,547 | |
Net Increase in Net Assets Resulting from Operations | $ 6,262,313 |
| * | Commencement of investment operations. |
See notes to financial statements.
STATEMENT OF CHANGES IN NET ASSETS | November 30, 2013 | |
For the Period | |
June 26, 2013* through | |
November 30, 2013 | |
Increase in Net Assets from Operations | |
Net investment income | $ 4,159,766 |
Net realized gain on investments and foreign currency transactions | 124,366 |
Net change in unrealized appreciation on investments, foreign currency translations | |
and unfunded commitments | 1,978,181 |
Net increase in net assets resulting from operations | 6,262,313 |
Distributions to Common Shareholders | |
From net investment income | (3,211,047) |
Capital Share Transactions | |
Net proceeds from the issuance of common shares | 158,271,887 |
Common share offering costs charged to paid-in capital | (331,250) |
Net increase from capital share transactions | 157,940,637 |
Total increase in net assets | 160,991,903 |
Net Assets | |
Beginning of period | — |
End of period (including undistributed net investment income of $948,719) | $ 160,991,903 |
| * | Commencement of investment operations. |
See notes to financial statements.
STATEMENT OF CASH FLOWS For the period June 26, 2013* through November 30, 2013 (Unaudited) | November 30, 2013 |
Cash Flows from Operating Activities: | |
Net increase in net assets resulting from operations | $ 6,262,313 |
Adjustments to Reconcile Net Increase in Net Assets Resulting from Operations to | |
Net Cash Used by Operating and Investing Activities: | |
Net unrealized appreciation on investments | (1,974,457) |
Net unrealized appreciation on unfunded commitments | (5,833) |
Net unrealized depreciation on foreign currency translations | 2,109 |
Net realized gain on investments | (278,065) |
Paydowns received | (86,503) |
Net accretion of bond discount and amortization of bond premium | (106,144) |
Purchase of long-term investments | (228,090,991) |
Proceeds from sale of long-term investments | 38,319,537 |
Increase in interest receivable | (3,348,948) |
Increase in receivable for securities sold | (7,136,903) |
Increase in other assets | (4,905) |
Increase in payable for securities purchased | 5,079,742 |
Increase in advisory fee payable | 165,287 |
Increase in interest due on borrowings | 18,570 |
Increase in administration fee payable | 4,541 |
Increase in accrued expenses and other liabilities | 150,903 |
Net Cash Used by Operating and Investing Activities | (191,029,747) |
Cash Flows From Financing Activities: | |
Net proceeds from the issuance of common shares | 158,271,887 |
Distributions to common shareholders | (3,211,047) |
Increase in reverse repurchase agreements | 43,409,480 |
Net Cash Provided by Financing Activities | 198,470,320 |
Net increase in cash | 7,440,573 |
Cash at Beginning of Period | — |
Cash at End of Period | $ 7,440,573 |
Supplemental Disclosure of Cash Flow Information: Cash paid during the period for interest | $ 51,426 |
| * | Commencement of investment operations. |
See notes to financial statements.
FINANCIAL HIGHLIGHTS | November 30, 2013 |
| For the Period | ||||
| June 26, 2013* | ||||
| through | ||||
Per share operating performance | November 30, 2013 | |||
for a share outstanding throughout the period | (Unaudited) | |||
Net asset value, beginning of period | $ | 23.82 | ||
Income from investment operations | ||||
Net investment income (a) | 0.64 | |||
Net realized and unrealized gain on investments and unfunded commitments | 0.31 | |||
Total from investment operations | 0.95 | |||
Distributions to Shareholders | ||||
From net investment income | (0.48 | ) | ||
Net asset value, end of period | $ | 24.29 | ||
Market value, end of period | $ | 22.35 | ||
Total investment return (b) | ||||
Net asset value | 4.03 | % | ||
Market value | -8.70 | % | ||
Ratios and supplemental data | ||||
Net assets, end of period (thousands) | $ | 160,992 | ||
Ratios to Average Net Assets: | ||||
Total expenses, excluding interest expense | 1.45 | %(c) | ||
Total expenses, including interest expense | 1.55 | %(c) | ||
Net investment income, including interest expense | 6.18 | %(c) | ||
Portfolio turnover rate (d) | 29 | % | ||
Senior Indebtedness: | ||||
Total Borrowings outstanding (in thousands) | $ | 43,409 | ||
Asset Coverage per $1,000 of indebtedness(e) | $ | 4,709 | ||
| * | Commencement of investment operations. |
| (a) | Based on average shares outstanding during the period. |
| (b) | Total investment return is calculated assuming a purchase of a share at the beginning of the period and a sale on the last day of the period reported either at net asset value (“NAV”) or market price per share. Dividends and distributions are assumed to be reinvested at NAV for NAV returns or the prices obtained under the Fund’s Dividend Reinvestment Plan for market value returns. Total investment return does not reflect brokerage commissions. A return calculated for a period of less than one year is not annualized. |
| (c) | Annualized. |
| (d) | Portfolio turnover is not annualized for periods of less than one year. |
| (e) | Calculated by subtracting the Fund’s total liabilities (not including borrowings) from the Fund’s total assets and dividing by the total borrowings. |
See notes to financial statements.
NOTES TO FINANCIAL STATEMENTS (Unaudited) | November 30, 2013 |
Note 1 – Organization:
Guggenheim Credit Allocation Fund (the “Fund”) was organized as a Delaware statutory trust on June 7, 2012, and commenced investment operations on June 26, 2013. The Fund is registered as a diversified, closed-end management investment company under the Investment Company Act of 1940, as amended (“1940 Act”).
The Fund’s investment objective is to seek total return through a combination of current income and capital appreciation.
Note 2 – Accounting Policies:
The preparation of the financial statements in accordance with U.S. generally accepted accounting principles (“GAAP”) requires management to make estimates and assumptions that affect the reported amounts and disclosures in the financial statements. Actual results could differ from these estimates.
The following is a summary of significant accounting policies consistently followed by the Fund.
(a) Valuation of Investments
The Fund values equity securities at the last reported sale price on the principal exchange or in the principal over-the-counter (“OTC”) market in which such securities are traded, as of the close of regular trading on the New York Stock Exchange (“NYSE”) on the day the securities are being valued or, if there are no sales, at the mean between the last available bid and asked prices on that day. Securities traded on NASDAQ are valued at the NASDAQ Official Closing Price. The Fund values debt securities (including corporate bonds, asset- backed securities, collateralized mortgage obligations and term loans) at the last available bid price for such securities or, if such prices are not available, at prices for securities of comparable maturity, quality, and type. The Fund’s securities that are traded primarily in foreign markets may be traded in such markets on days that the NYSE is closed. As a result, the net asset value of the Fund may be significantly affected on days when holders of common shares have no ability to trade the common shares on the NYSE. Short-term securities with remaining maturities of 60 days or less are valued at amortized cost, which approximates fair value.
For those securities where quotations or prices are not available, the valuations are determined in accordance with procedures established in good faith by management and approved by the Board of Trustees (“Trustees”). A valuation committee consisting of representatives from investment management, fund administration, legal and compliance is responsible for the oversight of the valuation process of the Fund and convenes monthly, or more frequently as needed. The valuation committee reviews monthly Level 3 fair valued securities methodology, price overrides, broker quoted securities, price source changes, illiquid securities, unchanged valuations, halted securities, price challenges, fair valued securities sold and back testing trade prices in relation to prior day closing prices. On a quarterly basis, the valuations and methodologies of all Level 3 fair valued securities are presented to the Fund’s Trustees.
Valuations in accordance with these procedures are intended to reflect each security’s (or asset’s) “fair value.” Fair value is defined as the price that the Fund would receive to sell an investment or pay to transfer a liability in an orderly transaction with an independent buyer in the principal market, or in the absence of a principal market, the most advantageous market for the investment or liability. Each such determination is based on a consideration of all relevant factors, which are likely to vary from one pricing context to another. Examples of such factors may include, but are not limited to: (i) the type of security, (ii) the initial cost of the security, (iii) the existence of any contractual restrictions on the security’s disposition, (iv) the price and extent of public trading in similar securities of the issuer or of comparable companies, (v) quotations or evaluated prices from broker-dealers and/or pricing services, (vi) information obtained from the issuer, analysts, and/or the appropriate stock exchange (for exchange traded securities), (vii) an analysis of the company’s financial statements, and (viii) an evaluation of the forces that influence the issuer and the market(s) in which the security is purchased and sold (e.g. the existence of pending merger activity, public offerings or tender offers that might affect the value of the security).
For fixed income securities, fair valuations may include input from Guggenheim Partners Investment Management, LLC (“GPIM”) utilizing a wide variety of market data including yields or prices of investments of comparable quality, type of issue, coupon, maturity, rating, indications of value from security dealers, evaluations of anticipated cash flows or collateral, spread over Treasuries, and other information and analysis. GPIM also uses third party service providers to model certain securities using cash flow models to represent a fair market value.
There are three different categories for valuation. Level 1 valuations are those based upon quoted prices in active markets. Level 2 valuations are those based upon quoted prices in inactive markets or based upon significant observable inputs (e.g. yield curves; benchmark interest rates; indices). Level 3 valuations are those based upon unobservable inputs (e.g. discounted cash flow analysis; non-market based methods used to determine fair valuations).
The Fund values Level 1 securities using readily available market quotations in active markets. The Fund values Level 2 fixed income securities using independent pricing providers who employ matrix pricing models utilizing market prices, broker quotes and prices of securities with comparable maturities and qualities. In addition, the Fund values certain Level 2 fixed income securities using broker quotes. The Fund values Level 2 equity securities using various observable market inputs as described above. The fair value estimates for the Level 3 securities in the Fund are determined in accordance with the Fund’s valuation procedures described above.
Transfers between valuation levels, if any, are in comparison to the valuation levels at the end of the previous fiscal year, and are effective using the fair value as of the end of the current fiscal period.
NOTES TO FINANCIAL STATEMENTS (Unaudited) continued | November 30, 2013 |
The following table represents the Fund’s investments carried on the Statement of Assets and Liabilities by caption and by level within the fair value hierarchy at November 30, 2013.
Description | Level 1 | Level 2 | Level 3 | Total |
Valuations (in $000s) | ||||
Assets: | ||||
Corporate Bonds | $ – | $ 87,596 | $ – | $ 87,596 |
Asset Backed Securities | – | 7,733 | – | 7,733 |
Term Loans | – | 96,472 | – | 96,472 |
Unfunded Commitments | – | 6 | – | 6 |
Total Assets | $ – | $ 191,807 | $ – | $ 191,807 |
There were no transfers between valuation levels as of the report date when compared to the valuation levels at inception.
(b) Investment Transactions and Investment Income
Investment transactions are accounted for on the trade date. Realized gains and losses on investments are determined on the identified cost basis. Paydown gains and losses on mortgage and asset-backed securities are treated as an adjustment to interest income. For the period ended November 30, 2013, the Fund recognized an increase of interest income and a decrease of net realized gain of $86,503. This reclassification is reflected on the Statement of Operations and had no effect on the net asset value of the Fund. Dividend income is recorded net of applicable withholding taxes on the ex-dividend date and interest income is recorded on an accrual basis. Discounts on debt securities purchased are accreted to interest income over the lives of the respective securities using the effective interest method. Premiums on debt securities purchased are amortized to interest income up to the next call date of the respective securities using the effective interest method.
(c) Currency Translation
Assets and liabilities denominated in foreign currencies are translated into U.S. dollars at the mean of the bid and asked price of respective exchange rates on the last day of the period. Purchases and sales of investments denominated in foreign currencies are translated at the exchange rate on the bid and asked price of respective exchange rates on the date of the transaction.
The Fund does not isolate that portion of the results of operations resulting from changes in foreign exchange rates on investments from the fluctuations arising from changes in market prices of securities held. Such fluctuations are included with the net realized and unrealized gain or loss from investments.
Foreign exchange realized gain or loss resulting from holding of a foreign currency, expiration of a currency exchange contract, difference in exchange rates between the trade date and settlement date of an investment purchased or sold, and the difference between dividends or interest actually received compared to the amount shown in the Fund’s accounting records on the date of receipt is shown as net realized gains or losses on foreign currency transactions on the Fund’s Statement of Operations.
Foreign exchange unrealized gain or loss on assets and liabilities, other than investments, is shown as unrealized appreciation (depreciation) on foreign currency translation on the Fund’s Statement of Operations.
(d) Forward Exchange Currency Contracts
The Fund entered into forward exchange currency contracts in order to hedge its exposure to changes in foreign currency exchange rates on its foreign portfolio holdings, to hedge certain firm purchases and sales commitments denominated in foreign currencies and for investment purposes. Forward exchange currency contracts are agreements between two parties to buy and sell currencies at a set price on a future date. Fluctuations in the value of open forward exchange currency contracts are recorded for financial reporting purposes as unrealized appreciation and depreciation by the Fund until the contracts are closed. When the contracts are closed, realized gains and losses are recorded, and included on the Statement of Operations.
Forward exchange currency contracts involve elements of both market and credit risk in excess of the amounts reflected on the Statement of Assets and Liabilities.
(e) Distributions to Shareholders
The Fund declares and pays monthly distributions to common shareholders. These distributions consist of investment company taxable income, which generally includes qualified dividend income, ordinary income and short-term capital gains. To the extent distributions exceed net investment income, the excess will be deemed a return of capital. Any net realized long-term capital gains are distributed annually to common shareholders.
Distributions to shareholders are recorded on the ex-dividend date. The amount and timing of distributions are determined in accordance with federal income tax regulations, which may differ from GAAP.
Note 3 – Investment Advisory Agreement, Sub-Advisory Agreement and Other Agreements:
Pursuant to an Investment Advisory Agreement (the “Agreement”) between the Fund and Guggenheim Funds Investment Advisors, LLC (“GFIA” or the “Adviser”), the Adviser furnishes offices, necessary facilities and equipment, provides administrative services, oversees the activities of GPIM, provides personnel including certain officers required for the Fund’s administrative management and compensates the officers or trustees of the Fund who are affiliates of the Adviser. As compensation for these services, the Fund pays the Adviser a fee, payable monthly, in an amount equal to 1.00% of the Fund’s average daily managed assets.
Pursuant to a Sub-Advisory Agreement among the Fund, the Adviser and GPIM, GPIM under the supervision of the Fund’s Board of Trustees and the Adviser, provides a continuous investment program for the Fund’s portfolio, provides investment research, makes and executes recommendations for the purchase and sale of securities and provides certain facilities and personnel, including certain officers required for its administrative management and pays the compensation of all officers and trustees of the Fund who are GPIM’s affiliates. As compensation for its
20 l GGM l GUGGENHEIM CREDIT ALLOCATION FUND SEMIANNUAL REPORT
NOTES TO FINANCIAL STATEMENTS (Unaudited) continued | November 30, 2013 |
services, the Adviser pays GPIM a fee, payable monthly, in an annual amount equal to 0.50% of the Fund’s average daily managed assets.
Certain officers and trustees of the Fund may also be officers, directors and/or employees of the Adviser or GPIM. The Fund does not compensate its officers or trustees who are officers, directors and/or employees of the aforementioned firms.
Pursuant to a Fund Administration agreement, Rydex Fund Services, LLC (“RFS”) serves as administrator to the Fund. RFS, GPIM and GFIA are affiliates of Guggenheim Partners, LLC, a global diversified financial services firm. RFS receives a fund administration fee payable monthly at the annual rate set forth below as a percentage of the average daily managed assets of the Fund.
Managed Assets | Rate |
First $200,000,000 | 0.0275% |
Next $300,000,000 | 0.0200% |
Next $500,000,000 | 0.0150% |
Over $1,000,000,000 | 0.0100% |
For purposes of calculating the fees payable under the foregoing agreements, “average daily managed assets” means the average daily value of the Fund’s total assets minus the sum of its accrued liabilities. “Total assets” means all of the Fund’s assets and is not limited to its investment securities. “Accrued liabilities” means all of the Fund’s liabilities other than borrowings for investment purposes.
The Bank of New York Mellon (“BNY”) acts as the Fund’s custodian. As custodian, BNY is responsible for the custody of the Fund’s assets.
RFS acts as the Fund’s accounting agent. As accounting agent, RFS is responsible for maintaining the books and records of the Fund’s securities and cash. RFS receives a fund accounting fee payable monthly at the annual rate set forth below as a percentage of the average daily managed assets of the Fund.
Managed Assets | Rate |
First $200,000,000 | 0.0300% |
Next $300,000,000 | 0.0150% |
Next $500,000,000 | 0.0100% |
Over $1,000,000,000 | 0.0075% |
Note 4 – Federal Income Taxes:
The Fund intends to comply with the requirements of Subchapter M of the Internal Revenue Code of 1986, as amended, applicable to regulated investment companies. Accordingly, no provision for U.S. federal income taxes is required.
Information on the components of investments and net assets as of November 30, 2013, is as follows:
Net Tax | ||||
Cost of | Net Tax | Unrealized | ||
Investments | Gross Tax | Gross Tax | Unrealized | Depreciation on |
for Tax | Unrealized | Unrealized | Appreciation on | Derivatives and |
Purposes | Appreciation | Depreciation | Investments | Foreign Currency |
$189,826,075 | $3,376,206 | $(1,401,749) | $1,974,457 | $(2,109) |
The net tax unrealized appreciation on unfunded commitments is $5,388.
Note 5 – Investments in Securities:
During the period ended November 30, 2013, the cost of purchases and proceeds from sales of investments, excluding short-term investments were $228,090,991 and $38,319,537, respectively.
Note 6 – Derivatives:
(a) Forward Exchange Currency Contracts
A forward exchange currency contract is a commitment to purchase or sell a foreign currency on a future date at a negotiated forward rate. The gain or loss arising from the difference between the original contracts and the closing of such contracts would be included in net realized gain or loss on foreign currency transactions. Risk may arise from the potential inability of a counterparty to meet the terms of a contract and from unanticipated movements in the value of a foreign currency relative to the U.S. dollar. The face or contract amount, in U.S. dollars, reflects the total exposure the Fund has in that particular currency contract.
At November 30, 2013, the following forward exchange currency contracts were outstanding:
| Contracts to Sell | Counterparty | Settlement Date | Settlement Value | Value at 11/30/13 | Net Unrealized Depreciation | |
EUR | 2,600,000 | |||||
for USD | 3,533,400 | The Bank of New York Mellon | 1/03/2014 | $3,533,400 | $3,533,569 | $ (169) |
Total unrealized depreciation for forward exchange currency contracts | $ (169) | |||||
NOTES TO FINANCIAL STATEMENTS (Unaudited) continued | November 30, 2013 |
(d) Summary of Derivatives Information
The Fund is required by GAAP to disclose: a) how and why a fund uses derivative instruments, b) how derivative instruments and related hedge fund items are accounted for, and c) how derivative instruments and related hedge items affect a fund’s financial position, results of operations and cash flows.
The following table presents the types of derivatives in the Fund by location as presented on the Statement of Assets Liabilities at November 30, 2013.
Statement of Assets and Liabilities Presentation of Fair Values of Derivative Instruments ($000s): | ||||||
Asset Derivatives | Liability Derivatives | |||||
| Statement of Assets | Statement of Assets | |||||
Primary Risk Exposure | and Liabilities Location | Fair Value | and Liabilities Location | Fair Value | ||
Unrealized appreciation on | Unrealized depreciation on | |||||
forward exchange currency | forward exchange currency | |||||
Currency risk | contracts | $ – | contracts | $169 | ||
The following table presents the effect of derivatives instruments on the Statement of Operations for the period ended November 30, 2013.
| Effect of Derivative Instruments on the Statement of Operations: | |
| Amount of Realized Gain (Loss) on Derivatives (value in $000s) | |
Primary Risk Exposure | Foreign Currency Transactions |
Currency risk | $(163) |
Change in Unrealized Appreciation (Depreciation) on Derivatives (value in $000s) | |
Primary Risk Exposure | Foreign Currency Translations |
Currency risk | $(–)* |
| * | Less than the minimum amount disclosed |
Derivative Volume | |
Forward Exchange Currency Contracts: | |
Average Settlement Value Purchased | $ – |
Average Settlement Value Sold | 2,398,394 |
Ending Settlement Value Purchased | – |
Ending Settlement Value Sold | 3,533,400 |
Note 7 – Leverage:
Reverse Repurchase Agreements
The Fund may enter into reverse repurchase agreements as part of its financial leverage strategy. Under a reverse repurchase agreement, the Fund temporarily transfers possession of a portfolio instrument to another party, such as a bank or broker-dealer, in return for cash. At the same time, the Fund agrees to repurchase the instrument at an agreed upon time and price, which reflects an interest payment. Such agreements have the economic effect of borrowings. The Fund may enter into such agreements when it is able to invest the cash acquired at a rate higher than the cost of the agreement, which would increase earned income. When the Fund enters into a reverse repurchase agreement, any fluctuations in the market value of either the instruments transferred to another party or the instruments in which the proceeds may be invested would affect the market value of the Fund’s assets. As a result, such transactions may increase fluctuations in the market value of the Fund’s assets. For the period ended November 30, 2013, the average daily balance for which reverse repurchase agreements were outstanding amounted to $32,306,948. The weighted average interest rate was 0.86%. At November 30, 2013, there was $43,409,480 in reverse repurchase agreements outstanding.
At November 30, 2013, the Fund had outstanding reverse repurchase agreements with various counterparties. Details of the reverse repurchase agreements by counterparty are as follows:
| Counterparty | Range of Interest Rates | Range of Maturity Dates | Face Value |
Barclays Capital, Inc. | 0.82% - 0.99% | 12/03/13 – 02/03/14 | 30,717,127 |
Citigroup, Inc. | 0.85% - 1.00% | 12/02/13 | 6,411,000 |
Credit Suisse Securities LLC | 0.67% - 0.92% | 12/04/13 - 12/23/13 | 6,281,353 |
| $43,409,480 |
Note 8 – Loan Commitments
Pursuant to the terms of certain Term Loan agreements, the Fund held unfunded loan commitments as of November 30, 2013. The Fund is obligated to fund these loan commitments at the borrower’s discretion. The Fund reserves against such contingent obligations by designating cash, liquid securities, and liquid term loans as a reserve. As of November 30, 2013, the total amount segregated in connection with reverse repurchase agreements and unfunded commitments was $123,751,416. The unrealized appreciation on these commitments of $5,833 as of November 30, 2013 is reported as “Unrealized appreciation on unfunded commitments” on the Statement of Assets and Liabilities.
At November 30, 2013, the Fund had the following unfunded loan commitments which could be extended at the option of the borrower:
| Borrower | Expiration Date | Principal Amount | Unrealized Appreciation |
American Stock Transfer | 06/11/2018 | $ 400,000 | $ 2,823 |
Darling International | 04/01/2014 | 1,100,000 | – |
| Digital Insight | 08/01/2018 | 350,000 | 3,010 |
National Financial Partners | 07/01/2018 | 1,500,000 | – |
| $5,833 |
Note 9 – Capital:
In connection with its organization process, the Fund sold 4,189 shares of beneficial interest to Guggenheim Funds Distributors, LLC, an affiliate of the Adviser, for consideration of $100,012 at a price of $23.88 per share. The Fund has an unlimited amount of common shares, $0.01 par value, authorized and 6,629,189 issued and outstanding. Of this amount, the
NOTES TO FINANCIAL STATEMENTS (Unaudited) continued | November 30, 2013 |
Fund issued 6,000,000 shares of common stock in its initial public offering. These shares were issued at $23.88 per share after deducting the sales load but before underwriters’ expense reimbursement.
In connection with the initial public offering of the Fund’s common shares, the underwriters were granted an option to purchase additionalcommon shares. The underwriters purchased, at a price of $23.88 per common share (after deducting the sales load but before offering expenses incurred by the Fund), 625,000 common shares of the Fund pursuant to the over-allotment option.
Offering costs, estimated at $331,250 or $0.05 per share, in connection with the issuance of common shares have been borne by the Fund and were charged to paid-in capital. The Adviser and GPIM have agreed to pay offering expenses (other than sales load, but including reimbursement of expenses to the underwriters) in excess of $0.05 per common share.
Common Shares
The Fund has an unlimited amount of common shares, $0.01 par value, authorized and 6,629,189 issued and outstanding.
Transactions in common shares were as follows:
Period Ended | |
November 30, 2013 | |
Beginning shares | – |
Common shares issued through organization process | 4,189 |
Common shares issued through underwritten offering | 6,000,000 |
Common shares issued through over-allotment option | 625,000 |
Ending shares | 6,629,189 |
Note 10 – Indemnifications:
In the normal course of business, the Fund enters into contracts that contain a variety of representations, which provide general indemnifications. The Fund’s maximum exposure under these arrangements is unknown, as this would require future claims that may be made against the Fund that have not yet occurred. However, the Fund expects the risk of loss to be remote.
Note 11 – Subsequent Event:
The Fund evaluated subsequent events through the date the financial statements were available for issue and determined there were no additional material events that would require disclosure in the Fund’s financial statements, except as noted below.
On December 2, 2013, the Fund declared a monthly dividend to common shareholders of $0.16146 per common share. The dividend was payable on December 31, 2013, to shareholders of record on December 12, 2013.
On January 2, 2014, the Fund declared a monthly dividend to common shareholders of $0.16146 per common share. The dividend is payable on January 31, 2014, to shareholders of record on January 15, 2014.
GGM l GUGGENHEIM CREDIT ALLOCATION FUND SEMIANNUAL REPORT l 23
SUPPLEMENTAL INFORMATION (Unaudited) | November 30, 2013 |
Federal Income Tax Information
In January 2014, you will be advised on IRS Form 1099 DIV or substitute 1099 DIV as to the federal tax status of the distributions received by you in the calendar year 2013.
Trustees
The Trustees of the Guggenheim Credit Allocation Fund and their principal occupations during the past five years:
Number of | ||||
| Name, Address*, | Portfolios in | |||
Year of Birth | Term of Office** | the Fund | Other | |
and Position(s) | and Length | Complex*** | Directorships | |
Held with | of Time | Principal Occupations during the Past Five Years and | Overseen by | Held by |
Registrant | Served | Other Affiliations | Trustee | Trustee |
Independent Trustees: | ||||
Randall C. Barnes | Since 2013 | Private Investor (2001-present). Formerly, Senior Vice President and | 52 | None |
Year of Birth: 1951 | Treasurer, PepsiCo., Inc. (1993-1997), President, Pizza Hut International | |||
Trustee | (1991-1993) and Senior Vice President, Strategic Planning and New | |||
Business Development of PepsiCo., Inc. (1987-1990). | ||||
Roman Friedrich III | Since 2013 | Founder and President of Roman Friedrich & Company, a US and | 48 | Director of Mercator Minerals |
Year of Birth: 1946 | Canadian-based business, which provides investment banking to the | Ltd. (September 2013-present), | ||
Trustee | mining industry (1998-present). Formerly, Senior Managing | First Americas Gold Corp. | ||
Director of MLV & Co., LLC, an investment bank and institutional | (2012-present) and Zincore Metals, | |||
broker-dealer specializing in capital intensive industries such as energy, | Inc. (2009 – present). Previously, | |||
metals and mining (2010-2011). | Director of Blue Sky Uranium Corp. | |||
(formerly, Windstorm Resources | ||||
Inc.) (2011– 2012); Axiom Gold and | ||||
Silver Corp. (2011-2012); Stratagold | ||||
Corp. (2003-2009); Gateway Gold | ||||
Corp. (2004-2008) and GFM | ||||
Resources Ltd. (2005-2010). | ||||
Robert B. Karn III | Since 2013 | Consultant (1998-present). Formerly, Arthur Andersen (1965-1997) and | 48 | Director of Peabody Energy |
Year of Birth: 1942 | Managing Partner, Financial and Economic Consulting, St. Louis | Company (2003-present), GP | ||
Trustee | office (1987-1997). | Natural Resource Partners LLC | ||
(2002-present). | ||||
Ronald A. Nyberg | Since 2013 | Partner of Nyberg & Cassioppi, LLC, a law firm specializing in corporate | 54 | None |
Year of Birth: 1953 | law, estate planning and business transactions (2000-present). Formerly, | |||
Trustee | Executive Vice President, General Counsel and Corporate Secretary of | |||
Van Kampen Investments (1982-1999). | ||||
Ronald E. Toupin, Jr. | Since 2013 | Portfolio Consultant (2010-present). Formerly, Vice President, Manager | 51 | Previously, Trustee, Bennett Group |
Year of Birth: 1958 | and Portfolio Manager of Nuveen Asset Management (1998-1999), Vice | of Funds (2011-September 2013). | ||
Trustee | President of Nuveen Investment Advisory Corp. (1992-1999), Vice President | |||
and Manager of Nuveen Unit Investment Trusts (1991-1999), and Assistant | ||||
Vice President and Portfolio Manager of Nuveen Unit Investment Trusts | ||||
(1988-1999), each of John Nuveen & Co., Inc. (1982-1999). | ||||
Interested Trustee: | ||||
Donald C. Cacciapaglia† | Since 2013 | Senior Managing Director of Guggenheim Investments (2010-present); | 212 | Trustee, Rydex Dynamic Funds, |
Year of Birth: 1951 | Chief Executive Officer of Guggenheim Funds Services, LLC (2012- | Rydex ETF Trust, Rydex Series Funds | ||
Trustee, | present); Chief Executive Officer (2012-present) and President (2010- | and Rydex Variable Trust | ||
Chief Executive Officer | present), Guggenheim Funds Distributors, LLC and Guggenheim Funds | (2012-present); Independent Board | ||
Investment Advisors, LLC; Chief Executive Officer of certain funds of the | Member, Equitrust Life Insurance | |||
Fund Complex (2012-present); President and Director of SBL Fund, | Company, Guggenheim Life and | |||
Security Equity Fund, Security Income Fund, Security Large Cap Value | Annuity Company, and Paragon Life | |||
Fund, and Security Mid Cap Growth Fund (2012-present); President, CEO | Insurance Company of Indiana | |||
and Trustee of Rydex Dynamic Funds, Rydex ETF Trust, Rydex Series Funds | (2011-present). | |||
and Rydex Variable Trust (2012-present). Formerly, Chairman and CEO of | ||||
Channel Capital Group Inc. and Channel Capital Group LLC (2002-2010). | ||||
24 l GGM l GUGGENHEIM CREDIT ALLOCATION FUND SEMIANNUAL REPORT
SUPPLEMENTAL INFORMATION (Unaudited) continued | November 30, 2013 |
| * | Address for all Trustees: 2455 Corporate West Drive, Lisle, IL 60532 |
| ** | This is the period for which the Trustee began serving the Fund. After a Trustee’s initial term, each Trustee is expected to serve a three year term concurrent with the class of Trustees for which he serves: |
-Messrs. Barnes and Cacciapaglia are Class I Trustees. Class I Trustees are expected to stand for re-election at the Fund’s annual meeting of shareholders for fiscal year ending May 31, 2014.
-Messrs. Friedrich and Nyberg are Class II Trustees. Class II Trustees are expected to stand for re-election at the Fund’s annual meeting of shareholders for fiscal year ending May 31, 2015.
-Messrs. Karn and Toupin are Class III Trustees. Class III Trustees are expected to stand for re-election at the Fund’s annual meeting of shareholders for fiscal year ending May 31, 2016.
| *** | As of period end. The Guggenheim Investments Fund Complex consists of U.S. registered investment companies advised or serviced by Guggenheim Funds Investment Advisors, LLC or Guggenheim Funds Distributors, LLC and/or its affiliates. The Guggenheim Investments Fund Complex is overseen by multiple Boards of Trustees. |
| † | Mr. Donald C. Cacciapaglia is an “interested person” (as defined in section 2(a)(19) of the 1940 Act) (“Interested Trustee”) of the Fund because of his position as the President and CEO of the Adviser. |
Principal Executive Officers
The executive officers of the Guggenheim Credit Allocation Fund who are not trustees and their principal occupations during the past five years:
| Name, Address*, | Term of Office** | |
| Year of Birth and | and Length | |
| Position(s) Held | of Time | Principal Occupations During the Past Five Years and |
with Registrant | Served | Other Affiliations |
Officers: | ||
Amy J. Lee | Since 2013 | Managing Director, Guggenheim Investments (2012-present); Senior Vice President & Secretary, Security Investors, LLC |
Year of Birth: 1961 | (2010-present); Secretary & Chief Compliance Officer, Security Distributors, Inc. (1987-2012); Vice President, Associate | |
Chief Legal Officer | General Counsel & Assistant Secretary, Security Benefit Life Insurance Company and Security Benefit Corporation (1987- | |
2012); Vice President & Secretary, Rydex Series Funds, Rydex ETF Trust, Rydex Dynamic Funds, and Rydex Variable Trust | ||
(2008-present). Officer of certain funds in the Fund Complex (2012-present). | ||
John L. Sullivan | Since 2013 | Senior Managing Director – Fund Administration, Guggenheim Investments (2010-present). Chief Financial Officer, |
Year of Birth: 1955 | Chief Accounting Officer and Treasurer of certain funds in the Fund Complex. Formerly, Chief Compliance Officer, | |
Chief Accounting | Van Kampen Funds (2004-2010). Head of Fund Accounting, Morgan Stanley Investment Management (2002-2004). Chief | |
Officer, Chief Financial | Financial Officer, Treasurer, Van Kampen Funds (1996-2004). | |
Officer and Treasurer | ||
Joanna M. Catalucci | Since 2013 | Managing Director of Compliance and Fund Board Relations, Guggenheim Investments (2012-present). Formerly, Chief |
Year of birth: 1966 | Compliance Officer & Secretary, SBL Fund; Security Equity Fund; Security Income Fund; Security Large Cap Value Fund | |
Chief Compliance Officer | & Security Mid Cap Growth Fund; Vice President, Rydex Holdings, LLC; Vice President, Security Benefit Asset | |
Management Holdings, LLC; and Senior Vice President & Chief Compliance Officer, Security Investors, LLC (2010-2012); | ||
Security Global Investors, LLC, Senior Vice President (2010-2011); Rydex Advisors, LLC (f/k/a PADCO Advisors, Inc.) and | ||
Rydex Advisors II, LLC (f/k/a PADCO Advisors II, Inc.), Chief Compliance Officer and Senior Vice President (2010-2011); | ||
Rydex Capital Partners I, LLC & Rydex Capital Partners II, LLC, Chief Compliance Officer (2006-2007); and Rydex Fund | ||
Services, LLC (f/k/a Rydex Fund Services, Inc.), Vice President (2001-2006). Chief Compliance Officer of certain funds in | ||
the Fund Complex. | ||
Mark E. Mathiasen | Since 2013 | Director; Associate General Counsel of Guggenheim Funds Services, LLC (2007-present). Secretary of certain funds |
Year of Birth: 1978 | in the Fund Complex. | |
Secretary | ||
| * | Address for all Officers: 2455 Corporate West Drive, Lisle, IL 60532. |
| ** | Officers serve at the pleasure of the Board of Trustees and until his or her successor is appointed and qualified or until his or her earlier resignation or removal. |
GGM l GUGGENHEIM CREDIT ALLOCATION FUND SEMIANNUAL REPORT l 25
DIVIDEND REINVESTMENT PLAN (Unaudited) | November 30, 2013 |
Unless the registered owner of common shares elects to receive cash by contacting Computershare Shareowner Services LLC (the “Plan Administrator”), all dividends declared on common shares of the Fund will be automatically reinvested by the Plan Administrator, Administrator for shareholders in the Fund’s Dividend Reinvestment Plan (the “Plan”), in additional common shares of the Fund. Participation in the Plan is completely voluntary and may be terminated or resumed at any time without penalty by notice if received and processed by the Plan Administrator prior to the dividend record date; otherwise such termination or resumption will be effective with respect to any subsequently declared dividend or other distribution. Some brokers may automatically elect to receive cash on your behalf and may re-invest that cash in additional common shares of the Fund for you. If you wish for all dividends declared on your common shares of the Fund to be automatically reinvested pursuant to the Plan, please contact your broker.
The Plan Administrator will open an account for each common shareholder under the Plan in the same name in which such common shareholder’s common shares are registered. Whenever the Fund declares a dividend or other distribution (together, a “Dividend”) payable in cash, non-participants in the Plan will receive cash and participants in the Plan will receive the equivalent in common shares. The common shares will be acquired by the Plan Administrator for the participants’ accounts, depending upon the circumstances described below, either (i) through receipt of additional unissued but authorized common shares from the Fund (“Newly Issued Common Shares”) or (ii) by purchase of outstanding common shares on the open market (“Open-Market Purchases”) on the New York Stock Exchange or elsewhere. If, on the payment date for any Dividend, the closing market price plus estimated brokerage commission per common share is equal to or greater than the net asset value per common share, the Plan Administrator will invest the Dividend amount in Newly Issued Common Shares on behalf of the participants. The number of Newly Issued Common Shares to be credited to each participant’s account will be determined by dividing the dollar amount of the Dividend by the net asset value per common share on the payment date; provided that, if the net asset value is less than or equal to 95% of the closing market value on the payment date, the dollar amount of the Dividend will be divided by 95% of the closing market price per common share on the payment date. If, on the payment date for any Dividend, the net asset value per common share is greater than the closing market value plus estimated brokerage commission, the Plan Administrator will invest the Dividend amount in common shares acquired on behalf of the participants in Open-Market Purchases.
If, before the Plan Administrator has completed its Open-Market Purchases, the market price per common share exceeds the net asset value per common share, the average per common share purchase price paid by the Plan Administrator may exceed the net asset value of the common shares, resulting in the acquisition of fewer common shares than if the Dividend had been paid in Newly Issued Common Shares on the Dividend payment date. Because of the foregoing difficulty with respect to Open-Market Purchases, the Plan provides that if the Plan Administrator is unable to invest the full Dividend amount in Open-Market Purchases during the purchase period or if the market discount shifts to a market premium during the purchase period, the Plan Administrator may cease making Open-Market Purchases and may invest the uninvested portion of the Dividend amount in Newly Issued Common Shares at net asset value per common share at the close of business on the Last Purchase Date provided that, if the net asset value is less than or equal to 95% of the then current market price per common share; the dollar amount of the Dividend will be divided by 95% of the market price on the payment date.
The Plan Administrator maintains all shareholders’ accounts in the Plan and furnishes written confirmation of all transactions in the accounts, including information needed by shareholders for tax records. Common shares in the account of each Plan participant will be held by the Plan Administrator on behalf of the Plan participant, and each shareholder proxy will include those shares purchased or received pursuant to the Plan. The Plan Administrator will forward all proxy solicitation materials to participants and vote proxies for shares held under the Plan in accordance with the instruction of the participants.
There will be no brokerage charges with respect to common shares issued directly by the Fund. However, each participant will pay a pro rata share of brokerage commission incurred in connection with Open-Market Purchases. The automatic reinvestment of Dividends will not relieve participants of any Federal, state or local income tax that may be payable (or required to be withheld) on such Dividends.
The Fund reserves the right to amend or terminate the Plan. There is no direct service charge to participants with regard to purchases in the Plan; however, the Fund reserves the right to amend the Plan to include a service charge payable by the participants.
All correspondence or questions concerning the Plan should be directed to the Plan Administrator, Computershare Shareowner Services LLC, P.O. Box 30170 College Station, TX 77842-3170; Attention: Shareholder Services Department, Phone Number: (866) 488-3559.
BOARD CONSIDERATIONS REGARDING APPROVAL OF INVESTMENT ADVISORY | |
AGREEMENT AND INVESTMENT SUB-ADVISORY AGREEMENT | November 30, 2013 |
On February 12, 2013, the Board, including those trustees who are not interested persons as defined by the 1940 Act (the “Independent Trustees”), considered the approval of the proposed investment advisory agreement (“Investment Advisory Agreement”) between Guggenheim Dynamic Opportunities Fund (n/k/a Guggenheim Credit Allocation Fund (the “Fund”)) and Guggenheim Funds Investment Advisors, LLC (“GFIA”) and the proposed investment sub-advisory agreement (“Investment Sub-Advisory Agreement”) among the Fund, GFIA, and Guggenheim Partners Investment Management, LLC (“GPIM”). The Investment Advisory Agreement and the Investment Sub-Advisory Agreement are together referred to as the “Advisory Agreements.”
The Board, including the Independent Trustees, discussed the proposed Advisory Agreements in light of the regulatory requirements and criteria in a Memorandum of Law provided by Fund counsel.
Based upon its review, the Board concluded that it was in the best interests of the Fund to approve the Advisory Agreements. In reaching this conclusion for the Fund, no single factor was determinative in the Board’s, but rather the Board considered a variety of factors and concluded the following:
Factors Considered
In considering the Advisory Agreements, the Board, including the Independent Trustees, did not identify any factor as all-important or all-controlling and instead considered many factors collectively in light of all of the Fund’s surrounding circumstances, including the following: (i) the investment objective and policies of the Fund, (ii) the background and experience of the investment advisory personnel at GPIM who will be primarily responsible for the day-to-day management of the Fund, (iii) the nature and quality of the services expected to be provided to the Fund by GFIA and GPIM, (iv) the Fund’s proposed advisory fees and estimated expense data as compared to a peer group of closed-end funds with similar or related investment strategies as the Fund, as identified by Guggenheim, and (v) the direct and indirect benefits to GFIA and GPIM from their relationships with the Fund.
During its deliberations, the Board focused, in part, on the experience, resources and strengths of (i) GFIA in supervising the investment activities of certain other closed-end funds and providing or overseeing various administrative and shareholder support services to closed-end funds, (ii) Guggenheim’s reputation as a diversified financial services firm with wealth management, capital markets, proprietary investing and investment management services to an elite mix of individuals, family offices, endowments, foundations and insurance companies, and (iii) GPIM’s experience in investing in credit securities. The Board also discussed the compliance and administrative staff at Guggenheim and received assurances that the services provided by such staff would be made available to the Fund. They also considered the compliance policies and procedures of GFIA and GPIM, specifically.
The Board also reviewed the Fund’s investment advisory fee rate, investment sub-advisory fee rate, and estimated total expense ratio as compared to those of closed-end funds with similar or related investment objectives and strategies (such information was provided by GFIA and GPIM). The Board observed that each of the Fund’s proposed investment advisory fee and total expense ratio was in line with the median advisory fee and expense ratio, respectively, of the peer group identified by management. In this connection, the Board noted the selection methodology employed by management in identifying the Fund’s peer group and took into account management’s explanation that the Fund’s prospective investment strategy will include a variety of dynamic strategies, some of which, but not all, may be employed by the other funds in the peer group, making the Fund a unique strategy. The Board also considered whether the Fund’s proposed advisory fee structure presented opportunities for economies of scale.
The Independent Trustees were represented by independent counsel who assisted them in their deliberations.
Conclusions
Based on the information reviewed and discussions held with respect to each of the foregoing items, the Board, including a majority of the Independent Trustees, concluded that:
| – | it was satisfied with the nature, extent and quality of the services expected to be provided by each of GFIA and GPIM to the Fund; |
| – | there did not appear at this time to be any significant economies of scale to be shared between the Fund and GPIM or GFIA; |
| – | in light of the anticipated costs of providing investment sub-advisory and investment advisory services to the Fund, and other ancillary benefits that GPIM and GFIA were projected to receive with regard to providing investment sub-advisory, investment advisory and other services to the Fund, the investment sub-advisory and investment advisory fees were reasonable; |
| – | each of the investment advisory fee rate and investment sub-advisory fee rate was reasonable in relation to such services, giving due regard to the investment strategies to be employed on behalf of the Fund and |
| – | approval of the Investment Advisory Agreement and Investment Sub-Advisory Agreement are in the best interests of the Fund and its shareholders. |
GGM l GUGGENHEIM CREDIT ALLOCATION FUND SEMIANNUAL REPORT l 27
This Page Intentionally Left Blank.
This Page Intentionally Left Blank.
This Page Intentionally Left Blank.
FUND INFORMATION | November 30, 2013 |
Board of Trustees | Executive Officers | Investment Adviser | Custodian |
Randall C. Barnes | Donald C. Cacciapaglia | Guggenheim Funds | The Bank of |
Chief Executive Officer | Investment | New York Mellon | |
Donald C. Cacciapaglia* | Advisors, LLC | New York, New York | |
Amy J. Lee | Lisle, Illinois | ||
Roman Friedrich III | Chief Legal Officer | Legal Counsel | |
Investment Sub-Adviser | Skadden, Arps, Slate, | ||
Robert B. Karn III | John L. Sullivan | Guggenheim Partners | Meagher & Flom LLP |
Chief Financial Officer, | Investment | New York, New York | |
Ronald A. Nyberg | Chief Accounting Officer | Management, LLC | |
and Treasurer | Santa Monica, California | Independent Registered | |
Ronald E. Toupin, Jr., | Public Accounting Firm | ||
Chairperson | Joanna M. Catalucci | Administrator and | Ernst & Young LLP |
Chief Compliance | Accounting Agent | Chicago, Illinois | |
Officer | Rydex Fund Services, LLC | ||
Rockville, Maryland | |||
Mark E. Mathiasen | |||
Secretary |
| * | Trustee is an “interested person” (as defined in section 2(a)(19) of the 1940 Act) (“Interested Trustee”) of the Fund because of his position as the President and CEO of the Adviser. |
Privacy Principles of the Fund
The Fund is committed to maintaining the privacy of its shareholders and to safeguarding their non-public personal information. The following information is provided to help you understand what personal information the Fund collects, how the Fund protects that information and why, in certain cases, the Fund may share information with select other parties.
Generally, the Fund does not receive any non-public personal information relating to its shareholders, although certain non-public personal information of its shareholders may become available to the Fund. The Fund does not disclose any non-public personal information about its shareholders or former shareholders to anyone, except as permitted by law or as is necessary in order to service shareholder accounts (for example, to a transfer agent or third party administrator).
The Fund restricts access to non-public personal information about its shareholders to employees of the Fund’s investment advisor and its affiliates with a legitimate business need for the information. The Fund maintains physical, electronic and procedural safeguards designed to protect the non-public personal information of its shareholders.
Questions concerning your shares of Guggenheim Credit Allocation Fund?
| · | If your shares are held in a Brokerage Account, contact your Broker. |
| · | If you have physical possession of your shares in certificate form, contact the Fund’s Transfer Agent: |
| Computershare Shareowner Services LLC, P.O. Box 30170 College Station, TX 77842-3170; (866) 488-3559. |
This report is sent to shareholders of Guggenheim Credit Allocation Fund for their information. It is not a Prospectus, circular or representation intended for use in the purchase or sale of shares of the Fund or of any securities mentioned in this report.
A description of the Fund’s proxy voting policies and procedures related to portfolio securities is available without charge, upon request, by calling the Fund at (800)345-7999.
Information regarding how the Fund voted proxies for portfolio securities, if applicable, during the most recent 12-month period ended June 30, is also available, without charge and upon request by calling (800) 345-7999, by visiting the Fund’s website at guggenheiminvestments.com/ggm or by accessing the Fund’s Form N-PX on the U.S. Securities and Exchange Commission’s (SEC) website at www.sec.gov.
The Fund files its complete schedule of portfolio holdings with the SEC for the first and third quarters of each fiscal year on Form N-Q. The Fund’s Form N-Q is available on the SEC website at www.sec.gov or by visiting the Fund’s website at guggenheiminvestments.com/ggm. The Fund’s Form N-Q may also be viewed and copied at the SEC’s Public Reference Room in Washington, DC; information on the operation of the Public Reference Room may be obtained by calling (800) SEC-0330 or at www.sec.gov.
Notice to Shareholders
Notice is hereby given in accordance with Section 23(c) of the Investment Company Act of 1940, as amended, that the Fund from time to time may purchase shares of its common stock in the open market.
GGM l GUGGENHEIM CREDIT ALLOCATION FUND SEMIANNUAL REPORT l 31
| ABOUT THE FUND MANAGER |
Guggenheim Partners Investment Management, LLC
Guggenheim Partners Investment Management, LLC (“GPIM”) is an indirect subsidiary of Guggenheim Partners, LLC, a diversified financial services firm. The firm provides capital markets services, portfolio and risk management expertise, wealth management, and investment advisory services. Clients of Guggenheim Partners, LLC subsidiaries are an elite mix of individuals, family offices, endowments, foundations, insurance companies and other institutions.
Investment Philosophy
GPIM’s investment philosophy is predicated upon the belief that thorough research and independent thought are rewarded with performance that has the potential to outperform benchmark indexes with both lower volatility and lower correlation of returns over time as compared to such benchmark indexes.
Investment Process
GPIM’s investment process is a collaborative effort between various groups including the Portfolio Construction Group, which utilize proprietary portfolio construction and risk modeling tools to determine allocation of assets among a variety of sectors, and its Sector Specialists, who are responsible for security selection within these sectors and for implementing securities transactions, including the structuring of certain securities directly with the issuers or with investment banks and dealers involved in the origination of such securities.
Guggenheim Funds Distributors, LLC | |
2455 Corporate West Drive | |
Lisle, IL 60532 | |
Member FINRA/SIPC | |
| (01/14) | |
CEF - GGM - SAR - 1113 | |
NOT FDIC-INSURED l NOT BANK-GUARANTEED l MAY LOSE VALUE |
Item 2. Code of Ethics.
Not applicable for a semi-annual reporting period.
Item 3. Audit Committee Financial Expert.
Not applicable for a semi-annual reporting period.
Item 4. Principal Accountant Fees and Services.
Not applicable for a semi-annual reporting period.
Item 5. Audit Committee of Listed Registrants.
Not applicable for a semi-annual reporting period.
Item 6. Schedule of Investments.
The Schedule of Investments is included as part of Item 1.
Item 7. Disclosure of Proxy Voting Policies and Procedures for Closed-End Management Investment Companies.
Not applicable for a semi-annual reporting period.
Item 8. Portfolio Managers of Closed-End Management Investment Companies.
(a) Not applicable for a semi-annual reporting period.
(b) The registrant commenced operations during the period and, as such, this is the registrant’s first filing on Form N-CSR. There has been no change, as of the date of filing, in any of the Portfolio Managers previously identified by the registrant on its Form N-2/A.
Item 9. Purchases of Equity Securities by Closed-End Management Investment Company and Affiliated Purchasers.
None.
Item 10. Submission of Matters to a Vote of Security Holders.
The registrant has not made any material changes to the procedures by which shareholders may recommend nominees to the registrant’s Board of Trustees.
Item 11. Controls and Procedures.
(a) The registrant's principal executive officer and principal financial officer have evaluated the registrant's disclosure controls and procedures (as defined in Rule 30a-3(c) under the Investment
Company Act) as of a date within 90 days of this filing and have concluded based on such evaluation, as required by Rule 30a-3(b) under the Investment Company Act, that the registrant's disclosure controls and procedures were effective, as of that date, in ensuring that information required to be disclosed by the registrant in this Form N-CSR was recorded, processed, summarized, and reported within the time periods specified in the Securities and Exchange Commission’s rules and forms.
(b) There were no changes in the registrant’s internal control over financial reporting (as defined in Rule 30a-3(d) under the Investment Company Act) that occurred during the registrant’s second fiscal quarter of the period covered by this report that have materially affected, or are reasonably likely to materially affect, the registrant’s internal control over financial reporting.
Item 12. Exhibits.
(a)(1) Not applicable.
(a)(2) Certifications of principal executive officer and principal financial officer pursuant to Rule 30a-2(a) of the Investment Company Act.
(a)(3) Not applicable.
(b) Certifications of principal executive officer and principal financial officer pursuant to Rule 30a-2(b) under the Investment Company Act and Section 906 of the Sarbanes-Oxley Act of 2002.
SIGNATURES
Pursuant to the requirements of the Securities Exchange Act of 1934 and the Investment Company Act of 1940, the registrant has duly caused this report to be signed on its behalf by the undersigned, thereunto duly authorized.
(Registrant) Guggenheim Credit Allocation Fund
By: /s/ Donald C. Cacciapaglia
Name: Donald C. Cacciapaglia
Title: Chief Executive Officer
Date: February 5, 2014
Pursuant to the requirements of the Securities Exchange Act of 1934 and the Investment Company Act of 1940, this report has been signed by the following persons on behalf of the registrant and in the capacities and on the dates indicated.
By: /s/ Donald C. Cacciapaglia
Name: Donald C. Cacciapaglia
Title: Chief Executive Officer
Date: February 5, 2014
By: /s/ John L. Sullivan
Name: John L. Sullivan
Title: Chief Financial Officer, Chief Accounting Officer and Treasurer
Date: February 5, 2014